2000 - ROSA P - Bureau of Transportation Statistics
491
-
Upload
khangminh22 -
Category
Documents
-
view
0 -
download
0
Transcript of 2000 - ROSA P - Bureau of Transportation Statistics

National Transportation Statistics
2000
Bureau ofTransportation
Statistics
BTS01-01 U.S. Department of Transportation

All material contained in this report is in the public domain andmay be used and reprinted without special permission; citation asto source is required.
Recommended citation
U.S. Department of TransportationBureau of Transportation StatisticsNational Transportation Statistics 2000BTS01-01 (Washington, DC,U.S. Government Printing Office, April 2001)
Copies of this report and other BTS products can be obtained via the following contacts:
Product ordersPhone 202.366.DATA [press 1]Fax 202.366.3640Internet www.bts.govMail Product Orders
Bureau of Transportation StatisticsU.S. Department of Transportation400 7th Street SW, Room 7412Washington, DC 20590
Information service Email [email protected] 800.853.1351

AcknowledgmentsProject Manager
Joanne Sedor
Editor
Chip Moore
Data Collection
Battelle
Contributors
Troy AbelFelix Ammah-TagoeCharles BeeneJohn BusheryLillian ChapmanDavid ChesserJoseph ClementsMichael CohenBingsong FangMarsha FennWendell FletcherRobert GibsonMarilyn GrossXiaoli HanMaha KhanWilliam MallettKirsten OldenburgLisa RandallThea Thomas
U.S. Department ofTransportation
Norman Y. MinetaSecretary
Michael P. JacksonDeputy Secretary
Bureau of TransportationStatistics
Ashish K. SenDirector
Rick KowalewskiDeputy Director
Susan J. LaphamAssociate Directorfor Statistical Programs

v
Compiled and published by the Bureau of Transportation Statistics (BTS),U.S. Department of Transportation, National Transportation Statistics
2000 presents information on the U.S. transportation system, including itsphysical components, safety record, economic performance, energy use, and envi-ronmental impacts. National Transportation Statistics 2000 is a companion docu-ment to the Transportation Statistics Annual Report, which analyzes the data pre-sented here.
The report has four chapters.
! Chapter 1 provides data on the extent, condition, use, and performance of thephysical transportation network.
! Chapter 2 details transportation's safety record, giving data on accidents,crashes, fatalities, and injuries for each mode and for hazardous materials.
! Chapter 3 focuses on the relationship between transportation and the economy,presenting data on transportation's contribution to gross domestic product,employment by industry and occupation, and transportation-related consumerand government expenditures.
! Chapter 4 presents data on transportation energy use and transportation-relatedenvironmental impacts.
Data are presented in five-year increments from 1960 through 1995 and annu-ally thereafter. For annual time-series statistics dating back to 1960, readers arereferred to the 1993 edition of this report. Because many data series presented inthe 1993 edition have since been revised, the reader should be careful when com-paring this earlier data series to that found in this edition.
BTS obtained the data in this report from many sources, including federal gov-ernment agencies, private industries, and associations. Some of the data are basedon samples and are subject to sampling variability. Data from all sources may besubject to omissions and errors in reporting, recording, and processing. Documentscited as sources for the tables often provide detailed information about definitions,methodologies, and statistical reliability. In addition, as part of BTS's ongoingefforts to identify and assess the extent of data errors, National Transportation
Statistics 2000 includes a brief discussion of the quality of the data presented inmany of the tables.
Introduction

Table of Contents ! vii
INTRODUCTION . . . . . . . . . . . . . . . . . . . . . . . . . . . . . . . . . . . . . . . . . . . . . . . . . . . . . . vTable A Social and Economic Characteristics of the United States . . . . . . . . . . . . . . . . . . xvii
Chapter 1. The Transportation SystemTable SECTION A. PHYSICAL EXTENT . . . . . . . . . . . . . . . . . . . . . . . . . . . . . . . . . Page1-1 System Mileage Within the United States . . . . . . . . . . . . . . . . . . . . . . . . . . . . . . 31-2 Number of Air Carriers, Railroads, Interstate Motor Carriers,
Marine Vessel Operators, and Pipeline Operators . . . . . . . . . . . . . . . . . . . . . . . . 41-3 Number of U.S. Airports . . . . . . . . . . . . . . . . . . . . . . . . . . . . . . . . . . . . . . . . . 51-4 Public Road and Street Mileage in the United States by Type of Surface . . . . . . . 61-5 U.S. Public Road and Street Mileage by Functional System . . . . . . . . . . . . . . . . . 71-6 Estimated U.S. Roadway Lane-Miles by Functional System . . . . . . . . . . . . . . . . . 81-7 Number of Stations Served by Amtrak and Rail Transit, Fiscal Year . . . . . . . . . . 81-8 U.S. Oil and Gas Pipeline Mileage . . . . . . . . . . . . . . . . . . . . . . . . . . . . . . . . . . . 9
SECTION B. VEHICLE, AIRCRAFT, AND VESSEL INVENTORY1-9 Number of U.S. Aircraft, Vehicles, Vessels, and Other Conveyances . . . . . . . . . . 131-10 Sales or Deliveries of New Aircraft, Vehicles, Vessels, and other Conveyances . . . 151-11 Active Air Carrier and General Aviation Fleet by Type of Aircraft . . . . . . . . . . . . 171-12 U.S. Automobile and Truck Fleets by Use . . . . . . . . . . . . . . . . . . . . . . . . . . . . . . 201-13 Annual U.S. Motor Vehicle Production and Factory (Wholesale) Sales . . . . . . . . 211-14 Retail New Passenger Car Sales . . . . . . . . . . . . . . . . . . . . . . . . . . . . . . . . . . . . . 221-15 New and Used Passenger Car Sales and Leases . . . . . . . . . . . . . . . . . . . . . . . . . . 231-16 Retail Sales of New Cars by Sector . . . . . . . . . . . . . . . . . . . . . . . . . . . . . . . . . . 231-17 Period Sales, Market Shares, and Sales-Weighted Fuel Economies of
New Domestic and Imported Automobiles, Selected Sales Periods . . . . . . . . . . . . 241-18 Period Sales, Market Shares, and Sales-Weighted Fuel Economies of
New Domestic and Imported Light Trucks, Selected Sales Periods . . . . . . . . . . . . 251-19 World Motor Vehicle Production, Selected Countries . . . . . . . . . . . . . . . . . . . . . 261-20 Number and Size of the U.S. Flag Merchant Fleet and Its Share
of the World Fleet . . . . . . . . . . . . . . . . . . . . . . . . . . . . . . . . . . . . . . . . . . . . . . . 29
SECTION C. CONDITION1-21 U.S. Airport Runway Pavement Conditions . . . . . . . . . . . . . . . . . . . . . . . . . . . . 331-22 Median Age of Automobiles and Trucks in Operation in the U.S. . . . . . . . . . . . . 331-23 Condition of U.S. Roadways by Functional System . . . . . . . . . . . . . . . . . . . . . . 341-24 Condition of U.S. Bridges . . . . . . . . . . . . . . . . . . . . . . . . . . . . . . . . . . . . . . . . . 371-25 Average Age of Urban Transit Vehicles . . . . . . . . . . . . . . . . . . . . . . . . . . . . . . . . 381-26 Class I Railroad Locomotive Fleet by Year Built . . . . . . . . . . . . . . . . . . . . . . . . . 391-27 Age and Availability of Amtrak Locomotive and Car Fleets . . . . . . . . . . . . . . . . 39
Table of Contents

viii " Table of Contents
1-28 U.S. Flag Vessels by Type and Age . . . . . . . . . . . . . . . . . . . . . . . . . . . . . . . . . . . 40
SECTION D. TRAVEL AND GOODS MOVEMENT1-29 U.S. Vehicle-Miles . . . . . . . . . . . . . . . . . . . . . . . . . . . . . . . . . . . . . . . . . . . . . . . 451-30 Roadway Vehicle-Miles Traveled (VMT) and VMT per Lane-Mile
by Functional Class . . . . . . . . . . . . . . . . . . . . . . . . . . . . . . . . . . . . . . . . . . . . . . 471-31 U.S. Passenger-Miles . . . . . . . . . . . . . . . . . . . . . . . . . . . . . . . . . . . . . . . . . . . . . 481-32 Principal Means of Transportation to Work . . . . . . . . . . . . . . . . . . . . . . . . . . . . 501-33 Long-Distance Travel in the United States by Selected Trip
Characteristics: 1995 . . . . . . . . . . . . . . . . . . . . . . . . . . . . . . . . . . . . . . . . . . . . . 511-34 Long-Distance Travel in the United States by Selected Traveler
Characteristics: 1995 . . . . . . . . . . . . . . . . . . . . . . . . . . . . . . . . . . . . . . . . . . . . . 541-35 U.S. Air Carrier Aircraft Departures, Enplaned Revenue Passengers,
and Enplaned Revenue Tons . . . . . . . . . . . . . . . . . . . . . . . . . . . . . . . . . . . . . . . 561-36 Passengers Boarded at the Top 50 U.S. Airports . . . . . . . . . . . . . . . . . . . . . . . . . 581-37 Air Passenger Travel Arrivals in the United States from Selected
Foreign Countries . . . . . . . . . . . . . . . . . . . . . . . . . . . . . . . . . . . . . . . . . . . . . . . 601-38 Air Passenger Travel Departures from the United States to Selected
Foreign Countries . . . . . . . . . . . . . . . . . . . . . . . . . . . . . . . . . . . . . . . . . . . . . . . 611-39 U.S.-Canadian Border Land-Passenger Gateways: 1999 . . . . . . . . . . . . . . . . . . . 621-40 U.S.-Mexican Border Land-Passenger Gateways: 1999 . . . . . . . . . . . . . . . . . . . . 631-41 U.S. Ton-Miles of Freight . . . . . . . . . . . . . . . . . . . . . . . . . . . . . . . . . . . . . . . . . 641-42 Average Length of Haul, Domestic Freight and Passenger Modes . . . . . . . . . . . . 651-43 Top U.S. Foreign Trade Freight Gateways by Value of Shipments: 1998 . . . . . . . 661-44 U.S.-Canadian Border, Land Freight Gateways: 1999 . . . . . . . . . . . . . . . . . . . . . 681-45 U.S.-Mexican Border, Land Freight Gateways: 1999 . . . . . . . . . . . . . . . . . . . . . . 681-46 U.S. Waterborne Freight . . . . . . . . . . . . . . . . . . . . . . . . . . . . . . . . . . . . . . . . . . 691-47 Tonnage of Top 50 U.S. Water Ports, Ranked by Total Tons . . . . . . . . . . . . . . . . 701-48 Growth of Freight Activity in the United States: Comparison of the
1997 and 1993 Commodity Flow Surveys . . . . . . . . . . . . . . . . . . . . . . . . . . . . . 721-49 Value, Tons, and Ton-Miles of Freight Shipments within the
United States by Domestic Establishments, 1997 . . . . . . . . . . . . . . . . . . . . . . . . 731-50 Value of U.S. Land Exports to and Imports from Canada and
Mexico by Mode . . . . . . . . . . . . . . . . . . . . . . . . . . . . . . . . . . . . . . . . . . . . . . . 751-51 Crude Oil and Petroleum Products Transported in the United States
by Mode . . . . . . . . . . . . . . . . . . . . . . . . . . . . . . . . . . . . . . . . . . . . . . . . . . . . . . 761-52 U.S. Hazardous Materials Shipments by Mode of Transportation, 1997 . . . . . . . 771-53 U.S. Hazardous Materials Shipments by Hazard Class, 1997 . . . . . . . . . . . . . . . 781-54 Worldwide Commercial Space Launches . . . . . . . . . . . . . . . . . . . . . . . . . . . . . . 79
SECTION E. PHYSICAL PERFORMANCE1-55 Passengers Denied Boarding by the Largest U.S. Air Carriers . . . . . . . . . . . . . . . 831-56 Mishandled-Baggage Reports Filed by Passengers with the Largest
U.S. Air Carriers . . . . . . . . . . . . . . . . . . . . . . . . . . . . . . . . . . . . . . . . . . . . . . . . 84

Table of Contents ! ix
1-57 Flight Operations Arriving On Time by the Largest U.S. Air Carriers . . . . . . . . . 841-58 U.S. Air Carrier Delay Greater Than 15 Minutes by Cause . . . . . . . . . . . . . . . . . 851-59 Major U.S. Air Carrier Delays, Cancellations, and Diversions . . . . . . . . . . . . . . . 851-60 Annual Person-Hours of Delay Per Eligible Driver . . . . . . . . . . . . . . . . . . . . . . . 861-61 Roadway Congestion Index . . . . . . . . . . . . . . . . . . . . . . . . . . . . . . . . . . . . . . . . 891-62 Congestion Index and Cost Values . . . . . . . . . . . . . . . . . . . . . . . . . . . . . . . . . . . 921-63 Amtrak On-Time Performance Trends and Hours of Delay by Cause . . . . . . . . . 95
Chapter 2. Transportation SafetySECTION A. MULTIMODAL
2-1 Transportation Fatalities by Mode . . . . . . . . . . . . . . . . . . . . . . . . . . . . . . . . . . . 992-2 Injured Persons by Transportation Mode . . . . . . . . . . . . . . . . . . . . . . . . . . . . . . 1022-3 Transportation Accidents by Mode . . . . . . . . . . . . . . . . . . . . . . . . . . . . . . . . . . 1052-4 Distribution of Transportation Fatalities by Mode . . . . . . . . . . . . . . . . . . . . . . . 1082-5 Highway-Rail Grade-Crossing Safety and Property Damage Data . . . . . . . . . . . . 1102-6 Hazardous Materials Safety and Property Damage Data . . . . . . . . . . . . . . . . . . . 1112-7 Transportation-Related Occupational Fatalities . . . . . . . . . . . . . . . . . . . . . . . . . 1132-8 Reporting Thresholds for Property Damage by U.S. Department of
Transportation Modal Administrations . . . . . . . . . . . . . . . . . . . . . . . . . . . . . . . 114
SECTION B. AIR2-9 U.S. Air Carrier Safety Data . . . . . . . . . . . . . . . . . . . . . . . . . . . . . . . . . . . . . . . 1172-10 U.S. Commuter Air Carrier Safety Data . . . . . . . . . . . . . . . . . . . . . . . . . . . . . . . 1192-11 U.S. Air Carrier Fatal Accidents by First Phase of Operation . . . . . . . . . . . . . . . 1212-12 U.S. Commuter Air Carrier Fatal Accidents by First Phase of Operation . . . . . . . 1212-13 U.S. On-Demand Air Taxi Safety Data . . . . . . . . . . . . . . . . . . . . . . . . . . . . . . . . 1222-14 U.S. General Aviation Safety Data . . . . . . . . . . . . . . . . . . . . . . . . . . . . . . . . . . . 1232-15 Number of Pilot-Reported Near Midair Collisions (NMAC) by
Degree of Hazard . . . . . . . . . . . . . . . . . . . . . . . . . . . . . . . . . . . . . . . . . . . . . . . 1242-16 Airline Passenger Screening Results by Type of Weapons Detected,
Persons Arrested, and Bomb Threats Received . . . . . . . . . . . . . . . . . . . . . . . . . . 125
SECTION C. HIGHWAY2-17 Motor Vehicle Safety Data . . . . . . . . . . . . . . . . . . . . . . . . . . . . . . . . . . . . . . . . 1292-18 Motor Vehicle Fatalities, Vehicle-Miles, and Associated Rates by
Highway Functional System . . . . . . . . . . . . . . . . . . . . . . . . . . . . . . . . . . . . . . . 1302-19 Occupant Fatalities by Vehicle Type and Nonoccupant Fatalities . . . . . . . . . . . . . 1322-20 Occupant and Non-Motorist Fatalities in Crashes by Number of
Vehicles and Alcohol Involvement . . . . . . . . . . . . . . . . . . . . . . . . . . . . . . . . . . . 1332-21 Passenger Car Occupant Safety Data . . . . . . . . . . . . . . . . . . . . . . . . . . . . . . . . . 1342-22 Motorcycle Rider Safety Data . . . . . . . . . . . . . . . . . . . . . . . . . . . . . . . . . . . . . . 1352-23 Truck Occupant Safety Data . . . . . . . . . . . . . . . . . . . . . . . . . . . . . . . . . . . . . . . 1362-24 Bus Occupant Safety Data . . . . . . . . . . . . . . . . . . . . . . . . . . . . . . . . . . . . . . . . . 138

x " Table of Contents
2-25 Fatalities by Highest Blood Alcohol Concentration (BAC) inHighway Crashes . . . . . . . . . . . . . . . . . . . . . . . . . . . . . . . . . . . . . . . . . . . . . . . 139
2-26 Number of States with Different Types of Anti-DUI/DWI Legislationin Effect as of January 1 of the Listed Year . . . . . . . . . . . . . . . . . . . . . . . . . . . . 140
2-27 Motor Vehicle Fatal Crashes by Day of Week, Time of Day, andWeather and Light Conditions . . . . . . . . . . . . . . . . . . . . . . . . . . . . . . . . . . . . . . 141
2-28 Motor Vehicle Fatal Crashes by Posted Speed Limit . . . . . . . . . . . . . . . . . . . . . . 1422-29 Safety Belt and Motorcycle Helmet Use . . . . . . . . . . . . . . . . . . . . . . . . . . . . . . . 1432-30 Estimated Number of Lives Saved by Use of Restraints . . . . . . . . . . . . . . . . . . . . 144
SECTION D. TRANSIT2-31 Transit Safety and Property Damage Data . . . . . . . . . . . . . . . . . . . . . . . . . . . . . 1472-32 Transit Safety Data by Mode for All Reported Accidents . . . . . . . . . . . . . . . . . . 1482-33 Transit Safety Data by Mode for All Reported Incidents . . . . . . . . . . . . . . . . . . . 1512-34 Reports of Violent Crime, Property Crime, and Arrests by Transit Mode . . . . . . 154
SECTION E. RAILROAD2-35 Railroad and Grade-Crossing Fatalities by Victim Class . . . . . . . . . . . . . . . . . . . 1612-36 Railroad and Grade-Crossing Injured Persons by Victim Class . . . . . . . . . . . . . . 1622-37 Train Fatalities, Injuries, and Accidents by Type of Accident . . . . . . . . . . . . . . . . 1632-38 Railroad Passenger Safety Data . . . . . . . . . . . . . . . . . . . . . . . . . . . . . . . . . . . . . 1642-39 Railroad System Safety and Property Damage Data . . . . . . . . . . . . . . . . . . . . . . 1652-40 Fatalities and Injuries of On-Duty Railroad Employees . . . . . . . . . . . . . . . . . . . . 166
SECTION F. WATER2-41 Waterborne Transportation Safety and Property Damage Data
Related to Vessel Casualties . . . . . . . . . . . . . . . . . . . . . . . . . . . . . . . . . . . . . . . . 1712-42 Waterborne Transportation Safety Data not Related to Vessel Casualties . . . . . . . 1712-43 Recreational Boating Safety, Alcohol Involvement, and Property
Damage Data . . . . . . . . . . . . . . . . . . . . . . . . . . . . . . . . . . . . . . . . . . . . . . . . . . 1722-44 Personal Watercraft Safety Data . . . . . . . . . . . . . . . . . . . . . . . . . . . . . . . . . . . . 1722-45 U.S. Coast Guard Search and Rescue Statistics, Fiscal Year . . . . . . . . . . . . . . . . . 173
SECTION G. PIPELINE2-46 Hazardous Liquid and Natural Gas Pipeline Safety and Property
Damage Data . . . . . . . . . . . . . . . . . . . . . . . . . . . . . . . . . . . . . . . . . . . . . . . . . . 177
Chapter 3. Transportation and the EconomySECTION A. TRANSPORTATION AND THE TOTAL ECONOMY
3-1a U.S. Gross Domestic Product (GDP) Attributed to For-HireTransportation Services (Current $ billions) . . . . . . . . . . . . . . . . . . . . . . . . . . . . 181

Table of Contents ! xi
3-1b U.S. Gross Domestic Product (GDP) Attributed to For-HireTransportation Services (Chained 1996 $ billions) . . . . . . . . . . . . . . . . . . . . . . . 182
3-2a U.S. Gross Domestic Product (GDP) Attributed to Transportation-RelatedFinal Demand (Current $ billions) . . . . . . . . . . . . . . . . . . . . . . . . . . . . . . . . . . . 183
3-2b U.S. Gross Domestic Product (GDP) Attributed to Transportation-RelatedFinal Demand (Chained 1996 $ billions) . . . . . . . . . . . . . . . . . . . . . . . . . . . . . . 185
3-3a U.S. Gross Domestic Demand (GDD) Attributed to Transportation-RelatedFinal Demand (Current $ billions) . . . . . . . . . . . . . . . . . . . . . . . . . . . . . . . . . . . 187
3-3b U.S. Gross Domestic Demand (GDD) Attributed to Transportation-RelatedFinal Demand (Chained 1996 $ billions) . . . . . . . . . . . . . . . . . . . . . . . . . . . . . . 188
3-4a Contributions to Gross Domestic Product (GDP): Selected Industries(Current $ billions) . . . . . . . . . . . . . . . . . . . . . . . . . . . . . . . . . . . . . . . . . . . . . . 189
3-4b Contributions to Gross Domestic Product (GDP): Selected Industries(Chained 1996 $ billions) . . . . . . . . . . . . . . . . . . . . . . . . . . . . . . . . . . . . . . . . . 191
3-5 Gross Domestic Product (GDP) by Major Social Function . . . . . . . . . . . . . . . . . 1933-6 National Transportation and Economic Trends . . . . . . . . . . . . . . . . . . . . . . . . . 194
SECTION B. TRANSPORTATION AND CONSUMER EXPENDITURES3-7 Passenger and Freight Transportation Expenditures . . . . . . . . . . . . . . . . . . . . . . 1973-8 Sales Price of Transportation Fuel to End-Users . . . . . . . . . . . . . . . . . . . . . . . . . 1993-9 Price Trends of Gasoline v. Other Consumer Goods and Services . . . . . . . . . . . . 2003-10 Producer Price Indices for Transportation Services . . . . . . . . . . . . . . . . . . . . . . . 2013-11 Producer Price Indices for Transportation Equipment . . . . . . . . . . . . . . . . . . . . . 2013-12 Personal Expenditures by Category . . . . . . . . . . . . . . . . . . . . . . . . . . . . . . . . . . 2023-13 Personal Consumption Expenditures on Transportation by Subcategory . . . . . . . 2033-14 Average Cost of Owning and Operating an Automobile . . . . . . . . . . . . . . . . . . . 2043-15a Average Passenger Fares (Current $) . . . . . . . . . . . . . . . . . . . . . . . . . . . . . . . . . 2053-15b Average Passenger Fares (Chained 1996 $) . . . . . . . . . . . . . . . . . . . . . . . . . . . . . 205
SECTION C. TRANSPORTATION REVENUES, EMPLOYMENT,AND PRODUCTIVITY
3-16 Average Passenger Revenue per Passenger-Mile . . . . . . . . . . . . . . . . . . . . . . . . . 2093-17 Average Freight Revenue per Ton-Mile . . . . . . . . . . . . . . . . . . . . . . . . . . . . . . . . 2103-18 Total Operating Revenues . . . . . . . . . . . . . . . . . . . . . . . . . . . . . . . . . . . . . . . . . 2113-19 Employment in For-Hire Transportation and Selected
Transportation-Related Industries . . . . . . . . . . . . . . . . . . . . . . . . . . . . . . . . . . . 2123-20 Employment in Transportation Occupations . . . . . . . . . . . . . . . . . . . . . . . . . . . 2153-21 Average Wage and Salary Accruals per Full-Time Equivalent Employee
by Transportation Industry . . . . . . . . . . . . . . . . . . . . . . . . . . . . . . . . . . . . . . . . 2163-22 Median Weekly Earnings of Full-Time Wage and Salary Workers in
Transportation by Detailed Occupation . . . . . . . . . . . . . . . . . . . . . . . . . . . . . . . 2173-23 Total Wage and Salary Accruals by Transportation Industry . . . . . . . . . . . . . . . . 2183-24 Labor Productivity Indices for Selected Transportation Industries . . . . . . . . . . . . 219

xii " Table of Contents
SECTION D. GOVERNMENT FINANCE3-25a Federal, State, and Local Government Transportation-Related Revenues
and Expenditures, Fiscal Year (Current $ millions) . . . . . . . . . . . . . . . . . . . . . . . 2233-25b Federal, State, and Local Government Transportation-Related Revenues
and Expenditures, Fiscal Year (Constant 1996 $ millions) . . . . . . . . . . . . . . . . . . 2233-26a Federal Transportation-Related Revenues, Fiscal Year (Current $ millions) . . . . . 2243-26b Federal Transportation-Related Revenues, Fiscal Year
(Constant 1996 $ millions) . . . . . . . . . . . . . . . . . . . . . . . . . . . . . . . . . . . . . . . . 2253-27a Federal Transportation-Related Expenditures by Mode, Fiscal Year
(Current $ millions) . . . . . . . . . . . . . . . . . . . . . . . . . . . . . . . . . . . . . . . . . . . . . 2263-27b Federal Transportation-Related Expenditures by Mode, Fiscal Year
(Constant 1996 $ millions) . . . . . . . . . . . . . . . . . . . . . . . . . . . . . . . . . . . . . . . . 2263-28 Cash Balances of the Transportation-Related Federal Trust Funds,
Fiscal Year . . . . . . . . . . . . . . . . . . . . . . . . . . . . . . . . . . . . . . . . . . . . . . . . . . . . 227
Chapter 4. Transportation, Energy, and the EnvironmentSECTION A. U.S. AND TRANSPORTATION SECTOR ENERGYCONSUMPTION
4-1 Overview of U.S. Petroleum Production, Imports, Exports, and Consumption . . 2314-2 U.S. Consumption of Energy from Primary Sources by Sector . . . . . . . . . . . . . . . 2324-3 Domestic Demand for Refined Petroleum Products by Sector . . . . . . . . . . . . . . . 233
SECTION B. TRANSPORTATION ENERGY CONSUMPTION BY MODE4-4 U.S. Energy Consumption by the Transportation Sector . . . . . . . . . . . . . . . . . . . 2374-5 Fuel Consumption by Mode of Transportation . . . . . . . . . . . . . . . . . . . . . . . . . . 2384-6 Energy Consumption by Mode of Transportation . . . . . . . . . . . . . . . . . . . . . . . . 2404-7 Domestic Demand for Gasoline by Mode . . . . . . . . . . . . . . . . . . . . . . . . . . . . . . 2424-8 Certificated Air Carrier Fuel Consumption and Travel . . . . . . . . . . . . . . . . . . . . 2434-9 Motor Vehicle Fuel Consumption and Travel . . . . . . . . . . . . . . . . . . . . . . . . . . . 2444-10 Estimated Consumption of Alternative and Replacement Fuels for
Highway Vehicles . . . . . . . . . . . . . . . . . . . . . . . . . . . . . . . . . . . . . . . . . . . . . . . 2454-11 Passenger Car and Motorcycle Fuel Consumption and Travel . . . . . . . . . . . . . . . 2464-12 Other 2-Axle 4-Tire Vehicle Fuel Consumption and Travel . . . . . . . . . . . . . . . . . 2484-13 Single-Unit 2-Axle 6-Tire or More Truck Fuel Consumption and Travel . . . . . . . 2484-14 Combination Truck Fuel Consumption and Travel . . . . . . . . . . . . . . . . . . . . . . . 2494-15 Bus Fuel Consumption and Travel . . . . . . . . . . . . . . . . . . . . . . . . . . . . . . . . . . . 2494-16 Transit Industry Electric Power and Primary Energy Consumption
and Travel . . . . . . . . . . . . . . . . . . . . . . . . . . . . . . . . . . . . . . . . . . . . . . . . . . . . 2504-17 Class I Rail Freight Fuel Consumption and Travel . . . . . . . . . . . . . . . . . . . . . . . 2514-18 Amtrak Fuel Consumption and Travel . . . . . . . . . . . . . . . . . . . . . . . . . . . . . . . . 2524-19 U.S. Government Energy Consumption by Agency and Source . . . . . . . . . . . . . . 253

Table of Contents ! xiii
SECTION C. TRANSPORTATION ENERGY INTENSITY ANDFUEL EFFICIENCY
4-20 Energy Intensity of Passenger Modes . . . . . . . . . . . . . . . . . . . . . . . . . . . . . . . . . 2574-21 Energy Intensity of Certificated Air Carriers, All Services . . . . . . . . . . . . . . . . . . 2584-22 Energy Intensity of Passenger Cars, Other 2-Axle 4-Tire Vehicles,
and Motorcycles . . . . . . . . . . . . . . . . . . . . . . . . . . . . . . . . . . . . . . . . . . . . . . . . 2604-23 Average Fuel Efficiency of U.S. Passenger Cars and Light Trucks . . . . . . . . . . . . 2614-24 Energy Intensity of Transit Motor Buses . . . . . . . . . . . . . . . . . . . . . . . . . . . . . . 2624-25 Energy Intensity of Class I Railroad Freight Service . . . . . . . . . . . . . . . . . . . . . . 2624-26 Energy Intensity of Amtrak Services . . . . . . . . . . . . . . . . . . . . . . . . . . . . . . . . . . 2634-27 Annual Wasted Fuel Due to Congestion . . . . . . . . . . . . . . . . . . . . . . . . . . . . . . . 2644-28 Wasted Fuel per Eligible Driver . . . . . . . . . . . . . . . . . . . . . . . . . . . . . . . . . . . . . 267
SECTION D. AIR POLLUTION4-29 Federal Exhaust Emission Certification Standards for Newly
Manufactured Gasoline- and Diesel-Powered Light-Duty Vehicles . . . . . . . . . . . . 2734-30a Federal Exhaust Emission Certification Standards for Newly
Manufactured Gasoline- and Diesel-Powered Light Duty Trucks(Category LDT1) (Grams per mile) . . . . . . . . . . . . . . . . . . . . . . . . . . . . . . . . . . 274
4-30b Federal Exhaust Emission Certification Standards for NewlyManufactured Gasoline- and Diesel-Powered Light Duty Trucks(Category LDT2) (Grams per mile) . . . . . . . . . . . . . . . . . . . . . . . . . . . . . . . . . . 276
4-30c Federal Exhaust Emission Certification Standards for NewlyManufactured Gasoline- and Diesel-Powered Light Duty Trucks(Category LDT3) (Grams per mile) . . . . . . . . . . . . . . . . . . . . . . . . . . . . . . . . . . 278
4-30d Federal Exhaust Emission Certification Standards for NewlyManufactured Gasoline- and Diesel-Powered Light Duty Trucks(Category LDT4) (Grams per mile) . . . . . . . . . . . . . . . . . . . . . . . . . . . . . . . . . . 280
4-31 Federal Exhaust Emission Certification Standards for NewlyManufactured Gasoline- and Diesel-Powered Medium-Duty PassengerVehicles (MDPV) . . . . . . . . . . . . . . . . . . . . . . . . . . . . . . . . . . . . . . . . . . . . . . . 282
4-32a Federal Exhaust Emissions Certification Standards for NewlyManufactured Gasoline- and Diesel-Powered Light Heavy-Duty Trucks(Grams per brake horsepower-hour) . . . . . . . . . . . . . . . . . . . . . . . . . . . . . . . . . 283
4-32b Federal Exhaust Emissions Certification Standards for NewlyManufactured Gasoline- and Diesel-Powered Heavy Heavy-Duty Trucks(Grams per brake horsepower-hour) . . . . . . . . . . . . . . . . . . . . . . . . . . . . . . . . . 284
4-33 Federal Exhaust Emissions Standards for Newly Manufactured Motorcycles . . . . 2854-34 Federal Exhaust Emissions Standards for Newly Manufactured and
In-Use Aircraft Engines . . . . . . . . . . . . . . . . . . . . . . . . . . . . . . . . . . . . . . . . . . . 2864-35 Federal Exhaust Emissions Standards for Locomotives . . . . . . . . . . . . . . . . . . . . 2884-36 Federal Exhaust Emissions Standards for Newly Manufactured Marine

xiv " Table of Contents
Spark-Ignition Outboard, Personal Watercraft, and Jet-Boat Engines . . . . . . . . . . 2904-37 Tier 2 Federal Exhaust Emissions Standards for Newly Manufactured
Commercial Marine Compression-Ignition Engines . . . . . . . . . . . . . . . . . . . . . . 2914-38 Estimated National Average Vehicle Emissions Rates by Vehicle Type
and Fuel . . . . . . . . . . . . . . . . . . . . . . . . . . . . . . . . . . . . . . . . . . . . . . . . . . . . . . 2924-39 Estimated National Average Vehicle Emissions Rates by Vehicle Type
Using Reformulated Gasoline . . . . . . . . . . . . . . . . . . . . . . . . . . . . . . . . . . . . . . 2944-40 Estimated National Emissions of Carbon Monoxide . . . . . . . . . . . . . . . . . . . . . 2954-41 Estimated National Emissions of Nitrogen Oxides . . . . . . . . . . . . . . . . . . . . . . . 2964-42 Estimated National Emissions of Volatile Organic Compounds . . . . . . . . . . . . . . 2974-43 Estimated National Emissions of Particulate Matter (PM-10) . . . . . . . . . . . . . . . 2984-44 Estimated National Emissions of Particulate Matter (PM-2.5) . . . . . . . . . . . . . . . 2994-45 Estimated National Emissions of Sulfur Dioxide . . . . . . . . . . . . . . . . . . . . . . . . . 3004-46 Estimated National Emissions of Lead . . . . . . . . . . . . . . . . . . . . . . . . . . . . . . . . 3014-47 Air Pollution Trends in Selected Metropolitan Statistical Areas . . . . . . . . . . . . . . 3024-48 Areas in Nonattainment of National Ambient Air Quality Standards
for Criteria Pollutants . . . . . . . . . . . . . . . . . . . . . . . . . . . . . . . . . . . . . . . . . . . . 3064-49 U.S. Carbon Dioxide Emissions from Energy Use by Sector, 1990-1998 . . . . . . . 311
SECTION E. WATER POLLUTION, NOISE AND SOLID WASTE4-50 Petroleum Oil Spills Impacting Navigable U.S. Waters . . . . . . . . . . . . . . . . . . . . 3154-51 Leaking Underground Storage Tank Releases and Cleanups . . . . . . . . . . . . . . . . 3164-52 Highway Noise Barrier Construction . . . . . . . . . . . . . . . . . . . . . . . . . . . . . . . . . 3164-53 Number of People Residing in High Noise Areas around U.S. Airports . . . . . . . . 3174-54 Motor Vehicles Scrapped . . . . . . . . . . . . . . . . . . . . . . . . . . . . . . . . . . . . . . . . . . 318
Appendix A. Modal ProfilesAir Carrier Profile . . . . . . . . . . . . . . . . . . . . . . . . . . . . . . . . . . . . . . . . . . . . . . . 321General Aviation Profile . . . . . . . . . . . . . . . . . . . . . . . . . . . . . . . . . . . . . . . . . . 328Highway Profile . . . . . . . . . . . . . . . . . . . . . . . . . . . . . . . . . . . . . . . . . . . . . . . . 331Automobile Profile . . . . . . . . . . . . . . . . . . . . . . . . . . . . . . . . . . . . . . . . . . . . . . 336Truck Profile . . . . . . . . . . . . . . . . . . . . . . . . . . . . . . . . . . . . . . . . . . . . . . . . . . . 340Bus Profile . . . . . . . . . . . . . . . . . . . . . . . . . . . . . . . . . . . . . . . . . . . . . . . . . . . . 344Transit Profile . . . . . . . . . . . . . . . . . . . . . . . . . . . . . . . . . . . . . . . . . . . . . . . . . . 347Rail Profile . . . . . . . . . . . . . . . . . . . . . . . . . . . . . . . . . . . . . . . . . . . . . . . . . . . . 353Water Transport Profile . . . . . . . . . . . . . . . . . . . . . . . . . . . . . . . . . . . . . . . . . . . 356Oil Pipeline Profile . . . . . . . . . . . . . . . . . . . . . . . . . . . . . . . . . . . . . . . . . . . . . . 361Natural Gas Pipeline Profile . . . . . . . . . . . . . . . . . . . . . . . . . . . . . . . . . . . . . . . 362
Appendix B. Metric Conversion Tables1-1M System Kilometers Within the United States . . . . . . . . . . . . . . . . . . . . . . . . . . . . 3671-6M Estimated U.S. Roadway Lane-Kilometers by Functional System . . . . . . . . . . . . . 368

Table of Contents ! xv
1-7M Number of Stations Served by Amtrak and Rail Transit, Fiscal Year . . . . . . . . . . 3681-29M U.S. Vehicle-Kilometers . . . . . . . . . . . . . . . . . . . . . . . . . . . . . . . . . . . . . . . . . . . 3691-30M Roadway Vehicle-Kilometers Traveled (VKT) and VKT per Lane-Kilometer
by Functional Class . . . . . . . . . . . . . . . . . . . . . . . . . . . . . . . . . . . . . . . . . . . . . . 3711-31M U.S. Passenger-Kilometers . . . . . . . . . . . . . . . . . . . . . . . . . . . . . . . . . . . . . . . . . 3721-41M U.S. Tonne-Kilometers of Freight . . . . . . . . . . . . . . . . . . . . . . . . . . . . . . . . . . . . 3741-42M Average Length of Haul, Domestic Freight and Passenger Modes . . . . . . . . . . . . 3751-46M U.S. Waterborne Freight . . . . . . . . . . . . . . . . . . . . . . . . . . . . . . . . . . . . . . . . . . 3761-51M Crude Oil Transported in the United States by Mode . . . . . . . . . . . . . . . . . . . . . 3774-3M Domestic Demand for Refined Petroleum Products by Sector . . . . . . . . . . . . . . . 3784-5M Fuel Consumption by Mode of Transportation . . . . . . . . . . . . . . . . . . . . . . . . . . 3794-6M Energy Consumption by Mode of Transportation . . . . . . . . . . . . . . . . . . . . . . . . 3814-7M Domestic Demand for Gasoline by Mode . . . . . . . . . . . . . . . . . . . . . . . . . . . . . . 3834-8M Certificated Air Carrier Fuel Consumption and Travel . . . . . . . . . . . . . . . . . . . . 3844-9M Motor Vehicle Fuel Consumption and Travel . . . . . . . . . . . . . . . . . . . . . . . . . . . 3854-11M Passenger Car and Motorcycle Fuel Consumption and Travel . . . . . . . . . . . . . . . 3864-13M Single-Unit 2-Axle 6-Tire or More Truck Fuel Consumption and Travel . . . . . . . 3884-14M Combination Truck Fuel Consumption and Travel . . . . . . . . . . . . . . . . . . . . . . . 3884-15M Bus Fuel Consumption and Travel . . . . . . . . . . . . . . . . . . . . . . . . . . . . . . . . . . . 3894-16M Transit Industry Electric Power and Primary Energy Consumption and Travel . . . 3894-17M Class I Rail Freight Fuel Consumption and Travel . . . . . . . . . . . . . . . . . . . . . . . 3904-19M U.S. Government Energy Consumption by Agency and Source . . . . . . . . . . . . . . 3914-20M Energy Intensity of Passenger Modes . . . . . . . . . . . . . . . . . . . . . . . . . . . . . . . . . 3934-21M Energy Intensity of Certificated Air Carriers, All Services . . . . . . . . . . . . . . . . . . 3944-22M Energy Intensity of Passenger Cars, Other 2-Axle 4-Tire Vehicles,
and Motorcycles . . . . . . . . . . . . . . . . . . . . . . . . . . . . . . . . . . . . . . . . . . . . . . . . 3964-23M Average Fuel Efficiency of U.S. Passenger Cars, Light Trucks,
and Light-Duty Vehicles . . . . . . . . . . . . . . . . . . . . . . . . . . . . . . . . . . . . . . . . . . 3984-24M Energy Intensiveness of Transit Motor Buses . . . . . . . . . . . . . . . . . . . . . . . . . . . 3994-25M Energy Intensity of Class I Railroad Freight Service . . . . . . . . . . . . . . . . . . . . . . 399
Appendix C. Source and Accuracy Statements . . . . . . . . . . . . . . . . . . . . . . . 401
Appendix D. Glossary . . . . . . . . . . . . . . . . . . . . . . . . . . . . . . . . . . . . . . . . . . 473
Appendix E. List of Acronyms and Initialisms . . . . . . . . . . . . . . . . . . . . . . . . 489
Index . . . . . . . . . . . . . . . . . . . . . . . . . . . . . . . . . . . . . . . . . . . . . . . . . . . . . . . . 491

Table of Contents !
xvii
Table A Social and Economic Characteristics of the United States
KEY: R = revised; U = data are not available
Continued next page
1980 1985 1990 1995 1996 1997 1998 1999
Total U.S. resident population (thousands)
a
227,255 237,924 R248,791 R262,803 R265,229 R267,784 R270,248 272,691
Ageb (thousands)Under 18 63,754 62,623 R63,949 R68,555 R69,109 R69,603 R69,903 70,19918-24 years 30,022 28,902 R26,961 R25,112 R24,843 R24,980 R25,476 26,01125-34 37,082 41,696 R43,174 R40,730 R40,246 R39,559 R38,743 37,93635-44 25,634 31,691 R37,444 R42,555 R43,365 R44,014 R44,498 44,81345-54 22,800 22,460 R25,062 R31,100 R32,358 R33,625 R34,575 35,80255-64 21,703 22,135 R21,116 R21,132 R21,353 R21,816 R22,666 23,38965 and over 25,550 28,415 R31,083 R33,619 R33,957 R34,185 R34,385 34,540
Sexc (thousands)Male 110,053 116,160 R121,284 R128,294 R129,504 R130,783 R132,030 133,277Female 116,493 122,576 R127,507 R134,510 R135,724 R137,001 R138,218 139,414
Metropolitan areas (population in millions) d
Large (over 1 million) 119.0 U R139 147 149 151 153 156Medium (250,000-999,999) 41.0 U R41 44 44 43 43 43Small (less than 250,000) 17.0 U R18 19 R19 20 20 20
Rural v. urbane (thousands)Rural 59,495 U 61,656 U U U U UUrban 167,051 U 187,053 U U U U U
Regionsf (millions)Northeast 49.1 49.9 50.8 51.4 51.6 51.6 R51.7 51.8South 75.4 81.4 85.5 91.8 93.1 94.2 R95.3 96.5Midwest 58.9 58.8 59.7 61.8 62.1 62.5 63.0 63.2West 43.2 47.8 52.8 57.7 58.5 59.4 60.3 61.2
Immigrants admittedg 530,639 570,009 1,536,483 720,461 915,900 798,378 660,477 U
Total area (square miles)h 3,618,770 U 3,717,796 U U U U U

xviii"Table of C
ontentsTable A
Cont’d Social and Economic Characteristics of the United States
KEY: R = revised; U = data are not available
Continued next page
1980 1985 1990 1995 1996 1997 1998 1999
Gross domestic product (chained $ 1996 billions) i 4,900.9 5,717.1 6,707.9 7,543.8 7,813.2 8,144.8 8,495.7 8,848.2Agriculture, forestry, fishing 66.5 97.5 118.3 123.1 130.4 143.1 142.9 UManufacturing 832.3 987.9 1,102.3 1,284.7 1,316.0 1,385.0 1448.7 UMining 90.6 96.2 105.8 113.0 113.0 119.4 126.4 UConstruction 249.4 270.5 287.5 299.6 316.4 329.3 342.9 UTransportation 154.0 170.9 180.6 225.1 243.4 256.8 261.6 UWholesale/retail trade 621.5 822.7 954.6 1,124.4 1,216.7 1,328.5 1459.7 UFinance, insurance, real estate 1,003.1 1,125.5 1,250.6 1,393.0 1,436.8 1,510.5 1606.7 UServices 928.1 1,103.3 1,361.9 1,510.4 1,564.2 1,634.4 1708.1 U
Total civilian labor force (thousands) 106,940 115,461 125,840 132,304 133,943 136,297 137,673 139,368Participation rate of men 77.4% 76.3% 76.4% 75.0% 74.9% 75.0% 74.9% 74.7%Participation rate of women 51.5% 54.5% 57.5% 58.9% 59.3% 59.8% 59.8% 60.0%
Number of households (thousands) 80,776 86,789 93,347 98,990 99,627 101,018 102,528 U
Average size of households 2.76 2.69 2.63 2.65 2.65 2.64 2.62 U
Median household income (chained $ 1996)
j R$33,722 R$34,439 R$35,945 R$35,082 $35,492 R$36,175 R$37,430 U
Average household expenditures (chained $ 1996) U R$34,253 R$34,070 R$33,217 $33,797 R$34,038 R$34,205 U

Table of Contents !
xix
Immigrants: 1980-85: Statistical Abstract of the United States 1990 (Washington, DC:1990), table 6.1990-96: Ibid., Statistical Abstract of the United States 1998 (Washington, DC: 1998), table 6.1997-98: U.S. Department of Justice, Immigration and Naturalization Service, Office ofPolicy and Planning, Statistics Branch, Annual Report, Legal Immigration, Fiscal Year 1998, No. 2,May 1999, Internet site http://www.ins.usdoj.gov/graphics/aboutins/statistics/index.htm, asof May 1, 2000.Total area: U.S. Department of Commerce, Bureau of the Census, Statistical Abstract ofthe United States 1998 (Washington, DC:1998), table 1.Gross domestic product: 1980-90: Ibid., Survey of Current Business (Washington,DC: November 1997)1995-97: Ibid., November 1998.1998: Ibid., September 1999.1999: Ibid., April 2000. Industry gross domestic products are expressed as chained 1996 dollarsusing industry-specific chain-type quantity indices from the Bureau of Economic Analysis.Civilian labor force: 1980-85: U.S. Department of Commerce, Bureau of the Census,Statistical Abstract of the United States 1998 (Washington, DC: 1998), table 644.1990-99: U.S. Department of Labor, Bureau of Labor Statistics, Current PopulationSurvey, Internet site http://www.bls.gov, specific series data query, as of May 1, 2000.Participation rates: 1985: U.S. U.S. Department of Commerce, Bureau of the Census,Statistical Abstract of the United States 1998 (Washington, DC: 1998), table 639.1990-99: U.S. Department of Labor, Bureau of Labor Statistics, Current PopulationSurvey, Internet site http://www.bls.gov, specific series data queries, as of May 1, 2000.Number and average size of households: 1980-97: U.S. Department of Commerce,Bureau of the Census, Statistical Abstract of the United States 1998 (Washington, DC:1998), table 69.1998: Ibid., Statistical Abstract of the United States 1999 (Washington, DC: 1999), table 70.Median household income: Ibid., Statistical Abstract of the United States 1999 (Washington,DC:1999), table 742. Converted to chained 1996 dollars using the chain-type price index forpersonal consumption expenditures from the Bureau of Economic Analysis.Average household expenditures: Ibid., U.S. Department of Labor, Bureau of LaborStatistics, Consumer Expenditure Survey, Internet site http://www.bls.gov/csxhome.htm.Converted to chained 1996 dollars using the chain-type price index for personal con-sumption expenditures from the Bureau of Economic Analysis.
Table ACont’d Social and Economic Characteristics of the United States
a Estimates as of July except 1980 and 1990, which are as of April 1.b Total population count has been revised since the 1980 census. Numbers by age have
not been corrected and may not sum to total.c 1995 through 1999 data are estimates.d Defined as Metropolitan Statistical Areas and Consolidated Metropolitan Statistical
Areas, as of July 1, 1994.e As of April 1 of year indicated. The Census Bureau only tabulates urban/rural numbers
for the decennial census years.f As of July 1 for all years except 1980 and 1990.g Fiscal year ending September 30h The Census Bureau tabulates area (square miles) data for the decennial census years only.
Data for 1990 reflect the inclusion of the Great Lakes, inland water, and coastal water.Data for prior years included inland water only.
i Estimates for 1980 and 1985 are shown on the basis of the 1972 Standard IndustrialCode (SIC); 1990-96 are based on the 1987 SIC.
j Households as of March of following year.SOURCES:U.S. resident population: 1980-90: U.S. Department of Commerce, Bureau of theCensus, Statistical Abstract of the United States 1998 (Washington, DC: 1998), table 2.1995-99: Ibid., Population Estimates Program, Population Division, Internet websitehttp://www.census.gov/populations/estimates/nation/intfile2-1.txt, as of April 27, 2000.Age: 1980-90: Statistical Abstract of the United States 1998 (Washington, DC: 1998), table 14.1995-99: Ibid., Populations Estimates Program, Population Division, Internet websitehttp://www.census.gov/populations/estimates/nation/intfile2-1.txt, as of April 27, 2000.Sex: 1980-90: Statistical Abstract of the United States 1998 (Washington, DC: 1998), table 19.1995-99: Ibid., Populations Estimates Program, Population Division, Internet websitehttp://www.census.gov/populations/estimates/nation/intfile2-1.txt, as of April 27, 2000.Metropolitan areas: 1980: Statistical Abstract of the United States 1995 (Washington,DC:1995), table 41.1990-96: Ibid., Statistical Abstract of the United States 1999 (Washington, DC: 1999), table 41.Rural/urban: Ibid., table 46.Regions: 1980-97: Ibid., table 29.1998-99: Ibid., Internet site http://www.census.gov/population/estimates/state/st-99-1.txt, as of Apr. 27, 2000.

The TransportationSystem
Section APhysical Extent
chapter one

Physical E
xtent !3
SOURCES:Highway: 1960-95: U.S. Department of Transportation, Federal HighwayAdministration, Highway Statistics Summary to 1995, FHWA-PL-97-009 (Washington, DC:Annual issues), table HM-212.1996-98: Ibid., Highway Statistics (Washington, DC: Annual issues), table HM-12.Class I rail: 1960-98: Association of American Railroads, Railroad Facts (Washington, DC:1998), p. 44.Amtrak: 1980: Amtrak, Corporate Planning and Development, personal communica-tion (Washington, DC).1985-98: Amtrak, Corporate Planning and Development, Amtrak Annual Report,Statistical Appendix (Washington, DC: Annual issues).Transit: U.S. Department of Transportation, Federal Transit Administration, NationalTransit Database (Washington, DC: Annual issues), table 18 (1996-1997) and table 19 (for1998) and similar tables in earlier editions.Navigable channels: 1960-96: U.S. Army Corps of Engineers, Ohio River Division,Huntington District, Ohio River Navigation System Report, 1996, Commerce on the Ohio Riverand its Tributaries (Fort Belvoir, VA: 1996), p. 2.1997-1998: Waterborne Commerce Statistics Center Databases, personal communica-tion, June 2000.Oil pipeline: 1960-98: Eno Transportation Foundation, Inc., Transportation in America,1998 (Washington, DC: 1999), p. 64.Gas pipeline: 1960-98: American Gas Association, Gas Facts (Arlington, VA : Annualissues), table 5-2 and similar tables in earlier editions.
Table 1-1 System Mileage Within the United States (Statute miles)
a All public road and street mileage. For years prior to 1980, some miles of nonpublic roadways are included. No consistent data on private road mileage are available.Includes District of Columbia. Beginning in 1996, mileage data for Puerto Rico are included.
b Data represent miles of road owned (aggregate length of road, excluding yard tracks,sidings, and parallel lines).
c Portions of Class I freight railroads, Amtrak, and commuter rail networks share commontrackage. Amtrak data represent miles of track operated.
d Transit system mileage is measured in directional route-miles. A directional route-mile isthe mileage in each direction over which public transportation vehicles travel while in revenue service. Directional route-miles are computed with regard to direction ofservice, but without regard to the number of traffic lanes or rail tracks existing in the right-of-way.
e The St. Lawrence Seaway is not included in this number because 3 of the 5 subsections are solely in Canadian waters, and the others are in international boundary waters. Ofthe 26,000 miles of navigable waterways, 10,867 miles are commercially significant shallow-draft inland waterways subject to fuel taxes.
f Includes trunk and gathering lines for crude-oil pipeline.g Excludes service pipelines. Data not adjusted to common diameter equivalent. Mileage
as of the end of each year. Includes field and gathering, transmission, and distribution mains. See table 1-8 for a more detailed breakout of oil and gas pipeline mileage.
NOTES: Total highway mileage in this table will not match that in tables 1-3 and 1-4because of a change in the way the U.S. Department of Transportation, Federal HighwayAdministration (FHWA) creates mileage-based tables derived from the HighwayPerformance Monitoring System, beginning with the 1997 issue of FHWA's HighwayStatistics. See the accuracy statement in the appendix for additional details.
KEY: N = data do not exist; R = revised
1960 1965 1970 1975 1980 1985 1990 1995 1996 1997 1998Highway a 3,545,693 3,689,666 3,730,082 3,838,146 3,859,837 3,863,912 3,866,926 3,912,226 3,919,450 3,944,597 3,948,893Class I rail b,c 207,334 199,798 196,479 191,520 164,822 145,764 119,758 108,264 105,779 102,128 100,570Amtrak c N N N N 24,000 24,000 24,000 24,000 25,000 25,000 22,000Transit d
Commuter rail c N N N N N 3,574 4,132 4,160 3,682 4,417 5,172 Heavy rail N N N N N 1,293 1,351 1,458 1,478 1,527 1,527 Light rail N N N N N 384 483 568 638 659 676Navigable channelse 25,000 25,000 26,000 26,000 26,000 26,000 26,000 26,000 26,000 26,000 26,000Oil pipelinef 190,944 210,867 218,671 225,889 218,393 213,605 208,752 R221,600 R177,535 179,873 178,648Gas pipeline g 630,950 767,520 913,267 979,263 1,051,774 1,118,875 1,206,894 1,262,152 1,276,315 R1,251,199 1,279,714

4"
Chapter 1 T
he Transportation System
pipeline system. The gas distribution pipeline system supplies the ultimate consumer who either purchases the gas directly through a meter or by other means, such as by rents.
SOURCES:Air carriers: U.S. Department of Transportation, Bureau of Transportation Statistics,Office of Airline Information, Air Carrier Financial Statistics Quarterly (Washington, DC:Fourth quarter issues), "Alphabetical List of Air Carriers by Carrier Group ...".Railroads: 1999: Association of American Railroads, Railroad Facts (Washington, DC: 2000).1989-1998: Ibid., Railroad Ten-Year Trends, Vol. 16 (Washington, DC: 1999), page 10.1986: Ibid., Vol. 3 (Washington, DC), table I-2.1960-1985: Ibid., Vol. 2 (Washington, DC), table I-2.Interstate motor carriers: U.S. Department of Transportation, Federal Motor CarrierSafety Administration, Motor Carrier Management Information System (MCMIS) data,personal communication, Apr. 5, 2000.Marine vessel operators: 1995-97: U.S. Army, Corps of Engineers, WaterborneTransportation Lines of the United States, Volume 2, Vessel Company Summary(New Orleans,LA: Annual issues), source data files obtained by personal communication, Apr. 12, 2000.1998: Ibid., Internet site: http://www.wrsc.usace.army.mil/ndc/datavess.htm as ofApr. 10, 2000.Pipeline Operators: U.S. Department of Transportation, Office of Pipeline Safety,personal communication, Jul. 28, 2000.
Table 1-2 Number of Air Carriers, Railroads, Interstate Motor Carriers, Marine Vessel Operators, and Pipeline Operators
a Carrier groups are categorized based on their annual operating revenues as major,national, large regional, and medium regional. The thresholds were last adjusted July 1,1999, and the threshold for major air carriers is currently $1 billion. The other air carrier category contains all national, large regional, and medium regional air carriers.
b Figures are for the fiscal year, October through September.c The printed source materials do not contain totals for the number of operators and data
files from which the figures can be determined are not available prior to 1993.d There is some overlap among the operators for the pipeline modes so the total number
of pipeline operators is lower than the sum for the the three pipeline modes.e Prior to 1980, the source of motor carrier data was the Interstate Commerce
Commission (ICC), which was abolished on Jan. 1, 1996. (Certain functions were transferred to the Surface Transportation Board and the Department of Transportation.)The system used by ICC to collect motor carrier data differs significantly from that used by the Federal Motor Carrier Safety Administration in its Motor Carrier Management Information System (MSMIS), which began operations in 1980. The MCMIS is updated weekly, but archive versions are not retained. Because of differences between the two systems, data are not comparable and thus are not included here.
f This value is for 1986. The number of hazardous liquid pipeline operators is not available for prior years.
g Includes master meter and mobile home park natural gas distribution operators. A master meter system is a pipeline system for distributing gas within, but not limited to, a definable area, such as a mobile home park, housing project, or apartment complex, where the operator purchases metered gas from an outside source for resale through a gas distribution
KEY: N = data do not exist; U = data are not available
1960 1965 1970 1975 1980 1985 1990 1995 1996 1997 1998 1999
Air Carriersa N N 39 36 63 102 70 96 96 96 96 94
Major Air Carriers N N N N N 13 14 11 12 13 13 13
Other Air Carriers N N N N N 89 56 85 84 83 83 81
Railroads 607 568 517 477 480 500 530 541 553 550 559 555
Class I Railroads 106 76 71 73 39 25 14 11 10 9 9 9
Other Railroads 501 492 446 404 441 f475 516 530 543 541 550 546
Interstate Motor Carriersb e e e e U U 216,000 346,000 379,000 417,000 477,486 517,297
Marine Vessel Operators c U U U U U U U 2,519 2,505 2,494 2,534 2,502
Pipeline Operatorsd N N 1,123 1,682 2,243 2,204 2,212 2,378 2,338 2,282 2,225 2,196
Hazardous Liquid N N N N N f222 187 209 215 217 225 237
Natural Gas Transmission N N 420 432 474 724 866 974 970 954 880 850
Natural Gas Distribution N N 938 g1,500 g1,932 1,485 1,382 1,444 1,397 1,363 1,366 1,351

Physical E
xtent !5
SOURCE: U.S. Department of Transportation,Federal Aviation Administration, Administrator's Fact Book (Washington, DC: Annualissues), Internet site http://www.ama500.jccbi.gov as of May 20, 2000.
Table 1-3 Number of U.S. Airportsa
a Includes civil and joint-use civil-military airports, heliports, STOLports, and seaplane bases in the United States and its territories.
b Certificated airports serve air-carrier operations with aircraft seating more than 30 passengers.
KEY: N = data do not exist
1980 1985 1990 1991 1992 1993 1994 1995 1996 1997 1998 1999
Public use, total% with lighted runways 66.2 68.1 71.4 71.9 72.3 72.8 73.5 74.3 74.5 74.6 74.8 76.2% with paved runways 72.3 66.7 70.7 71.5 71.6 72.2 72.9 73.3 73.7 74.0 74.2 74.2
4,814 5,858 5,589 5,551 5,545 5,538 5,474 5,415 5,389 5,357 5,352 5,354
Private use, total% with lighted runways 15.2 9.1 7.0 6.8 6.6 6.3 6.2 6.4 6.4 6.4 6.3 6.7% with paved runways 13.3 17.4 31.5 32.0 32.2 32.7 33.0 33.0 32.9 33.0 33.2 31.8
10,347 10,461 11,901 12,030 12,301 12,779 12,869 12,809 12,903 12,988 13,418 13,774
TOTAL airports 15,161 16,319 17,490 17,581 17,846 18,317 18,343 18,224 18,292 18,345 18,770 19,098
Certificatedb
Civil N N N N N N 577 572 577 566 566 565Civil-military N N N N N N 95 95 94 94 94 90
, total 730 700 680 669 664 670 672 667 671 660 660 655
General aviation, total 14,431 15,619 16,810 16,912 17,182 17,637 17,671 17,557 17,621 17,685 18,110 18,443
TOTAL airports 15,161 16,319 17,490 17,581 17,846 18,317 18,343 18,224 18,292 18,345 18,770 19,098

6"
Chapter 1 T
he Transportation System
thereof) and open to public travel. No consistent data onprivate road mileage are available (although for years prior to 1980, some nonpublicroadway mileage are included). Some years contain U.S. Department of Transportation,Federal Highway Administration (FHWA) estimates for some states.Numbers may not add due to rounding.Beginning with the 1997 issue of Highway Statistics, FHWA has instituted a new methodfor creating mileage based tables derived from the Highway Performance MonitoringSystem (HPMS) data. Previously, adjustments to tables developed from sampled datawere made using areawide mileage data provided by the States; these adjustments arenow made using the universe totals from the HPMS data set. In addition, rounding andexpansion related differences were spread across table cells so that all table-to-tablemileage totals on related tables matched precisely. While this cosmetic step makes allfunctional system table totals match, an unintended result is that the tables are notreproducible from the data set by any other users. As a result, FHWA made a decisionto discontinue the spreading process, and users may note minor differences in table-to-table mileage totals. For record purposes, FHWA considers the mileage totals from tableHM-20, Public Road Length, Miles by Functional System in Highway Statistics to be thecontrolling totals should a single value be required. Thus, total mileage in this table doesnot match that in tables 1-1 and 1-4.SOURCES: 1960-95: U.S. Department of Transportation, Federal HighwayAdministration, Highway Statistics Summary to 1995, FHWA-PL-97-009 (Washington, DC:July 1997), table HM-212.1996-98: Ibid., Highway Statistics (Washington, DC: Annual issues), table HM-12.
Table 1-4 Public Road and Street Mileage in the United States by Type of Surfacea (Millions of miles)
a 1960-95 data include the 50 states and the District of Columbia; 1996-98 data include the 50 states, District of Columbia, and Puerto Rico.
b Paved mileage includes the following categories: low type (an earth, gravel, or stone roadway that has a bituminous surface course less than 1" thick) ; intermediate type (a mixed bituminous or bituminous penetration roadway on a flexible base having a combined surface and base thickness of less than 7"); high-type flexible (a mixed bituminous or bituminous penetration roadway on a flexible base having a combined surface and base thickness of 7" or more; high-type composite (a mixed bituminous or bituminous penetration roadway of more than 1" compacted material on a rigid base with a combined surface and base thickness of 7" or more; high-type rigid (Portland cement concrete roadway with or without a bituminous wearing surface of less than 1".
c Unpaved mileage includes the following categories: unimproved roadways using the natural surface and maintained to permit passability; graded and drained roadways ofnatural earth aligned and graded to permit reasonably convenient use by motor vehicles,and that have adequate drainage to prevent serious impairment of the road by normal surface water--surface may be stabilized; and soil, gravel, or stone, a graded and drained road with a surface of mixed soil, gravel, crushed stone, slag, shell, etc.--surface may be stabilized. The percentage of unpaved roads that are nonsurfaced, dropped from approximately 42% in the 1960s to about 37% in the first half of the 1970s, to about 32% in 1980 and has held at about 22% since 1985.
d Source no longer sorts data into these particular categories.NOTES: A public road is any road under the jurisdiction of and maintained by a publicauthority (federal, state, county, town, or township, local government or instrumentality
KEY: N = data do not exist
1960 1965 1970 1975 1980 1985 1990 1995 1996 1997 1998
Pavedb
Low and intermediate type 0.672 0.758 0.897 0.967 1.041 1.015 1.025 1.062 1.066 Nd Nd
High-type 0.558 0.696 0.762 0.888 1.032 1.099 1.230 1.316 1.314 Nd Nd
Total 1.230 1.455 1.658 1.855 2.073 2.114 2.255 2.378 2.380 2.410 2.420
Unpavedc total 2.315 2.235 2.072 1.983 1.787 1.750 1.612 1.534 1.554 1.548 1.529
TOTAL paved and unpaved 3.546 3.690 3.730 3.838 3.860 3.864 3.867 3.912 3.934 3.958 3.949

Physical E
xtent !7
SOURCES: 1990-95: U.S. Department of Transportation, Federal HighwayAdministration, Highway Statistics Summary to 1995, FHWA-PL-97-009 (Washington, DC:July 1997), table HM-220.1996-99: Ibid., Highway Statistics (Washington, DC: Annual issues), table HM-20.
Table 1-5 U.S. Public Road and Street Mileage by Functional Systema
a Includes the 50 states and the District of Columbia. When states did not submit reports,data were estimated by the U.S. Department of Transportation, Federal Highway Administration.
NOTES: A public road is any road under the ownership of and maintained by a publicauthority (federal, state, county, town, or township, local government, or instrumentalitythereof) and open to public travel. No consistent data on private road mileage are avail-able. For more detailed information, including breakouts of mileage by ownership andtype of surface, see the source document.
1990 1991 1992 1993 1994 1995 1996 1997 1998 1999Urban mileagePrincipal arterials, Interstates 11,527 11,602 12,516 12,877 13,126 13,164 13,217 13,247 13,312 13,343Principal arterials, other
freeways and expressways 7,668 7,709 8,491 8,841 8,994 8,970 9,027 9,063 9,127 9,125Principal arterials, other 51,968 52,515 51,900 52,708 53,110 52,796 52,983 53,223 53,132 53,206Minor arterials 74,659 74,795 80,815 86,821 87,857 88,510 89,020 89,185 89,496 89,399Collectors 78,254 77,102 82,784 84,854 86,089 87,331 87,790 88,049 88,071 88,008Local 520,568 526,139 548,560 559,776 564,609 568,935 574,728 583,973 588,504 592,978 Total 744,644 749,862 785,066 805,877 813,785 819,706 826,765 836,740 841,642 846,059
Rural mileagePrincipal arterials, Interstates 33,547 33,677 32,951 32,631 32,457 32,580 32,820 32,817 32,813 32,974Principal arterials, other 83,802 86,747 94,947 96,770 97,175 97,948 98,131 98,257 98,852 98,856Minor arterials 144,774 141,795 137,685 137,577 138,120 137,151 137,359 137,497 137,308 137,463Major collectors 436,352 436,746 434,072 432,222 431,115 431,712 432,117 432,714 432,408 432,954Minor collectors 293,922 293,511 284,504 282,182 282,011 274,081 273,198 272,362 272,140 271,690Local 2,129,885 2,141,582 2,131,856 2,117,952 2,111,932 2,119,048 2,119,262 2,135,485 2,091,127 2,097,244 Total 3,122,282 3,134,058 3,116,015 3,099,334 3,092,810 3,092,520 3,092,887 3,109,132 3,064,648 3,071,181
TOTAL urban and rural mileage 3,866,926 3,883,920 3,901,081 3,905,211 3,906,595 3,912,226 3,919,652 3,945,872 3,906,290 3,917,240

8"
Chapter 1 T
he Transportation System
Rail transit: U.S. Department of Transportation,Federal Transit Administration, National Transit Database (Washington, DC: Annualissues), table 19 (for 1999 issue) and similar tables in earlier editions.
Table 1-7 Number of Stations Served by Amtrak and Rail Transit, Fiscal Year
NOTE: Rail transit is sum of commuter rail, heavy rail, and light rail. In several largeurban areas, Amtrak and commuter rail stations are shared.SOURCES:Amtrak: Amtrak, Amtrak Annual Report, Statistical Appendix (Washington, DC: Annual issues).
KEY: U = data are not available
SOURCES: 1980-95: U.S. Department of Transportation,Federal Highway Administration, Office of Highway Information Management, tableHM-260 (unpublished).1996: Ibid,. Highway Statistics (Washington, DC: Annual issues), table HM-60.1997-99: Ibid., Internet site www.fhwa.dot.gov/ohim.ohimstat.htm, as of Nov. 15, andDec. 8, 2000.
Table 1-6 Estimated U.S. Roadway Lane-Miles by Functional Systema
a Includes the 50 States, the District of Columbia, and Puerto Ricob Includes minor and major collectors.NOTE: In estimating rural and urban lane mileage, the U.S. Department ofTransportation, Federal Highway Administration assumed that rural minor collectors andurban/rural local roads are two lanes wide.
KEY: R = revised
UrbanInterstatesOther arterialsCollectorsLocal Total
RuralInterstatesOther arterialsCollectorsa
Local Total
1980
48,458333,673145,128867,986
1,395,245
130,980507,098
1,431,2674,457,5846,526,929
1985
57,295371,649162,377951,018
1,542,339
131,907510,005
1,466,7894,366,9546,475,655
1990
62,214399,376167,770
1,041,1361,670,496
135,871517,342
1,467,6024,259,7706,380,585
1995
71,377445,828185,032
1,137,8701,840,107
131,916530,706
1,417,4284,238,0966,318,146
1996
71,790449,480186,923
1,149,4561,857,649
132,963532,856
1,416,6624,238,5246,321,005
1997R
R72,966R455,872R190,153
R1,178,928R1,897,919
R133,165R537,870
R1,421,568R4,282,216R6,375,228
1998R
73,729456,333188,852
1,188,0151,906,929
133,640538,875
1,418,7334,193,5556,284,803
1999
74,038452,627187,612
1,197,0261,911,303
134,611540,208
1,416,9624,205,9606,297,741
1985 1990 1991 1992 1993 1994 1995 1996 1997 1998 1999Amtrak 503 516 523 524 535 540 530 542 516 508 510Rail transit 1,895 2,169 2,192 2,240 2,286 2,376 2,382 2,587 2,391 2,524 U

1960 1965 1970 1975 1980 1985 1990 1991Oil pipelineCrude linesa 141,085 149,424 146,275 145,679 129,831 117,812 118,805 115,860Product lines 49,859 61,443 72,396 80,210 88,562 95,793 89,947 87,968 Total 190,944 210,867 218,671 225,889 218,393 213,605 208,752 203,828
Gas pipelineb
Distribution mains 391,400 494,500 594,800 648,200 701,800 753,400 837,300 857,500Transmission pipelinesc 183,700 211,300 252,200 262,600 266,500 271,200 280,100 281,600Field and gathering lines 55,800 61,700 66,300 68,500 83,500 94,300 89,500 86,300 Total 630,950 767,520 913,267 979,263 1,051,774 1,118,875 1,206,894 1,225,358
1992 1993 1994 1995 1996 1997 1998Oil pipelineCrude linesa R110,651 R107,246 R103,277 R129,423 R92,610 91,523 87,663Product lines R85,894 R86,734 R87,073 R92,177 R84,925 88,350 90,985 Total R196,545 R193,980 R190,350 R221,600 R177,535 179,873 178,648
Gas pipelineb
Distribution mains 883,200 908,300 919,300 936,800 959,500 R957,100 980,800Transmission pipelinesc 284,500 269,600 268,300 263,900 259,300 R251,100 253,900Field and gathering lines 86,200 73,100 70,400 60,400 57,500 R43,000 45,000 Total 1,253,924 1,251,095 1,257,971 1,261,100 1,276,315 R1,251,200 1,279,700
Physical E
xtent !9
SOURCES:Oil pipeline: 1960-98: Eno Transportation Foundation, Inc., Transportation in America,1999 (Washington, DC: 1999), p. 64.Gas pipeline: 1960-98: American Gas Association, Gas Facts (Arlington, VA: Annualissues), tables 5-1 and 5-3, and similar tables in earlier editions.
Table 1-8 U.S. Oil and Gas Pipeline Mileage
a Includes trunk and gathering lines.b Excludes service pipe. Data are not adjusted to common diameter equivalent. Mileage as of the end of each year.
c After 1975, includes 5,000-6,200 miles of underground storage pipe.NOTE: Numbers may not add to totals due to rounding because the source providesexact numbers for totals, but rounded mileage for subtotals.
KEY: R = revised

Section BVehicle, Aircraft, and
Vessel Inventory
chapter one

1960 1965 1970 1975 1980 1985 1990 1995 1996 1997 1998AirAir carriera 2,135 2,125 2,679 2,495 3,808 4,678 6,083 7,411 7,478 7,616 8,111General aviationb (active fleet) 76,549 95,442 131,743 168,475 211,045 210,654 196,800 188,100 191,100 192,400 204,710
Highway (registered vehicles)
Passenger car 61,671,390 75,257,588 89,243,557 106,705,934 121,600,843 127,885,193 133,700,496 128,386,775 129,728,341 129,748,704 131,838,538Motorcycle 574,032 1,381,956 2,824,098 4,964,070 5,693,940 5,444,404 4,259,462 3,897,191 3,871,599 3,826,373 3,879,450Other 2-axle 4-tire vehicle N g 14,210,591 20,418,250 27,875,934 37,213,863 48,274,555 65,738,322 69,133,913 70,224,082 71,330,205Truck
Single-unit 2-axle 6-tire or more truck N 13,999,285 3,681,405 4,231,622 4,373,784 4,593,071 4,486,981 5,023,670 5,266,029 5,293,358 5,734,925
Combination truck h11,914,249 786,510 905,082 1,130,747 1,416,869 1,403,266 1,708,895 1,695,751 1,746,586 1,789,968 1,997,345Bus 272,129 314,284 377,562 462,156 528,789 593,485 626,987 685,503 694,781 697,548 715,540 Total highway 74,431,800 91,739,623 111,242,295 137,912,779 161,490,159 177,133,282 193,057,376 205,427,212 210,441,249 211,580,033 215,496,003
Transitc
Motor bus 49,600 49,600 49,700 50,811 59,411 64,258 58,714 67,107 71,678 R72,770 P74,641
Light rail cars 2,856 1,549 1,262 1,061 1,013 717 913 999 1,140 1,229 P1,205
Heavy rail cars 9,010 9,115 9,286 9,608 9,641 9,326 10,419 10,157 10,201 10,242 P10,301
Trolley bus 3,826 1,453 1,050 703 823 676 832 885 871 859 P880
Commuter rail cars and locomotives N N N N 4,500 4,035 4,415 4,565 4,665 4,943 P4,907
Demand response N N N N N 14,490 16,471 29,352 30,804 R32,509 P32,899Otherd N N N N N 867 1,197 2,809 3,003 R3,808 P4,137
RailClass I
Freight cars 1,658,292 1,478,005 1,423,921 1,359,459 1,168,114 867,070 658,902 583,486 570,865 568,493 575,604Locomotive 29,031 27,780 27,077 27,846 28,094 22,548 18,835 18,812 19,269 19,684 20,261
Nonclass I freight cars 32,104 37,164 29,787 29,407 102,161 111,086 103,527 84,724 87,364 116,108 121,659Car companies and
shippers freight cars 275,090 285,793 330,473 334,739 440,552 443,530 449,832 550,717 582,344 585,818 618,404Amtrak
Passenger train car N N N 1,913 2,128 1,854 1,863 1,722 1,730 1,728 1,962Locomotive N N N 355 419 291 318 313 299 332 345
Water Nonself-propelled vesselse 16,777 17,033 19,377 25,515 31,662 33,597 31,209 31,360 32,811 33,011 33,509Self-propelled vesselsf 6,543 6,083 6,455 6,144 7,126 7,522 8,236 8,281 8,293 8,408 8,523Oceangoing steam
and motor ships(1,000 gross tons and over) 2,926 2,376 1,579 857 864 737 636 509 495 477 470
Recreational boats 2,500,000 6,400,000 7,400,000 R7,303,286 R8,577,857 9,589,483 10,996,253 11,734,710 11,877,938 12,312,982 12,565,930
Vehicle, A
ircraft, and Vessel Inventory !
13
Table 1-9 Number of U.S. Aircraft, Vehicles, Vessels, and Other Conveyances
KEY: N = data do not exist; P = preliminary; R = revised
Continued next page

14"
Chapter 1 T
he Transportation System
Highway:Passenger car: 1960-90: U.S. Department of Transportation, Federal HighwayAdministration, Highway Statistics Summary to 1995, FHWA-PL-97-009 (Washington, DC:July 1997), table MV-201.1995-98: Ibid., Highway Statistics (Washington, DC: Annual issues), table VM-1.Motorcycle: 1960-90: U.S. Department of Transportation, Federal HighwayAdministration, Highway Statistics Summary to 1995, FHWA-PL-97-009 (Washington, DC:July 1997), table MV-201.1995-98: Ibid., Highway Statistics (Washington, DC: Annual issues), table VM-1.Other 2-axle 4-tire vehicles: 1970-90: U.S. Department of Transportation, Federal HighwayAdministration, Highway Statistics Summary to 1995, FHWA-PL-97-009 (Washington, DC:July 1997), table VM-201A.1995-98: Ibid., Highway Statistics (Washington, DC: Annual issues), table VM-1.Single-unit and combination trucks, and buses: 1960-90: U.S. Department of Transportation,Federal Highway Administration, Highway Statistics Summary to 1995, FHWA-PL-97-009(Washington, DC: July 1997), table VM-201A.1995-98: Ibid., Highway Statistics (Washington, DC: Annual issues), table VM-1.Transit:1960-97: American Public Transit Association, Transit Fact Book (Washington, DC: 1999),table 44.1998: Ibid., Public Transportation Fact Book (Washington DC:2000), table 46.Rail (all categories, except Amtrak): 1960-98: Association of American Railroads,Railroad Facts 1999 (Washington, DC: 1999), pp. 48, 50-51.Amtrak:Passenger train-cars and locomotives: 1975-80: Amtrak, State and Local Affairs Department,personal communication.1985-98: Ibid., Amtrak Annual Report, Statistical Appendix (Washington, DC: Annualissues), p. 44.Water transportation:Nonself-propelled vessels and self-propelled vessels: 1960-98: U.S. Army, Corps of Engineers,Waterborne Transportation Lines of the United States, Volume 1, National Summaries (NewOrleans, LA : Annual issues).Oceangoing steam motor ships: 1960-98: U.S. Department of Transportation, MaritimeAdministration, Merchant Fleets of the World (Washington, DC: Annual issues).Recreational boats: 1960-98: U.S. Department of Transportation, U.S. Coast Guard, BoatingStatistics (Washington, DC: Annual issues).
Table 1-9Cont’d Number of U.S. Aircraft, Vehicles, Vessels, and Other Conveyances
a Air carrier aircraft are those carrying passengers or cargo for hire under 14 CFR 121 and14 CFR 135. Beginning in 1990, the number of aircraft is the monthly average of the number of aircraft reported in use for the last three months of the year. Prior to 1990, itwas the number of aircraft reported in use during December of a given year.
b 1991-94 data revised to reflect changes in adjustment for nonresponse bias with 1996 telephone survey factors; 1995-97 data may not be comparable to 1994 and earlier years due to changes in methodology. Includes air taxi aircraft.
c Prior to 1984, excludes most rural and smaller systems funded via Sections 18 and 16(b)(2), Urban Mass Transportation Act of 1964, as amended. Also prior to 1984,includes total vehicles owned and leased.
d Other includes aerial tramway, automated guideway transit, cablecar, ferry boat, inclined plane, monorail, and vanpool.
e Nonself-propelled vessels include dry-cargo barges, tank barges and railroad-car floats.f Self-propelled vessels include dry-cargo and/or passenger, offshore supply vessels, rail
road-car ferries, tankers and towboats.g Included in single-unit truck.h All trucks.NOTES: Transit motor bus figure is also included as part of bus in the highway category.For more detail on oceangoing vessels, see table 1-19SOURCES:Air:Air carrier: 1960-65: U.S. Department of Transportation, Federal Aviation Administration,FAA Statistical Handbook of Aviation, 1970 (Washington, DC : 1970), table 5.3.1970-75: Ibid., 1979 edition (Washington, DC: 1979), table 5.1.1980-85: Ibid., Calendar Year 1986 (Washington, DC: 1986), table 5.1.1990-97: Ibid., Calendar Year 1997 (Washington, DC: unpublished), table 5.1, personalcommunication, March 19, 1999.1998: Aerospace Industries Association, Aerospace Facts and Figures (Washington DC:1999/2000), "Active U.S. Air Carrier Fleet".General aviation: 1960-65: U.S. Department of Transportation, Federal Aviation Administration,FAA Statistical Handbook of Aviation, 1969 (Washington, DC: 1969), table 9.10.1970-75: Ibid., Calendar Year 1976 (Washington, DC: 1976), table 8-6.1980: Ibid., General Aviation Activity Survey, Calendar Year 1980 (Washington, DC: 1981),table 1-3.1985:Ibid., Calendar Year 1985 (Washington, DC: 1987), table 2-9.1990-98: Ibid., General Aviation and Air Taxi Activity Survey, Calendar Year 1998 (Washington,DC: unpublished), table 1.3.

Vehicle, A
ircraft, and Vessel Inventory !
15
Table 1-10 Sales or Deliveries of New Aircraft, Vehicles, Vessels, and other Conveyances
KEY: N = data do not exist; P = preliminary; R = revised; U = data are not available
Continued next page
1960 1965 1970 1975 1980 1985 1990 1995 1996 1997 1998 1999Civilian aircraft (shipments)Transporta 245 233 311 315 387 278 521 256 269 374 R559 P620Helicopters N 598 482 864 1,366 384 603 292 278 346 R363 P342General aviation 7,588 11,852 7,283 14,072 11,881 2,029 1,144 1,077 1,130 1,569 R2,213 P2,455
HighwayPassenger car (new retail sales) 6,641,000 9,332,000 8,400,000 8,624,000 8,979,000 11,042,000 9,300,000 8,635,000 8,527,000 8,272,000 8,139,000 UMotorcycle (new retail sales)b N N 1,125,000 940,000 1,070,000 710,000 303,000 309,000 330,000 356,000 432,000 UTruck (factory sales, domestic)c 1,194,475 1,716,564 1,660,446 2,231,630 1,667,283 3,356,905 3,692,474 5,689,551 5,748,147 6,125,935 6,407,702 UBus (includes school bus)
(factory sales) I 35,241 31,994 40,530 34,385 33,533 32,731 23,918 27,583 26,882 27,483 URecreational vehicle (shipments) N 192,830 380,300 339,600 178,500 351,700 347,300 475,200 466,800 438,800 441,300 U
Bicycled N N N N 9,000,000 11,400,000 10,800,000 12,000,000 10,900,000 11,000,000 11,100,000 U
Transit (deliveries)Motor buse 2,415 3,000 1,424 5,261 4,572 3,367 4,779 6,022 6,016 R6,329 P6,450 ULight rail 0 0 0 0 32 63 55 38 39 76 P80 UHeavy rail 416 580 308 127 130 441 10 72 10 34 P120 UTrolley bus 0 0 0 1 98 0 118 3 3 0 P32 UCommuter rail 214 666 302 2,165 152 179 83 38 111 198 P122 U
Class I rail (deliveries)Freight carf 57,047 77,822 66,185 72,392 85,920 12,080 32,063 60,853 57,877 50,396 75,685 74,223Locomotive 389 1,387 1,029 772 1,480 522 530 928 761 743 889 709
Amtrak (deliveries)Passenger train car N N N 109 109 N 58 76 92 10 0 0Locomotive N N N 30 17 10 0 10 0 111 35 0
Water transportMerchant vesselg 20 13 13 15 23 14 0 1 0 1 4 2Recreational boath N N N N 642,800 674,600 525,300 663,760 634,750 610,100 R571,100 605,500

16"
Chapter 1 T
he Transportation System
1998: Ward's Communications, Motor Vehicle Facts & Figures, 1999 (Detroit, MI: 1998), p.21 (passenger car) and p. 6 (truck).Motorcycles: 1970-98: Motorcycle Industry Council, Inc., Motorcycle Statistical Annual,1999 (Irvine, CA: 1999), p. 5 and similar tables in earlier editions.Buses: 1965-97: American Automobile Manufacturers Association, Motor Vehicle Facts& Figures, 1998 (Detroit, MI: 1998), p. 6 and similar tables in earlier editions.1998: Ward's Communications, Motor Vehicle Facts & Figures, 1999 (Detroit, MI: 1999), p. 6and personal communication, July 14, 2000.Recreational vehicles: 1965-97: Ibid., Motor Vehicle Facts & Figures, 1998 (Detroit, MI:1998), p. 12 and similar tables in earlier editions.1998: Ward's Communications, Motor Vehicle Facts & Figures, 1999 (Detroit, MI: 1998), p. 11.Bicycles: 1980-98: National Bicycle Dealers Association, Internet sitehttp://www.nbda.com as of Mar. 5, 1999, and personal communication, Sept. 24, 1996.Transit: 1960-98: American Public Transit Association 2000, Public Transportation FactBook (Washington, DC: March 2000), table 56 and similar tables in earlier editions.Class I rail: 1960-98: Association of American Railroads, Railroad Facts (Washington,DC: 1999), p. 54 and similar tables in earlier editions.Amtrak: 1975-80: Ibid., Railroad Facts (Washington, DC: 1997), p. 17 and similar tablesin earlier editions.1985-99: Amtrak Annual Report, Statistical Appendix (Washington, DC: Annual Issues).Water:Merchant vessel: 1960-99: U.S. Department of Transprotation, MaritimeAdministration, Merchant Fleets of the World (Washington, DC: Annual issues).Recreational boat: 1980-99: National Marine Manufacturers Association, Boating 1999(Chicago, IL: 2000), annual retail unit estimates.
Table 1-10Cont’d Sales or Deliveries of New Aircraft, Vehicles, Vessels, and other Conveyances
a U.S.-manufactured fixed-wing aircraft over 33,000 pounds empty weight, including all jet transports plus the 4-engine turboprop-powered Lockheed L-100.
b Includes domestic and imported vehicles. Prior to 1985, all terrain vehicles (ATVs) wereincluded in the motorcycle total. In 1995, the Motorcycle Industry Council revised its data for the years 1985 to present to exclude ATVs from its totals.
c Includes large passenger or utility vehicles that may be considered cars in other tables.d Includes domestic and imported vehicles, wheel sizes 20 inches and over. 1997 and 1998
data are projections.e Buses or bus-type vehicles only. Includes demand response. Excludes vanpool vans and
most rural and smaller systems prior to 1984. Transit motor bus figure is also included as part of the bus total in the highway category.
f Includes all railroads and private car owners.g Self-propelled, 1,000 or more gross tons.h Retail unit estimates. Includes outboard, inboard, and sterndrive boats, jet boats (since
1995), personal watercraft (since 1991), sailboats and canoes. Also includes inflatable boats (until 1992) and sailboards (until 1990).
i Included in truck figure.SOURCES:Civilian aircraft: 1960-98: Aerospace Industries Association, Aerospace Facts and Figures(Washington, DC: Annual issues), "Civil Aircraft Shipments".1999: Ibid., Internet site www.aia-aerospace.org/departments/stats/Table5.html, as of July13, 2000.Highway:Passenger cars and trucks: 1960-97: American Automobile Manufacturers Association,Motor Vehicle Facts & Figures, 1998 (Southfield, MI: 1999), p. 21 (passenger car) and p. 6 (truck).

1965 1970 1975 1980 a1985 a1990 1995 1996 1997 1998
AIR CARRIERb 2,125 2,679 2,495 3,808 4,678 6,083 7,411 7,478 5,093 5,335
Fixed Wing 2,104 2,663 2,488 3,803 4,673 6,072 7,293 7,357 5,093 5,335Turbojet
Four engine 511 931 602 436 322 432 435 440 427 414Three engine 173 659 994 1,347 1,488 1,438 1,210 1,212 1,208 1,183Two engine 41 546 518 743 1,354 2,278 3,189 3,270 3,458 3,738
Total turbojet 725 2,136 2,114 2,526 3,164 4,148 4,834 4,922 5,093 5,335
TurbopropFour engine 215 110 68 92 108 88 81 56 U UTwo engine 89 259 192 590 965 1,507 1,634 1,639 U UOne engine 8 5 N N N N 0 5 U U
Total turboprop 312 374 260 682 1,073 1,595 1,715 1,700 U U
PistonFour engine 447 34 37 73 38 31 15 18 U UThree engine 590 110 69 N 4 6 1 7 U UTwo engine 30 9 8 522 394 292 329 313 U UOne engine N N N N N N 399 397 U U
Total piston 1,067 153 114 595 436 329 744 735 U U
Helicopter 21 16 7 2 5 11 118 121 U U
GENERAL AVIATION
(GENERAL FLEET)c 95,442 161,743 168,475 211,043 196,500 198,000 188,089 191,129 192,414 204,710
Fixed Wing d93,130 127,934 161,570 200,097 184,700 184,500 162,342 163,691 166,854 175,203Turbojet
Two engine N e822 e1,742 2,551 3,600 3,700 4,071 4,077 4,638 5,513Other N 128 f34 441 50 400 488 347 539 552
Total turbojet N 950 1,776 2,992 4,100 4,100 4,559 4,424 5,178 6,066
TurbopropTwo engine N 1,287 e2,486 3,966 4,900 4,900 4,295 4,917 4,939 5,076One engine N 138 33 N N N 668 719 650 1,033Other N 33 N 123 100 400 32 80 29 65
Total turboprop N 1,458 2,519 4,090 5,000 5,300 4,995 5,716 5,619 6,174
Vehicle, A
ircraft, and Vessel Inventory !
17
Table 1-11 Active Air Carrier and General Aviation Fleet by Type of Aircraft
KEY: N = data are not available; U = unavailable
Continued next page

1965 1970 1975 1980 a1985 a1990 1995 1996 1997 1998Fixed Wing (cont’d)
PistonTwo engine e11,422 15,835 e20,331 24,366 22,100 21,100 15,706 16,082 15,938 18,659One engine 81,134 109,492 136,944 168,435 153,400 154,000 137,049 137,401 140,038 144,234Other N 199 N 212 100 100 33 68 79 70
Total piston 92,556 125,526 157,275 193,014 175,600 175,200 152,788 153,551 156,056 162,963
Rotorcraft 1,503 2,255 4,073 6,001 6,000 6,900 5,830 6,570 6,786 7,425Piston N 1,666 2,499 2,794 2,700 3,200 1,863 2,507 2,259 2,545Turbine
Multi-engine N N N N N N 733 643 764 843One engine N 589 N N N N 3,234 3,420 3,762 4,038
Total turbine N 589 1,574 3,207 3,300 3,700 3,967 4,063 4,527 4,881
Other Aircraft 809 1,554 2,832 4,945 5,800 6,600 4,741 4,244 4,092 5,580Gliders N N N N N N 2,182 1,934 2,016 2,105Lighter-than-Air N N N N N N 2,559 2,310 2,075 3,475
Experimental N N N N N N 15,176 16,625 14,680 16,502Amateur Built N N N N N N 9,328 11,566 10,261 13,189Exhibition N N N N N N 2,245 2,094 1,798 1,630Other N N N N N N 3,603 2,965 2,620 1,684
18"
Chapter 1 T
he Transportation System
Table 1-11
Cont’d Active Air Carrier and General Aviation Fleet by Type of Aircraft
KEY: N = data are not available; U = unavailable
Continued next page

Vehicle, A
ircraft, and Vessel Inventory !
19
SOURCES:Air carriers: 1965: U.S. Department of Transportation, Federal AviationAdministration, FAA Statistical Handbook of Aviation, 1966 Edition. (Washington, DC:1966), table 7.5.1970: Ibid., Calendar Year 1971. (Washington, DC: 1972), table 5.5.1975: Ibid., Calendar Year 1975. (Washington, DC: December 31, 1975), table 5.3.1980: Ibid., Calendar Year 1980. (Washington, DC: December 31, 1980), table 5.2.1985: Ibid., Calendar Year 1993. FAA-APO-95-5 (Washington, DC: 1995), table 5.2.1990-96: Ibid., Calendar Year 1996, Internet site:http://www.api.faa.gov/handbook96/toc96.htm, as of March 31, 2000, table 5.2.1997-98: Ibid., FAA Aerospace Forecasts Fiscal Years 2000-2011 (March 2000), Internet site:http://api.hq.faa.gov/foreca00/tabv-1.pdf, as of May 18, 2000.General aviation: 1965: U.S. Department of Transportation, Federal AviationAdministration, FAA Statistical Handbook of Aviation, 1966 Edition. (Washington, DC:1966), table 5.1.1970: Ibid., Calendar Year 1971. (Washington, DC: 1972), table 8.3.1975: Ibid., Calendar Year 1975. (Washington, DC: December 31, 1975), table 8.4.1980: Ibid., General Aviation Activity and Avionics Survey, Annual Report Calendar Year 1980,FAA-MS-81-5 (Washington, DC: December 1985), table 2-6.1985: Ibid., Annual Summary Report 1994 Data, FAA-APO-95-10 (Washington, DC:1996), table 1.2.1990-1997: Ibid., General Aviation and Air Taxi Activity Survey, Annual Summary Report1997 Data, FAA-APO-99-4 (Washington, DC: 1999), table 1.2.
a Source reported rounded data for general aviation.b Air carrier aircraft are aircraft carrying passengers or cargo for hire under 14 CFR 121 (large aircraft--more than 30 seats) and 14 CFR 135 (small aircraft--30 seats or less).This definition is more encompassing than that in the Federal Aviation Administration (FAA) Aviation Forecast--jet aircraft, 60 seats or more carrying passengers or cargo for hire. Beginning in 1990, the number of aircraft is the monthly average reported in use for the last three months of the year. Prior to 1990, it was the number of aircraft reported in use during December of a given year.
c Columns may not add to totals due to estimation procedures. Beginning in 1993,excludes commuters. Prior to 1993, single engine turboprops were included in "Other turboprops"; single and multi-engine turbine rotorcraft were not shown separately;gliders and lighter-than-air aircraft were combined into the "Other" category; and experimental aircraft were included in the appropriate aircraft type. For example, prior to 1993, the single engine piston aircraft type included both experimental and non-experimental aircraft Starting in 1993, that aircraft type only includes non-experimental aircraft. Due to changes in methodology beginning in 1995, estimates may not be comparable to those for 1994 and earlier years. Values for 1991 through 1994 were revised to reflect changes in adjustment for nonresponse bias.
d Total includes 574 turbine aircraft of unspecified subtype.e Multi-engine.f Single-engine.NOTES: Prior to 1970, aircraft counts included aircraft retained in FAA data systemsuntil the owners requested that they be deregistered. As a result, thousands of aircraftthat had been destroyed over the years remained in the system. Since 1970, annual verifi-cation of aircraft registrations is required. Failure to comply with this requirement leadsto revocation of the registration certificate and exclusion of the aircraft from the officialcount of the following year. Listed engine configurations (e.g., two-, three-, multi-) repre-sent all applicable combinations for each aircraft type. Totals may not agree with those inother tables as revisions to prior year data are reported at the aggregate level only.
Table 1-11Cont’d Active Air Carrier and General Aviation Fleet by Type of Aircraft

1990 1991 1992 1993 1994 1995 1996 1997 1998 1999Number of Automobiles in Fleets of 25 or
more (10 or more cars for 1999)a
Businessb 2,889 2,628 2,492 1,751 1,722 1,326 1,295 1,188 1,159 3,195Governmentc 538 504 516 401 428 1,214 1,209 1,218 1,030 885Utilities 551 544 548 386 382 376 376 377 359 320Police 249 250 264 264 266 269 274 280 289 302Taxi (includes vans) 141 141 140 140 141 139 130 181 190 135 Rental (includes vans and SUVs) 990 1,160 1,448 1,501 1,473 1,518 1,590 1,608 1,602 1,733
Number of Automobiles in Fleets of 4-24(4 to 9 cars for 1999)a U U U U U 4,200 4,250 4,373 4,921 1,172 Total 9,042 9,124 9,225 9,550 7,742
more (10 or more trucks for 1999)a
Businessd U U 1,080 1,378 1,375 1,205 1,275 1,332 1,360 3,016Governmentc U U 297 632 646 2,221 2,215 2,223 2,010 2,400Utilities U U 593 493 487 480 482 483 459 499Other (police, taxi, etc.) U U 7 7 7 7 7 7 8 8Rental trucks (not vans and SUVs) U U 304 308 363 202 197 179 181 213
Number of Trucks in Fleets of 4-24(4 to 9 trucks for 1999)a U U U U U 2,100 2,270 2,420 3,311 1,652
Total 6,215 6,446 6,644 7,329 7,788
TOTAL automobiles and trucks in fleets 15,257 15,570 15,869 16,879 15,530
Number of Trucks in fleets of 25 or
20"
Chapter 1 T
he Transportation System
SOURCE: BobitPublishing Company, Automotive Fleet Fact Book (Torrance, CA: Annual issues).
Table 1-12 U.S. Automobile and Truck Fleets by Use (Thousands)
a The data source, Bobit Publishing, changed data collection categories for 1999.b Includes driver schools.c Includes military vehicles and federal, state, county, and local government vehicles.d Businesses with 25 or more Class 1-5 trucks including leasing, construction, plumbing,
heating, food distribution, pest control, cable TV, etc. (Also applies to 1999 data).
KEY: SUV = sport utility vehicles; U = data are not available

Vehicle, A
ircraft, and Vessel Inventory !
21
SOURCE: Ward's, Motor Vehicle Facts & Figures 1999 (Southfield, MI: 1999), p. 3.
Table 1-13 Annual U.S. Motor Vehicle Production and Factory (Wholesale) Sales (Thousands)
a Includes trucks under 10,000 pounds gross vehicle weight rating (gvwr), such as compact andconventional pickups, sport utility vehicles, minivans, and vans, and trucks and buses over 10,000 pounds gvwr.
NOTES: Factory sales can be greater than production total because of sales from previ-ous year's inventory. Numbers may not add to totals due to rounding.
1960 1965 1970 1975 1980 1985 1990 1995 1996 1997 1998ProductionPassenger cars 6,703 9,335 6,550 6,717 6,376 8,185 6,077 6,351 6,083 5,927 5,554Commercial vehiclesa 1,202 1,785 1,734 2,270 1,634 3,468 3,706 5,635 5,749 6,192 6,448 Total 7,905 11,120 8,284 8,987 8,010 11,653 9,783 11,985 11,833 12,119 12,003
Factory (wholesale) salesPassenger cars 6,675 9,306 6,547 6,713 6,400 8,002 6,050 6,310 6,140 6,070 5,677Commercial vehiclesa 1,194 1,752 1,692 2,272 1,667 3,464 3,725 5,713 5,776 6,153 6,435 Total 7,869 11,057 8,239 8,985 8,067 11,467 9,775 12,023 11,916 12,223 12,112

22 " Chapter 1 The Transportation System
Retaila New Passenger Car Sales (Thousands)
a Retail new car sales include both sales to individuals and to corporate fleets. It also includes leased cars.
b Includes cars produced in Canada and Mexico.SOURCES: 1970: American Automobile Manufacturers Association,Motor Vehicle Facts & Figures 1992 (Detroit, MI: 1992), p. 16.
1980: Ibid., Motor Vehicle Facts & Figures 1997 (Detroit, MI: 1997), p. 19.1975, 1985-98: Ward's, Motor Vehicle Facts & Figures 1999(Southfield, MI: 1999), p. 21.
Table 1-141970 1975 1980 1985 1990 1995 1996 1997 1998
Domesticb 7,119 7,053 6,581 8,205 6,897 7,129 7,254 6,917 6,761
ImportsJapan 313 808 1,906 2,218 1,719 982 727 726 691Germany 750 493 305 424 265 207 238 297 367Other 217 271 187 196 419 317 308 332 320 Total 1,280 1,571 2,398 2,838 2,403 1,506 1,273 1,355 1,378
TOTAL new passenger car sales 8,400 8,624 8,979 11,042 9,300 8,635 8,527 8,272 8,139

1960 1965 1970 1975 1980 1985 1990 1995 1996 1997 R1998 1999Sales of new carsConsumer 5,645 7,103 6,252 5,907 6,100 7,092 5,677 4,341 4,052 3,875 3,988 4,364Business 930 2,140 2,056 2,508 2,758 3,754 3,477 4,203 4,313 4,246 3,992 4,137Government 66 89 94 123 124 132 147 144 134 112 161 194 Total 6,641 9,333 8,402 8,538 8,982 10,978 9,300 8,688 8,499 8,232 8,142 8,695
Percentage of total salesConsumer 85.0 76.1 74.4 69.2 67.9 64.6 61.0 50.0 47.7 47.1 49.0 50.2Business 14.0 22.9 24.5 29.4 30.7 34.2 37.4 48.4 50.7 51.6 49.0 47.6
Vehicle, A
ircraft, and Vessel Inventory !
23
Used passenger car sales: ADTAutomotive, 2000 Used Car Market Report (Nashville, TN: 2000), p. 5.Leased passenger cars: CNW Marketing/Research, personal communication, May 31,2000.
Table 1-15 New and Used Passenger Car Sales and Leases (Thousands)
a Includes leased cars.b Used car sales include sales from franchised dealers, independent dealers, and casual sales.c Consumer leases only.SOURCES:New passenger car sales: 1994-98: Ward's, Motor Vehicle Facts & Figures, 1999(Southfield, MI: 1999)
KEY: R = revised; U = data are not available
SOURCE: U.S. Department of Commerce, Bureau ofEconomic Analysis, National Income and Wealth Division, unpublished data.
Table 1-16 Retail Sales of New Cars by Sector (Thousands)
NOTES: Includes imported cars, but not vans, trucks, or sport utility vehicles.Numbers may not add to totals due to rounding.
KEY: R = revised
1990 1991 1992 1993 1994 1995 1996 1997 1998 1999New passenger car salesa 9,300 8,175 8,213 8,518 8,991 8,635 R8,526 8,272 R8,139 UUsed passenger car salesb 37,530 37,290 36,950 38,057 40,141 41,758 40,828 40,270 R40,220 40,890 Value of transactions ($ billions) 219 230 247 279 312 338 337 338 R335 361 Average price (current $) 5,830 6,157 6,693 7,335 7,781 8,093 8,257 8,399 R8,341 8,828Total new and used passenger car sales 46,830 45,465 45,163 46,575 49,132 50,393 R49,354 48,542 R48,359 U
New passenger car leasesc 534 667 882 1,197 1,715 1,795 R1,806 2,062 R2,174 2,271

24"
Chapter 1 T
he Transportation System
SOURCE: Light-Duty Vehicle MPG and MarketShares System Database, as cited in Oak Ridge National Laboratory, Transportation EnergyData Book, Edition 20, ORNL-6941 (Oak Ridge, TN: 2000), table 7.5, p. 7-6.
Table 1-17Period Sales, Market Shares, and Sales-Weighted Fuel Economies of New Domestic and ImportedAutomobiles, Selected Sales Periodsa (Thousands)
a These figures represent only those sales that could be matched to corresponding U.S.Environmental Protection Agency fuel economy values.
NOTE: Numbers and percents may not add to totals due to rounding.
KEY: mpg = miles per gallon
1980 1985 1990 1991 1992 1993 1994 1995 1996 1997 1998 1999SalesTotal Units 9,095 10,969 9,224 8,380 8,107 8,388 8,916 8,725 8,652 8,261 8,071 8,646Minicompact 428 52 77 96 108 84 57 45 34 40 12 13Subcompact 3,441 2,382 2,030 2,256 2,074 1,945 2,015 1,518 1,315 1,510 1,491 1,622Compact 599 3,526 3,156 2,425 2,451 2,655 3,077 3,290 3,492 2,937 2,309 2,367Midsize 3,073 3,118 2,512 2,306 2,250 2,446 2,360 2,499 2,488 2,531 3,107 3,359Large 1,336 1,516 1,279 1,161 1,141 1,187 1,340 1,321 1,259 1,162 1,050 1,181Two-seater 216 374 170 135 83 70 67 53 62 81 101 103
Market share, %Minicompact 4.7 0.5 0.8 1.1 1.3 1.0 0.6 0.5 0.4 0.5 0.2 0.1Subcompact 37.8 21.7 22.0 26.9 25.6 23.2 22.6 17.4 15.2 18.3 18.5 18.8Compact 6.6 32.1 34.2 28.9 30.2 31.7 34.5 37.7 40.4 35.6 28.6 27.4Midsize 33.8 28.4 27.2 27.5 27.7 29.2 26.5 28.6 28.8 30.6 38.5 38.9Large 14.7 13.8 13.9 13.9 14.1 14.2 15.0 15.1 14.6 15.1 13.0 13.7Two-seater 2.4 3.4 1.8 1.6 1.0 0.8 0.8 0.6 0.7 1.0 1.3 1.2
Fuel economy, mpgFleet 23.2 27.0 27.6 27.7 27.7 27.8 27.8 28.0 28.3 28.3 28.3 28.0Minicompact 29.4 32.7 26.4 29.3 30.6 29.9 27.8 27.0 27.2 26.3 23.9 24.8Subcompact 27.3 30.1 31.3 31.6 31.8 31.9 31.3 31.7 32.1 32.6 31.3 31.0Compact 22.3 29.6 28.9 28.8 28.7 29.3 29.8 30.2 30.4 30.0 30.8 30.2Midsize 21.3 24.9 25.9 25.9 25.8 25.7 25.6 25.9 26.4 26.3 26.9 26.9Large 19.3 22.3 23.5 23.3 23.7 24.0 24.2 24.1 24.2 24.5 24.6 24.4Two-seater 21.0 27.6 28.0 27.3 25.9 24.8 23.9 24.7 25.4 26.3 25.4 25.3

Vehicle, A
ircraft, and Vessel Inventory !
25
table 1-10 are for domestic trucks only; and 2) this tablecovers only light trucks, whereas the numbers in table 1-10 include heavy trucks.SOURCE: Light-Duty Vehicle MPG and Market Shares System Database, as cited inOak Ridge National Laboratory, Transportation Energy Data Book, Edition 20, ORNL-6941(Oak Ridge, TN: 2000), table 7.6, p. 7-7.
Table 1-18Period Sales, Market Shares, and Sales-Weighted Fuel Economies of New Domestic and Imported LightTrucks, Selected Sales Periodsa (Thousa
a These figures represent only those sales that could be matched to corresponding U.S.Environmental Protection Agency fuel economy values.
b Some 4-wheel drive pickups previously classified as large pickups were correctly reclassified as small pickups.
NOTES: Numbers and percents may not add to totals due to rounding.Fleet sales total cannot be compared with truck sales in table 1-10 for the following rea-sons: 1) this table includes both domestic and imported trucks, whereas the numbers in
KEY: mpg = miles per gallon
1980 1985 1990 1991 1992 1993 1994 1995 1996 1997 1998 1999SalesTotal Units 2,217 4,235 4,515 4,048 4,392 5,056 5,724 5,934 6,237 6,527 7,138 8,002Small pickups 516 864 678 628 587 332 365 357 b575 521 460 302Large pickups 1,115 1,691 1,574 1,309 1,452 1,878 2,199 2,184 2,042 2,051 2,378 2,830Small vans 14 438 933 888 968 1,129 1,264 1,257 1,230 1,216 1,224 1,319Large vans 328 536 399 308 350 388 408 401 370 387 381 417Small utility 76 478 738 783 868 949 1,043 1,225 1,379 1,715 762 942Large utility 167 229 193 132 167 379 446 510 641 637 1,933 2,191
Market share, %Small pickups 23.3 20.4 15.0 15.5 13.4 6.6 6.4 6.0 9.2 8.0 6.4 3.8Large pickups 50.3 39.9 34.9 32.3 33.1 37.1 38.4 36.8 32.7 31.4 33.3 35.4Small vans 0.6 10.3 20.7 21.9 22.0 22.3 22.1 21.2 19.7 18.6 17.1 16.5Large vans 14.8 12.7 8.8 7.6 8.0 7.7 7.1 6.8 5.9 5.9 5.3 5.2Small utility 3.4 11.3 16.4 19.3 19.8 18.8 18.2 20.6 22.1 26.3 10.7 11.8Large utility 7.5 5.4 4.3 3.3 3.8 7.5 7.8 8.6 10.3 9.8 27.1 27.1
Fuel economy, mpgFleet 18.1 20.4 20.5 20.6 20.4 20.5 20.4 20.2 20.4 20.1 20.3 20.1Small pickups 25.5 26.8 25.2 25.7 25.0 24.9 25.3 25.6 25.6 24.6 24.5 24.8Large pickups 17.0 19.0 18.9 18.8 18.9 19.6 20.1 19.4 18.9 19.4 19.1 19.3Small vans 19.6 23.9 23.1 22.6 22.5 22.9 22.1 22.8 22.8 22.9 23.3 23Large vans 16.3 16.4 16.9 17.4 16.9 17.3 17.4 17.1 17.2 17.8 18.2 17.8Small utility 16.9 22.1 21.9 21.1 20.9 21.3 20.7 20.8 21.1 19.6 22.9 23Large utility 14.6 16.6 16.1 16.4 16.9 17.5 17.8 17.4 18.2 18.2 18.9 18.8

Passenger cars1961 1971 1981 1991 1994 1995 1996 1997 1998
Argentina 78 193 139 114 338 227 269 366 353Australia 182 393 352 269 323 314 303 320 350Austria 8 1 7 14 45 59 97 98 91Belgium N 279 216 253 409 386 368 356 319Brazil 98 342 406 705 1,248 1,297 1,459 1,680 1,244Canada 328 1,083 803 1,060 1,214 1,337 1,279 1,374 1,122China N N N 81 250 321 382 482 507Czech Republicc 59 149 181 173 174 208 263 321 368France 988 2,694 2,612 3,188 3,175 3,051 3,148 2,259 2,603Germany 1,802 3,829 3,758 4,677 4,094 4,360 4,540 4,678 5,348India 22 42 42 179 237 330 396 410 384Italy 694 1,701 1,257 1,633 1,341 1,422 1,318 1,563 1,402Japan 250 3,718 6,974 9,753 7,802 7,611 7,864 8,491 8,056South Korea N N 69 1,158 1,806 2,003 2,265 2,308 1,625Malaysia N N N 102 137 164 176 280 126Mexico N 154 355 720 857 699 798 855 953Netherlands 13 78 78 85 92 100 145 197 243Poland 14 86 248 168 349 347 353 295 460Portugal N N N N 38 41 119 186 181Romania N N N 84 85 71 76 108 104Russia 149 518 1,324 1,308 796 838 868 982 USpain 55 453 855 1,943 1,974 2,131 2,213 2,342 2,217Sweden 110 287 258 269 353 388 368 376 368Taiwan N N N 266 291 282 265 268 293Turkey N 13 25 196 213 233 208 243 UUnited Kingdom 1,004 1,742 955 1,237 1,467 1,532 1,686 1,698 1,748United States 5,522 8,584 6,253 5,439 6,614 6,351 6,083 5,927 5,554Yugoslavia, Federal Republic of 15 114 240 213 8 8 9 11 U Total world 11,391 26,453 27,407 35,287 R35,730 36,111 37,318 38,474 37,286
US % of world 48% 32% 23% 15% 19% 18% 16% 15% 15%
a
26 " Chapter 1 The Transportation System
World Motor Vehicle Production, Selected Countries (Thousands)Table 1-19
KEY: N = data do not exist; U = data are not available
Continued next page

Commercial vehicles1961 1971 1981 1991 1994 1995 1996 1997 1998
Argentina 58 60 33 25 70 59 44 80 105Australia 49 77 40 15 31 17 19 29 34Austria 5 6 8 6 3 9 9 10 12Belgium 1 17 41 84 70 82 69 74 87Brazil 47 174 374 255 334 332 346 388 329Canada 63 277 520 829 1,106 1,071 1,118 1,198 1,050China N N N 628 1,103 1,114 1,084 1,096 1,121Czech Republicc 17 28 49 29 6 8 9 47 42France 217 316 408 423 383 424 443 322 351Germany 411 312 358 358 262 307 303 345 379India 32 47 107 176 238 306 366 336 129Italy 65 116 176 245 194 245 227 254 290Japan 789 2,093 4,206 3,492 2,752 2,585 2,482 2,484 1,994South Korea N N 65 340 506 523 548 510 329Malaysia N N N 0 0 0 0 0 7Mexico N 57 242 269 266 236 422 503 500Netherlands 6 13 12 26 23 32 19 20 28Poland 22 60 60 25 16 34 48 27 39Portugal N N N 26 87 16 13 81 90Romania N N N 10 5 22 23 21 23Russia 406 612 874 744 206 156 136 192 USpain 20 79 132 139 168 203 199 220 609Sweden 22 30 55 75 82 102 95 104 114Taiwan N N N 116 132 124 101 113 112Turkey N 12 22 46 31 49 69 102 UUnited Kingdom 443 456 230 217 228 233 238 238 233United States 1,131 2,088 1,690 3,372 5,649 5,635 5,716 6,192 6,452Yugoslavia, Federal Republic of 5 18 27 26 2 2 1 2 U Total world 3,809 6,948 9,729 11,996 13,952 13,926 14,147 14,988 14,811
US % of world 30% 30% 17% 28% 40% 40% 40% 41% 44%
b
Vehicle, Aircraft, and Vessel Inventory ! 27
World Motor Vehicle Production, Selected Countries (Thousands)Table 1-19Cont’d
KEY: N = data do not exist; U = data are not available
Continued next page

28 " Chapter 1 The Transportation System
Total
1961 1971 1981 1991 1994 1995 1996 1997 1998Argentina 136 253 172 139 409 286 313 446 458Australia 231 470 392 284 354 331 322 349 384Austria 13 7 15 20 48 68 106 108 103Belgium 1 296 257 337 479 468 437 430 406Brazil 145 516 780 960 1,582 1,629 1,805 2,067 1,573Canada 391 1,360 1,323 1,889 2,320 2,408 2,397 2,571 2,173China N N N 709 1,353 1,435 1,466 1,578 1,628Czech Republicc 76 177 230 202 180 216 272 369 411France 1,205 3,010 3,020 3,611 3,558 3,475 3,591 2,581 2,954Germany 2,213 4,141 4,116 5,035 4,356 4,667 4,843 5,023 5,727India 54 89 149 355 475 636 762 746 513Italy 759 1,817 1,433 1,878 1,534 1,667 1,545 1,817 1,693Japan 1,039 5,811 11,180 13,245 10,554 10,196 10,346 10,975 10,050South Korea N N 134 1,498 2,312 2,526 2,813 2,818 1,954Malaysia N N N 102 137 164 176 280 134Mexico N 211 597 989 1,123 935 1,220 1,358 1,453Netherlands 19 91 90 111 115 132 164 218 271Poland 36 146 308 193 365 381 401 322 499Portugal N N N 26 125 57 132 267 271Romania N N N 94 90 93 99 129 127Russia 555 1,130 2,198 2,052 1,002 994 1,004 1,174 USpain 75 532 987 2,082 2,142 2,334 2,412 2,562 2,826Sweden 132 317 313 344 435 490 463 480 483Taiwan N N N 382 423 406 366 381 405Turkey N 25 47 242 244 282 277 344 UUnited Kingdom 1,447 2,198 1,185 1,454 1,695 1,765 1,924 1,936 1,981United States 6,653 10,672 7,943 8,811 12,263 11,986 11,799 12,119 12,006Yugoslavia, Federal Republic of 20 132 267 239 9 10 10 14 U Total world 15,200 33,401 37,136 47,283 49,681 50,037 51,465 53,463 52,098
US % of world 44% 32% 21% 19% 25% 24% 23% 23% 23%
World Motor Vehicle Production, Selected Countries (Thousands)
a Does not include minivans, pickups, and sport utility vehicles.b Includes all trucks and buses. Light trucks, such as pickups,
sport utility vehicles, and minivans, are included under commercial vehicles.
c Formerly Czechoslovakia.
NOTES: Production in this table refers to vehicles locally manu-factured. Numbers may not add to totals due to rounding.SOURCE: Ward's, Motor Vehicle Facts & Figures (Southfield, MI:1999), p. 12.
Table 1-19Cont’d
KEY: N = data do not exist; U = data are not available

1960 1965 1970 1975 1980 1985 1990 1995 1996 1997 1998 1999World fleet 17,317 18,329 19,980 22,872 24,867 25,555 23,596 25,608 26,858 27,557 27,825 28,259
U.S. fleet 2,926 2,376 1,579 857 864 737 636 509 495 477 470 463U.S. share of the world fleet 17% 13% 8% 4% 3% 3% 3% 2% 2% 2% 2% 2%
Freighters, Total 2,138 1,747 1,076 511 471 417 367 295 292 288 289 284
DWT (thousands) 21,877 18,127 11,733 7,051 6,885 7,353 7,265 6,517 6,419 6,458 6,732 6,696
General cargoa N N N 356 259 209 166 142 146 142 140 137DWT (thousands) N N N 4,640 3,329 2,980 2,605 2,472 2,467 2,420 2,400 2,404
Containership N N N 109 121 104 92 81 83 85 91 89DWT (thousands) N N N 1,773 2,289 2,651 2,856 2,600 2,639 2,743 3,096 3,056Partial containerships N N N 37 68 63 59 3 1 1 N NDWT (thousands) N N N 510 940 904 836 57 17 17 N N
RO/RO N N N 9 23 41 50 69 62 60 58 58DWT (thousands) N N N 128 327 818 968 1,388 1,296 1,278 1,236 1,236
Combination/passenger and cargo, Total 309 227 171 60 65 37 10 13 15 14 12 11
DWT (thousands) 2,070 1,488 1,107 388 446 299 91 115 139 136 116 99
Bulk carriers, Total 57 61 38 19 20 25 26 20 15 14 15 14 DWT (thousands) 805 1,107 767 544 607 1,152 1,270 925 575 321 604 579
Tankers, Total 422 341 294 267 308 258 233 181 173 161 154 154
DWT (thousands) 7,815 7,561 7,739 9,711 16,152 15,534 15,641 11,028 10,378 9,696 9,289 9,373
Petroleum/chemicalb ships N N N N N 244 219 167 159 148 145 146 DWT (thousands) N N N N N 14,574 14,681 10,123 9,473 8,857 8,737 8,845Liquefied petroleum/ natural gas ships N N N N N 14 14 14 14 13 9 8 DWT (thousands) N N N N N 960 960 905 905 839 552 528
Vehicle, A
ircraft, and Vessel Inventory !
29
SOURCES: 1960-1997:U.S. Department ofTransportation, Maritime Administration, Merchant Fleets of the World (Washington, DC:Annual issues), and unpublished revisions.1998-1999: Ibid., Personal communication, May 17, 2000.
Table 1-20Number and Size of the U.S. Flag Merchant Fleet and Its Share of the World Fleet (Oceangoing ships of 1,000 gross tons and over)
a Includes barge carriers.b Includes integrated tug/barges.NOTES: Excludes nonmerchant type and/or U.S. Navy-owned vessels currently in theNational Defense Reserve Fleet. Excludes ships operating exclusively on the Great Lakesand inland waterways and special types such as: channel ships, icebreakers, cable ships, andmerchant ships owned by military forces. All data are as of December 31 of year shown.
KEY: DWT = deadweight tons; N = data do not exist; RO/RO = roll-on/roll-off vessels

Section CCondition
chapter one

Automobiles Trucks1970 4.9 5.91975 5.4 5.81980 6.0 6.31985 6.9 7.61990 6.5 6.51991 6.7 6.81992 7.0 7.21993 7.3 7.51994 7.5 7.51995 7.7 7.61996 7.9 7.71997 8.1 7.81998 8.3 7.61999 8.3 7.2
Condition ! 33
U.S. Airport RunwayPavement Conditions
a The U.S. Department of Transportation, Federal Aviation Administration's (FAA's) National Plan of Integrated Airport Systems is composed of all commercial service airports, all relieverairports, and selected general aviation airports. It does not include over 1,000 publicly owned public-use landing areas, privately owned public-use airports, and other civil landing areas not open to the general public. NPIAS airports account for 100% of all enplanements and serve 91.5% of all aircraft (based on an estimated fleet of 200,000 aircraft). In 1997, there were 14,961 non-NPIAS airports. See table 1-2 for more detail on airports.
b Commercial service airports are defined as public airports receiving scheduled passenger service, and having at least 2,500 enplaned passengers per year.
NOTES: Data are as of January 1 of each year. Runway pavementcondition is classified by the FAA as follows:
Good: All cracks and joints are sealed.Fair: Mild surface cracking, unsealed joints, and slab edge spalling.Poor: Large open cracks, surface and edge spalling, vegetation growing through cracks and joints.
SOURCES:Condition (%): 1986-90: U.S. Department of Transportation,Federal Aviation Administration, National Plan of Integrated AirportSystems (Washington DC:1991).1993: Ibid., National Plan of Integrated Airport Systems (WashingtonDC: 1995).1997: Ibid., Office of Airport Planning and Programming, NationalPlanning Division, personal communication, 1997.1999: Ibid., Office of Airport Planning and Programming, NationalPlanning Division, personal communication, 2000.Total number of airports: 1986-99: U.S. Department ofTransportation, Federal Aviation Administration, Office of AirportPlanning and Programming, National Planning Division, personalcommunication, June 23, 2000.
Table 1-21
KEY: NPIAS = National Plan of Integrated Airport Systems
Median Age of Automobilesand Trucks in Operation in the U.S.
NOTE: The National Personal Transportation Survey conductedby the U.S. Department of Transportation, Federal HighwayAdministration, estimates the mean age of automobiles, trucks, andvans for several years:
1969 1977 1983 1990 1995Automobiles 5.1 5.5 6.7 7.6 8.2Trucks N 6.4 7.9 9.0 8.3 (inc. vans)KEY: N = data do not existSOURCE: The R.L. Polk Co., personal communication, Mar. 28, 2000.
Table 1-221986 1990 1993 1997 1999
NPIASa airports,total 3,243 3,285 3,294 3,331 3,344
Condition (%)Good 61 61 68 72 72Fair 28 29 25 23 23Poor 11 10 7 5 5
Commercial service airports,b total 550 568 554 566 547
Condition (%)Good 78 78 79 79 78Fair 15 17 18 19 20Poor 7 5 3 2 22

1990 1991 1992 1993 1994 1995 1996 1997 1998RURAL
Interstates Miles reported 33,547 33,677 33,027 29,089 31,502 31,254 31,312 31,431 30,498 Poor (%) 8.7 7.6 5.2 7.0 6.5 6.3 3.9 3.6 4.1 Mediocre (%) a a 14.1 27.7 26.5 20.7 19.1 19.1 16.5 Fair (%) 31.9 31.7 17.4 20.9 23.9 22.3 21.7 20.7 17.8 Good (%) a a 27.6 36.1 33.2 36.9 38.8 41.0 42.6 Very good (%) 59.5 60.7 35.6 8.3 9.9 13.9 16.6 15.7 19.0 Unpaved (%) N N N N N N N N N Miles not reported N N N 3,563 955 1,326 1,508 1,382 2,313
Other principal arterials Miles reported 83,802 85,729 94,798 78,296 89,506 89,265 92,103 92,170 93,333 Poor (%) 3.4 3.6 3.3 2.9 2.4 4.4 1.4 1.6 1.4 Mediocre (%) a a 5.9 9.2 8.2 7.6 5.8 4.9 4.6 Fair (%) 42.6 44.5 34.6 54.8 57.4 51.1 49.1 47.7 43.3 Good (%) a a 28.5 26.7 26.6 27.9 34.4 37.2 38.3 Very good (%) 53.8 51.9 27.6 6.4 5.4 9.0 9.3 8.6 12.3 Unpaved (%) N N N N N N N N N Miles not reported N N N 17,905 7,489 8,683 6,028 6,083 5,524
Minor arterials Miles reported 144,735 142,866 137,637 134,837 124,877 121,443 126,381 126,525 130,591 Poor (%) 4.6 4.3 3.9 3.9 3.5 3.7 2.3 2.3 1.9 Mediocre (%) a a 7.1 9.1 10.5 9.0 8.2 6.7 6.0 Fair (%) 48.2 47.3 36.4 53.5 57.9 54.7 50.7 50.4 47.2 Good (%) a a 25.3 25.0 23.6 23.9 31.0 33.6 34.3 Very good (%) 47.2 48.4 26.8 8.5 4.5 8.7 7.7 7.0 10.6 Unpaved (%) — — N N N N N N N Miles not reported N N N 12,740 13,294 15,708 11,201 10,978 6,664
Major collectors Miles reported 436,365 436,737 434,175 432,223 431,111 431,712 432,117 386,122 388,498 Poor (%) 8.9 7.7 7.8 6.8 6.5 6.5 6.7 7.8 7.4 Mediocre (%) a a 11.0 12.4 11.3 11.4 10.3 12.3 11.9 Fair (%) 43.8 45.2 32.3 37.7 33.5 30.8 34.3 37.6 39.0 Good (%) a a 17.7 16.3 16.1 17.4 20.0 23.0 23.4
34"
Chapter 1 T
he Transportation System
Table 1-23 Condition of U.S. Roadways by Functional System
KEY: N = data do not exist; R = revised;— =value too small to report
Continued next page

1990 1991 1992 1993 1994 1995 1996 1997 1998RURAL (continued)
URBAN
Very good (%) 36.2 36.1 20.4 15.9 21.9 23.7 18.4 19.3 18.3 Unpaved (%) 11.1 11.0 10.7 10.9 10.7 10.2 10.1 N N Miles not reported N N N N N N N 2,402 N
Interstates Miles reported 11,527 11,603 12,466 10,738 12,338 12,307 12,430 12,477 12,231 Poor (%) 8.6 7.7 7.1 10.6 13.0 10.4 8.6 9.0 9.4 Mediocre (%) a a 13.2 30.9 29.9 26.8 28.3 27.0 25.5 Fair (%) 32.2 32.3 17.0 23.6 24.2 23.8 24.7 24.4 21.8 Good (%) a a 28.0 28.3 26.7 27.5 30.7 32.9 32.0 Very good (%) 59.1 60.0 34.7 6.5 6.2 11.4 7.6 6.7 11.4 Unpaved (%) N N N N N N N N N Miles not reported N N N 2,140 788 857 787 771 1,040
Other freeways and expressways
Miles reported 7,670 7,714 8,465 7,011 7,618 7,804 8,410 8,480 8,772 Poor (%) 2.2 2.3 2.6 3.8 5.3 4.8 3.4 R3.3 3.2 Mediocre (%) a a 5.9 9.4 12.7 9.8 8.7 R8.7 8.7 Fair (%) 43.9 44.2 32.4 60.6 58.1 54.7 54.7 R58.5 54.3 Good (%) a a 28.1 22.7 20.9 20.4 26.3 R25.2 27.1 Very good (%) 53.9 53.5 31.0 3.5 2.9 10.3 6.8 R4.2 6.6 Unpaved (%) N N N N N N N N N Miles not reported N N N 1,846 1,377 1,166 619 579 397
Other principal arterials Miles reported 51,987 52,349 52,165 30,337 38,598 41,444 44,498 45,009 44,886 Poor (%) 5.9 6.6 6.8 9.2 12.5 12.4 11.8 R12.1 12.9 Mediocre (%) a a 11.5 13.3 16.3 14.7 14.1 R14.6 18.5 Fair (%) 49.0 49.1 34.8 55.0 50.8 47.2 48.9 R49.5 45.3 Good (%) a a 21.4 19.3 16.6 15.9 17.5 R17.8 17.6 Very good (%) 45.1 44.3 25.3 3.3 3.8 9.7 7.7 R6.0 5.8 Unpaved (%) N N N N N N N N N Miles not reported N N N 22,498 14,492 11,352 8,485 8,209 8,246
Condition !
35
Table 1-23Cont’d Condition of U.S. Roadways by Functional System
KEY: N = data do not exist; R = revised;— =value too small to report
Continued next page

1990 1991 1992 1993 1994 1995 1996 1997 1998URBAN (continued)
Minor arterials Miles reported 74,656 74,979 80,368 86,819 87,852 88,510 89,020 88,484 88,667 Poor (%) 8.9 7.4 7.9 7.9 6.7 6.7 6.9 7.2 7.3 Mediocre (%) a a 14.3 13.8 12.3 13.6 13.0 13.0 12.2 Fair (%) 48.5 49.9 34.1 40.2 38.1 36.9 37.9 37.9 39.5 Good (%) a a 19.2 18.4 20.5 20.4 20.7 21.4 21.1 Very good (%) 42.1 42.1 24.0 19.4 22.1 22.1 21.1 20.6 19.9 Unpaved (%) 0.5 0.6 0.5 0.4 0.3 0.3 0.4 N N Miles not reported N N N N N N N 374 N
Collectors Miles reported 78,248 77,097 82,657 84,856 86,098 87,331 87,790 86,666 86,705 Poor (%) 16.5 11.2 10.5 10.6 9.8 9.7 9.7 10.6 10.4 Mediocre (%) a a 16.9 16.8 16.2 16.8 16.6 16.0 15.0 Fair (%) 50.4 53.5 35.2 40.0 40.0 39.0 39.2 39.0 39.9 Good (%) a a 17.3 16.1 17.0 17.2 18.2 18.4 17.6 Very good (%) 31.7 34.2 19.1 15.5 16.0 16.6 15.4 15.9 17.1 Unpaved (%) 1.3 1.1 1.1 1.0 0.9 0.8 0.9 N N Miles not reported N N N N N N N 663 N
36"
Chapter 1 T
he Transportation System
December of those years; data for 1991,1994-96 are as of June of those years; anddata for 1993 is as of September of that year.SOURCE: U.S. Department of Transportation, FederalHighway Administration, Office of Engineering, BridgeDivision, National Bridge Inventory Database.
Table 1-23Cont’d Condition of U.S. Roadways by Functional System
NOTES: Structurally deficient bridges are defined as those needing significant mainte-nance attention, rehabilitation, or replacement. Functionally deficient bridges: those thatdo not have the lane widths, shoulder widths, or vertical clearances adequate to serve traf-fic demand; or the bridge may not be able to handle occasional roadway flooding. Tableincludes: rural--Interstate, principal arterial, minor arterial, major collector, minor collectorand local roads; urban--Interstate, other freeways or expressways, other principal arterial,minor arterial, collector, and local roads. Data for 1990, 1992 and 1997-99 are as of
KEY: N = data do not exist; R = revised;— =value too small to report

Condition !
37
December of those years; data for 1991, 1994-96 are as of June of those years; and datafor 1993 is as of September of that year.SOURCE: U.S. Department of Transportation, Federal Highway Administration,Office of Engineering, Bridge Division, National Bridge Inventory Database.
Table 1-24 Condition of U.S. Bridges
NOTES: Structurally deficient bridges are defined as those needing significant mainte-nance attention, rehabilitation, or replacement. Functionally deficient bridges: those thatdo not have the lane widths, shoulder widths, or vertical clearances adequate to serve traf-fic demand; or the bridge may not be able to handle occasional roadway flooding. Tableincludes: rural--Interstate, principal arterial, minor arterial, major collector, minor collectorand local roads; urban--Interstate, other freeways or expressways, other principal arterial,minor arterial, collector, and local roads. Data for 1990, 1992 and 1997-99 are as of
1990 1991 1992 1993 1994 1995 1996 1997 1998 1999Urban bridges 108,770 112,363 115,312 117,488 121,141 122,537 124,950 127,633 128,312 130,339Rural bridges 463,435 461,673 456,885 456,228 455,319 458,598 456,913 455,118 454,664 455,203 Total 572,205 574,036 572,197 573,716 576,460 581,135 581,863 582,751 582,976 585,542
Urban deficient bridgesStructurally 16,847 17,032 16,323 15,932 15,692 15,205 15,094 14,846 14,073 12,967Functionally 30,266 30,842 26,243 26,511 27,024 27,487 28,087 26,865 27,588 29,065 Total 47,113 47,874 42,566 42,443 42,716 42,692 43,181 41,711 41,661 42,032
Rural deficient bridgesStructurally 121,018 117,502 102,375 96,048 91,991 89,112 86,424 83,629 78,999 75,183Functionally 70,089 66,751 54,150 53,489 52,808 53,463 53,121 50,545 51,912 52,835 Total 191,107 184,253 156,525 149,537 144,799 142,575 139,545 134,174 130,911 128,018
All deficient bridgesStructurally 137,865 134,534 118,698 111,980 107,683 104,317 101,518 98,475 93,072 88,150Functionally 100,355 97,593 80,393 80,000 79,832 80,950 81,208 77,410 79,500 81,900 Total 238,220 232,127 199,091 191,980 187,515 185,267 182,726 175,885 172,572 170,050

38"
Chapter 1 T
he Transportation System
SOURCE: U.S. Department of Transportation,Federal Transit Administration, National Transit Database (Washington, DC: Annualissues), table 28 and similar tables in earlier editions.
Table 1-25 Average Age of Urban Transit Vehicles (Years)
a Locomotives used in Amtrak intercity passenger services are not included.b Full-size buses have more than 35 seats; mid-size buses have 25-35 seats; small buses
have fewer than 25 seats.
KEY: U = data are not available
1985 1990 1991 1992 1993 1994 1995 1996 1997 1998Transit railCommuter rail locomotivesa 16.3 15.7 15.3 15.8 15.6 15.3 15.9 17.6 17.0 14.7Commuter rail passenger coaches 19.1 17.6 17.3 19.3 18.6 20.1 21.4 24.1 21.6 19.4Commuter rail self-propelled passenger cars 12.3 15.9 16.5 17.6 18.2 16.0 19.8 21.1 22.3 23.2Heavy-rail passenger cars 17.1 16.2 16.9 17.7 17.8 15.8 19.3 20.2 21.1 22.0Light rail vehicles (streetcars) 20.6 15.2 16.6 17.0 14.9 16.7 16.8 16.0 15.9 15.7
Transit busb
Articulated 3.4 7.6 8.2 9.1 9.5 9.1 10.9 11.5 11.9 11.3Full-size 8.1 8.2 8.0 8.3 8.5 9.9 8.7 8.8 8.6 8.5Mid-size 5.6 6.6 6.7 6.8 6.4 7.2 6.9 6.3 5.8 5.7Small 4.8 3.9 4.0 4.1 4.0 4.4 4.1 4.1 4.0 4.0Trolley U 10.9 10.3 11.2 12.0 11.1 13.1 14.0 14.7 14.6
OtherVans 3.8 2.8 3.0 3.1 3.1 3.9 3.1 3.1 3.0 2.9Ferry boats U 21.7 19.6 22.7 24.7 23.5 23.4 25.3 25.4 25.8

Condition ! 39
Year builta 1990 1991 1992 1993 1994 1995 1996 1997 1998 1999Before 1970 5,117 4,353 4,038 3,766 3,535 b b b b b
1970-74 3,852 3,617 3,384 3,248 3,184 c6,048 c5,783 c5,529 c5,565 c5,1961975-79 4,432 4,375 4,292 4,352 4,275 4,254 4,274 4,219 4,116 4,0001980-84 2,837 2,826 2,784 2,730 2,625 2,754 2,735 2,728 2,723 2,5811985-89 1,989 1,985 1,970 1,968 1,971 1,890 1,866 1,829 1,830 1,7791990 608 605 604 604 599 d2,965 d2,959 d2,958 d2,736 d2,6881991 583 595 595 594
e e e e e
1992 337 340 339e e e e e
1993 558 602e e e e e
1994 781e e e e e
1995 901 945 983 953 9511996 707 696 708 7061997 742 741 7431998 889 8901999 722 Total 18,835 18,344 18,004 18,161 18,505 18,812 19,269 19,684 20,261 20,256
Class I Railroad Locomotive Fleet by Year Built (Locomotive units)
a Disregards year of rebuilding.b Included in 1970-74 category.c Includes all locomotives built before 1975.d Includes locomotives built between 1990-94.
e Included in 1990 figure.SOURCE: Association of American Railroads, Railroad Facts(Washington, DC: Annual issues).
Table 1-26
1972 1975 1980 1985 1990 1995 1996 1997 1998 1999Locomotives% available for servicea N 87 83 93 84 88 88 88 88 90Average age (years)b 22.3 14.4 7.4 7.0 12.0 13.9 14.4 12.0 12.6 12.8
Passenger and other train cars% available for servicea N 82 77 90 90 90 90 91 93 91Average age (years)b 22.0 24.7 14.3 14.2 20.0 21.8 20.7 20.2 17.3 17.2
Age and Availability of Amtrak Locomotive and Car Fleets
a Year-end daily average. Active units less backshop units undergoing heavy maintenance less back-ordered units undergoing progressive maintenance and running repairs.
b Year-end average.NOTE: 1972 was Amtrak's first full fiscal year of operation.
SOURCES: 1972-80:Amtrak, Amtrak Annual Report (Washington, DC: Annual issues).1985-99: Ibid., Amtrak Annual Report, Statistical Appendix(Washington, DC: Annual issues), pg. 44.
Table 1-27
KEY: N = data do not exist

40 " Chapter 1 The Transportation System
Offshore Tank/support/ liquid
Agea Dry cargo Tanker Towboat Passengerb crewboatsc Dry barge barged Totale
1990-91<=5 80 6 132 151 85 2,335 162 2,9516-10 161 38 706 120 318 4,570 316 6,22911-15 212 50 1,029 110 474 7,639 829 10,34316-20 141 35 844 80 144 6,374 750 8,36821-25 82 38 750 65 84 2,607 759 4,385>25 196 86 1,718 188 51 3,372 1,049 6,660
Totale 900 257 5,210 721 1,168 27,110 3,874 39,342
1992<=5 36 5 134 219 93 3,224 296 4,0126-10 73 28 398 198 208 1,783 121 2,82911-15 135 54 1,137 203 567 9,114 902 12,15016-20 73 33 926 169 189 6,696 740 8,85321-25 31 42 716 122 91 2,475 677 4,167>25 124 82 1,874 287 53 3,496 1,123 7,049
Totale 497 249 5,203 1,201 1,205 26,981 3,864 39,313
1993<=5 25 3 135 207 103 3,558 325 4,3566-10 67 22 205 221 107 1,070 68 1,76411-15 135 43 1,221 211 597 8,810 869 11,89416-20 70 33 968 164 218 6,772 791 9,01921-25 41 31 674 129 106 2,904 655 4,543>25 128 73 2,008 311 64 3,713 1,256 7,555
Totale 470 205 5,219 1,243 1,197 26,982 3,970 39,306
1994<=5 46 4 146 157 107 3,630 399 4,4896-10 103 12 151 185 61 1,171 36 1,71911-15 200 36 1,135 123 540 7,903 754 10,69116-20 130 44 966 122 309 6,314 799 8,68421-25 90 32 664 82 130 3,873 638 5,509>25 206 74 2,107 259 86 3,706 1,327 7,765
Vessel type
Totale 778 202 5,179 928 1,236 26,757 3,966 39,064
U.S. Flag Vessels by Type and Age (Number of vessels)Table 1-28
Continued next page

Condition ! 41
1995<=5 38 5 168 149 119 3,975 489 4,9436-10 90 8 134 195 58 1,483 46 2,01411-15 168 34 959 133 463 6,387 611 8,76016-20 135 38 988 121 412 6,507 736 8,93921-25 80 29 726 91 141 4,897 697 6,661
>25 213 64 2,146 263 92 3,966 1,403 8,148
Totale 726 178 5,127 954 1,288 27,375 3,985 39,641
1996<=5 43 7 205 153 123 5,189 573 6,2936-10 74 8 118 188 61 2,041 87 2,57711-15 141 29 715 142 351 4,505 346 6,22916-20 155 36 1,036 119 460 7,234 840 9,88121-25 79 23 842 87 155 5,416 723 7,325
>25 229 62 2,386 290 144 4,766 1,576 9,453 Totale 713 161 5,177 967 1,274 28,775 4,036 41,104
1997<=5 52 8 227 150 122 5,515 519 6,5936-10 66 2 118 187 94 2,582 181 3,23011-15 96 27 396 152 223 1,800 137 2,83116-20 183 36 1,173 131 588 8,943 928 11,98221-25 84 21 918 102 177 5,772 727 7,801
>25 209 53 2,332 302 159 4,284 1,477 8,816 Totale 692 147 5,173 1,025 1,369 29,040 3,971 41,419
1998<=5 56 12 247 150 163 5,877 485 6,9916-10 55 3 124 168 105 3,117 267 3,83911-15 105 19 196 166 111 1,113 72 1,78216-20 179 31 1,198 129 634 8,591 865 11,62621-25 88 22 979 106 211 5,909 763 8,076
>25 230 48 2,487 292 195 4,817 1,499 9,573
Totale 714 135 5,237 1,011 1,423 29,557 3,952 42,032
Offshore Tank/support/ liquid
Agea Dry cargo Tanker Towboat Passengerb crewboatsc Dry barge barged Totale
Vessel type
U.S. Flag Vessels by Type and Age (Number of vessels)
a Age is based on the year the vessel was built or rebuilt.b Includes passenger excursion/sightseeing, combination passenger
and dry cargo vessels, and ferries.c In 1992, offshore supply boats were designated as crewboats.d In 1992, tank barges were designated as liquid barges.e Totals may be greater than sum of columns because of
unclassified vessels and vessels of unknown age; figures include vessels available for operation.
SOURCE: U.S. Army Corps of Engineers, WaterborneTransportation Lines of the United States, Volume 1, National Summaries(New Orleans, LA: Annual issues), Table 4 in 1998 and similartables in previous years; also available on Internet sitewww.wrsc.usace.army.mil/ndc/wtlusvl1.pdf as of June 21, 2000.
Table 1-28Cont’d

Section DTravel and Goods
Movement
chapter one

Travel and Goods M
ovement !
45
Table 1-29 U.S. Vehicle-Miles (Millions)
KEY: N = data do not exist; P = preliminary; R = revised; U = data are not available
Continued next page
1960 1965 1970 1975 1980 1985 1990 1995 1996 1997 1998AirAir carrier, large certificated,
domestic, all services 858 1,134 2,068 1,948 2,523 3,046 3,963 4,629 4,811 4,911 5,035General aviationa 1,769 2,562 3,207 4,238 5,204 4,673 4,548 3,795 3,524 3,877 U
HighwayR
Passenger carb,c 587,012 722,696 916,700 1,033,950 1,111,596 1,246,798 1,408,266 1,428,497 1,469,854 1,502,556 1,549,577Motorcycleb h h 2,979 5,629 10,214 9,086 9,557 9,797 9,920 10,081 10,283Other 2-axle 4-tire vehiclec h h 123,286 200,700 290,935 390,961 574,571 790,029 816,540 850,739 868,275Truck
Single-unit 2-axle 6-tire or more truck 98,551 128,769 27,081 34,606 39,813 45,441 51,901 62,705 64,072 66,893 68,021
Combination truck 28,854 31,665 35,134 46,724 68,678 78,063 94,341 115,451 118,899 124,584 128,359Bus 4,346 4,681 4,544 6,055 6,059 4,478 5,726 6,420 6,563 6,842 7,007 Total highwayc 718,763 887,811 1,109,724 1,327,664 1,527,295 1,774,827 2,144,362 2,412,899 2,485,848 2,561,695 2,631,522
TransitMotor busd 1,576 1,528 1,409 1,526 1,677 1,863 2,130 2,184 2,221 R2,245 P2,291Light rail 75 42 34 24 18 17 24 35 38 41 P43Heavy rail 391 395 407 423 385 451 537 537 543 558 P566Trolley bus 101 43 33 15 13 16 14 14 14 14 P14Commuter rail N N N 173 179 183 213 238 242 251 P265Demand responsived N N N N N 247 306 507 548 R585 P698Ferry boat N N N N I I 2 3 3 2 2Other N N N 15 15 15 R18 R37 R45 R52 53 Total transite 2,143 2,008 1,883 2,176 2,287 2,791 3,242 3,550 3,650 R3,746 P3,932
RailClass I freight, train-miles 404 421 427 403 428 347 380 458 469 475 475Class I freight, car-miles 28,170 29,336 29,890 27,656 29,277 24,920 26,159 30,383 31,715 31,660 32,657Intercity/Amtrakf, train-miles 209 172 93 30 30 30 33 32 30 32 33Intercity/Amtrakf, car-miles 2,208 1,775 690 253 235 251 301 292 R276 288 312 Total train-milesg 613 593 520 433 458 377 413 490 499 507 508

46"
Chapter 1 T
he Transportation System
1980: U.S. National Transportation Safety Board estimate, personal communication,Dec. 7, 1998.1985-92: Ibid., General Aviation Activity and Avionics Survey (Washington, DC: Annualissues,) table 3.3.1993-97: Ibid., General Aviation and Air Taxi Activity and Avionics Survey (Washington, DC:Annual issues), table 3.3.Highway:Passenger car and motorcycle: 1960-94: U.S. Department of Transportation, FederalHighway Administration, Highway Statistics Summary to 1995 (updated June 1999),Internet site http://www.fhwa.dot.gov/ohim/summary95/index.html, as of July 28,2000, table VM-201A.1995-98: Ibid., Highway Statistics (Washington, DC: Annual issues), table VM-1, sum ofpassenger car and motorcycle.Motorcycle: 1970-80: U.S. Department of Transportation, Federal Highway Administration,Highway Statistics, Summary to 1985 (Washington, DC: 1986), table VM-201A.1985-98: Ibid., Highway Statistics (Washington, DC: Annual issues), table VM-1.Other 2-axle 4-tire vehicle: 1970-94: U.S. Department of Transportation, Federal HighwayAdministration, Highway Statistics Summary to 1995 (updated June 1999), Internet sitehttp://www.fhwa.dot.gov/ohim/summary95/index.html, as of July 28, 2000, table VM-201A.1995-98: Ibid., Highway Statistics (Washington, DC: Annual issues), table VM-1.Single-unit 2-axle 6-tires or more truck, combination truck, and bus: 1960-94: U.S. Departmentof Transportation, Federal Highway Administration, Highway Statistics Summary to 1995(updated June 1999), Internet sitehttp://www.fhwa.dot.gov/ohim/summary95/index.html, as of July 28, 2000, table VM-201A.1995-98: Ibid., Highway Statistics (Washington, DC: Annual issues), table VM-1.Transit:1960-98: American Public Transit Association, Public Transportation Fact Book(Washington, DC: 2000), table 42, 84, and similar tables in earlier editions.Rail:Class I rail freight train- and car-miles: 1960-98: Association of American Railroads, RailroadFacts, 1998 (Washington, DC: 1999), p. 33 (train-miles) and p. 34 (car-miles).Intercity/Amtrak train-miles: 1960-70: Association of American Railroads, Yearbook ofRailroad Facts (Washington, DC: 1975), p. 39.1975-98: Amtrak, Amtrak Annual Report, Statistical Appendix (Washington, DC: Annual issues).Intercity/Amtrak car-miles: 1960-75: Association of American Railroads, Yearbook ofRailroad Facts (Washington, DC: 1975), p. 40.1980-98: Amtrak, Amtrak Corporate Reporting, Route Profitability System, personalcommunication, 1999.
Table 1-29Cont’d U.S. Vehicle-Miles (Millions)
a All operations other than those operating under 14 CFR 121 and 14 CFR 135. Data for 1996 are estimated using new information on nonrespondents and are not comparable toearlier years. Mileage in source is multiplied by 1.151 to convert to nautical-miles for 1985-1997.
b U.S. Department of Transportation, Federal Highway Administration (FHWA), provides data separately for passenger car and motorcycle in its annual Highway Statistics series.However, the 1995 summary report provides updated data for passenger car and motorcycle combined. Passenger car figures in this table were computed by U.S. Department of Transportation, Bureau of Transportation Statistics by subtracting the most current motorcycle figures from the aggregate passenger car and motorcycle figures.
c In July 1997, the FHWA published revised vehicle-miles data for the highway modes for many years. The major change reflected the reassignment of some vehicles, such as sportutility vehicles and minivans, from the passenger car category to the other 2-axle 4-tire vehicle category.
d Motor bus and demand responsive figures are also included in the bus figure for highway.
e Prior to 1985, excludes demand responsive and most rural and smaller systems funded via Sections 18 and 16(b)2, Federal Transit Act. The series is not continuous between 1980 and 1985. Transit rail modes are measured in car-miles. Car-miles measure individual vehicle-miles in a train. A 10-car train traveling 1 mile would equal 1 train-mile and 10 car-miles.
f Amtrak began operations in 1971.g Although both train-miles and car-miles are shown for rail, only train-miles are included in the total. A train-mile is the movement of a train, which can consist of multiple vehicles (cars), the distance of 1 mile. This differs from a vehicle-mile, which is the movement of 1 vehicle the distance of 1 mile. A 10-vehicle train traveling 1 mile would be measured as 1 train-mile and 10 vehicle-miles. Caution should be used when comparing train-miles with vehicle miles.
h 1960–65, motorcycle data are included in passenger car, and other 2-axle 4-tire vehicle data included in single-unit 2-axle 6-tire or more truck.
i Ferry boat included with other.SOURCES:Air:Air carrier: 1960: Civil Aeronautics Board, Handbook of Airline Statistics 1969 (Washington,DC: 1970), part III, table 2.1965-70: Ibid., Handbook of Airline Statistics 1973 (Washington, DC: 1974), part III, table 2.1975-80: Ibid., Air Carrier Traffic Statistics (Washington, DC: 1976, 1981), p. 4 (December1976) and p. 2 (December 1981).1985-98: U.S. Department of Transportation, Bureau of Transportation Statistics, Officeof Airline Information, Air Carrier Traffic Statistics (Washington, DC: Annual Decemberissues), p. 2, line 27 plus line 50.General aviation: 1960-65: U.S. Department of Transportation, Federal AviationAdministration, FAA Statistical Handbook of Aviation 1972 (Washington, DC: 1973), table 9.10.1970-75: U.S. Department of Transportation, Federal Aviation Administration, FAAStatistical Handbook of Aviation 1976 (Washington, DC: 1976), table 8-5.

1980 1985 1990 1995 1996 1997 1998VMT (millions)UrbanInterstate 161,242 216,188 278,901 341,515 351,579 361,401 374,622Other arterialsa 484,189 578,270 699,233 815,102 834,623 846,659 862,994Collector 83,043 89,578 106,297 126,883 129,310 130,143 131,919Local 126,791 160,062 191,053 205,907 208,374 222,142 228,530 Total 855,265 1,044,098 1,275,484 1,489,407 1,523,886 1,560,345 1,598,065
RuralInterstate 135,084 154,357 200,173 223,382 232,565 240,255 251,520Other arterialsa 262,774 282,803 330,866 368,595 378,847 392,058 403,484Collectorb 189,468 206,669 240,460 236,148 241,030 254,364 257,858Local 84,704 86,899 97,379 105,164 107,752 114,673 120,595 Total 672,030 730,728 868,878 933,289 960,194 1,001,350 1,033,457
VMT per lane-mile (thousands)
UrbanInterstate 3,327 3,773 4,483 4,785 R4,897 4,953 5,081Other arterialsa 1,451 1,556 1,751 1,828 R1,857 1,857 1,891Collector 572 552 634 686 R692 694 699Local 146 168 184 181 181 188 192 Total 613 677 764 809 R820 822 838
RuralInterstate 1,031 1,170 1,473 1,693 R1,749 1,804 1,882Other arterialsa 518 555 640 695 710 729 749Collectorb 132 141 164 167 170 179 182Local 19 20 23 25 R25 27 29 Total 103 113 136 148 151 157 164
Travel and Goods Movement ! 47
Roadway Vehicle-Miles Traveled (VMT) and VMT per Lane-Mile by Functional Class
a For urban: the sum of other freeways and expressways, other principal arterials, and minor arterials.For rural: the sum of other principal arterials and minor arterials.
b Collector is the sum of major and minor collectors (rural only).NOTE: See table 1-5 for estimated highway lane-miles byfunctional class.SOURCES: 1980-90: U.S. Department of Transportation,Federal Highway Administration, Highway Statistics Summary to 1995,
FHWA-PL-97-009 (Washington, DC: July1997), table VM-202.1995-97: Ibid., Highway Statistics (Washington, DC: Annual issues),tables VM-2 and VM-2A.Lane-miles: 1980-95: Ibid., Office of Highway InformationManagement, unpublished data, 1997, table HM-260.1996-98: Ibid., Highway Statistics (Washington, DC: Annual issues),table HM-60.
Table 1-30
KEY: R = revised

48"
Chapter 1 T
he Transportation System
Table 1-31 U.S. Passenger-Miles (Millions)
KEY: N = data do not exist; P = preliminary; R = revised
Continued next page
1960 1965 1970 1975 1980 1985 1990 1995 1996 1997 1998AirAir carrier, certificated,
domestic, all services R31,099 R53,226 R108,442 136,000 R204,368 R277,836 R345,873 R403,888 R434,652 R450,612 463,262General aviationa 2,300 4,400 9,100 11,400 14,700 12,300 13,000 R10,800 R12,000 12,500 13,300
HighwayR
Passenger carb,c 1,144,673 1,394,803 1,750,897 1,954,166 2,011,989 2,094,621 2,281,391 2,271,310 2,337,068 2,389,064 2,463,827Motorcycleb,c g g 3,277 6,192 12,257 11,812 12,424 11,560 11,706 11,896 12,134Other 2-axle 4-tire vehiclec h h 225,613 363,267 520,774 688,091 999,754 1,295,648 1,339,126 1,395,212 1,423,971Truck Single-unit 2-axle 6-tire
or more truck 98,551 128,769 27,081 34,606 39,813 45,441 51,901 62,705 64,072 66,893 67,021 Combination truck 28,854 31,665 35,134 46,724 68,678 78,063 94,341 115,451 118,899 124,584 128,359Busd N N N N N 94,925 121,398 136,104 138,613 145,060 148,325 Totalc 1,272,078 1,555,237 2,042,002 2,404,954 2,653,510 3,012,953 3,561,209 3,892,778 4,009,484 4,132,709 4,243,637
TransitMotor busd N N N N R21,790 R21,161 R20,981 R18,818 R19,096 R19,604 P20,602Light rail N N N N 381 350 571 860 957 R1,035 P1,118Heavy rail N N N N R10,558 R10,427 R11,475 R10,559 R11,530 R12,056 P12,284Trolley bus N N N N 219 306 193 187 184 189 P182Commuter railR 4,197 4,128 4,592 4,513 6,516 6,534 7,082 8,244 8,351 8,038 P8,716Demand responsived N N N N N 364 431 607 656 R754 P1,012Ferry boat N N N N i i 286 260 256 349 P345Other N N N N 390 439 124 273 348 R314 P397
TotalR,e j4,197 j4,128 j4,592 j4,513 39,854 39,581 41,143 39,808 41,378 R42,339 P44,656
Rail
Intercity/Amtrakf,R 17,064 13,260 6,179 3,931 4,503 4,825 6,057 5,545 5,050 5,166 5,304

Travel and Goods M
ovement !
49
1975-80: Ibid., Air Carrier Traffic Statistics (Washington, DC: 1976, 1981), p. 4(December 1976) and p. 2 (December 1981).1985-98: U.S. Department of Transportation, Bureau of Transportation Statistics, Officeof Airline Information, Air Carrier Traffic Statistics (Washington, DC: Annual Decemberissues), page 2, line 1.General aviation: 1960-97: Eno Transportation Foundation, Inc., Transportation in America,1998 (Washington, DC: 1998), p. 47.Highway:Passenger car and motorcycle: 1960-94: U.S. Department of Transportation, FederalHighway Administration, Highway Statistics Summary to 1995 (updated June 1999),Internet site http://www.fhwa.dot.gov/ohim/summary95/index.html, as of July 28,2000, table VM-201A.1995-98: Ibid., Highway Statistics (Washington, DC: Annual issues), table VM-1, sum ofpassenger car and motorcycle.Motorcycle: 1970-80: U.S. Department of Transportation, Federal Highway Administration,Highway Statistics, Summary to 1985 (Washington, DC: 1986), table VM-201A.1985-98: Ibid., Highway Statistics (Washington, DC: Annual issues), table VM-1.Other 2-axle 4-tire vehicle: 1970-94: U.S. Department of Transportation, Federal HighwayAdministration, Highway Statistics Summary to 1995 (updated June 1999), Internet sitehttp://www.fhwa.dot.gov/ohim/summary95/index.html, as of July 28, 2000, tableVM-201A.1995-98: Ibid., Highway Statistics (Washington, DC: Annual issues), table VM-1.Single-unit 2-axle 6-tires or more truck, combination truck, and bus: 1960-94: U.S. Departmentof Transportation, Federal Highway Administration, Highway Statistics Summary to 1995(updated June 1999), Internet sitehttp://www.fhwa.dot.gov/ohim/summary95/index.html, as of July 28, 2000, tableVM-201A.1995-98: Ibid., Highway Statistics (Washington, DC: Annual issues), table VM-1.Transit:Ferry boat and other: 1992: American Public Transit Association, personal communica-tion, July 19, 2000.All other data: 1960-98: American Public Transit Association, Transit Fact Book(Washington, DC: 2000), table 30 and similar tables in earlier editions.Rail, Intercity/Amtrak: 1960-80: Association of American Railroads, Railroad Facts(Washington, DC: Annual issues).1985: Amtrak, Amtrak FY95 Annual Report Statistical Appendix (Washington, DC: 1996), p. 4.1990-98: Ibid., Amtrak FY99 Annual Report Statistical Appendix (Washington, DC: 2000), p. 43.
Table 1-31Cont’d U.S. Passenger-Miles (Millions)
a All operations other than those operating under 14 CFR 121 and 14 CFR 135.b U.S. Department of Transportation, Federal Highway Administration (FHWA), provides
data separately for passenger car and motorcycle in its annual Highway Statistics series.However, the 1995 summary report provides updated data for passenger car and motorcycle combined. Passenger car figures in this table were computed by U.S.Department of Transportation, Bureau of Transportation Statistics by subtracting the most current motorcycle figures from the aggregate passenger car and motorcycle figures.
c In July 1997, FHWA published revised passenger-miles data for the highway modes for anumber of years. The major change reflected the reassignment of some vehicles from thepassenger car category to the other 2-axle 4-tire vehicle category. Passenger-miles for passenger car, motorcycle, and other 2-axle 4-tire vehicles were derived by multiplying vehicle-miles for these vehicles by average vehicle occupancy rates, provided by the Nationwide Personal Transportation Survey, 1977, 1983, and 1995.
d Motor bus and demand responsive figures are also included in the bus figure for highway.e Prior to 1985, excludes demand responsive and most rural and smaller systems funded
via Sections 18 and 16(b)2, Federal Transit Act. The series is not continuous between 1980 and 1985. Transit rail modes are measured in car-miles. Car-miles measure individualvehicle-miles in a train. A 10-car train traveling 1 mile would equal 1 trainmile and 10 car-miles.
f Amtrak began operations in 1971. Does not include contract commuter passengers.g Included in passenger car.h Included in other single-unit 2-axle 6-tire or more truck.i Ferry boat included in other.j Includes commuter rail figures only.NOTES: Air carrier passenger-miles are computed by summing of the products of theaircraft-miles flown on each interairport segment multiplied by the number of passengerscarried on that segment. Highway passenger-miles are calculated by multiplying vehicle-miles of travel as cited by FHWA by the average number of occupants for each vehicletype. Average vehicle occupancy rates are based on various sources, such as theNationwide Personal Transportation Survey, conducted by the Federal HighwayAdministration, and the Truck Inventory and Use Survey, conducted by the Bureau of theCensus. Transit passenger-miles are the cumulative sum of the distances ridden by eachpassenger. Rail passenger-miles represent the movement of 1 passenger for 1 mile.SOURCES:Air:Air carrier, domestic, all services: 1960: Civil Aeronautics Board, Handbook of Airline Statistics1969 (Washington, DC: 1970), part III, table 2.1965-70: Ibid., Handbook of Airline Statistics 1973 (Washington, DC: 1974), part III, table 2.

50"
Chapter 1 T
he Transportation System
Principal Means of Transportation to Work (Thousands)
a Public transportation refers to bus, streetcar, subway, or elevated trains.b Other means include ferryboats, surface trains, and van service.NOTES: Principal means of transportation refers to the mode used most often, whendifferent means of transportation were used on different days of the week, or the modeused for the longest distance during the trip to work, when more than one mode is usedto get to work each day.
SOURCE: U.S. Department of Housing and Urban Development, American HousingSurvey (Washington, DC: Various years).
Table 1-32
Number Percent Number Percent Number Percent Number Percent Number Percent
All workers 99,592 100.0 106,630 100.0 103,741 100.0 116,469 100.0 118,041 100 Automobile 86,148 86.5 93,943 88.1 91,301 88.0 101,907 87.5 103,466 87.7 Drives self 72,137 72.4 81,322 76.3 79,449 76.6 90,207 77.5 92,363 78.2 Carpool 14,011 14.1 12,621 11.8 11,852 11.4 11,700 10.0 11,103 9.4 2 person 10,381 10.4 9,708 9.1 9,105 8.8 9,294 8.0 8,705 7.4 3 person 2,024 2.0 1,748 1.6 1,684 1.6 1,526 1.3 1,454 1.2 4+ person 1,606 1.6 1,165 1.1 1,063 1.0 881 0.8 945 0.8 Public transportationa 5,091 5.1 4,880 4.6 4,740 4.6 5,337 4.6 5,779 4.9 Taxicab 129 0.1 152 0.1 117 0.1 139 0.1 144 0.1 Bicycle or motorcycle 958 1.0 795 0.7 744 0.7 738 0.6 749 0.6 Walks only 4,032 4.0 3,634 3.4 3,227 3.1 3,869 3.3 3,627 3.1 Other meansb 286 0.3 491 0.5 474 0.5 867 0.7 987 0.8 Works at home 2,947 3.0 2,736 2.6 3,137 3.0 3,611 3.1 3,288 2.8
19991985 1989 1993 1997

Household trips(thousands)
Number %
Person trips(thousands)
Number %
Person-miles(millions)
Number %
Personal-usevehicle trips(thousands)
Number %
Personal-usevehicle miles
(millions)Number %
TOTAL 656,462 100.0 1,001,319 100.0 826,804 100.0 505,154 100.0 280,127 100.0
Principal means of transportationPersonal-use vehicle 505,154 77.0 813,858 81.3 451,590 54.6 505,154 100.0 280,127 100.0Airplane 129,164 19.7 161,165 16.1 355,286 43.0 NA NA NA NA Commercial airplane 124,884 19.0 155,936 15.6 347,933 42.1 NA NA NA NABus 17,340 2.6 20,445 2.0 13,309 1.6 NA NA NA NA Intercity 2,755 0.4 3,244 0.3 2,723 0.3 NA NA NA NA Charter or tour 11,890 1.8 14,247 1.4 9,363 1.1 NA NA NA NATrain 4,200 0.6 4,994 0.5 4,356 0.5 NA NA NA NAShip, boat, or ferry 391 0.1 614 0.1 1,834 0.2 NA NA NA NAOther 213 — 243 — 429 0.1 NA NA NA NARoundtrip distanceLess than 300 miles 194,098 29.6 306,433 30.6 74,658 9.0 185,418 36.7 45,159 16.1300-499 miles 174,389 26.6 274,045 27.4 106,007 12.8 159,743 31.6 61,779 22.1500-999 miles 140,046 21.3 214,006 21.4 146,631 17.7 106,846 21.2 72,114 25.71,000-1,999 miles 76,110 11.6 108,331 10.8 153,316 18.5 36,722 7.3 49,952 17.82,000 miles or more 71,819 10.9 98,503 9.8 346,192 41.9 16,425 3.3 51,123 18.3Mean (miles) 872 NA 826 NA NA NA 555 NA NA NAMedian (miles) 438 NA 425 NA NA NA 368 NA NA NACalendar quarter1st quarter 130,963 19.9 200,331 20.0 155,603 18.8 99,549 19.7 50,801 18.12nd quarter 168,669 25.7 258,400 25.8 208,256 25.2 130,135 25.8 72,421 25.93rd quarter 193,913 29.5 304,542 30.4 261,463 31.6 152,862 30.3 90,558 32.34th quarter 162,917 24.8 238,047 23.8 201,471 24.4 122,607 24.3 66,346 23.7
Travel and Goods M
ovement !
51
Table 1-33Long-Distance Travel in the United States by Selected Trip Characteristics: 1995(Roundtrips of 100 miles or more, one way, U.S. destinations only)
KEY: — = rounds to or represents zero; NA = not applicable
Continued next page

52"
Chapter 1 T
he Transportation System
Table 1-33
Cont’d
Long-Distance Travel in the United States by Selected Trip Characteristics: 1995(Roundtrips of 100 miles or more, one way, U.S. destinations only)
KEY: — = rounds to or represents zero; NA = not applicable
Continued next page
Main purpose of tripBusiness 192,537 29.3 224,835 22.5 212,189 25.7 125,036 24.8 61,929 22.1Pleasure 372,586 56.8 630,110 62.9 506,971 61.3 305,571 60.5 177,698 63.4 Visit relatives or friends 195,468 29.8 330,755 33.0 264,769 32.0 159,981 31.7 92,190 32.9 Leisurea 177,119 27.0 299,355 29.9 242,201 29.3 145,590 28.8 85,508 30.5 Rest or relaxation 65,017 9.9 115,154 11.5 100,838 12.2 53,780 10.6 33,598 12.0 Sightseeing 24,272 3.7 42,649 4.3 50,781 6.1 18,069 3.6 14,654 5.2 Outdoor recreation 39,899 6.1 65,418 6.5 41,620 5.0 35,987 7.1 19,407 6.9 Entertainment 37,456 5.7 58,757 5.9 42,929 5.2 27,920 5.5 14,531 5.2Personal business 91,319 13.9 146,338 14.6 107,621 13.0 74,532 14.8 40,490 14.5Other 19 — 36 — 23 — 16 — 9 —
Vacation or weekend tripsVacation trip 301,197 45.9 515,383 51.5 484,144 58.6 236,055 46.7 154,167 55.0Weekend trip 400,755 61.0 621,948 62.1 475,269 57.5 310,379 61.4 169,309 60.4 1 or 2 nights away from home 240,808 36.7 377,893 37.7 222,418 26.9 199,831 39.6 94,865 33.9 3-5 nights away from home 159,946 24.4 244,055 24.4 252,851 30.6 110,548 21.9 74,444 26.6
Travel party typeOne adult, no children under 18 386,479 58.9 386,510 38.6 352,350 42.6 275,034 54.4 144,795 51.7Two or more adults, no children under 18 155,147 23.6 299,485 29.9 248,762 30.1 133,163 26.4 79,273 28.3One adult, children under 18 29,436 4.5 67,959 6.8 48,083 5.8 24,879 4.9 13,827 4.9Two or more adults, children under 18 66,086 10.1 225,875 22.6 158,334 19.2 60,497 12.0 34,759 12.4No adult, one or more children under 18 19,313 2.9 21,489 2.1 19,275 2.3 11,581 2.3 7,473 2.7Mean travel party size 1.6 NA 2.2 NA NA NA 1.7 NA NA NA
Household trips(thousands)
Number %
Person trips(thousands)
Number %
Person-miles(millions)
Number %
Personal-usevehicle trips(thousands)
Number %
Personal-usevehicle miles
(millions)Number %

Travel and Goods M
ovement !
53
SOURCE: U.S.Department of Transportation, Bureau of Transportation Statistics, 1995 American TravelSurvey Profile, BTS/ATS95-US (Washington, DC: October 1997).
Table 1-33Cont’d
Long-Distance Travel in the United States by Selected Trip Characteristics: 1995(Roundtrips of 100 miles or more, one way, U.S. destinations only)
a Includes other leisure purposes not shown separately.NOTES: Numbers and percentages may not add to totals due to rounding. See glossaryfor definitions of categories.
KEY: — = rounds to or represents zero; NA = not applicable
Nights away from homeNone 164,032 25.0 239,727 23.9 104,444 12.6 140,914 27.9 49,619 17.71-3 nights 321,227 48.9 502,465 50.2 331,504 40.1 259,354 51.3 131,559 47.04-7 nights 121,279 18.5 184,766 18.5 243,546 29.5 76,380 15.1 61,318 21.98 or more nights 49,924 7.6 74,361 7.4 147,309 17.8 28,506 5.6 37,631 13.4Mean, excluding none (nights) 4.4 NA 4.3 NA NA NA 4.0 NA NA NA
Type of lodging at destinationFriend's or relative's home 211,832 43.6 345,506 45.9 290,428 41.0 170,271 47.3 103,180 45.7Hotel, motel, or resort 201,264 41.4 282,929 37.6 318,323 44.9 126,160 35.1 82,447 36.5Rented cabin, condo, or vacation home 20,205 4.2 38,572 5.1 26,269 3.7 18,103 5.0 9,819 4.3Owned cabin, condo, or vacation home 17,607 3.6 30,648 4.1 31,161 4.4 14,631 4.1 10,809 4.8Camper, trailer, recreational vehicle, tent 11,944 2.5 22,208 3.0 15,836 2.2 11,663 3.2 8,204 3.6Other type of lodging 23,452 4.8 32,095 4.3 27,080 3.8 18,917 5.3 11,542 5.1
Nights at destinationMean nights at destination 4.20 NA 4.0 NA NA NA 3.8 NA NA NA Friend's or relative's home 4.33 NA 4.0 NA NA NA 3.6 NA NA NA Hotel, motel, or resort 3.05 NA 3.0 NA NA NA 2.8 NA NA NA
Household trips(thousands)
Number %
Person trips(thousands)
Number %
Person-miles(millions)
Number %
Personal-usevehicle trips(thousands)
Number %
Personal-usevehicle miles
(millions)Number %

54 " Chapter 1 The Transportation System
TOTAL all person trips 1,001,319 100 834,676 100 813,858 100 454,787 100
Age and sexUnder 18 years 159,779 16.0 115,869 13.9 139,360 17.1 78,517 17.318-24 years 92,129 9.2 67,224 8.1 79,810 9.8 43,821 9.625-29 years 80,060 8.0 64,009 7.7 66,510 8.2 35,809 7.930-39 years 189,917 19.0 167,583 20.1 146,527 18.0 78,970 17.440-49 years 199,991 20.0 170,379 20.4 157,063 19.3 83,046 18.350-59 years 137,841 13.8 118,433 14.2 110,208 13.5 61,856 13.660-64 years 48,683 4.9 43,574 5.2 40,647 5.0 25,258 5.665 years and over 92,919 9.3 87,603 10.5 73,733 9.1 47,512 10.4 Total 1,001,319 100 834,676 100 813,858 100 454,787 100Median (years) 38 38
FemaleUnder 18 years 79,580 7.9 58,716 7.0 68,650 8.4 39,122 8.618-24 years 42,743 4.3 32,706 3.9 36,161 4.4 19,702 4.325-29 years 36,422 3.6 29,473 3.5 29,986 3.7 16,077 3.530-39 years 82,471 8.2 70,360 8.4 65,056 8.0 34,606 7.640-49 years 84,135 8.4 70,696 8.5 67,855 8.3 36,039 7.950-59 years 59,721 6.0 50,449 6.0 48,867 6.0 27,483 6.060-64 years 21,310 2.1 19,576 2.3 17,217 2.1 10,942 2.465 years and over 44,129 4.4 41,278 4.9 33,409 4.1 20,513 4.5 Total 450,512 45.0 373,254 44.7 367,203 45.1 204,485 45.0Median (years) 37 37
RaceWhite 891,443 89.0 739,444 88.6 726,632 89.3 403,045 88.6Black 59,923 6.0 44,935 5.4 49,175 6.0 28,115 6.2Asian or Pacific Islander 22,922 2.3 28,690 3.4 15,954 2.0 10,570 2.3American Indian, Eskimo, or Aleutian 10,707 1.1 8,103 1.0 8,807 1.1 5,233 1.2Other 16,324 1.6 13,504 1.6 13,290 1.6 7,825 1.7 Total 1,001,319 100 834,676 100 813,858 100 454,788 100
Ethnicity (Hispanic origin) 52,822 5.3 38,177 4.6 44,219 5.4 23,183 5.1 (Not of Hispanic origin) 948,497 94.7 796,499 95.4 769,640 94.6 431,605 94.9 Total 1,001,319 100 834,676 100 813,858 100 454,788 100
Person trips(thousands)
Number %
Person-miles(millions)
Number %
Personal-usevehicle trips(thousands)
Number %
Personal-usevehicle miles
(millions)Number %
Long-Distance Travel in the United States by Selected TravelerCharacteristics: 1995 (Roundtrips of 100 miles or more, one way)Table 1-34
Continued next page

Household incomeLess than $25,000 155,555 15.5 112,236 13.4 131,901 16.2 71,556 15.7$25,000-$39,999 200,981 20.1 148,185 17.8 175,186 21.5 98,074 21.6$40,000-$49,999 166,699 16.6 125,296 15.0 144,160 17.7 78,294 17.2$50,000-$59,999 143,946 14.4 118,691 14.2 117,579 14.4 66,363 14.6$60,000-$74,999 134,348 13.4 118,169 14.2 106,083 13.0 61,169 13.5$75,000-$99,999 104,698 10.5 102,112 12.2 79,397 9.8 45,406 10.0$100,000 or more 95,092 9.5 109,987 13.2 59,553 7.3 33,925 7.5
Household type Family household 840,438 83.9 693,794 83.1 692,146 85.0 388,534 85.4 Married-couple household 726,982 72.6 606,630 72.7 597,863 73.5 335,980 73.9 With children under 18 years 379,139 37.9 302,958 36.3 313,451 38.5 172,014 37.8 Female householder 76,942 7.7 60,665 7.3 62,583 7.7 35,023 7.7 With children under 18 years 43,389 4.3 31,963 3.8 35,986 4.4 19,421 4.3 Male householder 36,515 3.6 26,499 3.2 31,700 3.9 17,531 3.9 With children under 18 years 13,226 1.3 9,845 1.2 11,207 1.4 6,583 1.4 Nonfamily household 160,881 16.1 140,881 16.9 121,712 15.0 66,254 14.6
Educational attainment (Persons 16 years and over)Less than high school graduate 68,338 7.9 48,533 6.6 59,159 8.6 33,428 8.7High school graduate 219,549 25.5 165,361 22.6 187,762 27.2 105,957 27.6Some college, no degree 182,146 21.2 146,379 20.0 153,399 22.3 86,304 22.5Associate's degree 58,431 6.8 46,401 6.3 49,081 7.1 26,264 6.8Bachelor's degree 193,651 22.5 181,233 24.8 145,438 21.1 79,779 20.8Some grad school or grad degree 137,513 16.0 144,155 19.7 94,221 13.7 52,678 13.7 Total 859,629 100 732,062 100 689,060 100 384,409 100
Activity status (Persons 16 years and over)Working full time 547,232 63.7 470,855 64.3 428,319 62.2 228,969 59.6Retired 95,039 11.1 88,837 12.1 77,921 11.3 52,589 13.7Other 217,357 25.3 172,371 23.5 182,820 26.5 102,851 26.8 Total 859,629 100 732,062 100 689,060 100 384,409 100
Person trips(thousands)
Number %
Person-miles(millions)
Number %
Personal-usevehicle trips(thousands)
Number %
Personal-usevehicle miles
(millions)Number %
Travel and Goods Movement ! 55
Long-Distance Travel in the United States by Selected TravelerCharacteristics: 1995 (Roundtrips of 100 miles or more, one way)
NOTE: This table excludes travel outside the United States.Numbers and percents may not add to totals due to rounding.
SOURCE: U.S. Department of Transportation, Bureau ofTransportation Statistics, 1995 American Travel Survey data.
Table 1-34Cont’d

56"
Chapter 1 T
he Transportation System
Table 1-35 U.S. Air Carrier Aircraft Departures, Enplaned Revenue Passengers, and Enplaned Revenue Tons
Continued next page
AIRCRAFT DEPARTURESTotal performedTotal scheduled
Large HubsPerformedScheduled
Medium HubsPerformedScheduled
Small HubsPerformedScheduled
NonhubsPerformedScheduled
ENPLANED REVENUE
PASSENGERSa
Large HubsMedium HubsSmall HubsNonhubs
ENPLANED REVENUE
TONSb
FreightLarge HubsMedium HubsSmall HubsNonhubs
Total Freight
MailLarge HubsMedium HubsSmall HubsNonhubs
Total Mail
1975
4,555,5164,530,535
2,437,9582,409,874
902,652899,543
640,589644,133
574,317576,985
196,782,144133,975,90036,539,61319,406,6076,860,024
3,661,061
2,265,664.95358,043.5699,132.6241,922.32
2,764,763.45
677,179.12151,498.1348,486.0719,134.42
896,297.74
1980
5,156,8485,204,564
2,887,2392,905,923
1,048,7261,058,438
598,559608,738
622,324631,465
281,408,852197,679,37651,664,62723,393,3248,671,525
5,088,313
3,008,311.25414,324.7473,795.4965,755.91
3,562,187.39
1,091,059.45255,929.13148,115.7631,020.96
1,526,125.30
1985
5,505,6595,591,596
3,439,4463,487,660
1,185,0081,201,540
514,176524,048
367,029378,348
363,341,497264,507,14465,770,37624,240,7268,823,251
4,024,470
2,047,988.46469,057.0948,126.5935,854.90
2,601,027.04
1,082,566.55268,179.1459,916.5712,780.74
1,423,443.00
1990
6,641,6816,758,571
4,167,8684,237,466
1,394,8331,417,762
669,450679,103
409,530424,240
438,544,001317,595,09980,466,37330,771,3839,711,146
6,298,824
3,001,216.681,446,744.12
191,357.9093,407.35
4,732,726.05
1,146,589.25292,898.69108,655.7417,954.39
1,566,098.07
1995
8,030,5307,920,467
5,162,5345,147,875
1,439,6391,387,833
738,231711,947
690,126672,812
526,055,483392,601,89085,929,28533,561,09813,963,210
9,365,017
4,402,326.871,950,317.96
541,061.90310,772.09
7,204,478.82
1,546,567.80442,814.10136,007.6935,148.83
2,160,538.42
1996
8,204,6748,064,653
5,257,5415,243,646
1,425,2801,356,162
754,914722,170
766,939742,675
558,183,741417,339,69489,018,76437,122,97414,702,309
10,333,298
4,653,189.062,169,411.17
755,232.44469,962.24
8,047,794.91
1,630,444.73466,583.26157,137.0731,338.10
2,285,503.16
1997
8,095,8887,907,554
5,266,5605,219,161
1,430,5371,352,944
695,841660,685
702,950674,764
568,615,687426,246,42390,779,70536,298,97915,290,580
13,520,228
5,691,362.803,855,449.23
963,093.25653,542.47
11,163,447.75
1,699,154.46473,576.72138,817.8645,231.57
2,356,780.61
1998
8,248,2698,094,020
5,416,1585,405,728
1,429,7301,345,197
714,920674,812
687,461668,283
588,335,318442,402,44391,755,79337,675,30516,501,777
14,083,769
6,208,629.283,897,241.731,019,615.11
659,027.77
11,784,513.89
1,662,642.74482,710.49127,747.7826,153.61
2,299,254.62

Travel and Goods M
ovement !
57
and foreign-flag air carriers are not included. Air traffic hubs are designated as geo-graphical areas based on the percentage of total passengers enplaned in the area. A hubmay have more than one airport in it. This definition of hub should not be confusedwith the definition being used by the airlines in describing their "hub-and-spoke" routestructures. Individual communities fall into four hub classifications as determined byeach community's percentage of the total enplaned revenue passengers in all servicesand all operations of U.S. certificated route carriers within the 50 states, the District ofColumbia, and other U.S. areas. Classifications are based on the percentage of totalenplaned revenue passengers for each year according to the following: one percent ormore - large, 0.25 to 0.9999 percent - medium, 0.05 to 0.249 percent - small, less than0.05 - nonhub.SOURCE: U.S. Department of Transportation, Bureau of Transportation Statistics,Office of Airline Information, Airport Activity Statistics of Certified Route Air Carriers(Washington, DC: Annual issues), tables 2-5.
Table 1-35Cont’d U.S. Air Carrier Aircraft Departures, Enplaned Revenue Passengers, and Enplaned Revenue Tons
a The number of persons receiving air transportation from an air carrier for which renumeration is received by the carrier, excluding persons receiving reduced rate charges,such as air carrier employees, infants, and others (except ministers of religion, elderly individuals, and handicapped individuals).
b The number of short tons of freight transported by an air carrier aboard an aircraft.NOTES: Data are for all scheduled and nonscheduled service by large certificated U.S.air carriers at all airports served within the 50 states, the District of Columbia, and otherU.S. areas designated by the Federal Aviation Administration. Not all scheduled service isactually performed; however, because nonscheduled service is counted, the performedservice than scheduled service for some years. Prior to 1993, all scheduled and some non-scheduled enplanements for certificated air carriers were included; no enplanements wereincluded for air carriers offering charter service only. Prior to 1990, Freight includes bothfreight and express shipments and Mail includes priority and nonpriority U.S. mail and for-eign mail; beginning in 1990 only aggregate numbers are reported. Large certificated aircarriers hold Certificates of Public Convenience and Necessity issued by the U.S.Department of Transportation authorizing the performance of air transportation. Largecertificated air carriers operate aircraft with seating capacity of more than 60 seats or amaximum payload capacity of more than 18,000 pounds. Data for commuter, intrastate,

58 " Chapter 1 The Transportation System
1999 totalenplaned
passengers
1989 totalenplaned
passengers
%change1989-99Rank Rank
Atlanta, GA (William B Hartsfield) 1 37,223,698 3 20,397,697 82Chicago, IL (O'Hare Intl.) 2 31,656,550 1 25,664,266 23Dallas/Ft.Worth, TX (Dallas/Ft.Worth Intl.) 3 27,592,733 2 22,623,065 22Los Angeles, CA (Los Angeles Intl.) 4 24,024,215 4 18,583,292 29Denver, CO (Denver Intl.) 5 17,492,801 6 12,320,246 42Detroit, MI (Wayne County) 6 16,564,799 11 9,739,265 70San Francisco, CA (San Francisco Intl.) 7 16,540,786 5 13,326,085 24Phoenix, AZ (Phoenix Sky Harbor Intl.) 8 16,082,657 8 10,166,095 58Minneapolis, MN (Minneapolis-St. Paul Intl.) 9 15,390,488 16 8,460,115 82Las Vegas, NV (McCarran Intl.) 10 15,361,009 21 7,026,900 119St Louis, MO (Lambert-St. Louis Muni) 11 14,929,506 13 9,396,335 59Newark, NJ 12 14,904,697 10 9,822,419 52Houston, TX (Houston International) 13 14,734,821 20 7,030,001 110Seattle, WA (Seattle-Tacoma Intl.) 14 13,062,413 19 7,059,777 85Miami, FL (Miami Intl.) 15 12,721,257 15 8,591,936 48Orlando, FL (Orlando Intl.) 16 12,539,071 18 7,373,449 70Boston, MA (Logan Intl.) 17 11,078,408 12 9,661,258 15New York, NY (LaGuardia) 18 10,780,340 7 12,320,246 -12Philadelphia, PA 19 10,341,666 24 6,247,489 66New York, NY (JFK) 20 10,138,272 9 10,081,490 1Charlotte, NC (Douglas Muni) 21 9,442,197 22 6,903,482 37Salt Lake City, UT 22 8,715,175 26 5,244,238 66Honolulu, Hawaii 23 8,013,533 14 8,943,521 -10Pittsburgh, PA 24 8,013,533 17 7,940,962 1Baltimore, MD 25 8,002,750 28 4,446,139 80Cincinatti, OH 26 7,610,889 34 3,770,623 102San Diego, CA (Intl.-Lindbergh) 27 7,248,022 25 5,317,177 36Tampa, FL 28 6,912,195 29 4,409,261 57Washington, DC (Dulles Intl.) 29 6,830,051 27 4,543,530 50Washington, DC (Reagan National) 30 6,656,776 23 6,895,563 -3Portland, OR 31 6,510,393 42 3,054,925 113Miami/Ft. Lauderdale 32 6,223,731 37 3,645,786 71Chicago, IL (Midway) 33 6,137,747 38 3,409,726 80Cleveland, OH (Hopkins Intl.) 34 5,921,396 36 3,722,208 59Kansas City, MO 35 5,601,189 30 4,356,991 29San Jose, CA (San Jose Muni) 36 5,486,390 41 3,093,643 77Oakland, CA (Oakland Metropolitan Intl.) 37 4,737,711 53 2,030,847 133New Orleans, LA 38 5,468,799 40 3,170,967 72San Juan, PR (Luis Munoz Marin Intl.) 39 4,531,970 39 3,268,644 39Memphis, TN 40 4,523,926 32 3,989,814 13Houston, TX (William P. Hobby) 41 4,214,715 33 3,927,329 7Nashville, TN 42 4,062,749 35 3,746,367 8Raleigh, NC (Raleigh-Durham) 43 4,025,045 31 4,116,520 -2
Passengers Boarded at the Top 50 U.S. AirportsaTable 1-36
Continued next page

Travel and Goods Movement ! 59
Sacramento, CA 44 3,658,043 56 1,800,078 103Los Angeles, CA (Orange County) 45 3,642,214 50 2,173,502 68Indianapolis, IN 46 3,539,375 44 2,522,944 40Dallas, TX (Love Field) 47 3,414,265 43 2,773,836 23San Antonio, TX 48 3,340,285 46 2,493,393 34Austin, TX (Robert Muller Muni) 49 3,291,848 54 2,022,269 63Columbus, OH (Port Columbus Intl.) 50 3,120,242 58 1,662,389 88Top 50 Airports 512,057,341 351,910,836All Airports 611,299,415 455,263,066
1999 totalenplaned
passengers
1989 totalenplaned
passengers
%change1989-99Rank Rank
Passengers Boarded at the Top 50 U.S. AirportsaTable 1-36Cont’d
a Rank order by total enplaned passengers on large certificated U.S.air carriers, scheduled and nonscheduled operations, at all airportsserved within the 50 states, the District of Columbia, and other U.S. areas designated by the Federal Aviation Administration.Prior to 1993, all scheduled and some nonscheduled enplanementsfor certificated air carriers were included; no enplanements were included for air carriers offering charter service only.Large certificated air carriers hold Certificates of Public Convenience and Necessity issued by the U.S. Department ofTransportation authorizing the performance of air transportation.Large certificated air carriers operate aircraft with seating capacityof more than 60 seats or a maximum payload capacity of more than 18,000 pounds. Data for commuter, intrastate, and foreign-flag air carriers are not included.
NOTES: In 1989, Ontario, CA ranked 45th (2,608,588); WestPalm Beach, FL ranked 47th (2,403,585); Albuquerque, NM ranked48th (2,336,577); and Hartford, CT ranked 49th (2,269,982).
SOURCES:All airports, total enplaned passengers: 1989: U.S. Departmentof Transportation, Federal Aviation Administration and Researchand Special Programs Administration, Airport Activity Statistics ofCertificated Route Air Carriers, 12 Months Ending December 31, 1989(Washington, DC: 1989), table 1.1999:U.S. Department of Transportation, Bureau ofTransportation Statistics, Office of Airline Information, AirportActivity Statistics of Certificated Air Carriers: Summary Tables,TwelveMonths Ending December 31, 1999 (Washington, DC), table 1.Airport ranking: 1989: U.S. Department of Transportation,Federal Aviation Administration, FAA Statistical Handbook, CalendarYear 1989 (Washington, DC: 1989), table 4.11.1999: U.S. Department of Transportation, Bureau ofTransportation Statistics, Office of Airline Information, AirportActivity Statistics of Certificated Air Carriers: Summary Tables,TwelveMonths Ending December 31, 1999 (Washington, DC), tables 3-4.

60 " Chapter 1 The Transportation System
1975 1980 1985 1990 1995 1996 1997 1998Flag of carrierUnited States 6,502 10,031 11,798 19,145 24,582 25,148 26,744 27,390Foreign 6,144 10,231 12,357 17,269 22,328 24,704 27,571 28,791 Total arriving passengers 12,646 20,262 24,156 36,414 46,910 49,853 54,315 56,181
Country of embarkationa
Australia 106 227 277 495 581 622 618 613Bahama Islands 758 1,123 1,503 1,679 1,433 1,487 1,530 1,396Barbados 76 135 216 228 222 212 203 195Belgium 144 242 281 417 379 407 589 715Bermuda 398 497 434 487 426 363 425 407Brazil 212 300 352 584 1,112 1,176 1,388 1,377Canadab N N N 6,870 7,417 8,501 8,895 9,333China/Taiwan 50 113 206 325 972 1,017 1,068 1,080Colombia 173 315 279 286 481 499 586 606Denmark 222 267 241 313 221 236 252 225Dominican Republic 336 468 606 948 1,136 1,168 1,168 1,251France 512 689 955 1,777 2,045 2,178 2,323 2,523Germany 622 1,175 1,582 2,466 3,125 3,173 3,545 3,558Grand Cayman 25 121 173 273 314 323 328 370Greece 121 208 187 132 220 235 186 192Haiti 91 133 192 233 314 303 289 293Hong Kong 98 228 270 356 658 668 589 592Ireland 220 220 274 448 642 721 716 775Israel 84 189 294 204 412 483 482 502Italy 431 537 662 792 1,007 1,047 1,097 1,078Jamaica 457 429 707 975 1,124 1,136 1,162 1,219Japan 1,095 1,624 2,435 4,528 5,676 6,349 6,736 6,630Korea, Republic of 105 234 390 826 1,335 1,514 1,625 1,184Mexico 1,626 2,886 2,719 4,313 4,884 5,591 6,124 6,318Netherlands 312 427 583 837 1,580 1,774 2,074 2,213Netherland Antilles 213 327 407 388 339 305 368 382Panama Republic 97 150 180 153 225 229 227 267Philippines 108 194 145 246 397 379 410 275Spain 306 312 419 558 604 618 675 732Switzerland 236 312 452 616 733 790 910 1,068United Kingdom 1,549 2,973 3,460 5,166 6,648 7,131 7,935 8,640Venezuela 205 533 248 458 786 659 709 810 Total 10,988 17,588 21,129 38,377 47,448 51,294 55,232 56,819
Air Passenger Travel Arrivals in the United States from Selected ForeignCountries (Thousands)
a Country where passenger boarded a direct flight to the United States.b Canadian figure represents number of revenue passengers on
scheduled commercial and charter flights. Does not include foreign (non-Canadian, non-U.S.) scheduled carriers.
NOTES: Includes passengers on international commercial flights arriv-ing at U.S. airports and travelers between U.S. airports in the 50 states,Puerto Rico, Guam, or the Virgin Islands, and other U.S. territories.Data compiled from flight reports required by the U.S. Immigrationand Naturalization Service. Table includes a selected sample of coun-tries of embarkation for passengers arriving in the United States.Because two different data sources are used, the total number ofdeparting passengers may be less than the total for "country ofembarkation" listed here.
SOURCES: 1975-90: U.S.Department of Transportation, Research and Special ProgramsAdministration, Volpe National Transportation Systems Center,U.S. International Air Travel Statistics (Cambridge, MA: Annualissues), table IIa.1995: U.S. Department of Commerce, International TradeAdministration, U.S. International Air Passenger Statistics Report,Calendar Year 1995 (Washington, DC: 1996), table IIa.1996-98: Ibid., U.S. International Air Travel Statistics Report(Washington, DC: Annual issues), table IIa. Canada: StatisticsCanada, Air Carrier Traffic at Canadian Airports (Canada: Annualissues) and personal communication, March 28, 2000.
Table 1-37
KEY: N = data do not exist

Travel and Goods Movement ! 61
SOURCES: 1975-94: U.S.Department of Transportation, Research and Special ProgramsAdministration, Volpe National Transportation Systems Center, U.S.International Air Travel Statistics (Cambridge, MA: Annual issues), table IId.1995: U.S. Department of Commerce, International TradeAdministration, U.S. International Air Passenger Statistics Report, CalendarYear 1995 (Washington, DC: 1996), table IId.1996-98: Ibid., U.S. International Air Travel Statistics Report(Washington, DC: Annual issues), table IId. Canada: StatisticsCanada, Air Carrier Traffic at Canadian Airports (Canada: Annualissues) and personal communication, March 28, 2000.
a Country where passenger deboarded a direct flight from the United States.
b Canadian figure represents number of revenue passengers on scheduled commercial and charter flights. Does not include foreign (non-Canadian, non-U.S.) scheduled carriers.
NOTES: Includes passengers on international commercialflights departing U.S. airports, and Travelers between U.S. ports inthe 50 states, Puerto Rico, Guam, or the Virgin Islands, and otherU.S. territories. Data compiled from flight reports required bythe U.S. Immigration and Naturalization Service. Table includes aselected sample of countries of debarkation for passengersboarding in the United States. Because two different data sourcesare used, the total number of departing passengers may be lessthan the total for "country of debarkation" listed here.
1975 1980 1985 1990 1995 1996 1997 1998Flag of carrierUnited States 5,912 9,369 10,696 17,628 22,231 22,901 24,302 24,513Foreign 6,141 9,886 11,791 16,418 20,795 22,884 25,382 26,350 Total departing passengers 12,053 19,256 22,487 34,046 43,026 45,785 49,684 50,863
Country of debarkationa
Australia 103 245 232 540 560 614 606 607Bahama Islands 704 1,006 1,151 1,279 1,024 994 983 955Barbados 74 126 204 230 217 210 200 196Belgium 134 231 249 395 340 380 513 622Bermuda 372 467 389 277 199 196 215 207Brazil 206 291 322 560 1,024 1,135 1,292 1,297Canadab N N N 6,870 7,405 8,477 8,890 9,381China/Taiwan 41 90 187 337 891 945 939 934Colombia 171 299 294 277 461 467 567 588Denmark 188 254 254 307 229 227 259 217Dominican Republic 322 443 528 896 995 1,057 1,070 1,108France 470 635 894 1,626 1,868 2,021 2,147 2,289Germany 649 1,178 1,539 2,339 2,883 2,978 3,178 3,210Grand Cayman 26 112 161 250 264 285 290 305Greece 123 190 210 129 194 206 192 181Haiti 81 124 169 201 292 288 284 295Hong Kong 59 152 238 310 640 651 610 621Ireland 163 212 233 311 409 449 488 554Israel 105 186 255 259 426 492 499 488Italy 409 495 660 731 955 1,006 1,055 1,041
Jamaica 416 382 607 888 987 988 1,018 1,018Japan 1,183 1,602 2,255 4,471 5,452 6,187 6,796 6,487Korea, Republic of 60 186 333 723 1,252 1,382 1,461 1,032Mexico 1,525 2,886 2,671 4,136 4,568 5,133 5,613 5,771Netherlands 304 409 562 777 1,444 1,636 1,920 1,933Netherland Antilles 184 282 395 377 295 288 319 340Panama Republic 100 142 209 183 214 221 240 272Philippines 81 160 165 195 281 275 306 218Spain 260 273 397 540 573 577 615 669Switzerland 224 306 434 600 712 760 811 906United Kingdom 1,446 2,840 3,322 4,903 6,372 6,693 7,475 8,143Venezuela 198 518 245 444 778 644 698 782 Total 10,381 16,722 19,764 36,361 44,204 47,862 51,549 52,667
Table 1-38Air Passenger Travel Departures from the United States to Selected Foreign Countries (Thousands)
KEY: N = data do not exist

62 " Chapter 1 The Transportation System
Entering the U.S.Pedestrians – top 5 gatewaysBuffalo-Niagara Falls, NY 305,775 Calais, ME 51,003 Sumas, WA 35,941 Portland, MEa 29,883 International Falls-Ranier, MN 24,733
Entering the U.S.All U.S.-Canadian Land Gateways All personal vehicles 34,519,136 All personal vehicle passengers 87,691,325 All buses 181,581 All bus passengers 4,805,421 All train passengers 183,728 All pedestrians 586,765
Personal vehicles – top 5 gatewaysDetroit, MI 8,919,145 Buffalo-Niagara Falls, NY 7,441,950 Blaine, WA 3,312,775 Port Huron, MI 2,150,304 Calias, ME 1,427,853
Personal vehicle passengers – top 5 gateways
Detroit, MI 19,382,235 Buffalo-Niagara Falls, NY 16,531,915 Blaine, WA 8,442,615 Sault Ste. Marie, MI 5,765,704 Port Huron, MI 4,308,549
Buses top 5 gatewaysBuffalo-Niagara Falls, NY 61,507 Detroit, MI 39,455 Blaine, WA 20,478 Champlain-Rouses Point, NY 9,570 Skagway, AK 8,996
Bus passengers – top 5 gatewaysBuffalo-Niagara Falls, NY 1,795,942 Detroit, MI 624,974 Blaine, WA 469,659 Champlain-Rouses Point, NY 281,021 Skagway, AK 137,717
Train passengers – top 5 gateways Buffalo-Niagara Falls, NY 35,305 Blaine, WA 31,496 Port Huron, MI 28,795 Skagway, AK 28,166 Champlain-Rouses Point, NY 25,618
U.S.-Canadian Border Land-Passenger Gateways: 1999
a Gateway is a pedestrian/ferry combination crossing.NOTE: Data reflect all personal vehicles, buses, passengers andpedestrians entering the United States across the U.S.-Canadian bor-der, regardless of nationality.SOURCE: U.S. Department of Transportation, Bureau ofTransportation Statistics, special tabulation, August 2000. Based onthe following primary data source: U.S. Department of Treasury,U.S. Customs Service. Office of Field Operations. OperationsManagement Database. (Washington, DC: 1999).
Table 1-39
Continued next column

Travel and Goods Movement ! 63
Entering the U.S.Pedestrians top
5 gatewaysCalexico, CA 8,099,253 San Ysidro, CA 7,558,174 Laredo, TX 6,674,293 El Paso, TX 5,666,477 Nogales, AZ 4,806,076
Entering the U.S.All U.S.-Mexican Land
GatewaysAll personal vehicles 89,638,656 All personal vehicle passengers 242,613,249 All buses 295,429 All bus passengers 3,495,414 All train passengers 16,535 All pedestrians 48,186,155
Personal vehicles top 5 gateways
El Paso, TX 16,001,926 San Ysidro, CA 15,269,561 Hildago, TX 8,319,581 Brownsville, TX 7,579,231 Laredo, TX 6,894,982
Personal vehicle passengerstop 5 gateways
El Paso, TX 46,397,134 San Ysidro, CA 33,593,034 Hildago, TX 29,118,835 Calexico, CA 20,372,381 Brownsville, TX 18,948,078
Buses top 5 gatewaysSan Ysidro, CA 108,025 Hildalgo, TX 61,550 Otay Mesa, CA 46,142 Laredo, TX 31,371 Brownsville, TX 12,702
Bus passengerstop 5 gateways
Hildago, TX 1,384,270 San Ysidro, CA 854,098 Laredo, TX 379,425 Otay Mesa, CA 312,342 Brownsville, TX 145,298
Train passengers top 5 gateways
Tecate, CA 7,392 Eagle Pass, TX 5,756 Calexico East, CA 1,743 Nogales, AZ 900 San Ysidro, CA 384
U.S.-Mexican Border Land-Passenger Gateways: 1999
NOTE: Data reflect all personal vehicles, buses, passengers andpedestrians entering the United States across the U.S.-Mexican bor-der, regardless of nationality.SOURCE: U.S. Department of Transportation, Bureau ofTransportation Statistics, special tabulation, August 2000. Based onthe following primary data source: U.S. Department of Treasury,U.S. Customs Service. Office of Field Operations. OperationsManagement Database. (Washington, DC: 1999).
Table 1-40
Continued next column

64"
Chapter 1 T
he Transportation System
Intercity truck: 1960-98: EnoTransportation Foundation, Inc., Transportation in America, 1998 (Washington, DC: 1999), p. 44.Class I rail: 1960-98: Association of American Railroads, Railroad Facts (Washington,DC: 1999), p. 27.Domestic water transportation: 1965-98: U.S. Army Corps of Engineers, WaterborneCommerce of the U.S. (New Orleans, LA: Annual issues), part 5, section 1, table 1-4, andsimilar tables in earlier editions.Oil pipeline: 1960-70: Eno Transportation Foundation, Inc., Transportation in America,1998 (Washington, DC: 1998), p. 44.1975: Association of Oil Pipe Lines, Shifts in Petroleum Transportation (Washington, DC:Annual issues), table 4.1980-98: Ibid., Shifts in Petroleum Transportation (Washington, DC: Annual issues), table 1.
Table 1- 41 U.S. Ton-Miles of Freight (Millions)
a Includes freight, express, and mail revenue ton-miles as reported on U.S. DOT Form 41.b Revenue ton-miles.c Excludes intraterritorial traffic, for which ton-miles were not compiled.d Reflects startup between 1975 and 1980 of Alaska pipeline and consequent water
transportation of crude petroleum from Alaskan ports to mainland United States for refining.
NOTE: Domestic water transportation numbers may not add to totals due to rounding.SOURCES:Air carrier, domestic, all services: 1960-65: Civil Aeronautics Board, Handbook ofAirline Statistics, 1969 (Washington, DC: 1970).1970-80: Ibid., Air Carrier Traffic Statistics (Washington, DC: Annual issues), p. 2, line 3.1985-98: U.S. Department of Transportation, Bureau of Transportation Statistics, Office ofAirline Information, Air Carrier Traffic Statistics (Washington, DC: Annual issues), p. 2, line 3.
KEY: R = revised; U = data are not available
1960 1965 1970 1975 1980 1985 1990 1995 1996 1997 1998
Air carrier, domestic, allservicesa 553 1,353 2,709 3,470 4,528 5,156 9,064 12,520 12,861 13,601 13,756
Intercity truck 285,000 359,000 412,000 454,000 555,000 610,000 735,000 921,000 972,000 R996,000 1,027,000
Class I railb 572,309 697,878 764,809 754,252 918,958 876,984 1,033,969 1,305,688 1,355,975 1,348,926 1,376,802
Domestic water transportation
Coastwise U 302,546 359,784 315,846 d631,149 610,977 479,134 440,345 408,086 349,843 314,864Lakewise U 75,918 79,416 68,517 61,747 48,184 60,930 59,704 58,335 62,166 61,654Internal U 109,701 155,816 180,399 227,343 232,708 292,393 306,329 296,791 294,023 294,896Intraport U 1,638 1,179 1,222 1,596 1,102 1,087 1,350 1,475 1,378 1,381
Total domestic water transportationc U 489,803 596,195 565,984 921,835 892,970 833,544 807,728 764,687 707,410 672,795
Oil pipeline 229,000 306,000 431,000 507,000 588,200 564,300 584,100 601,100 619,200 616,500 619,800TOTAL 1,562,000 1,854,000 2,207,000 2,285,000 R2,989,000 2,949,000 3,196,000 3,648,000 3,725,000 R3,682,000 3,710,000

Travel and Goods Movement ! 65
1960 1965 1970 1975 1980 1985 1990 1995 1996 1997 1998FreightAir carrier 953 943 1,014 1,082 1,052 1,157 1,389 R1,069 R1,075 903 890Trucka 272 259 263 286 363 366 391 416 R426 435 444Class I rail 461 503 515 541 616 665 726 843 842 851 835Water Coastwise 1,496 1,501 1,509 1,362 1,915 1,972 1,604 1,652 1,526 1,330 1,261 Lakewise 522 494 506 530 536 524 553 514 508 R507 505 Internal 282 297 330 358 405 435 R470 494 477 R466 472 Intraport U U U 16 17 15 13 16 17 15 15Oil pipeline Crude 325 320 300 633 871 777 805 R747 R779 713 689 Petroleum products 269 335 357 516 414 391 389 R393 R393 393 393
PassengerAir carrier,
583 614 678 698 736 758 803 791 802 R817 813 domestic, scheduledBus, intercity 79 94 106 113 125 121 141 140 143 144 144Commuter rail 21 21 22 23 23 24 22 R24 24 23 UAmtrakb N N N 236 216 231 273 268 257 256 252
Average Length of Haul, Domestic Freight and Passenger Modes (Miles)
a Total Class I and Class II motor carriers of freight (less-than-truckload, specialized carrier for truckload, and others).
b Amtrak began operations in 1971. Data are reported for fiscal years.
NOTES: Average length of haul for freight is calculated bydividing ton-miles in the previous table by estimates of tonnagefrom the various data sources. The calculation of average lengthof haul for passenger trips varies by mode: for air carrier it is cal-culated by dividing revenue passenger-miles by revenue passengerenplanements; for commuter rail, intercity bus, and Amtrak it iscalculated by dividing passenger-miles by number of passengers.SOURCES:Freight:Air carrier, truck: Eno Transportation Foundation, Inc.,Transportation In America, 1999 (Washington, DC: 1999), p. 71.Class I rail: Association of American Railroads, Railroad Facts(Washington, DC: 1999), p. 36.Water: U.S. Army Corps of Engineers, Waterborne Commerce of theUnited States, Part 5 (New Orleans, LA: Annual issues), section 1,Table 1-4.
Oil pipeline: 1960-70: Transportation Policy Associates,Washington, DC, personal communication.1975-98: Eno Transportation Foundation, Inc., Transportation inAmerica, 1999 (Washington, DC: 1999), p. 71.Passenger:Air carrier: U.S. Department of Transportation, Bureau ofTransportation Statistics, Office of Airline Information, Air CarrierTraffic Statistics (Washington, DC: Annual issues).Intercity bus and commuter rail: Eno Transportation Foundation, Inc.,Transportation in America, 1999 (Washington, DC: 1999), p. 70.Amtrak: 1970-85: Amtrak, corporate communication, Jan. 26, 1999.1990-98: Amtrak, Amtrak Annual Report (Washington, DC: 1999),Statistical Appendix, p. III.
Table 1-42
KEY: N = data do not exist; R = revised; U = data are not available

66 " Chapter 1 The Transportation System
Rank Exports Imports TotalJFK International Airport, (a) 1 44.4 60.6 105.0Port of Detroit, MI (l) 2 48.5 44.1 92.6Port of Long Beach, CA (w) 3 14.3 75.2 89.5Port of Los Angeles, CA (w) 4 14.1 69.1 83.2Port of New York, NY and NJ (w) 5 17.9 54.2 72.1San Francisco Airport, CA (a) 6 32.1 39.8 71.9Port of Buffalo-Niagra Falls, NY (l) 7 35.2 35.6 70.8Los Angeles International Airport, CA (a) 8 35.9 31.3 67.2Port of Laredo, TX (l) 9 29.8 34.9 64.7Port of Huron, MI (l) 10 17.3 32.4 49.7Chicago, IL (a) 11 18.1 21.5 39.6Port of Houston, TX (w) 12 16.6 17.3 33.9Port of El Paso, TX (l) 13 13.8 19.0 32.8Port of Seattle, WA (w) 14 5.5 26.2 31.7Port of Charleston, SC (w) 15 11.2 18.3 29.5Port of Oakland, CA (w) 16 10.1 14.9 25.0Port of Norfolk Harbor, VA (w) 17 11.4 13.3 24.7New Orleans, LA. (a) 18 10.4 12.8 23.2Miami International Airport, FL (a) 19 15.1 8.0 23.1Anchorage, AK (a) 20 6.3 15.4 21.7Port of Baltimore, MD (w) 21 5.3 14.1 19.4Cleveland, OH (a) 22 8.1 9.3 17.4Port of Tacoma, WA (w) 23 3.8 13.1 16.9Port of Otay Mesa Station, CA (l) 24 6.2 9.5 15.7Port of Miami, FL (w) 25 7.1 8.4 15.5Port of Champlain-Rouses Pt., NY (l) 26 5.7 9.5 15.2Dallas-Fort Worth, TX (a) 27 6.2 7.8 14.0Atlanta, GA (a) 28 6.8 7.1 13.9Port of New Orleans, LA (w) 29 5.6 8.2 13.8Port of Savannah, GA (w) 30 5.1 8.4 13.5Port of Blaine, WA (l) 31 5.3 6.4 11.7Newark N.J. (a) 32 5.1 5.8 10.9Port of Port Everglades, FL (w) 33 4.8 5.7 10.5Port of Nogales, AZ (l) 34 4.2 6.4 10.6Port of Brownsville-Cameron, TX (l) 35 5.6 4.9 10.5
Top U.S. Foreign Trade Freight Gateways by Value of Shipments: 1998(1998 $ billions)Table 1-43
KEY: a = air; l = land; w = water
Continued next page

Travel and Goods Movement ! 67
Rank Exports Imports TotalPort of South Louisiana, LA, Port of (w) 36 7.7 2.8 10.5Port of Alexandria Bay, NY (l) 37 4.0 6.0 10.0Port of Jacksonville, FL (w) 38 1.9 7.9 9.8Port of Hildago, TX (l) 39 4.5 5.1 9.6Port of Portland, OR (w) 40 2.7 6.8 9.5Boston Logan Airport, MA (a) 41 5.6 3.7 9.3Seattle-Tacoma International Airport, WA (a) 42 3.3 5.3 8.6Port of Calexico-East, CA (l) 43 3.4 4.3 7.7Port of Highgate Springs-Alburg, VT (l) 44 3.0 4.6 7.6Port of Pembina, ND (l) 45 3.7 3.8 7.5Port of Eagle Pass, TX (l) 46 3.6 3.5 7.1Port of Corpus Christi, TX (w) 47 1.5 4.9 6.4Port of Sweetgrass, MT (l) 48 2.8 3.4 6.2Port of Beaumont, TX (w) 49 0.6 5.6 6.2Port of Philadelphia, PA (w) 50 0.5 5.4 5.9
Total top 50 gateways 541.7 841.6 1383.3
Top U.S. Foreign Trade Freight Gateways by Value of Shipments: 1998 (1998 $ billions)
NOTES:All data: Trade levels reflect the mode of transportation as a ship-ment enters or exits at a border port. Flows through individualports are based on reported data collected from U.S. trade docu-ments. Trade does not include low-value shipments. (In general,these are imports valued at less than $1,250 and exports that arevalued at less than $2,500).Air data: Data for all air gateways include a low level (generallyless than 2%-3% of the total value) of small user-fee airportslocated in the same region. Air gateways not identified by airportname (e.g., Chicago, IL, and others) include major airport(s) in thatgeographic area in addition to small regional airports. In addition,due to Bureau of Census confidentiality regulations, data for couri-er operations are included in the airport totals for JFKInternational Airport, New Orleans, Los Angeles, Cleveland,Chicago, Miami, and Anchorage.Numbers may not add to totals due to rounding.
SOURCES:(a) Air: U.S. Department of Commerce, Bureau of the Census,Foreign Trade Division, special tabulation, November 2000 .(w) Water: U.S. Department of Transportation, MaritimeAdministration, Office of Statistical and Economic Analysis, U.S.Waterborne Exports and General Imports, Annual 1998(Washington, DC: July 2000), and personal communication,December 20, 2000.(l) Land: U.S. Department of Transportation, Bureau ofTransportation Statistics, Transborder Surface Freight Data, 2000.
Table 1-43Cont’d
KEY: a = air; l = land; w = water

68 " Chapter 1 The Transportation System
Port NameTruckUS-Mexican Border, Total 4,267,259 Laredo, TX 1,486,489 El Paso, TX 673,003 Otay Mesa/San Ysidro, CA 545,724 Hildago, TX 325,225 Brownsville, TX 303,540
Rail (number of full and empty railcars)US-Mexican Border, Total 496,671 Laredo, TX 213,653 Brownsville, TX 119,590 Eagle Pass, TX 90,470 Nogales, AZ 33,692 El-Paso, TX 32,683
U.S.-Mexican Border, LandFreight Gateways: 1999(Number of Truck or RailcarCrossings)
NOTES:Truck: Data represent the number of truck crossings, not the num-ber of unique vehicles. Data are for both loaded and empty trucks.Rail: Data includes both loaded and unloaded rail cars.SOURCE: U.S. Department of Transportation, Bureau ofTransportation Statistics, special tabulation, August 2000. Based onthe following primary data source: U.S. Department of Treasury,U.S. Customs Service, Office of Field Operations, OperationsManagement Database, special tabulation (Washington, DC: 1999).
Table 1-45Port NameTruckUS-Canadian Border, Total 6,809,270
Detroit, MI 1,758,752Buffalo-Niagara Falls, NY 1,187,707Port Huron, MI 791,203Blaine, WA 491,885Champlain-Rouses Point, NY 398,385
Rail (number of full and empty railcars)US-Canadian Border, Total 1,475,131
Port Huron, MI 337,519Detroit, MI 262,084International Falls, MN 181,457Buffalo-Niagara Falls, NY 159,647Portal, ND 129,671
U.S.-Canadian Border, LandFreight Gateways: 1999(Number of Truck or RailcarCrossings)
NOTES:Truck: Data represent the number of truck crossings, not the num-ber of unique vehicles. Data are for both loaded and empty trucks.Rail: Data includes both loaded and unloaded railcars.SOURCE: U.S. Department of Transportation, Bureau ofTransportation Statistics, special tabulation, August 2000. Based onthe following primary data source: U.S. Department of Treasury,U.S. Customs Service, Office of Field Operations, OperationsManagement Database, special tabulation (Washington, DC: 1999).
Table 1-44

Travel and Goods M
ovement !
69
SOURCE: U.S. Army Corps of Engineers, Waterborne Commerce of the United States(New Orleans, LA: March 2000). Part 5, section 1.
Table 1-46 U.S. Waterborne Freight (Million short tons)
NOTE: Beginning in 1996, shipments of fish are excluded from domestic tonnage totals.
1960 1965 1970 1975 1980 1985 1990 1995 1996 1997 1998Foreign 339.3 443.7 581.0 748.7 921.4 774.3 1,041.6 1,147.4 1,183.4 1,220.6 1,245.4 Imports 211.3 269.8 339.3 476.6 517.5 412.7 600.0 672.7 732.6 788.3 840.7 Exports 128.0 173.9 241.6 272.1 403.9 361.6 441.6 474.7 450.8 432.3 404.7Domestic 760.6 829.2 950.7 946.3 1,077.5 1,014.1 1,122.3 1,093.0 1,100.7 1,112.5 1,094.1 Inland 291.1 369.6 472.1 503.9 535.0 534.7 622.6 620.3 622.1 630.6 625.0 Coastal 209.2 201.5 238.4 231.9 329.6 309.8 298.6 266.6 267.4 263.1 249.6 Great Lakes 155.1 153.7 157.1 129.3 115.1 92.0 110.2 116.1 114.9 122.7 122.2 Intraport 104.2 102.9 81.5 78.3 94.2 74.3 86.4 83.1 89.0 89.8 90.1 Intraterritory 1.0 1.5 1.6 2.9 3.6 3.4 4.5 6.9 7.3 6.3 7.2Total 1,099.9 1,272.9 1,531.7 1,695.0 1,998.9 1,788.4 2,163.9 2,240.4 2,284.1 2,333.1 2,339.5

70 " Chapter 1 The Transportation System
1999 1990
Rank Total tons Rank Total tons% change
1990-99South Louisiana, LA 1 214.2 1 194.2 10.3Houston, TX 2 158.8 3 126.2 25.9New York, NY and NJ 3 133.7 2 140.0 -4.5New Orleans, LA 4 87.5 6 62.7 39.5Corpus Christi, TX 5 78.1 7 62.0 25.9Beaumont, TX 6 69.5 23 26.7 160.0Baton Rouge, LA 7 63.7 5 78.1 -18.5Plaquemine, LA 8 62.4 8 56.6 10.3Long Beach, CA 9 60.9 10 52.4 16.2Valdez, AK 10 53.4 4 96.0 -44.3Pittsburgh, PA 11 52.9 19 35.5 49.0Tampa, FL 12 51.5 11 51.6 -0.2Lake Charles, LA 13 50.8 16 40.9 24.3Texas City, TX 14 49.5 12 48.1 3.0Mobile, AL 15 45.5 15 41.1 10.6
WI 16 42.3 17 40.8 3.8Los Angeles, CA 17 42.3 13 46.4 -8.7Norfolk Harbor, VA 18 40.8 9 53.7 -24.1Philadelphia, PA 19 39.3 14 41.8 -6.0Baltimore, MD 20 37.3 18 39.5 -5.7St. Louis, MO and IL 21 32.7 22 27.1 20.6Portland, OR 22 29.3 21 27.5 6.6Pascagoula, MS 23 28.1 24 26.5 6.1Freeport, TX 24 28.1 40 14.5 93.9Paulsboro, NJ 25 26.9 27 23.3 15.3Chicago, IL 26 26.0 28 22.5 15.3Huntington, WV 27 24.7 34 17.3 42.7Seattle, WA 27 25.5 30 21.6 18.2Richmond, CA 28 22.4 32 21.2 5.9Boston, MA 30 22.1 29 21.9 0.9
Duluth-Superior, MN and
Tonnage of Top 50 U.S. Water Ports, Ranked by Total Tonsa (Millions)Table 1-47
Continued next page

Travel and Goods Movement ! 71
Port Everglades, FL 31 22.1 42 14.1 56.2Tacoma, WA 32 21.1 31 21.4 -1.6Portland, ME 33 20.4 51 10.8 89.4Charleston, SC 34 19.9 54 9.7 105.2Marcus Hook, PA 35 19.3 25 25.9 -25.4Jacksonville, FL 36 19.3 36 15.1 27.6Port Arthur, TX 37 18.3 20 30.7 -40.4Savannah, GA 38 18.2 44 13.6 34.1Detroit, MI 39 16.9 33 17.7 -4.7Memphis, TN 40 16.6 47 12.4 34.3San Juan, PR 42 15.6 39 14.5 7.3Cleveland, OH 43 15.5 41 14.4 7.9Indiana Harbor, IN 44 15.1 37 14.7 2.9Newport News, VA 45 14.3 26 24.9 -42.7Cincinnati, OH 46 14.3 46 12.6 13.3Lorain, OH 47 13.0 43 14.0 -6.9Toledo, OH 48 12.3 38 14.7 -16.1Honolulu, HI 49 12.2 50 11.3 7.6Two Harbors, MN 50 11.9 48 12.3 -3.3 Total top 50 2,016.5 1,862.5 8.3
All ports 2,326.9 2,163.9 7.5
1999 1990
Rank Total tons Rank Total tons% change
1990-99
Tonnage of Top 50 U.S. Water Ports, Ranked by Total Tonsa (Millions)
a Tonnage totals include both domestic and foreign waterborne trade.NOTE: In 1990, Grays Harbor, Washington, ranked 45th (12.8)and Anacortes, Washington, ranked 35th (15.4).SOURCES: 1990: U.S. Army Corps of Engineers, WaterborneCommerce of the United States, Calendar Year 1990, Part 5, NationalSummaries (New Orleans, LA :1993), table 5-2.
1999: Ibid., Waterborne Commerce of the United States, Calendar Year1998, Part 5, National Summaries (New Orleans, LA :2000), tables1-1 and 5-2.
Table 1-47Cont’d

72"
Chapter 1 T
he Transportation System
SOURCE: U.S. Department ofTransportation, Bureau ofTransportation Statistics and U.S.Department of Commerce, Census Bureau 1997 Economic Census, Transportation, 1997Commodity Flow Survey (Washington, DC: December 1999), table 1b; the Bureau ofTransportation Statistics converted the value of 1993 commodities from 1993 current dol-lars to 1997 constant dollars using Bureau of Economic Analysis' chain-type price deflators.
Table 1-48Growth of Freight Activity in the United States:Comparison of the 1997 and 1993 Commodity Flow Surveys
a Truck as a single mode includes shipments that went by private truck only, for-hire truckonly, or a combination of both.
b Private truck refers to a truck operated by a temporary or permanent employee of an establishment or the buyer/receiver of the shipment.
c Excludes most shipments of crude oil.NOTE: Numbers and percents may not add to totals due to rounding.
Key: S = Data are not published because of high sampling variability or other reasons
Ton-Miles
Mode of Transportation
All modes
Single ModesTrucka
For-hire truck Private truckb
RailWaterShallow draft Great Lakes Deep draft Air (includes truck and air)Pipelinec
Multiple ModesParcel, U.S. Postal Service or courier
Truck and railTruck and waterRail and waterOther multiple modes
Other/unknown modes
All modes
1997(billion $ 1997)
6,944.0
5,719.64,981.52,901.32,036.5
319.675.853.91.5
20.4229.1113.5
945.9
855.975.78.21.84.3
278.6
6,944.0
1993(billion $ 1997)
6,360.8
5,376.34,791.02,856.11,910.4
269.267.144.31.3
21.5151.397.8
720.9
612.890.410.24.03.5
263.6
6,360.8
Percentchange
9.2
6.44.01.66.6
18.713.121.715.4-4.951.416.1
31.2
39.7-16.3-19.4-55.222.0
5.7
9.2
1997(millions)
11,089.7
10,436.57,700.73,402.64,137.31,549.8
563.4414.838.4
110.24.5
618.2
216.7
23.754.233.279.326.2
436.5
11,089.7
1993(millions)
9,688.5
8,922.36,385.92,808.33,543.51,544.1
505.4362.533.0
109.93.1
483.6
225.7
18.940.668.079.218.9
540.5
9,688.5
Percentchange
14.5
17.020.621.216.80.4
11.514.416.4
0.242.627.8
-4.0
25.433.5
-51.20.1
38.6
-19.2
14.5
1997(billions)
2,661.4
2,383.51,023.5
741.1268.6
1,022.5261.7189.313.459.06.2
S
204.5
18.055.634.877.618.6
73.4
2,661.4
1993(billions)
2,420.9
2,136.9869.5629.0235.9942.6272.0164.412.495.24.0
S
191.5
13.237.740.670.2
S
92.6
2,420.9
Value TonsPercentchange
9.9
11.517.717.813.98.5
-3.815.28.2
-38.055.5
S
6.8
36.847.5
-14.410.5
S
-20.7
9.9

Travel and Goods Movement ! 73
SCTG Commodity descriptionValue
($billions)Tons
(millions)Ton-miles(billions)
Valueper Ton
($)
AverageMiles perShipment
01 Live animals and live fish 6.2 5.9 1.5 1,042 27202 Cereal grains 59.6 489.7 200.6 122 12503 Other agricultural products 102.3 201.7 80.8 508 43804 Animal feed and products of animal origin
(NEC) 66.8 219.7 46.8 304 7905 Meat, fish, seafood, and their preparations 183.8 79.5 36.4 2,312 13706 Milled grain products and preparations, and
bakery products 109.9 102.7 48.5 1,069 12207 Other prepared foodstuffs and fats and oils 346.4 396.9 124.1 873 12708 Alcoholic beverages 87.9 81.1 27.8 1,085 5809 Tobacco products 56.4 4.1 1.0 13,661 296
10 Monumental or building stone 2.7 15.9 1.5 172 11511 Natural sands 4.3 442.5 25.5 10 4612 Gravel and crushed stone 11.5 1,814.8 92.9 6 3613 Nonmetallic minerals (NEC) 11.3 235.7 52.2 48 17414 Metallic ores and concentrates 12.6 90.7 47.7 139 30315 Coal 25.5 1,217.0 542.3 21 8117 Gasoline and aviation turbine fuel 217.1 962.8 136.6 225 4518 Fuel oils 94.3 481.7 51.2 196 2819 Coal and petroleum products (NEC) 74.9 475.1 81.9 158 85
20 Basic chemicals 159.6 296.1 136.8 539 33221 Pharmaceutical products 224.4 9.9 5.6 22,678 69222 Fertitizers 27.3 179.1 43.6 153 11623 Chemical products and preparations (NEC) 209.5 92.0 45.0 2,276 33324 Plastics and rubber 278.8 130.4 69.1 2,138 45125 Logs and other wood in the rough 15.1 370.7 28.1 41 8526 Wood products 126.4 329.1 96.9 384 28727 Pulp, newsprint, paper, and paperboard 106.6 152.3 83.7 700 19428 Paper or paperboard articles 98.3 73.5 22.0 1,338 30729 Printed products 260.3 78.1 22.8 3,335 431
30 Textiles, leather, and articles of textiles or leather 379.2 45.9 24.7 8,266 912
31 Nonmetallic mineral products 109.2 910.1 91.4 120 40132 Base metal in primary or semifinished forms
and in finished basic shapes 285.7 335.9 117.5 851 27633 Articles of base metal 227.2 106.5 48.7 2,133 40334 Machinery 417.1 49.9 27.0 8,356 35635 Electronic and other electrical equipment and
components and office equipment 869.7 39.6 27.1 21,955 640
Value, Tons, and Ton-Miles of Freight Shipments within the United States by Domestic Establishments, 1997Table 1-49
KEY: NEC = not elsewhere classified; SCTG = Standard Classification of Transportation Goods
Continued next page

74 " Chapter 1 The Transportation System
36 Motorized and other vehicles (including parts) 571.0 98.1 45.9 5,822 27837 Transportation equipment (NEC) 129.2 5.5 3.8 23,587 79638 Precision instruments and apparatus 157.9 2.9 2.2 53,741 84039 Furniture, mattresses and mattress supports,
lamps, lighting fittings, and illuminated signs 97.3 19.9 11.6 4,885 625
40 Miscellaneous manufactured products 420.9 112.5 39.9 3,741 86041 Waste and scrap 32.7 177.8 40.1 184 16443 Mixed freight 230.4 110.3 17.2 2,090 252
Commodity unknown 36.5 46.2 11.8 791 499
SCTG Commodity descriptionValue
($billions)Tons
(millions)Ton-miles(billions)
Valueper Ton
($)
AverageMiles perShipment
Value, Tons, and Ton-Miles of Freight Shipments within the United States by Domestic Establishments, 1997
NOTE: The 1997 Commodity Flow Survey data reported in thistable are based on SCTG code, which differs from the code used inthe 1993 CFS. Therefore, data in this table are not directly comparableto the 1993 data reported in the 1998 edition of this report.SOURCES: U.S. Department of Transportation, Bureau ofTransportation Statistics, U.S. Department of Commerce, CensusBureau, 1997 Economic Census, Transportation, 1997 CommodityFlow Survey (Washington, DC: December 1999), table 7.
Table 1-49Cont’d
KEY: NEC = not elsewhere classified; SCTG = Standard Classification of Transportation Goods

Travel and Goods Movement ! 75
1994 1995 1996 1997 1998 1999Exports
to CanadaTruck R89,151.1 97,423.4 102,743.0 111,173.8 114,806.1 123,140.0 Rail R13,593.9 15,271.9 R15,678.7 13,255.6 12,279.6 11,754.6 Pipeline R133.8 R121.3 162.2 180.6 93.4 113.9 Othera R21,753.2 17,010.5 R20,467.5 9,336.1 10,559.5 11,360.0 Mail R69.3 R57.0 R58.3 24.1 6.8 5.6 Total R124,701.3 R129,884.1 R139,109.7 R133,970.2 137,745.4 146,374.1
To MexicoTruck R39,066.5 35,914.2 R44,091.8 55,592.6 60,432.1 66,923.8 Rail 4,192.0 4,694.4 5,119.2 5,648.0 6,188.8 5,710.6 Pipeline 0.4 1.0 2.3 68.3 73.4 144.2 Othera 3,238.9 2,025.8 R2,540.1 2,860.5 3,470.0 3,349.6 Mailb R5.5 26.8 — 0.1 0.1 0.7 Total R46,503.3 R42,662.2 51,753.4 64,169.5 70,164.4 76,129.0
Importsfrom Canada
Truck R79,456.4 88,964.9 R98,400.8 99,814.8 108,856.7 118,901.4 Rail R30,322.8 39,996.9 R39,811.0 38,293.0 37,374.1 46,255.4 Pipeline R9,728.6 10,606.6 12,796.2 13,879.5 11,120.1 12,055.5 Othera R3,991.6 3,888.2 R4,968.4 3,572.5 4,575.1 6,386.9 Mail R5.5 5.2 R6.9 0.4 1.7 13.1 FTZc U 207.6 223.4 122.4 177.9 111.2 Total 123,504.9 R143,669.4 R156,206.7 155,682.6 162,105.7 183,723.5
From MexicoTruck 35,013.9 43,014.3 R48,350.0 56,716.5 65,883.7 76,448.0 Rail 7,769.0 R9137.9 12,297.7 12,646.9 12,029.7 14,693 Pipeline 187.9 R27.4 8.1 3.6 2.4 1.5 Othera 643.5 R768.9 639.2 668.2 917.8 1,255.8 Mail 1.9 R1.3 1.5 0.2 0.2 0.2 FTZc U 1,099.2 2,015.6 2,119.6 2,886.7 2,624.4 Total 43,616.2 R54,049.0 R63,312.1 72,155.0 81,720.3 95,023.4
Value of U.S. Land Exports to and Imports from Canada and Mexico by Mode ($ millions)
a Other includes "flyaway aircraft" or aircraft moving under their own power (i.e., aircraft moving from the manufacturer to a customer and not carrying any freight), powerhouse (electricity),vessels moving under their own power, pedestrians carrying freight, and unknown and miscellaneous.
b Beginning in January 1996, new edit checks were added to the processing of the Transborder Surface Freight Data. Because ofthese checks, the number of mail export shipments from the United States to Mexico declined sharply between 1995 and 1996. The Census Bureau found that a number of rail shipments were misidentified as mail shipments in 1994 and 1995, although the exact proportion of these is unknown.
c Foreign Trade Zones (FTZs) were added as a mode of transport for land import shipments beginning in April 1995. Although FTZs are being treated as a mode of transportation in the Transborder Surface Freight Data, the actual mode for a specific shipment into or out of an FTZ is unknown because U.S.Customs does not collect this information.
NOTES: Shipments that neither originate nor terminate in theUnited States (i.e., in transit, in-bond shipments) are not included
here, although they use the U.S. transportation system. Theseshipments are usually part of Mexico-Canada trade, and simplypass through the United States. Transshipments, however, areincluded between 1994, 1995, and 1996; these are shipments thatentered or exited the United States by way of a Customs port onthe northern or southern border, but whose origin or destinationwas a country other than Canada or Mexico. Starting in 1997,transshipments are excluded. Users should note these differencesbefore comparing figures for 1994-96 with 1997 and subsequentyear data. Data exclude export shipments valued at less than$2,500 and import shipments valued at less than $1,250.Individual modal totals may not sum to exact export or importtotals due to rounding.SOURCE: U.S. Department of Transportation, Bureau ofTransportation Statistics, Transborder Surface Freight Data, avail-able at www.bts.gov/transborder, 2000.
Table 1-50
KEY: — = value too small to report; R = revised;U = data are not available

76 " Chapter 1 The Transportation System
1975 1980 1985 1990 1995 1996 1997 1998Crude Oil
Ton-miles (billions)Pipelinesa 288.0 362.6 334.4 334.8 335.9 338.3 337.4 334.1Water carriers 40.6 c387.4 449.2 291.2 247.7 202.4 147.3 117.9Motor carriersb 1.4 2.5 1.8 1.5 1.7 1.7 1.7 1.6Railroads 1.5 0.5 0.8 0.7 0.8 0.8 0.5 0.5 Total 331.5 753.0 786.2 628.2 586.0 543.2 486.9 454.1
% of totalPipelinesa 86.9 48.2 42.5 53.3 57.3 62.3 69.3 73.6Water carriers 12.2 51.4 57.2 46.4 42.3 37.3 30.3 26.0Motor carriersb 0.4 0.3 0.2 0.2 0.3 0.3 0.3 0.3Railroads 0.5 0.1 0.1 0.1 0.1 0.1 0.1 0.1
Refined Petroleum ProductsTon-miles (billions)
Pipelinesa 219.0 225.6 229.9 249.3 265.2 280.9 279.1 285.7Water carriers 257.4 230.4 141.2 157.8 153.2 154.1 148.3 147.1Motor carriersb 26.2 24.3 26.9 28.2 24.6 28.0 26.0 26.7Railroads 12.6 12.0 11.3 13.3 15.9 16.0 16.2 16.2 Total 515.2 492.3 409.3 448.6 458.9 479.0 469.6 475.7
% of totalPipelinesa 66.1 30.0 29.2 39.7 45.3 51.7 57.3 62.9Water carriers 77.6 30.6 18.0 25.1 26.1 28.4 30.5 31.0Motor carriersb 7.9 5.0 3.4 4.5 5.3 5.9 5.3 5.9Railroads 3.8 1.6 2.7 2.1 2.7 2.9 3.5 3.4
Combined Crude and Petroleum Products Ton-miles (billions)
Pipelinesa 507.0 588.2 564.3 584.1 601.1 619.2 616.5 619.8Water carriers 298.0 c617.8 590.4 449.0 400.9 356.5 295.6 265.0Motor carriersb 27.6 26.8 28.7 29.7 26.3 29.7 27.7 28.3Railroads 14.1 12.5 12.1 14.0 16.6 16.8 16.7 16.7 Total 846.7 1,245.3 1,195.5 1,076.8 1,044.9 1,022.2 956.5 929.8
% of totalPipelinesa 59.9 47.2 47.2 54.2 57.5 60.6 64.5 66.7Water carriers 35.2 49.6 49.4 41.7 38.4 34.9 30.9 28.5Motor carriersb 3.3 2.2 2.4 2.8 2.5 2.9 2.9 3.0Railroads 1.7 1.0 1.0 1.3 1.6 1.6 1.8 1.8
Crude Oil and Petroleum Products Transported in the United States by Mode
a The amount carried by pipeline is based on ton-miles of crude and petroleum products for federally regulated pipelines (84%),plus an estimated breakdown of crude and petroleum products for the ton-miles for pipelines not federally regulated (16%).
b The amount carried by motor carriers is estimated.c Reflects the entrance between 1975 and 1980 of the Alaska
pipeline, moving crude petroleum for water transportation to U.S. refineries.
SOURCES: 1975: Association of Oil Pipe Lines, Shifts inPetroleum Transportation (Washington, DC: Annual issues), table 6.1980-98: Ibid., Shifts in Petroleum Transportation (Washington, DC:Annual issues), table 3.
Table 1-51

Travel and Goods Movement ! 77
Value($ million)
Tons(thousands)
Ton-miles(millions)Mode of Transportation Percent Percent Percent
Single modes 452.7 97.1 1,541.7 98.5 258.9 98.1Trucka 298.2 63.9 869.8 55.6 74.9 28.4 For-hire 134.3 28.8 336.4 21.5 45.2 17.1 Privateb 160.7 34.5 522.7 33.4 28.8 10.9Rail 33.3 7.1 96.6 6.2 74.7 28.3Water 27.0 5.8 143.2 9.1 68.2 25.9Air 8.6 1.8 0.1 – 0.1 –Pipelinec 85.7 18.4 432.1 27.6 S S
Multiple modes 5.7 1.2 6.0 0.4 3.1 1.2Parcel, U.S. Postal Service or Courier 2.9 0.6 0.1 – 0.1 –Other 2.9 0.6 5.9 0.4 3.0 1.1
Unknown and other modes 7.9 1.7 17.5 1.1 1.8 0.7
All modes 466.4 100.0 1,565.2 100.0 263.8 100.0
U.S. Hazardous Materials Shipments by Mode of Transportation, 1997
a Truck as a single mode includes shipments that went by private truck only, for-hire truck only, or a combination of both.
b Private truck refers to a truck operated by a temporary or permanent employee of an establishment or the buyer/receiver of the shipment.
c Excludes most shipments of crude oil. See previous table for the estimated amount of crude oil and petroleum products transported in the United States.
NOTE: Numbers and percents may not add to totals due torounding.
SOURCE: U.S. Department of Transportation, Bureau ofTransportation Statistics, U.S. Department of Commerce, CensusBureau, 1997 Economic Census 1997 Commodity Flow Survey,Hazardous Materials (Washington, DC: December 1999), table 1.
Table 1-52
KEY: S = data are not published because of highsampling variability or other reasons; – less than 1 unit of measure or equal to zero

Averagemiles pershipment
Value($ billion)
Tons(thousands)
Ton-miles(millions)Hazard Class and Description Percent Percent Percent
Class 1. Explosives 4.3 0.9 1.5 0.1 S S 549 Class 2. Gases 40.9 8.8 115.0 7.3 21.8 8.3 66 Class 3. Flammable liquids 335.6 72.0 1,264.3 80.8 160.0 60.6 73 Class 4. Flammable solids 3.9 0.8 11.8 0.8 9.6 3.6 838 Class 5. Oxidizers and organic peroxides 4.5 1.0 9.2 0.6 4.5 1.7 193 Class 6. Toxics (poison) 10.1 2.2 6.4 0.4 2.8 1.1 402 Class 7. Radioactive materials 2.7 0.6 0.9 0.1 – – 445 Class 8. Corrosive materials 40.4 8.7 91.6 5.9 41.2 15.6 201 Class 9. Miscellaneous dangerous goods 23.9 5.1 65.3 4.2 22.7 8.6 323 Total 466.4 100.0 1,565.2 100.0 263.8 100.0 113
78"
Chapter 1 T
he Transportation System
Table 1-53 U.S. Hazardous Materials Shipments by Hazard Class, 1997
NOTE: Numbers and percents may not add to totals due to rounding.SOURCE: U.S. Department of Transportation, Bureau of Transportation Statistics and U.S.Department of Commerce, Census Bureau, 1997 Economic Census, 1997 Commodity FlowSurvey, Hazardous Materials (Washington, DC: December 1999), table 2.
KEY: S = data were not published because of highsampling variability or other reasons; – less than 1 unit of measure or equal to zero

1990 1991 1992 1993 1994 1995 1996 1997 1998 1999 Total 1990-99United StatesAthena 0 0 0 0 0 1 0 0 0 3 4Atlas 0 2 3 1 3 5 6 6 3 3 32Conestoga 0 0 0 0 0 1 0 0 0 0 1Delta 4 4 3 1 1 1 2 7 11 5 39Pegasus 0 0 0 1 0 0 0 3 3 1 8Taurus 0 0 0 0 0 0 0 0 0 1 1Titan 3 0 0 0 0 0 0 0 0 0 3 Total 7 6 6 3 4 8 8 16 17 13 88
EuropeAriane 4 5 6 6 6 8 8 9 11 9 8 76 Total 5 6 6 6 8 8 9 11 9 8 76
RussiaCosmos 0 0 0 0 0 0 0 0 0 1 1Dnepr 0 0 0 0 0 0 0 0 0 1 1Proton 0 0 0 0 0 0 2 6 4 5 17Shtil 0 0 0 0 0 0 0 0 1 0 1Soyuz 0 0 0 0 0 0 0 0 0 6 6Start 0 0 0 0 0 0 0 1 0 0 1 Total 0 0 0 0 0 0 2 7 5 13 27
UkraineZenit 0 0 0 0 0 0 0 0 1 0 1 Total 0 0 0 0 0 0 0 0 1 0 1
ChinaLong March 2C 0 0 0 0 0 0 0 1 4 1 6Long March 2E 0 0 2 0 1 3 0 0 0 0 6Long March 3 1 0 0 0 1 0 1 0 0 0 3Long March 3B 0 0 0 0 0 0 1 2 0 0 3 Total 1 0 2 0 2 3 2 3 4 1 18
Sea Launcha
Zenit 0 0 0 0 0 0 0 0 0 1 1 Total 0 0 0 0 0 0 0 0 0 1 1
TOTAL space launches 13 12 14 9 14 19 21 37 36 36 211
Travel and Goods Movement ! 79
Worldwide Commercial Space Launches
a Sea Launch is an international venture involving organizations in four countries and uses its own launch facility outside national borders. Their first commercial launch, in 1999, was licensed by the Federal Aviation Administration.
NOTES: A commercial launch is a launch that is internationallycompeted, i.e., available in principle to international launchproviders, or whose primary payload is commercial in nature. Dataare for orbital launches only.
SOURCES: 1990-98: U.S. Department of Transportation, FederalAviation Administration, Associate Administrator for CommercialSpace Transportation, personal communication, Feb. 25, 1999.1999: Ibid., Commercial Space Transportation: 1999 Year in Review(Washington, DC: January 2000), Internet sitehttp://ast.faa.gov/launch_info/ as of Apr. 12, 2000, tables 1 and4 (with supporting text).
Table 1-54

Section EPhysical Performance
chapter one

Physical Performance ! 83
1990 1991 1992 1993 1994 1995 1996 1997 1998 1999Boarded (millions) 421 429 445 449 457 460 481 503 514 523
Denied boardingb (thousands)Voluntary 561 599 718 632 771 794 899 1,018 1,081 1,024Involuntary 67 47 46 51 53 49 58 54 45 46 Total 628 646 764 683 824 843 957 1,072 1,126 1,070
Passengers Denied Boarding by the Largest U.S. Air Carriersa
a Data are for nonstop scheduled service flights between points within the United States (including territories) by the 10 largest U.S. air carriers, i.e., those with at least 1% of total domestic scheduled-service passenger revenues (Alaska, America West,American, Continental, Delta, Northwest, Southwest, TWA,United, and US Airways). Before 1994, carriers included both majors and national airlines, i.e., airlines with over $100 million inrevenue.
b Number of passengers who hold confirmed reservations and aredenied boarding ("bumped") from a flight because it is oversold.
These figures include only passengers whose oversold flight departs without them; they do not include passengers affected bycanceled, delayed, or diverted flights.
SOURCE: U.S. Department of Transportation, Office of theSecretary, Air Travel Consumer Report (Washington, DC: AnnualApril issues).
Table 1-55

84"
Chapter 1 T
he Transportation System
NOTES: Domestic system only. Based on passenger reports of mishandled baggage,including those that did not subsequently result in claims for compensation.SOURCE: U.S. Department of Transportation, Office of the Secretary, Air TravelConsumer Report (Washington, DC: Annual compilation, February).
1990 b 1991 c 1992 1993 1994 1995 1996 1997 1998 1999Total mishandled-baggage reports (millions) 2.66 2.20 2.45 2.28 2.32 2.28 2.46 2.28 2.48 2.54Enplaned passengers (domestic) (millions) 395.7 408.5 417.0 407.5 435.7 439.8 464.0 459.8 481.7 499.1Reports per 1,000 passengers 6.73 5.38 5.87 5.60 5.33 5.18 5.30 4.96 5.16 5.08
Table 1-56 Mishandled-Baggage Reports Filed by Passengers with the Largest U.S. Air Carriersa
a Data include nonstop, scheduled service between points within the United States (including territories) by the 10 largest U.S. air carriers, i.e., those with at least 1% of the total domestic scheduled service passenger revenues (Alaska, America West, American,Continental, Delta, Northwest, Southwest, TWA, United, and US Airways).
b Includes Pan Am.c Includes Pan Am and Midway.
time shown in the carriers' Computerized Reservations Systems. Canceled and divertedoperations are counted as late.SOURCE: U.S. Department of Transportation, Office of the Secretary, Air Travel ConsumerReport (Washington, DC: Annual compilation, February), table 1a, 12-month column.
1990 1991 1992 1993 1994 1995 1996 1997 1998 1999
On-time flight operations 79.4 82.5 82.3 81.6 81.5 78.6 74.5 77.7 77.2 76.1
Table 1-57 Flight Operations Arriving On Time by the Largest U.S. Air Carriersa (Percent)
a Data include nonstop, scheduled service between points within the United States (including territories) by the 10 largest U.S. air carriers, i.e., those with at least 1% of the total domestic scheduled service passenger revenues (Alaska, America West, American,Continental, Delta, Northwest, Southwest, TWA, United, and US Airways).
NOTES: A flight is considered on time if it arrived less than 15 minutes after the scheduled

Physical P
erformance !
85
1987 1988 1989 1990 1991 1992 1993 1994 1995 1996 1997 1998 1999Operations delayed (thousands) 356 338 394 393 298 281 276 248 237 272 245 306 374
Cause (%)Weather 67 70 57 56 65 65 72 75 72 75 68 74 68Airport terminal volume 11 9 29 35 27 27 22 19 18 18 22 15 20ARTCC volume 13 12 8 2 0 0 0 0 0 0 0 0 2Closed runways/taxiways 4 5 3 3 3 3 3 2 3 3 3 3 3NAS equipment 4 3 2 1 2 2 2 2 3 2 3 2 2Other 1 1 1 4 3 3 2 2 4 2 4 6 5
Table 1-58 U.S. Air Carrier Delay Greater Than 15 Minutes by Cause
SOURCE: U.S. Department of Transportation, Federal Aviation Administration, AviationCapacity Enhancement Plan (Washington, DC: Annual issues), figure 3-2 and similar tables inearlier editions, and personal communications, July 6, 2000, and Dec. 5, 2000.
KEY: ARTCC = Air Route Traffic Control Center; NAS = National Airspace System
nation point other than the scheduled destination point. The total for late departuresincludes flights that were cancelled. The total for late arrivals includes both cancelledand diverted flights, in addition to flights that arrived at the destination airport at least15 minutes past scheduled arrival, and therefore measures all flights with arrival prob-lems.SOURCE: U.S. Department of Transportation, Bureau of Transportation Statistics,Office of Airline Information, Airline Service Quality Performance data.
Table 1-59 Major U.S. Air Carrier Delays, Cancellations, and Diversions
a Data are incomplete; December data not yet available.NOTES: Late departures and arrivals are strongly seasonal and are affected by weatherand the heavy demand in winter and summer months. The term "late" is defined as 15minutes after the scheduled departure or arrival time. Major air carriers are the 10 largestU.S. air carriers. A cancelled flight is one that was not operated, but was listed in a carri-er's computer reservation system within seven calendar days of the scheduled departure.A diverted flight is one that left from the scheduled departure airport but flew to a desti-
1988 1989 1990 1991a 1992 1993 1994a 1995 1996 1997 1998 1999 2000a
Late Departures 730,712 883,167 753,182 520,491 617,148 661,056 670,218 919,839 1,102,484 944,633 1,014,904 1,091,584 1,157,577Late Arrivals 1,042,452 1,208,470 1,087,774 748,842 902,567 931,437 884,317 1,141,647 1,362,702 1,193,678 1,227,741 1,320,591 1,378,040Cancellations 50,163 74,165 52,458 34,736 52,836 59,845 61,533 91,905 128,536 97,763 144,509 154,311 158,816Diversions 14,436 14,839 15,954 10,279 11,384 10,333 11,245 10,492 14,121 12,081 13,161 13,555 12,774
Total Operations 5,202,096 5,041,200 5,270,893 4,259,689 5,092,157 5,070,501 4,744,532 5,327,435 5,351,983 5,411,843 5,384,721 5,527,884 5,196,611

% change
Urban area 1982 1986 1990 1992 1995 1996 1997 % Rank % RankAlbany-Schenectady-Troy, NY 1 3 7 7 8 9 8 14 55 700 12Albuquerque, NM 4 9 15 18 31 34 39 117 6 875 8Atlanta, GA 16 33 27 30 53 61 68 127 4 325 39Austin, TX 11 18 20 29 38 40 53 83 15 382 32Bakersfield, CA 1 3 5 6 7 8 8 33 41 700 12Baltimore, MD 13 20 36 33 44 45 47 42 35 262 45Beaumont, TX 1 3 5 7 10 8 12 71 19 1,100 3Boston, MA 19 32 43 48 61 64 66 38 39 247 47Boulder, CO 1 2 3 4 5 5 6 50 31 500 22Brownsville, TX 1 1 3 3 4 4 3 0 64 200 52Buffalo-Niagara Falls, NY 2 3 5 5 7 7 7 40 38 250 46Charlotte, NC 9 11 22 24 28 30 41 71 19 356 36Chicago, IL-Northwestern, IN 13 26 31 34 38 41 44 29 44 238 48Cincinnati, OH-KY 5 8 18 21 26 28 31 48 33 520 19Cleveland, OH 2 4 9 10 16 19 20 100 8 900 5Colorado Springs, CO 2 4 6 10 14 14 16 60 25 700 12Columbus, OH 3 6 16 17 26 26 30 76 18 900 5Corpus Christi, TX 6 6 6 6 6 7 8 33 41 33 68Dallas, TX 15 35 35 39 49 49 58 49 32 287 41Denver, CO 10 15 22 28 40 43 45 61 23 350 38Detroit, MI 23 30 48 52 53 58 62 19 51 170 55El Paso, TX-NM 2 4 7 11 12 10 12 9 56 500 22Eugene-Springfield, OR 1 2 3 4 4 6 8 100 8 700 12Fort Worth, TX 8 18 23 24 32 34 38 58 26 375 33Fresno, CA 7 11 20 15 15 15 19 27 47 171 54Fort Lauderdale-Hollywood-Pompano Beach, FL 5 9 11 22 26 27 31 41 36 520 19Hartford-Middletown, CT 6 14 25 23 18 20 23 0 64 283 42Honolulu, HI 14 20 25 29 30 29 29 0 64 107 63Houston, TX 37 40 35 36 40 47 58 61 23 57 67Indianapolis, IN 3 7 11 16 44 46 52 225 1 1633 1Jacksonville, FL 11 14 21 23 31 35 35 52 29 218 51Kansas City, MO-KS 3 6 11 11 20 24 28 155 3 833 9
Short-term 1992-1997
Long-term1982-1997
86"
Chapter 1 T
he Transportation System
Table 1-60 Annual Person-Hours of Delay Per Eligible DriverR
KEY: R = revised
Continued next page

% change
Urban area 1982 1986 1990 1992 1995 1996 1997 % Rank % RankLaredo, TX 2 2 2 2 5 6 6 200 2 200 52Las Vegas, NV 7 11 28 23 35 37 34 48 33 386 31Los Angeles, CA 41 61 79 79 79 81 82 4 60 100 64Louisville, KY-IN 4 7 11 24 32 37 40 67 21 900 5Memphis, TN-AR-MS 4 5 10 15 26 28 29 93 10 625 17Miami-Hialeah, FL 22 29 48 54 54 50 57 6 59 159 56Milwaukee, WI 5 8 15 21 28 26 25 19 51 400 30Minneapolis-St. Paul, MN 4 8 15 18 27 28 34 89 11 750 11Nashville, TN 8 13 22 21 36 39 46 119 5 475 27New Orleans, LA 12 20 24 24 28 26 25 4 60 108 62New York, NY-Northeastern, NJ 15 22 31 27 32 34 38 41 36 153 57Norfolk, VA 9 17 22 22 26 32 34 55 28 278 43Oklahoma City, OK 2 4 8 10 13 16 18 80 17 800 10Omaha, NE-IA 5 9 18 24 30 33 31 29 44 520 19Orlando, FL 9 15 14 27 30 35 41 52 29 356 36Philadelphia, PA-NJ 16 20 21 21 23 26 27 29 49 69 65Phoenix, AZ 16 25 29 28 28 33 35 25 50 119 60Pittsburgh, PA 6 9 13 13 15 15 15 15 54 150 59Portland-Vancouver, OR-WA 9 18 27 38 50 55 52 37 40 478 26Providence-Pawtucket, RI-MA 5 10 20 16 20 22 21 31 43 320 40Rochester, NY 1 2 6 7 10 11 11 57 27 1,000 4Sacramento, CA 8 14 33 30 35 40 38 27 47 375 33Salem, OR 1 3 6 8 11 12 15 88 12 1,400 2Salt Lake City, UT 3 3 8 14 22 24 23 64 22 667 16San Antonio, TX 7 19 12 14 21 24 26 86 13 271 44San Bernardino-Riverside, CA 7 21 38 43 47 50 47 9 56 571 18San Diego, CA 6 18 34 35 35 36 36 3 62 500 22San Francisco-Oakland, CA 35 56 62 58 59 60 58 0 64 66 66San Jose, CA 14 28 49 48 47 47 45 -6 68 221 50Seattle-Everett, WA 21 36 53 68 61 62 69 1 63 229 49Spokane, WA 2 4 5 6 7 9 11 83 15 450 29St. Louis, MO-IL 11 16 24 28 50 50 52 86 13 373 35
Short-term1992-1997
Long-term1982-1997
Physical P
erformance !
87
Table 1-60Cont’d Annual Person-Hours of Delay Per Eligible DriverR
KEY: R = revised
Continued next page

88"
Chapter 1 T
he Transportation System
% change
Urban area 1982 1986 1990 1992 1995 1996 1997 % Rank % RankTacoma, WA 5 13 29 27 26 26 29 7 58 480 25Tampa, FL 19 24 28 35 40 39 41 17 53 116 61Tucson, AZ 5 5 13 13 18 20 28 115 7 460 28Washington, DC-MD-VA 30 45 58 60 70 76 76 27 47 153 57
Short-term1992-1997
Long-term1982-1997
Table 1-60Cont’d Annual Person-Hours of Delay Per Eligible DriverR
SOURCE: 1982-97: Texas Transportation Institute, The 1999Annual Urban Mobility Report (College Station, TX: 1999), table 4.
NOTES: An eligible driver is someone 16 years of age and older who is eligible for a driver'slicense. The cities shown represent the 50 largest metropolitan areas, as well as otherschosen by the states sponsoring the Texas Transportation Institute study on mobility. Dueto changes in methodology, data for all years shown were revised. For a detailed explana-tion of the formulas used, see the source document.
KEY: R = revised

% change
Urban area 1982 1986 1990 1992 1995 1996 1997 % Rank % RankAlbany-Schenectady-Troy, NY 0.48 0.56 0.68 0.69 0.72 0.74 0.75 9 35 56 60Albuquerque, NM 0.69 0.84 0.85 0.87 0.98 1.01 1.05 21 64 52 56Atlanta, GA 0.85 1.01 0.95 0.97 1.12 1.17 1.23 27 68 45 51Austin, TX 0.78 0.86 0.89 0.92 0.94 0.96 1.03 12 46 32 32Bakersfield, CA 0.47 0.57 0.66 0.69 0.72 0.74 0.75 9 35 60 63Baltimore, MD 0.78 0.81 0.94 0.95 1.03 1.04 1.05 11 41 35 38Beaumont, TX 0.67 0.74 0.75 0.81 0.82 0.84 0.90 11 41 34 35Boston, MA 0.91 1.01 1.08 1.12 1.19 1.22 1.24 11 41 36 42Boulder, CO 0.64 0.71 0.71 0.73 0.74 0.75 0.80 10 39 25 20Brownsville, TX 0.53 0.54 0.62 0.64 0.70 0.69 0.71 11 41 34 35Buffalo-Niagara Falls, NY 0.60 0.57 0.64 0.67 0.72 0.73 0.72 7 22 20 14Charlotte, NC 1.08 1.00 0.97 0.91 0.96 0.97 1.04 14 50 -4 1Chicago, IL-Northwestern, IN 0.94 1.06 1.15 1.18 1.24 1.26 1.28 8 26 36 42Cincinnati, OH-KY 0.81 0.78 0.89 0.91 1.00 1.02 1.08 19 62 33 33Cleveland, OH 0.75 0.77 0.89 0.90 0.98 0.99 1.01 12 46 35 38Colorado Springs, CO 0.62 0.63 0.66 0.67 0.75 0.74 0.77 15 54 24 19Columbus, OH 0.61 0.72 0.87 0.88 0.99 1.00 1.04 18 61 70 68Corpus Christi, TX 0.67 0.70 0.69 0.62 0.62 0.67 0.72 16 56 7 4Dallas, TX 0.77 0.97 0.99 1.01 0.98 1.00 1.04 3 13 35 38Denver, CO 0.77 0.84 0.91 0.92 1.03 1.07 1.08 17 57 40 45Detroit, MI 0.98 1.02 1.08 1.16 1.15 1.15 1.18 2 11 20 14El Paso, TX-NM 0.66 0.75 0.77 0.82 0.84 0.83 0.86 5 17 30 29Eugene-Springfield, OR 0.54 0.54 0.63 0.72 0.78 0.82 0.84 17 57 56 60Fort Lauderdale-Hollywood-Pompano Beach, FL 0.70 0.76 0.79 0.95 1.02 1.04 1.08 14 50 54 58Fort Worth TX 0.73 0.86 0.92 0.90 0.87 0.90 0.91 1 8 25 20Fresno, CA 0.81 0.89 0.93 0.85 0.87 0.84 0.90 6 21 11 8Hartford-Middletown, CT 0.69 0.79 0.87 0.86 0.87 0.88 0.90 5 17 30 29Honolulu, HI 0.86 0.99 1.04 1.07 1.07 1.07 1.06 -1 5 23 18Houston, TX 1.09 1.12 1.00 0.99 0.98 1.02 1.07 8 26 -2 2Indianapolis, IN 0.62 0.76 0.81 0.84 1.01 1.00 1.05 25 67 69 67Jacksonville, FL 0.84 0.87 0.87 0.84 0.88 0.92 0.93 11 41 11 8Kansas City, MO-KS 0.56 0.62 0.66 0.65 0.72 0.75 0.76 17 57 36 42
Short-term1992-1997
Long-term1982-1997
Physical P
erformance !
89
Table 1-61 Roadway Congestion IndexR
KEY: R = revised
Continued next page

% change
Urban area 1982 1986 1990 1992 1995 1996 1997 % Rank % RankLaredo, TX 0.52 0.56 0.61 0.51 0.54 0.56 0.61 20 63 17 11Las Vegas, NV 0.67 0.79 0.95 0.98 1.09 1.10 1.07 9 35 60 63Los Angeles, CA 1.39 1.46 1.56 1.54 1.50 1.54 1.51 -2 3 9 6Louisville, KY-IN 0.72 0.74 0.80 0.89 0.99 1.02 1.04 17 57 44 49Memphis, TN-AR-MS 0.76 0.73 0.84 0.85 0.93 0.95 0.96 13 49 26 22Miami-Hialeah, FL 0.97 1.05 1.23 1.24 1.28 1.22 1.26 2 11 30 29Milwaukee, WI 0.76 0.82 0.93 1.02 1.02 1.01 1.01 -1 5 33 33Minneapolis-St. Paul, MN 0.70 0.83 0.89 0.93 1.06 1.08 1.13 22 66 61 65Nashville, TN 0.71 0.82 0.85 0.86 0.93 0.92 0.96 12 46 35 38New Orleans, LA 0.89 0.93 1.01 0.98 1.02 0.99 0.99 1 8 11 8New York, NY-Northeastern, NJ 0.94 0.98 1.05 1.01 1.04 1.06 1.11 10 39 18 12Norfolk, VA 0.75 0.86 0.92 0.89 0.93 0.97 0.97 9 35 29 28Oklahoma City, OK 0.57 0.62 0.73 0.74 0.82 0.84 0.85 15 54 49 53Omaha, NE-IA 0.67 0.74 0.87 0.96 0.99 1.02 1.00 4 16 49 53Orlando, FL 0.65 0.80 0.76 0.86 0.84 0.87 0.93 8 26 43 48Philadelphia, PA-NJ 0.98 1.01 0.99 0.98 1.00 1.03 1.05 7 22 7 4Phoenix, AZ 0.94 1.04 1.04 1.06 1.06 1.11 1.13 7 22 20 14Pittsburgh, PA 0.72 0.73 0.75 0.74 0.76 0.76 0.76 3 13 6 3Portland-Vancouver, OR-WA 0.79 0.98 1.02 1.07 1.15 1.20 1.22 14 50 54 58Providence-Pawtucket, RI-MA 0.79 0.87 0.91 0.83 0.84 0.87 0.87 5 17 10 7Rochester, NY 0.53 0.58 0.72 0.74 0.79 0.79 0.78 5 17 47 52Sacramento, CA 0.71 0.86 1.06 1.06 1.12 1.15 1.14 8 26 61 65Salem, OR 0.57 0.67 0.72 0.76 0.77 0.80 0.82 8 26 44 49Salt Lake City, UT 0.68 0.66 0.78 0.91 1.04 1.05 1.04 14 50 53 57San Antonio, TX 0.73 0.85 0.75 0.76 0.88 0.89 0.92 21 64 26 22San Bernardino-Riverside, CA 0.73 0.83 1.06 1.15 1.16 1.17 1.15 0 7 58 62San Diego, CA 0.80 1.02 1.15 1.15 1.13 1.14 1.12 -3 1 40 45San Francisco-Oakland, CA 1.04 1.26 1.36 1.32 1.34 1.36 1.33 1 8 28 27San Jose, CA 0.76 0.87 1.07 1.11 1.08 1.08 1.08 -3 1 42 47Seattle-Everett, WA 1.05 1.22 1.21 1.17 1.20 1.22 1.26 8 26 20 14Spokane, WA 0.64 0.72 0.76 0.75 0.76 0.77 0.81 8 26 27 24St. Louis, MO-IL 0.81 0.84 0.93 0.95 1.00 1.01 1.03 8 26 27 24
Short-term1992-1997
Long-term1982-1997
90"
Chapter 1 T
he Transportation System
Table 1-61
Cont’d Roadway Congestion IndexR
KEY: R = revised
Continued next page

Physical P
erformance !
91
% change
Urban area 1982 1986 1990 1992 1995 1996 1997 % Rank % RankTacoma, WA 0.77 0.91 1.06 1.12 1.10 1.11 1.15 3 13 49 53Tampa, FL 0.91 0.91 1.02 1.09 1.11 1.09 1.07 -2 3 18 12Tucson, AZ 0.79 0.73 0.89 0.93 0.94 0.95 1.00 8 26 27 24Washington, DC-MD-VA 0.99 1.16 1.21 1.24 1.32 1.32 1.33 7 22 34 35
Short-term1992-1997
Long-term1982-1997
Table 1-61Cont’d Roadway Congestion IndexR
Due to changes in methodology, data for all years shown wererevised. For a detailed explanation of the formulas used, see the source document.SOURCE: 1982-97: Texas Transportation Institute, The 1999 Annual Urban MobilityReport (College Station, TX: 1999), Appendix A-4.
NOTES: The roadway congestion index (RCI) is a measure of vehicle travel density onmajor roadways in an urban area. An RCI exceeding 1.0 indicates an undesirable conges-tion level, on average, on the freeways and principal arterial street system during the peakperiod. The cities shown represent the 50 largest metropolitan areas, as well as otherschosen by the states sponsoring the Texas Transportation Institute study on mobility.
KEY: R = revised

92"
Chapter 1 T
he Transportation System
Table 1-62 Congestion Index and Cost Values
Continued next page
Urban area1994value
1996value
1997value
1994rank
1996rank
1997rank
1994value
1996value
1997value
1994rank
1996rank
1997rank
Albany-Schenectady-Troy, NY 270 295 140 62 61 62 105 115 55 59 61 59Albuquerque, NM 585 700 650 22 25 24 240 300 285 46 47 45Atlanta, GA 850 1,095 1,125 8 4 4 1,595 2,110 2,270 9 9 8Austin, TX 805 970 880 10 11 12 370 465 430 34 36 34Bakersfield, CA 220 270 155 64 65 61 55 70 40 63 63 61Baltimore, MD 565 715 780 25 23 16 950 1,205 1,330 17 16 14Beaumont, TX 150 180 225 66 68 56 15 20 25 67 67 63Boston, MA 720 900 1,095 14 14 5 1,725 2,170 2,635 8 8 7Boulder, CO 125 125 110 68 70 65 10 10 10 69 70 66Brownsville, TX 110 165 50 70 69 68 10 15 5 69 69 68Buffalo-Niagara Falls, NY 215 285 115 65 63 64 180 240 95 53 52 55Charlotte, NC 450 590 680 41 37 21 190 260 300 52 50 44Chicago, IL-Northwestern, IN 545 670 720 26 26 20 3,225 4,005 4,400 3 3 3Cincinnati, OH-KY 460 590 525 39 37 35 445 570 515 27 28 28Cleveland, OH 305 390 345 57 58 51 435 570 505 28 28 29Colorado Springs, CO 375 450 275 51 52 54 105 135 85 59 58 58Columbus, OH 410 505 515 47 45 36 320 400 405 40 41 37Corpus Christi, TX 240 285 110 63 63 65 50 65 25 64 64 63Dallas, TX 845 1,015 975 9 10 8 1,410 1,765 1,715 12 12 12Denver, CO 635 825 760 18 18 19 815 1,115 1,050 20 18 17Detroit, MI 860 1,095 1,010 7 4 6 2,655 3,165 3,145 6 6 5El Paso, TX-NM 280 290 205 59 62 58 115 125 90 58 60 57Eugene-Springfield, OR 125 220 120 68 66 63 20 35 20 66 66 65Fort Lauderdale-Hollywood-Pompano Beach, FL 495 625 515 32 30 36 515 730 605 26 25 25Fort Worth, TX 655 840 640 16 15 27 610 805 625 22 22 24Fresno, CA 280 350 315 59 59 52 100 130 120 61 59 54Hartford-Middletown, CT 490 640 390 33 29 49 240 320 195 46 46 53Honolulu, HI 465 520 510 37 43 38 250 285 280 45 48 46Houston, TX 935 1,055 960 5 7 9 2,040 2,405 2,210 7 7 9Indianapolis, IN 360 505 865 52 45 13 275 400 665 44 41 23
Annual congestion cost per driver ($) Annual congestion cost ($ millions)

Urban area1994value
1996value
1997value
1994rank
1996rank
1997rank
1994value
1996value
1997value
1994rank
1996rank
1997rank
Jacksonville, FL 600 830 580 19 17 30 355 505 360 35 32 41Kansas City, MO-KS 425 610 475 44 33 42 435 630 485 28 27 31Laredo, TX 150 200 90 66 67 67 15 20 10 67 67 66Las Vegas, NV 425 510 575 44 44 32 300 420 505 41 40 29Los Angeles, CA 1,035 1,205 1,370 1 2 1 9,185 10,805 12,405 1 1 1Louisville, KY-IN 540 720 680 27 22 21 340 475 455 38 34 32Memphis, TN-AR-MS 425 505 480 44 45 41 290 365 350 43 44 42Miami-Hialeah, FL 780 905 930 12 13 10 1,195 1,460 1,515 13 13 13Milwaukee, WI 405 495 425 48 49 46 385 475 410 31 34 36Minneapolis - St. Paul, MN 465 575 570 37 40 33 795 1,020 1,030 21 20 19Nashville, TN 730 920 765 13 12 17 350 450 375 36 37 39New Orleans, LA 440 500 400 43 48 47 375 430 350 32 39 42New York, NY-Northeastern, NJ 590 705 640 21 24 27 8,235 9,810 8,885 2 2 2Norfolk, VA 460 645 570 39 28 33 350 505 450 36 32 33Oklahoma City, OK 325 460 305 54 51 53 210 345 235 49 45 49Omaha, NE-IA 500 595 510 31 36 38 205 250 215 50 51 52Orlando, FL 505 660 670 30 27 23 375 535 555 32 31 27Philadelphia, PA-NJ 385 445 445 49 53 44 1,585 1,825 1,825 10 10 10Phoenix, AZ 580 590 580 24 37 30 950 1,070 1,050 17 19 17Pittsburgh, PA 385 485 245 49 50 55 595 755 370 23 24 40Portland-Vancouver, OR-WA 585 765 885 22 20 11 545 765 930 24 23 21Providence-Pawtucket, RI-MA 480 615 360 36 32 50 335 435 255 39 38 47Rochester, NY 280 405 200 59 56 59 135 190 95 57 57 55Sacramento, CA 595 730 645 20 21 26 540 670 595 25 26 26Salem, OR 310 395 215 56 57 57 40 55 30 65 65 62Salt Lake City, UT 315 430 400 55 54 47 195 270 255 51 49 47San Antonio, TX 450 605 435 41 35 45 405 550 395 30 30 38San Bernardino-Riverside, CA 890 1,030 815 6 9 15 855 990 790 19 21 22San Diego, CA 520 620 635 28 31 29 1,015 1,200 1,265 14 17 16San Francisco-Oakland, CA 975 1,055 995 4 7 7 3,000 3,250 3,065 4 5 6
Annual congestion cost per driver ($) Annual congestion cost ($ millions)
Physical P
erformance !
93
Table 1-62Cont’d Congestion Index and Cost Values
Continued next page

94"
Chapter 1 T
he Transportation System
The cost of congestion is estimated with a value for each hour of travel time and each gallonof fuel. For a more detailed explanation of the formulas used, see the source document.SOURCE: 1994-97: Texas Transportation Institute, The 1999 Annual Urban MobilityReport (College Station, TX: 1999), tables 7 and 8.
Urban area1994value
1996value
1997value
1994rank
1996rank
1997rank
1994value
1996value
1997value
1994rank
1996rank
1997rank
San Jose, CA 805 1,070 765 10 6 17 955 1,315 955 16 14 20Seattle-Everett, WA 995 1,155 1,165 3 3 3 1,495 1,780 1,805 11 11 11Spokane, WA 290 340 200 58 60 59 70 85 50 62 62 60St. Louis, MO-IL 650 825 845 17 18 14 995 1,280 1,310 15 15 15Tacoma, WA 510 535 500 29 42 40 220 240 225 48 52 50Tampa, FL 490 610 650 33 33 24 300 395 430 41 43 34Tucson, AZ 360 420 450 52 55 43 170 210 225 55 54 50Washington, DC-MD-VA 1,030 1,290 1,260 2 1 2 2,930 3,655 3,560 5 4 4
Annual congestion cost per driver ($) Annual congestion cost ($ millions)
Table 1-62Cont’d Congestion Index and Cost Values
NOTES: The roadway congestion index (RCI) is a measure of vehicle travel density onmajor roadways in an urban area. An RCI exceeding 1.0 indicates an undesirable conges-tion level, on average, on the freeways and principal arterial street system during the peakperiod. The cities shown represent the 50 largest metropolitan areas, as well as otherschosen by the states sponsoring the Texas Transportation Institute study on mobility.

Physical P
erformance !
95
Delayed departure Trip length (miles) time (minutes)
0-250 10251-350 15351-450 20451-550 25≥ 551 30
SOURCES: 1980: Amtrak, National Railroad Passenger Corporation Annual Report(Washington, DC: 1981).1985-99: Ibid., Amtrak Annual Report, Statistical Appendix (Washington, DC: Annual issues).
Table 1-63 Amtrak On-Time Performance Trends and Hours of Delay by Cause
a Amtrak delays include equipment malfunctions, train servicing in stations, and passenger-related delays.
b Freight delays include maintenance of way/slow orders, freight train interference, and signal delays.
c Other delays include passenger train interference, waiting for connections, running time,weather-related delays, and miscellaneous.
d Numbers may not add to totals due to rounding.NOTES: All percentages are based on Amtrak's fiscal year (October 1-September 30).Amtrak trips are considered delayed based on the following chart:
KEY: N = data do not exist
1980 1985 1990 1991 1992 1993 1994 1995 1996 1997 1998 1999On-time performance,
total % (weighted) 69 81 76 77 77 72 72 76 71 74 79 79Short distance (<400 miles) 71 82 82 82 82 79 78 81 76 79 81 80Long distance (>=400 miles) 64 78 53 59 61 a47 49 57 49 53 59 61
Hours of delay by causeAmtraka N N 3,565 5,915 6,433 8,488 8,538 5,527 5,193 5,310 4,796 4,891Freightb N N 4,244 7,743 8,229 12,827 14,319 11,224 11,438 12,904 14,202 16,158Otherc N N 4,316 7,426 8,185 11,675 11,871 8,497 8,425 7,611 8,291 8,203 Totald N N 12,126 21,084 22,847 32,991 34,729 25,248 25,056 25,825 27,289 29,252

Transportation Safety
Section AMultimodal
chapter two

Multim
odal !99
Table 2-1 Transportation Fatalities by Mode
KEY: N = data do not exist; R = revised; U = data are not available
Continued next page
1960 1965 1970 1975 1980 1985 1990 1995 1996 1997 1998 1999AirU.S. air carriera 499 261 146 124 1 526 39 168 380 8 1 12Commuter carrierb N N N 28 37 37 7 9 14 46 0 12On-demand air taxic N N N 69 105 76 R51 52 63 39 45 38General aviationd 787 1,029 1,310 1,252 1,239 956 R767 734 632 R643 R624 631
HighwayPassenger car occupants N N N 25,929 27,449 23,212 24,092 22,423 22,505 22,199 R21,194 20,818Motorcyclists 790 1,650 2,280 3,189 5,144 4,564 3,244 2,227 2,161 2,116 R2,294 2,472Truck occupantse N N N 5,817 8,748 7,666 9,306 10,216 10,553 10,972 R11,447 12,001Bus occupants N N N 53 46 57 32 33 21 18 R38 58Pedestrians 7,210 7,990 8,950 7,516 8,070 6,808 6,482 5,584 5,449 5,321 R5,228 4,906Pedalcyclists 490 690 760 1,003 965 890 859 833 765 814 R760 750Otherf 27,909 36,759 40,637 1,018 669 628 584 501 609 573 R540 606 Total highway 36,399 47,089 52,627 44,525 51,091 43,825 44,599 41,817 j42,065 42,013 R41,501 41,611
Railroadg
Highway-rail grade crossing 1,421 1,610 1,440 917 833 582 698 579 488 461 431 402Railroad 924 923 785 575 584 454 599 567 551 602 577 530
Transith N N N N N N 339 274 264 275 286 299
Waterbornei
Vessel-related N N 178 243 206 131 85 46 50 46 R59 44Not related to vessel casualties N N 420 330 281 130 101 137 111 108 76 67Recreational boating 739 1,360 1,418 1,466 1,360 1,116 865 829 709 821 R815 734
PipelineHazardous liquid pipeline N N 4 7 4 5 3 3 5 0 R2 4Gas pipeline N N 26 8 15 28 6 18 48 10 17 17
TOTAL fatalitiesR U U U U U U 47,348 44,563 44,808 44,472 43,876 43,866

100"
Chapter 2 Transportation S
afety
SOURCES:Air:U.S. air carrier: 1960: National Transportation Safety Board, Annual Review of Aircraft AccidentData: U.S. Air Carrier Operations, Calendar Year 1967 (Washington, DC: December 1968).1965-70: Ibid., Annual Review of Aircraft Accident Data: U.S. Air Carrier Operations, CalendarYear 1975, NTSB/ARC-77/1 (Washington, DC: January 1977).1975: Ibid., Annual Review of Aircraft Accident Data: U.S. Air Carrier Operations, CalendarYear 1983, NTSB/ARC-87/01 (Washington, DC: February 1987), table 18.1980: Ibid., Annual Review of Aircraft Accident Data: U.S. Air Carrier Operations, Calendar Year1981, NTSB/ARC-85/01 (Washington, DC: February 1985), tables 2 and 16.1985-99: Ibid., Internet site www.ntsb.gov/aviation, table 5, as of April 2000.Commuter: 1975-80: National Transportation Safety Board, Annual Review of AircraftAccident Data: U.S. Air Carrier Operations, Calendar Year 1980, NTSB/ARC-83/01(Washington, DC: January 1983), tables 26 and 40.1985-99: Ibid., Internet site www.ntsb.gov/aviation, table 9, as of April 2000.On-demand air taxi: 1975-80: National Transportation Safety Board, Annual Review ofAircraft Accident Data: U.S. Air Carrier Operations, Calendar Year 1981, NTSB/ARC-85/01(Washington, DC: February 1985), table 61.1985-99: Ibid., Internet site www.ntsb.gov/aviation, table 9, as of April 2000 (1999 dataas preliminary).General aviation: 1960-70: National Transportation Safety Board, Annual Review of AircraftAccident Data: U.S. General Aviation, Calendar Year 1970, NTSB/ARG-74/1 (Washington,DC: April 1974), table 117.1975-80: Ibid., Annual Review of Aircraft Accident Data: General Aviation, Calendar Year1985, NTSB/ARG-87/03 (Washington, DC: October 1987), table 21.1985-99: Ibid., Internet site www.ntsb.gov/aviation, table 10, as of April 2000.Highway:1960-65: Estimated by U.S. Department of Transportation, National Highway TrafficSafety Administration from data supplied by U.S. Department of Health and HumanServices, National Center for Health Statistics, and individual state accident reports(adjusted to 30-day deaths). Fatalities data prior to 1975 have been adjusted to reflect theFatality Analysis Reporting System's definition of a fatal crash as one that involves amotor vehicle on a trafficway that results in the death of a vehicle occupant or a non-motorist within 30 days of the crash.1970-97: U.S. Department of Transportation, National Highway Traffic Safety Administration,Traffic Safety Facts 1997, DOT HS 808 806 (Washington, DC: November 1998), table 4.1998-99: Ibid., Traffic Safety Facts 1998, DOT HS 808 983 (Washington, DC: October1999), table 4, and personal communication, July 24, 2000; and National Center forStatistics and Analysis, Fatality Analysis Reporting System (FARS) Database, personalcommunication, Sept. 11, 2000.
Table 2-1Cont’d Transportation Fatalities by Mode
a Carriers operating under 14 CFR 121, all scheduled and nonscheduled service. Since Mar. 20, 1997, 14 CFR 121 include aircraft with 10 or more seats that formerly operated under 14 CFR 135. This change makes it difficult to compare pre-1997 data for 14 CFR 121 and 14 CFR 135 with more recent data.
b All scheduled service operating under 14 CFR 135 (commuter air carriers). Before Mar.20, 1997, 14 CFR 135 applied to aircraft with 30 or fewer seats. Since Mar. 20, 1997, 14 CFR 135 includes only aircraft with fewer than 10 seats. This change makes it difficult to compare pre-1997 data for 14 CFR 121 and 14 CFR 135 with more recent data.
c Nonscheduled service operating under 14 CFR 135 (on-demand air taxis).d All operations other than those operating under 14 CFR 121 and 14 CFR 135.e Includes light and large trucks.f Includes occupants of other vehicle types and other nonmotorists. For 1960-70, the U.S.Department of Transportation, National Highway Traffic Safety Administration did not break out fatality data to the same level of detail as in later years, so fatalities for those years also include occupants of passenger cars, trucks, and buses.
g Includes Amtrak. Highway-rail grade crossing fatalities data for 1970 and before are not comparable with data after 1970 due to change in reporting system. Fatalities include those resulting from train accidents, train incidents, and nontrain incidents. Highway-rail grade crossing fatalities are counted under highway, except train occupants.
h Fatalities include those resulting from all reportable incidents, not just from accidents.i Vessel-related casualties include those involving damage to vessels such as caused by collisions or groundings. Fatalities not related to vessel casualties include deaths from falling overboard or from accidents involving onboard equipment.
j Includes 2 fatalities that have not been assigned to a specific vehicle type.NOTES: Numbers may not add to totals because some fatalities are counted in morethan one mode. To avoid double counting, the following adjustments have been made:most (not all) highway-rail grade-crossing fatalities have not been added because most (notall) such fatalities involve motor vehicles and, thus, are already included in highway fatali-ties; for transit, all commuter rail fatalities and motor-bus, trolley-bus, demand-responsiveand van-pool fatalities arising from accidents have been subtracted because they are count-ed as railroad, highway, or highway-rail grade-crossing fatalities. The reader cannot repro-duce the total fatalities in this table by simply leaving out the number of highway-railgrade-crossing fatalities in the sum and subtracting the above transit submodes, because inso doing, grade-crossing fatalities not involving motor vehicles would be left out (see table2-36 on rail). An example of such a fatality is a bicyclist hit by a train at a grade crossing.Caution must be exercised in comparing fatalities across modes because significantly dif-ferent definitions are used. In particular, rail and transit fatalities include incident-related(as distinct from accident-related) fatalities, such as fatalities from falls in transit stations orrailroad employee fatalities from a fire in a workshed. Equivalent fatalities for the air andhighway modes (fatalities at airports not caused by moving aircraft or fatalities from acci-dents in automobile repair shops) are not counted toward the totals for these modes.Thus, fatalities not necessarily directly related to in-service transportation are counted forthe transit and rail modes, potentially overstating the risk for these modes.
Continued next page

Multim
odal !101
Transit:1990-98: U.S. Department of Transportation, Federal Transit Administration, SafetyManagement Information Statistics 1998 (Washington, DC: 1999), p. 42.1999: Ibid., personal communication, Dec. 6, 2000.Water:Vessel- and nonvessel-related: 1970-98: U.S. Department of Transportation, U.S. CoastGuard, Office of Investigations and Analysis, Compliance Analysis Division, (G-MOA-2), personal communication, Apr. 13, 1999.Recreational boating: 1960-97: Ibid., Office of Boating Safety, Boating Statistics(Washington, DC: Annual issues).1998: Ibid., Personal communication, Oct. 4, 1999.Hazardous liquid and gas pipeline:1970-99: U.S. Department of Transportation, Research and Special ProgramsAdministration, Office of Pipeline Safety, personal communication and Internet sitehttp://ops.dot.gov as of June 28, 2000.
Table 2-1Cont’d Transportation Fatalities by Mode
Rail:Highway-rail grade crossing: 1960-70: National Safety Council, Accident Facts, 1974(Washington, DC: 1974).1975-80: U.S. Department of Transportation, Federal Railroad Administration, Office ofPolicy and Program Development, personal communication.1985-90: Ibid., Rail-Highway Crossing Accident/Incident and Inventory Bulletin (Washington, DC:Annual issues), table S.1995-97: Ibid., Railroad Safety Statistics Annual Report 1997 (Washington, DC: September1998), table 1-1.1998: Ibid., Office of Safety, Internet sitehttp://safetydata.fra.dot.gov/officeofsafety/Prelim/1998/r03.htm, as of July 23, 1999.1999: Ibid., Office of Safety, Internet sitehttp://safetydata.fra.dot.gov/officeofsafety/Prelim/1998/r01.htm, as of June 30, 2000.Railroad: 1960-65: National Safety Council, Accident Facts, 1974 (Washington, DC: 1974).1970-90: U.S. Department of Transportation, Federal Railroad Administration, Highway-Rail Crossing Accident/Incident and Inventory Bulletin (Washington, DC: Annual issues), table 7.1995-97: Ibid., Railroad Safety Statistics Annual Report 1997 (Washington, DC: September1998), table 1-1.1998: Ibid., Office of Safety, Internet sitehttp://safetydata.fra.dot.gov/officeofsafety/Prelim/1998/r03.htm, as of July 23, 1999.1999: Ibid., Office of Safety, Internet sitehttp://safetydata.fra.dot.gov/officeofsafety/Prelim/1998/r01.htm, as of June 30, 2000.

Aira
U.S. air carrierb
Commuter carrierc
On-demand air taxid
General aviatione
HighwayPassenger car occupantsMotorcyclistsTruck occupantsf
Bus occupantsPedestriansPedalcyclistsOtherg
Total highwayR
Railroadh
Highway-rail grade crossing Railroad
Transiti
Waterbornej
Vessel-relatedNot related to vessel casualties Recreational boating
Pipeline
Hazardous liquid pipelineGas pipeline
TOTAL injured persons R
1960
NNNN
NNNNNNNN
3,36716,113
N
N
N929
NN
U
1965
NNNN
NNNNNNNN
3,72521,930
N
N
N927
NN
U
1970
107NN
715
NNNNNNNN
3,27217,934
N
105
U780
21233
U
1975
81NN
769
NNNNNNNN
3,86050,138
N
97
U2,136
17214
U
1980
191443
R681
NNNNNNNN
3,55058,696
N
180
2,650
15177
U
1985
301641
483
NNNNNNNN
2,68731,617
N
172
U2,757
18108
U
1990
291136
402
2,376,00084,000
547,00033,000
105,00075,00011,000
3,231,000
2,40722,736
54,556
175
U3,822
769
U
252514
1153
1995
395
2,469,00057,000
752,00019,00086,00067,00014,000
3,465,000
1,89412,546
57,196
145
1,9164,141
3,518,000
R
1996
772
20359
2,458,00055,000
794,00020,00082,00058,00015,000
3,483,000
1,61010,948
55,288
129
1,2984,442
13114
3,532,000
1
5
1997
39
23365
2,341,00053,000
786,00017,00077,00058,00017,000
3,348,000
1,54010,227
56,132
109
9474,555
72
3,397,000
1998
282
R10R330
2,201,00049,000
792,00016,00069,00053,00012,000
3,192,000
1,30310,156
55,990
83
357R4,612
R6R75
3,241,000
1999
572
14325
2,138,00050,000
880,00022,00085,00051,00010,000
3,236,000
P1,39610,509
55,325
113
3994,315
2087
3,284,000
102"
Chapter 2 Transportation S
afety Table 2-2 Injured Persons by Transportation Mode
KEY: N = data do not exist; P = preliminary; R = revised; U = data are not available
Continued next page

Multim
odal !103
sit submodes, because in so doing, grade-crossing injuries not involving motor vehicleswould be left out (see table 2-36 on rail). An example of such an injury is a bicyclistinjured by a train at a grade crossing.SOURCES:Air:U.S. air carrier: 1970-90: National Transportation Safety Board, Annual Review of AircraftAccident Data: U.S. Air Carrier Operations (Washington, DC: Annual issues).1995-99: Ibid., Analysis and Data Division, personal communications, Aug. 8, 1996;Mar. 10, 1999; and Mar. 23, 2000.Commuter carrier, and on-demand air taxi: 1980-90: National Transportation Safety Board,Annual Review of Aircraft Accident Data: U.S. Air Carrier Operations (Washington, DC:Annual issues).1995-99: Ibid., Analysis and Data Division, personal communications, 1996, 1997, 1998,and Mar. 23, 2000.General aviation: 1970-90: National Transportation Safety Board, Annual Review of AircraftAccident Data: General Aviation (Washington, DC: Annual issues).1995-99: Ibid., Analysis and Data Division, personal communications, 1996, 1997, 1998,and Mar. 23, 2000.Highway:1990-97: U.S. Department of Transportation, National Highway Traffic SafetyAdministration, National Center for Statistics and Analysis, Traffic Safety Facts 1997, DOTHS 808 806 (Washington, DC: November 1998), table 4.1998: Ibid., Traffic Safety Facts 1998, DOT HS 808 983 (Washington, DC: October 1999),table 4.1999: Ibid., General Estimates System Database and personal communication, Sept. 8, 2000.Rail:Highway-rail grade crossings: 1960-70: National Safety Council, Accident Facts, 1974(Washington, DC: 1974).1975: U.S. Department of Transportation, Federal Railroad Administration, Office ofPolicy and Program Development, personal communication.1980-90: Ibid., Rail-Highway Crossing Accident/Incident and Inventory Bulletin (Washington,DC: Annual issues), table S.1995-97: U.S. Department of Transportation, Federal Railroad Administration, RailroadSafety Statistics Annual Report 1997 (Washington, DC: September 1998), table 1-1.1998-99: Ibid., Office of Safety, Internet site http://safetydata.fra.dot.gov/officeofsafe-ty/Prelim/1999/r11.htm, as of June 28, 2000.Railroad:1960-70: National Safety Council, Accident Facts, 1974 (Washington, DC: 1974).1970-90: U.S. Department of Transportation, Federal Railroad Administration, Highway-Rail Crossing Accident/Incident and Inventory Bulletin (Washington, DC: Annual issues), table 7.
Table 2-2Cont’d Injured Persons by Transportation Mode
a Injuries classified as serious. See definitions of injuries in the glossary.b All scheduled and nonscheduled service operating under 14 CFR 121. Since Mar. 20,1997, 14 CFR 121 includes only aircraft with 10 or more seats formerly operated under 14 CFR 135. This change makes it difficult to compare pre-1997 data for 14 CFR 121 and 14 CFR 135 with more recent data.
c All scheduled service operating under 14 CFR 135 (commuter air carriers). Before Mar.20, 1997, 14 CFR 135 applied to aircraft with 30 or fewer seats. Since Mar. 20, 1997, 14 CFR 135 includes only aircraft with fewer than 10 seats. This change makes it difficult tocompare pre-1997 data for 14 CFR 121 and 14 CFR 135 with more recent data.
d Nonscheduled service operating under 14 CFR 135 (on-demand air taxis).e All operations other than those operating under 14 CFR 121 and 14 CFR 135.f Includes light and large trucks.g Includes occupants of other unknown vehicle types and other nonmotorists.h Includes Amtrak. Figures include those injuries resulting from train accidents, train incidents, and nontrain incidents. Injury figures also include occupational illness. Railroadinjuries data for 1970 and before are not comparable with data after 1970 due to change in reporting system. Highway-rail grade crossing injuries are counted under highway,except train occupants.
i Includes motor bus, commuter rail, heavy rail, light rail, demand responsive, van pool,and automated guideway. Transit injuries include those resulting from all reportable incidents, not just from accidents.
j Vessel-related injuries include those involving damage to vessels such ascaused by collisions or groundings. Injuries not related to vessel casualties includethose from falls overboard or from accidents involving onboard equipment.
NOTES: The motor vehicle injury data in this table come from the U.S. Department ofTransportation, National Highway Traffic Safety Administration's General EstimatesSystem (GES). The data from GES, which began operation in 1988, are obtained from anationally representative probability sample selected from all police-reported crashes. TheGES sample includes only crashes where a police accident report was completed and thecrash resulted in property damage, injury, or death. The resulting figures do not take intoaccount crashes that were not reported to the police or did not result in property damage.The 1993 NTS Historical Compendium and earlier editions used injury figures estimatedby the National Safety Council, which used a different set of methods to arrive at its fig-ures. Thus, the injury figures in this edition of NTS may not be comparable with thosefound in earlier editions.Numbers may not add to totals because some injuries are counted in more than onemode. To avoid double counting, the following adjustments have been made in the totalinjured row:• most (not all) highway-rail grade crossing injuries have not been added because most (not
all) such injuries involve motor vehicles and, thus, are already included in highway injuries;• for transit, all commuter rail injuries and motor-bus, trolley-bus, demand-responsive, and
van-pool injuries arising from accidents have been subtracted because they are counted as railroad, highway, or highway-rail grade crossing injuries.
The reader cannot reproduce the total injuries count in this table by simply leaving out thenumber of highway-rail grade crossing injuries in the sum and subtracting the above tran- Continued next page

104"
Chapter 2 Transportation S
afety
Recreational boating: 1960-98: Ibid., Office of Boating Safety, Boating Statistics(Washington, DC: Annual issues).1998: Ibid., Personal communication, Oct. 4, 1999.Hazardous liquid and gas pipeline:1970-99: U.S. Department of Transportation, Research and Special ProgramsAdministration, Office of Pipeline Safety, personal communication; and Internet sitehttp://ops.dot.gov as of June 28, 2000.
Table 2-2Cont’d Injured Persons by Transportation Mode
1995-97: U.S. Department of Transportation, Federal Railroad Administration, RailroadSafety Statistics Annual Report 1997 (Washington, DC: September 1998), table 1-1.1998-99: Ibid., Office of Safety, Internet site http://safetydata.fra.dot.gov/officeofsafety/Prelim/1999/r01.htm, as of June 28, 2000.Transit:1990-98: U.S. Department of Transportation, Federal Transit Administration, SafetyManagement Information Statistics (Washington, DC: Annual issues).1999: Ibid., personal communication, Dec. 6. 2000.Water:Waterborne transportation: 1970-98: U.S. Department of Transportation, U.S. Coast Guard,Office of Investigations and Analysis, Compliance Analysis Division, (G-MOA-2), person-al communication, Apr. 13, 1999.

1960 1965 1970 1975 1980 1985 1990 1995 1996 1997 1998 1999AirU.S. air carrierb 90 83 55 37 19 21 24 36 38 49 R50 52Commuter carrierc N N N 48 38 18 15 12 11 17 8 13On-demand air taxid N N N 152 171 157 107 75 90 82 R77 76General aviatione 4,793 5,196 4,712 3,995 3,590 2,739 2,215 2,053 1,907 1,858 R1,908 1,909
HighwayPassenger car N N N N N N 5,561,000 5,594,000 5,599,000 5,423,000 5,146,000 4,916,000Motorcycle N N N N N N 103,000 66,000 66,000 61,000 54,000 57,000Truckf N N N N N N 2,460,000 3,039,000 3,175,000 3,225,000 3,168,000 3,425,000Bus N N N N N N 60,000 58,000 57,000 53,000 53,000 63,000
Total highway crashesa N N N N N N 6,471,000 6,699,000 6,770,000 6,624,000 6,335,000 6,279,000
RailHighway-rail grade crossing g,h
3,195 3,820 3,559 12,076 10,612 6,919 5,713 4,633 4,257 3,865 R3,508 3,489Railroadg,I N N 8,095 8,041 8,205 3,275 2,879 2,459 2,443 2,397 2,575 2,768
Transitj N N N N N N 58,002 25,683 25,166 24,924 23,937 23,416
WaterborneVessel-related N N 2,582 3,310 4,624 3,439 3,613 4,196 3,799 3,704 3,872 3,654Recreational boating 2,738 3,752 3,803 6,308 5,513 6,237 6,411 8,019 8,026 R8,047 R8,061 7,935
PipelineHazardous liquid pipeline N N 351 254 246 183 180 188 R193 R171 154 165Gas pipeline N N 1,077 1,338 1,524 334 198 161 187 175 R234 174
TOTAL accidents U U U U U U 6,517,000 6,752,000 R6,820,000 6,675,000 6,387,000 6,330,000
Multim
odal !105
Table 2-3 Transportation Accidentsa by Mode
KEY: N = data do not exist; R = revised; U = data are not available
Continued next page

106"
Chapter 2 Transportation S
afety
Note that the reader cannot reproduce the total accidents count in this table by simplyleaving out highway-rail grade-crossing accidents in the sum and subtracting the abovetransit submodes, because in so doing, grade-crossing accidents not involving motorvehicles would be left out (see table 2-36 on rail). An example of such an accident is abicyclist hit by a train at a grade crossing.SOURCES:Air:Air carrier: 1960: National Transportation Safety Board, Annual Review of Aircraft Accident Data:U.S. Air Carrier Operations, Calendar Year 1967 (Washington, DC: December 1968).1965-70: Ibid., Annual Review of Aircraft Accident Data: U.S. Air Carrier Operations, CalendarYear 1975, NTSB/ARC-77/1 (Washington, DC: January 1977).1975: Ibid., Annual Review of Aircraft Accident Data: U.S. Air Carrier Operations, CalendarYear 1983, NTSB/ARC-87/01 (Washington, DC: February 1987), table 18.1980: Ibid., Annual Review of Aircraft Accident Data: U.S. Air Carrier Operations, Calendar Year1981, NTSB/ARC-85/01 (Washington, DC: February 1985), tables 2 and 16.1985-97: Ibid., Press release, SB-99-06, Internet site www.ntsb.gov/aviation, table 5, asof Mar. 2, 1999.1998-99: Ibid., personal communication, Mar. 28, 2000.Commuter air carrier: 1975-80: National Transportation Safety Board, Annual Review ofAircraft Accident Data: U.S. Air Carrier Operations, Calendar Year 1980, NTSB/ARC-83/01(Washington, DC: January 1983), tables 26 and 40.1985-97: Ibid., Internet site www.ntsb.gov/aviation, table 8, as of Mar. 2, 1999.1998-99: Ibid., personal communication, Mar. 28, 2000.On-demand air taxi: 1975-80: National Transportation Safety Board, Annual Review ofAircraft Accident Data: U.S. Air Carrier Operations, Calendar Year 1981, NTSB/ARC-85/01(Washington, DC: Feb. 1985), table 61.1985-97: Ibid., Internet site www.ntsb.gov/aviation, table 9, as of Mar. 2, 1999.1998-99: Ibid., personal communication, Mar. 28, 2000.General aviation: 1960-70: National Transportation Safety Board, Annual Review of AircraftAccident Data: General Aviation, Calendar Year 1970, NTSB/ARG-74/1 (Washington, DC:April 1974), table 117.1975-80: Ibid., Annual Review of Aircraft Accident Data: General Aviation, Calendar Year1985, NTSB/ARG-87/03 (Washington, DC: October 1987), table 21.1985-97: Ibid., Press release, SB-99-06, Internet site www.ntsb.gov/aviation, table 10,Mar. 2, 1999.1998-99: Ibid., personal communication, Mar. 28, 2000.
Table 2-3Cont’d Transportation Accidentsa by Mode
a The U.S. Department of Transportation, National Highway Traffic Safety Administrationuses the term "crash" instead of accident in its highway safety data. Highway crashes often involve more than one motor vehicle, hence "total highway crashes" is smaller thanthe sum of the components.
b Carriers operating under 14 CFR 121, all scheduled and nonscheduled service. Since Mar. 20, 1997, 14 CFR 121 includes only aircraft with 10 or more seats formerly operated under 14 CFR 135. This change makes it difficult to compare pre-1997 data for 14 CFR 121 and 14 CFR 135 with more recent data.
c All scheduled service operating under 14 CFR 135. Since Mar. 20, 1997, 14 CFR 121 includes only aircraft with 10 or more seats formerly operated under 14 CFR 135. This change makes it difficult to compare pre-1997 data for 14 CFR 121 and 14 CFR 135 with more recent years’ data.
d Nonscheduled service operating under 14 CFR 135.e All operations other than those operating under 14 CFR 121 and 14 CFR 135.f Includes light and large trucks.g Includes Amtrak.h Includes both accidents and incidents. Data not comparable after 1970 due to change in reporting system. Most highway-rail grade crossing accidents are counted under highway.
i Train accidents only.j Accident figures include collisions with vehicles, objects, and people, derailments/vehicles going off the road. Accident figures do not include fires and personal casualties.
NOTES: The motor vehicle crash data in this table come from the U.S. Department ofTransportation, National Highway Traffic Safety Administrations' General EstimatesSystem (GES), which began operation in 1988. GES data are obtained from a nationallyrepresentative probability sample selected from all police-reported crashes. The GESsample includes only crashes where a police accident report was completed and the crashresulted in property damage, injury, or death. The resulting figures do not take intoaccount crashes that were not reported to the police or did not result in property damage.The 1993 NTS Historical Compendium and earlier editions used crash figures estimatedby the National Safety Council, which used a different set of methods to arrive at its fig-ures. Thus, the crash figures in this edition of NTS may not be comparable with thosefound in earlier editions.Numbers may not add to totals because some accidents/crashes are counted in more thanone mode. To avoid double counting, the following adjustments have been made:• most (not all) highway-rail grade-crossing injuries have not been added because most (not all) such accidents involve motor vehicles and, thus, are already included in highway crashes;
• for transit, all commuter rail accidents and motor bus, trolley bus, demand responsive,and van pool accidents have been subtracted because they are counted as railroad, highway, or highway-rail grade-crossing accidents.
Continued next page

Multim
odal !107
1995-98: Ibid., Railroad Safety Statistics Annual Report 1998 (Washington, DC: July 1999), table 1-1.1999: Ibid., Office of Safety, Internet sitehttp://safetydata.fra.dot.gov/officeofsafety/Prelim/1999/r01.htm, as of June 28, 2000.Transit:1990-98: U.S. Department of Transportation, Federal Transit Administration, SafetyManagement Information Statistics 1998 (Washington, DC: 2000), p. 53-54.1999: Ibid., personal communication, Dec. 6, 2000.Water:Vessel-related: 1970-98: U.S. Department of Transportation, U.S. Coast Guard, Office ofInvestigations and Analysis, Compliance Analysis Division, personal communication, Apr.13, 1999.Recreational boating: 1960-98: Ibid., Office of Boating Safety, Boating Statistics (Washington,DC: Annual issues).Hazardous liquid and gas pipeline:1970-99: U.S. Department of Transportation, Research and Special Programs Administration,Office of Pipeline Safety, Internet site, http://ops.dot.gov as of June 28, 2000.
Table 2-3Cont’d Transportation Accidentsa by Mode
Highway:1990-99: U.S. Department of Transportation, National Highway Traffic SafetyAdministration, National Center for Statistics and Analysis, Traffic Safety Facts 1998,DOT HS 808 983 (Washington, DC: October 1999), table 1, and personal communication,Sept. 11, 2000.Rail:Highway-rail grade crossings: 1960-70: U.S. Department of Transportation, Federal RailroadAdministration, Office of Policy and Program Development, Rail-Highway Grade-CrossingAccidents (Washington, DC: Annual issues).1975-80: Ibid., Office of Policy and Program Development, personal communication.1985-90: Ibid., Rail-Highway Crossing Accident/Incident and Inventory Bulletin (Washington, DC:Annual issues), table S.1995-97: Ibid., Railroad Safety Statistics Annual Report 1997 (Washington, DC: September1998), table 1-1.1999: Ibid., Office of Safety, Internet sitehttp://safetydata.fra.dot.gov/officeofsafety/Prelim/1998/r01.htm, as of July 28, 2000.Railroad: 1970-90: U.S. Department of Transportation, Federal Railroad Administration,Office of Policy and Program Development, Accident/Incident Bulletin (Washington, DC:Annual issues), table 4.
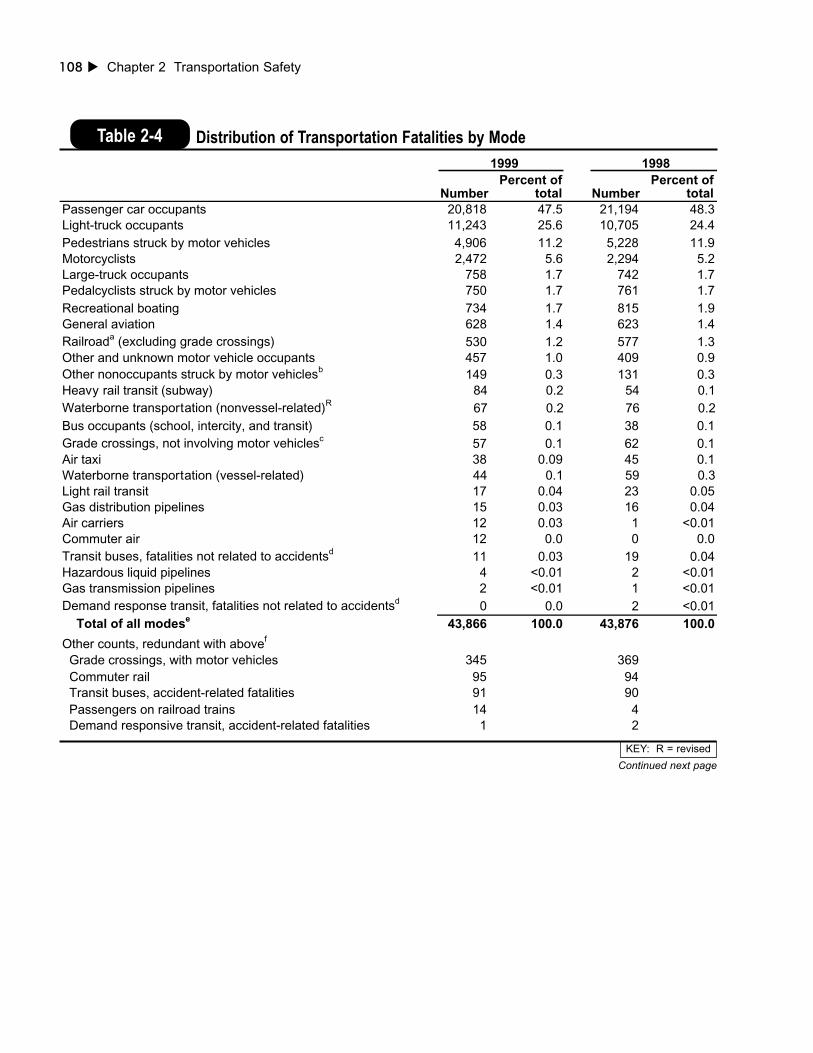
108 " Chapter 2 Transportation Safety
NumberPercent of
totalPassenger car occupants 20,818 47.5 21,194 48.3Light-truck occupants 11,243 25.6 10,705 24.4Pedestrians struck by motor vehicles 4,906 11.2 5,228 11.9Motorcyclists 2,472 5.6 2,294 5.2Large-truck occupants 758 1.7 742 1.7Pedalcyclists struck by motor vehicles 750 1.7 761 1.7Recreational boating 734 1.7 815 1.9General aviation 628 1.4 623 1.4Railroada (excluding grade crossings) 530 1.2 577 1.3Other and unknown motor vehicle occupants 457 1.0 409 0.9Other nonoccupants struck by motor vehiclesb 149 0.3 131 0.3Heavy rail transit (subway) 84 0.2 54 0.1Waterborne transportation (nonvessel-related)R 67 0.2 76 0.2Bus occupants (school, intercity, and transit) 58 0.1 38 0.1Grade crossings, not involving motor vehiclesc 57 0.1 62 0.1Air taxi 38 0.09 45 0.1Waterborne transportation (vessel-related) 44 0.1 59 0.3Light rail transit 17 0.04 23 0.05Gas distribution pipelines 15 0.03 16 0.04Air carriers 12 0.03 1 <0.01Commuter air 12 0.0 0 0.0Transit buses, fatalities not related to accidentsd 11 0.03 19 0.04Hazardous liquid pipelines 4 <0.01 2 <0.01Gas transmission pipelines 2 <0.01 1 <0.01Demand response transit, fatalities not related to accidentsd 0 0.0 2 <0.01 Total of all modese 43,866 100.0 43,876 100.0
Other counts, redundant with abovef
Grade crossings, with motor vehicles 345 369 Commuter rail 95 94 Transit buses, accident-related fatalities 91 90 Passengers on railroad trains 14 4 Demand responsive transit, accident-related fatalities 1 2
1999
NumberPercent of
total
1998
Distribution of Transportation Fatalities by ModeTable 2-4
KEY: R = revised
Continued next page

Multimodal ! 109
Distribution of Transportation Fatalities by ModeTable 2-4Cont’d
a Includes fatalities outside trains, except at grade crossings.b Includes all nonoccupant fatalities, except pedalcyclists and
pedestrians.c Grade-crossing fatalities involving motor vehicles are included in
counts for motor vehicles.d Fatalities not related to transit bus and demand responsive transit
accidents are not included under highway submodes.e Unless otherwise specified, includes fatalities outside the vehicle.f Fatalities at grade crossings with motor vehicles are included
under relevant motor vehicle modes. Commuter rail fatalities are counted under railroad. For transit bus and demand responsive transit accidents, occupant fatalities are counted under "bus" andnonoccupant fatalities are counted under "pedestrians," "pedalcyclists," or other motor vehicle categories.
SOURCES:Air data: National Transportation Safety Board, Internet sitewww.ntsb.gov/aviation, as of April 2000.
Highway data: U.S. Department of Transportation, NationalHighway Traffic Safety Administration, Traffic Safety Facts 1998(DOT HS 808 983) (Washington, DC : October 1999), table 4, andpersonal communication, Oct. 4, 1999.Railroad data: U.S. Federal Railroad Administration, RailroadSafety Statistics, Annual Report 1998 (Washington, DC: July 1999),table 1-1.Transit data: U.S. Department of Transportation, Federal TransitAdministration, Safety Management Information Statistics (Washington,DC: Annual issues).Waterborne transportation: U.S. Department of Transportation,U.S. Coast Guard, Office of Investigations and Analysis,Compliance Analysis Division, (G-MOA-2), personal communica-tion, Apr. 13, 1999.Recreational boating: Ibid., Office of Boating Safety. BoatingStatistics (Washington, DC: Annual issues).Pipeline data: U.S. Department of Transportation, Research andSpecial Programs Administration, Office of Pipeline Safety, andInternet site http://ops.dot.gov as of June 28, 2000.

110"
Chapter 2 Transportation S
afety
1998: Ibid., Internet sitehttp://safetydata.fra.dot.gov/OfficeofSafety, as of May 4, 1999, and May 17, 2000.Property damage: 1970-96: U.S. Department of Transportation, Federal RailroadAdministration, Office of Policy and Program Development, Accident/Incident Bulletin(Washington, DC: Annual issues), table 5.1996-98: Ibid., Internet site http://safetydata.fra.dot.gov, as of Aug. 17, 1999.1999: Ibid., Internet site http://safetydata.fra.dot.gov/objects/bul/99.pdf as of Nov. 28, 2000.
1970 1975 1980 1985 1990 1995 1996 1997 1998 1999Fatalities a1,440 917 833 582 698 579 488 461 431 402Injured persons 3,272 3,860 3,550 2,687 2,407 1,894 1,610 1,540 1,303 1,396Accidents a3,559 12,076 10,612 6,919 5,713 4,633 4,257 3,865 R3,508 3,489
Property damage ($ millions)Railroad vehicles and property N N 6.5 8.7 13.1 10.1 8.8 15.0 14.4 23.0
Table 2-5 Highway-Rail Grade-Crossing Safety and Property Damage Data
a 1970 data are not comparable to later years due to change in reporting system.SOURCES:Fatalities, injuries, accidents: 1970-90: U.S. Department of Transportation, FederalRailroad Administration, Office of Policy and Program Development, Rail-Highway CrossingAccident/Incident and Inventory Bulletin (Washington, DC: Annual issues), tables S and 11.1995: Ibid., Highway-Rail Crossing Accident/Incident and Inventory Bulletin (Washington, DC:Annual issues), tables S, 1, and 11.1997: Ibid., Railroad Safety Statistics Annual Report 1997 (Washington, DC: September 1998).
KEY: N = data do not exist; R = revised

1975 1980 1985 1990 1995 1996 1997 1998 1999Total fatalities 27 19 8 8 7 120 R12 13 5Accident-related 21 14 7 7 6 7 R10 8 3 Air fatalities 0 0 0 0 0 110 0 0 0 Accident-related 0 0 0 0 0 0 0 0 0 Highway fatalities 27 17 8 8 7 8 R12 13 5 Accident-related 21 12 7 7 6 5 R10 8 3 Rail fatalities 0 2 0 0 0 2 0 0 0 Accident-related 0 2 0 0 0 2 0 0 0 Watera fatalities 0 0 0 0 0 0 0 0 0 Accident-related 0 0 0 0 0 0 0 0 0 Otherb fatalities 0 0 0 0 0 0 0 0 0 Accident-related 0 0 0 0 0 0 0 0 0
Total injured persons 648 626 253 423 R400 R1,175 R225 197 267Accident-related 168 47 16 18 18 R864 16 15 13 Air injured persons 5 8 4 39 R33 R33 24 20 13 Accident-related 0 0 0 0 0 0 0 0 0 Highway injured persons 527 493 195 311 296 R216 R156 153 217 Accident-related 156 43 9 9 14 R22 11 11 13 Rail injured persons 99 121 53 73 71 926 45 22 37 Accident-related 12 4 7 9 4 842 5 4 0 Watera injured persons 2 1 0 0 0 0 0 2 0 Accident-related 0 0 0 0 0 0 0 0 0 Otherb injured persons 15 3 1 0 0 0 0 0 0 Accident-related 0 0 0 0 0 0 0 0 0
Total incidents 10,951 15,719 6,019 R8,879 14,743 R13,950 R13,995 15,349 16,881Accident-related 440 486 364 297 R294 R332 R310 316 272 Air incidents 147 223 114 297 R814 R916 R1,027 1,380 1,553 Accident-related 0 0 0 0 0 0 1 1 0 Highway incidents 10,063 14,161 4,752 R7,296 R12,764 R11,917 R11,861 12,968 14,281 Accident-related 330 347 302 249 R244 R289 R257 264 219
Multim
odal !111
Table 2-6 Hazardous Materials Safety and Property Damage Data
KEY: R = revised
Continued next page

112"
Chapter 2 Transportation S
afety Table 2-6
Cont’d Hazardous Materials Safety and Property Damage Data
should be classified as hazardous material-related after tele-phone contact with the carriers submitting incident reports.SOURCES: 1975-85: U.S. Department of Transportation, Research and SpecialPrograms Administration, Office of Hazardous Materials Safety, Hazardous MaterialsInformation System Database, 1999. 1990-99: Ibid., Internet sitehttp://hazmat.dot.gov/10yearfrm.htm, as of May 2, 2000.
a Water category only includes nonbulk marine. Bulk marine hazardous materials incidents are reported to the U.S. Coast Guard and are not included.
b Other category includes freight forwarders and modes not otherwise specified.c Property damage under $30,000 is reported to the nearest $100. Property damage
$30,000 or greater is reported to the nearest $1,000, therefore the total may not equal the sum.
NOTES: Hazardous materials information system database operations were initiated in1971. The Office of Hazardous Materials Safety determines whether fatalities and injuries
KEY: R = revised
1975 1980 1985 1990 1995 1996 1997 1998 1999
Rail incidents 694 1,271 842 1,279 1,153 R1,111 R1,102 990 1,039 Accident-related 109 134 61 48 50 R43 52 51 53 Watera incidents 28 34 7 7 12 6 R5 11 8 Accident-related 0 2 0 0 0 0 0 0 0 Otherb incidents 19 30 304 0 0 0 0 0 0 Accident-related 1 3 1 0 0 0 0 0 0
Total propertydamage (current $ thousands) c 8,090 10,829 22,993 32,353 R30,903 R46,849 R33,394 45,796 31,407Accident-related 6,051 6,236 20,268 24,792 23,516 R37,737 R25,069 36,770 19,406 Air property damage 8.9 12.3 12.3 142 R101 87 R336 267 283 Accident-related 0 0 0 0 0 0 0 0 0 Highway property damage 5,584 7,324 12,690 20,190 R22,144 R29,268 R24,664 28,155 23,213 Accident-related 3,694 3,782 10,175 14,132 16,256 R22,277 R17,730 21,332 13,361 Rail property damage 2,488 2,952 10,274 11,952 8,485 R17,374 R8,355 16,360 7,850 Accident-related 2,357 2,357 10,094 10,660 7,260 15,460 7,339 15,438 6,045 Watera property damage 6.1 505 3.2 70 174 120 R38 1015 61 Accident-related 0 81 0 0 0 0 0 0 0 Otherb property damage 3.5 35 14.4 0 0 0 0 0 0 Accident-related 0.3 15.6 <0.1 0 0 0 0 0 0

Multimodal ! 113
1992 1993 1994 1995 1996 1997 1998FatalitiesHighwayb 1,158 1,243 1,343 1,346 1,346 R1,393 1,431Nonhighwayc 436 392 409 387 374 377 384Aircraft 353 282 426 283 324 261 223Worker struck by vehicled 346 R365 391 388 353 367 413Water vehiclee 109 120 94 87 119 109 112Railwayf 65 86 81 82 74 93 60 Transportation-relatedg 2,484 2,501 2,762 2,587 2,601 R2,605 2,630 Total occupational fatalities 6,217 6,331 6,632 6,275 6,202 R6,238 6,026
% of total occupational fatalitiesHighway 19 20 20 21 22 22 24Nonhighway 7 6 6 6 6 6 6Aircraft 6 4 6 5 5 4 4Worker struck by vehicle 6 6 6 6 6 6 7Water vehicle 2 2 1 1 2 2 2Railway 1 1 1 1 1 1 1 Transportation-related 40 40 42 41 42 42 44
Transportation-Related Occupational Fatalitiesa
a Based on the 1992 Bureau of Labor Statistics, Occupational Injury and Illness Classification Structures.
b Includes collisions between vehicles/mobile equipment moving in the same or opposite directions, such as in an intersection;between moving and standing vehicles/mobile equipment at the side of a roadway; or a vehicle striking a stationary object. Also includes noncollisions, e.g., jack-knifed or overturned vehicle/mobile equipment–no collision; ran off highway–no collision; struck by shifting load; sudden start or stop, not elsewhere classified.
c Refers to farms and industrial premises. Includes collisions between vehicles/mobile equipment; vehicles/mobile equipment striking a stationary object. Also includes noncollisions such as a fall from a moving vehicle/mobile equipment, fall from and struck by vehicle/mobile equipment, overturned vehicle/mobile equipment, and loss of control of vehicle/mobile equipment.
d Includes worker struck by vehicle/mobile equipment in roadway,on side of road, in a parking lot, or nonroad area.
e Includes collisions, explosions, fires, fall from or on ship/boat,and sinking/capsized water vehicles involved in transportation.Does not include fishing boats.
f Includes collisions between railway vehicles, railway vehicle and other vehicle, railway vehicle and other object, and derailment.
g Numbers may not add to totals because transportation categoriesmay include subcategories not shown separately.
NOTES: Percents may not add to totals due to rounding. Theabove categories do not define the types of jobs people had, northe industries in which they worked. The categories define theways in which they died. For example, a sales representative travel-ing for business reasons who is killed in a rail accident would belisted under rail.SOURCE: U.S. Department of Labor, Bureau of Labor Statistics,News: National Census of Fatal Occupational Injuries. Internet sitewww.bls.gov/oshhome.htm, as of May 8, 2000. This document isbased on the U.S. Department of Labor, Bureau of LaborStatistics, Census of Fatal Occupational Injuries (Washington, DC:Annual issues), table 1.
Table 2-7
KEY: R = revised

114 " Chapter 2 Transportation Safety
Modal administration Reporting thresholdFederal Aviation Administration More than $25,000 damage to property other than the
aircraft.
Federal Highway Administration (FHWA) None; each state defines its own threshold and FHWA collects state reports.
Federal Railroad Administration More than $6,600 in damages to railroad on-track equipment, signals, track, track structures, and roadbed for accidents other than at grade crossings. No threshold for grade-crossing accidents.
National Highway Traffic Safety Administration None; property-damage-only crashes are recorded through the General Estimates System, a nationally representative sample of police-reported crashes of all severities.
Federal Transit Administration More than $1,000.
Research and Special Programs Administration More than $50,000 for gas pipelines.More than $50,000 for hazardous liquid pipelines.
U. S. Coast Guard More than $25,000 for commercial vessels.More than $500 for recreational boats.
Reporting Thresholds for Property Damage by U.S. Department of Transportation Modal Administrations
SOURCES:Federal Aviation Administration: U.S. General AccountingOffice, Transportation Safety: Opportunities for Enhancing Safety AcrossModes, T-RCED-94-120 (Washington, DC: February 1994).Federal Highway Administration: U.S. Department ofTransportation, National Highway Traffic Safety Administration,Traffic Safety Facts 1998, DOT HS 808 983 (Washington, DC: 1999);U.S. Department of Transportation, Federal HighwayAdministration, personal communication, 1997.Federal Railroad Administration: U.S. Department ofTransportation, Federal Railroad Administration, Railroad SafetyStatistics Annual Report 1998 (Washington, DC: July 1999).
Federal Transit Administration: U.S. Department ofTransportation, Federal Transit Administration, Safety ManagementInformation Statistics, DOT-FTA-MA-26-5011-00-1 (Washington,DC: 1999).Research and Special Programs Administration: Gas pipeline:49 CFR 191.3 (as of Oct. 1, 1999).Oil pipeline: 49 CFR 195.50 (as of Oct. 1, 1999).U.S. Coast Guard: Commercial shipping: 46 CFR 4.05-1 (as ofOct. 1, 1999).Recreational boating: 33 CFR 173.55 (as of Oct. 1, 1999).
Table 2-8

Section BAir
chapter two

Air !
117
Table 2-9 U.S. Air Carriera Safety Data
KEY: N = data do not exist; P = preliminary; R = revised
Continued next page
1960 1965 1970 1975 1980 1985 1990 1995 1996 1997 1998 1999P
Total fatalities 499 261 146 124 1 526 39 168 380 8 1 12Total seriously injured persons N N 107 81 19 30 29 25 77 39 28 57Total accidents 90 83 55 37 19 21 24 36 38 49 R50 52 Fatal 17 9 8 3 1 7 6 3 5 4 1 2
Aircraft-miles (millions) 1,130 1,536 2,685 2,478 2,924 3,631 4,948 5,654 5,873 R6,692 R6,744 6,793Rates per 100 million aircraft-miles
Fatalities R44.16 R16.99 R5.44 R5.00 0.034 R14.49 0.79 R2.97 R6.47 R0.12 R0.015 0.18 Seriously injured persons N N R3.99 R3.27 0.65 0.83 0.59 0.44 R1.31 0.58 R0.42 0.84 Total accidents R7.96 R5.40 R2.05 R1.49 0.65 0.58 0.49 0.64 0.65 0.73 R0.74 0.77 Fatal R1.50 0.59 0.30 R0.121 0.034 0.19 0.12 0.053 0.085 0.060 0.015 0.029
Aircraft departures(thousands) N N N N 5,479 6,307 8,092 8,457 8,229 R10,314 R10,986 11,636Rates per 100,000 aircraft departures
Fatalities N N N N 0.018 R8.34 0.48 R1.99 R4.62 0.078 R0.0091 0.10 Seriously injured persons N N N N 0.35 0.48 0.36 0.30 0.94 0.38 R0.25 0.49 Total accidents N N N N 0.35 0.33 0.30 0.43 0.46 0.48 R0.46 0.45 Fatal N N N N 0.018 0.11 0.074 0.035 0.061 0.039 R0.0091 0.017
Flight hours (thousands) N 4,691 6,470 5,607 7,067 8,710 12,150 13,505 13,746 R15,838 R16,846 17,428Rates per 100,000 flight hours Fatalities N R5.56 R2.26 R2.21 0.01 R6.04 0.32 R1.24 R2.76 R0.051 R0.0059 0.069 Seriously injured persons N N R1.65 R1.44 0.27 0.34 0.24 0.19 0.56 0.25 0.17 0.33 Total accidents N R1.77 0.85 0.66 0.27 0.24 0.20 0.27 0.28 0.31 R0.0059 0.30 Fatal N 0.19 0.12 0.054 0.014 R0.080 0.049 0.022 0.036 0.025 R0.0059 0.011

118"
Chapter 2 Transportation S
afety
1965-70: Ibid., Calendar Year 1975, NTSB/ARC-77/1 (Washington, DC: January 1977).1975 (all categories except miles): Ibid., Calendar Year 1983, NTSB/ARC-87/01(Washington, DC: February 1987), table 18.1975 (miles): Ibid., Calendar Year 1975, NTSB/ARC-77/1 (Washington, DC: January 1977 ).1980: Ibid., Calendar Year 1981, NTSB/ARC-85/01 (Washington, DC: February 1985),tables 2 and 16.1985-99: National Transportation Safety Board, Internet sitewww.ntsb.gov/aviation/Table5.htm, as of May 8, 2000.Serious injuries: 1970-90: Ibid. Annual Review of Aircraft Accident Data: U.S. Air CarrierOperations (Washington, DC: Annual issues).1995-99: Ibid., Analysis and Data Division, personal communications, Aug. 8, 1996; 1997;Mar. 10, 1999; Mar. 28, 2000.
Table 2-9Cont’d U.S. Air Carriera Safety Data
a Air carriers operating under 14 CFR 121, scheduled and nonscheduled service. Includes all scheduled and nonscheduled service accidents involving all-cargo carriers and commercial operators of large aircraft when those accidents occurred during 14 CFR 121 operations.Since Mar. 20, 1997, 14 CFR 121 includes aircraft with 10 or more seats formerly operated under 14 CFR 135. This change makes it difficult to compare pre-1997 data for 14 CFR 121 and 14 CFR 135 with more recent data.
NOTES: Miles, departures, and flight hours are compiled by the U.S. Department ofTransportation, Federal Aviation Administration. Rates are computed by dividing thenumber of fatalities, serious injuries, total accidents, and fatal accidents by the number ofmiles, departures, or flight hours. These figures are based on information provided by air-lines to the U.S. Department of Transportation, Bureau of Transportation Statistics,Office of Airline Information.SOURCES:Fatalities, accidents, miles, departures, and flight hours: 1960: NationalTransportation Safety Board, Annual Review of Aircraft Accident Data: U.S. Air CarrierOperations, Calendar Year 1967 (Washington, DC: December 1968).

Air !
119
Table 2-10 U.S. Commuter Air Carriera Safety Data
KEY: P = preliminary; R = revised
Continued next page
1980 1985 1990 1991 1992 1993 1994 1995 1996 1997 1998 1999P
Total fatalities 37 37 7 d77 21 24 25 9 14 46 0 12Total seriously injured persons 14 16 11 31 7 2 32 25 2 1 2 2Total accidents 38 18 15 23 e23 16 10 12 11 R16 8 13 Fatal 8 7 4 8 7 4 3 2 1 5 0 5
Aircraft-miles (millions) 192 301 450 434 508 555 594 550 591 R252 R51 42Rates per 100 million aircraft-miles Fatalitiesb 19.27 12.29 1.56 17.74 4.13 4.32 4.21 1.64 2.37 R18.28 0.00 28.57 Seriously injured personsb 7.29 5.32 2.44 7.14 1.38 0.36 5.40 4.55 0.34 R0.40 R3.94 4.76 Total accidentsb,c 19.79 5.98 3.33 5.30 R4.53 2.88 1.68 2.18 1.86 6.37 R15.76 30.95 Fatal b,c 4.17 2.33 0.89 1.84 1.38 0.72 0.51 0.36 0.17 R1.99 0.00 11.90
Aircraft departures (thousands) 1,777 2,561 3,160 2,820 3,115 3,601 3,581 3,220 3,515 R1,394 R707 530Rates per 100 thousand aircraft departures
Fatalitiesb 2.08 1.44 0.22 2.73 0.67 0.67 0.70 0.28 0.40 3.30 0.00 2.26 Seriously injured persons 0.79 0.62 0.35 1.10 0.22 0.06 0.89 0.78 R0.057 R0.072 R0.28 0.38 Total accidentsc 2.14 0.70 0.48 0.82 R0.74 0.44 0.28 0.37 0.31 R1.15 R1.13 2.45 Fatal c 0.45 0.27 0.13 0.28 0.23 0.11 R0.084 R0.062 R0.028 0.36 0.00 0.94
Flight hours (thousands) 1,176 1,737 2,342 2,292 2,335 2,638 2,784 2,628 2,757 983 R354 269Rates per 100 thousand flight hours Fatalities 3.15 2.13 0.30 3.36 0.90 0.91 0.90 0.34 0.51 4.68 0.00 4.46 Seriously injured persons 1.19 0.92 0.47 1.35 0.30 R0.076 1.15 0.95 R0.073 0.10 R0.57 0.74 Total accidentsc 3.23 1.04 0.64 1.00 R0.98 0.61 0.36 0.46 0.40 R1.63 R2.26 4.83 Fatal c 0.68 0.40 0.17 0.35 0.30 0.15 0.11 R0.076 R0.036 0.51 0.00 1.86

120"
Chapter 2 Transportation S
afety
number of fatalities, serious injuries, total accidents, and fatal accidents by the numberof miles, departures, or flight hours. These figures are based on information providedby airlines to the U.S. Department of Transportation, Bureau of TransportationStatistics, Ofiice of Airline Information.SOURCES:Fatalities, accidents, aircraft-miles, aircraft departures and flight hours: 1980:National Transportation Safety Board, Annual Review of Aircraft Accident Data: U.S. AirCarrier Operations, Calendar Year 1980, NTSB/ARC-83/01 (Washington, DC: January1983), tables 26 and 40.1985-99: Ibid., Internet site www.ntsb.gov/aviation/Table 8.htm, as of May 9, 2000.Serious injuries: 1980-94: Ibid., Annual Review of Aircraft Accident Data: U.S. Air CarrierOperations (Washington, DC: Annual issues).1995-99: Ibid., Analysis and Data Division, personal communications, 1996; 1997; 1998;and Mar. 28, 2000.
Table 2-10Cont’d U.S. Commuter Air Carriera Safety Data
a Air carriers operating under 14 CFR 135, scheduled service. Includes accidents involving all-cargo air carriers when those accidents occurred during scheduled 14 CFR 135 operations. Before March 20, 1997, 14 CFR 135 applied to aircraft with 30 or fewer seats.Since Mar. 20, 1997, 14 CFR 135 includes only aircraft with fewer than 10 seats. This change makes it difficult to compare pre-1997 data with more recent data.
bData updated by rounding to two significant digits instead of one.c Rates are based on all accidents, including some that involve operators not reporting mileage or other traffic data to the U.S. Department of Transportation
dTotal fatalities for 1991 do not include the 22 persons killed aboard an airliner when it and a commuter aircraft collided.
e An attempted suicide case in 1992 is included in accidents but excluded in accident rates in this table.
NOTES: Miles, departures, and hours are compiled by the U.S. Department ofTransportation, Federal Aviation Administration. Rates are computed by dividing the

Air ! 121
U.S. Air Carriera Fatal Accidents by First Phase of Operationb
a 14 CFR 121, scheduled operations. Before Mar. 20, 1997, 14 CFR 121 applied only to aircrft with more than 30 seats or a maximum payload capacity of more than 7,500 pounds. Since Mar. 20, 1997, 14 CFR 121 includes aircraft with 10 or more seats that formerly operated under 14 CFR 135. This change makes it difficult to compare pre-1997 data with more recent data.
b First phase of operation is the phase of flight in which the first occurrence leading to the accident happened.
c Includes instructional flights performing turns and agricultural flights for spraying and buzzing (repeated passes over a particular location).
SOURCES: 1990-95: National Transportation Safety Board,Annual Review of Aircraft Accident Data: U.S. Air Carrier Operations(Washington, DC: Annual issues), table 18.1996-97: Ibid., personal communication, Mar. 10, 1999 andMar. 28, 2000.
Table 2-11
1990 1991 1992 1993 1994 1995 1996 1997 1998 1999Phase of operation Approach/descent/landing 0 3 5 1 2 0 1 2 0 0Taxi/takeoff/climb 0 0 1 1 0 1 0 1 0 2Cruise (in flight) 3 2 1 1 1 0 0 0 0 3Standing (static) 0 1 0 1 0 0 0 0 0 0Maneuveringb 1 1 0 0 0 1 0 2 0 0Other/not reported 0 1 0 0 0 0 0 0 0 0 Total fatal accidents 4 8 7 4 3 2 1 5 0 5
U.S. Commuter Air Carriera Fatal Accidents by First Phase of Operation
a 14 CFR 135, scheduled operations. Before Mar. 20, 1997, 14 CFR applied to aircraft with 30 or fewer seats. Since Mar. 20,1997, 14 CFR 135 includes only aircraft with fewer than 10 seats. This change makes it difficult to compare pre-1997 data with more recent data.
b Includes instructional flights performing turns and agricultural flights for spraying and buzzing (repeated passes over a particular location).
SOURCES: 1990-95: National Transportation Safety Board,Annual Review of Aircraft Accident Data: U.S. Air Carrier Operations(Washington, DC: Annual issues), table 36.1996-99: Ibid., personal communication, Mar. 10, 1999 andMar. 28, 2000.
Table 2-12
1990 1991 1992 1993 1994 1995 1996 1997 1998 1999Phase of operationApproach/descent/landing 1 2 1 0 2 2 0 0 0 1Taxi/takeoff/climb 3 1 2 0 1 0 3 2 0 0Cruise (inflight) 1 0 0 0 0 0 1 1 0 0Standing (static) 1 1 1 1 0 0 0 1 1 1Maneuveringc 0 0 0 0 1 0 0 0 0 0Other/not reported 0 0 0 0 0 1 1 0 0 0 Total fatal accidents 6 4 4 1 4 3 5 4 1 2

122 " Chapter 2 Transportation Safety
1975 1980 1985 1990 1995 1996 1997 1998 1999P
Total fatalities 69 105 76 51 52 63 39 R48 38Total seriously injured persons N 43 41 36 14 20 23 R10 14Total accidents 152 171 157 107 75 90 82 R77 76 Fatal 24 46 35 29 24 29 15 R18 12Flight hours (thousands) 2,526 3,618 2,570 2,249 1,707 2,029 2,250 2,538 2,809
Rates per 100,000 flight hoursb
FatalitiesR 2.73 2.90 2.96 2.27 3.05 3.10 1.73 R1.89 1.35 Seriously injured personsR N 1.19 1.60 1.60 0.82 0.99 1.02 0.39 0.50 Total accidentsR 6.02 4.73 6.11 4.76 4.39 4.44 3.64 R3.03 2.71
FatalR 0.95 1.27 1.36 1.29 1.41 1.43 0.67 R0.71 0.43
U.S. On-Demand Air Taxia Safety Data
a Air carriers operating under 14 CFR 135, nonscheduled service.Accidents on foreign soil and in foreign waters are excluded.
b Rates are computed by dividing the number of fatalities, serious injuries, total accidents, and fatal accidents by the number offlight hours.
NOTE: Hours are estimated by the U.S. Department ofTransportation, Federal Aviation Administration.SOURCES:Fatalities, accidents and flight hours: 1975-80: NationalTransportation Safety Board, Annual Review of Aircraft AccidentData: U.S. Air Carrier Operations, Calendar Year 1981, NTSB/ARC-85/01 (Washington, DC: February 1985), table 61.
Table 2-13
1985-99: Ibid., Internet site www.ntsb.gov/aviation/Table9.htm, asof May 10, 2000.Serious injuries: 1980-90: Ibid., Annual Review of Aircraft AccidentData: U.S. Air Carrier Operations (Washington, DC: Annual issues).1995-99: Ibid., Analysis and Data Division, personal communica-tions, 1996; 1997; 1998; and Mar. 28, 2000.
KEY: N = data do not exist; P = preliminary; R = revised

Air !
123
SOURCES:Fatalities, accidents, and flight-hours: 1960-70: National Transportation SafetyBoard, Annual Review of Aircraft Accident Data: U.S. General Aviation, Calendar Year 1970,NTSB/ARG-74/1 (Washington, DC: April 1974), table 117.1975-80: Ibid., Annual Review of Aircraft Accident Data: General Aviation, Calendar Year1985, NTSB/ARG-87/03 (Washington, DC: October 1987), table 21.1985-99: Ibid., Internet site www.ntsb.gov/aviation/Table10.htm, as of May 10, 2000.Serious injuries: 1970-95: National Transportation Safety Board, Annual Review ofAircraft Accident Data: General Aviation (Washington, DC: Annual issues).1995-99: Ibid., Analysis and Data Division, personal communications, 1996; 1997; 1998;and Mar. 28, 2000.
Table 2-14 U.S. General Aviationa Safety Data
a U.S. registered civil aircraft not operated under 14 CFR 121 or 14 CFR 135. Accidents on foreign soil and in foreign waters are excluded. Suicide/sabotage cases included in accidents and fatalities but excluded from accident rates in this table are: 1985 (3 accidents, 2 fatal accidents); 1990 (1,0); 1995 (4,3).
b Since April 1995, the National Transportation Safety Board has been required by law to investigate all public-use accidents, increasing the number of NTSB reported general aviation accidents by approximately 1.75%.
c Rates are computed by dividing the number of fatalities, serious injuries, total accidents,and fatal accidents by the number of flight hours.
d Data for 1960, 1965, and 1970 include air taxi.NOTE: Flight hours are estimated by the U.S. Department of Transportation, FederalAviation Administration.
KEY: N = data do not exist; P = preliminary; R = revised
1960d 1965d 1970d 1975 1980 1985 1990 1995 1996 1997 1998 1999P
Total fatalities 787 1,029 1,310 1,252 1,239 956 767 734 632 R643 R623 628Total seriously injured persons N N 715 769 681 483 402 395 359 365 R330 325Total accidentsb 4,793 5,196 4,712 3,995 3,590 2,739 2,215 2,053 R1,908 R1,853 R1,909 1,908 Fatal 429 538 641 633 618 498 443 412 360 R353 R365 342Flight hours (thousands) 13,121 16,733 26,030 28,799 36,402 28,322 28,510 24,906 24,881 R25,464 26,796 27,080
Rates per 100,000 flight hoursc
Fatalities 6.00 6.15 5.03 4.35 3.40 3.38 2.69 R2.95 2.54 R2.53 R1.95 2.32 Seriously injured persons N N 2.75 2.67 1.87 1.71 1.41 R1.59 1.44 1.43 R1.23 1.2 Total accidents 36.53 R31.05 R18.10 R13.87 R9.86 R9.66 R7.77 R8.23 R7.67 R7.28 R7.12 7.05
Fatal 3.27 3.22 2.46 2.20 R1.70 R1.75 1.55 1.64 1.45 R1.39 R1.36 1.26

124"
Chapter 2 Transportation S
afety
121 includes aircraft with 10 or moreseats that formerly operated under 14 CFR 135. This change makes it difficult to compare pre-1997 data with more recent data.
NOTE: Includes air carriers, general aviation, military, and other aircraft involved inpublic-use operations.SOURCES: U.S. Department of Transportation, Federal Aviation Administration,Aviation Safety Statistical Handbook Annual Report (Washington, DC: Annual issues).NMAC involving 121 aircraft: Ibid., Air Traffic Resource Management, personal com-munications, Mar. 18, 1999 and May 22, 2000.
Table 2-15 Number of Pilot-Reported Near Midair Collisions (NMAC) by Degree of Hazard
a A situation where collision avoidance was due to chance, rather than an act on the part of the pilot. Less than 100 feet of aircraft separation would be considered critical.
b An incident that would probably have resulted in a collision if no action had been taken by either pilot. Less than 500 feet would usually be required in this case.
c When direction and altitude would have made a midair collision improbable, regardless of evasive action taken.
d No determination could be made, either due to insufficient evidence or unusual circumstances.e Incidents that are still under investigation.f Before Mar. 20, 1997, 14 CFR 121 applied only to aircraft with more than 30 seats or a maximum payload capacity of more than 7,500 pounds. Since Mar. 20, 1997, 14 CFR
KEY: R = reversed; U = data are not available
1980 1985 1990 1991 1992 1993 1994 1995 1996 1997 1998R 1999Degree of hazardCriticala 118 180 74 52 46 35 47 32 26 31 22 24Potentialb 319 423 266 197 195 158 139 139 101 105 97 100No hazardc 122 133 114 99 70 61 71 63 55 70 52 55Unclassifiedd 9 22 0 0 0 0 0 0 0 0 0 0Opene 0 0 0 0 0 0 18 4 12 30 37 73 Total 568 758 454 348 311 254 275 238 194 236 208 252
NMAC involving aircraft operating under 14 CFR 121f U U 121 101 72 60 63 43 49 81 64 63

Air !
125
Aviation Security Program, July1-December 31, 1985 (Washington, DC: May 1986).1990-99: Ibid., Office of Civil Aviation Security Policy and Planning, Annual Report toCongress on Civil Aviation Security (Washington, DC: Annual issues), and personal commu-nications, May 27, 1999 and Mar. 29, 2000.Bomb threats received: Ibid., Criminal Acts Against Civil Aviation (Washington, DC:Annual issues).
Table 2-16 Airlinea Passenger Screening Results by Type of Weapons Detected, Persons Arrested, and Bomb Threats Received
a Includes operators with a U.S. Department of Transportation, Federal Aviation Administration operating certificate engaged in scheduled passenger or public charter passenger operations and airports at which these operations are conducted.
b In 1980 and 1985, the "Other" category was included with firearms; in 1990, "Other" became "Other Dangerous Articles."
SOURCES:Persons screened and persons arrested: 1980-85: U.S. Department of Transportation,Federal Aviation Administration, Semiannual Report to Congress on the Effectiveness of the Civil
KEY: N = data do not exist; U = data are not available
1980 1985 1990 1991 1992 1993 1994 1995 1996 1997 1998 1999Persons screened (millions) 585 993 1,145 1,015 1,111 1,150 1,261 1,263 1,497 1,660 1,903 1,754Type of weapon detectedFirearms Handguns 1,878 2,823 2,490 1,597 2,503 2,707 2,860 2,230 1,999 1,905 1,401 1,421 Long guns 36 90 59 47 105 91 134 160 156 162 114 131 Total 1,914 2,913 2,843 1,644 2,608 2,798 2,994 2,390 2,155 2,067 1,515 1,552
Other/other dangerous articlesb 108 74 304 275 N N N N N N N NExplosive/incendiary devices 8 12 15 94 167 251 N N N N N N
Persons arrestedCarrying firearms/explosives 1,031 1,310 1,336 893 1,282 1,354 1,433 1,194 999 924 660 633Giving false information 32 42 18 28 13 31 35 68 131 72 86 58
Bomb threats receivedAgainst airports 1,179 477 448 498 188 304 250 346 N U U UAgainst aircraft 268 153 338 388 215 248 218 327 N U U U

Section CHighway
chapter two

Highw
ay !129
Crashes: Ibid., table 1.Vehicle-miles: 1960-65: U.S. Department of Transportation, Federal HighwayAdministration, Highway Statistics Summary to 1995, FHWA-PL-97-009 (Washington, DC:July 1997), table VM-201A.1970-98: Ibid., Highway Statistics (Washington, DC: Annual issues), table VM-1.1999: Ibid., Early Assessment of 1999 Crashes, Injuries, and Fatalities (Washington, DC:2000).Fatality and injury rates: 1960-98: U.S. Department of Transportation, NationalHighway Traffic Safety Administration, Traffic Safety Facts 1998 DOT HS 808 983(Washington, DC: October 1999), table 2.1999: Calculated by U.S. Department of Transportation, Bureau of TransportationStatistics.Crash rates: Calculated by U.S. Department of Transportation, Bureau ofTransportation Statistics.
Table 2-17 Motor Vehicle Safety Data
SOURCES:Fatalities: 1960-70: Estimated by U.S. Department of Transportation, National HighwayTraffic Safety Administration from data supplied by U.S. Department of Health andHuman Services, National Center for Health Statistics, and individual state accidentreports (adjusted to 30-day deaths). Fatalities data prior to 1975 have been adjusted toreflect the Fatality Analysis Reporting System's definition of a fatal crash as one thatinvolves a motor vehicle on a trafficway, which results in the death of a vehicle occupantor a nonmotorist within 30 days of the crash.1975-1998: U.S. Department of Transportation, National Highway Traffic SafetyAdministration, Traffic Safety Facts 1998, DOT HS 808 983 (Washington, DC: October1999), table 2.1999: Ibid., National Center for Statistics and Analysis, Fatality Analysis Reporting System(FARS) Database and General Estimates System Database, personal communication,Sept. 8, 2000.Injured persons: Ibid.
KEY: N = data do not exist; R = revised
1960 1965 1970 1975 1980 1985 1990 1995 1996 1997 1998 1999Fatalities 36,399 47,089 52,627 44,525 51,091 43,825 44,599 41,817 42,065 42,013 41,501 41,611Injured persons N N N N N N 3,231,000 3,465,000 R3,483,000 3,348,000 3,192,000 3,236,000Crashes N N N N N N 6,471,000 6,699,000 R6,770,000 6,624,000 R6,335,000 6,279,000Vehicle-miles (billions) 719 888 1,110 1,328 1,527 1,775 2,144 2,423 2,486 R2,562 R2,632 2,691
Rates per 100 million vehicle-miles Fatalities 5.1 5.3 4.7 3.4 3.3 2.5 2.1 1.7 1.7 1.6 R1.6 1.5 Injured persons N N N N N N 151 143 140 R131 R122 120 Crashes N N N N N N 302 277 272 R259 R241 233

130"
Chapter 2 Transportation S
afety Table 2-18 Motor Vehicle Fatalities, Vehicle-Miles, and Associated Rates by Highway Functional System
Continued next page
1980 1985 1990 1995 1996 1997 1998Fatalities
Rural 29,545 24,492 25,786 23,978 24,510 24,811 24,751Interstate 2,263 2,141 2,707 2,675 2,905 3,040 3,105Other arterial 12,268 9,940 9,893 9,947 9,458 9,678 9,594Collector 10,004 8,209 8,852 7,401 7,481 7,643 7,593Local 5,010 4,202 4,334 3,955 4,666 4,450 4,459
Urban 21,546 19,333 18,813 17,839 17,555 16,758 16,143Interstate 2,184 2,025 2,252 2,154 2,323 2,292 2,283Other arterial 12,752 12,521 11,742 10,916 10,756 10,239 9,902Collector 2,226 1,696 1,427 1,441 1,290 1,163 1,037Local 4,384 3,091 3,392 3,328 3,186 3,064 2,921
VMT (millions)Rural 672,030 730,728 868,878 933,289 960,194 1,001,350 1,033,457
Interstate 135,084 154,357 200,173 223,382 232,565 240,255 251,520Other arterial 262,774 282,803 330,866 368,595 378,847 392,058 403,484Collector 189,468 206,669 240,460 236,148 241,030 254,364 257,858Local 84,704 86,899 97,379 105,164 107,752 114,673 120,595
Urban 855,265 1,044,098 1,275,484 1,489,534 1,523,886 1,560,345 1,598,065Interstate 161,242 216,188 278,901 341,528 351,579 361,401 374,622Other arterial 484,189 578,270 699,233 815,170 834,623 846,659 862,994Collector 83,043 89,578 106,297 126,929 129,310 130,143 131,919Local 126,791 160,062 191,053 205,907 208,374 222,142 228,530

Highw
ay !131
Vehicle miles: 1980-94: U.S. Department of Transportation, Federal HighwayAdministration, Highway Statistics Summary to 1995, FHWA-PL-97-009 (Washington, DC:July 1997), table VM-202.1995-98: Ibid., Highway Statistics, Internet site www.fhwa.dot.gov/ohim/ohimstat.htm, asof Oct. 25, 2000, tables VM-2 and VM-2a.Fatality rates: Calculated by the U.S. Department of Transportation, Bureau ofTransportation Statistics.
Table 2-18Cont’d Motor Vehicle Fatalities, Vehicle-Miles, and Associated Rates by Highway Functional System
NOTES: Includes the 50 states and the District of Columbia. Fatality figures reflectoriginal figures received by FHWA from NHTSA, and, when totaled, differ slightly fromthe revised NHTSA figures that appear in other tables in this volume. VMT data arebased on revised estimates from state highway agencies for the various functional systemsand, when totaled, differ from the figures in the vehicle-miles table in chapter 1, whichhave not been revised by FHWA as of Oct. 25, 2000.SOURCES:Fatalities: 1980-95: U.S. Department of Transportation, Federal Highway Administration,Highway Statistics Summary to 1995, Internet site www.fhwa.dot.gov/ohim/ohimstat.htm, asof Oct. 25, 2000.1996-97: Ibid., Highway Statistics, Internet site www.fhwa.dot.gov/ohim/ohimstat.htm, asof Oct. 25, 2000, table FI-1.1998: Ibid., table FI-20.
1980 1985 1990 1995 1996 1997 1998Fatality rates per 100 million vehicle miles
Rural 4.40 3.35 2.97 2.57 2.55 2.48 2.39Interstate 1.68 1.39 1.35 1.20 1.25 1.27 1.23Other arterial 4.67 3.51 2.99 2.70 2.50 2.47 2.38Collector 5.28 3.97 3.68 3.13 3.10 3.00 2.94Local 5.91 4.84 4.45 3.76 4.33 3.88 3.70
Urban 2.52 1.85 1.47 1.20 1.15 1.07 1.01Interstate 1.35 0.94 0.81 0.63 0.66 0.63 0.61Other arterial 2.63 2.17 1.68 1.34 1.29 1.21 1.15Collector 2.68 1.89 1.34 1.14 1.00 0.89 0.79Local 3.46 1.93 1.78 1.62 1.53 1.38 1.28

1975 1980 1985 1990 1995 1996 1997 1998R 1999Occupant fatalities by vehicle type
Passenger carSubcompacta 3,834 7,299 7,993 8,309 6,791 6,618 6,220 5,514 4,930 Compact 614 927 2,635 5,310 6,899 7,288 7,195 6,804 6,967 Intermediate 1,869 3,878 4,391 4,849 4,666 4,670 4,794 4,617 4,743 Fullb 10,800 11,580 6,586 4,635 3,413 3,417 3,481 3,106 2,908 Unknown 8,812 3,765 1,607 989 654 512 509 1,153 1,270 Total 25,929 27,449 23,212 24,092 22,423 22,505 22,199 21,194 20,818
TruckLight 4,856 7,486 6,689 8,601 9,568 9,932 10,249 10,705 11,243 Large 961 1,262 977 705 648 621 723 742 758 Total 5,817 8,748 7,666 9,306 10,216 10,553 10,972 11,447 12,001
Other vehiclesMotorcycle 3,189 5,144 4,564 3,244 2,227 2,161 2,116 2,294 2,472 Bus 53 46 57 32 33 21 18 38 58 Other/unknown vehicle type 937 540 544 460 392 455 420 409 457 Total 4,179 5,730 5,165 3,736 2,652 2,637 2,554 2,741 2,987
TOTAL vehicle occupant fatalities 35,925 41,927 36,043 37,134 35,291 35,695 34,725 35,382 35,806
Nonoccupant fatalitiesPedestrian 7,516 8,070 6,808 6,482 5,584 5,449 5,321 5,228 4,906 Pedalcyclist 1,003 965 890 859 833 765 814 760 750 Other 81 129 84 124 109 154 153 131 149 Total nonoccupant fatalities 8,600 9,164 7,782 7,465 6,526 6,368 6,288 6,119 5,805
TOTAL traffic fatalities 44,525 51,091 43,825 44,599 41,817 d42,065 42,013 41,501 41,611
c
132"
Chapter 2 Transportation S
afety
SOURCE: U.S. Department of Transportation, NationalHighway Traffic Safety Administration, Traffic Safety Facts 1998, DOT HS 808 983(Washington, DC: October 1999), table 4, and personal communication, Sept.11, 2000.Breakout of passenger car types: Ibid., National Center for Statistics and Analysis,Fatality Analysis Reporting System Database, 1998.
Table 2-19 Occupant Fatalities by Vehicle Type and Nonoccupant Fatalities
a Includes minicompact cars (wheelbase under 95 inches) and subcompact cars (wheelbasebetween 95 and 99 inches).
b Includes cars with a wheelbase of 110 inches or greater.c See table 2-23 for definitions of light and large trucks.d Includes 2 fatalities that could not be assigned to a category above.
KEY: R = revised

Highw
ay !133
SOURCE: U.S. Department ofTransportation, National Highway Traffic Safety Administration, National Center forStatistics and Analysis, Fatality Analysis Reporting System (FARS) Database query,Internet site http://www-fars.nhtsa.dot.gov/www/query.html, as of July 27, 2000.
Table 2-20 Occupant and Non-Motorist Fatalities in Crashes by Number of Vehicles and Alcohol Involvement
NOTE: Alcohol involvement pertains to either or both drivers in two-vehicle crashesand in the case of pedestrians or pedalcyclists killed in single-vehicle crashes, either themotor vehicle driver and/or the pedestrian or pedalcyclist. Alcohol results are determinedfrom positive blood alcohol concentration (BAC) tests and police-reported alcoholinvolvement.
KEY: AI = Alcohol involvement; Fatal = Fatalities
Fatal AI Fatal AI Fatal AI Fatal AI Fatal AI Fatal AITotal Fatalities 43,825 22,715 44,599 22,085 41,508 19,887 39,250 17,859 40,150 17,473 40,716 16,580
Occupants 36,043 18,791 37,134 18,442 34,740 16,588 32,880 14,814 33,574 14,404 34,318 13,746Single-vehicle crashes 17,130 10,706 18,159 11,000 17,280 10,086 15,958 8,844 15,932 8,564 15,997 8,084Two-vehicle crashes 16,467 7,065 16,262 6,429 15,025 5,674 14,449 5,116 15,161 4,998 15,664 4,889More than two-vehicle crashes 2,446 1,021 2,713 1,013 2,435 828 2,473 854 2,481 842 2,657 773
Non-motorists 7,782 3,924 7,465 3,643 6,768 3,299 6,370 3,045 6,576 3,069 6,398 2,834Pedestrians 6,808 3,584 6,482 3,258 5,801 2,933 5,549 2,756 5,649 2,741 5,489 2,541
Single-vehicle crashes 6,342 3,297 5,990 2,971 5,302 2,643 5,099 2,494 5,180 2,477 5,027 2,286Multiple-vehicle crashes 466 287 492 287 499 290 450 261 469 263 462 254
Pedalcyclists 890 303 859 332 843 319 723 250 816 295 802 266Single-vehicle crashes 864 291 832 319 815 310 690 234 792 280 781 258Multiple-vehicle crashes 26 12 27 13 28 9 33 15 24 16 21 8
Others/unknown 84 37 124 53 124 47 98 39 111 33 107 27
1985 1990 1991 199419931992
Total Fatalities
OccupantsSingle-vehicle crashesTwo-vehicle crashesMore than two-vehicle crashes
Non-motoristsPedestrians
Single-vehicle crashesMultiple-vehicle crashes
PedalcyclistsSingle-vehicle crashesMultiple-vehicle crashes
Others/unknown
Fatal AI
41,817 17,247
35,291 14,28016,732 8,64315,744 4,7942,815 843
6,526 2,9675,584 2,6275,111 2,395
474 232833 303807 29226 11
109 37
1995Fatal AI
42,065 17,217
35,695 14,26416,723 8,57215,935 4,8133,037 878
6,370 2,9535,449 2,6155,024 2,389
425 227765 278739 26826 11
156 60
1996Fatal AI
42,013 16,190
35,725 13,48316,529 8,03216,218 4,6372,978 814
6,288 2,7075,321 2,3844,876 2,151
445 233814 268788 25926 8
153 55
1997Fatal AI
41,501 16,020
35,382 13,28116,666 8,15315,742 4,3632,974 766
6,119 2,7395,228 2,4294,801 2,203
427 226760 263736 25424 9
131 47
1998Fatal AI
41,611 15,786
35,806 13,14517,052 8,16315,690 4,2043,064 778
5,805 2,6424,906 2,3254,488 2,090
418 235750 286714 26736 19
149 31
1999

134"
Chapter 2 Transportation S
afety SOURCES:Fatalities, injuries, vehicle miles, fatality and injury rates: U.S. Department ofTransportation, National Highway Traffic Safety Administration, Traffic Safety Facts 1998,DOT HS 808 983 (Washington, DC: October 1999), table 7 and personal communica-tion, Sept. 11, 2000.Crashes: U.S. Department of Transportation, National Highway Traffic SafetyAdministration, National Center for Statistics and Analysis, Fatality Analysis ReportingSystem Database and General Estimates System Database, 1998.Crash rates: Calculated by U.S. Department of Transportation, Bureau ofTransportation Statistics by dividing the number of crashes by the vehicle-miles traveled.
1975 1980 1985 1990 1995 1996 1997 1998 1999
Fatalities 25,929 27,449 23,212 24,092 22,423 22,505 22,199 R21,194 20,818
Injured persons N N N 2,376,000 2,469,000 2,458,000 2,341,000 2,201,000 2,138,000
Crashes N N N 5,560,000 5,523,000 5,599,000 5,537,000 5,146,000 4,916,000
Vehicle-miles (billions) 1,030 1,107 1,249 1,427 1,478 1,499 1,528 1,552 1,567
Rates per 100 million vehicle-miles
Fatalities 2.5 2.5 1.9 1.7 1.5 1.5 1.4 1.4 1.3
Injured persons N N N 167 167 164 153 141 136
Crashes N N N 390 374 R373 R362 331 313
Table 2-21 Passenger Car Occupant Safety Data
NOTES: The injury and crash data in this table are from the U.S. Department ofTransportation (USDOT), National Highway Traffic Safety Administration's (NHTSA)General Estimates System (GES). The data from GES, which began operation in 1988, areobtained from a nationally representative probability sample selected from all police-report-ed crashes. The GES sample includes only crashes where a police accident report wascompleted and the crash resulted in property damage, injury, or death. The resulting fig-ures do not take into account crashes that were not reported to the police or that did notresult in property damage. The 1993 National Transportation Statistics (NTS) HistoricalCompendium and earlier editions illustrated crashes and injury figures estimated by theNational Safety Council, which used a different set of methods to arrive at its figures.Thus, the injury and crash figures in this edition of NTS may not be comparable withthose found in earlier editions. USDOT, Bureau of Transportation Statistics rounded vehi-cle-miles to the nearest billion. Vehicle-miles in this table and in table 2-23 are taken fromNHTSA revised data and are not based exclusively on USDOT, Federal HighwayAdministration (FHWA) data. The change was made to reflect the different vehicle classifi-cation schemes used by FHWA. and NHTSA. Thus, vehicle-miles for passenger cars, andlight and large trucks in this table and table 2-23 should not be compared with vehicle-miles in chapter 1, which are taken directly from FHWA.
KEY: N = data do not exist; R = revised

Highway ! 135
1990 1991 1992 1993 1994 1995 1996 1997 1998R 1999Fatalities 3,244 2,806 2,395 2,449 2,320 2,227 2,161 2,116 2,294 2,472
Injured persons 84,000 80,000 65,000 59,000 57,000 57,000 55,000 53,000 49,000 50,000
Crashes 103,000 106,000 72,000 72,000 67,000 63,000 66,000 61,000 54,000 57,000
Vehicle-miles (billions) 9.6 9.2 9.6 9.9 10.2 9.8 9.9 10.1 10.3 10.6
Rates per 100 million vehicle-miles a
Fatalities 34 31 25 25 23 23 22 21 22 23Injured persons 882 876 681 600 561 587 562 534 476 472CrashesR 1,078 1,155 753 727 654 643 675 604 524 538
Motorcycle Rider Safety Data
a U.S. Department of Transportation (USDOT), National HighwayTraffic Safety Administration (NHTSA) rounds its injury and crash data to the nearest thousand before publishing them, but it calculates injury rates using the unrounded data. NHTSA also calculates fatality and injury rates using vehicle-miles expressed toa higher level of precision than shown here. USDOT, Bureau ofTransportation Statistics rounded vehicle-miles to the nearest 100million in this table.
NOTE: The injury and crash data in this table are from NHTSA'sGeneral Estimates System (GES). The data from the GES, whichbegan operation in 1988, are obtained from a nationally representa-tive probability sample selected from all police-reported crashes.The GES sample includes only crashes where a police accidentreport was completed and the crash resulted in property damage,injury, or death. The resulting figures do not take into accountcrashes that were not reported to the police or that did not result inproperty damage. The 1993 National Transportation Statistics (NTS)Historical Compendium and earlier editions illustrated crashes and injury
figures estimatedby the National Safety Council, which used a different set ofmethods to arrive at its figures. Thus, the injury and crash figuresin this edition of NTS may not be comparable with those found inthe Compendium and earlier editions.SOURCES:Fatalities, injuries, and vehicle-miles: U.S. Department ofTransportation, National Highway Traffic Safety Administration,National Center for Statistics and Analysis, Traffic Safety Facts 1998,DOT HS 808 983 (Washington, DC: October, 1999), table 10, andpersonal communication, Sept. 11, 2000.Crashes: Fatality Analysis Reporting System and GeneralEstimates System, personal communications, Feb. 2, 1999, andSept. 11, 2000.
Table 2-22
KEY: R = revised; U = data are not available

136"
Chapter 2 Transportation S
afety Table 2-23 Truck Occupant Safety Data
KEY: N = data do not exist; R = revised; U = data are not available
Continued next page
1975 1980 1985 1990 1995 1996 1997 1998R 1999FatalitiesLight 4,856 7,486 6,689 8,601 9,568 9,932 10,249 10,705 11,243 Large 961 1,262 977 705 648 621 723 742 758 Total 5,817 8,748 7,666 9,306 10,216 10,553 10,972 11,447 12,001
Injured personsLight N N N 505,000 722,000 761,000 755,000 763,000 847,000 Large N N N 42,000 30,000 33,000 31,000 29,000 33,000 Total N N N 547,000 752,000 794,000 786,000 792,000 880,000
CrashesLight N N N 2,152,000 2,709,000 2,881,000 2,901,000 2,866,000 3,080,000 Large N N N 372,000 362,000 378,000 421,000 392,000 452,000 Total N N N 2,524,000 3,071,000 3,175,000 3,225,000 3,258,000 3,532,000
Vehicle-miles (billions)Light 204 295 389 556 750 787 824 860 ULarge 81 108 124 146 178 183 191 196 U
Rates per 100 million vehicle-miles
FatalitiesLight 2.4 2.5 1.7 1.5 1.3 1.3 1.2 1.2 1.2Large 1.2 1.2 0.8 0.5 0.4 0.3 0.4 0.4 0.4
Injured personsLight N N N 91 96 98 93 89 94Large N N N 29 17 18 16 15 17
CrashesLight N N N 387 361 366 352 333 ULarge N N N 255 203 207 220 200 U

Highw
ay !137
have been in earlier reports. The change was made to reflect the different vehicle classi-fication schemes used by FHWA and NHTSA. Thus, vehicle-miles for passenger carsand light and large trucks in table 3-19 and this table should not be compared with vehi-cle-miles in Chapter 1, which are taken directly from FHWA.SOURCES:Fatalities, injuries, vehicle-miles, fatality and injury rates: U.S. Department ofTransportation, National Highway Traffic Safety Administration, Traffic Safety Facts 1998,DOT HS 808 983 (Washington, DC: October 1999), tables 8 and 9, and personal com-munication, Sept. 11, 2000.Crashes: Ibid., National Center for Statistics and Analysis, Fatality Analysis ReportingSystem Database and General Estimates System Database, 1998, and personal commu-nication, Sept. 11, 2000.Crash rates: Calculated by the U.S. Department of Transportation, Bureau ofTransportation Statistics.
Table 2-23Cont’d Truck Occupant Safety Data
NOTES: Large trucks–trucks over 10,000 pounds gross vehicle weight rating, includingsingle-unit trucks and truck tractors. Light trucks--trucks of 10,000 pounds gross vehicleweight rating or less, including pickups, vans, truck-based stationwagons, and utility vehi-cles. The injury and crash data in this table are from the U.S. Department ofTransportation (USDOT), National Highway Traffic Safety Administration's (NHTSA)General Estimates System (GES). The data from GES, which began operation in 1988,are obtained from a nationally representative probability sample selected from all police-reported crashes. The GES sample includes only crashes where a police accident reportwas completed and the crash resulted in property damage, injury, or death. The resultingfigures do not take into account crashes that were not reported to the police or that didnot result in property damage. The 1993 National Transportation Statistics (NTS) HistoricalCompendium and earlier editions illustrated crashes and injury figures estimated by theNational Safety Council, which used a different set of methods to arrive at its figures.Thus, the injury and crash figures in this edition of NTS may not be comparable withthose found in the Compendium and earlier editions.USDOT, Bureau of Transportation Statistics rounded vehicle-miles to the nearest billion.Vehicle-miles in this table and in table 3-19 are taken from NHTSA revised data and arenot based exclusively on USDOT, Federal Highway Administration (FHWA) data, as they

138 " Chapter 2 Transportation Safety
1975 1980 1985 1990 1995 1996 1997 1998R 1999Fatalities 53 46 57 32 33 21 18 38 58Injured persons N N N 33,000 19,000 20,000 17,000 16,000 22,000Crashes N N N 60,000 58,000 57,000 R54,000 53,000 63,000Vehicle-miles (billions) 6.1 6.1 4.5 5.7 6.4 6.5 6.8 7.0 7.4
Rates per 100 million vehicle-miles b
Fatalities 0.9 0.8 1.3 0.6 0.5 0.3 0.3 0.5 0.8Injured persons N N N 576 298 305 R250 229 297Crashes N N N 1,048 909 869 R794 757 851
Bus Occupant Safety Dataa
a Bus includes school, transit, and intercity buses.b The U.S. Department of Transportation(USDOT), National
Highway Traffic Safety Administration(NHTSA) rounds its injury and crash data to the nearest thousand, but injury and crash rates are calculated using the unrounded data. NHTSA also calculates fatality, injury, and crash rates using vehicle-miles expressed to a higher level of precision than shown here. Thus,injury and crash rates shown in this table may differ slightly from the rates that would be calculated from the data in this table. USDOT, Bureau of Transportation Statistics has rounded vehicle-miles to the nearest 100 million in this table.
NOTES: The injury and crash data in this table are from the U.S.Department of Transportation (USDOT), National HighwayTraffic Safety Administration's (NHTSA) General EstimatesSystem (GES). The data from GES, which began operation in1988, are obtained from a nationally representative probabilitysample selected from all police-reported crashes. The GES sampleincludes only crashes where a police accident report was complet-ed and the crash resulted in property damage, injury, or death.The resulting figures do not take into account crashes that werenot reported to the police or that did not result in property dam-age. The 1993 National Transportation Statistics (NTS) Historical
Compendium and earlier editions illustrated crashes and injury fig-ures estimated by the National Safety Council, which used a differ-ent set of methods to arrive at its figures. Thus, the injury andcrash figures in this edition of NTS may not be comparable withthose found in the Compendium and earlier editions.SOURCES:Fatalities and injuries: 1975-99: U.S. Department ofTransportation, National Highway Traffic Safety Administration,Traffic Safety Facts 1998 DOT HS 808 983 (Washington, DC:October 1999), tables 4 and 51, and personal communication,Sept.11, 2000.Crashes: 1990-98: Ibid., General Estimates System Database, per-sonal communications.Vehicle-miles: 1975-90: U.S. Department of Transportation,Federal Highway Administration, Highway Statistics Summary to 1995(Washington, DC: July 1997), table VM-201A.1995-98: Ibid., Highway Statistics (Washington, DC: Annual issues),table VM-1.
Table 2-24
KEY: N = data do not exist; R = revised

Highw
ay !139
SOURCE: U.S. Departmentof Transportation, National Highway Traffic Safety Administration, National Center forStatistics and Analysis, Traffic Safety Facts 1998, DOT HS 808 983 (Washington, DC:October 1999), table 13, and personal communication, Sept.11, 2000.
Table 2-25 Fatalities by Highest Blood Alcohol Concentration (BAC) in Highway Crashes
NOTES: BAC values have been assigned by U.S. Department of Transportation,National Highway Traffic Safety Administration when alcohol test results are unknown.Alcohol-related crashes pertain to the BAC of the driver and nonoccupants struck bymotor vehicles.For some years, numbers may not add to totals due to rounding.
KEY: BAC = blood alcohol concentration; R = revised
1985 1990 1991 1992 1993 1994 1995 1996 1997 1998R 1999Total fatalities 43,825 44,599 41,508 39,250 40,150 40,716 41,817 42,065 42,013 41,501 41,611
Fatalities in alcohol- related crashes 22,716 22,084 19,887 17,858 17,473 16,580 17,247 17,218 16,189 16,020 15,786Percent 51.8 49.5 47.9 45.5 43.5 40.7 41.2 40.9 38.5 38.6 37.9
BAC = 0.00 Number 21,109 22,515 21,621 21,392 22,677 24,136 24,570 24,847 25,824 25,481 25,825 Percent 48.2 50.5 52.1 54.5 56.5 59.3 58.8 59.1 61.5 61.4 62.1
BAC = 0.01-0.09 Number 4,604 4,434 3,957 3,625 3,496 3,480 3,746 3,774 3,480 3,526 3,466 Percent 10.5 9.9 9.5 9.2 8.7 8.5 9.0 9.0 8.3 8.5 8.3
BAC = 0.10+ Number 18,111 17,650 15,930 14,234 13,977 13,100 13,501 13,444 12,710 12,494 12,321 Percent 41.3 39.6 38.4 36.3 34.8 32.2 32.3 32.0 30.3 30.1 29.6

140 " Chapter 2 Transportation Safety
1986 1990 1992 1994 1996 1997 1998 1999 2000BAC = 0.08 per se lawsa 2 4 5 10 13 13 15 16 c18
BAC level 0.02 or less for persons younger than 21 years 0 0 3 12 c28 c38 c51 c51 c51
Administrative license revocation (ALR) for DUI/DWI offendersb c21 c27 c30 c33 c38 c40 c41 c41 c41
Number of States with Different Types of Anti-DUI/DWI Legislation in Effect as of January 1 of the Listed Year
a Per se law makes it illegal in and of itself to drive with an alcohol concentration measured at or above a certain level.
b Those states that have thresholds for administrative license revocation (ALR) above those for DUI/DWI are not included inthis total. New York, which limits the duration of ALR, is also not included. States that impose additional thresholds for ALR beyond those imposed for DUI/DWI are not included in these figures.
c Includes the District of Columbia.NOTE: National Uniform Minimum Drinking Age Act, whichstandardized the minimum drinking age at 21, was enacted in 1984.SOURCES:0.02 BAC and Administrative license revocation: 1986-98: U.S.Department of Transportation, National Highway Traffic Safety
Administration, Traffic Safety Programs, Research and EvaluationDivision, personal communications, Apr. 9, 1999 and Oct. 4, 1999.1999-2000: Ibid., Impaired Driving Division, personal communica-tions, May 22, 2000.0.08 BAC: Ibid., Presidential Initiative for Making 0.08 BAC theNational Legal Limit, A Progress Report, Internet sitehttp://www.nhtsa.dot.gov/people/injury/alcohol/limit.08/08pro-gressreport/index.html, as of May 19, 2000.
Table 2-26
KEY: BAC = blood alcohol concentration;DUI = driving under the influence;DWI = driving while intoxicated

Highw
ay !141
Table 2-27 Motor Vehicle Fatal Crashes by Day of Week, Time of Day, and Weather and Light Conditions (percent)
SOURCE: U.S. Department of Transportation, National Highway Traffic SafetyAdministration, Traffic Safety Facts (Washington, DC: Annual issues), tables 24 and 25 andpersonal communication, Sept. 11, 2000.
KEY: R = revised
1990 1991 1992 1993 1994 1995R 1996 1997 1998 1999Fatal crashes 39,836 36,937 34,942 35,780 36,254 37,241 R37,494 R37,324 37,107 37,043
Day of weekSunday 16.1 16.2 15.9 15.8 15.9 15.7 15.2 15.8 15.5 15.8Monday 11.7 11.5 11.6 12.1 12.4 12.4 12.7 12.1 12.4 12.6Tuesday 11.5 11.5 11.5 11.8 11.7 11.8 12.4 R11.9 12.4 11.9Wednesday 11.5 11.9 12.3 12.0 12.3 11.9 12.2 13.0 12.4 12.5Thursday 12.5 12.5 13.2 13.0 12.7 13.0 13.3 13.0 R13.5 12.9Friday 16.6 16.5 16.1 16.3 16.3 16.6 16.1 16.1 15.8 15.9Saturday 19.9 19.9 19.3 19.0 R18.6 18.5 18.1 18.0 18.0 18.5Unknown 0.02 0.03 0.01 0.02 R0.04 0.03 0.04 0.05 0.04 0.02
Time of dayMidnight to 3 a.m. 15.7 15.3 14.3 R13.8 13.1 12.8 R12.6 12.2 12.3 12.23 a.m. to 6 a.m. 7.7 7.9 7.4 R7.3 7.3 7.5 7.4 7.2 7.3 7.86 a.m. to 9 a.m. 8.6 8.6 8.5 8.9 9.3 9.2 9.5 9.9 9.7 10.19 a.m. to noon 8.4 8.6 8.8 9.7 9.6 9.4 9.7 9.9 10.2 10.0Noon to 3 p.m. 11.5 0.0 12.4 12.5 13.1 12.9 12.7 13.3 13.4 13.23 p.m. to 6 p.m. 15.6 15.7 16.0 16.0 16.6 16.8 16.9 16.6 16.8 16.86 p.m. to 9 p.m. 15.5 15.6 16.5 16.2 15.7 15.9 15.7 15.9 15.6 15.49 p.m. to midnight 15.9 15.8 15.3 14.7 14.3 14.6 14.6 14.1 13.8 13.8Unknown 0.8 0.8 0.8 0.8 0.8 0.9 0.9 0.9 0.9 0.9
Atmospheric conditionNormal 86.7 86.7 85.6 R87.0 R87.3 86.4 86.3 R86.4 R87.2 89.0Rain 9.3 9.0 10.0 8.7 8.3 8.5 8.4 R8.8 8.8 7.3Snow/sleet 1.6 1.9 2.0 2.2 1.8 2.4 2.7 2.5 R1.7 1.6Other/unknown 2.3 2.4 2.3 R2.1 R2.5 2.6 2.6 R2.3 R2.3 2.1
Light conditionDaylight 45.0 45.4 46.0 47.7 R49.5 R48.7 49.3 R50.3 R50.5 50.7Dark, but lighted 17.7 17.4 17.4 R16.4 15.6 15.8 15.9 R15.6 R14.9 14.9Dark 32.7 33.0 32.4 R31.5 R30.3 R30.3 30.3 R29.5 30.0 29.7Dawn or dusk 4.2 3.9 3.9 4.2 R4.2 R4.2 R4.2 4.2 4.3 4.3Unknown 0.3 0.3 0.3 R0.2 R0.2 R0.4 0.3 1.0 R0.3 0.3

142"
Chapter 2 Transportation S
afety
SOURCES: 1975-93: U.S. Department ofTransportation, National Highway Traffic Safety Administration, National Center forStatistics and Analysis, Fatality Analysis Reporting System, personal communications,Oct. 22, 1996, February 1999, and Oct. 4, 1999.1994-98: Ibid., Internet data query from Internet site http://www-fars.nhtsa.dot.gov/www/query.html, as of June 13, 2000.
Table 2-28 Motor Vehicle Fatal Crashes by Posted Speed Limit
a The "No Statutory Limit" speed limit designation is included in this category.NOTES: In 1974, Congress enacted a national maximum speed limit of 55 miles perhour (mph). Amendments in 1987 and 1991 allowed states to increase speed limits to 65mph on rural Interstates and similar highways. The National Maximum Speed Limit wasrepealed in late 1995; speed limits are again set by the states, some of which have raisedtheir maximum speed limits to 70 mph or above.
KEY: N = data do not exist
1975 1980 1985 1990 1991 1992 1993 1994 1995 1996 1997 1998Under 55 mph0-25 mpha 2,617 2,865 2,504 2,234 2,097 1,911 1,895 1,890 1,893 1,896 1,955 1,87326-35 mph 6,099 8,527 7,889 7,756 6,908 6,696 6,759 6,565 6,681 6,445 6,383 6,02536-45 mph 4,276 6,256 6,813 7,092 6,608 6,345 6,454 6,632 6,938 7,096 7,132 7,34946-54 mph 2,241 2,431 2,072 2,054 1,894 1,875 1,877 1,861 1,927 1,908 1,788 1,771 Total 15,233 20,079 19,278 19,136 17,507 16,827 16,985 16,948 17,439 17,345 17,258 17,018
55 mph and above55 mph 16,094 20,352 18,862 17,556 16,543 15,444 15,980 16,512 16,753 14,097 12,897 12,52260 mph N N N 18 9 4 9 13 16 523 935 1,07365 mph N N N 2,175 2,078 2,002 2,155 2,173 2,323 3,214 3,311 3,42170 mph N N N 0 0 0 0 0 38 1,282 1,633 1,835Over 70 mph N N N 0 0 0 0 0 10 344 475 482 Total 16,094 20,352 18,862 19,749 18,630 17,450 18,144 18,698 19,140 19,460 19,251 19,333
Unknown, total 7,834 4,853 1,055 951 800 665 651 608 662 689 815 756
TOTAL fatal crashes 39,161 45,284 39,195 39,836 36,937 34,942 35,780 36,254 37,241 37,494 37,324 37,107

Highway ! 143
1994 1996 1998
OVERALL BELT USE 58.0% 61.3% 68.9%
Drivers 59.1% 62.2% 70.1%
Passengers 55.2% 58.8% 65.3%
Passenger cars 62.8% 64.4% 71.3%
Drivers 64.2% 65.1% 72.4%
Passengers 59.1% 62.3% 68.1%
Light trucksa 50.2% 56.4% 65.7%
Drivers 50.7% 57.5% 67.1%
Passengers 49.1% 53.0% 61.4%
Helmet Useb 62.5% 64.1% 67.2%
Operators 67.1% 65.5% 64.4%
Riders 54.4% 58.0% 84.4%
Safety Belt and Motorcycle Helmet Use
a Includes pickup trucks, vans, minivans, and sport utility vehicles.b In 1994, operators and riders were counted as helmeted if wearing any type of helmet. In 1996 and 1998, only those operators and riders wearing safety helmets that met U.S. Department ofTransportation (DOT) standards were counted. Those safety helmets that do not meet DOT standards were treated as if the operator/riderwere not wearing a helmet.
NOTE: Occupants of commercial and emergency vehicles areexcluded.SOURCE: U.S. Department of Transportation, National HighwayTraffic Safety Administration, Research Note, Observed Safety BeltUse in 1999, (Washington, DC: September 1999), Internet site-http://www.nhtsa.dot.gov/people/ncsa/98obbelt.html as of Apr. 6,2000, table 3. Data are from the National Occupant Protection UseSurvey (NOPUS), Moving Traffic Study, 1994, 1996, and 1998.
Table 2-29

144"
Chapter 2 Transportation S
afety
SOURCE: Computed by U.S. Department of Transportation, National HighwayTraffic Safety Administration, personal communication, Apr. 5, 2000.
1975 1980 1985 1990 1995 1996 1997 1998Total
1975-1998
Safety beltsa 978 575 2,435 6,592 9,790 10,414 10,750 11,018 112,016
Air bags 0 0 0 37 470 686 842 1,043 3,706
Motorcycle Helmets 823 871 788 602 506 490 486 500 16,605
Age 21 minimum legal drinking age 412 595 701 1,033 851 846 846 861 18,220
Child restraints 36 49 153 222 279 365 312 299 4,193
Safety seats 33 39 135 193 232 313 266 244 3,559
Adult safety beltsb 3 10 18 29 47 52 46 55 634
Table 2-30 Estimated Number of Lives Saved by Use of Restraints
a Represents all adults and children age 5 and older. Data are for passenger vehicles,which include cars, light trucks, vans, pickups, and utility vehicles. Excludes medium andheavy trucks.
b Represents children age 4 and younger restrained only by adult safety belts.

Section DTransit
chapter two

Transit !147
NOTES: Data are provided only for transit systems that fur-nished safety data for inclusion in the U.S. Department of Transportation, FederalTransit Administration Safety Management Information Statistics (SAMIS) annualreports. Transit vehicle-miles in this table differ from those reported in Chapter 1. TheAmerican Public Transit Association, which is the source for the vehicle-miles table inChapter 1, includes all transit systems, while SAMIS covers only directly operated urbantransit systems.SOURCE: U.S. Department of Transportation, Federal Transit Administration, SafetyManagement Information Statistics (SAMIS) 1998 Annual Report (Cambridge, MA: December1999), and personal communication, Dec. 6, 2000.
1990 1991 1992 1993 1994 1995 1996 1997 1998 1999Fatalitiesa 339 300 273 281 320 274 264 275 286 299Injuriesa 54,556 52,125 55,089 52,668 58,193 57,196 55,288 56,132 55,990 55,325Accidentsb 58,002 46,467 36,380 30,559 29,972 25,683 25,166 24,924 23,937 23,416Incidentsa,b (includes accidents) 90,163 83,139 73,831 64,986 70,693 62,471 59,392 R61,561 60,094 58,703
Vehicle-miles (millions) 2,490 2,478 2,510 2,535 2,581 2,620 2,605 2,702 2,833 2,927Rates per 100 million vehicle-milesc
Fatalities (all reportable incidents) 13.6 12.1 10.9 11.1 12.4 10.5 10.1 10.2 10.1 10.2 Injuries (all reportable incidents) 2,191 R2,103 2,195 R2,077 R2,254 R2,183 2,122 R2,078 1,976 1,890 Accidents 2,329 1,875 R1,450 1,205 1,161 980 966 922 845 800
Property damaged (current $ millions) 38.0 37.5 37.5 44.9 38.4 46.3 57.6 55.5 61.5 55.3
Table 2-31 Transit Safety and Property Damage Data
a Totals do not include data for cable car, inclined plane, jitney, and ferry boat. These data appear in the footnotes for table 2-29.
b Accidents include collisions with other vehicles, objects, and people (except suicides),and derailments/buses going off the road. Incidents include accidents plus personal casualties (inside vehicles, inside stations, and boarding and alighting vehicle) and fires.
c Fatality and injury rates are based on total incidents, including accidents, and were calculated by dividing the number of fatalities, injuries, and incidents in this table by the number of vehicle miles.
d Total does not include property damage for cable car, inclined plane, jitney, and ferry boat, which were: 1990-$300,000; 1991-$400,000; 1992-$300,000; 1993-$200,000; 1994-$300,000; 1995-$3,300,000; 1996-$200,000; 1997-$67,000; 1998-$24,000.
KEY: R = revised

1990 1991 1992 1993 1994 1995 1996 1997 1998 1999FatalitiesMotor busc 92 80 91 79 90 69 82 100 90 91Light rail 5 11 6 14 10 10 5 3 14 13Heavy rail 51 59 33 37 41 43 32 28 18 21Commuter rail 63 63 43 59 82 56 30 52 67 62Demand responsive 0 2 0 2 2 1 3 2 2 1Van pool 0 0 0 0 0 0 0 0 0 0Automated guideway 1 0 0 0 0 0 0 0 1 0 Total 212 215 173 191 225 179 152 185 192 188
Injured personsMotor busc 18,876 19,016 20,556 20,862 19,663 20,879 21,222 20,145 20,138 20,290Light rail 465 474 468 361 327 355 680 320 332 427Heavy rail 296 308 273 365 309 348 431 336 261 286Commuter rail 84 560 110 210 216 159 213 99 66 54Demand responsive 286 200 233 224 399 395 379 499 492 632Van pool 16 36 13 58 24 23 25 52 53 37Automated guideway 0 0 0 1 1 0 0 1 1 0 Total 20,023 20,594 21,653 22,081 20,939 22,159 22,950 21,452 21,343 21,726
AccidentsMotor busc 55,289 44,467 34,282 28,596 27,754 23,819 23,425 22,995 22,277 21,407Light rail 699 671 600 449 512 309 341 363 328 300Heavy rail 144 188 613 662 744 637 346 325 293 396Commuter rail 175 248 181 208 266 216 201 192 193 215Demand responsive 1,613 814 668 524 659 647 774 886 664 862Van pool 81 79 35 119 36 54 78 160 179 130Automated guideway 1 1 1 1 1 1 1 3 3 0 Total 58,002 46,468 36,380 30,559 29,972 25,683 25,166 24,924 23,937 23,310
148"
Chapter 2 Transportation S
afety Table 2-32 Transit Safety Data by Modea for All Reported Accidentsb
KEY: R = revised
Continued next page

Transit !149
Table 2-32Cont’d Transit Safety Data by Modea for All Reported Accidentsb
KEY: R = revised
Continued next page
1990 1991 1992 1993 1994 1995 1996 1997 1998 1999Vehicle miles (millions)Motor busc 1,668 1,661 1,688 1,690 1,702 1,702 1,687 1,719 1,779 1,835Light rail 24 27 28 27 34 34 37 41 43 48Heavy rail 529 522 520 518 522 537 543 558 566 578Commuter rail 187 188 188 206 210 217 203 216 242 249Demand responsive 74 71 72 77 94 109 108 134 157 167Van pool 8 8 13 16 18 19 25 33 44 49Automated guideway 0.6 0.5 1.0 1.0 1.2 1.1 1.4 1.4 1.4 1.4 Total 2,490 2,478 2,510 2,535 2,581 2,620 2,605 2,702 2,833 2,927
Rates per 100 million vehicle-miles d
FatalitiesMotor busc 5.5 4.8 5.4 4.7 5.3 4.1 4.9 5.8 5.1 5.0Light rail 20.8 40.3 21.2 51.1 29.6 29.0 R13.3 R7.4 32.3 27.1Heavy rail 9.6 11.3 6.3 7.1 7.9 8.0 5.9 5.0 3.2 3.6Commuter rail 33.6 R33.4 22.9 28.6 39.0 25.8 14.8 24.1 27.6 24.9Demand responsive 0 2.8 0 2.6 2.1 0.9 2.8 1.5 1.3 0.6Van pool 0 0 0 0 0 0 0 0 0 0Automated guideway R162.0 0 0 0 0 0 0 0 69.0 0 Total 8.5 8.7 6.9 7.5 8.7 6.8 5.8 6.8 6.8 6.4
Injured personsMotor busc 1,132 1,145 1,218 1,234 1,155 1,227 1,258 1,172 1,132 1,106Light rail 1,933 1,735 1,654 1,318 968 1,030 R1,815 R785 767 889Heavy rail 56 59 52 71 59 65 79 60 46 50Commuter rail 45 297 59 102 103 73 105 46 27 22Demand responsive 386 282 324 292 425 361 R349 372 313 379Van pool 208 430 103 363 132 123 R101 158 121 75Automated guideway 0 0 0 104 85 0 0 R70 69 0 Total 804 831 863 871 811 846 R881 794 753 742

150"
Chapter 2 Transportation S
afety
NOTES: Data are provided only for transit systems that haveprovided safety data for inclusion in the U.S. Department of Transportation, FederalTransit Administration, Safety Management Information Statistics (SAMIS) annualreports. SAMIS data cover only direct-operated urban transit systems. Vehicle-miles forall transit systems including nonurban and purchased can be found in the vehicle-milestable in Chapter 1.SOURCE: U.S. Department of Transportation, Federal Transit Administration, SafetyManagement Information Statistics (SAMIS) 1998 Annual Report (Cambridge, MA: Dec. 1999),and personal communication, Dec. 6, 2000.
1990 1991 1992 1993 1994 1995 1996 1997 1998 1999AccidentsMotor busc 3,315 2,678 2,031 1,692 1,631 1,400 1,389 1,338 1,252 1,166Light rail 2,906 2,456 2,121 1,639 1,516 897 R910 R891 758 624Heavy rail 27 36 118 128 142 119 64 58 52 69Commuter rail 93 132 96 101 127 100 99 89 80 86Demand response 2,177 1,147 928 682 702 591 R714 661 423 516Van pool 1,052 944 278 744 198 289 R314 485 408 263Automated guideway 162 204 102 104 85 87 R69 R209 207 0 Total 2,329 1,875 R1,450 1,205 1,161 980 R966 922 845 796
Table 2-32Cont’d Transit Safety Data by Modea for All Reported Accidentsb
a Accident statistics for cable car, inclined plane, jitney, and ferry boat are not available.The number of incidents, fatalities, and injuries for these modes appear in the footnotes for table 2-33.
b Accidents include collisions with vehicles, objects, people (except suicides), and derailments/vehicles going off road.
c Motor bus also includes trolley bus.d Rates are based on total incidents including accidents and were calculated by dividing the
number of fatalities, injuries, and incidents in this table by the number of vehicle miles.
KEY: R = revised

Transit !151
Table 2-33 Transit Safety Data by Modea for All Reported Incidentsb
KEY: R = revisedContinued next page
1990 1991 1992 1993 1994 1995 1996 1997 1998 1999FatalitiesMotor busc 110 88 99 83 108 82 101 109 109 102Light rail 7 13 9 15 13 15 6 3 23 17Heavy rail 117 103 91 83 85 79 74 77 54 84Commuter rail 104 93 74 98 112 92 72 79 94 95Demand responsive 0 3 0 2 2 6 11 7 4 1Van pool 0 0 0 0 0 0 0 0 0 0Automated guideway 1 0 0 0 0 0 0 0 2 0 Total 339 300 273 281 320 274 264 275 286 299
Injured personsMotor busc 40,006 38,619 40,090 38,873 42,195 41,297 39,709 39,181 41,035 41,221Light rail 1,244 1,251 1,268 982 1,181 1,319 1,604 1,087 1,076 1,271Heavy rail 10,036 9,285 10,446 10,532 11,673 11,238 11,093 12,285 11,059 9,665Commuter rail 2,438 2,308 2,546 1,560 2,374 2,374 1,953 2,388 1,677 1,761Demand responsive 807 622 713 652 731 935 882 1,121 1,064 1,345Van pool 21 40 19 59 29 25 27 54 67 41Automated guideway 4 0 7 10 10 8 20 16 12 21 Total 54,556 52,125 55,089 52,668 58,193 57,196 55,288 56,132 55,990 55,325
All incidentsMotor busc 70,437 63,453 52,482 45,580 49,185 42,780 40,456 40,524 41,616 41,094Light rail 1,465 1,543 1,492 1,136 1,413 1,276 1,350 1,173 1,121 1,182Heavy rail 12,178 14,102 15,512 15,082 15,869 14,327 13,748 15,151 13,516 12,196Commuter rail 3,031 2,716 3,160 2,111 3,115 2,847 2,449 3,078 2,410 2,499Demand responsive 2,965 1,241 1,137 946 1,062 1,173 1,284 1,454 1,221 1,577Van pool 84 83 40 121 39 58 80 162 194 135Automated guideway 3 1 8 10 10 10 25 19 16 20 Total 90,163 83,139 73,831 64,986 70,693 62,471 59,392 61,561 60,094 58,703

152"
Chapter 2 Transportation S
afety Table 2-33
Cont’d Transit Safety Data by Modea for All Reported Incidentsb
KEY: R = revised
Continued next page
1990 1991 1992 1993 1994 1995 1996 1997 1998 1999Passengers served (millions)
Motor busc 4,912 4,780 4,728 4,585 4,567 4,539 4,464 4,554 4,712 4,926Light rail 174 184 187 187 274 249 259 259 273 289Heavy rail 2,252 2,123 2,119 1,960 2,149 2,034 2,157 R2,429 2,393 2,521Commuter rail 286 274 262 303 318 322 302 311 360 347Demand responsive 14 13 13 15 17 18 17 48 22 23Van pool 2 2 3 4 5 5 6 8 9 10Automated guideway 6 4 R5 5 6 6 6 6 6 5 Total 7,646 7,380 7,318 7,059 7,335 7,172 7,211 R7,615 7,774 8,121
Rates per 100 million passengers d
FatalitiesMotor busc 2.2 1.8 2.1 1.8 2.4 1.8 2.3 2.4 2.3 2.1Light rail 4.0 7.1 4.8 8.0 4.7 6.0 2.3 1.2 8.4 5.9Heavy rail 5.2 4.9 4.3 4.2 4.0 3.9 3.4 3.2 2.3 3.3Commuter rail 36.4 33.9 R28.3 R32.4 35.2 28.6 23.8 25.4 26.1 25.4Demand responsive 0 R22.6 0 R13.5 R12.0 R33.9 R65.5 14.6 18.1 4.3Van pool 0 0 0 0 0 0 0 0 0 0Automated guideway R17.0 0 0 0 0 0 0 0 32.5 0 All modes 4.4 4.1 3.7 4.0 4.4 3.8 3.7 3.6 3.7 3.7
Injured personsMotor busc R815 808 848 848 924 910 890 860 871 837Light rail 715 R682 R677 R524 R432 R529 R620 R419 394 440Heavy rail 446 437 493 537 543 553 514 506 462 383Commuter rail R853 R843 972 R516 747 R738 R646 R769 466 471Demand responsive R5,835 R4,678 R5,393 R4,401 R4,390 R5,286 R5,251 R2,336 4,821 5,846Van pool R1,037 R1,721 R584 R1,398 R638 R537 R461 R701 773 411Automated guideway R68 0 R127 R194 R160 R123 R317 R272 195 389 All modes 714 706 753 746 793 798 767 R737 720 681

Transit !153
d Rates are based on total incidents including accidents and were calculated by dividing the number of fatalities, injuries, and incidents in this tableby the number of passengers served.
NOTES: Data are provided only for transit systems which have provided safety datafor inclusion in the U.S. Deaprtment of Transportation, Federal Transit Administration,Safety Management Information Statistics (SAMIS) annual reports. SAMIS data coversonly direct-operated urban transit systems.SOURCE: U.S. Department of Transportation, Federal Transit Administration, SafetyManagement Information Statistics (SAMIS) 1998 Annual Report (Cambridge, MA: December 1999),and personal communication, Dec. 6, 2000.
Table 2-33Cont’d Transit Safety Data by Modea for All Reported Incidentsb
a The figures for cable car, inclined plane, jitney, and ferry boat are lumped together and appear in this footnote as follows:
1990 1991 1992 1993 1994 1995 1996 1997 1998Fatalities: 2 1 0 1 0 0 1 0 0
Injuries: 378 327 399 383 616 598 354 357 379Incidents: 186 411 400 411 650 536 301 353 253
b Incidents include accidents (collisions with vehicles, objects, people (except suicides),derailments/vehicles going off road), plus personal casualties, fires, and property damage associated with transit agency revenue vehicles and all transit facilities.
c Motor bus also includes trolley bus.
KEY: R = revised
1990 1991 1992 1993 1994 1995 1996 1997 1998 1999All incidentsMotor busc R1,434 1,327 1,110 994 1,077 R943 906 890 883 834Light rail 842 R841 R796 R606 516 512 R522 R452 411 410Heavy rail 541 664 732 769 738 R705 637 R624 565 484Commuter rail 1,060 991 R1,207 R698 980 R885 R810 R991 670 668Demand responsive R21,440 R9,333 R8,600 R6,385 R6,378 R6,632 R7,644 R3,030 5,532 6,854Van pool R4,147 R3,570 R1,229 R2,867 R858 R1,245 R1,366 R2,104 2,238 1,353Automated guideway R51 R28 R145 R194 R160 R154 R396 R323 260 371 All modes 1,179 R1,126 1,009 921 964 871 824 808 773 723

154 " Chapter 2 Transportation Safety
1995 1996 1997 1998
Reported offenses, violent crime
Homicidea 19 20 19 51Motor bus 8 9 6 40Commuter rail 1 1 4 1Demand responsive 0 0 0 0Heavy rail 8 9 8 6Light rail 2 1 1 4
Otherb 0 0 0 0
Forcible rapec 29 38 31 47Motor bus 11 13 10 16Commuter rail 5 4 7 1Demand responsive 0 0 2 4Heavy rail 13 19 8 24Light rail 0 2 4 2
Otherb 0 0 0 0
Robberyd 2,811 4,563 4,760 3,684Motor bus 909 871 870 605Commuter rail 181 242 187 133Demand responsive 1 3 0 1Heavy rail 1,490 3,164 3,394 2,686Light rail 181 238 222 220
Otherb 49 45 87 39
Aggravated assaulte 2,701 3,084 3,105 2,314Motor bus 1,941 1,677 1,294 1,186Commuter rail 133 69 92 80Demand responsive 6 13 13 13Heavy rail 437 1,074 1,051 837Light rail 157 199 143 170
Otherb 27 52 512 28
Reports of Violent Crime, Property Crime, and Arrests by Transit ModeTable 2-34
Continued next page

Transit ! 155
1995 1996 1997 1998
Reported offenses, property crime
Theftf 10,596 13,238 14,486 11,830Motor bus 2,738 3,408 2,920 2,327Commuter rail 2,238 2,262 2,345 2,021Demand responsive 2 8 40 15Heavy rail 4,625 6,794 8,321 6,807Light rail 451 609 479 496
Otherb 542 157 381 164
Vehicle theftg 2,182 2,261 2,276 2,225Motor bus 263 306 198 208Commuter rail 253 125 262 470Demand responsive 0 1 3 9Heavy rail 1,536 1,694 1,630 1,234Light rail 128 135 179 273
Otherb 2 0 4 31
Burglaryh 1,759 1,650 1,757 491Motor bus 156 104 94 75Commuter rail 178 177 260 217Demand responsive 2 0 4 3Heavy rail 1,367 1,278 1,343 110Light rail 43 78 48 70
Otherb 13 13 8 16
Arsoni 63 96 75 60Motor bus 29 67 33 21Commuter rail 14 1 21 10Demand responsive 0 0 0 0Heavy rail 14 22 16 27Light rail 6 6 5 2
Otherb 0 0 0 0
Reports of Violent Crime, Property Crime, and Arrests by Transit ModeTable 2-34Cont’d
Continued next page

156 " Chapter 2 Transportation Safety
1995 1996 1997 1998
Reported offenses, arrests
Other assaultsj 2,991 3,088 2,697 2,787Motor bus 1,896 1,571 1,439 1,400Commuter rail 144 106 140 122Demand responsive 4 0 16 3Heavy rail 645 932 881 898Light rail 181 330 195 282
Otherb 121 149 26 82
Vandalismk 17,228 8,627 9,539 6,571Motor bus 13,343 6,167 5,262 3,656Commuter rail 1,071 309 659 778Demand responsive 12 17 8 10Heavy rail 1,157 1,339 1,128 1,067Light rail 1,505 609 2,084 947
Otherb 140 186 398 113
Sex offensesl 664 803 1,047 962Motor bus 242 260 363 258Commuter rail 100 41 82 91Demand responsive 5 0 6 2Heavy rail 249 430 517 541Light rail 59 71 79 68
Otherb 9 1 0 2
Drug abuse violationsm 2,578 3,944 4,355 3,792Motor bus 1,037 2,122 1,970 1,414Commuter rail 303 393 477 495Demand responsive 1 0 15 21Heavy rail 1,078 1,130 1,530 1,550Light rail 151 298 336 271
Otherb 8 1 27 41
Driving under the influencen 466 129 205 176Motor bus 91 82 101 101Commuter rail 26 21 22 21Demand responsive 0 0 1 4Heavy rail 52 8 22 21Light rail 292 16 31 21
Otherb 5 2 28 8
Reports of Violent Crime, Property Crime, and Arrests by Transit ModeTable 2-34Cont’d
Continued next page

Transit ! 157
1995 1996 1997 1998
Reported offenses, arrests
Drunkenesso 10,479 6,921 8,632 12,643Motor bus 6,457 3,936 5,346 3,046Commuter rail 71 23 226 156Demand responsive 2 2 46 34Heavy rail 1,511 1,617 1,601 7,340Light rail 2,255 1,305 1,258 1,844
Otherb 183 38 155 223
Disorderly conductp 22,206 26,178 25,325 15,897Motor bus 4,681 5,025 6,978 4,521Commuter rail 810 1,085 1,399 1,525Demand responsive 5 8 47 5Heavy rail 15,258 19,183 15,309 8,227Light rail 1,164 800 1,177 1,408
Otherb 288 77 415 211
Trespassingq 3,362 3,497 7,444 6,049Motor bus 928 604 1,225 1,283Commuter rail 845 674 4,150 2,850Demand responsive 0 0 2 2Heavy rail 1,155 1,208 1,398 1,254Light rail 400 653 463 443
Otherb 34 358 206 217
Fare evasionr 33,903 47,873 53,406 58,856Motor bus 3,172 2,372 1,819 1,694Commuter rail 140 334 310 204Demand responsive 1 1 2 5Heavy rail 8,247 39,957 46,106 40,350Light rail 22,212 1,185 912 12,798
Otherb 131 4,024 4,257 3,805
Curfew and loitering lawss 1,878 872 1,960 1,161Motor bus 1,201 241 1,112 291Commuter rail 19 27 223 72Demand responsive 0 1 5 0Heavy rail 462 493 530 680Light rail 161 95 80 106
Otherb 35 15 10 12
Reports of Violent Crime, Property Crime, and Arrests by Transit ModeTable 2-34Cont’d
Continued next page

158 " Chapter 2 Transportation Safety
Reports of Violent Crime, Property Crime, and Arrests by Transit ModeTable 2-34Cont’d
a The killing of one or more human beings by another. This includes murder, non-negligent manslaughter and manslaughter by negligence.
b Other transit mode includes automated guideway, cable car,ferryboat, trolleybus, vanpool, and monorail.
c The carnal knowledge of a female forcibly and against her will.This includes assault to rape or attempt to rape.
d The taking or attempting to take anything of value from the care,custody, or control of a person or persons by force or threat offorce or violence and/or by putting the victim in fear. The use orthreat of force includes firearms, knives or cutting instruments,other dangerous weapons (clubs, acid, explosives), and strong-arm techniques (hands, fists, feet).
e An unlawful attack by one person upon another for the purpose of inflicting severe or aggravated bodily injury. This type ofassault usually is accompanied by the use of a weapon or by means likely to produce death or great bodily harm.
f The unlawful taking, carrying, leading, or riding away of propertyfrom the possession or constructive possession of another. This includes pocket-picking, purse-snatching, shoplifting, thefts from motor vehicles, thefts of motor vehicle parts and accessories,theft of bicycles, theft from buildings, theft from coin-operated devices or machines, and all other theft not specifically classified.
g The theft or attempted theft of a motor vehicle. A motor vehicleis a self-propelled vehicle that runs on the surface of land and not on rails. Examples of motor vehicles are automobiles, trucks,buses, motor cycles, and motor scooters.
h The unlawful entry of a structure to commit a felony or a theft.This includes offenses known locally as burglary (any degree),unlawful entry with intent to commit a larceny or felony, breakingand entering with intent to commit a larceny, housebreaking,safe-cracking, and all attempts at these offenses.
i To unlawfully and intentionally damage, or attempt to damage,any real or personal property by fire or incendiary device.
j An unlawful attack or attempt by one person upon another where no weapon was used or which did not result in serious or aggravatedinjury to the victim. This includes simple assault, minor assault,assault and battery, injury by culpable negligence, intimidation,coercion, hazing, and all attempts to commit these offenses.
k The willful or malicious destruction, injury, disfigurement, or defacement of any public or private property, real or personal,without consent of the owner or person having custody or control by cutting, tearing, breaking, marking, painting, drawing,covering with filth, or any other such means as may be specified by local law.
l Any sexual acts except forcible rape, prostitution, and commercializedvice. This includes offenses against chastity, common decency,
morals, and the like, such as: adultery and fornication, buggery, incest,indecent exposure, indecent liberties, seduction, sodomy or crime against nature, statutory rape (no force), and all attempts to commit any of the above.
m Arrests requested based on the narcotics used. This includes all arrests for violations of state and local laws, specifically those relating to the unlawful possession, sale, use, growing, manufacturing,and making of narcotic drugs.
n The driving or operating of any vehicle or common carrier whiledrunk or under the influence of liquor or narcotics.
o Arrests for all offenses of drunkenness, which is the consumptionof alcoholic beverages to the extent that one’s mental faculties andphysical coordination are substantially impaired. This includes drunkenness, drunk and disorderly, common or habitual drunkard,and intoxication.
p All charges of committing a breach of the peace. This includes,affray; unlawful assembly; disturbing the peace; disturbing meetings; disorderly conduct in state institutions, at court, at fairs,on trains or public conveyances, etc.; blasphemy, profanity, and obscene language; desecrating the flag; refusing to assist an officer;and all attempts to commit any of the above.
q To unlawfully enter land, a dwelling, or other real property.r The unlawful use of transit facilities by riding without paying the
applicable fare.s All arrests for violations of local curfew or loitering ordinances where such laws exist.
NOTES: Data are from transit agencies in urbanized areas over200,000 population and include patrons, employees, and others.The figures for violent and property crime follow the FBI UniformCrime Reporting Handbook, (Washington, DC: 1984) and are basedon records of calls for service, complaints, and/or investigations.These figures are for reported offenses and do not reflect the find-ings of a court, coroner, jury, or decision of a prosecutor. Securitydata was first reported to the Federal Transit Administration in1995 and were not compiled for earlier years.SOURCE: 1995: U.S. Department of Transportation, FederalTransit Administration, National Transit Database, Data Tables,Internet sitehttp://www.fta.dot.gov/fta/library/reference/sec15/1995/htm/,as of May 2, 2000, tables 23-25.1996-97: Ibid., Internet sitehttp://www.ntdprogram.com/NTD/NTDData.nsf/Data+Tables?OpenView, as of May 2, 2000, tables 23-25.1998: Ibid., tables 24-26.

Section ERailroad
chapter two

Railroad ! 161
1980 1985 1990 1995 1996 1997 1998 1999Passengers on trains 4 3 3 0 12 6 4 14Railroad only 4 3 3 0 12 6 2 3Grade crossing only 0 0 0 0 0 0 2 11
Employees on duty 97 46 40 34 33 37 27 31Railroad only 97 44 35 32 32 37 23 29Grade crossing only 0 2 5 2 1 0 4 2
Employees not on duty 4 2 0 2 0 0 2 0Railroad only 3 2 0 2 0 0 2 0Grade crossing only 1 0 0 0 0 0 0 0
Contractor employees a a a 7 9 11 5 12Railroad only a a a 7 9 11 5 11Grade crossing only a a a 0 0 0 0 1
Nontrespassersb 746 511 554 443 365 363 326 302Railroad only 81 14 18 32 27 15 9 8Grade crossing only 665 497 536 411 338 348 317 294
Trespassers 566 474 700 660 620 646 644 572Railroad only 460 391 543 494 471 533 536 479Grade crossing only 106 83 157 166 149 113 108 93
Volunteer employees N N N N N 0 0 0Railroad only N N N N N 0 0 0Grade crossing only N N N N N 0 0 0
Railroad only 645 454 599 567 551 602 577 530Grade crossing only 772 582 698 579 488 461 431 402 Motor vehicles N 521 614 508 415 419 369 345 Nonmotor vehicles N 61 84 71 73 42 62 57 Total 1,417 1,036 1,297 1,146 1,039 1,063 1,008 932
Railroad and Grade-Crossing Fatalities by Victim Class
a Prior to 1995, contractor employees were included with non-trespassers. They include 7 in 1980, 4 in 1985, and 3 in 1990.
b Beginning in 1997, nontrespassers off railroad property are also included.
NOTES: "Railroad only" includes fatalities from train accidents,train incidents, and nontrain incidents (excludes highway-rail grade crossings). This table includes information for both freightand passenger railroad operations.
SOURCES: 1980-90: U.S.Department of Transportation, Federal Railroad Administration,Highway-Rail Crossing Accident/Incident and Inventory Bulletin(Washington, DC: Annual issues), and the Accident/IncidentBulletin (Washington DC: Annual issues).1995-99: Ibid., Internet sitehttp://safetydata.fra.dot.gov/objects/bull99.pdf as of Nov. 28, 2000.
Table 2-35
KEY: N = data do not exist

162 " Chapter 2 Transportation Safety
1980 1985 1990 1995 1996 1997 1998 1999Passengers on trains 593 657 473 573 513 601 535 481Railroad only 569 646 462 543 489 558 516 438Grade crossing only 24 11 11 30 24 43 19 43
Employees on duty 56,331 29,822 20,970 10,777 9,199 8,295 8,398 8,622Railroad only 56,201 29,667 20,801 10,654 9,120 8,184 8,276 8,482Grade crossing only 130 155 169 123 79 111 122 140
Employees not on duty 671 419 326 252 228 263 219 216Railroad only 671 418 324 248 226 260 216 215Grade crossing only 0 1 2 4 2 3 3 1
Contractor employees b b b 269 208 334 380 384Railroad only b b b 268 208 333 379 384Grade crossing only b b b 1 0 1 1 0
Nontrespassersa 3,923 2,672 2,581 1,869 1,660 1,540 1,236 1,342Railroad only 775 394 589 372 431 370 243 335Grade crossing only 3,148 2,278 1,992 1,497 1,229 1,170 993 1,007
Trespassers 728 734 793 700 750 728 677 650Railroad only 480 492 560 461 474 516 513 445Grade crossing only 248 242 233 239 276 212 164 205
Volunteer employees N N N N N 6 14 5Railroad only N N N N N 6 13 5Grade crossing only N N N N N 0 1 0
Railroad only 58,696 31,617 22,736 12,546 10,948 10,227 10,156 10,509Grade crossing only 3,550 2,687 2,407 1,894 1,610 1,540 1,303 1,396 Motor vehicles N 2,561 2,332 1,825 1,545 1,494 1,257 1,338 Nonmotor vehicles N 126 75 69 65 46 46 58 Total 62,246 34,304 25,143 14,440 12,558 11,767 11,459 11,905
Railroad and Grade-Crossing Injured Persons by Victim Class
a Beginning in 1997, nontrespassers off railroad property are also included.
b Prior to 1995, contractor employees were included with nontrespassers: they include 74 in 1980, 110 in 1985, and 242 in 1990.
NOTES: "Railroad only" includes fatalities from train accidents,train incidents, and nontrain incidents (excludes highway-rail gradecrossings). This table includes information for both freight andpassenger railroad operations.
SOURCES: 1980-90: U.S.Department of Transportation, Federal Railroad Administration,Highway-Rail Crossing Accident/Incident and Inventory Bulletin(Washington, DC: Annual issues), and Accident/Incident Bulletin(Washington, DC: Annual Issues).1995-99: Ibid., Internet site http://safetydata.fra.dot.gov/objects/bull99.pdf, as of Nov. 28, 2000.
Table 2-36
KEY: N = data do not exist

Railroad !
163
1997-98: Ibid., Railroad Safety Statistics Annual Report1998 (Washington, DC: September 1998), table 1-1, 1-3, 5-6.1999: Ibid., Internet sitehttp://safetydata.fra.dot.gov/OfficeofSafety/Prelim/1999/r01.htm, as of July 10, 2000.
Table 2-37 Train Fatalities, Injuries, and Accidents by Type of Accidenta
a Excludes highway-rail grade crossing accidents.NOTE: Train accidents only. This table includes information for both freight and pas-senger railroad operations.SOURCES: 1980-96: U.S. Department of Transportation, Federal RailroadAdministration, Highway-Rail Crossing Accident/Incident and Inventory Bulletin (Washington,DC: Annual issues), tables 1-1, 1-3.
KEY: U = data are unavailable
1980 1985 1990 1991 1992 1993 1994 1995 1996 1997 1998 1999FatalitiesDerailments 8 2 2 10 2 53 2 2 6 2 1 UCollisions 20 6 8 5 1 14 8 7 16 9 1 UOther 1 0 0 4 3 0 2 5 3 6 2 U Total 29 8 10 19 6 67 12 14 25 17 4 9
InjuriesDerailments 286 197 272 174 71 179 120 90 98 111 61 UCollisions 341 223 139 103 59 87 118 151 146 51 32 UOther 38 56 40 49 41 42 24 53 37 21 36 U Total 665 476 451 326 171 308 262 294 281 183 129 130
AccidentsDerailments 6,442 2,495 2,146 1,936 1,734 1,930 1,825 1,742 1,816 1,741 1,757 1,961Collisions 1,201 366 315 261 207 205 240 235 205 202 168 205Other 562 414 418 461 418 476 439 482 422 454 650 602 Total 8,205 3,275 2,879 2,658 2,359 2,611 2,504 2,459 2,443 2,397 2,575 2,768

164"
Chapter 2 Transportation S
afety
1997-98: Ibid., Railroad Safety StatisticsAnnual Report 1998 (Washington, DC: September 1999), table 1-1.Train-miles, passenger trains: 1990-96: U.S. Department of Transportation, Bureauof Transportation Statistics calculations (sum of all commuter rail train-miles reportedto USDOT, Federal Transit Administration, plus Amtrak train-miles).1997-98: U.S. Department of Transportation, Federal Railroad Administration, Office ofPolicy and Program Development, Railroad Safety Statistics Annual Report 1998(Washington, DC: September 1999), table 2-4.
1990 1991 1992 1993 1994 1995 1996 1997 1998 1999Passenger fatalities 3 8 3 58 5 0 12 6 4 14Injured persons 473 382 411 559 497 573 513 601 535 481Train-miles, passenger trains (millions) 72 74 74 75 75 76 R77 78 78 U Fatalities per 100 million passenger train-miles 4 11 4 77 7 0 R16 8 5 U Injuries per 100 million passenger train-miles 660 520 560 750 660 750 R663 770 683 U
Table 2-38 Railroad Passenger Safety Data
NOTE: A train-mile is the movement of a train (which can consist of many cars) thedistance of 1 mile. A train-mile differs from a vehicle-mile, which is the movement of1car (vehicle) the distance of 1 mile. A 10-car (vehicle) train traveling 1 mile would bemeasured as 1 train-mile and 10 vehicle-miles. Caution should be used when comparingtrain-miles to vehicle miles.SOURCES:Fatalities and Injuries: 1990-96: U.S. Department of Transportation, Federal RailroadAdministration, Office of Policy and Program Development, Accident/Incident Bulletin(Washington, DC: Annual issues), tables 5, 14, 15, and 36.
KEY: R = revised; U = data are not available

Railroad !
165
SOURCES:Fatalities, injuries, accidents, and property damage:1970-96: U.S. Department of Transportation, Federal Railroad Administration, Office ofPolicy and Program Development, Accident/Incident Bulletin (Washington, DC: Annualissues), tables 14 and 15.1997-98: Ibid., Railroad Safety Statistics Annual Report 1998 (Washington, DC: July 1999).1999: Ibid., Internet site http://safetydata.fra.dot.gov/objects/bull99.pdf, as of Nov. 28, 2000.Train-miles:1970-90: U.S. Department of Transportation, Federal Transit Administration, NationalTransit Database (Washington, DC: Annual issues), form 406.1990-99: U.S. Department of Transportation, Federal Railroad Administration, Internet sitehttp://safetydata.fra.dot.gov/OfficeofSafety/Prelim/1999/r02.htm, as of July 10, 2000.
Table 2-39 Railroad System Safety and Property Damage Data (Excludes highway-rail grade-crossing accidents)
a Train accidents only; excludes highway-rail grade-crossing accidents.b Train-miles in this table differ from train-miles in the vehicle-miles table in Chapter 1.Train-miles reported in Chapter 1 include only Class I rail (see glossary for definition),while this table includes Class I rail, Group II rail, and other rail. For example, in 1999 Group II rail accounted for 75 million train-miles, and other rail for 25 million train-miles. Moreover, the vehicle-miles table in Chapter 1 includes only train-miles between terminals and/or stations, thus excluding yard and switching miles. In 1999, Class I yard/switching train-miles totaled 70 million train-miles. Note that commuter rail safety data are reported in the rail mode and the transit mode. Commuter rail train-miles are included in Class I rail and Group II rail in this table.
c A train-mile is the movement of a train (which can consist of many cars) the distance of1 mile. A train-mile differs from a vehicle-mile, which is the movement of 1 car (vehicle) the distance of 1 mile. A 10-car (vehicle) train traveling 1 mile would be measured as 1 train-mile and 10 vehicle-miles. Caution should be used when comparing train-miles to vehicle-miles.
d 1970 injuries not comparable to later years due to change in reporting system.NOTE: This table includes information for both freight and passenger railroad operations.
KEY: N = data do not exist; R = revised
1970 1975 1980 1985 1990 1995 1996 1997 1998 1999Fatalities 785 575 584 454 599 567 551 602 577 530Injuried Persons d17,934 50,138 58,696 31,617 22,736 12,546 10,948 10,227 10,156 10,304Accidentsa 8,095 8,041 8,205 3,275 2,879 2,459 2,443 2,397 2,575 2,768Train-miles (millions)b,c 839 755 718 571 609 670 671 677 683 712Rates per 100 million train-miles Fatalities 94 76 81 80 98 85 82 89 84 74 Injuries N 6,640 8,180 5,540 3,740 1,870 1,630 1,511 1,487 1,446 Accidents 970 1,070 1,140 570 470 370 360 354 377 389Property damage (current $ millions) 121.6 177.4 267.4 179.3 198.7 189.2 212.3 210.4 R233.1 242.3

1990 1991 1992 1993 1994 1995 1996 1997 1998 1999Employee fatalities Accidents/incidents, total 40 35 34 47 31 34 33 37 27 31
Grade-crossing accidents and incidents 5 1 2 3 1 2 1 0 4 2 Train accidents and incidents only
(grade-crossing excluded) 20 22 23 32 25 27 24 U U U
Employees injured Accidents/incidents, total 20,970 19,626 17,755 15,363 13,080 10,777 9,199 8,295 8,398 8,622
Grade-crossing accidents and incidents 169 147 157 143 126 123 79 111 122 140 Train accidents and incidents only
(grade-crossing excluded) 3,282 3,003 2,274 1,832 1,703 1,500 1,303 U U U
Employee hours (millions) N 530.7 517.0 519.7 518.6 510.3 504.6 R503.9 514.9 510.0 Fatality rates per million employee hours
All accidents/incidents N 0.07 0.07 0.09 0.06 0.07 0.07 0.07 0.05 0.06 Grade-crossing accidents and incidents N <0.01 <0.01 0.01 <0.01 <0.01 <0.01 0.00 0.01 <0.01
Train accidents and incidents only (grade-crossing excluded) N 0.04 0.04 0.06 0.05 0.05 0.05 U U U
Injury rates per million employee hours All accidents/incidents N 37.0 34.3 29.6 25.2 21.1 18.2 16.5 16.3 16.9 Grade-crossing accidents and incidents N 0.3 0.3 0.3 0.2 0.2 0.2 0.2 0.2 0.3
Train accidents and incidents only (grade-crossing excluded) N 5.7 4.4 3.5 3.3 2.9 2.6 U U U
Train-miles (millions)a 609 577 594 614 655 670 671 677 683 712 Fatality rates per million train-miles
All accidents/incidents 0.07 0.06 0.06 0.08 0.05 0.05 0.05 0.05 0.04 0.04 Grade-crossing accidents and incidents 0.01 <0.01 <0.01 <0.01 <0.01 <0.01 <0.01 0.00 0.01 <0.01
Train accidents and incidents only (grade-crossing excluded) 0.03 0.04 0.04 0.05 0.04 0.04 0.04 U U U
Injury rates per million train-miles All accidents/incidents 34.4 34.0 29.9 25.0 20.0 16.1 13.7 12.3 12.3 12.1 Grade-crossing accidents and incidents 0.3 0.3 0.3 0.2 0.2 0.2 0.1 0.2 0.2 0.2
Train accidents and incidents only (grade-crossing excluded) 5.4 5.2 3.8 3.0 2.6 2.2 1.9 U U U
166"
Chapter 2 Transportation S
afety Table 2-40 Fatalities and Injuries of On-Duty Railroad Employees
KEY: N = data do not exist; U = data are unavailable; R = revised
Continued next page

Railroad !
167
NOTE: This table includes information for both freight and passenger railroad operations.SOURCES: 1990-96: U.S. Department of Transportation, Federal RailroadAdministration, Highway-Rail Crossing Accident/Incident and Inventory Bulletin (Washington,DC: Annual issues).1997: Ibid., Railroad Safety Statistics Annual Report 1997 (Washington, DC: September1998), table 1-1, 1-3.1998-99: Ibid., Internet sitehttp://safetydata.fra.dot.gov/OfficeofSafety/Prelim/1999/r01.htm, r02.htm, andr03.htm, as of June 23, 2000.1999: U.S. Department of Transportation, Federal Railroad Administration, Office ofSafety Analysis, personal communications, July 20, 2000.
Table 2-40Cont’d Fatalities and Injuries of On-Duty Railroad Employees
a Train-miles in this table differ from train-miles in the vehicle-miles table in Chapter 1.Train-miles reported in Chapter 1 include only Class I rail (see glossary for definition),while this table includes Class I rail, Group II rail, and other rail. In 1999, Group II rail accounted for 75 million train-miles, and other rail for 25 million train-miles. Moreover,the vehicle-miles table in Chapter 1 includes only train-miles between terminals and/or stations, thus excluding yard and switching miles. In 1999, Class I yard/switching train miles totaled 70 million train-miles. Note that commuter rail safety data are reported in the rail mode and in the transit mode. Commuter rail train-miles are included in Class I rail and Group II rail in this table.
b A train-mile is the movement of a train (which can consist of many cars) the distance of1 mile. A train-mile differs from a vehicle-mile, which is the movement of 1 car (vehicle) the distance of 1 mile. A 10-car (vehicle) train traveling 1 mile would be measured as 1 train-mile and 10 vehicle-miles. Caution should be used when comparing train-miles to vehicle miles.

Section FWater
chapter two

Water !
171
jurisdiction of the United States (within 12 miles,or having an interaction with a U.S. entity, such as a platform within 200 miles or a colli-sion with a U.S. ship). Includes commercial fishing vessels.1992-98 data come from the Marine Safety Management Information System. Data forprior years may not be directly comparable.SOURCE: U.S. Department of Transportation, U.S. Coast Guard, Office ofInvestigations and Analysis, Compliance Analysis Division (G-MOA-2), personalcommunication.
1970 1975 1980 1985 1990 1995 1996 1997 1998 1999Fatalitiesa 178 243 206 131 85 46 50 46 59 44Injured persons 105 97 180 172 175 145 129 109 107 113Accidentsb 2,582 3,310 4,624 3,439 3,613 4,196 3,799 3,704 3,872 3,654Vesselsc 4,063 5,685 7,694 5,694 5,494 6,849 6,075 5,819 5,793 5,285Property damage (current $ millions) U U U U U 127.2 111.8 128.5 161.5 115.3
Table 2-41 Waterborne Transportation Safety and Property Damage Data Related to Vessel Casualties
a Fatalities include the number of people who died or were declared missing subsequent to a marine accident.
b Accidents in this table are cited as "marine casualty cases" by the U.S. Department ofTransportation, U.S. Coast Guard.
c More than one vessel may be involved in a marine accident.NOTES: All deaths and injuries cited result from vessel casualties, such as groundings,collisions, fires, or explosions. The data are for all commercial vessels under U.S. jurisdic-tion, including U.S. flag vessels anywhere in the world and foreign flag vessels within the
KEY: U = data are not available
SOURCE: U.S. Department ofTransportation, U.S. Coast Guard, Office of Investigations and Analysis, ComplianceAnalysis Division (G-MOA-2), personal communications.
1970 1975 1980 1985 1990 1995 1996 1997 1998 1999Fatalitiesa 420 330 281 130 101 137 111 108 76 67Injured persons U U U U U 1,916 1,298 947 474 399Vesselsb U 321 274 128 98 131 R1,409 1,023 506 426
Table 2-42 Waterborne Transportation Safety Data not Related to Vessel Casualties
a Fatalities include people who were declared missing.b Figures represent the number of vessels involved in nonvessel casualties. These vessels
were not part of the accident, but the accident may have occurred on the vessel (e.g.,crewmembers swept overboard by a wave).
NOTES: Fatalities and injuries cited arise from an event not related to a marine casualty,such as falls or electrocution.1992-98 data come from the Marine Safety Management Information System. Data forprior years may not be directly comparable.
KEY: R = revised; U = data are not available

172"
Chapter 2 Transportation S
afety
SOURCE: U.S. Department ofTransportation, U.S. Coast Guard, Office ofBoating Safety, Boating Statistics (Washington, DC: Annual issues).
Table 2-43 Recreational Boating Safety, Alcohol Involvement, and Property Damage Data
a Prior to 1975, the count of numbered boats is an estimate.NOTE: Only a small fraction of property damages and nonfatal accidents are reportedto the U.S. Coast Guard.
KEY: N = data do not exist; R = revisedU = data are not available
Sales: Personal Watercraft Industry Association, Internet sitehttp://www.pwia.org/Abo_PWC.htm, as of June 19, 2000.Use: 1987-96: National Marine Manufacturers Association, data compiled by theUnited States Coast Guard, personal communications.1997-98: Ibid., Internet site http://www.nmma.org/facts/boatingstats/statistic98.html,as of June 19, 2000.
1987 1988 1989 1990 1991 1992 1993 1994 1995 1996 1997 1998 1987-98Fatalities 5 20 20 28 26 34 35 56 68 57 84 78 511Injured persons 156 254 402 532 708 730 915 1,338 1,617 1,837 1,812 1,743 12,044
Accidentsa 376 650 844 1,162 1,513 1,650 2,236 3,002 3,986 4,099 4,070 3,607 27,195Sales 29,000 48,000 64,000 72,000 68,000 79,000 107,000 142,000 200,000 191,000 176,000 130,000 1,306,000
Number in use 92,756 126,881 178,510 241,376 305,915 372,283 454,545 600,000 760,000 900,000 1,000,000 1,100,000 6,132,266
Table 2-44 Personal Watercraft Safety Data
a Total vessels involved.NOTE: Personal watercraft are less than 13 feet in length and are designed to be operated by aperson or persons sitting, standing, or kneeling on craft rather than within the confines of the hull.SOURCES:Fatalities, Injuries, and Accidents: U.S. Department of Transportation, United StatesCoast Guard, Office of Boating Safety, Boating Statistics - 1998 (Washington, DC: 1999).
1960 1965 1970 1975 1980 1985 1990 1995 1996 1997 1998 1999Fatalities 739 1,360 1,418 1,466 1,360 1,116 865 829 709 821 R815 734Injuries 929 927 780 2,136 2,650 2,757 3,822 4,141 4,442 4,555 R4,612 4,315Accidents 2,738 3,752 3,803 6,308 5,513 6,237 6,411 8,019 8,026 R8,047 R8,061 7,935Vessels involved 3,785 4,792 4,762 8,002 6,954 8,305 8,591 11,534 11,306 11,396 11,368 U
Numbered boats (millions)
a
2.5 6.4 7.4 7.3 8.6 9.6 11.0 11.7 11.9 12.3 12.6 URates per 100,000 numbered boats Fatalities 32.8 21.3 19.2 20.1 15.8 11.6 7.8 7.1 6.0 6.7 6.5 U Injuries 37.1 14.5 10.5 29.3 30.8 28.7 34.7 35.4 37.3 37.0 36.7 U Accidents 109.5 58.6 51.4 86.4 64.1 65.0 58.3 68.5 67.4 65.4 64.1 UAccident reports citing alcohol involvement N N N N N 279 568 472 601 R698 704 U
Property damage (current $ millions) 3.2 4.7 8.2 10.4 16.4 20.0 23.8 R30.3 R23.2 29.0 31 U

Water !
173
(i.e., Alien Migrant Interdiction Operations (AMIO)). AMIO lives saved in fiscal year 1992 was determined to be approximately 12,000. AMIO lives saved in fiscal year 1994 was determined to be 15,179.
SOURCE: U.S. Department of Transportation, U.S. Coast Guard, Search and RescueManagement Information Systems (SARMIS II) Database, 2000 for all data exceptSearch and Rescue resource hours U.S. Department of Transportation, U.S. CoastGuard, Abstract of Operations database, 2000 for Search and Rescue resource hours.
Table 2-45 U.S. Coast Guard Search and Rescue Statistics, Fiscal Year
a Responses are the number of U.S. Coast Guard units involved. Sorties are the number of trips made by boat, aircraft, or cutter.
b Search and Rescue resource hours represent the time that Coast Guard assets (i.e., aircraft, boats and cutters) perform Search and Rescue operations.
c Those persons whose lives were lost before the U.S. Coast Guard was notified of an incident.d Those persons whose lives were lost in an incident to which the U.S.Coast Guard was
responding, but who were alive at the time the U.S. Coast Guard was notified of the incident.e Calculations are lower in fiscal year 1991 due to incomplete data submissions by two districts.f The Search and Rescue management Information System's reporting policy has been
revised, and now requires complete reporting on all lives saved. This policy also includesreporting on "lives saved" in connection with Coast Guard Law Enforcement Activity
KEY: R = revised; U = data are not available
1985 1990 e1991 1992 1993 1994 1995 1996 1997 1998 1999Cases 60,775 R53,097 R52,782 R53,294 R53,026 R53,899 R49,704 R43,553 R41,096 37,218 39,844Responsesa 70,237 R64,971 R66,409 69,856 69,784 R70,337 R63,679 55,710 R52,141 46,602 50,622Sortiesa 88,449 84,033 84,872 88,388 88,147 R108,758 R110,267 98,423 R91,722 83,307 89,635Search and Rescue
resource hoursRb U 108,020 109,194 108,634 107,431 102,749 93,984 85,136 80,336 80,070 80,490Lives saved 6,497 R4,407 Re5,465 R17,543 R5,826 Rf23,211 R4,453 R5,047 R3,897 3,194 3,743Lives lost before notificationc 259 R622 R748 R540 R800 R593 R468 R611 R454 418 353Lives lost after notificationd 1,076 R463 R368 R399 R415 R338 R304 R367 R290 188 180 Total lives lost 1,335 R1,085 R1,116 R939 R1,215 R931 R772 R978 R744 606 533
Persons otherwise assisted 138,791 R117,327 R113,704 R121,826 R119,069 R116,912 R101,357 R85,869 R75,357 66,138 70,255Value of property lost
($ million) 424.3 R368.5 R213.6 R314.5 R316.2 R435.5 R222.6 R273.8 R414.8 84.3 262.3Value of property assisted
($ millions) 2,376.8 R2,044.9 R2,282.4 R1,951.4 R2,491.8 R2,891.2 R4,467.2 R3494.2 R1762.1 1,288.2 1,235.0Property loss prevented
($ million) 905.4 R1,673.4 R1,799.3 R1,550.1 R2,144.7 R2,628.4 R3,882.8 R3087.3 R1353.5 996.8 1,019.0

Section GPipeline
chapter two

Pipeline ! 177
1970 1975 1980 1985 1990 1995 1996 1997 1998 1999FatalitiesTotal hazardous liquid 4 7 4 5 3 3 5 0 R2 4Total gas 26 8 15 28 6 18 48 10 17 17 Transmission U U 1 6 0 2 1 1 1 2 Distribution U U 14 22 6 16 47 9 16 15
InjuriesTotal hazardous liquid 21 17 15 18 7 11 13 5 R6 20Total gas 233 214 177 108 69 53 114 72 R75 87 Transmission U U 13 12 17 10 5 5 11 8 Distribution U U 164 96 52 43 109 67 R64 79
IncidentsTotal hazardous liquid 351 254 246 183 180 188 R193 R171 154 165Total gas 1,077 1,338 1,524 334 198 161 187 175 R234 174 Transmission U U 389 129 89 64 77 73 98 54 Distribution U U 1,135 205 109 97 110 102 R136 120
Property damage (current $ millions)
Total hazardous liquid 1.2 2.2 5.7 5.1 15.7 32.5 49.7 R38.0 R59.8 42.8Total gas 3.3 5.0 10.0 22.9 18.9 21.0 29.4 24.6 R48.4 58.1 Transmission U U 8.8 13.4 11.3 10.0 13.1 12.1 29.7 17.7 Distribution U U 1.2 9.5 7.6 11.0 16.3 12.5 R19.1 25.9
Hazardous Liquid and Natural Gas Pipeline Safety and Property Damage Data
NOTES: Beginning with 1985 data, pipeline incidents are credit-ed to the year in which they occurred, not the year in which thereport was received. Gas numbers represent sum of transmissionand gathering and distribution operators. Property damageincludes, but is not limited to, damage to the operator's facilitiesand to the property of others; gas lost; restoration of service andrelighting; facility repair and replacement; leak locating; right-of-way cleanup; and environmental cleanup and damage.
SOURCES:1970-85: U.S. Department of Transportation, Research and SpecialPrograms Administration, Office of Pipeline Safety, personal com-munication, 1999.1990-99: Ibid., Internet site http://ops.dot.gov as of June 19, 2000.
Table 2-46
KEY: R = revised; U = data are not available

Transportation and the Economy
Section ATransportation and the
Total Economy
chapter three

Transportation and the Total Econom
y !181
SOURCE: 1990-98: U.S. Department of Commerce, Bureau ofEconomic Analysis, Survey of Current Business (Washington, DC: June 2000), table 1.
Table 3-1a U.S. Gross Domestic Product (GDP) Attributed to For-Hire Transportation Services (Current $ billions)
a Defined as services incidental to transportation, such as forwarding and packing and arranging passenger travel and freight transportation.
KEY: R = revised
1990 1991 1992 1993 1994 1995 1996 1997 1998
Total GDPR 5,803.2 5,986.2 6,318.9 6,642.3 7,054.3 7,400.5 7,813.2 8,300.8 8,759.9
GDPTrucking and warehousingR 69.4 70.9 74.5 79.2 86.4 89.0 92.1 99.5 106.5AirR 45.3 47.0 50.3 56.4 62.5 67.7 70.8 79.2 87.8Railroad R19.8 R22.0 R21.6 R22.0 R23.3 R23.6 23.4 R23.2 24.2Transportation servicesa,R 18.2 19.5 19.9 20.8 22.6 23.5 25.7 26.9 29.0Local and interurban passenger transit R 9.1 10.2 10.9 R11.3 R11.6 R12.4 R13.4 R14.8 16.0WaterR 10.0 11.1 10.7 10.7 11.5 11.6 12.2 13.3 13.9Pipelines, except natural gasR 5.5 5.5 5.5 5.6 5.5 5.5 5.7 5.9 6.5 TotalR 177.4 186.1 193.4 206.0 223.2 233.4 243.4 262.8 283.9
% of GDPTrucking and warehousing R1.2 R1.2 R1.2 R1.2 R1.2 R 1.2 1.2 1.2 1.2Air R0.8 R0.8 R0.8 R0.8 R0.9 R 0.9 0.9 R1.0 1.0Railroad 0.3 0.4 R0.3 0.3 0.3 0.3 0.3 0.3 0.3Transportation services 0.3 0.3 0.3 0.3 0.3 0.3 0.3 0.3 0.3Local and interurban passenger transit 0.2 0.2 0.2 0.2 0.2 0.2 0.2 0.2 0.2Water transportation 0.2 0.2 0.2 0.2 0.2 R0.2 0.2 0.2 0.2Pipelines, except natural gas 0.1 0.1 0.1 0.1 0.1 0.1 0.1 0.1 0.1 Total 3.1 3.1 3.1 3.1 3.2 R 3.2 3.1 3.2 3.2
% of for-hire transportationTrucking and warehousingR 39.1 38.1 38.5 38.4 38.7 38.1 37.8 37.9 37.5AirR 25.5 25.3 26.0 27.4 28.0 29.0 29.1 30.1 30.9Railroad R11.2 11.8 R 11.2 R10.7 R10.4 10.1 R 9.6 R 8.8 8.5Transportation services R10.3 R10.5 R10.3 R10.1 10.1 R10.1 R10.6 R10.2 10.2Local and interurban passenger transit 5.1 5.5 R 5.6 5.5 5.2 R 5.3 5.5 R 5.6 5.6Water transportationR 5.6 6.0 5.5 5.2 5.2 5.0 5.0 5.1 4.9Pipelines, except natural gas R 3.1 R 3.0 R 2.8 R 2.7 R2.5 R 2.4 R 2.3 2.2 2.3 Total 100.0 100.0 100.0 100.0 100.0 100.0 100.0 100.0 100.0
a
a

182"
Chapter 3 Transportation and the E
conomy
SOURCE: 1990-98: U.S. Department of Commerce, Bureau ofEconomic Analysis, Survey of Current Business (Washington, DC: June 2000), table 6.
Table 3-1b U.S. Gross Domestic Product (GDP) Attributed to For-Hire Transportation Services (Chained 1996 $ billions)
a Defined as services incidental to transportation, such as forwarding and packing and arranging passenger travel and freight transportation.
NOTE: For-hire transportation numbers may not equal total due to the nature of thechained dollar calculations.
KEY: R = revised
1990 1991 1992 1993 1994 1995 1996 1997 1998Total GDP 6,707.9 6,676.4 6,880.0 7,062.6 7,347.7 7,543.8 7,813.2 8,144.8 8,495.7
GDPTrucking and warehousing 68.1 71.6 75.7 79.1 85.3 86.6 92.1 97.5 96.6Air 46.9 45.0 49.2 51.9 59.6 62.9 70.8 75.5 78.1Railroad 18.1 20.9 20.8 21.0 22.1 22.7 23.4 23.0 22.7Transportation services 19.5 19.8 19.6 20.4 22.1 23.4 25.7 26.3 28.7Local and interurban passenger transit 12.8 12.5 12.4 12.7 12.8 13.2 13.4 14.8 15.3Water 10.2 10.5 10.3 10.5 11.3 11.3 12.2 13.4 13.4Pipelines, except natural gas 5.7 6.2 5.9 6.0 5.5 5.0 5.7 6.4 6.9 Total 180.6 185.9 193.6 201.2 218.6 225.1 243.4 256.8 261.6
% of GDPTrucking and warehousing 1.0 1.1 1.1 1.1 1.2 1.1 1.2 1.2 1.1Air 0.7 0.7 0.7 0.7 0.8 0.8 0.9 0.9 0.9Railroad 0.3 0.3 0.3 0.3 0.3 0.3 0.3 0.3 0.3Transportation services 0.3 0.3 0.3 0.3 0.3 0.3 0.3 0.3 0.3Local and interurban passenger transit 0.2 0.2 0.2 0.2 0.2 0.2 0.2 0.2 0.2Water 0.2 0.2 0.1 0.1 0.2 0.1 0.2 0.2 0.2Pipelines, except natural gas 0.1 0.1 0.1 0.1 0.1 0.1 0.1 0.1 0.1 Total 2.7 2.8 2.8 2.8 3.0 3.0 3.1 3.2 3.1
% of for-hire transportationTrucking and warehousing 37.7 38.5 39.1 39.3 39.0 38.5 37.8 38.0 36.9Air 26.0 24.2 25.4 25.8 27.3 27.9 29.1 29.4 29.9Railroad 10.0 11.2 10.7 10.4 10.1 10.1 9.6 9.0 8.7Transportation services 10.8 10.7 10.1 10.1 10.1 10.4 10.6 10.2 11.0Local and interurban passenger transit 7.1 6.7 6.4 6.3 5.9 5.9 5.5 5.8 5.8Water 5.6 5.6 5.3 5.2 5.2 5.0 5.0 5.2 5.1Pipelines, except natural gas 3.2 3.3 3.0 3.0 2.5 2.2 2.3 2.5 2.6 Total 100.0 100.0 100.0 100.0 100.0 100.0 100.0 100.0 100.0
a,R
a
a

Transportation and the Total Econom
y !183
Table 3-2a U.S. Gross Domestic Product (GDP) Attributed to Transportation-Related Final Demand (Current $ billions)
KEY: R = revised; U = data are not available
Continued next page
1980 1985 1990 1995 1996 1997 1998 1999Personal consumption
of transportationMotor vehicles and parts 87.0 175.7 210.3 R249.3 R256.3 R263.1 R289.2 316.1Gasoline and oil 86.7 97.2 109.2 R113.3 R124.2 R126.2 R112.9 123.8Transport services 64.7 100.0 143.7 R197.7 R214.2 R234.4 R245.2 255.0 Total 238.4 372.9 463.2 R560.3 R594.7 R623.7 R647.3 694.9
Gross private domestic investmentTransportation structures 3.7 4.3 3.0 4.4 5.4 6.1 6.8 UTransportation equipment 48.4 69.7 75.5 R126.1 R138.9 R150.9 R176.0 197.1 Total 52.1 74.0 78.5 R130.5 R144.3 R157.0 R182.8 197.1
Exports (+)Civilian aircraft, engines, and parts 14.1 13.5 32.2 26.1 30.8 41.4 R53.5 53.4Automotive vehicles, engines, and parts 17.4 24.9 36.5 61.8 65.0 74.0 R73.2 74.8Passenger fares 2.6 4.4 15.3 18.9 20.4 R20.8 R20.0 21.1Other transportation 11.6 14.7 22.7 R26.1 R26.1 R27.0 R25.5 27.5 Total 45.7 57.5 106.7 R132.9 R142.3 R163.2 R172.2 176.8
Imports (-)Civilian aircraft, engines, and parts 3.1 5.3 10.5 10.7 12.7 16.6 R21.8 23.4Automotive vehicles, engines, and parts 28.3 64.9 88.5 123.8 128.9 R139.8 R149.1 180.1Passenger fares 3.6 6.4 10.5 14.7 15.8 R18.1 R19.8 21.5Other transportation 11.8 15.6 25.2 R27.0 R27.4 R29.0 R30.5 34.2 Total 46.8 92.2 134.7 R176.2 R184.8 R203.5 R221.2 259.2
Net exports of transportation-relatedgoods and servicesa -1.1 -34.7 -28.0 -43.3 -42.5 -40.3 R-49.0 -82.4

184"
Chapter 3 Transportation and the E
conomy
GDP: U.S. Department of Commerce,Bureau of Economic Analysis, Internet sitehttp://www.bea.doc.gov/bea/dn/seltab29.exe, as of May 17, 2000, table 1.1.All other data: 1980-90: U.S. Department of Commerce, Bureau of EconomicAnalysis, personal communication.1995-99: Ibid., Survey of Current Business (Washington, DC: April 2000), tables 1.1, 2.2,3.10, 4.3, and 5.4.
Table 3-2aCont’d
U.S. Gross Domestic Product (GDP) Attributed to Transportation-Related Final Demand (Current $ billions)
a Sum of exports and imports.b Federal purchases and state and local purchases are the sum of consumption
expenditures and gross investment.c Defense-related purchases are the sum of transportation of material and travel.d Sum of total personal consumption of transportation, total gross private domestic
investment, net exports of transportation-related goods and services, and total government transportation-related purchases.
SOURCES:Federal, state, and local government transportation-related purchases: U.S.Department of Commerce, Bureau of Economic Analysis, Internet sitehttp://www.bea.doc.gov/bea/dn/annonly.exe, as of July 10, 2000. 1995-98 data alsoavailable in Survey of Current Business (Washington, DC: June 2000), table 3.15.
KEY: R = revised; U = data are not available
1980 1985 1990 1995 1996 1997 1998 1999Government transportation-
related purchasesFederal purchasesb, R 7.0 10.0 12.9 16.3 17.2 17.6 18.2 UState and local purchasesb, R 48.8 67.5 90.1 109.8 115.2 124.4 129.1 UDefense-related purchasesc 4.2 6.2 8.9 R8.4 R8.8 R8.1 R8.4 9.0 TotalR 60.0 83.7 111.9 134.5 141.2 150.1 155.7 U
Gross Domestic ProductR 2,795.6 4,213.0 5,803.2 7,400.5 7,813.2 8,300.8 8,759.9 9,256.1Total transportation-related
final demandd, R 349.4 495.9 625.6 782.0 837.7 890.5 936.8 UTotal transportation in GDP (%) 12.5% 11.8% R10.8% R10.6% R10.7% R10.7% R10.7% U

R1980 R1985 R1990 R1995 R1996 R1997 R1998 1999Personal consumption
of transportationMotor vehicles and parts 142.7 236.9 246.1 253.4 256.3 263.8 291.9 318.2Gasoline and oil 94.9 104.8 113.2 120.2 124.2 126.2 127.7 128.3Transport services 124.7 152.6 173.5 201.0 214.2 226.3 234.2 241.0 Total 362.3 494.3 532.8 574.6 594.7 616.3 653.8 687.5
Gross private domestic investmentTransportation structures U U U U U U U UTransportation equipment 77.6 93.9 87.4 128.2 138.9 149.6 175.3 195.7 Total 77.6 93.9 87.4 128.2 138.9 149.6 175.3 195.7
Exports (+)Civilian aircraft, engines, and parts 26.9 19.5 40.9 27.2 30.8 40.0 51.1 49.9Automotive vehicles, engines, and parts 28.3 30.5 39.8 62.5 65.0 73.4 72.5 73.7Passenger fares 4.5 7.1 19.1 18.9 20.4 21.5 20.9 20.5Other transportation 16.5 18.9 23.9 26.8 26.1 26.9 26.4 28.0 Total 76.2 76.0 123.7 135.4 142.3 161.8 170.9 172.1
Imports (-)Civilian aircraft, engines, and parts 6.0 7.7 13.5 11.2 12.7 16.0 20.7 21.7Automotive vehicles, engines, and parts 52.5 95.8 101.6 124.6 128.9 139.5 148.6 178.3Passenger fares 5.5 9.3 12.7 14.9 15.8 17.1 18.5 19.5Other transportation 17.2 19.3 27.2 27.8 27.4 29.6 31.7 31.9 Total 81.2 132.1 155.0 178.5 184.8 202.2 219.5 251.4
Net exports of transportation-relatedgoods and servicesa -5.0 -56.1 -31.3 -43.1 -42.5 -40.4 -48.6 -79.3
Transportation and the Total Econom
y !185
Table 3-2bU.S. Gross Domestic Product (GDP) Attributed to Transportation-Related Final Demand (Chained 1996 $ billions)
KEY: R = revised; U = data are not available
Continued next page

186"
Chapter 3 Transportation and the E
conomy
GDP: U.S. Department of Commerce,Bureau of Economic Analysis, Internet sitehttp://www.bea.doc.gov/bea/dn/seltab29.exe, as of May 17, 2000, table 1.2.All other data: 1980-90: U.S. Department of Commerce, Bureau of EconomicAnalysis, personal communication.1995-99: Ibid., Survey of Current Business (Washington, DC: April 2000), tables 1.1, 2.2,3.10, 4.3, and 5.4.Price indices (for computing 1980-1990 values): U.S. Department of Commerce,Bureau of Economic Analysis, Internet sitehttp://www.bea.doc.gov/bea/dn/seltab29.exe, as of May 17, 2000, tables 7.1, 7.4, 7.6,7.10, and 7.12.
Table 3-2bCont’d
U.S. Gross Domestic Product (GDP) Attributed to Transportation-Related Final Demand (Chained 1996 $ billions)
a Sum of exports and imports.b Federal and State purchases are the sum of consumption expenditures and gross investment.c Defense-related purchases are the sum of transportation of material and travel.d Sum of total personal consumption of transportation, total gross private domestic
investment, net exports of transportation-related goods and services and total government transportation-related purchases.
NOTE: Chained 1996 $ value = (Quantity index for year n * 1996 current $ value)/100.SOURCES:Federal, state, and local government transportation-related purchases:U.S. Department of Commerce, Bureau of Economic Analysis, Internet sitehttp://www.bea.doc.gov/bea/dn/annonly.exe, as of July 10, 2000. 1995-98 data alsoavailable in Survey of Current Business (Washington, DC: June 2000), table 3.15 and Survey ofCurrent Business (Washington, DC: June 2000), table 7.11 (price indices for federal non-defense and state and local).
KEY: R = revised; U = data are not available
R1980 R1985 R1990 R1995 R1996 R1997 R1998 1999Government transportation-
related purchasesFederal purchasesb 12.5 14.0 15.7 16.6 17.2 17.3 17.6 UState and local purchasesb 89.8 93.7 104.6 112.3 115.2 121.7 124.1 UDefense-related purchases
c5.8 8.1 10.4 8.7 8.8 8.2 8.3 8.7
Total 108.1 115.8 130.7 137.7 141.2 147.3 150.0 U
Gross Domestic Product 4,900.9 5,717.1 6,707.9 7,543.8 7,813.2 8,144.8 8,495.7 8,848.2Total transportation-related
final demandd 543.0 592.1 719.6 797.4 832.3 872.8 930.5 UTotal transportation in GDP (%) 11.1% 10.4% 10.7% 10.6% 10.7% 10.7% 11.0% U

1980 1985 1990 1995 1996 1997 1998 1999Personal consumption of transportationMotor vehicles and parts 87.0 175.7 210.3 R249.3 R256.3 R263.1 289.2 316.1Gasoline and oil 86.7 97.2 109.2 R113.3 R124.2 R126.2 112.9 123.8Transportation services 64.7 100.0 143.7 R197.7 R214.2 R234.4 245.2 255.0
Total 238.4 372.9 463.2 R560.3 R594.7 R623.7 647.3 694.9
Gross private domestic investmentTransportation structures 3.7 4.3 3.0 4.4 5.4 R5.9 6.6 UTransportation equipment 48.4 69.7 75.5 R126.1 R138.9 R150.9 176.0 U
Total 52.1 74.0 78.5 R130.5 R144.3 R156.8 182.6 U
Government transportation-related purchases
Federal purchasesa,R 7.0 10.0 12.9 16.3 17.2 17.6 18.2 UState and local purchasesa,R 48.8 67.5 90.1 109.8 115.2 124.4 129.1 UDefense-related purchasesb 4.2 6.2 8.9 R8.4 R8.8 R8.1 8.4 9.0
TotalR 60.0 83.7 111.9 136.6 141.2 150.1 155.7 U
Gross Domestic DemandR 2,810.5 4,327.2 5,874.6 7,484.7 7,902.1 8,389.1 8,909.5 9,510.0Total domestic transportation-related
final demandc,R 350.5 530.6 653.6 R827.4 R880.2 R930.6 985.6 UTotal transportation in GDD (%)R 12.5% 12.3% 11.1% 11.1% 11.1% 11.1% 11.1% U
Transportation and the Total Econom
y !187
Federal, state, and local govern-ment purchases: Ibid., Survey of Current Business (Washington, DC: June 2000), table 3.15.All other data: 1980-90: U.S. Department of Commerce, Bureau of EconomicAnalysis, personal communication.1995-99: Ibid., Survey of Current Business (Washington, DC: April 2000), tables 2.2, 3.10,5.6, 5.8, and 1 (p. 127).
Table 3-3a U.S. Gross Domestic Demand (GDD) Attributed to Transportation-Related Final Demand (Current $ billions)
a Federal purchases and state and local purchases are the sum of consumption expenditures and gross investment.
b Defense-related purchases are the sum of the transportation of material and travel.c Sum of total personal consumption of transportation, total gross private domestic
investment, and total government-related purchases.SOURCES:Gross domestic demand: U.S. Department of Commerce, Bureau of EconomicAnalysis, Survey of Current Business (Washington, DC: April 2000), table 1 (p. 127).
KEY: R = revised; U = data are not available

188"
Chapter 3 Transportation and the E
conomy
All other data: 1980-90: U.S.Department of Commerce, Bureau of Economic Analysis, personal communication.1995-99: Ibid., Survey of Current Business (Washington, DC: April 2000), tables 2.3, 5.7,5.9, 3.11, and 2A (p. 131).Price indices (for computing 1980-1990 values): U.S. Department of Commerce,Bureau of Economic Analysis, Internet sitehttp://www.bea.doc.gov/bea/dn/seltab29.exe, as of May 17, 2000, tables 7.4, 7.7, 7.8,and 7.12.
Table 3-3bU.S. Gross Domestic Demand (GDD) Attributed to Transportation-Related Final Demand (Chained 1996 $ billions)
a Federal purchases and state and local purchases are the sum of consumption expenditures and gross investments.
b Defense-related purchases are the sum of the transportation of material and travel.c Sum of total personal consumption of transportation, total gross private domestic
investment, and total government-related purchases.NOTE: Chained 1996 $ value= (Quantity index for year n * 1996 current $ value)/100.SOURCES:Federal, state, and local government transportation-related purchases: U.S.Department of Commerce, Bureau of Economic Analysis, Internet sitehttp://www.bea.doc.gov/bea/dn/annonly.exe, as of July 10, 2000. 1995-98 data alsoavailable in Survey of Current Business (Washington, DC: June 2000), table 3.15 and Survey ofCurrent Business (Washington, DC: June 2000), table 7.11 (price indices for federal non-defense and state and local).
KEY: R = revised; U = data are unavailable
R1980 R1985 R1990 R1995 R1996 R1997 1998 1999Personal consumption of transportationMotor vehicles and parts 142.7 236.9 246.1 253.4 256.3 263.8 291.9 318.2Gasoline and oil 94.9 104.8 113.2 120.2 124.2 126.2 127.7 128.3Transportation services 124.7 152.6 173.5 201.0 214.2 226.3 234.2 241.0 Total 362.3 494.3 532.8 574.6 594.7 616.3 653.8 687.5
Gross private domestic investmentTransportation structures 6.4 5.7 3.7 4.6 5.4 5.7 6.3 UTransportation equipment 77.6 93.9 87.4 128.2 138.9 149.6 175.3 U Total 84.0 99.6 91.1 132.8 144.3 155.3 181.6 U
Government transportation-relatedpurchases
Federal purchasesa 12.5 14.0 15.7 16.6 17.2 17.3 17.6 UState and local purchasesa 89.8 93.7 104.6 112.3 115.2 121.7 124.1 UDefense-related purchasesb 5.8 8.1 10.4 8.7 8.8 8.2 8.3 8.7 Total 108.1 115.8 130.7 137.7 141.2 147.3 150.0 U
Gross Domestic Demand 4,890.9 5,866.2 6,764.4 7,622.2 7,902.1 8,256.9 8,713.3 9,171.3Total domestic transportation-related
final demandc 554.4 709.7 754.6 845.1 880.2 918.9 985.4 UTotal transportation in GDD (%) 11.3% 12.1% 11.2% 11.1% 11.1% 11.1% 11.3% U

Transportation and the Total Econom
y !189
Table 3-4a Contributions to Gross Domestic Product (GDP): Selected Industries (Current $ billions)
KEY: R=Revised
Continued next page
1990 1991 1992 1993 1994 1995 1996 1997 1998GDP by industryServicesR 1,072 1,124 1,219 1,288 1,365 1,462 1,564 1,693 1,841 Health careR 314 345 378 395 414 433 459 476 496 Education 40 44 R47 49 R53 R56 58 R61 66Finance, insurance, and real estateR 1,010 1,072 1,141 1,205 1,255 1,347 1,437 1,562 1,674ManufacturingR 1,041 1,044 1,082 1,131 1,223 1,289 1,316 1,377 1,433 Durable goodsR 587 576 594 633 694 730 748 799 843 Nondurable goodsR 454 468 488 499 529 559 568 579 590GovernmentR 807 857 894 925 958 990 1,020 1,059 1,100 FederalR 300 322 334 336 340 342 347 355 361 State and localR 506 535 561 589 618 647 674 704 739Retail tradeR 508 524 552 578 621 647 687 734 782Wholesale tradeR 376 396 415 433 479 501 530 572 614ConstructionR 249 233 234 249 275 290 316 343 373For-hire transportation R177 186 193 R206 R223 R233 R243 R263 284Electric, gas, and sanitary servicesR 165 177 181 189 197 207 208 207 217CommunicationsR 148 156 164 179 191 202 215 243 259Agriculture, forestry, and fishing R108 103 112 R108 119 110 130 R130 125Mining 112 R97 R88 R88 R90 R96 R113 121 106 Total GDPR 5,803 5,986 6,319 6,642 7,054 7,401 7,813 8,301 8,760Statistical discrepancyR 31 20 44 64 59 27 33 -3 -48

190"
Chapter 3 Transportation and the E
conomy
Table 3-4aCont’d Contributions to Gross Domestic Product (GDP): Selected Industries (Current $ billions)
SOURCE: 1990-98: U.S. Department of Commerce, Bureau of Economic Analysis,Survey of Current Business (Washington, DC: June 2000), table 1.
KEY: R=Revised
1990 1991 1992 1993 1994 1995 1996 1997 1998
% of GDPServices 18 19 19 19 19 20 20 20 21 Health care 5 6 6 6 6 6 6 6 6 Education 1 1 1 1 1 1 1 1 1Finance, insurance, and real estate R17 18 18 R18 18 R18 R18 19 19Manufacturing 18 17 17 17 R17 R17 17 17 16 Durable goods 10 R10 9 R10 10 10 10 10 10 Nondurable goods R8 8 8 8 8 8 7 7 7Government 14 14 14 14 R14 13 13 13 13 Federal 5 5 5 5 5 5 4 4 4 State and local 9 9 9 9 9 9 9 R8 8Retail trade 9 9 9 9 9 9 9 9 9Wholesale trade 6 7 7 R7 7 7 7 7 7Construction 4 4 4 4 4 4 4 4 4For-hire transportation 3 3 3 3 3 3 3 3 3Electric, gas, and sanitary services 3 3 3 3 3 3 3 2 2Communications 3 3 3 3 3 3 3 3 3Agriculture, forestry, and fishing 2 2 2 2 2 R1 2 2 1Mining 2 2 1 1 1 1 1 1 1

Transportation and the Total Econom
y !191
Table 3-4b Contributions to Gross Domestic Product (GDP): Selected Industries (Chained 1996 $ billions)
KEY: R = revised
Continued next page
1990 1991 1992 1993 1994 1995 1996 1997 1998
GDP by industryServicesR 1,362 1,352 1,391 1,418 1,458 1,510 1,564 1,634 1,708 Health servicesR 423 433 443 437 438 444 459 463 467 Educational servicesR 50 53 53 55 57 59 58 59 61Finance, insurance,
1,251 1,271 1,297 1,329 1,348 1,393 1,437 1,511 1,607 and real estateR
ManufacturingR 1,102 1,066 1,085 1,123 1,206 1,285 1,316 1,386 1,449 Durable goodsR 585 559 569 600 657 715 748 820 907 Nondurable goodsR 520 511 520 525 551 570 568 566 546GovernmentR 1,008 1,012 1,015 1,013 1,016 1,017 1,020 1,036 1,047 FederalR 385 385 382 373 367 354 347 349 350 State and localR 624 628 634 640 649 663 674 687 697Retail tradeR 560 555 570 582 617 641 687 739 796Wholesale tradeR 395 417 445 452 482 483 530 589 664ConstructionR 291 269 272 279 297 300 316 329 343For-hire transportation R181 186 R194 201 R219 R225 R243 R257 262Electric, gas, and
190 196 193 193 197 207 208 203 208 sanitary servicesR
CommunicationsR 155 162 169 182 191 202 215 240 257Agriculture, forestry,
119 121 131 123 136 123 130 143 143 and fishingR
MiningR 106 101 96 101 108 113 113 119 126Total GDPR 6,708 6,676 6,880 7,063 7,348 7,544 7,813 8,145 8,496
Statistical discrepancya, R 35 22 47 68 61 27 33 -3 -46

1990 1991 1992 1993 1994 1995 1996 1997 1998% of GDPServicesR 20 20 20 20 20 20 20 20 20 Health services 6 6 6 6 6 6 R6 R6 5 Educational services 1 1 1 1 1 1 1 1 1Finance, insurance,
R19 R19 R19 R19 18 18 18 R19 19 and real estateManufacturingR 16 16 16 16 16 17 17 17 17 Durable goodsR 9 8 8 8 9 9 10 10 11 Nondurable goods 8 8 8 R7 8 8 R7 7 6Government R15 R15 R15 14 R14 13 13 R13 12 Federal R6 R6 R6 5 5 R5 4 4 4 State and local 9 9 9 9 9 9 R9 8 8Retail trade R8 R8 R8 R8 R8 9 R9 R9 9Wholesale trade 6 6 R6 R6 7 R6 7 7 8Construction 4 4 4 4 4 4 4 4 4For-hire transportation 3 3 3 3 3 3 3 3 3Electric, gas, and
3 3 3 3 3 3 3 R2 2 sanitary servicesCommunications 2 R2 R2 3 3 3 3 3 3Agriculture, forestry,
2 2 2 2 2 2 2 2 2 and fishingMining 2 2 1 R1 R1 R1 1 R1 1
192"
Chapter 3 Transportation and the E
conomy
SOURCE: 1990-98: U.S. Department of Commerce, Bureau ofEconomic Analysis, Survey of Current Business (Washington, DC: June 2000), table 1.
Table 3-4bCont’d Contributions to Gross Domestic Product (GDP): Selected Industries (Chained 1996 $ billions)
a Equals the current dollar statistical discrepancy deflated by the implicit price deflator for gross domestic business product.
KEY: R = revised

Transportation and the Total Economy ! 193
1991 1992 1993 1994 1995 1996 1997 1998 1999HousingR 1,392 1,486 1,584 1,703 1,766 1,874 1,970 2,107 2,239 % of total 23 24 24 24 24 24 24 R24 24HealthcareR 818 893 957 1,011 1,086 1,142 1,200 1,272 1,356 % of total 14 14 14 14 R15 R15 14 15 15FoodR 791 819 839 889 926 985 1,014 1,058 1,104 % of total 13 13 13 R13 R13 R13 12 12 12Transportationa, R 617 656 699 748 782 838 890 937 980 % of total R10 R10 11 11 11 11 11 11 11Education 409 428 R447 469 R511 R541 R574 R608 644 % of total 7 7 7 7 7 7 7 7 7OtherR 1,958 2,036 2,116 2,233 2,330 2,434 2,653 2,779 2,934 % of total R33 32 R32 R32 31 31 32 R32 32 Total GDPR 5,986 6,319 6,642 7,054 7,401 7,813 8,301 8,760 9,256
Gross Domestic Product (GDP) by Major Social Function (Current $ billions)
a Transportation-related final demand.NOTE: Numbers and percents may not add to totals due torounding.SOURCES: 1991-94: U.S. Department of Commerce, Bureau ofEconomic Analysis, unpublished data and personal communications.1995-98: Ibid., Survey of Current Business (Washington, DC:December 1999), tables 2.4, 3.10, 3.15, 4.3, 5.6, 5.8, 5.10, and(Washington, DC: June 2000), table 3.15.
1999: Ibid., (Washington, DC: June 2000),table 1.1; and U.S. Department of Transportation, Bureau ofTransportation Statistics, extrapolations based on average annualeconomic growth rates during the 1990s.
Table 3-5
KEY: R = revised

1960 1965 1970 1975 1980 1985 1990 1995 1996 1997 1998 1999
Passenger-miles (billions)R 1,327 1,630 2,170 2,561 2,895 3,326 3,946 4,333 4,483 4,623 4,749 UIndex (1980 = 100) 46 56 75 88 100 115 136 150 155 160 164 U
Ton-miles (billions) 1,562 1,854 2,207 2,285 R2989 2,949 3,196 3,648 3,725 R3682 3,710 UIndex (1980 = 100) 52 62 74 76 100 99 107 122 125 R123 124 U
Populationa (millions) 181 194 205 216 228 238 250 263 265 268 271 UIndex (1980 = 100) 79 85 90 95 100 104 110 115 116 118 119 U
Industrial Production Indexb
(1992 = 100)R 37 50 59 63 80 88 99 114 R119 127 R132 P137
Gross Domestic ProductCurrent $ (billions) 527 719 1,036 1,063 2,784 4,181 5,744 7,270 7,662 8,111 R8,760 9,255Index (1980 = 100) 19 26 37 R38 100 150 206 261 275 291 R315 332Chained (1992) $ (billions) 2,263 2,881 3,398 3,398 4,615 5,324 6,136 6,762 6,995 7,270 8,516 8,867
194"
Chapter 3 Transportation and the E
conomy
Industrial Production Index: 1960-99: Councilof Economic Advisors, Economic Report of thePresident (Washington, DC: February 2000), table B-49.Gross Domestic Product: 1960-97: U.S. Department of Commerce, Bureau ofEconomic Analysis, Survey of Current Business (Washington, DC: August 1998), table 1,pp. 147-148, and table 2A, pp. 151-152.1998-99: Ibid., Survey of Current Business (Washington, DC: February 2000), tables 1.1and 1.2.
Table 3-6 National Transportation and Economic Trends
a Estimates as of July 1. Includes Armed Forces abroad.b Industrial Production Index covers manufacturing, mining, and utilities.SOURCES:Passenger-miles: 1960-98: Summation of all modes from the passenger-miles table inchapter 1.Ton-miles: 1960-98: Summation of all modes from the ton-miles table in chapter 1.Population: 1960-98: U.S. Department of Commerce, Census Bureau, Statistical Abstractof the United States, 1999 (Washington, DC: 1999), table 2.
KEY: P = preliminary; R = revised; U = data are not available

Section BTransportation and
Consumer Expenditures
chapter three

1960 1965 1970 1975 1980 1985 1990 1995 1996 1997 P1998Passenger transportationHighway Auto purchases and
ownershipa,f R53,659 71,628 R94,963 R152,256 R269,220 R426,766 R507,922 R634,049 647,716 R700,572 722,624 Local Bus and transitb 1,337 1,454 1,841 4,697 9,297 13,548 16,651 21,572 21,239 21,282 21,430 Taxi R870 1,113 R1,740 R2,900 R2,755 R3,770 R4,030 R4,960 R5,425 R5,735 5,735 School bus 486 707 1,219 R2,377 3,833 R5,722 R8,031 R9,889 R10,396 R10,353 10,326 Intercity, bus 559 629 799 1,016 1,709 1,989 1,750 1,481 1,472 R1,625 1,738 Total highway R56,911 75,531 R100,562 R163,246 R286,814 R451,795 R538,384 R671,951 R686,248 R739,567 761,853
Air totalc 3,555 5,682 10,565 18,851 38,135 50,319 R73,280 R81,360 87,027 R93,463 97,662Rail totald 759 598 464 1,212 2,976 3,875 4,521 6,693 5,896 5,764 5,709Water total (includes
international) 281 345 287 294 304 R600 R1,386 R1,709 1,741 R1,180 1,153Total passenger
transportationexpenditures R61,506 82,156 R111,878 R183,603 R328,229 R506,589 R617,571 R761,713 R780,912 R839,974 866,377
Transportation and Consum
er Expenditures !
197
Table 3-7 Passenger and Freight Transportation Expenditures (Current $ millions)
KEY: R = revised; P = preliminary
Continued next page

198"
Chapter 3 Transportation and the E
conomy
SOURCES:Passenger and freight: 1960, 1970-75: Eno Transportation Foundation, Inc.,Transportation in America, 1998 (Washington, DC: 1998), pp. 40, 42.1965: Ibid., Transportation in America, 1993 (Lansdowne, VA: 1994), p. 42 (Passenger only);and Transportation in America 1997 (Washington, D.C.: 1997), p. 40 (freight only).1980-90, 1995-97: Ibid., Transportation in America, 1998, Supplement (Washington, D.C.:1999), pp. vii-x.1998: Ibid., Transportation in America, 1998, (Washington, DC: 1999), pp. 40, 42.
Table 3-7Cont’d Passenger and Freight Transportation Expenditures (Current $ millions)
a Includes business expenditures for passenger cars.b Includes federal/state operating subsidies, and federal capital grants. Beginning in 1994,
includes taxes levied directly by transit agencies and local subsidies such as bridge and tunnel tolls, and nontransit parking lot funds.
c Air includes aircraft and operating costs, plus domestic and international air passenger federal excise taxes.
d Data from 1980 include federal/state/local operating subsidies and capital grants.Figures also include federal operating subsidies and capital grants for Amtrak and the Northeast Corridor.
e Domestic freight forwarder’s revenues after payment to live-haul carriers plus other shippercosts such as loading and unloading freight cars.
f Auto purchases and ownership data were completely revised in Transportation in America 1997, but data for 1965 and 1996 were not published in the current revised edition and are, therefore, not comparable to other years.
KEY: R = revised; P = preliminary
1960 1965 1970 1975 1980 1985 1990 1995 1996 1997 P1998Freight transportation
expendituresHighway Local, truck 14,289 23,779 28,819 37,287 60,545 82,200 108,350 128,352 132,973 R138,727 144,276 Intercity Bus 42 70 122 156 235 245 126 130 132 134 141 Truck 17,958 23,628 33,553 47,400 94,551 123,200 162,300 219,627 235,440 257,807 282,814 Total highway 32,289 47,477 62,494 84,843 155,331 205,645 270,776 348,109 368,545 R396,668 427,231
Air total (domestic and international) 354 708 1,171 1,838 4,013 6,817 13,706 R18,735 20,397 R22,711 24,523
Rail total 9,028 9,923 11,869 16,509 27,858 29,150 30,067 R34,343 35,059 35,349 35,294Water total 3,487 3,903 5,257 8,221 15,498 R18,448 20,121 R21,781 24,564 R20,992 22,565Oil pipeline total 895 1,051 1,396 2,220 7,548 8,910 8,387 R8,278 8,635 R8,607 8,656Other totale 1,714 1,869 1,791 2,208 3,488 4,642 7,774 R9,342 9,907 10,590 11,100 Total freight
transportationexpenditures 47,767 64,931 83,978 115,839 213,736 R273,612 350,831 R440,588 467,107 R494,917 529,369
TOTAL passenger and freight transportation expenditures R109,273 147,087 R195,856 R299,442 R541,965 R780,201 R968,402 R1,202,301 R1,248,019 R1,334,891 1,395,746

Transportation and Consum
er Expenditures !
199
Railroad fuel: Associationof American Railroads,Railroad Facts (Washington,DC: 2000), p. 60.
Table 3-8 Sales Price of Transportation Fuel to End-Users (Current ¢/gallon)
a Sales to end users (those sales made directly to the ultimate consumer, including bulk customers in agriculture, industry, and utility).
b Average retail price.SOURCES:All data except railroad fuel: U.S. Department of Energy, Energy InformationAdministration, Annual Energy Review 1999, DOE/EIA-0384(97) (Washington, DC: July2000), tables 5.20 and 5.22.
KEY: N = data do not exist; P = preliminary; R revised; U = data are not available
1980 1985 1990 1991 1992 1993 1994 1995 1996 1997 1998 1999Aviation fuel
(excluding taxes)Aviation gasolinea 108.4 120.1 112.0 104.7 102.7 99.0 95.7 100.5 111.6 R112.8 97.5 105.9Jet fuel kerosenea 86.8 79.6 76.6 65.2 61.0 58.0 53.4 54.0 65.1 R61.3 45.2 53.8
Highway fuelGasoline
(including taxes)Leadedb 119.1 111.5 114.9 U U U U U U U U UUnleaded premiumb N 134.0 134.9 132.1 131.6 130.2 130.5 R134.0 R141.0 R142.0 125.0 136.0Unleaded regularb 124.5 120.2 116.4 114.0 112.7 110.8 111.2 R115.0 R123.0 R123.0 106.0 117.0All types 122.1 119.6 121.7 119.6 119.0 117.3 117.4 R121.0 R129.0 R129.0 112.0 122.0
Diesel no. 2a
(excluding taxes) 81.8 78.9 72.5 64.8 61.9 60.2 55.4 56.0 68.1 64.2 49.4 57.9
Railroad fuelDiesel 82.6 77.8 69.2 67.2 63.3 63.1 59.9 60.0 67.7 67.8 57.0 55.5

200"
Chapter 3 Transportation and the E
conomy
Service station price (including taxes): U.S.Department of Energy, Energy Information Administration, Annual Energy Review 1998,DOA/EIA-0384(97) (Washington, DC: July 1999), table 5.22. Also available at Internetsite http://www.eia.doe.gov/pub/energy.overview/aer98/txt/aer0522.txtConsumer price indices: Council of Economic Advisors, Economic Report of thePresident (Washington, DC: February 1999), tables B-60 and B-61. Also available atInternet site http://w3.access.gpo.gov/eop/
Table 3-9 Price Trends of Gasoline v. Other Consumer Goods and Services
a Calculated by subtracting state and federal taxes from service station price (including taxes).b State and federal taxes are weighted averages computed by the American Petroleum
Institute, based on gasoline sold in the 50 states.SOURCES:Retail price of regular grade gasoline except service station prices (including taxes):American Petroleum Institute, Basic Petroleum Data Book (Washington, DC: Annual issues),section VI, table 5, and similar tables in earlier editions.
KEY: NA = not applicable
1960 1965 1970 1975 1980 1985 1990 1995 1996 1997 1998Retail price of regular grade gasoline (¢/gallon)Service station price (excluding taxes)a 21.0 20.7 24.6 44.8 105.3 89.5 88.0 74.3 82.4 80.6 70.4State and federal taxesb 10.1 10.5 11.1 12.4 13.8 22.0 26.9 40.4 40.7 42.8 41.5
Service station price (including taxes)Leaded 31.1 31.2 35.7 56.7 119.1 111.5 114.9 NA NA NA NAUnleaded NA NA NA NA 124.5 120.2 116.4 114.7 123.1 123.4 106.0
Consumer price indices (1982-84 = 100)All items 30 32 39 54 82 108 131 152 157 161 163Food 30 32 39 60 87 106 132 148 153 157 161Shelter 25 27 36 49 81 110 140 166 171 176 182Apparel and upkeep 46 48 59 73 91 105 124 132 132 133 133Motor fuel 24 25 28 45 97 99 101 100 106 106 92Medical care 22 25 34 48 75 114 163 221 228 235 242

Transportation and Consum
er Expenditures !
201
SOURCE: U.S. Department of Labor,Bureau of Labor Statistics, Internet site www.bls.gov/datahome.htm, as of May 12, 2000.
Table 3-10 Producer Price Indices for Transportation Services
NOTES: Data are reported monthly from January to December. The monthly indices, how-ever, are available for fewer than 12 months for some years. In both cases, a simple averageof the available monthly indices is reported for each year. Data are not seasonally adjusted.
KEY: R = revised; U = data are not available
SOURCE: U.S. Department ofLabor, Bureau of Labor Statistics, Producer Price Index Revision – Current Series,Internet site www.bls.gov/datahome.htm, as of May 12, 2000.
Table 3-11 Producer Price Indices for Transportation Equipment
NOTES: Bureau of Labor Statistics data are reported monthly from January toDecember. The monthly indices, however, are available for fewer than 12 months forsome years. In both cases, a simple average of the available monthly indices is reportedfor each year. Data are not seasonally adjusted.
KEY: NEC = not elsewhere classified; R = revised
Basedate 1990 1991 1992 1993 1994 1995 1996 1997 1998 1999
Railroads, line-haul operating (SIC 4011) 12/84 107.5 109.3 109.9 110.9 111.8 111.7 111.5 112.1 113.4 113.0Motor freight transportation and warehousing (SIC 42) 06/93 U U U R99.9 101.9 104.5 106.3 108.9 111.6 114.8Water transportation (SIC 44) 12/92 U U 100.0 99.7 100.0 103.0 103.7 104.2 R105.6 113.0Air Transportation (SIC 45) 12/92 U U 100.0 105.6 108.5 113.7 121.1 125.3 R124.5 130.8Pipelines, except natural gas (SIC 46) 12/86 95.8 96.1 96.4 96.6 102.6 110.8 104.6 98.8 99.2 98.3Travel agencies (SIC 4724) 12/89 107.3 113.6 113.4 115.3 115.3 111.3 109.9 114.5 R112.1 112.0Freight transportation arrangement (SIC 4731) 12/94 U U U U 100.0 99.8 101.5 101.4 R99.7 99.2
Basedate 1990 1991 1992 1993 1994 1995 1996 1997 1998 1999
Transportation equipment (SIC 37) 12/84 115.6 119.8 123.0 126.3 130.1 132.2 134.2 134.1 133.6 134.5Motor vehicles and motor vehicle equipment (SIC 371) 12/84 113.0 117.4 120.5 123.8 127.5 129.1 130.4 129.0 127.7 128.3Motor vehicles and passenger car bodies (SIC 3711) 06/82 119.9 125.3 129.1 133.2 138.0 139.1 140.4 138.7 136.8 137.6Truck and bus bodies (SIC 3713) 12/82 125.4 128.1 131.1 132.8 136.8 145.5 149.9 153.5 155.3 157.0Motor vehicle parts and accessories (SIC 3714) 12/82 108.9 110.3 111.0 111.7 112.0 113.5 114.0 113.1 112.6 112.0Truck trailers (SIC 3715) 12/79 125.6 128.1 131.2 134.2 138.6 148.6 147.8 147.7 152.2 153.6Motor homes built on purchased chassis (SIC 3716) 06/84 125.8 128.7 131.8 133.9 134.5 137.8 141.6 143.1 R145.0 147.6Aircraft (SIC 3721) 12/85 116.0 120.4 124.3 128.6 132.9 137.3 140.5 142.3 R142.7 144.1Aircraft engines and engine parts (SIC 3724) 12/85 112.6 117.9 123.6 125.7 129.0 130.9 133.4 134.8 R135.8 136.8Aircraft parts and auxiliary equipment, NEC (SIC 3728) 06/85 116.3 120.3 124.9 128.0 130.7 131.7 136.3 139.0 R140.8 142.2Shipbuilding and repairing (SIC 3731) 12/85 114.0 116.2 118.3 123.3 126.8 127.6 130.1 133.3 134.8 135.4Boatbuilding and repairing (SIC 3732) 12/81 136.0 140.1 144.9 147.7 150.2 154.6 159.6 165.0 168.6 172.7Railroad equipment (SIC 3743) 06/84 114.2 117.3 118.7 119.8 122.6 127.6 129.6 127.4 127.5 128.1Motorcycles, bicycles, and parts (SIC 3751) 12/84 109.9 111.8 114.4 116.9 119.0 122.2 123.3 123.3 R124.2 125.5Travel trailers and campers (SIC 3792) 06/84 118.1 120.1 122.2 123.2 124.7 127.2 129.0 129.6 130.3 132.0Transportation equipment, NEC (SIC 3799) 06/85 112.5 114.9 116.1 117.2 119.1 123.3 126.6 128.7 R131.3 132.2

1960 1965 1970 1975 1980 1985 1990 1995 1996R 1997R 1998 1999Transportation 42,900 59,100 81,100 130,200 238,400 372,800 463,300 574,100 594,600 623,700 647,400 705,500 Transportation as a
% of total 12.9 13.3 12.5 12.7 13.5 13.8 12.1 11.6 11.4 11.3 11.1 11.3Food and tobacco 89,200 108,800 154,600 238,200 376,200 497,300 672,500 780,400 834,100 866,300 907,400 963,800Clothing, accessories,
and jewelry 32,700 41,400 57,600 85,600 132,300 188,300 262,700 321,800 333,300 348,200 367,900 397,200Personal care 5,600 8,100 11,800 16,700 26,600 39,100 57,300 71,800 71,600 76,100 80,500 86,000Housing 48,200 65,400 94,000 147,000 255,200 407,100 586,300 750,400 772,500 809,800 855,900 906,200Household operation 46,700 62,100 84,800 135,400 232,600 342,000 436,200 559,400 589,200 617,500 646,500 682,500Medical care 22,100 34,100 60,000 107,900 206,400 366,700 615,600 875,000 932,300 977,600 1,032,300 1,102,600Personal business 14,600 20,900 32,000 53,000 101,200 182,600 290,100 388,800 435,100 488,300 528,600 586,200Recreation 18,500 26,800 43,100 70,500 116,300 185,900 281,600 404,200 429,600 457,800 494,700 534,900Education and research 4,300 6,900 12,500 20,500 33,300 52,900 80,700 112,000 122,300 130,700 139,200 148,900Religious and welfare
activities 5,300 7,700 12,100 19,700 38,300 62,600 100,400 138,600 146,800 150,300 163,500 170,200Foreign travel and
other, net 2,100 2,900 4,500 4,400 3,500 7,500 -7,400 -22,700 -24,100 -21,800 -15,300 -15,400Total expenditures 332,200 444,200 648,100 1,029,100 1,760,300 2,704,800 3,839,300 4,953,900 5,237,300 5,524,500 5,848,600 6,268,700
Disposable Personal Income (DPI)R 366,200 498,900 736,500 1,181,400 2,019,800 3,086,500 4,293,600 5,422,600 5,677,700 5,982,800 6,286,200 6,637,700Transportation as a
% of DPIR 11.7 11.9 11.1 11.2 11.8 12.1 10.8 10.6 10.5 10.4 10.3 10.6
202"
Chapter 3 Transportation and the E
conomy
1998: Ibid., Survey of Current Business: Internet sitewww.bea.doc.gov/bea/pubs.htm, table B.4.1999: Ibid., Survey of Current Business (Washington, DC: October 2000), Vol. 80., No. 10,table B.4.
Table 3-12 Personal Expenditures by Category (Current $ millions)
SOURCES:DPI: 1960-1999: U.S. Department of Commerce, Bureau of Economic Analysis, Table209, Internet site http://www.bea.doc.gov, as of Dec. 14, 2000.All but DPI: 1960-90: Ibid., personal communication.1995-97: Ibid., Survey of Current Business (Washington, DC: August 1998), table 2.4.
KEY: R = revised

Transportation and Consum
er Expenditures !
203
1992-93: Ibid., Survey of CurrentBusiness (Washington, DC: August 1997), table 2.4.1994-98: Ibid., Survey of Current Business, Internet sitehttp://www.bea.doc.gov/bea/pubs.htm, table B.4.
Table 3-13 Personal Consumption Expenditures on Transportation by Subcategory (Current $ millions)
NOTE: Numbers may not add to totals due to rounding.SOURCES: 1960-91: U.S. Department of Commerce, Bureau of Economic Analysis,National Income and Wealth Division, personal communication, 1998.
KEY: R = revised; RVs = recreational vehicles
1960 1965 1970 1975 1980 1985 1990 1995 R1996 R1997 1998User-operated transportationNew cars and net purchases of
used cars 16,600 25,200 26,800 36,800 57,200 110,700 124,000 139,600 133,300 136,200 146,100New and used trucks and RVs 610 1,280 2,700 7,700 11,800 40,800 56,900 79,700 84,300 87,200 101,400Tires, tubes, accessories, and parts 2,500 3,500 6,100 10,300 17,900 24,300 29,400 36,200 38,700 39,700 41,700Repair and rental 5,500 7,700 12,300 19,800 34,000 60,500 87,300 128,700 134,200 145,900 153,800Gasoline and oil 12,000 14,800 21,900 39,700 86,700 97,200 109,200 115,600 124,200 126,200 112,900Tolls 310 460 650 820 1,100 1,520 2,000 2,800 3,700 4,000 4,400Insurance premiums, less claims paid 2,000 2,400 3,800 3,800 9,400 10,000 18,000 29,400 31,800 36,300 37,800 Total 39,500 55,100 74,200 118,920 218,300 344,900 426,900 531,900 550,200 575,600 598,000
Purchased intercity transportationRailroad 310 280 210 270 300 480 800 800 600 700 700Intercity bus 290 380 530 740 1,400 1,350 R1,000 1,100 1,800 1,800 2,000Airline 680 1,280 3,100 5,900 12,800 17,600 23,900 27,900 26,200 29,000 29,500Other 35 54 182 390 910 1,720 2,800 3,300 4,700 4,700 5,100 Total 1,310 2,000 4,000 7,300 15,410 21,100 27,800 33,000 33,300 36,300 37,200
Purchased local transportationMass transit system 1,420 1,450 1,810 2,100 2,900 4,200 5,200 6,000 7,700 8,100 8,400Taxi 610 610 1,180 1,970 1,870 2,600 2,600 3,200 3,500 3,700 3,700 Total 2,000 2,100 2,990 4,100 4,770 6,800 7,800 9,100 11,200 11,800 12,100
Total transportation 42,900 59,100 81,100 130,200 238,400 372,800 463,200 574,100 594,600 623,700 647,400

204"
Chapter 3 Transportation and the E
conomy
sonal use of vehicles driven less than 10 miles to or from work, with no drivers under25 years old. Normal depreciation costs are based on the vehicle's trade-in value at theend of 4 years or 60,000 miles. American Automobile Association analysis covers vehi-cles equipped with standard and optional accessories including automatic transmission,air conditioning, power steering, power disc brakes, AM/FM stereo, driver- and passen-ger-side air bags, anti-lock brakes, cruise control, tilt steering wheel, tinted glass, emis-sions equipment, and rear-window defogger.SOURCE: American Automobile Association, Your Driving Costs (Heathrow, FL:Annual issues).
1975 1980 1985 1990 1995 1996 1997 1998 1999Average total cost per mile (current ¢) 14.4 21.2 23.2 33.0 41.2 42.6 44.8 46.1 49.1Gas and oil 4.8 5.9 5.6 5.4 5.8 5.6 6.6 6.2 6.9 Gas and oil as a % of total cost 33.4 27.9 24.0 16.4 14.1 13.1 14.7 13.4 14.1Maintenance 1.0 1.1 1.2 2.1 2.6 2.8 2.8 3.1 3.6Tires 0.7 0.6 0.7 0.9 1.2 1.2 1.4 1.4 1.7Average total cost per 15,000 miles, (current $) 2,154 3,176 3,484 4,954 6,185 6,389 6,723 6,908 7,363Variable cost 968 1,143 1,113 1,260 1,440 1,440 1,620 1,605 1,829Fixed costb 1,186 2,033 2,371 3,694 4,745 4,949 5,103 5,303 5,534
Table 3-14 Average Cost of Owning and Operating an Automobilea (Assuming 15,000 Vehicle-Miles per Year)
a All figures reflect the average cost of operating a vehicle 15,000 miles per year in stop and go conditions.
b Fixed costs (ownership costs) include insurance, license, registration, taxes, depreciation,and finance charges.
NOTES: Changes in the way costs were calculated make it difficult to compare pre 1985data with more recent years. Prior to 1985, the cost figures are for a mid-sized, currentmodel, American car equipped with a variety of standard and optional accessories. After1985, the cost figures represent a composite of three current model American cars. The1999 fuel costs are based on an average price of $1.285 per gallon of regular unleadedgasoline, weighted 20% full-serve and 80% self-serve. Insurance figures are based on per-

Transportation and Consum
er Expenditures !
205
Class I bus, intercity: 1960-90:Interstate Commerce Commission, Transport Statistics in the United States, Motor Carriers(Washington, DC: Annual issues), part 2.1995-97: U.S. Department of Transportation, Bureau of Transportation Statistics,Selected Earnings Data, Class I Motor Carriers of Passengers (Washington, DC: Annualissues).Transit and commuter rail: 1960-98: American Public Transit Association, Transit FactBook (Washington, DC: Annual issues) (passenger fares/passenger trips).Intercity/Amtrak: 1960-70: Association of American Railroads, Railroad Facts(Washington, DC: Annual issues).1975-80: Amtrak, State and Local Affairs Department and Public Affairs Department,personal communication.1985-98: Amtrak, Amtrak Annual Report, Statistical Appendix (Washington, DC: Annualissues) (transportation revenues/Amtrak system passenger trips).
1960 1965 1970 1975 1980 1985 1990 1995 1996 1997 1998Air carrier, domestic, scheduled service 33.01 34.13 40.65 53.64 84.60 92.53 107.86 106.66 110.37 114.10 114.08Class I bus, intercity
a2.46 2.73 3.81 5.46 10.57 11.98 20.22 20.10 22.85 20.57 U
Transit, all modesb (unlinked) 0.14 0.16 0.22 0.27 0.30 0.53 0.67 R0.88 0.93 0.89 0.87
Commuter rail 0.64 0.71 0.84 1.04 1.41 2.85 2.90 3.13 3.25 3.30 3.28Intercity/Amtrak
c4.22 3.92 3.19 12.96 17.72 26.15 38.51 39.03 42.54 44.31 43.98
Table 3-15a Average Passenger Fares (Current $)
a Regular route intercity service.b Prior to 1984, excludes commuter railroad, automated guideway, urban ferryboat,
demand responsive, and most rural and smaller systems.c Amtrak began operations in 1971.SOURCES:Air carrier, domestic, scheduled service: 1960: Civil Aeronautics Board, Handbook ofAirline Statistics, 1969 (Washington, DC: February 1970), part III, table 2 (enplanements);part IV, table 2 (passenger revenue).1965-70: Ibid., Handbook of Airline Statistics, 1973 (Washington, DC: March 1974), part III,table 2 (enplanements); part IV, table 2 (passenger revenue).1975-80: Ibid., Air Carrier Financial Statistics (Washington, DC: Annual December issues), p.1, line 3; and Air Carrier Traffic Statistics (Washington, DC: Annual December issues), p.2, line 16 (passenger revenue/revenue passenger enplanements).1985-98: U.S. Department of Transportation, Bureau of Transportation Statistics, Office ofAirline Information, Air Carrier Financial Statistics (Washington, DC: Annual December issues),p. 1, line 3 (passenger revenues); Air Carrier Traffic Statistics (Washington, DC: AnnualDecember issues), p. 2, line 16 (passenger revenue/revenue passenger enplanements).
KEY: R = revised; U = data are not available
NOTE: BTS converted current dol-lars to chained dollars using a combination of deflators constructed from the Bureau ofLabor Statistics' Consumer Price Index and the Bureau of Economic Analysis' chain-type price index.SOURCES: See table 3-15a for data sources.
R1960 R1965 R1970 R1975 R1980 R1985 R1990 R1995 R1996 R1997 1998Air carrier, domestic, scheduled service 192.03 181.93 177.59 174.16 184.39 143.77 133.24 109.68 110.37 110.59 108.33Class I bus, intercity
a14.31 14.55 16.64 17.73 23.04 18.61 24.98 20.67 22.85 19.94 U
Transit, all modesb (unlinked) 0.81 0.85 0.96 0.88 0.65 0.82 0.83 0.90 0.93 0.86 0.83
Commuter rail 3.72 3.78 3.67 3.38 3.07 4.43 3.58 3.22 3.25 3.20 3.11Intercity/Amtrak
c24.55 20.90 13.94 42.08 38.62 40.64 47.58 40.14 42.54 42.95 41.76
Table 3-15b Average Passenger Fares (Chained 1996 $)
a Regular route intercity service.b Prior to 1984, excludes commuter railroad, automated guideway, urban ferryboat,
demand response, and most rural and smaller systems.c Amtrak began operations in 1971.
KEY: R = revised; U = data are not available

Section CTransportation Revenues,
Employment, andProductivity
chapter three

Transportation Revenues, E
mploym
ent, and Productivity !
209
1985-98: U.S. Department of Transportation,Bureau of Transportation Statistics, Office of Airline Information, Air Carrier FinancialStatistics (Washington, DC: Annual December issues), p. 1, line 3.Ibid., Air Carrier Traffic Statistics (Washington, DC: Annual December issues), p. 2, line 9(total passenger operating revenues/total revenue passenger-miles).Intercity class I bus and commuter rail: 1960-98: Eno Transportation Foundation,Inc., Transportation in America, 1998 (Washington, DC: 2000), p. 50.Intercity/Amtrak: 1960-70: Association of American Railroads, Railroad Facts(Washington, DC: Annual issues).1975-80: Eno Transportation Foundation, Inc., Transportation in America, 1994(Lansdowne, VA: 1994), p. 50.1985-98: Amtrak. Amtrak Annual Report, Statistical Appendix (Washington, DC: Annualissues) (transportation revenues/passenger-miles).Consumer Price Index: 1960-98: Council of Economic Advisors, Economic Report ofthe President, 2000 (Washington, DC: 2000), table B-58.
Table 3-16 Average Passenger Revenue per Passenger-Mile (Current ¢)
a Regular route intercity service.b Amtrak began operations in 1971.c In 1998, the Consumer Price Index (CPI) was revised to reflect several improvements. For
example, the CPI sample area was updated to include 1990 Census data on the regional distribution of the population (1980 population data were previously used). The CPI was also updated to reflect 1993-95 spending patterns (1982-84 data were previously used).
SOURCES:Air carrier, domestic, scheduled service: 1960: Civil Aeronautics Board, Handbook ofAirline Statistics, 1969 (Washington, DC: February 1970), part III, table 2 (passenger-miles); part IV, table 2 (passenger revenues).1965-70: Ibid., Handbook of Airline Statistics, 1973 (Washington, DC: March 1974), part III,table 2 (passenger-miles); part IV, table 2 (passenger revenues).1975-80: Ibid., Air Carrier Financial Statistics (Washington, DC: Annual December issues),p. 2, line 3.Ibid., Air Carrier Traffic Statistics (Washington, DC: Annual December issues), p. 4, line 9.
KEY: P = Preliminary; R = revised
1960 1965 1970 1975 1980 1985 1990 1995 1996 1997 1998Air carrier, domestic,
scheduled service 6.1 6.1 6.0 7.7 11.5 12.2 13.4 13.5 13.8 13.9 14.0Index (1980 = 100) 53 53 52 67 100 106 117 117 120 121 122
Class I bus,a intercity 2.7 2.9 3.6 4.9 7.3 9.9 11.6 12.2 12.3 12.5 P12.5Index (1990 = 100) 23 25 31 42 63 85 100 106 106 108 108
Commuter rail 2.9 3.3 3.8 4.6 6.7 12.1 13.5 13.1 13.7 R14.7 P14.6Index (1990 = 100) R22 R25 28 34 50 90 100 97 R102 R109 109
Intercity/Amtrakb 3.0 3.1 4.0 5.7 8.2 11.3 14.1 14.6 16.6 17.3 17.5Index (1990 = 100) 21 22 28 40 58 80 100 103 118 123 124
Consumer Price Index (1982-84=100) 30 32 39 54 82 108 131 152 157 161 c163

1960 1965 1970 1975 1980 1985 1990 1995 1996 1997 1998Air carrier, domestic,
scheduled service 22.8 20.5 21.9 28.2 46.3 48.8 64.6 76.5 81.5 R79.8 84.1
Index (1980 = 100) 49 44 47 61 100 105 140 165 176 172 182
Trucka 6.3 6.5 8.5 11.6 18.0 22.9 24.4 25.1 R26.0 26.1 26.2Index (1990 = 100) 26 26 35 48 74 94 100 103 107 107 107
Class I rail 1.40 1.27 1.43 2.04 2.87 3.04 2.66 2.40 2.35 2.40 2.34Index (1990 = 100) 53 48 54 77 108 114 100 90 88 90 88
Barge N 0.35 0.30 0.52 0.77 0.80 0.76 0.73 0.73 0.73 0.74Index (1990 = 100) N 46 39 68 101 105 100 96 96 96 98
Oil pipeline 0.32 0.28 0.27 0.37 b1.33 1.57 1.44 1.51 1.37 1.37 1.40Index (1990 = 100) 22 19 19 26 92 109 100 105 95 95 97
Producer Price Index (1982 = 100)c 33 34 39 58 88 105 119 128 131 132 131
210"
Chapter 3 Transportation and the E
conomy
1985-98: U.S. Department of Transportation,Bureau of Transportation Statistics, Office of Airline Information, Air Carrier FinancialStatistics (Washington, DC: Annual December issues), p. 1, line 4.Ibid., Air Carrier Traffic Statistics (Washington, DC: Annual December issues), p. 2, line18 (freight operating revenues/freight revenue ton-miles).Truck, barge, and oil pipeline: 1960-98: Eno Transportation Foundation, Inc.,Transportation in America, 1999 (Washington, DC: 1999), p. 49.Class I rail: 1960-98: Association of American Railroads, Railroad Facts (Washington,DC: 1998), p. 30.Producer Price Index: 1960-98: Council of Economic Advisors, Economic Report of thePresident, 2000 (Washington, DC: February 2000), table B-63.
Table 3-17 Average Freight Revenue per Ton-Mile (Current ¢)
a General freight common carriers, most of which are LTL (less-than-truckload) carriers.b Reflects entrance of Alaska pipeline moving crude petroleum to U.S. refineries between 1975 and 1980.
c Total finished goods.SOURCES:Air carrier, domestic, scheduled service: 1960: Civil Aeronautics Board, Handbook ofAirline Statistics, 1969 (Washington, DC: 1970), part III, tables 2 and 131965-70: Ibid., Handbook of Airline Statistics, 1973 (Washington, DC: 1974), part III, tables2 and 13.1975-80: Ibid., Air Carrier Traffic Statistics (Washington, DC: 1976, 1981), pp. 4 and 14(December 1976) and pp. 2 and 3 (December 1981).
KEY: N = data do not exist; R = revised

R1960 R1965 R1970 R1975 R1980 R1985 R1990 R1995 R1996 R1997 1998Air carrier, domestic, all services 2,178 3,691 7,180 12,020 26,440 37,629 57,961 70,885 76,891 82,250 87,000Trucking and courier services,
except air N N N N N N 127,314 161,806 174,743 183,153 R197490Class I bus, intercity 463 607 722 955 1,397 1,233 943 917 912 1,000 UTransita 1,407 1,444 1,707 3,451 6,510 12,195 16,053 18,241 19,151 19,515 P18,897Class I rail 9,514 10,208 11,992 16,402 28,258 27,586 28,370 32,279 32,693 33,118 R33151Intercity/Amtrakb N N N 253 454 832 1,308 1,497 1,555 1,674 R2285Water transportation (domestic)c 1,722 1,822 2,070 3,293 7,219 7,703 7,940 7,712 7,684 6,901 P6,886Oil pipelined 895 1,051 1,396 2,220 7,548 8,910 8,387 8,278 8,635 8,607 8,656Gas pipeline (investor-owned)e 8,700 11,500 16,400 30,551 85,918 103,945 66,027 58,435 72,025 53,328 64,905 Transmission companies 3,190 4,088 5,928 11,898 41,604 45,738 21,756 12,092 12,050 10,339 9,450 Distribution companies N N N 5,938 14,013 21,510 18,750 19,421 30,407 30,864 27,542 Integrated companies N N N 6,962 17,300 17,396 10,117 10,899 11,941 12,125 10,954 Combination companies N N N 5,753 13,001 19,301 15,404 16,023 17,627 U 16,959
Transportation Revenues, E
mploym
ent, and Productivity !
211
Trucking and courier services,except air: 1990-98: U.S. Department
of Commerce, Bureau of the Census,Transportation Annual Survey, 1998 (Washington, DC: January 2000), table 1.Intercity Class I bus: 1960-90: Interstate Commerce Commission, Annual Report of theInterstate Commerce Commission (Washington, DC: Annual issues).1995-97: U.S. Department of Transportation, Bureau of Transportation Statistics, SelectedEarnings Data, Class 1 Motor Carriers of Passengers (Washington, DC: Annual issues).Transit: 1960-98: American Public Transportation Association, Public Transportation FactBook (Washington, DC: March 2000), table 21, and similar tables in earlier editions ofthe APTA Transit Fact Book.Class I rail: 1960-98: Association of American Railroads, Railroad Facts(Washington, DC: 1998), p. 12.Intercity/Amtrak: 1975-80: Amtrak, State and Local Affairs Department and PublicAffairs Department, personal communication.1985-98: Ibid., Amtrak Annual Report, Statistical Appendix (Washington, DC: Annual issues).Water transportation: 1960-98: Eno Transportation Foundation, Inc., Transportation inAmerica (Washington, DC: Annual issues and supplements), p. 40.Oil pipeline: 1960-98: Eno Transportation Foundation, Inc., Transportation in America(Washington, DC: Annual issues and supplements), p. 40.Gas pipeline: 1960-98: American Gas Association, Gas Facts (Arlington, VA: Annualissues), tables 12-1, 12-2, 12-3, and 12-4; and similar tables in income accounts sectionin earlier editions.
Table 3-18 Total Operating Revenues (Current $ millions)
a Excludes commuter rail, automated guideway, urban boat, demand responsive, and most rural and smaller systems prior to 1984. Includes operating assistance.
b Amtrak began operations in 1971.c Includes foreign traffic moving on domestic inland waterways.d Oil pipeline revenues are much smaller than gas pipeline revenues because oil pipeline
companies are common carriers that include transportation costs only.e Data are not directly comparable from year to year due to acquisition and mergers. Prior
to 1975, pipeline companies are not categorized by distribution, integrated, or combination. Total numbers for these companies are 1960 = 5,505; 1965 = 7,437;1970 = 10,542. In 1997, the American Gas Association revised the database that identifies companies by type (distribution, integrated, or transmission). This reclassification of companies has resulted in numerous additions to the distribution company sample, in particular from the integrated company sample.
NOTE: In January 2000, the American Public Transit Association changed its name tothe American Public Transportation Association (APTA). The APTA Transit Fact Book isnow referred to as the Public Transportation Fact Book.SOURCES:Air carrier, domestic, all services: 1960-70: Civil Aeronautics Board, Handbook ofAirline Statistics, 1973 (Washington, DC: March 1974).1975-80: Ibid., Air Carrier Financial Statistics (Washington, DC: Annual issues), p. 1.1985-98: U.S. Department of Transportation, Bureau of Transportation Statistics, Officeof Airline Information, Air Carrier Financial Statistics (Washington, DC: Annual Decemberissues), p. 1.
KEY: N = data do not exist; P = preliminary;R = revised; U = data are not available

212"
Chapter 3 Transportation and the E
conomy
Table 3-19 Employment in For-Hire Transportation and Selected Transportation-Related Industriesa (Thousands)
KEY: N = data do not exist; R = revised; U = data are not available
Continued next page
SICTotal U.S. labor forceb
For-hire transportation industry45 Air42 Trucking and warehousing41 Local and interurban passenger
transit413 Intercity and rural bus411 Local and suburban415 School busc
412 Taxi Other local and interurband
40 Railroad44 Water46 Liquid pipeline
492 Natural gas pipelinee
f
Distribution Transmission Integrated Combination Noninvestor-owned
47 Transportation services Total for-hire transportation
196054,189
191856
41UN
121R123885
N23
N31NNNN
R2,271
196560,763
229964
42UN
110R11873522820
N30NNN
85R2,559
197070,880
3521,083
43UN
106R13163421218
N32NNN
115R2,726
197576,945
3631,108
4069658511
54819418
5137555211
1342,841
198090,406
4531,280
38798053
R1653221121
5245535213
1983,175
198597,387
5221,361
35929138
R2235918519
6246435312
2753,214
1990109,403
9681,395
261411113228
27917719
6537405012
R336R3,715
1995117,191
1,0681,587
2420313131
R3123817515
6228364211
401R4,083
1996119,608
1,1071,637
2421813231
R3323117415
80321339
R16418
R4,198
1997122,690
R1,134R1,677
R22R229R137
31R34227
R17914
752812319
R441R4,278
1998R125,826
R1,183R1,745
R26R235R141
31R35
R231R180
14
R70R28R14R30
R9R455
R4,427
1999
128,615
1,2371,813
282421463134
23018113
UUUUU
4694,425

Transportation Revenues, E
mploym
ent, and Productivity !
213
Table 3-19Cont’d
Employment in For-Hire Transportation and Selected Transportation-Related Industriesa (Thousands)
KEY: N = data do not exist; R = revised; U = data are not available
Continued next page
SIC37 Equipment manufacturing
372 Aircraft and parts371 Motor vehicles and equipment374 Railroad equipment373 Ship and boat building
and repairing301 Tires and inner tubes
Other g
Total SIC 37 and SIC 301
Related industries553 Automotive and home supply
stores75 Automotive repair, services,
and parking554 Gasoline service stations161 Highway and street construction501 Motor vehicles, parts,
and supplies551 New and used car dealers
Other automotive retail h
Total related industries
Government employmentU.S. DOT j
State and local highway k
i
Total governmentemployment
Total transportation-relatedlabor force
1960
60572443
141105155
1,773
U
U461
U
UUN
461
N532
532
R5,037
1965
60184356
160102193
1,955
U
U522
U
UUN
522
N577
577
R5,613
1970
64479951
172116167
1,949
U
U613
U
UUN
613
104607
711
6,000
1975
49979257
194124157
1,824
212
439622
U
382731112
2,498
112604
716
7,879
1980
63378971
221115
R167R1,995
261
571561
U
434745122
2,694
112559
671
8,536
1985
61688333
18794
2412,054
304
730588264
454856
R140R3,336
100549
649
R9,252
1990
71281233
18884
2442,073
337
914647239
456924
R155R3,672
104569
673
10,133
1995
45197138
16080
R172R1,872
369
1,020649228
492996176
3,930
101R543
R644
R10,527
1996
45896736
15980
165R1864
380
1,080669236
5031,031
1874,086
99lN
99
R10,247
1997
R501R986
R34
R15878
167R1,923
R392
R1,120R676R243
R513R1,046
197R4,186
98R531
R629
R11,016
1998
R524R990
R37
R16679
R168R1,963
R398
R1,144R689R253
R518R1,048
206R4,257
99R530
R629
R11,276
1999
4901,000
35
16477
1661,932
405
1,185702264
5321,081
2184,386
100U
100
10,843

214"
Chapter 3 Transportation and the E
conomy
industries have nontransportation jobs (e.g., a bookkeeper in a trucking firm), and somepeople with transportation occupations do not work in the transportation industry (e.g.,a truck driver for a construction firm). Beginning in January 1999, data are not strictlycomparable with data for 1998 and earlier years because of revisions in the populationcontrols used in the household survey.SOURCES:All data, except as noted: 1960-85: U.S. Department of Labor, Bureau of LaborStatistics, Employment, Hours and Earnings, United States, 1909-1994 (Washington, DC:September 1994).1990-99: Ibid., Internet site www.bls.gov/datahome.htm, database query for individualseries, as of Apr. 20, 2000.Natural gas pipeline: 1975-99: American Gas Association, Gas Facts (Arlington, VA:Annual issues), table 14-2 and similar tables in earlier editions.Government employment:USDOT: 1970-75: U.S. Department of Commerce, Bureau of the Census, StatisticalAbstract of the United States, 1976 (Washington, DC: 1976), table 409, and U.S.Department of Transportation, U.S. Coast Guard, G-WPM, Office of MilitaryPersonnel, personal communication.1980-85: U.S. Department of Transportation, Office of the Secretary of Transportation,DOT Employment Facts, A Report to Management (Washington, DC: Annual issues).1990-99: Ibid., DOT Workforce Demographics (Washington, DC : Annual issues).State and local highway: 1960-90: U.S. Department of Commerce, Bureau of theCensus, Statistical Abstract of the United States, 1993 (Washington, DC: 1993), table 500and similar tables in earlier editions.1995-98: Ibid., Internet site http://www.census.gov/pub/govs/www/apesstl.html, as ofApr. 24, 2000.
Table 3-19Cont’d
Employment in For-Hire Transportation and Selected Transportation-Related Industriesa (Thousands)a Annual averages.b Excludes farm employment.c Does not include drivers employed by school districts.d Difference between the total of SIC 41 and the sum of 411, 412, 413, and 415.e In 1997, the American Gas Association revised the database that identifies companies by type (e.g., distribution, integrated, or transmission). This reclassification has resulted in additions to the distribution and reductions to the integrated company categories beginning with the revised data in 1996. Additionally, data by company type are not directly comparable from year to year due to acquisitions and mergers.
f Transportation services are defined as those incidental to transportation, such as forwarding and packing; motor vehicle inspection; and freight broker, tour operator, and travel agency services, etc.
g The difference between the total of SIC 37 and the sum of 371, 372, 373, and 374.h The difference between the total of SIC 55 and the sum of 551, 553, and 554.i Not all government agencies are included (e.g., the National Transportation Safety Board).j U.S. Department of Transportation was created in 1966. Data are for fiscal year and
include permanent civilians as well as temporary employees, and military.k Full-time equivalent employment. Data prior to 1986 are not directly comparable to data
from later years due to a change in the way full-time equivalent was calculated. Full-time equivalent was not calculated for 1985.
l Due to a change in the reference period, from October to March, the October 1996 Annual Survey of Government Employment and Payroll was not conducted.
NOTES: The employment totals in tables 3-19 and 3-20 differ. Table 3-19 showsemployment in transportation and selected transportation-related industries. Table 3-20shows employment by transportation occupation. Some employees of transportation

Transportation Revenues, Employment, and Productivity ! 215
1985 1990 1995 1996 1997 1998 1999
Total workers, 16 years and over 107,150 118,793 124,900 126,708 129,558 131,463 133,488Total workers in transportation occupations 3,681 4,039 4,308 4,451 4,534 4,499 4,629Transportation occupation as % of total workers, 16 years and over 3.4 3.4 3.4 3.5 3.5 3.4 3.5
Motor vehicle operatorsSupervisors, motor vehicle operators 51 76 87 85 95 88 86Truck drivers 2,412 2,627 2,860 3,018 3,075 3,012 3,116Drivers-sales workers 214 201 158 156 150 159 160Bus drivers 394 443 526 512 472 471 490Taxicab drivers and chauffeurs 180 213 211 203 248 273 271Parking lot attendants 45 53 50 46 46 62 68Motor transportation occupations, NEC 2 5 8 4 4 3 11 Total 3,298 3,618 3,900 4,024 4,090 4,069 4,202
Rail transportationRailroad conductors and yardmasters 36 36 33 45 48 50 45Locomotive operating occupations 59 46 51 49 53 41 45Railroad brake, signal, and switch operators 46 28 17 15 14 7 9Rail vehicle operators, NEC 7 8 3 7 6 6 7 Total 148 118 104 116 121 104 106
Water transportationShip captains and mates, except fishing boats 32 27 33 32 24 22 31Sailors and deckhands 18 18 26 25 21 30 16Marine engineers 1 2 3 8 2 3 5Bridge, lock, and lighthouse tenders 8 6 4 5 5 8 5 Total 59 53 66 70 52 63 57
Air transportationAirplane pilots and navigators 77 114 114 114 120 113 143Air traffic controllers 34 36 30 32 36 26 24 Total 111 150 144 146 156 139 167
Public transportation attendants 65 100 94 95 115 124 111
Employment in Transportation Occupations (Thousands)
NOTES: Beginning in January 1998, data are not comparablewith data for 1997 and earlier years due to the new composite esti-mation procedures and revised population controls used in thehousehold survey. See source for additional information. Theemployment totals in tables 3-19 and 3-20 differ. Table 3-19shows employment in transportation and related industries; Table3-20 shows employment by transportation occupation. Someemployees of transportation industries have nontransportationjobs (e.g., a bookkeeper in a trucking firm), and some people intransportation occupations do not work in the transportationindustry (e.g., a truck driver for a construction firm).
SOURCES:All data except total workers, 16 years and over: U.S.Department of Labor, Bureau of Labor Statistics, Employment andEarnings (Washington, DC: Annual January issues), table 11 of theHousehold Data Annual Averages Tables, Internet sitehttp://stats.bls.gov/pdf/cpsaatab.htm, as of May 31, 2000.Ibid., Personal communications, Apr. 15, 1998, Feb. 26, 1999, andunpublished revisions, Mar. 11, 1999; Mar. 12, 1999; May 31, 2000.Total workers, 16 years and over: Ibid., Employment and Earnings(Washington, DC: January 1999), revised totals, table 1, Internetsite http://stats.bls.gov/pdf/cpsaatab.htm, as of May 31, 2000.
Table 3-20
KEY: NEC = not elsewhere classified

1960 1965 1970 1975 1980 1985 1990 1995 1996 1997 1998 1999Wages, U.S. labor force 4,822 5,807 7,743 10,808 15,790 21,293 26,257 30,996 32,040 33,428 35,112 36,153
Transportation industry 5,835 6,989 9,396 13,550 20,818 25,324 28,900 32,349 33,197 34,439 35,621 37,189Air 6,929 8,495 12,027 17,035 25,649 32,131 32,747 36,365 37,238 38,705 40,095 42,379Trucking and warehousing 5,396 6,623 8,672 12,765 19,204 22,383 26,180 29,591 30,351 31,753 32,934 34,042Local and interurban
passenger transit 4,877 5,553 6,996 9,462 13,530 15,706 17,517 20,112 20,811 21,189 21,981 22,676Railroad 6,241 7,460 10,110 14,987 25,049 36,611 43,614 51,236 54,706 56,505 56,322 60,667Water 6,212 7,402 10,302 14,136 22,746 28,531 33,855 37,856 38,934 40,421 42,341 43,286Pipelines, except natural gas 6,957 8,053 10,765 16,765 26,227 37,316 46,167 57,867 58,286 59,929 60,500 64,846Transportation servicesb 5,380 6,239 8,232 11,430 16,005 20,530 26,058 30,869 31,523 32,805 34,688 36,170
216"
Chapter 3 Transportation and the E
conomy
SOURCE: 1960-1998: U.S. Department of Commerce, Bureauof Economic Analysis, National Income and Products Accounts, tables 6.6b and 6.6c,Internet site http://www.bea.doc.gov/bea/dn1.htm (file:http://www.bea.doc.gov/bea/dn/seltab29.exe), as of May 17, 2000. 1995-1998 data arealso available from Survey of Current Business (Washington, DC: April 2000), table 6.6c.1999: U.S. Department of Commerce, Bureau of Economic Analysis, Survey of CurrentBusiness, (Washington, DC: October 2000), Vol. 80, No. 10, table B.9.
Table 3-21Average Wagea and Salary Accruals per Full-Time Equivalent Employee by Transportation Industry (Current $)R
a Wages do not include supplements to wages and salaries such as pension, profit-sharing,and other retirement plans, and health, life, and unemployment insurance compensation.
b Establishments furnishing services incidental to transportation, such as forwarding and packing services and the arrangement of passenger and freight transportation.
NOTES: Use care in comparing the data in this table with those in table 3-22. Thistable includes weighted part-time employees’ salaries. Table 3-22 covers only full-timeemployees. 1960-85 data are based on the 1972 SIC codes; 1990-98 data are based on the1987 SIC codes.
KEY: R = revised

Transportation Revenues, Employment, and Productivity ! 217
1985 1990 1995 1996 1997 1998 199916 years and over, alla 343 412 479 490 503 523 549
Airplane pilots and navigators 738 910 956 1,138 1,079 1,383 1,048
Public transportation attendants N 635 450 417 521 524 604
Motor vehicle operators 343 400 475 473 496 503 514 Supervisors, motor vehicle operators N 520 549 583 589 595 585 Truck drivers N N 481 481 506 516 527 Drivers-sales workers 399 439 517 506 524 526 534 Bus drivers 344 355 419 396 405 428 428 Taxicab drivers and chauffeurs 262 307 352 374 405 379 427
Nonmotor vehicle operators 559 687 711 691 761 834 761 Rail transportation operators 599 717 741 740 814 849 816 Water transportation 463 547 624 586 641 812 604
Median Weekly Earnings of Full-Time Wage and Salary Workers inTransportation by Detailed Occupation (Current $)
a Earnings for all workers, not just transportation related.NOTES: Use care in comparing the figures in this table with thosein table 3-21. This table does not include part-time employees; table3-21 includes weighted part-time employees’ salaries.SOURCES: U.S. Department of Labor, Bureau of LaborStatistics, Employment and Earnings (Washington, DC: AnnualJanuary issues), table 39 of the Household Data Annual Averages
Tables. Based on the U.S. CensusBureau's Current Population Survey. Water transportation: U.S.Department of Labor, Bureau of Labor Statistics, unpublisheddata, Mar. 1, 1999 and Mar. 11, 1999, and Apr. 25, 2000.
Table 3-22
KEY: N = data do not exist

218"
Chapter 3 Transportation and the E
conomy
SOURCE: 1960-1998: U.S. Department of Commerce, Bureauof Economic Analysis, National Income and Products Accounts, tables 6.3b and 6.3c,Internet site http://www.bea.doc.gov/bea/dn1.htm (file:http://www.bea.doc.gov/bea/dn/seltab29.exe), as of May 17, 2000. 1995-1998 data arealso available from Survey of Current Business (Washington, DC: April 2000), table 6.3c.
Table 3-23 Total Wagea and Salary Accruals by Transportation Industry (Current $ millions)R
a Wages do not include compensation (supplements to wages and salaries such as pension,profit-sharing, and other retirement plans, and health, life, and unemployment insurance).
b Defined as services incidental to transportation, such as forwarding and packing services and arranging passenger travel and freight transportation.
KEY: R = revised
1960 1965 1970 1975 1980 1985 1990 1995 1996 1997 1998Total wage and salary
accruals 272,800 363,700 551,500 814,700 1,377,600 1,995,700 2,757,500 3,441,060 3,630,142 3,884,713 4,189,515
TransportationAir 1,268 1,852 4,029 5,894 11,029 15,744 29,440 36,183 38,839 41,143 44,826Trucking and warehousing 4,592 6,265 9,123 13,786 23,755 29,725 34,715 44,830 47,074 50,678 54,671Local and interurban
passenger transit 1,307 1,427 1,868 2,375 3,423 4,272 5,658 7,723 8,366 8,857 9,496Railroad 5,498 5,446 6,268 8,108 12,850 11,862 10,729 11,272 11,543 11,753 11,546Water 1,379 1,584 2,112 2,601 4,572 5,050 5,620 6,322 6,463 6,912 7,325Pipeline, except natural gas 160 153 183 285 577 709 831 868 816 839 847Transportation servicesb 425 549 922 1,463 3,041 5,420 8,521 11,977 12,483 13,647 14,985 Total 14,629 17,276 24,505 34,512 59,247 72,782 95,514 119,175 125,584 133,829 143,696

Transportation Revenues, Employment, and Productivity ! 219
1960 1965 1970 1975 1980 1985 1990 1995 1996 1997 1998Output per houra workedAirb N N N N N N 93 109 111 112 109Bus, Class Ic 106 128 118 107 111 96 95 105 R101 118 99Railroad 22 32 36 43 55 82 119 156 R167 170 UTrucking, except localb N N N N N N 111 125 131 132 130Petroleum pipelinesc 31 49 76 91 89 100 103 116 131 134 136
Output per employeed
Air 22 35 45 56 71 92 93 109 111 112 109Bus, Class Ic 108 129 119 103 99 93 94 100 R98 114 98Railroad 25 36 42 46 55 79 120 162 172 177 UTrucking, except local 48 56 60 64 78 94 111 125 131 132 130Petroleum pipelinesc 30 48 75 89 89 98 102 121 139 141 145
Labor Productivity Indices for Selected Transportation Industries
a Based on the number of paid hours.b The average weekly hours were assumed to be constant for these
industries; therefore, the output per hour worked and the output per employee measures are identical in the years for which data are given for both measures.
c Data did not meet the publication standards for the Bureau ofLabor Statistics and are considered less reliable than the published series.
d Full-time and part-time employees are counted equally. Hence,these data do not reflect output per full-time equivalent employee.
NOTE: Index, 1987 = 100.SOURCE: U.S. Department of Labor, Bureau of Labor Statistics,Industry Productivity, Internet site www.bls.gov/iprhome.htm, asof May 16, 2000, and unpublished data.
Table 3-24
KEY: N = data do not exist; R = revised;U =data are not available

Section DGovernment Finance
chapter three

Governm
ent Finance !
223
NOTE: Numbers may not add to totals due to rounding.SOURCES: 1985-95: U.S. Department of Transportation, Bureau of TransportationStatistics, Government Transportation Financial Statistics: Fiscal Years 1985-95, Internet sitehttp://www.bts.gov, as of July 25, 2000, Appendix A, tables A-2, A-4 and A-13. Constantdollar deflator: U.S. Department of Commerce, Bureau of Economic Analysis, Survey ofCurrent Business (Washington, DC : August 1998), table 3, "Chain Type Price Indexes."
1985 1990 1991 1992 1993 1994 1995Total government revenues 52,038 69,901 77,411 80,199 85,034 87,569 93,716Federal 18,388 21,532 25,995 25,797 27,310 27,143 30,223State and Local 33,649 48,369 51,417 54,403 57,723 60,426 63,493
Total government expenditures 74,515 99,869 107,446 112,863 115,647 124,079 129,289State and local expenditures less federal grantsa 46,810 69,703 75,280 78,544 79,342 85,407 89,359Federal grants 18,227 19,786 20,579 21,364 22,598 23,721 25,034Federal expenditures, less grants 9,478 10,380 11,586 12,955 13,307 14,951 14,896
Table 3-25aFederal, State, and Local Government Transportation-Related Revenues and Expenditures, Fiscal Year (Current $ millions)
a Based on data from the U.S. Department of Commerce, Census Bureau, which uses different definitions and accounting methods than those used by some modal administrations of the U.S. Department of Transportation. For example, highway expenditures in this table do not include traffic control activities by police or public safety activities; while the highway expenditure statistics published by the U.S.Department of Transportation, Federal Highway Administration do include these items.
NOTE: Numbers may not add to totals due to rounding.SOURCES: 1985-95: U.S. Department of Transportation, Bureau of TransportationStatistics, Government Transportation Financial Statistics: Fiscal Years 1985-95, Internet sitehttp://www.bts.gov, as of July 25, 2000, Appendix A, tables A-2, A-4 and A-13. Constantdollar deflator: U.S. Department of Commerce, Bureau of Economic Analysis, Survey ofCurrent Business (Washington, DC: April 2000), table 3, "Chain Type Price Indexes."
Table 3-25bFederal, State, and Local Government Transportation-Related Revenues and Expenditures, Fiscal Year(Constant 1996 $ millions)
a Based on data from the U.S. Department of Commerce, Census Bureau, which uses different definitions and accounting methods than those used by some modal administrations of the U.S. Department of Transportation. For example, highway expenditures in this table do not include traffic control activities by police or public safety activities; while the highway expenditure statistics published by the U.S.Department of Transportation, Federal Highway Administration do include these items.
1985 1990 1991 1992 1993 1994 1995Total government revenues 70,990 81,839 87,824 88,978 91,969 92,299 96,032Federal 24,300 25,701 29,818 28,718 29,627 28,720 31,090State and Local 46,689 56,139 58,007 60,260 62,343 63,580 64,941
Total government expenditures 101,564 116,906 121,823 125,205 124,643 130,783 132,473State and local expenditures less federal grants 64,951 80,899 84,928 87,000 85,692 89,864 91,397Federal grants 24,087 23,617 23,605 23,783 24,515 25,099 25,752Federal expenditures, less grants 12,525 12,390 13,290 14,422 14,436 15,819 15,324
a

1980 1985 1990 1991 1992 1993 1994 1995 1996 1997 1998Airport/airway trust funda 2,274 3,598 4,945 6,206 5,918 6,096 6,027 6,291 3,128 4,488 8,654Highway trust fund Highway account b 7,647 12,908 13,453 15,303 16,572 16,864 17,005 R20,967 R22,692 21,491 24,364 Mass transit account X 1,420 1,977 3,149 1,816 2,735 2,691 2,813 3,282 3,819 4,269Water receiptsc 381 463 1,147 1,325 1,474 1,591 1,394 R1,711 R1,608 1,593 1,487Pipeline safety fund X X 10 11 14 15 19 35 31 30 29Emergency preparedness
fund X X X X 3 10 7 7 7 7 8 Total 10,302 18,388 21,532 25,995 25,797 27,310 27,143 R31,824 R30,748 31,428 40,298
224"
Chapter 3 Transportation and the E
conomy
SOURCES: 1980: U.S.Department of Transportation, Bureau of Transportation Statistics, TransportationReceipts and Outlays in the Federal Budget, Fiscal Years 1977-94 (Washington, DC: April 1997),table C-1.1985-95: Ibid., Government Transportation Financial Statistics: Fiscal Years 1985-95, Internetsite www.bts.gov, table A-2.1996-98: U.S. Executive Office of the President, Office of Management and Budget,Budget of the United States Government, Appendix (Washington, DC: Annual issues).
Table 3-26a Federal Transportation-Related Revenues, Fiscal Year (Current $ millions)
a The tax requirement that allows for the 10% passenger ticket tax and certain other taxes paid by airport and airway users to be transferred to the Airport and Airway Trust Fund expired on Dec. 31, 1995; it was reenacted in August 1996; but expired again in December 1996.
b Beginning in 1983, a portion of the fuel tax credited to the Highway Trust Fund is earmarked for transit.
c Water receipts include the Harbor Maintenance Trust Fund, St. Lawrence Seaway tolls,the Inland Waterway Trust Fund, Panama Canal receipts, and the Oil Spill Liability Trust Fund. 1998 Panama Canal receipts are estimates.
NOTE: Numbers my not add to totals due to rounding.
KEY: R = revised; X = no activity or a value of zero

Governm
ent Finance !
225
SOURCES: 1980: U.S.Department of Transportation, Bureau of Transportation Statistics, TransportationReceipts and Outlays in the Federal Budget, Fiscal Years 1977-94 (Washington, DC: April 1997),table C-1.1985-95: Ibid., Government Transportation Financial Statistics: Fiscal Years 1985-95, Internetsite www.bts.gov, Appendix A, table A-2.1996-98: U.S. Executive Office of the President, Office of Management and Budget,Budget of the United States Government, Appendix (Washington, DC: Annual issue). Constantdollar deflator: U.S. Department of Commerce, Bureau of Economic Analysis, Surveyof Current Business (Washington, DC: June 2000), table 7-11, "Chain Type PriceIndexes-Federal."
Table 3-26bR Federal Transportation-Related Revenues, Fiscal Year (Constant 1996 $ millions)
a The tax requirement that allows for the 10% passenger ticket tax and certain other taxes paid by airport and airway users to be transferred to the Airport and Airway Trust Fund expired on Dec. 31, 1995; it was reenacted in August 1996; but expired again in December 1996.
b Beginning in 1983, a portion of the fuel tax credited to the Highway Trust Fund is earmarked for transit.
c Water receipts include the Harbor Maintenance Trust Funds, St. Lawrence Seaway tolls,the Inland Waterway Trust Fund, Panama Canal receipts, and the Oil Spill Liability Trust Fund. 1998 Panama Canal receipts are estimates.
NOTE: Numbers may not add to totals due to rounding.Totals may not add due to rounding.
KEY: R = revised; X = no activity or a value of zero
Airport/airway trust funda
Highway trust fund
Highway accountb
Mass transit account
Water receiptsc
Pipeline safety fundEmergency preparednessfund
Total
1980
3,958
13,311X
663X
X17,932
1985
4,755
17,0581,877
612X
X24,300
1990
5,902
16,0572,360
1,36912
X25,699
1991
7,119
17,5543,612
1,52013
X29,818
1992
6,588
18,4492,022
1,64116
328,719
1993
6,613
18,2942,967
1,72616
1129,626
1994
6,377
17,9932,847
1,47520
728,720
1995
6,472
21,5692,894
1,76036
732,737
1996
3,128
22,6923,282
1,60831
730,748
1997
4,429
21,2093,769
1,57230
731,015
1998
8,449
23,7884,168
1,45228
837,893

226 " Chapter 3 Transportation and the Economy
1980 1985 1990 1991 1992 1993 1994 1995 1996Air 3,762 4,947 7,305 8,282 9,313 10,049 10,146 10,389 10,135Highway 11,706 15,031 15,452 15,860 16,773 18,081 20,053 20,082 20,634Transit 3,307 3,427 3,832 3,917 3,675 3,517 3,770 4,474 4,375Rail 2,170 1,057 534 779 900 811 832 1,034 995Water 2,837 3,054 2,844 3,048 3,357 3,502 3,473 3,565 3,374Pipelinea 3 5 9 9 12 13 12 17 31General supportb 177 182 190 270 289 333 387 369 332 Total 23,961 27,705 30,166 32,166 34,319 36,305 38,672 39,930 39,874
Federal Transportation-Related Expenditures by Mode, Fiscal Year(Current $ millions)
a Includes gas and liquid pipeline.b General support represents administrative and operating
expenditures of the U.S. Department of Transportation, the Interstate Commerce Commission, and the National Transportation Safety Board.
NOTE: Numbers may not add to totals due to rounding.SOURCES: 1980: U.S. Department of Transportation, Bureau ofTransportation Statistics. Transportation Receipts and Outlays in the FederalBudget, Fiscal Years 1977-94 (Washington, DC: April 1997), table C-3.
1985-96: Ibid., Government Transportation Financial Statistics: FiscalYears 1985-95, Internet site www.bts.gov, Appendix A, tables A-4,and Appendix B, tables B-5 through B-12. Constant dollar defla-tor: U.S. Department of Commerce, Bureau of EconomicAnalysis, Survey of Current Business (Washington, DC: June2000), table 7-11, "Chain Type Price Indexes-Federal."
Table 3-27a
1980 1985 1990 1991 1992 1993 1994 1995 1996Air 6,548 6,538 8,719 9,500 10,368 10,901 10,736 10,687 10,135Highway 20,376 19,864 18,443 18,193 18,673 19,614 21,218 20,658 20,634Transit 5,756 4,529 4,574 4,493 4,091 3,815 3,989 4,602 4,375Rail 3,777 1,397 637 894 1,002 880 880 1,064 995Water 4,938 4,036 3,394 3,496 3,737 3,799 3,675 3,667 3,374Pipelinea 5 7 11 10 13 14 13 17 31General supportb 308 241 227 310 322 361 409 380 332 Total 41,708 36,613 36,004 36,897 38,207 39,384 40,919 41,076 39,874
Federal Transportation-Related Expenditures by Mode, Fiscal Year(Constant 1996 $ millions)
a Includes gas and liquid pipeline.b General support represents administrative and operating
expenditures of the U.S. Department of Transportation, the Interstate Commerce Commission, and the National Transportation Safety Board.
NOTE: Numbers may not add to totals due to rounding.SOURCES: 1980: U.S. Department of Transportation, Bureau ofTransportation Statistics. Transportation Receipts and Outlays in the FederalBudget, Fiscal Years 1977-94 (Washington, DC: April 1997), table C-3.
1985-96: Ibid., Government TransportationFinancial Statistics: Fiscal Years 1985-95, Internet site www.bts.gov,Appendix A, tables A-4, and Appendix B, tables B-5 through B-12.Constant dollar deflator: U.S. Department of Commerce, Bureauof Economic Analysis, Survey of Current Business (Washington,DC: June 2000), table 7-11, "Chain Type Price Indexes-Federal."
Table 3-27bR
KEY: R = revised

Governm
ent Finance !
227
dollar deflator: U.S. Department ofCommerce, Bureau of Economic Analysis, Survey of Current Business (Washington, DC:June 2000), table 7-11, "Chain Type Price Indexes-Federal."
Table 3-28 Cash Balances of the Transportation-Related Federal Trust Funds, Fiscal Year ($ millions)
SOURCES: 1980-94: U.S. Department of Transportation, Bureau of TransportationStatistics, Transportation Receipts and Outlays in the Federal Budget, Fiscal Years 1977-94(Washington, DC: April 1997), table 1-3.1995-97: U.S. Executive Office of the President, Office of Management and Budget,Budget of the United States Government, Appendix (Washington, DC: Annual issues). Constant
KEY: N = data do not exist; R = revised
1980 1985 1990 1991 1992 1993 1994 1995 1996 1997 1998Airport/Airway
Trust Fund $ current 5,442 7,426 14,355 15,263 15,204 12,850 12,386 11,365 7,692 6,358 9,411 $ constant 1996R 9,473 9,814 17,133 17,508 16,926 13,940 13,106 11,691 7,692 6,274 9,188
Highway Trust FundHighway account $ current 10,999 10,361 9,629 10,246 11,300 11,523 7,927 9,421 11,658 12,575 8,519 $ constant 1996R 19,145 13,692 11,493 11,753 12,580 12,500 8,388 9,691 11,658 12,410 8,318
Transit account $ current N 2,524 7,155 9,250 9,798 10,617 9,945 9,579 9,525 9,857 10,051 $ constant 1996R N 3,336 8,540 10,610 10,908 11,517 10,523 9,854 9,525 9,727 9,813
Harbor Maintenance Trust Fund
$ current N N 30 74 121 305 451 621 865 1,106 1,246 $ constant 1996R N N 36 85 135 331 477 639 865 1,091 1,217
Inland Waterway Trust Fund
$ current N 172 281 217 186 180 214 238 275 300 327 $ constant 1996R N 227 335 249 207 195 226 245 275 296 319
Oil Spill Liability Trust Fund
$ current N N 345 647 866 1,024 993 1,121 1,124 1,110 1,083 $ constant 1996R N N 412 742 964 1,111 1,051 1,153 1,124 1,095 1,057
Total all funds $ current 16,441 20,483 31,795 35,697 37,475 36,499 31,916 32,345 31,139 31,306 30,637 $ constant 1996R 28,618 27,069 37,949 40,947 41,720 39,594 33,771 33,273 31,139 30,894 29,913

Transportation, Energy,and the Environment
Section AU.S. and Transportation Sector
Energy Consumption
chapter four

U.S
. and Transportation Sector E
nergy Consum
ption !231
1975-99: Ibid., MonthlyEnergy Review, DOE/EIA-0035 (03/99) (Washington, DC: March 2000), tables 3.1A(domestic production); 3.1B (imports and exports); and 10.2 (U.S. petroleum consumption).1999: Ibid., International Energy Database, December 1999, Table 12.xls, available atInternet site www.eia.doe.gov/emeu/international/petroleu.htm#ConsumptionA, as ofDec. 8, 2000.World petroleum consumption: 1960-96: Ibid., Annual Energy Review 1997,DOE/EIA-0384(97) (Washington, DC: July 1998), table 11.9.1999: Ibid., International Energy Database, December 1999, Table 1.2, available at Internet sitewww.eia.doe.gov/emeu/international/petroleu.htm#ConsumptionA, as of Dec. 8, 2000.
Table 4-1 Overview of U.S. Petroleum Production, Imports, Exports, and Consumption (Million barrels per day)
a Includes lease condensate.b Includes crude oil, natural gas plant liquids, and other liquids.c Includes imports for the Strategic Petroleum Reserve, which began in 1977.d Beginning in 1985, motor gasoline blending components and aviation gasoline blending
components are included.e Net imports = imports minus exports.NOTE: Numbers may not add to totals due to rounding.SOURCES:Domestic production, imports, exports, and U.S. petroleum consumption: 1960-70:U.S. Department of Energy, Energy Information Administration, Annual Energy Review1997, DOE/EIA-0384(97) (Washington, DC: July 1998), table 5.1.
KEY: E = estimate; R = revised; U = data are not available
1960 1965 1970 1975 1980 1985 1990 1995 1996R 1997 1998 1999Domestic productionCrude oila 7.04 7.80 9.64 8.38 8.60 8.97 7.36 6.56 6.47 6.45 R6.25 E5.93Natural gas plant liquids 0.93 1.21 1.66 1.63 1.57 1.61 1.56 1.76 1.83 1.82 R1.76 1.83 Totalb 7.96 9.01 11.30 R10.05 R10.21 R10.64 R8.99 R8.63 R8.61 R8.61 R8.39 R8.14
Gross importsCrude oilc 1.02 1.24 1.32 4.11 5.26 3.20 5.89 7.23 7.51 8.23 R8.71 8.59Petroleum productsd 0.80 1.23 2.10 1.95 1.65 1.87 2.12 1.61 1.97 1.94 R2.00 1.96 Total 1.81 2.47 3.42 6.06 6.91 5.07 8.02 8.84 9.48 10.16 R10.71 10.55
Exports 0.20 0.19 0.26 0.21 0.54 0.78 0.86 0.95 0.98 1.00 R0.95 0.94
U.S. net importse 1.61 2.28 3.16 5.85 6.37 4.29 7.16 7.89 8.50 9.16 R9.76 9.61
U.S. petroleum consumption 9.80 11.51 14.70 16.32 17.06 15.73 16.99 R17.73 18.31 18.62 R18.92 19.39By the transportation sector 5.14 6.04 7.78 8.95 9.55 9.85 10.97 R11.73 11.96 12.10 12.47 12.75Transportation petroleum use as % of domestic petroleum production 64.6 67.0 68.8 R89.1 R93.5 R92.6 R122.0 R135.9 R139.1 R140.5 148.6 156.6Transportation petroleum use as % of domestic petroleum consumption 52.4 52.5 52.9 54.8 56.0 62.6 64.6 65.9 R65.3 R65.0 R65.9 65.8
World petroleum consumption 21.34 31.14 46.81 56.20 63.07 60.10 65.99 R69.93 71.52 73.01 R73.64 UU.S. petroleum consumption as % of world petroleum consumption 45.9 37.0 31.4 29.0 27.0 26.2 25.7 25.5 25.6 25.5 R25.7 U

1960 1965 1970 1975 1980 1985 1990 1995 1996 1997 1998 1999Energy consumptionTransportation 10.56 12.40 16.06 18.21 19.66 20.02 22.49 R23.92 R24.47 R24.77 R25.3 25.89% of total 24.1 23.5 24.2 R25.8 25.9 R27.1 27.7 R27.3 R27.1 R27.2 R27.7 28
Industrial 16.26 19.24 21.92 20.39 21.07 17.67 19.62 R21.27 R21.97 R22.07 R21.68 21.96% of total 37.1 36.5 33.0 28.9 27.7 23.9 24.1 R24.3 R24.3 R24.3 R23.8 23.7
Residential and commercial 8.75 10.00 12.14 11.60 10.72 9.78 9.55 R10.31 R10.96 R10.70 R9.85 10.17% of total 20.0 19.0 18.3 16.4 14.1 13.2 11.8 R11.8 R12.1 R11.8 R10.8 11
Energy Input at electric utilities 8.19 11.01 16.27 20.35 24.51 26.52 29.62 R32.06 R33.01 R33.43 R34.4 34.49% of total 18.7 20.9 24.5 28.8 32.3 35.8 36.4 R36.6 R36.5 R36.7 R37.7 37.3 Total 43.80 52.68 66.43 70.55 75.96 73.98 R81.29 R87.56 R90.42 R90.98 R91.23 92.52
Percentage of primary demand met by petroleum
Transportation 96.0 95.7 95.3 96.7 96.7 97.4 R97.0 97.0 97.0 96.9 R97.4 97.5Industrial 35.4 35.3 35.5 R39.9 45.2 44.2 42.4 R40.5 R41.4 42.2 R42.2 43.1Residential and commercial 39.8 38.6 35.4 32.8 28.3 R25.8 R22.8 R20.1 R20.1 20.0 R20.0 20.4Electric utilities 6.7 6.7 13.0 15.6 10.7 4.1 4.2 2.1 2.2 2.5 3.4 2.7
232"
Chapter 4 Transportation, E
nergy, and the Environm
entNumbers may not add to totals due torounding.SOURCES: 1960-70: U.S. Department of Energy, Energy Information Administration,Annual Energy Review 1990, DOE/EIA-0394(90) (Washington, DC: May 1991), table 4.1975-99: Ibid., Monthly Energy Review, Internet sitewww.eia.doe.gov/gov/pub/energy.overview/monthly.energy/ as of Apr. 27, 2000,tables 2.2, 2.3, 2.4, 2.5, and 2.6.
Table 4-2 U.S. Consumption of Energy from Primary Sources by Sector (Quadrillion Btu)
NOTES: The data for residential, commercial, and industrial sectors include only fossilfuels consumed directly. Most renewable fuels are not included. The data for the trans-portation sector includes only fossil and renewable fuels consumed directly. The data forelectric utilities includes all fuels (fossil, nuclear, geothermal, hydro, and other renewables)used by electric utilities. Due to a lack of consistent monthly historical data, some renew-able energy resources are not included in this table. The totals in table 4-4 are the bestnumbers for total U.S. energy consumption from all sources.
KEY: Btu = British thermal unit; R = revised

U.S
. and Transportation Sector E
nergy Consum
ption !233
1975-99: Ibid., Monthly Energy Review,Internet site www.eia.doe.gov/gov/pub/energy.overview/monthly.energy/ as of May 8, 2000,tables, 1.4, 2.3, 2.4, 2.5, and 2.6.
Table 4-3 Domestic Demand for Refined Petroleum Products by Sector (Quadrillion Btu)
NOTE: Transportation's share of U.S. petroleum demand in this table differs slightlyfrom table 4-1 because this table takes into account differences within sectors in the use ofvarious grades of petroleum-based fuel that have different Btu content per unit volume.SOURCES: 1960-70: U.S. Department of Energy, Energy Information Administration,Annual Energy Review 1997, DOE/EIA-0384(97) (Washington, DC: July 1998), tables 2.1,5.12b, and A3.
KEY: Btu = British thermal unit; R = revised
1960 1965 1970 1975 1980 1985 1990 1995 1996 1997 1998 1999Transportation 10.13 11.87 15.31 17.61 19.01 19.50 21.81 R23.20 R23.74 R24.00 R24.64 25.23Industrial 5.75 6.79 7.79 8.15 9.53 7.81 8.32 8.62 9.10 9.31 R9.15 9.46Residential and commercial 3.49 3.87 4.31 3.81 3.04 2.52 2.17 2.08 2.20 2.14 R1.97 2.07Electric utilities 0.55 0.73 2.12 3.17 2.63 1.09 1.25 0.66 0.73 0.82 R1.17 0.94 Total petroleum demand 19.92 23.26 29.53 R32.73 R34.20 30.92 33.55 R34.55 R35.76 R36.27 R36.93 37.71
Transportation as % of total 50.9 51.0 51.8 53.8 55.6 63.1 65.0 67.1 66.4 66.2 R66.7 66.9

Section BTransportation EnergyConsumption by Mode
chapter four

Transportation Energy C
onsumption by M
ode !237
Short tons: 1960-99: Ibid.,Annual Energy Review 1998, DOE/EIA-0384(98) (Washington, DC: July 1999), table 7.3.Natural gas: Btu: 1960-70: Ibid., Annual Energy Review 1997, DOE/EIA-0384(97)(Washington, DC: July 1998), table 6.6, and A4 for conversion.1975-99: Ibid., Monthly Energy Review, DOE/EIA-0035(00/06) (Washington, DC: June2000), table 2.5.Cubic feet: 1960-70: Ibid., Annual Energy Review 1997, DOE/EIA-0384(97) (Washington,DC: July 1998), table 6.6.1975-99: Ibid., Monthly Energy Review, DOE/EIA-0035(00/06) (Washington, DC: June2000), table 4.4.Petroleum products: Btu: 1960-70: Ibid., Annual Energy Review 1997, DOE/EIA-0384(97) (Washington, DC: July 1998), table 2.1.1975-99: Ibid., Monthly Energy Review, DOE/EIA-0035(00/06) (Washington, DC: June2000), table 2.5.Barrels: 1960-97: Ibid., Annual Energy Review 1997, DOE/EIA-0384(97) (Washington,DC: July 1998), table 5.12b (barrels/day x 365 or 366 for leap years).Electricity and electrical system energy losses: 1960-70: Ibid., State Energy DataReport 1993 (Washington, DC: July 1995), table 15.1975-99: Ibid., Monthly Energy Review, DOE/EIA-0035(00/06) (Washington, DC: June2000), table 2.5.
Table 4-4 U.S. Energy Consumption by the Transportation Sector (Quadrillion Btu)
a Sum of primary consumption, electricity, and electrical system energy losses categories.b Sum of coal, natural gas, and petroleum categories.c Consumed in the operation of pipelines, primarily in compressors, and small amounts
consumed as vehicle fuel.d Includes small amounts (about 0.1 quadrillion Btu per year since 1990) of renewable
energy in the form of ethanol blended into motor gasoline.e From 1980, small amounts of coal consumed for transportation are included in
industrial sector consumption.NOTES: Energy consumption (all sectors) differs from totals in table 4-2 for 1990 andsubsequent years. Table 4-2 includes primary energy consumption only.SOURCES:Energy consumption (all sectors) and total transportation consumption: 1960-70:U.S. Department of Energy, Energy Information Administration, Annual Energy Review1997, DOE/EIA-0384(97) (Washington DC: July 1998), table 2.1.1975-99: Ibid., Monthly Energy Review, DOE/EIA-0035(00/06) (Washington, DC : June2000), table 2.2 and table 2.5.Total primary consumption: 1960-70: Ibid., Annual Energy Review 1990, DOE/EIA-0384(90) (Washington, DC: May 1991), table 4.1975-99: Ibid., Monthly Energy Review, DOE/EIA-0035(00/06) (Washington, DC: June2000), table 2.5.Coal: Btu: 1960-70: Ibid., Annual Energy Review 1997, DOE/EIA-0384(97) (Washington,DC: July 1998), table 7.3, and A5 for conversion.1975-99: Ibid., Monthly Energy Review, DOE/EIA-0035(00/06) (Washington, DC: June2000), table 2.5.
KEY: Btu = British thermal unit; E = estimated; R = revised
1960 1965 1970 1975 1980 1985 1990 1995 1996 1997 1998 1999Energy consumption (all sectors) 43.80 52.68 66.43 70.55 75.96 73.98 R81.29 R87.56 R90.42 R90.98 R91.23 92.78Total transportation consumptiona 10.60 12.43 16.09 18.24 19.70 20.07 R22.54 R23.97 R24.52 R24.82 R25.36 26.09 % of total energy consumption 24.2 23.6 24.2 25.9 25.9 27.1 27.7 R27.4 R27.1 R27.3 R27.8 28.1Total primary consumptionb 10.56 12.40 16.06 18.21 19.66 20.02 22.49 R23.92 R24.47 R24.77 R25.30 26.04Coal 0.074 0.017 0.007 0.001 e e e e e e e e
Million short tons 3.0 0.7 0.3 <0.05 e e e e e e e e
Natural gasc 0.36 0.52 0.74 0.60 0.65 0.52 0.68 0.72 0.73 0.78 R0.66 0.66 Trillion cubic feet 0.35 0.50 0.72 0.58 R0.63 0.50 0.66 0.70 0.71 R0.76 R0.64 E0.64Petroleum productsd 10.13 11.87 15.31 17.61 19.01 19.50 21.81 R23.20 R23.74 R24.00 R24.64 25.38 Million barrels 1,881 2,205 2,840 3,267 3,495 3,595 4,004 4,281 R4,377 R4,431 E4,552 E4,654Electricity 0.011 0.010 0.009 0.010 0.011 R0.014 R0.016 R0.017 R0.017 R0.017 R0.017 0.017Electrical system energy losses 0.027 0.023 0.021 R0.024 R0.027 R0.033 R0.036 R0.036 R0.036 R0.035 R0.036 0.035

238"
Chapter 4 Transportation, E
nergy, and the Environm
entTable 4-5 Fuel Consumption by Mode of Transportation
Continued next page
KEY: kWh = kilowatt-hour; N = data do not exist; P = preliminary; R = revised
1960 1965 1970 1975 1980 1985 1990 1995 1996 1997 1998AirCertificated carriersa
Jet fuel (million gallons) 1,954 3,889 7,857 7,558 9,096 10,121 R12,429 12,812 13,188 13,660 13,877General aviationb
Aviation gasoline (million gallons) 242 292 551 412 520 421 353 276 287 R292 311 Jet fuel (million gallons) N 56 208 453 766 691 663 544 568 R642 815
HighwayGasoline, diesel and other fuels(million gallons)
Passenger car and motorcycle 41,171 49,723 67,879 74,253 70,186 71,700 69,759 68,268 69,419 R70,094 72,414 Other 2-axle 4-tire vehicle N e 12,313 19,081 23,796 27,363 35,611 45,605 47,354 R49,388 50,579 Single-unit 2-axle 6-tire or more truck N 13,848 3,968 5,420 6,923 7,399 8,357 9,216 9,409 R9,576 9,741 Combination truck N 6,658 7,348 9,177 13,037 14,005 16,133 19,777 20,193 R20,302 21,100 Bus 827 875 820 1,053 1,018 834 895 968 990 R1,027 1,049
Transitc
Electricity (million kWh) 2,908 2,584 2,561 2,646 2,446 4,216 4,837 5,068 5,007 R4,988 P5,250Motor fuel (million gallons) Diesel 208 248 271 365 431 609 651 678 693 R717 P700 Gasoline and other nondiesel fuelsd 192 124 68 8 11 46 34 61 61 R59 P50 Compressed natural gas N N N N N N N 11 15 R24 P31
Rail, Class I (in freight service)Distillate/diesel fuel (million gallons) 3,463 3,592 3,545 3,657 3,904 3,110 3,115 3,480 3,579 3,575 3,583

1960 1965 1970 1975 1980 1985 1990 1995 1996 1997 1998AmtrakElectricity (million kWh) N N N 180 254 295 330 304 293 282 275Distillate/diesel fuel (million gallons) N N N 63 64 65 82 66 71 75 75
Water Residual fuel oil (million gallons) 3,952 3,093 3,774 4,060 8,952 4,590 6,326 5,886 5,701 5,010 5,620Distillate/diesel fuel oil (million gallons) 787 652 819 1,098 1,478 1,699 2,065 2,339 2,491 2,574 2,595Gasoline (million gallons) N N 598 730 1,052 1,053 1,300 1,060 994 987 956
PipelineNatural gas (million cubic feet) 347,075 500,524 722,166 582,963 634,622 503,766 659,816 700,335 711,446 R751,470 635,477
Transportation Energy C
onsumption by M
ode !239
Transit:Electricity/motor fuel/compressed natu-ral gas: 1960-98: American PublicTransit Association, Transportation Fact Book (Washington, DC: February 1999), tables 65,66, 67, and similar tables in earlier editions.Rail:1960-98: Association of American Railroads, Railroad Facts (Washington, DC: May 1999), p. 40.Amtrak:1975-98: Amtrak, State and Local Affairs Department, personal communication.Water:Residual and distillate/diesel fuel oil: 1960-80: American Petroleum Institute, Basic PetroleumData Book (Washington, DC: Annual issues), tables 10, 10a, 12, and 12a.1985-98: U.S. Department of Energy, Energy Information Administration, Fuel Oil andKerosene Sales (Washington, DC: Annual issues), tables 2 and 4, and similar tables in ear-lier editions.Gasoline: 1970-98: U.S. Department of Transportation, Federal Highway Administration,Highway Statistics (Washington, DC: Annual issues), table MF-24 and similar tables inearlier editions.Pipeline:1960-96: U.S. Department of Energy, Natural Gas Annual 1997 (Washington, DC:October 1998), table 101.1997-98: U.S. Department of Energy, Energy Information Administration, Natural GasAnnual 1998 (Washington, DC: Annual Issues), table 1.
Table 4-5Cont’d Fuel Consumption by Mode of Transportation
a Domestic operations only.b Includes fuel used in air taxi operations, but not commuter operations. Data for 1996
are estimated using new information on nonrespondents and are therefore not comparable to earlier years. See the accuracy statement in the appendix for more detailed information.
c Prior to 1984, excludes commuter rail, automated guideway, ferryboat, demand responsive vehicles, and most rural and smaller systems.
d Gasoline and all other nondiesel fuels such as liquefied natural gas, methanol and propane, except compressed natural gas.
e Included in single-unit 2-axle 6-tire or more truck category.SOURCES:Air:Certificated air carriers: 1960-98: U.S. Department of Transportation, Bureau ofTransportation Statistics, Office of Airline Information, Internet sitehttp://www.bts.gov/oai/fuel/fuelyearly.html, as of July 5, 2000.General aviation: 1960-70: U.S. Department of Transportation, Federal AviationAdministration, FAA Statistical Handbook of Aviation - 1972 edition (Washington, DC:1973), table 9.12.1975-97: Ibid., General Aviation and Air Taxi Activity Survey (Washington, DC: Annualissues), table 5.1, and similar tables in earlier editions.1998: Ibid., FAA Aerospace Forecasts Fiscal Years 2000-2011 (Washington, DC: March 2000),table 29.Highway:1960-90: U.S. Department of Transportation, Federal Highway Administration, HighwayStatistics, Summary to 1995, FHWA-PL-97-009 (Washington, DC: July 1997), table VM-201A.1995-98: Ibid., Highway Statistics (Washington, DC: Annual issues), table VM-1.
KEY: kWh = kilowatt-hour; N = data do not exist; P = preliminary; R = revised

1960 1965 1970 1975 1980 1985 1990 1995 1996 1997 1998AirCertificated carriersa
Jet fuel 264 525 1,061 1,020 R1,150 1,366 R1,678 1,730 1,780 1,844 1,873General aviationb
Aviation gasoline 29 35 66 50 63 51 42 R35 R35 35 37 Jet fuel N 8 28 61 103 93 90
R76
R82
R87 110
HighwayGasoline, diesel and other fuels Passenger car and motorcycle 5,146 6,215 8,485 9,282 8,773 8,963 8,720 8,534 8,677 R8,762 9,052 Other 2-axle 4-tire vehicle N e 1,539 2,385 2,975 3,420 4,451 5,701 5,919 R6,173 6,322 Single-unit 2-axle 6-tire or more truck N 1,921 550 752 960 1,026 1,159 1,278 1,305 R1,328 1,351 Combination truck N 923 1,019 1,273 1,808 1,942 2,238 2,743 2,801
R2,816 2,927
Bus 115 121 114 146 141 116 124 134 137 R142 145
Transitc
Electricity 10 9 9 9 8 14 17 17 17 17 P18Motor fuel Diesel 29 34 38 51 60 84 90 94 96 R99 P97 Gasoline and other nondiesel fuelsd 24 16 9 1 1 6 4 8 8 7 P6
Compressed natural gas N N N N N N N R1 2 3 P4
Rail, Class I (in freight service)Distillate/diesel fuel 480 498 492 507 541 431 432 483 496 496 497
AmtrakElectricity N N N 1 1 1 1 1 1 1 1Distillate/diesel fuel N N N 9 9 9 11 9 10 10 10
Water Residual fuel oil 592 463 565 608 1,340 687 947 881 853 750 841Distillate/diesel fuel oil 109 90 114 152 205 236 286 324 346 357 360Gasoline N N 75 91 132 132 163 133 124 123 120
PipelineNatural gas 358 516 745 601 654 519 680 722 734 775 655
240"
Chapter 4 Transportation, E
nergy, and the Environm
entTable 4-6 Energy Consumption by Mode of Transportation (Trillion Btu)
KEY: Btu = British thermal units; kWh = kilowatt-hour; N = data do not exist; P = preliminary; R = revised
Continued next page

Transportation Energy C
onsumption by M
ode !241
Highway:1960-94: U.S. Department of Transportation, Federal Highway Administration, Highway Statistics, Summary to 1995,FHWA-PL-97-009 (Washington, DC: July 1997), table VM-201A.1995-98: Ibid., Highway Statistics (Washington, DC: Annual issues), table VM-1.Transit:Electricity/motor fuel/compressed natural gas: 1960-98: American Public Transit Association,Transportation Fact Book (Washington, DC: February 1999), tables 65, 66, 67, and similartables in earlier editions.Rail:1960-98: Association of American Railroads, Railroad Facts (Washington, DC: May 1999), p. 40.Amtrak:1975-98: Amtrak, State and Local Affairs Department, personal communication.Water:Residual and distillate/diesel fuel oil: 1960-80: American Petroleum Institute, Basic PetroleumData Book (Washington, DC: Annual issues), tables 10, 10a, 12, and 12a.1985-98: U.S. Department of Energy, Energy Information Administration, Fuel Oil andKerosene Sales (Washington, DC: Annual issues), tables 2 and 4, and similar tables in ear-lier editions.Gasoline: 1970-98: U.S. Department of Transportation, Federal Highway Administration,Highway Statistics (Washington, DC: Annual issues), table MF-24 and similar tables inearlier editions.Pipeline:1960-96: U.S. Department of Energy, Natural Gas Annual 1997 (Washington, DC:October 1998), table 101.1997-98: Ibid., table 1.
Table 4-6Cont’d Energy Consumption by Mode of Transportation (Trillion Btu)
a Domestic operations only.b Includes fuel used in air taxi operations, but not commuter operations.c Prior to 1984, excludes commuter rail, automated guideway, ferryboat, demand
responsive vehicles, and most rural and smaller systems.d Gasoline and all other nondiesel fuels such as liquefied natural gas, methanol, and
propane, except compressed natural gas.e Included in other single-unit 2-axle 6-tire or more truck category.NOTES: The following conversion rates were used:Jet fuel = 135,000 Btu/gal.Compressed natural gas = 138,700 Btu/gal.Aviation gasoline = 120,200 Btu/gal.Distillate fuel = 138,700 Btu/gal.Automotive gasoline = 125,000 Btu/gal.Residual fuel = 149,700 Btu/gal.Diesel motor fuel = 138,700 Btu/gal.Natural gas = 1,031 Btu/ft3Electricity 1kWh = 3,412 Btu, negating electrical system loses. To include electrical sys-tem loses, multiply this conversion factor by approximately 3.SOURCES:Air:Certificated air carriers: 1960-98: U.S. Department of Transportation, Bureau ofTransportation Statistics, Office of Airline Information Internet sitehttp://www.bts.gov/oai/fuel/fuelyearly.html, as of July 5, 2000.General aviation: 1960-80: U.S. Department of Transportation, Federal AviationAdministration, Office of Aviation Policy, Plans, and Management Analysis, FAAStatistical Handbook of Aviation (Washington, DC: Annual issues).1985-97: Ibid., General Aviation and Avionics Survey (Washington, DC: Annual issues), table5.1 and similar tables in earlier editions.1998: Ibid., FAA Aerospace Forecasts Fiscal Years 2000-2011 (Washington, DC: March 2000),table 29.

1960 1965 1970 1975 1980 1985 1990 1995 1996 1997 1998Highway 55,429 66,979 85,598 99,354 101,183 103,545 109,529 117,061 119,515 120,938 124,694
NonhighwayAgriculture 2,292 1,963 1,932 1,565 1,059 1,081 681 927 918 984 907Aviationa 1,324 501 393 410 413 382 361 367 344 335 351Marine 61 96 598 730 1,052 1,053 1,300 1,060 994 987 956Otherb 1,656 1,647 1,080 938 1,131 1,490 1,733 838 825 990 1,070 Total nonhighway 5,332 4,208 4,003 3,642 3,655 4,005 4,076 3,192 3,081 3,297 3,284
TOTAL demand 60,761 71,187 89,601 102,996 104,838 107,550 113,606 120,253 122,595 124,235 127,978
242"
Chapter 4 Transportation, E
nergy, and the Environm
ent
SOURCES:Highway: 1960-95: U.S. Department of Transportation, Federal Highway Administration,Highway Statististics, Summary to 1995 (Washington, DC: 1996), table MF-221.1996-98: Ibid., Highway Statistics (Washington, DC: Annual issues), table MF-21.Nonhighway: 1960-98: Ibid., Highway Statistics (Washington, DC: Annual issues), tableMF-24, and unpublished revisions.
Table 4-7 Domestic Demand for Gasoline (Million gallons) by Mode
a Does not include aviation jet fuel.b Includes state, county, and municipal use, industrial and commercial use, construction
use, and miscellaneous.NOTES: All nonhighway uses of gasoline were estimated by the U.S. Department ofTransportation, Federal Highway Administration. These estimates may not be comparableto data for prior years due to revised estimation procedures.Numbers may not add to totals due to rounding.

Transportation Energy C
onsumption by M
ode !243
1965-70: Ibid., Handbook of Airline Statistics 1973 (Washington, DC: 1974),part III, tables 2 and 13.1975-80: Ibid., Air Carrier Traffic Statistics (Washington, DC: December 1976), pp. 4 and14; and (December 1981), pp. 2 and 3.1985-98: U.S. Department of Transportation, Bureau of Transportation Statistics, Officeof Airline Information, Air Carrier Traffic Statistics (Washington, DC: Annual issues,December), pp. 2 and 3, line 27 plus line 50.1999: Ibid., Internet site http://www.bts.gov/programs/oai, as of July 14, 2000.Fuel consumption: 1960-99: U.S. Department of Transportation, Bureau ofTransportation Statistics, Office of Airline Information, Internet sitehttp://www.bts.gov/programs/oai/fuel/fuelyearly.html, as of July 5, 2000.1999: Ibid., Personal communication, July 27, 2000.
Table 4-8 Certificated Air Carrier Fuel Consumption and Travela
a Aircraft operating under 14 CFR 121 and 14 CFR 135.SOURCES:Number of aircraft: 1960-65: U.S. Department of Transportation, Federal AviationAdministration, FAA Statistical Handbook of Aviation, 1970 edition (Washington, DC: 1970),table 5.3.1970-75: Ibid., FAA Statistical Handbook of Aviation, Calendar Year 1979 (Washington, DC:1979), table 5.1.1980-85: Ibid., FAA Statistical Handbook of Aviation, Calendar Year 1986 (Washington, DC:1986), table 5.1.1990-97: Ibid., FAA Statistical Handbook of Aviation, Calendar Year 1997 (Washington, DC:unpublished), personal communication, Mar. 19, 1999.1998-99: Aerospace Industries Association, Aerospace Facts and Figures (Washington DC:Annual Issues), "Active U.S. Air Carrier Fleet".Aircraft-miles flown: 1960: Civil Aeronautics Board, Handbook of Airline Statistics 1969(Washington, DC: 1970), part III, tables 2 and 13.
KEY: R = revised
1960 1965 1970 1975 1980 1985 1990 1995 1996 1997 1998 1999Number of aircraft 2,135 2,125 2,679 2,495 3,808 4,678 6,083 7,411 7,478 7,616 R8,111 8,228Average miles flown per
aircraft (thousands) 487 667 949 932 768 740 776 759 783 791 R767 774
Aircraft-miles (millions)Domestic operations 858 1,134 2,068 1,948 2,523 3,046 3,963 4,629 4,811 4,911 5,031 5,176International operations 182 284 475 377 401 415 760 998 1,043 1,114 1,191 1,197
Fuel consumption(million gallons)
Domestic operations 1,954 3,889 7,857 7,558 9,096 R10,115 R12,429 12,812 R13,187 13,660 13,877 14,491International operations 566 1,280 2,243 1,949 1,938 R2,488 R3,963 R4,511 R4,658 4,964 5,186 5,277
Aircraft-miles flown per gallon
Domestic operations 0.44 0.29 0.26 0.26 0.28 0.30 0.32 0.36 0.36 0.36 0.36 0.36International operations 0.32 0.22 0.21 0.19 0.21 0.17 0.19 0.22 0.22 0.22 0.23 0.23

244"
Chapter 4 Transportation, E
nergy, and the Environm
ent
1995-98: Ibid., Highway Statistics (Washington, DC: Annualissues), table VM-1.
Table 4-9 Motor Vehicle Fuel Consumption and Travel
a Includes personal passenger vehicles, buses, and trucks.NOTE: See tables 4-11, 4-12, 4-13, 4-14, and 4-15 for individual highway vehicles.SOURCES: 1960-90: U.S. Department of Transportation, Federal HighwayAdministration, Highway Statistics Summary to 1995, FHWA-PL-97-009 (Washington, DC:July 1997), table VM-201A.
KEY: R = revised
1960 1965 1970 1975 1980 1985 1990 1995 1996 1997 1998
Vehicles registered(thousands)a 73,858 90,358 111,242 137,913 161,490 177,133 193,057 205,427 210,441 211,580 215,496
Vehicle-miles traveled(millions) 719,000 888,000 1,110,000 1,328,000 1,527,000 1,775,000 2,144,000 2,423,000 2,486,000 R2,561,695 2,625,367
Fuel consumed(million gallons) 57,880 71,104 92,329 108,984 114,960 121,301 130,755 143,834 147,365 R150,386 154,884
Average miles traveled per vehicle (thousands) 9.7 9.8 10.0 9.6 9.5 10.0 11.1 11.8 11.8 12.1 12.2
Average miles traveledper gallon 12.4 12.5 12.0 12.2 13.3 14.6 16.4 16.8 16.9 17.0 17.0
Average fuel consumed per vehicle (gallons) 784 787 830 790 712 685 677 700 700 711 719

Transportation Energy C
onsumption by M
ode !245
NOTE: Numbers may not add to totals due to rounding.SOURCE: U.S. Department of Energy, Energy Information Administration, availableat Internet site www.eia.doe.gov/cneaf/solar.renewables/alt_trans_fuel98/atf_99.htmlas of June 26, 2000.
Table 4-10Estimated Consumption of Alternative and Replacement Fuels for Highway Vehicles (Thousand gasoline-equivalent gallons)
a The remaining portion of 85% methanol, 85% ethanol, and 95% ethanol fuels is gasoline. Consumption data include the gasoline portion of the fuel.
b Includes a very small amount of other ethers, primarily tertiary-amyl-methyl-ether and ethyl-tertiary-butyl-ether.
c Gasoline consumption includes ethanol in gasohol and methyl-tertiary-butyl-ether.d Total fuel consumption is the sum of alternative fuels, gasoline, and diesel. Oxygenate
consumption is included in gasoline consumption.
KEY: E = estimate; R = revised
1992 1993 1994 1995 1996 1997 1998R 1999 2000
Alternative fuelsLiquefied petroleum gases 208,142 264,655 248,467 232,701 239,158 238,356 241,583 R
E
243,648 249,550Compressed natural gas 16,823 21,603 24,160 35,162 46,923 R65,192 73,251 R86,073 104,501Liquefied natural gas 585 1,901 2,345 2,759 3,247 3,714 5,343 R6,062 7,460Methanol, 85%a 1,069 1,593 2,340 2,023 1,775 1,554 1,212 R1,108 1,062Methanol, neat 2,547 3,166 3,190 2,150 347 347 449 R449 449Ethanol, 85%a 21 48 80 190 694 1,280 1,727 R2,489 3,283Ethanol, 95%a 85 80 140 995 2,699 1,136 59 59 59Electricity 359 288 430 663 773 1,010 1,202 R1,458 1,712 Total 229,631 293,334 281,152 276,643 295,616 R312, 589 324,826 R341,346 368,076
OxygenatesMethyl-tertiary-butyl-etherb 1,175,000 2,069,200 2,018,800 2,691,200 2,749,700 3,104,200 2,915,600 R3,079,800 3,111,500Ethanol in gasohol 701,000 760,000 845,900 910,700 660,200 830,700 916,000 R890,200 908,700
Traditional fuelsGasolinec 110,135,000 111,323,000 113,144,000 115,943,000 117,783,000 119,336,000 122,849,000 R124,591,000 127,568,000Diesel 23,866,000 24,296,630 27,293,370 28,555,040 30,101,430 31,949,270 33,665,360 R34,239,260 35,212,860 Total 134,001,000 135,620,000 140,437,000 144,498,000 147,884,000 151,285,270 156,514,360 R158,830,260 162,780,860
TOTAL fuel consumptiond 134,231,000 135,913,000 140,719,000 144,775,000 148,180,000 R151,597,859 156,839,186 R159,171,606 163,148,936

246"
Chapter 4 Transportation, E
nergy, and the Environm
entTable 4-11 Passenger Car and Motorcycle Fuel Consumption and Travel
KEY: R = revised
Continued next page
1960 1965 1970 1975 1980 1985 1990 1995 1996 1997 1998
Vehicles registered (thousands) Passenger cars 61,671 75,258 89,244 106,706 121,601 127,885 133,700 128,387 129,728 129,749 131,839Motorcycles 574 1,382 2,824 4,964 5,694 5,444 4,259 3,897 3,872 3,826 3,879
Vehicle-miles traveled (millions) Passenger cars 587,000 723,000 917,000 1,034,000 1,112,000 1,247,000 1,408,000 1,438,000 1,470,000 R1,502,556 1,545,830Motorcycles a a 3,000 5,600 10,200 9,100 9,600 9,800 9,900 R10,081 10,260
Fuel consumed (million gallons) Passenger cars 41,171 49,723 67,819 74,140 69,982 71,518 69,568 68,072 69,221 R69,892 72,209Motorcycles a a 60 113 204 182 191 196 198 202 205
Average miles traveled per vehicle (thousands) Passenger cars 9.5 9.6 10.3 9.7 9.1 9.8 10.5 11.2 11.3 11.6 11.7Motorcycles a a 1.1 1.1 1.8 1.7 2.2 2.5 2.6 2.6 2.6
Average miles traveled per gallon Passenger cars 14.3 14.5 13.5 13.9 15.9 17.4 20.2 21.1 21.2 21.5 21.4Motorcycles a a 50 50 50 50 50 50 50 50 50
Average fuel consumed per vehicle (gallons) Passenger cars 668 661 760 695 576 559 520 530 534 R539 548Motorcycles a a 21 23 36 33 45 50 51 53 53

Transportation Energy C
onsumption by M
ode !247
Motorcycle:Number registered: 1960-94: U.S. Department of Transportation, Federal HighwayAdministration, Highway Statistics Summary to 1995, FHWA-PL-97-009 (Washington, DC:July 1997), table MV-201.1995-98: Ibid., Highway Statistics (Washington, DC: Annual issues), table VM-1.All other motorcycle data: 1970-85: U.S. Department of Transportation, FederalHighway Administration, Highway Statistics Summary to 1985, table VM-201A.1990-98: Ibid., Highway Statistics (Washington, DC: Annual issues), table VM-1.Average miles traveled per vehicle, average miles traveled per gallon, average fuel con-sumed per vehicle: Derived by calculation.
Table 4-11Cont’d Passenger Car and Motorcycle Fuel Consumption and Travel
a Included in passenger car.NOTE: See table 4-12 for other 2-axle 4-tire vehicles.SOURCES:Passenger car:Number registered: 1960-94: U.S. Department of Transportation, Federal HighwayAdministration, Highway Statistics Summary to 1995, FHWA-PL-97-009 (Washington, DC:July 1997), table MV-201.1995-98: Ibid., Highway Statistics (Washington, DC: Annual issues), table VM-1.All other passenger car data: 1960-94: U.S. Department of Transportation, FederalHighway Administration, Highway Statistics Summary to 1995, FHWA-PL-97-009(Washington, DC: July 1997), table VM-201A. For 1970-94, the unrevised motorcyclevehicle-miles and fuel consumed are subtracted from the combined passenger car andmotorcycle vehicle-miles and fuel consumed from VM-201A.1995-98: Ibid., Highway Statistics (Washington, DC: Annual issues), table VM-1.

248"
Chapter 4 Transportation, E
nergy, and the Environm
ent
SOURCES: 1970-90: U.S. Department of Transportation, Federal HighwayAdministration, Highway Statistics Summary to 1999, FHWA-PL-97-009 (Washington, DC:July 1997), table VM-201A.1995-98: Ibid., Highway Statistics (Washington, DC: Annual issues), table VM-1.
1970 1975 1980 1985 1990 1995 1996 1997 1998Number registered (thousands) 14,211 20,418 27,876 37,214 48,275 65,738 69,134 70,224 71,818Vehicle-miles traveled (millions) 123,000 201,000 291,000 391,000 575,000 790,000 817,000 850,000 866,228Fuel consumed (million gallons) 12,313 19,081 23,796 27,363 35,611 45,605 47,354 49,370 50,579Average miles traveled per vehicle (thousands) 8.7 9.8 10.4 10.5 11.9 12.0 11.8 12.1 12.1Average miles traveled per gallon 10.0 10.5 12.2 14.3 16.1 17.3 17.2 17.2 17.1Average fuel consumed per vehicle (gallons) 866 934 854 735 738 694 685 703 704
Table 4-12 Other 2-Axle 4-Tire Vehicle Fuel Consumption and Travel
NOTES: Nearly all vehicles in this category are light trucks, which include vans, pickuptrucks, and sport utility vehicles. In 1995, the U.S. Department of Transportation, FederalHighway Administration revised its vehicle categories beginning with 1993 data. They arepassenger car, other 2-axle 4-tire vehicle, single-unit 2-axle 6-tire or more truck, and com-bination truck. Prior to 1993, some minivans and sport utility vehicles were includedunder the passenger car category.
SOURCES: 1970-90: U.S. Department of Transportation,Federal Highway Administration, Highway Statistics Summary to 1995, FHWA-PL-97-009(Washington, DC: July 1997), table VM-201A.1995-98: Ibid., Highway Statistics (Washington, DC: Annual issues), table VM-1.
Table 4-13 Single-Unit 2-Axle 6-Tire or More Truck Fuel Consumption and Travel
NOTES: In 1995, the U.S. Department of Transportation, Federal HighwayAdministration revised its vehicle categories beginning with 1993 data to include passen-ger cars, other 2-axle 4-tire vehicles, single-unit 2-axle 6-tire or more trucks, and combina-tion trucks. Single-unit 2-axle 6-tire or more trucks are on a single frame with at least 2axles and 6 tires. Pre-1995 data have been reassigned to the most appropriate category.
KEY: R = revised
1970 1975 1980 1985 1990 1995 1996 1997 1998
Number registered (thousands) 3,681 4,232 4,374 4,593 4,487 5,024 R5,265 5,293 5,414
Vehicle-miles (millions) 27,100 34,600 39,800 45,400 51,900 R62,705 R63,967 R66,893 67,894
Fuel consumed (million gallons) 3,968 5,420 6,923 7,399 8,357 9,216 R9,365 R9,576 9,741
Average miles traveled per vehicle (thousands) 7.4 8.2 9.1 9.9 11.6 12.5 12.2 12.6 12.5
Average miles traveled per gallon 6.8 6.4 5.8 6.1 6.2 6.8 6.8 7.0 7.0
Average fuel consumed per vehicle (gallons) 1,078 1,281 1,583 1,611 1,862 1,835 R1,779 R1,809 1,799

Transportation Energy C
onsumption by M
ode !249
1995-98: Ibid., Highway Statistics (Washington, DC: Annualissues), table VM-1.
Table 4-14 Combination Truck Fuel Consumption and Travel
SOURCES: 1965-90: U.S. Department of Transportation, Federal HighwayAdministration, Highway Statistics Summary to 1995, FHWA-PL-97-009 (Washington, DC:July 1997), table VM-201A.
KEY: R = revised
1995-98: Ibid., Highway Statistics (Washington, DC: Annualissues), table VM-1.
Table 4-15 Bus Fuel Consumption and Travel
NOTE: Includes both publicly and privately owned school, transit, and other commer-cial buses.SOURCES: 1960-90: U.S. Department of Transportation, Federal HighwayAdministration, Highway Statistics Summary to 1995, FHWA-PL-97-009 (Washington, DC:July 1997), table VM-201A.
KEY: R = revised
1965 1970 1975 1980 1985 1990 1995 1996 1997 1998
Number registered (thousands) 787 905 1,131 1,417 1,403 1,709 1,696 1,747 1,790 1,831
Vehicle-miles traveled (millions) 31,700 35,100 46,700 68,700 78,100 94,300 115,500 118,900 R124,584 128,159
Fuel consumed (million gallons) 6,658 7,348 9,177 13,037 14,005 16,133 19,777 20,193 20,294 21,100
Average miles traveled per vehicle (thousands) 40.3 38.8 41.3 48.5 55.6 55.2 68.1 68.1 69.6 70.0
Average miles traveled per gallon 4.8 4.8 5.1 5.3 5.6 5.8 5.8 5.9 6.1 6.1
Average fuel consumed per vehicle (gallons) 8,465 8,119 8,116 9,201 9,980 9,441 11,663 11,561 11,338 11,526
1960 1965 1970 1975 1980 1985 1990 1995 1996 1997 1998Number registered (thousands) 272 314 378 462 529 593 627 686 695 698 716
Vehicle-miles traveled (millions) 4,300 4,700 4,500 6,100 6,100 4,500 5,700 6,400 6,600 R6,842 6,996
Fuel consumed (million gallons) 827 875 820 1,053 1,018 834 895 968 990 R1,027 1,049
Average miles traveled per vehicle(thousands) 16.0 14.9 12.0 13.1 11.5 7.5 9.1 9.4 9.4 9.8 9.8
Average miles traveled per gallon 5.3 5.3 5.5 5.8 6.0 5.4 6.4 6.6 6.6 6.7 6.7Average fuel consumed per vehicleR
(gallons) 3,039 2,784 2,172 2,279 1,926 1,405 1,428 1,412 1,425 1,471 1,466

250"
Chapter 4 Transportation, E
nergy, and the Environm
ent
In January 2000, theAmerican Public TransitAssociation changed itsname to the American Public Transportation Association (APTA). The Transit Fact Book isnow referred to as the Public Transportation Fact Book.SOURCE: American Public Transportation Association, Public Transportation Fact Book(Washington, DC: March 2000), tables 42, 46, 65, 66, 67, and similar tables in earlier edi-tions of the APTA Transit Fact Book.
Table 4-16 Transit Industry Electric Power and Primary Energy Consumptiona and Travel
a Prior to 1985, excludes commuter rail, automated guideway, urban ferryboat, demand responsive vehicles, and most rural and smaller systems.
b For 1995, includes propane, liquid petroleum gas, liquefied natural gas, kerosene, and all other nondiesel fuels except compressed natural gas. 1960 to 1990 data include propane.
NOTES: The heat equivalent factors used in Btu conversions are: diesel = 138,700Btu/gallon; electric = 3,412 Btu/kWh, negating electrical system loses (to include electri-cal system loses, multiply this conversion factor by approximately three) gasoline =125,000 Btu/gallon.
KEY: Btu = British thermal unti; kWh = kilowatt hour;N = data do not exist; P = preliminary; R = revised
1960 1965 1970 1975 1980 1985 1990 1995 1996 1997R 1998P
Number of vehicles 65,292 61,717 61,298 62,183 75,388 94,368 92,961 115,874 122,362 126,360 128,970Vehicle-miles traveled 2,143 2,008 1,883 2,176 2,287 2,791 3,242 3,550 3,650 3,746 3,932Electric power consumed (million kWh hours) 2,908 2,584 2,561 2,646 2,446 4,216 4,837 5,068 5,007 4,988 5,250
Primary energy consumed(thousand gallons)
Diesel 208,100 248,400 270,600 365,060 431,400 608,738 651,030 678,286 692,714 716,952 700,081 Gasoline and other nondiesel fuelsb 191,900 124,200 68,200 7,576 11,400 45,704 33,906 60,730 61,213 59,463 50,405 Compressed natural gasR N N N N N N N 10,740 15,092 23,906 30,915

Transportation Energy C
onsumption by M
ode !251
SOURCES:All data except for locomotive unit-miles: Association of American Railroads,Railroad Facts (Washington, DC: October 1999), pp. 33, 34, 40, 48, 50.Locomotive unit-miles: 1975-90: Ibid., Railroad Ten-Year Trends (Washington, DC:Annual issues).1995-98: Ibid., Analysis of Class I Railroads (Washington, DC: Annual issues), p. 29.
Table 4-17 Class I Rail Freight Fuel Consumption and Travel
a For 1960-80, the total includes a small number of steam and electric units,which are not included in the per locomotive fuel consumption figure.
b Includes cars owned by Class I railroads, other railroads, and car companies and shippers.
c Based on the distance run between terminals and/or stations; does not include yard or passenger train-miles.
KEY: N = data do not exist
1960 1965 1970 1975 1980 1985 1990 1995 1996 1997 1998Number in use Locomotivesa 29,031 27,780 27,077 27,846 28,094 22,548 18,835 18,812 19,269 19,684 20,261 Carsb 1,965,486 1,800,962 1,784,181 1,723,605 1,710,827 1,421,686 1,212,261 1,218,927 1,240,573 1,270,419 1,315,667Miles traveled (millions) Freight train-milesc 404 421 427 403 428 347 380 458 469 475 475 Locomotive unit-miles N N N 1,479 1,531 1,228 1,280 1,445 1,465 1,423 1,440 Car-miles 28,170 29,336 29,890 27,656 29,277 24,920 26,159 30,383 31,715 31,660 32,657Average miles traveled
per vehicle (thousands) Locomotives N N N 53.1 54.5 54.5 68.0 76.8 76.0 72.3 71.1 Cars 14.3 16.3 16.8 16.0 17.1 17.5 21.6 24.9 25.6 24.9 24.8Average miles traveled
per gallon Trains 0.12 0.12 0.12 0.11 0.11 0.11 0.12 0.13 0.13 0.13 0.13 Cars 8.13 8.17 8.43 7.56 7.50 8.01 8.40 8.73 8.86 8.86 9.11Fuel consumed
(million gallons) 3,463 3,592 3,545 3,657 3,904 3,110 3,115 3,480 3,579 3,575 3,583Average fuel consumed
per locomotivea
(thousand gallons) 119.3 129.3 130.9 131.3 139.0 137.9 165.4 185.0 185.7 181.6 176.8

1972 1975 1980 1985 1990 1995 1996 1997 1998 1999Number in use Locomotives 185 355 419 291 318 313 299 332 345 329 Cars 1,569 1,913 2,128 1,854 1,863 1,722 1,730 1,728 1,962 1,992Miles traveled (millions) Train-miles 26 30 30 30 33 32 30 32 33 34 Car-miles 213 253 235 251 301 292 276 288 312 342Locomotive fuel consumed Electric (million of kWh hours) N 180 254 295 330 304 293 282 275 283 Diesel (million gallons) N 63 64 65 82 66 71 75 75 74Average miles traveled per car 136,000 132,000 110,000 135,000 162,000 170,000 160,000 167,000 159,000 172,000
252"
Chapter 4 Transportation, E
nergy, and the Environm
ent
Car-miles: 1972: Ibid., TrainInformation System Reports(Washington, DC).1975: Association of American Railroads, Yearbook of Railroad Facts 1975 (Washington,DC: 1976), p. 40.1980-85: Amtrak, State and Local Affairs Department and Public Affairs Department,personal communication.1990-99: Ibid., Amtrak Corporate Reporting, Route Profitability System, personal com-munication, May 4, 2000.Locomotive fuel consumed:1975-99: Ibid., State and Local Affairs Department, personal communications.
Table 4-18 Amtrak Fuel Consumption and Travel
NOTE: The heat equivalent factors used in Btu conversions are: diesel = 138,700Btu/gallon; electric = 3,412 Btu/kWh, negating electrical system loses (to include electri-cal system loses, multiply this conversion factor by approximately three).SOURCES:Number of locomotives and cars: 1972-80: Amtrak, State and Local AffairsDepartment, personal communication.1985-99: Ibid., Amtrak Annual Report, Statistical Appendix (Washington, DC:Annual issues).Miles traveled:Train-miles: 1972-99: Ibid., Amtrak Annual Report, Statistical Appendix (Washington, DC:Annual issues).
KEY: Btu = British thermal unit; kWh = kilowatt hour;N = data do not exist

PetroleumMotor
gasolineDistillate and
residual fuel oilJet fuel and aviation gas Othera Total Electricity
Natural gas
Coal and otherb Total
1989Agriculture 4.5 0.7 0.1 0.2 5.4 1.8 1.4 0.1 8.7Defense 17.9 220.7 752.0 3.7 994.3 119.7 108.1 52.3 1,274.4Energy 1.3 3.1 0.5 0.2 5.0 19.2 9.2 10.8 44.3GSA 0.1 0.5 0.0 0.0 0.7 7.4 2.7 1.9 12.7Health and Human Services 0.2 1.9 0.0 0.1 2.3 2.5 1.8 0.1 6.7Interior 1.9 1.2 0.2 1.1 4.5 1.5 1.0 0.1 7.1Justice 1.9 0.3 0.2 0.0 2.5 1.7 2.5 1.1 7.7NASA 0.2 1.0 1.4 0.0 2.6 6.4 2.8 0.3 12.1Postal Service 8.8 4.6 0.0 0.2 13.6 11.4 4.7 0.6 30.3Transportation 0.8 5.6 6.9 0.1 13.4 4.0 1.1 0.0 18.5Veterans Affairs 0.5 2.4 0.0 0.0 3.0 7.8 14.3 1.2 26.2Otherc 3.0 3.1 1.2 0.0 7.3 5.0 2.7 0.6 15.6 Total 41.1 245.1 762.5 5.7 1,054.4 188.5 152.4 69.2 1,464.5
1999P
Agriculture 3.3 0.1 0.0 0.1 3.5 1.9 2.0 0.5 7.8Defense 13.5 143.4 436.8 1.7 595.4 98.7 86.0 30.5 810.7Energy 1.0 1.1 0.0 0.1 2.3 15.7 6.7 4.7 29.4GSA 0.1 0.1 0.0 0.0 0.2 9.5 3.2 1.5 14.3Health and Human Services 0.4 0.3 0.0 0.1 0.9 2.8 3.3 0.1 7.0Interior 2.8 0.8 0.1 0.7 4.5 1.5 1.4 0.1 7.5Justice 4.8 0.4 1.5 0.0 6.7 3.8 4.5 0.4 15.4NASA 0.2 0.4 1.1 0.0 1.8 6.4 3.0 0.2 11.4Postal Service 10.4 5.0 0.0 0.0 15.4 16.3 7.5 0.6 39.8Transportation 0.8 6.5 4.4 0.0 11.7 7.8 1.0 0.0 20.5Veterans Affairs 1.2 1.1 0.0 0.0 2.3 9.4 14.3 1.5 27.5
Otherd 2.4 3.1 0.9 0.0 6.4 13.3 4.8 0.6 25.1 Total 41.1 162.3 444.7 2.9 651.0 187.2 137.6 40.5 1,016.3
Transportation Energy C
onsumption by M
ode !253
Table 4-19 U.S. Government Energy Consumption by Agency and Source (Trillion Btu)
KEY: Btu = British thermal unit; GSA = General Services Adminstration;NASA = National Aeronautics and Space Administration; P = preliminary
Continued next page

254"
Chapter 4 Transportation, E
nergy, and the Environm
ent
NOTES: Numbers may not add to totals due to rounding. These data include energyconsumed at foreign installations and in foreign operations, including aviation and oceanbunkering, primarily by the U.S. Department of Defense. U.S. government energy usefor electricity generation and uranium enrichment is excluded. Other energy used by U.S.agencies that produce electricity or enriched uranium is included. The U.S. government'sfiscal year runs from October 1 through September 30.This table uses a conversion factor for electricity of 3,412 Btu per kilowatt-hour, and aconversion factor for purchased steam of 1,000 Btu per pound.SOURCE: U.S. Department of Energy, Energy Information Administration, AnnualEnergy Review 1999, DOE/EIA-0384(99) (Washington, DC: July 2000), table 1.13.Internet site http://www.eia.doe.gov/emeu/aer/ as of June 27, 2000.
Table 4-19Cont’d U.S. Government Energy Consumption by Agency and Source (Trillion Btu)
a Includes liquefied petroleum gases.b Includes purchased steam, coal, and other.c Includes U.S. Department of Commerce, Panama Canal Commission, Tennessee Valley
Authority, U.S. Department of Labor, U.S. Department of Housing and Urban Development, Federal Communications Commission, Office of Personnel Management,U.S. Department of State, Small Business Administration, National Science Foundation,U.S. Department of Treasury, and Environmental Protection Agency.
d Includes National Archives and Records Administration, U.S. Department ofCommerce, U.S. Department of Labor, U.S. Department of State, Environmental Protection Agency, Federal Communications Commission, Federal Trade Commission,Panama Canal Commission, Equal Employment Opportunity Commission, Nuclear Regulatory Commission, Office of Personnel Management, U.S. Department ofHousing and Urban Development, U.S. Department of Treasury, Tennessee Valley Authority, Railroad Retirement Board, U.S. Information Agency, and Federal Emergency Management Agency.

Section CTransportation Energy
Intensity and Fuel Efficiency
chapter four

Transportation Energy Intensity and F
uel Efficiency !
257
1995-98: Ibid., HighwayStatistics (Washington, DC:Annual issues), table VM-1.Other 2-axle 4-tire vehicle: 1970-94: Ibid., Highway Statistics Summary to 1995, FHWA-PL-97-009 (Washington, DC: July 1997), table VM-201A.1995-98: Ibid., Highway Statistics (Washington, DC: Annual issues), table VM-1.Motorcycle: 1970-85: Ibid., Highway Statistics Summary to 1985, FHWA-PL-97-009(Washington, DC: July 1997), table VM-201A.1990-98: Ibid., Highway Statistics (Washington, DC: Annual issues), table VM-1.Transit motor bus:1980-98: American Public Transportation Association, Public Transportation Fact Book(Washington, DC: March 2000), tables 30, 42; and 65.Amtrak:1975-98: Amtrak, State and Local Affairs Department, personal communications.
Table 4-20 Energy Intensity of Passenger Modes (Btu per passenger-mile)
a Included in passenger car.b For 1995 and subsequent years, highway passenger-miles were taken directly from
Highway Statistics rather than derived from vehicle-miles and average occupancy, as is the case for 1960-1994.
NOTES: To calculate total Btu, multiply fuel consumed (see tables 4-22, 4-23, 4-24, 4-25)by 135,000 Btu/gallon for air carrier, 125,000 Btu/gallon for passenger car, other 2-axle 4-tire vehicle, and motorcycle, and 138,700 Btu/gallon for transit motor bus and Amtrak.SOURCES:Air:Certificated air carriers:Passenger-miles: 1960-99: Air Transport Association, Internet site http://www.air-trans-port.org/public/industry, as of July 5, 2000.Fuel consumed: 1960-99: U.S. Department of Transportation, Bureau of TransportationStatistics, Office of Airline Information, Internet site http://www.bts.gov/oai/fuel/fue-lyearly.html, as of July 5, 2000.Highway:Passenger car: 1960-94: U.S. Department of Transportation, Federal HighwayAdministration, Highway Statistics Summary to 1995, FHWA-PL-97-009 (Washington, DC:July 1997), table VM-201A.
KEY: Btu = British thermal unit; N = data do not exist;P = preliminary; R = revised
1960 1965 1970 1975 1980 1985 1990 1995 1996 1997 1998AirR
Certificated air carrier Domestic operations 8,633 10,118 10,185 7,746 5,727 5,047 4,932 4,382 4,183 4,146 4,123 International operations 9,199 10,292 10,986 8,465 8,866 5,103 4,546 4,173 4,108 4,168 4,278
Highwayb
Passenger car 4,495 4,455 4,841 4,743 4,348 4,267 3,812 3,721 3,702 3,657 3,672
Other 2-axle 4-tire vehicle N N 6,810 6,571 5,709 4,971 4,451 R4,539 R4,560 R4,563 4,591
Motorcycle a a 2,500 2,354 2,125 1,896 1,990 R2,227 R2,250 R2,295 2,330
Transit motor bus N N N N 2,742 R3,396 R3,723 R4,155 R4,196 R4,228 P3,729
Amtrak N N N 2,383 R2,164 R2,094 R2,064 1,838 R2,148 2,200 2,138

258"
Chapter 4 Transportation, E
nergy, and the Environm
entTable 4-21 Energy Intensity of Certificated Air Carriers, All Servicesa
KEY: Btu = British thermal unit; R = revised
Continued next page
1960 1965 1970 1975 1980 1985 1990 1995 1996 1997 1998 1999Aircraft-miles (millions)Domestic operations 858 1,134 2,068 1,948 2,523 3,046 3,963 4,629 4,811 4,911 5,031 5,176International operations 182 284 475 377 401 415 760 998 1,043 1,114 1,191 1,197
Available seat-miles (millions)R
Domestic operations 52,220 94,787 213,160 241,282 346,028 445,826 563,065 603,917 626,389 640,319 649,442 686,940International operations 13,347 29,533 51,960 61,724 86,507 101,963 170,310 203,160 208,682 216,913 224,728 230,909
Passenger-miles (millions)R
Domestic operations 30,557 51,887 104,147 131,728 200,289 270,584 340,231 394,708 425,596 442,640 455,799 479,689International operations 8,306 16,789 27,563 31,082 54,363 65,819 117,695 145,948 153,067 160,779 163,656 171,908
Fuel consumed (million gallons)
Domestic operations 1,954 3,889 7,857 7,558 9,096 R10,115 R12,429 12,812 R13,187 13,660 13,877 14,402International operations 566 1,280 2,243 1,949 1,938 R2,488 R3,963 R4,511 R4,658 4,964 5,186 5,250
Seats per aircraftR
Domestic operations 60.9 83.6 103.1 123.9 137.1 146.4 142.1 130.5 130.2 131.1 129.1 132.7International operations 73.3 104.0 109.4 163.7 215.7 245.7 224.1 203.6 200.1 194.7 188.7 192.9
Seat-miles per gallonR
Domestic operations 27 24 27 32 38 44 45 47 48 47 47 48International operations 24 23 23 32 45 41 43 45 45 44 43 44
Energy intensity (Btu/passenger-mile)b, R
Domestic operations 8,633 10,118 10,185 7,746 6,131 5,047 4,932 4,382 4,183 4,146 4,123 4,053International operations 9,199 10,292 10,986 8,465 4,813 5,103 4,546 4,173 4,108 4,168 4,278 4,123
Load factor (%)Domestic operations R58.5 R54.7 R48.9 R54.6 R58.0 R60.7 R60.4 R65.4 R67.9 69.1 70.2 69.8International operations R62.2 R56.8 R53.0 R54.4 R62.8 R64.6 R69.1 R71.8 R73.3 74.1 R72.8 74.4

Transportation Energy Intensity and F
uel Efficiency !
259
SOURCES:Aircraft-miles, available seat-miles, passenger-miles, and load factor: 1960-80: AirTransport Association, Internet site http://www.air-transport.org/public/industry, as ofJuly 5, 2000.1985-98: U.S. Department of Transportation, Bureau of Transportation Statistics, Office ofAirline Information, Air Carrier Traffic Statistics (Washington DC: Annual December issues).Fuel consumed: 1960-99: U.S. Department of Transportation, Bureau ofTransportation Statistics, Office of Airline Information, Internet sitehttp://www.bts.gov/oai/fuel/fuelyearly.html, as of July 5, 2000.Seats per aircraft, seat-miles per gallon, and energy intensiveness: Derived by calculation.
Table 4-21Cont’d Energy Intensity of Certificated Air Carriers, All Servicesa
a U.S. owned carriers only. Operation of foreign-owned carriers in or out of the United States not included.
b Calculation based on unrounded figures not shown here.NOTES: Aircraft-miles includes all four air-carrier groups (majors, nationals, largeregionals, and medium regionals), scheduled and charter, passenger, and all-cargo. Fuelconsumed includes majors, nationals, and large regionals, scheduled and charter, passenger,and all-cargo. Passenger-miles includes all four air-carrier groups, scheduled and charter,passenger service only. International operations include operations outside the UnitedStates, including those between the United States and foreign countries and the UnitedStates and its territories or possessions. Domestic and international load factor values for1999 are derived by calculation. Heat equivalent factor used for Btu conversion is 135,000Btu/gallon.

1960 1965 1970 1975 1980 1985 1990 1995 1996 1997 1998Vehicle-miles (millions)Passenger car 587,000 723,000 917,000 1,034,000 1,112,000 1,247,000 1,408,000 1,438,000 1,470,000 R1,503,000 1,546,000Other 2-axle 4-tire vehicle N N 123,000 201,000 291,000 391,000 575,000 790,000 817,000 R851,000 866,000Motorcycle b b 3,000 5,600 10,200 9,100 9,600 9,800 9,900 10,100 10,300
Passenger-miles (millions)a
Passenger car 1,145,000 1,395,000 1,751,000 1,954,000 2,012,000 2,094,000 2,282,000 R2,287,000 2,337,000 R2,389,000 2,458,000Other 2-axle 4-tire vehicle N N 226,000 363,000 521,000 688,000 1,000,000 R1,256,000 R1,298,000 R1,353,000 1,377,000Motorcycle b b 3,000 6,000 12,000 12,000 12,000 R11,000 R11,000 R11,000 11,000
Fuel consumed (million gallons)Passenger car 41,171 49,723 67,819 74,140 69,982 71,518 69,568 68,072 69,221 R69,892 72,209Other 2-axle 4-tire vehicle N N 12,313 19,081 23,796 27,363 35,611 45,605 47,354 R49,388 50,579Motorcycle b b 60 113 204 182 191 196 198 202 205
Energy intensity (BTU/passenger-mile)Passenger car 4,495 4,455 4,841 4,743 4,348 4,269 3,811 3,721 3,702 3,657 3,672Other 2-axle 4-tire vehicle N N 6,810 6,571 5,709 4,971 4,451 4,539 4,560 4,563 4,591Motorcycle a a 2,500 2,354 2,125 1,896 1,990 2,227 2,250 2,295 2,330
260"
Chapter 4 Transportation, E
nergy, and the Environm
ent
1995-98: Ibid.,Highway Statistics (Washington, DC: Annual issues), table VM-1.Other 2-axle 4-tire vehicle: 1960-90: Ibid., Highway Statistics, Summary to 1995, FHWA-PL-97-009 (Washington, DC: July 1997), table VM-201A.1995-98: Ibid., Highway Statistics (Washington, DC: Annual issues), table VM-1.Motorcycle: 1970-85: Ibid., Highway Statistics, Summary to 1985 (Washington, DC: 1986),table VM-201A. For 1970-90, the unrevised motorcycle vehicle-miles are subtractedfrom the combined passenger car and motorcycle vehicle-miles from VM-201A.1990-98 Ibid., Highway Statistics (Washington, DC: Annual issues), table VM-1.Passenger-miles: Passenger-miles multiplied by vehicle occupancy rates.Fuel consumed: 1960-90: U.S. Department of Transportation, Federal HighwayAdministration, Highway Statistics Summary to 1995, FHWA-PL-97-009 (Washington, DC:July 1997), table VM-201A. For 1970-90, the unrevised motorcycle fuel consumed is sub-tracted from the combined passenger car and motorcycle fuel consumed from VM-201A.1995-98: Ibid., Highway Statistics (Washington, DC: Annual issues), table VM-1.
a Passenger-miles are derived by multiplying vehicle-miles by an average occupancy rate forthat vehicle type based on data provided by the Federal Highway Administration,Nationwide Personal Transportation Survey, 1977, 1983, 1995. Average vehicle occupancy rates are as follows: passenger car (1960-97): 1.95, 1.93, 1.91, 1.89, 1.81, 1.68,1.62, 1.62, 1.61, 1.61, 1.60, 1.59, 1.59, 1.59; other 2-axle 4-tire vehicle (1960-97): 1.87,1.85, 1.83, 1.81, 1.79, 1.76, 1.74, 1.72, 1.70, 1.68, 1.66, 1.64, 1.64, 1.64; motorcycle (1960-97): 1.1, 1.1, 1.1, 1.1, 1.2, 1.3, 1.3, 1.27, 1.25, 1.23, 1.21, 1.18, 1.18, 1.18.
b Included in passenger car.NOTES: In 1995, the U.S. Department of Transportation, Federal HighwayAdministration revised its vehicle type categories for 1993 and later data. These new cate-gories include passenger car, other 2-axle 4-tire vehicle, single-unit 2-axle 6-tire or moretruck, and combination truck. Other 2-axle 4-tire vehicle includes vans, pickup trucks,and sport utility vehicles. In previous years, some minivans and sport utility vehicles wereincluded in the passenger car category. Single-unit 2-axle 6-tire or more trucks are on asingle frame with at least 2 axles and 6 tires. Pre-1993 data have been reassigned to theclosest available category.The heat equivalent factor used for Btu conversion is 125,000 Btus/gallon.SOURCES:Vehicle-miles:Passenger car: 1960-90: U.S. Department of Transportation, Federal HighwayAdministration, Highway Statistics Summary to 1995, FHWA-PL-97-009 (Washington, DC:July 1997), table VM-201A.
Table 4-22 Energy Intensity of Passenger Cars, Other 2-Axle 4-Tire Vehicles, and Motorcycles
KEY: Btu = British thermal unit; N = data do not exist; R = revised

Transportation Energy Intensity and Fuel Efficiency ! 261
1980 1985 1990 1995 1996 1997 1998 1999Average U.S. passenger car fuel efficiency (mpg) (calendar year)Passenger car 15.9 17.4 20.2 21.1 21.2 21.5 R21.6 21.4Other 2-axle 4-tire vehicle 12.2 14.3 16.1 17.3 17.2 17.2 R17.2 17.1
New vehicle fuel efficiency (mpg)a
(model year)Light-duty vehicle (passenger cars
plus light trucks) Domestic 21.4 24.0 23.9 23.8 24.1 R23.3 R23.3 23.7 Imported 28.6 30.3 28.5 27.9 27.7 27.5 27.6 26.9 Passenger car Domestic 22.6 26.3 26.9 27.7 28.3 R27.8 R28.1 28.2 Imported 29.6 31.5 29.9 30.3 29.7 R30.1 R30.0 28.4 Light truck (<8,500 lbs GVWR) Domestic 16.8 19.6 20.3 20.3 20.5 R20.2 20.5 20.4 Imported 24.3 26.5 23.0 21.5 22.2 22.1 22.9 22.5
CAFE standards (mpg)a
(model year)Passenger car 20.0 27.5 27.5 27.5 27.5 27.5 27.5 27.5Light truck 16.0/14.0b 19.5 20.0 20.6 20.7 20.7 20.7 20.7
Average Fuel Efficiency of U.S. Passenger Cars and Light Trucks
a Assumes 55% city and 45% highway-miles. The source calculatedaverage miles per gallon for light-duty vehicles by taking the reciprocal of the sales-weighted average of gallons per mile. Thisis called the harmonic average.
b 2 Wheel Drive/4 Wheel Drive. No combined figure available forthis year.
NOTE: The fuel efficiency figures for light duty vehicles repre-sent the sales-weighted harmonic average of the combined passen-ger car and light truck fuel economies.SOURCES:Average U.S. passenger car fuel efficiency: 1980-90: U.S.Department of Transportation, Federal Highway Administration,Highway Statistics Summary to 1995, FHWA-PL-97-009 (Washington,DC: July 1997), table VM-201A.1995-98: Ibid., Highway Statistics (Washington, DC: Annual issues),table VM-1.New vehicle fuel efficiency (based on model year production):1980-90: U.S. Environmental Protection Agency, final fuel econo-my calculations for the U.S. Department of Transportation,National Highway Traffic Safety Administration, as cited in
Internet sitewww.nhtsa.dot.gov/cars/problems/fuelecon/index.html.1995-99: Manufacturer's preliminary estimates for the U.S.Department of Transportation, as cited in National HighwayTraffic Safety Administration, Automotive Fuel Economy Program,Twenty-Fourth Annual Report to Congress, Calendar Year 1999, Internetsite www.nhtsa.dot.gov/cars/problems/fuelecon/index.html.CAFE standards: 1980-99: U.S. Department of Transportation,National Highway Traffic Safety Administration, Automotive FuelEconomy Program, Twenty-Fourth Annual Report to Congress, CalendarYear 1999, Internet site www.nhtsa.dot.gov/cars/problems/fuele-con/index.html.
Table 4-23
KEY: CAFE = Corporate Average Fuel Economy; GVWR = gross vehicle weight rating; mpg = miles per gallon; R = revised;

262"
Chapter 4 Transportation, E
nergy, and the Environm
ent
SOURCE: American PublicTransportation Association,Public Transportation Fact Book(Washington, DC: March 2000), tables 65 and 79, and similar tables in earlier editions ofthe Transit Fact Book.
1960 1965 1970 1975 1980 1985 1990 1995 1996 1997 1998Vehicle-miles (millions) 1,576 1,528 1,409 1,526 1,677 1,863 2,130 2,184 2,165 2,307 2,291Passenger-miles (millions) N N N N 21,800 21,200 21,000 18,800 19,100 20,400 20,603Fuel consumed (million gallons diesel) 208 248 271 365 431 518 563 564 R577 R597 P554Energy intensity (Btu/passenger-mile) N N N N 2,742 3,389 3,718 4,161 4,029 R4,059 3,730
Table 4-24 Energy Intensity of Transit Motor Buses
NOTES: Heat equivalent factor used for Btu conversion is 138,700 Btu/gallon. InJanuary 2000, the American Public Transit Association changed its name to the AmericanPublic Transportation Association (APTA). The Transit Fact Book is now referred to as thePublic Transportation Fact Book.
KEY: Btu = British thermal unit; N = data do not exist;P = preliminary; R = revised
SOURCE: Association of American Railroads,Railroad Facts (Washington, DC: November 2000).
Table 4-25 Energy Intensity of Class I Railroada Freight Service
a Class I railroads are those that have operating revenues of $255 million or more.NOTE: The heat equivalent factor used for Btu conversion is 138,700 Btu/gallon.
KEY: Btu = British thermal unit
1960 1965 1970 1975 1980 1985 1990 1995 1996 1997 1998 1999Revenue freight
ton-miles (millions) 572,309 697,878 764,809 754,252 918,958 876,984 1,033,969 1,305,688 1,355,975 1,348,926 1,376,802 1,433,461Car-miles
(millions) 28,170 29,336 29,890 27,656 29,277 24,920 26,159 30,383 31,715 31,660 32,657 33,851Tons per car load 44 49 55 61 67 68 67 65 67 63 64 63Fuel consumed
(million gallons) 3,463 3,592 3,545 3,657 3,904 3,110 3,115 3,480 3,579 3,575 3,583 3,715Energy intensity
(Btu/revenue freight ton-mile) 839 714 643 672 589 492 418 370 366 368 361 359
Energy intensity (Btu/car-mile) 17,051 16,983 16,450 18,341 18,495 17,310 16,516 15,886 15,652 15,662 15,218 15,222

1975 1980 1985 1990 1991 1992 1993 1994 1995 1996 1997 1998 1999Revenue passenger-miles (millions) 3,931 4,503 4,785 6,057 6,273 6,091 6,199 5,921 5,545 5,050 5,166 5,304 5,330Locomotive fuel consumed Total fuel consumed (billion Btu)a 9,367 9,673 9,995 12,512 12,406 12,328 12,511 11,457 10,191 10,875 11,365 11,341 11,229 Electric (millions of kWh)a 180 254 295 330 303 300 301 309 304 293 282 275 283 Diesel (million gallons) 63 64 65 82 82 82 83 75 66 71 75 75 74Energy intensity
(Btu/revenue passenger-mile)a 2,383 2,148 2,089 2,066 1,978 2,024 2,018 1,935 1,838 2,153 2,200 2,138 2,107
Transportation Energy Intensity and F
uel Efficiency !
263
SOURCES:Revenue passenger-miles: Amtrak, Amtrak Annual Report, Statistical Appendix(Washington, DC: Annual issues).Locomotive fuel consumed: 1975-99: Ibid., State and Local Affairs Department, per-sonal communications.
Table 4-26 Energy Intensity of Amtrak Services
a Does not include electric power generation and distribution losses, which, if included,would triple the electric conversion factor given below, and would increase the numbers in this row by about 20%.
NOTE: The heat equivalent factors used in Btu conversion are: diesel = 138,700Btus/gallon; electric = 3,412 Btu/kWh.
KEY: Btu = British thermal unit; kWh = kilowatt hour

264"
Chapter 4 Transportation, E
nergy, and the Environm
entTable 4-27 Annual Wasted Fuel Due to Congestion
KEY: NM = not meaningful; R = revised
Continued next page
% change
Urban area R1982 R1986 R1990 R1992 R1995 R1996 1997 % Rank % RankAlbany-Schenectady-Troy, NY 0 2 4 4 4 5 5 25 50 NM 59Albuquerque, NM 2 4 9 11 19 22 25 127 6 1150 3Atlanta, GA 31 69 71 84 162 185 214 155 3 590 22Austin, TX 5 11 14 20 27 30 40 100 11 700 14Bakersfield, CA 0 0 2 2 2 3 3 50 32 NM 59Baltimore, MD 26 44 84 82 114 117 123 50 32 373 36Beaumont, TX 0 0 0 1 2 2 2 100 11 NM 59Boston, MA 63 109 163 175 220 229 236 35 43 275 42Boulder, CO 0 0 0 0 0 0 0 NM 65 NM 59Brownsville, TX 0 0 0 0 0 0 0 NM 65 NM 59Buffalo-Niagara Falls, NY 3 3 7 7 8 8 9 29 47 200 48Charlotte, NC 4 6 12 14 18 20 27 93 16 575 23Chicago, IL-Northwestern, IN 108 205 271 297 342 371 398 34 44 269 44Cincinnati, OH-KY 8 11 26 32 41 43 49 53 31 513 27Cleveland, OH 4 7 19 23 37 44 48 109 9 1100 4Colorado Springs, CO 0 2 2 4 7 7 7 75 22 NM 59Columbus, OH 4 6 18 20 33 32 37 85 18 825 12Corpus Christi, TX 2 2 2 2 2 3 3 50 32 50 58Dallas, TX 33 81 87 97 133 136 162 67 26 391 34Denver, CO 17 27 43 52 80 88 96 85 18 465 29Detroit, MI 98 131 211 241 245 266 288 20 53 194 49El Paso, TX-NM 2 2 4 7 8 7 9 29 47 350 38Eugene-Springfield, OR 0 0 0 0 1 2 2 NM 65 NM 59Fort Lauderdale-Hollywood-
Pompano Beach, FL 7 14 18 35 44 49 55 57 30 686 17
Gallons Wasted (millions)Short-term Long-term
1982-19971992-1997

% change
Urban area R1982 R1986 R1990 R1992 R1995 R1996 1997 % Rank % RankFort Worth, TX 11 24 34 34 47 52 59 74 23 436 31Fresno, CA 2 4 9 7 8 8 10 43 38 400 33Hartford-Middletown, CT 3 10 17 18 15 16 19 6 60 533 25Honolulu, HI 10 15 21 23 25 24 25 9 58 150 52Houston, TX 103 133 120 122 140 167 206 69 25 100 55Indianapolis, IN 3 7 14 19 53 55 61 221 1 1933 1Jacksonville, FL 8 11 18 20 29 33 33 65 27 313 40Kansas City, MO-KS 4 8 15 17 32 38 45 165 2 1025 7Laredo, TX 0 0 0 0 0 0 0 NM 65 NM 59Las Vegas, NV 3 7 22 22 41 45 44 100 11 1367 2Los Angeles, CA 490 764 1,044 1,042 1,066 1,092 1,108 6 60 126 54Louisville, KY-IN 4 7 12 22 32 39 42 91 17 950 9Memphis, TN-AR-MS 4 4 11 15 27 30 32 113 7 700 14Miami-Hialeah, FL 44 61 102 119 125 118 136 14 56 209 47Milwaukee, WI 7 12 22 31 41 39 38 23 51 443 30Minneapolis-St. Paul, MN 8 20 37 47 76 80 96 104 10 1100 4Nashville, TN 5 9 15 15 27 30 35 133 5 600 21New Orleans, LA 16 25 30 31 36 33 32 3 62 100 55New York, NY-Northeastern, NJ 314 405 616 567 680 724 802 41 40 155 51Norfolk, VA 9 18 25 25 31 38 41 64 28 356 37Oklahoma City, OK 2 3 7 9 15 20 22 144 4 1000 8Omaha, NE-IA 3 5 10 14 18 21 19 36 42 533 25Orlando, FL 7 13 15 29 35 42 50 72 24 614 20Philadelphia, PA-NJ 70 92 113 120 139 159 166 38 41 137 53Phoenix, AZ 25 48 62 65 73 90 93 43 38 272 43
Gallons Wasted (millions)Short-term Long-term
1982-19971992-1997
Transportation Energy Intensity and F
uel Efficiency !
265
Table 4-27Cont’d Annual Wasted Fuel Due to Congestion
KEY: NM = not meaningful; R = revised
Continued next page

% change
Urban area R1982 R1986 R1990 R1992 R1995 R1996 1997 % Rank % RankPittsburgh, PA 12 19 28 27 33 32 33 22 52 175 50Portland-Vancouver, OR-WA 11 25 38 52 75 85 84 62 29 664 19Providence-Pawtucket, RI-MA 4 9 20 16 21 24 23 44 37 475 28Rochester, NY 1 2 4 6 8 9 9 50 32 800 13Sacramento, CA 8 16 42 43 50 57 54 26 49 575 23Salem, OR 0 0 2 2 2 2 3 50 32 NM 59Salt Lake City, UT 2 2 7 13 22 23 23 77 21 1050 6San Antonio, TX 8 21 17 19 30 34 38 100 11 375 35San Bernardino-Riverside, CA 9 25 50 62 70 74 72 16 55 700 14San Diego, CA 15 47 100 108 111 114 117 8 59 680 18San Francisco-Oakland, CA 149 241 288 276 286 291 280 1 63 88 57San Jose, CA 20 42 80 85 87 89 86 1 63 330 39Seattle-Everett, WA 40 74 122 150 143 148 165 10 57 313 40Spokane, WA 0 2 2 2 3 3 4 100 11 NM 59St. Louis, MO-IL 23 36 55 66 116 117 122 85 18 430 32Tacoma, WA 2 7 17 18 18 18 21 17 54 950 9Tampa, FL 12 16 23 29 38 37 38 31 46 217 46Tucson, AZ 2 2 8 9 13 15 19 111 8 850 11Washington, DC-MD-VA 101 164 225 248 300 326 327 32 45 224 45
Gallons Wasted (millions)Short-term Long-term
1982-19971992-1997
266"
Chapter 4 Transportation, E
nergy, and the Environm
ent
SOURCES: 1982-1996: TexasTransportation Institute, unpublished data.1997: Ibid., The 1999 Annual Urban Mobility Report (College Station, TX: 1999), table 6.
Table 4-27Cont’d Annual Wasted Fuel Due to Congestion
NOTES: "Wasted" fuel is the difference between the fuel consumed under estimatedexisting conditions and the fuel consumed if all traffic was moving at free-flow conditions.Calculations are made for peak period speeds and for free-flow speeds on both the free-way and principal arterial systems. For a more detailed description of the formulas used,see the source document. The cities shown represent the 50 largest metropolitan areas, aswell as others chosen by the states sponsoring the study.
KEY: NM = not meaningful; R = revised

% change
Urban area R1982 R1986 R1990 R1992 R1995 R1996 1997 % Rank % RankAlbany-Schenectady-Troy, NY 0 5 10 10 10 13 13 30 40 NM 59Albuquerque, NM 6 11 23 28 45 51 57 104 6 850 3Atlanta, GA 25 53 43 47 84 96 106 126 3 324 30Austin, TX 17 30 33 45 57 63 82 82 14 382 27Bakersfield, CA 0 0 10 9 8 12 12 33 38 NM 59Baltimore, MD 20 31 54 51 68 69 72 41 32 260 35Beaumont, TX 0 0 0 11 20 18 18 64 18 NM 59Boston, MA 27 48 67 73 91 95 98 34 37 263 34Boulder, CO 0 0 0 0 0 0 0 NM 62 NM 59Brownsville, TX 0 0 0 0 0 0 0 NM 62 NM 59Buffalo-Niagara Falls, NY 4 4 9 8 10 10 11 38 35 175 44Charlotte, NC 15 19 34 36 42 45 61 69 17 307 31Chicago, IL-Northwestern, IN 20 38 47 51 58 62 65 27 46 225 39Cincinnati, OH-KY 9 13 30 34 42 44 50 47 26 456 18Cleveland, OH 3 5 14 16 26 30 33 106 5 1000 2Colorado Springs, CO 0 9 9 16 24 23 23 44 28 NM 59Columbus, OH 6 9 27 27 42 41 47 74 15 683 9Corpus Christi, TX 11 10 10 10 9 13 13 30 40 18 58Dallas, TX 24 55 56 62 78 78 92 48 25 283 33Denver, CO 16 23 34 43 61 65 70 63 20 338 29Detroit, MI 35 46 72 79 80 86 92 16 51 163 47El Paso, TX-NM 6 6 10 18 19 16 20 11 53 233 38Eugene-Springfield, OR 0 0 0 0 6 13 12 NM 62 NM 59Fort Lauderdale-Hollywood-
Pompano Beach, FL 8 14 17 35 40 42 47 34 36 488 14Fort Worth, TX 13 28 37 38 49 54 60 58 22 362 28
Gallons WastedShort-term Long-term
1982-19971992-1997
Transportation Energy Intensity and F
uel Efficiency !
267
Table 4-28 Wasted Fuel per Eligible Driver
KEY: NM = not meaningful; R = revised
Continued next page

% change
Urban area R1982 R1986 R1990 R1992 R1995 R1996 1997 % Rank % RankFresno, CA 8 14 29 20 22 22 26 30 40 225 39Hartford-Middletown, CT 7 23 37 37 31 32 38 3 60 443 21Honolulu, HI 22 31 38 43 46 44 45 5 57 105 51Houston, TX 57 63 55 56 63 73 90 61 21 58 57Indianapolis, IN 5 10 19 26 68 70 79 204 1 1480 1Jacksonville, FL 17 22 33 35 48 54 53 51 24 212 42Kansas City, MO-KS 5 9 17 18 31 37 44 144 2 780 8Laredo, TX 0 0 0 0 0 0 0 NM 62 NM 59Las Vegas, NV 9 18 42 35 53 55 50 43 29 456 18Los Angeles, CA 64 92 118 118 120 122 122 3 59 91 53Louisville, KY-IN 7 11 19 37 49 59 63 70 16 800 5Memphis, TN-AR-MS 7 7 17 23 39 42 44 91 9 529 13Miami-Hialeah, FL 31 43 69 79 80 73 83 5 56 168 46Milwaukee, WI 8 13 24 33 43 41 39 18 50 388 26Minneapolis-St. Paul, MN 6 14 23 28 43 45 53 89 12 783 7Nashville, TN 13 22 33 33 55 61 71 115 4 446 20New Orleans, LA 20 31 37 37 42 38 37 0 62 85 54New York, NY-Northeastern, NJ 24 33 46 41 49 52 58 41 31 142 49Norfolk, VA 15 27 34 34 40 49 52 53 23 247 37Oklahoma City, OK 4 5 13 15 21 27 29 93 8 625 11Omaha, NE-IA 8 13 26 35 43 50 45 29 44 463 17Orlando, FL 15 24 22 42 44 52 60 43 29 300 32Philadelphia, PA-NJ 22 29 32 31 34 39 40 29 43 82 55Phoenix, AZ 23 37 43 42 42 50 51 21 49 122 50Pittsburgh, PA 8 13 18 18 22 21 22 22 48 175 44
Gallons WastedShort-term Long-term
1982-19971992-1997
268"
Chapter 4 Transportation, E
nergy, and the Environm
entTable 4-28
Cont’d Wasted Fuel per Eligible Driver
KEY: NM = not meaningful; R = revised
Continued next page

% change
Urban area R1982 R1986 R1990 R1992 R1995 R1996 1997 % Rank % RankPortland-Vancouver, OR-WA 14 30 44 60 79 85 80 33 38 471 15Providence-Pawtucket, RI-MA 6 14 30 23 30 34 32 39 34 433 23Rochester, NY 2 5 9 13 17 19 19 46 27 850 3Sacramento, CA 12 22 50 48 55 62 59 23 47 392 25Salem, OR 0 0 17 15 15 14 21 40 33 NM 59Salt Lake City, UT 4 3 11 22 35 37 36 64 18 800 5San Antonio, TX 12 28 20 22 33 37 42 91 10 250 36San Bernardino-Riverside, CA 13 34 59 67 73 77 74 10 54 469 16San Diego, CA 11 30 55 57 57 59 59 4 58 436 22San Francisco-Oakland, CA 56 86 96 91 93 94 91 0 62 63 56San Jose, CA 23 42 75 73 73 72 69 -5 68 200 43Seattle-Everett, WA 33 56 83 104 94 96 106 2 61 221 41Spokane, WA 0 9 9 8 12 12 16 100 7 NM 59St. Louis, MO-IL 16 24 36 43 75 75 79 84 13 394 24Tacoma, WA 6 19 45 44 41 40 47 7 55 683 9Tampa, FL 29 33 41 51 58 57 58 14 52 100 52Tucson, AZ 6 6 20 20 27 30 38 90 11 533 12Washington, DC-MD-VA 46 69 88 91 106 115 116 27 45 152 48
Gallons WastedShort-term Long-term
1982-19971992-1997
Transportation Energy Intensity and F
uel Efficiency !
269
SOURCES: 1982-1996: TexasTransportation Institute, unpublished data.1997: Ibid., The 1999 Annual Urban Mobility Report (College Station, TX: 1999), table 6.
Table 4-28Cont’d Wasted Fuel per Eligible Driver
NOTES: "Wasted" fuel is the difference between the fuel consumed under estimatedexisting conditions and the fuel consumed if all traffic was moving at free-flow conditions.Calculations are made for peak period speeds and for free-flow speeds on both the free-way and principal arterial system. For a more detailed description of the formulas used,see the source document. An eligible driver is someone 16 years and older who is eligiblefor a driver's license. The cities shown represent the 50 largest metropolitan areas, as wellas others chosen by the states sponsoring the study.
KEY: NM = not meaningful; R = revised

Section DAir Pollution
chapter four

Tier 1i Interim Tier 2i Tier 2iEngine type and pollutant
Prior to controld
1968-1969
1970-1971 1972
1973-1974
1975-1976
1977-1979 1980 1981
1982-1986
1987-1993
GasolineHC (total) 11 g 2.2 3.4 1.5 0.41 0.41 (h) h
NMHC e h 0.25 (0.31) h
NMOG e h 0.125 (0.156) 0.100 (0.125)CO 80 g 23 39 15 7.0 3.4 3.4 (4.2)
Cold-temp. COc e h 10 (h)NOx 4 h 3.0 3.1 2.0 1.0 0.4 (0.6) 0.14 (0.20)Particulates e h 0.08 (0.10) 0.08 (0.08) 0.02 (0.02)Formaldehyde e h 0.015 (0.018)DieselHC (total) 11 h 1.5 0.41 0.41 (h) h
NMHC e h 0.25 (0.31) h
NMOG e h h (0.156) 0.100 (0.125)CO 80 h 15 7.0 3.4 3.4 (4.2) h (4.2) 3.4 (4.2)NOx 4 h 3.1 2.0 1.0 1.0 (1.25) h (0.6) 0.14 (0.20)Particulates e h 0.60 0.20 0.08 (0.10) h (0.10) 0.02 (0.02)Formaldehyde e h h (0.018) 0.015 (0.018)
Test procedure 7-mode CVS-72 CVS-75h 5 years/50,000 miles5 years/50,000 miles 10 years/100,000 miles 10 years/120,000 miles(full)
1994-2003b 2004-2006 2007+
Useful life (intermediate) b,f
Air P
ollution !273
g In 1968-69, exhaust emissions standards were issued in parts permillion rather than grams per mile and are, therefore,incompatible with this table.
hNo standard has been set.i The term "tier" refers to a level of standards and is associated with specific years.Interim Tier 2 refers to an intermediate level of standards that move manufacturers toward compliance with Tier 2 standards. Interim Tier 2 and Tier 2 standards are established as "bins." Each bin is a set of standards for NOx, CO, NMOG,formaldehyde, and particulate matter; HC and NMHC standards are dropped for Tier 2 and Interim Tier 2. Manufacturers may certify any given vehicle family to any of the bins available for that vehicle class as long as the resulting sales-weight corporate average NOx standard is met for the full useful life of the vehicle. The Tier 2 corporate average NOx standard is 0.07 grams/mile. Interim corporate-based average NOx standards are based on vehicle type. The interim sales-weighted average for light-duty vehicles (LDVs) is 9.3 grams/mile. For LDVs, Tier 2 standards will be phased in at a rate of 25% in 2004, 50% in 2005, 75% in 2006, and 100% in 2007. During this period, all LDVs not meeting the Tier 2 standards must meet Interim Tier 2 standards.SOURCES: 40 CFR 86, Subpart A (July 1, 1998). U.S. Environmental ProtectionAgency, Office of Air and Radiation, personal communication.
Table 4-29Federal Exhaust Emission Certification Standards for Newly Manufactured Gasoline- and Diesel-Powered Light-Duty Vehiclesa,b (Grams per mile)
a The test procedure for measuring exhaust emissions has changed several times over the course of vehicle emissions regulations. The 7-mode procedure was used through modelyear 1971 and was replaced by the CVS-72 procedure beginning in model year 1972.The CVS-75 procedure became the test procedure as of model year 1975. While it may appear that the total HC and CO standards were relaxed in 1972-74, these standards were actually more stringent due to the more stringent nature of the CVS-72 test procedure. Additional standards for CO and composite standards for NMHC and NOx tested under the new Supplemental Federal Test Procedure will be phased-in beginning with model year 2000; these standards are not shown in this table.
b All emissions standards must be met for a useful life of 5 years/50,000 miles. Beginningwith model year 1994, a second set of emissions standards must also be met for a fulluseful life of 10 years/100,000 miles; these standards are shown in parentheses. Tier 1 exhaust standards were phased-in during 1994-96 at a rate of 40%, 80%, and 100%,respectively.
c The cold CO emissions standard is measured at 20 ºF (rather than 75 ºF) and is applicable for a 5-year/50,000-mile useful life.
d The "Prior to control" column reports emissions estimates of a typical newly manufacturedcar in the years before exhaust emissions certification standards were implemented.
e No estimate available.f Manufacturers can opt to certify vehicles for a full useful life of 15 years/150,000 miles and
have either 1) intermediate useful life standards waived or 2) receive additional NOx credits.
KEY: CO = carbon monoxide; HC = hydrocarbons; NMHC = nonmethane hydrocarbons;NMOG = nonmethane organic gases;NOx = nitrogen oxides

Tier 1k Interim Tier 2k Tier 2kEngine type and pollutant Prior to controlg
1968-1969
1970-1971 1972
1973-1974 1975
1976-1978
1979-1981
1982-1983 1984
1985-1986 1987
1988-1993 2007+
Gasoline
HC (total) 11 i 2.2 3.4 2.0 1.7 0.80 j j
NMHC h j 0.25 (0.31) j
NMOG h j 0.125 (0.156) 0.100 (0.125)
CO 80 i 23 39 20 18 10 3.4 (4.2)
Cold-temp. COd e j 10 (j)
NOx 4 j 3.0 3.1 2.3 1.2 0.4 (0.6) 0.14 (0.20)
Particulates h j 0.08 (0.10) 0.08 (0.08) 0.02 (0.02)
Formaldehyde h j 0.015 (0.018)
Diesel
HC (total) 11 j 2.0 1.7 0.80 j (0.80) j
NMHC h j 0.25 (0.31) j
NMOG h j j (0.156) 0.100 (0.125)
CO 80 j 20 18 10 3.4 (4.2) j (4.2) 3.4 (4.2)NOx 4 j 3.1 2.3 1.2 1.0 (1.25) j (0.6) 0.14 (0.20)
Particulates h j 0.60 0.26 0.08 (0.10) j (0.10) 0.02 (0.02)
Formaldehyde h j j (0.018) 0.015 (0.018)
LDT1 weight criterae GVWR up through 6,000 pounds GVWR up through 8,500 pounds
Test procedure b 7-mode CVS-72 CVS-75j 5 years/50,000 miles 5 years/50,000miles
5 years/50,000 miles 11 years/120,000 miles 10 years/100,000 miles 10 years/120,000 miles(full)
1994 1995-2003 2004-2006
GVWR up through 6,000 lbs; LVW up through 3,750 pounds
Useful life (intermediate) c,f
274"
Chapter 4 Transportation, E
nergy, and the Environm
entTable 4-30a
Federal Exhaust Emission Certification Standards for Newly Manufactured Gasoline- and Diesel-Powered Light Duty Trucks (Category LDT1) a,b,c (Grams per mile)
KEY: CO=carbon monoxide; GVWR=gross vehicle weight rating;HC=hydrocarbons; LVW=loaded vehicle weight;NMHC=nonmethane hydrocarbons;NMOG= nonmethane organic gases;NOx=nitrogen oxides
Continued next page

Air P
ollution !275
f Manufacturers can opt to certify vehicles for a full useful life of 15 years/150,000 miles and either have (1) intermediate useful life standards waived or (2) receive additional NOx credits.
g The "Prior to controls" column reports emissions estimates of a typical newly manufactured car in the years before exhaust emissions certification standards,
were implemented.h No estimate available.i In 1968-69, exhaust emissions standards were issued in parts per million rather than grams per mile and are, therefore, incompatible with this table.
j No standard has been set.k The term "tier" refers to a level of standards for specific years. Interim Tier 2 refers to an intermediate level of standards that move manufacturers toward compliance withTier 2 standards. Interim Tier 2 and Tier 2 standards are established as "bins." Each bin is a set of standards for NOx, CO, NMOG, formaldehyde, and particulates (HC and NMHC standards are dropped for Tier 2 and Interim Tier 2). Manufacturers may certify any given vehicle family to any of the bins available for that vehicle class as longas the resulting sales-weighted corporate average NOx standard is met for the full useful life. The Tier 2 corporate average NOx standard is 0.07 grams/mile. Interim corporate-based average NOx standards are based on vehicle type. The interim corporate sales-weighted average for LDT1 vehicles is 0.3 grams/mile. Tier 2 standards will be phased in at a rate of 25% in 2004, 50% in 2005, 75% in 2006, and 100% in 2007. During this period, all LDT1 vehicles not meeting the Tier 2 standards must meet Interim Tier 2 standards.SOURCES: 40 CFR 86, Subpart A (July 1, 1998). U.S. Environmental ProtectionAgency, Office of Air and Radiation, personal communication, April 1999, and theFederal Register, Vol. 65, No. 28, pp. 6851-6870.
Table 4-30aCont’d
Federal Exhaust Emission Certification Standards for Newly Manufactured Gasoline- and Diesel-Powered Light Duty Trucks (Category LDT1) a,b,c (Grams per mile)
a Light-duty truck categories LDT1-LDT4 were not created until 1994. From 1968 to 1978, all trucks with a GVWR up to 6,000 pounds were classified as light-duty trucks andwere required to meet the same standards. As of 1979, the maximum weight was raised to 8,500 pounds GVWR. During 1988-93, light duty trucks were divided into two subcategories that coincide with the current LDT1-LDT4 categories. The standards for LDT2, LDT3, and LDT4 are shown in tables 4-30b through 4-30d.
b The test procedure for measuring exhaust emissions has changed several times over the course of vehicle emissions regulation. The 7-mode procedure was used through model year 1971 and was replaced by the CVS-72 procedure beginning in model year 1972.The CVS-75 procedure became the test procedure as of model year 1975. While it may appear that total HC and CO standards were relaxed in 1972-74, these standards were actually more stringent due to the more stringent nature of the CVS-72 test procedure.Additional standards for CO and composite standards for NMHC and NOx tested over the new Supplemental Federal Test Procedure will be phased-in beginning with model year 2000. These standards are not shown in this table.
c Emissions standards had to be met for a useful life of 5 years/50,000 miles through modelyear 1983, and a full useful life of 11 years/120,000 miles was defined for 1985-93 (severaluseful life options were available for 1984). Beginning in model year 1994, emissions standards were established for an intermediate useful life of 5 years/50,000 miles as well as a full useful life (full useful life standards are shown in parentheses). HC standards,however, were established only for full useful life. Tier 1 exhaust standards, except particulates standards, were phased-in during 1994-96 at a rate of 40%, 80%, and 100%,respectively. PM standards were phased-in at a rate of 40%, 80%, and 100% during 1995-97.
d The cold CO emissions standard is measured at 20 ºF (rather than 75 ºF) and is applicablefor a 5-year/50,000-mile useful life.
e GVWR is the maximum design loaded weight. LVW is the curb weight (nominal vehicleweight) plus 300 pounds.

Tier 1k Interim Tier 2k Tier 2kEngine type and pollutant Prior to controlg
1968-1969
1970-1971 1972
1973-1974 1975
1976-1978
1979-1981
1982-1983 1984
1985-1986 1987
1988-1990
1991-1993
GasolineHC (total) 11 e 2.2 3.4 2.0 1.7 0.80 j (0.80) j
NMHC h j j (0.40) j
NMOG h j 0.125 (0.156) 0.100 (0.125)CO 80 I 23 39 20 18 10 4.4 (5.5) 3.4 (4.2)
Cold-temp. COd h j 12.5 (j)
NOx 4 j 3.0 3.1 2.3 1.7 0.7 (0.97) 0.4 (0.6) 0.14 (0.20)Particulates h j 0.08 (0.10) 0.08 (0.08) 0.02 (0.02)
Formaldehyde h j 0.015 (0.018)
DieselHC (total) 11 j 2.0 1.7 0.80 j (0.80) j
NMHC h j 0.32 (0.40) j
NMOG h j j (0.156) 0.100 (0.125)CO 80 j 20 18 10 4.4 (5.5) j (4.2) 3.4 (4.2)NOx 4 j 3.1 2.3 1.7 j (0.97) j (0.6) 0.14 (0.20)Particulates h j 0.60 0.50 0.45 0.13 0.08 (0.10) j (0.10) 0.02 (0.02)
Formaldehyde h j j (0.018) 0.015 (0.018)
GVWR up through 6,000 pounds GVWR up through 8,500 pounds
7-mode CVS-72 CVS-75j
5 years/50,000 miles 10 years/100,000 miles 10 years/120,000 miles
5 years/50,000miles5 years/50,000 miles
11 years/120,000 miles(full)Useful life (intermediate)c, f
1994
LDT2 weight criteriae
Test procedureb
GVWR up through 6,000 pounds; LVW over 3,750 pounds
2007+1995-2003 2004-2006
276"
Chapter 4 Transportation, E
nergy, and the Environm
entTable 4-30b
Federal Exhaust Emission Certification Standards for Newly Manufactured Gasoline- and Diesel-Powered Light Duty Trucks (Category LDT2) a,b,c (Grams per mile)
KEY: CO=carbon monoxide; GVWR=gross vehicle weight rating;HC=hydrocarbons; LVW=loaded vehicle weight;NMHC=non-methane hydrocarbons;NMHC=nonmethane hydrocarbons;NMOG=nonmethane organic gases;NOx=nitrogen oxides
Continued next page

Air P
ollution !277
f Manufacturers can opt to certify vehicles for a full useful life of 15 years/150,000 miles and either have (1) intermediate useful life standards waived or (2) receive additional NOx credits.
g The "Prior to controls" reports emissions estimates of a typical newly manufacturedcar in the years before exhaust emissions certification standards were implemented.hNo estimate available.i In 1968-69, exhaust emissions standards were issued in parts per million rather than grams per mile and are, therefore, incompatible with this table.
j No standard has been set.k The term "tier" refers to a level of standards for specific years. Interim 2 refers to an intermediate level of standards that move manufacturers toward compliance with Tier 2 standards. Interim Tier 2 and Tier 2 standards are established as "bins." Each bin is aset of standards for NOx, CO, NMOG, formaldehyde, and particulates (HC and NMHC standards are dropped for Tier 2 and Interim Tier 2). Manufacturers may certify any given vehicle family to any of the bins available for that vehicle class as longas the resulting sales-weighted corporate average NOx standard is met for the full useful life. The Tier 2 corporate average NOx standard is 0.07 grams/mile. Interim corporate-based average NOx standards are based on vehicle type. The interim corporate sales-weighted average for LDT2 vehicles is 0.3 grams/mile. Tier 2 standardswill be phased in at a rate of 25% in 2004, 50% in 2005, 75% in 2006, and 100% in 2007. During this period all LDT2 vehicles not meeting the Tier 2 standards must meet Interim Tier 2 standards.SOURCES: 40 CFR 86, Subpart A (July 1, 1998). U.S. Environmental ProtectionAgency, Office of Air and Radiation, personal communication, April 1999, and theFederal Register, Vol. 65, No. 28, pp. 6851-6870.
Table 4-30bCont’d
Federal Exhaust Emission Certification Standards for Newly Manufactured Gasoline- and Diesel-Powered Light Duty Trucks (Category LDT2) a,b,c (Grams per mile)
a Light-duty truck categories LDT1-LDT4 were not created until 1994. From 1968 to 1978 all trucks with a GVWR up to 6,000 pounds were classified as light-duty trucks andwere required to meet the same standards. As of 1979, the maximum weight was raised to 8,500 pounds GVWR. During 1988-93, light-duty trucks were divided into two subcategories that coincide with the current LDT1-LDT4 categories. The standards for LDT1, LDT3, and LDT4 are shown in tables 4-30a, 4-40c, and 4-30d.
b The test procedure for measuring exhaust emissions has changed several times over the course of vehicle emissions regulation. The 7-mode procedure was used through model year 1971 and was replaced by the CVS-72 procedure beginning in model year 1972.The CVS-75 procedure became the test procedure as of model year 1975. While it may appear that the total HC and CO standards were relaxed in 1972-74, these standards were actually more stringent due to the more stringent nature of the CVS-72 test procedure. Additional standards for CO and composite standards for NMHC and NOx tested over the new Supplemental Federal Test Procedure will be phased-in beginning with model year 2000. These standards are not shown in this table.
c Emissions standards had to be met for a useful life of 5 years/50,000 miles through model year 1983, and a full useful life of 11 years/120,000 miles was defined for 1985-93(several useful life options were available for 1984). Beginning in model year 1994,emissions standards were established for an intermediate useful life of 5 years/50,000 miles as well as a full useful life (full useful life standards are shown in parentheses). HC standards, however, were established only for full useful life. Tier 1 exhaust standards,except particulates standards, were phased-in during 1994-96 at a rate of 40%, 80%, and 100%, respectively. Particulates standards were phased-in at a rate of 40%, 80%, and 100% during 1995-97.
d The cold CO emissions standard is measured at 20 ºF (rather than 75 ºF) and is applicablefor a 5-year/50,000-mile useful life.
e GVWR is the maximum design loaded weight. LVW is the curb weight (nominal vehicle weight) plus 300 pounds.

Interim Tier 2 k Tier 2kEngine type and pollutant
Prior to controlg
1968- 1969
1970-1971 1972
1973-1974 1975
1976-1978
1979-1981
1982-1983 1984
1985-1986 1987
1988-1989 1990
1991-1995
GasolineHC (total) 11 I 2.2 3.4 2.0 1.7 0.80 j (0.80) j
NMHC h j 0.32 (0.46) j
NMOG h j 0.160 (0.230) 0.125 (0.156)CO 80 i 23 39 20 18 10 4.4 (6.4) 3.4 4.2Cold-temp. COd h j 12.5 (j)
NOx 4 j 3.0 3.1 2.3 2.3 1.7 0.7 (0.98) 0.4 (0.6) 0.14 (0.20)Particulates h j j (0.10) 0.08 (0.08) 0.02 (0.02)Formaldehyde h j 0.018 (0.027) 0.015 (0.018)
DieselHC (total) 11 j 2.0 1.7 0.80 j (0.80) j
NMHC h j 0.32 (0.46) j
NMOG h j j (0.230) 0.125 (0.156)CO 80 j 20 18 10 4.4 (6.4) j 3.4 4.2NOx 4 j 3.1 2.3 2.3 1.7 j (0.98) j (0.6) 0.14 (0.20)
Particulates h j 0.60 0.50 0.45 0.13 j (0.10) j (0.08) 0.02 (0.02)
Formaldehyde h j j (0.027) 0.015 (0.018)
LDT3 weight criteriae Any ALVW
Test procedureb 7-mode CVS-72 CVS-75
Useful life (intermediate) c,f j
(full) 5 years/50,000 miles 11 years/120,000 miles
Tier 1k
1996-2007 2008 2009+
GVWR up through 6,000 pounds GVWR up through 8,500 pounds
5 years/50,000 miles
ALVW up through 5,750 poundsGVWR 6,001-8,500 pounds
278"
Chapter 4 Transportation, E
nergy, and the Environm
entTable 4-30c
Federal Exhaust Emission Certification Standards for Newly Manufactured Gasoline- and Diesel-Powered Light Duty Trucks (Category LDT3)a,b,c (Grams per mile)
KEY: ALVW=adjusted loaded vehicle weight; CO = carbon monoxide;GVWR=gross vehicle weight rating; HC = hydrocarbons;NMHC=nonmethane hydrocarbon;NMOG=nonmethane organic gases;NOx=nitrogen oxides
Continued next page

Air P
ollution !279
f Manufacturers can opt to certify vehicles for a full useful life of 15 years/150,000 miles and either have (1) intermediate useful life standards waived or (2) receive additional NOx credits.
g The "Prior to controls" column reports emissions estimates of a typical newly manufactured car in the years before exhaust emissions certification standards were implemented.
h No estimate available.i In 1968-69, exhaust emissions standards were issued in parts per million rather than grams per mile and are, therefore, incompatible with this table.
j No standard has been set.k The term "tier" refers to a level of standards for specific years. Interim 2 refers to an intermediate level of standards that moves manufacturers toward compliance with Tier2 standards. Interim Tier 2 and Tier 2 standards are established as "bins." Each bin is a set of standards for NOx, CO, NMOG, formaldehyde, and particulates (HC and NMHC standards are dropped for Tier 2 and Interim Tier 2). Manufacturers may certify any given vehicle family to any of the bins available for that vehicle class as longas the resulting sales-weighted corporate average NOx standard is met for full useful life. The Tier 2 corporate average NOx standard is 0.07 grams/mile. Interim corporate-based average NOx standards are based on vehicle type. The interim corporatesales-weighted average for LDT3 vehicles is 0.6 grams/mile. Tier 2 LDT3 standards willbe phased in during 2008 and 2009. In 2008, 50% of LDT3 vehicles must meet Tier 2standards; the others must meet Interim Tier 2 standards. Beginning in 2009, all LDT3vehicles must meet Tier 2 standards.SOURCES: 40 CFR 86, Subpart A (July 1, 1998). U.S. Environmental ProtectionAgency, Office of Air and Radiation, personal communication, April 1999, and theFederal Register, Vol. 65, No. 28, pp. 6851-6870.
Table 4-30cCont’d
Federal Exhaust Emission Certification Standards for Newly Manufactured Gasoline- and Diesel-Powered Light Duty Trucks (Category LDT3)a,b,c (Grams per mile)
a Light-duty truck categories LDT1-LDT4 were not created until 1994. From 1968 to 1978 all trucks with a GVWR up to 6,000 pounds were classified as light-duty trucks andwere required to meet the same standards. As of 1979, the maximum weight was raised to 8,500 pounds GVWR. During 1988-93, light-duty trucks were divided into two subcategories that coincide with the current LDT1-LDT4 categories. The standards for LDT1, LDT2, and LDT4 are given in tables 4-30a, 4-40b, and 4-30d.
b The test procedure for measuring exhaust emissions has changed several times over the course of vehicle emissions regulation. The 7-mode procedure was used through model year 1971 and was replaced by the CVS-72 procedure beginning in model year 1972.The CVS-75 procedure became the test procedure as of model year 1975. While it may appear that the total HC and CO standards were relaxed in 1972-74, these standards were actually more stringent due to the more stringent nature of the CVS-72 test procedure. Additional standards for CO and composite standards for NMHC and NOxtested over the new Supplemental Federal Test Procedure will be phased-in beginning with model year 2002. These standards are not shown in this table.
c Emissions standards had to be met for a full useful life of 5 years/50,000 miles through model year 1983, and a full useful life of 11 years/120,000 miles was defined for 1985-93(several useful life options were available for 1984). Beginning in model year 1996,emissions standards were established for an intermediate useful life of 5 years/50,000 miles as well as a full useful life of 11 years/120,000 miles (intermediate and full useful life standards are shown in parentheses). This applied to all pollutants except HC and particulates for all LDT3 vehicles and NOx for diesel-powered LDT3 vehicles, which were only required to meet full useful life standards. Tier 1 exhaust standards were phased-in during 1996-97 at a rate of 50% and 100%, respectively.
d The cold CO emissions standard is measured at 20 ºF (rather than 75 ºF) and is applicable for a 5-year/50,000-mile useful life.
e GVWR is the maximum design loaded weight. ALVW is the numerical average of the GVWR and the curb weight.

Interim Tier 2k Tier 2kEngine type and pollutant Prior to controlg
1968-1969
1970-1971 1972
1973-1974 1975
1976-1978
1979-1981
1982-1983 1984
1985-1986 1987
1988-1989 1990
1991-1995
GasolineHC (total) 11 I 2.2 3.4 2.0 1.7 0.80 j (0.80) j
NMHC h j 0.39 (0.56) j
NMOG h j 0.160 (0.230) 0.125 (0.156)
CO 80 i 23 39 20 18 10 5.0 (7.3) 4.4 (6.4) 3.4 (4.2)
Cold-temp. COd h j 12.5 (j)
NOx 4 j 3.0 3.1 2.3 2.3 1.7 1.1 (1.53) 0.4 (0.6) 0.14 (0.20)
Particulates h j j (0.12) 0.08 (0.08) 0.02 (0.02)
Formaldehyde h j 0.018 (0.027) 0.015 (0.018)
DieselHC (total) 11 j 2.0 1.7 0.80 j (0.80) j
NMHC h j 0.39 (0.56) j
NMOG h j j (0.230) 0.125 (0.156)
CO 80 j 20 18 10 5.0 (7.3) j (6.4) 3.4 (4.2)NOx 4 j 3.1 2.3 2.3 1.7 j (1.53) j (0.6) 0.14 (0.20)
Particulates h j 0.60 0.50 0.45 0.13 j (0.12) j (0.08) 0.02 (0.02)
Formaldehyde h j j (0.027) 0.015 (0.018)
LDT4 weight criteriae Any ALVW
Test procedureb 7-mode CVS-72 CVS-75
Useful life (intermediate)c, f j
(full) 5 years/50,000 miles 11 years/120,000 miles
GVWR up through 6,000 pounds GVWR up through 8,500 poundsGVWR 6,001-8,500 pounds
5 years/50,000 miles
ALVW over 5,750 pounds
Tier 1k
1996-2007 2008 2009+
280"
Chapter 4 Transportation, E
nergy, and the Environm
entTable 4-30d
Federal Exhaust Emission Certification Standards for Newly Manufactured Gasoline- and Diesel-Powered Light Duty Trucks (Category LDT4) a,b,c (Grams per mile)
KEY: ALVW=adjusted loaded vehicle weight; CO = carbon monoxide;GVWR=gross vehicle weight rating; HC = hydrocarbons;NMHC=nonmethane hydrocarbon; NMOG=nonmethane organic gases; NOx=nitrogen oxides
Continued next page

Air P
ollution !281
f Manufacturers can opt to certify vehicles for a full useful life of 15 years/150,000 miles and either have (1) intermediate useful life standards waived or (2) receive additional NOx credits.
g The "Prior to controls" column reports emissions estimates of a typical newly manufacturedcar in the years before exhaust emissions certification standards were implemented.
hNo estimate available.i In 1968-69, exhaust emissions standards were issued in parts per million rather than grams per mile and are, therefore, incompatible with this table.
j No standard has been set.k The term "tier" refers to a level of standards for specific years. Interim 2 refers to an intermediate level of standards that moves manufacturers toward compliance with Tier2 standards. Interim Tier 2 and Tier 2 standards are established as "bins." Each bin is aset of standards for NOx, CO, NMOG, formaldehyde, and particulate matter (HC andnon-methane HC standards are dropped for Tier 2 and interim Tier 2). Manufacturers may certify any given vehicle family to any of the bins available for that vehicle class aslong as the resulting sales-weighted corporate average NOx standard is met for full useful life. The Tier 2 corporate average NOx standard is 0.07 grams/mile. Interim corporate-based average NOx standards are based on vehicle type. The interim corporate sales-weighted average for LDT4 vehicles is 0.6 grams/mile. Tier 2 standardswill be phased in during 2008 and 2009. In 2008, 50% of LDT4 vehicles must meet Tier 2 standards; the others must meet Interim Tier 2 standards. Beginning in 2009, all LDT4 vehicles must meet Tier 2 standards.SOURCES: 40 CFR 86, Subpart A (July 1, 1998). US Environmental ProtectionAgency, Office of Air and Radiation, personal communication, April 1999, and the U.S.Federal Register, Vol. 65, No. 28, pp. 6851-6870.
Table 4-30dCont’d
Federal Exhaust Emission Certification Standards for Newly Manufactured Gasoline- and Diesel-Powered Light Duty Trucks (Category LDT4) a,b,c (Grams per mile)
a Light-duty truck categories LDT1-LDT4 were not created until 1994. From 1968 to 1978 all trucks with a GVWR up to 6,000 pounds were classified as light-duty trucks andwere required to meet the same standards. As of 1979, the maximum weight was raised to 8,500 pounds GVWR. During 1988-93, light-duty trucks were divided into two subcategories that coincide with the current LDT1-LDT4 categories. The standards for LDT1, LDT2, and LDT3 are given in tables 4-30a, 4-40b, and 4-30c.
b The test procedure for measuring exhaust emissions has changed several times over the course of vehicle emissions regulation. The 7-mode procedure was used through model year 1971 and was replaced by the CVS-72 procedure beginning in model year 1972.The CVS-75 procedure became the test procedure as of model year 1975. While it may appear that the total HC and CO standards were relaxed in 1972-74, these standards were actually more stringent due to the more stringent nature of the CVS-72 test procedure. Additional standards for CO and composite standards for NMHC and NOxtested over the new Supplemental Federal Test Procedure will be phased-in beginning with model year 2002. These standards are not shown in this table.
c Emissions standards had to be met for a full useful life of 5 years/50,000 miles through model year 1983, and a full useful life of 11 years/120,000 miles was defined for 1985-93(several useful life options were available for 1984). Beginning in model year 1996,emissions standards were established for an intermediate useful life of 5 years/50,000 miles as well as a full useful life of 11 years/120,000 miles (intermediate and full useful life standards are shown in parentheses). This applied to all pollutants except HC and particulates for all LDT4 vehicles and NOx for diesel-powered LDT4 vehicles, which were only required to meet full useful life standards. Tier 1 exhaust standards were phased-in during 1996-97 at a rate of 50% and 100%, respectively.
d The cold CO emissions standard is measured at 20 ºF (rather than 75 ºF) and is applicablefor a 5-year/50,000-mile useful life.
e GVWR is the maximum design loaded weight. ALVW is the numerical average of the GVWR and the curb weight.

282 " Chapter 4 Transportation, Energy, and the Environment
Engine type and pollutant 2004 2008 2009+GasolineNMOG 0.195 (0.280) 0.125 (0.156)CO 5.0 (7.3) 3.4 (4.2)Cold-temp. COc 12.5NOx 0.6 (0.9) 0.14 (0.20)Particulates 0.12 (0.12) 0.02 (0.02)Formaldehyde 0.022 (0.032) 0.015 (0.018)DieselHC 1.3 g/bhp-hrNMHCHC + NOx 2.4 g/bhp-hrNMOG g (0.280) 0.125 (0.156)CO 15.5 g/bhp-hr g (7.3) 3.4 (4.2)NOx 4.0 g/bhp-hr g (0.9) 0.14 (0.20)Particulates 0.10 g/bhp-hr g (0.12) 0.02 (0.02)Formaldehyde g (0.032) 0.015 (0.018)
Smoke opacity (acceleration/lugging/peak)d 20/15/50
Weight Criteria Greater than 8,500 pounds GVWR; less than 10,000 pounds GVWRTest procedure-gasoline CVS-75
diesel EPA Transient CVS-75Useful life-gasoline (intermediate)b,e 5 years/50,000 miles
(full) 11 years/120,000 miles
Useful life-diesel (intermediate) b,e g 5 years/50,000 miles(full) 8 years/110,000 miles 11 years/120,000 miles
Federal Exhaust Emission Certification Standards for Newly ManufacturedGasoline- and Diesel-Powered Medium-Duty Passenger Vehicles (MDPV)a,b
(Grams per mile)
a The MDPV category was created for the Interim Tier 2 and Tier2 vehicle emissions standards. This category was specifically designed to help bring passenger vehicles (such as large sport utility vehicles and passenger vans) over 8,500 pounds GVWR into the Tier 2 program. MDPVs are defined as any complete heavy-duty vehicle less than 10,000 pounds GVWR designed primarily for transportation of persons, including conversion vans (i.e., vans which are intended to be converted to vans used primarily for transporting people). This does not include vehiclesthat have 1) a capacity of more than 12 persons total, or 2) are designed to accommodate more than 9 persons seated rearward of the driver's seat, or 3) have a cargo box (i.e., a pickup-bed or box) of six feet or more in interior length. Prior to Tier 2 standards, these vehicles would have been regulated as light heavy-duty trucks.
b Diesel MDPVs can continue to use light heavy-duty truck standards for new vehicle certification until 2008. Note that thesestandards are measured in grams per brake horsepower-hour (g/bhp-hr). Beginning in 2008, MDPVs must use the same on-chassis testing procedure as heavy light-duty trucks (categories LDT3 and LDT4) and must meet standards for MDPVs.Beginning in 2009, MDPVs must meet the same standards as light heavy-duty trucks, except MDPVs are not required to meet Supplemental Federal Test Procedure standards.
c The cold CO emissions standard is measured at 20 ºF (rather than 75 ºF) and is applicable for a full useful life of 5-years/50,000-miles.
d Smoke opacity is expressed as a percentage for acceleration, lugging,and peak operation modes. Lugging occurs when a vehicle is carrying a load.
e Manufacturers can opt to certify vehicles for a full useful life of15 years/150,000 miles and have either 1) intermediate useful lifestandards waived or 2) receive additional NOx credits.
f The term "tier" refers to a level of standards for specific years.Interim 2 refers to an intermediate level of standards that moves manufacturers toward compliance with Tier 2 standards. Tier 2 and interim Tier 2 standards are established as "bins." Each bin isa set of standards for NOx, CO, NMOG, formaldehyde, and particulates (HC and NMHC standards are dropped for Tier 2 and Interim Tier 2). Manufacturers may certify any given vehicle family to any of the bins available for that vehicle class as long asthe resulting sales-weighted corporate average NOx standard is met for full useful life. The Tier 2 corporate average NOxstandard is 0.07 grams/mile. Interim corporate-based average NOx standards are based on vehicle type. The interim corporate sales-weighted average for MDPVs is 0.6 grams/mile. Tier 2 MDPV standards will be phased in during 2008 and 2009. In 2008, 50% of MDPVs must meet Tier 2 standards; the other 50% of MDPVs must meet interim Tier 2 standards. Beginning in 2009, all MDPVs must meet Tier 2 standards.
g Diesel MDPVs are not required to meet intermediate life standards during this time period.SOURCE: Federal Register, Vol. 65, No. 28, pp. 6698-6870.
Table 4-31
KEY: CO = carbon monoxide; g/bhp-hr = grams per brake horsepower/hour; GVWR = gross vehicle weight rating; HC = hydrocarbons; NMHC=nonmethane hydrocarbon;NMOG = nonmethane organic gases;NOx = nitrogen oxides

Engine type and pollutant 1970-73 1974-78 1979-83 1984 1985-86 1987 1988-89 1990 1991-93 1994-97 1998-2003 2004+
GasolineHC + NOx e 16 10 e
HC f e 1.5 1.9 1.1NOx e 10.6 6.0 5.0 4.0CO f 40 25 37.1 14.4
DieselHC + NOx e 16 10 eHC f e 1.5 1.3NOx e 10.7 6.0 5.0 4.0Nonmethane HC + NOx e 2.4g
CO f 40 25 15.5Particulates e 0.60 0.25 0.10
Smoke opacity (acceleration/lugging/peak) a 40/20/e 20/15/50
Weight criteria for light heavy-duty trucks b GVWR over 6,000 lbs GVWR over 8,500 lbs GVWR 8,501 through 14,000
Test procedure (gasoline)c 9-mode steady-state MVMA transient
(diesel) c 13-mode steady-state EPA transient
Useful life (gasoline) d 5 years/50,000 miles 8 years/110,000 miles
Air P
ollution !283
e No standard set.f Although emissions standards
for HC and CO were in effect for these years, they were not measured in grams per brake horsepower-hour and are, therefore, incompatible with this table.
g Vehicles can meet a composite nonmethane HC and NOx standard of 2.5, given they meet a nonmethane HC standard of no more than 0.5.NOTE: Tables 4-31a and 4-31b are identical for diesel.SOURCES: 40 CFR 86, Subpart A (July 1, 1998); U.S. Environmental ProtectionAgency, Office of Air and Radiation, personal communication, April 1999.
Table 4-32aFederal Exhaust Emissions Certification Standards for Newly Manufactured Gasoline- and Diesel-Powered Light Heavy-Duty Trucks (Grams per brake horsepower-hour)
a Smoke opacity is expressed in percentage for acceleration, lugging, and peak modes (acceleration/lugging/peak). Lugging is when a vehicle is carrying a load.
b Gross vehicle weight rating (GVWR) is the maximum design loaded weight.c Several testing procedures have been used during the course of exhaust emissions
control. A steady-state 9-mode test procedure (13-mode for diesel) was used for 1970-83 standards. For 1984, either the steady-state tests or the U.S. Environmental ProtectionAgency (EPA) transient test procedure could be used. For diesels, the EPA transient testwas required from 1985 to the present. For gasoline-powered vehicles, either the EPA or the Motor Vehicle Manufacturers Association (MVMA) transient test procedure couldbe used during 1985-86, and the MVMA procedure was required thereafter.
d Emissions standards apply to the useful life of the vehicle. Useful life was 5 years/50,000 miles through 1983, and 8 years/110,000 miles for model year 1985 and after. 1984 was a transitional year in which vehicles could meet the older standard (and test procedure) or the newer one. Useful life requirement for gasoline-powered trucks meeting NOx standards for 1998 and after is 10 years/110,000 miles. The useful life requirements for heavy-duty diesel truck standards are more complex and vary by vehicle weight, pollutant, test procedure, and year. Consult the U.S. Code of Federal Regulations for further information.
KEY: CO = carbon monoxide; HC = hydrocarbon; NOx = nitrogen oxides

Engine type and pollutant 1970-73 1974-78 1979-83 1984 1985-86 1987 1988-89 1990 1991-93 1994-97 1998-2003 2004+
GasolineHC + NOx e 16 10 eHC f e 1.5 1.9NOx e 10.6 6.0 5.0 4.0CO f 40 25 37.1DieselHC + NOx e 16 10 eHC f e 1.5 1.3NOx e 10.7 6.0 5.0 4.0Nonmethane HC + NOx e 2.4g
CO f 40 25 15.5Particulates e 0.60 0.25 0.10 Smoke opacity (acceleration/lugging/peak) a 40/20e 20/15/50
Weight criteria for heavy heavy-duty trucks b GVWR over 6,000 lbs GVWR over 8,500 lbs GVWR over 14,000 lbs
Test procedure (gasoline) c 13-mode steady-state MVMA
(diesel) c 13-mode steady-state EPA transient
Useful life (gasoline) d 5 years/50,000 miles 8 years/110,000 miles
284"
Chapter 4 Transportation, E
nergy, and the Environm
ent
e No standard set.f Although emissions standards for HC and CO were in effect for these years, they were
not measured in grams per brake horsepower-hour and are, therefore, incompatible with this table.
g Vehicles can meet a composite nonmethane HC and NOx standard of 2.5, given they meet a nonmethane HC standard of no more than 0.5.NOTES: Tables 4-31a and 4-31b are identical for diesel.SOURCES: 40 CFR 86, Subpart A (July 1, 1998).U.S. Environmental Protection Agency, Office of Air and Radiation, personal communi-cation, April 1999.
Table 4-32bFederal Exhaust Emissions Certification Standards for Newly Manufactured Gasoline- and Diesel-Powered Heavy Heavy-Duty Trucks (Grams per brake horsepower-hour)
a Smoke opacity is expressed in percentage for acceleration, lugging, and peak modes (acceleration/lugging/peak). Lugging is when a vehicle is carrying a load.
b Gross vehicle weight rating (GVWR) is the maximum design loaded weight.c Several testing procedures have been used during the course of exhaust emissions
control. A steady-state 9-mode test procedure (13-mode for diesel) was used for 1970-83 standards. For 1984, either the steady-state tests or the U.S. Environmental ProtectionAgency (EPA) transient test procedure could be used. For diesels, the EPA transient testwas required from 1985 to the present. For gasoline-powered vehicles, either the EPA or the Motor Vehicle Manufacturers Association (MVMA) transient test procedure couldbe used during 1985-86, and the MVMA procedure was required thereafter.
d Emissions standards apply to the useful life of the vehicle. Useful life was 5 years/50,000 miles through 1983, and 8 years/110,000 miles for model year 1985 and after. 1984 was a transitional year in which vehicles could meet the older standard (and test procedure) or the newer one. Useful life requirement for gasoline-powered trucks meeting NOx standards for 1998 and after is 10 years/110,000 miles. The useful life requirements for heavy-duty diesel truck standards are more complex and vary by vehicle weight, pollutant, test procedure, and year. Consult the U.S. Code of Federal Regulations for further information.
KEY: CO = carbon monoxide; HC = hydrocarbon; NOx = nitrogen oxides

Air P
ollution !285
d D = engine displacement in cubic centimeters (cc). For example, the standard for a 300 cc engine would be 5.0 + 0.0155(300-170) = 7.0 g/km.SOURCES: 40 CFR 86 Subpart E (July 1, 1998); U.S. Environmental ProtectionAgency, Office of Air and Radiation, personal communication, Apr. 4, 1998.
Table 4-33 Federal Exhaust Emissions Standards for Newly Manufactured Motorcyclesa (g/km)b
a A motorcycle is any motor vehicle with a headlight, taillight, and stoplight, and having two or three wheels and a curb mass less than or equal to 793 kg (1,749 lb). (The limit was 680 kg, or 1,499 lb prior to the 1998 model year.) A motorcycle is excluded from thestandards if it has a displacement of less than 50 cc (3.1 cubic inches) or if with a 80 kg (176 lb) driver it cannot start from a dead stop using only the engine or exceed a speed of 40 km/h (25 mph) on a level, paved surface.
b Readers who wish to compare motorcycle regulations with passenger car and truck regulations should note that 5.0 g/km = 8.0 g/mi and 12 g/km = 19 g/mi. The formula for 1978-79 HC emissions by motorcycles 170-749 cc becomes, in g/mi., approximately 8.0 + 0.025(D-170).
c Estimates of emissions rates prior to controls are ranges of emissions for all engine displacements. Not available for motorcycles powered by fuels other than gasoline.
KEY: cc = cubic centimeters; D = engine displacement; g = gram; h = hour;HC = hydrocarbon; kg = kilogram; km = kilometer; lb = pound; LPG = liquefied petroleum gas; mi = miles; mph = miles per hour
PollutantEngine displacement
Emissions prior to controls c 1978-79 1980-89 1990-96 1997+
Gasoline-powered
HC 50-169 cc 5
170-749 cc 5 + 0.0155(D-170) d 5.0
750 cc and greater 14 5.0
CO 50 cc and greater 11.0-31.0 17 12
Methanol-powered
Total HC equivalent 50 cc and greater 5.0
CO 50 cc and greater 12
Natural gas- and LPG-powered
HC 50 cc and greater 5.0
CO 50 cc and greater 12
Useful life (Class I) 50-169 cc 5 years or 12,000 km (7,456 mi), whichever comes first
(Class II) 170-279 cc 5 years or 18,000 km (11,185 mi), whichever comes first
(Class III) 280 cc and greater 5 years or 30,000 km (18,641 mi), whichever comes first
1.0-13.8

286"
Chapter 4 Transportation, E
nergy, and the Environm
entTable 4-34 Federal Exhaust Emissions Standards for Newly Manufactured and In-Use Aircraft Enginesa, b
Continued next page
KEY: CO = carbon monoxide; g = gram; g/kN = grams of pollutant per kilonewtons of thrust; HC = hydrocarbon, kN = kilonewtons; kW = kilowatt; NOx = nitrogen oxides; rO = rated output, which is the maximum power or thrust available for takeoff; rPR = rated pressure ratio
Year of engine manufacture
Engine type c Pollutant 1974-75 1976-77 1978-82 1983 1984-96 1997-99 2000+
Turboprop
Smokeh187(rO)-0.168
Class T3 turbojet
CO (g/kN) d 118
HC (g/kN) d 19.6
NOx (g/kN) d j40 + 2(rPR) k32 + 1.6(rPR)
Smoke 25 i83.6(rO)-0.274
Class T8 turbojet
CO (g/kN) d 118
HC (g/kN) d 19.6
NOx (g/kN) d j40 + 2(rPR) k32 + 1.6(rPR)
Smoke e30 i83.6(rO)-0.274
Turbofan and turbojet engines other than Classes T3, T8, and TSS
CO (g/kN) d 118
HC (g/kN) d 19.6
NOx (g/kN) d j40 + 2(rPR) k32 + 1.6(rPR)
Smoke f83.6(rO)-0.274 g83.6(rO)-0.274 i83.6(rO)-0.274
TSS engines (supersonic aircraft engines)
HC (g/kN) rPR140(0.92)
Smoke i83.6(rO)-0.274

Air P
ollution !287
d rO >= 1,000 kWe Applies to engines with rO>26.7 kN.f Effective as of July 7, 1997. This standard applies only to those engines of a type or
model for which the date of manufacture of the first individual production model wason or before Dec. 31, 1995 and for which the date of manufacture of the individual engine was on or before Dec. 31, 1999.
g Effective as of July 7, 1997. This standard also applies to engines of a type or model for which the date of manufacture of the first individual production model was after Dec. 31, 1995 and for which the date of manufacture of the individual engine was on or before Dec. 31, 1999.
h Engines with rO>=26.7 kN. Smoke number may not exceed 50.i Engines manufactured after Feb. 1, 1974 and before 1984. This is also the in-use
standard for all such aircraft engines manufactured after Feb. 1, 1974.j Engines with rated output rO>=129 kN. This is also the in-use standard for all such
aircraft engines.k Engines with rO<26.7 kN. Smoke number may not exceed 50.SOURCES: 40 CFR 87, Subparts A-D (July 1, 1998); Jane's Information Group Inc. 1992.Jane's All the World's Aircraft, 1992-93 (Alexandria, VA).
Table 4-34Cont’d Federal Exhaust Emissions Standards for Newly Manufactured and In-Use Aircraft Enginesa, b
a Federal standards apply to all planes operating in the United States, regardless of where they were manufactured. This table primarily displays exhaust emissions standards for newly manufactured aircraft engines. Only two standards (smoke standards) have been set for in-use aircraft engines (see footnotes j and k). Therefore, unless otherwise noted,emissions in this table apply to new aircraft engines only.
b HC, CO, and NOx are measured using the International Civil Aviation Organization (ICAO) Gaseous Emissions Test Procedure. Smoke is measured using the ICAO Smoke Emission Test Procedure. There is no useful life or warranty period for purposes ofcompliance with emissions standards.
c Examples of commercial aircraft that use each engine type include the following:• Class T3 turbojet--Boeing 707-320s (Class T3 engines are currently out of production,
though some are still in use).• Class T8 turbojet--Boeing 727s and 737-200s, and McDonnell-Douglas MD-80s and
DC-9s.• Turbofans and turbojets other than T3, T8, and TSS--Boeing 747-400s, 757s, 767-200s
and 777s, and McDonnell-Douglas MD-11s; Canadair Regional Jets.• Turboprops--Used mostly in regional airliners such as ATR 72, Dornier 328, and Saab
SF 340.• TSS--British Aircraft Corp./Aerospatiale Concorde (the only supersonic aircraft
currently used in commercial civil aviation).

Tier 0 Tier 1 Tier 2Pollutant Duty-cycle f 1973-2001 h 2002-2004 2005+
Total HC b Line-haul 1.00 0.55 0.30
Switch 2.10 1.20 0.60
Nonmethane HC c Line-haul 1.00 0.55 0.30
Switch 2.10 1.20 0.60
Total HC equivalent d Line-haul 1.00 0.55 0.30Switch 2.10 1.20 0.60
CO Line-haul 5.0 2.2 1.5
Switch 8.0 2.5 2.4
Line-haul (optional standard) g 10.0 10.0 10.0Switch (optional standard) g 12.0 12.0 12.0
NOx Line-haul 9.5 7.4 5.5
Switch 14.0 11.0 8.1
Particulates Line-haul 0.60 0.45 0.20
Switch 0.72 0.54 0.24
Line-haul (optional standard) g 0.30 0.22 0.10Switch (optional standard) g 0.36 0.27 0.12
Smoke opacity Steady-state 30% 25% 20%(% opacity-normalized) e 30-second peak 40% 40% 40%
3-second peak 50% 50% 50%
Useful life 7.5 MWh per hp or 10 years i, j
288"
Chapter 4 Transportation, E
nergy, and the Environm
entTable 4-35 Federal Exhaust Emissions Standards for Locomotivesa (g/bhph except where noted)
KEY: bhp = boiler horsepower; bhph = boiler horsepower hour;CO = carbon monoxide; g = gram; h = hour; MW = megawatt; MWh = megawatt hour; NOx = nitrogen oxides; PM = particulate matter
Continued next page

Air P
ollution !289
standards. However, a manufacturer or remanufacturer using the alternate standards must meet both the CO and the PM standards. This allows locomotives to have higher CO emissions in exchange for meeting more stringent PM standards.
h Tier 0 standards apply to all new production locomotives in the 2001 model year, as well as for any 1994 through 2001 model year freight locomotives remanufactured on or after Jan. 1, 2001. They also apply to all other 1973 through 2001 model year locomotives remanufactured on or after Jan. 1, 2002. Other phase-in options are also avail-able for manufacturers (see 40 CFR 92 for more detail on phase-in options).
i For Tier 0 locomotives not equipped with MW/h meters, the minimum useful life is 750,000 miles or 10 years, whichever comes first.
j This is a minimum standard. The certifying manufacturer or remanufacturer must specify a longer useful life if the locomotive or locomotive engine is designed to last longer than the applicable minimum useful life.SOURCE: 40 CFR 92, July 1, 1998.
Table 4-35Cont’d Federal Exhaust Emissions Standards for Locomotivesa (g/bhph except where noted)
a Locomotive standards apply to both new and remanufactured locomotives, except as noted.b Total HC standards apply to locomotives powered by any fuel except alcohol or natural
gas or fuels primarily composed of alcohol or natural gas.c Nonmethane HC standards apply to locomotives powered by natural gas or fuels that are
primarily composed of natural gas.d Total HC equivalent standards apply to locomotives powered by alcohol or fuels that are primarily composed of alcohol.
e Smoke opacity values are normalized to be equivalent to a 1 meter path length.f The line-haul duty-cycle is weighted toward operation in the higher power notches and is
typical of line-haul applications. The switch duty-cycle is typical of switch operations,with more emphasis on idle and low power notch emissions. Locomotives generally are required to meet the standards for both duty-cycles. However, Tier 0 dedicated switch locomotives rated at 2,300 hp or less are only required to meet the switch duty-cycle standard.
g Manufacturers and remanufacturers can elect to comply with the alternate CO and PM

HC + NOx (g/kWh)
YearRated power < 4.3
kW Rated power >= 4.3 kW c,d,e Warranty period Useful life e
1998 278.00 (0.917 x (151 + 557/P0.9)) + 2.441999 253.00 (0.833 x (151 + 557/P0.9)) + 2.89 1 yr for all emissions-related components2000 228.00 (0.750 x (151 + 557/P0.9)) + 3.33 Outboard engines:2001 204.00 (0.667 x (151 + 557/P0.9)) + 3.78 1 yr for all emission-related components; 350 hr/10 yr2002 179.00 (0.583 x (151 + 557/P0.9)) + 4.22 3 yr/200 hr for specified major
2003 155.00 (0.500 x (151 + 557/P0.9)) + 4.67emissions control components
Personal watercraft:2004 130.00 (0.417 x (151 + 557/P0.9)) + 5.11 2 yr/200 hr for all emissions-related 350 hr/5 yr2005 105.00 (0.333 x (151 + 557/P0.9)) + 5.56 components; 3 yr/200 hr for specified
2006+ 81.00 (0.250 x (151 + 557/P0.9)) + 6.00major emissions control components
290"
Chapter 4 Transportation, E
nergy, and the Environm
ent
d As an example, the standards for an outboard engine of 125 hp (just over 93 kW) would be 149.53 g/kWh in 1998, 123.63 g/kWh in 2000, 97.74 g/kWh in 2002, 72.00 g/kWh in 2004, and 46.10 g/kWh in 2006.
e All emissions standards must be met for the useful life of the engine.SOURCES: 40 CFR 91 July 1, 1998 edition, pp. 242-243.Society of Automotive Engineers, Small Craft--Marine Propulsion Engine and Systems--Power Measurements, Document J1228, November 1991.
Table 4-36Federal Exhaust Emissions Standards for Newly Manufactured Marine Spark-Ignition Outboard,Personal Watercrafta, and Jet-Boat Enginesb (g/kWh)
a The standards for personal watercraft did not go into effect until 1999, although the standard went into effect for outboard engines in 1998.
b The standards apply to marine spark-ignition outboard, personal watercraft, and jet-boat engines only. There are currently no federal standards for marine spark-ignition sterndrive/inboard engines (previously proposed standards have not been finalized).Marine compression-ignition engines under 50 hp are covered under the proposed nonroad compression-ignition engine standards. Federal standards are in development for marine compression-ignition engines over 50 hp.
c P = the average power of the engine family in kilowatts (sales-weighted).
KEY: g = gram; hr = hour; HC = hydrocarbon; hp = horsepower; kW = kilowatt;kWh = kilowatt hour; NOx = nitrogen oxide; yr = year

Engine Displacement Rated Power NOx + THC PM COCategoryc (liters/cylinder) (kW) Year (g/kW-hr) (g/kW-hr) (g/kW-hr) Useful Lifed Warranty Period 5
< 0.9 2005 7.5 0.400.9 to < 1.2 2004 7.2 0.301.2 to < 2.5 2004 7.2 0.202.5 to < 5.0 2007 7.2 0.205.0 to < 15.0 37 kW and above 7.8 0.2715.0 to < 20.0 37 kW to < 3,300 kW 8.7 0.5015.0 to < 20.0 3,300 kW and above 9.8 0.5020.0 to < 25.0 37 kW and above 9.8 0.5025.0 to < 30.0 37 kW and above 11.0 0.50
3 30 and above 37 kW and above No Tier 2 emissions standards have been set for Category 3 commercial marine vessels.
5.0
5.0
1
2
37 kW and above10 yrs or 10,000 hrs operation
10 yrs or 20,000 hrs operation
5 yrs or 5,000 hrs operation
5 yrs or 10,000 hrs operation
2007
Air P
ollution !291
Category 2 (>= 5 liters displacement/cylinder to < 30 liters displacement/cylinder andrated power >=37 kW): The largest engines that are widely used as propulsion enginesin harbor and coastal vessels in U.S. waters. These engines also provide auxiliary poweron very large vessels. Many of these engines are of similar size and configuration as locomotive engines or use comparable emissions control technologies.Category 3 (>= 30 liters displacement/cylinder and rated power = 37kW): These are very large high-power engines that are used almost exclusively for propulsion on vessels engaged in international trade.
d Manufacturers must demonstrate that the engine or engine family will meet all standards for its useful life. Certification for useful life is accomplished by testing a sample of engines. The warranty period applies to each engine manufactured. The manufacturer of each engine must provide a warranty to the ultimate purchaser or owner (and each subsequent purchaser or owner) that the engine is designed, built, andequipped so as to conform at the time of sale with Tier 2 standards and is free from defects in materials and workmanship that would cause the engine to fail to conform to these standards for the warranty period. Furthermore, this warranty cannot be shorter than any mechanical warranty on the engine and must be at least one half ofthe useful life period.SOURCE: Federal Register, Vol. 64, No. 249, Dec. 29, 1999, pp 73,299-73,373.
Table 4-37Tier 2 Federal Exhaust Emissions Standards for Newly Manufactured Commercial Marine Compression-Ignition Enginesa b
a Tier 2 emissions standards established by Congress apply to commercial compression-ignition (diesel) engines with a power rating of at least 37 kW. Both propulsion and auxiliary engines are covered under these standards, but land-based engines used in portable auxiliary equipment are exempted. Smaller compression-ignition engines are covered under a separate rule. The U.S. Environmental Protection Agency (EPA) also intends to regulate recreational diesel engine emissions under a separate rule and is establishing provisions to allow exemptions for category 1 and 2 engines used as auxiliary engines in U.S.-flagged vessels engaged in foreign trade or overseas operations at least 75 percent of the time (i.e., operation will occur more than 320 nautical kilometers outside the United States, not including trips between U.S. ports in Alaska,Hawaii, the continental United States, or its territories).
b MARPOL Annex VI nitrogen oxide (NOx) standards (international standards adopted by the International Maritime Convention on the Prevention of Pollution from Ships) are referred to as Tier 1 emissions standards. These standards apply to any diesel engineover 130 kW installed on a vessel constructed on or after Jan. 1, 2000 and to any engine that undergoes major conversion after that date. MARPOL standards are currently voluntary for ships engaged in domestic travel but will be required for ships engaged in foreign trade with countries that ratify MARPOL standards. Although they have not yet been ratified by the United States, EPA encourages engine manufacturers to make compliant engines and encourages owners to purchase them. If ratified by the United States, MARPOL Annex VI NOx standards will be retroactively effective Jan. 1, 2000.
c Emissions standards are based on displacement/cylinder and rated power. The three standards categories are as follows:Category 1 (< 5 liters displacement/cylinder and rated power >=37 kW): These engines are typically used as propulsion engines on relatively small commercial vessels (fishing vessels, tugboats, crewboats, etc.). They are also used as auxiliary engines on vessels of all sizes and applications.
KEY: CO=carbon monoxide; disp=displacement; g/kW-hr=gram per kilowatt-hour;hrs=hours;kW=kilowatt; NOx=nitrogen oxides; PM=particulate matter; THC=total hydrocarbons; yrs=years

1990 1991 1992 1993 1994 1995 1996 1997 1998 1999 2000GASOLINE (assuming zero RFG)
Light-duty vehicles Exhaust and nonexhaust hydrocarbons (HC) 3.09 2.91 2.77 2.65 2.57 2.49 R2.42 2.36 2.29 2.23 2.16 (Exhaust HC) (2.05) (1.92) (1.81) (1.72) (1.66) (1.60) (1.55) (1.51) (1.47) (1.44) (1.42) (Nonexhaust HC) (1.04) (0.99) (0.96) (0.93) (0.91) (0.89) (0.87) (0.85) (0.82) (0.79) (0.74) Exhaust carbon monoxide (CO) 24.68 23.42 22.40 21.65 21.10 20.52 20.14 19.86 19.52 19.36 19.28 Exhaust nitrogen oxide (NOx) 1.81 1.76 1.72 1.69 1.67 1.61 1.56 1.51 1.45 1.41 1.38
Light-duty trucks Exhaust and nonexhaust HC 4.68 4.34 4.01 3.77 3.57 3.38 3.24 3.14 3.01 2.93 2.85 (Exhaust HC) (3.24) (3.03) (2.80) (2.61) (2.46) (2.31) (2.21) (2.13) (2.05) (1.99) (1.95) (Nonexhaust HC) (1.44) (1.31) (1.21) (1.16) (1.11) (1.07) (1.03) (1.01) (0.96) (0.94) (0.90) Exhaust CO 36.32 34.01 31.78 30.03 28.62 27.41 26.83 26.38 25.69 25.29 24.99 Exhaust NOx 2.36 2.25 2.16 2.10 2.04 1.97 1.95 1.92 1.87 1.84 1.80
Heavy-duty vehicles Exhaust and nonexhaust HC 11.89 10.90 10.06 9.24 8.49 7.89 7.30 6.70 6.11 5.70 5.32 (Exhaust HC) (7.45) (6.79) (6.22) (5.53) (4.92) (4.51) (4.13) (3.73) (3.33) (3.07) (2.82) (Nonexhaust HC) (4.44) (4.11) (3.84) (3.71) (3.57) (3.38) (3.17) (2.97) (2.78) (2.63) (2.50) Exhaust CO 131.19 120.49 111.05 101.92 93.61 85.10 76.97 69.13 61.07 54.65 48.67 Exhaust NOx 6.49 6.28 6.05 5.85 5.69 5.48 5.36 5.25 5.05 4.89 4.72
Motorcycles Exhaust and nonexhaust HC 4.68 4.56 4.48 4.41 4.38 4.33 4.29 4.29 4.27 4.26 4.26 (Exhaust HC) (2.31) (2.19) (2.11) (2.05) (2.02) (1.96) (1.93) (1.92) (1.90) (1.89) (1.89) (Nonexhaust HC) (2.37) (2.37) (2.37) (2.36) (2.36) (2.37) (2.36) (2.37) (2.37) (2.37) (2.37) Exhaust CO 20.89 20.61 20.60 20.59 20.59 20.47 20.47 20.47 20.35 20.35 20.35 Exhaust NOx 0.85 0.85 0.85 0.85 0.85 0.84 0.84 0.84 0.83 0.83 0.83
E
292"
Chapter 4 Transportation, E
nergy, and the Environm
entTable 4-38 Estimated National Average Vehicle Emissions Rates by Vehicle Type and Fuel (Grams per mile)
KEY: E = estimate; GVWR = gross vehicle weight rating;R = revised; RFG = reformulated gasoline
Continued next page

1990 1991 1992 1993 1994 1995 1996 1997 1998 1999 2000DIESEL
Light-duty vehicles Exhaust HC 0.73 0.74 0.75 0.75 0.76 0.77 0.76 0.74 0.71 0.67 0.63 Exhaust CO 1.68 1.71 1.72 1.73 1.74 1.74 1.71 1.67 1.62 1.57 Exhaust NOx 1.65 1.67 1.68 1.68 1.66 1.64 1.60 1.55 1.48 1.40 1.33Light-duty trucks Exhaust HC 1.08 1.14 1.15 1.14 1.13 1.11 1.09 1.05 0.98 0.91 0.84 Exhaust CO 2.03 2.10 2.09 2.07 2.04 2.02 1.99 1.95 1.88 1.80 1.73 Exhaust NOx 1.97 2.00 1.99 1.97 1.94 1.90 1.85 1.78 1.67 1.56 1.46Heavy-duty vehicles Exhaust HC 3.30 3.08 2.89 2.75 2.65 2.54 2.44 2.36 2.30 2.25 2.22 Exhaust CO 13.71 13.38 13.07 12.76 12.50 12.28 12.08 11.93 11.77 11.63 11.53 Exhaust NOx 21.05 19.59 18.14 16.89 15.81 14.79 13.96 13.33 12.66 11.93 11.24
AVERAGE OF ALL VEHICLES, GASOLINE AND DIESEL
Exhaust and nonexhaust HC 3.75 3.52 3.31 3.15 3.02 2.90 2.80 2.71 2.62 2.54 2.47 (Exhaust HC) (2.56) (2.40) (2.25) (2.13) (2.03) (1.93) (1.86) (1.80) R(1.74) (1.70) (1.67) (Nonexhaust HC) R(1.18) (1.12) (1.06) (1.02) R(1.00) (0.97) (0.94) (0.91) (0.88) (0.84) (0.80) Exhaust CO 29.97 28.29 26.81 25.62 24.68 23.75 23.11 22.58 21.94 21.53 21.20 Exhaust NOx 3.09 2.99 2.89 2.80 2.73 2.63 2.56 2.50 2.41 2.34 2.27
E
Air P
ollution !293
See Table 4-37 for emis-sions from vehicles operat-ing on reformulated gasoline.Data for nonexhaust HC is negligible for diesel light-duty vehicles, light-duty trucks, andheavy-duty vehicles.SOURCE: U.S. Environmental Protection Agency, National Vehicle and FuelEmissions Laboratory, unpublished data, Aug. 10, 2000.
Table 4-38Cont’d Estimated National Average Vehicle Emissions Rates by Vehicle Type and Fuel (Grams per mile)
NOTES: As of July 1 of each year. Vehicles types are defined as follows: light-dutyvehicles (passenger cars up to 6,000 lb GVWR); light-duty trucks (pickups and minivansup to 8,500 lb GVWR); heavy-duty vehicles (8,501 lbs or more GVWR) ; motorcycle(highway only). This table revises the data shown in National Transportation Statistics 1999because it is based on MOBILE5b, the U.S. Environmental Protection Agency's (EPA) lat-est highway vehicle emissions factor model. Interested readers can learn more about theMobile5b model at the following EPA Internet site http://www.epa.gov/otaq. Emissionsfactors are national averages based on the following assumptions: ambient temperature 75 ºF,daily temperature range 60-84 ºF, average traffic speed 19.6 mph (representative of overalltraffic in urban areas), standard operating mode (cold-start, hot-start, stabilized), vehicle-miles traveled fractions, no inspection/maintenance or antitampering programs, and gaso-line volatility 9.0 per square inch RVP (Reid vapor pressure).
KEY: E = estimate; GVWR = gross vehicle weight rating;R = revised; RFG = reformulated gasoline

294 " Chapter 4 Transportation, Energy, and the Environment
1995 1996 1997 1998 1999 2000Light-duty vehiclesExhaust HC 1.43 1.38 1.34 1.30 1.28 1.16Nonexhaust HC 0.69 0.68 0.66 0.64 0.60 0.37 Total HC 2.12 2.06 2.00 1.94 1.88 1.53
Exhaust CO 16.46 16.14 15.90 15.62 15.48 15.41Exhaust NOx 1.59 1.54 1.49 1.43 1.39 1.29
Light-duty trucksExhaust HC 2.11 2.02 1.93 1.84 1.78 1.63Nonexhaust HC 0.85 0.80 0.78 0.75 0.73 0.47 Total HC 2.96 2.82 2.71 2.59 2.51 2.10
Exhaust CO 22.15 21.62 21.20 20.59 20.22 19.95Exhaust NOx 1.96 1.93 1.91 1.85 1.82 1.71
Heavy-duty vehiclesExhaust HC 4.40 4.02 3.62 3.22 2.96 2.65Nonexhaust HC 2.53 2.38 2.24 2.10 1.99 1.30 Total HC 6.93 6.40 5.86 5.32 4.95 3.95
Exhaust CO 72.26 65.30 58.59 51.68 46.18 41.04Exhaust NOx 5.47 5.35 5.24 5.04 4.88 4.67
MotorcyclesExhaust HC 1.92 1.89 1.88 1.86 1.86 1.82Nonexhaust HC 1.91 1.91 1.91 1.91 1.90 1.43 Total HC 3.83 3.80 3.79 3.77 3.76 3.25
Exhaust CO 17.46 17.46 17.46 17.36 17.36 17.36Exhaust NOx 0.84 0.84 0.84 0.83 0.83 0.83
Average of all RFG and diesel vehicles
Exhaust HC 1.77 1.70 1.64 1.58 1.54 1.41Nonexhaust HC R0.75 0.73 0.71 R0.68 0.64 0.41 Total HC 2.52 2.43 2.35 2.25 2.18 1.82
Exhaust CO 19.38 18.83 18.37 17.81 17.45 17.17Exhaust NOx 2.61 2.54 2.48 2.39 2.32 2.19
E
Estimated National Average Vehicle Emissions Rates by Vehicle Type Using Reformulated Gasoline (Grams per mile)
NOTES: As of July 1 of each year. Vehicle types are defined as fol-lows: light-duty vehicles (passenger cars up to 6,000 lb gross vehicleweight rating GVWR) ; light-duty trucks (pickups and minivans up to8,500 lb GVWR); heavy-duty vehicles (8,501 lb or more GVWR);motorcycle (on-highway only). The data in this table are based onMOBILE5b, and reflect the introduction of RFG starting in 1995.Emissions factors are national averages based on the followingassumptions: ambient temperature 75 ºF, daily temperature range 60 -84 ºF, average traffic speed 19.6 mph (representative of overall trafficin urban areas), standard operating mode (cold-start, hot-start, stabi-lized), vehicle-miles traveled fractions, no inspection/maintenance or
antitampering programs, and gasoline volatility 9.0 per square inchRVP (Reid vapor pressure).Emissions estimates in this table assume 100% RFG.SOURCE: U.S. Environmental Protection Agency, National Vehicleand Fuel Emissions Laboratory, unpublished data, Aug. 10, 2000.
Table 4-39
KEY: CO = carbon monoxide; E = estimate; HC = hydrocarbon; NOx = nitrogen oxide; R = revised; RFG = reformulated gasoline

1970 1975 1980 1985 1990 1995 1996 1997 1998TransportationOn-road vehicles 88.03 83.13 78.05 77.39 57.85 54.11 53.26 R51.67 50.39Off-road Aircraft 0.51 0.60 0.74 0.83 0.90 0.94 0.95 R0.95 0.96 Railroads 0.07 0.08 0.10 0.11 0.12 0.11 0.11 0.12 0.12 Marine vesselsR 0.02 0.03 0.06 0.07 0.13 0.13 0.13 0.14 0.14 Other off-roada, R 2.04 2.17 2.30 2.43 2.50 2.56 2.56 2.57 2.58 Total transportationR 90.67 86.01 81.25 80.83 61.50 57.85 57.01 55.45 54.19
NontransportationFuel combustion 4.63 4.48 7.30 8.49 5.51 5.93 R6.15 R5.42 5.37Industrial processesb 9.84 7.54 6.95 5.28 4.77 4.61 R3.57 R3.70 3.71Waste disposal and recycling 7.06 3.23 2.30 1.94 1.08 1.19 R1.13 R1.14 1.15Miscellaneousc, R 17.25 15.50 19.63 20.49 25.66 23.78 27.62 28.71 25.05 Total nontransportationR 38.78 30.75 36.18 36.20 37.02 35.51 38.47 38.97 35.28
TOTAL all sourcesR 129.44 116.76 117.43 117.01 98.52 93.35 95.48 94.41 89.45
Air P
ollution !295
years. Therefore, some estimates in this table may not matchestimates produced in previous reports, and some trends may not be consistent acrossyears in which major methodology changes have occurred.Numbers may not add to totals due to rounding.SOURCES: U.S. Environmental Protection Agency, National Air Pollutant EmissionTrends: 1900-1998 (EPA-454/R-00-002) (Research Triangle Park, NC: March 2000), tableA-1; also available at Internet site www.epa.gov/ttn/chief/trends98/emtrnd.html, as ofAug. 8, 2000.
Table 4-40 Estimated National Emissions of Carbon Monoxide (Million short tons)
a Other off-road comprises nonroad gasoline- and diesel-powered recreational, airport service and railway maintenance vehicles, and recreational marine vessels.
b Industrial processes comprise chemical and allied product manufacturing, metals processing, petroleum and related industries, and other industrial processes; and solvent utilization, storage, and transport.
c Miscellaneous comprises nonroad gasoline- and diesel-powered construction, industrial,lawn and garden, farm, light-commercial, logging vehicles and other non-road sources;health services, cooling towers, fugitive dust; and other combustion sources that could not be accurately allocated to specific source categories.NOTES: The methodologies used to estimate emissions constantly evolve and undergomajor changes. These improved methods are often used to revise estimates for previous
KEY: R = revised

1970 1975 1980 1985 1990 1995 1996 1997 1998TransportationOn-road vehicles 7.39 8.65 8.62 8.09 R7.09 R7.83 R7.85 R7.88 7.77Off-road Aircraft 0.07 0.09 0.11 0.12 0.16 0.17 0.17 R0.17 0.17 Railroads 0.50 0.59 0.73 0.81 0.93 0.99 0.92 0.95 0.95 Marine vesselsR 0.17 0.21 0.47 0.56 0.94 0.94 0.99 1.00 1.01 Other off-roada, R 0.04 0.04 0.04 0.06 0.08 0.08 0.09 0.09 0.09 Total transportationR 8.17 9.58 9.97 9.64 9.20 10.01 10.02 10.09 9.99
NontransportationFuel combustion 10.06 10.49 11.32 10.05 10.89 10.83 R10.35 R10.40 10.19Industrial processesb 0.78 0.54 0.56 0.80 0.80 0.77 R0.76 R0.79 0.80Waste disposal and recycling 0.44 0.16 0.11 0.09 0.09 0.10 0.10 0.10 0.10Miscellaneousc R1.49 R1.88 R2.43 R2.62 R3.07 R3.22 R3.46 R3.46 3.40 Total nontransportation R12.77 R13.07 R14.42 R13.56 R14.85 R14.92 R14.67 R14.75 14.49
TOTAL all sourcesR 20.93 22.63 24.38 23.20 24.05 24.92 24.68 24.82 24.45
296"
Chapter 4 Transportation, E
nergy, and the Environm
ent
years. Therefore, some estimates in this table may not matchestimates produced in previous reports, and some trends may not be consistent acrossyears in which major methodology changes have occurred.Numbers may not add to totals due to rounding.SOURCES: U.S. Environmental Protection Agency, National Air Pollutant EmissionTrends: 1900-1998 (EPA-454/R-00-002) (Research Triangle Park, NC: March 2000), tableA-2; also available at Internet site www.epa.gov/ttn/chief/trends98/emtrnd.html, as ofAug. 8, 2000.
Table 4-41 Estimated National Emissions of Nitrogen Oxides (Million short tons)
a Other off-road comprises nonroad gasoline- and diesel-powered recreational, airport service and railway maintenance vehicles, and recreational marine vessels.
b Industrial processes comprises chemical and allied product manufacturing, metals processing, petroleum and related industries, and other industrial processes; and solvent utilization, storage, and transport.
c Miscellaneous comprises nonroad gasoline- and diesel-powered construction, industrial,lawn and garden, farm, light-commercial, logging vehicles, and other non-road sources;health services, cooling towers, fugitive dust; and other combustion sources that could not be accurately allocated to specific source categories.NOTES: The methodologies used to estimate emissions constantly evolve and undergomajor changes. These improved methods are often used to revise estimates for previous
KEY: R = revised

1970 1975 1980 1985 1990 1995 1996 1997 1998TransportationOn-Road vehicles 12.97 10.55 8.98 9.38 6.31 5.70 5.49 R5.33 5.33Off-Road Aircraft 0.10 0.12 0.15 0.17 0.18 0.18 0.18 R0.18 0.18 Railroads 0.02 0.03 0.03 0.04 0.05 0.05 0.05 0.05 0.05 Marine vessels 0.01 0.01 R0.02 R0.02 R0.03 R0.03 R0.03 R0.03 0.04
Other off-roada R0.87 R0.93 R0.98 R1.03 R0.92 R0.93 R0.92 R0.92 0.92 Total transportation R13.97 R11.64 R10.16 R10.64 R7.49 R6.89 R6.67 R6.51 6.52
NontransportationFuel combustion 0.72 0.66 1.05 1.57 1.01 1.07 R1.04 R0.90 0.89Industrial processesb 12.33 11.10 12.10 9.50 9.01 9.71 R8.17 R8.39 8.02Waste disposal and recycling 1.98 0.98 0.76 0.98 0.99 1.07 R0.42 R0.43 0.43Miscellaneousc, R R1.98 R1.71 R2.22 R1.75 R2.42 R2.07 R2.43 R2.64 2.05 Total nontransportation R17.02 R14.45 R16.13 R13.80 R13.44 R13.93 R12.07 R12.37 11.40
TOTAL all sourcesR R30.98 R26.08 R26.34 R24.43 20.94 R20.82 R18.74 R18.88 17.92
Air P
ollution !297
NOTES: The methodologies used to estimate emissions constantlyevolve and undergo major changes. These improved methods are often used to reviseestimates for previous years. Therefore, some estimates in this table may not matchestimates produced in previous reports, and some trends may not be consistent acrossyears in which major methodology changes have occurred.Numbers may not add to totals due to rounding.SOURCES: U.S. Environmental Protection Agency, National Air Pollutant EmissionTrends: 1900-1998 (EPA-454/R-00-002) (Research Triangle Park, NC: March 2000), tableA-3; also available at Internet website www.epa.gov/ttn/chief/trends98/emtrnd.html, asof Aug. 8, 2000.
Table 4-42 Estimated National Emissions of Volatile Organic Compounds (Million short tons)
a Other off-road comprises nonroad gasoline- and diesel-powered recreational, airport service and railway maintenance vehicles, and recreational marine vessels.
b Industrial processes comprises chemical and allied product manufacturing, metals processing, petroleum and related industries, and other industrial processes; and solvent utilization, storage, and transport.
c Miscellaneous comprises nonroad gasoline- and diesel-powered construction, industrial,lawn and garden, farm, light-commercial, logging vehicles, and other non-road sources;geogenic sources, catastrophic and accidental releases, health services, cooling towers,nontransportation-related fugitive dust, agriculture and forestry, structural fires, agriculturefires, slash/prescribed burning, forest wildfires, and other combustion sources that could not be accurately allocated to specific source categories.
KEY: R = revised

298"
Chapter 4 Transportation, E
nergy, and the Environm
ent
NOTES: The methodologies used to esti-mate emissions constantly evolve and undergo major changes. These improved meth-ods are often used to revise estimates for previous years. Therefore, some estimates inthis table may not match estimates produced in previous reports, and some trends maynot be consistent across years in which major methodology changes have occurred.Numbers may not add to totals due to rounding.SOURCES: U.S. Environmental Protection Agency, National Air Pollutant EmissionTrends: 1900-1998 (EPA-454/R-00-002) (Research Triangle Park, NC: March 2000), tableA-5; also available at Internet site www.epa.gov/ttn/chief/trends98/emtrnd.html, as ofAug. 8, 2000.
Table 4-43 Estimated National Emissions of Particulate Matter (PM-10)a (Million short tons)
a Fine particulate matter less than 10 microns.b Other off-road comprises nonroad gasoline- and diesel-powered recreational, airport
service and railway maintenance vehicles, and recreational marine vessels.c Industrial processes comprise chemical and allied product manufacturing, metals
processing, petroleum and related industries, and other industrial processes; solvent utilization; and storage and transport.
d Miscellaneous comprises nonroad gasoline- and diesel-powered construction, industrial,lawn and garden, farm, light-commercial, logging vehicles and other non-road sources;geogenic sources; agriculture and forestry, cooling towers, nontransportation-related fugitive dust, wildfires, managed burning, and other combustion sources that could not be accurately allocated to specific source categories.
KEY: N = data do not exist; R = revised
1970 1975 1980 1985 1990 1995 1996 1997 1998TransportationOn-road vehicles 0.44 0.47 0.40 0.36 0.34 0.29 0.28 0.27 0.26Off-road Aircraft 0.02 0.03 0.03 0.04 0.04 0.04 0.04 0.04 0.04 Railroads 0.03 0.03 0.04 0.04 0.05 0.03 0.03 0.03 0.03Marine vessels 0.01 0.01 0.02 R0.03 R0.04 R0.04 R0.04 R0.04 0.04Other off-roadb R<0.01 0.03 R0.03 R0.03 0.04 R0.04 R0.04 R0.04 0.04 Total transportation-fuel-related R0.49 0.57 0.52 0.50 0.51 0.44 0.43 0.42 0.41
Transportation-related fugitive dustUnpaved highways N N N 11.64 11.23 10.36 12.06 R12.53 12.67Paved highways N N N 5.08 2.25 2.41 2.39 R2.54 2.62 Total transportation R0.49 R0.57 R0.52 17.22 R13.99 13.21 14.88 R15.49 15.70
NontransportationFuel combustion 2.87 2.25 2.45 1.54 1.20 1.18 R1.17 R1.09 1.09Industrial processesc 7.67 3.70 2.75 1.06 1.04 0.95 R0.68 R0.70 0.71Waste disposal and recycling 1.00 0.37 0.27 0.28 0.27 0.29 R0.30 R0.31 0.31
Miscellaneousd,R 1.00 0.78 1.13 25.34 13.47 11.45 16.00 16.64 16.94
Total nontransportationR 12.54 7.10 6.60 28.22 15.98 13.87 18.15 18.74 19.05
TOTAL all sourcesR 13.04 7.67 7.12 45.45 29.96 27.07 33.04 34.23 34.74

1990 1991 1992 1993 1994 1995 1996 1997 1998TransportationOn-road vehicles 0.28 0.29 0.28 0.26 0.26 0.23 0.22 0.21 0.20Aircraft 0.03 0.03 0.03 0.03 0.03 0.03 0.03 0.03 0.03Railroads 0.05 0.05 0.05 0.05 0.05 0.03 0.02 0.03 0.03Marine vessels R0.03 R0.03 R0.03 R0.03 R0.03 R0.03 R0.04 R0.04 0.04Other off-roadb R0.03 R0.03 R0.03 0.04 0.04 0.04 0.04 0.04 0.04Transportation-related
fugitive dust Unpaved roads 1.69 1.68 1.64 1.72 1.71 1.56 1.82 R1.89 1.91 Paved roads 0.56 0.60 0.61 0.62 0.63 0.59 0.60 R0.64 0.66 Total transportation 2.67 2.71 2.67 R2.75 R2.75 R2.51 R2.77 R2.88 2.91
NontransportationFuel combustion 0.91 0.89 0.93 0.85 0.84 0.90 R0.86 R0.79 0.79Industrial processesc 0.56 0.57 0.58 0.50 0.50 0.50 R0.38 R0.39 0.39Waste disposal and recycling 0.23 0.24 0.24 0.29 0.27 0.25 R0.23 R0.24 0.24Miscellaneousd 3.59 3.32 R3.22 R2.95 R3.62 R3.04 R3.96 R4.21 4.06 Total nontransportation 5.29 5.02 R4.97 R4.59 R5.23 R4.69 R5.43 R5.63 5.49
TOTAL 7.96 7.74 R7.65 R7.33 R7.98 R7.18 R8.19 R8.48 8.38
Air P
ollution !299
formation of fine particulates resulting from emissions of nitro-gen oxide, sulfur dioxide, volatile organic compounds, and other substances is also a significant source of PM-2.5.Numbers may not add to totals due to rounding.The methodologies used to estimate emissions constantly evolve and undergo majorchanges. Improved methods are often used to revise estimates for previous years.Therefore, some estimates in this table may not match estimates produced in previousreports, and some trends may not be consistent across years in which major methodologychanges have occurred.SOURCES: U.S. Environmental Protection Agency, National Air Pollutant EmissionTrends: 1900-1998 (EPA-454/R-00-002) (Research Triangle Park, NC: March 2000), tableA-6; also available at Internet site www.epa.gov/ttn/chief/trends98/emtrnd.html, as ofAug. 8, 2000.
Table 4-44 Estimated National Emissions of Particulate Matter (PM-2.5)a (Million short tons)
a Particulate matter less than 2.5 microns in size.b Other off-road comprises nonroad gasoline- and diesel-powered recreational, airport
service and railway maintenance vehicles and recreational marine vessels.c Industrial processes comprise chemical and allied product manufacturing, metals
processing, petroleum and related industries, and other industrial processes; solvent utilization; and storage and transportation.
d Miscellaneous comprises nonroad gasoline- and diesel-powered construction, industrial,lawn and garden, farm, light-commercial, logging vehicles and other non-road sources;geogenic sources, agriculture and forestry, cooling towers, nontransportation-related fugitive dust, wildfires, managed burning, and other fugitive dust and combustion (that could not accurately be allocated to specific source categories).NOTES: The emissions estimates shown here are those that are directly emitted, whichrepresent only a portion of the total PM-2.5 emissions found in the air. Secondary
KEY: R = revised

1970 1975 1980 1985 1990 1995 1996 1997 1998TransportationOn-road vehicles 0.41 0.50 0.52 0.52 0.54 0.30 0.32 0.32 0.33Off-road Aircraft <0.01 <0.01 0.01 0.01 0.01 0.01 0.01 0.01 0.01 Railroads 0.04 0.04 0.05 0.06 0.12 0.11 0.11 0.12 0.11 Marine vessels 0.04 0.05 0.12 0.14 0.25 0.24 0.24 0.25 0.26 Total transportation 0.49 R0.59 0.70 0.73 R0.92 R0.66 0.68 R0.70 0.71
NontransportationFuel combustion 23.46 22.66 21.39 20.02 20.29 16.23 R16.32 R16.73 16.72Industrial processesa 7.09 4.68 3.77 2.43 1.86 1.59 R1.41 R1.46 1.46Waste disposal and recycling 0.01 0.05 0.03 0.03 0.04 0.05 R0.04 R0.04 0.04
Miscellaneousb 0.11 0.02 0.01 R0.44 R0.55 0.65 R0.67 R0.69 0.71 Total nontransportation 30.67 27.41 25.20 R22.92 R22.74 18.52 R18.44 R18.92 18.93
TOTAL all sources 31.16 28.01 25.91 R23.66 R23.66 R19.18 R19.12 R19.62 19.65
300"
Chapter 4 Transportation, E
nergy, and the Environm
ent
ous reports, and some trends may not be consistent across yearsin which major methodology changes have occurred.Numbers may not add to totals due to rounding.SOURCES: U.S. Environmental Protection Agency, National Air Pollutant EmissionTrends: 1900-1998 (EPA-454/R-00-002) (Research Triangle Park, NC: March 2000), tableA-4; also available at Internet site www.epa.gov/ttn/chief/trends98/emtrnd.html, as ofAug. 8, 2000.
Table 4-45 Estimated National Emissions of Sulfur Dioxide (Million short tons)
a Industrial processes comprise chemical and allied product manufacturing, metals processing, petroleum and related industries, and other industrial processes; solvent utilization; and storage and transport.
b Miscellaneous comprises nontransportation-related fugitive dust, nonroad gasoline, nonroad diesel, other nonroad sources and other miscellaneous combustion that could not be accurately allocated to specific source categories.NOTES: The methodologies used to estimate emissions constantly evolve and undergomajor changes. These improved methods are often used to revise estimates for previousyears. Therefore, some estimates in this table may not match estimates produced in previ-
KEY: R = revised

1970 1975 1980 1985 1990 1995 1996 1997 1998TransportationHighway vehicles 171.96 130.21 60.50 18.05 0.42 0.02 0.02 0.02 0.02Aircraft 1.40 1.12 0.89 0.69 0.62 0.54 0.51 0.50 0.50
Total transportationR 173.36 131.33 61.39 18.74 1.04 0.56 0.53 0.52 0.52
Fuel combustion 10.62 10.35 4.30 0.52 0.50 0.49 0.49 0.50 0.50Industrial processesa 26.36 11.38 3.94 2.53 R2.48 2.27 2.27 R2.32 2.33Waste disposal and recycling 2.20 1.60 1.21 0.87 0.80 0.60 R0.61 R0.62 0.62Miscellaneousb 8.34 5.01 3.32 0.23 0.16 <0.01 <0.01 <0.01 <0.01Total nontransportation 47.52 R28.34 12.77 4.15 3.94 R3.36 R3.37 R3.44 3.45
TOTAL 220.87 159.66 74.15 22.89 4.98 R3.93 R3.90 R3.95 3.97
Air P
ollution !301
go major changes. Improved methods are often used to reviseestimates for previous years. Therefore, some estimates in this table may not matchestimates produced in previous reports, and some trends may not be consistent acrossyears in which major methodology changes have occurred.Numbers may not add to totals due to rounding.SOURCES: U.S. Environmental Protection Agency, National Air Pollutant EmissionTrends Update: 1970-1997 (EPA 454/E-98-007) (Research Triangle Park, NC: December1998), table A-7; also available at Internet websitehttp://www.epa.gov/ttn/chief/trends98/emtrnd.html, as of Sep. 22, 2000.
Table 4-46 Estimated National Emissions of Lead (Thousand short tons)
a Industrial processes comprise chemical and allied product manufacturing, metals processing, and other industrial processes.
b Miscellaneous comprises other nonroad gasoline, engines and vehicles that could not be accurately allocated to specific source categories.NOTES: Total lead emissions decreased sharply from 1970 to 1995 as a result of regula-tory actions. The lead content of leaded gasoline was reduced dramatically in 1985. Inaddition, unleaded gasoline was introduced in 1975 for use in automobiles equipped withcatalytic control devices. By 1995, unleaded gasoline sales accounted for 99% of the gaso-line market. The methodologies used to estimate emissions constantly evolve and under-
KEY: R = revised

302"
Chapter 4 Transportation, E
nergy, and the Environm
entTable 4-47
Air Pollution Trends in Selected Metropolitan Statistical AreasR
(Number of days with AQI values greater than 100 at trend sites and all monitoring sites)
KEY: R = revised
Continued next page
All sites
Totalnumberof sites
AQI days >100 (1998)
Numberof trend
sites 1989 1990 1991 1992 1993 1994 1995 1996 1997 1998Akron, OH Albany-Schenectady-Troy, NY Albuquerque, NMAllentown-Bethlehem-Easton, PAAtlanta, GAAustin-San Marcos, TXBakersfield, CABaltimore, MDBaton Rouge, LABergen-Passaic, NJBirmingham, ALBoston, MA-NHBuffalo-Niagara Falls, NY Charleston-North Charleston, SC Charlotte-Gastonia-Rock Hill, NC-SC Chicago, IL Cincinnati, OH-KY-INCleveland-Lorain-Elyria, OHColumbus, OHDallas, TXDayton-Springfield, OH Denver, CODetroit, MIEl Paso, TXFort Lauderdale, FL
61325
918
5162210
8162521
92661234012111329322218
1420
1860
6785121
023
913
351102022233621
917
81
57
219757
1568
162521
91046202410
810203017
8
1548
1114
4113
281212
512
45
13161918
71810141825
6
948
1042
4972928
828
781
314
1910
42413
91119
1
3095
1423
3109
501111
513
92
1222222317
212
628
70
8503
181
10023
52
12930
1143
115
11288
102
10506
302
9748
53
10612
233
1313
71211
3574
861
1012
49841
756
104298
1923101514
11311
1
1230
173312
10436151132
861
13212324153611
214
51
11406
210
10928
73
15233
186
1117161218
013
71
630
1326
05530
858813
269
1112
815
90
1230
1420
1843
5755114
023
713
348
71420191819
517
51
Trend sites

All sites
1989 1990 1991 1992 1993 1994 1995 1996 1997 1998Fort Worth-Arlington, TX Fresno, CAGary, INGrand Rapids-Muskegon-Holland, MIGreensboro-Winston-Salem-High Pt, NCGreenville-Spartanburg-Anderson, SC Harrisburg-Lebanon-Carlisle, PAHartford, CT Honolulu, HIHouston, TXIndianapolis, INJacksonville, FLJersey City, NJ Kansas City, MO-KS Knoxville, TN Las Vegas, NV-AZ Little Rock-North Little Rock, AR Los Angeles-Long Beach, CALouisville, KY-INMemphis, TN-AR-MSMiami, FLMiddlesex-Somerset-Hunterdon, NJMilwaukee-Waukesha, WIMinneapolis-St. Paul, MN-WIMonmouth-Ocean, NJ
81522101677
15142637157
2218
287
382614124
22374
17691019302922100
4022107
1555113
5629278
22121
31
811188757
156
2629157
211467
381813104
18243
1791151663
10190
43154
1542
361
2151585
19178
15
16622
10122
10130
5493
152
23211
17310241
2484
21
20838
2653
21230
37120
25111083
1691591
24242
20
76956251
150
327291740
1752
1438336
95903
209
15140
2893
194
2062
13420156
1340
11
31556
1275
12180
45222
12101382
139271019943
2861171768
13140
66191
16222017
11321212
161476
147011767350
281315
101951
9410191851
12
1475128
13109
160
471249
183601
6013173
1840
12
17679
13252922100
3819107
155202
5624278
21100
19
Trend sites
Totalnumberof sites
AQI days >100 (1998)
Numberof trend
sites
Air P
ollution !303
Table 4-47Cont’d
Air Pollution Trends in Selected Metropolitan Statistical AreasR
(Number of days with AQI values greater than 100 at trend sites and all monitoring sites)
KEY: R = revised
Continued next page

304"
Chapter 4 Transportation, E
nergy, and the Environm
entTable 4-47
Cont’d
Air Pollution Trends in Selected Metropolitan Statistical AreasR
(Number of days with AQI values greater than 100 at trend sites and all monitoring sites)
KEY: R = revised
Continued next page
Nashville, TNNassau-Suffolk, NY New Haven-Meriden, CTNew Orleans, LANew York, NY Newark, NJ Norfolk-VA Beach-Newport News, VA-NC Oakland, CAOklahoma City, OK Omaha, NE-IAOrange County, CAOrlando, FL Philadelphia, PA-NJPhoenix-Mesa, AZPittsburgh, PAPonce, PRPortland-Vancouver, OR-WA Providence-Fall River-Warwick, RI-MA Raleigh-Durham-Chapel Hill, NC Richmond-Petersburg, VARiverside-San Bernardino, CARochester, NYSacramento, CASt. Louis, MO-ILSalt Lake City-Ogden, UT
218
10113912122914121113444953
11713181151
8336323
321110
721231512
756
14383739
035
402896
4332419
174
10112912122010
911
9362341
11211
41035
8135412
121411
42921
4641
569
443021
029
1411
1875
632521
312017
63623
8441
454
391219
0111315
6158
53623
5
132529
24935
7440
351
491121
08
205
18154
16543220
65
105
1010
8320
354
2413
906508
1742
4415
9
181517
6191319
421
254
511613
007
1130
1680
1495
211014
82113
6351
153
261019
0272
13149
1303213
289
14201920
61213
191
302225
02
111
19124
63234
4
23688
1512
411
2191
221711
06415
1190
3020
8
208
197
231317
04034
321220
00
101321
10665
151
301010
717231511
756
11371739
034
212894
4172312
All sites
1989 1990 1991 1992 1993 1994 1995 1996 1997 1998
Trend sites
Totalnumberof sites
AQI days >100 (1998)
Numberof trend
sites

Air P
ollution !305
"trend sites" if they have complete data for at least 8 of the 10years between 1989 and 1998.SOURCE: U.S. Environmental Protection Agency, Office of Air Quality Planning andStandards, National Air Quality and Emissions Trends Report, 1998 (Research Triangle Park,NC: 2000), table A-15.
Table 4-47Cont’d
Air Pollution Trends in Selected Metropolitan Statistical AreasR
(Number of days with AQI values greater than 100 at trend sites and all monitoring sites)
NOTES: The Air Quality Index (AQI) integrates information on 5 major pollutants(particulate matter less than 10 microns in diameter, sulfur dioxide, carbon monoxide,ozone, and nitrogen dioxide) across an entire monitoring network into a single numberthat represents the worst daily air quality experienced in an urban area. An AQI greaterthan 100 indicates that at least 1 criteria pollutant exceeded air quality standards on a givenday; therefore, air quality would be in the unhealthful range on that day. In 1997, 4,738monitoring sites reported air quality data. Air quality monitoring sites are selected as
KEY: R = revised
San Antonio, TXSan Diego, CASan Francisco, CASan Jose, CASan Juan-Bayamon, PRScranton-Wilkes Barre-Hazleton, PASeattle-Bellevue-Everett, WASpringfield, MASyracuse, NYTacoma, WATampa-St. Petersburg-Clearwater, FLToledo, OHTucson, AZTulsa, OKVentura, CAWashington, DC-MD-VA-WVWest Palm Beach-Boca Raton, FLWilmington-Newark, DE-MD Youngstown-Warren, OH
728111127112613
89
326
25111546
91015
635
08173734
11609
3047
22822
723
98
10111613
67
226
20111232
659
3127
018
066
10234825
8724
112
8
496
07099
1315631
167025
093
367
011
017
41511
1160
128748
01214
166
03033
12221211
5414
075
358
040
100
13401714
3748
310
2
446
02073
1202391
126320
050
1848
210
012
0910293
216529
01211
331
071465013
110
146218
035
314
002
111
10004417
4429
063
633
05173724
11509
2945
28
15
All sites
1989 1990 1991 1992 1993 1994 1995 1996 1997 1998
Trend sites
Totalnumberof sites
AQI days >100 (1998)
Numberof trend
sites

O3 e CO SO2 PM-10 Pb NO2
d O3 d CO SO2 PM-10 Pb
Totalexposed
1 AK Anchorage 2 AK Fairbanks 3 AK Juneau 4 AL Birmingham 5 AZ Ajo 6 AZ Bullhead City 7 AZ Douglas 8 AZ Miami-Hayden 9 AZ Morenci
10 AZ Nogales 11 AZ Paul Spur 12 AZ Payson 13 AZ Phoenix 14 AZ Rillito 15 AZ San Manuel
6
1338
516 AZ Yuma 17 CA Imperial Valley 18 CA Los Angeles-South Coast Air Basin 19 CA Mono Basin (in Mono Co.) 20 CA Owens Valley 21 CA Sacramento Metro 22 CA San Diego 23 CA San Francisco-Oakland-San Jose 24 CA San Joaquin Valley 25 CA Santa Barbara-Santa Maria-Lompoc 26 CA Searles Valley 27 CA Southeast Desert Modified AQMA 28 CA Ventura Co.
751
2,092
13,000
1,6392,4985,8152,742
370
384669
29 CO Aspen 30 CO Denver-Boulder
•••1••••••••
••••••••
1••••1••11111•11••
11••
1••
1
••••••••••1
••••1•121•••••1•••••••••••••••
••
•
1•1•1111•11111•111111••1•12•11
••••••••••••••••••••••••••••••
••••••••••••••••••••••••••••••
22230
2,006
13,000
1,800
170
12 65
133
1918
2,1220
5492
13,0000
181,041
2,742
30349
5
1,836
2223012
75165
1338
1918
2,12205
5492
13,0000
181,6392,4985,8152,742
37030
384669
51,836
Number of areas in nonattainment c Area population, in 1000s n
StatesConsolidated nonattainment
area name aRef.no.
306"
Chapter 4 Transportation, E
nergy, and the Environm
entTable 4-48
Areas in Nonattainment of National Ambient Air Quality Standards for Criteria Pollutants(Condensed nonattainment area list as of July 31, 2000)
KEY: CO = carbon monoxide; NO2 = nitrogen dioxide; O3 = ozone; Pb = lead;PM-10 = particulate matter smaller than 10 microns; SO2 = sulfur dioxide;• = all areas in attainment for a particular pollutant
Continued next page

31 CO Fort Collins 10632 CO Lamar 33 CO Pagosa Springs 34 CO Steamboat Springs 35 CO Telluride 36 CT Greater Connecticut37 DC-MD-VA Washington 38 GA Atlanta 39 GU b Piti Power Plant 40 GU b Tanguisson Power Plant 41 ID Bonner Co.(Sandpoint ) 42 ID Fort Hall Indian Reservation 43 ID Portneuf Valley 44 ID Shoshone Co. 45 IL-IN Chicago-Gary-Lake County 46 KY Boyd Co. (Ashland) 47 KY-IN Louisville 48 LA Baton Rouge 49 MA Springfield (W. Mass) 50 MD Baltimore 51 MD Kent and Queen Anne Cos.52 MN Minneapolis-St. Paul 53 MN Olmsted Co. (Rochester) 54 MO Dent 55 MO Liberty-Arcadia 56 MO-IL St. Louis i1
2,4703,9232,653
7,887
834559812
2,34852
2,390
322
57 MT Butte 58 MT Columbia Falls 59 MT Kalispell 60 MT Lame Deer
•••••111••••••1•11111••••1••••
1••• •••••••••••••••••••••••••
••••••••11••••1
g1••••••1•••••••
•11111••••11123••••••1••••1111
•••••••••••••••••••••••11
••••
••••••••••••••••••••••••••••••
00
47551
71
8161
126
261
7413
625
272
333
121
1068161
2,4703,9232,653
00
261
7413
7,88751
834559812
2,34852
2727132
2,390333
121
O3 e CO SO2 PM-10 Pb NO2
d O3 d CO SO2 PM-10 Pb
Totalexposed
Number of areas in nonattainment c Area population, in 1000s n
StatesConsolidated nonattainment
area name aRef.no.
Air P
ollution !307
Table 4-48Cont’d
Areas in Nonattainment of National Ambient Air Quality Standards for Criteria Pollutants(Condensed nonattainment area list as of July 31, 2000)
Continued next page
KEY: CO = carbon monoxide; NO2 = nitrogen dioxide; O3 = ozone; Pb = lead;PM-10 = particulate matter smaller than 10 microns; SO2 = sulfur dioxide;• = all areas in attainment for a particular pollutant

61 MT Lewis & Clark (E. Helena) 62 MT Libby 63 MT Missoula 64 MT Polson 65 MT Ronan 66 MT Thompson Falls 67 MT Whitefish 68 MT Yellowstone Co. (Laurel) 69 NE Douglas Co. (Omaha) 70 NM Anthony 71 NM Grant Co. 72 NM Sunland Park f 73 NV Central Steptoe Valley 74 NV Las Vegas 75 NV Reno 76 NY-NJ-CT New York-N. New Jersey-Long Island77 OH Cleveland-Akron-Lorain 78 OH Jefferson Co. (Steubenville) 79 OH Lucas Co. (Toledo) 80 OR Grants Pass 81 OR Klamath Falls 82 OR LaGrande 83 OR Lakeview 84 OR Medford
43
258134
12,338
1718
6285 OR Oakridge 86 OR Springfield-Eugene 87 PA Lancaster 88 PA Pittsburgh-Beaver Valley 89 PA Warren Co
2 5
28 2
1,412
462
44622
90 PA-DE-NJ-MD Philadelphia-Wilmington-Trenton
•••••••••••1•••1••••••••••11•1
••1•••••••
•••
••••111•••11••1••••••
1••••••1••1•1•••1•1••••••••22•
•111111••1•••11111•1111111•1••
j1
1
8
17,943
4232,468
6,010
3
433213 2
741254
1,4881,412
4
1718123
633
157
75
2 1
23
433213512
2882
741254
17,9431,412
44621718123
633
157423
2,46822
6,010
O3 e CO SO2 PM-10 Pb NO2
d O3 d CO SO2 PM-10 Pb
Totalexposed
Number of areas in nonattainment c Area population, in 1000s n
StatesConsolidated nonattainment
area name aRef.no.
•••••
•••••
•••••
•••••••••••••••
••••
••••••••••••••••••••
308"
Chapter 4 Transportation, E
nergy, and the Environm
entTable 4-48
Cont’d
Areas in Nonattainment of National Ambient Air Quality Standards for Criteria Pollutants(Condensed nonattainment area list as of July 31, 2000)
Continued next page
KEY: CO = carbon monoxide; NO2 = nitrogen dioxide; O3 = ozone; Pb = lead;PM-10 = particulate matter smaller than 10 microns; SO2 = sulfur dioxide;• = all areas in attainment for a particular pollutant

91 PA-NJ Allentown-Bethlehem 92 PR Guaynabo Co. 93 TN Shelby Co. (Memphis) 94 TX Beaumont-Port Arthur 95 TX Dallas-Fort Worth 96 TX El Paso97 TX Houston-Galveston-Brazoria98 UT Ogden99 UT Salt Lake City
100 UT Tooele Co. 101 UT Utah Co. (Provo) 102 WA Olympia-Tumwater-Lacey103 WA Seattle-Tacoma 104 WA Spokane 105 WA Wallula 106 WA Yakima 107 WI Manitowoc Co.108 WI Marathon Co. (Wausau) 109 WI Milwaukee-Racine
3613,561
5923,731
80
1,735110 WI Oneida Co. (Rhinelander) 111 WV Follansbee 112 WV New Manchester Gr. (in Hancock Co) 113 WV Wier.-Butler-Clay (in Hancock Co)
54
63
85
279
91
72526
115
31
1025
114 WY Sheridan
••1111•••••••••1•1•••••
•••••1•1••1••1••••••••••
1•••••••11•••••••1•1•11•
1•••1•11•113111••••1•11
•
k1•••••••••••••••••••••
•••••••••••••••••••••••
85
515
63725
26363
7301774754
3
2213
826
9185
826361
3,561592
3,73163
72526
26363
730279475480
1151,735
313
102513
31 17 28 76 6 0 90,800 30,515 4,664 29,792 836 100,593National totals (114 areas) c
O3 e CO SO2 PM-10 Pb NO2
d O3 d CO SO2 PM-10 Pb
Totalexposed
Number of areas in nonattainment c Area population, in 1000s n
StatesConsolidated nonattainment
area name aRef.no.
Air P
ollution !309
Table 4-48Cont’d
Areas in Nonattainment of National Ambient Air Quality Standards for Criteria Pollutants(Condensed nonattainment area list as of July 31, 2000)
Continued next page
KEY: CO = carbon monoxide; NO2 = nitrogen dioxide; O3 = ozone; Pb = lead;PM-10 = particulate matter smaller than 10 microns; SO2 = sulfur dioxide;• = all areas in attainment for a particular pollutant
310"
Chapter 4 Transportation, E
nergy, and the Environm
ent
j Lead nonattainment area is a portion of Lewis and Clark County, Montana.k Lead nonattainment area is a portion of Shelby County, Tennessee.l Lead nonattainment area is a portion of Williamson County, Tennessee.m Lead nonattainment area is Frisco, Texas, in Collin County.n Population figures were obtained from the 1990 census data. For nonattainment areas
defined as only partial counties, population figures for just the nonattainment area were used when these were available. Otherwise, whole county population figures wereused. When a larger nonattainment area encompasses a smaller one, double counting the population in the "Total exposed" column is avoided by only counting the population of the larger nonattainment area.The "Total exposed" values represent estimated population living in areas that are in nonattainment for at least one pollutant.NOTE: Reference numbers 1-130 do not indicate ranking.SOURCE: U.S. Environmental Protection Agency, Office of Air Quality Planning andStandards, USA Air Quality Nonattainment Areas, Internet websitehttp://www.epa.gov/airs/nonattn.html as of Oct. 17, 2000.
a This is a simplified listing of classified nonattainment areas. Unclassified and Section 185a (transitional) nonattainment areas are not included. Names of nonattainment areas are listed alphabetically within each state. Note that several smaller nonattainment areas may be inside one larger nonattainment area. In these cases, the smaller nonattainment areas are listed on the same line as the larger one, and the number of nonattainment areas are indicated under each pollutant.
b Guam (U.S. territory)c National total includes Guam (U.S. territory).d The number of nonattainment areas for each of the criteria pollutants is listed. A dot (.)
indicates that all areas are in attainment for that pollutant.Note that there are no areas in nonattainment for NO2.
e 1-hour ozone standard.f Ozone nonattainment area is a portion of Dona Ana County, New Mexico.g SO2 nonattainment area is a portion of Boyd County, Kentucky.h Lead nonattainment area is a portion of Franklin township, Marion County, Indiana.i Lead nonattainment area is Herculaneum, Missouri in Jefferson County.
Table 4-48Cont’d
Areas in Nonattainment of National Ambient Air Quality Standards for Criteria Pollutants(Condensed nonattainment area list as of July 31, 2000)

Sector 1990 1991 1992 1993 1994 1995 1996 1997 1998 1999
Industrial 454.8 444.1 461.6 461.0 471.0 469.2 483.8 489.7 480.2 481.2Residential 254.2 259.0 258.6 274.3 272.2 273.4 289.6 288.6 288.8 290.1Commercial 207.7 208.0 207.8 213.6 217.1 220.6 229.2 241.5 244.5 243.5Transportation 431.8 424.3 431.1 436.4 449.1 457.6 468.7 473.6 481.9 496.1 Motor Gasoline 260.6 259.2 263.1 268.9 273.3 279.0 284.0 286.5 292.9 299.1 Liquid Petroleum Gas 0.4 0.3 0.3 0.3 0.6 0.3 0.3 0.2 0.2 0.3 Jet Fuel 60.1 58.1 57.6 58.1 60.4 60.0 62.7 63.3 64.2 66.3 Distillate Fuel 75.7 72.6 75.3 77.3 82.5 85.1 89.7 93.5 96.4 100.1 Residual Fuel 21.9 22.0 23 19.4 19.1 19.7 18.4 15.5 15.2 17.5 Lubricants 1.8 1.6 1.6 1.6 1.7 1.7 1.6 1.7 1.8 1.8 Aviation Gas 0.8 0.8 0.8 0.7 0.7 0.7 0.7 0.7 0.7 0.7 Total Petroleum 421.2 414.6 421.6 426.4 438.2 446.5 457.4 461.5 471.5 485.8 Natural Gas 9.8 9.0 8.8 9.3 10.2 10.4 10.6 11.2 9.5 9.5 Electricity 0.7 0.7 0.7 0.7 0.9 0.8 0.8 0.8 0.9 0.8
Total CO2 Emissions fromEnd-Use Sector EnergyConsumption 1,348.6 1,335.3 1,359.1 1,385.3 1,409.6 1,421.0 1,471.5 1,493.4 1,495.4 1,510.8
Total U.S. CO2 Emissions 1,350.0 1,338.4 1,365.1 1,396.8 1,422.5 1,434.7 1,484.1 1,505.2 1,507.4 1,526.8
Air P
ollution !311
SOURCE: U.S. Department of Energy, Energy Information Administration, Emissionsof Greenhouse Gases in the United States 1999, DOE/EIA-0573(98) (Washington, DC:October 1999), available at Internet site www.eia.doe.gov/oiaf/1605/ggrpt/html, as ofNov. 7, 2000.
Table 4-49 U.S. Carbon Dioxide Emissions from Energy Use by Sector, 1990-1998 (Million Metric tons of Carbon)
NOTES: Electric utility emissions are distributed across end-use sectors.Numbers may not add to totals due to rounding.Tons of carbon can be converted to tons of carbon dioxide gas by multiplying by 3.667.One ton of carbon equals 3.667 tons of carbon dioxide gas.

Section EWater Pollution, Noise
and Solid Waste
chapter four

Water P
ollution, Noise, and S
olid Waste !
315
c Mystery spills are spills from unknown or unidentified sources. U.S. Coast Guard investigators are unable to identify the vessel or facility that spilled the oil into U.S.navigable waters.SOURCE: U.S. Coast Guard, Oil Spill Compendium 2000, available at Internet sitewww.uscg.mil/hq/g-m/nmc/response/stats/aa/htm.
Table 4-50 Petroleum Oil Spills Impacting Navigable U.S. Watersa
a Other vessels include commercial vessels, fishing boats, freight barges, freight ships,industrial vessels, oil recovery vessels, passenger vessels, unclassified public vessels,recreational boats, research vessels, school ships, tow and tug boats, mobile offshore drilling units, offshore supply vessels, publicly owned tank and freight ships, as well as vessels not fitting any particular class (unclassified).
b Other nonvessel sources include designated waterfront facilities, nonmarine land facilities,fixed offshore and inshore platforms, mobile facility, municipal facility, aircraft, land vehicles, railroad equipment, bridges, factories, fleeting areas, industrial facilities, intakes,locks, marinas, MARPOL reception facilities, nonvessel common carrier facilities, outfalls, sewers, drains, permanently moored facilities, shipyards, ship repair facilities.
Source
Vessel Sources Tankship Tank barge Other vesselsa
Total vessel sources
Nonvessel sources
Offshore pipelinesOnshore pipelinesOtherb
Total nonvessel sources
Mysteryc
Total All Spills
IncidentsGallonsSpilled
164 732,397385 3,683,548
1,113 446,966
1,662 4,862,911
23 17,977362 759,040
2,417 2,473,212
2,802 3,250,229
1,705 323,108
6,169 8,436,248
GallonsSpilledIncidents
249 4,977,251457 992,025
1,779 417,882
2,485 6,387,158
73 46,22876 270,700
2,435 1,091,544
2,584 1,408,472
3,108 119,377
8,177 7,915,007
GallonsSpilledIncidents
148 125,491353 1,101,938
4,977 396,724
5,478 1,624,153
7 1,14323 10,751
1,086 946,328
1,116 958,222
2,444 55,854
9,038 2,638,229
GallonsSpilledIncidents
122 219,311313 1,163,258
5,151 298,451
5,586 1,681,020
4 38613 978,006
1,061 429,911
1,078 1,408,303
2,671 28,508
9,335 3,117,831
GallonsSpilledIncidents
124 22,429252 165,649
4,971 192,801
5,347 380,879
13 81019 223,312
1,324 227,143
1,356 451,265
1,921 60,430
8,624 892,574
GallonsSpilledIncidents
104 56,673220 248,089
4,848 316,473
5,172 621,235
10 84335 47,020
1,508 198,853
1,553 246,716
1,590 17,352
8,315 885,303
GallonsSpilledIncidents
92 8,414227 158,977
5,361 409,084
5,680 576,475
5 35,70720 433
1,590 515,241
1,615 551,381
1,244 44,593
8,539 1,172,449
19991985 1990 1995 1996 1997 1998

316"
Chapter 4 Transportation, E
nergy, and the Environm
ent
1998-99: Ibid., Internet site http://www.epa.gov/swerust1/cat/camarchv.htm, as ofJune 27, 2000.
Table 4-51 Leaking Underground Storage Tank Releases and Cleanups
NOTE: All numbers are cumulative.SOURCES: 1990-97: U.S. Environmental Protection Agency, Office of UndergroundStorage Tanks, personal communications, Nov. 17 and Nov. 18, 1998.
assigned a year of construction, cannot beassigned a cost. Data are produced on a 3-year cycle.SOURCE: U.S. Department of Transportation, Federal Highway Administration,Office of Environment and Planning, Highway Traffic Noise Barrier Construction Trends(Washington, DC: 2000), tables 1 and 3.
TotalUnknown R1970-79 R1980-89 R1990 R1995 1996 1997 1998 1970-98
Type I barriersa 6 102 419 44 87 34 47 114 1,146Type II barriersb
d
0 70 128 19 32 15 31 22 391All other typesc N 2 28 0 6 0 1 1 79
Total length 6 175 575 63 125 49 78 137 1,623
Cost (1998 $ millions) N 134 656 89 152 60 111 169 1,931
Table 4-52 Highway Noise Barrier Construction (Miles)
a A Type I barrier is built on a highway project to construct a new highway or to physicallyalter an existing highway.
b A Type II barrier is built to abate noise along an existing highway (often referred to as retrofit abatement) and is not mandatory.
c All other types of barriers are nonfederally funded.d Have not been assigned a year of construction or a cost.NOTES: Miles have been converted from kilometers. Totals may not match the sum of yearlyestimates due to rounding and converting from metric. Twenty-four miles of barriers, while
KEY: N = data do not exist; R = revised
1990 1991 1992 1993 1994 1995 1996 1997 1998 1999Total confirmed releases
Cleanups initiated 51,770 79,506 129,074 171,082 209,797 238,671 252,615 292,446 314,965 346,300Cleanups not initiated 35,758 47,689 55,383 65,940 60,770 64,964 64,873 49,327 56,422 51,521
87,528 127,195 184,457 237,022 270,567 303,635 317,488 341,773 371,387 397,821
Cleanups completed 16,905 26,666 55,444 87,065 107,448 131,272 152,683 178,297 203,247 228,925Releases not cleaned up 70,623 100,529 129,013 149,957 163,119 172,363 164,805 163,476 168,140 168,896

Water Pollution, Noise, and Solid Waste ! 317
YearPeople
(millions)
Percent of U.S.Resident
Population
U.S. Resident Population
(millions)
1975198019851990199519961998
7.05.23.42.71.71.61.1
3.22.31.41.10.60.60.4
215.5227.2237.9249.4262.8265.2270.3
Exposure
Number of People Residing inHigh Noise Areas around U.S.Airportsa,b,c(within 65 dBDNL noise level contours)
a Noise-level contours are graphical representations of noise levels on a map, similar to elevation contours on a topographic map.Noise-level contours are lines that join points of equal sound levels. Areas between given noise-level contour lines would have a noise level between the two contour values. The U.S.Department of Transportation, Federal Aviation Administration (FAA) has identified FNL 65 dB as the highest threshold ofairport noise exposure that is normally compatible with indoor andoutdoor activity associated with a variety of land uses, including residential, recreational, schools, and hospitals.
b Estimates are for areas surrounding airport property of 250 of thelargest civil airport with jet operations in the United States. They exclude exposure to aircraft noise within an airport boundary.
c 1975 exposure estimates were made by the U.S. Environmental Protection Agency. 1980-99 estimates were made by FAA. See the source and accuracy statement for more details on how exposure estimates are made.SOURCES:Exposure: U.S. Department of Transportation, Federal AviationAdministration, Office of Environment and Energy (AEE-12), per-sonal communications.Population: U.S. Department of Commerce, Census Bureau, StatisticalAbstract of the United States 1999 (Washington, DC: 2000), table 2.
Table 4-53
Key: db=decibels; DNL=day night sound level

318"
Chapter 4 Transportation, E
nergy, and the Environm
ent
SOURCE: The Polk Co., personal communication, May 4, 2000.
1970 1975 1980 1985 1990 1995 1996 1997 1998 1999Passenger cars 7,461 5,669 8,405 7,729 8,897 7,414 7,527 8,244 6,819 7,216Trucks 837 908 1,732 2,100 2,177 2,918 3,284 4,265 4,846 4,447 Total motor vehicles 8,298 6,577 10,137 9,829 11,074 10,332 10,811 12,509 11,665 11,664
Table 4-54 Motor Vehicles Scrappeda (Thousands)
a Data are for the period July 1 to June 30 of the given year.NOTE: Figures represent vehicles that are not re-registered.

Modal Profiles
appendix a

Financial 1995 1996 1997 R1998Operating revenues(thousand dollars)
Domestic totala,b 2,178,339 R7,180,161 26,440,297 57,960,508 70,885,050 76,890,526 82,249,568 86,493,789 90,517,576Majors, all services 1,942,635
e6,272,775
e23,012,073f
53,333,552h
64,317,169h
70,036,709h
74,942,391h
77,650,810h
80,797,402h
Nationals, all services 146,481 736,831 3,182,418 4,167,552i
5,935,773i
5,990,391i
6,163,458i
8,113,690i
8,933,847i
Large regionals, all services N N 245,806 459,404j
632,108j
863,426j
1,143,719j
729,289j
786,328j
International total 705,938 2,109,497 6,442,144 17,990,355 23,433,483 25,046,820 27,318,034 26,971,289 27,809,573
Majors, all services 705,938 2,109,497 5,976,221g
16,761,376h
19,892,111h
21,524,274h
23,608,853h
23,356,233h
24,446,105h
Nationals, all services N N 465,923 901,352i
3,282,606i
3,326,467i
3,376,014i
3,161,212i
2,954,249i
Large regionals, all services N N N 327,627j
258,766j
196,079j
333,166j
453,844j
409,219j
Total certificated a R2,884,877 R9,289,658 32,882,441 75,950,863 94,318,533 101,937,346 109,567,602 113,465,078 118,327,149
Operating expenses(thousand dollars)
Domestic totala 2,052,094 7,001,668 26,465,999 58,953,086 66,119,699 71,573,073 75,731,215 78,388,515 84,344,125Majors, all services 1,907,785 6,256,039 23,150,527
f54,209,401
h59,721,080
h64,793,763
h68,307,270
h70,114,852
h75,244,844
h
Nationals, all services 144,309 745,629 3,058,289 4,297,823i
5,750,372i
5,847,797i
6,163,923i
7,500,451i
8,342,749i
Large regionals, all services N N 257,183 445,862j
648,247j
931,513j
1,260,021j
773,212j
756,532j
International total 665,660 2,065,605 6,642,095 18,914,480 22,335,257 24,155,203 25,249,593 25,748,752 26,132,232
Majors, all services 665,660 2,065,605 6,171,366g
17,746,006h
19,061,258h
20,807,517h
21,688,642h
22,321,441h
23,048,059h
Nationals, all services N N 470,729 853,361i
3,025,707i
3,166,097i
3,253,249i
3,014,282i
2,698,045i
Large regionals, all services N N N 315,113j
248,292j
181,589j
307,702j
413,029j
386,129j
Total certificateda 2,717,754 9,067,273 33,108,094 77,867,566 88,454,956 95,728,276 100,980,807 104,137,267 110,476,358
Inventoryc
Number of carriers
Total domestic and international 55k
39k kR kR kR kR kR kR
66 59 89 90 82 81 84k
Majors N N R14 12 11 12 13 13 13
Nationals N N R18 R15 R27 R31 31 R28 33
Regionals N N R34 R32 R51 R47 R38 R40 38
P19991960 1970 1980 1990
Appendix A
Modal P
rofiles !321
Air Carrier Profile
KEY: N = data do not exist; R = revised; U = data are not available
Continued next page

Inventory cont'd
Number of aircraft available for service
Total domestic and international 2,135l
2,690l
2,818l
4,727l
5,567l
5,961l
5,770l
6,144l
6,254l
Majors N N 2,071 3,854 4,039 4,422 4,352 4,605 4,711Nationals N N 432 650 1,143 1,167 967 1,113 1,319Regionals N N 315 223 385 372 451 426 224
Number of employeesTotal domestic and international 169,872
k304,690
k354,264
k588,926
k R610,363k 634,866k R656,243k R696,202k 728,495
k
Majors 118,189 214,021 318,973 549,100 533,313 564,631 597,953 623,389 650,267Nationals 12,470 24,913 29,922 32,077 59,444 56,586 R47,662 R59,414 68,138Regionals N N 5,369 7,749 R17,606 13,649 R10,628 R13,399 10,090
Performance
Aircraft revenue-miles
Domestic b
Certificated, all servicesa 858,451m
2,067,598m
2,523,375n
3,963,263o
4,629,394o
4,811,453o
4,910,948o
5,034,691o
5,308,533o
Major, all servicesa 716,961 1,778,065 2,113,669 3,547,339p
3,953,287p
4,083,664p
4,191,113p
4,260,052p
4,445,131p
Nationals, all servicesa 94,794 247,055 330,528 351,946q
569,641q
614,519q
594,241q
702,913q
781,351q
Large regionals, all servicesa N N 56,995 60,542n
85,363n
96,573n
112,682n
51,199n
57,360n
InternationalCertificated, all servicesa 181,605 474,666 400,971
r760,338
s997,658
s1,043,313
s1,113,816
s1,192,489
s1,223,177
s
Major, all servicesa N N 330,391 666,231q
822,283q
859,483q
917,109q
1,003,726q
1,043,737q
Nationals, all servicesa N N 66,499 48,812t
141,870t
150,147t
145,821t
145,494t
137,996t
Large regionals, all servicesa N N 2,948 60,542u
27,761u
22,519u
47,138u
40,398u
35,766u
Medium regionals, all services, domestic and international a N N 23,204 9,017
v28,847v 27,861
v16,660
v21,024
v30,369
v
Total certificateda 1,040,056 2,542,264 2,924,346 4,723,601 5,627,052 5,854,766 6,024,764 6,227,180 6,531,710
Aircraft revenue-hoursDomesticb
Certificated, all servicesa 3,672,900 5,133,161 6,247,795n
9,717,375o
11,378,134o
11,871,886o
12,060,253o
12,445,483o
13,040,149o
Major, all servicesa 2,802,317 4,066,480 4,941,327 8,524,236p
9,257,260p
9,584,525p
9,828,418p
9,957,390p
10,349,988p
Nationals, all servicesa 606,146 908,935 919,187 1,016,491q
1,839,835q
1,981,219q
1,882,975q
2,299,916q
2,472,930q
Large regionals, all servicesa N N 267,522 167,826n
223,007n
260,985n
315,506n
143,197n
153,616n
1995 1996 1997 R1998 P19991960 1970 1980 1990
(thousands)
322"
Appendix A
Modal P
rofiles Air Carrier Profile
Cont’d
KEY: N = data do not exist; R = revised; U = data are not available
Continued next page

Performance cont'd
International Certificated, all servicesa 608,736 977,325 819,518
r1,556,760
s2,021,060
s2,113,467
s2,235,441
s2,394,095
s2,452,176
s
Major, all servicesa N N 668,199 1,351,349q
1,634,465q
1,712,416q
1,819,583q
1,992,776q
2,071,513q
Nationals, all servicesa N N 140,329 101,533t
314,066t
329,311t
309,948t
311,540t
289,523t
Large regionals, all servicesa N N 7,583 88,641u
59,572u
48,619u
97,304u
83,437u
75,851u
Medium regionals, all services,Domestic and international a N N 123,411 24,059
v70,989
v68,278
v41,960
v51,322
v78,904
v
Total certificated a 4,281,636 6,110,486 7,190,724 11,298,194 13,399,194 13,985,353 14,295,694 14,839,578 15,492,325
Revenue passenger-miles (thousands)
Domesticb
Certificated, all services 31,098,944 108,441,978 204,367,599n
345,872,950o
403,887,802o
434,651,687o
450,612,482o
463,262,198o
487,905,650o
Majors, all services 29,430,428 99,903,229 182,984,795 327,112,620p
368,701,100p
395,099,254p
410,906,050p
421,217,665p
440,441,958p
Nationals, all services 1,170,779 7,642,071 20,466,712 16,756,818q
29,255,179q
33,000,546q
33,241,082q
37,699,063q
43,040,816q
Large regionals, all services N N 711,868 1,752,615n
4,381,267n
5,443,071n
5,778,338n
3,124,802n
3,205,805n
International
Certificated, all services 8,950,672m
39,695,392m
63,354,387r
126,362,697s
154,869,249s
161,512,010s
169,356,100s
172,255,197s
180,263,824s
Majors, all services N N 54,318,160 118,268,507q
137,986,520q
145,330,811q
153,564,956q
157,398,986q
166,321,018q
Nationals, all services N N 8,659,592 6,794,533t
16,128,695t
14,681,127t
13,616,245t
13,471,798t
11,498,538t
Large regionals, all services N N 330,288 1,219,706u
676,925u
505,337u
2,148,486u
1,097,330u
2,034,607u
Medium regionals, all services, domestic and international a N N 250,571 330,848
v1,627,365
v2,103,551
v713,425
v1,507,751
v1,626,732
v
Total certificateda 40,049,616 148,137,370 267,972,557 472,566,495 558,757,051 596,163,697 619,968,582 635,517,395 668,169,474
Average passenger revenue/passenger-mile
(Domestic, scheduled service) 6.09 6.00 11.49 13.43 13.48 13.76 13.97 14.08 13.96
Average passenger fare(Domestic, scheduled service) 30.01 40.65 84.60 107.86 106.66 110.37 114.10 114.34 114.99
1995 1996 1997 R1998 P19991960 1970 1980 1990
Appendix A
Modal P
rofiles !323
Air Carrier ProfileCont’d
KEY: N = data do not exist; R = revised; U = data are not available
Continued next page

324"
Appendix A
Modal P
rofiles Air Carrier Profile
Cont’d
KEY: N = data do not exist; R = revised; U = data are not available
Continued next page
Performance cont'd
Revenue passenger enplanements (thousands)
Domesticb
Certificated, all servicesa 56,352m
153,662m
275,182n
428,767o
506,789o
538,394o
548,735o
566,951o
588,601o
Major, all servicesa 48,678 122,866 223,237 393,927p
441,650p
466,743p
478,253p
486,903p
502,305p
Nationals, all servicesa 5,949 26,726 47,145 32,015q
55,656q
62,183q
61,316q
74,281q
80,504q
Large regionals, all servicesa N N 3,748 2,566n
7,136n
7,887n
8,203n
4,352n
4,254n
International
Certificated, all servicesa 5,904 16,620 26,514r
46,126s
52,864s
54,515s
56,767s
57,759s
57,699s
Major, all servicesa N N 23,949 42,207q
44,155q
46,302q
48,614q
49,610q
49,768q
Nationals, all servicesa N N 2,343 2,632t
8,114t
7,401t
6,896t
7,038t
6,279t
Large regionals, all servicesa N N 149 1,246u
556u
405u
1,231u
940u
1,322u
Medium regionals, all services, domestic and international a N N 1,125 300
v2,386
v1,988
v989
v1,586
v1,868
v
Total certificateda 62,256 169,922 302,821 475,193 559,653 592,909 605,502 624,710 646,300
Revenue passenger
Load factor (%) (scheduled service)
Domesticb
Certificated 58.5 48.9 58.0n
60.4o
65.4o
67.9o
69.1o
70.0o
69.8o
Majors 59.5 49.3 58.1 60.6p
65.7p
68.5p
69.7p
70.4p
70.2p
Nationals 41.9 43.6 58.4 56.6q
61.9q
61.5q
63.2q
65.1q
66.1q
Large regionals N N 47.7 48.7n
56.0n
60.4n
60.7n
58.8n
58.7n
International
Certificated 62.2 53.0 62.8r
69.1s
71.8s
73.3s
74.1s
72.8s
74.4s
Majors N N 62.8 69.1q
72.1q
73.7q
74.4q
72.9q
74.5q
Nationals N N 65.5 73.4t
67.7t
67.8t
69.6t
70.9t
73.8t
Large regionals N N 73.9 66.5u
44.5u
0.0u
64.9u
46.0u
Uu
Medium regionals, all services, domestic and international a N N 46.7
v0.0
v59.3
v66.7
v49.7
v58.2
v48.4
v
1995 1996 1997 R1998 P19991960 1970 1980 1990

Appendix A
Modal P
rofiles !325
Air Carrier ProfileCont’d
KEY: N = data do not exist; R = revised; U = data are not available
Continued next page
Performance cont'd 1995 1996 1997 R1998U.S. international passenger travelTotal passenger-arrivals (thousands)
Flag of carrier
United States 1,332w
5,531w
10,031x
19,145x
24,582y
25,148x
26,744x
27,390x
27,462x
Foreign 1,234 4,343 10,231 17,269 22,328 24,704 27,571 28,791 30,324
Total passenger-departures (thousands)
Flag of carrier
United States 1,200 4,949 9,369 17,628 22,231 22,901 24,302 24,513 25,457
Foreign 1,136 4,147 9,886 16,418 20,795 22,884 25,382 26,350 28,399
Total revenue ton-miles (thousands)d
Domesticb
Certificated, all services 3,732,949m
13,876,802m
24,964,907n
43,651,162o
52,910,081o
56,326,750o
58,658,887o
60,199,459o
62,743,196o
Majors, all services 3,332,483 12,589,057 21,427,534 39,107,033p
47,015,642p
50,096,661p
52,254,323p
53,424,349p
55,599,771p
Nationals, all services 121,157 850,477 3,336,057 3,561,283q
4,996,345q
231,398q
5,317,576q
6,012,665q
6,327,438q
Large regionals, all services N N 180,042 945,929n
718,659n
863,449n
971,942n
508,172n
584,773n
InternationalCertificated, all services 1,291,336 6,308,701 9,689,067
r19,975,915
s26,295,684
s28,177,721
s30,944,299
s31,481,513
s32,780,309
s
Majors, all services N N 7,377,733 17,803,825q
21,517,789q
22,880,295q
24,971,379q
25,794,344q
27,764,472q
Nationals, all services N N 2,261,534 1,229,849t
4,116,380t
4,603,920t
4,657,365t
4,376,654t
4,123,176t
Large regionals, all services N N 44,438 835,701u
513,476u
396,142u
1,240,303u
1,269,602u
830,782u
Medium regionals, all servicesdomestic and international a N N 28,178 143,457
v327,474
v432,606
v190,298
v265,186
v293,093
v
Total certificated a 5,024,285 20,185,503 34,682,153 63,770,534 79,205,765 84,504,471 89,603,186 91,650,972 95,523,505
Revenue ton-miles of freight (thousands)
Domesticb
Certificated, all services 552,756 2,708,900 4,528,316n
9,063,864o
12,520,057o
12,860,845o
13,601,412o
13,839,605o
13,957,599o
Majors, all services 321,176 U 3,129,087 6,395,767p
10,145,537p
10,586,741p
11,163,518p
11,302,583p
11,555,578p
Nationals, all services 3,850 U 1,289,510 1,885,600q
2,070,570q
1,931,201q
1,993,498q
2,239,140q
2,023,150q
Large regionals, all services N N 108,864 770,670n
280,512n
318,542n
398,153n
195,791n
269,628n
P19991960 1970 1980 1990

326"
Appendix A
Modal P
rofiles Air Carrier Profile
Cont’d
KEY: N = data do not exist; R = revised; U = data are not available
Continued next page
Performance cont'd 1995 1996 1997 R1998International
Certificated, all services 268,156m
1,566,105m
3,353,371r
7,339,660s
10,854,620s
12,031,634s
14,008,685s
14,262,373s
14,752,926s
Majors, all services N N 1,945,660 5,976,973q
7,719,138q
8,347,214q
9,614,881q
10,054,448q
11,132,370q
Nationals, all services N N 1,395,575 550,409t
2,549,371t
3,140,921t
3,295,738t
3,035,853t
2,972,323t
Large regionals, all services N N 11,409 713,733u
445,783u
345,609u
1,025,455u
1,159,869u
627,320u
Medium regionals, all services,domestic and international a N N 3,124 110,372
v163,766
v222,251
v118,854
v114,294
v130,156
v
Total certificateda 820,907 3,755,436 7,884,811 16,513,896 23,374,677 24,892,479 27,610,097 28,101,978 28,710,525
Safety
Air carrier fatalities
Operating under 14 CFR 121 (airlines)Scheduled services N N 0
z39
z166
z342
z3
z1
z12
z
Nonscheduled services N N 1 0 2 38 5 0 0
Operating under 14 CFR 135
Scheduled services (commuters) N N 37 7 9 14 46 0 12
Nonscheduled services (on–demand air taxis) N N 105 51 52 63 39 R48 38
Totala 499AA
146AA
143 97 229 457 93 49 62
Air carrier accidentsOperating under 14 CFR 121 (airlines)
Scheduled services N N 15 22 34 32 44 R43 48
Nonscheduled services N N 4 2 2 6 5 7 4
Operating under 14 CFR 135
Scheduled services (commuters) N N 38 15 12 11 R17 8 13
Nonscheduled services (on–demand air taxis) N N 171 107 75 90 82 R77 76
Total a 90AA
55AA R228 146 123 139 148 R135 141
P19991960 1970 1980 1990

Appendix A
Modal P
rofiles !327
o U.S. Department of Transportation,Bureau of Transportation Statistics,(pre-1995, U.S. Department of Transportation, Research and Special Programs Administration), Air Carrier Traffic Statistics, December 1991/1990, 1992/1991, 1993/1992, 1994/1993, 1995/1994, 1996/1995, 1997/1996, 1998/1997, 1998/1999(Washington, DC), p. 2.
p Ibid., p. 5.q Ibid., pp. 52, 53, 59.r Civil Aeronautics Board, Air Carrier Traffic Statistics, December 1981 (Washington, DC),
pp. 3, 6, 85, 115.s U.S. Department of Transportation, Bureau of Transportation Statistics, (pre-1995,
U.S. Department of Transportation, Research and Special Programs Administration),Air Carrier Traffic Statistics, December 1991/1990, 1992/1991, 1993/1992, 1994/1993, 1995/1994, 1996/1995, 1997/1996, 1998/1997, 1998/1999 (Washington, DC), p. 3.
t Ibid., pp. 52, 53, 56, 60.u Ibid., pp. 118, 119, 133, 134.v Ibid., pp. 178, 182, 187.w U.S. Department of Justice, Immigration and Naturalization Service, Report of Passenger
Travel Between the U.S. and Foreign Countries, 1960, 1970 (Washington, DC).x U.S. Department of Transportation, Research and Special Programs Administration,
U.S. International Air Travel Statistics (Washington, DC: Annual issues), tables IIa and IId.y U.S. Department of Commerce, International Trade Administration, U.S. International
Air Passenger Statistics Report, Calendar Year 1995, (Washington, DC), tables IIa, IId.z National Transportation Safety Board, NTSB Press Release, SB-00-05, 2000, tables 6
through 9, available at http://www.ntsb.gov/aviation/Stats.htm.AA Ibid., personal communication.
Air Carrier ProfileCont’d
a Totals include data not in table; thus totals may not be sum of table data.b Domestic encompasses operations within and between the 50 states of the United
States, the District of Columbia, Puerto Rico and the Virgin Islands. It also encompassesCanadian and Mexican transborder operations (U.S. airlines only).All other operations are considered international.
c Includes scheduled and nonscheduled (charter) operators. By Sec. 2 of the Airline Deregulation Act of 1978 "charter air carrier" and "charter air transportation" replaced supplemental air carriers and supplemental air transportation which were formerly Sec.101(36) and (37) of the Act. The 24 pre–deregulation supplemental carriers now have scheduled service authority.
d Total Revenue Ton–Miles includes Passenger, Freight, Express and Mail.SOURCES: Unless otherwise noted, refer to chapter tables for sourcese Civil Aeronautics Board, Handbook of Airline Statistics, 1969 and 1973 (Washington, DC),
pp. 69, 71.f Ibid., Air Carrier Financial Statistics, December 1981 (Washington, DC), pp. 3/28, 44.g Ibid., pp. 42, 44.h U.S. Department of Transportation, Bureau of Transportation Statistics, (pre-1995, U.S.
Department of Transportation, Research and Special Programs Administration), Air Carrier Financial Statistics, December Various years (Washington, DC) p. 3.
i Ibid., pp. 30, 31, 32, 35.j Ibid., pp. 65, 71, 72, 76.k U.S. Department of Transportation, Bureau of Transportation Statistics, Office of
Airline Information, http://www.bts.gov/oai/employees/employcov.html.l Ibid., personal communication.mCivil Aeronautics Board, Handbook of Airline Statistics, 1973, (Washington, DC), Part III,
Tables 2, 4, 7, 13.n Ibid., Air Carrier Traffic Statistics, December 1981 (Washington, DC), pp. 2, 5, 46, 84.
KEY: N = data do not exist; R = revised; U = data are not available
Safety cont'd 1995 1996 1997 R1998Fatal air carrier accidentsOperating under 14 CFR 121 (airlines)
Scheduled services N N 0 6 2 3 3 1 2
Nonscheduled services N N 1 0 1 2 1 0 0
Operating under 14 CFR 135
Scheduled services (commuters) N N 8 4 2 1 5 0 5
Nonscheduled services (on–demand air taxis) N N 46 29 24 29 15 R18 12
Totala 17AA
8AA
55 39 29 35 24 R19 19
P19991960 1970 1980 1990

Financial 1960 1970 1980 1990 1995 1996 1997 1998
Expenditures ($ millions)Aircraft 202h 339h 2,853h R3,398h 4,260h 5,297h R7,174h 9,571h
Operating costs 693 1,696 5,200 R6,744 R6,324 6,443 R6,818 7,105 Total 895 2,035 8,053 R10,142 R10,584 11,740 R13,992 16,676
Inventory
Number of active aircraft by
Corporate N 6,835i 14,860i 10,100i 9,800i 9,300i 10,411i 11,250i
Business N 26,900 49,391 33,100 26,200 28,200 27,716 32,611
Instructional N 10,727 14,862 18,600 14,800 14,300 14,663 11,375
Personal N 65,398 96,222 112,600 109,300 109,600 115,630 124,347Aerial application N 5,455 7,294 6,200 5,100 5,400 4,858 4,550
Aerial observation N N N 4,900 4,700 3,200 3,311 3,242
External load N N N N 200 400 186 313Other worka N 2,054 2,813 1,400 1,100 1,100 579 1,116Air taxi/air toursb N N N 5,800 4,100 3,900 4,948 5,190Sight seeingc N N N N 900 900 677 679Other N 8,249 17,045 4,100 6,300 6,700 5,250 6,010
Public use N N N N N 4,200 4,130 4,029
Total 76,549i 131,743 211,045 196,800 188,100 191,100 192,400 204,710
primary use
328"
Appendix A
Modal P
rofiles General Aviation Profile
KEY: N = data do not exist; R = revised
Continued next page

Performance 1960 1970 1980 1990 1995 1996 1997 1998
Number of flight hours by use (thousands)CorporateBusinessInstructional
PersonalAerial application
Aerial observationExternal loadOther worka
Air taxi/air toursb
Sight seeingc
OtherPublic used
TotalVehicle-milese (millions)Passenger-milese (millions)Fuel consumed e (million gallons)Aviation gasolineJet fuel
N5,699j
1,828
3,172N
NN
NN
N2,422
N13,1211,769k
2,300h
242l
242N
N7,204j
6,791
6,896N
NN
NN
N5,139
N26,0303,207k
9,100h
759l
551208
5,332j
8,4345,748
8,8942,044
NN
1,053N
N4,925
N36,4305,204k
14,700h
1,286l
520766
2,913j
4,4177,244
9,2761,872
1,745N
5722,249
N475
N30,763R4,548k
13,000h
1,016l
353663
2,869j
3,1914,106
9,3201,557
1,385118
2681,527
2061,121
N25,6673,795k
R10,800h
R847q
R287R560
2,718j
3,1524,425
8,8931,787
1,036203
2621,773
186644
1,02126,1003,524k
R12,000h
R896q
R289R608
2,878j
3,0064,956
9,6441,562
1,261112
1392,120
127819
1,09627,7133,877k
12,500h
R934q
R292R642
3,213j
3,5233,961
9,7811,306
812153
2862,583
169940
1,37328,100
Uk
13,300h
1,126q
311815
Appendix A
Modal P
rofiles !329
KEY: N = data do not exist; R = revised
Continued next page
General Aviation ProfileCont’d

Safety 1960 1970 1980 1990 1995 1996 1997 1998
Fatalitiesf
Corporate N 28m 66n 21n 15n 20n 3n 0p
Business N 148 126 80 73 44 53 42Instructional N 93 73 62 44 40 38 36
Personal N 726 808 492 488 413 436 424Aerial application N 41 32 17 15 10 18 6Other N 174 134 95 99 105 122 112
Total 787m 1,310 1,239 767 734 632 660 620Accidents
Fatal 429o 641o 618o 443o 412o 360o R353o 365o
Total 4,793 4,712 3,590 2,215 2,053 R1,908 R1,853 1,909
Accident rate g
(per 100,000 flight hours)Fatal 3.3 2.5 1.7 1.6 1.6 1.5 1.4 1.4
Total 36.5 18.1 9.9 7.8 8.2 7.7 7.3 7.1
330"
Appendix A
Modal P
rofiles
SOURCES: Unless otherwise noted, referto chapter tables for sources.h Eno Transportation Foundation, Inc., Transportation in America, Annual Issues
(Washington, DC), pp. 42, 47.I United States. Federal Aviation Administration, General Aviation and Air Taxi Activity
and Avionics Survey (Washington, DC: 1990-1997 issues), table 1.1.j Ibid., table 1.4.k Ibid., table 3.3.l Ibid., table 5.1.m National Transportation Safety Board, RE-50, personal communication.n Ibid., Annual Review of Aircraft Accident Data, U.S. General Aviation, Calendar Year 1998
(Washington, DC: July 2000), charts 27, 39, 40, 41, 42 and 43.o Ibid., NTSB Press Release, SB99-06 (Washington, DC: 2000, and earlier issues).p Ibid., personal communication, Aug. 29, 2000.q 1998: U.S. Department of Transportation, Federal Aviation Administration, FAA
Aerospace Forecasts, Fiscal Years 2000-2011 (Washington, DC: March 2000), table 29.
a In 1960, 1970, 1980, classified as "Industrial."b Includes air tours done under 14 CFR 135: air taxi operators and commercial operators.c Includes sight seeing done under 14 CFR 91: general operating and flight rules.d Federal, state or local Government-owned or leased aircraft used for the purpose of fulfilling a government position.
e Includes air taxi operations. Nautical miles in source multiplied by 1.151 to convert from nautical miles.
f Sum of fatalities does not necessarily equal total. Differences are due to methodology used to count collisions involving aircraft in different categories.
g Suicide/sabotage cases are included in accidents and fatalities data but are excluded fromaccident rates.
NOTES: Numbers may not add to totals due to rounding. Total fatalities in this profilemay not match those in table 3-14, due to when the total fatalities data were received andthe data breakdown by type of flying. NTSB constantly updates and reclassifies accidentand fatality data.1995 data for active aircraft by use, and flight hours, have been revised to reflect changesin adjustment for nonresponse bias with 1996 telephone survey factors. 1996 vehicle-milesand fuel consumption data are estimated using new information on nonrespondents andare not comparable to earlier years.
KEY: N = data do not exist; R = revised
General Aviation ProfileCont’d

Financial 1960 1970 1980 1990 1995 1996 1997 R1998
Government receipts ($ millions)Total federal 2,771 6,160 9,949 14,576 19,851 R23,196 R21,648 24,509 Highway trust funda 2,531i 5,464i 7,615i 13,380i 18,835j R22,036j 20,500j 23,396j
Other 240 696 2,334 1,196 1,016 R1,160 R1,148 1,113State and local total
State and D.C. 6,055 11,737 19,666 40,026 50,064 R52,808 R58,087 58,806
Local 2,367 3,866 10,219 20,842 26,432 R26,767 R27,686 28,266
Total 11,193 21,763 39,834 75,444 96,347 R102,771 R107,421 111,581
Government expenditures ($ millions)Total federal 197 425 874 664 1,402 R1,598 R1,315 1,355
Highway trust fund a 27 83 315 358 1,092 R1,384 R1,103 1,156Other b 170 342 559 306 310 R214 212 199
State and local total
State and D.C. 7,125 14,100 25,936 45,609 56,981 59,709 61,534 65,507
Local 3,435 6,304 14,953 29,135 35,095 R36775 R39,104 41,093
Total 10,757 20,829 41,763 75,408 93,478 R98,082 R101,953 107,955
State highway user tax revenues ($ millions)c
Motor fuel tax 3,374k 6,433k 9,485k 19,658k 26,881k 27,555l 28,477l 29,803l
Other motor fuel receipts d 22 44 92 220 108 63 55 58Motor vehicle registration fees 1,514m 2,873m 5,173m 10,257m 11,942m 13,234n 13,631n 14,552n
Other motor vehicle fees e 235 577 1,490 3,353 4,416 4,689 4,704 5,068Motor carrier taxes f 110 176 323 695 770 726 729 861
Miscellaneous fees 68 181 615 1,761 3,307 3,489 3,785 4,165
Total 5,323 10,284 17,177 35,944 47,424 49,756 51,381 54,507
Appendix A
Modal P
rofiles !331
Highway Profile
KEY: N = data do not exist; R = revised;U = data are not available
Continued next page

332"
Appendix A
Modal P
rofiles Highway Profile
Cont’d
Continued next page
KEY: N = data do not exist; R = revised;U = data are not available
Inventory 1960 1970 1980 1990 1995 1996 1997 R 1998
Rural/urban mileage by ownershipRural mileage
Under state control 658,896o 707,002o 750,479p 702,486p
690,924p R691,156q 692,767q 660,834q
Under federal control g 111,912 187,696 246,130 178,188 170,568 R168,938 167,369 118,369Under local control 2,345,317 2,274,714 2,234,327 2,241,608 2,231,029 R2,232,793 2,248,357 2,285,447
County roads 1,742,404 1,732,981 1,542,984 1,616,634 1,626,927 R1,627,639 1,642,468 1,647,025Town and township roads 538,651 510,174 458,231 437,460 424,529 426,170 426,433 426,340
Other local roads 64,262 31,559 233,112 187,514 179,573 R178,984 179,456 212,082
Total rural mileage 3,116,125 3,169,412 3,230,936 3,122,282 3,092,520 R3,092,887 3,108,493 3,064,650Urban mileage
Under state control 50,158 74,103 97,287 95,778 111,766 R111,924 112,226 110,017Under federal control g N N 1,495 1,024 1,509 R1,470 1,464 1,485Under local control N N 530,119 647,842 706,431 R713,371 722,418 730,152
County roads N N 71,357 95,929 117,518 R117,181 117,487 117,016Town and township roads N N 37,583 42,752 60,561 60,926 74,402 75,195Other local roads 379,410 486,567 421,179 509,161 528,352 R535,264 530,529 537,941
Total urban mileage 429,568 560,670 628,901 744,644 819,706 R826,765 836,108 841,654Total rural and urban mileage 3,545,693 3,730,082 3,859,837 3,866,926 3,912,226 R3,919,652 3,944,601 3,906,304
Rural/urban mileage by functional system
Rural mileageInterstate N N 31,905r R33,547r 32,580r 32,820s 32,817s 32,803s
Other principal arterial N N 82,569 83,802 97,948 98,131 98,257 98,852
Minor arterial N N 149,057 144,774 137,151 137,359 R137,497 137,308Major collector N N 439,000 436,352 431,712 432,117 432,714 432,408Minor collector N N 299,613 293,922 274,081 273,198 272,362 272,140
Local N N 2,228,792 2,129,885 2,119,048 R2,119,262 R2,135,485 2,091,127
Total rural mileage 3,116,125t 3,169,412t 3,230,936 3,122,282 3,092,520 R3,092,887 R3,109,132 3,064,649

Appendix A
Modal P
rofiles !333
Highway ProfileCont’d
Continued next page
KEY: N = data do not exist; R = revised;U = data are not available
Inventory cont'd 1960 1970 1980 1990 1995 1996 1997 R1998
Urban mileage
Interstate N N 9,215 11,527 13,164 R13,217 R13,247 13,312Other freeways and expressways N N 6,774 7,668 8,970 R9,027 R9,063 9,127
Other principal arterial N N 44,155 51,968 52,796 R52,983 R53,223 53,132Minor arterial N N 66,377 74,659 88,510 R89,020 R89,195 89,496
Collector N N 68,387 78,254 87,331 R87,790 R88,049 88,071Local N N 433,993 520,568 568,935 R574,728 R583,973 588,504
Total urban mileage 429,568 560,670 628,901 744,644 819,706 R826,765 R836,740 841,642
Total rural and urban mileage 3,545,693 3,730,082 3,859,837 3,866,926 3,912,226 R3,919,652 R3,945,872 3,906,290
U.S. roads and streets by surfacePaved mileage
Rural 919,082 1,188,080 1,490,050t 1,550,283t 1,591,334t R1,582,166u 1,605,804u 1,612,251u
Urban 311,387 470,341 582,642 704,539 786,934 R798,484 804,131 808,093Total 1,230,469 1,658,421 2,072,692 2,254,822 2,378,268 R2,380,650 2,409,935 2,420,344
Percent paved 34.7% 44.5% 53.7% 58.3% 60.8% R60.5% R60.9% 61.3%Unpaved mileage
Rural 2,197,043t 1,981,332t 1,740,886t 1,571,999t 1,501,186t R1,518,310u 1,510,330u 1,490,488u
Urban 118,181 90,329 46,259 40,105 32,772 R35,227 38,019 38,061
Total 2,315,224 2,071,661 1,787,145 1,612,104 1,533,958 R1,553,537 1,548,349 1,528,549
Percent unpaved 65.3% 55.5% 46.3% 41.7% 39.2% R39.5% R39.1% 38.7%
Number of employeesState and local govt. streets and highways 532,000v 607,000v 559,000v 569,000v 560,000v U 548,000v U
Highway and street construction U U U 238,700w 227,900w 236,100w R242,800w 256,500w

Performance 1960 1970 1980 1990 1995 1996 1997 R 1998
Vehicle-miles of travel by functional system (millions)h
Rural
Interstate 10,514x
79,516x 135,084x 200,173x 223,382y 232,565y R240,255y 251,520y
Other principal arterial N N 132,958 175,133 215,567 221,403 R228,716 237,704Minor arterial N N 129,816 155,733 153,028 157,444 R163,342 165,780
Major collector N N 150,186 190,512 186,212 190,923 R201,790 203,580Minor collector N N 39,282 49,948 49,936 50,107 R52,574 54,278
Local N N 84,704 97,379 105,164 R107,752 R114,673 120,595
Total Rural 400,463 539,472 672,030 868,878 933,289 R960,194 R1,001,350 1,033,457
UrbanInterstate 13,365 81,532 161,242 278,901 341,515 351,579 R361,401 374,622
Other freeways and expressways N N 79,690 127,465 151,509 157,502 R159,622 166,626Other principal arterial N N 229,469 335,543 370,365 377,776 R385,125 388,073
Minor arterial N N 175,030 236,225 293,228 299,345 R301,912 309,295
Collector N N 83,043 106,297 126,883 129,310 R130,143 131,919Local N N 126,791 191,053 205,907 208,374 R222,142 228,530
Total urban 318,299 570,252 855,265 1,275,484 1,489,407 1,523,886 R1,560,345 1,598,065
Total rural and urban 718,762 1,109,724 1,527,295 2,144,362 2,422,696 R2,484,080 R2,561,695 2,631,522
Highway demand for petroleum(thousand barrels)Motor fuel 1,378,095z 2,198,310z 2,737,143z 3,113,214z 3,424,616AA R3,492,285AA R3,580,620AA 3,687,704AA
Asphalt and road oil 110,000BB
163,000BB 145,000BB 176,340CC 177,543CC R177,206CC 184,383CC 190,258CC
Total 1,488,095 2,361,310 2,882,143 3,289,554 3,602,159 R3,669,491 R3,765,003 3,877,962
Safety
Fatalities 36,399DD
52,627DD 51,091DD 44,599DD 41,817DD 42,065DD R42,013DD 41,501DD
Injured persons N N N 3,231,000 3,465,000 R3,483,000 3,348,000 3,192,000Crashes N N N 6,471,000 6,699,000 6,770,000 6,624,000 6,335,000
334"
Appendix A
Modal P
rofiles Highway Profile
Cont’d
Continued next page
KEY: N = data do not exist; R = revised;U = data are not available

Appendix A
Modal P
rofiles !335
j Ibid., Highway Statistics (Washington, DC: 1996, 1997, 1998), tables HF-10A and HF-10.k Ibid., Highway Statistics, Summary to 1995, FHWA-PL-97-009 (Washington, DC: July
1997), table MF-201A.l Ibid., Highway Statistics (Washington, DC: 1996, 1997, 1998), table MF-1.mIbid., Highway Statistics, Summary to 1995, FHWA-PL-97-009 (Washington, DC: July
1997), table MV-202.n Ibid., Highway Statistics (Washington, DC:1996, 1997, 1998) table MV-2.o Ibid., Highway Statistics, Summary to 1985, FHWA-PL-97-009 (Washington, DC: July
1997), table M-203.p Ibid., Table HM-210.q Ibid., Highway Statistics (Washington, DC: 1996, 1997, 1998), table HM-10.r Ibid., Table HM-220.s Ibid., Highway Statistics (Washington, DC: 1996, 1997, 1998), table HM-20.t Ibid., Highway Statistics, Summary to 1995, FHWA-PL-97-009 (Washington, DC: July
1997), table HM-212.u Ibid., Table HM-12.v U.S. Department of Commerce, Statistical Abstract of the United States, various years, State
and Local Government Section.w Ibid., Internet site http://stats.bls.gov/sahome.html, as of Aug. 16, 2000.x U.S. Department of Transportation, Federal Highway Administration, Highway Statistics,
Summary to 1985 (Washington, DC: April 1987), table VM-201.y Ibid., Highway Statistics (Washington, DC: Various years), table VM-2, VM-2A.z Ibid., Highway Statistics, Summary to 1995, FHWA-PL-97-009 (Washington, DC: July
1997), table VM-201A (total fuel consumed in thousands of gallons divided by 42).AA Ibid., Highway Statistics (Washington, DC: Annual issues), table VM-1(total fuel
consumed in thousands of gallons divided by 42).BB U.S. Department of Energy, Energy Information Administration, State Energy Data
Report, 1960-1980 (Washington, DC), p. 13.CC Ibid., Petroleum Supply Annual (Washington, DC: Annual issues), table 2.DDU.S. Department of Transportation, National Highway Traffic Safety Administration,
National Center for Statistics and Analysis, NRD-30, personal communication.
Highway ProfileCont’d
a The Federal Highway Trust Fund was created with the enactment of the Highway Revenue Act of 1956. The total receipts shown for 1995 are overstated by approximately$1.59 billion due to a fiscal year(FY) 1994 error by the Treasury Department in reconcilingestimated deposits to the actual tax revenue. The correction was made after the close ofFY1994 and is shown in FY1995 receipts.
b Figures obtained by addition/subtraction and may not appear directly in data source.c Revenues not necessarily allocated to highway expenditures.d Includes distributors and dealers licenses, inspection fees, fines and penalties, and
miscellaneous receipts.e Includes drivers licenses, title fees, special title taxes, fines and penalties, estimated
service charges, and local collections.f Includes carrier gross receipt taxes; mileage, ton–mile and passenger–mile taxes; special
license fees and franchise taxes; and certificate or permit fees.g Mileage in Federal parks, forests, and reservations that are not a part of the state and
local highway system.h Highway category classifications changed several times before 1980. Actual 1960 data
categories were: main Rural Roads, local Rural Roads and Urban Streets; 1970 data categories were: Rural Interstate, Rural Other Arterial, Other Rural, Urban Interstate andOther Urban.
NOTES: Motor vehicle injury and crash data in this profile come from the NationalHighway Traffic Safety Administration's General Estimates System (GES). The data fromGES, which began operation in 1988, are obtained from a nationally representative proba-bility sample selected from all police-reported crashes, and the GES sample includes onlycrashes where a police accident report was completed and the crash resulted in propertydamage, injury, or death. The resulting figures do not take into account crashes whichwere not reported to the police or which did not result in at least property damage.Earlier editions of NTS, particularly the 1993 Historical Compendium, used crash andinjury figures estimated by the National Safety Council, which employed a different set ofmethods to arrive at its figures. Thus, the injury and crash figures in this edition of NTSmay not be comparable with those found in earlier editions.In 1998, FHWA instituted a new method of creating mileage based tables derived fromthe Highway Peformance Monitoring System (HPMS). See Chapter 1 accuracy profilesfor more information about the HPMS.SOURCES: Unless otherwise noted, please refer to chapter tables for sources.i U.S. Department of Transportation, Federal Highway Administration, Highway Statistics,
Summary to 1995, FHWA-PL-97-009 (Washington, DC: July 1997), table HF-210.

Financial 1960 1970 1980 1990 1995 R1996 R1997 R1998Personal auto expenditures ($ millions)
New and used carsa g16,571 g26,754 g57,243 g,R119,000 g,R132,200 g,R133,300 g,R135,600 g143,100
Tires, tubes, accessories, and parts 2,487 6,087 17,926 R29,900 R36,900 R38,700 R39,600 41,700
Gasoline and oil 12,004 21,921 86,689 R107,300 R113,300 R124,200 R128,100 115,200
Tolls 310 652 1,104 R2,300 R3,400 R3,700 R4,000 4,200
Insurance premiums less claims paid 2,029 3,752 9,443 R18,100 R29,700 R31,800 R36,300 38,000
Repair, greasing, washing, parking, storage, rental, and leasing 5,519 12,329 34,022 R84,900 R122,200 R134,200 R146,300 153,100
Auto registration fees h867 h1,668 h2,893 h6,054 h7,043 i7,698 i8,163 l8,630
Driver's license fees 119 222 370 638 823 893 865 917Totala 39,906 R73,385 209,690 R368,192 R445,567 R474,491 R498,928 504,847
Taxi expenditures ($ millions) g609 g1,180 g1,866 g,R2,600 g3,200 g3,500 g,R3,700 g4,100
InventoryNumber of vehicle registrations
Passenger car and motorcycle j62,245,422 j92,067,655 j127,294,783 j137,959,958 k132,283,966 k,R133,599,940 k133,575,077 135,717,988
Other 2-axle 4-tire vehicle e 14,210,591 27,875,934 48,274,555 65,738,322 R69,133,913 70,224,082 71,330,205
Motorcycle 574,032 2,824,098 5,693,940 4,259,462 3,897,191 R3,871,599 3,826,373 3,879,450
Motor vehicle licensed drivers l87,252,563 l111,542,787 l145,295,036 l167,015,250 l176,628,482 l179,539,340 l182,709,204 184,980,177
Number of employeesTaxicabsm 120,700 106,400 52,500 32,400 30,700 30,500 30,600 31,200
Automotive dealers and service stations 1,267,200 1,617,400 1,688,500 2,063,100 2,189,600 2,266,700 R2,310,800 2,332,300
Motor vehicles, parts, and supplies N N 434,300 456,000 492,100 502,800 R513,000 516,600
Auto repair, services, and parking N N 570,900 913,700 1,020,100 1,080,000 R1,119,600 1,145,200
PerformanceVehicle-miles (millions)
Passenger car and motorcycle
Rural highway
Rural interstate N n62,342 n89,488 n117,519 k115,991 k,R120,323 k,R121,095 128,447
Rural other arterial n233,452 182,213 180,857 211,066 212,063 R217,559 R221,732 230,435
Other rural roads 80,171 179,533 180,314 219,325 199,878 R203,147 R212,400 220,376
All rural 313,623 361,746 361,171 430,391 527,932 R541,029 R555,227 579,258Urban highwayb
Urban interstate N 69,369 124,480 184,783 205,489 R211,817 R215,525 222,066
Other urban N 426,222 546,671 685,129 714,670 726,928 R741,885 758,536
All urban 273,389 495,591 671,151 869,912 920,159 R938,745 R957,410 980,602
Total rural and urban highway 587,012 857,337 1,032,322 1,300,303 1,448,091 R1,479,744 R1,512,637 1,559,860
336"
Appendix A
Modal P
rofiles Automobile Profile
KEY: N = data do not exist; R = revisedContinued next page

Performance cont'd 1960 1970 1980 1990 1995 R1996 R1997 R1998Vehicle-miles (millions) cont'd
Other 2-axle 4-tire vehicle
Rural highway
Rural interstate e 6,766 19,952 46,298 63,329 65,779 R69,030 72,345
Rural other arterial e 29,808 56,137 87,474 118,305 R122,212 R129,890 132,043
Other rural roads e 37,017 73,471 94,059 113,838 R119504 R128,396 130,420
All rural e 73,591 149,560 227,831 295,472 R307495 R327,316 334,806Urban highway c
Urban interstate e 6,252 23,067 71,500 109,807 112,908 R116,680 121,700
Other urban e 43,443 118,308 275,239 384,750 R396,137 R406,743 411,769
All urban e 49,695 141,375 346,739 494,557 R509,045 R523,423 533,469
Total rural and urban highway e 123,286 290,935 574,570 790,029 R816540 R850,739 868,275
Vehicle-miles (millions)
Passenger car and motorcycle j587,012 j919,679 j1,121,810 j1,417,823 1,448,091 R1,479,774 R1,512,637 1,559,860
Other 2-axle 4-tire vehicle e 123,286 290,935 574,571 790,029 R816,540 R850,739 868,275
Motorcycle f 2,979 10,214 9,574 9,797 R9,920 R10,081 10,283
Total 587,012 1,042,965 R1,412,745 1,992,394 R3,280,932 R2,296,314 R2,363,376 2,428,135
Passenger-milesc (millions)
Passenger car and motorcycle a1,145,000 a1,754,175 a2,024,246 2,293,815 R2,282,870 R2,348,774 R2,400,960 2,475,961
Other 2-axle 4-tire vehicle e 225,613 520,774 999,754 1,295,648 R1,339,126 R1,395,212 1,423,971
Motorcycle f 3,277 12,257 12,424 11,560 11,706 11,896 12,134
Total 1,145,000 1,979,787 2,545,020 3,293,569 R3,578,518 R3,687,900 R3,796,172 3,899,932
Average miles traveled per vehicle
Passenger car and motorcycle R9,431 9,989 8,813 10,277 10,947 R13,892 R14,216 14,404
Other 2-axle 4-tire vehicle e 8,676 10,437 11,902 12,018 R11,811 R12,115 12,173
Motorcycle f 1,055 1,794 2,244 2,514 R2,562 R2,635 2,651
Fuel consumed (million gallons)
Passenger car and motorcycle 41,171 67,879 70,186 69,759 68,268 R69,095 R70,094 71,904
Other 2-axle 4-tire vehicle e 12,313 23,796 35,611 45,605 R47,133 R49,387 50,462
Motorcycle f 60 204 191 196 198 202 205
Average fuel consumption per vehicle (gallons)
Passenger car and motorcycle 668 737 551 506 516 R585 591 597
Other 2-axle 4-tire vehicle e 866 854 738 694 R685 703 707
Motorcycle f 21 36 45 50 R51 53 53
Appendix A
Modal P
rofiles !337
Automobile ProfileCont’d
KEY: N = data do not exist; R = revisedContinued next page

Performance cont'd 1960 1970 1980 1990 1995 R1996 R1997 R1998Vehicle-miles (millions) cont'd
Average miles traveled per gallon of fuel consumed
Passenger car 14.3 13.5 16.0 20.3 21.2 R21.4 21.6 21.5
Other 2-axle 4-tire vehicle e 10.0 12.2 16.1 17.3 R17.2 17.2 17.1
Motorcycle f 50.0 50.0 50.0 50.0 50.0 50.0 50.0
SafetyNumber of occupants and nonoccupant fatalities
Passenger car N N o27,449 o24,092 o22,423 o22,505 o22,199 21,194
Motorcycle 790 2,280 5,144 3,244 2,227 2,161 2,116 2,294Bicycled 490 760 965 859 833 765 814 760Pedestriand 7,210 8,950 8,070 6,482 5,584 5,449 5,321 5,228
Occupant fatality rates
Per 100 million vehicle-miles
Passenger car 4.7 3.8 2.5 1.7 1.5 1.5 R1.5 1.4
Motorcycle N 76.5 50.4 33.9 22.7 21.8 R21.0 22.3
Per 10,000 registered vehicles
Passenger car 5.1 3.9 2.6 R1.8 R1.7 R1.7 R1.8 1.7
Motorcycle R13.8 8.1 9.0 7.6 5.7 5.6 5.5 5.9
Vehicle involvement rate (fatal crashes)
Per 100 million vehicle-miles
Passenger car N 5.6 3.5 2.4 2.1 2.0 2.0 1.9
Motorcycle N 22.9 50.9 34.3 23.1 21.9 21.4 22.7
Per 10,000 registered vehicles
Passenger car N 5.6 3.7 2.8 2.5 2.5 2.4 2.3
Motorcycle N 8.2 9.1 7.7 5.8 5.6 5.6 6.0
338"
Appendix A
Modal P
rofiles Automobile Profile
Cont’d
KEY: N = data do not exist; R = revisedContinued next page

Appendix A
Modal P
rofiles !339
i Ibid., Highway Statistics (Washington, DC: Annual issues), table MV-2.j Ibid., Highway Statistics, Summary to 1995, FHWA-97-009 Washigton, DC: July
1997), table VM–201A.k Ibid., Highway Statistics (Washington, DC: Annual issues), table VM-1.l Ibid., Highway Statistics (Washington, DC: Annual issues), table DL-22.mIbid., internet site http://stats.bls.gov/sahome.html, as of Aug. 17, 2000, codes
“414120 Taxicabs”, “605500 Automotive Dealers and Service Stations”, “525010 Motor Vehicle Parts, and Supplies” and “807500 Auto Repair, Services and Parking."
n U.S. Department of Transportation, Federal Highway Administration, Highway Statistics, Summary to 1995, FHWA-PL-97-009 (Washington, DC: July 1997), table VM-201.
o U.S. Department of Transportation, National Highway Traffic Safety Administration (NHTSA), Traffic Safety Facts 1998 (Washington, DC: October 1998), tables 3, 4, 7, and 10.
NOTES:a Figures obtained by addition/subtraction and may not appear directly in data source.b Urban consists of travel on all roads and streets in urban places of 5,000 or greater population.c In July 1997, the USDOT, Federal Highway Administration published revised passenger-
miles data for the highway modes for many years. The major change reflected the reassignment of some vehicles from the passenger car category to the other 2-axle 4-tire vehicle category.
d Involvement only with motor vehicle.e Included in single-unit 2-axle 6-tire or more truck category.f Included in passenger car and motorcycle.SOURCES: Unless otherwise noted, refer to chapter tables for sources.g U.S. Department of Commerce, Bureau of Economic Analysis, "Annual Only" NIPA
Table 2.4 available at http://www.bea.doc.gov/bea/dn1.htm as of Aug 17, 2000h U.S. Department of Transportation, Federal Highway Administration (FHWA), Highway
Statistics, Summary to 1995, FHWA-97-009 (Washington, DC: July 1997), table MV-202.
Automobile ProfileCont’d

340"
Appendix A
Modal P
rofiles Truck Profile
KEY: N = data do not exist; R = revised; U = data are not available
Continued next page
Financial 1960 1970 1980 1990 1995 R1996 1997 R1998Operating revenues, total ($ millions) N N N 127,314 161,806 172,743 183,153 197,490
Local trucking N N N 31,397 43,830 46,589 49,972 55,553 Trucking, except local N N N 74,465 91,675 97,586 103,847 109,351 Local trucking with storage N N N 4,115 5,154 5,502 5,860 6,144 Courier services, except by air N N N 17,337 21,147 23,066 23,474 26,442
Operating expenses, total ($ millions) N N N 118,968 151,628 162,825 170,998 179,908
Local trucking N N N 28,049 38,695 41,325 43,871 47,478 Trucking, except local N N N 70,965 88,061 94,390 98,570 101,584 Local trucking with storage N N N 3,885 4,817 5,121 5,439 5,638 Courier services, except by air N N N 16,069 20,055 21,989 23,118 25,207
Truck highway-user taxes ($ millions)
State 1,709 3,429 6,731 12,691 13,844 U 15,750 15,611 Federal 1,121 2,203 3,157 6,665 11,273 U 12,260 13,086
Totalb 2,830 5,632 9,888 19,356 R25,117 U 28,010 28,697
InventoryNumber of truck registrations
Single-unit truck N 3,681,405 4,373,784 4,486,981 5,023,670 R5,266,029 5,293,358 5,734,925Combination truck N 905,082 1,416,869 1,708,895 1,695,751 R1,746,586 1,789,968 1,997,345
Total 11,914,249 4,586,487 5,790,653 6,195,876 6,719,421 7,012,615 7,083,326 7,732,270Number of employees
Trucking and courier services, except air N 998,500 1,182,000 1,273,900 1,440,000 R1,482,000 R1,514,200 1,568,800Truck drivers and deliverymen 1,477,000 1,565,000 1,931,000 2,148,000 2,861,000 2,542,000 R2,602,000 2,601,000
Number of trucking and courier establishments N 64,756 69,796 90,709 112,887 116,861 121,111 U

Performance 1960 1970 1980 1990 1995 R1996 1997 R1998Vehicle-miles (millions)
Rural highwayRural interstate N 10,069
n25,111
n35,789
n43,351
i45,721
i R49,336 i49,896
Rural other arterial N 17,625 24,789 31,331 37,056 37,875 R39,193 39,724Other rural roads N 11,550 18,876 22,572 25,624 R25,884 R26,169 25,522All rural roads 84,508
n39,244 68,776 89,692 106,031 R109,480 R114,698 115,142
Urban highwayc
Urban interstate N 5,634 13,135 22,163 25,639 26,256 R28,549 30,193Other urban streets N 17,337 26,580 34,387 46,486 47,235 R48,230 51,045All urban streets 42,896 22,971 39,715 56,550 72,125 73,491 R76,779 81,238
Total rural and urban highway 127,405 62,215 108,491 146,242 178,156 R182,971 R191,477 196,380
Passenger-milese (millions)
Single-unit truckd 98,551 27,081 39,813 51,901 62,705 R64,072 R66,893 68,021Combination truck 28,854 35,134 68,678 94,341 115,451 R118,899 R124,584 128,359All trucks 127,405 62,215 108,491 146,242 178,156 R182,971 R191,477 195,380
Ton-miles, intercity (millions) 285,000o
412,000o
555,000o
735,000o
921,000o
972,000o R996,000 o
1,027,000
Fuel consumed (million gallons)
Single-unit truck N 3,968h
6,923h
8,357h
9,216i R9,409 i R9,576 i
6,817i
Combination truck N 7,348 13,037 16,133 19,777 R20,192 R20,302 25,158All trucks 15,882
h11,316 19,960 24,490 28,993 R29,601 R29,878 31,975
Average fuel consumption per vehicle (gallons)
Single-unit truck N 1,078
1,583
1,862
1,835 R1,787 R1,809 1,189
Combination truck N 8,119 9,201 9,441 11,663 R11,561 R11,342 12,596
All trucks 1,333
2,467 3,447 3,953 4,315 R4,221 R4,218 4,135
Average miles traveled per gallon of fuel consumed
Single-unit truck N 6.8 5.8 6.2 6.8 6.8 7.0 10.0Combination truck N 4.8 5.3 5.8 5.8 5.9 6.1 5.1All trucks 8.0 5.5 5.4 6.0 R6.1 6.2 6.4 6.1
Appendix A
Modal P
rofiles !341
Truck ProfileCont’d
KEY: N = data do not exist; R = revised; U = data are not available
Continued next page

Performance cont'd 1960 1970 1980 1990 1995 R1996 1997 R1998Average miles traveled per vehicle
Single-unit truck N 7,356 9,103 11,567 12,482 R12,167 R12,637 11,861Combination truck N 38,819 48,472 55,206 68,083 R68,075 R69,601 64,265All trucks 10,693
13,565 18,736 23,603 26,514 R26,092 R27,032 25,397
Average length of haul (domestic freight) (miles) 272
p263
p363
p391
p416
p R426 p435 444
Safety
Occupant fatalitiesLight truck N N 7,486
q8,601
q9,568
q9,932
q R10,249 q10,705
Large truck N N 1,262 705 648 621 R723 742All trucks N N 8,748 9,306 10,216 10,553 R10,972 11,447
Occupant fatality ratePer 100 million vehicle-miles
Light truck N N 2.5 1.5 1.3 1.3 1.2 1.2Large truck N N 1.2 0.5 0.4 0.3 0.4 0.4All trucks N N 2.2 1.3 1.1 1.1 1.1 1.1
Per 10,000 registered vehiclesLight truck N N 2.5 1.7 1.5 1.5 1.5 1.5
Large truck N N 2.2 1.1 1.0 0.9 1.0 1.0
All trucks N N 2.4 1.7 1.5 1.5 1.5 1.5
Vehicle involvement rate (fatal crashes)
Per 100 million vehicle-milesLight truck N N 4.3 2.8 2.3 2.3 R2.3 2.2
Large truck N N 5.0 3.3 2.5 2.6 R2.6 2.5
All trucks N N 4.5 2.9 2.4 2.4 2.3 2.3Per 10,000 registered vehicles
Light truck N N 4.2 3.1 2.8 2.8 2.8 2.8
Large truck N N 9.3 7.7 6.7 6.8 6.9 6.4
All trucks N N 5.0 3.6 3.2 3.2 3.3 3.1
342"
Appendix A
Modal P
rofiles Truck Profile
Cont’d
KEY: N = data do not exist; R = revised; U = data are not available
Continued next page

Appendix A
Modal P
rofiles !343
a Local trucking (SIC 4212) - Establishments primarily engaged in furnishing trucking or transfer services without storage for freight generally weighing more than 100 pounds.Trucking, except Local (SIC 4213) - Establishments primarily engaged in furnishing "over-the-road" trucking services or trucking services and storage services, including household goods either as common carriers or under special or individual contracts or agreements, for freight generally weighing more than 100 pounds.Local trucking, without Storage (SIC 4214) - Establishments primarily engaged in furnishing both trucking and storage services, including household goods.Courier Services, except by Air (SIC 4215) - Establishments primarily engaged in the delivery of individually addressed letters, parcels, and packages (generally under 100 pounds).
bNumbers may not equal totals due to rounding.c Urban consists of travel on all roads and streets in urban places of 5,000 or greater population.dIncludes other 2-axle 4-tire vehicle in 1960.e Highway passenger-miles are calculated by multiplying vehicle miles of travel as cited by the Federal Highway Administration (FHWA) by the average number of occupants for each vehicle type as estimated by the FHWA using the Nationwide Personal Transportation Survey.
NOTE: In 1995, FHWA revised its vehicle type categories. These new categoriesinclude passenger car, other 2-axle 4-tire vehicle, single-unit 2-axle 6-tire or more truck,and combination truck. Other 2-axle 4-tire vehicles include vans, pickup trucks, andsport/utility vehicles. In previous years, some minivans and sport/utility vehicles wereincluded in the passenger car category. Single-unit 2-axle 6-tire or more trucks are on asingle frame with at least 2 axles and 6 tires.SOURCES: Unless otherwise noted, refer to chapter tables for sources.
f U.S. Census Bureau, Transportation Annual Survey (Washington, DC : December 1998), table 1.
g American Trucking Association, American Trucking Trends (Washington, DC:Annual issues).
h U.S. Department of Transportation, Federal Highway Administration, Highway Statistics Summary to 1995, FHWA-PL-97-009 (Washington, DC: July 1997), table VM-201A.
i Ibid., Highway Statistics (Washington, DC: Annual issues), table VM-1.j U.S. Department of Labor, Bureau of Labor Statistics, Employment, Hours and
Earnings, United States, 1909-1994 (Washington, DC: September 1994), SIC 421.k Ibid., Internet site www.bls.gov, as of Apr. 19, 1999.l Eno Transportation Foundation, Inc., Transportation in America, 1998 (Washington,
DC: 1998), p. 61.mU.S. Bureau of the Census, County Business Patterns (Washington, DC: Annual
issues), table 1b (SIC 421).n U.S. Department of Transportation, Federal Highway Administration, Highway
Statistics Summary to 1995, FHWA-PL-97-009 (Washington, DC: July 1997), table VM-201.o Eno Transportation Foundation, Inc., Transportation in America, 1998 (Washington,
DC: 1998), p. 44.p Ibid., p. 71.q U.S. Department of Transportation, National Highway Traffic Safety Administration,
Traffic Safety Facts 1999, DOT HS 808 983 (Washington, DC: October 1999), tables 3, 8, and 9.
Truck ProfileCont’d

Financial 1960 1970 1980 1990 1995 1997 R1998Expenditures ($ thousands)
School bus 486,000b
1,219,000b R3,833,000 b R8,031,000 b R9,889,000 b R10,396,000 b R10,353,000 b
10,326,000b
Operating revenues ($ thousands)
Intercity bus, class I 463,100c
721,700c
1,397,378c
943,268c
917,298d
911,504d
999,918d
Ud
Operating expenses ($ thousands)
Intercity bus, class I 405,400 639,000 1,318,372 1,026,213 899,176
878,185 947,556 U
Inventory
Number of operating companies
Intercity bus, class I 143 71 61 31 28d
27d
U Ud
Number of vehicles
All buses 272,129e
377,562e
528,789e
626,987e
685,503e
694,781e
697,548e
715,540e
Number of employees
Intercity and rural bus 40,500f
43,400f
37,900f
26,100f
23,800g
23,800g R22,200 g
24,400g
School bus N N 79,900 111,200 131,100 132,200 R136,500 141,000
Performance
Vehicle-miles (millions)
All buses
Rural highway
Interstate rural N 339h
533h
567h
711h
742i
794i
834i
Other arterial rural N 944 991 995 1,134 1,201 R1,243 1,282
Other rural N 1,266 1,511 1,882 1,972 2,015 R2,072 2,135
All rural 2,332h
2,549 3,035 3,444 3,817 3,958 R4,109 4,251
Urban highwaya
Interstate urban N 277 560 455 580 598 647 663
Other urban N 1,718 2,464 1,828 1,986 2,007 2,086 2,093
All urban 2,014 1,995 3,024 2,283 2,566 2,605 2,733 2,756
Total rural and urban highway 4,346
4,544 6,059 5,726 6,383 6,563 6,842 7,007
1996
344"
Appendix A
Modal P
rofiles Bus Profile
KEY: N = data do not exist; R = revised; U = data are not available
Continued next page

Appendix A
Modal P
rofiles !345
Bus ProfileCont’d
KEY: N = data do not exist; R = revised; U = data are not available
Continued next page
Performance cont'd 1960 1970 1980 1990 1995 1997 R1998
Passenger-miles (millions)
All buses N
N
N
121,398 136,104 138,613 R145,060 148,558
Number of revenue passengers (thousands)
Intercity bus, total 366,000b
401,000b
370,000b
334,000b
366,500b
347,900b
350,600b
357,600b
Average miles traveled per vehicle
All buses 15,970I
12,035I
11,458I
9,133I
9,365i
9,446i R9,809 i
9,793i
Fuel consumed (million gallons)
All buses 827 820 1,018 895 968 990 R1,027 1,040
Average fuel consumption per vehicle (gallons)
All buses 3,039 2,172 1,925 1,427 1,412 R1425 R1,472 1,454
Average miles traveled per gallon of fuel consumed
All buses 5.3 5.5 6.0 6.4 6.6 R6.6 R6.7 6.7
Average revenue per passenger-mile (cents) (intercity) 2.71
b3.60
b7.26
b11.55
b12.19
b12.30
b R12.45 b12.48
b
Safety
Number of fatalities
School bus-related N N 150k
115k 123k
136k
131k
128k
School bus
Occupants N N 9 11 13 10 8 6
Other vehicle
Occupants N N 88 64 72 101 99 91
Nonoccupants N N 53 40 38 25 24 31
Occupant fatalities
All buses N N 46 32 R33 R21 18 38
School buses N N 14 13 R12 R10 8 6
Cross country buses N N 23 2 6 3 R5 13
Transit buses N N 6 3 R1 5 3 2
Other and unknown N N 3 14 14 3 R2 17
1996

Safety cont'd 1960 1970 1980 1990 1995 1997 R1998Fatalities in vehicular accidents
All buses N N 390 340 340 297 343 334
Occupant fatality rate
Per 100 million vehicle-miles
All buses N N 0.8 0.6 0.5 0.3 R0.3 0.5
Per 10,000 registered vehicles
All buses N N 0.9 0.5 0.5 R0.3 R0.3 0.5
Vehicle involvement rate
Per 100 million vehicle-miles
All buses N N 6.4 5.9 5.3 4.5 4.4 4.2
Per 10,000 registered vehicles
All buses N N 7.4 5.4 5.0 4.3 4.3 4.1
1996
346"
Appendix A
Modal P
rofiles
f U.S. Department of Labor, Bureau of LaborStatistics, Employment, Hours and Earnings, United States, 1909-1994 (Washington, DC: September 1994), SIC codes 413, 415.
g Ibid., Internet site www.bls.gov, as of August 18, 2000.h U.S. Department of Transportation, Federal Highway Administration, Highway
Statistics, Summary to 1985 (Washington, DC: July 1997), table VM-201.i Ibid., Highway Statistics (Washington, DC: Annual issues), table VM-1.j Ibid., Highway Statistics, Summary to 1995, FHWA-PL-97-009 (Washington, DC: July 1997), table VM-201A.
k Ibid., National Highway Traffic Safety Administration, Traffic Safety Facts 1998, DOT HS 808 983 (Washington, DC: October 1999), Tables 74, 93.
Bus ProfileCont’d
NOTE: See transit profile for transit bus data.a Urban consists of travel on all roads and streets in urban places of 5,000 or greater population.SOURCES: Unless otherwise noted, refer to chapter tables for sources.b Eno Transportation Foundation, Inc., Transportation In America, 1999 (Washington, DC:
2000), p. 42, 48, 50.c Interstate Commerce Commission, Annual Report of the ICC (Washington, DC: Annual
issues), Appendix F, tables 1, 6.d U.S. Department of Transportation, Bureau of Transportation Statistics, Selected Earnings
Data, Class I Motor Carriers of Passengers (Washington, DC: Annual issues).e U.S. Department of Transportation, Federal Highway Administration, Highway Statistics
(Washington, DC: Annual issues), table MV-10.
KEY: N = data do not exist; R = revised; U = data are not available

Financial 1960 1970 1980 1990 1995 1996 1997 1998P
Passenger operating revenues ($ millions)
Passenger fares 1,335I
1,639I
2,556I R5,891 I
6,801I
7,416I R7,546 I
7,717I
Motor bus N N N 2,967 3,287 3,515 R3,558 3,703
Heavy rail N N N 1,741 2,018 2,322 2,351 2,297
Light rail N N N 83 127 144 139 150
Trolley bus N N N 46 54 55 57 55
Demand responsive N N N 41 146 157 R170 153
Ferry boata N N N 56 60 54 R51 69
Commuter rail N N N 952 1,078 1,146 1,178 1,255
Otherb N N N 26 46 24 R42 35
Other operating revenue 72x
68x
248x
895x
2,812x R2,928 x R3,308 x
2,875x
Total operating revenues 1,407 1,707 2,805 6,786 9,613 R10,345 R10,854 10,592
Operating assistancec
State and local N N 2,611 8,297 7,811 8,210 R8,014 7,579
Federal N N 1,093 970 817 R596 R647 727
Total operating assistance N N 3,705 9,267 8,628 8,807 R8,661 8,305
Total revenues 1,407 1,707 6,510 16,053 18,241 19,151 R19,515 18,897
Operating expenses ($ millions)
Motor bus N N N 8,903j
10,321j
10,575j R10,944 j
11,048j
Heavy rail N N N 3,825 3,523 3,402 3,474 3,530
Light rail N N N 237 376 442 R473 503
Trolley bus N N N 109 139 135 140 147
Demand responsive N N N 518 1,000 1,187 R1,285 1,273
Ferry boata N N N 171 210 183 R221 267
Commuter rail N N N 1,939 2,211 2,294 R2,278 2,365
Otherb N N N 41 67 124 R122 117
Total operating expensesd N N 6,247 15,742 17,849 18,341 R18,936 19,249
Appendix A
Modal P
rofiles !347
Transit Profile
KEY: ~ = included in heavy rail figure; + = included in motor bus figure; N = data do not exist; NA = not applicable; P = preliminary; R = revised
Continued next page

Financial cont'd 1960 1970 1980 1990 1995 1996 1997 1998P
Depreciation and amortization N N 278k
1,593k
2,601k
2,885k R3,106 k
3,349k
Other reconciling items N N 186 644 1,091 1,034 R1,117 1,116
Total expenses 1,377 1,996 6,711 17,979 21,540 22,260 R23,159 23,715
Average passenger revenue per passenger-mile ($)
Motor bus N N N 0.14il
0.17il
0.18il
0.18il
0.18il
Heavy rail N N N 0.15 0.19 0.20 0.20 0.19
Light rail N N N 0.15 0.15 0.15 0.13 0.13
Trolley bus N N N 0.24 0.29 0.30 0.30 0.30
Demand responsive N N N 0.10 0.29 0.24 R0.23 0.15
Ferry boata N N N 0.20 0.23 0.21 R0.17 0.20
Commuter rail N N N 0.14 0.13 0.14 0.15 0.14
Otherb N N N 0.21 0.17 0.07 R0.11 0.09
All modes N N N 0.14 R0.17 0.18 0.18 0.17
Average passenger fare ($)
Motor bus N N N 0.52m
0.66m
0.70m
0.70m
0.69m
Heavy rail N N N 0.74 0.99 1.08 0.97 0.96
Light rail N N N 0.47 0.50 0.55 0.53 0.55
Trolley bus N N N 0.36 0.45 0.47 0.47 0.47
Demand responsive N N N 0.60 2.26 2.21 1.83 1.60
Ferry boata N N N 1.11 1.31 1.12 R0.99 1.32
Commuter rail N N N 2.90 3.13 3.24 3.30 3.28
Otherb N N N 0.90 1.57 1.33 0.66 0.62
All modes 0 0 0 0.67 0.87 0.93 0.89 0.87
348"
Appendix A
Modal P
rofiles Transit Profile
Cont’d
KEY: ~ = included in heavy rail figure; + = included in motor bus figure; N = data do not exist; NA = not applicable; P = preliminary; R = revised
Continued next page

Inventory 1960 1970 1980 1990 1995 1996 1997 1998P
Number of systems
Motor bus 1,236n
1,075n
1,022n
2,685n
2,250n
2,250n
2,250n
2,262n
Heavy rail 31 15 11 12 14 14 14 14
Light rail ~ ~ 9 17 22 22 22 23
Trolley bus 19 6 5 5 5 5 5 5
Demand responsive N N N 3,193 5,214 5,214 5,214 5,254
Ferry boata N N 16 27 25 25 25 28
Commuter rail N N 18 14 16 16 18 18
Otherb N N 5 35 69 69 70 72
Totale 1,286 1,096 1,055 5,078 5,973 5,973 5,975 6,000
Number of vehicles
Motor bus 49,600o
49,700o
59,411o
58,714o
67,107o
71,678o R72,770 o
74,641o
Heavy rail 9,010 9,286 9,641 10,419 10,157 10,201 10,242 10,301
Light rail 2,856 1,262 1,013 913 999 1,140 1,229 1,205
Trolley bus 3,826 1,050 823 832 885 871 859 880
Demand responsive N N N 16,471 29,352 30,804 R32,509 32,899
Ferry boata
N N N 108 110 109 R134 124
Commuter rail N N 4,500 4,415 4,565 4,665 4,943 4,907
Otherb N N N 1,089 2,699 2,894 R3,674 4,013
Total 65,292 61,298 75,388 92,961 115,874 122,362 R126,360 128,970
Number of employeesf
Motor bus 121,300p
101,598p
N 162,189p
181,973p
190,152p R196,861 193,542
Heavy rail 35,100 36,442 N 46,102 R45,644 45,793 45,935 45,155
Light rail + + N 4,066 4,935 5,728 R5,940 6,048
Trolley bus + + N 1,925 1,871 2,084 2,037 2,047
Demand responsive N N N 22,740 39,882 44,667 R44,029 47,509
Ferry boata N N N 2,813 2,697 2,830 R3,166 3,433
Commuter rail N N N 21,443 22,320 22,604 R21,651 22,399
Otherb N N N 898 1,169 1,086 R1,140 1,246
Total 156,400 138,040 189,300 262,176 300,491 314,944 R320,759 321,379
Appendix A
Modal P
rofiles !349
Transit ProfileCont’d
KEY: ~ = included in heavy rail figure; + = included in motor bus figure; N = data do not exist; NA = not applicable; P = preliminary; R = revised
Continued next page

Performance 1960 1970 1980 1990 1995 1996 1997 1998P
Vehicle-miles (millions)
Motor bus 1,576q
1,409q
1,677q
2,130q
2,184q
2,221q R2,245 q
2,291q
Heavy rail 391 407 385 537 537 543 558 566
Light rail 75 34 18 24 35 38 41 43
Trolley bus 101 33 13 14 14 14 14 14
Demand responsive N N N 306 507 548 R585 698
Ferry boata N N 2 2 3 3 R3 2
Commuter rail N N 179 213 238 242 251 265
Otherb N N 13 16 33 43 R50 53
Total 2,143 1,883 2,287 3,242 3,550 3,650 R3,746 3,932
Unlinked passenger trips (millions)
N 5,034r
5,837r
5,677r
4,848r
4,887r R5,013 r
5,387r
N 1,881 2,108 2,346 2,033 2,157 2,430 2,393
N 124 133 175 251 261 R262 275
N 182 142 126 119 117 121 117
N N – 68 88 93 R99 95
N N 63 50 47 48 R51 52
N N 280 328 344 352 357 382
N N 4 29 33 33 R41 45
N 7,332 8,567 8,799 7,763 7,948 R8,374 8,746
Passenger-miles (millions)
N N 21,790y
20,981y
18,818y
19,096y R19,604 y
20,602y
N N 10,558 11,475 10,559 11,530 12,056 12,284
N N 381 571 860 957 R1,035 1,118
N N 219 193 187 184 189 182
N N N 431 607 656R
754 1,012
N N c 286 260 256 R294 345
N N 6,516 7,082 8,244 8,351 8,038 8,716
N N 390 124 273 348 R369 397
N N 39,854 41,143 39,808 41,378 R42,339 44,656
Motor bus
Heavy rail
Light rail
Trolley bus
Demand responsive
Ferry boata
Commuter rail
Otherb
Total
Motor bus
Heavy rail
Light rail
Trolley bus
Demand responsive
Ferry boata
Commuter rail
Otherb
Total
350"
Appendix A
Modal P
rofiles Transit Profile
Cont’d
KEY: ~ = included in heavy rail figure; + = included in motor bus figure; N = data do not exist; NA = not applicable; P = preliminary; R = revised
Continued next page

Performance cont'd 1960 1970 1980 1990 1995 1996 1997 1998P
Average trip length (miles)Motor bus N N N N 4
s4
s4
s4
s
Heavy rail N N N N 5 5 5 5
Light rail N N N N 3 4 4 4
Trolley bus N N N N 2 2 2 2
Demand responsive N N N N 8 9 10 11
Ferry boata N N N N 6 5 R6 6
Commuter rail N N N N 24 24 23 23
Vanpool N N N N 35 34 33 36
Otherb N N N N 1 1 1 1
All modes N N N N 5 5 5 5
Average speed (miles per hour)
Motor bus N N N N 13t
13t
13t
13t
Heavy rail N N N N 21 21 21 21Light rail N N N N 14 14 16 16
Trolley bus N N N N 8 8 8 8
Demand responsive N N N N 15 15 15 17
Ferry boata N N N N 6 7 R7 8
Commuter rail N N N N 34 33 34 32
Vanpool N N N N 35 37 36 37
Otherb N N N N 6 7 7 7
All modes N N N N 15 15 15 15
Energy consumption, diesel (million gallons)
Motor bus N N N 563u
564u
578u R598 554
Heavy rail NA NA NA NA NA NA NA NA
Light rail NA NA NA NA NA NA NA NA
Trolley bus NA NA NA NA NA NA NA NA
Demand responsive N N N 15 29 31 R32 44
Ferry boata N N N 20 22 22 24 24
Commuter rail N N N 53 63 62 R63 78
Otherb N N N R<1 < 1 < 1 < 1 <1
Total 208u
271u
431u
651 678 693 R717 700
Appendix A
Modal P
rofiles !351
Transit ProfileCont’d
KEY: ~ = included in heavy rail figure; + = included in motor bus figure; N = data do not exist; NA = not applicable; P = preliminary; R = revised
Continued next page

Performance cont'd 1960 1970 1980 1990 1995 1996 1997 1998P
Gasoline and other nondiesel fuelsg 192v
68v
11v
33v
61v
61v R59 v
50v
Compressed natural gas U U U U 11 15 R24 31
Total 192 69 11 34 71 76 R83 81
Energy consumption (million kWh)
Motor bus NA NA NA NA NA NA NA NA
Heavy rail N N N 3,284w
3,401w
3,332w
3,253w
3,280w
Light rail N N N 239 288 321 R361 383
Trolley bus N N N 69 100 69 78 74
Demand responsive NA NA NA NA NA NA NA NA
Ferry boata NA NA NA NA NA NA NA NA
Commuter rail N N N 1,226 1,253 1,255 R1,270 1,480
Otherb N N N 19 26 30 R26 33
Total 2,908w
2,561w
2,446w
4,837 5,068 5,007 R4,988 5,250
Safetyh
Fatalities, all modes N N N 339 274 264 275 286
Injured persons, all modes N N N 54,556 57,196 55,288 56,132 55,990
Incidents, all modes N N N 90,163 62,471 59,392 R61,561 60,094
352"
Appendix A
Modal P
rofiles
l Ibid., 2000 edition table 18, and similar tables in earlier years.m Ibid., 2000 edition table 20, and similar tables in earlier years.n Ibid., 2000 edition table 1, and similar tables in earlier years.o Ibid., 2000 edition table 46, and similar tables in earlier years.p Ibid., 2000 edition table 62, and similar tables in earlier years.q Ibid., 2000 edition table 42, and similar tables in earlier years.r Ibid., 2000 edition table 26, and similar tables in earlier years.s Ibid., 2000 edition table 39, and similar tables in earlier years.t Ibid., 2000 edition table 44, and similar tables in earlier years.u Ibid., 2000 edition table 65, and similar tables in earlier years.v Ibid., 2000 edition table 66, and similar tables in earlier years.w Ibid., 2000 edition table 67, and similar tables in earlier years.x Ibid., 2000 edition table 17, and similar tables in earlier years.y Ibid., 2000 edition table 30, and similar tables in earlier years.
a Excludes international, rural, rural interstate, island and urban park ferries.Includes cable car, inclined plane, aerial tramway, monorail, vanpool, and automated guideway.
c Beginning in 1992, local operating assistance and other revenue declined by about $500 million due to change in accounting procedures at the New York City Transit Authority.Beginning in 1992, total operating expense declined by about $400 million due to a change in accounting procedures at the New York City Transit Authority.
d Included in other.e The total figure represents the number of transit agencies. It is not the sum of all modes since many agencies operate more than one mode.
f Based on employee equivalents of 2,080 hours equals one employee; beginning in 1993,based on number of actual employees.
g Liquefied natural gas, liquefied petroleum gas, methanol, propane, and other nondeisel fuels, except compressed natural gas.
SOURCES: Unless otherwise noted, refer to chapter tables for sources.hU.S. Department of Transportation, Federal Transit Administration.Safety Management Information Statistics (SAMIS), (Washington, DC: Annual reports).
i American Public Transportation Association, Transportation Fact Book (Washington, DC:2000), tables 21, 22, D2 and similar tables for prior years.
j Ibid., 2000 edition table 25, and similar tables in earlier yearsIbid., 2000 edition table 24, and similar tables in earlier years.
Transit ProfileCont’d
KEY: ~ = included in heavy rail figure; + = included in motor bus figure; N = data do not exist; NA = not applicable; P = preliminary; R = revised

Financial 1960 1970 a 1980 1990 1995 1996 1997 1998Class Ib
Operating revenues ($ millions)
Passenger 640f
421f
446f
94f
89f
59f
60f
61f
Freight 8,025 10,922 26,350 27,471 31,356 31,889 32,322 32,247
Other 849 649 1,462 805 835 745 736 843
Total 9,514 11,992 28,258 28,370 R32,279 32,693 33,118 33,151
Operating expenses ($ millions)c 8,775 11,478 26,355 24,652 27,897 26, 331 27,291 27,916
Amtrak
Total revenue ($ millions) N 162 429 1,308h
1,497h
1,555h
1,674h
2,285h
Total expenses ($ millions) N 301 1,103 2,012 2,305 2,318 2,436 2,638
InventoryClass Ib
Number of vehicles
Class I freight cars 1,658,292 1,423,921f
1,168,114f
658,902f
583,486f
570,865f
568,493f
575,604f
Other nonclass I freight cars 307,194 360,260 542,713 553,359 635,441 669,708 701,926 740,063
Freight cars, total 1,965,486 1,784,181 1,710,827 1,212,261 1,218,927 1,240,573 1,270,419 1,315,667
Locomotives 29,031 27,077 28,094 18,835 18,812 19,269 19,684 20,261
Number of companies 106 71 38 14 11 10 9 9
Number of employees 780,494 566,282 458,994 216,424 188,215 181,809 177,981 178,222
Miles of road owned 207,334 196,479 164,822 119,758 108,264 105,779 102,128 100,570
Amtrak
Number of vehicles
Passenger
Train-cars N 1,569g
2,128g
1,863h
1,722h
1,730h
1,728h
1,962h
Locomotives N 185 419 318 313 299 332 345
Number of employees N 1,500j
21,416j
24,000j
23,646 23,278g
23,555g
24,528f
System route mileage N N 24,000k
24,000k
24,000 25,000h
25,000h
22,000h
Appendix A
Modal P
rofiles !353
Rail Profile
KEY: N = data do not exist; R = revised;U = data are not available
Continued next page

Performance 1960 1970 a 1980 1990 1995 1996 1997 1998Class Ib
Car mileage, freight (thousands) 28,170,000f
29,890,000f
29,277,000f
26,159,000f
30,383,000f
31,715,000f
31,660,000f
32,657,000f
Train mileage, freight (thousands) 404,464 427,065 428,498 379,582 458,271 468,792 474,954 474,947
Locomotive mileage (thousands)
Freight 421,900l
1,278,200l
1,319,010l
1,144,559l
1,293,851l
1,311,351l
1,281,768l
1,285,706l
Train and yard switching N N 212,040 135,806 150,840 153,798 141,461 153,997
Total N N 1,531,050 1,280,365 1,444,691 1,465,149 1,423,229 1,439,703
Revenue ton-miles of freight (millions) 572,309f
764,809f
918,958f
1,033,969f
1,305,688f
1,355,975f
1,348,926f
1,376,802f
Average length of haul, freight (miles) 461 515 616 726 843 842 851 835
Fuel consumed in freight service (million gallons) 3,463 3,545 3,904 3,115 3,480 3,579 3,575 3,583
Average miles traveled per vehicle
Locomotive N N 54,497 67,978 76,796 76,037 72,304 71,058
Car 14,332 16,753 17,113 21,579 24,926 25,565 24,921 24,822
Average miles traveled per gallon
Train 0.12 0.12 0.11 0.12 0.13 0.13 0.13 0.13
Car 8.13 8.43 7.50 8.40 8.73 8.86 8.86 9.11
Amtrak
Passenger train car-miles (millions) N 213m
235m
301m
292p
276p
288p
312p
Passenger train-miles (millions) N 26 30 33 32 30 32 33
Passenger locomotive-miles (millions) N N 41 49 48 U U U
Revenue passengers carried (millions) N 17 21 22 21 20 20 21
Revenue passenger-miles (millions) N 3,039 4,503 6,057h
5,545h
5,050h
5,166h
5,304h
Average passenger fare (dollars) N 8.3n
17.7 38.5 39.0 42.5 44.3 44.0
Average passenger revenue/passenger-mile (cents) N 4.5 8.2 14.1 14.6 16.6 17.3 17.5
Average passenger trip length (miles) N 182.6 217.0 273.0 267.6 256.9 255.8 251.5
Locomotive fuel consumed
Diesel (million gallons) N N 64 82 66q
71q
75q
75q
Electric kWh (millions) N N 254 330 304 293 282 275
354"
Appendix A
Modal P
rofiles Rail Profile
Cont’d
KEY: N = data do not exist; R = revised;U = data are not available
Continued next page

Safetyd,o 1960 1970 a 1980 1990 1995 1996 1997 1998Number of fatalities, railroads
and grade crossings
Passenger on trains 34 10 4 3 0 12 6 4
Employees on duty 215 179 97 40 34 33 37 27
Employees not on duty N N 4 0 2 0 0 2
Trespassers 637 607 566 700 660 620 646 644
Non-trespassers 1,459 1,535 R746 R554 443 365 363 326
Contractor employees N N 7 3 7 9 11 5
Railroad and grade crossing, total 2,345 2,225 1,417 1,297 1,146 1,039 1,063 1,008
Grade crossing only 1,421 1,440 R772 698 579 488 461 431
Railroad onlye 924 785 R645 599 567 551 602 577
Appendix A
Modal P
rofiles !355
j Ibid., Public Affairs, personal communication.
k Ibid., Route Miles by Railroad, Corp. Planning & Development.l Association of American Railroads (AAR), Analysis of Class 1 Railroads, annual issues.mAmtrak, Train Information System Reports.n Ibid., Train Earnings Reports.o1960-80: U.S. Department of Transportation, Federal Railroad Administration,Systems Support Division, RRS-22, personal communication.1990-96: Ibid., Accident/Incident Bulletin, annual issues, tables 7 and 9.1997-98: Ibid., Railroad Safety Statistics, Annual Report 1998, table 1-3.
pAmtrak Corporate Reporting, Route Profitability System, Washington D.C., personal communication, June 1999.
q Amtrak General Accounting, Pennsylvania, personal communication, June 1999.
Rail ProfileCont’d
KEY: N = data do not exist; R = revised;U = data are not available
a Amtrak data in this column are for 1972, Amtrak's first full year of operation.b Excluding Amtrak and all non-Class I railroads, except for Section IV.c Operating expenses include equipment, joint facility rents, leased roads and equipment,
and all taxes except Federal income.d Safety figures from U.S. Department of Transportation, Federal Railroad Administration
are for all railroads.e Figures may not appear directly in data source.NOTE: Amtrak figures are based on Amtrak fiscal year (October 1-September 30).SOURCES: Unless otherwise noted, refer to chapter tables for sources.f Association of American Railroads (AAR), Railroad Facts, Annual issues, 1990-1998, pp.
3, 10, 12, 13, 14, 33, 34, 36, 40, 44, 48, 50, 56, 78.g Amtrak, National Railroad Passenger Corporation Annual Report,1972, 1980, 1990, 1993-95.h Ibid., Statistical Appendix to Amtrak Annual Report, annual issues.i Ibid., Human Resources Information Center, personal communication.

356"
Appendix A
Modal P
rofiles Water Transport Profile
KEY: N = data do not exist; R = revised; U = data are not available
Continued next page
Financial 1960 1970 1980 1990 1995 1996 1997 1998Operating revenues ($ millions)
Domestic freight 1,722i
2,070i
7,219i
7,940i
7,712i
7,684i R6,901 i
6,886i
Coastal waterways 747 834 3,155 3,066 2,774 2,782 R2,169 i2,115
i
Inland waterways 461 621 2,395 2,956 2,964 3,044 R2,860 2,801
Great lakes 227 239 513 615 585 579 R615 612
Locks, channels 287 376 1,156 1,303 1,389 1,279 1,257 1,358
International freighth 1,765 3,187 8,279 12,181 R14,069 17,281 R14,091 15,679
Passenger, total 281 287 304 R1,386 R1,709 R1,800 0 R1,180 0 1,147
Domestic passenger, intercity 14 12 21 R99 u R129 u R141 u R141 u147
u
International passengera 267 275 283 1,287i
1,580i
1,659i R1,039 i
1,000i
Revenues of U.S. commercial fishing
Fleet (domestic landings) ($ millions) 354 j 613 j 2,237 j 3,522 j 3,770 j 3,487 j
R3,448 j 3,128 j
Inventory
Number of domestic inland Vessel operatorsb 228
k380
k403
k565
k557
k554
kU U
Number of employees
Ships, boat building, and repairing 141,200l
171,800l
220,500l
187,700m
159,600n
158,800n R158,300 n
165,900n
Water transportationc N 212,300 211,200 176,600 174,500 174,100 R178,700 180,000
Number of employeesd
Passenger/combo 8,560o
2,178o
618o
642o
642o
321o
321o
321o
Cargo 28,668 22,257 9,878 7,019 5,400 4,964 4,831 4,924
Tankers 12,053 10,567 8,722 4,471 4,261 3,965 3,785 3,711
Total 49,281 35,000 19,218 12,132 10,303 9,250 8,937 8,956
Mileage of commercially Navigable channels 25,000
i26,000
i26,000
i26,000
i26,000
i26,000
i R26,000 i26,000
i
Number of vessels
Total nonself-propelled 16,777p
19,377p
31,662p
31,209p
31,360p
32,811p
33,011p
33,509p
Dry cargo barges and scows 14,025 15,890 27,426 27,091 27,342 28,743 29,006 29,526
Tankers 2,429
3,281
4,166
3,913
3,985
4,036 3,971 3,952
Railroad car floats 323 206 70 13 33 32 34 31

Appendix A
Modal P
rofiles !357
Water Transport ProfileCont’d
KEY: N = data do not exist; R = revised; U = data are not available
Continued next page
Inventory cont'd 1960 1970 1980 1990 1995 1996 1997 1998 Total self-propelled 6,543 6,455 7,126 8,236 8,281 8,293
8,408 8,523
Dry cargo/passenger 1,796 1,761 2,036 2,678 2,804 2,782 2,905 2,938
Ferries, railroad car 31 17 67 135 172 173 183 213
Tankers 489 421 330 213 178 161 147 135
Towboats/tugs 4,203 4,248 4,693 5,210 5,127 5,177 5,173 5,237
U.S. merchant marine ships (over 1,000 gross tons)
Total U. S. flag 2,926q
1,579q
864q
636q
509q
495q
477 470
Passenger/cargo 309 171 65 10 13 15 14 12
Freighters 2,138 1,076 471 367 295 292 288 289
Bulk carriers 57 38 20 26 20 15 14 15
Tankers 422 294 308 233 181 173 161 154
Privately owned 1,008 U 578 408 319 302 285 281
Government owned 1,918 U 286 228 190 193 192 189
Number of recreational boats (thousands)e 2,500 r 7,400 r R8,905 r R10,996 r R11,735 r R11,878 r 12,313 r 12,567 r
PerformanceTon-miles (thousands)f
Domestic water freight
Coastwise N 359,784,000s
631,149,247s
479,133,600s
440,345,100s
408,086,100s
349,843,000s
314,863,900s
Internal N 155,816,000 227,342,991 292,393,300 306,329,100 296,790,600 R294,023,000 294,896,400
Lakewise N 79,416,000 61,747,114 60,929,900 R59,703,800 58,335,300 R62,165,900 61,654,300
Intraport N 1,179,000 1,596,412 1,087,000 1,349,600 1,474,500 1,378,100 1,380,700
Total N 596,195,000 921,835,764 853,543,800 748,023,800 764,686,500 R707,409,900 672,795,000
Tons of freight hauled (thousands)
Domestic
Coastwise 209,197 238,440 329,609 298,637 266,612 267,389 R263,146 249,633
Internal 291,057 472,123 534,979 622,595 620,324 622,081 R630,558 625,028
Lakewise 155,109 157,059 115,124 110,159 116,127 114,870 R122,734 122,156
IntraportR 104,193 81,475 94,184 86,378 83,104 89,011 R89,816 90,077
Intraterritory 1,017 1,630 3,588 4,529 6,868 7,327 R6,273 7,217
Total 760,573 950,727 1,077,483 1,122,299 1,093,035 1,100,679 R1,112,527 1,094,112

358"
Appendix A
Modal P
rofiles Water Transport Profile
Cont’d
KEY: N = data do not exist; R = revised; U = data are not available
Continued next page
Performance cont'd 1960 1970 1980 1990 1995 1996 1997 1998Exports
Great lakes ports 23,150 35,932 45,077 32,898 32,968 31,855 33,209 36,876
Coastal ports 104,810 205,698 358,806 408,688 441,732 418,940 399,104 367,831
Total 127,961 241,629 403,883 441,586 474,700 450,794 432,313 404,708
Imports
Great lakes ports 12,851
26,406
15,515
17,578
18,897
24,503
24,532 25,558
Coastal ports 198,466 312,934 502,006 582,412 653,760 708,090 763,771 815,122
Total 211,316 339,340 517,521 599,970 672,657 732,593 788,303 840,680
Average haul, domestic system (miles)f
Coastwise 1,496 1,509 1,915 1,604 1,652 1,526 1,330 1,261
Internal 282 330 405 R470 494 477 466 472
Lakewise 522 506 536 553 514 508 507 505
Cargo capacity (short tons)
Total nonself-propelled vessels 16,355,657p
24,026,024p
44,875,116p R48,946,785 p
51,140,530p
54,086,973p
54,974,961p
55,999,952p
Dry cargo barges 12,147,006 17,695,275 34,486,851 R38,189,490 39,971,443 42,748,644 43,710,093 44,718,691
Tankers 4,208,651 6,330,749 10,388,265 R10,757,295 11,169,087 11,338,329 11,264,868 11,281,261
Total self-propelled vessels 15,905,881 19,284,050 23,906,346 19,723,788 15,783,399 14,850,253 14,161,739 12,970,167
Dry cargo/passenger 12,188,956 10,815,977 8,011,587 7,042,263 6,484,707 6,208,011 6,685,719 6,371,425
Tankers 3,716,925 8,468,073 15,894,753 12,681,525 9,298,692 8,642,242 7,476,020 6,598,742
Fuel consumption (thousand barrels)
Diesel fuel and distillate 18,730i
19,503i
35,201i
52,310i
47,098i
51,848i
50,180i
50,609i
Residual fuel oil 94,084 89,850 213,131 148,764 153,125 138,213 114,044 110,480
Gasoline 9,200 14,238 25,048 30,962 25,250 23,659 R23,659 22,767
Total 122,014 123,591 273,380 232,036 225,473 213,720 R187,883 183,856

Safety 1960 1970 1980 1990 1995 1996 1997 1998Fatalities in waterborne transport
(vessel casualties only)
Freight N 30t
8t
0t
0t
0t
2t
0t
Tankship N 4 4 5 0 0 0 0
Passenger vessel N 1 5 3 4 2 1 3
Tug/towboat N 22 14 13 1 1 4 1
Offshore supply N N N 2 2 2 0 3
Fishing vessel N 77 60 47 18 38 22 35
Recreational vessel N N N 3 20 3 7 5
MODUg N N N 0 0 0 4 0
Platform N N N 1 0 1 0 1
Freight barge N N N 0 0 0 5 2
Tank barge N H N 0 0 0 0 0
Miscellaneous N 44 56 11 1 3 1 9
Total N 178 206 85 46 50 46 59
Injuries in waterborne transport
Freight N 14 8 10 1 0 3 4
Tankship N 19 9 13 5 5 1 0
Passenger vessel N 10 10 51 50 60 37 29
Tug/towboat N 10 27 19 18 12 20 15
Offshore supply N N N 9 10 7 3 5
Fishing Vessel N 13 28 31 32 32 25 33
Recreational vessel N N N 2 19 7 5 6
MODUg N N N 13 0 0 2 0
Platform N N N 9 1 0 0 1
Freight barge N N N 3 0 0 6 1
Tank barge N H N 3 3 1 0 0
Miscellaneous N 39 98 12 6 5 7 13
Total N 105 180 175 145 129 109 107
Appendix A
Modal P
rofiles !359
Water Transport ProfileCont’d
KEY: N = data do not exist; R = revised; U = data are not available
Continued next page

Safety cont'd 1960 1970 1980 1990 1995 1996 1997 1998Fatalities in recreational boating
(vessel casualties only)
Air thrust N N N N 4r
1r
6r
11r
Propeller N N N N 475 363 R436 462
Inboard N 119r
100r
50r
N N N N
Outboard N 774 609 454 N N N N
Inboard/outboard N 28 47 53 N N N N
Jet N N 10 25 68 61 83 82
Sail N 44 43 20 4 8 15 5
Manual (oars, paddle) N 205 272 182 148 109 150 151
Other N 29 14 5 8 8 10 0
Propulsion unknown N 219 265 76 122 159 121 104
Total 739r
1,418 1,360 865 829 709 821 815
360"
Appendix A
Modal P
rofiles
k U.S. Department of Transportation,Maritime Administration, MAR-450,personal communication.
l U.S. Department of Labor, Bureau of Labor Statistics, Employment, Hours and Earnings,United States, 1909-1994, (Washington, DC: September 1994), SICs 373 and 44.
m Ibid., Employment, Hours and Earnings, 1988-1996 (Washington, DC: August 1996),SICs 373 and 44.
n Ibid., Internet website www.bls.gov, as of April 21, 2000.o U.S. Department of Transportation, Maritime Administration, U.S. Merchant Marine
Data Sheet (Washington, DC: Annual issues).p U.S. Army, Corps of Engineers, Summary of U.S. Flag Passenger & Cargo Vessels (New
Orleans, LA: Annual issues).q U.S. Department of Transportation, Maritime Administration, Merchant Fleets of the
World (Washington, DC: Annual issues).r U.S. Coast Guard, Boating Statistics (Washington, DC: Annual issues).s U.S. Army Corps of Engineers, Waterborne Commerce of the United States (New Orleans,
LA: Annual issues), part 5, section 1, table 1 & table 4.t U.S. Coast Guard, Office of Investigations and Analysis, G-MAO-2, personal
communication.u U.S. Department of Commerce, Bureau of Economic Analysis, Selected NIPA Tables,
table 2.4, Internet website http://www.bea.doc.gov, as of August 21, 2000.
Water Transport ProfileCont’d
a Revenues paid by American travelers to U.S. and foreign flag carriers.b Does not include vessel operators whose primary area of operation is fishing, towing,
passenger transport, ferrying, or crew boat utility service.c Includes commercial port, marina, and other employees; excludes employees of non-
for-hire private businesses.d Estimate based on established active jobs for licensed and unlicensed personnel aboard
oceangoing ships of 1,000 gross-tons and over, privately owned and operated,government-owned ships under bare boat charters, ship managers and General Agency Agreement, supplemented by Military Sealift Command employment totals for ships with Civil Service crews.
e The U.S. Coast Guard changed its methodology for counting the number ofrecreational boats.Figures cited represent number of numbered boats, not estimates as previously noted for 1960 and 1970.
f Does not include intraterritorial traffic (traffic between ports in Puerto Rico and the Virgin Islands, which are considered a single unit).
g Mobile Offshore Drilling Units.h The international water freight operating revenues data was revised in Transportation in
America 1998 for all years expect 1994 & 1996. Therefore, the international water freightdata for years 1994 & 1996 may not be comparable to other years.
SOURCES: Unless otherwise noted, refer to chapter tables for sources.i Eno Transportation Foundation Inc., Transportation in America,1999 (Washington, DC:
2000), pp. 40, 42, 57, 64.j U.S. Department of Commerce, National Marine Fisheries Services, Fisheries of the
United States (Washington, DC: Annual issues), p. 5 and similar tables in earlier editions.
KEY: N = data do not exist; R = revised; U = data are not available

Financial 1960 1970 1980 1990 1995 1996 1997 1998Operating revenues ($ millions)
FERC-regulated 770 c 1,188 c 6,340 c R7,045 c R6,962 c 7,262 c R7,264 c 7,300 c
Nonregulated 125 208 1,208 1,342 R1,316 1,373 R1,343 1,356
Total 895 1,396 7,548 R8,387 R8,278 8,635 R8,607 8,656
InventoryNumber of FERC-regulated companies 87 d 101 d 130 d 150 d 161 d 160 d U U
Number of employees, pipeline companiesa 23,100 e 17,600 e 21,300 e 18,500 f R15,100 g 14,500 g R14,200 g 13,800 g
Miles of pipeline (statute miles)b
Crude lines 141,085 h 146,275 h 129,831 h 118,805 h R129,423 h R92,610 h 91,523 h 87,663 h
Product lines 49,859 72,396 88,562 89,947 R92,177 R84,925 88,350 90,985
All lines 190,944 218,671 218,393 208,752 221,600 177,535 179,873 178,648
PerformanceIntercity ton-miles (millions)
Crude oil N N 362,600 i 334,800 i 335,900 i 338,300 i R337,400 I 334,100 I
Petroleum products N N 225,600 249,300 265,200 280,900 R279,100 285,700
Total 229,000 i 431,000 i 588,200 584,100 601,100 619,200 R616,500 619,800
Tons transported (millions) 468.4 790.3 960.8 1,057.4 R1,124.8 1,099.0 R1183.8 1,211.8
Average length of haul (statute miles)
Crude oil 325 j 300 j 871 j 805 j R747 j R779 j 713 689
Petroleum products 269 357 414 389 R393 R393 393 393
SafetyFatalities N 4 k 4 k 3 k 3 k 5 k 0 k 2 k
Injuried Persons N 21 15 7 11 13 5 6
Incidents N 351 246 180 188 R193 R171 153 Appendix A
Modal P
rofiles !361
f Ibid., Employment, Hours and Earnings, United States,1988-1996 (Washington, DC:July 1996), SIC 46.
g Ibid., Internet website www.bls.gov, as of Apr.19, 1999.
h Eno Transportation Foundation, Inc., Transportation In America, 1998 (Washington,DC: 1998), p. 64; and Transportation in America, Supplement, 1999, (Washington,DC: 1999), p. xii.
i Ibid., pp. 44, 59, 46.j Ibid., p. 71.k U.S. Department of Transportation, Research and Special Programs Administration,Office of Pipeline Safety, DPS-35, personal communication, and Internet website http://ops.dot.gov, as of Mar. 18, 1999.
Oil Pipeline Profile
a Includes companies whose pipelines carry crude petroleum, petroleum products, and nonpetroleum pipeline liquids.
b Regulated plus unregulated mileage of crude oil trunk and gathering lines, plus refined oil trunk lines.
NOTE: The Interstate Commerce Committee regulated oil pipelines in the 1960s and 1970s.SOURCES: Unless otherwise noted, refer to chapter tables for sources.c Eno Transportation Foundation, Inc., Transportation In America, 1998 (Washington,DC: 1998), p. 40.
d Federal Energy Regulatory Commission, personal communication.e U.S. Department of Labor, Bureau of Labor Statistics, Employment, Hours and Earnings, United States, 1909-94 (Washington, DC: September 1994), SIC 46.
KEY: FERC = Federal Energy Regulatory Commission; N = data do not exist; R = revised;U = data are not available

Financial ($ millions) 1960 1970 1980 1990 1995 1996R 1997 1998
Transmission pipeline companies
Total operating revenues 3,190d
5,928d
41,604e
21,756e
12,092e
12,050e
10,339e
9,450e
Total operating expensesa 2,698 5,088 39,709 19,484 9,534 9,603 7,862 6,795
Taxes (federal, state, local)b 319 376 1,991 1,245 1,582 1,643 1,531 1,481
Operation and maintenance 2,095 4,203 36,480 17,058 6,680 6,802 5,381 4,260
Distribution pipeline companies
Total operating revenues N N 14,013d
18,750f
19,421f
30,407f
30,817f
27,542f
Total operating expensesa N N 13,263 17,125 17,402 27,917 R27,445 25,039
Taxes (federal, state, local)b N N 1,136 1,625 1,888 2,668 R2,415 2,422
Operation and maintenance N N 11,791 14,544 14,170 23,301 R23,155 20,910
Investor-owned, total industry
Total operating revenues N N 85,918g
66,027g
58,434g
63,600g R62,660 h
57,117h
Total operating expensesa N N 81,789 60,137 50,800 56,695 R55,422 50,896
Taxes (federal, state, local)b N N 4,847 4,957 6,186 6,362 R6,384 5,429
Operation and maintenance N N 74,508 51,628 40,041 45,785 R44,851 41,026
Inventory
Pipeline mileage
Transmission 183,700I
252,200I
266,500j
280,100j R268,300 j
259,300j R251,100 j
253,900
Distribution 391,400 594,800 701,800 837,300 R936,800 959,500 R957,100 980,800
Field and gathering 55,800 66,300 83,500 89,500 R60,400 57,500 R43,000 45,000
Total 630,950 913,267 1,051,774 1,206,894 1,262,152 1,276,315 R1251,200 1,279,700
Number of employees
Investor-owned companies 206,400k
211,700k
215,400l
204,200l
179,000l R179,000 l R154,600 l
151,500l
Transmission pipeline companies 31,400 32,400 45,200 37,400 28,000 32,300 27,500 28,400
Distribution pipeline companies N N 52,100 64,700 61,600 79,700 R75,000 69,700
Integrated pipeline companies N N 53,200 39,900 36,400 12,700 12,300 13,600
Combination pipeline companies N N 52,200 50,100 42,100 38,700 30,600 30,400
Total N N 202,700 192,100 168,100 163,500 145,400 142,100
Number of interstate natural gas pipeline companiesc 87
m89
m91
m132
m133
n138
n86
o86
o
362"
Appendix A
Modal P
rofiles Natural Gas Pipeline Profile
KEY: N = data do not exist; R = revised
Continued next page

Performance (million cubic ft.) 1960 1970 1980 1990 1995 1996R 1997 1998Marketed production, total 12,771,038
p21,920,642
p20,179,724
p18,593,792
p19,506,474
p R19,812,241 p R19,866,093 p19,645,554
p
Delivered to consumers, total 10,382,681q
19,018,462q
18,216,233q
16,818,882q
19,660,161q
20,005,508q R20,004,012 q
19,469,047q
Consumed, total 11,966,537 21,139,386 19,877,293 18,715,090 21,580,665 R21,966,616 R21,958,660 21,262,023
Gas used as a pipeline fuel, total 347,075 722,166 634,622 659,816 700,335 711,446 R751,470 635,477
SafetyFatalities N 26
r15
r6
r18
r48
r R10 r17
r
Injured persons N 233 177 69 53 114 R72 75
Incidents N 1,077 1,524 198 161 187 R175 234
Appendix A
Modal P
rofiles !363
k Ibid., Gas Facts, 1979 (Arlington, VA ),table 153.
l Ibid., Gas Facts (Arlington, VA: Annual issues), table 14–2, and similar tables in earlier editions.
m U.S. Department of Energy, Energy Information Administration, Statistics ofInterstate Natural Gas Pipeline Companies (Washington, DC: Annual issues), preface.
n Federal Energy Regulatory Commission, personal communication.o American Gas Association, personal communication, Aug 17, 2000.p U.S. Department of Energy, Energy Information Administration, Natural Gas Annual, 1998
(Washington, DC: October 1999), table 98. Internet site http://www.eia.doe.gov/oil_gas/natural_gas/data_publications/natural_gas_annual/nga.html as of Aug 9, 2000.
q Ibid., Table 100.r U.S. Department of Transportation, Research and Special Programs Administration,
Office of Pipeline Safety, DPS-35, personal communication, and Internet site http://ops.dot.gov/stats.htm, as of Aug. 9, 2000.
Natural Gas Pipeline ProfileCont’d
a Does not add due to omission of line from source table for depreciation and other non-cash expenses.
b Figures obtained by addition/subtraction and may not appear directly in data source.c As of Sept. 30 each year.NOTE: Numbers may not add to totals due to rounding.SOURCES: Unless otherwise noted, refer to chapter tables for sources.d American Gas Association, Gas Facts, 1979 (Arlington, VA), table 134.e Ibid., Gas Facts (Arlington, VA: Annual issues), table 12-2, and similar tables in
earlier editions.f Ibid., table 12-3, and similar tables in earlier editions.g Ibid., table 12-1.h Ibid., Unpublished data and personal communication, Aug 17, 2000.i Ibid., Gas Facts, 1979 (Arlington, VA ), table 44.j Ibid., Gas Facts (Arlington, VA: Annual issues), table 5-1, and similar tables in
earlier editions.
KEY: N = data do not exist; R = revised

Metric Conversion Tables
appendix b

1960 1965 1970 1975 1980 1985 1990 1995 1996 1997 1998Highwaya 5,706,240 5,937,942 6,002,985 6,176,897 6,211,806 6,218,364 6,223,214 6,296,117 6,307,743 6,348,214 6,355,127Class I railb,c 333,672 321,544 316,202 308,222 265,255 234,584 192,732 174,234 170,235 164,359 161,852Amtrakc N N N N 38,624 38,624 38,624 38,624 40,234 40,234 35,406Transitd
Commuter railc N N N N N 5,752 6,649 6,695 5,926 7,108 8,324 Heavy rail N N N N N 2,081 2,174 2,346 2,379 2,457 2,457 Light rail N N N N N 618 777 913 1,027 1,061 1,088Navigable channelse 40,234 40,234 41,843 41,843 41,843 41,843 41,843 41,843 41,843 R41,843 41,843Oil pipelinef 307,295 339,358 351,917 363,533 351,469 343,764 335,954 R356,631 R285,715 R289,478 287,506Gas pipelineg 1,015,416 1,235,204 1,469,761 1,575,971 1,692,666 1,800,655 1,942,308 2,031,237 2,054,030 R2,013,610 2,059,500
Appendix B
Metric C
onversion Tables !367
SOURCES:Highway: 1960-95: U.S. Department of Transportation, Federal HighwayAdministration, Highway Statistics Summary to 1995, FHWA-PL-97-009 (Washington, DC:Annual issues), table HM-212.1996-98: Ibid., Highway Statistics (Washington, DC: Annual issues), table HM-12.Class I rail: 1960-98: Association of American Railroads, Railroad Facts (Washington,DC: 1998), p. 44.Amtrak: 1980: Amtrak, Corporate Planning and Development, personal communica-tion (Washington, DC).1985-98: Amtrak, Corporate Planning and Development, Statistical Appendix to AmtrakAnnual Report (Washington, DC: Annual issues).Transit: U.S. Department of Transportation, Federal Transit Administration, NationalTransit Database (Washington, DC: Annual issues), table 18 (1996-1997) and table 19 (for1998) and similar tables in earlier editions.Navigable channels: 1960-96: U.S. Army Corps of Engineers, Ohio River Division,Huntington District, Ohio River Navigation System Report, 1996, Commerce on the Ohio Riverand its Tributaries (Fort Belvoir, VA: 1996), p. 2.1997-1998: Waterborne Commerce Statistics Center Databases, personal communica-tion, June 2000.Oil pipeline: 1960-98: Eno Transportation Foundation, Inc., Transportation in America,1998 (Washington, DC: 1999), p. 64.Gas pipeline: 1960-98: American Gas Association, Gas Facts (Arlington, VA : Annualissues), table 5-2 and similar tables in earlier editions.
Table 1-1M System Kilometers Within the United States (Statute kilometers)
a All public road and street mileage. Prior to 1980, some miles of nonpublic roadways are included. No consistent data on private road mileage are available. Includes District of Columbia.
b Data represent miles of road owned (aggregate length of road, excluding yard tracks,sidings, and parallel lines).
c Portions of Class I freight railroads, Amtrak, and commuter rail networks share commontrackage. Amtrak data represent miles of track operated.
d Transit system mileage is measured in directional route-miles. A directional route-mile isthe mileage in each direction over which public transportation vehicles travel while in revenue service. Directional route-miles are computed with regard to direction ofservice, but without regard to the number of traffic lanes or rail tracks existing in the right-of-way.
e The St. Lawrence Seaway is not included in this number because 3 of the 5 subsections are solely in Canadian waters, and the others are in international boundary waters. Ofthe 26,000 miles of navigable waterways, 10,867 miles are commercially significant shal-lowdraft inland waterways subject to fuel taxes.
f Includes trunk and gathering lines for crude-oil pipeline.g Excludes service pipelines. Data not adjusted to common diameter equivalent. Mileage
as of the end of each year. Includes field and gathering, transmission, and distribution main. See table 1-8 for a more detailed breakout of oil and gas pipeline mileage.
NOTE: Total highway mileage in this table will not match that in tables 1-3 and 1-4 becauseof a change in the way the U.S. Department of Transportation, Federal HighwayAdministration (FHWA) creates mileage-based tables derived from the Highway PerformanceMonitoring System, beginning with the 1997 issue of FHWA's Highway Statistics.
KEY: N = data do not exist; R = revised

UrbanInterstatesOther arterialsCollectorsLocal Total
RuralInterstatesOther arterialsCollectorsa
Local Total
TOTAL lane-kilometers
1980
77,986536,995233,561
1,396,8882,245,429
210,792816,095
2,303,4017,173,786
10,504,074
12,749,503
1985
92,207598,111261,320
1,530,5152,482,154
212,284820,773
2,360,5687,027,931
10,421,557
12,903,711
1990
100,124642,733270,000
1,675,5462,688,403
218,663832,581
2,361,8766,855,435
10,268,556
12,956,959
1991
101,109647,536266,005
1,693,4772,708,127
219,680833,339
2,361,8106,893,084
10,307,914
13,016,041
1992
108,254673,041283,465
1,765,6432,830,403
214,794847,664
2,319,8156,861,779
10,244,052
13,074,455
1993
111,341700,686289,123
1,801,7442,902,894
212,655846,364
2,308,5616,817,027
10,184,606
13,087,501
1994
113,993712,093295,078
1,817,3002,938,464
211,252852,659
2,304,8856,797,650
10,166,447
13,104,911
1995
114,870717,491297,780
1,831,2242,961,365
212,298854,089
2,281,1296,820,554
10,168,070
13,129,436
1996
115,535723,368300,823
1,849,8702,989,596
213,983857,549
2,279,8966,821,243
10,172,671
13,162,268
1997R
117,427733,655306,022
1,897,3013,054,405
214,308865,618
2,287,7926,891,559
10,259,277
13,313,681
1998R
118,655734,397303,928
1,911,9253,068,905
215,073867,235
2,283,2296,748,873
10,114,410
13,183,315
1999
119,153728,433301,932
1,926,4273,075,944
216,635869,381
2,280,3796,768,836
10,135,232
13,211,176
368"
Appendix B
Metric C
onversion Tables SOURCES: 1980-95: U.S. Department of Transportation,Federal Highway Administration, Office of Highway Information Management, tableHM-260 (unpublished).1996: Ibid,. Highway Statistics (Washington, DC: Annual issues), table HM-60.1997-99: Ibid., Internet site www.fhwa.dot.gov/ohim.ohimstat.htm, as of Nov. 15, andDec. 8, 2000.
Table 1-6M Estimated U.S. Roadway Lane-Kilometers by Functional Systema
a Includes the 50 States, the District of Columbia, and Puerto Ricob Includes minor and major collectors.NOTE: In estimating rural and urban lane mileage, the U.S. Department ofTransportation, Federal Highway Administration assumed that rural minor collectors andurban/rural local roads are two lanes wide.
KEY: R = revised

1960 1965 1970 1975 1980 1985 1990 1995 1996 1997 1998AirAir carrier, large certificated,
domestic, all services 1,381 1,825 3,328 3,135 4,060 4,902 6,378 7,450 7,743 R7,904 8,097General aviationa 2,847 4,123 5,161 6,820 8,375 7,520 7,319 6,107 5,671 6,239 U
HighwayR
Passenger carb,c 944,706 1,163,069 1,475,288 1,663,984 1,788,944 2,006,531 2,266,389 2,298,947 2,347,942 2,401,910 2,487,782Motorcycleb h h 4,794 9,059 16,438 14,623 15,381 15,767 15,953 16,224 16,512Other 2-axle 4-tire vehiclec h h 198,410 322,996 468,215 629,192 924,684 1,271,431 1,313,124 1,369,134 1,394,061Truck
Single-unit 2-axle 6-tire or more truck 158,603 207,234 43,583 55,693 64,073 73,130 83,527 100,914 103,006 107,654 109,265
Combination truck 46,436 50,960 56,543 75,195 110,527 125,630 151,827 185,801 191,245 200,499 206,252Bus 6,994 7,533 7,313 9,745 9,751 7,207 9,215 10,332 10,522 11,011 11,259 Total highwayc 1,156,739 1,428,796 1,785,931 2,136,672 2,457,948 2,856,313 3,451,023 3,883,192 3,981,793 4,106,432 4,208,615
TransitMotor busd 2,537 2,460 2,268 2,456 2,699 2,998 3,428 3,515 3,574 R3,613 P3,687Light rail 120 67 54 38 28 27 39 56 61 66 P69Heavy rail 629 636 655 681 619 725 864 864 874 898 P911Trolley bus 162 69 53 25 21 25 22 23 23 23 P23Commuter rail N N N 278 288 295 343 383 389 404 P426Demand responsived N N N N N 398 492 816 882 R941 P1,123Ferry boat N N N N I I 4 5 5 3 3Other N N N 24 25 24 R29 R60 R72 R84 85 Total transite 3,449 3,232 3,030 3,502 3,681 4,492 R5,218 5,713 5,874 R6,029 P6,328
RailClass I freight, train-kilometers 650 678 687 649 689 558 612 737 754 764 764Class I freight, car-kilometers 45,335 47,212 48,103 44,508 47,117 40,105 42,099 48,897 51,040 50,952 52,556Intercity/Amtrakf, train-kilometers 336 277 150 48 48 48 53 51 48 51 53Intercity/Amtrakf, car-kilometers 3,554 2,857 1,110 407 378 404 484 470 444 463 502
Total train-kilometersg 987 954 837 697 737 607 665 789 803 816 818
Appendix B
Metric C
onversion Tables !369
Table 1-29M U.S. Vehicle-Kilometers (Millions)
KEY: N = data do not exist; P = preliminary; R = revised; U = data are not available
Continued next page

370"
Appendix B
Metric C
onversion Tables
1980: U.S. National Transportation Safety Board estimate, personal communication,Dec. 7, 1998.1985-90: Ibid., General Aviation Activity and Avionics Survey (Washington, DC: Annualissues,) table 3.3.1995-97: Ibid., General Aviation and Air Taxi Activity and Avionics Survey (Washington, DC:Annual issues), table 3.3.Highway:Passenger car and motorcycle: 1960-90: U.S. Department of Transportation, FederalHighway Administration, Highway Statistics Summary to 1995 (updated June 1999),Internet site http://www.fhwa.dot.gov/ohim/summary95/index.html, as of July 28,2000, table VM-201A.1995-98: Ibid., Highway Statistics (Washington, DC: Annual issues), table VM-1, sum ofpassenger car and motorcycle.Motorcycle: 1970-80: U.S. Department of Transportation, Federal Highway Administration,Highway Statistics, Summary to 1985 (Washington, DC: 1986), table VM-201A.1985-98: Ibid., Highway Statistics (Washington, DC: Annual issues), table VM-1.Other 2-axle 4-tire vehicle: 1970-90: U.S. Department of Transportation, Federal HighwayAdministration, Highway Statistics Summary to 1995 (updated June 1999), Internet sitehttp://www.fhwa.dot.gov/ohim/summary95/index.html, as of July 28, 2000, table VM-201A.1995-98: Ibid., Highway Statistics (Washington, DC: Annual issues), table VM-1.Single-unit 2-axle 6-tires or more truck, combination truck, and bus: 1960-90: U.S. Departmentof Transportation, Federal Highway Administration, Highway Statistics Summary to 1995(updated June 1999), Internet sitehttp://www.fhwa.dot.gov/ohim/summary95/index.html, as of July 28, 2000, table VM-201A.1995-98: Ibid., Highway Statistics (Washington, DC: Annual issues), table VM-1.Transit:1960-98: American Public Transit Association, Public Transportation Fact Book(Washington, DC: 2000), table 42, 84, and similar tables in earlier editions.Rail:Class I rail freight train- and car-miles: 1960-98: Association of American Railroads, RailroadFacts, 1998 (Washington, DC: 1999), p. 33 (train-miles) and p. 34 (car-miles).Intercity/Amtrak train-miles: 1960-70: Association of American Railroads, Yearbook ofRailroad Facts (Washington, DC: 1975), p. 39.1975-98: Amtrak, Amtrak Annual Report, Statistical Appendix (Washington, DC: Annual issues).Intercity/Amtrak car-miles: 1960-75: Association of American Railroads, Yearbook ofRailroad Facts (Washington, DC: 1975), p. 40.1980-98: Amtrak, Amtrak Corporate Reporting, Route Profitability System, personal
Table 1-29MCont’d U.S. Vehicle-Kilometers (Millions)
a All operations other than those operating under 14 CFR 121 and 14 CFR 135. Data for 1996 are estimated using new information on nonrespondents and are not comparable toearlier years. Mileage in source is multiplied by 1.151 to convert to nautical-miles for 1985-1997, data is then converted to kilometers.
b U.S. Department of Transportation, Federal Highway Administration (FHWA), provides data separately for passenger car and motorcycle in its annual Highway Statistics series.However, the 1995 summary report provides updated data for passenger car and motorcycle combined. Passenger car figures in this table were computed by U.S. Department of Transportation, Bureau of Transportation Statistics by subtracting the most current motorcycle figures from the aggregate passenger car and motorcycle figures.
c In July 1997, the FHWA published revised vehicle-kilometers data for the highway modes for many years. The major change reflected the reassignment of some vehicles from the passenger car category to the other 2-axle 4-tire vehicle category.
d Motor bus and demand responsive figures are also included in the bus figure for highway.e Prior to 1985, excludes demand response and most rural and smaller systems funded via Sections 18 and 16(b)2, Federal Transit Act. The series is not continuous between 1980 and 1985. Transit rail modes are measured in car-kilometers. Car-kilometers measure individual vehicle-kilometers in a train. A 10-car train traveling 1 kilometer would equal 1 train-kilometer and 10 car-kilometers. Motor bus and demand response figures are alsoincluded in the bus figure for highway.
f Amtrak began operations in 1971.g Although both train-kilometers and car-kilometers are shown for rail, only train-kilometersare included in the total. A train-kilometer is the movement of a train, which can consistof multiple vehicles (cars), the distance of 1 kilometer. This differs from a vehicle-kilometer,which is the movement of 1 vehicle the distance of 1 kilometer. A 10-vehicle train traveling 1 kilometer would be measured as 1 train-kilometer and 10 vehicle-kilometers.Caution should be used when comparing train-kilometers with vehicle kilometers.
h 1960–65, motorcycle data are included in passenger car, and other 2-axle 4-tire vehicle data included in single-unit 2-axle 6-tire or more truck.
i Ferry boat included with other.SOURCES:Air:Air carrier: 1960: Civil Aeronautics Board, Handbook of Airline Statistics 1969 (Washington,DC: 1970), part III, table 2.1965-70: Ibid., Handbook of Airline Statistics 1973 (Washington, DC: 1974), part III, table 2.1975-80: Ibid., Air Carrier Traffic Statistics (Washington, DC: 1976, 1981), p. 4 (December1976) and p. 2 (December 1981).1985-98: U.S. Department of Transportation, Bureau of Transportation Statistics, Officeof Airline Information, Air Carrier Traffic Statistics (Washington, DC: Annual Decemberissues), p. 2, line 27 plus line 50.General aviation: 1960-65: U.S. Department of Transportation, Federal AviationAdministration, FAA Statistical Handbook of Aviation 1972 (Washington, DC: 1973), table 9.10.1970-75: U.S. Department of Transportation, Federal Aviation Administration, FAAStatistical Handbook of Aviation 1976 (Washington, DC: 1976), table 8-5.

1980 1985 1990 1995 1996 1997 1998VKT (millions)UrbanInterstate 259,494 R347,922 448,848 R549,616 R565,813 R581,571 602,551Other arterialsa R779,228 R930,637 R1,125,309 R1,311,782 R1,343,198 R1,362,467 1,387,975Collector 133,645 144,162 R171,069 R204,199 R208,105 209,957 210,601Local R204,051 257,595 R307,471 R331,376 R335,346 R357,314 361,046 Total R1,376,418 R1,680,316 R2,052,696 R2,396,973 R2,452,461 R2,511,309 2,562,172
RuralInterstate 217,397 248,414 R322,148 R359,499 R374,278 R386,438 404,046Other arterialsa R422,895 R455,128 R532,478 R593,197 R609,696 R630,029 649,505Collectorb R304,920 332,602 R386,984 R380,044 R387,901 R408,464 415,323Local 136,318 R139,851 R156,717 169,245 R176,256 184,288 194,081 Total
R1,081,529 R1,175,995 R1,398,326 R1,501,986 R1,548,131 R1,609,218 1,662,954
VKT per lane-kilometer (thousands)
UrbanInterstate R3,327 R3,773 R4,483 R4,785 R4,902 R5,005 5,140Other arterialsa R1,451 R1,556 R1,751 R1,828 R1,855 R1,868 1,899Collector R572 R552 R634 R686 R687 R693 698Local R146 R168 R184 R181 292 R190 191 Total R613 R677 R764 R809 R819 R830 842
RuralInterstate R1,031 R1,170 R1,473 R1,693 R1,748 R1,803 1,885Other arterialsa R518 R555 R640 R695 1,144 R729 750Collectorb R132 R141 R164 R167 274 R179 182Local R19 R20 R23 R25 R25 R27 29 Total R103 R113 R136 R148 245 R157 165
Appendix B Metric Conversion Tables ! 371
Roadway Vehicle-Kilometers Traveled (VKT) and VKT per Lane-Kilometer byFunctional Class
a For urban: the sum of other freeways and expressways, other principal arterials, and minor arterials. For rural: they represent the sum of other principal arterials and minor arterials.
b Collector is the sum of major and minor collectors (rural only).NOTE: See table 1-5M for estimated highway lane-kilometers byfunctional class.SOURCES:Vehicle-kilometers: 1980-90: U.S. Department ofTransportation, Federal Highway Administration, Highway StatisticsSummary to 1995, FHWA-PL-97-009 (Washington, DC: July 1997),table VM-202.
1995-97: Ibid., Highway Statistics (Washington,DC: Annual issues), tables VM-2 and VM-2A.Lane-kilometers: 1980-95: Ibid., Office of HighwayInformation Management, unpublished data, 1997, table HM-260.1996-98: Ibid., Highway Statistics (Washington, DC: Annual issues),table HM-60.
Table 1-30M
KEY: R = revised

372"
Appendix B
Metric C
onversion Tables Table 1-31M U.S. Passenger-Kilometers (Millions)
KEY: N = data do not exist; P = preliminary;R = revised
Continued next page
1960 1965 1970 1975 1980 1985 1990 1995 1996 1997 1998AirAir carrier, certificated,
domestic, all services R50,049 R85,659 R174,521 218,871 R328,899 R447,135 R556,630 R649,996 R699,506 R725,191 745,549General aviationa 3,701 7,081 14,645 18,347 23,657 19,795 R20,922 R17,381 R19,312 20,117 21,404
HighwayR
Passenger carb,c 1,842,177 2,244,722 2,817,801 3,144,930 3,237,988 3,370,971 3,671,550 3,655,326 3,733,228 3,819,037 3,929,311Motorcycleb,c f f 5,274 9,965 19,725 19,009 19,995 18,604 18,825 19,145 19,484Other 2-axle 4-tire vehiclec g g 363,090 584,623 838,106 1,107,378 1,608,950 2,085,147 2,153,524 2,245,380 2,286,261Truck
Single-unit 2-axle 6-tire or more truck 158,603 207,234 43,583 55,693 64,073 73,130 83,527 100,914 103,006 107,654 109,265
Combination truck 46,436 50,960 56,543 75,195 110,527 125,630 151,827 185,801 191,245 200,499 206,252Busd N N N N N 152,767 195,372 219,039 223,918 233,452 238,706 Totalc 2,047,216 2,502,916 3,286,290 3,870,406 4,270,419 4,848,887 5,731,220 6,264,830 6,423,746 6,625,167 6,789,280
TransitMotor busd N N N N R35,068 R34,055 R33,766 R30,285 R30732 R31,550 P33,156Light rail N N N N 613 563 919 1,384 1,540 R1,666 P1,799Heavy rail N N N N R16,991 R16,781 R18,467 R16,993 R18,556 R19,402 P19,769Trolley bus N N N N 352 492 311 301 296 304 P293Commuter railR 6,754 6,643 7,390 7,263 10,487 10,515 11,397 13,267 13,440 12,936 14,027Demand responsived N N N N N 586 694 977 1,056 R1,213 1,629Ferry boat N N N N h h 460 418 412 562 P555Other N N N N 628 707 200 439 560 R505 P639 TotalR i6,754 i6,643 i7,390 i7,263 64,139 63,700 66,213 64,065 66,592 R68,138 P71,867
Rail
Intercity/Amtrake,R 27,462 21,340 9,944 6,326 7,247 7,765 9,748 8,924 8,127 8,314 8,536

Appendix B
Metric C
onversion Tables !373
1985-98: U.S. Department of Transportation, Bureau of Transportation Statistics, Officeof Airline Information, Air Carrier Traffic Statistics (Washington, DC: Annual Decemberissues), page 2, line 1.General aviation: 1960-97: Eno Transportation Foundation, Inc., Transportation inAmerica, 1998 (Washington, DC: 1998), p. 47.Highway:Passenger car and motorcycle: 1960-90: U.S. Department of Transportation, FederalHighway Administration, Highway Statistics Summary to 1995 (updated June 1999),Internet site http://www.fhwa.dot.gov/ohim/summary95/index.html, as of July 28,2000, table VM-201A.1995-98: Ibid., Highway Statistics (Washington, DC: Annual issues), table VM-1, sum ofpassenger car and motorcycle.Motorcycle: 1970-80: U.S. Department of Transportation, Federal Highway Administration,Highway Statistics, Summary to 1985 (Washington, DC: 1986), table VM-201A.1985-98: Ibid., Highway Statistics (Washington, DC: Annual issues), table VM-1.Other 2-axle 4-tire vehicle: 1970-90: U.S. Department of Transportation, Federal HighwayAdministration, Highway Statistics Summary to 1995 (updated June 1999), Internet sitehttp://www.fhwa.dot.gov/ohim/summary95/index.html, as of July 28, 2000, table VM-201A.1995-98: Ibid., Highway Statistics (Washington, DC: Annual issues), table VM-1.Single-unit 2-axle 6-tires or more truck, combination truck, and bus: 1960-90: U.S. Department ofTransportation, Federal Highway Administration, Highway Statistics Summary to 1995(updated June 1999), Internet site http://www.fhwa.dot.gov/ohim/summary95/index.html,as of July 28, 2000, table VM-201A.1995-98: Ibid., Highway Statistics (Washington, DC: Annual issues), table VM-1.Transit:All other data: 1960-98: American Public Transit Association, Transit Fact Book(Washington, DC: 2000), table 30 and similar tables in earlier editions.Rail:Intercity/Amtrak: 1960-80: Association of American Railroads, Railroad Facts(Washington, DC: Annual issues).1985: Amtrak, Amtrak FY95 Annual Report Statistical Appendix (Washington, DC: 1996), p. 4.1990-98: Ibid., Amtrak FY99 Annual Report Statistical Appendix (Washington, DC: 2000), p. 43.
Table 1-31MCont’d U.S. Passenger-Kilometers (Millions)
a All operations other than those operating under 14 CFR 121 and 14 CFR 135.b U.S. Department of Transportation, Federal Highway Administration (FHWA), provides data separately for passenger car and motorcycle in its annual Highway Statistics series.However, the 1995 summary report provides updated data for passenger car and motorcycle combined. Passenger car figures in this table were computed by U.S.Department of Transportation, Bureau of Transportation Statistics by subtracting the most current motorcycle figures from the aggregate passenger car and motorcycle figures.
c In July 1997, FHWA published revised passenger-kilometers data for the highway modes for a number of years. The major change reflected the reassignment of some vehicles from the passenger car category to the other 2-axle 4-tire vehicle category. Passenger-kilometers for passenger car, motorcycle, and other 2-axle 4-tire vehicles were derived by multiplying vehicle-kilometers for these vehicles by average vehicle occupancy rates,provided by the Nationwide Personal Transportation Survey, 1977, 1983, and 1995.
d Motor bus and demand responsive figures are also included in the bus figure for highway.e Amtrak began operations in 1971. Does not include contract commuter passengers.f Included in passenger car.g Included in other single-unit 2-axle 6-tire or more truck.h Ferry boat included in other.i Includes commuter rail figures only.NOTES: Air carrier passenger-kilometers are computed by summing of the products of theaircraft-kilometers flown on each interairport segment multiplied by the number of passengerscarried on that segment. Highway passenger-kilometers are calculated by multiplying vehicle-kilometers of travel as cited by FHWA by the average number of occupants for each vehicletype. Average vehicle occupancy rates are based on various sources, such as the NationwidePersonal Transportation Survey, conducted by the Federal Highway Administration, and theTruck Inventory and Use Survey, conducted by the Bureau of the Census. Transit passenger-kilometers are the cumulative sum of the distances ridden by each passenger. Rail passenger-kilometers represent the movement of 1 passenger for 1 kilometer.SOURCES:Air:Air carrier, domestic, all services: 1960: Civil Aeronautics Board, Handbook of Airline Statistics1969 (Washington, DC: 1970), part III, table 2.1965-70: Ibid., Handbook of Airline Statistics 1973 (Washington, DC: 1974), part III, table 2.1975-80: Ibid., Air Carrier Traffic Statistics (Washington, DC: 1976, 1981), p. 4 (December1976) and p. 2 (December 1981).

1960 1965 1970 1975 1980 1985 1990 1995 1996 1997 1998Air carrier, domestic,
all servicesa 807 1,975 3,955 5,066 6,611 7,528 13,233 18,279 18,777 19,857 20,083
Intercity truck R416,093 R524,131 R601,510 R662,829 R810,286 R890,585 R1,073,082 R1,344,637 R1,419,096 R1,454,135 1,499,394
Class I railb R835,557 R1,018,884 R1,116,602 R1,101,189 R1,341,656 R1,280,375 R1,509,569 R1,906,272 R1,979,690 R1,969,398 2,010,096
Domestic water transportation
Coastwise U R441,709 R525,276 R461,127 d,R921,462 R892,010 R699,523 R642,893 R595,795 R510,762 459,694Lakewise U 110,838 115,946 100,033 90,149 70,347 88,956 87,166 R85,168 90,761 90,013Internal U 160,161 227,487 263,378 R331,915 R339,748 426,886 R447,233 433,307 R429,266 430,541Intraport U 2,392 1,721 1,785 2,331 1,609 1,587 1,971 2,153 2,012 2,016Total domestic water
transportationc U 715,100 870,430 826,322 1,345,856 1,303,714 1,216,953 1,179,263 1,116,424 1,032,801 982,264
Oil pipeline 334,334 446,752 R629,249 R740,207 R858,757 R823,864 R852,771 R877,591 R904,017 R900,075 904,892TOTAL R2,280,481 R2,706,794 R3,222,165 R3,336,043 R4,363,865 R4,305,466 R4,666,080 R5,325,989 R5,438,407 R5,375,628 5,416,507
374"
Appendix B
Metric C
onversion Tables
Intercity truck: 1960-98: EnoTransportation Foundation, Inc., Transportation in America, 1998 (Washington, DC:1999), p. 44.Class I rail: 1960-98: Association of American Railroads, Railroad Facts 1998(Washington, DC: 1999), p. 27.Domestic water transportion: 1965-98: U.S. Army Corps of Engineers, WaterborneCommerce of the U.S. (New Orleans, LA: Annual issues), part 5, section 1, table 1-4, andsimilar tables in earlier editions.Oil pipeline: 1960-70: Eno Transportation Foundation, Inc., Transportation in America,1998 (Washington, DC: 1998), p. 44.1975: Association of Oil Pipe Lines, Shifts in Petroleum Transportation (Washington, DC:Annual issues), table 4.1980-98: Ibid., Shifts in Petroleum Transportation (Washington, DC: Annual issues), table 1.
Table 1-41M U.S. Tonne-Kilometers of Freight (Millions)
a Includes freight, express, and mail revenue tonne-kilometers as reported on U.S. DOT Form 41.
b Revenue tonne-kilometers.c Excludes intraterritorial traffic, for which tonne-kilometers were not compiled.d Reflects startup between 1975 and 1980 of Alaska pipeline and consequent water
transportation of crude petroleum from Alaskan ports to mainland United States for refining.
NOTE: Domestic water transportation numbers may not add to totals due to rounding.SOURCES:Air carrier, domestic, all services: 1960-65: Civil Aeronautics Board, Handbook ofAirline Statistics, 1969 (Washington, DC: 1970).1970-80: Ibid., Air Carrier Traffic Statistics (Washington, DC: Annual issues), p. 2, line 3.1985-98: U.S. Department of Transportation, Bureau of Transportation Statistics, Office ofAirline Information, Air Carrier Traffic Statistics (Washington, DC: Annual issues), p. 2, line 3.
KEY: R = revised; U = data are not available

1960 1965 1970 1975 1980 1985 1990 1995 1996 1997 1998FreightAir carrier 1,534 1,518 1,632 1,741 1,693 1,862 2,235 R1,720 R1,730 R1,453 1,432Trucka 438 417 423 460 584 589 629 669 R686 R700 715Class I rail 742 810 829 871 991 1,070 1,168 1,357 1,355 1,370 1,344Water Coastwise 2,408 2,416 2,429 2,192 3,082 3,174 2,581 2,659 2,456 2,140 2,029 Lakewise 840 795 814 853 863 843 890 827 818 816 813 Internal 454 478 531 576 652 700 756 795 768 750 760 Intraport U U U 26 27 24 21 26 27 24 24Oil Pipeline Crude 523 515 483 1,019 1,402 1,250 1,296 R1,202 R1,254 R1,147 1,109 Petroleum products 433 539 575 830 666 629 626 R632 R632 R632 632
PassengerAir carrier,
938 988 1,091 1,123 1,184 1,220 1,292 1,273 1,291 R1,315 1,308 domestic, scheduledBus, intercity 127 151 171 182 201 195 227 225 230 R232 232Commuter rail 33 34 36 37 37 38 35 39 39 R37 UAmtrakb RN RN RN R380 R348 R372 439 431 414 412 406
Appendix B
Metric C
onversion Tables !375
Oil pipeline: 1960-70: Transportation PolicyAssociates, Washington, DC, personal com-munication.1975-98: Eno Transportation Foundation, Inc., Transportation in America, 1999(Washington, DC: 1999), p. 71.Passenger:Air carrier: U.S. Department of Transportation, Bureau of Transportation Statistics, Officeof Airline Information, Air Carrier Traffic Statistics (Washington, DC: Annual issues).Intercity bus and commuter rail: Eno Transportation Foundation, Inc., Transportation inAmerica, 1999 (Washington, DC: 1999), p. 70.Amtrak: 1970-85: Amtrak, corporate communication, Jan. 26, 1999.1990-98: Amtrak, Amtrak FY99 Annual Report (Washington, DC), statistical appendix, p. III.
Table 1-42M Average Length of Haul, Domestic Freight and Passenger Modes (Kilometers)
a Total Class I and Class II motor carriers of freight (less-than-truckload, specialized carrier for truckload, and others).
b Amtrak began operations in 1971. Data are reported for fiscal years.NOTES: Conversion to Kilometers occurred after the following calculations. Averagelength of haul for freight is calculated by dividing ton-miles in table 1-11 by estimates oftonnage from the various data sources. The calculation of average length of haul for pas-senger trips varies by mode: for air carrier it is calculated by dividing revenue passenger-miles by revenue passenger enplanements; for commuter rail, intercity bus, and Amtrak itis calculated by dividing passenger-miles by number of passengers.SOURCES:Freight:Air carrier, truck: Eno Transportation Foundation, Inc., Transportation In America, 1999(Washington, DC: 1999), p. 71.Class I rail: Association of American Railroads, Railroad Facts (Washington, DC: 1999), p. 36.Water: U.S. Army Corps of Engineers, Waterborne Commerce of the United States, Part 5 (NewOrleans, LA: Annual issues), section 1, Table 1-4.
KEY: N = data do not exist; R = revised;U = data are not available

1960 1965 1970 1975 1980 1985 1990 1995 1996 1997 1998Foreign 307.8 402.5 527.0 679.2 835.9 702.5 944.9 1,040.9 1,073.6 1,107.3 1,129.8 Imports 191.7 244.8 307.8 432.3 469.5 374.4 544.3 610.2 664.6 715.1 762.7 Exports 116.1 157.8 219.2 246.9 366.4 328.1 400.6 430.6 409.0 392.2 367.1Domestic 690.0 752.2 862.5 858.5 977.5 920.0 1,018.1 991.6 998.5 R1,009.3 992.6 Inland 264.0 335.3 428.3 457.2 485.3 485.0 564.8 562.7 564.3 572.0 567.0 Coastal 189.8 182.8 216.3 210.4 299.0 281.0 270.9 241.9 242.6 238.7 226.4 Great Lakes 140.7 139.4 142.5 117.3 104.4 83.4 99.9 105.3 104.2 111.3 110.9 Intraport 94.5 93.3 73.9 71.0 85.4 67.4 78.4 75.4 80.7 81.5 81.7 Intraterritory 0.9 1.3 1.5 2.6 3.3 3.1 4.1 6.2 6.6 5.7 6.5Total 997.8 1,154.8 1,389.5 1,537.7 1,813.4 1,622.4 1,963.0 2,032.5 2,072.1 2,116.6 2,122.4
376"
Appendix B
Metric C
onversion Tables
SOURCE: U.S. Army Corps of Engineers, Waterborne Commerce ofthe U.S. (New Orleans, LA: March 2000). Part 5, section 1.
Table 1-46M U.S. Waterborne Freight (Million metric tons)
NOTE: Beginning in 1996, shipments of fish are excluded from domestic tonnage totals. KEY: R = revised

Appendix B Metric Conversion Tables ! 377
Crude Oil and Petroleum Products Transported in the United States by Mode
a The amount carried by pipeline is based on tonne-kilometers ofcrude and petroleum products for federally regulated pipelines (84%), plus an estimated breakdown of crude and petroleum products for the tonne-kilometers for pipelines not federally regulated (16%).
b The amount carried by motor carriers is estimated.c Reflects the entrance between 1975 and 1980 of the Alaska pipeline,
moving crude petroleum for water transportation to U.S. refineries.
SOURCES: 1975: Association of Oil Pipe Lines, Shifts inPetroleum Transportation (Washington, DC: Annual issues), table 6.1980-98: Ibid., Shifts in Petroleum Transportation (Washington, DC:Annual issues), table 3.
Table 1-51M1975 1980 1985 1990 1995 1996 1997 1998
Crude OilTonne-kilometers (billions)
Pipelinesa 420.5 529.4 488.2 488.8 490.4 493.9 492.6 487.8Water carriers 59.3 c565.6 655.8 425.1 361.6 295.5 215.1 172.1Motor carriersb 2.0 3.6 2.6 2.2 2.5 2.5 2.5 2.3Railroads 2.2 0.7 1.2 1.0 1.2 1.2 0.7 0.7 Total 484.0 1099.3 1147.8 917.2 855.7 793.1 710.9 663.0
% of totalPipelinesa 86.9 48.2 42.5 53.3 57.3 62.3 69.3 73.6Water carriers 12.2 51.4 57.1 46.4 42.3 37.3 30.3 26.0Motor carriersb 0.4 0.3 0.2 0.2 0.3 0.3 0.3 0.4Railroads 0.5 0.1 0.1 0.1 0.1 0.1 0.1 0.1
Refined Petroleum ProductsTonne-kilometers (billions)
Pipelinesa 319.7 329.4 335.6 364.0 387.2 410.1 407.5 417.1Water carriers 375.8 336.4 206.1 230.4 223.7 225.0 216.5 214.8Motor carriersb 38.3 35.5 39.3 41.2 35.9 40.9 38.0 39.0Railroads 18.4 17.5 16.5 19.4 23.2 23.4 23.7 23.7 Total 752.2 718.7 597.6 654.9 670.0 699.3 685.6 694.5
% of totalPipelinesa 66.1 30.0 29.2 39.7 45.2 51.7 57.3 62.9Water carriers 77.6 30.6 18.0 25.1 26.1 28.4 30.5 32.4Motor carriersb 7.9 3.2 3.4 4.5 4.2 5.2 5.3 5.9Railroads 3.8 1.6 1.4 2.1 2.7 2.9 3.3 3.6
Combined Crude and Petroleum Products Tonne-kilometers (billions)
Pipelinesa 740.2 858.8 823.9 852.8 877.6 904.0 900.1 904.9Water carriers 435.1 c902 862.0 655.5 585.3 520.5 431.6 386.9Motor carriersb 40.3 39.1 41.9 43.4 38.4 43.4 40.4 41.3Railroads 20.6 18.2 17.7 20.4 24.2 24.5 24.4 24.4 Total 846.7 1,818.1 1,745.4 1,572.1 1,525.5 1,492.4 1,396.5 1,357.5
% of totalPipelinesa 87.4 47.2 47.2 54.2 57.5 60.6 64.5 66.7Water carriers 51.4 72.4 49.4 41.7 38.4 34.9 30.9 28.5Motor carriersb 4.8 2.2 2.4 2.8 2.5 2.9 2.9 3.0Railroads 2.4 1.0 1.0 1.3 1.6 1.6 1.7 1.8

1960 1965 1970 1975 1980 1985 1990 1995 1996 1997 1998 1999Transportation 10,688 12,524 R16,154 18,580 20,057 20,574 R23,012 R24,478 R25,048 R25,322 R25,998 26,620Industrial 6,067 7,164 8,219 8,599 10,055 8,240 8,778 9,095 9,601 9,823 R9,654 9,981Residential and commercial 3,682 4,083 4,547 4,020 R3,208 2,659 R2,290 2,195 2,321 2,258 R2,079 2,184Electric utilities 579 771 2,237 3,346 2,770 1,155 1,323 694 770 865 1,234 992 Total petroleum demand R21,017 R24,542 R31,157 R34,533 R36,084 R32,628 R35,403 R36,454 R37,730 R38,268 R38,965 39,788Transportation as % of total 50.9 51.0 51.8 53.8 55.6 63.1 65.0 R67.1 R66.4 R66.2 R66.7 66.9
378"
Appendix B
Metric C
onversion Tables
1975-99: Ibid., Monthly Energy Review, Internet sitewww.eia.doe.gov/gov/pub/energy.overview/monthly.energy/, as of May 8, 2000, tables,1.4, 2.3, 2.4, 2.5, and 2.6.
Table 4-3M Domestic Demand for Refined Petroleum Products by Sector (Petajoules)
NOTE: Transportation's share of U.S. petroleum demand in this table differs slightlyfrom table 4-1 because this table takes into account that sectors use various grades ofpetroleum-based fuel that have different Petajoule content per unit volume.SOURCES: 1960-70: U.S. Department of Energy, Energy Information Administration,Annual Energy Review 1997, DOE/EIA-0384(97) (Washington, DC: July 1998), tables 2.1,5.12b, and A3.
KEY: R = revised

1960 1965 1970 1975 1980 1985 1990 1995 1996 1997 1998AirCertificated carriersa
Jet fuel (million liters) 7,397 14,721 29,742 28,610 34,432 38,312 R47,049 48,499 49,922 51,709 52,530General aviationb
Aviation gasoline (million liters) 916 1,105 2,086 1,560 1,968 1,594 1,336 1,045 1,086 R1,105 1,177 Jet fuel (million liters) N 212 787 1,715 2,900 2,616 2,510 2,059 2,150 R2,430 3,085HighwayGasoline, diesel and other fuels
(million liters)Passenger car and motorcycle 155,849 188,222 256,950 281,078 265,683 271,414 264,067 258,424 262,780 R265,335 274,117Other 2-axle 4-tire vehicle N e 46,610 72,229 90,078 103,580 134,802 172,634 179,254 R186,954 191,462Single-unit 2-axle 6-tire or
more truck N 52,420 15,021 20,517 26,206 28,008 31,635 34,886 35,617 R36,249 36,874Combination truck N 25,203 27,815 34,739 49,350 53,015 61,070 74,864 76,439 R76,851 79,872Bus 3,131 3,312 3,104 3,986 3,854 3,157 3,388 3,664 3,748 R3,888 3,971
Transitc
Electricity (million kWh) 2,908 2,584 2,561 2,646 2,446 4,216 4,837 5,068 5,007 R4,988 P5,250
Motor fuel (million liters)Diesel 787 939 1,026 1,382 1,632 2,305 2,464 2,567 2,623 R2,714 P2,650Gasoline and other nondiesel fuelsd 727 469 257 30 42 174 129 231 231 R223 P189Compressed natural gas N N N N N N N 42 57 R91 P117
Rail, Class I (in freight service)Distillate/diesel fuel (million liters) 13,109 13,597 13,419 13,843 14,778 11,773 11,792 13,173 13,548 13,533 13,563AmtrakElectricity (million kWh) N N N 180 254 295 330 304 293 282 275Distillate/diesel fuel (million liters) N N N 238 242 246 310 250 269 284 284Water Residual fuel oil (million liters) 14,960 11,708 14,286 15,369 33,887 17,375 23,947 22,281 21,581 18,965 21,274Distillate/diesel fuel oil (million liters) 2,979 2,468 3,100 4,156 5,595 6,431 7,817 8,854 9,429 9,744 9,823Gasoline (million liters) N N 2,264 2,763 3,982 3,986 4,921 4,013 3,763 3,736 3,619
PipelineNatural gas (million cubic meters) 9,828 14,173 20,449 16,508 17,970 14,265 18,684 19,831 20,146 R21,279 17,995
Appendix B
Metric C
onversion Tables !379
Table 4-5M Fuel Consumption by Mode of Transportation
KEY: kWh = kilowatt-hour; N = data do not exist;P = preliminary; R = revised
Continued next page

380"
Appendix B
Metric C
onversion Tables
Transit:Electricity/motor fuel/compressed natural gas: 1960-98: American Public Transit Association,Transportation Fact Book (Washington, DC: February 1999), tables 65, 66, 67, and similartables in earlier editions.Rail:1960-98: Association of American Railroads, Railroad Facts (Washington, DC: May1999), p. 40.Amtrak:1975-98: Amtrak, State and Local Affairs Department, personal communication.Water:Residual and distillate/diesel fuel oil: 1960-80: American Petroleum Institute, Basic PetroleumData Book (Washington, DC: Annual issues), tables 10, 10a, 12, and 12a.1985-98: U.S. Department of Energy, Energy Information Administration, Fuel Oil andKerosene Sales (Washington, DC: Annual issues), tables 2 and 4, and similar tables in earliereditions.Gasoline: 1970-98: U.S. Department of Transportation, Federal Highway Administration,Highway Statistics (Washington, DC: Annual issues), table MF-24 and similar tables inearlier editions.Pipeline:1960-96: U.S. Department of Energy, Natural Gas Annual 1997 (Washington, DC:October 1998), table 101.1997-98: Ibid., table 1.
Table 4-5MCont’d Fuel Consumption by Mode of Transportation
a Domestic operations only.b Includes fuel used in air taxi operations, but not commuter operations. Data for 1996 are estimated using new information on nonrespondents and are therefore not comparable to earlier years. See the accuracy statement at the end of this chapter for more detailed information.
c Prior to 1984, excludes commuter rail, automated guideway, ferryboat, demand responsivevehicles, and most rural and smaller systems.
d Gasoline and all other nondiesel fuels such as liquefied natural gas, methanol and propane, except compressed natural gas.
e Included in single-unit 2-axle 6-tire or more truck category.SOURCES:Air:Certificated air carriers: 1960-98: U.S. Department of Transportation, Bureau ofTransportation Statistics, Office of Airline Information, Internet sitehttp://www.bts.gov/oai/fuel/fuelyearly.html, as of July 5, 2000.General aviation: 1960-70: U.S. Department of Transportation, Federal AviationAdministration, FAA Statistical Handbook of Aviation - 1972 edition (Washington, DC:1973), table 9.12.1975-97: Ibid., General Aviation and Air Taxi Activity Survey (Washington, DC: Annualissues), table 5.1, and similar tables in earlier editions.1998: Ibid., FAA Aerospace Forecasts Fiscal Years 2000-2011 (Washington, DC: March2000), table 29.Highway:1960-90: U.S. Department of Transportation, Federal Highway Administration, HighwayStatistics, Summary to 1995, FHWA-PL-97-009 (Washington, DC: July 1997), table VM-201A.1995-98: Ibid., Highway Statistics (Washington, DC: Annual issues), table VM-1.

1960 1965 1970 1975 1980 1985 1990 1995 1996 1997 1998AirCertificated carriersa
Jet fuel 278 554 1,119 1,077 R1,213 1,442 R1,770 1,825 1,878 1,946 1,976General aviationb
Aviation gasoline 31 37 70 52 66 53 45 R37 R37 37 39Jet fuel N 8 30 65 109 98 94 R80 R87 R92 116
HighwayGasoline, diesel and other fuels
Passenger car and motorcycle 5,430 6,558 8,952 9,793 R9,257 9,456 9,200 R9,004 9,155 R9,245 9,551Other 2-axle 4-tire vehicle N d 1,624 R2,517 3,138 3,609 R4,697 R6,015 6,245 R6,513 6,671Single-unit 2-axle 6-tire or
more truck N 2,027 581 793 1,013 1,083 1,223 1,349 1,377 1,401 1,425Combination truck N 974 1,075 1,343 1,908 R2,050 2,361 2,894 2,955 R2,971 3,088Bus 121 128 120 154 149 122 131 142 R145 150 153
Transitc
Electricity 10 9 9 10 9 15 17 18 18 18 P19Motor fuel
Diesel 30 36 40 53 63 89 95 100 101 R104 P102Gasoline and other nondiesel
fuelse 25 16 9 1 1 6 4 8 8 8 R6Compressed natural gas N N N N N N N R1 2 3 R4
Rail, Class I (in freight service)
Distillate/diesel fuel 507 526 519 535 571 455 456 509 524 523 524AmtrakElectricity N N N 1 1 1 1 1 1 1 1Distillate/diesel fuel N N N 9 9 10 12 10 10 11 11Water Residual fuel oil 624 489 596 641 1,414 725 999 930 900 791 888Distillate/diesel fuel oil 115 95 120 161 216 249 302 342 365 377 380Gasoline N N 79 96 139 139 171 140 131 130 126PipelineNatural gas 378 544 786 634 690 548 718 762 774 818 691
Appendix B
Metric C
onversion Tables !381
Table 4-6M Energy Consumption by Mode of Transportation (Petajoules)
Continued next page
KEY: kWh = kilowatt-hour; N = data do not exist;P = preliminary; R = revised

382"
Appendix B
Metric C
onversion Tables
1998: Ibid. FAA Aerospace Forecasts Fiscal Years 2000-2011 (Washington, DC: March2000), table 29.Highway:1960-90: U.S. Department of Transportation, Federal Highway Administration,Highway Statistics, Summary to 1995, FHWA-PL-97-009 (Washington, DC: July 1997),table VM-201A.1995-98: Ibid., Highway Statistics (Washington, DC: Annual issues), table VM-1.Transit:Electricity/motor fuel/compressed natural gas: 1960-98: American Public Transit Association,Transportation Fact Book (Washington, DC: February 1999), tables 65, 66, 67, and similartables in earlier editions.Rail:1960-98: Association of American Railroads, Railroad Facts (Washington, DC: May1999), p. 40.Amtrak:1975-98: Amtrak, State and Local Affairs Department, personal communication.Water:Residual and distillate/diesel fuel oil: 1960-80: American Petroleum Institute, BasicPetroleum Data Book (Washington, DC: Annual issues), tables 10, 10a, 12, and 12a.1985-98: U.S. Department of Energy, Energy Information Administration, Fuel Oil andKerosene Sales (Washington, DC: Annual issues), tables 2 and 4, and similar tables in ear-lier editions.Gasoline: 1970-98: U.S. Department of Transportation, Federal Highway Administration,Highway Statistics (Washington, DC: Annual issues), table MF-24 and similar tables inearlier editions.Pipeline:1960-96: U.S. Department of Energy, Natural Gas Annual 1997 (Washington, DC:October 1998), table 101.1997-98: Ibid., table 1.
Table 4-6MCont’d Energy Consumption by Mode of Transportation (Petajoules)
a Domestic operations only.b Includes fuel used in air taxi operations, but not commuter operations.c Prior to 1984, excludes commuter rail, automated guideway, ferryboat, demand responsive vehicles, and most rural and smaller systems.
d Included in other single-unit 2-axle 6-tire or more truck category.e Gasoline and all other nondiesel fuels such as liquefied natural gas, methanol, and propane, except compressed natural gas.
NOTES: The following conversion rates were used:Jet fuel = 37,626,700 joules/ litersCompressed natural gas = 38,657,950 joules/ litersAviation gasoline = 33,501,698 joules/ litersResidual fuel = 41,723,829 joules/ litersAutomotive gasoline = 34,839,537 joules/ litersResidual fuel = 41,723,829 joules/ litersDiesel motor fuel = 38,657,950 joules/ litersNatural gas = 38,413,974 joules/ m3Electricity 1kWh = 3,600,000 joules, negating electrical system loses. To include electricalsystem loses, multiply this conversion factor by approximately 3.SOURCES:Air:Certificated air carriers: 1960-98: U.S. Department of Transportation, Bureau ofTransportation Statistics, Office of Airline Information Internet sitehttp://www.bts.gov/oai/fuel/fuelyearly.html, as of July 5, 2000.General aviation: 1960-80: U.S. Department of Transportation, Federal AviationAdministration, Office of Aviation Policy, Plans, and Management Analysis, FAAStatistical Handbook of Aviation (Washington, DC: Annual issues).1985-97: Ibid., General Aviation and Avionics Survey (Washington, DC: Annual issues), table5.1 and similar tables in earlier editions.

1960 1965 1970 1975 1980 1985 1990 1995 1996 1997 1998Highway 209,820 253,541 324,025 376,094 383,019 391,960 414,614 443,125 452,412 457,800 472,018NonhighwayAgriculture 8,675 7,432 7,313 5,924 4,009 4,091 2,579 3,508 3,475 3,727 3,433Aviationa 5,011 1,898 1,488 1,551 1,563 1,444 1,366 1,389 1,301 1,267 1,329Marine 230 365 2,264 2,762 3,983 3,986 4,923 4,014 3,761 3,737 3,619
Otherb 6,270 6,235 4,087 3,551 4,280 5,639 6,562 3,172 3,124 3,749 4,050 Total nonhighway 20,185 15,930 15,152 13,788 13,834 15,160 15,430 12,083 11,662 12,479 12,431TOTAL demand 230,005 269,471 339,178 389,882 396,854 407,121 430,044 455,209 464,074 470,279 484,449
Appendix B
Metric C
onversion Tables !383
SOURCES:Highway: 1960-95: U.S. Department of Transportation, Federal Highway Administration,Highway Statistics, Summary to 1995 (Washington, DC: 1996), table MF-221.1996-98: Ibid., Highway Statistics (Washington, DC: Annual issues), table MF-21.Nonhighway: 1960-98: Ibid., Highway Statistics (Washington, DC: Annual issues), tableMF-24, and unpublished revisions.
Table 4-7M Domestic Demand for Gasoline (Million liters) by Mode
a Does not include aviation jet fuel.b Includes state, county, and municipal use, industrial and commercial use, construction use, and miscellaneous.
NOTES: All nonhighway uses of gasoline were estimated by the U.S. Department ofTransportation, Federal Highway Administration or data were obtained from othersources. These estimates may not be comparable to data for prior years due to revisedestimation procedures.Numbers may not add to totals due to rounding.

384"
Appendix B
Metric C
onversion Tables
1965-70: Ibid., Handbook of AirlineStatistics 1973 (Washington, DC: 1974), part III, tables 2 and 13.1975-80: Ibid., Air Carrier Traffic Statistics (Washington, DC: December 1976), pp. 4 and14; and (December 1981), pp. 2 and 3.1985-98: U.S. Department of Transportation, Bureau of Transportation Statistics, Officeof Airline Information, Air Carrier Traffic Statistics (Washington, DC: Annual issues,December), pp. 2 and 3, line 27 plus line 50.1999: Ibid., Internet site http://www.bts.gov/programs/oai, as of July 14, 2000.Fuel consumption: 1960-99: U.S. Department of Transportation, Bureau ofTransportation Statistics, Office of Airline Information, Internet sitehttp://www.bts.gov/programs/oai/fuel/fuelyearly.html, as of July 5, 2000.1999: Ibid., Personal communication, July 27, 2000.
Table 4-8M Certificated Air Carrier Fuel Consumption and Travela
a Aircraft operating under 14 CFR 121 and 14 CFR 135.SOURCES:Number of aircraft: 1960-65: U.S. Department of Transportation, Federal AviationAdministration, FAA Statistical Handbook of Aviation, 1970 edition (Washington, DC: 1970),table 5.3.1970-75: Ibid., FAA Statistical Handbook of Aviation, Calendar Year 1979 (Washington, DC:1979), table 5.1.1980-85: Ibid., FAA Statistical Handbook of Aviation, Calendar Year 1986 (Washington, DC:1986), table 5.1.1990-97: Ibid., FAA Statistical Handbook of Aviation, Calendar Year 1997 (Washington, DC:unpublished), personal communication, Mar. 19, 1999.1998-99: Aerospace Industries Association, Aerospace Facts and Figures (Washington DC:Annual Issues), "Active U.S. Air Carrier Fleet".Aircraft-kilometers flown: 1960: Civil Aeronautics Board, Handbook of Airline Statistics1969 (Washington, DC: 1970), part III, tables 2 and 13.
KEY: R = revised; U = data are unavailable
1960 1965 1970 1975 1980 1985 1990 1995 1996 1997 1998 1999Number of aircraft 2,135 2,125 2,679 2,495 3,808 4,678 6,083 7,411 7,478 7,616 R8,111 8,228Average kilometers flown per
aircraft (thousands) 784 1,074 1,528 R1,500 1,236 1,191 1,250 1,222 1,260 1,273 R1,234 1,246
Aircraft-kilometers (millions)Domestic operations 1,381 1,825 3,328 3,135 4,060 4,902 6,378 7,450 7,743 R7,904 8,097 8,330International operations 293 457 764 607 645 668 1,223 1,606 1,679 1,793 1,917 1,926
Fuel consumption (million liters)Domestic operations 7,397 14,721 29,742 28,610 34,432 R38,289 R47,049 48,499 R49,918 51,709 52,530 54,854International operations 2,143 4,845 8,491 7,378 7,336 R9,418 R15,002 R17,076 R17,632 18,791 19,631 19,976
Aircraft-kilometers flown per literDomestic operations 0.19 0.12 0.11 0.11 0.12 0.13 0.14 0.15 0.16 0.15 0.15 0.15
International operations 0.14 0.09 0.09 0.08 0.09 0.07 0.08 0.09 0.10 0.10 0.10 0.10

Appendix B
Metric C
onversion Tables !385
1995-98: Ibid., Highway Statistics (Washington, DC: Annualissues), table VM-1.
Table 4-9M Motor Vehicle Fuel Consumption and Travel
a Includes personal passenger vehicles, buses, and trucks.NOTE: See tables 4-11, 4-12, 4-13, 4-14, and 4-15 for individual highway vehicles.SOURCES: 1960-90: U.S. Department of Transportation, Federal HighwayAdministration, Highway Statistics Summary to 1995, FHWA-PL-97-009 (Washington, DC:July 1997), table VM-201A.
KEY: R = revised
1960 1965 1970 1975 1980 1985 1990 1995 1996 1997 1998
Vehicles registered (thousands)a 73,858 90,358 111,242 137,913 161,490 177,133 193,057 205,427 210,441 211,580 215,496
Vehicle-kilometers traveled (millions)R 1,157,120 1,429,100 1,786,375 2,137,213 2,457,473 2,856,591 3,450,440 3,899,448 4,000,837R4,122,656 4,225,127
Fuel consumed (million liters) 219,100 269,158 349,503 412,549 435,171 459,174 494,962 544,471 557,837 R569,273 586,300
Average kilometers traveled per vehicle(thousands) 15.7 15.8 16.1 15.5 15.2 16.1 17.9 19.0 19.0 19.5 19.6
Average kilometers traveled per liter 5.3 5.3 5.1 5.2 5.6 6.2 7.0 7.2 7.2 7.2 7.2
Average fuel consumed per vehicle(liters) R2,968 2,979 3,142 R2,990 2,695 R2,593 R2,563 2,650 R2,650 R2,691 2,722

386"
Appendix B
Metric C
onversion Tables Table 4-11M Passenger Car and Motorcycle Fuel Consumption and Travel
KEY: R = revised
Continued next page
1960 1965 1970 1975 1980 1985 1990 1995 1996 1997 1998
Vehicles registered (thousands)
Passenger cars 61,671 75,258 89,244 106,706 121,601 127,885 133,700 128,387 129,728 129,749 131,839Motorcycles 574 1,382 2,824 4,964 5,694 5,444 4,259 3,897 3,872 3,826 3,879
Vehicle-kilometers traveled (millions)
Passenger cars 945,000 1,164,000 1,476,000 1,664,000 1,790,000 2,007,000 2,266,000 2,314,000 2,366,000 R2,418,000 2,488,000Motorcycles a a 4,800 9,000 16,400 14,600 15,400 15,800 15,900 R16,200 16,500
Fuel consumed (million liters)
Passenger cars 155,849 188,222 256,723 280,650 264,911 270,725 R263,343 R257,680 262,030 R264,570 273,341Motorcycles a a 227 428 772 689 723 742 750 765 776
Average kilometers traveled per vehicle (thousands)
Passenger cars 15.3 15.5 16.5 15.6 14.7 15.7 16.9 18.0 18.2 18.6 18.9Motorcycles a a 1.7 1.8 2.9 2.7 R2.2 4.1 4.1 R4.2 4.3
Average kilometers traveled per liter
Passenger cars 6.1 6.2 5.7 5.9 6.8 7.4 8.6 9.0 9.0 9.1 9.1Motorcycles a a 21 21 21 21 21 21 21 21 21
Average fuel consumed per vehicle (liters)
Passenger cars 2,527 2,501 2,877 2,630 2,179 2,117 1,970 2,007 2,020 R2,039 2,073Motorcycles a a 80 86 136 127 170 190 194 200 200

Appendix B
Metric C
onversion Tables !387
Motorcycle:Number registered: 1960-90: U.S. Department of Transportation, Federal HighwayAdministration, Highway Statistics Summary to 1995, FHWA-PL-97-009 (Washington, DC:July 1997), table MV-201.1995-98: Ibid., Highway Statistics (Washington, DC: Annual issues), table VM-1.All other motorcycle data: 1970-85: U.S. Department of Transportation, Federal HighwayAdministration, Highway Statistics Summary to 1985, table VM-201A.1990-98: Ibid., Highway Statistics (Washington, DC: Annual issues), table VM-1. Averagekilometers traveled per vehicle, average kilometers traveled per liter, average fuel con-sumed per vehicle: Derived by calculation.
Table 4-11MCont’d Passenger Car and Motorcycle Fuel Consumption and Travel
a Included in passenger car.NOTE: See table 4-12 for other 2-axle 4-tire vehicles.SOURCES:Passenger car:Number registered: 1960-90: U.S. Department of Transportation, Federal HighwayAdministration, Highway Statistics Summary to 1995, FHWA-PL-97-009 (Washington, DC:July 1997), table MV-201.1995-98: Ibid., Highway Statistics (Washington, DC: Annual issues), table VM-1.All other passenger car data: 1960-90: U.S. Department of Transportation, Federal HighwayAdministration, Highway Statistics Summary to 1995, FHWA-PL-97-009 (Washington, DC:July 1997), table VM-201A. For 1970-94, the unrevised motorcycle vehicle-miles and fuelconsumed are subtracted from the combined passenger car and motorcycle vehicle-milesand fuel consumed from VM-201A.1995-98: Ibid., Highway Statistics (Washington, DC: Annual issues), table VM-1.

1970 1975 1980 1985 1990 1995 1996 1997 1998
Number registered (thousands) 3,681 4,232 4,374 4,593 4,487 5,024 R5,265 5,293 5,414
Vehicle-kilometers (millions)R 43,613 55,683 64,052 73,064 83,525 R100,914 R102,945 R107,654 109,265
Fuel consumed (million liters) 15,021 20,517 26,206 28,008 31,635 34,886 R35,450 R36,249 36,874
Average kilometers traveled per vehicle (thousands) 11.8 13.2 R14.6 15.9 18.6 20.1 19.6 20.3 20.2
Average kilometers traveled per liter 2.9 2.7 2.4 2.6 2.6 2.9 2.9 3.0 3.0
Average fuel consumed per vehicle (liters) 4,080 4,848 5,992 6,098 7,050 6,944 R6,734 R6,848 6,810
388"
Appendix B
Metric C
onversion Tables
SOURCES: 1970-90: U.S. Department of Transportation, FederalHighway Administration, Highway Statistics Summary to 1995, FHWA-PL-97-009(Washington, DC: July 1997), table VM-201A.1995-98: Ibid., Highway Statistics (Washington, DC: Annual issues), table VM-1.
Table 4-13M Single-Unit 2-Axle 6-Tire or More Truck Fuel Consumption and Travel
NOTES: In 1995, the U.S. Department of Transportation, Federal HighwayAdministration revised its vehicle categories beginning with 1993 data to include passen-ger cars, other 2-axle 4-tire vehicles, single-unit 2-axle 6-tire or more trucks, and combina-tion trucks. Single-unit 2-axle 6-tire or more trucks are on a single frame with at least 2axles and 6 tires. Pre-1993 data have been reassigned to the most appropriate category.
KEY: R = revised
1995-98: Ibid., Highway Statistics (Washington, DC: Annualissues), table VM-1.
Table 4-14M Combination Truck Fuel Consumption and Travel
SOURCES: 1965-90: U.S. Department of Transportation, Federal HighwayAdministration, Highway Statistics Summary to 1995, FHWA-PL-97-009 (Washington, DC:July 1997), table VM-201A.
KEY: R = revised
1965 1970 1975 1980 1985 1990 1995 1996 1997 1998
Number registered (thousands) 787 905 1,131 1,417 1,403 1,709 1,696 1,747 1,790 1,831
Vehicle-kilometers traveled (millions)R 51,016 56,488 75,157 110,562 125,690 151,761 185,880 191,351 R200,499 206,252
Fuel consumed (million liters) 25,203 27,815 34,739 49,350 53,015 61,070 74,864 76,439 76,821 79,872
Average kilometers traveled per vehicle (thousands) R64.9 62.4 66.5 R78.0 89.6 88.8 109.6 R109.5 112.0 112.6
Average kilometers traveled per liter 2.0 2.0 2.2 2.2 2.4 2.5 2.5 2.5 2.6 2.6
Average fuel consumed per vehicle (liters) 32,044 30,732 30,722 34,831 37,780 35,737 44,148 R43,763 R42,919 43,631

1960 1965 1970 1975 1980 1985 1990 1995 1996 1997R 1998P
Number of vehicles 65,292 61,717 61,298 62,183 75,388 94,368 92,961 115,874 122,362 126,360 128,970Vehicle-kilometers traveled 3,449 3,232 3,030 3,502 3,681 4,492 R5,218 5,713 5,874 6,029 6,328Electric power consumed
(million kWh hours) 2,908 2,584 2,561 2,646 2,446 4,216 4,837 5,068 5,007 4,988 5,250Primary energy consumed
(thousand liters)Diesel 787,744 940,296 1,024,332 1,381,903 1,633,027 2,304,324 2,464,417 2,567,592 2,622,208 2,713,959 2,650,095Gasoline and other
nondiesel fuelsb 726,421 470,148 258,165 28,678 43,154 173,008 128,348 229,888 231,716 225,092 190,804Compressed natural gas N N N N N N N 40,655 57,129 90,494 117,026
Appendix B
Metric C
onversion Tables !389
1995-98: Ibid., Highway Statistics (Washington, DC: Annualissues), table VM-1.
Table 4-15M Bus Fuel Consumption and Travel
NOTE: Includes both publicly and privately owned school, transit, and other commercial buses.SOURCES: 1960-90: U.S. Department of Transportation, Federal HighwayAdministration, Highway Statistics Summary to 1995, FHWA-PL-97-009 (Washington, DC:July 1997), table VM-201A.
KEY: R = revised
Transit Association to AmericanPublic Transportation Association in January 2000. The APTA TransitFact Book changed to the Public Transportation Fact Book in March 2000.SOURCE: American Public Transportation Association, Public Transportation Fact Book(Washington, DC: March 2000), tables 42, 46, 65, 66, 67, and similar tables in earlier edi-tions of the APTA Transit Fact Book.
Table 4-16M Transit Industry Electric Power and Primary Energy Consumptiona and Travel
a Prior to 1985, excludes commuter rail, automated guideway, urban ferryboat, demand responsive vehicles, and most rural and smaller systems.
b For 1995-96, includes propane, liquid petroleum gas, liquefied natural gas, kerosene,and all other nondiesel fuels except compressed natural gas. From 1960 to 1990,includes propane.
NOTE: To convert to joules, use the following energy conversion factors:1kWh=3,600,000 joules, negating electrical system loses. To include electrical system loses,multiply this conversion factor by approximately three; 1 liter of gasoline = 34,839,537joules; 1 liter of diesel fuel=38,657,950 joules. APTA changed from American Public
KEY: kWh = kilowatt hour; N = data do not exist;P = preliminary; R = revised
1960 1965 1970 1975 1980 1985 1990 1995 1996 1997 1998Number registered (thousands) 272 314 378 462 529 593 627 686 695 698 716Vehicle-kilometers traveled (millions)R 6,920 7,564 7,242 9,817 9,817 7,242 9,173 10,300 10,622 R11,011 11,259Fuel consumed (million liters) 3,131 3,312 3,104 3,986 3,854 3,157 3,388 3,664 3,748 R3,888 3,971Average kilometers traveled per vehicle (thousands) 25.4 R24.1 R19.2 21.2 R18.6 R12.2 R14.6 15.0 15.3 R15.8 15.7
Average kilometers traveled per liter 2.2 R2.3 2.3 2.5 2.5 2.3 2.7 2.8 2.8 2.8 2.8Average fuel consumed per vehicleR (liters) 11,504 10,539 8,221 R8,627 R7,291 5,319 R5,406 5,345 R5,394 R5,568 5,549

1960 1965 1970 1975 1980 1985 1990 1995 1996 1997 1998Number in use
Locomotivesa 29,031 27,780 27,077 27,846 28,094 22,548 18,835 18,812 19,269 19,684 20,261Carsb 1,965,486 1,800,962 1,784,181 1,723,605 1,710,827 1,421,686 1,212,261 1,218,927 1,240,573 1,270,419 1,315,667
Kilometers traveled (millions)Freight train-kiliometersc 650 677 687 648 689 559 611 738 754 764 764Locomotive unit-kilometers N N N 2,380 2,464 1,976 2,060 2,326 2,358 2,290 2,317Car-kilometers 45,335 47,212 48,103 44,508 47,117 40,105 42,099 48,897 51,040 50,952 52,556
Average kilometers traveled per vehicle (thousands)Locomotives N N N 85.5 87.7 87.6 109.4 123.6 122.4 116.3 114.4Cars 23.1 26.2 27.0 25.8 27.5 28.2 34.7 40.1 41.1 40.1 39.9
Average kilometers traveled per literTrains 0.05 0.05 0.19 0.05 0.05 0.05 0.05 0.06 0.06 0.06 0.06Cars 3.46 3.47 13.57 3.22 3.19 3.41 3.57 3.71 3.77 3.77 3.87
Fuel consumed (million liters) 13,109 13,597 13,419 13,843 14,778 11,773 11,792 13,173 13,548 13,533 13,563Average fuel consumed
per locomotivea
(thousand liters) 451.5 489.5 495.6 497.1 526.0 522.1 626.0 700.3 703.1 687.5 669.4
390"
Appendix B
Metric C
onversion Tables
Locomotive unit-miles: 1975-90: Ibid., Railroad Ten-Year Trends (Washington, DC: Annual issues).1995-98: Ibid., Analysis of Class I Railroads (Washington, DC: Annual issues), p. 29
Table 4-17M Class I Rail Freight Fuel Consumption and Travel
a For 1960-80, locomotives total includes a small number of steam and electric units,which are not included in the per locomotive fuel consumption figure.
b Includes cars owned by Class I railroads, other railroads, and car companies and shippers.c Based on the distance run between terminals and/or stations; does not include yard or
passenger train-miles.SOURCES:All data except for locomotive unit-miles: Association of American Railroads, RailroadFacts (Washington, DC: October 1999), pp. 33, 34, 40, 48, 50.
KEY: N = data do not exist

PetroleumMotor
gasolineDistillate and
residual fuel oilJet fuel and aviation gas Othera Total Electricity Natural gas
Coal and otherb Total
1989Agriculture 4.7 0.7 0.1 0.2 5.7 1.9 1.5 0.1 9.2Defense 18.9 232.9 793.4 3.9 1,049.1 126.3 114.1 55.2 1,344.6Energy 1.4 3.3 0.5 0.2 5.3 20.3 9.7 11.4 46.7GSA 0.1 0.5 0.0 0.0 0.7 7.8 2.8 2.0 13.4Health and
Human Services 0.2 2.0 0.0 0.1 2.4 2.6 1.9 0.1 7.1Interior 2.0 1.3 0.2 1.2 4.7 1.6 1.1 0.1 7.5Justice 2.0 0.3 0.2 0.0 2.6 1.8 2.6 1.2 8.1NASA 0.2 1.1 1.5 0.0 2.7 6.8 3.0 0.3 12.8Postal Service 9.3 4.9 0.0 0.2 14.3 12.0 5.0 0.6 32.0Transportation 0.8 5.9 7.3 0.1 14.1 4.2 1.2 0.0 19.5Veterans Affairs 0.5 2.5 0.0 0.0 3.2 8.2 15.1 1.3 27.6Otherc 3.2 3.3 1.3 0.0 7.7 5.3 2.8 0.6 16.5 Total 43.4 258.6 804.5 6.0 1,112.5 198.9 160.8 73.0 1,545.2
1999P
Agriculture 3.5 0.1 0.0 0.1 3.7 2.0 2.1 0.5 8.2Defense 14.2 151.3 460.9 1.8 628.2 104.1 90.7 32.2 855.4Energy 1.1 1.2 0.0 0.1 2.4 16.6 7.1 5.0 31.0GSA 0.1 0.1 0.0 0.0 0.2 10.0 3.4 1.6 15.1Health and
Human Services 0.4 0.3 0.0 0.1 0.9 3.0 3.5 0.1 7.4Interior 3.0 0.8 0.1 0.7 4.7 1.6 1.5 0.1 7.9Justice 5.1 0.4 1.6 0.0 7.1 4.0 4.7 0.4 16.2NASA 0.2 0.4 1.2 0.0 1.9 6.8 3.2 0.2 12.0Postal Service 11.0 5.3 0.0 0.0 16.2 17.2 7.9 0.6 42.0Transportation 0.8 6.9 4.6 0.0 12.3 8.2 1.1 0.0 21.6Veterans Affairs 1.3 1.2 0.0 0.0 2.4 9.9 15.1 1.6 29.0
Otherd 2.5 3.3 0.9 0.0 6.8 14.0 5.1 0.6 26.5 Total 43.4 171.2 469.2 3.1 686.9 197.5 145.2 42.7 1,072.3
Appendix B
Metric C
onversion Tables !391
Table 4-19M U.S. Government Energy Consumption by Agency and Source (Petajoules)
KEY: GSA = General Services Adminstration; NASA = National Aeronautics and Space Administration; P = preliminary
Continued next page

392"
Appendix B
Metric C
onversion Tables
NOTES: Numbers may not add to totals due to rounding. These data include energyconsumed at foreign installations and in foreign operations, including aviation and oceanbunkering, primarily by the U.S. Department of Defense. U.S. government energy usefor electricity generation and uranium enrichment is excluded. Other energy used by U.S.agencies that produce electricity or enriched uranium is included. The U.S. government'sfiscal year runs from October 1 through September 30. This table uses a conversionfactor for electricity of 3,600,000 joules per kilowatt-hour, and a conversion factor forpurchased steam of 2,326 Kilojoules per kilogram.SOURCE: U.S. Department of Energy, Energy Information Administration, AnnualEnergy Review 1999, DOE/EIA-0384(99) (Washington, DC: July 2000), table 1.13.Internet site http://www.eia.doe.gov/emeu/aer/ as of June 27, 2000.
Table 4-19MCont’d U.S. Government Energy Consumption by Agency and Source (Petajoules)
a Includes liquefied petroleum gases.b Includes purchased steam, coal, and other.c Includes U.S. Department of Commerce, Panama Canal Commission, Tennessee Valley
Authority, U.S. Department of Labor, U.S. Department of Housing and Urban Development, Federal Communications Commission, Office of Personnel Management,U.S. Department of State, Small Business Administration, National Science Foundation,U.S. Department of Treasury, and Environmental Protection Agency.
d Includes National Archives and Records Administration, U.S. Department ofCommerce, U.S. Department of Labor, U.S. Department of State, Environmental Protection Agency, Federal Communications Commission, Federal Trade Commission,Panama Canal Commission, Equal Employment Opportunity Commission, Nuclear Regulatory Commission, Office of Personnel Management, U.S. Department of Housingand Urban Development, U.S. Department of Treasury, Tennessee Valley Authority,Railroad Retirement Board, U.S. Information Agency, and Federal Emergency Management Agency.

1960 1965 1970 1975 1980 1985 1990 1995 1996 1997 1998
AirR
Certificated air carrier Domestic operations 5,664 6,639 6,682 5,082 3,757 3,311 3,236 2,875 2,744 2,720 2,705 International operations 6,036 6,753 7,208 5,554 5,817 3,348 2,983 2,738 2,695 2,735 2,807
Highwayb
Passenger car R2,949 R2,923 R3,176 R3,112 R2,853 R2,800 R2,501 R2,441 R2,429 R2,399 2,409Other 2-axle 4-tire vehicle N N R4,468 R4,311 R3,746 R3,261 R2,920 R2,978 R2,992 R2,994 3,012Motorcycle a a R1,640 R1,544 R1,394 R1,244 R1,306 R1,461 R1,476 R1,506 1,529
Transit motor bus N N N N R1,799 R2,228 R2,443 R2,726 R2,753 R2,774 P2,447
Amtrak N N N R1,563 R1,420 R1,374 1,354 R1,206 R1,409 R1,443 1,403
Appendix B
Metric C
onversion Tables !393
1995-98: Ibid., HighwayStatistics (Washington, DC: Annual issues), table VM-1.Other 2-axle 4-tire vehicle: 1970-90: Ibid., Highway Statistics Summary to 1995, FHWA-PL-97-009 (Washington, DC: July 1997), table VM-201A.1995-98: Ibid., Highway Statistics (Washington, DC: Annual issues), table VM-1.Motorcycle: 1970-85: Ibid., Highway Statistics Summary to 1985, FHWA-PL-97-009(Washington, DC: July 1997), table VM-201A.1990-98: Ibid., Highway Statistics (Washington, DC: Annual issues), table VM-1.Transit motor bus:1980-98: American Public Transit Association, Public Transportation Fact Book(Washington, DC: 2000), tables 30, 42, and 65.Amtrak:1975-90: Amtrak, State and Local Affairs Department, personal communication.1995-98: Ibid., Personal communication, June 25, 1999.
Table 4-20M Energy Intensity of Passenger Modes (Thousand joules per passenger-kilometer)
a Included in passenger car.b Energy intensity for highway vehicles may not match similar values in table 4-22 due to
rounding error.NOTE: To calculate total joules multiply fuel consumed by 37,626,700 joules/liter for aircarrier and 34,839,537 joules/liter for passenger car, other 2-axle 4-tire vehicle, and motor-cycle, and 90,999,114 for transit motor bus and Amtrak.SOURCES:Air:Certificated air carriers:Passenger-miles: 1960-99: Air Transport Association, Internet site http://www.air-trans-port.org/public/industry, as of July 5, 2000.Fuel consumed: 1960-99: U.S. Department of Transportation, Bureau of TransportationStatistics, Office of Airline Information, Internet site http://www.bts.gov/oai/fuel/fue-lyearly.html, as of July 5, 2000.Highway:Passenger car: 1960-90: U.S. Department of Transportation, Federal HighwayAdministration, Highway Statistics Summary to 1995, FHWA-PL-97-009 (Washington, DC:July 1997), table VM-201A.
KEY: N = data do not exist; P = preliminary; R = revised

394"
Appendix B
Metric C
onversion Tables Table 4-21M Energy Intensity of Certificated Air Carriers, All Servicesa
KEY: R = revised
Continued next page
1960 1965 1970 1975 1980 1985 1990 1995 1996 1997 1998 1999Aircraft-kilometers
(millions)Domestic operations 1,381 1,825 3,328 3,135 4,060 4,902 6,378 7,450 7,743 R7,904 8,097 8,330International operations 293 457 764 607 645 668 1,223 1,606 1,679 1,793 1,917 1,926
Available seat-kilometers (millions)R
Domestic operations 84,040 152,545 343,048 388,306 556,879 717,489 906,167 971,912 1,008,077 1,030,495 1,045,178 1,105,525International operations 21,480 47,529 83,622 99,335 139,220 164,094 274,088 326,955 335,842 349,088 361,665 371,613
Passenger-kilometers (millions)R
Domestic operations 49,177 83,504 167,609 211,996 322,335 435,464 547,550 635,222 684,932 712,361 733,539 771,986International operations 13,367 27,019 44,358 50,022 87,489 105,926 189,412 234,881 246,338 258,749 263,379 276,660
Fuel consumed (million liters)
Domestic operations 7,397 14,721 29,742 28,610 34,432 R38,289 R47,049 48,499 R49,918 51,709 52,530 54,518International operations 2,143 4,845 8,491 7,378 7,336 R9,418 R15,002 R17,076 R17,632 18,791 19,631 19,873
Seats per aircraftR
Domestic operations 60.9 83.6 103.1 123.9 137.1 146.4 142.1 130.5 130.2 131.1 129.1 132.7International operations 73.3 104.0 109.4 163.7 215.7 245.7 224.1 203.6 200.1 194.7 188.7 192.9
Seat-kilometer per literR
Domestic operations 11 10 12 14 16 19 19 20 20 20 20 20International operations 10 10 10 13 19 17 18 19 19 19 18 19
Energy intensiveness (1000 Joules/passenger-kilometer)b, R
Domestic operations 5,664 6,639 6,682 5,082 4,022 3,311 3,236 2,875 2,744 2,720 2,705 2,659International operations 6,036 6,753 7,208 5,554 3,158 3,348 2,982 2,738 2,695 2,735 2,807 2,705
Load factor (%)Domestic operations R58.5 R54.7 R48.9 R54.6 R58.0 R60.7 R60.4 R65.4 67.9 69.1 70.2 69.8International operations R62.2 R56.8 R53.0 54.4 R62.8 R64.6 R69.1 71.8 73.3 74.1 R72.8 74.4

Appendix B
Metric C
onversion Tables !395
SOURCES:Aircraft-kilometers, available seat-kilometers, passenger-kilometers, and load factor:1960-80: Air Transport Association, Internet site http://www.air-transport.org/public/industry, as of July 5, 2000.1985-98: U.S. Department of Transportation, Bureau of Transportation Statistics, Office ofAirline Information, Air Carrier Traffic Statistics (Washington DC: Annual December issues).Fuel consumed: 1960-99: U.S. Department of Transportation, Bureau ofTransportation Statistics, Office of Airline Information, Internet sitehttp://www.bts.gov/oai/fuel/fuelyearly.html, as of July 5, 2000.Seats per aircraft, seat-kilometers per liter, and energy intensiveness: Derived by calculation.
Table 4-21MCont’d Energy Intensity of Certificated Air Carriers, All Servicesa
a U.S. owned carriers only. Operation of foreign-owned carriers in or out of the United States not included.
b Calculation based on unrounded figures not shown here.NOTES: Aircraft-kilometers includes all four air-carrier groups (majors, nationals, largeregionals, and medium regionals), scheduled and charter, passenger, and all-cargo. Fuelconsumed includes majors, nationals, and large regionals, scheduled and charter, passenger,and all-cargo. Passenger-kilometers includes all four air-carrier groups, scheduled andcharter, passenger service only. International operations include operations outside theUnited States, including those between the United States and foreign countries and theUnited States and its territories or possessions.Domestic and international load factor values for 1999 are derived by calculation.Heat equivalent factor used for joules conversion is 37,626,700 joules/liter.

1960 1965 1970 1975 1980 1985 1990 1995 1996 1997 1998Vehicle-kilometers
(millions)Passenger car R944,687 R1,163,558 R1,475,771 R1,664,065 R1,789,594 R2,006,856 R2,265,961 R2,314,241 R2,365,740 R2,418,849 2,488,050Other 2-axle 4-tire vehicle N N R197,950 R323,479 R468,320 R629,255 R925,375 R1,271,384 R1,314,836 R1,369,554 1,393,695Motorcycle b b 4,828 9,012 16,415 14,645 15,450 15,772 15,933 16,254 16,576
Passenger-kilometers (millions)a
Passenger car R1,842,702 R2,245,039 R2,817,967 R3,144,664 R3,238,006 R3,369,973 R3,672,530 R3,680,577 R3,761,044 R3,844,730 3,955,775Other 2-axle 4-tire vehicle N N 363,712 R584,193 R838,470 R1,107,231 R1,609,347 R2,021,340 R2,088,932 R2,177,446 2,216,071Motorcycle b b 4,828 9,656 19,312 19,312 19,312 R17,703 R17,703 R17,703 17,703
Fuel consumed (million liters)
Passenger car 155,849 188,222 256,723 280,650 264,911 270,725 263,344 257,681 262,030 R264,570 273,341Other 2-axle 4-tire vehicle N N 46,610 72,229 90,078 103,580 134,802 172,634 179,254 R186,954 191,462Motorcycle b b 227 428 772 689 723 742 750 765 776
Energy intensiveness (1,000 Joules/passenger-kilometer)R
Passenger car 2,947 2,921 3,174 3,109 2,850 2,799 2,498 2,439 2,427 2,397 2,407Other 2-axle 4-tire vehicle N N 4,465 4,308 3,743 3,259 2,918 2,975 2,990 2,991 3,010Motorcycle a a 1,639 1,543 1,393 1,243 1,304 1,460 1,475 1,505 1,527
396"
Appendix B
Metric C
onversion Tables Table 4-22M Energy Intensity of Passenger Cars, Other 2-Axle 4-Tire Vehicles, and Motorcycles
KEY: N = data do not exist; R = revised
Continued next page

Appendix B
Metric C
onversion Tables !397
1995-98: Ibid., Highway Statistics (Washington, DC: Annual issues), table VM-1.Other 2-axle 4-tire vehicle: 1960-90: Ibid., Highway Statistics, Summary to 1995, FHWA-PL-97-009 (Washington, DC: July 1997), table VM-201A.1995-98: Ibid., Highway Statistics (Washington, DC: Annual issues), table VM-1.Motorcycle: 1970-85: Ibid., Highway Statistics, Summary to 1985 (Washington, DC: 1986),table VM-201A. For 1970-90, the unrevised motorcycle vehicle-kilometers are subtract-ed from the combined passenger car and motorcycle vehicle-kilometers from VM-201A.1990-98 Ibid., Highway Statistics (Washington, DC: Annual issues), table VM-1.Passenger-kilometers:Passenger-kilometers multiplied by vehicle occupancy rates.Fuel consumed:1960-90: U.S. Department of Transportation, Federal Highway Administration, HighwayStatistics Summary to 1995, FHWA-PL-97-009 (Washington, DC: July 1997), table VM-201A. For 1970-90, the unrevised motorcycle fuel consumed is subtracted from thecombined passenger car and motorcycle fuel consumed from VM-201A.1995-98: Ibid., Highway Statistics (Washington, DC: Annual issues), table VM-1.
Table 4-22MCont’d Energy Intensity of Passenger Cars, Other 2-Axle 4-Tire Vehicles, and Motorcycles
a Passenger-kilometers are derived by multiplying vehicle-kilometers by an average occupancy rate for that vehicle type based on data provided by the Federal Highway Administration, Nationwide Personal Transportation Survey, 1977, 1983, 1995. Average vehicle occupancy rates are as follows: passenger car (1960-97): 1.95, 1.93, 1.91, 1.89,1.81, 1.68, 1.62, 1.62, 1.61, 1.61, 1.60, 1.59, 1.59, 1.59; other 2-axle 4-tire vehicle (1960-97): 1.87, 1.85, 1.83, 1.81, 1.79, 1.76, 1.74, 1.72, 1.70, 1.68, 1.66, 1.64, 1.64, 1.64; motorcycle(1960-97): 1.1, 1.1, 1.1, 1.1, 1.2, 1.3, 1.3, 1.27, 1.25, 1.23, 1.21, 1.18, 1.18, 1.18.
b Included in passenger car.NOTES: In 1995, the U.S. Department of Transportation, Federal HighwayAdministration revised its vehicle type categories for 1993 and later data. These new cate-gories include passenger car, other 2-axle 4-tire vehicle, single-unit 2-axle 6-tire or moretruck, and combination truck. Other 2-axle 4-tire vehicle includes vans, pickup trucks,and sport utility vehicles. In previous years, some minivans and sport utility vehicles wereincluded in the passenger car category. Single-unit 2-axle 6-tire or more trucks are on asingle frame with at least 2 axles and 6 tires. Pre-1993 data have been reassigned to theclosest available category.The heat equivalent factor used for joules conversion is 34,839,537 joules/liter.SOURCES:Vehicle-kilometers:Passenger car: 1960-90: U.S. Department of Transportation, Federal HighwayAdministration, Highway Statistics Summary to 1995, FHWA-PL-97-009 (Washington, DC:July 1997), table VM-201A.

398 " Appendix B Metric Conversion Tables
Average Fuel Efficiency of U.S. Passenger Cars, Light Trucks, and Light-Duty VehiclesTable 4-23M
New vehicle fuel efficiency (based on model year produc-tion): 1980-99: U.S. Environmental Protection Agency, final fueleconomy calculations for the U.S. Department of Transportation,National Highway Traffic Safety Administration, as cited inInternet site www.nhtsa.dot.gov/cars/problems/fuelecon/index.html.1995-99: Manufacturer's preliminary estimates for the U.S.Department of Transportation, National Highway Traffic SafetyAdministration, as cited in Internet sitewww.nhtsa.dot.gov/cars/problems/fuelecon/index.html.CAFE standards: 1980-99: U.S. Department of Transportation,National Highway Traffic Safety Administration, as cited inInternet site www.nhtsa.dot.gov/cars/problems/fuelecon/index.html.
aAssumes 55% city and 45% highway-kilometers. The source calcu-lated average kilometers per liter for light-duty vehicles by taking the reciprocal of the sales-weighted average of liters per kilometer.This is called the harmonic average.
b 2 Wheel Drive/4 Wheel Drive. No combined figure available forthis year.
NOTE: The fuel efficiency figures for light duty vehicles repre-sent the sales-weighted harmonic average of the combined passen-ger car and light truck fuel economies.SOURCES:Average U.S. passenger car fuel efficiency: 1980-90: U.S.Department of Transportation, Federal Highway Administration,Highway Statistics Summary to 1995, FHWA-PL-97-009 (Washington,DC: July 1997), table VM-201A.1995-98: Ibid., Highway Statistics (Washington, DC: Annual issues),table VM-1.
KEY: CAFE = Corporate Average Fuel Economy;GVWR = gross vehicle weight rating;kpl = kilometers per liter; R = revised; U = data are unavailable
Average U.S. passenger car fuel efficiency (kpl) (calendar year)R
Passenger carOther 2-axle 4-tire vehicle
New vehicle fuel efficiency (kpl)a
(model year)R
Light-duty vehicle (passenger cars plus light trucks)DomesticImported
Passenger carDomesticImported
Light truck (<3,865 lbs GVWR)DomesticImported
CAFE standards (kpl)a
(model year)R
Passenger carLight truck
1980
6.85.2
9.112.2
9.612.6
7.110.3
8.56.8/6.0b
1985
7.46.1
10.212.9
11.213.4
8.311.3
11.78.3
1990
8.66.8
10.212.1
11.412.7
8.69.8
11.78.5
1995
9.07.4
10.111.9
11.812.9
8.69.1
11.78.8
1996
9.07.3
10.211.8
12.012.6
8.79.4
11.78.8
1997
9.17.3
9.911.7
11.812.8
8.69.4
11.78.8
1998
9.27.3
9.911.7
11.912.7
8.79.7
11.78.8
1999
9.17.3
10.111.4
12.012.1
8.79.6
11.78.8

Appendix B
Metric C
onversion Tables !399
SOURCE: American Public TransportationAssociation, Public Transportation Fact Book (Washington, DC: March 2000), tables 65 and79, and similar tables in earlier editions of the APTA Transit Fact Book.
Table 4-24M Energy Intensiveness of Transit Motor Buses
NOTES: Heat equivalent factor used for joules conversion is 38,657,950 joules/liter.APTA changed from American Public Transit Association to American PublicTransportation Association in January 2000. The APTA Transit Fact Book changed to thePublic Transportation Fact Book in March 2000.
KEY: N = data do not exist; R = revised
SOURCE: Association of American Railroads, Railroad Facts (Washington, DC:October 1999), pp. 34, 37, and 40.
Table 4-25M Energy Intensity of Class I Railroada Freight Service
a Class I railroads are those that have operating revenues of $255 million or more.
1960 1965 1970 1975 1980 1985 1990 1995 1996 1997 1998Vehicle-kilometers (millions) 2,536 2,459 2,268 2,456 2,699 2,998 3,428 3,515 3,484 3,713 3,687Passenger-kilometers (millions)R N N N N 35,084 34,118 33,796 30,256 30,739 32,831 33,157Fuel consumed (million liters diesel) 787 939 1,026 1,382 1,632 1,961 2,131 2,135 R2,184 R2,260 2,097Energy intensiveness
(1,000 Joules/passenger-kilometer)R N N N N 1,798 2,222 2,438 2,728 2,747 2,661 2,445
1960 1965 1970 1975 1980 1985 1990 1995 1996 1997 1998Revenue freight tonne-kilometers
(millions) R835,557 R1,018,884 R1,116,602 R1,101,189 R1,341,656 R1,280,375 R1,509,569 R1,906,272 R1,979,690 R1,969,398 2,010,096Car-kilometers (millions) 45,335 47,212 48,103 44,508 47,117 40,105 42,099 48,897 51,040 50,952 52,556Tonnes per car load 40 44 50 55 61 61 60 59 60 57 58Fuel consumed (million liters) 13,109 13,597 13,419 13,843 14,778 11,773 11,792 13,173 13,548 13,533 13,563Energy intensiveness
(1000 Joules/revenue freight tonne-kilometer) R607 516 465 486 426 355 302 267 265 266 261
Energy intensiveness (1000 Joules/car-kilometer) 11,178 11,134 R10,785 12,024 12,125 11,348 10,828 10,415 10,261 10,268 9,977

Source andAccuracy Profiles
appendix c

Appendix C Source and Accuracy Profiles ! 403
TABLE 1-1. System Mileage Within theUnited States
HighwayThe Highway Performance Monitoring System
(HPMS) is the source of road mileage data and isconsidered reliable. (See box 1-1 for detailedinformation about the HPMS.) The FederalHighway Administration (FHWA) of the U.S.Department of Transportation (USDOT) collectsand reviews state-reported HPMS data for com-pleteness, consistency, and adherence to specifica-tions. Some inaccuracy may arise from variationsacross states in their adherence to federal guide-lines in the Traffic Monitoring Guide and theHighway Performance Monitoring System FieldManual for the Continuing Analytical and Statis-tical Database.
Beginning with the 1997 issue of HighwayStatistics, FHWA instituted a new method for cre-ating mileage-based tables derived from theHPMS. Previously, adjustments to tables devel-oped from sample data were made using area-widemileage information provided by states. Theseadjustments are now being made using universetotals from the HPMS dataset. In addition, FHWAhas discontinued the process of spreading round-ing and other differences across table cells. Thus,users may note minor differences in table-to-tabletotals. FHWA considers mileage totals from tableHM-20, “Public Road Length, Miles by FunctionalSystem” to be the controlling totals should a sin-gle value be required.
Reliability may be diminished for comparisonswith pre-1980 data, which were collected via dif-ferent methods and special national studies. Forinstance, pre-1980 mileage data included some
nonpublic roadways (95,000 miles in 1979) whilepost-1980 data reports only public road mileage(roads or streets governed and maintained by apublic authority and open to public travel).
Class I RailThese data are from Railroad Facts, published
annually by the Association of American Railroads(AAR). AAR data are based on 100-percentreporting by Class I railroads to the SurfaceTransportation Board (STB) via Schedule 700 ofthe R1 Annual Report. The STB defines Class Irailroads as having operating revenues at or abovea threshold indexed to a base of $250 million(1991) and adjusted annually in concert withchanges in the Railroad Freight Rate Index pub-lished by the Bureau of Labor Statistics. In 1998,the threshold for Class I railroads was $259.4 mil-lion. Declassification from Class I status occurswhen a railroad falls below the applicable thresh-old for three consecutive years. Although Class Irailroads represent only 2 percent of railroads inthe country, they account for over 70 percent ofthe industry’s mileage.
To obtain railway mileage, AAR subtractstrackage rights from miles of rail traveled on line57 in the Schedule 700 report. Historical reliabil-ity may vary due to changes in the railroad indus-try, including bankruptcies, mergers, anddeclassification by the STB. Small data errors mayalso exist because of because of independentrounding of this series by AAR.
AmtrakThese statistics originate from the Statistical
Appendix to Amtrak’s Annual Report. Amtrakestimates track mileage based on point-to-point
Data Source and
Accuracy Statements
Chapter 1 Extent, Condition, and Performance

404 " Appendix C Source and Accuracy Profiles
Box 1-1. Highway Performance Monitoring SystemSampling Frame Construction
The Highway Performance Monitoring System (HPMS) sample is a stratified simple random sample of highway links (small sec-tions of roadway) selected from state inventory files. The 1997 sample consists of about 120,000 samples. Each state maintains anindependent inventory of highway road links for those roads that the state is responsible for (in some cases this can be a low percent-age of total road miles within the state). Lower jurisdictions (MPO’s, counties, cities, national parks, Indian reservations, etc.) may alsomaintain inventories of highway links under their jurisdiction. The HPMS sample was originally selected in 1978 based on guidelinesprovided by the FHWA for sampling highway systems excluding those roads functionally classified as local. The sampling frame for thestate systems were the state inventories. The estimates represent the highway systems of each state. The HPMS sample was designedas a fixed sample to minimize data collection costs but adjustments to maintain representativeness are carried out periodically. TheHPMS also consists of universe reporting (a complete census) for the Interstate and the National Highway System, and tabular summaryreporting of limited information. A small number of data items (about 30) are reported for the complete universe. The universe infor-mation contains no sampling error. There are 4 tables reported as part of the summary.
StratificationThe HPMS sample (and universe) is stratified by state, type of area (rural, urban, and individual urbanized areas), highway func-
tional classification, and traffic (annual average daily traffic (AADT) volume groups). Complete information is provided in the HPMSField Manual.
WeightingThe HPMS sample expansion factors are the ratio of universe mileage to sample mileage in each strata.
Data CollectionData are collected independently by the 50 states, metropolitan planning organizations (MPOs), and lower jurisdictions. Many of
the geometric data items rarely change, such as number of lanes. Others change frequently, such as traffic. Typically, the states main-tain data inventories that are the repositories of a wide variety of data items. The HPMS data items are extracted from these inventories.For example, each State has a traffic volume counting program. Typically, equipment is installed or placed on the roads to measuretraffic. The counts are then converted to annual average daily traffic (AADT) and stored in the state databases. AADT is one of the sam-ple and universe items extracted from the inventories and reported to the HPMS. The FHWA provides guidelines for data collection inthe HPMS Field Manual, which the states follow to varying extents depending on issues such as staff, resources, state perspective, usesof the data, state/MPO/local needs for data, etc. Traffic data collection, for example, is an expensive and dangerous undertaking, par-ticularly in high volume urban areas.
State departments of transportation report HPMS data annually to the FHWA. There are about 80 data items reported for the sam-ple component. The reporting deadline is June 15. Except for special cases where major problems occur, data items are reported foreach sample. There is no provision for nonresponse since a number is available for each section in the state inventories; however, statesdo leave items blank to indicate that no data collection has taken place for a specific item (e.g., if no system to measure pavement hasbeen implemented in the state, the pavement condition item may be left blank.) The HPMS has gone through a major restructuring effort,and major data item reductions, modifications, and other changes will begin to be implemented with the 1999 data reported by June 15,2000.
Sampling ErrorThe sample size is estimated based on traffic volume (AADT) within each stratum. Traffic volume is the most variable data item.
Sampling error can be estimated directly based on the sample design for each stratum and aggregated by stratified random sample meth-ods to total values. This exercise was done originally in 1980 for some of the most variable data items including vehicle-miles traveled.It has not been repeated since due to the work involved and the limited impact of sampling error as compared to nonsampling error.

city timetables that railroad companies provide forengineers. The figures are estimates, but are con-sidered reliable.
TransitThese figures are based on information in the
U.S. Department of Transportation, FederalTransit Administration (FTA), National TransitDatabase. Section 15 of the Federal Transit Actrequires federally funded transit agencies to pro-vide detailed financial and operating data, includ-ing vehicle inventories and directly operatedmileage. Transit operators that do not report toFTA are those that do not receive federal funding,typically private, small, and rural operators. Thedata are generally considered accurate becauseFTA reviews and validates information submittedby individual transit agencies. Reliability may varybecause some transit agencies cannot obtain accu-rate information or may misinterpret certain datadefinitions.
Navigable ChannelsThese statistics originate from a mid-1950s
U.S. Army Corps of Engineers (USACE) estimatethat there were approximately 25,000 miles ofcommercially important navigable channels in theUnited States. That number has been adjustedfrom time to time, for example, by addition of the234-mile Tennessee-Tombigbee Waterway in the
early 1980s. The 25,000 plus mile number hasbeen universally quoted for decades, but has defi-nitional and methodological uncertainties.USACE is currently developing a rigorous, GlobalInformation System (GIS)-based approach to facil-itate tabulation of the lengths of shallow and deep-draft commercially navigable waterways in theUnited States; this calculation will be available inseveral years.
Oil PipelineThe data are from Transportation in America,
published by the Eno Transportation Foundation,Inc. (Eno). The numbers reprinted here for 1960,1965, 1970, and 1975 are Eno estimates from theU.S. Department of Energy (DOE) Energy DataReport issues labeled “Crude-oil and RefinedProducts Mileage in the United States.” Eno esti-mated the 1980 number based on the assumptionthat refinement of old, less profitable, and smallerlines exceeded in mileage the construction of new,larger, and more profitable lines. Post-1985 datawere calculated using a base figure reported in a1982 USDOT study entitled Liquid PipelineDirector and then combined with data from theAssociation of Oil Pipe Lines and the Oil PipelineResearch Institute. Lack of additional informationraises definitional and methodological uncer-tainties for the data’s reliability. Moreover, thethree different information sources introduce data
Appendix C Source and Accuracy Profiles ! 405
Nonsampling ErrorThis is a major item of concern for the HPMS. For some of the most variable and important data items, such as AADT, guidelines
for measurement and data collection have been produced. States have the option of using the guidelines or using their own procedures.Many data items are difficult and costly to collect and are reported as estimates not based on direct measurement. The data are collectedand reported by many entities and individuals within the responsible organizations. Most do a reasonably good job, but staff turnover,cost, equipment issues, etc., can create difficulties identifying data problems. As mentioned before, a response is usually provided foreach link as included in state inventories. Measurement errors are unknown, but the difficulty of collecting some of the data items iswell known. For highway links not the responsibility of states, metropolitan planning organizations and lower jurisdictions using a widevariety of methods may collect the data. This a major area of concern and efforts are underway within States to standardize data collec-tion. The major effort with the HPMS is to insure the collection and reporting of reliable annual data. The FHWA field offices in eachstate conduct annual verification of the data reported. Computer software is provided to build the database and conduct logic edits priorto submittal. The reported data are subjected to intense editing and comparison with previous reporting and a written annual report isprovided to each state to document problems found and encourage correction. Data resubmittal is requested in cases where major prob-lems are found. The process involves many people and substantial resources, but it provides extensive quality assurance. Completeinformation on data items, edits, processing, expansion, sample design, definitions, data reporting, etc., is included in the HPMS FieldManual.

discontinuities, making time comparisons unreli-able.
Gas PipelineThese statistics originate from annual editions
of Gas Facts, published by the American GasAssociation (AGA). The data reported by theAGA are based on gas utilities participation andreporting to the Uniform Statistical Report.Utilities reporting represented 98 percent of gasutility industry sales while the remaining 2 percentwas estimated for nonreporting companies basedon recent historical experience. Varying percent-ages of nonreporters from year to year introduceminor reliability problems for time-series compar-isons.
TABLE 1-3. Number of U.S. Airports
The Federal Aviation Administration (FAA),Office of Airport Safety and Standards Admin-istrator’s Fact Book (annual issues) furnished thedata shown in this table and includes airports cer-tified for air carrier operations with aircraft thatseat 30 or more passengers. These airports includecivil and joint civil-military use airports, heliports,STOLports (short takeoff and landing), and sea-plane facilities. The FAA obtained this data viaphysical inspections and mail solicitations of allfederally regulated landing facilities. Since this isa census of all U.S. airports, reliability should behigh. Data, however, may be subject to reportingerrors typical of administrative recordkeeping.
TABLE 1-4. Public Road and Street Mileage inthe United States by Type of Surface
TABLE 1-5. U.S. Public Road and StreetMileage by Functional System
TABLE 1-6. Estimated U.S. Roadway Lane-Miles by Functional Class
The Highway Performance Monitoring System(HPMS) is the source of road mileage data and isconsidered reliable. (See box 1-1 for detailedinformation about the HPMS.) The U.S.Department of Transportation, Federal Highway
Administration collects and reviews state-reportedHPMS data for completeness, consistency, andadherence to specifications. Some inaccuracy mayarise from variations across states in their adher-ence to federal guidelines in the Traffic Moni-toring Guide and the Highway PerformanceMonitoring System Field Manual for theContinuing Analytical and Statistical Database.
Beginning with the 1997 issue of HighwayStatistics, FHWA instituted a new method for cre-ating mileage-based tables derived from theHPMS. Previously, adjustments to tables devel-oped from sample data were made using area-widemileage information provided by states. Theseadjustments are now being made using universetotals from the HPMS dataset. In addition,FHWA has discontinued the process of spreadingrounding and other differences across table cells.Thus, users may note minor differences in table-to-table totals. FHWA considers mileage totalsfrom table HM-20, “Public Road Length, Milesby Functional System” to be the controlling totalsshould a single value be required.
Lane-miles are calculated by multiplying thecenterline length by the number of through lanes.Because the HPMS requires that the number oflanes be reported for all principal arterials, otherNational Highway System (NHS) roads, and allstandard samples, lane length can be computed forthe Interstate, other principal arterials, and theNHS on a 100-percent basis. For minor arterials,rural major collectors, and urban collectors, lanelength is calculated based on standard sample sec-tions using the reported number of through lanes,length of section, and an expansion factor. FHWAuses the expanded sample to check that the cen-terline length of a state’s functional systemmatches the universe functional system length. Ifthe centerline length and functional system lengthdo not match, FHWA may ask a state to makeadjustments.
Reliability may be diminished for comparisonswith pre-1980 data, which were collected via dif-ferent methods and special national studies. Forinstance, pre-1980 mileage data included somenonpublic roadways (95,000 miles in 1979) whilepost-1980 data reports only public road mileage(roads or streets governed and maintained by apublic authority and open to public travel).
406 " Appendix C Source and Accuracy Profiles

TABLE 1-7. Number of Stations Served byAmtrak and Rail Transit, Fiscal Year
These numbers originate from Amtrak’sStatistical Appendix to Amtrak’s Annual Reportand the U.S. Department of Transportation,Federal Transit Administration’s National TransitDatabase.
Amtrak maintains a computer database with arecord of every station, locomotive, and car itoperates. Those records include for each vehiclethe year built, its service status (operating or noton a daily basis), and location. These data shouldbe considered very reliable.
TABLE 1-8. U.S. Oil and Gas Pipeline Mileage
Oil PipelineThe data are from Transportation in America,
published by the Eno Transportation Foundation,Inc. (Eno). The numbers reprinted here for 1960,1965, 1970, and 1975 are Eno estimates from theU.S. Department of Energy’s Energy Data Reportissues labeled “Crude-oil and Refined ProductsMileage in the United States.” Eno estimated the1980 number based on the assumption that refine-ment of old, less profitable, and smaller linesexceeded in mileage the construction of new, larg-er, and more-profitable lines. Figures from 1985and later years are calculated from a base figurethat Eno obtained from the 1982 U.S. Departmentof Transportation study Liquid Pipeline Directorand then incorporated that figure with data fromthe Association of Oil Pipe Lines and the OilPipeline Research Institute. Lack of additionalinformation raises definitional and methodologicaluncertainties for the data’s reliability. Moreover,the three different information sources introducedata discontinuities making time comparisons lessreliable.
Gas PipelineThese statistics originate from annual editions
of Gas Facts published by the American GasAssociation (AGA). The data reported by AGAare based on gas utilities participation and report-ing to the Uniform Statistical Report. Utilities
reporting in 1991 represented 98 percent of totalgas utility industry sales while the remaining 2 per-cent was estimated for the nonreporting companiesbased on recent historical experience. Varying per-centages of nonreporters from year to year intro-duce minor reliability problems for time-seriescomparisons.
TABLE 1-2. Number of Air Carriers,Railroads, Interstate Motor Carriers, MarineOperators, and Pipeline Operators
Air CarriersThe data are from the Air Carrier Financial
Statistics Quarterly, published by the Office ofAirline Information of the U.S. Department ofTransportation, Bureau of Transportation Statis-tics (BTS). The Alphabetical List of Air Carriers byCarrier Group at the beginning of each fourthquarter edition is used to determine the number ofmajor air carriers and other air carriers in opera-tion at the end of each calendar year. The publi-cation draws its data from the T-100 and T-100(f)databases maintained by BTS. These databasesinclude data obtained from a 100-percent censusof BTS Form 41 schedule submissions by large cer-tificated air carriers, which are carriers that hold acertificate issued under section 401 of the FederalAviation Act of 1958 and that (1) operate aircraftdesigned to have a maximum passenger seatingcapacity of more than 60 seats or a maximum pay-load capacity of more than 18,000 pounds or (2)that conduct international operations. Carriers aregrouped as major, national, large regional, ormedium regional based on their annual operatingrevenues. The thresholds were last adjusted July 1,1999 and the threshold for major air carriers iscurrently $1 billion. The table combines the num-ber of national, large regional, and medium region-al air carriers into the other air carrier category.
RailroadsThe Association of American Railroads
(AAR)’s Railroad Ten-Year Trends series is thesource for the number of railroads. The number ofClass I railroads is based on 100-percent reportingby Class I railroads to the Surface TransportationBoard (STB) via Schedule 700 of the R1 Annual
Appendix C Source and Accuracy Profiles ! 407

Report. The STB defines Class I railroads as hav-ing operating revenues at or above a thresholdindexed to a base of $250 million (1991) andadjusted annually in concert with changes in theRailroad Freight Rate Index published by theBureau of Labor Statistics. In 1998, the thresholdfor Class I railroads was $259.4 million. Declassi-fication from Class I status occurs when a railroadfalls below the applicable threshold for three con-secutive years. Although Class I railroads repre-sent only 2 percent of railroads in the country, theyaccount for over 70 percent of the industry’smileage.
The Association of American Railroadsthrough an annual determines the number of non-Class I railroads, comprehensive survey sent toevery U.S. freight railroad. By following up withnonrespondents, the AAR obtains essentially a100-percent census of all railroads. Use of the cur-rent survey instrument began in 1986.
Interstate Motor CarriersThe Motor Carrier Management Information
System (MCMIS), maintained by the U.S. Depart-ment of Transportation, Federal Motor CarrierSafety Administration, contains information onthe safety of all commercial interstate motor carri-ers and hazardous material (HM) shippers subjectto the Federal Motor Carrier Safety Regulationsand the Hazardous Materials Regulations. Allcarriers operating in interstate or foreign com-merce within 90 days of beginning operationsmust submit a Form MCS 150, Motor CarrierIdentification Report. Carriers may use the formto update their information. The Motor CarrierSafety Improvement Act of 1999 requires thatreports be periodically updated, but not more thanonce every two years. MCMIS is updated on aweekly basis, and periodic archives are not made.Historical data are only available from summaryinformation previously prepared, including tablesand reports. MCMIS began operations in 1980,but data prior to 1990 are not available. Datasince 1990 are available on a fiscal year basis(October through September). As MCMIS dataare from a 100-percent census, they are believed tobe very accurate.
Marine Vessel OperatorsThe U.S. Army Corps of Engineers (USACE)
provides the data for marine vessel operatorsthrough the Waterborne Transportation Lines ofthe United States. Data are collected by theUSACE’s Navigation Data Center (NDC) by vari-ous means, including the U.S. Coast Guard’s reg-istry, maritime service directories, and waterwaysector publications. However, an annual survey ofcompanies that operate inland waterway vessels isthe principle source of data. More than 3,000 sur-veys are sent to these companies and responserates are typically above 90 percent. However, aUSACE official did report that less than 10 percentof the total number of companies operating inlandwater vessels either did not receive or respond tothe annual survey.
Pipeline OperatorsThe Office of Pipeline Safety (OPS) in the U.S.
Department of Transportation’s Research andSpecial Programs Administration collects annualreport data from natural gas transmission and dis-tribution operators as required by 49 CFR 191.17and 191.11, respectively. Annual data must besubmitted by March 15 of the following calendaryear. No annual report is required for hazardousliquid pipeline operators. However, information isavailable through the pipeline safety program.Since 1986, the program has been funded by feesassessed to each OPS-regulated pipeline operatorbased on per-mile of hazardous pipeline operated.Data for each operator and each mile of pipelineare stored in the OPS user-fee database, which isrevised annually as updated fees are assessed.
Totals for pipeline operators in this table willdiffer from those in other tables due to differencesin the regulatory authority of USDOT and theFederal Energy Regulatory Commission (FERC).FERC regulates only interstate pipelines, whereasDOT regulates both interstate and intrastatepipelines, except for rural gathering lines andsome offshore pipelines, which fall under juris-diction of the U.S. Coast Guard or the U.S.Department of the Interior’s Minerals Manage-ment Service. An OPS official stated that FERCregulates about two-thirds the amount of pipelinemileage that USDOT regulates.
408 " Appendix C Source and Accuracy Profiles

TABLE 1-9. Number of U.S. Aircraft, Vehicles,Vessels, and Other Conveyances
TABLE 1-11. Active Air Carrier and GeneralAviation Fleet by Type of Aircraft
Air Carrier, Certificated, All ServicesData are from the U.S. Department of
Transportation, Federal Aviation Administration(FAA), FAA Statistical Handbook of Aviation.U.S. air carrier fleet data are based on reports col-lected by FAA field offices from carriers. Thereports include information on the number of air-craft by type used in air carrier service. The FAApoints out that this information is not an invento-ry of the aircraft owned by air carriers, but repre-sents the aircraft reported to the FAA as being usedin air carrier fleet service. The reported aircraft areall aircraft carrying passengers or cargo for com-pensation or hire under 14 CFR 121 and 14 CFR135.
General AviationThe 1960-1980 figures originated from the
FAA Statistical Handbook of Aviation. Later dataare from FAA annual issues of the GeneralAviation and Air Taxi Activity (GAATA) Surveyreport, table 3.1. The FAA collects both aircraftregistration data and voluntary information aboutaircraft operation, equipment, and location.Before 1978, the FAA mandated owners to annu-ally register their aircraft for the Aircraft Regis-tration Master File. This was a complete enumer-ation of operating aircraft. Registrants were alsoasked to voluntarily report information on hoursflow, avionics equipment, base location, and use.The FAA changed their data collection methodol-ogy in 1978. The annual registration requirementbecame triennial and the General Aviation Activityand Avionics Survey was initiated to sample air-craft operation and equipment data.
The General Aviation Activity and AvionicsSurvey was renamed the General Aviation and AirTaxi Activity Survey in 1993 to reflect the fact thatthe survey includes air taxi aircraft. This survey isconducted annually and encompasses a stratified,systematic design from a random start to generatea sample of all general aviation aircraft in theUnited States. It is based on the FAA registry as
the sampling frame. FAA established three strati-fication design variables in the survey: 1) the aver-age annual hours flown per aircraft by aircrafttype, 2) the aircraft manufacturer/model charac-teristics, and 3) the state of aircraft registration.
Data ReliabilityBecause of the change in 1978, the reliability of
comparisons over time will be affected. The FAAasserted that the change to a triennial registrationdeteriorated the Aircraft Registration Master Filein two ways. First, the resulting lag in registrationupdates caused the number of undeliverable ques-tionnaires to steadily increase over the three-yearperiod. Second, inactive aircraft would remain inthe registry, inflating the general aviation fleetcount. In addition, a new regulation added twocategories of aircraft to the general aviation fleet.However, FAA concluded that these changesresulted in no more than a five-percent error in thefleet population estimate.
The reliability of the GAATA survey can beimpacted by two factors: sampling and nonsam-pling error. A measure, called the standard error,is used to indicate the magnitude of sampling error.Standard errors can be converted for comparabili-ty by dividing the standard error value by the esti-mate (derived from sample survey results) andmultiplying it by 100. This quantity, referred to asthe percent standard error, totaled seven-tenths ofa percent in 1997 for the general aviation fleet. Alarge standard error relative to an estimate indi-cates lack of precision and, inversely, a small stan-dard error indicates precision.
Nonsampling errors could include problemssuch as nonresponse, respondent’s inability orunwillingness to provide correct information, dif-ferences in interpretation of questions, and data-entry mistakes. Readers should note that non-response bias might be a component of reliabilityerrors in the data from 1980 to 1990. The FAAconducted telephone surveys of nonrespondents in1977, 1978, and 1979 and found no significant dif-ferences or inconsistencies in respondents’ andnonrespondents’ replies. The FAA discontinuedthe telephone survey of nonrespondents in 1980 tosave costs. Nonresponse surveys were resumed in1990, and the FAA found notable differences and
Appendix C Source and Accuracy Profiles ! 409

thus adjusted its fleet estimates. The 1991 through1996 data have been revised to reflect nonresponsebias. In 1997, a sample of 29,954 aircraft wasidentified and surveyed from an approximate pop-ulation of 251,571 registered general aviation air-craft. Just over 65 percent of the sample respond-ed to the survey.
Highway, Total (registered vehicles)The 1960 to 1980 figures are from the U.S.
Department of Transportation, Federal HighwayAdministration (FHWA) document, HighwayStatistics, Summary to 1985, table MV-201 andrelated tables. Data quality and consistency willbe less reliable for these years because of a diver-sity of registration practices from state to state.Users should recognize that motor vehicle statisti-cal information is not necessarily comparableacross all states or within a state from year to year.For instance, the FHWA reported that separatedata on single-unit trucks and combinations wasunobtainable from all states in 1990.
After 1980, the FHWA began to use theHighway Performance Monitoring System(HPMS) database, which improved data reliabili-ty. FHWA reviews state-reported HPMS data forcompleteness, consistency, and adherence to thesespecifications. Some inaccuracy may arise fromvariations across states in their adherence to fed-eral guidelines in the Highway PerformanceMonitoring System Field Manual for theContinuing Analytical and Statistical Database.
If choosing to compare state data, the FHWArecommends that users carefully select a set of peerstates that have characteristics similar to the spe-cific comparison. Improperly selected peer statesare likely to yield invalid data comparisons.Characteristics that a user needs to consider indetermining compatibility of a peer state includesimilarities and differences in urban/rural areas,population densities, degrees of urbanization, cli-mate, geography, state laws and practices thatinfluence data definitions, administrative controlsof public road systems, state economies, trafficvolumes, and degrees of centralization of statefunctions. The FHWA has developed a set of vari-ables that users may use to determine appropriatepeer states.
Other 2-Axle 4-Tire Vehicle (truck)Sources for these figures included FHWA’s
Highway Statistics, Summary to 1995 (table VM-201A) and annual issues of Highway Statistics(table VM-1). FHWA compiles these figures fromthe U.S. Bureau of the Census’ Truck Inventoryand Use Survey (TIUS). Since 1963, Census hasconducted the TIUS every five years with the lastsurvey completed in 1997. The Census Bureauchanged the name of the survey to the VehicleInventory and Use Survey (VIUS) in 1997. TheVIUS collects data and the physical and opera-tional characteristics of the nation’s truck popula-tion. In 1997, 131,000 trucks were surveyed froman estimated universe of over 75 million trucks.Chronological reliability may be diminished dueto sampling design changes in 1977, 1982, and1992. In 1977, the sampling universe was firststratified by the number of trucks in a state: large(> 1.5 million trucks), medium (700,000 to 1.5million), and small (< 700,000); and then by twotruck sizes.
Stratification in 1982 was then based on bodytype rather than vehicle weight. In 1992 and1997, the sampling universe was first subdividedgeographically and then into five strata: 1) pick-ups, 2) vans, 3) single-unit light, 4) single-unitheavy, and 5) truck tractor. Cases were thenselected randomly within each stratum.
Census delivered a mail-out/mail-back surveyto the owner identified in the vehicle registrationrecords. Data collection is staggered as staterecords become available. Owners report dataonly for the vehicles selected. In the 1992 survey,a method was employed to also collect data onnew truck purchases in the latter half of the yearto estimate the fleet for the calendar year. Thisadjustment in the sampling frame had not beendone in previous surveys and may diminishchronological reliability. The sample for 1997 wassome 22,500 vehicles smaller than for 1992. The1997 VIUS had two sampling stages. For the firststage, the Census Bureau surveyed about 131,000trucks registered as of July 1, 1997. The secondstage sampled a total of 3,000 truck owners withstate mailing addresses different from the state oftruck registration.
410 " Appendix C Source and Accuracy Profiles

The accuracy and reliability of the VIUS surveydepends jointly on sampling variability and non-sampling errors. Standard errors arising fromsampling variability can be converted for compa-rability by dividing the standard error value by theestimate and multiplying it by 100. This quantity,referred to as the percent standard error, totaledtwo-tenths of a percent in 1992 and 1997 for theVIUS sample. A large standard error relative to anestimate indicates lack of precision and, inversely,a small standard error indicates precision. The1992 TIUS achieved over 90.2 percent reportingand the 1997 response rate equaled 84.5 percent,thus reliability may have decreased in the mostrecent survey.
TransitThe American Public Transit Association
(APTA) provided these data, which are based onthe Federal Transit Administration (FTA),National Transit Database. These data are gener-ally accurate because the FTA reviews and vali-dates information submitted by individual transitagencies. Reliability may vary because some tran-sit agencies cannot obtain accurate information ormay misinterpret data. APTA conservativelyadjusts FTA data to include transit operators thatdo not report to the database (private, very small,and rural operators).
Railroad (all categories)The data are from Railroad Facts, published
annually by the Association of American Railroads(AAR). AAR data are based on 100-percentreporting by Class I railroads to the SurfaceTransportation Board (STB) via Schedule 700 ofthe R1 Annual Report. Thus, data estimates areconsidered very reliable. The STB defines Class Irailroads as having operating revenues at or abovea threshold indexed to a base of $250 million(1991) and adjusted annually in concert withchanges in the Railroad Freight Rate Index pub-lished by the Bureau of Labor Statistics. In 1998,the adjusted threshold for Class I railroads was$259.4 million. Declassification from Class I sta-tus occurs when a railroad falls below the applica-ble threshold for three consecutive years.Although Class I railroads represent only 2 percent
of railroads in the country, they account for over70 percent of the industry’s mileage.
AAR determines the number of non-Class Irailroads through an annual, comprehensive sur-vey sent to every U.S. freight railroad. By follow-ing up with nonrespondents, the AAR obtainsessentially a 100 percent census of all railroads.Use of the current survey instrument began in1986.
AmtrakAmtrak maintains a computer database with a
record of every locomotive and car it operates. Foreach vehicle, those records include the year built,service status (operating or not operating on adaily basis), and location. This data should beconsidered very reliable.
Water TransportationThe source for Inland Nonself-Propelled
Vessels, Self-Propelled Vessels, and flag passengerand cargo vessels is the U.S. Army Corps ofEngineers (USACE), Waterborne TransportationLines of the United States, annual issues. Data arecollected by the USACE’s Navigation Data Center(NDC) by various means, including the U.S. CoastGuard’s registry, maritime service directories, andwaterway sector publications. However, an annu-al survey of companies that operate inland water-way vessels is the principle source of data. Morethan 3,000 surveys are sent to these companies,and response rates are typically above 90 percent.However, a USACE official did report that lessthan 10 percent of the total number of companiesoperating inland vessels either did not receive orrespond to the annual survey.
Oceangoing Steam Motor ShipsMerchant Fleets of the World, published annu-
ally by the U.S. Department of Transportation,Maritime Administration (MARAD), is the sourceof these data. MARAD, which classifies vessels asmerchant based on size and type, compiles thesefigures from a data service provided by Lloyd’sMaritime Information Service (LMIS). The parentcompany, Lloyd’s Register (LR), collects data from200 offices worldwide, from data transfers andagreements with other classification societies, from
Appendix C Source and Accuracy Profiles ! 411

questionnaires to ship owners and ship builders,from feedback from government agencies, andfrom input from port agents. According to an LRofficial, consistent data-gathering methods havebeen maintained for more than 30 years. Thesame official did caution that there are sometimesinconsistencies in groupings of ship types overtime. For example, propelled tank barges are nowincluded in the tanker ship-type grouping.
Recreational BoatsBoating Statistics, published annually by the
U.S. Coast Guard (USCG), is the source. TheUSCG derives these figures from state and otherjurisdictional reporting of the actual count of validboat numbers issued. In accordance with federalrequirements, all 55 U.S. states and territoriesrequire motor-powered vessels to be numbered.However, over half the states do not require non-powered vessels to be numbered. Accuracy canalso be diminished by noncompliance of boatowners with numbering and registration laws. In1996, the USCG estimated that approximatelyeight million recreational boats are not numberedand, thus, are excluded from the reported numberof recreational vessels. The USCG did not provideestimates for the number of boats without num-bering in their 1997 and 1998 reports. Some juris-dictions fail to report by publication deadlines,and the USCG provided estimates based on theprevious year’s estimate.
TABLE 1-10. Sales or Deliveries of NewAircraft, Vehicles, Vessels, and OtherConveyances
Civilian AircraftThe Aerospace Industries Association (AIA)
provided this data in their annual issues AerospaceFacts and Figures, “Civil Aircraft Shipments.”AIA collects their data from aircraft companyreports, the General Aviation ManufacturersAssociation (GAMA), and the U.S. Department ofCommerce’s (DOC) International Trade Admini-stration. DOC data provide total number of ship-ments and exports, and the difference computed
by AIA equals domestic shipments. DOC collectsshipments data separately for individual factoriesor establishments and not at the company level. Apotential limitation of this approach is when a fac-tory producing aircraft for shipment also makesaircraft parts. If the establishment has 80 percentof its production in aircraft and 20 percent inparts, all of the output is attributed to aircraftshipments.
TransportThe Aerospace Industries Association (AIA) is
the source of these data. AIA obtains quarterlydata from Boeing Corp., now the sole U.S. manu-facturer of transport aircraft, and publicly avail-able financial disclosure information filed with theU.S. Securities and Exchange Commission (SEC)via Form 10-k. SEC requires a publicly tradedcompany to file an annual report 90 days after theend of the company’s fiscal year to provide anoverview of that business.
HelicoptersAIA surveyed and received data from all 10
major helicopter manufacturers on their sales anddeliveries.
General AviationThe general aviation figures are taken from the
General Aviation Statistical Databook publishedby the GAMA. General aviation refers usually tothe small aircraft industry in the United States.GAMA collects quarterly data from the 10 to 14manufacturers who nearly equal a census of thegeneral aviation sector.
Passenger Car, Truck, Bus, and RecreationalVehicles
Ward’s Motor Vehicle Facts and Figures is thesource of these data. Ward’s obtains sales datadirectly from manufacturers. Readers should notethat automobile manufacturers have inflated salesfigures in the past, but Ward’s does contact com-panies to verify numbers that appear too high orlow.
412 " Appendix C Source and Accuracy Profiles

MotorcycleThe Motorcycle Industry Council, Inc. (MIC)
publishes the Motorcycle Statistical Annual, whichis the source for these data. MIC derived the esti-mate for new retail motorcycle sales for each statefrom the MIC Retail Sales Report, and adjusted fortotal retail sales. Motorcycle company reportsprovided sales data. Prior to 1985, all-terrain vehi-cles (ATVs) were included in the motorcycle total.In 1995, the Motorcycle Industry Council revisedits data for the years 1985 to present to exclude allterrain vehicles from its totals.
BicycleThe National Bicycle Dealers Association
(NBDA) reported these data, which are based onBicycle Manufacturers Association (BMA) infor-mation through 1996. BMA stopped reportingmembers’ shipments in 1996. Moreover, BMArepresents the largest bicycle manufacturers(Huffy, Roadmaster, and Murray), and thus thedata do not reflect specialty bike makers or othermanufacturers. The Bicycle Council estimated1997 and 1998 figures in the table. According toa Bicycle Council representative, the estimates area combination of domestic forecasts produced bya panel of industry experts and import data frommonthly U.S. census databases.
TransitThe American Public Transit Association pro-
vided these figures, which are based on informa-tion in the U.S. Department of Transportation,Federal Transit Administration (FTA), NationalTransit Database. These data are generally consid-ered accurate because the FTA reviews and vali-dates information submitted by individual transitagencies. Reliability may vary because some tran-sit agencies cannot obtain accurate information ormisinterpret data. APTA conservatively adjustsFTA data to include transit operators that do notreport to the database (private, very small, andrural operators).
Class I RailThe data are from Railroad Facts, published
annually by the Association of American Railroads
(AAR). AAR data are based on 100-percentreporting by Class I railroads to the SurfaceTransportation Board (STB) via Schedule 700 ofthe R1 Annual Report. STB defines Class I rail-roads as having operating revenues at or above athreshold indexed to a base of $250 million (1991)and adjusted annually in concert with changes inthe Railroad Freight Rate Index published by theBureau of Labor Statistics. In 1998, the thresholdfor Class I railroads was $259.4 million. AlthoughClass I railroads encompass only 2 percent of thenumber of railroads in the country, they accountfor over 70 percent of the industry’s mileage oper-ated. Historical reliability may vary due tochanges in the railroad industry, including bank-ruptcies, mergers, and declassification by the STB.Small data errors may also have occurred becauseof independent rounding in this series by the AAR.
AmtrakAmtrak maintains a computer database with a
record of every locomotive and car it operates. Foreach vehicle, those records include the year built,its service status (operating or not on a daily basis),and location. These data should be consideredvery reliable.
Water TransportationU.S. Department of Transportation, Maritime
Administration (MARAD), which classifies vesselsas merchant based on size and type, reports thesedata in annual issues of its Merchant Fleets of theWorld. MARAD compiles these figures from adata service provided by Lloyd’s MaritimeInformation Service. The parent company, Lloyd’sRegister (LR), collects data from several sources:its 200 offices worldwide, data transfers and agree-ments with other classification societies, question-naires to shipowners and shipbuilders, feedbackfrom government agencies, and input from portagents. According to an LR official, consistentdata gathering methods have been maintained formore than 30 years but cautioned that inconsis-tencies may occur in groupings of ship types overtime. For example, tank barges are now includedin the tanker ship-type grouping rather than thebarge grouping.
Appendix C Source and Accuracy Profiles ! 413

TABLE 1-12. U.S. Automobile and Truck Fleetsby Use
These statistics originate from two sources.The R.L. Polk Co. provides numbers for commer-cial fleet vehicles from state registrations. BobitPublishing Co. also obtains fleet vehicle sales datafrom automobile manufacturers. These twosources cover nearly 100 percent of fleet vehiclesin the United States. Thus, the data should be veryaccurate.
TABLE 1-13. Annual U.S. Motor VehicleProduction and Factory (Wholesale) Sales
TABLE 1-14. Retail New Passenger Car Sales
TABLE 1-15. New and Used Passenger CarSales and Leases
TABLE 1-19. World Motor Vehicle Production,Selected Countries
Motor Vehicle Production, Factory Sales, andNew Passenger Car Retail Sales
Ward’s Motor Vehicle Facts & Figures is thesource of these data. Ward’s obtains sales datadirectly from manufacturers. Readers should notethat automobile manufacturers have inflated salesfigures in the past, but Ward’s does contact com-panies to verify numbers that appear too high orlow.
Used Passenger Car Sales and LeasedPassenger Cars
ADT Automotive Used Car Market Report isthe source of these data. The Wall Street Journal(WSJ) is the original source of 1999 data.According to an ADT representative, publishingdeadlines require ADT to use WSJ numbers untilthey can be replaced with National AutomotiveDealers Association data. ADT Automotive’sMarket Analysis Department also gathers figuresfrom CNW Marketing/Research and the R.L. PolkCo. CNW estimates used car sales volumes by col-lecting state title transfer data and determining ifa transaction was made between private individu-als or between a consumer and a franchised or
independent dealer. This estimate is evaluated bycomparing total transactions with state automo-bile sales revenues. Polk, an additional source ofdata, maintains a state vehicle registration data-base. For 1998, the ADT representative statedthat Polk’s data were within 5 percentage points ofCNW estimates.
TABLE 1-16. Retail Sales of New Cars bySector
The U.S. Department of Commerce, Bureau ofEconomic Analysis, uses data from Ward’sAutomotive Reports. The sectoral break down isderived from registration data obtained from R.L.Polk. Ward’s obtains sales data directly frommanufacturers. Readers should note that auto-mobile manufacturers have inflated sales figures inthe past, but Ward’s does contact companies toverify numbers that appear too high or low.
TABLES 1-17 and 1-18. Period Sales, MarketShares, and Sales-Weighted Fuel Economiesof New Domestic and Imported Automobilesand Light Trucks, Selected Sales Periods
These data originate from Oak Ridge NationalLaboratory’s (ORNL) Light-Duty MPG andMarket Shares System database, which relies oninformation from monthly Ward’s AutomotiveReports. Comparisons and observations are madeon sales and fuel economy trends from one modelyear to the next. ORNL has adopted several con-ventions to facilitate these comparisons, such asthe use of sales-weighted average to estimate fueleconomy and vehicle characteristics. For example,“sales-weighted” miles per gallon refers to a com-posite or average fuel economy based on the dis-tribution of vehicle sales. ORNL’s methodologyfor sales-weighting can be found in the Appendixof the Highway Vehicle MPG and Market SharesReport: Model Year 1990 (the latest publishedreport). The method was changed dramatically in1983, and data reliability prior to that year isquestionable. This information is now publishedannually in ORNL’s Transportation Energy DataBook.
414 " Appendix C Source and Accuracy Profiles

TABLE 1-20. Number and Size of the U.S.Flag Merchant Fleet and Its Share of theWorld Fleet
The U.S. Department of Transportation,Maritime Administration, which classifies vesselsas merchant based on size and type, compiles thesefigures from a data service provided by Lloyd’sMaritime Information Service. The parent compa-ny, Lloyd’s Register (LR), collects data from sever-al sources: its 200 offices worldwide, datatransfers and agreements with other classificationsocieties, questionnaires to shipowners and ship-builders, feedback from government agencies, andinput from port agents. According to an LR offi-cial, consistent data gathering methods have beenmaintained for more than 30 years, but cautionedthat inconsistencies may occur in groupings of shiptypes over time. For example, tank barges are nowincluded in the tanker ship-type grouping ratherthan the barge grouping.
TABLE 1-21. U.S. Airport Runway PavementConditions
These data originate from the U.S. Departmentof Transportation, Federal AviationAdministration (FAA), National Plan of IntegratedAirport Systems (NPIAS). The NPIAS includes allcommercial service airports, all reliever airports,and selected general aviation airports. It does notinclude more than 1,000 publicly owned public uselanding areas, privately owned public use airports,and other civil landing areas not open to the gen-eral public. NPIAS airports serve 92 percent ofgeneral aviation aircraft (based on an estimatedfleet of 200,000 aircraft). In 1998, the NPIASencompassed 3,344 of the 5,357 airports withpublic access. Runway pavement condition is clas-sified as follows:
Good: All cracks and joints are sealed.Fair: Mild surface cracking, unsealed joints,
and slab edge spalling.Poor: Large open cracks, surface and edge
spalling, vegetation growing through cracks andjoints.
On a rotating basis, the FAA arranges annualinspections for about 2,000 of the approximately4,700 public-use airports. The inspections arebased on funding availability and not on statisticalcriteria, and nearly all runways are inspected everytwo years. Inspections are primarily made to col-lect information for pilots on airport conditions.The FAA relies on state and local agencies to per-form inspections, so some inaccuracy may arisefrom variation in their adherence to federal guide-lines regarding pavement condition reporting. In1998, the U.S. General Accounting Office foundthat Pavement Condition Index information wasavailable for about 35 percent of NPIAS airports(GAO/RCED-98-226).
TABLE 1-22. Median Age of Automobiles andTrucks in Operation in the United States
The R.L. Polk Co. is a private enterprise thatpurchases state registration data to maintain adatabase of operational vehicles. Its data representa near census of registered vehicles in the UnitedStates, and the age estimate should be consideredvery reliable.
TABLE 1-23. Condition of U.S. Roadways byFunctional System
U.S. Department of Transportation, FederalHighway Administration (FHWA) collects pave-ment condition data from each state through theHighway Performance Monitoring System. TheFHWA uses two rating schemes—the PresentServiceability Rating (PSR) and the InternationalRoughness Indicator (IRI). IRI is used to measurethe condition of Interstates, other principal arteri-als, rural minor arterials, and other NationalHighway System roadways. PSR is used to meas-ure the condition of rural major collectors andurban minor arterials and collectors. Rural minorcollectors are not measured. Where IRI data arenot reported for sampled sections, the PSR data arecollected. Using the PSR, values range from 0.1to 5.0, where 5.0 denotes new pavement in excel-lent condition and 0.1 denotes pavement inextremely poor condition. On the IRI scale how-
Appendix C Source and Accuracy Profiles ! 415

ever, lower values indicate smoother roads (e.g.,<60 for interstate pavement in very good condi-tion to >170 for interstate pavement in poor con-dition).
The IRI is an objective measure of pavementroughness developed by the World Bank. The PSRis a more subjective measure of a broader range ofpavement characteristics and therefore less com-parable. Prior to 1993, all pavement conditionswere evaluated using PSR values. Beginning withdata published in Highway Statistics 1993, theFHWA began a transition to the IRI, which shouldeventually replace the PSR. The change from PSRto IRI makes comparisons between pre-1993pavement condition data and 1993 and later pave-ment condition data difficult. Thus, trend com-parisons should be made with care.
FHWA indicates that the protocol of measur-ing pavement roughness is not followed by allstates, and some did not report for all requiredmileage. Totals only reflect those states reportingusable or partially usable data. Column percent-ages may not sum to 100 and may differ slightlyfrom percentages in source tables, which wereadjusted so that they would add to 100. FHWAbelieves that the IRI data are of “reasonably goodquality.”
TABLE 1-24. Condition of U.S. Bridges
These figures are from the U. S. Department ofTransportation, Federal Highway Administration(FHWA), National Bridge Inventory Database.State highway agencies are required to maintain abridge inspection program and inspect mostbridges on public roadways at a minimum of everytwo years. With FHWA approval, certain bridgesmay be inspected less frequently. A complete fileof all bridges is collected and maintained, repre-senting a very reliable assessment of bridge condi-tions. However, some inaccuracy may beattributable to variations in state inspector’sadherence to the National Bridge InspectionStandards.
TABLE 1-25. Average Age of Urban TransitVehicles
These figures are based on information in theU.S. Department of Transportation, Federal
Transit Administration (FTA), National TransitDatabase. Section 15 of the Federal Transit Actrequires federally funded transit agencies to pro-vide detailed financial and operating data, includ-ing vehicle inventories. Transit operators that donot report to FTA are those that do not receive fed-eral funding, typically private, small, and ruraloperators. The data are generally consideredaccurate because FTA reviews and validates infor-mation submitted by individual transit agencies.Reliability may vary because some transit agenciescannot obtain accurate information or may misin-terpret certain data definitions.
TABLE 1-26. Class I Railroad Locomotive Fleetby Year Built
The data are from Railroad Facts, publishedannually by the Association of AmericanRailroads (AAR). Figures reported by the AARare based on 100-percent reporting by Class I rail-roads to the Surface Transportation Board (STB)via Schedule 700 of the R1 Annual Report. STBdefines Class I railroads as having operating rev-enues at or above a threshold indexed to a base of$250 million (1991) and adjusted annually in con-cert with changes in the Railroad Freight RateIndex published by the Bureau of Labor Statistics.In 1998, the threshold for Class I railroads was$259.4 million. Declassification from Class I sta-tus occurs when a railroad falls below the appli-cable threshold for three consecutive years.Although Class I railroads encompass only 2 per-cent of the number of railroads in the country, theyaccount for over 70 percent of the industry’smileage.
TABLE 1-27. Age and Availability of AmtrakLocomotive and Car Fleets
Amtrak maintains a computer database with arecord of every locomotive and car it operates.For each vehicle those records include the yearbuilt, its service status (operating or not on a dailybasis), and location. These data should be con-sidered very reliable.
416 " Appendix C Source and Accuracy Profiles

TABLE 1-28. U.S. Flag Vessels by Typeand Age
The data are from the U.S. Army Corps ofEngineers (USACE), Waterborne TransportationLines of the United States (WTLUS), annual issues.The WTLUS database contains information onvessel operators and characteristics and descrip-tions for all domestic vessel operations. Data arecollected by the USACE’s Navigation Data Center,primarily through a survey of vessel operatingcompanies. More than 3,000 surveys are sent tothese companies and response rates are typicallyabove 90 percent. However, a USACE official didreport that less than 10 percent of the total num-ber of companies operating inland vessel fleetseither did not receive and/or did not respond to theannual survey.
TABLE 1-29. U.S. Vehicle-Miles
TABLE 1-30. Roadway Vehicle-MilesTraveled (VMT) and VMT per Lane-Mileby Functional Class
TABLE 1-31. U.S. Passenger-Miles
Air Carrier, Certificated, Domestic, AllServices
The U.S. Department of Transportation(USDOT), the Bureau of Transportation Statistics,Office of Airline Information, reports aircraft rev-enue-miles and passenger-miles in its publicationAir Traffic Statistics. These numbers are based on100-percent reporting of passengers and triplength by large certificated air carriers. Minorerrors arise from nonreporting but amount to lessthan 1 percent of all air carrier passenger-miles.The figures do not include data for all airlines,such as most scheduled commuter airlines and allnonscheduled commuter airlines. These, if added,may raise total air passenger-miles by about 5 per-cent.
General AviationPassenger-mile numbers for 1975 to present are
calculated by adjusting the Interstate CommerceCommission’s 1974 figure for air passenger-milesby the percentage change in annual hours flown by
general aviation aircraft as published in theUSDOT, Federal Aviation Administration (FAA),FAA Statistical Handbook of Aviation. Numbersin the handbook are based on the General Aviationand Air Taxi Survey (GAATA). In 1993, theGAATA stopped including commuter aircraft.Commuter-miles collected before 1993 by theGAATA were, according to one FAA official, woe-fully underreported. Therefore, problems with theestimate of general aviation aircraft include: abreak in the series between 1992 and 1993, a pos-sible outdated factor used to calculate passenger-miles, and the classification of commuter opera-tions.
HighwayHighway vehicle-miles of travel (vmt) are esti-
mated using data from the Highway PerformanceMonitoring System (HPMS), a database main-tained by FHWA that contains information onhighway characteristics supplied by individualstates. Annual vmt by highway functional systemis calculated as the product of the annual averagedaily traffic (AADT) along each highway section,the centerline length of each highway section, andthe number of days in the year. Also, expansionfactors are used for roadways that are sampledrather than continuously monitored. Vmt by vehi-cle type is estimated using vehicle share estimatessupplied by states.
FHWA has established methods for collecting,coding, and reporting HPMS data in two manuals:Traffic Monitoring Guide (TMG) and HighwayPerformance Monitoring System Field Manual.The prescribed sampling process for collectinghighway volume data, which is used to estimateAADT, is based on statistical methods. However,in practice, several factors affect the ultimate qual-ity of the data. FHWA discusses many of theseissues in their annual Highway Statistics reportand other publications. However, BTS is notaware of any study or report that has statisticallyquantified the accuracy of vmt estimates. Some ofthe primary issues related to data quality are notedhere.
1. The sampling procedures suggested in theTMG and HPMS Field Manual are designed toproduce traffic volume estimates with an aver-
Appendix C Source and Accuracy Profiles ! 417

age precision level of 80-percent confidencewith a 10-percent allowable error at the statelevel. FHWA provides additional guidance tostates through annual workshops and otheravenues to help them follow these proceduresas closely as possible. However, the actual dataquality and consistency of HPMS informationare dependent on the programs, actions, andmaintenance of sound databases by numerousdata collectors, suppliers, and analysts at thestate, metropolitan, and other local area levels.Not all states follow the recommended sam-pling, counting, and estimating procedures con-tained in the Traffic Monitoring Guide, and theexact degree to which the states follow theseguidelines overall is unknown. However,FHWA believes that most states generally fol-low the guidelines.
2. Estimates for higher level roadway sys-tems are more accurate than those for lowerlevel ones, since traffic volumes on higher levelroadways are sampled at a higher rate. TheTMG recommends that traffic counts be col-lected for all Interstate and principal arterialsections on a three-year cycle. Under thisscheme, about one-third of the traffic countsfor these roadway sections in a given year areactually measured, while volumes on theremainder are factored to represent presentgrowth. Although some States collect data atall traffic count locations every year, most usesome variation of the TMG data collectionguidelines. Volumes on urban and rural minorarterials, rural major collectors, and urban col-lectors are collected using a sampling proce-dure. States are not required to report volumesfor rural/urban local systems and rural minorcollectors, though most do so. However, themethods used to estimate travel on these road-ways vary from state to state since there are nostandard guidelines for calculating travel onthese roadways.
3. Vmt estimates by vehicle type are lessaccurate than are estimates for total motorvehicle vmt for several reasons: 1) vehicle clas-sification equipment can frequently misclassifyvehicles (see B.A. Harvey et al, Accuracy ofTraffic Monitoring Equipment, GDOT 9210,(Georgia Tech Research Institute: 1995)); 2)
vehicle shares are often determined by methodsor by special studies that are not directly com-patible with HPMS data definitions and/or pur-poses, and observed local-level vehicle classifi-cation counts are difficult to apply on astatewide basis; and 3) vehicle type definitionscan vary among states.
4. Vmt estimates for combination trucks inHPMS differ from survey-based estimates fromthe Truck Inventory and Use Survey (TIUS), asmuch as 50 percent for some categories ofcombination trucks. Much of this discrepancyappears to be due to differences in truck classi-fication definitions and biases introduced bydata collection practices. See R.D. Mingo et al.1995. Transportation Research Record, No.1511 (Washington, DC: National AcademyPress), pp. 42-46.
5. FHWA adjusts questionable data using avariety of standard techniques and profession-al judgement. For example, national averagetemporal adjustment factors developed fromHPMS and other national highway monitoringprograms are applied to State data, when nec-essary, to compensate for temporal deficienciesin sampling practices. Also, in estimating vmtby vehicle type, FHWA employs an iterativeprocess to reconcile vmt, fuel economy (milesper gallon), fuel consumption, and vehicle reg-istration estimates. Fuel consumption, totalvmt by highway functional class, and registra-tions by vehicle group are used as controltotals. This process limits the size of errors andensures data consistency.
6. Passenger-miles of travel (pmt) are calcu-lated by multiplying vmt estimates by vehicleloading (or occupancy) factors from varioussources, such as the Nationwide PersonalTransportation Survey conducted by FHWAand TIUS. Thus, pmt data are subject to thesame accuracy issues as vmt, along with uncer-tainties associated with estimating vehicle load-ing factors.
TransitThe American Public Transit Association
(APTA) figures are based on information inUSDOT, Federal Transit Administration (FTA),
418 " Appendix C Source and Accuracy Profiles

National Transit Database. Transit data are gen-erally considered accurate because FTA reviewsand validates information submitted by individualtransit agencies. However, reliability may varybecause some transit agencies cannot obtain accu-rate information or may misinterpret data. APTAadjusts the FTA data to include transit operatorsthat do not report to the FTA database (private,very small, and rural operators).
Class I Rail (vehicle-miles)Data are from Railroad Facts, published annu-
ally by the Association of American Railroads(AAR). AAR data are based on 100-percentreporting by Class I railroads to the SurfaceTransportation Board (STB) via Schedule 700 ofthe R1 Annual Report required of Class I rail-roads. STB defines Class I railroads as havingoperating revenues at or above a threshold indexedto a base of $250 million (1991) and adjustedannually in concert with changes in the RailroadFreight Rate Index published by the Bureau ofLabor Statistics. In 1998, the threshold for Class Irailroads was $259.4 million. Declassificationfrom Class I status occurs when a railroad fallsbelow the applicable threshold for three consecu-tive years. Although Class I railroads representonly 2 percent of railroads in the country, theyaccount for over 70 percent of the industry’smileage.
Intercity TrainThe AAR passenger-miles number is based on
an almost 100-percent count of tickets and, there-fore, is considered accurate.
TABLE 1-33. Long-Distance Travel in theUnited States by Selected TripCharacteristics: 1995
TABLE 1-34. Long-Distance Travel in theUnited States by Selected TravelerCharacteristics: 1995
The data presented in these tables are estimatesderived from the 1995 American Travel Survey(ATS) conducted for the U.S. Department ofTransportation, Bureau of Transportation Statis-
tics. The survey’s estimation procedure inflatesunweighted sample results to independent esti-mates of the total population of the United States.Values for missing data are estimated throughimputation procedures.
Since ATS estimates come from a sample, theyare subject to two possible types of error: nonsam-pling and sampling. Sources of nonsampling errorsinclude inability to obtain information about allsample cases, errors made in data collection andprocessing, errors made in estimating values formissing data, and undercoverage.
The accuracy of an estimate depends on bothtypes of error, but the full extent of the nonsam-pling error is unknown. Consequently, the usershould be particularly careful when interpretingresults based on a relatively small number of casesor on small differences between estimates.
Standard errors for ATS estimates that indicatethe magnitude of sampling error as well as com-plete documentation of the source and reliability ofthe data may be obtained from detailed ATSreports. Because of methodological differences,users should use caution when comparing thesedata with data from other sources.
TABLE 1-35. U.S. Air Carrier Departures,Enplaned Revenue Passengers, and EnplanedRevenue Tons
The Airport Activity Statistics of CertificatedAir Carriers (AAS) is the source of these data.Published annually by the U.S. Department ofTransportation, Bureau of TransportationStatistics, Office of Airline Information (OAI), theAAS presents traffic statistics for all scheduled andnonscheduled service by large certificated U.S. aircarriers for each airport served within the 50states, the District of Columbia, and other U.S.areas designated by the Federal AviationAdministration. The publication draws its datafrom the T-100 and T-3 databases maintained byOAI. These data are based on a 100-percentreporting of enplanements, departures, and ton-nage information by large certificated U.S. air car-riers via BTS Form 41.
Prior to 1993, the AAS included all scheduledand some nonscheduled enplanements for certifi-
Appendix C Source and Accuracy Profiles ! 419

cated air carriers but did not include enplanementsfor air carriers offering charter service only. Priorto 1990, the freight category was divided into bothfreight and express shipments and the mail cate-gory was divided into U.S. mail (priority and non-priority) and foreign mail. Beginning in 1990,only aggregate numbers were reported for freightand mail.
Air traffic hubs are designated as geographicalareas based on the percentage of total passengersenplaned in the area. A hub may have more thanone airport. This definition of hub should not beconfused with the definition used by airlines indescribing their “hub-and-spoke” route structures.
TABLE 1-36. Passengers Boarded at the Top50 U.S. Airports
The Airport Activity Statistics of CertificatedAir Carriers (AAS), is the source of these data.Data for 1998 are from the U.S. Department ofTransportation (USDOT), Federal AviationAdministration’s Statistical Handbook of Avia-tion. Published by USDOT, Bureau of Trans-portation Statistics, Office of Airline Information(OAI), the AAS presents traffic statistics for allscheduled and nonscheduled service by large cer-tificated U.S. air carriers for each airport servedwithin the 50 states, the District of Columbia, andother U.S. areas designated by the Federal AviationAdministration. The publication draws its datafrom the T-100 and T-3 databases maintained byOAI. These data are based on a 100-percentreporting of enplanements, departures, and ton-nage information by large certificated U.S. air car-riers via BTS Form 41.
Prior to 1993, the AAS included all scheduledand some nonscheduled enplanements for certifi-cated air carriers but did not include enplanementsfor air carriers offering charter service only. Priorto 1990, the freight category was divided into bothfreight and express shipments and the mail cate-gory was divided into U.S. mail (priority and non-priority) and foreign mail. Beginning in 1990,only aggregate numbers were reported for freightand mail.
TABLE 1-37. Air Passenger Travel Arrivals inthe United States from Selected ForeignCountries
TABLE 1-38. Air Passenger Travel Departuresfrom the United States to Selected ForeignCountries
The International Trade Administration in theU. S. Department of Commerce publishes thesedata, which are based on information collectedfrom 100,000 international visitors.
TABLE 1-41. U.S. Ton-Miles of Freight
Air CarrierAir Carrier Traffic Statistics, published by the
U.S. Department of Transportation, Bureau ofTransportation Statistics (BTS), Office of AirlineInformation (OAI), is the source of these data.Large certificated U.S. air carriers report domesticfreight activities to OAI via BTS Form 41. Theinformation reported in the table represents trans-portation of freight (excluding passenger bag-gage), U.S. and foreign mail, and express mailwithin the 50 states, the District of Columbia,Puerto Rico, and the Virgin Islands. It also coverstransborder traffic to Canada and Mexico by U.S.carriers. The data does not include informationon small certificated air carriers, which representless than 5 percent of freight ton-miles.
Intercity TruckThe data are estimates from Transportation in
America, published by the Eno TransportationFoundation, Inc. (Eno). Eno’s estimates of interci-ty truck ton-miles are based on historic data fromthe former Interstate Commerce Commission(ICC), estimates from the American TruckingAssociation, and other sources. Eno supplementsits estimates by using additional information onvehicle-miles of truck travel published in HighwayStatistics by the Federal Highway Administration.Users should note that truck estimates in the tablesdo not include local truck movements.
420 " Appendix C Source and Accuracy Profiles

Appendix C Source and Accuracy Profiles ! 421
Class I RailThe data are from Railroad Facts, published
annually by the Association of American Railroads(AAR). AAR data are based on 100-percentreporting by Class I railroads to the SurfaceTransportation Board (STB). The data representall revenue freight activities of the Class I railroadsand are not based on information from the RailWaybill Sample. The STB defines Class I railroadsas having operating revenues at or above a thresh-old indexed to a base of $250 million (1991) andadjusted annually in concert with changes in theRailroad Freight Rate Index published by theBureau of Labor Statistics. In 1998, the thresholdfor Class I railroads was $259.4 million.Declassification from Class I status occurs when arailroad falls below the applicable threshold forthree consecutive years. Although the Class I rail-roads represented only 2 percent of the number ofrailroads in the country, they account for over 90percent of the rail industry’s freight revenues.
Domestic Water TransportThe data are from Waterborne Commerce of
the United States, published by the U.S. ArmyCorps of Engineers (USACE). All vessel operatorsof record report their domestic waterborne trafficmovements to USACE via ENG Forms 3925 and3925b. Cargo movements are reported accordingto points of loading and unloading. Certain cargomovements are excluded: 1) cargo carried on gen-eral ferries, 2) coal and petroleum products loadedfrom shore facilities directly into vessels for fueluse, 3) military cargo moved in U.S. Department ofDefense vessels, and 4) cargo weighing less than100 tons moved on government equipment.USACE calculates ton-miles by multiplying thecargo’s tonnage by the distance between the pointsof loading and unloading.
Oil PipelineThe data for 1960, 1965, and 1970 are from
Transportation in America, published by the EnoTransportation Foundation, Inc., and the data for1975 to 1998 are from Shifts in PetroleumTransportation, by the Association of Oil PipeLines (AOPL). Eno’s data are based on informa-tion from the former Interstate Commerce
Commission’s Transport Economics. Commoncarrier oil pipelines reported all freight activities tothe ICC.
AOPL obtains barrel-miles from the FederalEnergy Regulatory Commission (FERC), whichrequires petroleum shippers to report annual ship-ments. AOPL then coverts barrel-miles to ton-miles using conversion figures in the AmericanPetroleum Institute’s (API’s) Basic Petroleum DataBook. Since 16 percent of pipeline shipments areintrastate and not subject to FERC reportingrequirements, AOPL makes adjustments to FERCdata.
TABLE 1-42. Average Length of Haul:Domestic Freight and Passenger Modes
Freight
Air Carrier and TruckThe Eno Transportation Foundation, Inc. esti-
mated these figures.
Class I RailThe data are from Railroad Facts, published
annually by the Association of American Railroads(AAR). AAR data are based on 100-percentreporting by Class I railroads to the SurfaceTransportation Board (STB) via Schedule 700 ofthe R1 Annual Report required of Class I rail-roads. The STB defined Class I railroads as havingoperating revenues at or above a threshold indexedto a base of $250 million (1991) and adjustedannually in concert with changes in the RailroadFreight Rate Index published by the Bureau ofLabor Statistics. In 1998, the threshold for Class Irailroads was $259.4 million. Declassificationfrom Class I status occurs when a railroad fallsbelow the applicable threshold for three consecu-tive years. Although Class I railroads representonly 2 percent of railroads in the country, theyaccount for over 70 percent of the industry’smileage.
WaterThe data are from Waterborne Commerce of
the United States, published by the U.S. ArmyCorps of Engineers (USACE). All vessel operators

of record report their domestic waterborne trafficmovements to USACE via ENG Forms 3925 and3925b. Cargo movements are reported accordingto points of loading and unloading. Certain cargomovements are excluded: 1) cargo carried on gen-eral ferries, 2) coal and petroleum products loadedfrom shore facilities directly into vessels for fueluse, 3) military cargo moved in U.S. Departmentof Defense vessels, and 4) cargo weighing less than100 tons moved on government equipment.USACE calculates ton-miles by multiplying thecargo’s tonnage by the distance between points ofloading and unloading.
Oil PipelineThe Eno Transportation Foundation, Inc.,
provided these figures, which are estimates basedon U.S. Department of Energy and Association ofOil Pipe Lines reports. Figures are derived bydividing estimated pipeline ton-miles by estimatedcrude and petroleum products tonnage.
Passenger
Air CarrierThe U.S. Department of Transportation
(USDOT), the Bureau of Transportation Statistics,Office of Airline Information, reports average triplength in its publication Air Traffic Statistics.These numbers are based on 100-percent report-ing of passengers and trip length by large certifi-cated air carriers via BTS Form 41. The figures donot include data for all airlines, such as mostscheduled commuter airlines and all nonscheduledcommuter airlines.
BusThe Eno Transportation Foundation, Inc. esti-
mated these figures based on Class I carrier pas-senger data and vehicle-miles data from HighwayStatistics, an annually published report of theUSDOT, Federal Highway Administration.
Commuter RailThe American Public Transit Association
(APTA) provided these data, which are based onthe USDOT, Federal Transit Administration’s(FTA’s), National Transit Database. Transit data
are generally accurate because the FTA reviewsand validates information submitted by individualtransit agencies. Reliability may vary becausesome transit agencies cannot obtain accurateinformation or may misinterpret data. APTA con-servatively adjusts FTA data to include transitoperators that do not report to the database (pri-vate, very small, and rural operators).
Intercity/AmtrakThe Statistical Appendix to the Amtrak
Annual Report is the source of these data. Amtrakdata are based on 100 percent of issued tickets,and thus should be accurate.
TABLE 1-43. Top U.S. Foreign Trade FreightGateways by Value of Shipments: 1998
The value of U.S. air, maritime, and landimports and exports are captured from adminis-trative documents required by the U.S.Departments of Commerce and Treasury. In 1990,the United States entered into a Memorandum ofUnderstanding with Canada concerning theexchange of import data. As a consequence, eachcountry is using the other’s import data to replaceits own export data. U.S. international merchan-dise trade statistics, therefore, are no longerderived exclusively from the administrativerecords of the Departments of Commerce andTreasury, but from Revenue Canada. Import valueis for U.S. general imports, customs value basis.Export value is FAS (free along ship) and repre-sents the value of exports at the U.S. port ofexport, including the transaction price and inlandfreight, insurance, and other charges. Trade levelsreflect the mode of transportation as a shipmententered or exited a U.S. Customs port.
Truck, rail pipeline, mail, and miscellaneousmodes are included in the total for land modes.Data present trade activity between the UnitedStates, Puerto Rico, and the U.S. Virgin Islandsand Canada and Mexico. These statistics do notinclude traffic between Guam, Wake Island, andAmerica Samoa and Canada and Mexico. Thesestatistics also exclude imports that are valued atless than $1,250 and for exports that are valued atless than $2,500.
422 " Appendix C Source and Accuracy Profiles

TABLE 1-46. U.S. Waterborne Freight
The data are from Waterborne Commerce ofthe United States, published by the U.S. ArmyCorps of Engineers (USACE). All vessel operatorsof record report their domestic waterborne trafficmovements to USACE via ENG Forms 3925 and3925b. Cargo movements are reported accordingto points of loading and unloading. Certain cargomovements are excluded: 1) cargo carried on gen-eral ferries, 2) coal and petroleum products loadedfrom shore facilities directly into vessels for fueluse, 3) military cargo moved in U.S. Department ofDefense vessels, and 4) cargo weighing less than100 tons moved on government equipment.USACE calculates ton-miles by multiplying thecargo’s tonnage by the distance between points ofloading and unloading.
Foreign waterborne statistics are derived fromCensus Bureau and U.S. Customs data, whichexcludes traffic between Guam, Wake Island, andAmerican Samoa and any other foreign country,and imports and exports used by U.S. ArmedForces abroad. Individual vessel movements withorigins and destinations at U.S. ports, traveling viathe Panama Canal are considered domestic traffic.
TABLE 1-47. Tonnage of Top 50 U.S. WaterPorts, Ranked by Total Tons
Data on the weight of U.S. maritime importsand exports are captured from administrative doc-uments required by the U.S. Departments ofCommerce and Treasury. In 1990, the UnitedStates entered into a Memorandum ofUnderstanding with Canada concerning theexchange of import data. As a consequence, eachcountry is using the other’s import data to replaceits own export data. The United States’ merchan-dise trade statistics, therefore, are no longerderived exclusively from U.S. government adminis-trative records, but from Revenue Canada.Maritime weight data are initially processed andedited by the Foreign Trade Division, U.S. CensusBureau (Census) as part of the overall edits andquality checks performed on all U.S. internationalmerchandise trade data. After Census processing,the U.S. Army Corps of Engineers (USACE) and
the Maritime Administration (MARAD) performadditional maritime-specific processing and quali-ty edits on maritime-related data elements, includ-ing the weight of maritime imports and exports.The USACE and MARAD began performing thisfunction in October 1998 after the ForeignWaterborne Trade data program was transferredfrom the Census Bureau. Prior to October 1998,the USACE historically performed additional spe-cialized edits at the port level, including reassign-ment of some tonnage data to the actualwaterborne port rather than the reported U.S.Customs port.
TABLE 1-43. Modal Shares of FreightShipments within the United States byDomestic Establishments: 1993 and 1997
TABLE 1-49. Value, Tons, and Ton- Miles ofFreight Shipments within the United States byDomestic Establishment, 1997
TABLE 1-52. U.S. Hazardous MaterialsShipments by Mode of Transportation, 1997
TABLE 1-53. U.S. Hazardous MaterialsShipments by Hazard Class, 1997
These data are collected via the 1997Commodity Flow Survey (CFS) undertakenthrough a partnership between the U.S.Department of Commerce, Census Bureau(Census), and the U.S. Department ofTransportation, Bureau of TransportationStatistics. For the 1997 CFS, Census conducted asample of 100,000 domestic establishments ran-domly selected from a universe of about 800,000multiestablishment companies in the mining, man-ufacturing, wholesale trade, and selected retailindustries. It excluded establishments classified asfarms, forestry, fisheries, governments, construc-tion, transportation, foreign, services, and mostretail.
Reliability of the EstimatesAn estimate based on a sample survey poten-
tially contains two types of errors—sampling andnonsampling. Sampling errors occur because theestimate is based on a sample, not on the entire
Appendix C Source and Accuracy Profiles ! 423

universe. Nonsampling errors can be attributed tomany sources in the collection and processing ofthe data and occur in all data, not just those froma sample survey. The accuracy of a survey resultis affected jointly by sampling and nonsamplingerrors.
Sampling VariabilityBecause the estimates are derived from a sam-
ple of the survey population, results are notexpected to agree with those that might beobtained from a 100-percent census using thesame enumeration procedure. However, becauseeach establishment in the Standard StatisticalEstablishment List had a known probability ofbeing selected for sampling, estimating the sam-pling variability of the estimates is possible. Thestandard error of the estimate is a measure of thevariability among the values of the estimate com-puted from all possible samples of the same sizeand design. Thus, it is a measure of the precisionwith which an estimate from a particular sampleapproximates the results of a complete enumera-tion. The coefficient of variation is the standarderror of the estimate divided by the value beingestimated. It is expressed as a percent. Note thatmeasures of sampling variability, such as the stan-dard error or coefficient of variation, are estimat-ed from the sample and are also subject tosampling variability. Standard errors and coeffi-cients of variation for CFS data presented in thisreport are given in Appendix B of the 1997Economic Census report, and are available onlinewww.census.gov/econ/wwwse0700.html.
Nonsampling ErrorsIn the CFS, as in other surveys, nonsampling
errors can be attributed to many sources, includ-ing 1) nonresponse; 2) response errors; 3) differ-ences in the interpretation of questions;4) mistakes in coding or recoding the data; and5) other errors of collection, response, coverage,and estimation.
A potentially large source of nonsamplingerror is due to nonresponse, which is defined asthe inability to obtain all intended measurementsor responses from selected establishments.Nonresponse is corrected by imputation.
TABLE 1-50. Value of U.S. Land Exports toand Imports from Canada and Mexico byMode
The Transborder Surface Freight Data (TSFD)is derived from official U.S. international mer-chandise import and export data. (For a descrip-tion of U.S. merchandise trade statistics, seewww.census.gov/foreign-trade/www/index.html.)As of December 1995, about 96 percent of thevalue of all U.S. imports has been collected elec-tronically by the Automated Broker InterfaceSystem. About 55 percent of the value of all U.S.exports is collected electronically through theU.S./Canada Data Exchange and the AutomatedExport Reporting Program. The balance is col-lected from administrative records required by theU.S. Departments of Commerce and Treasury.
The TSFD incorporates all data, by surfacemode, on shipments entering or exiting the UnitedStates from or to Canada or Mexico. Prior toJanuary 1997, this dataset also included trans-shipments—shipments entering or exiting theUnited States by way of U.S. Customs ports on thenorthern or southern borders even when the actu-al origin or final destination of the goods wasother than Canada or Mexico. (In other U.S.Bureau of the Census trade statistics, transship-ments through Canada and Mexico are credited tothe true country of origin or final destination.) Tomake this dataset more comparable to other U.S.Census Bureau trade statistics, detailed informa-tion on transshipments has been removed. TheTSFD presents a summary of transshipments bycountry, direction of trade, and mode of trans-portation. Shipments that neither originate norterminate in the United States (i.e., intransits) arebeyond the scope of this dataset because they arenot considered U.S. international trade shipments.
In general, the reliability of U.S. foreign tradestatistics is very good. Users should be aware thattrade data fields (e.g., value and commodity clas-sification) are typically more rigorously reviewedthan transportation data fields (e.g., the mode oftransportation and port of entry/exit). Usersshould also be aware that the use of foreign tradedata to describe physical transportation flows maynot be accurate. For example, this dataset pro-vides surface transportation information for indi-
424 " Appendix C Source and Accuracy Profiles

vidual U.S. Customs districts and ports on thenorthern and southern borders. However, becauseof filing procedures for trade documents, theseports may or may not record where goods physi-cally cross the border. This is because the infor-mation filer may choose to file trade documents atone port while shipments actually enter or exit atanother port. The TSFD, however, is the best pub-licly available approximation for analyzing trans-border transportation flows.
Since the dataset was introduced in April 1993,it has gone through several refinements andimprovements. When improbabilities and incon-sistencies were found in the dataset, extensive ana-lytical reviews were conducted and improvementsmade. However, accuracy varies by direction oftrade and individual field. For example, importdata are generally more accurate than export data.This is primarily because the U.S. Customs Bureauuses import documents for enforcement purposeswhile it performs no similar function for exports.For additional information on TSFD, the reader isreferred to the U.S. Department of Transportation,Bureau of Transportation Statistics Internet site atwww.bts.gov/transborder.
TABLE 1-51. Crude Oil and PetroleumProducts Transported in the United Statesby Mode
PipelinesThe Association of Oil Pipelines (AOPL)
obtains barrel-miles from the Federal EnergyRegulatory Commission (FERC), which requirespetroleum shippers to report annual shipments.AOPL then coverts barrel-miles to ton-miles usingconversion figures in the American PetroleumInstitute’s (API’s) Basic Petroleum Data Book.Since 16 percent of pipeline shipments areintrastate and not subject to FERC reportingrequirements, AOPL makes adjustments to FERCdata to include intrastate shipments. AOPL alsoconducts periodic studies to estimate intrastateshipments.
Water CarriersData are from Waterborne Commerce of the
United States, published by the U.S. Army Corps
of Engineers (USACE). All vessel operators ofrecord report domestic freight and tonnage infor-mation to USACE via ENG Forms 3925 and3925b. Cargo movements are reported accordingto points of loading and unloading. Certain cargomovements are excluded: 1) cargo carried on gen-eral ferries, 2) coal and petroleum products loadedfrom shore facilities directly into vessels for fueluse, 3) military cargo moved in U.S. Department ofDefense vessels, and 4) cargo weighing less than100 tons moved on government equipment.USACE calculates ton-miles by multiplying thecargo’s tonnage by the distance between the pointsof loading and unloading.
Motor CarriersAOPL estimates ton-miles by multiplying tons
by the average length of haul. For crude, the ton-nage of the prior year is projected by using agrowth rate established by data from the U.S.Department of Energy, Energy InformationAdministration’s Petroleum Supply Annual, vol. 1,table 37. For products, the same calculation ismade but with a growth rate estimated by theAmerican Trucking Association in Financial andOperating Statistics, Class I and II, MotorCarriers, Summary table VI-B. Average length ofhaul is determined from the prior six years of datafor ton-miles and tonnage of crude and petroleumproducts moved by motor carriers.
RailroadAOPL calculates ton-miles by multiplying ton-
nage by average length of haul. Tonnage data forcrude and products comes from the Association ofAmerican Railroad’s Freight Commodity Statistics,U.S. Class I Railroads. The U.S. Department ofTransportation, Federal Railroad Commissionprovides the average length of haul for crude andproducts in its Carload Way Bill Statistics.
TABLE 1-54. Worldwide Commercial SpaceLaunches
The U.S. Department of Transportation,Federal Aviation Administration, AssociateAdministrator for Commercial Space Transpor-tation (AST) licenses and regulates U.S. commer-
Appendix C Source and Accuracy Profiles ! 425

cial space launches as authorized by theCommercial Space Launch Act of 1984 andExecutive Order 12465. Every commercial spacelaunch must be approved and monitored by AST.Thus, data reliability is high.
TABLE 1-55. Passengers Denied Boarding bythe Largest U.S. Air Carriers
TABLE 1-56. Mishandled-Baggage ReportsFiled by Passengers with the Largest U.S. AirCarriers
TABLE 1-57. Flight Operations Arriving OnTime for the Largest U.S. Air Carriers
These numbers are based on data filed with theU.S. Department of Transportation on a monthlybasis by the largest U.S. air carriers – those thathave at least one percent of total domestic sched-uled-service passenger revenues. Data cover non-stop scheduled service flights between pointswithin the United States (including territories).The largest U.S. carriers account for more than 90percent of domestic operating revenues. Theyinclude Alaska Airlines, America West Airlines,American Airlines, Continental Airlines, Delta AirLines, Northwest Airlines, Trans World Airlines,Southwest Airlines, United Airlines, and USAirways. However, there are other carriers offer-ing domestic scheduled passenger service that arenot required to report. In some cases, major air-lines sell tickets for flights that are actually oper-ated by a smaller airline that is not subject to thereporting requirement.
TABLE 1-58. U.S. Air Carrier Delays Greaterthan 15 Minutes by Cause
The source of these data, the U.S. Departmentof Transportation (USDOT), Federal AviationAdministration (FAA), counts a flight as delayed ifit departed or arrived more than 15 minutes afterits scheduled gate departure and arrival times.FAA calculates delayed departures based on thedifference between the time a pilot requests FAAclearance to taxi and the time an aircraft’s wheelslift off the runway, minus the airport’s standard
unimpeded taxi-out time. Users should note thattaxi-out time varies by airport due to differencesin configurations. The cause of delay is alsorecorded, e.g., weather, terminal volume, closedrunways, etc.
USDOT guidance defines departure as the timethe aircraft parking brake is released and gatearrival as the time the brake is set. According tothe USDOT’s Office of the Inspector General(OIG), FAA’s omission of part of a plane’s groundmovement compromises the data’s validity. Arecent OIG report noted that the FAA tracksground time only after a pilot requests clearanceand fails to track a plane’s time in the ramp area.OIG found that ramp time comprised 28.7 percentto 40.5 percent of the average taxi-out time at thethree major New York area airports (OIG AuditReport CR-2000-112), and would not be countedas an FAA delay.
ReliabilitySeveral data collection changes complicate
comparisons over time. For example, FAA modi-fied its method for calculating volume-relateddelays that resulted in a 17 percent drop in suchdelays. Decreases in volume-related delays from1998 to 1999 totaled less than one percent.Moreover, prior to 1999, USDOT did not providea clear definition of what a departure was. AnOIG Audit (CE-1999-054) report noted that aircarriers used four different departure events: 1)rolling of aircraft wheels; 2) release of parkingbrake; 3) closure of passenger and/or cargo doors;and 4) a combination of door closures and releaseof the parking break. The same report also notederrors in the reporting of departure times by theair carriers.
Data are now manually entered in FAA’sOperations Network (OSPNET) database, andreporting errors may arise and decrease reliability.The FAA monitors data quality assurance by spotchecking the reported delay data and requestingthat discrepancies be reviewed by the responsiblefacility. According to an OIG Audit (CR-2000-112), however, mistakes are not reliably correctedand many air traffic controllers suggested thatdelays are underreported sometimes by as much as30 percent.
426 " Appendix C Source and Accuracy Profiles

TABLE 1-59. Major U.S. Air Carrier Delays,Cancellations, and Diversions
A second data source for air-carrier delay is theUSDOT, Bureau of Transportation Statistics,Office of Airline Information (OAI). This infor-mation originates from the Airline Service QualityPerformance data. These figures are collected fromthe largest airlines—those that have at least onepercent or more of total domestic scheduled serv-ice passenger revenues. Delays are categorized byphase of flight (i.e., gate-hold, taxi-out, airborne,or taxi-in delays). These data differ from FAA’sOSPNET information due to differences in defini-tion of delay.
While the FAA tracks delays on the taxiway,runway, and in the air, BTS tracks delays at thedeparture and arrival gates. OAI calculates delaysas the difference between scheduled and actualgate departure. If a flight leaves the gate within 15minutes of its scheduled time, then OAI wouldrecord it as departed on-time even if it sat for sev-eral hours on the ramp or runway, in which casethe delay would be accounted for as a late arrival.
TABLE 1-60. Annual Person-Hours of DelayPer Eligible Drive
TABLE 1-61. Roadway Congestion Index
TABLE 1-62. Congestion Index and CostValues
The Texas Transportation Institute’s (TTI)Urban Roadway Congestion Annual Report pro-vided figures for tables 1-54 through 56. TTI relieson data from the U.S. Department ofTransportation, Federal Highway Administration,Highway Performance Monitoring System data-base (HPMS). TTI utilizes these data as inputs toits congestion estimation model. Detailed docu-mentation for the TTI model and estimations canbe found at this website http://mobility.tamu.edu/study/index.stm.
Structure, Assumptions, and ParametersUrban roadway congestion levels are estimated
using a formula measuring traffic density. Averagetravel volume per lane on freeways and principal
arterial streets are estimated using area wide esti-mates of vehicle-miles of travel (vmt) and lanemiles of roadway. The resulting ratios are com-bined using the amount of travel on each portionof the system so that the combined index measuresconditions on the freeway and principal arterialstreet systems. Values greater than one are indica-tive of undesirable congestion levels. Readersseeking the algorithm for the congestion indexshould examine this website http://mobility.tamu.edu/study/numbers.stm.
Annual person-hours of delay results from themultiplication of daily vehicle-hours of incidentand recurring delay times 250 working days peryear times 1.25 persons per vehicle. Two types ofcosts are incurred due to congestion: time delayand fuel consumption. Delay costs are the productof passenger vehicle hours of delay times $12.00per hour person time value times 1.25 occupantsper vehicle. Fuel costs are calculated for passengerand commercial vehicles from the multiplication ofpeak period congestion speeds, the average fueleconomy, fuel costs, and vehicle-hours of delay.
In previous reports, the TTI methodologyassumed that 45 percent of all traffic, regardless ofthe urban location, occurred in congested condi-tions. TTI indicated that this assumption overesti-mated travel in congested periods. Thus, their1999 estimates now vary by urban area anywherefrom 21 percent to 50 percent of travel that occursin congestion. TTI’s model structure applies totwo types of roads: freeways and principal arterialstreets. The model derives estimates of vehicletraffic per lane and traffic speed for an entire urbanarea. Based on variation in these amounts, travelis then classified under 5 categories: uncongested,moderately congested, heavily congested, severelycongested, and extremely congested (a new cate-gory in 1999). The threshold between uncongest-ed and congested was changed in 1999. Previouseditions classified congested travel when areawidetraffic levels reached 13,000 vehicles per lane perday on highways and 5,000 vehicles per lane perday on principal arterial streets. These thresholdswere raised in the latest report to 14,000 and5,500 vehicles per lane per day respectively.Comparisons across time will be questionable dueto these changes. For instance, TTI applied thenew methodology to 1996 data that resulted in
Appendix C Source and Accuracy Profiles ! 427

lower congestion levels. Readers should refer tothe TTI Internet site for more detailed algorithmsand estimation procedures at http://mobility.tamu.edu/estimating_mobility.
TTI reviews and adjusts the data used in theirmodels. State and local officials also review theTTI data and estimations. Some of the limitationsacknowledged in the TTI report include themacroscopic character of the index. Thus, it doesnot account for local variations in travel patternsthat may affect travel times. The index also doesnot account for local improvements, such as rampmetering or travel speed advantages obtained withtransit or carpool lanes.
TABLE 1-63. Amtrak On-TimePerformance Trends and Hours ofDelay by Cause
Amtrak determines on-time performancethrough its computer system maintained at theNational Operations Center (NOPS) inWilmington, Delaware. If a train is delayed, a callis made to the NOPS for recordkeeping. Thesedata can be supplemented with computer entriesmade for locomotive or car malfunctions thatcause delays. These data should be consideredreliable.
428 " Appendix C Source and Accuracy Profiles

AIR DATA
TABLE 2-1. Transportation Fatalities by Mode
TABLE 2-2. Injured Persons by TransportationMode
TABLE 2-3. Transportation Accidents by Mode
TABLE 2-4. Distribution of TransportationFatalities by Mode
TABLE 2-7. Transportation-RelatedOccupational Fatalities
TABLE 2-9. U.S. Air Carrier Safety Data
TABLE 2-10. U.S. Commuter Air CarrierSafety Data
TABLE 2-11. U.S. Air Carrier Fatal Accidentsby First Phase of Operation
TABLE 2-12. U.S. Commuter Air Carrier FatalAccidents by First Phase of Operation
TABLE 2-13. U.S. On-Demand Air Taxi SafetyData
TABLE 2-14. U.S. General Aviation SafetyData
National Transportation Safety Board investi-gators perform onsite and offsite investigations ofall accidents involving U.S. registered air carriersoperating under 14 CFR 121, 14 CFR 135, andgeneral aviation U.S. Department of Transpor-tation (USDOT), Federal Aviation Administration(FAA) regulations. The investigators compileinformation on fatalities and injuries for all acci-dents. The counts for fatalities and serious injuriesare expected to be extremely accurate. (See glos-sary for serious injury definition.)
Exposure data (aircraft-miles, aircraft-hours,and aircraft-departures) are obtained from theFAA, which in turn gets some of its exposure datafrom the USDOT, Bureau of TransportationStatistics, Office of Airline Information (OAI) andother exposure data from its own General Aviationand Air Taxi Activity and Avionics (GAATAA)Survey. The OAI data represent 100 percent
reporting by airlines. Tables that include air carri-ers (14 CFR 121, scheduled and nonscheduledservice) and commuter air carriers (14 CFR 135,scheduled service only) use OAI exposure data.Tables that include on-demand air taxi (14 CFR135, nonscheduled service) and general aviationuse GAATAA Survey results. For informationabout the GAATA Survey, please refer to the chap-ter 1 data accuracy statement for table 1-9.
The coefficients of variation for aircraft-hoursvary by year, but are usually in the 9 to 10 percentrange for on-demand air taxi and are approxi-mately 2 percent for general aviation.
TABLE 2-15. Number of Pilot-Reported NearMidair Collisions by Degree of Hazard
Near Midair Collision reports are providedvoluntarily by air carriers, general aviation com-panies, and the military, and this information isadded to the Near Midair Collisions System data-base. Factors that may influence whether or not anear midair collision is reported include the pilot’sor other crew member’s perception of whether areportable near midair collision occurred, which inturn can depend on factors such as visibility con-ditions; the reporter’s flying experience; or the sizeof the aircraft involved. A reportable incident isone in which an aircraft is within 500 feet ofanother aircraft and a possibility of collisionexisted.
TABLE 2-16. Airline Passenger ScreeningResults by Type of Weapons Detected,Persons Arrested, and Bomb Threats Received
Federal Aviation Regulations (FARs) mandatethat passenger screening be performed by each aircarrier required to implement an approved securi-ty program. The USDOT, Federal AviationAdministration, monitors the records of passengerscreening in accordance with FAR, and overseescompliance with the carriers’ security programsthrough, for example, scheduled and unscheduledinspections. FAR requires the reporting of infor-mation on bomb threats.
Appendix C Source and Accuracy Profiles ! 429
Chapter 2 Safety

HIGHWAY DATA
TABLE 2-1. Transportation Fatalities by Mode
TABLE 2-2. Transportation Injuries by Mode
TABLE 2-3. Transportation Accidents by Mode
TABLE 2-4. Distribution of TransportationFatalities by Mode
TABLE 2-5. Highway-Rail Grade-CrossingSafety Data and Property Damage
TABLE 2-7. Transportation-RelatedOccupational Fatalities
TABLE 2-17. Motor Vehicle Safety Data
TABLE 2-18. Motor Vehicle Fatalities, Vehicle-Miles, and Associated Rates by HighwayFunctional System
TABLE 2-19. Occupant Fatalities by VehicleType and Nonoccupant Fatalities
TABLE 2-21. Passenger Car Occupant SafetyData
TABLE 2-22. Motorcycle Ride Safety Data
TABLE 2-23. Truck Occupant Safety Data
TABLE 2-24. Bus Occupant Safety Data
TABLE 2-25. Fatalities by Highest BloodAlcohol Concentration in Highway Crashes
TABLE 2-27. Motor Vehicle Fatal Crashes byDay of Week, Time of Day, and Weather andLight Conditions
TABLE 2-28. Motor Vehicle Fatal Crashes byPosted Speed Limit
TABLE 2-20. Occupant and NonmotoristFatalities in Crashes by Number of Vehiclesand Alcohol Involvement
FatalitiesHighway fatality data come from the Fatality
Analysis Reporting System (FARS), which is com-piled by trained FARS analysts at USDOT,National Highway Traffic Safety Administration(NHTSA) regional offices. Data are gathered from
a census of police accident reports (PARs), statevehicle registration files, state drivers licensingfiles, state highway department data, vital statis-tics, death certificates, coroner/medical examinerreports, hospital medical reports, and emergencymedical service reports. A separate form is com-pleted for each fatal crash. Blood alcohol concen-tration (BAC) is estimated when not known.Statistical procedures used for unknown data inFARS can be found in the NHTSA report AMethod for Estimating Posterior BAC Distri-butions for Persons Involved in Fatal TrafficAccidents, DOT HS 807 094 (Washington, DC:July 1986).
Data are collected from relevant state agenciesand electronically submitted for inclusion in theFARs database on a continuous basis. Cross-verification of PARs with death certificates ensuresthat undercounting is rare. Moreover, when dataare entered, they are checked automatically foracceptable range values and consistency, enablingquick corrections when necessary. Several pro-grams continually monitor the data for complete-ness and accuracy. Periodically, sample cases areanalyzed for accuracy and consistency.
Note that the FARS data do not include motorvehicle fatalities on nonpublic roads. However,previous NHTSA analysis found that these fatali-ties account for 2 percent or fewer of the totalmotor vehicle fatalities per year. (See glossary forhighway fatality definition.)
Injuries and CrashesNHTSA’s General Estimates System (GES)
data are a nationally representative sample ofpolice-reported crashes that contributed to aninjury or fatality or resulted in property damage,and involved at least one motor vehicle travelingon a trafficway. Trained GES data collectors ran-domly sample PARs and forward copies to a cen-tral contractor for coding into a standard GESsystem format. Documents such as police dia-grams or supporting text provided by the officersmay be further reviewed to complete a data entry.
NHTSA suggests that about half of motorvehicle crashes in the United States are not report-ed to police and that the majority of these unre-ported crashes involve minor property damage andno significant personal injury. A NHTSA study of
430 " Appendix C Source and Accuracy Profiles

injuries from motor vehicle crashes estimated thetotal count of nonfatal injuries at over 5 millioncompared with the GES’s estimate of 3.2 million in1998. (See glossary for highway crash and injurydefinitions.)
(See U.S. Department of Transportation,National Highway Traffic Safety Administration,Traffic Safety Facts, 1998, DOT HS 808 983(Washington, DC: October 1999), appendices Band C for further information on the GES, includ-ing a table of standard errors applicable to GESdata.)
TABLE 2-29. Safety Belt and MotorcycleHelmet Use
The National Occupant Protection Use Survey(NOPUS), conducted in 1994, 1996, and 1998 bythe U.S. Department of Transportation, NationalHighway Traffic Safety Administration is thesource for these data.
In 1994 and 1996, NOPUS consisted of threeseparate studies: 1) the Moving Traffic Study,which provides information on overall shoulderbelt use, 2) the Controlled Intersection Study,which provides more detailed information aboutshoulder belt use by type of vehicle, characteristicsof the belt users and child restraint use, and 3) theShopping Center Study, which provides informa-tion on rear-seat belt use and shoulder belt misuse.In 1998, the Shopping Center Study was droppedfrom the survey. The Controlled IntersectionStudy includes the collection of license plate infor-mation to link seat belt use to vehicle type. As theresults of the Controlled Intersection Study for1998 were not available prior to publication, onlythe Moving Traffic Study data were used in thistable.
In 1998, the NOPUS separated pickups fromthe light truck category, thereby creating three cat-egories of passenger vehicles: passenger cars, pick-up trucks, and other passenger vehicles. Otherpassenger vehicles include vans, minivans, andsport utility vehicles. In this table, 1998 data forpickup trucks and other vehicles are combined intothe light truck category to allow comparison todata from the earlier surveys.
In 1994, operators and riders wearing any typeof helmet were counted as helmeted. In 1996 and1998, motorcycle helmets that meet USDOT stan-dards are counted as valid protection, whereasthose that do not meet USDOT standards weretreated as if the operator/rider were not wearing ahelmet.
Data collection from the moving traffic studywas conducted at over 3,800 sites across the coun-try. Shoulder belt use was obtained for drivers andright-front passengers only. Three observers (twoobservers in 1994 and 1996) were stationed for 30minutes at interstate/highway exit ramps, con-trolled (intersections with stop signs or traffic sig-nals), and uncontrolled intersections. Every day ofthe week and all daylight hours (8 a.m. to 6 p.m.)were covered in each survey. Commercial andemergency vehicles were excluded.
NOPUS was designed as a multistage proba-bility sample to ensure that the results would rep-resent occupant protection use in the country. Inthe first stage, counties were grouped by region(northeast, midwest, south, west), level of urban-ization (metropolitan or not), and level of belt use(high, medium, or low). Fifty counties or groupsof counties were selected based on the vehicle milesof travel in those locations. In the next stage, road-ways were selected from two categories: majorroads and local roads. Finally, approximately4,000 intersections or exit ramps were chosen onthese roadways. Of the originally selected sites,some were found to be ineligible during mappingand data collection, and at some sites no vehicleswere observed. In 1998, a total of 199,412 pas-senger cars, 135,505 light trucks (of which 76,004were other vehicles and 59,501 were pickuptrucks), and 1,444 motorcycles were observed.
Each reported estimate has been statisticallyweighted according to the sample design. Twokinds of error can be attributed to all surveyresearch: sampling and nonsampling. A measure,called the standard error, is used to indicate themagnitude of sampling error. The source informa-tion provides two standard errors along with eachestimate. Nonsampling errors could include prob-lems such as vehicles not counted, incorrect deter-mination of restraint use, and data entry mistakes,among others.
Appendix C Source and Accuracy Profiles ! 431

TABLE 2-30. Estimated Number of LivesSaved by Use of Restraints
The U.S. Department of Transportation,National Highway Traffic Safety Administration(NHTSA) uses data obtained from the FatalityAnalysis Reporting System to calculate the numberof lives saved by the use of restraints. The method-ology used is outlined in a NHTSA report,Research Note, Estimating Lives Saved byRestraint Use in Potentially Fatal Crashes(Washington, DC: June 1995). The generalapproach is to adjust the observed number of fatal-ities by a determined effectiveness rate for eachtype of restraint. This equates to subtracting theactual fatalities from the potential fatalities todetermine the number of lives saved. This methodis more accurate than earlier estimation methodssince all calculations are derived from NHTSA’scount of fatalities in which restraints were used.Reported restraint use is believed to be accurate forfatalities.
The key to NHTSA’s calculations is the effec-tiveness estimate for preventing fatalities for eachtype of restraint. With the exception of an adjust-ment in the effectiveness estimate for front out-board air bag-only restraint use in passenger cars(NHTSA, Fourth Report to Congress, Effec-tiveness of Occupant Protection Systems and TheirUse, Washington, DC, May 1999), a list of effec-tiveness estimates can be found in a NHTSAreport, Estimating Alcohol Involvement in FatalCrashes in Light of Increases in Restraint Use,published in March 1998. This report alsoincludes additional references describing the deter-mination of these effectiveness estimates.
TRANSIT DATA
TABLE 2-1. Transportation Fatalities by Mode
TABLE 2-2. Transportation Injuries by Mode
TABLE 2-3. Transportation Accidents by Mode
TABLE 2-4. Distribution of TransportationFatalities by Mode
TABLE 2-31. Transit Safety and PropertyDamage Data
TABLE 2-32. Transit Safety Data by Mode forAll Reported Accidents
TABLE 2-33. Transit Safety Data by Mode forAll Reported Incidents
TABLE 2-34. Reports of Violent Crime,Property Crime, and Arrests by Transit Mode
The data for this report are obtained from theU.S. Department of Transportation, FederalTransit Administration’s (FTA’s) National TransitDatabase (NTD) Reporting System. Transit agen-cies are required to file an NTD report at regularintervals if they are recipients of Urbanized AreaFormula Funds. In 1998, 575 agencies reported tothe NTD. Of that total, 60 transit agenciesreceived exemptions from detailed reportingbecause they operated 9 or fewer vehicles, and 6were deleted because their data were incomplete.Thus, 509 individual reporters were included inthe NTD, accounting for 90 to 95 percent of pas-senger-miles traveled on transit. Of the transitagencies reporting, 56.2 percent contract for someor all of their transportation from private or pub-lic companies or organizations.
Transit operators report fatalities, injuries,accidents, incidents, and property damage inexcess of $1,000. Electronic reporting has recent-ly been implemented for the NTD. Certificationfrom a company’s Chief Executive Officer mustaccompany all NTD reports along with an inde-pendent auditor’s statement. Upon receipt, anNTD report is reviewed and outstanding itemsnoted in writing to the agency that submitted theform. (See glossary for transit fatality, injury, andaccident definitions.)
Four major categories of transit safety are col-lected: 1) collisions, 2) derailments/buses going offthe road, 3) personal casualties, and 4) fires.These major categories are divided into subcate-gories. The collisions category comprises colli-sions with vehicles, objects, and people (exceptsuicides). Of the four major categories, only thefirst two are included in the definition of transitaccidents adopted in this report (see glossary).Understanding this definition of accident is rele-vant to understanding how double counting isremoved in the grand total of U.S. transportation
432 " Appendix C Source and Accuracy Profiles

fatalities and injuries. (See cross modal commentsin box 2-1.)
Transit data submitted to the NTD are gener-ally considered accurate because the FTA reviewsand validates information submitted by individualtransit agencies. However, reliability may varybecause some transit agencies cannot obtain accu-rate information or misinterpret data.
SecurityFTA collects security data from transit agencies
serving urbanized areas of over 200,000 in popu-lation, using Form 405, and manages it in theNational Transit Database (NTD). The reportingof security data follows the FBI Uniform CrimeReporting Handbook (Washington, DC: 1984)and is divided into two categories: 1) ReportedOffenses, including violent and property crime,and 2) Arrests, consisting of less serious crimes.The figures for violent and property crime arebased on records of calls for service, complaints,and/or investigations. They do not reflect the find-ings of a court, coroner, jury, or decision of a pros-ecutor. Security data were first reported in 1995and were not compiled for earlier years.
In 1998, the number of agencies reporting tothis database was 575. Of that, 60 transit agenciesreceived exemptions from detailed reportingbecause they operated nine or fewer vehicles, andsix were deleted because their data were incom-plete. Thus, 509 individual reporters are includedin the full database in 1998. Of the transit agen-cies reporting, 56.2 percent contract for some orall of their transportation from private or publiccompanies or organizations.
RAILROAD DATA
TABLE 2-1. Transportation Fatalities by Mode
TABLE 2-2. Transportation Injuries by Mode
TABLE 2-3. Transportation Accidents by Mode
TABLE 2-4. Distribution of TransportationFatalities by Mode
TABLE 2-5. Highway-Rail Grade-CrossingSafety Data and Property Damage
TABLE 2-7. Transportation-RelatedOccupational Fatalities
TABLE 2-35. Railroad and Grade-CrossingFatalities by Victim Class
TABLE 2-36. Railroad and Grade-CrossingInjured Persons by Victim Class
TABLE 2-37. Train Fatalities, Injuries, andAccidents by Type of Accident
TABLE 2-38. Railroad Passenger Safety Data
TABLE 2-39. Railroad System Safety andProperty Damage Data
TABLE 2-40. Fatalities and Injuries of On-DutyRailroad Employees
Railroads are required to file a report for eachtrain accident resulting in property damage inexcess of $6,600, each highway-rail accident, andeach incident involving the operation of a railroadresulting in a fatality or a reportable injury. (Seeglossary for reportable injury, train accident andincident, and nontrain incident definitions.)
Reporting requirements, which are fixed inlaw, are very broad and encompass events notstrictly related to transportation. For example, ifa passenger falls on a staircase and breaks a leg in
Appendix C Source and Accuracy Profiles ! 433
Box 2-1.Cross-Modal Comparisons
Caution must be exercised in comparing fatalities (andinjuries) across modes because different definitions forreportable events are used among the modes. In particular, railand transit facilities and injuries include deaths and injuriesthat are not, strictly speaking, caused by transportation acci-dents, but are caused by such events as a fall on a transit sta-tion escalator; or for railroad employees, a fire in a workshed.Similar fatalities for the air and highway modes (death at air-ports not caused by moving aircraft, or fatalities from accidentsin automobile repair shops) are not counted towards the totalsfor these modes.
Total fatalities (injuries) in the tables are less than thesum of the modal totals because some deaths (injuries) arereported and counted in more than one mode. To avoid dou-ble counting, adjustments have been made to fatality totals(see table 2-4).

the station while going to a train, the injury wouldbe reported and appear in the data as a rail injury.
WATERBORNE TRANSPORTATIONDATA
TABLE 2-1. Transportation Fatalities by Mode
TABLE 2-2. Transportation Injuries by Mode
TABLE 2-3. Transportation Accidents by Mode
TABLE 2-4. Distribution of TransportationFatalities by Mode
TABLE 2-7. Transportation-RelatedOccupational Fatalities
TABLE 2-41. Waterborne TransportationSafety Data and Property Damage Related toVessel Casualties
TABLE 2-42. Waterborne TransportationSafety Data Not Related to Vessel Casualties
U.S. waterborne fatality and injury data arebased on reports required by CFR Part 4.05-10.This code requires that the owner, agent, master,operator, or person in charge file a written reportof any marine casualty or accident within five daysof the accident. Reports must be delivered toInvestigative Officers (IOs) at a U.S. Coast GuardMarine Safety Office or Marine Inspection Officeat the U.S. Department of Transportation, whouse these reports as guides to investigate themarine casualty or accident. The IO ensures thatall the entries on the forms are filled out and errorsare corrected. Regulations require IO notificationof marine casualties for certain circumstances,including loss of life; injuries that require medicaltreatment beyond first aid; and, for individualsengaged or employed onboard a vessel in com-mercial service, injuries that render a person unfitto perform routine duties.
Incidents requiring an investigation includedeath, injury resulting in substantial impairment,and other incidents determined important to pro-moting the safety of life or property or to protectthe marine environment. These incidents are
investigated in accordance with procedures setforth in the regulations. Furthermore, the FederalWater Pollution Control Act mandates that cer-tain incidents be reported to the U.S. Coast Guard.The reports are entered into the Marine SafetyInformation System, which is later analyzed andtransferred to the Marine Safety ManagementSystem maintained in Washington, DC.
RECREATIONAL BOATING DATA
TABLE 2-1. Transportation Fatalities by Mode
TABLE 2-2. Transportation Injuries by Mode
TABLE 2-3. Transportation Accidents by Mode
TABLE 2-4. Distribution of TransportationFatalities by Mode
TABLE 2-43. Recreational Boating Safety,Alcohol Involvement, and Property DamageData
TABLE 2-44. Personal Watercraft Safety Data
TABLE 2-45. U.S. Coast Guard Search andRescue Statistics, Fiscal Years
Operators of boats involved in an accidentresulting in 1) a fatality, 2) an injury requiringmedical treatment beyond first aid, 3) damage tothe vessel or other property greater than $500 orcomplete loss of vessel, or 4) the disappearance ofa person from the vessel under circumstances indi-cating death or injury are required to file a reportwith the U.S. Coast Guard. If a person dies with-in 24 hours of the occurrence, requires medicaltreatment beyond first aid, or disappears from thevessel, reports must be made within 48 hours ofthe occurrence. In cases involving only damage tothe vessel and/or property, reports are to be sub-mitted within 10 days of the occurrence.Although there is no quantitative estimate of theresponse rate, there may be considerable underre-porting, especially of nonfatal accidents, becauseof the difficulty of enforcing the requirement andbecause boat operators may not always be awareof the law.
434 " Appendix C Source and Accuracy Profiles

NATURAL GAS AND LIQUIDPIPELINE DATA
TABLE 2-1. Transportation Fatalities by Mode
TABLE 2-2. Transportation Injuries by Mode
TABLE 2-3. Transportation Accidents by Mode
TABLE 2-4. Distribution of TransportationFatalities by Mode
TABLE 2-46. Hazardous Liquid and NaturalGas Pipeline Safety and Property DamageData
U.S. fatality and injury data for natural gaspipelines are based on reports filed with the U.S.Department of Transportation (USDOT), Office ofPipeline Safety (OPS). Accidents must be reportedas soon as possible, but no later than 30 days afterdiscovery. Reports are sent to the InformationSystems Manager at the OPS. Possible sources oferror include a release going undetected; even ifsubsequently detected and reported, it may not bepossible to accurately reconstruct the accident.Property damage figures are estimates. (See glos-sary for gas and liquid pipeline fatality data andinjury definitions.)
TABLE 2-6. Hazardous Materials Safety Dataand Property Damage Data
Incidents resulting in certain unintentionalreleases of hazardous materials must be reported
under 49 CFR 171.16. Each carrier must submita report to the U.S. Department of Transportation,Research and Special Programs Administration(RSPA) within 30 days of the incident, includinginformation on the mode of transportationinvolved, results of the incident, and a narrativedescription of the accident. These reports aremade available on the incident database within 60days of receipt.
Fatalities and injuries are counted only if theyare directly due to a hazardous material. Forexample, a truck operator killed by impact forcesduring a motor vehicle crash would not be count-ed as a hazardous-material fatality. RSPA verifiesall reported fatalities and injuries by telephonewith the carrier submitting the report.
Possible sources of error include a release goingundetected; even if subsequently detected andreported, it may not be possible to accuratelyreconstruct the accident. Although RSPAacknowledges that there is some level of underre-porting, it believes that the underreporting is lim-ited to small, nonserious incidents. As incidentseverity increases, it is more likely that the incidentwill come to RSPA’s attention and will ultimatelybe reported. Additionally, the reporting require-ments were extended to intrastate highway carrierson October 1, 1998, and the response rate fromthis new group is expected to increase over time.Property damage figures are estimates determinedby the carrier prior to the 30-day reporting dead-line and are generally not subsequently updated.Property damage figures, therefore, may underesti-mate actual damages.
Appendix C Source and Accuracy Profiles ! 435

TABLE 3-1a & 3-1b. U.S. Gross DomesticProduct Attributed to For-Hire TransportationServices (Current and chained 1996 dollars)
TABLE 3-2a & 3-2b. U.S. Gross DomesticProduct Attributed to Transportation-RelatedFinal Demand (Current and chained 1996dollars)
TABLE 3-3a & 3.3b. U.S. Gross DomesticDemand Attributed to Transportation-RelatedFinal Demand (Current and chained 1996dollars)
TABLE 3-4a & 3-4b. Contributions to GrossDomestic Product: Selected Industries(Current and chained 1996 dollars)
TABLE 3-5. Gross Domestic Product by MajorSocial Function
Tables 3-1 through 3-5 present data on trans-portation's contributions to the economy throughconsumption (or the money spent on transporta-tion activity). The Survey of Current Business(SCB) published by the U.S. Department ofCommerce, Bureau of Economic Analysis (BEA).The SCB is a monthly journal that contains esti-mates of U.S. economic activity, including industrycontributions to the Gross Domestic Product(GDP). GDP is defined as the net value of the out-put of goods and services produced by labor andproperty located in the United States. BEA con-structs two complementary measures of GDP-onebased on income and the other on expenditures(product). Together, they represent the NationalIncome and Product Accounts (NIPA), ournation's principle framework for macroeconomicestimates. The product side results from the addi-tion of labor, capital, and taxes for producing out-put. Consumption derives from household,business, and government expenditures and netforeign purchases.
Table 3-3 presents transportation's economicimpact in a different form, Gross DomesticDemand (GDD). Also derived from the nationalaccounts, GDD is the sum of personal consump-tion, gross private domestic investment, and gov-
ernment purchases. GDD includes imports, butexcludes exports, thus counting only what is con-sumed, purchased, or invested in the United States.
GDP MethodologyThe 1960 through 1985 data in table 3-1 are
from the November 1993 issue of the SCB. The1990 through 1991 data and 1992 through 1996data are from an August 1996 and November1997 SCB issue respectively. The October 1999issue introduced a revised methodology for GDPestimates (Yuskavage 1996). This sectiondescribes BEA's methodology for estimating trans-portation's share of GDP.
BEA's current-dollar estimates of GDP byindustry rely on several sources, including theBureau of Labor Statistics (BLS), the Health CareFinancing Administration, and the InternalRevenue Service (IRS). Some of the tables in thischapter report chained-dollar figures. BEAderived chained dollars by using the Fisher IdealQuantity Index to calculate changes between adja-cent years (Parker and Triplett 1996; Landerfeldand Parker 1997). Annual changes are thenchained to form a time series that incorporates theeffects of relative price and output compositionchanges. Please refer to page 142 of the August1996 issue of the Survey of Current Business forthe mathematical formulas (Yuskavage 1996).This method produced separate estimates of grossoutput and intermediate inputs for a sector's GDPcalculation. BEA updated the reference year forthe chained-dollar estimates from 1992 to 1996.
Transportation GDP in chained dollars wasestimated using the double-deflation method,which relies on a chain-type quantity index for-mula, and requires gross output and intermediateinput information. Principal source data for thetransportation categories include: 1) operatingrevenues of air carriers and Federal Express fromthe U.S. Department of Transportation and publicsources (air); 2) operating revenues for Class Imotor carriers from historical records of theInterstate Commerce Commission and CensusBureau annual surveys (trucking and warehous-ing); 3) BEA personal consumption expenditures
436 " Appendix C Source and Accuracy Profiles
Chapter 3 Transportation and the Economy

(PCE), BLS, and trade sources (local and interur-ban passenger transit); 4) operating revenues forClass I railroads and Amtrak (rail); and 5) othertrade sources (pipelines). Data sources for waterwere not provided (Yuskavage, 1996).
Table 3-1 reported current dollar estimatesfrom various SCB issues. BEA derived the 1991data and subsequent years in four steps:
1. BEA's benchmark input-output (I-O)tables produced input compositions for 1977,1982, and 1987.
2. BEA estimated 1978 through 1981 and1983 through 1986 input compositions byinterpolating the 1977, 1982, and 1987 fig-ures.
3. BEA estimates the 1977 through 1987imported and domestically imported shares ofeach detailed input.
4. BEA estimates the 1988 through 1994input compositions based on the 1987 figuresand the Economic Censuses of 1992.For intermediate input estimations, BEA
deflates each of the current-dollar inputs. (BEAdeflates import and domestic production separate-ly.) For deflation, quantities are approximated byreal values (expressed at present with 1996 as thebase period) that are calculated by dividing thecurrent-dollar value of the component by its priceindex. BEA develops estimates for import priceswith data from a variety of sources, but primarilyfrom the BLS import price series
Reliability and AccuracyBEA views GDP as a reliable measure of out-
put because of the source data underlying the esti-mates. The following reliability comments arebased on the Valliant (1993) SCB article and Ritter(2000). GDP data originate from three types ofsources. The foundational data come first fromthe economic censuses conducted every five years.These approach complete enumerations of sectoralactivity in state and local governments, manufac-turing, services, retail trade, wholesale trade, con-struction, transportation, communications andutilities, mining, finance, insurance, and realestate. Annual estimates form the second tier ofGDP data and emanate form sources such as IRS
tax returns and smaller surveys of establishments.The Annual Retail Trade Survey, for instance,forms one of the major components of the annualestimates. The U.S. Census Bureau collects salesand end-of-year inventory data from about 22,000retail firms totaling $2 trillion of the $8.8 trillionGDP amount. While considered reliable by manyeconomists, sampling variability may introduceerrors into these annual estimates. Moreover, theCensus Bureau imputes (substitutes estimates formissing or clearly incorrect data) about 11 percentof reported national annual retail sales because ofaccounting inconsistencies or raw survey dataerrors. The third component of the GDP flowsfrom quarterly estimates.
In the October 1993 SCB, Valliant describedthe reliability and accuracy of the quarterly esti-mates of GDP, providing insights into the pre-1985data in terms of dispersion and bias. BEA followeda schedule that produced three successive "cur-rent" estimates; advanced, preliminary, and final.BEA analysts developed a dispersion and biasmeasure based on the difference between thesethree estimates.
Dispersion is the average of the absolute valuesof the revisions, or, the difference between P, rep-resenting the percentage change in the current esti-mates, and L representing the percentage change inthe latest available estimates, divided by n, repre-senting the number of quarterly changes. Bias isthe average of the revisions. According to theOctober 1993 SCB, dispersion averaged 1.6 per-cent from 1958 to 63 and dropped to 1.1 percentfor 1968 to 1972. BEA stated that these declines indispersion correspond with more accurate initialand final estimates subsequent to the late 1950s.For years after 1973 until 1991, the BEA conclud-ed that more accurate source data for preliminaryand final estimates did not improve reliability bymuch. BEA also determined that bias was notlarge enough from 1978 to 1991 to be significantunder normality assumptions at the five- percentconfidence level. Overall, for the period beginningin 1978 and covering the 1985 data from table 3-1, the BEA concluded there was no evidence of reli-ability increases. BEA also questioned its ownestimating procedures and, in particular, the use ofdisparate sources of data, which may explain whyreliability levels have not increased.
Appendix C Source and Accuracy Profiles ! 437

The NIPA framework also undergoes majorupdates referred to as comprehensive, or bench-mark revisions. Eleven of these have been com-pleted including one in 1996 and most recently onOctober 28, 1999 that provided the data for tables3-1 through 3-5. The major change encompasseda definitional change reflecting our evolving eco-nomic system. Software became a business invest-ment rather than just a "purchased input," or theequivalent of raw material. Unless the companyincreased the price of its product to cover softwarepurchases, no impact registered in the GDP. Withthis benchmark revision, the Census Bureauincreased the 1996 estimate by $115 billion, or 1.5percent--the amount of software investmentsmade in that year. Another change involved theCensus Bureau's interpretation of the value of"unpriced" banking services such as ATM (auto-matic teller machine) contributions to an estab-lishment's productivity. Previously, bankingservice productivity relied only on an index con-structed from labor input. Economists argued thatthis ignored productivity gains from technologicalimprovements such as ATMs and electronic bank-ing. The BLS developed a productivity basedinstead of bank transactions, and this was used inthe 1999 revision. For more detail, readers shouldrefer to Moulton and Seskin (1999).
Sources of Error for GDP EstimatesThe GDP estimates can contain several kinds
of error. One source of error arises from estimatesbased on preliminary or incomplete tabulations ofsource data or BEA judgment in the absence ofdata. Errors may also arise because of samplingerrors and biases in monthly, quarterly, annual, orperiodic tabulations. Another source of potentialerror may arise when data are seasonally adjusted.Readers should refer to the October 1993 SCBissue for more detail (Young 1993).
NIPA and Transportation-Related FinalDemand
For table 3-2, transportation-related finaldemand (TRFD) is from NIPA reported in theSCB. It represents the sum of all consumer andgovernment expenditures for transportation pur-poses, plus the value of goods and services pur-chased by business as investment for transporta-
tion purposes. Since TRFD includes only expen-ditures on the final products of the economy, it iscomparable to GDP and provides a measure oftransportation's importance from a consumptionperspective.
NIPA tables report the composition of pro-duction and the distribution of incomes earned inproduction. The totals of these produce a GDPestimate that should theoretically be equal, butthere is always a difference referred to as the "sta-tistical discrepancy." NIPA is based on four sub-accounts of national economic activity. Theseinclude 1) the personal income and outlayaccount, 2) the gross savings and investmentaccount, 3) the government receipts and expendi-tures account, and 4) the foreign transactionsaccount.
Personal Consumption Expenditures (PCE) fortransportation include 1) road motor vehicles,such as new and used automobiles, and motorcy-cles; 2) motor vehicle parts, such as tires, tubes,accessories; 3) motor fuels and lubricants; and 3)transportation services, such as repair, greasing,washing, parking, storage, rental, leasing, tolls,insurance, and purchased local and intercity trans-portation services. Motor vehicles used primarilyfor recreation, boats, noncommercial trailers, andaircraft are excluded.
Gross private domestic fixed investment intransportation includes private purchases of trans-portation structures and equipment. Trans-portation structures include railroads and petrole-um pipelines. Transportation equipment consistsof automobiles, trucks, buses, truck trailers, air-craft, ships and boats, and railroad equipment.
Goods and services that are counted as part oftransportation-related exports include 1) civilianaircraft, engines, and parts; 2) road motor vehi-cles, engines, and parts; 3) passenger fares, includ-ing receipts of U.S. air and ocean/cruise carriersfor transporting non-U.S. residents between theUnited States and foreign countries or betweentwo foreign points; and 4) other transportation.The total for road motor vehicles, engines andparts excludes boats, aircraft, and noncommercialtrailers. Other transportation includes 1) thefreight revenues of U.S.-operated ocean, air, andother carriers (e.g., rail, pipeline, and Great Lakes
438 " Appendix C Source and Accuracy Profiles

shipping) for international transport of U.S.exports and for transporting foreign freightbetween foreign points; 2) port expenditurereceipts (representing payments for goods andservices purchased in the United States by foreign-operated carriers); and 3) receipts of U.S. ownersfrom foreign operators for the charter of vesselsand rental of freight cars and containers.
Goods and services that are counted as part oftransportation-related imports include 1) civilianaircraft, engines, and parts; 2) road motor vehi-cles, engines, and parts; 3) passenger fares, includ-ing payments to foreign air and ocean/cruisecarriers for the transportation of U.S. residentsbetween the United States and foreign countries orbetween two foreign points; and 4) other trans-portation. The total for road motor vehicle,engines and parts excludes boats, aircraft, andnon-commercial trailers. Other transportationincludes 1) freight revenues of foreign-operatedocean, air, and other carriers (e.g., rail, pipeline,and Great Lakes shipping) for international trans-port of U.S. imports and for the transportation offoreign freight between foreign points; 2) portexpenditure receipts (representing payments forgoods and services purchased in foreign countriesby U.S.-operated carriers); and 3) payments to for-eign owners from U.S. operators for the charter ofvessels and rental of freight cars and containers.
Transportation-related government purchasesinclude federal, state, and local purchases of trans-portation services, and government expenditureson transportation-related structures and equip-ment. Federal, state, and local purchases representthe sum of consumption expenditures and grossinventory. Defense-related purchases includeexpenditures on the transportation of materials(care and movement of goods by water, rail, truck,and air); the rental of trucks and other transporta-tion equipment and warehousing fees; and travelof persons (care and movement of Department ofDefense military civilian employees), includingtickets for all modes of travel, per diem, taxi fares,automobile rental, and mileage allowances for pri-vately owned vehicles.
Further ReferencesThis data source and accuracy statement is
based on several papers that have appeared in the
SCB. Data users who desire more methodologicaldetail can refer to the list of references at the endof this chapter.
TABLE 3-6. National Transportation andEconomic Trends
The Statistical Abstract of the United Statespublished by the U.S. Department of Commerce,Census Bureau, is the source of the populationdata. The Current Population Reports are thesource of the Abstract's data that are collectedthrough the Current Population Survey (CPS).This is a monthly survey administered by theCensus Bureau of a scientifically selected samplerepresentative of the noninstitutional civilian pop-ulation in 754 areas covering every state and theDistrict of Columbia. Like other surveys, the CPSis subject to sampling error. Readers should notethat estimates based on the CPS may not agreewith census counts because different proceduresare used. Changes in the CPS also mean that annu-al comparisons must be made with caution. Forinstance, in 1994, the CPS methodology was dra-matically changed, and the estimates began toincorporate 1990 census population controls,adjusted for the estimated undercount.
Industrial production data come from theIndustrial Production Index, produced by theBoard of Governors of the Federal Reserve Systemand published in the Economic Report of thePresident. For annual figures, individual industri-al production (IP) indexes are constructed from avariety of sources, including the quinquennialCensuses of Manufactures and Mineral Industries;the Annual Survey of Manufactures, prepared bythe Census Bureau; the Minerals Yearbook, pre-pared by the U.S. Department of the Interior; andpublications of the U.S. Department of Energy.The Federal Reserve Board (FRB) uses these datain a modeling framework to produce estimates ofindustrial production. Below are brief discussionson three major sources for the IP indexes; the sur-vey of manufactures, the census of manufactures,and the electric utility survey.
Annual Survey of ManufacturersThe Census Bureau conducts a mail survey of
approximately 55,000 manufactures with three
Appendix C Source and Accuracy Profiles ! 439

different sample strata. The sampling frame isbased on previously surveyed firms and is updatedannually based partially on IRS administrativerecords and other sources. Large manufactures(shipments > $500 million, and > 250 employees),some computer manufacturing firms, and allremaining firms with at least 250 employees areselected. Establishments with employment gener-ally ranging from 20 to 250 employees are sam-pled with a probability proportional to acomposite measure of establishment size.Approximately 5,000 of the smallest firms (5 to 20employees) are also sampled and receive a shortersurvey instrument. Additional information on thesurvey, readers should refer to www.census.gov/econ/www/ma0300.html.
Census of ManufacturersThe Census of Manufactures collects data
through mail surveys from approximately 237,000multiunit and single-unit firms with a minimumpayroll figure. This census is supplemented by IRSadministrative data from over 142,000 firms notcontacted by mail. For additional information onthe census, readers should refer to www.census.gov/econ/www/ma0100.html.
Electric Utility SurveySince 1971, the FRB has conducted the
Monthly Survey of Industrial Electricity Use basedon responses from utilities and manufacturing andmining firms that are cogenerators. This survey isthe basis for estimates of the amount of electricitypower used by 120 industrial sectors. More than40 industrial production series estimates are basedon data from this survey and compose 28 percentof the Industrial Production Index in 1994 value-added proportions.
Survey responses are voluntary and are gath-ered from a panel of 175 utilities and 186 cogen-erating companies with a monthly response ratenear 95 percent. In 1992, an additional 71 newcogenerators joined the panel. This resulted,according to an FRB statistical analysis, in adecrease of the standard deviation of errors forelectricity growth rates from 3.0 to 1.9 percentagepoints. Overall, the estimates for total power useproduce a standard error of about 0.5 percentage
points. The panel accounts for approximately 73percent of industrial electric power use in theUnited States.
The Survey of Current Business, published bythe U.S. Department of Commerce, Bureau ofEconomic Analysis, is the source of GDP esti-mates. Readers should refer to the source andaccuracy statement for tables 3-1 through 3-5 forinformation on GDP estimates.
TABLE 3-7. Passenger and FreightTransportation Expenditures
Detailed information from the source was notavailable at the time of publication. Readersshould contact the Eno Transportation Founda-tion, Inc. directly for information about method-ologies and reliability.
TABLE 3-8. Sales Price of Transportation Fuelto End-Users
The U.S. Department of Energy, EnergyInformation Administration's (EIA's) AnnualEnergy Review 1999, tables 5.20 and 5.21, pro-vided price data, except for railroad fuel. Pre-1981 data were reported by the EIA from Bureauof Labor Statistics reports. Beginning in 1983, theEIA administered a series of surveys to collect dataon petroleum prices, market distribution, supply,and demand. The EIA-782 series encompassesthree surveys: 1) Form EIA-782A, Refiners'/GasPlant Operators' Monthly Petroleum ProductSales Report; 2) Form EIA-782B, Resellers'/Retailers' Monthly Petroleum Product SalesReports; and 3) Form EIA-782C, Monthly Reportof Prime Supplier Sales of Petroleum Products Soldfor Local Consumption.
EIA developed a method for comparing datafrom the new surveys with older informationgathered by various methods. As a result, a num-ber of adjustment factors were developed and usedto "backcast" price estimates. Readers whorequire a more detailed description of this method-ology should refer to EIA's petroleum data publi-cations web page (www.eia.doe.gov/oil_gas/petroleum/pet_frame.html) and the explanatorynotes section.
440 " Appendix C Source and Accuracy Profiles

Changes in sample elements or collectionmethods may affect data continuity. Two regula-tory changes affected data collection in October1993. The Clean Air Act Amendments of 1990required that oxygenated gasoline be sold in thewinter months in ozone nonattainment areas.Thus, the EIA-782 forms were modified to collectinformation on fuels divided among conventional,oxygenated, and reformulated categories. Second,requirements for the production and selling of low-sulfur diesel were required and necessitated theseparation of diesel fuel into high- and low-sulfurcategories. Moreover, surveys prior to October1993 did not include propane. The EIA followedseveral different sampling designs during two peri-ods in the 1980s and thus, there may be some priceestimate discontinuity for periods betweenDecember 1983 and January 1984 as well asbetween August and September of 1988.
Data CollectionThe 782 series occurs on a monthly schedule
via mail. The 782A and 782C surveys reflect acensus of about 115 and 190 firms, respectively.The 782B samples about 2,000 firms. The EIAfirst stratifies by sales volume for the form 782Bsurvey to ensure that dealers with 5 percent ormore of the market are captured with certainty.The remaining elements of the frame were assigneda probability of selection to form a 2,200 firm sur-vey. These "noncertainty" companies were post-stratified by geographic area and type of salescategory
Data ReliabilityEIA has studied its sampling effects on reliabil-
ity and determined that the sample size of 2,000should yield a less than 1-percent price coefficientof variation in its estimates. Errors can arisebecause of nonresponse, but an EIA official indi-cated that the response rates for the 1997-1999782A, B, and C surveys averaged 95 percent, 86percent, and 96 percent, respectively. Because sur-vey data invariably contain incomplete data(because of reporting errors or nonresponse), EIAestimates or "imputes" missing data. Readersrequiring imputation algorithms should refer tothe 782 series explanatory notes referred to above.
TABLE 3-9. Price Trend of Gasoline v. OtherConsumer Goods and Services
Data in this table were reproduced from theAmerican Petroleum Institute's (API) BasicPetroleum Data Book. API noted that data report-ed prior to 1981 was obtained from Platt's OilPrice Handbook and Oilmanac. Platt's is part ofStandard and Poor's, and an independent thirdparty organization that tracks the petroleum indus-try. Platt's reported the retail price of gasolinebased on telephone interviews with gas stations in55 cities. More detailed historical information ontheir data collection methods could not be ascer-tained and the data's reliability is uncertain. APIreported the Bureau of Labor Statistics (BLS) as itsdata source for 1981 to 1998 retail gasoline prices.The remainder of this section discusses the BLSConsumer Price Index (CPI) data collection andestimation methods used to derive the averageretail price of gasoline.
BLS uses the CPI as a measure of average pricechanges paid by urban consumers for a fixed bas-ket of goods and services. BLS estimates the CPIwith a survey-based approach. Survey resultsdefine a categorization of goods and services, a rep-resentative sample of items to track, and weightsaccording to the consumption of an average con-sumer during a base period.
Sample DesignBLS relies on two sampling frames for their CPI
estimates. One represents the universe of retailoutlets from which households may purchasedefined groups of commodities and services includ-ing gasoline. A second represents householdsacross urban areas. Moreover, the householdframe is based on an "urban-consumer" popula-tion and consists of households in MetropolitanStatistical Areas (MSA's) and in urban places withmore than 2,500 inhabitants. This "all urban" CPI(CPI-U) provides the estimates for retail gasolineprices shown in table 3-9. Thus, this frame doesnot represent non-urban consumers.
For the retail outlet sampling frame, BLS relieson the Point-of-Purchase Survey (CPOPS) con-ducted by the Census Bureau in 94 Primary
Appendix C Source and Accuracy Profiles ! 441

Sampling Units (PSUs) identified by BLS. PSUs arebased on urban counties, groups of contiguousurban counties, or MSAs. For the household sam-ple, a noncompact clustering procedure wasemployed which dispersed households evenlywithin a Census enumeration district (ED). Moredetailed sampling design information can be foundin BLS's Handbook of Methods at http://stats.bls.gov/opub/hom/homhome.htm.
Prices for the goods and services used to cal-culate the CPI are collected in 91 PSUs located in85 urban areas throughout the country. The sam-ple size for the CPOPS totals about 21,000 retailand service establishments-supermarkets, depart-ment stores, gasoline stations, hospitals, etc.Food, fuels, and a few other items are pricedmonthly in all 85 locations. BLS field representa-tives collect all price information through visits ortelephone calls in the household surveys. Pricechanges are computed based on a sample of out-lets selected from locations identified by con-sumers. Specific sample items are then selectedfrom each sample outlet to ensure that the marketbasket is representative of where households shop.
EstimationBLS routinely updates its price estimates for
specific items among the collection of goods andservices, for example, a new car model year. BLSemploys three techniques to produce new priceestimates. First, an item that is directly compara-ble to the previous discontinued good will be usedto provide a price estimate. However, a substituteitem may be inappropriate when goods changeslightly in their characteristics. BLS relies onHedonic regression modeling as a second "qualityadjustment" for price estimates. This statisticaltechnique can model the importance of variousquality characteristics that add value to a particu-lar good (the fiber content and construction ofapparel products for instance). A researcher canestimate a Hedonic regression model that identi-fies the factors most important is determining theprice of a good, and BLS field representatives willnote these in their data collection. Imputation is athird quality adjustment used for "noncompara-ble" substitutions where BLS estimates the pricechange from previous averages. Detailed algo-rithms can be found in chapter 17 of the BLS
Handbook of Methods at http://stats.bls.gov/opub/hom/homhome.htm.
Effective January 1999, BLS began using anew formula for calculating the basic componentsof the Consumer Price Index for all UrbanConsumers (CPI-U) and the Consumer Price Indexfor Urban Wage Earners and Clerical Workers(CPI-W). The new formula, the geometric meanestimator, is used in index categories that compriseapproximately 61 percent of total consumerspending represented by the CPI-U. Based on BLSresearch, it is expected that use of the new formu-la will reduce the annual rate of increase in the CPIby approximately 0.2 percentage point per year.Additional information on this change was pub-lished in the April 1998 CPI Detailed Report andis available on the Internet at http://stats.bls.gov/cpihome.htm.
AccuracyOne of the CPI's limitations is that it repre-
sents price movements for urban residents andmay not correctly represent nonurban consump-tion patterns. The CPI may also contain samplingerror because it is estimated from a sample of con-sumer purchases. Nonsampling error may occur ifrespondents provide BLS field representatives withinaccurate or incomplete information. Anotherpotential source of error identified by BLS mayoccur because of a time lag between the Point-of-Purchase Survey and the initiation of price collec-tion for commodities and services at resampledoutlets. Because of the time lag, the productsoffered by the outlet at the time pricing is initiat-ed may not coincide with the set from which theCPOPS respondents were purchasing.
The CPI is also subject to response error whendata are not collected because of non-response.BLS established a nonresponse auditing programin 1986. It reported that response rates in 1990for transportation commodities and services wereabove 90 percent.
BiasFour categories of bias were identified in the
BLS report, Measurement Issues in the ConsumerPrice Index, published in 1997. First, because ofthe fixed-weight nature of the index, the CPI cre-ates substitution bias by placing too much weight
442 " Appendix C Source and Accuracy Profiles

on items measured in previous surveys from whichconsumers may have shifted away. Second, thestudy found that the index did not account for con-sumers switching to discount stores. Third, a qual-ity change bias was also identified when thedifferences between goods priced in two differentperiods cannot be accurately measured nordeduced from the accompanying price differencebetween the goods. Finally, the report noted thatthe CPI also had a new product bias because theindex inadequately reflected consumer value ofproducts introduced into the market. The com-mission concluded that the CPI overstated the truecost-of-living change by 1.1 percentage points peryear.
TABLE 3-10. Producer Price Indices forTransportation Services
TABLE 3-11. Producer Price Indices forTransportation Equipment
Data shown in these tables are drawn fromannual issues of The Supplement to Producer PriceIndexes published by the Bureau of LaborStatistics (BLS) in the U.S. Department of Labor.These indexes represent a measure of outputs in allgoods-producing American industries as well aspartial coverage of service industries includingtransportation. BLS defines a price as the net rev-enue accrued to a specified production establish-ment from a specified kind of buyer for a specificproduct shipped under specific transaction termson a specified day of the month. BLS collects thisdata series through surveys of a sample of estab-lishments that report their prices from economictransactions.
Data CollectionA BLS field economist visits an establishment
or cluster of establishments selected for price sam-pling. The economist uses a disaggregation proce-dure to select a sample of transactions from all theestablishment's revenue-producing activities. Thisdisaggregation procedure assigns a probability ofselection to each shipping or receipt category pro-portionate to its value within a reporting unit. Inmost cases, the final price index produced by theBLS requires that 1) there are at least three differ-
ent respondents to a survey, 2) at least two report-ing units provide price information in a givenmonth, and 3) no single respondent accounts for50 percent or more of the weight for a given item.
BLS regional offices review field data for con-sistency and completeness. The national officethen conducts a final review and a survey is thentailored specifically to establishments or clusters ofestablishments. BLS refers to these as repricingschedules and sends them to reporting establish-ments on a regular basis. Most prices refer to areporting schedule on a particular day of themonth, usually, the first Tuesday or the 13th of amonth.
EstimationBLS collects prices for over 100,000 items. It
utilizes several different weighting schemes for thenumerous indexes produced because some prod-ucts will have a greater effect on the movement ofgroupings of individual products. BLS utilizes thenet output of shipment values as weights for the 4-digit SIC industries. Net output values includeonly shipments from establishments in one indus-try to other industry establishments and, thus, dif-fer from gross shipment values. The latter wouldinclude shipments among establishments in thesame industry, even if those establishments are sep-arate firms. BLS also makes seasonal adjustmentsif statistical tests and economic rationale justifythem, and imputes data when a participating com-pany does not deliver a price report. BLS bases themissing price estimation on the average of pricechanges for similar products reported by otherestablishments.
AccuracyAs in all surveys, the accuracy of producer
price indexes depends on the quality of informa-tion voluntarily provided by participating estab-lishments. One of the accuracy concerns of BLSrevolves around the preferred use of realistic trans-action prices (including discounts, premiums,rebates, allowances, etc.) rather than list or bookprices. Before BLS fully changed its data collectionmethod in 1986, a survey indicated that about 20percent of traditional commodity indexes werebased on list prices. The newer and more system-atic methodology decreased the use of list prices.
Appendix C Source and Accuracy Profiles ! 443

BLS documentation (available at http://stats.bls.gov/opub/hom) provided no more details on sam-pling error, response rates, or the availability ofgeneralized variance parameters or techniques forestimating them.
TABLE 3-12: Personal Expenditures byCategory
TABLE 3-13: Personal ConsumptionExpenditures on Transportation bySubcategory
Data used in these tables are from the Bureauof Labor Statistics, Annual Report of ConsumerExpenditure Survey. The Consumer ExpenditureSurvey (CEX) collects information from U.S.households and families on their buying habits(expenditures), income, and consumer characteris-tics. The strength of the survey is that it allowsdata users to relate the expenditures and income ofconsumers to the characteristics of those con-sumers. BLS uses 11 standard characteristics toclassify consumers, including income, before-taxincome class, age, size of the consumer unit, com-position of the consumer unit, number of earners,housing tenure, race, type of area (urban or rural),region, and occupation.
The CEX is a national probability sample ofhouseholds. The sampling frame (i.e., the list fromwhich housing units are chosen) for this survey isgenerated from the 1990 census 100-percent detailfile, which is augmented by a sample drawn fromnew construction permits. Coverage improvementtechniques are also utilized to eliminate recognizeddeficiencies in the census.
Data CollectionThe current survey consists of two separate
surveys (Interview and Diary), each utilizing a dif-ferent data collection technique and sample. Datais collected for each survey from approximately5,000 households. In the Interview survey, eachconsumer unit (CU) in the sample is interviewedevery three months over five calendar quarters.The interviewer uses a structured questionnaire tocollect both the demographic and expendituredata in the Interview survey. The interviewer col-lects the demographic data in the Diary survey
whereas the respondent enters the expendituredata on the diary form. Both surveys accept proxyresponses from any eligible household memberwho is at least 16 years old if an adult is not avail-able after a few attempts to contact that person.The respondent family completes the Diary (orrecordkeeping) survey at home for two consecu-tive one-week periods.
A reinterview program for the CEX providesquality control. The program provides a means ofevaluating individual interviewer performance todetermine how well the procedures are being car-ried out in the field. A member of the superviso-ry staff conducts the reinterview. Subsamples ofapproximately 6 percent of households in theInterview survey and 17 percent in the Diary sur-vey are reinterviewed on an ongoing basis. A newdiary form with more categories and expanded useof cues for respondents was introduced in 1991,based on results from earlier field and laboratorystudies.
EstimationMissing or invalid data on demographic or
work experience are imputed. No imputation isdone for missing data on expenditures or income.Selected portions of the Diary data are also adjust-ed by automated imputation and allocation rou-tines when respondents report insufficient detail tomeet publication requirements. These proceduresare performed annually on the data. The imputa-tion routines assign qualifying information to dataitems when there is clear evidence of invalid non-response.
The statistical estimation of the populationquantities of interest, such as the average expendi-ture on a particular item by a CU or the total num-ber of CUs in a particular demographic group, isconducted via a weighting scheme. Each CUincluded in the survey is assigned a weight that isinterpreted as representing the number of similarfamilies in the universe of interest, the U.S. civiliannoninstitutional population. Readers should referto http://stats.bls.gov/opub/hom/homch16_c.htmfor the detailed weighting method.
Beginning with 1997 data, BLS introduced anew calibration method to compute weights in theConsumer Expenditure Survey. The weights are
444 " Appendix C Source and Accuracy Profiles

calculated using a model-assisted, design-basedregression estimator.
AccuracyThe Consumer Expenditures Survey is a sam-
ple survey and hence is subject to two types oferrors, nonsampling and sampling. Nonsamplingerrors can be attributed to many sources, such asdifferences in the interpretation of questions,inability or unwillingness of the respondent to pro-vide correct information, mistakes in recording orcoding the data obtained, and other errors of col-lection, response, processing, coverage, and esti-mation for missing data. The full extent ofnonsampling error is unknown. Sampling errorsoccur because the survey data are collected from asample and not from the entire population. Tableswith coefficients of variation and other reliabilitystatistics are available on request from the nation-al office. However, because the statistics areshown at the detailed item level, the tables areextensive.
TABLE 3-14. Cost of Owning and Operatingan Automobile
Your Driving Costs produced by the AmericanAutomobile Association (AAA) provided the datafor this table. Prior to 1985, the cost figures arefor a mid-sized, current model, American carequipped with a variety of standard and optionalaccessories. After 1985, the cost figures are for acomposite of three current model American cars:
1. a 1999 Chevrolet Cavalier LS,2. a 1999 Ford Taurus GL, and3. a 1999 Mercury Grand Marquis GS.
Thus, the estimates are not reliable estimatesfor all cars.
Fuel costs were based on an average price of$1.34 per gallon of regular unleaded gasoline,weighted 20 percent full-serve and 80 percent self-serve. Insurance figures were based on personaluse of vehicles driven less than 10 miles to or fromwork, with no young drivers. Normal deprecia-tion costs were based on the vehicle's trade-invalue at the end of four years or at 60,000 miles.
American Automobile Association (AAA) analysiscovers vehicles equipped with standard andoptional accessories, including automatic trans-mission, air conditioning, power steering, powerdisc brakes, AM/FM stereo, driver-and passengerside air bag, anti-lock brakes, cruise control, tiltsteering wheel, tinted glass, emission equipmentand rear window defogger.
TABLE 3-15a & 3-15b. Average PassengerFare (Current and chained 1996 dollars)
TABLE 3-18. Total Operating Revenues
AirThe U.S. Department of Transportation,
Bureau of Transportation Statistics (BTS), Officeof Airline Information, reports passenger fares andoperating revenues in its publication Air CarrierFinancial Statistics. These numbers are based on100 percent reporting by large certificated air car-riers. Minor errors from nonreporting may occurbut amount to less than one percent of all passen-ger or freight activity. The figures do not includedata for all airlines; such as most scheduled com-muter airlines and all nonscheduled commuter air-lines.
Class I BusClass I passenger motor carriers are required to
report financial and operating information to BTSusing form MP-1. (Prior to 1996, Class I carrierswere required to report to the Interstate CommerceCommission.) Class I passenger motor carriers aredefined as those having annual gross operating rev-enues, as adjusted for inflation, of $5,000,000 ormore. This table does not include Class I carrierswhose data had not been received at the time ofpublication. Thus, these data do not representtotal Class I passenger motor carrier activity.
TransitThe American Public Transit Association
(APTA) reports these figures, which are based onthe annual National Transit Database report pub-lished by the USDOT, Federal Transit Admin-istration (FTA). Section 15 of the Federal TransitAct requires federally funded transit agencies toprovide detailed financial and operating data
Appendix C Source and Accuracy Profiles ! 445

including capital expenditures, revenues andexpenses. These data are generally consideredaccurate because the FTA reviews and validatesinformation submitted by individual transit agen-cies. Reliability may vary because some transitagencies cannot obtain accurate information ormisinterpret certain data definitions. APTA con-servatively adjusts FTA data to include transitoperators that do not report to the database (pri-vate and very small operators and rural operators).
RailData are from Railroad Facts published annu-
ally by the Association of American Railroads(AAR). AAR figures are based on 100-percentreporting by all nine Class I railroads to theSurface Transportation Board (STB) via Schedule700 of the R1 Annual Report. STB defines ClassI railroads as having operating revenues at orabove a threshold indexed to a base of $250 mil-lion in 1991 and adjusted annually in concert withchanges in the "Railroad Freight Rate Index" pub-lished by the Bureau of Labor Statistics. In 1998,the threshold for Class I railroads was $259.4 mil-lion. Declassification from Class I status occurswhen a railroad falls below the applicable thresh-old for three consecutive years. Although Class Irailroads represent only 2 percent of the numberof railroads in this country, they account for over90 percent of the industry's freight revenues.
Intercity/AmtrakAverage passenger fare data are based on 100
percent of issued tickets, and thus should be accu-rate. Created as a publicly-owned for-profit cor-poration, Amtrak collects its own financial dataand reports this information in its annual report.Auditing should ensure the accuracy of the oper-ating revenue figures.
Trucking and Courier Services (except air)The Census Bureau's Transportation Annual
Survey (formerly known as the Motor FreightTransportation and Warehousing Survey) is thesource of this information. The sample surveyrepresents all employer firms with one or moreestablishments engaged primarily in providing
commercial motor freight transportation or publicwarehousing services. It excludes motor carriersthat operate as auxiliary establishments to non-transportation companies, as well as independentowner-operators with no paid employees. Thus,the data do not represent the total trucking indus-try.
As with all sample surveys, two types of errorsare possible: sampling and nonsampling. Non-sampling errors may include response errors andmistakes in coding or keying data. For additionalinformation about the survey and data reliability,the reader is referred to the Census Bureau websiteat www.census.gov.
Water (Domestic)Eno Transportation Foundation, Inc. is the
source of these data. Eno estimates these figuresby multiplying ton-mile figures by estimated rev-enue per ton-mile. The U.S. Army Corps ofEngineers reports the ton-mile figures in its publi-cation Waterborne Commerce of the UnitedStates, and the revenue per ton-miles figures areestimated by Eno..
Oil PipelineEno Transportation Foundation, Inc., publish-
es these data, which are based on Federal EnergyRegulatory Commission (FERC) data and report-ed by the Oil Pipeline Research Institute for years1977 to the present. FERC data originates fromrequired quarterly reports filed by pipeline com-panies. Prior to 1977, the data are based on theformer Interstate Commerce Commission data forregulated pipelines, and estimated to be 16 percentof the total of nonregulated pipelines.
Gas PipelineThese statistics originate from Gas Facts, pub-
lished annually by the American Gas Association(AGA). AGA data are based on gas utilities par-ticipation and reporting to the Uniform StatisticalReport and estimates for those companies notreporting based on recent historical experience.Varying percentages of nonreporters from year toyear introduce minor reliability problems for time-series comparisons.
446 " Appendix C Source and Accuracy Profiles

TABLE 3-19. Employment in For-HireTransportation and Selected Transportation-Related Industries
Employment data by industry are from theNational Employment, Hours, and Earnings esti-mates published by the Bureau of Labor Statistics(BLS), U.S. Department of Labor. These estimatesoriginate from the Current Employment Statistics(CES) survey program. The CES is a monthly sur-vey conducted by state employment security agen-cies in cooperation with the BLS. The surveyprovides employment, hours, and earnings esti-mates based on payroll records of nonfarm busi-ness establishments, including government.
BLS uses a stratified sample based on a sector'semployment size, or the degree of variabilityamong its establishments, or both. This ensuresthat BLS captures a more representative surveyfrom employers with large payrolls. Thus, largeestablishments are certain of selection while small-er ones have less of chance.
Data CollectionData are collected electronically from about
two-thirds of the respondents and by mail or faxfrom the remainder. The primary type of electron-ic reporting is touch-tone phone self-response; oth-ers are computer-assisted phone interviews andphone voice recognition technology. Increasingly,data are collected through electronic data inter-change from a small but growing number of com-panies that have a large number of establishmentsacross the country. Mail respondents submit Form790 to the BLS each month. It is then edited andreturned to the respondent for use again the fol-lowing month. All firms with 250 employees ormore are asked to participate in the survey, as wellas a sample of smaller firms.
EstimationEmployment estimates are made at what is
termed the basic estimating cell level and aggregat-ed upward to broader levels of industry detail bysimple addition. Basic cells are defined by indus-try (usually at the 3- or 4-digit SIC level) and arestratified within industry by geographic regionand/or size class in the majority of cases. Within
the wholesale trade, retail trade, and services divi-sions, most industries are stratified into three tofive size classes (beginning in 1984).
Most national employment estimates are mul-tiplied by bias adjustment factors to produce themonthly published estimates. Bias adjustment fac-tors are used primarily to compensate for theinability to capture the entry of new firms on atimely basis. New firms contribute a substantialamount to employment growth each year, but thereis a lag between the creation of a firm and its inclu-sion on the sample frame (i.e., the UnemploymentInsurance universe file). It is, therefore, necessaryto use modeling techniques to capture this segmentof the population. BLS also performs seasonaladjustments for certain SIC industries.
AccuracyBLS does not publish data reliability informa-
tion along with estimates. Instead, it provides esti-mation formula and the necessary parameters sothat users can estimate standard errors. For addi-tional information, see the "Explanatory Notesand Estimates of Error" in the BLS monthly publi-cation Employment and Earnings.
The CES survey, which began over 50 yearsago, predates the introduction of probability sam-pling as the internationally recognized standard forsample surveys. Instead, a quota sample has beenused since its inception. Quota samples are at riskfor potentially significant biases, and recently com-pleted BLS research suggests that, despite the largeCES sample size, employment estimates based onthat sample at times diverge substantially fromthose that a more representative sample wouldhave been expected to produce. This leads to anover-reliance on bias adjustment in the estimationprocedure. Because bias adjustment is primarilybased on past experience, it is limited in its abilityto accurately reflect changing economic conditionson a timely basis.
Government EmploymentThe Office of the Secretary provides employ-
ment figures for the U.S. Department ofTransportation. State and local highway depart-ment employment figures are from the' State andLocal Government Employment and Payroll
Appendix C Source and Accuracy Profiles ! 447

Estimates, published by the U.S. Department ofCommerce, Bureau of the Census. The data arefor the 50 states and the District of Columbia.Employment and payroll data pertain to themonth of October. At present, data are collectedfor one pay period that includes October 12(regardless of the period's length) through thePublic Employment Survey (PES).
Employment refers to all persons gainfullyemployed by and performing services for a gov-ernment. Employees include all persons paid forpersonal services performed from all sources offunds, including persons paid from federally fund-ed programs, paid elected officials, persons in apaid leave status, and persons paid on a per meet-ing, annual, semiannual, or quarterly basis.Excluded from employment statistics are unpaidofficials, pensioners, persons whose work is per-formed on a fee basis, and contractors and theiremployees.
The Census Bureau derives full-time equiva-lent (FTE) employment by summing the numberof full-time employees reported and converting thenumber of hours worked by part-time employeesto a full-time equivalent amount. Up until 1985data, the method used to calculate FTEs was basedsolely on payroll data. Effective with 1986 data,the annual employment survey started collectingdata on the number of hours worked by part-timeemployees in order to provide a more accuraterepresentation of full-time equivalent employ-ment. No October 1985 FTE employment dataare available.
Beginning in 1999, the Public EmploymentSurvey (PES) was conducted using a separate sam-ple of approximately 11,000 government units toimprove data accuracy and survey efficiency.Government units meeting any of the followingcriteria are included in the survey: 1) countieswith populations greater than 100,000; 2) citieswith populations greater than 75,000; 3) town-ships in New England and Mid-Atlantic with pop-ulations greater than 50,000; 4) special districtswith FTEs greater than 1000; 5) independentschool districts with enrollment greater than10,000; and 6) all dependent and independentschools providing college level education. In1999, government units were sampled to obtain arelative standard error of 3 percent or less for FTE
and total payroll for each of the states by type ofgovernment groups.
Prior to 1993, the PES used a joint sample ofapproximately 24,000 units for both employmentand finance. From 1993 to 1998, the sample sizewas reduced to around 14,000 units. The stan-dard error for the PES prior to 1999 was designedto be around 3 percent for major state- or county-level estimates of finance variables (state-level for1993-1998 and county-level prior to 1993).Employment estimates are made using regression,except when the number of noncertainty casescontributing to the estimate is less than 20, wherea simple unbiased estimate is used.
TABLE 3-20. Employment in TransportationOccupations
TABLE 3-22. Median Weekly Earnings of Full-Time Wage and Salary Workers inTransportation by Detailed Occupation
Employment by detailed transportation occu-pation data are from the OccupationalEmployment Statistics (OES) survey, collected bythe Bureau of Labor Statistics (BLS). The OES isa periodic mail survey of nonfarm establishmentsthat collects occupational employment data onworkers by industry. The OES program surveysapproximately 725,000 establishments in 400detailed industries. The average response rate forthe last three years, according to a BLS official,averaged about 70 percent.
The sample is selected primarily from the listof business establishments reporting to the stateunemployment insurance program. The OES sam-ple initially stratifies the universe of establish-ments by three-digit industry code and size- classcode. Establishments employing 250 employees ormore are sampled with certainty. Establishmentsemploying fewer than 250 employees but morethan 4 employees are sampled with probabilityproportional to the size class employment withineach three-digit industry. Establishments employ-ing four or fewer employees (i.e., size class 1 estab-lishments) are not sampled. Instead, theemployment for these establishments are account-ed for by assigning a larger sampling weight to
448 " Appendix C Source and Accuracy Profiles

establishments employing five to nine employees(i.e., size-class 2 establishments). Within eachthree-digit industry/size- class cell, establishmentsare systematically selected into the sample througha single random start.
Data CollectionEmployers are the source of occupational data.
Within establishments, the main source of occupa-tional data reported by respondents is personnelrecords. Data are collected from respondents pri-marily by mail. Occasionally, visits are made tolarge employers and to other respondents whoindicate particular difficulty in completing thequestionnaires. Ordinarily, two mailings follow theinitial mailing. After the third mailing, a subsam-ple of the remaining nonrespondents is drawn andcontacted by telephone. The OES survey follows a3-year cycle. Three surveys are conducted alter-nately for manufacturing, nonmanufacturing, andthe balance of nonmanufacturing industries.
EstimationDuring the sample selection process, each sam-
pled establishment is assigned a sampling weightthat is equal to the reciprocal of its probability ofselection. For example, if an establishment on thesampling frame had a 1 in 10 chance of beingselected into the sample, then its sampling weightis 10. For establishments that did not respond tothe survey, a nonresponse adjustment factor is cal-culated and applied against the sampling weightsof the responding establishments within eachstate/3-digit industry/size-class cell. Multiplyingthese adjustment factors by sampling weightsincreases the weight of the responding establish-ments so they can account for the missing employ-ment data of the nonresponding establishments.
AccuracyThe OES survey uses a subsample replication
technique to estimate variances in occupationalemployment at the 3-digit industry/size-class level.For additional information on occupationalemployment estimates and measurements of sam-pling error associated with the estimates, the read-er is referred to http://stats.bls.gov/oeshome.htm.
TABLE 3-21. Average Wage and SalaryAccruals per Full-Time Equivalent Employeeby Transportation Industry
TABLE 3-23. Total Wage and Salary Accrualsby Transportation Industry
The Survey of Current Business (tables 6.3cand 6.6c) published by the U.S. Department ofCommerce, Bureau of Economic Analysis, is thesource of transportation wage and salary data.These estimates are based on BLS tabulations ofemployee wages that are covered by State unem-ployment insurance. As a component of theincome side of National Income and ProductAccount, wages and salaries comprise part of theGDP calculation. These data reflect the monetaryremuneration of employees in terms of wageaccruals less disbursements. It is defined as the dif-ference between wages and salaries on a "when-earned" basis, or accrued, and wages and salarieson a "when-paid," or disbursed basis. This com-putation was instituted in 1992 because a signifi-cant portion of bonus payments were missed inprevious calculations. Readers should also refer tothe earlier discussion of GDP methods and relia-bility for more detail.
TABLE 3-24. Labor Productivity Indices forSelected Transportation Industries
The Bureau of Labor Statistic's (BLS) IndustryProductivity Measures is the source of transporta-tion labor productivity data. BLS develops indus-try productivity measures based on various datasources.
For rail, BLS uses freight ton-mile and passen-ger miles that are collected by the SurfaceTransportation Board (STB), the Association ofAmerican Railroads (AAR), and Amtrak. BLS alsoaggregates four different air transportation outputsto form a single productivity index: domestic pas-senger-miles, domestic freight ton-miles, interna-tional passenger-miles, and international freightton-miles. Air transportation data come from AirCarrier Traffic Statistics and Air Carrier FinancialStatistics, published by the U.S. Department of
Appendix C Source and Accuracy Profiles ! 449

Transportation, Bureau of Transportation Statis-tics. For petroleum pipeline, BLS relies on datafrom the Association of Oil Pipelines and derivedan output index based on trunkline barrel-miles.A barrel-mile is one barrel of petroleum movedthrough one mile of pipeline.
EstimationBLS generally calculates labor productivity by
dividing an index of output (in this case, ton-miles) by an index of hours. Output is derivedwith a weight adjusted Tornqvist formula thatproduces an output ratio for one year. BLS thencombines these in a series that produces a chainedoutput index. The hour indexes are developedfrom data in BLS's Current Employment Statistics(CES; see discussion above for table 3-12) and arethe results of dividing the annual aggregate hoursfor each year by a base-period figure. Readerswho need more detail, such as mathematical spec-ifications or equations, should refer to Kunze andJablonski (Kunze and Jablonski 1998) or call theOffice of Productivity and Technology at BLS.
AccuracyBLS provides no measures of reliability.
However, BLS makes an assumption that trans-portation outputs should be measured using theproduction of passenger-miles or freight-miles.Another school of thought might assume thatmany transportation firms or facilities are actual-ly providing capacity rather than actual use. Thus,an argument can be made that productivity shouldbe based on capacity rather than use. In fact, thisis how BEA measures transportation output. Toevaluate the BLS assumption, one study comparedthe two approaches by examining the differentgrowth rates produced by BLS and BEA and foundthat in 25 of 35 service industries, the differencesare within one percentage point. For transporta-tion, differences in growth rates across BLS andBEA estimates were two percentage points or less(Kunze and Jablonski 1998).
Beginning with 1997 data, the indices for busand petroleum pipelines did not meet BLS publi-cation standards and are considered less reliablethan those for other modes. These industries hadbetween 14,000 and 15,000 employees, far belowthe 50,000-employee threshold established for
transportation industries by BLS. However, theyboth met a basic test of variability of the annualpercent changes in the output per hour measure.
GOVERNMENT REVENUES ANDEXPENDITURES
TABLE 3-25a &3-25b. Federal, State, andLocal Government Transportation-RelatedRevenues and Expenditures, Fiscal Year(Current and constant 1996 dollars)
TABLE 3-26a & 3-26b. FederalTransportation-Related Revenues, Fiscal Years(Current dollars and constant 1996 dollars)
TABLE 3-27a & 3-27b. FederalTransportation-Related Expenditures byMode, Fiscal Year (Current and constant1996 dollars)
TABLE 3-28. Cash Balances of theTransportation-Related Federal Trust Funds,Fiscal Year
The main sources for federal-level data are theBudget of the United States and the Appendix tothe Budget. These data are the "actual" figures asreported for the various transportation-relatedprograms in the appendices of each year's budgetdocument.1 The figures are consistent from year toyear and follow the definitional structure requiredby the Office of Management and Budget (OMB).
Primary sources for state and local transporta-tion-related revenues and expenditures data arecensuses and surveys collected by the U.S. CensusBureau. All units of government are included in
450 " Appendix C Source and Accuracy Profiles
1 The federal budget is broken down into 20 functional cat-egories, of which one is transportation (function 400).Function 400 is not tied to any one department or agency,but instead aggregates transportation functions wherever inthe federal government they occur. Thus, the transportationfunction may include many activities, such as highway con-struction and safety, airways and airports, maritime subsidies,U.S. Coast Guard operations, railroads, and mass transit. Italso covers grants-in-aid programs to support state and localactivities. A good summary of the federal budget process canbe found in Collender, Stanley E., The Guide to the FederalBudget, Fiscal 1996 (Washington, DC: Urban Institute Press.1995).

the Census of Governments, which is taken at five-year intervals for years ending in "2" or "7," andthese data are "full counts," and not subject tosampling error.
State and local government data for noncensusyears are obtained by annual surveys, which aresubject to sampling error. For the U.S. totals oflocal government revenues and expenditures in thisreport, the sampling variability is in most casessmall (less than 2 percent).
The federal figures in this report correspond tothe federal fiscal year, which begins on October 1,while state and local data are for fiscal years thatgenerally start in July. While this may create asmall error in totals for any given year, the data aresuitable for illustrating trends in public trans-portation finance. Programs that were terminatedbefore 1985 are excluded from the tables. Thetotals for transportation revenues and expendi-tures in this report are the sum of the CensusBureau's state and local figures plus the total of thefederal figures.
The source of the constant dollar deflators isThe Survey of Current Business, August 1998,Bureau of Economic Analysis, table 3, "ChainType Price Indexes." All inflation-adjusted dataare for the base year 1992, instead of 1987 as inthe previous editions of the NTS. Note that dif-ferent deflators are used for the federal data andthe state and local data. Thus, if expenditures aretotaled across different levels of government inconstant dollars before and after Federal granttransfers, the totals do not match.
Limitations of the Source Data SetsSome federal agencies, such as the U.S.
Department of Health and Human Services, havesubstantial transportation activities, but do notdistinguish these activities as individual programsand do not report transportation revenues, obliga-tions, and expenditures as separate items. There isreason to believe that the effect of omitting thetransportation activities in those agencies and pro-grams with missing data is relatively small (lessthan 10 percent).
The same is true in the case of Census Bureaudata at the state and local levels. It is known, forexample, that the states expend funds for intercity
rail and bus services and pipeline safety programs,but the Census Bureau does not report these out-lays at the state and local government levels sepa-rately. BTS has collected data from other sourcesor estimated data using assumptions about ratiosbetween federal, state, and local funds. Data fromother sources include the Federal HighwayAdministration’s (FHWA’s) Highway Statisticsreport for federal-level highway data, the NationalAeronautics and Space Administration (NASA)aeronautics expenditures data from theAeronautics and Space Report of the President,and pipeline expenditures data from direct agencycontacts.
The Census Bureau's database also does notinclude detailed modal information on interestearnings and bond issue proceeds on the revenueside nor bond retirement and interest payments onthe expenditure side. In addition, the CensusBureau's highway expenditures data, in particular,do not include highway law enforcement expendi-tures, which form a part of the state and local high-way expenditures published in Highway Statistics.However, to maintain consistency between the dif-ferent modes regarding the types of revenues andexpenditures included, these additional data fromthe Highway Statistics report have not been used.
Transportation RevenuesTransportation revenue estimates include
transportation-related user charges, taxes, or feesearmarked for transportation-related expendi-tures, and funds that support federal transporta-tion programs through the U.S. government'sGeneral Fund. Estimates include transit fares fromsystems owned and operated by state and localgovernments, including those systems operatedunder contract by a private firm while the govern-ment maintains day-to-day financial oversight.
Not all transportation-related revenues areincluded, however. Other funds exist that could becategorized as transportation-related revenues,such as local government property taxes on vehi-cles, equipment, and streets, and state incometaxes to support rail and intercity bus services.However, it is impossible to identify these revenuesbecause they are not shown as such in the sourcematerials used to compile the database in thisreport.
Appendix C Source and Accuracy Profiles ! 451

In addition, taxes collected from users of thetransportation system that go into the GeneralFund are not included as transportation revenues.This occurred in 1981 and 1982 when the Airportand Airway Trust Fund (AATF) revenues wereassigned to the General Fund of the Treasuryrather than the AATF.
The reader should note that in the case of railtransportation, revenue estimates do not existsince both freight and passenger rail yield no rev-enues to federal, state, or local governments.
Federal transportation revenues generally con-sist of trust-fund collections from user charges,such as fuel taxes, vehicle taxes, registration andlicensing fees, and air passenger ticket taxes.Interest earned on fund balances are added tothese funds, along with any damage paymentsmade by private parties and deposited in the fundsto reimburse the government for related fundexpenditures.
The five transportation-related Federal trustfunds are established by law:
1. Highway Trust Fund (HTF) (whichincludes both highway and transitaccounts),2. Airport and Airway Trust Fund (AATF),3. Harbor Maintenance Trust Fund (HMTF),4. Inland Waterways Trust Fund (IWATF),and5. Oil Spill Liability Trust Fund (OSLTF).
These tables also contain data relating to thePipeline Safety Fund, which has not been desig-nated by law as a trust fund, but has been set upto record revenues and disbursements of fees ear-marked to support the pipeline safety program. Astatus report of each of these funds made annual-ly in the Appendix to the Budget shows their rev-enues, expenditures, and interest earnings.
Air RevenuesFederal air revenues are derived from the
AATF, which includes a passenger ticket tax andother taxes paid by airport and airway users on aircargo and general aviation fuel. Most of this trustfund is devoted to airport grants and capitalimprovements, such as new radar and traffic con-
trol towers. Within certain limits set by Congress,some of the remaining money can be used to coverthe Federal Aviation Administration's (FAA) oper-ation and maintenance expenses. The portion ofthe FAA's operation and maintenance expensesnot paid from the trust fund revenues are financedby general funds of the Treasury.
State and local revenues from the air mode arederived from airport charges. Beginning in 1992,local governments began collecting passengerfacility charges and spending these revenues (bothsubject to FAA approval) to finance capital pro-grams. The collection of passenger facility chargeswas authorized by the Aviation Safety andCapacity Expansion Act of 1990.2
Highway RevenuesThe major source of Federal highway revenues
is the Highway Trust Fund (HTF). HTF revenuesare derived from various excise taxes on highwayusers (e.g., motor fuel, motor vehicles, tires, andparts and accessories for trucks and buses). Themoney paid into the fund is earmarked primarilyfor the Federal-aid highway program. The excisetax on gasoline is the greatest individual source ofHTF revenues. Although the excise tax per gallonchanged several times during the 1985 through1995 period, the amount dedicated to the HTFonly increased once during that time. Portions ofthe gasoline excise tax per gallon were dedicatedto budget deficit reduction and to the LeakingUnderground Storage Tank Trust Fund.
State and local highway revenues include stateand local taxes on motor fuels, motor vehiclelicenses, and motor vehicle operator licenses,along with state and local charges for regular tollhighways and local parking charges. Regularhighway charges (revenues) include reimburse-ments for street construction and repairs; fees forcurb cuts and special traffic signs; and mainte-nance assessments for street lighting, snowremoval, and other highway or street servicesunrelated to toll facilities. Local governmentsfinance local road and street programs with spe-cial assessments and property taxes that may becommingled with other local revenue in a generalfund. Consistent with federal revenues, state and
452 " Appendix C Source and Accuracy Profiles
2 Public Law 101-508, 104 Stat. 1388 (November 5, 1990).

local transportation revenues in this report do notinclude general funds that may be allocated totransportation.
Transit RevenueEffective April 1983, one cent per gallon of the
federal excise tax on gasoline sales was set asidefor the Mass Transit Account of the Highway TrustFund; on December 1, 1990, this was increased to1.5 cents per gallon. Although highway users paythe taxes, these funds are treated as federal transitbudget revenues in calculating user coverage.
State and local transit revenues include rev-enues from operations of public mass transporta-tion systems (rapid transit, subway, bus, street,railway, and commuter rail services), such as fares,charter fees, advertising income, and other opera-tions revenues. They exclude subsidies from othergovernments to support either operations or capi-tal projects.
Waterway and Marine RevenuesFederal water revenues come from four pri-
mary sources: the Inland Waterways Trust Fund,the Harbor Maintenance Trust Fund, the Oil SpillLiability Trust Fund, and tolls and other chargescollected by the Panama Canal Commission.
Established by the Inland Waterways RevenueAct of 1978, the Inland Waterways Trust Fund hasbeen in effect since fiscal year 1981. The source forthe fund is a fuel tax paid by freight carriers oninland waterways. From this tax of 24.2 cents pergallon, 4.3 cents goes for deficit reduction, and astatutory maximum of 20 cents (raised to that levelfrom the previous maximum of 19 cents at thebeginning of 1995) flows to the Trust Fund. Fundsare earmarked for 50 percent of the constructionand rehabilitation costs of specified inland water-way projects.
Rail RevenuesThere are no governmental transportation rev-
enues for rail. (Rail generates fuel taxes that aredesignated for deficit reduction and, thus, are notconsidered transportation revenues in these tables.Rail also pays substantial taxes because it does nothave a publicly maintained infrastructure.)
Pipeline RevenuesThe Pipeline Safety Program is funded by user
fees assessed on a per-mile basis. The assessmentsare made on each pipeline operator regulated bythe Office of Pipeline Safety (OPS) of the Researchand Special Programs Administration in the U.S.Department of Transportation. There are no stateand local revenues for pipeline.
General Support RevenuesGeneral Support revenues come from the
Emergency Preparedness Fund, which is generatedfrom fees paid by registered shippers of hazardousmaterials. RSPA administers and distributes therevenues to states, territories, and tribes throughthe Hazardous Materials Emergency Preparedness(HMEP) grant program, which is authorized bythe Federal Hazardous Materials TransportationLaw.
Transportation ExpendituresExpenditures, rather than obligations, are used
in these tables because they represent the final,actual costs to the government, by year, for capitalgoods and operating services required by thetransportation programs. Obligations suggestgovernment commitment to future transportationexpenditures, but do not indicate when the fundswill actually be disbursed or even if the amountsobligated will be spent.
It is important to recognize that in someaccounts in the Budget of the United StatesGovernment, expenditures for a particular yearunderstate total government disbursements. Thisis because certain offsetting collections of fees andassessments from the public are not treated as gov-ernment revenues, but deducted from disburse-ments to determine expenditures. These collec-tions are those mandated, by statute, to be applieddirectly to fund agency expenditures rather thanbeing transferred to the Treasury. For this reason,expenditures do not necessarily indicate how muchthe Federal government actually spends on trans-portation each year.
Air ExpendituresFederal expenditures reported here consist of
all FAA expenditures, such as those associated
Appendix C Source and Accuracy Profiles ! 453

with constructing, operating, and maintaining thenational air traffic system; administration of theairport grant program; safety regulation; andresearch and development. NASA expenses relat-ed to air transportation are also included.
State and local expenditures for air include theoperation and maintenance of airport facilities, asadministered by local airport and port authori-tiesquasi-government agencies with responsibil-ities for promoting safe navigation and operationsforair modes.
Highway ExpendituresFHWA expenditures include funds for Federal
Aid Highways (financed from the HTF) and theInterstate Substitution and Railroad CrossingDemonstration (financed from the general fund).The National Highway Traffic Safety Admin-istration (NHTSA) expenditures include: opera-tions, research, and highway traffic safety grants.Federal highway expenditures also include roadconstruction activities managed by theDepartment of the Interior's National ParkService, Bureau of Indian Affairs, Bureau ofReclamation, and Bureau of Land Management;the Department of Agriculture's Forest Service; theDepartment of Housing and Urban Development;and other federal agencies.
State and local governments' highway expen-ditures reported by the Census Bureau are gener-ally slightly lower than those reported in FHWA'sHighway Statistics because the FHWA includessome highway expenditure data, such as lawenforcement activities and patrols, and policing ofstreets and highways not included in the Censusdata. Box 3-1 outlines the major differences inCensus Bureau and FHWA calculation of state andlocal highway transportation financial statistics.
Transit ExpendituresFederal expenditures include grants to states
and local agencies for the construction, acquisi-tion, and improvement of mass transportationfacilities and equipment and for the payment ofoperating expenses. Several other items are alsoincluded: Federal Railroad Administration (FRA)commuter rail subsidies related to the transition ofConrail to the private sector; research and admin-
istrative expenses of the Federal Transit Admin-istration (FTA); and Federal interest payment con-tribution to the Washington Metropolitan AreaTransportation Authority (WMATA).
Waterway and Marine ExpendituresFederal expenditures comprise those parts of
U.S. Coast Guard's expenses that are transporta-tion-related, such as aids to navigation, marinesafety, and marine environmental protection. Allexpenses of the U.S. Maritime Administration areincluded, such as subsidies for construction andoperation of vessels by U.S.-flag operators,research and development, and training of shipofficers. Also included are those expenses of theU.S. Army Corps of Engineers for constructionand operations and maintenance of channels, har-bors, locks and dams; protection of navigation;the salaries and expenses of the Federal MaritimeCommission; and the expenses of the PanamaCanal Commission.
State and local governments incur water trans-portation expenditures by operating and main-taining water terminal facilities within ports andharbors.
Rail ExpendituresFederal rail transportation expenditures
include:1. expenses for rail safety enforcement;2. inspection and program administration;3. railroad research and development;4. financial assistance to states for planning,acquisition, rail facility construction, andtrack rehabilitation with respect to low vol-ume freight lines;5. grants to Amtrak, including funds toupgrade the high-speed line between Boston,MA, and Washington, DC, owned by Amtrak(the Northeast Corridor ImprovementProgram); annual appropriations to coveroperating losses; and funds to invest in newequipment and facilities;6. the purchase of redeemable preferenceshares for track rehabilitation and line acqui-sition; and
454 " Appendix C Source and Accuracy Profiles

7. loan guarantee defaults for railroad reha-bilitation and improvement and Conrail laborprotection.3
The local rail freight assistance program, a pro-gram of FRA grants to state governments, has hada 70:30 percent federal-state funding share sincein 1982.
Pipeline ExpendituresThe OPS reimburses state agencies up to 50
percent of their costs to carry out the state'spipeline safety program. Federal expenditures arefor the enforcement programs, research and devel-
opment, and grants for state pipeline safety pro-grams.
General Support ExpendituresGeneral Fund expenditures include all of the
expenses of the following agencies: Office ofInspector General, National Transportation SafetyBoard, all expenses of RSPA (except pipelineexpenditures) and the Office of the Secretary ofTransportation (except for payments to AirCarriers and the Commission on Aircraft Safety).
REFERENCESCorrado, C., C. Gilbert, et al. (1997).
"Industrial production and capacity utilization:historical revision and recent developments."Federal Reserve Bulletin 83(2): 67.
Korn, E.L. and B.I. Graubard. 1991. "A Noteon the Large Sample Properties of Linearization,
Box 3-1.U.S. Census Bureau and Federal Highway Administration calculations of state and local transportation financialstatistics differ in the following ways:
ITEM CENSUS FHWA
Appendix C Source and Accuracy Profiles ! 455
Motor Fuel TaxRevenues
Motor Vehicle LicenseTax Revenues
Local Parking ChargesRevenues
Highway Expenditures
Includes state and local tax revenues onany fuel used in motor vehicles, and ongasoline used by aircraft.
Includes vehicle mileage and weight taxeson motor carriers; highway use taxes; oroff-highway fees.
Includes local parking revenues.
Excludes patrols or policing of streets andhighways; traffic control activities ofpolice or public safety agencies; lawenforcement and safety activities of vehi-cle inspection enforcement, and vehiclesize and weight enforcement; street clean-ing activities; and roads within parksmaintained by a park agency.
Includes state and local fuel tax revenues attributed tohighway use of fuels, including diesel fuel, gasohol andliquefied petroleum gas used by private and commercialhighway use motor vehicles and transit. Does notinclude revenues on gasoline used by aircraft.
Does not include vehicle mileage and weight taxes onmotor carriers; highway use taxes or off-highway fees.
Not explicitly collected.
Includes patrols or policing of streets and highways;traffic control activities of police or public safety agen-cies; law enforcement and safety activities of vehicleinspection enforcement, and vehicle size and weightenforcement; street cleaning activities; and roads withinparks maintained by a park agency.
3 Funds in the Conrail Labor Protection Program were pro-vided for benefits to Conrail employees deprived of employ-ment because of work force reductions and other actions.This program no longer exists since Conrail has beenreturned to the private sector. In 1988, the unobligated bal-ances available from this program were transferred to theUSCG and in 1990 they were returned to the U.S. Treasury.

Jackknife and Balanced Repeated ReplicationMethods for Stratified Samples." The Annals ofStatistics 19 (4): 2275-2279.
Krewski, D. and J.N. K. Rao. 1981."Inference from Stratified Samples: Properties ofLinearization, Jackknife and Balanced RepeatedReplication Methods." The Annals of Statistics9(5): 1010-1019.
Kunze, K. and M. Jablonski (1998).Productivity in service-producing industries.Brookings Workshop on New Service-Sector Data,Washington, DC.
Landerfeld, J. S. and R. P. Parker (1997)."BEA's chain indexes, time series, and measures oflong-term economic growth." Survey of CurrentBusiness 77(5): 58.
Moulton, B.R. and Seskin, E.P. (1999). "Apreview of the 1999 comprehensive revision of theNational Income and Product Accounts: statisti-cal changes." Survey of Current Business 79(October 1999): 6-17.
Parker, R. P. and J. E. Triplett (1996). "Chain-type measures of real output and prices in the U.S.national income and product accounts: anupdate." Business Economics 31(4): 37.
Ritter, J.A. (2000). "Feeding the national
accounts." Federal Reserve Bank of St. LouisReview. March/April: 11-20.
SCB (1991). "Gross Domestic Product as ameasure of U.S. Production." Survey of CurrentBusiness.
Seskin, E. P. and R. P. Parker (1998). "A guideto the NIPA's." Survey of Current Business 78(3):26.
U.S. Department of Labor, Bureau of LaborStatistics. 1997. Measurement Issues in theConsumer Price Index. Referenced athttp://stats.bls.gov/cpigm697.htm on May 13,1999.
Valliant, R. 1993. "Poststratification andConditional Vairance Estimation." Journal of theAmerican Statistical Association 88 (421): 89-96.
Young, A. H. (1993). "Reliability and accura-cy of the quarterly estimates of GDP." Survey ofCurrent Business 73(10): 29.
Young, A. H. and H. S. Tice (1985). "An intro-duction to national economic accounting." Surveyof Current Business 65: 59.
Yuskavage, R. E. (1996). "Improved estimatesof gross product by industry, 1959-94." Survey ofCurrent Business 76(8): 133.
456 " Appendix C Source and Accuracy Profiles

PETROLEUM SUPPLY
TABLE 4-1. Overview of U.S. PetroleumProduction, Imports, Exports, andConsumption
The petroleum supply system is extremelycomplicated, with many different processes, prod-ucts, and entities involved. Briefly, crude oil is pro-duced or imported, transported to refineries whereit is refined into various products, and then trans-ported to markets. Imports and exports of crudeoil and products must be accounted for, as must benonpetroleum components of final products, suchas natural gas plant liquids and ethanol for gaso-line blending.
The U.S. Department of Energy, EnergyInformation Administration (EIA) collects exten-sive data at select points in the petroleum supplysystem. Sixteen surveys are conducted by EIA'sPetroleum Supply Reporting System to track thesupply and disposition of crude oil, petroleumproducts, and natural gas plant liquids:
· five weekly surveys cover refineries (formEIA-800), bulk terminal stocks (form EIA-801), product pipelines (form EIA-802),crude stocks (form EIA-803), and imports(form EIA-804).
· eight monthly surveys cover the same fivepoints plus tanker and barge movement(form EIA-817), gas processing facilities(form EIA-816), and oxygenates (form EIA-819M).
· one survey (form EIA-807) collects propanedata on a monthly basis in the warmermonths (April-September) and on a weeklybasis in the colder months.
· one annual survey determines productioncapacity of oxygenates and fuel ethanol(form EIA-819A), and
· one annual survey determines refinery fueluse, capacity, and crude oil receipts by trans-portation mode (form EIA-820).
The five weekly surveys target key points in thepetroleum supply system. They do not include allcompanies, but sample 90 percent of volume ateach selected point in the supply system. EIA rank-orders the companies involved in the survey andsends surveys as it scrolls down the list, stoppingwhen it reaches the 90 percent level. Although 100percent coverage is sacrificed, this method keepsthe level of incoming data manageable and avoidsburdening the smallest companies. All data arereviewed and anomalies checked.
Monthly surveys provide data that are used inthe monthly and annual reports. They are similarto the weekly surveys, but are more exhaustive inboth the range of data collected and the depth ofthe collection. Sample sizes and response rates forseveral of the key points in the supply system areshown in table 4-1. The eight monthly surveyscover the industry more accurately than the week-ly surveys and provide some double-check pointsthat the other surveys do not. EIA expends con-siderable effort to ensure that its data are as accu-rate as possible. Revisions are made throughoutthe year. For example, EIA's Annual EnergyReview 1996, released in July 1997, provided a
Appendix C Source and Accuracy Profiles ! 457
Chapter 4 Energy and the Environment
Table 4-1.Average Response Rates for MonthlySurveys, 1998
Refinery 252 243 96.3
Bulk terminal 300 287 95.6
Pipeline 81 80 99.3
Crude oil stocks 174 169 99.1
NOTE: The average response rate is calculated by summingindividual monthly response rates and dividing by 12.
SOURCE: Tammy G. Heppner and Carol L. French, EnergyInformation Administration, U.S. Department of Energy,Accuracy of Petroleum Supply Data (Washington, DC: 1998).
Surveysite Percent
Averageuniverse
site
Averagenumber of
respondents

preliminary 1996 number for total petroleum pro-duction of 8.30 million barrels per day (mmbd).The Annual Energy Review 1997, released a yearlater, revised that to 8.25 mmbd, and the 1999Review reported 8.29 mmbd.
No complicated survey is likely to be 100 per-cent accurate. EIA lists four sources of potentialsystematic errors:
1. Some members of the target populationare missed. EIA reports that it continuallyreviews the lists and searches industry period-icals and newspapers to identify new actors.Considering the nature of the petroleum indus-try, it is very unlikely that companies with sig-nificant production are not surveyed.
2. Some members of the target populationdo not respond. EIA reports a 97 percentresponse rate for monthly surveys. For somepoints in the supply system, the averageresponse is over 99 percent. Survey respon-dents are required by law to respond, but somenonresponse is inevitable, especially amongsmall companies. EIA assumes that the non-respondent's value for that month is the sameas for the previous month except for imports.Since imports vary widely, with respondentsfrequently having no imports, EIA assumes anonresponse means zero imports. It can beassumed that EIA is good at "filling in theblanks." Assuming for illustration purposesthat 0.5 percent of production does notrespond, and that EIA is 90 percent accurate incovering the gap, then there is a possibility ofa 0.05 percent error. Applying that to totalproduction of 8.29 mmbd in 1999 suggeststhat there could be an error of 0.0041 mmbd(4,100 barrels per day), which would notaffect the published number.
3. The most serious problem may beresponse error. A company may have poordata, perhaps as a result of imperfect meas-urements, or it may transmit the wrong num-ber. EIA has no control over a company's dataquality. Companies have incentive to measuretheir inputs and products accurately. Other-wise, they may be cheating themselves or risk-ing ill will with their customers or suppliers.However, no instrumentation is perfectly accu-
rate. The high throughput of, say, a refinerywith capacity of several hundred thousandbarrels per day, with a variety of productschanging density and some lost or used on site,is very complicated to measure. Instrumen-tation errors are likely to be systematic at anyone site, although they will be more nearly ran-dom in the aggregate for all facilities. There ispotential for small but significant overallerrors.
Mistakes may be made in recording and trans-ferring the data. EIA reviews the data andflags gross errors or missing data for review bythe respondent. However, not all errors will bepicked up by EIA and/or the respondent.Overall, response errors probably are severaltimes as large as nonresponse errors, but it isbeyond the scope of this profile to estimatethem.
4. The final potential source of systemat-ic error is in the clarity of the survey form, i.e.,whether all respondents interpret it correctly.No doubt errors and ambiguities can creepinto a form, but at least for petroleum supply,that does not appear to be a major risk. Thesupply system is not changing rapidly, and EIAshould be able to keep with it and the termi-nology. However the final digit of EIA's pub-lished supply data is questionable.
For additional information on survey method-ology and statistical reliability, the reader isreferred to the EIA reference cited in the tables orthe EIA Internet site at www.eia.doe.gov.
FUEL AND ENERGY CONSUMPTION
TABLE 4-1. Overview of U.S. PetroleumProduction, Imports, Exports, andConsumption
TABLE 4-2. U.S. Consumption of Energy fromPrimary Sources by Sector
TABLE 4-3. Domestic Demand for RefinedPetroleum Products by Sector
TABLE 4-4. U.S. Energy Consumption by theTransportation Sector
458 " Appendix C Source and Accuracy Profiles

TABLE 4-7. Domestic Demand for Gasoline
Petroleum consumption is far more complex tomeasure than supply. Instead of a few hundredcompanies at most measuring points in the supplysystem, there are tens of millions of consumers. Itwould be impossible for any survey of individualconsumers to produce the high rate of return ofU.S. Department of Energy (DOE), EnergyInformation Administration's (EIA's) supply sur-veys. EIA's transportation data collection is furtherlimited by the termination of the ResidentialTransportation Energy Consumption Survey(RTECS). Therefore, EIA uses surveys of sales ofproducts (e.g., Form EIA-821: Annual Fuel Oiland Kerosene Sales Report) or tax collection datafrom the U.S. Department of Transportation,Federal Highway Administration (FHWA).
EIA reviewed the accuracy of its energy con-sumption data in a 1990 monograph EnergyConsumption by End-Use Sector, a Comparison ofMeasures by Consumption and Supply Surveys.Unfortunately, this monograph does not discussthe transportation sector because the consumptionand supply surveys were not comparable. How-ever, some of the results from other sectors indicatethe discrepancies between supply and consumptionsurveys. Table 4-2 shows the ratio of fuel suppliedto the sector to consumption reported by the sec-tor in consumption surveys.
In most cases, supply is reported as substan-tially larger than consumption. Supplies of fuel oilto the commercial sector are reported at almost
twice the level of consumption reported by thatsector. Some of the discrepancies may be due todefinition differences (e.g., fuel oil for apartmentbuildings is included in commercial supply surveysbut not in consumption surveys.) Overall, howev-er, the differences are too large for great confidencein the accuracy of the data.
If transportation had been reviewed in thesame format, it is likely that the discrepancieswould have been larger. Most transportation fuel(gasoline for automobiles) is purchased in smallquantities at irregular intervals and cannot bechecked simply by looking at a utility bill. Hence,highway transportation energy consumption sur-veys must be extensive to avoid the risk of largeuncertainties in the data. But, with the terminationof the RTECS, EIA ceased conducting such sur-veys. Consumption data must be derived indirect-ly from sales of petroleum products and taxcollection data. While petroleum supply may beaccurate to one decimal place, it is likely that dis-aggregating by sector use may be within plus orminus several percentage points, or perhaps abouthalf a quadrillion British thermal unit (Btu) in table4-1.
Motor GasolineAlmost all gasoline is consumed in the trans-
portation sector. Small amounts are used in thecommercial sector for nonhighway use and theindustrial sector, which includes agriculture, con-struction, and other uses. Subtracting estimates ofthose uses from the known total sales yields thetransportation sector's total, which is further sub-divided into highway and marine use. Aviationgasoline is, of course, used entirely in the trans-portation sector (for a very few high-performanceautomobiles as well as small aircraft).
Data on actual sales is collected by the statesfor revenue purposes. These data are forwarded toFHWA. EIA uses the data from FHWA to allocatehighway consumption of motor gasoline amongthe states. For 1998, FHWA reported 124.7 billiongallons of gasoline sold nationally for highway use.EIA's table 5.12b of the Annual Energy Review1999 lists 8.13 mmbd of gasoline supplied for thetransportation sector, the same as 124.7 billiongallons.
Appendix C Source and Accuracy Profiles ! 459
Table 4-2.Reported Ratio of Fuel Supply to ReportedConsumption
Residential 1.05 .92 .92
Commercial 0.91 1.38 1.96
Industrial 1.18 1.28 1.34
SOURCE: U.S. Department of Energy, Energy InformationAdministration, Energy Consumption by End-Use Sector, AComparison of Measures by Consumption and SupplySurveys, DOE/EIA-0533 (Washington, DC: 1990).
Sector OilElectricity Gas

Such close agreement between supply anddemand is not totally convincing. Definitions areunique to each state (e.g., whether gasohol iscounted as pure gasoline or part gasoline and partrenewables), measurement points vary from stateto state, and each state handles losses differently.Hence, the total of all states' sales of gasoline isnot entirely consistent.
Separation of highway from nonhighway usesof gasoline is, by necessity, based in part on care-ful estimates. Nevertheless, overall gasoline salesare well documented, and the separation is proba-bly fairly accurate. Refinery output of motorgasoline was 7.94 mmbd in 1999, which is proba-bly accurate to the first decimal place and maybea little better. The transportation sector's 8.13mmbd would have about the same accuracy.
Diesel FuelDiesel fuel is used in highway vehicles, rail-
roads, boats, and military vehicles. Sales are onlyabout 30 percent of gasoline in the transportationsector, but uncertainties are greater. More dieselthan gasoline is used for nonhighway purposes,especially agriculture and construction. In addi-tion, there has been more potential for cheating toavoid the tax; heating oil is virtually the same asdiesel fuel and can easily be transferred to a vehi-cle. However, this is less significant now that trac-ers have been added to fuel oil. After the additionof tracers, the amount of transportation diesel fueluse jumped.
To estimate diesel fuel sales by mode, EIAstarts with the total supply of distillate fuel andsubtracts the small amount sold to electric utilities(the most accurately known sector, as measured byEIA Form EIA-759). The remainder is dividedamong the other end-use sectors according toEIA's sales surveys (Form EIA-821: Annual FuelOil and Kerosene Sales Report, and Form EIA-863: Petroleum Product Sales Identification Sur-vey).
This method introduces several potential ele-ments of inaccuracy. First, the surveys of each sec-tor are probably less accurate than the supply sur-veys noted earlier. Companies and individualsmay inadvertently send incorrect data, or not
respond at all. Then EIA has to determine whatadjustment factor to use for each end-use sector.Since each sector will have a different response rateto the surveys, the adjustments will be different.Large adjustments can introduce large errors. EIAhas not published its adjustments for the trans-portation sector. As shown in table 2, the adjust-ments in other sectors range from 5 to 96 percentof reported consumption. Even a 20 percentadjustment could introduce an error of one or twopercentage points (plus or minus) for any one sec-tor.
Overall, the accuracy of diesel fuel use in thetransportation sector should be viewed with someskepticism.
Jet FuelJet fuel is the only other petroleum-based fuel
that is used in large quantities (over 1 million bar-rels/day) in the transportation sector. Virtually allof it is used by airlines. These data are accuratebecause airlines are required to report usage, andbecause there are relatively few certificated air car-riers, data collection should be manageable.
NONPETROLEUM FUELSCONSUMPTION
TABLE 4-10. Estimated Consumption ofAlternative and Replacement Fuels forHighway Vehicles
Collectively, oxygenates, natural gas, electrici-ty, and various alternative fuels amount to onlyabout 3 percent of all energy used in the trans-portation sector. While this may not be muchgreater than the error bars associated with petro-leum use, it is important to track changes in thesefuels accurately.
OxygenatesOxygenates, mostly methyl tributyl ether
(MTBE), which is derived from natural gas andethanol, are part of mainstream gasoline supply.They are measured routinely with petroleum sup-ply (forms EIA-819A and 819M). Consumption
460 " Appendix C Source and Accuracy Profiles

is estimated from production, net imports, andstock changes. Refineries and other entities arerequired to report data on oxygenates, and EIAalso monitors production capability to provide acrosscheck. Thus, oxygenates data are likely to bereasonably accurate.
Natural GasNatural gas is used in the transportation sector
mainly as the fuel for compressor stations on nat-ural gas transmission lines. A small but growingamount is used in compressed or liquefied form invehicles. EIA collects data on natural gas much asit does for petroleum, but the system is much sim-pler. Natural gas transmission companies may notknow exactly how much gas is used in compressorstations, but they have a good idea based on thesize of the equipment and the load on the line. Thereported numbers probably are reasonably accu-rate. Data on natural gas-fueled vehicles are col-lected by DOE via Form-886, which is sent to fuelsuppliers, vehicle manufacturers, and consumers.In addition, private associations and newslettersare important sources of information on alterna-tive vehicles and alternative fuels use. Since mostgroups work cooperatively with DOE, it is likelythat the data reported are accurate. EIA tracks thenumber of natural gas vehicles and the number ofrefueling stations to provide a cross check on esti-mates of natural gas consumption.
ElectricityElectricity powers intercity trains (Amtrak)
and intracity rail systems. In addition, the numberof electric vehicles is growing. There is consider-able uncertainty over the energy consumed bythese modes. Amtrak no longer provides nationaltotals of its electricity consumption. Data onintracity transit is based on U.S. Department ofTransportation, Federal Transit Administration's(FTA's) National Transit Database that containsinformation for directly operated services by fed-erally funded transit agencies. Section 15 of theFederal Transit Act requires that these agenciesprovide detailed financial and operating informa-tion, including energy use. Although the data isgenerally considered accurate because FTA reviewsand validates information submitted, reliability
may vary because some transit agencies cannotobtain accurate information or may misinterpretcertain data.
If electric vehicles become important over thenext decade or two, dedicated charging stationsmay become commonplace, which could provideaccurate data. Fleet owners (e.g., electric utilities)can keep accurate records, but individuals whoplug their vehicles in at home may not. Electricityuse must be estimated from the number of suchvehicles and the expected driving cycles. Hence,data on electric power for transportation must beviewed as an estimate.
It should also be noted that electricity is a formof work that usually is generated from heat withthe loss of about two-thirds of the energy.Automobile engines are equivalent to electric gen-erators in that they convert chemical energy to heatand then to work, losing most of the energy aswaste heat. When electrical energy is compared topetroleum in transportation, the waste heat mustbe included for consistency. A kilowatt-hour ofelectricity is equivalent to 3,413 British thermalunits (Btu), but about 10,000 Btu of heat arerequired to produce it. This factor is dropping asgenerators become more efficient. High efficiencygas turbines may require 8,000 Btu or less, but theaverage is much higher. It is usually impossible totell where the power for a specific use is generated,so average figures for a region are used to estimatethe waste energy, a factor that further reduces theaccuracy of the data.
Alternative FuelsIn addition to oxygenates, natural gas, and
electricity, alternative fuels include ethanol andmethanol. EIA tracks the numbers of such vehiclesthrough Form-886, state energy offices, federaldemonstration programs, manufacturers, and pri-vate associations. These numbers probably arefairly accurate although it is difficult to monitorretirements. Fuel consumption is estimated fromthe types of vehicles in operation, vehicle milestraveled, and expected fuel efficiency. Adjust-ments are necessary for the relatively few flexible-fuel vehicles. Obviously, the reported data areestimates only.
Appendix C Source and Accuracy Profiles ! 461

FUEL AND ENERGY CONSUMPTIONBY MODE
TABLE 4-5. Fuel Consumption by Mode ofTransportation
TABLE 4-6. Energy Consumption by Mode ofTransportation
TABLE 4-8. Certificated Air Carrier FuelConsumption and Travel
TABLE 4-9. Motor Vehicle Fuel Consumptionand Travel
TABLE 4-11. Passenger Car and MotorcycleFuel Consumption and Travel
TABLE 4-12. Other 2-Axle 4-Tire Vehicle FuelConsumption and Travel
TABLE 4-13. Single-Unit 2-Axle 6-Tire orMore Truck Fuel Consumption and Travel
TABLE 4-14. Combination Truck FuelConsumption and Travel
TABLE 4-15. Bus Fuel Consumption andTravel
TABLE 4-16. Transit Industry Electric Powerand Primary Energy Consumption and Travel
TABLE 4-17. Class I Rail Freight Service FuelConsumption and Travel
TABLE 4-18. Amtrak Fuel Consumption andTravel
Fuel consumption data are collected quite dif-ferently than supply data collected by the U.S.Department of Energy, Energy InformationAdministration (EIA). Highway fuel consump-tion, for example, is based on U.S. Department ofTransportation, Federal Highway Administration(FHWA) data collected from states in the course ofrevenue collection. EIA starts from the fuel deliv-ered to transportation entities.
HighwayHighway fuel data (tables 4-5, 4-9, and 4-11
through 4-15) are collected mainly by FHWA. Allstates plus the District of Columbia report totalfuel sold along with travel by highway category
and vehicle registration. Data typically flows fromstate revenue offices to the state departments oftransportation to FHWA. Even if reporting is rea-sonably accurate, some data are always anom-alous or missing and must be modified to fitexpected patterns. In addition, as discussed earli-er, there are some significant differences inmethodology and definitions among the states. Inparticular, states differ in where the tax is appliedin the fuel supply system, how gasohol is counted,how nonhighway use is treated, and how lossesare handled.
Nonhighway use of gasoline and diesel fuel isa particularly large source of potential error. Somestates designate nonhighway users as tax-exempt,others make the tax refundable. In either case,many people won't bother to apply if the amountof money is small. Nonhighway use of diesel fuelis especially large because many construction andagricultural vehicles are diesel powered. Thus, thefraction of petroleum attributed to transportationcould be overestimated. On the other hand, somenonhighway fuel finds its way into the transporta-tion system because heating oil can be used asdiesel fuel, evading the tax. Tracers are nowadded to heating oil, which appears to havereduced the level of such tax evasion-if found in atruck's fuel tank, the tracer indicates diversionfrom a nontaxed source.
Breaking fuel use down by class of motor vehi-cle introduces the potential for error. FHWA mustestimate the miles each class is driven and the fueleconomy. Estimation of miles is based on the 1995Nationwide Personal Transportation Survey(NPTS), administered by FHWA, and the VehicleInventory and Use Survey (formerly known as theTruck Inventory and Use Survey) conducted by theU.S. Census Bureau. For information about thesetwo surveys, the reader is referred to the technicalappendix of Our Nation's Travel, available fromthe FHWA, Office of Highway InformationManagement; and the 1997 Census of Trans-portation, available from the Economics andStatistics Administration within the Census Bu-reau. Fuel economy is based on state-supplieddata, TIUS, and the National Highway TrafficSafety Administration data on new car fuel econ-omy, which must be reduced by about 15 percentto reflect actual experience on the road. Overall,
462 " Appendix C Source and Accuracy Profiles

both vehicle-miles of travel and fuel economy areestimates.
Fuel consumption by buses is particularlyuncertain. FHWA collects data on intercity buses,and the American Public Transit Association(APTA) covers local travel. Very little data are col-lected on school buses. APTA figures are based ondata from the USDOT, Federal Transit Admin-istration's (FTA's) National Transit Database,which covers about 90 to 95 percent of total pas-senger-miles. These data are generally accuratebecause FTA reviews and validates informationsubmitted by individual transit agencies.Reliability may vary because some transit agenciescannot obtain accurate information or may misin-terpret data. APTA conservatively adjusts the FTAdata to include transit operators that do not reportto FTA, such as private and very small operatorsand rural operators. Prior to 1984, APTA did notinclude most rural and demand responsive systems.
AirThe U.S. Department of Transportation,
Bureau of Transportation Statistics, Office ofAirline Information (OAI) is the source of thesedata. The numbers are based on 100-percentreporting of fuel use by large certificated air carri-ers (those with revenues of more than $100 millionannually) via Form 41. The data are probably rea-sonably accurate because the airlines report fueluse regularly, and the limited number of airlinesaids data management.
Smaller airlines, such as medium size regionaland commuter air carriers, are not required toreport energy data. OAI estimates that about 8percent would have to be added to the total of thelarger airlines to account for this use, but that hasnot been done in table 4-5 or 4-8.
General aviation aircraft and air taxis are cov-ered in the General Aviation and Air Taxi andAvionics Survey, conducted by the Federal AviationAdministration (FAA). The survey is conductedannually and encompasses a stratified, systematicdesign from a random start to generate a sample ofall general aviation aircraft in the United States. Itis based on the FAA registry as the sampling frame.For instance, in 1997, a sample of 29,954 aircraftwas identified and surveyed from an approximate
population of 251,571 registered general aviationaircraft.
The reliability of the GAATA survey can beimpacted by two factors: sampling and nonsam-pling error. A measure, called the standard error,is used to indicate the magnitude of sampling error.Standard errors can be converted for comparabili-ty by dividing the standard error by the estimate(derived from the sample survey results) and mul-tiplying it by 100. This quantity, referred to as thepercent standard error, totaled seven-tenths of apercent in 1997 for the general aviation fleet. Alarge standard error relative to an estimate indi-cates lack of precision, and inversely, a small stan-dard error indicates precision.
Nonsampling errors could include nonre-sponse, a respondent's inability or unwillingness toprovide correct information, differences in inter-pretation of questions, and data entry mistakes.The reliability of general aviation fleet data com-parisons over time would decrease because ofchanges implemented in 1978 and sampling errorsdiscussed above. Readers should note that nonre-sponse bias may be a component of reliabilityerrors in the data from 1980 to 1990. The FAAconducted telephone surveys of nonrespondents in1977, 1978, and 1979 and found no significant dif-ferences or inconsistencies between respondent andnonrespondent replies. The FAA discontinued thetelephone survey of nonrespondents in 1980 tosave costs. Nonresponse surveys were resumed in1990; and the FAA found notable differences andmake adjustments to its data to reflect nonresponsebias.
The U.S. Government, in particular the Depart-ment of Defense (DOD), uses a large amount of jetfuel as shown in table 4-19 (see discussion on gov-ernment consumption below). However, DODreports all fuel purchased, including from foreignsources for operations abroad. While the data maybe accurate, it is not comparable to EIA's overallU.S. supply and consumption figures on jet fuel.
International operations are included in table4-8 but not table 4-5. The fuel use for internationaloperations includes that purchased by U.S. airlinesfor return trips. OAI does not collect data on for-eign airline purchases of fuel in the United States.Thus, a significant use of U.S. jet fuel is missed.
Appendix C Source and Accuracy Profiles ! 463

However, these two factors approximately balanceeach other out. As shown in table 1-34, foreigncarrier traffic is just slightly less than U.S. carrierinternational traffic, so presumably the fuel pur-chased here by foreign carriers is very close to thefuel purchased abroad by U.S. carriers.
RailThe data are from Railroad Facts, published
annually by the Association of American Railroads(AAR). AAR figures are based on 100 percentreporting by Class I railroads to the SurfaceTransportation Board (STB) via Schedule 700 ofthe R1 Annual Report. Thus, the data are consid-ered accurate. STB defines Class I railroads as hav-ing operating revenues at or above a thresholdindexed to a base of $250 million (1991) andadjusted annually in concert with changes in theRailroad Freight Rate Index published by theBureau of Labor Statistics. In 1998, the adjustedthreshold for Class I railroads was $259.4 million.Although Class I railroads represent only 2 percentof the number of railroads in the country, theyaccount for over 70 percent of the industry'smileage operated and more than 90 percent of allfreight revenue; energy consumption should be ofthe same order. For passenger travel, informationis unavailable. Amtrak no longer provides data ona national basis, and the regional data appears tobe inconsistent.
TransitThe APTA figures are based on information in
FTA's National Transit Data Base. APTA conser-vatively adjusts FTA data to include transit opera-tors that do not report to the FTA Database(private and very small operators and rural opera-tors), which accounts for about 90 to 95 percentof the total passenger-miles. The data are gener-ally accurate because the FTA reviews and vali-dates information submitted by individual transitagencies. Reliability may vary because some tran-sit agencies cannot obtain accurate information ormisinterpret certain data definitions in federalguidelines.
WaterThe EIA collects data on residual and distillate
fuel oils and diesel through its Annual Fuel Oiland Kerosene Sales Report survey, form EIA-821.The survey targets companies that sell fuel oil andkerosene to end users. This survey commenced in1984 and data from previous years should be usedwith caution.
Sampling Frame and DesignThe sample's target universe includes all com-
panies that sell fuel oil and kerosene to end users.EIA derives the sampling frame from the EIA-863database containing identity information forapproximately 22,300 fuel oil and kerosene sell-ers. EIA stratifies the sampling frame into two cat-egories: companies selected with certainty anduncertainty. Those in the certainty category var-ied but included the end use "vessel bunkering,"orsales for the fueling of commercial and privatewatercraft.
Sampling Error, Imputation, and EstimatesEIA reported a 91.3 percent response rate for
the 1999 survey. The EIA also provides estimatesof the sampling error for geographic areas andU.S. averages are 1.3 for residential distillate fueloil, 0.9 for nonresidential retail distillate fuel oil,and 0.1 for retail residual fuel oil. Some firmsinevitably ignore survey requests, causing datagaps. EIA estimates the volumes of these firm'ssales by imputation; more detailed informationand the algorithm can be obtained at EIA's website in the technical notes for the Annual Fuel Oiland Kerosene Sales Report. See http://www.eia.doe.gov/oil_gas/petroleum/data_publications/fuel_oil_and_kerosene_sales/foks.html.
TABLE 4-19. U.S. Government EnergyConsumption by Agency and Source
Energy consumption data are collected byDOE's Office of Federal Energy ManagementPrograms in cooperation with most departmentsand agencies. DOD is by far the largest consumer,
464 " Appendix C Source and Accuracy Profiles

accounting for about 80 percent of the total. Asdiscussed above, the data includes fuel purchasedabroad for military bases. Since government agen-cies are required to report these data, they areprobably accurate. However, it is possible thatsome consumption is missed. For example, someagencies may report only fuel supplied directly,missing consumption such as gasoline purchasedby employees while on government business forwhich they are then reimbursed. In addition,smaller agencies were neglected. Overall, howev-er, the data should provide a fairly good approxi-mation of government energy consumption.
ENERGY EFFICIENCY
TABLE 4-20. Energy Intensity of PassengerModes
TABLE 4-21. Energy Intensity of CertificatedAir Carriers, All Services
TABLE 4-22. Energy Intensity of PassengerCars, Other 2-Axle 4-Tire Vehicles, andMotorcycles
TABLE 4-24. Energy Intensity of Transit MotorBuses
TABLE 4-25. Energy Intensity of Class IRailroad Freight Service
TABLE 4-26. Energy Intensity of AmtrakService
Total energy consumed for each mode can beestimated with reasonable accuracy. Miles trav-eled are known for some modes, such as air carri-ers, but less accurately for others, most notablyautomobiles. When the numbers of passengers ortons are required to calculate energy efficiency,another uncertainty is introduced. Again, air car-riers and intercity buses know how many passen-gers are on board and how far they travel, but onlyestimates are available for automobiles andintracity buses.
Thus, table 4-21 should be quite accurate forcertificated air carriers, though it is missing smallairlines and private aircraft. Table 4-22 is based onFHWA fuel tax data, derived from state fuel taxrevenues. VMT is as discussed for tables 1-9 and
1-10. Data for motorcycles must be adjusted sig-nificantly more than for automobiles because lessinformation is collected from the states or fromsurveys. Transit bus data (table 4-24) are veryuncertain because, unlike intercity buses, the dis-tance each passenger travels is not measured byticket sales.
The intermodal comparison of passenger trav-el in table 4-20 must be viewed with considerablecaution. Data for the different modes are collect-ed in different ways, and the preparation of thefinal results is based on different assumptions. Asnoted above, airlines accurately record passengermiles, but the data on occupancy of private auto-mobiles must be estimated from surveys. Even rel-atively certain data, such as state sales of gasoline,must be modified to resolve anomalies, and transitdata are even harder to make consistent. Further-more, different groups collect the data for the var-ious modes, and they have different needs, assump-tions, and methodologies. Thus, the comparisonsare only approximate.
Freight service data (table 4-25) are fromRailroad Facts, published annually by the Associ-ation of American Railroads (AAR). AAR figuresare based on 100 percent reporting by Class I rail-roads to the Surface Transportation Board (STB)via Schedule 700 of the R1 Annual Report. STBdefines Class I railroads as having operating rev-enues at or above a threshold indexed to a base of$250 million (1991) and adjusted annually in con-cert with changes in the Railroad Freight RateIndex published by the Bureau of Labor Statistics.In 1998, the adjusted threshold for Class I rail-roads was $259.4 million. Although Class I rail-roads comprise only 2 percent of the number ofrailroads in the country, they account for over 70percent of the industry's mileage and 90 percent ofall freight revenue; energy data should be of thesame order.
TABLE 4-27. Annual Wasted Fuel Due toCongestion
TABLE 4-28. Wasted Fuel per Eligible Driver
The Texas Transportation Institute's (TTI)Urban Roadway Congestion Annual Report pro-
Appendix C Source and Accuracy Profiles ! 465

vided figures for tables 4-27 and 4-28. TTI relieson data from the U.S. Department of Trans-portation, Federal Highway Administration,Highway Performance Monitoring System data-base (HPMS). (See box 1-1 for detailed informa-tion about the HPMS.) TTI utilizes these data asinputs for its congestion estimation model.Detailed documentation for the TTI model andestimations can be found at http://mobility.tamu.edu/study/index.stm.
The sum of fuel wasted in typical congestion(recurring delay) and incident related delays equalthe annual wasted fuel for an urban area.Recurring delay is the product of recurring delay(annual hours in moderate, heavy, and severedelays) and average peak period system speeddivided by average fuel economy. Incident delayhours are multiplied by the average peak periodsystem speed and divided by the average fuel econ-omy to produce the amount of incident fuel wast-ed.
Structure, Assumptions, and ParametersUrban roadway congestion levels are estimat-
ed using a formula measuring traffic density.Average daily travel volume per lane on freewaysand principal arterial streets are estimated usingarea wide estimates of vehicle-miles of travel andlane miles of roadway. The resulting ratios arecombined using the amount of travel on each por-tion of the system (freeway and principal arterials)so that the combined index measures conditionsoverall. This variable weighting factor allowscomparisons between areas such as Phoenix-where principal arterial streets carry 50 percent ofthe amount of travel of freeways-and cities such asPhoenix where the ratio is reversed. Values greaterthan one are indicative of undesirable congestionlevels. Readers seeking the algorithm for the con-gestion index should examine http://mobility.tamu.edu/study/numbers.stm.
In previous reports, TTI assumed that 45 per-cent of all traffic, regardless of the urban location,occurred in congested conditions. TTI indicatedthat this presumption overestimated travel in con-gested periods. Its 1997 estimates now vary byurban area anywhere from 21 to 50 percent oftravel that occurs in congestion. TTI's model
structure applies to two types of roads: freewaysand principal arterial streets. The model derivesestimates of vehicle traffic per lane and trafficspeed for an entire urban area. Based on variationin these amounts, travel is then classified under 5categories: uncongested, moderately congested,heavily congested, severely congested, andextremely congested (a new category in 1999).The threshold between uncongested and congest-ed was changed in 1999. Previous editions classi-fied congested travel when area wide traffic levelsreached 13,000 vehicles per lane per day on high-ways and 5,000 vehicles per lane per day on prin-cipal arterial streets. These thresholds were raisedin the latest report to 14,000 and 5,500 vehiclesper lane per day respectively. Comparisons acrosstime will be questionable due to these changes.For example, TTI applied the new methodology to1996 data that resulted in lower congestion levels.Readers should refer to the TTI website for moredetailed information on its estimation procedureshttp://mobility.tamu.edu/estimating_mobility.
TTI reviews and adjusts the data used in itsmodel, including statewide average fuel cost esti-mates (published by the American AutomobileAssociation) and the number of eligible drivers foreach urban area (taken from the StatisticalAbstract of the United States, published by theU.S. Department of Commerce, Bureau of theCensus). The model has some limitations becauseit does not include local variations (such as bottle-necks, local travel patterns, or transportationimprovements) that affect travel times. TTI docu-mentation does not provide information on peer-review, sensitivity analysis, or estimation errors fortheir model. Information about sensitivity analy-sis or external reviews of the model could not beobtained and users should interpret the data cau-tiously.
ENVIRONMENT
TABLE 4-38. Estimated National AverageVehicle Emissions Rates by Vehicle Type andFuel
TABLE 4-39. National Average VehicleEmissions Rates by Vehicle Type UsingReformulated Gasoline
466 " Appendix C Source and Accuracy Profiles

The U.S. Environmental Protection Agencyuses its Mobile Source Emissions Factor Model(MOBILE) to generate average emissions factorsfor each vehicle and fuel type. The methods usedin the model are theoretically sound, the assump-tions are reasonable, but the data vary in quality,and no formal analysis of the accuracy of theseestimates has been performed. Emissions rate esti-mates for light-duty vehicles are considered morereliable than those for heavy-duty vehicles becausein-use emissions tests are performed on a sample ofvehicles each year. Deterioration for heavy-dutyvehicles in the national fleet are based only onmanufacturer's engine deterioration tests. In addi-tion, because reformulated fuels (table 4-37) arenewer than other gasoline fuels (table 4-36), in-useemissions test data for reformulated fuels are notas extensive.
The estimates in the tables represent averageemissions rates taking into account the character-istics of the nation's fleet, including vehicle typeand age, and fuel used. The model also assumesFederal Test Procedure conditions. The modeldoes not take into account actual travel distribu-tions across different highway types with theirassociated average speeds and operating modefractions, nor do they consider ambient local tem-peratures. However, fleet composition and deteri-oration because of age are considered. Thus, theserates illustrate only trends due to vehicle emissionscontrol improvements and their increasing use inthe national fleet and should not be used for otherpurposes.
TABLES 4-40, 4-41, 4-42, 4-43, 4-44, 4-45and 4-46. Estimates of National Emissions ofCarbon Monoxide, Nitrogen Oxides, VolatileOrganic Compounds, Particular Matter, SulfurDioxide, and Lead
Emissions by sector and source are estimatedusing various models and calculation techniquesand are based on a number of assumptions and ondata that vary in precision and reliability. Themethods used are theoretically sound, the assump-tions are reasonable, but the data vary in quality,and no formal analysis of the accuracy of theseestimates has been performed.
Carbon Monoxide (CO), Nitrogen Oxides(NOx), and Volatile Organic Compounds(VOCs)
Highway vehicle emissions of CO, NOx, andVOC are generated by the U.S. EnvironmentalProtection Agency's (EPA's) Mobile SourceEmissions Factor Model (MOBILE), which usesper-mile vehicle emissions factors and vehicle trav-el (vehicle-miles) to calculate county-level emis-sions. Emissions rates are then adjusted based onfuel characteristics, vehicle fleet composition, emis-sions control measures, average vehicle speed, andother factors that can affect emissions. (Emissionsrates used in MOBILE are based on vehicle certifi-cation tests, emissions standards, and in-use vehi-cle tests and are updated approximately every threeyears.) The U.S. Department of Transportation,Federal Highway Administration's HighwayPerformance Monitoring System is the source ofvehicle travel estimates used in the model.Although the methodology for this survey data issound and well documented, analyses have shownthat individual states vary in how rigorously theyfollow the established sampling guidelines.
Nonhighway vehicle emissions are calculatedby applying a growth factor (based on modal activ-ity trends) to modal emissions estimates from themost recently conducted state emissions invento-ries. These emissions inventories are typically esti-mated every three years in accordance with theClean Air Act of 1970,1 but the methodology mayvary among states and by year.
Particulate Matter Under 10 Microns (PM-10)and 2.5 Microns (PM-2.5) in Size
Highway vehicle emissions are estimated usingthe U.S. Environments Protection Agency's PARTmodel, which estimates emissions factors forexhaust emissions and brake and tire wear by vehi-cle type. Exhaust emissions factors are based oncertification tests, while brake wear (per vehicle)and tire wear (per tire) are assumed values whichare constant over all years. Per-mile emissions fac-tors are multiplied by vehicle travel (vehicle-miles)and adjusted to account for other factors that effectexhaust emissions (e.g., fuel composition, weather,
Appendix C Source and Accuracy Profiles ! 467
1 Public Law 91-604, 84 Stat. 1705 (December 31, 1970).

etc.). The U.S. Department of Transportation,Federal Highway Administration's HighwayPerformance Monitoring System is the source ofvehicle-miles of travel (vmt) estimates used in themodel. While the methodology for this surveydata is sound and well documented, analyses haveshown that individual states vary in how rigor-ously they follow the established sampling guide-lines.
Fugitive dust estimates for paved and unpavedroads are calculated by multiplying vmt on eachtype of road by emissions factors for each vehicletype and road type.
Nonhighway vehicle emissions are calculatedby applying a growth factor (based on modalactivity trends) to modal emissions estimates fromthe most recently conducted state emissions inven-tories. These emissions inventories are typicallyestimated every three years in accordance with theClean Air Act of 1970, but the methodology mayvary among states and by year.
Sulfur Dioxide (SO2)Highway vehicle SO2 emissions are estimated
by multiplying vehicle travel (for each vehicle typeand highway type) by an emissions factor reflect-ing each vehicle type and highway type. HighwaySO2 emissions factors are based on vehicle typeand model year, sulfur content of fuel by type andyear, fuel density by fuel type, and vehicle fuel effi-ciency by type and model year.
In general, estimates for nonhighway vehiclesare calculated based on fuel consumption and sul-fur content of fuel, though other factors may beconsidered.
LeadIn general, lead emissions are estimated by
multiplying an activity level by an emissions factorthat represents the rate at which lead is emitted forthe given source category. This estimate is thenadjusted by a factor that represents the assumedeffectiveness of control technologies. For leadreleased during combustion, a top-down approachis used to share national estimates of fuel con-sumption by fuel type to each consumption cate-gory (e.g., motor fuel, electric utility, etc.) and,
subsequently, each source (e.g., passenger cars,light-duty trucks, etc.).
TABLE 4-47. Air Pollution Trends in SelectedMetropolitan Statistical Areas (MSAs)
TABLE 4-48. Areas in Nonattainment ofNational Ambient Air Quality Standards forCriteria Pollutants
The U.S. Environmental Protection Agencymeasures concentrations of pollutants in the ambi-ent air at its air quality monitoring sites, which areoperated by state and local agencies. These sitesconform to uniform criteria for monitor siting,instrumentation, and quality assurance, and eachsite is weighted equally in calculating the compos-ite average trend statistics. Furthermore, trendsites must have complete data for 8 of the 10 yearsin the trend time period to be included. However,monitoring devices are placed in areas most likelyto observe significant concentrations of air pollu-tants rather than a random sampling of sitesthroughout the nation.
TABLE 4-49. U.S. Carbon Dioxide Emissionsfrom Energy Use by Sector
The combustion of fossil fuels, such as coal,petroleum, and natural gas, is the principalanthropogenic (human caused) source of carbondioxide (CO2) emissions. Since fossil fuels are typ-ically 75 percent to 90 percent carbon by weight,emissions from the combustion of these fuels canbe easily measured in carbon units, as is shown inthe table.
CO2 emissions data are derived from esti-mates. The U.S. Department of Energy, EnergyInformation Administration (EIA), estimates CO2
emissions by multiplying energy consumption foreach fuel type by its carbon emissions coefficient,then subtracting carbon that is sequestered bynonfuel use of fossil fuels. Carbon emissions coef-ficients are values used for scaling emissions tospecific activities (e.g., pounds of CO2 emitted perbarrel of oil consumed).
468 " Appendix C Source and Accuracy Profiles

Emissions estimates are based on energy con-sumption data collected and published by EIASeveral small adjustments are made to its energyconsumption data to eliminate double counting ormiscounting of emissions. For example, EIA sub-tracts the carbon in ethanol from transportationgasoline consumption because of its biological ori-gin.
Emissions coefficients are based on the density,carbon content, and heat content of petroleumproducts. For many fuels, except liquefied petro-leum gas (LPG), jet fuel, and crude oil, EIAassumed coefficients to be constant over time. ForLPG, jet fuel, and crude oil, EIA annualized carbonemissions coefficients to reflect changes in chemi-cal composition or product mix.
Since the combustion of fossil fuels is a majorproducer of CO2 emissions, sources of uncertain-ty are related to: 1) volumes of fuel consumed; 2)characteristics of fuel consumed; 3) emissions coef-ficients; and 4) coverage. EIA notes that volumet-ric fuel data are fairly reliable in the 3 percent to 5percent range of uncertainty. The density andenergy content of fuels are usually estimated.According to EIA, the reliability of these estimatesvary. For example, estimates of the energy contentof natural gas are reliable to 0.5 percent, while esti-mates for coal and petroleum products are lowerbecause they are more heterogeneous fuels. Thereliability of emissions coefficients depends onwhether the characteristics of a fuel are difficult tomeasure accurately. Finally, uncertainties mayresult because data may be excluded or unknownsources of emissions not included.
EIA's estimation methods, emissions coeffi-cients, and the reliability of emissions estimates arediscussed in detail in U.S. Department of Energy,Energy Information Administration, Emissions ofGreenhouse Gases in the United States, 1998available on www.eia.doe.gov/oiaf/1605/ggrpt/index.html.
TABLE 4-50. Annual Oil Spills in U.S.Navigable Waters by Vessel Type
The U. S. Coast Guard's (USCG) Marine SafetyInformation System (MSIS) is the source of these
data. It includes data on all oil spills impactingU.S. navigable waters and the Coastal Zone. TheUSCG learns of spills through direct observation,reports from responsible parties and third parties.Responsible parties are required by law to reportspills to the National Response Center (NRC).Reports may be made to the USCG or Envi-ronmental Protection Agency pre-designated OnScene Coordinator for the geographic area wherethe discharge occurs if direct reporting to the NRCis not practicable. There is no standard format forthese reports, but responsible personnel face sig-nificant penalties for failing to do so. Most reportsare made by telephone, and USCG personnel com-plete investigations based on the information pro-vided. The type and extent of an investigationconducted varies depending on the type and quan-tity of the material spilled. Each investigation willdetermine as closely as possible source of the pol-lutant, the quantity of the material spilled, thecause of the accident, as well as whether there isevidence that any failure of material (either physi-cal or design) was involved or contributed to theincident. These are so financial responsibility maybe properly assigned for the incidents, as well asproper recommendations for the prevention of therecurrence of similar incidents may be made.
Some spills may not be entered into MSISbecause they are either not reported to or discov-ered by the USCG. The probability of a spill notbeing reported is inversely proportional to its size.Large spills impact a large area and a large num-ber of people, resulting in numerous reports ofsuch spills. Small spills are less likely to be report-ed, particularly if they occur at night or in remoteareas where persons other than the responsibleparty are unlikely to detect them. Responsible par-ties are required by law to report spills and facepenalties for failing to do so, providing a strongincentive to report spills that might be detected byothers. Experience with harbor patrols shows thatthe number of spills increases as the frequency ofpatrols increases. However, the volume of materi-al spilled does not increase significantly, indicatingthat the spills discovered through increased harborpatrols generally involved very small quantities.
Appendix C Source and Accuracy Profiles ! 469

Data CollectionFrom 1973 to 1985, data were collected on
forms completed by the investigator and laterentered into the Pollution Incident ReportingSystem (PIRS) by data entry clerks at USCG head-quarters. Since 1985, data have been entereddirectly into MSIS by the investigator. From 1985to 1991, data were entered into a specific elec-tronic form that captured information on thespilled substance and pollution response actions.Since 1995, a growing number of reports of pol-lution incidents of 100 gallons or less of oil havebeen captured on a Notice of Violation ticketform, which are then entered into MSIS.
The information shown in this table comesfrom the USCG Spill Compendium, which con-tains spill data from the applications describedabove. The Compendium contains summary datafrom 1969 through 1999 and is intended to pro-vide general information to the public, the mar-itime industry and other interested persons aboutspills in and around U.S. waterways. For moreinformation about spill data, please refer to theUSCG Internet sit at http://www.uscg.mil/hq/g-m/nmc/response/stats/aa.htm.
Nonsampling ErrorsAccording to the USCG, nonsampling errors,
such as nonreporting and mistakes made in datacollection and entry, should not have a majorimpact on most interpretations of the data, but theimpact will vary depending on the data used. Theerror rate for volume spilled is estimated to be lessthan 5 percent because larger spills, which accountfor most of the volume of oil spilled, are thor-oughly reviewed at several levels. The error ratefor the number of spills is difficult to estimate pri-marily due to low reporting rates for small spills.Most of the error in spill counts involves spills ofless than 100 gallons.
TABLE 4-51. Leaking Underground StorageTank Releases and Cleanups
A national inventory of reported spills andcorrective actions taken for leaking undergroundstorage tanks is compiled biannually based on
state counts of leaking tanks reported by ownersas required by the Resource Conservation andRecovery Act of 1976.2 These data may be affect-ed by general accounting errors, some of whichhave changed semiannual counts by as many as2,000 actions.
TABLE 4-52. Highway Noise BarrierConstruction
State highway agencies (SHAs) provide dataon highway noise barrier construction, extent, andcosts to the U.S. Department of Transportation,Federal Highway Administration. Individual SHAdefinitions of barriers and costs may differ. Thiscould lead to nonuniformity and/or anomaliesamong state data, which will in turn affect nation-al totals.
TABLE 4-53. Number of People Residing inHigh-Noise Areas Around U.S. Airports
The number of the people exposed to aircraftnoise around airports is estimated by computermodeling rather than by actual measurements.The U.S. Department of Transportation (USDOT),Federal Aviation Administration's (FAA's)Integrated Noise Model (INM) has been the pri-mary tool for assessing aircraft noise around air-ports for nearly 30 years. This model usesinformation on aircraft mix, average daily opera-tions, flight tracks, and runway distribution togenerate and plot contours of Day Night SoundLevel (DNL). With the addition of a digitized pop-ulation census database, the model can estimatethe number of residents exposed to noise levels of65 decibels (db) DNL.
The U.S. Environmental Agency (EPA) pro-duced the first estimate of airport noise exposurein 1975. It reported that 7 million residents wereexposed to significant levels of aircraft noise in1978. This number became the "anchor point"for all future estimates of the nationwide noiseimpacts. In 1980, FAA developed another meth-odology for estimating the change in the number
470 " Appendix C Source and Accuracy Profiles
2 Public Law 94-580, 90 Stat. 2795 (October 21, 1976).

of people impacted by noise (from the 1975 anchorvalue) as a function of changes in both the nation-al fleet and in the FAA's Terminal Area Forecast(TAF). In 1990, the FAA created an improvedmethod of estimating the change in number of peo-ple impacted (relative to the 1980 estimates).
In 1993, the FAA began using its newly devel-oped Nationwide Airport Noise Impact Model(NANIM) to estimate the impact of airplane noiseon residential communities surrounding U.S. air-ports that support jet operations. FAA uses thismodel to determine the relative changes in numberof people and land area exposed to 65 db DNL asa result of changes in nationwide aircraft fleet mixand operations. NANIM uses data on air trafficpatterns found in the Official Airline Guide(OAG), air traffic growth projections found inFAA's TAF, population figures from the U.S.Census Bureau, and information on noise contourareas for the top 250 U.S. civil airports with jetoperations.
The methodology used in NANIM has beenpeer reviewed and approved. However, a formalevaluation of the model's accuracy has not beenconducted. Some data used in NANIM are updat-ed manually, thus the possibility of data entryerrors does exist. Entries are reviewed and thencorrected as appropriate. The aircraft mix andoperations files from FAA's TAF and OAG areupdated automatically. Changes to either of thesources could introduce errors. For example, itwas recently discovered that OAG redefined someaircraft codes and altered some data fields in itsdatabase. These changes make it impossible forthe NANIM utility program to accurately read thecurrent OAG database. A rewrite of the sourcecode is necessary to eliminate this error. Also,since airport authorities are not required to pro-duce noise exposure maps and reports unless theyintend to apply for Federal grants, 14 of the 50busiest commercial airports, including JFK andLaGuardia, have not produced (for public con-sumption) noise exposure maps in several years. Inthe absence of actual data, the NANIM databasecontains approximations of the noise contoursareas based on airports of similar size and similaroperation. Without actual airport data, it is impos-sible to quantify the error introduced by theapproximation.
TABLE 4-54. Motor Vehicles Scrapped
The Polk Company's Vehicles in Operationdatabase is the source of these data. This databaseis a census of vehicles that are currently registeredin all states within the United States. It is based oninformation from state department of motor vehi-cles. Polk updates the database quarterly (March,June, September, and December).
Scrapped vehicles are those that Polk removesfrom its database when: 1) States indicate regis-tered vehicles have suffered major damage (such asa flood or accident), or 2) No renewal (reregistra-tion) notice is received by Polk within a state'sallotted time (normally one year). In the lattercase, if a vehicle is subsequently reregistered, it isreturned to the database. The Polk data on motorvehicles is broken down into passenger cars andtrucks, and this identification comes with the reg-istration data from the DMV.
REFERENCESU.S. Department of Energy, Energy Infor-
mation Administration. 1994. Accuracy ofPetroleum Supply Data. Tammy G. Heppner andCarol L. French, eds. Washington, DC.
U.S. Department of Energy, Energy Infor-mation Administration. 1990. Energy Consump-tion by End-Use Sector, A Comparison ofMeasures by Consumption and Supply Surveys,DOE/EIA-0533. Washington, DC.
U.S. Environmental Protection Agency, Officeof Mobile Sources. 1998. MOBILE5 InformationSheet #7: NOx Benefits of Reformulated GasolineUsing MOBILE5a. Ann Arbor, MI. September 30.
U.S. Environmental Protection Agency, Officeof Air Quality Planning and Standards. 1998.National Air Pollutant Emission Trends,Procedure Document, 1900-1996. EPA-454/R-98-008. Research Triangle Park, NC. May.
U.S. Environmental Protection Agency, Officeof Mobile Sources. 1996. Memorandum onRelease of MOBILE5b. (Revised Chapter 2 for theUsers Guide to MOBILE5). October 11.
Appendix C Source and Accuracy Profiles ! 471

U.S. Environmental Protection Agency, Officeof Air Quality and Standards, Emission Factor andInventory Group. 1995. Compilation of Air Pol-lutant Emission Factors AP-42, Volume II: MobileSources. Appendix H. Fifth ed. June 30.
U.S. Environmental Protection Agency, Officeof Mobile Sources (OMS). 1995. Draft User'sGuide to PART5: A Program for Calculating Par-ticle Emissions from Motor Vehicles, EPA-AA-AQAB-94-2. Ann Arbor, MI. February.
U.S. EPA, Office of Mobile Sources. 1994.Users Guide to MOBILE5 (Mobile Source Emis-sion Factor Model), EPA-AA-TEB-94-01. AnnArbor, MI. May.
U.S. Environmental Protection Agency, Officeof Air and Radiation. 1992. Procedures for Emis-sion Inventory Preparation, Volume IV: MobileSources, EPA-450/4-81-026d (Revised).
472 " Appendix C Source and Accuracy Profiles

473
14 CFR 121 (Air): Code of Federal Regulations,Title 14, part 121. Prescribes rules governing theoperation of domestic, flag, and supplemental aircarriers and commercial operators of large aircraft.
14 CFR 135 (Air): Code of Federal Regulations,Title 14, part 135. Prescribes rules governing theoperations of commuter air carriers (scheduled)and on-demand air taxi (unscheduled).
ACCIDENT (Aircraft): As defined by theNational Transportation Safety Board, an occur-rence incidental to flight in which, as a result ofthe operation of an aircraft, any person (occupantor nonoccupant) receives fatal or serious injury orany aircraft receives substantial damage.
ACCIDENT (Automobile): See Crash (Highway)
ACCIDENT (Gas): 1) An event that involves therelease of gas from a pipeline or of liquefied natu-ral gas (LNG) or other gas from an LNG facilityresulting in personal injury necessitating in-patient hospitalization or a death; or estimatedproperty damage of $50,000 or more to the oper-ator or others, or both, including the value of thegas that escaped during the accident; 2) An eventthat results in an emergency shutdown of an LNGfacility; or 3) An event that is significant in thejudgment of the operator even though it did notmeet the criteria of 1) or 2).
ACCIDENT (Hazardous liquid or gas): Releaseof hazardous liquid or carbon dioxide while beingtransported, resulting in any of the following: 1)An explosion or fire not intentionally set by theoperator; 2) Loss of 50 or more barrels of haz-ardous liquid or carbon dioxide; 3) Release to theatmosphere of more than 5 barrels a day of high-ly volatile liquids; 4) Death of any person; 5)Bodily harm resulting in one or more of the fol-lowing: a) The loss of consciousness, b) The neces-sity of carrying person from the scene, c) Thenecessity for medical treatment, d) Disability thatprevents the discharge of normal duties; and 6)Estimated damage to the property of the opera-tors and/or others, exceeding $50,000.
ACCIDENT (Highway-Rail Grade-Crossing): Animpact between on-track railroad equipment andan automobile, bus, truck, motorcycle, bicycle,farm vehicle, or pedestrian or other highway userat a designated crossing site. Sidewalks, pathways,shoulders, and ditches associated with the crossingare considered to be part of the crossing site.
ACCIDENT (Rail): A collision, derailment, fire,explosion, act of God, or other event involvingoperation of railroad on-track equipment (stand-ing or moving) that results in railroad damageexceeding an established dollar threshold.
ACCIDENT (Recreational Boating): An occur-rence involving a vessel or its equipment thatresults in 1) A death; 2) An injury that requiresmedical treatment beyond first aid; 3) Damage toa vessel and other property, totaling to more than$500 or complete loss of a vessel; or 4) The dis-appearance of the vessel under circumstances thatindicate death or injury. Federal regulations (33CFR 173-4) require the operator of any vessel thatis numbered or used for recreational purposes tosubmit an accident report.
ACCIDENT (Transit): An incident involving amoving vehicle. Includes a vehicle, object, or per-son (except suicides) or a derailment/left roadway.
ACTIVE AIRCRAFT (General Aviation): Alllegally registered civil aircraft that flew one ormore hours.
AERIAL APPLICATION FLYING (GeneralAviation): The operation of aircraft for the pur-poses of dispensing any substances required foragriculture, health, forestry, seeding, firefighting,and insect control purposes.
AERIAL OBSERVATION FLYING (GeneralAviation): Any use of an aircraft for aerial map-ping and photography, surveying, patrolling, fishspotting, search and rescue, hunting, sightseeing,or highway traffic advisory not included underFederal Aviation Regulations (FAR) Part 135.
AIR CARRIER: A person who undertakes direct-ly, by lease, or other arrangement to engage in air
Glossary
appendix d

474 ! Appendix D Glossary
transportation. More specifically, the commercialsystem of air transportation comprising large cer-tificated air carriers, small certificated air carriers,commuter air carriers, on-demand air taxis, sup-plemental air carriers, and air travel clubs.
AIR ROUTE TRAFFIC CONTROL CENTER:A facility established to provide air traffic controlservice to aircraft operating on an IFR (instrumentflight rule) flight plan within controlled airspaceand principally during the en route phase of flight.
AIR TAXI: An aircraft operator who conductsoperations for hire or compensation in accor-dance with 14 CFR 135 (for safety purposes) orFAR Part 135 (for economic regulations/reportingpurposes) in an aircraft with 30 or fewer passen-ger seats and a payload capacity of 7,500 poundsor less. An air taxi operates on an on-demandbasis and does not meet the flight scheduled qual-ifications of a commuter air carrier (see below).
AIRCRAFT REVENUE HOURS: The airbornehours in revenue service, computed from themoment an aircraft leaves the ground until it lands.
AIRCRAFT REVENUE MILES: The miles (com-puted in airport-to-airport distances) for eachinterairport hop actually completed in revenueservice, whether or not performed in accordancewith the scheduled pattern. For this purpose,operation to a flag stop is a hop completed even ifa landing is not actually made. In cases where theinterairport distances are inapplicable, aircraft-miles flown are determined by multiplying thenormal cruising speed for the aircraft type by theairborne hours.
AIRPORT: A landing area regularly used by aircraftfor receiving or discharging passengers or cargo.
AIRPORT/AIRWAY TRUST FUND: See TrustFunds.
ALTERNATIVE FUELS: The Energy Policy Actof 1992 defines alternative fuels as methanol,denatured ethanol, and other alcohol; mixturescontaining 85 percent or more (but not less than70 percent as determined by the Secretary ofEnergy by rule to provide for requirements relat-ing to cold start, safety, or vehicle functions) byvolume of methanol, denatured ethanol, andother alcohols with gasoline or other fuels.Includes compressed natural gas, liquid petroleum
gas, hydrogen, coal-derived liquid fuels, fuelsother than alcohols derived from biological mate-rials, electricity, or any other fuel the Secretary ofEnergy determines by rule is substantially notpetroleum and would yield substantial energysecurity and environmental benefits.
AMTRAK: Operated by the National RailroadPassenger Corporation of Washington, D.C., thisrail system was created by the Rail PassengerService Act of 1970 (P.L. 91-518, 84 Stat. 1327)and given the responsibility for the operation ofintercity, as distinct from suburban, passengertrains between points designated by the Secretaryof Transportation.
ARTERIAL HIGHWAY: A major highway usedprimarily for through traffic.
ASPHALT: A dark brown to black cement-likematerial containing bitumens as the predominantconstituent. The definition includes crude asphaltand finished products such as cements, fluxes, theasphalt content of emulsions, and petroleum distil-lates blended with asphalt to make cutback asphalt.Asphalt is obtained by petroleum processing.
AVAILABLE SEAT-MILES (Air Carrier): The air-craft miles flown in each interairport hop multi-plied by the number of seats available on that hopfor revenue passenger service.
AVERAGE HAUL: The average distance, inmiles, one ton is carried. It is computed by divid-ing ton-miles by tons of freight originated.
AVERAGE PASSENGER TRIP LENGTH(Bus/Rail): Calculated by dividing revenue pas-senger-miles by the number of revenue passengers.
AVIATION GASOLINE (General Aviation): Allspecial grades of gasoline used in aviation recip-rocating engines, as specified by American Societyof Testing Materials (ASTM) Specification D910and Military Specification MIL-G5572.
Includes refinery products within the gasolinerange marketed as or blended to constitute avia-tion gasoline.
BARREL (oil): A unit of volume equal to 42 U.S.gallons.
BLOOD ALCOHOL CONCENTRATION(Highway): A measurement of the percentage ofalcohol in the blood by grams per deciliter.

Appendix D Glossary " 475
BRITISH THERMAL UNIT: The quantity ofheat needed to raise the temperature of 1 poundof water by 1 °F at or near 39.2 °F.
BULK CARRIER (Water): A ship with special-ized holds for carrying dry or liquid commodities,such as oil, grain, ore, and coal, in unpackagedbulk form. Bulk carriers may be designed to carrya single bulk product (crude oil tanker), or accom-modate several bulk product types (ore/bulk/oilcarrier) on the same voyage or on a subsequentvoyage after holds are cleaned.
BUS: Large motor vehicle used to carry morethan 10 passengers, includes school buses, interci-ty buses, and transit buses.
BUSINESS TRIP (American Travel Survey): Atrip taken for business or business combined withpleasure, or for attending a convention, confer-ence, or seminar.
CAFE STANDARDS: See Corporate AverageFuel Economy Standards.
CAR-MILE (Rail): The movement of a railroadcar a distance of 1 mile. An empty or loaded car-mile refers to a mile run by a freight car with orwithout a load. In the case of intermodal move-ments, the designation of empty or loaded refersto whether the trailers/containers are moved withor without a waybill.
CERTIFICATE OF PUBLIC CONVENIENCEAND NECESSITY (Air Carrier): A certificateissued by the Department of Transportation to anair carrier under Section 401 of the FederalAviation Act authorizing the carrier to engage inair transportation.
CERTIFICATED AIR CARRIER: An air carrierholding a Certificate of Public Convenience andNecessity issued by the U.S. Department ofTransportation (DOT) to conduct scheduled serv-ices interstate. These carriers may also conductnonscheduled or charter operations. Certificatedair carriers operate large aircraft (30 seats or moreor a maximum load of 7,500 pounds or more) inaccordance with FAR Part 121. See also LargeCertificated Air Carrier.
CERTIFICATED AIRPORTS: Airports that serv-ice air carrier operations with aircraft seatingmore than 30 passengers.
CHAINED DOLLARS: A measure used to expressreal prices, defined as prices that are adjusted toremove the effect of changes in the purchasingpower of the dollar. Real prices usually reflect buy-ing power relative to a reference year. The“chained-dollar” measure is based on the averageweights of goods and services in successive pairs ofyears. It is “chained” because the second year ineach pair, with its weights, becomes the first year ofthe next pair. Prior to 1996, real prices wereexpressed in constant dollars, a weighted measureof goods and services in a single year. See alsoConstant Dollars and Current Dollars.
CLASS I RAILROAD: A carrier that has anannual operating revenue of $250 million or moreafter applying the railroad revenue deflator for-mula, which is based on the Railroad Freight PriceIndex developed by the U.S. Department of Labor,Bureau of Labor Statistics. The formula is the cur-rent year's revenues x 1991 average index/currentyear's average index.
COASTWISE TRAFFIC (Water): Domestic traf-fic receiving a carriage over the ocean, or the Gulfof Mexico (e.g., between New Orleans andBaltimore, New York and Puerto Rico, SanFrancisco and Hawaii, Alaska and Hawaii).Traffic between Great Lakes ports and seacoastports, when having a carriage over the ocean, isalso considered coastwise.
COEFFICIENT OF VARIATION: Ratio of thesampling error (or standard error) of a statistic tothe value of that statistic. Also referred to as rel-ative standard error.
COLLECTOR (Highway): In rural areas, routesthat serve intracounty rather than statewide travel.In urban areas, streets that provide direct access toneighborhoods and arterials.
COLLISION WITH OBJECT (Transit): An inci-dent in which a transit vehicle strikes an obstacleother than a vehicle or person (e.g., building, utili-ty pole). Reports are made if the accident results ina death, injury, or property damage over $1,000.
COLLISION WITH PEOPLE (Transit): An inci-dent in which a transit vehicle strikes a person.Excludes suicides and suicide attempts. Reportsare made if the incident results in death, injury, orproperty damage over $1,000.

476 ! Appendix D Glossary
COLLISION WITH VEHICLE (Transit): Anincident in which a transit vehicle strikes or isstruck by another vehicle. Reports are made if theincident results in a death, injury, or propertydamage over $1,000.
COMBINATION TRUCK: A power unit (trucktractor) and one or more trailing units (a semi-trailer or trailer).
COMMERCIAL BUS: Any bus used to carry pas-sengers at rates specified in tariffs; charges may becomputed per passenger (as in regular route serv-ice) or per vehicle (as in charter service).
COMMERCIAL SERVICE AIRPORT: Airportreceiving scheduled passenger service and having2,500 or more enplaned passengers per year.
COMMUTER AIR CARRIER: Different defini-tions are used for safety purposes and for eco-nomic regulations and reporting. For safetyanalysis, commuter carriers are defined as air car-riers operating under 14 CFR 135 that carry pas-sengers for hire or compensation on at least fiveround trips per week on at least one routebetween two or more points according to pub-lished flight schedules, which specify the times,days of the week, and points of service. On March20, 1997, the size of the aircraft subject to 14CFR 135 was reduced from 30 to fewer than 10passenger seats. (Larger aircraft are subject to themore stringent regulations of 14 CFR 121.)Helicopters carrying passengers or cargo for hire,however, are regulated under CFR 135 whatevertheir size. Although, in practice, most commuterair carriers operate aircraft that are regulated forsafety purposes under 14 CFR 135 and most air-craft that are regulated under 14 CFR 135 areoperated by commuter air carriers, this is not nec-essarily the case.
For economic regulations and reporting require-ments, commuter air carriers are those carriersthat operate aircraft of 60 or fewer seats or amaximum payload capacity of 18,000 pounds orless. These carriers hold a certificate issued undersection 298C of the Federal Aviation Act of 1958,as amended.
COMMUTER RAIL (Transit): Urban passengertrain service for short-distance travel between acentral city and adjacent suburb. Does notinclude rapid rail transit or light rail service.
COMPACT CAR: An automobile industry desig-nation usually consisting of cars with a wheelbasebetween 100 and 104 inches.
COMPRESSED NATURAL GAS: Natural gascompressed to a volume and density that is prac-tical as a portable fuel supply. It is used as a fuelfor natural gas-powered vehicles.
CONSTANT DOLLAR: Dollar value adjustedfor changes in the average price level by dividinga current dollar amount by a price index. See alsoChained Dollar and Current Dollar.
CORPORATE AVERAGE FUEL ECONOMYSTANDARDS (CAFÉ): Originally established byCongress for new automobiles and later for lighttrucks. Under CAFE, automobile manufacturersare required by law to produce vehicle fleets witha composite sales-weighted fuel economy notlower than the CAFE standards in a given year.For every vehicle that does not meet the standard,a fine is paid for every one-tenth of a mile per gal-lon that vehicle falls below the standard.
CORPORATE FLYING (General Aviation):Corporate aircraft piloted by a professional crew.
CRASH (Highway): An event that producesinjury and/or property damage, involves a motorvehicle in transport, and occurs on a trafficway orwhile the vehicle is still in motion after runningoff the trafficway.
CRUDE OIL: A mixture of hydrocarbons that existsin the liquid phase in natural underground reservoirsand remains liquid at atmospheric pressure afterpassing through surface-separating facilities.
CURRENT DOLLAR: Dollar value of a good orservice in terms of prices current at the time thegood or service is sold. See also Chained Dollarand Current Dollar.
DEADWEIGHT TONNAGE (Water): The carry-ing capacity of a vessel in long tons (2,240pounds). It is the difference between the numberof tons of water a vessel displaces “light” and thenumber of tons it displaces when submerged tothe “load line.”
DEMAND-RESPONSIVE VEHICLE (Transit): Anonfixed-route, a nonfixed-schedule vehicle thatoperates in response to calls from passengers ortheir agents to the transit operator or dispatcher.

Appendix D Glossary " 477
DERAILMENT/LEFT ROADWAY (Transit): Anoncollision incident in which a transit vehicleleaves the rails or road on which it travels. Thisalso includes rollovers. Reports are made for alloccurrences.
DESTINATION OF TRIP (American TravelSurvey): The place the survey respondent namesas the destination of the trip. If more than onelocation is visited on the same trip, the farthestpoint from the origin is considered the destination.
DIESEL FUEL: A complex mixture of hydrocar-bons with a boiling range between approximately350 and 650 °F. Diesel fuel is composed primari-ly of paraffins and naphthenic compounds thatauto-ignite from the heat of compression in adiesel engine. Diesel is used primarily by heavy-duty road vehicles, construction equipment, loco-motives, and by marine and stationary engines.
DISTILLATE FUEL OIL: A general classificationfor one of the petroleum fractions produced inconventional distillation operations. Included areNo. 1, No. 2 and No. 4 fuel oils and No. 1, No.2, and No. 4 diesel fuels. Distillate fuel oil is usedprimarily for space heating, on- and off- highwaydiesel engine fuel (including railroad engine fueland fuel for agricultural machinery), and electricpower generation.
DISTRIBUTION MAINS (Gas): A network ofpipelines, services, and equipment that carry orcontrol the supply of gas from the point of localsupply to, and including, the sales meters.
DOMESTIC FREIGHT (Water): All waterbornecommercial movements between points in theUnited States, Puerto Rico, and the Virgin Islands,excluding traffic with the Panama Canal Zone.Cargo moved for the military in commercial ves-sels is reported as ordinary commercial cargo; mil-itary cargo moved in military vessels is omitted.
DOMESTIC OPERATIONS (Air Carrier): All aircarrier operations having destinations within the50 United States, the District of Columbia, theCommonwealth of Puerto Rico, and the U.S.Virgin Islands.
DOMESTIC PASSENGER (Water): Any persontraveling on a public conveyance by waterbetween points in the United States, Puerto Rico,and the Virgin Islands.
DRY CARGO BARGES (Water): Large flat-bot-tomed, nonself-propelled vessels used to transportdry-bulk materials such as coal and ore.
EMERGENCY PREPAREDNESS TRUST FUND:See Trust Funds.
ENERGY EFFICIENCY: The ratio of energyinputs to the outputs from a process; for example,miles traveled per gallon of fuel (mpg).
ENPLANED PASSENGERS (Air Carrier): SeeRevenue Passenger Enplanements.
ETHANOL: A clear, colorless, flammable oxy-genated hydrocarbon with a boiling point of 78.5 °C.in the anhydrous state. It is used in the UnitedStates as a gasoline octane enhancer and oxy-genate (10-percent concentration). Ethanol canbe used in high concentrations in vehicles opti-mized for its use. Otherwise known as ethyl alco-hol, alcohol, or grain-spirit.
FATAL CRASH (Highway): A police-reportedcrash involving a motor vehicle in transport on atrafficway in which at least one person dies with-in 30 days of the crash as a result of that crash.
FATAL INJURY (Air): Any injury that results indeath within thirty days of the accident.
FATALITY: For purposes of statistical reportingon transportation safety, a fatality shall be consid-ered a death due to injuries in a transportationcrash, accident, or incident that occurs within 30days of that occurrence.
FATALITY (Rail): 1) Death of any person froman injury within 30 days of the accident/incident(may include nontrain accidents/incidents); or 2)Death of a railroad employee from an occupa-tional illness within 365 days after the occupa-tional illness was diagnosed by a physician.
FATALITY (Recreational Boating): All deaths(other than deaths by natural causes) and missingpersons resulting from an occurrence that involvesa vessel or its equipment.
FATALITY (Transit): A transit-caused death con-firmed within 30 days of a transit incident.Incidents include collisions, derailments, personalcasualties, and fires associated with transit agencyrevenue vehicles, transit facilities on transit prop-erty, service vehicles, maintenance areas, andrights of way.

478 ! Appendix D Glossary
FATALITY (Water): All deaths and missing per-sons resulting from a vessel casualty.
FEDERAL ENERGY REGULATORY COMMIS-SION (FERC): The Federal agency with jurisdic-tion over, among other things, gas pricing, oilpipeline rates, and gas pipeline certification.
FERRY BOAT (Transit): Vessels that carry pas-sengers and/or vehicles over a body of water.Generally steam or diesel-powered, ferry boatsmay also be hovercraft, hydrofoil, and other high-speed vessels. The vessel is limited in its use to thecarriage of deck passengers or vehicles or both,operates on a short run on a frequent schedulebetween two points over the most direct waterroutes other than in ocean or coastwise service,and is offered as a public service of a type nor-mally attributed to a bridge or tunnel.
FIELD AND GATHERING GAS PIPELINES:A network of pipelines (mains) transporting natu-ral gas from individual wells to a compressor sta-tion, processing point, or main trunk pipeline.
FLAG STOP (Air): A drop-off or pick-up pointalong a predetermined route that is visited only byrequest or if a signal to stop is given.
FOSSIL FUELS: Any naturally occurring organicfuel formed in the Earth's crust, such as petrole-um, coal, and natural gas.
FREIGHT REVENUE (Rail): Revenue from thetransportation of freight and from the exercise oftransit, stopoff, diversion, and reconsignmentprivileges as provided for in tariffs.
FREIGHTERS (Water): General cargo carriers,full containerships, partial containerships, roll-on/rolloff ships, and barge carriers.
FULL-SIZE CAR: As designated by the automo-bile industry, cars with a wheelbase between 110and 114 inches.
GAS TRANSMISSION PIPELINES: Pipelinesinstalled for the purpose of transmitting gas froma source or sources of supply to one or more dis-tribution centers, or to one or more large volumecustomers; or a pipeline installed to interconnectsources of supply. Typically, transmission linesdiffer from gas mains in that they operate at high-er pressures and the distance between connectionsis greater.
GASOHOL: A blend of finished motor gasoline(leaded or unleaded) and alcohol (generallyethanol but sometimes methanol) limited to 10percent by volume of alcohol.
GASOLINE: A complex mixture of relativelyvolatile hydrocarbons, with or without smallquantities of additives that have been blended toproduce a fuel suitable for use in spark ignitionengines. Motor gasoline includes both leaded orunleaded grades of finished motor gasoline,blending components, and gasohol. Leaded gaso-line is no longer used in highway motor vehicles inthe United States.
GENERAL AVIATION: 1) All facets of civil avi-ation, except facets of those air carriers holding aCertificate of Public Convenience and Necessity.2) All civil aviation activity except that of air car-riers certificated in accordance with FederalAviation Regulations (FAR) Parts 121, 123, 127,and 135. The types of aircraft used in general avi-ation range from corporate multiengine jet air-craft piloted by professional crews to amateur-built single-engine piston-driven acrobatic planesto balloons and dirigibles. 3) All civil aviationoperations other than scheduled air services andnonscheduled air transport operations for taxis,commuter air carriers, and air travel clubs that donot hold Certificates of Public Convenience andNecessity.
GENERAL ESTIMATES SYSTEM: A Data col-lection system that uses a nationally representativeprobability sample selected from all police-report-ed highway crashes. It began operation in 1988.
GROSS DOMESTIC PRODUCT: The total out-put of goods and services produced by labor andproperty located in the United States, valued atmarket prices. As long as the labor and propertyare located in the United States, the suppliers(workers and owners) may be either U.S. residentsor residents of foreign countries.
GROSS VEHICLE WEIGHT RATING (gvwr)(Truck): The maximum rated capacity of a vehicle,including the weight of the base vehicle, all addedequipment, driver and passengers, and all cargo.
HARBOR MAINTENANCE TRUST FUND:See Trust Funds.

Appendix D Glossary " 479
HAZARDOUS MATERIAL: Any toxic sub-stance or explosive, corrosive, combustible, poi-sonous, or radioactive material that poses a risk tothe public's health, safety, or property-particular-ly when transported in commerce.
HEAVY RAIL (Transit): An electric railway withthe capacity to transport a heavy volume of pas-senger traffic and characterized by exclusive rights-of-way, multicar trains, high speed, rapid accelera-tion, sophisticated signaling, and high-platformloading. Also known as “subway,” “elevated (rail-way),” or “metropolitan railway (metro).”
HIGHWAY-RAIL GRADE CROSSING (Rail):A location where one or more railroad tracks arecrossed by a public highway, road, or street or aprivate roadway at grade, including sidewalks andpathways at or associated with the crossing.
HIGHWAY TRUST FUND: A grant-in-aid typefund administered by the U.S. Department ofTransportation, Federal Highway Administration.Most funds for highway improvements are appor-tioned to States according to formulas that giveweight to population, area, and mileage.
HOUSEHOLD TRIP (American Travel Survey):A trip in which one or more members of a house-hold travel together.
HIGHWAY-USER TAX: A charge levied on personsor organizations based on their use of public roads.Funds collected are usually applied toward highwayconstruction, reconstruction, and maintenance.
INCIDENT (Hazmat): Any unintentional releaseof hazardous material while in transit or storage.
INCIDENT (Train): Any event involving themovement of a train or railcars on track equip-ment that results in a death, a reportable injury, orillness, but in which railroad property damagedoes not exceed the reporting threshold.
INCIDENT (Transit): Collisions, derailments,personal casualties, fires, and property damage inexcess of $1,000 associated with transit agencyrevenue vehicles; all other facilities on the transitproperty; and service vehicles, maintenance areas,and rights-of-way.
INJURY (Air): See SERIOUS INJURY (air andgeneral aviation).
INJURY (Gas): Described in DOT Forms 7100.1or 7100.2 as an injury requiring “in-patient hos-pitalization” (admission and confinement in ahospital beyond treatment administered in anemergency room or out-patient clinic in whichconfinement does not occur).
INJURY (Hazardous Liquid Pipeline): An injuryresulting from a hazardous liquid pipeline acci-dent that results in one or more of the following:1) Loss of consciousness, 2) A need to be carriedfrom the scene, 3) A need for medical treatment,and/or 4) A disability that prevents the dischargeof normal duties or the pursuit of normal dutiesbeyond the day of the accident.
INJURY (Highway): Police-reported highwayinjuries are classified as follows:
Incapacitating Injury: Any injury, other than afatal injury, that prevents the injured person fromwalking, driving, or normally continuing theactivities the person was capable of performingbefore the injury occurred. Includes severe lacer-ations, broken or distorted limbs, skull or chestinjuries, abdominal injuries, unconsciousness ator when taken from the accident scene, and inabil-ity to leave the accident scene without assistance.Exclusions include momentary unconsciousness.
Nonincapacitating Evident Injury: Any injury,other than a fatal injury or an incapacitatinginjury, evident to observers at the scene of the acci-dent. Includes lumps on head, abrasions, bruises,minor lacerations, and others. Excludes limping.
Possible Injury: Any injury reported or claimedthat is not evident. Includes momentary uncon-sciousness, claim of injuries not obvious, limping,complaint of pain, nausea, hysteria, and others.
INJURY (Highway-Rail Grade Crossing): 1) Aninjury to one or more persons other than railroademployees that requires medical treatment; 2) Aninjury to one or more employees that requires med-ical treatment or that results in restriction of workor motion for one or more days, or one or morelost work days, transfer to another job, terminationof employment, or loss of consciousness; 3) Anyoccupational illness affecting one or more railroademployees that is diagnosed by a physician.
INJURY (Rail): 1) Injury to any person otherthan a railroad employee that requires medicaltreatment, or 2) Injury to a railroad employee that

480 ! Appendix D Glossary
requires medical treatment or results in restrictionof work or motion for one or more workdays, oneor more lost workdays, termination of employ-ment, transfer to another job, loss of conscious-ness, or any occupational illness of a railroademployee diagnosed by a physician.
INJURY (Recreational Boating): Injury requiringmedical treatment beyond first aid as a result of anoccurrence that involves a vessel or its equipment.
INJURY (Transit): Any physical damage or harmto a person requiring medical treatment or anyphysical damage or harm to a person reported at thetime and place of occurrence. For employees, aninjury includes incidents resulting in time lost fromduty or any definition consistent with a transitagency's current employee injury reporting practice.
INJURY (Water): All personal injuries resultingfrom a vessel casualty that require medical treat-ment beyond first aid.
INLAND AND COASTAL CHANNELS:Includes the Atlantic Coast Waterways, theAtlantic Intracoastal Waterway, the New YorkState Barge Canal System, the Gulf CoastWaterways, the Gulf Intracoastal Waterway, theMississippi River System (including the IllinoisWaterway), Pacific Coast Waterways, the GreatLakes, and all other channels (waterways) of theUnited States, exclusive of Alaska, that are usablefor commercial navigation.
INSTRUCTIONAL FLYING: Flying under thesupervision of a flight instructor (excludes profi-ciency flying).
INTERCITY CLASS BUS I: As defined by theBureau of Transportation Statistics, an interstatemotor carrier of passengers with an average annu-al gross revenue of at least $1 million.
INTERCITY TRUCK: Truck that carries freightbeyond local areas and commercial zones.
INTERMEDIATE -SIZE CAR: As designated bythe automobile industry, a car with a wheelbasebetween 105 and 109 inches.
INTERNAL TRAFFIC (Water): Vessel move-ments (origin and destination) that take placesolely on inland waterways located within theboundaries of the contiguous 48 states or withinthe state of Alaska. The term “internal traffic”
also applies to carriage on both inland waterwaysand the water of the Great Lakes; carriagebetween offshore areas and inland waterways;and carriage occurring within the Delaware Bay,Chesapeake Bay, Puget Sound, and the SanFrancisco Bay, which are considered internal bod-ies of water rather than arms of the ocean.
INTERSTATE HIGHWAY: Limited access, divid-ed highway of at least four lanes designated by theFederal Highway Administration as part of theInterstate System.
INTRAPORT (Water): Movement of freightwithin the confines of a port whether the port hasone or several channels included in the port defi-nition. Does not include car-ferries and generalferries moving within a port.
INTRATERRITORY TRAFFIC (Water): Trafficbetween ports in Puerto Rico and the U.S. VirginIslands, which are considered a single unit.
JET FUEL: The term includes kerosene-type jetfuel and naphtha-type jet fuel. Kerosene-type jetfuel is used primarily for commercial turbojet andturboprop aircraft engines. Naphtha-type jet fuelis used primarily for military turbojet and turbo-prop aircraft engines.
LAKEWISE OR GREAT LAKES TRAFFIC:Waterborne traffic between U.S. ports on theGreat Lakes system. The Great Lakes system istreated as a separate waterways system ratherthan as a part of the inland system.
LARGE CERTIFICATED AIR CARRIERS: Anair carrier holding a certificate issued under section401 of the Federal Aviation Act of 1958, as amend-ed, that: 1) Operates aircraft designed to have amaximum passenger capacity of more than 60 seatsor a maximum payload capacity of more than18,000 pounds, or 2) Conducts operations whereone or both terminals of a flight stage are outsidethe 50 states of the United States, the District ofColumbia, the Commonwealth of Puerto Rico, andthe U.S. Virgin Islands. Large certificated air carri-ers are grouped by annual operating revenues: 1)Majors (more than $1 billion in annual operatingrevenues), 2) Nationals (between $100 million and$1 billion in annual operating revenues), Largeregionals ($20 million and $99,999,999 in annualoperating revenues), and 4) Medium regionals (lessthan $20 million in annual operating revenues).

Appendix D Glossary " 481
LARGE REGIONALS (Air): Air carrier groupswith annual operating revenues between $20 mil-lion and $99,999,999.
LARGE CAR: As designated by the automobileindustry, a car with a wheelbase greater than 114inches.
LARGE TRUCK: Trucks over 10,000 poundsgross vehicle weight rating, including single-unittrucks and truck tractors.
LEASE CONDENSATE: A mixture consistingprimarily of pentanes and heavier hydrocarbons,which are recovered as a liquid from natural gasin lease or field separation facilities. This catego-ry excludes natural gas liquids, such as butaneand propane, which are recovered at natural gasprocessing plants or facilities.
LIGHT-DUTY VEHICLE: A vehicle categorythat combines light automobiles and trucks.
LIGHT RAIL: A streetcar-type vehicle operatedon city streets, semiexclusive rights-of-way, orexclusive rights-of-way. Service may be providedby step-entry vehicles or by level boarding.
LIGHT TRUCK: Trucks of 10,000 pounds grossvehicle weight rating or less, including pickups,vans, truck-based station wagons, and sport utili-ty vehicles.
LIQUEFIED NATURAL GAS (LNG): Naturalgas, primarily methane, that has been liquefied byreducing its temperature to -260 °F. at atmos-pheric pressure.
LIQUEFIED PETROLEUM GAS (LPG):Propane, propylene, normal butane, butylene,isobutane, and isobutylene produced at refineriesor natural gas processing plants, including plantsthat fractionate new natural gas plant liquids.
LOCOMOTIVE: Railroad vehicle equipped withflanged wheels for use on railroad tracks, powereddirectly by electricity, steam, or fossil fuel, andused to move other railroad rolling equipment.
LOCOMOTIVE-MILE: The movement of alocomotive unit, under its own power, the dis-tance of 1 mile.
MAINS (Gas): A network of pipelines that servesas a common source of supply for more than onegas service line.
MAJORS (Air): Air carrier groups with annualoperating revenues exceeding $1 billion.
MEDIUM REGIONALS (Air): Air carrier groupswith annual operating revenues less than $20 million.
MERCHANDISE TRADE EXPORTS: Merchan-dise transported out of the United States to foreigncountries whether such merchandise is exported fromwithin the U.S. Customs territory, from a U.S.Customs bonded warehouse, or from a U.S. ForeignTrade Zone. (Foreign Trade Zones are areas, operat-ed as public utilities, under the control of U.S.Customs with facilities for handling, storing, manip-ulating, manufacturing, and exhibiting goods.)
MERCHANDISE TRADE IMPORTS: Com-modities of foreign origin as well as goods ofdomestic origin returned to the United States withno change in condition or after having beenprocessed and/or assembled in other countries.Puerto Rico is a Customs district within the U.S.Customs territory, and its trade with foreigncountries is included in U.S. import statistics. U.S.import statistics also include merchandise tradebetween the U. S. Virgin Islands and foreign coun-tries even though the Islands are not officially apart of the U.S. Customs territory.
METHANOL: A light, volatile alcohol producedcommercially by the catalyzed reaction of hydro-gen and carbon monoxide. Methanol is blendedwith gasoline to improve its operational efficiency.
METHYL TERTIARY BUTYL ETHER(MTBE): A colorless, flammable, liquid oxy-genated hydrocarbon that contains 18.15 percentoxygen. It is a fuel oxygenate produced by react-ing methanol with isobutylene.
MID-SIZE CAR: See Intermediate-Size Car.
MINI-COMPACT CAR: An automobile industrydesignation usually consisting of cars with awheelbase of less than 95 inches.
MINOR ARTERIALS (Highway): Streets andhighways linking cities and larger towns in ruralareas, in distributing trips to small geographicareas in urban areas (not penetrating identifiableneighborhoods).
MOTOR BUS (Transit): A rubber-tired, self-pro-pelled, manually steered bus with fuel supplyonboard the vehicle. Motor bus types include:intercity, school, and transit.

482 ! Appendix D Glossary
MOTORCYCLE: A two- or three-wheeledmotor vehicle designed to transport one or twopeople, including motor scooters, minibikes, andmopeds.
NATIONALS (Air): Air carrier groups withannual operating revenues between $100 millionand $1 billion.
NATURAL GAS: A naturally occurring mixtureof hydrocarbon and nonhydrocarbon gases foundin porous geologic formations beneath the Earth'ssurface, often in association with petroleum. Theprincipal constituent is methane.
NATURAL GAS PLANT LIQUIDS: Liquidsrecovered from natural gas in processing plants orfield facilities, or extracted by fractionators. Theyinclude ethane, propane, normal butane, isobu-tane, pentanes plus, and other products, such asfinished motor gasoline, finished aviation gaso-line, special naphthas, kerosene, and distillate fueloil produced at natural gas processing plants.
NEAR MIDAIR COLLISION (Air): An incidentin which the possibility of a collision occurred asa result of aircraft flying with less than 500 feet ofseparation, or a report received from a pilot orflight crew member stating that a collision hazardexisted between two or more aircraft.
NONOCCUPANT (Automobile): Any personwho is not an occupant of a motor vehicle intransport (e.g., bystanders, pedestrians, pedalcy-clists, or an occupant of a parked motor vehicle).
NONRESPONSE ERROR: Error that resultsfrom some members of the sample or census notproviding information. Nonresponse bias resultsfrom a systematic difference between those whodo and those who do not respond to the measure-ment instrument.
NONSAMPLING ERROR: All sources of bias orinaccuracy in a study other than sampling error.Examples of nonsampling errors include process-ing, recording, or dataentry errors; nonresponseerror; and response error.
NONSCHEDULED SERVICE (Air): Revenueflights not operated as regular scheduled service,such as charter flights, and all nonrevenue flightsincident to such flight.
NONSELF-PROPELLED VESSEL (Water): Avessel without the means for self- propulsion.Includes dry cargo and tanker barges.
NONTRAIN INCIDENT: An event that resultsin a reportable casualty, but does not involve themovement of ontrack equipment, and does notcause reportable damage above the thresholdestablished for train accidents.
NONTRESPASSERS (Rail): A person lawfully onany part of railroad property used in railroad oper-ations, or a person adjacent to railroad premiseswhen injured as the result of railroad operations.
NONVESSEL-CASUALTY-RELATED DEATH:A death that occurs onboard a commercial vesselbut not as a result of a vessel casualty, such as acollision, fire, or explosion.
OCCUPANT: Any person in or on a motor vehi-cle in transport. Includes the driver, passengers,and persons riding on the exterior of a motorvehicle (e.g., a skateboard rider holding onto amoving vehicle). Excludes occupants of parkedcars unless they are double parked or motionlesson the roadway.
OCCUPATIONAL FATALITY: Death resultingfrom a job-related injury.
OPERATING EXPENSES (Air): Expensesincurred in the performance of air transportation,based on overall operating revenues and expenses.Does not include nonoperating income andexpenses, nonrecurring items, or income taxes.
OPERATING EXPENSES (Rail): Expenses offurnishing transportation services, includingmaintenance and depreciation of the plant used inthe service.
OPERATING EXPENSES (Transit): The total ofall expenses associated with operation of an indi-vidual mode by a given operator. Includes distri-butions of “joint expenses” to individual modesand excludes “reconciling items,” such as interestexpenses and depreciation. Should not be con-fused with “vehicle operating expenses.”
OPERATING EXPENSES (Truck): Includesexpenditures for equipment maintenance, supervi-sion, wages, fuel, equipment rental, terminal oper-ations, insurance, safety, and administrative andgeneral functions.
OPERATING REVENUES (Air): Revenues fromthe performance of air transportation and relatedincidental services. Includes l) Transportationrevenues from the carriage of all classes of traffic

Appendix D Glossary " 483
in scheduled and nonscheduled services, and 2)Nontransportation revenues consisting of federalsubsidies (where applicable) and services relatedto air transportation.
OTHER FREEWAYS AND EXPRESSWAYS(Highway): All urban principal arterials with lim-ited access but not part of the Interstate system.
OTHER PRINCIPAL ARTERIAL (Highway):Major streets or highways, many of multilane orfreeway design, serving high-volume traffic corridormovements that connect major generators of travel.
OTHER RAIL REVENUE: This includes rev-enues from miscellaneous operations (i.e., dining-and bar-car services), income from lease of roadand equipment, miscellaneous rental income,income from nonoperating property, profit fromseparately operated properties, dividend income,interest income, income from sinking and otherreserve funds, release or premium on funded debt,contributions from other companies, and othermiscellaneous income.
OTHER REVENUE VEHICLES (Transit): Otherrevenue-generating modes of transit service, suchas cable cars, personal rapid transit systems,monorail vehicles, inclined railway cars, etc., notcovered otherwise.
OTHER 2-AXLE 4-TIRE VEHICLES (Truck):Includes vans, pickup trucks, and sport utilityvehicles.
OTHER WORK (General Aviation): Con-struction work (not Federal Aviation Regulations,Part 135), helicopter hoist, parachuting, aerialadvertising, and towing gliders.
OXYGENATES: Any substance that when addedto motor gasoline increases the amount of oxygenin that gasoline blend. Includes oxygen-bearingcompounds such as ethanol, methanol, and methyltertiary butyl ether. Oxygenated fuel tends to givea more complete combustion of carbon into car-bon dioxide (rather than monoxide), therebyreducing air pollution from exhaust emissions.
PASSENGER CAR: A motor vehicle designed pri-marily for carrying passengers on ordinary roads,includes convertibles, sedans, and stations wagons.
PASSENGER-MILE: 1) Air: One passenger trans-ported 1 mile; passenger-miles for one interairportflight are calculated by multiplying aircraft miles
flow by the number of passengers carried on theflight. The total passenger-miles for all flights isthe sum of passenger-miles for all interairportflights. 2) Auto: One passenger traveling 1 mile;e.g., one car transporting two passengers 4 milesresults in eight passenger-miles. 3) Transit: Thetotal number of miles traveled by transit passen-gers; e.g., one bus transporting five passengers 3miles results in 15 passenger-miles.
PASSENGER REVENUE: 1) Rail: Revenue fromthe sale of tickets. 2) Air: Revenues from thetransport of passengers by air. 3) Transit: Fares,transfer, zone, and park-and-ride parking chargespaid by transit passengers. Prior to 1984, farerevenues collected by contractors operating tran-sit services are not included.
PASSENGER VESSELS: A vessel designed for thecommercial transport of passengers.
PEDALCYCLIST: A person on a vehicle that ispowered solely by pedals.
PEDESTRIAN: Any person not in or on a motorvehicle or other vehicle. Excludes people in build-ings or sitting at a sidewalk cafe. The NationalHighway Traffic Safety Administration also usesan “other pedestrian” category to refer to pedes-trians using conveyances and people in buildings.Examples of pedestrian conveyances include skate-boards, nonmotorized wheelchairs, rollerskates,sleds, and transport devices used as equipment.
PERSON-MILES (American Travel Survey): Anestimate of the aggregate distances traveled by allpersons on a given trip based on the estimatedtransportation-network-miles traveled on that trip.
PERSON TRIP (American Travel Survey): A triptaken by an individual. For example, if three per-sons from the same household travel together, thetrip is counted as one household trip and threeperson trips.
PERSONAL BUSINESS TRIP (American TravelSurvey): A trip taken for a school-related activityor for personal or family business, including wed-dings and funerals.
PERSONAL-USE VEHICLE TRIP (AmericanTravel Survey): A trip in which the principle meansof transportation is a car, pickup truck, or van;other truck; rental car, truck, or van; recreationalvehicle or motor home; or motorcycle or moped.

484 ! Appendix D Glossary
PLEASURE TRIP (American Travel Survey): Atrip taken to visit friends or relatives or for leisure.
PERSONAL CASUALTY (Transit): 1) An inci-dent in which a person is hurt while getting on oroff a transit vehicle (e.g., falls or door incidents),but not as a result of a collision, derailment/leftroadway, or fire. 2) An incident in which a per-son is hurt while using a lift to get on or off a tran-sit vehicle, but not as a result of a collision, derail-ment/left roadway, or fire. 3) An incident inwhich a person is injured on a transit vehicle, butnot as a result of a collision, derailment/left road-way, or fire. 4) An incident in which a person ishurt while using a transit facility. This includesanyone on transit property (e.g., patrons, transitemployees, trespassers), but does not include inci-dents resulting from illness or criminal activity.
PERSONAL WATERCRAFT: Craft less than 13feet in length designed to be operated by a personor persons sitting, standing, or kneeling on thecraft rather than within the confines of a hull.
PETROLEUM (Oil): A generic term applied to oiland oil products in all forms, such as crude oil, leasecondensate, unfinished oils, petroleum products,natural gas plant liquids, and nonhydrocarbon com-pounds blended into finished petroleum products.
PROPERTY DAMAGE (Transit): The dollaramount required to repair or replace transit prop-erty (including stations, right of way, bus stops, andmaintenance facilities) damaged during an incident.
PUBLIC ROAD: Any road under the jurisdictionof and maintained by a public authority (federal,state, county, town, or township, local govern-ment, or instrumentality thereof) and open topublic travel.
RAIL MOTOR CARS: Self-propelled passengerrail cars that are driven by electric motors ener-gized from an electrified roadway or by a genera-tor driven by a diesel or gas turbine engine.
RAPID RAIL TRANSIT: Transit service usingrail cars driven by electricity usually drawn froma third rail, configured for passenger traffic, andusually operated on exclusive rights-of-way. Itgenerally uses longer trains and has longer stationspacing than light rail.
REFORMULATED GASOLINE: Gasolinewhose composition has been changed to meet per-
formance specifications regarding ozone-formingtendencies and release of toxic substances into theair from both evaporation and tailpipe emissions.Reformulated gasoline includes oxygenates and,compared with gasoline sold in 1990, has a lowercontent of olefins, aromatics, volatile compo-nents, and heavy hydrocarbons.
RESIDUAL FUEL OIL: The heavier oils thatremain after the distillate fuel oils and lighterhydrocarbons are distilled away in refinery opera-tions and that conform to American Society forTesting and Materials (ASTM) SpecificationsD396 and 976. Includes, among others, NavySpecial oil used in steam-powered vessels in gov-ernment service and No. 6 oil used to powerships. Imports of residual fuel oil include import-ed crude oil burned as fuel.
RESPONSE ERROR: Error that results from thetendency of people to answer a question falsely,deliberate misrepresentation, unconscious falsifi-cation, or misunderstanding of what is required.
REVENUE: Remuneration received by carriersfor transportation activities.
REVENUE PASSENGER: 1) Air: Person receiv-ing air transportation from an air carrier forwhich remuneration is received by the carrier. Aircarrier employees or others, except ministers ofreligion, elderly individuals, and handicappedindividuals, receiving reduced rate charges (lessthan the applicable tariff) are considered nonrev-enue passengers. Infants, for whom a token fareis charged, are not counted as passengers. 2)Transit: Single-vehicle transit rides by initial-board (first-ride) transit passengers only.Excludes all transfer rides and all nonrevenuerides. 3) Rail: Number of one-way trips made bypersons holding tickets.
REVENUE PASSENGER ENPLANEMENTS(Air): The total number of passengers boardingaircraft. Includes both originating and connectingpassengers.
REVENUE PASSENGER LOAD FACTOR (Air):Revenue passenger-miles as a percent of availableseat-miles in revenue passenger services. The termis used to represent the proportion of aircraft seat-ing capacity that is actually sold and utilized.
REVENUE PASSENGER-MILE: One revenuepassenger transported 1 mile.

Appendix D Glossary " 485
REVENUE PASSENGER TON-MILE (Air): Oneton of revenue passenger weight (including allbaggage) transported 1 mile. The passengerweight standard for both domestic and interna-tional operations is 200 pounds.
REVENUE TON-MILE: One short ton of freighttransported 1 mile.
REVENUE VEHICLE-MILES (Transit): Onevehicle (bus, trolley bus, streetcar) traveling 1 milewhile revenue passengers are on board generatesone revenue vehicle-mile. Revenue vehicle-milesreported represent the total mileage traveled byvehicles in scheduled or unscheduled revenue-pro-ducing services.
ROAD OIL: Any heavy petroleum oil, includingresidual asphaltic oil, that is used as a dust pallia-tive and surface treatment on roads and highways.It is generally produced in 6 grades from 0, themost liquid, to 5, the most viscous.
ROLL ON/ROLL OFF VESSEL: Ships that aredesigned to carry wheeled containers or otherwheeled cargo and use the roll on/roll off methodfor loading and unloading.
ROUND-TRIP DISTANCE (American TravelSurvey): The estimated transportation network-miles traveled at the time of the trip from thehousehold residence to the destination and back.
RURAL HIGHWAY: Any highway, road, orstreet that is not an urban highway.
RURAL MILEAGE (Highway): Roads outsidecity, municipal district, or urban boundaries.
SAMPLING ERROR: The estimated inaccuracyof the results of a study when a population sam-ple, rather than a census, is used to explain thebehavior of the total population. (Also referred toas margin of error and standard error.)
SCHEDULED SERVICE (Air): Transport serviceoperated pursuant to published flight schedules.
SCHOOL BUS: A passenger motor vehicle that isdesigned or used to carry more than 10 passen-gers, in addition to the driver, and, as determinedby the Secretary of Transportation, is likely to besignificantly used for the purpose of transportingpre-primary, primary, or secondary school stu-dents between home and school.
SCHOOL-BUS-RELATED CRASH: Any crash inwhich a vehicle, regardless of body design, used asa school bus is directly or indirectly involved, suchas a crash involving school children alighting froma vehicle.
SCOW (Water): Any flat-bottomed, nonself-pro-pelled, rectangular vessel with sloping ends. Largescows are used to transport sand, gravel, or refuse.
SELF-PROPELLED VESSEL: A vessel that has itsown means of propulsion. Includes tankers, con-tainerships, dry bulk cargo ships, and generalcargo vessels.
SERIOUS INJURY (Air Carrier/GeneralAviation): An injury that requires hospitalizationfor more than 48 hours, commencing within 7days from the date when the injury was received;results in a bone fracture (except simple fracturesof fingers, toes, or nose); involves lacerations thatcause severe hemorrhages, nerve, muscle, or ten-don damage; involves injury to any internalorgan; or involves second- or third-degree burnsor any burns affecting more than 5 percent of thebody surface.
SMALL CERTIFICATED AIR CARRIER: An aircarrier holding a certificate issued under section401 of the Federal Aviation Act of 1958, asamended, that operates aircraft designed to have amaximum seating capacity of 60 seats or fewer ora maximum payload of 18,000 pounds or less.
STATE AND LOCAL HIGHWAY EXPENDI-TURES: Disbursements for capital outlay, main-tenance and traffic surfaces, administration andresearch, highway law enforcement and safety,and interest on debt.
STREETCARS: Relatively lightweight passengerrail cars operating singly or in short trains, orfixed rails in right-of-way that are not always sep-arated from other traffic for much of the way.Streetcars do not necessarily have the right-of-wayat grade crossings with other traffic.
SUBCOMPACT CAR: As designated by theautomobile industry, a car with a wheelbasebetween 95 and 99 inches.
SUPPLEMENTAL AIR CARRIER: An air carri-er authorized to perform passenger and cargocharter services.

486 ! Appendix D Glossary
TANKER: An oceangoing ship designed to haulliquid bulk cargo in world trade.
TON-MILE (Truck): The movement of 1 ton ofcargo the distance of 1 mile. Ton-miles are calcu-lated by multiplying the weight in tons of eachshipment transported by the miles hauled.
TON-MILE (Water): The movement of 1 ton ofcargo the distance of 1 statute mile. Domestic ton-miles are calculated by multiplying tons moved bythe number of statute miles moved on the water(e.g., 50 short tons moving 200 miles on a water-way would yield 10,000 ton-miles for that water-way). Ton-miles are not computed for ports. Forcoastwise traffic, the shortest route that safe navi-gation permits between the port of origin and des-tination is used to calculate ton-miles.
TRAFFICWAY (Highway): Any right-of-wayopen to the public as a matter of right or customfor moving persons or property from one place toanother, including the entire width between prop-erty lines or other boundaries.
TRAIN LINE MILEAGE: The aggregate lengthof all line-haul railroads. It does not include themileage of yard tracks or sidings, nor does itreflect the fact that a mile of railroad may includetwo or more parallel tracks. Jointly-used track iscounted only once.
TRAIN-MILE: A train-mile is the movement of atrain, which can consist of many cars, the distanceof 1 mile. A train-mile differs from a vehicle-mile,which is the movement of one car (vehicle) thedistance of 1 mile. A 10-car (vehicle) train travel-ing 1 mile is measured as 1 train-mile and 10 vehi-cle-miles. Caution should be used when compar-ing train-miles to vehicle-miles.
TRANSIT VEHICLE: Includes light, heavy, andcommuter rail; motor bus; trolley bus; van pools;automated guideway; and demand-responsivevehicles.
TRANSSHIPMENTS: Shipments that enter orexit the United States by way of a U.S. Customsport on the northern or southern border, butwhose origin or destination was a country otherthan Canada or Mexico.
TRAVEL PARTY (American Travel Survey):Household and nonhousehold members travelingtogether on a trip.
TRESPASSER (Rail): Any person whose presenceon railroad property used in railroad operations isprohibited, forbidden, or unlawful.
TRIP (American Travel Survey): Roundtrip trav-el to a destination at least 100 miles from home.The following types of trips are excluded: 1) trav-el as part of an operating crew on a train, air-plane, truck, bus, or ship; 2) regular commutingto work or school; 3) one-way trips to move to anew destination; and 4) trips by members of theArmed Forces while on active duty.
TROLLEY BUS: Rubber-tired electric transitvehicle, manually steered and propelled by amotor drawing current, normally through over-head wires, from a central power source.
TRUST FUNDS: Accounts that are specificallydesignated by law to carry out specific purposesand programs. Trust Funds are usually financedwith earmarked tax collections.
TUG BOAT: A powered vessel designed for thetowing or pushing of ships, dumb barges, pushed-towed barges, and rafts, but not for the carriageof goods.
U.S. FLAG CARRIER OR AMERICAN FLAGCARRIER (Air): One of a class of air carriersholding a Certificate of Public Convenience andNecessity issued by the U.S. Department ofTransportation and approved by the President,authorizing scheduled operations over specifiedroutes between the United States (and/or its terri-tories) and one or more foreign countries.
UNLEADED GASOLINE: See Gasoline.
UNLINKED PASSENGER TRIPS (Transit): Thenumber of passengers who board public trans-portation vehicles. A passenger is counted eachtime he/she boards a vehicle even if on the samejourney from origin to destination.
URBAN HIGHWAY: Any road or street withinthe boundaries of an urban area. An urban areais an area including and adjacent to a municipali-ty or urban place with a population of 5,000 ormore. The boundaries of urban areas are fixed bystate highway departments, subject to theapproval of the Federal Highway Administration,for purposes of the Federal-Aid highway program.
VANPOOL (Transit): Public-sponsored com-

Appendix D Glossary " 487
muter service operating under prearranged sched-ules for previously formed groups of riders in 8-to 18-seat vehicles. Drivers are also commuterswho receive little or no compensation besides thefree ride.
VEHICLE MAINTENANCE (Transit): All activ-ities associated with revenue and nonrevenue(service) vehicle maintenance, including adminis-tration, inspection and maintenance, and servic-ing (cleaning, fueling, etc.) vehicles. In addition,it includes repairs due to vandalism or to revenuevehicle accidents.
VEHICLE-MILES (Highway): Miles of travel byall types of motor vehicles as determined by thestates on the basis of actual traffic counts andestablished estimating procedures.
VEHICLE-MILES (Transit): The total number ofmiles traveled by transit vehicles. Commuter rail,heavy rail, and light rail report individual car-miles, rather than train-miles for vehicle-miles.
VEHICLE OPERATIONS (Transit): All activitiesassociated with transportation administration,including the control of revenue vehicle move-ments, scheduling, ticketing and fare collection,system security, and revenue vehicle operation.
VESSEL CASUALTY (Water): An occurrenceinvolving commercial vessels that results in 1)Actual physical damage to property in excess of$25,000; 2) Material damage affecting the sea-worthiness or efficiency of a vessel; 3) Strandingor grounding; 4) Loss of life; or 5) Injury causingany person to remain incapacitated for a period inexcess of 72 hours, except injury to harbor work-ers not resulting in death and not resulting fromvessel casualty or vessel equipment casualty.
VESSEL-CASUALTY-RELATED DEATH: Fatalitythat occurs as a result of an incident that involvesa vessel or its equipment, such as a collision, fire,or explosion. Includes drowning deaths.
WATERBORNE TRANSPORTATION: Transportof freight and/or people by commercial vesselsunder U.S. Coast Guard jurisdiction.
WAYBILL: A document that lists goods and ship-ping instructions relative to a shipment.
WEEKEND TRIP (American Travel Survey):Travel by persons who stay one or two nightsaway, including a Friday and/or Saturday night.Travel over three to five nights including a Fridayand/or Saturday night stay is defined as a long-weekend trip.

AAccidents
airport, 121air transportation, 105, 111, 117, 326–327
commuter carrier, 105, 119, 121general aviation, 105, 123, 330hazardous material-related, 111, 112near mid-air collisions, 124, 429on-demand air taxi, 105, 122by phase of operation, 121
buses, 105, 138transit, 148–153
data sources, 429–435distribution by mode of transport, 105–106fatalities. See Fatalitiesgrade crossing, 105, 110hazardous materials-related, 111–112highway, 334injuries. See Injuriesmotorcycle, 105, 135, 338motor vehicle, 105, 111, 129, 135, 338
alcohol involvement, 133, 139circumstances and conditions, 133, 141effectiveness of restraint devices, 144, 431hazardous material-related, 111, 112number of vehicles in, 133by posted speed limit, 142
petroleum spills, 315pipeline, 102, 105, 361, 363property damage. See Property damage, accidentsrailroad, 105, 111–112, 148–153, 165,
433–434distribution by type, 163hazardous material-related, 111, 112railroad employees in, 166by train-miles traveled, 165
recreational boating, 105, 172personal watercraft, 172
transit systems, 105, 147–153, 352, 432–433truck, 105, 136, 342waterborne transportation, 105, 111, 112, 171,
434Accommodations, travel, 53Administrator’s Fact Book, 406
ADT Automotive Used Car Market Report, 414Aerospace Facts and Figures, 412Aerospace Industries Association, 412Age of vehicles/vessels
Amtrak fleet, 39marine vessels, 40–41motor vehicles, 33railroad locomotive fleet, 39transit vehicles, 38
Age patterns, population, xviitraveler characteristics, 52, 54trends, xvii
Agricultural sectoreconomic indices, 189, 190, 191, 192, xviiigasoline demand, 242, 383
Air bags, 144Air Carrier Financial Statistics Quarterly, 407,
445Air carriers
accidents, 105, 117, 119, 326–327, 429hazardous materials-related, 111, 112by phase of operation, 121, 429See also Air carriers, fatalities; Air carriers,
injuriesaircraft miles traveled, 45, 322–323, 369arrivals/departures, 56, 419–420
accident rate per, 117, 119canceled flights, 85, 427data sources/analysis, 407, 409–410, 417,
419–420, 421, 422, 426, 429, 463–464delayed flights, 426, 427
causes, 85number of, 85
diverted flights, 85energy consumption, 240, 381fatalities, 99, 117, 119, 326, 327
hazardous materials-related, 111by phase of operation, 121
fleet characteristics, 17freight transportation, 419–420
length of haul, 65, 375revenue per ton-mile, 210revenue tons, 56ton-miles, 64, 325–326, 374
Index
491
Italic page numbers refer to metric conversions.

fuel consumption, 238, 243, 379, 384, 463–464efficiency/intensity, 257, 258, 393, 394, 465
injuries, 102, 117, 119, 429hazardous materials-related, 111See also Air carriers, fatalities
mishandled baggage reports, 84, 426number of aircraft, 13, 322number of employees, 322number of operators, 4, 321, 407number of revenue passengers, 56, 324, 325on-time flight operations, 84, 426, 427passenger fare trends, 205, 323, 445passenger-miles traveled, 48, 372
average trip length, 65, 375, 422revenue per, 209
passengers denied boarding by, 83, 426revenue
freight, 210operating, 211, 321passenger, 56, 209
vehicle-miles traveled, 417See also Aircraft; Airports; Air transportation;
Commuter air transportation; General aviationAir Carrier Traffic Statistics, 420Aircraft
accident rate, 117data sources, 409–410, 412exhaust emissions
carbon monoxide, 295lead, 301nitrogen oxides, 296particulate matter, 298, 299standards, 286–287sulfur dioxide, 300volatile organic compounds, 297
fleet characteristics, 17–18flight hours, 117, 322–323fuel consumption, 243, 384fuel prices, 199miles traveled, 45, 369
accident and injury rates, 117fuel consumption, 243, 384passenger miles, 323per aircraft, 243, 384revenue miles, 322
number of, 13, 409–410producer price indices, 201sales/delivery of, 15, 412See also Air carriers; Air transportation; Com-
muter air transportation; General aviation
Airport Activity Statistics of Certificated Air Car-riers, 419, 420
Airportsaccidents, 121aircraft departures, number of, 56causes of flight delays, 85data sources, 406, 415, 420noise exposure, 317, 470–471number of, 5, 406number of passengers boarded, 58–59, 420passenger screening results, 125, 429private use, 5public use, 5runway conditions, 5, 33, 415
Air qualityareas not meeting federal standards, 306–310urban trends, 302–305See also Exhaust emissions; specific pollutant
Air taxi, 99, 102, 105, 108, 122, 326, 327data sources, 409, 429
Air traffic control, 215causes of flight delays, 85
Air Traffic Statistics, 422Air transportation
accidents, 105, 111, 112data sources, 429, 445, 452, 453–454economic value, 181, 182employees
injuries and fatalities, 113productivity, 219trends, 212, 213, 215wages and salaries, 216–218
fatalities, 99, 113federal expenditures, 226, 453–454federal revenues from, 224, 225, 452freight
growth, 72hazardous materials, 77
gasoline demand, 242, 383, 460hazardous materials incidents, 111, 112injuries, 102, 111, 112long-distance travel characteristics, 51near mid-air collisions, 124, 429passenger arrivals from foreign countries, 60passenger departures to foreign countries, 61passenger expenditures, 197passenger-miles traveled, 48, 372passenger screening results, 125personal consumption expenditures, 202, 203producer price indices, 201
492 ! Index
Italic page numbers refer to metric conversions.

transportation-related demand, 183, 185See also Air carriers; Aircraft; Airports; Com-
muter air transportation; General aviationAlabama
port tonnage, 70urban air pollution, 302
Alaskaareas not meeting national air quality standards,
306Canadian border crossings, 62international trade gateways, 66port tonnage, 70
Alcohol-related incidentsmotor vehicle, 133
blood alcohol concentration, 139fatalities, 133, 139
prevention, 144in recreational boating, 172state laws, 140in transit systems, 156, 157
Alternative fuels, 245, 460–461American Automobile Association, 445American Gas Association, 406, 407, 446American Petroleum Institute, 421, 425, 441American Public Transit Association, 411, 413,
418–419, 422, 445, 446, 463, 464American Travel Survey, 419American Trucking Association, 420, 425Amtrak
age of vehicles, 39, 416car-miles traveled, 45, 252, 354, 369data sources/analysis, 403–405, 407, 411, 413,
416, 422, 428, 446delays, 95employees, 353energy consumption, 238, 240, 252, 354, 379,
381efficiency/intensity, 257, 263, 393
locomotive fleet characteristics, 39miles of track operated, 3, 353, 367
data sources, 403–405new vehicles, sales/delivery of, 15number of vehicles, 13, 353, 411on-time performance, 95, 428operating expenses, 353operating revenue, 211, 353, 446passenger fare trends, 205, 354, 446passenger-miles traveled, 48, 354, 372revenue per passenger-mile, 209, 354stations served, 8, 368, 407
train-miles traveled, 45, 252, 354, 369trip length, 65, 354, 375, 422
Annual Energy Review, 440, 457–458Annual Report of Consumer Expenditure Survey,
444Annual Retail Trade Survey, 437Argentina, motor vehicle production, 26–28Arizona
airports, 58areas not meeting national air quality standards,
306international trade gateways, 66, 68Mexican border crossings, 63roadway congestion, 90, 91
cost values, 93, 94fuel wasted due to, 265, 266, 268, 269
urban air pollution, 303, 304, 305urban traffic delays, 87, 88
Arkansasroadway congestion, 90
cost values, 93fuel wasted due to, 265, 268
urban air pollution, 303urban traffic delays, 87
Arson, 155Assault, 154, 156Association of American Railroads, 403, 407,
408, 411, 416, 419, 421, 425, 446, 464, 465Association of Oil Pipe Lines, 405, 407, 421, 422,
425Australia
air passenger arrivals from, 60air passenger departures to, 61motor vehicle production, 26–28
Austria, motor vehicle production, 26–28Automated Broker Interface System, 424Automobiles. See Passenger cars; Personal use
vehiclesAviation Safety and Capacity Expansion Act, 452
BBahama Islands
air passenger arrivals from, 60air passenger departures to, 61
Barbadosair passenger arrivals from, 60air passenger departures to, 61
Barges, 40, 41, 356, 358, 359revenue per ton-mile, 210
Basic Petroleum Data Book, 421, 425, 441
Index " 493
Italic page numbers refer to metric conversions.

Belgiumair passenger arrivals from, 60air passenger departures to, 61motor vehicle production, 26–28
Bermudaair passenger arrivals from, 60air passenger departures to, 61
Bicycle Council, 413Bicycle Manufacturers Association, 413Bicycles
data sources, 413fatalities, 99, 108, 132, 133injuries, 102as means of transport to work, 50producer price indices, 201sales/delivery of, 15
Boating Statistics, 412Boats. See Marine vessels; Recreational boatingBobit Publishing Co., 414Bomb threats, 125, 429Brazil
air passenger arrivals from, 60air passenger departures to, 61motor vehicle production, 26–28
Bridges, condition of, 37, 416Budget of the United States, 450, 453Bureau of Census, 410, 423, 437, 438, 439–440,
441–442, 446, 448, 450, 451, 455, 462Bureau of Economic Analysis, 436–437, 449Bureau of Labor Statistics, 403, 408, 416, 419,
421, 436, 440, 441, 442, 443–444, 447, 448,449–450
Bureau of Transportation Statistics, 407, 417,419, 420, 422, 423, 427, 429, 445, 450, 463Internet site, 425
Burglary, 155Buses
accidents, 105, 138, 148–153average trip length, 65, 375, 422Canadian border crossings, 62data sources, 422, 445economic indices, 344employees, 344, 450energy consumption, 240, 381fatalities, 99, 108, 132, 138, 148–153, 345–346freight transportation expenditures, 198fuel consumption, 238, 249, 345, 379, 389fuel economies, 249, 257, 262, 345, 389, 393,
399injuries, 102, 138, 148–153
intercity, 197, 198, 203, 205, 209, 212, 344labor productivity, 219long-distance travel characteristics, 51Mexican border crossings, 63number of, 13, 344number of operators, 344number of passengers, 345passenger expenditures, 197passenger fare trends, 205passenger-miles traveled, 48, 345, 372personal consumption expenditures, 203professional operators, 215, 217revenue per passenger-mile, 209sales/delivery of, 15school, 197, 212, 344transit, 212
accidents and injuries, 148–153age of vehicles, 38average trip length, 351criminal behavior in, 154–158, 433economic indices, 347, 348fuel economies, 257, 262, 351–352, 393, 399inventory, 349number of, 13passenger expenditures, 197passenger-miles traveled, 48, 350, 372speed, 351vehicle miles-traveled, 45, 350, 369
vehicle-miles traveled, 45, 249, 344, 345, 369,389accident and injury rate, 138
Business travelfleet characteristics, 20general aviation fleet, 328, 329, 330trip characteristics, 52vehicle sales, 23
CCAFE standards, 261, 398California
airports/water ports, 58, 59, 70areas not meeting national air quality standards,
306international trade gateways, 66, 67, 68Mexican border crossings, 63roadway congestion, 89, 90
cost values, 92, 93, 94fuel wasted due to, 267, 268, 269
urban air pollution, 302, 303, 304, 305urban traffic delays, 86, 87
494 ! Index
Italic page numbers refer to metric conversions.

Canadaair passenger arrivals from, 60air passenger departures to, 61data sources, 422, 423, 424–425land freight shipments
border crossings, 68value, 75
land-passenger border crossings, 62motor vehicle production, 26–28
Carbon dioxide emissions, 311, 468–469Carbon monoxide emissions, 295
federal standards, 273–291in reformulated gasoline engines, 294by vehicle type, 292–293, 467
Carload Way Bill Statistics, 425Carpools, 50Cars. See Passenger cars; Personal-use vehiclesChina
air passenger arrivals from, 60air passenger departures to, 61motor vehicle production, 26–28space launches, 79
Cities. See Urban areas; specific stateClean Air Act, 468
Amendments of 1990, 441Coal
consumption by transportation sector, 237federal government consumption, 253, 391
Coastwise transportation, 64, 65, 69, 356, 357,358, 374, 375, 376
Colombiaair passenger arrivals from, 60air passenger departures to, 61
Coloradoairports/water ports, 58areas not meeting national air quality standards,
306–307roadway congestion, 89
cost values, 92fuel wasted due to, 264, 267
urban air pollution, 302urban traffic delays, 86
Commercial Space Launch Act, 426Commercial vehicle production, 21, 27Commodity Flow Surveys, 72, 73–74, 423–424Communications industries/services, 189, 190,
191, 192Commuter air transportation
accidents, 105, 119, 429by phase of operation, 121
aircraft-miles traveled, 119arrivals/departures, 119data sources, 429fatalities, 99, 108, 119, 429
by phase of operation, 121flight hours, 119injuries, 102, 119, 429
Commuter rail transportationaccidents, 148–153age of vehicles, 38average trip length, 65, 351, 375, 422criminal behavior in, 154–158, 433data sources, 422economic indices, 347, 348energy consumption, 351, 352fatalities, 108, 148–153injuries, 148–153new vehicles, sales/delivery of, 15number of transit operators, 349number of vehicles, 13, 349passenger fare trends, 205passenger-miles traveled, 48, 350, 372revenue per passenger-mile, 209speed, 351system mileage, 3, 367vehicle-miles traveled, 45, 350, 369
Commuter travel, 50See also Business travel; Commuter air trans-
portation; Commuter rail transportation;Transit vehicles/systems
Connecticutareas not meeting national air quality standards,
307roadway congestion, 89
cost values, 92fuel wasted due to, 265, 268
urban air pollution, 303, 304urban traffic delays, 86
Construction industries, 189, 190, 191, 192, xviiiConsumer Expenditure Survey, 444–445Consumer price indices, 200, 210, 441–443Consumer spending, 202
cost of automobile ownership, 204, 445data sources, 438, 440, 444–446fares, 197, 203, 205, 347, 348, 354, 440, 445–446freight, 198fuel, 199, 200, 440–443household, xviiitaxis, 336user-operated transportation, 203, 204, 336
Index " 495
Italic page numbers refer to metric conversions.

Containerships, 29Corrosive materials, 78Courier services, 72, 77, 340, 446Crashes. See Accidents; Fatalities; InjuriesCriminal acts
air passenger screening results, 125, 429state DUI/DWI regulations, 140in transit systems, 154, 433
Crude oil, 9, 65, 76, 361, 375, 377Current Population Survey, 439Czech Republic, motor vehicle production, 26–28
DData sources/analysis, v
age of vehicles/vessels, 415, 416–417airports, 406, 415, 420air transportation, 407, 409–410, 412, 417,
419–420, 422, 426, 429, 445, 453–454,463–464passenger screening, 429safety, 429
Amtrak, 403–405, 407, 411, 413, 416, 422,428, 446
bicycles, 413buses, 422, 445commuter rail transportation, 422consumer price indices, 441–443economic indices, 436–455exhaust emissions, 466–469freight tonnage/ton-miles, 420–426fuel consumption/efficiency, 414, 458–466fuel prices, 440–441gas pipeline, 405–406, 407, 435, 446General Estimates System, 134, 135, 137, 138government revenues/expenditures, transporta-
tion-related, 450–455Gross Domestic Product, 436–439hazardous materials, 423–424, 435international travel, 420long-distance traveler/trip characteristics, 419motorcycles, 413, 431motor vehicles, 410, 412, 414, 415, 417–418,
427–428, 430–432, 462–463use/effectiveness of restraints, 431, 432
noise exposure, 470–471number of vehicles/carriers, 407–412oil pipeline, 405–406, 407, 421, 422, 425, 446oil spills/leaks, 469–470petroleum supply, 457–458port traffic, 422–423
producer price indices, 443–444property damage reporting thresholds, 114railroads, 403, 407–408, 411, 413, 416, 419,
421, 425, 433–434, 446, 464recreational boating, 412, 434roadway congestion, 427–428roadways, 403, 404–405, 406, 415–416safety performance, 429–435sales of vehicles/vessels, 412–413, 414system mileage, 403–406transit systems, 405, 411, 413, 416, 418–419,
432–433, 445–446, 454, 464transportation employment, 429, 447–450trucks/trucking, 408, 410–411, 414, 420, 425,
446vehicle-miles traveled, 417–419waterborne transportation, 405, 408, 411–412,
413, 415, 417, 421–422, 423, 425, 434, 446,464
Delaware, urban air pollution, 305Demand responsive transit
accidents and injuries, 108, 148–153average trip length, 351criminal behavior in, 154–158economic indices, 347, 348energy consumption, 351–352fleet characteristics, 20number of employees, 349number of operators, 349number of vehicles, 13, 349passenger expenditures, 197passenger-miles traveled, 48, 350, 372professional operators, 215, 217vehicle-miles traveled, 45, 350, 369See also Taxis
Demographicseducational attainments, 55gender, 54, xvii, xviiirace/ethnicity, 54traveler/trip characteristics, 54–55, 419See also Age patterns, population; Population,
U.S.Denmark
air passenger arrivals from, 60air passenger departures to, 61
Diesel engine emissionsfederal standards, 273–284, 288rates, 293
Diesel fuel, 199, 245, 250, 252, 389, 460Amtrak consumption, 354
496 ! Index
Italic page numbers refer to metric conversions.
consumption by transportation sector, 238, 239,240, 241, 379, 381
marine vessel consumption, 358District of Columbia, 58
air quality, 307roadway congestion, 91
cost values, 94fuel wasted due to, 266, 269
traffic delays, 87urban air pollution, 305
Dominican Republicair passenger arrivals from, 60air passenger departures to, 61
Drug abuse, 156See also Alcohol-related incidents
EEconomic indices
air carrier performance, 56, 209, 210, 211, 321,322–326
aircraft sales, 15Amtrak, 353bus operations, 344commodity shipments, value of, 73–74compensation in transportation industries,
216–218consumer price indices, 200, 441–443data sources/analysis, 436–455disposable personal income, 202freight transportation
expenditures, 198growth, 72revenue per ton-mile, 210
fuel prices, 199, 200gas pipeline operations, 362government expenditures, transportation-relat-
ed, 184, 186, 187, 188, 223, 226government revenues, transportation-related,
223–225gross domestic product, 181–186, 189–192,
xviiiby social function, 193
household expenditures, xviiihousehold income, xviii
long-distance travel and, 55international trade
freight shipments, 66–67, 75transportation-related exports, 183, 185
oil pipeline revenues, 361operating revenues, by mode, 211
passenger car sales, 21–24passenger fare trends, 205, 323passenger-mile trends, 194personal expenditures
by economic category, 202passenger expenditures, 197transportation services, 202, 203
personal watercraft sales, 172producer price indices, 201, 443–444rail transport, 181, 182, 198, 203, 210, 211,
353, 446revenue per passenger-mile, by mode, 209traffic congestion costs, 92–94, 427–428transit operations, 347–348transportation equipment, 201transportation-related final demand, 183–188transportation services, 201trucking, 181, 182, 201, 203, 211, 219, 340See also Employment; Fuel economies; Gross
Domestic Product; International tradeEconomic Report of the President, 439Educational attainment, traveler characteristics,
55Educational services, 189, 190, 191, 192, 193
personal expenditures, 202Electric power, 245
Amtrak consumption, 252, 263, 354consumption by transportation sector, 237, 238,
239, 240, 241, 379, 381, 461data sources, 440federal government consumption, 253, 391transit vehicle consumption, 250, 389
Emergency preparedness, 224, 225, 453Employment
gender distribution, xviiimeans of transport to work, 50pipeline, 361transportation occupations, 353, 356
air carrier, 322bus transportation, 344data sources, 429, 447–450distribution by mode, 212–214, 215fatalities, 113, 355, 429motor vehicle-related, 336productivity, 219, 449–450professional operators, 215, 217railroad injuries, 162, 166roadway operations/construction, 213, 333transit, 349trends, 212–214, 215
Index " 497
Italic page numbers refer to metric conversions.

trucking, 340wage and salary trends, 216–218, 448–450
traveler status, 55Energy consumption
carbon dioxide emissions, 311by economic sector, 232federal government, 253, 391transit vehicles/systems, 351–352for transportation, 231, 232, 237
by mode, 240–241, 381See also Fuel consumption; Fuel efficiency/inten-
sity; Gasoline; Natural gas; PetroleumEnergy Data Report, 405, 407Energy efficiency/intensity. See Fuel
efficiency/intensityEnergy Information Administration, 425, 440,
441, 457–458, 459, 460, 462, 464, 468, 469Eno Transportation Foundation, Inc., 405, 407,
420, 421, 422, 446Environmental protection. See Exhaust emissions,
federal standards; RecyclingEthanol fuel, 245, 461Europe
space launches, 79See also specific country
Exhaust emissions, 292–293, 294carbon dioxide, 311, 468–469carbon monoxide, 273–295data sources, 466–469federal standards
aircraft engines, 286–287heavy heavy-duty trucks, 284light-duty vehicles, 273light heavy-duty trucks, 283light trucks, 273, 274–281locomotives, 288–289marine engines, 290–291medium-duty passenger vehicles, 282motorcycles, 285
lead, 301, 468nitrogen oxides, 273–294, 296particulate emissions, 273–284, 288, 298, 299in reformulated gasoline engines, 294sulfur dioxide, 300, 467, 468
Experimental aircraft, 18Explosives
detected at airports, 125, 429shipments, 78
Exports. See International trade
FFAA Statistical Handbook of Aviation, 409, 417Fatalities
air transportation, 99, 117, 326, 327, 429commuter carrier, 119, 121general aviation, 123, 330on-demand air taxi, 122, 326, 327by phase of operation, 121
bicyclist, 99, 108, 132, 133buses, 99, 108, 132, 138, 148–153, 345–346comparison across modes, 433data sources, 429–435distribution by mode, 99–100, 108–109grade crossing, 99, 108, 110, 355hazardous materials-related, 111highway, 334motorcycle, 99, 108, 132, 135, 338motor vehicle, 99, 108, 129
alcohol involvement, 133, 139circumstances and conditions, 141by highway type, 130–131nonoccupant, 132, 133number of vehicles in accident, 133by posted speed limit, 142prevention, 144, 432by vehicle type, 132
occupational, 113, 166, 429pedestrian, 99pipeline-related, 99, 108, 361, 363railroad, 99, 108, 111, 113, 148–153, 165, 355,
433–434among railroad employees, 166by train-miles traveled, 164, 165by type of accident, 163
recreational boating, 172personal watercraft, 172
transit systems, 99, 108, 147–153, 352,432–433
truck, 99, 108, 132, 136, 342waterborne transportation, 99, 108, 113, 171,
359, 360, 434Federal Aviation Act, 407Federal Aviation Administration, 114, 406,
409–410, 415, 417, 420, 425, 426, 429, 452,463, 470–471Operations Network database, 426, 427
Federal Energy Regulatory Commission, 408,421, 425, 446
Federal governmentcontributions to GDP, 189–192
498 ! Index
Italic page numbers refer to metric conversions.

employment, transportation-related, 213,447–448, 453–455
energy consumption, 253, 391, 464–465exhaust emission standards, 273–291revenues, transportation-related, 223–225,
450–453road ownership, 332spending, transportation-related, 184, 186, 187,
188, 226transit subsidies, 347trust funds, 224, 225, 227, 452, 453See also specific U.S. department or agency
Federal Highway Administration, 114, 410,415–416, 422, 451, 454, 455, 459, 462, 463,468Highway Performance Monitoring System, 403,
404–405, 406, 410, 417–418, 427Federal Maritime Administration, 454Federal Motor Carrier Safety Administration, 408Federal Motor Carrier Safety Regulations, 408Federal Railroad Administration, 114Federal Railroad Commission, 425Federal Reserve Board of Governors, 439, 440Federal Transit Act, 405, 445–446Federal Transit Administration, 114, 405, 407,
411, 413, 416, 418–419, 422, 432, 445, 463,464
Ferries, 347, 348, 349, 350, 351, 352, 357age of vessels, 38passenger-miles traveled, 48, 372vessel miles traveled, 45, 369
Financial services, 189, 190, 191, 192, xviiiFishing, commercial, 356, 359Flammable materials, 78Florida
airports/water ports, 58, 70, 71international trade gateways, 66, 67roadway congestion, 89, 90, 91
cost values, 92, 93, 94fuel wasted due to, 264, 265, 266, 267, 268,
269urban air pollution, 302, 303, 304, 305urban traffic delays, 86, 87, 88
Food services, 193consumer price indices, 200personal expenditures, 202
Foreign Trade Zones, 75For-hire transportation services, 72, 193, xviii
economic value, 181–182, 189, 190, 191, 192employment, 212–214
Formaldehyde emissions, 273–282France
air passenger arrivals from, 60air passenger departures to, 61motor vehicle production, 26–28
Freight Commodity Statistics, 425Freight transportation
air carrier, 419–420growth, 72revenue tons, 56ton-miles, 64, 325–326, 374
by commodity, 73–74, 423–424data sources, 421–422, 423–424, 440expenditures, 198, 440growth, 72hazardous materials, 77, 78length of haul, 65, 342, 375, 421–422
by commodity, 63–74multiple mode, 72, 77petroleum products, 76
See also Oil pipelinesproducer price indices, 201rail
growth, 72international, 75operating revenues, 353ton-miles, 64, 374vehicle-miles traveled, 45, 369
truck, 340–342growth, 72international, 75number of interstate carriers, 4ton-miles, 64, 341, 374
waterborne, 29, 40–41, 70–71distribution by vessel type, 29domestic, 64, 69, 374, 376fleet characteristics/performance, 29, 40–41,
356–359growth, 72international, 69, 376top ports, 70–71
See also International trade; Tonnage/ton-milesFuel consumption
alternative fuels, 245, 460–461Amtrak, 239, 241, 379, 381aviation, 199, 238, 240, 243, 329, 379, 381,
384, 460federal government, 253, 391
buses, 249, 389data sources, 414, 440–443, 458–465
Index " 499
Italic page numbers refer to metric conversions.

efficiency. See Fuel efficiency/intensityfederal government, 253, 391gas pipeline operations, 363by mode, 238–241, 379–381, 462–464motorcycles, 246, 337, 386motor vehicle, 199, 238, 240, 244, 337, 345,
379, 381, 385, 462highway demand, 334
passenger cars, 246, 337, 386price trends, 199, 200, 440–443railroad, 238, 240, 251, 354, 379, 381, 390,
464taxes, 200, 224, 225, 331transit vehicles, 238, 240, 250, 379, 381, 389trucks, 248, 249, 341, 388wastage due to congestion, 264–269, 465–466water transportation, 239, 241, 358, 379, 381
Fuel efficiency/intensityaircraft, 243, 257, 258, 384, 393, 394Amtrak, 257, 263, 393buses, 249, 345, 389CAFE standards, 261, 398data sources, 465–466highway vehicles, 257, 260, 338, 393, 396motorcycles, 246, 257, 260, 338, 386, 393, 396new truck sales, 25passenger cars, 24, 246, 257, 260, 261, 338,
386, 393, 396, 398imported, 261, 398
railroad, 251, 262, 354, 390, 399transit buses, 257, 262, 393, 399trucks, 25, 248, 249, 261, 341, 388, 398
GGas Facts, 406, 407, 446Gasohol, 245Gasoline, 441
consumer spending, 336cost of operating automobile, 204data sources, 459–460marine vessel consumption, 358personal consumption expenditures, 203price trends, 199, 200transportation consumption, 238, 239, 240,
241, 250, 329, 379, 381, 389, 459–460transportation-related demand, 183, 185, 187,
188, 242, 383Gender
labor force participation rate, xviiipopulation distribution, xvii
traveler characteristics, 54General aviation
aircraft, 13data sources, 409, 412, 417, 429economic indices, 328energy consumption, 240, 381fatalities, 99, 108, 429fleet characteristics, 17–18, 328–329fuel consumption, 238, 329, 379new aircraft, sales/delivery of, 15number of aircraft, 328passenger-miles traveled, 48, 329, 372safety performance, 99, 105, 108, 123, 330, 429vehicle-miles traveled, 45, 329, 369, 417
General Aviation and Air Taxi Activity and Avion-ics Survey, 429, 463
General Aviation and Air Taxi Activity Survey,417
General Aviation and Air Taxi Activity Survey,409
General Aviation Manufacturers Association, 412General Aviation Statistical Databook, 412General Estimates System, 134, 135, 137, 138Georgia
airports/water ports, 58, 66, 71areas not meeting national air quality standards,
307roadway congestion, 89
cost values, 92fuel wasted due to, 264, 267
urban air pollution, 302urban traffic delays, 86
Germanyair passenger arrivals from, 60air passenger departures to, 61motor vehicle production, 26–28new retail car sales to U.S., 22
Glider aircraft, 18Government
expenditures, transportation-related, 23, 184,186, 187, 188, 223, 225, 453–455highway, 331transit systems, 347
marine vessel ownership, 357revenues, transportation-related, 223–225,
450–453highway, 331trust fund balances, 227See also Taxes
vehicle fleet, 20
500 ! Index
Italic page numbers refer to metric conversions.

See also Federal government; State and localgovernment
Grade-crossing accidents and injuries, 99, 102,105, 108, 110, 162, 166, 355
Grand Caymanair passenger arrivals from, 60air passenger departures to, 61
Great Lakes, 356, 358freight transportation
growth, 72short tons, 69, 376
Greeceair passenger arrivals from, 60air passenger departures to, 61
Gross Domestic Demand, 187, 188, 436Gross Domestic Product, xviii
distribution by industry, 189–192for-hire transportation services, 181–182methodology for analyzing, 436–439by social function, 193transportation-related final demand, 183–186,
438–439trends, 194
Guam, air quality, 307Guided vehicles, 148–153
HHaiti
air passenger arrivals from, 60air passenger departures to, 61
Hawaiiairports/water ports, 58, 71roadway congestion, 89
cost values, 92fuel wasted due to, 265, 268
urban air pollution, 303urban traffic delays, 86
Hazardous Materials Regulations, 408Hazardous materials shipments, 453
accidents, 105, 111–112, 435associated fatalities, 99, 108, 111, 435associated injuries, 102, 111, 435by class, 78data sources, 423–424, 435modal distribution, 77by pipeline, 4, 435
accidents, 105associated fatalities, 99, 108associated injuries, 102
Health Care Financing Administration, 436
Health services, 189, 190, 191, 192, 193consumer price indices, 200personal expenditures, 202
Helicopters, 17, 412sales/delivery of, 15
Highway Performance Monitoring System, 403,404–405, 406, 410, 417–418, 427
Highways. See RoadwaysHighway Statistics, 403, 406, 410, 416, 417, 422,
451Highway vehicles
accidents, 105, 430–431hazardous materials-related, 111, 112
data sources, 430–432energy consumption, 238, 239, 240–241, 379,
381, 460–461, 462alternative fuels, 245gasoline demand, 242, 383
exhaust emissions, 296–301, 466–468carbon monoxide, 295lead, 301nitrogen oxides, 296particulate matter, 298, 299sulfur dioxide, 300volatile organic compounds, 297
fatalities, 99, 430alcohol-related, 139occupational, 113
freight transportation expenditures, 198injuries, 102, 430–431
hazardous materials-related, 111miles traveled, 45, 47, 369, 371new, sales/delivery of, 15numbers of, 13passenger-miles traveled, 48, 372See also Buses; Light Trucks; Motorcycles;
Motor vehicles; Passenger cars; Personal-usevehicles; Trucks and trucking
Homicide, 154Hong Kong
air passenger arrivals from, 60air passenger departures to, 61
Household characteristics, xviiiexpenditures on household operations, 202long-distance trips, 51–53, 55
Hydrocarbon emissionsfederal standards, 273–291in reformulated gasoline engines, 294by vehicle type, 292–293
Index " 501
Italic page numbers refer to metric conversions.

IIdaho, 307Illinois
airports/water ports, 58, 70areas not meeting national air quality standards,
307international trade gateways, 66roadway congestion, 90
cost values, 92, 94fuel wasted due to, 266, 269
urban air pollution, 302, 304urban traffic delays, 87
Immigrant population, xviiImports. See International tradeIndia, motor vehicle production, 26–28Indiana
airports/water ports, 59, 71areas not meeting national air quality standards,
307roadway congestion, 89, 90
cost values, 92, 93fuel wasted due to, 264, 265, 267, 268
urban air pollution, 302, 303urban traffic delays, 86, 87
Industry Productivity Measures, 449Injuries
air transportation, 102, 111, 112, 117, 429commuter carrier, 119general aviation, 123on-demand air taxi, 122
bicyclists, 102buses, 102, 138, 148–153data sources, 429–435distribution by mode of transport, 102–103grade crossing, 102, 110, 162hazardous materials-related, 111highway, 334motorcycle, 102, 135motor vehicle, 102, 129, 135, 136, 138pedestrians, 102pipeline-related, 102, 361, 363railroad, 102, 111–112, 148–153, 162, 165,
433–434among railroad employees, 166by train-miles traveled, 164, 165by type of accident, 163
recreational boating, 172personal watercraft, 172
transit systems, 102, 147–153, 352, 432–433truck, 102, 136
waterborne transportation, 102, 111, 112, 171,359, 434
See also FatalitiesInland Waterways Revenue Act, 453Insurance, 203, 336Internal Revenue Service, 436International trade
aircraft sales, 183, 185air freight, 325, 326automobile sales, 22, 183, 185data sources, 422, 423, 424–425gateway cities, 66–67, 68, 422land shipments, 68, 75, 424–425natural gas, 231petroleum, 231transportation-related demand, 183, 185,
438–439value of shipments, 66–67, 422waterborne, 69, 358, 376, 422–423
International Trade Administration, 412, 420International travel
air arrivals/departures, 60, 61, 324, 325air carrier revenue/expenses, 321, 322, 323Canadian border traffic, 62data sources, 420economic value, 183, 185Mexican border traffic, 62waterborne, 356
Interstate Commerce Commission, 417, 420, 421,446
Interstate highways, 334condition, 34, 35fatalities, 130–131system mileage, 7, 8, 332, 333, 368vehicle-miles traveled, 47, 336, 337, 371
Interstate motor carriers, 4, 408Iowa
roadway congestion, 90cost values, 93fuel wasted due to, 265, 268
urban air pollution, 304urban traffic delays, 87
Irelandair passenger arrivals from, 60air passenger departures to, 61
Israelair passenger arrivals from, 60air passenger departures to, 61
Italyair passenger arrivals from, 60
502 ! Index
Italic page numbers refer to metric conversions.

air passenger departures to, 61motor vehicle production, 26–28
JJamaica
air passenger arrivals from, 60air passenger departures to, 61
Japanair passenger arrivals from, 60air passenger departures to, 61motor vehicle production, 26–28new retail car sales to U.S., 22
KKansas
roadway congestion, 89cost values, 93fuel wasted due to, 265, 268
urban air pollution, 303urban traffic delays, 86
Kentuckyareas not meeting national air quality standards,
307roadway congestion, 89, 90
cost values, 92, 93fuel wasted due to, 264, 267, 268
urban air pollution, 302, 303urban traffic delays, 86, 87
Koreaair passenger arrivals from, 60air passenger departures to, 61
LLabor. See EmploymentLicensing and registration
aircraft, 409motor vehicle registration, 244, 246, 248, 249,
336, 410consumer spending, 336state government revenues, 331trucks, 340
recreational boats, 412space launches, 425–426transit vehicles, 249, 250
Lighter-than-air aircraft, 18Light rail. See Railroads, light railLight trucks, 25
accidents, 136data sources, 414exhaust emissions
federal standards, 273–281rates, 292, 293, 294
fatalities, 108, 132, 136fuel consumption, 248, 388
efficiency/intensity, 25, 257, 260, 261, 393,396, 398
injuries, 136safety belt use, 143sales, 25vehicle-miles traveled, 136See also Trucks and trucking
Liquefied petroleum gas, 29, 285Liquid Pipeline Directory, 405, 407Lloyd’s Maritime Information Service, 411–412,
413, 415Lloyd’s Register, 411–412, 413, 415Local government. See State and local governmentLocal travel
employment, 212, 215, 216, 217, 218expenditures, 198trucking operations, 340See also Commuter travel; Transit vehicles/systems
Long-distance travelby calendar quarter, 51data sources, 419by distance traveled, 51household characteristics, 55household trips, 51–53person-miles, 51–55person trips, 51–55by purpose of trip, 52traveler characteristics, 54–55travel party characteristics, 52trip duration, 53types of lodging used, 53vehicle miles, 51–55vehicle trips, 51–55by vehicle type, 51See also International travel
Louisianaairports/water ports, 58, 70international trade gateways, 66, 67roadway congestion, 90
fuel wasted due to, 265, 268urban air pollution, 302, 304urban traffic delays, 87
MMail and parcel shipments
air carrier revenue tons, 56
Index " 503
Italic page numbers refer to metric conversions.

growth, 72hazardous materials, 77international, 75
MaineCanadian border crossings, 62port tonnage, 71
Maintenance and repair, including partsautomobile costs, 204automobile spending, 336employment trends in transportation industries,
213marine vessels, 356motor vehicle-related employment, 336natural gas pipeline, 362personal consumption expenditures, 203
Malaysia, motor vehicle production, 26–28Manufacturing sector
economic indices, 189, 190, 191, 192, xviiitransportation equipment
employment trends, 213producer price index, 201
Marine Safety Information System, 434, 469Marine vessels, 13, 29
accidents, 105, 111, 112, 171, 434See also Marine vessels, fatalities; Marine ves-
sels, injuriesbarge, 40, 41, 356, 359containerships, 29data sources, 408, 411–412, 413, 415, 417dry cargo, 40, 41employees
injuries and fatalities, 113in manufacturing and repair, 213, 356
energy consumption, 238, 240, 358, 379, 381,464
exhaust emissionscarbon monoxide, 295nitrogen oxides, 296particulate matter, 298, 299standards, 290–291sulfur dioxide, 300volatile organic compounds, 297
fatalities, 99, 108, 171, 359, 360, 434among employees, 113
fleet characteristics, 29, 356–357, 413, 415, 417freighters, 29government owned, 357hazardous materials incidents, 111, 112injuries, 102, 111, 112, 171, 434long-distance travel characteristics, 51
manufacturing and repair, employment trends,213, 356
merchant fleet, 15, 29, 357, 415new, sales/delivery of, 15number of, 13, 40–41, 356–357, 411–412number of operators, 4, 356, 408passenger, 40, 41, 356, 357, 359petroleum spills, 315producer price indices, 201roll-on/roll-off, 29sail, 360tankers, 29, 40, 41, 315, 356, 357, 358, 359towboats, 40, 41See also Recreational boating; Waterborne
transportationMaritime Administration, 411, 413, 415, 423,
454Maryland
airports/water ports, 58, 70areas not meeting national air quality standards,
307international trade gateways, 66roadway congestion, 89, 91
cost values, 92, 94fuel wasted due to, 264, 266, 267, 269
urban air pollution, 302, 305urban traffic delays, 86, 88
Massachusettsairports/water ports, 58, 70areas not meeting national air quality standards,
307international trade gateways, 67roadway congestion, 89, 90
cost values, 92, 93fuel wasted due to, 264, 266, 267, 269
urban air pollution, 302, 304, 305urban traffic delays, 86, 87
Medium-duty passenger vehicles, 282Merchant fleet, U. S., 29, 357, 411–412, 413, 415Merchant Fleets of the World, 411, 413Methanol fuel, 245, 285, 461Methyl-tertiary-butyl-ether, 245, 460–461Metric conversions, 367–399Metropolitan areas. See Urban areasMexico
air passenger arrivals from, 60air passenger departures to, 61data sources, 424–425land freight shipments
border crossings, 68
504 ! Index
Italic page numbers refer to metric conversions.

value, 75land-passenger border crossings, 63motor vehicle production, 26–28
Michiganairports/water ports, 58, 71Canadian border crossings, 62international trade gateways, 66, 68roadway congestion, 89
cost values, 92fuel wasted due to, 264, 267
urban air pollution, 302, 303urban traffic delays, 86
Mileage. See Passengers-miles traveled; Systemmileage; Vehicle-miles traveled
Mining industries, 189, 190, 191, 192, xviiiMinnesota
airports/water ports, 58, 70, 71areas not meeting national air quality standards,
307Canadian border crossings, 62international trade gateways, 68roadway congestion, 90
cost values, 93fuel wasted due to, 265, 268
urban air pollution, 303urban traffic delays, 87
Mississippiport tonnage, 70roadway congestion
cost values, 93fuel wasted due to, 265
urban air pollution, 303urban traffic delays, 87
Missouri, 58areas not meeting national air quality standards,
307port tonnage, 70roadway congestion, 89, 90
cost values, 93, 94fuel wasted due to, 265, 266, 268, 269
urban air pollution, 303, 304urban traffic delays, 86, 87
Montanaareas not meeting national air quality standards,
307–308international trade gateways, 67
Monthly Survey of Industrial Electricity Use, 440Motor Carrier Management Information System,
408Motor Carrier Safety Improvement Act, 408
Motorcycle Industry Council, Inc., 413Motorcycles
accidents, 105, 135, 338See also Motorcycles, fatalities; Motorcycles,
injuriesdata sources, 413exhaust emissions
federal standards, 285rates, 292, 294
fatalities, 99, 108, 132, 135, 338fuel economies, 246, 257, 260, 337–338, 386,
393, 396helmet use, 143, 144injuries, 102, 135
See also Motorcycles, fatalitieslicensing and registration, 336as means of transport to work, 50new, sales/delivery of, 15number of, 13passenger-miles traveled, 48, 337, 372producer price indices, 201vehicle-miles traveled, 45, 246, 336, 337, 369, 386
accident and injury rate, 135Motor Vehicle Facts, 412Motor vehicles
accidents, 105, 129, 430–431alcohol involvement, 133, 139circumstances and conditions, 141by posted speed limit, 142at railroad crossings, 99, 102, 105, 108, 110,
162See also Motor vehicles, fatalities; Motor vehi-
cles, injuriesage of vehicles, 33data sources, 410–411, 430–432, 459–460employment related to, 336energy consumption, 240, 381fatalities, 99, 108, 129, 430
alcohol involvement, 133circumstances and conditions, 141effectiveness of restraint devices, 144, 431by highway type, 130–131number of vehicles in accident, 133occupant/nonoccupant, 132, 133by posted speed limit, 142by vehicle type, 132
fleet characteristics, 20fuel consumption, 238, 244, 334, 337–338,
379, 385, 414, 459–460federal government, 253, 391
Index " 505
Italic page numbers refer to metric conversions.

fuel prices, 199, 200grade-crossing accidents and injuries, 99, 102,
105, 108, 110, 162injuries, 102, 129, 135, 136, 138, 162, 430–431
See also Motor vehicles, fatalitieslicensing and registration, 336long-distance travel characteristics, 51–55as means of transport to work, 50number of, 410–411passenger-miles traveled, 48, 337, 372passenger restraints, 143, 144, 431personal consumption, 183, 185, 187, 188
expenditures, 203producer price indices, 201production, 21, 26–28, 414
employment trends, 213professional operators, 215, 217repair expenditures, 203sales, 15, 21–25, 414scrapped, 318, 471vehicle-miles traveled, 45, 336–337, 369
accident and injury rate, 129See also Buses; Highway vehicles; Motorcycles;
Passenger cars; Personal-use vehicles; Trucksand trucking
NNational Automotive Dealers Association, 414National Bicycle Dealers Association, 413National Bridge Inventory Database, 416National Highway Traffic Safety Administration,
114, 134, 137, 138, 430–431, 432, 454National Income and Product Accounts, 436, 438,
449National Occupant Protection Use Survey, 431National Plan of Integrated Airport Systems, 415National Transit Database, 405, 407, 411, 413,
416, 418–419, 422, 432–433, 445, 463, 464National Transportation Safety Board, 429Nationwide Personal Transportation Survey,
418–419, 462Natural gas
compressed, 238, 240, 245, 250, 379, 381, 389consumption, 231, 237, 238, 239, 240, 241,
379, 381, 461federal government, 253, 391motor vehicle, 245, 250, 389
international trade, 231liquefied, 245merchant fleet, 29
motor vehicle emissions standards, 285pipelines
accidents, 102, 105, 363, 435associated fatalities, 99, 108, 363, 435associated injuries, 102, 363, 435data sources, 406, 407, 408, 435, 446economic indices, 362employment trends, 212, 362fuel consumption, 363number of operators, 4, 362operating revenue, 211production, 363system mileage, 3, 9, 362, 367, 406, 407
production, 231Navigation Data Center, 408, 411, 417Near Midair Collisions Systems database, 429Nebraska
areas not meeting national air quality standards,308
roadway congestion, 90cost values, 93fuel wasted due to, 265, 268
urban air pollution, 304urban traffic delays, 87
Netherland Antillesair passenger arrivals from, 60air passenger departures to, 61
Netherlandsair passenger arrivals from, 60air passenger departures to, 61motor vehicle production, 26–28
Nevada, 58areas not meeting national air quality standards,
308roadway congestion, 90
cost values, 93fuel wasted due to, 265, 268
urban air pollution, 303urban traffic delays, 87
New Hampshire, 302New Jersey
airports, 58areas not meeting national air quality standards,
308international trade gateways, 66port tonnage, 70roadway congestion, 90
cost values, 93fuel wasted due to, 265, 268
urban air pollution, 302, 303, 304
506 ! Index
Italic page numbers refer to metric conversions.

urban traffic delays, 87New Mexico
areas not meeting national air quality standards,308
roadway congestion, 89cost values, 92fuel wasted due to, 264, 267
urban air pollution, 302urban traffic delays, 86
New York stateairports/water ports, 58, 70areas not meeting national air quality standards,
308Canadian border crossings, 62international trade gateways, 66, 67, 68roadway congestion, 89
cost values, 92fuel wasted due to, 264, 265, 266, 267, 269
urban air pollution, 302, 304, 305urban traffic delays, 86, 87
Nitrogen oxide emissionsfederal standards, 273–291vehicle rates, 296, 467
in reformulated gasoline engines, 294by vehicle type, 292–293
Noise exposuredata sources, 470–471high noise areas, 317highway noise barrier construction, 316, 470
North Carolina, 58roadway congestion, 89
cost values, 92fuel wasted due to, 264, 267
urban air pollution, 303, 304urban traffic delays, 86
North Dakota, 67, 68
OOak Ridge National Laboratory, 414Occupational Employment Statistics, 448–449Office of Airline Information, 407, 417, 419, 420,
422, 427, 429, 445, 463Office of Airport Safety and Standards, 406Office of Management and Budget, 450Office of Pipeline Safety, 408, 435, 453Ohio
airports/water ports, 58, 59, 71areas not meeting national air quality standards,
308international trade gateways, 66
roadway congestion, 89cost values, 92fuel wasted due to, 264, 267
urban air pollution, 302, 305urban traffic delays, 86
Oil. See Oil pipelines; PetroleumOil Pipeline Research Institute, 405, 407, 446Oil pipelines
crude, 9, 65, 76, 361, 375, 377data sources/analysis, 405–406, 407, 421, 422,
425, 446employment, 361expenditures, 198labor productivity, 219leaks/spills, 315length of haul, 65, 361, 375, 422number of operators, 361operating revenue, 211, 361revenue per ton-mile, 210safety performance, 361system mileage, 3, 9, 361, 367
data sources, 405–406, 407ton-miles of product, 64, 76, 361, 374, 377,
421Oklahoma
roadway congestion, 90cost values, 93fuel wasted due to, 265
urban air pollution, 304, 305urban traffic delays, 87
Operations Network database, 426, 427Oregon
airports/water ports, 58, 70areas not meeting national air quality standards,
308international trade gateways, 67roadway congestion, 89, 90
cost values, 93fuel wasted due to, 264, 266, 267, 269
urban air pollution, 304urban traffic delays, 86, 87
PPanama Republic
air passenger arrivals from, 60air passenger departures to, 61
Parcels. See Mail and parcel shipmentsParticulate emissions, 467–468
federal standards, 273–284, 288trends, 298, 299
Index " 507
Italic page numbers refer to metric conversions.

Passenger carsaccidents, 105, 134, 338
See also Passenger cars, fatalities; Passengercars, injuries
age of vehicles, 33, 415Canadian border crossings, 62commuter characteristics, 50consumer spending, 336cost of owning and operating, 204, 445data sources, 414, 415, 430–432, 445exhaust emissions
federal standards, 273rates, 292, 293, 294
fatalities, 99, 108, 132, 133, 134, 338fleet characteristics, 20, 414fuel consumption, 238, 240, 246, 337, 379,
381, 386efficiency/intensity, 24, 246, 257, 260, 338,
386, 393, 396, 465injuries, 102, 134
See also Passenger cars, fatalitieslicensing and registration, 336long-distance trip characteristics, 51Mexican border crossings, 63number of, 13passenger-miles traveled, 48, 337, 372personal consumption expenditures, 203person-hours of traffic delay, 86–88purchase expenditures, 197safety belt use, 143, 144use characteristics, 20
work commute, 50vehicle-miles traveled, 45, 246, 336, 337, 369,
386accident and injury rate, 134
vehicle production, 21vehicle sales, 15, 21–24, 414vehicle size, 24world production, 26See also Motor vehicles; Personal-use vehicles
Passenger-miles traveledair, 48, 51, 323, 372, 417
fuel economies, 257, 258, 294, 393general aviation, 329revenues per, 209
Amtrak, 48, 354, 372fuel economies, 257, 263, 393
data sources, 417–419fuel consumption, 257, 258, 260, 262, 263,
393, 394, 396, 399
highway, 48, 51, 337, 341, 345, 372fuel economies, 257, 260, 393, 396revenues per, 209
long-distance trip characteristics, 51–55passenger revenue, 209rail, 48, 51, 373
revenues per, 209transit, 48, 348, 350, 372
fuel economies, 257, 262, 393, 399revenues per, 209, 348
traveler characteristics, 54–55trip characteristics, 51–53, 65, 375by vehicle type, 48, 372water transport, 51
Pedalcycles. See BicyclesPedestrian traffic, 50
Canadian border crossings, 62fatalities, 99, 108, 132, 133injuries, 102Mexican border crossings, 63
Pennsylvaniaairports/water ports, 58, 70areas not meeting national air quality standards,
308–309international trade gateways, 67port tonnage, 71roadway congestion, 90
cost values, 93fuel wasted due to, 265, 266, 268
urban air pollution, 302, 303, 304, 305urban traffic delays, 87
Personal-use vehiclesage of vehicles, 20Canadian border crossings, 62consumer spending, 336fleet characteristics, 20long-distance travel characteristics, 51Mexican border crossings, 63number of, 13sales, 15use characteristics, 20See also Light trucks; Motorcycles; Motor vehi-
cles; Passenger carsPetroleum
consumption, 231, 237, 238, 239, 240, 241,379, 381federal government, 253, 391
data sources, 425, 457–458demand, by economic sector, 233, 378, 459energy demand met by, 232
508 ! Index
Italic page numbers refer to metric conversions.
highway demand, 334international trade, 231production, 231, 457–458spills and leaks, 315, 469–470transportation
by mode, 76, 425waterborne, 29, 76
See also Oil pipelinesPetroleum Supply Annual, 425Philippines
air passenger arrivals from, 60air passenger departures to, 61
Pipelines, 72accidents, 102, 105associated fatalities, 99, 108associated injuries, 102data sources, 408economic value, 181, 182employment trends, 212, 450
productivity, 219wages and salaries, 216, 218
energy consumption, 238, 240, 379, 381federal expenditures, 226, 455federal revenues from, 224, 225, 453gas. See Natural gas, pipelineshazardous liquid, 4, 99international shipments, value of, 75leaks/spills, 315number of operators, 4oil. See Oil pipelinesproducer price indices, 201
Poland, motor vehicle production, 26–28Police
air travel-related arrests, 125, 429fleet characteristics, 20motor vehicle accident reports, 430
Pollutionareas not meeting national air quality standards,
306–310noise, 317petroleum spills, 315storage tank leaks, 316urban air quality trends, 302–305See also Exhaust emissions
Population, U.S., xviihouseholds, xviiilabor force, xviiitraveler characteristics, 54–55trends, 194See also Demographics
PortsCanadian gateways, 68, 75data sources, 422–423federal trust fund, 227harbor maintenance, 227Mexican gateways, 68, 75top tonnage ports, 70–71, 423top trade gateways, 66–67, 422waterborne tonnage, 70–71, 357–358See also Airports
Portugal, motor vehicle production, 26–28Postal services. See Mail and parcel shipmentsProducer price indices, 201, 210, 443–444Productivity, in transportation sectors, 219,
449–450Property damage, accidents
in hazardous materials incidents, 112in railroad accidents, 110, 165recreational boating accidents, 172reporting thresholds, 114transit accidents, 147waterborne transportation accidents, 171
Public transportationattendants, 215, 217use characteristics, 50See also Transit systems
Puerto Ricoairports/water ports, 58, 71areas not meeting national air quality standards,
309urban air pollution, 304, 305
RRace/ethnicity, traveler characteristics, 54Radioactive materials, 54Railroad Facts, 403, 411, 416, 419, 421, 464, 465Railroad Freight Rate Index, 408, 419, 421Railroads
accidents, 105, 165, 433–434distribution by type, 163hazardous material-related, 111–112by train-miles traveled, 165transit systems, 148–153See also Railroads, fatalities; railroads, injuries
Canadian border crossings, 62, 68car-miles traveled, 45, 251, 354, 369, 390, 419data sources/analysis, 403, 407, 411, 413, 416,
419, 421, 425, 433–434, 446, 464economic value, 181, 182employees
Index " 509
Italic page numbers refer to metric conversions.

injuries and fatalities, 113, 166, 355productivity, 219trends, 212, 213, 215, 353wages and salaries, 216–218
equipment manufacturingemployment trends, 213producer price index, 201
exhaust emissionscarbon monoxide, 295nitrogen oxides, 296particulate matter, 298, 299standards, 288–289sulfur dioxide, 300volatile organic compounds, 297
fatalities, 99, 108, 165, 355, 433–434among employees, 113, 166, 355hazardous material-related, 111by train-miles traveled, 164, 165transit systems, 148–153by type of accident, 163
federal expenditures, 226, 454–455freight, 421
expenditures, 198fuel economies, 262, 399growth, 72hazardous materials, 77length of haul, 65, 354, 375new vehicles, sales/delivery of, 15number of international gateway crossings, 68number of vehicles, 13oil/petroleum products, 76, 377, 425operating revenues, 353revenue per ton-mile, 210ton-miles transported, 64, 354, 374vehicle-miles traveled, 45, 369
fuel consumption, 238, 240, 251, 379, 381,390, 464efficiency/intensity, 251, 262, 354, 390, 399,
465grade crossing accidents and injuries, 99, 102,
105, 108, 110, 162, 355hazardous materials shipments, 77, 111, 112heavy rail systems
accidents and injuries, 148–153age of vehicles, 38criminal behavior in, 154–158new vehicles, sales/delivery of, 15number of vehicles, 13passenger-miles traveled, 48, 372system mileage, 3
transit, 347, 348, 349, 350, 351, 352vehicle-miles traveled, 45, 369
injuries, 102, 162, 165, 433–434among employees, 162, 166hazardous material-related, 111–112by train-miles traveled, 164, 165transit systems, 148–153by type of accident, 163See also Railroads, fatalities
light railaccidents and injuries, 148–153age of vehicles, 38average trip length, 351criminal behavior in, 154–158economic indices, 347, 348energy consumption, 351, 352new vehicles, sales/delivery of, 15number of vehicles, 13passenger-miles traveled, 48, 350, 372system mileage, 3, 367vehicle-miles traveled, 45, 369
locomotive fleet characteristics, 39, 416long-distance travel characteristics, 51Mexican border crossings, 63, 68number of operators, 4, 353, 407–408number of stations, 8, 407number of vehicles, 13, 353, 411operating expenses, 353operating revenue, 211, 353, 446passenger expenditures, 197, 353, 446passenger-miles traveled, 48, 372personal consumption expenditures, 203petroleum products transport, 76, 377producer price indices, 201system mileage, 3, 353, 367, 403train-miles traveled, 45, 165, 251, 369, 390,
419accident and injury rates, 164, 165, 166
transit systemage of vehicles, 38economic indices, 347, 348inventory, 349new vehicles, sales/delivery of, 15number of vehicles, 13passenger-miles traveled, 48, 350, 372stations served, 8, 368system mileage, 3, 367vehicle-miles traveled, 45, 369
See also Amtrak; Commuter rail transportationRailroad Ten-Year Trends, 407
510 ! Index
Italic page numbers refer to metric conversions.

Rape, 154Recreational boating
accidents, 105, 172alcohol-related incidents, 172data sources, 412, 434fatalities, 99, 108, 172, 359, 360injuries, 102, 172, 359new vessels, sales/delivery of, 15number of vessels, 13, 357
accident and injury rates, 172personal watercraft, 172, 290, 434
Recreational vehicles, 15Recycling
scrap motor vehicles, 318, 471waste emissions, 295–301
Rental vehicle fleet, 20Repairs. See Maintenance and repair, including partsResearch and Special Programs Administration,
114, 408, 435, 453Revenues, transportation
air carrier, 321Amtrak, 353, 354buses, 344data sources, 445–446foreign trade gateways, 66–67freight, 210
by commodity, 73–74growth, 72top foreign trade gateways, 66–67
government. See Government, revenuesimports
from Canada, 75from Mexico, 75
natural gas pipelines, 362oil pipeline, 210, 211, 361operating, 211, 321, 353, 356, 446passenger, 209rail, 211, 353, 416, 446transit systems, 347–348trucking, 211, 340waterborne transportation, 211, 356
Rhode Islandroadway congestion, 90
cost values, 93fuel wasted due to, 266, 269
urban air pollution, 304urban traffic delays, 87
R.L. Polk, Co., 414, 415, 471Roadways
accidents, 334
bridges, 37condition, 34–36, 37, 333, 415–416congestion, 427–428
cost values, 92–94fuel wastage associated with, 264–269,
465–466index, 89–91
data sources/analysis, 403, 406, 415–416,427–428
employment, in construction/operations, 213,333
fatalities, 130–131, 334functional classification, 332–333
distribution, 7, 8fatality rate, 130–131
government ownership, 332government revenues/expenses, 331, 452–453, 454injuries, 334noise barrier construction, 316passenger-miles traveled, 48, 51, 209, 337, 341,
345, 372petroleum demand, 334rail crossing accidents and injuries, 99, 102,
105, 108, 110, 162, 166speed limits, 142system mileage, 3, 6, 7, 8, 332–333, 367, 368
data sources, 403, 406urban traffic delays, 86–88vehicle-miles traveled, 47, 334, 341, 344, 371,
417–418Robbery, 154Romania, motor vehicle production, 26–28Rural areas
bridges, 37population, xviiroadways
conditions, 34–35, 37, 333fatalities, 130–131government ownership, 332miles of road, 7, 8, 332, 333, 368vehicle-miles traveled, 47, 334, 336, 337, 341,
344, 371Russia
motor vehicle production, 26–28space launches, 79
SSafety belt use, 143, 144, 431, 432School buses, 197, 212, 344, 345Scrap
Index " 511
Italic page numbers refer to metric conversions.

freight shipments, 74motor vehicle, 318, 471
Service industryeconomic indices, 189, 190, 191, 192, xviiitransportation-related, 201, 212, 216
Sex offenses, 154, 156Shifts in Petroleum Transportation, 421Smoke opacity standards, 282–284, 288Socioeconomic status
household income, 55, xviiitrip/traveler characteristics, 55
South Carolinainternational trade gateways, 66port tonnage, 71urban air pollution, 302, 303
South Korea, motor vehicle production, 26–28Space launches, 79, 425–426Spain
air passenger arrivals from, 60air passenger departures to, 61motor vehicle production, 26–28
Speed limits, motor vehicle, 142State and local government
contributions to GDP, 189–192DUI/DWI legislation, 140employment, transportation-related, 213, 333,
447–448expenditures, transportation-related, 184, 186,
187, 188, 454, 455revenues, transportation-related, 223, 450–451,
452–453highway, 331licensing and registration, 331, 336
road ownership, 332transit subsidies, 347
Statistical Abstract of the United States, 439Statistical Handbook of Aviation, 420Storage tank leaks, 316Substance abuse. See Alcohol-related incidents;
Drug abuseSulfur dioxide emissions, 300, 467, 468Supplement to Producer Price Indexes, 443Surface Transportation Board, 403, 407–408,
416, 421, 446, 464, 465Survey of Current Business, 436, 449, 451Sweden, motor vehicle production, 26–28Switzerland
air passenger arrivals from, 60air passenger departures to, 61
System mileage
Amtrak, 3, 353, 367data sources/analysis, 403–406gas pipeline, 3, 9, 362, 367highway/roadway, 3, 6, 7, 8, 332–333, 367navigable channels, 3, 356, 367oil pipeline, 3, 9, 361, 367rail, 3, 353, 367transit, 3, 367
TTaiwan, 60, 61
motor vehicle production, 26–28Tanker ships, 29, 40, 41, 76, 315, 356, 357, 358,
359, 377Taxes
data sources, 452–453fuel, 200, 224, 225, 331, 462natural gas pipeline, 362transportation-related revenues, 223–225, 340See also Government, revenues, transportation-
relatedTaxis
consumer spending, 336employment trends, 212, 215fleet characteristics, 20as means of transport to work, 50personal consumption expenditures, 203See also Demand responsive transit
Tennesseeairports/water ports, 58, 71areas not meeting national air quality standards,
309roadway congestion, 90
cost values, 93fuel wasted due to, 265, 268
urban air pollution, 303, 304urban traffic delays, 87
Texasairports/water ports, 58, 59, 70areas not meeting national air quality standards,
309international trade gateways, 66, 67, 68Mexican border crossings, 63port tonnage, 71roadway congestion, 89, 90
cost values, 92, 93fuel wasted due to, 264, 265, 266, 267, 269
urban air pollution, 302, 303, 305urban traffic delays, 86, 87
Texas Transportation Institute, 427, 428, 465–466
512 ! Index
Italic page numbers refer to metric conversions.

Theft, 155Tires, 203, 204, 336Tolls, 203Tonnage/ton-miles
air, 56, 64, 374data sources, 420hazardous materials transport, 77revenues, 210
all modes, 64growth, 72hazardous materials transport, 77petroleum, 76, 377revenues, 210
by commodity, 73–74data sources, 420–421, 423–424freight revenue tons, 56, 354freight ton-miles, 64, 374
revenue per ton-mile, 210growth, 72hazardous material transport, 77, 78mail, 56, 72national trends, 194petroleum products, 64, 76, 374, 377pipelines, 64, 374
data sources, 420petroleum, 64, 76, 374, 377revenues, 210
rail, 64, 354, 374data sources, 420growth, 72hazardous materials transport, 77petroleum, 76, 377revenues, 210
revenues, 210truck, 64, 341, 374
data sources, 420growth, 72hazardous materials transport, 77petroleum, 76, 377revenues, 210
waterborne, 64, 69, 357–358, 374, 376data sources, 420growth, 72hazardous materials transport, 77petroleum, 76, 377revenues, 210top U.S. ports, 70–71
Towboats/tugboats, 40, 41, 357, 359Toxic material shipments, 78Traffic Monitoring Guide, 417–418
Trains. See RailroadsTransborder Surface Freight Data, 424Transit vehicles/systems
accidents/incidents, 105, 147–153, 352,432–433
age of vehicles, 38, 416average trip length, 351data sources/analysis, 405, 411, 413, 416,
418–419, 432–433, 445–446, 464demand responsive, 197
accidents and injuries, 148–153criminal behavior in, 154–158economic indices, 347, 348
economic indices, 181, 182, 211, 347–348,445–446
employment trends, 212, 349wages and salaries, 216–218
energy consumption, 238, 240, 250, 351–352,379, 381, 389efficiency/intensity, 257, 262, 393, 399, 465
fatalities, 99, 108, 147–153, 345, 352, 432–433government expenditures, 226, 347, 454government revenues, 453injuries, 102, 147–153, 352, 432–433new vehicles, sales/delivery of, 15number of systems, 349number of vehicles, 13, 349, 411operating expenses, 347–348operating revenue, 211, 347, 445–446passenger fare trends, 205, 348, 445–446passenger-miles traveled, 48, 350, 372personal consumption expenditures, 197, 203,
347, 348system mileage, 3, 367, 405vehicle-miles traveled, 45, 350, 369, 418–419
accident and injury rate, 147, 149–150, 152–153vehicle speed, 351See also specific mode
Transportation Energy Data Book, 414Transportation in America, 405, 407, 420, 421Transport Economics, 421Travel, long-distance. See Long-distance travelTravel agencies, 201Trespassing, 157, 162, 355Trolley buses, 347, 348, 349, 350, 351, 352
age of vehicles, 38new vehicles, sales/delivery of, 15number of, 13passenger-miles traveled, 48, 372vehicle-miles traveled, 45, 369
Index " 513
Italic page numbers refer to metric conversions.

Truck Inventory and Use Survey, 418Trucks and trucking
accidents, 105, 136, 342See also Trucks and trucking, fatalities; Trucks
and trucking, injuriesage of vehicles, 33, 415commercial vehicle production, 21data sources/analysis, 408, 410–411, 414, 415,
420, 421, 425, 446economic indices, 181, 182, 211, 340employment trends, 212, 340
productivity, 219professional operators, 215, 217wages and salaries, 216–218
energy consumption, 240, 381exhaust emissions
federal standards, 283–284rates, 292, 293, 294
fatalities, 99, 108, 132, 136, 342fleet characteristics, 20freight transportation, 420
domestic length of haul, 65, 375expenditures, 198growth, 72hazardous materials, 77intercity ton-miles, 64, 374number of international gateway crossings, 68oil/petroleum products, 76, 377, 425revenue per ton-mile, 210
fuel consumption, 238, 248, 249, 341, 379, 388efficiency/intensity, 25, 248, 249, 341, 388
hazardous materials shipments, 77injuries, 102, 136
See also Trucks and trucking, fatalitiesinterstate carriers, number of, 4, 408labor productivity, 219length of haul, 342number of, 13, 410–411number of commercial establishments, 340oil transport, 76, 377operating revenue, 211passenger-miles traveled, 48, 341, 372personal consumption expenditures, 203producer price indices, 201sales, 15, 25taxes paid, 340use characteristics, 20vehicle-miles traveled, 45, 248, 249, 341, 342,
369, 388accident and injury rate, 136
See also Light trucksTrust funds, federal, 224, 225, 227, 331, 452, 453Tugboats, 40, 41, 357, 359Turkey, motor vehicle production, 26–28
UUniform Statistical Report, 406, 407United Kingdom
air passenger arrivals from, 60air passenger departures to, 61motor vehicle production, 26–28
Urban areasair pollution trends, 302–305, 468bridges, condition of, 37population distribution, xviipopulation trends, xviiroadways
conditions, 35–36, 333congestion, 89–91, 264–269, 427–428, 466fatalities, 130–131government ownership, 332miles of road, 7, 8, 332, 333traffic delays, 86–88vehicle-miles traveled, 47, 334, 336, 337, 341,
344, 371See also specific state
Urban Roadway Congestion Annual Report, 427U.S. Army Corps of Engineers, 405, 408, 411,
417, 421, 423, 425, 446, 454U.S. Coast Guard, 114, 408, 411, 412, 434, 469,
470search and rescue efforts, 173, 434
U.S. Customs Service, 423, 425U.S. Department of Commerce, 412, 414, 420,
422, 424, 436, 448, 449U.S. Department of Defense, 422, 423, 463,
464–465U.S. Department of Energy, 405, 407, 422, 425,
439, 440, 457, 459, 462, 464, 468U.S. Department of Labor, 443, 447U.S. Department of the Interior, 408, 439U.S. Department of Transportation, 405, 407,
417, 426, 447–448, 449–450, 453See also specific administration, bureau, or office
U.S. Department of Treasury, 422, 424U.S. Environmental Protection Agency, 467, 468,
470Utah, 58
areas not meeting national air quality standards,309
514 ! Index
Italic page numbers refer to metric conversions.

roadway congestion, 90cost values, 93fuel wasted due to, 266, 269
urban air pollution, 304urban traffic delays, 87
Utility vehicles, 20
VVacation and pleasure travel, trip characteristics,
52–53Vandalism, 156Vans/vanpools, 25, 38
accidents and injuries, 148–153average trip length, 351vehicle speed, 351
Vehicle-miles traveledair transport, 45, 369, 417
average length of haul, 65, 375fuel consumption, 243, 384general aviation, 329, 417revenue miles, 322safety performance, 117, 119
Amtrak, 354data sources, 417–419fuel consumption, 243, 244, 246, 248–252,
260, 262, 384–389, 399highway, 45, 334, 336–337, 341, 342, 344, 345,
369average length of haul, 65, 375exhaust emission rates, 292–294exhaust emission standards, 273–282fuel consumption, 244, 246, 248, 249, 260,
385–389by roadway type, 47, 336–337, 371safety performance, 129, 134, 135, 136, 138,
338, 342long-distance personal-use, 51–55rail, 45, 354, 369
average length of haul, 65, 375fuel consumption, 251, 262, 390, 399safety performance, 164, 165, 166transit, 350
by roadway type, 47, 336–337, 371transit, 45, 350, 369, 418–419
fuel consumption, 250safety performance, 147
by vehicle type, 45, 369water vessels, 65, 375
Vehicle trips, long-distance personal-use, 51–55Venezuela
air passenger arrivals from, 60air passenger departures to, 61
Vermont, 67Virginia
international trade gateways, 66port tonnage, 70, 71roadway congestion, 90, 91
cost values, 93, 94fuel wasted due to, 265, 266, 268, 269
urban air pollution, 304, 305urban traffic delays, 87
Volatile organic compounds, 297, 467
WWages and salaries, 216–218Wall Street Journal, 414Ward’s Automotive Reports, 414Ward’s Motor Vehicle Facts & Figures, 414Washington, D.C. See District of ColumbiaWashington state
airports/water ports, 58, 70, 71areas not meeting national air quality standards,
309Canadian border crossings, 62international trade gateways, 66, 67roadway congestion, 90, 91
cost values, 93, 94fuel wasted due to, 266, 269
urban air pollution, 304, 305urban traffic delays, 87, 88
Waste. See Exhaust emissions; Recycling; ScrapWaterborne Commerce of the United States, 421,
423, 425Waterborne transportation
accidents, 105, 111, 112, 171age of vessels, 40–41Coast Guard search and rescue efforts, 173coastwise shipping, 64, 65, 69, 374, 375, 376data sources/analysis, 405, 408, 411–412, 413,
417, 421–422, 425, 434, 446, 464domestic freight
length of haul, 65, 375short tons, 69, 376ton-miles, 64, 374
economic value, 181, 182employment trends, 212, 215, 356
wages and salaries, 216–218federal expenditures, 226, 454federal revenues from, 224, 225, 453freight transportation, 421
Index " 515
Italic page numbers refer to metric conversions.

capacity, 358expenditures, 198fleet characteristics/performance, 356, 357,
358, 359length of haul, 358revenues, 356tonnage/ton-miles, 357–358
gasoline demand, 242, 383growth, 72hazardous materials, 77injuries, 102, 171, 359intraport shipping, 64, 65, 69, 357, 374, 375,
376lakewise shipping, 64, 65, 357, 358, 374, 375merchant fleet characteristics, 29oil/petroleum products, 76, 377, 425operating revenue, 211, 356passenger expenditures, 197passenger revenues, 356passenger trip characteristics, 51petroleum products, 76, 377producer price indices, 201safety data, 102, 105, 111, 112, 171, 359, 434tonnage by port, 70–71See also Marine vessels; Recreational boating
Waterborne Transportation Lines of the UnitedStates, 408, 411, 417
Water Pollution Control Act, 434Waterways
data sources, 405navigable channel miles, 3, 356, 367petroleum spills, 315, 469–470
Weapons detected at airports, 125Weather conditions
air transit delays and, 85at time of motor vehicle accidents, 141
West Virginiaareas not meeting national air quality standards,
309port tonnage, 70urban air pollution, 305
Wholesale/retail tradeaircraft sales, 15, 412economic indices, 189, 190, 191, 192, xviiiemployment trends in transportation industries,
213passenger car sales, 22–24, 412, 414
Wisconsinareas not meeting national air quality standards,
309port tonnage, 70roadway congestion, 90
cost values, 93fuel wasted due to, 265, 268
urban air pollution, 303urban traffic delays, 87
World Bank, 416Wyoming
areas not meeting national air quality standards,309
YYugoslavia, motor vehicle production, 26–28
516 ! Index
Italic page numbers refer to metric conversions.

U.S./Metric Conversions
U.S. to Metric
Length (approximate)1 yard (yd) = 0.91 meters (m)1 mile (mi) = 1.61 kilometers (km)
Mass/Weight (approximate) 1 pound (lb) = 0.45 kilograms (kg)1 short ton = 2,000 pounds (lbs) = 0.91 metrictons (t)
Volume (approximate)1 quart (qt) = 0.95 liters (l)1 gallon (gal) = 3.78 liters (l)
Energy Units (approximate)1 British thermal unit (Btu) = 250 calories =1,055 joules (J)1 calorie (cal) = 4.1868 joules (exactly) (J)1 kilowatt hour = 3.6 megajoules (exactly) (mj)1 barrel of oil = 42 U.S. gallons (gal) = 0.16cubic meters (m3)1 quadrillion Btu (Quad) = about 170 millionbarrels (mbbl) of crude oil
Metric to U.S.
Length (approximate)1 meter (m) = 3.28 feet (ft)1 meter (m) = 1.09 yards (yd)1 kilometer (km) = 0.62 miles (mi)
Mass/Weight (approximate)1 gram (gm) = 0.035 ounces (oz)1 kilogram (kg) = 2.21 pounds (lb)1 metric ton (t) = 1,000 kilograms (kg) = 1.1short tons
Volume (approximate) 1 liter (l) = 1.05 quarts (qt)1 liter (l) = 0.26 gallons (gal)
Energy1 joule = 0.24 calories (cal)1 metajoule = 106 joules1 petajoule = 1015 joules1 exajoule = 1018 joules
SOURCE: U.S. Department of Commerce,National Institute of Standards and Technology.
For additional information, contact the U.S.Department of Commerce, Office of MetricPrograms, Washington, DC 20239, (301) 975-3690, Internet site www.nist.gov/metric.

National Tr a n s p o rtation Statistics 2000 p re s e n t sstatistics on the U.S. transportation system, including its physical components, safety re c o rd, economicp e rf o rmance, the human and natural environment, and national security.
Bureau of Transportation Statistics
OUR MISSION
To lead in developing transportation data and inform a t i o nof high quality and to advance their effective use in bothpublic and private transportation decisionmaking.
OUR VISION FOR THE FUTUREData and information of high quality will support everysignificant transportation policy decision, thus advancingthe quality of life and the economic well-being of allAmericans.
TO OBTAIN THIS AND OTHER BTS PUBLICATIONS CONTA C T:
Product ordersPhone 202-366-DATA [press 1]
Fax 202-366-3640Internet www.bts.gov
Mail Product OrdersBureau of Transportation StatisticsU.S. Department of Transportation400 7th Street SW, Room 7412Washington, DC 20590
Information serviceEmail [email protected]
Phone 800-853-1351