1/(l - IN-TECH International Conference on Innovative ...
374
� tl_J_�\_� � IN-TECH2016 PRAGUE, CZECH REPUBLIC 6. - 8. 9. 2016
-
Upload
khangminh22 -
Category
Documents
-
view
0 -
download
0
Transcript of 1/(l - IN-TECH International Conference on Innovative ...

tl_J_Jlj\_Jh_jh_
1/(l
IN-TECH2016 PRAGUE, CZECH REPUBLIC 6. - 8. 9. 2016

International Conference on Innovative Technologies, IN‐TECH 2016,
Prague, 6. ‐ 8. 9. 2016
International Conference on Innovative Technologies
IN-TECH 2016
Prague
Proceedings
IN-TECH 2016
Proceedings of International Conference on Innovative Technologies

International Conference on Innovative Technologies, IN‐TECH 2016, Prague, 6. ‐ 8. 9. 2016
Editors: Zlatan Car – Croatia Jan Kudláček – Czech Republic
IN-TECH 2016 Organization committee:
Zlatan Car – Croatia Jan Kudláček – Czech Republic Tomaž Pepelnjak – Slovenia Leon Šikulec – Croatia Petr Drašnar – Czech Republic Michal Zoubek – Czech Republic Michal Pakosta – Czech Republic Jelena Višnić – Croatia Nadija Surać – Croatia
Publisher: Faculty of Engineering University of Rijeka
Printed by: TISK AS, s.r.o., Jaroměř, Czech Republic
Printed in 100 copies.
IN-TECH 2016 International Conference on Innovative Technologies
runs from 6. 9. 2016 to 8. 9. 2016 in Prague, Czech Republic.
E-mail: [email protected]: http://www.in-tech.info
ISSN 1849-0662

International Conference on Innovative Technologies, IN‐TECH 2016, Prague, 6. ‐ 8. 9. 2016
SPONSORS & SUPPORTERS
CENTRAL EUROPEAN EXCHANGE PROGRAM FORUNIVERSITY STUDIES, NATIONAL CEEPUS OFFICECROATIA HR – 108 Network, http://www.ceepus.info.
ORGANIZED IN COOPERATION BETWEEN:
University of Rijeka Faculty of Engineering
http://www.riteh.uniri.hr/
Czech Technical University in Prague Faculty of Mechanical Engineering,
http://www.fs.cvut.cz

International Conference on Innovative Technologies, IN‐TECH 2016, Prague, 6. ‐ 8. 9. 2016
SCIENTIFIC COMMITTEE
Ali Hashem, O. (Egypt) Bozek, P. (Slovakia) Brdarevic, S. (B & H) Burger, W. (Germany) Car, Z. (Croatia) Carjali, E. (Romania) Carlos Bernardo (Portugal) Castilla Roldán, M. V. (Spain) Cep, R. (Czech Republic) Chen, W. (Netherland) Cizek, J. (Singapure) Cosic, P. (Croatia) Cotetiu, R. (Romania) Crisan, L. (Romania) Czan, A. (Slovakia) Duda, J. (Poland) Durakbasa, N. (Austria) Elhalabi, M. (Egypt) Evin, E. (Slovakia) Frietsch, M. (Germany) Filipović, N. (Serbia) Galvao, J. R. (Portugal) Genis, V. (USA) Gomez, M. E. (Columbia) Greenhut, V. (USA) Guarino, S (Italy) Gyenge, C. (Romania) Hodolič, J. (Serbia) Ivanov, K. (Russia) Jung, J. (Korea) Junkar, M. (Slovenia) Katalinić, B. (Austria) Kiss, I. (Romania) Kocov, A. (Macedonia) Kozak, D. (Croatia) Kreibich, V. (Czech Republic) Kudláček, J. (Czech Republic) Kundrak, J. (Hungary)
Kuric, I. (Slovakia) Kuzman, K. (Slovenia) Kuzmanović, S. (Serbia) Lee, J. H. (Korea) Legutko, S. (Poland) Li, M. (China) Majstorović, V. (Serbia) Makis, V. (Canada) Mamuzić, I. (Croatia) Math, M. (Croatia) Matsuda, H. (Japan) Miltenovic, V. (Serbia) Ohkura, K. (Japan) Ohmura, E. (Japan) Omran, A (Malaysia) Pepelnjak, T. (Slovenia) Plančak, M. (Serbia) Pop-Iliev, R. (Canada) Raos, P. (Croatia) Rucki, M. (Poland) Sankaranarayanasamy, K. (India) Senabre, C. (Spain) Sercer, M. (Croatia) Serpil, K. (Turkey) Suchánek, J. (Czech Republic) Sučić, V. (Croatia) Szalay, T. (Hungary) Tingle, J. (Croatia) Tisza, M. (Hungary) Tomesani L. (Italy) Turkalj, G. (Croatia) Udiljak, T. (Croatia) Ungureanu, N. (Romania) Varga, G. (Hungary) Velay X. (Great Britain) Wilke, M. (Germany) Yashar, J. (Iran) Zivkovic, D. (Serbia)

International Conference on Innovative Technologies, IN‐TECH 2016, Prague, 6. ‐ 8. 9. 2016
INVITED PAPERS
S. A. Meguid NOVEL MULTIFUNCTIONAL NANOCOMPOSITES FOR AEROSPACE, DEFENCE
AND MARINE APPLICATIONS
K. T. Ooi and K. S. Yap INNOVATIONS IN POSITIVE DISPLACEMENT ROTARY COMPRESSOR TECHNOLOGY
A. M. Noor, M. R. Abbas,M. B. Uday
and S. Rajoo
IMPROVING THERMAL EFFICIENCY OF AN AUTOMOTIVE TURBOCHARGER TURBINE WITH CERAMIC THERMAL BARRIER COATING INTO THE INNER
PASSAGE OF THE TURBINE
M. V. Castilla INTEGRATED MULTI-TOOL SYSTEM IN CREATIVE DESIGN FOR SOLAR RADIATION
S. Feustel, S. Cabaand M. Koch
CONTINUOUS FIBER REINFORCED THERMOPLASTIC SHEET BY DIRECT EXTRUSION
M. Petrik and K. Jármai OPTIMIZATION AND COMPARISON OF WELDED I- AND BOX BEAMS
T. Szalay AUTOMATED FIXTURE DESIGN SOLUTIONS FOR MACHINING AND FOR WELDING
W. Arrasmith,B. Webster and F. Saqib
SOFTWARE DOMINANT UNCONVENTIONAL OPTICAL IMAGING THROUGH ATMOSPHERIC TURBULENCE WITH ADVANCES TOWARDS REAL-TIME,
DIFFRACTION-LIMITED PERFORMANCE
M. Ruckiand N.E.A. Crompton
TWO LEGS BALANCING ROBOT PROBLEMS: COMPARISON OF HUMAN AND APE CONSTRUCTIONAL DETAILS
M. Zoubek, T. Moulis,J. Kudláček, F. Herrman
and Z. Car
POTENTIAL OF ANTICORROSIVE PROTECTION OF COATING SYSTEMS CONTAINING MAGNESIUM PIGMENTS
S. Blazevic, S. Braut,Z. Car and R. Zigulic
MODIFICATION ON ACTIVE MAGNETIC BEARINGS TEST-RIG FOR IMPLEMENTING DIFFERENT CONTROL ALGORITHMS

International Conference on Innovative Technologies, IN‐TECH 2016, Prague, 6. ‐ 8. 9. 2016

International Conference On Innovative Technologies, IN‐TECH 2016,
Prague, 6. ‐ 8. 9. 2016
CONTENTS
INNOVATIONS IN POSITIVE DISPLACEMENT ROTARY COMPRESSOR TECHNOLOGY
K.T. Ooi and K.S. Yap 1
BASIC ZEOLITES AS ENVIRONMENTALLY FRIENDLY CATALYSTS
R. Ionut-Valentin and S. Ionel 5
NOVEL MULTIFUNCTIONAL NANOCOMPOSITES FOR AEROSPACE, DEFENCE AND MARINE APPLICATIONS
S. A. Meguid 9
EXPERIMENTAL AND ANALYTICAL STUDY OF THE TRANSIENT PROCESS OF INFILTRATION / EXFILTRATION IN WALK-IN COOLERS
K. N. Homayun, K. Kamensky, A Mazyar and R. Faramarzi 13
IMPROVING THERMAL EFFICIENCY OF AN AUTOMOTIVE TURBOCHARGER TURBINE WITH CERAMIC THERMAL BARRIER COATING INTO THE INNER PASSAGE OF THE TURBINE
A.M. Noor, M.R. Abbas, M. B. Uday and S. Rajoo 19
SIMULATION AND DESIGN OF RADIATION SHIELDING AND COLLIMATION SYSTEMS FOR THE PRECISE GAMMA-SPECTROMETRIC EQUIPMENT
O.Jakovlevs, N. Jefremova, V.Gostilo and J.Viba 23
INTEGRATED MULTI-TOOL SYSTEM IN CREATIVE DESIGN FOR SOLAR RADIATION
M. V. Castilla 27
AN APPROACH FOR INCREASING THE RELIABILITY OF PRODUCTION PLANNING IN SINGLE-ITEM PRODUCTION
F. Akhavei and P. Kreuzer 31
CONTINUOUS FIBER REINFORCED THERMOPLASTIC SHEET BY DIRECT EXTRUSION
S. Feustel, S. Caba and M. Koch 35
IMPROVEMENTS OF 2D NUMERICAL MODEL FOR VERTICAL GROUND HEAT EXCHANGERS
F. Cruz-Peragón, P.J. Casanova-Peláez, R. López-García and J.M. Palomar-Carnicero 39
DESIGN AND CONSTRUCTION OF AN EXPERIMENTAL ROTARY DRYER FOR DRYING OF OLIVE MILL WASTES
F.J. Gómez-de la Cruz, J.M. Palomar-Carnicero, P.J. Casanova-Peláez and F. Cruz-Peragón 43
A LITTLE TWO AXES MECHANICAL STRUCTURE FOR GENERAL PURPOSES
J. M. Cano-Martínez, P. J. Casanova-Peláez, J. M. Palomar-Carnicero and F. Cruz-Peragón 47
UNMANNED AIRCRAFT SYSTEM – A FUTURE TECHNOLOGY OF FIRE BRIGADE AND CIVIL PROTECTION
C.A. Dreßler and U. Meinberg 51
EFFICIENT ROAD COMPACTION BASED ON NONLINEAR DYNAMICS
D. Wiss and R. Anderegg 55
ADVANCED MTCONNECT ASSET MANAGEMENT (AMAM)
T. Trautner, F. Pauker and B. Kittl 59
CAN SMART VEHICLE ACCELERATION SYSTEM REDUCE EMISSION FORMATION IN CITY CENTERS? NUMERICAL STUDY OF DIFFERENT ACCELERATION STRATEGIES
L. Lešnik and I. Biluš 63
EMPLOYEE MOTIVATION AS AN INITIATOR IN IMPROVING THE STATE OF QMS - LITERATURE REVIEW
M. Stanojeska, R. Minovski and B. Jovanoski 67
EFFICIENCY IN GREENHOUSE FOR INTELLIGENT MANAGEMENT ENERGY
A. Nabais, R. M. T. Ascenso and J.R. Galvão 71

International Conference On Innovative Technologies, IN‐TECH 2016, Prague, 6. ‐ 8. 9. 2016
PROTOTYPE IMPLEMENTATION OF A PROCESS MODEL FOR MULTIDIMENSIONAL DESIGN AND EVALUATION OF PROCESS CHAINS
D. Grzelak, R. Freund, H. Wiemer and S. Ihlenfeldt 75
AGENT BASED CLOUD SERVICES DISCOVERY
R. M. Alhazmi and F. E. Eassa 79
GENERATIONS OF INNOVATION MODELS AND THEIR CHARACTERISTICS – TOWARDS CREATING A NEW INNOVATION MODEL
Lj. Stefanovska Ceravolo and R. Polenakovikj 85
MODIFICATION ON ACTIVE MAGNETIC BEARINGS TEST-RIG FOR IMPLEMENTING DIFFERENT CONTROL ALGORITHMS
S. Blazevic, S. Braut, Z. Car and R. Zigulic 89
PICTOGRAM PHILOSOPHY (UNTRADITIONAL GRAPHIC LANGUAGE) IN THE DESIGN OF MOVIE POSTER
R. Mahmoud 93
THE INFLUENCE OF WEAVE ON THE PROPERTIES OF SINGLE CURVED FRP-LAMINATES
C. Fiebig, B. Neitzel and M. Koch 97
THE COMPARISON OF NUMERICAL MODELS FOR SIMULATION OF WATER TURBINE
I. Biluš and L. Lešnik 101
STUDY OF INFLUENCE OF GEOMETRY, ROTATIONAL SPEED AND HEAT GENERATED BY WOOD CUTTING ON VIBRATIONS OF CIRCULAR SAW BLADE
N.Anđelić, Z.Car, S.Braut and R. Žigulić 105
CARBON-DIOXIDE GAS SEPARATION FROM INDUSTRIAL FLUE GASES USING AN INNOVATIVE TUBULAR CERAMIC MEMBRANE TECHNOLOGY FOR MITIGATION OF GHG EMISSIONS
B. I. Ismail and R. Feeny 111
PERFORMANCE CHARACTERISTICS OF A SIMULATED GEOTHERMAL HEAT PUMP TECHNOLOGY FOR POTENTIAL HEATING APPLICATIONS AT GOLDCORP-MUSSELWHITE MINE SITE IN NORTHWESTERN ONTARIO, CANADA
B. I. Ismail and A. Abdelrahman 115
OPTIMIZATION AND COMPARISON OF WELDED I- AND BOX BEAMS
M. Petrik and K. Jármai 119
RISK MANAGEMENT IN PETROL STATIONS. PERCEPTIONS OF USERS, WORKERS, AND SAFETY TECHNICIANS
JC. Rubio-Romero, A. López-Arquillos and M. Pardo-Ferreira 123
INFLUENCE OF CUTTING PARAMETERS ON SURFACE ROUGHNESS IN TURNING PROCESS USING TAGUCHI METHOD
D. Begic-Hajdarevic, B. Brdaric, M. Pasic, A. Cekic and M. Mehmedovic 127
WALKING MECHANISM DYNAMICS MODELING AND CONTROLS
E. Kljuno and M. Petrovic 131
135
139
143
NEW POTENTIAL RISKS DUE THE NEARLY SILENT ELECTRIC AND HYBRID VEHICLES. OCCUPATIONAL DRIVERS PERCEPTION
J.C. Rubio-Romero, C. Pardo-Ferreirauras, A. López-Arquillos and F. Galindo-Reyes
OPTIMISATION OF BIOMASS TORREFACTION
Z. Szamosi, H. Bouras, K. Jármai and Z. Siménfalvi
METHOD OF ANALYZING TECHNICAL AND LEGAL CONVERGENCES AT THE LEVEL OF MUNICIPAL WASTE MANAGEMENT FROM THE PERSPECTIVE OF CIRCULAR ECONOMY
V. F. Soporan, A. L. Pop and S. Pădurețu
CASTINGS MANUFACTURE FROM THE PERSPECTIVE OF DIGITAL COMMUNICATION IN VIRTUAL SPACE
M. M. Vescan, V. F. Soporan and A. L. Pop 147

International Conference On Innovative Technologies, IN‐TECH 2016, Prague, 6. ‐ 8. 9. 2016
EXPERIMENTAL RESEARCH OF TENDON SUTURE QUALITY WITH MODIFIED KESSLERS AND CRUCIATE TECHNIQUES
A. Cekic, G. Obradovic and Dj. Begic-Hajdarevic 151
NET AND 5-FORCES ANALYSIS OF HEALTH FUNCTIONAL FOOD INDUSTRY IN SOUTH KOREA
J. Lee, Y. J. Choi 155
SIMULATION OF INDUCTION HEATING-HEAD AND SAMPLE SYSTEM BASED ON DIFFERENT SCHEMATIC MODELS
B. Eckl, C. Blága and K. Beleon 157
PRINCIPLE OF TOOTHED VARIATOR CREATION
K. S. Ivanov, R. K. Koilybaeva, A. D. Dinassylov and B. T. Shingissov 161
THE PROCESS OF AGEING OF BITUMINOUS BINDERS USED IN WATERPROOFING MATERIALS - LABORATORY TEST METHODS
M. Ratajczak and M. Babiak 165
SOFTWARE DOMINANT UNCONVENTIONAL OPTICAL IMAGING THROUGH ATMOSPHERIC TURBULENCE WITH ADVANCES TOWARDS REAL-TIME, DIFFRACTION-LIMITED PERFORMANCE
W. Arrasmith, B. Webster and F. Saqib 169
STRENGTHENING OF ECONOMIC COMPETITIVENESS BY PROMOTING ENERGY EFFICIENCY AND USE OF RENEWABLE ENERGY – CASE OF CROATIA
D. Hruška, J. Bevanda and M. Erić 173
COMPARISON OF MLP NETWORK AND GRAMMATICAL EVOLUTION IN MODELING OF NONLINEAR DYNAMIC SYSTEM
S. Kajan and D. Pernecký 177
SOME ASPECTS OF THE PROFICIENCY TESTING FOR DIMENSIONAL LABORATORIES USING THE GAUGE BLOCKS
A.Softić and H.Bašić 181
PERFORMANCE EVALUATION BY USING OVERALL EQUIPMENT EFFECTIVENESS (OEE): AN ANALYZING TOOL
K. Mahmood, T. Otto, E. Shevtshenko and T. Karaulova 185
TWO LEGS BALANCING ROBOT PROBLEMS: COMPARISON OF HUMAN AND APE CONSTRUCTIONAL DETAILS
M. Rucki and N.E.A. Crompton 189
ASSESSMENT OF THE DEFORMED LAYER DEPTH AND THE TENSIONS IN THE BURNISHING PROCESS WITH STRAIN HARDENING
M. Kowalik, T. Mazur, M. Rucki and Z. Siemiątkowski 193
BACK-PRESSURE UNCERTAINTY ESTIMATION FOR THE AIR GAUGE EXPERIMENTAL RIG
Cz. J. Jermak, M. Jakubowicz, J. Dereżyński and M. Rucki 197
AUTOMATED FIXTURE DESIGN SOLUTIONS FOR MACHINING AND FOR WELDING
T. Szalay 201
TRIP STEEL PROCESSING APPLIED TO LOW ALLOYED STEEL WITH CHROMIUM
L. Kučerová, M. Bystrianský and V. Kotěšovec 205
GLOCAL ADVERTISING A DIFFERENT CONCEPT OF LOCAL & GLOBAL ADVERTISING
N. Ezzat and G. El-Di 209
GESTURE RECOGNITION OF AMERICAN SING LANGUAGE USING KINECT
S. Kajan and D. Pernecký 213
MONITORING OF CHLORINE IN SWIMMING POOL BY FIBRE OPTIC SENSOR
B. Obrovski, J. Bajić, M. Vojinović Miloradov, I. Mihajlović, A. Joža, N. Živančev and M. Živanov 217

International Conference On Innovative Technologies, IN‐TECH 2016, Prague, 6. ‐ 8. 9. 2016
A COMPARATIVE EXPERIMENTAL STUDY OF THE MACHINABILITY OF UD-CFRP USING RIGHT-HAND-CUT AND LEFT-HAND-CUT END MILLS
N. Geier, Gy. Mátyási and T. Szalay 221
CONCEPT, DEFINITION AND STRUCTURE OF THE SYSTEM
A. Macura 225
INVESTIGATION OF THE LIMITS OF RADIUS MEASUREMENTS WITH THE APPLICATION OF COORDINATE MEASUREMENT TECHNOLOGY
M. Czampa, J. Cs. Igali and T. Szalay 229
GLOBAL AND S. KOREAN MARKET OPPORTUNITY ANALYSIS OF FORENSIC TECHNOLOGIES
Y. L. Jung and Y. J. Choi 233
FROM ELLIPTIC CURVE TO AUTOMATION?
I. Markechová 235
ELABORATION OF FRAMEWORK FOR GREEN AND COST EFFICIENT PACKAGE DEVELOPMENT FOR ELECTRONIC INDUSTRY
E. Shevtshenko, T. Karaulova, M. Pohlak and K. Mahmood 239
MODELLING AND CLOSED-LOOP IDENTIFICATION OF MAGNETIC LEVITATION
P. Balko, M. Hypiusová and D. Rosinová 243
POWER COST AND PRICING ESTIMATION OF A SUPERCOMPUTER BASED DATA CENTER
M. Puskaric, Z. Car and G. Janes 247
IN-SITU METHOD OF BALANCING HEAT FOR DETERMINATION OF EFFICIENCY OF ELECTRIC MOTOR FOR DRIVE PUMP COOLING WATER HIGH POWER
N. Delalic, D. Kadric and B. Delalic 251
TESTING OF IMPROVED GENETIC ALGORITHM IN RAMBERG–OSGOOD MATERIAL MODEL PARAMETERS IDENTIFICATION
G. Janeš, Z. Car, M Puskaric and V. Margan 255
FLAME AEROSOL SYNTHESIS OF OXIDES AND SALTS
N. E. Machin 259
COMPARATIVE ANALYSIS AND EVALUATION OF MEASUREMENT CAPABILITIES OF CONTACT AND NON-CONTACT DEVICES
M. Sokac, V. Margan, Z. Car and I. Budak 263
CONTROL MECHATRONIC SYSTEM OF THE ELECTRONIC DIFFERENTIAL SYSTEM DESIGN FOR SMALL EV
V. Ferencey and M. Bugár 267
DRIVING SIMULATOR MOTION PLATFORM DESIGN
V. Croitorescu and R. Hariton 271
MODAL ANALYSIS OF THE MULTILAYER SHELL
J. Murín, S. Kugler, J. Hrabovský, D. Búc, V. Goga, M. Držík, V. Kutiš and Š. Rehák 275
ONTOLOGICAL MODELLING FOR AVIATION SAFETY DOMAIN
J. Ahmad and P. Křemen 279
DYNAMIC ANALYSIS OF ROBOT MANIPULATORS: A COMPONENT MODEL APPROACH
V. Damic and M. Cohodar 283
A DEFINITION METHOD OF OPTIMAL CUTTING PARAMETERS FOR FACE TURNING OF METALLIC PARTS ACCORDING TO CUTTING FORCES AND TO SURFACE ROUGHNESS
I. Biró and T. Szalay 287
ONBOARD COMPUTER OF FIRST SLOVAK SATELLITE
J. Slačka and O. Závodský 291

International Conference On Innovative Technologies, IN‐TECH 2016, Prague, 6. ‐ 8. 9. 2016
RUNNING ENDOTOXIN TEST TO ESTIMATE RISK OF USING NANOMATERIALS IN TRIBOLOGICAL PROCESSES
H. Husain and J. Skopal 295
EFFECTS OF MELT AND MOLD TEMPERATURE ON MECHANICAL PROPERTIES OF INJECTION MOLDED PART
P. Raos, J. Stojsic and K. Peresin 299
ANALYSIS OF EXTERNAL FACTORS DISTURBING PRODUCTION LEVELLING
P. Rewers and J. Trojanowska 303
ROAD TRANSPORT OF LIVESTOCK IN THE EUROPEAN UNION – ISSUES AND DEVELOPMENT PERSPECTIVES
P. Trojanowski 307
SYNERGETIC SYSTEM INTEGRATION
Z. Kremljak and M. Hočevar 311
INNOVATIVE APPROACH TO ECONOMIC EVALUATION OF ARTIFICIAL LIGHTING SYSTEMS IN THE DESIGN OR REDESIGN STAGE
D. Franković, M. Maračić and V. Kirinčić 315
AN AUTOMATED QUESTION ANSWERING SYSTEM FOR SUBJECTIVE INQUIRIES
L. Acharya, B. Webster and W. Arrasmith 319
THE PROCESS OF INTEGRATED MARKETING COMMUNICATION
S. Firsova, V. Prajová and P. Božek 323
PROPOSAL METHOD OF CHEMICAL PRE-TREATMENT ON HOT-DIP GALVANIZATION SURFACE FOR ADHESION ORGANIC COATINGS
J. Svoboda, J. Kudláček and V. Kuklík 327
POTENTIAL OF ANTICORROSIVE PROTECTION OF COATING SYSTEMS CONTAINING MAGNESIUM PIGMENTS
M. Zoubek, T. Moulis, J. Kudláček, F. Herrman and Z. Car 331
ANTICORROSIVE PROPERTIES OF COATING SYSTEMS CONTAINING MAGNESIUM PARTICLES ON AN ALUMINIUM ALLOY 2024
P. Drašnar, L. Fialová, M. Zoubek and J. Kudláček 335
NEW ANTISTATIC WATER-SOLUBLE COATING MATERIALS
M. Zoubek, J. Otta, V. Kreibich, F. Matas and T. Pepelnjak 339
CHEMICAL CLEANING INNER SURFACE HEATING AND ENERGY EQUIPMENT
J.Kuchař, V. Kreibich, Z. Hazdra, H.Hrdinová and M. Petřík 343
CORROSION RESISTANT COATING FOR THE PRINTING INDUSTRY
J.Kuchař, M. Pakosta, P. Tesařiková and J. Miřejovský 347
NUMERICAL SIMULATION OF STRAIN RATE IN THE STAMPING PROCESS
M. Valeš, F. Tatíček, L. Chrášťanský and M. Kubelka 351
THE INFLUENCE OF SCREW GEOMETRY ON EXTRUSION OF POLYPROPYLENE
T. Pepelnjak and M. Jeseničnik 357

International Conference On Innovative Technologies, IN‐TECH 2016, Prague, 6. ‐ 8. 9. 2016

International Conference on Innovative Technologies, IN‐TECH 2016,
Prague, 6. ‐ 8. 9. 2016
INNOVATIONS IN POSITIVE DISPLACEMENT ROTARY COMPRESSOR TECHNOLOGY
K.T. Ooi1 and K.S. Yap1
1 School of Mechanical and Aerospace Engineering, Nanyang Technological University, Singapore 639798
Keywords: Refrigeration; Compressor; Innovation; Cross Vane; CVEC; Revolving Vane; RV. Abstract: Compressors have been used in gas compression, refrigeration and many other related industries. Among these compressors, a positive displacement rotary compressor which is widely used in refrigeration and air-conditioning industries is rolling piston type compressor. The rolling piston compressor has many advantages such as: lower vibration and noise; it is compact as it operates at higher speeds; it also has fewer components and hence lower production cost. However, due to its higher operational speeds and more rubbing surfaces, it has high frictional losses. To minimize these problems, the revolving vane compressor was introduced. The uniqueness of the revolving vane compressor is that the cylinder now rotates together with the rotor, and hence reduces the frictional loss significant. Additionally, the vane tip is now not in contact with other surfaces and thus eliminates the vane tip friction. This compressor has been shown to reduce frictional losses by up to 80% on discharge pressure ranges around 20-25 bars. At higher operational pressure ranges such as CO2 refrigeration, where the pressure ranges is easily above 100 bars, an even more significant reduction in frictional losses can be achieved, which is due to decoupling of the pressure differential term from the vane side force, by design. Recently, further improvement attempts on revolving compressor to reduce its materials usage, has resulted in the birth of the cross-vane mechanism. This new cross vane mechanism allows the function of an expander and a compressor to be seamlessly integrated into a simple geometry. While ref (1) focuses the evolution of the design, in this paper, updates on these innovations will be elaborated and resulted mechanisms which have been successfully tested will also be shown. Introduction
Positive displacement compressors have been widely used for air compression, cooling and heating applications. Among these, the most widely used rotary compressor is the rolling piston compressor. in 2015, global rotary compressor demand came to 130 million units [2], these compressors are mostly for room air-conditioners. Reciprocating mechanism was among the earliest, if not the earliest compressing mechanism that was introduced. It is still being used today, especially in small capacity refrigerators. It is reliable, relatively energy efficient, thought it inherently has significant vibration and noise related issues, especially when compared with the rotary compressors. Among the widely used rotary mechanisms are rolling piston, rotary screw and the scroll. Among them, rolling piston compressor is simplest in its construction, energy efficient and suitable for air-conditioning and refrigeration. It has been used in almost all the small and medium room air-conditioners, up-to 10 kW or even 15 kW cooling capacity. Using this rotary mechanism as a reference design, improvements have been carried out to further improve the operational efficiency and cost reduction of compressor, the brief of which are elaborated below. More details on the deign evolution of these compressors are available in ref [1]. Rolling piston compressor
Rolling piston compressor is a positive displacement rotary compressor that is widely used in refrigeration and air-conditioning industries. It has many advantages such as: lower vibration and noise; it is compact as it operates at higher speeds; it also has fewer components and hence lower production cost. However, due to its higher operational speeds and more rubbing surfaces, it has high frictional losses. These frictional losses occur at the rubbing surfaces at the following locations: (i) Vane tip and roller, (ii) roller and eccentric (iii) Roller and endfaces, (iv) eccentric and endfaces, (v) vane sides and vane slot (vi) Vane edges and endfaces, and (vii) roller and cylinder, see Figure 1. Apart from the above, there are also minor frictional losses at the shaft bearings. The total frictional loss [2] is close to 20% of the power input and half of it is at the roller-eccentric contact. To minimize these problems, the revolving vane compressor was introduced in 2008.
Fig. 1 Locations where frictional losses occur. Adapted from ref [2]. Fig. 2 Schematic of Revolving Vane compressor
1

International Conference on Innovative Technologies, IN‐TECH 2016,
Prague, 6. ‐ 8. 9. 2016
Revolving vane compressor (RV)
With the aim to reduce the frictional losses of a rolling piston compressor, revolving vane compressor is introduced. Figure 2 shows the schematic of a revolving vane compressor, hence forth refers to as RV. The uniqueness of this compressor is that the eccentric-and roller found in the rolling piston compressor is replaced by a rotor. Additionally, the cylinder of the RV is made to rotate together with the rotor, and hence reduces the relative speed at the rubbing surfaces which leads to significant reduction in frictional losses and thus increases in mechanical efficiency. Figure 3 shows the comparison between frictional losses of various compressors.
Fig. 3 Comparison of mechanical efficiency for various rotary compressors [3].
Moreover, the vane in RV can now be fixed onto the cylinder, and hence the vane sides and slot friction has been eliminated. Additionally, the vane tip is now not in contact with other surfaces and thus eliminates the vane tip friction. This compressor has been shown to reduce frictional losses by up to 80% on normal operational pressure ranges, where the discharge pressure is around 20-25 bars. At higher operational pressure ranges such as CO2 refrigeration, where the pressure ranges is easily above 100 bars, even more significant of frictional losses reduction can be achieved. The latter saving is caused by the fact that the vane-slot frictional loss is now not dependent on the pressure differential across the vane, but only the rotating inertia of the other rotating component, in this case the rotor. Equation (1) shows that the vane tip contact force, (and hence the frictional force) is independent of the pressure differential caused by the two working chambers, but it is only dependent on the rotating inertia of the rotor.
F (1)
where Ir rotational inertia of the rotor [kg m4] αr angular acceleration of the rotor [rad s-2] Rr rotor radius [m] φc rotational angle of the cylinder [rad] φr rotational angle of the rotor [rad]
The RV compressor has been tested and it performance has been verified [6].
Such a mechanism as shown in Figure 4, has been targeted to be employed in automobile compressors for air-conditioners [5]. The measurement of power consumption and mass flowrate in comparison with prediction from the mathematical model are shown in figure 5. It has been also concluded that RV mechanism works reliably at 2000 rev/min with R134a as the refrigerant and attained a pressure ratio of 5.32. Additionally, more than 30 hours of operation has been clocked [6].
Fig. 4 Prototype machine intended to be used for automotive air-conditioner [6].
Cross-vane expander-compressor (CVEC)
The rotor appeared in the RV seems to have occupied a big space as compared to the size of the working chamber. To reduce the wastage of the materials due to the size of the rotor, this solid rotor has been made hollow to “accommodate” an expander. The resulted new mechanism allows the function of an expander and a compressor to be seamlessly integrated into a single simple geometry and is called cross vane mechanism, See Fig. 5. The outer cylinder functions as a compressor and the inner cylinder as an expander. Such a mechanism can be used in vapour compressor cycle where the expander is used to recover the refrigerant at the high pressure energy from the liquid refrigerant leaving the condenser. The expander replaces the expansion valve. Energy recovered from this expansion process, is directly used to reduce the energy required by the compressor from external source. Such a system will be best where the operating pressures are high such as those in super-critical CO2 cycle. It has been shown that [7] in such a cycle, as much as 40% improvement in COP can be obtained by replacing the expansion valve with an expander. Fig. 6 shows the predicted instanteneous pressure in expander and compressor. Measurements are currently on going for the initial prototype machine for CVEC shown in Figure 9. The design of the test bed shown in figure 10 has also been setup and instrumented. Figure 11 shows the preliminary measurement of the pressure curve for the compressor as compared with the predictions.
2

International Conference on Innovative Technologies, IN‐TECH 2016,
Prague, 6. ‐ 8. 9. 2016
(a) Basic schematic of the CVEC (b) A CVEC embodiment Design
Fig. 5 CVEC Design
(a) Expander (b) Compressor
Fig. 6 Pressure variations for both expander and compressor
Fig. 7 A completed prototype machine Fig. 11 Initial measurement of pressure variation. Conclusion
Compressors have been around for more than a century and they have penetrated so deeply into our everyday life. The collaborations among research institutes, industries and universities have seen much progress in innovating this product towards a more sustainable deployment of compressors. The ever demands for higher energy efficiency, lower production and material cost will continue to stimulate innovations in compressors, though the journey is getting more and more challenging. It is believe that a successful innovation will need to have at least these criteria: higher energy efficiency, lower manufacturing cost and more reliable in operation, attempts presented in this paper are among such examples towards that direction.
Motor
Expansion and compression chamber
Oil sump
Outer Cylinder
Vane
Inner Cylinder
shaft
bush
3

International Conference on Innovative Technologies, IN‐TECH 2016,
Prague, 6. ‐ 8. 9. 2016
References
[1] Ooi, K.T. Yap, K.S. (2015) Design Evolution: From Rolling Piston to Revolving Vane to Cross-Vane Expander-compressor unit, IOP Conference Series: Materials Science and Engineering, v 90, p 012036 (8 pp.)
[2] Japan Air Conditioning, heating & refrigeration news, Special Edition on Refrigeration and air-conditioning compressors, February 25 2016, serial number 565-S.
[3] Ooi K.T., Wong T.N. (1997). A computer simulation of a rotary compressor for house-hold refrigerators. Applied Thermal Engineering, 17(1), 65-78.
[4] Ooi K.T. (2004). Design Optimization of a rolling piston compressor for refrigerators. Applied Thermal Engineering, 25(5-6), 813-829.
[5] Ooi, K T and Teh Y L, (2008) Design Improvements of Revolving Vane Compressors, RV-i". International Compressor Engineering Conference. Paper 1882.
[6 Tan K M and Ooi K T. (2011). Heat transfer in compression chamber of a revolving vane (RV) compressor. Applied Thermal Engineering, v 31(n 8-9), 1519-1526.
[7] Tan KM, Choo WC, Chee M, Law K, Iswan I, Ooi KT (2014) Performance Measurement of Revolving Vane Compressor. International Compressor Engineering Conference. Paper 1290.
[8] D. Westphalen and J. Dieckmann, "Scroll Expander for Carbon Dioxide Cycle," presented at the International Refrigeration and Air Conditioning Conference, Purdue University, 2006.
4

International Conference on Innovative Technologies, IN‐TECH 2016,
Prague, 6. ‐ 8. 9. 2016
BASIC ZEOLITES AS ENVIRONMENTALLY FRIENDLY CATALYSTS
R. Ionut-Valentin 1a and S. Ionel 1 1 Splaiul Independenţei nr. 313, Sector 6, Bucureşti, CP 060042, Romania
Keywords: Zeolites; Catalyst; X-Ray Diffraction; Catalytic Activity Abstract: The oxidative methylation of toluene with methane over basic zeolite catalysts produces ethylbenzene and styrene. The advantage of this process over the conventional one for production of ethylbenzene and styrene from benzene and ethylene consists in lower toluene and methane cost as compared to that of benzene and ethylene. Furthermore, the replacement of the hazardous AlCl, catalyst used in the conventional process can avoid corrosion and environmental problems. The proposed in the present work basic zeolites as catalysts for the oxidative methylation of toluene with methane are new, not dangerous and easy-to-use environmentally friendly catalysts. The paper presents result from catalyst characterization and toluene methylation over MgO and BaO impregnated X zeolites. Characterization methods include X-ray diffraction (XRD) and temperature-programmed desorption (TPD) of CO2. The samples contain 13 wt.% MgO and BaO, respectively. A preserved crystal structure, existence of low amount of MgO and BaO crystal phases, and formation of BaCO) are detected in the catalysts. The amount and strength of basic sites are correlated to the catalytic results. Catalytic activity, selectivity and yield to C8 hydrocarbons (ethylbenzene plus styrene) generated by MgO/NaX sample are much lower than those generated by BaO/NaX sample. Both catalysts show good stability. Concerning styrene formation, which is the most desirable reaction product, BaO/NaX zeolite catalyst gives yield of 32 %. Introduction
Nowadays, many efforts have been made to produce environmentally friendly technologies in the chemical industry. The trouble about the environment forces restrictions and sometimes prohibition on the use of old technologies. Introduction of cleaner technologies is acknowledged everywhere. The environmentally friendly processing includes the reduction of use of acids and bases as catalysts, because of the need of their further neutralization leading to waste products. For example, the current way for styrene production is from benzene and ethane over the hazardous AlCl3-HCI catalyst. The increased environmental concern impulses the developing of new catalysts for the same reaction based on solids. A new route for styrene formation is the oxidative methylation of toluene with methane", The latter process has two advantages. First advantage is related to the replacement of the expensive source benzene and ethane, obtained from crude oil and petroleum gas, with the abundant and cheaper sources toluene and methane. The second advantage includes the use of basic zeolites as catalysts for the reaction [2].
The goal is to avoid waste production, especially salt formation, by the use of new environmentally more friendly catalysts. The origin of zeolite basicity is considered to be the oxygen ions in the zeolite framework. Selecting the exchangeable cations, encapsulated oxides, Si/Al ratio. type of zeolite, etc. the base strength can be controlled. Also, ion exchange and impregnation cause different zeolite basicity, as the impregnation results in stronger basic sites than the ion exchange.
The studies of strongly basic zeolites have started quite recently. That's why to establish the characteristic features of differently modified zeolites, i.e. their activity, selectivity, stability, basicity and another physic-chemical property in oxidative methylation of toluene with methane, is useful and just in time. Our unpretending contribution to this area consists in suggesting the ability of alkali containing zeolites to act as basic catalysts for the same reaction [4] [5] [7]. A study is devoted to the effect of preparation on the catalytic performance of CsX zeolite. In a subsequent work we have studied the effect of the zeolite structure.
Li (except Cs) modified zeolites with different structures arc also studied as catalysts for oxidative methylation of toluene with methane. The simultaneous presence of both Li and Cs in the parent zeolite highly favors the catalytic behavior. The basicity guides the catalytic activity in the direction that the more basic zeolites display better catalytic properties [1].
The reported in the previous communications basic guests, which were introduced into the zeolite host, represented alkali oxides. The purpose of the present contribution is to introduce into the zeolite host alkali earth oxides which are preferred to alkali oxides from the point of view of environmental protection and to show their basic and catalytic properties. Our goal is to outline the characteristic features of the catalysts during oxidative methylation of toluene with methane. XRD and TPD of CO2 are used to explain the catalytic behavior. Experimental
The catalysts were prepared by an impregnation method. The starting material was NaX (Si/Al = 1.23) obtained from private company
Atlas S.A. To produce a catalyst loaded with 13.3 wt.% MgO, 15 g of NaX were stirred with 0.5 M aqueous solution of magnesium nitrate (103 ml). For the catalyst loaded with 13.4 wt.% BaO, 15 g of NaX were stirred with 0.1 M aqueous solution of barium nitrate (149 ml). The stirring was carried out at 353 K for 1 h, followed by evaporation to dryness. The catalysts were dried at 393 K and calcined at 823 K for 7 h prior to use.
Oxidative methylation of toluene with methane was used as a probe reaction for catalyst testing. The reaction was performed in a vertical, fixed-bed quartz reactor of flow type. Reaction parameters were as follows: temperature 1023 K, space velocity 1854 h-1, feed flow rate of the gas mixture after passing through a toluene saturator, maintained at 295 K 30.9 ml/min (methane 15 ml/min, air 15 ml/min, toluene (gas) 0.9 ml/min). The condensed products detected during catalyst testing were benzene, toluene, ethylbenzene, styrene, certain amounts of xylenes and unidentified hydrocarbons, and water.
They were collected in an ice salt trap for 3 h and analyzed by an off-line gas chromatograph, which employed a Carbowax (10% on Chromosorb W) column and a flame ionization detector. The conversion was expressed as the fraction of moles of toluene converted. The selectivity was the ratio of the number of moles of each product to the total number of moles of all the products. The yield was the product of the conversion and the selectivity.
5

International Conference on Innovative Technologies, IN‐TECH 2016,
Prague, 6. ‐ 8. 9. 2016
TPD profiles were obtained using CO2 as a probe. The sample was pull into a quartz reactor of flow type, coupled to a thermal conductivity detector. Then the sample was heated in a stream of dry argon to 1073 K at a heating rate of 10 K/ min. After cooling to 323 K CO2 was fed at a rate of 20 ml/min for 30 min.
The physically adsorbed CO2 was removed under the same conditions in a stream of argon. The TPD of the chemically adsorbed CO2 was carried out in argon flow of 20 ml/min by increasing the temperature to 1073 K (rate 10 K/min) and maintained at this temperature until desorption was completed. XRD patterns were obtained with a diffractometer employing CuK monochromatic irradiation (λ=1.5418 Å) in the 5<2θ<70° range. The crystal phase composition was determined by comparing the measured d-spacing’s with standard ASTM values [3].
Results and discussion The side chain methylation of toluene was catalyzed by the three examined zeolite samples, but to different degree. The catalytic
results are compiled in Fig. 1. Depending on the type of impregnated oxide, the conversion, selectivity and yield change significantly. The zeolite sample with BaO shows highest selectivity and yield of C8 hydrocarbons (ethylbenzene plus styrene). The MgO/NaX zeolite sample, which is less basic zeolite (see further down) shows lower C8 selectivity and yield. The situation is different with the parent NaX, where at the same reaction conditions the lowest activity (conversion, selectivity and yield) is observed.
Figure 2 summarizes the results for selectivity of each C8 hydrocarbon reaction product, i.e. ethylbenzene and styrene, detected over the three catalysts. It is seen that the impregnation of NaX with alkali earth oxides is quite effective. BaO/ NaX zeolite catalyst is more reactive, especially for ethylbenzene dehydrogenation, than the analogous MgO/NaX, which is indicated by the increased styrene/ ethylbenzene ratio detected over BaO/NaX sample. Thus, the selectivity for styrene increases over BaO (NaX sample, whereas the selectivity for ethylbenzene decreases. Figure 2 also shows that at the reaction conditions of Fig. 1 the NaX sample yields small (approximately equal) amounts of ethylbenzene and styrene.
The obtaining of such amounts from NaX indicates that side chain toluene methylation to ethylbenzene and its dehydrogenation to styrene occurs at the same extent. Figure 3 summarizes the results for the yield of ethylbenzene and styrene, which show similar trends to the just discussed in fig. 2 selectivity results.
Fig. 1 Toluene conversion (horizontal hatched bar), C8 selectivity (upward diagonal hatched bar) and C8 yield (downward diagonal
hatched bar) over the investigated zeolites at 1023 K
Fig. 2 Selectivity to ethylbenzene (full bar) and styrene (empty bar) over the investigated zeolite, at 1023 K
Figure 4 shows the yield changes of ethylbenzene and styrene in dependence on the time-on-stream over the alkali earth modified X zeolites. At constant temperature the yield of ethylbenzene from MgO/NaX keeps a fairly constant value after 27 h time-on-stream (Fig. 4, a). This trend is also seen for the yield of styrene, which is formed in lower concentration than ethylbenzene. The BaO/NaX zeolite is far more active for oxidative methylation of toluene with methane than MgO/ NaX. Increased yield of ethylbenzene and styrene is observed during prolonged time of investigation (Fig. 4, b).
The very important result is that BaO/NaX zeolite catalyst forms predominantly styrene. Also, higher time-on-stream increases the ratio styrene/ethylbenzene. Khan et al. [7] found that the higher styrene formation in oxidative dehydrogenation of ethylbenzene is related to the accumulation of coke. We also reported recently that styrene for motion on Cs modified zeolites is affected by the coke deposition [6].
The results presented in the current work draw the following points. As mentioned above along with ethylbenzene and styrene, benzene is also registered in the condensed reaction products. This implies that the equilibrium reaction alkylation-de alkylation changes its direction and some de alkylation takes place, which could be favored by the acidic active sites of the zeolite. It seems that the role of acidic sites becomes better expressed with time-on-stream.
As already shown in Fig. 4, b ethylbenzene is not affected negatively by the time-on-stream. The amount of ethylbenzene even slightly increases. Considering the coke to some extent as a catalyst for the oxidative dehydrogenation of ethylbenzene, we expected that amount of ethylbenzene would decrease at the expense of increased amount of styrene.
Fig. 3 Yield to ethylbenzene (full bar) and styrene (empty bar)
over the investigated zeolite Fig. 4 Change in the yield to ethylbenzene (full bar) and styrene
(empty bar) with time-on-stream over the MgO/ NaX (a) and BaO/NaX zeolites (b) at 1023 [8]
6

International Conference on Innovative Technologies, IN‐TECH 2016,
Prague, 6. ‐ 8. 9. 2016
However, in the present case the observed amount of ethylbenzene could be a result not only of toluene methylation over basic active sites, but also of ethylation of the already formed benzene over acidic active sites.
Obviously, the regarded as pair concepts acidity and basicity are essential upon explaining the catalytic properties of the modified zeolites [5]. The basic sites perform only a qualitative aspect of the desorption profiles of CO2 and are reported in arbitrary units.
The maximum temperature at which CO2 desorbs is indicative for the strength of basic sites. The amount of CO2 desorbed by increasing the temperature is indicative for the number of basic sites. The start of CO2 desorption above 973 K is observed for the alkali earth modified zeolites (Fig. 5, curves 2 and 3). The CO2 desorption reaches Tmax, above 1073 K.
Both temperatures exceed the registered up to now temperatures for CO2 desorption, characteristic of the alkali modified zeolites [6][7]. This is an indication for the presence of very strong basic sites in alkali earth modified zeolites. The similarity between Mg and Ba modified zeolites is shown by the almost equal Tmax desorption of CO2 from the two samples.
The difference between the same samples is the amount of CO2 desorbed. This amount depends on the alkali earth nature, as Ba modified zeolite exhibits higher number of strong basic sites than Mg modified one. The last effect correlates with the increase of initial basicity of alkali earth elements from Mg to Ba.
Regarding the possible influence of desorbed carbonates on TPD profiles, it can be noted that the regions of MgC03 and BaC03 decomposition are outside the observed TPD signals (MgC03 and BaC03 decompose about 813 and 1193 K, respectively). The TPD signals may be hence related to CO2 desorption from the basic sites formed in the zeolites after modification.
Thus, the alkali earth modification creates strong basicity. To compare this basicity with the basicity of the parent zeolite NaX, the TPD profile of the last zeolite is also shown in Fig. 5 (curve 1).
The basic sites of different strength are registered in NaX. The represented desorption signal at 323-523 K is ascribed to weak basic sites. The relatively strong basic sites are representing by a broad signal above 813 K. Despite of the higher number of basic sites characteristic for the NaX zeolite, the strongest basic sites are created when alkali earth oxides are incorporated in NaX zeolite.
Fig. 5 TPD profiles of CO, adsorbed over the zeolites NaX (1), MgO/NaX (2) and BaO/NaX (3)
The catalytic role of basic sites of MgO/NaX and BaO/NaX is shown in the catalytic section. Higher values for activity, C8 selectivity and C8 yield are observed with these samples as compared to NaX zeolite.
The catalytic and basicity results for the MgO/NaX and BaO/NaX catalysts are well fitted. However, the same fitting for the MgO/NaX and BaO/NaX catalysts, and the parent NaX zeolite is not evident. It can be concluded that the effectiveness of alkali earth modified zeolites in this case is affected more or less by other factors besides by the overall basicity.
One possible suggestion is the different accessibility of basic sites of the three investigated samples for the molecule of toluene. During the oxidative methylation reaction, the molecule of toluene cannot penetrate to all basic sites, registered for NaX catalyst. As a whole, the catalyst before impregnation shows low activity.
After impregnation different number and strength of basic sites are created (as already shown). The accessibility of these basic sites to the reacting molecule of toluene obviously increases resulting in increased catalytic activity of the obtained samples. The increased accessibility of the basic sites may be related to the reduced surface area, which explains also the smaller number of basic sites after impregnation.
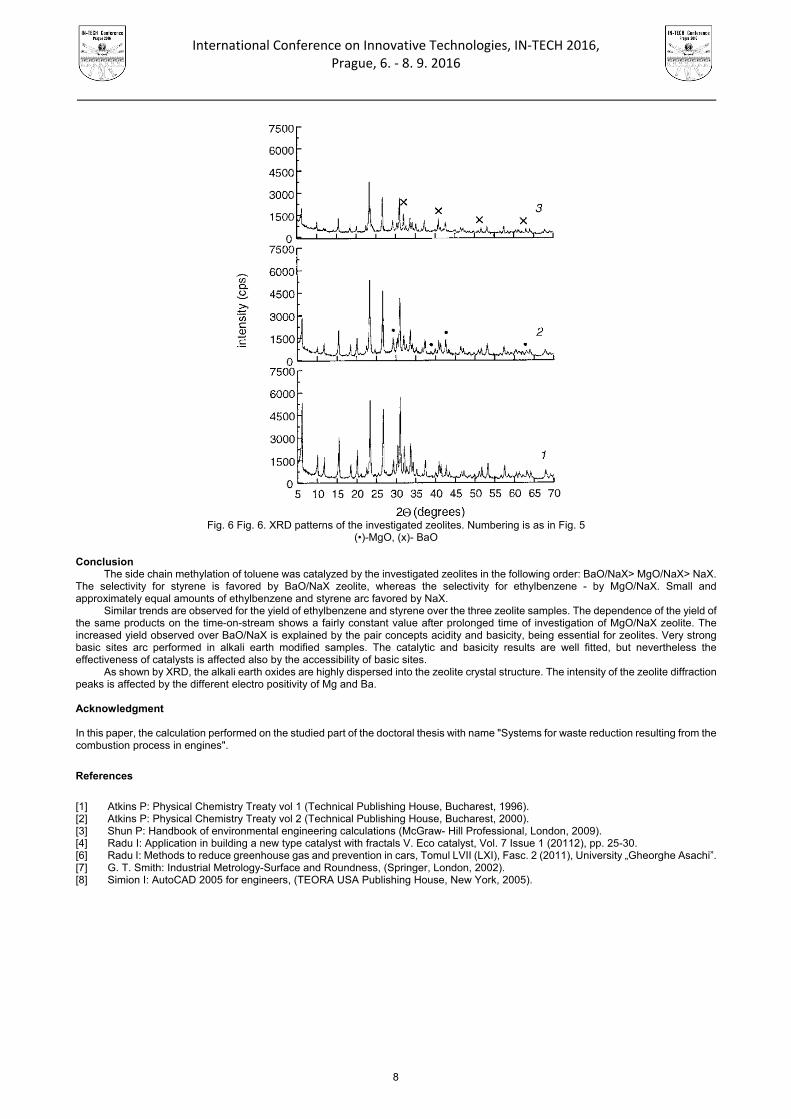
The diffraction peaks characteristic for the zeolite structure, as well as for the alkali earth oxides arc registered in the diffract grams of the modified zeolites (Fig. 6). The intensity of the zeolite peaks (d = 14.45, 8.85, 7.55, 5.74, 3.81) is better preserved when Mg is impregnated into NaX zeolite. In the case of Ba impregnated sample, a slight intensity decrease is observed.
This effect is most probably due to a strong interaction between Ba and zeolite tetrahedra. Elements like Cs and Ba, being highly electropositive, affect more or less negatively the intensity of the diffraction peaks [6] [3].
Nevertheless, the empiric ratio between the intensities of several peaks, characteristic for the zeolite crystal structure, follows the order I331 > I220 > I311 before and after impregnation with Ba, which is an evidence of the uniform distribution of Ba in the zeolite crystal lattice.
Unfortunately, more of the peaks, characteristic for MgO (d = 3.03, 2.02) and for BaO (d = 2.80, 2.21, 1.80, 1.49) overlap with the rich diffraction pattern of zeolite. The important result (obtained on a qualitative base) is a low amount of alkali earth oxides in the zeolite structure, detectable by XRD.
The possible reasons for this result are related to a high dispersity of the alkali earth crystal phases in the zeolite structure, formation of some amorphous phases, partial ion exchange. Considering the specificity of our catalytic system, i.e. the surface of the zeolite support and the amount of oxides spent on impregnation, we have assumed that the alkali earth oxides are highly dispersed in the zeolite structure. After 3 h of catalytic use the intense peaks characteristic for BaCO3, (not shown in Fig. 6) have appeared in the BaO/NaX sample.
The corresponding peaks for MgC03 were not observed after use of the MgO/NaX sample. In contrast to Rosynek et al. [3], no catalyst deactivation due to the formation of BaC03 took place after prolonged catalytic use (Fig. 3). We interpret this fact in therms of the different nature of zeolite and oxide supports, used in the two studies. The BaC03 formed cannot noticeably block the large zeolite surface.
7
International Conference on Innovative Technologies, IN‐TECH 2016,
Prague, 6. ‐ 8. 9. 2016
Fig. 6 Fig. 6. XRD patterns of the investigated zeolites. Numbering is as in Fig. 5
(•)-MgO, (x)- BaO
Conclusion The side chain methylation of toluene was catalyzed by the investigated zeolites in the following order: BaO/NaX> MgO/NaX> NaX.
The selectivity for styrene is favored by BaO/NaX zeolite, whereas the selectivity for ethylbenzene - by MgO/NaX. Small and approximately equal amounts of ethylbenzene and styrene arc favored by NaX.
Similar trends are observed for the yield of ethylbenzene and styrene over the three zeolite samples. The dependence of the yield of the same products on the time-on-stream shows a fairly constant value after prolonged time of investigation of MgO/NaX zeolite. The increased yield observed over BaO/NaX is explained by the pair concepts acidity and basicity, being essential for zeolites. Very strong basic sites arc performed in alkali earth modified samples. The catalytic and basicity results are well fitted, but nevertheless the effectiveness of catalysts is affected also by the accessibility of basic sites.
As shown by XRD, the alkali earth oxides are highly dispersed into the zeolite crystal structure. The intensity of the zeolite diffraction peaks is affected by the different electro positivity of Mg and Ba. Acknowledgment In this paper, the calculation performed on the studied part of the doctoral thesis with name "Systems for waste reduction resulting from the combustion process in engines".
References
[1] Atkins P: Physical Chemistry Treaty vol 1 (Technical Publishing House, Bucharest, 1996). [2] Atkins P: Physical Chemistry Treaty vol 2 (Technical Publishing House, Bucharest, 2000). [3] Shun P: Handbook of environmental engineering calculations (McGraw- Hill Professional, London, 2009). [4] Radu I: Application in building a new type catalyst with fractals V. Eco catalyst, Vol. 7 Issue 1 (20112), pp. 25-30. [6] Radu I: Methods to reduce greenhouse gas and prevention in cars, Tomul LVII (LXI), Fasc. 2 (2011), University „Gheorghe Asachi”. [7] G. T. Smith: Industrial Metrology-Surface and Roundness, (Springer, London, 2002). [8] Simion I: AutoCAD 2005 for engineers, (TEORA USA Publishing House, New York, 2005).
8
International Conference on Innovative Technologies, IN‐TECH 2016,
Prague, 6. ‐ 8. 9. 2016
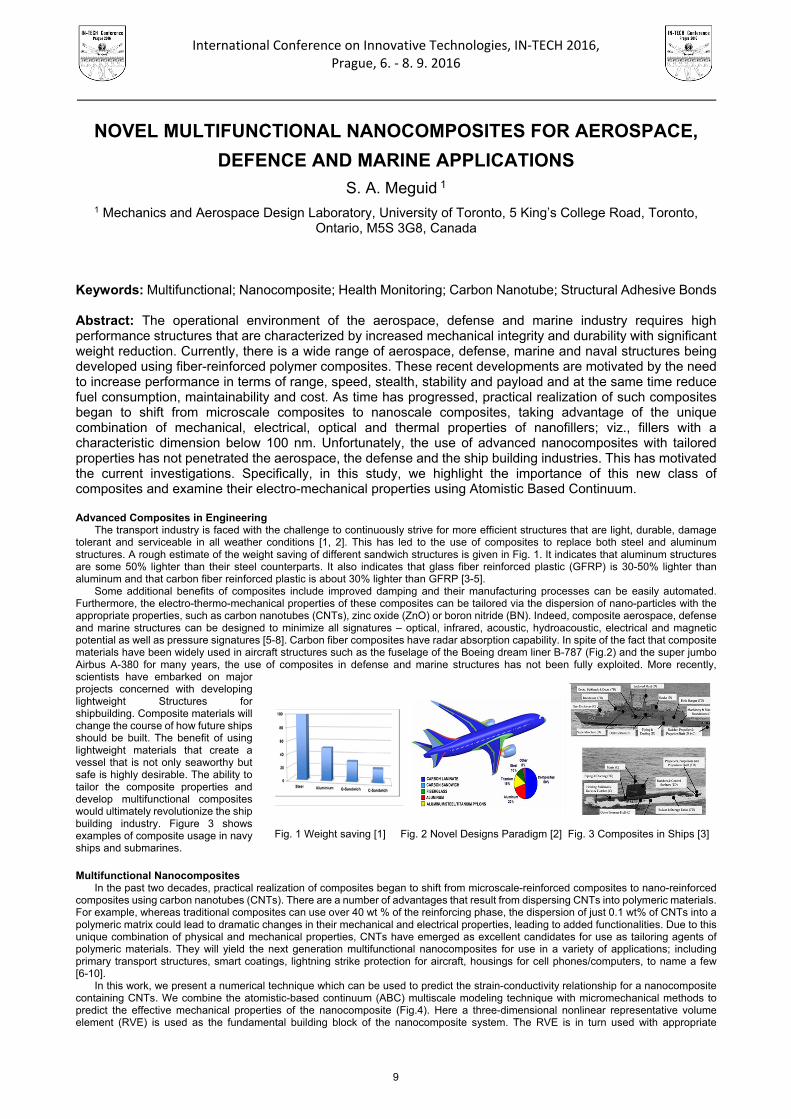
Fig. 1 Weight saving [1] Fig. 2 Novel Designs Paradigm [2] Fig. 3 Composites in Ships [3]
NOVEL MULTIFUNCTIONAL NANOCOMPOSITES FOR AEROSPACE,
DEFENCE AND MARINE APPLICATIONS
S. A. Meguid 1 1 Mechanics and Aerospace Design Laboratory, University of Toronto, 5 King’s College Road, Toronto,
Ontario, M5S 3G8, Canada
Keywords: Multifunctional; Nanocomposite; Health Monitoring; Carbon Nanotube; Structural Adhesive Bonds Abstract: The operational environment of the aerospace, defense and marine industry requires high performance structures that are characterized by increased mechanical integrity and durability with significant weight reduction. Currently, there is a wide range of aerospace, defense, marine and naval structures being developed using fiber-reinforced polymer composites. These recent developments are motivated by the need to increase performance in terms of range, speed, stealth, stability and payload and at the same time reduce fuel consumption, maintainability and cost. As time has progressed, practical realization of such composites began to shift from microscale composites to nanoscale composites, taking advantage of the unique combination of mechanical, electrical, optical and thermal properties of nanofillers; viz., fillers with a characteristic dimension below 100 nm. Unfortunately, the use of advanced nanocomposites with tailored properties has not penetrated the aerospace, the defense and the ship building industries. This has motivated the current investigations. Specifically, in this study, we highlight the importance of this new class of composites and examine their electro-mechanical properties using Atomistic Based Continuum. Advanced Composites in Engineering
The transport industry is faced with the challenge to continuously strive for more efficient structures that are light, durable, damage tolerant and serviceable in all weather conditions [1, 2]. This has led to the use of composites to replace both steel and aluminum structures. A rough estimate of the weight saving of different sandwich structures is given in Fig. 1. It indicates that aluminum structures are some 50% lighter than their steel counterparts. It also indicates that glass fiber reinforced plastic (GFRP) is 30-50% lighter than aluminum and that carbon fiber reinforced plastic is about 30% lighter than GFRP [3-5].
Some additional benefits of composites include improved damping and their manufacturing processes can be easily automated. Furthermore, the electro-thermo-mechanical properties of these composites can be tailored via the dispersion of nano-particles with the appropriate properties, such as carbon nanotubes (CNTs), zinc oxide (ZnO) or boron nitride (BN). Indeed, composite aerospace, defense and marine structures can be designed to minimize all signatures – optical, infrared, acoustic, hydroacoustic, electrical and magnetic potential as well as pressure signatures [5-8]. Carbon fiber composites have radar absorption capability. In spite of the fact that composite materials have been widely used in aircraft structures such as the fuselage of the Boeing dream liner B-787 (Fig.2) and the super jumbo Airbus A-380 for many years, the use of composites in defense and marine structures has not been fully exploited. More recently, scientists have embarked on major projects concerned with developing lightweight Structures for shipbuilding. Composite materials will change the course of how future ships should be built. The benefit of using lightweight materials that create a vessel that is not only seaworthy but safe is highly desirable. The ability to tailor the composite properties and develop multifunctional composites would ultimately revolutionize the ship building industry. Figure 3 shows examples of composite usage in navy ships and submarines. Multifunctional Nanocomposites
In the past two decades, practical realization of composites began to shift from microscale-reinforced composites to nano-reinforced composites using carbon nanotubes (CNTs). There are a number of advantages that result from dispersing CNTs into polymeric materials. For example, whereas traditional composites can use over 40 wt % of the reinforcing phase, the dispersion of just 0.1 wt% of CNTs into a polymeric matrix could lead to dramatic changes in their mechanical and electrical properties, leading to added functionalities. Due to this unique combination of physical and mechanical properties, CNTs have emerged as excellent candidates for use as tailoring agents of polymeric materials. They will yield the next generation multifunctional nanocomposites for use in a variety of applications; including primary transport structures, smart coatings, lightning strike protection for aircraft, housings for cell phones/computers, to name a few [6-10].
In this work, we present a numerical technique which can be used to predict the strain-conductivity relationship for a nanocomposite containing CNTs. We combine the atomistic-based continuum (ABC) multiscale modeling technique with micromechanical methods to predict the effective mechanical properties of the nanocomposite (Fig.4). Here a three-dimensional nonlinear representative volume element (RVE) is used as the fundamental building block of the nanocomposite system. The RVE is in turn used with appropriate
9

International Conference on Innovative Technologies, IN‐TECH 2016,
Prague, 6. ‐ 8. 9. 2016
Fig. 4 Multiscale model Fig. 5 Equivalent resistor network model
Fig. 6 Carbon nanotube spaceframe structure.
micromechanical modeling methods to scale up to the macro level and predict the bulk mechanical properties [7, .9, 14]. The electrical conductivity is predicted via an equivalent resistor network model developed using Monte Carlo simulations (Fig,5). The constitutive laws which govern electron tunneling are formulated on the basis of the landauer-Buttiker formula while the intrinsic conductivity is accounted for through the Drude model. we will present the results of our ABC modeling and micromechanical analysis and discuss the effects of such processing parameters as CNT alignment, concentration and aspect ratio on the effective mechanical properties. he transport industry
Atomistic Based Continuum Model A three-dimensional nonlinear RVE is developed to study the
nano-reinforced epoxy system. The RVE consists of the reinforcing CNT, the surrounding polymer matrix, and the CNT-epoxy interface. Due to the inherent nano-scale involved in simulating CNT structures, an atomistic description is incorporated. First, the covalent bonds in the CNT structure are described using the Modified Morse interatomic potential. Secondly, the atomic vdW interactions between the atoms in the CNT and the atoms in the epoxy matrix are described using the Lennard-Jones (LJ) interatomic potential. This description implies the assumption of a non-bonded interfacial region. The CNT is modeled as a space-frame structure as depicted in Fig. 6. In the space-frame model, each beam element corresponds to an individual chemical bond in the CNT. As in traditional FE models, nodes are used to connect the beam elements to form the CNT structure. In this case, the nodes represent the carbon atoms and their positions are defined by the same atomic coordinates. We adopt the Modified Morse potential with an added angle-bending potential to describe the atomic interactions in the CNT. This potential is given by:
bs EEE
(1))
1exp12 ror
es DE
(2)
42 12
1osexticob kkE
(3)
where ro is the initial bond length, θo is the initial angle between adjacent bonds, De is the dissociation energy, β is a constant which controls the ‘width’ of the potential, and kθ and ksextic are the angle-bending force constants. Nonlinear rotational spring elements are used to account for the angle-bending component, while beam elements are used to represent the stretching component of the potential. The Lennard-Jones interatomic potential is used to describe the vdWs interactions at the CNT/polymer interface. The LJ potential is defined as
612
4rr
ELJ
(4)
where
is the potential well depth,
is the hard sphere radius of the atom or the distance at which ELJ is zero, and r is the distance between the two atoms. Differentiating the potential with respect to the separation distance, we arrive at an expression for the vdW force between two interacting atoms
713
LJ rr224F
(5)
10
International Conference on Innovative Technologies, IN‐TECH 2016,
Prague, 6. ‐ 8. 9. 2016
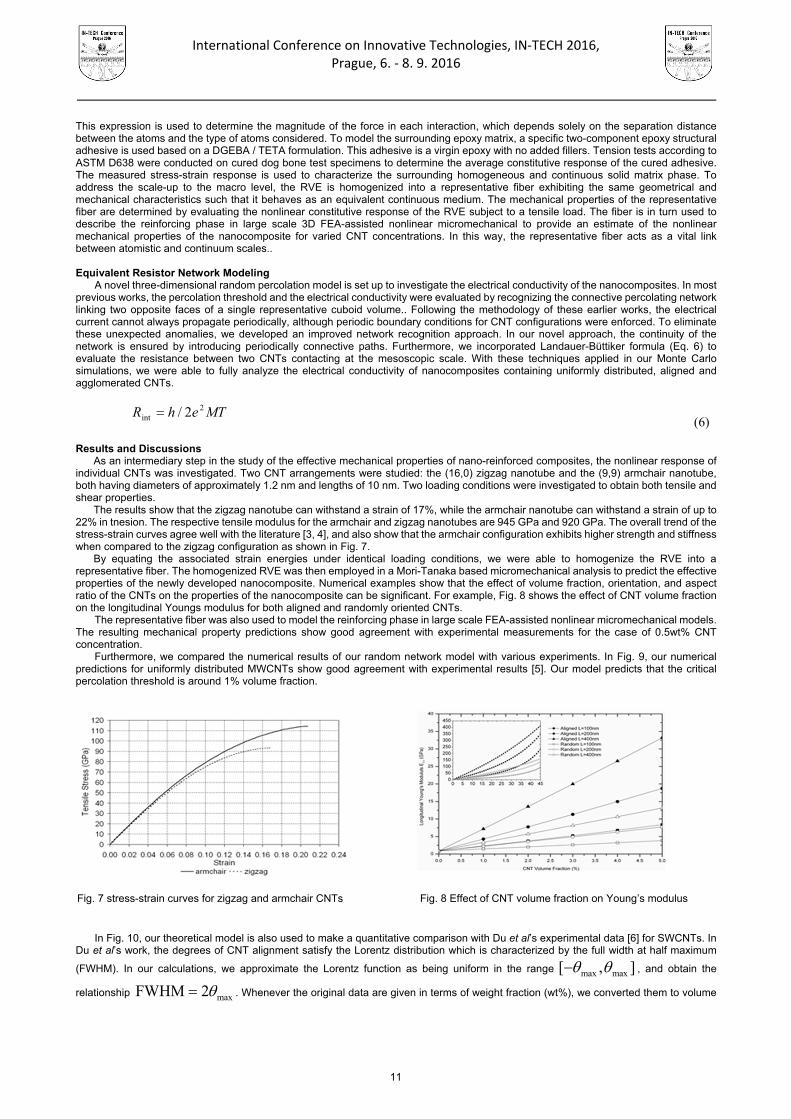
Fig. 7 stress-strain curves for zigzag and armchair CNTs Fig. 8 Effect of CNT volume fraction on Young’s modulus
This expression is used to determine the magnitude of the force in each interaction, which depends solely on the separation distance between the atoms and the type of atoms considered. To model the surrounding epoxy matrix, a specific two-component epoxy structural adhesive is used based on a DGEBA / TETA formulation. This adhesive is a virgin epoxy with no added fillers. Tension tests according to ASTM D638 were conducted on cured dog bone test specimens to determine the average constitutive response of the cured adhesive. The measured stress-strain response is used to characterize the surrounding homogeneous and continuous solid matrix phase. To address the scale-up to the macro level, the RVE is homogenized into a representative fiber exhibiting the same geometrical and mechanical characteristics such that it behaves as an equivalent continuous medium. The mechanical properties of the representative fiber are determined by evaluating the nonlinear constitutive response of the RVE subject to a tensile load. The fiber is in turn used to describe the reinforcing phase in large scale 3D FEA-assisted nonlinear micromechanical to provide an estimate of the nonlinear mechanical properties of the nanocomposite for varied CNT concentrations. In this way, the representative fiber acts as a vital link between atomistic and continuum scales.. Equivalent Resistor Network Modeling
A novel three-dimensional random percolation model is set up to investigate the electrical conductivity of the nanocomposites. In most previous works, the percolation threshold and the electrical conductivity were evaluated by recognizing the connective percolating network linking two opposite faces of a single representative cuboid volume.. Following the methodology of these earlier works, the electrical current cannot always propagate periodically, although periodic boundary conditions for CNT configurations were enforced. To eliminate these unexpected anomalies, we developed an improved network recognition approach. In our novel approach, the continuity of the network is ensured by introducing periodically connective paths. Furthermore, we incorporated Landauer-Büttiker formula (Eq. 6) to evaluate the resistance between two CNTs contacting at the mesoscopic scale. With these techniques applied in our Monte Carlo simulations, we were able to fully analyze the electrical conductivity of nanocomposites containing uniformly distributed, aligned and agglomerated CNTs.
MTehR 2int 2/ (6)
Results and Discussions As an intermediary step in the study of the effective mechanical properties of nano-reinforced composites, the nonlinear response of
individual CNTs was investigated. Two CNT arrangements were studied: the (16,0) zigzag nanotube and the (9,9) armchair nanotube, both having diameters of approximately 1.2 nm and lengths of 10 nm. Two loading conditions were investigated to obtain both tensile and shear properties.
The results show that the zigzag nanotube can withstand a strain of 17%, while the armchair nanotube can withstand a strain of up to 22% in tnesion. The respective tensile modulus for the armchair and zigzag nanotubes are 945 GPa and 920 GPa. The overall trend of the stress-strain curves agree well with the literature [3, 4], and also show that the armchair configuration exhibits higher strength and stiffness when compared to the zigzag configuration as shown in Fig. 7.
By equating the associated strain energies under identical loading conditions, we were able to homogenize the RVE into a representative fiber. The homogenized RVE was then employed in a Mori-Tanaka based micromechanical analysis to predict the effective properties of the newly developed nanocomposite. Numerical examples show that the effect of volume fraction, orientation, and aspect ratio of the CNTs on the properties of the nanocomposite can be significant. For example, Fig. 8 shows the effect of CNT volume fraction on the longitudinal Youngs modulus for both aligned and randomly oriented CNTs.
The representative fiber was also used to model the reinforcing phase in large scale FEA-assisted nonlinear micromechanical models. The resulting mechanical property predictions show good agreement with experimental measurements for the case of 0.5wt% CNT concentration.
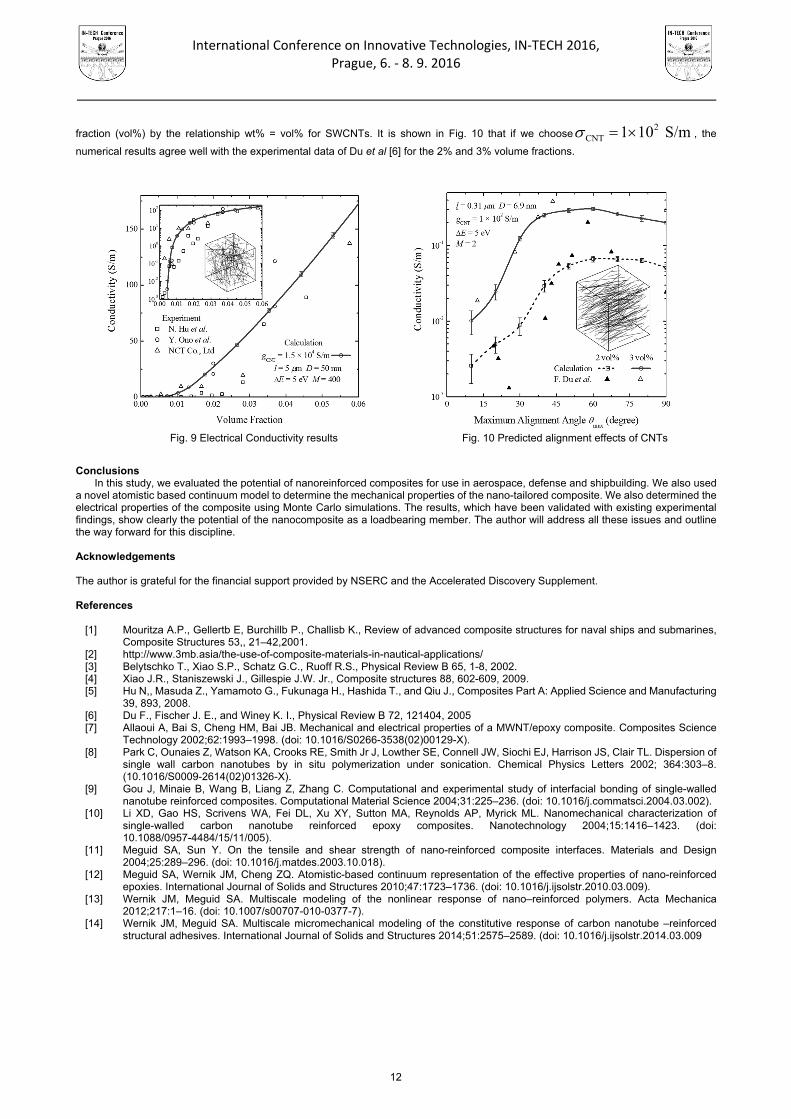
Furthermore, we compared the numerical results of our random network model with various experiments. In Fig. 9, our numerical predictions for uniformly distributed MWCNTs show good agreement with experimental results [5]. Our model predicts that the critical percolation threshold is around 1% volume fraction.
In Fig. 10, our theoretical model is also used to make a quantitative comparison with Du et al’s experimental data [6] for SWCNTs. In
Du et al’s work, the degrees of CNT alignment satisfy the Lorentz distribution which is characterized by the full width at half maximum
(FWHM). In our calculations, we approximate the Lorentz function as being uniform in the range max max[ , ] , and obtain the
relationship maxFWHM 2 . Whenever the original data are given in terms of weight fraction (wt%), we converted them to volume
11
International Conference on Innovative Technologies, IN‐TECH 2016,
Prague, 6. ‐ 8. 9. 2016
fraction (vol%) by the relationship wt% = vol% for SWCNTs. It is shown in Fig. 10 that if we choose2
CNT 1 10 S/m , the
numerical results agree well with the experimental data of Du et al [6] for the 2% and 3% volume fractions.
Conclusions
In this study, we evaluated the potential of nanoreinforced composites for use in aerospace, defense and shipbuilding. We also used a novel atomistic based continuum model to determine the mechanical properties of the nano-tailored composite. We also determined the electrical properties of the composite using Monte Carlo simulations. The results, which have been validated with existing experimental findings, show clearly the potential of the nanocomposite as a loadbearing member. The author will address all these issues and outline the way forward for this discipline.
Acknowledgements The author is grateful for the financial support provided by NSERC and the Accelerated Discovery Supplement. References
[1] Mouritza A.P., Gellertb E, Burchillb P., Challisb K., Review of advanced composite structures for naval ships and submarines, Composite Structures 53,, 21–42,2001.
[2] http://www.3mb.asia/the-use-of-composite-materials-in-nautical-applications/ [3] Belytschko T., Xiao S.P., Schatz G.C., Ruoff R.S., Physical Review B 65, 1-8, 2002. [4] Xiao J.R., Staniszewski J., Gillespie J.W. Jr., Composite structures 88, 602-609, 2009. [5] Hu N,, Masuda Z., Yamamoto G., Fukunaga H., Hashida T., and Qiu J., Composites Part A: Applied Science and Manufacturing
39, 893, 2008. [6] Du F., Fischer J. E., and Winey K. I., Physical Review B 72, 121404, 2005 [7] Allaoui A, Bai S, Cheng HM, Bai JB. Mechanical and electrical properties of a MWNT/epoxy composite. Composites Science
Technology 2002;62:1993–1998. (doi: 10.1016/S0266-3538(02)00129-X). [8] Park C, Ounaies Z, Watson KA, Crooks RE, Smith Jr J, Lowther SE, Connell JW, Siochi EJ, Harrison JS, Clair TL. Dispersion of
single wall carbon nanotubes by in situ polymerization under sonication. Chemical Physics Letters 2002; 364:303–8. (10.1016/S0009-2614(02)01326-X).
[9] Gou J, Minaie B, Wang B, Liang Z, Zhang C. Computational and experimental study of interfacial bonding of single-walled nanotube reinforced composites. Computational Material Science 2004;31:225–236. (doi: 10.1016/j.commatsci.2004.03.002).
[10] Li XD, Gao HS, Scrivens WA, Fei DL, Xu XY, Sutton MA, Reynolds AP, Myrick ML. Nanomechanical characterization of single-walled carbon nanotube reinforced epoxy composites. Nanotechnology 2004;15:1416–1423. (doi: 10.1088/0957-4484/15/11/005).
[11] Meguid SA, Sun Y. On the tensile and shear strength of nano-reinforced composite interfaces. Materials and Design 2004;25:289–296. (doi: 10.1016/j.matdes.2003.10.018).
[12] Meguid SA, Wernik JM, Cheng ZQ. Atomistic-based continuum representation of the effective properties of nano-reinforced epoxies. International Journal of Solids and Structures 2010;47:1723–1736. (doi: 10.1016/j.ijsolstr.2010.03.009).
[13] Wernik JM, Meguid SA. Multiscale modeling of the nonlinear response of nano–reinforced polymers. Acta Mechanica 2012;217:1–16. (doi: 10.1007/s00707-010-0377-7).
[14] Wernik JM, Meguid SA. Multiscale micromechanical modeling of the constitutive response of carbon nanotube –reinforced structural adhesives. International Journal of Solids and Structures 2014;51:2575–2589. (doi: 10.1016/j.ijsolstr.2014.03.009
Fig. 9 Electrical Conductivity results Fig. 10 Predicted alignment effects of CNTs
12
International Conference on Innovative Technologies, IN‐TECH 2016,
Prague, 6. ‐ 8. 9. 2016
EXPERIMENTAL AND ANALYTICAL STUDY OF THE TRANSIENT PROCESS OF INFILTRATION/EXFILTRATION IN WALK-IN COOLERS
K. N Homayun 1, K. Kamensky 2, A. Mazyar 3 and R. Faramarzi 4
1 Department of Mechanical Engineering, Kettering University, Flint, Michigan
2 Michigan State University,East Lansing, Michigan 3 Miami University, Engineering Technology Department, Middletown, Ohio
4 Southern California Edison Company, Irwindale, California
Currently at NREL (National Renewable Energy Laboratory)
Keywords: Mealy Bug; Waste Water From Rice Flour Fermentation; Cassava Fields; Bio-Pesticide; Lactic Acid Bacteria Abstract: Experimental method of tracer gas technique and computational fluid dynamic (cfd) analysis are used to study the transient exfiltration/infiltration process into a walk-in cooler. initially, the “natural exfiltration/infiltration” of cold air (through cracks and seals) in a walk-in cooler is measured to establish the baseline (sink term) for the cfd analysis and also correcting the experimental data because of the existence of natural infiltration at all times. it was found that the exfiltration of cold air from the cooler or infiltration of warm air into the cooler is a transient process never modelled or measured in the past. the time dependency of the process starts with an initial significant amount of cold air rushing out and its gradual decay depending on the duration of time that the door stays open. the hybrid modelling/experimental approach for different cooler’s inside and outside temperatures will not only capture the transient behavior of the entire process, but also assists in accurate prediction of the cooling load. Introduction
Infiltration of walk-in coolers account for more than 50% of the cooling load according to SCE (2011) and ASHRAE (2009). However, thus far there is no robust technology to precisely measure the infiltration rate of walk-in coolers during the door opening period. Upon systematic and direct measurement of the infiltration rate, the operating conditions that could reduce the infiltration rate can be identified. Furthermore, the infiltration rate of walk-in coolers due to small openings and unsealed (or poorly sealed) areas has never been accurately measured. We refer to this process as “natural infiltration.” Previous to this study, there was no experimental flow visualization completed of the infiltration phenomenon that occurs when the door is open.
There is a common model that is frequently used to find the infiltration of warm air through doorways between a warm and cold room. This model was derived by Tamm (1965), and correlates the infiltration rate to geometric dimensions of the door and densities of warm and cold air. The effect of relative humidity is embedded in the density of air. This equation is given as:
3
31
1
1267.0
s
sgHWHQTamm (1)
Tamm’s model has been modified by Chen et al. (2002) for the impact of door open time, plastic strip curtains, and traffic through empirical equations. However, this equation is based on a fully developed flow between the warm air and cold air areas. The most recent work is presented by Reindl and Jekel (2009), where they use carbon dioxide as a tracer gas in a blast freezing environment. The infiltration takes place naturally through small openings and is measured by a hand-held infrared detector. Another widely used model is Gosney and Olama (1975) using a derivation of the cooling load as a function of the geometry of the door and density and enthalpy of the warm and cold air. This model does not directly calculate the infiltration rate, but it links the infiltration rate, through an energy balance equation, to the cooling load and the infiltration rate thereafter. This derivation is also for fully developed flows. The Gosney equation is:
5.1
31
5.0
5.0
1
2
125.2754
outside
inside
inside
outsideinsideinsideoutside
gH
hhAq
(2)
Another approach to quantify air infiltration based on hydrodynamic theory for a flow through an orifice is Cleland’s (2004) equation that may be adequate for refrigerated warehouses, but not walk-ins. These models are only valid if both rooms (cold and warm) are
13

International Conference on Innovative Technologies, IN‐TECH 2016,
Prague, 6. ‐ 8. 9. 2016
considered to be a reservoir.
gHP
Where
PACQ
outsideinside
insideOCleland
)(
2
(3a)
To take abrupt expansion into account, a corrective factor is added:
expansionabrupt for Correction
2
L
insideLOCleland
K
PAKCQ
(3b)
Special attention should be given to the term of type
inside
outside
1 . If the values of inside and outside temperatures are fixed at
a prescribed value, both of these equations will yield a constant value of infiltration that is somewhat far from the reality. For this assumption to be true, both rooms must be considered as reservoirs, which is not the case. However, if the cooler air density is taken to be a function of time as infiltration dictates, a more realistic estimate of infiltration by these two equations may be obtained. This requires information about the average air temperature in the cooler as a function of time after the air inside the cooler stabilizes. In our experiment this stabilization of inside air could be easily detected by the tracer gas, enabling us to find this functionality and use a transient value for air density inside the cooler to present “modified” Tamm, Gosney or Cleland equations.
In our research, emphasis is on capturing the actual transient behavior of the infiltration rate. The benefit of this method in the actual periodical operation of coolers will lead to accurate prediction of the cooling load. Let us consider a typical scenario where a frequent closing and opening of a walk-in cooler exists. Figure 1 depicts a typical scenario. The blue lines refer to the exfiltration of cold air and therefore infiltration of the warm air into the cooler during the door opening interval. The red lines are when the door is kept close and the inside air is cooled. The temperature may or may not reach the nominal operating value (desired value) because the next door opening may occur before this time. The green line is the natural infiltration that occurs while the door is not opened through the unsealed areas or cracks. As it is seen from Figure 1, the exfiltration/infiltration phenomenon is a transient process and it cannot be modelled by any of the previous models unless the cold space is very large, so that the amount of exfiltrated air to the total amount of cold air is small. The purpose of this work was to find the “blue” line portion of Figure 1 that represents exfiltration/infiltration of air out- or into a walk-in. It is seen that the process is transient and comes into equilibrium (there will not be any more cold air left in the walk-in) asymptotically. The blue line representing exfiltration/infiltration processes can vary as the temperature gradient, fan speed, and relative humidity differences between the cold air (inside the walk-in) and warmer air (outside the cooler) change. In this study, we are going to measure and create the blue line portion of Figure 1 under different conditions. Although, this work was performed for a specific walk-in, it can be generalized to provide a library of these “blue” lines in a form of an equation that can be used by industry and fitted to their specific operating conditions. We have also used the computational fluid dynamic (CFD) modelling identical to the experimental procedure that was used. It should also be mentioned that since the amount of cold air leaving the walk-in is equal to the amount of warm air infiltrating into the cooler, we have used the terms exfiltration and infiltration interchangeably (in terms of volume and not mass).
This project will provide the manufacturers with a tool and a protocol that can be used to find the infiltration rate into walk-in coolers very accurately through direct measurements of the tracer gas concentration. This method has been used by Amin, et al. (2009) for measuring the infiltration rate of open refrigerated display cases and is adopted in this work as a robust, accurate and simple-to-use technique.
Fig. 1 Sequence of infiltration/exfiltration processes in a typical walk-in cooler
Experimental setup Series of tests were performed with the walk-in cooler at Southern California Edison’s Thermal Test Center (TTC) facilities to study
the infiltration rate and also visualize the flow pattern at the door during the event of infiltration. CO2, an inexpensive and safe tracer gas was used to monitor the infiltration rate. The process consists of bringing the tracer gas concentration to a stable level inside the cooler
14

International Conference on Innovative Technologies, IN‐TECH 2016, Prague, 6. ‐ 8. 9. 2016
when the door is closed and monitoring the concentration during the opening period. After the closing of the door, the concentration in the room becomes uniform due to the operation of the fan and the convective motion of air. The difference between the initial and final concentration at steady state conditions can be correlated to the amount of CO2 loss during infiltration. This concentration can be related to the amount of cold air that leaves the cooler or the warm air that infiltrates into the cooler.
Several probes were installed throughout the cooler for collecting samples to obtain a good representation of the average CO2 concentration inside the cooler. These collected samples were taken to the gas analyzer for data logging. Suction pumps drew the mixture of tracer gas and air from the desired points and transferred it to the gas analyzer. The pumps should be installed between the sampling probes and the gas analyzer to force the samples into the analyzer. Each gas analyzer channel requires its own dedicated pump. The outside area where the warm air was infiltrating into the cooler was a controlled environment room. To retain accuracy of the data, the CO2 concentration had to be monitored inside this room. The maximum amount was only about 6% of the total amount of the initial tracer gas, and is accounted for throughout the calculations. 25% of the cooler was filled with food products yielding a cold air volume of 630 ft3 (17.8 m3) with a total cooler volume of 842 ft3 (23.8 m3). The outside room is conditioned at several temperature and relative humidity combinations as described in the results section. Another parameter that was investigated was the fan speed that varied from zero to 100% capacity. The temperature of the cooler was recorded in time. However, the infiltration was only initiated when the cooler temperature was stabilized at 35oF (2oC). Furthermore, we used the varying air density inside the cooler to capture some of the transient nature of the infiltration process in the conventional methods.
Results We have considered the following four cases for this work:
a. Conditioned Space 75oF (24oC) and RH=55% Cooler always at 35oF (2oC) b. Conditioned Space 80oF (27oC) and RH=60%c. Conditioned Space 84oF (29oC) and RH=82%d. Conditioned Space 115oF (46oC) and RH=14%
The results of the tracer gas method were compared with Tamm’s, Gosney’s, and Cleland’s models. Since these models do not represent the transient exfiltration process that is being considered in this work, a few of their predictions have been presented for completeness.
Tamm, Gosney, and Cleland model prediction for Case (a) are presented in Figures 2, 3, and 4. It is evident that these models are steady state without accounting for time. They may have some value for predicting the exfiltration rate in very large warehouses. However, that also depends on the time interval that the door is left open. That is to say that the infiltration rate is quite large at the beginning where a large amount of cold air is lost in a few minutes, therefore, invalidating any steady state approach. It seems that the Gosney model predicts somewhat lower infiltration rates. The Cleland’s model over-predicts the infiltration by a factor of 4 compared to the other two models. This model is based on the analogy between the infiltration phenomenon and the orifice flow. However, it can be further corrected for abrupt expansion (into the outside room) which lowers the over-prediction by 25%. The results of the Cleland’s model are shown in Figure 4. It can be seen from Figures 2-4, that all these models predict about 10% lower infiltration if the fan stops while the door is open. This is not the case in actual measurements.
The result of the tracer gas method is shown in Figure 5. Based on the tracer gas model, only 5% of the infiltration difference can be attributed to fan speed. Furthermore, the transient nature of the infiltration is captured in this method. The infiltration as a function of time has to asymptotically go to zero and that is when there are no temperature or humidity gradients between the inside cooler and outside air.
The area under the curve,
dtdt
d
time
represents the total volume (mass) of air displaced. This value cannot be more than the initial
volume of air inside the cooler. The earlier models do not consider a finite volume for the cooler, and therefore, they cannot be accurate for walk-in coolers that are not the size of big warehouses. Furthermore, based on the tracer gas results shown in Figure 5, the area under the curve can be calculated to be about 640 ft3 which is very close to the earlier calculations of the empty (cold air) volume inside the cooler. This is actually a verification of the method that indicates the decaying nature of the infiltration for the cooler as the inside and outside air come into equilibrium.
15

International Conference on Innovative Technologies, IN‐TECH 2016,
Prague, 6. ‐ 8. 9. 2016
Fig. 5 The exfiltration/infiltration rate as measured by the gas analyser
The results for other cases demonstrate similar trend and we only present a few of them. However, the exfiltration results by the
tracer gas method for Cases b and c are presented in Figures 6 and 7. The experimental results indicate that there was no definite indication that the fan speed affected the infiltration rate significantly. However, it was found that the fan off scenario does not necessarily reduce the infiltration rate. In fact, for case d, it was found that the 50% fan had the lowest exfiltration rate. We can postulate that the existence of air motion (momentum) inside the cooler may be designed to somewhat reduce the exfiltration process. This may be due to the existing flow parallel to the door which may prevent the cold air from moving outside.
Fig. 8 CFD and experimental Tracer Gas result comparison at Fan Speed = 0
CFD simulation for the infiltration problem in a walk-in cooler was performed from the first principle. The tool used is a full incompressible Navier-Stokes with an energy equation and natural convection from buoyancy forces. The 3D code is an in-house computer program based on a finite volume discretization of the incompressible Navier-Stokes equation using the artificial compressibility method and the Roe flux-difference splitting with a third order limiter. The time marching method is fully implicit and the solution is obtained
16
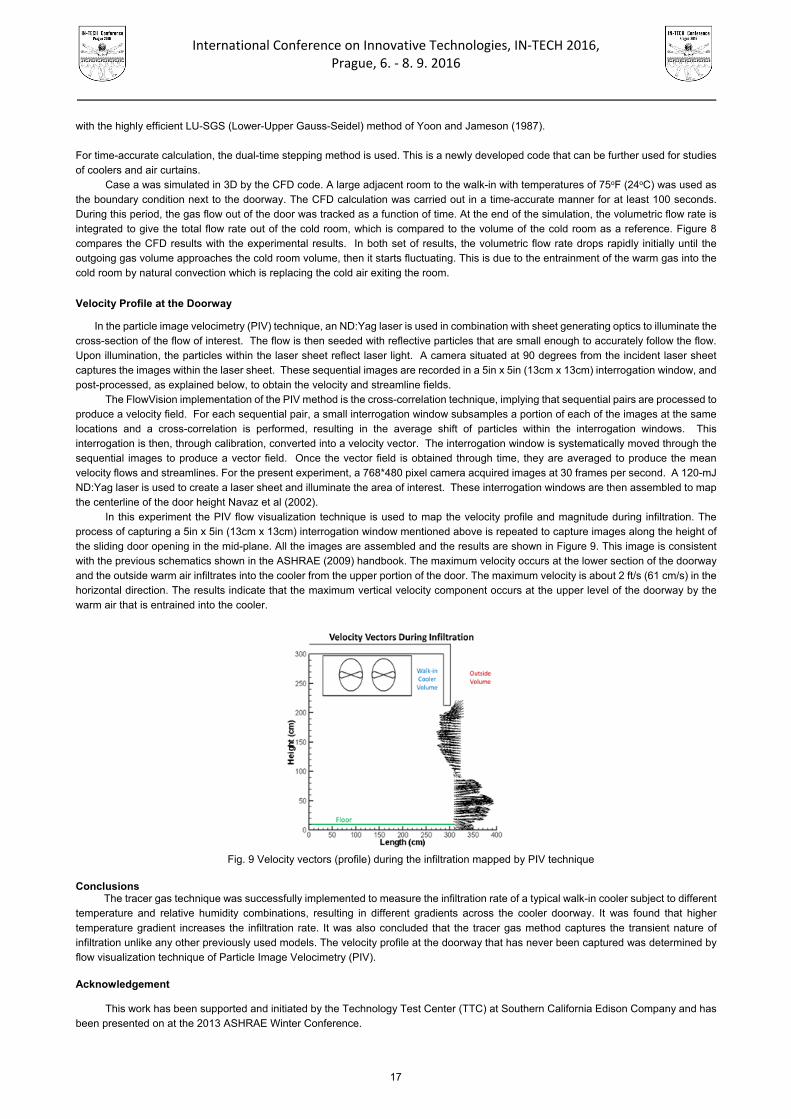
International Conference on Innovative Technologies, IN‐TECH 2016,
Prague, 6. ‐ 8. 9. 2016
with the highly efficient LU-SGS (Lower-Upper Gauss-Seidel) method of Yoon and Jameson (1987).
For time-accurate calculation, the dual-time stepping method is used. This is a newly developed code that can be further used for studies of coolers and air curtains.
Case a was simulated in 3D by the CFD code. A large adjacent room to the walk-in with temperatures of 75oF (24oC) was used as the boundary condition next to the doorway. The CFD calculation was carried out in a time-accurate manner for at least 100 seconds. During this period, the gas flow out of the door was tracked as a function of time. At the end of the simulation, the volumetric flow rate is integrated to give the total flow rate out of the cold room, which is compared to the volume of the cold room as a reference. Figure 8 compares the CFD results with the experimental results. In both set of results, the volumetric flow rate drops rapidly initially until the outgoing gas volume approaches the cold room volume, then it starts fluctuating. This is due to the entrainment of the warm gas into the cold room by natural convection which is replacing the cold air exiting the room.
Velocity Profile at the Doorway
In the particle image velocimetry (PIV) technique, an ND:Yag laser is used in combination with sheet generating optics to illuminate the cross-section of the flow of interest. The flow is then seeded with reflective particles that are small enough to accurately follow the flow. Upon illumination, the particles within the laser sheet reflect laser light. A camera situated at 90 degrees from the incident laser sheet captures the images within the laser sheet. These sequential images are recorded in a 5in x 5in (13cm x 13cm) interrogation window, and post-processed, as explained below, to obtain the velocity and streamline fields.
The FlowVision implementation of the PIV method is the cross-correlation technique, implying that sequential pairs are processed to produce a velocity field. For each sequential pair, a small interrogation window subsamples a portion of each of the images at the same locations and a cross-correlation is performed, resulting in the average shift of particles within the interrogation windows. This interrogation is then, through calibration, converted into a velocity vector. The interrogation window is systematically moved through the sequential images to produce a vector field. Once the vector field is obtained through time, they are averaged to produce the mean velocity flows and streamlines. For the present experiment, a 768*480 pixel camera acquired images at 30 frames per second. A 120-mJ ND:Yag laser is used to create a laser sheet and illuminate the area of interest. These interrogation windows are then assembled to map the centerline of the door height Navaz et al (2002).
In this experiment the PIV flow visualization technique is used to map the velocity profile and magnitude during infiltration. The process of capturing a 5in x 5in (13cm x 13cm) interrogation window mentioned above is repeated to capture images along the height of the sliding door opening in the mid-plane. All the images are assembled and the results are shown in Figure 9. This image is consistent with the previous schematics shown in the ASHRAE (2009) handbook. The maximum velocity occurs at the lower section of the doorway and the outside warm air infiltrates into the cooler from the upper portion of the door. The maximum velocity is about 2 ft/s (61 cm/s) in the horizontal direction. The results indicate that the maximum vertical velocity component occurs at the upper level of the doorway by the warm air that is entrained into the cooler.
Fig. 9 Velocity vectors (profile) during the infiltration mapped by PIV technique
Conclusions
The tracer gas technique was successfully implemented to measure the infiltration rate of a typical walk-in cooler subject to different temperature and relative humidity combinations, resulting in different gradients across the cooler doorway. It was found that higher temperature gradient increases the infiltration rate. It was also concluded that the tracer gas method captures the transient nature of infiltration unlike any other previously used models. The velocity profile at the doorway that has never been captured was determined by flow visualization technique of Particle Image Velocimetry (PIV). Acknowledgement
This work has been supported and initiated by the Technology Test Center (TTC) at Southern California Edison Company and has been presented on at the 2013 ASHRAE Winter Conference.
17

International Conference on Innovative Technologies, IN‐TECH 2016,
Prague, 6. ‐ 8. 9. 2016
Nomenclature
A = Doorway area
Ci = Mass fraction
Co = Orifice coefficient
g = Gravitational acceleration
h = Enthalpy
KL = Corrective factor
M = Molecular weight
m = Mass flow rate
n = Number of moles
P = Pressure
Q = Volumetric (Infiltration) flow rate
q = Sensible and latent refrigeration load
RH = Relative Humidity
s = Ratio of warm air density to cold air density
T = Temperature
u = Horizontal component of velocity
v = Vertical component of velocity
W = Width
y = Mole fraction
Special characters
= Air volume inside cooler
ρ = Density
ω = Humidity ratio
Subscripts
Cleland = Derived by D. Cleland
CO2 = Carbon Dioxide
da = Dry air
inside = Air or volume inside the walk-in (refrigerated)
mix = Mixture of CO2, dry air and vapor
outside = Air or volume outside the walk-in (ambient)
Tamm = Derived by W. Tamm
v = Vapor
References [1] Amin, M., D. Dabiri, and Navaz, H.K. (2009), “Tracer Gas Technique: a New Approach for Steady State Infiltration Rate Measurement
of Open Refrigerated Display Cases,” Journal of Food Engineering, Vol 92., pp. 172-18. ASHRAE (2009), Refrigeration Load, 2006 ASHRAE Handbook, Chapter 13 [2] Cleland, D., Lovatt, S., Chen, P., and M. Bassett (2004), A Modified Model to Predict Air Infiltration into Refrigerated Facilities
Through Doorways, ASHRAE Document 4672 [3] Chen, P., Cleland, D., Lovatt, S., and M. Bassett (2002), Am empirical model for predicting air infiltration into refrigerated stores
through doors, International Journal of refrigeration, Vol. 25, pp. 799-812. [4] Gosney, W., and H. Olama (1975), Heat and enthalpy gains through cold room doorways. Proceedings of the Institute of
Refrigeration, Vol 72, pp. 31-41 [5] Navaz, H.K., Faramarzi, R., Dabiri, D., Gharib, M., and Modarress, D. (2002), “The Application of Advanced Methods in Analyzing the
Performance of the Air Curtain in a Refrigerated Display Case,” Journal of Fluid Engineering, ASME Transactions, Vol. 124, pp. 756-764
[6] Reindl, D., and T. Jekel (2009), Infiltration Rate Determination for Low Temperature Freezing Systems, ASHRAE Transaction SL-08-027
SCE, (2011), A Comprehensive Study of Infiltration Rate into Walk-in Coolers by Tracer Gas Technique and Particle Image Velocimetry, Southern California Edison Company Report.
[7] Tamm, W. (1965), Air Flow with air curtains to protect cold rooms. Proceedings 11th International Congress of Refrigeration, Vol. 2, pp. 1025-1038.
[8] Yoon, S.; Jameson, A.: LU Implicit Schemes with Multiple Grids for the Euler equations. AIAA Journal 7 (1987), pp.929-935
18
International Conference on Innovative Technologies, IN‐TECH 2016,
Prague, 6. ‐ 8. 9. 2016
IMPROVING THERMAL EFFICIENCY OF AN AUTOMOTIVE TURBOCHARGER TURBINE WITH CERAMIC THERMAL BARRIER
COATING INTO THE INNER PASSAGE OF THE TURBINE
A.M. Noor 1,2, M.R. Abbas 3, M. B. Uday1 and S. Rajoo1
1 UTM Centre for Low Carbon Transport, Faculty of Mechanical Engineering, Universiti Teknologi Malaysia, 81310 Skudai, Malaysia
2 Centre for Biomedical Engineering, Universiti Teknologi Malaysia, 81310 Skudai, Malaysia
3 Hassan Usman Katsina Polytechnic, P.M.B 2052, Katsina, Katsina State, Nigeria
Keywords: Automotive Turbocharger; Ceramic Coating; Thermal Barrier; Material Sciences; Heat Transfer Abstract: Engine downsizing has been proven to improve fuel economy and turbocharging is considered to be one of the key enablers. Turbine volute which experiences extreme temperature needs to be made from durable and cost effective material. Alternatively, thermal barrier coating could be used to insulate a cheaper and lighter material, so it could operate in extreme temperature conditions. This paper describes an attempt to improve the thermal properties of nickel metal (substrate) through the use of simple and cost effective functionally graded thermal barrier coating technique, as an alternative choice for turbocharger turbine volute casing material. Commercial computational tools were used to predict the heat transfer behaviour as well as engine level effects of different functionally graded thermal barrier coating layers. The coating slurry was developed using appropriate mixture of yttria-stabilized zirconia (YSZ) and nickel (Ni) powder, distilled water, polyvinyl alcohol and ammonium citrate tribasic. The three different compositional layers of the coating were deposited on the nickel substrate using an “automatic film applicator”. The design compositions of Sample A (30wt% YSZ & 70wt% Ni), Sample B (55wt% YSZ & 45wt% Ni) and Sample C (75wt% YSZ & 25wt% Ni) produced the best coating result for the first, second and third layer respectively. The optimum percentage for the best slurry composition were found to be 45.5wt% ceramic-metal, 51.20wt% solvent, 3wt% binder and 0.3wt% dispersant. With an initial temperature of 750°C, the heat resistance capability was found to be 40°C, 130°C and 250°C for the first, second and third layer respectively. The average turbine efficiency of 54.1%, 59.2%, 63.4% and 68.03% were achieved for the engine speed of 1000rpm, 1500rpm, 2000rpm and 2500rpm, respectively. Similarly, the compressor efficiency was found to be 59.3%, 62.2%, 65.5% and 69.97 respectively. Introduction
Automotive turbocharger turbine is being subjected to high temperature and corrosive exhaust gases. The extreme temperature leads to heat transfer issues which affect the engine-turbo matching as well. Furthermore, the high temperature conditions necessitate the turbine casing material to be highly durable. The structure of a turbocharger is complicated and its working environment is severe, thus it is one of the high risk components in an engine [1]. The life-span of a turbocharger, its efficiency and reliability can be affected by factors such as the modality of the turbine-engine conduction [2]. In addition, the high cost and high density of tungsten, which is the material currently used for this purpose has made the turbocharger relatively expensive and heavy. As a result, researchers and engineers are hitherto intensifying effort towards improving the turbocharger reliability and service life for better performance at lower manufacturing cost [3]. Furthermore, the thermal energy transfer from the turbine has serious effect on the turbocharger overall performance as it restrict the engine charging process which significantly reduces the turbine power and influences turbo lag at no-load and part-load engine operations as well as during engine start up [4]. Also the unrelenting quest of fuel economy improvement in automotive and gas turbine engines has aggravated the situation and thus compelled researchers, engineers and designers to find alternative way(s) of improving the thermal efficiency of engines and high temperature capability of the existing engine components through the use of thermal barrier coating techniques.
Functionally graded thermal barrier coating (FG-TBC) is a new technique consisting of non-homogeneous materials whose composition and microstructure are varied according to a predetermined profile. This is done in order to enhance its thermo-mechanical properties and reduced spallation problems occurring in thermal barrier coated engineering materials [5-7]. Two or more different materials (in powder form), in most cases ceramic and metal, are mixed and used depending on the objective, applications and the nature of the substrate material. Recent studies have shown that FG-TBC technique had received a lot of attention from various applications in the field of science and engineering. Some of the applications are for heat-resistance, electronic, biological and chemical engineering [5].
The aim of the present study is to evaluate the quality, integrity and reliability of slurry based functionally graded thermal barrier coating (FG-TBC) deposited using automatic film applicator with respect to thermal efficiency improvement in automotive turbocharged engines. Identification of Coating Materials and Process
The selection of thermal barrier coating materials is restricted by some basic requirements such as high melting point, lower thermal conductivity, good adherence to substrate and chemical inertness. For this study, the yttria-stabilized zirconia (YSZ) was used due to its best high temperature performance capabilities [8-11]. In order to reduce the residual thermal stress due to the thermal expansion mismatch between the substrate and the YSZ, nickel metal powder was used during the ceramic slurry preparations [12]. Finally, a new
19

International Conference on Innovative Technologies, IN‐TECH 2016,
Prague, 6. ‐ 8. 9. 2016
laboratory-scale surface coating technique using an automatic film application was adopted in this study due to its advantages in terms of low cost, accuracy, simplicity and reproducibility [13, 14].
Substrate material and its preparations The substrate material for the thermal barrier coating plays a vital role in the fabrication of quality coatings. Nickel alloy with
commercial purity of 99.7 % was used in this study as the substrate material for the coatings based on the cost implication and ease of availability in comparison to tungsten, which is currently the material used in turbine volute for automotive engines. Nickel alloy has relatively inherent thermal and mechanical properties capable of withstanding the working environment for the turbocharger application [15-17]. Furthermore, a glow discharger spectrometer (GDS) test was carried out on the Nickel alloy material in order to confirm its elemental composition. The detailed substrate surface preparation, the selection of optimum material compositions, the procedures and the results have been reported in reference [18].
Material properties
The basic material properties such as thermal conductivity, density and specific heat capacity at constant pressure for the substrate material (Nickel), first FG-TBC, second FG-TBC and third FG-TBC layers are shown in Table 1.
Table 1. Basic thermal and material properties of functionally graded thermal barrier coating (FG-TBC) layers S/NO. Layer Thermal conductivity (Wm-1K-1) Density (kgm-3) Specific heat capacity (J/kg 0C)
1 First 13.60 6480 320
2 Second 10.50 5720 280
3 Third 7.35 5110 245
4 Substrate 60.7 8880 460
The substrate surface preparations in relation to the quality and integrity of thermal barrier coatings is significant as it improves the
diffusion bonding between the substrate and the coating [19]. Sand blasting was used in this study as it exposes the microstructure of the substrate and also its surface roughness, thus enabling the slurry mixture to be adequately soaked in the substrate. The advantages of sand blasting is reported by Bernard-Granger, et al. [19] and Kawamura, et al. [20]. The nickel substrates were first cut into pieces of 60mm x 30mm x 4mm, which are then sand blasted. The sand blasting processes were effectively done on all the cut samples by maintaining the same amount of sand pressure as it strikes the surface of the substrate, thereby maintaining almost a uniform surface roughness across all samples.
Thermal conductivity, Density and Specific heat capacity
Cussons thermal conductivity apparatus (Manchester, UK) was used in this work to determine the thermal conductivity of the different compositional mixtures for the functionally graded materials (35wt%YSZ-65wt%Ni; 60wt%YSZ-40wt%Ni; 80wt%YSZ-20wt%Ni). An ASTM standard with designation C20-00 was used to determine the bulk density of the different compositions for the functionally graded material. Three different samples with compositional YSZ:nickel ration of 35:65, 60:40 and 80:20 for samples A, B and C respectively were prepared for the experiment. Each sample mixture was then vigorously mixed using distilled water and polyvinyl alcohol (PVA) as the solvent and binder respectively. Slurry was prepared from each sample mixture which was then poured into a 1 inch diameter PVC pipe serving as the curing mould and it was allowed for 48 hours of effective curing. After the curing process and prior to sintering, the samples were removed from the PVC mould and further dried in the oven for 2 hours at 100°C. After drying the samples were sintered in a high temperature muffle furnace at 1200oC one hour in the presence of Argon air.
A differential scanning calorimeter (DSC) was used in this work to determine the specific heat capacity of the different compositional mixture for the functionally graded materials – 6.4mg mass for sample A(35wt% YSZ and 65wt% Nickel) and sample C(80wt% YSZ and 20wt% Nickel), then 6.1mg for sample B (60wt% YSZ and 40wt% Nickel). The experiment was started at 30°C and heated at the rate of 10°C per minute up to the temperature of 595.8oC which is the highest temperature the testing apparatus can attain. The output readings of the rate of heat flow, temperature and time were recorded. Results of both thermal conductivity and specific heat capacity of this materials have been reported in reference [21]. Engine performance evaluation
After all the FG-TBC coated samples were tested physically and evaluated microstructurally, a commercial 1D code was used to evaluate the engine performance with the turbocharger turbine volute being modified based on the properties of the fabricated FG-TBC coated samples. Result and discussions Thermal resistance
Figures 1(a) to 1(c) are the 2-dimensional and 3-dimensional results of the heat transfer predictions analysis across the different FG-TBC layers. The figures show the temperature reduction capabilities of one layer, two layers and three layers of the FG-TBCs respectively. The temperature reduction ability of the FG-TBC increases with an increase in the amount of the YSZ content in the compositions, which can be attributed to the heat insulation capability of the YSZ. The temperature reduction ability also increases with the number of coating layers, however this will inevitably increases the coating thickness. Simulation results indicate that the FG-TBC compositions is a good candidate to be used as thermal barreir coating, which is supported by other research findings on the temperature reductions of thermal barrier coatings reported in the literature [22-28].
20
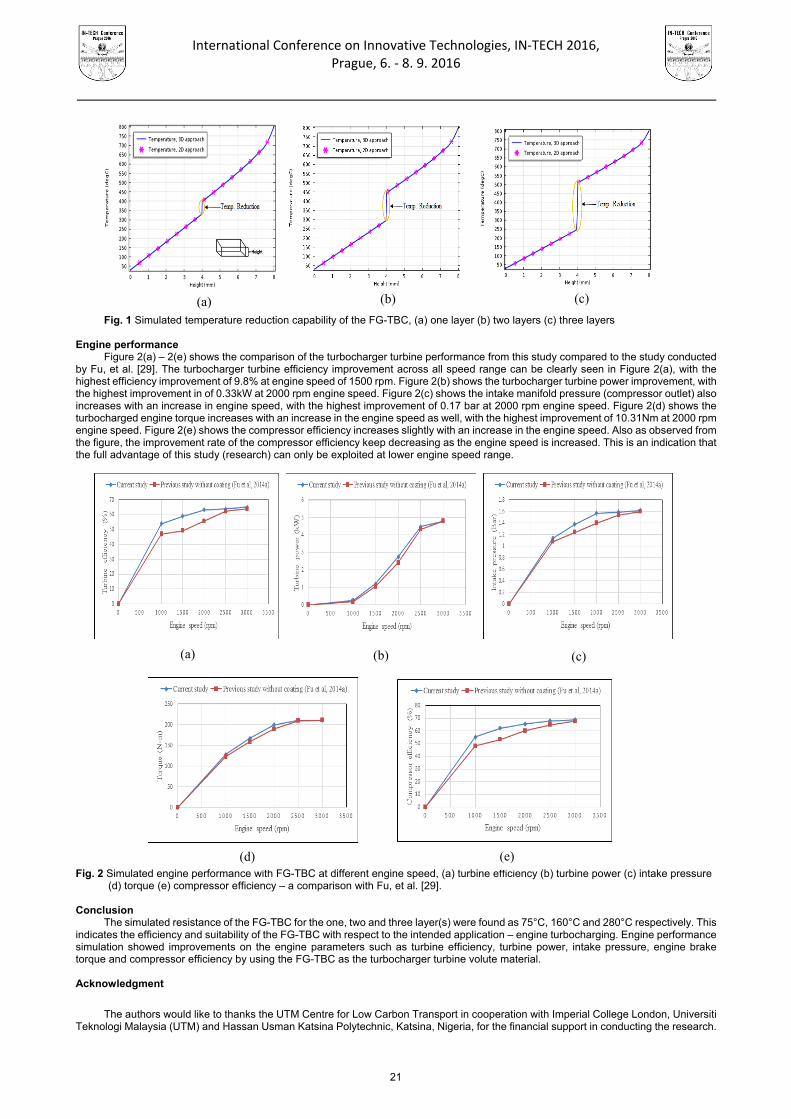
International Conference on Innovative Technologies, IN‐TECH 2016,
Prague, 6. ‐ 8. 9. 2016
Fig. 1 Simulated temperature reduction capability of the FG-TBC, (a) one layer (b) two layers (c) three layers
Engine performance
Figure 2(a) – 2(e) shows the comparison of the turbocharger turbine performance from this study compared to the study conducted by Fu, et al. [29]. The turbocharger turbine efficiency improvement across all speed range can be clearly seen in Figure 2(a), with the highest efficiency improvement of 9.8% at engine speed of 1500 rpm. Figure 2(b) shows the turbocharger turbine power improvement, with the highest improvement in of 0.33kW at 2000 rpm engine speed. Figure 2(c) shows the intake manifold pressure (compressor outlet) also increases with an increase in engine speed, with the highest improvement of 0.17 bar at 2000 rpm engine speed. Figure 2(d) shows the turbocharged engine torque increases with an increase in the engine speed as well, with the highest improvement of 10.31Nm at 2000 rpm engine speed. Figure 2(e) shows the compressor efficiency increases slightly with an increase in the engine speed. Also as observed from the figure, the improvement rate of the compressor efficiency keep decreasing as the engine speed is increased. This is an indication that the full advantage of this study (research) can only be exploited at lower engine speed range.
Fig. 2 Simulated engine performance with FG-TBC at different engine speed, (a) turbine efficiency (b) turbine power (c) intake pressure (d) torque (e) compressor efficiency – a comparison with Fu, et al. [29]. Conclusion
The simulated resistance of the FG-TBC for the one, two and three layer(s) were found as 75°C, 160°C and 280°C respectively. This indicates the efficiency and suitability of the FG-TBC with respect to the intended application – engine turbocharging. Engine performance simulation showed improvements on the engine parameters such as turbine efficiency, turbine power, intake pressure, engine brake torque and compressor efficiency by using the FG-TBC as the turbocharger turbine volute material.
Acknowledgment
The authors would like to thanks the UTM Centre for Low Carbon Transport in cooperation with Imperial College London, Universiti
Teknologi Malaysia (UTM) and Hassan Usman Katsina Polytechnic, Katsina, Nigeria, for the financial support in conducting the research.
(a) (b) (c)
(a) (b) (c)
(d) (e)
21

International Conference on Innovative Technologies, IN‐TECH 2016,
Prague, 6. ‐ 8. 9. 2016
This research work has been supported by the UTM Research University Grant (01G51) and the grant (4F445) from Ministry of Education Malaysia (MOE). References
[1] N. He and H. Zhang, The Rotor Dynamic Analysis and Optimization in Turbocharger. Applied Mechanics and Materials (2012).
226-228: p. 651-655. [2] L. Barelli, G. Bidini, and F. Bonucci, Diagnosis of a turbocharging system of 1MW internal combustion engine. Energy
Conversion and Management, Volume 68 (2013), p. 28-39. [3] A.A. Alsaeed, A Study of Methods for Improving the Dynamic Stability of High-Speed Turbochargers, (2010), Virginia
Polytechnic Institute and State University: PhD Dissertation. [4] S. Shaaban and J. Seume, Impact of Turbocharger Non-adiabatic Operation on Engine Volumetric Efficiency and Turbo Lag.
International Journal of Rotating Machinery, Volume 2012 (2012), p. 1-11. [5] G. Udupa, S.S. Rao and K.V. Gangadharan, Functionally Graded Composite Materials: An Overview. Procedia Materials
Science, Volume 5 (2014), p. 1291-1299. [6] G. Bolelli, V. Cannillo, L. Lusvarghi, et al., Functionally graded WC–Co/NiAl HVOF coatings for damage tolerance, wear and
corrosion protection. Surface and Coatings Technology, Volume 206 (2012), Issues 8-9, p. 2585-2601. [7] V. Teixeira, Influence of elastic properties of substrate and coating on residual stress distribution of FGM coatings. Key
Engineering Materials, (2002), Issues 230-232, p. 335-338. [8] M. Keshavarz, M., M.H. Idris, and N. Ahmad, Mechanical properties of stabilized zirconia nanocrystalline EB-PVD coating
evaluated by micro and nano indentation. Journal of Advanced Ceramics, Volume 2 (2013). Issue 4, p. 333-340. [9] C. Amaya, W. Aperador, J.C. Espinoza-Beltran, et al., Corrosion study of Alumina/Yttria-Stabilized Zirconia (Al2O3/YSZ)
nanostructured Thermal Barrier Coatings (TBC) exposed to high temperature treatment, Corrosion Science, Volume 51 (2009), p. 2994-2999.
[10] S. Salman, K. Ramazan, L. Urtekin, et al., An investigation of different ceramic coating thermal properties. Materials and Design, Volume 27 (2006), p. 585-590.
[11] X.Q. Cao, R. Vassen and D. Stoever, Ceramic materials for thermal barrier coatings. Journal of the European Ceramic Society, Volume 24 (2004), Issue 1, p. 1-10.
[12] X.C Zhang, B.S. Xu, H.D. Wang, et al., Modelling of thermal residual stresses in multilayer coatings with graded properties and compositions. Thin Solid Films, Volume 497 (2006). Issues 1-2, p. 223-231.
[13] I. Sheen, 1132N Automatic film applicator. Sheen Instruments, (2014), www.sheeninstruments.com, [14]. S.A. Adegbite, Coating of catalyst support: Links between slurry characteristics, coating process and final coating quality,
(2010), University of Birmingham, UK: PhD Thesis. [15] T. Fiedler, T. Fedorova, J. Rosler, et al., Design of a Nickel-Based Bond-Coat Alloy for Thermal Barrier Coatings on Copper
Substrates. Metals, Volume 4 (2014), Issue 4, p. 503-518. [16] X. Zhao and P. Xiao, Thermal Barrier Coatings on Nickel Superalloy Substrates. Materials Science Forum, Volume 606 (2009),
p. 1-26. [17] A. Okada, Ceramic technologies for automotive industry: Current status and perspectives. Materials Science and Engineering
B, Volume 161 (2009), p. 182-187. [18] A.M. Noor, M.R. Abbas and U.M. Basheer. Solvent based functional graded thermal barrier coating for application in automotive
turbocharger turbine volute casing, Fifth International Conference on Advances in Mechanical, Aeronautical and Production Techniques (MAPT), Kuala Lumpur, Malaysia (2016), Insititute of Research Engineers and Doctors, USA.
[19] G. Bernard-Granger, N. Monchalin and C. Guizard, Comparisons of grain size-density trajectory during spark plasma sintering and hot-pressing of zirconia. Materials Letters, Volume 62 (2008), Issue 30, p. 4555-4558.
[20] M. Kawamura, H. Okado, K. Nishio, et al., Effect of interface roughness on internal stress of ceramic thermal barrier coating. Zairyo/Jaournal of the Society of Materials Science Japan, Volume 53 (2004), Issue 9, p. 1019-1023.
[21] M.R. Abbas, A.M. Noor, S. Rajoo, et al., Thermal Conductivity and Specific Heat Capacity of Different Compositions of Yttria Stabilized Zirconia-Nickel Mixtures. Advanced Materials Research, Volume 1119 (2015), p. 783-788.
[22] B.A. Lyashenko, E.B. Soroka and K.G. Akinin, On the connection between the adhesive strength and temperature drops in heat-protective coatings. Strength of Materials, Volume 30 (1998). Issue 4, p. 450-454.
[23] G. Qian, T. Nakamura and C.C. Berndt, Effects of thermal gradient and residual stresses on thermal barrier coating fracture. Mechanics of Materials, Volume 27 (1998), Issue 2, p. 91-110.
[24] T.W. Clyne, I.O. Golosnoy, J.C. Tan, et al., Porous materials for thermal management under extreme conditions. Phil. Trans. R. Soc. A, Volume 364 (2006), p. 125-146.
[25] R.S. Lima and B.R. Marple, Nanostructured YSZ thermal barrier coatings engineered to counteract sintering effects. Materials Science and Engineering: A, Volume 485 (2008), Issuees 1–2, p. 182-193.
[26] I.O. Golosnoy, A. Cipitria and T.W. Clyne, Heat transfer through plasma-sprayed thermal barrier coatings in gas turbines: A review of recent work. Journal of Thermal Spray Technology, Volume 18 (2009). Issues 5-6, p. 809-821.
[27] M. Cerit, Thermo mechanical analysis of a partially ceramic coated piston used in an SI engine. Surface and Coatings Technology, Volume 205 (2011), p. 3499-3505.
[28] V.K. Domakonda and R.K. Puli, Application of thermal barrier coatings in diesel engines: A review. Energy and Power, Volume 2 (2012), Issue 1, p. 9-17.
[29] J. Fu, J. Deng, B. Feng, et al., An approach for exhaust gas energy recovery of internal combustion engine: Steam-assisted turbocharging, Energy Conversion and Management, Volume 85 (2014), p. 234-244.
22

International Conference on Innovative Technologies, IN‐TECH 2016,
Prague, 6. ‐ 8. 9. 2016
SIMULATION AND DESIGN OF RADIATION SHIELDING AND COLLIMATION SYSTEMS FOR THE PRECISE GAMMA-SPECTROMETRIC
EQUIPMENT
O.Jakovlevs1,2, N. Jefremova1, V.Gostilo1 and J.Viba2 1Baltic Scientific Instruments, Riga, Latvia,
2Riga Technical University, Riga, Latvia.
Keywords: Radiation Shielding; Spectrometric Equipment; Simulation; Shielding Design; Equipment Design Abstract: Space radiation and natural radioactivity make application of the modern precise spectrometric equipment impossible without high quality radiation shielding which improves its background performance. This work presents the obtained results of simulation and design of radiation shielding for precise gamma-spectrometric equipment based on semiconductor detectors for nuclear radiation. Special attention is paid to radiation pure lead materials (<50 Bq/kg) and tungsten alloys with nickel and copper linings. Laboratory, industrial, mobile and portable spectrometers developed in SolidWorks software as well as their collimation and shielding systems are described. The background performance of the developed spectrometers with passive shielding are presented, minimal radionuclide activities detected by developed spectrometers are provided. Introduction
Due to the cosmic radiation and the existence of natural radioactivity in the environment, all radiation detectors are recording some background signals. As the magnitude of the background ultimately determines the minimum detectable radiations level, the level of background radiation at the measurements should be provided as minimal. That is why the precision equipment should apply the outer shielding of the detector and collimators to reduce the level of the registered background.
The most widely spread shielding material is the lead as it is easily accessible, has density of 11,35 g/cm3, atomic number 82 and is relatively cheap [1-3]. Some cases apply tungsten (atomic number 74) instead of the lead for the shield and collimators because it has rather higher density of 17 g/cm3. That is why the tungsten has considerably higher linear attenuation factor than the lead. It is necessary to note that the materials themselves applied at the development of the shielding and detectors collimators could be the sources of the background signals. Therefore only radiation pure, certified materials should be applied.
The present work shows the results of the computer simulation and development of the passive radiation shieldings and collimators for the precision gamma-spectrometric equipment based on semiconductor detectors of nuclear radiations for various applications. Shielding Systems Computer Simulation
At the development of the passive shielding systems one should have the ability to calculate their sizes and simulate their influence on the characteristics of the precision spectrometric equipment. The calculations of the shielding thickness are computerized and usually we apply for our calculations the program [5]. A special program package named Eff Maker [6] has been developed for the simulation of the shielding impact on the spectrometric equipment behaviour. The package provides the modeling of gamma-spectra and the calculation of registration efficiency for complex shaped objects that are obtained with the use of semiconductor detectors of gamma radiation. The modeling is realized by Monte-Carlo method.
Shielding and Collimation Systems Computer Design
The development of the passive shielding systems for spectrometric equipment are made by us in the software SolidWorks, demonstrated in our projects its optimal feasibility for the design of all systems of the developed spectrometric equipment [7]. Fig.1. shows the section of the computer model of a standard lead shield which provides the screening for HPGe detector (1) in the vacuum cryostat (2). Inner diameter of the shield is defined by the diameter of the applied Marinelli beaker (3). The total lead thickness in standard equipment shield usually is 100 mm, what provides the attenuation of Co-60 in ~315 times, but Cs-137 in ~ 5000 times.
With the account of the lead weight the shielding is developed dismountable so that two specialists could easily assembly it and avoid the presence of the splits due to the dissection of the lead shielding into several parts. All lead rings (4) after the installation are tightened with thread bolts (5), what provides the stability for the design and assist to avoid reliably the radiation gaps. The design of the moving carriage (6) allows the operator to move it easily, manually changing the samples in the chamber. As the carriage shield should maintain the high level of the radiation shielding against the external radiation sources, the copper and tin or cadmium screens with the copper screws (7) are also fixed on the bottom of lead base of the carriage. Under its high plasticity the lead should be protected against the mechanical deformations. Steel shell (8) with the thickness of 0.8 mm serves as the protective screen against the mechanical deformations as well as the additional radiation screen. The standard shielding for the vertical cryostat includes also the lead insert with the copper strip, installed between the table and the shielding to avoid the gaps.
As the basic material in the design of the shielding we apply the lead Pb-210 of radiation purity < 50 Bq/kg. As the applied lead is cleared from other elements, in the radiation of the lead shielding itself dominates Pb-210 (E = 46.6 keV). When the lead is irradiated with the space radiation there appear the X-ray quanta with the energies of Кα=74.22 keV and Кβ=84,86 keV. For the screening of those gamma-lines inside the lead shield the copper screens (9) with the thickness up to 10 mm, covered with nickel or tin to suppress the own copper lines. To simplify the production of the copper screens for the radiation protection we apply the copper sheets with the thickness of 1 to 3 mm which are processed by the rolling till the required shape. The combination of several such cylinders makes copper screen of the required thickness.
The content of Pb-210 increases the content of Bi-210 (beta source, daughter nuclide Pb-210), which bremsstrahlung increases the background. To decrease the present effect in several shielding the inner screen (10) of pure lead with activity Pb-210 <5 Bq/kg is installed. In some cases also we apply the organic glass of 5 mm thickness as an additional screen. The organic glass screen serves as
23
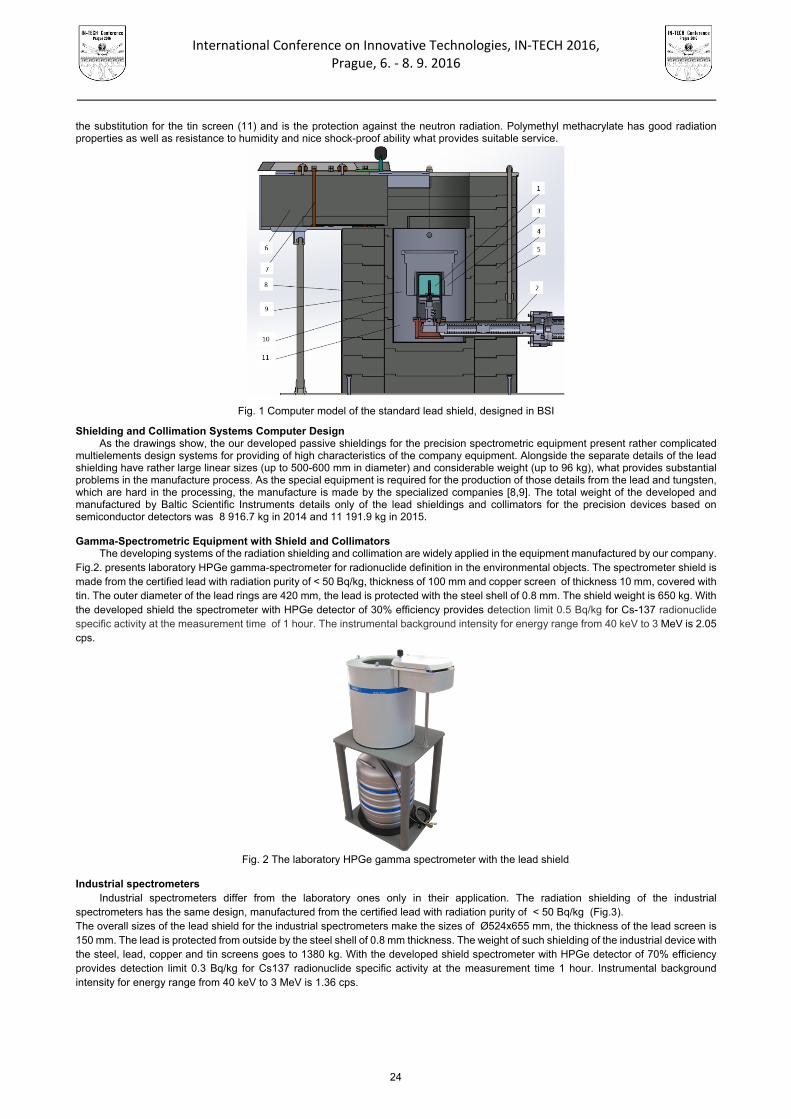
International Conference on Innovative Technologies, IN‐TECH 2016,
Prague, 6. ‐ 8. 9. 2016
the substitution for the tin screen (11) and is the protection against the neutron radiation. Polymethyl methacrylate has good radiation properties as well as resistance to humidity and nice shock-proof ability what provides suitable service.
Fig. 1 Computer model of the standard lead shield, designed in BSI
Shielding and Collimation Systems Computer Design As the drawings show, the our developed passive shieldings for the precision spectrometric equipment present rather complicated
multielements design systems for providing of high characteristics of the company equipment. Alongside the separate details of the lead shielding have rather large linear sizes (up to 500-600 mm in diameter) and considerable weight (up to 96 kg), what provides substantial problems in the manufacture process. As the special equipment is required for the production of those details from the lead and tungsten, which are hard in the processing, the manufacture is made by the specialized companies [8,9]. The total weight of the developed and manufactured by Baltic Scientific Instruments details only of the lead shieldings and collimators for the precision devices based on semiconductor detectors was 8 916.7 kg in 2014 and 11 191.9 kg in 2015. Gamma-Spectrometric Equipment with Shield and Collimators
The developing systems of the radiation shielding and collimation are widely applied in the equipment manufactured by our company. Fig.2. presents laboratory HPGe gamma-spectrometer for radionuclide definition in the environmental objects. The spectrometer shield is made from the certified lead with radiation purity of < 50 Bq/kg, thickness of 100 mm and copper screen of thickness 10 mm, covered with tin. The outer diameter of the lead rings are 420 mm, the lead is protected with the steel shell of 0.8 mm. The shield weight is 650 kg. With the developed shield the spectrometer with HPGe detector of 30% efficiency provides detection limit 0.5 Bq/kg for Cs-137 radionuclide specific activity at the measurement time of 1 hour. The instrumental background intensity for energy range from 40 keV to 3 MeV is 2.05 cps.
Fig. 2 The laboratory HPGe gamma spectrometer with the lead shield
Industrial spectrometers
Industrial spectrometers differ from the laboratory ones only in their application. The radiation shielding of the industrial spectrometers has the same design, manufactured from the certified lead with radiation purity of < 50 Bq/kg (Fig.3). The overall sizes of the lead shield for the industrial spectrometers make the sizes of Ø524x655 mm, the thickness of the lead screen is 150 mm. The lead is protected from outside by the steel shell of 0.8 mm thickness. The weight of such shielding of the industrial device with the steel, lead, copper and tin screens goes to 1380 kg. With the developed shield spectrometer with HPGe detector of 70% efficiency provides detection limit 0.3 Bq/kg for Cs137 radionuclide specific activity at the measurement time 1 hour. Instrumental background intensity for energy range from 40 keV to 3 MeV is 1.36 cps.
24
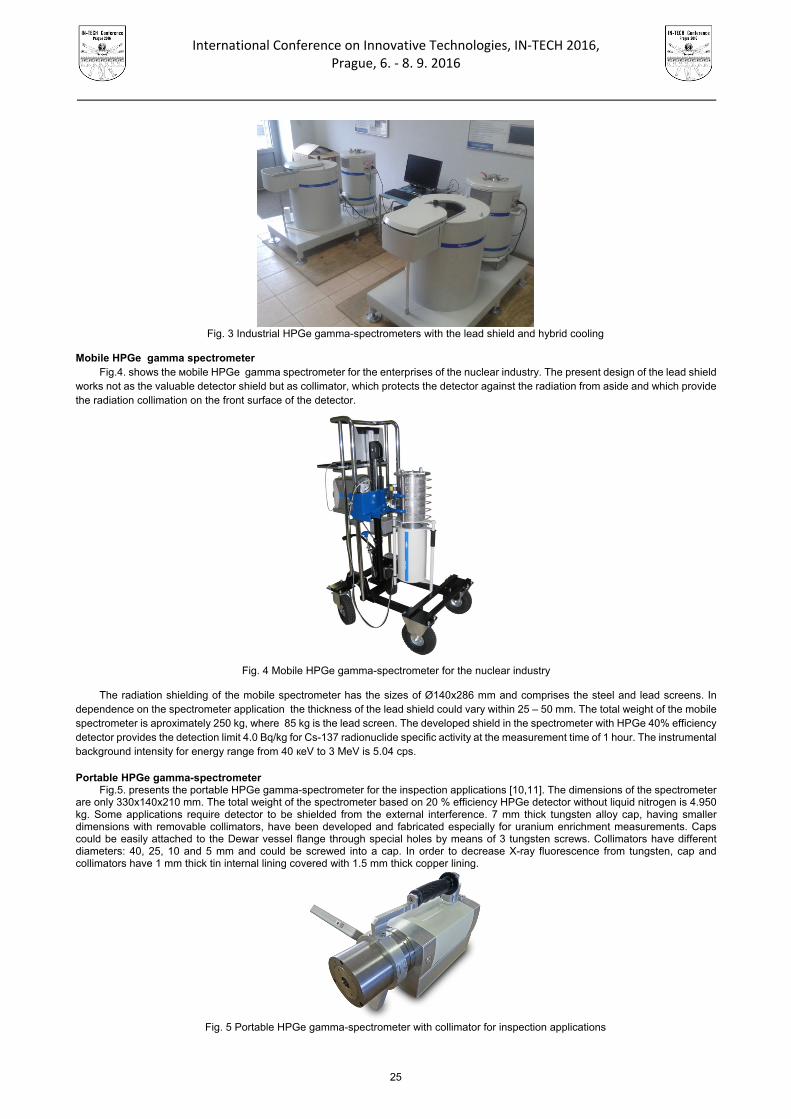
International Conference on Innovative Technologies, IN‐TECH 2016,
Prague, 6. ‐ 8. 9. 2016
Fig. 3 Industrial HPGe gamma-spectrometers with the lead shield and hybrid cooling
Mobile HPGe gamma spectrometer
Fig.4. shows the мobile HPGe gamma spectrometer for the enterprises of the nuclear industry. The present design of the lead shield works not as the valuable detector shield but as collimator, which protects the detector against the radiation from aside and which provide the radiation collimation on the front surface of the detector.
Fig. 4 Mobile HPGe gamma-spectrometer for the nuclear industry
The radiation shielding of the mobile spectrometer has the sizes of Ø140x286 mm and comprises the steel and lead screens. In
dependence on the spectrometer application the thickness of the lead shield could vary within 25 – 50 mm. The total weight of the mobile spectrometer is aproximately 250 kg, where 85 kg is the lead screen. The developed shield in the spectrometer with HPGe 40% efficiency detector provides the detection limit 4.0 Bq/kg for Cs-137 radionuclide specific activity at the measurement time of 1 hour. The instrumental background intensity for energy range from 40 кeV to 3 MeV is 5.04 cps.
Portable HPGe gamma-spectrometer
Fig.5. presents the portable HPGe gamma-spectrometer for the inspection applications [10,11]. The dimensions of the spectrometer are only 330x140x210 mm. The total weight of the spectrometer based on 20 % efficiency HPGe detector without liquid nitrogen is 4.950 kg. Some applications require detector to be shielded from the external interference. 7 mm thick tungsten alloy cap, having smaller dimensions with removable collimators, have been developed and fabricated especially for uranium enrichment measurements. Caps could be easily attached to the Dewar vessel flange through special holes by means of 3 tungsten screws. Collimators have different diameters: 40, 25, 10 and 5 mm and could be screwed into a cap. In order to decrease X-ray fluorescence from tungsten, cap and collimators have 1 mm thick tin internal lining covered with 1.5 mm thick copper lining.
Fig. 5 Portable HPGe gamma-spectrometer with collimator for inspection applications
25

International Conference on Innovative Technologies, IN‐TECH 2016,
Prague, 6. ‐ 8. 9. 2016
Passive Gamma Emission Tomographic System
This system was designed and fabricated for inspection control of spent fuel road assemblies in water pool of NPPs [12,13]. Because assemblies of spent fuel rods, stored in water pool, have a huge activity [3], equipment for it control should have very sick and efficient shielding. On this reason the shield and collimators were designed and fabricated from tungsten, what is extremely expensive, but can provide efficient shielding at the acceptable weight. Passive Gamma Emission Tomographic System consists of two linear arrays, placed in water sealed case [12,13]. Each linear array comprised 104 CdTe detectors with processing electronics based on ASICs. Both were placed in tungsten alloy shields with multi-slit collimators. In order to utilize this method for spent fuel rod assemblies, a collimator-detector arrangement is needed for the detection of emitted radiation in narrow strips [14]. Figure 6 shows a frontal view of the linear array with electronics in the shield with multi-slit collimator during laboratory tests.
Fig. 6 Linear Array of Passive Gamma Emission Tomographic System in tungsten shield with multi slit collimator
The multi-slit collimator is a set of tungsten alloy plates, which are fixed with four through pins. Thickness of the tungsten alloy is 100
mm. The shield unit of 30 mm thick ismade from separate tungsten alloy elements, jointed together with grooves. The tungsten alloy shield provides screening against detector background radiation in real application conditions. The manufacturing accuracy of the multi-slitcollimator and shield unit is determined by the precision of technology processes in M&I Materials Ltd [9]. Weight of linear array is 80kg. Conclusion
Shielding and collimation systems in radiation equipment determine the level of its background performance. Using computer simulation and computer design we succeed to organize high quality technological process for development and fabrication of these products for precise gamma-spectrometric equipment based on semiconductor detectors for nuclear radiation. Due to application of radiation pure lead materials and tungsten alloys we provided low level of minimal detecting activity in our laboratory, industrial, mobile and portable spectrometers. Acknowledgment
The authors provide their gratitude for Mr. Henk Duiker, Managing Director of the company Von Gahlen Nederland B.V. for the continuous successfull cooperation in the sphere of the manufacture of the shield elements for our spectrometric equipment.
References [1] G.Knoll. Radiation Detection and Measurements. 3rd ed.,John Wiley&Sons, 2000. 796 p. [2] D.Reilly, N.Ensslin, H.Smith, Jr. and S.Kreiner. “Passive Nondestructive Assay of Nuclear Materials”, United States: Nuclear
Regulatory Commission, March 1991, 699p. [3] G. Gilmore. Practical Gamma-Ray Spectrometry. John Wiley, 2nd edition, 2008. 408 p. ISBN978-0-470-86196-7. [4] V.Gulbin. “Development of composite materials modified with nanopowders for radiation shielding in nuclear energy.”
Nanotechnologycal Society of Russia. May 2012. 21 p. (In Russian). [online] [26.04.2015] Available at:http://www.rusnor.org/pubs/articles/7865.htm
[5] Rad Pro Calculator online. [online] [24.04.2016]. Available at: http://radprocalculator.com/Gamma.aspx [6] Calibration software EffMaker. [online] [24.04.2016]. Available at:
http://bsi.lv/en/products/software/advanced-software-package-effmaker/ [7] O.Jakovlevs, N.Jefremova, V.Gostilo, J.Viba.”Computer Design of Precise Spectrometric Equipment With Innovative Cooling
Systems”. Proceedings of the II International Scientific Congress “Innovations In Engineering 2016”. Varna, Bulgaria, 20-23 June, 2016, p.34-36. [online] [20.06.2016]. Available at: http://innova-eng.eu/proceedings/2016.pdf
[8] Von Gahlen. Modern state-of-the-art manufacturer of lead shielding products. [online] [24.04.2016]. Available at: http://www.vongahlen.nl/
[9] M&I. Materials for Industry and Science. [online] [24.04.2016]. Available at: http://www.mimaterials.com/ [10] A.Kail, M.Kaiser, S.Kim, E.Loshevich, A.Sokolov. Development of Portable HPGe Spectrometer for In-Situ Measurements. Nuclear
Technology & Radiation Protection, Vol.ХХХ, No.2 (June 2015), p.154-157. NT&RP Journal Serbia, Belgrad. [11] A.Sokolov, E.Loshevich, S.Kim, J.Brutscher, A.Rozite, A.Nazarenko. Ultra Compact HPGe Spectrometer for In-situ Measurements.
ESARDA 35th Annual Meeting CD proceedings. EUR Number 26127; ISSN 1831-9424; ISBN 978-92-79-32730-8; Catalogue Number LC-NA-26127-EN-N.
[12] A.Bulycheva, M.Shorohov, A.Lupilov, V.Gostilo, W.Inui, M.Funaki. CdTe linear arrays for registration of gamma-ray hard fluxes. Nuclear Inst. and Methods in Physics Research (NIM) A 607 (2009) pp.107-109.
[13] A.Sokolov, V.Kondratjev, V.Kourlov, F.Levai, T.Honkamaa. CdTe Linear Arrays with Integrated Electronics for Passive Gamma Emission Tomography System. NSS Conference Record, 2008, NSS'08 IEEE, p.999-1002.
[14] F.Levai, Sz.Czifrus, S.Feher, T.Q.Dung, P.Kerrey, T.Heri. Application of Nuclear Imaging Methods for Providing Additional NDA Capability for Safeguards. Proc.of the ESARDA Seminar on Strengthening of Safeguards: Integrating the New and Old. Dresden, Germany, 2000, 415-420.
26

International Conference on Innovative Technologies, IN‐TECH 2016,
Prague, 6. ‐ 8. 9. 2016
INTEGRATED MULTI-TOOL SYSTEM IN CREATIVE DESIGN FOR SOLAR RADIATION
M. V. Castilla 1
1 University of Seville, Spain
Keywords: Engineering Design; Multi-Tool System; Integrated Software; Energy Efficiency; Solar Radiation; Computer Aided Architectural.
Abstract: This research proposes a theoretical framework and practical model for the development of integrated software environment based on the optimization tools and a collaborative design. This approach is completely innovative: so far, engineering and architectural designs have not had a practical system with direct coupling to an intelligent environment, which deals with the conceptual design, simulation phase and its materialization as a whole. The purpose of the model is to integrate the creative design process in the engineering and architectural applications. In this sense, this work proposes an optimal model to be highly efficient for estimating solar radiation in a Japanese house, as a case study. The proposed strategy could also some suggestion to subsequent researchers in selecting the optimal radiative transfer model under different situations of available meteorological data and some scientific disciplines as neural network, genetic algorithms and others. Introduction
The creative process is one of the most challenging in architectural design. On the other hand, it is creative highly complex process, where multiple, conflicting requirements should be satisfied at the same time. In this sense, an architectural design involves a number of activities and considerations due to the broad scope of knowledge that is necessary from different experts.
It is well known, that in a technological environment characterized by the omnipresence of computers, a different set of scientific domains, as genetic algorithms, discrete mathematics, wavelet transform, coding theory, signal processing, dynamical systems and so on, have acquired an increasing application in the creative process. In that respect, the Sciences, the Information and the Communication Computer Technology (SIC2T) tools can have an important role in solar radiation analysis which is a significant aspect of the creative process. This paper gives a novel perspective on the utilization of the SIC2 T, and proposes an efficient integrated software environment that describes the possibilities opened up by the virtual environment. From the technical point of view, we will aim to present the specific software and hardware required for the successful application of this virtual environment as an efficient strategy for solar radiation buildings as a case study. Literature Review
Many software systems were an active field of research during the past decade. Despite this, only a few practical applications exist and the building simulation programs are not recognized as design support tools. Until recently, the role of computers in the design and creative process has been that of a partner. The idea of making intelligent environments was first suggested by Negroponte, [1]. Several papers have dealt with this topic, [2, 3] but the new collaborative design concept is essential, as is developed in [4]. In this sense, we are now at a stage that the Science, Information and Communication Computer Technology, (SIC2T), allows us to develop new techniques and methodologies to use computers as a partner by means of knowledge integration, (mathematic, physic), decision support and artificial intelligence systems.
Research on integrated software environments for the architectural process has been carried out with very different objectives to facilitate the increasing complexity of the design domain, architectural CAD dimensions, prototypical systems, managing free architecture, building materialization modeling etc. [5]. Many of the most renowned architects and engineers today, such a J. Herzog, P. Meuron or F.O. Gehry, are those who had the ability to combine the various and new tools in their designs and projects. Unfortunately, many contributions do not consider the multi-tool character of an integrated environment for some concrete aspects of the creative process as the solar radiation analysis.
The large number of papers published, motivated by these new strategies and concepts, suggests that the work has not been finished. Architectural design is a very complex process combining different variables. As a consequence, the question arises how architects and others involved in the creative process can be supported in handling this complex situation. In this paper we will discuss the possibilities that can be provided by means of multi-tool systems applied to the solar radiation modeling. Integrated Multi-Tool System
The application of new techniques, methods and other tools in the building sector is a very complex problem. Contributions can be made by developing tools in three groups where the computer can be seen as a partner. In this way, any integrated software environment can be viewed as a composition of the three basic multi-tool groups that are dynamic in nature, Table 1.
Table 1. Multi-Tool Groups
Group 1 Creative design related tools: conceptual phase Group 2 Data related tools: simulation phase Group 3 Materialization process related tools: materialization phase
27

International Conference on Innovative Technologies, IN‐TECH 2016,
Prague, 6. ‐ 8. 9. 2016
Therefore, the intersection of these three groups defines the environment and the general concept of the approach, Fig. 1. They tend to change over time, requiring different physical settings according to the type of designs, the preference of designers, and the spatial and temporal context of the materialization.
Fig. 1 General Concept. Diagram. Creative design related tools: conceptual phase
In the conceptual design phase we deal with the creative process of model finding. In this phase, the designer starts by making a spatial perception of the design in their mind. There are no general, unanimous rules applicable to each process and each designer. A fundamental premise that should be present in every design process is the consideration of creativity in a way not restricted by any software. For this purpose, the creative design related tools must be able to handle complexity and flexibility, enabling the designer to express their ideas in all their dimensions, while supporting creativity in reformulating forms and concepts. In general, design tools are essential in the initial stage of the creative design where the simulation process is of great importance. The simulation of the new reality is the best way of evaluating the creativity and quality of a model and opens the door to collaboration with others for future versions.
Data related tools: simulation phase
A main area in which computer science may support the designer is in exchanging and processing data. Parallel to the advancements in computer technology, there is a need for enhanced information processing virtually in all disciplines to handle all the incoming information; this is basically due to growing data and information processing as a demand of modern technologies. Data will have to be ordered and processed very efficiently, but the problem is how to order this data so that it can be easily processed. This requires a reliable data model. To solve this problem, it is absolutely necessary to organize the information as a layered structure that includes different levels of data, which are arranged hierarchically. In this respect, the hierarchically-layered tool structure is well aligned with the structure of the task environment, which is hierarchical in its composition. On the other hand, the tools tend to change over time, requiring different physical settings according to the type of designs, the preference of designers, and the spatial and temporal context of the materialization.
Materialization process related tools: materialization phase
Before the developments of the SIC2T, almost every decision was based on our knowledge and experience. Nowadays, with the development of new technologies, much software has been written for specific problems, but still there is no software available which can integrate these different concepts in science, information, communication and computing technology into one system to support the designer while taking decisions. In design disciplines, the growing need for information processing can be expected due to the advancements in data acquisition and strong demands on real-time operations in dynamical systems. The development of methodologies by 3D materialization can be supported by means of the SIC2T, although this is a largely unexplored field. Therefore, we focus on the development of a new design tool using mathematical methods [6].
In the materialization phase the question arises how to determine which material, element or aspect will best satisfy all requirements regarding costs, installations and aesthetic details. In this process there is a great need for applied knowledge, physics and mathematics, material science etc. The system, which has to be developed, should integrate the various areas of design during the design process and should give continuous feedback to the graphic part within an innovative environment of visualization.
In conclusion, each group of tools provides those requirements that the system needs to be processed to achieve the design. Once it is processed, it becomes a part of a knowledge base for reaching the final result.
A case study: Shell House
Solar energy is the main source for climate control in bioclimatic housing to achieve optimal comfort and energy savings. To evaluate the energy performance of a building, there are transient simulation programs, [7], that help us with the analysis of climate data, the solar factor, the solar radiation and the simulation of the trajectory of the sun. Also there are other ways to build simulation models that allow 2D and 3D objects to predict the behavior of natural light into the building as is suggested by [8]. Both forms are disjointed and far from what now must be an intelligent environment for the analysis of solar radiation in buildings. Our work considers a new multi-tool integrated system for the simulation of solar radiation in a tropical buildings and verification of sunlight in scale models from a specific case study for a Japanese house.
In terms of environmental perception of daylight, the representation of this element in particular has been the subject matter of computer science and design methods, as well as computer aided design research.
There are many computer aided architectural design tools which have been developed to support early decision-making based on the simplified performance modeling approach. These tools are insufficient to accurately assess the performance implications of the design parameters because the evaluation of lighting conditions involves not only basic parameters but expert systems, signal processing, looking at space, volume, complex geometries, parametric design, texture etc. Beside, solar radiation data is a fundamental input for solar energy applications such as photovoltaic systems, solar air conditioning climate control in buildings and solar collectors for heating, [9, 10, 11].
In this respect, the architectural geometry constitutes a new and challenging research area which provides analysis design tools, as geometric algebra, [12], genetic algorithms [13], artificial neural network [14], parametric design [15], wavelet transform [16], etc. Finally, this paper has investigated the problems encountered in developing the environmental analysis of light in a multi-tool integrated software environment for the architectural creative process.
The analysis of solar radiation in the Shell House, located in the woods of Karazuizawa, Nagano, Japan, aims to clarify the integrated software environment function, Fig. 2.
28

International Conference on Innovative Technologies, IN‐TECH 2016,
Prague, 6. ‐ 8. 9. 2016
Fig. 2 Exterior view of the Shell House. Karazuizawa, Nagano. Japan
This building respects the relationship uchi/soto, always present in the traditional Japanese house that establishes a connection with the outside through openings and reflections of light from within its environment. Its coordinates are 33º29’N latitude and 131º44’E longitude with an elevation of 5 meters above sea level and in a time zone GMT +9. We choose the Weather Data from the city Kagoshima. From the proposed integrated environment, we have obtained the level of direct sunlight and diffused sunlight during the solstices, considering summer and winter time from 8:00 am and 6:00 p.m. held on June 21 and December 21 respectively. During the measuring periods we analysed the sky component, external reflected component, internal reflected component the direct and diffused solar radiation. At the same time, we analysed the sunlight in the Shell House. Fig.3 shows external solar radiation in the house and Fig.4 represents the horizontal distribution.
Fig. 3 and Fig. 4 Natural light level (lux). 3D and 2D representations. Shell House, Nagano. Japan
Concludings remarks and future research
In this model, the light is already colored by the shadows of the forest, and helps to control exposure with contributions from nature. Trees, in and out of season, make a perfect control element of the intensity of light that we receive. This always favors the final exposure terms. On the following points, we will analyze each result obtained:
a) The Shell House has unique geometry that helps to reduce the greenhouse effect by protecting windows in summer and avoiding openings in full East and West solar orientations which are more difficult to protect. In this climate, the walls and particularly the roof, receive high solar radiation, by presenting the entire surface in white and avoiding dark colors it is protected.
b) The Shell House, is well orientated, has good cross-ventilation and is elevated off the ground thus providing good wind flow. The first objective of using natural light is to bring light to the deepest areas of the house increasing the level of lighting and to reduce level differences between different parts of a space. The Shell House has a central patio and different heights in two blocks, thus helping its design.
c) In Fig. 3 and Fig. 4, we found there are areas in the house where the lighting level is higher near the window (500 lux) and quickly descending to a (200 lux) as we move to the interior. To avoid these contrasts, the patio brings a more uniform illumination. Consequently, the model uses bilateral lighting for a better distribution of light.
d) The house has a good level of natural light thanks to its organic shape and use of materials. This model covers walls and ceilings in light colors to help get reflected light into the interior; disseminating glares and excessive
contrast of light thus avoiding dark shadows, Fig. 5 and Fig. 6.
Fig. 5 and Fig. 6 Natural Reflected Light level (%) and Sky component (%). 2D representations. Shell House
e) In the analysis of summer and winter solstices, it is found that the house is designed and planned for an optimum use of daylight and solar radiation. Longer transition zones of solar radiation during the winter thus improving the lighting and comfort of the house. In contrast, during the summer, the radiation penetrates less than before and the minimum value obtained is generalized to the entire space, getting an optimal sun exposure of light throughout the year. This way of light control is optimized by the sinuous shapes of the volumes, the distribution of windows and their solar orientations. This is not due to chance, but rigorous analysis. Fig. 7 show extreme days at 12:00 pm during solstices. The sun enters the house in winter and it does not in summer, reaching the physical limit in-out, uchi-soto.
29

International Conference on Innovative Technologies, IN‐TECH 2016,
Prague, 6. ‐ 8. 9. 2016
Fig. 7. Shade Study on June and December the 21st at 12:00pm. Shell House
f) Finally, we would like to emphasize the importance of this work in adapting the model to the climate where it is located, as well as the
right measure of the solar orientation, cross ventilation and use of suitable materials. There is no doubt that the architecture will contribute to a more habitable and sustainable world but the architects need to provide the combined scientific, technical, artistic and creative knowledge in order to achieve this.
Conclusion
One of the problems that modern architecture has to deal with is the quantity of information and the increasing complexity of most of the architectural projects. Only recently have architects started to utilize integrated software to address this problem. This paper proposes a theoretical framework and practical model for the development of integrated software environment based on the optimization tools and a collaborative design.
This approach is completely innovative: so far, engineering and architectural designs have not had a practical system with direct coupling to an intelligent environment, which deals with the conceptual design, simulation phase and its materialization as a whole. The purpose of the model is to integrate the creative design process in the architectural and engineering applications. In this sense, this work proposes an optimal model to be highly efficient for estimating solar radiation in a Japanese house, as a case study. The proposed strategy could also be a suggestion to subsequent researchers in selecting the optimal influences to solve problems and achieve goals in the creative and innovative design process. Furthermore, SIC2T and Internet technologies provide a closer link between designers in the design process, their activities, knowledge and information. We conclude that innovation, collaboration and communication will be increasingly important in the future design process. References [1] N. Negroponte, Soft architecture machines, MIT Press, (1975). [2] S. Sariyildiz, et al., Computer as valuable and reliable partner. Technical University of Bialystok, Poland. Eds. A. Asanowicz and A.
Jakimowicz. (1998). [3] L. Savioja, et al., Utilizing Virtual Environment in Construction Proyects, ITcon, 8 (2003), pp. 85-99. [4] J. Jaewook, An application of the Theory of Collaborative Design to Intelligent Environmet, Journal of Asian Architecture and
Building Engineering, 8(1), (2009), pp. 81-88. [5] H. Pentilä, Describing the changes in architectural information technology to understand design complexity and free-form
architectural expression, ITcon.11, (2006), pp. 395-408. [6] J.M. Cabeza-Lainez, Fundamentos de Transferencia Radiante Luminosa, Netbiblo S.L. ISBN: 978-84-9745-385-1. (2009), La
Coruña, Spain. [7] O. Ozgener, H.A. Hepbasli, Parametrical study on the energetic and exergetic assessment of a solar assisted vertical ground
source heat pump system used for heating a greenhouse, Building and Environment, 42(1), (2007), pp. 11-44. [8] D.J. Harris, N. Helwig, Solar chimney and building ventilation, Applied Energy, 84(2), (2007), pp. 135-146. [9] Ch. Rensheng, et al., Estimating daily global radiation using two types of revised models in China, Energy Conversion
andManegement, 47, (2006), pp. 875-878. [10] M. Palescu, et al., Models for obtain daily global solar irradiation from air temperature data, Atmospheric Research. 79, (2006), pp.
27-240. [11] G. Wu, et al., Methods and strategy for modeling daily global solar radiation with measured metereological data, China, Energy
Conversion and Management, 48, (2007), pp. 2447-2452. [12] M.V. Castilla, M. Ordoñez, Geometrical Objects: Powerful Tools in 3D Images Modeling. INTECH-2010, Prague (2010), Czech
Republic. [13] K.F. Man, et al., Genetic Algorithms: Concepts and Applications, IEEE Transactions on Industrial Electronics, 45(5), (1996), pp.
519-534. [14] G. Lopez, et al., Selection of input parameters to model direct solar irradiance by using artificial neural networks, Energy, Elsevier,
30, (2005), pp. 1675-1684. [15] L. Petrusevxki, et al., Parametric curves and surfaces: Mathematical demonstrations as a tool in exploration of architectural form.
SPATIUM International Review, 22, (2010), pp. 67-72. [16] E. Salajegheh, et al., Optimum design of structures against earthquake by discrete wavelet transform, International Journal for
Numerical Methods in Engineering, Int. J. Number. (Meth. Engng), 62, (2005), pp. 2178-219.
30

International Conference on Innovative Technologies, IN‐TECH 2016,
Prague, 6. ‐ 8. 9. 2016
AN APPROACH FOR INCREASING THE RELIABILITY OF PRODUCTION PLANNING IN SINGLE-ITEM PRODUCTION
F. Akhavei 1 and P. Kreuzer 2 1 Institute for Production Engineering and Laser Technology, Vienna University of Technology, Getreidemarkt
9 / E311, 1050 Vienna, Austria
2 Kresta Industrial Plant Engineering GmbH, Krestastrasse 1, 9433 St. Andrae, Austria
Keywords: Single-Item And Small Series Production; Predictive Analytics; Predictive Modelling; Reliability Of Production Planning Abstract: The high variability of customer expectations results in the complexity of product development, production planning and manufacturing processes, which exists obviously in all types of production systems. One of these production systems with a high level of complexity, is single-item production, which is addressed in this paper. The deficiency of repetition effect in single-item and small batch production in metal industry limits an exact determination of process time for production planning and furthermore restricts the application of production planning systems. This challenge is especially noticeable in manual work stations. This paper introduces an approach to improve the estimation accuracy of process time in single-item production systems. In this approach the process times are estimated on basis of historical operating data and product design parameters through predictive analytics methodology. In this paper the predictive model is developed based on correlation analyses and different regression models. Standardized production processes and structure of data acquisition are also a strong requirement to apply this approach in single-item production systems. The structure of data acquisition is developed on basis of process model and design structure. This approach is applied in a practical case study, which is introduced in this paper. This methodology supports single-item producers to improve their production planning quality in metal industry. Introduction
The reliability of production planning plays a critical role for the effectiveness and efficiency of modern production systems. The accuracy of the determination of production planning parameters like process and setup time is also a strong requirement for the reliability of production planning and the differences between planning parameters and the real production parameters reduce the accuracy and reliability of production planning. Schuh, Potente, Thomas and Hauptvogel have shown that on average the deviation of the planning parameters may occur on 25% in only three days after system validation (Schuh & Potente & Thomas, & Hauptvogel, 2013, pp. 477-484). The lack of high repetition effect in the single-item production in metal industry limits an exact determination of the necessary process parameters like process time in production planning. In single-item production, the different parts in a work station often have different dimensions. Therefor the estimation of process time is a big challenge in production planning. Because of the high impact of not technological influence aspects like ergonomic and organizational parameters in the manual work stations, this challenge is also bigger in manual process. In this work we introduce the predictive analytics method as a possible solution. Through our approach, an output parameter, in our case process time, is estimated based on mathematical relation and correlation with different entry parameters. These entry parameters are design and construction parameters in single-item production, which are determined after the product design phase. The historical operating data is used as basis to develop the predictive model. In this methodology the regression models are used as a predictive tool. The major advantage of this methodology is its high flexibility. This methodology can be also carried out only on the basis of historical data and it is not necessary to apply another process knowledge. Furthermore, all process parameters whether technical, logistical, organizational or ergonomic are noted automatically in this solution.
State of the art
Predicative analytics is an advanced analytics method, which predicts unknown future events through techniques like data mining, statistics modeling, machine learning, and artificial (OECD, 2016) . Kuns and Johnson defined predictive modeling as “the process of developing a mathematical tool or model that generates an accurate prediction” (Martin Atzmueller, 2016). There are several works that use this method to attain different goals but only a few of them apply this methodology in the field of production. For example Lee and Davari have demonstrated the application of this methodology in production assessment management (Lee & Kao & Ardakani, & Siegel, 2015). They proposed that an agent capable of predictive analysis can benefit manufacturers to acquire the exact information of their factory asset earlier, and improve current processes immediately. It can also optimize the manufacturing process and also extend the collaboration among manufacturers, suppliers, and customers. Van der Aalst and Schonenberg have presented a new method for predicting the ‘future of running instance’ in production. Through their method they predict incidents like the end of production (Aalsta & Schonenberga, & Songa, 2011).
In the current state of the art some works can be found, which introduce different approaches to predict the process time. For example, Faisst, Schneeweiß and Guenther have presented an approach based on a mathematical forecasting system to predict the process time (Dudic, 2010). This prediction system constitutes a learning effect through a larger data base, which improves the accuracy of the results continuously. Luehe has also introduced a similar approach to estimate process times by applying mathematical methods (Lühe, 2013). The model of Seung-Jun, Jungyub and Sudarsan can also be viewed as a very interesting and relevant approach for determining the production parameters in complex production systems (Seung-Jun & Jungyub, & Sudarsan, 2014, pp. 153-158). Even though, their model was developed to predict the energy consumption in production systems. Their approach can be used also to predict the planning relevant production parameters. To develop the forecast model for energy consumption in manufacturing, they have applied the analytics methodology based on big data. In their model, the correlations of the input parameters like material, machine tools etc. with
31

International Conference on Innovative Technologies, IN‐TECH 2016,
Prague, 6. ‐ 8. 9. 2016
a determined unit of energy (output parameters) are analyzed and the predictive modelling has been developed based on a neural network. The model is developed based on a large proportion of existing data (10,000 records). Jodlbauer, Palmetshofer and Reitner have also used the predictive modeling to predict the process time. They have classified the process time as a constant characteristic for each material and machine based on historical data. These characteristics are used to predict the new process times. It is a big advantage of this method, that except historical data, no extra information is required (Jodlbauer & Palmetshofer, & Reitner, 2005).
Methodology
The standardization of the production process and the work station is the first step to improve the reliability of production planning in single-part production. Through this process standardization it is ensured that the same process flow and technology is used to assemble the same or similar assemblies and components. After process standardization the operation data like process time can also be gathered and saved in a harmonized form and structure and can be used to develop the predictive modeling. Collecting data in required quality is a main demand to applicate this method. After the process standardization, the saved data should be classified. Through the process standardization in Single-Item production systems, the assemblies with similar forms should be manufactured in the same work station. These assemblies can also have different materials or need to be assembled with different standard process flows or manufactory technologies, which influence the process time. Because of this, it is required, that saved data records are classified in different categories based on relevant influence factors like manufacturing technology or material, which can be selected according to some other factors such as situation or kind of product family. The correlation analysis can be applied to support the decision about the data classes. In this case, a correlation analyses between entry and output parameter should be carried out once for all data records and once for each class. If the results are similar with a big “coefficient of determination”, the classification is not necessary. If the results are similar with a small “coefficient of determination”, the entry parameter is irrelevant and if the results are different, the classification is necessary.
Principally two different approaches can be introduced to develop the modeling to predict the process time based on construction parameters. The first one is modeling without any kind of process knowledge and often with using of predictive analytics and machine learning software and algorithms. This modeling approach can be applied very effective in case of big data records like series production. But normally, because of limited production orders in single-item production systems compared to series production, collecting of so many data records can take years and normally the old data records do not correspond with the actual situation in production. Because of this, this modeling method is generally not suitable for single-item production systems. In the second approach, it is tried to limit the entry parameters through process knowledge, and simple correlation analyses and regression models are used as predictive tools. To simplify the analysis and modeling, the output parameter (process time) can be integrated with one or more independent entry parameters and they are transformed to a characteristic indicator like work performance per minute or hour. This approach presents an effective solution to reduce the influence parameters and simplify the predictive modeling. The predictive model in this approach, estimates the indicator and not process time directly. The indicator must be transformed to process time based on (an) integrated entry parameter(s). In this methodology, only 75% of historical data records are used for modelling and 25% of them are used for validation and reliability. The data records, which are used for reliability, were not used for modeling. Case study
This case has considered the assembly of tank’s bodies (cylinders and caps) in an assembly work station with a not automated but standardized procedure. The cylinder parts of tank shells and tank caps are assembled and welded here with TIG process (tungsten inert gas welding). Aforementioned, a major demand of this method is operating data, which were gathered in this study for about 5 months and includes 81 historical data records. Each data record contains man-hours (work effort), diameter, length, sheet thickness and number of tank shells in each tank (measurement data), that are different in various projects. Normally, the man-hour is converted to process time based on the actual available capacity in the work station. Collected data are classified to be ready for analyzing and modelling to estimate the process time and all data records in this case study, are also from the same material. In this model, the process time is calculated through a specific indicator. This indicator describes the rate of assembly, which defines the work performance in an hour (work speed). Regression models are used here as predictive models and the average deviation of 5%, is adopted as a goal for the predictive model. Selection of entry parameters
In the first step the relation between the construction parameters as entry parameters and the man-hour as output parameter is analyzed through correlation and regression analysis. In this case, the parameters are considered isolated and each parameter, which had a coefficient of determination (R²) over 0,5 with process time has been selected.
Fig. 1 Correlation of man-hour with diameter of cylinder Fig. 2 Correlation of man-hour with sheet thickness
32

International Conference on Innovative Technologies, IN‐TECH 2016,
Prague, 6. ‐ 8. 9. 2016
Fig. 3 Correlation of man-hour with length of tank Fig. 4 Correlation of man-hour with number of cylinder part The following table compares the “coefficients of determination” of the different analyses with each other:
Table 1. Analyses results
Diameter sheet thickness length of tank cylinder parts
R² with man-hour 0,797 0,829 0,358 0,383
Selected (yes/no) yes yes no no
The results of selection analysis have shown, that the diameter and sheet thickness as entry parameters, have stark correlation with
man-hour and process time and therefore they should be selected for predictive modeling. The additional correlation analysis between the length of tank and the number of cylinder parts process has demonstrated a strong correlation with R²=0,89. Because of this, the length of tank can be ignored in the predictive model. The challenge of this analysis approach, which is also applied in modern predictive analytics software, is the isolated consideration of entry parameters. Because of this, hidden or special relations of parameters cannot be considered. Impact of process knowledge
The additional analysis of historical data from different old projects in the ERP system has shown, that more than 80% of process time in this work station is accounted for welding workers. This means that the welding process is the main production process in the assembly work station in this case study. The process observation in the production salon has also shown, that eventually there is a strong relation between the sum of welding length and the sum of required man-hours in the assembly station. In this analysis the data are also more concentrated on the regression line compared to each single entry parameter. On basis of this process knowledge, it has been tried to calculate the sum of the welding length and to find its correlation with the required man-hours as output parameter. The result of the analysis has also confirmed our adoption and has shown a strong correlation between this new entry parameter and the required man-hours (R²: 0,793). Calculation formal of welding length: Sum of welding length = (Diameter X π) X (Number of cylinder parts + 1)
This new entry parameter is principally nothing else than an integration of two construction parameters (diameter and number of cylinder parts). The strong correlation of welding length with output parameter has also demonstrated, that not using of number cylinder parts in the predictive model eventually is not the best decision. Now welding length and sheet thickness are two entry parameters for predictive modeling. Model simplification and optimization through a characteristic indicator
Predictive modeling with two entry parameters needs the application of multi regression models and because of the non-linear relation of entry and output parameters in this case, the modeling complies with complication. Because of this and to simplify the modeling, it has been tried to integrate one additional entry parameter in the output parameter. In this model the welding length parameter and man-hour are transformed to a specific and characteristic output parameter, which defines as assembly performance the working rate in an hour. Now, only sheet thickness has to be used as entry parameter if it demonstrates a strong correlation with assembly performance.
The correlation analysis demonstrates a very strong correlation between assembly performance and sheet thickness with R²=0,988 and therefore the sheet thickness can be applied now as entry parameter to predict the assembly performance. The simple regression model between assembly performance and sheet thickness is also used as predictive model. After predicting the assembly performance, it is converted to man-hour based on calculated welding length.
The reliability of the predictive model is tested with 20 independent data records, which weren’t applied for modeling. Through the reliability test, the required man-hours of 20 manufacturing orders based on their construction parameters have been predicted and the results have been compared with real measured values. The reliability test demonstrates an average deviation of 5,19%, which is a very good result compared to the amount of data records. Conclusion
The results of the case study have shown, that predictive modelling can be applied as effective solution to predict the process time in single-item production. The application of a characteristic indicator is also a good way to simplify the modeling. Through this methodology, the predictive modeling can be carried out based on simple regression models and the process knowledge can support the simplification of modeling and the reduction of entry parameters enormously. Because of the limitation of the number of data records in single-item production compared to series production, the introduced methodology based on process knowledge and characteristic indicators can be much more effective and practical than other methodology based on big data and machine learning algorithms.
33
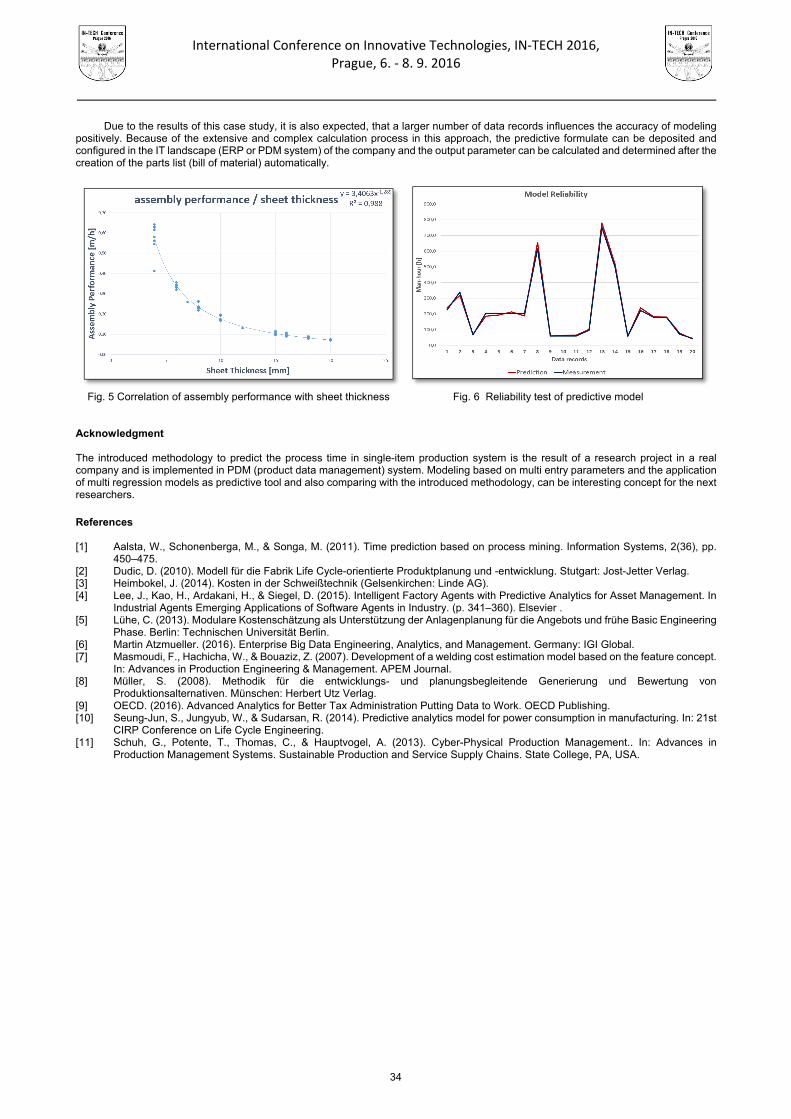
International Conference on Innovative Technologies, IN‐TECH 2016,
Prague, 6. ‐ 8. 9. 2016
Due to the results of this case study, it is also expected, that a larger number of data records influences the accuracy of modeling positively. Because of the extensive and complex calculation process in this approach, the predictive formulate can be deposited and configured in the IT landscape (ERP or PDM system) of the company and the output parameter can be calculated and determined after the creation of the parts list (bill of material) automatically.
Fig. 5 Correlation of assembly performance with sheet thickness Fig. 6 Reliability test of predictive model Acknowledgment The introduced methodology to predict the process time in single-item production system is the result of a research project in a real company and is implemented in PDM (product data management) system. Modeling based on multi entry parameters and the application of multi regression models as predictive tool and also comparing with the introduced methodology, can be interesting concept for the next researchers. References [1] Aalsta, W., Schonenberga, M., & Songa, M. (2011). Time prediction based on process mining. Information Systems, 2(36), pp.
450–475. [2] Dudic, D. (2010). Modell für die Fabrik Life Cycle-orientierte Produktplanung und -entwicklung. Stutgart: Jost-Jetter Verlag. [3] Heimbokel, J. (2014). Kosten in der Schweißtechnik (Gelsenkirchen: Linde AG). [4] Lee, J., Kao, H., Ardakani, H., & Siegel, D. (2015). Intelligent Factory Agents with Predictive Analytics for Asset Management. In
Industrial Agents Emerging Applications of Software Agents in Industry. (p. 341–360). Elsevier . [5] Lühe, C. (2013). Modulare Kostenschätzung als Unterstützung der Anlagenplanung für die Angebots und frühe Basic Engineering
Phase. Berlin: Technischen Universität Berlin. [6] Martin Atzmueller. (2016). Enterprise Big Data Engineering, Analytics, and Management. Germany: IGI Global. [7] Masmoudi, F., Hachicha, W., & Bouaziz, Z. (2007). Development of a welding cost estimation model based on the feature concept.
In: Advances in Production Engineering & Management. APEM Journal. [8] Müller, S. (2008). Methodik für die entwicklungs- und planungsbegleitende Generierung und Bewertung von
Produktionsalternativen. Münschen: Herbert Utz Verlag. [9] OECD. (2016). Advanced Analytics for Better Tax Administration Putting Data to Work. OECD Publishing. [10] Seung-Jun, S., Jungyub, W., & Sudarsan, R. (2014). Predictive analytics model for power consumption in manufacturing. In: 21st
CIRP Conference on Life Cycle Engineering. [11] Schuh, G., Potente, T., Thomas, C., & Hauptvogel, A. (2013). Cyber-Physical Production Management.. In: Advances in
Production Management Systems. Sustainable Production and Service Supply Chains. State College, PA, USA.
34

International Conference on Innovative Technologies, IN‐TECH 2016,
Prague, 6. ‐ 8. 9. 2016
CONTINUOUS FIBER REINFORCED THERMOPLASTIC SHEET BY DIRECT EXTRUSION
S. Feustel 1, S. Caba 1 and M. Koch1 1 Department of Plastics Technologies, TU Ilmenau, 98693 Ilmenau, Germany
Keywords: Fiber Reinforced Thermoplastic; Lightweight Design; Energy Efficiency; Porosity Content; Mechanical Properties Abstract: Lightweight design with fiber reinforced plastics is a method for weight reduction in vehicles. Thermoplastic sheets with continuous fabric or roving reinforcement offer short cycle times. Current production solutions require double belt presses where semi-manufactured plastic sheets or powders are processed. An improvement for continuous fiber reinforced thermoplastic (CFRT) sheet production can be achieved through reduced energy consumption, increased output, improved impregnation, better quality and waste reduction. This can be accomplished with a direct extrusion process. It enables the impregnation and consolidation of woven textiles in an extrusion die with minimum void content and continuous throughput. A novel production line was developed and investigated for process capability. This extrusion process allows the production of CFRT sheet starting from thermoplastic granulate and woven textile in one single production line integrating plasticization, impregnation and sheet forming. An extruder conveys a melt stream into an impregnation die and a subsequent calibration unit. In the impregnation die two layers of plastic melt are conveyed onto the fiber structure carried through the die. In a consolidation zone the fiber structure is effectively wetted and voids are eliminated. In a calibration zone the fiber volume content is adjusted and a desired surface quality is obtained. As compared to film stacking or powder impregnation the plastic needs only one melting process to reach its state in the CFRT sheets. This integrated process saves energy, minimizes degradation of the polymer matrix and provides an effective impregnation with minimum void content and high mechanical properties. The consolidation in a low pressure process with a conventional extruder reduces investment costs and reduces floor space requirement in comparison to double belt presses. Production capability for a multilayered continuous fiber reinforced thermoplastic will be developed in future work. Introduction
The demand for continuous fiber reinforced thermoplastics is consistently growing. Increases for CFRT of 17% p.a. and 5 % p.a. for GFRP are expected. The growth can only be achieved by tapping the potential of savings of 30 percent until 2020. [1] While only a fifth of these savings can be contributed by the material, especially the cost of fiber filaments and the further processing to fabrics, most improvements are achievable in the production processes. Potential savings are valued at 40 percent. The replacement of thermosets by thermoplastics offers the possibility for shorter cycle times. Current major tasks are customized thermoplastics, reducing labor cost through automation and simplification of the process. [1] Another obstacle for establishing serial processes is insufficient quality of the laminate. Improved composites especially require a reduction of the porosity content and an increased wetting of the fiber structure with the thermoplastic melt. Applications of CFRT
The application of CFRT allows selective utilization of high mechanical properties at predefined locations. The CFRT components are manufactured in high throughput processes like thermoforming and direct forming during injection molding. This enables the connection of high mechanical properties of the continuous fiber reinforcement and a process suitable for mass production. Organic sheets are used due to their high lightweight potential increasingly in aircraft and automobile industry like shown in the pictures below.
Fig. 1 Example parts with CFRT
Typical use for organic sheet are components for slats or stiffeners of aircrafts like A340neo and A380. For optical parts in the field of automotive engineering PMMA and carbon fiber fabric can be used. Even with decor film sealed organic sheets are used in sports equipment and firefighter helmets. CFRT Production
Continuous fiber reinforced thermoplastics can be differentiated by kind of fiber, used matrix material, fiber undulation and degree of impregnation. The combination of multiple source materials can be selected by adapting it to the component or thermal or mechanical specifications. Depending on the application different types of textile semi-finished products can be used, so as scrims, mats, fabrics, knits, braids or fabrics. The matrix material necessary for the impregnation may be present in the form of film, powder, melt, solution or polymer
35

International Conference on Innovative Technologies, IN‐TECH 2016,
Prague, 6. ‐ 8. 9. 2016
filament. For every matrix material other manufacturing processes for producing CFRT are suitable. The illustration below shows the process chain for film stacking as a discontinued process.
Fig. 2 Source material to final component by film stacking [2]
The plastic granulate is processed to films in an upstream process. This occurs for example in a blown film process or by die cast extrusion. The film is then being stacked for a desired layer structure with fabric in between layers. The semi-finished product produced thereby is heated and pressed to CFRTs at melt temperature [3]. It can be cut and formed to a final product in a hybrid process on an injection molding machine. Therefore, the semi-finished fiber reinforced sheet is heated in an oven and moved by a handling system into an open mold. The mold closing movement shapes the sheet. Subsequent overmolding allows the functionalization, e.g. by targeted injection of reinforcing ribs or connection components. For increased productivity, double belt presses can be used for film stacking. These cost-intensive systems make it possible to produce endless semi-finished products in a continuous process. Another possibility is the production of prepregs by powder impregnation or the use of hybrid fabrics [4]. In powder impregnation, reinforcing layers are provided in the fluidized bed process with a polymer powder. The so prepared prepreg can be stored without time limitation as opposed to preregs based on thermosets. The production of hybrid fabrics allows the impregnation of reinforcement material with matrix material during the textile process. The production of fully impregnated and consolidated semi-finished products can then be carried out in a double belt press. It is a cost and energy intensive production process that leads to high quality products with a homogenous matrix distribution. Direct Extrusion Technology
The direct extrusion process is examined in this paper and is based on a direct feed method. Plastic melt is conveyed through a flat sheet die channel onto the reinforcement fabric being conveyed through the die and directly consolidated in the glazing and outlet section of the die. The principle is illustrated in the Figure 3 below.
Fig. 3 Material flow to a component by direct extrusion [2]
The melt provided by an extruder can be applied on one or on both sides of the woven layer. This influences the impregnation paths and the pressure needed for consolidation, but also affects the void content in the resulting CFRT. The impregnated semi-finished product can be consolidated by use of a siphon kind of unit. In this case, as shown in Figure 4, the impregnated fabric belt is pulled through a sinusoidal cavity and resulting shear and pressure peaks assert best possible impregnation.
Fig. 4 Schematic principle of the direct extrusion process
The compression of the melt films above and below the textile semi-finished product allows the consolidation by increased local
hydraulic pressure [5]. The resulting fiber volume ratio can be adjusted through extruder output and haul-down speed of the textile. The gap height can be varied by sliding elements to generate sufficient consolidation pressure even at high production speeds.
Main advantages in the direct extrusion process for CFRT lie in energy saving, intense consolidation and reduced material exposure during processing this also making thermally sensitive materials suitable for the process. Impregnation and consolidation are accomplished with high control and efficiency at a lower investment level that in a double belt process. Figure 5 and 6 show the difference in efficiency between the production of CFRT in the direct extrusion process and the continuous film stacking.
36
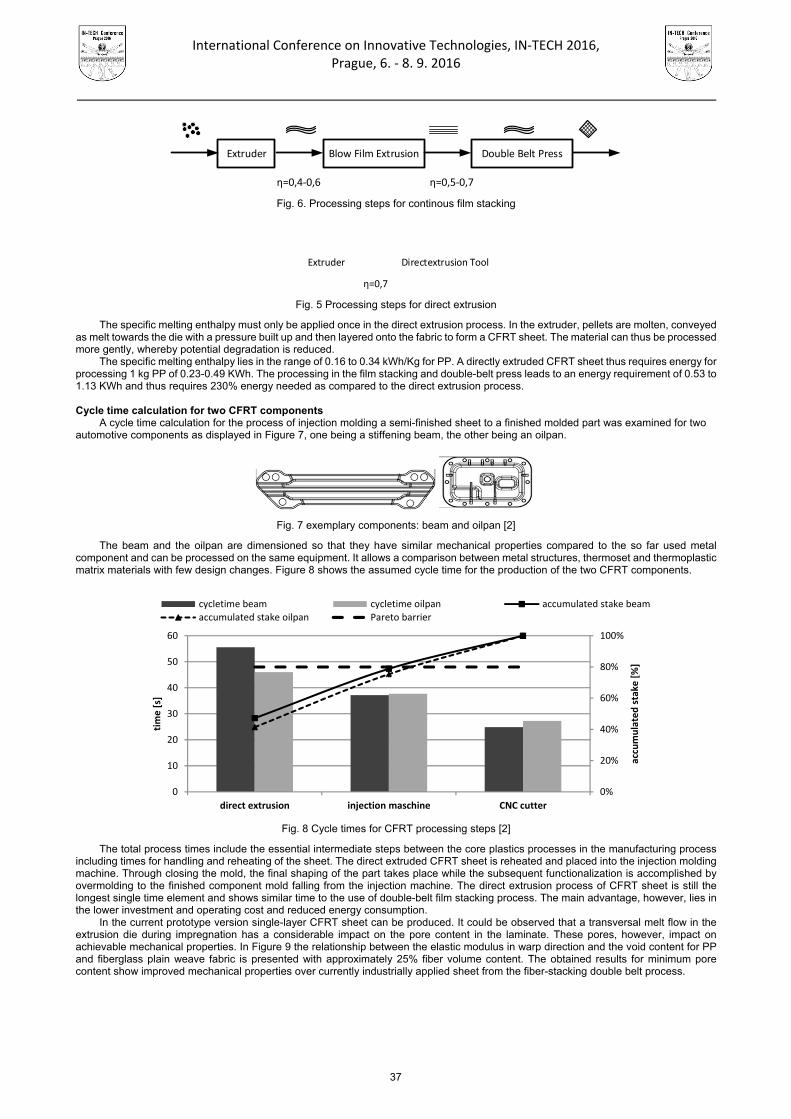
International Conference on Innovative Technologies, IN‐TECH 2016,
Prague, 6. ‐ 8. 9. 2016
Extruder Blow Film Extrusion Double Belt Press
η=0,4‐0,6 η=0,5‐0,7 Fig. 6. Processing steps for continous film stacking
Extruder Directextrusion Tool
η=0,7 Fig. 5 Processing steps for direct extrusion
The specific melting enthalpy must only be applied once in the direct extrusion process. In the extruder, pellets are molten, conveyed as melt towards the die with a pressure built up and then layered onto the fabric to form a CFRT sheet. The material can thus be processed more gently, whereby potential degradation is reduced.
The specific melting enthalpy lies in the range of 0.16 to 0.34 kWh/Kg for PP. A directly extruded CFRT sheet thus requires energy for processing 1 kg PP of 0.23-0.49 KWh. The processing in the film stacking and double-belt press leads to an energy requirement of 0.53 to 1.13 KWh and thus requires 230% energy needed as compared to the direct extrusion process. Cycle time calculation for two CFRT components
A cycle time calculation for the process of injection molding a semi-finished sheet to a finished molded part was examined for two automotive components as displayed in Figure 7, one being a stiffening beam, the other being an oilpan.
Fig. 7 exemplary components: beam and oilpan [2]
The beam and the oilpan are dimensioned so that they have similar mechanical properties compared to the so far used metal component and can be processed on the same equipment. It allows a comparison between metal structures, thermoset and thermoplastic matrix materials with few design changes. Figure 8 shows the assumed cycle time for the production of the two CFRT components.
Fig. 8 Cycle times for CFRT processing steps [2]
The total process times include the essential intermediate steps between the core plastics processes in the manufacturing process including times for handling and reheating of the sheet. The direct extruded CFRT sheet is reheated and placed into the injection molding machine. Through closing the mold, the final shaping of the part takes place while the subsequent functionalization is accomplished by overmolding to the finished component mold falling from the injection machine. The direct extrusion process of CFRT sheet is still the longest single time element and shows similar time to the use of double-belt film stacking process. The main advantage, however, lies in the lower investment and operating cost and reduced energy consumption.
In the current prototype version single-layer CFRT sheet can be produced. It could be observed that a transversal melt flow in the extrusion die during impregnation has a considerable impact on the pore content in the laminate. These pores, however, impact on achievable mechanical properties. In Figure 9 the relationship between the elastic modulus in warp direction and the void content for PP and fiberglass plain weave fabric is presented with approximately 25% fiber volume content. The obtained results for minimum pore content show improved mechanical properties over currently industrially applied sheet from the fiber-stacking double belt process.
0%
20%
40%
60%
80%
100%
0
10
20
30
40
50
60
direct extrusion injection maschine CNC cutter
accumulated stake
[%]
time [s]
cycletime beam cycletime oilpan accumulated stake beam
accumulated stake oilpan Pareto barrier
37

International Conference on Innovative Technologies, IN‐TECH 2016,
Prague, 6. ‐ 8. 9. 2016
Fig. 9 Relationship between E-Modulus and void content in direct extruded CFRP sheet
An increase of the pore content leads to a linear decrease of the E modulus, until reaching the E modulus of the matrix material at about 10-15% void content. The direct extrusion process allows a minimum void content of 2-3% thus leading the highly attractive mechanical properties. Conclusion
The direct CFRT sheet extrusion process shows potential for considerable lower production cost and improved mechanical properties at consistent levels. By saving expensive equipment, reducing double melting and being more efficient in energy application the total operational cost in comparison to conventional production techniques can be saved. The improved wetting and impregnation in the extrusion die asserts a lower void content in the CFRT sheet structure and thus making sure that the consistency of the sheet and its mechanical property are considerably improved over existing processes. The result is an improved component property allowing further weight savings. The first prototype that was designed and put in operation shows promising results and allows the production of single-layer organic sheets. Further development work will focus on the development of a die making it possible to processes a multi-layered CFRT sheets with minimum void content comprising multiple fabric layers with load tailored fiber direction in the sheet. References [1] R. Lässig, M. Eisenhut, A. Mathias, R.T. Schulte, F. Peters, T. Kühmann, T. Waldmann, W. Begemann: Series production of
high-strength composites; Roland Berger Strategy Consulting 2012 [2] M. Koch, S. Caba, M. Steffen: Prozessketten für faserverstärkte Strukturbauteile, Abschlussbericht der Forschergruppe
Kunststoffbasierte Leichtbauverbunde für Fahrzeuge, founded by the state thuringia, Grant ID: 2011FGR0109, Ilmenau 2015 [3] F.C. Campbell: Structural Composite Materials ASM International Materials Park, Ohio 44073-0002; 2010 [4] M. Fleischhauer: Untersuchung der Einsatzmöglichkeit von thermoplastischen Faserverbundwerkstoffen für hoch belastete
Strukturbauteile in der Fahrzeugtechnik, Doctoral thesis, Univerity of Darmstadt 2007 [5] A. Miaris: Experimental and simulative analysis of impregnation mechanics of endless fiber rovings, Doctoral thesis, University of
Kaiserslautern 2012
0
2
4
6
8
10
12
0 2 4 6 8 10 12 14 16
E‐Modulus in warp [GPa]
void content [%]
38

International Conference on Innovative Technologies, IN‐TECH 2016,
Prague, 6. ‐ 8. 9. 2016
IMPROVEMENTS OF 2D NUMERICAL MODEL FOR VERTICAL GROUND HEAT EXCHANGERS
F. Cruz-Peragón 1, P.J. Casanova-Peláez 2, R. López-García1 and J.M. Palomar-Carnicero1 1 Department of Mechanical and Mining Engineering, EPS of Jaén, University of Jaén, Campus Las Lagunillas
s/n, 23071, Jaén (Spain)
2 Department of Electronic Engineering and Automatics, EPS of Jaén, University of Jaén, Campus Las Lagunillas s/n, 23071, Jaén (Spain)
Keywords: Ground Source Heat Pump (GSHP); Ground Heat Exchanger (GHE); 2D Numerical Model; Thermal Response Test (TRT); Parameter identification procedure Abstract: This work is based on the most widely used generic structure (deduced from the literature) for the definition of a 2D model of heat transfer between the fluid from the external equipment of a refrigeration machine / heat pump and the surrounding ground through a vertical thermal borehole. Several improvements have been taken into account when the model was developed, in order to enhance the results and extend the given information from it: i) geometrical considerations, by introducing a triangular unstructured mesh; ii) inclusion of boundary conditions between different sub-domains of the mesh (fluid-tube; tube-borehole and borehole-ground) to obtain directly the heat flow between them; iii) axial effects of the fluid flow: the thermal behavior along its downward and upward path follows two analytical functions in order to describe the observed trends in the literature. The overall model has been validated with several experimental Thermal Response Tests (TRT), by adjusting the values of the main thermal parameters associated to the heat exchanger buried. This setting procedure uses a two-step identification algorithm via a Newton’s method that minimizes the error between the fluid outlet temperatures, both modeled and measured
Introduction
For detailed evaluation of the heat transfer between the fluid of a Ground Source Heat Pump (GSHP) system and the surrounding ground, numerical models constitute the most used procedures, using Finite Difference Method (FDM), Finite Volume Method (FVM) and Finite Element Method (FEM). These methods have been also used as starting point to establish and validate practical approaches to the process [1, 2]. The nature of the problem requires a multi-physics modeling. It means that it is necessary the analysis of the heat conduction (including its storing) into the solids (tubes, borehole filling and soil), and heat transferred from the circulating fluid (boundary condition) into the pipe. Particularly, 3D models applied to vertical Ground Heat Exchangers (GHE) have been quite effective. They carry out short-term simulations, and validated with synthetic and real data (by Thermal Response Tests, TRT). These kinds of models are capable to establish the fluid and solids temperature distribution in axial and radial directions from the borehole. Nevertheless, they require a high computational charge that could be drastically increased if the fluid field is evaluated. It has provoked focusing efforts towards developments of 2D models [3].
As a result of revising the bibliography, most of the 2D and 3D models has been validated with others well established, using synthetic data [3-5] or experimentally obtained [6-8]. FEM [4-6, 9] is the most used numerical methodology. In any case, size of elements starts from a very little volume around the tubes. It increases as nodes depart from the borehole center, as well as symmetry conditions are used to reduce the number of nodes. For 3D models, unstructured meshes are usually used (prismatic elements with triangular section), and the fluid field is also analyzed to evaluate the heat transfer along borehole depth. On the other hand, for 2D models, it has been constructed a regular geometry at each analyzed case, and the heat transfer from fluid to pipe is approached with a semi-empirical equation, such as the Dittus-Bolter correlation. It is justified because the fluid is considered as fully developed turbulent flow in almost its entire length.
The most conflictive point when 2D models are used is related to the axial effects that cannot be evaluated. For solid materials, radial sense depicts the main direction that takes the heat flux, and a mean temperature can be considered along the depth without considerable errors [2]. Even a mean undisturbed ground temperature, obtained from a complementary test to the TRT [10], is usually considered as boundary condition of whole the evaluated geometry. Nevertheless, the varying temperature of the fluid along its path into the borehole tubes cannot be neglected. It introduces axial effects that must be considered. Experiments and 3D approaches show this behavior [2, 9, 11]. In this sense, a mean fluid temperature can be used for each pipe branch (downward and upward) for evaluating the heat transfer, including their corresponding heat balance equation next to the rest of the nodes into the equation set that gives the 2D temperature distribution along the evaluated time. But later, a post-processing procedure must be carried out in order to analyze the fluid temperature profile with depth, as references show.
In this work, all these considerations serve to construct a general 2D model with several improvements that will be explained in the next section. This Model will be validated with experimental results from TRT in vertical GHE, using parameter identification procedures based on Newton’s method.
Materials and methods
Materials
The general characteristics of the device used to making TRT are shown in Table 1 [12]. On the other hand, it is necessary the knowledge of the geometry and characteristics of tubes and rest of elements, given also in Table 2. Once the developed appliance for perform TRT is connected to the corresponding experimental GHE, the first goal is determining the mean undisturbed soil temperature Ts
39
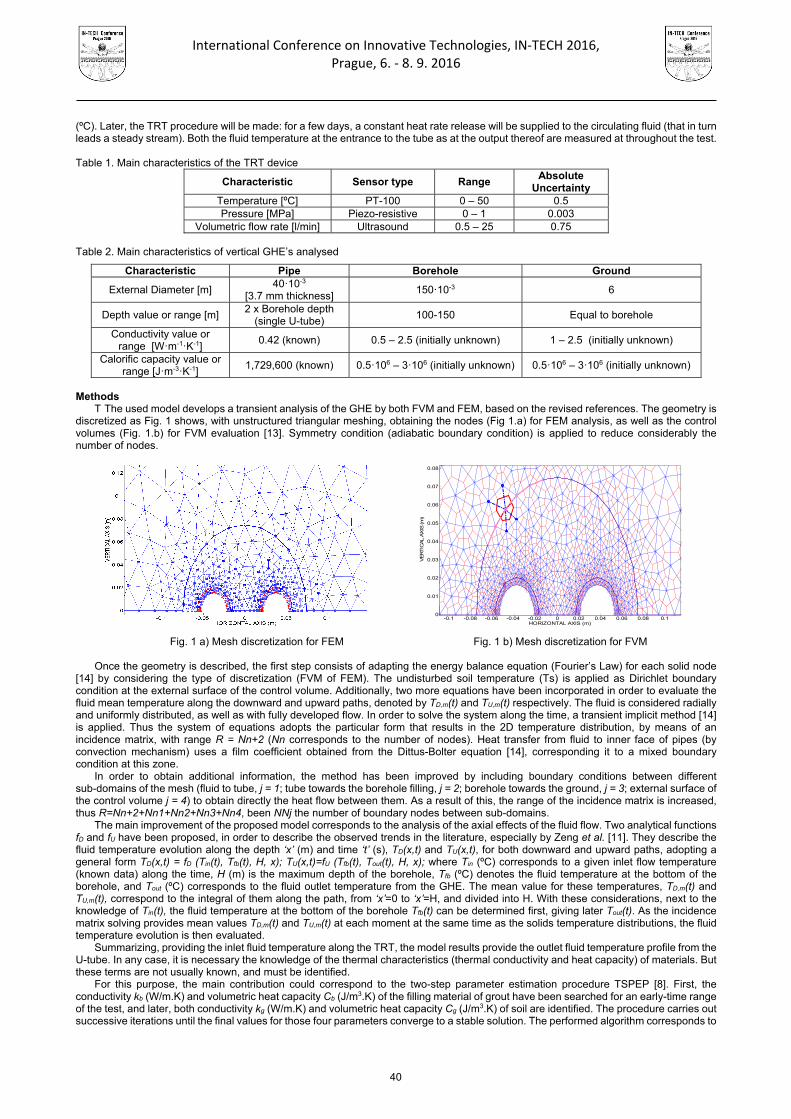
International Conference on Innovative Technologies, IN‐TECH 2016,
Prague, 6. ‐ 8. 9. 2016
(ºC). Later, the TRT procedure will be made: for a few days, a constant heat rate release will be supplied to the circulating fluid (that in turn leads a steady stream). Both the fluid temperature at the entrance to the tube as at the output thereof are measured at throughout the test.
Table 1. Main characteristics of the TRT device
Characteristic Sensor type Range Absolute
Uncertainty Temperature [ºC] PT-100 0 – 50 0.5 Pressure [MPa] Piezo-resistive 0 – 1 0.003
Volumetric flow rate [l/min] Ultrasound 0.5 – 25 0.75
Table 2. Main characteristics of vertical GHE’s analysed
Characteristic Pipe Borehole Ground
External Diameter [m] 40·10-3
[3.7 mm thickness] 150·10-3 6
Depth value or range [m] 2 x Borehole depth
(single U-tube) 100-150 Equal to borehole
Conductivity value or range [W·m-1·K-1]
0.42 (known) 0.5 – 2.5 (initially unknown) 1 – 2.5 (initially unknown)
Calorific capacity value or range [J·m-3·K-1]
1,729,600 (known) 0.5·106 – 3·106 (initially unknown) 0.5·106 – 3·106 (initially unknown)
Methods
T The used model develops a transient analysis of the GHE by both FVM and FEM, based on the revised references. The geometry is discretized as Fig. 1 shows, with unstructured triangular meshing, obtaining the nodes (Fig 1.a) for FEM analysis, as well as the control volumes (Fig. 1.b) for FVM evaluation [13]. Symmetry condition (adiabatic boundary condition) is applied to reduce considerably the number of nodes.
Fig. 1 a) Mesh discretization for FEM Fig. 1 b) Mesh discretization for FVM
Once the geometry is described, the first step consists of adapting the energy balance equation (Fourier’s Law) for each solid node
[14] by considering the type of discretization (FVM of FEM). The undisturbed soil temperature (Ts) is applied as Dirichlet boundary condition at the external surface of the control volume. Additionally, two more equations have been incorporated in order to evaluate the fluid mean temperature along the downward and upward paths, denoted by TD,m(t) and TU,m(t) respectively. The fluid is considered radially and uniformly distributed, as well as with fully developed flow. In order to solve the system along the time, a transient implicit method [14] is applied. Thus the system of equations adopts the particular form that results in the 2D temperature distribution, by means of an incidence matrix, with range R = Nn+2 (Nn corresponds to the number of nodes). Heat transfer from fluid to inner face of pipes (by convection mechanism) uses a film coefficient obtained from the Dittus-Bolter equation [14], corresponding it to a mixed boundary condition at this zone.
In order to obtain additional information, the method has been improved by including boundary conditions between different sub-domains of the mesh (fluid to tube, j = 1; tube towards the borehole filling, j = 2; borehole towards the ground, j = 3; external surface of the control volume j = 4) to obtain directly the heat flow between them. As a result of this, the range of the incidence matrix is increased, thus R=Nn+2+Nn1+Nn2+Nn3+Nn4, been NNj the number of boundary nodes between sub-domains.
The main improvement of the proposed model corresponds to the analysis of the axial effects of the fluid flow. Two analytical functions fD and fU have been proposed, in order to describe the observed trends in the literature, especially by Zeng et al. [11]. They describe the fluid temperature evolution along the depth ‘x’ (m) and time ‘t’ (s), TD(x,t) and TU(x,t), for both downward and upward paths, adopting a general form TD(x,t) = fD (Tin(t), Tfb(t), H, x); TU(x,t)=fU (Tfb(t), Tout(t), H, x); where Tin (ºC) corresponds to a given inlet flow temperature (known data) along the time, H (m) is the maximum depth of the borehole, Tfb (ºC) denotes the fluid temperature at the bottom of the borehole, and Tout (ºC) corresponds to the fluid outlet temperature from the GHE. The mean value for these temperatures, TD,m(t) and TU,m(t), correspond to the integral of them along the path, from ‘x’=0 to ‘x’=H, and divided into H. With these considerations, next to the knowledge of Tin(t), the fluid temperature at the bottom of the borehole Tfb(t) can be determined first, giving later Tout(t). As the incidence matrix solving provides mean values TD,m(t) and TU,m(t) at each moment at the same time as the solids temperature distributions, the fluid temperature evolution is then evaluated.
Summarizing, providing the inlet fluid temperature along the TRT, the model results provide the outlet fluid temperature profile from the U-tube. In any case, it is necessary the knowledge of the thermal characteristics (thermal conductivity and heat capacity) of materials. But these terms are not usually known, and must be identified.
For this purpose, the main contribution could correspond to the two-step parameter estimation procedure TSPEP [8]. First, the conductivity kb (W/m.K) and volumetric heat capacity Cb (J/m3.K) of the filling material of grout have been searched for an early-time range of the test, and later, both conductivity kg (W/m.K) and volumetric heat capacity Cg (J/m3.K) of soil are identified. The procedure carries out successive iterations until the final values for those four parameters converge to a stable solution. The performed algorithm corresponds to
-0.1 -0.08 -0.06 -0.04 -0.02 0 0.02 0.04 0.06 0.08 0.10
0.01
0.02
0.03
0.04
0.05
0.06
0.07
0.08
HORIZONTAL AXIS (m)
VER
TIC
AL
AXIS
(m
)
40
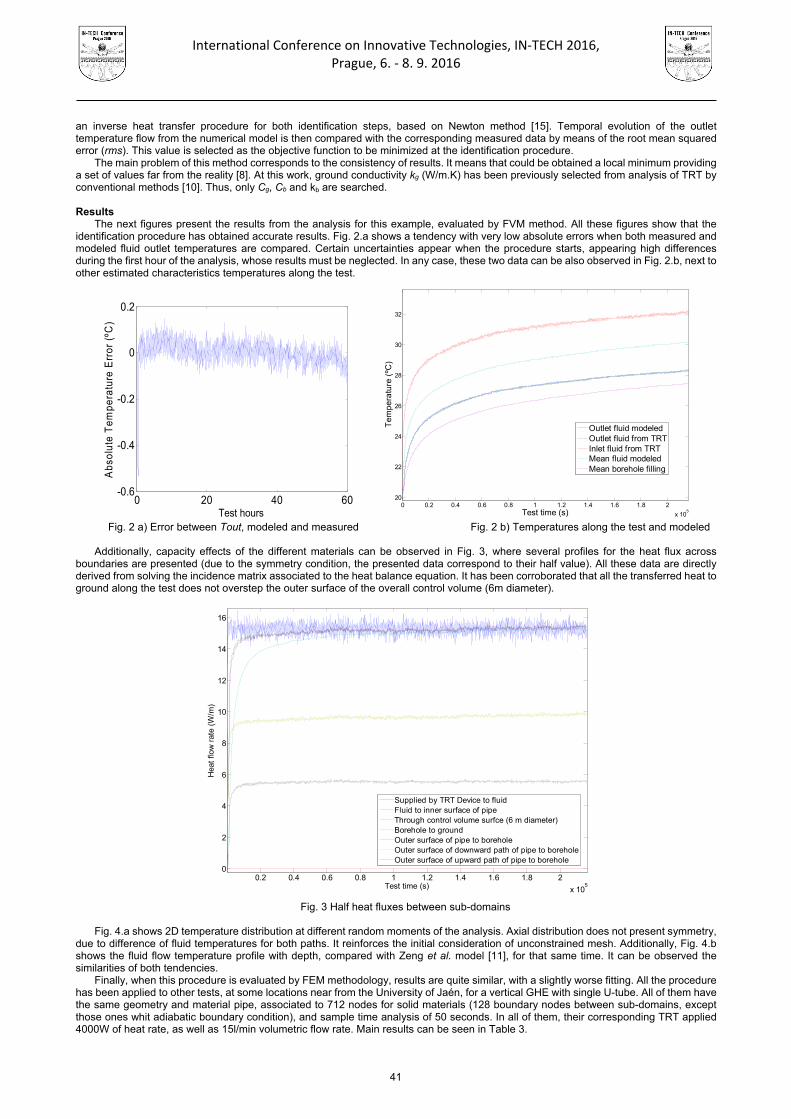
International Conference on Innovative Technologies, IN‐TECH 2016,
Prague, 6. ‐ 8. 9. 2016
an inverse heat transfer procedure for both identification steps, based on Newton method [15]. Temporal evolution of the outlet temperature flow from the numerical model is then compared with the corresponding measured data by means of the root mean squared error (rms). This value is selected as the objective function to be minimized at the identification procedure.
The main problem of this method corresponds to the consistency of results. It means that could be obtained a local minimum providing a set of values far from the reality [8]. At this work, ground conductivity kg (W/m.K) has been previously selected from analysis of TRT by conventional methods [10]. Thus, only Cg, Cb and kb are searched.
Results
The next figures present the results from the analysis for this example, evaluated by FVM method. All these figures show that the identification procedure has obtained accurate results. Fig. 2.a shows a tendency with very low absolute errors when both measured and modeled fluid outlet temperatures are compared. Certain uncertainties appear when the procedure starts, appearing high differences during the first hour of the analysis, whose results must be neglected. In any case, these two data can be also observed in Fig. 2.b, next to other estimated characteristics temperatures along the test.
Fig. 2 a) Error between Tout, modeled and measured Fig. 2 b) Temperatures along the test and modeled
Additionally, capacity effects of the different materials can be observed in Fig. 3, where several profiles for the heat flux across
boundaries are presented (due to the symmetry condition, the presented data correspond to their half value). All these data are directly derived from solving the incidence matrix associated to the heat balance equation. It has been corroborated that all the transferred heat to ground along the test does not overstep the outer surface of the overall control volume (6m diameter).
Fig. 3 Half heat fluxes between sub-domains
Fig. 4.a shows 2D temperature distribution at different random moments of the analysis. Axial distribution does not present symmetry,
due to difference of fluid temperatures for both paths. It reinforces the initial consideration of unconstrained mesh. Additionally, Fig. 4.b shows the fluid flow temperature profile with depth, compared with Zeng et al. model [11], for that same time. It can be observed the similarities of both tendencies.
Finally, when this procedure is evaluated by FEM methodology, results are quite similar, with a slightly worse fitting. All the procedure has been applied to other tests, at some locations near from the University of Jaén, for a vertical GHE with single U-tube. All of them have the same geometry and material pipe, associated to 712 nodes for solid materials (128 boundary nodes between sub-domains, except those ones whit adiabatic boundary condition), and sample time analysis of 50 seconds. In all of them, their corresponding TRT applied 4000W of heat rate, as well as 15l/min volumetric flow rate. Main results can be seen in Table 3.
0 20 40 60-0.6
-0.4
-0.2
0
0.2
Test hours
Abs
olu
te T
empe
ratu
re E
rror
(ºC
)
0 0.2 0.4 0.6 0.8 1 1.2 1.4 1.6 1.8 2
x 105
20
22
24
26
28
30
32
Test time (s)
Te
mp
era
ture
(ºC
)
Outlet fluid modeledOutlet fluid from TRTInlet fluid from TRTMean fluid modeledMean borehole filling
0.2 0.4 0.6 0.8 1 1.2 1.4 1.6 1.8 2
x 105
0
2
4
6
8
10
12
14
16
Test time (s)
Hea
t flo
w r
ate
(W/m
)
Supplied by TRT Device to fluidFluid to inner surface of pipeThrough control volume surfce (6 m diameter)Borehole to groundOuter surface of pipe to boreholeOuter surface of downward path of pipe to boreholeOuter surface of upward path of pipe to borehole
41

International Conference on Innovative Technologies, IN‐TECH 2016,
Prague, 6. ‐ 8. 9. 2016
Fig. 4.a) 2D Temperature distribution in solids (ºC) Fig 4 b) Fluid temperature along path into the borehole
Table 3. Results for different tests Characteristic Test Nr. 1 Test Nr. 2 Test Nr. 3
Borehole depth [m] 130 110 120 Mean Undisturbed Ground Temperature, TS [ºC] 20.1 16.2 17.8
Ground Conductivity value, kg [W·m-1·K-1] 1,84 1,85 1,61 Ground Calorific capacity value, Cg [J·m-3·K-1] 1,25·106 2,29·106 1,2·106
Borehole Filling Conductivity value, kb [W·m-1·K-1] 1,7 1,7 2 Borehole Filling Calorific capacity value, Cb [J·m-3·K-1] 1,9·106 3·106 2,25·106
Mean absolute error [ºC] with FVM -0.0029 0,00026 0,0041 Mean absolute error [ºC] with FEM -0.0066 - 0,00368 -0,033
Conclusions
The developed 2D model follows the general layout of other researchers, applying both FEM and FVM with high accuracy, and improving them in; i) geometry: unconstrained meshing of elements is recommendable, because no axial symmetry exists, due to temperature differences between the downward and upward paths of the fluid flow; ii) more information, such as heat flux and temperatures at different locations. As equations associated to boundary conditions between different materials are included, they allow directly obtaining heat flux between them. The corresponding capacity effects can be observed, as well as assuring that no heat flux crosses the external surface of the control volume at any time; iii) the main contribution is associated to the axial effects of fluid, which are evaluated by means of analytical functions that follow the tendencies observed experimentally in the revised researchs. Discretization of fluid path along the depth is not necessary.
Acknowledgment Authors thank to the projects executed by the University of Jaén, with codes 2406 and 2439, for the financial support
References
[1] P. Eskilson, Thermal analysis of heat extraction boreholes, PhD. Thesis (Dep. Of Mathematical Physics, University of Lund,
Sweden, 1987). [2] L. Lamarche, S. Kajl, B. Beauchamp, A review of methods to evaluate borehole thermal resistances in geothermal heat-pump
systems, Geothermics, Vol. 39 (2010), p. 187-200 [3] C. Yavuzturk, J.D. Spitler, S.J. Rees, A transient two-dimensional finite volume model for the simulation of vertical U-tube ground
heat exchangers, ASHRAE Trans., Vol. 105 (2), (1999), p. 465-474 [4] P. Pasquier, D. Marcote, Short-term simulation of ground heat exchanger with an improved TRCM, Renewable Energy, Vol. 46
(2012), p. 92-99 [5] J. C. Choi, S.R. Lee, D.S: Lee, Numerical simulation of vertical ground heat exchangers: Intermittent operation in unsaturated soil
conditions, Computers and Geotechnics, Vol. 38 (2011) p. 949–958 [6] Jalaluddin, A. Miyara, Thermal performance investigation of several types of vertical ground heat exchangers with different
operation mode, Applied Thermal Engineering, Vols. 33-34 (2012) p. 167-174 [7] H. Esen, M. Inalli, Y, Esen, Temperature distribution in boreholes of a vertical ground-coupled heat pump system, Renewable
Energy, Vol. 34 (2008), p. 2872-2879. [8] F. Bozzoli, G. Pagliarini, S. Rainieri, L. Schiavi: Estimation of soil and grout thermal properties through a TSPEP (two-step
parameter estimation procedure) applied to TRT (thermal response test) data, Energy, Vol. 36 (2011), p. 839-846. [9] D. Marcotte, P. Pasquier: On the estimation of thermal resistance in borehole thermal conductivity test, Renewable Energy, Vol. 33
(2008), p. 2407-2415 [10] M. Li, A.C.K. Lai, Parameter estimation of in-situ thermal response tests for borehole ground heat exchangers, Intl. J. of Heat and
Mass Transfer, Vol. 55 (2012), p. 2615-2624 [11] H. Zeng, N. Diao, Z. Fang, Heat transfer analysis of boreholes in vertical ground heat exchangers, Intl. J. of Heat and Mass Transfer,
Vol. 46 (2003), p. 4467-4481 [12] P.J. Casanova-Peláez, J.M. Palomar-Carnicero, R. López-García, F. Cruz-Peragón, Development of device for ground thermal
response tests (TRT) in geothermal installations, Dyna (Bilbao), Vol. 89 (3), (2014), p. 316-324 [13] S.P. Ketkar, Numerical thermal analysis, (American Society of Mechanical Engineers, New York, 1999) [14] F.P. Incropera, D.P. DeWitt, T.L. Bergman, A.S. Lavine, Fundamentals of heat and mass transfer, (John Wiley & Sons Inc, New
York,2007) [15] PE. Gill, W. Murray, M.H. Wright: Practical Optimization, (Academic Press, London, 1997)
28 29 30 310
20
40
60
80
100
120
Fluid Temperature (ºC)
Dis
tance
to b
ore
hole
botto
m (m
)
Analytical approachZeng approach
42

International Conference on Innovative Technologies, IN‐TECH 2016,
Prague, 6. ‐ 8. 9. 2016
DESIGN AND CONSTRUCTION OF AN EXPERIMENTAL ROTARY DRYER FOR DRYING OF OLIVE MILL WASTES.
F.J. Gómez-de la Cruz 1, J.M. Palomar-Carnicero 1, P.J. Casanova-Peláez 2
and F. Cruz-Peragón 1 1 Dep. of Mechanical and Mining Engineering, Escuela Politécnica Superior de Jaén,
University of Jaén, Campus Las Lagunillas s/n, 23071, Jaén (Spain).
2 Dep. of Electronic Engineering and Automatics, Escuela Politécnica Superior de Jaén,
University of Jaén, Campus Las Lagunillas s/n, 23071, Jaén (Spain).
Keywords: Drying; Rotary Dryer; Modeling; Olive Mill Wastes; Experimental Equipment; Biomass. Abstract: This paper presents the new experimental equipment developed by the Mechanical Department of the University of Jaén (Spain). The equipment consists of a small rotary dryer especially destined for drying of olive mill wastes. The problems caused by the transition from three-phase system to two-phase system in the olive oil extraction process, have originated that the drying of two-phase olive mill waste presents serious problems due to high moisture contents, nature and composition. For this reason, the development of this equipment comes from the need to improve the drying process of these wastes in this type of dryers. The main objective of this equipment is to analyze the heat and mass transfer phenomena during the drying process in the trommel. Other aspects like the improvements in the automation, control and optimization during the drying of these by-products are considered as well. This rotary dryer has been designed to be analyzed by means of a sectioned model. The design and manufacture of this equipment aims to improve the drying performance of these by-products in rotary dryers. Introduction
The main by-product obtained in the olive oil extraction is the two-phase olive mill waste. It is formed by a mixture of olive cake and aqueous sludge with moisture contents between 60 % and 70%. This waste is an environmental problem in the olive sector and it should be removed [1]. In addition to deleting an environmental problem, biomass product, “orujillo”, and olive pomace oil are obtained in the drying of two-phase olive oil mill waste. To extract the olive oil contained in it, this sludge should be dried to values close to 8% moisture content. Then, it is mixed with a solvent, usually hexane, which facilitates its extraction. Initially, the extracted oil is refined, and later, it is combined with virgin oils. When the olive pomace oil is extracted, a new biomass product is obtained, the “orujillo”. It is a green energy source with a high calorific value to consider in Mediterranean countries where the olive oil production is important. This biofuel has special interest as fuel in boilers for residential heating [2], fuel consumption in the drying furnaces and fuel for cogeneration [3] and generation [4] plants. Moreover, the cost per kg is low compared with other energy sources such as diesel and natural gas, being a tough competitor with respect to other biomass fuels. The energy released can be regarded as clean. The net calorific value is around 17.5 MJ / kg and after drying, the moisture content ranges from 0.08 to 0.12 kg water/kg product.
At present, practically all is dried in rotary dryers. These systems are crucial for ecological management of the olive oil in the world, since this by-product is a serious environmental problem due to its high biochemical oxygen demand (BOD) [5]. Olive mill waste rotary dryers work with drying air temperatures higher than 500 ºC and velocities between 2 and 5 m/s. This implies that the drying process should be controlled to avoid the risk of fire inside the trommel and the occurrence of polycyclic aromatic hydrocarbons (PAH) such as the benzopyrene [6]. Furthermore, the current waste originated in olive-oil mills, the two-phase olive-oil mill waste, has a moisture content of 65 % and sugar which promote agglomerations during the drying process (increasing the particle size to dry).
In this sense, the difficulty of drying of olive mill waste in rotary dryers has promoted the need to study this phenomenon from an experimental rotary dryer designed to analyze the drying process by sectioned model. In this model the trommel can be divided in several sections in which the drying air temperature, the drying air velocity and the moisture content of the by-product can be obtained and calculated. In addition, drying kinetics of two-phase olive-oil mill waste has been studied for different authors to obtain important parameters of heat and mass transfer such as drying times, drying rates and effective moisture diffusivities which add much information in the drying of this waste in rotary dryers [7,8].
Materials and Methods
The experimental rotary dryer has been placed in the laboratory of thermal machines of the University of Jaen (Spain) (figure 1). The equipment consists of a trommel of 3.5 m of length and a diameter of 0.5 m, a main blower that originates the drying air flow, a secondary blower connected to aspiration tube which allows to measure the air velocity, a cyclone that allows to recover the suspended particles, a set of electrical resistances to heat the drying air flow, a feed hopper that is connected to an Archimedes screw which supplies the by-products, a gears system that produces the trommel rotation, an outlet gases pipe and finally, an Archimedes screw that allows to obtain the final dry product. All equipment is controlled by a control panel acting on electrical resistances and electric motors. This rotary dryer has been designed to perform multiples experiments from the main variables in a drying process such as drying air velocity, inlet or outlet drying air temperature, trommel rotational speed and inlet by-product flow. The main design and construction parameter of the experimental rotary dryers are shown in Table 1.
43

International Conference on Innovative Technologies, IN‐TECH 2016,
Prague, 6. ‐ 8. 9. 2016
Fig. 1 Experimental rotary dryer for drying of olive mill by-products. Table 1. Parameters of the experimental rotary dryer.
Parameter Value
Length, L (m) 3.5 Diameter, D (m) 0.5 Volume, V (m3) 0.67 Flights per section 10 Electrical resistors power (kW) 45 Residence time, (minutes) 20 Dryer Holdup, H* (%) 10 Permissible air mass velocity, uP (kg/s·m2) 1 Percentage of the dryer cross section represents a free area for the air to pass, j (%) 85 Speed trommel, N (rpm) Until 6 Drying air velocity in the trommel, v (m/s) Until 5 Maximum inlet drying air temperature, T (ºC) 450 Maximum intlet by-product, (kg/h) 600
Results and discussion
The main objective of this equipment is to analyze the heat and mass transfer phenomena during the drying process in the trommel. Other aspects like the improvements in the automation, control and optimization during the drying of these by-products are considered as well. This rotary dryer has been designed to be analyzed by means of a sectioned model where the main equations are based on the heat and mass transfer balance applied to a volume element (Fig. 2). Trommel has been divided into five sections. In each section, the drying air temperature, the drying air velocity, the by-product temperature and moisture content can be measured and controlled. The control panel is connected to a computer and all data are monitored. Furthermore, the equipment can be controlled via Wi-Fi.
Fig. 2 Analysis of volume element in the sectioned model where i represents the number of section studied.
44

International Conference on Innovative Technologies, IN‐TECH 2016,
Prague, 6. ‐ 8. 9. 2016
And the heat and mass transfer equations that govern the problem are:
(1)
(2)
, , , (3)
, (4)
, ,, , , ,
, (5)
, ,
, , , ,
, (6)
where Eqs. (1-4) represent the mass balance in the dry product flow, in the dry air flow, in the water contained in the product and in the vapor contained in the air, respectively and Eqs. (5-6) indicate the conservation equation of energy in the olive mill waste and the dry air.
Conclusion
The design and manufacture of this equipment aims to improve the drying performance of these by-products in rotary dryers. Furthermore, the experiments carried out in this equipment will allow knowing better the heat and mass transfer phenomena during the drying process. This equipment will be used for conducting new experiments that improve the optimization and control processes in the drying of olive mill wastes. The final objective is to create a dynamic model that efficiently controls the process. Acknowledgment This work has been conducted with the financial support of the Spanish “Consejería Andaluza de Innovación, Ciencia y Empresa” through the research projects AGR-6131 (“Modelado y Control de secadero rotativo de orujo”) and AGR-6509 (“Producción de biocombustible utilizando hueso de aceituna y residuos de poda de olivo”) as part of the research program “Proyectos de Excelencia de la Junta de Andalucía 2010-2014”. The authors gratefully acknowledge the financial support provided.
References [1] F.J. Gómez-de la Cruz, P.J. Casanova-Peláez, R. López-García, F. Cruz-Peragón. Review of the drying kinetics of olive oil mill
wastes: Biomass recovery, Bioresources, Volume 10 (2015), Issue 3, p. 6055-6080. [2] J.M. Rosúa, M. Pasadas. Biomass potential in Andalusia, from grapevines, olives, fruit trees and poplar, for providing heating in
homes, Renewable and Sustainable Energy Review, Volume 16 (2012) p. 4190-4195. [3] F. Jurado, A. Cano, J. Carpio. Modelling of combined cycle power plants using biomass, Renewable Energy, Volume 28 (2003) p.
743-753. [4] A. García, M. Zamorano, A. Ramos, L.F. Díaz. Analysis of olive grove residual biomass potential for electric and thermal energy
generation in Andalusia (Spain), Renewable and Sustainable Energy Review, Volume 16 (2012) p. 745-751. [5] F.J. Gómez-de la Cruz, P.J. Casanova-Peláez, J.M Palomar-Carnicero, F. Cruz-Peragón. Modeling of olive-oil mil waste rotary
dryers: Green energy recovery systems, Applied thermal Engineering, Volume 80 (2015) p. 362-373. [6] P.G. Ergönül, S. Sánchez, Evaluation of polycyclic aromatic hydrocarbons content in different types of olive and olive pomace oils
produced in Turkey and Spain, European Journal of Lipid Science and Technology. Volume 115 (2013), Issue 9, p. 1078-1084. [7] F.J. Gómez-de la Cruz, P.J. Casanova-Peláez, J.M. Palomar-Carnicero, S. Sánchez, R. Pacheco, F. Cruz-Peragón, Obtaining of
the drying rate of alpeorujo for applications on rotary dryers, Int. Sci. J.-Environ. Sci, Volume 3 (2014), p. 191-197. [8] R.R. Milczarek, A.A. Dai, C.G. Otoni, T.H. McHugh, Effect of shrinkage on isothermal drying behavior of 2-phase olive mill waste, J.
Food Eng, Volume 103 (2011), Issue 4, p. 434-441.
45

International Conference on Innovative Technologies, IN‐TECH 2016,
Prague, 6. ‐ 8. 9. 2016
46

International Conference on Innovative Technologies, IN‐TECH 2016,
Prague, 6. ‐ 8. 9. 2016
A LITTLE TWO AXES MECHANICAL STRUCTURE FOR GENERAL PURPOSES
J. M. Cano-Martínez1, P. J. Casanova-Peláez1, J. M. Palomar-Carnicero2
and F. Cruz-Peragón2 1 Dep. of Electronic and Automatics Engineering, Escuela Politécnica superior de Jaén, University of Jaén,
Campus Las Lagunillas s/n, 23071 Jaén, Spain.
2 Dep. of Mechanical and Mining Engineering, Escuela Politécnica superior de Jaén, University of Jaén, Campus Las Lagunillas s/n, 23071 Jaén, Spain.
Keywords: Two Axes Structure; Control Position; Measurement; Data Processing Abstract: A two axes robust mechanical structure, with a small size, has been developed and implemented with a stepper motors friendly control. It is focused to hemispherical positional tracking. The structure is able to support little dispositive such as irradiance sensors, under 1 kg weight approximately. The main power is on two hybrid stepper motors, and the transmission-reduction is by solid screws in both axes. The vertical axis, for horizontal motion, is 450 mm high with a platform support to hold the mechanical structure, isolated in a box support (370 x 275 x 140 mm), so it can work in outdoors applications. Each one of the axes is controlled by a position sensor. The system control is completed with a well-liked interface platform and a friendly programming environment, including an USB communication port with the computer. There is a software version for manually and programmed modes function, developed and created for laboratory tests. The complete system is able to take and register data and signals from each sensor type to install, and the signal can be adapted on the interface board ,as well as the system can be reprogrammed easily. The first laboratory probe, focused on motion function, was successful. The next phase will be testing it in outside environment with the desired sensor type. Introduction
There are different types of mechanical structures for measurements field application and solar energy use. From large structures of two axes for photovoltaic panels systems applications [1], to complete monitoring control systems, measurement and storage [2], comprising control system and storage similar to other designs [3]. Team researchers of PAIDI TEC-250 group [4] have experience in the development and study two axes structures [1] for applications on solar energy, and also in the field of the measurement of solar radiation with silicon cells, as well as conditioning and data acquisition [5]. The investigation has resulted in the development of a prototype two axes structure of small size and general purpose for measurement applications, initially in the solar energy field. Along with the structure, it is also presented the design of a control system similar to those mentioned in [2, 3] and signal conditioning solutions already experienced [6], resulting in a versatile system, reprogrammable, with autonomy of operation with no connection to the computer, which uses software tools and standard hardware easy application and communication with user. The system consists of a mechanical platform powered by two stepper motors controlled by position sensors; the programming environment MatLAB for data acquisition and control board; a graphical application for computer operation; and the interface communication and control Arduino. The first results obtained in the laboratory were satisfactory, achieving the movement of the structure in its operation modes (“Automatic sequence”, “Manual”, and “Initial position”) and verifying the possibilities of parameters control modification and sequences reprogramming. Materials and methods
Two axes structure system The main mechanical structure is made of an single
material (steel F-114). To ensure a good stability to the structure, the support platform is square surface and it is ready for a good grip (Fig. 1). The structure devices are located in the interior of a box, capable of protecting them from rain, exposure to UV rays and external agents. For the distribution of the weight of the whole, the center of gravity has been established as close as possible to the vertical axis, thus contributing to the stability of the structure and the inertia moments that must endure in addition to diverse environmental conditions. It has counterweights that optimize the movement of the assembly (Fig. 2), and support bars measuring devices "medium" size / weight.
Fig. 1 Devices layout. Fig. 2 Box and sensor.
47

International Conference on Innovative Technologies, IN‐TECH 2016,
Prague, 6. ‐ 8. 9. 2016
Thanks to the configuration with two perpendicular rotational axes, it can take, in theory, infinite points of measurement in the celestial hemisphere.
Transmission of movement Each axe is powered by a two-phase bipolar hybrid stepper motor of 40 W, 2.3 A by phase (type 17 HS-240E), and 200 steps/rev
(400 in ½ step mode), with a resolution of 1.8 degrees/step in normal mode. To increase the torque transmitted and perform movements with charge, the transmission is made via a gear system with a winder of 30 and 40 teeth according to the axis, and a no end screw transmits directly the rotational movement of the stepper motor (Fig. 3). The term Eq. (1) on both axes transmission ratio is less than unity, which act as reducer with 30:1 ratio for the azimuth axis, and 40:1 for the zenith axis.
i = 1/z, (1) Where: i is the transmission ratio; z the number of slots (disc edges) of the winder.
Fig. 3 Motors-crown transmission. Fig. 4 Encoder details.
Resolution The resolution corresponds with the minimum angular motion allowing the steppers motors, which is 1.8 degrees in 200 steps/rev
mode, and 0.9 degrees in 400 steps/rev. mode, according to their expression in Eq (2). Rm = βa/Ns, (2) Where: Rm is motor resolution; βa is angular displacement of reach (360 °); Ns is the number of steps by revolution. But the relationship of transmission Eq (1) is 1/40 for zenithal axis and 1/30 for azimuth axis. Thus, the maximum range of resolution
transmitted to the axes might be 0.9/40 degrees (0.0225°/step) and 0.9/30 degrees (0.03°/step) respectively, that it is the minimum angular movement that can be obtained by sending a pulse.
However, as in both cases it has an encoder of 72 teeth or slots (disc groves), with overhang for end stop (Fig. 4) solidarity to the corresponding axis, the minimum resolution or motion that it can detect is limited by its mechanical features of design. In addition to the angular displacement of reach, the reading of the encoder resolution depends on the number of disc slots, and these indicate the number of changes (pulses) that detects. Thus, in the expression of the resolution of the encoder Eq. (3) these factors are involved:
Re = βa/Nc, (3) Where: βa is angular displacement of reach (360 °); Nc is the number of slots (disc groves) of the encoder (72) In our particular case, encoder resolution is 5 degrees. By applying Eq (3) we can also know the number of pulses that we should
detect for an angular displacement required βx, Np = βx/Re = βx/(360º/72), (4) Where: βx is the angle that should move the corresponding axis; Np is the number of pulses of the detector.
Power and control hardware
For positioning control of the axes (vertical-horizontal) and covering the movement in the celestial hemisphere of reach, it has opted for the use of typical sensors for the counting of pulses (optocouplers) for movement, and for detection of both initial and final positions, it has used Arduino® programming platform in combination with Matlab® for the system controlling. The interconnection structure is as shown in fig. 5 below.
48

International Conference on Innovative Technologies, IN‐TECH 2016,
Prague, 6. ‐ 8. 9. 2016
Fig. 5 Functional/Blocks system diagram.
Control hardware is based on the AMTEL® processor, which allows multiple designs, and its evolution in the model Atmega1280 with USB connector, voltage regulator, converter serial port - USB, among other features that can be developed with board Arduino Duemilanove low cost and easy to program.
Two digital outputs and two digital inputs are used to control the direction, and pulses signal (CLK) for the movement of each motor. Moreover, it has potential for expansion, as the conditioning of analog inputs to configure it for different types of sensors.
Table 1. Connections list for Arduino board.
Pin No. Type Description Var. name 8 Digital In Vertical motor optocoupler sensor OPTO1 9 Digital In Vertical motor end sensor FINAL1
12 Digital In Horizontal motor optocoupler sensor OPTO2 13 Digital In Horizontal motor end sensor FINAL2 6 Digital Out Vertical Motor direction DIR1 7 Digital Out Vertical motor pulses CLK1
10 Digital Out Horizontal motor direction DIR2 11 Digital Out Horizontal motor pulses CLK2
The signals interconnection between the motor control board and the programmable interface allows a programmable motion control
of two axes structure. For motors feed, it has two general purpose control board for steppers motors of easy interconnection and integration, with a configuration for typical bipolar windings excitation in H-bridge, and built-in 3.5 A power supply of +/-12 V and +/-5 V.
All signals are 0 V - 5 V TTL logical type (low 0, high 1), except the signal generated depending on sensor type used. For structure positioning and motor operation, it sends a pulses train with an equivalent number to angular displacement required. Thus, for a given displacement of the structure, the term Eq. (5) resolves the number of pulses (steps) that are necessary for a displacement given, which should consider the effects due to the rate of transmission in Eq (1) and resolution motor in Eq (2).
Np = (βx / i ) / Rm (5) Where: Ns is the number of steps; βx is angular displacement; i is the corresponding rate transmission; and Rm motor resolution. In the following example it is resolved, for the horizontal axis (azimuth movement), the number of pulses needed for a 10 degrees
displacement of the structure, which coincides with the number of motor steps: Np = ((10º·40) / ((360º/400s) = 444 (steps) (6)
Data acquisition and control software
Arduino programming supports all basic structures and most bookstores universal programming language C ++. The programs developed are formed by different “skecth” with the same structure, and it has specific functions that allow to configure the different terminals of the board as inputs or outputs.
Since all Arduino boards are equipped with one or more drives UART 0 V - 5 V, the serial communication computer is made through the USB port, with standard controllers USB-COM, serial ports that are bound to different terminals, so we cannot use the serial ports drivers as I/O while the serial communication is active. On the other hand, it can also work independently having separate power supply, if the USB port is released. It can work without being connected to the computer once loaded the driver program.
Due to the simplicity of communication monitor, it can only send and receive information without storage possibilities. Consequently, MatLAB is used for its ability of calculation and the comfort it can bring the GUIDE tool MatLAB. It incorporates a system of rapid application creation and events based on form GUI, like "visual" environ, and allows simulation and program implementation in a simple way. It allows creating environments graphical form, building the programming structure that draws on the screen, and activates a function allowing the event generated (Fig. 6).
49

International Conference on Innovative Technologies, IN‐TECH 2016,
Prague, 6. ‐ 8. 9. 2016
Fig. 6 Visual interface for operation system. Once serial connection through the button “Start” is established, there is communication with Arduino and the different operation
modes are available: 1-Initial Position, 2- Automatic Sequence, 3-Manual. On option, it develops the scheduled process in Arduino. Option 1 starts position function, which is recommended once the system is connected. Option 2 allows programming any kind of sequence of movements according to the mechanical limitations. And option 3 allows selecting the number of degrees, and the direction in which each motor must be moved. In this last mode, all the information is sent by a line that/which Arduino recognizes, which consists in a vector “V” that contains the following data: No. 3, DIR1, MOTOR1, DIR2, MOTOR2.
The system is able to detect errors and send warning messages to MatLAB, such as reading optocoupler two consecutive equal data (00, 11), due to a jam. The system is able to detect errors and send warning messages to Matlab, such as reading optocoupler two equal consecutive data (00, 11), due to a clogging.
Results
The functioning of the structure has been verified and, especially, operation modes and events activation in MatLAB, as well as error detection and display of warnings. For Automatic Sequence mode, an automatic sequence in the Arduino environment has been programmed, which previously had simulated/designed graphically using MatLAB, in a similar manner to the one shown in Fig. (7).
It makes a sweep hemispherical sequentially reaching points separate 10 degrees both horizontally and vertically. In the first Laboratory tests, it is undergoing/subjecting the repetitive execution of scripts during 3-4 hours a day, 2-3 times a week. Mechanical misalignments and failures in some connections were found, and subsequently corrected. Alarming temperature operation has not been appreciated, and the motors have not exceeded 45 degrees, well below that specified by the manufacturer. The price of the complete system is competitive and can be optimized for production. Additionally, the mechanical and electrical elements, as well as the interface and software platforms, are standard and easily available on the market.
Fig. 7 Simulation points grid for data programming. Conclusion
A mechanical structure of two axes and its control system It has been designed, in a friendly environment and versatile user iteration that allows the reprogramming, adaptation of different sensors types, and automatic operation without the need to connect the computer. It has proven its ability to follow a sequence of moves automatically and go to a point indicated by the user, and the system is ready for connecting measuring sensors. After the first tests carried out in the laboratory, with a satisfactory outcome in accordance with the initial goal, it also comprises possible actions which are being evaluated, as improvements in error detection and sensors connection. The next step is installing the system in field, and the installation of a sensor for signals analysis. It presents possibilities of production, previous study and tests in field, and it will be able to be used in verification field and measurements calibration with scope/range to/at the hemisphere celestial. Acknowledgments The following people have significantly contributed to the work presented here: Prof. R. López García, director of the department of mechanical engineering and mining at the University of Jaen, Prof. M. Fuente Ruz from the department of electronics and Automation engineering of the University of Jaen, Mr. J. Abril Duro, electronic engineer for Granada University, Prof. J. Raez, director of secretariat international mobility of University of Jaen, and all the staff of the research group Mechanics and Energy (PAIDI TEP-250).
References [1] Cruz P., F.., Casanova P., P.J., Díaz G., F.A., López G., R., Palomar C., J.M. “An approach to evaluate the energy advantage of two
axes solar tracking systems in Spain”. Applied Energy (2011). No. 88, pp. 5131-5142. [2] Roth, P., Georgiev, A., Boudinov, H. “Cheap two axis sun following device”. Energy Conversion and management (2005). No. 46,
pp. 1179-1192. [3] Mukaro, R., Carelse, X.F. “A Microcontroller-Based Data Acquisition System for Solar Radiation and Environmental Monitoring”.
IEEE transactions on instrumentation and measurement (1999). Vol. 48, No. 6, pp. 1232-1238. [4] http://www10.ujaen.es/investigacion/grupos/tep-250 [5] Gómez M., A., Casanova P., P.J., Díaz G., F.A., Palomar C., J.M., López G., R., Cruz P., F. “Response fitting in low-cost radiation
sensors”. Renewable energy and power quality journal (RE&PQJ) (2010); Vol. 8, pp. 523.01-523.06. [6] Harrison, R.G., Knight, J.R. “Thermopile radiometer signal conditioning for surface atmospheric radiation measurements”. Review of
scientific instruments (2006). Vol. 77, No. 11, No. Art. 116105.
50

International Conference on Innovative Technologies, IN‐TECH 2016,
Prague, 6. ‐ 8. 9. 2016
UNMANNED AIRCRAFT SYSTEM – A FUTURE TECHNOLOGY OF FIRE BRIGADE AND CIVIL PROTECTION
C.A. Dreßler1 and Dr. U. Meinberg2 1 Brandenburg University of Technology, Chair of Industrial Information Systems, Universitätsstr. 22, 03046
Cottbus, Germany – [email protected], +49 (0) 355 – 69 4498
2 Brandenburg University of Technology, Chair of Industrial Information Systems, Universitätsstr. 22, 03046 Cottbus, Germany – [email protected], +49 (0) 355 – 69 4581
Keywords: Unmanned Aircraft System; UAS; Remotely Piloted Aircraft System; RPAS; Civil Use; Fire Brigade; Civil Protection; Crisis Management; Photogrammetry; Augmented Reality Abstract: In the past 20 years unmanned aircraft systems (UAS) have been increasing in popularity, particularly in relation to the use in the civilian sector. The spectrum of civil applications of UAS is very large and largely untapped. Within this publication, the potential of technology will be shown by the example of usage at the fire brigade and civil protection. The focus will be placed on the support of decision-making and an efficient coordination of operations during a forest fire fighting, especially in the state of Brandenburg (Germany). Introduction
2015 there were 1071 forest fires on a total area of 525.5 hectares in Germany. The majority fell here to the state of Brandenburg with 315 forest fires on an area of 321.3 hectares. [1] The Reason for this are the great pine forests in Brandenburg, which simultaneously brings an allocation of the area to the highest forest fire danger level in Europe with itself. Besides the large pine forests Brandenburg is characterized by two particularities, which require in case of a forest fire tactical adaptation of combat:
Mining landscapes - Due to the possible risk of ground failure, whose consequences may be landslides, there is a specific classification of these areas in restricted areas.1
Remains of munition and mines - Starting from contaminated regions such as military training areas, there is an increased risk of explosion.2
In the case of a forest fire within these areas, a ride on these areas as well as a conduction of a direct combat is not possible. Therefore it is only possible to monitor the fire development within the areas from a distance and from the air, and to initiate countermeasures in the adjoining regions by the technical command and control center.
For an effective and efficient forest fire fighting, particularly in the areas mentioned, the standing ready information base of the current situation is deciding. The acquisition of the specific location information on site can currently be done using the following emergency vehicles:
Motorcycle – Expansive exploration of the incident location in terms of fire development and site technical particularities at ground level.
Lifting vehicle – Farsighted exploration of the incident location and the fire development starting from a fixed position and a restricted height.
Helicopter / Airplane3 – Extensive exploration of the incident location and the fire development based on flexible angles from the air.
These emergency vehicles, however, have some disadvantages regarding to the situation acquisition. So the use of helicopters or airplanes is very expensive and usually requires a lead time. On the other hand, the situation acquisition with the help of motorcycles or lifting vehicles is often limited and inflexible. As a result, the analysis of the situation as well as decision-making by the technical command and control center based on the acquired information can become complicated. The information system concept
The conventional methods, to detect the situation at an incident location, can be optimized through the use of modern information technologies. It is possible to increase the flexibility as well as the speed of the acquisition, to protect the fire fighters at the same time and to increase the quality of the collected information base for decisions on site by a substantial factor. A possible information system, to realize that potential, will be described conceptually below.
The architecture of the information system can be fundamentally described by the following three components (see Fig. 1): Unmanned Aircraft System – The main component of the system is an unmanned aircraft system (UAS) [2], where different
payloads can be mounted on the bottom. It serves as a platform for one or more cameras (RGB, thermography), to explore the incident location flexibly from the air in different angles. For that, a multicopter is used, which belongs to the group of rotary-wings. The advantage of multicopters lies in the ability to take off and land vertically. Therefore the use of UAS is independent of terrain characteristics, as long as the airspace can be achieved unrestricted. At the same time the unmanned aircraft system can hover at a specific position in the air, that enables an exploration of the incident location from a fixed air perspective.
In addition to the camera shots (image, video), the aircraft provides various telemetry data to the information system, such as its current position and orientation, through a wireless data link.
Wearable Computer – Another component of the system are wearable computers [3], for example intelligent textiles. These computer systems consist of a microchip, several sensors and transmitter / receiver and are carried by the rescuers during a
1 In Brandenburg restricted areas are reported by „Lausitzer und Mitteldeutsche Bergbau-Verwaltungsgesellschaft mbH (LMBV)“. 2 In Brandenburg contamination sites are reported by „Zentraldienst der Polizei (ZDPol)“. 3 In Brandenburg often provided by police and air rescue services, but also by adjoining airfields.
51
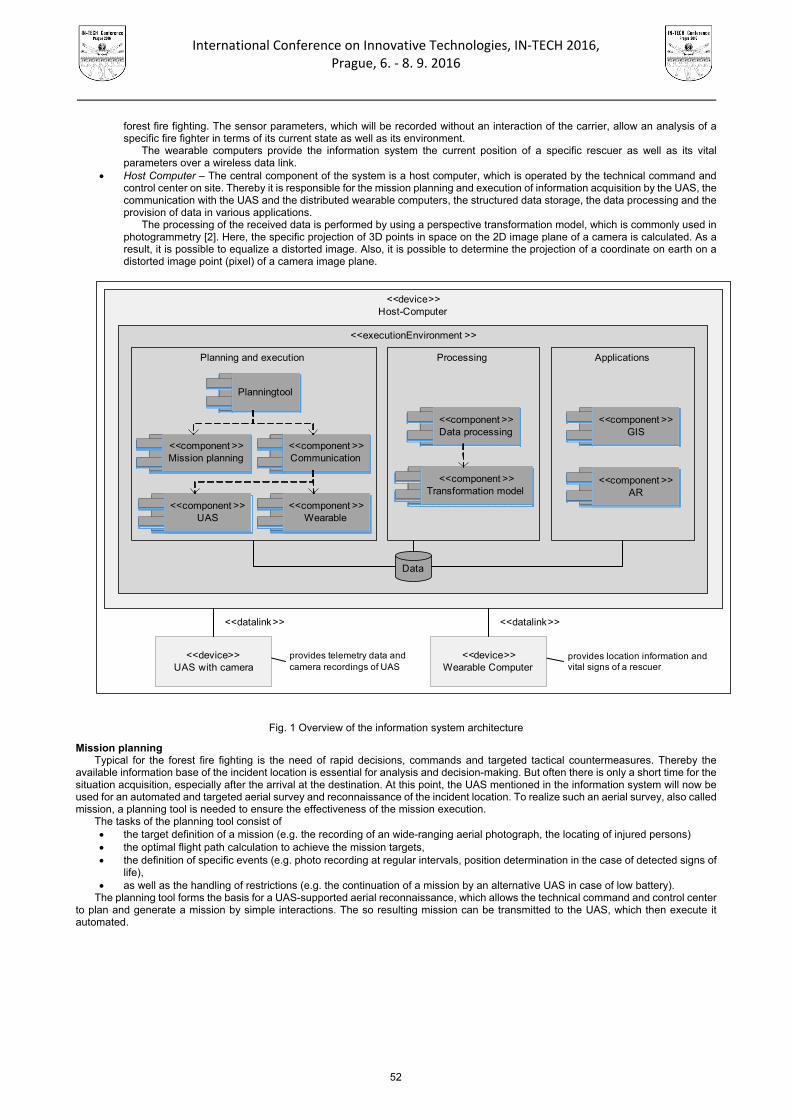
International Conference on Innovative Technologies, IN‐TECH 2016,
Prague, 6. ‐ 8. 9. 2016
forest fire fighting. The sensor parameters, which will be recorded without an interaction of the carrier, allow an analysis of a specific fire fighter in terms of its current state as well as its environment.
The wearable computers provide the information system the current position of a specific rescuer as well as its vital parameters over a wireless data link.
Host Computer – The central component of the system is a host computer, which is operated by the technical command and control center on site. Thereby it is responsible for the mission planning and execution of information acquisition by the UAS, the communication with the UAS and the distributed wearable computers, the structured data storage, the data processing and the provision of data in various applications.
The processing of the received data is performed by using a perspective transformation model, which is commonly used in photogrammetry [2]. Here, the specific projection of 3D points in space on the 2D image plane of a camera is calculated. As a result, it is possible to equalize a distorted image. Also, it is possible to determine the projection of a coordinate on earth on a distorted image point (pixel) of a camera image plane.
Planningtool
<<component >>GIS
<<component >>Data processing
<<component >>Communication
Data
<<component >>UAS
<<component >>Wearable
provides location information and vital signs of a rescuer
provides telemetry data and camera recordings of UAS
<<datalink>><<datalink>>
<<component >>Mission planning
<<component >>Transformation model
<<component >>AR
Planning and execution Processing Applications
<<executionEnvironment >>
<<device>>Host-Computer
<<device>>UAS with camera
<<device>>Wearable Computer
Fig. 1 Overview of the information system architecture
Mission planning Typical for the forest fire fighting is the need of rapid decisions, commands and targeted tactical countermeasures. Thereby the
available information base of the incident location is essential for analysis and decision-making. But often there is only a short time for the situation acquisition, especially after the arrival at the destination. At this point, the UAS mentioned in the information system will now be used for an automated and targeted aerial survey and reconnaissance of the incident location. To realize such an aerial survey, also called mission, a planning tool is needed to ensure the effectiveness of the mission execution.
The tasks of the planning tool consist of the target definition of a mission (e.g. the recording of an wide-ranging aerial photograph, the locating of injured persons) the optimal flight path calculation to achieve the mission targets, the definition of specific events (e.g. photo recording at regular intervals, position determination in the case of detected signs of
life), as well as the handling of restrictions (e.g. the continuation of a mission by an alternative UAS in case of low battery).
The planning tool forms the basis for a UAS-supported aerial reconnaissance, which allows the technical command and control center to plan and generate a mission by simple interactions. The so resulting mission can be transmitted to the UAS, which then execute it automated.
52

International Conference on Innovative Technologies, IN‐TECH 2016,
Prague, 6. ‐ 8. 9. 2016
Applications
The information system can be used by the technical command and control center in two different applications (see Fig. 2): Geographic Information System – At the incident location there will be often used a geographic information system, so called
GIS, for the coordination of a forest fire fighting. In this are static information stored, such as access roads, forest roads or water points. Now this information can be extended by an orthophotographic. For this purpose, after arrival on site a UAS is used to explore the area widely. During the flight, many aerial photographs will be taken, which are equalized then, stitched and georeferenced by the help of the transformation model. The resulting orthophotographic can be placed in the background of a GIS then. A development example of this application is for instance described in [4].
As a result, the line of the fire, its direction and the development of site technical conditions of the incident location can be taken and analyzed in the GIS now. In addition, the location information of the rescuers, which are provided by the wearable computers, as well as the position of emergency vehicles can be visualized in the GIS and be used for an efficient coordination of the forest fire fighting.
Augmented Reality – Another innovative use of the acquired data is the extension of reality perception by synthetic data, also called Augmented Reality (AR). For this, a UAS is used for an exploration of the incident location. During the flight, an aerial photograph will be recorded by the UAS and sent to the host computer in form of a video stream. At the same time the wearable computers of the rescuers send their sensor data (position, vitals) to the host computer. With the help of the perspective transformation model a rescuer can be marked in the aerial photograph in real-time now. As a result, it is possible to detect visually a rescuers position in the aerial photograph now, also in case of none visual contact within the camera view, caused by treetops or smoke. The coordination of the forest fire fighting as well as the protection of the rescuers can so be done based on real-time situation information.
Fig. 2 Fire brigade applications of aerial photographs recorded by UAS
Advantages In comparison to the conventional measures for the situation acquisition, the use of the previously described information system during
a forest fire fighting results the following advantages: 1. Fast, flexible, cost-efficient and continuous situation acquisition with short repetition times. 2. Efficient detection and visualization of the fire source and their propagation direction. 3. Efficient coordination of methods for rapid and targeted firefighting based on real-time situation information. 4. Localization and visualization of rescuers, emergency vehicles and operating resources on site. 5. Efficient acquisition and visualization of danger spots for rescuers, emergency vehicles and the resources in the field. 6. Quick and efficient initiation of assistance measures for vulnerable (injured, disoriented) rescuers. 7. Protection of rescuers through continuous monitoring of vital signs and an optimal planning of exchanges. 8. Automated search for (injured) persons on site.
Conclusion
The state of Brandenburg is a special place due to its particularities (large pine forests, mining landscapes, contaminated regions) in relation to the forest fire fighting. It is thereby an ideal basis for an investigation of the use of new technologies, in particular to increase the quality of the information base of the incident location. The conventional methods for detecting a situation can thereby be supplemented through the use of new technologies such as unmanned aerial systems. These may cause a flexible exploration of the incident location after arrival on site and therefore to optimize the already first decision-making. The reconnaissance of the incident location out of the air leads in result to an information base that contributes, in addition to an efficient coordination of forest fire fighting, to a protection of the rescuers.
In the next step, the concept described will examined in the context of a future project in order to tap the potential now.
53

International Conference on Innovative Technologies, IN‐TECH 2016,
Prague, 6. ‐ 8. 9. 2016
References
[1] Lachmann, M. (2016): Waldbrandstatistik der Bundesrepublik Deutschland für das Jahr 2015, in: Bundesanstalt für Landwirtschaft
und Ernährung, URL: http://www.ble.de/SharedDocs/Downloads/01_Markt/10_Statistik/Waldbrandstatistik/Waldbrandstatistik-2015.pdf?__blob=publicationFile, 15.07.2016.
[2] Colomina, I.; Molina, P. (2014): Unmanned aerial systems for photogrammetry and remote sensing: A Review, in: ISPRS Journal of Photogrammetry and Remote Sensing, Vol. 92, p. 79-97
[3] Hinck, S. (2007): Overview of Wearable Computing in Extreme Situations, in: Hamburg University of Applied Sciences, URL: https://users.informatik.haw-hamburg.de/~ubicomp/projekte/master06-07-aw/hinck/report.pdf, 15.07.2016
[4] van Persie, M.; Oostdijk, A.; Fix, J.; van Sijl, M.C.; Edgardh, L. (2011): Real-time UAV based geospatial video integrated into the fire brigades crisis management GIS system, in: ISPRS – International Archives of the Photogrammetry, Remote Sensing and Spatial Informormation Sciences, Vol. XXXVIII-1/C22, p. 173-175
54
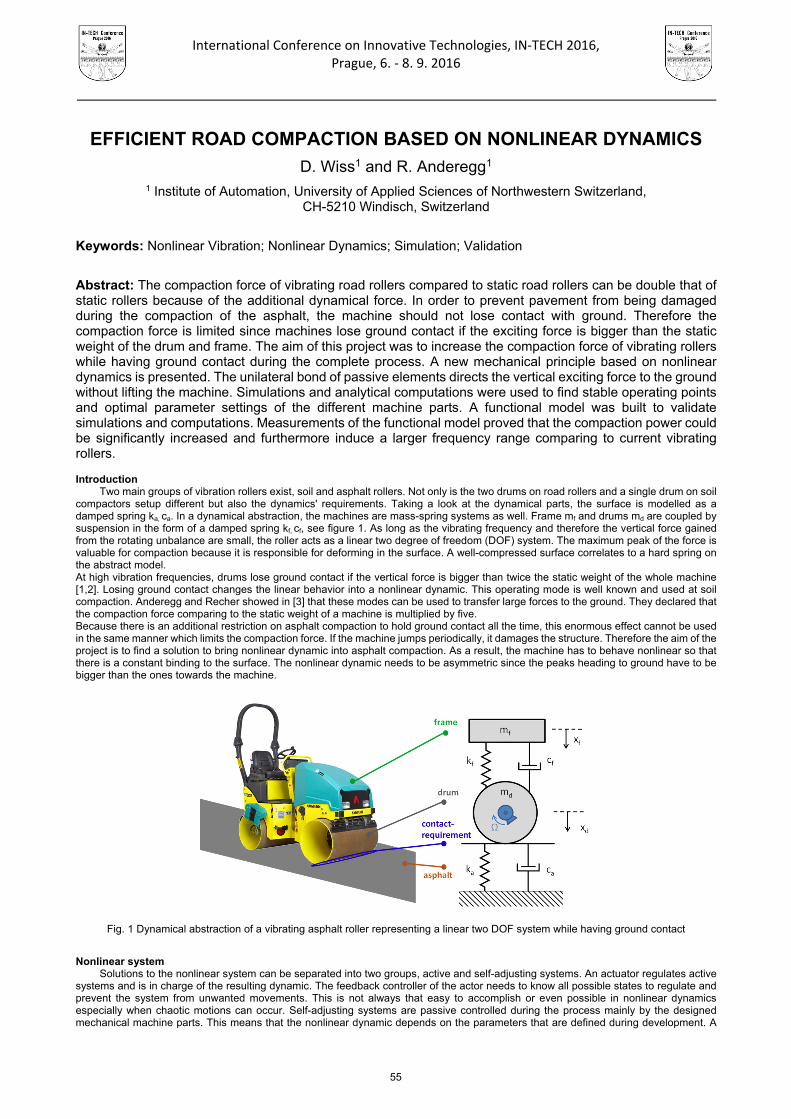
International Conference on Innovative Technologies, IN‐TECH 2016,
Prague, 6. ‐ 8. 9. 2016
EFFICIENT ROAD COMPACTION BASED ON NONLINEAR DYNAMICS
D. Wiss1 and R. Anderegg1 1 Institute of Automation, University of Applied Sciences of Northwestern Switzerland,
CH-5210 Windisch, Switzerland
Keywords: Nonlinear Vibration; Nonlinear Dynamics; Simulation; Validation
Abstract: The compaction force of vibrating road rollers compared to static road rollers can be double that of static rollers because of the additional dynamical force. In order to prevent pavement from being damaged during the compaction of the asphalt, the machine should not lose contact with ground. Therefore the compaction force is limited since machines lose ground contact if the exciting force is bigger than the static weight of the drum and frame. The aim of this project was to increase the compaction force of vibrating rollers while having ground contact during the complete process. A new mechanical principle based on nonlinear dynamics is presented. The unilateral bond of passive elements directs the vertical exciting force to the ground without lifting the machine. Simulations and analytical computations were used to find stable operating points and optimal parameter settings of the different machine parts. A functional model was built to validate simulations and computations. Measurements of the functional model proved that the compaction power could be significantly increased and furthermore induce a larger frequency range comparing to current vibrating rollers. Introduction
Two main groups of vibration rollers exist, soil and asphalt rollers. Not only is the two drums on road rollers and a single drum on soil compactors setup different but also the dynamics' requirements. Taking a look at the dynamical parts, the surface is modelled as a damped spring ka, ca. In a dynamical abstraction, the machines are mass-spring systems as well. Frame mf and drums md are coupled by suspension in the form of a damped spring kf, cf, see figure 1. As long as the vibrating frequency and therefore the vertical force gained from the rotating unbalance are small, the roller acts as a linear two degree of freedom (DOF) system. The maximum peak of the force is valuable for compaction because it is responsible for deforming in the surface. A well-compressed surface correlates to a hard spring on the abstract model. At high vibration frequencies, drums lose ground contact if the vertical force is bigger than twice the static weight of the whole machine [1,2]. Losing ground contact changes the linear behavior into a nonlinear dynamic. This operating mode is well known and used at soil compaction. Anderegg and Recher showed in [3] that these modes can be used to transfer large forces to the ground. They declared that the compaction force comparing to the static weight of a machine is multiplied by five. Because there is an additional restriction on asphalt compaction to hold ground contact all the time, this enormous effect cannot be used in the same manner which limits the compaction force. If the machine jumps periodically, it damages the structure. Therefore the aim of the project is to find a solution to bring nonlinear dynamic into asphalt compaction. As a result, the machine has to behave nonlinear so that there is a constant binding to the surface. The nonlinear dynamic needs to be asymmetric since the peaks heading to ground have to be bigger than the ones towards the machine.
Fig. 1 Dynamical abstraction of a vibrating asphalt roller representing a linear two DOF system while having ground contact
Nonlinear system
Solutions to the nonlinear system can be separated into two groups, active and self-adjusting systems. An actuator regulates active systems and is in charge of the resulting dynamic. The feedback controller of the actor needs to know all possible states to regulate and prevent the system from unwanted movements. This is not always that easy to accomplish or even possible in nonlinear dynamics especially when chaotic motions can occur. Self-adjusting systems are passive controlled during the process mainly by the designed mechanical machine parts. This means that the nonlinear dynamic depends on the parameters that are defined during development. A
55
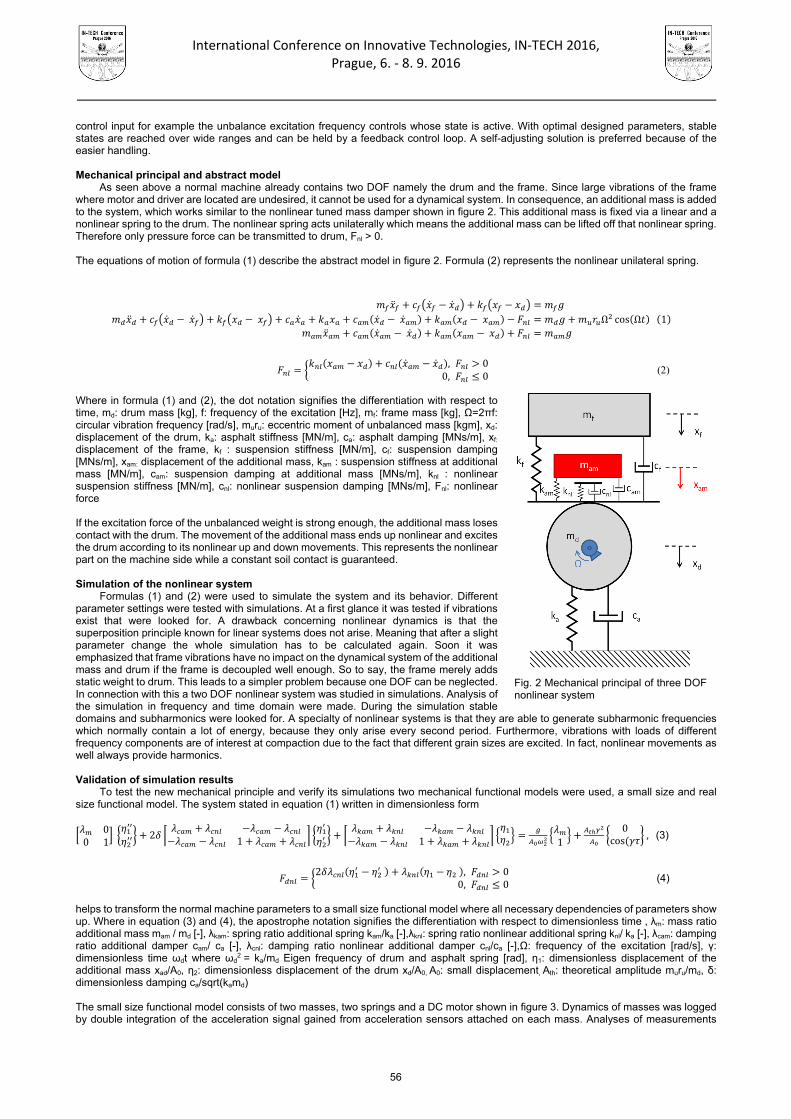
International Conference on Innovative Technologies, IN‐TECH 2016,
Prague, 6. ‐ 8. 9. 2016
control input for example the unbalance excitation frequency controls whose state is active. With optimal designed parameters, stable states are reached over wide ranges and can be held by a feedback control loop. A self-adjusting solution is preferred because of the easier handling. Mechanical principal and abstract model
As seen above a normal machine already contains two DOF namely the drum and the frame. Since large vibrations of the frame where motor and driver are located are undesired, it cannot be used for a dynamical system. In consequence, an additional mass is added to the system, which works similar to the nonlinear tuned mass damper shown in figure 2. This additional mass is fixed via a linear and a nonlinear spring to the drum. The nonlinear spring acts unilaterally which means the additional mass can be lifted off that nonlinear spring. Therefore only pressure force can be transmitted to drum, Fnl > 0. The equations of motion of formula (1) describe the abstract model in figure 2. Formula (2) represents the nonlinear unilateral spring.
Ω cos Ω 1
, 00, 0
(2)
Where in formula (1) and (2), the dot notation signifies the differentiation with respect to time, md: drum mass [kg], f: frequency of the excitation [Hz], mf: frame mass [kg], Ω=2πf: circular vibration frequency [rad/s], muru: eccentric moment of unbalanced mass [kgm], xd: displacement of the drum, ka: asphalt stiffness [MN/m], ca: asphalt damping [MNs/m], xf: displacement of the frame, kf : suspension stiffness [MN/m], cf: suspension damping [MNs/m], xam: displacement of the additional mass, kam : suspension stiffness at additional mass [MN/m], cam: suspension damping at additional mass [MNs/m], knl : nonlinear suspension stiffness [MN/m], cnl: nonlinear suspension damping [MNs/m], Fnl: nonlinear force If the excitation force of the unbalanced weight is strong enough, the additional mass loses contact with the drum. The movement of the additional mass ends up nonlinear and excites the drum according to its nonlinear up and down movements. This represents the nonlinear part on the machine side while a constant soil contact is guaranteed. Simulation of the nonlinear system
Formulas (1) and (2) were used to simulate the system and its behavior. Different parameter settings were tested with simulations. At a first glance it was tested if vibrations exist that were looked for. A drawback concerning nonlinear dynamics is that the superposition principle known for linear systems does not arise. Meaning that after a slight parameter change the whole simulation has to be calculated again. Soon it was emphasized that frame vibrations have no impact on the dynamical system of the additional mass and drum if the frame is decoupled well enough. So to say, the frame merely adds static weight to drum. This leads to a simpler problem because one DOF can be neglected. In connection with this a two DOF nonlinear system was studied in simulations. Analysis of the simulation in frequency and time domain were made. During the simulation stable domains and subharmonics were looked for. A specialty of nonlinear systems is that they are able to generate subharmonic frequencies which normally contain a lot of energy, because they only arise every second period. Furthermore, vibrations with loads of different frequency components are of interest at compaction due to the fact that different grain sizes are excited. In fact, nonlinear movements as well always provide harmonics. Validation of simulation results
To test the new mechanical principle and verify its simulations two mechanical functional models were used, a small size and real size functional model. The system stated in equation (1) written in dimensionless form
00 1
2 1 1 10
cos ,(3)
2 , 0
0, 0 (4)
helps to transform the normal machine parameters to a small size functional model where all necessary dependencies of parameters show up. Where in equation (3) and (4), the apostrophe notation signifies the differentiation with respect to dimensionless time , λm: mass ratio additional mass mam / md [-], λkam: spring ratio additional spring kam/ka [-],λknl: spring ratio nonlinear additional spring knl/ ka [-], λcam: damping ratio additional damper cam/ ca [-], λcnl: damping ratio nonlinear additional damper cnl/ca [-],Ω: frequency of the excitation [rad/s], γ: dimensionless time ωdt where ωd
2 = ka/md Eigen frequency of drum and asphalt spring [rad], η1: dimensionless displacement of the additional mass xad/A0, η2: dimensionless displacement of the drum xd/A0, A0: small displacement, Ath: theoretical amplitude muru/md, δ: dimensionless damping ca/sqrt(kamd) The small size functional model consists of two masses, two springs and a DC motor shown in figure 3. Dynamics of masses was logged by double integration of the acceleration signal gained from acceleration sensors attached on each mass. Analyses of measurements
Fig. 2 Mechanical principal of three DOFnonlinear system
56
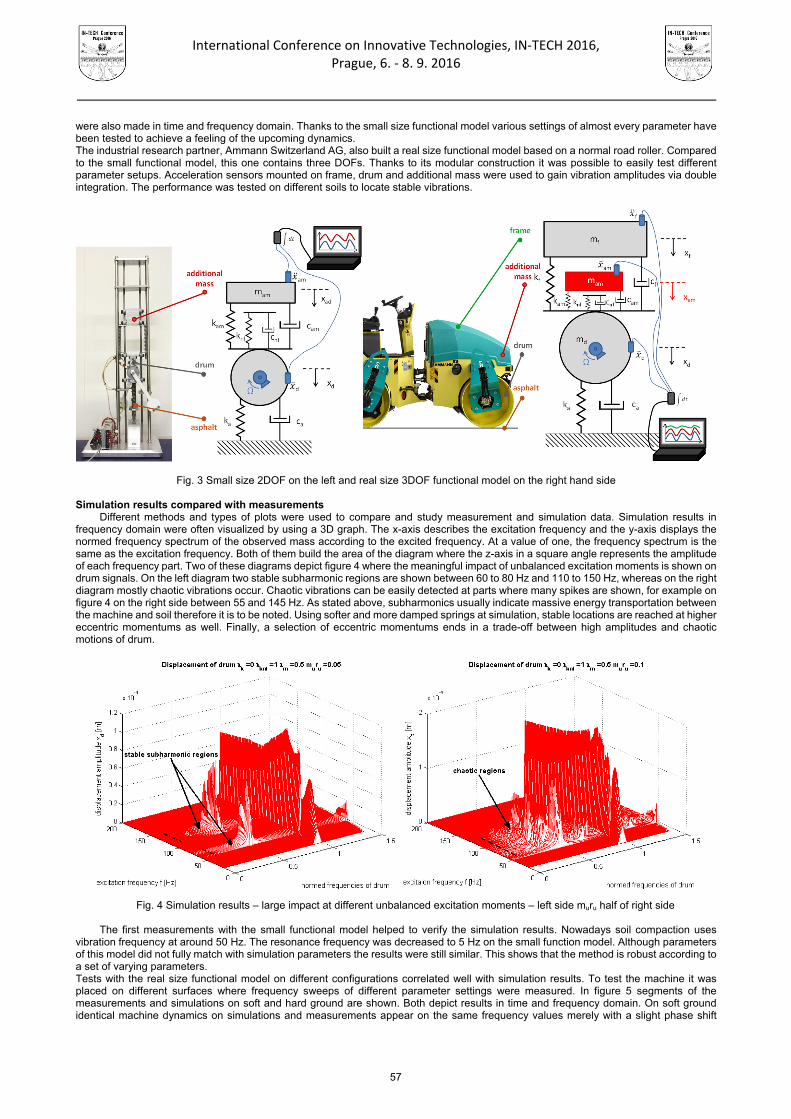
International Conference on Innovative Technologies, IN‐TECH 2016,
Prague, 6. ‐ 8. 9. 2016
were also made in time and frequency domain. Thanks to the small size functional model various settings of almost every parameter have been tested to achieve a feeling of the upcoming dynamics. The industrial research partner, Ammann Switzerland AG, also built a real size functional model based on a normal road roller. Compared to the small functional model, this one contains three DOFs. Thanks to its modular construction it was possible to easily test different parameter setups. Acceleration sensors mounted on frame, drum and additional mass were used to gain vibration amplitudes via double integration. The performance was tested on different soils to locate stable vibrations.
Fig. 3 Small size 2DOF on the left and real size 3DOF functional model on the right hand side Simulation results compared with measurements
Different methods and types of plots were used to compare and study measurement and simulation data. Simulation results in frequency domain were often visualized by using a 3D graph. The x-axis describes the excitation frequency and the y-axis displays the normed frequency spectrum of the observed mass according to the excited frequency. At a value of one, the frequency spectrum is the same as the excitation frequency. Both of them build the area of the diagram where the z-axis in a square angle represents the amplitude of each frequency part. Two of these diagrams depict figure 4 where the meaningful impact of unbalanced excitation moments is shown on drum signals. On the left diagram two stable subharmonic regions are shown between 60 to 80 Hz and 110 to 150 Hz, whereas on the right diagram mostly chaotic vibrations occur. Chaotic vibrations can be easily detected at parts where many spikes are shown, for example on figure 4 on the right side between 55 and 145 Hz. As stated above, subharmonics usually indicate massive energy transportation between the machine and soil therefore it is to be noted. Using softer and more damped springs at simulation, stable locations are reached at higher eccentric momentums as well. Finally, a selection of eccentric momentums ends in a trade-off between high amplitudes and chaotic motions of drum.
Fig. 4 Simulation results – large impact at different unbalanced excitation moments – left side muru half of right side
The first measurements with the small functional model helped to verify the simulation results. Nowadays soil compaction uses
vibration frequency at around 50 Hz. The resonance frequency was decreased to 5 Hz on the small function model. Although parameters of this model did not fully match with simulation parameters the results were still similar. This shows that the method is robust according to a set of varying parameters. Tests with the real size functional model on different configurations correlated well with simulation results. To test the machine it was placed on different surfaces where frequency sweeps of different parameter settings were measured. In figure 5 segments of the measurements and simulations on soft and hard ground are shown. Both depict results in time and frequency domain. On soft ground identical machine dynamics on simulations and measurements appear on the same frequency values merely with a slight phase shift
57

International Conference on Innovative Technologies, IN‐TECH 2016,
Prague, 6. ‐ 8. 9. 2016
between drum and additional mass. Displacements of the additional mass end up quite large compared to the drum displacements at real measurements which were observed at smaller frequencies on simulation results. Validation on hard ground was more difficult since behaviors tend to arise at different frequencies, seen on figure 5 on the right side. The phase shift and amplitude still, however, look almost even. It is seen that the curves of drum and additional mass behave nonlinear with maximal peaks heading towards ground. Based on several similar results matching real measurements with simulations, the validation is successful.
Fig. 5 Measurement and simulation results of the real size functional model
Analytical model of nonlinear system
The theory was proven by validating the simulations with the mechanical model. The optimal dimensioning of the machine parts, which means where the machine works stable at wide ranges of varying soil stiffness, remained. Drum and additional mass represent the two necessary subsystems which are in need for autoparametric resonance. The additional mass is used as a nonlinear tuned mass damper of the drum. The drum contains the parametrically exciting unbalance. This principle in use of autoparametric resonance stated in [3, 4, 5] can be used for this system as well. The essential nonlinearity builds the periodic loss of contact between the additional mass and the excited drum. Feedback Control algorithm
A developed control algorithm guarantees stable operating points and adopts the vibrating frequency to the stiffness value of the asphalt which changes during the process. As seen in the measurements, in addition to the frequencies, phase angles also play a role and need to be supervised. Vertical displacement of drum and additional mass are measured to control the system. As previously explained, the system is set up as self-adjusting although its operating points still vary. A feedback loop of mass displacements is mandatory to hold the vibrations at stable operation. Excitation frequency and eccentricity of unbalance build the two actuators to control the dynamic behavior of the machine. Conclusions and Summary
A new nonlinear theory is established to increase the compaction force of road rollers where the nonlinear part is located totally on the machine side. A third mass spring system added to a normal machine represents the nonlinear part, which is used as a nonlinear tuned mass damper. Proven in theory and practice, nonlinear dynamics occur even with constant contact to soil which is a criterion for nondestructive asphalt compaction. This means nonlinear dynamics is enlarged to soft ground and asphalt compaction machines, which opens a completely new area of application. Validated simulations confirm that compaction force can be increased significant to normal machines and furthermore induce a larger frequency range compared to today's road rollers. This project proves that the use of nonlinear dynamics is the key for future efficient road construction. Acknowledgment The authors would like to thank their industrial research project partner, the Ammann Switzerland AG, Langenthal for the very enjoyable cooperation. The project is supported by the Swiss Innovation Promotion Agency (CTI).
References [1] R. Anderegg and K. Kaufmann: "Intelligent Compaction with Vibratory Rollers", Journal of Transportation Research Board, 2004,
No.1868, pp. 124-134. [2] R. Anderegg: "Nichtlineare Schwingungen bei dynamischen Bodenverdichtern", Ph. D. Thesis, Federal Institute of Technology ETH
Zürich, 1997. [3] R. Anderegg, L. Recher: "Control of chaotic vibrations using the principle of autoparametric reesonances", Mechatronics
Conference, 2010. [4] A. Tondl, T. Ruijgrok, F. Verhulst and R. Nabergoj, "Autoparametric Resonance in Mechanical Systems", Cambridge University
Press, 2000. [5] J. J. Thomsen: "Vibrations and Stability - Advanced Theory, Analysis and Tools", Springer, 2003.
58

International Conference on Innovative Technologies, IN‐TECH 2016,
Prague, 6. ‐ 8. 9. 2016
ADVANCED MTCONNECT ASSET MANAGEMENT (AMAM)
T. Trautner 1, F. Pauker 1 and B. Kittl1 1 Institute for Production Engineering and Laser Technology – Vienna University of Technology, Getreidemarkt
9, 1060 Vienna, Austria
Keywords: Mtconnect; Asset, Agent; ISO 13399; Cutting Tool; Tool Management; Tool Measurement Abstract: The universal factory floor communications protocol MTConnect allows the exchange of information between shop floor equipment and software applications. Data from shop floor devices is collected by a piece of software called adapter. The adapter sends the data to a local webserver called agent, which associates the data with an information model and makes machine data available to clients in uniform MTConnect representations. The standardized MTConnect schema definition serves as a structure for modeling devices, independent components of the devices and device’s design characteristics. Additional equipment associated with the manufacturing process that is not a component of a device can be modeled as an MTConnect asset. Examples of assets are objects like cutting tools, workholding systems, parts and fixtures. Apart from the fact that currently only few MTConnect adapters available on the market provide asset data, state of the art NC controllers only manage rudimentary data regarding assets such as cutting tools or workholding systems. To tackle this problem the paper describes a network architecture for Asset Management based on the MTConnect standard and a piece of software called Asset Broker, distributing assets to multiple Machine Agents and allowing for detailed asset updates with regard to process information. The Asset Broker thereby closes the gap between MTConnect assets and current machine tools poor asset management capabilities and enables the synchronization of updated asset information between Machine Agents and software applications such as Manufacturing Execution Systems (MES), Tool Management Software (TMS) or Enterprise Resource Planning Systems (ERP). Introduction
Initiatives like Industrie 4.0 (I4.0) and Industrial Internet of Things (IIoT) force the integration of Information and Communication Technologies (ICT) in manufacturing. One key task is machine data acquisition from a diverse set of industrial equipment on the shop floor. Therefore uniform, robust communications are part of the necessary infrastructure for modern manufacturing systems. MTConnect, as an open, royalty-free standard, allows great interoperability between both devices and software applications and is getting more important in the manufacturing domain. With MTConnect machine tools provide a unique data model of their physical structure and the data items they offer. This allows the monitoring of machine tool’s process states and performing data analytics based on standardized software applications. Besides the components and data items of machine tools, a manufacturing process is related to other objects that are not a component of a machine, but also need to be addressed by the MTConnect standard, because they contain or provide viable process information. These objects can be cutting tools, workpieces (parts), NC-programs, a work order or other objects that can be created, transformed or removed within the process. To allow generating and managing such complex data models at runtime, MTConnect assets were introduced. As a consequence MTConnect assets can also change their data structure in the XML (Extensible Markup Language) representation and therefore may offer a good framework for future expansions and developments within the MTConnect standard. Several machine tool producers already offer an MTConnect adapter (e.g. Mazak or DMG [1]), but most of them only allow data access for the device and do not support MTConnect assets. Other adapters like the Okuma MTConnect adapter [2] already generate and provide cutting tool assets for agents, but lack the ability to import those assets from agents and thus may lose information added from other sources to the assets. To tackle this problem, the paper presents an approach for advanced MTConnect Asset Management. Therefore an MTConnect Asset Broker is presented which could be used for MTConnect based monitoring of manufacturing equipment and thereby allows for managing and updating assets with process data.
The first part of the paper gives a general overview of MTConnect and MTConnect assets. In the second section the MTConnect Asset Management is specified in detail. After that an MTConnect Cutting Tool Broker, which has specialized functionality for cutting tools, is described as a sample application. In the last section we give an outlook to future steps. MTConnect
MTConnect (Manufacturing Technology Connect) is a one-way (read-only) communication standard developed by the University of California, Berkeley. MTConnect was primarily developed to provide manufacturing equipment, especially CNC machine tools, with a standardized interface, the Bluetooth of manufacturing [3]. This allows connecting manufacturing equipment on the shop-floor to a local area network and is so far mainly used for manufacturing data acquisition. It does not only define how data is transferred, but it also describes what is transferred based on pre-defined types. Therefore MTConnect offers a language (schema definition) for the exchange of semantic data between manufacturing equipment and software applications that delivers a standardized information model to provide a description of a machine tool’s (device) physical structure through its components and subcomponents. These components are extended with data items, defined by specific types and categories. A category may be an event for discrete data items, a sample for continuous values or a condition for health and error messages, whereas types describe the meaning of a specific data item like the Position of an axis or the RotaryVelocity of a spindle. This allows the mapping of the real process data to a virtual device structure.
With MTConnect data collection from the adapters, data processing and information serving is handled by a standardized application, the MTConnect agent. The agent is an open-source software application that implements the adapter socket communication and a Hypertext Transfer Protocol (HTTP) server [4]. This is a web server, which provides clients like software applications with all the necessary information about a system. The MTConnect agent provides different types of data exchange. Besides the polling function using HTTP GET the agent also supports event-based streaming services using network sockets. Accordingly, the communication between agent and clients is realized using established web-technologies, which provide a simple way to monitor and collect data for users and software applications. HTTP allows clients to access the agent from any location within the same local area network by connecting to the agent’s
59
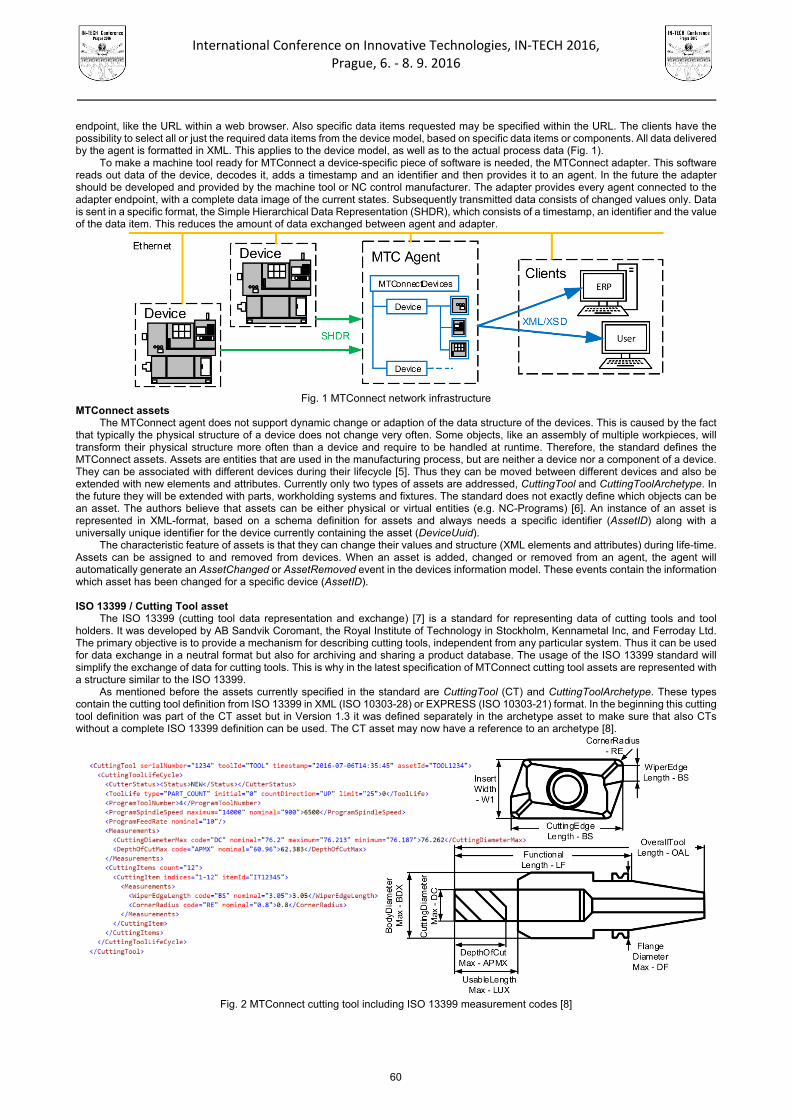
International Conference on Innovative Technologies, IN‐TECH 2016,
Prague, 6. ‐ 8. 9. 2016
endpoint, like the URL within a web browser. Also specific data items requested may be specified within the URL. The clients have the possibility to select all or just the required data items from the device model, based on specific data items or components. All data delivered by the agent is formatted in XML. This applies to the device model, as well as to the actual process data (Fig. 1).
To make a machine tool ready for MTConnect a device-specific piece of software is needed, the MTConnect adapter. This software reads out data of the device, decodes it, adds a timestamp and an identifier and then provides it to an agent. In the future the adapter should be developed and provided by the machine tool or NC control manufacturer. The adapter provides every agent connected to the adapter endpoint, with a complete data image of the current states. Subsequently transmitted data consists of changed values only. Data is sent in a specific format, the Simple Hierarchical Data Representation (SHDR), which consists of a timestamp, an identifier and the value of the data item. This reduces the amount of data exchanged between agent and adapter.
Fig. 1 MTConnect network infrastructure
MTConnect assets The MTConnect agent does not support dynamic change or adaption of the data structure of the devices. This is caused by the fact
that typically the physical structure of a device does not change very often. Some objects, like an assembly of multiple workpieces, will transform their physical structure more often than a device and require to be handled at runtime. Therefore, the standard defines the MTConnect assets. Assets are entities that are used in the manufacturing process, but are neither a device nor a component of a device. They can be associated with different devices during their lifecycle [5]. Thus they can be moved between different devices and also be extended with new elements and attributes. Currently only two types of assets are addressed, CuttingTool and CuttingToolArchetype. In the future they will be extended with parts, workholding systems and fixtures. The standard does not exactly define which objects can be an asset. The authors believe that assets can be either physical or virtual entities (e.g. NC-Programs) [6]. An instance of an asset is represented in XML-format, based on a schema definition for assets and always needs a specific identifier (AssetID) along with a universally unique identifier for the device currently containing the asset (DeviceUuid).
The characteristic feature of assets is that they can change their values and structure (XML elements and attributes) during life-time. Assets can be assigned to and removed from devices. When an asset is added, changed or removed from an agent, the agent will automatically generate an AssetChanged or AssetRemoved event in the devices information model. These events contain the information which asset has been changed for a specific device (AssetID). ISO 13399 / Cutting Tool asset
The ISO 13399 (cutting tool data representation and exchange) [7] is a standard for representing data of cutting tools and tool holders. It was developed by AB Sandvik Coromant, the Royal Institute of Technology in Stockholm, Kennametal Inc, and Ferroday Ltd. The primary objective is to provide a mechanism for describing cutting tools, independent from any particular system. Thus it can be used for data exchange in a neutral format but also for archiving and sharing a product database. The usage of the ISO 13399 standard will simplify the exchange of data for cutting tools. This is why in the latest specification of MTConnect cutting tool assets are represented with a structure similar to the ISO 13399.
As mentioned before the assets currently specified in the standard are CuttingTool (CT) and CuttingToolArchetype. These types contain the cutting tool definition from ISO 13399 in XML (ISO 10303-28) or EXPRESS (ISO 10303-21) format. In the beginning this cutting tool definition was part of the CT asset but in Version 1.3 it was defined separately in the archetype asset to make sure that also CTs without a complete ISO 13399 definition can be used. The CT asset may now have a reference to an archetype [8].
Fig. 2 MTConnect cutting tool including ISO 13399 measurement codes [8]
60
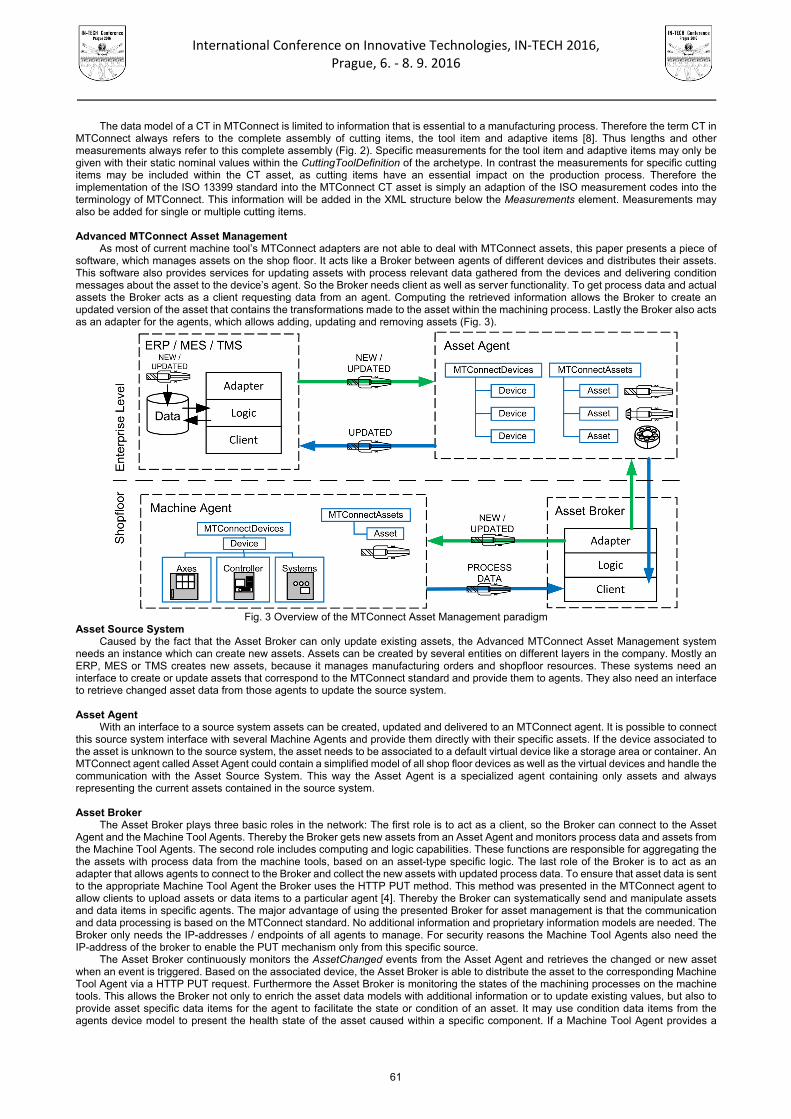
International Conference on Innovative Technologies, IN‐TECH 2016,
Prague, 6. ‐ 8. 9. 2016
The data model of a CT in MTConnect is limited to information that is essential to a manufacturing process. Therefore the term CT in MTConnect always refers to the complete assembly of cutting items, the tool item and adaptive items [8]. Thus lengths and other measurements always refer to this complete assembly (Fig. 2). Specific measurements for the tool item and adaptive items may only be given with their static nominal values within the CuttingToolDefinition of the archetype. In contrast the measurements for specific cutting items may be included within the CT asset, as cutting items have an essential impact on the production process. Therefore the implementation of the ISO 13399 standard into the MTConnect CT asset is simply an adaption of the ISO measurement codes into the terminology of MTConnect. This information will be added in the XML structure below the Measurements element. Measurements may also be added for single or multiple cutting items. Advanced MTConnect Asset Management
As most of current machine tool’s MTConnect adapters are not able to deal with MTConnect assets, this paper presents a piece of software, which manages assets on the shop floor. It acts like a Broker between agents of different devices and distributes their assets. This software also provides services for updating assets with process relevant data gathered from the devices and delivering condition messages about the asset to the device’s agent. So the Broker needs client as well as server functionality. To get process data and actual assets the Broker acts as a client requesting data from an agent. Computing the retrieved information allows the Broker to create an updated version of the asset that contains the transformations made to the asset within the machining process. Lastly the Broker also acts as an adapter for the agents, which allows adding, updating and removing assets (Fig. 3).
Fig. 3 Overview of the MTConnect Asset Management paradigm
Asset Source System Caused by the fact that the Asset Broker can only update existing assets, the Advanced MTConnect Asset Management system
needs an instance which can create new assets. Assets can be created by several entities on different layers in the company. Mostly an ERP, MES or TMS creates new assets, because it manages manufacturing orders and shopfloor resources. These systems need an interface to create or update assets that correspond to the MTConnect standard and provide them to agents. They also need an interface to retrieve changed asset data from those agents to update the source system.
Asset Agent
With an interface to a source system assets can be created, updated and delivered to an MTConnect agent. It is possible to connect this source system interface with several Machine Agents and provide them directly with their specific assets. If the device associated to the asset is unknown to the source system, the asset needs to be associated to a default virtual device like a storage area or container. An MTConnect agent called Asset Agent could contain a simplified model of all shop floor devices as well as the virtual devices and handle the communication with the Asset Source System. This way the Asset Agent is a specialized agent containing only assets and always representing the current assets contained in the source system.
Asset Broker
The Asset Broker plays three basic roles in the network: The first role is to act as a client, so the Broker can connect to the Asset Agent and the Machine Tool Agents. Thereby the Broker gets new assets from an Asset Agent and monitors process data and assets from the Machine Tool Agents. The second role includes computing and logic capabilities. These functions are responsible for aggregating the the assets with process data from the machine tools, based on an asset-type specific logic. The last role of the Broker is to act as an adapter that allows agents to connect to the Broker and collect the new assets with updated process data. To ensure that asset data is sent to the appropriate Machine Tool Agent the Broker uses the HTTP PUT method. This method was presented in the MTConnect agent to allow clients to upload assets or data items to a particular agent [4]. Thereby the Broker can systematically send and manipulate assets and data items in specific agents. The major advantage of using the presented Broker for asset management is that the communication and data processing is based on the MTConnect standard. No additional information and proprietary information models are needed. The Broker only needs the IP-addresses / endpoints of all agents to manage. For security reasons the Machine Tool Agents also need the IP-address of the broker to enable the PUT mechanism only from this specific source.
The Asset Broker continuously monitors the AssetChanged events from the Asset Agent and retrieves the changed or new asset when an event is triggered. Based on the associated device, the Asset Broker is able to distribute the asset to the corresponding Machine Tool Agent via a HTTP PUT request. Furthermore the Asset Broker is monitoring the states of the machining processes on the machine tools. This allows the Broker not only to enrich the asset data models with additional information or to update existing values, but also to provide asset specific data items for the agent to facilitate the state or condition of an asset. It may use condition data items from the agents device model to present the health state of the asset caused within a specific component. If a Machine Tool Agent provides a
61
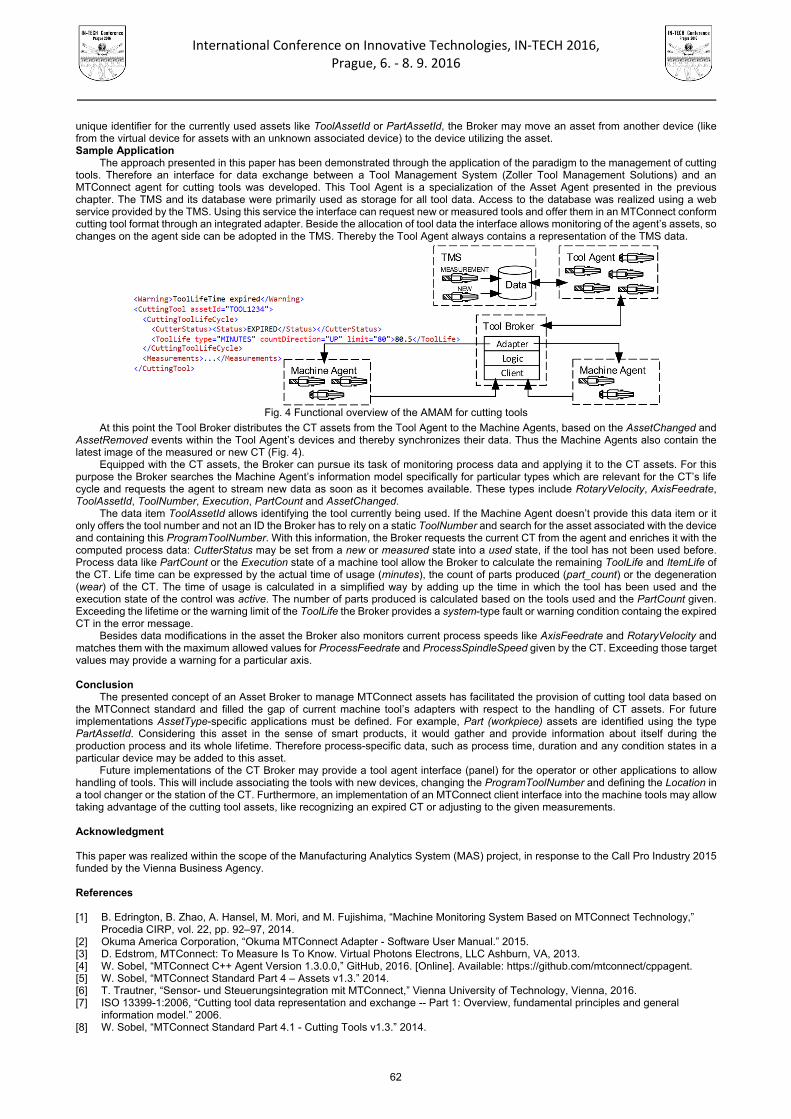
International Conference on Innovative Technologies, IN‐TECH 2016,
Prague, 6. ‐ 8. 9. 2016
unique identifier for the currently used assets like ToolAssetId or PartAssetId, the Broker may move an asset from another device (like from the virtual device for assets with an unknown associated device) to the device utilizing the asset. Sample Application
The approach presented in this paper has been demonstrated through the application of the paradigm to the management of cutting tools. Therefore an interface for data exchange between a Tool Management System (Zoller Tool Management Solutions) and an MTConnect agent for cutting tools was developed. This Tool Agent is a specialization of the Asset Agent presented in the previous chapter. The TMS and its database were primarily used as storage for all tool data. Access to the database was realized using a web service provided by the TMS. Using this service the interface can request new or measured tools and offer them in an MTConnect conform cutting tool format through an integrated adapter. Beside the allocation of tool data the interface allows monitoring of the agent’s assets, so changes on the agent side can be adopted in the TMS. Thereby the Tool Agent always contains a representation of the TMS data.
Fig. 4 Functional overview of the AMAM for cutting tools
At this point the Tool Broker distributes the CT assets from the Tool Agent to the Machine Agents, based on the AssetChanged and AssetRemoved events within the Tool Agent’s devices and thereby synchronizes their data. Thus the Machine Agents also contain the latest image of the measured or new CT (Fig. 4).
Equipped with the CT assets, the Broker can pursue its task of monitoring process data and applying it to the CT assets. For this purpose the Broker searches the Machine Agent’s information model specifically for particular types which are relevant for the CT’s life cycle and requests the agent to stream new data as soon as it becomes available. These types include RotaryVelocity, AxisFeedrate, ToolAssetId, ToolNumber, Execution, PartCount and AssetChanged.
The data item ToolAssetId allows identifying the tool currently being used. If the Machine Agent doesn’t provide this data item or it only offers the tool number and not an ID the Broker has to rely on a static ToolNumber and search for the asset associated with the device and containing this ProgramToolNumber. With this information, the Broker requests the current CT from the agent and enriches it with the computed process data: CutterStatus may be set from a new or measured state into a used state, if the tool has not been used before. Process data like PartCount or the Execution state of a machine tool allow the Broker to calculate the remaining ToolLife and ItemLife of the CT. Life time can be expressed by the actual time of usage (minutes), the count of parts produced (part_count) or the degeneration (wear) of the CT. The time of usage is calculated in a simplified way by adding up the time in which the tool has been used and the execution state of the control was active. The number of parts produced is calculated based on the tools used and the PartCount given. Exceeding the lifetime or the warning limit of the ToolLife the Broker provides a system-type fault or warning condition containg the expired CT in the error message.
Besides data modifications in the asset the Broker also monitors current process speeds like AxisFeedrate and RotaryVelocity and matches them with the maximum allowed values for ProcessFeedrate and ProcessSpindleSpeed given by the CT. Exceeding those target values may provide a warning for a particular axis. Conclusion
The presented concept of an Asset Broker to manage MTConnect assets has facilitated the provision of cutting tool data based on the MTConnect standard and filled the gap of current machine tool’s adapters with respect to the handling of CT assets. For future implementations AssetType-specific applications must be defined. For example, Part (workpiece) assets are identified using the type PartAssetId. Considering this asset in the sense of smart products, it would gather and provide information about itself during the production process and its whole lifetime. Therefore process-specific data, such as process time, duration and any condition states in a particular device may be added to this asset.
Future implementations of the CT Broker may provide a tool agent interface (panel) for the operator or other applications to allow handling of tools. This will include associating the tools with new devices, changing the ProgramToolNumber and defining the Location in a tool changer or the station of the CT. Furthermore, an implementation of an MTConnect client interface into the machine tools may allow taking advantage of the cutting tool assets, like recognizing an expired CT or adjusting to the given measurements. Acknowledgment This paper was realized within the scope of the Manufacturing Analytics System (MAS) project, in response to the Call Pro Industry 2015 funded by the Vienna Business Agency. References [1] B. Edrington, B. Zhao, A. Hansel, M. Mori, and M. Fujishima, “Machine Monitoring System Based on MTConnect Technology,”
Procedia CIRP, vol. 22, pp. 92–97, 2014. [2] Okuma America Corporation, “Okuma MTConnect Adapter - Software User Manual.” 2015. [3] D. Edstrom, MTConnect: To Measure Is To Know. Virtual Photons Electrons, LLC Ashburn, VA, 2013. [4] W. Sobel, “MTConnect C++ Agent Version 1.3.0.0,” GitHub, 2016. [Online]. Available: https://github.com/mtconnect/cppagent. [5] W. Sobel, “MTConnect Standard Part 4 – Assets v1.3.” 2014. [6] T. Trautner, “Sensor- und Steuerungsintegration mit MTConnect,” Vienna University of Technology, Vienna, 2016. [7] ISO 13399-1:2006, “Cutting tool data representation and exchange -- Part 1: Overview, fundamental principles and general
information model.” 2006. [8] W. Sobel, “MTConnect Standard Part 4.1 - Cutting Tools v1.3.” 2014.
62

International Conference on Innovative Technologies, IN‐TECH 2016,
Prague, 6. ‐ 8. 9. 2016
CAN SMART VEHICLE ACCELERATION SYSTEM REDUCE EMISSION FORMATION IN CITY CENTERS? NUMERICAL STUDY OF DIFFERENT
ACCELERATION STRATEGIES.
L. Lešnik1 and I. Biluš2 1 University of Maribor, Faculty of mechanical engineering, Smetanova ulica 17, SI-2000 Maribor, Slovenia,
2 University of Maribor, Faculty of mechanical engineering, Smetanova ulica 17, SI-2000 Maribor, Slovenia.
Keywords: SI Engine; Acceleration; Emission Regulation; Emission Reduction
Abstract: The influence of fossil fuel combustion in internal combustion engines is highly contributing to the air pollution. The pollution is strongly noticeable in city centers where we don’t have enough of green spaces. Daily traffic is causing traffic jams on roads to and in city centers where vehicles speeds are low. The process of driving in traffic jams consist of several stops followed by accelerations. Normal road precautions to decrease vehicle speed and acceleration like speed bumps are not sufficient in these situations because of the low vehicles speeds and several stops. In the presented paper different accelerations strategies were tested. Test where made numerically using AVL BOOST simulation program, its VIBE 2-zone combustion model and implemented emission models. In order to investigate acceleration in city center we perform two simulations with different acceleration strategies up to 10 m/s. From the presented results can be concluded that by regulating the vehicle acceleration rate we can contribute to a reduction of fuel consumption and also reduce total amount of formatted emissions by scarifying acceleration time. This indicates that smart vehicle system, which would be able to regulate vehicle acceleration rate in city center traffic jams, can contribute to a reduction of air pollution. Introduction
The quality of the air in city centers is heavily influenced by emissions which are by-product of fossil fuels combustion in internal combustion engines. In recent decades several biofuels were produced and tested in internal combustion engines. The interest in their usage is still increasing. They have great potential to be used as alternative fuels in internal combustion (IC) engine, have lower environmental impact (compared to fossil fuels) and help to reduce greenhouse gas emission formation. Considering the fact that transport sector contributes to almost 20 % of total emission released in European Union [1] usage of biofuel can make significant contribution in emission reduction.
The emission formation process in vehicles with internal combustion engines is heavily influenced also by vehicle acceleration. André and Pronello [2] tested how vehicle acceleration and speed influence on emission formation. The study was preformed using 58 different vehicles on 8230 trips and more then 73k km driven. They concluded that the influence of vehicle acceleration on emission formation process is the most significant when using cars equipped with three-way catalytic converter built in all modern vehicle with spark ignition (SI) engines. When increasing vehicle acceleration from 0.4 m/s2 to 1 m/s2 the emissions formation increase for average of 40 % and for average of 70 % by vehicles with catalytic converter. Wang et al. [3] have performed real-time in situ measurements of black carbon emissions factors. They concluded that much higher emissions of black carbon are formatted in period of vehicles acceleration then when driving with constant speeds. Chen and Borken-Kleefeld [4] made a report of long-term remote sensing of cars and light duty vehicle emission at Zurich. They concluded that average NOx emission formation rates depend on vehicle acceleration rate and speed. The same conclusion was also obtained in study of Carslaw and Rhys-Tyler [5]. The extensive study of variability in exhaust emission and fuel consumption in urban driving was made by Ericsson in [6]. They concluded that emission formation in urban areas depend on several factors which include street type, traffic condition and also characteristic of a driver. The significant interaction between street type and driver gender was found in the study. Male drivers usually accelerate with higher rates which results in higher fuel consumption and emission formation rates when using catalyst equipped vehicles. Influence of vehicle acceleration and speed was also studied in work of Rodriguez et al. [7]. They confirmed the dependence of emission formation process on vehicle acceleration rate and frequency. The presented results of conducted studies indicate on strong relationship between vehicle acceleration rate and emission formation process. Vehicle acceleration rates can be decreased using different methods like speed humps, traffic circles and road island, warning signs, speed controls with cameras and display boards, education, etc. [8]. All this methods are effective but require significant intervention in road infrastructure.
One of the possibilities to reduce emission formation during the vehicle acceleration period is to limit engine or. vehicle acceleration ability. In the presented paper two different engine ECU maps were used to numerically accelerate test vehicle with SI engine to 10 m/s. The study was made numerically using AVL BOOST simulation program. The obtained results indicate that slower acceleration decrease fuel consumption and emission formation rates. This indicate that smart communication between engine ECU and vehicle control units combined with smart regulation of engine operating conditions can lead to decrease of fuel consumption in city centers which further contribute to lower the impact of fossil fuel combustion on the environment. Such system will also eliminate the effect of the driver on vehicle acceleration describe in [6]. The idea of vehicle ‘’smart communication system’’
The idea of smart communication system is to share the information of individual system with other systems and to use it for regulation of vehicle acceleration rate. In the presented paper we only present our view/idea on how such system can perform in real operating conditions. The idea is to regulate vehicle acceleration ability in situations where we do not need to accelerate rapidly. Such situations
63
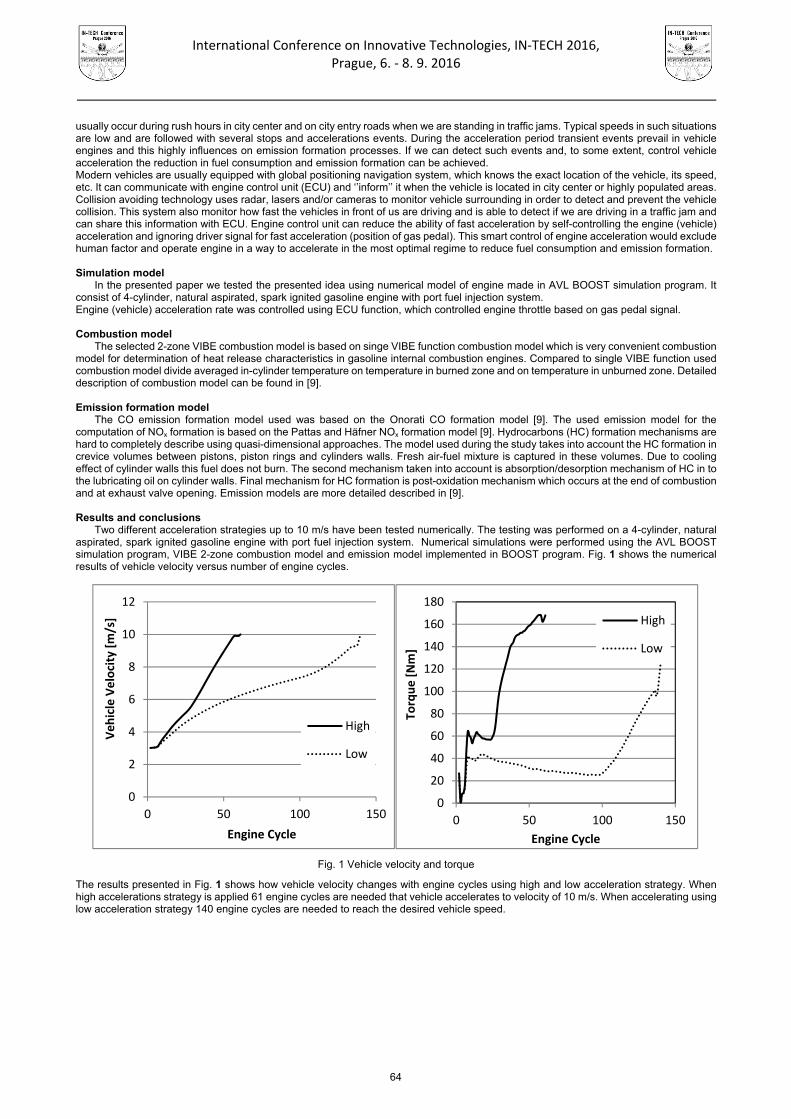
International Conference on Innovative Technologies, IN‐TECH 2016,
Prague, 6. ‐ 8. 9. 2016
usually occur during rush hours in city center and on city entry roads when we are standing in traffic jams. Typical speeds in such situations are low and are followed with several stops and accelerations events. During the acceleration period transient events prevail in vehicle engines and this highly influences on emission formation processes. If we can detect such events and, to some extent, control vehicle acceleration the reduction in fuel consumption and emission formation can be achieved. Modern vehicles are usually equipped with global positioning navigation system, which knows the exact location of the vehicle, its speed, etc. It can communicate with engine control unit (ECU) and ‘’inform’’ it when the vehicle is located in city center or highly populated areas. Collision avoiding technology uses radar, lasers and/or cameras to monitor vehicle surrounding in order to detect and prevent the vehicle collision. This system also monitor how fast the vehicles in front of us are driving and is able to detect if we are driving in a traffic jam and can share this information with ECU. Engine control unit can reduce the ability of fast acceleration by self-controlling the engine (vehicle) acceleration and ignoring driver signal for fast acceleration (position of gas pedal). This smart control of engine acceleration would exclude human factor and operate engine in a way to accelerate in the most optimal regime to reduce fuel consumption and emission formation. Simulation model
In the presented paper we tested the presented idea using numerical model of engine made in AVL BOOST simulation program. It consist of 4-cylinder, natural aspirated, spark ignited gasoline engine with port fuel injection system. Engine (vehicle) acceleration rate was controlled using ECU function, which controlled engine throttle based on gas pedal signal. Combustion model
The selected 2-zone VIBE combustion model is based on singe VIBE function combustion model which is very convenient combustion model for determination of heat release characteristics in gasoline internal combustion engines. Compared to single VIBE function used combustion model divide averaged in-cylinder temperature on temperature in burned zone and on temperature in unburned zone. Detailed description of combustion model can be found in [9]. Emission formation model
The CO emission formation model used was based on the Onorati CO formation model [9]. The used emission model for the computation of NOx formation is based on the Pattas and Häfner NOx formation model [9]. Hydrocarbons (HC) formation mechanisms are hard to completely describe using quasi-dimensional approaches. The model used during the study takes into account the HC formation in crevice volumes between pistons, piston rings and cylinders walls. Fresh air-fuel mixture is captured in these volumes. Due to cooling effect of cylinder walls this fuel does not burn. The second mechanism taken into account is absorption/desorption mechanism of HC in to the lubricating oil on cylinder walls. Final mechanism for HC formation is post-oxidation mechanism which occurs at the end of combustion and at exhaust valve opening. Emission models are more detailed described in [9]. Results and conclusions
Two different acceleration strategies up to 10 m/s have been tested numerically. The testing was performed on a 4-cylinder, natural aspirated, spark ignited gasoline engine with port fuel injection system. Numerical simulations were performed using the AVL BOOST simulation program, VIBE 2-zone combustion model and emission model implemented in BOOST program. Fig. 1 shows the numerical results of vehicle velocity versus number of engine cycles.
Fig. 1 Vehicle velocity and torque
The results presented in Fig. 1 shows how vehicle velocity changes with engine cycles using high and low acceleration strategy. When high accelerations strategy is applied 61 engine cycles are needed that vehicle accelerates to velocity of 10 m/s. When accelerating using low acceleration strategy 140 engine cycles are needed to reach the desired vehicle speed.
0
2
4
6
8
10
12
0 50 100 150
Vehicle Velocity [m/s]
Engine Cycle
High
Low
0
20
40
60
80
100
120
140
160
180
0 50 100 150
Torque [Nm]
Engine Cycle
High
Low
64
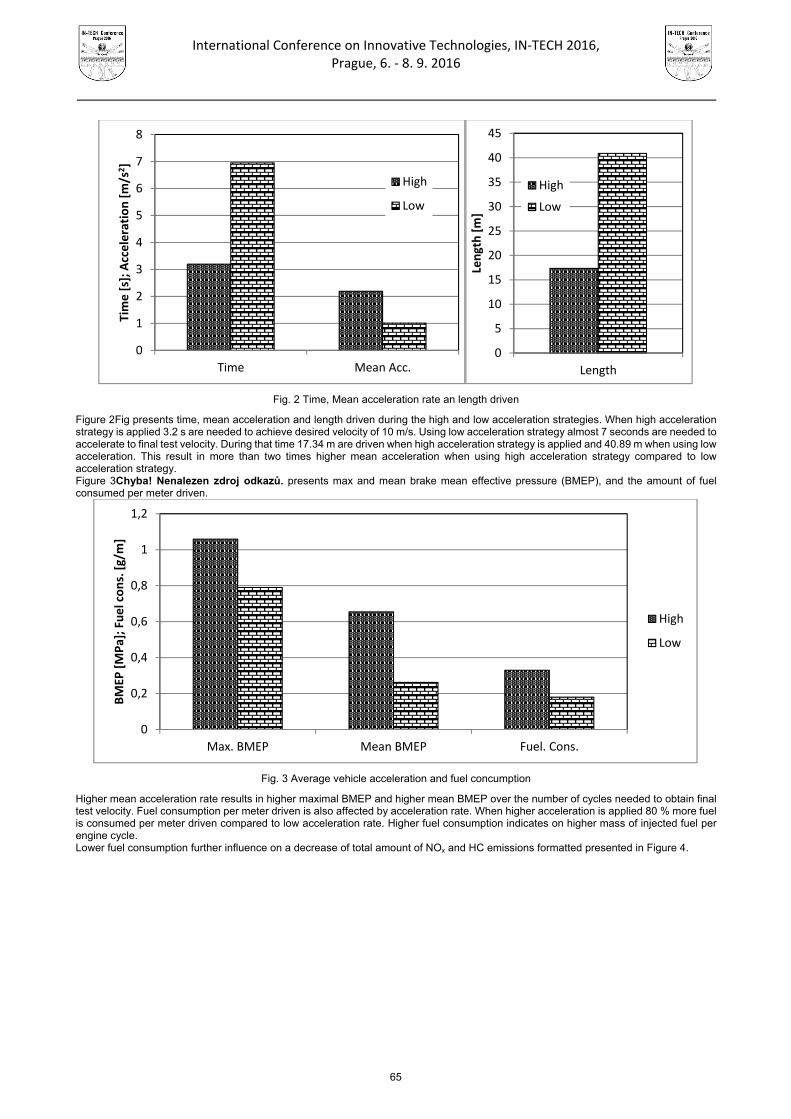
International Conference on Innovative Technologies, IN‐TECH 2016,
Prague, 6. ‐ 8. 9. 2016
Fig. 2 Time, Mean acceleration rate an length driven
Figure 2Fig presents time, mean acceleration and length driven during the high and low acceleration strategies. When high acceleration strategy is applied 3.2 s are needed to achieve desired velocity of 10 m/s. Using low acceleration strategy almost 7 seconds are needed to accelerate to final test velocity. During that time 17.34 m are driven when high acceleration strategy is applied and 40.89 m when using low acceleration. This result in more than two times higher mean acceleration when using high acceleration strategy compared to low acceleration strategy. Figure 3Chyba! Nenalezen zdroj odkazů. presents max and mean brake mean effective pressure (BMEP), and the amount of fuel consumed per meter driven.
Fig. 3 Average vehicle acceleration and fuel concumption
Higher mean acceleration rate results in higher maximal BMEP and higher mean BMEP over the number of cycles needed to obtain final test velocity. Fuel consumption per meter driven is also affected by acceleration rate. When higher acceleration is applied 80 % more fuel is consumed per meter driven compared to low acceleration rate. Higher fuel consumption indicates on higher mass of injected fuel per engine cycle. Lower fuel consumption further influence on a decrease of total amount of NOx and HC emissions formatted presented in Figure 4.
0
1
2
3
4
5
6
7
8
Time Mean Acc.
Time [s]; A
cceleration [m/s
2]
High
Low
0
5
10
15
20
25
30
35
40
45
Length
Length [m]
High
Low
0
0,2
0,4
0,6
0,8
1
1,2
Max. BMEP Mean BMEP Fuel. Cons.
BMEP
[MPa]; Fuel cons. [g/m]
High
Low
65
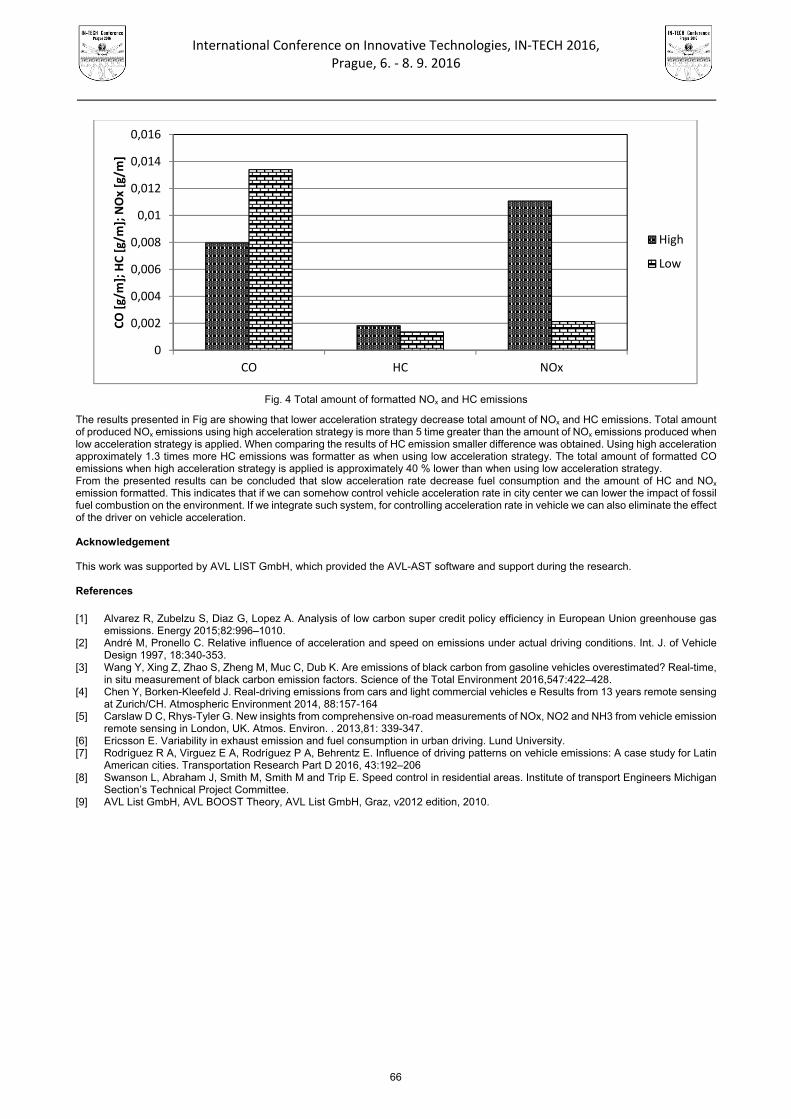
International Conference on Innovative Technologies, IN‐TECH 2016,
Prague, 6. ‐ 8. 9. 2016
Fig. 4 Total amount of formatted NOx and HC emissions
The results presented in Fig are showing that lower acceleration strategy decrease total amount of NOx and HC emissions. Total amount of produced NOx emissions using high acceleration strategy is more than 5 time greater than the amount of NOx emissions produced when low acceleration strategy is applied. When comparing the results of HC emission smaller difference was obtained. Using high acceleration approximately 1.3 times more HC emissions was formatter as when using low acceleration strategy. The total amount of formatted CO emissions when high acceleration strategy is applied is approximately 40 % lower than when using low acceleration strategy. From the presented results can be concluded that slow acceleration rate decrease fuel consumption and the amount of HC and NOx emission formatted. This indicates that if we can somehow control vehicle acceleration rate in city center we can lower the impact of fossil fuel combustion on the environment. If we integrate such system, for controlling acceleration rate in vehicle we can also eliminate the effect of the driver on vehicle acceleration. Acknowledgement This work was supported by AVL LIST GmbH, which provided the AVL-AST software and support during the research. References [1] Alvarez R, Zubelzu S, Diaz G, Lopez A. Analysis of low carbon super credit policy efficiency in European Union greenhouse gas
emissions. Energy 2015;82:996–1010. [2] André M, Pronello C. Relative influence of acceleration and speed on emissions under actual driving conditions. Int. J. of Vehicle
Design 1997, 18:340-353. [3] Wang Y, Xing Z, Zhao S, Zheng M, Muc C, Dub K. Are emissions of black carbon from gasoline vehicles overestimated? Real-time,
in situ measurement of black carbon emission factors. Science of the Total Environment 2016,547:422–428. [4] Chen Y, Borken-Kleefeld J. Real-driving emissions from cars and light commercial vehicles e Results from 13 years remote sensing
at Zurich/CH. Atmospheric Environment 2014, 88:157-164 [5] Carslaw D C, Rhys-Tyler G. New insights from comprehensive on-road measurements of NOx, NO2 and NH3 from vehicle emission
remote sensing in London, UK. Atmos. Environ. . 2013,81: 339-347. [6] Ericsson E. Variability in exhaust emission and fuel consumption in urban driving. Lund University. [7] Rodríguez R A, Virguez E A, Rodríguez P A, Behrentz E. Influence of driving patterns on vehicle emissions: A case study for Latin
American cities. Transportation Research Part D 2016, 43:192–206 [8] Swanson L, Abraham J, Smith M, Smith M and Trip E. Speed control in residential areas. Institute of transport Engineers Michigan
Section’s Technical Project Committee. [9] AVL List GmbH, AVL BOOST Theory, AVL List GmbH, Graz, v2012 edition, 2010.
0
0,002
0,004
0,006
0,008
0,01
0,012
0,014
0,016
CO HC NOx
CO [g/m]; HC [g/m]; NOx [g/m
]
High
Low
66

International Conference on Innovative Technologies, IN‐TECH 2016,
Prague, 6. ‐ 8. 9. 2016
EMPLOYEE MOTIVATION AS AN INITIATOR IN IMPROVING THE STATE OF QMS - LITERATURE REVIEW
M. Stanojeska1, R. Minovski2 and B. Jovanoski2 1Zito Polog AD, M. Tito, 134, Tetovo, Macedonia
2 Faculty of Mechanical Engineering, University of Cyril and Methodius, Karpos II, bb, Skopje, Macedonia
Keywords: Employee Motivation; Employee Satisfaction; Involvement; QMS; ISO 9001; TQM Abstract: The employee involvement is recognized as one of the main prerequisites for successful implementations of Total Quality Management (TQM). Organizations with ISO 9001 Quality Management System (QMS) that tends to move towards TQM need to create a climate for motivation of employees. The employee motivation represents a kind of “initiator” that encourages their commitment for further development of QMS. The main objective of the paper is to analyze the literature, in order to investigate the level of influence of the employee motivation and involvement on the successful integration of the TQM practices. For that sake, a comprehensive literature survey in the pinpointed areas was conducted, using following key words: employee,motivation, involvement, satisfaction, QMS and TQM. The survey results are structured and presented in accordance with chosen criteria: methodology, aim, results and conclusions of the papers. The achieved conclusions in the further advanced research will serve for validation of correlation dependencies between employee motivation and state of QMS when designing the System Dynamic (SD) model. The created SD model will enable experimentation in direction of transition of ISO 9001 towards TQM practices under the influence of employee motivation. Introduction
In the contemporary dynamic environment, the traditional business organizations are not capable of coping with the challenges of the modern corporate operations. Advanced managerial concepts emerged in many world-class companies as mechanisms for reaching the objectives. One of them is the Total Quality Management (TQM). Oakland [1] defines TQM as an approach for market sustainability of the organisations which improves the efficiency, flexibility and the working competitiveness, and for which meeting the clients’ requirements represents a major objective. The TQM implementation enables the organizations ability for rapid adaptation to the changes in the environment, which enables TQM organizations to become competitive on the global market. Quality management systems like those in accordance with the ISO 9001 standard in many organizations represent initial stimulation for further TQM development.
Adequate preconditions are needed for introduction of advanced managerial concepts, including TQM. Employee motivation is one of them. If the employees are not motivated enough, their participation in the improvement of ISO 9001 will be only formal and will not lead to further development of the QMS and integration of the TQM practices in the processes. TQM philosophy create a climate in which employees are encouraged to locate the quality problems and find a solution for them.
In that direction, the main research challenge in the presented paper is to investigate the level of influence of the employee motivation and involvement on the successful integration of the TQM practices through comprehensive literature survey. The achieved conclusions in the further advanced research will serve for creation of dynamic model for experimentation in direction of transition of ISO 9001 towards TQM practices under the influence of employee motivation. Influence of the employee motivation on transition of ISO 9001 towards TQM
The top management is responsible for identification and provision of the necessary resources for successful operation of ISO 9001 and transition towards TQM [2]. Employees from other hierarchical levels are also implementers of decisions adopted by the top management, enforcers of defined principles and objectives of the highest level to the other organisational levels and direct participants and carriers of the operations. Employee behavior, such a quality awareness, employee competence and motivation to create quality products becomes a strategy to improve organizational performance [3]. Poor motivation of the employees may cause inertia and resistance to change leading to inefficient introduction of new methodologies such as the TQM. Inclusion of employees gives them an opportunity to improve their personal abilities, to gain appropriate knowledge, to increase their confidence, to express the individual creativity and to participate in solving specific problems [4]. Top management should develop philosophy to involve the employees in the TQM effort and improvement activities [5]. Numerous studies in the last period are oriented towards determination of the connection between the ISO 9000 series and the human resources management in the context of quality management [6].
Research methodology
The research methodology to investigate the level of influence of the employee motivation and involvement on the successful integration of the TQM practices included two methodological steps. First of all, analysis of the literature in the areas of ISO 9001, QMS, TQM, employees motivation was conducted. The comprehensive literature research encompassed Emerald, Scopus and Ebsco, in the period from August 2014, to April, 2016, using following key words: employees, motivation, involvement, satisfaction, QMS and TQM. A total of 14 papers published in English were considered as appropriate for this research.
After the identification of the relevant papers, they were analysed and structured in accordance with following criteria: methodology, objective, results and conclusions of the papers. Results and Discussion
The results generated from a comprehensive literature survey are presented in Table 1.
67

International Conference on Innovative Technologies, IN‐TECH 2016,
Prague, 6. ‐ 8. 9. 2016
Table 1. Review of the analysis of the relevant articles
Author Research objective Methodology Structured analysis of the relevant article Rice [4]
Determination of the impact of
employees motivation on successful implementation of
QM/QCI.
Literature overview
An integrated model in the process of motivation as a tool for understanding the needs of employees is created. Employee satisfaction has a positive influence on the process of implementation of QCI/TQM in organizations.
Chang et al. [7]
Analysis of the relationship between TQM practices and the
satisfaction and loyalty of employees.
Questionnaire Leadership, training, teamwork and confidence of employees are positively correlated with the employees satisfaction and loyalty. A theoretical model for surveys of employees satisfaction and loyality is designed.
Dubey [8] Investigation of the impact of "soft dimensions" to the successful
implementation of TQM.
Literature overview
Increasing the commitment of employees should enable complete participation in the process of quality improvement.
Pool [9] Research of the relationship between TQM, organizational
culture, employees motivation and organizational learning.
Questionnaire Synergistic relationship between successful implementation of TQM and organizational culture in direction of motivation of employees to learn is found. A linear structural model for reliability of organizational culture, TQM principles and motivation of employees to organizational learning is developed.
Swartling and Poksinska
[10]
Determintion of mechanisms for motivation of employees to
participate in continuous improvement.
Questionnaire Eight mechanisms are identified to encourage the motivation of the employees to participate in continuous improvement are identified. These mechanisms enable the transformation from managerial push to employees pull.
Kappelman and Prybutok
[11]
Determination of the role of employees on implementation of
TQM programs.
Questionnaire Training provides an opportunity to empower and motivate employees, reduces employee resistance and increases chances of TQM success.
Ugboro and Obeng [12]
Determination of the relationship among top management, training,
employees satisfaction and customer satisfaction.
Questionnaire Top management has to develope organizational climate to satisfy and empower employees in direction of overall quality and customer satisfaction.
Daily and Bishop [13]
Investigation of the mechanisms in TQM frame, which serve as a
stimulus for employees involvement in the implementation
of TQM.
Questionnaire Rewarding the employees is closely related to their comitted participation in the implementation of TQM.
Chowdhury et al. [14]
Identifycation of the TQM key factors in order to ensure high
quality products.
Questionnaire When the top management is strongly commited, employees involvement and innovation are two key factors for quality improvement. While at low commitment of top management employees involvement and customer focus are two critical factors that improve quality products.
Mohsan et al. [15]
Research of the connection between employees motivation,
commitment and job involvement.
Questionnaire The creation of comitted and motivated employees is the key to achieve global competitiveness. The positive correlation between the three areas: motivation - commitment - involvement of employees is confirmed.
Trivellas [16] Investigation of the influence of strategic human resource
management to employees satisfaction and comittment.
Questionnaire Strategic human resource management in order to increase commitment and employees satisfaction, enables successful implementation of TQM practices and global competitiveness.
Cheng and Chan [17]
Research of influence of employees motivation to sucessful
TQM implementation.
Questionnaire The motivation of employees to implement TQM, should not be treated as a separate segment addressed on the implementation of new methodologies. It has to be treated as an integral part of the performance of actual operative activities.
Psychogios et al. [18]
Determination of TQM influence affected on middle manager
autonomy.
Questionnaire Managers increase the effect of implementation of TQM using hard management practices, like statistical process control and techniques, giving less imporatance to employee involvement and encouragement. The implementation of TQM positively affects the autonomy and commitment of middie managers.
Tang and Wu [19]
Developing a model that contained identified influence factors of
employees involvement in TQM.
Questionnaire Variation of the level of involvement of employees in TQM are generated as a result of the differences in their past employment, education level, job assignments and responsibilities. Individual effectiveness and confidence are the basic prerequisite for employees involvement in TQM.
The view of Rice [4] is that only the employees can improve the process, and just only if they are motivated. Chang [7] pointed out
that employee satisfaction and loyalty may be improved throuhg the inclusion of TQM practices associated with human resources. The study shows that employee empowerment, employee compensation, teamwork, confidence and management leadership are significantly positive predictors of employee satisfaction. Speaking about improvement, it has to be stressed again that it differs on different management levels. Namely, Dubey [8] sugested that the front-lines workers are faced with operational problems, that opportunities for improvement are primarily in their hands. According to Pool [9], the implementation of the TQM principles in organizations is positively
68

International Conference on Innovative Technologies, IN‐TECH 2016,
Prague, 6. ‐ 8. 9. 2016
correlated with successful implementation of TQM in direction of motivate employees to learn. The paper of Swartling and Poksinska [10] identifies eights mechanisms that create motivation for continous impovement work, like: settings goals, providing training and resources, demostrating support, communicating with employees, trust and meaningfulness, see employees as individuals, increased authority and responsibility. Kappelmen and Prybotok [11] noted that the training provides an opportunity to empower and motivate employees. The improvements in employee motivation could affectively double the chance of overall TQM programs success since workers play such essential role in the success of TQM programs. Similar findings support Chowdhury et al. [14] - to improve the product quality employees need to improve their skills. Training provides an opportunity to empower and motivate employees, reduces employees resistance and increases chances of TQM success. Psychogios et al. [18] provide the basic TQM soft principles as follows: continuous improvement, training, involvement, teamwork, empowerment, top management commitment and support, customer satisfaction, culture change and democratic style and TQM hard practices like: statistical process control, quality function deeployment, ISO 9000 series and statistical tool and techniques. Authors suggested the implementation of soft and hard sides of TQM positively affects the autonomy to make a decision and involve middle managers. The hard factors, due to the soft principles of TQM play a less important role in the reported changes of autonomy of middle managers. The objective of study of Ugboro and Obeng [12] is to provide empirical assessment of the assumed relationship between top management commitment, employee empowerment, job satisfaction and customer satisfaction. Additionally, top management roles should include initiating and devising credible reward systems that recognize employees contributions to total quality objectives. Related findings reported by Daily and Bishop [13] are that rewarding is related to employee involvement in TQM implementation. An appropriate reward system has been recognized as an important management tool toward employee involvement. According to Cheng and Chan [17], the „pulling“ forces can be the actual work motivational needs of the workers. Top management has to develop organizational climate to satisfy and empower employees in direction of overall quality and customer satisfaction. Tang and Wu [19] highlight that top management commitment increase loyalty of the employees, which leads towards increasing of their level of satisfaction. Mohsan et al. [15] pointed the well motivated employees with high levels of job involvement are considered to be the most important assets for any organizations which serves as a key to quality improvement.
Research has suggested that all the above mentioned findings can be systematized through logical way of subsequently connection of issues and principles from the TQM perspective (Fig. 1).
Fig. 1 Systematization of findings
Top management has to be strong committed to provide appropriate training of employees and establish effective reward system to increase the level of employee satisfaction. It is necessary for employees to be empowered in order to achieve team structured organizations and to strengthen their confidence. Employee involvement has been associated with other valued outcomes such as employee motivation, as a crucial factor for the continuous improvement of quality management system. This brings in additional employees commitment to quality development and subsequently enhances implementation of TQM practices and ultimately customer satisfaction.
Conclusion
This literature overview brings the conclusion that motivation is a mechanism that can increase the involvement and commitment of the employees in the process of TQM implementation. The role of employees can be of significant importance in the process of improvement of QMS and directly related with integration of TQM practices. It can be noticed that the process of motivation of employees can not be analyzed separately as an individual phenomenon. Clearly, the motivation process can be initiated and supported exclusively by top management. Therefore, the discussion in terms of initiatives towards implementation of new methodologies always starts from top management but do not depend only on their commitment. The employees are the implementers and supporters of any ideas generated by top management. Besides that, top management has a crucial role in establishing quality policies, providing resources, stimulating involvement of the employees. The responsibility of top management is to provide adequate training for the employees for improvement the QMS towards the TQM. Top management should actively communicate company philosophy to the employees and involve them in the TQM effort and improvement activities. Therefore, the influence of employees motivation in order to implement TQM practices is crucial and symbiotically related to top management.
The researched results in the further advanced research will serve for validation of correlations among employees motivation and state of QMS when designing the System Dynamic (SD) model. The created SD model will enable experimentation in direction of transition of ISO 9001 towards TQM practices under the influence of employee motivation.
Top management commitment
Reward system
Training
Employee satisfaction
Empowerment
Job involvement
Team work
Confidence
Employee motivation
Continuous improvement
TQM implementation
Customer satisfaction
69

International Conference on Innovative Technologies, IN‐TECH 2016,
Prague, 6. ‐ 8. 9. 2016
References
[1] J.S. Oakland: Total quality management: Text with cases (Butterworth–Heinemann, London, U.K, 1995). [2] I. Sila, M. Ebrahimpour: Examination and comparison of the critical factors of total quality management (TQM) across countries,
International Journal of Quality & Reliability Management, Volume 41 (2003), Issues 2, p. 235-268. [3] H. Respati, R. Ami: Research on Continues Mediation: Employee Behavior and TQM Practice as ISO 9000 Strategy to Improve
Performance of Manufacturing Company in East Java, Indonesia, European Journal of Business and Management, Volume 6 (2014), Issues 29, p.125-136.
[4] W.R. Rice: Motivation: The Most Basic Process in TQM/CQI, JHG, Volume 15 (1993), Issues 3. [5] A. Brown, T. Wiele: (1996). A Tipology of Approaches to ISO Certification and TQM, Australian Journal of Management, Volume 21
(1996), Issues 1, p. 57-72. [6] V. Spasojević-Brkić: Kontingent theory and quality management (in Serbian), (University of Belgrade, Faculty of Mechanical
engineering, 2009). [7] C.C. Chang, C.M. Chiu, C.A. Chen: The effect of TQM practices on employee satisfaction and loyalty in government, Total Quality
Management, Volume 21 (2010), Issues 12, p. 1299–1314. [8] S.K. Dubey, T. Singh, P. Greetika: A Theoretical Framework for soft dimensions of Total Quality Management, 2011 International
Conference on Economics and Finance Research IACSIT Press, Singapore, Volume 4 (2011), p. 529-533. [9] S.W. Pool: The learning organization: motivating employees by integrating TQM philosophy in a supportive organizational culture,
Leadership & Organization Development Journal, Volume 21 (2000), Issues 8, p. 373-378. [10] D. Swartling, B. Poksinska: Management Initiation of continuous improvement from a Motivational perspective, Journal of Applied
Economics and Business research, Volume 3 (2013), Issue 2, p. 81-94. [11] L. Kappelman, V. Prybutok: Empowerment, Motivation, Training and TQM Program Implementation Success, Total Quality
Management, Industrial Management, Volume 37 (1995), Issues 3, p.11-15. [12] I.O. Ugboro, K. Obeng: Top management leadership, employee empowerment, job satisfaction and customer satisfaction in TQM
organizations: an empirical study, Journal of quality management, Volume 5 (2000), p. 247-272. [13] B.F. Daily: TQM Workforce factors and employee involvement: The pivotal role of teamwork. Journal of managerial issues, Volume
15 (2003), Issues 4, p. 393-412. [14] M. Chowdhury, H. Paul, A. Das: The impact of Top Management Commitment on Total Quality Management Practice: An
Exploratory Study in the Thai Garment Industry, 2007, Global Journal of Flexible Systems Management, Volume 8 (2007), Issues 1/2, p. 17-29.
[15] F. Mohsan, M. M. Nawaz, M. S. Khan, Z. Shaukat, N. Aslam: TQM Are Employee Motivation, Commitment and Job Involvement Inter-related: Evidence from Banking Sector of Pakistan, International Journal of Business and Social Science, Volume 2 (2011), Issues 17, p. 226-233.
[16] P. Trivallas: Impact of Strategic Human Resource Management on Organisational Commitment and Employee Satisfaction in ISO 9001 Certified Firms: An empirical Study in the Central of Greece, 6th International Conference on Enterprise Systems, Accounting and Logistics, 18-19 May 2009, Thessaloniki, Greece.
[17] T. Cheng, S.F Chan: Quality motivation in China: humanistoc and technological, Total Quality Management, Volume 10 (1999), Isues 7, p. 967-978.
[18] Z. Tang, Z. Wu: Using behaviour theory to investigate individual-level determinants of employee involvement in TQM, Total Quality Management, Bussiness Excellence, Volume 21 (2010), Isues 12, p. 1231-1260.
70

International Conference on Innovative Technologies, IN‐TECH 2016,
Prague, 6. ‐ 8. 9. 2016
EFFICIENCY IN GREENHOUSE FOR INTELLIGENT MANAGEMENT ENERGY
A. Nabais1, R. M. T. Ascenso1,2 and J.R. Galvão1,3
1 Department of Electrical Engineering and Computer Science - Leiria Polytechnic Institute, Apartado 4163 | 2411- 901 Leiria - Portugal
e-mail: [email protected]; [email protected]; [email protected]; 2 Center for Research in Informatics and Communications of Polytechnic Institute of Leiria
3 INESC Coimbra - Institute of Systems Engineering and Computers at Coimbra R&D Unit
Keywords: Energy Management; Efficiency; Environment; Heating; IoT. Abstract: Energy efficiency is one of the pillars of the EU’s Europe 2020 Strategy for sustainable growth and one path to efficient economy. It is also a relevant route to reduce CO2 emissions, contribute to energy-supply security, and most likely to create new jobs and make European organizations of the most well-managed worldwide. Therefore, improving the efficiency with which energy is consumed by citizens is a major aspect of the European Union's energy policy [1]. The main costs associated to the crops produced in greenhouses are related to energy consumption and environment impacts if the main suppliers are fossil fuels. There’s a growing concern attributed to these components because of the impact that these may represent for enterprises competitiveness. This condition is even more relevant when we discuss about massive agriculture and greenhouse intensive production, for example floriculture. This type of agriculture is demanding on production conditions, so in order to generate and maintain, the optimum conditions, higher heating and cooling are requiring great energy consumption. These requirements lead entrepreneurs of the sector, to hold their investments in areas with more moderate climates, aware that this condition depreciates, the charges associated with the production profitability and environmental sustainability. The study presented assesses the constructive patterns of a greenhouse structure and the way the maintenance is done, also determines the energy consumption, comparing different energy sources, analysing fuel heating values, boiler combustion, exhaust emissions and parameters inside the greenhouse. As a result, the use of renewable energy sources was proposed and, accordingly, the installation of a photovoltaic system with self-consumption regime, aiming to contribute to energetic and environmental efficiency in this type of agricultural production. In addition to these actions, the economic viability of the proposed energy model was analyzed. As future perspectives, a new energy model that retrofits the system of a greenhouse based on multiple sensors in one grid, coupled with sensing technologies supported with Information and Communication Technologies (ICT) and Internet of Things (IoT) could lead to a new architectural approach, based on a sustainable and more engineering autonomous process that could improve energy efficiency [2]. Introduction
In energy terms, Europe is highly dependent from the outside, because it has few reserves, despite being the largest importer in the world [3]. The Directive of Energy Efficiency (DEE) imposes measures, which are legally binding towards a more efficient use of energy, particularly in terms of air-conditioning systems, transformation, transport and energy distribution, training and information and significant importance to energy audits [4]. One of the possible means to achieve this goal is the use of more efficient technologies and changing processes and consumption patterns associated with citizens cultural changes. Technologically there is considerable potential for growth in the entire energy chain, which enables significant improvements in efficiency, covering all process from the extraction of primary energy until the end use the equipment [1]. Despite the efforts, the energy consumed worldwide, is not getting cleaner because emerging economies are still very dependent on fossil fuels for power generation, which represents a major threat to achieving low carbon in the present and in the future. In many countries, the implementation of a renewable energy production leads in achieving it 2Ds goal, which aims to achieve by 2050, a reduction of carbon dioxide (CO2) emissions and limit the rise in average temperature in 2°C, the growth of competitiveness of economies is short-term and robust political contribution is appropriate to achieve this goal. It is estimated that the renewable energy (RE) dominate the generation of electricity and through this energy resource, this represents 57% of global production [5]. Associating with this type of energy production the concept of energy efficiency (EE), air conditioning systems should use technologies that result in low or zero CO2 emissions.
Given that demand for energy has had a considerable increase, including in agriculture, due to the introduction of high-yield crops, producers are increasingly aware of the high cost of fossil fuels and their emissions of pollutants. As a result, many industry entrepreneurs are looking for alternatives, using the RE, seeking to satisfy their energy needs, lower economic and environmental costs. One of the most intensive agricultural products is appealing to the plant growth in greenhouses and indoor environments, in order to increase the turnover and profitability of crops. It is intense in many aspects like: it produces every year; it has high energy consumption and needs financial means.
71
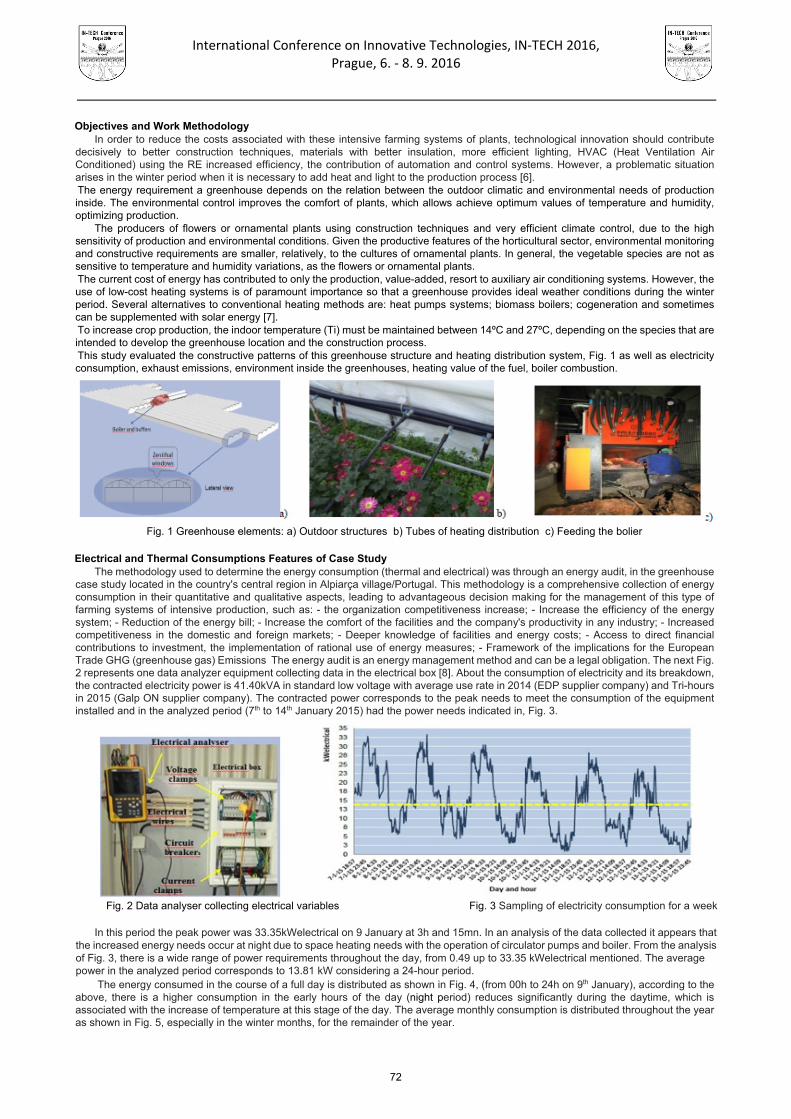
International Conference on Innovative Technologies, IN‐TECH 2016,
Prague, 6. ‐ 8. 9. 2016
Objectives and Work Methodology
In order to reduce the costs associated with these intensive farming systems of plants, technological innovation should contribute decisively to better construction techniques, materials with better insulation, more efficient lighting, HVAC (Heat Ventilation Air Conditioned) using the RE increased efficiency, the contribution of automation and control systems. However, a problematic situation arises in the winter period when it is necessary to add heat and light to the production process [6]. The energy requirement a greenhouse depends on the relation between the outdoor climatic and environmental needs of production inside. The environmental control improves the comfort of plants, which allows achieve optimum values of temperature and humidity, optimizing production.
The producers of flowers or ornamental plants using construction techniques and very efficient climate control, due to the high sensitivity of production and environmental conditions. Given the productive features of the horticultural sector, environmental monitoring and constructive requirements are smaller, relatively, to the cultures of ornamental plants. In general, the vegetable species are not as sensitive to temperature and humidity variations, as the flowers or ornamental plants. The current cost of energy has contributed to only the production, value-added, resort to auxiliary air conditioning systems. However, the use of low-cost heating systems is of paramount importance so that a greenhouse provides ideal weather conditions during the winter period. Several alternatives to conventional heating methods are: heat pumps systems; biomass boilers; cogeneration and sometimes can be supplemented with solar energy [7]. To increase crop production, the indoor temperature (Ti) must be maintained between 14ºC and 27ºC, depending on the species that are intended to develop the greenhouse location and the construction process. This study evaluated the constructive patterns of this greenhouse structure and heating distribution system, Fig. 1 as well as electricity consumption, exhaust emissions, environment inside the greenhouses, heating value of the fuel, boiler combustion.
Fig. 1 Greenhouse elements: a) Outdoor structures b) Tubes of heating distribution c) Feeding the bolier
Electrical and Thermal Consumptions Features of Case Study
The methodology used to determine the energy consumption (thermal and electrical) was through an energy audit, in the greenhouse case study located in the country's central region in Alpiarça village/Portugal. This methodology is a comprehensive collection of energy consumption in their quantitative and qualitative aspects, leading to advantageous decision making for the management of this type of farming systems of intensive production, such as: - the organization competitiveness increase; - Increase the efficiency of the energy system; - Reduction of the energy bill; - Increase the comfort of the facilities and the company's productivity in any industry; - Increased competitiveness in the domestic and foreign markets; - Deeper knowledge of facilities and energy costs; - Access to direct financial contributions to investment, the implementation of rational use of energy measures; - Framework of the implications for the European Trade GHG (greenhouse gas) Emissions The energy audit is an energy management method and can be a legal obligation. The next Fig. 2 represents one data analyzer equipment collecting data in the electrical box [8]. About the consumption of electricity and its breakdown, the contracted electricity power is 41.40kVA in standard low voltage with average use rate in 2014 (EDP supplier company) and Tri-hours in 2015 (Galp ON supplier company). The contracted power corresponds to the peak needs to meet the consumption of the equipment installed and in the analyzed period (7th to 14th January 2015) had the power needs indicated in, Fig. 3.
Fig. 2 Data analyser collecting electrical variables Fig. 3 Sampling of electricity consumption for a week
In this period the peak power was 33.35kWelectrical on 9 January at 3h and 15mn. In an analysis of the data collected it appears that
the increased energy needs occur at night due to space heating needs with the operation of circulator pumps and boiler. From the analysis of Fig. 3, there is a wide range of power requirements throughout the day, from 0.49 up to 33.35 kWelectrical mentioned. The average power in the analyzed period corresponds to 13.81 kW considering a 24-hour period.
The energy consumed in the course of a full day is distributed as shown in Fig. 4, (from 00h to 24h on 9th January), according to the above, there is a higher consumption in the early hours of the day (night period) reduces significantly during the daytime, which is associated with the increase of temperature at this stage of the day. The average monthly consumption is distributed throughout the year as shown in Fig. 5, especially in the winter months, for the remainder of the year.
72

International Conference on Innovative Technologies, IN‐TECH 2016,
Prague, 6. ‐ 8. 9. 2016
Fig. 4 The electricity consumption in a day Fig. 5 Annual average electrical consumption
Although the difference is not significant in view of the need, for strong ventilation with frequent opening zenithal windows, at the time
of higher temperatures, as well as, the increased demand for energy in cold chambers. With regard to thermal variables particular to the greenhouse heating can be performed by a variety of technologies, ranging from simple portable heaters, water heating boilers using distributed pipes or hot air generators. Regardless of the technology used, the efficiency of the selected equipment is extremely important in order to reduce energy consumption required to obtain a good air conditioning. The technologies available for heating using boilers is one that has represented major developments in efficiency concerns, perhaps taking advantage of the latest generation of these devices, called condensation. More recently emerged accessories which increase the efficiency of boilers such as condensers and economizers which allow to recover the dissipated thermal energy, usually the chimney and which result in efficiencies up to 96% independently of the fuel [natural gas, LPG (liquid petroleum gas), gas oil, fuel oil / naphtha and biomass].
In this case study the heating is done using four hot water circuits, divided by the five blocks that make up all the greenhouses. To calculate the direct method measurements were taken on March28th, 2015, the flow of water and wood consumed in the reporting period (4h and 55 min). During this period, rose water temperature of the buffer (60,000liters) of 22ºC to 87ºC. At certain times of the year and there are certain types of biomass, which is a raw material with a competitive cost per tonne for the other, energy sources -co olive pomace pellets, a new assessment to η boiler, with power of this fuel considering the following starting data: raising the temperature of water 26ºC buffers to 88.6ºC and record the amount of pellets consumed for raising this differential. Energy needed to calculated in kWh, for that DT temperature difference (K) through the following equation: = ṁ Δ [9]: - Q Total energy (kWh), mass ṁ of water (kg) cp specific gravity of water (kJ/kg.ºK). Energy requirements for the lifting of this temperature are 4.256 kWh.
The Table 1 presents the annual consumption in kWh and ton biomass, as well as the costs of use of each type of fuel. It follows that the moisture of the wood is very penalizing in operating costs due to low η boiler. A reduction in MC (Moisture Content) 40% to 30%, in addition to technical and environmental gains, translates into annual savings of about 11,560€. This means that the biomass is dried by natural or artificial processes. It was used the thermography to heat leak detection and to improve heat distribution/hot water near the plants, Fig. 6. Table 1. Annual consumption in kWh and ton biomass
* The 25% reduction is due to the amount of area which at all times is inoperative due to replanting chrysanthemums.
Fig. 6 Thermographic images in greenhouses: a) Leaks heat b) Hot water circulation piping.
Results and Proposals
The results allowed to present a proposal for energy model, the following Fig. 7, which includes the fuel to be used in the boiler: biomass pellets, the optimal storage conditions, thermal insulation of pipes, and analysis of the economic viability of new thermal inertia equipment and the installation of a photovoltaic production system. Will be overall high performance of this case study, in agriculture and still view the resource, the multiple sensors that send energy data collected for storage and management in a cloud computing model for rapid analysis and decision making, which lead to greater energy sustainability and independence of the process.
73

International Conference on Innovative Technologies, IN‐TECH 2016,
Prague, 6. ‐ 8. 9. 2016
This part consists of the presentation of the new energy model for the case study and consists of distinct parts, for improved energy performance of the whole chain of the production process. The climate of the greenhouses is in terms of energy, the main cost of operating representing about 78% of total costs. In this context it is paramount, making decisions which result in significant reductions in energy expended in its air conditioning. This model aim to reducing costs, both by increased energy efficiency, either by changing habits and routines, as well as an environmental improvement resulting in a reduction of emissions supported, with a autonomous production of electricity through photovoltaic panels. .
Fig. 7 Several areas of the energy model proposed for this model of greenhouses, more efficient and environmentally sustainable.
Conclusions
All sectors of society require energy to perform their daily functions, but it contributes when using non-renewable energy sources to the increases in greenhouse gases and climate change. As the demand for food will increase due to the increase in population in some regions of the world, this requires that the way to produce such goods is done in a faster and more securely, but not contributing for the greenhouse gases. So a better and more effective management of this type of intensive farming of food, control of energy variables, makes this research very relevant today, whether the knowledge achieved in this research were applied in food plant growth areas or horticulture.
The energy model presented in this research includes a range of proposals for possible options, both technological and change procedures and alternatives, with the aim of increasing the competitiveness of the greenhouse in the economic and environmental aspects. The energy and environmental model of this physical system was developed in order to improve efficiency and sustainability, having advantages and synergies, if included a lot of sensors for controlling the several parts of greenhouse, for supported with a platform of Information and Communication Technologies (ICT) and Internet of Things (IoT) could lead to a new architectural approach, which reinforces a more sustainable production of plants in greenhouses. To know the energy variables of the case study an energy audit was performed for to found weaknesses in the use of energy, both electricity and thermal, namely in boiler supply and biomass storage. The humidity of biomass has strong impact on the efficiency of the boiler and the environment. Taking account of the conditions of storage of biomass yield and cost comparison, the best option is to use olive pomace pellets. There is a pressing need in the insulation of equipment and structures. The implementation of a photovoltaic self-consumption system is a measure of economic and environmental interest. Indeed, it is a fact that the implementation of any innovation / change depends on the benefits that accrue in relation to technology and established operating modus. Inertia in its implementation is influenced much by the actual costs and the perception of financial risks. Acknowledgment
This work has been partially supported by the Portuguese Foundation for Science and Technology under project grant PEst-OE/EEI/UI308/2014.
References [1] Launch of the European Energy Efficiency Platform (E3P). Part of Intelligent Energy Europe - European Commission, see:
http://www.buildup.eu/en/news/launch-european-energy-efficiency-platform-e3p ; access in april 2016. [2] T. Oliveira, Filipe T; Leitão, Ségio A; Nabais, Adelino S; Ascenso, Rita M; Galvão, João R., “Greenhouse with Sustainable Energy
for IoT”, In Technological Innovation for Cyber-Physical Systems, ed. Luis M. Camarinha Matos, António J. Falcão, Nazanin Vafaei Shirin Najdi, 416 - 424. ISBN: 978-3-319-31164-7, Springer International Publishing; 2016, doi: 10.1007/978-3-319-31165-4_39.
[3] Comissão Europeia, “Uma energia sustentável, segura e a preços acessíveis para os europeus,” Energia, pp. 3–16, 2012. [4] Parlamento Europeu e o Conselho da União Europeia, Diretiva 2012/27/E 2012, pp. 1–56.
[4] Parlamento Europeu e o Conselho da União Europeia, Diretiva 2012/27/E 2012, pp. 1–56. [5] V. Manique, “Gas Natural:Combustible clave en la transición hacia un sistema energético más limpio e sustentable,”
Innovación-CDT Gás, pp. 27 – 31, 2011. [6] M. Djevic and A. Dimitrijevic, “Energy consumption for different greenhouse constructions,” Elsivier, vol. 801 PART 1, no. 9, pp.
781– 786, 2008. [7] M. Esen and T. Yuksel, “Experimental evaluation of using various renewable energy sources for heating a greenhouse,” Energy
Build., vol. 65, pp. 340–351, 2013. [8] Adelino dos Santos Nabais, “Energy and Environmental Analysis in Agricultural Greenhouses/ Análise Energética e Ambiental em
Estufas Agrícolas”; Master Tesis, Leiria Polytechnic Institute, Portugal, 2015. [9] J. A. E. Ramos, “Disciplina de Climatização-1o ano Mestrado em Engenharia e Energia do Ambiente-IPL,” 2014.
74

International Conference on Innovative Technologies, IN‐TECH 2016,
Prague, 6. ‐ 8. 9. 2016
PROTOTYPE IMPLEMENTATION OF A PROCESS MODEL FOR MULTIDIMENSIONAL DESIGN AND EVALUATION OF PROCESS CHAINS
D. Grzelak 1, R. Freund 1, H. Wiemer1 and S. Ihlenfeldt1 1 Institute of Machine Tool and Control Engineering, Technical University Dresden, Germany
Keywords: Process Chain; Multidimensional Analysis; IT-Tool Abstract: For analysing hybrid process chains the holistic evaluation approach MEMPHIS (Multidimensional Evaluation Method for Process Chains of Hybrid Structures) was developed. It consists of a process model to design resource-efficient processes, which are evaluated in a multidimensional analysis of the whole process chain [1, 2]. The principal purpose is to compare manufacturing process chains for hybrid lightweight constructions (HLWC) with conventional ones, considering the aspects of energy and economic efficiency, as well as robustness. In this work the prototype of an IT tool for the realization of MEMPHIS is presented. MEMPHIS unifies the different methods developed for every aspect and the IT tool supports the user to enter, evaluate and compare process chains for HLWC with respect to the mentioned target figures. The prototype supports the first three steps of MEMPHIS and also includes different library systems, like a production process library and a machine library. The application is introduced with an example from the MERGE sub-project B2 (metal-intensive technologies for manufacturing of hybrid metal/plastics composites). The focus of this work is to introduce the IT tool for planning and evaluating process chains and how the integrated libraries influence the multidimensional analysis.
Introduction and Motivation Within the Cluster of Excellence “MERGE Technologies for Multifunctional Lightweight Structures”, a generic modelling approach
named MEMPHIS (Multidimensional Evaluation Method for Process chains of HybrId Structures) was developed for the resource-efficient process design for the manufacturing of hybrid structures, which is based on a multidimensional analysis. MEMPHIS is a holistic procedure model for optimising the three target figures, energy efficiency, the cost-effectiveness, the robustness of process chains as well as the maturity regarding series production will be considered during the entire development process. [3,4]
MEMPHIS has its origin from the procedure model of Götze et al [5] and comprises five segments which define the basis for the IT-tool [6]:
MEMPHIS serves as the foundation for the assessment of hybrid process chains and aids the user step by step to conduct an
evaluation. The goal was to develop a web application with particular attention to user friendliness. MEMPHIS unifies the different methods developed for every evaluation aspect (the target figures) and the IT-tool supports the user to input, evaluate and compare process chains for HLWC with respect of the mentioned target figures. The web based approach allows a managed decentral data acquisition for many users working together from different places. Pre-defined process blocks helping the user to create process chains in an efficient manner based on the used production method following Din Norm 8580 [7]. Required parameters can be added or pre-defined for the specific target figures at any time in the process. The target user group for the IT-tool are business economists within the various interactive research domains of MERGE.
In a repeating process of creating design concepts (Mock-ups) the concepts were evaluated repeatedly in small user studies [6]. From the beginning of the development much importance was placed to the avoidance of media discontinuities and at the same time fulfils the worked out requirements for the software. A great value was also place on non-functional requirements (usability) according to DIN EN ISO 9241-110 [8]. The current state of the IT-tool to guide and support the potential user through the MEMPHIS procedure model for the evaluation of hybrid process chains is described in this article.
Structure of the IT-tool An interactive system was the premise which reacts on the users input and functioning like a wizard to work the user through the
whole computation process. The implementation of MEMPHIS defines the basis for the computational part. Up to the current state of research the focus was laid
to research & development. Parameters of the process model can be seen as the core of the software: They are the foundation for the calculation to evaluate and compare process chains. Parameters come always as a pair of a pre-defined value (which can be changed) and a unit. Estimate values are handled as well. For every parameter one of the three evaluation domains energy, costs, and robustness, can be assigned. Hence a filtered data entry is possible regarding the evaluation domain. Access to electronic catalogue data for machines and production methods is available as well as pre-defined templates for generic process chains.
Three Pillars of Resources Software-technically seen resources are classified into one of the three tiers: type, exemplar (model), and instances. Resources in
this context are defined as machines, and tools.
75

International Conference on Innovative Technologies, IN‐TECH 2016,
Prague, 6. ‐ 8. 9. 2016
Resources categorized as types are assigned to production methods. They have to be defined for later data acquisition. The basis for such parameters is a template They come with pre-defined default parameters which are needed for the target figure calculation, e.g. useful life, cost price, area required, machine hours, etc.
Exemplar resources build upon the type resources. Therefore a fixed allocation to the production method is ensured. The advantage: an automatic creation of the needed type parameters. Additionally manufacturer’s data can be entered as well. Thus the resource catalogue and the catalogue for the machinery park can be extended in a natural way.
Instance resources are an exact manifestation of an exemplar with a specific reference to an actual project. This means the machine exists and is used for a process. They are relevant for the machine utilization and in turn for the production costs.
Production Processes Production processes are used for the modelling of the process chain. They are hierarchically structured and follow the DIN NORM
8580:2003-09 [7], and can be extended dynamically. An extension is planned to create “supportive” methods [9], speaking of transportation, maintenance, and handling for example. The structure of the user interface (UI) is depicted in Fig. 1 for the creating of such a production process.
The UI shows the pre-sets for a process with its settings and disturbance variables. As mentioned every parameter has a unit, a default value and is assigned to one or more evaluation domains. Production processes inherit their properties (marked with blue background) of they have a parent. Detailed process definitions are possible without defining new parameters every time. Inherited parameters can’t be changed (only at the parent process) but can be deselected if they are not necessary for the evaluation.Specification of machines and tools based on resource templates (cf. Three Pillars of Resources). The user can choose an existing template or create a new one at this page.
Evaluation Domains Required parameters can be filtered in the data acquisition step. It is planned to utilize different key figures for every domain. The
current state of the research of MEMPHIS for the implanted key figures for each target figure: KEA (energy), robustness factor (robustness), production costs (economic). [1, 2, 3, 4, 10]
Procedure Model MEMPHIS This section describes the software integration of the MEMPHIS model. In the current state of the software only the first three steps
are implemented.
Step 1 – Defining the Analysis System In the first step the concrete system boundaries for the following evaluation has to be defined as well as the necessary key figures (cf.
Fig. 2). The purpose of the evaluation is important: Questions like “What key figures should be considered”, and “In which extent or complexity the present process chain should be evaluated (one single process step or the whole one)?” This definition of the level of detail determines the complexity of the following assessment. System boundaries specify which steps of the process chain should be analysed. Additionally the lifecycle phase has to be specified (development phase or production phase). If an assessment is conducted in the early development phase only few information are available about experiments under laboratory conditions. In contrast, comprehensive data is available in the production phase. The first step includes the definition of the evaluation scale for every key figure. Minimal and maximal acceptable values have to be specified. The user can tick what key figures should be evaluated which serves also as a filter for the following steps regarding the data acquisition (amount of data the user has to input).
Fig. 1 User Interface for the creation of production methods according to DIN 8580:2003-09
76

International Conference on Innovative Technologies, IN‐TECH 2016,
Prague, 6. ‐ 8. 9. 2016
Step 2 – Modelling the Process Chain After specifying all necessary boundaries a process chain will be modelled to gain a better understanding of the present process
chain. All relevant information are collected from the user by use of a process datasheet. Additionally all relevant process chains are displayed graphically with the help of symbols and lines. The analytical model is based on the Input-Throughput-Output-Model (ITO-Modell). Its possible to extend or reduce the process chain in a flexible manner depending on the complexity of the analysis.
Fig. 3 Data acquisition via process datasheets
Step 3 – Evaluating the Process Chain After creating the process chain provided with all necessary data the evaluation can be conducted in step three. At first, each single
target figure (energy, economic, robustness) is calculated with predefined calculation rules stored in the system. The results are summarized and displayed graphically for an easier understanding.
Conclusion
The IT tool for aiding the user through the MEMPHIS procedure model was presented. The user has the possibility to collect and store economic and energy related values of a process chain to conduct an assessment and later compare different alternative process chains with each other.
Next steps are the implementation of the steps four and five of the MEMPHIS procedure model. An optimisation can be performed if a sensitive analysis is conducted. This shows the interactions between each process parameter and how sensitive the output parameters
Fig. 2 First step of the evaluation procedure
77

International Conference on Innovative Technologies, IN‐TECH 2016,
Prague, 6. ‐ 8. 9. 2016
(and with that the target figures) are with changing input parameters. A scenario analysis is performed in the fifth step. The influence of intrinsic and extrinsic factors can be analysed – a more detailed look onto the process chain is possible. Development opportunities and possible alternative results can be prognosticated. In MERGE this would include changing production factors and environmental ones.
After that another evaluation of the prototype is performed, for which purpose two methods are used. First, the application is evaluated with an process chain example from the MERGE interactive research domain B2 (metal-intensive technologies for manufacturing of hybrid metal/plastics composites) respecting the functional requirements. Second, the audit is directly conducted by users while providing questionnaires according to DIN EN ISO 9241-110 [8]. Acknowledgment
This work was performed within the Federal Cluster of Excellence EXC 1075 “MERGE Technologies for Multifunctional Lightweight Structures” and supported by the German Research Foundation (DFG). Financial support is gratefully acknowledged.
References [1] C. Schwerma et al: Multidimensional analysis of process chains regarding the resource-efficient manufacturing of hybrid
structures, 12th Global Conference on Sustainable Manufacturing, Vol. 26 (2015), pp. 595-600. [2] J. Katzenberger et al: Manufacturing of Hybrid Structures – Multidimensional Analysis for Resource-Efficient Processes, Euro
Hybrid Materials and Structures, pp. 172-181, 2014. [3] J. Boll, A. Rautenstrauch, C. Symmank, B. Awiszus, D. Landgrebe, and U. Götze: MEMPHIS - Methode zur Analyse von
Prozessketten für die Herstellung hybrider Strukturen. Werkstoffe in der Fertigung, 2015, 4, pp. 25-27, ISBN 0939-2629. [4] C. Symmank, J. Boll. A. Rautenstrauch, U. Götze, B. Awiszus, and D. Landgrebe: Holistic Evaluation of Process Chains for
Resource-efficient Manufacturing of Hybrid Structures. Proceedings of ICAFT 2015 /SFU 2015 Chemnitz, pp. 457-476, ISBN: 978-3-95735-029-9.
[5] U. Gotze et al.: Zur Analyse und Bewertung von Produkt-Prozessketten- Kombinationen der hybriden Produktion. In: Neugebauer R. et al. (Hrsg.): Energetisch-wirtschaftliche Bilanzierung - Diskussion der Ergebnisse des Spitzentechnologieclusters eniPROD, Verlag Wiss. Scripten, Auerbach, pp. 21-32, 2014.
[6] D. Grzelak, R. Freund, A. Rautenstrauch, C. Symmank, J. Boll, H. Wiemer, D. Landgrebe, U. Götze, and B. Awiszus: Requirements and Design Concepts of a Software Tool for a Multidimensional Analysis of Process Chains. Proceedings of the 2nd International MERGE Technologies Conference IMTC 2015 Lightweight Structures, 2015 Chemnitz, pp. 339 – 341, ISBN 978-3-95735-025-1.
[7] DIN Deutsches Institut für Normung, Fertigungsverfahren - Begriffe, Einteilung, DIN 8580:2003-09, 2003. [8] DIN Deutsches Institut für Normung, Ergonomie der Mensch-System-Interaktion - Teil 110: Grundsätze der Dialoggestaltung (ISO
9241-110:2006), 2008. [9] T. Nebl: Produktionswirtschaft, (Oldenburg Verlag, München, 2011). [10] D. Landgrebe, V. Kräusel, A. Rautenstrauch, A. Albert, and R. Wertheim: Energy-efficiency in a Hybrid Process of Sheet Metal
Forming and Polymer Injection Moulding. Proceedings of 13th Global Conference on Sustainable Manufacturing 2016, Vol. 40 (2016), pp. 109-114.
78

International Conference on Innovative Technologies, IN‐TECH 2016,
Prague, 06. ‐ 08.09.2016
AGENT BASED CLOUD SERVICES DISCOVERY
R.M. Alhazmi 1 and F.E. Eassa 2
1 Department of Computer Science, King Abdulaziz University, Jeddah, Saudi Arabia
[email protected], [email protected]
Keywords: Cloud Computing; Cloud Services; Services Discovery; Service Selection; Agent Based
Abstract: Cloud computing services are one of the latest revolutions in the field of information technology. It is widely used by governments, business organizations, educational institutions, home users, etc. because it saves money and works everywhere and anytime. However, choosing the right cloud service that satisfies the customer’s functional and nonfunctional requirements from other major cloud services that have the same characteristics becomes a dilemma for consumers. Up until now, there was no intelligent search engine for this purpose. In this paper, we aim to enhance and automate the process of discovering and selecting cloud services to make them more effective and efficient. We built an agent based manager for discovering and finding cloud distributed services that satisfy customer criteria such as functional, cost, and quality of service. We conducted several evaluation experiments to assess the performance, quality, and accuracy of the proposed system and compare it with other earlier research studies. The assessment yielded the following results: the percentage of recall, precision, F1 score, and accuracy were dramatically enhanced.
Introduction Nowadays, many organizations and people use cloud computing services in order to expand and develop their business and research.
This population of cloud customers dramatically increases every single year because cloud computing provides many benefits for commercial and scientific fields [1, 2]. The most acknowledged advantages of the cloud environment are it is flexibility, scalability, and cost efficiency[3]. Cloud computing offers a shared pool of configurable computing resources such as computer servers, storage, and application that offer available, on demand access, and pay per use facilities [4, 5]. These computing resources are known as cloud services and they tend to be widely used. It can be generally categorized as infrastructure, platform, software, data, and communication as services [5]. Those cloud services are provided by cloud providers such as Microsoft Azure [6], Google [7], and Salesforce [8].
Resource pooling and sharing by multiple users are the most critical issues in cloud computing [9,10,11]. Practically, customers must make challenging decisions in order to select the right provider who offers a suitable service that satisfies their requirements. After that, the customer needs to negotiate with the provider in order to get ideal service contracts. These procedures of resource discovery and selection are very difficult and time consuming for humans because the number of provided cloud services is increasing every day and there are a large number of similar services with slight different in their attributes [12]. Moreover, customers not only need to search for cloud services; they also need to choose the optimal service that fulfils all their functions and nonfunctional requirements within the budget, which can be a huge challenge [13, 14].
Using regular search engines to discover cloud services, such as the Google search engine, is not practical because they only provide many URLs and some of them may not even be relevant to cloud services [11, 15, 16].Until now, the user did not have a professional search engine to discover cloud services [17,18, 19]. Thus, cloud consumers need an intelligent system that can move the discovery and selection process of the cloud service from being managed manually to being managed automatically. Users need a system to express their requirements, as well as an objective technique to evaluate matching services. This kind of challenge motivated us to conduct this study in order to address the limitations of search tools. In this research, we aim to develop an agent based cloud computing system for discovering cloud services. The purpose of the system is to enhance the cloud service’s finding process in order to get the most suitable service and a list of recommended services accurately and quickly according to the consumer’s criteria.
The rest of this paper is organize as following: Section II discusses existing works related to this research. The proposed architecture is described in detail in Section III. Section IV presents the tools and techniques used to implement and test the proposed system. In Section V, fully detailed evaluation experiments are presented. Finally, Section VI concludes this paper and makes suggestions for future work.
Literature Review There are a number of studies introduced by researchers focusing on automating the process of discovering and selecting the right
cloud services by using different methods. They improve algorithms and approaches in order to develop systems that deliver a suitable cloud service to the cloud customer based on what he/she needs.
Chang et al. [16] proposed a framework that integrated intelligent agent techniques and ontology based methods. It discovers existing cloud services and obtains optimal cloud services based on the flat query text that users type through the system interface. Nevertheless, there are limitations on dealing with user dynamic query requirements.
In [20], Sim introduces a method to manage cloud computing resources using an agent based method. A cloud crawler is added to the architecture of the Cloudle to improve the previous architecture [9, 15, 19, 21, 22], which depended only on cloud providers to register services in the database. The cloud crawlers search the Internet to find information about the cloud providers and store it in the database. The main part of Cloudle is a service discovery agent (SDA), which consists of a query processor, a service reasoning module (similarity reasoning, compatibility reasoning, and numerical reasoning), a price and time slot matching module, and a service rating module. SDA searches the database and the cloud ontology to find matches for a customer’s functional, technical, and budgetary requests.
In 2014, Gong and Sim developed a centroid based cloud service search engine (CB-Cloudle) for discovering existing cloud services and choosing the optimal services that satisfy the desired user functional and nonfunctional requirements [23]. They implement an automatic cloud services crawler for each cloud provider to fetch his published services information. In addition, they used an improved K Mean clustering technique to organize and group the similar services into one cluster group. Furthermore, the clustering method was used during the selection process as well. Moreover, Gong and Sim in [24] enhanced the similarity reasoning format used for the K Mean Clustering
79
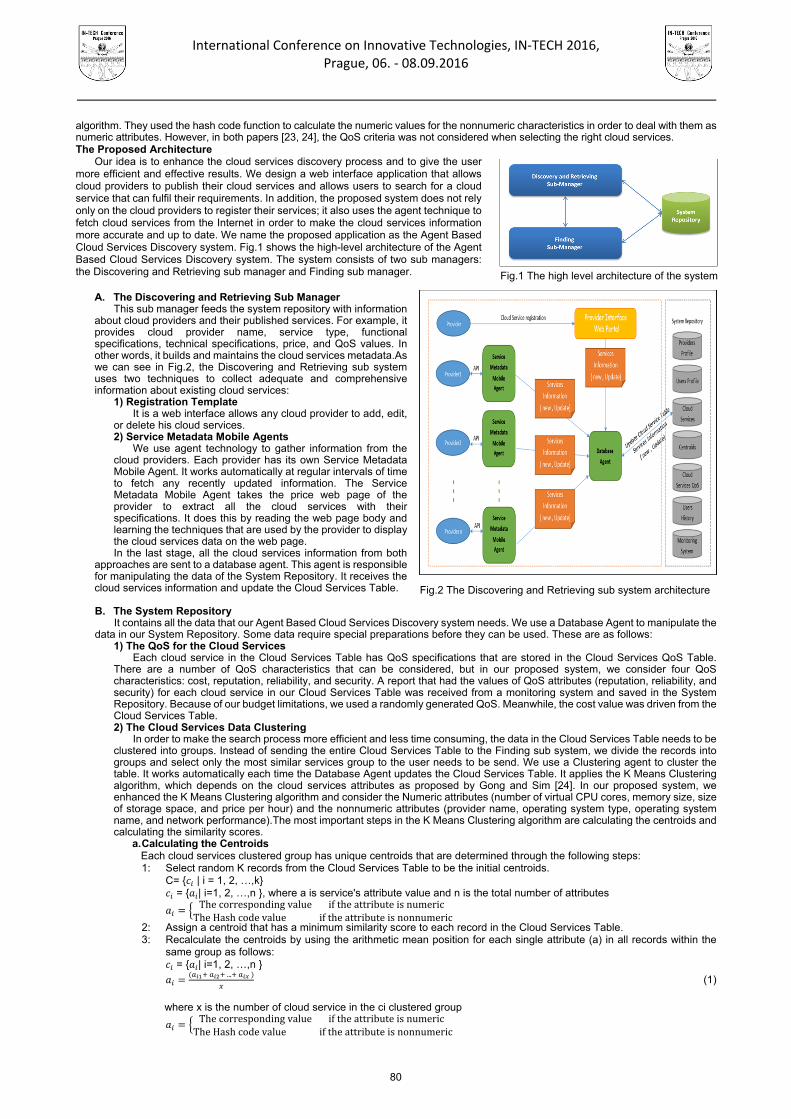
International Conference on Innovative Technologies, IN‐TECH 2016,
Prague, 06. ‐ 08.09.2016
Fig.1 The high level architecture of the system
Fig.2 The Discovering and Retrieving sub system architecture
algorithm. They used the hash code function to calculate the numeric values for the nonnumeric characteristics in order to deal with them as numeric attributes. However, in both papers [23, 24], the QoS criteria was not considered when selecting the right cloud services. The Proposed Architecture
Our idea is to enhance the cloud services discovery process and to give the user more efficient and effective results. We design a web interface application that allows cloud providers to publish their cloud services and allows users to search for a cloud service that can fulfil their requirements. In addition, the proposed system does not rely only on the cloud providers to register their services; it also uses the agent technique to fetch cloud services from the Internet in order to make the cloud services information more accurate and up to date. We name the proposed application as the Agent Based Cloud Services Discovery system. Fig.1 shows the high-level architecture of the Agent Based Cloud Services Discovery system. The system consists of two sub managers: the Discovering and Retrieving sub manager and Finding sub manager.
A. The Discovering and Retrieving Sub Manager
This sub manager feeds the system repository with information about cloud providers and their published services. For example, it provides cloud provider name, service type, functional specifications, technical specifications, price, and QoS values. In other words, it builds and maintains the cloud services metadata.As we can see in Fig.2, the Discovering and Retrieving sub system uses two techniques to collect adequate and comprehensive information about existing cloud services:
1) Registration Template It is a web interface allows any cloud provider to add, edit,
or delete his cloud services. 2) Service Metadata Mobile Agents
We use agent technology to gather information from the cloud providers. Each provider has its own Service Metadata Mobile Agent. It works automatically at regular intervals of time to fetch any recently updated information. The Service Metadata Mobile Agent takes the price web page of the provider to extract all the cloud services with their specifications. It does this by reading the web page body and learning the techniques that are used by the provider to display the cloud services data on the web page. In the last stage, all the cloud services information from both
approaches are sent to a database agent. This agent is responsible for manipulating the data of the System Repository. It receives the cloud services information and update the Cloud Services Table.
B. The System Repository
It contains all the data that our Agent Based Cloud Services Discovery system needs. We use a Database Agent to manipulate the data in our System Repository. Some data require special preparations before they can be used. These are as follows:
1) The QoS for the Cloud Services Each cloud service in the Cloud Services Table has QoS specifications that are stored in the Cloud Services QoS Table.
There are a number of QoS characteristics that can be considered, but in our proposed system, we consider four QoS characteristics: cost, reputation, reliability, and security. A report that had the values of QoS attributes (reputation, reliability, and security) for each cloud service in our Cloud Services Table was received from a monitoring system and saved in the System Repository. Because of our budget limitations, we used a randomly generated QoS. Meanwhile, the cost value was driven from the Cloud Services Table. 2) The Cloud Services Data Clustering
In order to make the search process more efficient and less time consuming, the data in the Cloud Services Table needs to be clustered into groups. Instead of sending the entire Cloud Services Table to the Finding sub system, we divide the records into groups and select only the most similar services group to the user needs to be send. We use a Clustering agent to cluster the table. It works automatically each time the Database Agent updates the Cloud Services Table. It applies the K Means Clustering algorithm, which depends on the cloud services attributes as proposed by Gong and Sim [24]. In our proposed system, we enhanced the K Means Clustering algorithm and consider the Numeric attributes (number of virtual CPU cores, memory size, size of storage space, and price per hour) and the nonnumeric attributes (provider name, operating system type, operating system name, and network performance).The most important steps in the K Means Clustering algorithm are calculating the centroids and calculating the similarity scores.
a. Calculating the Centroids Each cloud services clustered group has unique centroids that are determined through the following steps: 1: Select random K records from the Cloud Services Table to be the initial centroids.
C= | i = 1, 2, …,k = | i=1, 2, …,n , where a is service's attribute value and n is the total number of attributes
ThecorrespondingvalueiftheattributeisnumericTheHashcodevalueiftheattributeisnonnumeric
2: Assign a centroid that has a minimum similarity score to each record in the Cloud Services Table. 3: Recalculate the centroids by using the arithmetic mean position for each single attribute (a) in all records within the
same group as follows: = | i=1, 2, …,n
... (1)
where x is the number of cloud service in the ci clustered group
ThecorrespondingvalueiftheattributeisnumericTheHashcodevalueiftheattributeisnonnumeric
80
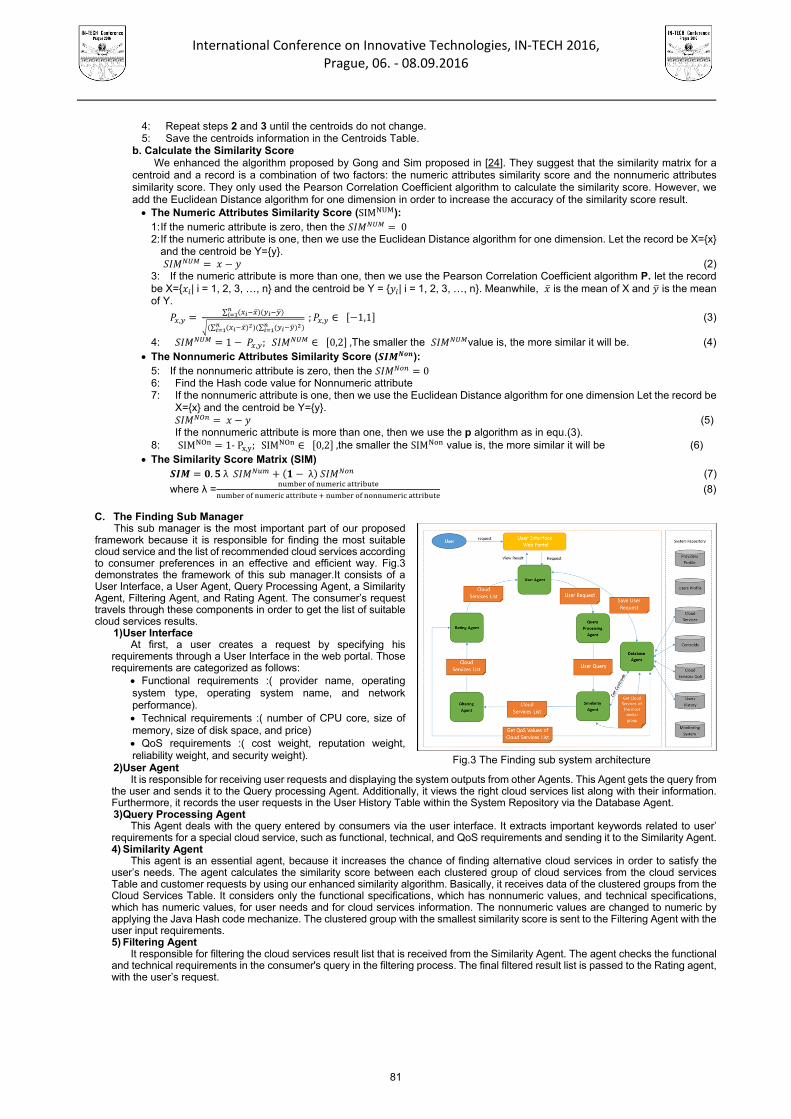
International Conference on Innovative Technologies, IN‐TECH 2016,
Prague, 06. ‐ 08.09.2016
Fig.3 The Finding sub system architecture
4: Repeat steps 2 and 3 until the centroids do not change. 5: Save the centroids information in the Centroids Table.
b. Calculate the Similarity Score We enhanced the algorithm proposed by Gong and Sim proposed in [24]. They suggest that the similarity matrix for a
centroid and a record is a combination of two factors: the numeric attributes similarity score and the nonnumeric attributes similarity score. They only used the Pearson Correlation Coefficient algorithm to calculate the similarity score. However, we add the Euclidean Distance algorithm for one dimension in order to increase the accuracy of the similarity score result. The Numeric Attributes Similarity Score (SIM ):
1: If the numeric attribute is zero, then the 0 2: If the numeric attribute is one, then we use the Euclidean Distance algorithm for one dimension. Let the record be X=x
and the centroid be Y=y. (2)
3: If the numeric attribute is more than one, then we use the Pearson Correlation Coefficient algorithm P. let the record be X= | i = 1, 2, 3, …, n and the centroid be Y = | i = 1, 2, 3, …, n. Meanwhile, is the mean of X and is the mean of Y.
, ∑
∑ ∑ ; , ∈ 1,1 (3)
4: 1 , ; ∈ 0,2 ,The smaller the value is, the more similar it will be. (4) The Nonnumeric Attributes Similarity Score ( ):
5: If the nonnumeric attribute is zero, then the 0 6: Find the Hash code value for Nonnumeric attribute 7: If the nonnumeric attribute is one, then we use the Euclidean Distance algorithm for one dimension Let the record be
X=x and the centroid be Y=y. (5)
If the nonnumeric attribute is more than one, then we use the p algorithm as in equ.(3). 8: SIM 1‐P , ;SIM ∈ 0,2 ,the smaller the SIM value is, the more similar it will be (6)
The Similarity Score Matrix (SIM) . λ λ (7)
where λ =
(8)
C. The Finding Sub Manager
This sub manager is the most important part of our proposed framework because it is responsible for finding the most suitable cloud service and the list of recommended cloud services according to consumer preferences in an effective and efficient way. Fig.3 demonstrates the framework of this sub manager.It consists of a User Interface, a User Agent, Query Processing Agent, a Similarity Agent, Filtering Agent, and Rating Agent. The consumer’s request travels through these components in order to get the list of suitable cloud services results.
1) User Interface At first, a user creates a request by specifying his
requirements through a User Interface in the web portal. Those requirements are categorized as follows:
Functional requirements :( provider name, operating system type, operating system name, and network performance). Technical requirements :( number of CPU core, size of memory, size of disk space, and price) QoS requirements :( cost weight, reputation weight, reliability weight, and security weight).
2) User Agent It is responsible for receiving user requests and displaying the system outputs from other Agents. This Agent gets the query from
the user and sends it to the Query processing Agent. Additionally, it views the right cloud services list along with their information. Furthermore, it records the user requests in the User History Table within the System Repository via the Database Agent. 3) Query Processing Agent
This Agent deals with the query entered by consumers via the user interface. It extracts important keywords related to user’ requirements for a special cloud service, such as functional, technical, and QoS requirements and sending it to the Similarity Agent. 4) Similarity Agent
This agent is an essential agent, because it increases the chance of finding alternative cloud services in order to satisfy the user’s needs. The agent calculates the similarity score between each clustered group of cloud services from the cloud services Table and customer requests by using our enhanced similarity algorithm. Basically, it receives data of the clustered groups from the Cloud Services Table. It considers only the functional specifications, which has nonnumeric values, and technical specifications, which has numeric values, for user needs and for cloud services information. The nonnumeric values are changed to numeric by applying the Java Hash code mechanize. The clustered group with the smallest similarity score is sent to the Filtering Agent with the user input requirements. 5) Filtering Agent
It responsible for filtering the cloud services result list that is received from the Similarity Agent. The agent checks the functional and technical requirements in the consumer's query in the filtering process. The final filtered result list is passed to the Rating agent, with the user’s request.
81
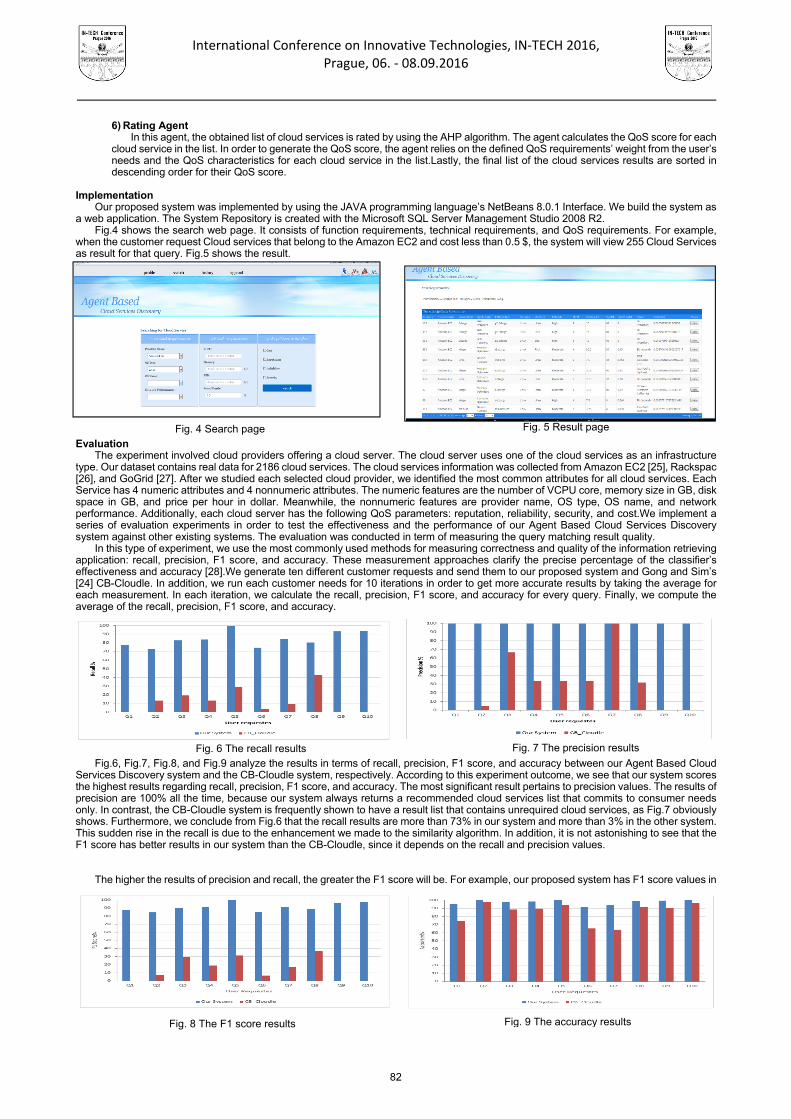
International Conference on Innovative Technologies, IN‐TECH 2016,
Prague, 06. ‐ 08.09.2016
Fig. 4 Search page Fig. 5 Result page
Fig. 6 The recall results
Fig. 8 The F1 score results
Fig. 7 The precision results
Fig. 9 The accuracy results
6) Rating Agent In this agent, the obtained list of cloud services is rated by using the AHP algorithm. The agent calculates the QoS score for each
cloud service in the list. In order to generate the QoS score, the agent relies on the defined QoS requirements’ weight from the user’s needs and the QoS characteristics for each cloud service in the list.Lastly, the final list of the cloud services results are sorted in descending order for their QoS score.
Implementation
Our proposed system was implemented by using the JAVA programming language’s NetBeans 8.0.1 Interface. We build the system as a web application. The System Repository is created with the Microsoft SQL Server Management Studio 2008 R2.
Fig.4 shows the search web page. It consists of function requirements, technical requirements, and QoS requirements. For example, when the customer request Cloud services that belong to the Amazon EC2 and cost less than 0.5 $, the system will view 255 Cloud Services as result for that query. Fig.5 shows the result.
Evaluation
The experiment involved cloud providers offering a cloud server. The cloud server uses one of the cloud services as an infrastructure type. Our dataset contains real data for 2186 cloud services. The cloud services information was collected from Amazon EC2 [25], Rackspac [26], and GoGrid [27]. After we studied each selected cloud provider, we identified the most common attributes for all cloud services. Each Service has 4 numeric attributes and 4 nonnumeric attributes. The numeric features are the number of VCPU core, memory size in GB, disk space in GB, and price per hour in dollar. Meanwhile, the nonnumeric features are provider name, OS type, OS name, and network performance. Additionally, each cloud server has the following QoS parameters: reputation, reliability, security, and cost.We implement a series of evaluation experiments in order to test the effectiveness and the performance of our Agent Based Cloud Services Discovery system against other existing systems. The evaluation was conducted in term of measuring the query matching result quality.
In this type of experiment, we use the most commonly used methods for measuring correctness and quality of the information retrieving application: recall, precision, F1 score, and accuracy. These measurement approaches clarify the precise percentage of the classifier’s effectiveness and accuracy [28].We generate ten different customer requests and send them to our proposed system and Gong and Sim’s [24] CB-Cloudle. In addition, we run each customer needs for 10 iterations in order to get more accurate results by taking the average for each measurement. In each iteration, we calculate the recall, precision, F1 score, and accuracy for every query. Finally, we compute the average of the recall, precision, F1 score, and accuracy.
Fig.6, Fig.7, Fig.8, and Fig.9 analyze the results in terms of recall, precision, F1 score, and accuracy between our Agent Based Cloud
Services Discovery system and the CB-Cloudle system, respectively. According to this experiment outcome, we see that our system scores the highest results regarding recall, precision, F1 score, and accuracy. The most significant result pertains to precision values. The results of precision are 100% all the time, because our system always returns a recommended cloud services list that commits to consumer needs only. In contrast, the CB-Cloudle system is frequently shown to have a result list that contains unrequired cloud services, as Fig.7 obviously shows. Furthermore, we conclude from Fig.6 that the recall results are more than 73% in our system and more than 3% in the other system. This sudden rise in the recall is due to the enhancement we made to the similarity algorithm. In addition, it is not astonishing to see that the F1 score has better results in our system than the CB-Cloudle, since it depends on the recall and precision values.
The higher the results of precision and recall, the greater the F1 score will be. For example, our proposed system has F1 score values in
82

International Conference on Innovative Technologies, IN‐TECH 2016,
Prague, 06. ‐ 08.09.2016
range of 84.62–100%, while the CB-Cloudle has F1 score results in the range of 6.65–36.49%.Besides, our proposed system increases the accuracy values rapidly if we compare it with the CB-Cloudle system results, as Fig.9 shows. We have great accuracy results between 91% to almost 100%, whereas the CB-Cloudle has results from 63% to 97%. Conclusion
Currently, cloud computing services are widely used by many users, companies, and organizations. This type of service is in high demand and needs to be used effectively and efficiently. There are a large number of cloud services over the Internet, and in the near future, this number will be dramatically increased. To the best of our knowledge, there is no agent based cloud computing system for discovering cloud services dependent on user’s functional, technical, budget, and QoS requirements. The novelty of this paper is that it gives the user the ability to express his or her needs in order to get the best appropriate service with a great quality and other recommended cloud services ranked by their QoS score results. In addition, the cloud services metadata is periodically updated automatically by the system or manually by cloud providers. To evaluate this proposed work, a series of experimental test was conducted. The test yielded the following results: the percentages of recall, precision, F1 score, and accuracy were radically enhanced by our system. The precision of retrieving results was always 100%. The accuracy was improved by about 14.43%. There are many areas for further exploration such as automate the entire life cycle of cloud services: negotiation, composition, consumption .Moreover, define a unified standard for description cloud services characteristics, QoS criteria, and SLA. Also, extend our work in this paper to cover another area such as cloud services management and allocation. References
[1] Buyya, R., Yeo, C., Venugopal, S., Broberg, J., & Brandic, I., Cloud Computing and Emerging IT Platforms: Vision, Hype, and Reality
for Delivering Computing as the 5th Utility. Future Generation Computer Systems, 2009. 25(6): p. 599-616.
[2] O, Akinwunmi A, A., Olajubu E, & A., Aderounmu G., A Trustworhty Model for Reliable Cloud Service Discovery. International Journal of Computer Applications, 2014. Volume 87 - Number 16: p. 23-30.
[3] Aswathi Vandana P, Bhaggiaraj S., Ranking Prediction of Cloud Services based on BPR. International Journal of Computer Applications, 2014. Volume 89(Number 9): p. 26-31.
[4] Linthicum, D.S., Cloud Computing and SOA Convergence in Your Enterprise: a step-by-step guide. 1 ed. 2009: Addison-Wesley.
[5] Mell, P. and T. Grance, NIST Definition of Cloud Computing. National Institute of Standards and Technology Special Publication 800-145, 2011.
[6] Microsoft Azure. Available from: https://azure.microsoft.com/en-us/.
[7] Google Cloud. Available from: https://cloud.google.com/.
[8] Salesforce. Available from: http://www.salesforce.com/.
[9] Kang, J. and K.M. Sim, Cloudle: An Agent-based Cloud Search Engine that Consults a Cloud Ontology in Cloud Computing and Virtualization Conference 2010.
[10] Mukhopadhyay, F.J.C. and Jadhav, N. N., QoS Based Framework for Effective Web Services in Cloud Computing Journal of Software Engineering and Applications, 2012. 5(11A): p. 952-960.
[11] Parhi, M., B. Pattanayak, and M. Patra, A Multi-agent-Based Framework for Cloud Service Description and Discovery Using Ontology, in Intelligent Computing, Communication and Devices, L.C. Jain, S. Patnaik, and N. Ichalkaranje, Editors. 2015, Springer India. p. 337-348.
[12] Garg, S.K., S. Versteeg, and R. Buyya, A framework for ranking of cloud computing services. Future Generation Computer Systems, 2013. 29(4): p. 1012-1023.
[13] Ali, A., S.M. Shamsuddin, and F.E. Eassa, Ontology-based Cloud Services Representation. Research Journal of Applied Sciences, Engineering and Technology, 2014. 8(1): p. 83-94.
[14] Wu, J., Chen, L., Xie, Y., & Zheng, Z., Titan: a system for effective web service discovery, in Proceedings of the 21st International Conference on World Wide Web2012, ACM: Lyon, France. p. 441-444.
[15] Kang, J. and K.M. Sim, A Cloud Portal with a Cloud Service Search Engine,, in 2011 International Conference on Information and Intelligent Computing2011.
[16] Yue-Shan, C., Tong-Ying, J., Che-Hsiang, C., & Jing-Shyang, Y. Integrating intelligent agent and ontology for services discovery on cloud environment. in Systems, Man, and Cybernetics (SMC), 2012 IEEE International Conference on. 2012.
[17] Afify, Y., Moawad, I., Badr, N., & Tolba, M. F., Cloud Services Discovery and Selection: Survey and New Semantic-Based System, in Bio-inspiring Cyber Security and Cloud Services: Trends and Innovations, A.E. Hassanien, et al., Editors. 2014, Springer Berlin Heidelberg. p. 449-477.
[18] Han, T. and K.M. Sim. An Ontology-enhanced Cloud Service Discovery System. in Proceedings of the International MultiConference of Engineers and Computer Scientists2010. 2010. Hong Kong.
Kang, J. and K. Sim, Cloudle: An Ontology-Enhanced Cloud Service Search Engine, in Web Information Systems Engineering – WISE 2010 Workshops, D.W. Chiu, et al., Editors. 2011, Springer Berlin Heidelberg. p. 416-427.
[19] Kwang Mong, S., Agent-Based Cloud Computing. Services Computing, IEEE Transactions on, 2012. 5(4): p. 564-577.
[20] Jaeyong, K. and S. Kwang Mong. Cloudle: A Multi-criteria Cloud Service Search Engine. in Services Computing Conference (APSCC), 2010 IEEE Asia-Pacific. 2010.
[21] Jaeyong, K. and S. Kwang Mong. Ontology and search engine for cloud computing system. in System Science and Engineering (ICSSE), 2011 International Conference on. 2011.
[22] Shengjie, G. and S. Kwang Mong. CB-cloudle: A centroid-based cloud service search engine. in Proceedings of the International MultiConference of Engineers and Computer Scientists. 2014.
[23] Shengjie, G. and S. Kwang Mong. CB-Cloudle and cloud crawlers. in Software Engineering and Service Science (ICSESS), 2014 5th IEEE International Conference on. 2014.
83

International Conference on Innovative Technologies, IN‐TECH 2016,
Prague, 06. ‐ 08.09.2016
[24] Amazon EC2. Available from: https://aws.amazon.com/ec2/.
[25] Rackspace. Available from: http://www.rackspace.com/.
[26] GoGrid. Available from: www.gogrid.com/.
[27] Chang, Y.-S. and H.-T. Cheng, A scientific data extraction architecture using classified.
84

International Conference on Innovative Technologies, IN‐TECH 2016,
Prague, 6. ‐ 8. 9. 2016
GENERATIONS OF INNOVATION MODELS AND THEIR CHARACTERISTICS – TOWARDS CREATING A NEW INNOVATION
MODEL
Lj. Stefanovska Ceravolo 1 and R. Polenakovikj2 1 “Goce Delcev” University in Stip, Faculty of Mechanical Engineering, Republic of Macedonia
2 University “Ss. Cyril and Methodius” Skopje, Faculty of Mechanical Engineering, Republic of Macedonia
Keywords: Innovation; Innovation Models; Open Innovation; Technological Innovation; Innovation Process
Abstract: Innovation is a process that consists of phases and activities and requires resources and knowledge. Innovation models define the innovation process. Innovation models are mentioned in the literature reviews with different names such as work frame, paradigm, sequence, process, etc. In this paper we give a summary of six generations of innovation models in order to show their transformation from linear models to models of open innovation. Each generation of innovation models has a specific character. Independent of the chronology and typology that has been used to separate models into generations, the focus can be put on social, educational and organizational innovation on one side, and technological innovation on the other side. We focus on the company level innovation models. The first and second generation innovation models are very simple and they are predictors of innovation models of the third generation which confirm that innovation can occur in different places throughout the process. The fourth generation focuses on product and process integration and the fifth generation models accent system integration and networking. The sixth generation of innovation models is characterized by dynamism, integration, systematic approach and a high level of interactivity. Introduction
Innovation models are not news in the modern economy. They have been used to help companies achieve their peak of innovation and success. The innovation process has evolved tremendously in the last few decades of the XX century, beginning with linear and sequential models. Large corporations create their own innovation models in order to manage the innovation process [1]. Companies need to create innovation models because it will help them manage the order in which innovation activities are happening, define resources and responsibilities, it will help in determining which methods and tools they will use etc. Innovation models are mentioned in the literature reviews from the late 1960’s and early 1970’s with different names such as work frame, paradigm, sequence, process, and very rarely the word model is being used. After the 1970’s authors tend to use the word model in order to describe the innovation process flow or framework for innovation activities and we can notice the words models of change, models of invention, models of creativity, etc. [2]. The popular linear innovation model is referred in the earlier literature more as a linear sequence, and not so much as a linear model. Types of innovation and their classification
All classification of innovation models in literature represent terms that explain where something new, better or different occurs, depending on the degree of detail. Innovation can occur at any level of a company and by any employee. Therefore, we made a list of different types of innovation that we simplified and will use for further reference and analysis. Innovation may be classified as: a) according to object/subject of innovation (innovation of a product/process/service/production method or work placement to new markets, sources of supply, ways of organizing work); b) according to how big the innovation is and to whom it would be considered an innovation (innovation for the firm, innovation for the market and sector, news for the world etc.); c) according to target/target groups of innovations (disruptive and maintained innovation); d) according to the openness of the innovation (open and closed innovation); e) according to the impact of the innovation on the overall business strategy (innovation that creates value for customers, for the business and innovations that are trying to reach the purchasing power of consumers); f) according to the frequency of innovations (continuous and non-consistent innovation); g) according to the functionality to which innovations relate (modular and architectural innovation) [3,4,5,6]. Because of the many different types and classifications of innovation, this research paper will continue to focus on three classifications of innovation and their types: 1) object of innovation (innovation of products/goods/services, methods of production, business processes, marketing innovation, technological innovation); 2) the innovation size (radical, incremental and disruptive innovation); and 3) place of innovation activity and where it occurs (open and closed innovation). We narrowed the classifications mostly because many companies are not able to recognize the type and/or classification of innovations they have.
Generations of innovation models and their characteristics
Innovation as a process has a very dynamic characteristic, and that is why the models of innovations have transformed throughout the years. Different researchers give their own typologies of innovation models that mainly use the chronology of Rothwell’s five generations of innovation models. Rothwell gives a historical perspective of innovations management that shows how innovation models have transformed from linear to complex interactive models [7]. The approach to innovation management he gives in his classification relates to the evolution of organizations, the strategies of innovations management under various socio-economic and political circumstances and not the substantive development of the innovation models themselves [8]. Another typology of innovation models is presented by Marinova and Phillimore where they present six generations of innovation models [9]. They use technological models that apply to the overall economy, and give a theoretical background of the generations of the innovation models and their positive sides as well as their faults [10]. Rothwell’s typology is based on company’s models of innovation. Based on the chronology and typology of Rothwell, Kotsemir
85

International Conference on Innovative Technologies, IN‐TECH 2016,
Prague, 6. ‐ 8. 9. 2016
and Meissner suggest six generations of innovation models, where they add the open innovation model as a sixth generation model [11]. Table 1 shows the generations of innovation models by Rothwell [12], Marinova and Phillimore [13] and Kotsemir and Meissner (2013) [14].
Table 1. Generations of innovation models, author’s adaptation of Rothwell (1992), Marinova and Phillimore (2003) and Kotsemir and Meissner (2013)
Generation Period Rothwell Marinova & Phillimore Kotsemir & Meissner
1 1950’s –
mid 1960’s Technology push model The black box model
Technology push model
2 Mid 1960’s
– early 1970’s
Market pull model Linear models (technology
push – need pull)
Market need pull model
3 Early
1970’s – mid 1980’s
Interactive or Coupling model Interactive models (coupling
and integrated models)
Coupling model
4
Early 1980’s –
early 1990’s
Integrated innovation process (parallel development)
Models of innovation systems (networks and national
innovations system)
Interactive model
5 1990’s SIN (Systems integration and
Networking Model) Evolutionary models
Networking model
6 Innovation milieu Open innovation model The father of the open innovation model is Henry W. Chesbrough, who has introduced this concept stating that innovation has
become an increasingly open process thanks to a growing division of labor [15].
First generation of innovation models
The linear model of innovation represents the first generation of innovation models. It is a simple model, with no feedback loops, with predetermined phases and of a consecutive nature. The model was widely used after World War II, and has been developed in three phases such as: 1) phase of idealization of pure science; 2) applied science and its connection to pure science; and 3) development phase [16]. Therefore, the main phases of the first generation linear model of innovation (technology push) are: 1) basic science; 2) design and engineering; 3) manufacturing; 4) marketing and 5) sales [17,18]. Emphasis was put on R&D in companies, where it was believed that the more R&D is done, then more new products will be out. This did push innovations forward, but did not give enough attention to the transformation process [19] or the needs of the market place and the consumers [20]. Such innovation model can and is still being used by some companies mainly for defining the process of product and service development, and collaboration with suppliers. All but the marketing phase are existent, and it doesn’t take in consideration the customer’s needs. An additional control element is added between each phase, to approve the transition from one phase to another. It is called the first generation innovation model from the USA [21].
Second generation of innovation models
In this generation, emphasis was put on the market and consumer needs. That is why the linear model of the second generation was given the name market pull/demand pull/need pull. The difference between this model and the previous one is that this model sees the consumer need as a source of ideas for the marketplace [22]. One of the most popular models of the second generation of innovation models in the USA is the stage-gate model, predominantly used by NASA in the 1960’s while trying to find creative innovative ideas to send a man on the Moon. This model, further simplified and suggested by Cooper [23] consists of five relevant phases or stages (Fig. 1), and decisions (happen at the gates which function as a controlling element) positioned after each phase in order to follow the fulfillment of strict and predetermined criteria before we move onto the next stage [24]. Research shows that this type of model has been adopted and used by many other companies as well [25].
Fig. 1 Cooper’s Stage Gate Model (Source: Cooper, 1994)
Third generation of innovation models
This generation of innovation models treats innovation as a combination of technology pushes and market pulls. The models include interaction and feedback [26]. Its representative is the Interactive model of innovation or Coupling model (for ex. The Coupling model of Myers & Marqis), where the innovation activities are divided in subcategories under each phase, and all of them are interacting [27]. According to Rothwell and Zegveld (1965), the whole scheme of the innovation process can be pictured as a complexed network of
86

International Conference on Innovative Technologies, IN‐TECH 2016,
Prague, 6. ‐ 8. 9. 2016
communication paths, inside an organization as well as outside of it, connecting the different inter organization functions and the company with the broad scientific and technological environment and the market. According to Mowery and Rosenberg (1991) these models could not differentiate the need from the demand.
Fourth generation of innovation models
The fourth generation of innovation models has the Chain-Linked Model as its representative, developed by Rosenberg and Kline (1986). The models from this generation consist of the basic stages of the linear models of innovations, enriched by many feedback loops and interaction between the stages, as well as a validation of the knowledge gained in the innovation process [28]. It corresponds to the Japanese perception of the innovation process and it was the answer to the need of replacing the linear model with a different model that can reflect the complex innovation process [29].
Fifth generation of innovation models
Rothwell’s SIN (Systems Integration and Networking) model is a model of the fifth generation of innovation models. It incorporates the higher integration inside companies as well as with the outside entities such as suppliers, consumers, universities and authorities [30]. The different activities within the innovation process are integrated and can occur simultaneously, with feedback loops. Functions can overlap, and innovation happens inside the company. The need for such a model started since there was a trend of cutting down on R&D costs, so companies had to network and find different ways to run their innovative activities [31]. Information systems became the next big thing and started being incorporated into company’s work, especially in process automation and in expediting the communications inside a company’s network [32].
Sixth generation of innovation models
The Open Innovation Model (Fig. 2 The Open Innovation Model [33]) is created and introduced by Chesbrough and underlines idea management not just within the organizations, but also with other organizations. This model promotes using outside knowledge, such as suppliers, competition, entrepreneurs, scientists etc. [34]. R&D is being done by outside partners, and ideas can occur while developing a new product/service and can change the course of the process. The main sources of the innovative ideas are outside sources such as universities, research centers, suppliers, competition, government bodies and consumers [35]. The main four phases of this innovation model are:1) research; 2) development; 3) manufacturing; and 4) marketing, but they are coupled with other processes and entities and are of an interactive nature [36]. The Open Innovation Model puts its emphasis on reducing the cost for R&D which will be taken over by publicly funded research centers or universities, and ideas will be chosen through a highly competitive selection process. It also promotes transparency as a key for a successful innovation, as well as generating a large amount of innovative ideas. Such models have been implemented in large companies, but there are also findings that open innovation models have been used in SME’s as well, primarily for market related motives, such as meeting customer demands and keeping up with competitors where the biggest challenges lie in organizational and cultural issues as a consequence with dealing with increased external contacts [37]. The open innovation process can be 1) the outside in process; 2) the inside out process; and 3) the coupling process [38].
Fig. 2 The Open Innovation Model (Chesbrough, 2014) Conclusion
From the above mentioned we can conclude that the innovation model that could be widely applicable to different types and sizes of companies, should be of a simple nature, easy to use with enough details that will be able to clearly describe the innovation process. A set of measures should be predetermined and tools for evaluation of the feedback received by customers and suppliers. A focus should be put on knowledge gain and on maintaining the knowledge level at the company, as well as achieving a continuous learning culture. Networking is one of the best ways for a company to increase its innovation capability and performance. Companies need to determine what drives their innovations and to take action. As a beginning of the innovation process we can say that generation of ideas is the most important part, as well as planning a reliable and safe funneling and distribution of the same ideas. The next stage should be the selection stage, where companies can determine whether their ideas have the potential for realization or not. Four components should be taken in consideration: marketing, legal, economical and developmental component. These can be used as controlling elements in order to determine whether a company should proceed with the next stage or not. Next stages for continuing of the innovation process are planning
87

International Conference on Innovative Technologies, IN‐TECH 2016,
Prague, 6. ‐ 8. 9. 2016
and realization, diffusion and marketing, and of course the feedback (from customers, suppliers and environment) which is a “must have” in innovation models.
References
[1] D. Jovanoski, Innovations management (University “Ss. Cyril and Methoduis”, Faculty of Mechanical engineering, Skopje, 2012) [2] B. Godin: The Linear model of innovation the historical construction of an analytical framework. Science, Technology & Human
Values, 31(6) (2006), pp.639-667. [3] R. Garcia and R. Calantone: A critical look at technological innovation typology and innovativeness terminology: a literature review.
Journal of product innovation management, 19(2) (2002), pp.110-132. [4] H. W. Chesbrough, Open Innovation: The new imperative for creating and profiting from technology. (Harvard Business School
Press, Boston, 1 March 2003, ISBN 978-1578518371) [5] C. J. Colin Cheng, and E. K. Huizingh: When is open innovation beneficial? The role of strategic orientation. Journal of product
innovation management 31, no. 6 (2014): 1235-1253. [6] A. Brem, and I. Björn: Do Frugal and Reverse Innovation Foster Sustainability? Introduction of a Conceptual Framework, Journal of
Technology Management for Growing Economies (2013) 4, no. 2. [7] R. Rothwell, and W. Zegveld, Innovation and the small and medium sized firm. (University of Illinois at Urbana-Champaign's
Academy for Entrepreneurial Leadership Historical Research Reference in Entrepreneurship, 1982) [8] M.N.Kotsemir, A. Abroskin and D. Meissner: Innovation concepts and typology–an evolutionary discussion. Higher School of
Economics Research Paper No. WP BRP. (2013) Feb 20;5. [9] D. Marinova and J. Phillimore: Models of innovation, The international handbook on innovation (2003) pp. 44-53 [10] same as [8] [11] same as [8] [12] R. Rothwell:Towards the Fifth‐generation Innovation Process, International Marketing Review (1994), Vol. 11 Iss: 1, pp.7 - 31 [13] L. V. Shavinina (Ed.) The international handbook on innovation. (Elsevier, 2003). [14] same as [8] [15] H. W. Chesbrough: Why companies should have open business models. MIT Sloan management review (2007), 48(2), 22. [16] same as [2] [17] same as [2] [18] A. Le Corre and G. Mischke, The innovation game: a new approach to innovation management and R&D. (Springer, 2002). [19] C. F. Carter and B. R. Williams, Industry and technical progress (1957) [20] R. Rothwell and H. Wissema: Technology, culture and public policy. Technovation (1986), 4(2), 91-115. [21] same as [1] [22] G. D. Hughes and D. C. Chafin: Turning new product development into a continuous learning process, Journal of Product Innovation
Management (1996), 13(2), 89-104 [23] R. G. Cooper: Third‐generation new product processes, Journal of product innovation management 11 (1994), no. 1: 3-14. [24] R. G. Cooper and E. J. Kleinschmidt: Stage-gate process for new product success, Innovation Management U 3 (2001): 2001. [25] R. G. Cooper, S. J. Edgett and E. J. Kleinschmidt:Optimizing the stage-gate process: what best-practice companies do—I
Research-Technology Management (2002), 45(5), 21-27. [26] M. Hobday: Firm-level innovation models: perspectives on research in developed and developing countries, Technology Analysis &
Strategic Management (2005), 17(2), 121-146 [27] same as [9] [28] C. D. Ryan and P. W. Phillips: Knowledge management in advanced technology industries: an examination of international
agricultural biotechnology clusters, Environment and Planning C (20040, 22(2), 217-232 [29] D. Mahdjoubi: The Linear Model Of Technological Innovation: Background and Taxonomy, UTexas working paper (1997) [30] same as [26] [31] same as [26] [32] G. Gabison and A. Pesole: An Overview of Models of Distributed Innovation. Open Innovation, User Innovation, and Social
Innovation. No. JRC93533. (Institute for Prospective and Technological Studies, Joint Research Centre, 2014) [33] H. Chesbrough and M. Bogers, Explicating open innovation: Clarifying an emerging paradigm for understanding innovation, (In: H.
Chesbrough, W. Vanhaverbeke, J. West, eds. New Frontiers in Open Innovation. Oxford University Press, Oxford, forthcoming. Downloaded from https://yannigroth.com/2011/10/18/academic-representations-of-crowdsourcing-co-creation-and-open-innovation/ )
[34] same as [32] [35] same as [32] [36] same as [4] [37] V. Van de Vrande, J. P. De Jong, W. Vanhaverbeke and M. De Rochemont, Open innovation in SMEs: Trends, motives and
management challenges. Technovation (2009), 29(6), 423-437. [38] E. Enkel, O. Gassmann and H. Chesbrough: Open R&D and open innovation: exploring the phenomenon. R&D Management
(2009), 39: 311–316.
88

International Conference on Innovative Technologies, IN‐TECH 2016,
Prague, 6. ‐ 8. 9. 2016
MODIFICATION ON ACTIVE MAGNETIC BEARINGS TEST-RIG FOR IMPLEMENTING DIFFERENT CONTROL ALGORITHMS
S. Blazevic1, S. Braut 2, Z. Car 3 and R. Zigulic 4 1, 2, 3, 4 Faculty of Engineering University of Rijeka, Vukovarska 58, 51000, Rijeka, Croatia,
1 [email protected], 2 [email protected], 3 [email protected], 4 [email protected]
Keywords: Active Magnetic Bearings; Control; Modification On Controller Components Abstract: Decentralized PID control with notch filters is still one of the simplest control strategy for active magnetic bearings (AMB) supporting an elastic rotors. In a case of upgrading an existing PID control system one of possible solution could be to add a new FPGA controller and retaining an existing AMB power electronics, to be able of implementing different control algorithms and decoupling of control axis. The first step of implementing this idea, elaborated in this paper, is transferring PID controller from original to a new FPGA controller. In the absence of original controller design data, the reverse engineering is applied. Application of new controller design ensured a stable rotor levitation, comparable to levitation accomplished by original controller. Introduction
Active magnetic bearings needs active control of the system to work stabile. To achieve this a variety of control algorithms is available depending on different application e.g. required pass through first critical frequency [1 2], robust control [3], adaptive control [4, 5], decoupling and centralized control [6].
This paper consider upgrade of existing test rig based on decentralized 4 axis AMB controller. To be able to implement more complex centralized control algorithms an additional FPGA controller is added but the existing power electronics will be used. This paper gives verification of the first step of proposed upgrade by means that PID control logic is transferred to new FPGA controller.
Original System Description
Active magnetic bearing test rig is shown on Fig. 1 and contains two active magnetic bearings (1, 2), rotor (3), disks (4, 5), clutch (6), electromotor (7), and connection place of sensors (8). Fig. 2 a) shown control part of AMB test rig, which contains of two controllers (1, 2), three rectifiers (3, 4, 5) and frequency converter for electromotor (6). Fig. 2 b) shown principal connection scheme of original AMBs test rig system. Original controller software [7] allows only change parameters of PID controller Fig. 3 (P - proportion gain, D - derivative gain, I – integration gain, Imax – integration limit) and frequencies of low pass and notch filters, in other words only decentralized control is possible. In Fig. 3 is shown original controller application for setting the parameters of the system. With experiments it is determine that system work well with parameters for bearing A (P=80, D=120, I=20, Imax= 450, NT1=155 Hz, NT2=273 Hz) and for bearing B (P=55, D=120, I=20, Imax= 450, NT2=273 Hz).
Fig. 1 Active magnetic bearing test rig
System Upgrade
For implementation of mentioned algorithms, it is required to install new controller Fig. 4 a). Hardware components for new controller is chosen to be NI cRIO-9024 [8] with FPGA (Field-Programmable gate array) and processor, input module NI 9215 [9] and output module NI 9263 [10]. The preferred way is to leave original controller and to add new controller, because power electronics circuitry of original controller can be used. For connecting new controller sensor connector must be disconnected from original controller and connected to input module. Output module needs to be connected to original controller where sensor was connected earlier. Principal connection scheme is given in Fig 4 b). In the first place for confirming that system can work with a new controller is to get same response with PID algorithms programed in it.
Parameters for PIDs are not in the standard unit expected for this system, so reverse engineering for obtain true meaning of that parameters is required. For obtain P parameter for this system we set P on some value, w# set to some constant value with disconnected inputs, unset notch filters and measure iset#. One unit of P is equal 91.41 A/m or 0.02774 A/V. Similar is for I component where we watch
89

International Conference on Innovative Technologies, IN‐TECH 2016,
Prague, 6. ‐ 8. 9. 2016
increase or decrease of iset# signal when w# is constant in some time period. One unit of I is equal to 890.25 A/(ms) or 0.2672 A/(Vs). For D sine wave of constant frequency is used to compare amplitudes of iset# and w#. One unit of D is equal 0.298 As/m or 8.953·10-5 As/V.
Fig. 2 Original controller and principal scheme for AMBs test rig
Fig. 3 Original controller application
Application for control active magnetic bearing test rig in c-RIO is develop in Labview 2014. Part of block diagram for control AMB AX
is shown in Fig. 6, and other three axis have the same architecture. First is three filters one low pass and two notch in the same frequencies mentioned earlier (for AMB B there is only one notch and low pass filter). Next is calibration voltage to reset value over central position and regulation error calculation. Next is PID controller algorithm where P, D, I component is numerically calculated and add together. To avoid wind-up effect, it is necessary to put limitation on integral component and overall it is necessary to check if the voltage signal is in the range from 0 to 3,33 V, because over voltage may do damage in input card of original controller.
In MXCo we set P to 37 in accordance to earlier measured and calculated parameters. In Labview application we set parameters like is shown in Fig. 7. It is also necessary to put low pass filter off in MXCo application, so it is set to value of 3000 Hz, which is a lot greater than 600 Hz witch is set in Labview application so it does not affect the control system.
Fig. 4 New FPGA controller and principal scheme for AMB test rig
90
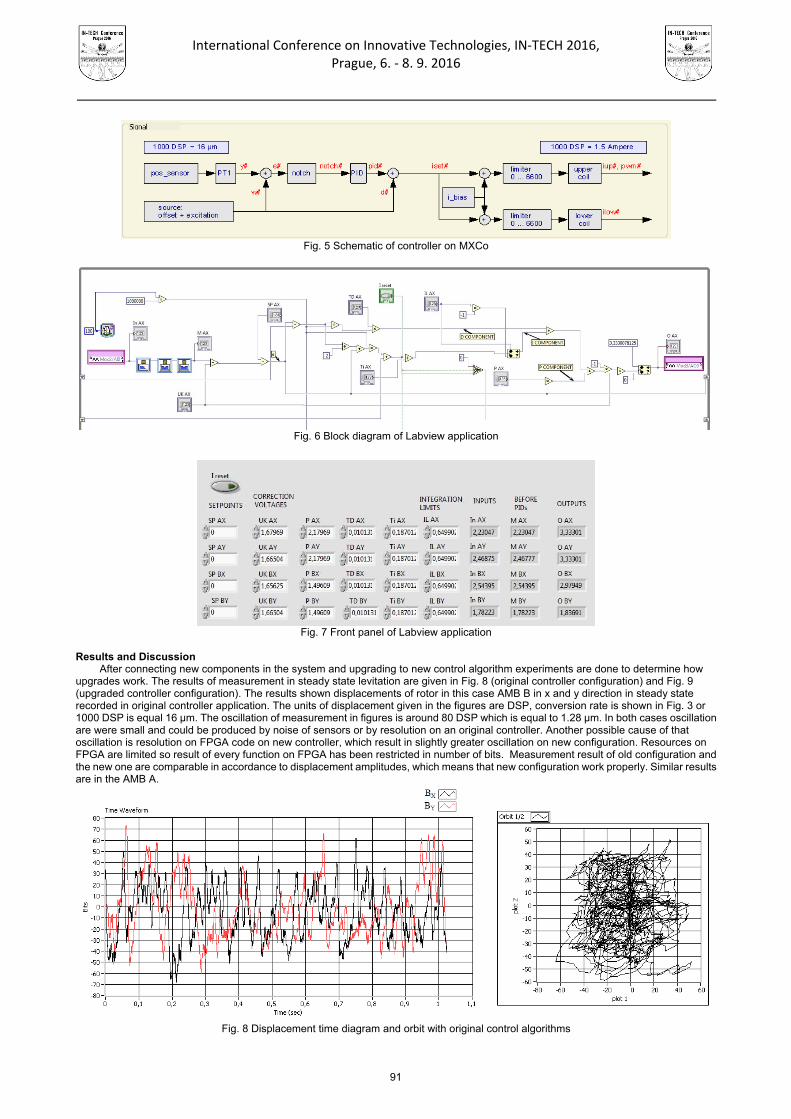
International Conference on Innovative Technologies, IN‐TECH 2016,
Prague, 6. ‐ 8. 9. 2016
Fig. 5 Schematic of controller on MXCo
Fig. 6 Block diagram of Labview application
Fig. 7 Front panel of Labview application
Results and Discussion
After connecting new components in the system and upgrading to new control algorithm experiments are done to determine how upgrades work. The results of measurement in steady state levitation are given in Fig. 8 (original controller configuration) and Fig. 9 (upgraded controller configuration). The results shown displacements of rotor in this case AMB B in x and y direction in steady state recorded in original controller application. The units of displacement given in the figures are DSP, conversion rate is shown in Fig. 3 or 1000 DSP is equal 16 µm. The oscillation of measurement in figures is around 80 DSP which is equal to 1.28 µm. In both cases oscillation are were small and could be produced by noise of sensors or by resolution on an original controller. Another possible cause of that oscillation is resolution on FPGA code on new controller, which result in slightly greater oscillation on new configuration. Resources on FPGA are limited so result of every function on FPGA has been restricted in number of bits. Measurement result of old configuration and the new one are comparable in accordance to displacement amplitudes, which means that new configuration work properly. Similar results are in the AMB A.
Fig. 8 Displacement time diagram and orbit with original control algorithms
91

International Conference on Innovative Technologies, IN‐TECH 2016,
Prague, 6. ‐ 8. 9. 2016
Fig. 9 Displacement time diagram and orbit with new control algorithms
Conclusion This paper consider upgrade of existing test rig based on decentralized 4 axis AMB controller. To be able to implement more complex
centralized control algorithms an additional FPGA controller is added but the existing power electronics is used. Developed code in Labview 2014 is given. Verification of this first step of proposed upgrade is performed by means that PID control algorithms is transferred to new FPGA controller. Given results of stable levitation is presented as an amplitudes in time domain.
Next step of research will be implementation of centralized control to achieve better performance in supercritical rotor operation. Not enough resources in FPGA for implementing complex algorithms is a limitation. Another step is to try implementing those code on cRIO processor and confirm with experiment that this idea work. Acknowledgment This study is supported by University of Rijeka Grants (No. 13.09.1.2.11 and No. 13.09.2.2.19). References [1] E. Tang, J. Fang, S Zheng and D. Jiang: Active Vibration Control of the Flexible Rotor to Pass the First
Bending Critical Speed in High Energy Density Magnetically Suspended Motor, Journal of Engineering for Gas Turbines and Power-Transaction of ASME, Vol. 137 (2015), Issue 11, pp. 112501-112501-9.
[2] E. Tang, J. Fang and B. Han: Active Vibration Control of the Flexible Rotor in High Energy Density Magnetically Suspended Motor with Mode Separation Method, Journal of Engineering for Gas Turbines and Power-Transaction of ASME, Vol. 137 (2015), Issue 8, pp. 082503-082503-10.
[3] A. Noshadi, J. Shi, W. S. Lee, P. Shi and A. Kalam: System Identification and Robust Control of Multi-Input Multi-Output Active Magnetic Bearing Systems, IEEE Transaction on Control Systems Technology, Volume 24 (2016), Issue 4, pp. 1227-1239.
[4] C. Liuand G. Liu: Autobalancing Control for MSCMG Based on Sliding-Mode Observer and Adaptive Compensation, IEEE Transaction on Industrial Electronics, Volume 63 (2016), Issue 7, pp. 4346-4356.,
[5] X. Xu, S. Chen and Y. Zhang: Automatic Balancing of AMB Systems Using Plural Notch Filter and Adaptive Synchronous Compensation, Journal of Sound and Vibration, Volume 374 (2016), pp 29-42.
[6] H. Jeon, and C. Lee: Proportional-Integral-Derivative Control of Rigid Rotor-Active Magnetic Bearing System via Eigenvalue Assignment for Decoupled Translational and Conical Modes, Journal of Vibration and Control, Volume 21 (2015), Issue 12, pp. 2372-2393.
[7] C. Klesen, U. Oldendorf and M. Aenis: Mecatronix: User Interface MXCoMB 8.2.6, Mecatronix GmbH, Darmstand, Njemačka, 2009. [8] National Instruments: NI cRIO-9024, National Instruments, http://sine.ni.com/nips/cds/view/p/lang/en/nid/207371, 2.5.2016 [9] National Instruments: NI 9215, National Instruments, http://sine.ni.com/nips/cds/view/p/lang/en/nid/208793, 2.5.2016 [10] National Instruments: NI 9263, National Instruments, http://www.ni.com/datasheet/pdf/en/ds-59, 2.5.2016
92

International Conference on Innovative Technologies, IN‐TECH 2016,
Prague, 6. ‐ 8. 9. 2016
PICTOGRAM PHILOSOPHY (UNTRADITIONAL GRAPHIC LANGUAGE) IN THE DESIGN OF MOVIE POSTER
R. Mahmoud 1
1 Assistant professor, Advertising department, Faculty of Applied Arts, Helwan University, Egypt Keywords: Pictogram; Movie Poster; Design; Untraditional Graphic Language Abstract: A movie poster in its broad meaning is considered as a poster used to promote and advertise a movie. It is normally contains an image with text. Recently, posters are often featuring photographs of the main actors. Prior to the 1990s, illustrations, instead of photos, were far more commonly used. The texts on a movie poster were usually emphasized the title of the movie in large letterings and very often the names of the main actors and actresses. Also, it may included a tagline, the name of the director, names of characters, the release date, etc.The most effective movie posters are iconic, presenting the themes of the movie without resorting out what it is about. These posters use imagery, whether a close-up of a character or item that is a major plot point or a simple graphic, to establish the movie’s plot. Combined with an eye-grabbing design, an incredibly effective way to gain attention and create interest at once could be attained. It was concluded that the pictogram is a quick and clear communication tool without using language or words. The pictogram is understood independently of writing, words, culture and language and indicator of path finding. It is interpreted quickly and clearly, gives knowledge, save the time for users, draw attention and therefore useful for users. from the afore mentioned information, this research will try to study the benefits of using the pictogram as a graphic element in the design of the movie posters in an attempt to achieve an unusual form to show, easily and unusually, dramatic content in the poster.
Introduction An eye-catching and original poster is very important for any major success of a movie. It is a pretty hard task to embody the plot in
one single poster. Of course the designer can use such powerful tools like typography, colors and protagonist faces; but still he has to know the secret formula for mixing all these things in the right way. Nowadays, many talented artists are trying to represent the movie poster in a new style by using abstract pictures such as pictograms in order to get out of the normal style of common movie posters. It was a real challenge to mark out some features of pictogram as a graphic language since pictorgrams utilize design elements in a manner differs from ordinary pathway of routine elements used to describe movie posters. From this prospective, the present research will focus on how to use the pictograms in the design of movie poster in order to make it more attractive and easier in reaching its dramatic content. [11] The study involved: a review of the effectiveness and the importance of pictograms a survey of pictograms used in movie posters and their analyses an applied experimental design What is a movie poster?
A movie poster is a poster used to promote and advertise a film. Studios often print several posters that vary in size and contents for various domestic and international markets. These posters are normally containing an image with text. Film posters have been used since the earliest public exhibitions of films. They began as outside placards listing the program of (short) films to be shown inside the hall or movie theater. During early 1900s, they began to feature illustrations of a film scene or an array of overlaid images from several scenes. Other posters have used artistic interpretations of a scene or even the theme of the film, represented in a wide variety of artistic styles. [8] The main elements of movie poster :
Part 1 – STYLE : When the designer set out to design the movie poster; he needs to decide first what kind of movie his poster is going to represent. The designer should try to convey the general mood of the film to its graphic design. The poster should be striking, memorable and focused on a single and clear message.
Part 2 – TEXT : The next thing to focus on is the text. A part from the movie title; the movie poster must also contain a tag line (a striking sentence or branding slogan that conveys the movie’s message), the name of the director, names of main actors or characters, the release date and a billing block (credits at the bottom).
Part 3 – IMAGES : The most difficult step when designing the movie poster is choosing images. If there aren't any good pictures of actors or movie scenes, the designer can try to substitute them by more symbolic images. Otherwise, the designer may have to forgo photos for representative drawings, which would make the poster illustrative rather than photographic. [10] What is pictograms?
There are many definitions of pictograms; here is a review of some of them: A pictogram is a stylized figurative drawing that is used to convey information of an analogical or figurative nature directly to indicate an object or to express an idea. [1]
93

International Conference on Innovative Technologies, IN‐TECH 2016,
Prague, 6. ‐ 8. 9. 2016
The Pictogram, a visual language developed for all people. It is an attractive way of displaying data. [6] p.1 Pictograms or icons are a keystone of nonverbal and multicultural communication . [4] pictogram is a symbol of the pictorial graphic system. It is an image created by people for the purpose of quick and clear
communication. It is essentially a picture of the objects they signify. Pictograms are generally used in graphic systems and writings which have characters that appear in a pictorial form. [9]
Pictograms are international symbols replace and support, where necessary, written and spoken language. [3] P6 A pictogram, in contrast, is to gain one single meaningful message, which in an optimal case has the same meaning across
cultures and languages. [2]
Pictogram – untraditional graphic language in a poster : Many of the best modern film posters use pictures that place the viewer in the middle of a scene of a film, creating tension and a major
incentive. The incentive is required in order to resolve the situation in a manner that the person looking at the poster needs to watch the film and figure out what happens in a film. [12] Having a good movie poster is very important. Visual design which represents the poster should compel and excite the potential viewers to influence their decisions and to create a good perception of the film. To improve the results, the movie poster must create an immediate impact and touch the audience at the right emotional level. The starting point of the overall brand strategy is the movie poster design. Before designing any graphic elements, the designer should decide the message that he wants to communicate. [10]
Pictograms may be used as a graphic element and thus can communicate easily and effectively with speakers of different cultures and languages.
Fig. 1 Show the highest average for using graphic elements in communication
As it shown in (Fig1) When using a pictogram in a movie poster, it is much easier to reach the required message because certain materials and signs of the pictogram possess a universal appeal and are used globally since they could be easily understood by different audiences. The standard system of pictograms was laid down in the “Public Information Symbols” which has been accredited as the “international standard ISO 7001”. [9]
In order to be adopted, pictograms can provide a certain level of effectiveness, especially when the information to be conveyed will be distributed to various people. [1] For example:
94

International Conference on Innovative Technologies, IN‐TECH 2016,
Prague, 6. ‐ 8. 9. 2016
The applied experimental design:
95

International Conference on Innovative Technologies, IN‐TECH 2016,
Prague, 6. ‐ 8. 9. 2016
The benefits and roles of using pictograms in movie posters: 1- Iconography – showing without telling. The most effective movie posters are iconic, presenting the themes of the film without resorting out what it is about. This can be incredibly an effective pathway to gain attention and create interest at once. 2- Attention – jump out from the wall. If there is one simple sales formula that everyone in a performance-based position should know; it is AIDA. The four-step formula – attention, interest, desire, and action – has been used as the basis of thousands of successful movie advertising campaigns.By using pictogram in the movie poster design may perform that and grab the attention of passers-by and encourage them to have a look. 3- Interest – create an incentive to watch the film. Using icons and more abstract imageries provides the viewer with an idea about the story and creates a great idea to possess an interest to the audience. 4- Appeal – create desire with fans and non-fans alike. Great film posters, particularly those for adaptations, use this dual appeal to enhance their advertising. 5- Style – a look that is consistent with the idea of the film: Some of the most memorable movie posters have used bold, unique artistic styles to enhance their advantages. What separates these posters from their ineffective art-for-art’s-sake rivals is that they were consistent with the style, in both the movie’s promotional materials and throughout the film itself. [12]
Conclusion 1 - It was concluded that the pictograms are communicative tools without using languages or words, and could be understood independently of writing, words, culture and language. They are indicator of path finding and therefore quite useful in the design of a movie poster to draw attention of the audience .…… 2 - Pictograms, however, have a beneficial role as attractors to movie messages and as reminders of these messages. 3 - The effectiveness of pictograms relies upon how well the message will be understood. 4 - The effectiveness of pictograms in a movie poster also relies upon their noticeability . This includes their size, positioning, design and association with the idea of the movie. 5 - There may be two possible functions for pictograms: as a reminder/attention grabber for an established message, or to stand alone to convey a message. These different functions require different treatment.p3 6 - Pictogram will be not instantly effective; the longer a pictogram is in circulation, the better it will be known. [5] p3 Recommendations: 1- Existing design conventions need to be identified and evaluated to guide any future development of pictograms - this would include design conventions that are considered successful and those that to be avoided. 2- The development of new pictograms and any future adaptations or applications of existing pictograms needs to be controlled, preferably internationally. 3- Assessing the time and cost of development and full consumer testing; evaluation must be cross-cultural, taking in account all relevant factors. 4- Identifying all potential critical confusions with pictogram messages in movie poster that could be implied. 5-Using pictograms in movie posters needs to be established on the basis of the poster design criteria . 6-Care should be taken in case of using the pictograms to describe complex messages, particularly complex prescriptive or proscriptive messages. Testing stringent consumers can identify whether or not a particular message could be effectively conveyed by a pictogram. [5] p.32
References [1] Charles Tijus, Javier Barcenilla, Brigitte Cambon de Lavalette, and Jean-Guy Meunier:" The design, understanding and usage of
pictograms ". http://www.cognition-usages.org/chart/dmdocuments/inrets22.pdf [2] Jenny Gemmell:" Pictograms – The New Sliced Bread in Icon Design" , April, 2012.
http://www.centigrade.de/blog/en/article/pictograms-the-new-sliced-bread-in-icon-design/ [3] Kerstin Falck:"The Practical Application of Pictogram",Swedish Institute for Special Needs Education, 2001. [4] Rayan Abdullah, Roger Hübner:" Pictograms, Icons & Signs: A Guide to Information Graphics" , Thames & Hudson, 2006. [5] S Davies, HM Haines and BJ Norris:" the role of pictograms in the conveying of consumer safety information" , government
consumer safety research, London-SW1H 0ET,reprinted 2000 . [6] Tony Jenkins:" Pictograms" ,Newcastle-under-Lyme College,2008. [7] http://www.skillsworkshop.org/ [8] https://en.wikipedia.org/wiki/Film_poster [9] http://pubs.sciepub.com/education/3/8/19/ [10] http://www.filmmakingstuff.com/how-to-create-a-great-movie-poster/ [11] http://www.noupe.com/inspiration/design-trends-of-movie-posters-2010.html
96

International Conference on Innovative Technologies, IN‐TECH 2016,
Prague, 6. ‐ 8. 9. 2016
THE INFLUENCE OF WEAVE ON THE PROPERTIES OF SINGLE CURVED FRP-LAMINATES
C. Fiebig 1, B. Neitzel 1 and M. Koch1 1 Technical University of Ilmenau, Department of Plastic Technologies, 98693 Ilmenau, Germany
Keywords: Fiber Reinforced Plastics; Undulation; Classical Laminate Theory; Weave; Single Curved Laminate Abstract: Energy consumption and mass reduction, as well as material efficiency in the machinery industry enhances the attractiveness of using fiber reinforced plastics (FRP) components in fast moving machine components. Due to the high specific stiffness and strength at minimal weight, the composite components are particularly suitable for addressing this challenge. Typically, calculation results show much better performance than manufactured components. Material properties can only be described idealistically making it necessary to understand the part design and manufacturing factors impacting on mechanical performance. The classic laminate theory (CLT) is typically used to define the performance of a laminate. However, this tool has limitations when it comes to woven fabrics, since the stress condition inside the fabric cannot be accurately described. The undulation of the fiber is caused by the weaving and affects the mechanical properties of the fabric. There are commonly used types of weaves for fibers e.g. plain and twill weave. It is shown that the undulation of the roving influences the performance of the laminates. It can be seen that the properties of the laminate depend on the number of fiber crossings using the same type of fibers. In this paper an undulation angle β is developed. This factor was derived from the geometric conditions of the fabrics. A comparison of the theoretically and experimentally determined values of the tensile stiffness Ex (Young’s-modulus in the longitudinal direction) was drawn. It is assumed that the laminate with 0°/90° unidirectional (UD) fabric has a higher young’s modules due to the missing fiber crossings. In order to prove this hypothesis, a simple model is developed and can be used to describe the influence of the fiber’s undulation on the stiffness of the laminate. Introduction General context
The presented problem deals with the influence of fiber undulation on the mechanical properties of fiber reinforced plastics (FRP) and how this influence can be integrated into the classical laminate theory (CLT). This is necessary to enhance the accuracy of the calculation of the behavior of FRP. The reliability of the simulation depends on the calculation. The fibers’ undulation is caused by several phenomena. Firstly, every roving is slightly wavy. Secondly, there is undulation caused by the weave of the fabrics. To identify the influence of the fiber undulation on the mechanical properties of the laminate, several specimen need to be produced and tested. For a better visibility of imperfections inside the laminate, glass fibers are used. Motivation for research
Even single filaments show a slight ripple inside a fiber strand as a result of its manufacture process. This effect is intensified by bundling single fibers into rovings. The result of the undulation is a reduced young’s modulus because the fibers need to be stretched under external load before they can transfer all forces acting on them. The effect of the undulation on the mechanical properties can be described for every single laminate by testing a specimen of this specific laminate. However, this method leads to a huge amount of tests because they need to be repeated for every single laminate configuration. Therefore, another method to describe this effect is necessary. Since the existing laminate theory is a good basis for many calculations, it is reasonable to use it and expand it by an additional factor. In contrast to metal, the determination of the failure of FRP is researched insufficiently. Although the use of simulation software facilitates the assessment of new designs, the result concerning loading conditions is still too imprecise. This leads to high safety factors and thus, to an additional mass fraction in the finished component. A factor considering the undulation of the fibers allows minor safety factors whereby the lightweight potential is exploited more effectively.
Calculation of fibre reinforced plastics
The computation of FRP is divided into the calculation of the material properties of the laminate e.g. the young’s modulus and the calculation of the stresses caused by external forces and momenta. In addition to the young’s moduli E1 and E2, there are equations for the shear modulus G12 and the Poisson’s ratio ν12. These parameters can be calculated as described in [3]. Values for the factors for fiber volume content (φ – FVC), young’s modulus of the fiber in the longitudinal, in the transverse direction and of the matrix (EF1, EF2, EH), the shear moduli of the fiber and matrix (GF, GH) and the Poisson's ratios of fiber and matrix (νF, νH) need to be determined experimentally. Additionally, the thickness of the single layer needs to be identified. To determine the stresses inside the laminate, the CLT is used. The basis of the CLT is the Kirchhoff-Love theory of plates, which describes the behavior of even and thin plates under load. It is assumed that in the present case there are small strains inside the laminate and the single layer. Furthermore, there is a linear-elastic connection between stress and strain. This applies Hooke’s law:
∙ (1)
In the following, the CLT is applied using the previously identified input variables. The stiffness matrix Q of the single layers is set up:
00
0 0 (2)
97

International Conference on Innovative Technologies, IN‐TECH 2016,
Prague, 6. ‐ 8. 9. 2016
Thereby, the following correlations are applied:
∙
∙
∙
∙ (3)
Afterwards, the laminate stiffness matrix A and the resulting laminate stiffness matrix is determined. On the basis of the foregoing, the
engineering constants of the laminate can be calculated by using Hooke’s law, the stresses and strain of the laminate under external forces can be calculated. In the presented experiment it is assumed that the tractive forces only act in one direction which eliminates thrusts. With the application of failure criterions the strength properties of the laminate can be determined after completion of the CLT. Applied materials und processes
All experiments were performed using glass fiber reinforced plastics. The used fiber material is E-glass. Glass fibers are suitable for the tests, since imperfections of the material are easily visible. Thus, the quality of the produced specimen can be evaluated. Three different weaves were chosen for the experiments [4]:
unidirectional non-woven fabric (UD) twill weave 2/2 plain weave 1/1
The three weaves show a different degree of undulation. The unidirectional layers solely have fiber undulation. The twill weave has the
lowest undulation among the layers because the passing rovings of the warp and weft direction cross after two or three uncrossed threads. The plain weave is undulated mostly since warp and weft threads are binding by turns. Due to compressive stresses occurring at the crossing points [5] of the fibers, it is assumed that the following correlation applies:
UD < twill < plain (4) The specimens were produced by using the vacuum infusion (VI) process. Advantages of this process are a good link of fiber and
matrix and a minimal blistering in the laminate. The fiber volume content can be achieved precisely. As a result, specimens in the same and in different weaves are reproducible. The method’s parameters were kept constant to minimize the influence of the production process on the test results.
Purpose
The objective of this investigation is to establish a factor to represent the undulation effect towards the mechanical performance of plane and single curved laminates and its calculation with the CLT. It ensures the consideration of the fiber’s undulation while calculating fiber composites. Depending on the undulation, the mechanical properties of the test laminates need to be identified and included in the calculation equation of the young’s modulus of the single layer. Using the re-calculated material data, the stress and strain is calculated by means of the CLT. Initial data and methods Concept
The implementation of correction factors is done by observing the geometry of the fabric. The undulation of the fibers causes an angle deviation in the z-direction. This new angle is named β and describes average deviation of the fibers in the single layer. In theory, the effect of this undulation based deviation is equal to this caused by the standard ply angle α (Fig. 1).
Fig. 1 Distribution of the angles a and b In order to determine β, each fabric needs to be measured. Therefore the width of the roving, the gap between the rovings and the
thickness of the single layer need to be detected (Fig. 2) using a laminated specimen. Using Eq. (5) the angle can be calculated.
Fig. 2 Determination of b
(5)
To integrate the new angle β, a new stiffness-matrix Qundu of the unidirectional single-layer has to be calculated. According to the
classical laminate theory, the ply angle α has to be considered, if the direction of the single layer does not match the direction of laminate. This method is repeated for the undulation angle β to create Qundu. Therefore the transformation matrix Tβ (Eq. (6)) is used to develop the stiffness matrix Qundu out of the stiffness matrix QSL of the single layer (Eq. (7)).
98

International Conference on Innovative Technologies, IN‐TECH 2016,
Prague, 6. ‐ 8. 9. 2016
² ² 2² ² 2
² (6)
∙ ∙ (7) To fulfil the mechanical boundary conditions, only the Q11 part of the stiffness matrix Qundu will be used for further calculations with the
the new stiffness matrix QSL,new of the single layer (Eq. (8)).
,
, , 0
, , 00 0 ,
(8)
The circumferential and radial stresses σθ and σr in the single curved specimen are calculated following Fig. 3 and the Eq. (9) to (11).
Fig. 3 geometrical conditions for the single curved specimen
∙∙ (9)
∙ (10)
4 (11)
Basic data
The basic characteristics of the used fiber material are presented in Table 1 and Table 2. Table 1. Properties of the applied fibers
tissue unit UD Twill plain
fiber material - glass
grammage mfg [g/m²] 440 390 420
young’s modulus Ef [GPa] 72
weave - - 2/2 1/1 Table 2: Properties of the resin used
resin density ρr young’s modulus Er tensile strength Rr elongation at break Ar
unit [g/cm³] [GPa] [MPa] [%]
EP 1,1 – 1,25 2,8 – 3,6 70 – 90 6 – 8
Table 2. shows the characteristics of the injection resin which consists of epoxy resin and the associated hardener. Following parameters were chosen for the VI process [6]:
mold temperature: Tmol = 23°C injection temperature: Tinj = 23°C vacuum pressure: Pvac = 0,95 bar
In each case, three plain and single curved test plates are produced out of ten layers of the woven fabric. Density, fiber volume
content and the young’s modulus in the longitudinal direction were determined for all specimens. Since Ex ≈ Ey and the fabrics are woven regularly in 0°/90°-direction, only the determining of the young’s modulus Ex is applied in a first step. Ex was determined with a 50 kN tensile testing machine following DIN EN ISO 527-4 [7]. The tested specimens comply with the “type 2”-specimen of this DIN standard. Results
The examination of the sample sheets resulted in the measured values shown in table 3.They are the basis for a further calculation of laminate properties using CLT. Contrary to the expectations, the measurements indicate that the undulation can have a positive effect on the young’s modulus Ex (Fig. 4). The values of woven fabric’s Ex increase up to 7% compared to Ex of the UD fabric. The laminate made with the twill weave has the highest Ex, followed by the unidirectional fabric and the plain weave. It is assumed that the higher stiffness of the woven fabric laminates benefits from a stronger support between the fibers. In comparison to the young’s modulus, a tight weaving leads to a reduced strength. The laminate with the plain weave fails first, followed by the twill weave. The UD fabric has the highest strength. The higher compressive stresses between the fibers might be a reason for the lower strength of the woven fabric. These stresses lead to damaged fibers which consequences in failure.
99
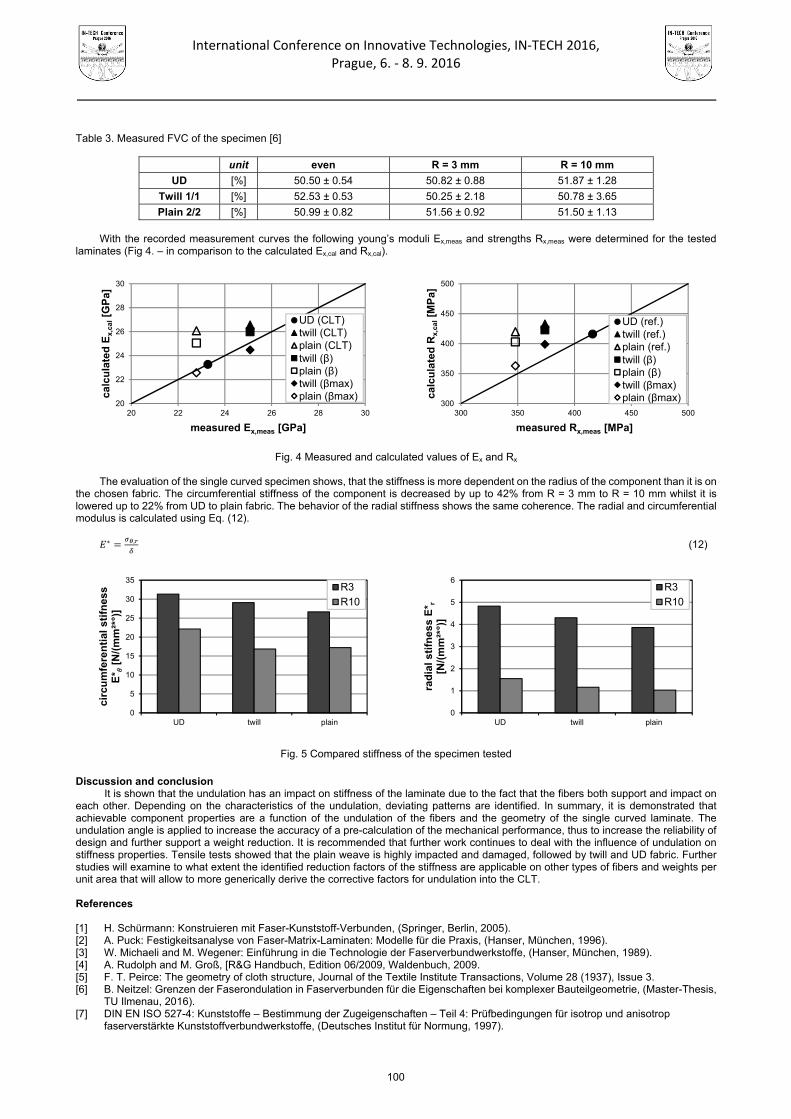
International Conference on Innovative Technologies, IN‐TECH 2016,
Prague, 6. ‐ 8. 9. 2016
Table 3. Measured FVC of the specimen [6]
unit even R = 3 mm R = 10 mm
UD [%] 50.50 ± 0.54 50.82 ± 0.88 51.87 ± 1.28
Twill 1/1 [%] 52.53 ± 0.53 50.25 ± 2.18 50.78 ± 3.65
Plain 2/2 [%] 50.99 ± 0.82 51.56 ± 0.92 51.50 ± 1.13
With the recorded measurement curves the following young’s moduli Ex,meas and strengths Rx,meas were determined for the tested laminates (Fig 4. – in comparison to the calculated Ex,cal and Rx,cal).
Fig. 4 Measured and calculated values of Ex and Rx
The evaluation of the single curved specimen shows, that the stiffness is more dependent on the radius of the component than it is on
the chosen fabric. The circumferential stiffness of the component is decreased by up to 42% from R = 3 mm to R = 10 mm whilst it is lowered up to 22% from UD to plain fabric. The behavior of the radial stiffness shows the same coherence. The radial and circumferential modulus is calculated using Eq. (12).
∗ , (12)
Fig. 5 Compared stiffness of the specimen tested Discussion and conclusion
It is shown that the undulation has an impact on stiffness of the laminate due to the fact that the fibers both support and impact on each other. Depending on the characteristics of the undulation, deviating patterns are identified. In summary, it is demonstrated that achievable component properties are a function of the undulation of the fibers and the geometry of the single curved laminate. The undulation angle is applied to increase the accuracy of a pre-calculation of the mechanical performance, thus to increase the reliability of design and further support a weight reduction. It is recommended that further work continues to deal with the influence of undulation on stiffness properties. Tensile tests showed that the plain weave is highly impacted and damaged, followed by twill and UD fabric. Further studies will examine to what extent the identified reduction factors of the stiffness are applicable on other types of fibers and weights per unit area that will allow to more generically derive the corrective factors for undulation into the CLT. References [1] H. Schürmann: Konstruieren mit Faser-Kunststoff-Verbunden, (Springer, Berlin, 2005). [2] A. Puck: Festigkeitsanalyse von Faser-Matrix-Laminaten: Modelle für die Praxis, (Hanser, München, 1996). [3] W. Michaeli and M. Wegener: Einführung in die Technologie der Faserverbundwerkstoffe, (Hanser, München, 1989). [4] A. Rudolph and M. Groß, [R&G Handbuch, Edition 06/2009, Waldenbuch, 2009. [5] F. T. Peirce: The geometry of cloth structure, Journal of the Textile Institute Transactions, Volume 28 (1937), Issue 3. [6] B. Neitzel: Grenzen der Faserondulation in Faserverbunden für die Eigenschaften bei komplexer Bauteilgeometrie, (Master-Thesis,
TU Ilmenau, 2016). [7] DIN EN ISO 527-4: Kunststoffe – Bestimmung der Zugeigenschaften – Teil 4: Prüfbedingungen für isotrop und anisotrop
faserverstärkte Kunststoffverbundwerkstoffe, (Deutsches Institut für Normung, 1997).
20
22
24
26
28
30
20 22 24 26 28 30
calc
ula
ted
Ex,
cal[G
Pa]
measured Ex,meas [GPa]
UD (CLT)twill (CLT)plain (CLT)twill (β)plain (β)twill (βmax)plain (βmax)
300
350
400
450
500
300 350 400 450 500
calc
ula
ted
Rx,
cal[M
Pa]
measured Rx,meas [MPa]
UD (ref.)twill (ref.)plain (ref.)twill (β)plain (β)twill (βmax)plain (βmax)
0
5
10
15
20
25
30
35
UD twill plain
circ
um
fere
nti
al s
tifn
ess
E*
[N/(
mm
²*°)
]
R3
R10
0
1
2
3
4
5
6
UD twill plain
rad
ial
stif
nes
s E
* r[N
/(m
m²*
°)]
R3
R10
100

International Conference on Innovative Technologies, IN‐TECH 2016,
Prague, 6. ‐ 8. 9. 2016
THE COMPARISON OF NUMERICAL MODELS FOR SIMULATION OF WATER TURBINE I. Biluš 1 and L. Lešnik 2
1 University of Maribor, Faculty of Mechanical Engineering, Smetanova ulica 17, SI-2000 Maribor, Slovenia, [email protected]
2 University of Maribor, Faculty of Mechanical Engineering, Smetanova ulica 17, SI-2000 Maribor, Slovenia Keywords: CFD; Numerical Mode; Water Turbine
Abstract: The strategy for Energy Union in European Union member states is to achieve climate and energy targets for 2030 and to ensure that the EU will become a leading manufacturer of renewable energy on a global scale. According to this, new projects and research at the field of Energy Technology go mainly in the direction of self-sufficiency in electricity from renewable energy sources. The Republic of Slovenia has an obligation to increase the percentage of electricity produced from renewable energy sources. Following this the several studies exist, which were performed to analyse the possibility of exploitation of water potential of lowland rivers. The production of energy from these energy sources often requires the use of water turbines placed in the river flow directly, that means without barriers and results in decreased impact on the environment. In contrast with the past, the researchers are able to perform the numerical simulation of flow through complete water turbine systems nowadays. In this way, it is possible to simulate, understand and optimize the turbine operation and characteristics for different operating conditions. The contribution shows the results of numerical simulation performed on the case of lowland river turbine. Three different numerical models were used for same turbine geometry, the results were compared and the advantages / disadvantages of each numerical model are summarised in the contribution. It is shown, that usage of different computational models leads to the similar results, if the flow physics is properly defined during pre-processing phase. Introduction
The numerical simulation of physical phenomena is increasingly replacing the expensive experiments nowadays. Numerical simulation enables the examination of processes that cannot be experimentally tested and accelerates the development of new products in the technical research and practice. In the future, numerical simulation will emerge as a key technology [1].
In order to perform efficient and accurate numerical simulations, it is necessary to research, develop and test all aspects of numerical simulation. Following this, interdisciplinary cooperation of natural scientists, engineers, mathematicians and computer scientists will be necessary in fields of mathematical modeling, discretization, development of efficient solution methods / fast solvers, parallelization of the new algorithms, and visualization of the computed results.
The major and general task of all numerical simulations is to include mathematical models which describe reality as accurately as possible while still remaining solvable. This task includes the proper modelling of the change in the reference frame when simulating turbomachinery cases which is related to the setup of domain interfaces where computational domain consists of rotating and static part. According to this, interfaces are always required when multiple assemblies (rotor/stator) are used within a domain or across multiple domains. If the required domain interfaces are not created, the regions will remain part of the same boundary conditions. Since the change in the reference frame always exist between turbine rotor and stator (one side is in a rotating frame of reference and the other side is in a stationary frame of reference), the appropriate domain interface has to be chosen. Domain Interfaces are typically placed midway between the rotor and stator for turbomachinery cases [1].
This paper presents results of the study of different interface models used with computations carried out on the basis of the Unsteady Reynolds-Averaged Navier-Stokes (URANS) formulation of the fluid flow equations on the case of lowland river turbine. In the first step the conventional multiple frame of reference steady and unsteady simulation was performed for the turbine geometry in the flow. In the continuation the 6DOF simulation of rigid turbine rotor movement was simulated, where apparent body forces for rotating motion were accounted for in the fluid equations of motion solved by ANSYS CFX software [2].
The results show reasonable agreement and confirms the fact that different numerical models can adequately predict the hydraulic performance of the turbine if physical laws are defined with proper relationships between mathematical quantities during pre-processing. Domain interfaces and numerical model
In general, there are two types of frame change models which are being used at the domain interfaces in practice, when performing conventional multiple frame of reference simulations on turbomachinery cases. They are briefly described in following chapters.
Frozen rotor
The Frozen Rotor model treats the flow from one component to the next by changing the frame of reference while maintaining the relative position of the components. Usually, periodicity is used to reduce the number of components to a subset that has approximately the same pitch ratio as the full geometry. To account for differences in pitch ratio between the subset and the full geometry, the flow passing through the interface is scaled according to the net pitch ratio of the subsets.
The Frozen Rotor model must be used for non-axisymmetric flow domains, such as impeller/volute, turbine/draft tube, propeller/ship
and scroll/volute cases. It can also be used for axial compressors and turbines. The Frozen Rotor model has the advantages of being robust, using less computer resources than the other frame change models, and being well suited for high blade counts. The drawbacks of
101

International Conference on Innovative Technologies, IN‐TECH 2016,
Prague, 6. ‐ 8. 9. 2016
the model include inadequate prediction of physics for local flow values and sensitivity of the results to the relative position of the rotor and stator for tightly coupled components.
Transient Rotor-Stator
The Transient Rotor-Stator model takes into account all of the transient flow characteristics. A sliding interface is used to allow a smooth rotation between components. As with the Frozen Rotor model, the Transient Rotor-Stator model scales the flow from one component to the next in order to account for a non-unity net pitch ratio. This model is robust and yields high accuracy predictions of loading. The drawbacks include high computational cost and large amounts of storage required to hold the transient data.
The dynamic re-intersection of the interface at the start of each time step may result in a different interface topology, which in turn may require more or less memory. Unlike the static interfaces (Frozen Rotor, Stage), which are only intersected once (first time step of a serial run or partitioner in a parallel run), the initial memory estimate might not be sufficient for the whole run. To avoid potential memory problems, it might be necessary to start the simulation with more conservative (larger) memory factors.
Fluid driven turbine rotor “6DOF”
During the fluid driven turbine rotor simulation or 6DOF simulation the mesh of rigid turbine rotor moves in 6 DOF with the water flow, so that apparent body forces for 6 DOF motion are accounted for in the fluid equations of motion solved by CFD software [2]. The ANSYS CFX, which was used for numerical simulation computes the position and orientation of a rigid turbine rotor using equations of motion. These equations can provide up to six degrees of freedom (“6 DOF”): up to three translational and up to three rotational degrees of freedom. The full control over which degrees of freedom are allowed in a given simulation is therefore possible. In the context of rigid bodies in ANSYS CFX, an orientation is represented by a collection of three Euler angles (Fig. 1).
In the present study the rotor mesh rotated around one axis but did not translate with the flow.
Fig. 1 The rigid body angles [1]
The equations of motion of a rigid body can be written as:
F = dP/dt, (1) m = dπ/dt, (2)
These equations state that for a rigid body undergoing translation and/or rotation the rate of change of linear and angular momentum,
P and π, respectively, of the rigid body is equal to the applied force and torque, F and m, respectively, acting on the turbine rotor.
Numerical simulation
Computational Domain The simulation domain contains two parts: the part marked with “Turbine rotor” is the turbine rotor with blades, which is the rotation
domain, and that marked with “Water” is the stationary one. The sketch of the computation domain with inlet and outlet surfaces is shown in Fig. 2. The origin of coordinates is set at the centroid of the turbine rotor.
Used domain or calculation area had the size of l × h × w = 6.6 × 1.2 × 3.75 m. The turbine axis was positioned for a distance 2D from the inlet surface and 9D mm from the outlet surface as shown at Fig. 2.
The unstructured hexahedron mesh was used for discretization of the computational domain. The mesh with total number of 972500 elements was used.
Boundary conditions
The boundary conditions in the domain were set as follows: Water velocity at the inlet: v = 1.0 m/s and v = 2.0 m/s. Relative pressure at the outlet prel = 0 Pa. No slip at the river bed. Free slip at boundary surfaces.
102

International Conference on Innovative Technologies, IN‐TECH 2016,
Prague, 6. ‐ 8. 9. 2016
Fig. 2 The computational domain
The main parameters of turbine model are shown in Table 1.
Table 1. Main parameters of turbine model
Parameter Value
Rotor diameter 0.6 m Rotor width 1.75 m
Number of blades 3 Chord length 0.075 m
Mass 23 kg Results
For the operating characteristics comparison of analyzed turbine geometry, the torque acting on the turbine shaft and the rotating speed of the rotor were measured at two stream flow velocities v i.e. 1.0 and 2.0 m/s. The rotating speed of the rotor for MFR simulations was calculated using 6DOF simulation, where electric resistance loads R were gradually added to vary the rotation speed of turbine rotor.
The results are shown at Figs. 3 and 4 [4]. Fig.3 shows the torque time series for the case of transient rotor stator at v = 1.0 m/s and R=1.0 Nm, where vertical lines indicate the 360° turn of the turbine rotor. Fig. 4 shows the velocity and pressure fields at v = 2.0 m/s and R=1.0 Nm.
Fig. 3 The torque value time series (transient rotor stator v = 1.0 m/s; R=1.0 Nm) The periodic nature of torque is evident from the torque time series at Fig. 3. The three torque peaks within each turn of the rotor
correspond to three bladed rotor geometry rotation. The calculated values of averaged torque are summarized in table 2 [4].
Table 2. The averaged torque values calculated for transient rotor-stator and 6DOF simulations
Boundary conditions Transient
rotor-stator 6DOF
Stream flow velocity v (m/s)
Electric resistance R (Nm)
Torque (Nm) Torque (Nm)
1.0 1.0 1.17 1.15 2.0 1.0 0.81 0.93 2.0 2.0 1.54 2.12 2.0 3.0 2.28 2.75
‐10,0
‐5,0
0,0
5,0
10,0
0 1 2 3 4 5 6
Torque [Nm]
Time [s]
103

International Conference on Innovative Technologies, IN‐TECH 2016,
Prague, 6. ‐ 8. 9. 2016
Velocity field Pressure field F
roze
n ro
tor
Tra
nsie
nt r
otor
-sta
tor
6D
OF
Fig. 4 The velocity and pressure fields (v = 2.0 m/s; R=1.0 Nm) It is evident from the Fig. 4 that it is not possible to detect unsteady Karman nature of flow in the turbine wake when using Frozen rotor
approach. The result is expected since frozen rotor maintain relative position of domains during steady state simulation. The pressure field shows the same flow physics which reflects in stagnation point and logical pressure distribution at upper and lower blade surfaces for all numerical models analyzed.
Conclusion
The performed simulations of the fluid flow through simple turbine geometry offered the possibility to compare the torque values and velocity and pressure fields for the lowland hydrokinetic turbine simulated with different numerical models.
The comparison of the numerical results indicates that analyzed numerical schemes can adequately predict the hydraulic performance of the turbine with good convergence. The quantitative comparison of simulation results shows good agreement with tolerances within expectations. It can be concluded that that certain unsteady properties of the flow cannot be completely detected if the relative position of the domains in maintained during simulation.
The main future steps in this study will be to change relative positon of components in steady state simulation and to analyze the turbulence model influences on used numerical models. Thereby, the eventual accuracy gains in the quantitative characteristics values will be evaluated. Other future investigations will also consider the effect of blade profile change on torque characteristics.
References [1] M. Griebel, T. Dornseifer, T. Neunhoeffer: Numerical Simulation in Fluid Dynamics, (Society for Industrial and Applied Mathematics,
Philadelphia, 1997). [2] ANSYS CFX Theory Guide Release 17.1, Ansys Inc. 2016. [3] T. Pepely, B. Barish: 6-dof numerical simulation of the vertical-axis water turbine, Proc of ASME-JSME-KSME Joint Fluids
Engineering Conference 2011, ASME Journal of Materials Processing Technology, Volume 1 (2011), p. 673 – 678. [4] M. Germek: Numerical Simulation of Hydrokinetic Water Turbine in the River Mura (University of Maribor, Maribor, 2015).
104

International Conference on Innovative Technologies, IN‐TECH 2016,
Prague, 6. ‐ 8. 9. 2016
STUDY OF INFLUENCE OF GEOMETRY, ROTATIONAL SPEED AND HEAT GENERATED BY WOOD CUTTING ON VIBRATIONS OF
CIRCULAR SAW BLADE
N.Anđelić 1, Z.Car 2, S.Braut 3 and R. Žigulić 4
1 Faculty of Engineering Rijeka, Vukovarska 58, 51000 Rijeka, Croatia, Email: [email protected] 2 Faculty of Engineering Rijeka, Vukovarska 58, 51000 Rijeka, Croatia, Email: [email protected]
3 Faculty of Engineering Rijeka, Vukovarska 58, 51000 Rijeka, Croatia, Email: [email protected] 4 Faculty of Engineering Rijeka, Vukovarska 58, 51000 Rijeka, Croatia, Email: [email protected]
Keywords: Circular Saw Blade; Vibrations; Wood Cutting; Natural Frequency; Rotational Speed; Heat Generated by Wood Cutting Abstract: It is well know that the behavior of wood material deviates from generally used engineering materials since wood is anisotropic material with viscoelastic properties which have highly aggravated derivation of generally valid relationships. Machining usually alters the shape, size and surface quality of wood. In most cases wood machining occurs by cutting and the chips are the by-product which can be used for chipboard production or to generate energy. Heat generated by wood cutting is caused by friction between cutting tool and wood. This heat can have negative influence on tool because it causes tool wear so extensive research is required. In this paper the results of investigation of geometry, rotational speed and heat generated by wood cutting on vibrations of circular saw blade are presented [1]. First the analytical method for determining the natural frequencies of annular plates is used and compared with FEM models of annular plates and circular saw blades [2]. The influence of slot shape and rotational speed on vibrations of circular saw blade was investigated using FEM method. Based on previous research [3] and [4] the heat generated by wood cutting is calculated and used for numerical analysis using FEM method. Besides heat the effect of slot length and rotational speed on vibrations of circular saw blade was investigated. Introduction
Today circular plates are used in many industries and consumer tools such as circular saw blades, hard drives, BD disks etc. so detail investigation of dynamic characteristics and influence of different loads on plates are necessary in order to optimize performance and prevent failure. Lamb and Southwell were one of first researchers that investigated the vibrations of circular saw blade in 1921. A year later Southwell published another paper were the vibrations of annular plates were investigated. Their investigation was based on Kirchhoff – Love plate theory or theory of thin plates. Since Lamb and Southwell investigations the area of application has been widen to hard disks, turbines and circular saw blades.
In this paper the main focus is to present results of investigation on influence of geometry, rotational speed, heat generated by cutting on vibrations of circular saw blade that were financed and supported by European project ADRIA-HUB. The main focus in this paper will be to shortly present results obtained by analytical method that is used for determining natural frequencies of circular saw blades and comparison of these results to results obtained using Finite Element Method and also to present influence of slot length rotational speed, heat generated by cutting on vibrations of circular saw blade.
Analytical method for determining natural frequencies of annular plates and comparison with FEM models of annular plates and circular saw blades
Fig. 1 Annular disk clamped at inner radius
The procedure for determining natural frequencies of annular disk as shown in Fig.1 is well documented in literature. First to determine
the differential equation which describes the natural frequencies of circular and annular plates is to define the terms for kinetic and potential energy. If there are no external loads that are acting on the system then inside the potential energy term there is no term which can be described as work done by external forces. In many cases the potential energy is the same while the most influential factor is kinetic energy in deriving the differential equation which describes the phenomenon of spinning disk. Of course if the aim is to determine the differential equation which describes the vibrations of stationary disk then the kinetic energy part is equal to zero.
105

International Conference on Innovative Technologies, IN‐TECH 2016,
Prague, 6. ‐ 8. 9. 2016
After the development of potential and kinetic energy part the terms are all put together using Hamilton’s principle or variation of Lagrangian function. In case of stationary circular or annular plate the differential equation which describes the vibrations of the plate can be written in the following form:
D(∂2w/∂r2+(1/r)(∂w/∂r)+(1/r2)(∂2w/∂θ2))2+∂2w/∂t2=0 (1)
The Eq. (1) is solved using separation of variables and the resulting solution can be written in the following form: w(r,θ,t)=ΣΣWm,n(r)cos(nθ)eiωm.nt (2) where: Wm,n(r,θ,t)=AmnJn(λm,nr/b)+ BmnYn(λm,nr/b)+ CmnIn(λm,nr/b)+ DmnKn(λm,nr/b) (3) in which n and m represent the number of nodal diameter and nodal circles, respectively. Amn, Bmn, Cmn and Dmn are the mode shape coefficients which are determined by the boundary conditions. Jn and Yn are the Bessel functions of the first and second kind while In and Kn
are the modified Bessel function of the first and second kind respectively. Boundary conditions for circular saw blade or annular plate are: For inner clamped edge r = a of annular plate w = 0, (4) ∂w/∂r = 0. (5) For outer free edge r = b of annular plate Mr = -D(∂w/∂r+(v/r)(∂w/∂r)+(v/r)(∂w/∂θ)) = 0, (6) Qr+(1/r)(∂Mr,θ/∂θ) = -D[∂(∂2w/∂r2+(1/r)(∂w/∂r)+(1/r2)(∂2w/∂θ2))/∂r+((1-v)/r2)+∂2(∂w/∂r-w/r)/∂θ2] = 0. (7) In Eq. (6) and (7) Mr and Mr,θ are the bending and twisting moments and Qr is transverse shear force. For the analysis the AISI 304 material is used. The geometry parameters and material characteristics of annular plate are given in Tab.1. Table 1. Characteristics of annular plate
Results of analytical method are given in Tab. 2.
Table 2. Frequency parameters for annular plate clamped at the inner edge and free on the outer edge
The comparison of results obtained using analytical and numerical (FEM) method are given in Tab. 3. From Tab. 3 it’s obvious that
analytical approach gives good results when compared to numerical (FEM) method. Fig. 2 shows difference between nodal circles and nodal diameters. According to literature [3] nodal circle is a concentric circle which is stationary during the vibration cycle while the nodal diameter is diameter line which remains stationary during vibration cycle.
106

International Conference on Innovative Technologies, IN‐TECH 2016,
Prague, 6. ‐ 8. 9. 2016
Table 3. Comparison of frequencies of annular plate using analytical and FEM method
Fig. 2 Modal shapes of annular plate: a) 1 nodal circle and b) 2 nodal diameters.
Now the advantage of FEM method is possibility of determining the natural frequencies of more complex models and in our case its
circular saw blade. For FEM analysis the material of a circular saw blade dis is AISI 304 while teeth are made from Tungsten Carbide. The geometry and material used in FEM analysis are given in Tab. 4.
Table 4. Material characteristics of circular saw disk and teeth
Results obtained for circular saw blade using FEM method are shown in Tab. 6.
Table 5. Comparison of natural frequencies between analytical and numerical FEM method
107
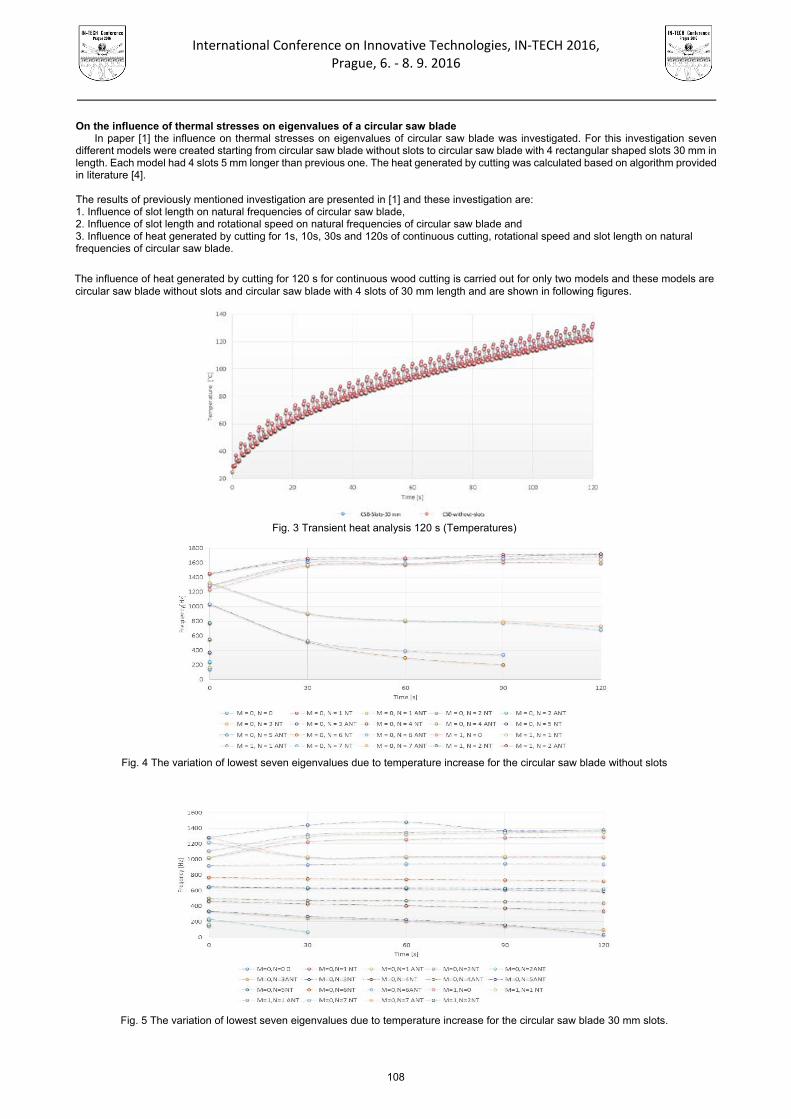
International Conference on Innovative Technologies, IN‐TECH 2016,
Prague, 6. ‐ 8. 9. 2016
On the influence of thermal stresses on eigenvalues of a circular saw blade
In paper [1] the influence on thermal stresses on eigenvalues of circular saw blade was investigated. For this investigation seven different models were created starting from circular saw blade without slots to circular saw blade with 4 rectangular shaped slots 30 mm in length. Each model had 4 slots 5 mm longer than previous one. The heat generated by cutting was calculated based on algorithm provided in literature [4]. The results of previously mentioned investigation are presented in [1] and these investigation are: 1. Influence of slot length on natural frequencies of circular saw blade, 2. Influence of slot length and rotational speed on natural frequencies of circular saw blade and 3. Influence of heat generated by cutting for 1s, 10s, 30s and 120s of continuous cutting, rotational speed and slot length on natural frequencies of circular saw blade. The influence of heat generated by cutting for 120 s for continuous wood cutting is carried out for only two models and these models are circular saw blade without slots and circular saw blade with 4 slots of 30 mm length and are shown in following figures.
Fig. 3 Transient heat analysis 120 s (Temperatures)
Fig. 4 The variation of lowest seven eigenvalues due to temperature increase for the circular saw blade without slots
Fig. 5 The variation of lowest seven eigenvalues due to temperature increase for the circular saw blade 30 mm slots.
108

International Conference on Innovative Technologies, IN‐TECH 2016,
Prague, 6. ‐ 8. 9. 2016
Conclusions
The analytical method used in this paper and in [1] and [2] gives good approximation when compared with results of obtained using numerical FEM method. The influence of heat generated by cutting lowers the natural frequencies. The influence of slot geometry, rotational speed and heat generated by cutting not only lowers the natural frequencies but some of them vanish after the circular saw blade starts cutting wood. Acknowledgment
The results presented in this paper are results from investigation which was implemented as part of the activity inside the "Adria Hub-Bridge technical differences and social suspicions contributing to transform the Adriatic area in a stable hub for a sustainable technological development" project. This action was co-funded by the European Union by the Instrument for Pre-Accession Assistance (IPA) on Adriatic Territory.
References [1] N.Anđelić, R.Žigulić and M.Čanađija: On the influence of thermal stresses on eigenvalues of circular saw blade, Proc ImechE Part
C: J Mechanical Engineering Science, 0 (0), 2016, pp. 1-13 DOI: 10.1177/0954406216641148 [2] A. Skoblar, N. Anđelić and R. Žigulić: Determination of Critical Rotational Speed of Circular Saws from Natural Frequencies of
Annular Plate with Analogous Dimensions, International Journal for Quality Research, Vol. 10(1), 2016, pp. 177-192 DOI: 10.18421/IJQR10.01-09
[3] S.Nishio, E. Marui: Effects of Slots on the Lateral Vibration of a Circular Saw Blade , International Journal of Machine Tools and Manufacture, Vol 36(7), 1996, pp. 771-787
[4] E.Csandy and E. Magoss: Mechanics of Wood Machining, (Springer, Verlang, 2013.) [5] V. Manique, “Gas Natural:Combustible clave en la transición hacia un sistema energético más limpio e sustentable,” Innovación-CDT Gás, pp. 27 – 31, 2011.
109

International Conference on Innovative Technologies, IN‐TECH 2016,
Prague, 6. ‐ 8. 9. 2016
110

International Conference on Innovative Technologies, IN‐TECH 2016,
Prague, 6. ‐ 8. 9. 2016
CARBON-DIOXIDE GAS SEPARATION FROM INDUSTRIAL FLUE GASES USING AN INNOVATIVE TUBULAR CERAMIC MEMBRANE
TECHNOLOGY FOR MITIGATION OF GHG EMISSIONS
B. I. Ismail1 and R. Feeny1 1 Department of Mechanical Engineering, Lakehead University, 955 Oliver Road, Thunder Bay,
Ontario P7B 5E1, Canada, corresponding author: [email protected])
Keywords: CO2 Gas Separation; CO2 Gas Capture Technology; Post-Combustion Flue Gases; Tubular Ceramic Membrane; GHG Emissions; Innovative Clean Technology; Power Generation; Global Warming Abstract: In most industrialized countries, the industry sector including fossil-fueled power generation represents one of the major sources of greenhouse gas (GHG) emissions causing global warming and climate change. Carbon dioxide (CO2) gas is known for being the main contributor to the GHG emissions. Ceramic membrane CO2 gas separation is a promising technology for CO2 removal from post-combustion flue gas streams due to its compactness, environmental benefits, energy efficiency, and cost-effectiveness. This innovative technology has not been studied in detail previously and there seems to be lack of understanding of how this technology works. The main objective of this research is to investigate experimentally the viability of separating CO2 gas from a lab-simulated flue gas stream mixture using a mono-channel tubular nano-porous ceramic membrane device. A fully-instrumented and controlled lab-scale CO2 separation test-loop was designed and constructed in order to experimentally investigate in detail the performance separation characteristics of five novel ceramic membranes with different separation layers and nano-scale pore sizes using a Tubular Ceramic Membrane Device (TCMD). Tri-gas mixture of CO2/N2/Ar separation tests were performed and analyzed for evaluating and understanding the performance aspects and main processes involved in the separation of the CO2 under thermal and vacuum conditions. The experimental results showed merits in CO2 separation using the TCMD and provided good understanding of this technology. Some performance characteristics and parameters that detrimentally influence the performance the TCMD system will be presented and discussed in this paper. Introduction
Carbon dioxide (CO2) gas is known for being the main contributor to the greenhouse gas (GHG) emissions. The largest sources of CO2 emissions are those produced from the combustion of fossil fuels such as coal, oil and gas production, power plants, automobiles and industrial processes, mining and mineral production. Strict environmental regulations (e.g. Koyoto Protocol, 1998 [1] and Copenhagen Accord, 2009) have forced industries to find technological solutions to reduce GHG emissions into the atmosphere. For example, Canada ratified the Copenhagen agreement with a commitment for Canada to reduce its GHGs by 17% of 2005 levels by the year 2020 [2]. Current methods for reducing the GHG emissions also include improving efficiency and CO2 capture and sequestration. One of the innovative methods of post-combustion CO2 gas separation and capture is the membrane gas separation method (MGSM) [3]. Membrane gas separation is a very promising technology to separate CO2 from flue gases. It is dependent on the choice of permeation rates and selectivity which allows for very high purity CO2 capture. Gas separation membranes used for post-combustion as a competing technology possesses the advantages of end-of-pipe application and offers less environmental impact than the chemical absorption method. The compact and modular structure of the membranes also makes it flexible in use and has the potential for retrofitting. Ceramic membranes are made from inorganic materials such as alumina, zirconia oxides, and even carbon. There are many advantages to using ceramic membranes over polymer based membranes. Some of these advantages include: its thermal stability at higher temperature and its ability to separate chemicals from aggressive acids and solvents. Ceramic membranes are also mechanically and chemically stable and can withstand pressure drops. Examples of high temperature gas separation membranes include micro porous and dense membranes. Ceramic membranes can also offer a low fouling rate, long and reliable service life, and can also be economically feasible. A ceramic membrane should have a high mass transfer flux, be free of defects, and also have a long life on a large scale [4]. Membranes should also be in a compact form, and economical to produce. Pores in a membrane are classified by their size and depending on their size they can be macro-porous, meso-porous, micro-porous, or nano-porous [3,4]. A schematic showing a simple membrane gas separation process is shown in Fig. 1.
Fig. 1 A schematic showing a simple membrane gas separation process
There have been a number investigations in the development of ceramic membranes for limited flue gas mixture separation. There have been, however, fewer studies which characterized experimentally the separation of CO2 from a flue gas mixture such as CO2/N2/Ar using ceramic membrane technology. Therefore, the objective of this study was to experimentally investigate the separation characteristics of CO2 from a lab-simulated flue tri-gas mixture of CO2/N2/Ar using five novel mono-channel tubular nano-porous ceramic membranes.
111
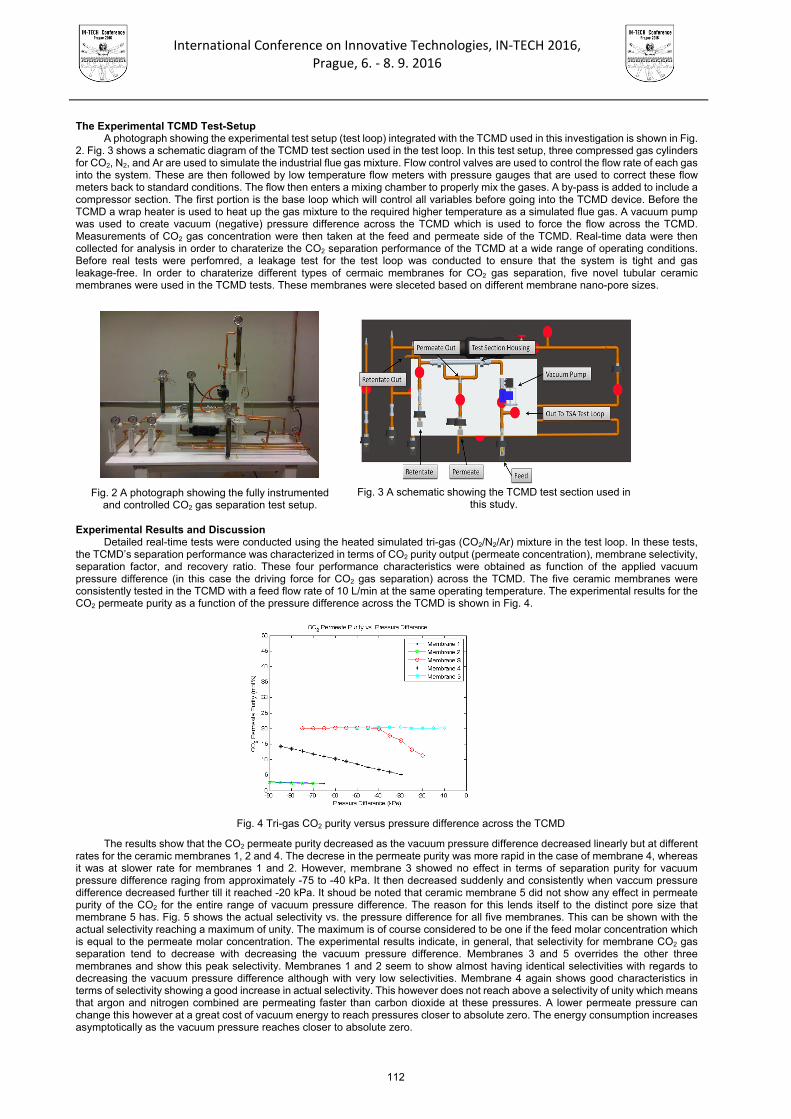
International Conference on Innovative Technologies, IN‐TECH 2016,
Prague, 6. ‐ 8. 9. 2016
The Experimental TCMD Test-Setup
A photograph showing the experimental test setup (test loop) integrated with the TCMD used in this investigation is shown in Fig. 2. Fig. 3 shows a schematic diagram of the TCMD test section used in the test loop. In this test setup, three compressed gas cylinders for CO2, N2, and Ar are used to simulate the industrial flue gas mixture. Flow control valves are used to control the flow rate of each gas into the system. These are then followed by low temperature flow meters with pressure gauges that are used to correct these flow meters back to standard conditions. The flow then enters a mixing chamber to properly mix the gases. A by-pass is added to include a compressor section. The first portion is the base loop which will control all variables before going into the TCMD device. Before the TCMD a wrap heater is used to heat up the gas mixture to the required higher temperature as a simulated flue gas. A vacuum pump was used to create vacuum (negative) pressure difference across the TCMD which is used to force the flow across the TCMD. Measurements of CO2 gas concentration were then taken at the feed and permeate side of the TCMD. Real-time data were then collected for analysis in order to charaterize the CO2 separation performance of the TCMD at a wide range of operating conditions. Before real tests were perfomred, a leakage test for the test loop was conducted to ensure that the system is tight and gas leakage-free. In order to charaterize different types of cermaic membranes for CO2 gas separation, five novel tubular ceramic membranes were used in the TCMD tests. These membranes were sleceted based on different membrane nano-pore sizes.
Experimental Results and Discussion Detailed real-time tests were conducted using the heated simulated tri-gas (CO2/N2/Ar) mixture in the test loop. In these tests,
the TCMD’s separation performance was characterized in terms of CO2 purity output (permeate concentration), membrane selectivity, separation factor, and recovery ratio. These four performance characteristics were obtained as function of the applied vacuum pressure difference (in this case the driving force for CO2 gas separation) across the TCMD. The five ceramic membranes were consistently tested in the TCMD with a feed flow rate of 10 L/min at the same operating temperature. The experimental results for the CO2 permeate purity as a function of the pressure difference across the TCMD is shown in Fig. 4.
Fig. 4 Tri-gas CO2 purity versus pressure difference across the TCMD
The results show that the CO2 permeate purity decreased as the vacuum pressure difference decreased linearly but at different rates for the ceramic membranes 1, 2 and 4. The decrese in the permeate purity was more rapid in the case of membrane 4, whereas it was at slower rate for membranes 1 and 2. However, membrane 3 showed no effect in terms of separation purity for vacuum pressure difference raging from approximately -75 to -40 kPa. It then decreased suddenly and consistently when vaccum pressure difference decreased further till it reached -20 kPa. It shoud be noted that ceramic membrane 5 did not show any effect in permeate purity of the CO2 for the entire range of vacuum pressure difference. The reason for this lends itself to the distinct pore size that membrane 5 has. Fig. 5 shows the actual selectivity vs. the pressure difference for all five membranes. This can be shown with the actual selectivity reaching a maximum of unity. The maximum is of course considered to be one if the feed molar concentration which is equal to the permeate molar concentration. The experimental results indicate, in general, that selectivity for membrane CO2 gas separation tend to decrease with decreasing the vacuum pressure difference. Membranes 3 and 5 overrides the other three membranes and show this peak selectivity. Membranes 1 and 2 seem to show almost having identical selectivities with regards to decreasing the vacuum pressure difference although with very low selectivities. Membrane 4 again shows good characteristics in terms of selectivity showing a good increase in actual selectivity. This however does not reach above a selectivity of unity which means that argon and nitrogen combined are permeating faster than carbon dioxide at these pressures. A lower permeate pressure can change this however at a great cost of vacuum energy to reach pressures closer to absolute zero. The energy consumption increases asymptotically as the vacuum pressure reaches closer to absolute zero.
Fig. 2 A photograph showing the fully instrumented
and controlled CO2 gas separation test setup.
Fig. 3 A schematic showing the TCMD test section used in
this study.
112
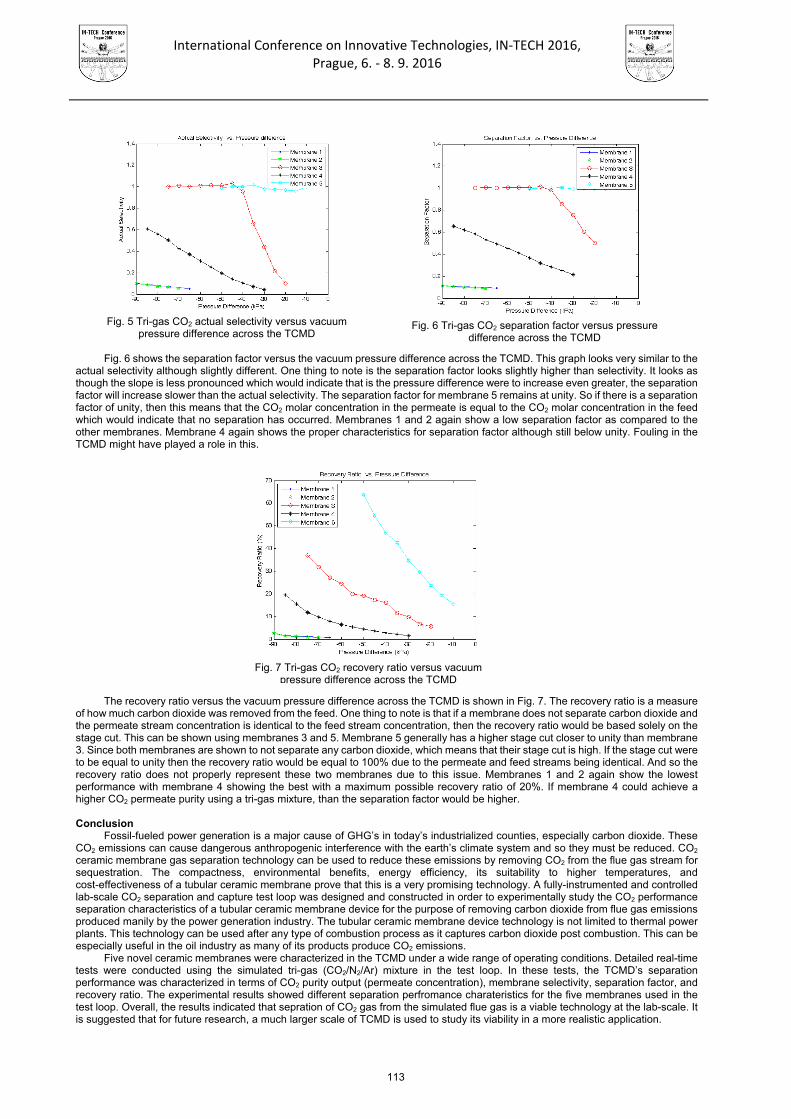
International Conference on Innovative Technologies, IN‐TECH 2016,
Prague, 6. ‐ 8. 9. 2016
Fig. 6 shows the separation factor versus the vacuum pressure difference across the TCMD. This graph looks very similar to the
actual selectivity although slightly different. One thing to note is the separation factor looks slightly higher than selectivity. It looks as though the slope is less pronounced which would indicate that is the pressure difference were to increase even greater, the separation factor will increase slower than the actual selectivity. The separation factor for membrane 5 remains at unity. So if there is a separation factor of unity, then this means that the CO2 molar concentration in the permeate is equal to the CO2 molar concentration in the feed which would indicate that no separation has occurred. Membranes 1 and 2 again show a low separation factor as compared to the other membranes. Membrane 4 again shows the proper characteristics for separation factor although still below unity. Fouling in the TCMD might have played a role in this.
The recovery ratio versus the vacuum pressure difference across the TCMD is shown in Fig. 7. The recovery ratio is a measure
of how much carbon dioxide was removed from the feed. One thing to note is that if a membrane does not separate carbon dioxide and the permeate stream concentration is identical to the feed stream concentration, then the recovery ratio would be based solely on the stage cut. This can be shown using membranes 3 and 5. Membrane 5 generally has a higher stage cut closer to unity than membrane 3. Since both membranes are shown to not separate any carbon dioxide, which means that their stage cut is high. If the stage cut were to be equal to unity then the recovery ratio would be equal to 100% due to the permeate and feed streams being identical. And so the recovery ratio does not properly represent these two membranes due to this issue. Membranes 1 and 2 again show the lowest performance with membrane 4 showing the best with a maximum possible recovery ratio of 20%. If membrane 4 could achieve a higher CO2 permeate purity using a tri-gas mixture, than the separation factor would be higher.
Conclusion
Fossil-fueled power generation is a major cause of GHG’s in today’s industrialized counties, especially carbon dioxide. These CO2 emissions can cause dangerous anthropogenic interference with the earth’s climate system and so they must be reduced. CO2 ceramic membrane gas separation technology can be used to reduce these emissions by removing CO2 from the flue gas stream for sequestration. The compactness, environmental benefits, energy efficiency, its suitability to higher temperatures, and cost-effectiveness of a tubular ceramic membrane prove that this is a very promising technology. A fully-instrumented and controlled lab-scale CO2 separation and capture test loop was designed and constructed in order to experimentally study the CO2 performance separation characteristics of a tubular ceramic membrane device for the purpose of removing carbon dioxide from flue gas emissions produced manily by the power generation industry. The tubular ceramic membrane device technology is not limited to thermal power plants. This technology can be used after any type of combustion process as it captures carbon dioxide post combustion. This can be especially useful in the oil industry as many of its products produce CO2 emissions.
Five novel ceramic membranes were characterized in the TCMD under a wide range of operating conditions. Detailed real-time tests were conducted using the simulated tri-gas (CO2/N2/Ar) mixture in the test loop. In these tests, the TCMD’s separation performance was characterized in terms of CO2 purity output (permeate concentration), membrane selectivity, separation factor, and recovery ratio. The experimental results showed different separation perfromance charateristics for the five membranes used in the test loop. Overall, the results indicated that sepration of CO2 gas from the simulated flue gas is a viable technology at the lab-scale. It is suggested that for future research, a much larger scale of TCMD is used to study its viability in a more realistic application.
Fig. 5 Tri-gas CO2 actual selectivity versus vacuum
pressure difference across the TCMD
Fig. 7 Tri-gas CO2 recovery ratio versus vacuum
pressure difference across the TCMD
Fig. 6 Tri-gas CO2 separation factor versus pressure
difference across the TCMD
113

International Conference on Innovative Technologies, IN‐TECH 2016,
Prague, 6. ‐ 8. 9. 2016
Acknowledgment
The main author of this work wishes to acknowledge the funding contributions provided by the Natural Sciences and Engineering Research Council of Canada (NSERC - Discovery Grant) in this main research area of clean CO2 membrane gas separation and capture technologies for industrial GHG emissions reduction and control. Acknowledgements also go to Mr. N. Nasir and Ms. S. Herron for their help in the construction phase of the experimental test-setup used in this research at the Department of Mechanical Engineering at Lakehead University, Thunder Bay, Ontario, Canada.
References
[1] M. C. Trachtenberg, R. M. Cowan, D. A. Smith: Proceedings of the Sixth Annual Conference on Carbon Capture &
Sequestration (2007), Pittsburgh, USA. [2] United Nations, Kyoto Protocol to the United Nations Framework Convention on Climate Change. Retrieved from
http://unfccc.int [Accessed 20 February 2009]. [3] Y. S. Lin: Microporous and dense inorganic membranes: current status and prospective, Separation and Purification
Technology, Vol. 25 (2001), pp. 39-55. [4] K. Li, Ceramic Membranes for Separation and Reaction (West Sussex, England: John Wiley & Sons Ltd, 2007).
114

International Conference on Innovative Technologies, IN‐TECH 2016,
Prague, 6. ‐ 8. 9. 2016
PERFORMANCE CHARACTERISTICS OF A SIMULATED GEOTHERMAL HEAT PUMP TECHNOLOGY FOR POTENTIAL
HEATING APPLICATIONS AT GOLDCORP-MUSSELWHITE MINE SITE IN NORTHWESTERN ONTARIO, CANADA
B. I. Ismail1 and A. Abdelrahman1 1Department of Mechanical Engineering, Lakehead University, 955 Oliver Road, Thunder
Bay,Ontario P7B 5E1, Canada, corresponding author: [email protected]
Keywords: Geothermal Energy; Geothermal Heat Pump; Renewable Energy; Ground-Source Heat Pump; Residential Heating Applications, Northwestern Ontario, Canada, Goldcorp-Musselwhite Mine, Innovative Clean Technology; Lakehead University; Mining Industries; Global Warming Abstract: Mining is a highly important industry in Northern Ontario and energy is a major contributor to the economics of this industry. Mining facilities in Northern Ontario, typically operating in harsh cold environments, are known for being energy intensive (i.e. have high demand for both electrical and thermal energy). Providing large quantities of energy to their facilities using conventional technologies is very costly due to their relatively remote and isolated location. Therefore, utilization of potential renewable geothermal energy resources for indirect heating applications by mining industry in Northern Ontario is promising for efficient performance, improving economics and reducing air pollution and greenhouse gas emissions for compliance with the increasing stringent environmental regulations. The main objective of this study is to experimentally characterize the performance characteristics of a lab-scale geothermal heat pump (GHP) using actual geothermal temperature profiles at a Goldcorp-Musselwhite Mine site in Northwestern Ontario, Canada. Extensive tests were performed using the fully instrumented geothermal simulator setup in order to assess the performance of the GHP under a wide range of operating conditions. Some important performance characteristics of the experimental simulations will be presented and discussed in this research paper. Introduction
Increasing thermal and electricity demand especially in cold remote locations, strict regulations for environmental issues of greenhouse gas emissions and air pollution, and the limitations and conservation of natural energy resources have recently increased interest and research in innovative renewable energy technologies for heating, cooling, and electrical power generation [1,2]. The term “geothermal’ is derived from Greek words; “geo” meaning earth and “therme” meaning heat, so geothermal means earth heat or ground heat. Geothermal heat pumps benefit from a physical fact that ground temperature at certain depth is fairly constant and stable around the year. Also, a geothermal heat pump (GHP) can operate in cooling or heating modes since ground tends to be warmer in the winter and cooler in the summer than the surface. Geothermal heat pumps are attractive alternative to conventional heating and cooling systems owing to their higher energy utilization efficiency. They are widely used in buildings for space cooling and heating and for water heating. There are many benefits of using GHP systems for heating and cooling purposes. Some of these benefits are environmental, operation cost, comfort, and safety. In conventional heating systems, all burning fossil fuel, natural gas, and methane gas consume oxygen (O2) and produce carbon dioxide (CO2) gas, which is known to have a significant effect on increasing greenhouse gas (GHG) emessions (contributing to global warming and climate change), and other pollutants that are harmful to the environment. However, geothermal driven heat pump systems produce much less CO2 emissions and pollutants. Therefore, geothermal heat pump innovative clean technology is receiving increasing interest in North America and Europe because of their potential to reduce primary energy consumption and thus reduce the GHG emissions and other pollutants. In addition, by using a GHP system, the operating cost can be significantly reduced. Most of the heat distribution systems used in GHP systems tend to have low-temperature radiant floor and wall heating. This insures comfortable and healthy living climate by minimizing overheating and excusive air and dust turbulence. A geothermal heat pump system is a thermodynamics cycle without combustion and flame which reduces chance of accident and fire [3,4].
A heat pump is a thermodynamic device which can be used to supply heat energy for heating applications. Typically, there are four types of heat pumps: air-to-air, air-to-water, water-to-air, and water-to-water [3,4]. The most common type of a heat pump used in geothermal application is the water-to-air heat pump. The performance of a heat pump is normally measured using the coefficient of performance A heat pump system consists of four major components: the evaporator, compressor, condenser, and expansion valve. The most common type of refrigerant used in the heat pump as working fluid is R-134a. Geothermal heat pump systems include a ground closed circuit loop (typically a heat exchanger buried under ground in a certain configuration), a heat pump closed circuit loop, and a heat distribution system as hsown in Fig. 1. A GHP works by circulating a fluid (usually an anti-freeze) using plastic pipe buried horizontally under the ground or ran vertically into the ground to absorb ground heat. This heat is then exchanged between the anti-freeze and the refrigerant of the heat pump loop at the evaporator side. Refrigerant (as the heat pump cycle‘s working fluid) is then compressed in the heat pump ccyle to a higher temperature using electrically drive compressor. At the condenser side of the heat pump loop, heat is then absorbed from the refrigerant by the air form the circulating fan delivered to the heating space using ducts (heat distribution systems). A geothermal heat pump system consists of three majors components. The first component is the geothermal heat exchanger (ground loop), the second component is the heat pump cycle, and the third component is the HVAC distribution loop shown in Fig. 1.
115

International Conference on Innovative Technologies, IN‐TECH 2016,
Prague, 6. ‐ 8. 9. 2016
A Potential Application of a GHP system for Mining Industry in Northwestern Ontario Mining is a highly important industry in Northern Ontario and energy is a major contributor to the economics of this industry. Mining
facilities in Northern Ontario, typically operating in harsh cold environments, are known for being energy intensive (i.e. have high demand for both electrical and thermal energy). Providing large quantities of energy to their facilities using conventional technologies is very costly due to their relatively remote and isolated location. Therefore, utilization of renewable geothermal energy resources by mining industry in Northern and Northwestern Ontario is promising for efficient performance, improving economics and reducing air pollution and greenhouse gas emissions for compliance with the stringent environmental regulations. Musselwhite gold mine is located approximately 470 km north of Thunder Bay, Ontario, and has approximately 310 m elevation. The latitude and longitude of its location are 52.6o N and 90.36o W, respectively. Fig. 2 shows an aerial view for the mine location. The mine currently uses electric/propane for heating applications.
Fig. 2 An aerial view of the Goldcorp Ltd-Musselwhite Mine in Northwestern Ontario, Canada. There have been a number of investigations that characterized the performance of geothermal heat pump systems. However,
there have been few investigations that characterized the performance of GHP systems taking into considerations actual measurements of geothermal properties and ground temperature profiles for the particular site under investigation for possible heating applications. These properties and profiles are important in the feasibility study to provide more accurate assessment. Therefore, the main objective of this research study is to experimentally characterize the performance characteristics of a lab-scale geothermal heat pump (will be referred to as GHP simulator) using actual geothermal temperature profiles at a Goldcorp-Musselwhite Mine site in Northwestern Ontario, Canada. Geothermal logging and micro-weather stations were installed at the mine site and extensive real-time geothermal temperature measurements were performed at various depths from the ground for two different locations using ground temperature sensors and remote-radio data acquiring technology. Extensive tests were then performed using the fully instrumented lab-scale GHP simulator using mine’s ground thermal data in order to assess the performance of the GHP under a wide range of operating conditions for future potential large-scale heating application at the mine’s site. Some important performance characteristics of this detailed experimental simulations will be presented in he next sections of this paper.
The Experimental GHP Simulator Test-Setup Used in this Research In this study, a lab-scale fully-instrumented geothermal heat pump system simulator was designed and constructed. Detailed tests
were performed using this setup and energy analysis was applied in order to better understand the performance of the system udner a wide range of operating conditions simulating the geothermal data obtained from the mine‘s site. A schematic diagram and photograph of the lab-scale GHP simulator used in this research is shown in Fig. 3. The GHP system consist of two main loops; namely, the geothermally simulated ground loop and the heat pump loop (refrigerant thermodynamic cycle). In addition, a heat delivery duct system is incorporated into the test setup for space heating application. In this simulator, a plate-type heat exchanger is used to exchange heat between the simulated geothermal heat source and the refrigerant in the heat pump cycle. The inlet temperature to the heat pump was varied in order to investigate the performance characteristics of the GHP system. The test setup was instrumented with pressure gages, thermocouples, and control valves at various locations of the GHP system.
Fig. 1 A schematic diagram showin a typical geothermal heat pump system.
116
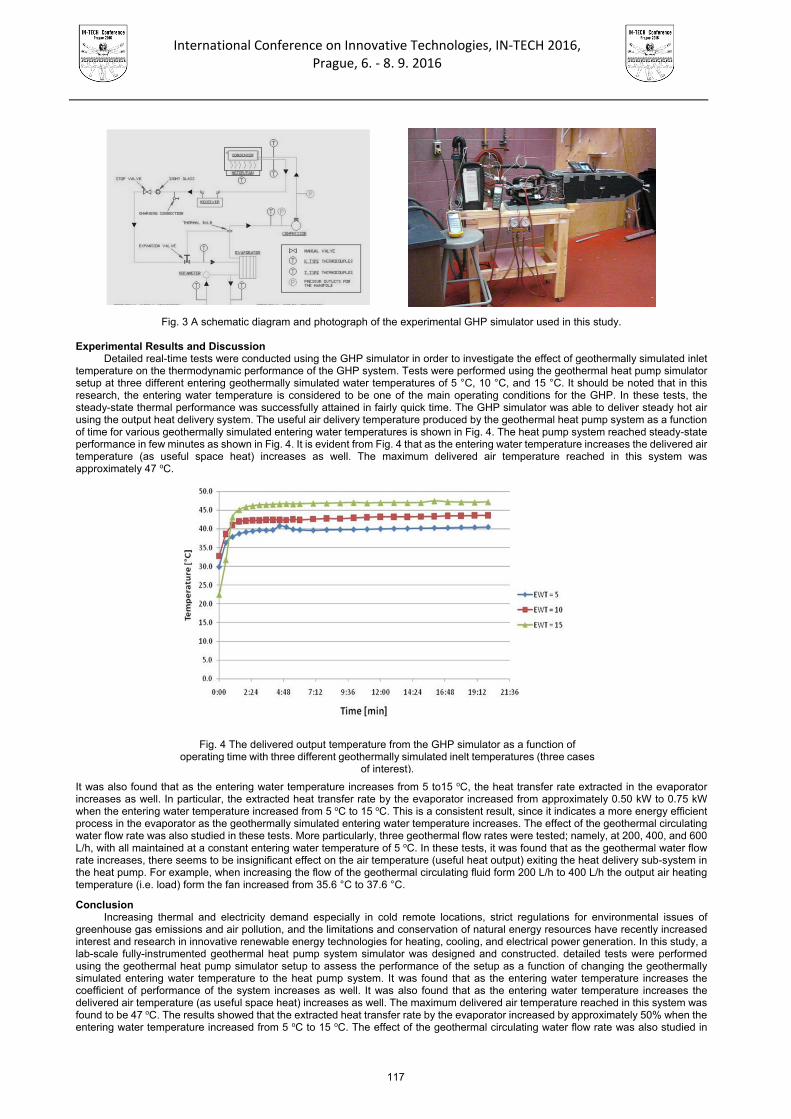
International Conference on Innovative Technologies, IN‐TECH 2016,
Prague, 6. ‐ 8. 9. 2016
Fig. 3 A schematic diagram and photograph of the experimental GHP simulator used in this study. Experimental Results and Discussion
Detailed real-time tests were conducted using the GHP simulator in order to investigate the effect of geothermally simulated inlet temperature on the thermodynamic performance of the GHP system. Tests were performed using the geothermal heat pump simulator setup at three different entering geothermally simulated water temperatures of 5 °C, 10 °C, and 15 °C. It should be noted that in this research, the entering water temperature is considered to be one of the main operating conditions for the GHP. In these tests, the steady-state thermal performance was successfully attained in fairly quick time. The GHP simulator was able to deliver steady hot air using the output heat delivery system. The useful air delivery temperature produced by the geothermal heat pump system as a function of time for various geothermally simulated entering water temperatures is shown in Fig. 4. The heat pump system reached steady-state performance in few minutes as shown in Fig. 4. It is evident from Fig. 4 that as the entering water temperature increases the delivered air temperature (as useful space heat) increases as well. The maximum delivered air temperature reached in this system was approximately 47 oC.
It was also found that as the entering water temperature increases from 5 to15 oC, the heat transfer rate extracted in the evaporator increases as well. In particular, the extracted heat transfer rate by the evaporator increased from approximately 0.50 kW to 0.75 kW when the entering water temperature increased from 5 oC to 15 oC. This is a consistent result, since it indicates a more energy efficient process in the evaporator as the geothermally simulated entering water temperature increases. The effect of the geothermal circulating water flow rate was also studied in these tests. More particularly, three geothermal flow rates were tested; namely, at 200, 400, and 600 L/h, with all maintained at a constant entering water temperature of 5 oC. In these tests, it was found that as the geothermal water flow rate increases, there seems to be insignificant effect on the air temperature (useful heat output) exiting the heat delivery sub-system in the heat pump. For example, when increasing the flow of the geothermal circulating fluid form 200 L/h to 400 L/h the output air heating temperature (i.e. load) form the fan increased from 35.6 °C to 37.6 °C.
Conclusion Increasing thermal and electricity demand especially in cold remote locations, strict regulations for environmental issues of
greenhouse gas emissions and air pollution, and the limitations and conservation of natural energy resources have recently increased interest and research in innovative renewable energy technologies for heating, cooling, and electrical power generation. In this study, a lab-scale fully-instrumented geothermal heat pump system simulator was designed and constructed. detailed tests were performed using the geothermal heat pump simulator setup to assess the performance of the setup as a function of changing the geothermally simulated entering water temperature to the heat pump system. It was found that as the entering water temperature increases the coefficient of performance of the system increases as well. It was also found that as the entering water temperature increases the delivered air temperature (as useful space heat) increases as well. The maximum delivered air temperature reached in this system was found to be 47 oC. The results showed that the extracted heat transfer rate by the evaporator increased by approximately 50% when the entering water temperature increased from 5 oC to 15 oC. The effect of the geothermal circulating water flow rate was also studied in
Fig. 4 The delivered output temperature from the GHP simulator as a function of
operating time with three different geothermally simulated inelt temperatures (three cases of interest).
117

International Conference on Innovative Technologies, IN‐TECH 2016,
Prague, 6. ‐ 8. 9. 2016
these tests. In these tests, it was found that as the geothermal water flow rate increases, there seems to be insignificant effect on the air temperature (useful heat output) exiting the heat delivery sub-system in the heat pump. The experimental results suggested that a more efficient performance for the heat delivery system at relatively higher geothermal entering water temperature. Also, the results suggested that the utilization of GHP systems in large-scale heating applications, such for mining industry in cold climate is viable and promising option.
Acknowledgment
The main author of this work wishes to acknowledge the funding contributions provided by Goldcorp Canada Ltd-Musselwhite Mine and the project collaborators Mr. E. Figueroa and Mr. N. Hmidi from Musselwhite mine. Acknowledgements also go to all those who helped in the construction phase of the GHP experimental test-setup and the geothermal logging station at the mine’s site in Northwestern Ontario, used in this research.
References
[1] B. I. Ismail: Thermophotovoltaic energy conversion for direct generation of electricity as an alternative clean energy source
technology, Recent Patents on Mechanical Engineering, Vol. 4 (2011), pp. 188-197. [2] B. I. Ismail: Power Generation Using Nonconventional Renewable Geothermal & Alternative Clean Energy Technologies, Chapter
18, in: Plant Earth 2011 – Global Warming Challenges and opportunities for Ploicy and Practice, Ed. by Elias G. Carayannis, InTech Open Access Publishing Company, ISBN: 978-953-307-733-8.
[3] B. I. Ismail, Book Editor, Advances in Geothermal Energy, (In-Tech publisher, Rijeka, Croatia, 2016). [4] K. Ochsner, Geothermal heat pumps, (Cromwell Press, Trowbridge, 2008).
118

International Conference on Innovative Technologies, IN‐TECH 2016,
Prague, 6. ‐ 8. 9. 2016
OPTIMIZATION AND COMPARISON OF WELDED I- AND BOX BEAMS
M. Petrik 1 and K. Jármai 2
1 PhD student, University of Miskolc, H-3515 Miskolc, Egyetemváros, Hungary
2 Professor, University of Miskolc, H-3515 Miskolc, Egyetemváros, Hungary
Keywords: Structural Optimization; Welded Structures; Overall Stability; Local Buckling Abstract: The optimization is made for welded I- and box beams. Optimization means mass minimization in this case. The considered cross sections are welded I- and box. The unknowns are the sizes. The constraints are the overall and local stability, stress and size limitations. We have made the stability calculations according to the Eurocode 3. Several steel grades have been considered, from 235 up to 690 MPa yield stress. The beam length, the bending and compression forces are also changed. For the optimization the Excel Solver is used. A great number of comparisons show the best optima in the function of length, bending forces and moments and steel grades. Introduction
Structural optimization is a design system for searching better solutions, which better fulfil engineering requirements. The main requirements of a modern load-carrying structure are the safety, fitness for production and economy. The safety and producibility are guaranteed by design and fabrication constraints, and economy can be achieved by minimization of a cost function. The main aim of this paper is to give designers and fabricators aspects for selection of the best structural solution at beams. A lot of structural versions fulfil the design and fabrication constraints and designers should select from these possibilities the best ones. A suitable objective function helps this selection, since a modern structure should be not only safe and fit for production but also economic.
The symmetrical plated unstiffened I- and box cross-sections of the beam has four variable dimensions and four longitudinal fillet welds. Since the cross-section is constant for the whole beam, in the minimum volume design it is sufficient to optimize the cross-section area. For the minimum cost design the whole beam should be investigated. The minimum cross-section area design results in relatively simple closed formulae.
Minimum cross-sectional area design
The symmetrical plated unstiffened I- and box cross-sections of the beam has four variable dimensions (h, tw or tw/2, b, tf) and four longitudinal fillet welds (Fig. 1). Since the cross-sections are constant for the whole beam, in the minimum volume design it is sufficient to optimize the cross-section area. For the minimum cost design the whole beam should be investigated [1,2,3,4].
Fig. 1 Simply supported welded I- and box beams
119

International Conference on Innovative Technologies, IN‐TECH 2016,
Prague, 6. ‐ 8. 9. 2016
The formulation of the optimum design of an I- and box beam is as follows: find the optimum values of the dimensions h, tw, tw/2, b, tf to minimize the whole cross-section area (objective function)
= + 2 (1) and fulfil the following constraints:
According to Eurocode 3 [5] the box section is not susceptible to torsional deformations, thus , kyx = 0 and the second constraint in EC3
should not be considered should not be considered.
These values must be calculated in the x and the y axis too. The specific buckling will be the bigger of these two values.
β is a factor which takes into account the change of the bending moment along the beam. In the calculation this is = = 1.4. Optimization
Design Data Compression force: N = 0-80 [kN], Concentrated force: F = 0-80 [kN], Column length: L = 1-10 [m], Bending factor: γ = 0-1 [-], Yield stress: fy = 235, 355, 460, 690 [MPa].
120
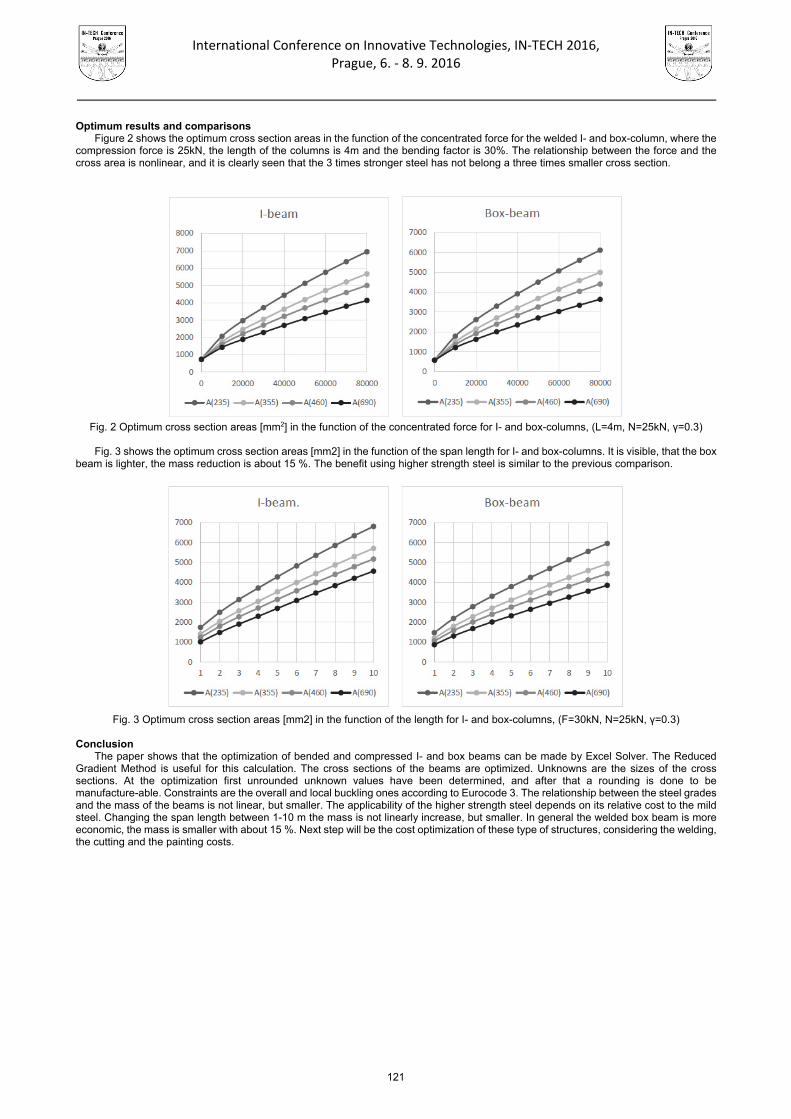
International Conference on Innovative Technologies, IN‐TECH 2016,
Prague, 6. ‐ 8. 9. 2016
Optimum results and comparisons
Figure 2 shows the optimum cross section areas in the function of the concentrated force for the welded I- and box-column, where the compression force is 25kN, the length of the columns is 4m and the bending factor is 30%. The relationship between the force and the cross area is nonlinear, and it is clearly seen that the 3 times stronger steel has not belong a three times smaller cross section.
Fig. 2 Optimum cross section areas [mm2] in the function of the concentrated force for I- and box-columns, (L=4m, N=25kN, γ=0.3)
Fig. 3 shows the optimum cross section areas [mm2] in the function of the span length for I- and box-columns. It is visible, that the box
beam is lighter, the mass reduction is about 15 %. The benefit using higher strength steel is similar to the previous comparison.
Fig. 3 Optimum cross section areas [mm2] in the function of the length for I- and box-columns, (F=30kN, N=25kN, γ=0.3)
Conclusion
The paper shows that the optimization of bended and compressed I- and box beams can be made by Excel Solver. The Reduced Gradient Method is useful for this calculation. The cross sections of the beams are optimized. Unknowns are the sizes of the cross sections. At the optimization first unrounded unknown values have been determined, and after that a rounding is done to be manufacture-able. Constraints are the overall and local buckling ones according to Eurocode 3. The relationship between the steel grades and the mass of the beams is not linear, but smaller. The applicability of the higher strength steel depends on its relative cost to the mild steel. Changing the span length between 1-10 m the mass is not linearly increase, but smaller. In general the welded box beam is more economic, the mass is smaller with about 15 %. Next step will be the cost optimization of these type of structures, considering the welding, the cutting and the painting costs.
121

International Conference on Innovative Technologies, IN‐TECH 2016,
Prague, 6. ‐ 8. 9. 2016
Fig. 4 Optimum cross section areas [mm2] in the function of the bending factor for I- and box-columns, (F=30kN, N=25kN, L=4m)
Fig. 5 Screenshot of the Excel Solver
Acknowledgment
The research was supported by the Hungarian Scientific Research Fund OTKA T 109860 project and was partially carried out in the framework of the Center of Excellence of Innovative Vehicle, Mechanical and Energy Engineering Design and Technologies at the University of Miskolc. References [1] Farkas J, Jármai K (1997) Analysis and optimum design of metal structures. Balkema, Rotterdam [2] Farkas J, Jármai K (2003) Economic design of metal structures. Millpress, Rotterdam [3] Farkas J, Jármai K (2008) Design and optimization of metal structures. Horwood , Chichester UK. [4] Farkas J, Jármai K (2013) Optimum design of steel structures. Springer Verlag, Heidlberg [5] Eurocode 3. Design of steel structures. Part 1-1. (2005) General structural rules [6] Knobloch M, Fontana M, Frangi A (2008) On the interaction of global and local buckling of square hollow sections in fire. In 5th
International Conference on coupled instabilities in metal structures. CMIS, Sydney, Australia. 587-594
122

International Conference on Innovative Technologies, IN‐TECH 2016,
Prague, 6. ‐ 8. 9. 2016
RISK MANAGEMENT IN PETROL STATIONS. PERCEPTIONS OF USERS, WORKERS, AND SAFETY TECHNICIANS
J.C. Rubio-Romero 1, A. López-Arquillos 2 and M. Pardo-Ferreira 3 1 Dpto. de Organización de Empresas. Escuela de Ingenierías. Universidad de Málaga.
C/ Dr. Ortiz Ramos S/N, 29071. [email protected]. Málaga. Spain.
2 Dpto. de Organización de Empresas. Escuela de Ingenierías. Universidad de Málaga. C/ Dr. Ortiz Ramos S/N, 29071. [email protected]. Málaga. Spain.
3 Dpto. de Organización de Empresas. Escuela de Ingenierías. Universidad de Málaga. C/ Dr. Ortiz Ramos S/N, 29071. [email protected]. Málaga. Spain.
Keywords: Risk; Management; Worker; Safety; Petrol Station Abstract: Risk management in petrol stations is a cause of concern due two main reasons. The exposure to dangerous substances and the lack of training of the users, who frequently develop risky activities in self-service stations. The objective of the research is to compare different risk perception between users, workers, and safety technicians. A specific survey was designed and carried out between the cited groups and results were compared. Results showed that general perception of risks was higher in users in comparison with workers. Workers showed the lowest perception of risks. In order to prevent accidents due to overconfidence, occupational safety training should be carried on between workers Introduction
Risk management in petrol stations is a cause of concern due to the presence, transport and use of dangerous substances. The impact in the health and safety of workers exposed to fuel have been studied previously in several countries as Spain [1], India [2], or Brasil [3] or Ghana [4]. Many researches have studied the genotoxicity between filling station attendants due to the exposition of toxic substances as benzene and hydrocarbons [5],[6],[7],[8],[9].
However, in nowadays many users have become in occasional workers in self-service stations due to the lack of attendant workers.
It is evident that their time of exposition is significant lower in comparison with usual workers, but their perception of the risk can be different from workers and safety technicians, because they do not have the same information about the risk and preventive measures. It is a cause of concern that majority of users have no received any training about the minimum occupational health and safety requirements in a petrol station. They only received the information showed in the safety signals around the installation, and in many cases they did not read the signals or they ignored them.
Objectives
Due to the lack of previous studies about the risks of users as occasional workers at petrol station services, the objective of the current research is to evaluate and compare the risk perception from users, workers and occupational safety technicians.
Methods
A specific survey was carried out in order to obtain the perception based on the opinion of the three group of interest. The respondent were asked to evaluate the level of risk of different activities performed frequently in petrol station services. Methodology “Simplified Method for evaluating Accident Risks” proposed by Belloví and Malagon [10] was applied.
A sample of 200 respondents answered the survey. Distribution of respondents was the following: 150 users, 30 workers
and 20 technicians.
Fig. 1 Distribution of respondents
USERS75%
WORKERS15%
TECHNICIANS10%
123

International Conference on Innovative Technologies, IN‐TECH 2016,
Prague, 6. ‐ 8. 9. 2016
Results
Results range was from 0 to 5. (0 Minimum risk; 5 Maximum risks). According to the results from users, discharge of fuel from truck tanks was the most risky activity perceived by users (3.78), following by loading vehicle tanks (3.53), and use of electronic devices.
Fig. 2 Users risk perception
In contrast, butane selling was the most dangerous activity in opinion of the workers (4.53), following by discharge of fuel from truck
tanks (3.98), and loading tank (3.78).
Fig. 3 Workers risk perception Similarly, safety technicians scored butane selling (4.23) and discharge of fuel from tanks (4.01) as the most dangerous activities
0
1
2
3
4
5
Discharge of fuel fromtruck tanks
Loading vehicle tanks
Use of electronicdevices
Butane selling
Walking in the station
0
1
2
3
4
5
Discharge of fuel fromtruck tanks
Loading vehicle tanks
Use of electronicdevices
Butane selling
Walking in the station
124

International Conference on Innovative Technologies, IN‐TECH 2016,
Prague, 6. ‐ 8. 9. 2016
Fig. 4 Technicians risk perception
Fig. 5 Risk perception averages
It is remarkable that the group of technicians, that was considered the group more trained and informed about occupational health and safety issues, perceived the risks, in general, as more dangerous that the rest of studied groups. Then, lack of training can be a cause of overconfidence, and it could have negative consequence in some dangerous situations. Conclusion
Results from users obtained the lowest risk scores from the three group of stake-holders surveyed. Then, perception of the users risk should be trained improving information and communications systems at petrol station services, in order to prevent accidents due to a low risk perception. Effectiveness of signals and warnings at petrol stations should be studied in future researches.
00,51
1,52
2,53
3,54
4,5
Discharge of fuel fromtruck tanks
Loading vehicle tanks
Use of electronic devicesButane selling
Walking in the station
3,102
3,418
3,712
0 1 2 3 4 5
USERS
WORKERS
TECHNICIANS
125

International Conference on Innovative Technologies, IN‐TECH 2016,
Prague, 6. ‐ 8. 9. 2016
References [1] Periago, J. (2005). Evolution of Occupational Exposure to Environmental Levels of Aromatic Hydrocarbons in Service Stations.
Annals of Occupational Hygiene, 49(3), pp.233-240. [2] Majumdar (neé Som), D., Dutta, C., Mukherjee, A.and Sen, S. (2008). Source apportionment of VOCs at the petrol pumps in
Kolkata, India; exposure of workers and assessment of associat-ed health risk. Transportation Research Part D: Transport and Environment, 13(8), pp.524-530.
[3] Cezar-Vaz, M., Rocha, L., Bonow, C., da Silva, M., Vaz, J. and Cardoso, L. (2012). Risk Perception and Occupational Accidents: A Study of Gas Station Workers in Southern Brazil. Inter-national Journal of Environmental Research and Public Health, 9(12), pp.2362-2377.
[4] Monney, I., Dramani, J. B., Aruna, A., Tenkorang, A. G., & Osei-Poku, F. (2015). Health and safety in high-risk work environments: A study of fuel service stations in Ghana. J Environ Occup Sci, 4(3), 133.
[5] Rekhadevi, P. V., Rahman, M. F., Mahboob, M., & Grover, P. (2010). Genotoxicity in filling station attendants exposed to petroleum hydrocarbons. Annals of occupational hygiene, 54(8), 944-954
[6] Bindhya, S., Balachandar, V., Sudha, S., Devi, S. M., Varsha, P., Kandasamy, K., ... & Sasikala, K. (2010). Assessment of occupational cytogenetic risk, among petrol station workers. Bulletin of environmental contamination and toxicology, 85(2), 121-124.
[7] Moro, A. M., Charão, M. F., Brucker, N., Durgante, J., Baierle, M., Bubols, G., ... & Gauer, B. (2013). Genotoxicity and oxidative stress in gasoline station attendants. Mutation Research/Genetic Toxicology and Environmental Mutagenesis, 754(1), 63-70.
[8] Sellappa, S., Sadhanandhan, B., Francis, A., & Vasudevan, S. G. (2010). Evaluation of genotoxicity in petrol station workers in South India using micronucleus assay. Industrial health, 48(6), 852-856.
[9] Rekhadevi, P. V., Mahboob, M., Rahman, M. F., & Grover, P. (2011). Determination of genetic damage and urinary metabolites in fuel filling station attendants. Environmental and molecular mutagenesis, 52(4), 310-318.
[10] Belloví, M. B, & Malagón, F. P. (1993). NTP 330: Sistema simplificado de evaluación de riesgos de accidente. Centro Nacional de Condiciones de Trabajo, INSHT, Barcelona.
126
International Conference on Innovative Technologies, IN‐TECH 2016,
Prague, 6. ‐ 8. 9. 2016
INFLUENCE OF CUTTING PARAMETERS ON SURFACE ROUGHNESS IN TURNING PROCESS USING TAGUCHI METHOD
D. Begic-Hajdarevic1, B. Brdaric1, M. Pasic1, A. Cekic1 and M. Mehmedovic2 1 Faculty of Mechanical Engineering, University of Sarajevo, Vilsonovo setaliste 9, 71000 Sarajevo,
Bosnia and Herzegovina
2 Faculty of Mechanical Engineering, University of Tuzla, Univerzitetska 4, 75000 Tuzla,
Bosnia and Herzegovina
Keywords: Carbon Steel; Cutting Parameters; Surface Roughness; Taguchi Method; Turning Process Abstract: In this paper effect of cutting parameters on surface roughness in turning process is analyzed. The experiments are conducted at three levels of the selected cutting parameters such as spindle speed, feed rate and depth of cut. Taguchi orthogonal array is employed to minimize the number of experiments. The experiments are carried out on high strength carbon steel bar using the coated carbide tool insert in the turning process. Diameter and length of the bars used in the experiments are 99 mm and 400 mm respectively. The cutting parameters are optimized using signal to noise ratio. Results of this study indicate that the spindle speed has the most significant effect on surface roughness. The optimum cutting conditions for desired surface roughness are at a high level of the spindle speed, medium level of the feed rate and low level of the depth of the cut from the selected levels. Introduction
Turning process is one of the most basic machining processes. This process can produce various shapes of materials such as straight, conical, curved or grooved work pieces. In turning process parameters such as cutting tool geometry and materials, number of passes, spindle speed or cutting speed, depth of cut, feed rate as well as the use of cutting fluids will impact the production costs, material removal rates, tool life and machining qualities like the surface roughness and dimensional deviations of the product. Surface roughness and tool life are strongly correlated with cutting parameters such as spindle speed, feed rate and depth of cut. Proper selection of these parameters can lead to the cost minimization, material removal rate maximization, longer tool life and better surface roughness [1].
Various analytical methods for surface roughness prediction, dimensional deviations, tool life and cutting forces have been analyzed by many researchers. Development of mathematical models for machinability parameters in a variety of machining processes have been performed based on data from different methods such as statistical methods, artificial neural networks, genetic algorithm etc. The system of automatic detecting of wear and damages of the end mill tool by the use of computer vision was analyzed in [2]. Simulation results have confirmed that the proposed approach can improve monitoring of tool wear and damages and consequently the effectiveness and reliability of CNC milling machine tool. The effect of cutting parameters and cutting fluid types on process responses such as specific energy, tool life and surface roughness during end milling process of AISI 304 material by using D-optimal methods was analyzed in [3]. The results of the optimization shown that Canola cutting fluid was the best to minimize the surface roughness and specific energy. Experimental study was made [4] to investigate the effect of cutting speed and feed per tooth and the cutting tool diameter on surface roughness in dry high speed milling of hardened tool steel. Results show that the good surface roughness can be achieved in high speed machining of examined steel but rapidly tool wear is observed. Using artificial neural network Davim et al. [5] developed surface roughness prediction models to investigate effects of the cutting conditions during turning of free machining steel 9SMnPb28k (DIN). The artificial neural network model of surface roughness parameters was developed with the cutting conditions such as feed rate, cutting speed and depth of cut as the affecting process parameters. The analysis revealed that cutting speed and feed rate have significant effects in reducing the surface roughness, while the depth of cut has the least effect. Abburi and Dixit [6] developed a knowledge-based system for the prediction of surface roughness in turning process. Neural networks and fuzzy set theory were used for this purpose. The performance of the developed knowledge-based system was studied with the experimental data of dry and wet turning of mild steel with HSS and carbide tools. A hybrid enhanced genetic algorithm was developed by Yildiz and Ozturk [7] for solving the optimization problems in design and manufacturing. After the approach was validated by single and multi-objective benchmark problems, it was applied to the optimization of machining economic problems in multi-pass turning operation. The surface roughness of Al–SiC (20 p) was studied in [8] by turning the composite bars using coarse grade polycrystalline diamond insert under different cutting conditions. Experimental data collected were tested with analysis of variance (ANOVA) and artificial neural network (ANN) techniques. On completion of the experimental test ANOVA and an ANN were used to validate obtained results and to predict the behavior of the system as well under any condition within the operating range. Experimental research was shown in [9] during intermittent turning of UNS M11917 magnesium alloy evaluating various machining conditions (cutting speed, depth of cut and feed rate) under dry machining and MQL system. Intermittent process was evaluated using the surface roughness as response variable. Full factorial experimental design was used and results were analyzed using the analysis of variance. Performed statistical analysis enabled to identify feed rate as the main factor in order to explain surface roughness variability. In particular, the increase of feed rate leads to higher surface roughness. Nalbant et al. [10] used Taguchi method to find the optimal cutting parameters for surface roughness in turning process. The orthogonal array, the S/N ratio, and ANOVA were employed to study the performance characteristics in turning operations of AISI 1030 steel bars using TiN-coated tools. Three cutting parameters namely, insert radius, feed rate, and depth of cut, were optimized with considerations of surface roughness. In research work [11], the optimum novel uses of SiO2 nano-lubrication parameters in hard turning AISI4140 steel to improve machining performance were investigated. Fuzzy logic and response analysis was used to determine which process parameters are statistically significant. Debnath et al. [12] studied the effect of various cutting fluid levels and cutting parameters on surface roughness and tool wear. The experiments were carried out on mild steel bar using a TiCN + Al2O3 + TiN coated carbide tool insert in the CNC turning process. The effect of feed rate was found to be dominant factor contributing 34.3% to surface roughness of the work-piece.
127
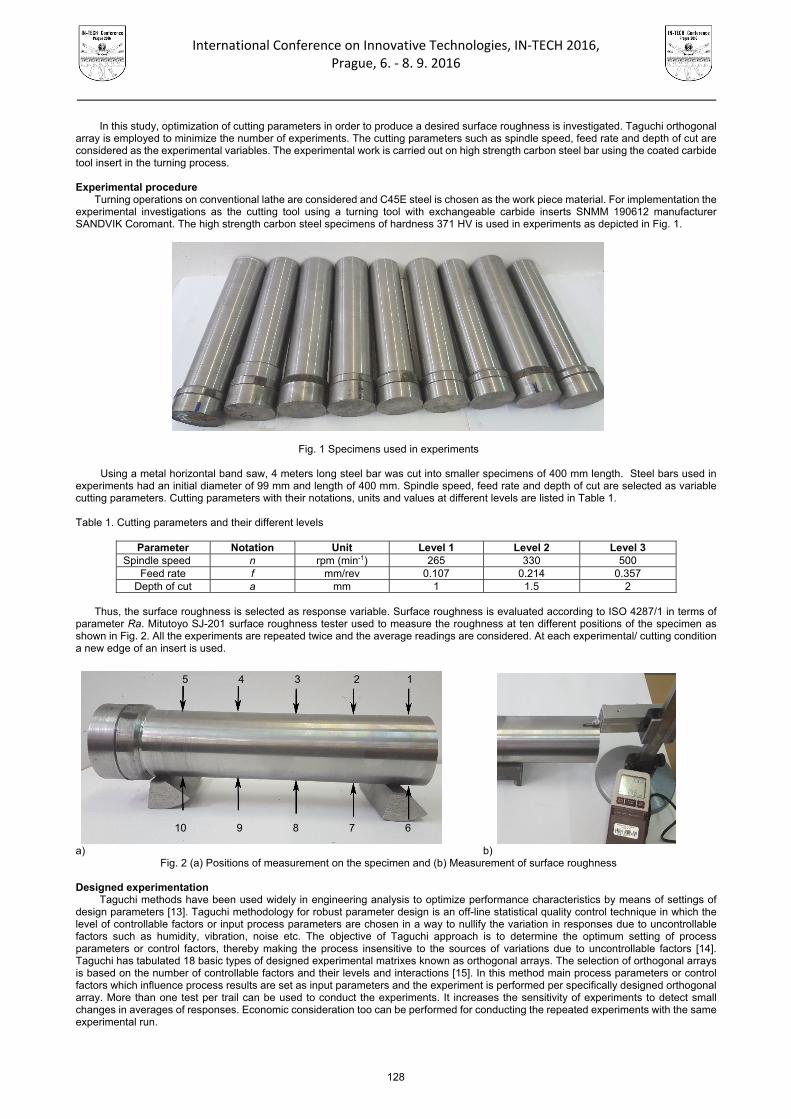
International Conference on Innovative Technologies, IN‐TECH 2016,
Prague, 6. ‐ 8. 9. 2016
In this study, optimization of cutting parameters in order to produce a desired surface roughness is investigated. Taguchi orthogonal array is employed to minimize the number of experiments. The cutting parameters such as spindle speed, feed rate and depth of cut are considered as the experimental variables. The experimental work is carried out on high strength carbon steel bar using the coated carbide tool insert in the turning process.
Experimental procedure
Turning operations on conventional lathe are considered and C45E steel is chosen as the work piece material. For implementation the experimental investigations as the cutting tool using a turning tool with exchangeable carbide inserts SNMM 190612 manufacturer SANDVIK Coromant. The high strength carbon steel specimens of hardness 371 HV is used in experiments as depicted in Fig. 1.
Fig. 1 Specimens used in experiments
Using a metal horizontal band saw, 4 meters long steel bar was cut into smaller specimens of 400 mm length. Steel bars used in experiments had an initial diameter of 99 mm and length of 400 mm. Spindle speed, feed rate and depth of cut are selected as variable cutting parameters. Cutting parameters with their notations, units and values at different levels are listed in Table 1. Table 1. Cutting parameters and their different levels
Parameter Notation Unit Level 1 Level 2 Level 3
Spindle speed n rpm (min-1) 265 330 500 Feed rate f mm/rev 0.107 0.214 0.357
Depth of cut a mm 1 1.5 2
Thus, the surface roughness is selected as response variable. Surface roughness is evaluated according to ISO 4287/1 in terms of parameter Ra. Mitutoyo SJ-201 surface roughness tester used to measure the roughness at ten different positions of the specimen as shown in Fig. 2. All the experiments are repeated twice and the average readings are considered. At each experimental/ cutting condition a new edge of an insert is used.
a)
b) Fig. 2 (a) Positions of measurement on the specimen and (b) Measurement of surface roughness
Designed experimentation
Taguchi methods have been used widely in engineering analysis to optimize performance characteristics by means of settings of design parameters [13]. Taguchi methodology for robust parameter design is an off-line statistical quality control technique in which the level of controllable factors or input process parameters are chosen in a way to nullify the variation in responses due to uncontrollable factors such as humidity, vibration, noise etc. The objective of Taguchi approach is to determine the optimum setting of process parameters or control factors, thereby making the process insensitive to the sources of variations due to uncontrollable factors [14]. Taguchi has tabulated 18 basic types of designed experimental matrixes known as orthogonal arrays. The selection of orthogonal arrays is based on the number of controllable factors and their levels and interactions [15]. In this method main process parameters or control factors which influence process results are set as input parameters and the experiment is performed per specifically designed orthogonal array. More than one test per trail can be used to conduct the experiments. It increases the sensitivity of experiments to detect small changes in averages of responses. Economic consideration too can be performed for conducting the repeated experiments with the same experimental run.
5 4 3 2 1
10 9 8 7 6
128

International Conference on Innovative Technologies, IN‐TECH 2016,
Prague, 6. ‐ 8. 9. 2016
If full factorial design is applied 27 experimental runs must be conducted for this study. In this study Taguchi orthogonal array was applied to minimize the number of experiments. Accordingly, only nine experiments are required for three parameters based on Taguchi orthogonal array design. The experimental data for surface roughness is given in Table 2. Table 2. Surface roughness obtained from experiments
Exp. no Cutting parameters level Measured parameter, Ra (µm)
n, rpm f, mm/rev a, mm First pass Second pass Average 1 1 1 1 2.43 2.43 2.430 2 1 2 2 2.19 1.82 2.005 3 1 3 3 3.55 3.34 3.445 4 2 1 2 2.12 1.76 1.940 5 2 2 3 2.60 2.11 2.355 6 2 3 1 2.43 2.26 2.345 7 3 1 3 1.93 1.27 1.600 8 3 2 1 1.23 1.54 1.385 9 3 3 2 1.85 2.98 2.415
Taguchi method uses the S/N ratio to measure the characteristic deviating from the desired value. The S/N ratio is the ratio of the
mean to the standard deviation. Taguchi method suggests that the signal to noise ratio (S/N) can be used as a quantitative analysis tool. Since smaller surface roughness values are desired in this experiment the signal-to-noise ratio is chosen as:
⁄ 10 log1
1
where: is the observed data of quality characteristic at the -th trial and is the number of repetitions at the same trial. The S/N ratio represents the desired part/ undesired part and the aim is always to maximize the S/N ratio whatever is the nature of quality characteristics. Based on the experimental results S/N ratio is obtained as shown in Table 3. Table 3. S/N ratio calculated for surface roughness
Exp. no Cutting parameter level
Ra (µm) S/N ratio n, rpm f, mm/rev a, mm
1 1 1 1 2.430 -7.71 2 1 2 2 2.005 -6.08 3 1 3 3 3.445 -10.75 4 2 1 2 1.940 -5.79 5 2 2 3 2.355 -7.48 6 2 3 1 2.345 -7.41 7 3 1 3 1.600 -4.26 8 3 2 1 1.385 -2.88 9 3 3 2 2.415 -7.89
Results and discussion
The effect of each cutting parameter level on the surface roughness is analyzed using signal to noise ratio. The effect of cutting parameters on surface roughness for the S/N ratio and for means are shown in Figs. 3 and 4, respectively.
Fig. 3 The effect of cutting parameters on surface roughness for S/N ratio
500330265
-5
-6
-7
-8
-90,3570,2140,107 2,01,51,0
Spindle Speed
Mea
n of
SN
ratio
s
Feed Rate Depth of cut
Main Effects Plot for SN ratiosData Means
Signal-to-noise: Smaller is better
129

International Conference on Innovative Technologies, IN‐TECH 2016,
Prague, 6. ‐ 8. 9. 2016
Fig. 4 The effect of cutting parameters on surface roughness for Means From the S/N ratio analysis shown in Fig. 3 optimal cutting parameters for surface roughness are determined as spindle speed 500
rpm, feed rate 0.214 mm/rev and depth of cut 1 mm. It can be observed from Fig. 4 that the spindle speed has most significant effect on surface roughness when compared to the feed rate and depth of cut. Surface roughness decreases as spindle speed increases, while the surface roughness increases as feed rate and depth of cut increase. The higher spindle speed leads to higher cutting speed, so formation of the build-up edge will be eliminated. So, build-up edge deposition on surface is minimized and it reduces the surface roughness. Also, it can be seen that the surface roughness rapidly increases at the high feed rate. At higher feed rate the tool vibrations are higher as well as the cutting forces and the temperature in the cutting area. All these factors cause the higher surface roughness values. Conclusion
In this paper the effect of the cutting parameters on the surface roughness in turning process of high strength carbon steel is analyzed using Taguchi method orthogonal array. Spindle speed has the most significant effect on the surface roughness, as well as the feed rate. Depth of cut has less effect on the surface roughness in comparison to the spindle speed and feed rate. The optimal cutting parameters for desired surface roughness are obtained at high level of spindle speed, medium level of feed rate and low level of depth of cut from the selected levels. References [1] R. Venkata Rao: Advanced Modeling and Optimization of Manufacturing Processes (Springer-Verlag, London, 2011). [2] S. Klancnik, M. Ficko, J. Balic and I. Pahole: Computer vision – based approach to end mill tool monitoring, International journal of
simulation modelling, Vol. 14 (2015), No. 4, pp. 571 - 583. [3] E. Kuram, B. Ozcelik, M. Bayramoglu, E. Demirbas and B. Tolga Simsek: Optimization of cutting fluids and cutting parameters
during end milling by using D-optimal design of experiments, Computer vision – based approach to end mill tool monitoring, Journal of cleaner production, Vol. 42 (2013), pp. 159 – 166.
[4] D. Begic-Hajdarevic, A. Cekic and M. Kulenovic: Experimental study of the high speed machining of hardened steel, Procedia Engineering, Vol. 69 (2014), pp. 291 - 295.
[5] J.P. Davim, V. N. Gaitonde and S. R. Karnik: Investigations into the effect of cutting conditions on surface roughness in turning of free steel by ANN models, Journal of Materials Processing Technology, Vol. 205 (2008), Issues 1-3, pp.16-23.
[6] N.R. Abburi and U.S. Dixit: A knowledge-based system for the prediction of surface roughness in turning process, Robotics and Computer-Integrated Manufacturing, Vol. 22 (2006) 4, pp.363-372.
[7] A.R. Yildiz and F.Ozturk: Hybrid enhanced genetic algorithm to select optimal machining parameters in turning operation, Proceedings of the Institution of Mechanical Engineers, Part B: Journal of Engineering Manufacture, Vol. 220 (2006) No.12, pp. 2041-2053.
[8] N. Muthukrishnan and J. P. Davim: Optimization of machining parameters of Al/SiC-MMC with ANOVA and ANN analysis, Journal of Materials Processing Technology, Vol. 209 (2009) Issue 1, pp.225-232.
[9] D. Carou, E.M. Rubio, C.H. Lauro and J.P. Davim: Experimental investigation on surface finish during intermittent turning of UNS M11917 magnesium alloy under dry and near dry machining conditions, Measurement, Vol. 56 (2014), pp.136–154.
[10] M. Nalbant, H. Gökkaya and G. Sur: Application of Taguchi method in the optimization of cutting parameters for surface roughness in turning, Materials & Design, Vol.28 (2007) Issue 4, pp. 1379–1385.
[11] M. Sayuti, A.A.D. Sarhan and F. Salem: Novel uses of SiO2 nano-lubrication system in hard turning process of hardened steel AISI4140 for less tool wear, surface roughness and oil consumption, Journal of Cleaner Production, Vol. 67 (2014), pp. 265-276.
[12] S. Debnath, M.M. Reddy and Q.S. Yi: Influence of cutting fluid conditions and cutting parameters on surface roughness and tool wear in turning process using Taguchi method, Measurement, Vol. 78 (2016), pp.111-119.
[13] G.Taguchi: Tables of orthogonal arrays and linear graphs (Maruzen, Tokyo, 1962). [14] M.S. Phadke: Quality engineering using robust design (Prentice-Hall, New Jersey, 1989). [15] P.J. Ross: Taguchi techniques for quality engineering (McGraw Hill, New York, 1988).
500330265
2,7
2,6
2,5
2,4
2,3
2,2
2,1
2,0
1,9
1,8
0,3570,2140,107 2,01,51,0
Spindle Speed
Mea
n of
Mea
ns
Feed Rate Depth of cut
Main Effects Plot for MeansData Means
130

International Conference on Innovative Technologies, IN‐TECH 2016,
Prague, 6. ‐ 8. 9. 2016
WALKING MECHANISM DYNAMICS MODELING AND CONTROLS
E. Kljuno1 and M. Petrovic1 University of Sarajevo, Vilsonovo setaliste 9, 71000 Sarajevo, Bosnia and Herzegovina
Keywords: Walking Robot; String-Driven; Mechanical Energy; Controller Abstract: Dynamics of walking robots are discontinuous and highly nonlinear which represents challenge to find adequate control strategies. Multiple DOF mechanisms with open and closed mechanical chains (loops) consisted of (theoretically) absolutely rigid segments are represented by complicated differential equations. Complexity is largely expanded if we consider elasticity of materials within the walking mechanism. Unless we significantly simplify model of walking mechanism dynamics, model based controller implementation would require significant computational capacities embedded into the hardware.
This paper presents dynamics modeling, a controller design and mechanical energy analysis of a walking robot with a unique type of actuation using elastic strings. Conventional walking robots consist of direct drives at revolute joints. Since the major part of the mass is associated with the motors, directly attached motors to the joints result in relatively heavy legs and arms with high moments of inertia, which makes balancing robot dynamic walking difficult due to high inertial forces of distal segments.
Recovery ratio is an efficiency measure that is conceptually adopted from biology, but the definition is adjusted to cover non-steady walk. The paper shows an analysis of the way biological walkers store and reuse energy cyclically during every step. The walking robot architecture with strings mimics the biological architecture to a certain extent, since the hip joint is a 3-dof spherical joint, 1-dof knee joint, and 2-dof ankle joint. When compared to conventional direct-drive architecture, the walker architecture is more compact since 3 dof are made at a single ball and socket joint, rather than 3 separate joints that would be the case with directly attached drives. Based on the kinematic and dynamic analysis of the robot, the mathematical model is formed, which is then used for the controller design implemented in a hardware. Introduction
Mechanical work done by actuators in robotic walking mechanisms depends on control algorithm applied and the way robot recovers energy from a step to step. By studying biological walking mechanisms, it has been found that a large portion of kinetic energy gets recovered through a step transition phase of walking cycles [1, 2, 3]. A parameter that shows how much of potential energy gets accumulated and stored in tendons is the recovery ratio defined as
n
1i
*iF,K,
*iF,K,
n
1iiP,iP,
n
1iiV,K,iV,K,
*n
1i
*iF,K,
*iF,K,
n
1iiP,iP,
n
1iiV,K,iV,K,
E)E(sign12
1E)E(sign1
2
1E)E(sign1
2
1
E)E(sign12
1E)E(sign1
2
1E)E(sign1
2
1
ratioRecovery extW
, (1)
where: n is the number of increments of a single step,
iVK,E and iFK,E are the increments in kinetic energy associated with the
vertical motion and forward motion, iPE is the potential energy increment, cycleF,K,
n
1ii,exti,ext
*ext E)(sign1
2
1
WWW is the external work
reduced by the quantity of the forward motion kinetic energy change over the walking cycle, *iF,K,E is the forward motion kinetic energy
increment reduced by the corresponding kinetic energy portion related to the acceleration, which can be simplified as n
cycleF,K,E that
represents a uniform distribution of the kinetic energy change over the cycle. Simplified way to compare performances of robotic walking mechanisms is to use an adjusted parameter that is used to compare
biological walkers [4]. The cost of transportation is defined as Cet =(total energy usage)/(weight×distance walked), (2)
which is a dimensionless quantity that is convenient to compare efficiency of biological mechanisms. Although, the total energy for biological walkers is measured via oxygen consumption, an analog expression can be used for robotic walkers efficiency comparison, as well. The adjustment of the expression in case of robotic walkers is related to the total energy calculation using the total work done by actuators of the robot on the walked distance.
Since robotic walkers carry independent energy sources (e.g. batteries), it is essential to optimize energy consumption keeping the capacity of actuators sufficient, such that the walker can satisfy the performance requirements regarding accelerations, weight carrying and ground inclinations. Minimization of energy consumption results in reduction of the energy source weight. Further on, the reduction of the energy source weight is directly reflected in reduction in the actuator capacity needed to operate the robot walker. It can be seen that this relationship represents an optimization loop. Reduction of energy consumption can be done in several ways that can be divided into two groups, reduction by optimization the control strategy and reduction by optimizing the hardware. A good approach to energy optimization is to accept a biomimetic strategy and try to implement hardware that has counterparts in biological walkers, as well as to implement control algorithms that would cause that robotic walkers move similarly as biological walkers.
131
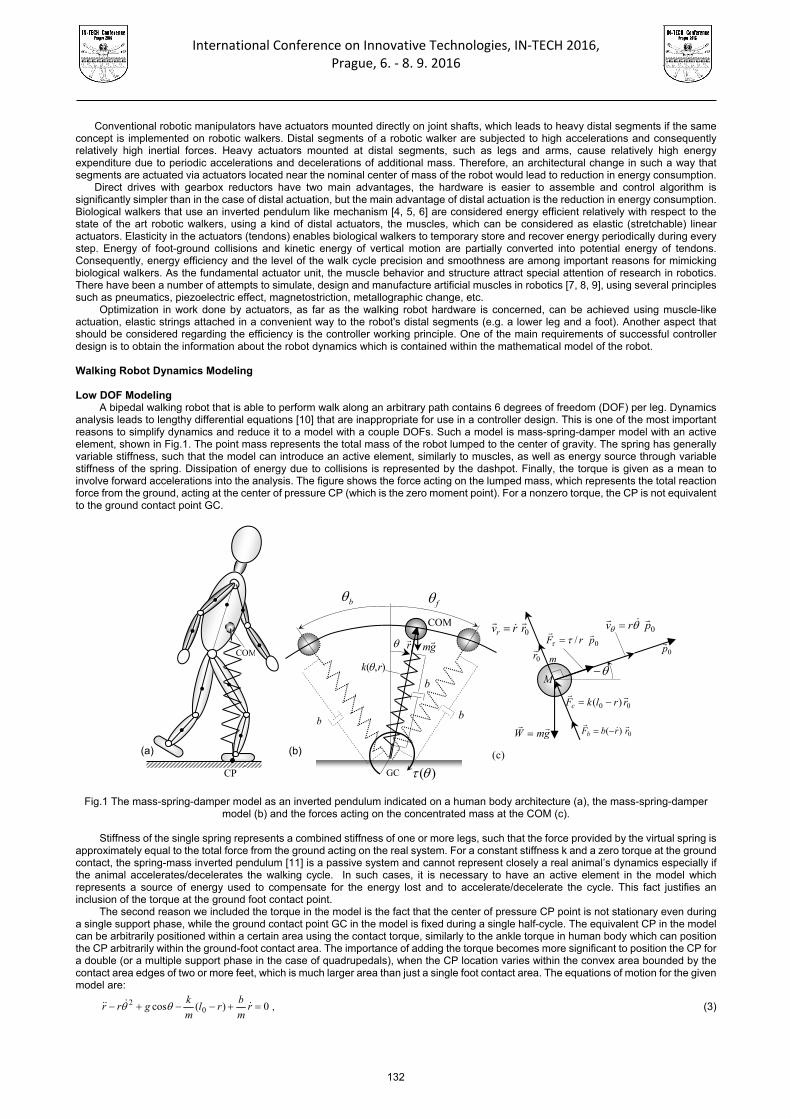
International Conference on Innovative Technologies, IN‐TECH 2016,
Prague, 6. ‐ 8. 9. 2016
Conventional robotic manipulators have actuators mounted directly on joint shafts, which leads to heavy distal segments if the same concept is implemented on robotic walkers. Distal segments of a robotic walker are subjected to high accelerations and consequently relatively high inertial forces. Heavy actuators mounted at distal segments, such as legs and arms, cause relatively high energy expenditure due to periodic accelerations and decelerations of additional mass. Therefore, an architectural change in such a way that segments are actuated via actuators located near the nominal center of mass of the robot would lead to reduction in energy consumption.
Direct drives with gearbox reductors have two main advantages, the hardware is easier to assemble and control algorithm is significantly simpler than in the case of distal actuation, but the main advantage of distal actuation is the reduction in energy consumption. Biological walkers that use an inverted pendulum like mechanism [4, 5, 6] are considered energy efficient relatively with respect to the state of the art robotic walkers, using a kind of distal actuators, the muscles, which can be considered as elastic (stretchable) linear actuators. Elasticity in the actuators (tendons) enables biological walkers to temporary store and recover energy periodically during every step. Energy of foot-ground collisions and kinetic energy of vertical motion are partially converted into potential energy of tendons. Consequently, energy efficiency and the level of the walk cycle precision and smoothness are among important reasons for mimicking biological walkers. As the fundamental actuator unit, the muscle behavior and structure attract special attention of research in robotics. There have been a number of attempts to simulate, design and manufacture artificial muscles in robotics [7, 8, 9], using several principles such as pneumatics, piezoelectric effect, magnetostriction, metallographic change, etc.
Optimization in work done by actuators, as far as the walking robot hardware is concerned, can be achieved using muscle-like actuation, elastic strings attached in a convenient way to the robot's distal segments (e.g. a lower leg and a foot). Another aspect that should be considered regarding the efficiency is the controller working principle. One of the main requirements of successful controller design is to obtain the information about the robot dynamics which is contained within the mathematical model of the robot.
Walking Robot Dynamics Modeling
Low DOF Modeling
A bipedal walking robot that is able to perform walk along an arbitrary path contains 6 degrees of freedom (DOF) per leg. Dynamics analysis leads to lengthy differential equations [10] that are inappropriate for use in a controller design. This is one of the most important reasons to simplify dynamics and reduce it to a model with a couple DOFs. Such a model is mass-spring-damper model with an active element, shown in Fig.1. The point mass represents the total mass of the robot lumped to the center of gravity. The spring has generally variable stiffness, such that the model can introduce an active element, similarly to muscles, as well as energy source through variable stiffness of the spring. Dissipation of energy due to collisions is represented by the dashpot. Finally, the torque is given as a mean to involve forward accelerations into the analysis. The figure shows the force acting on the lumped mass, which represents the total reaction force from the ground, acting at the center of pressure CP (which is the zero moment point). For a nonzero torque, the CP is not equivalent to the ground contact point GC.
Fig.1 The mass-spring-damper model as an inverted pendulum indicated on a human body architecture (a), the mass-spring-damper model (b) and the forces acting on the concentrated mass at the COM (c).
Stiffness of the single spring represents a combined stiffness of one or more legs, such that the force provided by the virtual spring is
approximately equal to the total force from the ground acting on the real system. For a constant stiffness k and a zero torque at the ground contact, the spring-mass inverted pendulum [11] is a passive system and cannot represent closely a real animal’s dynamics especially if the animal accelerates/decelerates the walking cycle. In such cases, it is necessary to have an active element in the model which represents a source of energy used to compensate for the energy lost and to accelerate/decelerate the cycle. This fact justifies an inclusion of the torque at the ground foot contact point.
The second reason we included the torque in the model is the fact that the center of pressure CP point is not stationary even during a single support phase, while the ground contact point GC in the model is fixed during a single half-cycle. The equivalent CP in the model can be arbitrarily positioned within a certain area using the contact torque, similarly to the ankle torque in human body which can position the CP arbitrarily within the ground-foot contact area. The importance of adding the torque becomes more significant to position the CP for a double (or a multiple support phase in the case of quadrupedals), when the CP location varies within the convex area bounded by the contact area edges of two or more feet, which is much larger area than just a single foot contact area. The equations of motion for the given model are:
0)(cos 02 r
m
brl
m
kgrr , (3)
(a)
COM
CP
r
COM
b
),( rk
GC )(
bb
b
f
(b)
gm
0rrvr
0)( rrbFb
0prv
gmW
00 )( rrlkFc
m
0/ prF
M
0p
0r
)c(
132

International Conference on Innovative Technologies, IN‐TECH 2016,
Prague, 6. ‐ 8. 9. 2016
m
b
mgrrrr )sin(22 . (4)
where: 0l is the unloaded spring length, b is the dashpot (damper) coefficient, b is the rotational motion dampening coefficient,
with other quantities explained earlier. The model described can be used for motion analysis in the sagittal plane and the dynamics of motion in the frontal plane should be
considered separately. Although the dynamics of the motion in the sagittal and the frontal planes are coupled, the coupling terms can be neglected for the sake of simplicity of equations of motion and for the controller design.
Full DOF Modeling
Dynamics of the walking robot is approximated by the dynamics of the walking robot model. Regularly, walking robots have relatively high number of joints and consequently, high DOF. Walking robot models regularly have significantly reduced DOF when compared to DOF of walking robots implemented in hardware. However, to improve the controller performance, a high DOF model need to be used [7, 10]. The full biped model architecture is consisted of 6 DOF per leg, 3 DOF at the trunk and 3 DOF per arm.
Biological walkers have a physical ball and socket joint at the hip. It is a spherical joint with three DOF. This joint cannot be directly actuated using motors directly attached to joint axes. Robotic ball and socket joints can be implemented in the form of three revolute joints that are apart by additional links. However, the ball and socket joint can be actuated using strings or some sort of special design using dislocated motors [7]. Since the kinematics and dynamics analysis for this robot architecture requires much more space than is allowed for this paper, the mathematical model is not given here, but the analysis can be found in [10].
Energy Recovery Ratio
Recovery ratio, as explained in the introduction, is one of essential indicators of walking mechanism efficiency. Mechanical energy of the walking mechanism is consisted of kinetic and potential energy. In an ideal case of passive walk without losses, the total mechanical energy remains constant. A portion of mechanical energy is lost at every step mainly due to collisions and internal friction. Similarly to biological walkers, walking robots need to compensate the portion of mechanical energy through actuators’ activity. Figure 2 shows the total kinetic and the total potential energy for an accelerating walk and for a decelerating walk.
0 10 20 30 40 50 60 70 80 90 100-100
-50
0
50
100
percentage of the cycle [%]
Epr
, E
kr [
J]
Ekr
[J]
Epr
[J]
0 10 20 30 40 50 60 70 80 90 100
-150
-100
-50
0
50
100
percentage of the cycle [%]
Epr
, E
kr [
J]
Ekr [J]
Epr
[J]
Fig. 2 Relative potential and kinetic energy for an accelerating (left) and a decelerating (right) walking cycle (m=80 kg, inv =1.5 m/s,
2m/s71.0avera )
Using the walking mechanism model, the recovery ratio was predicted for two major groups of walkers: (a) “small” animals
(approximately m<5kg) and (b) “larger” animals (m5 kg). The model applies to robotic walkers that have capabilities to store potential energy, recover it and convert into kinetic energy at every step, using a kind of elastic tendons. Figure 3 shows the recovery ratio dependence on an average acceleration over the walking cycle plotted for different walking speeds.
-1 -0.8 -0.6 -0.4 -0.2 0 0.2 0.4 0.6 0.8 10.1
0.2
0.3
0.4
0.5
0.6
0.7
0.8
0.9
accaver
[m/s2]
Rec
over
y ra
tio [
1]
vhmin
0.32 m/s0.36 m/s
0.39 m/s
0.425 m/s
0.46 m/s0.495 m/s
0.53 m/s
0.565 m/s0.6 m/s
0.635 m/s
data11data12data13data14
data15data16
data17
data18data19
data20
-1 -0.8 -0.6 -0.4 -0.2 0 0.2 0.4 0.6 0.8 10.1
0.2
0.3
0.4
0.5
0.6
0.7
0.8
0.9
accaver
[m/s2]
Rec
over
y ra
tio [1]
1.5 m/s1.575 m/s
1.65 m/s
1.725 m/s
1.8 m/s1.875 m/s
1.95 m/s
2.025 m/s2.1 m/s
2.175 m/s
2.25 m/s
data12data13data14data15data16data17data18data19
data20
Fig. 3 Recovery ratio functions of the average acceleration/deceleration within the range [-1.2, 1.2 ] m/s2 for different walking speeds:
(left) small animals (0.5 kg), (right) large animals (30 kg) Interesting results can be noticed by comparing the recovery ratio plots for small (a) and larger (b) walkers. Small walker recovery
ratio is not as much dependent on the acceleration magnitude as the recovery ratio of larger walkers. Although the small walker’s recovery ratio is generally lower for the chosen speeds ranges, it is noticeable that the gradient with respect to the acceleration magnitude is
S
L
133
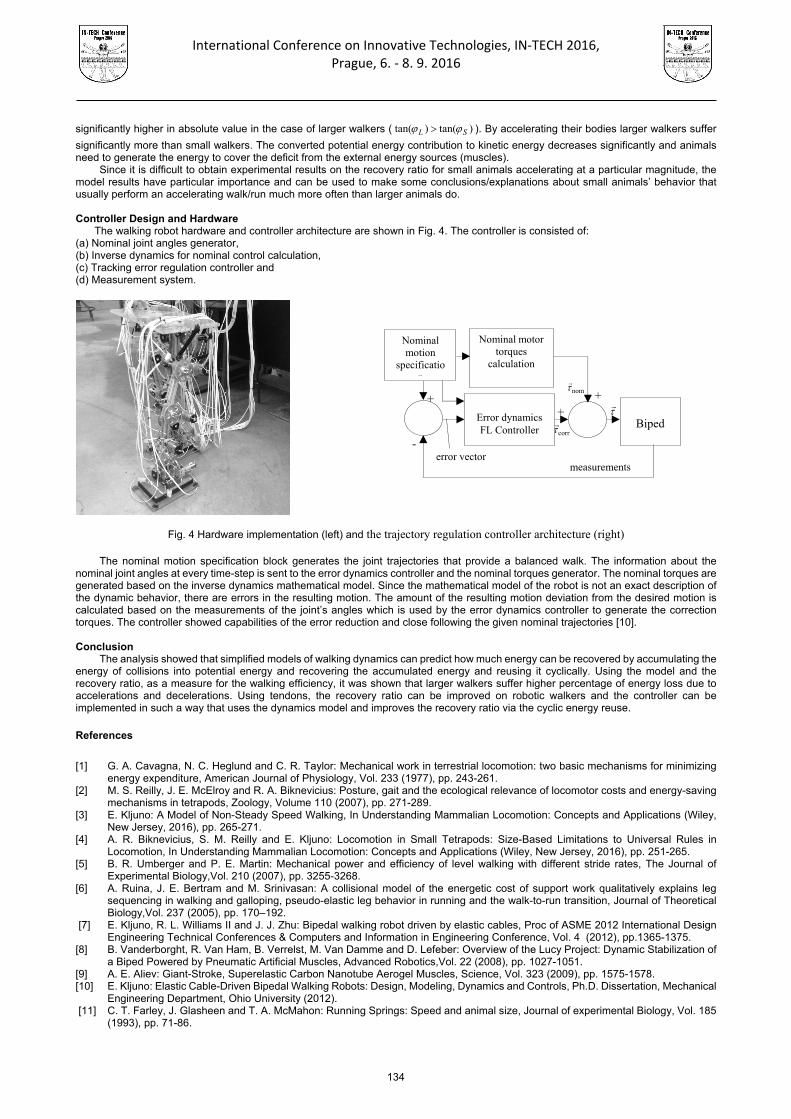
International Conference on Innovative Technologies, IN‐TECH 2016,
Prague, 6. ‐ 8. 9. 2016
significantly higher in absolute value in the case of larger walkers ( )tan()tan( SL ). By accelerating their bodies larger walkers suffer
significantly more than small walkers. The converted potential energy contribution to kinetic energy decreases significantly and animals need to generate the energy to cover the deficit from the external energy sources (muscles).
Since it is difficult to obtain experimental results on the recovery ratio for small animals accelerating at a particular magnitude, the model results have particular importance and can be used to make some conclusions/explanations about small animals’ behavior that usually perform an accelerating walk/run much more often than larger animals do.
Controller Design and Hardware
The walking robot hardware and controller architecture are shown in Fig. 4. The controller is consisted of: (a) Nominal joint angles generator, (b) Inverse dynamics for nominal control calculation, (c) Tracking error regulation controller and (d) Measurement system.
Fig. 4 Hardware implementation (left) and the trajectory regulation controller architecture (right)
The nominal motion specification block generates the joint trajectories that provide a balanced walk. The information about the
nominal joint angles at every time-step is sent to the error dynamics controller and the nominal torques generator. The nominal torques are generated based on the inverse dynamics mathematical model. Since the mathematical model of the robot is not an exact description of the dynamic behavior, there are errors in the resulting motion. The amount of the resulting motion deviation from the desired motion is calculated based on the measurements of the joint’s angles which is used by the error dynamics controller to generate the correction torques. The controller showed capabilities of the error reduction and close following the given nominal trajectories [10].
Conclusion
The analysis showed that simplified models of walking dynamics can predict how much energy can be recovered by accumulating the energy of collisions into potential energy and recovering the accumulated energy and reusing it cyclically. Using the model and the recovery ratio, as a measure for the walking efficiency, it was shown that larger walkers suffer higher percentage of energy loss due to accelerations and decelerations. Using tendons, the recovery ratio can be improved on robotic walkers and the controller can be implemented in such a way that uses the dynamics model and improves the recovery ratio via the cyclic energy reuse. References
[1] G. A. Cavagna, N. C. Heglund and C. R. Taylor: Mechanical work in terrestrial locomotion: two basic mechanisms for minimizing
energy expenditure, American Journal of Physiology, Vol. 233 (1977), pp. 243-261. [2] M. S. Reilly, J. E. McElroy and R. A. Biknevicius: Posture, gait and the ecological relevance of locomotor costs and energy-saving
mechanisms in tetrapods, Zoology, Volume 110 (2007), pp. 271-289. [3] E. Kljuno: A Model of Non-Steady Speed Walking, In Understanding Mammalian Locomotion: Concepts and Applications (Wiley,
New Jersey, 2016), pp. 265-271. [4] A. R. Biknevicius, S. M. Reilly and E. Kljuno: Locomotion in Small Tetrapods: Size-Based Limitations to Universal Rules in
Locomotion, In Understanding Mammalian Locomotion: Concepts and Applications (Wiley, New Jersey, 2016), pp. 251-265. [5] B. R. Umberger and P. E. Martin: Mechanical power and efficiency of level walking with different stride rates, The Journal of
Experimental Biology,Vol. 210 (2007), pp. 3255-3268. [6] A. Ruina, J. E. Bertram and M. Srinivasan: A collisional model of the energetic cost of support work qualitatively explains leg
sequencing in walking and galloping, pseudo-elastic leg behavior in running and the walk-to-run transition, Journal of Theoretical Biology,Vol. 237 (2005), pp. 170–192.
[7] E. Kljuno, R. L. Williams II and J. J. Zhu: Bipedal walking robot driven by elastic cables, Proc of ASME 2012 International Design Engineering Technical Conferences & Computers and Information in Engineering Conference, Vol. 4 (2012), pp.1365-1375.
[8] B. Vanderborght, R. Van Ham, B. Verrelst, M. Van Damme and D. Lefeber: Overview of the Lucy Project: Dynamic Stabilization of a Biped Powered by Pneumatic Artificial Muscles, Advanced Robotics,Vol. 22 (2008), pp. 1027-1051.
[9] A. E. Aliev: Giant-Stroke, Superelastic Carbon Nanotube Aerogel Muscles, Science, Vol. 323 (2009), pp. 1575-1578. [10] E. Kljuno: Elastic Cable-Driven Bipedal Walking Robots: Design, Modeling, Dynamics and Controls, Ph.D. Dissertation, Mechanical
Engineering Department, Ohio University (2012). [11] C. T. Farley, J. Glasheen and T. A. McMahon: Running Springs: Speed and animal size, Journal of experimental Biology, Vol. 185
(1993), pp. 71-86.
Biped
Error dynamics FL Controller
measurements
Nominal motor torques
calculation
Nominal motion
specification
error vector -
+ +
+
nom
corr
134

International Conference on Innovative Technologies, IN‐TECH 2016,
Prague, 6. ‐ 8. 9. 2016
NEW POTENTIAL RISKS DUE THE NEARLY SILENT ELECTRIC AND HYBRID VEHICLES.
OCCUPATIONAL DRIVERS PERCEPTION
J.C. Rubio-Romero1, C. Pardo-Ferreirauras 2, A. López-Arquillos3 and F. Galindo-Reyes4 1 Dpto. de Organización de Empresas. Escuela de Ingenierías. Universidad de Málaga.
C/ Dr. Ortiz Ramos S/N, 29071. [email protected]. Málaga. Spain.
2 Dpto. de Organización de Empresas. Escuela de Ingenierías. Universidad de Málaga. C/ Dr. Ortiz Ramos S/N, 29071. [email protected]. Málaga. Spain.
3 Dpto. de Organización de Empresas. Escuela de Ingenierías. Universidad de Málaga. C/ Dr. Ortiz Ramos S/N, 29071. [email protected]. Málaga. Spain.
4 Dpto. de Organización de Empresas. Escuela de Ingenierías. Universidad de Málaga. C/ Dr. Ortiz Ramos S/N, 29071. [email protected]. Málaga. Spain.
Keywords: Electric Vehicle; Noise; Risk; Perception; Driver; Occupational Abstract: The lack of noise of hybrid and electric vehicle had been considered an advantage of these vehicles because it favored the reduction of noise pollution in urban environments. Nevertheless, since 2009, the emergence of new risks for pedestrians and cyclists, because of this lack of noise, is being studied. Diferent reports by US, Netherlands, Japan and UK governments have been published. They agree on the possibility of problems at low speeds (below 30 km/h), when maneuvering, start, turn, backing up or in parking lots. The highest incidence of accidents, however, only has been justified in the American study, which has been criticized by other reports. Therefore, it should remain cautious with this issue and more research is needed to justify government intervention. In a first step, a state of the art was conducted, finding that studies so far are based on the analysis of accidents recorded and conducting experiments with blind people in relation to the perception of the proximity of the vehicles, according to types. Studies based on the drivers perception of the lack of noise are few. Any occupational studies or studies on motorcycles were found from the perspective of the lack of noise from the hybrid and electric vehicles. In a second step, an occupational study on the drivers perception of hybrid or electric car and motorcycles will be conducted, in order to try to determinate the real problem significance. Thus, a questionnaire was designed using the studies of Rundmo, Cocron and Labeye and was administered to administered to 58 workers, who drive hybrid or electric motocycle or car at work. The results indicated that half of participants think that the low noise outside of the electric vehicle is potentially dangerous. Introduction
Urban mobility objectives set by the European Union in its strategy on transport, posed by halving the use of conventional fuel vehicles until 2030 and its replacement by 2050. If this is true, in the future the majority vehicles in cities will be electric. For this reason, it is important to consider whether the lack of noise that has this type of vehicle can be a new emerging risk for pedestrians and cyclists. Since 2009, when the problem was revealed in the US, diferent reports by US [1], Netherlands [2], Japan [3] and UK [4] governments have been published. They agree on the possibility of problems at low speeds (below 30 km/h), when maneuvering, start, turn, backing up or in parking lots. These studies also come to agree that at higher speeds the noise rolling wheels are greater than the engine, thus masking it. The highest incidence of accidents, however, only has been justified in the American study, which has been criticized by other reports. Some authors like Sandberg [5] consider it necessary to conduct a thorough investigation of the matter before adding sounds to vehicles, as this would have a negative impact on the urban acoustic environment. Also notes that it is the responsibility of vehicle drivers to observe pedestrians and their behaviour. The silent nature of the EV obligate the driver to adopt more attentive behaviours to other road users [6]. According Rundmo [7] the risk perception is primarily interesting because it may affect behavior. For this reason, to know the perception of the conductors is important to clarify the extent of the problem of the lack of noise. Objectives
Due to the controversy over the risk that could lead to the lack of noise of electric vehicles, this study is conducted in order to obtain a first general approach on the perception of the silent feature of electric vehicles by the workers who use them in their workday.
Methods
The study is part of Traffic General Direction of Spain Project, led by University of Malaga and is entitled “Perception of experienced drivers of electric vehicles 2 and 4 wheels on the vehicle impact on road safety” (SPIP2015-01765). In a first step, a state of the art was conducted and any occupational studies or studies on motorcycles were found from the perspective of the lack of noise from the hybrid and electric vehicles. In this way, studies so far are based on the analysis of accidents recorded and conducting experiments with blind people in relation to the perception of the proximity of the vehicles, according to types. Studies based on the drivers perception of the lack of noise are few.
In a second step, a questionnaire was designed with the purpose to facilitate the collection of information. To develop this questionnaire previous studies by Rundmo [7], Cocron [8] [9] and Labeye [6] taken into account. Also, the data collection tool set originally designed by the German research team that worked on the first MINI E study [8] [9] was used for the questionnaire. The City Hall of Malaga and several municipal companies, which have electric vehicles in its fleet, collaborated with this study. Thus, the questionnaire was administered to all workers of these companies who use these electric vehicles during working hours.
135

International Conference on Innovative Technologies, IN‐TECH 2016,
Prague, 6. ‐ 8. 9. 2016
A sample of 58 workers answered the survey. The average age of test drivers was 45 years, and the sample comprised 52 male and 6 female Participants. They have all been driving the electric vehicle for more than two years. In general, they use it mostly for displacement in urban environments and always during the day. These workers occupy different positions in companies such as managers, management positions, technical positions and operators.
The companies had three models of hybrid and electric vehicles, all have been included in this study. These vehicles were Mitsubi i-MiEV, which is a model of electric car, Piaggio Porter box Rossi, which is a minivan electric vehicle four-wheel and Piaggio MP3, which is a hybrid motorcycle. Distribution of vehicles was the following:
Fig. 1 Distribution of vehicles
Results The results presented in this study are partial results, as currently the project is still running. The items presented in this study are part
of the total of the items included in the questionnaire. Only items focused on the silent feature electric vehicle are presented. In figures 2, 3, 4, 5 and 6 are shown the responses of the workers to the items included in the questionnaire about the silent characteristics of electric vehicles. Each item was rated using a 6-point Likert scale ranging from 1 (very strongly disagree) to 6 (very strongly agree).
In the table 1, the responses were grouped taking the three highest values of the Likert scale (Mostly agree (4), Strongly agree (5) and Very strongly agree (6)), indicating the percentage of “agreement” answers for each item in the table 1. Similarly, the responses of the three lowest values of the Likert scale (Very strongly disagree (1), Strongly disagree (2) and Mostly agree (3)) are grouped, indicating the percentage of “disagreement” answers for each item.
Fig. 2 Distribution of responses to the item 1 Fig. 3 Distribution of responses to the item 2
Fig. 4 Distribution of responses to the item 3 Fig. 5 Distribution of responses to the item 4
136

International Conference on Innovative Technologies, IN‐TECH 2016,
Prague, 6. ‐ 8. 9. 2016
Fig. 6 Distribution of responses to the item 5
Table 1. Mean value and percentage of agreement and disagreement answers for each item
The distribution of responses included in this study show that 86% of workers considered that the electric vehicle is difficult for others to hear, specifically, 50% declared that they was very strongly agree with this sentence. The half of all users think the low noise outside of the electric vehicle is potentially dangerous, of which 31% say that they was mostly agree.
It was found that 24% of workers reported that while driving the electric vehicle, they mostly had to get used to the lack of noise. Thereby, most of surveyed workers did not had to get used to the lack of noise electric vehicle while driving, thus 40% was very strongly disagree with the item 3.
Only 17% of workers confirmed that they had to change their driving behaviour due to the lack of outside noise of the electric vehicle, nothing more than 14% of workers were mostly agree with item 4. In fact, the mean value for this item is 1,9, that is to say, that most of the workers had not changed their driving behaviour. Thus, 60% of workers were very strongly disagree with the item 4. Many of them showed that they were aware that they could not be heard or be heard late and paid more attention to pedestrians and cyclists, but they felt that their driving behavior was the same.
For the last item, more than half of workers, more precisely, 53% of workers would not mind if their electric vehicle had an idle noise so that others can hear them at any time (while standing, with engine on). In fact, 33% of them were very strongly agree.
Therefore, the results of this study show that more than three-quarters of the participants, who use electric vehicles in their work, think that the electric vehicle is difficult for others to hear, they mostly did not had to get used to the lack of noise while driving the electric vehicle and they did not had to change their driving behaviour due to the lack of outside noise of the electric vehicle.
About half the participants reported that the low noise outside of the electric vehicle is potentially dangerous and they would not mind if their electric vehicle had an idle noise so that others can hear them at any time (while standing, with engine on). Conclusion
It is important to note that half of participants think that the low noise outside of the electric vehicle is potentially dangerous. Consequently, it can be concluded that it is necessary to continue to conduct studies to determine more precisely the drivers perception. Based on this, it shall be studied which would be the measures necessary to reduce the risk of a road user is harmed. Not only studying the possibility of adding sound to electric vehicles, but rather considering alternatives such as road safety education campaigns or other measures.
Acknowledgment
This study is part of the project "Perception of experienced drivers of electric vehicles 2 and 4 wheels on the vehicle impact on road safety” (SPIP2015-01765), which is being conducted by the University of Malaga and has been funded by Traffic General Direction of Spain. We are grateful to the City Hall of Malaga, especially, to its Area of innovation and new technologies. Also we are grateful to the municipal enterprises, Servicios de Limpieza Integral de Málaga (LIMASA) and Empresa Municipal de Aguas de Málaga (EMASA). The support of all had made our research possible. We also thank the participants for their support in the studies. References [1] Hanna, R. (2009). Incidence of pedestrian and bicyclist crashes by hybrid electric passenger vehicles. NHTSA (No. HS-811
204). [2] Verheijen, E., & Jabben, J. (2010). Effect of electric cars on traffic noise and safety. Bilthoven: RIVM. [3] JASIC (2009). A Study on Approach Warning Systems for hybrid vehicle in motor mode. Informal document N° GRB-49-10 (49th
GRB, 16-18 February 2009), GRB, WP29, ECE, Geneva, Switzerland., [4] Morgan, P. A., Morris, L., Muirhead, M., Walter, L. K., & Martin, J. (2011). Assessing the perceived safety risk from quiet electric
and hybrid vehicles to vision-impaired pedestrians. TRL Published Project Reports,2011(PPR525), 1-74. [5] Sandberg, U., Goubert, L., & Mioduszewski, P. 2010. Are vehicles driven in electric mode so quiet that they need acoustic
warning signals. In20th International Congress on Acoustics.
137

International Conference on Innovative Technologies, IN‐TECH 2016,
Prague, 6. ‐ 8. 9. 2016
[6] Labeye, E., Hugot, M., Brusque, C., & Regan, M. A. (2016). The electric vehicle: a new driving experience involving specific
skills and rules.Transportation research part F: traffic psychology and behaviour, 37, 27-40. [7] Rundmo, T., & Iversen, H. (2004). Risk perception and driving behaviour among adolescents in two Norwegian counties before
and after a traffic safety campaign. Safety science, 42(1), 1-21. [8] Cocron, P., Buhler, F., Neumann, I., Franke, T., Krems, J. F., Schwalm, M., & Keinath, A. (2011). Methods of evaluating electric
vehicles from a user's perspective-the MINI E field trial in Berlin. IET Intelligent Transport Systems,5(2), 127-133. [9] Cocron, P., & Krems, J. F. (2013). Driver perceptions of the safety implications of quiet electric vehicles. Accident Analysis &
Prevention, 58, 122-131.
138

International Conference on Innovative Technologies, IN‐TECH 2016,
Prague, 6. ‐ 8. 9. 2016
OPTIMISATION OF BIOMASS TORREFACTION
Z. Szamosi 1, H. Bouras 2, K. Jármai1 and Z. Siménfalvi1 1 University of Miskolc, Institute of Energy Engineering and Chemical Machinery, Hungary
2 University of Debrecen, Hungary
Keywords: Biomass; Biomass Upgrade; Optimisation; Renewable Energy; Torrefaction
Abstract: In this paper, our last results about the research of the torrefaction is introduced. The torrefaction is a heat treatment process to increase the energy density of any kind of biomass. The most important technology conditions are the inert atmosphere, the temperature, which is necessary to be below 300°C and the residence time. The final product of the process is a solid fuel, which has a higher heating value. As the process needs external heat energy to heat up the system so that amount of energy is increasing along the residence time. However the energy demand is increasing the heating value increment is not so significant. During that research, the torrefaction, as a heat treatment process, was optimised according to residence time and input energy. The different residence times have been examined, which means different amount of external energy, in the function of the final heating value. In our research three different biomasses have been examined, wheat straw, rapeseed straw, and vine so in that investigation we would like to find the answer for the following question: which is the optimal point between the heating value increment and input energy? Introduction
The principle of Torrefaction (in order to release the fragrance or flavour of certain goods) has been known for more than 5 centuries now (Maillard reaction). On the other hand, when it comes to Torrefaction of biomass (for energy purposes) the concept is much more recent and the purpose of the treatment process is not the same. Actually, the objective is not to release the flavours and fragrance, but rather to degrade the fibres contained in the biomass. Torrefaction (also referred to as depolymerisation) of biomass is a “soft” thermo-chemical treatment usually between 200 and 300° C in order to eliminate water and to modify a part of the organic matter of the biomass so that the fibres are broken. During the process of Torrefaction, the light organic matter is extracted and the structure of the biomass is depolymerized and modified which leads to the cracking of the fibres. This modification leads to a significant change of the physical properties of the biomass: the biomass becomes crumbly, (easy to break) which facilitates and enhances its shaping and compacting. The biomass becomes moderately hydrophobic, which allows longer duration storage without distortion of the product quality (no biological degradation, no fermentation). About Torrefaction
Torrefaction of the biomass is different from the classical roasting of some edible goods (coffee, cacao, etc…) it consists of a thermo-chemical treatment allowing the elimination of water along with a transformation of a part of the organic matter. The biomass is not “grilled” but rather is heated uniformly from the outside inwards to the core.[1]
If we take the particular case of wood, it is composed of hemicellulose, cellulose, lignin and other organic substances in lower quantities (polysaccharides, pentosanes, hexosanes, resins, tannins, colorants, alkaloids, etc…) these organic substances are often referred to as extracts.
During torrefaction, the molecular structure of the wood is modified, which leads to a change in its properties. Torrefaction releases water and evaporates volatile organic matter by decomposition of the hemicellulose and the extracts.
Lignin undergoes a minor modification though, more like softening and weakening, while cellulose is not affected at all by the temperature. Since the hemicellulose serves as a linkage for the cellulose, its suppression weakens the general structure and makes it fragile. Thus the material becomes friable. The degradation of the hemicellulose allows the elimination of the water and makes the wood irreversibly hydrophobic [2]. So when the water is evaporated, it can no longer be absorbed by the wood.
From the point of view of energy, the energy contained in the biomass is almost totally preserved: for example, for the wood, 95% of the initial energy is conserved when the torrefaction is done at 240°C (specific torrefaction temperature of this material). Laboratory measurements
At the University of Miskolc, in the laboratory of the Chemical Machinery Department the torrefaction process was analyzed. According to an early research, the torrefaction was occurred at 240°C for different residence time. During that research the correlation between the torrefaction residence time and heating value was analyzed. After 15 minutes the heating value increment was not significant. So in our recent research 1, 2, 3, 4, 5 minutes were investigated.
The measurements were executed with the equipment which can be seen on the 1. Figure. The laboratory furnace has a heating surface (1) which can be controlled by the PID device (8) with temperature control (6). The (7) cylinder is a closable part of the device, which is the container of the premade biomass. The (5) nozzle is for the gas evacuation, the internal temperature (3) and the pressure (4) were measured by two sensors.
139

International Conference on Innovative Technologies, IN‐TECH 2016,
Prague, 6. ‐ 8. 9. 2016
Fig.1 The laboratory scale furnace [3]
The objective of this experiment is to measure the amount of the heat energy required for the torrefaction of wheat straw and its heating value for different residence times. From previous experiments, the oven temperature of 370°C is needed to obtain the corresponding torrefaction temperature of the wheat straws which is around 240°C.
Two measurements have been conducted: • The results of the first measurement the power consumption required to maintain the oven and the empty container at the
required temperatures (370°C and 240°C respectively) for the desired residence times. • The second measurement will have the power consumption required to maintain the oven and the container loaded with the
biomass at the required temperatures (370°C and 240°C respectively) for the desired residence times. • The power consumption required to maintain the biomass alone at the torrefaction temperature 240°C will be equal to the
difference of the two above mentioned measurements. In order to do this, the biomass is to be heated up in the laboratory oven up to a certain temperature and then left at this temperature
for the desired time duration (residence time). This allows us to measure the power consumption required to heat up and maintain both the oven and the biomass at the desired temperatures.
Note that because of an independent container is used, heat must be transferred from the heating surface to the container which will result in a difference in temperatures. Thus, the working temperature of the oven is higher than the desired torrefaction temperature (the temperature inside the container).
Before starting the heating process, the container must be purged by sealed well to avoid any interference with the power consumption and the heating process. The container must be sealed off by using a high temperature rubber gasket to improve the isolation of the system.
Then, while heating, the working pressure must be kept at around 1.1 bara. Pressure build up inside the container (due to evaporation of water and volatile material) must be avoided; the container has a manual valve which allows pressure control. By opening this valve more water vapour is allowed to escape and thus pressure will decrease inside.
Measurement procedure
The power consumption of the furnace as the energy was electricity a power consumption measurer was used (Voltcraft Plus) to determine the energy demand of the process. The measurement steps were the followings: when the temperature of the oven reaches 370°C, the power consumption meter was reset to zero and the timer was started. When all the measurements were taken, the oven was switched off and was let it cool down to room temperature. The same procedure was repeated at least three times for consistency. Now proceed with measuring the power consumption required for the furnace and the biomass together, first 40g of biomass and was weighted then inserted it into the container. The container was taken into the preheated oven. The oven and container were insulated well to minimize the heat losses. When the internal temperature reaches the 240°C the power consumption was recorded. After each measurement the heating value of the biomass was determined in a calorimeter bomb in Parr 6200 type calorimeter (see on Fig. 2.).
Table 1. Results of the higher heating value measurements
Residence
time [min]
Ha
[MJ/kg] H
[m/m%] W
[m/m%] Hu
[MJ/kg]
0 16,3630 4,98 7,2 15,100
1 20.6978 5.22 4.41 19.4505
2 22.0945 5.28 4.23 20.8385
3 22.7005 5.35 4.05 21.4336
4 23.0454 5.4 3.67 21.7769
5 23.3204 5.6 3.52 22.0119
140

International Conference on Innovative Technologies, IN‐TECH 2016,
Prague, 6. ‐ 8. 9. 2016
To determine the lower heating value of the biomass, according to the DIN standard [4] the following equation should be used: Hu = Ha – 24.42·(8.94·H + W) (1) where: Hu: heating value [J/g], 24.42 correction factor adequate for 1% moisture content on 25°C, Ha higher heating value [J/g], H the
hydrogen content of the sample [m/m %], 8.94 the calculation coefficient of the hydrogen to water, W the moisture content of the sample [m/m %].
Fig. 2 The schematic drawing of the calorimeter
As one can see according to the calorific measurements the increment of the heating value is significant if we compare to the initial
heating value. The initial date is in the first line, the residence time „0“ means the untreated biomass, the raw wheat straw. In the Table 2 one can see the results of the two measurements. According to the different residence time the initial heating value
(15,1 MJ/kg) of the wheat straw increased to the value which can be seen in the 4th column of the table. While 40 grams were taken into the container the 2nd column shows the energy demand of the heat treatment. The 3rd column shows the calculated values to unit mass of kilograms. The 5th column (name “Increment”) shows the energy increment from the initial heating value. The 6th column contains the difference between the heating value increment and the energy demand of the process. These are average values.
Table 2. Results of the measurements
Residence time [min]
Energy demand [MJ/40g]
Energy demand [MJ/kg]
Heating value
Hu [MJ/kg]
Increment [MJ/kg]
Increment-energy demand [MJ/kg]
Gradient
1 0.0216 0.54 19.4505 4.3505 3.8105 -
2 0.036 0.9 20.8385 5.7385 4.8385 1.3879
3 0.0432 1.08 21.4336 6.3336 5.2536 0.5951
4 0.0504 1.26 21.7769 6.6769 5.4169 0.3433
5 0.054 1.35 22.0119 6.9119 5.5619 0.2350
141
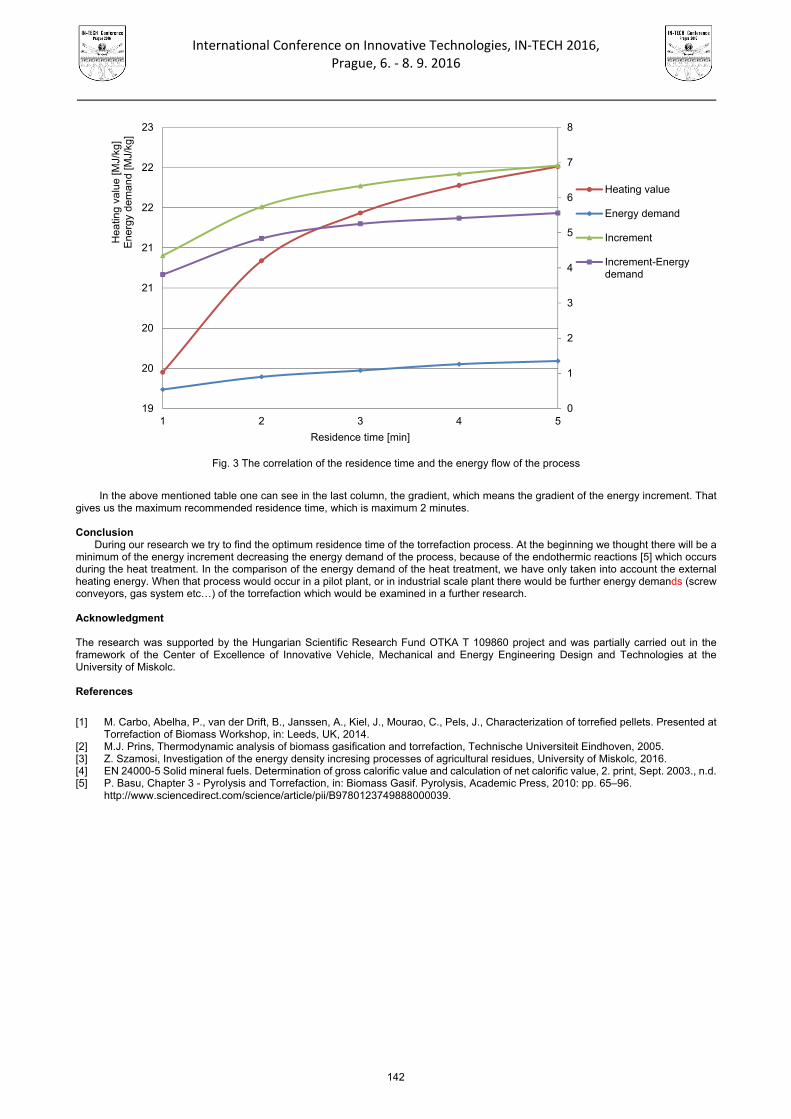
International Conference on Innovative Technologies, IN‐TECH 2016,
Prague, 6. ‐ 8. 9. 2016
Fig. 3 The correlation of the residence time and the energy flow of the process
In the above mentioned table one can see in the last column, the gradient, which means the gradient of the energy increment. That
gives us the maximum recommended residence time, which is maximum 2 minutes. Conclusion
During our research we try to find the optimum residence time of the torrefaction process. At the beginning we thought there will be a minimum of the energy increment decreasing the energy demand of the process, because of the endothermic reactions [5] which occurs during the heat treatment. In the comparison of the energy demand of the heat treatment, we have only taken into account the external heating energy. When that process would occur in a pilot plant, or in industrial scale plant there would be further energy demands (screw conveyors, gas system etc…) of the torrefaction which would be examined in a further research.
Acknowledgment The research was supported by the Hungarian Scientific Research Fund OTKA T 109860 project and was partially carried out in the framework of the Center of Excellence of Innovative Vehicle, Mechanical and Energy Engineering Design and Technologies at the University of Miskolc.
References
[1] M. Carbo, Abelha, P., van der Drift, B., Janssen, A., Kiel, J., Mourao, C., Pels, J., Characterization of torrefied pellets. Presented at
Torrefaction of Biomass Workshop, in: Leeds, UK, 2014. [2] M.J. Prins, Thermodynamic analysis of biomass gasification and torrefaction, Technische Universiteit Eindhoven, 2005. [3] Z. Szamosi, Investigation of the energy density incresing processes of agricultural residues, University of Miskolc, 2016. [4] EN 24000-5 Solid mineral fuels. Determination of gross calorific value and calculation of net calorific value, 2. print, Sept. 2003., n.d. [5] P. Basu, Chapter 3 - Pyrolysis and Torrefaction, in: Biomass Gasif. Pyrolysis, Academic Press, 2010: pp. 65–96.
http://www.sciencedirect.com/science/article/pii/B9780123749888000039.
0
1
2
3
4
5
6
7
8
19
20
20
21
21
22
22
23
1 2 3 4 5
Hea
ting
valu
e [M
J/kg
]E
nerg
y de
man
d [M
J/kg
]
Residence time [min]
Heating value
Energy demand
Increment
Increment-Energydemand
142

International Conference on Innovative Technologies, IN‐TECH 2016,
Prague, 6. ‐ 8. 9. 2016
METHOD OF ANALYZING TECHNICAL AND LEGAL CONVERGENCES AT THE LEVEL OF MUNICIPAL WASTE MANAGEMENT FROM THE
PERSPECTIVE OF CIRCULAR ECONOMY
V.F. Soporan1, A.L. Pop1 and S. Pădurețu1 1Tehnical University of Cluj Napoca,Bd. Muncii 103-105, Cluj-Napoca, Romania
e-mail: [email protected] Keywords: Circular Economy; Waste Management; Technical and Legal Convergences; Analytical Hierarchical Process Abstract: Motivation: The work stems from the fact that a number of complex processes - such as the one related to the sustainable management of municipal waste - are influenced by the structure of the activities which are interdisciplinary interconnected through public policies, regulatory framework, technical solutions, technological and financing arrangements as well as the use of financial instruments. Objective:The objective is to structure, in terms of interdisciplinary scientific research, an instrument for action at the level of municipal waste management, from the perspective of circular economy, through technical and legal convergences. Research method: the methodology of analysis followed the following phases: critical analysis of knowledge in the field of technical and legal convergences in waste management; structuring waste management activities by technical and legal convergences at the level of circular economy; structuring the AHP method on the analysis of technical and legal convergences present in the municipal waste management. Research achievements: We consider that the paper presents a few contributions to the process of substantiating technical and legal convergences: structuring waste management activities through technical and legal convergences at the level of circular economy; a hierarchy of parameters that influence the process of good waste management. Major contribution of research: Research materialization in substantiating the algorithmization of waste management procedures benefits from a procedure developed on two levels: that of structuring the architecture of the analyzed system and that of hierarchy method. Research conclusions: The investigated domain is a contemporary one because through the analysis of legal-technical convergences priorities can be modeled, and thus it is possible to transform them into instruments of action for better municipal waste management in terms of circular economy, the processes being carried out at the institutional structuring of responsibilities and restrictions regarding sustainable development. Introduction
The essential problem, which arises from the legal-technical convergence for modeling a complex process with multiple influences, is to establish a hierarchy of influences characteristics present in the functioning of the whole process, using the AHP (Analytic Hierarchy Process). The problem is difficult because the influences are different, and hardly could be placed in a common denominator through which it can achieve a ranking of the importance of process parameters.
The assessment presented is noted that the complex problems there are several levels at which one can establish hierarchies, in a first phase, and subsequently in order to ascertain the influence of algorithmic feature in the process as a whole.
The essence of the method consists in determining the influence of a parameter at the global process, including the influences of other parameters multistage tracking hierarchical influences.
Presentation of system architecture analysis
Schematic presentation of the system architecture analysis is done in Figure 1 and its elements will be used in structuring step of the hierarchy of influence for the analyzed characteristics.
Analyzed the system architecture is structured on process characteristics - CRJ, J ∈ 1, 2, 3, ..... N, assigned or determined by a specific procedure established institutional or through a specific methodology.
This first phase of construction of architecture called during construction of the entire process analyzed (PA) by adding features, namely:
(PA) = sum of CRJ, where J ∈ 1, 2, 3, ...., N. The second step is the establishment of the first stage hierarchic where the defined characteristics of the process are allocated
according to certain criteria in groups ordering level 1, notation being accomplished MO1FI where I ∈ 1, 2, 3, ....., P1. The present
structure is in P1 (P1∈M) groups hierarchical level 1 criteria of belonging to each group is to fulfillment of conditionalities for the formation of the group, and each characteristic is assigned only a single hierarchical level groups 1. Hierarchical level groups 1 are allocated to local stage hierarchy.
The third stage is the establishing of the second hierarchical levels, wherein said ordering Level 1, defined - MO1FI are allocated, again according to certain criteria in groups of ordering level two MO2FI so constituted where I ∈ 1, 2, 3, ...., P2. In this case, it constitutes
143

International Conference on Innovative Technologies, IN‐TECH 2016,
Prague, 6. ‐ 8. 9. 2016
P2 (P2∈M) groups hierarchical level 2 criterion of belonging to each group is constituted fulfillment of conditionalities its generation, and each hierarchical level 1 group is assigned to a single group hierarchical level 2.
Step compose from hierarchical level groups 2, belong to the intermediate levels of hierarchical analysis. The construction of intermediate steps may continue through the construction of hierarchical level 3, level 4 to level "m". The matrices
corresponding hierarchical steps mentioned above will be marked as: MO3FI, I ∈ 1, 2, 3, ...., P3; MO4FI, i ∈ 1, 2, 3, ...., P 4; MB (m-1)
Fi, i ∈ 1, 2, 3, ...., P (m-1), MOmFI, i ∈ 1, 2, 3, ...., P m, where P3, P4, ..... Pm-1, Pm∈M, m∈M. The last stage of structuring the architecture review process is the formation of groups of global ordering, MOG, the groups
hierarchical level "m" are allocated based on criteria established structures of this hierarchical level. In this case, the one built at Figure 1, it constitutes Pg groups hierarchical global consisting of matrixes last intermediate stages conditionings of belonging is related to the fulfillment criteria definition to the group and that each of the foregoing groups belong only one of the groups defined globally.
Therefore, the structure of the analyzed system architecture comprises: up phase structure by the characteristics of components that will be taken into account; up phase of the first stage hierarchical by constituent groups and their characteristics allocations; up phase of hierarchical access by specific groups and allocations successive steps; up phase of the global matrix
Fig. 1 Formation of system architecture analysis
144

International Conference on Innovative Technologies, IN‐TECH 2016,
Prague, 6. ‐ 8. 9. 2016
Step of the hierarchy
Assuming that have been identified through a certain process a number of "n" parameters (influences) for a given process, it is determined within this framework, the number of hierarchical levels "m" groups successive "P1", "P2" "P3" ..... "Pm" for which it's made the hierarchical analysis.
Therefore, given the data starting at establishing hierarchies defining characteristics (parameters) in the process includes the following steps:
- Hierarchical system architecture construction process; - Establishing the importance of each characteristic in the process of hierarchy; - Construction of ordering fuzzy matrices for each stage of hierarchy; - Determine weights for each stage of hierarchy; - Determining weights taking into account the characteristics of each step influences the ranking; - Establish hierarchy analyzed the influence of characteristics in the process according to the percentage calculated to take account
of the influence of each hierarchical levels; - Comments and discussion of the results obtained;
Construction system architecture hierarchy process
– E1 - analyzing and determining the process or influence within it;
– E2 - retention characteristics to be included in the analysis or indication of the "CRN" influences;
– E3 - specifying the "m" which is performed at speed connections and influence hierarchy structures;
– E4 - setting successive groups "P1," "P2," "P3", ..... "Pm" for each hierarchical level, which will be allocated according to certain criteria, and groups formed initially defined characteristics each step hierarchical structure that will be set at a higher level.
– E5 - CLR parameter assignment of ownership, j ∈ 1, 2, ..., n in group MO1FI, I ∈ 1,2, .., P1, noting that each parameter belonging to a single group (stage first ranking);
– E6 - assigning groups on the hierarchical level (k-1) in the groups established at the hierarchical level (k) (the construction of intermediate steps);
– E7 - assigning groups on the hierarchical level (m) groups formed on the global layer of hierarchy (G);
Establishing the importance of each characteristic in the process hierarchy
– E8 - specification the objective and criteria by which the ranking is done; - E9 - setting the levels of classification by objective and established criteria, with five levels of assessment importance: very
important, important, medium, low and very low; - E10 - a system of scoring through a correlation between the levels of importance of the previously defined functions, and fuzzy
numbers; - E11 - fuzzy number assignment for each parameter in the analysis according to criteria; 3.3. Construction of ordering fuzzy matrices for each stage of hierarchy
– E12 - construction matrix for the first step of ordering fuzzy hierarchy - MO1FI (local stage) through the following sequence: • loading matrix fuzzy, • defazification; • introducing changes convex after selecting the values of "alpha" and "beta" by it trends upward neutral and downward, being the
operation assigning "crisp number". - E13 - construction ordering matrix for the second stage fuzzy hierarchy - MO2FI, following the same methodology used in the first
stage (first stage intermediate); - E14 - construction of ordering fuzzy matrices for other levels of hierarchy - MO3FI, MO4FI ....., after the methodology presented
MOMFI (other stair intermediate); - E15 - global ranking matrix construction, MOG, after the method of ordering fuzzy matrices of last step intermediate elements
constitute the groups established at the last form of hierarchy;
Determining weights for each stage of hierarchy Determining weights was done using MATLAB (Matrix Laboratory, characterized to have a "language" mathematical senior and
interactive environment for modeling characteristics, parameters, steps, weights, hierarchies of systems data) With this one calculates the matrix s -They set weights on different stages of the hierarchy and globally, as follows:
– E16 - setting "weight" features in ordering fuzzy matrices present in the first stage of the hierarchy - WEIGHT step 1 (local weight); - E17 - establishing the "weight" of the first step of ordering matrix ranking within the second stage of hierarchy - WEIGHT step 2
(intermediate 1 weight);
– E18 - setting "weight" Matrix ordering rank (k-1) in step hierarchy (k) - WEIGHT LEVEL k (weighting intermediate (k-1)), the process continuing until all the intermediate steps, namely the step hierarchical level "m". Basically determine at this stage: WEIGHT LEVEL 3, WEIGHT LEVEL 4 ... WEIGHT LEVEL "m";
- E19 - setting "weight" parameters in the matrix present in the matrix of global ordering - GLOBAL WEIGHT G.
Calculation of the share taking into account the characteristics of each step influences the ranking
– E20 - calculating weight feature CRJ to the influences of each hierarchical levels, where it is present, and step overall is calculated using the formula: WEIGHT CRJ = WEIGHT 1 (CRJ) x WEIGHT 2 (CRJ) x WEIGHT 3 (CRJ) x. .. x WEIGHT "m" (CRJ) x PONDRE "G" (CRJ);
145

International Conference on Innovative Technologies, IN‐TECH 2016,
Prague, 6. ‐ 8. 9. 2016
Establishing hierarchy analyzed the influence of characteristics in the process according to the percentage calculated to take account of the influence of each hierarchical levels
– E21 - setting parameters influence in the process hierarchy by weight calculated through the presented, noting that the ranking could be done in ascending version (optimistic), neutral and downward (pessimistic); Comments and discussion of results
– E22 - comments and discussion about the results. Conclusions
This paper is provided a method of hierarchical criteria analysis technical and legal convergence in this method using numbers fuzzy logic.
The method can be applied in waste management to make an assessment of the characteristics of waste by reference to criteria circular economy.
The method is complex, through which you can establish a hierarchy of influences characteristics present in the functioning of the whole waste management process, which is necessary for a complete and comprehensive analysis of the field.
The method is innovative in that it compares the different groups, which can hardly be compared otherwise, establishing a hierarchy based on their criteria circular economy. Very important to note is that through the method is comparing the features and evaluated each of it with consideration of all others.
The method can be applied in other fields where it wants to establish a hierarchy of features that can be used later, for example when making decisions, implementing certain policies, etc. References [1] A.L. Pop, V.F. Soporan, and T. Gabor, European Union legislation and objectives in municipal waste management, Acta Tehnica
Napocensis, Series Entrepreneurship Environmental Engineering and Sustainable Development,Vol.3, (2014), No.3, pp.33-49. [2] A.L. Pop, 2015, Contributions to the analysis of technical and legal convergence at the level of municipal waste management from
the perspective of circular economy, Thesis, Technical University of Cluj Napoca. 105-164pp. [3] Guide méthodologique du développement des stratégies régionales d’économie circulaire en france, 2014. Agence de
l’Environnement et de la Maîtrise de l’Énergie (ADEME), Online la: http://www.presse.ademe.fr/wp-content/uploads/2014/11/Guide-strategie-eco-circulaire-FINAL.pdf.
[4] N. Georgescu-Roegen, La décroissance. Entropie-Ecologie-Economie (1979), 2nd édition, online la: http://www.fichier-pdf.fr/2014/02/08/la-decroissance-nicholas-georgescu-roetgen/la-decroissance-nicholas-georgescu-roetgen.pdf, pp.71-75.
[5] V.F. Soporan, V. Dan, and A.L. Pop, Ecoresponsabil Entrepreneurship in European Documents. (ISBN 978-606-17-0302-9). Casa Cărții de Știință, Cluj-Napoca, România, 2013, 474pp.
146

International Conference on Innovative Technologies, IN‐TECH 2016, Prague, 6. ‐ 8. 9. 2016
CASTINGS MANUFACTURE FROM THE PERSPECTIVE OF DIGITAL COMMUNICATION IN VIRTUAL SPACE
M. M. Vescan1, V. F. Soporan1 and A. L. Pop1
1 Technical University of Cluj Napoca, Bd. Muncii 103-105, Cluj-Napoca, Romania
e−mail: [email protected]
Keywords: Circular Economy; Entrepreneurial Platform; Manufacture Castings; Sustainable Development; Environmental Protection
Abstract: The paper presents the features of entrepreneurial platform for circular economy from the perspective of one area affecting natural resources (materials and energy) and has an aggressive impact on the environment. For achieving the goals set in the methodology mentioned there are presented the results of the scientific approach on adapting castings to the requirements of circular economy mainly on the following issues: the technological concern, the current situation, the market trends, the instruments of the circular economy, public policies, legal frameworks, technical and technological solutions, financing solutions and financial instruments, examples of good practice, process actors, events, production issues from the perspective of circular economy, publications and other issues. In terms of scientific analysis, actors of the manufacturing process are divided into the following categories: manufacturers of molding pieces, raw material suppliers, equipment and installations suppliers, advisory and technical assistance services, circular economy services suppliers, educational service providers and training providers, brokerage services, scientific and technological units in manufacturing molding pieces to the requirements of circular economy, socio-professional and scientific associations, public regulatory, execution and monitoring authorities, banking and investment funds units to manufacture castings in circular economy, institutional fund management units (local, national and European) related to castings in circular economy and the beneficiaries of the molded pieces. Other levels of entrepreneurial platform covers the following aspects: events in manufacturing moldings following the requirements of the circular economy, the aspect of castings production in terms of circular economy and publications on manufacturing molding pieces from the perspective of circular economy. At the active online platform level of manufacturing castings from the perspective of circular economy the following items are analyzed: continuous online exhibition of castings; online conference of scientific conferences in the field of manufacturing castings following the requirements of circular economy; institutional and technical multilingual dictionaries on manufacturing castings; general business offer of the platform; overall demand of the platform; platform’s share trade and specific activities of the platform component units.
The view on castings manufacturing Castings manufacture has faced, in the last half century, a diversity of problems caused by the restrictive conditions regarding the
usage of energy-related resources and the environmental impact, developed under increased requirements and diversification of characteristics and of usage areas.
Meanwhile, at the general level, one can witness complex computing processes that influence the functioning of the entire economic and social system, in a context in which the national dimension is increasingly replaced by globalization (Fig. 1).
Within the new economic context which has become increasingly globalized, Romanian business environment has been challenged to synchronize efficiently the new products and the global services with improved supply and demand. This challenge involves interconnection and virtual management of demand and supply regarding products and services within a common platform for coordinating and consolidating inclusion markets of various economic fields.
Assuming that taking part in the global market for the Romanian e-business environment depends on how it relates to foreign markets, the emergence of computerized tools for coordinating, synchronizing and intermediating businesses becomes an obvious necessity within the need of the Romanian economy to succeed leading, as in the case of castings manufacture, to the necessity to create a an online support and assistance platform (SA-P) specific for the circular economy.
147
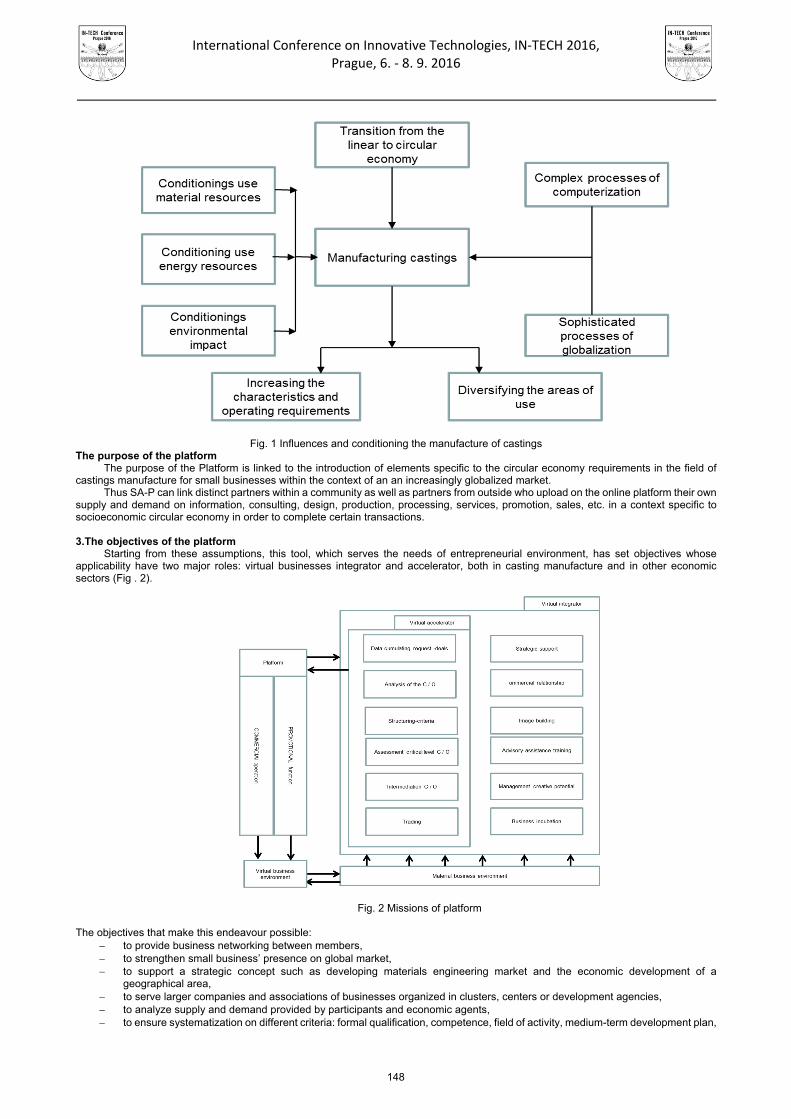
International Conference on Innovative Technologies, IN‐TECH 2016,
Prague, 6. ‐ 8. 9. 2016
Fig. 1 Influences and conditioning the manufacture of castings The purpose of the platform
The purpose of the Platform is linked to the introduction of elements specific to the circular economy requirements in the field of castings manufacture for small businesses within the context of an an increasingly globalized market.
Thus SA-P can link distinct partners within a community as well as partners from outside who upload on the online platform their own supply and demand on information, consulting, design, production, processing, services, promotion, sales, etc. in a context specific to socioeconomic circular economy in order to complete certain transactions.
3.The objectives of the platform
Starting from these assumptions, this tool, which serves the needs of entrepreneurial environment, has set objectives whose applicability have two major roles: virtual businesses integrator and accelerator, both in casting manufacture and in other economic sectors (Fig . 2).
Fig. 2 Missions of platform The objectives that make this endeavour possible:
to provide business networking between members, to strengthen small business’ presence on global market, to support a strategic concept such as developing materials engineering market and the economic development of a
geographical area, to serve larger companies and associations of businesses organized in clusters, centers or development agencies, to analyze supply and demand provided by participants and economic agents, to ensure systematization on different criteria: formal qualification, competence, field of activity, medium-term development plan,
148

International Conference on Innovative Technologies, IN‐TECH 2016, Prague, 6. ‐ 8. 9. 2016
to strengthen supply and demand includes: summing up data referring to supply and demand of companies’ internal markets, assessing the critical level from which they are relevant, summing up relevant supply and demand by using material-symbolic relation between participants who have generated it,
to take part in online economy, which means that after supply and demand has been strengthened it is available in online markets in order to link external online partners,
to facilitate constructive business relationships for members and partners to facilitate supply and offer by providing interconnection between partners within the online framework business incubators for startup companies by providing support, consulting and training services to support new initiatives and their development in online environment to manage the creative resources and to make them visible in online for mentors, trainers and trainees, to develop upgraded supply and demand for an improved globalized market, to set a platform to support Romanian inclusion markets and to strengthen global market demands and connecting them with the
requirements of the global market Performing the tasks mentioned before, this online platform represents a powerful tool to improve the presence of small businesses
on global market. Otherwise, in the absence of such an aggregation tool, these companies and communities might not be so visible and connected to the local and global economic environment.
Users Since this platform represents a linking tool between the Romanian and European business areas, establishing a powerful
entrepreneurial community, based on a social network managed virtually by application-modules as well as an instrument available to entrepreneurs in engineering materials or castings manufacture casting, the range of participants who use the facility provided becomes increasingly wider.
Therefore, the online platform is designed for the following categories of users: - experienced business people - they know the demand and supply of the market and are aware of the advantages of an online
platform; - users with newly founded businesses – are highly motivated, have the necessary skills and are seeking this kind of assistance;- users and founders of representative organizations and associations - have high expectations from such a project and are
familiar with the organizational environment within the network formed; - users who initiate new businesses - creative people who can be stimulated and guided in the entrepreneurship field and who are
to be identified and included in the shared network of the Platform; - professional mentors and trainers – by using their expertise to help other users, and by setting the views and values within the
social networks they have the potential to promote the necessary ideas and values; - business graduates of training courses - their connection with the university environment can lead to a better inclusion in the
network, while their professional training can make them receptive for new ideas and concepts; - various business people - their input within the network can provide the conversion of the typical economy into online economy
providing contact with real market and being a constant resource of Portal-Platform’s users due to their business relationships with other participants in the global market.
From the perspective of managing and using SA-P Platform operating roles set the following distribution: Public User (PU) can be any person accessing the portal SA-P who views or reads published articles in various fields. In order to
access the application SDC, an account must be created which will lead to becoming Member User. Member User (MU) can be any person who, after creating an Account, defines his profile. Thus he can view, search and post a
request and/or an offer on a certain Domain, Category or Article. Domain Administrators (DA) are people appointed to configure and manage Domains. They configure and manage Domain
depending on the specific market in different windows incorporating multimedia articles and content; configure and manage SDC application with various offers and requests till the Criterion level; oversee and are in charge with Domain and SDC Module in terms of relevance, accuracy and ethics of the posted materials.
Technical Administrator (TA) represents the technical team with duties in creation, maintenance, troubleshooting, intervention and technical support needed for proper functioning of the platform. The team creates Domains, accounts for DA, and has unrestricted access to all the levels of the Platform.
The components (modules) of the platform Currently, SA-P has three specific applications: ‐ Demand-supply connection (DSC), meeting the demand with several supplies (and vice versa) through multiple search, ‐ Search-selection-classification (SSO), which allows accessing and organizing data base according to Member Users (people
and companies): name, address, e-mail address, phone number, professions, occupation, position, specific activity, etc. ‐ Mail-mailing-operation (MMO), supporting personalized, automatic and simultaneous communication with all user members.
These three applications currently provide networking and communication management among members of social network created on the online platform.
Usage of platform From the functional perspective the online support and assistance platform (SA-P) is divided into two parts:
-Application part located in the top horizontal navigation bar,-Domain part located in the right vertical barApplication represents, within the functional purpose of the platform, various software developments, which have some functionality to anyuser perceived as final customer/user. It can configure and enter data and get response depending on the application that is running.Different applications will correspond and interact with their application domains.
In the described version, the application that can be accessed and rolled is (SDC) module SUPPLY-DEMAND CONNECTION. The connection supply-demand is achieved by responding to the indexing of certain parameters in the search. Thus, a product or a service, an economic activity that can be described by a variety of parameters can be identified by parameterization of its characteristic properties which are simultaneous or consecutive search criteria in the searching process.
149

International Conference on Innovative Technologies, IN‐TECH 2016,
Prague, 6. ‐ 8. 9. 2016
There are two types of searches: ‐ by words, titles, contents ‐ multi-criterial search by one or more predefined criteria in which response values are reduced as the number of criteria
indexed simultaneously increases. Thus there are 4 ways of indexing descriptive parameters: ‐ word-phrase indexing based on certain phrases in the title or the content of the demand/supply ‐ indexing parameters according to supply/demand criteria configuration ‐ combined indexing – a combination of the two ways mentioned before ‐ general indexing through which when clicking on ”Search” without any other previous indexing all searches/offers posted in
that certain Domain or Category are being listed Domain means an object market or an area of interest (geographic, economic, related to the field of activity, expertise, etc.) that
defines a virtual space on the platform (e.g. Environment = domain). Category represents incorporating an area of activity into a Domain, depending on a number of specific elements with a high degree of similarity (e.g. Environment = domain, Green Energy = category). Article means a tradable economic unit (service, product, etc.) that is described by a number of specific elements, items to be indexed as search parameters in the SDC module (e.g. Environment = domain, Green Energy = category, Wind energy = article). The article is, at the same time, the item being traded by connecting the demand-supply SDC in the real market (Object).
Criterion is a defining attribute as text numeric value, logical values (yes, no), dates of an article (e.g. Environment = domain, Green energy = category, Wind energy = article, 1 megawatt power = criterion). This way, after defining the criteria, posting the demands and offers in this particular context some companies ‘applications can easily find their complementary offer (the business function), and, conversely, for certain pending offers may occur related applications (the promotion function), all resulting in an accumulation of positive economic transactions in a given market. Interface with casting manufacture
Using the SA-P platform for the online public of castings manufacturing using the interface, with which it interacts. If the Platform is a multitude of dynamic applications which enter data and get responses for the purposes and effects mentioned above, the user-interface represents a fixed application with the main objective of defining the field of casting manufacture. Thus, user-interface ensures the positioning and shaping of the topics specific to this area in the global economic context.
An overview of the topics specific for the field of castings manufacture as access buttons within the user-interface would include: 1. General presentation: introduction, history of platform, flowchart, economic date of the domain; 2. Platform’s potential: boosting social relations of users, media and events communication, information, publication of
specific materials, partnerships (organization), technical coordination, legal services, training services and providing human resource, environmental protection services, hygiene and safety, economic and statistical information analysis;
3. Partners: professional associations, public authorities, certification-authorization, research institutes, training, infrastructure, unprocessed materials, consulting institutions;
4. Data on the technological potential of the platform; technologies, alloys, terminology; 5. Technological innovation: research-development (topics, users), technology innovation, quality and control, materials and
alloy innovations, examples of innovations; 6. Eco-responsibility and social innovation: management, human resources, environment protection, circular economy,
energy economy; 7. Overview on the development of the sector: public authorities, castings manufacturers, suppliers, related activities; 8. Jobs and trainings: current situation, perspectives, document presentation, training, training levels, training institutions,
teaching resources, trade records; 9. Human resources: pupils, students, graduates, trainees, trainers; 10. Employment: job characteristics, job descriptions, offers, CV applications; 11. News: members, publications, communication; 12. Demands – offers.
Conclusions
In this respect, the endeavour to create an instrument that would boost economic activities in castings manufacturing can be materialized by creating this portal-platform which using online communication can speed up exchanges within the material economy environment. Thus the technical, economic, scientific and information features are provided by accessing user-interface, while meeting supply and demand, trading materials, speeding up and boosting trade is accomplished by using SA-Platform, as an online instrument of aggregation and consolidation in the field of casting manufacturing in Romania and worldwide.
References [1] Soporan, V.F., Tiuc, A. Portfolio overview: "Online business for creative partnerships, CPADDD", . (CPADDD, Cluj-Napoca, 2013) [2] Soporan., V.F Entrepreneurship, business environment and sustainable development, (Casă Cărţii de Ştiinţă, Cluj-Napoca, 2011) [3] Toffler, A. Toffler, H. Moving Wealth, (Antet Bucharest, , 2006) [4] Anghel, T. Everything we need to know about internet, (Polirom,Iaşi, 2010) [5] D'Souza,S. (2009), Be a genius. Networking, (Rentrop & Straton, Bucharest, 2011) [6] Cismaru, D.M. Communication within organizations, (Tritonic, Bucharest, 2008) [7] Cismaru, D.M., Social media and the management of reputation, (Tritonic, Bucharest, 2012)
150
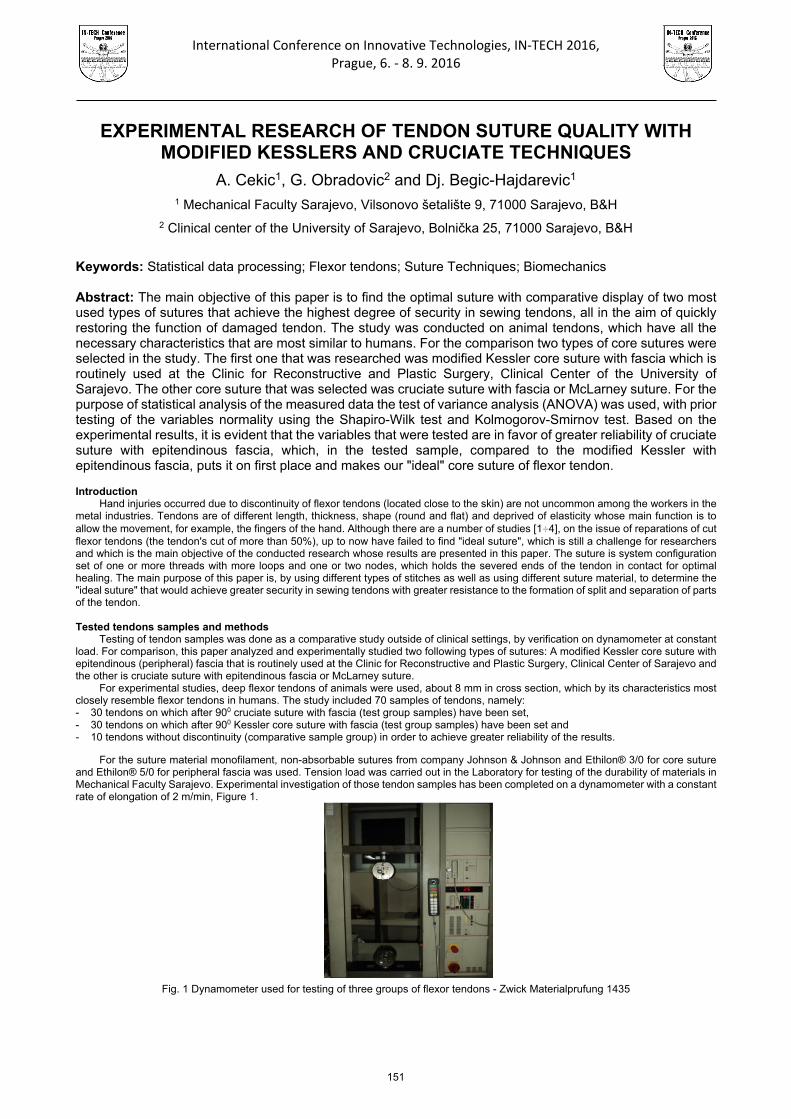
International Conference on Innovative Technologies, IN‐TECH 2016, Prague, 6. ‐ 8. 9. 2016
EXPERIMENTAL RESEARCH OF TENDON SUTURE QUALITY WITH MODIFIED KESSLERS AND CRUCIATE TECHNIQUES
A. Cekic1, G. Obradovic2 and Dj. Begic-Hajdarevic1
1 Mechanical Faculty Sarajevo, Vilsonovo šetalište 9, 71000 Sarajevo, B&H
2 Clinical center of the University of Sarajevo, Bolnička 25, 71000 Sarajevo, B&H
Keywords: Statistical data processing; Flexor tendons; Suture Techniques; Biomechanics
Abstract: The main objective of this paper is to find the optimal suture with comparative display of two most used types of sutures that achieve the highest degree of security in sewing tendons, all in the aim of quickly restoring the function of damaged tendon. The study was conducted on animal tendons, which have all the necessary characteristics that are most similar to humans. For the comparison two types of core sutures were selected in the study. The first one that was researched was modified Kessler core suture with fascia which is routinely used at the Clinic for Reconstructive and Plastic Surgery, Clinical Center of the University of Sarajevo. The other core suture that was selected was cruciate suture with fascia or McLarney suture. For the purpose of statistical analysis of the measured data the test of variance analysis (ANOVA) was used, with prior testing of the variables normality using the Shapiro-Wilk test and Kolmogorov-Smirnov test. Based on the experimental results, it is evident that the variables that were tested are in favor of greater reliability of cruciate suture with epitendinous fascia, which, in the tested sample, compared to the modified Kessler with epitendinous fascia, puts it on first place and makes our "ideal" core suture of flexor tendon.
Introduction Hand injuries occurred due to discontinuity of flexor tendons (located close to the skin) are not uncommon among the workers in the
metal industries. Tendons are of different length, thickness, shape (round and flat) and deprived of elasticity whose main function is to allow the movement, for example, the fingers of the hand. Although there are a number of studies [1÷4], on the issue of reparations of cut flexor tendons (the tendon's cut of more than 50%), up to now have failed to find "ideal suture", which is still a challenge for researchers and which is the main objective of the conducted research whose results are presented in this paper. The suture is system configuration set of one or more threads with more loops and one or two nodes, which holds the severed ends of the tendon in contact for optimal healing. The main purpose of this paper is, by using different types of stitches as well as using different suture material, to determine the "ideal suture" that would achieve greater security in sewing tendons with greater resistance to the formation of split and separation of parts of the tendon.
Tested tendons samples and methods Testing of tendon samples was done as a comparative study outside of clinical settings, by verification on dynamometer at constant
load. For comparison, this paper analyzed and experimentally studied two following types of sutures: A modified Kessler core suture with epitendinous (peripheral) fascia that is routinely used at the Clinic for Reconstructive and Plastic Surgery, Clinical Center of Sarajevo and the other is cruciate suture with epitendinous fascia or McLarney suture.
For experimental studies, deep flexor tendons of animals were used, about 8 mm in cross section, which by its characteristics most closely resemble flexor tendons in humans. The study included 70 samples of tendons, namely: - 30 tendons on which after 900 cruciate suture with fascia (test group samples) have been set,- 30 tendons on which after 900 Kessler core suture with fascia (test group samples) have been set and- 10 tendons without discontinuity (comparative sample group) in order to achieve greater reliability of the results.
For the suture material monofilament, non-absorbable sutures from company Johnson & Johnson and Ethilon® 3/0 for core sutureand Ethilon® 5/0 for peripheral fascia was used. Tension load was carried out in the Laboratory for testing of the durability of materials in Mechanical Faculty Sarajevo. Experimental investigation of those tendon samples has been completed on a dynamometer with a constant rate of elongation of 2 m/min, Figure 1.
Fig. 1 Dynamometer used for testing of three groups of flexor tendons - Zwick Materialprufung 1435
151

International Conference on Innovative Technologies, IN‐TECH 2016,
Prague, 6. ‐ 8. 9. 2016
Research results In order to define the so-called "ideal suture" experimental researches were performed on the following three groups of prepared flexor tendons: - tendon sewed using modified Kessler suture: core suture using thread Ethilon® size 3/0 and with a simple fascia using Ethilon® size
5/0, - Tendon suture with modified cross-stitch: core suture using thread Ethilon® size 3/0 with a simple fascia with end Ethilon® size 5/0, - Intact (complete) tendon as a control group.
During testing of tendons on the dynamometer, the graph paper that was placed behind a single tendon was used to monitor the occurrence of 1 mm and 2 mm split. In addition, a stopwatch was used to monitor the time it takes to form a split of 2 mm. Tendons were stretched using a constant speed of 2 m/min. Test results are presented in Table 1. Force is expressed in Newton and stretching is expressed in millimeters, which were required for occurrence of split in stitched tendons of 1 mm and 2 mm. The parameters for complete tendon to the moment of fracturing or loosening from grip of dynamometer were also shown.
Table 1. Force (N) and stretching (mm) obtained during testing of test tendons on occurrence of split from 1 mm and 2 mm
No.
Kessler suture Cruciate suture Complete tendon
P, N L, mm P, N L, mm P,N L, mm P, N L, mm P, N L, mm
1 mm split 2 mm split 1 mm split 2 mm split
1. 15,0 5.84 19,0 6.64 36,0 6.38 36.5 6.78 306 9.40
2. 22,0 6.81 26,0 7.91 36,0 5.81 35,0 7.09 345 9.00
3. 19,0 4.71 20,0 6.09 45,0 8.35 45,0 9.68 348 8.61
4. 29,0 5.14 27,0 6.15 34,0 5.72 33.6 6.58 368 10.84
5. 16,0 3.28 18,0 3.75 28,0 5.17 28,0 6.40 319 9.54
6. 17,0 4.81 20.6 5.58 26,0 4.50 28,0 5.35 354 11.80
7. 20,0 5.73 16,0 5.90 26,0 4.39 32,0 5.36 360 11.80
8. 28,0 5.79 23,0 6.36 28,0 4.27 32,0 5.12 355 11.48
9. 19,0 3.83 22,0 5.42 28,0 4.72 27,0 5.68 374 11.62
10. 18,0 4.13 20,0 4.52 34,0 7.40 33,0 8.32 377 10.96
11. 22,0 5.83 22.5 7.00 35,0 6.67 38,0 7.08
12. 24,0 6.22 23.5 6.69 33,0 5.80 36.5 6.68
13. 22,0 5.60 25,0 6.48 31,0 5.33 35,0 6.20
14. 26,0 5.98 27,0 6.54 38,0 6.88 35,0 7.20
15. 27,0 7.50 29,0 8.26 33,0 6.04 37,0 6.97
16. 19,0 4.01 17.5 4.80 30,0 6.22 29,0 7.23
17. 18,0 4.95 17,0 5.92 44,0 6.32 48,0 7.04
18. 17,0 3.50 18,0 5.45 35,0 7.68 36,0 8.55
19. 17,0 3.85 18,0 3.96 32,0 4.69 31.5 5.55
20. 13,0 3.07 15,0 3.24 41,0 6.22 40,0 7.30
21. 19,0 3.69 25,0 4.90 40,0 5.90 38.5 6.90
22. 19,0 4.85 18,0 5.58 39,0 6.99 39,0 7.90
23. 14,0 4.72 11,0 5.20 44,0 6.85 42,0 7.90
24. 30,0 7.41 29,0 7.76 34,0 6.55 39,0 7.13
25. 24,0 4.83 30,0 6.07 47,0 6.80 44.5 7.77
26. 17,0 4.25 18,0 4.52 36,0 7.79 40,0 8.80
27. 20,0 4.08 19,0 4.48 35,0 6.68 34,0 8.00
28. 19,0 4.40 18,0 4.95 39,0 6.92 38,0 8.00
29. 20,0 4.18 20,0 4.95 39,0 7.25 37,0 8.75
30. 20,0 4.17 22,0 4.52 40,0 6.52 38.5 7.70
MEDIAN 19,0 4.765 20,0 5.58 35,0 6.35 36.5 7.11 354.5 10.90
AVG 20.33 4.91 21.14 5.65 35.53 6.23 36.22 7.17 350.60 10.51
MIN 13,0 3.07 11,0 3.24 26,0 4.27 27,0 5.12 306.00 8.61
MAX 30,0 7.50 30,0 8.26 47,0 8.35 48,0 9.68 377.00 11.80
RANGE 17,0 4.43 19,0 5.02 21,0 4.08 21,0 4.56 71.00 3.19
From the presented measured values, for resulting split of 1 mm and 2 mm for both examined suture, it is obvious that after the formation of split of 1 mm (modified Kessler median 19 N, cruciate suture median 35 N), it does not require a large force to form a split of 2 mm (modified Kessler median 20 N, cruciate suture median 36.5 N). The interpretation can be found in the fact that loosening from one of two stitches, will quickly lead to the final breakdown of the repair complex. According to the median force required to form a split from 2 mm on a modified Kessler suture from 20 N and the cruciate suture from 36,5 N, it is evident that the cruciate suture is far more reliable.
If minimum and maximum values of the median force for split from 2 mm on a modified Kessler suture (at least 11 N, a maximum of 30 N, with a range of 19 N) and cruciate -suture (minimum of 27 N, a maximum of 48 N, with a range of 21 N) are observed, one can see large span of force movements.
Also, comparatively speaking, the median force required for sewn and entire tendon break to occur is very different (modified Kesslers 20 N, cruciate suture 36,5 N and complete tendon 354,5 N), which best shows the strength of our suture compared to the entire tendon that is almost 10 times less.
152

International Conference on Innovative Technologies, IN‐TECH 2016,
Prague, 6. ‐ 8. 9. 2016
Statistical analysis
Statistical data analysis was processed by the method of descriptive statistics (mean, standard deviation, standard error of the mean, range, and 95% confidence interval). Given that it was necessary to examine the differences of measurements in three groups (modified Kessler suture, cruciate suture and complete tendon) the most reliable and the most commonly used test is the analysis of variance (ANOVA) which is used in the event that the measurements (variables) in the groups come from normally distributed populations. Data, statistically processed, was assessment of force required for the formation of splits of 1 mm and 2 mm, (stretching) as well as time of stretching, and the maximum tearing force. Test of variance analysis (ANOVA), as well as prior testing of normality of variables using the Shapiro -Wilk test and Kolmogorov-Smirnov test was performed. These tests were selected because the sample sizes (> 50). All variables in all the samples met the requirement of normality, and so analysis of arithmetic mean variance difference of three observed groups, with subsequent comparison pairs using post hoc Bonfferoni test was applied. Results were obtained by using SPSS 17.0 (IBM) software package for statistical analysis. All results were obtained by measuring the processed test analysis of variance (ANOVA) and a statistically significant difference was established in which the cruciate suture with epitendinous fascia is stronger than the modified Kessler's with epitendinous fascia. Figure 2 shows the comparative force required for the formation of a split in the stitched tendons of 2 mm. It can be seen that almost double the force is required for the occurrence of rips with set cruciate - suture and fascia (median 36,5 N, 36,22 N average and the maximum value of 48 N) compared to the modified Kessler's suture with fascia ( median 20 N, average 21,14 N and the maximum value of 30 N). Also, it is clear that the upper quartile of force overlaps for the modified Kessler and lower quartile force for cruciate suture. Also, the intact tendon requires force to ten times higher than the sewn tendons (median 354,4 N, average 350,60 N and the maximum value of 377 N) which indicates the absolute superiority of complete tendons.
Kessler suture Cruciate suture Complete tendom
Fig.2 Graphical interpretation of required force for formation of a 2 mm split in the stitched and complete tendons
Data on the values of strain samples was statistically analyzed using test analysis of variance (ANOVA). Based on the test results of analysis of variance (p = 0,00 <0,05), it is concluded that there is a statistically significant difference in the elongation of tendons to form a gap size of 2 mm in the case of tendons stitched with Kessler's suture (median 5,58 mm, average 5,65 mm, maximum 8,26 mm) and a cruciate- suture (median 7,11 mm, average 7,17 mm, maximum 9,68 mm), and for the whole tendon (median 354,4 mm, 350,6 mm average, and a maximum of 377 mm). Figure 3 shows the total stretching of the tendons of the respective groups. Comparing the stretching in millimeters, which is needed to make a gap of 2 mm on the severed tendons and by comparison with a control group of intact tendons, it is concluded that there is a statistically significant difference.
Kessler suture Cruciate suture Complete tendom
Fig. 3Tendons stretching by groups to form a split of 2 mm
Additionally, data that was obtained by recording the time needed with stopwatch for stretching of examined groups of tendons to form a gap of 2 mm was also processed by test analysis of variance (ANOVA). Based on the p values of Bonfferoni test (all are less than 0,05), it is concluded that there is a statistically significant difference in the time of tendon stretching that is required to form a gap size of 2 mm, in the case of the comparison of group tested tendons. There is a statistically significant difference for three tested groups of tendons: For modified Kessler suture 169,59 s was necessary, for cruciate suture tendons 215,01 s and for the entire tendon 350,60 s. Graphic interpretation of time required for stretching of all three groups of investigated tendons is given in Figure 4. It can be seen that breaking of complete tendons takes the most time.
153

International Conference on Innovative Technologies, IN‐TECH 2016, Prague, 6. ‐ 8. 9. 2016
Kessler suture Cruciate suture Complete tendom
Fig. 4 Time required for 2 mm split for three groups of tested tendon
The maximum force required to completely tear the sewn tendon ends as well as the control group tendons, Figure 5, has been tested. Since the maximum power in the sample tendon with cruciate stitch does not meet the assumption of normality, the difference was tested by non-parametric Mann-Whitney U test. The following graph shows that the maximum force needed for tearing tendon sewn using cruciate -stitching is significantly higher (average 43,03 N) than the tendon sewn using modified Kessler's suture (average 27,35 N). Using experimental and statistical demonstration (p <0.05 ) it is shown, as the value is closer to maximum total force required for the final collapse of suture, that cruciate suture is more reliable.
Kessler suture Cruciate suture Complete tendom
Fig. 5 Display of maximum force required to completely tear the sewn tendon ends and a control group
Conclusions So-called "Optimal suture", which is the crossover core suture with epitendinous fascia with feature of "having a maximum tear
resistance with a minimal amount of suture material, is defined using experimental research and statistical analysis of data for all three groups of flexor tendons. This way it is possible to quickly restore the function of the hand. The most important conclusions are: - Based on the values of tensile strength to split stitched tendons of 2 mm, one can conclude that the selected cruciate suture with
epitendinous fascia better supports the ends of broken tendon (F = 36,22 N) in relation to the modified Kessler with epitendinous fascia(F = 21,14 N).
- Higher maximum tearing force of cruciate suture is statistically shown (F = 43,03 N) in relation to the modified Kessler with epitendinousfascia (F = 27,35 N), which makes it "more ideal" core suture of flexor tendon.
- As for loosening suture, in case of cruciate stitches there was a large number of fracturing in relation to intersections tendon, leavingopen the possibility of using a stronger or thicker thread.
The authors intend to perform further experimental research in order to improve (find) suture material, which may be the subject of subsequent studies. Also, the authors of this paper are preparing adequate experimental research in order to determine optimal suture application of additive technologies (bioprinting).
Acknowledgment
The authors would like to thank: Clinical Center of Sarajevo and the Faculty of Mechanical Engineering, University of Sarajevo on the assistance in implementation of these experimental researches.
References
[1] Scott W. Wolfe, Robert N. Hotchkiss, William C. Pederson, and Scott H. Kozin: Greens Operative Hand Surgery. 2011; 7:186-238.[2] Lehfeldt M, Ray E, Sherman R. MOC-PS(SM) CME article: treatment of flexor tendon laceration. Plast Reconstr Surg
2008;121:1-12.[3] Vucekovich K, Gallardo G, Fiala K. Rehabilitation after flexor tendon repair, reconstruction, and tenolysis. Hand Clin
2005;21:257-65.[4] Iamaguchi RB, Villani W, Rezende MR, Wei TH, Cho AB, dos Santos GB, Mattar R Jr. Biomechanical comparison of
the four-strand cruciate and Strickland techniques in animal tendons. Clinics (Sao Paulo). 2013 Dec;68(12):1543-7.
154

International Conference on Innovative Technologies, IN‐TECH 2016,
Prague, 6. ‐ 8. 9. 2016
NET AND 5-FORCES ANALYSIS OF HEALTH FUNCTIONAL FOOD INDUSTRY IN SOUTH KOREA
J. Lee 1, Y. J. Choi 1 1 Korea Institute of Science and Technology Information, 66 Hoegi-ro, Dongdaemun-gu, Seoul, S. Korea
Keywords: Health Functional Food; NET; 5-Force Analysis
Abstract: As population is aging, demand of dietary food increases, expectation of cosmetic effect from food is getting high, health functional food become to grow fast, while there is still a low reliability of effect/function, short product life cycle, and polarization of revenue between blockbuster products and non-blockbusters. This paper is for explaining what the value chain of health functional food is like, how its global market has been and is expected, and eventually the results of NET analysis and 5-forcec analysis of health functional food. Introduction
Health functional food is a food with a health-promoting or disease-preventing function. There are two kinds of functional food ingredients; “officially notified ingredients” and “individually approved ingredients” by Korean Ministry of Food and Drug Safety.
As population is aging, demand of dietary food increases, expectation of cosmetic effect from food is getting high, health functional food become to grow fast, while there is still a low reliability of effect/function, short product life cycle, and polarization of revenue between blockbuster products and non-blockbusters. Value Chain of Health Functional Food
The value chain of health functional food in South Korea goes from raw material, producer, wholesale, retail sales to customers. The ratio of sales is more than 96%.
Fig. 1 NET Analysis of Health Functional Food in S. Korea
Global Market of Health Functional Food
Health functional food is expected to grow at 6.2% of CAGR with about 120 US billion dollars in 2016 from 89 US billion dollars in 2011 and in terms of market share, the US has more than 33% of world market, followed by 18.1% of western Europe.
Fig. 2 Global Market Size and Share of Health Functional Food
NET Analysis of Health Functional Food
As population is aging, demand of dietary food increases, expectation of cosmetic effect from food is getting high, health functional food become to grow fast, while there is still a low reliability of effect/function, short product life cycle, and polarization of revenue between blockbuster products and non-blockbusters. Prevalent online sales of functional food, huge interest in immunity due to environmental contamination like air pollution, and health oriented consumption propensity make functional food industry flourish. But, many companies should pay lots of royalty to foreign brands and the industry relies on foreign economic policies of government or quarantine system.
155

International Conference on Innovative Technologies, IN‐TECH 2016,
Prague, 6. ‐ 8. 9. 2016
Technologically, various R&Ds are expected for gentrification of food and organic food development. But it will be hard to differentiate products and prove safety and functionality of food.
Fig. 3 NET Analysis of Health Functional Food 5-Forces Analysis of Health Functional Food
Power of suppliers will be high since raw material or ingredients consists of about 20% of a product and only notified or approved ingredients should be used. So far in Korea, call sales or multilevel sales are more popular for functional food than online sales, but online revenue is expected to grow very fast. Often, since there is an exclusive contract between ingredient company and selling agencies, it is very critical to find valuable marketing channels. It is expected that threat of substitution and threat of entry will be low since the barrier to register for a company for functional food production is low in terms of regulation, but in order for an ingredient to get approved by KMFDS, much investment is needed. Since Korean functional food market shows oligopolistic competition, the degree of internal rivalry will be intense..
Fig. 4 5-Forces Analysis of Health Functional Food Conclusion
Health functional food in S. Korea needs to be developed more for disease precaution, aging and obesity rather than for simple growth promotion, according to NET analysis. It has become that customers need health functional food with natural substances more and more as well as with customized recipe. Since lots of countries including China try to develop health functional food with very low prices, related companies should study for the purpose of low manufacturing cost, as well. Acknowledgment The authors thank Ministry of Science, ICT and Future Planning in S. Korea for fund. References
[1] Global Nutritional Supplement Market Report : 2013 Edition(2013) [2] Nutrition Business Journal(2012, Consumer sales) [3] Global Supplement and Nutrition Industry Report (2012) [4] Strategic Analysis of the Nutritional and Functional Food Ingredients Market in Europe : An Aging Population in the Region Drives
Market Growth, Frost and Sullivan (2012) [5] current state and future of Health/functional food materials market, Yano Economy Research Center, 2012, Japan
156
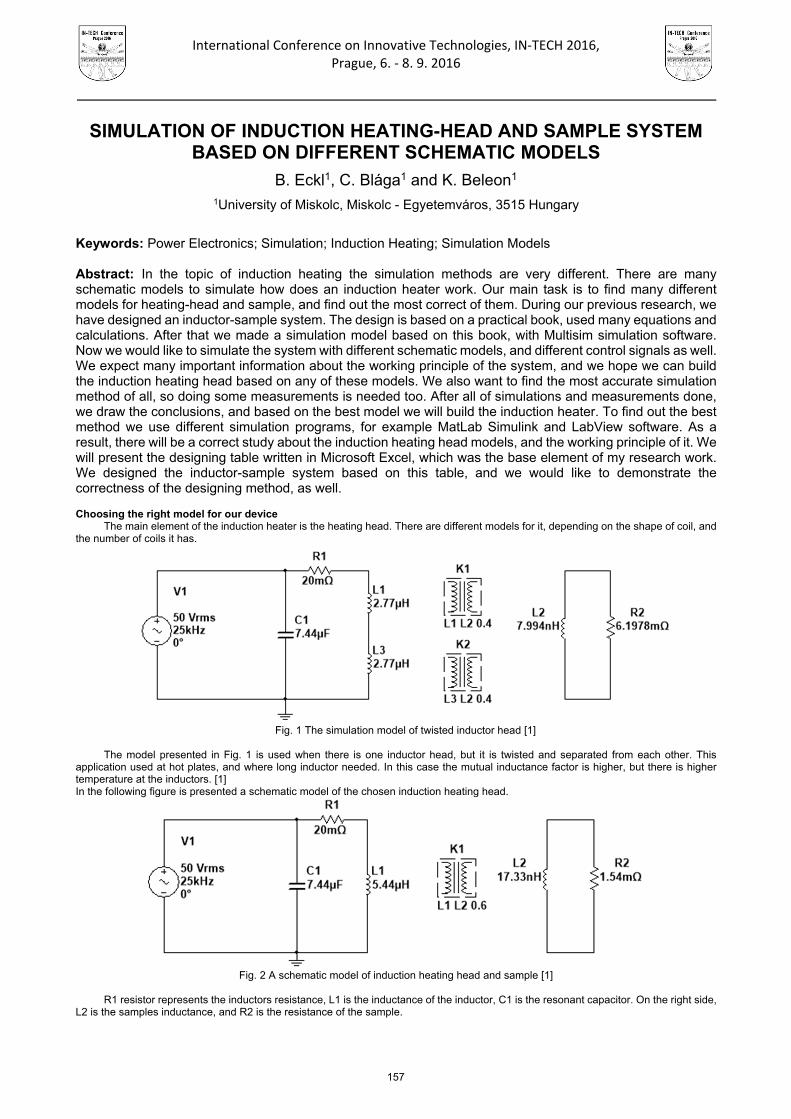
International Conference on Innovative Technologies, IN‐TECH 2016, Prague, 6. ‐ 8. 9. 2016
SIMULATION OF INDUCTION HEATING-HEAD AND SAMPLE SYSTEM BASED ON DIFFERENT SCHEMATIC MODELS
B. Eckl1, C. Blága1 and K. Beleon1
1University of Miskolc, Miskolc - Egyetemváros, 3515 Hungary
Keywords: Power Electronics; Simulation; Induction Heating; Simulation Models
Abstract: In the topic of induction heating the simulation methods are very different. There are many schematic models to simulate how does an induction heater work. Our main task is to find many different models for heating-head and sample, and find out the most correct of them. During our previous research, we have designed an inductor-sample system. The design is based on a practical book, used many equations and calculations. After that we made a simulation model based on this book, with Multisim simulation software. Now we would like to simulate the system with different schematic models, and different control signals as well. We expect many important information about the working principle of the system, and we hope we can build the induction heating head based on any of these models. We also want to find the most accurate simulation method of all, so doing some measurements is needed too. After all of simulations and measurements done, we draw the conclusions, and based on the best model we will build the induction heater. To find out the best method we use different simulation programs, for example MatLab Simulink and LabView software. As a result, there will be a correct study about the induction heating head models, and the working principle of it. We will present the designing table written in Microsoft Excel, which was the base element of my research work. We designed the inductor-sample system based on this table, and we would like to demonstrate the correctness of the designing method, as well.
Choosing the right model for our device The main element of the induction heater is the heating head. There are different models for it, depending on the shape of coil, and
the number of coils it has.
Fig. 1 The simulation model of twisted inductor head [1]
The model presented in Fig. 1 is used when there is one inductor head, but it is twisted and separated from each other. This application used at hot plates, and where long inductor needed. In this case the mutual inductance factor is higher, but there is higher temperature at the inductors. [1] In the following figure is presented a schematic model of the chosen induction heating head.
Fig. 2 A schematic model of induction heating head and sample [1]
R1 resistor represents the inductors resistance, L1 is the inductance of the inductor, C1 is the resonant capacitor. On the right side, L2 is the samples inductance, and R2 is the resistance of the sample.
157

International Conference on Innovative Technologies, IN‐TECH 2016,
Prague, 6. ‐ 8. 9. 2016
Introduction of the dimensions of heating-head and sample model
The main point of our research is to examine the efficiency and the power consumption of the head-sample system, when the voltage is sinusoidal and the head is in resonant state. The frequency is considered constant 25 kHz. The values in the model were calculated based on an induction heater designer book. [1]. We made an Excel table, based on this book, so either parameter can be changed easily. The inductor and its significant parameters marked in Fig. 1 were designed based also on this book. During the research we used three different samples. The parameters of the induction heating-head and samples are marked in the figure below.
Fig. 3 The structure of the induction heating-head and sample [1]
There are three important parameters in the figure, and during the work we changed the parameters of them. d2 the internal diameter of the sample, d2k the external diameter of the sample and l2 is the height of the sample. The distance between the external and internal diameter is the depth of penetration of current. This distance depends on the frequency of current, and the material of the sample. During the simulations we used cylindrical sample and the following table shows its parameters. Table 1. The dimensions and the simulation parameters of the sample
Dimensions of the samples
The first sample The second sample The third sample
d2k 0,08 m 0,06 m 0,03 m
d2 0,079 m 0,059 m 0,029 m
l2 0,08 m 0,04 m 0,02 m In the first column you can see the optimal sample parameters. In this case the efficiency is maximum. In the second column the sample is not as big as the inductors internal area, so the air gap is much bigger, and the efficiency will be much lower. In the last case you can see the dimensions of a very little sample, which results extremely bad efficiency and low heating power. The mutual inductance (aM) is calculated by a function of parameters of heating head and sample [1]. The results of the simulation
The power supply’s voltage was sinusoidal, it is 50 V RMS. In this case we get the following results.
Table 2. The results of the simulation in different cases
Results of the simulation
The first sample The second sample The third sample
Input power [W] 913,421 415,734 79,604
Transferred power [W] 793,754 337,587 12,81
Efficiency [%] 86,89903122 81,202644 16,09215617
Based on the Table 2 we can declare that the first case is an optimum. As it can be seen in this case results the best efficiency, and the biggest power is transferred here. In the second case it is transferred much less power, then in the first case but the efficiency is quite well. That is because of the higher air gap, and worse geometrical arrangement. It is important to mention, that in all cases the sample is placed in the center of inductor to grant the highest density of magnetic field. In the third case the efficiency is extremely bad, and also the transferred power is very low. In this case there are two main options the solve this problem. If it is possible we have to increase the magnetizing current, or we have to change the heating head. Increasing the magnetizing current will not increase the efficiency. With different head parameters and structures both problems can be solved. In our case the first sample will be heated, that is why we design for this case. The practical realization is in progress now, but we hope that would it be testable in the near future.
Simulation parameters
The first sample The second sample The third sample
L2 17,33 nH 16,43 nH 7,994 nH
R2 1,54 mΩ 3,099 mΩ 6,1978 mΩ
aM 0,6 0,45 0,15
158

International Conference on Innovative Technologies, IN‐TECH 2016, Prague, 6. ‐ 8. 9. 2016
The basis of practical realization Now we are building a device that can able to heat any ferromagnetic sample under the Curie-temperature with 1 kW power. In the
next figure you can see the block diagram of our induction heater.
Fig. 4 The block structure of the induction heater
It will work from a single phase 50 Hz network, and there will be a rectifier and an inverter circuit in it. That is important because we have to reach higher frequency than the network frequency. All of these circuits controlled by a computer, via a PXI card of National Instruments. The controlling software is going to be written in LabView. Of course there will be sensors in the device, these signals will be handled by the PXI card too.
Fig. 5 The schematic of power section of the heater
In the input section of the power line contains a power switch, a disturbance filter inductor, and a single phase transformer. This connects to a rectifier bridge, and the rectified voltage connects to a half-bridge inverter. The work coil is L1 and its resistance is 20 mΩ. It is interesting to use the inverter without DC-filter circuit. The secondary coil of transformer is secured by a fuse, and also the diode bridge is secured. The R1 resistor limits the current of standby LED. D5 is a suppressor diode. After creating the schematic structure, we have done some simulation on this circuit. The time function of the output voltage resulted from simulation is presented in the figure below.
159

International Conference on Innovative Technologies, IN‐TECH 2016,
Prague, 6. ‐ 8. 9. 2016
Fig.6 The waveform of voltage at the DC line
This simulation result was correct if the voltage at the secondary coil is 28 VRMS. Without filter, the DC voltage has two frequency component. The first is 100 Hz, this caused by the network’s frequency (on the left), and the second one caused by the resonant inverter (on the right). The frequency of inverter is 25 kHz. The DC line’s voltage is higher because of the resonance and the structure of the resonant circuit. If we used a filter, we should use an LC filter, which contains an inductor and a capacitor. These devices are very expensive, and robust and that is why we will not us it. Conclusion
We have done some simulation on the sample and on the power circuit. These results will be really interesting, when we can build the device, and prove the simulation results with measurements. We hope that in our oral presentation several measured results will be presented, and they will demonstrate or not the accuracy of the simulation. If the model was correct, we will try other methods to increase the efficiency and transferred power. Acknowledgment
This research was carried out in the framework of the Center of Excellence of Mechatronics and Logistics at the University of Miskolc.
References [1] L. Koller: Ellenállás és indukciós hevítés (Tankönyvkiadó, Budapest 1987) [2] P.G. Simpson: Induction Heating Coil and System Design (McGraw-Hill Book Company, London, 1960)
160
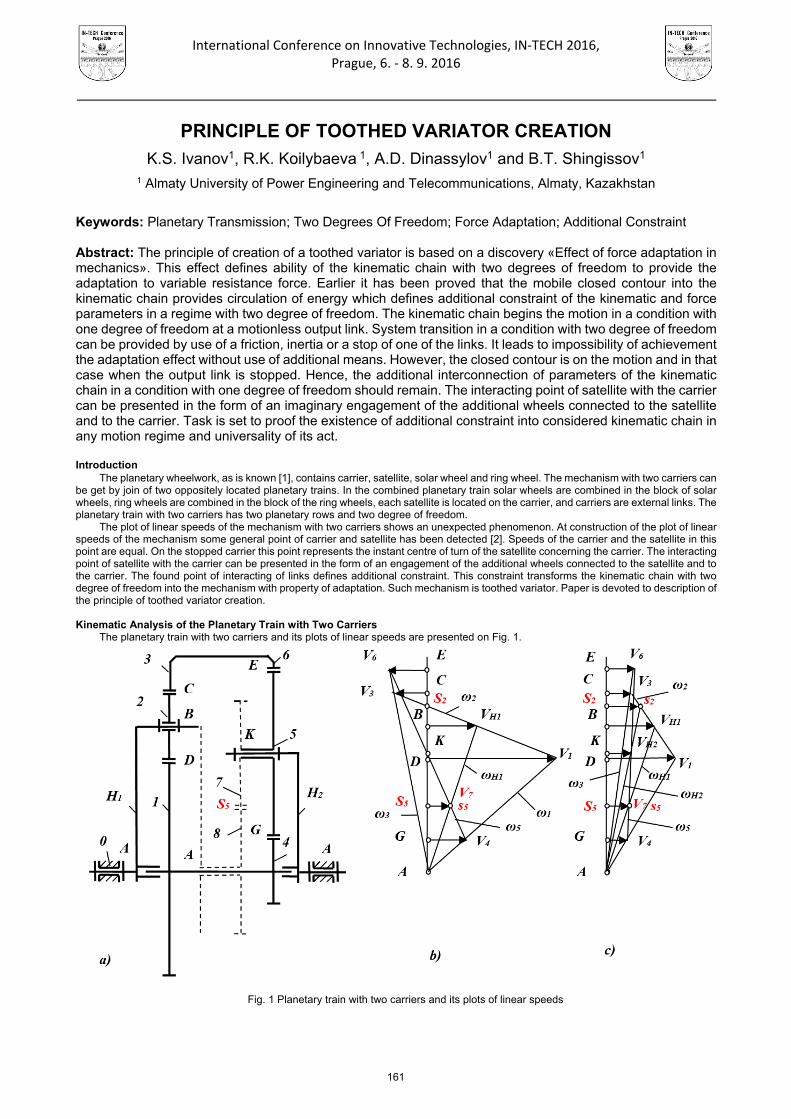
International Conference on Innovative Technologies, IN‐TECH 2016,
Prague, 6. ‐ 8. 9. 2016
PRINCIPLE OF TOOTHED VARIATOR CREATION
K.S. Ivanov1, R.K. Koilybaeva 1, A.D. Dinassylov1 and B.T. Shingissov1
1 Almaty University of Power Engineering and Telecommunications, Almaty, Kazakhstan
Keywords: Planetary Transmission; Two Degrees Of Freedom; Force Adaptation; Additional Constraint Abstract: The principle of creation of a toothed variator is based on a discovery «Effect of force adaptation in mechanics». This effect defines ability of the kinematic chain with two degrees of freedom to provide the adaptation to variable resistance force. Earlier it has been proved that the mobile closed contour into the kinematic chain provides circulation of energy which defines additional constraint of the kinematic and force parameters in a regime with two degree of freedom. The kinematic chain begins the motion in a condition with one degree of freedom at a motionless output link. System transition in a condition with two degree of freedom can be provided by use of a friction, inertia or a stop of one of the links. It leads to impossibility of achievement the adaptation effect without use of additional means. However, the closed contour is on the motion and in that case when the output link is stopped. Hence, the additional interconnection of parameters of the kinematic chain in a condition with one degree of freedom should remain. The interacting point of satellite with the carrier can be presented in the form of an imaginary engagement of the additional wheels connected to the satellite and to the carrier. Task is set to proof the existence of additional constraint into considered kinematic chain in any motion regime and universality of its act.
Introduction The planetary wheelwork, as is known [1], contains carrier, satellite, solar wheel and ring wheel. The mechanism with two carriers can
be get by join of two oppositely located planetary trains. In the combined planetary train solar wheels are combined in the block of solar wheels, ring wheels are combined in the block of the ring wheels, each satellite is located on the carrier, and carriers are external links. The planetary train with two carriers has two planetary rows and two degree of freedom.
The plot of linear speeds of the mechanism with two carriers shows an unexpected phenomenon. At construction of the plot of linear speeds of the mechanism some general point of carrier and satellite has been detected [2]. Speeds of the carrier and the satellite in this point are equal. On the stopped carrier this point represents the instant centre of turn of the satellite concerning the carrier. The interacting point of satellite with the carrier can be presented in the form of an engagement of the additional wheels connected to the satellite and to the carrier. The found point of interacting of links defines additional constraint. This constraint transforms the kinematic chain with two degree of freedom into the mechanism with property of adaptation. Such mechanism is toothed variator. Paper is devoted to description of the principle of toothed variator creation. Kinematic Analysis of the Planetary Train with Two Carriers
The planetary train with two carriers and its plots of linear speeds are presented on Fig. 1.
Fig. 1 Planetary train with two carriers and its plots of linear speeds
161

International Conference on Innovative Technologies, IN‐TECH 2016, Prague, 6. ‐ 8. 9. 2016
The planetary train (Fig. 1 a) contains carrier H1, satellite 2, block of solar wheels 1-4, block of ring (epicyclical) wheels 3-6, satellite 5, and carrier H2. Mechanism has two degree of freedom and two input links - carriers H1 and H2. We will perform the kinematic analysis by means of the plot of linear speeds.
At first we will construct the plot of linear speeds at motionless carrier H2 (Fig. 1 b). On Fig. 1 linear speeds are denoted by horizontal vectors, angular velocities are denoted by inclined lines. We specify angular velocity ω5 of satellite 5 and draw the angular velocity line through point K. We construct speeds V6 and V4. We draw a line of angular velocity ω3 through point A and terminus V6. We construct vector V3. We draw a line of angular velocity ω1 through point A and terminus V4. We construct vector V1. We draw a line of angular velocity ω2 of satellite 2 through the terminuses V1 and V3. We construct vector VH1 and a line of carrier H1 angular velocity ωH1.
The constructed plot of speeds contains surprising result: lines of angular velocity ωH1 of the carrier H1 and angular velocity ω5 of the satellite 5 are cross in one point s5 and define terminus V7 of some point S5 belonging simultaneously to the carrier H1 and the satellite 5. Speeds of these two points of different links are coinciding. Such point S5 can be realized practically in the form of a pitch point of two toothed wheels 7 and 8 (it is shown by a dot line). The wheel 7 is rigidly connected with the satellite 5, the wheel 8 is rigidly connected with the carrier H1. Obviously at constant angular velocity of carrier H1 linear speed V7 of the point S5 of the wheel 7 should be constant, and the point S5 should occupy an invariable position.
To be convinced of it we will construct the plot of linear speeds of the mechanism for the general case (ωH2≠0) at former angular velocity of the carrier H1, and angular velocity of the wheel 2 we will change (Fig. 1 c).
Singularity of the found phenomenon consists in the following. The carrier and opposite satellite have no direct connection and perform independent motions. But the speeds of some contact point of these links are equal in each instant time. Practical realization of such point is possible in the form of engagement of two toothed wheels. One wheel belongs to the carrier; other wheel belongs to the satellite.
Let's prove analytically an invariance of this contact point position on the mechanism. It is possible most simply to install the point S5 position using the plot of linear speeds of the mechanism in initial position (Fig. 1 b)
when the speed VH1 is specified and carrier H2 is stopped VH2=0 (point K). In this case the vector V7 of the conditional wheel 7 rigidly connected with the satellite 5, lined out of point S5, is simultaneously a vector
of speed V8 of the conditional toothed wheel 8 rigidly connected with the input carrier. The point S5 position is defined by radius of a conditional toothed wheel 7. We will determine the radius out of a condition
7 8V V . (1)
Let's express linear speeds through angular velocities ω7= ω5, ω8= ωH1 and radiuses of wheels r7, r8= rH2 - r7. Taking into account directions of angular velocities we will get next result
5 7 H1 H2 7r ( r r ). (2)
The formulas of angular velocities of planetary mechanism with two carriers are presented in article [3]. The carrier H2 in the
considered instant time is motionless, ωH2=0. Therefore ( H 2 )5 56 6u . Then
( H1)13
6 3 H1 ( H1) ( H 2 )13 45
1 u
u u, ( H1 )
13 3 1u z / z , ( H 2 )46 6 4u z / z , ( H 2 )
56 6 5u z / z .
After substitution of these magnitudes in the equation (2) there will be a cancellation of angular velocity ωH1. From the equation (2) we will get the next
( H1)( H 2 ) 1356 7 H 2 7( H1) ( H 2 )
13 46
1 uu r r r .
u u
(3)
From the equation (3) we will define radius of the conditional wheel 7
( H1) ( H 2 )13 46
7 H 2 )H 2 ) ( H 2 )56 46
u ur r
u (1 u ) . (4)
The equation (4) does not contain angular velocities; hence, the radius of the wheel 7 and the point S5 position does not depend on magnitudes of angular velocities. The point S5 occupies a constant position on the plot of linear speeds. Appearance of the centre of coincidence of speeds S5 of two independently moving links represents brand new phenomenon in the mechanics. Let's consider the regularities of the found phenomenon.
The constant position of the point S5 defines some conditional geometric constraint. It is possible to present this geometric constraint as the higher kinematic pair connecting carrier H1 and satellite 5. It is possible to present constructive performance of this constraint in the form of engagement of two conditional toothed wheels 7 and 8. The wheel 7 is rigidly connected with the satellite 5. The wheel 8 is rigidly connected with the carrier H1. Presence of additional constraint in a point of engagement of wheels 7 and 8 transforms the kinematic chain with two degree of freedom into the mechanism having one degree of freedom and only one input link. We will consider the carrier H1 as the input carrier.
Thus, the surprising phenomenon is opened: the mechanism with two carriers, having two real structural degree of freedom has definability of motion at presence of only one input link. It occurs because of appearance of an additional conditional geometric constraint. The found phenomenon is the geometrical demonstration of presence of additional constraint in the mechanism with two degree of freedom which has been executed earlier by means of a principle of virtual works [3].
To fathom mechanical essence of the phenomenon we will consider habitual concept of the transfer ratio. The transfer ratio (or the ratio of angular velocities) can be expressed through force parameters (the moments of forces) on the basis of law of conservation of energy. In the presence of ideal constraints between input link 1 and output link 2
1 1 2 2M M . (5)
162

International Conference on Innovative Technologies, IN‐TECH 2016,
Prague, 6. ‐ 8. 9. 2016
From here we will get next transfer ratio for the mechanism with one degree of freedom
12 1 2 2 1u / M / M . (6)
The equation (6) divides force and kinematic parameters. Considering the named regularity in the mechanism with two carriers we will present the law of conservation of energy matching the
formula (5) in a following aspect H 2 H1 H1 H 2M / M . (7)
Formula (7) defines brand new phenomenon in the mechanics and in the theory of machines and mechanisms: effect of force
self-regulation. If constant input power takes place, then the output angular velocity inversely proportional to output resistance moment. Conclusions
The phenomenon of the centre of coincidence of speeds provides the principle of toothed variator creation. Additional constraint reduces number of a degree of freedom of the kinematic chain per unit. The considered kinematic chain with two carriers is the mechanism at presence only one input link. Thus the mechanism gets brand new property of force self-regulation. Such mechanism is gear variator with constant gearing. References [1] Artobolevsky I.I. Theory of mechanisms. "Science". Moscow. 1967. 720 p. [2] Ivanov K.S. Paradox in Mechanism Science. 1-st International Symposium on Education in Mechanism and Machine Science.
Madrid. Spain, 2013, pp. 132-138. [3] Ivanov K.S. Creation of Adaptive-Mechanical Continuously Variable Transmission. 5th International Conference on Advanced
Design and Manufacture (ADM 2013). Valencia. Spain, 2013, pp. 63-70.
163

International Conference on Innovative Technologies, IN‐TECH 2016,
Prague, 6. ‐ 8. 9. 2016
164

International Conference on Innovative Technologies, IN‐TECH 2016, Prague, 6. ‐ 8. 9. 2016
THE PROCESS OF AGEING OF BITUMINOUS BINDERS USED IN WATERPROOFING MATERIALS - LABORATORY TEST METHODS
M. Ratajczak1, M. Babiak2
1 Institute of Structural Engineering, Poznan University of Technology, Piotrowo 5, 60-965 Poznan, E-Mail: [email protected], POLAND
2 Institute of Structural Engineering, Poznan University of Technology, Piotrowo 5, 60-965 Poznan, E-Mail: [email protected], POLAND
Keywords: Ageing; Bitumen; Laboratory simulation; Waterproofing
Abstract: Waterproofing materials are in almost 70% made of bitumen. That is why the properties of binder have a significant effect on properties of the final product. With time the properties of bitumen are changing. Mostly it is the effect of the ageing process. A comprehensive literature distinguishes two kinds of ageing - short-term ageing (effect of the high temperature during asphalt mixing) and long-term ageing (effect of the ambient temperature during in-service). The European Standards provide three test methods to simulate the short-term ageing process: RTFOT, TFOT and RFT and two test methods to simulate the long-term ageing: PAV and RCAT. All of them are dedicated to bitumen used in pavement and the philosophy of the methods express the process of production of MMA (short-term ageing) and the pavement in-service (long-term ageing). The European Standards predict the laboratory simulation of ageing only for waterproofing, not particular for the bitumen used in the production of waterproofing materials. This paper considers the assumptions and ideas of the laboratory test methods of simulation of ageing process in pavement bitumen. The effect of the analysis will be to choose the test method which expresses in the best way the process of production of waterproofing materials.
Introduction For decades bitumen membrane has been the primary waterproofing material used both in building construction and in civil
engineering. Due to the rapid development of polymer chemistry and synthetics we could recently observe the replacement of traditional waterproofing materials by mineral materials (mineral slurries, bentonite, plaster barrier) or by synthetic waterproofing (resins, dispersions, sheets). The latest significant reductions in oil prices in the world markets have contributed to the price decrease of bitumen waterproofing materials. Bitumen membrane has become fashionable again and membrane manufacturers started to work on new innovative solutions.
Bitumen membrane, depending on the type and degree of binder modification, consists of 70% - 80% of bituminous binder. Therefore bitumen properties have the decisive impact on the quality of the final product. Research and observations conducted over the years have helped to present and describe quite accurately the behaviour of bitumen during its preparation and during the production of waterproofing materials. Durability and stability of this type of building material still remains a huge challenge for researchers, producers and users. The main factor responsible for these properties is the process of bitumen aging taking place in time. The applicable standards simulate these processes in laboratory conditions, however, they are dedicated to civil engineering experts and reflect bitumen behaviour in a mineral and bitumen mix. Bitumen membrane manufacturers must make use of the tests developed by and for civil engineers/ road builders. It is therefore important to answer the question: which of the methods developed by them reflects in the best way the processes occurring during the production and service life of waterproofing materials?
Bitumen ageing Bitumen ageing is a physicochemical process which occurs due to the impact of high temperature, air, infrared and ultraviolet
radiation and leads to gradual changes of bitumen properties in time. The main factors stimulating the ageing processes are: oxidation, evaporation of oil fractions and physical hardening [1] [2]. As a result, the basic characteristics of bitumen are subject to change: softening point, breaking point and penetration increase. We can differentiate two types of bitumen ageing: short-term (also known as technological ageing) and long-term (also referred to as in-service ageing) [2] [3] [4]. The former is triggered off by a short-term but rapid impact of high temperature. It occurs during the process of obtaining bitumen and during the production of bitumen waterproofing materials or the production of mineral and bitumen mix. The in-service ageing (long-term ageing) occurs during the service life of the structure or building. This is a slow and long-lasting process and its course is affected mainly by weather conditions and external factors (biological, chemical). While the external factors occurring during the production of bitumen membranes do not differ a lot from those occurring in the production of mineral and bitumen mix, the nature of the membrane performance is significantly different from what the road surface is exposed to. Therefore the waterproofing solutions dedicated to civil engineering require a good understanding of the concept of laboratory tests.
Laboratory tests European standards describe three laboratory methods simulating technological ageing processes (RTFOT, TFOT, RFT) and two
which simulate in-service ageing processes (PAV, RCAT). Currently numerous studies are being conducted in order to develop new and better methods which will describe in a more detailed way the phenomena occurring during the ageing processes, e.g., UV radiation, γ radiation [5].
RTFOT One of the most commonly used test method is RTFOT technological ageing (Rolling Thin Film Oven Test) performed in accordance
with standard [6]. The test involves subjecting a thin bitumen film to the impact of hot air stream in a given time period. Bitumen samples placed in standardised glass containers are monitored in a special rotating disk inside a drying oven for RTFOT tests at the temperature of 163 °C with activated air flow. During the test, the containers with bituminous binder are in continuous movement during which liquid bitumen keeps flowing along the wall of the glass container and the bitumen surface is subject to hot air impact. After a specified time
165
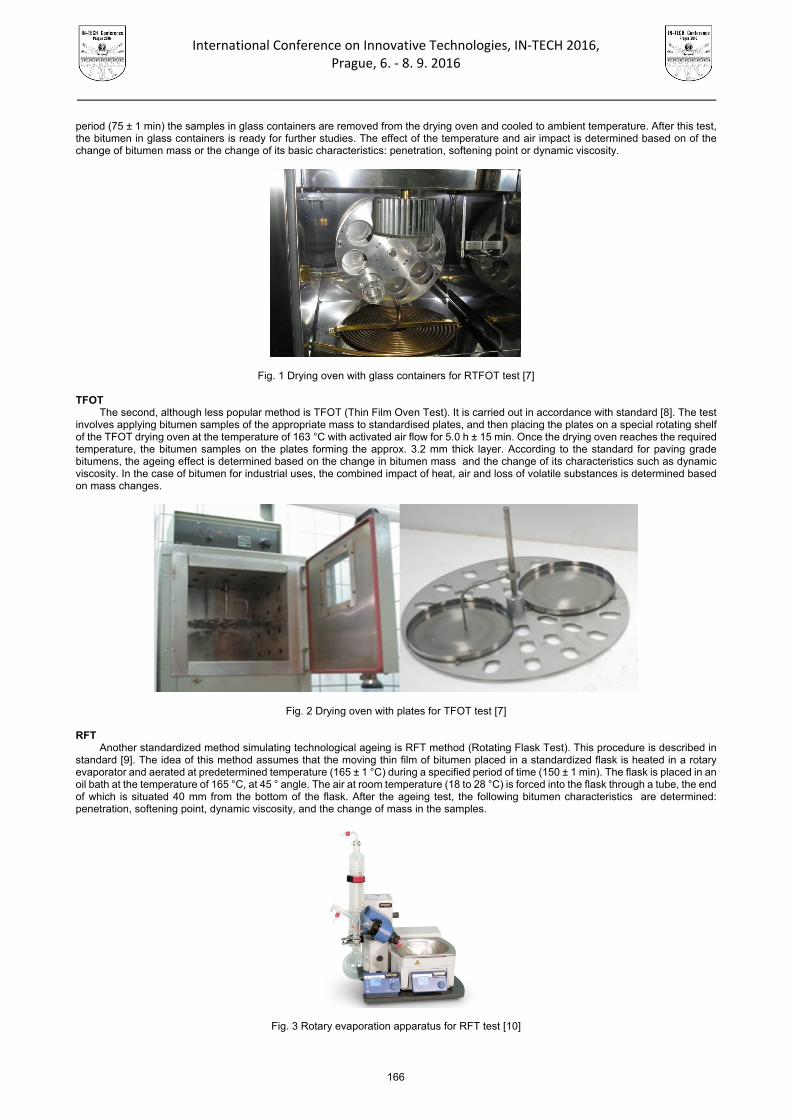
International Conference on Innovative Technologies, IN‐TECH 2016, Prague, 6. ‐ 8. 9. 2016
period (75 ± 1 min) the samples in glass containers are removed from the drying oven and cooled to ambient temperature. After this test, the bitumen in glass containers is ready for further studies. The effect of the temperature and air impact is determined based on of the change of bitumen mass or the change of its basic characteristics: penetration, softening point or dynamic viscosity.
Fig. 1 Drying oven with glass containers for RTFOT test [7]
TFOT The second, although less popular method is TFOT (Thin Film Oven Test). It is carried out in accordance with standard [8]. The test
involves applying bitumen samples of the appropriate mass to standardised plates, and then placing the plates on a special rotating shelf of the TFOT drying oven at the temperature of 163 °C with activated air flow for 5.0 h ± 15 min. Once the drying oven reaches the required temperature, the bitumen samples on the plates forming the approx. 3.2 mm thick layer. According to the standard for paving grade bitumens, the ageing effect is determined based on the change in bitumen mass and the change of its characteristics such as dynamic viscosity. In the case of bitumen for industrial uses, the combined impact of heat, air and loss of volatile substances is determined based on mass changes.
Fig. 2 Drying oven with plates for TFOT test [7]
RFT Another standardized method simulating technological ageing is RFT method (Rotating Flask Test). This procedure is described in
standard [9]. The idea of this method assumes that the moving thin film of bitumen placed in a standardized flask is heated in a rotary evaporator and aerated at predetermined temperature (165 ± 1 °C) during a specified period of time (150 ± 1 min). The flask is placed in an oil bath at the temperature of 165 °C, at 45 ° angle. The air at room temperature (18 to 28 °C) is forced into the flask through a tube, the end of which is situated 40 mm from the bottom of the flask. After the ageing test, the following bitumen characteristics are determined: penetration, softening point, dynamic viscosity, and the change of mass in the samples.
Fig. 3 Rotary evaporation apparatus for RFT test [10]
166
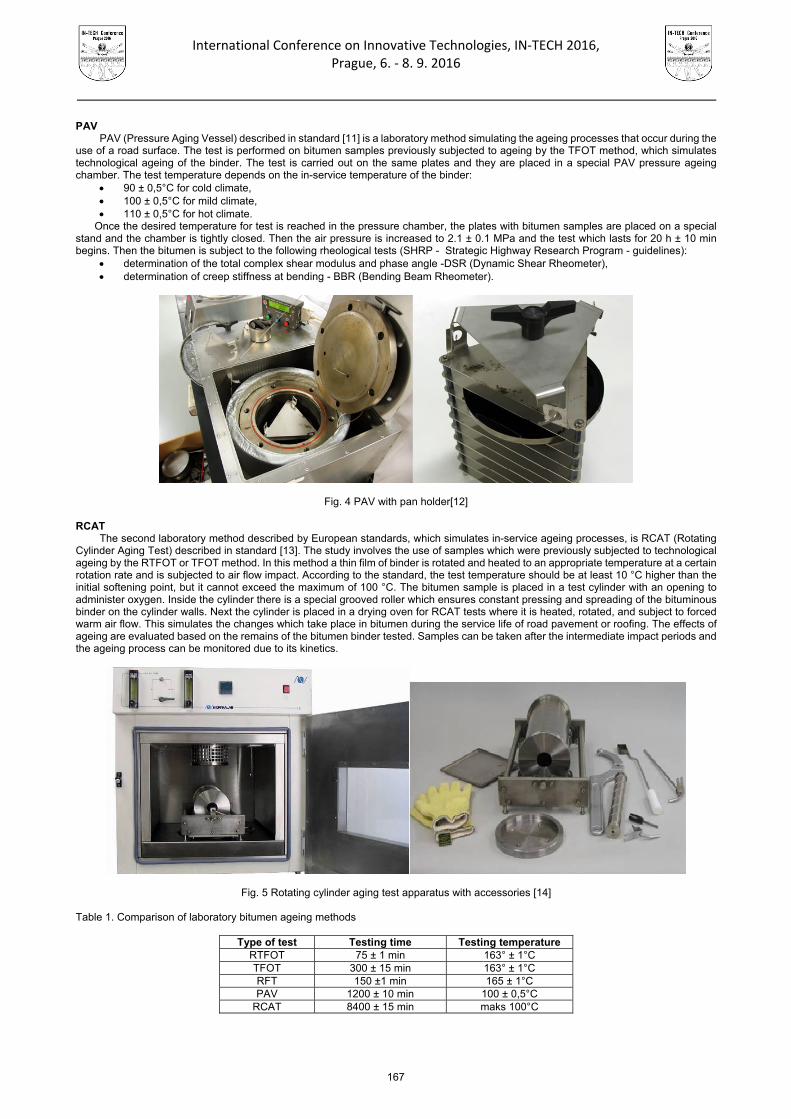
International Conference on Innovative Technologies, IN‐TECH 2016, Prague, 6. ‐ 8. 9. 2016
PAV PAV (Pressure Aging Vessel) described in standard [11] is a laboratory method simulating the ageing processes that occur during the
use of a road surface. The test is performed on bitumen samples previously subjected to ageing by the TFOT method, which simulates technological ageing of the binder. The test is carried out on the same plates and they are placed in a special PAV pressure ageing chamber. The test temperature depends on the in-service temperature of the binder:
90 ± 0,5°C for cold climate, 100 ± 0,5°C for mild climate, 110 ± 0,5°C for hot climate.
Once the desired temperature for test is reached in the pressure chamber, the plates with bitumen samples are placed on a specialstand and the chamber is tightly closed. Then the air pressure is increased to 2.1 ± 0.1 MPa and the test which lasts for 20 h ± 10 min begins. Then the bitumen is subject to the following rheological tests (SHRP - Strategic Highway Research Program - guidelines):
determination of the total complex shear modulus and phase angle -DSR (Dynamic Shear Rheometer), determination of creep stiffness at bending - BBR (Bending Beam Rheometer).
Fig. 4 PAV with pan holder[12]
RCAT The second laboratory method described by European standards, which simulates in-service ageing processes, is RCAT (Rotating
Cylinder Aging Test) described in standard [13]. The study involves the use of samples which were previously subjected to technological ageing by the RTFOT or TFOT method. In this method a thin film of binder is rotated and heated to an appropriate temperature at a certain rotation rate and is subjected to air flow impact. According to the standard, the test temperature should be at least 10 °C higher than the initial softening point, but it cannot exceed the maximum of 100 °C. The bitumen sample is placed in a test cylinder with an opening to administer oxygen. Inside the cylinder there is a special grooved roller which ensures constant pressing and spreading of the bituminous binder on the cylinder walls. Next the cylinder is placed in a drying oven for RCAT tests where it is heated, rotated, and subject to forced warm air flow. This simulates the changes which take place in bitumen during the service life of road pavement or roofing. The effects of ageing are evaluated based on the remains of the bitumen binder tested. Samples can be taken after the intermediate impact periods and the ageing process can be monitored due to its kinetics.
Fig. 5 Rotating cylinder aging test apparatus with accessories [14]
Table 1. Comparison of laboratory bitumen ageing methods
Type of test Testing time Testing temperature RTFOT 75 ± 1 min 163° ± 1°C TFOT 300 ± 15 min 163° ± 1°C RFT 150 ±1 min 165 ± 1°C PAV 1200 ± 10 min 100 ± 0,5°C
RCAT 8400 ± 15 min maks 100°C
167

International Conference on Innovative Technologies, IN‐TECH 2016, Prague, 6. ‐ 8. 9. 2016
Conclusion The laboratory ageing methods described in this paper were developed bearing in mind the production process of mineral and
bitumen mixes and the nature of road surfaces service life. When analysing each method it should be concluded that in the case of technological ageing occurring during the production of waterproofing materials, the most adequate research method is the TFOT method. The production process of bitumen membranes is not as dynamic as it is in the case of MMA. The bituminous binder is applied to reinforcement and then passed through pressing cylinders, due to which only a thin top layer of bitumen is subject to hot air impact. In the in-service ageing, however, the PAV method is a more adequate method of laboratory ageing. Waterproofing products are rarely subject to dynamic impacts and the process of bitumen oxidation or its interaction with the environment occurs only in a thin top layer, similarly to the manufacturing process. This phenomenon is less dynamic and takes place over a long period of time.
Acknowledgment
This research was supported by research grant Applied Research Programme III (PBS3/B2/17/2015) from the National Centre of Research and Development.
References
[1] J. Piłat, J. Król: The Evaluation of ageing processes of the polymer modified bitumen by mage analysis, Foundation of Civil andEnvironmental Engineering, Vol. 11 (2008), p. 113-122.
[2] E. Trzaska: Laboratoryjne metody badani procesu starzenia lepiszczy asfaltowych, symulujące starzenie technologiczne ieksploatacyjne (The laboratory methods of testing bitumen binders ageing processes to simulate technological and operationalageing), Nafta-Gaz, Vol. 6 (2010), p. 500-506.
[3] J. Piłat, P. Radziszewski: Nawierzchnie asfaltowe (Asphalt surfaces), Wydawnictwo Komunikacji i Łączności, Warszawa 2004.[4] I. Gaweł, M. Kalabińska, J. Piłat: Asfalty drogowe (Paving bitumen), Wydawnictwo Komunikacji i Łączności, Warszawa 2001.[5] M. Naskar, K. S. Reddy, T. K. Chaki, M.K. Divya, A. P. Deshpande: Effect of ageing on different modified bituminous binders:
comparison between RTFOT and radiation ageing, Materials and Structures, Vol. 7 (2013).[6] EN 12607-1: Bitumen and bituminous binders – Determination of the resistance to hardening under the influence of heat and air –
Part 1: RTFOT method.[7] http://www.ztmind.il.pw.edu.pl/?p=330[8] EN 12607-2: Bitumen and bituminous binders – Determination of the resistance to hardening under the influence of heat and air –
Part 2: TFOT method.[9] EN 12607-3: Bitumen and bituminous binders – Determination of the resistance to hardening under the influence of heat and air –
Part 3: RFT method[10] http://matest.com/en/[11] EN 14769: Bitumen and bituminous binders – Accelerated long-term ageing conditioning by a Pressure Ageing Vessel (PAV).[12] http://www.pavementinteractive.org/[13] EN 15323: Bitumen and bituminous binders – Accelerated long-term ageing/conditioning by the rotating cylinder method (RCAT).[14] http://www.g-labo.de/
168

International Conference on Innovative Technologies, IN‐TECH 2016, Prague, 6. ‐ 8. 9. 2016
SOFTWARE DOMINANT UNCONVENTIONAL OPTICAL IMAGING THROUGH ATMOSPHERIC TURBULENCE WITH ADVANCES TOWARDS
REAL-TIME, DIFFRACTION-LIMITED PERFORMANCE
W. Arrasmith 1, B. Webster 1 and F. Saqib1
1 150 W. University Blvd., Melbourne FL 32901, USA
Keywords: Atmospheric Turbulence Compensation; Adaptive Optics; High-Speed Blind Deconvolution; Incoherent Imaging Methods; Passive Imaging; Field Programmable Gated Array
Abstract: Ever since ancient times, when observers of the heavens noted the twinkling of stars, the Earth’s atmosphere has seriously degraded the ability to produce diffraction-limited imagery for even “perfect” imaging systems with apertures larger than the atmospheric coherence length (Fried Parameter), ro. In this paper we provide an overview of the atmospheric turbulence compensation (ATC) problem for near-field (ground-to-sky/space), far-field (sky/space-to-ground), and distributed (ground-to-ground) imaging applications, and provide background on some software dominant unconventional imaging methods that mitigate the effects of atmospheric turbulence, and provide near diffraction-limited spatial resolution performance. We provide special emphasis on near-field atmospheric turbulence conditions and address the theory, mathematical, and computational modeling aspects of these ATC systems. We describe the use of weighted Zernike polynomials to model the effects of atmospheric turbulence and discuss their accuracy when compared to the optimal Karhunen-Loeve basis function expansion. Computer simulation is used to show the application of selectable amounts of atmospheric turbulence for weak and strong atmospheric turbulence conditions, and the subsequent removal of the atmospheric turbulence using only the atmospheric turbulence degraded images and recent software-based ATC methods is presented. We use the aperture averaged mean-squared residual phase error to predict the performance of the ATC imaging system and provide initial experimental results in implementing fundamental ATC calculations on a high-speed, parallel processing device, namely a field programmable gated array (FPGA).
Introduction The earth’s atmosphere provides a fundamental limit on the achievable spatial resolution of uncorrected optical imaging systems that
have apertures that are larger than the atmospheric coherence length (Fried Parameter) ro [1]. The atmosphere introduces aberrations in the refracted electromagnetic field that, if uncorrected, result in phase and possibly amplitude perturbations that severely degrades the optical system’s ability to sharply resolve the intended object of interest. In the following sections, we provide background material on how the atmosphere affects the imaging system for different scenarios such as earthbound systems viewing objects of interest in the sky/space, or viewing other earthbound objects. We also discuss space-based systems viewing earthbound objects. We provide a summary of some recent notable methods for removing the effects of atmospheric aberrations from collected imagery [2, 3, 4]. It must be noted that these methods are a subset of the many interesting and effective adaptive optics (AO) and ATC methods available in the literature – too many to adequately represent in this short paper – but instead are a representative set of effective methods to provide comparisons between different classes of atmospheric turbulence mitigation techniques (e.g. adaptive optics, atmospheric turbulence compensation, and hybrid methods). AO systems are typically hardware-based, real-time systems, ATC systems are typically software-dominant and non real-time, while hybrid systems are a mixture of these two methods. For the software-dominant ATC methods used in our comparison, these examples were also chosen since there is evidence that these ATC methods may be adapted for real-time applications using high-speed, parallel processing technology [5]. We then provide background on the theoretical, mathematical, and computational models used to describe and simulate the performance of optical systems and to model the effects of atmospheric turbulence. Afterwards, we provide results showing the application of simulated atmospheric turbulence to an object of interest for the cases of weak turbulence (Channel 1) and strong turbulence (Channel 2). Results are also shown for the application of an adapted diversity-based ATC method that uses only the atmospheric turbulence degraded simulated measured images corresponding to Channel 1 and Channel 2, and no additional information except known aspects of the imaging system itself (e.g. diameter of the entrance pupil, effective focal length of the imaging system, technical parameters that are known a priori to the imaging system designer/user) [5]. We also provide initial experimental results that implement a key diversity-based error metric and search algorithm on a field programmable gated array (FPGA) and show that the key equation and search paradigm can be implemented in real-time (30 Hz or faster).
Background In this section, we provide some important background information that describes the physical nature of atmospheric turbulence
along with some mitigation methods that attempt to remove the presence of atmospheric turbulence aberrations from collected turbulence-degraded optical imagery. We also provide a theoretical, mathematical, and computer simulation/modeling background information for how to model atmospheric turbulence effects in connection with optical imagery. We also present one prevalent methodology that uses Zernike polynomials to describe and model atmospheric aberrations. The effect that the atmosphere has on a propagating electromagnetic wave that is being refracted through the atmosphere depends on the path of propagation of the electromagnetic wave. Ultimately, atmospheric aberrations that affect refracted imagery are caused by changes in the atmosphere’s index of refraction due to the non-uniform heating of the Earth’s surface. These aberrations are a strong function of the atmospheric temperature and wind profile and lead to three separate imaging domains: a) near-field imaging domain, b) far-field imaging domain, and c) distributed turbulence domain. Near-field atmospheric turbulence is where the imaging system is immersed in the strongest part of the turbulence and the object that is being viewed is in weaker turbulence. An example would be an earth-based telescopic imaging system that is viewing an
169

International Conference on Innovative Technologies, IN‐TECH 2016, Prague, 6. ‐ 8. 9. 2016
object in the air (airplane) or an object in space (satellite). For this case, the aberration model is a phase only model in that the aberrations are modeled as phase aberrations in the entrance pupil of the imaging system. There may be observable amplitude effects in derived mathematical quantities such as the Optical Transfer Function (OTF) that is discussed later but these are derived from only phase perturbations in the imaging system’s entrance pupil. Far-Field results describe the case of an imaging system in space that is looking at a terrestrial object, whereas distributed turbulence describes the situation where both the imaging system and the object are located in the turbulence. For these last two cases, the aberration model in the imaging system’s entrance pupil has both amplitude and phase variations. The addition of the amplitude term complicates the atmospheric turbulence mitigation problem and many AO/ATC methods have trouble or fail altogether when strong entrance pupil amplitude effects are present. It should be noted that many of the diversity-based methods are surprisingly resilient to the differences in atmospheric turbulence types (i.e. near-field, far-field, and distributed turbulence). Table 1 shows some notable methods for removing the effects of atmospheric turbulence along with some qualitative systems comparisons such as, is there hardware (H/W) required for the proposed method (Column 2)? Can the method be implemented in real-time (Column 3)? What is the relative Systems Cost (Column 4) where the plus signs indicate some increase over the provided cost estimate (e.g. Low+ is a bit costlier than Low, and Low++ is a bit more costlier than Low+)? These cost assessments
Table 1. Some Recent Notable Methods for Mitigating Atmospheric Turbulence Effects in Optical Imagery
are largely based on the required hardware needed to implement the atmospheric turbulence mitigation method. Column 5 shows whether or not the technique provides some inherent benefit with regards to the detected Signal-to-Noise ratio in the detector plane of the imaging system. Column 6 shows whether-or-not the method may apply to very large apertures that exceed the isoplanatic angle, and the last column assesses whether the technique has portability advantages. For example, AO systems require a wavefront sensor (WFS), deformable mirror (DM) and typically require a high degree of stability and alignment making them less portable than some of the ATC methods that just require a computer and perhaps parallel processing architectures such as FPGAs, graphics processors, and/or an application specific integrated circuit (ASIC). The asterisk on the last technique (Constrained-Diversity) indicates that this method is in its preliminary stages and even the name has not yet been established. Never the less, this technique shows surprising promise in that it may be applicable to regions outside of the isoplanatic angle and so may be useful in synthetic aperture applications. The theoretical, mathematical, and computer modeling framework that can be used to model the imaging system and the effect of atmospheric aberrations on the captured images is shown in Figure 1 below [6]. On the left side of Figure 1 we see the incoherent imaging model
Fig. 1 Incoherent imaging model and mathematical framework (left) and mathematical generation of optical transfer function (right).
that is used in many linear, shift-invariant systems approaches, to describe the passive imaging (non-coherent) imaging scenario. For active imaging (coherent imaging scenarios such as when using lasers), a similar model as in Figure 1 can be constructed but we focus on passive imaging, and near-field turbulence for this paper. For the figure on the left, is the object brightness (W/cm2) at spatial position
, is the point spread function (PSF), and is the image irradiance in units of W/cm2. It can be shown that for a linear, shift-invariant system, the image is the 2-D spatial convolution between the object brightness and the PSF. The quantities at the bottom of the left figure are the object spectrum , the Optical Transfer Function , and the image spectrum , which are relatable to their
spatial domain counterparts through the 2-D spatial Fourier Transform and inverse Fourier Transform as shown above. The quantity is a 2-D spatial frequency variable. The right side of Figure 1 shows how to estimate the OTF from the Generalized Pupil Function (GPF), which is given by the complex exponential of the entrance pupil plane phase aberrations for the near-field imaging scenario. The 2-D spatial frequency Fourier transform of the GPF gives the impulse response , and the magnitude squared of the impulse response gives the PSF. Taking the 2-D spatial Fourier Transform of the PSF yields the un-normalized OTF and dividing this by its maximum real value gives the OTF. For a circular entrance pupil plane aperture, we can use Zernike polynomials as basis functions in describing the entrance pupil plane phase aberrations due to atmospheric turbulence [7]. These aberrations can be described as a superposition of weighted Zernike polynomials, which are defined everywhere on the unit circle, and are functions of the normalized entrance pupil radius and a corresponding radial angle . The actual radius r in the entrance pupil plane aperture is given by r = rp where rp is the entrance pupil plane radius for a circular aperture. With these definitions, the zero mean phase aberrations in the entrance pupil plane of the imaging system can be modeled by,
170

International Conference on Innovative Technologies, IN‐TECH 2016,
Prague, 6. ‐ 8. 9. 2016
(R, ) aiZi (, )i1
N, (1)
, (2)
, and,
Zi (, ) Rnm(), m = 0 (3)
with,
, (4)
where ai is the weight on the ith Zernike polynomial Zi, and n and m are indices defined by Noll that relate a particular Zernike basis function to the index “i” above. This set of equations can be used to model the atmospheric turbulence effects in the imaging system’s entrance pupil and the resulting phase can be used to generate the previously discussed GPF. It can be shown that the aperture averaged mean squared residual phase error is given by [4],
, (5) where is a weighting function that is 1 inside the clear aperture of the imaging system’s entrance pupil and 0 elsewhere, is the phase aberration in the entrance pupil plane (not zero mean as shown in Equation (1) above), and , is the residual entrance pupil plane phase after subtracting out the corrections of the first “i” Zernike terms that have been corrected using an AO and/or ATC method. It should be mentioned that single aperture imaging systems are insensitive to the mean value of the entrance pupil phase and only relative phase differences are important. The second moment shown at the end of Equation (5) can be determined from [5],
(6) and,
(7) where D is the diameter of the entrance pupil, is the Gamma Function, and the other terms have been previously defined. Using the Zernike basis functions instead of the optimal Karhunen-Loeve basis functions produces a progressively smaller (less than 1 percent) squared error difference for the 21st Zernike term and lower (i.e. for Zernike terms with index “i” equal to or less than 21). Consequently, the convenience of the set of well-defined Zernike basis functions justifies their use in most practical applications.
Results The approach in the previous section has been applied to generate simulated turbulence degraded images. Subsequently, a representative ATC method was used to remove the effects of atmospheric turbulence using only the turbulence degraded images themselves and an ATC algorithm that was implemented in Matlab. Fig 2 below from left to right shows the a) simulated turbulence degraded image for the case of weak turbulence (Channel 1), b) the ATC corrected image using only the image in a) and known imaging system parameters as its input, c) simulated turbulence degraded image for strong turbulence (Channel 2), and d) the corresponding
Fig. 2 Simulated and atmospheric turbulence compensated images: a) weak turbulence (far left), b) compensated weak turbulence
image (2nd from left), c) strong turbulence (3rd from left), and d) compensated strong turbulence image ATC corrected image. We then implemented the critical error equation for our representative ATC method along with an un-optimized search algorithm that searches through the various realizations of the error metric on a Zynq 7020 FPGA. Figure 3 shows the conceptual model used for the implementation of the critical calculations for the diversity-based ATC method. In these initial steps, we focused only on
Zieven(, ) n1 Rnm() cos(m )
Ziodd(, ) n1 Rnm() sin(m )
Rnm() (1)s(n s)!
s![(nm) 2 s]![((nm) 2 s]!n2s
s0
(nm) 2
ai aj 0.0072(D
r0
)5
3 (1)(ninj2mi ) 2[(ni1)(nj1)]1
2 (14 3) [(ni nj 5 3) 2]
[(ni nj 17 3) 2] [(ni nj 17 3) 2] [(ni nj 23 3) 2], for i j even
ai aj 0, for i j odd
m ≠ 0
171

International Conference on Innovative Technologies, IN‐TECH 2016,
Prague, 6. ‐ 8. 9. 2016
the critical error equation for the diversity-based ATC method along with an un-optimized search algorithm that searches through the various realizations of the error metric on a Zynq 7020 FPGA, part number XC7Z020.
Fig. 3 Implementation of main error metric on Zed Board (Zynq 7020) Field Programmable Gated Array
Zynq is a Xilinx based system on chip (SoC) that integrates on-chip memory, dual core ARM Cortex A9, and 28nm programmable logic. The designed architecture utilizes the re-configurable logic blocks to design the atmospheric turbulence compensation in real-time with 30 Hz speed. The pixels are stored in the on-chip memory called Block random access memory BRAM, and the results are also stored back on memory. The speedup is achieved using parallel engines, where each stage calculates the error value per pixel using the configurable logic blocks (CLB). Table 3 shows our timing results on the FPGA H/W as a function of the number of pixels. The results
Table 3. Timing results for diversity error equation calculation in FPU and FSM as function of number of pixels
Pixels FPU (in sec) FSM (in sec) Real-time
1 pixel 0.000001490 0.000001690 0.033 sec
4 pixels (2 * 2) 0.000005960 0.000006760
16 pixels (4 * 4) 0.000023840 0.000027040
64 pixels (8 * 8) 0.000095360 0.000108160
16384 pixels (128 * 128) 0.024 0.028
65536 Pixels (256 * 256) 0.097 0.110
are shown for both the basic FPGA processing unit that implements the error equation and search on the floating point unit (FPU), and for the Finite State Machine (FSM), which controls the sequence of operations and the data input/output processes working on a frequency of 100 Hz. Each FSM process has 2 memory operations, reads the inputs from the BRAM and writes the calculated error value into the BRAM. It takes 1690 ns for a single FSM process for a single pixel and it is shown that for an un-optimized search, we can process the core ATC error calculation with search (including data input and output on the FSM) faster than 30 Hz for a 128 by 128 pixel image block. Conclusions
We have described the atmospheric turbulence mitigation problem including how to theoretically, mathematically, and computationally model the effects of atmospheric turbulence in optical imagery. We generated simulated atmospheric turbulence degraded images for the cases of weak turbulence and strong turbulence and showed how an atmospheric turbulence compensation method can remove the effects of atmospheric turbulence from our simulated images. We then implemented the key calculation and un-optimized search paradigm on the Zyng 7020 FPGA and showed that these calculations can be accomplished in real-time (30 Hz or faster) for image segments up to 128 by128 pixels. In the future, we need to expand the ATC implementation on the FPGA, optimize the search, and use real turbulence degraded images instead of the simulated ones. We also plan to use decision-engineering methods in determining the optimum configuration of our imaging system (e.g. determining optimal dynamic system parameters such as sampling requirements, magnification, search optimization, required sensor integration time, and more).
References [1] D. L. Fried: Optical resolution through a randomly inhomogenous medium for very long and very short exposures, J. Opt. Soc.
Amer, Volume 56 (1966), pp.1372-1379. [2] R. A. Gonsalves, R. Chidlaw: Wavefront Sensing by Phase Retrieval, Proc. on Applications of Digital Image Processing III, SPIE
Vol. 207 (1979). [3] H. R. Ingleby, D. R. McGaughey: Parallel multiframe blind deconvolution using wavelength diversity, Proc. on Image
Reconstruction from Incomplete Data III, SPIE Vol. 5562 (2002), pp. 58 - 64. [4] M. C. Roggemann, B. Welsh: Imaging through Turbulence, (CRC Press, New York, 1996). [5] W. Arrasmith: Generalized Wavelength Diversity Method for High Speed, High Resolution Color Images, Proc of IN-TECH
International Conference on Innovative Technology (2013), pp. 5-9. [6] J. W. Goodman: Introduction to Fourier Optics 3rd ed., (Roberts & Company, Greenwood Village Colorado, 2005). [7] R. J. Noll: Zernike polynomials and atmospheric turbulence, J. Opt. Soc. Am., Volume 66 (1976), pp. 207-211.
172

International Conference on Innovative Technologies, IN‐TECH 2016,
Prague, 6. ‐ 8. 9. 2016
STRENGTHENING OF ECONOMIC COMPETITIVENESS BY PROMOTING ENERGY EFFICIENCY AND USE OF RENEWABLE ENERGY – CASE OF
CROATIA
D. Hruška, Ph.D.1, J. Bevanda2 and M. Erić3 1 Associate Professor, Faculty of Economics and Business, University of Zagreb, Trg j. F. Kennedy 6,
10000 Zagreb, Croatia
2Director, Speculum d.o.o., Bartolici 49, 10000 Zagreb, Croatia
3Student, Faculty of Economics and Business, University of Zagreb, Trg j. F. Kennedy 6, 10000 Zagreb, Croatia
Keywords: Economic Competitiveness; Energy Efficiency; Renewable Energy; Croatia Abstract: At the macro level, national competitiveness or the competitiveness of countries can be defined as the ability of the country to achieve economic growth faster than other countries and to increase the economic well-being in a manner that its economic structure changes to the better. Investment in energy efficiency and the systematic fostering and use of renewable energy sources aims at the increase of energy independence of the country hence representing one of the most important parts of economic matrix of any country. This paper aims to determine the potential of energy efficiency investments in the Croatian economy as well as the reach of further investment in the use of renewable energy. In addition, the paper examines the causes that create difficulties in the implementation of such projects and can be used to assist the devising of a strategic model that can help guiding the economy to increase competitiveness and sustainable development, for better positioning in the regional market. Introduction
The issue of competitiveness, especially in a small open economy like Croatian, needs to be observed through the ability of the entire economy and society, to operate successfully within the economic environment of the enlarged European Union, but also of the today's world, where markets and production sites are becoming global. There are different views on the measurement of competitiveness among countries. Some analysts even advocate an extreme position that the concept of competitiveness is not applicable at the level of countries, but only at the enterprise level. However, significant differences in economic developments across countries at a similar stage of economic development clearly point to the existence of successful and less successful countries.
If we take into account its commitments under the Kyoto Protocol, Croatia is obliged to reduce energy consumption by 20% by 2020, increase the share of renewable energy to 20%, and reduce CO2 emissions by 20%. EU invests nearly 10% of the overall budget in non-repayable financing of green projects. As the largest donor grants in the world, the European Union is reinvested in the economy about 30% of its annual budget through grants. The aim of this paper is to explore and define a sustainable model of economic policy that will aim at creating a supportive investment climate in energy efficiency and renewable energy sources, both for the individual, as well as for large investors. As an industrial unpolluted and under developed country, Croatia has a unique opportunity to assess its economic guidelines in respect to its energetic strategy.
Main goal of this paper is to shed light on the processes by which the models of sustainable development based on the promotion of energy efficiency and renewable energy of the Croatian economy can be defined. Through the achievement of that goal we hope that we will be able to contribute to quality interdisciplinary problem solving, especially when it comes to economic sectors burdened with low competitiveness and uncertain supply of inputs.
Competitiveness of a Small Open Economy
The concept of competitiveness has gone through significant changes over time. Adam Smith argued that the exchange between the two countries is mutually lucrative if every country has an absolute advantage in the production of a good compared to other countries. A nation has an absolute advantage in the production of a good if its production consumes less work than other countries [1]. Classical economists such as Smith and D. Ricardo as the primary determinants of comparative advantage identified the availability of factors of production such as land, capital, natural resources and labour. Differences in the economic performance of individual countries Weber [2] explains by individual socio-economic factors such as the system of values and religion, which is defined as a socio-cultural capital.
Schumpeter [3] emphasizes the role of entrepreneurship, innovation and technology, while Drucker [4] develops the concept of management as the main factors of competitiveness. Solow [5] emphasizes the role of education and technological innovation for long-term economic growth. Porter rounds up all these ideas in a systematic model known as diamond of competitiveness [6]. As an another distinctive contribution to the conversation about competitiveness, Trabold [7] analysed four important aspects that define competitiveness: (1) the ability to sell in the global market (export), (2) the possibility of attracting investment (location), (3) the possibility of adapting the economy, and (4) the ability to create and increase in disposable income.
Krugman [8] emphasizes the importance of monitoring both national and global economic trends that point to the growing importance of sustainable development and the creation of an appropriate model of economic policy which will focus on creating a favourable investment environment which is important both for individuals and large investors. This is one of the priorities of every national economic policy. One of the possible scenarios that can help solve the problem of sustainable development involves the systematic use of energy efficiency and the introduction of renewable energy in the economic development project.
Renewable energy sources represent a great opportunity for Croatia to take over the role of the energy leader in the region, which would increase the competitiveness of the economy, ensure energy stability and increase production efficiency and reduce unemployment. Unfortunately, there are still many problems that stand in the way of our energy development, primarily high-quality
173

International Conference on Innovative Technologies, IN‐TECH 2016,
Prague, 6. ‐ 8. 9. 2016
connections with other strategic principles of development of the domestic economy. If we could create a model that offers high-quality networking of key economic subjects, we could make a major step towards sustainable development. For such actions, we need high-quality development projects that involve micro economy of certain regions gathered around the same goal. Those regions (cities, municipalities, counties) who were first to embrace sustainable development in their own development strategies have done so because they were the first to be affected by threats from the environment, but are also among the first to realize the development opportunities offered by the incorporation of sustainable development principles. In the last ten years there have been numerous studies that have resulted in quality development models based on tried and tested techniques. Strenghtening Economic Competitiveness by Promoting Energy Efficiency
A research was conducted among the owners and managers of Croatian companies with the aim of identifying the key problems in projects involving energy supply, and their share in the cost of an average business. The research was conducted through survey. The survey covered the approximate ratio of large, medium and small companies in accordance with the real situation on the market. It included 168 respondents, among which were owners, managers or high-level employees of companies in the real sector.
Table1. The basic activity of the surveyed companies
Activity Pct. (%)
Production 32%
Processing / finishing 6%
Trade/services 39%
IT technology 10%
Other 13%
The survey includes questions concerning energy efficiency and renewable energy sources, along with some additional or compatible
issues that complement the market picture. The results we obtained, in the first part of the research, in general indicate insufficient awareness of entrepreneurs on which all
measures can be applied in their operations in order to increase their market opportunities and improve business efficiency. The procedure of collecting information was difficult due to the specific requirement of the sample (owners and managers), and considering that those people do not usually have time to for surveys, the response rate was a success.
Furthemore, we based on simple questions in the survey, which can indicate the final problems and solutions with its synthesis. Although this is a subject in which Croatia is behind the rest of Europe, some countries, thinking about different solutions, went a few steps further, so we should use their experience and adapt it to apply it on our model of development. Table 2. Possibility of obtaining significant savings by using energy rationally, for example. electrical energy, thermal energy, gas or water
Possibility Pct. (%)
Yes, I think they could achieve savings of up to 30% compared to current consumption 32%
Yes, I think they could achieve savings of over 30% compared to current consumption 8%
Yes, I think they could achieve savings but do not know how much 44%
No, I don’t think substantial savings can be achieved in my business 15%
The responses indicate an obvious awareness of entrepreneurs that interventions to encourage energy efficiency can increase
competitiveness (Table 2). While only 15% of respondents declared negative, as much as 85% of them think that it is possible to achieve savings in their business. Table 3. Main obstacles in the realization of such projects
Obstacles Pct. (%)
Lack of awareness of the potential of saving 44%
Lack of professional support 27%
Lack of money 58%
Lack of time 20%
I don’t know 7%
Something else 5%
The responses indicate the broadness of possible reasons why energy efficiency projects are not done enough (Table 3). According to
the answers of respondents, the highest percentage of them says the main problem is the lack of money (58%), as well as lack of awareness of the potential savings (44%).
Furthermore, over 60% of respondents heard of the existence of incentive lines for energy efficiency projects (Table 4). However, if we look at the previous answers that indicate a lack of understanding and lack of knowledge related to the reduction of energy consumption and basic guidelines for energy efficiency, we come to the conclusion that indeed more than one third of respondents are not even familiar
174

International Conference on Innovative Technologies, IN‐TECH 2016, Prague, 6. ‐ 8. 9. 2016
with the programs that are available to businesses. If this information is put into a ratio of small / medium / large enterprises in the Republic of Croatia, we come to interesting information that about 40% of companies are not sufficiently familiar with the above measures, and if in this ratio we put that in Croatia about 92% of companies have less than 10 employees, what is left is around 8% of those larger ones, with more than 10 employees, that can achieve very significant savings. If we consider that the average savings in similar projects is around 30%, and if we consider that the construction and industry and occupy about 60% of total energy consumption, then we can say that the percentage of firms that are not informed is about 24%. If we take into account the potential savings, we can say that the untapped potential is about 7.5% savings in total energy consumption in Croatia.
Table 4. Awareness of tenders for the award of incentive projects to strengthen energy efficiency
Awareness Pct. (%)
Yes, but incentives are symbolic 46%
Yes, and incentives are very attractive 15%
I do not know of such projects 38%
Most respondents confirmed that they are insufficiently informed about the potential of energy efficiency, so that should become the basis for building a society that will be able to determine the way to strengthen their competitiveness.
Sustainable Development of Croatian Economy Based on Renewable Energy Sources The second survey was conducted among participants appearing in projects obtaining various types of grant subsidies. The surveys
results are presented in percentages with comments.
Table 5. The forms of renewable energy that you find the most interesting for your business
Forms Pct. (%)
Photovoltaic systems for production of electricity 76%
Solar collectors for water heating 36%
Wind power plant 5%
Hydroelectric power plants 3%
Biogas plants 5%
Cogeneration biomass plant 15%
Geothermal energy 17%
Something else 5%
According to the information received (Table 5), we can conclude that the photovoltaic solar technology arouses greatest interest. The reason for this can be viewed through two facts: on the one hand it is a technology that is being developed over 30 years, with which the public is already familiar. On the other hand, photovoltaic technology is adaptable to the amount of investment, therefore, is available for a very wide range of potential investors, unlike some technologies that require a large capital investment regardless of size (e.g., biogas plant, wind power plants, etc.).
The motives that drove the interest of entrepreneurship for renewable energy projects are mostly pragmatic. Strengthening the competitiveness of business is the most common response (55%), which once again proves the connection between these projects with the general competitiveness of the economy. In the second place of responses is the purchase price of produced energy guaranteed by the state (32%), which in some ways can also be interpreted as a factor of competitiveness.
Table 6. Changes in the regulations that would encourage the development of renewable energy projects
Changes in the regulations Pct. (%)
Removing administrative barriers, simpler procedures 20
Educating the population, increasing the level of awareness 14
Assistance in the implementation of projects (co-financing, incentives, benefits…) 17
Clear and transparent criteria 8
Encouraging domestic production of renewable energy sources 3
Professionals instead of politics on positions of responsibility 9
The positive atmosphere of business 3
Creating opportunities for interconnection of investors 7
To the question of what should new regulations contain so that the companies like yours would be more intensely involved in those projects was answered by 29% of the total number of respondents. Despite the free form which the respondents could use to express themselves, their responses are classified into several main groups, which give a clear idea of what is the biggest obstacle in the implementation of projects (Table 6).
175

International Conference on Innovative Technologies, IN‐TECH 2016,
Prague, 6. ‐ 8. 9. 2016
Conclusion When it comes to prospects of the energy sector and achieving the objectives of energy policy, it can be concluded that the international infrastructure facilities are necessary for ensuring access to energy sources and new supply routes. In the Croatian case, the selection of relevant projects depends on factors outside the region; it primarily refers to resources and markets. The order of adoption and implementation of investment decisions can affect the diversification of sources and routes, as well as cost-effectiveness of alternative projects.
Regarding investment, it can be concluded that a significant portion of facilities for the production of electricity will be decommissioned over the next ten years. To ensure security of supply it will be necessary to invest in facilities to produce electricity (revitalization of existing power plants and / or building new ones), build storage facilities and ensure access to energy sources and supply routes because domestic reserves of gas and oil, as well as storage facilities, are limited. To achieve the objectives of energy policy are required therefore the investment on market principles in the different energy sources.
As for the role of the state and the market is concerned, we can say that Croatia formally committed to the development of the energy sector based on market principles, which means limiting the role of government. The liberalization of the energy sector implies the reform of the system of prices and their rise to market levels. In Croatia, the energy policy is used as an instrument of social policy through the policy of prices. The role of the state in the energy sector, through equity participation, affects the prospects of the government and usually has a short-term prospect, while energy subjects have prospect that takes into account the return on investment (typically more than 20 years). Reducing the role of the state strengthens commercial interests and only those investments that bring profits and allow further research and investment in infrastructure are realized. The importance of social and political interest is reduced, as well as the objectives of acceptability of prices for households and industry.
References [1] Lj. Jurčić: Konkurentska sposobnost poduzeća, (Chapter 3), D. Tipurić, edt : Konkurentska sposobnost poduzeća, (Sinergija,
Zagreb, 1999). [2] M. Weber: Theory of Social and Economic Organisation, (The Free Press, New York, 1947). [3] J. A. Schumpeter: The Theory of Economic Development: An Inquiry into Profits, Capital, Credit, Interest, and the Business Cycle,
Harvard Economic Studies 46 [4] P. F. Drucker: Managing for the future, (Routledge, New York, 2011). [5] R. M. Solow: Technical Progress, Capital Formation, and Economic Growth.The American Economic Review 52.2 (1962): 76-86. [6] M. E. Porter: Konkurentska prednost, postizanje i održavanje vrhunskog poslovanja, ( Masmedia, Zagreb, 2001). [7] H. Trabold: Die internationale Wettbewerbsfähigkeit einer Volkswirtschaft. (Međunarodna konkurentnost gospodarstva). Deutsches
Institut für Wirtschaftsforschung. (Njemački institut za ekonomska istraživanja), (Duncker & Humblot, Berlin, 1995). [8] P. R. Krugman: Making Sense of the Competitiveness Debate, International Competitiveness, Oxford Review of Economic Policy,
12(3), pp. 17–25, 1996 [9] W. Bienkowski: How much are studies of competitiveness worth? Some critical theoretical refl ections on the issue, The Second
Economic Forum On “New Europe”, Lancut, April, 2006.
176

International Conference on Innovative Technologies, IN‐TECH 2016,
Prague, 6. ‐ 8. 9. 2016
COMPARISON OF MLP NETWORK AND GRAMMATICAL EVOLUTION IN MODELING OF NONLINEAR DYNAMIC SYSTEM
S. Kajan1 and D. Pernecký1 1 Institute of Robotics and Cybernetics, Faculty of Electrical Engineering and Information Technology, Slovak
University of Technology in Bratislava, Slovak Republic
Keywords: Grammatical Evolution; Genetic Algorithm; Nonlinear Dynamic System; Neural Network; Modeling Abstract: In this paper evolutionary algorithms and neural network were used for modeling a nonlinear dynamic system. In the first approach a grammatical evolution (GE) was used. This approach is based on modeling an internal structure of an unknown system. The system is modeled as a black-box, its structure as well as the parameters are unknown. The model of the system is represented in form of a function where only arguments are defined: input and output variables of the modeled dynamic system and their derivatives. For the evolution of the model simple grammatical rules were used. In the second approach a multilayer perceptron (MLP) neural network was used. For modeling the nonlinear dynamic system nonlinear autoregressive neural network structure (NARX) was used. The training process of neural model consisted of two steps. In the first step the MLP network without recurrent feedback was trained by the Levenberg-Marquardt method. In the second step the MLP with recurrent feedback was trained by the genetic algorithm (GA). Results were compared with a linear model, obtained by a genetic algorithm. Introduction
For the purposes of nonlinear system control, it is important to have an exact model of the dynamic system. Considering very good approximating ability of the multilayer perceptron networks (MLP), we are able to create an accurate neural model of nonlinear system. In addition to the neural model approaches, several authors have applied various evolutionary-based approaches for modeling the nonlinear dynamic systems [1, 2]. From a general point of view it is possible to divide these approaches into two groups. The first group is based on searching for a set of predefined number of parameters in a fixed model structure. Where the structure is known - specified by a designer. For solving this task the Genetic Algorithm (GA) [1, 2] or some other evolutionary optimization techniques e.g. Particle Swarm Optimization, Differential Evolution, Artificial Immune System etc. can be applied. The second group of approaches is based on searching for the internal structure as well as for the parameters of the unknown system . The model is taken as black-box. In this case the genotypes are defined as a changing structure with changing size. For that reason the more general evolutionary approaches as Genetic programming (GP) [3, 4], Cartesian programming [5, 6] or Grammatical evolution (GE) [7, 8, 9] can be used.
In this paper we compare two approaches, GE – based modeling and MLP neural network modeling. For correct comparison a linear ARX model, which parameters were obtained by GA, is compared to the proposed nonlinear models.
In the second part the design principles of GE based modeling are described: the representation of the individual (e.g. the specific solution encoding) and the fitness function evaluation. The evolution of the model is based on an open loop simulations of the modeled system, which is the main part of the fitness function. The evolution performs a direct search/optimization in the model structure space and the model parameters space simultaneously. The model structure is implemented in form of a mathematical function, which arguments are signals of the modeled dynamic system (system input, system output and their derivatives). In the thirds part the MLP model is described and in the fourth part the comparison of these methods is provided. Modeling of dynamic systems based on Grammatical Evolution
Problem definition and individual representation
The used model of a nonlinear dynamic system is based on the state-space representation, which takes the following form:
dx(t)/dt = f(x(t),u(t)), (1) y(t) = h(x(t)), where: x is the state vector, u is the system input, y is the system output, f and h are some smooth continuous functions. The presented model is implemented in form of a continuous-time function Fm which arguments are the state vector x and the input
vector u (Fig.1).
Fig. 1 Open loop for process modeling, Fm - model function, S – modeled dynamic system
. . .
Fm(X)
u
xn-1
x1
S
1/s x2 x3
y
dym ds-1ym dsym e
-
+
1/s
ym
177

International Conference on Innovative Technologies, IN‐TECH 2016,
Prague, 6. ‐ 8. 9. 2016
The goal of the design optimization task is to find such function f, which preserves the best possible performance (2) – e.g. maximizes the defined fitness criterion. The function Fm represents a prescription defining which elements of xi are selected, which mathematical relations are placed between them and what are the parameters of the mathematical operations. The considered set of input variables is xj є uj, ymj, dymj, …, ds-1ymj , where ui is input of system, ymj is output of system model, dymj, …, ds-1ymj are derivatives of ym and s is order of dynamic system.
The following set of mathematical operations are considered +, -, *, /, ( ). In general, any other operations and functions can be used. Each potential solution (individual of the population) is represented in form of 3n genes: individual=f1,f2,…,fn, x1, x2,…,xn, p1,p2,…,pn . fi is the code of a mathematical operation, xi is argument - input variable and pi is the gain of each appropriate variable xi. The coding of the mathematical operations fi in the considered grammar is as follows:
0:λ→λ, 1:λ→λ+λ, 2:λ→λ-λ, 3:λ→λ*λ, 4: λ →λ/ λ, 5: λ →(λ), The symbol λ is in the end substituted for λi=pixi .
Fitness function evaluations
The aim of modeling dynamic system is to create a model of system with the same dynamic properties as the modeled system. In order to represent the dynamics of the system it is necessary to perturb the system inputs across their whole operating range which yields relevant fitting data. The quality of the model can be expressed as the error between system output y and model output ym and also the stability of the model over the operating range. Without loss of generality, let’s consider a simple process modeling scheme (Fig. 2), where the modeled process is a continuous-time nonlinear dynamic system, the model is a dynamic system with unknown structure, e is error between system output y and model output ym.
Fig. 2 Simple process modeling scheme
Consider an appropriate simulation model (or real output data of the process) of this model scheme to be available. Let the model
performance criterion be simple mean square error between system output y and model output ym defined as: J =1/N∑i=1:N (yi-ymi)2 → min, (2) where: N is number of discretely measured samples. Modeling the system is actually an optimization task – search for such a model
structure and parameters, which minimizes the chosen performance criterion. The evaluation of the cost function consists of three steps. The first step is a transformation from the representation form of the model in the GE domain (chromosome) into the simulation model – Fm (decoding of the genotype into the phenotype). The second step is a time response simulation of the tested model and the last step is the performance index evaluation.
Evolutionary algorithm
A parallel evolutionary algorithm which is similar to the parallel Genetic algorithm was used. The only difference is in the individual representation, which is characteristic for the GE. The algorithm uses a parallel architecture with 9 islands, which are interconnected with migration connections and each island contains 50 individuals [10]. The algorithm can be described by following steps:
1. Population initialization (by random values), 2. genotype to phenotype transformation and evaluation of fitness of each individual of the population, 3. selection of unchanged individuals (30% of population in each island by random, but including the best one), selection of parents
(70% by tournament selection), 4. crossover (10 individuals) and mutation of parents (30 individuals), 5. completion of the new population which will consist from children mutated individuals and unchanged individuals, 6. migration of the clone of the best individual from each island 2-9 to island 1, migration period is 1 generation (migration topology is
shown in Fig.3), 7. asynchronous re-initialization of islands 2-9 (occurs in each island in which the convergence of fitness is stagnating for 50
generations [10]) 8. test of terminating conditions, end or jump to point 3.
Fig. 3 Migration topology of the Parallel genetic algorithm
Modeling of dynamic systems using MLP neural network Let us consider a neural model of the process represented by a three-layer artificial neural network of the MLP type. The objective of
the MLP network is to approximate the input/output relation of the system. The nonlinear autoregressive network with exogenous inputs (NARX) is a recurrent dynamic network, with feedback connections enclosing several layers of the network. The nonlinear dynamic system can be described by the following NARX model:
ym(k) = f([y(k-1),…,y(k-n),u(k-1),…,u(k-m)]), (3)
y
Model
u Process
ym e
-
+
178

International Conference on Innovative Technologies, IN‐TECH 2016,
Prague, 6. ‐ 8. 9. 2016
where: u is the process input, y is the process output, n is the number of the past output steps, m is the number of the past input steps, f is some nonlinear relation, k is the discrete-time step (t=k.Ts , Ts is sampling period). The block schemes of the artificial neural network modeling are in Fig. 4. [11]. Inputs of NARX model with series-parallel architecture are delayed input and output of process (Fig. 4a). The NARX neural model output is located in parallel to the process, and prediction error is used as network training signal for the training algorithm.
a) b)
Fig. 4 The process modeling block schemes with NARX neural model, a) Series-parallel architecture b) Parallel architecture If the neural model doesn’t have the real process output y available (our goal is to replace modeled system output with neural network
model and therefore also the system output), then it is possible to replace the process output y with the model output ym. The problem of this feedback is that, the difference between real process and model is causing error. This error enters the model and can cause an unstable state of the NARX model. This problem can be partially eliminated by using recurrent neural network [12]. Block scheme using a recurrent neural network is in Fig. 4b. The training process consists of two steps. In the first step a feed-forward MLP network without recurrent feedback was trained by the Levenberg-Marquardt method [13]. In the second step we added recurrent feedback and the MLP was trained by the genetic algorithm [12].
Experimental results
The GE-based design method has been tested on nonlinear system. In cases of nonlinear systems the benefits of the nonlinear properties of the GE-based design brings considerable improvement of model quality compared to a linear model. The modeled nonlinear process was defined in form of a differential equation (4).
d3y(t)/dt3 = 0.2u-10d2y(t)/dt2 – 5y2 dy(t)/dt-2y, (4)
The phenotype of the GE-based model is in form d3y(t)/dt3 = 0.39u-11y2*dy(t)/dt-20d2y(t)/dt2 +(dy(t)/dt(7.5 dy(t)/dt+3.7)-3.9)y-dy(t)/dt(1.7dy(t)/dt-14d2y(t)/dt2+0.25u+ 8dy(t)/dt*d2y(t)/dt2+2.2(dy(t)/dt)2), (5)
Design of the GE-designed Fm-model, neural model and linear model was fitted from simulated data of a nonlinear system (Fig. 5). The sampling period Ts was set to 0.1s. The cost function formulated as the mean-squared error (MSE) (2) on the training data has been minimized with respect to model parameters. The accurate evaluation of model errors for selected methods is shown in Table 1. The models were tested on the training and the testing data sets. In Fig. 6 the comparisons of a neural model using multilayer perceptron network, GE-designed Fm-model and linear model.
0 200 400 600 800 1000 1200 1400 1600 1800 20002
4
6
8
10
u
Data of system input
0 200 400 600 800 1000 1200 1400 1600 1800 20000
0.5
1
1.5
Time [s]
y
Data of system output
Fig. 5 Excitation data (u) and system time-responses (y) used for model identification
Table 1. Mean-square error (MSE) of three various models
Method Training data Testing data GE-based model 1.4881e-006 1.4052e-006
Neural model 8.0076e-005 4.6814e-005 Linear model 9.8008e-004 5.2461e-004
y
MLP neural network
u Process
ym
e
-
+ Delay
Delay
Genetic algorithm
y
MLP neural network
u Process
ym
e
-
+ Delay
Delay
Learning algorithm
179

International Conference on Innovative Technologies, IN‐TECH 2016, Prague, 6. ‐ 8. 9. 2016
Fig. 6 Comparison of the modeled system output and model output time-responses of the GE-based model, neural network (NN) model and linear model (Lin)
Conclusion In our paper a Grammatical evolution-based modeling procedure for continuous-time dynamic systems is presented. The obtained
results were compared with a neural model using multilayer perceptron network trained by the Levenberg-Marquardt Back-propagation algorithm or the Genetic algorithm respectively, and with a linear model (which was parameterized using an Genetic algorithm). The experimental results suggest, that the GE-based model design is able to produce good results for modeling of nonlinear dynamic systems, which are better than results obtained with neural models as well as linear models. It can be assumed, that in our experiment the model obtained in form (5) is not the best possible solution. Finding of the optimal model (global optimum) is a very difficult task due to the large search space. But as it was demonstrated above, the proposed approach can produce acceptable results, which are in this case better than when using traditional approaches. Moreover, the potential of this approach can be increased with the high computation power and/or high computation time. With minor changes this approach is able to solve designs of complex, nonlinear, multi-input and multi-output systems. The main drawback of this method in comparison to the neural network models is the larger computation time.
Acknowledgment
The work has been supported by the grant agency VEGA No. 1/0475/16 and KEGA No. 010STU-4/2014.
References
[1] V. Duong, A. R. Stubberud: System Identification by Genetic Algorithm. Jet Propulsion Laboratory, California Institute ofTechnology, (2002) (http://trs-new.jpl.nasa.gov/dspace/bitstream/ 2014/13573/1/01-2715.pdf?origin=publication_detail)
[2] I. Sekaj: Control algorithm design based on evolutionary algorithms. In: Chugo, D., Yokota, S. Introduction to Modern Robotics.iConcept Press, Hong Kong, (2011), ISBN 978-0980733068
[3] J.R. Koza: Genetic Programming. Cambridge, MA, MIT Press, (1992)[4] I. Sekaj, J. Perkácz: Genetic Programming - Based Controller Design. IEEE Congress on Evolutionary Computation, Singapore,
(2007)[5] L. Sekanina, at all.: Evoluční hardvare. Academia Praha, (2009) (in czech)[6] I. Sekaj, B. Kadlic, T. Gašparík: Cartesian genetic programming based controller design. Proceedings on the conference Mendel
2012, Brno, (2012)[7] C. Ryan, J.J. Collins and M. O’Neill: Grammatical Evolution: Evolving Programs for an Arbitrary Language, EuroGP',98:
Proceedings of the First European Workshop on Genetic Programming, vol. 1391, pp.83 -95, (1998) Springer-Verlag[8] O. Popelka, P. Ošmera: Parallel Grammatical Evolution for Circuit Optimisation. Proceedings on the ICES’08, pp. 425-430,
Springer-Verlag Berlin, Heidelberg (2008)[9] I. Zelinka, at all.: Evoluční výpočetní techniky, principy a aplikace. Ben, Praha (2009) (in czech)[10] I. Sekaj, M. Linder: Population Re-initialisation in Parallel Genetic Algorithms, Proceedings on the conference Mendel 2012, Brno,
Czech Rep., (2012)[11] A. Jadlovská: Modelovanie a riadenie dynamických procesov s využitím neurónových sietí, Edícia vedeckých spisov FEI TU Košice,
ISBN 80-8894122-9, (2003) (in slovak)[12] Y. Zhu: Nonlinear System Identification using a Genetic Algorithm and Recurrent Artificial Neural Networks, Thesis of Applied
Science at Concordia University Montreal, Canada, (2006)[13] M. T. Hagan, M. B. Menhaj: Training Feedforward Networks with the Marquardt Algorithm. Submitted to the IEEE Proceedings on
Neural Net, (1994)
180

International Conference on Innovative Technologies, IN‐TECH 2016, Prague, 6. ‐ 8. 9. 2016
SOME ASPECTS OF THE PROFICIENCY TESTING FOR DIMENSIONAL LABORATORIES USING THE GAUGE BLOCKS
A.Softić 1 and H.Bašić 1
1 Mechanical Engineering Faculty Sarajevo, Vilsonovo setaliste 9, Sarajevo, Bosnia and Herzegovina
Keywords: Proficieny Testing; Gauge Block; Inter-Laboratory Comparison; Measurement Uncertainty
Abstract: In this paper inter-comparison of set gauge blocks (class K) in four dimensional laboratories and their measurement results will be demonstrated. The reported results are analyzed by simple statistical means and investigated statistical distribution of the results. The uncertainties quoted by participants are different from one participant to another, so it wasn’t suitable to use simple arithmetic mean as an estimator of the true mean. Instead, it was used weighted mean, and that approach requires that the participants have made correct estimates of their uncertainty of measurements. Proficiency testing (PT) is an indispensible tool for developing and maintaining of infrastructure of modern society built of competent measurements, standards and accreditation. The primary aim of proficiency testing is to provide a quality assurance tool for individual laboratories to enable them to compare their performance with similar laboratories, to take any remedial action, and to facilitate improvement. It is analyzed situation in these laboratories in field of length unit using calibration process of gauge blocks on mechanical comparator. For inter-comparison the set of class K gauge blocks is used thru four dimensional laboratories. The reported measurement results are analyzed by simple statistical means and investigated statistical distribution of the results. It was clear that the uncertainties quoted by participants are different from one participant to another, so it wasn’t suitable to use simple arithmetic mean as an estimator of the true mean. Instead, it was used weighted mean, and that approach requires that the participants have made correct estimates of their uncertainty of measurements. Results of statistical analysis vary in different ways, pointing to the fact that with caution it must be chosen way of processing results of proficiency testing. For this detailed approach to the processing of data of proficiency testing should be a great experience in such schemes.
Introduction In view of the ever-increasing globalisation of economy, the removal of technical barriers to trade has become a central political task.
To establish the preconditions for free trade throughout world, the World Trade Organization adopted agreement encouraging the development of mutual recognition agreements and of international conformity assessment systems.
Such agreements are based on mutual confidence and manifest the final result of a continuous and close cooperation programme essentially consisting of three major elements: the harmonization of accreditation criteria and operation procedures, a comprehensive programme of interlaboratory comparisons and peer assessments by an international team of experienced accreditation experts, [1,2].
The most appropriate means of monitoring the quality of the measurement results of laboratories is to include them in programs proficiency testing or external quality assessment or participate in other inter-laboratory comparisons, [3,4]. The testing/calibration laboratories shall demonstrate their performance through their participation in appropriate proficiency testing (PT) schemes by means of inter-laboratory comparisons.
The role of proficiency testing Inter-laboratory comparisons (ILC) represent organization, implementation and evaluation of measurements or tests on identical or
similar items carried out in two or more laboratories in accordance with pre-determined conditions, while proficiency testing (proficiency testing, PT) refers to evaluation competence of the participants according to predetermined criteria by inter-laboratory comparisons.
The primary aim of proficiency testing is to provide a quality assurance tool for individual laboratories to enable them to compare their performance with similar laboratories, to take any remedial action, and to facilitate improvement.
Proficiency testing (PT) is an indispensible tool for developing and maintaining of infrastructure of modern society built of competent measurements, standards and accreditation Also, proficiency testing is powerful tool to help laboratory to demonstrate competence to an accreditation body or other third party, enables laboratories to monitor their test over time as well as tool for education and self-improvement.
Many laboratories operate in isolation from other laboratories and do not have ongoing opportunities to compare their data with others. Without such opportunities there are risks that a laboratorys data may have errors, biases or significant differences compared to similar laboratories.
The typical format of proficiency testing programs issues a set of samples to each participant together with a set of instructions and any necessary background information. The participants then carry out the requested measurements in their normal manner and submit their results. The results are then statistically handled to generate a report. Each participant is confidentially provided with report to allow them to compare their performance with other participants. The performance of individual laboratories will only be known by that particular laboratory and a limited number of management personnel.
The statistical aspects of proficiency testing The statistical methods which organizer of proficiency testing is used for processing of the results are intended to show the results of
tests and evaluation in a way that allows participating laboratories, as well as other interested parties, simply and clearly consideration.
Analysis of the data must identify extreme results and assess, in a certain level of confidence, their impact on the final statistical results, in accordance with statistical design of PT schemes. There are different methods in application, from numerical to graphic, as described in ISO 5725 and ISO 13528, which are used in a function of PT schemes.
181

International Conference on Innovative Technologies, IN‐TECH 2016,
Prague, 6. ‐ 8. 9. 2016
During of a statistical analysis of the results obtained in the inter-laboratory comparison, it is necessary to consider: number of participating laboratories; number of samples for testing and the number of tests on each sample; assessment of the assigned values; accuracy and trueness of the results obtained; differences between participating laboratories at a desired level of confidence.
The consensus values have to be determined on the basis which enables correctly evaluating the results of participating laboratories.
Consensus values can be determined in several ways as results obtained in the reference laboratories or consensus values from expert laboratories. A consensus value has the advantage that it often has a lower uncertainty than the value reported by reference laboratory.
Statistical analysis of the measuring results
Organizer ILC/PT scheme was Laboratory for dimensional metrology on Mechanical Engineering Faculty of University of Sarajevo, which analyzed and processed the results of all participants according to the standards ISO/IEC 17043: 2010 and ISO 13528: 2005, [3,5], and official reports of regional metrology organizations, [6].
It is analyzed situation in these laboratories in field of length unit using calibration process of gauge blocks on mechanical comparator. For inter-comparison the set of class K gauge blocks is used thru four dimensional laboratories. The technical protocol was issued to all participants prior to comparison. The reported measurement results are analyzed by simple statistical means and investigated statistical distribution of the results.
It was clear that the uncertainties quoted by participants are different from one participant to another, so it wasn’t suitable to use simple arithmetic mean as an estimator of the true mean. Instead, it was used weighted mean, and that approach requires that the participants have made correct estimates of their uncertainty of measurements, [4, 6].
For each laboratory measured deviation from nominal size is denoted as xi and its associated standard uncertainty u(xi), [7].
The normalized weight, wi, for the result xi is given by:
∙ (1)
Where the normalizing factor, C, is given by:
∑
, (2)
Then the weighted mean is:
∑ ∙ , (3)
The uncertainty of the weighted mean can be calculated as so-called internal standard deviation. Internal standard deviation is based
on estimated uncertainties, u(xi), as reported by the participants:
∑√ , (4)
After deriving the weighted mean and its associated uncertainty, the deviation of each laboratory’s result from weighted mean is
determined simply as xi . The uncertainty of this deviation is calculated as a combination of the uncertainties of the result, u(xi), and the uncertainty of the weighted mean. In the case considered in this research, the uncertainty of the weighted mean is taken as .
The uncertainty of the deviation from the weighted mean is given by equation (5), which includes a minus sign to take into account the
correlation between two uncertainties, [6],
, (5)
A check for statistical consistency of the results with their uncertainties is made calculating the value for each laboratory, where is defined as the ratio of deviation from the weighted mean, divided by the uncertainty of this deviation:
, (6)
where: xi – participants measurement result
– assigned value-weighted mean – uncertainty of measuring result
– uncertainty of the weighted mean.
182

International Conference on Innovative Technologies, IN‐TECH 2016, Prague, 6. ‐ 8. 9. 2016
values for each laboratory have been calculated and are also reported, for different nominal values of gauge blocks and all participating laboratories.
The results reported by participants are given in table and show reported deviations from nominal length, with standard uncertainties. In the Table 1 the deviation in central length of 50 mm gauge block is given.
Table 1. Results of measurement and calculation of En for the gauge block 50 mm.
The graphical presentation of the deviation in central length of 50 mm gauge block for all participating laboratories is given in the Figure 1.
Fig. 1 Deviation in central length of number for the gauge block 50 mm.
The analysis is quite straightforward since all of the results have En value less than one, at confidence level 95% (k = 2) confidence level. This means that the results are all in agreement with the relevant weighted mean, and there are there no outliers and no further processing is required.
Conclusion Proficiency testing is gaining increasing importance as a quality assurance tool for laboratories. It is important for laboratories to have
comprehensive information on the scope and availability of proficiency testing schemes in the areas in which they work. The experience of each laboratory, which confers inter-comparisons, it cannot replace modern equipment and other assumptions.
Results of statistical analysis for this PT scheme vary in different ways, pointing to the fact that with caution it must be chosen the way of processing results of proficiency testing. For this detailed approach to the processing of data of proficiency testing should be a great experience in such schemes.
That leads to good knowledge of the participating laboratories, their technical capabilities, personnel and environment conditions, as well as the status of the laboratory with regard to accreditation, traceability levels, whether national laboratories and more.
One unsatisfactory result in any round does not make laboratory poor, neither does achievement of 100% satisfactory results in any round make a laboratory necessarily good.
The main objective of PT scheme is to help the participating laboratory to assess the accuracy of its test results. It is important that laboratories give to its customers the right information regarding the accuracy of the measuring results.
0.03 L1
‐0.01 L2
0.03 L30.05 L4
‐0,15
‐0,1
‐0,05
0
0,05
0,1
0,15
0,2
183

International Conference on Innovative Technologies, IN‐TECH 2016,
Prague, 6. ‐ 8. 9. 2016
References
[1] Brinkman, K.: “EAL interlaboratory comparisons: a prerequisite for establishing mutual recognition agreements between
accreditation bodies”, Springer-Verlag, 1998, 292-294. [2] ILAC document, ILAC-P9 ILAC Policy for Participation in Proficiency Testing Activities, 2010. [3] ISO/IEC 17043:2010, Conformity assessment-General requirements for proficiency testing, International Organization for
Standardization (ISO), 2010. [4] ISO 13528:2005, Statistical methods for use in proficiency testing by inter-laboratory comparisons, International Organization for
standardization (ISO), 2005. [5] Lewis, A., Testa, N.: “Calibration of gauge blocks by mechanical comparison”, EUROMET.L-S16, final report, Project No.797,
NPL, Teddington, 2009. [6] Bašić, H., Softić A.: “The importance of interlaboratory comparison in length measurement as a prerequisite for raising the
accuracy of measurement and development of measurement traceability”, 14th International Research/Expert Conference ‘Trends in the Development of Machinery and Associated Technology”, TMT 2010, pp. 185-188.
[7] Kimothi, S. K., The Uncertainty of Measurements – Physical and Chemical Metrology: Impact and Analysis, ASQ Quality Press, Wisconsin, 2002.
184

International Conference on Innovative Technologies, IN‐TECH 2016, Prague, 6. ‐ 8. 9. 2016
PERFORMANCE EVALUATION BY USING OVERALL EQUIPMENT EFFECTIVENESS (OEE): AN ANALYZING TOOL
K. Mahmood 1, T. Otto 1, E. Shevtshenko 1 and T. Karaulova 1
1 Tallinn University of Technology, Department of Mechanical and Industrial Engineering, Ehitajate tee 5 19086 Tallinn, Estonia
Keywords: Performance Evaluation; Overall Equipment Effectiveness; Manufacturing Equipmen; Overtime Reduction
Abstract: In today’s advance world the companies are continuously seeking for productivity improvement to stay competitive that has led to a necessity for thoroughly defined a performance evaluation system for manufacturing processes. In this paper, overall equipment effectiveness (OEE) is depicted as a performance evaluation tool that measures different types of production losses (six big losses) and reveals areas of process improvement. Moreover, a tool is developed to analyze and avoid overtime being observed in production areas by providing enhanced and in-depth visualization of the OEE for manufacturing equipment. An industrial case study of OEE application is discussed that leads to the assessment and regular performance monitoring of manufacturing machines through this analyzing tool. The output of the tool such as list of potential causes of production losses, graphical view of daily OEE and its elements, monthly performance report is circulated within the enterprise, so that personnel involved in this activity can acknowledge the problems that affect their efforts and manufacturing process as a whole. In addition, a performance evaluation approach is also presented in this paper.
Introduction In order to manage the manufacturing, a number of management techniques have been established. The common problems faced by
manufacturing companies are waste of time, money, energy and overloaded staff. There are several lean measures that can be used to evaluate the performance of manufacturing equipment and as the name suggests, OEE is an overall measure that reflects performance from various perspectives. It is a novel technique to measure the effectiveness of a machine, while it shrinks difficult production problems into simple and thorough visualization of information [1]. Furthermore, it facilitates systematically analyzing the process and finding the potential obstacle areas affecting the utilization of machines.
The OEE metric combines characteristics of reliability, performance and quality into a single key performance indicator (KPI) – expressed as a percentage. Since it covers such broad inputs, OEE can be a useful measure when trying to improve the management and performance of a critical piece of equipment especially in terms of its maintenance, production scheduling, day to day operation and process capability [2].
The objective of this study is to contribute and present the use of OEE for operational evaluation of equipment in production companies, where OEE adopt as an indicator of process improvement activities within a manufacturing environment. Further this study aims to convey the precise monitoring of the OEE as it is a starting point for productivity enhancement of manufacturing equipment, and so, the drive towards operational excellence. In order to provide a comprehensive view a tool has been developed in response to the realization of the following research questions:
What are the major causes of overtime that leads to extra cost?
How to analyze the performance of manufacturing equipment to reduce overtime?
In this study a qualitative case study methodology is used to answer the research questions [3]. Information has been collected through on site (production floor) observations and through interviews with machine’s operators, technical staff (maintenance specialist) and production managers of two different industrial fields of production companies. Pharmaceutical and packaging films firms have been involved in the study.
Literature review – OEE as a Measuring Tool In this section overview of OEE as a measuring tool will be discussed that comprises of definition of OEE, purpose of OEE and six big
losses. Ideal values for the OEE components will also be the part of this section.
Interpretation of OEE OEE assessment tool derived from the concept of Total Productive Maintenance (TPM) and Nakajima [4] describes the TPM as a
combination of three aspects: Escalating equipment effectiveness; Self-sufficient maintenance by operators; and Small group activities. In this perspective OEE can be reflected to combine the operation, maintenance and management of manufacturing equipment and resources. According to Nakajima the most sufficient application of OEE is by process terms in concurrence with the application of the basic quality control tools, such as Pareto and cause and effect diagram. These applications can be an essential supplement to the existing factory performance measurement system. Due to this regard OEE must be considered an operational measure, rather than strategic. Moreover, he suggests that OEE – “A measure that attempts to reveal hidden costs” [4, 5].
In addition, OEE is best suited for environments of high volume based production where capacity utilization is one of the higher priority and stoppages are costly in terms of lost capacity [6].
Purpose of OEE The purpose of OEE is to identify the sources of lost time and lost production. Since OEE is a measure of manufacturing equipment
performance, hence needs to be correctly monitored and presented on daily basis, along with the past history to show the trend, in order to make sure that the machine is working well as far as the Availability, Performance and Quality characteristics are concerned [7].
185
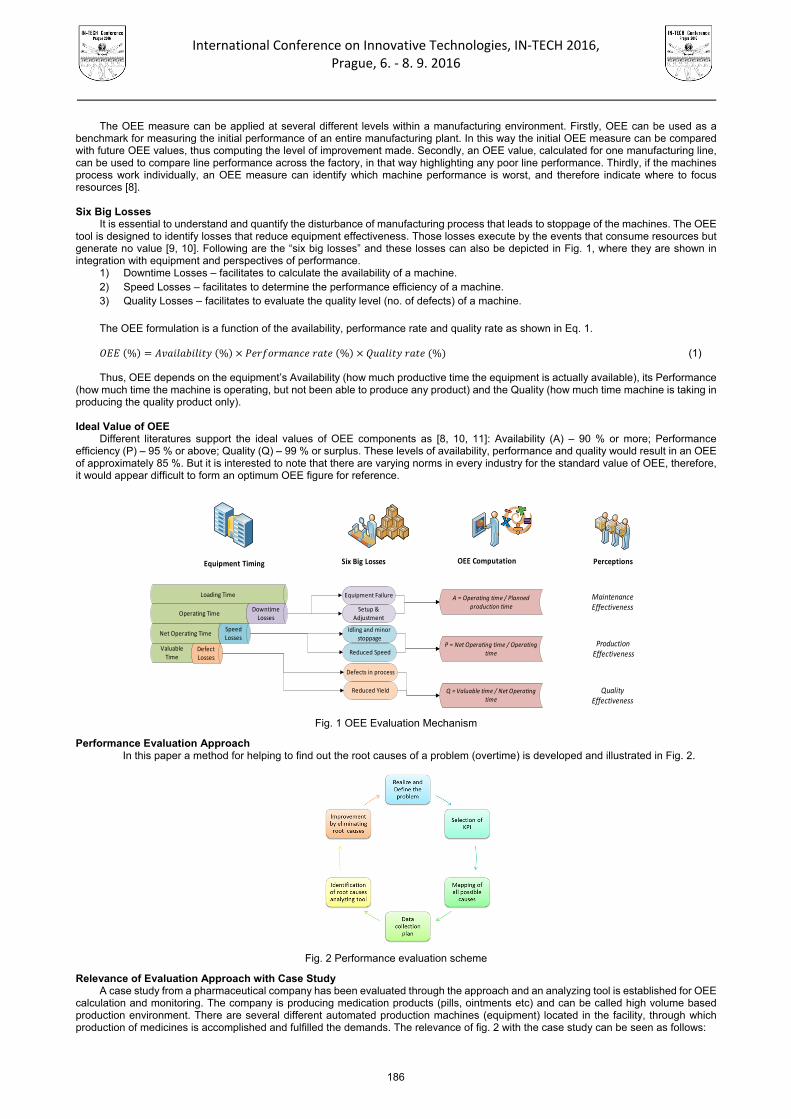
International Conference on Innovative Technologies, IN‐TECH 2016,
Prague, 6. ‐ 8. 9. 2016
The OEE measure can be applied at several different levels within a manufacturing environment. Firstly, OEE can be used as a benchmark for measuring the initial performance of an entire manufacturing plant. In this way the initial OEE measure can be compared with future OEE values, thus computing the level of improvement made. Secondly, an OEE value, calculated for one manufacturing line, can be used to compare line performance across the factory, in that way highlighting any poor line performance. Thirdly, if the machines process work individually, an OEE measure can identify which machine performance is worst, and therefore indicate where to focus resources [8]. Six Big Losses
It is essential to understand and quantify the disturbance of manufacturing process that leads to stoppage of the machines. The OEE tool is designed to identify losses that reduce equipment effectiveness. Those losses execute by the events that consume resources but generate no value [9, 10]. Following are the “six big losses” and these losses can also be depicted in Fig. 1, where they are shown in integration with equipment and perspectives of performance.
1) Downtime Losses – facilitates to calculate the availability of a machine. 2) Speed Losses – facilitates to determine the performance efficiency of a machine. 3) Quality Losses – facilitates to evaluate the quality level (no. of defects) of a machine.
The OEE formulation is a function of the availability, performance rate and quality rate as shown in Eq. 1.
% % % % (1)
Thus, OEE depends on the equipment’s Availability (how much productive time the equipment is actually available), its Performance (how much time the machine is operating, but not been able to produce any product) and the Quality (how much time machine is taking in producing the quality product only). Ideal Value of OEE
Different literatures support the ideal values of OEE components as [8, 10, 11]: Availability (A) – 90 % or more; Performance efficiency (P) – 95 % or above; Quality (Q) – 99 % or surplus. These levels of availability, performance and quality would result in an OEE of approximately 85 %. But it is interested to note that there are varying norms in every industry for the standard value of OEE, therefore, it would appear difficult to form an optimum OEE figure for reference.
Equipment Timing Six Big Losses OEE Computation Perceptions
Loading Time
Operating TimeDowntime Losses
Net Operating TimeSpeed Losses
Valuable Time
Defect Losses
Equipment Failure
Setup & Adjustment
Idling and minor stoppage
Reduced Speed
Defects in process
Reduced Yield
A = Operating time / Planned production time
P = Net Operating time / Operating time
Q = Valuable time / Net Operating time
Maintenance Effectiveness
Production Effectiveness
Quality Effectiveness
Fig. 1 OEE Evaluation Mechanism
Performance Evaluation Approach In this paper a method for helping to find out the root causes of a problem (overtime) is developed and illustrated in Fig. 2.
Fig. 2 Performance evaluation scheme
Relevance of Evaluation Approach with Case Study A case study from a pharmaceutical company has been evaluated through the approach and an analyzing tool is established for OEE
calculation and monitoring. The company is producing medication products (pills, ointments etc) and can be called high volume based production environment. There are several different automated production machines (equipment) located in the facility, through which production of medicines is accomplished and fulfilled the demands. The relevance of fig. 2 with the case study can be seen as follows:
186

International Conference on Innovative Technologies, IN‐TECH 2016,
Prague, 6. ‐ 8. 9. 2016
Realization of Problem – Overtime being observed in production areas that leads to extra cost and pop-up the issue of utilization. Selection of KPI – According to literature OEE is best suited to high volume production and problem demands also OEE as a KPI.
OEE Components Calculation Procedure The formulae of each element of OEE are underlined in this section that helps in the development of analyzing tool. First one is
machine or process ‘availability’, a main factor within the availability element is loading time as in Eq. 2. Loading time (planned production time) can be defined as the total length of the shift after any deductions for planned downtime (breaks). Planned downtime can normally include: meal breaks and short breaks (waiting due to completion of an order, operator training etc). Other causes of downtime could be: startup and shutdown cleaning; material changeover; batch and/or product change; production trials; shortage of material/operator; mechanical/electrical breakdown; maintenance; defective material/packing.
%
100 (2)
Where: (3)
(4)
The next factor in OEE calculation is ‘performance rate’ and it can be considered as a ratio of actual production rate to ideal production rate as in Eq. 5, it reflects the speed of equipment.
%
100 (5)
Where:
(6)
The final factor of OEE calculation is ‘quality rate’ and it indicates the proportion of defective production to the total production volume.
It can be formulated as in Eq. 7:
%
100 (7)
Development of an analyzing tool
A tool has been developed in Microsoft Excel environment to solve the problem of case study and to answer the research question. The tool provides ease in data entering and results inferring. Following features have been introduced so that the OEE can be monitored and presented with least efforts:
Fool-Proof – Visual indication of possible mistakes/errors and highlights logical errors Individual Availability, Performance and Quality Factors Charts; Daily and Monthly OEE Charts
Monthly Report which analyzes causes for reduced OEE
Input to the tool
The data can only be entered in correct format, as recommended by the author. The feature has been incorporated so as to make the tool fool–proof. For e.g., the user cannot intentionally or mistakenly enter negative and alphanumeric values, which if entered, an error message would be pop-up. Following are the parameters that must be entered as input data and tool input screen can be seen in Fig. 3.
- Total shift duration - Downtime of possible causes - Break (meals and etc)
- Total actual production - Ideal production rate - Total rejected pieces
Output from the tool As an output, the tool generates and updates Monthly Report that compares total overtime done in the month with the total time lost
due to reduced Availability, Performance and Quality factors. Analyzes and suggests which of the above factors to be addressed first, second and third in order to eliminate the overtime. The Tool also generates and updates five following charts. An example of daily OEE chart and the monthly report are depicted in Fig. 4 and Fig. 5 respectively.
- Availability factor chart - Performance factor chart - Quality factor chart
- Daily OEE chart - Monthly OEE chart
Significance of monthly report The monthly report summarizes the machine’s monthly performance and highlights weak areas to be focused so as to increase the
OEE and avoid overtime. It mainly describes how much overtime is performed on that specific machine. It also reflects the total time lost due to Availability, Performance and Quality Issues. Moreover, comparing total time lost with total overtime to determine which one is greater. The Gap Color is automatically updates to the decision. The Red color shows that the Performance Factor needs to be addressed first if we want to increase the OEE. It is decided because the Performance Factor is farthest from its standard, i.e., 15%. After that, the Availability and Quality Factors should be focused respectively.
Root Causes and improvement of OEE
In order increase the OEE for this specific case study example, the performance and availability factors must be improved. As those factors depend upon the stoppages and breakdowns, the report presents Pareto Chart of all the stoppages observed in a month. Pareto chart suggest that causes A, B, I, E and G should be considered to avoid overtime and reduce losses as shown in Fig 6. In order to increase the OEE, it needs to be focused why stoppages and breakdowns are observed in Start–up and Shutdown Cleaning, Equipment and Material Changeover, Defective Material and Packing, Power Supply Failure and Maintenance. OEE would be improved and more consistent after fixing these issues.
187

International Conference on Innovative Technologies, IN‐TECH 2016,
Prague, 6. ‐ 8. 9. 2016
Fig. 3 Tool input screen shot
Fig. 5 Monthly performance report
Conclusion The study concludes that the analysis of the OEE tool, its development and application in the industries leads OEE is a valuable
indicator that offers information on the causes of lost time and production. Many companies regularly hit capacity constraints and straightaway consider adding overtime for existing workers, hiring workers for new shifts, or procuring new production equipment to enhance their production capacity. For those companies, the OEE tool can help to optimize the performance of the existing capacity
The developed OEE analyzing tool helps in identification of root causes and determines the weakest area or hurdle in a machine’s optimal performance. Additionally, it helps to find how much overtime is being performed against the time lost due to availability, performance and quality issues. The reduction or completely avoidance of overtime can save: direct savings for the overtime amount paid to labors, utilities consumed during the overtime, expected life increase for the equipment and accessories.
The other important aspect is the accuracy of OEE data that have to be collected for OEE measure and without accurate data the result can easily lead to the unreliability and wrong decisions. Hence one should spend money and time to improve data collection.
References [1] R. Singh, D.B. Shah, A.M. Gohil, H.M. Shah: Overall equipment effectiveness (OEE) calculation – Automation through hardware &
software development, Procedia Engineering Elsevier Ltd., Vol. 51 (2013), pp. 579-584. [2] Q. Brook: Lean six sigma and minitab, (OPEX Resources Ltd. UK, 2010). [3] R.K. YIN: Case Study Research – Design and Methods, (Sage publications, Thousand Oaks, CA., 1994). [4] S. Nakajima: Introduction to Total Productive Maintenance (TPM), (Productivity Press, Cambridge. MA, 1988). [5] B. Dal: Audit and review of manufacturing performance measures at Airbags International Limited, MSc dissertation, (Manchester
School of Management, UMIST, Manchester, 1999). [6] B. Dal, P. Tugwell, R. Greatbanks: Overall equipment effectiveness as a measure of operational improvement – A practical
analysis, International Journal of Operations & Production Management, Vol. 20 (2000) Issue 12, pp. 1488 – 1502. [7] P. Muchiri, L. Pintelon: Performance measurement using overall equipment effectiveness (OEE): literature review and practical
application discussion, International Journal of Production Research, Vol. 46 (2008) Issue 13, pp. 3517-3535. [8] S. Nakajima: TPM Development Program, (Productivity Press, Cambridge. MA. 1989). [9] J.A. Garza-Reyes, S. Eldridge, K.D. Barber, S.H. Meier: Overall equipment effectiveness and process capability measures,
International Journal of Quality & Reliability Management, Vol. 27 (2008) Issue 1 pp. 48 – 62. [10] P. Jonsson, M. Lesshammar: Evaluation and improvement of manufacturing performance measurement systems – the role of OEE,
International Journal of Operations & Production Management, Vol. 19 (1999), Issue 1, pp. 55-78. [11] V. Bashkite, T. Karaulova: Decision-making Framework for Used Industrial Equipment, Engineering Economics, Vol. 27, pp. 23−31.
Fig. 4 Daily OEE chart
188
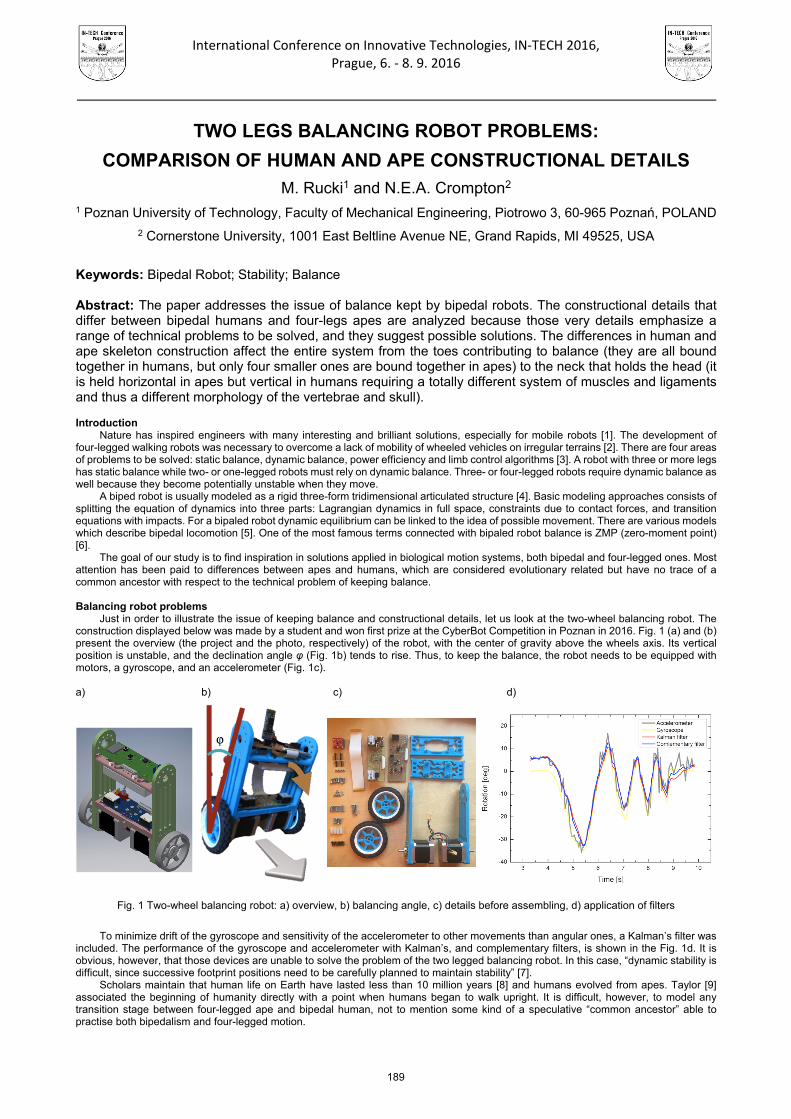
International Conference on Innovative Technologies, IN‐TECH 2016,
Prague, 6. ‐ 8. 9. 2016
TWO LEGS BALANCING ROBOT PROBLEMS:
COMPARISON OF HUMAN AND APE CONSTRUCTIONAL DETAILS
M. Rucki1 and N.E.A. Crompton2 1 Poznan University of Technology, Faculty of Mechanical Engineering, Piotrowo 3, 60-965 Poznań, POLAND
2 Cornerstone University, 1001 East Beltline Avenue NE, Grand Rapids, MI 49525, USA
Keywords: Bipedal Robot; Stability; Balance Abstract: The paper addresses the issue of balance kept by bipedal robots. The constructional details that differ between bipedal humans and four-legs apes are analyzed because those very details emphasize a range of technical problems to be solved, and they suggest possible solutions. The differences in human and ape skeleton construction affect the entire system from the toes contributing to balance (they are all bound together in humans, but only four smaller ones are bound together in apes) to the neck that holds the head (it is held horizontal in apes but vertical in humans requiring a totally different system of muscles and ligaments and thus a different morphology of the vertebrae and skull). Introduction
Nature has inspired engineers with many interesting and brilliant solutions, especially for mobile robots [1]. The development of four-legged walking robots was necessary to overcome a lack of mobility of wheeled vehicles on irregular terrains [2]. There are four areas of problems to be solved: static balance, dynamic balance, power efficiency and limb control algorithms [3]. A robot with three or more legs has static balance while two- or one-legged robots must rely on dynamic balance. Three- or four-legged robots require dynamic balance as well because they become potentially unstable when they move.
A biped robot is usually modeled as a rigid three-form tridimensional articulated structure [4]. Basic modeling approaches consists of splitting the equation of dynamics into three parts: Lagrangian dynamics in full space, constraints due to contact forces, and transition equations with impacts. For a bipaled robot dynamic equilibrium can be linked to the idea of possible movement. There are various models which describe bipedal locomotion [5]. One of the most famous terms connected with bipaled robot balance is ZMP (zero-moment point) [6].
The goal of our study is to find inspiration in solutions applied in biological motion systems, both bipedal and four-legged ones. Most attention has been paid to differences between apes and humans, which are considered evolutionary related but have no trace of a common ancestor with respect to the technical problem of keeping balance. Balancing robot problems
Just in order to illustrate the issue of keeping balance and constructional details, let us look at the two-wheel balancing robot. The construction displayed below was made by a student and won first prize at the CyberBot Competition in Poznan in 2016. Fig. 1 (a) and (b) present the overview (the project and the photo, respectively) of the robot, with the center of gravity above the wheels axis. Its vertical position is unstable, and the declination angle φ (Fig. 1b) tends to rise. Thus, to keep the balance, the robot needs to be equipped with motors, a gyroscope, and an accelerometer (Fig. 1c).
a) b) c) d)
Fig. 1 Two-wheel balancing robot: a) overview, b) balancing angle, c) details before assembling, d) application of filters
To minimize drift of the gyroscope and sensitivity of the accelerometer to other movements than angular ones, a Kalman’s filter was
included. The performance of the gyroscope and accelerometer with Kalman’s, and complementary filters, is shown in the Fig. 1d. It is obvious, however, that those devices are unable to solve the problem of the two legged balancing robot. In this case, “dynamic stability is difficult, since successive footprint positions need to be carefully planned to maintain stability” [7].
Scholars maintain that human life on Earth have lasted less than 10 million years [8] and humans evolved from apes. Taylor [9] associated the beginning of humanity directly with a point when humans began to walk upright. It is difficult, however, to model any transition stage between four-legged ape and bipedal human, not to mention some kind of a speculative “common ancestor” able to practise both bipedalism and four-legged motion.
189

International Conference on Innovative Technologies, IN‐TECH 2016,
Prague, 6. ‐ 8. 9. 2016
Transitional forms of robots
Evolutionary biologists pose a mission impossible for the “blind watchmaker” driven by natural selection and mutations. It can be illustrated by the example of differences between two-wheeled balancing robots and four-legged ones. Just to mention one detail, the latter needs 20 motors to move and keep balance, and each of its joints must be controlled and data processed [10]. In the case of bipedal robots, there remains the permanent risk of it losing its balance [11]. To keep the robot from falling it is necessary to monitor the degree of instability. The stabilizing reaction is based on detection and classification of a fall according to its direction and intensity. To classify a forthcoming fall, there are procedures based on the foot tilting angle and its angular velocity with a field of pattern recognition algorithms.
Interestingly, the development of biped robot design does not take into account any transitional form from a four-legged machine. A successful approach was proposed by scholars at the University of Colombia [12]. It is an iterative approach aimed at developing simple and effective control systems. The models, simulations and mechanics were based on knowledge of biped robot dynamics, based on system dynamics but with no reference to four-legged prototypes. In fact, biped robots and four-legged ones differ so much, that building any transitional form between them would generate a series of additional insolvable problems (e.g. maintaining functionality after replacement of a detail or a unit).
Balance kept in humans and apes
There are 4 extant species of great apes; Pongo pygmaeus, Gorilla gorilla, Pan troglodytes (and Pan paniscus), which form the family Pongidae. They share many similarities with humans, Homo sapiens, who belong to the family Hominidae.
Genetic differences Genome comparisons between ape and man sound extraordinarily close, numbers vary from 95% to 99.4%. However, “similar DNA”
claims are ambiguous. Only 1% of the genome “exonic coding DNA” was used for comparison. The rest 99% is ignored. The sequences are available to download from genomic databases, e.g. http://genome.ucsc.edu [13]. A strict comparison of all DNA base pairs is presented in Table 1 and only 26% similarity (completely random = 25%) is observed. Even if exonic DNA is used the values we are told are still misleading because the “indels” (deletion and insertion events) are excluded. If they weren’t the similarities drop to 86% to 89% [14] which sounds reasonable given the many anatomical differences known to exist between the apes and man. Chimps have 3 billion base pairs, man has 3.23 (7% more DNA). Chimps have 18,759 protein coding genes, man has more than 24,000 (20% more genes).
Table 1. Base-by-base chromosome comparison
Group Percentage of the similar genes Group A 1: 21.1% 2b: 14.9% 3: 25.2% Group B 4: 24.6% 5: 24.2%
Group C 6: 25.6% 7: 25.5% 8: 24.2% 9: 33.4% 10: 25.8% 11: 26.1% 12: 24.1%
Group D 13: 35.1% 14: 37.6% 15: 38.0% Group E 16: 30.3% 17: 21.1% 18: 24.3% Group F 19: 32.5% 20: 26.2% Group G 21: 45.4% 22: 45.2% Sex chr. X: 23.83% Y: 9.3% Average 26%
Constructional differences Despite superficial similarities, especially when seeing a gorilla stand up on his hind legs and “walk”, there are many differences between
apes and humans in constructional details. Apes have a huge laryngeal sac in their chest, man does none. Apes have substantial labial salivary glands, man has almost none. Apes have an osculum, man has none. Apes have four hands; man has two hands and two feet, etc. etc. etc. Consider just the average number of the coccygeal vertebrae, man differs more from apes than any two apes differ from one another:
• Man 4.2 (745 specimens) • Chimpanzee 3.2 (47) • Gorilla 3.0 (69) • Orangutan 2.8 (56) • Gibbon 2.7 (47) • Siamang 2.6 (13) Another noticeable difference are the ischial callosities found in all gibbons, some chimpanzees, gorillas and orangutans. In man callosities
never have or will be found because the ischial tuberosities are completely padded by muscles arising from their entire surfaces, preventing skin from being pressed against the bone. Features designed to keep balance at four-legged motion are following (Fig. 2):
long arms (arm bones 120% larger than their leg bones), short legs with the knee cannot be straightened and must be continually loaded in flexion (bent leg), funnel-shaped ribs, opposable big toes, projecting cervical vertebrae to support the forward projecting head, etc. On the other hand, in humans, the center of gravity when in the upright position is right over the pelvic area. To achieve that and to
ensure dynamic stability of the bipedal motion, there are many unique constructional characteristics of humans: shorter arms (approximately 70% of the size of leg bones), the curvature of the spine is “S” shaped in humans, unlike in apes, human knee joint is unique in that it can be locked in an upright position, human’s scapula sits right on the back.
190

International Conference on Innovative Technologies, IN‐TECH 2016,
Prague, 6. ‐ 8. 9. 2016
a) b)
Fig. 2 Different constructional features of apes and humans: a) posture and neck [15], b) transverse metatarsal
ligament In humans, but not apes, the transverse metatarsal ligament joins the big toe. Moreover, the ratio of the power arm (the distance from
the heel to the talocrural joint) to the load arm (that from the talocrural joint to the distal head of the metatarsals) differs markedly between the human and ape foot [16]. It minimizes muscle force at the talocrural joint of around 40%, reduces forces in the plantar musculature and aponeurosis and has a lower total of force in joints and muscles than do the ape feet. The observation that “chimpanzees and gorillas possess feet adapted for both arboreal and terrestrial substrates” [17] emphasizes the fact that those constructional features are aimed at specific functions. In the case of apes, especially gorillas, it is possible to perform bipedal motion, but It is difficult and unnatural for monkeys and apes to maintain a vertical posture with their legs [18].
Conclusion
Several practical conclusions could be derived from the above observations. First, four-legged systems need different constructional and control approaches than bipedal ones. Second, the design of a four-legged robot able to perform some functions like a bipedal one (comparable to an ape walking on hind legs) requires additional energy and sensors, and control systems to keep balance in both conditions. In fact, it requires the redesign of systems to provide static balance, dynamic balance, power efficiency and limb control algorithms. Third, some solutions like knee joints and foot platform of humans prove to save up to 40% of muscle energy, which indicates the directions of further improvement of robot mechanics.
However, the mechanical engineering perspective makes it extremely difficult to address the evolutionary issue of humans and apes. The problem is that both technical solutions (human and ape locomotion) are unique and stable and leave no place for any transitional forms. There are no traces of evolution or devolution between bipedalism to four-legged motion, since these two systems require different mechanics, kinematic and dynamic solutions. Additionally, the entire control system would require redesigning to achieve the stability of four-legged machine when two legs are removed (or redesigned for different functions). In fact, evolutionary biologists who require transitional forms for everything have a far more difficult task than engineers who redesign and rebuild their robots from scratch.
References [1] K.J. Waldron, M.O. Tokhi, G.S. Virk (eds.): Nature-Inspired Mobile Robotics, (World Scientific Publishing Co., Singapore, 2013). [2] Ch.F. Huai, X.Y. Jia and P.A. Liu: Robust Control for a Mixed Leg Mechanism Four-Legged Walking Robot. In: D. Jin and S. Lin
(eds.): Advances in Computer Science and Information Engineering, Vol. 1 (Springer, Berlin, 2012), pp. 73-80. [3] H.H. Poole: Fundamentals of Robotics Engineering, (Van Nostrand, New York, 1989). [4] B. Siciliano, O. Khatib (eds.): Springer Handbook of Robotics, (Springer, Berlin, 2008). [5] R. Chakraborty, G.C. Nandi, S. Kundu: Component based computational model for bipedal locomotion, Robotics and Autonomous
Systems, Vol. 81 (2016), pp. 48-56. [6] M. Vukobratović, B. Borovac: Zero-moment point—thirty five years of its life, International Journal of Humanoid Robotics, Vol. 1
(2004), pp. 157-173. [7] H. Hexmoor: Essential Principles for Autonomous Robotics, (Morgan&Claypool Publishers, 2013). [8] F.J. Ayala: Am I a Monkey? Six Big Questions about Evolution, (The Johns Hopkins University Press, Baltimore, 2010). [9] T. Taylor: The Artificial Ape: How Technology Changed the Course of Human Evolution, (Palgrave Macmillan, New York, 2010). [10] J. Hilljegerdes, D. Spenneberg and F. Kirchner: The Construction of the Four Legged Prototype Robot ARAMIES, Proc of the 8th
International Conference on Climbing and Walking Robots and the Support Technologies for Mobile Machines, CLAWAR (2005), pp. 335-342.
[11] O. Hohn, J. Gacnik and W. Gerth: Detection and Classification of Posture Instabilities of Bipedal Robots, Proc of the 8th International Conference on Climbing and Walking Robots and the Support Technologies for Mobile Machines, CLAWAR (2005), pp. 409-416.
[12] M.A. Roa, R.E. Ramirez and D.A. Garzon: Development of Biped Robots at the National University of Colombia, Proc of the 8th International Conference on Climbing and Walking Robots and the Support Technologies for Mobile Machines, CLAWAR (2005), pp. 357-364.
[13] Genome Browser http://genome.ucsc.edu (available 22.07.2016). [14] Tomkins, J. 2011. Genome-Wide DNA Alignment Similarity (Identity) for 40,000 Chimpanzee DNA Sequences Queried against the
Human Genome is 86 – 89% Answers Res J 4:233-241. [15] H. C. Raven, The Anatomy of the Gorilla, (Columbia University Press, 1950). [16] W.J. Wang and R.H. Crompton: Analysis of the human and ape foot during bipedal standing with implications for the evolution of the
foot, J Biomech. 2004 Dec;37(12):1831-6. [17] D.L. Gebo: Plantigrady and foot adaptation in African apes: implications for hominid origins, Am J Phys Anthropol. 1992 Sep;
89(1):29-58. [18] G. Barnard, A. McIntosh and S. Taylor: Origins: Examining the Evidence, (Truth in Science, 2011)
191

International Conference on Innovative Technologies, IN‐TECH 2016,
Prague, 6. ‐ 8. 9. 2016
192
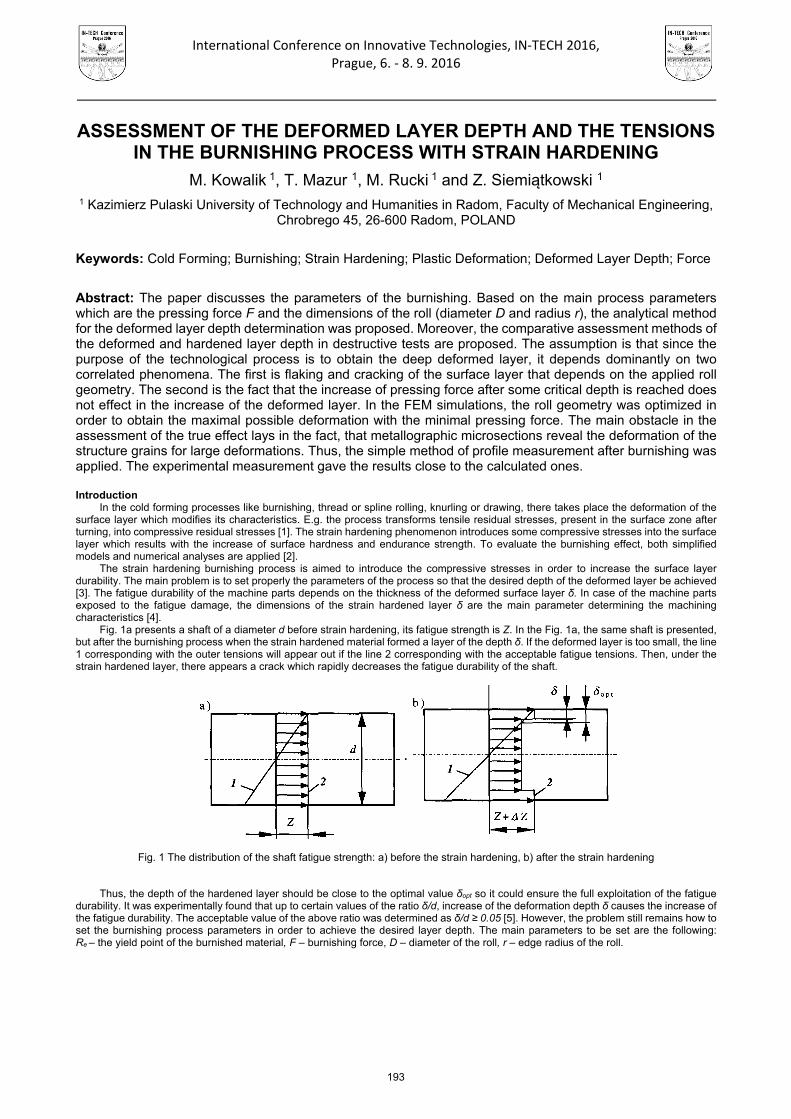
International Conference on Innovative Technologies, IN‐TECH 2016,
Prague, 6. ‐ 8. 9. 2016
ASSESSMENT OF THE DEFORMED LAYER DEPTH AND THE TENSIONS IN THE BURNISHING PROCESS WITH STRAIN HARDENING
M. Kowalik 1, T. Mazur 1, M. Rucki 1 and Z. Siemiątkowski 1 1 Kazimierz Pulaski University of Technology and Humanities in Radom, Faculty of Mechanical Engineering,
Chrobrego 45, 26-600 Radom, POLAND
Keywords: Cold Forming; Burnishing; Strain Hardening; Plastic Deformation; Deformed Layer Depth; Force
Abstract: The paper discusses the parameters of the burnishing. Based on the main process parameters which are the pressing force F and the dimensions of the roll (diameter D and radius r), the analytical method for the deformed layer depth determination was proposed. Moreover, the comparative assessment methods of the deformed and hardened layer depth in destructive tests are proposed. The assumption is that since the purpose of the technological process is to obtain the deep deformed layer, it depends dominantly on two correlated phenomena. The first is flaking and cracking of the surface layer that depends on the applied roll geometry. The second is the fact that the increase of pressing force after some critical depth is reached does not effect in the increase of the deformed layer. In the FEM simulations, the roll geometry was optimized in order to obtain the maximal possible deformation with the minimal pressing force. The main obstacle in the assessment of the true effect lays in the fact, that metallographic microsections reveal the deformation of the structure grains for large deformations. Thus, the simple method of profile measurement after burnishing was applied. The experimental measurement gave the results close to the calculated ones.
Introduction
In the cold forming processes like burnishing, thread or spline rolling, knurling or drawing, there takes place the deformation of the surface layer which modifies its characteristics. E.g. the process transforms tensile residual stresses, present in the surface zone after turning, into compressive residual stresses [1]. The strain hardening phenomenon introduces some compressive stresses into the surface layer which results with the increase of surface hardness and endurance strength. To evaluate the burnishing effect, both simplified models and numerical analyses are applied [2].
The strain hardening burnishing process is aimed to introduce the compressive stresses in order to increase the surface layer durability. The main problem is to set properly the parameters of the process so that the desired depth of the deformed layer be achieved [3]. The fatigue durability of the machine parts depends on the thickness of the deformed surface layer δ. In case of the machine parts exposed to the fatigue damage, the dimensions of the strain hardened layer δ are the main parameter determining the machining characteristics [4].
Fig. 1a presents a shaft of a diameter d before strain hardening, its fatigue strength is Z. In the Fig. 1a, the same shaft is presented, but after the burnishing process when the strain hardened material formed a layer of the depth δ. If the deformed layer is too small, the line 1 corresponding with the outer tensions will appear out if the line 2 corresponding with the acceptable fatigue tensions. Then, under the strain hardened layer, there appears a crack which rapidly decreases the fatigue durability of the shaft.
Fig. 1 The distribution of the shaft fatigue strength: a) before the strain hardening, b) after the strain hardening
Thus, the depth of the hardened layer should be close to the optimal value δopt so it could ensure the full exploitation of the fatigue durability. It was experimentally found that up to certain values of the ratio δ/d, increase of the deformation depth δ causes the increase of the fatigue durability. The acceptable value of the above ratio was determined as δ/d ≥ 0.05 [5]. However, the problem still remains how to set the burnishing process parameters in order to achieve the desired layer depth. The main parameters to be set are the following: Re – the yield point of the burnished material, F – burnishing force, D – diameter of the roll, r – edge radius of the roll.
193

International Conference on Innovative Technologies, IN‐TECH 2016,
Prague, 6. ‐ 8. 9. 2016
Technological parameters of burnishing
The analytical method of the deformed layer depth prediction from the input process parameters (F, D, r and Re) was worked out. The theoretical model of the burnishing process was based on the assumptions presented in the Fig. 2, where the burnished shaft surface underwent the pressing force F from the undeformable roller of diameter D with the edge of radius r.
Fig. 2 The burnishing model assumed for the calculations
The simplifying assumption was made that the roller was not deformable, and the material adjacent to the roll underwent exclusively
elastic strain irrespectively of the force value F. The distribution of the elastic tensions represents the dotted curve σred while on the line marked k-k, the value of σred= Re. In the area over the line k-k, there appear the tensions σred> Re i.e. the plastic deformation area, while below lays the area of elastic strain [6]. In practice, the two areas of different types of deformation take place, but the division between them is not as sharp as it is presented in the Fig. 2. Hence, the coordinate z= δ that determines the line k-k, where σred= Re, divides the material into two zones: upper plastic deformed one and lower elastic deformed one.
It could be assumed that the tensions in the upper area of plastic deformation do not transform substantially the distribution of the tensions in the lower zone. Thus, to calculate the coordinate z= δ that divide between two zones, the strain theory could be applied to know the position of the line k-k. The analytical calculations were based on the Hertz – Bielayev method that describes the contact of two strain bodies. The solution concerns with the symmetric case where it is assumed that the contact surface is of the ellipsoid shape with equal semi-axes. After a series of calculations [6], the equation (1) is achieved:
2 2
4 32 1 1
31e
Farcctg
e eR e
e
, (1)
where: F – pressing force, Re – yield point, ν –Poisson’s number for the burnished material, e – Hertz’s semi-axis. From the equation (1), it could be calculated how the changes of Re value can affect the pressing force value required to cause the
deformation of the shaft surface layer at the desired depth δ. The Fig. 3 presents the graphs calculated for the following data: E=2×10⁵ MPa, ν=0.3, D=40 mm, d=20 mm, r=10 mm.
Fig. 3 The examples of graphs of function F=f(δ, Re) calculated for the parameters E=2×10⁵ MPa, ν=0.3, D=40 mm, d=20 mm, r=10 mm [6]
Experimental verification
In order to perform experimental verifications of the deformed layer depth dependent on the pressing force during the burnishing process, the dimensions of the processed ring samples were chosen [7]. In the Fig. 4, there is presented a set of the samples to be burnished fixed on the rod. The frontal surfaces, as well as the cylindrical surface were grinded precisely. Compressive stress caused by the screw momentum was ca. 2 MPa.
194
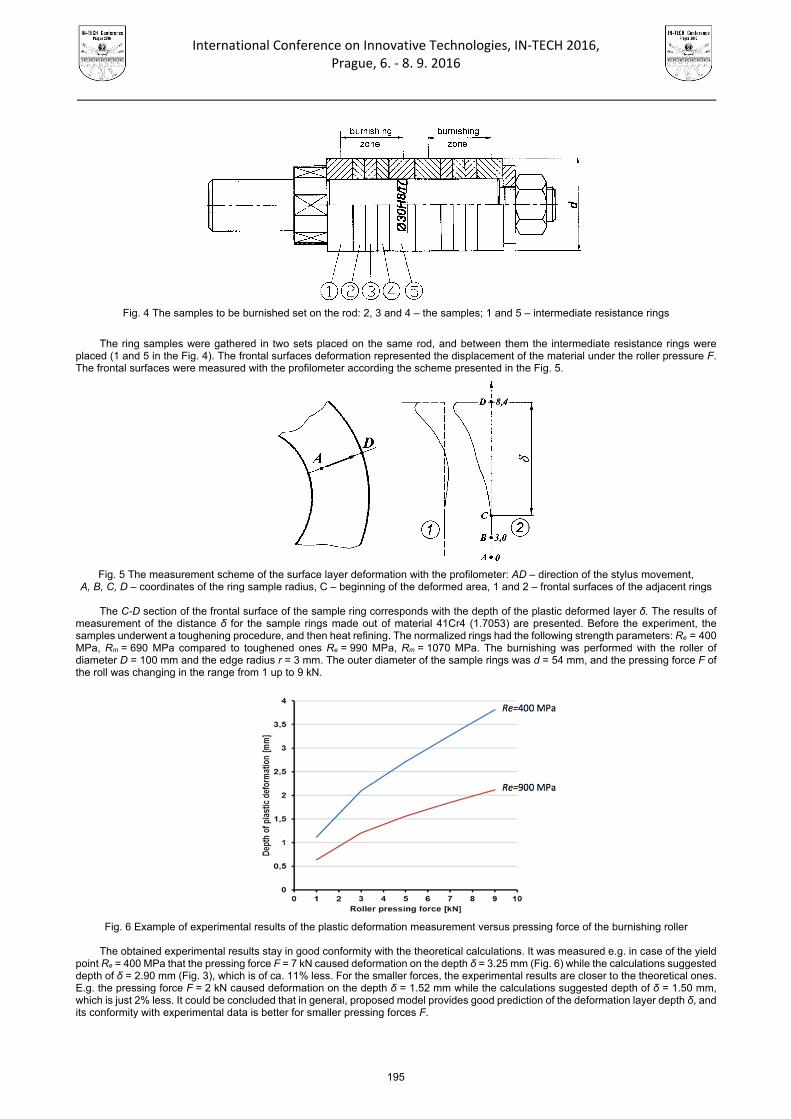
International Conference on Innovative Technologies, IN‐TECH 2016,
Prague, 6. ‐ 8. 9. 2016
Fig. 4 The samples to be burnished set on the rod: 2, 3 and 4 – the samples; 1 and 5 – intermediate resistance rings
The ring samples were gathered in two sets placed on the same rod, and between them the intermediate resistance rings were
placed (1 and 5 in the Fig. 4). The frontal surfaces deformation represented the displacement of the material under the roller pressure F. The frontal surfaces were measured with the profilometer according the scheme presented in the Fig. 5.
Fig. 5 The measurement scheme of the surface layer deformation with the profilometer: AD – direction of the stylus movement,
A, B, C, D – coordinates of the ring sample radius, C – beginning of the deformed area, 1 and 2 – frontal surfaces of the adjacent rings
The C-D section of the frontal surface of the sample ring corresponds with the depth of the plastic deformed layer δ. The results of measurement of the distance δ for the sample rings made out of material 41Cr4 (1.7053) are presented. Before the experiment, the samples underwent a toughening procedure, and then heat refining. The normalized rings had the following strength parameters: Re = 400 MPa, Rm = 690 MPa compared to toughened ones Re = 990 MPa, Rm = 1070 MPa. The burnishing was performed with the roller of diameter D = 100 mm and the edge radius r = 3 mm. The outer diameter of the sample rings was d = 54 mm, and the pressing force F of the roll was changing in the range from 1 up to 9 kN.
Fig. 6 Example of experimental results of the plastic deformation measurement versus pressing force of the burnishing roller
The obtained experimental results stay in good conformity with the theoretical calculations. It was measured e.g. in case of the yield
point Re = 400 MPa that the pressing force F = 7 kN caused deformation on the depth δ = 3.25 mm (Fig. 6) while the calculations suggested depth of δ = 2.90 mm (Fig. 3), which is of ca. 11% less. For the smaller forces, the experimental results are closer to the theoretical ones. E.g. the pressing force F = 2 kN caused deformation on the depth δ = 1.52 mm while the calculations suggested depth of δ = 1.50 mm, which is just 2% less. It could be concluded that in general, proposed model provides good prediction of the deformation layer depth δ, and its conformity with experimental data is better for smaller pressing forces F.
195

International Conference on Innovative Technologies, IN‐TECH 2016,
Prague, 6. ‐ 8. 9. 2016
Conclusion
The measurement of the frontal surface deformation of the sample rings after burnishing is simple and efficient method that requires a profilometer of typical characteristics. The performed analysis confirmed that simple and fast calculation method based on Hertz – Belayev theory of the strain bodies contact could be successfully applied for the calculation of the deformed layer depth in the burnishing process. Its simplifying assumption of the process symmetry does not affect the final results in unacceptable way. Knowing the burnishing parameters (Re – the yield point of the burnished material, F – burnishing force, D – diameter of the roll, r – edge radius of the roll), it is possible to calculate the expected depth of the deformed layer. On the other hand, it is possible to select the proper parameters to achieve the desired depth δ. The obtained experimental results showed good conformity with the theoretical calculations.
Since the burnishing process is designed to form a strengthened layer under the surface, to improve the fatigue durability of the machine part, its effect should be predictable within reasonable accuracy range. The applied simplified model provide good results, accurate enough for the practical manufacturing purposes.
References
[1] B. Zabkar, J. Kopac: An investigation into roller burnishing process, Journal of Production Engineering, Vol. 16, No. 2 (2013), pp.
45-48. [2] Dyl T.: The numerical analysis of burnishing process of hollow steel tubes. In: Mechatronics: Ideas, Challenges, Solutions and
Applications, Eds. J. Awrejcewicz, K.J. Kaliński, R. Szewczyk, M. Kaliczyńska, (Springer, London, 2016) pp. 65-74. [3] J.R. Clark, M.B. Grant: The effect of surface finish on component performance, Int. J. Mech. Tools Manufacturing, Vol. 32 (1992),
pp. 57–66. [4] R. Patyk, S. Patyk, L. Kukielka: The numerical determination of contact zone tool and work-pieces in burnishing rolling process,
Computer Methods in Materials Science, Vol. 23 (2009), pp. 61-65. [5] B. Kotiveerachari, R.L. Murthy: Study of some aspects of burnishing, Int. J. Production Res, Vol. 23, pp. 499–521. [6] J. Jezierski, T. Mazur, K. Tubielewicz: Analysis of the state of plastic deformation in the upper layer after surface burnishing,
Advances in Manufacturing Sciences and Technology, Vol. 25 (2001), pp. 59-74. [7] J. Jezierski, T. Mazur: Analysis of the thickness of the plasticized zone in the surface burnishing process, Archive of Mechanical
Engineering, Vol. 59 (2002), pp. 105-126.
196
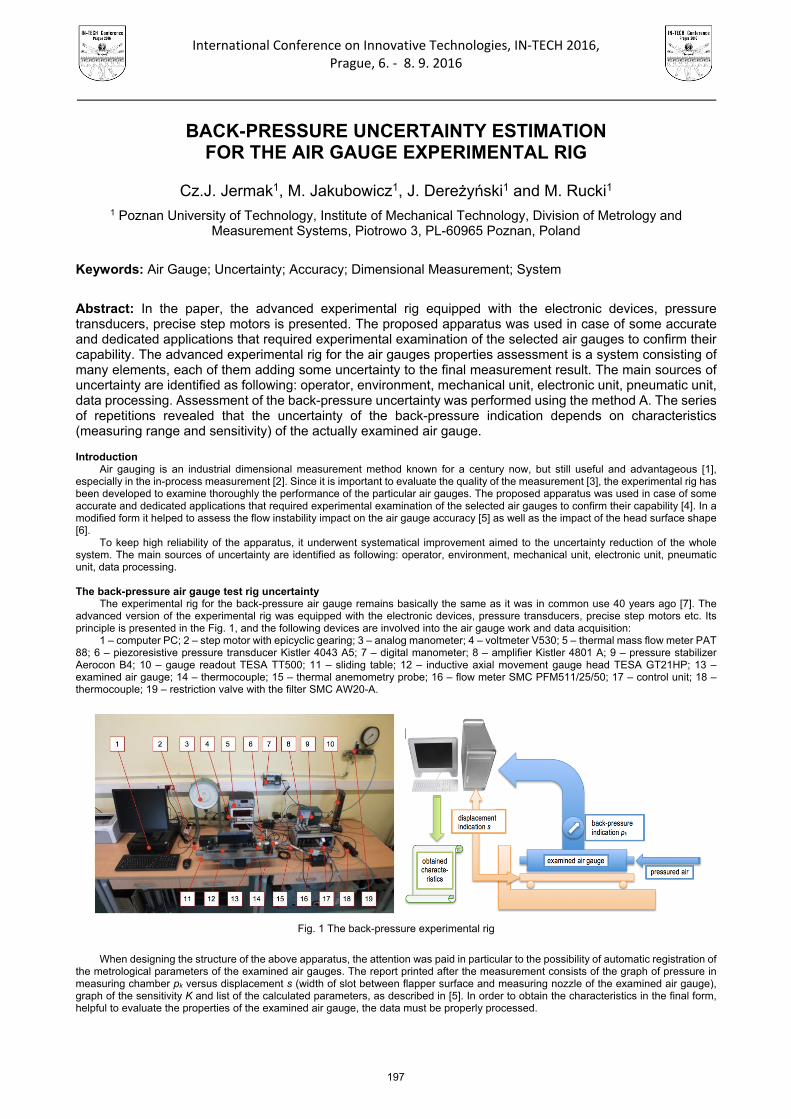
International Conference on Innovative Technologies, IN‐TECH 2016,
Prague, 6. ‐ 8. 9. 2016
BACK-PRESSURE UNCERTAINTY ESTIMATION FOR THE AIR GAUGE EXPERIMENTAL RIG
Cz.J. Jermak1, M. Jakubowicz1, J. Dereżyński1 and M. Rucki1 1 Poznan University of Technology, Institute of Mechanical Technology, Division of Metrology and
Measurement Systems, Piotrowo 3, PL-60965 Poznan, Poland
Keywords: Air Gauge; Uncertainty; Accuracy; Dimensional Measurement; System
Abstract: In the paper, the advanced experimental rig equipped with the electronic devices, pressure transducers, precise step motors is presented. The proposed apparatus was used in case of some accurate and dedicated applications that required experimental examination of the selected air gauges to confirm their capability. The advanced experimental rig for the air gauges properties assessment is a system consisting of many elements, each of them adding some uncertainty to the final measurement result. The main sources of uncertainty are identified as following: operator, environment, mechanical unit, electronic unit, pneumatic unit, data processing. Assessment of the back-pressure uncertainty was performed using the method A. The series of repetitions revealed that the uncertainty of the back-pressure indication depends on characteristics (measuring range and sensitivity) of the actually examined air gauge. Introduction
Air gauging is an industrial dimensional measurement method known for a century now, but still useful and advantageous [1], especially in the in-process measurement [2]. Since it is important to evaluate the quality of the measurement [3], the experimental rig has been developed to examine thoroughly the performance of the particular air gauges. The proposed apparatus was used in case of some accurate and dedicated applications that required experimental examination of the selected air gauges to confirm their capability [4]. In a modified form it helped to assess the flow instability impact on the air gauge accuracy [5] as well as the impact of the head surface shape [6].
To keep high reliability of the apparatus, it underwent systematical improvement aimed to the uncertainty reduction of the whole system. The main sources of uncertainty are identified as following: operator, environment, mechanical unit, electronic unit, pneumatic unit, data processing. The back-pressure air gauge test rig uncertainty
The experimental rig for the back-pressure air gauge remains basically the same as it was in common use 40 years ago [7]. The advanced version of the experimental rig was equipped with the electronic devices, pressure transducers, precise step motors etc. Its principle is presented in the Fig. 1, and the following devices are involved into the air gauge work and data acquisition:
1 – computer PC; 2 – step motor with epicyclic gearing; 3 – analog manometer; 4 – voltmeter V530; 5 – thermal mass flow meter PAT 88; 6 – piezoresistive pressure transducer Kistler 4043 A5; 7 – digital manometer; 8 – amplifier Kistler 4801 A; 9 – pressure stabilizer Aerocon B4; 10 – gauge readout TESA TT500; 11 – sliding table; 12 – inductive axial movement gauge head TESA GT21HP; 13 – examined air gauge; 14 – thermocouple; 15 – thermal anemometry probe; 16 – flow meter SMC PFM511/25/50; 17 – control unit; 18 – thermocouple; 19 – restriction valve with the filter SMC AW20-A.
Fig. 1 The back-pressure experimental rig
When designing the structure of the above apparatus, the attention was paid in particular to the possibility of automatic registration of
the metrological parameters of the examined air gauges. The report printed after the measurement consists of the graph of pressure in measuring chamber pk versus displacement s (width of slot between flapper surface and measuring nozzle of the examined air gauge), graph of the sensitivity K and list of the calculated parameters, as described in [5]. In order to obtain the characteristics in the final form, helpful to evaluate the properties of the examined air gauge, the data must be properly processed.
197

International Conference on Innovative Technologies, IN‐TECH 2016, Prague, 6. ‐ 8. 9. 2016
Thorough uncertainty analysis [8] should be performed for the proposed methods and measurement systems [9], either with GUM [10] or Monte Carlo methods [11]. The final uncertainty of the air gauge characteristics is a result of the propagation of the uncertainties ofall devices included into the system and participating in the data collection and processing. The mechanical unit of the analyzedmeasurement system responsible for the setting proper value of the displacement has many factors that may affect the accuracy of theobtained results. The most obvious ones are the friction between the moving parts, the velocity of the sliding table, and the backlasheswithin the system, which may result in random variability of the measured displacement. Thus, the most proper uncertainty analysis for thisunit should be Method A proposed by GUM [10].
Next, the displacement value s is measured, and all involved devices add their own uncertainty. Simultaneously, the back-pressure pk is measured with its own uncertainty affected additionally with the analog to digital conversion [12], so the couples of values (si+∆si; pki+∆pki) are obtained. The program starts to process the collected data, estimating the functions and calculating the main characteristics of the examined air gauge.
Pressure transducer indications pk
Inductive gauge head indication s
Couples of values (si+∆si; pki+∆pki);
estimation of function pk = f(s)
GT21HP Repeatability (±2σ) = 0.01 µm non-linearity =0.007+0.4L (µm, Lmm) temperature zero drift <±0.5%/FSO uncertainty of the inductive gauge head ∆si
Positioning uncertainty ±2σ Method A
Gauge readout TT500 Linearity < 0,012% Hystheresis <0,005%
Kistler 4043A5 non-linearity <0.3%FSO uncertainty of the pressure transducer ∆pki
Multiplier 4618A2 error in temperatures 0-60°C for 0 input <±1 mV for sensitivity <±0.2%FSP
Estimation, smoothening, algoritms
Interpolation, linearization, rounding off
Uncertainty of conversion A/C: ADAM + measurement algoritm
Fig. 2 The sources of uncertainty in the air gauge test rig
198

International Conference on Innovative Technologies, IN‐TECH 2016,
Prague, 6. ‐ 8. 9. 2016
Uncertainty of the indications of the back-pressure
Since the air gauge is the examined device, the uncertainties generated by the pneumatic unit should be considered most carefully. The Fig. 3 presents the scheme of the pressured air supply and the devices directly involved into the assessment of the back-pressure pk:
- pressure transducer Kistler 4043A5 (non-linearity <0.3% FSO), - amplifier 4618A2 with the following errors in the temperatures 0-60°C:
for 0 input <±1 mV, for sensitivity <±0.2% FSP,
- data acquisition module ADAM produced by Advantech.
Fig. 3 Pneumatic path of the back-pressure experimental rig
The uncertainty of the back-pressure pk digital value ascribed to the certain slot width s underwent statistical analysis, because the
final result is affected by the gas dynamic phenomena that could not be estimated in any other way [13]. Thus, 30 repetitions of the back-pressure measurement were performed according to the statistics requirements [14]. Each time the slot width s was set to the value corresponding with the initial point of static characteristics (sp), its end point (sk) as well as the central point (s0). The Table 1 presents the results for the analog indications [V] and for the digital ones recalculated into the pressure units [kPa]. The geometry configuration of the examined air gauge was following: measuring nozzle diameter dp = 1.391 mm, and inlet nozzle diameter dw = 0.830 mm. Table 1. Repetitions of the back-pressure indications
pk (sp) [V] pk (sp) [kPa] pk (s0) [V] pk (s0) [kPa] pk (sk) [V] pk (sk) [kPa]
1 9.53 142.95 8.21 123.15 6.52 97.80 2 9.54 143.10 8.19 122.85 6.52 97.80 3 9.54 143.10 8.19 122.85 6.52 97.80 4 9.55 143.25 8.19 122.85 6.52 97.80 5 9.54 143.10 8.20 123.00 6.53 97.95 6 9.54 143.10 8.20 123.00 6.52 97.80 7 9.55 143.25 8.19 122.85 6.52 97.80 8 9.54 143.10 8.20 123.00 6.52 97.80 9 9.55 143.25 8.19 122.85 6.53 97.95
10 9.55 143.25 8.19 122.85 6.53 97.95 11 9.54 143.10 8.19 122.85 6.51 97.65 12 9.54 143.10 8.19 122.85 6.52 97.80 13 9.54 143.10 8.19 122.85 6.52 97.80 14 9.55 143.25 8.19 122.85 6.52 97.80 15 9.55 143.25 8.19 122.85 6.53 97.95 16 9.54 143.10 8.19 122.85 6.53 97.95 17 9.55 143.25 8.19 122.85 6.51 97.65 18 9.56 143.40 8.19 122.85 6.52 97.80 19 9.55 143.25 8.19 122.85 6.52 97.80 20 9.54 143.10 8.19 122.85 6.52 97.80 21 9.55 143.25 8.19 122.85 6.52 97.80 22 9.55 143.25 8.19 122.85 6.52 97.80 23 9.56 143.40 8.20 123.00 6.52 97.80 24 9.56 143.40 8.19 122.85 6.53 97.95 25 9.56 143.40 8.19 122.85 6.52 97.80 26 9.56 143.40 8.18 122.70 6.53 97.95 27 9.56 143.40 8.19 122.85 6.51 97.65 28 9.56 143.40 8.19 122.85 6.52 97.80 29 9.56 143.40 8.19 122.85 6.52 97.80 30 9.56 143.40 8.19 122.85 6.52 97.80
Mean 9.55 143.24 8.19 122.88 6.52 97.82 Max 9.56 143.40 8.21 123.15 6.53 97.95 Min 9.53 142.95 8.18 122.70 6.51 97.65
R(Max-Min) 0.03 0.45 0.03 0.45 0.02 0.30 σ 0.009 0.133 0.005 0.080 0.006 0.086
199

International Conference on Innovative Technologies, IN‐TECH 2016,
Prague, 6. ‐ 8. 9. 2016
For each measured slot width, the expanded uncertainty corresponding with probability P=0.95 was calculated for the single measurement:
U0.95 = 1.960σ, (1)
where: σ is the standard deviation. The largest uncertainty for a single measurement U0.95 = 0.260 [kPa] was obtained for the initial point of the static characteristics sp. It
corresponds with the air gauge indication 0.52 µm. This value consists not only the uncertainties of the pressure transducer and A/D conversion, but also the one generated by the airflow inside the examined air gauge.
The series of repetitions revealed that the uncertainty of the back-pressure indication depends on the air gauge characteristics (measuring range and sensitivity). For example, the air gauge of measuring range zp = 107 µm and sensitivity |K| = 0.459 kPa/µm enabled to point out the back-pressure within bounds corresponding with ∆=±1.2 µm for a single measurement and ∆=±0.6 µm for a series of 15 repetitions. On the other hand, the air gauge of measuring range zp = 65 µm and sensitivity |K| = 0.951 kPa/µm enabled to point out the back-pressure within bounds corresponding with ∆=±1.9 µm for a single measurement and ∆=±1.0 µm for a series of 15 repetitions.
Conclusion
The back-pressure uncertainty analysis proved high accuracy of the examined air gauge test rig. To assess the overall system uncertainty, the other sources apart of pneumatic unit should undergo analysis: operator, environment, mechanical unit, electronic unit and data processing (i.e. estimation, smoothening, rounding off, interpolation, linearization etc.). The equipment variation of the entire system including the examined air gauge should be calculated in order to evaluate capability of the system to meet the accuracy requirements.
References [1] G. Schuetz: Pushing the Limits of Air Gaging—And Keeping Them There, Quality Magazine, Vol. 54/7 (2015), pp. 22-26. [2] Ch. Koehn: In-Process Air Gaging, Quality Magazine, Vol. 53/5 (2014), pp. 22-23. [3] R. Bullock, R. Deckro, Foundations for system measurement, Measurement, Vol. 39 (2006), pp. 701-709. [4] Cz.J. Jermak, M. Rucki: Static Characteristics of Air Gauges Applied in the Roundness Assessment, Metrology and Measurement
Systems, Vol. 23 (2016), pp. 85-96. [5] M. Rucki, B. Barisic, T. Szalay: Analysis of air gage inaccuracy caused by flow instability, Measurement, Vol. 41 (2008), pp.
655-661. [6] Cz.J. Jermak, B. Barisic, M. Rucki: Correction of the metrological properties of the pneumatic length measuring gauges through
changes of the measuring nozzle head surface shape, Measurement, Vol. 43 (2010), pp. 83-91. [7] V.R. Burrows: The Principles and Applications of Pneumatic Gauging, Founding, Welding, Production Engineering, Oct. 1976, pp.
31-42. [8] L. Šiaudinyte, K. Grattan: Uncertainty evaluation of trigonometric method for vertical angle calibration of the total station instrument,
Measurement, Vol. 86 (2016), pp. 276-282. [9] S. Ito et al., Uncertainty analysis of slot die coater gap width measurement by using a shear mode micro-probing system, Precision
Engineering, Vol. 43 (2016), pp. 525-529. [10] Guide to the Expression of Uncertainty in Measurement (GUM), (International Organization for Standardization (ISO), Geneva,
1995). [11] A. Chen, Ch. Chen: Comparison of GUM and Monte Carlo methods for evaluating measurement uncertainty of perspiration
measurement systems, Measurement Vol. 87 (2016), pp. 27-37. [12] A. Domanska: Uncertainty of the Analog to Digital Conversion Result. In: Measurement Uncertainty, Theory and Practice, Eds.
P. Fotowicz et al., (GUM, Warsaw, 2011), pp. 22-31 (in Polish). [13] M. Rucki: Reduction of Uncertainty in Air Gauge Adjustment Process, IEEE Transactions on Instrumentation and Measurement,
Vol. 58 (2009), pp. 52-57. [14] W. Miller: Statistics and Measurement Concepts with OpenStat, (Springer, New York, 2013).
200

International Conference on Innovative Technologies, IN‐TECH 2016, Prague, 6. ‐ 8. 9. 2016
AUTOMATED FIXTURE DESIGN SOLUTIONS FOR MACHINING AND FOR WELDING
T. Szalay1
1 Budapest University of Technology and Economics, Department of Manufacturing Science and Engineering, Műegyetem rakpart 3, H-1111 Budapest, Hungary
Keywords: Precision Clamping; Automated Fixture Design; Solid Edge Macro; Modular Fixture
Abstract: In up to date manufacturing the increasing accuracy requirement is one of the most relevant challenges. The position, the measure and the form accuracy prescriptions are frequently defined as only some microns. To achieve this requirement the positioning and fixturing gained the highest importance. Providing appropriate clamping several modular system solutions support the machining and the welding processes. In order to help the selection of the system components the automated design or construction software development are adequate task for manufacturing engineers. The producers of the fixturing components provide the 3D model of their parts, the selecting and building modules must be developed in commercial modelling environments. Based on the Halder V70 modular system for machining and Tünkers Rundrohrsystem for welding automated fixture design macros were developed in Solid Edge ST6 modelling software. After some predefined requirements the macros are able to build the positioning and clamping environment using the decision algorithm of a rule based expert system. These macros are actually in initial phase only basic geometry and limited measures are allowed. However it can demonstrate the possible efficiency of the automated fixture design.
Introduction Automating the design of the modular fixtures and virtual building of modular clamping solutions are not a very new concept. Modular
fixturing concept implied to create the model of the standard parts, and later, when the CAD systems support assembly and constrains virtual demonstration of the modules and the fixtures became evident. Application of rule-based or knowledge based expert systems for automating the positioning and clamping rules in manufacturing [1, 2]. In the first development projects the early stages of the design such as the recognition of fixturing requirements, or the high-level description of the modules and of the basic functional units of fixtures were investigated and solved [4, 5]. As another solution concept the automated synthesis of the fixture where the rules, the modules, the machining tools and its applied path are known and the chosen solution is derived by the synthesis of this knowledge [3].
In early solutions in automating developed stand-alone software regularly using a symbolic language. Márkus et al used prolog procedures in the expert system developed for automated fixture design [6]. Others used the built in software tools tailoring the CAD software and provided unique solution in a particular CAD environment [7, 8].
However the positioning rules are exactly defined and the solutions used generally similar clamping devices and concepts (the parts of the modular fixture systems are well predefined) the automating efforts has provided only limited results. Some fully automated algorithm focused on the clamping of 2D prismatic parts. Penev and Requicha defined a potential filed in a fixing point set on the pallet to find the optimal positioning places for pins [9]. Brost and Peters applied simple force search method on the points of the given pallet and stop the search after finding an acceptable solution. They programmed their search in a CAD environment (Fig. 1). Clamping 3D parts was solved by Trappey and Matrubhutam in [11]. The part was projected to a 2D view and they manipulated the clamping using this 2D geometry.
Fig.1 Clamping design example for a complicated 2D part (cast house) [10]
201

International Conference on Innovative Technologies, IN‐TECH 2016,
Prague, 6. ‐ 8. 9. 2016
The new approaches in Industry 4.0 refreshed the application of CAD and virtual building of clamping. Some new aspects are also got in scope such as more strict accuracy [12] or CAE investigation. The main focus of the fixture design oriented to the clamping solutions for machining. For vehicle industry the importance of welding especially robotic spot welding became very high and the clamping design automating for spot welding is as popular nowadays as for the machining [13]. Handling the 3D parts is also gained importance [14] and CAD modelling system provides more sophisticated possibilities for special development and tailoring [15].
Development automated clamping design for machining Extension modules were implemented in Solid Edge ST6 CAD modelling system that is capable of analyzing the geometry of a
workpiece and as a result of it generating a modular device made of Halder units under predefined initial conditions. The CAD models of the Halder standard parts were imported from the Halder on-line catalog [16]. Using the extension modules we can designate datum surfaces and the surfaces desire to machine which affect the implementation of positioning and clamping. The algorithms were written in Visual Basic language and the procedures are based on geometric basics and functions provided by the CAD system which are intended to cover the ground rules of thumb in device creation [17]. Experience and tests have shown that the program is functional under the given conditions [18]. Figure 2 demonstrate the result of fixturing a simple valve house using the developed software extension.
Fig. 2 Clamping design steps, example a) Model of the machining part b) Defining of the datum surface c) Choosing the surface to machine d) Analysis of the geometry e) The generated fixture
During the user manipulation of the machining part color codes help the users to mark the particular surfaces (datum – red and
machining surfaces – green, bad choice is marked blue). The menu extension of the CAD system was organized in a separated window. Figure 3 shows this menu window and the description of the icons in it.
Datum definition
Choosing the surface to machine (optional)
Analysis of the geometry
Surfaces non applicable for clamping (optional)
Generating of the fixture
Fig. 3 The menu window of the extension modules and the meaning of the icons The most complicated module in the extension is the analysis of the geometry. In this module the algorithm checks the surfaces of
the part step by step, and the possible locating and clamping surfaces are defined based on some simple rules. In this module the program generates several possible solutions and a ranking system evaluates these solutions to choose the best of them. In order to choose the appropriate elements of the modular fixture system the program analyses the measure, the center of gravity, the form of the chosen surface and the desired function of the element. It is necessary to define the connection and the constraints for the parts of the modular fixture – in our case the clamping slots define these connections. Finally, the list of the necessary elements (with the DIN number) is generated to help the user in ordering the parts.
The developed software for generating modular fixture actually works in the case of machining parts with simple (rectangular) geometry and can handle only limited number of the standard parts in Halder catalog. However after definition of the required surfaces an applicable modular fixture is generated. Further extension must be created to solve the fixturing of complicated geometries.
202

International Conference on Innovative Technologies, IN‐TECH 2016,
Prague, 6. ‐ 8. 9. 2016
Development automated clamping design for welding
Based on the same concept a similar tool was developed to support the clamping in spot welding of metal sheets. This technique is widely used in car manufacturing, where the variation of the shell in auto body requires several clamping device. In spite of the high importance of this technology much less effort can be found to automate the fixture design for spot welding.
Because of the geometry the metal sheets need additional support; the program uses additional marking for surfaces dedicated for the supporting pins. In the case of spot welding a robot manipulation is frequently used. It is obvious that grasping locations (and welding locations) must leave free during the clamping. Not only the choice of the clamping and supporting positions is more complicated in this case. The fixture structure may vary depending the length and joining solutions of the tube type elements. In this modular system we used the standard parts of the Tünkers Gripper Technology [19]; the models of the parts must have been created [20]. Figure 4 shows the example part with the marked datum and support surfaces. The software checks if we have chosen surfaces in the opposite edge and in a rectangular side edge because without these choices the algorithm cannot solve the fixturing. Figure 5 demonstrate the solution generated by the software.
Fig. 4 The part and the marked surfaces Fig. 5 The suggested fixture system The program automatically adjusts the length of the tubes, the number of the joining parts and the pitching room may require
additional length and more complicated structure. The possible variation of it almost infinite that’s why as soon as the program find an acceptable solution the searching is over. Figure 6 shows step by step the building of the fixture.
a) b) c) d)
e) f) g) h)
Fig. 6 The step by step building of the fixture (a – fitting the locating and supporting elements, b – adding the tubes,
c – positioning the joining parts, d – adding the vertical tubes, e – adding necessary tubes, f – assembling the cross tubes, g – adding the feet elements, h – finishing the joining)
Conclusion
The developed extensions for help to design fixturing system might seem rudimentary when compared to a computer-aided automated device generation process applicable in manufacturing, and there can always be exceptions to the written rules and the model geometry can be continuously simplified. However the actual version is capable to use in the frame of the known simplification and the system is ready for further development. The two different applications and their, sometimes, variant requirements may prove that the concept of the program is good.
203

International Conference on Innovative Technologies, IN‐TECH 2016,
Prague, 6. ‐ 8. 9. 2016
Acknowledgment
This research is partly supported by the EU funded H2020 project "Centre of Excellence in Production Informatics and Control" (EPIC) under project number H2020-WIDESPREAD-2014-1-FPA 664403. The research results are used in the international bilateral project “Experimental and theoretical optimization and control of machining technology and tool path for micro milling” listed under number TÉT_12_MX-1-2013-0015. The authors would also like to acknowledge the support provided by the CEEPUS III HR 0108 project. References [1] K. Nyamekye and J.T. Black, "Rational approach in the design analysis of flexible fixtures for an unmanned cell", in: Proc. 15th
North American Manufacturing Research Conference, Bethlehem, PA, 1987, pp. 600-607. [2] K. Youcef-Toumi, J.J. Bausch and S.J. Blacker, "Automated setup and reconfiguration for modular fixturing", in: G. Chryssolouris,
B. von Turkovich and P. Francis (eds.), Proc. Manufacturing International "88, Atlanta, GA, ASME, 1988, pp. 121-128. [3] Márkus, A., Ruttkay, Zs. and Váncza, J.: “Automating fixture design - From imitating practice to understanding principles”.
Computers in Industry, 14(1-3) 1990, pp. 99-108 [4] P.J. Englert and P.K. Wright, "Applications of AI and the design of fixtures for automated manufacturing", IEEE Int. Conf. on
Robotics and Automation, 1985, pp. 345-351. [5] P.J. Englert and P.K. Wright, "Principles for part setup and workholding in automated manufacturing", J. Manuf. Syst., Vol. 7, No.
2, 1988, pp. 147-161. [6] A. Márkus, Z. Márkusz, J. Farkas and J. Filemon, "Fixture design using Prolog: an expert system", Robot. Cornput. Integrated
Manuf, Vol. 1, No. 2, 1984, pp. 167-172. [7] A.S. Miller and R.G. Hannam, "Computer aided design using a knowledge base approach and its application to the design of jigs
and fixtures", Proc. Inst. Mech. Eng., Vol. 199, No. B4, 1985, pp. 227-234 [8] S. Markos, T. Szalay, J. Kovács: „Modular Tool and Fixture Design by CAD/CAM Systems” GÉPGYÁRTÁSTECHNOLÓGIA 36
1996, pp. 31-37 [9] K. Penev, A. A. G. Requicha: “A Potential Field Algorithm for Fixture Synthesis in 2D” ASME Design Engineering Technical
Conferences and Computers in Engineering Conference, Irvine, California 1996 [10] R. C. Brost, R. R. Peters: “A CAD Tool that Automatically Designs Fixtures and Pallets” Proceedings of the 1996 IEEE International
Conference on Robotics and Automation Minneapolis. Minnesota - April 1996, pp. r95-502. [11] A, J. C. Trappey, S. Matrubhutam: “Fixture Configuration Using Projective Geometry” Journal of Manufacturing Systems Volume
12, Issue 6, 1993, Pages 486-495 [12] Kršulja, M.; Barišić, B. & Kudlaček, J: “ASSEMBLY SETUP FOR MODULAR FIXTURE MACHINING PROCESS” Int. Journal of
Advanced Engineering Vol. 3/1 2009, pp. 39-51 [13] M. Krsulja, M. Sasa, B. Barisic, Z. Car: “Design and Planning of Clamping Work-holder Station for Sheet Metal Part of Car Body”
Journal of Manufacturing and Industrial Engineering 11(2) 2012, pp. 38-43 [14] A. Rétfalvi: „Fixture Design System with Automatic Generation and Modification of Complementary Elements for Modular Fixtures”
ACTA POLYTECHNICA HUNGARICA 12:(7) 2015, pp. 163-182. [15] T. Gmeiner, K. Shea “An Ontology for the Autonomous Reconfiguration of a Flexible Fixture Device” Journal of Computing and
Information Science in Engineering | Vol. 13/2, 021003 (Apr 22, 2013) (11 pages) [16] On-line catalog of Halder Standard Parts – http://www.tracepartsonline.net/(S(unpynestfyl1rn45ynloxqmg))/
content.aspx?class=HALDERN, Downloaded in May 14, 2014 [17] Solid Edge – Siemens PLM Software: .NET Programmer’s Guide, Solid Edge with Synchronous Technology API, User Manual
2013. [18] I. Spéder: Development of computer aided machining fixture design system (in Hungarian Számítógépes forgácsoló készülék építő
keretrendszer fejlesztése), MSc thesis, Budapest University of Technology and Economics, 2014 [19] TÜNKERS Gripper Technology - http://www.tuenkers.com/products/gripper-technology/mn_105 Downloaded in August 2015 [20] B. Schmalzel: Development of computer aided welding fixture design system (in Hungarian Számítógépes fhegesztő készülék
építő keretrendszer fejlesztése), MSc thesis, Budapest University of Technology and Economics, 2015
204

International Conference on Innovative Technologies, IN‐TECH 2016,
Prague, 6. ‐ 8. 9. 2016
TRIP STEEL PROCESSING APPLIED TO LOW ALLOYED STEEL WITH CHROMIUM
L. Kučerová1, M. Bystrianský1 and V. Kotěšovec1 1RTI, UWB in Pilsen, Universitni 8, 30614 Pilsen, Czech Republic
Keywords: TRIP Steel; Retained Austenite; Chromium
Abstract. Thermo-mechanical processing with various processing parameters was applied to 0.2%C-0.6%Mn-2S%i-0.8%Cr low alloyed high strength steel. The parameters were optimized to achieve final microstructures typical for TRIP (transformation induced plasticity) steels. These microstructures consist of ferrite, bainite and retained austenite and they enable TRIP steels to reach very good combinations of ductility, formability and strength, which makes them interesting for applications in automotive industry. TRIP steels based on C-Mn-Si concept have been already commercially produced by rolling in the form of thin sheets. Some other alloying elements have been recently tested, for example aluminium, phosphorus or niobium, however little attention has been paid to chromium alloying. As chromium can refine the microstructure of the steel, it can contribute to further strengthening of TRIP steel. Thermo-mechanical processing used in this work incorporated various numbers of deformation steps. The deformations were in all the cases carried out during the cooling from soaking temperatures to a bainite hold temperatures. Bainitic hold is a typical feature of TRIP steel processing, as it helps to increase carbon content in remaining austenite thus increasing its stability toward martensitic transformation during final cooling to room temperature. In this way, around 10% of retained austenite should remain in the final microstructure. The complex character of TRIP steel microstructure is responsible for its good formability and ductility, while deformation induced transformation to martensite increases the strength of the final product. The strengths achieved in this work were in the range of 740MPa – 836MPa with ductility A5mm of 31-41%. Introduction
Modern TRIP (transformation induced plasticity) steels have been developed as low alloyed high strength materials with good ductility, formability and ability to absorb impact energy. This made them very practical for applications in an automotive industry, which has been on the lookout for materials enabling safe construction of lightweight car parts. There have been lately some attempts to apply TRIP steels also to the production of seamless tubes [1] or wires [2].
Multiphase microstructure of TRIP steels with retained austenite is typically commercially prepared either by cold rolling [3] and subsequent two-step annealing, or by thermo-mechanical processing [4,5] with controlled cooling and the hold at the temperatures in bainitic region. This hold ensures creation of sufficient amount of carbide-free bainite and carbon diffusion into remaining austenite. Higher local carbon contents suppress martensite start temperature of these particular islands below room temperature providing the final microstructure with around 5-15% of metastable retained austenite. Properly stabilized retained austenite gradually transforms to martensite during cold plastic deformation utilizing the TRIP effect and enhancing tensile strength and ductility of the steel [6].
Various alloying concepts have been investigated for TRIP steels and other advanced multiphase high strength steels, usually based on carbon, manganese, silicon, aluminium and phosphorus [7,3]. Suitable combinations of alloying elements are in the case of TRIP steel mainly used to stabilize retained austenite, postpone pearlitic transformation and delay carbide precipitation, particularly during bainitic hold. It has been already successfully demonstrated in the case of QP (quenching and partitioning) processing, that chromium can also play a positive role in delaying pearlite formation and generally improving mechanical properties of this steel [7,8]. The addition of low contents of chromium to DP (dual phase) high strength steel have also proved to be beneficial for its mechanical properties [9]. As both, TRIP and QP processing are based on retained austenite stabilization in the final microstructure; the effect of chromium on the performance of low carbon low alloyed TRIP steel was tested in this article. High strength low alloyed steel with 0.5% Cr was further reported to show improved corrosion resistance [3].
Experimental Program Low alloyed steel with 0.2% of carbon was used for this experimental program (Table 1). The steel is alloyed by 0.6% of manganese
to support austenite stabilization and by 2% of silicon to suppress cementite formation during isothermal hold in bainitic region. While these three elements are typical for most of the TRIP steels, special addition of 0.8% of chromium was used in this case to improve mechanical properties and further enhance ferritic area in TTT (time temperature transformation) diagram. TTT diagram of used steel was calculated by JMatPro software (Fig. 1).
Table 1. Chemical composition (in weight %)
C Mn Si P S Cr Al Nb Mo
0.2 0.6 2 0.009 0.004 0.8 0.001 0.04 0.03
Processing of all samples was carried out at thermo-mechanical simulator (Table 2). Several methods of thermos-mechanical processing were designed for this steel. Thermo-mechanical processing always consisted of soaking at the temperatures of 850°C or 900°C, two or three deformation steps carried out during the cooling to 750°C, 720°C, 700°C or 680°C, cooling by various cooling rates 16°C/s, 20°C/s or 30°C/s down to bainitic hold at 400°C or 425°C. The main aim of the optimization of processing parameters was to obtain typical TRIP microstructure consisting of ferrite, bainite, retained austenite and possibly M-A constituent (island of austenite partially transformed to martensite) and to achieve the best combination of tensile strength and ductility. All the deformations were compressive
205

International Conference on Innovative Technologies, IN‐TECH 2016,
Prague, 6. ‐ 8. 9. 2016
and each was equal to 10% of actual size of the sample. The original size of the sample was cylindrical with 8mm diameter and 16 mm active length.
Table 2. Processing parameters (TS soaking temperature (hold always 100s), Tdef temperature of individual compressive deformations, TB bainite hold temperature (always 600s hold time), mechanical properties and retained austenite volume fraction (RA)
TS [°C]
Def. Number
Tdef [°C]
Cooling rate [°C/s]
TB [°C]
UTS [MPa]
A5mm [%]
UTSxTEI [MPa%]
RA [%]
900
2 900, 720
16 425
743 41 30463 4
900, 700 756 37 27972 6 3 900, 720, 680 786 31 24366 5 2 900, 720 400 768 42 32254 7
850
2 850, 720 16
425 743 40 29720 7
400
729 43 31347 7 20 760 34 25840 6 30 836 35 29260 10
Fig. 1 TTT diagram of used steel
Resulting microstructures were analysed by scanning electron microscopy and volume fraction of retained austenite was determined
by X-ray diffraction phase analysis. Mechanical properties were measured by tensile test on small flat samples with sample geometry 2x1.5mm and 5mm active length. The ability to absorb deformation energy during plastic deformation was further evaluated tensile strength to ductility balance (UTSxA5mm), which is the measure typically used for TRIP steels for automotive applications. In the first set of samples, soaking temperature of 900°C was used and the first deformation was always carried out at this temperature at the end of 100s soaking hold. The temperature of the second deformation was either 720°C or 700°C and in one case, the third deformation was added at 680°C. Three processing had the same 600s bainitic hold at 420°C. The best processing with two deformations at 900°C and 720°C was repeated with lower bainitic hold of 600s at 400°C. Lower hold temperature was supposed to refine bainitic microstructure. All processing methods used average cooling rate 16°C/s, which was chosen on the base of previous results [10].
In the second step, soaking temperature was decreased to 850°C to increase free ferrite fraction and to keep the processing as cost efficient as possible. All the processing with this soaking temperature had two deformations, the first one being applied at 850°C, the second at 720°C. Bainitic holds at 425°C and 400°C were again tested. Three average cooling rates 16°C/s, 20°C/s and 30°C/s were applied to the samples with lower bainitic hold at 400°C. Higher cooling rates were used to prevent pearlite formation during the cooling. Results
Processing with higher soaking temperature 900°C, the second deformation applied at 720°C and bainitic hold at 425°C produced fine microstructure containing ferrite (F), bainite (B), M-A constituent and very fine pearlitic (P) areas growing either from ferrite grain boundaries or at the edges of larger islands of M-A constituent (Fig.2). There was about 4% of retained austenite, tensile strength was 743MPa and ductility A5mm =41%.
Decrease of the deformation finish temperature resulted in microstructural changes. Drop of deformation finish temperature from 720°C to 700°C was accompanied by coarsening of pearlite lamellas and the areas of M-A constituent (Fig.3). There was just a slight increase in tensile strength obtained after this processing, however ductility was lower than in the case of deformation finish temperature of 720°C, while the amount of retained austenite was practically the same as in previous sample. Further decrease of deformation finish temperature to 680°C resulted in the growth of larger pearlitic areas with very fine lamellas on the expense of bainite and M-A constituent, which nearly disappeared (Fig.4). This microstructure development was reflected in the increase of tensile strength to 786MPa and decrease of ductility A5mm to only 31%.
The best combination of tensile strength 768MPa and ductility A5mm=42% was achieved for the processing with the second deformation at 720°C and lower bainitic hold at 400°C. The distribution of small bainitic and pearlitic areas is the densest and most homogeneous of all the microstructures produced by soaking at 900°C. The areas of very fine pearlitic lamellas are of the same size or slightly larger than bainitic blocks, both being in the range of approximately 2-5 micrometres (Fig.5).
The processing with lower soaking temperature 850°C followed by two deformations at 850°C nad 720°C and bainitic hold at 425°C caused microstructure refinement. Bainitic and pearlitic areas were smaller and fewer (Fig.6) and volume fraction of retained austenite was by 3% higher than for the same processing with higher soaking temperature. However mechanical properties were the same as for the same processing with soaking temperature 900°C (743MPa and 40%), suggesting that 50°C change in heating temperature did not influence mechanical properties of the steel. In addition, even the decrease of bainitic hold to 400°C did not bring any significant changes to mechanical properties, producing tensile strength of 729MPa and ductility A5mm of 43%. However, lower bainitic hold caused formation of higher amount of fine bainite and finer islands of M-A constituent in the microstructure (Fig. 7).
More important impact on mechanical properties than soaking and bainitic hold temperatures turned out to have cooling rate from the soaking temperature to bainitic hold temperatures. Cooling rates of 16°C/s, 20°C/s and 30°C/s were tested. Cooling rate 16°C/s was previously used for TRIP steel processing of the steel with similar chemical composition without chromium [10]. Despite the fact, that chromium addition was supposed to further postpone pearlite formation, this cooling rate repeatedly produced pearlite in the final microstructure and therefore quicker cooling rates were also applied to the steel (Fig.8, Fig.9). However, even the quickest cooling by 30°C/s was not sufficient to avoid the pearlite completely and few small areas with lath length below 0.5 micrometre were observed (Fig.9). This is probably the reason, why this microstructure had the highest volume fraction of retained austenite of 10%, the highest strength of 835MPa and still reasonable ductility A5mm of 35%.
206

International Conference on Innovative Technologies, IN‐TECH 2016,
Prague, 6. ‐ 8. 9. 2016
Fig. 2 900°C/100s, 2 deformations at 900°C and 720°C, cooling rate 16°C/s, bainitic hold at 425°C
Fig. 3 900°C/100s, 2 deformations at 900°C, 700°C, cooling rate 16°C/s, bainitic hold at 425 °C
Fig. 4 900°C/100s, 3 deformations at 900°C, 720°C and 680°C, cooling rate 16°C/s, bainitic hold at 425°C
Fig.5 900°C/100s, 2 deformations at 900°C and 720°C, cooling rate 16°C/s, bainitic hold 400°C/600s
Fig. 6 850°C/100s, 2 deformations at 850°C and 720°C, cooling rate 16°C/s, bainitic hold at 425°C
Fig. 7 850°C/100s, 2 deformations at 850°C and 720°C, cooling rate 16°C/s, bainitic hold at 400°C
Fig. 8 850°C/100s, 2 deformations at 850°C, 720°C, cooling rate 20°C/s, bainitic hold at 400°C
Fig.9 850°C/100s, 2 deformations at 850°C, 720°C, cooling rate 30°C/s, bainitic hold at 400°C
207

International Conference on Innovative Technologies, IN‐TECH 2016,
Prague, 6. ‐ 8. 9. 2016
Conclusion
Complex multiphase microstructures, consisting of ferrite, bainite, M-A constituent and small pearlitic colonies with extremely fine lamellas were achieved after all the processing. Despite the presence of pearlite in all the samples, 4-10% of retained austenite was detected in the microstructures and mechanical properties were good. Ductility A5mm reached 31-73% and tensile strength 729-836MPa. Increasing cooling rate from 16°C/s to 30°C/s resulted in an increase of tensile strength from 729MPa to 836MPa and slight drop of ductility A5mm from 43% to 35%. Positive effect of chromium addition on the hindrance of pearlite formation was not confirmed; even the highest cooling rate of 30°C/s still produced very fine pearlitic areas in the final microstructure. Highest cooling rate however helped to stabilized the highest amount of retained austenite (10%) and to achieve the highest strength of 836MPa. Decrease in deformation finish temperature from 720°C to 680°C also caused increase of tensile strength from 743MPa to 789MPa and the decrease of ductility A5mm from 41% to 31%. The best combination of high strength 768MPa and ductility A5mm=42% and the highest strength to ductility balance 32254 MPa% were obtained for the processing with higher soaking temperature 900°C, deformation finish temperature 720°C, cooling rate 16°C/s and bainitic hold at 400°C. Acknowledgment
The present contribution has been prepared under project LO1502 ‘Development of the Regional Technological Institute‘ under the
auspices of the National Sustainability Programme I of the Ministry of Education of the Czech Republic aimed to support research, experimental development and innovation.
References [1] Ming-ya ZHANG, Fu-xian ZHU, Dong-sheng ZHENG: Mechanical Properties and Retained Austenite Transformation Mechanism of
TRIP-Aided Polygonal Ferrite Matrix Seamless Steel Tube, Journal of Iron and Steel Research, International, Volume 18 (2011), Issues 8, p. 73-78.
[2] S. Wiewiórowska, Z. Muskalski: The application of low and medium carbon steel with multiphase TRIP structure in drawing industry, Procedia Manufacturing, Volume 2 ( 2015 ), p. 181 – 185.
[3] G Ling-yun Zhan, Di Wu, Zhuang Li: Influence of Alloying Elements on Mechanical Properties and Corrosion Resistance of Cold Rolled C-Mn-Si TRIP Steels, Journal of Iron and Steel Research, International, Volume 19 (2012), Issues 12, p. 42-47.
[4] L. Skálová, R. Divišová, D. Jandová: Thermo-mechanical processing of low-alloy TRIP-steel, Journal of Materials Processing Technology, Volume 175 (2006), Issues 1-3, p. 387-392.
[5] Zi-cheng ZHANG, Fu-xian ZHU, Yan-mei LI: Effect of Thermomechanical Control Processing on Microstructure and Mechanical Properties of Fe-0.2C-1.44Si-1.32Mn Hot Rolled TRIP steel, Journal of Iron and Steel Research, International, Volume 17 (2010), Issues 7, p. 44-50.
[6] S. Zaefferer, J. Ohlert, W. Bleck: A study of microstructure, transformation mechanisms and correlation between microstructure and mechanical properties of a low alloyed TRIP steel, Acta Materialia, Volume 52, (2004), Issue 9, p. 2765-2778
[7] Kučerová et al.: The effect of alloying on mechanical properties of advanced high strength steels, Archives of Metallurgy and Materials, Volume 59 (2014), p.1189-1192.
[8] H. Jikrová, et al.: The effect of chromium on microstructure development during Q-P process, Materials Today: Proceedings 2S (2015), p. 627-630.
[9] Y. Han et al.: Effect of Chromium on Microstructure and Mechanical Properties of Cold Rolled Hot-dip Galvanizing DP450, Journal of Iron and Steel Research, International, Volume 22 (2015), Issues 11, p. 1055-1061.
[10] L. Kučerová, H. Jirková, B. Mašek: Continuous cooling of CMnSi TRIP steel, Materials Today: Proceedings 2S (2015), p. 677-680.
208

International Conference on Innovative Technologies, IN‐TECH 2016,
Prague, 6. ‐ 8. 9. 2016
GLOCAL ADVERTISING A DIFFERENT CONCEPT OF LOCAL & GLOBAL ADVERTISING
1nDi-El .G ,1Ezzat .N
Assistant professor, Advertising Department, Faculty of Applied Arts, Helwan University1
Egypt
onal Advertising MassageAdvertising; InternatiGlocal Advertising Strategy;Global Keywords:
Abstract: Globalization emphasizes since its inception to the need for a unified global market and a cultural identity especially with the great technological development which is creating a rapid digital world which caused the advertising passage with multiple stages starting with Local Advertising , National & Multinational Advertising then Global Advertising. So that the consumer loyalty changed from loyalty to a local cultures to loyalty to the culture with humanity rational that a new private communication processes in international markets is more complicated because they are made through multiple contexts are different in terms of language, culture and influence. Global advertising embraces standardized strategy in which advertising content is the same worldwide under the premise that the entire world is a single entity.global advertising may be appropriate for brands that use image campaigns with universal appeals based on similar tastes, interests, needs and values. Despite the allure of global advertising benefits, market variances do exist in terms of cultural differences, differing rates of economic and market development, media availability, and legal restrictions. Many companies, upon producing unwanted results from executing global campaigns, have reverted back to international advertising strategies. From the afore mentioned information this research will try to study the meaning of Glocal advertising. it is the best captured in the phrase, "think global and act local." Glocal marketers standardize certain core elements of the advertising strategy while incorporating local cultural influences into advertising executions. It was concluded that Great Advertising Is Both Local and Global,so that an effective glocal strategy requires a global appeal that inspires universal motivation, a brand vision "that respects local nuances," and an organizational structure that encourages collaboration between the global advertising strategists and local implementers. Introduction Global and international advertising are alternative communication strategies that companies employ to drive demand for goods and services in foreign markets. International advertising strategies are tailored to reflect regional, national, and local market cultural differences and preferences. Global advertising embraces standardized strategy in which advertising content is the same worldwide under the premise that the entire world is a single entity. [1] Despite the allure of global advertising benefits There is still disagreement about the question of using standardize or specialize (adapt) for the commercial advertising messages. Global standardization strategy The general definition of global standardization is the ability to use standardized visual images internationally. In other words, it's the ability for a company or business to use the same marketing strategy from one country to the next, and across various cultures. When a product has basically the same appeal all over the world . [2] also it is a process of expanding competing in globalized markets. A company will strategize to adjust their products and pricing, and assess domestic and international marketplaces to determine how they can satisfy a global audience with few variations in their product, service, and brand. [3] The positive aspects of using global standardization - Costs - a company does not have to pay for special marketing for each market. One marketing strategy can be used in multiple areas of the world, therefore cutting the cost of having to develop several marketing strategies. - Brand - a strong brand can have the same effect in different areas around the world. What makes a strong presence in one country, can have the same effect in other countries. Now, there is at least one negative aspect to global standardization. - Sensibility - while some countries may appreciate and accept a product, others may not agree or have a different opinion about that product. A Western country may view a car or a washing machine as normal in everyday life, while a developing country could view the same item as a luxury. And while one country may sell a health product using sensual advertisement, a more conservative country might need a more rational message. These differences in perspective could force a company to develop a more customizable market strategy for different areas of the world. [2] Global standardization strategy & different consumer with different culture International advertising campaigns sometimes ignore cultural values in foreign markets, but multinational firms pay particular attention to both cultural similarities and differences when considering the transfer of marketing strategies, especially when developing international advertising messages .The existence of cultural diversity implies that the degree of standardization of marketing strategy may
209
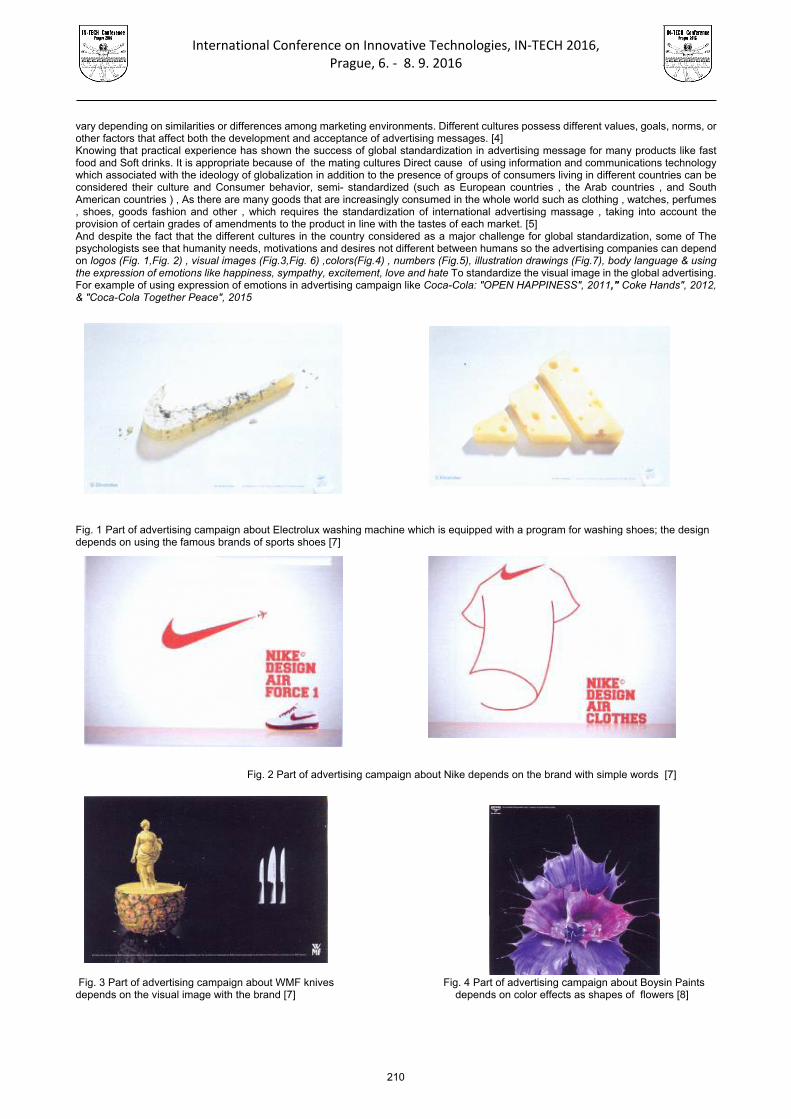
International Conference on Innovative Technologies, IN‐TECH 2016,
Prague, 6. ‐ 8. 9. 2016
vary depending on similarities or differences among marketing environments. Different cultures possess different values, goals, norms, or other factors that affect both the development and acceptance of advertising messages. [4] Knowing that practical experience has shown the success of global standardization in advertising message for many products like fast food and Soft drinks. It is appropriate because of the mating cultures Direct cause of using information and communications technology which associated with the ideology of globalization in addition to the presence of groups of consumers living in different countries can be considered their culture and Consumer behavior, semi- standardized (such as European countries , the Arab countries , and South American countries ) , As there are many goods that are increasingly consumed in the whole world such as clothing , watches, perfumes , shoes, goods fashion and other , which requires the standardization of international advertising massage , taking into account the provision of certain grades of amendments to the product in line with the tastes of each market. [5] And despite the fact that the different cultures in the country considered as a major challenge for global standardization, some of The psychologists see that humanity needs, motivations and desires not different between humans so the advertising companies can depend on logos (Fig. 1,Fig. 2) , visual images (Fig.3,Fig. 6) ,colors(Fig.4) , numbers (Fig.5), illustration drawings (Fig.7), body language & using the expression of emotions like happiness, sympathy, excitement, love and hate To standardize the visual image in the global advertising. For example of using expression of emotions in advertising campaign like Coca-Cola: "OPEN HAPPINESS", 2011," Coke Hands", 2012, & "Coca-Cola Together Peace", 2015
Fig. 1 Part of advertising campaign about Electrolux washing machine which is equipped with a program for washing shoes; the design depends on using the famous brands of sports shoes [7]
Fig. 2 Part of advertising campaign about Nike depends on the brand with simple words [7]
Fig. 3 Part of advertising campaign about WMF knives Fig. 4 Part of advertising campaign about Boysin Paints depends on the visual image with the brand [7] depends on color effects as shapes of flowers [8]
210

International Conference on Innovative Technologies, IN‐TECH 2016,
Prague, 6. ‐ 8. 9. 2016
Fig. 5 Part of advertising campaign about OLAY Cosmetics Company with slogan 'correct your age' depends on numbers [9]
Fig. 6 Part of advertising campaign about stop smoking depends on visual image without any words which is
appropriate for multi cultures all over the world [9]
Fig. 7 Part of advertising campaign of Amnesty International Corporation which is considered as one of human rights Corporation. This campaign is about combating violence especially during the wars depending on Simplified illustration drawings. [9] It can be an adjusted detailed information based on the domestic market so as to provide utmost importance to local customers and local markets but in order to discharge the said general behavior of the consumer is affected by the culture in where he lives, and that there are certain cultures untouchable, for example, the green color in Malaysia means death and disease while the Southeast Asian yellow teeth symbol of prestige and respect and not commensurate with the announcement of the toothpaste is Received teeth So white. every culture includes opposite or contradictory values, such as the contradiction between freedom and affiliation, between tradition and innovation, between East and West, even in the European Union there are contradictions in terms of values vary between freedom and order in Germany than in the Netherlands or France.[6,10]
211

International Conference on Innovative Technologies, IN‐TECH 2016,
Prague, 6. ‐ 8. 9. 2016
The rules vary internationally ads in using of women in the advertisement which is prohibited in Saudi Arabia, where women's appearance without a veil in Malaysia cannot be that women show a bare shoulders while in Pakistan, it cannot be that women appear only in black uniforms. Rules also differ on the use of children in the declaration from one country to another and more radical states in France this matter. Some references have indicated that some of the topics targeted by the announcement of voluntary controls which including: Providing incorrect information to consumers, creating a desire among consumers to get products that do not need them, Encourage consumers for using harmful goods, giving priority to the material values of spiritual values, and Corrupting public taste[11,12] the conditions of using global advertising. Marketers generally agree that global advertising can work under certain conditions. Philip Kotler, marketing professor at Northwestern University, says that global strategies work best in
- categories where the trend toward global integration is strong - categories where the local cultural influences are weak, such as the consumer electronics market. - According to an international marketing study guide from Villanova University, global advertising may be appropriate for brands
that use image campaigns with universal appeals based on similar tastes, interests, needs and values. - The products that are advertised with pictures on global matters such as wealth, music and more. - New products entering the world for the first time and nothing to do with the heritage of a country. - Products that meet the needs of different markets. - Products that meet common global needs such as interest and affiliation. - World renowned products such as products that are characterized by a country, and that the reputation of this country in this
area in particular.[13,14]
Glocal Advertising Many multinational marketers embrace a compromise between global and international advertising, which is often called "glocal" advertising. Glocal advertising is best captured in the phrase, "think global and act local." Glocal marketers standardize certain core elements of the advertising strategy while incorporating local cultural influences into advertising executions. According to Wind, Sthanunathan and Malcolm in their "Harvard Business Review" article, "Great Advertising Is Both Local and Global," an effective glocal strategy requires a global appeal that inspires universal motivation, a brand vision "that respects local nuances," and an organizational structure that encourages collaboration between the global advertising strategists and local implementers. [14]
Conclusion Despite the allure of global advertising benefits the global strategy works best in - categories where the trend toward global integration is strong - categories where the local cultural influences are weak, such as the consumer electronics market. - According to an international marketing study guide from Villanova University, global advertising may be appropriate for brands
that use image campaigns with universal appeals based on similar tastes, interests, needs and values. - The products that are advertised with pictures on global matters such as wealth, music and more. - New products entering the world for the first time and nothing to do with the heritage of a country. - Products that meet the needs of different markets. - Products that meet common global needs such as interest and affiliation. - World renowned products such as products that are characterized by a country, and that the reputation of this country in this
area in particular. It is the best to "think global and act local." Glocal marketers standardize certain core elements of the advertising strategy while incorporating local cultural influences into advertising executions. An effective glocal strategy requires a global appeal that inspires universal motivation, a brand vision "that respects local nuances," and an organizational structure that encourages collaboration between the global advertising strategists and local implementers. References
[1] George Boykin: What Is the Difference in Global Advertising & International Advertising? http://smallbusiness.chron.com/difference-global-advertising-international-advertising-66112.html [2] Brianna Whiting: Global Standardization in marketing strategy –video &lesson Transcript –study.com http://study.com/academy/lesson/global-standardization-in-marketing-definition-strategy-quiz.html [3] Monica Gregg: global strategy, Definition & Example, video &lesson Transcript, study.com http://study.com/academy/lesson/global-strategy-definition-example.html [4] Gary D. Gregory and James M. Munch: Cultural Values in International Advertising: An Examination of Familial Norms and Roles in Mexico, Psychology & Marketing , March 1997- Volume 14, Issue 2 ,pages 99–119, [5] Roger Bennett, Jim Blythe : International marketing: strategy planning, market entry &implementation, London, 2003, p304. [6] prof. Susan p. Douglas, prof.c.Samuel Craig : International advertising ,New York university, Stern School of Business , Article 31 , Section 5.2, (http://pages.stern.nyu.edu/sdouglas/rpubs/intad.html) [7] https://adsoftheworld.com/media/print [8] https://www.beautifullife.info/advertisment/create-your-adicolor [9] https://adsoftheworld.com/top-ads [10] Marieke K.de Mooij : Global Marketing and Advertising – understanding cultural paradoxes – sage publications,inc-second edition -2005-p.6 [11] Marieke K.de Mooij : Global Marketing and Advertising , understanding cultural paradoxes ,sage publications,inc-second edition -2005-p.8 [12] prof. Susan p. Douglas, prof.c.Samuel Craig: International advertising, New York University, Stern School of Business, Article 31 , Section 5.2, (http://pages.stern.nyu.edu/sdouglas/rpubs/intad.html [13] Roger Bennett, Jim Blythe : International marketing: strategy planning, market entry &implementation,London, 2003, p307. [14] George Boykin : What Is the Difference in Global Advertising & International Advertising? http://smallbusiness.chron.com/difference-global-advertising-international-advertising-66112.html
212

International Conference on Innovative Technologies, IN‐TECH 2016,
Prague, 6. ‐ 8. 9. 2016
GESTURE RECOGNITION OF AMERICAN SING LANGUAGE USING KINECT
S. Kajan1 and D. Pernecký1 1Institute of Robotics and Cybernetics, Faculty of Electrical Engineering and Information Technology,
Slovak University of Technology in Bratislava, Slovak Republic
Keywords: Gesture Recognition; American Sing Language (ASL); Neural Network; Kinect; Hand Tracking; Depth Sensors Abstract: This paper is focused on an automatic hand gestures recognition by using depth sensors. Kinect for XBOX360 which consists of depth sensors was used in this work. The algorithm for the hand-tracking is based on fingertips detection method and on centers of palms detection method. In our previous algorithm we changed algorithm for wrist detection, palm center and a parameter of hand area was added to classification process. For demonstration and evaluation purposes a HandTrackerApp application was developed in C++ programming language. The application executes the whole process, which consists of retrieving the image, filtering, hand-tracking and gesture recognition. A multi-layer perceptron (MLP) network for gesture recognition is used. Error backpropagation algorithm was used for training the multilayer neural network. Training dataset consisted of a database of 26 letters and 10 numbers - gestures from ASL database. Results for algorithm’s recognition ability are compared to an existing recognition algorithm for the ASL database. The modified algorithm is able to process 29 signs what is 10 more than in the original algorithm. Introduction
In the last years there has been great development in area of depth cameras. The use of these cameras, with their available prices, can be found in control of video games by moving body. For example Xbox 360 with the motion sensor Kinect from Microsoft uses this type of control. Besides the motion sensor Kinect there are other alternatives from different companies. Kinect sensor has been used in this work too.
Many applications are developed with use of the Kinect motion sensor and one of them is also hand tracking and hand gestures recognition. This paper also focuses on such application. Gesture recognition is very important in the area of robotics, which makes it possible to control and teach robots to perform certain actions. Nowadays there is a tendency to create programs for gesture language recognition.
For gesture recognition several algorithms were created [1-7]. Proposed algorithms have to solve data processing from sensors, hand segmentation, hand tracking, obtaining necessary parameters for classification and the most important the gesture classification itself. In this paper we describe modifications of algorithm proposed in [7] - the hand-tracking algorithm, which is based on the fingertips detection method and on the centers of palms detection method. We made 2 modifications of the hand-tracking algorithm. In the first modification there were made some changes for better practical implementation [8, 9]. In the second modification, we changed algorithm for wrist detection, palm center and we added a parameter of hand area to classification process. By reason of existing problem with the wrist detection problem in the original algorithm, we normalized the data used for gestures classification from the palm center. Direct gesture classification by MLP network was used for normalized fingertips positions. Testing of the modified algorithm was made on the ASL database - American Sign Language gestures. Hand tracking algorithm
At first the Hand tracking algorithm has to filter out the hand from a background screen. Then it is necessary to use such transformation, which produces an output as dataset of hand orientation description. These output data are afterwards used for the gesture classification. A block diagram for gesture recognition is in figure 1 [5].
Fig. 1 Block scheme of gesture recognition system
Hand segmentation Hand segmentation from image was realized on a basis of a depth map. The depth map and the depth filter area are displayed in
figure 2.
213

International Conference on Innovative Technologies, IN‐TECH 2016,
Prague, 6. ‐ 8. 9. 2016
Fig. 2 Segmentation on the base of the depth map: left - original, right - depth filtered area Hand tracking
When the area is containing only the hand and part of the wrist is found, it is possible to analyze this filtered area. Our algorithm was inspired by work of Zhi-Hua, K. Jung-Tae, L. Jianning, Z. Jing, and Y. Yu-Bo [7] but it was largely reworked and its final version is described below.
The output data from the depth sensor are noisy so it is necessary to filter out the output data. The first used filter was median filter, used for removing the noise on edges of the mask. The contours from binary image are obtained by using findContours function from OpenCV library [10]. To find the palm center we used distance transformation. For each point of binary map a distance to the nearest zero point of binary map is calculated. For calculating the distance Euclidean norm was used. In figure 3 distance transformation is shown, where white color indicates the maximum distance value and black color indicates the minimum distance value. The palm center cp represents the point with maximum distance. The palm radius Rp is calculated as the distance between the palm center and the nearest point lying on a palm contour (right in Fig. 3).
Fig. 3 Left – hand mask, middle – result of distance transformation, right - depicting of circle with center in palm centre cp and radius Rp The palm isolation consists of creating the palm contour, which is obtained by creating the palm circle in the palm center cp with the
radius Rp. For fingertips positions tracking it is necessary to find a wrist points c1 and c2, which are used for creating a reference coordinate. To obtain fingers we subtract the palm mask from the hand mask, as it is shown in figure 4. So we get several objects among which are the fingers.
Fig. 4 The procedure of obtaining fingers mask The original tracking algorithm [8, 9] is unable to detect gesture from a side view and has problems with the wrist detection. For all that
some modifications in palm center detection and hand mask were made. For palm center identification the distance transformation was used. The palm center is point with the highest distance concentration. However this is not true in gestures where the hand is in side view (letter C, left in Fig. 5). For that reason before the distance transformation we cut off the hand by a circle with radius R and center in the closest point at the hand to the camera (right in Fig. 5). The circle radius is normalized by distance between the hand and the camera and was chosen so that the forearm was cut off.
Fig. 5 Results of distance transformation and cutting of hand part for obtaining of palm centre
214

International Conference on Innovative Technologies, IN‐TECH 2016,
Prague, 6. ‐ 8. 9. 2016
For obtaining the hand mask it is important to delete unnecessary part of the object in the next step – the forearm (Fig. 6). Border
between the hand and the forearm is a tangent line to the circle with center in the palm center and with the radius 1.2* Rp.
Fig. 6 Obtaining of hand mask and final results of tracking algorithm Gesture classification The multi-layer perceptron (MLP) network was used for gesture classification [11-14]. MLP network was used for direct gesture
classification of positioning the fingertips vi. In the first algorithm the fingertips positions were normalized by the wrist positions c1 and c2. Normalized fingertips position ui are
calculated by an equation (1) (left in Fig. 7), where cw are wrist center from positions c1 and c2.
ui = (vi-cw)/(c2-c1) , i є 1,2,3,4,5 (1)
Normalization by distancec2-c1enables the neural network to be invariant with respect to the hand distance from the camera and normalization by the wrist center also enables to be invariant to the position and the hand orientation.
In second algorithm the fingertips positions were normalized by palm center. Normalized fingertips positions ui are calculated by an equation (2) (right in Fig. 7), where cp is centre and Rp is the palm radius.
ui = (vi-cp)/Rp , i є 1,2,3,4,5 (2)
Fig. 7 Input data for gesture recognition using MLP neural network
The tree-layered feed-forward neural network with one hidden layer was used for gesture recognition. In the hidden and output
network layer the logical sigmoid function was used. The network inputs in the database were represented as normalized positions of fingertips in a range of (0, 1). Based on this data the MLP realized classification into classes. In second modification of the algorithm we added to classification process a parameter of the hand area, normalized by the palm radius. Every network output had a value in a range of (0, 1), representing a group membership rate. For the MLP network training the modified error back-propagation with adaptive learn rate and momentum parameter algorithm was used.
Results
The training of the MLP network was realized using the OpenNN library [15]. For training and testing of the MLP network a database of 29 gestures from ASL gestures (Fig. 8) was used [16, 17]. Where every gesture has 20 samples from two people. Crossed out gestures in the database were not used (Fig. 8). This gestures database was obtained by HandTrackerApp application, which was developed in C++ programming language [8].
The data from gesture database were divided into training (60%) and testing (40%) datasets. The testing dataset was divided in equal proportion of the testing and the validating data. One hidden layer was selected in our network structure. The number of neurons in hidden layer was adjusted to 20 neurons, fixed for all datasets. By this we ensured an independence of obtained results in term of several gestures comparison. In order to generalize the obtained results, we used statistical validation method for verification. For classification problems the Cross Validation method [14] is commonly used. By dividing dataset in 10 parts at the same rate, in term of distribution of classified groups, we have created independent data sets. Combining these individual data components, we have created 10 different data blocks, which were assigned for training, testing and validation.
215

International Conference on Innovative Technologies, IN‐TECH 2016,
Prague, 6. ‐ 8. 9. 2016
Fig. 8 ASL gestures used for gesture recognition. The crossed gestures were not used because of their similarity
For each data block five training experiments of neural network were realized. For statistical evaluation we therefore had 50 neural
models. The created neural models were compared in terms of average and maximum successful percentage rate. In the training process of neural network, we observed the error function behavior, which is defined as mean square error (MSE). Obtained results are shown in Table 1. Table 1. Comparison of successful rate for recognition algorithms in ASL gestures
Method Recognition successful rate [%] Wrong classified gestures
(successful rate [%]) Mean Max Original 65.32 72.86 A, C, E, G, H, K, O, Q, R, X (<25%) , other (>90%) Modified 95.62 100.00 2, 9, C, F, O, V, (>90%), other (100%)
Conclusion
For demonstration and evaluation purposes, the HandTrackerApp application was developed in C++ programming language. MLP network was implemented and trained in HandTrackerApp application using OpenNN library. If the position of the fingertips was correctly detected by tracking algorithm, then the neural classification model had a very good percentage rate. Results of the algorithm’s recognition ability are compared to an existing recognition algorithm for the ASL database. The modified algorithm is able to process 29 signs what is 10 more than the original algorithm. By successful testing of the MLP network for the classification problems we verified the suitability of their use in gesture recognition.
Acknowledgment
The work has been supported by the grant agency KEGA No. 010STU-4/2014. References [1] A. Argyros, M. Loukaris: Real-Time Tracking of Multiple Skin-Colored Objects with a Possibly Moving Camera. (2004), [online].:
http://users.ics.forth.gr/~argyros/mypapers/2004_05_eccv_hand_tracking_2d.pdf [2] P. Breuer, C. Eckes, S. Muller: Hand Gesture Recognition with a Novel IR Time-of-Flight Range Camera–A Pilot Study v Mirage
Computer Vision/ Computer Graphics Collaboration Techniques, pp. 247-260, (2007) [3] C. Keskin, F. Kirac, E. Y. Kara,. L. Akarun: Real time hand pose estimation using depth sensors, Consumer Depth Cameras for
Computer Vision, Part of the series Advances in Computer Vision and Pattern Recognition, pp. 119-137, (2013) [4] I. Oikonomidis, N. Kyriazis, A. Argyros: Efficient model based 3d tracking of hand articulations using kinect, FORTH Institute of
Computer Science, (2011). [5] J. Suarez, R. Murphy: Hand Gesture Recognition with Depth Images: A Review v The 21st IEEE International Symposium on Robot
and Human Interactive Communication, France, (2012). [6] P. Viola, M. Jones: Rapid object detection using a boosted cascade of simple features, Computer Vision and Pattern Recognition
(CVPR), pp. I-511 -I-518, (2001) [7] CH. Zhi-Hua, K. Jung-Tae, L. Jianning, Z. Jing, Y. Yu-Bo: Real-Time Hand Gesture Recognition Using Finger Segmentation, The
Scientific World Journal, Volume 2014 (2014), Article ID 267872 [8] A. Hammad. Rozpoznávanie pohybu ruky senzorom Kinect, Diploma thesis, FEI STU Bratislava, (2015), (in Slovak) [9] S. Kajan, D. Pernecký, A. Hamad: Hand gesture recognition using multilayer perceptron network, 23th Annual Conference
Proceedings, Technical Computing Prague, (2015) [10] OpenCV library, 2014 [Online]. Available: http://opencv.org [11] S. Kajan: GUI for classification using multilayer perceptron network, 17th Annual Conference Proceedings, Technical Computing
Prague , (2009) [12] V. Kvasnička, a kol.: Úvod do teórie neurónových sietí. Bratislava: Iris, (1997), 285 pp., ISBN 8088778301, (in Slovak) [13] M. Negnevitsky: Artificial Intelligence. Pearson Education Limited, (2005) [14] D. Ripley: Pattern recognition and neural networks. Cambridge university press, (1996). 403 pp. ISBN 0-521-46086-7. [15] OpenNN library, 2015 [Online]. Available: http://www.opennn.net [16] P. Bakyta: Rozpoznávanie povelov rukov neurónovými sieťami, Bachelor thesis FEI STU in Bratislava, 2016, (in Slovak) [17] R. Mitchell, et al.: How Many People Use ASL in the United States?: Why Estimates Need Updating. In Sign Language Studies
(journal). 2006, Vol. 6, No .3, pp. 306-335., (2006), ISSN 0302-1475
216

International Conference on Innovative Technologies, IN‐TECH 2016,
Prague, 6. ‐ 8. 9. 2016
MONITORING OF CHLORINE IN SWIMMING POOL BY FIBRE OPTIC SENSOR
B. Obrovski 1, J. Bajić 2, M. Vojinović Miloradov 1, I. Mihajlović 1, A. Joža 2, N. Živančev 1, M. Živanov2
1University Of Novi Sad, Faculty Of Technical Sciences, Department Of Environmental Engineering, Trg Dositeja Obradovića 6, 21000 Novi Sad, Serbia
2University Of Novi Sad, Faculty Of Technical Sciences, Department of Power, Electronic and Telecommunication Engineering, Trg Dositeja Obradovića 6, 21000 Novi Sad, Serbia
Keywords: Fibre Optic Sensor; Water; Chlorine Abstract: Fibre optic sensor (FOS) is applied to measure the concentration of total chlorine in samples of water from swimming pool. FOS is innovative method that enables measurement of selected analytes in the examined water body. Implemented color sensor device is based on the color intensity of the sample which determines the concentration for selected parameter. Sensor converts RGB (red-green-blue) color model to HSV (hue-saturation-value) color model and measure concentration for total chlorine. The paper examined the applicability of FOS for measurement in laboratory controlled conditions, and the ability to use the device for monitoring of water from swimming pool. Comparison of results obtained with standard methods (UV-VIS spectrophotometer) and FOS was carried out to confirm the possibility of using FOS sensor as a replacement for standard analytical expensive equipment. Introduction
Great efforts have been made in the development of new devices and equipment to provide quality and more reliable monitoring program. The standard laboratory methods are generally accepted and reliable, however, they have certain disadvantages. Disadvantages are related to the use of expensive and specific chemicals, the complexity of the analysis, the loss of the desired analyte in the process of sampling, transportation, extraction and storage. The great weakness is the impossibility of obtaining real-time results for the examined water body. At the moment, research has focused on the development of devices that can provide reliable, prompt and real time result which is extremely important in monitoring of different media in environment.
FOS is a new method, which is increasingly developing because of the possibility of getting real-time, immediate and reliable data about the current state of the environment. At the first stage of the development of FOS, difficulties in field devices construction were present due to the high price of the components for construction of device, the high cost of examinations and inability to fulfill performances which possess existing conventional equipment and methods. With time, the price of the components for making FOS dropped, and performance of the device are significantly enhanced. Nowadays, FOS are applied as a replacement for conventional methods, as well as in areas where no appropriate devices exist for prompt measuring of selected parameters.
FOS has advantages used for a variety of applications: simple to use, low-cost device, small dimensions (which enables measurements where other devices do not have access), resistant to electromagnetic influences and corrosion, enabling measurements in inaccessible and remote areas, possibility to use in high aggressive chemical environments, electric power is not required at sampling points, etc. There is also the possibility of increasing the number of sensors along a single optical fiber which can reduce the cost of developing devices and the possibility of monitoring parameters over large areas. These advantages enable usage of FOS for environmental monitoring, process control, biomedical investigations, agriculture and construction[1]. The FOS are used for monitoring of drinking water, groundwater and surface water, leachate from landfills, examination of acid rain and waste water from agricultural run-off [2].
Large numbers of FOS based on different principles were developed and have been applied for detecting different physico-chemical parameters in aqueous media. FOS are constructed to detect low concentrations of nitrate [3], BOD (Biological Oxygen Demand) [4], ammonia [5], sodium [6], copper [7], potassium [8] and nitrate [5,9] in aqueous solutions and chlorohydrocarbons in waste water [10]. Multiparameter FOS were constructed for measuring of temperature, pH and potassium ions in drinking water [11], cyanide, phosphate, sulfate, nitrate and nitrite [2] and heavy metal cations Men+
(aq): Co2+, Cu2+, Ni2+, Fe3+, Cd2+, Zn2+, Pb2+ and Hg2+ in the aquatic environment [12], as well as prototype field device for measuring organic pollutants in groundwater [13].
Fiber optic color sensor (FOS) was proved to be applicable for monitoring of orthophosphate, nitrite, sulfate, chlorine and hexavalent chromium in surface water in laboratory controlled conditions [14]. This paper presents a color sensor used to measure total chlorine in swimming pools. The use of chlorine compounds is widespread as a disinfectant for drinking water and swimming pool water intended for recreational activities. During disinfection process, carcinogenic and toxic organic chlorine compounds could be generated as disinfection by-products. Chlorine is continuously used in the pool, and different factors determine the chlorine transformation and “consumption”, including bathing frequency, water temperature, sunlight and pool size. Concentration of chlorine is changing rapidly in water samples and even in low concentrations chlorine may have a negative effect on humans. Therefore, it is extremely important to get real data on the state of the chlorine in the pool. The results obtained by standard laboratory methods (UV- Vis spectrophotometer) and FOS are compared in order to demonstrate the efficiency of the device. Measurements were repeated to prove reproducibility of results and the possibility of using FOS in laboratory under controlled conditions. Materials and methods
Samples of pool water for laboratory analysis were collected from swimming pool in the city of Novi Sad, Serbia. Examined swimming pool was of closed type with size of 25*50 meters and height of 2.8m. Swimming pool is used for recreational activities and as object for waterpolo games and sport swimming club in Novi Sad.
Samples are poured into 1 L glass bottles, stored in hand refrigerator at 4 0C, and transported to the laboratory. Analyses were carried out in accredited Laboratory for monitoring of landfills, wastewater and air, Department of Environmental Engineering and Occupational Safety and Health, Faculty of Technical Sciences, University of Novi Sad, Novi Sad. Concentrations of total chlorine in water
217

International Conference on Innovative Technologies, IN‐TECH 2016,
Prague, 6. ‐ 8. 9. 2016
samples were analyzed by original FOS method and results were compared with standard analytical HACH Method (HACH Method 8167) measured with UV-VIS spectrophotometer (DR 5000, HACH, Germany).
Operating principle of implemented FOS is the absorption of light (Figure 1). When the light passes through a liquid, certain wavelengths will be transmitted while others are absorbed depending on the color of the tested liquid. Fiber optic sensor detects the color and converts RGB color model in HSV color model. The used sensor determines V and S value and calculates concentration of the parameters of interest, and H value which is used for calculation of wavelength.
Fig. 1 Schematic principle of operation for FOS
The sensor consists of three plastic optical fibres (POFs) that emit red, green and blue components mounted around a central optical
fibre collecting light reflected from the mirror (Figure 1). Three light-emitting diodes red, green and blue are set to different frequencies. In this way detection of the reflected signal is achieved with only one photodetector and three bandpass filters. The applied sensor is presented in Figure 2.
Fig. 2 Applied sensor (FOS) Results and discussion
Total presence of chlorine in the swimming pool must be frequently monitored and controlled due to hygienic and safety reasons, according to the prescribed laws and sub-laws. The concentration of total chlorine must be in the same controlled level, according to the photochemical transformation and chlorine-based by-products which could have a number of unwanted effects. For controlling the concentrations of total chlorine in swimming pool as well as to examine the efficiency, accuracy and applicability of the sensor, the results by FOS were compared with results obtained by the standard analytical laboratory methods (HACH Method 8167 with DR 5000, HACH, Germany).
Calibration curves for the FOS were constructed with five different concentrations of total chlorine standard solution. Standard solution with the lowest concentration of total chlorine has bright pink color and with increasing concentrations of total chlorine, the color of the sample becomes more intense.
Total chlorine concentration was calculated and determined on the basis of the parameter S, based on calibration curve obtained with the standard solution and the relative difference (Table 1). The V value is a constant for total chlorine and could not be used for determination of its concentration with the applied sensor. Table 1. Comparison of the concentration obtained by standard analytical method (UV-Vis spectrophotometer) and sensor (FOS).
Measurement UV-Vis
[mg/l] FOS [mg/l]
Relative difference [%]
1 0,49 0,488 0,41 2 0,66 0,608 7,88 3 0,51 0,512 0,39
218

International Conference on Innovative Technologies, IN‐TECH 2016,
Prague, 6. ‐ 8. 9. 2016
Fig. 3 Concentration for total chlorine detected with FOS based of S value
Relative differences for observed parameters measured by FOS are lower than 10 %, confirming the successful usage of optical
sensor in laboratory controlled conditions. H value is almost constant for total chlorine. UV-Vis spectrophotometer measures concentration of examined parameter at 530 nm.
The wavelength for FOS was calculated from the equation (1), and FOS measures concentration of selected parameter at 527 nm. Relative difference is 0,56 % which confirms the possibility of using the FOS as “low-cost” and practical, prompt laboratory equipment.
λ = -1.1 × H [0] + 700 (1) where: λ is wavelength and H is hue value. After the conducted comparison and discussion of the results, it could be concluded that the FOS is reliable and applicable for
laboratory measuring of total chlorine in water samples from swimming pool. The FOS represents a “low cost” solution and there is a possibility to replace the expensive standard analytical equipment. Conclusion
FOS is successfully applied in laboratory controlled conditions for monitoring of key parameters in surface water, as well as for controlling of two parameters (total and residual chlorine) in water from swimming pool. On the preliminary results of our laboratory, there is a possibility of designing field device, which could be used for providing reliable and real-time data.
Future research is in progress and will focus on improving the performance of fiber optic colour sensor by providing better quality choice of LED diode, which would improve the accuracy and precision of the device. The sensor shows greater deviations at low concentrations, so increasing of device sensitivity will enhance the range of its implementation for different applications. Applied FOS is multiparameter device which can be optimally used for five parameters in surface water and two parameters in waters from swimming pool. One of the great advantages of the applied sensor could be low price of components for the construction of device.
Construction of field device with improved performances will provide higher quality monitoring program and more reliable results which is important in the case of contamination and early responses in order to prevent the contamination. Acknowledgment: The authors acknowledge for the funding provided by the Ministry of Education, Science and Technological Development of Republic of Serbia under project ‘Development of methods, sensors and systems for monitoring quality of water, air and soil’, number III43008. References [1] Ghong S S, Abdul Aziz A R, Harun S W (2013) Fibre Optic Sensors for Selected Wastewater Characteristics. Sensors 13, 8640-
8668. [2] S. M. Klainer, J. R. Thomas, J. C. Francis: Fiber-optic chemical sensors offer a realistic solution to environmental monitoring needs,
Sensors and Actuators B, 11, 1993, 81-86. [3] P. S. Kumar, C. P. G. Vallabhan, V. P. N. Nampoori, V. N. S. Pillai, P. Radhakrishnan: A fibre optic evanescent wave sensor used
for the detection of trace nitrites in water, Journal of Optics A: Pure and Applied Optics, 4, 2002, 247-250. [4] C. Preininger, I. Klimant, O. S. Wolfbels: Optical fiber sensor for Biological Oxygen Demand, Analytical Chemistry, 66, 1994, 1841-
1846. [5] P. S. Kumar: Desing and development of fiber optic sensor for trace detection of certain environmental pollutants, PhD Thesis,
Cochin University of Science and Technology, 2003.
1,61,20,80,40,0
200
150
100
50
0
Concetration [mg/l]
S Va
lue
Concetration1. measurement2. measurement3. measurement
219

International Conference on Innovative Technologies, IN‐TECH 2016,
Prague, 6. ‐ 8. 9. 2016
[6] F. Buchholz, N. Buschmann: A fibre-optical sensor for the determination of sodium with a reversible response, Sensors and
Actuators B, 9, 1992, 41-47. [7] C. B. Ojeda, F. S. Rojas: Recent Development in Optical Chemical Sensors Coupling with Flow Injection Analysis, Sensors, 6, 2006,
1245-1307. [8] R. Narayanaswamy: Current developments in optical biochemical sensors, Biosensors and Bioelectronics, 6, 1991, 467-475. [9] N. S. Aulkh, R. S. Kaler: Fiber optic interrogator based on colorimetry technique for in-situ nitrate detection in groundwater, Optica
Applicata, 38, 208, 727-735. [10] F. Regan: Sample matrix effects on measurements using a fiber-optic infrared sensor, Instrumentation Science and Technology,
42, 2014, 1-14. [11] A. Dybko, W. Wroblewski, E. Rozniecka, K. Pozniakb, J. Maciejewski, R. Romaniuk, Z. Brzozka: Assessment of water quality based
on multiparameter fiber optic probe, Sensors and Actuators B, 51, 1998, 208-213. [12] N. Malcik, O. Oktar, M. E. Ozser, P. Caglar, L. Bushby, A. Vaughan, B. Kuswandi, R. Narayanaswamy: Immobilised reagents for
optical heavy metal ions sensing, Sensors and Actuators B, 53, 1998, 211-221. [13] H. Steiner, M. Jakusch, M. Kraft, M. Karlowatz, B. Mizaikoff, T. Baumann, R. Niessner, W. Konz, A. Brandenburg, K. Michel, C.
Boussard-Pledel, B. Bureau, J. Lucas, Y. Reichlin, A. Katzir, N. Fleischmann, K. Staubmann, R. Allabashi, J. M. Bayona: In Situ Sensing of Volatile Organic Compounds in Groundwater: First Field Tests of a Mid-Infrared Fiber-Optic Sensing System, Society for Applied Spectroscopy, 57, 2003, 124-130.
[14] B. Obrovski, J. Bajić, I. Mihajlović, M. Vojinović Miloradov, B. Batinić, M. Živanov: Colorimetric fiber optic probe for measurement of chemical parameters in surface water, Sensors and Actuators B: Chemical, 228, 2016, 168-173.
220
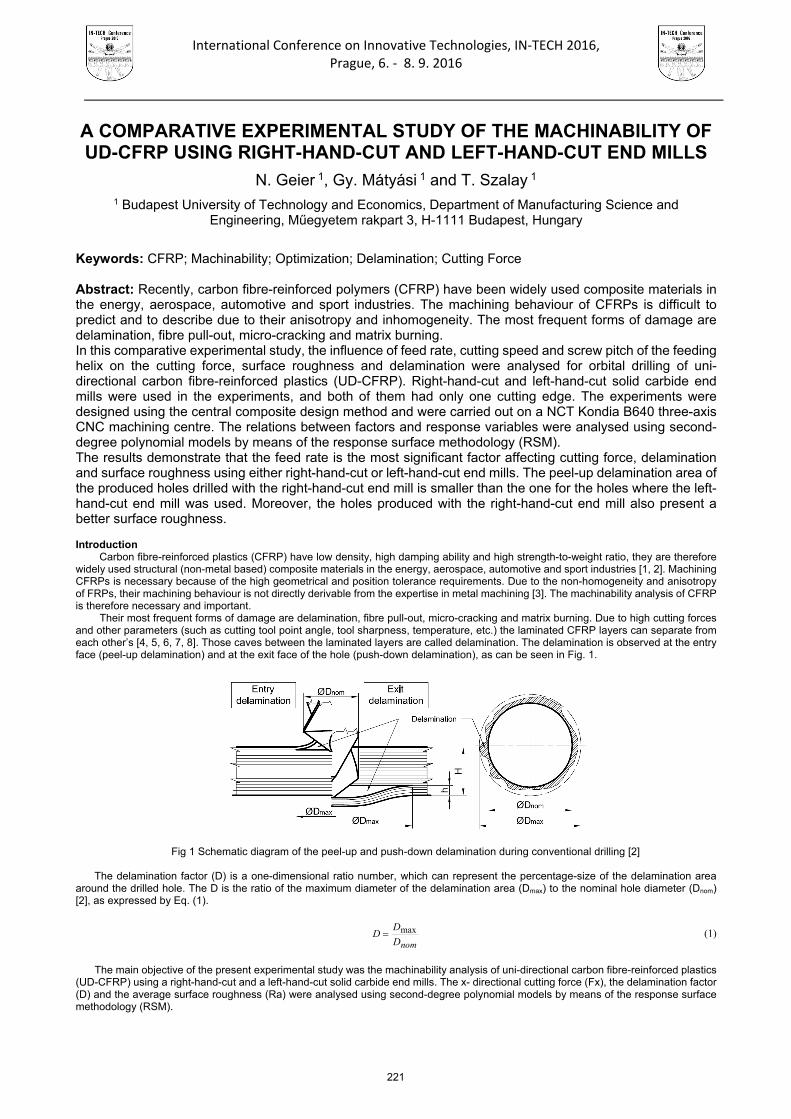
International Conference on Innovative Technologies, IN‐TECH 2016,
Prague, 6. ‐ 8. 9. 2016
A COMPARATIVE EXPERIMENTAL STUDY OF THE MACHINABILITY OF UD-CFRP USING RIGHT-HAND-CUT AND LEFT-HAND-CUT END MILLS
N. Geier 1, Gy. Mátyási 1 and T. Szalay 1 1 Budapest University of Technology and Economics, Department of Manufacturing Science and
Engineering, Műegyetem rakpart 3, H-1111 Budapest, Hungary
Keywords: CFRP; Machinability; Optimization; Delamination; Cutting Force Abstract: Recently, carbon fibre-reinforced polymers (CFRP) have been widely used composite materials in the energy, aerospace, automotive and sport industries. The machining behaviour of CFRPs is difficult to predict and to describe due to their anisotropy and inhomogeneity. The most frequent forms of damage are delamination, fibre pull-out, micro-cracking and matrix burning. In this comparative experimental study, the influence of feed rate, cutting speed and screw pitch of the feeding helix on the cutting force, surface roughness and delamination were analysed for orbital drilling of uni-directional carbon fibre-reinforced plastics (UD-CFRP). Right-hand-cut and left-hand-cut solid carbide end mills were used in the experiments, and both of them had only one cutting edge. The experiments were designed using the central composite design method and were carried out on a NCT Kondia B640 three-axis CNC machining centre. The relations between factors and response variables were analysed using second-degree polynomial models by means of the response surface methodology (RSM). The results demonstrate that the feed rate is the most significant factor affecting cutting force, delamination and surface roughness using either right-hand-cut or left-hand-cut end mills. The peel-up delamination area of the produced holes drilled with the right-hand-cut end mill is smaller than the one for the holes where the left-hand-cut end mill was used. Moreover, the holes produced with the right-hand-cut end mill also present a better surface roughness. Introduction
Carbon fibre-reinforced plastics (CFRP) have low density, high damping ability and high strength-to-weight ratio, they are therefore widely used structural (non-metal based) composite materials in the energy, aerospace, automotive and sport industries [1, 2]. Machining CFRPs is necessary because of the high geometrical and position tolerance requirements. Due to the non-homogeneity and anisotropy of FRPs, their machining behaviour is not directly derivable from the expertise in metal machining [3]. The machinability analysis of CFRP is therefore necessary and important.
Their most frequent forms of damage are delamination, fibre pull-out, micro-cracking and matrix burning. Due to high cutting forces and other parameters (such as cutting tool point angle, tool sharpness, temperature, etc.) the laminated CFRP layers can separate from each other’s [4, 5, 6, 7, 8]. Those caves between the laminated layers are called delamination. The delamination is observed at the entry face (peel-up delamination) and at the exit face of the hole (push-down delamination), as can be seen in Fig. 1.
Fig 1 Schematic diagram of the peel-up and push-down delamination during conventional drilling [2]
The delamination factor (D) is a one-dimensional ratio number, which can represent the percentage-size of the delamination area
around the drilled hole. The D is the ratio of the maximum diameter of the delamination area (Dmax) to the nominal hole diameter (Dnom) [2], as expressed by Eq. (1).
nomD
DD max (1)
The main objective of the present experimental study was the machinability analysis of uni-directional carbon fibre-reinforced plastics
(UD-CFRP) using a right-hand-cut and a left-hand-cut solid carbide end mills. The x- directional cutting force (Fx), the delamination factor (D) and the average surface roughness (Ra) were analysed using second-degree polynomial models by means of the response surface methodology (RSM).
221

International Conference on Innovative Technologies, IN‐TECH 2016,
Prague, 6. ‐ 8. 9. 2016
Experimental setup
The orbital drilling (hole machining strategy, using an end mill with helical tool patch) experiments were carried out on a Kondia B640 three-axis CNC milling machining centre with maximum rotational speed of 12,000 rpm. The machining centre was equipped with a NILFISK GB733 vacuum cleaner (14.7 kPa) to clear off the chips from the cutting area. A Ø10 mm right-hand-cut and an Ø8 mm left-hand-cut solid carbide end mills were used and both of them had only one cutting edge, as shown in Fig. 3.
Fig 2 The cutting experimental setup a) Vacuum cleaner; b) Cutting tool; c) CFRP; d) Fixture; e) KISTLER load cell [2]
Fig 3 The cutting tools used during this study. A right-hand-cut solid carbide end mill (left) and a left-hand-cut solid carbide end
mill (right)
The cutting force components (Fx, Fy, Fz) were measured with a KISTLER 9281B load cell with a sampling frequency of 2000 Hz. The data were collected using the KISTLER Dyno Ware software. The delamination was analysed and measured through an Olympus SZX16 optical microscope. The average surface roughness was measured and calculated with a Mitutoyo SJ-400 instrument. The machining experimental setup (vacuum cleaner, cutting tool, workpiece, fixture and load cell) can be seen in Fig. 2.
The experiments were designed using the central composite (CCI) design of experiments (DOE) method. The factors and their levels were defined based on previous works and suggestions of other researchers [1, 2, 4]. The cutting speed (vc), feed rate (f) and the screw pitch of the feeding helix (h) were the numerical, continuous factors, which have an influence on the responses (Fx, D, Ra). The factors and their levels can be seen in Table 1. Table 1. Central composite (CCI) experiment parameters for the Ø10 PERFOR 823665110008 right-hand-cut and for the Ø8 PERFOR 82366610800 left-hand-cut solid carbide end mills.
Tools Factors Levels -23/4 -1 0 +1 +23/4
Right-hand-cut end mill
Cutting speed (m/min) 50 70 100 130 150 Feed rate (mm/rev) 0.020 0.028 0.040 0.051 0.060 Screw pitch (mm) 0.10 0.068 1.55 2.41 3.00
Left-hand-cut end mill
Cutting speed (m/min) 50 70 100 130 150 Feed rate (mm/rev) 0.020 0.028 0.040 0.051 0.060 Screw pitch (mm) 0.10 0.068 1.55 2.41 3.00
Results
The response surface methodology (RSM) is a mathematical technique to analyse the influences of the factors on the response. The response surface is an n-degree polynomial regression model which can be generated through the measured values. The machining behaviours of the CFRPs are non-linear [1, 3], a second degree (n=2) polynomial regression model was therefore used in the present study, as expressed by Eq. (2).
1
1 11
2
1
0
n
i
j
n
ij
iij
n
i
iiii
n
i
ii xxbxbxbby (2)
Where y is the corresponding response which we are interested in, xi are the input variables (factors), which affect the y response. i is the number of the factors, bi, bij and bii are the regression coefficients of the factors, and δ is the random experimental error. The analysis of variance (ANOVA) was used to analyse the main effects and the significant factors. The ANOVA is a statistical test used to decide if rejecting or not the null hypotheses (H0,i, which means that the xi factor doesn’t have a significant effect on the response). If the calculated k value is bigger than a critical k value, the H0 is rejected. Cutting force
Three cutting force components (Fx, Fy and Fz) were measured by the KISTLER load cell. The axial cutting force component (Fz) was not as significant as the force component in the direction of the feed rate, the x-directional force component was therefore analysed and used to describe the machining behaviour of the UD-CFRP. The RSM based mathematical regression models can see in Eq. (3) for the right-hand-cut and in Eq. (4) for the left-hand-cut end mill. The models are shown in the Fig. 4 and 5. As the ANOVA and the diagrams accurately show, the factor that most significantly influence the Fx is the screw pitch of the feeding helix (h). The cutting speed, on the contrary, does not have an appreciable effect on the response.
As observable in Fig. 4 and 5, if the screw pitch increases, the Fx increases as well using both cutting tool. In case of increasing of the feed rate, the Fx also increases. If the diagrams are compared, the maximal measured x-directional force is one order of magnitude higher when using the left-hand-cut than with the right-hand-cut end mill. The reason of this difference can be found in the non-homogeneity and anisotropy of CFRPs.
Right-hand-cut solid carbide end mill
Type: PERFOR 823665110008
Diameter: Ø10 Cutting edges: 1 Helix angle: 25°
Left-hand-cut solid carbide end mill
Type: PERFOR 82366610800
Diameter: Ø8 Cutting edges: 1 Helix angle: 25°
222
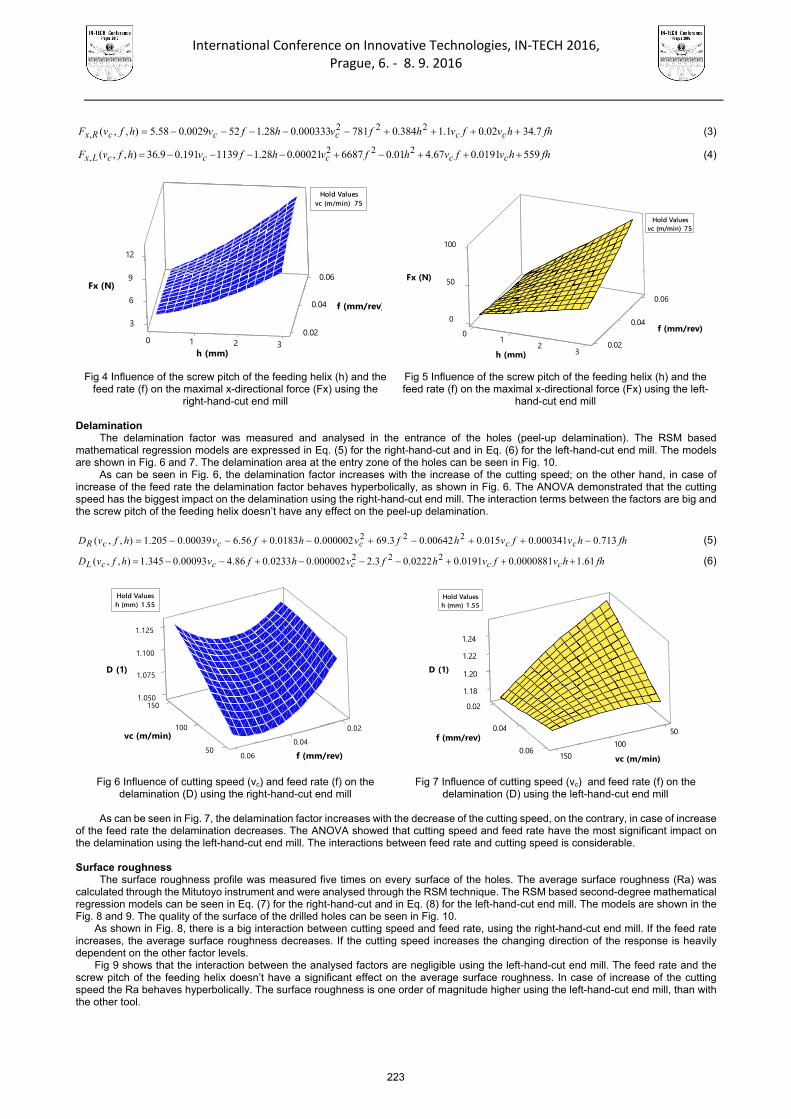
International Conference on Innovative Technologies, IN‐TECH 2016,
Prague, 6. ‐ 8. 9. 2016
fhhvfvhfvhfvhfvF cccccRx 7.3402.01.1384.0781000333.028.1520029.058.5),,( 222, (3)
fhhvfvhfvhfvhfvF cccccLx 5590191.067.401.0668700021.028.11139191.09.36),,( 222, (4)
Fig 4 Influence of the screw pitch of the feeding helix (h) and the feed rate (f) on the maximal x-directional force (Fx) using the
right-hand-cut end mill
Fig 5 Influence of the screw pitch of the feeding helix (h) and the feed rate (f) on the maximal x-directional force (Fx) using the left-
hand-cut end mill Delamination
The delamination factor was measured and analysed in the entrance of the holes (peel-up delamination). The RSM based mathematical regression models are expressed in Eq. (5) for the right-hand-cut and in Eq. (6) for the left-hand-cut end mill. The models are shown in Fig. 6 and 7. The delamination area at the entry zone of the holes can be seen in Fig. 10.
As can be seen in Fig. 6, the delamination factor increases with the increase of the cutting speed; on the other hand, in case of increase of the feed rate the delamination factor behaves hyperbolically, as shown in Fig. 6. The ANOVA demonstrated that the cutting speed has the biggest impact on the delamination using the right-hand-cut end mill. The interaction terms between the factors are big and the screw pitch of the feeding helix doesn’t have any effect on the peel-up delamination.
fhhvfvhfvhfvhfvD cccccR 713.0000341.0015.000642.03.69000002.00183.056.600039.0205.1),,( 222 (5)
fhhvfvhfvhfvhfvD cccccL 61.10000881.00191.00222.03.2000002.00233.086.400093.0345.1),,( 222 (6)
Fig 6 Influence of cutting speed (vc) and feed rate (f) on the delamination (D) using the right-hand-cut end mill
Fig 7 Influence of cutting speed (vc) and feed rate (f) on the delamination (D) using the left-hand-cut end mill
As can be seen in Fig. 7, the delamination factor increases with the decrease of the cutting speed, on the contrary, in case of increase
of the feed rate the delamination decreases. The ANOVA showed that cutting speed and feed rate have the most significant impact on the delamination using the left-hand-cut end mill. The interactions between feed rate and cutting speed is considerable.
Surface roughness
The surface roughness profile was measured five times on every surface of the holes. The average surface roughness (Ra) was calculated through the Mitutoyo instrument and were analysed through the RSM technique. The RSM based second-degree mathematical regression models can be seen in Eq. (7) for the right-hand-cut and in Eq. (8) for the left-hand-cut end mill. The models are shown in the Fig. 8 and 9. The quality of the surface of the drilled holes can be seen in Fig. 10.
As shown in Fig. 8, there is a big interaction between cutting speed and feed rate, using the right-hand-cut end mill. If the feed rate increases, the average surface roughness decreases. If the cutting speed increases the changing direction of the response is heavily dependent on the other factor levels.
Fig 9 shows that the interaction between the analysed factors are negligible using the left-hand-cut end mill. The feed rate and the screw pitch of the feeding helix doesn’t have a significant effect on the average surface roughness. In case of increase of the cutting speed the Ra behaves hyperbolically. The surface roughness is one order of magnitude higher using the left-hand-cut end mill, than with the other tool.
vc (m/min) 75Hold Values
3
0 1
6
9
20.02 3
0.06
04.0
12
)ver/mm( f
)N( xF
)mm( h
vc (m/min) 75Hold Values
0 1 2
0
50
40.0
0.023
0
0.06
40.0
001
)N( xF
)ver/mm( f
)mm( h
h (mm) 1 .55Hold Values
001
50 0.06
5. 001150
1.075
20.040.0
0.101
.1251
)1( D
)nim/m( cv
)ver/mm( f
h (mm) 1 .55Hold Values
. 40 0
6.0 0 051
81.10.02
01.2
05100
01 2
.1 22
2.1 4
)1( D
)ver/mm( f
)nim/m( cv
223

International Conference on Innovative Technologies, IN‐TECH 2016,
Prague, 6. ‐ 8. 9. 2016
fhhvfvhfvhfvhfvRa cccccR 380262.015.1319.12135000263.048.94803.04.14),,( 222 (7)
hvfvhfvhfvhfvRa cccccL 629.153.44.27571602816.07.295119734.9753),,( 222 (8)
Fig 8 Influence of cutting speed (vc) and feed rate (f) on the average surface roughness (Ra) using the right-hand-cut end
mill
Fig 9 Influence of cutting speed (vc) and feed rate (f) on the average surface roughness (Ra) using the left-hand-cut end mill
Fig 10 The surfaces and entry zones of the drilled holes a) right-hand-cut end mill b) left-hand-cut end mill
Summary and conclusions
The main goal of the present experimental study was the machinability analysis of a UD-CFRP using a right-hand-cut and a left-hand-cut solid carbide end mills. The x- directional cutting force (Fx), the delamination factor (D) and the average surface roughness (Ra) were analysed using second-degree polynomial models by means of the response surface methodology (RSM).
The results showed that both x-directional cutting force and average surface roughness of the drilled holes were one order of magnitude higher using the left-hand-cut end mill than the right-hand-cut one. The reason of this differences can traced back to the non-homogeneity and anisotropy of CFRPs. The delamination, fibre pull-out, micro-cracking and matrix burning were also more significant using the left-hand-cut end mill. To summarize, the right-hand-cut solid carbide end mill is able to produce a good quality (with respect to delamination, average surface roughness, fibre pull-out etc.) holes contrary to the left-hand-cut end mill. Acknowledgment
The authors would like to acknowledge the support provided by the CEEPUS III HR 0108 project. The current research is connected to the topic of the project TéT-12_MX Hungarian-Mexican Bilateral Project “Experimental and theoretical optimization and control of machining technology and tool path for micro milling”. This research was partly supported by the EU H2020-WIDESPREAD-2014-1-FPA-664403 Teaming project “Centre of Excellence in Production Informatics and Control”. The publication of the work reported herein has been supported by ETDB at BME. References
[1] Haijin Wang, Jie Sun, Jianfeng Li, Laixiao Lu, Nan Li (2015) Evaluation of cutting force and cutting temperature in milling carbon
fiber-reinforced polymer composites. Int J Adv Manuf Technol 71:1295–1307 [2] Geier N, Matyasi G (2015) Machinability study of unidirectional CFRP using central composite design of experiments. IESB 2015
Conference ISSN 2062-2872 [3] Y. Karpat, B. Değer, O. Bahtiyar (2014) Experimental evaluation of polycrystalline diamond tool geometries while drilling carbon
fiber-reinforced plastics. Int J Adv Manuf Technol 71:1295–1307 [4] Wang H, Sun J, Li J, Lu L, Li N (2015) Evaluation of cutting force and cutting temperature in milling carbon fiber-reinforced polymer
composites. Int J Adv Manuf Technol 82:1517–1525 [5] Wang H, Sun J, Li J, Li W (2014) Investigation on delamination morphology during drilling composite laminates. Int J Adv Manuf
Technol 74:257–266 [6] Abrao AM, Faria PE, Campos Rubio JC, Reis P, Davim JP (2007) Drilling of fiber reinforced plastics: A review. Journal of Materials
Processing Technology 186:1–7 [7] Singh AP, Sharma M, Singh I (2013) A review of modeling and control during drilling of fiber reinforced plastic composites.
Composites Part B 47:118–125 [8] Hocheng H, Dharan CKH (1990) Delamination during drilling in composite laminates. ASME J Eng Ind 112:236 –239
h (mm) 1 .55Hold Values
0.02
.0 0
.21
. 40 0
60.0
100
051
50
4.2
6.3
)mμ( aR
)ver/mm( f )nim/m( cv
h (mm) 1 .55Hold Values
00. 50. 40
0.03
5- 00.06
0
021001
08
140021
50
)mμ( aR
)ver/mm( f )nim/m( cv
a) a) b)
b)
224

International Conference on Innovative Technologies, IN‐TECH 2016,
Prague, 6. ‐ 8. 9. 2016
CONCEPT, DEFINITION AND STRUCTURE OF THE SYSTEM
A. Macura1
1Faculty of Transport and Traffic Engineering, Zagreb, Vukeliceva 4, Croatia¨
Keywords: System; System Elements; The Hierarchy of System; Entropy of System; Progression Abstract: Systematic thinking is applied to complex phenomena and systems, so the focus usually occurs over a sufficient knowledge, with an emphasis on the analysis of processes in the system and knowing a whole,rather than its components. Because of this, the development and application of systematic thinking represents the development of new scientific concepts, methods, ideas and theories. A systematic approach is characterized by the observation of phenomena in their dynamism and integrity, which on the basis of the knowledge that can be reached by studying system enables managment of system development through the optimization of its processes and functions. The task of General systems theory is that by using math, and other methodological disciplines, formulate, develops, and apply common patterns of system behavior. A fundamental characteristic of the systemic approach is interconnectivity and dynamism of the subjects of the research, which develop in the interaction of the parts in relation to the whole. The system is a word of Czech origin who is described as the totality of the principles of the things coordinated and linked into a whole. The idea of systems dates back to the ancient Greek thinkers Plato, Aristotle, Democritus, and others. Aristotle defined the system as a whole that's greater than the sum of its parts. The system is therefore, appropriate(functional) unit, which makes certain components and relationships between them. There are many definitions of system,almost as much as theorists who study the system. The term system means a set of (composition) elements (parts) whose mutual relations are based on certain laws (principles) and all are directly related to the system environment. The dynamics of a system entails changing its state in a certain space over a period of time. Introduction
Systems theory is an interdisciplinaray field that studies the relations/ratio as whole (1).The formation of systems theory is related to the year 1954. and a meeting of the American society for the advancement of science. On that occasion, the society was established for the theory of the system for the purpose of research of transformation of the system, models and patterns in various scientific fields, as well as encouraging the creation of theoretical models in the field of science. The purpose of the foundation refers to the reduction of parallel research to a minimum in various scientific fields, as well as improving communication between scientists of different specialties, and organizing and stimulating teamwork on joint projects. The main subject of study of these theories according to its creators is the growth and development of the system, because these processes everywhere follow the same laws regardless of scientific discipline(2). As an example, take the following formula:
B = X (1 + z) n (1) where is: B - System Development, X - component of the system, z - rate of system components, n – period. Theory of systems and types of systems
There is more than one definition of the system, which as an object must contain at least 2 elements, as illustrated by the following scheme:
Fig. 1 Sheme of Theory of systems and types of systems
225

International Conference on Innovative Technologies, IN‐TECH 2016,
Prague, 6. ‐ 8. 9. 2016
Graphical interpretation of the above contributions can be mathematically expressed as a ratio of X = (T, Xv, Z) where T. . . X – system, T - system structure, XV - system property, Z - system links.
In the analysis of the system, they can be parsed so that subsystems are becoming systems with their own elements,but when it comes to the hierarchical structure of large systems, then the subsystems and components are called by one name, system components. Systems can be divided in different way depending on the criteria according to the properties of the elements, the types of behaviours, relationships with the environment, the range, stability, hierarchy, etc. But, if the theory of the system is observed as a means of addressing the specific problem, then we share the systems into four basic groups:
The first group — according to the degree of abstraction The second group — according to the time behaviour of the system The third group — according to the complexity of the system The fourth group — according to the specificity of the system behavior
• According to the degree of abstraction systems can be concrete and abstract. Concrete can be natural and artificial. Natural systems
are those that arise and function without conscious reaction of the people. These are almost all biological systems. Artificial systems are the ones that people are creating consciously with a specific purpose. Artificial can be considered those systems that are the result of action of other artificial system. Abstract, are all those systems that are the result of human opinions, which have not been realized in the concrete material elements.
• According to the change of the system in the time we distinguish between static and dynamic systems Static systems are according to the definition,such systems in which neither the elements nor their structures are not subject to change. There are no real,completely static systems because one of the basic properties of these systems is just susceptibility to changes. Dynamic systems are those systems in which there is a substantial change in time. Dynamic are all biological systems and many artificial systems.
• According to the complexity of the systems we have simple, complicated and complex systems. They are simple systems that have a very simple structure, i. e. the very few elements and very little connection between the elements. Complicated systems are systems that have more elements and more connections, and whose function is also complex, i. e. conditioned with more parameters. Complex systems are such systems whose structures can not identify in detail and whose behavior is not determined. The function of such systems is also very complex.
• According to the specificity of behavior we know determined or defined systems, stochastic or probable systems and indeterminate or indefinite systems. The system is determined or defined when his behavior is known, or if the well-known circumstances can safely predict his reaction. Stochastic are mostly complex systems whose outputs can be found in the time intervals in certain areas of probability. Indeterminate systems are those, whose behavior can not be predicted, or systems which probability to predict is very small.
The basic settings and the entropy of the system
The system is regulated entity. The science community has a system of individual parts, which are organized and held by the structure of their organization. Each system consists of elements (components and subsystems) that are in their mutual relations. Each system is a subsystem of higher order and this is called the hierarchy. The system is in a State of entropy if no energy is invested in it. The basic settings of the system are purposefulness, isomorphism, the principle of equifinality and holistic approach (2). • The purposefulness of the system is achieved when the elements of the system enable its functioning by their mutual interaction. • The Isomorphism of the system means that the more different systems has the same properties and equal to respond to external
action. • The principle of equifinality enables the function of the system can be achieved in several different ways. • A holistic approach indicates that the elements of the system are observed in the functioning of the system and not separately.
From the fact that each system represents a whole sets of elements in state of order (T1, T2, . . . . TN) it follows that these elements at some point or in a time period (n) represent some State of the system (X). How the State of the system (X) over the time change, then that change is what we call "process", and is expressed by a set of a series of System State (x 1, x 2, . . . . Xn). However, under the influence of the environment and law of the internal functioning of the system, there are a variety of probability (pi) occurrence of a particular independent event p (xi) over time. p (x1) = p1, p(x2) = p2.....p(xn) = pn (2)
Starting from the assertion that probability of the behaviour of the system can be determined in advance,then the behavior of the system (x) can be represented by the following mathematical relationship.The enthropy is
(3)
If the value of entropy (H) = 0, then the system can tell that his condition is completely taken care of, and by doing so implies that there is no uncertainty principle, as in the behavior of the system, and in the behavior of its elements. The degree of entropy is actually a measurement that is used when considering the quality of the encoding.
The fact is that the systems evolve, develop, become more complex, and then stagnate, die off and eventually disappear.
226

International Conference on Innovative Technologies, IN‐TECH 2016,
Prague, 6. ‐ 8. 9. 2016
General features of the system are (4): • Integrity and independence. The integrity is the property under which each part of the system is linked with other elements so that
its change means change in all other parts of, or a change in behavior of the system. Independence is opposite property, according to which a change in any given element does not affect the whole, rather than only to that part of the system.
• Progressive factorization. If changes in the system over time, gradually leads from the state of integrity to the independence of its parts, then this is a progressive factorization, when the system ceases to act as a system and come up with their end, and comes to his dissolution as a form of this process. The second form of progressive factorization is the growth of the system in a way that over time parts of it become more increasingly diverse in structure and functions through the formation and development of new subsystems.
• Progressive codification. System from a State of owning a relatively independent parts goes into the State of integrity. Some of the ways by which such changes occures are connecting the previously unconnected parts of the system by strengthening the existing relationship between the elements of the system, and gradually adding elements and connections to the existing system:
• Centralization and decentralization. Centralized system is the unit in which one subsystem has a dominant role in the functioning of the whole unit.
Conclusion
Systems theory is a recent area of science. It was created in the framework of Cybernetics. The development of the scientific knowledge of Cybernetics and systems, as well as the technical-technological development, given rise to the development of, or organizing and designing of modern information systems. In terms of the development of the transport system, the system must be well organized, because traffic congestion slowing down the flow of people and goods, and thereby increase the price of the product and reduce the efficiency of the business. References [1] https://wikipedia.org/System Theory, accessed on 07/15/2016 [2] V. Grbavac: Faculty of organization and informatics, Contemporary Communications, Year 9, No. 4, pages 275-284, in 1987 [3] https:// wikipedia.Wiki/Org/System, accessed on 07/15/2016 [4] V. Srica: System, information, computer, Zagreb, Informator, in 1981
227

International Conference on Innovative Technologies, IN‐TECH 2016,
Prague, 6. ‐ 8. 9. 2016
228

International Conference on Innovative Technologies, IN‐TECH 2016,
Prague, 6. ‐ 8. 9. 2016
INVESTIGATION OF THE LIMITS OF RADIUS MEASUREMENTS WITH THE APPLICATION OF COORDINATE MEASUREMENT TECHNOLOGY
M. Czampa1, J. Cs. Igali1 and T. Szalay1 1 Budapest University of Technology and Economics, Department of Manufacturing Sciences and
Engineering, H-1111 Budapest, Muegyetem emb. 3., Hungary, +36 1 463 1875, [email protected]
Keywords: Coordinate Metrology, Measurement Accuracy, Radius Measurements, Measurement Uncertainty Abstract. By the help of coordinate measurement technology we are able to measure characteristics which cannot, or can only be measured with some difficulties when applying traditional measurement equipment. However, the coordinate measurement technology – as every other method – also has its technological limitations. It is a known fact that in the case of measuring diameters the different coordinate measuring machines give false results below a certain central angle. This can occur when we cannot measure the elements with a central angle of 360° because of the component geometry (e.g. in the case of different radiuses on the machined parts). In our research we investigated the limits of different radius measurements by the help of coordinate measuring technology. What are the limit central angles under which the measured results are no longer acceptable? At first, we established a general measurement plan, which were carried out on four different coordinate measuring machines with the help of five etalon rings having different diameters. This measurement plan was repeated five times in various positions within the working are of the used machines. All of the etalon rings were measured with seven different central angles from 360° to 5°. These procedures provided a database large enough to draw the appropriate conclusions based on it. After carrying out the measurements, a general method (calculation method of the resultant measurement uncertainty) was defined to calculate the errors of the radius measurements in each cases. After this the calculated uncertainties were compared to the maximum permissible errors of the given measuring machines. Introduction
Coordinate measurement technology nowadays is a widely applied measurement method. With its application we are able to examine the size and form tolerances of simple and complex shapes. When using this method we suppose a Descartes coordinate system, and we define points on the shape we would like to measure. Each point can be defined by three spatial (XYZ) coordinates. The evaluating software fits a given shape on the points based on a defined method. The evaluation of information regarding size and orientation is carried out with the help of the software too [1].
The more measured points we have, the more exact the shape fitted by the software is. However, evaluating softwares sometimes provide false results even though the measured parts are accurately manufactured.
In our research we focused on the measurement of inner roundings (radiuses) occurring on different workpieces. These features mainly occur in the case of pockets, slots or inner shaped surfaces. In this case the specialty of the measurement is that we have to fit a circle on the points, but these points are not measured with a central angle of 360°.
It is a general industrial observation [2] that the result provided by the given machine are not reliable when the central angle is under 120°. The reason for this comes from the software’s method of fitting. It often places the circle on the points falsely even if the points are correctly positioned. We can say that the lower the central angle is, the larger the error is.
During our work our aim was to define the diameter dependence and the critical central angle interval in the case of different softwares with the application of the same method. During the evaluation we applied the method of standard measurement uncertainty which is widely applied on the area of coordinate measurement technology [3, 4 and 5].
We usually use the extended measurement uncertainty as the uncertainty of the given machine. The extended measurement uncertainty of a measuring machine is – according to the industrial practice – the total of the 45% of the measuring machine’s tactile uncertainty and the length-dependent part of the maximal permissible error. The maximal permissible error (MPE) is a value consisting of a constant and a length-dependent part. This number generally provides the limit under which the values measured by the given measuring machine can be accepted. In our case this number gives the maximal error under which the results provided by the given machine can be accepted near the given central angle. Design of experiments
During our research our aim was to measure parts with different diameters in order to gain information regarding the diameter dependence of precision. To define the mentioned interval we chose measurement etalons - if we measure parts with known sizes, it is reasonable to apply etalons in order to minimize the form error of the part.
During our experiments we compared different probes and softwares in order to receive a complete picture about the inaccuracies of the radius measurements. The experimental plan can be seen in Table 1.
229

International Conference on Innovative Technologies, IN‐TECH 2016,
Prague, 6. ‐ 8. 9. 2016
Table 1. The experimental design for the radius measurements
Diameter of etalon rings [mm]
Central angles [°]
Number of measuring points Coordinate measuring machine
50
25
15
10
5
360 180 90 45 30 15 5
36 18 11 11 11 11 11
Mitutoyo Crysta-Plus M574
ZEISS PRISMO navigator 12/24/10
Mitutoyo Crysta-APEX S 776
SIP CMM 5
The five different etalons cover the interval of the most frequently occurring radius sizes. We chose the interval of the central angles
so that we could receive the most accurate results possible when measuring with the central angle of 360° and – in the case of lower central angles -we could examine the cases frequently occurring on the industrial field.
During our research we carried out tactile measurements in order to receive more accurate results. When defining the number of the measurement points our aim was to establish a plan where the probe does not touch the same point in the case of different angles. Through this we could make the regular errors random. The circles were fitted onto the measured points by the Chebyshev method, this way the geometrical deviations of the etalon rings could also be take into consideration.
We carried out the measurement on four different measuring machines according to the table. We applied different measuring probes on each machine [6, 7, 8 and 9]. We executed the measurement plan on each machine in five different positions. In each position we executed the plan on every etalon with each contact angle; on this way the systematic errors became random. The evaluation was carried out based on the values measured in the five different positions.
Results and discussion
According to the NAR-EA-4-02 document of the National Accrediting Embassy (Nemzeti AKkreditáló Testület – NAT) the measuring uncertainty is a value which belongs to the result of the measurement and it typifies the variance of the measured values.
During the evaluation we had to define the main parameters whose uncertainties we had to take into consideration when establishing the calculation method of the resultant measurement uncertainty. We used the uncertainty of nine different parameters. These uncertainties were the following: the uncertainties of the machine, the diameter measuring, the form difference of the etalon, the machine’s coefficient of thermal expansion, the etalons’ coefficient of thermal expansion, and the temperature deviation of the machine, the temperature deviation of the etalons, the resolution of the machine and the measured deviation of circularity.
While carrying out our evaluation we used temperature deviation values in the equations, and as coordinate measuring machines display the temperature values with the °C unit, we used this unit during our calculations. The reference temperature was 20°C during the measurements. Based on preliminary observations we supposed that the coefficient of the thermal expansion of both the machine and the material of the etalons can be substituted with the coefficient of the thermal expansion of steel (αM=αE=11,5*10-6 ±1*10-6 [1/°C]). In addition, we supposed that the temperature deviations of the machine and the etalons are equal (ΔtM=ΔtE=±1 °C). We could use these simplifications as they only have an irrelevant effect on the result, but they significantly simplify the method of calculation.
After finishing the calculations, about which we do not go into details in this article, we could determine the resultant uncertainty in the case of every diameter and central angle. An example for the calculated uncertainties (errors) compared to the MPE of the used CMM can be seen at Fig. 1-4. On the diagrams the red lines symbolize the MPE range of the used machines.
Fig.1 Calculated uncertainties (errors) for Mitutoyo Crysta Plus 574
-170-140-110-80-50-20104070100
515304590180360
Error diagram for the 50 mm etalon ringMitutoyo Crysta Plus 574
Error [µm]
Central angle [°]
230

International Conference on Innovative Technologies, IN‐TECH 2016,
Prague, 6. ‐ 8. 9. 2016
Fig.2 Calculated uncertainties (errors) for ZEISS Prismo Navigator
Fig.3 Calculated uncertainties (errors) for Mitutoyo Crysta Apex S 776
Fig.4 Calculated uncertainties (errors) for SIP CMM5
After calculating the resultant uncertainty for each measurement, we compared the results to the given measuring machine’s maximal permissible error in order to draw general conclusions. Based on it we could establish that under 90° central angles the measured results were not acceptable because of the high measurement uncertainty. Between 90° and 180° the results could be accepted when the calculated uncertainty is smaller than the MPE value of the used CMM. Above 180° central angles the measured results were acceptable in each cases.
-170-140-110-80-50-20104070100130160190220250
515304590180360
Error diagram for the 50 mm etalon ringZEISS Prismo Navigator
Central angle [°]
Error [µm]
-170-140-110-80-50-20104070100130160190
515304590180360
Error diagram for the 50 mm etalon ring Mitutoyo Crysta Apex S 776
Central angle [°]
Error [µm]
-910-810-710-610-510-410-310-210-110-1090
515304590180360
Error diagram for the 50 mm etalon ringSIP CMM 5
Central angles [°]
Error [µm]
231

International Conference on Innovative Technologies, IN‐TECH 2016,
Prague, 6. ‐ 8. 9. 2016
Conclusion
During our research we examined the central angle and diameter dependence of the process of industrial radius measurement with the application of coordinate measurement technology. We established a general measurement plan in order to make a database based on which it is possible to make general conclusions those can be successfully applied on the industrial field.
For the evaluation of our measurements we defined the error equation of the circle measurement, with which the uncertainty of the measurements could be calculated. We compared the calculated values to the maximal permissible error (MPE) of the given machine.
We could establish, as a main conclusion, that under 90° central angles the measured results were not acceptable due to the high measurement uncertainty. This statement is independent from the measured diameters. Acknowledgment
This research is partly supported by the EU funded H2020 project "Centre of Excellence in Production Informatics and Control" (EPIC) under project number H2020-WIDESPREAD-2014-1-FPA 664403. The research results are used in the international bilateral project “Experimental and theoretical optimization and control of machining technology and tool path for micro milling” listed under number TÉT_12_MX-1-2013-0015. The authors would also like to acknowledge the support provided by the CEEPUS III HR 0108 project. The authors also express their gratitude to Mitutoyo Hungária Kft, Zeiss IMT Hungária Kft., and to the Metrology Authority for supporting the investigations and for cooperating in their evaluation.
References [1] D. Flack, J. Claverley, R. Leach: Chapter 9 - Coordinate Metrology, In Micro and Nano Technologies, William Andrew Publishing,
Oxford (2014), p. 295-325. [2] http://www.zeiss.hu/industrial-metrology/hu_hu/home.html, (Accessed on: 19.05.2016.) [3] W. Jakubiec, W. Płowucha, M. Starczak: Analytical estimation of coordinate measurement uncertainty, Measurement, Volume 45
(2012), Issue 10, p. 2299-2308. [4] A. B. Forbes, B. Hughes, W. Sun: Comparison of measurements in co-ordinate metrology, Measurement, Volume 42 (2009), Issue
10, p. 1473-1477. [5] R. Acero, J. Santolaria, M. Pueo, J. Abad: Uncertainty estimation of an indexed metrology platform for the verification of portable
coordinate measuring instruments, Measurement, Volume 82 (2016), p. 202-220. [6] http://ecatalog.mitutoyo.com/Crysta-Plus-M4435747106-Series-196-Manual-Floating-Type-CMM-C1621.aspx, (Accessed on
19.05.2016) [7] http://www.mitutoyo.com/wp-content/uploads/2013/01/2097_CRYSTA_ApexS.pdf, (Accessed on: 19.05.2016) [8] http://www.zeiss.co.uk/industrial-metrology/en_gb/products/systems/bridge-type-cmms/accura.html, (Accessed on: 19.05.2016.) [9] http://www.bachtoolprecision.com/metrology.php, (Accessed on: 19.05.2016.) [10] The calculation of the measurement uncertainty in case of calibrations, NAR-EA-4-02, (2003), Nemzeti Akkreditálási Rendszer.
(Accessed on 06.05.2016.)
232

International Conference on Innovative Technologies, IN‐TECH 2016, Prague, 6. ‐ 8. 9. 2016
GLOBAL AND S. KOREAN MARKET OPPORTUNITY ANALYSIS OF FORENSIC TECHNOLOGIES
Y. L. Jung1 and Y. J. Choi1
1 Dept. of Business Opportunity Analysis, Korea Institute of Science and Technology Information (KISTI), S.
Korea
Keywords: Forensic Science, Forensic Market Opportunity, Forensic Products and Services, Business Opportunity Analysis
Abstract. The importance and necessity of forensic science are increased followed by the growth of forensic products and services market utilizing forensic technologies. It possesses great business opportunities due to various market drivers. The business opportunities analysis is provided in this study based on the viewpoint of of policy, market, society, and technology.
Introduction Forensic science is defined as the application of science to criminal and civil laws. Various scientific techniques and processes are
used to examine and identify any evidence related to criminal investigation. Since forensic science enables more rapid, reliable and efficient resolution of criminal cases, the importance and necessity of forensic science are increased followed by the growth of forensic products and services market utilizing forensic technologies.
Table 1. Forensic Science Working Group Classification of ENFSI
DNA Finger Print Handwriting
Digital Imaging Firearms/GSR Mark
Animal, Plant and Soil Traces
Textile & Hair Paint & Glass
Document Fire & Explosions Investigation
Road Accident Analysis
Drug Forensic Information Technology
Scene of Crime
Explosives Forensic Speech and Audio Analysis
Markets of Global and S. Korea The global forensic products and services market is expected to grow from $11.5 billion in 2015 to $19.7 billion in 2020 with a CAGR
of 11.4%. Although United States contributes about 50% of the global market at present, Asian market is expected to reach 60% of the global market in 2020 because of highly increasing market demands of Asian countries including S. Korea. Among the various segments, DNA profiling and digital/computer forensics are the fastest growing areas.
.
Fig. 1 Forensic Products and Services Market
233

International Conference on Innovative Technologies, IN‐TECH 2016,
Prague, 6. ‐ 8. 9. 2016
Since DNA profiling (e.g. Short Tandem Repeat (STR) analysis or real-time Polymerase Chain Reaction (PCR)) exhibits very high discrimination ability, its market shows a robust growth. Digital/computer forensics which investigates evidence found in electronic devices is also growing remarkably due to the abundance of various kinds of digital devices.
Fig. 2 Global DNA profiling & Digital forensics Market Business Opportunities Analysis
As demands for forensic investigation increase, private sector will play more significant role and the participation of companies which provide forensic products and services to public sector is gradually increasing. Therefore, it will create attractive business opportunities for many companies involved in this industry. More detailed analyses in the viewpoint of policy, market, society, and technology are shown in Figure 3.
Fig. 3 Business Opportunities Analysis of Forensic Science Conclusion
The global and S. Korean forensic technologies markets are growing rapidly due to the various market drivers described above. It is anticipated that the companies which have more advanced, reliable, and fundamental technologies will play significant role in forensic investigation. Therefore, it offers potential growth opportunities for high-tech market players. Acknowledgment This study was supported by Korea Institute of Science and Technology Information. References
[1] Y. L. Jung, Forensic Science Market, KISTI market report, vol. 4, no. 9, pp. 20-23, 2014. [2] European Network of Forensic Science Institutes [3] Forensic Technologies Markets, Transparency Market Research, 2013 [4] Forensic technologies: new and growing markets, BCC research, 2013 [5] Forensic technologies, BCC research, 2011 [6] Global digital forensics market, IndustryARC, 2013
234

International Conference on Innovative Technologies, IN‐TECH 2016,
Prague, 6. ‐ 8. 9. 2016
FROM ELLIPTIC CURVE TO AUTOMATION?
I. Markechová1 1Institute of Applied Informatics, Automation and Mechatronics, Faculty of Materials Science and Technology
in Trnava, Slovak University of Technology in Bratislava, J. Bottu 25, 917 24 Trnava, Slovakia
Keywords: Elliptic Curve (EC); Translational Surface (TS); Ellipse; Synograph; Dynamical System; Origami-Like Object; Heaven-And-Hell (H&H); Robotics; Self-Foldability; Computer Graphics; Winplot; Mupad Abstract: The aim of the paper is to briefly inform about interesting phenomenon – an applications of elliptic curve (EC) in preliminary two various fields, both – maybe surprisingly – different from cryptography. Starting from an analytical form y2 = x3 + ax + b of EC in Cartesian coordinate system, there are two cases of doublet a, b given here. A set of negative and positive value – 1, 1 generates – on the author best known original – marvelous finding, namely next concept to an ellipse constructing. A pair of nonzero and zero value 1, 0 leads to heaven-end-hell-origami-like structure. Both cases of a, b values have their intrinsic potential, because of an ellipse is an icon of a linear harmonic oscillator without dumping and origami engineering is relatively young research branch and its rate of evolution is quite high. A way from corresponding EC to an ellipse as well as to H&H-origami-like object consists of the same, simple steps: i) making of a translational surface with the EC in a role of each of both governing curves and ii) several linear transformations (planar symmetry and/or rotation). An ellipse and an origami-like structure, here both with EC “roots”, generate a lot of open questions on relationship between EC and control theory (via dynamical systems), and also among EC and robotics (by heaven-and-hell-origami-like object). The first finding (new way to an ellipse) was described elsewhere. Here, attention is concentrated on unifying view on two unusual phenomena, both risen from an elliptic curve and at the same time both far from probably assumed cryptography. Introduction
An elliptic curve (EC), not an ellipse, belongs to the icons of the elliptic curve cryptography (ECC). In a framework of research of synographs on an elliptic curve basis, interesting by-phenomena were observed.
Synograph is a graphical equivalent of a synonym. Synograph denotes various symbols or the graphs with the same or very nearly the same significance. Up to now synographs have appeared relatively rarely and in diverse branches. They are, e. g. software engineering, linguistics, medicine, marketing. Synographical approach can serve as a next alternative inspiration in a research as well as in an education [1, 2, 3]. Synographs, in a sense of the graphs with identical form of analytical representation, were studied recently. Diversity consists in the using of different coordinate systems (CSs) to graphically represent synographs: analytical form remains without changes – graphical one varies.
Here analytical representations of EC in 2D Cartesian coordinate system (O; x, y) is used in the form y2 = P(x), where P(x) is a polynomial of degree three, namely y2 = x3 + ax + b. In next sections two cases of doublet values a, b are chosen. Both cases result in construction of surprising objects and each of them, a) an ellipse as the intersection of two translational surfaces on the EC basis and b) analytical representation of heaven-and-hell-origami-like object - although arising from the elliptic curve – points to a possible connection to the automation.
Case a, b = – 1, 1, Next/New Concept to an Ellipse Constructing
EC defined by the implicit equation y2 = x3 – x + 1 (Fig. 1, left) has two parts, above and below the x-axis. These are graphs of functions √ 1 . Having in mind monotonicity point of view, both functions are not monotonic. Thank to this fact, translational
surface (Fig. 1, the third from the left) as the graphical representation of the function of two variables, can contain various stationary points, maximum, minimum and saddle point. Ellipse-shape intersection of starting TS and linearly transformed TS is shown on Fig. 1, right, and on Fig. 2. For more particularities cf. [4].
Fig. 1 Key steps in a process of the creating an ellipse by the EC, via two TSs; SW WinPlot [5]
x
y
235

International Conference on Innovative Technologies, IN‐TECH 2016,
Prague, 6. ‐ 8. 9. 2016
Fig. 2 Two views on the pair of surfaces with the intersection of the elipse-shape; SW MuPAD via MATLAB
Case a, b = 1, 0, Heaven-and-Hell-Origami-Like Object
Each explicit function in doublet √ is monotonic (Fig. 3, left); one function is monotonically increasing, the second one for negative coordinate y is monotonically decreasing. If compared with the previous case a, b = – 1, 1 monotonicity gives totally different direction of further research of TS via EC, transformed TSs as well as of the generating a new object (Fig. 4). It consists of the eight TSs and looks like the heaven-and-hell origami. An algorithm of all the construction, analytical representations of individual parts, relevant sub-graphs, needed mapping steps and next relevant details are in [6].
Fig. 3 Base steps in a process of the creating heaven-and-hell-origami-like object; SW WinPlot [5]
x
y
xy
z
236

International Conference on Innovative Technologies, IN‐TECH 2016,
Prague, 6. ‐ 8. 9. 2016
Fig. 4 Some views on heaven-and-hell-origami-like object; the first three pictures are prepared by means of CAS MuPAD via MATLAB, the last one is a photo of heaven-and-hell-origami object
Conclusion
There are plenty of open problems flowing from both findings corresponding to two cases of a, b values; some of them are pointed out in [4] and [6]. Both issues, new way of the ellipse creating and analytical representation of the heaven-and-hell-origami-like object, offer possible connections to various subfields of automation; the ellipse as the phase space diagram/trajectory for an undamped linear harmonic oscillator/pendulum, physically, or ellipse as a member in phase-space portraits sequence for the dynamical system of the second order, in version of automation dictionary. An analytical representation of origami-like object can serve as a possible model for virtual origami robot by means of appropriate computer system. Review papers [7] and [8] point out some, as well as they give many useful inspirations. Acknowledgment This publication is the result of implementation of the project: "UNIVERSITY SCIENTIFIC PARK: CAMPUS MTF STU - CAMBO" (ITMS: 26220220179) supported by the Research & Development Operational Program funded by the EFRR. The author is also grateful to M. I. K. as well as to J. M. Jr. for their specific help. References [1] I. Markechová, H. Stúpalová: Synographical Approach to Dynamical Systems Analysis, Trans Tech Publications, Inc., Applied
Mechanics and Materials, Vol. 693, 2014, pp. 129–134. [2] M. Mišútová, M. Mišút: ICT as a Mean for Enhancing Flexibility and Quality of Mathematical Subjects Teaching, Lecture Notes in
Electrical Engineering, 313 (2015), pp. 263-267. [3] M. Mišútová, M. Mišút: Assessment with information technology support,” Procedia - Social and Behavioral Sciences, Vol. 177
(2015), pp. 300-305. [4] I. Markechová, Z. Červeňanská: Is There any Correlation Between Elliptic Curve and Lissajous Figure? In: Actual problems of
modern science: IV International scientific - practical conference, Alushta, Stavropol, Russia, 4/II (2015), pp. 199-203. [cit. 2016-06-01, http://stavuniver.ru/uploads/files/270/2.pdf].
[5] SW WinPlot, [cit. 2016-06-02, https://software.nasa.gov/software/MFS-31664-1]. [6] I. Markechová, L. Čipková Hamplová: Origami Robot Model via an Elliptic Curve? In: IEEE 14th International Symposium on
Intelligent Systems and Informatics (SISY 2016), accepted for publication. [7] N. Turner, B. Goodwine, M. Sen: A review of origami applications in mechanical engineering, Journal of Mechanical Engineering
Science, (2015). [8] L. J. Fei, D. Sujan: Origami Theory and its Applications: A literature Review, International Journal of Social, Behavioral, Educational,
Economic, Business and Industrial Engineering, Vol. 7 (2013), No.1, pp. 229-233, [cit. 2016-06-09, http://waset.org/publications/1557/origami-theory-and-its-applications-a-literature-review]
237

International Conference on Innovative Technologies, IN‐TECH 2016,
Prague, 6. ‐ 8. 9. 2016
Appendix Here is MuPAD source code for generating a) an ellipse with the help of the elliptic curve (EC), via translational surface with the EC in the position of each of both governing curves
plotfunc3d(sqrt(x^3 - x + 1)+sqrt(y^3 - y + 1)-1, sqrt(-x^3 + x + 1)+sqrt(-y^3 + y + 1)-1, x = -1.32..1.32, y = -1.32..1.32, Colors = [RGB::White, RGB::White]): b) heaven-and-hell-origami-like object
plot(plot::Surface([(t + u + sqrt(2)*(sqrt(t^3 + t) + sqrt(u^3 + u))/2 )/2, (t + u - sqrt(2)*(sqrt(t^3 + t) + sqrt(u^3 + u))/2 )/2, (u - t)*sqrt(2)/2],t = 0..1, u = 0..1), plot::Surface([(t + u + sqrt(2)*(sqrt(t^3 + t) - sqrt(u^3 + u))/2 )/2, (t + u - sqrt(2)*(sqrt(t^3 + t) - sqrt(u^3 + u))/2 )/2, (u - t)*sqrt(2)/2],t = 0..1, u = 0..1), plot::Surface([(t + u + sqrt(2)*(-sqrt(t^3 + t) + sqrt(u^3 + u))/2 )/2, (t + u - sqrt(2)*(-sqrt(t^3 + t) + sqrt(u^3 + u))/2 )/2, (u - t)*sqrt(2)/2],t = 0..1, u = 0..1), plot::Surface([(t + u + sqrt(2)*(-sqrt(t^3 + t) - sqrt(u^3 + u))/2 )/2, (t + u - sqrt(2)*(-sqrt(t^3 + t) - sqrt(u^3 + u))/2 )/2, (u - t)*sqrt(2)/2],t = 0..1, u = 0..1), plot::Surface([t, u, (sqrt(t^3 + t) - sqrt(u^3 + u))/2], t = 0..1, u = 0..1), plot::Surface([t, u, (sqrt(t^3 + t) + sqrt(u^3 + u))/2], t = 0..1, u = 0..1), plot::Surface([t, u, (-sqrt(t^3 + t) + sqrt(u^3 + u))/2], t = 0..1, u = 0..1), plot::Surface([t, u, (-sqrt(t^3 + t) - sqrt(u^3 + u))/2], t = 0..1, u = 0..1), Color = RGB::White)
238

International Conference on Innovative Technologies, IN‐TECH 2016,
Prague, 6. ‐ 8. 9. 2016
ELABORATION OF FRAMEWORK FOR GREEN AND COST EFFICIENT PACKAGE DEVELOPMENT FOR ELECTRONIC INDUSTRY
E. Shevtshenko 1, T. Karaulova 1, M. Pohlak1 and K. Mahmood1 1 Tallinn University of Technology, Department of Mechanical and Industrial Engineering,
Ehitajate tee 5 19086 Tallinn, Estonia
Keywords: Green Packaging; Package Design Solution; Package Test Analysis Abstract: The manufacturer must deliver each product to the customer without defects. Usually, there is an opinion that the purpose of package design is just to protect a product inside, but there are much more possibilities and opportunities for the companies related to package and its design. The objectives of this paper are the selection of alternative materials, to propose the environmentally friendly materials if possible and to reduce the cost of package fitments currently used in the company. The research team has to create a solution for existing package alternatives analysis, which should provide the suggestions for packaging cost reduction, for example, business process or design improvement, and selection of alternative materials. Moreover, the study introduces the packaging design process and which aspects the manufacturer needs to take into account, like material strength testing, assessment of production line capability and considering packaging cost. The motivation for this research is that the current packaging solution requirements are not time relevant. The manufacturer can optimize package material in the way that the solution still fulfills standard requirements and reduce the total cost of the package at the same time. The objective of the research project case study is to verify the framework ability to propose new cost saving packaging design with analysis of cost reduction, comparison of current package material drop tests results with the new solution and assessment of possible risks to receive the claim. Introduction
Often companies using a package solution that cost too much and exceeds the quality specifications. It means that the companies are using quality standards with too high limits for the type of the products that it should protect. Companies have to remember that product's package also has a communication purpose: what your brand stands for and what it means for your customers. It is important to adjust packaging to the product and to consider the necessary protection for material selection. Poor packaging can have a significant impact on the product quality and also on the company`s reputation, raise the cost of the products defects caused by the weak package, improper design or waste of the material. The package can also cause environmental pollution if selected materials are not sustainable [1].
However, packaging may also be harmful to the environment during its whole life cycle. Among the environmental criteria that manufacturer might consider through life cycle analysis are: [2, 3].
The reduction of packages weight or volume, Improvement of energy efficiency in the manufacturing process, Optimisation of package production process, Improvement of product’s life cycle, Selection of raw materials with a less environmental impact compatible with recycling processes.
Usually, the package consist of multiple components (Fig. 1) and its primary purpose is to protect a product. Fitments are packaging components and their purpose is to absorb the impact and vibration loads, which are main loads in packaging load distribution. Fitments should be able to protect the products against most kinds of damages and electrostatic discharge (ESD) and at the same time suppress the impact. It is possible to produce the fitments from different materials. The commonly used materials are polymeric foams and cellulose-based structures. Protection bag protects the products from moisture and other environmental caused damages like mold or rust. Package box is keeping the entire package set together, takes some of the impact loads and pressure of boxes, placed on each other.
Fig. 1 Package set and packaging cost
In the right side of Fig.1 shows the percentages of the full package set prices for selected products. As can be seen on the pie chart,
the largest cost consumers are fitments with ~60%, then cardboard with ~20%, and then other smaller components. Therefore, it means that the fitment solution is the most expensive part of package set, and it has the largest effect on yearly packing cost.
239

International Conference on Innovative Technologies, IN‐TECH 2016,
Prague, 6. ‐ 8. 9. 2016
The purpose of this research is to reduce the cost of the package materials and to choose environmentally friendly materials. The current research is limited only to the fitments, which have the highest cost in the package set.
Determine the packaging alternatives The manufacturer should consider multiple aspects during the package design:
What package component manufacturer needs to design, Which material(s) the manufacturer is using, How manufacturer can process them, Which company or national standards manufacturer needs to follow, How many products manufacturer needs to fit into a single package.
To design new fitments research group has discovered all aspects that influence on products safety and found the best feasible
solution to the research objectives (price and green material). In Fig. 2, the general scheme of research is showing the main steps of packaging selection.
Fig. 2 The general scheme of research.
The research group has performed brainstorming to find the possible packaging alternatives. Group has generated the ideas sketches
for each possible new design version, added them into evaluation matrix, added suitable materials, evaluated the package design properties based on green and price categories and calculated the total grade for each alternative solution. Of course, design developer should consider the exact product before package final design and material selection, but it is possible to propose material for each preliminary design solution. The purpose is to select best design solution based on total grade calculated as shown in Fig 3.
Fig. 3 Evaluation matrix
To compare the different design versions the researchers assessed the alternative solution by green and price categories. Each category consist of several criteria evaluated based on 1-5 scale. The green category consist of following criteria:
Effectiveness – is the ability of the package to satisfy functional requirements for the particular product. The designer should try to
avoid using many types of different materials. Efficiency – is the reasonable usage of materials, energy, and water throughout the package life cycle. The designer should replace
heavy materials with lighter ones. Recyclable/Cyclicality - is the usage of renewable materials, like wooden particles, paper mold, bioplastic. Safety - for people and the natural environmental, whether it is compostable, biodegradable.
Percentage 40% 20% 15% 25% 100% 30% 15% 30% 25% 100%
VersionMaterial\properties
Effectiveness
Efficiency
Cyclicality Safety Total
Additional tools Weight
Assembling
Properties Total All total
Soft pillows in cornerFoam, small particles, wooden 3,5 3 3 4 13,5 4 3,5 4 3,5 15 28,5
Extruded Clamp board 3 3,5 3 4 13,5 2,5 2,5 3 3 11 24,5Eco pulp Pulp, recycled paper 3,5 3,5 4,5 4,5 16 4,5 4 4,5 4 17 33Loose foam particles Foam 2 2,5 3 3,5 11 3,5 3 4 2,5 13 24Bubble film Biodegradable film 2,5 3,5 3,5 4,5 14 3 3 4,5 2 12,5 26,5Loose thick paper Paper 2 3,5 3,5 4 13 4 2 4 2,5 12,5 25,5Tension springs Plastics, rubber 1,5 2,5 2,5 3 9,5 2,5 2,5 3,5 2 10,5 20Fiber mesh fiber 3,5 2,5 3 3,5 12,5 3 3,5 3,5 3 13 25,5Inflatable balloons Rubber, plastic film 3 2 2 2,5 9,5 3,5 3,5 4 3 14 23,5Brush like fibers Bio plastics 1,5 3 3 3 10,5 3 3 3 2 11 21,5Standard foam plates Foam 4 3 3,5 3,5 14 3,5 3,5 3,5 3,5 14 28Air tubes Rubber, plastic film 1,5 2,5 3 3,5 10,5 3 3,5 4 3 13,5 24Small foam layer+imp reaction mat. Foam capsules 3 2 2 3 10 2,5 2,5 4 4 13 23honeycomb Card board 2 3 3,5 4 12,5 4,5 3,5 4 2,5 14,5 27Magnetic leviation Permanent magnets 2 3,5 3 3 11,5 1,5 2 2,5 3 9 20,5Poroloon, contact Poroloon 3 3 3 3 12 4 3 4 4 15 27Pressure Balls ball 2 3,5 3,5 3 12 4 3 4 2,5 13,5 25,5Foam sticks Foam 2,5 3,5 3,5 3 12,5 4 3 3 2,5 12,5 254 products packages foam 3,5 3,5 3 3,5 13,5 3,5 2,5 4 3 13 26,5usage and cover with bubble film
Foam or other material 4 4 3,5 3,5 15 4 4 4 4,5 16,5 31,5
and bottom Foam 4,5 4 3,5 3,5 15,5 4,5 5 4,5 4,5 18,5 34
GREEN PRICE
Consideration of all possible variants for each product
Evaluation of all variants and selection of best solution by highest grade
Brainstorming Evaluation matrix
Testing of all potential fitment materials
Material strength testing
Development and testing of fitment design
CAD, Ansys
Database elaboration and data input
IDEF1x, DBMS
Finding packaging alternatives
Selecting of data from database and decision making
Decision stage
240

International Conference on Innovative Technologies, IN‐TECH 2016,
Prague, 6. ‐ 8. 9. 2016
The criteria’s for the price: Additional tools requirement – is a need for new machines or tools for manufacturing and how complex they are. Properties – whether the selected material is suitable for a particular solution, for example; too rigid material will not absorb shocks. Weight – is the relation to material density and material usage; package should use as little material as possible. For example, over
packing with extra or higher density foams is not protecting the product from damage. Assembling – whether it is difficult to pack the product into the box, like too many objects to put into the box, if not needed.
The each criteria weight in percentage authors has defined based on enterprise expert’s opinions. Packaging design and testing
Package testing involves measurements of different characteristics. It is a measurement of interactions between product and the different parts of the package under external forces. The examples of testing procedures are vibration, compression, impact, climatic and thermal testing. The manufacturer can perform package testing as laboratory experiments, it can be live testing or through subjective evaluations. [4-7]
The manufacturer can perform testing of packaging also virtually. One of the possibility to do a virtualized testing is using a program called ANSYS. Ansys is a program that enables users to predict the product performance during falling or vibration etc. Ansys can create complete virtualised impacts or other scenarios considering mechanical or electrical perspectives. [8]
The manufacturer can minimise the environmental impact by using as minimum material as possible either by weight or by volume. Furthermore, it can be done by replacing the current heavy materials with lighter ones, analysing the changes in transport logistics, product dimensions, product fragility level, and by adapting design quickly to these changes [9, 11]. Data structure for decision making
Authors have elaborated database structure for data collection by using CASE (Computer Aided Software Engineering) methods IDEF1X and ERwin Data Modeller (All Fusion) software. All objects (tables) are connected by using a key attributes. The authors have introduced the entity level of the packaging data in Fig. 4. This structure may be used in several Database Management Systems (DBMS) for data collection, analysing and selection. In Fig.5 authors show the data needed for decision making, which was selected from several tables of a current database.
Fig. 4 Database structure for packaging
Structure consists of next main parts with the following parameters: Product data: Product Type, Product Number, Weight, Sizes (Lp, Wp, Hp).
Packaging Structure data, which includes a description of fitments: Fitment drawing number, Type, Weight, Sizes (Lf, Wf, Hf), Cost. Packaging Material data: Fitment material data, Box material, and Secondary box material.
Packaging process data: Process Time and Cost.
Material Tests: fitment material parameters such as Density, Deformation, Elastic module, Acceleration, recycling parameters [10] Embodied energy (EE) and Embodied carbon (EC) and Fitment material cost.
Packaged product test data: Testing type, Acceleration probe by the corner, edge, flat.
Fig. 5 Data for fitment selection
Packaging Material
Material Test
Packaging Structute
Packaged Product Test
Fitment design
Fitment_material
Box Secondary_box
Box_material Secondary_Box_materia
MaterialTest
PackagingTest ing
ImpactMateriaTest
Product Data
Packaging process
Product Type
Lp mm
Wp mm
Hp mm
Product Weight
kg Fitment No.Fitment
Type
Fitm Weight
g Lf mm Wf mm Hf mm Material TypeDensity kg/m3
Acceleration g
Deformation %
Elastic modulu
s
Embodied energy
EE=MJ/kgEnergy
(MJ)
Embodied carbon EC=kgCO
2/kg
CO2 (kg/per fitment)
Price €/kg
Fitment Mat
Cost €
Product A 705 310 180 22,2 RLX12345 Top/Bottom 489 777 376 270 EPP 25 15 6 0,158 93,1 46 2,7 1,32 12 5,87
Product A 705 310 180 22,2 EPF.04.00.00 Top/Bottom 400 2x180 2x395 2x260 EPP 25 15 6 0,158 93,1 37 2,7 1,08 12 4,80
Product A 705 310 180 22,2 Top/Bottom 800 2x180 2x395 2x260 EPS50 50 18 7 88,6 71 2,55 2,04 0,87 0,70
Product A 705 310 180 22,2 Top/Bottom 1 920 2x180 2x395 2x260 EPS120 120 17 12 88,6 170 2,55 4,90 0,61 1,17
Product A 705 310 180 22,2 Top/Bottom 400 2x180 2x395 2x260 XPS 25 18 20 88,6 35 2,55 1,02 3,8 1,52
Product A 705 310 180 22,2 Top/Bottom 600 2x180 2x395 2x260 EPE 60 18 5 0,13 80 48 1,7 1,02 5,4 3,24
Product A 705 310 180 22,2 ECO.04.00.00 Right/Left 1350 2x160 2x360 2x220 pulp 325 25 34 1,29 1,74 2,74 0,58
Product A 705 310 180 22,2 MUS.04.00.00 Corners 200 765 370 240 Myco foam 4 50 47 25 5 1,29 0,26 5,50
Product A 705 310 180 22,2 BUB.04.00.00 Right/Left 205 2x200 2x365 2x260 Air bags (PE) 18 34 77,2 16 1,69 0,35 0,7 2,00
Product B 518 470 186 26,3 RLX67890 Top/Bottom 580 690 535 286 EPS 35 6 88,6 51 2,55 1,48 1 0,29
Product B 518 470 186 26,3 EPF.04.00.00 Right/Left 580 2x160 2x570 2x260 EPS 35 15 0,158 88,6 51 2,55 1,48 1 0,58
Product B 518 470 186 26,3 Right/Left 800 2x160 2x570 2x260 EPS50 50 18 7 88,6 71 2,55 2,04 0,87 0,70
Product B 518 470 186 26,3 Right/Left 1 920 2x160 2x570 2x260 EPS120 120 17 12 88,6 170 2,55 4,90 0,61 1,17
Product B 518 470 186 26,3 Right/Left 400 2x160 2x570 2x260 XPS 25 18 20 88,6 35 2,55 1,02 3,8 1,52
Product B 518 470 186 26,3 Right/Left 600 2x160 2x570 2x260 EPE 60 18 5 0,13 80 48 1,7 1,02 5,4 3,24
Product B 518 470 186 26,3 ECO.04.00.00 Right/Left 1450 2x110 2x526 2x220 pulp 325 25 36 1,29 1,87 2,74 3,98
Product B 518 470 186 26,3 MUS.04.00.00 Corners 200 578 530 246 Myco foam 4 25 5 1,29 0,26 5,50
Product B 518 470 186 26,3 BUB.04.00.00 Right/Left 200 2x160 2x530 2x260 Air bags (PE) 18 77,2 15 1,69 0,34 0,7 1,80
Product Fitment Size Material Properties
241

International Conference on Innovative Technologies, IN‐TECH 2016,
Prague, 6. ‐ 8. 9. 2016
Fig. 5 is presented several fitments data for two product types. Those fitments don’t have Fitment Nr are of the same design (EFF0400). Selection framework for fitment design and material selection for decision making is introduced in Fig.6.
Fig.6 The framework of green and cheap packaging selection.
The following alternative solutions are suggested based on current data (see Fig. 5) and the comparison is based on current fitments
of expanded polypropylene (EPP) material: A green solution of mushroom fitments is made from Myco foam material: This packaging solution can be used for all products. It has
lower emissions, but the cost of material is comparable with current EPP fitment (material cost reduction 5%). The outbound logistics costs are the same because it is possible to fit approximately the same amount of boxes to the pallet.
Green and Eco pulp is made from bamboo and bagasse blend: The bamboo-based material enables to apply the packaging solution for all products. Compared to current solution the inbound logistics costs are smaller because more units can be stacked into a container, it has lower emissions. Moreover, the cost of material is (20-35%) less when compared to current fitment, the outbound logistics costs are is minimized by 25%, since it is possible to fit more boxes on the pallet.
Bubble solution (or air Pod): Inbound logistics costs are very cheap, which depends on the product. It has lower emissions due to 2% of film and 98% of air, the cost of material is much lower (65%), when compared to the current fitment. The outbound logistics costs are lower because it is possible to fit more boxes on the pallet (up to 25-30%), but it is more risky in a way that extra protection corners should be added to secure the product from damage.
Hence, the eco pulp fitment solution is the suitable feasible packaging solution as compared to current using packaging material. Conclusion
The goal of this research was to reduce the package cost and choose an environmentally friendly material, which is easy to process. Material and design selection were done using several methodology steps, which were shown in the general scheme of this research. All of the results were applied to the most expensive product groups. Current material values were compared with the new material values and the final selection was done based on that values. This research study is giving an idea about packaging design and corresponding aspects need to be taken into account in material strength testing, line capability wise and packaging cost. Proposed framework enables to decrease inbound logistics costs leads to more fitments can be loaded on one pallet. It has lower emissions and material cost. The outbound logistics costs decreased only based on fitment material weight. Acknowledgment This research was supported by Estonian Ministry of Education and Research for targeted financing scheme B41. References [1] E. Shevtshenko, V. Bashkite, M. Maleki, Y. Wang: Sustainable design of material handling equipment: a win-win approach for
manufactures and customers, Mechanika Vol. 18, (2012), Issue 5, pp. 561-568. http://dx.doi.org/10.5755/j01.mech.18.5.2703. [2] Packaging guide, Rio 2016 (2013) (https://www.rio2016.com/sustentabilidade/wp-content/uploads/2016/02/Rio-2016-
Sustainability-Guide-for-Packaging1.pdf). [3] S.G. Lee, S.W. Lye: Design for manual packaging, International Journal of Physical Distribution & Logistics Management, Vol. 33
(2003), Issue 2, pp. 163 – 189. [4] T.J. Urbanik, S.K. Lee, C.G. Johnson: Column compression strength of tubular packaging forms made from paper, Journal of
Testing and Evaluation, Vol. 34 (2006), issue 6, pp. 1 – 7. [5] S. pira: Vibration and shock filed data measurement, (2016) (http://www.smitherspira.com/services/distribution-testing/vibration-
and-shock-field-data-measurement). [6] D. Batz, C. Donnelly, M. James, D. Leinberger, P. McKenzie, B. Vertner: Product and Package Testing Requirements for
Transportation, Storage and Delivery, (www.xerox.com, Xerox, 2008). [7] Shock and Vibration Performance Comparison of MEMS and Quartz-based Oscillators: The Smart Timing Choice, 2014.
(http://www.sitime.com/support2/documents/AN10032-Shock-Vibration-Comparison-MEMS-and-Quartz-Oscillators.pdf) [8] Ansys, 2016. (http://www.ansys.com). [9] H. Herranen, A. Kuusik, T. Saar, A. Reidla, R. Land, O. Märtens, J. Majak: Acceleration Data Acquisition and Processing System
for Structural Health Monitoring. IEEE (2014) pp. 244-246. [10] G. Hammond, C. Jones: Inventory of carbon & energy (ICE) – Sustainable Energy Research Team (SERT), (University of Bath,
UK, 2008). [11] V. Bashkite, V. Moseichuk, T. Karaulova: Green Manufacturing in Machinery Industry, Journal of Machine Engineering, Vol. 9
(2009), Issue 4, pp. 94-106.
242

International Conference on Innovative Technologies, IN‐TECH 2016,
Prague, 6. ‐ 8. 9. 2016
MODELLING AND CLOSED-LOOP IDENTIFICATION OF MAGNETIC LEVITATION
P. Balko1, M. Hypiusová1 and D. Rosinová1 1Institute of Automotive Mechatronics
Faculty of Electrical Engineering and Information technology Slovak University of Technology in Bratislava
Ilkovičova 3, 812 19 Bratislava, Slovakia Keywords: Nonlinear System; Mechatronic System; Unstable System; Closed-Loop System Identification; Magnetic Levitation (Maglev) Abstract: The paper presents and demonstrates two possibilities of modelling unstable Magnetic Levitation System (MLS) with two electromagnets. The first modelling approach is based on physical laws, the second one uses closed-loop system identification. The proposed modelling scheme is applied for MLS with only one electromagnet (the upper one). The closed-loop identification is shown in determined working point, where the linearized model (transfer function) is obtained. Various order models are validated and compared to choose the one which best fits the measured data. The modelling aim is to obtain the model as simple as possible, for control loop design. The comparison of simulation results for both obtained models illustrates the effectiveness of the used modelling approach for unstable magnetic levitation system. Introduction
The magnetic levitation systems are challenging plants for control aims, because of a nonlinear dynamics, very small degree of natural damping in the process, a strict positioning specifications often required by the application, and open-loop unstable system dynamics.
Magnetic levitation technology has a wide range of applications, for instance, high-speed transportation system [1], seismic attenuators for gravitational wave antennas [2], self-bearing blood pumps [3] for use in artificial hearts, haptic interfaces [4], microrobots [5] and photolithography devices for semiconductor manufacturing [6], magnetic suspension, [9]. One of control aims in controlling magnetic levitation system is to control a position of a levitating object. In this paper, we deal with laboratory magnetic levitation system by Inteco, [7], with 2 electromagnets. The controlled output is a ball position between the electromagnets, in experiments only one electromagnet - the upper one, is considered.
Modelling of the controlled plant dynamics is a basic issue in control loop design. The mathematical model can be obtained from basic physical laws (first principles) or by a data driven identification methods based on measurement of input and output data for adequately excited system. Frequently, both these approaches are combined, the structure is determined according to a theoretical (first principle based) model and parameter values are estimated from measured data using identification methods.
For an unstable system, there are various possibilities to identify a mathematical model, using data driven approach, [7], [8]. Model parameters are in this case frequently identified for a modelled plant operating in a stabilized closed loop. Standard approaches to closed loop identification can be basically divided into three groups: direct methods (control input and output are used directly to identify a plant model), indirect methods and joint input-output methods, [9]. In this paper, the indirect identification method is used to obtain data based model of magnetic levitation, where in the first step, the closed-loop system model is estimated regarding the externally exciting test signal as an input and then the plant model is determined from the closed-loop model estimate and the known controller. We present the identified model and a model obtained by mathematical modelling from first principles, and verify them by simulations and comparison with experimental results on real laboratory plant. Magnetic levitation systems with 2 electromagnets, physical model
Levitation can be interpreted as the stable equilibrium of an object without contact and can be achieved using electric or magnetic forces. In a magnetic levitation, or maglev system, a ferromagnetic object is suspended in air using electromagnetic forces. These forces cancel the effect of gravity, effectively levitating the object and achieving stable equilibrium.
The model of magnetic levitation system with 2 electromagnets (MLS2EM) is shown in Fig. 1. Two electromagnetic forces and gravity force act on the ferromagnetic sphere located between electromagnets. The lower electromagnet can be used for external force excitation or as an additional force to the gravity force.
The nonlinear physical model of the MLS2EM can be described by state equations obtained from basic physical laws for a ball motion in electromagnetic field
421
4
311
3
212
21
1
1
xcukxxf
x
xcukxf
x
m
Fg
m
Fx
xx
iidi
iii
emem
(1)
243

International Conference on Innovative Technologies, IN‐TECH 2016,
Prague, 6. ‐ 8. 9. 2016
where
1,,1,,38.2,,38.2,,,016.0,0
exp
exp,exp
214321
2
1
2
11
2
1
2
1242
2
1
2
1231
MINMINMINMIN
iPiP
iPi
emP
d
emP
emPem
emPemP
emPem
uuuuixixRxx
f
x
f
fxf
F
xx
F
FxF
F
x
F
FxF
actuatorsbothfor
and state variables in (1) represent: 1x - position of the sphere, 2x - velocity of the sphere, 3x - current in upper coil and 4x - current in
lower coil. The parameters of the above equations are given in Table 1.
Fig. 1 Magnetic Levitation System with 2 Electromagnets
Table 1. Parameters of the equations (1)
Parameters Values Units
m 0.016, 0.023, 0.039 Kg g 9.81 m/s2
Fem1,Fem2 function of x1 and x3 N FemP1 0.017521 H FemP2 0.0058231 m fi(x1) function of x1 s-1 fiP1 1.4142 10-4 ms fiP2 4.5626 10-3 m ci 0.0243 A ki 2.5165 A xd distance between electromagnets minus ball diameter (0.1- 0.033 / 0.04 / 0.054) m
iMIN 0.03884 A uMIN 0.00498 MU
The linearized state space model for (1) can be obtained using Jacobian linearization around the determined working point as
txtCxty
tu
b
btx
aa
aa
aaatButAxtx
0001
0
0
00
00
00
00
0
0010
4
3
4,41,4
3,31,3
4,23,21,2
(2)
244

International Conference on Innovative Technologies, IN‐TECH 2016,
Prague, 6. ‐ 8. 9. 2016
where the elements of the A and B matrices are for the working point defined by [ ],,, 40302010 xxxx , given as
104
103
104,4
2
104020
101,4
103,3
2
103010
101,3
2
10
2
1404,2
2
10
2
1303,2
2
102
2
1240
2
102
2
1230
1,2
11
1exp
1
1exp
1
exp2
exp2
expexp
xxfkb
xfkb
xxfa
f
xxxcuk
xfa
xfa
f
xxcuk
xfa
F
xx
F
F
m
xa
F
x
F
F
m
xa
F
xx
F
F
m
x
F
x
F
F
m
xa
dii
ii
diiP
dii
i
iiPii
i
emP
d
emP
emP
emPemP
emP
emP
d
emP
emP
emPemP
emP
The input current respective to the position of ball is depicted in Fig. 2 for all three balls. This dependence is used for determining the working point corresponding to the required ball position.
Fig. 2 Dependence of input current on ball position
We use MLS with only one electromagnet (the upper one), i.e. ][040 Ax and ][020 MUu therefore the row and column corresponding
to 4x in matrix A is omitted in this case; matrix B has only the first column with three elements; matrix C has first three elements.
Specifically, we consider the working point for the big ball given by ][01.010 mx , ][8415.030 Ax and ][343.010 MUu , the state space
model is then
txtCxty
tutxtButAxtx
001
0
0
03088
05.1684
010
726.7013288.7746-
23.3137- (3)
and the respective transfer function is
27.3839.377.289
169421
ssssG
4.145e05- s 1685 - s 288.8 + s
-1694223
. (4)
State space model (3) and transfer function (4) represent linearized model of MLS derived from physical laws around the considered working point.
Indirect closed-loop identification
Levitation is unstable system and identification of its model will be performed in closed loop with stabilizing controller (Fig.3), using indirect approach. We consider PD controller determined by Inteco, [7]. The indirect identification approach is used in the following way. Firstly, the transfer function from reference input w to system output y is identified
)()()(1
)()()( sW
sGsG
sGsGsY
SR
SR
(5)
Secondly, the transfer function from reference input w to control variable u is identified
)()()(1
)()( sW
sGsR
sRsU
(6)
245

International Conference on Innovative Technologies, IN‐TECH 2016,
Prague, 6. ‐ 8. 9. 2016
Finally, the identified transfer function of magnetic levitation is obtained by dividing the former two ones
)()(
)(sG
sU
sY (7)
To identify transfer function in the considered working point, the ARX model was used. The obtained results are
65.13
2.25/
s
sG WY (8)
6523
8625
/10487.210908.21625
10133.110965.109.10
002.93.1941422
68.5710947.1088.10
sss
ss
sss
sssG WU (9)
865
6523
52101010
10211.610262.74059498.2
65.1368.5710947.1
002.93.19414224976.2)(
1.533 + s 8.573 + s 1.948 - s 23
sss
sss
ssssG (10)
The identified transfer function for the considered working point is given by (10).
Comparison of simulation results
In this section, the closed loop simulation results for derived linearized model (4) and identified model (10) are compared with measured data from real laboratory plant. The results are shown in Fig. 4. Though the transfer functions (4) and (10) differ significantly, the step responses in Fig. 4 indicate in both cases good approximation of measured data.
Fig. 4 Comparison of identified, linearized and measured data for control variable u (left hand side) and output y – ball position (right hand side)
Conclusion The comparison of simulation results of both obtained models illustrates that both used approaches are effective for unstable
magnetic levitation system. Acknowledgment The authors would like to thank for financial contribution from the STU Grant scheme for Support of Young Researchers No. 1320 and VEGA grant No 1/0672/15. References [1] P. Holmer: Faster than a speeding bullet train, IEEE Spectrum, Vol. 40 (2003), No. 8, pp. 30-34. [2] M. Varvella, E. Calloni, L. Di Fiore, L. Milano, N. Arnaud: Feasibility of magnetic suspension for second generation gravitational
wave interferometers, Astroparticle Physics, Vol. 21 (2004), No. 3, pp. 325-335. [3] T. Masuzawa, S. Ezoe, T. Kato, Y. Okada: Magnetically suspended centrifugal blood pump with an axially levitated motor, Artificial
Organs, Vol. 27 (2003), No. 7. pp. 631-638. [4] P.J. Berkelman, R.L. Hollis: Lorentz magnetic levitation for haptic interaction: Device design, performance, and integration with
physical simulations, International Journal of Robotics Research, Vol. 19 (2000), No. 7, pp. 644-667. [5] M.B. Khamesee, N. Kato, Y. Nomura, T. Nakamura: Design and control of a microrobotic system using magnetic levitation,
EEE-ASME Transactions on Mechatronics, Vol. 7 (2002), No. 1, pp. 1-14. [6] W.J. Kim, D.L. Trumper: High-precision magnetic levitation stage for photolithography, Precision Engineering, Vol. 22 (1998), No. 2,
pp. 66-77. [7] Magnetic Levitation System 2EM – User’s Manual (Inteco Ltd, Krakow, Poland, 2008). [8] Y. Qin, H. Peng, W. Ruan, J. Wu, J. Gao: A modeling and control approach to magnetic levitation system based on state-dependent
ARX model, Journal of Process Control, Vol. 24 (2014), No.1, pp. 93-112. [9] L. Sun, Y. Miyake, H. Ohmori, A. Sano: New Direct Closed-Loop Identification Method for Unstable Systems and Its Application to
Magnetic Suspension System, Trans. of the Society of Instrument and Control Engineers, Vol. E-2 (2002), No.1, pp.72-80.
246

International Conference on Innovative Technologies, IN‐TECH 2016,
Prague, 6. ‐ 8. 9. 2016
POWER COST AND PRICING ESTIMATION OF A SUPERCOMPUTER BASED DATA CENTER
M. Puskaric 1, Z. Car 1 and G. Janes1 1 University of Rijeka Center for Advanced Computing and Modelling, Radmile Matejcic 2, Rijeka, Croatia
Keywords: Power Cost; Supercomputer; Data Center; High-Performance Computing; Computer Cluster Abstract. This paper discusses the case study of the power cost and pricing estimation of a data center which incorporates a supercomputer used mainly for academic purposes. Studied supercomputer is based on a hybrid computer architecture which includes shared memory nodes, computer cluster and hierarchical storage management. Cooling system plays very important role in every data center, and in this case, there is a power efficient cooling system with the ability of free cooling. At the beginning of this case study, rated power consumption was used as a help for estimating the maximum one of the data center. Later in the analysis, server monitoring systems have been proven to be helpful for real consumption. Some guidelines are named in this paper, that were taken into consideration when developing a spreadsheet application which determines both power cost and price of high-performance computing (HPC) services. It will be showed how power cost can be reduced if submitted tasks are in hold mode until night so they can start performing in the overnight period of a reduced electricity cost. Other factors include power usage effectiveness (PUE) factor, cooling system structure and electricity rates. A short overview of similar data centers and HPC services will be showed as well. Introduction
The increasing energy price demands very careful planning of costs and pricing in the web-based service industry. A large demand for computing power and storage capacity results with sophisticated and energy consuming data centers. Therefore, matching computing performances with the complexity of services is of an utmost importance. Since a by-product of computing is heat, cooling systems provide optimisation potentials for reducing consumption. So called power usage effectiveness or PUE shows the ratio between overall consumed power in the data center and power used for computing. Data center which houses a supercomputer usually perform scientific calculations and simulations with runtime from a couple of hours or days up to weeks.
Most of today supercomputers are based on a cluster architecture which is suited for parallel computing operations. Cluster consists of multiple compute nodes that are in most cases mutually connected to a network. Parallel operations can be managed by proper software code and careful distribution on the instances. Therefore it is up to users and software developers to develop code that can perform quicker and help to reduce power consumption.
The motivation for writing this paper comes from a need for covering the operating expenses of the university supercomputer in terms of software licenses and energy costs. Solutions for data centers and pricing
Today’s data centers care about sustainability and ecology. So called green data centers are becoming more popular since they care about the environment through the use of energy efficient cooling system and related optimisations. A good example is “Green Cube” [1], data center located in Darmstadt in Germany. They implemented the solution for dissipating heat in the doors of the computer cabinets using cooled water. Company Kyoto Cooling [2] offers an innovative waterless cooling system with a rotating wheel used for cooling the air. This technology provides (PUE) factor of less than 1.1. Some of data centers owned by Facebook [3] use air for cooling while achieving same low PUE factor.
Pricing for computing services is usually applied to processor (CPU) cores. Other services may include storage, high-speed interconnections, initial setup etc. The price of initial setup is followed by free storage and lower CPU core price. If graphical processing units are offered, their price is higher than the CPU core due to increased demand for power consumption. Higher CPU core price includes all services and in some situations it is easier for users to calculate their cost. Table 1 presents some of the providers with their infrastructure and prices:
Table 1. HPC service providers
Name Penguin Computing
[4] Sabalcore [5] Arctur [6] MS Azure [7]
HPC infrastructure
Intel® E5-2600v3 Series (Haswell), Bare-metal, QDR
Infiniband interconnect, 10GigE data network, and
minimum 6.4GB RAM per core.
Intel Xeon Up to 3.1Ghz. Bare-metal.
Infiniband up to 56Gbps (Infiniband FDR). 100GB Free
Intel Xeon X5650 processors (6 cores @ 2,66 GHz) 32 GB
RAM per server
16 CPU Cores, 56 GB RAM, 800 GB
Storage
Price per CPU core 0,09 € 0,11 € 0,1 € 0,12 € Infiniband interconnections between compute nodes are an imperative for high-performance computing because parallel calculations
scaled over the larger number of nodes will perform faster. Cloud computing platforms such as Microsoft Azure, Amazon Web Services are also suitable for high-performance computing. More information about cloud computing for scientific purposes can be found in [8].
247

International Conference on Innovative Technologies, IN‐TECH 2016,
Prague, 6. ‐ 8. 9. 2016
Power Cost
Two major components that form an overall power consumption are the power used by IT equipment and power used by anything that is not considered a computing equipment such as cooling, lighting etc. They form a previously mentioned PUE factor whose expression is given by:
PUE=Total power consumption
Power used for computing 1
A value of PUE factor depends mostly on cooling system. Today’s average is around 2, while most advanced data centers achieved
a value close to 1. Geographical position plays very important role in the design of a cooling system. Therefore data centers located close to the body of water or watercourse and in the colder climate conditions are more efficient. However, PUE factor doesn’t provide information about system’s efficiency since it can be masked in the colder climate conditions. It means that power and cooling technology doesn’t need to be advanced for achieving higher values. Supercomputer Case Study
University of Rijeka acquired the Bura supercomputer with the performance of 234 ∙ 10 floating point operations per second (FLOPS). It is based on hybrid computer architecture which includes computer cluster with 288 CPU nodes, 4 CPU+GPU nodes and 2 symmetric multiprocessor (SMP) nodes. The supercomputer is used mainly for academic purposes and calculations can last from a couple of hours to months and in some cases even years. Calculations are submitted using portable batch system (PBS) for job scheduling. With increased computing performance comes the opportunity to implement a more complex calculations. As mentioned earlier, a power consumption of the entire data center varies according to usage and the outside temperature.
Amortisation is divided into two parts, facility and IT equipment. For facility is amortisation usually around 15 years or 180 months, while for the IT equipment is two to five years.
Power Consumption
The data center is placed in the relatively warm Mediterranean climate with implied wind conditions. Figure 1 shows the relative connection between outside temperature (upper line) and power consumption during constant load between June 20th and July 20th, 2016. The conclusion is that temperature has a substantial impact on power consumption.
Fig. 1 Comparison of power consumption and outside temperature
Throughout the operation, slight differences in power consumption between compute nodes assigned to one job are noticed. Figure 2 shows an example with GPU nodes. Differences are between 400 W and 500 W range.
Fig. 2 Comparison between compute nodes performing the same calculations
248

International Conference on Innovative Technologies, IN‐TECH 2016,
Prague, 6. ‐ 8. 9. 2016
Guidelines for Pricing Estimation
When determining the price of the HPC services, following costs should be taken into consideration: Software licenses Cooling system maintenance IT infrastructure administration Power system maintenance
The cost of software licenses usually includes job schedulers, compilers and various scientific software. Other software worth considering are the ones for storage management, high-speed node interconnections and other administering tools. Cooling system maintenance comprises servicing of pumps, chillers and automation equipment such as programmable logic controllers (PLCs), communication devices etc. IT infrastructure administration contains mostly cost of labour and equipment such as the firewall. Power system maintenance includes uninterruptible power supply (UPS) units, batteries and other power control units. Other costs may include certificates for fire and security alarms and attestation for fire protection system.
For calculating the amortisation expenses per hour of the entire data center with facility and IT equipment separated, following expression is used:
8640
2
where is a price of data center facility, price of IT equipment, 8640 is a result of multiplying 12*30*24 and it is used to calculate the cost per hour. stand for a total number of CPU cores. and are amortization periods for facility and IT respectively.
For calculating the power cost, price model for electricity should be known. In the case of University of Rijeka, 10-hour overnight period has a smaller price for 1 kWh. Following expression is used:
124
∗ ∗14 ∗ 10 ∗
3
where P is power consumption of the entire data center, is a electricity cost for 1 kWh during the day, is an electricity cost
for 1 kWh during the night period. is used to get the rate per hour. In this case, job scheduler with the ability of holding once started jobs
until night could decrease power cost. Overall cost is a sum of (2) and (3):
4 and should participate in price with 70%. In case both CPU+GPU and SMP nodes are not used, the bottom line of profitability for CPU nodes is 40% of average usability. As an example, the comparison between prices of optimised and constant load has been made. Assumptions are that electricity price is 50% smaller in the overnight period. Average usability is 53% or 40 % during the day and 70% during the night. Figure 3 shows the comparison in power cost between optimised and constant load for a submitted cluster.
Fig. 3 Comparison in power cost between equal and optimised load for the submitted compute nodes
249

International Conference on Innovative Technologies, IN‐TECH 2016,
Prague, 6. ‐ 8. 9. 2016
Conclusion
By proper maintenance of data center cooling system and IT equipment, reduction in power consumption can be achieved. If electricity has a lower price in the night period, job scheduler with the option of holding submitted jobs after they are put into operation could also decrease cost. However, computing capabilities should not be affected. This paper showed basic pricing estimation of HPC services and guidelines for power management. Since university uses this data center for scientific research, the accent is not on incomes and profit but self-sustaining, so it creates an excellent opportunity for implementing various pricing and power management methods. The end users should be however informed about how the supercomputer is managed, through documents which describe the terms and conditions. Acknowledgments The authors thank the European Union and their development funds for financing the purchase of supercomputer and therefore a chance for writing this paper. This work was also co-founded by the University of Rijeka through programme “Development of cloud manufacturing systems for supervision, control and automation of manufacturing processes” led by prof. Zlatan Car.
References [1] http://www.gsi.de [2] http://www.kyotocooling.com [3] http://www.facebook.com/PrinevilleDataCenter [4] http://www.penguincomputing.com [5] http://www.sabalcore.com [6] http://www.arctur.si/eng [7] http://www.azure.microsoft.com [8] Ogrizović, D., Car, Z., Janeš, G., & Kovačić, B. (2013, January). Doing Science in the Cloud. In International Conference on
Innovative Technologies IN-TECH.
250

International Conference on Innovative Technologies, IN‐TECH 2016,
Prague, 6. ‐ 8. 9. 2016
IN-SITU METHOD OF BALANCING HEAT FOR DETERMINATION OF EFFICIENCY OF ELECTRIC MOTOR FOR DRIVE PUMP COOLING WATER
HIGH POWER
N. Delalic1, D. Kadric1 and B. Delalic1 1Faculty of Mechanical Engineering Sarajevo,Vilsonovo setaliste 9, BA-71000 Sarajevo
Keywords: Efficiency of The Pumping Unit; Efficiency of Electric Motors; Losses of Electric Motors; In-Situ Method of Balancing Heat Abstract: In the process of determining the efficiency of the pump for transportation of cooling water in thermal power plants, there is the problem of determining in particular the efficiency of the electric motor and in particular the efficiency of the pump. The efficiency of the pump is determined according to the procedures given in the relevant standards, based on measurements of certain physical parameters. The problem is not as pronounced, if it is a new electric motor, whose efficiency is determined in the laboratory. However, if the electric motor power rating of 1000 kW, with a large number of working hours, which is constantly in operation, determining the efficiency of such engines is a serious problem. The paper describes the procedure for determining the efficiency of electric motors by measuring in-site electric losses. The procedure is based on the assumption that all losses of electric motors converted in to heat. For the purposes of determining the heat balance of electric motors, a special equipment with inlet and outlet of air for cooling the electric motor was designed and developed. By measuring the input and output parameters of air for cooling electric motors, can be determined with the method of balancing heat losses of electric motors. The advantage of this method is that the process of determining the loss of electric motors can be done on site and without down time of the pump unit, which normally works approximately 5500 hours per year without interruption. The measurement results were compared with the declared. As before testing pump, pumping unit has undergone a thorough revitalisation, the results of determining the loss of electric motors have a slightly lower value than the declared value. Introduction
As part of the thermal power plant, cooling water pumps are used to circulate cooling water between the condenser steam turbines and cooling tower. They are very engaged and work around 5500 hours per year. Performance testing of pumps for cooling water is done in order to prove the guaranteed performance of built-new pump. The procedure of testing the pump is defined by ISO 9906 [1]. For conducting the tests, it is required to have an appropriate, calibrated measuring equipment defined by the same standard. Figure 1 shows the scheme of the pumping station. The new pump is designed with a nominal volume rate flow in the operating point Q = 14000 m3/h at a nominal head H = 17,5 m. Driving motor pump is mounted vertically above the pump and transfer of torque is directly to the pump shaft. The nominal motor power is Pm = 1000 kW, voltage U = 6000 V, current I = 121 A, speed of rotation n = 593 min-1, cos=0,85.
Among other characteristics of the pump, it is essential to demonstrate the characteristics of Q-H; P-Q; Q-. The efficiency of the motor pump unit can be easily determined as the ratio of output power pump and input power of electric motors. Due to lack of knowledge of the efficiency of electric motors, the problem is the determination of efficiency of the pump. Measuring the torque on the shaft of such large pumps is not possible. The scope of testing
The testing was conducted in order to determine actual characteristics of the cooling water pump in units 5 and 6 of TPP "Kakanj". [2] In order to obtain sufficient and high-quality fund of data for determining the pump charachteristics, measurements for determining the parameters of the pump were organized and carried out. The measurements were made in the range of flow possible to achieve, given the possibilities of control equipment and the security of operation of the TPP unit. Therefore, measurements on the pump are performed in the entire range of flow from the minimum to the maximum flow. Total of 9 measurements were conducted for the pump and they inculded:measurements of pressure on the discharge of the pump, measurments of water temperature, measurments of the head pump,measurements of the water level in the pumping station, volume flow rate measurement, measurement of vibration at certain parts of the pump, measurements of the speed of rotationof the pump shaft and measurements of electrical parameters of the drive motor.Accounting period is given for each test mode, and the testing lasted even longer in order to achieve the steady state operation. The accounting period is taken for the measurements in which the conditions prescribed by the standars are met. These conditions imply that the fluctuation of measured values of flow rates, head and power of pump was less than or equal to 3% and the speed of rotationof the pump shaft is not changed by more than 1%. The pump is started at a flow rate of zero. However, it was not possible to perform measurements of head at zero flow rate because it might be a treat to the elements of the plant. The measurement of relevant parameters of pump
Measuring the volume flow rate was conducted on the pipeline for cooling water, directly behind the pump. Diameter pipeline is 1630x15 mm. The measurement was conducted with an ultrasonic flow sensor (measured error +0,5% of reading) and the results of measurements are given in Table 1. for the nine-points of measurement.The measurement started with a fully open gate valves, continued to to the closure of 50%, and then back to the fully open gate valves. Determining the total head of pump is done according to the equatio:
251

International Conference on Innovative Technologies, IN‐TECH 2016,
Prague, 6. ‐ 8. 9. 2016
tt Yg
UhH 2
2, (1)
where: H, (m) total head of pump, ht ,(m) is the pressure head related to the centre of the cross-section, U2/2g, (m) velocity head related to the centre of the cross-section according to Figure 1. , U, (m/s)meanvelocity in the pipeline in the same section, Yt,(m) suction head, measured as the difference between the height position of the centre of the cross-section and water level in the suction chamber.
Fig. 1 Layout pump station
Fig. 2 Pump with data acquisition system
Mean velocity is calculated using the flow rate as:
24iDQU , (2)
where: Q, (m3/s) volume flow rate, Di, (m) inside diameter of the pipeline. The static pressure is measured after the pump, so the information on static pressure is given from four points along the
circumference of the pipeline and equalized to one collector duct along the circumference of the pipe, and then taken to a pressure transducer, which was set on the level of pipe centre axis. The acquisition of the measured data, Figure 2, is set so the sample is taken every 5 seconds and then averaged.
Measuring the suction height, or the height difference between the water level in the suction chamber and the height of the pressure transducer, is carried out with measuring rods with sliding.
The density of water is determined based on the water temperature, which is measured continuously during the test. The acquisition of the measured data is also set to take samples every 5 seconds and then to average.
Speed of rotation of pump shaft is measured by a digital optical tachometer, which is based on measuring changes in the frequency of markers on the pump shaft. During the test, the speed of rotation of pump has not changed for any mode, and amounted to 594 min-1.
To determine the input power of an electric motor that drives the pump, it is necessary to measure the voltage and current and cos on the motor pump. The measurement was carried out with a system for electrical measurement, brand METREL, that performes readings every second, and then for each test mode it also performs averaging of measured parameters. Testing used the measuring transformers for voltage 6000/100 V, and for the the current 100/5 A, accuracy class 0,5.
Input power of electric motor is determined on the basis of equation:
3cos. IUP inel , (3)
where: Pel.in, (W) input power of electric motor, U, (V) voltage, I (A) current. The input pump power is determined as the output power of electric motors:
melineloutel PP ... , (4)
where: Pel.out, (W) output power of electric motors The efficiency of electric motors is not known, because the engine is very old. It has passed through a reconstruction, but without
measuring of the efficiency. The efficiency of the pump is determined from the ratio of output (power that pump transfers to the water) and input power pump (power on pump shaft), as:
outeloutel
h
PQHg
PP
..
, (5)
where: Ph, (W) output power pump, , (kg/m3) water density, The pumping unit overall efficiency is determined by the equation:
inelinel
hgr P
QHgPP
..
, (6)
252
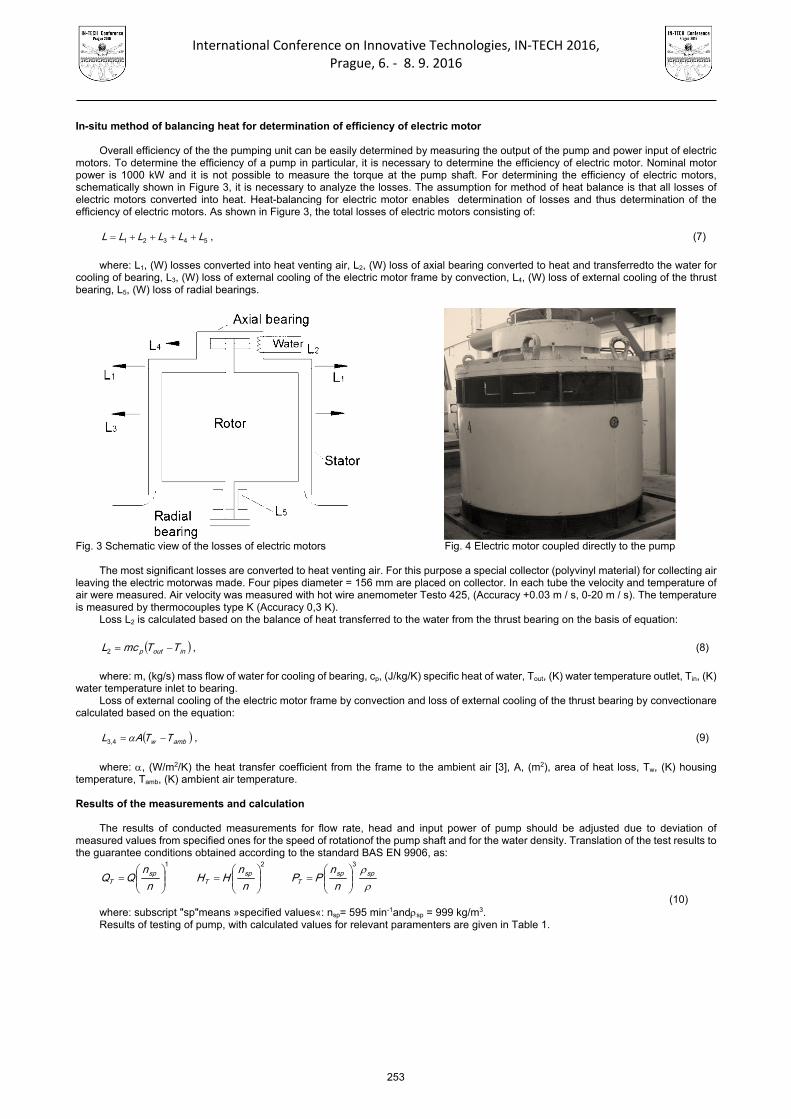
International Conference on Innovative Technologies, IN‐TECH 2016,
Prague, 6. ‐ 8. 9. 2016
In-situ method of balancing heat for determination of efficiency of electric motor
Overall efficiency of the the pumping unit can be easily determined by measuring the output of the pump and power input of electric
motors. To determine the efficiency of a pump in particular, it is necessary to determine the efficiency of electric motor. Nominal motor power is 1000 kW and it is not possible to measure the torque at the pump shaft. For determining the efficiency of electric motors, schematically shown in Figure 3, it is necessary to analyze the losses. The assumption for method of heat balance is that all losses of electric motors converted into heat. Heat-balancing for electric motor enables determination of losses and thus determination of the efficiency of electric motors. As shown in Figure 3, the total losses of electric motors consisting of:
54321 LLLLLL , (7)
where: L1, (W) losses converted into heat venting air, L2, (W) loss of axial bearing converted to heat and transferredto the water for
cooling of bearing, L3, (W) loss of external cooling of the electric motor frame by convection, L4, (W) loss of external cooling of the thrust bearing, L5, (W) loss of radial bearings.
Fig. 3 Schematic view of the losses of electric motors
Fig. 4 Electric motor coupled directly to the pump
The most significant losses are converted to heat venting air. For this purpose a special collector (polyvinyl material) for collecting air
leaving the electric motorwas made. Four pipes diameter = 156 mm are placed on collector. In each tube the velocity and temperature of air were measured. Air velocity was measured with hot wire anemometer Testo 425, (Accuracy +0.03 m / s, 0-20 m / s). The temperature is measured by thermocouples type K (Accuracy 0,3 K).
Loss L2 is calculated based on the balance of heat transferred to the water from the thrust bearing on the basis of equation:
inoutp TTmcL 2 , (8)
where: m, (kg/s) mass flow of water for cooling of bearing, cp, (J/kg/K) specific heat of water, Tout, (K) water temperature outlet, Tin, (K)
water temperature inlet to bearing. Loss of external cooling of the electric motor frame by convection and loss of external cooling of the thrust bearing by convectionare
calculated based on the equation:
ambw TTAL 4,3 , (9)
where: , (W/m2/K) the heat transfer coefficient from the frame to the ambient air [3], A, (m2), area of heat loss, Tw, (K) housing
temperature, Tamb, (K) ambient air temperature.
Results of the measurements and calculation
The results of conducted measurements for flow rate, head and input power of pump should be adjusted due to deviation of measured values from specified ones for the speed of rotationof the pump shaft and for the water density. Translation of the test results to the guarantee conditions obtained according to the standard BAS EN 9906, as:
1
nn
QQ spT
2
nn
HH spT
spsp
T nn
PP3
(10)
where: subscript "sp"means »specified values«: nsp= 595 min-1andsp = 999 kg/m3. Results of testing of pump, with calculated values for relevant paramenters are given in Table 1.
253

International Conference on Innovative Technologies, IN‐TECH 2016,
Prague, 6. ‐ 8. 9. 2016
Table1.Results of measurements and calculation of energy performance of pumps
No.
Outlet pump pressure
Suction head Density
Water temp Velocity
velocity head
Speed of rotation
Power electric motor cos
Volume flow rate
Total head
Power pump output
Pumping unit overall efficien.
Pump efficiency
bar m kg/m3 oC m/s m 1/min kW m3/h m kW / /
1 1,29 3,06 997,4 23,70 4,49 1,03 594 862 0,828 14803 17,29 695,73 0,81 0,84
2 1,25 3,06 997,4 23,70 4,50 1,03 594 861 0,823 14831 16,90 681,14 0,79 0,82
3 1,26 3,08 997,4 23,60 4,51 1,03 594 859 0,821 14852 17,02 687,16 0,80 0,83
4 1,33 3,08 997,4 23,70 4,39 0,98 594 861 0,823 14462 17,67 694,72 0,81 0,84
5 1,40 3,08 997,4 23,60 4,28 0,93 594 870 0,832 14096 18,32 701,89 0,81 0,84
6 1,53 3,09 997,4 23,60 3,91 0,78 594 876 0,835 12902 19,53 684,79 0,78 0,81
7 1,63 3,12 997,4 23,70 3,50 0,63 594 886 0,839 11548 20,40 640,43 0,72 0,75
8 1,25 3,13 997,4 23,70 4,58 1,07 594 867 0,832 15109 16,95 695,87 0,80 0,83
9 1,26 3,06 997,4 23,70 4,52 1,04 594 860 0,822 14913 17,01 689,51 0,80 0,83 The energy performance of the tested pump is given in Figure 5. Table 2 presents the losses of electric motors, which are determined by the method of balancing heat for determination of efficiency of electric motor, in-situ.
Fig. 5 The energy performance of the tested pump
Table 2. Heat losses of electric motor
Air flow Specific heat Density Air outlet temp Air inlet temp Heat loss
Heat loss L1 m3/h J/kg/k kg/m3 K K W
Tube 1 1043 1070 1,1 40,1 22,5 6002
Tube 2 1046 1070 1,1 41,1 22,5 6361
Tube 3 1213 1070 1,1 41,2 22,9 7257
Tube 4 1165 1070 1,1 42,1 22,6 7427
TOTAL L1 27047
Water flow Specific heat Air density Water outlet Water inlet temp Heat loss
m3/h J/kg/k kg/m3 K K
Heat transf.coef. Frame diameter Frame High Frame temp Ambient air Heat losses
W/m2/K m m K K W
Heat loss L3 25 1,73 0,89 38,8 23 1910
Heat loss L4 20 1 0,35 41,8 23 413 TOTAL Heat
l L30208
The loss L5 is included in the L1 losses. The total losses of electric motor amounted to 30 208 W, or 3,5% related to the measured power of 860 kW. Declared losses of electric motors are 6% in nominal motor power 1000 kW. Conclusion
Based on the measurement of losses of electric motors it is possible to calculate the efficiency of the pump separately. This is very important, because most clients are interested in the efficiency of the pump to be installed in facility, with large power and working extensive number of hours in a year. In this instance, it was obvious that the efficiency of electric motors is higher than the nominal with the difference of 2,6%. However, the pump efficiency is reduced by the same amount and this is a problem in the process of proving guaranteed parameters of the pump, particularly its efficiency. This method can serve in a situation where it is not possible to measure torque at the pump shaft. References [1] Rotodynamic pumps — Hydraulic performance acceptance tests — Grades 1, 2 and 3 (EN ISO 9906:2012), International
Organization for Standardization, Geneva, 2012. [2] N.Delalic: Hydraulic performance acceptance tests of thepump for transportationofcooling water, Thermalpowerplants "Kakanj",
Facultyofmechanicalengineering Sarajevo, Sarajevo 2011. [3] E.N.Ganic: Prijenos toplote, mase i količine kretanja, SVJETLOST, Sarajevo, 2008.
254

International Conference on Innovative Technologies, IN‐TECH 2016,
Prague, 6. ‐ 8. 9. 2016
TESTING OF IMPROVED GENETIC ALGORITHM IN RAMBERG–OSGOOD MATERIAL MODEL PARAMETERS IDENTIFICATION
G. Janeš 1, Z. Car 1,2 , M Puskaric 1,3 and V. Margan2 1 Center for advanced computing and modelling, University of Rijeka, Radmile Matejčić 2, 51000 Rijeka,
Croatia
2 Faculty of Engineering, University of Rijeka, Vukovarska 58, 51000 Rijeka, Croatia
3 Department of biotechnology, Radmile Matejčić 2, 51000 Rijeka, Croatia
Keywords: Improved Genetic Algorithm; Material Parameter Identification; Genetic Algorithm; Computer Simulation Abstract: Search based on traditional genetic algorithms have a major drawback - high computational power requirements. The goal of this research was to test improved genetic algorithm in material model parameters identification for low-cycle fatigue. The experimental results show that this GA model has a very good accuracy in material model parameters’ identification. Introduction
Methods used in genetic algorithms (GA) search mechanisms are inspired by Charles Darwin's theory of evolution and problems are solved by using techniques of natural evolution: crossover, inheritance, mutation and selection [1,2].
Genetic algorithms as search mechanism are usually used when there is no or very little knowledge of the solution space or when there are far too many solutions to use standard search/optimization methods. GA can be used to solve every optimization problem which can be described with the chromosome encoding, and it is very easy to understand, and it can get multiple solutions that can be evaluated later with other methods [2,3]. Recently we developed fast GA suitable to run in highly parallelized computer environment. Main advantage of proposed algorithm is its speed since:
Works with only one population – less memory is used and less data is moved in computer memory than in algorithms that use two populations.
A low number of calculations are required – fitness for each individual (possible solution) is only calculated when that particular individual is created or its genome is altered. There is not sorting and only individuals with best and worst fitness are located and marked within a population.
Only one individual in the whole population is protected from mutation – best one, so there is no need for additional sorting and calculations to determine individuals protected by elitism in each generation of GA.
Material behaviour is vital in the prediction of failures in a highly loaded engineering components. Accurate information on material properties is critical in design and optimization of mechanical components [4]. Numerous material models were developed and used to describe materials’ stress–strain behaviour as much accurately as possible. In this paper proposed GA was tested on Ramberg–Osgood model on materials with known cycle loading properties [5]. Properties of materials used in this article (detailed response to the cycle loading) were obtained from MatDat material database [6].
Problem definition The material model in consideration is strain-controlled and strain is divided into elastic and a plastic part:
(1)
Where εe is elastic and εp is plastic strain. The elastic behaviour is represented by the linear stress–strain relationship:
(2)
εe - elastic strain
E - modulus of elasticity, MPa
Ϭ – Stress
Proposed GA was tested on Ramberg–Osgood model which describes a relationship between stress and strain. This model is especially useful for metals that harden with plastic deformation. For cyclic stress Ramberg–Osgood model is
(3)
A genetic algorithm is robust evolutionary search / optimization method and in this investigation we tested the efficiency of proposed GA in determining parameters for Ramberg–Osgood model and compared it with data set obtained from MatDat material database [6] - table 1.
255

International Conference on Innovative Technologies, IN‐TECH 2016,
Prague, 6. ‐ 8. 9. 2016
Table 1. Example Material ID 265, material properties - response to the cycle loading
Ϭa Ϭ ε Nf
MPa MPa % Cycles 394 0 1,2 559 380 0 1 974 369 0 0,8 1495 331 0 0,6 2270 313 0 0,5 4290 305 0 0,4 7670 275 0 0,3 13740 260 0 0,24 28520 242 0 0,2 63770 236 0 0,17 133790 225 0 0,145 708880
A standard strain - controlled test consists of constant amplitude completely reversed straining at a constant or nearly constant strain rate - Fig 1. Stress response generally changes with continued cycling. Stress and plastic strain variations are usually recorded periodically throughout the test and cycling are continued until fatigue failure occurs (Nf).
Fig. 1 hysteresis loop The proposed algorithm
Traditional GA has the problems of poor local search ability, a significant amount of calculation – so modified, improved GA was developed. The aim was to develop fast algorithm suitable to work on highly paralyzed computer systems, not only on cluster systems but also multiple processor cores working simultaneously on the same population. Initial Population
In research for this paper, the initial population has been created randomly. Random creation of initial population may require, in some cases, longer search time and more computer resources but this method provides a high level of genetic diversity. Like in real life, high level of genetic diversity helps a population to adapt faster and better to the environmental changes. Or in this case, it improves the chance to find a better solution at the end of a search.
In this research population sizes of 100 to 1000 individuals was used in algorithms. Such big range in population sizes was used to test speed and efficiency of this GA.
Fig. 2 GA flowchart
256
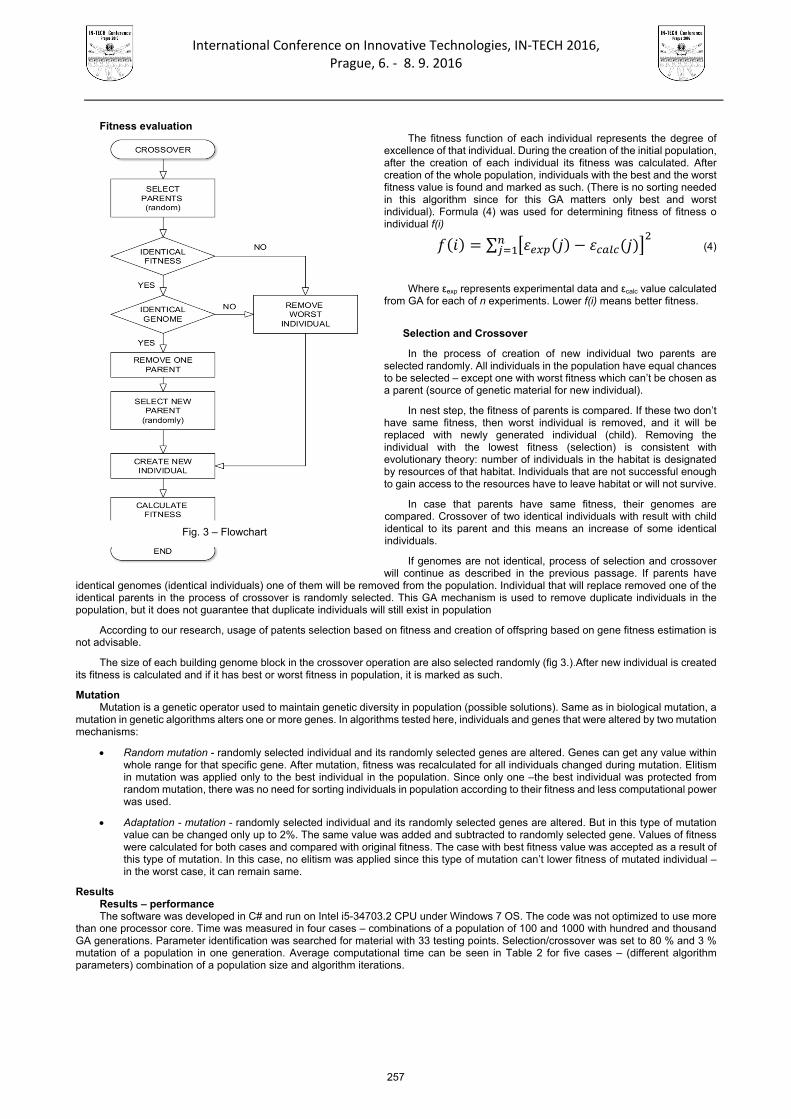
International Conference on Innovative Technologies, IN‐TECH 2016,
Prague, 6. ‐ 8. 9. 2016
Fitness evaluation The fitness function of each individual represents the degree of
excellence of that individual. During the creation of the initial population, after the creation of each individual its fitness was calculated. After creation of the whole population, individuals with the best and the worst fitness value is found and marked as such. (There is no sorting needed in this algorithm since for this GA matters only best and worst individual). Formula (4) was used for determining fitness of fitness o individual f(i)
∑ (4) Where εexp represents experimental data and εcalc value calculated
from GA for each of n experiments. Lower f(i) means better fitness.
Selection and Crossover
In the process of creation of new individual two parents are selected randomly. All individuals in the population have equal chances to be selected – except one with worst fitness which can’t be chosen as a parent (source of genetic material for new individual).
In nest step, the fitness of parents is compared. If these two don’t have same fitness, then worst individual is removed, and it will be replaced with newly generated individual (child). Removing the individual with the lowest fitness (selection) is consistent with evolutionary theory: number of individuals in the habitat is designated by resources of that habitat. Individuals that are not successful enough to gain access to the resources have to leave habitat or will not survive.
In case that parents have same fitness, their genomes are compared. Crossover of two identical individuals with result with child identical to its parent and this means an increase of some identical individuals.
If genomes are not identical, process of selection and crossover will continue as described in the previous passage. If parents have
identical genomes (identical individuals) one of them will be removed from the population. Individual that will replace removed one of the identical parents in the process of crossover is randomly selected. This GA mechanism is used to remove duplicate individuals in the population, but it does not guarantee that duplicate individuals will still exist in population
According to our research, usage of patents selection based on fitness and creation of offspring based on gene fitness estimation is not advisable.
The size of each building genome block in the crossover operation are also selected randomly (fig 3.).After new individual is created its fitness is calculated and if it has best or worst fitness in population, it is marked as such.
Mutation Mutation is a genetic operator used to maintain genetic diversity in population (possible solutions). Same as in biological mutation, a
mutation in genetic algorithms alters one or more genes. In algorithms tested here, individuals and genes that were altered by two mutation mechanisms:
Random mutation - randomly selected individual and its randomly selected genes are altered. Genes can get any value within whole range for that specific gene. After mutation, fitness was recalculated for all individuals changed during mutation. Elitism in mutation was applied only to the best individual in the population. Since only one –the best individual was protected from random mutation, there was no need for sorting individuals in population according to their fitness and less computational power was used.
Adaptation - mutation - randomly selected individual and its randomly selected genes are altered. But in this type of mutation value can be changed only up to 2%. The same value was added and subtracted to randomly selected gene. Values of fitness were calculated for both cases and compared with original fitness. The case with best fitness value was accepted as a result of this type of mutation. In this case, no elitism was applied since this type of mutation can’t lower fitness of mutated individual – in the worst case, it can remain same.
Results Results – performance The software was developed in C# and run on Intel i5-34703.2 CPU under Windows 7 OS. The code was not optimized to use more
than one processor core. Time was measured in four cases – combinations of a population of 100 and 1000 with hundred and thousand GA generations. Parameter identification was searched for material with 33 testing points. Selection/crossover was set to 80 % and 3 % mutation of a population in one generation. Average computational time can be seen in Table 2 for five cases – (different algorithm parameters) combination of a population size and algorithm iterations.
Fig. 3 – Flowchart
257

International Conference on Innovative Technologies, IN‐TECH 2016,
Prague, 6. ‐ 8. 9. 2016
Table 2. Compuatational time
Population 100 100 500 1000 1000
GA generations 100 1000 500 100 1000 average time 4.328 sec 41.237 sec 1 min 57.364 sec 48.051 sec 7 min 37.26 sec
Results - parameter identification The validation of result was made by comparing results obtained with custom written software with data from the material database
[6] and experimental results. GA was run for ten times and with a population of 500 individuals, 100 generation, and 3 % mutation.
Table 3. Parameter identification - results
material K’ (base) n’ (base) Fitness (base)
K’ (best GA)
n’ (best GA)
Fitness (best GA)
K’ (worst GA)
n’ (worst GA)
Fitness (worst GA)
ID 608 893 0,18 0,240 1304,077 0,257 0,267 1352,558 0,264 0,289 ID 609 1262 0,251 0,658 616,367 0,139 0,191 625,396 0,142 0,203 ID 265 1367 0,104 2,529 938,809 0,189 0,228 942,810 0,190 0,228 ID 229 675 0,22 0,333 631,157 0,206 0,475 631,157 0,206 0,475
In table contains fitness value of data obtained from the material database [6] and this values can be compared with best and worst
result obtained with custom software based on the improved genetic algorithm. As can be seen from results in Table 3, proposed algorithm gives reliable and accurate results in an acceptable time (table2) [7,8].
Conclusion
Modelling of material behaviour is very important in design and optimization of mechanical structures and in this paper the improved genetic algorithm was tested on solving Ramberg–Osgood material model parameters identification problem. Software in MS C# was developed specially for this research.In previous research speed of this GA was tested for wireless network optimization and job shop scheduling problems [7] and results showed that proposed algorithm works fast and can be used in the optimization problems where speed (time) is important.
The performance of GA was validated by comparing computational results with experimental data for the set of materials.Results of specially developed software based on this GA software for this purpose show that modelling material behaviour for numerous materials is possible and tested algorithm is fast and have reliable convergence to the accurate results.
In future works, the performance of proposed genetic algorithm will be tested even more complex problems, and software will be modified to work with different material models and on highly parallel computer systems.
References [1] Tsoukalas, L. , and Uhrig, R. Fuzzy and Neural Approaches in Engineering. Wiley, 1997. [2] Bart Rylander : Computational Complexity and the Genetic Algorithm [3] Deepti Gupta, Shabina Ghafir : An Overview of methods maintaining Diversity in Genetic Algorithm s, International Journal of
Emerging Technology and Advanced Engineering (Volume 2, Issue 5, May 2012) [4] Bäumel A, Seeger T. : Materials data for cyclic loading - Supplement 1. Amsterdam: Elsevier; 1990. [5] Beggiolaro, M.A.; Castro, J.T.P.: “ Statistical evaluation of strain-life fatigue crack initiation predictions, International Journal of
Fatigue 26, str. 463-476“, Elsevier, 2004. [6] Basan, Robert (2011): MATDAT Materials Properties Database. Version 1.1. MATDAT Materials Properties Database.
http://www.matdat.com/ [7] G. Janeš, Z. Car and D. Ogrizović : A fast genetic algorithm based on single gene evaluation fitness mechanism for job-shop
scheduling problem, International Conference on Innovative Technologies, IN-TECH 2013,Budapest. [8] Joachim Wegener, Harmen Sthamer, Bryan F. Jones, David E. Eyres : Testing real-time systems using genetic algorithms,
Software Quality Journal, (1997), Volume 6, Issue 2, pp 127-135
258

International Conference on Innovative Technologies, IN‐TECH 2016,
Prague, 6. ‐ 8. 9. 2016
FLAME AEROSOL SYNTHESIS OF OXIDES AND SALTS
N. E. Machin1 1 Atilim University, Chemical Engineering and Applied Chemistry Department,
Incek-Ankara, Turkey
email: [email protected]
Keywords: Nanomaterials; Flame Spray Pyrolysis; Metal Oxides Abstract: A Flame Spray Pyrolysis system to produce nano-materials for variety of applications has been studied. A premixed burner integrated with a two-substance nozzle has been designed, and materials produced were collected on a vacuum applied filtering system. Liquid precursors were sprayed into the center of the flamelets ring to produce the nano particles within the main flame. Collected particles were characterized by SEM (Scanning Electron Microscopy) and TEM (Transmission Electron Microscopy) for their size and surface morphology, HRTEM (High Resolution Transmission Electron Microscopy), TEM-EDS (Transmission Electron Microscopy-Energy Dispersive Spectrometer) and Selected Area Electron Diffraction (SAED) for their crystallinity. X-Ray Diffraction technique for the bulk crystal phase identifications, and Brunauer-Emmet-Teller (BET) technique for specific surface area determinations were used. Depending on the applications, other tests have also been applied (e.g. Fourier transform infrared spectrospcopy (FTIR), contact angle measurements, electrochemical tests, mechanical analysis). Mixed or single metal oxides, and salts were produced. Precursor concentration and flow rate, and nozzle dispersion gas flow rates were found to have a strong effect on the end products morphology and crystal phases. Nano-V2O5 was produced to test its potential as a cathode material in Li-ion rechargeable batteries. The results showed high rate reversibility, low polarization during lithium insertion/extraction, stable interfacial resistance and high electrical conductivity. Metal oxides (single or mixed) showed good activity in the catalytic combustion of methane, or Li-ion batteries as cathode material. Calcium phosphates at different Ca/P ratios were prepared, and at a 5-50 μg/ml range of doses, they were not toxic on urine derived stem cells and caused improved osteogenic differentiation of these cells. Flame Spray Pyrolysis (FSP) technology is probably the most versatile technique known for the production of nanoparticles, including very complex ones, in a single step in a laboratory scale. Substantial research is required in order to scale up the FSP technology under the constraints of maintaining the purity and the size of the particles for producing nanoparticles in large scale. Introduction
Combustion synthesis of nanomaterials provides significant advantages, because of the available heat of combustion to activate the precursor reaction in a single step synthesis, provided that the final product properties can be controlled [1]. The important task here is to tailor the size and the properties of the particles to the needs of the application on which its function is based. A broad spectrum of metals and mixed metal oxides are produced by this method including catalysts [2]. The incentive to produce catalyst particles in nano size is to maximize the surface area of the active phase for reactions, providing higher reaction rate as well as a significant cost reduction. The most important commercial products produced by combustion synthesis are carbon blacks (Cabot, Degussa, Columbia), fumed silica (Cabot, Degussa), pigmentary titania (DuPont, Millenium, Kerr-McGee) and optical fibers (Corning, Lucent, Sumitomo) [3].
Nano-particles can be synthesized by a variety of methods, such as chemical and physical vapor deposition, laser ablation, grinding, sol–gel, co-precipitation and flame aerosol technologies. As one of the flame aerosol technology, flame spray pyrolysis (FSP) method has been developed tremendously within the past 10 years, allowing nano-particle mass production in one step, and presenting a clear advantage over conventional multistep processes [4,5]. High synthesis temperature (over 1600 oC) and short residence times within the flame provide higher thermal stability, better crystal structure and morphology. Here, oxides and salts produced by this technique in a FSP system will be reviewed, which was designed and set up in our laboratory [6], inspired by the original design by Madler et al.[7].
Experimental Material and methods
In our FSP system (Fig. 1), metal precursor, which was dissolved in an appropriate solvent, was carried into a premixed burner by using a liquid pump and a two-phase nozzle with a capillary insertion, which was located in the center of the burner. Precursor solution was then sprayed into the flame by an oxygen dispersion gas, and ignited by 25 premixed methane/oxygen flamelets creating a stable main flame in which the particles were formed. Particles produced in the flame were collected on a vacuum applied glass fiber filter (GF/B) simultaneously. The burner and the chamber where the GFB filter was placed were cooled to prevent overheating.
259

International Conference on Innovative Technologies, IN‐TECH 2016,
Prague, 6. ‐ 8. 9. 2016
Fig.1 FSP production system schematics and a flame picture
Characterization X-ray diffraction (XRD), scanning electron microscopy (SEM), transmission electron microscopy–energy dispersive
spectrometry (TEM–EDS), selected area electron diffraction (SAED) and high resolution transmission electron microscopy (HRTEM) techniques were used for structural and morphological characterization of the nano-particles. XRD and SEM were used to determine the crystal phase and to investigate the general morphology. TEM and HRTEM were used for more detailed analyses: for atomic lattice imaging, nano-particle size and crystal structure. Brunauer–Emmett–Teller specific surface area (SBET) measurements were used to determine the surface area of the particles produced by using Micromeritics Gemini 2365 Automated Physisorption Analyzer.
Results and Discussion
Precursor concentration and flow rate, and nozzle dispersion gas flow rates were found to have a strong effect on the end products morphology and crystal phases. The main function of the dispersion oxygen in a two-phase nozzle is to spray the liquid feed into the flame environment. At constant dispersion oxygen flow rates in the nozzle, it was observed that by increasing the concentration and the flow rate of the liquid precursor flow rate, the number of the different crystal phase formation have increased. For example, for a La and Co Acetate precursor in propionic acid feed, the crystal phases of the product ranged from LaCoO3 + LaO + Co3O4 at high concentration to LaCoO3 only. The higher the concentration of the precursor in the flame environment, the higher the probability of the collisions between the precursor in liquid and gas phase, which results in different crystal phase formation in the flame. As the concentration of the precursor was lowered, the only crystal phase formed was LaCoO3 under the conditions studied. The higher concentrations also resulted in larger sintered particles in the flame. A comparative TEM pictures are shown in Fig. 2 with a decreasing concentration. Another observation is the inhomogeneous particle size distribution in the final product.
Fig. 2 TEM pictures of La/Co oxides
In flame spray pyrolysis, when solvent + precursor mixture sprayed into the flame environment, due to the high flame temperatures, the mist immediately evaporates and ignites, and organic solvent reacts with oxygen to form carbon dioxide and water vapor, while the metal precursor goes through a series of reactions forming the particle nucleus which is then followed by the particle growth through agglomeration and sintering depending on the residence time in the flame [8]. In this process, particle formation takes place from gas to particle and/or droplet to particle, depending on several parameters. The liquid precursor flow rate and concentration (effects the particle residence time and the degree of sintering), and dispersion oxygen flowrate (effects the liquid droplets size in the spray) are among the most important parameters along with others. SEM and TEM results indicated that, the particle formation in our system follows both gas to particle and droplet to particle mechanism under the conditions we studied. When the dispersion oxygen flowrate is increased under constant precursor concentration and flowrate, higher surface area and smaller particle size are obtained.
We explored the possibility of the production of nano-V2O5 by our system with desired properties such as large surface area and good crystallinity, and tested it as a cathode material in Li-ion batteries to investigate whether cathodic properties were improved compared to the commercial micron size V2O5 cathode material [6]. SEM and TEM images showed that the particles prepared were at nano size and mostly spherical shape. SEM pictures showed agglomeration of the primary particles. TEM images indicated spherical primary particles necking and forming chainlike aggregate structures. HRTEM picture of a V2O5 nanoparticle
260
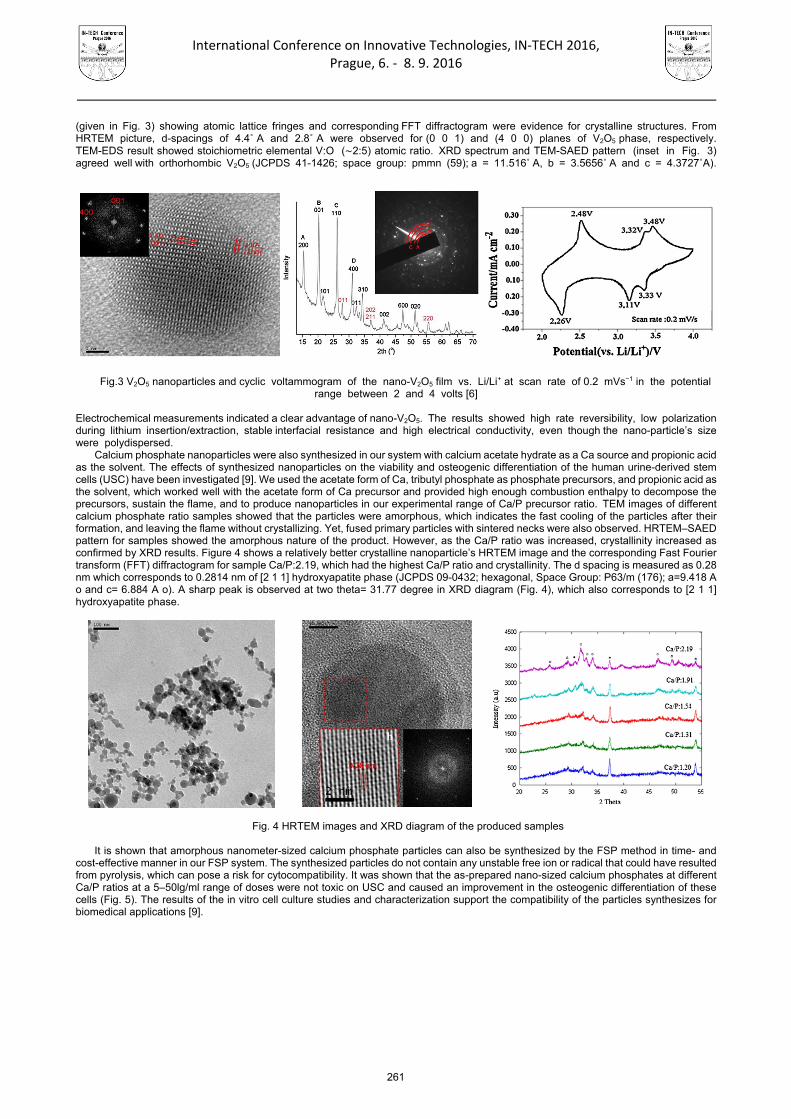
International Conference on Innovative Technologies, IN‐TECH 2016,
Prague, 6. ‐ 8. 9. 2016
(given in Fig. 3) showing atomic lattice fringes and corresponding FFT diffractogram were evidence for crystalline structures. From HRTEM picture, d-spacings of 4.4˚ A and 2.8˚ A were observed for (0 0 1) and (4 0 0) planes of V2O5 phase, respectively. TEM-EDS result showed stoichiometric elemental V:O (∼2:5) atomic ratio. XRD spectrum and TEM-SAED pattern (inset in Fig. 3) agreed well with orthorhombic V2O5 (JCPDS 41-1426; space group: pmmn (59); a = 11.516˚ A, b = 3.5656˚ A and c = 4.3727˚A).
Fig.3 V2O5 nanoparticles and cyclic voltammogram of the nano-V2O5 film vs. Li/Li+ at scan rate of 0.2 mVs−1 in the potential range between 2 and 4 volts [6]
Electrochemical measurements indicated a clear advantage of nano-V2O5. The results showed high rate reversibility, low polarization during lithium insertion/extraction, stable interfacial resistance and high electrical conductivity, even though the nano-particle’s size were polydispersed.
Calcium phosphate nanoparticles were also synthesized in our system with calcium acetate hydrate as a Ca source and propionic acid as the solvent. The effects of synthesized nanoparticles on the viability and osteogenic differentiation of the human urine-derived stem cells (USC) have been investigated [9]. We used the acetate form of Ca, tributyl phosphate as phosphate precursors, and propionic acid as the solvent, which worked well with the acetate form of Ca precursor and provided high enough combustion enthalpy to decompose the precursors, sustain the flame, and to produce nanoparticles in our experimental range of Ca/P precursor ratio. TEM images of different calcium phosphate ratio samples showed that the particles were amorphous, which indicates the fast cooling of the particles after their formation, and leaving the flame without crystallizing. Yet, fused primary particles with sintered necks were also observed. HRTEM–SAED pattern for samples showed the amorphous nature of the product. However, as the Ca/P ratio was increased, crystallinity increased as confirmed by XRD results. Figure 4 shows a relatively better crystalline nanoparticle’s HRTEM image and the corresponding Fast Fourier transform (FFT) diffractogram for sample Ca/P:2.19, which had the highest Ca/P ratio and crystallinity. The d spacing is measured as 0.28 nm which corresponds to 0.2814 nm of [2 1 1] hydroxyapatite phase (JCPDS 09-0432; hexagonal, Space Group: P63/m (176); a=9.418 A o and c= 6.884 A o). A sharp peak is observed at two theta= 31.77 degree in XRD diagram (Fig. 4), which also corresponds to [2 1 1] hydroxyapatite phase.
Fig. 4 HRTEM images and XRD diagram of the produced samples
It is shown that amorphous nanometer-sized calcium phosphate particles can also be synthesized by the FSP method in time- and cost-effective manner in our FSP system. The synthesized particles do not contain any unstable free ion or radical that could have resulted from pyrolysis, which can pose a risk for cytocompatibility. It was shown that the as-prepared nano-sized calcium phosphates at different Ca/P ratios at a 5–50lg/ml range of doses were not toxic on USC and caused an improvement in the osteogenic differentiation of these cells (Fig. 5). The results of the in vitro cell culture studies and characterization support the compatibility of the particles synthesizes for biomedical applications [9].
261

International Conference on Innovative Technologies, IN‐TECH 2016,
Prague, 6. ‐ 8. 9. 2016
(a) (b) (c)
Fig. 5 Phase-contrast micrographs of urine-derived stem cells at a: days 3–5, b: day 7, c:day 10 [9]
Conclusion Nanomaterials ranging from single to mixed oxides and salts have been produced with Flame Spray Pyrolysis (FSP) system. It is
probably the most versatile technique known for the production of nanoparticles, including very complex ones, in a single step in a laboratory scale. Substantial research is required in order to scale up the FSP technology under the constraints of maintaining the purity and the size of the particles for producing nanoparticles in large scale.
Acknowledgment The author would like to acknowledge The Scientific and Technological Research Council of Turkey (TUBITAK, Grant No 106M232) for financial support.
References
[1] D.E. Rosner: Flame Synthesis of Valuable Nanoparticles: Recent Progress/Current Needs in Areas of Rate Laws, Population
Dynamics and Characterization, Ind. Eng. Chem. Res., vol. 44 (2005), 6045-6055. [2] G. L. Messing, S.C. Zhang, G.V. Jayanthi: Ceramic Powder Synthesis by Spray Pyrolysis, J. Am. Chem. Soc., Vol. 76 (1993),
2707-2726. [3] K. Wegner and S.E. Pratsinis: Scale-up of Nanoparticle Synthesis in Diffusion Flame Reactors, Chem. Eng. Sci., Vol. 58, (2003),
4581-4589. [4] J.A. Schwarz: Methods for Preparation of Catalytic Materials, Chem. Rev.. Vol. 95 (1995), 477–510. [5] R. Strobel, A. Baiker, S.E. Pratsinis: Aerosol Flame Synthesis of Catalysts, Adv. Powder Technol., Vol. 17 (2006), 457–480 [6] S. Sel, O. Duygulu, U. Kadiroglu, N.E. Machin: Synthesis and Characterization of Nano-V2O5 by Flame Spray Pyrolysis, and its
Cathodic Performance in Li-ion Rechargeable Batteries, Appl Surf Sci., Vol.318 (2014),150–156. [7] L. Madler, H.K. Kammler, R. Mueller, S.E. Pratsinis: Controlled Synthesis of Nanostructured Particles by Flame Spray Pyrolysis,
J. Aerosol Sci., Vol. 33 (2002), 369–389. [8] W.Y. Teoh, R. Amal,L. Madler: Flame Spray Pyrolysis: An Enabling Technology for Nanoparticles Design and Fabrication,
Nanoscale, Vol. 2 (2010), 1324–1347. [9] S. Ataol, A. Tezcaner, O. Duygulu, D. Keskin, N.E. Machin: Synthesis and Characterization of Nano-sized Calcium Phosphates by
Flame Spray Pyrolysis, and their Effect on Osteogenic Differentiation of Stem Cells”, J. of. Nanoparticle Res.,(2015) DOI 10.1007/s11051-015-2901-0.
262

International Conference on Innovative Technologies, IN‐TECH 2016,
Prague, 6. ‐ 8. 9. 2016
COMPARATIVE ANALYSIS AND EVALUATION OF MEASUREMENT CAPABILITIES OF CONTACT AND NON-CONTACT DEVICES
M. Sokac 1, V. Margan 2, Z. Car 2 and I. Budak 1 1 University of Novi Sad, Faculty of Technical Sciences, Trg Dositeja Obradovica 6, 21000 Novi Sad, Serbia
2 University of Rijeka, Faculty of Engineering, Vukovarska 58, 51000 Rijeka, Croatia
Keywords: Measurement; Comparison; CMM; ATOS GOM; 3D Printing Abstract: In this article, results from a comparative tests carried out with a non-contact optical scanner (GOM Atos Triple Scan 5M) and a contact CMM (CARL ZEISS CONTURA G2) will be shown. A short overview of both systems’ specifications will be given, as well as a description and features of the parts that will be measured. For the measured objects with the features needed to conduct the test, 3D models were designed in CAD software and then 3D printed with ABS filament using a 3D printer (Zortrax M200). Several parts of different sizes where printed that consist of features with specific geometry for better assessment of both devices. Each of them was scanned several times in order to ensure repeatability and accurate conclusions based on the performed test. After the objects were measured, inspection was performed using GOM Inspect and CALYPSO software. Advantages and disadvantages of both systems will be presented, as well as times needed to perform preparations and the measuring itself. The biggest challenges for the CMM were negative angles and hard to reach surfaces, while for the optical scanner holes with small diameters presented the greatest difficulty. The main purpose of the tests performed was to obtain results which will help new users to select a measurement device best suited for their needs. Introduction
Advancement of technology today dictates the requirements needed for accurate and precise measurements, but also new solutions needed in quality control. Those expectations are especially pointed out in the industrial field. With the development of today’s modern acquisition systems, it enabled a steady approach that follows those demands. However, not all data acquisition systems can achieve the needed level of accuracy, and at a fast pace that the industry demands. Leading technological ingenuities in the fields of 3D scanning, measurement and quality control today are constantly trying to improve the existing state in those files, resulting in constant and steady advancement and progress. Coordinate measuring machines (CMM) equipped with contact sensors are frequently used today due to their high accuracy and repeatability that they provide. However, today’s demands are becoming more and more demanding, which results in use of optical scanners for parts that are not suitable for contact measurement due to their complexity of measurement time. [1] Therefore, use of these measurement devices allows a vast approach to different measurements situations, and also their continuous race to have an advantage over the other one. There are many research papers that are dealing with the analysis of different aspects of measurement results and comparison of different contact and non-contact measurement methods. Some of them are focused mainly on a comparative analysis of different measurement devices of different measurement principle [1], of even of the same measurement principle [2, 3] while some of them are more focused on a specific features such as drilled holes of different diameters. [4]
Basic principles of contact and non-contact 3D digitizing methods
Depending on the desired action, today’s acquisition systems offer a variety of different 3D digitizing approaches, most commonly divided into contact and non-contact measurement methods. For a comparative analysis in this paper, two of those systems are used in order to enable a better insight into their practical use and selection for the desired task. Those are non-contact optical scanner GOM Atos Triple Scan 5M from GOM GMBH and a contact coordinate measuring machine CONTURA G2 from CARL ZEISS, shown in figure 1. These two systems were selected because of their practical use and high accuracy of measurement results that they provide. While the tactile sensor’s principle of operation is based on mechanical contact with the object of measurement, the optical method captures an object's full surface geometry and primitives precisely in a dense point cloud or polygon mesh. Then the signals are derived for further processing. The proper evaluation of the measuring capability of a measuring device is very important today, especially in the field of quality assurance as it presents a part of a measurement system analysis. [5, 6]
Fig. 1 (a) CMM Contura G2 and (b) ATOS TRIPLE SCAN 5M used for comparative analysis
263
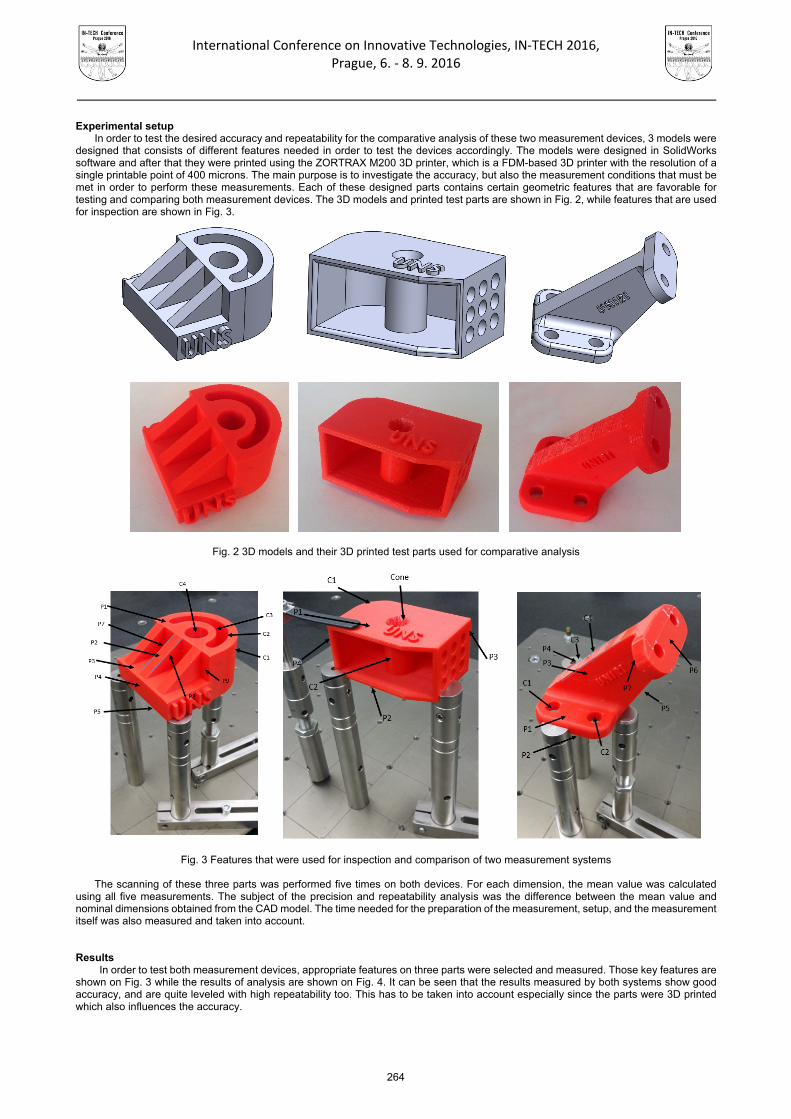
International Conference on Innovative Technologies, IN‐TECH 2016,
Prague, 6. ‐ 8. 9. 2016
Experimental setup
In order to test the desired accuracy and repeatability for the comparative analysis of these two measurement devices, 3 models were designed that consists of different features needed in order to test the devices accordingly. The models were designed in SolidWorks software and after that they were printed using the ZORTRAX M200 3D printer, which is a FDM-based 3D printer with the resolution of a single printable point of 400 microns. The main purpose is to investigate the accuracy, but also the measurement conditions that must be met in order to perform these measurements. Each of these designed parts contains certain geometric features that are favorable for testing and comparing both measurement devices. The 3D models and printed test parts are shown in Fig. 2, while features that are used for inspection are shown in Fig. 3.
Fig. 2 3D models and their 3D printed test parts used for comparative analysis
Fig. 3 Features that were used for inspection and comparison of two measurement systems
The scanning of these three parts was performed five times on both devices. For each dimension, the mean value was calculated using all five measurements. The subject of the precision and repeatability analysis was the difference between the mean value and nominal dimensions obtained from the CAD model. The time needed for the preparation of the measurement, setup, and the measurement itself was also measured and taken into account. Results
In order to test both measurement devices, appropriate features on three parts were selected and measured. Those key features are shown on Fig. 3 while the results of analysis are shown on Fig. 4. It can be seen that the results measured by both systems show good accuracy, and are quite leveled with high repeatability too. This has to be taken into account especially since the parts were 3D printed which also influences the accuracy.
264

International Conference on Innovative Technologies, IN‐TECH 2016,
Prague, 6. ‐ 8. 9. 2016
Fig. 4 Measurements results of ATOS and CMM compared to the nominal values for all three parts
Time required for measurement
While the accuracy of the obtained results presents a key feature that most papers are focused on, the time required for measurement of these parts was also taken into account and measured for all parts, during all five measurements. For CMM, the measurement time needed for fixture design of the test parts was also measured and taken into account, and which is around 6-8 minutes per part. And for the optical scanner, that time is eliminated due to the fact the there is no need for fixtures during measurement. On the Fig. 5 below are shown times that are needed for measurement of each part, during all five measurements with both ATOS and CMM.
05
10152025303540455055606570758085
C1 C2 Cone P1‐P2 P3‐P4
mm
Analzyed features
Part 1 ATOS CMM Nominal
05
101520253035404550556065707580
C1 C2 C3 C4 P1‐P3 P1‐P5 P3‐P5 P4‐P9 P7‐P8
mm
Analzyed features
Part 2 ATOS CMM Nominal
05
101520253035404550556065
P1‐P5 C1 C2 C3 C4 P1‐P2 P3‐P4 P6‐P7
mm
Analyzed features
Part 3 ATOS CMM Nominal
265

International Conference on Innovative Technologies, IN‐TECH 2016,
Prague, 6. ‐ 8. 9. 2016
Fig. 5 Comparison of measurement time for both CMM and ATOS optical scanner
It can be seen that the time required for all these measurements is substantially longer for the CMM than for the ATOS optical scanner, especially for the first measurement of each part. The time required for CMM measurements of the first part was the longest, as it required the setup and preparation of desired features that needed to be measured, but also to define measurements strategies too. The time for optical measurement of the second part was the longest because it had some features which required scans from a different point of view. Also, for the CMM measurement, the extra time was needed for reconstruction of the fixture that will hold the parts in place during measurement. Limitations of both measurement devices
While both measurement devices obtained relatively high accuracy results, there are certain limitations regarding measurement with both devices. While the contact CMM gives good results and high repeatability, the time required for measuring is quite long since it is a contact method, and the small unreachable places while performing measurements still present a difficult task to perform.
And with the optical measurement system, the benefits are that the time required for measurement is substantially smaller, and there is no need for a clamping fixture that holds the part in place during measurements. However, adequate targets should be placed on the object for easier alignment of scans. Also, deep holes present a problem for scanning, which can be solved by using a combining scanning and tactical measurement. [7] Conclusion
This paper provides an in-depth study on the comparative analysis of contact CMM and non-contact optical scanner GOM Atos Triple Scan 5M where three test parts were designed for comparison and printed using 3D printer. The aim of this analysis was to obtain a deeper insight into the basic characteristics of measuring systems and their performance. Through experimental analysis, the purpose of this paper was to gain better insight into strengths and weaknesses of these systems, as well as the way in which some problems were eliminated during measurement, or at least reduced to their smallest extent. Analysis was mainly focused on preparation for measurement, measurement procedure, and also on accuracy and repeatability of results obtained from these two measurement devices. Several features on all three test parts and the results of analysis from the perspective of accuracy and repeatability of the measurement have shown good results, considering that the parts used for analysis were 3D printed. Aberrations from these values are caused by noise of adjacent features at the top of the cylindrical surfaces, as well on the flat surfaces due to the 3D printer accuracy.
The case study presents measurement results with respect to the both methods where their setup time was also compared. The measurement error to the tactile reference measurement remains within the same order of magnitude, as with the optical device. Both of these systems showed good key points, but also drawbacks in some other areas, and that was the purpose of the comparison presented in this paper.
Acknowledgment The authors would like to thank TOPOMATIKA Ltd. & IZIT Ltd. for providing us with the Zortrax M200 FDM printer. The authors would also like to acknowledge the scientific support from the University projects "Development of Cloud Manufacturing of intelligent systems for control management and automation of the production process." and "Research Infrastructure for Campus-based Laboratories at the University of Rijeka" which is co-funded by the European Union. References [1] P. Ka, M. Dovica, S. Slosar, and J. Ková, “Comparision of contact and contactless measuring methods for form evaluation,”
Procedia Eng., vol. 48, pp. 273–279, 2012. [2] T. Tóth and J. Živčák, “A Comparison of the Outputs of 3D Scanners,” Procedia Eng., vol. 69, pp. 393–401, 2014. [3] R. Mendricky, “ANALYSIS OF MEASUREMENT ACCURACY OF CONTACTLESS 3D OPTICAL SCANNERS,” pp. 711–716, 2015. [4] B. Boeckmans, M. Zhang, F. Welkenhuyzen, W. Dewulf, J. Kruth, K. U. Leuven, D. M. Engineering, D. Pma, and B.- Leuven,
“COMPARISON OF ASPECT RATIO , ACCURACY AND REPEATABILITY OF A LASER LINE SCANNING PROBE AND A TACTILE PROBE,” in 11th Laser Metrology for Precision Measurement and Inspection in Industry 2014, 2014, no. 11, pp. 1–6.
[5] H. Zhao, J. Kruth, N. Van Gestel, B. Boeckmans, and P. Bleys, “Automated dimensional inspection planning using the combination of laser scanner and tactile probe,” Measurement, vol. 45, no. 5, pp. 1057–1066, 2012.
[6] J. Vagovský, I. Buranský, and A. Görög, “Evaluation of Measuring Capability of the Optical 3D Scanner,” Procedia Eng., vol. 100, pp. 1198–1206, 2015.
[7] http://www.gom.com/metrology-systems/gom-touch-probe.html [Accessed: 10-July-2016].
05
101520253035404550556065707580859095
100105110115120125130
CMM Part1
ATOS Part1
CMM Part2
ATOS Part2
CMM Part3
ATOS Part3
Time [m
in]
Part 1 Part 2 Part 3
CMM vs. ATOS measurement time
5th measurement
4th measurement
3rd measurement
2nd measurement
1st measurement
266

International Conference on Innovative Technologies, IN‐TECH 2016,
Prague, 6. ‐ 8. 9. 2016
CONTROL MECHATRONIC SYSTEM OF THE ELECTRONIC DIFFERENTIAL SYSTEM DESIGN FOR SMALL EV
V. Ferencey1 and M. Bugár1 1 Institute of Automotive Mechatronics, Faculty of Electrical Engineering and Information Technology, Slovak
University of Technology in Bratislava, Ilkovičova 3, 812 19 Bratislava, Slovakia, e-mail: [email protected], [email protected]
Keywords: Differential; System; Small Electric Vehicle; Model; Geometric Parameters; Steering Angles Abstract: The aim of this was design and implement an electronic differential for EV (electric vehicle) and its management. The first part of this work deals with analysis of the current stage, concepts and management systems of electronic differential. Furthermore, the work deals with kinematic-dynamic model of the vehicle cornering. Complex model that uses „Magic formula“ for modeling the interaction of the tire with the road presented is. The next part described EV for which the system was designed, the basic geometric parameters, the parameters of the electromotor/generator and inverter. These parameters were used in the next part of the work, where with the help of the program MSC.ADAMS a kinematic-dynamic model of the vehicle was constructed. This model was imported into MATLAB where the course of turning the vehicle for different vehicle speeds and steering angles was simulated. The results of the simulation represented the angular speed of the rear wheels. Introduction
Each car has at the same speed on all four wheels during straight driving. Geometry of movement is based on that the wheels on different sides during cornering must have difference of the angular velocity. For correct rolling wheels of the vehicle during cornering is used mechanical differential. Mechanical differential operates on the principle of transmitting the same torque to the left and right wheel independently of the wheel velocity.
Each electric car that contains two electric motors / generators in the rear drive axle requires an electronic differential. If electronic differential would operate properly, it will be necessary to know well to evaluate the angular velocity of each wheel when the vehicle is cornering [2,3]. After finding the desired angular velocity is further necessary that the electric motor / generator regulates driving at the required at speed or the torque. The simplest possible solutions of the electronic differential is using a model during cornering and subsequent management of the electric motor via a PI controller. This approach was chosen, where the required velocities are sent to a PI controller, which it sends a signal to the DTC (Direct Torque Control - direct torque control) [3,5], and controls the electric motor / generator to the required torque. Such an electronic differential acts on two inputs (Fig 1), on the basis of the rotational angle based on a wheel velocity and the pedal depression.
Fig. 1 The components of the control system [3]
267

International Conference on Innovative Technologies, IN‐TECH 2016,
Prague, 6. ‐ 8. 9. 2016
Mathematical Definition of the Electric Vehicle Turning
Two-track electric vehicle model can be seen on Fig 2 and Fig.3. The electric vehicle model has 8 degrees of freedom. Model is based on two-wheeled vehicle model. They had to lay criteria that determine the validity of this model. The main parameters was defined at the center of the vehicle, vehicle width (Fig. 3). The longitudinal axis of the electric vehicle is axis of symmetry of the electric vehicle [1,3].
Fig. 2 Ackermann - Jeantand vehicle model [1] Fig. 3 Full model of the electric vehicle during motion and
cornering [3] After determining the longitudinal velocity of the right and left wheel it was necessary to express the angular velocity of the wheel
(right wheel angular velocity, angular velocity of the left wheel) (Fig. 2), provided that the value was known dynamic radius of the wheels [1].
After setup the radius of the vehicles was defined equation for the left and right wheel. These equations are the two unknown variables, defining the longitudinal velocity of the vehicle center of gravity and rotation of the front wheel. After defining the steering angle as a defining ratio between turning the wheel and the wheel resulting equation for the angular speed of the rear wheels were:
d
v
dR rL
iDv
r
v
..2
)tan(.. (1)
d
v
dL rL
iDv
r
v
..2
)tan(.. (2)
Where: ωR - angular velocity of the right rear wheel, ωL - angular velocity of the left rear wheel, v - vehicle velocity, rd - dynamic radius of the wheel, D - vehicle width, L - vehicle length, I - steering transmission coefficient, δv - angle of the steering wheel. Design of the Simulation model
The prepared small electric vehicle model in MSC ADAMS (Fig 4) has been exported and ready for import into Matlab. Input control variable is vehicle ”traction” force contains simple loop control with feedback. Entering the control loop was desired electric vehicle velocityy, which was compared with the actual velocity. Output control loop parameters was sent to the fuzzy controller, which evaluated what was necessary to send control acting input to the model and sent value of the traction force to input "COG_force" (Center Of Gravity) (Fig 5). Input control variables in the model were: • Turning angle of the right front wheel. • Turning angle of the front left wheel. • The traction force acting at the center of the gravity of the small vehicle. Model contains fourteen output parameters (Fig 5). The control management were needed only four main control parameters, which were necessary to determine the velocity of the center of the rear axle. Other output variables were used only for next data evaluation and observation. Those able to determine whether the output angular velocity is correct and whether the EV model behaves correctly.
Output variables of the model were:
• The angular velocity of all four wheels (Fig.5 LF_OMEGA, RF_OMEGA, LR_OMEGA, RR_OMEGA). • Dynamic radius of the rear wheel (Fig.5 Lr, Rr). • The angular velocity of the center of gravity around the axis "Z" - (Fig.5 ang_vel). • Speed and acceleration in the COG, axis "X" and "Y" (Fig.5 COG_vel_x, COG_vel_y, COG_acc_x, COG_acc_y). • The vertical speed of gravity on the axis "Z" (Fig.5 GOC_vel_z_adams). • Slip angles of the rear wheels (Fig.5 left_lat_angle, right_lat_angle).
268
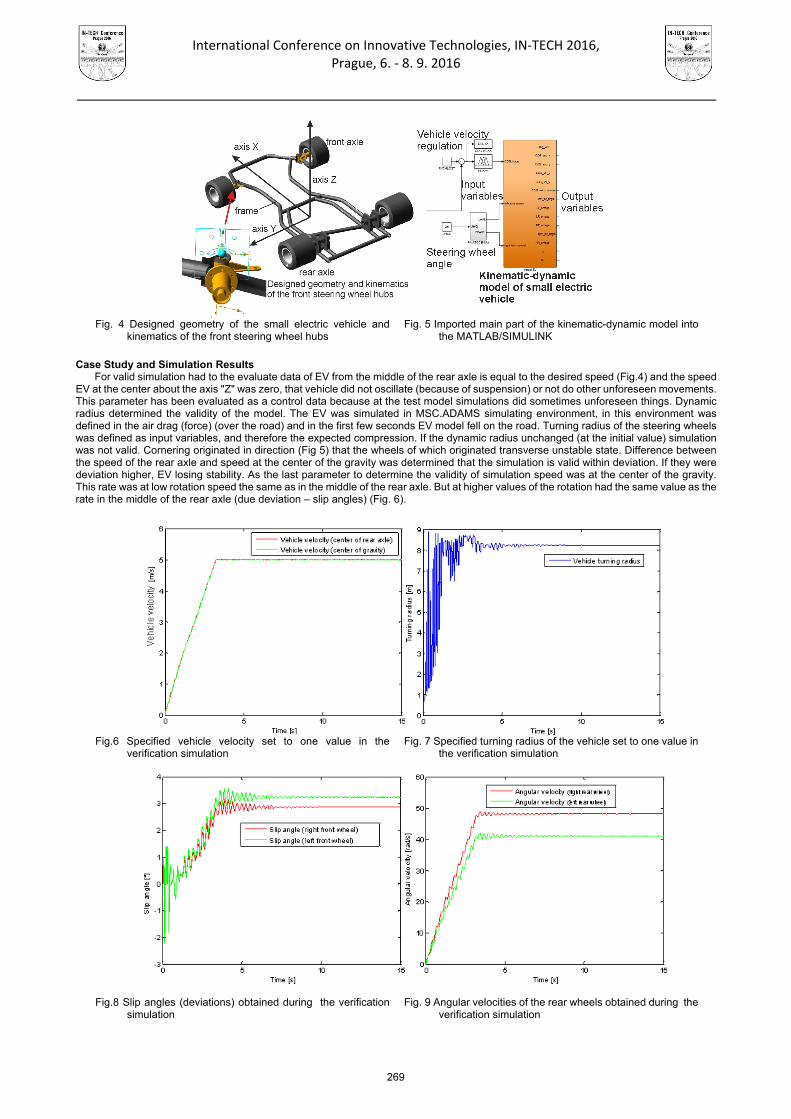
International Conference on Innovative Technologies, IN‐TECH 2016,
Prague, 6. ‐ 8. 9. 2016
Fig. 4 Designed geometry of the small electric vehicle and
kinematics of the front steering wheel hubs Fig. 5 Imported main part of the kinematic-dynamic model into
the MATLAB/SIMULINK
Case Study and Simulation Results For valid simulation had to the evaluate data of EV from the middle of the rear axle is equal to the desired speed (Fig.4) and the speed
EV at the center about the axis "Z" was zero, that vehicle did not oscillate (because of suspension) or not do other unforeseen movements. This parameter has been evaluated as a control data because at the test model simulations did sometimes unforeseen things. Dynamic radius determined the validity of the model. The EV was simulated in MSC.ADAMS simulating environment, in this environment was defined in the air drag (force) (over the road) and in the first few seconds EV model fell on the road. Turning radius of the steering wheels was defined as input variables, and therefore the expected compression. If the dynamic radius unchanged (at the initial value) simulation was not valid. Cornering originated in direction (Fig 5) that the wheels of which originated transverse unstable state. Difference between the speed of the rear axle and speed at the center of the gravity was determined that the simulation is valid within deviation. If they were deviation higher, EV losing stability. As the last parameter to determine the validity of simulation speed was at the center of the gravity. This rate was at low rotation speed the same as in the middle of the rear axle. But at higher values of the rotation had the same value as the rate in the middle of the rear axle (due deviation – slip angles) (Fig. 6).
Fig.6 Specified vehicle velocity set to one value in the
verification simulation Fig. 7 Specified turning radius of the vehicle set to one value in
the verification simulation
Fig.8 Slip angles (deviations) obtained during the verification simulation
Fig. 9 Angular velocities of the rear wheels obtained during the verification simulation
269

International Conference on Innovative Technologies, IN‐TECH 2016,
Prague, 6. ‐ 8. 9. 2016
Fig.10 3D data map of the left rear traction wheel obtained during vehicle cornering and implemented into the electric control unit of the electric differential
Fig. 11 3D data map of the right rear traction wheel obtained during vehicle cornering and implemented into the electric control unit of the electric differential
Depending on the direction that was not necessary to quantify the maximum difference.
The simulation was run as follows: • Into the center of the gravity of the electric vehicle was applied forward force. • The turning angle of the steering wheel was applied after specified vehicle velocity (Fig.7). • Regulation of the force on the basis of deviations was set to control the desired velocity. • The electric vehicle was stable (at the required speed and steering angle) and was stored angular velocity data of the rear wheels (Fig 7). Conclusions
The main task of the work was the design of the system electronically controlled differential for EV. The first part was an analysis of the status quo, basic principles and management system, electric traction drive. It was analyzed conceptual design and the most common types of motors / generators. EV, which was implemented on an electronic differential. Used motor / generator was BLDC (Brushless Direct Current). Due to this concept and its condition allows designed electronic differential. The created vehicle model was verified and first simulated directly in the environment MSC.ADAMS®.
Verified and correct kinematic-dynamic model of the small EVwas ready for import into Matlab / SIMULINK®. Designed implemented model is able to regulate vehicle speed, acceleration of the process simulation and verification of the validity of the simulation (Fig. 6 , Fig. 7, Fig. 8 and Fig. 9). The other aim was to create maps / table angular velocity dependent on vehicle speed and steering angle (Fig. 10 and Fig. 11).. To control the rate of Matlab was necessary to design a fuzzy controller and then create a script that loops through various carry out simulation speed and steering angle (Fig. 10 and Fig. 11).
This will obtain the necessary maps / table angular velocity rounds. The actual model had to be limited, since the stability of the vehicle is possible only within certain speed and steering angle.
Analogically to the internal combustion engine is controlled by 3D data and they were evaluated the 3D data of the electronic differential was collected and will be useful to implement 3D maps. Electronic differential will be managed on the basis of principles of 3D maps control system [4].
Aim of this work has been design electric differential system for small vehicle. System was built on the Arduino board is open to future adaptation and upgrading. Possible improvements could include vector control torque on the wheels, thereby achieving active yaw control system, which enables enhanced stability at low and high speeds. Acknowledgment
This work has been supported by grant KEGA No 035 STU – 4/2014. References [1] DE NOVELLIS L., GRUBER P.. Design and Comparison of the Handling Performance of Different Electric Vehicle Layouts. [Online].
London: University of Surrey, 2013. [cit. 22/05/2015] http://epubs.surrey.ac.uk/804854/1/IMechE Part D Handling Performance Of Different EV layouts R1 LDN AS Surrey Open Access.pdf.
[2] MADARAS, J.. Modelovanie a simulácia dynamických javov pohonných systémov elektromobilov: dizertačná práca. Bratislava: STU, 2014. 190s. SjF-10940-41578.
[3] HARTANI K., MILOUD Y., MILOUDI A.. Electric Vehicle Stability with Rear Electronic Differential Traction. [Online]. Saida Universite de Saida, 2010. [cit. 22/05/2015] http://www.researchgate.net/publication/228464812 Electric Vehicle Stability with Rear Electronic Differential Traction.
[4] TONHAJZER R., PUŠKÁR M., KOPAS M., FALTINOVÁ E., ČOPAN, P.. Actuation of control system for racing engine using active data maps. In Applied Mechanics and Materials, 2014, vol. 611, s.304-310.
[5] ZHOU Y., LI S., ZHOU X., FANG Z.. The Control Strategy of Electronic Differential for EV with Four-in Wheel Motors. [online] Xian:NorthwesternPolytechnicalUniversity,2010.[cit.22/05/2015] http://ieeexplore.ieee.org/stamp/stamp.jsp?tp=&arnumber=5498381.
270

International Conference on Innovative Technologies, IN‐TECH 2016,
Prague, 6. ‐ 8. 9. 2016
DRIVING SIMULATOR MOTION PLATFORM DESIGN
V. Croitorescu1 and R. Hariton1 1313 Splaiul Independentei st., Scientific Research and Continuous Training Center for Sustainable
Automotive Technologies, University Politehnica of Bucharest, Romania
Keywords: Driving Simulator; Motion Platform; Kinematics; Design; Hexapod Abstract: The driving simulators are complex mechatronic systems responsible for defining the vehicle dynamics in a safe environment, very difficult to be reproduced in real life. Its construction consists in different mechatronic and mechanical components that act as supporting the driving simulator behavior. This paper highlights the motion platform design of a hexapod, taking into account the possibility for virtually charging the loads corresponding to the vehicle and the dome, emphasizing both the geometrical and the functional behavior. Introduction
The next innovative vehicles are designed especially to fulfil all the consumers’ requests in terms of comfort, safety and security. Starting from the early beginning, the vehicle manufactures are taking into account several driving assistance systems to be implemented on vehicles. All these systems are following modular designs and the testing methodologies include also the driving simulators use.
The driving behavior depends on each driver, therefore the testing equipment has to be chosen accordingly. The driving simulator is able to evaluate both the vehicle and the driver needs and to find the best solution in driving assistance. The driver and the vehicles are linked through a closed loop in which the dedicated vehicle control as well as the driving simulator kinematics play the crucial role. The driving simulator kinematics are based on the motion platform behavior, which is based on an adapted non-linear controller playing the driver`s role.
The driving simulator is able to re-create the driving environment, virtually, very close to the real one, offering no risks to the drivers while testing different driving scenarios and the possibilities of repeating the same tests several times, including parameters impossible to be reproduced in real world. The driver`s behavior is able to be reproduced after testing and the driving assistance systems are able to be designed to support all the driving lacks.
The validity of the testing results using the driving simulator is much discussed and several development strategies are defined. The validity can be achieved in a functional way, on its behavioral approach, by using virtual simulation tools to provide many needed results and results coming from real testing, where possible, to compare with. The physical validation is able to be achieved designing a testing bench, including the small scale mock-up, for defining the vehicle dynamics and the limits of how the visual system is able to reproduce the reality based on the obtained results when the vehicle is running defined scenarios.
The studied driving simulator consists in a hexapod with two different platforms, a lower fixed platform and an upper moving platform linked by six different actuators that are reproducing the vehicles` motions. The moving system
The moving system is known as the motion platform and represents the most important component of the driving simulator. The moving system consists in the motion platform and all the components that link it to the lower platform, including the lower and the upper joints that are connected to the actuators. The six different actuators are defining the motion, the speed motion and the maximum motion angles following the driving scenarios. The motion platform may include the dome, but not mandatory.
The geometrical model design
The motion platform dimensions are set accordingly with the selected vehicle or cockpit. The motion platform is sustaining the vehicle and all the systems that are involved in the driving tasks. To increase the modularity of the hexapod, the motion platform can be sustained by another independent structure, known as the upper platform. The upper platform is the resulted triangle defined by the projections of the upper joints on the motion platform, as presented in figure 1 and figure 2.
Fig. 1 The upper platform triangle and the motion reference point definition
271

International Conference on Innovative Technologies, IN‐TECH 2016,
Prague, 6. ‐ 8. 9. 2016
Fig. 2 The hexapod virtually developed with both the lower and upper platform triangles design
The motion reference point is set to be in the geometrical center of the equilateral resulted triangle. Its role is to act as the origin for the entire system, where all the forces, torques and accelerations act in. The motion reference point follows the motion platform operation, also for horizontal, vertical, or rotation motion.
The motion platform is able to define the tilt angles for all the directions. The rotation angles of the horizontal plan assumed to be the motion platform, around the motion reference point, are limited by the actuators active strokes and by the maximum rotation angle of the spherical joints, [1].
The rotation motions around the three axis, X, Y and Z, are defined as follows: the pitch motion is the tilting rotation around the Y-axis, the roll motion is the tilting rotation around X-axis, and the yaw motion is the horizontal rotation around the Z-axis, [1].
The actuators can be electromechanically, hydraulically, electro-hydraulically or electrically controlled. The actuators’ response time defines the simulation accuracy and how close to reality the motion is reproduced, based on the acceleration. The environment perception while using the hexapod during predefined driving scenarios will validate the rotation angle values, for all directions, and the actuators’ maximum active strokes. Their control include two basic stages, the power supply stage, based on the received signals from the digital system in order to control the second stage, which converts the received information into motion by developing the needed torques. The better interpretation on how the actuators operate is described in figure 3. The main energy types involved in actuators design and operation pursue the available energy for each implemented system. Although, the power fluid is known as the fastest solution in operating the actuators for such systems, but the electrical energy types are able to fulfill many of the limitations the fluid power actuators may have.
Fig. 3 The actuators operation types The hexapod is simulating all the vehicle behavior that is following defined driving cycles, being able to determine and define the roll,
the yaw and the pitch motions. The actuators together with the joints are setting the maximum rotation angles. Assuming that the maximum rotation angle for the motion platform is 23 0, the actuators active strokes can be determined using the roll motion approach, as presented in figure 4. All the loads are acting in the motion reference point and in the imaginary center of gravity for the dome. All the motions are related to the rods displacement inside the actuators that make the motion possible. The simulator motions for all the six degrees of freedom are limited by the joints and actuators design. The maximum permitted joint angles together with the maximum displacement of the rods are able to provide and define the maximum upper platform tilt related to the three axis. But the tilt motion cannot be used for defining the heave motion, [1]. For faster actuators response, the starting position is adopted. Exemplifying the roll motion, the hexapod external angular dimensions are being established.
In addition, the pitch motion is used for the complete description and determination of the other sides’ rotation, while the actuators active stroke remain the same (figure 5), taking also into account that all loads act in the motion reference point and in the imaginary center of the gravity of the dome.
272

International Conference on Innovative Technologies, IN‐TECH 2016,
Prague, 6. ‐ 8. 9. 2016
Fig. 4 Defining the maximum active actuators stroke and motion platform rotation angles during the roll motion
Fig. 5 Defining the motion platform rotation angles during the pitch motion The static loads verification is performed using real parameters for both the vehicle and the simulator. To determine the maximum
loads and the upper platform behavior during the roll and the pitch motions, the following assumption are made: the normal component of the force of gravity is evenly distributed on the surface side of the upper platform and the joints are formed at the ends of the sides of the upper platform. Based on equilibrium equations, the loads are determined (figure 6, a, b). The maximum values are reached in section 1 during the pitch motion.
a b
Fig. 6 Upper platform loads diagram during (a) the roll and (b) the pitch motions
273

International Conference on Innovative Technologies, IN‐TECH 2016,
Prague, 6. ‐ 8. 9. 2016
The functional model design
The motion platform functional behavior refers especially to the dynamic behavior of the hexapod. For reducing the investigated mechanical components that are responsible for the driving simulator operation, the main motion platform parameters are considered. Using the already designed geometrical model, all its characteristics are imported to a dedicated software, which is able to correlate these information with the center of gravity positions, the inertia for each component and the joints type, being than converted to the functional simulation model, as presented in figures 7 and 8. Each information that simulates the actuators behavior are taken from the acting loads and the results are the actuators response speed.
Fig. 7 The approach used for defining the functional model
Fig. 8 The motion platform functional model Conclusion
Installing the vehicle on the upper platform, which is mobile due to the links between the joints and actuators, all the loads, forces, torques etc. that act on the vehicle will act on the motion reference point, from the motion reference point to the joints, and from the joints to the actuators rod, making possible the roll, pitch and yaw motions by the longitudinal displacement of the rod. The obtained motion for the entire system is very complex.
The resulted loads during the roll and the pitch motions help to select the profile shape, the dimensions and the material for the upper platform components. The selections take into consideration that the subassembly have to be light and rigid.
The functional behavior of the motion platform was developed using the current loads for the roll and the pitch motion, being able to determine the actuators response speeds.
The motion platform design was made in a modular way in order to define also the inverse kinematics, starting from the virtual vehicle driving simulation during defined driving cycles.
References
[1] V. Croitorescu, C. Andreescu, Driving Simulator Development Phase III – Defining Basic Vehicle Dynamics by Driving Simulation,
Proceedings of the Industrial Simulation Conference, Bucharest, Romania (2016) [2] L.D. Reid and M.A. Nahon, Flight simulation motion base drive algorithms: Part 1. Developing and testing the equations, University
of Toronto, Canada, Tech Rep. UTIAS 296 (1985) [3] L.D. Reid and M.A. Nahon, Flight simulation motion-base drive algorithms: Part 2. Selecting the system parameters, Institute for
Aerospace Studies, University of Toronto (1986) [4] L.D. Reid and M.A. Nahon, Flight Simulation Motion-base Drive Algorithms: Part 3. Pilot Evaluations, Institute for Aerospace
Studies, University of Toronto (1986) [5] S. Nordmark and M. Lidström, Moving base driving simulator with wide angle visual system, SAE Technical Paper Series 845100,
Society of Automotive Engineers, Warrendale, PA, USA, (1984) [6] A. Tucă, V. Croitorescu, and T. Brandmeier, Driving Simulator Development: Phase I – From State of Art to State of Work,
Proceedings of Industrial Simulation Conference, Universidad Politecnica de Valencia, Spain (2015) [7] A. Tucă, A., V. Croitorescu, and T. Brandmeier, Driving Simulator Development Phase II – Building and Controlling Scenarios
through the Motion Algorithm, Proceeding of European Simulation and Modelling Conference, United Kingdom (2015)
274

International Conference on Innovative Technologies, IN‐TECH 2016,
Prague, 6. ‐ 8. 9. 2016
MODAL ANALYSIS OF THE MULTILAYER SHELL
J.Murín1, S. Kugler2, J. Hrabovský1, D. Búc 1, V. Goga1, M. Držík3 , V. Kutiš1 and Š. Rehák4
1Institute of Automotive Mechatronics, Faculty of Electrical Engineering and Information Technology, Slovak University of Technology in Bratislava, Ilkovičova 3, 812 19 Bratislava, Slovak Republic
2University of Applied Sciences Wiener Neustadt, Johaness Gutenberg/Strasse 3, A/2700 Wr. Neustadt, Austria
3International Laser Centre, Ilkovičova 3, 841 04 Bratislava, Slovak Republic
4Europurs.r.o.,Kočovská 14, 91501 Nové Mesto nad Váhom, Slovak Republic
Keywords: GM Shell Finite Element; Multilayer Composite; Modal Analysis; Experimental Measurement Abstract: The main goal of the presentation is an experimental verification of new functionally graded material (FGM) shell finite element that was developed within the APVV project. Modal analysis of the rectangular composite multilayer shell is performed using new FGM shell finite element and standard shell finite element of the software ANSYS. The core of the multilayer shell is made of steel on which the thin layers of nickel are deposited. For deposition and stripping of the nickel films the technological process is used developed by MacDermid Inc. Coating was deposited from the both sides on a solid steel sheet. The measured thickness of the Ni layer was ~10 µm. To evaluate the resonant frequency spectrum the method of vibration measurement by noncontact Laser Doppler Vibrometry is applied. Numerical and experimental results are evaluated and compared. Very good agreement of the numerical and experimental results is obtained. Introduction
Functionally graded materials are characterized by a variation of material properties over the volume under consideration. Those variations are designed to achieve specific functions and applications. Important classes of structural components where FGMs are used are beams and shells. For their analysis a new effective FGM shell finite element [1] was established. For its evaluation a comparative calculations and experimental measurement of calculated results is needed. In the contribution, a comparison of modal analysis results obtained by our FGM shell [1] and SHELL181 finite element [2] and the measurement results is presented. All the analysis are performed on the multilayer composite shell. The FGM shell finite element
The FGM shell finite element [1] was extended for modal analysis of the composite structures and is used in following modal analysis. It is a quadrilateral general purpose shell element with six degrees of freedom at each node. The constitutive relation is based on effective elastic properties for membrane and bending behaviour which are evaluated at each nodal position. The shear correction factor is assumed to be constant within the element and is defined at the element’s centre. Numerical analysis and experimental measurement
For the numerical simulations and the experimental measurements the sample according the Fig. 1 has been considered. Its rectangular cross-section is of constant height h1 = 0.8 mm and width b = 24.48 mm. The length of the sample is L = 100 mm. The thickness of the Ni layer is h2 =~10 µm.
The material of the sample consists of two components: Steel and Nickel layers. The material properties of the components are constant and their values read: Steel – the elastic modulus E = 210 GPa, the Poisson’s ratio ν= 0.3, the mass density ρ = 7850 kgm-3; Nickel – the elastic modulus E = 200 GPa, the Poisson’s ratio ν= 0.31, the mass density ρ = 8908 kgm-3.
Fig. 1 The sample for the numerical simulation and experimental measurement
steel
Ni layer
b
h1
h2
h2
L
275
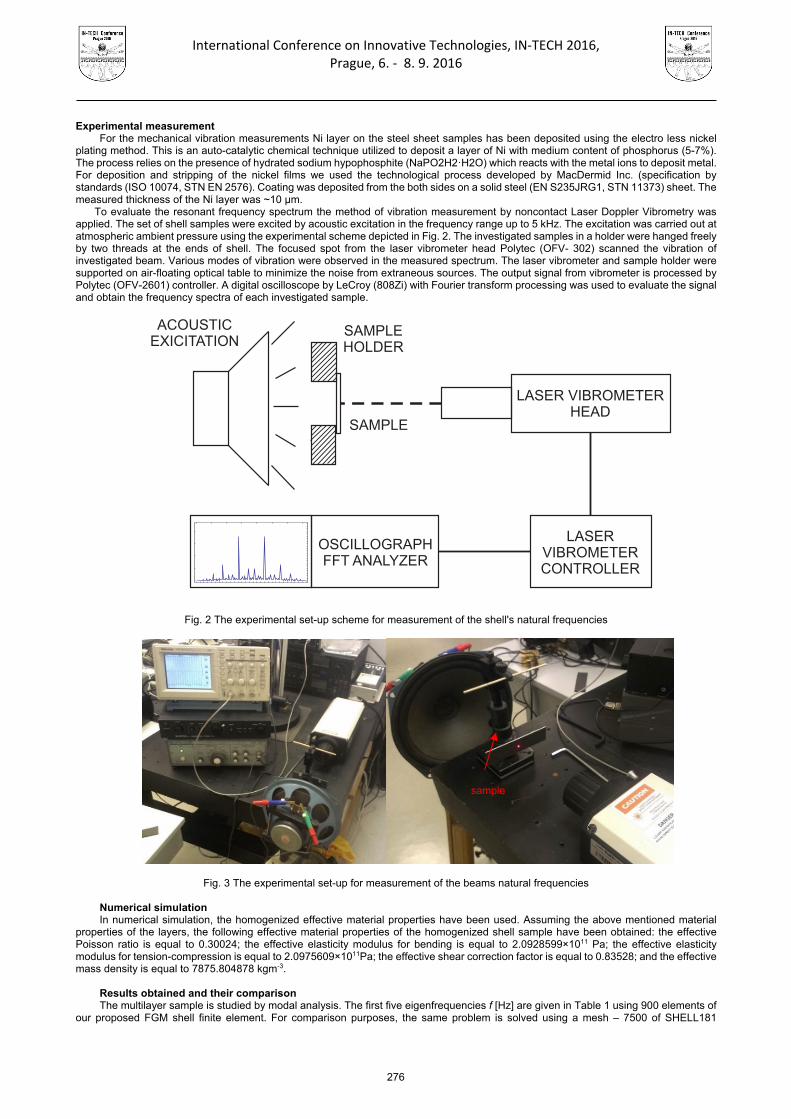
International Conference on Innovative Technologies, IN‐TECH 2016,
Prague, 6. ‐ 8. 9. 2016
Experimental measurement
For the mechanical vibration measurements Ni layer on the steel sheet samples has been deposited using the electro less nickel plating method. This is an auto-catalytic chemical technique utilized to deposit a layer of Ni with medium content of phosphorus (5-7%). The process relies on the presence of hydrated sodium hypophosphite (NaPO2H2·H2O) which reacts with the metal ions to deposit metal. For deposition and stripping of the nickel films we used the technological process developed by MacDermid Inc. (specification by standards (ISO 10074, STN EN 2576). Coating was deposited from the both sides on a solid steel (EN S235JRG1, STN 11373) sheet. The measured thickness of the Ni layer was ~10 µm.
To evaluate the resonant frequency spectrum the method of vibration measurement by noncontact Laser Doppler Vibrometry was applied. The set of shell samples were excited by acoustic excitation in the frequency range up to 5 kHz. The excitation was carried out at atmospheric ambient pressure using the experimental scheme depicted in Fig. 2. The investigated samples in a holder were hanged freely by two threads at the ends of shell. The focused spot from the laser vibrometer head Polytec (OFV- 302) scanned the vibration of investigated beam. Various modes of vibration were observed in the measured spectrum. The laser vibrometer and sample holder were supported on air-floating optical table to minimize the noise from extraneous sources. The output signal from vibrometer is processed by Polytec (OFV-2601) controller. A digital oscilloscope by LeCroy (808Zi) with Fourier transform processing was used to evaluate the signal and obtain the frequency spectra of each investigated sample.
Fig. 2 The experimental set-up scheme for measurement of the shell's natural frequencies
Fig. 3 The experimental set-up for measurement of the beams natural frequencies Numerical simulation In numerical simulation, the homogenized effective material properties have been used. Assuming the above mentioned material
properties of the layers, the following effective material properties of the homogenized shell sample have been obtained: the effective Poisson ratio is equal to 0.30024; the effective elasticity modulus for bending is equal to 2.0928599×10¹¹ Pa; the effective elasticity modulus for tension-compression is equal to 2.0975609×10¹¹Pa; the effective shear correction factor is equal to 0.83528; and the effective mass density is equal to 7875.804878 kgm-3.
Results obtained and their comparison The multilayer sample is studied by modal analysis. The first five eigenfrequencies f [Hz] are given in Table 1 using 900 elements of
our proposed FGM shell finite element. For comparison purposes, the same problem is solved using a mesh – 7500 of SHELL181
LASERVIBROMETERCONTROLLER
LASER VIBROMETERHEAD
OSCILLOGRAPHFFT ANALYZER
ACOUSTICEXICITATION
SAMPLE
SAMPLEHOLDER
sample
276
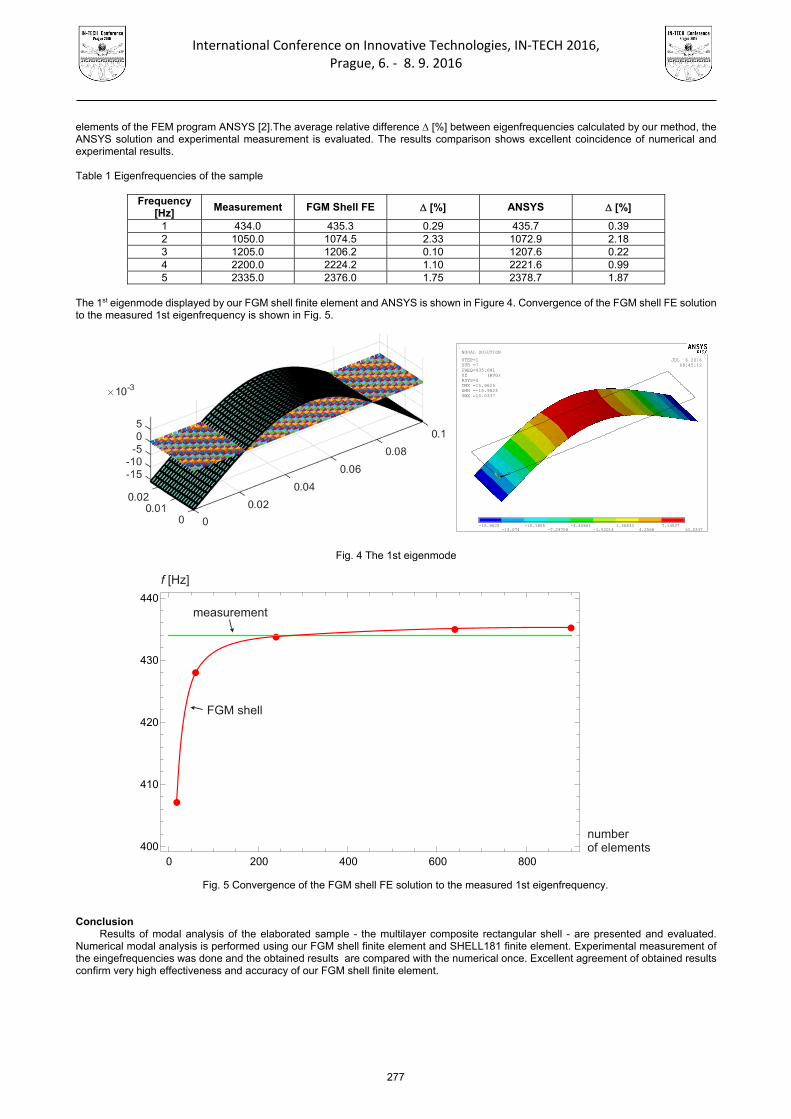
International Conference on Innovative Technologies, IN‐TECH 2016,
Prague, 6. ‐ 8. 9. 2016
elements of the FEM program ANSYS [2].The average relative difference [%] between eigenfrequencies calculated by our method, the ANSYS solution and experimental measurement is evaluated. The results comparison shows excellent coincidence of numerical and experimental results.
Table 1 Eigenfrequencies of the sample
Frequency
[Hz] Measurement FGM Shell FE [%] ANSYS [%]
1 434.0 435.3 0.29 435.7 0.39 2 1050.0 1074.5 2.33 1072.9 2.18 3 1205.0 1206.2 0.10 1207.6 0.22 4 2200.0 2224.2 1.10 2221.6 0.99 5 2335.0 2376.0 1.75 2378.7 1.87
The 1st eigenmode displayed by our FGM shell finite element and ANSYS is shown in Figure 4. Convergence of the FGM shell FE solution to the measured 1st eigenfrequency is shown in Fig. 5.
Fig. 4 The 1st eigenmode
Fig. 5 Convergence of the FGM shell FE solution to the measured 1st eigenfrequency.
Conclusion
Results of modal analysis of the elaborated sample - the multilayer composite rectangular shell - are presented and evaluated. Numerical modal analysis is performed using our FGM shell finite element and SHELL181 finite element. Experimental measurement of the eingefrequencies was done and the obtained results are compared with the numerical once. Excellent agreement of obtained results confirm very high effectiveness and accuracy of our FGM shell finite element.
1
MN
MX
XYZ
-15.9625
-13.074-10.1855
-7.29708-4.40861
-1.520141.36833
4.25687.14527
10.0337
JUL 6 201608:45:12
NODAL SOLUTION
STEP=1SUB =7FREQ=435.681UZ (AVG)RSYS=0DMX =15.9625SMN =-15.9625SMX =10.0337
0 200 400 600 800
400
410
420
430
440
f [Hz]
numberof elements
measurement
FGM shell
277

International Conference on Innovative Technologies, IN‐TECH 2016,
Prague, 6. ‐ 8. 9. 2016
Acknowledgment This paper has been supported by the Slovak Grant Agencies APVV-0246-12. Authors are also grateful to Europurs.r.o. for their offer of the electroless deposition on the samples. References [1] S. Kugler, P.A. Fotiu, J. Murin: The numerical analysis of FGM shells with enhanced finite elements. Engineering Structure, 49,
(2013), 920 - 935. [2] ANSYS, ANSYS V11 Documentation.
278

International Conference on Innovative Technologies, IN‐TECH 2016,
Prague, 6. ‐ 8. 9. 2016
ONTOLOGICAL MODELLING FOR AVIATION SAFETY DOMAIN
J. Ahmad 1 and P. Křemen 1
1 Department of Cybernetics, Faculty of Electrical Engineering, Czech Technical University,
Karlovo náměstí 13, Prague 2, Czech Republic
Keywords: Ontology; Aviation Safety; UFO Abstract: In recent decades, in the aviation safety community, there is an increasing amount of requirements especially relating to technology and performance. In this paper we discuss how to model aviation safety domain using Unified Foundational Ontology (UFO), which is a top-level ontology aimed at specifications of domain ontologies, which are formal descriptions of concepts and the relationships between these concepts that describe a specific application area. UFO can be used for evaluating business modeling methods and providing real-world semantics for their modeling constructs. Introduction
In recent years, an increasing attention has been paid to the development of aviation safety, i.e. to improve aviation safety systems, to enhance quality of safety data, and finally to avoid accidents and incidents in this domain. In the aviation safety community, there is a big effort to adopt techniques such as Business Intelligence on a national and international scale [2]. Thus in our work we model aviation safety domain using Unified Foundational Ontology (UF), for representing aviation safety concepts and the relationships that exist between those concepts.
We came across the idea of this paper during our cooperation with the Civil Aviation Authority of the Czech Republic and several Czech aviation organizations including Prague airport or Air Navigation Services of the Czech Republic, within two national projects focused on IT support for aviation safety.
Section 2 shows related work. In Section 3 we define the notion of Unified Foundational Ontology (UFO). Section 4 discusses our
aviation safety Ontology model. Finally, Section 5 shows conclusion of this work. Related Work
The main conceptual modeling languages are Nijssen’s Information Analysis Method (niam), which provides a powerful grammar for generating conceptual schema diagrams NIAM [8], ER [9], UML which is a modeling language typically used in the field of software engineering, [10], and OWL [11].
Unified Foundational Ontology (UFO)
Unified Foundational Ontology (UFO), is a top-level ontology aimed at specifications of domain ontologies and languages. It can be used for evaluating business modeling methods and providing real-world semantics for their modeling constructs. In general, it aims at developing theories, methodologies and engineering tools with the goal of advancing conceptual modeling as a theoretically sound discipline but also one that has concrete and measurable practical implications [3]. UFO is divided into three layers:
UFO-A: Object and Trope model part (An Ontology of Endurants) [1].
UFO-B: Event and Process model part (An Ontology of Perdurants) [4].
UFO-C: Social and Agent model part (An Ontology of Intentional and Social Entities) [5].
UFO has been developed based on a number of theories from Formal Ontology,Philosophical Logics, Philosophy of Language, Linguistics and Cognitive Psychology. The core of this ontology (UFO-A) is presented in depth and formally characterized in [1]. Moreover, in a number of publications, UFO has been successfully employed to evaluate, re-design and integrate the models of conceptual modeling languages as well as to provide real-world semantics for their modeling constructs. In [1], a complete evaluation and re-design of the UML 2.0 metamodel using UFO is presented.
279
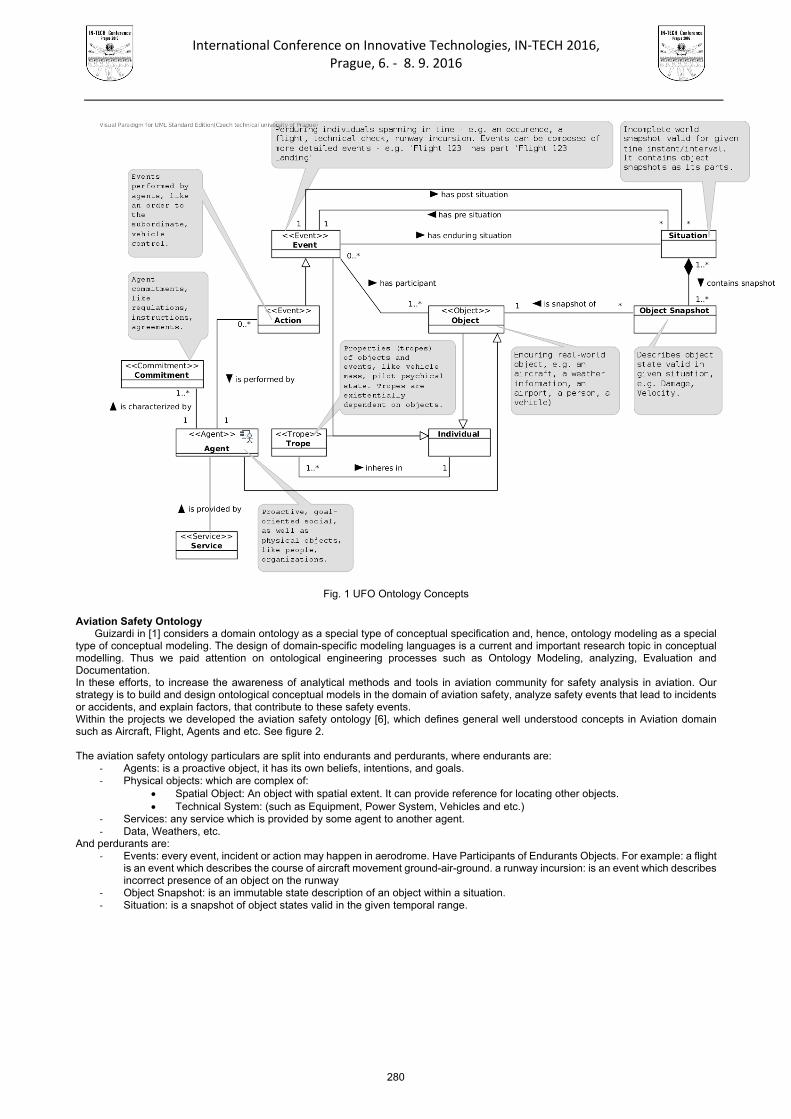
International Conference on Innovative Technologies, IN‐TECH 2016,
Prague, 6. ‐ 8. 9. 2016
Fig. 1 UFO Ontology Concepts Aviation Safety Ontology
Guizardi in [1] considers a domain ontology as a special type of conceptual specification and, hence, ontology modeling as a special type of conceptual modeling. The design of domain-specific modeling languages is a current and important research topic in conceptual modelling. Thus we paid attention on ontological engineering processes such as Ontology Modeling, analyzing, Evaluation and Documentation. In these efforts, to increase the awareness of analytical methods and tools in aviation community for safety analysis in aviation. Our strategy is to build and design ontological conceptual models in the domain of aviation safety, analyze safety events that lead to incidents or accidents, and explain factors, that contribute to these safety events. Within the projects we developed the aviation safety ontology [6], which defines general well understood concepts in Aviation domain such as Aircraft, Flight, Agents and etc. See figure 2. The aviation safety ontology particulars are split into endurants and perdurants, where endurants are:
‐ Agents: is a proactive object, it has its own beliefs, intentions, and goals. ‐ Physical objects: which are complex of:
Spatial Object: An object with spatial extent. It can provide reference for locating other objects. Technical System: (such as Equipment, Power System, Vehicles and etc.)
‐ Services: any service which is provided by some agent to another agent. ‐ Data, Weathers, etc.
And perdurants are: ‐ Events: every event, incident or action may happen in aerodrome. Have Participants of Endurants Objects. For example: a flight
is an event which describes the course of aircraft movement ground-air-ground. a runway incursion: is an event which describes incorrect presence of an object on the runway
‐ Object Snapshot: is an immutable state description of an object within a situation. ‐ Situation: is a snapshot of object states valid in the given temporal range.
280

International Conference on Innovative Technologies, IN‐TECH 2016,
Prague, 6. ‐ 8. 9. 2016
Fig. 2 Aviation Safety Ontology Conclusion In this paper we developed aviation safety ontology using Unified Foundational Ontology (UFO), in order to describe, model and analyze main concepts and classes in aviation safety domain, and specify the relation between those concepts. Acknowledgment This work was supported by grant No. TA04030465 Research and development of progressive methods for measuring aviation organi-zations safety performance of the Technology Agency of the Czech Republic. More information about the project can be found on www.inbas.cz.
281

International Conference on Innovative Technologies, IN‐TECH 2016,
Prague, 6. ‐ 8. 9. 2016
References
[1] Guizzardi, G. Ontological Foundations for Structural Conceptual Models, PhD Thesis (CUM LAUDE), University of Twente, the
Netherlands. Published as the book “Ontological Foundations for Structural Conceptual Models”, Telematica Instituut Fundamental Research Series No. 15, ISBN 90-75176- 81-3 ISSN 1388-1795; No. 015; CTIT PhD-thesis, ISSN 1381-3617; No. 05-74.
[2] http://eccairsportal.jrc.ec.europa.eu. Cited 16.7.2016. [3] Giancarlo Guizzardi, Gerd Wagner, João Paulo Andrade Almeida, Renata S. S.Guizzardi,& quot;Towards ontological foundations
for conceptual modeling: The unified foundational ontology (UFO) story". Applied Ontology 10(3-4):259- 271 (2015). [4] Giancarlo Guizzardi, Gerd Wagner, Ricardo de Almeida Falbo, Renata S. S.Guizzardi, João Paulo A. Almeida, "Towards
Ontological Foundations for the Conceptual Modeling of Events". ER 2013: 327-341. [5] Julio Cesar Nardi, Ricardo de Almeida Falbo, João Paulo A.Almeida, Giancarlo Guizzardi, Luís Ferreira Pires, Marten van
Sinderen, Nicola Guarino, "Towards a Commitment-Based Reference Ontology for Services". EDOC 2013: 175-184. [6] http://www.inbas.cz/ontologie. Cited 7.16.2016. [7] Giancarlo Guizzardi, Gerd Wagner, João Paulo Andrade Almeida, Renata S. S. Guizzardi: “Towards ontological foundations for
conceptual modeling: The unified foundational ontology (UFO) story”. Applied Ontology 10(3-4):259-271 (2015). [8] Weber, R., Zhang., Y., (1991),” An Ontological Evaluation of NIAMs Grammar for Conceptual Schema”. [9] Wand., Storey V.C., Weber R (1999),” An ontological analysis of the relationship construct in Conceptual Modeling. ACM Trans. On
data Dtatabase System, 24(4):494-528. Dec. [10] Evermann, J. and Wendy. (2001),” Towards ontologically based semantics for UML constructs”. [11] Bream, Wendy. (2004),” Analyzing OWL using a philosophy-based ontology in Formal Ontology in Information Systems,
Amsterdam: IOS press.
282

International Conference on Innovative Technologies, IN‐TECH 2016,
Prague, 6. ‐ 8. 9. 2016
DYNAMIC ANALYSIS OF ROBOT MANIPULATORS: A COMPONENT MODEL APPROACH
V. Damic 1 and M. Cohodar 2 1 University of Dubrovnik, Department of Maritime Engineering, Cira Carica 4, Dubrovnik, Croatia, tel.:+385 20
445 713, E-mail: [email protected]
2 University of Sarajevo, Faculty of Mechanical Engineering, Vilsonovo setaliste 9, Sarajevo, Bosnia and Herzegovina, tel.:+387 33 729 871, E-mail: [email protected]
Keywords: Multibody System; Robot Manipulator; Bond Graphs; Component Model
Abstract: This paper proposes approach to develop of the dynamic model of mechatronic system in which component model plays fundamental rule. To build a component model an acausal bond graphs are applied. Procedure is described on example of robot system, because it consists of several subsystems from different physical domains: mechanical part of the robot composed of serial chain of links and joints, sensors, actuators and controller. Each part of such a system may be modelled by separate component, which is realized on more hierarchical levels depending of its complexity. Decomposition of the complete system into its components generally simplifies the modeling task and gives a better insight into the system’s structure. Such a representation is a great help in interpreting model behavior in terms of the real engineering systems. As example, robot SCARA (ABB IRB 910SC 450) is considered. It is developed using software package BondSim. In order to verify of robot motion, the robot virtual 3D model is also developed in the paper. It is done using another software package BondSimVisual.
Introduction
With increase of computer power and processor speed, modeling and simulation of complex engineering problems become more attractive and gain attention of many investigators around the world. In this paper a general methodology for developing mechatronic systems is described. Component model approach to modeling is general adopted methodology in many popular software for dynamic analysis (Matlab/Simulink, Dymola, 20Sim etc.).
Main idea of proposed approach in the paper is based on concept of bond graph components. The basic tools are bond graphs that graphically describe the power flow through the system, providing description of mechatronics system in unique way [1-3]. In contrary to common praxis in bond graphs, in the described approach there is no implemented causalities. Proposed methodology is combination of several methods and techniques, but its root is general modeling method based on system decomposition [1,4]. Models of mechatronics systems can be viewed as branches of the model tree. The leaves of the tree are elementary components that model basic physical processes in the system. Proposed methodology is explained on example of a famous robot SCARA (Selective Compliance Articulated Robot Arm).
Dynamic model is developed in an integrated programing environment of BondSim (developed by the first author of the paper) [1,5]. It enables developing of object oriented models systematically simply by drag and drop techniques without need for a programme language. The constitutive relations of elementary processes are described by simple mathematical expressions. Mathematical model is automatically generated in form of differential algebraic equations (DAEs) and are solved using suitable BDF solver during the simulation. Basic idea of component model approach
In order to create the model of a component it is necessary to create a component object as a word model and to create document object by ‘opening’ the component. Thus the components represents the containers of the document which describes its model in terms of bond graphs. Interactions between components take place through their ports, Fig.1. There are two types of ports: power (graphically interpreted by half arrow) and control, providing power and information transfer between components, respectively. In the simplest case power port is described by a pair variables – effort and flow which product is power. Similarly, information at component control port can be described by a single control variable. In general, the dimension of the connected ports can be different. The dimension assigned to a port indicates the number of ports connected internally. For instance, the power port dimension of component D from Fig.1 is three, but it could be any other number. Hence, a component port can be looked at more properly as a tree of connected component ports, with elementary ports as its leaves [1].
Fig. 1 Bond graph components
Case study: Robot manipulator ABB IRB 910SC 450
To demonstrate proposed approach ABB robot manipulator IRB 910SC 450 is analyzed [6]. It mainly consists of four bodies (Fig.2): the base, arm1, arm2 and tool. Arm1 is connected to the base and the arm2 by revolute joints. The tool can translate and rotate regarding to arm2.
283

International Conference on Innovative Technologies, IN‐TECH 2016,
Prague, 6. ‐ 8. 9. 2016
Kinematic model of robot Robot IRB 910SC 450 has four axis, Fig. 2. The first two are revolute with angle rotations θ1 and θ2, the third is prismatic with
translation of d3 and the fourth joint is revolute with angle rotation of θ4.To develop the direct kinematic model of robot manipulator the coordinate frame is attached to the each link, as shown in Fig. 2. The inertial coordinate frame is denoted by index 0. Its position and orientation is the same as position and orientation of the inertial frame of the real robot, defined by manufacturer ABB. Finally, the tool coordinate frame, OtoolXtoolYtoolZtool is attached to the tool central point (TCP) with orientation determined by the unit vector n (normal), s (slide) and a (approach), as defined by ABB.
Position and orientation between two neighboring frames is defied by the homogeneous transformation matrix:
1 1 2 2 2 4 4 4
1 1 2 2 4 40 1 2 3 41 2 3 4
1 3 3 5
0 0 0 1 0 0 0 0 1 0 0 0
0 0 0 0 0 1 0 0 0 0 0 1 0 0, , , ,
0 0 1 0 0 0 1 0 0 1 0 0 1 0 0 0 1
0 0 0 1 0 0 0 1 0 0 0 1 0 0 0 1 0 0 0 1
tool
c s c s L L c s
s c s c s c
L d L L
A A A A A ,
(1)
where: ci=cos(i) and ci=sin(i), (i=1,2,3) and lengths Li (1..5) are depicted in Fig.2.
The position and orientation of the tool frame with respect to the base frame is defined by the direct kinematics function, obtained by products of the homogeneous transformation matrices of Eq.(1):
124 124 4 12 2 1
124 124 4 12 2 10 0 1 2 3 41 2 3 4
1 3 5 3
0
0,
0 0 1
0 0 0 1
tool tool
c s L c L c
s c L s L s
L L L d
A A A A A A (2)
where: c124=cos(1+2+4) and s124=sin(1+2+4).
Fig. 2 Robot manipulator ABB IRB 910SC 450 with attached coordinate frames
Bond graph model of manipulator IRB 910SC 450
The system level of robot bond graph model is shown in Fig. 3a. Owing to component model approach there are only main subsystems of robot at the system level: Manipulator, Workspace and Controller. These are used in combination with signal processing components and display plots.
a) b) Fig. 3 Bond graph model of: a) robot ABB IRB 910SC 450 (the system level); b) Manipulator; c) Controller
These three components represent three main subsystems of robot. Component Manipulator is mechanical part of robot. Its structure on the next level of decomposition, as shown in Fig.3b, looks like real manipulator structure obtained as serial kinematic chain consisting of a sequence of links interconnected by joints or means of articulations. Each link is developed as a rigid body on several levels. As axis of translation of the third joint and rotation axis of fourth revolute joint are coincident, they are combined in one, named Joint 3 which permits two requested motions. On the last level of decomposition there are the basic bond graph components. Decomposition of the component Link1 that represents the arm1 of robot manipulator is depicted on Fig.3b. Dynamic of rigid body is described by the classical Newton-Euler approach. How to develop bond graph model of a rigid body is explained in [1] in detail. We just picked up component from the BondSim library. Robot is controlled by PD controller in the joint space. Structure of controller is presented in Fig. 3c.
c)
L1=0.195 m L2=0.200 m L3=0.067 m L4=0.250 m L5=0.042 m
284

International Conference on Innovative Technologies, IN‐TECH 2016,
Prague, 6. ‐ 8. 9. 2016
Simulation results Validation of developed model is done in this section. Simulation time is 10 s. in order to visualize of motion, as extension of the
paper, the virtual model of robot is developed using program BonSimVisual (developed by the first author) [5]. BondSim provides connection with any external application during simulation. In our case we are connected the dynamic model, developed by bond graphs using BondSim with virtual one developed in BondSimVisual. Dynamic model sends information about joint variables to the virtual which redraws virtual scene after each output interval. It is established two-way communication. That means virtual model can send information to the dynamic model. In this simulation virtual model sends back coordinates of TCP point (to verify validity of the model). To develop virtual model it is used 3D models of each robot part (the base, arm1, arm2 and tool) in form of stl files from official ABB website [6]. Development of virtual model by BondSimVisual based on the usage of 3D models in form of stl file is described in [1,7,8] .
During the first two seconds robot moves from initial posture for which all joint variables are zero (Fig.4a) to the position above the small table (Fig.4b). When reached this position, the tool moves to the table (Fig.4c) and comes back (Fig.4d) in the next two seconds. Then, the robot moves to position above the large table (Fig.4e), the tool moves to the table (Fig.4f), the tool rotates for 360 degrees (Fig.4g), the tool comes back to upper position (Fig.4h), and, finally robot moves to initial posture (Fig.4i). This motion is saved during simulation and uploaded on [5]
a) b) c)
d) e) f)
g) h) i) Fig. 4 Sequence of robot motion after: a) 0 s; b) 2s; c) 3s; d) 4s; e) 6s; f) 7 s; g) 8 s; h) 9 s; i) 10s.
Joint variables are determined by cubic polynomials [9.], for i = qi (i=1,2,4) in [degrees] and d3 = q3 in [mm]:
3 2 3 2
3 2 3 2
1 2
3 2 3 2
12.5 37.5 0 2 8.75 26.25 0 2
50 2 4 35 2 4
, 44.25 4 132.75 4 50 4 6 22.04 4 66.11 4 35 4 6
127 6 9 53.13 6 9
254 9 381 9 127 9 10 106.26 9 159.39 9 53
t t t t t t
t t
q qt t t t t t
t t
t t t t t
.13 9 10
,
t
(3)
3 2
3 2 3 2
3 4
3 2
3 2
0 0 2, 4 6, 7 8, 9 10,
300 2 450 2 2 3 0 0 7
300 3 450 3 150 3 4 , 720 7 1080 7 7 8
0 8 10300 6 450 6 6 7
300 8 450 8 150 8 9
t t t t
t t t t
t t tq q t t t
tt t t
t t t
(4)
285

International Conference on Innovative Technologies, IN‐TECH 2016,
Prague, 6. ‐ 8. 9. 2016
In order to drive robot to follow joint variables defined by Eqs.(3) and (4), PD controller is applied. Its bond graph model is shown in Fig.3c. After some experimenting we accepted following values of proportional Kp and derivative Kd gains: Kp1= Kp2=2e5; Kp3=3e5, Kp4=100, Kd1= Kd2=3e3, Kd3=5e3 and Kd4=1. The total mass of robot is 24.5 kg [6]. We are imported 3D models of IRB 910SC 450 in form of step files in CATIA in which we read moment inertia of robot parts. Their masses are distributed proportionally to the link volumes (read also from CATIA) over the each link such that their sum is 24.5 kg. Lengths of links are given in Fig.2 [6]. Reference inputs and responses for the joint variables are shown in Fig.5. Trajectory which follows TCP point in the global frame is depicted in Fig.6a-c. Obtained value is compared with ones calculated by direct kinematics function (the first three elements of the fourth column of (2)). Results of comparison are presented in Fig.6d showing very good agreement.
a) b) c) d) Fig. 5 Reference inputs and responses for the joint variables: a) q1; b) q2; c) q3; d) q4.
a) b) c) d) Fig. 6 Motion of TCP in the global frame: a) X-coordinate; b) Y-coordinate; c) Z-coordinate; d) Error in TCP coordinates.
Conclusion
The paper describes procedure for physical modeling of mechatronic system by acausal bond graphs. Technique of bond graphs graphically represents power flow through the system providing unique description system from different physical domains. In the paper, the attention is paid on the components as the basic building elements of engineering systems. Component can be realized systematically on more hierarchical levels depending of its complexity. On the last level there are only elementary bond graph components.
Proposed procedure is applied to model an industrial robot (ABB IRB 910SC-450). It is robot SCARA which consists of four joint – three revolute and one prismatic. Manipulator is driven by the PD controller. Owing to use of the component model approach in object-oriented environment of software package BondSim, physical modeling is a straight forward task.
Finally, in this paper it is shown how robot dynamic model, developed by BondSim can be connected to its 3D visual model, realized using BondSimVisual. Two models exchange necessary information during simulation and behave as one complex system. This opens many possibilities for the future investigations. References
[1] V. Damic, J. Montgomery: Mechatronics by Bond Graphs, An object oriented Approach to Modelling and Simulation
(Springer-Verlag, Berlin Heidelberg, 2015). [2] D.C. Karnopp, D.L. Margolis, R. C. Rosenberg: System Dynamics, Modeling and Simulation of Mechatronic System, (John
Wiley&Sons, Inc. 2000). [3] W. Borutzky: Bond Graph Methodology: Development and Analysis of Multidisciplinary Dynamic system Models, (Springer, 2010). [4] V. Damic, Modelling flexible body systems: a bond graph component model approach, Mathematical and Computer Modelling of
Dynamical Systems 12(2-3), ( 2006), pp. 175-187. [5] www.bondsimulation.com [6] http://new.abb.com/products/robotics/industrial-robots/irb-910sc (the approach date: Aug, 01 2016). [7] V. Damic, M. Cohodar: Dynamic analysis and 3D visualization of multibody systems, Proc of 8th International Conference on
Integrated Modeling and Analysis in Applied Control and Automation, (2015), pp.89-96. [8] V. Damic, M. Cohodar, D. Damic: Multibody Systems Dynamical Modeling and Visualization based on IPC technique, Proc of the
2014 Int. Con. on Bond Graph Modeling and Simulation – ICBGM’2014, Simulation Series, The Society of Modeling & Simulation, Vol.46, No.8, (2014), pp. 773:778.
[9] V.Damić, M.Cohodar, M. Kulenovic, Physical Modeling and Simulation of Mechatronics Systems by Acausal Bond Graphs, Annals of DAAAM for 2011 & Proc of the 22nd International DAAAM Symposium, Volume 22, No.1, (2011), pp. 247-248.
[10] B. Siciliano, L. Sciavicco, L. Villani, G. Oriolo, Robotics, Modelling, Planning and Control, (Springer-Verlag, London, 2009).
286

International Conference on Innovative Technologies, IN‐TECH 2016,
Prague, 6. ‐ 8. 9. 2016
A DEFINITION METHOD OF OPTIMAL CUTTING PARAMETERS FOR FACE TURNING OF METALLIC PARTS ACCORDING TO CUTTING
FORCES AND TO SURFACE ROUGHNESS
I. Biró1 and T. Szalay1 1 Budapest University of Technology and Economics, Department of Manufacturing Science and Engineering,
Műegyetem rkp. 3., 1111 Budapest, Hungary
Keywords: Cutting Force; Face Turning; Machinability; Parameter Optimization; Surface Roughness Abstract: The aim of current research is to provide a practical, compact and reliable method for defining optimal cutting parameters for a given cutting environment. The goal of the optimization is the stable controlling of surface roughness along with the minimization of cutting energy (forces, temperature, power). In order to acquire information about the characteristics of the machining process, Central Composite Design of experiment was created for test pieces made from 3 different structural steels (S960QL, C45E, A50). Direct benefit of this research is a novel experimental method of parameter optimization and a set of recommended cutting parameters for the given conditions. Introduction
Mechanical machining is still a dominant shaping method in part manufacturing. This is a reliable process to achieve the given criteria of macro- and microgeometry for various types of part material. Therefore, it bears a crucial responsibility to choose the correct cutting conditions, including the cutting environment (tool, machine) and parameters (cutting speed, feed rate, depth of cut). Defining the required conditions is possible due to the availability of an extended amount of technological data and experience, which are collected in machining handbooks, guides of tool manufacturers and industrial practice.
However, every manufacturing installation has different local specifications, which slightly differ from standard catalogue data. Therefore it is required to perform unique calibration and field testing, thus precisely fitting the already used modeling methods to the given conditions and thus making accurate predictive process planning achievable.
The goal of current research was to develop a novel optimization method of cutting parameters, which require quickly realizable cutting tests, automated calculation and decision methods. The aim of research was to describe the optimization field from the aspect of machinability. Machinability is no standard definition: it is based on comparison of cutting process parameters, which are observable during machining of two different materials (the examined one and a base material with known cutting behavior). [1] However, it can indirectly give information about the required conditions to perform a cutting process on a specific material. Concept of optimization method
Optimization of cutting parameters is generally based on the Black Box method [2]: in order to perform reliable, mathematically-statistically valid and reproducible optimization, one needs to know the following 3 components of the process:
- Starting conditions: input parameters, properties (e.g. technical condition) of the cutting environment before the cutting process; - Black Box: correlations between input and output parameters, modeling and calculation methods; - Optimization parameters and goals: output parameters, sequence of optimization as per parameters (i.e. level of parameter
significance referring to the optimization process). For general cutting operations, the optimization parameters can be classified into 2 major types:
- In-process parameters: these are the parameters which are describing the circumstances of process running. Such parameters are: energetic parameters (e.g. cutting force, cutting temperature, cutting power), efficiency parameters (e.g. material removal rate) and tool condition (e.g. extend of tool wear, speed of wearing mechanism).
- After-process parameters: such parameters refer mainly to the condition of the cutting environment (e.g. rate of amortization), productivity (e.g. number of finished parts) and the final quality of the parts (e.g.macro- and microgeometry, surface structure) [5].
It is practical for general optimization purposes, that the optimization process handles both in-process and after-process parameters in order to reach (or at least to approach) an all-efficient state of the cutting process. However, this current research enlightens the cutting process from the view of machinability, thus we were exclusively focusing on parameters, which are strictly related to the energetics of the process and the microgeometry of the produced part surface. Taking these revelations into account, the optimization method developed in current research handles the following optimization parameters: surface roughness of the finished part, cutting force, cutting power.
The classic cutting parameters: feed rate (f), depth of cut (a) and cutting speed (v) were chosen as input parameters of optimization. Cutting tests are designed as factorial experiments - this means in our case, that the design of a 3 factorial system may be necessary. However, by applying face turning as the experimental method, cutting speed ceases to exist as an actual factor: it can be conceded, that cutting at the same rotation number (RPM – Rotations per Minutes) but at different working radius (or diameter) will naturally result different cutting speeds (see Fig.2). This fact greatly reduces the required number of cutting tests without distorting the statistical reliability of the evaluation method significantly. Definition of optimization parameters
Average surface roughness (Ra) was chosen to represent the microgeometrical characteristics of the machined surface. Fig.1 represents a measured surface profile, which can be regarded as typical in our current research: the effect of cutting speed (in correlation with the r working radius) is clearly observable. Definition of Ra was based on the standard ISO 4287; however, the measuring sections of Ra were defined as a scaled length of the total working radius of the test part (see Fig.1-2 and Eq.1), thus differing from standard.
k
N
1k
M
1jj,i
i,2i,1k
N
1k
r
ri,2i,1i,meas Y
rr
1
N
1drY
rr
1
N
1Ra
i,2
i,1
[µm]; i = 1…10 (1)
287

International Conference on Innovative Technologies, IN‐TECH 2016,
Prague, 6. ‐ 8. 9. 2016
where: Rameas,i is the average surface roughness based on the measured Y surface profile and related to the i section, N = 3 is the number of repeated measurements on the i section, r1,i and r2,i are the starting and ending working radii of the i section, respectively, M = 900 is the number of discrete measured values of surface profile for the i section. In order to make tendencies more clearly observable, the regression model of Eq.2 was fitted on the data of each i section by applying Least Squares Method.
i,Rai,Ra yx
i,Rai afCRa [µm] (2)
where: Rai is the average surface roughness of the i section calculated from the regression model, CRa,i is a linear coefficient, xRa,i and
yRa,i are the power coefficients of feed rate and depth of cut, respectively.
Fig. 1 Surface profile produced on C45 (Nr.1) and definition sections of surface roughness (for specifications, see Tables 1-2)
However, the introduction of the Ra definition sections results the fact, that cutting speed cannot be interpreted as a continuous parameter: each Rai is valid for discrete cutting speed domains related to the i sections. An equivalent cutting speed can be applied to numerically represent these cutting speed domains and it can be calculated as an integrated mean according Eq. (3).
1000
nrrdr
1000
nr2
rr
1v i,2i,1
r
ri,2i,1i,eq
i,2
i,1
[m/min] (3)
where: vi,eq is the equivalent cutting speed of the i section, n is the rotation number of part. Main cutting force (Fc) is the most significant and characteristic cutting force component: it has a parallel direction to the v cutting
speed (which is the peripheral speed of part at the actual working radius) and it provides direct information about the energetic circumstances of chip creation [3]. Therefore Fc and its related cutting power (Pc) were chosen to describe the energetic condition of the cutting process. Due to the introduction of cutting speed sections, the regression model of Eq.4 was fitted on the Fc data applying the same methods as for the Ra model (Eq.1). Following the same ideas, the main cutting power can be calculated according Eq.5.
i,Fci,Fc yxi,Fci,c afCF [N] and
60
vFP
i,eqi,ci,c
[W] (4) and (5)
Design of experiment
The cutting experiments were carried out as face turning tests. The test pieces had an outer diameter of d = 37 [mm] and a hole in the middle with a diameter of d0 = 8 [mm] (to avoid disadvantageous cutting conditions at the tool’s run-out). Test pieces were made of S960QL (1.8933), A50 (1.0050) and C45E (1.1045) structural steels (for chemical compositions, see Table 3). A constant rotation number of n = 1980 [1/min] was set for all tests, thus defining the range of cutting speed as v = 50…230 [m/min]. Inscribed Central Composite Design (ICCD) [2] was applied to produce the list of parameter configurations, where the range of feed rate and depth of cut were f = 0.01…0.1 [mm/rev] and a = 0.1…1.0 [mm], respectively. The center point of ICCD (f = 0.055 [mm/rev]; a = 0.55 [mm]) was repeated 6-times. The sequence of parameter configurations was randomized. Tool wear was checked but not controlled: a maximum flank wear of 0.1 [mm] was allowed. The set of parameters is presented in Table 1.
Fig. 2 Setup of the cutting environment
Cutting tests were carried out on a Hembrug Mikroturn 50 ultraprecision CNC lathe using SECO DCMT11T304-F1-TP1500 cemented carbide inserts. Cutting force measurement was realized by a Kistler 9257A 3-component piezoelectric sensor and a Kistler 5080A charge amplifier. A National Instruments USB-4431 data acquisition unit was used to collect force data. A Mitutoyo SJ-400 tester was applied for surface profile measurements. Data acquisition frequency was set to a constant of faq = 720 [sample/rev] = 23760 [Hz].
288
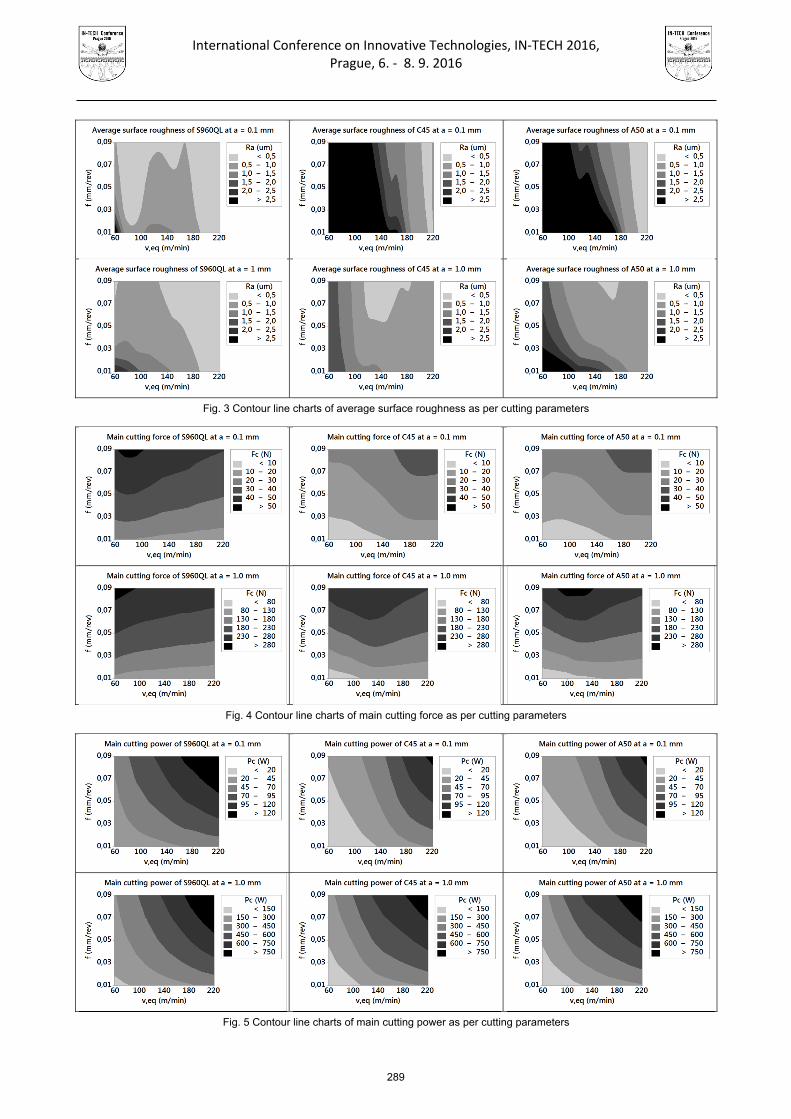
International Conference on Innovative Technologies, IN‐TECH 2016,
Prague, 6. ‐ 8. 9. 2016
Fig. 3 Contour line charts of average surface roughness as per cutting parameters
Fig. 4 Contour line charts of main cutting force as per cutting parameters
Fig. 5 Contour line charts of main cutting power as per cutting parameters
289

International Conference on Innovative Technologies, IN‐TECH 2016,
Prague, 6. ‐ 8. 9. 2016
Table 1. Parameter table of face turning experiment
Number of experiment 1. 2. 3. 4. 5. 6. 7. 8. 9. 10. 11. 12. 13. 14. Feed rate, f [mm/rev] 0.100 0.055 0.023 0.087 0.055 0.055 0.055 0.055 0.055 0.055 0.087 0.023 0.010 0.055 Depth of cut, a [mm] 0.55 0.55 0.87 0.23 0.55 0.55 0.10 1.00 0.55 0.55 0.87 0.23 0.55 0.55 RPM, n [1/min] 1980 1980 1980 1980 1980 1980 1980 1980 1980 1980 1980 1980 1980 1980
Table 2. Sections of cutting speed as per working radius Number of
section Working radius Cutting speed
Starting Ending Starting Ending Equivalent i r1,i [mm] r2,i [mm] v1,i [m/min] v2,i [m/min] veq,i [m/min]
1. 18,50 17,05 230 212 221 2. 17,05 15,60 212 194 203 3. 15,60 14,15 194 176 185 4. 14,15 12,70 176 158 167 5. 12,70 11,25 158 140 149 6. 11,25 9,80 140 122 131 7. 9,80 8,35 122 104 113 8. 8,35 6,90 104 86 95 9. 6,90 5,45 86 68 77
10. 5,45 4,00 68 50 59
Table 3. Nominal chemical compositions of the tested materials Material C% Si% Mn% Cr% Mo% Ni% V% Cu% P% S% S960QL 0.20 0.80 1.70 1.50 0.70 2.00 0.12 0.50 0.02 0.01
A50 0.30 0.30 0.60 - - - - - 0.05 0.05 C45 0.45 0.30 0.70 - - - - - - 0.03
Results
The results of evaluation can be expressively visualized in a form of contour line charts, as seen in Fig. 3-5, where the i sections are represented by the related veq,i (as seen in Table 2). It can be stated, that generally lower surface roughness is achievable in case of S960QL compared to the other materials. Local minimum of Ra is observable as per cutting parameters for each material. Local maximum of Fc can be discovered for C45 and A50. This can be justified by the presence of Salomon-effect [4]: the increasing rate of chip section and cutting speed increases the ratio of frictional mechanisms, thus increasing cutting temperature, which causes the machined material to be less hardened at the cutting area. Generally said, the characteristics of surface roughness, cutting force and power bear great similarities for C45 and A50. This effect can be explained by the relative similar chemical composition of these 2 materials compared to S960QL (see Table 3).
A demonstration of the optimization method can be introduced by a theoretical example: a finishing face turning operation with a = 0.1 [mm] is required for a flat surface made from S960QL. Priority sequence of criteria and decision method are presented in Table 4.
Table 4. Example for manual decision table of optimization based on data of Fig.3-5 Version of decision
Priority sequence of criteria Acceptance 1. Ra ≤ 0.5 [µm] 2. Fc min 3. Pc min 4. Material removal rate max
f [mm/rev] v [m/min] f [mm/rev] v [m/min] f [mm/rev] v [m/min] q [mm3/min] = a ∙ f ∙ v ∙ 1000 a 0.03…0.09 70…100 0.03 70…100 0.03 70 0.1 ∙ 0.03 ∙ 70 ∙1000 = 210 yes b 0.01…0.09 190…220 0.01…0.03 190…220 0.01 190 0.1 ∙ 0.01 ∙ 190 ∙1000 = 190 no
Conclusion, discussion
A novel optimization method for face turning has been developed. Its primary advantages are the quick realizability, low material and time consumption rate and it is does not require special machining setup. Furthermore, results are displayable in a very expressive way; therefore manual decisions can be quickly and easily carried out beside automated calculations. However, face turning is a special cutting process regarding kinematic and dynamic behavior, therefore the validity of current results is still questionable for other cutting processes (e.g. longitudinal turning, milling). Further experiments are required to verify the reliability of current testing method for such conditions. Acknowledgment This research is partly supported by the EU funded H2020 project "Centre of Excellence in Production Informatics and Control" (EPIC) under project number H2020-WIDESPREAD-2014-1-FPA 664403. The research results are used in the international bilateral project “Experimental and theoretical optimization and control of machining technology and tool path for micro milling” listed under number TÉT_12_MX-1-2013-0015. The authors would also like to acknowledge the support provided by the CEEPUS III HR 0108 project. Furthermore, the authors thank Tamás Makovics for his help to carry out the experiments and taking the photograph of Fig.2. References [1] I. Biró, T. Szalay: Machinability of S960QL high strength structural steel: energetic description of cutting at small chip-thickness in
face milling, Proceedings of International Conference on Innovative Technologies – IN-TECH 2013 (2013), p.498-501. [2] R.E. Kirk: Experimental Design – Procedures for the Behavioral Sciences, Brooks/Cole Publishing Co., Pacific Grove, USA), 1982 [3] I. Biró, T. Szalay: Extension of empirical specific cutting force model for the process of fine chip-removing milling, International
Journal of Advanced Manufacturing Technology, Online First (2016), p. 1-9. (DOI: 10.1007/s00170-016-8957-x) [4] J.M. Longbottom, J.D. Lanham: A review of research related to Salomon’s hypothesis on cutting speeds and temperatures,
International Journal of Machine Tools and Manufacture, vol. 46 (2006), no. 14, p. 1740–1747 [5] G.M. Krolczyk, J.B. Krolczyk, R.W. Maruda, S. Legutko, M. Tomaszewski: „Metrological changes in surface morphology of
high-strength steels in manufacturing processes” Measurement Volume 88, June 2016, Pages 176–185
290

International Conference on Innovative Technologies, IN‐TECH 2016,
Prague, 6. ‐ 8. 9. 2016
ONBOARD COMPUTER OF FIRST SLOVAK SATELLITE
J. Slačka1 and O. Závodský2 1 Faculty of Electrical engineering and Information technology, Slovak University of Technology, Bratislava,
Ilkovicova 3, (e-mail: [email protected], [email protected]) 2Slovak Organization for Space Activities, Bratislava, (e-mail: [email protected])
Keywords: Onboard Computer; RTOS; Cubesat; MSP; Radiation Hardening; Double Processor Board Abstract: In recent years small satellites called CubeSats became very popular. The main purpose of these satellites is to provide on hand experience with the space technology for university students for reduced launch and development cost compared to standard satellites. This was the main reason why first Slovak satellite called skCube will use CubeSat form factor. This paper discusses the design of a onboard computer, which will control all subsystems on skCube satellite. The onboard computer is the main central part of six satellite subsystems. All six subsystems are briefly described in the paper. The onboard computer consists of two Microchip MSP microcontrollers with FRAM memory which is more durable and has better hardness against cosmic radiation. A unique external supervisor was designed to watch proper operation of primary microcontroller and if any problems occur, it will automatically switch control of all communication buses and subsystems to a secondary backup microcontroller. Both of onboard computer microcontrollers are powered by special real time operating system, which was designed from scratch to fulfill safety critical standards. This paper briefly describes the process of developing, radiation testing and radiation hardening of the onboard computer. It also briefly covers architecture and main characteristics of our unique real time operating system. Introduction
In recent years small satellites called CubeSats became very popular. Slovak Organization for Space Activities together with technology universities in Slovakia developed a first Slovak satellite called skCube (Fig. 1). The satellite is now fully assembled and it will be launched by SpaceX in the end of year 2016 [1].
The main onboard computer is a master device, which controls all subsystems of the skCube satellite. Therefore if this component fails during the mission all subsystems will be not able to operate properly and communicate with each other. During the development of onboard computer we have designed three different prototypes and one test board to test radiation hardness of main processor.
It is quite common to use standard of the shelf components in CubeSat hardware design. Many CubeSat teams choose not to use military or aerospace grade components because of their high price. In skCube onboard computer we have tried different approach to this problem.
Fig. 1 skCube
291

International Conference on Innovative Technologies, IN‐TECH 2016,
Prague, 6. ‐ 8. 9. 2016
Main processor of the onboard computer
As a main processor architecture we have considered ARM v7 and MSP architecture. The ARM v7 architecture is frequently used in CubeSats and offer very good performance whit floating point operations, 32 bit architecture, big amount of RAM and FLASH memory and lot of peripherals. The downside of many ARM v7 processors is fact that they use dynamic CMOS technology which is more prone to cosmic radiation that static CMOS. Another big disadvantage is use of FLASH memory, which uses charge pump to write/erase data. This charge pump is very vulnerable against high dose particles.
Fig. 2 MSP simple arithmetic operations per second The MSP processor uses 16 bit core. Compared to ARM it has poor computing performance, and offers less RAM and program
memory. One of the best advantages of this processor is that it uses FRAM memory which is very durable and has good radiation resistance. The MSP processor uses also static CMOS technology, which will result in longer lifespan in radiation environment.
The only concern was about performance of MSP architecture. We have designed few simple arithmetic (Fig. 2) and goniometric function benchmarks. The performance in floating point operations was poor, resulting in long calculation times of standard goniometric functions. We have decided, to modify our orientation estimation and orientation control algorithms to use only quaternion operations, which resulted in simplified mathematical operations. These operations did not consume much of MSP computing power and we have decided to use this processor in our onboard computer.
Hardware design
To improve hardiness a two processor design was chosen as can be seen in Fig 3. These two processors are exactly the same, with same software and configuration parameters. One processor is running and controlling all peripherals via bus. The second processor is turned off. A external hardware watchdog is controlling proper operation of running processor. If the running processor fails, the watchdog will trigger the D flip circuit, which turns this processor of, switch all busses to secondary processor and then power it up.
Fig. 3 Onboard computer architecture
292

International Conference on Innovative Technologies, IN‐TECH 2016,
Prague, 6. ‐ 8. 9. 2016
This simple technique allows us to use dual processor redundancy and thus improve radiation hardiness of onboard computer. It is clear, that now the most critical part of this system is the external watchdog. If it fails, the whole onboard computer will malfunction. That is why all watchdog components are designed from radiation hardened parts. Because of simplicity of these parts compared to processors their price is low and we were able to achieve good radiaton hardiness with tight financial budget.
Radiation testing
For purpose of radiation testing, we have developed simple PCB board (Fig. 4) with one MSP processor and peripherals we will be using in on board computer.
.
Fig. 4 Radiation testing boards
This board was then irradiated in medical X-ray machine, which was able to dose radiation in small steps. A special algorithm which
was performing tests on all critical processor parts like registers, arithmetical and logical unit, GPIO pins, RAM memory and FRAM memory was running in small time loop. The results were send via 1 wire bus to logging computer. European Space Agency has preformed radiation tests on different MSP processors without fram memory [2]. In these test a MSP processor could withstand dose of 40 Krads. Our tests confirm this measurement. Since skCube will be launched to low Earth orbit which is shielded by Van Allen belts we expect a yearly dose of 20Krads. Hence, the lifespan of onboard computer should be around two years which is sufficient for skCube mission.
Real time operating system
For purposes of attitude determination and control a real time operating system was needed. Since MSP processors have small amount of RAM and FRAM memory, we decided not to use any of existing free RTOS, rather we have developed our own RTOS with very small footprint and safety critical standards in mind. The operating system fulfills Misra C standard [3] and is programmed in ANSI C.
We have implemented protection against single upset events like flip bits in the core and scheduler of the operating system. There is
also implemented dual scheduling technique, but all these features are beyond scope of this paper. The RTOS structure can be divided into three layers as can be seen in Fig 5. The first layer consists of Board Support Package, which is specific for every development PCB prototype of onboard computer. In the second layer is operating RTOS kernel together with drivers which are controlling different peripherals. On the top layer, there are user task, and programs to gather data from sensors, satellite health diagnostics, etc.
Fig. 5 RTOS structure
293

International Conference on Innovative Technologies, IN‐TECH 2016,
Prague, 6. ‐ 8. 9. 2016
Conclusion
In this paper a brief process of developing of onboard computer for skCube satellite was described. Two different processor architectures were concerned and one with better assumption for radiation hardness was chosen. Our tests were corresponding with tests which were taken in ESA and the chosen MSP processor has proven it will fulfill our demands in terms of performance and reliability in difficult conditions which will occur in Space. A complete functionality of supervisor switching technique between two processors was described. In the last paragraph a need for special real time operating system was introduced. Acknowledgment This work has been supported by the Slovak Grant Agency VEGA, grant No.1/0276/14. References
[1] Project skCube, available online, http://www.skcube.sk/en. [2] Tanya Vladimirova, Christoper P. Bridges, George Prassions and co., Characterising Wireless Sensor Motes for Space
Applications, Second NASA/ESA Conference on Adaptive Hardware and Systems 2007, ISBN: 0-7965-2866-X/07. [3] Misra Limited, MISRA-C:2004 Guidelines for the use of the C language in critical systems, 2004, ISBN: 978-0-9524156-4-0.
294

International Conference on Innovative Technologies, IN‐TECH 2016,
Prague, 6. ‐ 8. 9. 2016
RUNNING ENDOTOXIN TEST TO ESTIMATE RISK OF USING NANOMATERIALS IN TRIBOLOGICAL PROCESSES
H. Husain 1 and J. Skopal 1 1 Department of Manufacturing Technology, Faculty of Mechanical Engineering, Czech Technical University
in Prague, Technická 4, 166 07 Prague 6, Czech Republic
Keywords: Nanomaterials; Tribology; Endotoxin; Wear and Endurance; Tribometer Abstract: To improve the oil-lubricity using nanoparticles, a new technology was used to prepare a kind of lubricant containing titanium dioxide (TiO2) and other nanoparticles. Tribological properties of this nanoparticles are used as an additive in base oil. Other technologies also concentrate on the possibility of adding nanoparticles and use it in the surface painting. The main aim of this paper lies in estimating the toxicity effect of using nanoparticles after solving and how to prevent the side effects of using materials in Nano particles shape. By this paper we will be able to understand the theory of nanomaterials as a first step and after that explain the theory of tribology including wear that accrues to metal during work. As a last part will be estimation of the risk factor for utilization nanomaterial in tribological processes by running endotoxin tests. Theory of Nanomaterials
Nanoparticles have one dimension that measures 100 nanometers or less. The properties of many conventional materials change when formed from nanoparticles. This is typically because nanoparticles have a greater surface area per weight than larger particles which causes them to be more reactive to some other molecules. Nanoparticles are used, or being evaluated for use, in many fields. We can mention and introduce several of the uses under development like: Applications in Medicine, applications in Energy and Electronics, applications in Manufacturing and Materials and their effect on the environment. Classification of nano particles: Nano particles can be broadly grouped into two: namely organic and inorganic nanoparticles. Organic nanoparticles may include carbon nanoparticles (fullerenes) while some of the inorganic nanoparticles may include magnetic nanoparticles, noble metal nanoparticles (like gold and silver) and semiconductor nanoparticles (like titanium dioxide and zinc oxide). Theory Tribology and Wear or Endurance
Tribology deals with interaction of surfaces in relative motion depending on their design, friction, wear and lubrication. The proper use of process fluids or lubricants can bring a significant reduction in friction and the amount of wear, thereby leading to a reduction in power consumption. During different technological operations contamination of used process fluids or lubricants occurs. Such contamination leads not only to a reduction of the lifetime of the lubricants but it can also change the functional properties and increase the health risks for operators. The quality of the process fluid is among other things influenced by bacterial attacks. The use of Nano additives is one method for inhibiting the bacteria and improving the bioavailability and stability of the technological fluids. Nano lubricant is a new system composed of nanometre-sized particles dispersed in a base lubricant. The doping of lubricants with nanoparticles is one of the ways to solve problems with the removal of bacteria, whereby improving the biological, chemical and technological stability of process fluids.
As an example we could monitor the effects of doping process fluids with nanoparticles of silica (SiO2), titanium dioxide (TiO2), silver nitrate (AgNO3) and ascorbic acid (C6H8O6) on the friction coefficient and on the wear of friction pairs of Si3N4 balls against steel 16MnCr5.
Experimental results with nanoparticles used as additives in oil lubricants show that they deposit on the friction surfaces and improve the tribological properties of the base oil, displaying good friction and wear reduction features, even at low concentrations. Inter alia, titanium dioxide (TiO2) nanoparticles as lubricant additive were studied with much more attention, because of their good performance on anti-oxidant features, relatively low toxicity, pleasant odor, and non-volatility.
We would like to understand more clearly how the TiO2 nanomaterial will react after adding it to lubricating oil. Titanium (Ti) atoms of TiO2 coordinate with either two or three oxygen atoms (O) to form TiO2 or Ti2O3 groups, so they are hybridized to a planar or three-dimensional structure. Such structure units can comprise several different typical groups through various combinations, which lead to a structure more complex and cause the difficulty of surface modification of TiO2. However, the transfer and adhesion of the nanoparticles accelerates surface modification, self-reduction, and the formation of a fine TiO2 tribofilm that reduced the coefficient friction, pressure, and temperature in contact area and hence wear. Thus, it can be concluded that both methods (listed above) are classical and have their own defects (the addition of dispersant or usage of surfactant into base oil) for solving the oil solubility of TiO2 nanoparticles
According to many researches which approve that the nano material TiO2 is a suitable material for reducing tribological disadvantages, we will concentrate on the side effect of using this material and its risk factors utilization of Nanomaterial TiO2 in Tribological Processes. Harmlessness tests (Health Safety) utilization of nanomaterials
The safety of nanomaterials has become a crucial question in the last few years, particularly as the number of consumer products containing them has been rising every year. The fact that nanomaterials, by definition, are materials that have a size comparable to biomolecules (e.g. proteins, DNA) raises the question of their safety. Could nanomaterials interact with biomolecules in an adverse manner, triggering a toxic effect? Could nanomaterials pass protection barriers in cells? What happens when materials containing nanoparticles reach landfills and degrade? Will nanomaterials be dispersed in the environment? In what dose? Could this cause harm to ecosystems?
295

International Conference on Innovative Technologies, IN‐TECH 2016,
Prague, 6. ‐ 8. 9. 2016
It would be incorrect to say that we know nothing about the toxicological properties of nanomaterials. In the last years, a wealth of information has been collected and reported by authoritative research groups. What it is not clear is how relevant these results are for humans, since not all tests according to standards have been conducted in vitro for all used nano particles.
Researches so far has mainly focused on two groups of materials: carbon-based nanomaterials (carbon nanotubes and fullerenes) and metal or metal-oxide nanoparticles (e.g. ultrafine titanium dioxide, TiO2).
Several studies seem to indicate that some forms of carbon nanotubes show pulmonary toxicity and that this depends on the production method and the length and surface properties of the carbon tubes. Similarly, TiO2 has been reported to cause inflammation in the lungs when inhaled in high doses.
These results guide us to one fact that whole nano technology society should cooperate together to fulfill all requirements and to estimate the risk factor for nano particles usage.
To go more deeply in this issue, first we should recognize that before a full assessment of nanomaterial toxicity can proceed, some fundamental issues need to be resolved.
1- The need for a definition of nanomaterial is crucial. It is not just a matter of nomenclature; it is, more importantly, a matter of defining what ‘cut size’ should be considered in Nano-toxicology. It is a common belief among toxicologists that the conventional scale 1–100 nm now used to define a nanomaterial in Nano-toxicology is not exhaustive, as nanomaterials often aggregate or agglomerate in larger particles with dimensions ranging from hundreds of nanometers to microns.
2- The reference materials must be defined and fully characterized, which means deciding what standard measuring methods to use (or, possibly, developing new ones, if the existing ones prove inadequate).
3- It is important to test materials pure and free from contaminations. 4- The medium used to disperse the nanomaterial during the toxicological testing is crucial. For example fullerenes are best
dispersed in calf serum, whereas they cannot be dispersed at all in water. Lack of dispersion can lead to false results or confused toxicological results: therefore, it is essential that dispersion media are defined for each nanomaterial to be tested.
Based on these facts and in parallel with following standards (for example: ČSN EN ISO 29701). We would like to introduce a way for testing toxicity of using nano particles.
Standard LAL test according to ČSN EN ISO 29701: Endotoxins (lipopolysaccharides LPS) are part of the outer membrane of the cell wall of Gram-negative bacteria such as E. coli, Salmonella, Shigella, Pseudomonas, Neisseria, Haemophilus. Endotoxins can cause a variety of systemic reactions in mammals, including humans, such as fever, disseminated intravascular coagulation, hypotension, shock and death: the responses are mediated by production of various kinds of cytokines, activation of the complement cascade, activation of the coagulation cascade, etc.
Endotoxins are present in the ordinary environment. Since most test samples of nanomaterials intended for in vitro and in vivo test systems require various preparation procedures, endotoxins might contaminate the test nanomaterials if the samples are prepared without special care. For the purpose of toxicity screening or biocompatibility testing of nanomaterials, or mechanism studies on the possible toxicity induced by nanomaterials, various cell-based in vitro test systems and in vivo animal models are being developed and employed.
In in vitro test systems, macrophages and other relevant mammalian cells are frequently used as the test cells especially for nanomaterials because they are primarily the responsible surveillance cells in the body. However, these cells are highly reactive to endotoxins; therefore it is difficult to distinguish the response to endotoxins from that to nanomaterials. Consequently, contamination by endotoxins would confound the result of tests in vitro.
Contamination by endotoxins of test samples may be reduced if appropriate precautions are followed in preparation of the test sample. Therefore the preliminary detection of endotoxins is required to minimize the contamination by endotoxins or confirm the insignificant levels of endotoxins in the test sample. It is also important to quantify endotoxin levels for the adequate interpretation of data obtained by in vitro biological test systems.
Since endotoxins may contaminate medical devices and medicines for parenteral use, quantitative and semi-quantitative assay methods to test for endotoxins both in vivo and in vitro have been developed and used for regulatory purposes as well as laboratory standard operational procedures for nanomaterials. The bacterial endotoxin test using Limulus amebocyte lysate (LAL) reagent has been developed as an in vitro assay method to test for the presence of endotoxin contamination as an alternative to the pyrogenicity test using rabbits, and methods are described in the pharmacopoeia of many countries.This International Standard provides considerations for the application of the LAL test to nanomaterial samples intended for in vitro biological tests.
To have a clear idea about what is LAL test main idea, Endotoxins activate a factor in the LAL and trigger a proteolytic cascade. The clotting enzyme, which is released from the proclotting enzyme by one of the activated factors, catalyses a proteolysis of coagulogen in the LAL and the resulting fragments, coagulins, spontaneously bind to each other through disulfide linkage to develop the turbidity of the LAL and finally form a gel-clot. The gel-clot formation is principally determined by visual inspection after inverting test tubes. This method requires no optical reader and the procedures are easy to perform. The most sensitive gel-clot method using commercially available reagents measures 0,015 EU/mL. Endpoint photometric method
The optical density (OD) of the reaction mixture is measured after a certain period of reaction time. With regard to endpoint photometric methods, there are two techniques; the turbidimetric technique measuring the turbidity of the reaction mixture and the chromogenic technique measuring p-nitroaniline (p-NA) liberated from a synthetic substrate, such as Boc-Leu-Gly-Arg-p-NA or Boc-Thr-Gly-Arg-p-NA for the clotting enzyme. There are at least two procedures for measuring p-NA in the reaction mixture:
one measures the OD of p-NA directly at a wavelength of 405 nm, and the other measures the diazotized magenta derivative of p-NA photometrically at a wavelength of between 540 nm and 550 nm.
The sensitivity of endpoint photometric method using commercially available reagents by measuring the OD at a wavelength of 405 nm is 0,01 EU/mL while that of the diazo-coupling method is 0,001 EU/mL. Kinetic methods
The time required to reach the predetermined OD of the reaction mixture or the rate of colour or turbidity development is determined by an optical reader. With regard to kinetic procedures, the OD of p-NA liberated from the synthetic peptide stated above or turbidity of the reaction mixture is read at multiple time points as the reaction proceeds, and thus several types of automated instruments have been developed. To detect endotoxins more precisely and accurately with kinetic methods, sophisticated automated instruments are necessary. The best sensitivity of the kinetic method using a commercially available automated instrument is 0,001 EU/mL.
296

International Conference on Innovative Technologies, IN‐TECH 2016,
Prague, 6. ‐ 8. 9. 2016
Conclusion
After presenting all of these facts we can say that we live in a world where ‘saving energy’ and ‘cost cut down’ are two important notions. The tribological issue involves both, i.e., friction = energy loss and wear = increase in maintenance costs. Both friction and wear can only be mitigated, never eliminated. Nanostructured coatings serve as good alternatives to the conventional materials thanks to their superior mechanical and tribological properties. Industrial data on the performance of nanostrucutured coatings in the field are still scarce. More tribological data illustrating their superior reliability compared to current industrial benchmarks are needed to establish confidence in the technology among end users. The search for optimum materials with multifunctional properties will continue. Features such as self-healing, smart coatings capable of adjustment based on tribological needs, and compatible surfaces with an affinity towards lubricant additives are some promising research avenues.
From other hand we have to concentrate more often on risk factor before, during and after utilization of nanomaterials for raising the efficiency of tribological phenomenon.
LAL test results indicate that nanoparticles (TiO2, Ag, CaCO3, SiO2) can interfere with certain endotoxin detection methods (gel clot LAL assay, endotoxin extraction protocol), while other assays (chromogenic-based LAL assay, TLR4 reporter cells) are not hampered. Dependent on the particle and its concentration used, a convenient endotoxin detection test method must be chosen. Acknowledgment
The research was financed by SGS13/187/OHK2/3T/12. Research and development in the field of advanced engineering technologies.
References [1] Ing.Hadi Husain, Critical Research “Nanocoatings for Tribological Applications“ Czech Technical University in Prague. 2015 [2] Filip Ilie and Cristina Covaliu, Tribological Properties of the Lubricant Containing Titanium Dioxide Nanoparticles as an Additive.
Department of Machine Elements and Tribology, Polytechnic and Department of Biotechnical Systems, Polytechnic University of Bucharest 2016
[3] Boris Zhmud and Bogdan Pasalskiy, Nanomaterials in Lubricants: An Industrial Perspective on Current Research, Applied Nano Surfaces, Knivstagatan 12, Uppsala 75323, Sweden. 2013
[4] T Bakalova, L Svobodová, K Borůvková, P Louda, L Voleský, The influence of nanoadditives on the tribological properties of process fluids. Institute for Nanomaterials, Advanced Technology and Innovation, Technical University of Liberec, Studentska 2, 461 17, Czech Republic. 2015
[5] D. L. CURSARU*, I. RAMADAN, C. TANASESCU, R. RIPEANU. STUDY OF THE TRIBOLOGICAL BEHAVIOR OF DIFFERENT CARBONACEOUS NANOMATERIALS SUCH AS ANTIWEAR ADDITIVES FOR AN ENVIRONMENTALLY FRIENDLY LUBRICANT. Petroleum-Gas University of Ploieşti . 2013
297

International Conference on Innovative Technologies, IN‐TECH 2016,
Prague, 6. ‐ 8. 9. 2016
298
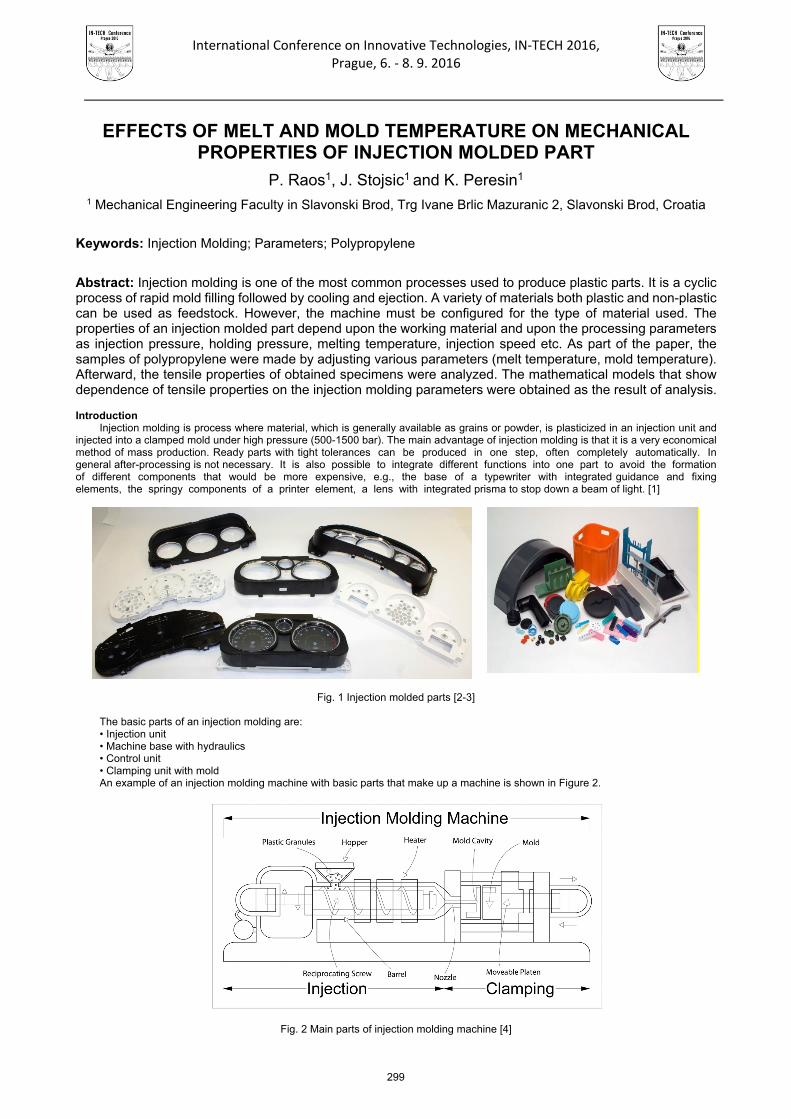
International Conference on Innovative Technologies, IN‐TECH 2016,
Prague, 6. ‐ 8. 9. 2016
EFFECTS OF MELT AND MOLD TEMPERATURE ON MECHANICAL PROPERTIES OF INJECTION MOLDED PART
P. Raos1, J. Stojsic1 and K. Peresin1 1 Mechanical Engineering Faculty in Slavonski Brod, Trg Ivane Brlic Mazuranic 2, Slavonski Brod, Croatia
Keywords: Injection Molding; Parameters; Polypropylene
Abstract: Injection molding is one of the most common processes used to produce plastic parts. It is a cyclic process of rapid mold filling followed by cooling and ejection. A variety of materials both plastic and non-plastic can be used as feedstock. However, the machine must be configured for the type of material used. The properties of an injection molded part depend upon the working material and upon the processing parameters as injection pressure, holding pressure, melting temperature, injection speed etc. As part of the paper, the samples of polypropylene were made by adjusting various parameters (melt temperature, mold temperature). Afterward, the tensile properties of obtained specimens were analyzed. The mathematical models that show dependence of tensile properties on the injection molding parameters were obtained as the result of analysis. Introduction
Injection molding is process where material, which is generally available as grains or powder, is plasticized in an injection unit and injected into a clamped mold under high pressure (500-1500 bar). The main advantage of injection molding is that it is a very economical method of mass production. Ready parts with tight tolerances can be produced in one step, often completely automatically. In general after-processing is not necessary. It is also possible to integrate different functions into one part to avoid the formation of different components that would be more expensive, e.g., the base of a typewriter with integrated guidance and fixing elements, the springy components of a printer element, a lens with integrated prisma to stop down a beam of light. [1]
Fig. 1 Injection molded parts [2-3] The basic parts of an injection molding are: • Injection unit • Machine base with hydraulics • Control unit • Clamping unit with mold An example of an injection molding machine with basic parts that make up a machine is shown in Figure 2.
Fig. 2 Main parts of injection molding machine [4]
299
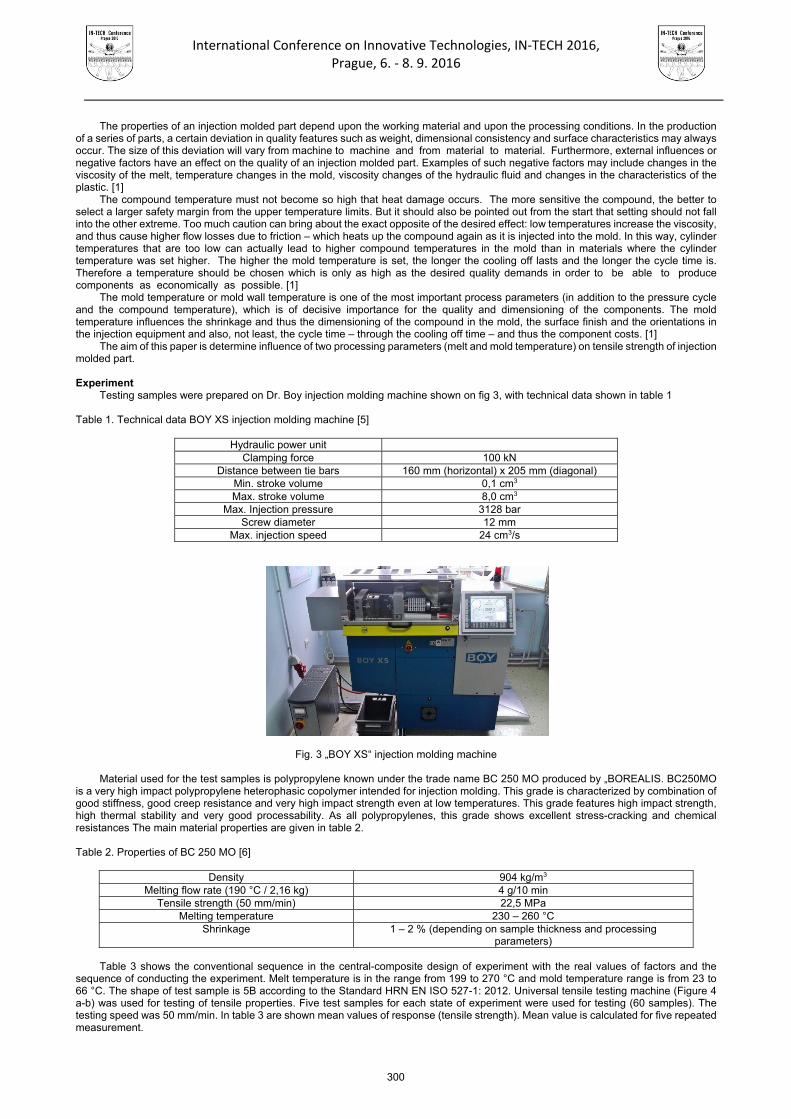
International Conference on Innovative Technologies, IN‐TECH 2016,
Prague, 6. ‐ 8. 9. 2016
The properties of an injection molded part depend upon the working material and upon the processing conditions. In the production of a series of parts, a certain deviation in quality features such as weight, dimensional consistency and surface characteristics may always occur. The size of this deviation will vary from machine to machine and from material to material. Furthermore, external influences or negative factors have an effect on the quality of an injection molded part. Examples of such negative factors may include changes in the viscosity of the melt, temperature changes in the mold, viscosity changes of the hydraulic fluid and changes in the characteristics of the plastic. [1]
The compound temperature must not become so high that heat damage occurs. The more sensitive the compound, the better to select a larger safety margin from the upper temperature limits. But it should also be pointed out from the start that setting should not fall into the other extreme. Too much caution can bring about the exact opposite of the desired effect: low temperatures increase the viscosity, and thus cause higher flow losses due to friction – which heats up the compound again as it is injected into the mold. In this way, cylinder temperatures that are too low can actually lead to higher compound temperatures in the mold than in materials where the cylinder temperature was set higher. The higher the mold temperature is set, the longer the cooling off lasts and the longer the cycle time is. Therefore a temperature should be chosen which is only as high as the desired quality demands in order to be able to produce components as economically as possible. [1]
The mold temperature or mold wall temperature is one of the most important process parameters (in addition to the pressure cycle and the compound temperature), which is of decisive importance for the quality and dimensioning of the components. The mold temperature influences the shrinkage and thus the dimensioning of the compound in the mold, the surface finish and the orientations in the injection equipment and also, not least, the cycle time – through the cooling off time – and thus the component costs. [1]
The aim of this paper is determine influence of two processing parameters (melt and mold temperature) on tensile strength of injection molded part.
Experiment
Testing samples were prepared on Dr. Boy injection molding machine shown on fig 3, with technical data shown in table 1 Table 1. Technical data BOY XS injection molding machine [5]
Hydraulic power unit
Clamping force 100 kN Distance between tie bars 160 mm (horizontal) x 205 mm (diagonal)
Min. stroke volume 0,1 cm3 Max. stroke volume 8,0 cm3
Max. Injection pressure 3128 bar Screw diameter 12 mm
Max. injection speed 24 cm3/s
Fig. 3 „BOY XS“ injection molding machine Material used for the test samples is polypropylene known under the trade name BC 250 MO produced by „BOREALIS. BC250MO
is a very high impact polypropylene heterophasic copolymer intended for injection molding. This grade is characterized by combination of good stiffness, good creep resistance and very high impact strength even at low temperatures. This grade features high impact strength, high thermal stability and very good processability. As all polypropylenes, this grade shows excellent stress-cracking and chemical resistances The main material properties are given in table 2.
Table 2. Properties of BC 250 MO [6]
Density 904 kg/m3
Melting flow rate (190 °C / 2,16 kg) 4 g/10 min Tensile strength (50 mm/min) 22,5 MPa
Melting temperature 230 – 260 °C Shrinkage 1 – 2 % (depending on sample thickness and processing
parameters) Table 3 shows the conventional sequence in the central-composite design of experiment with the real values of factors and the
sequence of conducting the experiment. Melt temperature is in the range from 199 to 270 °C and mold temperature range is from 23 to 66 °C. The shape of test sample is 5B according to the Standard HRN EN ISO 527-1: 2012. Universal tensile testing machine (Figure 4 a-b) was used for testing of tensile properties. Five test samples for each state of experiment were used for testing (60 samples). The testing speed was 50 mm/min. In table 3 are shown mean values of response (tensile strength). Mean value is calculated for five repeated measurement.
300
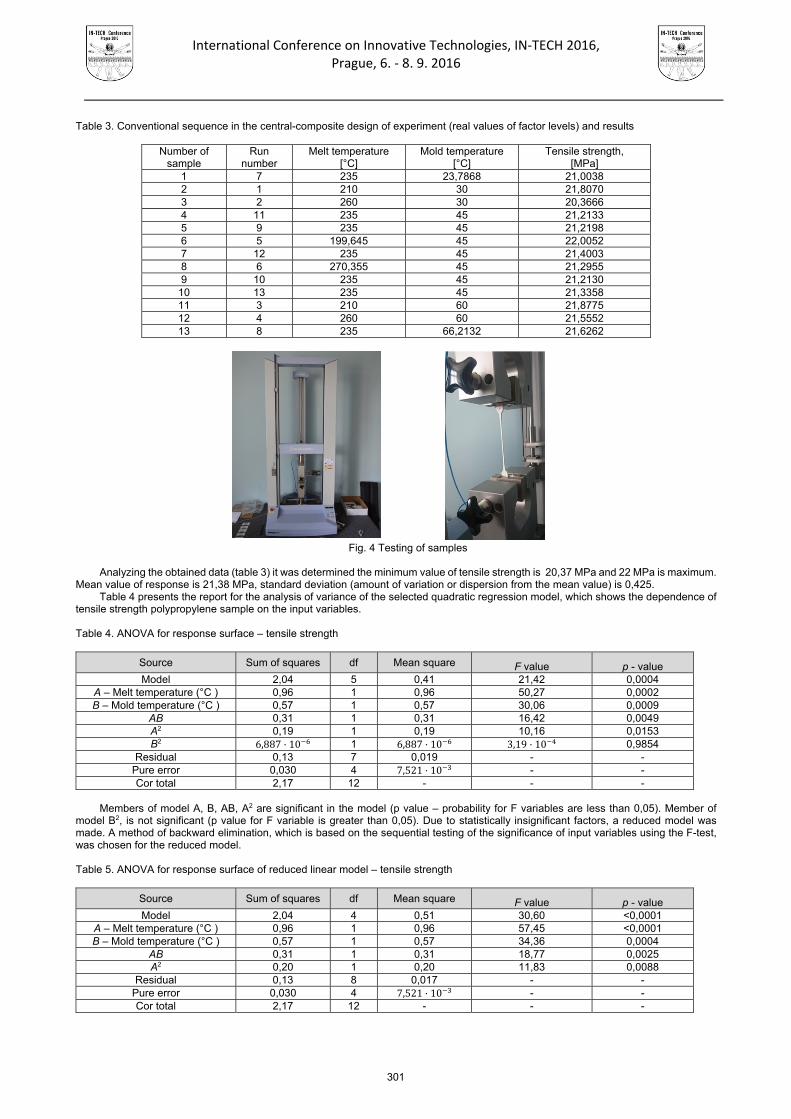
International Conference on Innovative Technologies, IN‐TECH 2016,
Prague, 6. ‐ 8. 9. 2016
Table 3. Conventional sequence in the central-composite design of experiment (real values of factor levels) and results
Number of
sample Run
number Melt temperature
[°C] Mold temperature
[°C] Tensile strength,
[MPa] 1 7 235 23,7868 21,0038 2 1 210 30 21,8070 3 2 260 30 20,3666 4 11 235 45 21,2133 5 9 235 45 21,2198 6 5 199,645 45 22,0052 7 12 235 45 21,4003 8 6 270,355 45 21,2955 9 10 235 45 21,2130
10 13 235 45 21,3358 11 3 210 60 21,8775 12 4 260 60 21,5552 13 8 235 66,2132 21,6262
Fig. 4 Testing of samples
Analyzing the obtained data (table 3) it was determined the minimum value of tensile strength is 20,37 MPa and 22 MPa is maximum.
Mean value of response is 21,38 MPa, standard deviation (amount of variation or dispersion from the mean value) is 0,425. Table 4 presents the report for the analysis of variance of the selected quadratic regression model, which shows the dependence of
tensile strength polypropylene sample on the input variables.
Table 4. ANOVA for response surface – tensile strength
Source Sum of squares df Mean square F value p - value Model 2,04 5 0,41 21,42 0,0004
A – Melt temperature (°C ) 0,96 1 0,96 50,27 0,0002 B – Mold temperature (°C ) 0,57 1 0,57 30,06 0,0009
AB 0,31 1 0,31 16,42 0,0049 A2 0,19 1 0,19 10,16 0,0153 B2 6,887 10 1 6,887 10 3,19 10 0,9854
Residual 0,13 7 0,019 - - Pure error 0,030 4 7,521 10 - - Cor total 2,17 12 - - -
Members of model A, B, AB, A2 are significant in the model (p value – probability for F variables are less than 0,05). Member of
model B2, is not significant (p value for F variable is greater than 0,05). Due to statistically insignificant factors, a reduced model was made. A method of backward elimination, which is based on the sequential testing of the significance of input variables using the F-test, was chosen for the reduced model.
Table 5. ANOVA for response surface of reduced linear model – tensile strength
Source Sum of squares df Mean square F value p - value Model 2,04 4 0,51 30,60 <0,0001
A – Melt temperature (°C ) 0,96 1 0,96 57,45 <0,0001 B – Mold temperature (°C ) 0,57 1 0,57 34,36 0,0004
AB 0,31 1 0,31 18,77 0,0025 A2 0,20 1 0,20 11,83 0,0088
Residual 0,13 8 0,017 - - Pure error 0,030 4 7,521 10 - - Cor total 2,17 12 - - -
301

International Conference on Innovative Technologies, IN‐TECH 2016,
Prague, 6. ‐ 8. 9. 2016
Members of model A, B, AB, A2 are significant in the model (p value – probability for F variables are less than 0,05). The coefficient of determination R2 is the portion of explained variability (how much the regression y deviates from the mean) in the total variability (how much the real y deviates from the mean), and is 0,94. Expression 1 illustrates the reduced regression model with the real values of factors.
Tensile strength = 46,35 – 0,17 · melt temperature - 0,16 · mold temperature + 7,45 · 10-4 · melt temperature · mold temperature + 2,67 · 10-4 · melt temperature2 (1)
The graphic representation of reduced model is shown in fig 5.
Fig. 5 The graphic representation of reduced model
Conclusion
Injection molding is one of the most common cyclic processes used to produce plastic parts. Today more than one-third of all polymeric materials are injection molded. Parameters of injection molding as melting temperature, mold temperature, clamping force, injection pressure, injection speed etc., significantly affect the properties of molded parts. In this paper, the impact of two parameters (melt and mold temperature) on tensile strength of polypropylene injection molded part was determined.
The analysis of variance showed that melt and mold temperature have the significant influence on the tensile strength at the significance level α = 0,05. The regression analysis revealed the expressions that show the function dependence of melt and mold temperature of polypropylene injection molded part. References
[1] Vanessa Goodship (ed.), Pratical Guide to injection Moulding, Rapra Technology, Shawbury, United Kingdom [2] China plastic molding blog: Home,URL:http://chinaplasticmoldingblog.blog.com/ (15.7.2016.) [3] CNMoulding, Shanghai: Home, URL: http://www.plastic-injectionmoulding.com/ (15.7.2016.) [4] AV PLASTICS: Home, URL: http://www.avplastics.co.uk/what-is-injection-moulding (03.07.2016.) [5] Dr. Boy GmbH & Co. Kg: Products, URL: http://dr-boy.de/de/product/boy-xs/ (03.07.2016.) [6] Borealis AG, Vienna – Austrija, Polypropylene BC250MO, 2007
URL:http://www.arcopolimeri.com/UserFiles/files/ProdottiPlastics/Borealis%20BC%20250%20MO%20tech%20english.pdf (16.06.2016)
30
45
60210
235
260
20.00
21.25
22.50
Ten
sile
str
engt
h (M
Pa)
A: Melt temperature (°C) B: Mold temperature (°C)
302

International Conference on Innovative Technologies, IN‐TECH 2016,
Prague, 6. ‐ 8. 9. 2016
ANALYSIS OF EXTERNAL FACTORS DISTURBING PRODUCTION LEVELLING
P. Rewers1 and J. Trojanowska1 1Poznan University of Technology, Chair of Management and Production Engineering, Poland
Keywords: Levelling Production; Analytic Hierarchy Process; External Factors Abstract: In the current market situation in almost every manufacturing company involved in the production of a wide range of products in the conditions of various sizes irregularly flowing purchases can be observed problems in the area of production management. Article focuses in the area of production planning and analyzes external factors adversely affecting in this area. The analysis in the article is the first step in a new approach to leveling production. Introduction
Constantly increasing competition in the machine building industry, constantly changing customer requirements in field of terms of the order and the need to meet the individual needs of customers makes the company need to look for organizational solutions that will help in the management of production and help build stable production plans. One of the tools corresponding to the need to improve production flow and reduce lead time by increasing efficiency and production flexibility is the production levelling (also known as heijunka). Levelling of production achieves the stability of the production process by eliminating the unequal workload. Process stability is possible after elimination of all waste that negatively sail for the time of production. Waste arising during the implementation of production processes, such as unnecessary movement of material and operators, excessive inventories and expectation are caused by factors, both internal and external, affecting the production system.
The purpose of this article is to identify external factors affecting the production system and an indication, by using the method of Analytic Hierarchy Process (AHP), the factors that have a crucial impact on the stability of production processes, and thus create difficulties in production levelling.
Production levelling
Heijunka is a core concept that helps bring stability to a manufacturing process by converting uneven customer demand into an even and predictable manufacturing process [1]. Heijunka is a concept developed by Toyota [2] for the automotive industry. The concept is widely universal and by now has been implemented in many different manufacturing environments, even in process industries [3,4]. Heijunka in recent years has gained popularity as a lean management tool for smoothing production, and as a result better control of the inventory of finished products [2]. The objective of heijunka is to avoid peaks and valleys in the production schedule [5].
Heijunka refers to three interrelated factors affecting the continuity of production: demand smoothing, load levelling, line balancing.
Analysis of external factors
External factors affecting the production system are related to the interaction of individual elements of the economic system. Treasury acts on a company by determining the amount of taxes and subsidies. Banks support manufacturing companies by providing investment funding. Consumers in one hand, a market for the products offered by the company, on the other hand, are a source of knowledge and skills, which the company needs its employees to the proper functioning of the production system.
Research conducted at the Poznan University of Technology made it possible to determine a set of external factors affecting the production system, as shown in the table 1.
Table 1. External factors affecting the production system
Symbol Factor
F1 development of technology F2 opportunity to develop professional competence of workers F3 market capacity F4 law regulations (including international law regulation) F5 availability of raw materials F6 currency stability F7 market competition of manufacturers
To find the factors that most disturb the production levelling we used Analytic Hierarchy Process (AHP). The Analytic Hierarchy
Process is a general theory of measurement. It is used to derive ratio scales from both discrete and continuous paired comparisons. These comparisons may be taken from actual measurements or from a fundamental scale which reflects the relative strength of preferences and feelings. The AHP has a special concern with departure from consistency, its measurement and on dependence within and between the groups of elements of its structure. It has found its widest applications in multicriteria decision making, planning and resource allocation and in conflict resolution [5]. In its general form the AHP is a nonlinear framework for carrying out both deductive and inductive thinking without use of the syllogism by taking several factors into consideration simultaneously and allowing for dependence and for feedback, and making numerical tradeoffs to arrive at a synthesis or conclusion [6].
In the first stage we set the target of decision support as: Selection of external factors affecting on levelling of production (Fig.1). Following selection criteria were defined:
- demand - understood as the stability of demand,
303

International Conference on Innovative Technologies, IN‐TECH 2016,
Prague, 6. ‐ 8. 9. 2016
- supplies - understood as stability of supplies management, - human resources - understood as stability of human resources management.
Demand SuppliesHuman
resources
F1
F2
….
F7
F1
F2
….
F7
F1
F2
….
F7
TARGET: Selection of external factors affecting on leveling of production
Crit
eria
Var
ian
ts
Fig.1. Target, criteria and variants. Own study
Variants are the predefined external factors interfere with the process of F1-F7 (Table 1). In the second stage, the validity of the criteria were calculated. For this purpose, the relative relationship between the criteria on a
scale 1-9 were determined, designated vector of weight, and then used the method of the largest eigenvalue of the matrix, to bring to the integrity of the matrix relationship relative. As a result of the calculation validity of the criteria have been determined as follows:
- demand - 0,777 - supplies - 0,057 - human resources - 0,166 Result of calculation was shown in Fig.2.
Fig.2. Validity of the criteria. Own study
In the third step we specified preferences of variants against each criterion. Three matrices was elaborated. For criterion of stability of demand solutions was found in 7 iterations and shown in table 2.
Table 2. Decision matrix for stability of demand
1 2 3 4 5 6 7
1 1 3.00 0.17 0.25 0.25 0.17 0.12 2 0.33 1 0.14 0.25 0.12 0.20 0.12 3 6.00 7.00 1 7.00 4.00 1.00 0.25 4 4.00 4.00 0.14 1 0.20 0.17 0.14 5 4.00 8.00 0.25 5.00 1 5.00 0.14 6 6.00 5.00 1.00 6.00 0.20 1 0.14 7 8.00 8.00 4.00 7.00 7.00 7.00 1
In case to receive priorities 21 number of comparisions was made. The resulting weights for the criteria demand, based on pairwise
comparisons was shown in table 3.
Table 3. Demand
Category 1 2 3 4 5 6 7 Priority 2.9% 1.9% 19.5% 4.5% 15.5% 11.1% 44.6% Rank 6 7 2 5 3 4 1
For criterion of supplies management solutions was found in 8 iterations and shown in table 4.
0
0,2
0,4
0,6
0,8
demand supplies human resources
304

International Conference on Innovative Technologies, IN‐TECH 2016,
Prague, 6. ‐ 8. 9. 2016
Table 4. Decision matrix for supplies management
1 2 3 4 5 6 7
1 1 1.00 0.25 2.00 0.14 0.20 0.20 2 1.00 1 0.17 1.00 0.17 0.14 0.12 3 4.00 6.00 1 6.00 0.12 3.00 4.00 4 0.50 1.00 0.17 1 0.20 1.00 0.33 5 7.00 6.00 8.00 5.00 1 6.00 5.00 6 5.00 7.00 0.33 1.00 0.17 1 1.00 7 5.00 8.00 0.25 3.00 0.20 1.00 1
In case to receive priorities 21 number of comparisions was made. The resulting weights for the criteria supplies management, based
on pairwise comparisons was shown in table 5.
Table 5. Supplies
Category 1 2 3 4 5 6 7 Priority 3.9% 3.1% 19.7% 4.4% 47.6% 9.9% 11.4% Rank 6 7 2 5 1 4 3
For criterion of human resources management solutions was found in 6 iterations and shown in table 6.
Table 6. Decision matrix for human resources management
1 2 3 4 5 6 7 1 1 0.14 1.00 0.33 3.00 1.00 0.33 2 7.00 1 06.00 4.00 4.00 3.00 1.00 3 1.00 0.17 1 1.00 2.00 3.00 0.33 4 3.00 0.25 1.00 1 2.00 2.00 0.33 5 0.33 0.25 0.50 0.50 1 3.00 0.33 6 1.00 0.33 0.33 0.50 0.33 1 0.20 7 3.00 1.00 3.00 3.00 3.00 5.00 1
In case to receive priorities 21 number of comparisions was made. The resulting weights for the criteria human resources
management, based on pairwise comparisons was shown in table 7.
Table 7. Human resources
Category 1 2 3 4 5 6 7 Priority 7.9% 34.0% 9.5% 11.2% 6.9% 5.3% 25.2% Rank 5 1 4 3 6 7 2
The results of previous steps are shown schematically in Fig.3.
Demand0,777
Supplies0,057
Human resources 0,166
F1 0,029
F2 0,019
F3 0,195
F4 0,045
F1 0,039 F1 0,079
TARGET: Selection of external factors affecting on leveling of production
F5 0,155
F6 0,111
F7 0,446
F2 0,031
F3 0,197
F4 0,044
F5 0,476
F6 0,099
F7 0,114
F2 0,34
F3 0,095
F4 0,112
F5 0,069
F6 0,053
F7 0,252
In the final stage we made calculation, which show the following hierarchy of external factors affecting on production system and
negatively affecting on levelling of production. Results are shown in table 8.
305

International Conference on Innovative Technologies, IN‐TECH 2016,
Prague, 6. ‐ 8. 9. 2016
Table 8. Results of analyse
Factors Result Ranking
F1 development of technology 0,04 7 F2 opportunity to develop professional competence of workers 0,07 5 F3 market capacity 0,18 2 F4 law regulations (including international law regulation) 0,06 6 F5 availability of raw materials 0,16 3 F6 currency stability 0,10 4 F7 market competition of manufacturers 0,39 1
The analysis shows that external factors affecting negatively on production planning to the greatest extent are market competition of
manufacturers, market capacity and availability of raw materials. Percentage impact of individual factors shows on the graph (fig.4).
Fig.4. Impact of external factors for production system
It is worth noting that the impact of the first two factors is compared with the total impact of the others. This means that market
competition of manufacturers and market capacity have a critical effect on the stability of the production system.
Conclusion Strength of the impact of external factors on the production process was analyzed. Indication of these factors is one of the first steps in
creating new methodology of production levelling, which the main objective is flexibility in the production of what the customer exactly expects, without having to maintain a large inventory in stock of finished goods and problems with scheduling resulting from fluctuations in demand. Identification of critical factors allows to choose the appropriate methods of production planning, which will be able to deal with specific interference. New methodology of production levelling will be implemented in selected manufacturing company, which at the moment are carried out preparatory work. It should be noted that heijunka requires that the company has already introduced other lean management tools, such as: takt time, kanban planning, reduction of changeover and set-up times. Acknowledgment
The presented results of the research, carried out under the theme No. 02/23/DSMK/7677, was funded with a grant to science granted
by the Ministry of Science and Higher Education. References [1] P. Korytowski, F. Grimaud, A. Dolgui: Exponential smoothing for multi-product lot-sizing with heijunka and varying demand,
Management and Production Engineering Review, Vol. 5, No. 2, June 2014, pp. 20–26 [2] J.K. Licker, Toyota fieldbook (McGraw-Hill, New York, 2005). [3] D. Powell, E. Alfnes, M. Semini: The Application of Lean Production Control Methods within a Process- Type Industry?: The Case of
Hydro Automotive Structures, International Federation for Information Processing, 2010, pp.243-250 [4] Pool A.,Wijngaard J., van der Zee D.-J., Lean planning in the semi-process industry - a case study, International Journal of
Production Economics, 131, 1, 2009, pp.194–203 [5] T.L. Saaty: The Analytic Hierarchy Process, (McGraw-Hill, New York, 1980). [6] R.W. Saaty: The Analytic Hierarchy Process - what it is and how it is used, Math Modelling, Vol.9, No. 3-5, 1987, pp.161-176.
306
International Conference on Innovative Technologies, IN‐TECH 2016,
Prague, 6. ‐ 8. 9. 2016
ROAD TRANSPORT OF LIVESTOCK IN THE EUROPEAN UNION – ISSUES AND DEVELOPMENT PERSPECTIVES
P. Trojanowski1, 1 West Pomeranian University of Technology, Faculty of Maritime Technology and Transport, 41 Piastów
Street, 71-069 Szczecin, Poland
Keywords: Road Transport; Livestock Transport; Control Posts Abstract: Road transport plays a key role in the world economy. The shipment of people and items is an important indicators of industrial development potential. The sector is divided into many parts. Livestock transport is one of them. Because of its size (smaller than conventional goods transportation), it is relatively rarely studied. However, because of the specificity of the carried load and the intensified activity of the European Union in this sector, animal transport plays an increasingly important role. The following work examines how the transport of selected kinds of animals is handled in different countries of the EU. Control posts, also very important elements of animal transport are discussed. Problems and perspectives of the discussed sector are also described. The last part introduces the control of animal transportation. Introduction
Billions of animals are transported around the world every year. Even though they make up only a fraction of all cargo, the specificity of the load make them an important part of scientific studies. Road transport of livestock is very demanding for all subjects participating in the process. Additional legal restrictions affects all elements of the logistic chain. The basic legal document regulating the transportation of livestock in the European Union is the Council Regulation (EC) No 1/2005 of 22 December 2004 on the protection of animals during transport and related operations and amending Directives 64/432/EEC and 93/119/EC and Regulation (EC) No 1255/97 [1]. It consists of six chapters: - scope, definitions and general conditions for the transport of animals, - organisers, transporters, keepers and assembly centres, - duties and obligations of the competent authorities, - enforcement and exchange of information, - implementing powers and committee procedure, - final provisions. Livestock transportation in the European Union
Livestock transportation in the European Union is subject to the respective Veterinary Inspectorate. Every Inspectorate is connected to TRACES (TRAde Control and Expert System) administered by the European Commission. It allows to gather information on livestock road transport. The “Report from the commission to the European parliament and the council on the impact of council regulation (ec) no 1/2005 on the protection of animals during transport” includes data regarding the number of animals transported in the years 2005-2009 (table 1). Table 1. Total number of live animals transported (intra-EU trade and EU imports/exports) per species between 2005 - 2009
Total number of live animals transported per species 2005 between and 2009
Cattle Pigs Sheep Horses 2005 3 973 008 16 438 637 4 209 196 176 348 2007 4 222 859 21 696 563 9 112 233 224 449 2009 4 299 255 27 802 500 4 335 078 147 122
change 2005-2009 326 247 11 363 863 125 882 - 29 226 % change 2005-2009 + 8 % + 70 % + 3 % - 17 %
The data presented in Table 1 indicates a considerable increase in the amount of animals transported, especially that of pigs. A
slight decrease in the number of horses transported has been noted down. The value of animal exports from Poland amounted to over 267 million euros [3]. The table lacks data regarding the livestock transported in the largest quantities – birds.
Council Regulation (EC) No 1/2005 of 22 December 2004 can be divided into three sections: formal requirements, animal keepers and their responsibilities, and forms of transport. One of the obligatory documents for carriers is a permit issued by an authorized veterinarian. The permit is valid for up to 5 years. [4] Every animal-transporting vehicle must carry documents allowing to determine their owner, departure and destination locations, time and date, and the estimated duration of transport. Additional requirements also apply to the drivers, who must have an appropriate license. The animal keepers are responsible, among others, for the lawful embarkation of animals, checking up animals after their arrival at the destination or transit point, as well as keeping a travel journal (in case of long-distance routes).
Means of transportation must be constructed in a way that prevents bedding, food and waste from leaking or falling out from the vehicle. After every finished route, they must be cleaned and disinfected. Figure 1 shows a cargo area with an appropriate non-slip floor and a visible partition.
Technical requirements regarding means of transportation have been presented in the appendix. The basic requirement is to adapt the vehicle in a manner allowing to avoid animal suffering. The cargo area must protect them from adverse weather conditions and temperature changes. Access to a watering trough must be provided. The floor must have an anti-skidding surface. It is also necessary to provide sufficient lighting to allow inspecting and care taking of the transported animals. The trailers' space must be adjusted to the
307

International Conference on Innovative Technologies, IN‐TECH 2016,
Prague, 6. ‐ 8. 9. 2016
kind of transported animals, as specified in the regulations. The space must be separated by partitions enduring the weight of the animals.
Fig. 1 Animal transport trailer with the partition and non-slip floor indicated.[5] Control posts
Control posts (also referred to as resting points or staging areas) play an important role in the animal transportation infrastructure. According to the regulations, they are places, in which animals should rest for at least 12 hours. A control post needs to comply with the following standards [1]: - be located, designed, constructed and operated as to ensure sufficient bio-security preventing the spreading of serious infectious diseases to other holdings and between consecutive consignments of animals passing through these premises; - be constructed, equipped and operated as to ensure that cleaning and disinfection procedures can be carried out. A lorry wash shall be provided on the spot. Such facilities must be operational under all weather conditions; - be cleansed and disinfected before and after each use, as required by the official veterinarian.
Requirements regarding the personnel supporting specific points, cleaning and disinfecting rooms, interims between bringing in respective batches of animals etc. are also specified.
Animal resting points in the European Union are privately-owned. In order to manage such an enterprise a permission from a Veterinary Inspector is needed. The European Commission also published a register of existing staging areas located in EU countries. The distribution of control posts is very uneven. The number of control posts within the EU (as of May 17, 2016) is presented in the table below: Table 2. Number of control posts in European Union member states
Member State N° of Control Posts
Austria, Cyprus, Denmark, Luxembourg, Lithuania, Latvia, Malta, Portugal, Sweden;
0
Estonia, Finland, Croatia, Slovenia, Slovakia; 1 Ireland, Romania; 3 Czech Republic, Greece, The Netherlands; 4 Belgium; 5 Bulgaria, Spain; 6 Hungary; 8 United Kingdom; 10 Italy; 13 Poland; 17 Germany; 27 France; 30
It is necessary to add that the data presented in Table 2 also includes temporarily suspended control posts. Some of them are not available to all users, functioning only within deals with some transport companies. Control posts available to all users are presented in Figure 2.
There is a number of issues related to the connection between long-distance livestock transport and control posts: - uneven distribution of resting points – impeding route planning, sometimes forcing a much longer route to be taken - no uniform regulations regarding reservations - major differences in the numbers and kinds of accepted animals in individual control posts – for instance, the „SMEETRANS Coenenhofweg, 4 3990 Peer, Belgium” control post allows for only 4 horses to be accepted, while the „PALI bvba Arselt 32 2360 Oud-Turnhout, Belgium” control post allows for over 6 thousand animals to rest (divided into 6 kinds) - ununiform opening times of different control posts – while most of them is open 24 hours per day and 7 days per week, some only work only in specified times and days.
Figure 2 (based on maps.google.pl) clearly shows the uneven distribution of animal resting points. The largest number of staging areas is located (accordingly) in France, Germany and Poland. Unfortunately, 14 EU countries (half of all EU member states!) have only one or none resting points. Even in some of the countries with a larger number of staging areas there are vast areas lacking specialized posts for receiving transported animals.
308

International Conference on Innovative Technologies, IN‐TECH 2016,
Prague, 6. ‐ 8. 9. 2016
Fig. 2 Public control posts Issues and perspectives of animal transport
The issues regarding control posts are not the only issues in animal transportation. They exist on every phase of transportation, from planning and organizing transports to debarking animals at the destination point. There are many situations in which the legal norms of particular EU countries differ from the Council Regulation (EC) No 1/2005 of 22 December 2004. The lack of regulation harmonization is problematic both for the workers carrying out transports, as well as for freight forwarders responsible for its logistics. Accordance to the regulations regarding both the driver's resting time and the resting time of animals (both regulated by separate laws) is another important issue. Another essential technical issue related to animal transportation is the process of their embarkation and disembarkation. According to surveys, inadequate adaptation of embarkation platforms on farms is one of the major problems. Embarkation/disembarkation devices should be constructed in a way that prevents animals from being harmed. Ramp angle is important, depending on the type of animal. Carriers should also make sure that there is no gap between the ramp and the vehicle's floor. In the case of short-distance transport, an unfavorable proportion of outlays to work time and labor sometimes occurs. Because of the usual small cargo load, low-load vehicles are often utilized without using their full capacity. [6] Regulations regarding means of transportation pose yet another problem. The growing demands force entrepreneurs to modernize their fleet. According to one European Commision report [2] the cost of modernizing one animal transportation set can cost up to 12 thousand euros. The appointment of costs is presented in Table 3. Table 3. Modernization costs of a single road set
Required equipment Cost (EU average) 1. Insulated roof and drinking devices with tank € 5 000 2. Satellite navigation system, including temperature monitoring and recording
system € 3 800
3. Ventilation system € 2 300 Total costs € 11 900
It is important to note that modernization investments contribute to a decrease in the number of animals dying during transport. They
also allow transport companies to better control their fleet using satellite navigation systems, which has a positive impact on the business.
Development perspectives of the livestock road transport industry are strictly related to animal well-being. The European Union is striving towards the improvement of animal well-being by issuing new directives and ordinances. The latest essential document regarding the well-being of animals is COMMUNICATION FROM THE COMMISSION TO THE EUROPEAN PARLIAMENT, THE COUNCIL AND THE EUROPEAN ECONOMIC AND SOCIAL COMMITTEE on the European Union Strategy for the Protection and Welfare of Animals 2012-2015 [7], providing a list of factors influencing the well-being of animals: - Lack of enforcement of EU legislation by the Member States is still common in a number of areas, - Consumers' lack of appropriate information on animal welfare aspects, - Many stakeholders lack sufficient knowledge about animal welfare, - A need to simplify and develop clear principles for animal welfare. The European Union's strategy is also directed towards simplifying the legal framework. In order to achieve it, scientifically revised animal well-being indicators are planned to be used. There are also plans to establish a European network of reference centers and to unify the requirements regarding the competences of animal keepers.
309

International Conference on Innovative Technologies, IN‐TECH 2016,
Prague, 6. ‐ 8. 9. 2016
On one hand, the improvement of conditions regarding animal welfare during transport is an issue related to the necessity of bearing specified costs. On the other hand, it also contributes to the improvement of meat quality in cases of transporting porkers to slaughterhouses. Plenty of studies [8, 9, 10, 11] indicate a correlation between transport conditions and adverse changes in meat quality.
Livestock transport supervision
According to the previously mentioned Regulation 1/2005, in case of long-distance transport, agencies authorized to carry out inspections check, whether the carriers indicated in the journal have the all the appropriate permits, certificates and attestations. The travel journal, submitted by the carrier, is also verified, taking in account whether the proposed travel plan is possible to be fulfilled in accordance to legal requirements. If said requirements are not fulfilled, corrections to the travel plan are necessary. Once the plan is approved, the agencies are obliged to immediately pass on the information regarding animal transport to the appropriate authorities at the destination point. During transportation, inspection are carried out at random, with the travel and rest times compliance with appropriate regulations being prioritized. When transporting goods in between EU states, inspections are carried out before embarkation. The Veterinary Inspection is one of the subjects authorized to inspect livestock transports. The rules of conducting such inspections by district veterinarians are described in the Chief Veterinary Officer Manual No. GIWz.420/AW- 62/11 published on 7 October 2011 [12]. The document regulates situations such as: - approving carriers and vehicles used in livestock transportation - inspecting carriers - carrying out animal road transport inspections in terms of their well-being The Supreme Audit Council (NIK) and the Road Transport Inspectorate (ITD) also inspects companies engaged in commercial animal road transport. A joint inspection conducted by NIK and ITD [13] showed abnormalities in more than a half of such companies (the inspection included 36 subjects). The inspection dealt with [13]: - inappropriate technical conditions for transporting livestock (7 subjects) - using vehicles not approved for transporting livestock (3 subjects) - lack of vehicle disinfection or documents confirming it (9 subjects) - lack of transported livestock's records (5 subjects) - exceeding the maximum driving time or shortening the daily rest time (7 subjects) - lack of proper certification and licenses for animal transportation and domestic item transportation (3 subjects) - lack of devices measuring the drivers' working time or invalid and incomplete entries (9 subjects) - not presenting invoices or not paying tolls (3 subjects) Conclusion
Road transport of livestock in the EU has shown a major growth in the years analyzed. The EU legislature follows this tendency. At the present moment, the most important legal document regulating livestock transportation is the Council Regulation (EC) No 1/2005 of 22 December 2004 on the protection of animals during transport and related operations and amending Directives 64/432/EEC and 93/119/EC and Regulation (EC) No 1255/9. Additionally, a unified strategy regarding animal well-being was in preparation during the years 2012-2015. Laws regulating animal transportation include all subjects taking part in shipment, together with its direct environment. Control posts play a key role in long-distance transport. Currently, 124 control posts are reported to function in the EU. Their distribution is very uneven, adding difficulties to route planning. Half of the EU member states have only one or no control posts. Another issue with which transport companies have to deal with is the inadequate infrastructure needed for embarkation and disembarkation of animals and high costs of fleet modernization. The prospects of livestock transport development are strictly related to EU legislature. Aspirations to limit long-distance livestock transportation or at least ensure better resting conditions for transported animals have also appeared.
References
[1] Council Regulation (EC) No 1/2005 of 22 December 2004 on the protection of animals during transport and related operations and amending Directives 64/432/EEC and 93/119/EC and Regulation (EC) No 1255/97.
[2] Report from the commission to the european parliament and the council on the impact of council regulation (ec) no 1/2005 on the protection of animals during transport.
[3] A. Szczepańska: Wymogi dotyczące środków transportowych przy przewozie żywych zwierząt, Logistyka 3/2012. [4] A. Nieoczym: Transport zwierząt – wymagania prawne i kontrola, Logistyka 4/2014. [5] http://www.bobyfleisch.cz/wp-uploads/images//prepravniky-zvirata/prepazky.jpg. [6] S. Kokoszka Postęp technologiczny a struktura czasu pracy I nakłady robocizny w transporcie zwierząt, Acta Scientiarum
Polonorum, Technica Agraria, 7 (1-2) 2008. [7] Communication from the Commission to the European Parliament, the Council and the European Economic and Social
Committee on the European Union Strategy for the Protection and Welfare of Animals 2012-2015. [8] A. Tareszkiewicz, P. Molenda, K. Pokrywka: Aktualne problemy w transporcie tuczników, Logistyka 3/2011. [9] K. Borzuta: Zasady obrotu i postępowania przedubojowego zmniejszające stres tuczników oraz straty ilościowe i jakościowe
mięsa, Trzoda Chlewna 8-9, 90, 1998. [10] R. Kołacz: Wymogi w zakresie transportu, Trzoda Chlewna 11, 95, 2003. [11] K. Tereszkiewicz, M. Ruda: Meat quality of gilts and barrows transported at various distances, Annales of Animal Science. 2,
357-360, 2002. [12] Chief Veterinary Officer Manual No. GIWz,420/AW-62/11 published on 7 October 2011 concerning proceedings of state
veterinarians during: approving carriers and vehicles used in livestock transportation, inspecting carriers, carrying out animal road transport inspections in terms of their well-being and conducting reports from such inspections
[13] Supreme Audit Council (NIK): Information regarding the results of auditing supervision over trading and slaughtering fatstock with special regard to the well-being of animals, Warsaw 2005.
310

International Conference on Innovative Technologies, IN‐TECH 2016,
Prague, 6. ‐ 8. 9. 2016
SYNERGETIC SYSTEM INTEGRATION
Z. Kremljak 1 and M. Hočevar2 1 Telekom Slovenije, Cigaletova 10, SI–1000 Ljubljana, Slovenia
2 University of Ljubljana, Faculty of Economics, Kardeljeva ploscad 17, SI–1000 Ljubljana, Slovenia
Keywords: System; Synergy; Connection; Organization; Management; Componibility; Composition Abstract: The concept of contribution is based on the theory of systems. This article focuses on the foundry system and the machining system, both operating as distinctive systems. Due to synergistic effects it made sense to connect the both systems into a single one, in which the output from foundry system is at the same time the input to the processing system. On the one hand the business functions of purchasing, sales, finance and human resources are combined into a single integrated system, whilst the technical function of the business process remains the same in both subsystems. At first theoretical basis of the theory of systems are provided, while the rest of the paper describes a practical connection between the two systems in a single one. Key findings of the activities carried are contained in the end of the paper. The linkage of the systems is found to lead to better co-ordination of functions, higher value added products, shorter lead times in production, lower costs, streamlined information system, etc. Introduction
This paper deals with two production systems (foundry and processing), which are synergistic to such an extent, that any of them cannot survive without the other, because of the market conditions and the industries they represent. Connectionless systems have a poor chance of survival, which makes them risky in terms of job positions. By the connection of the systems we achieve stability of the interconnected system and thus ensure long-term continuous development process and preserve jobs.
The company A was founded with an aim to produce valves which are about to be used in the food, chemical, petrochemical, oil and process industry. Products include stainless steel, carbon steel, modular cast iron, DIN, ISO, ASTM, GOST, BS standards. Today almost 90 % of the company production is placed on the German market, while the rest covers the Austrian, Russian, Croatian and Slovenian markets. In the future the company wants to increase its production as well as to gain new markets in Eastern Europe, the Middle East and North Africa. The future concept is to develop products with high added value by increasing their quality and productivity. The production is organized on the casting (foundry) and machining (processing) work so it was decided to link the two systems in one. Existing Potential Connections
Theoretically possible connections are displayed in Fig. 1. Experience demonstrates that it favors a horizontal connection. Based on this model we opted for horizontally organized management system.
Fig. 1 Horizontal and vertical connection Fig. 2 Scheme of the combined system Horizontal integration exists if the secondary producer B is associated with the producer A at the level of the producer E. Vertical connection exists if the secondary producer E is associated with the primary producer D, which is a supplier of the system E
– to the return of the vertical links. If the secondary producer is associated with E, which distributes the product it creates advanced vertical connection. If two business transactions are completely unrelated that creates a conglomerate links of the system.
Fig. 2 highlights the link between the foundry and the processing system, whereas the output from the first represents entrance into the second system. Technologies in the foundry system are: melting and casting, cleaning and thermal processing, die casting, quality
311

International Conference on Innovative Technologies, IN‐TECH 2016,
Prague, 6. ‐ 8. 9. 2016
control according to DIN, ASTM, BS, GOST ..., and assembly. Technologies in the machining system are: grinding, milling, drilling, polishing, storing, welding, control, assembly, delivery.
The entire system is managed by the Management System and is supported by the information system, which has the business functions of Finance, Sales, Procurement, Human Resources, Technological work preparation, Development and Information Technology.
Synergy of the Systems
The managers` task is to create a vision and mission, to establish goals of the business and to steer it in that end (frames of company policy), to select management to perform the operations and to monitor the management in terms of performance as well. The management is successful if it reaches the set goals, which means that it accomplishes its goals in the best manner. Task of the management is to design and plan the operations and development, to organize the company, to lead the people towards achieving the outcomes and to manage the company in general.
"The combination of capacity and human capital in order to achieve more by the same means" is just one of the definitions of positive synergy, which is simply defined as "2 + 2 = 5", in case the negative synergy is defined as "2 + 2 = 3" [1]. Thus, it can be concluded that the positive synergy leads to a better outcome. The right order of goals, the smart combination of capacities and the guidance of the people towards the outcome is a task of the management. Therefore the search for a synergy is a task of the management, the accomplishment of the synergistic effects their mission. That is the subject covered by this paper.
We distinguish four functionally different synergies and two timely different synergies. The first ones refer to the sales synergy, the production synergy, the investment synergy and the managerial synergy, whilst the timely different synergies are acknowledged to be the startup and the operational synergy.
The sales synergy is created by exploitation of the opportunities to sell extra products using the already established selling channels, the joint sales, the common storage, etc. The production synergy consists of better usage of the production means, economy of quantities, etc. The investment synergy is created by exploitation of the existing investments in specific areas, technological development, etc. (when it is possible to use the existing state with an intention to introduce an additional program of products). The managerial synergy represents a possibility to apply already developed solutions on similar problem solving issues emerging on new markets. For all these synergies it is typical, that they use joint opportunities.
Regarding the timely synergies it is worth noting that these synergies represent a transfer of the already reached solutions on new programs, e.g. market penetration by applying already used strategy or transfer of knowledge in terms of a particular program to another, similar program.
Such joint opportunities should be identified within the companies and should be analyzed in terms of their synergistic effects, which allows their application later on. The development of products and the diversification during the companies` growth phase are important areas in synergy terms.
Rational and Synergetic Effects
Reduction of the costs and the increase of productivity are nothing disputable in the economy, whilst the said cannot be applied in terms of synergy. The concept of synergy has been introduced in the economy by Ansoff in the year 1965 in the book “Corporate Strategy” in relation to the strategic decisions regarding the competence of the company on specific markets. The synergetic effects are demonstrated in the form of increased profitability, which is accomplished by the company, if it is present on more markets. The synergetic effects are calculated as a difference between the profitability, which can be achieved by two companies on two separate markets and the profitability achieved by one company on those markets. Ansoff has later spread the concept of synergy on other areas as well, such as production, investments and management. Twenty years later, Porter has deepened and expanded the concept of synergy on the field of competitive advantage of the company in the value chain. Porter has later expanded the concept value chain on specific units within the company. That provides the basic difference between the internal and external synergetic effects [2].
Theoretically the concept of synergy has been most in depth treated by Kajzer [3], who derived from the described general meaning of the concept of synergy, as accomplished increase in quality of the new whole in relation to the sum of the quality of the specific parts. Only compositions, whereas increased quality will be reached should be considered reasonable, since for some specific compositions the increase of quality can be negative, positive or void. Therefore the synergy can be used as a general rate of compatibility regarding the systems of “low” type towards the systems of “high” type. Kajzer has found out that a certain synergy can be necessary, but not sufficient prerequisite of compatibility. We can assume that it is possible to increase the quality of the given initial systems, without combining them in a mutual system of higher type. Therefore he supplemented the concept of synergy by considering the sum of the maximum possible quality of the specific systems of lower types. He introduced the concept of optimal synergy, which can be reached by connecting the pieces in a whole and which equals the difference between the optimal effect of the whole and the sum of the optimal effects of its parts.
Synergy is mutual participation of groups (systems, etc.) with an objective to achieve a better result in contrast to one that would be provided by the individual (individual system), which is also one of the most important headings of the engineering. It accelerates the effective cooperation between specific groups and companies. Teamwork emphasizes interpersonal relations, negotiations and joint decisions [4]. Therefore the managerial team is responsible to establish a balance within and between the specific teams.
Prasad has identified seven points, which should be considered in order to establish synergy [5]: 1. Independence: the construction team should enjoy freedom, authority and all other possibilities in order to do their task as it should
be done, already in their first try. The managerial team should clearly determine the main goals, the budget and the limitations. 2. Adequacy: identification of the knowledge and the experience needed for the referred task. In case the team does not have a
particular knowledge, an expert should be invited in order to compensate for the missing skills. 3. Organization: requires application of tools such as: determination of the main points, determination of the procedure on selection of
team members, determination on the procedure on decision making, brainstorming, etc. 4. Leadership: includes motivational tasks, leading and coaching both the technical staff and the supporting staff. Greater focus is on
the leadership in relation to the management. 5. Evaluation: the team should be focused on achieving the mutual goals. The project team has to determine procedures on the
evaluation of those goals. 6. Autonomy: it is necessity. Management should be involved in the project, but should let the team have its competence over the
decision making procedure. 7. Preservation of knowledge: the technical team is responsible for archiving as much more knowledge and experience. The
management has to guarantee for such archiving. According to the previous ideas we have create a new managerial system of the combined production system, as shown in Fig. 3.
Considering the fact that we have to reach a permanent solution of the machining and the foundry systems, we have chosen a project of permanent connection, which will enable us a stable production process and preservation of jobs. Stable input and output allow plan fulfilment, which were short-term outlined [6].
312

International Conference on Innovative Technologies, IN‐TECH 2016,
Prague, 6. ‐ 8. 9. 2016
Fig. 3 Managerial system
Meaning of the Composition and Criteria of Componibility
Composition is a procedure of creation such whole, which has new characteristics. The effect of the composition is certainly also a reverse one: by the creation of the new whole, the quality of its parts also changes. They gather new characteristics, which derive from their new connections in the whole.
Let`s try to specify the above described synergy as a general rate of componibility of the systems of the “lower” type in the systems of the “higher” type.
If we assume, that the quality of a particular system can be expressed by the rate “k” then we have to record the systems of the first row Si
(1) in the plurality S(1).
.;, 111 IikSS ii (1)
Due to the fact that in the procedure of composition in the system of the second row Sx
(2) we can connect different systems of the first row Si
(1) by using different manners in the plurality S(1) we can deduce "r" from the operation K.
12j
Jj
r SrS K
(2)
where J ⊆ I and r = 1, 2, …, n; n = f(m). By the procedure we gather possible systems of the second row S(2), which can be analogically recorded as:
2S 22 , rr kS ; r = 1, 2, …, n (3) The recorded demand in the previous point indicates that the composition is rational, when we achieve new, greater quality and it can
be exposed as follows: specific composition Kr is acceptable, if the following demand is met:
kr(2) >
1j
Jj
k
or kr(2) –
1j
Jj
k
> 0, (4)
or when the new quality kr(2) of the system of the second row Sr
(2) is higher in contrast to the sum from the old qualities kj(1) composed from
the first row systems Sj(1). So, is that demand needed and sufficient condition in terms of compatibility of the provided initial systems in a
system of a higher row? Certainly it is a needed condition, but not absolutely sufficient. It is completely realistic to anticipate increase of quality on the initial level, without composition. Therefore we have to primary look for an optimal quality of the systems of the first row, which can be achieved by research of the existing components of the composition ki
(1) in the systems of the first row Si(1):
11
ipip KS K , where i ϵ I and p = 1, 2, …, q. (5)
By the procedure of recomposition we accomplish plurality of possible compositions Sip(1) from the system of the first row Si
(1) with the associated rates of quality kip
(1): Si
(1) = ( Sip(1), kip
(1) ); p = 1, 2, …, q , i ϵ I (6) If we define the optimal possible quality kio
(1) of the first row system Si(1) by an expression:
kio
(1) = max [ kip(1) ], i ϵ I and p = 1, 2, …, q, (7)
we will accomplish quality growth pi
(1), which can be achieved on the same systematic level – on the level of the first row system Si(1).
pi
(1) = kio(1) – ki
(1), i ϵ I. (8) Therefore: pi
(1) > 0, i ϵ I. This is the part of the quality change, which certainly cannot be attributed to the composition system of the first row Si
(1) in the system of the second row Sr
(2), which means that we have to amend the prerequisite of compatibility and demand: kr
(2) > 1jo
n
k , r = 1, 2, …, n, (9)
i.e. that the quality kr(2) of the generated system of the second row Sr
(2) is higher than the sum of optimal quality kio(1) of the composed
systems of the first order Sj(1). By the composition Kr we achieve synergy σr
(12) on the level of the system of the second row Sr(2), which can
be expressed by the difference:
313

International Conference on Innovative Technologies, IN‐TECH 2016,
Prague, 6. ‐ 8. 9. 2016
σr
(12) = kr(2) – 1
jon
k , r = 1, 2, …, n. (10)
The above expression includes synergy i.e. that quality growth, which can be accomplished only by composition of systems of the first row in system of the second row. That means that the requirement is a sufficient prerequisite for compatibility of the systems of the lower rows in the system(s) of the higher rows. Considering the requirement, we will take into account those compositions Kr, whereas systems of the second row demonstrate increased quality, positive synergy.
σr
(12) > 0, r = 1, 2, …, n. (11) By that procedure in the plurality of possible systems of the second row S(2) we form subplurality of acceptable systems of the second
row Ss(2), or such systems that meet the criteria:
Ss(2) = (Ss
(2), σr(12)); Ss
(2) ϵ Ss(2) ∧ σr
(12) > 0 , (12)
whilst the other possible systems of the second row Sq(2), that does not meet the criteria will be rejected. The plurality of acceptable
systems of the second row from the above expression is the basis for the following step: the selection of the optimal system of the second row Sopt
(2) is justified by the identifying of the optimal synergy σopt(12):
σopt(12) = max σs
(12) = max (ks(2) – 12
joJj
s kk
), (13)
which represents a criteria for the selection of the optimal system of the second row Sopt(2):
St(2) = Sopt
(2) ⇔ (Ǝ(St(2), σt
(12))) (∀(Ss(2), σs
(12))), (St(2) ϵ Ss
(2) ∧(Ss(2) ϵ SS
(2) ∧t ≠ s ∧ (σt(12) ≥≥ σs
(12)), s ϵ L. (14) Certainly different compositions can lead to equivalent synergies and that is the precise reason why there are more optimal systems
Sopt(2) in the plurality of systems of the second row Ss
(2). In such cases additional criteria and evaluation is recommended. The research of the synergy as consequence and festival of the composition is possible and meaningful expanded on more levels: mutual synergy σ(nv) (v = n + r) can be reached by complex composition K(r) and defined as sum of synergies on specific levels of the composition.
1
12 .v
g gn
g n
(15)
It is reasonable to emphasize that we have to treat the compositions with more levels always along a decomposition, since it it is not
possible to anticipate that we are going to achieve optimal synergy σopt(nv) on the systematic level S(n) to S vS [7].
Conclusion
We had two systems, the foundry and the processed one. Because of many factors, such as the remoteness of the systems, the own managerial functions of the systems, the IT systems and the poor communication both of the systems proved to be instable and sensitive on the market developments on the sales, the production, the purchase and the informational side as well [8]. The disconnectedness of the systems has been demonstrated in the insufficient flexibility of the technological process, the development elements of the products, the quality and the measurable economic effects as well, all of them related to the aforesaid shortcomings. The connected system has become more flexible and more stable. The flexibility has improved regarding the development of new products and regarding the buyers` demands. Stability has improved within the focus of permanent and stable production and jobs. The economy and the profession had their role in the decision making process. The anticipated and selected option ensures long-term and stable production and sale process as well. The connected system has managed to provide better economic indicators in the form of increased market share, sales and profits.
It is inevitably to mention one additional and important aspect. Systems integration is necessary to address complex interconnections and identify effective solutions to sustainability challenges too [9]. It is critical to understand socioeconomic, production and environmental interconnections and to create sustainability solutions. Recent advances include the development and quantification of integrated frameworks, which can help address important knowledge gaps, link seemingly unconnected challenges, and inform policy and management decisions.
References
[1] J. Belak, J.-P. Thommen, J. Mugler: Synergy and development management (in Slovene), MER Evrocenter, Lesicno, 1998. [2] B. Melnikas: Knowledge Economy: Synergy effects, interinstitutional interaction and internationalization processes, Engineering
Economics, Volume 22 (2011), Issue 4, p. 367-379. [3] S. Kajzer: Cybernetics of Economic Systems (in Slovene), VEKŠ, Maribor, 1987. [4] C. Z. Raluca: Synergy effects in work teams, Network Intelligence Studies, Volume 2 (2014), Issue 3, p. 122-128. [5] B. Prasad: Integrated Product and Process Organisation, Concurrent Engineering Fundamentals; Prentice Hall, New Jersey, 1996. [6] C. Ritz, J. C. Streibig: From additivity to synergism – A modelling perspective, Synergy, Volume 1 (2014), Issue 1, p. 22-29. [7] C. Bertoluzza, P. Miranda, P. Gil: A generalization of local divergence measures, International Journal of Approximate Reasoning,
Volume 40 (2005), Issue 3, p. 127-146. [8] G. Mavrotas, J. R. Figueira, E. Siskos: Robustness analysis methodology for multi-objective combinatorial optimization problems
and application to project selection, Omega – International Journal of Management Science, Volume 52 (2015), p. 142-155. [9] J. Liu, H. Mooney, V. Hull, S. J. Davis, J. Gaskell, T. Hertel, J. Lubchenco, K. C. Seto, P. Gleick, C. Kremen, S. Li: Systems
integration for global sustainability, Science, Volume 347 (2015), Issue 6225, p. 960-963.
314

International Conference on Innovative Technologies, IN‐TECH 2016,
Prague, 6. ‐ 8. 9. 2016
INNOVATIVE APPROACH TO ECONOMIC EVALUATION OF ARTIFICIAL
LIGHTING SYSTEMS IN THE DESIGN OR REDESIGN STAGE
D. Franković1, M. Maračić1 and V. Kirinčić1 1 Faculty of Engineering, Vukovarska 58, 51000 Rijeka, Croatia
Keywords: Artificial Lighting; Design; Redesign; Economic Analysis; Software Tool Abstract: In an era of increased sensitivity to socio-ecological consequences of irrational energy consumption, concerns about efficient energy usage should be positioned high on a priority list. Energy consumption of existing lighting systems, as indicated by many researchers and headmost institutions in the energy field, represents nearly 20% of total world’s electricity consumption. Obviously, this is an enormous potential for implementation of measures to increase energy efficiency. However, if energy efficiency measures are not well thought, i.e. if not all relevant economic parameters in the life-cycle analysis are taken into consideration, cost-effectiveness of energy efficiency measures becomes questionable. In order to assist lighting systems designers when deciding which lighting technology to adopt (e.g. incandescent, fluorescent, LED) a software tool has been designed at the Faculty of engineering in Rijeka as part of a master thesis. The software tool harmoniously complements well known software tools for lighting systems planning and design and gives valuable economic information to lighting system designers. Introduction
Domestic lighting contributes significantly to greenhouse gas emissions given the reliance on current forms of electric energy production. According to the International Energy Agency (IEA), almost 20% of the world's total electricity consumption in 2013, equivalent to the total production of all nuclear power plants in the world, is spent on lighting [1]. Obviously, this represents an enormous potential for implementation of measures to increase energy efficiency. Promotion of measures to increase energy efficiency in artificial lighting systems is, therefore, a logical step.
Interior lighting system design for a new building, as well as a redesign of the lighting system for an existing building is subject to relevant standards that encompass design criteria for lighting of work places and energy requirements for lighting (e.g. EN 12464-1:2012, EN 15193:2010). An experienced designer will most likely correctly decide which lighting technology to adopt and later, using a dedicated software tool, elaborate the lighting design taking into consideration relevant regulations, standardization, investor criteria and good design practice. Economy considerations, especially life cycle analysis, are rarely taken into account in the design stage. The building type, local climate, and study period affect the financial benefits from energy efficiency improvements. The longer the study period, the greater the energy savings from energy efficiencies and the lower the life-cycle costs for more energy efficient building designs [2]. Therefore, at the Faculty of engineering in Rijeka, a software tool, as an aid for indoor lighting system designers, has been designed. The software tool is flexible, intuitive with straight-forward results. Calculation parameters like per-unit investment costs, per-unit replacement costs, mean life-time, simulation duration etc. are freely configurable. The results are presented on a chart and can be exported in CSV or XLS format. Energy requirements for lighting
Every inhabited building necessitates some kind of lighting to ensure that people have adequate visibility to orient themselves, be able to take part in activities and carry out visual tasks. The quantity and quality of lighting varies for different types of buildings, activities and visual tasks. As mentioned before, a good design practice is to follow conditions defined in the CEN lighting application standards EN 12464-1 for indoor work places, EN 12193 for sports facilities and EN 1838 for emergency lighting. Required lighting conditions can be achieved with artificial light or daylight, or better yet, a combination of the two.
In order to determine energy efficiency, i.e. energy requirement for building’s lighting system, multiple parameters must be considered. Among other parameters, they include: installed lighting power of the luminaires fitted, the constant illuminance factor and the daylight dependency factor. The analysis usually starts by calculating the energy consumption for the lighting system. This value consists of the energy consumed by the luminaires itself and of the so-called parasitic energy, consumed when the light sources are turned off. The parameters that most strongly affect the value of the energy consumed are: control of the constant illuminance of lighting, control and adjustment of the luminaires, use of daylight. In fact, considering these parameters one is able to calculate the so-called LENI factor, which is the abbreviation for Lighting Energy Numeric Indicator. The LENI factor is determined on the basis of annual energy consumption for lighting divided by the total area of the lighted surface and it is expressed in kWh/m2/a:
∙ ∙
1.000∙
1.000 , (1)
where: P is the power of all luminaires in the room or zone, Ppc is the input power of all control systems in luminaires in the room or
zone when the lamps are not operating, Pem is the input charging power of all emergency lighting luminaires in the room or zone, tN denotes the operating hours during the non-daylight time, tD denotes the operating hours during the daylight time, ty – is the number of hours in one standard year (8760 hours), te denotes emergency lighting charge time, Fc is the constant illuminance factor, FO is the occupancy dependency factor and FD is the Daylight Dependency Factor.
The cut score values of the LENI factor are defined in the CEN EN standard 15193 [4]. A very useful feature is that comparisons on the basis of LENI factors can be made between different buildings having the same or similar functions, but of different design and size. Table 1 gives an example of the LENI factor for some typical building types.
315

International Conference on Innovative Technologies, IN‐TECH 2016,
Prague, 6. ‐ 8. 9. 2016
Table 1. Characteristic values of the LENI factor for typical building types and activities [4]
Building type
Parasitic energy Pload tD tN
Fc FO FD
LENI LENI
LENI LENI
No cte* cte*
Limiting value
Limiting value
Emergency Control Illumin-
ance Illumin-
ance Manu Auto Manu Auto
Manu Auto
Manu Auto
kWh/m2/a kWh/m2/a W h h
- - - -
kWh/m2/a
kWh/m2/a
Office
* 1 5 15 2250 250 1 0.9 1 0.9 1 0.9
42.1 35.3
38.3 32.2
** 1 5 20 2250 250 1 0.9 1 0.9 1 0.9
54.6 45.5
49.6 41.4
***
1 5 25 2250 250 1 0.9 1 0.9 1 0.9
67.1 55.8
60.8 50.6
Educational facility
* 1 5 15 1800 200 1 0.9 1 0.9 1 0.8
34.9 27.0
31.9 24.8
** 1 5 20 1800 200 1 0.9 1 0.9 1 0.8
44.9 34.4
40.9 31.4
***
1 5 25 1800 200 1 0.9 1 0.9 1 0.8
54.9 41.8
49.9 38.1
Hospital
* 1 5 15 3000 2000 1 0.9 0.9 0.8 1 0.8
70.6 55.9
63.9 50.7
** 1 5 25 3000 2000 1 0.9 0.9 0.8 1 0.8
115.6 91.1
104.4 82.3
***
1 5 35 3000 2000 1 0.9 0.9 0.8 1 0.8
160.6 126.3
144.9 114.0
Hotel
* 1 5 10 3000 2000 1 0.9 0.7 0.7 1 1
38.1 38.1
34.6 34.6
** 1 5 20 3000 2000 1 0.9 0.7 0.7 1 1
72.1 72.1
65.1 65.1
***
1 5 30 3000 2000 1 0.9 0.7 0.7 1 1
108.1 108.1
97.6 97.6
* Constant illuminance control system
Indoor lighting system design – general considerations
Design is the science and art of making things useful to humankind and lighting design is the application of lighting—including daylight when it is specifically used as source of lighting — to human spaces. Like architecture, engineering and other design professions, lighting design relies on a combination of specific scientific principles, established standards and conventions, and a number of aesthetic, cultural and human factors applied in an artful manner [3].
Design of the lighting system, considering recognized engineering practice and respecting the provisions of the relevant standards will result in a meaningful, comprehensive and energy efficient installation. Such lighting system will ensure adequate visual comfort, which is reflected in the following:
appropriate level of illumination, uniformity of illumination, uniformity of luminance, luminance limitation, satisfactory contrast, proper orientation lighting, variability of light, appropriate color rendering index, appropriate light color temperature, glare limitation, flicker limitation.
In addition to the visual comfort it is important to achieve the appropriate energy efficiency of the lighting system, which is reflected in:
low power consumption, i.e. operational costs, appropriate maintenance costs.
Commercial lighting system design software
In order to plan lighting system designers use sophisticated software tools e.g. Dailux, Relux, etc. Such professional software is able to model and calculate lighting system parameters of inner premises, outdoor areas, lighting of facades, etc. The software is able of calculating natural light as well as energy consumption in a particular object depending on artificial light. These programs precisely estimate vertical and horizontal lighting levels, blinding and natural light factors. It is possible to accurately visualize 3D graphic design presenting natural light breaks, reflections and object views from various angles, Fig. 1.
Fig. 1 Visualization of the calculation results (commercial software)
316
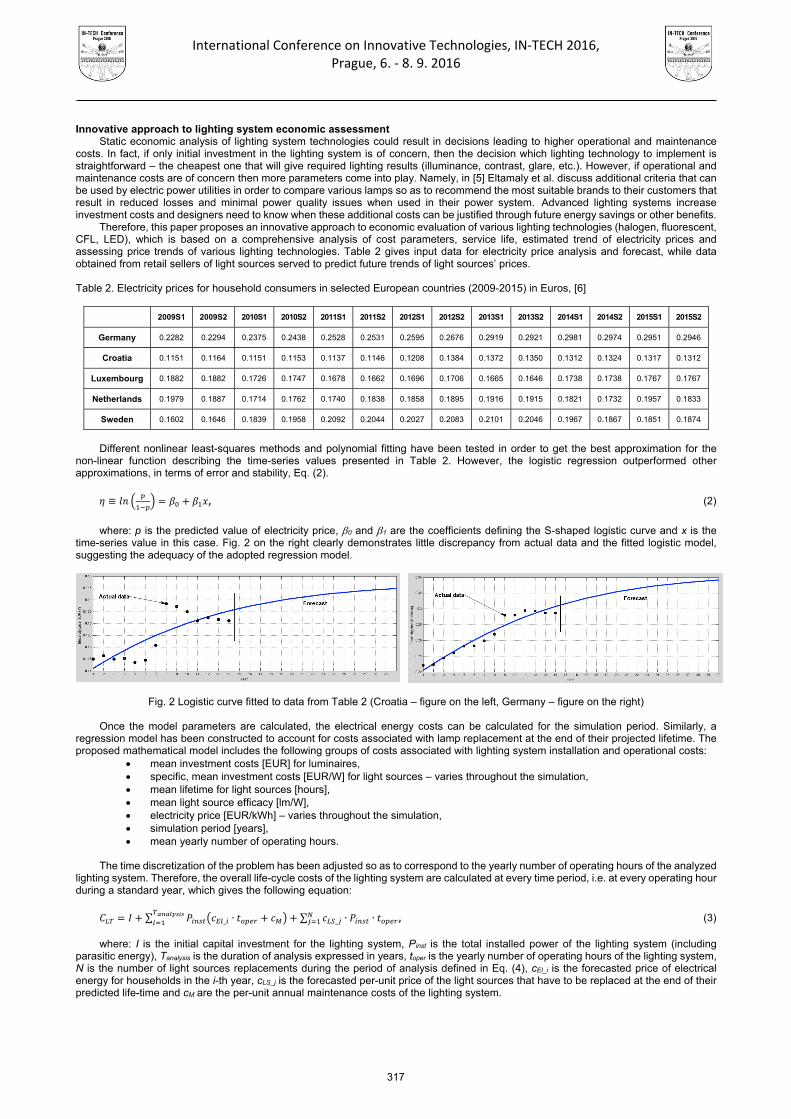
International Conference on Innovative Technologies, IN‐TECH 2016,
Prague, 6. ‐ 8. 9. 2016
Innovative approach to lighting system economic assessment
Static economic analysis of lighting system technologies could result in decisions leading to higher operational and maintenance costs. In fact, if only initial investment in the lighting system is of concern, then the decision which lighting technology to implement is straightforward – the cheapest one that will give required lighting results (illuminance, contrast, glare, etc.). However, if operational and maintenance costs are of concern then more parameters come into play. Namely, in [5] Eltamaly et al. discuss additional criteria that can be used by electric power utilities in order to compare various lamps so as to recommend the most suitable brands to their customers that result in reduced losses and minimal power quality issues when used in their power system. Advanced lighting systems increase investment costs and designers need to know when these additional costs can be justified through future energy savings or other benefits.
Therefore, this paper proposes an innovative approach to economic evaluation of various lighting technologies (halogen, fluorescent, CFL, LED), which is based on a comprehensive analysis of cost parameters, service life, estimated trend of electricity prices and assessing price trends of various lighting technologies. Table 2 gives input data for electricity price analysis and forecast, while data obtained from retail sellers of light sources served to predict future trends of light sources’ prices.
Table 2. Electricity prices for household consumers in selected European countries (2009-2015) in Euros, [6]
2009S1 2009S2 2010S1 2010S2 2011S1 2011S2 2012S1 2012S2 2013S1 2013S2 2014S1 2014S2 2015S1 2015S2
Germany 0.2282 0.2294 0.2375 0.2438 0.2528 0.2531 0.2595 0.2676 0.2919 0.2921 0.2981 0.2974 0.2951 0.2946
Croatia 0.1151 0.1164 0.1151 0.1153 0.1137 0.1146 0.1208 0.1384 0.1372 0.1350 0.1312 0.1324 0.1317 0.1312
Luxembourg 0.1882 0.1882 0.1726 0.1747 0.1678 0.1662 0.1696 0.1706 0.1665 0.1646 0.1738 0.1738 0.1767 0.1767
Netherlands 0.1979 0.1887 0.1714 0.1762 0.1740 0.1838 0.1858 0.1895 0.1916 0.1915 0.1821 0.1732 0.1957 0.1833
Sweden 0.1602 0.1646 0.1839 0.1958 0.2092 0.2044 0.2027 0.2083 0.2101 0.2046 0.1967 0.1867 0.1851 0.1874
Different nonlinear least-squares methods and polynomial fitting have been tested in order to get the best approximation for the
non-linear function describing the time-series values presented in Table 2. However, the logistic regression outperformed other approximations, in terms of error and stability, Eq. (2).
≡ , (2)
where: p is the predicted value of electricity price, 0 and 1 are the coefficients defining the S-shaped logistic curve and x is the
time-series value in this case. Fig. 2 on the right clearly demonstrates little discrepancy from actual data and the fitted logistic model, suggesting the adequacy of the adopted regression model.
Fig. 2 Logistic curve fitted to data from Table 2 (Croatia – figure on the left, Germany – figure on the right)
Once the model parameters are calculated, the electrical energy costs can be calculated for the simulation period. Similarly, a regression model has been constructed to account for costs associated with lamp replacement at the end of their projected lifetime. The proposed mathematical model includes the following groups of costs associated with lighting system installation and operational costs:
mean investment costs [EUR] for luminaires, specific, mean investment costs [EUR/W] for light sources – varies throughout the simulation, mean lifetime for light sources [hours], mean light source efficacy [lm/W], electricity price [EUR/kWh] – varies throughout the simulation, simulation period [years], mean yearly number of operating hours.
The time discretization of the problem has been adjusted so as to correspond to the yearly number of operating hours of the analyzed
lighting system. Therefore, the overall life-cycle costs of the lighting system are calculated at every time period, i.e. at every operating hour during a standard year, which gives the following equation:
∑ _ ∙ ∑ _ ∙ ∙ , (3) where: I is the initial capital investment for the lighting system, Pinst is the total installed power of the lighting system (including
parasitic energy), Tanalysis is the duration of analysis expressed in years, toper is the yearly number of operating hours of the lighting system, N is the number of light sources replacements during the period of analysis defined in Eq. (4), cEl_i is the forecasted price of electrical energy for households in the i-th year, cLS_j is the forecasted per-unit price of the light sources that have to be replaced at the end of their predicted life-time and cM are the per-unit annual maintenance costs of the lighting system.
317
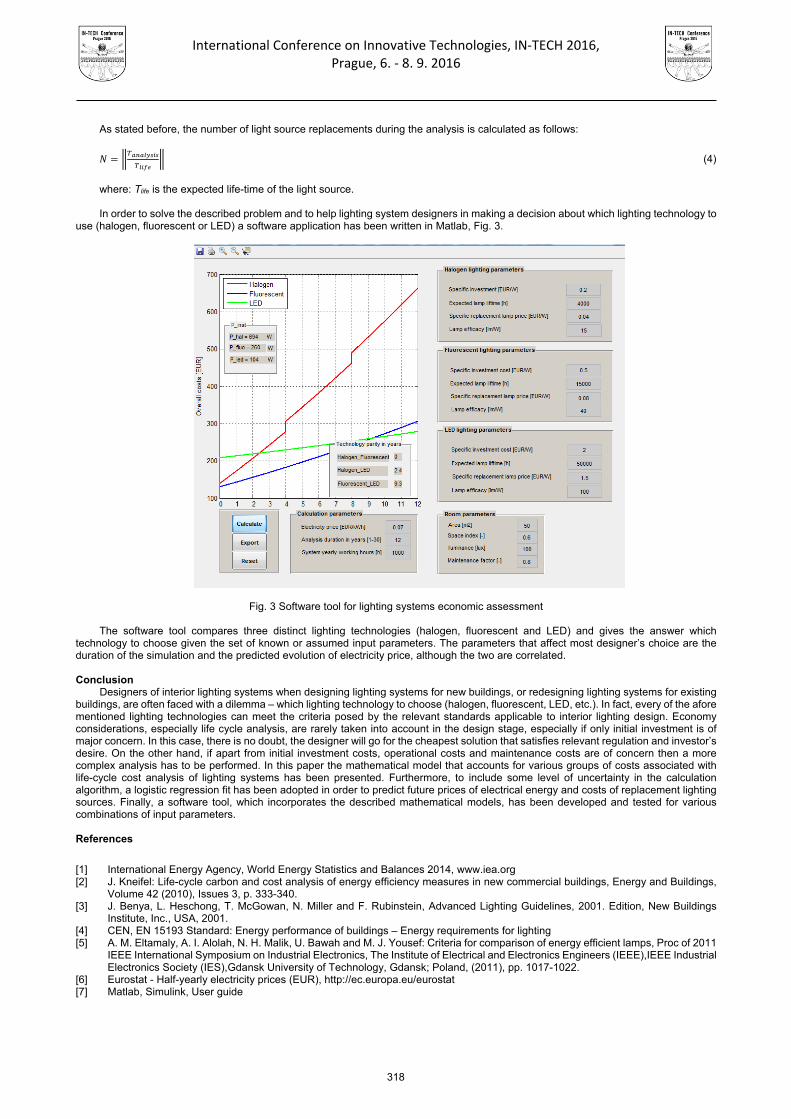
International Conference on Innovative Technologies, IN‐TECH 2016,
Prague, 6. ‐ 8. 9. 2016
As stated before, the number of light source replacements during the analysis is calculated as follows:
(4)
where: Tlife is the expected life-time of the light source. In order to solve the described problem and to help lighting system designers in making a decision about which lighting technology to
use (halogen, fluorescent or LED) a software application has been written in Matlab, Fig. 3.
Fig. 3 Software tool for lighting systems economic assessment
The software tool compares three distinct lighting technologies (halogen, fluorescent and LED) and gives the answer which technology to choose given the set of known or assumed input parameters. The parameters that affect most designer’s choice are the duration of the simulation and the predicted evolution of electricity price, although the two are correlated. Conclusion
Designers of interior lighting systems when designing lighting systems for new buildings, or redesigning lighting systems for existing buildings, are often faced with a dilemma – which lighting technology to choose (halogen, fluorescent, LED, etc.). In fact, every of the afore mentioned lighting technologies can meet the criteria posed by the relevant standards applicable to interior lighting design. Economy considerations, especially life cycle analysis, are rarely taken into account in the design stage, especially if only initial investment is of major concern. In this case, there is no doubt, the designer will go for the cheapest solution that satisfies relevant regulation and investor’s desire. On the other hand, if apart from initial investment costs, operational costs and maintenance costs are of concern then a more complex analysis has to be performed. In this paper the mathematical model that accounts for various groups of costs associated with life-cycle cost analysis of lighting systems has been presented. Furthermore, to include some level of uncertainty in the calculation algorithm, a logistic regression fit has been adopted in order to predict future prices of electrical energy and costs of replacement lighting sources. Finally, a software tool, which incorporates the described mathematical models, has been developed and tested for various combinations of input parameters. References
[1] International Energy Agency, World Energy Statistics and Balances 2014, www.iea.org [2] J. Kneifel: Life-cycle carbon and cost analysis of energy efficiency measures in new commercial buildings, Energy and Buildings,
Volume 42 (2010), Issues 3, p. 333-340. [3] J. Benya, L. Heschong, T. McGowan, N. Miller and F. Rubinstein, Advanced Lighting Guidelines, 2001. Edition, New Buildings
Institute, Inc., USA, 2001. [4] CEN, EN 15193 Standard: Energy performance of buildings – Energy requirements for lighting [5] A. M. Eltamaly, A. I. Alolah, N. H. Malik, U. Bawah and M. J. Yousef: Criteria for comparison of energy efficient lamps, Proc of 2011
IEEE International Symposium on Industrial Electronics, The Institute of Electrical and Electronics Engineers (IEEE),IEEE Industrial Electronics Society (IES),Gdansk University of Technology, Gdansk; Poland, (2011), pp. 1017-1022.
[6] Eurostat - Half-yearly electricity prices (EUR), http://ec.europa.eu/eurostat [7] Matlab, Simulink, User guide
318

International Conference on Innovative Technologies, IN‐TECH 2016,
Prague, 6. ‐ 8. 9. 2016
AN AUTOMATED QUESTION ANSWERING SYSTEM FOR SUBJECTIVE INQUIRIES
L. Acharya1, B. Webster1 and W. Arrasmith1 1 Florida Institute of Technology, 150 W University Blvd, Melbourne, FL 32901, United States of America
Keywords: Automated Question Answering; Text Mining; Web Mining; Information Retrieval; Natural Language Processing; Subjective; Sentiment Analysis
Abstract: An automated question answering system aims to develop automated techniques that can answer many varieties of questions, from simple yes/no to very complex subjective questions. The goal of such a system is to find the best answer to a given question from a large amount of data available through search engine results. Although a number of question answering systems capable of carrying out this function with a high level of accuracy have been developed, very little work has been reported on techniques for automatically finding reasonable answers to highly subjective questions. The objective of this paper is to present a self-contained, automated system for searching for desired information, evaluating that information, resolving conflicting evidence, and returning answers to a wide variety of subjective questions. A multi-phase approach is presented for accomplishing this process, and a number of real world subjective events are used to test the accuracy of the system and to make predictions within complex situations. An explanation accompanies each final answer as an output of the system, providing transparency, clarification, and rationale for that answer.
Introduction Using the Internet to look for answers to questions of interest has been observed to be the norm for a great many people, primarily
because of the speed and efficiency by which answers to those questions can be obtained [1]. However, given the enormous amount of results returned by search engines, it is very easy to be overwhelmed by the amount of data that such searches produce. Question Answering (QA), a sub-field of Information Retrieval (IR), is a solution to this problem which uses computerized resources to seek out and return answers to questions of interest from a data source. While IR is one of the oldest fields within the area of searching for information, QA is one of the newest and most exciting research areas within IR, with a potential to be commercially successful [2].
A QA system searches a large text collection and constructs a short phrase or sentence that precisely answers a user's question. QA can also be seen as a multidisciplinary field involving information technology, artificial intelligence, natural language processing, knowledge and database management, and cognitive science, that automatically answers questions asked by humans in a natural language [3].
While there can be slight variations in how users actually accomplish QA, investigations have revealed a general overall process that can be identified [4]. Additional investigations have resulted in a suggested method which can be used to perform QA in a manner similar to the general process, but which is also tailored for doing so in an automated fashion [5]. This suggested general process consists of seven phases, which are:
1. Question selection – the question for which an answer is being sought is identified. 2. Search engine selection – a search engine (or possibly multiple search engines), usually from those widely available on the
World Wide Web (WWW) such as Google, Bing, Yahoo, etc., is chosen to perform the search for information relevant to answering the selected question [1].
3. Query execution – one or more keywords and/or phrases is/are input into the selected search engine(s), and a query is conducted to locate sources of information that could potentially be used to answer the selected question. The result of the query is a (typically very large) collection of websites.
4. Selection of websites to search for evidence – since the number of websites returned by queries is usually much too large to search in their entirety, a determination is made as to which of the websites will be further examined for evidence related to answering the selected question.
5. Identification of evidence – the selected websites are systematically searched, looking for any and all evidence that could be used in support of an answer to the selected question.
6. Processing of evidence – evidence collected from selected websites is analyzed to produce a set of individual answers to the selected question. The individual answers are then combined into a single final answer. This will often involve the need to reconcile pieces of evidence that point to different answers to the selected question.
7. Delivery of final answer – based on the results of processing the collected evidence, an answer to the selected question is returned to the user.
When this process is performed by human users (again, perhaps with minor variations), the majority of the process must be accomplished manually. Of course, the actual searching of the WWW is performed by the selected search engine. However, all other phases of the process must be performed by the users themselves. This paper, on the other hand, presents a novel approach to allow automation of all of these phases except the initial selection of a question and a portion of the query formation. This enables users to obtain answers to highly subjective and potentially complex questions in a matter of seconds rather than hours. It also ensures that the QA process is conducted in a standard and repeatable manner – systematically, consistently, and thoroughly.
Background QA traces its origins back to the 1960s, when the automatic answering of questions began with the systems BASEBALL, which
answered questions about baseball statistics, and LUNAR, which replied to questions regarding the analysis of rocks returned by the Apollo moon missions [6]. In more recent years, a variety of QA systems have appeared. Some of the current widely recognized QA systems are:
AnswerBus – an open-domain system based on sentence level web information retrieval [7].
319

International Conference on Innovative Technologies, IN‐TECH 2016,
Prague, 6. ‐ 8. 9. 2016
AskMSR – uses an architecture consisting of query-reformulation, filtering, and n-gram mining and tiling (n-grams being contiguous sequences of n items appearing together in a particular order). This system works well for producing short answers to factually-based questions [8].
Mulder – performs the following steps to find an answer: question parsing in search-engines, question classification, query formulation, choice of search engine, answer extraction, and selection of answer by voting procedure [9].
Predictive Annotation – more a technique than a system, it uses analysis of questions and ranking of selected answers to determine the best answer [10].
Watson – a natural language system that does not use prepared answers, but produces answers and associated confidence scores based on knowledge it has acquired [11].
For this paper, an alternative method for answering subjective questions using general purpose search engines was developed. In doing so, the intent was to construct a system which automated as much of the QA process as practical, and which differed significantly from these other currently available QA systems in such a way as to introduce some improvements. The resulting Automated Question Answering (AQA) process allows users to obtain answers to their questions simply by entering a few pieces of information, and the system does the rest of the processing and returns the answer. This frees users from having to manually perform the various steps of the QA process themselves, thus dramatically increasing the speed at which answers are returned without decreasing the reasonability of those answers.
Research Methodology The AQA process began with the selection of questions to be used for testing its effectiveness. Selected questions needed to be
highly subjective, as this was the target category of questions to be answered, and somewhat controversial such that there was a high likelihood that answers to the questions would be different from one website to another. In some cases, though, less subjective questions that would predict future events were formulated so as to be able to test the accuracy of the AQA process once the actual answers to those questions became known. Using these criteria, a set of questions dealing with popular and well-debated topics was assembled. Some of the questions addressed scientific topics such as the possibility of faster-than-light travel, while others addressed topics of a more social nature such as the acceptability and successfulness of arranged marriages. Questions of a political nature were included (such as who should be the next President of the United States), as were questions the mere mention of which would be almost certain to start an argument within many groups of people (such as the reality and extent of global climate change).
To answer the selected questions, the next step was to select the search engine. For the purposes of this work, a search engine was defined as any tool that facilitates the searching of information contained within the WWW. There are many available general purpose search engines – Google, Bing, and Yahoo being the most popular [5]. Each has its strengths and weaknesses, and each may return different results for a given query. Bing was ultimately selected since its pre-defined HTML structure made it easier to analyze the search results and corresponding links.
Having selected the search engine to be used, queries needed to be executed using that search engine for each of the selected questions. This entailed the selection of search terms and keywords, which are words and/or short phrases that are used as input to a search engine for the purpose of representing the topic of the question being considered. When conducting a search, the choice of search terms and keywords used can affect the applicability and completeness of the information returned, so a careful selection is warranted. For each of the selected questions, search keywords were identified based on their having a close relationship to the original question. This could mean that the keyword appeared as an actual word within the original question, or it held a direct connection to the topic of the original question. At this initial stage of development, up to three keywords/phrases could be identified per question for the sake of simplicity and consistency across all of the selected questions. Additionally, it was possible to specify up to three “sub-questions” for each main question. These sub-questions were of a more basic nature than the main questions, and identified topics upon which the main questions depended. Using the sub-questions allowed for a deeper analysis of the main questions, which was intended to result in a better focus on the underlying issues associated with those questions.
Out of the several tens of thousands of results returned by the search queries, only a relative few could be chosen for searching for evidence. One of the primary intents of the AQA process was to return answers quickly, which limited the number of websites that could reasonably be searched to a collection that could be processed in less than one minute. The issue then became how to determine which websites to include in this collection. A survey conducted for [4] found that people are very likely to simply select the first several websites (often five or fewer) shown in the search results. This selection can sometimes be altered by other factors that have been shown to be taken into consideration when users make a determination of the relative value of the returned websites [12]. These factors include:
The content of a website displayed within the search results (i.e. title, text snippet, etc.) is closely related to the search terms used to perform the search query.
The relative usefulness of a website for the purpose of answering the question under consideration is high, as perceived by the user [13]. For example, a scientific publication website will generally be perceived to be more useful for answering a science-related question than an online marketplace website.
The level of trustworthiness of a website is perceived by the user to be high. That is, a website has a reputation for being reliable, or in some cases simply appears to the user to be authoritative.
A website has complementary relationships with other websites in the search list [4]. This could mean that the website contains some of the same elements in its displayed content as other websites, or the website appears to have a relationship with another website, such as one news website with another, or one website appears to be relevant to one facet of the question at hand and another appears to be relevant to a different facet of the question.
The responsiveness of a website is high, meaning that it is rendered in its entirety quickly when selected. Also, if there are any user input items on the website, responses to selections made by the user are also handled quickly.
Based on these findings, it was decided that all the websites returned in the first page of the search results would be selected, which ranged from 10 to 15 results for each main and sub-question. Since these were the top results returned by the search engines, this would mimic the manner in which users would perform the same selection process, and would allow for the necessary brevity of processing.
The selected websites next needed to be searched for evidence related to the question under consideration. The searching process needed to be able to extract identifiable concepts and facts to determine whether they included evidence that could be used to answer that question, and if so, the direction in which the discovered evidence pointed. Sentiment Analysis (SA), a form of concept extraction that attempts to determine the attitude of the content of documents, was then used as the analysis mechanism. SA, also known as opinion extraction, opinion mining, sentiment mining, and subjectivity analysis, attempts to classify a document as positive, negative, or neutral according to the relative tone of the opinions expressed within the text of that document. If the opinions detected within a document are mostly favorable towards the topic of that document, it is given a positive “polarity”. Likewise, if the opinions detected are mostly unfavorable towards the document topic, that document is given a negative polarity. If SA is unable to determine the overall tone of the document, or there is a relatively even mix of opinions, that document is given a neutral polarity. The assessed relative strength of the
320

International Conference on Innovative Technologies, IN‐TECH 2016,
Prague, 6. ‐ 8. 9. 2016
detected sentiment is given by the assignment of a floating-point number (valued between 0.0 and 1.0) to each document classified, called the polarity confidence value [5].
Currently, there are three main types of approaches to conducting SA: knowledge-based, statistical, and hybrid. Knowledge-based approaches look for terms that unambiguously indicate sentiment, such as “good” or “dislike”, and can be assisted through the use of databases of terms which have already been classified according to their sentiment polarity. These databases can be very large and difficult to maintain, but utilities such as WordNet and dictionaries can be used. WordNet is a lexical database that groups words into collections called “synsets” containing words that have the same or very nearly the same meanings. Statistical approaches to SA use machine learning techniques to make probabilistic assessments of the sentiments, while hybrid approaches combine techniques of knowledge-based and statistical approaches when performing an analysis.
In the next phase of the AQA process, the evidences collected from the selected websites for answering the selected questions (and their associated sub-questions) were examined for conflicts. The sentiments extracted from the documents contained within the selected websites became individual answers to the question under consideration. A document having a positive SA polarity would be indicating a “yes” answer to the question (or one of the sub-questions for that question), a negative SA polarity would indicate a “no” answer, and a neutral SA polarity would equate to an answer of “maybe” to the question or sub-question. The collection of individual answers could then be combined into an overall answer for the original question. If all of the individual answers had the same polarity, then determination of an overall answer became simple. However, this was not to be expected; the nature of the selected questions was intentionally such that there was a strong likelihood that there would be different SA polarities determined for different documents.
In such situations of conflicting opinion, a decision-making technique needed to be applied to reconcile the conflicts and determine a reasonable overall answer. A number of such techniques are available, including Multiple Criteria Decision Analysis (MCDA), Analytic Hierarchy Process (AHP), Decision Trees, Multi-voting, Linear Programming (LP), etc. If a more complicated method could be shown to produce better answers, then the additional computational cost would be justifiable and that method should be used. On the other hand, if a simpler method gave answers that were just as reasonable, then that method should be used since that would result in easier implementation and faster processing. After examining a variety of methods for reconciling conflicting evidence, it was concluded that there was no reliable way to definitively and consistently determine that any one method produced reconciliations resulting in more reasonable final answers than any other method. Consequently, majority rule was selected for reconciling the conflicting evidences because of its simplicity. Whichever polarity appeared the most frequently among the documents searched determined what the final answer to the question would be. In case of ties, majority rule was accompanied by summation of the polarity confidence values.
It should be noted that, though the SA processing produced only yes, no, or maybe polarities, it was not limited to use on only yes/no questions. Because SA analyzes the relative tone of a document, it will analyze whatever tone is present. Thus, regardless of the topic with which a document is dealing, SA will still identify the relative tone of the document towards that topic. As such, SA could be adapted to analyze the tone of a variety of topics, and in this way, the analyses could be combined to address even complex questions such as a number of those included within the selected set used for this work.
Once a final answer had been determined, the AQA process concluded by returning that answer to the user. To facilitate the use of the AQA process, a user interface was developed using the C# programming language, which is a simple, general purpose object-oriented programming language developed for use within the Microsoft .Net framework. This user interface is shown in Fig. 1:
Fig. 1 AQA User Interface
Results and discussion The main motivation behind the work for this paper was to develop a basic AQA system capable of taking highly subjective, possibly
controversial questions and automatically produce consistently reasonable answers to those questions. The process that was developed was assessed through the series of selected questions, as mentioned earlier. In each case, the answer produced by the system was reasonable. This determination was made by manually examining the documents contained within the websites that had been selected to be searched for evidence, and verifying both that the SA had reached the correct conclusions for those documents, and that reconciliation of any conflicting evidence had not resulted in any improper skewing of the final answers which would be returned to the user. An example output of the AQA process is shown in Fig. 2:
321

International Conference on Innovative Technologies, IN‐TECH 2016,
Prague, 6. ‐ 8. 9. 2016
Fig. 2 Example Results Window
These results indicated that the system was consistently producing reasonable answers, and the generic nature of the system demonstrated that the proposed process is applicable to a broad spectrum of tasks, from scientific research to household inquiries. As the AQA system developed here is still in its infancy, the findings presented in this paper are somewhat preliminary, yet they demonstrate very high potential for continuation of this research. Because of its ability to handle subjective and complex questions while using a very simple evidence reconciliation method, this AQA system was shown to be able to reliably produce reasonable answers to highly subjective and potentially controversial questions in a very short amount of time. Also, by virtue of its simple user interface, the system is very easy to understand and use. Additionally, this AQA system clearly showed some advantages over existing QA systems, namely:
1. AskMSR uses Bayesian analyses which require non-zero initial conditional probabilities (which are arbitrarily determined), whereas the AQA system presented here does not have any such prerequisites. Also, AskMSR is only suitable for short, fact-based questions.
2. Mulder uses a voting method for evidence reconciliation, which may underrepresent a minority of evidence that could have a strong influence on the overall answer, whereas this AQA system has the ability to reward strongly opinioned evidence.
3. Predictive Annotation makes use of ranking of the selected answers, while this AQA system takes into account the fact that such ranking cannot reliably be performed for subjective questions.
4. AnswerBus uses sentence level information retrieval, which can be computationally expensive, whereas this AQA system determines the overall polarity and confidence on a per-document basis. All data within each document are considered when determining the polarities and confidence levels, but overall the processing is less intensive than performing analysis sentence by sentence.
5. Watson requires application of machine learning and statistical techniques and relies on a complex database of knowledge, while this AQA system, though also capable of using complex databases, does not require one to operate.
Conclusion Although this AQA system looks very promising for answering complex subjective questions, it still requires users’ input for directing
the search engine through sub-questions and keywords. Slightly different inputs on the sub-questions and/or keywords can result in very different data. Additional work will be done to incorporate increased automation into the system, as well as to provide improvements to each phase of the QA processing. Possibilities have been identified for improvements to the query formulation procedure, the website selection procedure, and the website content analysis procedures. Deeper investigations into the issues and potential approaches to evidence reconciliation are also planned. Work has already commenced on these endeavors, and we look forward to seeing where it might take us. References [1] K. Purcell, J. Brenner and L. Rainie. Search Engine Use 2012. [Online] March 2012.
http://www.pewinternet.org/2012/03/09/search-engine-use-2012/.
[2] Natural language question answering: the view from here. L. Hirchman and R. Gaizauskas. s.l. : Cambridge University Press, 2001, Natural Language Engineering, pp. 275–300.
[3] A Survey of Text Question Answering Techniques. P. Gupta and V. Gupta. 2012, International Journal of Computer Applications.
[4] Website Selection in Internet Search Engines. M. Abdirad and B. Webster. unpublished.
[5] M. Abdirad. Thesis. s.l. : Florida Institute of Technology, 2016.
[6] Question Answering. D. Jurafsky and J. H. Martin. 2014, Speech and Language Processing.
[7] AnswerBus Question Answering System. Z. Zheng. 2007, University of Michigan.
[8] AskMSR: Question Answering Using the Worldwide Web. M. Banko, E. Brill, S. Dumais and J Lin. 2002. American Association for Artificial Intelligence.
[9] Scaling Question Answering to the Web. C. Kwok, O. Etzioni and D. S. Weld. 2001, pp. 150-161.
[10] Question-Answering by Predictive Annotation. J. Prager, E. Brown and A. Coden. 2000. SIGIR '00 Proceedings of the 23rd annual international ACM SIGIR conference on research and development in information retrieval. pp. 184-191.
[11] S. Chandrasekaran and C. DiMascio. Create a natural language question answering system with IBM Watson and Bluemix services. IBM.COM. [Online] 2014. http://www.ibm.com/developerworks/cloud/library/cl-watson-films-bluemix-app/.
[12] A Decision Support System for Website Selection for Internet based Advertising and Promotions. A. K. Kar. 2014, Springer.
[13] Perceived Usefulness, Perceived Ease of Use, and User Acceptance of Information Technology. F. D. Davis. 1983, MIS Quarterly, p. 319.
322

International Conference on Innovative Technologies, IN‐TECH 2016,
Prague, 6. ‐ 8. 9. 2016
THE PROCESS OF INTEGRATED MARKETING COMMUNICATION
S. Firsova1, V. Prajová2 and P. Božek3 1 Department of Finance and Credit, Engineering and Economics Faculty,Izhevsk state technical university of
the name M.T. Kalashnikov, 7 Studencheskaya street, 426069 Izhevsk, Russia 2 Slovak University of Technology, Faculty of Materials Science and Technology, Institute of Industrial
Engineering and Management, J. Bottu 25, Trnava 91724, Slovakia
3 Slovak University of Technology, Faculty of Materials Science and Technology, Institute of Applied Informatics, Automation and Mechatronics, J. Bottu 25, Trnava 91724, Slovakia
Keywords: Marketing Communication; Implementation; Stage Abstract: IMK process it based on the process of creating marketing communication strategy and plan that diagram and description of the scale of work further on the strategy of the company, from the analysis of customer requirements, whose outputs are suggestions to improve customer satisfaction and loyalty and marketing communication process. The implementation process is the realization of IMK. The implementation process in the company IMK is important to follow the plan of marketing and communication process. Efficient functioning of IMK implementation process must respect the objectives, planning and components IMK. Introduction After the analysis, the use of ICT in manufacturing companies that, to increase the competitiveness of these enterprises should begin to strengthen some interactive forms of IMK. In recent years seen a big boom in social networking. In addition to ordinary users get their benefits already noticed by some entrepreneurs. The results of the analysis and the results of the analysis of external companies showed that this leaves significant scope for integrated marketing - communications platform through which businesses may interact with customers, detect its needs, preferences, and not least because of the views. From the analysis, the profiled customer who is a beneficiary of the social network Facebook, university educated, aged 24-45 years, with an annual household income of over € 1,300 and from places which have over 100,000 residents. Through communication with those customers on the social network, business receives feedback and so can react flexibly and adapt their activities in the field of integrated marketing communication. [3] Figure shows the effect of various integrated marketing communication tools way Through the Line (TLT).
TTL (Through the Line)
Advertising (Advertising)
Personal Selling (Personal Selling)
Sales Promotion (Sales Promotion)
Direct marketing (Direct marketing)
Public relations (Public relations)
Fig.1 Representation of the integrated operation of individual tools of marketing communication method TTL [7]
The implementation process of integrated marketing communication, which is characterized by various stages [4]:
The stage design - provides the basis for proper and successful implementation of the process of integrated marketing communication.
Draft documentation and documentation of the process must be carried out by workers in an organization created in the conceptual
phase, which were defined in the rules of operation and was created in order to implement the process. At this stage, it creates a description of the process as the process of implementation and management of the organization. It is a document that will be presented to senior management, other employees and will provide a link between the vision and the actual implementation.
An integral part of this phase of the training / retraining of employees directly involved in the process of integrated marketing
communications to meet the requirements of the organization. For workers who are in the process carried out various activities. Therefore, it is necessary to have the process involved employees who are competent in terms of their education, training, ability to use their knowledge and skills. Training / retraining of employees involved in the data-IMK must possess the knowledge, procedural knowledge, communication skills, skills to work with modern communication and information technologies, skills in information security and not least the skills of coping with difficult and problematic situations.
IMK after documented process leads to its commenting and approval. Workers performing the activity process, together with the senior management team of workers and drawing up the process, submit their comments, which were then incorporates into the process while the process of removing any gaps. Impetus to the implementation stage of the process is agreed and approved documentation
ATL (Abowe the Line)
BTL (Below the Line)
323

International Conference on Innovative Technologies, IN‐TECH 2016,
Prague, 6. ‐ 8. 9. 2016
process and its top management. [2]
stage of implementation - a phase during which there is a process of introducing into practice. At this stage, all personnel involved process of performing a specific process activities in accordance with the approved documentation process. There is additional documentation and process changes according to the needs resulting from the introduction into practice. As part of this phase is the re-training of internal auditors, whose task is to prepare and evaluate the audit process and the audit of the process.
verification stage – at this stage, it prepares audit process, and carried out the actual audit process and its evaluation. To the assessment and evaluation of the completeness of the established process, verification of compliance with the requirements of the organization. The output of this stage is the audit report that provides an accurate record of the audit and the findings, conclusions and recommendations for improvement.
stage improvements – in that phase of the process in place to improve on the results of the audit process IMK.
Fig.2 The implementation process IMK [3]
The proposed implementation process IMK is prepared, in general, and its application should be possible in any organization. If
nature does not allow organizations to apply any of the actions proposed by IMK implementation process, it is possible to assess the modification, respectively accumulation of steps, depending on the organization's own terms. IMK importance of the implementation process in organizations will only take effect when the process is constantly active. Appropriate instrument for the implementation of corrective actions and improvements in the methodology of PDCA (Plan / Plan - Do / do - verify / check -, act / act) that can be used at all levels of the organization. [2] This tool can be briefly stated as [5,6]:
Plan (P) – Planning and design process IMK - at this stage there is in setting objectives and programs to determine the activities and to determine the resources needed to achieve the necessary results in accordance with the marketing and communication strategy, business plan and in accordance with the requirements of the customer.
Do (D) – The application process IMK - phase embodiment of the process - where there is assessment of the existing situation, the identification of the target group in setting objectives IMK, the selection of appropriate communication tools for compilation of communications information to develop systems to measure the effectiveness and efficiency of the IMK, the verifications of information security and not least to management and coordination of IMK.
Certified (C) – Keeping the process IMK - at the stage of verification occurs the collection of information for the analysis and evaluation of feedback, the verifications satisfaction with the application of tools for monitoring and measuring process to review potential risks and review the process.
Action (A) – Process improvement IMK - it is the phase during the formation of the conclusions, the observed deficiencies, the
324

International Conference on Innovative Technologies, IN‐TECH 2016,
Prague, 6. ‐ 8. 9. 2016
determination of the corrective measures for continuous improvement of process performance IMK. It is evident that communication through traditional media in developed countries decline to some extent. We stand at the beginning of development, which requires new forms of integrated marketing communication in organizations of various types. The quality of external and internal communication in an organization can have a direct impact on the positive results of their own business activities, increasing competitiveness to reduce costs, but mainly on the improvement of relationship building customer confidence. The criterion of the quality of communication activities can not be quantity but especially their optimal differentiated track.[1] Prospects for the development of quality communication is based, inter alia, the implementation of an integrated system approach and the application of multimedia that can be outsourced (but internal) communication with an emphasis on the resulting effect.
Acknowledgment Currently one of the most important indicators for the enterprise are financial indicators. Using the proposed implementation process IMK, swiping all parts of this process and the possibilities of social networks in the IMK is also reflected in increased business compe-titiveness, which also lead to financial benefits of such an undertaking.The contribution is sponsored by VEGA MŠ SR No 1/0367/15 prepared project „Research and development of a new autonomous system for checking a trajectory of a robot“ and project KEGA MŠ SR No 006STU-4/2015 prepared project „University textbook "The means of automated pro-duction" by interactive multimedia format for STU Bratislava and Kosice“. References [1] Boyd D. M. – Ellison N. B., (2007) Social Network Sites : Definition, History and Scholarship. [online], Available on the Internet:
http://jcmc.indiana.edu/vol13/issue1/boyd.ellison.html.. [2] DePelsmacker P. - Geuens M. - Van Den Bergh J., (2003) Marketing communication, Grada Publishing, Praha, ISBN 80-247-
0254-1 Morua M., Watt D.N. Information Technology in Complex Systems // The Env. Journal. August 2014. Vol. 5, 5. PP. 93-100.
[3] Hlinková D., (2011) Social Networking - effective trend in marketing communication, In: Proceedings of scientific studies on the history and theory of marketing communications and media nr.10, Book&Book Publisher, ISBN 978-80-970247-5-8, str.221-233.
[4] Kitchen P.J. – Schultz D. E. – Kim I. - Han D. – Li T., (2004) Will agencies ever „get“(or understand) IMC? European Journal of Marketing, 38 (11/12), str. 1417-1436.
[5] Kitchen P.J. – Schutltz D., (1999) A multi-country comparison of the drive for IMC. Journal of Advertising Research, 39. [6] Schultz D.E. – Schultz H., (2003) IMC – the next generation: five steps for delivering value and measuring returns using markting
communication. New York: McGraw-Hill [7] Kašík, M. – Havlíček, K., (2012) Marketing in shaping corporate strategy, 2. Aktualizované vydanie. Praha: Vysoká škola finanční
a správní, Edice EUPRESS, ISBN 978-80-7408-060-9
325

International Conference on Innovative Technologies, IN‐TECH 2016,
Prague, 6. ‐ 8. 9. 2016
326

International Conference on Innovative Technologies, IN‐TECH 2016,
Prague, 6. ‐ 8. 9. 2016
PROPOSAL METHOD OF CHEMICAL PRE-TREATMENT ON HOT-DIP GALVANIZATION SURFACE FOR ADHESION ORGANIC COATINGS
J. Svoboda1, J. Kudláček1 and V. Kuklík1
1 Czech Technical University in Prague, Faculty of Mechanical Engineering, Technická 4, 166 07 Praha 6, Czech Republic
Keywords: Duplex Systems; Hot-Dip Coating; Adhesive; Coating Systems; Conversion Layers; Corrosion; Chemical Pretreatment Of Surface Abstract: The first part of this paper deals about chemical surface pre-treatments of zinc and the impact of alternative pre-treatments for adhesion of organic coating. The second part is devoted to the experimental part, which was created several surface pre-treatments of hot-dip galvanization and subsequently applied two kinds of paints. The objective was comparison of pre-treatment and the effect of each on the adhesion of the organic coating. It was created seven variations pre-treatment of hot-dip galvanization surfaces. Adhesion of these systems was investigated by pull-off test according to ČSN EN ISO 4624, adhesion test with X-cut tape test according to ASTM D 3359, adhesion cross cut test according to ČSN EN ISO 2409. In this work was investigated two coating systems at six chemical and one mechanical pre-treatment of the surface of the hot-dip galvanization. Introduction
Duplex system is one type of surface treatment material, where the total protection system consists of a zinc coating and coating paints. These systems are frequent technology corrosion protection. With the highest life is then a method for protection of steel structures, especially in atmospheric conditions. Concentration of the coating system and the zinc coating to prolong the lifetime of the system up to 100 years, but depending on the aggressive corrosive environments, and many other factors [1,2].
Galvanized sheets are usually protected from the corrosive environment conversion coatings (phosphate, chromate etc.) and are provided with organic coatings which provide barrier protection against corrosion. The conversion layer is created particularly for higher corrosion resistance, but also to improve the adhesion of organic coatings, provide sufficient porosity and roughness for adhesion of organic coatings [3]. However, there are many methods for producing conversion layers on the basis of phosphate, chromate, modified types of ferrous phosphate, Ti-Zr conversion layers etc. Each of the above-mentioned chemical surface pre-treatment has its own effect on the adhesion of organic coatings, which is also the subject of investigation of this work.
Conversion layers Phosphating
It is the most chemical treatment of steel in which are formed on the surface of the tercial phosphates of zinc, calcium and manganese. Other capabilities of these layers is binding certain organic substances on their surface. These include petrolatum, impregnating oils, but especially paints. Phosphate coatings are also used to form the insulating properties at the surface of transformer sheets to reduce friction of the moving parts [4].
Using phosphates under organic coatings increases the corrosion resistance of the whole system. Phosphate layer prevents corrosion of paint systems and increases the adhesion to the metal surface. To increase adhesion is required fine grained layers (10-60 mg.dm-2), because thick layers of phosphate leads to the release of the individual crystals.
Fig.1 Left: SEM image an amorphous of ferrous phosphate, Right: SEM image hopeitu crystals of zinc phosphate [5]
Chromating It is a widely used method of passivation is used to improve the corrosion resistance and adhesion of organic coatings especially for
non-ferrous metals, for example zinc, aluminium and cadmium coatings. Electrolytic galvanizing and subsequent treatment of the zinc surface with chromate conversion layers is now very widespread, but it is an effort to replace these conversion layers with new alternative chemical pre-treatments. Chromate coatings provide improved corrosion resistance of zinc coatings mainly due passivation effect of chromium compounds present in the coating [4]. Chromate bath may be alkaline or acidic type. Alternative technologies for the ferrous phosphating and chromating
Chemical pretreatment is an essential step process for producing conversion layers, in particular steel, aluminum, zinc materials. With these surface pretreatments we achieve increase adhesion of the coating system and the overall corrosion resistance. Traditional surface preparation before application of organic paints are now turn into those more environmentally friendly. However, it was proved that some alternative conversion layers are not able to have a corrosion resistance, such as is the case of conversion layers on the basis of Cr [6], although certain sources describe an almost identical or even higher corrosion resistance of these alternative chemical surface pretreatment of low carbon steel, particularly TiO2 and ZrO2 [7].
327

International Conference on Innovative Technologies, IN‐TECH 2016,
Prague, 6. ‐ 8. 9. 2016
Coatings based on zirconium oxide and titanium
Conversion layer based on Ti or Zr in recent years become a major alternative to the chemical pre-treatment based on chromium. Pre-treatment Ti / Zr have not been studied as extensively as chromium pre-treatment and their effects are less well known [6]. For these applications, the most commonly used coatings based on zirconium and titanium secreted from solutions containing fluorozirconate (Bonderite NT 1 TecTalis) but also coatings hydrolysed organosilicate (Dynasilan Degussa ff.) [8]. The phosphate conversion coatings are increasingly replacing various alternatives, mainly because of environmental friendliness, energy and other procedural aspects.
In recent decades, proved another perspective technology that can fairly well to replace phosphate. In particular, the use of zirconium oxide on the surface using the sol - gel method, or immersion in acid H2ZrF6. It was found that coatings ZrO2, thicknesses of 18 to 30 nm provide a higher corrosion resistance compared to conventional phosphates. These methods are also commonly used for chemical pre-treatment of hot-dip galvanized coating. Zircon absorbed in surface layers most often occurs as a zirconia (ZrO2). It was found that zirconium oxide layers 50 nm or less, has comparable resistance to conventional chromate and phosphate [7].
Today new TecTalis® surface pre-treatment, which is commercially available, is based on acid H2ZrF6 and fully replaces the phosphating process. This product can be applied by spraying or by immersion at room temperature does not require sealed with chromic acid and can be used on a variety of metal surfaces (steel, aluminium, zinc). The bath is based on dilute H2ZrF6 (Zr ˂ 200 mg.l-1) with a small amount of Si and Cu for improved long-term performance bath [7]. TecTalis reaction during layer formation
pH = 3,8 – 4,8, T = 10 – 50 °C, Time = 30 – 180 s, reaction:
Fig.2 Reactions in the formation of layers [8]
Fig.3 Appearance of the coating Zn phosphate (left) TecTalis (right) [8]
Experimental part In the experimental part were used paints ZINOREX (S2211) and AXAPUR (U2218) were applied to the pretreated surfaces of the
zinc. Another objective of the experimental part was to verify the physical - mechanical properties of coating systems. For experimental section was created seven variants of the pretreatment hot dip galvanized samples, six chemical and one mechanical surface preparation:
1. SurTec 678 2. Pragokor BP
3. Nanotech cs-one 4. Interlox 5705
5. Activation with HNO3 6. Light blasting - sweeping
7. Degrease of hot dipped galvanized samples SurTec 678
Trivalent passivation for zinc and alloys of zinc / nickel, is a highly concentrated product, containing Cr (III) and cobalt salts. Pragokor BP
This is a composition that do not contain chromate ions, chromium or other environmentally harmful substances. Effect bath passivate surfaces microscopic pores or other inhomogeneities in the phosphate coating, so it is possible to increase the corrosion resistance. The passivation effect of this product is higher than the range of compositions based on chromate ion. Furthermore, it can be used to passivate the active surfaces of non-phosphated steel, aluminum and magnesium alloys, zinc and tin coatings, zinc castings after degreasing or other activated surface. Nanotech cs-one
Nanotech en-one product is supplied from a Turkish company CHEMSOLL - chemical laboratories solution, it is an alternative method of phosphating iron and zinc. Eliminates the disadvantages of the use of phosphate baths and according to the manufacturer should provide effective adhesion and long life of the coating versus phosphate. On the surface material are formed transparent nano-ceramic surface [9]. Interlox 5705
Interlox 5705 contains a two-component bath free of chromium, which creates a conversion layer on aluminum, aluminum alloys, magnesium, zinc and steel. This is a composition which enhances the corrosion protection of parts of a cast and wrought aluminum alloys. It provides a basic layer on aluminum, zinc and steel before wet and powder coating and it’s Qualicoat approved pretreatment (A-65). This product is not recommended for steel passivation without subsequent painting. Activation with HNO3
In this case, the chemical pretreatment of the surface of the zinc was the activation of the zinc coating with an alkaline degreasing and nitric acid (HNO3). With this chemical pre-treatment to achieve clarification of the surface, without the thin oxide layers. Light blasting
328

International Conference on Innovative Technologies, IN‐TECH 2016,
Prague, 6. ‐ 8. 9. 2016
For comparison mechanical and chemical pre-treatments was selected mechanical pre-treatment using light blasting. Light blasting technology in the pretreatment of zinc coatings still very popular and effective pretreatment prior to application of organic coating systems. The main objective of this pre-treatment is to achieve a perfectly clean surface, free from corrosion products of zinc, and a rough surface for the subsequent application of other finishes. The experimental part was chosen abrasive resource (brown artificial corundum). Light blast zinc coating should ensure a minimum consumption of zinc layer, mostly in terms of removing the surface layer up to 10 microns. Samples were blasted by a pneumatic blasting equipment PTZ 100 I by S.A.F. setting the nozzle pressure of 0.5 MPa. The degreased hot dipped galvanized samples For comparison of the various pretreatments of the hot-dip galvanization samples were prepared only alkali-degreased using a degreasing product Simple Green in a concentration of 1:30.
Verification physico - mechanical properties of the coating systems
They were investigated various test procedures for the determination of physico - mechanical properties of coating systems. a) determine the thickness of coatings according to DIN EN ISO 2808 non-destructive electromagnetic method. The type Elcometer 456 b) determine the adhesion of coatings cut test according to DIN EN ISO 2409 c) determine the adhesion of paint tear test according to DIN EN ISO 4624. d) determination of adhesion and cross-cut according to ASTM D 3359
Comparison of various pretreatments
Table 1. Summary of test results for individual adhesion of surface preparation the hot-galvanization zinc
Pre-treatment + Coating system Zinorex (S2211)
The average adhesive strength MPa]
Surtec 678 0,34 Pragokor BP 0,59
Nanotech cs-one 0,15 Interlox 5705 2,13
HNO3 4,63 Light blasting 3,27
Degreased samples 2,69 Pre-treatment + Coating system
AXAPUR (U2218) The average adhesive strength
[MPa] Surtec 678 12,46
Pragokor BP 7,37 Nanotech cs-one 7,42
Interlox 5705 15,63 HNO3 18,13
Light blasting 18,53 Degreased samples 14,12
The results show that good adhesive strength reached with use a coating system AXAPUR (U2218), which was formed by the paint
itself AXAPUR and hardener C 7002. These are polyurethane coatings which were applied with a ruler. In all applications of this coating system was applied one layer, which was achieved excellent results in terms of adhesion and coating quality after curing the coating system. In the case of an acrylate coating system ZINOREX (S2211) in many applications was achieved low values of adhesive strength and coating was non-quality. Reasons for the poor quality of the coating can be different, it could be an unsatisfactory application temperature or temperature curing paint shop also inadequate moisture for the application of paints or poor mixing of the individual components of the coating system. Finally, it could be a chemical reaction of the zinc surface pre-treatment with the ZINOREX (S2211). The causes will be investigated further.
Fig.4 Comparison of adhesion of each type of pretreatment of hot-dip galvanization with using the coating system AXAPUR (U2218) and ZINOREX (S2211)
Surtec678 ‐ NS:Axapur(U2218)
PragokorBP ‐ NS:Axapur(U2218)
Nanotechcs‐one ‐NS:
Axapur(U2218)
Interlox5705 ‐NS:
Axapur(U2218)
HNO3 ‐NS:
Axapur(U2218)
Lightblasting ‐
NS:Axapur(U2218)
Degreased samples
‐ NS:Axapur(U2218)
Surtec678 ‐ NS:Zinorex(S2211)
PragokorBP ‐ NS:Zinorex(S2211)
Nanotechcs‐one ‐NS:
Zinorex(S2211)
Interlox5705 ‐NS:
Zinorex(S2211)
HNO3 ‐NS:
Zinorex(S2211)
Lightblasting ‐
NS:Zinorex(S2211)
Degreased samples
‐ NS:Zinorex(S2211)
Mpa 12,46 7,37 7,42 15,63 18,13 18,53 14,12 0,34 0,59 0,15 2,13 4,63 3,27 2,69
0,00
2,00
4,00
6,00
8,00
10,00
12,00
14,00
16,00
18,00
20,00
MPa
Comparison of adhesion of each type of pretreatment of hot‐dip galvanization with using the coating system AXAPUR (U2218) and ZINOREX (S2211)
329

International Conference on Innovative Technologies, IN‐TECH 2016,
Prague, 6. ‐ 8. 9. 2016
Conclusion
It is obvious that some alternative method of passivating the surface of of hot dip galvanized parts can compete with today trivalent passivation in the adhesion of paint systems. Particularly in comparison product SurTec 678, which is a trivalent transparent passivation to zinc and alloys of Zn / Ni achieved tension using coating system AXAPUR (U2218) values of adhesive strength on average 12.46 MPa, whereas the alternative methods Interlox 5705, which constitute a two-component spa containing chromium, which produces the conversion coating on aluminium, aluminium alloys, magnesium, zinc and steel, reached values adhesive strength of coating system AXAPUR (U2218) on average 15.63 MPa. When using other alternative methods of surface passivation of hot dip galvanized components Pragokor BP, which is free chromate passivating agent based hexafluorozirconate ammonium and ammonium hydrogendifluoride, made a breakaway tension when using NS. AXAPUR (U2218) values adhesive strength on average 7.37 MPa. It should be noted that this is still an adhesive strength, which is corresponds with according of the internal regulations for the protection of hot-dip galvanized structures, more than 5 MPa. Another alternative method was investigated by Nanotech cs-one, which is a new generation of nano - ceramic coatings. In this application using the coating system AXAPUR (U2218) were achieved adhesive strength on average 7.42 MPa, the main advantage of this product are low temperature applications without necessarily degreasing.
The best results in terms of adhesion of the chemical pre-treatment the zinc reached degreasing and subsequent activation of the surface using HNO3 with coating system AXAPUR (U2218). The adhesive strength average on 18,13 MPa. This chemical pre-treatment is from an economic point of view very interesting, but the problem is the high toxicity and the dangers of handling this acid, there is a problem with many European regulations. Under regulation European directive no. 1272/2008 the substance is classified as dangerous.
When activating the surface using HNO3 is achieved comparable adhesive strength, as when using a mechanical pre-treatment light blasting, adhesive strength 18.53 MPa. It should be noted that duplex systems in this work have been tested only on verifying the adhesion of individual methods of pre-treatment with the zinc surface. The corrosion resistance of individual pre-treatments was not investigated and will be subject to further examination, together with the application of coatings applied by pneumatic spraying.
The results of the experimental part are obvious that some alternative chemical pre-treatment of the surface of the zinc are comparable with today trivalent passivation and many of them can cope even the most commonly used mechanical pre-treatment of the surface of the zinc, a light blasting. Use of these methods will be further examined.
Acknowledgment
The research was financed by The Technology Agency of the Czech Republic (TAČR), Competence Center (CVPÚ) – Research Center Of Surface Treatment TE02000011.
References [1] Povrchová úprava. Aktuální problémy vytváření povlaku typu duplex na podkladech zinkovaných ponorem [online].
[cit. 2015-03-14]. Available from: http://povrchovauprava.cz/clanek/49/aktualni-problemy-vytvareni-povlaku-typu-duplex-na-podkladech-zinkovanych-ponorem
[2] Časopis Povrcháři. Duplexní povlaky ocelových konstrukcí [online]. [cit. 2015-03-14]. Available from: http://www.povrchari.cz/kestazeni/201201_povrchari.pdf
[3] J.B. Bajat, V.B. Mišković-Stanković, J.P. Popić, D.M. Dražić, Adhesion characteristics and corrosion stability of epoxy coatings electrodeposited on phosphated hot-dip galvanized steel, Progress in Organic Coatings, Volume 63, Issue 2, September 2008, Pages 201-208, ISSN 0300-9440, http://dx.doi.org/10.1016/j.porgcoat.2008.06.002.
[4] Kreibich, Viktor. Teorie a technologie povrchových úprav. Vyd. 1. Praha: České vysoké učení technické, 1996. ISBN 800101472X.
[5] POKORNÝ P., V. MEJTA a P. SZELAG. Povrchová úprava: Příspěvek k teoretickým základům tvorby fosfátového povlaku [online]. Hradec Králové: IMPEA, s. r. o., 2011, VII, [cit. 2012-05-01]. ISSN 1801-707X. Dostupné z:
http://www.povrchovauprava.cz/uploads/assets/casopisy/pu-2011-03.pdf [6] SAARIMAA, V., KAUPPINEN, E., MARKKULA, A., JUHANOJA, J., Bengt-Johan SKRIFVARS, STEEN, P. Microscale
distribution of Ti-based conversion layer on hot dip galvanized steel, Surface and Coatings Technology, Volume 206, Issues 19–20, 25 May 2012, Pages 4173-4179, ISSN 0257-8972,
[7] Saikat Adhikari, K.A. Unocic, Y. Zhai, G.S. Frankel, John Zimmerman, W. Fristad, Hexafluorozirconic acid based surface pretreatments: Characterization and performance assessment, Electrochimica Acta, Volume 56, Issue 4, 15 January 2011, Pages 1912-1924,ISSN 0013-4686
[8] Szelag, Petr. Pragochema, spol. s.r.o. – interní pdf dokument pro výuku. Železnaté fosfátování. [cit. 2016-04-29]. [9] Chemsoll.com – internetový zdroj. Nanotech CS-ONE. [online]. [cit. 2016-06-07]. Available from:
http://www.chemsoll.com/kategori/nanotech-cs-one
330

International Conference on Innovative Technologies, IN‐TECH 2016,
Prague, 6. ‐ 8. 9. 2016
POTENTIAL OF ANTICORROSIVE PROTECTION OF COATING SYSTEMS CONTAINING MAGNESIUM PIGMENTS
M. Zoubek1, T. Moulis1, J. Kudláček1, F. Herrman2 and Z. Car3
1 Czech Technical University in Prague, Faculty of Mechanical Engineering, Technická 4, 166 07 Praha 6, Czech Republic
2 Synpo a.s., S. K. Neumanna 1316, 532 07 Pardubice, Czech Republic
3 Faculty of Engineering University of Rijeka, Vukovarska 58, 51000, Rijeka, Croatia
Keywords: Anticorrosive Protection; Coating Material; Corrosion Tests; Metal Pigment; Magnesium Abstract: The aim of this thesis is to determine the potential of anticorrosive protection with an epoxy coating material containing metal pigments. The work focuses primarily on coating systems with magnesium particles, but coating systems with zinc particles are also included. Testing was carried on as accelerated laboratory anticorrosive testing simulating natural weather conditions. Anticorrosive properties were tested on steel surfaces and multilayer coatings with a polyurethane top coat were examined. Introduction
The most common way of coating is the use of organic coating materials. They should meet the requirements for anticorrosive resistance, resistance to weather conditions, UV rays, chemicals, and many others. There is a big demand to meet these requirements and one method to meet them is adding metal pigments into coating materials. Zinc powder, which belongs to metal pigments, has a high protective potential based on barrier of electrochemical methods. Magnesium powder is now being studied and is supposed to show higher anticorrosive protection of a surface. Experiment Pigments and Their Characteristics
Coats with two different kinds of magnesium particles were prepared for testing. The concentrations of the first magnesium particles (Mg-I) with size 30-200 µm were 1.5 wt%, 3.0 wt% and 8.0 wt%. . The concentrations of the second magnesium particles (Mg-II) with size 40-45 µm were 3.0 wt%, 8.0 wt% and 49.0 wt%. Other layers of the coating system were made of base epoxy resin LV EPS 620 and polyurethane.
Pre-treatment of Samples and Coating Materials
The work deals with anticorrosive properties of coating materials containing metal particles applied on low alloyed steel ČSN 11 523 (S355J0). Samples were pre-treated according to ČSN EN ISO 9227. Steel sheets were blasted with steel grit to Sa 2 ½. Epoxy-urethane paint LV EPS 620 was used as a primer and base.
Use of Coating Materials
Coating materials were sprayed – HVLP pneumatic spraying method with the pressure of 3.5-5.0 bar. Hardening was done in a curing oven in the temperature of 60°C for 24 hours
Corrosion Tests
The samples were cut according to ČSN EN ISO 17872 for neutral salt spray test according to ČSN EN ISO 9227 in the temperature of 35°C and 5.0% NaCl solution. Results of Corrosion Tests of Coating Materials Containing Magnesium Particles
The evaluation of the results was based on the amount and the area of defects on exposed coatings, especially blisters according to ČSN EN ISO 4628-2, assessment of degree of rusting according to ČSN EN ISO 4628-3, assessment of degree of delamination and corrosion around a scribe according to ČSN EN ISO 4628-8.
Table 1. Test samples Sample First layer1 Thickness [μm] Second layer Thickness [μm] Third layer Thickness [μm] 1,5Mg-I 1.5 wt.% Mg-I 160 --- --- --- ---
1,5Mg-I+P 1.5 wt.% Mg-I 140 LV EPS 620 150 Polyurethan 60 3Mg-I 3.0 wt.% Mg-I 150 --- --- --- ---
3Mg-I+P 3.0 wt.% Mg-I 150 LV EPS 620 155 Polyurethan 60 8Mg-I 8.0 wt.% Mg-I 140 --- --- --- ---
8Mg-I+P 8.0 wt.% Mg-I 140 LV EPS 620 160 Polyurethan 60 3Mg-II 3.0 wt.% Mg-II 70 --- --- --- ---
3Mg-II+P 3.0 wt.% Mg-II 70 Polyurethan 60 --- --- 8Mg-II2 8.0 wt.% Mg-II 80 --- --- --- ---
8Mg-II+P2 8.0 wt.% Mg-II 80 Polyurethan 60 --- ---
1 First layer contain LV EPS 620 with dispersed part of magnesium particles. 2 These samples are shown phoographically.
331

International Conference on Innovative Technologies, IN‐TECH 2016,
Prague, 6. ‐ 8. 9. 2016
49Mg-II2 49.0 wt.% Mg-II 180 --- --- --- ---
Fig. 1 Sample 8Mg-II – before exposure (left), after exposure (middle), corrosion around a scribe (right) Table 2. Neutral salt spray test – Sample 8Mg-II – evaluation
Rusting Corrosion Delamination Corrosion around
a scribe Blisters Exposure time [hr]
Ri 5 In defect, under
the blisters 0 1,3 5 – 5(S2) 1000
Fig. 2 Sample 8Mg-II+P – before exposure (left), after exposure (middle), corrosion around a scribe (right)
332

International Conference on Innovative Technologies, IN‐TECH 2016,
Prague, 6. ‐ 8. 9. 2016
Table 3. Neutral salt spray test – Sample 8Mg-II+P – evaluation
Rusting Corrosion Delamination Corrosion around
a scribe Blisters Exposure time [hr]
Ri 0 In defect 0 3,5 3 – 3(S2) 1000
Fig. 3 Sample 49Mg-II – before exposure (left), after exposure (middle), corrosion around a scribe (right)
Table 4. Neutral salt spray test – Sample 49Mg-II – evaluation
Rusting Corrosion Delamination Corrosion around
a scribe Blisters Exposure time [hr]
Ri 2 In defect 0 1,6 2 – 2(S3) 715
Evaluation of Anticorrosive Properties of Coating Materials Containing Magnesium Particles (Samples apart polyurethane and 49Mg-II)
As seen out of the corrosion tests results above, corrosion behaviour of the coatings with magnesium particles is dependent on several factors. In the case of the low weight concentration of metal particles (1.5 wt%, 3.0 wt%, 8.0 wt%) there always occurred coating degradation by osmotic blisters. Blistering depends mainly on exposure of particulate magnesium in NSS testing chamber. Oxide on the surface of magnesium in humid environments passes to hydroxide Mg(OH)2, which due to the low solubility forms a protective barrier against the action of corrosive atmosphere. As stated in the chapter 5.2.3, hydroxide then passes to carbonate with high corrosion resistance. This property is of course dependent on the pH and temperature. [1] In the neutral environment was proved totally insufficient corrosion resistance of magnesium, due to insufficient rate of formation of corrosion protective products of magnesium.
Coatings comprising one layer of coating (1.5Mg-I, 3Mg-I, 8Mg-I 3Mg-II 8Mg-II) showed already after 48 hours exposure blistering. The amount of blistering was proportional to the mass proportion of the dispersed particles. Blistering reached the highest value at a coating with 8 wt% of magnesium particles, wherein in the area of cut was also a partial delamination. Content of the area affected by blisters is 1.5 for the sample of Mg-I, 7%, 3Mg-I, 22% and 8 Mg-I 42%. Area affected by blisters in the case of particles of magnesium Mg-II was similar to Mg-I. When testing low weight concentrations there was not proved the effect of different particle sizes on the corrosion behaviour of the samples. After removal of the coating it is apparent that corrosion blisters affected the substrate.
Evaluation of Anticorrosive Properties of Coating Materials Containing Magnesium Particles (Samples containing a layer of Polyurethane)
Significant increase of corrosion resistance showed the samples with a polyurethane coating. Polyurethane due to its low permeability and porosity greatly slows the diffusion of corrosive atmosphere to the surface. By creating of additional barriers by using coating from LV EPS 620 and polyurethane, throughput of the coating system was reduced and blistering was significantly reduced. The same result was achieved by coating systems comprising of one layer of the dispersed magnesium particles and a second layer of polyurethane. As seen from the figures, the corrosion products are formed on samples with polyurethane, especially in the area of the cut. This is where the concentration of corrosion products occurs. They cause relatively high corrosion around the cut.
Evaluation of Anticorrosive Properties of Coating Materials Containing Magnesium Particles (Sample 49Mg-II) Coating with a higher proportion of metal particles in a matrix followed the corrosion behaviour, especially in view of electrochemical
protection mechanism. Due to the lack of data about the particles of Mg-II it was not possible to calculate KOKP for this type of particles. The amount of 49 wt%. magnesium particles that was used was determined based on the viscous behaviour of the suspension in the dispersion. The sample showed a partial formation of corrosion products in the cut after 330 hours. During exposure after 378 hours there
333

International Conference on Innovative Technologies, IN‐TECH 2016,
Prague, 6. ‐ 8. 9. 2016
was made the second cut on the sample, wherein the formation of corrosion at the cut occurred after 244 hours. Blisters appeared after 322 hours of exposure, which is significantly later compared to samples with lower content of magnesium particles. Even after 715 hours exposure the exposed surface was not affected by the blisters in the whole area. There was significantly suppressed the production of blistering, the degree of corrosion in the cut and the formation of corrosion in the cut. In the case of this sample there has been proved the effect of the electrochemical protection mechanism that is dependent on the weight proportion of particles in the matrix. [2, 3] Conclusion
From the outputs of the carried experiments and reached results commented in previous chapters it can be stated that the use of low mass concentration of magnesium particles in the coating system is not entirely suitable for exposure in a neutral salt spray environment. Corrosion products that are formed after 48 hours of exposure in NSS environment completely degrade coating system.
Conversely, there has been proven the electrochemical potential of protection using magnesium particles when using mass concentration of particles of 49%. Tested samples showed resistance to corrosion for 330 hours in NSS environment, which was followed by a slight degradation as blistering. However, even after 715 hours of exposure time they reached satisfactory results.
The increase of corrosion protection is also effected by topcoat of polyurethane, which forms a barrier and restricts passing of corrosion products to the substrate.
An important factor influencing the possibility of using magnesium particles in coating systems is their high reactivity. Due to high cost of the magnesium particles and the above mentioned reactivity with the environment is the use in general industry considerably reduced. Acknowledgment
The research was financed by The Technology Agency of the Czech Republic (TAČR), Competence Center (CVPÚ) – Research Center Of Surface Treatment TE02000011.
References
[1] ČERNÝ, Miroslav. Korozní vlastnosti kovových konstrukčních materiálů. Praha: Státní nakladatelství technické literatury, 1984. [2] BATTOCCHI, D., A.M. SIMÕES, D.E. TALLMAN a G.P. BIERWAGEN. Electrochemical behaviour of a Mg-rich primer in the
protection of Al alloys. Corrosion Science [online]. 2006, 48(5), 1292-1306 [cit. 2016-07-15]. DOI: 10.1016/j.corsci.2005.04.008. ISSN 0010938x. Dostupné z: http://linkinghub.elsevier.com/retrieve/pii/S0010938X05001241
[3] SIMÕES, Alda, Dante BATTOCCHI, Dennis TALLMAN a Gordon BIERWAGEN. Assessment of the corrosion protection of aluminium substrates by a Mg-rich primer: EIS, SVET and SECM study. Progress in Organic Coatings [online]. 2008, 63(3), 260-266 [cit. 2016-07-15]. DOI: 10.1016/j.porgcoat.2008.02.007. ISSN 03009440. Dostupné z: http://linkinghub.elsevier.com/retrieve/pii/S0300944008000507
[4] KALENDOVÁ, A. Metody testování vlastností organických povlaků [online]. Učební text VŠCHT. 2001. [cit. 17.4.2016]. Dostupné z: http://www.upce.cz/fcht/uchtml/12-onhop/studijni-materialy/metody-test-kor-vl.pdf
[5] YANG, L.H., LIU F.C., HAN, E.H. Effect of P/B on the properties of anticorrosive rating with different particle size. Progress in Organic Coating. Volume 53, Issue 2. 2005. Pages 91-98
[6] KALENDOVÁ, A. Mechanismus působení a optimální koncentrace částic práškového zinku v organických povlacích z hlediska ochranné účinnosti. Časopis Koroze a ochrana materiálu. 2001. 45 (2). Str. 28-33. ISSN 0452-599X
[7] BENEŠOVÁ, J., SVOBODA, M. Predikce účinnosti organických povlaků na základě laboratorních zkoušek. Praha: SVÚOM . 2010. Metody sledování životnosti. ISBN 978-80-87444-06-1
[8] ANDREI, M., F. DI GABRIELE, P. L. BONORA a D. SCANTLEBURY. Corrosion behaviour of magnesium sacrificial anodes in tap water. Materials and Corrosion [online]. 2003, 54(1), 5-11 [cit. 2016-07-15]. DOI: 10.1002/maco.200390010. ISSN 0947-5117. Dostupné z: http://doi.wiley.com/10.1002/maco.200390010
[9] NANNA, M. E., BIERWAGEN, G.P. Mg-rich Coating: A New Paradigm for Cr-free Corrosion Portection of Al Aerospace Alloys. JCT Research. Vol. 1. No.2. April 2004. Pages 69-80.
[10] BIERWAGEN, Gordon, Roger BROWN, Dante BATTOCCHI a Scott HAYES. Active metal-based corrosion protective coating systems for aircraft requiring no-chromate pretreatment. Progress in Organic Coatings [online]. 2010, 67(2), 195-208 [cit. 2016-07-15]. DOI: 10.1016/j.porgcoat.2009.10.009. ISSN 03009440. Dostupné z: http://linkinghub.elsevier.com/retrieve/pii/S0300944009002392
334

International Conference on Innovative Technologies, IN‐TECH 2016,
Prague, 6. ‐ 8. 9. 2016
ANTICORROSIVE PROPERTIES OF COATING SYSTEMS CONTAINING MAGNESIUM PARTICLES ON AN ALUMINIUM ALLOY 2024
P. Drašnar1, L. Fialová1, M. Zoubek1 and J. Kudláček1
1 Czech Technical University in Prague, Faculty of Mechanical Engeneering, Technická 4, 166 07 Prague 6, Czech Republic
Keywords: Corrosion; Aluminium Alloy; Superdural; Magnesium Particles; Epoxy Resins Abstract: The article deals with anticorrosive resistance of an aluminium alloy 2024 and possibilities of its protection with coating materials containing magnesium and zinc particles. Various coating materials based on an epoxy resin with different percentage of metal particles were used. The objective of the work is to determine the potential of anticorrosive protection with various concentrations of magnesium and zinc pigments dispersed in a coating material. Anticorrosive properties tested on aluminium alloy surfaces were examined. Testing was carried on as accelerated laboratory anticorrosive testing: in salt spray test and adhesion pull-off test. Introduction
An alluminium alloy is the most commonly used alloy in aeronautics. It is used for manufacturing a fuselage, wings and other parts of planes. Copper, which is the integral part of the alloy, improves strength of the material but anticorrosive properties are reduced. With copper percentage higher than 0.2% there are soft oxidic layers with poor anticorrosive properties. Due to that fact, coating systems containing magnesium were developed. Magnesium was chosen because of positive properties of products produced by its oxidation. The equation of oxidation reaction is as follows 12: Mg Mg2+ + 2e-
Magnesium particles create two kinds of protection Cathodic – in the first stage of a corrosion process. The particles have to be in an immediate contact among themselves and a
metal substrate. In that case they corrode first and protect the substrate. Nevertheless, this kind of protection is short-term phenomenon.
Barrier – magnesium is influenced by increasing pH, which is caused by the decrease of oxygen or more precisely of water and magnesium changes into Mg(OH) or MgCO3. These chemical reactions are: 2H2O + 2e- H2 + 2OH- (1) 2H2O + O2 + 4e- 4OH- (2) These flocculated products make a porous layer on the surface which serves as a protective barrier. It is mentioned as a thin film
in many studies 12.
Zinc particles can be used as a barrier protection because of their low concentration. Corrosion products are formed by outer environment and they close pores in a base coat and harden it. In that way they reduce an immediate contact between the substrate and its surroundings.
Types of samples
The aluminium alloy Al 2024 – T3 (SUPERDURAL) was used for the experiment. T3 is the state after annealing, cold forming and natural ageing which guarantees a sufficient stable state. The size of samples was 150 x 100 x 2 mm. The samples were blasted with corundum grit to Sa 2 ½. Metal pigments
Coats with zinc and magnesium particles were prepared for testing. The concentration of the magnesium particles with size 30-200 µm were 1.5 wt%, 3.0 wt% and 8.0 wt% and the concentration of magnesium II with size 40 – 45 μm were 3.0 wt%, 8.0 wt% and 49.0 wt%. The concentrations of the zinc particles with size 3.4-3.9 µm were 1.5%, 3.0%, 8.0 % and 49.0%. When mixed Zn and Mg particles the concentration were 16.0 wt% Mg and 8.0 wt% Zn and vice versa. Other layers of the coating system were made of base epoxy resin LV EPS 620 and polyurethane /PUR/ made by Synpo a.s. Dispersion was done with rotor-stator dispersing device. Use of coating materials
Coating materials were sprayed – HVLP pneumatic spraying method with the pressure of 3.5 – 5.0 bar. Hardening was done in a curing oven in the temperature of 60°C for 24 hours. Corrosion Tests
The samples were cut horizontally and vertically according to ČSN EN ISO 17872 for Neutral Salt Spray Test - NSS Test (729 hours
of exposure) according to ČSN EN ISO 9227 in the temperature of 35°C and 5.0% NaCl solution.
335

International Conference on Innovative Technologies, IN‐TECH 2016,
Prague, 6. ‐ 8. 9. 2016
Experiment
The composition of the coatng system is summarized in Table 1.
Table 1. The composition of coating systems with Mg particles
Sample
1st layer of Mg particles+Epoxy-Urethane 2nd layer
Epoxy-Urethane µm
3rd layer Polyurethane
µm wt% Mg/(Zn) Epoxy – urethane µm
1,5 Mg 1.5 150
- - 8 Mg 8.0 - -
8 Mg + PUR 8.0 150 60 8 Mg II 8.0 80 - -
49 Mg II 49.0 200 - - 16M8Zn 16.0/8.0 100 - -
Fig. 1 Samples of Epoxy – Urethane matrix LV EPS 620 during NSS Test
Fig. 2 Samples of 1.5 Mg during NSS Test
336

International Conference on Innovative Technologies, IN‐TECH 2016,
Prague, 6. ‐ 8. 9. 2016
Fig. 3 Samples of 8.0 Mg during NSS Test
Fig. 4 Samples of 8.0 Mg + PUR during NSS Test
Fig. 5 Samples of 8.0 Mg II during NSS Test
337

International Conference on Innovative Technologies, IN‐TECH 2016,
Prague, 6. ‐ 8. 9. 2016
Fig. 6 Samples of 49.0 wt.% Mg during NSS Test
Fig. 7 Samples of 16.0 wt% Mg / 8.0 wt% Zn during NSS Test
For epoxy coatings during exposure, there were no blisters, there were only white corrosion products around the cut. As seen in the figure, when the Mg concentration was 1.5 wt% and 8.0 wt% the blisters occurred already after 48 hours of exposure. Particles were too large and protruded from the coating to the surface. The density of blisters is directly proportional to the amount of magnesium. Making of these blisters is probably given by low concentration of CO2 in the corrosion chamber. Water is absorbed on the surface of the magnesium particles and reacts into a form of magnesium hydroxide and hydrogen which makes blisters when leaks through the coating to the surface. For a coating system where the second and the third layer is added the blistering is reduced. When testing the second group of magnesium particles, identified as Mg II, blisters occur rarely and only around the cut. Around the cut there are recognizable white corrosion products. In a sample that contained 49.0 wt% Mg there were no blisters, the surface looked like before exposure. In the case when there were used magnesium together with zinc blistering occurred over the entire surface of the exposed sample. Conclusion
Best results were demonstrated by coating with a magnesium content of 49.0 tw%, when the concentration was lower, corrosion products appeared. For large particles there occurred a large number of blisters that were directly proportional to the amount of metal particles. The experiments carried out that it is better to use higher concentration of small size particles. Some other studies present that in the outdoor atmosphere the blisters do not occur. To verify this fact the samples are now exposed to outdoor atmosphere for long term corrosion test.
Acknowledgment
The research was financed by The Technology Agency of the Czech Republic (TAČR), Competence Center (CVPÚ) – Research Center Of Surface Treatment TE02000011.
References
[1] NANNA, M.E. a G.P BIERWAGEN. Mg - Rich coatings: A new paradigm for Cr - free corrosion protection of Al aerospace alloys. North Dakota State University, 2004.
[2] DEROSA, R.L., I. SZABO, G.P. BIERWAGEN a D. BATTOCCHI. Organic coatings: The effect of exposure condition on the degradation behavior ofmagnesium rich coatings. United States, 2015
[3] NANNA, M. E., BIERWAGEN, G.P. Mg-rich Coating: A New Paradigm for Cr-free Corrosion Portection of Al Aerospace Alloys. JCT Research. Vol. 1. No.2. April 2004. Pages 69-80.
338

International Conference on Innovative Technologies, IN‐TECH 2016,
Prague, 6. ‐ 8. 9. 2016
New Antistatic Water-Soluble Coating Materials
M. Zoubek1, J. Otta1, V. Kreibich1, F. Matas2 and T. Pepelnjak3
1 Department of Manufacturing Technology, Faculty of Mechanical Engineering, Czech Technical University in Prague, Technicka 4, 166 07 Praha 6, Czech Republic
2 Viton s.r.o., Tř. Československé armády 167, 391 81 Veselí nad Lužnicí, Czech Republic
3 Forming Laboratory, Faculty of Mechanical Engineering, University of Ljubljana, Aškerčeva 6, SI-1000 Ljubljana, Slovenia
Keywords: Electrical Conductivity; Multi Wall Carbon Nanotubes; Graphite; Antistatic; Coating Material Abstract: Required changes of functional properties of coating materials can be modified with a suitable matrix and a certain amount of a filler. The main aim of this work is to find the most convenient filler and its optimum concentration which will guarantee higher electrical conductivity. Two fillers were used - MWCNT - multi wall carbon nanotubes and graphite. Various methods and parameters of dispersing these particles lead to modification of application and functional properties of a coating system. Another aim is to find a suitable method of dispersing with an influence on electrical conductivity of a coating. Introduction
Coating materials with higher conductivity are used because of their antistatic properties which are suitable for the environment where it is necessary to prevent negative effects of an electrostatic charge (static discharge, accumulation of dust particles, etc.). These coating materials are used in petrochemical industry, precise optics, electrical engineering and other branches of industry. An electrostatic charge is risky in explosive environments and such a risk can be eliminated by antistatic treatment. As to coating materials it means lower electric resistance of coating materials with suitable fillers. Antistatic coating systems conduct electrostatic charge away from a surface. This effect is caused by the change of electric resistance to ≤ 1.106 . Coating Material and Fillers
Coating material CP 55 by Viton s.r.o. (Viton Ltd.) was used for the experiment. CP 55 is a self-base water-down coating material. Two different fillers were used: one was suspension containing MWCNT AQUACYL 0301 and the other was graphite Fichema – finely ground to 25 µm. Conductive fillers in the forms of MWCNT and graphite enable to reach conductive properties of a coating material. Coating materials were applied with and applicator or pneumatic spraying (HVLP).
Methods of Dispersing
Apart from the functional filler and its concentration, the method of dispersing the filler in a coating material is very important. Appropriate technology and parameters of a dispersing process of liquid suspensions achieve better utility value of a coating and, possibly a lower proportion of the filler which is necessary to get specific properties, especially an electrical conducting coating system. Insufficient dispersing may lead to the lack of protective functions (discontinuous coating, lower adhesion) or specific functions such as electrical conductivity. These devices were used for testing graphite filler: a paddles blade, rotor – stator stirrer, visco-jet stirrer and dispersion blade. In case of the filler containing MWCNT first an ultrasonic homogenizer was used before other above mentioned stirrers to achieve high quality dispersion of conductive particles. Another reason for the use of the ultrasonic homogenizer was the aggregation of particles during the dispersing process.
Application and Methods of Testing
Individual coatings created by coating materials mentioned above were realized onto various types of steel samples. Not further prepared steel grinded test sheets Q – panel (standard version, S235JRG1) were used and circular steel cuttings blasted by steel grit. Onto these pre-treated samples various coating materials were applied by pneumatic spraying technology (HVLP) and with an applicator. Only pneumatic spraying was used for steel blasted samples. Following tests were made: determination of the internal electrical resistance of the coating, determination of specular gloss at the angle of 60 °, bend test on a conical mandrel, cross cut test and X-cut tape test.
Determination of the Internal Electrical Resistance of the Coating TESPO 1 device was used to determine the internal electrical resistance of the coatings with increased electrical conductivity. It is measured by direct two-point method where the measurable values range from 104 to 1011 Ω. The device shows numerical data 0 – 1999 during the measurement, next the data could be converted to electrical resistance using the conversion relationship (individual for each device) or a table. The results of each measurement are shown below.
Fig. 1 TESPO 1 device was used to determine the internal electrical resistance
339

International Conference on Innovative Technologies, IN‐TECH 2016,
Prague, 6. ‐ 8. 9. 2016
Adhesion Test Adhesion test of the coating material to the substrate was realized by pull-off test according to ČSN EN ISO 24624. All of the pull-offs were realized on the coating materials applied on blasted circular cuttings and steel grinded test sheets Q – panel. Two-component epoxy glue DP 460 Scotch Weld and pull-off device Elcometer 510 Automatic Pull-Off Adhesion Gauge were used. Pull-off test is based on the use of a sample piece glued on a coating. When it dries up, it is pulled-off with a pull-off device and adhesion tension is recorded. The adhesion tension and refraction are limited factors for the evaluation of adhesion test results. The results of each measurement are shown below. Determination of Specular Gloss at the Angle of 60 ° To determine the gloss of the coating at the angle of 60° according to ČSN ISO 2813 TQC SOLOGloss device was used. After calibration the device measures surface gloss in gloss units [GU], while a high level of gloss at the angle of incidence of the illumination beam 60° is considered as a value > 70 GU. Specular gloss of black glass with a refractive index of 1.567 has a value of 100 GU. The main aim was to identify which filler and which concentration lead to higher or lower gloss of a coating material. The results of each measurement are shown below.
Fig. 2 TQC SOLOGloss for determine the gloss of the coating at the angle of 60° Bend Test on a Conical Mandrel
Bend test was realized on Q – Panel samples using a conical mandrel according to ČSN EN ISO 1519. Any noticeable differences among the tested coatings during their bending were not seen as well as peeling from the coating material from the substrate. Adhesion Cross Cut Test and X-cut Tape Test
Adhesion cross cut test according to ČSN EN ISO 2409 and X-cut tape test according to ASTM D 3359 were made on both types of samples. In adhesion cross cut test all cuts were absolutely smooth and no square was damaged. In X-cut tape test the results were the same with no peeling at all. Determining the Suitability of Fillers
At first CP55 coating material was manually mixed. The individual components according to Table. 1 were weighed using a laboratory balance and subsequently the process of dispersion started. In this case there was used four-blades stirrer with inclined blades. The stirrer was inserted into the vessel always slightly off axis in order to minimize air leak from the environment as much as possible. Rotation speed was chosen to reach the circulation in the whole volume of the batch with the minimum air suction from the surroundings. The aim of the experiment was to observe the behaviour of each filler and the effect of their increasing concentration on the coating. Procedure was carried out as follows: the first batch was prepared with the minimal concentration of the individual fillers, subsequently it was mixed for 15 minutes and then the coating material was applied to the test sample by a special ruler (applicator). Then the weight concentration in the batch was increased (see Table no. 1) and the process was repeated until it was possible to mix the coating. After drying of the coatings there were measured internal electrical resistance and gloss on the test samples. The results of each measurement are shown in the following table. Table 1. Results of coatings when using paddle stirrer
Filler Concentration [wt. %] Gloss [GU] Tespo 1 Internal resistance [Ω]
MWCNT
0.5 9.6 1850.0 4.78.106
1.0 9.1 1985.3 4.08.105
1.5 7.9 1990.0 2.68.105
2.0 7.5 1986.7 3.68.105
2.5 3.2 1989.3 2.88.105
3.0 2.5 1987.3 3.48.105
Grafit
8.0 3.7 1831.7 5.41.105
10.0 3.3 1989.0 2.98.105
12.0 2.4 1991.3 2.28.105
14.0 1.9 1991.3 2.28.105
16.0 1.8 1990.7 2.48.105
18.0 1.5 1991.7 2.18.105 Discussion of Results
The measured values show that the best conductivity are achieved by coatings using 12 wt. % and more graphite. However, measuring of the electrical conductivity in the graphite might be distorted because when using a paddle stirrer the graphite microparticles have not been completely dispersed, and thus in the resulting coating there were small clusters of small particles that could affect the measurement. The best application and appearance properties of coatings were reached by using the MWCNT filler in suspension form
340

International Conference on Innovative Technologies, IN‐TECH 2016,
Prague, 6. ‐ 8. 9. 2016
AQUACYL 0301. Using this suspension the lowest values of the internal electrical resistance were achieved by coating with 1.5 wt% MWCNT. The measurement results could also be affected by the process of mixing when the batch using higher amounts wt. % of fillers was mixed considerably longer because of the increase of various concentrations. Furthermore, there was measured the gloss at an angle of 60° on created coatings. The results show that the more wt. % of individual fillers the coating contained, the lower values it reached; thus it reached greater tarnish. Used method of dispersion - a paddle stirrer - does not reach the parameters like rotor - stator stirrer. It can therefore be assumed that the rotor – stator stirrer, which achieves greater dispersion / homogenization efficiency and higher speed, can achieve much better results. Determination of Optimal Concentration of Filler
Because the paddle stirrer was not sufficient for dispersion, there was selected rotor – stator stirrer for further experiment. As the filler there were chosen multi-walled carbon nanotubes (MWCNT) that showed the best application and appearance properties when using a paddle stirrer. After dispersing the coatings were applied onto the test samples by using the technology of the pneumatic spraying (HVLP). The results of the tests of created coatings, which were made 7 days after application, are shown in table no. 2.
Table 2. The results of coatings when using rotor – stator stirrer and when using MWCNT
Discussion of Results
Dispersion using a rotor - stator stirrer showed better results in comparison with paddle stirrer. When measuring the internal electric resistance there were not such fluctuations in measured values as when using a paddle stirrer and values were almost constant on the whole surface of the coating. The results in Table 2 shows that to create a coating with increased electrical conductivity there was necessary to use at least 1.0 wt. % MWCNT. The results show that with increasing concentration of MWCNT the value of internal electrical resistance is greatly reduced (i.e. electrical conductivity of the coating increases). Values from Tespo device 1 shown in Table. 2, from which was internal electrical resistance calculated are the arithmetic average of 24 measurements. The goal of adhesion testing is to verify that the use of AQUACYL 0301 has no negative effect on the adhesion of the resultant coating containing MWCNT. Of the average pull of tension it not seems that the matrix CP55 using the suspension AQUACYL 0301 is negatively affected. In most cases there occurred a separation of testing dolly in the coating. When using 0.5 wt % MWCNT the fracture between coatings and adhesives dominated. Comparison of Dispersing Methods
The following experiment was focused on the effectiveness of different methods of dispersion and determination of the effect of dispersion on the final properties of the coating. There were compared rotor – stator stirrer (RS), Visco – jet (VJ) and dispersion blade (ZM). There was chosen weight concentration of MWCNT (0.5 wt % and 2.5 wt. %) and graphite (8.0 wt. % and 16.0 wt. %). In the case of using 16.0 wt. % of graphite the dispersion of the batch failed. The problem occurred when using 2.5 wt % of MWCNT and dispersion blade, when the batch had such a high viscosity that the coating could not be applied to the test samples. For this reason these two cases are not mentioned in the Table 3. Coatings were applied on the test samples by using pneumatic spraying technology and the applicator.
Table 3. Results of coatings when using Visco – jet, rotor – stator and dispersion blade
Filler Dispersing
device Concentration
[wt. %] Gloss [GU]
Adhesion tension [MPa]
Tespo 1 Internal resistance [Ω]
MWCNT
VJ 0.5 11.6 8.53 0.04 2.84.1012
2.5 4.1 8.90 1988.00 3.29.105
RS 0.5 10.7 9.95 0.04 2.84.1012
2.5 4.4 8.78 1986.00 3.76.105
ZM 0.5 10.5 9.91 0.08 1.42.1012
Graphite
VJ 8.0 4.3 5.16 1985.00 4.09.105
RS 8.0 4.7 5.49 150.00 7.30.108
ZM 8.0 4.5 5.66 1970.00 8.80.105
Discussion of Results
When using the filler MWCNT in suspension form AQUACYLU 0301 it is obvious from the above results in Table 3 that antistatic properties were obtained by coatings with only 2.5 wt. % MWCNT. When comparing the various methods of dispersing out of the results of an internal electrical resistance the best option seems to be Visco – jet, where the average value of the equipment Tespo 1 is the highest. However, when applying coatings using HVLP technology the coatings using fillers MWCNT showed the best application and appearance properties prepared by rotor - stator stirrer. Conversely, when using 8.0 wt. % of finely ground graphite Fichema the best application method of dispersion seemed to be Visco – jet. The resulting coating prepared stirrer Visco - jet when using 8.0 wt. % had even the best electrical conductivity. Average values of pull of tension measured on samples pre-treated by blasting, have been in the case of using MWCNT significantly higher than in the case of graphite. When assessing the nature of the fractures the individual dispersion used for weight concentration had almost no effect. When using graphite there predominated fracture in the coating composition, when using 0.5 wt. % there predominated fracture between the adhesive and the coating and in the case of 2.5 wt. % there predominated adhesive fracture between the substrate and the coating.
Filler Concentration [wt. %] Gloss [GU] Adhesion tension [MPa] Tespo 1 Internal resistance [Ω]
MWCNT
0.5 10.7 9,95 0,04 2.84.1012
1.0 9.2 8,99 1966.00 9.90.105
1.5 5.1 6,20 1978.00 6.31.105
2.0 6.8 7,10 1983.00 4.86.105
2.0 4.4 8,78 1986.00 3.76.105
341

International Conference on Innovative Technologies, IN‐TECH 2016, Prague, 6. ‐ 8. 9. 2016
Table 4. Comparison of applications using the HVLP and applicator
Filler Dispersing device Concentration [wt. %] Internal electrical resistance [Ω]
HVLP Aplicator
MWCNT
VJ 0.5 2.84.1012 3.38.1010
2.5 3.29.105 2.38.105
RS 0.5 2.84.1012 1.56.108
2.5 3.76.105 1.58.105
ZM 0.5 1.42.1012 7.58.109
Graphite
VJ 8.0 4.09.105 3.28.106
RS 8.0 7.30.105 4.11.107
ZM 8.0 8.80.105 1.30.107
Discussion of Results In the Table 4 there is a comparison of the internal electrical resistance in terms of application of coating on the test samples. When
using MWCNT fillers the value of internal electrical resistance is significantly lower in coatings applicate by a ruler (applicator). Different results could be caused by changing the orientation and distribution of the particles in the final coating due to its application on the test samples. The lowest value of the internal electrical resistance (i.e. the highest electrical conductivity) was reached by a coating with 2.5 wt. % MWCNT, while the batch was dispersed by using a rotor - stator stirrer. The greatest efficiency of stirrer rotor – stator is confirmed by lower internal electrical resistance than when using a stirrer Visco - jet or dispersion blade when having the minimum of weight concentration of MWCNT (0.5 wt. %). Coating with an admixture of 8.0 wt. % graphite achieved the best electrical conductivity when applying coatings by the technology of the pneumatic spray (HVLP). Coating material was prepared by dispersing stirrer Visco - jet. As mentioned above, the coatings with an admixture of graphite the dispersion by Visco - jet appeared to be the best option.
Conclusion The above mentioned testing led to the conclusion that dispersion of a functional filler is the main decisive point as concerns final
properties of a coating material. Concerning electrical conductivity the best coating material seems to be coating system with 2.5 weight percentage of MWCNT with dispersing method of rotor-stator stirrer. The stirrer is the most efficient one because with a minimum concentration of MWCNT 0.5%, internal electrical resistance is considerably lower in comparison with dispersion blade or visco-jet. When graphite is used as a filler, the best dispersing device is visco-jet.
Acknowledgment
The research was financed by The Technology Agency of the Czech Republic (TAČR), Competence Center (CVPÚ) – Research Center Of Surface Treatment TE02000011.
References [1] AZIM, S. Syed, A. SATHEESH, K.K. RAMU a G. VENKATACHARI. Studies on graphite based conductive paint coatings [online].Tamilnadu 630 006, India: Central Electrochemical Research Institute, 2005 [cit. 2016-04-11].Dostupné z: http://krc.cecri.res.in/ro_2006/107-2006.pdf[2] SHENA, Wenning, Lajun FENGA, Xiao LIUA, Zheng LIUA, Hong LUOB, Peiru TONGA a Weihua ZHANG.Multiwall carbon nanotubes-reinforced epoxy hybrid coatings withhigh electrical conductivity and corrosion resistance prepared viaelectrostatic spraying [online].Sichuan 643000, China: Material Corrosion and Protection Key Laboratory of Sichuan Province, 2015 [cit. 2016-04-11].Dostupné z: http://www.sciencedirect.com/science/article/pii/S0300944015301855[3] KUDLÁČEK, Jan, Michal ZOUBEK, Viktor KREIBICH, Miroslav VALEŠ a František HERRMANN. Aplikace nátěrových systémů sezvýšenou elektrickou vodivostí. Povrcháři [online]. 2014, (7) [cit. 2016-04-11]. ISSN 1802-9833. Dostupné z:http://www.povrchari.cz/kestazeni/201407_povrchari.pdf[4] TŮMA, Zdeněk. Stav a trendy vývoje průmyslových NH. Transfer [online]. Praha: Výzkumný a zkušební letecký ústav, a.s, 2014 [cit.2016-04-11].
342

International Conference on Innovative Technologies, IN‐TECH 2016,
Prague, 6. ‐ 8. 9. 2016
CHEMICAL CLEANING INNER SURFACE HEATING AND ENERGY EQUIPMENT
J.Kuchař1, V. Kreibich1, Z. Hazdra1, H.Hrdinová1 and M. Petřík2 1CTU in Prague, Faculty of Mechanical Engineering, Technicka 4, 166 07, Prague, Czech Republic
2Olympus Czech Group, s.r.o., Evropska 176, 160 41, Prague, Czech Republic
Keywords: Chemical Cleaning, Heating System, Inner Surfaces
Abstract: The article deals with chemical cleaning interior surfaces of the heating and power plants. Furthermore,a comparison of various chemical detergents, which took place cleaner and movement did not take place. After laboratory testing and evaluation of the results was done cleaning the boiler.
Introduction The inner surface of heating and cooling systems during their operation are successively covering, due to the chemical and
physico-chemical reactions, solid, some dirt, minerals, and corrosion products.The resulting deposits are a thermal insulator and prevents heat transfer. This results in limiting the effectiveness of systems, increased energy and pressure loss and also reduce the possibility of regulation and the overall reduction in the efficiency of these systems. Maintenance and cleaning interior surfaces of these systems can perform both mechanically and chemically particular. Structural design of the heating system of a number of different materials (steel, brass, copper, plastic), and it is therefore necessary to choose such methods and means that individual materials system damaged. [1]
Experiment
On the market there are a number of different safe and effective detergents. Thus they were subjected to laboratory tests and comparing different resources from different manufacturers. The test sample was corroded steel. The samples were accurately weighed and then immersed in detergent compositions at 24 hours. After this time the samples were blotted dry and weighed again precisely. They were observed weight losses, thus the influence of chemical composition on the purified material. Cleaning was carried different products from various domestic and foreign suppliers. Since one of the suppliers wished disclosures preparations are lettered A, B, C, D, E, F and G. The tests were conducted for both stationary method, where the product did not take place movement for a method where product movement took place. Evaluation criterion was the amount of, respectively, the concentration of the product and its effectiveness in cleaning. Table 1. Concentrations and weight before and after cleaning the test preparations, which does not take place cleaner movement.
Preparation Sample Concentration
[vol. %] Weight before
test [g] Weight after
test [g]
Weight loss
[mg] [%]
A 1 10 % 27.4880 27.1565 331.5 1.2059
B 2 1 % 27.2457 27.1022 143.5 0.5266
C 3 50 % 27.2100 26.5749 635.1 2.3340
D 4 10 % 27.2636 26.7620 501.6 1.8398
E 5 1 % 27.5555 27.5248 30.7 0.1114
F 6 3 % 27.3271 27.2961 31 0.1134
G 7 1 % 27.2100 27.1626 47.4 0.1742
343

International Conference on Innovative Technologies, IN‐TECH 2016,
Prague, 6. ‐ 8. 9. 2016
The graph (Fig. 1 and Fig. 2) may monitor and compare the weight losses in milligrams samples using various cleaning agents (listed
in Tab. 1).
Fig. 1 Weight decrease of detergent in milligrams.
Fig. 2 Weight decrease of individual cleaners percentage.
Further testing was done when the cleaner is held motion (Tab. 2, Fig. 3 and 4).
Table 2 Concentration and weight before and after cleaning the test product when held cleaner movement.
Preparation Sample Concentration
[vol. %]
pH before
the test
pH after
the test
Weight
before test
[g]
Weight after
test [g]
Weight loss
[mg] [%]
A 1 10 % 3.7 4.0 26.4870 26.0813 405.7 1.5317
B 2 1 % 3.2 3.6 27.5774 27.4261 151.3 0.5486
C 3 50 % 3.5 3.8 28.0364 27.3756 660.8 2.3569
D 4 10 % 0.7 0.8 28.2429 27.7075 535.4 1.8957
E 5 1 % 4.4 4.7 27.9743 27.9437 30.6 0.1093
F 6 3 % 4.3 4.7 28.1600 28.1194 40.6 0.1441
G 7 1 % 3.9 4.2 27.8259 27.8137 12.2 0.0438
331,5
143,5
635,1501,6
30,7 31 47,4
0
500
1000
Sample 1 Sample 2 Sample 3 Sample 4 Sample 5 Sample 6 Sample 7
Weight loss [mg]
Comparing weight loss [mg]
1,2059
0,5266
2,334
1,8398
0,1114 0,1134 0,1742
0
1
2
3
Sample 1 Sample 2 Sample 3 Sample 4 Sample 5 Sample 6 Sample 7
Weight loss [%]
Comparing weight loss [%]
344
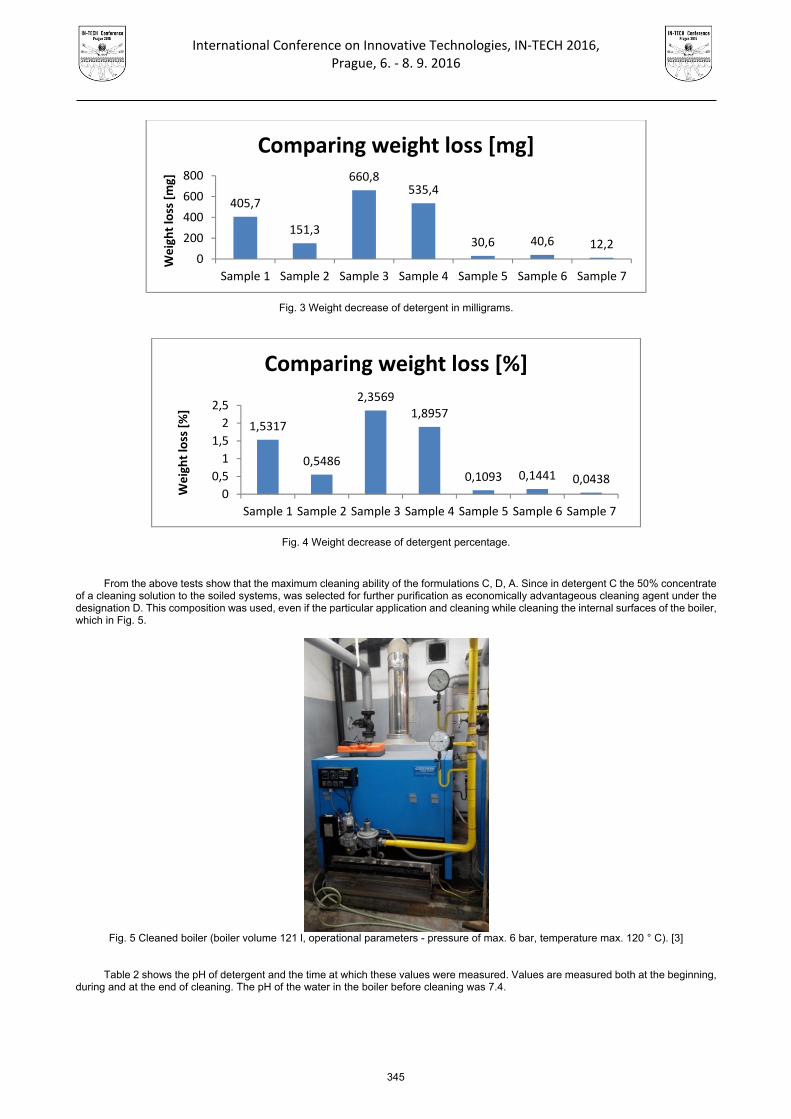
International Conference on Innovative Technologies, IN‐TECH 2016,
Prague, 6. ‐ 8. 9. 2016
Fig. 3 Weight decrease of detergent in milligrams.
Fig. 4 Weight decrease of detergent percentage.
From the above tests show that the maximum cleaning ability of the formulations C, D, A. Since in detergent C the 50% concentrate of a cleaning solution to the soiled systems, was selected for further purification as economically advantageous cleaning agent under the designation D. This composition was used, even if the particular application and cleaning while cleaning the internal surfaces of the boiler, which in Fig. 5.
Fig. 5 Cleaned boiler (boiler volume 121 l, operational parameters - pressure of max. 6 bar, temperature max. 120 ° C). [3]
Table 2 shows the pH of detergent and the time at which these values were measured. Values are measured both at the beginning, during and at the end of cleaning. The pH of the water in the boiler before cleaning was 7.4.
405,7
151,3
660,8535,4
30,6 40,6 12,20
200
400
600
800
Sample 1 Sample 2 Sample 3 Sample 4 Sample 5 Sample 6 Sample 7
Weight loss [mg]
Comparing weight loss [mg]
1,5317
0,5486
2,35691,8957
0,1093 0,1441 0,04380
0,5
1
1,5
2
2,5
Sample 1 Sample 2 Sample 3 Sample 4 Sample 5 Sample 6 Sample 7
Weight loss [%]
Comparing weight loss [%]
345

International Conference on Innovative Technologies, IN‐TECH 2016,
Prague, 6. ‐ 8. 9. 2016
Table 3. The pH and the time before and during cleaning. Measurement pH Time [min] Note
1 7.4 - Before cleaning - pH of water in the boiler 2 0.5 0 Start of cleaning - the pH after mixing the concentrate 3 0.7 7 Cleaning process 4 0.9 11 Cleaning process 5 1.0 21 Cleaning process 6 1.2 36 Cleaning process 7 1.3 46 Cleaning process 8 1.3 60 Cleaning process 9 1.3 75 End cleaning process
Industrial endoscope / videoscope Olympus Series C (Fig. 5) was controlled boiler cleaning before and after cleaning. Basic industrial videoscope Olympus offers exceptional Articulation, resistance and excellent optics that allow you to get magnified image as needed. This device is designed for use wherever it is needed, and is packed with features that are reserved for more expensive equipment. Videoscope Series C will save you time and money. Metallically clean surface iron confirmed qualitatively useful properties of this composition. [2] [3]
Fig. 6 Left industrial endoscope / videoscope Olympus Series C [2] and shot from the right controls on the internal surface of the cleaned boiler. [3] Conclusion
Detergent, which takes place the movement has a greater cleaning effect. After verifying the laboratory results in various cleaners has been selected best detergent. With this device was cleaned industrial heating boiler with a capacity of 121 liters. cleaning took 75 minutes. As is evident from defectoscopy image in Figure 5, the boiler was cleaned successfully in surface quality - the original state, surface without any damage.
Unprofessional access for cleaning of these devices may result in a shortened lifetime and hazardous material damage, resulting when in operation the cleaned equipment.
Many companies, without the necessary qualifications, often does not know the material composition of the purified composition or composition used for cleaning. They do not realize that performs surgery on pressurized systems. It is therefore necessary to ask when choosing companies to demonstrate their qualifications and guarantees for work performed. The same responsibility on the part of customers cleaning and contracting tender. The cheapest deal is not necessarily the best. For the required high level of safety and the environment, it is necessary to choose appropriate cleaning methods, agents and producers and professional firms with the appropriate qualifications and past in demanding cleaning equipment.
Acknowledgment
The research was financed by SGS13/187/OHK2/3T/12. Research and development in the field of advanced engineering technologies.
References
[1] KUCHAŘ, Jiri and Viktor KREIBICH. Cisteni otopnych a energetickych zarizeni.Technologie, kvalita a rizika ve vyrobe 2016. TISK AS, s.r.o., Jaromer, 2016. ISBN 978-80-87583-16-6.
[2] Olympus Europa SE & CO. KG. Olympus Czech Group, s.r.o. [online]. 2016 [cit. 2016-07-04]. Reachable: https://www.olympus.cz/ [3] KUCHAR, Jiri and Viktor KREIBICH and et al. Cleaning the internal surfaces of heating systems. Technological Forum 2016. ISBN 978-80-87583-17-3
346

International Conference on Innovative Technologies, IN‐TECH 2016,
Prague, 6. ‐ 8. 9. 2016
CORROSION RESISTANT COATING FOR THE PRINTING INDUSTRY
J.Kuchař1, M. Pakosta1, P. Tesařiková1 and J. Miřejovský2
1CTU in Prague, Faculty of Mechanical Engineering, Technicka 4, 166 07, Prague, Czech Republic
2 SOMA, s.r.o., B. Smetany 380, 563 01, Lanškroun, Czech Republic
Keywords: Corrosion; Corrosion Resistance; Plating; Composite Coatings
Abstract: The aim of the experiment was plating test samples and their subsequent test for corrosion resistence of various coatings in aggressive environments.
Introduction Printing is a field whose main task is the processing and dissemination of information, especially through the press. The name
originated from two Greek words, polys - and many grafein - write, draw. In addition to the name of the printing industry we can meet also with the name also print or graphics industry. [1]
Print quality is increasing and thus make high demands on the quality of the performance and life of the individual machine components. Printing cylinders are not only exposed to abrasion (abrasion), but also in terms of corrosion resistance. These cylinders operate in aggressive compositions with different pH values. Therefore, it is necessary that the coating printing cylinders have the best anti-corrosion and abrasion resistant properties.
Surface finishing technology is constantly evolving and creates new composite coatings that can compete in the future, now commonly used coatings (chromium coatings, nickel coatings, etc.).
Corrosion is defined as a "self-sustaining irreversible process of gradual degradation of material breaches and chemical and physical - chemical effects of the environment." [2] Corrosion subject not only metals, but also non-metallic substances such as inorganic materials (glass, cement), organic material (rubber, plastic). Corrosion may occur as damage the appearance of the material (loss of gloss, color), in extreme cases, as a violation of the integrity of the material and is thus decomposed material.
Corrosion is caused by corrosion system (material - environment) aims to be more probable (unorderer) state with a smaller free enthalpy. [3] Experiment
Be metallized series of test samples were examined for corrosion resistance. They were used as the base, alloy and composite coatings. As samples were used rings and tablets. The rings are made of material 11532 and the tablets were of materials used for high strength bolts grade 10.9 and 34Cr4. Tablet dimensions and rings are shown in Fig. 1.
Fig. 1 Tablet dimensions (left) and the dimensions of the rings (right)
Corrosion testing
The corrosion test was carried out in the salt spray according to DIN EN ISO 9,227th test principle is based on the conclusion of the test samples into the chamber, where they will be exposed to salt spray (5% NaCl). Samples were tested in neutral salt spray chamber type S 400 -TR (Fig. 2). This is a classical chamber trunks perform a volume of 400 liters. The test was carried out at pH values ranging from 6.5 to 7.2 and a temperature of 35 ± 2 ° C for 140 hours. The corrosion resistance of the coating was evaluated on the basis of the formation of corrosion products (corrosion pits, craters, blisters and other defects devaluing base metal).The course of the corrosion test was regularly documented. In the first five hours of test photographs were taken every hour, then 20, 24, 44, 119 and 140 hours. The work presents photographs after 140 hours in corrosion chamber.
347

International Conference on Innovative Technologies, IN‐TECH 2016,
Prague, 6. ‐ 8. 9. 2016
Fig. 2 Neutral Salt chamber (left) and hanging samples (right)
Table 1. Comparison of the results for the various coatings of the corrosion chamber for tablets.
Tablets
Coating m0 [g] m1 [g] Δm [g]
1 Electroplating Ni – P 18.9053 18.8790 0.0263
2 NiP – D 18.6238 18.6136 0.0102
3 NiP – Al2O3 19.0712 19.0439 0.0273
4 NiP – CNT 17.1949 17.1619 0.033
5 NiP – XLS 19.1618 19.1260 0.0358
6 Electroplating chrome 18.6104 18.5935 0.0169
7 Electroless Ni – P 17.9662 17.9651 0.0011
Table 2. Comparison of results for the individual coating of corrosion chamber rings.
Rings
Coating m0 [g] m1 [g] Δm [g]
1 Electroplating Ni – P 23.0296 22.8041 0.2255
2 NiP – D 23.0616 22.8415 0.2201
3 NiP – Al2O3 23.1264 22.9583 0.1681
4 NiP – CNT 23.0844 22.8125 0.2719
5 NiP – XLS 23.2163 22.9882 0.2281
6 Electroplating chrome 22.9181 22.6650 0.2531
348

International Conference on Innovative Technologies, IN‐TECH 2016,
Prague, 6. ‐ 8. 9. 2016
Fig. 3 Coating NiP – Al2O3 after 140 hours in the corrosion chamber
Fig. 4 Coating NiP – CNT after 140 hours in the corrosion chamber
Fig. 5 Coating NiP – D after 140 hours in the corrosion chamber
Fig. 6 Electroplating coating chrome after 140 hours in the corrosion chamber
349

International Conference on Innovative Technologies, IN‐TECH 2016,
Prague, 6. ‐ 8. 9. 2016
Fig. 7 Coating NiP after 140 hours in the corrosion chamber
Fig. 8 Coating NiP – XLS after 140 hours in the corrosion chamber
Conclusion
The aim of the experiment was to determine the best coating with corrosion resistance. During the test, the corrosion chamber showed the best results chemically precipitated nickel coating. On the tested tablets had the second best corrosion resistance and NiP composite coating - diamond. The rings test confirmed good corrosion resistance of composite coatings NiP - diamond, but more landed composite coating NiP - Al2O3. Price chemically excluded nickel coating is significantly lower than the cost galvanically excluded composite coatings, so it is advisable to select the corrosion protection coating chemically precipitated or. electroplated chrome coating excluded.
Acknowledgment
The research was financed by Technology Agency of the Czech Republic (TAČR), Program ALFA TA04010971.
References [1] POP, Pavel. Úvod do polygrafie. Praha: Nakladatelství grafické školy, 2003. ISBN 80-902978-7-0. [2] KREIBICH, Viktor. Teorie a technologie povrchových úprav. Vyd. 1. Praha: České vysoké učení technické, 1996, 89 s. ISBN
80-01-01472-x. [3] KRAUS, Václav. Povrchy a jejich úpravy. 1. vyd. Plzeň: Západočeská univerzita, 2000, 216 s. ISBN 80-7082-668-1
350
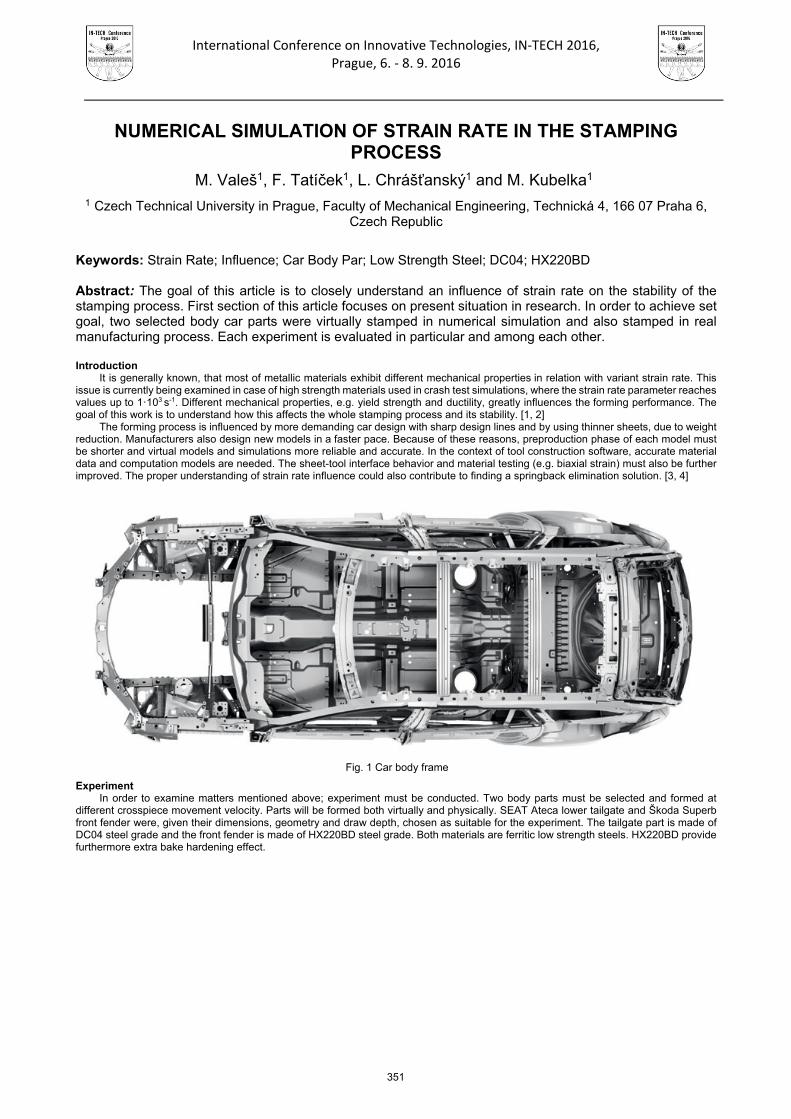
International Conference on Innovative Technologies, IN‐TECH 2016,
Prague, 6. ‐ 8. 9. 2016
NUMERICAL SIMULATION OF STRAIN RATE IN THE STAMPING PROCESS
M. Valeš1, F. Tatíček1, L. Chrášťanský1 and M. Kubelka1 1 Czech Technical University in Prague, Faculty of Mechanical Engineering, Technická 4, 166 07 Praha 6,
Czech Republic
Keywords: Strain Rate; Influence; Car Body Par; Low Strength Steel; DC04; HX220BD Abstract: The goal of this article is to closely understand an influence of strain rate on the stability of the stamping process. First section of this article focuses on present situation in research. In order to achieve set goal, two selected body car parts were virtually stamped in numerical simulation and also stamped in real manufacturing process. Each experiment is evaluated in particular and among each other. Introduction
It is generally known, that most of metallic materials exhibit different mechanical properties in relation with variant strain rate. This issue is currently being examined in case of high strength materials used in crash test simulations, where the strain rate parameter reaches values up to 1·103 s-1. Different mechanical properties, e.g. yield strength and ductility, greatly influences the forming performance. The goal of this work is to understand how this affects the whole stamping process and its stability. [1, 2]
The forming process is influenced by more demanding car design with sharp design lines and by using thinner sheets, due to weight reduction. Manufacturers also design new models in a faster pace. Because of these reasons, preproduction phase of each model must be shorter and virtual models and simulations more reliable and accurate. In the context of tool construction software, accurate material data and computation models are needed. The sheet-tool interface behavior and material testing (e.g. biaxial strain) must also be further improved. The proper understanding of strain rate influence could also contribute to finding a springback elimination solution. [3, 4]
Experiment
In order to examine matters mentioned above; experiment must be conducted. Two body parts must be selected and formed at different crosspiece movement velocity. Parts will be formed both virtually and physically. SEAT Ateca lower tailgate and Škoda Superb front fender were, given their dimensions, geometry and draw depth, chosen as suitable for the experiment. The tailgate part is made of DC04 steel grade and the front fender is made of HX220BD steel grade. Both materials are ferritic low strength steels. HX220BD provide furthermore extra bake hardening effect.
Fig. 1 Car body frame
351
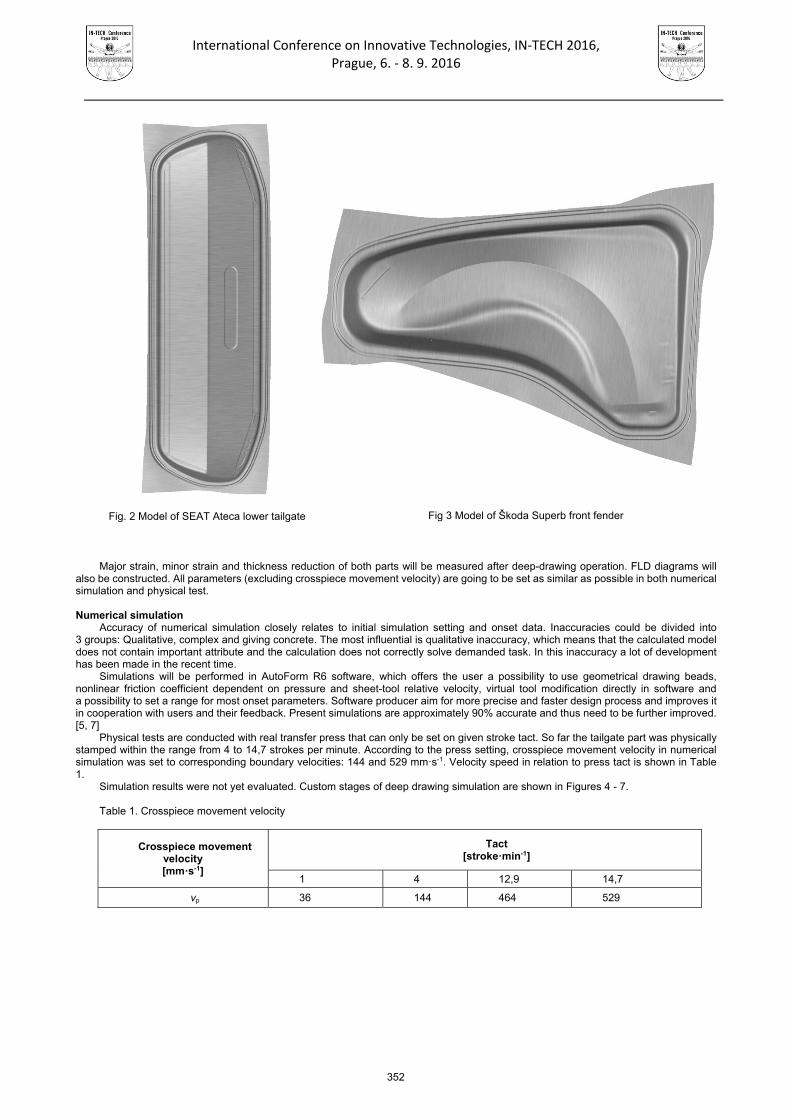
International Conference on Innovative Technologies, IN‐TECH 2016,
Prague, 6. ‐ 8. 9. 2016
Major strain, minor strain and thickness reduction of both parts will be measured after deep-drawing operation. FLD diagrams will also be constructed. All parameters (excluding crosspiece movement velocity) are going to be set as similar as possible in both numerical simulation and physical test.
Numerical simulation
Accuracy of numerical simulation closely relates to initial simulation setting and onset data. Inaccuracies could be divided into 3 groups: Qualitative, complex and giving concrete. The most influential is qualitative inaccuracy, which means that the calculated model does not contain important attribute and the calculation does not correctly solve demanded task. In this inaccuracy a lot of development has been made in the recent time.
Simulations will be performed in AutoForm R6 software, which offers the user a possibility to use geometrical drawing beads, nonlinear friction coefficient dependent on pressure and sheet-tool relative velocity, virtual tool modification directly in software and a possibility to set a range for most onset parameters. Software producer aim for more precise and faster design process and improves it in cooperation with users and their feedback. Present simulations are approximately 90% accurate and thus need to be further improved. [5, 7]
Physical tests are conducted with real transfer press that can only be set on given stroke tact. So far the tailgate part was physically stamped within the range from 4 to 14,7 strokes per minute. According to the press setting, crosspiece movement velocity in numerical simulation was set to corresponding boundary velocities: 144 and 529 mm·s-1. Velocity speed in relation to press tact is shown in Table 1.
Simulation results were not yet evaluated. Custom stages of deep drawing simulation are shown in Figures 4 - 7. Table 1. Crosspiece movement velocity
Crosspiece movement velocity [mm·s-1]
Tact [stroke·min-1]
1 4 12,9 14,7
vp 36 144 464 529
Fig. 2 Model of SEAT Ateca lower tailgate Fig 3 Model of Škoda Superb front fender
352
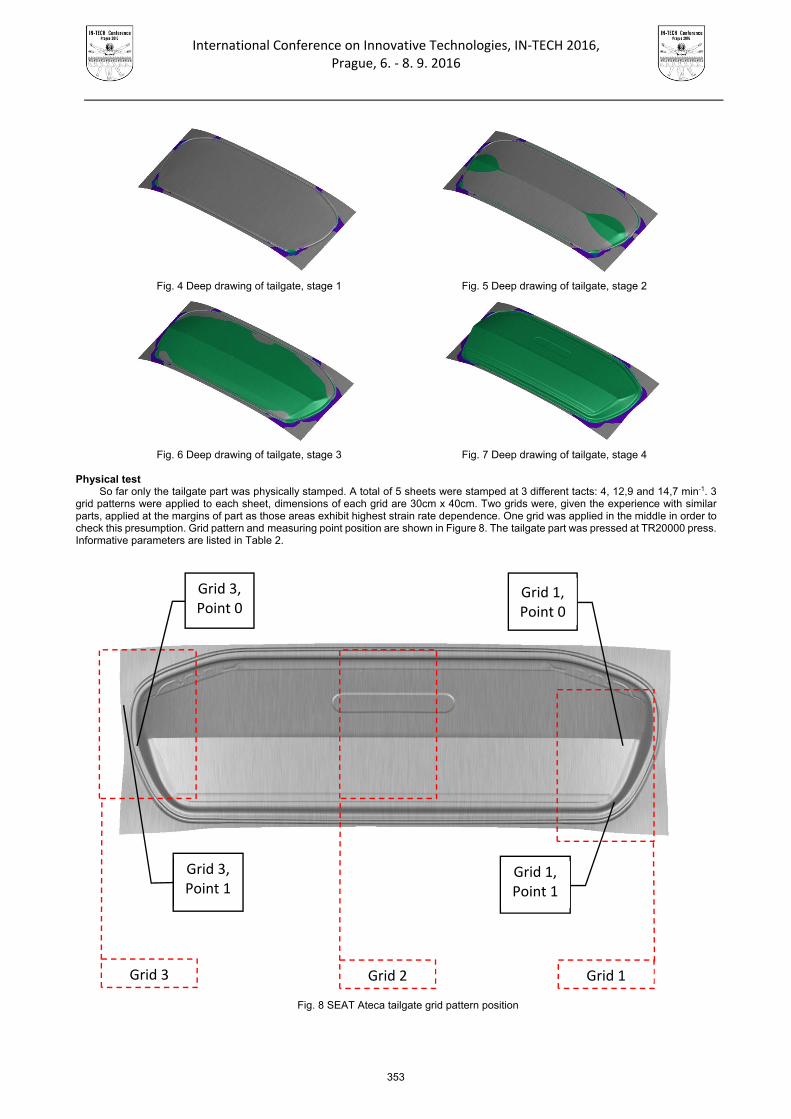
International Conference on Innovative Technologies, IN‐TECH 2016,
Prague, 6. ‐ 8. 9. 2016
Fig. 4 Deep drawing of tailgate, stage 1 Fig. 5 Deep drawing of tailgate, stage 2
Fig. 6 Deep drawing of tailgate, stage 3 Fig. 7 Deep drawing of tailgate, stage 4
Physical test
So far only the tailgate part was physically stamped. A total of 5 sheets were stamped at 3 different tacts: 4, 12,9 and 14,7 min-1. 3 grid patterns were applied to each sheet, dimensions of each grid are 30cm x 40cm. Two grids were, given the experience with similar parts, applied at the margins of part as those areas exhibit highest strain rate dependence. One grid was applied in the middle in order to check this presumption. Grid pattern and measuring point position are shown in Figure 8. The tailgate part was pressed at TR20000 press. Informative parameters are listed in Table 2.
Fig. 8 SEAT Ateca tailgate grid pattern position
Figure 4.1 – SEAT Ateca tailgate grid pattern position
Grid 1, Point 0
Grid 3, Point 0
Grid 3, Point 1
Grid 1, Point 1
Grid 3 Grid 2 Grid 1
353
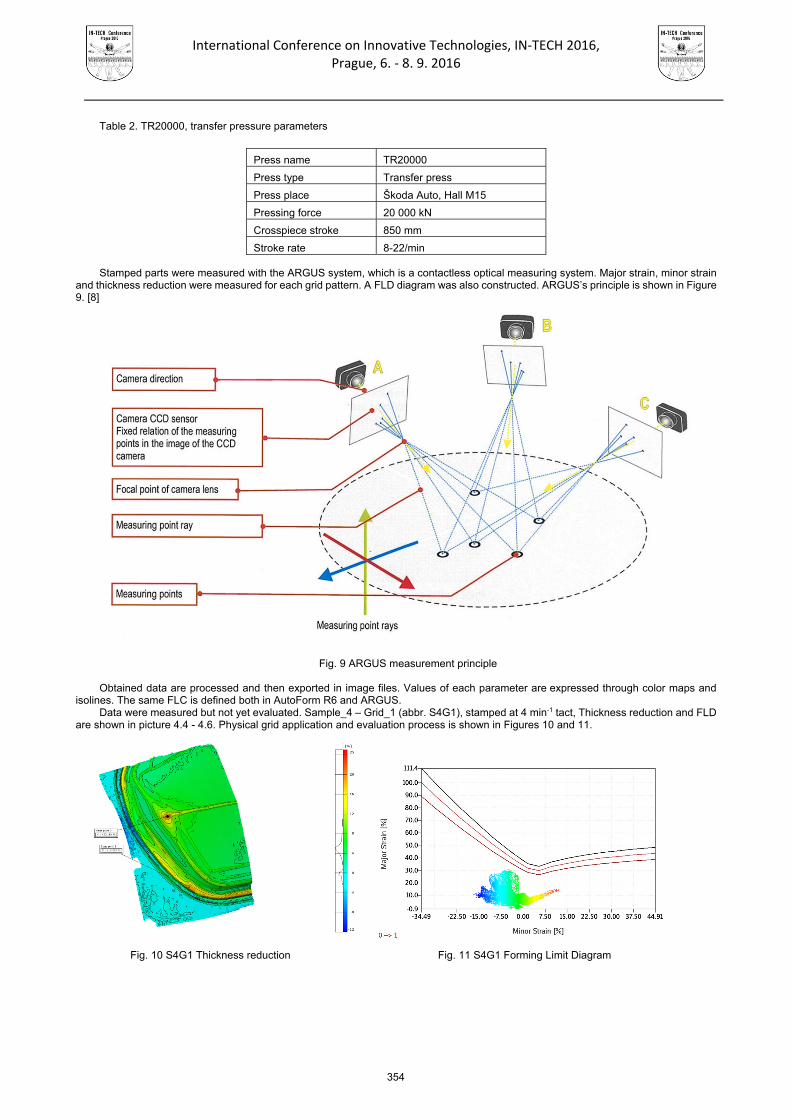
International Conference on Innovative Technologies, IN‐TECH 2016,
Prague, 6. ‐ 8. 9. 2016
Table 2. TR20000, transfer pressure parameters Stamped parts were measured with the ARGUS system, which is a contactless optical measuring system. Major strain, minor strain
and thickness reduction were measured for each grid pattern. A FLD diagram was also constructed. ARGUS’s principle is shown in Figure 9. [8]
Fig. 9 ARGUS measurement principle
Obtained data are processed and then exported in image files. Values of each parameter are expressed through color maps and
isolines. The same FLC is defined both in AutoForm R6 and ARGUS. Data were measured but not yet evaluated. Sample_4 – Grid_1 (abbr. S4G1), stamped at 4 min-1 tact, Thickness reduction and FLD
are shown in picture 4.4 - 4.6. Physical grid application and evaluation process is shown in Figures 10 and 11.
Fig. 10 S4G1 Thickness reduction Fig. 11 S4G1 Forming Limit Diagram
Press name TR20000
Press type Transfer press
Press place Škoda Auto, Hall M15
Pressing force 20 000 kN
Crosspiece stroke 850 mm
Stroke rate 8-22/min
354
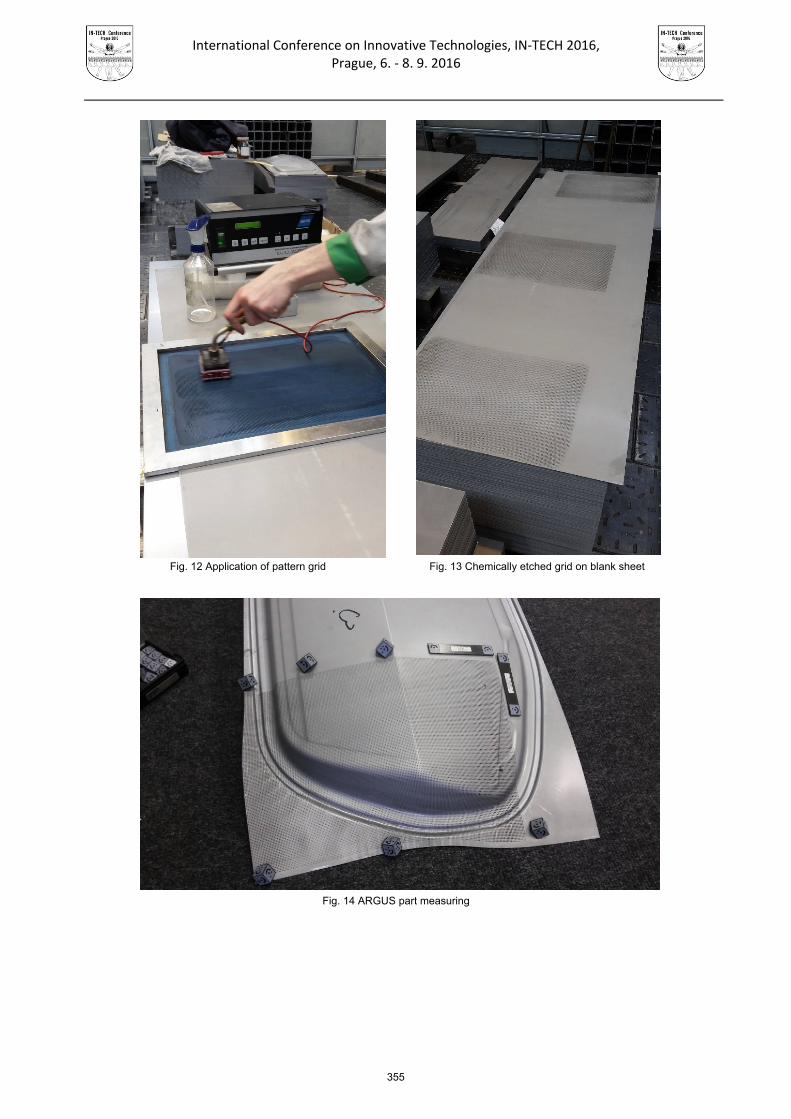
International Conference on Innovative Technologies, IN‐TECH 2016,
Prague, 6. ‐ 8. 9. 2016
Fig. 12 Application of pattern grid Fig. 13 Chemically etched grid on blank sheet
Fig. 14 ARGUS part measuring
355

International Conference on Innovative Technologies, IN‐TECH 2016, Prague, 6. ‐ 8. 9. 2016
Conclusion In the field of car body parts forming tool construction, the strain rate influences the stability of forming process. Therefore, this
parameter needs to be further examined. In order to deeply understand this issue, an experiment was conducted. Two chosen car body parts were formed both in numerical simulation and real physical forming process. The principle of this experiment was to set all parameters (excluding crosspiece movement velocity) as close as possible in both tests.
Major strain, minor strain, thickness reduction and FLD diagram were evaluated for each sample/simulation. The goal of this experiment was to find parameters and geometry most influenced by strain rate.
Acknowledgment
The research was financed by SGS13/187/OHK2/3T/12. Research and development in the field of advanced engineering technologies.
References
[1] DOUBEK, Pavel. Výzkum deformačního chování vysokopevných plechů při vyšších rychlostech deformace. Liberec, 2006.Dizertační práce. Technická univerzita v Liberci. Vedoucí práce Mirko Král.
[2] NÉMET, Miroslav a Mária MIHALÍKOVÁ. THE EFFECT OF STRAIN RATE ON THE MECHANICAL PROPERTIES OFAUTOMOTIVE STEEL SHEETS. Acta Polytechnica. Košice: Czech Technical University in Prague, 2013, 5(53), 4. ISSN 1210-2709.
[3] CANADINC, D., T. NIENDORF a H.J. MAIER. On the coupled temperature–strain rate sensitivity of ultrafine-grained interstitial-free steel. Scripta Materialia [online]. 2010, 63(5), 544-547 [cit. 2016-06-02]. DOI: 10.1016/j.scriptamat.2010.05.026. ISSN13596462. Dostupné z:http://linkinghub.elsevier.com/retrieve/pii/S1359646210003519
[4] VORGELEGT VON PATRICK LAROUR. Strain rate sensitivity of automotive sheet steels: influence of plastic strain, strain rate,temperature, microstructure, bake hardening and pre-strain. [Online-Ausg.]. Aachen: Shaker, 2010. ISBN 978-383-2291-495.[5]FUSEK, Martin a Radim HALAMA. MKP a MHP. Ostrava, 2011. Dostupné z:http://mi21.vsb.cz/sites/mi21.vsb.cz/files/unit/mkpamhp_obr.pdf
[6] BENEŠOVÁ, Soňa. Materiálové modelování a numerická simulace jako nástroj pro vývoj technologických procesů. Plzeň, 2007.Dizertační práce. ZČU v Plzni. Vedoucí práce Vladimír Bernášek.
[7] Počítačová simulace tváření plechů. MM Průmyslové spektrum [online]. 2001 [cit. 2016-06-02]. Dostupné z:http://www.mmspektrum.com/clanek/pocitacova-simulace-tvareni-plechu.html
[8] interní dokument Škoda Auto, a.s., ARGUS Handbook
356

International Conference on Innovative Technologies, IN‐TECH 2016, Prague, 6. ‐ 8. 9. 2016
THE INFLUENCE OF SCREW GEOMETRY ON EXTRUSION OF POLYPROPYLENE
T. Pepelnjak1 and M. Jeseničnik2
1 Forming Laboratory, Faculty of Mechanical Engineering, University of Ljubljana, Aškerčeva 6, SI-1000 Ljubljana, Slovenia
2 Na gmajni 19, SI-3205 Vitanje, Slovenia
Keywords: Extrusion; Polypropylene; Screw Geometry; Sheet Polymer
Abstract: The quality extrusion of polypropylene in the shape of wide sheets is influenced by several parameters. If the parameters are inappropriate, the surface mistakes on the sheets are so extent that the sheets must be recycled. The influence of different geometries of a single screw and various temperature profiles of heating zones of cylinder were analysed based on the behaviour of the screw and its mass flux with the help of computer - aided program package Virtual Extrusion Laboratory. It was found out that, in order to achieve homogeneity of melting at the exit of extruder, the geometry of screws must necessarily form distributive as well as dispersive mixing elements.
IntroductionExtrusion is a complex and one of the most widely used polymer materials processing technologies. The process use as a raw
material polymer granules, powders, and semi-finished products for further industrial needs [1]. It is a continuous process of pushing the heated and molten material by means of a screw. The used machines are generally divided into two main groups – single screw and twin screw extruders. In the presented paper single screw extruder is analyzed.
Extrusion line is essentially composed of dispenser, hopper, screw, nozzles, calandar system and transport lines – Fig. 1. It is thus a line of many interdependent actors that deliver the finished product. The material is in the form of granules or powder, entering the machine through the hopper and falling on a rotating screw by continuously pushing against the head of the extruder – Fig. 2. In doing so, the material is heated, softened and melted, at the same time it reduces the volume. Because the material does not achieve a sufficiently high processing temperature by the friction, it is necessary to additional heat the cylinder of the screw further by means of electric heaters. The cylinder of the extruder ends with a flange where intermediate parts such as the exchange network or disk are mounted. This is followed by a nozzle, through which the melt is formed into the required dimensions of the feedstock or final product with a corresponding state of the surface. Technological problems [2, 3] appearing at extrusion process are resulting from incorrect temperature profile of the extruder, incorrect components of the entry material, cooling the transition from the hopper into the extruder, inadequate temperature melt, etc ... All this contributes to the fact that the final products are not in accordance with the expected specifications, and consequently the customer's wishes.
Fig. 1 Sheet extrusion process [1]
A very important parameter that directly affects the properties and processing of polymers during the extrusion process is the ratio between the length of a screw (L) and its external diameter (D) called also the L/D ratio. The mass flow of the extruded polymer processed at extrusion is directly dependent on the L/D ratio. If two machines of the same diameter of the extruder screw having different lengths are compared the mass flow can significant distinction. Machines with longer screws have a higher melting and mixing capacity and are capable of achieving higher rotation speeds. The most common form of single screws are between 20 and 30 times diameter D. Feeding zone at classic single screw is between 4 and 8*D, compression of transition zone between 6 and 10*D and metering zone between 10 and 12*D. For proper mixing and processing of the material also dividing and dispersive elements are used. In presented paper the influence of
357

International Conference on Innovative Technologies, IN‐TECH 2016, Prague, 6. ‐ 8. 9. 2016
classical dispersive Maddock [4] mixing element and dividing pineapple [5] element were analysed. The geometry of Maddock and pineapple elements is presented on Fig. 3.
Fig. 2 Composition of a single screw extrusion system [3]
Fig. 3 Maddock (left) and pineapple (right) mixing element [4, 5]
Material The analysis of the screw geometry on extrusion process was performed with polypropylene material. The melted polypropylene
exhibits pseudo plastic properties, that in order to achieve the appropriate viscosity (102 to 105 Pa * s) requires relatively high process temperature with regulated heaters of the cylinder. The intermediate parts need to be heated up to 220 to 230 °C [6]. The degree of molecular orientation in the pipe is conditional on the rheological behaviour of the polypropylene. Polypropylene is a partially crystalline polymer which operates in shear stress caused by shear flow. Generated shear flow has a strong influence on the nucleation and crystallization of polypropylene. Crystallization process consists of the molecular melt in the orderly structure of the clotting process. Rheology shows a strong influence in the processing of polymers especially in theoretical analyzes. Therefore, proper selection of the rheological model is crucial for accurate analysis of the material behaviour at the extrusion process.
Visco-elastic properties of polypropylene are commonly described by the Maxwell and Kelvin model. The latter perfectly describes the processes of creep, while Maxwell relaxation processes in the material. During the process of extrusion of a melt of polypropylene under the influence of shear stresses mutual chain between molecules and break of the melt in this way starts to move forward. Upon the dissolution of the shear stress between the molecules re-establish links and the molecules re-orient begin. This explains the phenomenon of extrudate swelling and instability in the material flow, which often happens during the process of extrusion of polypropylene. Swelling of the extrudate is closely associated with an elastic return at the exit of the melt from the nozzle. The most extensive description of the polymer material is presented with Carreau model being also implemented in the program Virtual Extrusion Laboratory. The viscosity of polymeric materials is dependent on the size and structure of its forming molecules [7]. In comparison with the Ostwald model [8, 9] has Carreau model the advantage of described viscosity for a wide range of shear rates. It includes Ostwald model with by power function depending from as well as the behavior of Newtonian fluids under the effect of very low and high shear rates [9].
Carreau model is represented with equation [9]:
∗ ∗ (1)
In equation 3.22, the symbol represents viscosity under the action of a very low or zero shear rates, while the symbol represents the viscosity under the action of high shear forces respectively. Shear rate ( ) is expressed in s-1, while n represents the index of the current behavior. The program developed by the company Compuplast use modified Carreau model described with equation:
,
(2)
The material properties of isotactic polypropylene used in performed simulations are as follows [10]:
Name: Typical 3.5 MFR PP (Carreau) Used modified Carreau model: A0 = 10000 Pa * s, n = 0.3079, r = 0.5443, a = 0.5000 Thermal properties: ρ = 735 kg/ , = 2100 J/kg/ °C, k = 0.2 W/m/ °C, = 163 °C, = 138 °C, = 1700 J/kg/ °C, kT =
0.22 W/m/ °C, = 160000 J/kg
358

International Conference on Innovative Technologies, IN‐TECH 2016, Prague, 6. ‐ 8. 9. 2016
Simulations of the screw geometry In order to analyse the influence of the distributive and dividing mixing elements the analyses were performed for three different screw
geometries. The entire screw having the total length of 5250 mm and diameter of 150 mm is composed of fixed dimension and geometry of feed zone and compression zone. The screw in the feed zone (CFZ) has constant classic shape with the helix width of 15 mm and helix step of 150 mm. The compressive zone (BS) designed for the melting of the material has barrier screw with helix with reduced width starting at 15 mm and decreasing down to 3 mm [11].
The metering zone differs for all three simulations. The only element being constant for all three cases is the dividing pineapple element (MDP) at the end of the metering zone since this type of element is the most effective dividing element shaping for the processing of the polypropylene.
In the first simulation the metering zone consists of two spiral Maddock elements (MDM1 and MDM2) following by the pineapple element, second simulation was performed with classical Maddock element (MDMC) and pineapple element while in the third simulation the combination of Dulmage element (MDD) and pineapple element was analysed. Since the influence of the processing parameters like the changes in temperature profile of the extruder was not the task of the presented paper the temperature profile was held constant with a profile ranging from 30°C at the hopper up to the 210°C at the end of the compression zone. In the metering zone the temperature was increased to 220°C.
Table 1. Dimensions of the analysed screw geometry
Feed zone Compression zone Metering zone Simulation
1-T23VAbbreviation of the part name
CFZ BS MDM1 MDM2 MDP
Length [mm] 1800 2300 400 400 350 Simulation
2-T23VAbbreviation of the part name
CFZ BS MDMC MDP
Length [mm] 1800 2300 600 550 Simulation
3-T23VAbbreviation of the part name
CFZ BS MDD MDP
Length [mm] 1800 2300 750 400
Feed zone Compressive zone Metering zone
Analysed mixing elements C
lass
ic
Mad
dock
(M
DM
C)
Spi
ral
Mad
dock
(M
DM
)
Dul
mag
e (M
DD
)
Results With the numerical simulations of the material flow through the extruder with selected geometry of the mixing element various
parameters were observed. The simulations were performed by the industrial simulation package Virtual Extrusion laboratory [10] by the company Compuplast which is specialised for the simulations of the extrusion process. Observed parameters were: shear stresses guiding the mixing of the material (high shear stresses result in intensive mixing), temperature profile and total time used to process the molten material through the extruder. The comparative shear stresses are presented on Fig. 4. Initial high shear stresses due to the partial solid state of the semi-molten material decrease to the end of the compressive zone where the entire material was in liquid state. In the metering zone the mixing follows which is again evaluated by the level of shear stresses. Here, the Maddock elements are far more efficient as the Dulmage element. Comparative evaluation of the flow capacity of the polypropylene processing at the selected extruder geometry by implementation of all three combinations of dispersive elements shows the highest values by the implementation of spiral Maddock element, following by the clasical Maddock elements. Use of Dulmage element delivers signifficant lower mass flux through the analysed extruder – Fig. 5.
Conclusion With the results obtained, it was found out that a prerequisite for high-quality processing of polypropylene in the metering zone is use
of the dispersion and distributive mixing elements. In the case of design of the screw with only distributive mixing elements the shear speed and stress falls below the critical threshold and thus greatly reduce the processing quality and the mass flow of the melt.
359

International Conference on Innovative Technologies, IN‐TECH 2016, Prague, 6. ‐ 8. 9. 2016
Fig. 4 Shear stresses along the screw length.
Fig. 5 Comparison of mass flux through the extruder
Acknowledgment
This paper is part of research work within the program Nr. P2-0248 entitled Innovative Production Systems financed by the Slovene Ministry of Education, Science and Sport. The authors are very grateful for the financial support. The authors thank the CEEPUS program for enabling them to be mobile within the CIII-HR-0108 network. The sincere thanks also go to the company Compuplast, especially to Mrs. Sarka Vasirova for the donation of the simulation software Virtual Extrusion laboratory.
References
[1] H.F. Giles, Jr. et al: Extrusion: The Definitive Processing and Handbook. William Andrew publishing, New York, 2005.[2] N.N.: Vitasheet Group: Extrusion Technology. http://www.vitasheetgroup.com/en/extrusion_technology.htm (10.8.2016).[3] S. Nasseri: Properties of polymer melts extrusion manufacturing processes. V: S. Naseri (ed.): Shaping process for plastics.
Southern Polytechnic State University. Marietta, Georgia, 2015, p.18.[4] J. Frankland: Single-Screw Mixing 101. Plastics Technology, Vol.56, Num. 5 (2010), p. 22.[5] EP0644034 B1: Single screw extruder capable of generating chaotic mixing.[6] Z.M. Ariff et al: Rheological behaviour of polypropylene through extrusion and capillary rheometry. V: F. Dragon: Polypropylene.
Intech, Rijeka, 2012. p. 28-49.[8] A.M. Robertson: Lecture Notes on Non-Newtonian Fluids Part I: Inelastic Fluids. University of Pittsburgh, Pittsburgh, 2005.[7] H. Moradi: Experimental investigation of polymer flow through water and oil wet porous media: magistrsko delo. University of
Stavanger: Faculty of science and technology. 2011.[9] A. Foegeding et al: Dairy systems. In: I. Norton et al: Practical food Rheology: an interpretive approach. John Willey & Sons, New
York, 2011. p. 133-172.[10] Compuplast: Virtual extrusion laboratory: Sheet extrusion, 2015.[11] M. Jeseničnik: Vpliv geometrije polžnega vijaka in procesnih parametrov na iztiskavanje polipropilena (The influence of geometry of
a screw and process parameters on extrusion of polypropylene), Master Thesis, University of Ljubljana, Faculty of MechanicalEngineering, Ljubljana 2016, 115 p. (in Slovene).
0102030405060708090
100110120
0 500 1000 1500 2000 2500 3000 3500 4000 4500 5000
Shear stress at the cilin
der wall
[kPa]
Screw length[mm]
simulacija 1 – T23V
simulacija 2 – T23V
simulacija 3 – T23V
100120140160180200220240260280
Mass flux[kg/h]
1 – T23V 2 – T23V 3 – T23V
360

tl_J_Jlj\_Jh_jh_
1/(l
IN-TECH2016 PRAGUE, CZECH REPUBLIC 6. - 8. 9. 2016