1997 •BROADCAST ENGINEERING CONFERENCE
577
-
Upload
khangminh22 -
Category
Documents
-
view
0 -
download
0
Transcript of 1997 •BROADCAST ENGINEERING CONFERENCE

100 1.1
1997 • BROADCAST ENGINEERING CONFERENCE

(A-kb 1997 • BROADCAST ENGINEERING CONFERENCE
PROCEEDINGS 51st Annual
Broadcast Engineering Conference Proceedings
Las Vegas, Nevada April 5-10, 1997
Special Section includes: Papers from The Fibre Channel Seminar held at the
NAB '97 Electronic Distribution Conference
NM'

Noffonol A m,- iatirrl of
B. These proceedings contain technical papers presented at the NAB Broadcast Engineering Conference, April 5-10, 1997.
Published by the NAB Office of Science and Technology
Copyright 1997 National Association of Broadcasters
ISBN 0-89324-268-3
Reproduction or publication of the content, in whole or in part, without expressed permission is prohibited. No liability is assumed with respect to the use of the information contained herein.
References to the papers contained in the 1997 Proceedings may be made without specific permission but attributed to the NAB 51st Annual Broadcast Engineering Conference.
Additional copies of the 1997 Proceedings are available through NAB Services, 1771 N Street, N. W. Washington, DC 20036-2891. For price information, please write or call 1 (800) 368-5644, or +1 (202) 429-5373.

Nahonal Association of
NAB Science & Technology
FOREWORD
1771 N Street, NW Washington, DC 20036-2891
(202) 429-5346 Fax: (202) 775-4981
The theme for this year's NAB Broadcast Engineering Conference is Keeping Pace with Technology. This Proceedings was compiled to serve as a reference for engineers in the broadcast profession who are facing the challenges of implementing digital technologies. We hope you had the opportunity to attend the conference and interact with our many expert presenters. If not, this publication should help you in your quest to enhance your career.
Changes in the broadcast industry are occurring at an unprecedented rate. Broadcasters are taking advantage of facility consolidation, making the transition to digital technologies, coping with spectrum issues and seeking opportunities on the Internet. As we race toward the 21st century, take time to learn about new technologies and consider how they may benefit you, your company and the lives of your listeners and viewers.
The time has never been more challenging and demanding for broadcasters. We sincerely thank those professionals who gave their time and energies to make this conference a success. Among them are our friends and colleagues of the Society of Broadcast Engineers (SBE) who co-produced the conference. For the first time, the IEEE Broadcast Technology Society and the National Institute of Standards and Technology (NIST) teamed up to provide an exceptional tutorial on digital video. Finally, in the spirit of international cooperation, we were again honored by the participation of members of the European Broadcasting Union under the expert leadership of Dr. George Waters.
As always, the NAB/SBE Conference Planning Committee welcomes your comments not only on this year's conference, but also for future conferences. We invite you to call or write anytime.
Jerry Whitaker Lynn D. Claudy Chairman Senior Vice President NAB/SBE Engineering Conference Committee NAB Science & Technology

1996-97 NAB/SBE CONFERENCE PLANNING COMMITTEE
Jerry Whitaker, Chairman Technical Press
3830 N. W. 172nd Place Beaverton, OR 97006
Joe Fedele Fedele & Associates
12900 N. Bayshore Drive N. Miami, FL 33181
Marvin Born Vice President of Engineering Dispatch Broadcast Group 770 Twin Rivers Drive
P.O. Box 1010 Columbus, OH 43216
Andy Butler Public Broadcasting Service 1320 Braddock Place Alexandria, VA 22314
Jerry Butler WETA-TV Box 2626
Washington, DC 20013
Dane Ericksen, P.E. Hammett & Edison, Inc. P.O. Box 280068
San Francisco, CA 94128
Skip Pizzi BE Radio/Intertec Publishing
9800 Metcalf Overland Park, KS 66212-2215
Robert Seidel VP, Engineering
CBS 524 W. 57th Street New York, NY 10019
Milford Smith Vice President, Engineering
Greater Media, Inc. 2 Kennedy Blvd.
East Brunswick, NJ 08816
E. Glynn Walden Westinghouse Broadcasting
KYVV Radio Independence Mall East Philadelphia, PA 19106

TABLE OF CONTENTS
BROADCAST ENGINEERING CONFERENCE OPENING KEYNOTE Sunday, April 6, 1997 1
DIGITAL TV: STUDIO AND PRODUCTION ISSUES Sunday, April 6, 1997 3
HDTV/FILM PERFORMANCE COMPARISON Henry W. Mahler, CBS, Inc., New York, NY 5
THE HDTV SYSTEM FOR THE ATLANTA OLYMPICS Kenichiro Nagano, Manabu Hanada and Kohei Nakae, NHK 13
LEARNING FROM HISTORY: A PLAN FOR ATV Brad Dick, Broadcast Engineering magazine 19
DIGITAL SOUND BROADCASTING: TESTING AND REGULATORY ISSUES Sunday, April 6, 1997 25
PROGRESS TOWARDS THE DEVELOPMENT OF DIGITAL MODULATION IN THE LONG WAVE, MEDIUM WAVE AND SHORTWAVE BANDS Daniel Bochent, TeleDiffusion de France; H. Donald Messer, USIA; Patrick Bureau and Pierre Laurent, Thomcast; Dietmar Rudolph, Deutsche Telekom AG 27
FIELD TESTING OF PROPOSED DIGITAL AUDIO RADIO SYSTEMS - PART I: MOBILE DATA COLLECTION SYSTEM Stanley Salek and Daniel Mansergh, Hammett & Edison, Inc 49
FIELD TESTING OF PROPOSED DIGITAL RADIO SYSTEMS - PART II: THE EIA-CEMA DAR FIELD TEST TASK GROUP FIELD TEST DATA PRESENTATION Robert Culver, Lohnes & Culver 58
DIGITAL TV: SIGNAL AND TRANSMISSION ISSUES Sunday, April 6, 1997 81
MOVING FROM VHF-NTSC TO UHF-HDTV WITHOUT BANKRUPTING YOUR STATION 0. Bendov, GS Dielectric Communications 83
PLANNING YOUR DIGITAL TELEVISION TRANSMISSION SYSTEM Robert J. Plonka, Harris Corporation. 89
A NE W HIGH PO WER, MULTICHANNEL, UHF ANTENNA DESIGN FOR THE SIMULCAST NTSC/HDTV PERIOD Kerry W. Cozad, Andrew Corporation 98
SIMULATION OF THE EFFECTS OF VARIOUS NON-IDEAL COMPONENTS OF A DIGITAL TV TRANSMISSION SYSTEM ON THE TRANSMISSION QUALITY Noel McDonald and Robin Blair, Radio Frequency Systems 105
DEMODULATION AND DEGHOSTING OF VSB SIGNALS Majid Chelehmal and Tom Williams, Cable Television Laboratories Inc.; Yasuhiro Ito, NHK 109
HDTV MODULATOR Steve Kuh, K Tech Telecommunications, Inc 119
THE DEVELOPMENT OF A HDTV ENCODER Chai Yeol Rim, Woo Sung Jeon, Kyung Won Lim, Jong Beom Ra, Munhwa Broadcasting Corporation 122
DIGITAL SOUND BROADCASTING: IMPLEMENTING NE W TECHNOLOGY Sunday, April 6, 1997 129
THE WORLDSPACE SYSTEM: ARCHITECTURE, PLANS AND TECHNOLOGIES D.K. Sachdev, WorldSpace 131

DAB RECEIVER ISSUES - PANEL Thomas Lauterbach, Eureka 147/Bosch; Jurgen Althoff, Deutsche Telekom; Peter Shellswell, BBC; Franc Kozamemick, European Broadcasting Union; Masaoki Takai, Kenwood 140
EUREKA 147 DEVELOPMENTS WORLD-WIDE David Witherow, World DAB Forum 146
AUDIO PROCESSING: COMPETING WITH DIGITAL SERVICES Monday, April 7, 1997 153
A ONE STOP SHOP FOR AUDIO DATA COMPRESSION Fred Wylie, Audio Processing Technology Ltd 155
DIGITAL BROADCAST AUDIO PROCESSING: FINALLY, THE NE W FRONTIER Frank Foti, Cutting Edge 162
AUDIO SIGNAL PROCESSING FOR DIGITAL MEDIUMS Greg J. Ogonowski, Modulation Index 170
EMERGENCY PLANNING: STAYING ON THE AIR Monday, April 7, 1997 173
DISASTER PLANNING . . . BEFORE AND AFTER THE FACT Thomas G. Osenkowsky, Consultant 175
KEEP IT SIMPLE AND REDUNDANT Sanford B. Cohen, KQNA / Prescott Valley Broadcasting Company 180
STAYING ON THE AIR: CASE STUDIES IN EMERGENCY PLANNING - RADIO AND TV David C. Kobe, Harris Corporation .. 182
BROADCAST TOWERS: MAXIMIZING YOUR VERTICAL REAL ESTATE Monday, April 7, 1997 193
ADDING ANTENNAS TO A TO WER: RF ISSUES W.C. Alexander, Crawford Broadcasting 195
CUSTOMER SERVICE: WHEN NEXT DAY SERVICE AND MONEY BACK GUARANTEES ARE NOT ENOUGH Steve Epstein, Intertec Publishing....204
ENGINEERING OF EXISTING TV TOWERS FOR NE W A N ANTENNAS Madison J. Batt, Tower Engineering Consultants, Inc. 208
WHICH REVISION OF THE TIA/EIA 222 STANDARD SHOULD BE USED TO EVALUATE THE TRANSMITTER TO WER FOR A N? E. Mark Malouf, Malouf Engineering International 213
NEW CHANNEL COMBINING DEVICES FOR DTV Paul D. Smith, Micro Communications, Inc 218
HYBRID STORAGE TECHNOLOGIES: DOWNLOADING THE MEGABYTES Monday, April 7, 1997 223
SERVERS: DISTRIBUTED OR CENTRAL STORAGE? Jeff Stewart, Quantel ...225
AUTOMATED INDEXING AND RETRIEVAL FROM LARGE DIGITAL VIDEO LIBRARIES Krishna V. Pendyala, Howard D. Wactlar, Mark J. Juliano, Informedia Digital Video Library 233
INSTALLATION OF INTEGRATED NE WS OPERATION SYSTEM USING MPEG-2 NON-LINEAR VIDEO SERVER Tomoyuki Okamura, Fuji Television Network, Inc. 237
MPEG-2 CUTS-EDITING Christopher D. Bennett, Hewlett Packard 246
THE REAL WORLD OF VIDEO NETWORKING Brad Gilmer, Turner Broadcasting Systems 252

DVDS BROADCAST PC Mel Gable, Indigita 254
DESIGNING TELEVISION FACILITIES: PART I Tuesday, April 8, 1997 261
TUBE VERSUS SOLID STATE AMPLIFIERS Stephan Van Fleteren, CPI 263
USING A Ti SUBCARRIER ON A VIDEO MICRO WAVE SYSTEM Robert L. Band, Intraplex, Inc. 266
DESIGNING THE DIGITAL TELEVISION STATION OF THE FUTURE- Shannon L. Skemp and David Horowitz, Advanced Television Technology Center 269
IMPLEMENTING DIGITAL TELEVISION - WRAL CASE STUDY David C. Danielsons, Harris Corporation 279
NO FAILURE TO COMMUNICATE De Wayne Gray, M&C Systems 285
DESIGNING RADIO FACILITIES: PART I Tuesday, April 8, 1997 295
AN INNOVATIVE AM RADIATOR DESIGN EMPLOYING RADIATING GUY WIRES AND AM ANTENNA SYSTEM TECHNOLOGY UPDATE Clarence M. Beverage, Communications Technologies,Inc.; Al Christman, Grove City College 297
PERFORMANCE OF MODERN AM MODULATION METHODS INTO VARIED ANTENNA CONDITIONS John L. Delay and Hilmer I. Swanson, Harris Corporation 306
SIDELOBE-FREE ANTENNA ARRAYS - A NE W BREED IN FM BROADCAST ANTENNAS Ali Mahnad, Micro-Tek Engineering 316
A NE W METHOD OF GENERATING FM AND TELEVISION STEREO COMPOSITE BASEBAND YIELDS IMPROVED BROADCAST PERFORMANCE William H. Gillman, Gentner Communications Company 325
IMPROVING IMMUNITY TO RF INTERMODULATION IN FM SOLID STATE BROADCAST: TRANSMITTERS FROM INTERFERING SIGNALS OF CO-LOCATED STATIONS Mukunda B. Shrestha, Broadcast Electronics, Inc 331
STAYING ON THE AIR DURING ANTENNA SERVICE Timothy C. Cutforth P.E., Vii James P.0 343
DESIGNING TELEVISION FACILITIES: PART II Tuesday, April 8, 1997 347
DEVELOPMENT OF THE VIRTUAL STUDIO-SET SYSTEM AND ITS USE FOR TV PROGRAM PRODUCTION Kiyotaka Aoki and Ryu Watanabe, NHK 348
ANALOG TO DIGITAL VIDEO: TESTING THE SYSTEM Stephane Billat, SENCORE, Inc. 356
DEVELOPMENT OF A SMPTE STANDARD FOR THE DIGITAL INTERFACE BETWEEN THE DTV TRANSPORT MULTIPLEXER AND THE VSB TRANSMITTER Raymond Hauge, Zenith Electronics Corporation, and Bernard J. Lechner, Consultant 363
DIGITAL TRANSMISSION MANAGEMENT Michael A. Ledwich, Columbine JDS Systems, Inc. 365
THE ALL DIGITAL PC-BASED STUDIO NETWORK Alain Legault and Janet Matey, Matrox Video Products Group 374
ARCHITECTURE FOR TOTALLY DIGITAL NETWORKS Adriano Barzaghi and Corrado Riccio, Elettronica lndustriale 384
NETWORKING AND MIXED-PLATFORM INTEGRATION: AN OPEN AND SHUT CASE? Tony Davis, Quantel 388
PICTURE QUALITY ASSESSMENT TEST: CODING EFFICIENCY AND SERVICE BIT RATE OF 525-LINE PROGRESSIVE SCAN IMAGES Joji Urano, Hiranao Sakaguchi and Hideo Yamauchi, Nippon Television Network 395
DESIGNING RADIO FACILITIES: PART II Tuesday, April 8, 1997 403
A COST-EFFECTIVE MASTER FM ANTENNA SYSTEM Jay M. Jacobsmeyer and Jay S. Martin, Pericle Communications Company.. 405
TO WERS, RF AND FM ANTENNAS Ali Mahnad, Micro-Tek Engineering 415
BUILDING THE DIGITAL STUDIO AND TRANSMITTER PLANT W. Lee Simmons, Adventure Technology, Inc. 424
DIGITAL RADIO STUDIOS AT ANALOG PRICES- A COST EFFECTIVE APPROACH TO DESIGNING AND BUILDING A FULLY INTEGRATED DIGITAL BROADCAST FACILITY Russ W. Mundschenk, WBEB-FM 432
HIGH SPEED DIGITAL SUBCARRIER LABORATORY TESTS (HSSC) Thomas B. Keller, David M. Londa, Robert W. McCutcheon, Consultants/CEMA 440
TELEVISION TECHNICAL/REGULATORY ISSUES Wednesday, April 9, 1997 447
ADJACENT CHANNEL INTERFERENCE REVISITED Stanley J. Salamon, Advanced Television Technology Center 449
RADIO TECHNICAL/REGULATORY ISSUES Wednesday, April 9, 1997 457
ENG/SNG: DIGITAL QUALITY IN THE FIELD Wednesday, April 9, 1997 459
HIGH ORDER DIGITAL MODULATION FOR BROADCAST NET WORKS Mark Weigel, EFData Corporation....461
MOBILE DIGITAL SNG Haruhiko Mizuno, NHK 468
DIGITAL SATELLITE NE WS GATHERING IN THE DVB ENVIRONMENT- Alberto Morello, Mario Cominetti, Roberto VitaIone, RAI Radiotelevisione Italiana 476
RADIO/TELEVISION TECHNICAL REGULATORY ISSUES Wednesday, April 9, 1997 487
IMPACT OF NE W FCC NIER GUIDELINES UPON BROADCASTERS James B. Hatfield P.E., Hatfield & Dawson Consulting Engineers, Inc 489
THE MARRIAGE OF PC AND BROADCAST: A LOOK AT THE FUTURE Thursday, April 10, 1997 493
DATA SERVICES IN DIGITAL DBS Chai Yeol Rim, Woo Sung Jeon, Munhwa Broadcasting Corporation 495
USE OF SERVER-INCLUDES FOR WEBSITE AUTOMATION Michael C. Rau, Radio Data Group, Inc. 500
BROADCAST ON-LINE TV - A NE W ELECTRONIC MEDIUM FOR THE DISTRIBUTION OF INFORMATION Rudolf Werner Lorenz, Deutsche Telekom AG, A. Finger, Technishe Universitat Dresden 505
HOW SATELLITE TRANSPONDERS CAN BE USED IN DIGITAL BROADCASTING - MULTI-PROGRAM BROADCASTING POSSIBILITIES Hideo Yamauchi, Keiichi Saji, Nippon Television Network 511
DIGITAL TV: ALLOCATION AND POLICY ISSUES Thursday, April 10, 1997 519

DIGITAL TV: EMERGING RF TECHNOLOGIES Thursday, April 10, 1997 521
THE CONSTANT EFFICIENCY AMPLIFIER Robert S. Symons, Litton Electron Devices, San Carlos, CA 523
A NE W HIGHER PO WER, IOT SYSTEM FOR ANALOG AND DIGITAL UHF TELEVISION TRANSMISSION Roy Heppinstall, EEV, Ltd 531
SPECIAL SECTION - The Fibre
Channel Seminar 539
FIBRE CHANNEL RAID FOR THE DIGITAL STUDIO Bill Moren, Ciprico 541
TRANSPORTING MULTIPLE STREAMS OF SERIAL DIGITAL OVER FIBRE CHANNEL Michael W. Pugh, Digital Acoustics and Marc Friedmann, Prisa Networks 549
FIBRE CHANNEL AND TRADITIONAL VIDEO MERGE IN THE BROADCAST ENVIRONMENT TO FORM A POTENT SOLUTION Matthew H. Klein, Hewlett Packard Company 556
INDEX 563

'. ..

BROADCAST ENGINEERING CONFERENCE OPENING KEYNOTE Sunday, April 6, 1997 9:00 - 9:30 am
Chairperson: Jerry Whitaker, Technical Press, Beaverton, OR
*WHAT'S NEXT IN CONSUMER MEDIA! Rick Ducey NAB Washington, DC
'Paper not available at the time of publication
1

2

DIGITAL TV: STUDIO AND PRODUCTION ISSUES Sunday, April 6, 1997 9:30 am - 12:00 pm
Session Chairperson: Jerry Whitaker, Technical Press, Beaverton, OR
HDTV/FILM PERFORMANCE COMPARISON Henry W. Mahler CBS, Inc. New York, NY
*DVB: THE GLOBAL PACKAGE George Waters and David Wood European Broadcasting Union Geneva, Switzerland
THE HDTV SYSTEM FOR THE ATLANTA OLYMPICS Kenichiro Nagano NHK Tokyo, Japan
*DESIGNING AND BUILDING A MULTICHANNEL / DIGITAL STUDIO FACILITY Frank W. Rees and Ralph Blackman Rees Associates I lc. Dallas, TX Jay Adrick Harris Corporation Florence, KY Frank Bugg Georgia Public Telecommunications Commission, Atlanta, GA Charlie Bowers Consultant, Lexington, SC
LEARNING FROM HISTORY: PLANNING FOR A N Brad Dick Broadcast Engineering magazine Overland Park, KS
*Paper not available at the time of publication
3

-- _
4

HDTV/FILM PERFORMANCE COMPARISON
Henry W. Mahler
CBS, Inc.
New York, New York
Abstract
A significant percentage of program material initially transmitted in the FCC approved
Advanced Television transmission format will originate from 35mm feature films and episodic television series currently shot on film. Since some of these series currently employ 16mm
film. CBS has conducted tests to determine if 16mm or Super 16mm film is capable of providing the level of quality necessary for transfer to HDTV. Objective measurement data
and subjective comparisons are presented.
Objective
It is anticipated that a significant percentage of
the program material initially presented in the new Advanced Television transmission format
will originate from feature films and episodic television series currently shot on film. Furthermore, it is a well established fact that
feature films on 35mm film have sufficient resolution to generate HDTV images which fully exploit the bandwidth/resolution limits of the ATV standard.
In 1984 CBS performed tests which were aimed at determining the resolution required by the
emerging HDTV standard to match that of theatrically project 35mm film'.
This work established that the HDTV standard and equipment was sufficient to provide that resolution.
However many of the made-for-TV series are presently utilizing 16mm film. This is satisfactory for the current television standard which transmits less than 350 TV lines-per-picture-height (TVL/PH), but the proposed
HDTV transmission standard is capable of over 870 TVL/PH2. The current HDTV production standard, SMPTE Standard 274M, specification
of 1920 pixels/1080 lines, 2:1 interlace format will also produce over 870 TVL/PH.
A theoretical paper from Kodak in 19893 examined the transfer of 35 and 16mm film to HDTV and the predicted resolution and noise performance. However, there are no published test results that we are aware of which establish whether 16mm film is capable of providing this resolution at a sufficient level when converted to the SMPTE 274M format.
The present task was to conduct an engineering test to measure the resolution capability of 35mm and 16mm film when transferred to the Advanced Television electronic format and determine the suitability of each format for such use.
Methodology
To answer this question, CBS Engineering recently conducted tests at the CBS Studio
Center back lot in Los Angeles, California.
5

A series of outdoor scenes and various test charts were shot on film and video. The film was shot on 35nun, Super 16mm, and 16mm. All were framed in the appropriate 16:9 aspect ratio for the format and carefully imaged on the same scenes and test charts. An HDTV camera was also used to record the same scenes and charts on a digital VTR. The film was converted to video using the highest quality HDTV film transfer equipment and all digital processing. Then a blind sequence of scenes were intercut to a video tape to subjectively assess and compare the resolution capabilities of each source. Detailed quantitative measurements were also made of the camera negatives as well as the HDTV signal from the telecine and HDTV camera.
Equipment Employed
The motion picture equipment employed was selected by the cinematographer Michael O'Shay, ASC as representative of the highest quality normally employed for the production of TV movies and series. Panavision of Hollywood provided the film cameras, lenses, and accessories. Sony Broadcast and Professional Products Group supplied the HDTV equipment. Each film camera was equipped with a Panavision supplied graticule which had the 16:9 image area defined for that film format. A TV pick-off was utilized, along with the cameraman's eyepiece to establish the 35nun framing. This was recorded to assist in matching the HDTV, Super 16, and 16mm to the 35min image.
The following image sizes shown in Figure 1 are those defined by Panavision for the 16x9 image on each film format:
CAMERA IMAGE SIZE COMPARISON (mm)
(Based on Panavision Defined 16X9 Image Sizes)
• OD 1.14
24 00
FIGURE I
Film Tyne Horizontal x Vertical
35mm 24mm x 13.49nun
S 16mm 11.94mm x 6.71rnm
16mm 9.60mm x 5.38mm
The Sony HDTV camera.' employs three 1" CCD's which have an image diagonal of 16mm and the following 16 x 9 size:
HD CCD
Size
Pixels
Horizontal
13.94mm
1920
Film Equipment
• Vertical
• 7.85nun
• 1036
Panavision SuperGold 35nun camera, Serial No. PFX-53-G2 Panavision Panaflex Super 16mm camera, Serial No. PFXEL-2 Panavision Panaflex 16mm camera, Serial No. PFXEL-23 Panavision Primo Zoom 17.5-724inm lens, Serial No. SLZ-111 Panavision/Canon Zoom 11.5-1324nun lens, Serial No. 16ZM12X-05 Panavision/Canon Zoom 8-624mm lens, Serial No. 16ZM8X-02
6

Film
The film stock employed in the test was Eastman color negative 5248/7248 (35mm/16mm), which is used for the majority of filming at Studio Center. It is characterized by Eastman Kodak as "a medium-speed film, 100/21 Tungsten-64/19 Daylight, featuring micro-fine grain, very high sharpness, and high resolving power, with a wide exposure latitude."
HDTV Equipment
Sony HDC-500 camera, Serial Number 10130 Fujinon HR6X12ERD, 6x1 Zoom Lens, Serial Number 331259 Sony HDD-1000 Digital VTR & HDDP-1000 Processor, Serial Number 13202
HDTV Telecine
The Sony Pictures High Definition Telecines is a custom device built for Sony Pictures by the Atsugi camera group. Unlike the Rank Flying Spot Scanner or the BTS line array CCD, this telecine does not scan film continuously. The telecine utilizes a modified High Definition Hyper-HAD array CCD camera head from the Sony HDC-500 camera and a pin-registered intermittent projector movement developed for Sony by SEIKI Japan.
In use, the film perforation is first measured and the movement adjusted to the actual dimension of the film to minimize wear and maximize registration accuracy.
The system progressively scans either 16mm or 35mm film, negative or positive 24, 25, or 30 frames per second. A 3/2 pulldown sequence is added to enable compatible recording of SMPTE 260M on HDD-1000 digital recorders. After gamma pre-amplification, the output of the camera head is digitized at 10 bits in ROB color space. The approximate signal-to-noise performance is 60dB at a bandwidth of 30 MHz.
The image processing side of the telecine has extensive image control capabilities, such as programmable dye masking in log space and a gamma corrector with 14 bit resolution.
Test Procedure
A wide, medium, and tight scene was set-up on the "Seinfeld" exterior New York street with two young ladies seated in front of the background of store fronts. Diffusion material was stretched across the street (silk-in) to eliminate direct sunlight and deep shadows. No supplemental lighting or reflective devices were used.
Each scene was set-up and shot sequentially by the four cameras within a short period of time. All cameras were placed upon the same tripod and adjusted to the same lens height to minimize any field-of-view or parallax differences.
To establish depth-of-field based upon distance-to-subject, lens focal length, and iris setting each scene was first filmed with the 35mm camera. The remaining cameras were then set to the iris opening which would provide the same depth-of-field. Neutral density filters were used to produce the correct exposure.
To match depth-of-field among the various formats with widely differing image areas it is necessary to operate at different iris settings. Using the American Cinematographers Handbook and the formulas for calculating near and far focus limits, the following f stops and neutral density filters were employed for all scenes.
HDTV 35mm Super 16 16mm
Iris setting f# 5.6 8.5 4.6 4.6
ND filter 0.9 none 0.6 0.6
Due to the differing image format sizes, the focal length utilized was determined by conforming the scene displayed by the TV assist to the previously recorded 35mm scene. Distance to the subject was determined by the cinematographer
7

on the 35trun camera for each of the three scenes and duplicated for the other cameras.
Scene Wide Medium Tiatil
Object Distance/ft 30 15 12
Focal Length/nun
35nun HDTV Super 16 16rrun
20 27 40 12 16 25 10 15 22 8+ 12 20
A color correction filter, type 85, was used on each of the film cameras to correct the tungsten film for daylight exposure. The built-in daylight correction filter was used in the HDTV camera.
Post Processing
Following completion of filming, the exposed film was delivered to Foto-Kem/Foto-Tronics of Burbank, California for development. The negative material was then transferred to the HDTV format at Sony Pictures High Definition Center on their custom telecine. The output of the telecine produces RGB signals at a bandwidth of 30 MHz in the 1125 line standard and is digitally recorded on the HDD-1000 in the Y, B-Y, R-Y format at 30 MHz for Y and 15 MHz for B-Y, R-Y. This provides 873 TVL/PH of video resolution.
During the transfer process fine adjustments were performed to match the size and framing to the HDTV recorded images as well as preliminary color and gamma corrections. Final color correction was performed digitally on a Digital Vision HDTV color corrector. The matching and color correction of the transferred film to the recorded HDTV scenes was done to eliminate distractions. Thus, the attentions of observers will be concentrated mainly on evaluation of resolution differences between formats, which is the main goal of the study.
For use in blind subjective comparisons, unidentified short segments of each scene from
each format were recorded sequentially. Digital machine-to-machine editing was used to eliminate any possible degradation of the signal. Following these segments the sequence is repeated but with identification of the formats present. The identified section of the presentation was edited in the analog domain through a Sony HDS-1000T switcher specified at 30 MHz bandwidth.
Objective Measurements
For objective measurements a Marconi Test Pattern No. 1 was imaged by each camera during shooting. With this chart framed to fill the height of the 16 x 9 image it provides a maximum spatial frequency of 800 TV Lines-per-Picture Height (TVL/PH). It was also framed at one-half picture height to produce a maximum of 1600 TVL/PH.
The Sony HDC-500 camera utilized in the test employs a one inch image format, two million pixel CCD. The output response6 of the HDC-500 is shown in Figure 2.
120
7. RESPONSE
0 200 400 600 800 1000
TV LINES / PICTURE HEIGHT HORIZONTAL RESOLUTION
FIGURE 2
1200
Although it provides usable horizontal resolution to 1000 TVL/PH, after recording the signal on the HDD-1000 digital VTR it is limited to 30 MHz bandwidth.
8
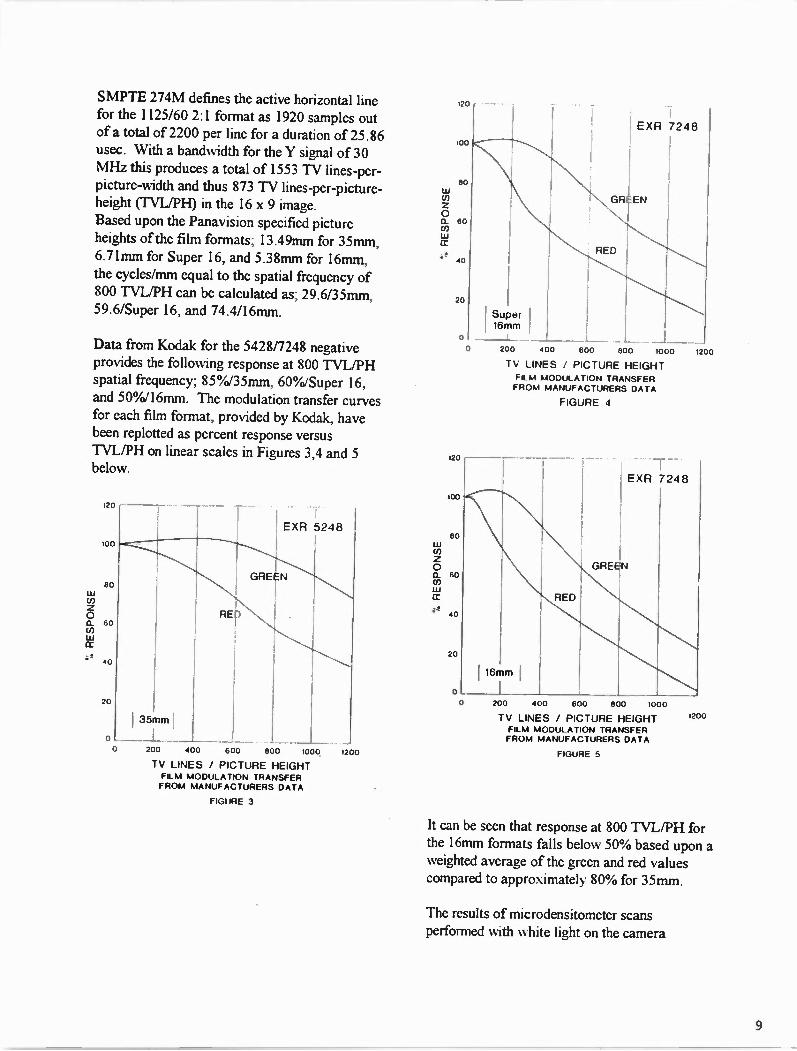
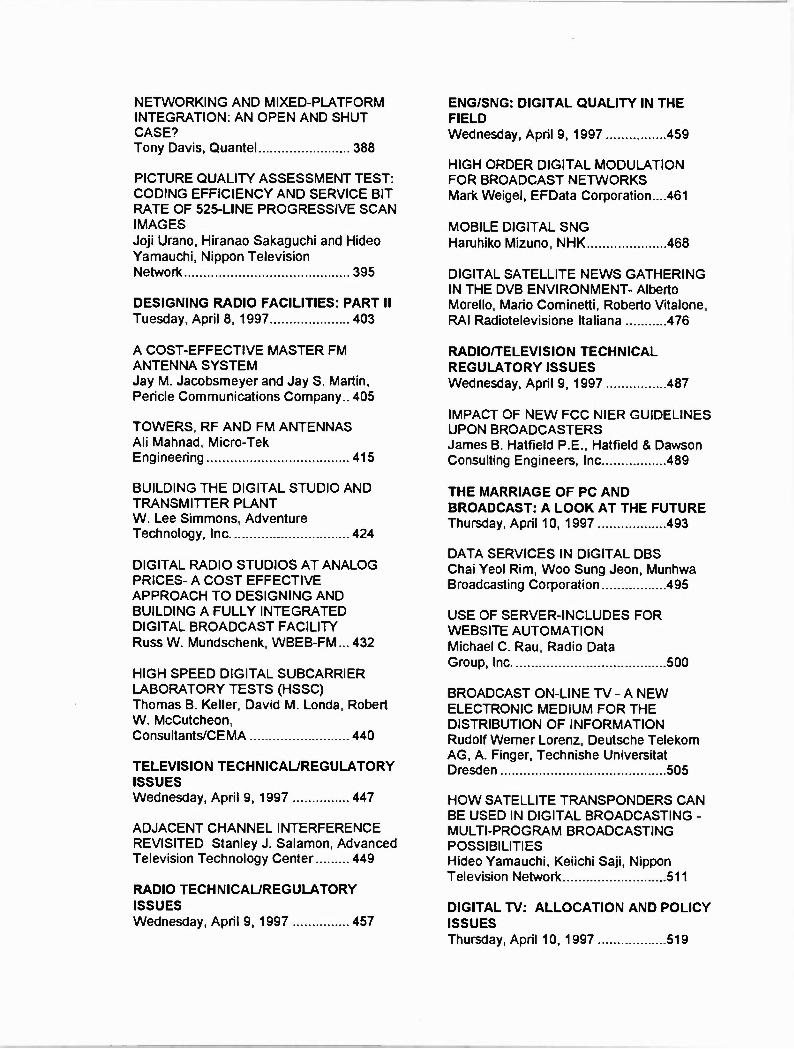
SMPTE 274M defines the active horizontal line for the 1125/60 2:1 format as 1920 samples out of a total of 2200 per line for a duration of 25.86 usec. With a bandwidth for the Y signal of 30 MHz this produces a total of 1553 TV lines-per-picture-width and thus 873 TV lines-per-picture-height (TVL/PH) in the 16 x 9 image.
Based upon the Panavision specified picture heights of the film formats; 13.49mm for 35mm, 6.71mm for Super 16, and 5.38mm for 16mm, the cycles/mm equal to the spatial frequency of 800 TVL/PH can be calculated as; 29.6/35inm, 59.6/Super 16, and 74.4/16mm.
Data from Kodak for the 5428/7248 negative provides the following response at 800 TVL/PH spatial frequency; 85%/35nun, 60%/Super 16, and 50%/16mm. The modulation transfer curves for each film format, provided by Kodak, have been replotted as percent response versus TVL/PH on linear scales in Figures 3,4 and 5 below.
',.. RESPONSE
120
100
SO
60
40
20
RE
35mml
0 200 400 600
EXR 5248
GRE
800 1000
TV LINES / PICTURE HEIGHT FILM MODULATION TRANSFER FROM MANUFACTURERS DATA
FIGURE 3
1200
120
80 ILI
0 0. 80 CO Ui CC
it 40
•,'. RESPONSE
20
Super 16 mm
GR
RED
EXR 7248
EN
0
0 200 400 600 800 1000 1200
120
100
80
80
40
20
0
TV LINES / PICTURE HEIGHT FILM MODULATION TRANSFER FROM MANUFACTURERS DATA
FIGURE 4
RED
118mm I
GRE
-T
EXR 7248
0 200 400 600 800 1000
TV LINES / PICTURE HEIGHT FILM MODULATION TRANSFER FROM MANUFACTURERS DATA
FIGURE 5
1200
It can be seen that response at 800 TVL/PH for the 16rnm formats falls below 50% based upon a weighted average of the green and red values compared to approximately 80% for 35mm.

negative images of the Marconi Test Chart are shown in Figure 6 for the three film formats.
Y. RESPONSE
120
100
80
60
40
20
0
200 400 600 800 1000
TV LINES PICTURE HEIGHT EXPOSED FILM MICRODENSITOMETER
SQUARE WAVE RESPONSE
FIGURE 6
1200
From this graph we can observe the significant reduction of response at mid and high spatial
frequencies for the 16mm formats as compared to 35mm. As mentioned earlier, resolution data in the range from 800 TVL/PH to 1600 TVL/PH was obtained by imaging the Marconi Test Chart at half size. It should be noted that the Marconi chart contains square wave patterns rather than sine waves necessary for a true modulation transfer function response.
Once transferred to the HDTV format, MTF measurements may be performed in the video
domain up to the limit of the standard which is 873 TVUPH. The following measurements of the Marconi chart, Figure 7, were performed using the Y output of a Sony HDD-1000 displayed on a Tektronix 1735HD waveform monitor.
These measurements include the effects of gamma correction and video enhancement since they were measured from the videotape processed
for direct display on a CRT. Gamma correction and enhancement of the HDTV camera signal were performed in the HDC-500 prior to
recording. Gamma correction and enhancement of the film images was performed in the telecine
transfer process prior to recording to obtain the closest visual match to the HDTV camera image.
Format HDTV 35mm Super 16 16mm
TVL/PH 300 400 500 600 700 800
114 110 107 100 80 71 73 47
Noise and Granularity
% Response 91 80 66 60 87 73 52 36 56 36 20 5 36 23 3 —
Kodak3has reported on the conversion of film granularity to video signal-to-noise and calculated that Super 35, which closely
approximates the image size utilized for the 35mm 16 x 9 format, has an unweighted rms noise level in dB below peak signal level of 50 dB for EXR5254 film. These calculations have been extended to EXR5248/72484 and produce the following equivalent signal-to-noise ratios compared to the HDC-500.
Equivalent SIN dB
Format
HDC-500 35mm Super 16mm 16mm
54 48 42
Analysis of Results
Horizontal Resolution
40
Comparing the microdensitometer response of 5248, 35mm film Figure 3, to the basic response of the HDC-500 high definition camera, Figure 2, shows a very close correlation up to 900 TVL/PH. Both these responses are subject to an additional MTF. The film will be processed by the telecine system while the HDC-500 response will be modified by the MTF of the lens employed.
The resulting responses, plotted from the digital VTR output in Figure 7, correlated very well up to 800 TVL/PH. However, at 300 lines of
resolution, the 16mm and Super 16mm film
10

120 Y. RESPONSE
100
ao
80
40
20
0 200 400
HOC -500
\, 35mm
'Super
.1 II
16mm
BOO 800 1000 1200
TV LINES / PICTURE HEIGHT MEASURED SQUARE WAVE
LUMINANCE RESPONSE OF HO VIDEO
FIGURE 7
deliver only about half the response of the 35mm film and HDTV camera systems. This
significant reduction in response of both 16mm formats compared to the HDD-500 and 35mm format is obvious at all stages.
In the range of 600 to 800 TVL/PH they exhibit more than 50% lower response than the HDD-500 and the 35mm format. The 16mm formats have reached limiting resolution in the 700-800 TVL/PH region, while the HDD-500 and 35mm produce levels exceeding 25% response at the 30 MHz band limit of 873 TVL/PH. In fact, for comparability, the 35rrun and HDTV response at 700 TVL/PH can be compared to the Super 16 and 16rrun results at 300 TVL/PH. There was
no measurable response from the Super 16 and 16mm formats in the range of 700 TVL/PH. However, there was a measurable resolution produced by 35mm and HDTV in the 600 to 800 TVL/PH range. In this range the response from the HDTV camera was approximately 25% higher than that of the 35rrun film system.
Other Considerations
The basic size difference between the 35rrun and the 16mm 16 x 9 formats is shown in Figure 1, it demonstrates that less than one-fourth the area of
film is utilized for 16mm and Super 16mm as compared with 35mm.
The additional magnification required for the Super 16mm and 16mm film results in a
reduction of equivalent signal-to-noise of 6 dB and 8 dB. In addition, this magnification amplifies any imperfection or debris which might be present on the film. At the increased resolution capability and greater viewing angle
expected for advanced television displays, such imperfections will become more apparent than with current standard resolution television.
Subjective Observations
The sequential recording of unidentified short segments of each scene from each format were
used to conduct a subjective comparison of the HDTV tape transfers. The blind sequence was followed by the second sequence which was a repeat of the first but with identification of the formats present. Several expert viewers were shown the sequence and concluded that the Super 16mm and 16mm pictures were noticeably softer than the 35mm and HDTV material. The 35mm and HDTV sequences were judged to be very similar to one another.
The observers also noted that the weave, judder and grain noise was more evident in the small film format transfers. It was felt that the film motion artifacts may be attributable to the fact that there are fewer sprocket holes in the 16mm film. In fact there is a two to one relationship between the number of sprocket holes per picture in 35mm to that of 16mm.
Conclusion
Based upon both a subjective as well as objective review of the transferred film material it is evident that the 16mm source imagery exhibits a significant reduction in resolution capability and an increase in visible grain structure. From these observations, CBS has concluded 35mm film should be employed to preserve the image quality
of productions currently utilizing film which might be transferred to the new ATV video format.
11

References
Kaiser et al "Resolution Requirements for HDTV Based upon the Performance of 35rnm Motion-Picture Films for Theatrical Viewing", SMPTE Journal, June, 1985.
2 ATSC - Digital Television Standard. ATSC-Digital Audio Compression (AC-3) Standard. ATSC-Program Guide for Digital Television. ATSC-System Information for Digital Television.
3 Kennel et al "A Comparison of Color Negative Films and HDTV Cameras for Television Program Production". SMPTE Journal, May 1991.
4 Thorpe et al "A Comparison Between HD
Hyper HAD CCD Camera and Color Film for Television Program Production", SMPTE Journal, June 1994.
'Galt "The Interface of Motion Picture film & High Definition Television", SMPTE Conference, October, 1996
6 Thorpe, "HDTV Electronic Cinematography - A Film Cinematographer's Nightmare or the Videographer's Dream?" Society of Operating Cameramen, Summer 1994.
12
THE HDTV SYSTEM FOR THE ATLANTA OLYMPICS
Kenichiro Nagano
Manabu Hanada
Kohei Nakae
1. INTRODUCTION
Outside broadcasting of HDTV at the Atlanta Olympics was carried out as a co-production with ZDF. NHK took charge of the opening and closing ceremonies and nine athletic events, including the marathon, gymnastics, judo and soccer, while ZDF handled other events. Original programs produced by both
organizations were transmitted first to the IBC (International Broadcast Center), and there converted into the HDTV system of each organization in their respective MCRs (Master Control Room). This is because NHK's HDTV system has 1125 scanning lines, while that of Eureka has 1250. However, actual broadcasts to Europe were carried out not by the Eureka system, but by "PAL plus." HDTV programs were produced unilaterally
by NHK. In this production work, we were very conscious of the need to distinguish this system from the so-called next generation TV and conventional NTSC systems. The opening and closing ceremony and
athletic venues, including those for the main athletic track and field events, swimming and gymnastics, were connected to the IBC by optical fiber. Programs for broadcast sent from these venues were transmitted to Japan in real time via the IBC. International transmission was carried out by
the under-sea optical fiber cable of 1CDD, rather than by satellite circuits. Features of the outside broadcast program
production and transmission are summarized as follows; • 1. Introduction of new apparatus, including the new HDTV OB-van 2. Use of optical fiber transmission devices
• 45 Mbps suppressed frequency band-width transmission device • 1.5 Gbps full frequency band-width transmission device
3. Expansion of the time brackets scheduled for live broadcast
2. TRANSMISSION BETWEEN THE USA AND JAPAN THE SYSTEM PRIOR TO BROADCASTING
Optical fiber transmission was used for all routes from Atlanta to NHK Broadcasting Center in Tokyo. It was therefore possible to avoid the deterioration of quality entailed in multi-stage relay via satellite. The stretch from the IBC in Atlanta to a city
on the west coast used optical fiber of DS3 rating with 45 Mbps transmission capability. The under-sea optical cable of TPC-5 across the Pacific Ocean transmitted the programs to Japan. In Japan, they were transmitted to the HDTV studio of NHK Broadcasting Center via 1CDD Ohtemachi station. They were there converted to MUSE signals and up-linked to the broadcasting satellite.
13

tBS-9411 NHK
14 I Japan Broadcastiong Center
NHK OB-VAN 1 NHK OB-VAN 2 NHK OB-VAN 3 ZDF OB-BAN
Opening, Closing Ceremony Athletic Swimmimg
•
UNDER-SEA OPTICAL FIBER
HAWAII GUAM TPC.5
•
Swimmimg Judo Gymnastic Tennis Soccer Marathon Synchronized Swim. Beach Valley
IBC International Broadcasting Center
• •
Optical Fiber Cable
Fig. 1 Overview for the Transmission
3. INTRODUCTION OF NEW APPARATUS
The following three new equipment items were introduced for use in program production at the Olympics this time.
1. New HDTV 013-van One of the biggest features of the new OB-
van is that it can be used for both the HDTV and NTSC systems. It is standardly equipped with 5 new cameras,
with a CCU which has SDI (Serial Digital Interface) output. The camera system is wholly digitalized together with the VCRs and a switcher. The switcher is provided with its own 3- dimensional DVE function which assures more precise image effects than those secured by the conventional HDTV OB-van. VCRs of the HD-D5 for use with 1/2 inch
cassette tape were carried on board. There were replaced the 1 inch VTRs conventionally used. Cameras and VCRs were provided with
functions for switching field frequencies between 59.94H7 and 601-17 in order to
Opening Ceremony Athletic Swimming Valleyball Basketball Hokey
t) -12-/ • #
e.
ATLANTA
correspond to both the HDTV and NTSC systems.
2. New camera The features are as follows; (1) 2 million picture elements with 2/3 inch ca)
(2) F8 (2000 lx), S/N 54dB (3) Capability to transmit long distance
(max. 31cm) using a new type of optical fiber cable (corresponding to 1.5Gbps transmission)
(4) Capability to output HDTV and NTSC images simultaneously from a CCU
(5) Capability for attachment of a high magnification lens (x65) by building up the system
(6) Compact, and lightweight
3. New VCR HD-D5 This HDTV VCR was developed from the
standard D-5 VCR, which has the highest recording bit rate among 1/2 inch cas:
VC12c It wag combined with:
14

digital processor, which compresses and expands HDTV signals. The features are as follows; (1) The image band-width is compressed to
1/4.3 by adoption of an inside field DCT (Discrete Cosine Transform).
(2) The whole system is compact, including auxiliary apparatus such as the digital processor, and A/D and D/A converters.
(3) Recording duration is increased to 2 hours for a cassette, twice the maximum of 1 hour in the case of 1 inch VTR. This makes long recording and playback possible. In addition, the tape itself is inexpensive, compact and easy to handle, because it is in a cassette.
(4) Recording, playback and editing are possible for either of the field frequencies, 59.9Hz and 60Hz.
(5) Power consumption is decreased.
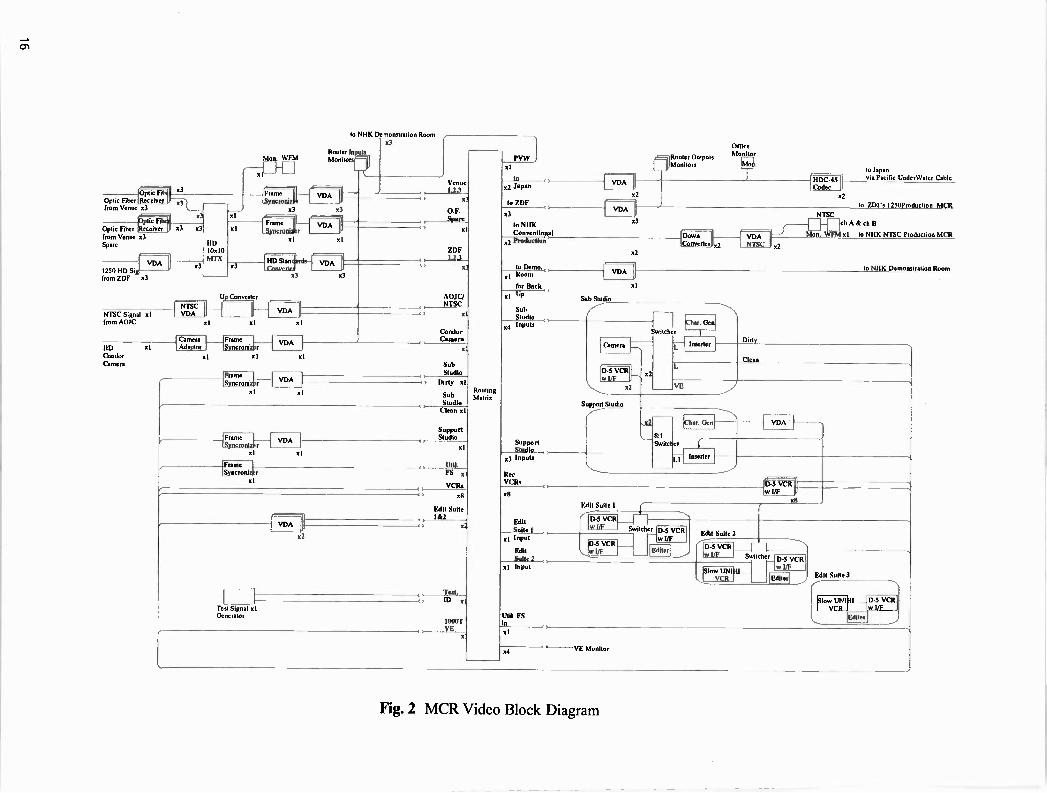
4. MCR SYSTEM AND MATERIAL EXCHANGE
1. MCR system An MCR was constructed in the IBC with a
space of 210m2. This was used unilaterally for HDTV operation. Live relay programs from each venue and
those on recorded tapes brought from the venues were edited at the MCR, and transmitted from there. Program material for exchange with ZDF was also recorded, played back and edited there. Live broadcasting was carried out 7 hours
daily, from 18:00 to 01:00 Atlanta time.
(1) The MCR system was composed with a routing switcher for both video and audio signals as a main element. The mixing control table for transmission is
composed of 7 inputs video switcher and 24 channels audio mixer. An robot camera was installed on top of a 40
meter tower located beside the IBC building. This was used as a camera for picking up scenic shots.
8 HD-D5 VCRs were used for all recording and playback uses. The broadcast signals picked up by the NHK-
uni OB-van, which was sent to swimming and athletic venues, had to be mixed at the IBC with the international signals produced by ZDF, because there was no system converter at the venues. Since they had to be sent back to the venues, a time delay of about 100 msec was caused by the conversion. This had to be taken into consideration during the mixing operation.
(2) Transmission equipment The IBC was connected to each venue for
swimming, track and field athletics and gymnastics by 2 circuits of optical fiber cables. A full band-width optical transmission device of 1.5Gbps was used as a major line, and a 140Mbps band suppressed bandwidth optical transmission device as a spare. For transmission to Japan, an under-sea
optical fiber cable was used. A 45Mbps band suppressed optical transmission device, newly developed by KDD, was sele cted. A CODEC was also developed by KDD. As
mentioned above, the audio signal was composed to include 4 channels; 2 channels of program audio and two of IS (International Sound) signals. These were effective for improving the efficiency of editing of the highlighted programs. A 45Mbps CODEC was also used at the live
relay of the marathon for transmission from the middle point. The signal was transmitted to the Olympic stadium, which was the starting and finishing point.
(3) Editing apparatus 3 sets of editing apparatus were installed. The first set included 2 VCRs for playback
and 1 for recording. It controlled a switcher and a 12 channels mixer using the editing controller. The second set was provided with 2 UNIHIs
and 1 VCR for playback, and another VCR was used for recording. It controlled a switcher nd a 12 channels mixer using the editing
15
Optic Fiber Receiver _ from Venue x3
x3
Optic Fiber x3 x..3 from Venue x3 Spare
— 1250 HD Si . —
gEVDA
from ZDF x3
HD 10.10 MIX
x3 1 H -13.u wet x3
U Convener NTSC VDA NTSC Signal Xi
from, AOJC
HD x I Condor Camas
Canters Frame A0W111 _ octopi
x I xl
xl
to NHK Demonstration Roo x3
Router Mnn. WFM Mmdlc
_ x3
x3
VDA
VDA
Velma Iii
II
VDA
RI
ZDF Lii
x3
AOJC/ NTSC
RI x I
Condor Cement
RI
X
r-
me-
xl
xl
Sub Studio
-4, Dirty xi
Sub Studio Clean xl
xl
VDA
Support Studio
xl
, UH L ES xl
VCRs
aS
Edit Suite , 114
Test Sipx1 xl Omemlue
Rowing Mallix
?VW xl
is a Japan
I. ZDF
I. NIOE Cmweallewel Predeellee
I. Dews.
re
x3 hiliols
Kee VCRs
VDA 1
xl
Sub Studio
Router Outputs Monitors
Office Mon tor
D-5 VCR
x2
'Dews Coavelier, x2
Chat. Snotcher
Dirty
Cie
-I HDC-45 OAK__
x2
rnsc
vim xi to N M NISC ?radix-den MCR
le lapse via Pacific UadetWater Cable
to ZDFa 1250Prodeclioe MCR
to NHK Deineminaloe Room
Supped Radio
8: I 9e/licber
LI
104ic --- 1 VDA
XS
Edit Salle I
xl 'RPM
RAI Sidle 2
11111 FS In _ x I
x4
Edit Suite I
13-5 VCR VF
D-S VCR w VF
[Sew DROLL _ ....I VCR I
Kali Salk 2
Vcr - 1-9___F-6111111111h Swilcbel
Suite 3
Monllor
Fig. 2 MCR Video Block Diagram

and was used to edit materials from the ENG crews. The remaining set was composed of 1
playback UNIHI and 1 recording VCR, with a editing controller and a 12 channels mixer.
2. The exchange of program material with ZDF Program material exchange was carried out
via lines connecting the MCRs of both organizations in the IBC. System conversion was conducted at the receiving side. NHK received R, G, B and Sync signals from
ZDF, while NHK converted output signals from the routing switchers (Y, Pb, Pr and Sync) into R, G, B and Sync signals for sending to ZDF. They were transmitted by two channels; one as the main and the other as the spare. Switching of the main and spare channels
was mutually possible from the receiving side. For this purpose, each delivered a remote control unit for the routing switcher to the other party. ZDF had one system convertor for HDTV,
which was used for "PAL plus" conversion. The transmission from NHK was the therefore controlled for play back with an adequate time difference to correspond to the signals of ZDF. Signals of the Eureka system from ZDF were
converted to the 1125 system by three system convertors, after passing through an input 10:10 matrix switcher. Then, they were either broadcast or recorded. Audio signals were delivered as IS stereo
signals both ways.
5. NHK CREWS' ALLOTMENT
Events allotted to NHK by the arrangement with ZDF were separated into three groups, each of which was allotted to three crews for program production. 013-vans allocated to each group were
supplied with power at each venue. The power supply system of the USA is a three phase three wire system, with a voltage between each phase of 208 volts.
1. Crew 1 Allocated events: Opening and closing ceremony, swimming, athletics and marathon One of the new OB-vans sent from Japan was
used by this team. 4 cameras were used for the ceremonies, and
5 cameras for events. One was used exclusively for interviews, the output of which was down-converted to the NTSC system and used in common by both systems. Five HD-D5 VCRs type and one UNIH1 VCR were usually carried on board. HD-D5 VCRs were used for main-line recording or slow-motion playback, while the UNTHI unit was kept as a spare. At the swimming and athletic events it was
impossible to install a system convertor at the venue, and the exchange of materials had to be carried out at the MCR. A tally output was sent from the MCR to the OB-van via a telephone line, to control the switching of images to be sent back to cameras at the venue through the same line.
2. Crew 2 Allocated events: Gymnastics, soccer, synchronized swimming, beach volleyball Crew 2 used one of the same new OB-vans as
Crew 1. 6 cameras were used for gymnastics, 3 for beach volleyball, 4 for soccer and 5 for synchronized swimming, including one for interview use. At the gymnastics and soccer venues, we
were able to set the above numbers of cameras in the best locations. Five HD-D5 VCRs were also carried on
board. Two were used to record main line images and the other three for special line image recording or slow-motion playback. One UNIHI was kept as a spare. At the men's gymnastics, six events were carried on simultaneously, so the recording on the special lines was extremely busy. At the gymnastic and synchronous swimming
venues, data such as the scores and times of
17

athletes were sent on-line to an IBM computer at ACOG (the Atlanta Committee for the Olympic Games). The data were converted to images by VFE (Visuals Font Engine) and superimposed on the main image.
3. Crew 3 Allocated events: Judo, marathon and tennis An OB-van of a US production company was
used. The technical staff consisted of local members except for the TD (Technical Director). A compact OB-van was also used for the marathon at the middle point. Five major cameras were used, including the
1 inch CCD cameras. Two new 2/3 inch cameras were used at the middle point with the compact OB-van. A 12 meter crane was use for high shots. Four HD-D5 VCRs were brought from Japan
and installed on the compact OB-van. These were used for recording main programs and also special line images. They were used also for slow-motion playback. All the apparatus attached to this 013-van was composed by the R, G, B system, so a system convertor between the R, G, B and Y, Pb, Pr systems was necessary at the input and output of the VCR processor. Judo and tennis were basically recorded on
VCR tapes, but in some cases when they had to be played back for transmission on the same day it was necessary to bring the recorded tapes to the MCR as soon as possible. Judo was recorded from the preliminary
matches and highlight scenes were also picked up and edited. Some were played back for insert in the images of the final tournament. The HD-D5 VCR had good response characteristics for slow-motion playback, and improved the convenience of the remote control of the VCR and effective slow motion playback were realized. On the judo pictures, two kinds of data were
superimposed; namely the time display showing remaining bout time and the display of the derisive moment of virtm-v The FIT T video
and KEY signal showing these data were delivered from the TOC (Technical Operation Center) of the venue as NTSC signals, which were then up-converted to HDTV signals in the OB-van, and superimposed on the main picture through a switcher. Usual off-line data such as the names of players were superimposed by VFE.
6. Closing Comments
Most of apparatus used at these Olympic games were newly-manufactured or bought, and there was not enough time to ascertain their operational results by using them in Japan. However, the broadcasting period of 17
days, from the opening to the closing ceremony, was successful. HDTV pictures were produced and broadcast
as NHK's unilateral system but including material from ZDF, as in the case of Barcelona. Owing to recent technical developments, mutual system conversion was easier this time, and the mobility of the cameras was also improved to the extent that they could be handled as easily as those for the NTSC system. Thus, production was remarkably improved. In order to match the scale and the duration
of Olympic events, for this was the biggest and longest Olympics ever, technical trials were pursued actively in order to improve the expression of images in programs, and to also enrich the content. Fierce and beautiful contests between world-famous players were selected for the production of high quality pictures with excellent sound. We thus presented the most impressive Olympics yet. We think that we achieved a great success. We hope that further technical developments
will be made to present ever more impressive images and sound with strong appeal to the increasing number of home viewers during the Winter Olympics in a year from now at Nagano.
18

Learning from History: A plan for ATV
Brad Dick Broadcast Engineering magazine
Overland Park, KS
Abstract
As station engineers contemplate the future, one aspect that's worth recalling is that new technologies are seldom embraced by the public as soon as proponents claim. Therein
lies the two-fold purpose of this paper. First to briefly examine the history of broadcast color television and second, to consider how that history may provide an accurate model for how broadcasters can expect ATV to be adopted by the American public.
Some history
Even a novice in the history of broadcast television can recall some of the major historical points. There were two different types of proposed color transmission systems. One was the spinning wheel, developed by CBS and initially approved by the FCC. There also was the NTSC, also called the RCA system, which later became the nation's accepted standard. Getting to the system we now refer to as NTSC is replete with many years of hard fought battles between two giants among men: Peter Goldmark of CBS and David Sarnoff of RCA.
Peter Goldmark of CBS actually began the design process for color TV broadcasting while he was on his honeymoon in Montreal in 1940. While watching the movie Gone with the wind, he relined the tremendous potential in being able to transmit color images over television. This became his all consuming goaL
Goldmark soon convinced CBS management to devote resources to making it a reality. Goldmark's staff developed the ill-fated hybrid
electro-mechanical, three-filter spinning wheel. With a synchronized wheel at both the camera and receiver, color transmission became possible. However, it required lots of bandwidth and was only useable on UHF channels.
Unfortunately for Goldmark, David Sarnoff and RCA had a different scheme in mind. First of all, RCA made black and white TV sets and Sarnoff wasn't about to let a burgeoning industry be torpedoed before it could blossom. In early 1946 Sarnoff began waging a public war against CBS, calling Goldmark's invention incompatible with the day's TV sets, which it was. (Recognize any parallels between ATV and today's NTSC here?)
Recognizing the soft spot in his invention, Goldmark then developed what was really a converter box, which would allow a B/W TV set to receive a monochrome image from a color transmission.
In March, 1947, the FCC declared that the CBS color system was premature and needed further testing. The commission reaffirmed its monochrome standards and RCA continued to flood the market with receivers.
Although RCA continued to work on color TV technology, the company's future, as far as Sarnoff could see, was in the manufacture and
19

sale of B/W TV sets--not in the marketing of a technology that would obsolete all those new sets he was making. The B/W TV set market was still young and profitable. From his perspective, he wasn't yet ready to kill his golden goose. Besides, the FCC hadn't yet approved the CBS color wheel transmission system.
Unexpected by Sarnoff, the FCC reversed itself in 1950 and approved the CBS color TV system for marketing. Sarnoff was livid, telling his staff to make more B/W TV sets. "Every set we get out there makes it that much tougher on CBS," he said. Keep in mind that as of this point, the CBS system was incompatible with B/W transmissions. Although CBS was authorized to begin color broadcasting, there were no sets on the market. CBS had no manufacturing capability and the rest of the set-making industry, was quite happy to remain in the B/W world and was unwilling to support the new technology.
The first public CBS color transmission was of the Ed Sullivan show on June 25, 1951. Unfortunately, the broadcast was largely invisible. Out of the some 12 million TV sets in use, perhaps only a few dozen could receive the color program.
But, the set industry was healthy and two years later, by 1953, the number of sets had almost doubled to 23 million. Behing-the-scene wars continued and on December 17th of that year, the FCC reversed itself and approved the NTSC color system for broadcast. RCA immediately claimed victory for "its" color system. While known official as the NTSC color system, that didn't prevent RCA from claiming total victory over CBS. Despite Samoffs claim of victory, what he didn't realize was that the war wasn't over. Sarnoff didn't realize that his competition, General Electric, Westinghouse and Philco
didn't want to sell color TV sets. They were still quite happy with the profits they were making on B/W sets. A new technology like color would only anger customers and increase their manufacturing costs.
The early RCA color sets cost $1000, about one-quarter the average person's salary. A B/W set cost one-third that amount. By the end of 1954, RCA had sold only 5,000 color sets, not the 75,000 Sarnoff had predicted. And, his own service company was receiving twice as many service calls from these few sets as from the millions of B/W sets in the field. Even the press was against Sarnoffs plan, calling color television "the most resounding industrial flop of 1956".
By 1959 RCA had spent more than $130million on color TV development and marketing without realizing one dollar of profit.
Almost 40 years later
Having looked at the less than light speed success that color TV enjoyed, is there something to be learned with regard to the public's possible embracement of HDTV set? Several points need to be emphasized.
First, TV set makers have a history (as would any company) of not introducing a new technology if it might cannibalize their current product line--and reduce profits.
Second, the set industry only came around to build color TV sets when their B/W products matured and they needed new products to continue sales growth.
Third, color sets did not become popular until there was programming to support it.
Finally, as set makers found in the late 1950's, the public is often satisfied with the current
20

The line so often voiced by ecy is that "as soon as the public
teo „ey'll love it. But,. the facts t 18,eas years, the public was
es‘t1 B/W technology. In fact, as sesvetire making money on the B/W cioat the manufacturers collectively ,ng color TV sets. They were tie technology too.
smartest things Sarnoff did to help ,blic to buy his new color TV sets was .e rights to the Walt Disney program aunch it as "Walt Disney's Wonderful of Color". It was the programming that
caught viewer's attention—not the technology.
Will history be repeated?
The broadcast industry now finds itself in a situation not unlike that with color. And, like Sarnoff, its the set makers that want to sell more products. Keep in mind this extremely important point: the dynamics are only slightly different from 40 years ago. Then, set manufacturers had new products to sell and didn't want to cannibalize the profits from B/W TV sets with a more expensive, unproved technology called color TV. The problem for today's set makers is that they have nothing new to sell! That's the reason they are such vocal proponents for HDTV technology.
This is well illustrated in Figure 1. The graph shows that since 1987 the number of color sets produced has remained relatively flat. Household penetration of color-TV sets has grown only slightly, from 93% to 98%. This is a mature market. With average set life being around seven or eight years, there is no growth (or money) in making NTSC color TV sets. It's this dilemma that was largely behind the original drum beat to adopt HDTV, and it continues to get louder by the minute. The set makers need a new product and HDTV is it!
Three steps have to be completed before the new sets can be unleashed upon the American viewer. Two have been completed. First, HDTV technology had to be developed. That has been done and the set makers are ready to make TVs. Second, the FCC had to approve a system. That was accomplished with the agreement between the broadcast, computer and consumer electronic industries. All the set makers need now is for the FCC to approve a channel allocation table and set a deadline for ATV to be implemented and NTSC to go dark.
The broadcaster's challenge
All this means that the challenge for TV stations isn't whether to go HDTV, but when. Once the FCC fires the starting gun, there can be no looking back to the good 'ol days of NTSC color. Instead, stations will be forced to build the new ATV systems and maybe, just maybe, do so in a very short time frame.
The FCC's original goal was to force stations to make the transfer to HDTV operation over a 15 year period. The plan allowed three year increments of applying for a license, beginning construction, ending construction, beginning simultaneous transmission and then separate operation. The goal was to get every TV station onto their HDTV assignment within this time frame.
The problem with this scenario is that even 15 years is a short period for most stations. And, as we'll see, consumers have a history of slowly adopting new TV technology. Even the color images from Sarnoff's new TVs, did not spur the American viewer to quickly adopt the technology. In fact, it was more than 18 years before there was a color TV in even half of the American homes! This important point is reinforced in Figure 2.
21

Here are some important points to keep in mind when a set manufacturer tells you viewers will quickly embrace new HDTV technology.
•It took eight years for even one percent of the homes to have color TV. Even after 10 years had lapsed, penetration had barely reached 3%.
•If the adoption rate of HDTV parallels that of color, by the time TV stations are required to turn off their NTSC transmitters, only one-third of their audiences will even have HDTV sets. This would mean that at the 15 year turn off point, 66% of the American public would be without TV service and stations without viewers.
•Even if we apply a generous multiplier (even a factor of 10) to the early adoption rates, there is little evidence that after a station's first 10 years of operation that a significant portion of the audience will have adopted ATV technology. And, during this time, stations will have been suffering under the load of operating dual transmitters. In this theoretical model, even after a TV station has operated an HDTV system for 10 years, 70% of its viewers will still not have HDTV receivers. They will still be depending on those NTSC transmitters for their entertainment.
-Today a high quality NTSC set, complete with picture within a picture, remote control and stereo audio can all be had for around $500. Yet the consumer electronic industry, lead by the set makers, are claiming that consumers will flock to the stores to plunk down $3000 to $5000 to buy these new HDTV sets. These same set makers have refused to release any studies, which would back up their claims that viewers are clamoring for these expensive sets.
In a recent magazine article, a spokesman for Thomson Consumer Electronics said, "Consumers very definitely can see the
difference (between HDT‘ portion of them indicated tht. premium for it." Thomson bell() will be willing to pay from $1,0( 411 c/a extra for an HDTV set. Keep in e brings the set cost to about $2,000 what can be had today for a mere $5
The price of admission
Stations are between a rock and a hard plac Without a doubt, the final pages of ATV rulet and regulations will be approved this year and stations will have to begin the building process. Once the table of allocations is approved and the time table set, stations have two choices: 1) begin implementing HDTV, or 2) elect to go out of business.
However, the goal of this paper is not to paint the picture of an impossible situation because it isn't. Rather, it is to make the reader aware of the implications of industry and commission decisions. Also, knowing how, historically, the American public has adopted new TV technology, this paper can offer encouragement in that stations need not panic and spend money unwisely--or too soon. The key is to plan.
Develop an action plan
Pay attention to what's happening. Anytime there is the chance to protect your station through publicity and delaying tactics, do it. Contact your congressional representative. If the 8, 10 or 15-year time frames are lengthened to 20 years, every broadcaster benefits.
Plan carefully. Write an action plan, complete with time frames for equipment purchases, license application and construction tasks. What do you really have to buy and when do you need to buy it? You don't need an HDTV switcher or tape recorder now, but you will soon need to build an ATV-compatible
22

transmitter site. Here are some simple and inexpensive steps you can take now.
Step 1) Towers and antennas. Develop a good relationship with a tower company. Have a
structural analysis on your tower done now.
If you can strengthen your tower sufficiently so it can accommodate an ATV antenna, do it as soon as fiscally possible. Don't wait. This is an area where quantities will not force a drop in prices. In fact, as the tower companies get busier, the costs may actually go up and delivery and service times will lengthen.
And, there's the chance that less qualified companies may surface. You don't want to risk your entire investment and business plan on a tower that wasn't properly reconfigured to support an ATV antenna. Besides, if you need a new tower or tower site, it may take two years or more to obtain site clearance and have the tower delivered. There is a very real cost in waiting.
All of the above applies to ATV antennas. Because of the mechanical interface between a tower and antenna, it's best to consider the antenna as an integral part of the tower rather than of the transmitter.
Step 2) Transmitters. Your 1997 NAB shopping list should include transmitter technology. You probably don't want to buy one now (although you could) but you need to be familiar with all the transmitter companies, their products and their reputations. Remember, there are only two HDTV transmitters on the air today so any company's reputation must largely be based on how they've serviced their NTSC customers.
Once you have developed a time line for your station's conversion, determine when you'll need the transmitter. Consider placing an order for it
now. This process guarantees you a place in the manufacturing process and yet will not tie up lots of capital.
Remember that today it's still a buyer's market. Transmitter manufacturers want to be able to announce sales, which represents market share. Today you may have some room to negotiate price and other issues. Once everyone panics and the number of orders exceeds the number of transmitters that can be produced in a given time frame, the rules may change. The laws of supply and demand have yet to be overturned in any market. Consider that if there is currently an on-going demand for 100 transmitters a year and that demand suddenly explodes to 500 because of ATV, last on that list is not where you want to be.
Step 3) Studio equipment. Plan for initial HDTV pass-through capability. Don't worry about originating HDTV from day one. The networks will supply the M TV programming, just be sure you can get it on the air. The needed backbone equipment for such routing is available today on the NAB show floor.
Step 4) When considering major equipment purchases, keep two things in mind: digital and multichannel.
Because ATV signals will be digital, now's the time to begin building as much digital capability in key areas as possible. Whenever possible, purchase digital backbone equipment. Be sure it's upgradeable to the higher data rates needed for HDTV. With cameras, check out the switchable 4x3 and 16x9 lenses and image blocks. Thay way, you'll be able to make 16x9 images for your local production.
Also, build for multichannel operation. The TV stations of tomorrow will not broadcast just one channel. Multichannel operation will be required. However, consider that those channels
23

may not just be more channels of Gilligan's Island or reruns of Bay Watch.
There will be many new opportunities for what I've called "invisible" broadcasting. Transmitting data (not video data) may become a lucrative business. Be sure you don't preclude any opportunities for revenue streams with your equipment purchases. Remember, you don't have to buy everything now. Try to not panic. Remember ATV can be a financial opportunity!
Becoming successful with ATV
The old joke about the light at the end of the tunnel being a train is true. It really is a train. The HDTV, ATV or DTV trim, whatever you want to call it, is on its way. Whether you get on board or get run over is your choice.
The successful stations will be those who make the transition to ATV in carefully planned and cost effective manner. This requires developing a transition plan now and investment later. Don't reverse this process.
Biliography:
American Heritage-of Invention & Technology, Winter, 1997. "The Color War".
Wired, February, 1-997. "The Great HDTV Swindle.
Direct-View Color TV sets produced Figure 1
25000
7 20000 -
S' 15000
1.7. 10000
-2 5000
I 1 1 1 1, 1987T 1989 1991 1.993 1995 1997
Year of production
Figure 1. The market for color TV sets is mature. Note the relative stagnant growth in the
number of sets produced over the past 10 years. Future growth for this product is unlikely with household penetration at 98%._
% Penetration
Household color TV set penetration Figure 2
100
80
60
40
20
0
0
' I 01/1
810 15 23 30 39
Years
Figure 2. This chart shows the percent of penetration.of color TV sets into American homes. Note that 10 years after its introduction, only_ 3%_of the_homes had_a_color TV set. It took 18 years to reach the 50% penetration level!
24

DIGITAL SOUND BROADCASTING: TESTING AND REGULATORY ISSUES Sunday, April 6, 1997 9:30 am - 12:00 pm
Chairperson: Milford Smith, Greater Media, Inc., East Brunswick, NJ
*EXPERIMENTAL DAB SYSTEM IN OTTAWA Gerald Chouinard Communications Research Centre Ottawa, Ontario, Canada
PROGRESS TOWARDS THE DEVELOPMENT OF DIGITAL MODULATION IN THE LONGWAVE, MEDIUMWAVE AND SHORTWAVE BANDS Daniel Bochent TeleDiffusion de France Paris, France
FIELD TESTING OF PROPOSED DIGITAL AUDIO RADIO SYSTEMS Stanley Salek and Daniel Mansergh Hammett & Edison, Inc. San Francisco, CA
THE EIA-CEMA DAR FIELD TEST TASK GROUP FIELD TEST DATA PRESENTATION Robert Culver Lohnes & Culve -
Laurel, MD
*IN BAND ADJACENT CHANNEL - PRELIMINARY FIELD TEST RESULTS Edward Y. Chen AT&T Labs Murray Hill, NJ
•Papers not available Et the time of publication
25

26

PROGRESS TOWARDS THE DEVELOPMENT OF DIGITAL MODULATION IN THE LONGWAVE, MEDIUMWAVE AND SHORTWAVE BANDS
Mr. Daniel Bochent TeleDiffusion de France Paris, France
Dr. H. Donald Messer International Bureau of Broadcasting United States Information Agency Washington, D.C., U.S.A.
1.0 INTERNATIONAL BROADCASTING AND DIGITAL AM
Mr. Daniel Bochent
International broadcasting in HF is an old and mature technology, having been born before and during World War II; in the past ten years many stations and broadcasters celebrated their 50th or 60 anniversaries. Historically, much of the motivation for international HF broadcasting originated from the strong need of nations to reach distant audiences of expatriates and foreign listeners with "messages" and foreign diplomacy information.
HF transmissions started with 10, 20, or 50 kW HF power transmitters. Decade after decade, the power of HF units has increased up to 500 kW or even 1000 kW. Considerable progress has been made in transmitter power and efficiency, in audio frequency processing, and in transmitting antenna design. But one aspect of HF broadcasting remains unchanged: in 1997 as in 1937 HF broadcasting transmitters are operated in double side-band AM (amplitude modulation) mode.
Today it is often commented that, at least in some parts of the world there is a trend towards a
Mr. Patrick Bureau Mr. Pierre Laurent (TCC) Thomcast Conflans Ste. Honorine, France
Prof. Dr. Dietmar Rudolph Zentrum fiir Rundfunk und Audiovision Deutsche Telekom AG Berlin, Germany
declining use of international HF broadcasting and national AM broadcasting as well. Some of the reasons cited for this are:
• Increased free flow of information in an increasing number of countries as a consequence of the world political situation observed since 1989;
• Request from listeners for radio services which provide an improved reception quality, with consequent increasing competition from media which deliver higher quality signals, such as satellite TV/radio service, Terrestrial Digital Audio Broadcasting (T-DAB), local FM transmitters or relays, cable networks, and the Internet;
• High investment and operation costs for high power HF and MW stations;
• Announcements of imminent launchings of satellites for world direct radio broadcasting, with low-cost individual domestic and portable receivers;
• Increased budget requirements for national and international TV programming competing for budgets formerly dedicated to AM broadcasting;
• General cuts in budgets.
27

Even AM broadcasting in the LW and MW bands for national and international purposes is suffering from the same constraints, namely high cost of operation, poor audio quality and competition with FM, DAB and satellites.
Despite the trend towards the disuse of the international SW broadcasting bands, they have some qualities which are extremely valuable for national and international operators. The most important of these are that extremely effective and economical coverage of large areas of the world can be accomplished in these bands, along with the fact that SW transmissions to interested listeners are very difficult for third parties to limit and control.
The virtues of the AM band performance are so substantial that, if they could be freed from the negative qualities of the analog amplitude modulation process, the trend towards the disuse of the AM bands would be dramatically reversed, and their use lifetime extended for many decades.
The minimum improvements required to do this are:
• Substantial improvement in the overall reliability and audio quality of signal delivery in the AM bands;
• Significant reduction of the power requirements for AM band broadcasting;
• Reduction of band congestion through reduction of numbers of the simultaneous transmissions required to attain an acceptable overall transmission reliability;
• Provision of additional services and data transmission.
International Consortium for Digital AM
The apparent benefits to be accrued by the application of currently available digital techniques to broadcasting in the AM bands are so great that many organizations associated with
national and international broadcasting are banding together to promote it. A meeting for this purpose was held in Paris on November 27, 1996, hosted by Radio France Internationale and Telediffusion de France. It was attended by representatives of many broadcasters (BBC, DW, Deutsche Telekom, RAI, RFI, TDF, RCI, RNW, Nozema, VOA), transmitter manufacturers (Continental Electronics, Telefunken, Thomcast, Kokusai Electric), receiver manufacturers (Sangean, Sony), chip manu.facturers (Motorola), and Universities (University of Kentucky).
At this meeting the organization of an international consortium, to be called Digital Radio Mondiale, was initiated. The purpose of this new group is to provide an activity framework which will serve to accelerate the formulation of a tested non-proprietary design to be advocated as a single world for digital AM. The primary activities of Digital Radio Mondiale are:
• To call a worldwide conference on digital techniques in LW, MW, and SW broadcasting;
• To create an international joint panel of broadcasting experts which would ultimately formulate an AM digital system design to be proposed as a single world AM digital system.
The purpose of the Worldwide Conference, to be held in late 1997 or early 1998, is to focus attention on Digital AM broadcasting and maintain momentum towards its worldwide implementation. Its main thrust will be:
• To report on current progress in the many ingoing programs for the development of digital AM; and
• To develop and demonstrate the vision of the application of digital technology in the LW, MW, and SW bands as an important and lasting tool in national and international broadcasting.
28

In addition, Digital Radio Mondiale will use the occasion of the worldwide conference to formally launch the activities of a joint panel of broadcasting experts which would coordinate activities related to the formulation of a AM system design. The principal activities of this panel would be as follows.
• Oversee the testing of digital AM technologies under development in Europe, the U.S., and elsewhere;
• Formulate the short, medium, and long-term functional requirements for digital AM broadcasting and services;
• Formulate a joint specification for a tested single non-proprietary design for digital AM broadcasting, taking into account performance, receiver cost, and broadcasters' requirements.
At the Digital Radio Mondiale formation meeting, it was agreed that:
• Cooperation with the International Broadcasting Unions and the ITU should be sought;
• Information on the scope of the conference should be spread all over the world;
• There is a great need to convince the greatest possible number of broadcasters to switch to "digital" when a world standard becomes available.
At this meeting, a series of workgroups were formed to make recommendations with respect to the organization of the world conference on digital AM, to draft the functional requirements for national and international AM digital broadcasting; and to recommend a framework for the scope of operation and function of the joint panel of broadcasting experts for digital AM. These groups will report their conclusions and recommendations at the next meeting of the main consortium group which will be held just prior to the NAB Broadcast Engineering
Conference in Las Vegas, Nevada, U.S.A., in April 1997.
Those interested in further information or contact with Digital Radio Mondiale should contact M. Arnaud Littardi, Chief of External Relations, Radio France Internationale. He can be reached at +33 1 44 30 89 20 (fax) or [email protected] (E-Mail).
Digital AM Systems Presently Under Development
At this time there are at least three systems under development which have characteristics compatible with those which would be required of a standard for digital system for transmissions in the world AM bands. Those presented in this paper are: the Skywave 2000 system of Thomcast; the Voice of America/Jet Propulsion Laboratory system; and the Deutsche Telekom Zentnun fur Rundfunk und Audiovision system. Each of these is in an advanced state of development, as described below.
2.0 SICYVVAVE 2000 - THE THOMCAST PROPOSAL FOR A DIGITAL
BROADCASTING SYSTEM IN THE AM
BANDS
Mr. Patrick Bureau Mr. Pierre Laurent (TCC)
2.1 Overall system description
General overview
Skywave 2000 is the result of an optimisation between possible data rates, bandwidth, channel coding, complexity, quality and flexibility.
Skywave 2000 provides a single solution for all AM frequency bands (LW, MW, SW) which will bring benefits to the listener and to the radio broadcaster in terms of simplicity of receivers,
29

economies of scale, and a wider introduction of the new digital transmission mode. It is the result of a global system approach considering both existing receiver and transmitter techniques and easily implemented at low cost with the technology available today.
In addition, Slcywave 2000 approaches the problem of the transition period between the introduction of digital AM Radio broadcasting today and the future fully digital multimedia service by offering a progressive, compatible (digital and analog) signal which can be received by both today's conventional consumer receivers and by future low cost digital receivers.
Slcywave 2000 is based upon a parallel modem which has been proven to be an efficient, reliable and flexible technical solution.
Its incremental architecture allows easy and transparent adaptation to bandwidth, bit rate and level of protection which are required in all present and future implementations, without any change on the receiver side.
The transmitted signal consists of:
• one kernel group of carriers of 3 kHz total bandwidth containing all the signals which are necessary for frequency synchronization, time synchronization, remote control of the receiver, and transmission of a basic bit stream of 8 kb/s with 64 QAM in normal mode and 6 kb/s with 16 QAM in fall back mode.
• a number of additional groups of carriers, each of 1.5 kHz bandwidth, conveying a nominal bitstream of 4 kb/s of audio together with a little more than 200 b/s of data ; the number of additional blocks depends upon the total available bandwidth.
This allows signal bandwidths of 3 kHz, 4.5 kHz, 9 kHz. with bit rates of 8 kb/s, 12 kb/s, 24 kb/s ...(64 QAM)
Signal formatting
The basic frame length is 18 ms, corresponding to a useful symbol duration of 15 ms with a guard interval of 3 ms.
The sub-carriers are at multiples of 66.666 Hz (1/15 ms). This spacing has been chosen taking into account the maximum propagation delay spread.
The frames are grouped into bursts of 16 frames (288 ms) labeled 0...15.
In the kernel group of sub-carriers (47 sub-carriers), three are transmitted unmodulated : they are frequency references for fast acquisition and doppler tracking.
In the kernel group, all the carriers of frame 0 are unmodulated, and have relative phases ensuring a very low peak factor : this is the time synchronization waveform.
In every group (kernel group, and additional groups of 22 carriers), frames 0, 4, 8 and 12 contain gain references (unmodulated symbols) on even sub-carriers (frames 0 and 8) or odd sub-carriers (frames 4 and 12). This represents an average of 1 reference symbol for each group of 8 symbols.
In each frame, carriers which are neither frequency references, nor time synchronization nor gain references are symbols conveying audio or data. These symbols are modulated using TCM with 64 QAM at 4 bits/symbol (nominal), 16 QAM at 3 bits/symbol (fall back bit rate) or 256 QAM at 6 bits/symbol (maximum bit rate).
In order to improve the channel estimation, and taking into account their low proportion (1/8) reference signals are transmitted at a substantially higher level than free symbols, typically 3 to 6 dB.
30

Addlicnal Gruuns
- 22 Stb•caTier . umrdulated stb-carners. —
fra me 0, dk 8, 12k n references
-31:039,4430fs
. 288 kr aula
na mt 64 CI1M tan back 16 CAM
. 20 for eternal cbtasers4ces:
b's 16 (:) W
Kerma' Grap
-47stb-caries
. izrrodulated sub.creers: —
n10, 2) ard 40 kr frersarbw references
hare 0 kr syrercrimbal
fra me 4, 8 12 kr gain references
-601 Weilds
. 576 fur atria —
nzdrial: 64 CAM fall back 16 CAM
.21 for aukxrubc rextforatiat
3 tires 7 ceded symbols (7/4 Reed Sala mi)
.4 fcr quaky cartel
Audio source coding
64 72 rrs low
18 r113— * r
gi
70 69
43
47
43
23
10
0 0 1 2 3 4 5 6 7
2E8 rrs
Adciti Drial
-1
-23 -23
-44 -45
-03
Grum
8 9 10 11 12 13 14 15
Adritiami Grtxp n°3
Addtional Gap rf4
Adcitional Grow rf6
Skywave 2000 Signal Formatting
The audio source coder for this type of application is mainly defmed by the available bit rate which is inherently variable according to the available bandwidth and to the degree of protection.
A minimum of 6 kb/s (reduced bandwidth, SSB-like speech only) to a maximum of 48 kb/s
(stereo music) can be considered like the proper limits of an efficient and convenient system.
Additional Group rf'5
i
Consequently, the chosen coder will be the one which provides the best perceptual quality in real transmission conditions, i.e. taking into account the effect of transmission errors. :t will have to be slightly modified - and its useful bit rate reduced - to add protection bits to critical parameters (gains...) in order to ensure graceful degradation of the quality in bad transmission conditions.
31

Other data
A highly protected low bit rate data stream is devoted to the remote control of the receiver (internal service data). It conveys the transmission parameters : modulation format (16 QAM, 64 QAM, ...), interleaving depth, total bandwidth, ...
A second bit stream, proportional to the total occupied bandwidth, transmits data directly related to the actual transmission : textual informations, next frequency to use, service data, etc...
Finally, in some circumstances, a portion or the totality of the bit stream conveying audio data can be temporarily replaced by bursts of other data (fixed images...) : the audio coder bit rate has to be locally reduced in this case, ideally without loss of quality (this can be done during silences, for example).
Compatibility with existing receivers (Simulcast)
In the transition phase, compatibility with existing standard AM receivers can be achieved by simultaneous transmission of:
• a half bit rate version of the digital audio system
• a compatible SSB transmission of the analog signal, with residual carrier and possibly vestigial side-band to improve quality in the presence of fading and to increase adjacent channel protection.
The digital signal has to be on the high frequency side of the audio signal, since standard receivers attenuate strongly high frequencies : the digital part of the transmission is then heard as a weak high frequency unstructured noise.
Analog program
3.5 kHz
Digital program 12 (9) Mats + 208 Ws
Audio bandwidth: (4) kHz RF bandwidth: 9 kHz
II (GI kW*
vi K • 4.6 kHz
Digital program
>14 0.423 kHz i46
Of myelin, way:
4 (3) kbis 206 bh• O(6) klgs
4.6 kHz • N o :
Analog program
PiP 1>DPI,C0
3kHz Mt :
:411 46 kHz )10 4.6 kHz )b.
Slcywave 2000 Simulcast Mode
In addition, if correctly filtered and amplified at the transmitter side, the analog part of the signal has no effect on the digital part.
Integrated solution
The Slcywave 2000 program is conducted with a global system approach from digital source and channel coder at the transmitting side up to digital demodulator/decoder at the receiving side.
The final objective is to develop a component which can be inserted both in the existing radio sets and into the new digital ones.
Features of this component will provide the usual functions of AM receivers and will integrate the new digital demodulator/decoder.
Beyond the sound quality improvements, the digital capabilities integrated into the component will allow new services within the receiver. The component will be very low cost and very low power consumption (less than ten milliwatts) and should preferably be able to work with 1.5 V batteries. The component will integrate a 100
32

Skywave 2000 Ensures Maximum Compatibility with Existing Equipment
MOPS DSP core (Digital Signal Processor), a microcontroller core, several analog converters and a set of on-chip peripheral modules.
2.2 - Thomcast's Skywave 2000 demonstrator
Throughout 1996 and the beginning of 1997 different demonstrations have been performed showing Skywave 2000 capabilities and experiments progress in order to demonstrate the short term feasibility and to inform a large public about the promising possibilities of digital AM.
From the 31' Radio Symposium Montreux in June 96 to NAB Las Vegas in April 97, Skywave 2000, the Thomcast Digital AM system has demonstrated fast progress (see next chapter Tests Results and Progress).
The demonstrator, as shown in the following block diagram, consists mainly of:
• the real time digital processing systems for coder, decoder and modem (already described), implemented on standard DSP PC boards,
• an HF channel simulator:
The HF channel simulator is implemented on a standard DSP board with 2 analog inputs and outputs.
The input signal is complex represented in the I/Q form. The I and Q signals can be between -3 and +3 V with an impedance of at least 1 kOlun.
The output signal is similar to the input, and can directly drive the transmitter.
The input/output sampling frequency is 32 kHz. i.e. 2 times the actual effective sampling and computing rate (16 kHz.). Note that it is necessary to insert external analog low-pass filters on the I and Q output signals in order to avoid artefacts due to sampling.
The input and output gains can be individually adjusted.
The internal output filter is a Tchebyshev type 2 filter of 6th order, the bandwidth of which can be continuously adjusted between 3 kHz. And 12 kHz.
33

Skywave 2000 Demonstrator Block Diagram
The average signal to noise ratio is continuously adjustable, as well as frequency offset.
The propagation model is an augmented Watterson model with a maximum of 3 different paths.
Each path has a deterministic (fixed amplitude) component and a fluctuating (random, Rayleigh) component so that its amplitude has a Rice distribution law. The average power of the two components is adjustable. The frequency offset of the deterministic component is variable. The Doppler spread of the random component can also be modified.
The maximum delay of each path is 8 ms, except for the first one which has a delay of 0 ms (not including processing time).
In addition, one can add up to 3 narrow band jammers, with variable level and frequency.
The simulator has an integrated help file. It can be locked/unlocked (password required).
The user interface is based upon menus and dialog boxes.
The user can store on disk and retrieve from disk up to 20 custom configurations.
• A combined analog / digital low power exciter operating in the SW frequency band,
• A standard short wave consumer receiver dedicated to receive the analog programme,
• A modified short wave consumer receiver dedicated to receive the digital programme. The modification consists mainly in an implementation of an IF2 output with a wider IF2 filter connected to the digital decoder.
The demonstrator developed by Thomcast for experimentation and demonstration allows real AM broadcasting operating conditions and offers a maximum of flexibility as concerns transmission channel characteristics (already described) and transmission modes.
34

Skywave 2000 in Demonstration During IBC - 96
Among the large choice of transmission modes:
• standard AM DSB, • SSB: USB or LSB,
• simulcast (Analog compatible AM + Digital) with two versions: • analog programme within USB or SB • full digital.
Different configurations are available for simulcast and full digital modes. From a nominal 9 kHz RF bandwidth fully compatible with ITU channel allotment and spacing to an extended 12 kHZ RF bandwidth compatible with the audio bandwidth of modem existing transmitters (PDM or PSM).
The extended RF bandwidth mode allows to demonstrate, at the current stage of audio compression techniques, the highest reachable audio quality and the possibilities for additional
data services that a digital system like Skywave 2000 can offer to AM broadcasting if channel allotment and spacing is revised.
This extended mode leads to:
• a digital stereo audio at a usable bit rate of 32 kb/s and 10 kHz audio bandwidth in normal mode and a usable 24 kb/s in fall back mode,
• additional data services with a usable bit rate of 1250 b/s.
2.3 - Skywave 2000 tests results and progress
In less than one year, the system developed by Thomcast has demonstrated real and fast improvement capability.
• A simulcast mode where an analog
programme was only accessible by a SW receiver equipped with SSB mode in June
35
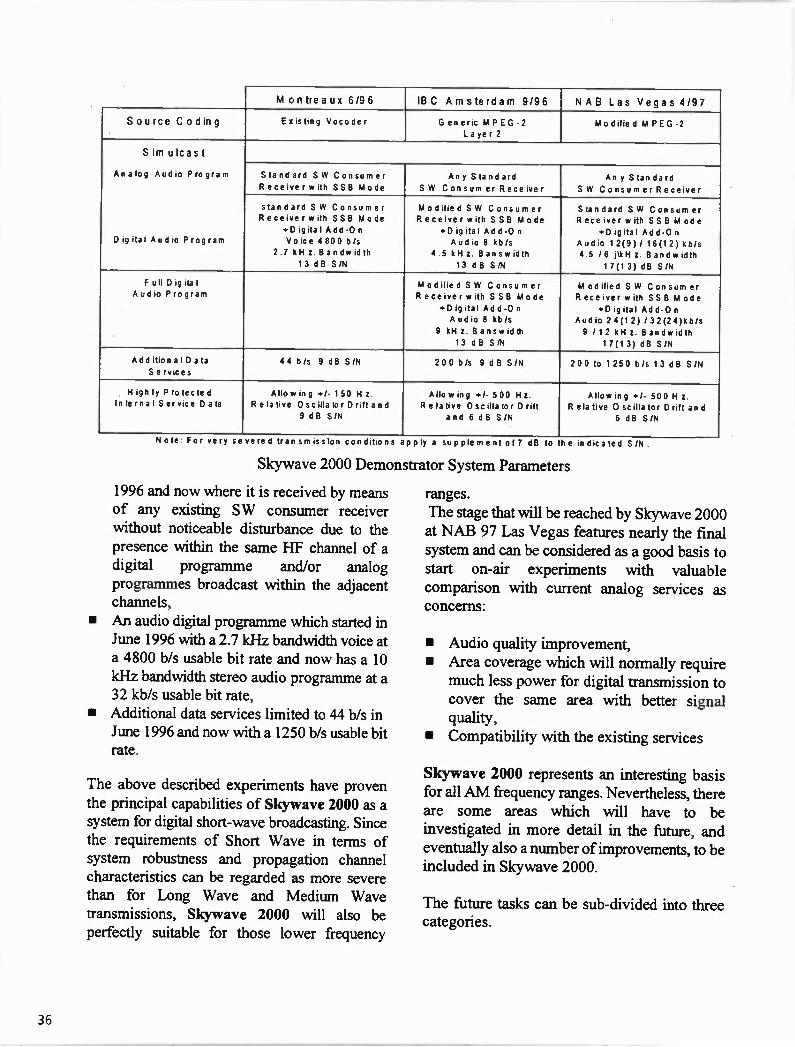
M o n tre a u x 6/96 IBC Am sterdam 9/96 NAB Las Vegas 4/97
Source Coding Existing Vocoder Generic MPEG -2
Layer 2 Modified M PEG -2
S im ulcast
Analog Audio Program
Digital Audio Program
Standard SW Consumer
Receiver with SSB Mode Any Standard
SW Consumer Receiver Any Standard
SW Consu mer Receiver
standard SW Consumer Receiver with SSB Mode
+Digital Add-0 n
Voice 4800 b/s 2.7 kH z.Bandwidth
13 dB S/N
Modified SW Consumer
Receiver with SSB Mode
+Digital Add-0 n Audio 8 kb/s
4.5 kH z. Ban swidth
13 dB S /1,-1
Standard SW Consum er
Receiver with SSB Mode
... Digital Add-On
Audio 12(9)/ 16(12) kb/s 4.5 /6 j1kH z. Bandwidth
17(13) dB S/N
Full Digital
Audio Program Modified SW Consumer
Receiver with SSB Mode
+Digital Add-On Audio 8 kb/s
9 kH z. Banswidth
13 dB S/N
Modified SW Consum er Receiver with SSB Mode
+Digital Add-0 n Audio 24(12) /32(24)kb/s
9 /12 kH z. Bandwidth
17(13) dB S/N
Add itionalD a ta
Services 44 b/s 9 dB S/N 200 b/s 9 dB S/N 200 to 1250 b/s 13 dB S/N
Highly Protected
Internal Service Data Allowing +/- 150 Hz
Relative Oscillator D rift a n d
9 dB S/N
Allowing +/- 500 Hz.
Relative 0 sc illa tor D rift
and 6 dB S/N
Allowing +/- 500 Hz
Relative Oscillator D rift and
6 dB S/N
o e. For very severed transmission conditions apply a supplement of 7 dB to he indicated S/N
Skywave 2000 Demonstrator System Parameters
1996 and now where it is received by means of any existing SW consumer receiver without noticeable disturbance due to the presence within the same HF channel of a digital programme and/or analog programmes broadcast within the adjacent channels,
• An audio digital programme which started in June 1996 with a 2.7 IcHz bandwidth voice at a 4800 b/s usable bit rate and now has a 10
IcHz bandwidth stereo audio programme at a 32 kb/s usable bit rate,
• Additional data services limited to 44 b/s in June 1996 and now with a 1250 b/s usable bit rate.
The above described experiments have proven the principal capabilities of Skywave 2000 as a system for digital short-wave broadcasting. Since the requirements of Short Wave in terms of system robustness and propagation channel characteristics can be regarded as more severe than for Long Wave and Medium Wave transmissions, Skywave 2000 will also be perfectly suitable for those lower frequency
ranges.
The stage that will be reached by Skywave 2000 at NAB 97 Las Vegas features nearly the final
system and can be considered as a good basis to start on-air experiments with valuable comparison with current analog services as concerns:
• Audio quality improvement, • Area coverage which will normally require much less power for digital transmission to cover the same area with better signal quality,
• Compatibility with the existing services
Skywave 2000 represents an interesting basis for all AM frequency ranges. Nevertheless, there are some areas which will have to be investigated in more detail in the future, and eventually also a number of improvements, to be included in Skywave 2000.
The future tasks can be sub-divided into three categories.
36

• Stepwise quality reduction in case of propagation channel impairment (graceful degradation),
• Automatic elimination of interference and jamming signals,
• Improved data compression techniques • Investigations of high power AM
transmitters: • Evaluation of the state of the art PDM/PSM
transmitters, • Necessary modifications in modulators and
RF amplification chain, • Investigations of linearity requirement as
function of modulation parameters. • Creation of a receiver standard with low
cost, low consumption objectives: • Development of a suitable chip-set.
Today's AM and SW broadcasters and the public have a strong interest in conserving the unique characteristics of their propagation media well into the future.It has been shown that a technical solution for digital modulation technology in today's AM frequency bands exists and can be easily implemented.
The Thomcast Skywave 2000 system offers a progressive strategy for introducing digital modulation: • In all AM Bands (LW, MW, SW), • Compatible format (Simulcast of digital
and analog programmes usable by old and new receivers),
• With maximum flexibility for evolution from analog, to simulcast, to fully digital as the receiver base evolves.
3.0 THE VOICE OF AMERICA/JET PROPULSION LABORATORY SYSTEM
Dr. H. Donald Messer
3.1. Overall System Description
The Voice of America/Jet Propulsion Laboratory (VOA/JPL) digital sound broadcasting system was originally designed for transmission and reception of satellite and complementary terrestrial (gap filler) delivery at frequencies from 1400 to 2400 MHz (L-band and S-band). Audio quality up to and including CD quality equivalence were available. (In ITU-R terminology, this system is called Digital System B.)
The design was based upon a contiguous narrow band spectrum for a given broadcast program. The bandwidth required, including that for all the forward error correction and training symbols for adaptive equalization mitigation of terrestrially boosted (gap filler) complementary terrestrial transmissions, was approximately 200 kHz for a CD quality signal. Proportionally less was needed as a function of bit rate from the source encoder. The original design went as low as 32 kbps, roughly equivalent to a 25 kHz bandwidth requirement. Phase shift keying modulation (MPSK) was used exclusively, with pulse shaping. The level of modulation tested mostly was QPSK (M = 4).
The system has been tested, with very successful results, via a NASA satellite (TDRS) that happens to have a steerable 2 degree S-band transponder/downlink antenna. These tests have been conducted during the past few years by VOA/JPL and independently by the Electronic Industries Association in the U.S.
In 1995, based on the successful testing of this design, we concluded that an adaptation of this system for shortwave and mediumwave broadcasting would be possible, and of great
37

advantage to international broadcasters such as the VOA. Since May 1996 we have been working on a project to provide the same type of robust digital sound broadcasting terrestrially via shortwave skywave propagation.
3.1.1 Important Design Factors
The following restrictions were placed for the design of Digital System B (VOA/JPL system) applied to shortwave use:
• The bandwidth of the RF signal should be contained within the 10 kHz associated with the existing use of the HF Broadcasting subbands that are contained within the overall HF spectrum from 3 to 30 MHz.
• The signal would be solely a digital one using the full 10 kHz, that is, no simultaneous broadcast on the same channel assignment of amplitude modulated and digitally modulated signals.
• The highest inherent audio quality that can be obtained within a 10 kHz bandwidth should be transmitted.
• However, this quality level has to be determined as part of an overall trade-off among audio quality level, skywave propagation realities that affect the level of error correction, etc. required, and carrier-to-noise protection ratios required to receive the MPSK signal in an environment where interference from other broadcasts, particularly analog, will be present, both co-channel and adjacent.
3.1.2 VOA/JPL System Design Characteristics
The VOA/JPL (Digital System B) design characteristics for shortwave use are summarized in this section. Work is in progress,
based first on initial propagation campaigns to understand how skywave propagation affects 10 kHz bandwidth digital PSK signals, to determine the specific values for some of these characteristics. However, decisions are firm on the overall selections, such as MPSK.
The VOA/JPL system consists of the following components:
• Coherent MPSK, with "M" to be determined as a result of the next series of field tests.
• Forward error correction (FEC), using Viterbi and Reed-Solomon techniques.
• Time interleaving.
• Adaptive equalization to mitigate against multipath.
We have found that significant multipath is a major characteristic of one, two and three hop skywave circuits, and that our adaptive equalization technique developed for the higher satellite frequencies works well in eliminating it.
We have found that some level of time interleaving will be useful because short burst errors occur frequently, and can be eliminated using this technique.
Finally, some level of FEC is probably needed, but most likely not as great as we have found was needed at the L-band and S-band frequencies.
3.2 Transmitter Requirements
The VOA/JPL system's modulation relies on phase shift keying (MPSK), with pulse shaping to ensure that the power is nearly totally contained within the 10 kHz channel assignment.
38

This permits the use of existing shortwave transmitters with little or no modification. Our initial tests used a typical VOA 250 kW HF transmitter at our California relay station with no modification.
Linearity for the digital PSK signal is important. Some spectral spreading occurred prior to the output from the transmitter at the amplifier class of operation we were using. As we continue with development, we may see a need to correct for this, possibly by operating at a lower class of amplification.
3.3 Receiver Requirements
The basic receiver requirements have been summarized in Section 3.2.1.2. These include decoding of MPSK, FEC decoding, time interleaving unscrambling, and adaptive equalization use of the associated transmitted training symbols.
As with any conversion from an analog service to a digital service, the receiver will need to contain all the above-mentioned functions in the requisite hardware/software design. A consumer
product that is capable of receiving both AM and digital shortwave most likely can utilize some common parts—antenna, front end,...
Obviously, one wants the 600,000,000 or so existing shortwave receivers not to be detrimentally affected by the introduction of digital signals. Therefore, the digital circuitry, modulation, filtering, etc., needs to be protective of distorting any adjacent analog channel assignments.
3.4 Present State of Development and Testing
A series of tests was conducted during the second half of October 1996 to obtain essential information on slcywave HF propagation effects on 10 kHz PSK digital signals. These were preliminary to the actual design selection of level of PSK eventually selected, amount of forward error correction used, etc.
Daily for two weeks we broadcast from Delano, California from an antenna horizontally slewed to have an electronic boresight that reached over Texas, the northeastern U.S. and on over the Atlantic Ocean to the west of the west African
Figure 1. VO MPL Test Configuration, October 1996: Receive Site in Austin, Texas, Washington D.D. and Toledo, Spain.
39

Figure 2. VOA/JPL October 1996 HF Broadcast Experiment: BPSK Pulse Shaped Signal Used at 8kBPS
bulge. We recorded the results on an adapted HF receiver as depicted in Figure 1. Reception in Texas was "one hop", in Washington, D.C. "two hop" and in Spain "three or four hop". The Spanish recording site was chosen simply because we were attending an ITU-R conference in Toledo. It was well off electronic boresight, with an expected C/N around 0 dB. Based on VOACAP propagation predictions, we used carrier frequencies at 15.2 MHZ and 5.9 KHZ, depending on the time of the day.
The transmitted test sequence consisted each day per carrier frequency of a 20 minute sequence repeated 3 times. For comparison purposes, the 20 minute sequence included both analog and digital modulation. Briefly, the sequence contained: analog music, a BPSK pseudo noise 63 bit sequence, the same thing with pulse shaping of the BPSK signal, and BPSK digital audio.
The pseudo noise signals were the source of the data for analysis. The object was to determine bit error rate and multipath information from these non-forward error corrected signals.
Figure 2 shows the power spectrum of the pulse shaped BPSK we used. Note that there is approximately a 30 dB reduction in power spectral density outside of the 10 kHz channel.
Figure 3. VOA/JPL Pseudo-Noise BPSK Test Signal: Autocorrelation Plot of Unimpaired 63 bit Sequence (Prior to transmission)
Figure 4. VOA/JPL Pseudo-Noise Test Result Example After Reception on October 21, 1996 in Washington D.c. From Delano, Calif. At 15.2 MHz: Correlation of Received signal with Transmitted Signal.
Figures 3 and 4 illustrate the effects of skywave propagation over long distances. They are both correlation functions associated with the pseudo noise (PN) 63 bit sequence. Figure 3 is the measured autocorrelation function prior to transmission. The peak on the left is the "no delay" condition (tau = 0). The peak to the right is associated with the time delay when the function repeats itself. Figure 4 is the same display of a correlation function between the sent and received signals for "two hop" reception received in Washington, D.C. on October 21, 1996. It clearly shows multipath--one dominant
40

0000 —
0
Oft110
" I "
• ISM M ao Hi s Ti m (111.0n m
I • I
01601,0 eat s &OLIO
Figure 5. VOA/JPL Test Results: Cumulative Bit Errors over a 3 Minute BPSK Sequence on a Path from Delano, California to Washington D.C. at 15.2 MHz. (October 18, 1996).
and one intermediate level signal. In this case, the lower level signal was received before the "main signal", a condition very different from the usual case for satellite delivery. The time separation between the two signals is around 0.4 milliseconds. This separation interval is typical--large fractions of a millisecond--and contrasts with the several microsecond delays that appear via satellite or for local FM reception. Another common phenomenon encountered was "burst errors" lasting fractions of a second. This is illustrated in Figure 5, which is a typical time plot of errors over the 3 minute period we devoted to each PN BPSK portion of the 20 minute audio sequence. Practically all the errors occurred in two burst steps, a little to the right of the one and a half minute mark on the abscissa. This causes "scratches" in any digital audio. Its cause is probably out of channel interference from other broadcasts. Since the interval is so short, a practical amount of time interleaving, less than a second, will eliminate this effect.
In summary, based on the slcywave propagation campaign summarized above and with the selection of MPSK coherent modulation, we expect that:
• We can support an information transfer rate of 32 kbps or higher in a 10 kHz channel, with higher orders of PSK modulation than BPSK.
• Power levels required will be less, perhaps much less, than for AM for the same geographic coverage.
• Practical error mitigation techniques consisting of time interleaving and low levels of error correction coding will achieve robust, reliable quality audio significantly higher than existing AM in HF bands.
• Adaptive equalization is a necessary and effective method for mitigating the severe multipath conditions that exist with skywave HF propagation.
3.5 Projected Schedule of Development
The next phase of development, ending in September 1997, will determine the specific best levels of PSK modulation, and the amount of time interleaving and forward error correction needed to permit excellent reception of digital audio at shortwave frequencies, at least for "one and two hop" situations. The associated distances go up to a few thousand miles. Most likely, good reception for longer distances, at least within the main beam of the transmit antenna, is also possible with a good selection of carrier frequency.
A key activity for these determinations will be another round of test transmissions from a VOA relay station. The impressed digital signals will include the gamut of MPSK signals and error mitigation levels that our laboratory analysis indicates should be investigated. We will probably test "M" up to 64, although we expect that a lower level, such as 32, 16 or 8, will be "optimum", all things considered.
During several months after September 1997, we will develop a compact hardware/software prototype embodying the techniques earlier developed, and test it thoroughly.
41

4.0 THE DTAG ZRA DIGITAL AM SYSTEM
Prof. Dr. Dietmar Rudolph
4.1 Introduction
Modem AM transmitters of today are generally compatible with digital modulation inputs. The only modification required concerns the master oscillator. Digital transmissions cannot be received with ordinary AM receivers. Ordinary AM band channel spacing is generally compatible with the requirements of digital transmissions. Because of this, transition from analog to digital services in the AM bands can be made on a channel-by-channel basis. Generally there is little interference from and to cochannels and adjacent channels for either the analog or the digital case. A digital transmission produces a white noise like audio signal when received in a conventional AM receiver.
Deutsche Telekom now operates a low power (400W)solid-state transmitter (adapted for PDM modulation from its original analog AM configuration) in south-east Berlin. Figure 1 shows the location of this transmittor in Berlin. Also shown are the relative effective day and night coverages of the digital transmissions, in comparison with the day and night coverages of a 2.5 kW analog AM transmitter (whose daytime coverage is roughly equivalent to that of the digital transmitter).
In Figure 1 coverage area of the digital transmission is defined by that area having a bit error rate (ber) of the demodulated signal of less than 10. This ber results in a stable audio signal without disturbances, and which is superior in all audio quality characteristics to those of a class A analog MW broadcast signal. In this figure is clearly demonstrated the shrinking of the night coverages of the two modulation types. As can be seen, the effective night coverages of the digital transmissions are
considerably greater than those of the analog transmission, despite the significant difference in transmitter powers.
Figure 1. Comparison of the Digital and Analog AM Coverages of Berlin During the Day and the Night, for Transmitters of the Same Daytime Performance.
Daytime Night-time
AnalogAM (2,5 kW)
Digital AM (0,4 kW)
4.2 Principles of Digital Transmission in the AM Bands
Due to the narrow bandwiths (9 kHz.. or 10 kHz..) of the AM bands a high state modulation is required for the transmission of the necessary data rate. Assuming that 7200 Symbols per second can be transmitted in a 9 kHz.. AM channel, and that 36 kbit/sec have to be transmitted, one concludes that a modulation of 32 states (5 bits per symbol) will be required. With the necessary channel coding there will be a usable data rate of e.g. 21 kbit/sec. Of this, 20 kbit/sec will be used for coded audio transmission and 1 kbit/sec for ancillary data. These are the parameters that are used with the
42
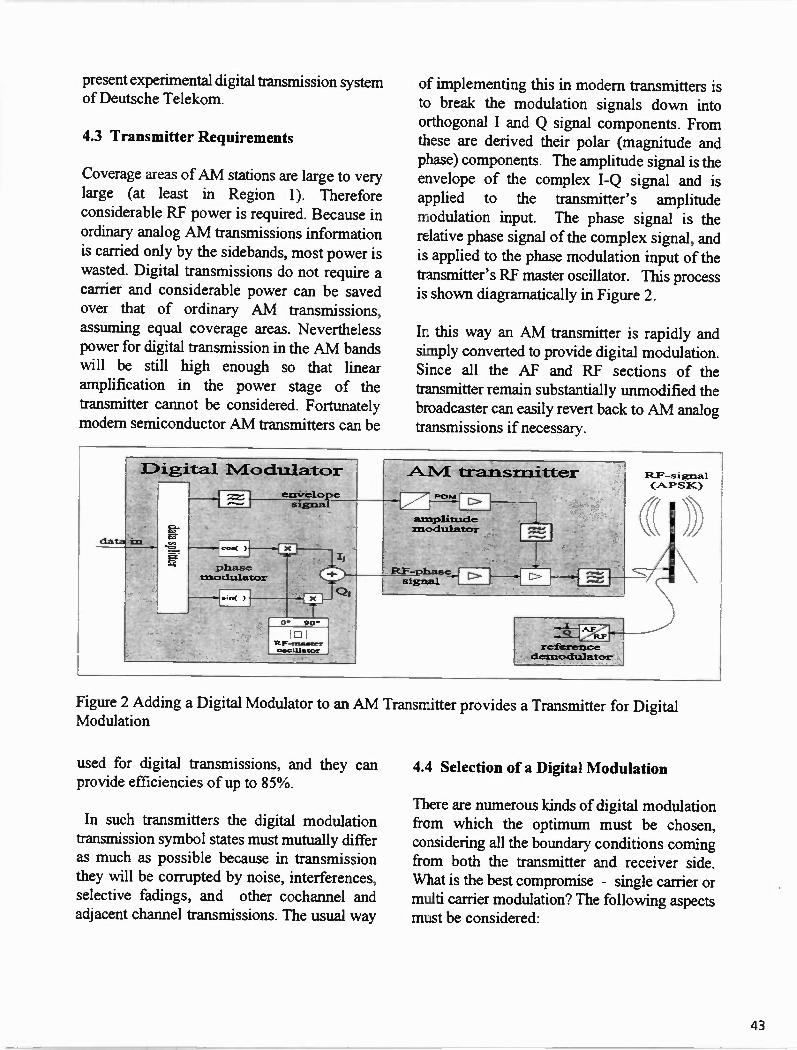
present experimental digital transmission system of Deutsche Telekom.
4.3 Transmitter Requirements
Coverage areas of AM stations are large to very large (at least in Region 1). Therefore considerable RF power is required. Because in ordinary analog AM transmissions information is carried only by the sidebands, most power is wasted. Digital transmissions do not require a carrier and considerable power can be saved over that of ordinary AM transmissions, assuming equal coverage areas. Nevertheless power for digital transmission in the AM bands will be still high enough so that linear amplification in the power stage of the transmitter cannot be considered. Fortunately modem semiconductor AM transmitters can be
of implementing this in modern transmitters is to break the modulation signals down into orthogonal I and Q signal components. From these are derived their polar (magnitude and phase) components. The amplitude signal is the envelope of the complex I-Q signal and is applied to the transmitter's amplitude modulation input. The phase signal is the relative phase signal of the complex signal, and is applied to the phase modulation input of the transmitter's RF master oscillator. This process is shown diagramatically in Figure 2.
In this way an AM transmitter is rapidly and simply converted to provide digital modulation. Since all the AF and RF sections of the transmitter remain substantially unmodified the broadcaster can easily revert back to AM analog transmissions if necessary.
data
1Digital M odulator
U I
phase m odulator
en*relore
R P- mamma,. oecillatcar
Ii
A M trans mitter
O M
arnplitude m odulator
R F-phase signal
Ft_F-signal CA.PSIC)
reference de modulator
Figure 2 Adding a Digital Modulator to an AM Transmitter provides a Transmitter for Digital Modulation
used for digital transmissions, and they can provide efficiencies of up to 85%.
In such transmitters the digital modulation transmission symbol states must mutually differ as much as possible because in transmission they will be corrupted by noise, interferences, selective fadings, and other cochannel and adjacent channel transmissions. The usual way
4.4 Selection of a Digital Modulation
There are numerous kinds of digital modulation from which the optimum must be chosen, considering all the boundary conditions coming from both the transmitter and receiver side. What is the best compromise - single carrier or multi carrier modulation? The following aspects must be considered:
43

• Transmitter complexity • Receiver complexity • Transmission channel bandwidth • In-channel disturbances and interference • Robustness and speed of receiver synchronization
• Hand-over to alternate receiving frequencies
Transmitter Considerations
Analyzing the transmitter side single carrier transmission appears to be favourable. The following factors are considered.
• The crestfactor of single carrier transmission is much smaller than that of multi carrier transmission. A big crest factor means that the peak power capability of the transmitter is large compared to its effective power. A single carrier transmission has a crest factor less than 100% that of AM, whereas multi carrier transmission has a crest factor much higher than 100% of AM. So for multi carrier transmission the transmitter must be able to provide a large peak power, which means lower efficiency and increased nonlinearities of the transmitter.
• Single carrier transmission allows a concentric symbol constellation, called amplitude phase shift keying (APSK). With a concentric constellation differences in the delay times of the amplitude and phase signal paths have less effect. For multi carrier transmission this does not apply because differences in delay times lead to loss of orthogonality.
• Because single carrier symbols are always of the same shape, a reference demodulator near the transmitter can detect differences between the theoretically required shape and the actual transmitted shape, arising, for example, from mismatching of the antenna. A feedback control then can easily equalize the symbol shape. For multi carrier transmission this is not possible.
Figure 3a. The APSK 32 I-Q-Plane Asterisk
Bate: 24.93.96 Time: 11:07
TRACE A Ch1 Spectrum
0 dBn
LodMod
10 dB
/d iv
-103 dElm
A Morkcr 200 000.0 Hz -36.826 dm
OW
i n
47.1\ 1 J1V4vi ,..40.T.P1411..1 Tr.
I
enter: 200 kHz Span: 20 kHz
Figure 3b. The Measured RF Spectrum of the Experimental 32 APSK Modulation.
Receiver Considerations
In considering the constraints of the receiver side, one again concludes that single carrier digital modulation mode is superior to multi
44

carrier transmission. This is demonstrated by the following analyses.
• On fading channels, single carrier modulation requires an adaptive equalizer. On channels without fading (LW at all times, and MW daytime) an equalizer can be omitted. Thus great flexibility for receivers for different applications will be possible, which is important at least in the beginning of digital AM service. In contrast, multi-carrier modulation has to be processed by a Fast Fourier Transform in every case, which requires great receiver complexity.
• The amount of equalization depends on delay time of echoes compared to symbol length. With narrow channel bandwidth, symbols must be long. If the echo delay time for MW is assumed to be 2 ms, this means 15 symbols for a 9 kHz. channel spacing. On SW there could be an echo delay up to 8 ms which requires a mean length of 60 symbols. It is only at this large symbol length that receivers for multicarrier modulation become less complex than those required for single carrier transmission.
• For a single carrier transmission with a hierarchical modulation scheme the receiver can be constructed for a maximum of 16 states instead of the 64 which would be required for SW application in other modulation modes.
The layout of the digital AM receiver is conventional from the front end down to the IF. At this point a quadrature (I/Q) baseband demodulator, followed by digital signal and audio processing is required.
Structure of Modulation Stream
Single carrier modulation uses periodical test sequences embedded in the data digital stream, transmitted as 2PSK signals. From these sequences the receiver extracts the channel information for adaptive equalizing. 2PSK is a
Figure 4 Structure of Data Stream of Single Carrier Modulation. Data blocks are embedded between periodically repeated test sequences. Additionally every second data block is omitted to produce a gap where the receiver can measure interferences or alternative frequencies.
very robust modulation mode and thus can also be used for quick receiver synchronization. These test sequences, repeated periodically 25 times per second in MW mode, serve for the fcllowing functions.
• Synchronization, frequency control, phase control, and timing.
• Level control, channel estimation, adaptive equalization, suppression of carriers, channel bandwidth setting, bit error measurement, and determination of the level of the hierarchical modulation.
• The test sequences enable a fine-tuning control of the receiver of up to +/- 4 kHz.
The periodically repeated gap does not mean any loss of audio signal continuity or data because all information in the transmission sequences are properly arranged. Also, during the gap the receiver is free to tune around and make the following measurements:
• Search for alternative frequencies and determine their frequency, phase, timing, and level;
• Determine all disturbing carriers which are not in the middle of the channel.
Interferences within the broadcast channel
In addition to white Gaussean noise and Rayleigh or Rice fading there are specific
45

interferences of data transmission resulting from distant co-channel AM transmitters. During the time of transition from analog to digital transmissions, when some transmitters already use digital modulation while others still use AM transmission, interference, especially by carriers, has to be expected. Thus interferences between digital transmissions and co-channel and adjacent channel AM has to be mastered in order to guarantee the success of digital AM.
The receiver for digital transmission can detect whether a received signal is analog or digital. This is due to the test sequences. It also detects the channel spacing (9 kHz. or 10 kHz.). And, of course, if it is desired that a receiver be able to receive both analog and digital AM signals, only an additional second envelope detector at the output of the last IF amplifier need be added to the digital device.
Effect of interference by a carrier
During the night the following measurements can be made at a station receiving the Deutsche Telekom digital test transmitter in Berlin:
S.
Figure 5(a) Phase Asterisk of 32 APSK signal with
Interference.
1
Date: 02.413.36 Tian: 09:24
TRACE A: Ch1 Spectrum
10 dem
LOgliad
10 dC
/d iv
M Markt,. 199 9158.75 HE 1.155 dB.
40
Center: 200 kHz Spa: SO kHz
Figure 5 (b) Measured Spectrum of the Digital Test Transmission (810 kHz.) With Interfering Carrier Approximately in the Middle of the Channel (199,96875 kHz. instead of 200 kHz.).
• With the digital test transmitter switched off, cocharuiel programs of BBC in Great Britain and other transmissions from southern east Europe can be identified.
• With the test transmitter in operation, a cochannel carrier many dB higher than the digital spectrum can be identified.
The effect of this inchannel AM interference has been simulated by adding an AM signal to the received digital signal at day time. Measurement was made in the IF range (200 kHz.). Since the interfering AM signal was not exactly in the middle of the channel, the AM carrier was measured not exactly at 200 kHz. The measured phase asterisk and the corresponding spectrum is shown in Figure 5.
The interfering carrier can be up to 30 dB larger than the digital spectrum without AM, and can be up to 6 dB larger with 100% AM, without causing bit errors.
The phase asterisk for this case looks strange. To understand this examine the receiver structure. It has a minimum of one local oscillator and possibly a second one which provide mixing
46

down to l/Q baseband signals. All the quartz local oscillators do not have exact frequencies. Thus the phase asterisk rotates. Additionally the phase asterisk will be displaced by the interfering carrier. This displacement is large because this carrier is much higher amplitude than the digital signal. And again, because the interfering carrier is not exactly in the middle of the channel, the phase asterisk will additionally rotate like a planet around the sun.
Normally an interfering carrier must not displace the points in the phase asterisk more than half way to the decision lines, but here this is far more. So the decision lines have to follow the movement of the phase asterisk. This is established by the aid of the test sequence. During test sequences rotation of the phase asterisk can be measured if there are less than 90 degrees between 2 points. So the effects of the tolerances of the quartz oscillators can be eliminated and exact phase can be determined. If the test sequence is long enough and free of a DC component, the average of a test sequence gives the information about the interfering carrier. In this way the interfering carrier can effectively be removed from the data stream.
4.5 Present State of Development and Testing
The Berlin DTAG test transmitter, operating on 810 kHz. with 400 W power, has been in operation for about a year. Presently our receiver consists of an array of components: a ferrite antenna, a commercial SW receiver (EKD 500) with an additional 200 kHz. output, a quadrature downrnixer, signal processor boards (TMS 320C40) for demodulation etc. within a PC, and a Fraunhofer audio decoder (MPEG 2, layer 3).
In the beginning of our experiments we transmitted pseudo random data for measuring bit error rates. We now transmit audio signals. (Simultaneous bit error rate measurements are
still possible with the aid of the test sequences.)
For our audio transmissions there are several modes available, depending on the features of the audio coding system:
• Transmission in mono with an audio bandwidth of over 6 kHz.
• Transmission in (joint) stereo with audio bandwidth of about 4 kHz. per channel.
In our system the audio decoder is set to the right mode automatically. In contrast to AM analog transmission, where audio bandwidth depends much on the shape of the IF filters of the receiver, that of our digital transmission provides flat frequency response up the the specified upper frequency of the audio bandwidth. Also, the dynamic range of the received audio signal corresponds exactly to that of the CD audio source signal, and is thus far better than that of FM transmissions. And, of course, the received audio signals are completely free from all the usual disturbances associated with AM analog transmissions.
Our system is in daily operation, and we invite visitors so that we can demonstrate how attractive and economical is digital AM transmission.
4.6 Projected Schedule of Development
Our next step will be the development of a single processor demodulator, using an available chip (e.g. ADR). After development of the single processor demodulator receiver, we will modify the transmission method to meet the needs of SW transmission. Later, we plan to implement a hierarchical modulation with 64 states. Once this is done the receiver can choose to demodulate 64 or 16 or 4 states, depending from the receiving conditions. The 64 state modulation corresponds to a demodulated signal of joint stereo audio plus data; the 16 state modulation to mono audio plus data; and the 4
47

state modulation to telephone quality audio plus data, respectively. By using a receiver programmed to accommodate different state modulations, graceful degradation in response to transmission path conditions is established. This is an extremely useful strategy to avoid disruption of program and data transmission.
With the single processor demodulator available in summer of this year, our system will be applied to data transmission on a Long Wave channel below 150 kHz. With this an efficient and inexpensive data service will be possible. Because this will be a system used exclusively for national broadcasting no international standardization will be required.Our existing receiving system is designed for LW and MW transmission. It will be redesigned for SW by the autumn of this year. In this way we will be
able to demonstrate digital transmission on a world-wide basis. For this part of our development of digital AM transmissions Shortwave transmissions from our Juelich transmitting station will be used. With the single processor demodulator now being developed world-wide demonstrations and testing of our system will be possible.
5.0 Acknowledgement
This article was coordinated, edited and assembled on behalf of Digital Radio Mondiale by Dr. Robert L. Everett of the Office of Engineering of the International Broadcasting Bureau of The United States Information Agency. -30-
48

FIELD TESTING OF PROPOSED DIGITAL AUDIO RADIO SYSTEMS PART I: MOBILE DATA COLLECTION SYSTEM
Stanley Salek, P.E., and Daniel G.P. Mansergh Hammett & Edison, Inc. Consulting Engineers San Francisco
ABSTRACT
This technical paper describes application of the mobile data collection system that was used to evaluate proponent Digital Audio Radio (DAR) systems in the San Francisco Bay Area in 1996, for a program sponsored by the Consumer Electronics Manufacturers Association (CEMA). To complete the task, the project required development of field test routes, refinement of test procedures, and FCC authorization for construction of transmitting facilities at a multi-user communications site. In addition to the engineering tasks, the hiring and training of personnel to act as real-time observers were required.
The test van included a computer data gathering system developed and constructed by the CEMA laboratory at the NASA/Lewis Research Center in Cleveland, Ohio. That system was used to gather data related to vehicle speed and position, observer reports of system performance, and RF signal levels encountered throughout the test routes. Recordings of the proponent DAR system recovered audio were made, along with video recordings of the vehicle path and spectrum analyzer images related to system performance.
INTRODUCTION
The beginning of 1996 brought with it the first on-site activities related to the CEMA DAR field testing program in San Francisco. In the prior year, eight
proponent systems had been exhaustively tested in CEMA laboratory space at NASA/Lewis Research Center. The results of those laboratory tests were presented at a meeting in Monterey, California, in August 1995. [1] After completing some retesting activities requested by individual proponents, final
planning of the field testing project phase began, including final selection of a transmitting site and construction of a suitable "mobile laboratory" that would be used to gather field data.
During several committee meetings related to the DAR
testing process, the San Francisco Bay Area had been mentioned often as a potential location for conducting
field tests of DAR systems, because of the desire to prove seamless mobile reception in an environment that
included widely varying terrain and, consequently, varying radio wave propagation conditions. As many
radio broadcast engineers know, the San Francisco Bay Area can offer no single transmission site that provides line-of-sight transmission to all populated areas. Three popular sites in the Bay Area host most of these transmitting facilities. The first site, containing the majority of FM stations, is situated atop San Bruno Mountain, just south of San Francisco. The second site is
Sutro Tower, located within San Francisco, and the third site is known as Mt. Beacon, located just north of the Golden Gate Bridge in Mann County. While all three of these sites arguably serve San Francisco proper, they are all shielded by intervening terrain to many growing
communities in the East Bay. Additionally, some North Bay communities also are shielded by terrain from all three sites. Therefore, in developing a plan for field testing, the San Francisco Bay Area was chosen because it was believed to be at least as challenging to radio wave propagation as any other location within the United States.
While it is beyond the scope of this technical paper to
cover the characteristics of proponent DAR systems, some discussion is warranted to better describe the challenges faced in designing field tests. Of the nine system variants tested in the laboratory, all were originally designated for field testing. Four of the systems are designed to operate terrestrially within the
FM broadcast band using a host FM station; those systems were called in-band on-channel, abbreviated as "IBOC." Two other FM broadcast band systems operated on adjacent channels (in-band adjacent-channel, or "IBAC"), and in place of an FM station, in an incompatible mode (in-band reserved-channel, or "IBRC"), respectively. Another IBOC system operated within the AM broadcast band, and it was designated
"IBOC-AM." The remaining proponents consisted of
49

the Eureka 147 terrestrial system, operating within the L-band (1,468 MHz) and the Voice of America/Jet Propulsion Laboratory ("VOA/JPL") satellite delivered system, operating within the S-band (2,030 and 2,050 MHz). A detailed technical description of each proponent system is provided in Reference [1].
For various reasons, all of the IBOC systems and the
IBRC system eventually were withdrawn from field testing, leaving only the AT&T/Lucent IBAC, Eureka
147, and VOA/JPL systems. Operation of the IBAC system required construction of a terrestrial transmission system that used a conventional FM broadcast antenna but employed a transmitter specifically tailored to support the proponent RF signal. The Eureka 147 system required construction of a custom L-band transmission facility. Being satellite-based, testing of the VOAMPL system required no construction of transmitting facilities aside from the existing uplink facility, which was located in New Mexico. A custom audio compact disc was produced by the National Radio Systems Committee, Digital Audio Broadcasting Field Test Task Group, containing one hour of programming and station identification, which was used for testing of all systems. Receivers for each tested system were
installed within the mobile test van, as described later.
TEST SITE CONSTRUCTION
As a result of related committee activities, use of the Mt. Beacon transmitting site was secured for the DAR field test program. As described above, Mt. Beacon is located just north of San Francisco; it hosts four FCC-grandfathered super-power Class B FM stations, two
FM translators, and numerous other communications facilities. Thus, a challenging atmosphere was added to the test situation, in that the proponent equipment was required to operate in the presence of other strong RF signals without adverse effects to its own transmitted signal or to the transmitted signals of other stations.
Site Modifications To construct the IBAC and Eureka 147 transmitting facilities, a few site modifications were required. First, a new 200-ampere three-phase electrical service was
installed, which proved to be a somewhat difficult task in that the electrical service to the site was already near its capacity. After a number of discussions with the power provider, a method to accommodate the new service was devised. Second, an air conditioning system had to be installed in the test room. While the Mt. Beacon climate is usually quite mild during most of the year, the testing process began during the summer
months, in the midst of an ongoing "heat wave" in the area. Temperatures in the test room rose to over 90
degrees Fahrenheit, which proved to be too high for proper operation of the prototype proponent equipment. Third, tower space was located for the proponent test antennas. Initially, the Eureka 147 transmitting panel antenna was side-mounted on a tower adjacent to the transmitter building, and the four-bay IBAC antenna was mounted on a nearby shorter tower. After initial
propagation tests by the AT&T/Lucent engineers, the IBAC antenna was rebuilt into a three-bay, half-wave-
spaced design, and it was remounted in the same position as the Eureka 147 antenna, once testing of the Eureka 147 system was completed.
FCC Authorizations and Site Management FCC experimental authorizations were required for operation of both the IBAC and Eureka 147 systems. The IBAC system was proposed at 5 kilowatts effective radiated power on 96.9 MHz, which was second-adjacent to two San Francisco stations and co-channel to stations in Sacramento and Monterey, California, those being adjacent markets to the San Francisco Bay Area. The FCC granted use of the proposed frequency only after appropriate interference studies were submitted by others and agreements were received from all of the potentially affected stations. Securing an FCC authorization for the Eureka 147 system proved to be more difficult, in that the desired L-band frequencies are assigned only for military and government use in the
United States. CEMA negotiated with the FCC, the National Telecommunications and Information
Administration, and various other government and military agencies for over one year before final permission was secured to operate the test station. The agreement required real-time contact with a military frequency coordinating agency, as well as the establishment of an independent monitoring station on the grounds of NASA/Ames Research Center, in
Sunnyvale, California, located about 35 miles south of the Mt. Beacon test site.
As a part of the FCC authorization documentation, surveys for the presence of non-ionizing RF radiation in excess of FCC/ANSI occupational limits were performed for each system installation. Fortunately, measured RF radiation levels of the Eureka 147 and redesigned IBAC transmitting antenna installations were found to be well under applicable limits. During transmitting antenna installation and removal, significant power cutbacks were required of the other site users to ensure that the tower riggers would not be exposed to excessive fields while climbing or working on the towers. While the associated coordination process
50

was challenging at times, other site users were cooperative in agreeing to reduce power during nighttime antenna work.
During construction, adjustment, and operation of the transmitting facilities, strict supervision of on-site proponent activities was required to certify that no inadvertent or intentional proponent modifications had been made to encoders or modulators, which was the same equipment previously evaluated at the test laboratory. Additionally, site supervision was required at all times when transmitters were in operation. Not unexpectedly, the proponents spent many hours setting up and troubleshooting installation and equipment operation problems, many of which were related to the high RF field characteristics present at the site.
Eureka 147 system installation. The Eureka 147 DAR system consisted of one primary encoder/modulator equipment rack, which was installed in the test room, along with a 200-watt power amplifier
that was installed in a penthouse room at the site. A length of low-loss coaxial cable interconnected the power amplifier, through a filter network, to the panel antenna, which was mounted about 15 meters above
ground. Complicating the project were additional installations at two other sites, which allowed the
system to be tested in a "network" mode in addition to a single transmitter mode. The second installation was constructed at San Bruno Mountain, south of San Francisco, while the third site was constructed atop Round Top Mountain, in the East Bay hills near Oakland, California. The San Bruno Mountain site was interconnected to Mt. Beacon by way of a baseband RF signal carried on a common carrier microwave link. The
Round Top Mountain site was constructed as an on-channel booster, with receiving and retransmitting antennas located at different levels on the same tower. All construction activities at the San Bruno and Round Top Mountain sites were handled by the proponent.
Supervision was not necessary because no special modifications to the system encoder or modulator were required.
AT&T/Lucent IBAC system installation. The IBAC system consisted of an encoder/modulator equipment
rack, an intermediate power amplifier rack, and a large final power amplifier. Both rack units were installed in the test room, while the final power amplifier, because of its large size, was placed in a temporary container located just outside the transmitter building. Two large notch filter assemblies also were installed within the outdoor container. A length of pressurized air dielectric coaxial cable was used to interconnect the filter output to the
transmitting antenna. As mentioned above, the IBAC transmitting antenna was installed in the same location as the Eureka 147 antenna, after the conclusion of Eureka 147 field tests.
VOA/JPL system installation. The VOA/JPL S-band satellite system was uplinked from the JPL laboratory near White Sands, New Mexico, to a NASA Tracking and Data Relay Satellite in geosynchronous orbit over the
Pacific Ocean. The VOA/JPL encoding equipment, taken from the CEMA laboratory in Cleveland, was installed at the uplink facility by a CEMA engineer. Initial tests were conducted to verify proper operation of the receiver, which was already installed in the DAR field test vehicle.
MOBILE DATA COLLECTION SYSTEM
CEMA and its related committees had determined the
types of data that would be gathered during the field testing phase of the project to complement the laboratory data. Of key interest were the RF level, audio availability, and decoded audio quality of each proponent's system, linked to real-time vehicle location and speed data. Real-time recordings of the RF spectrum adjacent to the proponent system's signal and examples of comparable analog FM reception were also deemed potentially useful for subsequent analysis of the data.
Test Vehicle Configuration With the objectives stated above in mind, along with the goal of automating as much of the data gathering process
as possible, the CEMA crew at the NASA/Lewis Research Center designed a recording system that
simultaneously collected audio, video, and computer data on each proponent system under test, linked together using SMPTE timecode. Audio information, consisting of the decoded stereo audio of the proponent system
along with the output of two independent stereo analog FM receivers and the output of microphones located in the cockpit of the test vehicle, was recorded using a Tascam DA-88 8-track digital audio recorder. Two color video cameras were mounted above the driver in the test vehicle and were positioned in such a way as to provide a nearly 180° view of the test route in front and to the sides of the vehicle. The output of these cameras was combined with the video output of two spectrum analyzers (one displaying the RF environment around the proponent system signal and the other displaying the
instantaneous RF level of the signal in zero-span mode) using a quad mixer, similar to those used in surveillance and security applications, and was recorded using a Super-VHS VCR with insert recording capability.
51

Audio Video
Stereo Decoded Proponent Audio
Stereo Analog FM Receiver 1
Stereo Analog FM Receiver 2
Cockpit Audio
Forward Video Camera Left
Forward Video Camera Right
Wide-Span Spectrum Analyzer
Zero-Span Spectrum Analyzer
Quad Video Mixer
8
SVHS VCR
Data
Shaft Encoder Counter Output
Observer 1 Control Pad
Observer 2 Control Pad
Route Landmark Increments
DC Voltage
SMPTE Timecode DA-88 8-track
Digital Audio Recorder
1
Data Gathering Computer
Figure 1. Simplified block diagram of test vehicle data collection system.
A PC-compatible computer running custom data collection software was the heart of the system, continuously recording the instantaneous RF level of the
system under test via the DC output port of the zero-span spectrum analyzer, along with indications of audio dropouts and defects made by two human observers pressing buttons on standard PC game controllers. The software also recorded vehicle position data, consisting of continuous distance measurement determined by an optical shaft encoder mounted to the vehicle's rear wheel and discrete position landmarks along each test route that were manually incremented by the test system operator. To ensure data integrity and to protect against device failure, a spare DA-88 and VCR were incorporated into the system to provide real-time backup of the audio and video data. A simplified diagram of the field test system is shown in Figure 1.
Test Vehicle Outfitting The entire system was preassembled at NASA/Lewis prior to installation into the test vehicle, a 1986 24-foot "Honey" motorhome, shown in Figure 2. To accommodate the weight and power requirements of the
test system and of the proponent systems' receiving
equipment, the vehicle required substantial modifications, performed by the NASA/Lewis crew. The interior of the vehicle was gutted, the rear suspension
was raised and strengthened, and additional bracing was added to the walls and ceiling. New plywood flooring was installed, three captain's chairs were mounted for observers and the system operator, four large equipment racks were mounted along the side of the vehicle, and an
AC power system consisting of paired rear-slung generators and interior uninterruptable power supply units was installed. To support the various antennas
required by the proponent systems, a platform was constructed at the front of the roof of the vehicle and
fitted with an aluminum ground plane, with a roof catwalk and rear-mounted steel ladder installed to facilitate access. This area is shown in Figure 3. The mounting of the optical shaft encoder used for distance measurement is shown in Figure 4.
Once these modifications to the vehicle were complete, the testing system and proponent receiving equipment were installed and connected. Digital and analog audio
52

Figure 2. The CEMA DAR field test vehicle.
Figure 3. Antenna mounting plane and catwalk.
Figure 4. Optical shaft encoder installation.
were routed through patch bays to facilitate quick system changes. A video monitor, powered audio speakers, and headphone distribution amplifiers were installed for monitoring of the test data being collected. A portion of the equipment installation is shown in Figure 5. After all systems were installed and checked at NASA/Lewis, the test vehicle was shipped to San Francisco.
Test Route Selection To ensure that all proponent systems were tested under a
range of propagation conditions, the CEMA committees determined that six "long path" routes, averaging about one hour in length each, would be driven for each of the proponent systems. The routes were selected to be representative of the challenging propagation characteristics for which the San Francisco Bay Area was chosen as a field test site, including terrain shielding, urban shielding, heavy foliage, long over-water paths, and dense multipath environments. A map of the routes selected is shown in Figure 6. That figure also shows the locations of the Mt. Beacon, San Bruno Mountain, and Round Top Mountain test sites. As previously discussed, the Mt. Beacon site was employed for both Eureka 147 and AT&T/Lucent testing, while the San Bruno and Round Top sites were used only for Eureka 147 testing.
Field Activities To serve as a base of operations for all field activities, a
staging area was constructed in Mill Valley, about five kilometers (three miles) north of the Mt. Beacon transmission site. A large garage bay was selected at a storage facility with convenient access to U.S. Highway 101, the main north-south route on the western side of San Francisco Bay. The facility was also adjacent to a
well-stocked hardware store and service station, both of which proved to be invaluable resources throughout the preparation and testing phases. The garage bay itself was
large enough to accommodate the test vehicle as well as a heavy-duty workbench and storage cabinet for blank data tapes, proponent equipment, cables, and spare parts. A temporary electrical system was installed prior to the test vehicle's arrival to provide overhead lighting and a shore power connection for the vehicle's power subsystem.
Test vehicle staffing. During normal field testing operations, the test vehicle was staffed by a crew of four:
a driver, a test equipment operator, and two observers. The observers were trained prior to the commencement of testing to identify signal dropouts and audio defects, and to mark each event by pressing the appropriate buttons on their game controllers. The test equipment operator oversaw the operation of the entire system, controlled the software, supervised the observers' indication of signal events, assisted the driver with navigation, and incremented landmarks along each route.
Timecode synchronization. SMPTE timecode was used to synchronize all of the data recording devices, with the video subsystem serving as the timecode source for the other two recording subsystems. The audio and video tapes were "prestriped" with timecode prior to
53
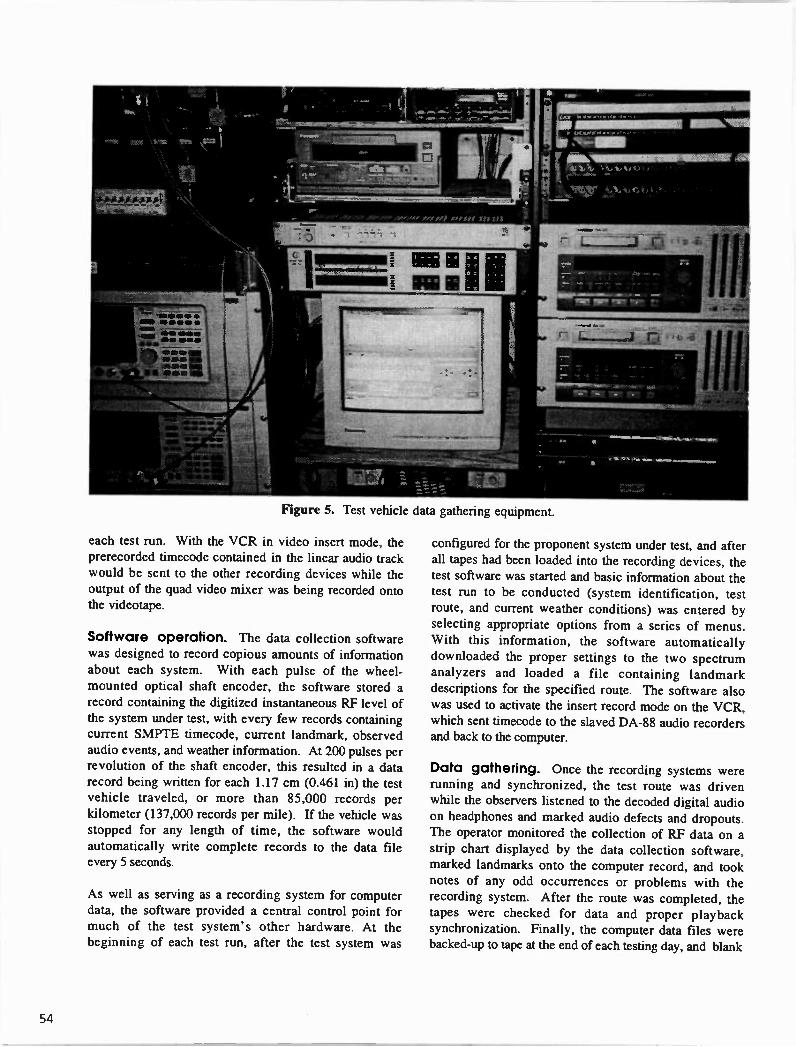
Figure 5. Test vehicle data gathering equipment.
each test run. With the VCR in video insert mode, the prerecorded timecode contained in the linear audio track would be sent to the other recording devices while the output of the quad video mixer was being recorded onto the videotape.
Software operation. The data collection software was designed to record copious amounts of information about each system. With each pulse of the wheel-mounted optical shaft encoder, the software stored a record containing the digitized instantaneous RF level of the system under test, with every few records containing
current SMPTE timecode, current landmark, observed audio events, and weather information. At 200 pulses per revolution of the shaft encoder, this resulted in a data record being written for each 1.17 cm (0.461 in) the test
vehicle traveled, or more than 85,000 records per kilometer (137,000 records per mile). If the vehicle was
stopped for any length of time, the software would automatically write complete records to the data file every 5 seconds.
As well as serving as a recording system for computer data, the software provided a central control point for much of the test system's other hardware. At the beginning of each test run, after the test system was
configured for the proponent system under test, and after all tapes had been loaded into the recording devices, the test software was started and basic information about the test run to be conducted (system identification, test route, and current weather conditions) was entered by
selecting appropriate options from a series of menus. With this information, the software automatically
downloaded the proper settings to the two spectrum analyzers and loaded a file containing landmark descriptions for the specified route. The software also was used to activate the insert record mode on the VCR,
which sent timecode to the slaved DA-88 audio recorders and back to the computer.
Data gathering. Once the recording systems were running and synchronized, the test route was driven while the observers listened to the decoded digital audio on headphones and marked audio defects and dropouts. The operator monitored the collection of RF data on a strip chart displayed by the data collection software, marked landmarks onto the computer record, and took notes of any odd occurrences or problems with the
recording system. After the route was completed, the tapes were checked for data and proper playback synchronization. Finally, the computer data files were backed-up to tape at the end of each testing day, and blank
54

Novato
Mt. Beacon Test Site
San Francisco
Route P San Francisc Perimeter
Route D San Francisco Downtown
Half Moon Bay
Route W Peninsula
• • •
\II 0 5 10 15 25 20 15 10 5 0 KM 5
Route N North Bay
Rafael
Sausalito
Vallejo
Berkeley
EU147 Test Site Round Top Mtn.
San Mateo
Redwoo City
Concord
Walnut Creek
Route E East Bay
Sunnyvale
Route S South Bay
Fremont
San Jose
Figure 6. Selected test routes.
55

tapes were loaded for prestriping in preparation for the next day's testing activities.
POTENTIAL IMPROVEMENTS
The organization and supervision of such a field testing project led to realization of several ways in which future projects of this type could be made more efficient. Areas for improvement were determined both at the test site and for the test van operation, as described below.
Test Site Improvements While the cooperation of a site manager and reasonable lease rates are important aspects, selection of a test transmitting site should consider factors that will reduce the amount of time and expense that must be expended to make it suitable for field testing. A site
should be selected that can offer enough room for all of the associated equipment to be set up in one place. Depending on the geographic area, air conditioning and/or
other climate control methods should be present to allow the test area to be maintained at a nominal room temperature. Adequate AC power reserves should be available without the need to install a new service; some stations, for instance, have the capacity to operate both main and auxiliary transmitters simultaneously, and that excess capacity might be made available for use during testing operations.
The availability of tower space is also important. A proposed test transmission site should offer several "equivalent" locations on one or more towers at which antennas could be mounted, to minimize the time and
effort that must be spent installing and removing transmitting antennas. Also, the antenna mounting locations should be selected such that other nearby facilities need not be required to shut down during antenna rigging operations to meet RF radiation protection requirements.
A site that would meet all of these "wish list" requirements is probably a rarity, but a site that has at least some of these desirable features would have helped in completing testing operations more quickly and efficiently than at the Mt. Beacon site.
Test Van Improvements First and foremost, the need for a reliable test vehicle was identified early on during field test preparations. It was evident that the ten year-old motorhome selected to serve as a test vehicle had led a hard life, and the loss of test time due to its numerous breakdowns was excessive. Problems encountered during the testing process
included brake system replacement, manifold and muffler system replacement, transmission adjustments, and oil leak repairs. Additionally, cracks and rotting areas in the camper shell were a concern if wet weather was ever encountered; luckily, the weather remained clear during testing, but leaks were found during the rainy weather that followed completion of the testing. Clearly, use of a new or newer vehicle would have avoided these problems.
Regarding parts of the van-mounted test system, the
shaft encoder, used to measure distance traveled, was a continual problem area. Being mounted to the back wheel of the test van, it was open to damage by road debris and sudden shock, leading to the breakage of its metal shaft during data gathering operations. Eventually, an acceptable mounting configuration was determined, and a spare encoder was carried as a backup. The shaft encoder
system allowed distance measurement in resolutions of less than 1.3 centimeters (about 0.5 inches), but clearly that level of precision was not needed for the long path routes over which data was gathered. A better system might have employed a Global Positioning System (GPS) receiver; GPS receivers are presently inexpensive and
they offer position data output of sufficient accuracy that is easily interfaced with recording computers. [2]
Other problems encountered with the test van system
included data gathering computer failures, camera misalignment, connector separations due to vibration, and failure of one of the audio recorders. The data gathering computer consisted of a consumer "Pentium clone" IBM compatible unit. It failed randomly numerous times, requiring that several portions of test routes be repeated
after rebooting. A better choice would have been an industrial-rated computer, constructed to withstand the shocks of mobile operation. This is substantiated by the fact that two of the proponent receiver systems employed industrial computers that never experienced any failures.
The other vibration-related problems were addressed and corrected as required. A modified mount was devised for the video cameras, which cured the misalignment problem. Connectors were replaced and improved as
necessary, and the presence of a backup audio recorder proved invaluable, in that the main recorder failed during the main part of testing operations. In a related area, the inclusion of analog and digital audio patch bays was an excellent idea on the part of the test van construction personnel, as it allowed for the audio rerouting required
to use the backup audio recorder as a main without rewiring the cable harnesses and interconnections in inaccessible portions of the equipment racks.
56

CONCLUSION
Being a part of the CEMA DAR field tests was a rewarding experience. While experience was drawn from prior mobile data gathering projects, the complexity of coordinating the assembly of a test transmission site and
the operation of a related mobile data gathering system provided enjoyable challenges. The project resulted in
the generation of concise and fairly obtained data for all tested proponent systems. A complete report of the test results has been prepared, and it is available from CEMA. [3]
ACKNOWLEDGMENTS
The authors would like to thank Ralph Justus of CEMA for his guidance and confidence in our abilities throughout the project. We also would like to thank Erick Steinberg, site manager of the Mt. Beacon transmission facility, for his assistance in facilitating construction of the test site, and Hammett & Edison staff member Linda Siemer, who always managed to find someone on short notice for repair of the test van, as well
as to schedule the test van driver and observers.
REFERENCES
[1] Keller, Thomas B., David M. Londa, Robert W. McCutcheon, and Stanley S. Toncich, Report on Digital Radio Laboratory Tests - Transmission Quality, Failure Characterization and Analog Compatibility, Electronic Industries Association, Digital Audio Radio Subcommittee, August 11, 1995.
[2] Salek, Stanley, and Robert P. Smith, "Transmitting Site Evaluation Using a Mobile Spectrum Measurement System," Proceedings of the 50th Annual Broadcast Engineering Conference, National Association of Broadcasters, April 1996, pp. 278-285.
[3] Culver, Robert D., Report of the Field Test Task Group; Field Test Data Presentation, Working Group B "Testing" of the Consumer Electronics Manufacturers Association - Digital Audio Radio Subcommittee, December 1996.
57

FIELD TESTING OF PROPOSED DIGITAL AUDIO RADIO SYSTEMS
PART II: THE EIA-CEMA DAR FIELD TEST TASK GROUP FIELD TEST DATA PRESENTATION
Robert D. Culver, P.E. Lohnes & Culver
Consulting Radio Engineers Laurel, MD 20707
ABSTRACT
The Consumer Electronics Manufacturers Association (CEMA), a sector of Electronic Industries Association (EIA), has conducted field testing of several proponent DAR systems in the area around San Francisco during the early fall of 1996. The results of that testing was presented to CEMA and is presented here in a condensed form with selected samples of the data graphs and appendices attached to the full Field Test Data Report
INTRODUCTION
The full field test Task Group Field Test Data Report was presented to the (EIA-CEMA) DAR Subcommittee on January 11, 1997. The over 350 pages of report included
14 pages of text, 6 separate segments on long path measurement data and 8 appendices with supporting documentation. The full report is available directly from CEMA, through the contact listed at the bottom of the page of Attachment 1 to this paper.
The Field Data presented in the report is available for independent study by others by request to the same contact as listed on the index page. The data is quite voluminous and exists in several segments, each with different forms, including computer files, multitrack DAT recordings, Video recordings, CD recording, etc.
The data contained in the full report is presented in six groups of graphs presenting the measured RF. signal level audio event observations, calculated vehicle velocity and landmark and "environment" Labels along a linear path distance graph_ Only a few examples of such graphs are included in this condensed report.
Various Appendices are attached to and supplied with the full report An illustrative list of the appendices is
attached for information in the table of contents for this report
The purpose of the Field Test Data Report is to present the field test data in a form sufficient for review and analysis by various parties for the preparation of positions relating to the DAR systems. Questions and comments relating to the data content and the methods of collection and reporting should be referred to the EIA-DAR subcommittee. This data is "reported" directly from the measured data of the field test program without further comment or analysis. Some data such as the vehicle velocity, has been "calculated" from the measured data
from the distance and time information, and presented as an adjunct and demonstration of other useful data which may be extracted upon further study. No "analysis" or "results of performance" of the systems under test is made within this report. Any items presenting measured data which may be considered to be analytical, are presented only to illustrate the type, method and sufficiency of the data collected and reported.
The author of this paper was retained by CEMA as the
Field Test Design Engineer and charged virith preparation of a field test plan_ Participants in the interpretation of the plan to build the field test hardware and software included him, Tom Keller, Dave Londa and Robert McCutcheon from the EIA-DAR test laboratory and Michael Grimes of Lohnes and Culver. Stanley Salek and Daniel Mansergh, both of the engineering firm of Hammett and Edison were responsible for assembling the field test transmission systems and conducting the actual test measurements.
PROPONENT SYSTEM TESTING
The early CEMA-DAR testing plans called for both laboratory and field testing to be conducted on all the proponent systems submitted for testing. As many as four
58

proponents with nine systems or variations were to be submitted for field testing and the plan and test vehicle, of necessity, was designed to accommodate them all. Three proponents with four systems or variations were tested in the field, and are listed in Table 1.
Table 1. Field tested systems
PROPONENT BAND DESCRIPTION
EU-147
,
L-band Multiple-transmitter SFN
EU-147 L-band Single transmitter
AT&T / Lucent VHF IBAC
VOA-JPL S-band Satellite
For the two higher frequency systems, the L-Band and S-Band systems, the receiver antennas with associated filters and pre-amplifiers were supplied by the proponents. For the VHF system the antenna was built by the crew assembling the test system and consisted of a 1/4 wavelength monopole over a ground plane. All antenna systems were tested and measured at the Audio Systems Engineering department of Ford Motor Company and a full report of those measurements is available on request
DATA COLLECTION
The same route and landmarks were used for each proponent for each of four passes along six mutes. The landmarks are intended to form a uniform basis to determine position along a route. Linear position between landmarks was precisely determined by the use of a shaft encoder attached to the drive wheels of the test van. The shaft encoder delivered 200 pulses, or distance "Tic Marks" for each revolution of the vehicle wheels. The precise distance traveled by the van for a given number of wheel revolutions was measured and the shaft encoder distance constant was established as listed in Table 2.
Table 2. Distance / Tic Mark Conversions
DISTANCE TIC MARKS
1.171 cm 1.0
0.461 in 1.0
1 m 85.4
1 ft. 26.0
1 km 85,394
1 mi. 137,430
The short distance tic marks were used to begin the repetitive collection of data to precisely mark distance along a path and, together with other data (time) to calculate additional data (velocity).
Computer Data
The data to be collected is described in detail in the field test plan and includes:
RF. SIGNAL LEVEL - The method and location of RF. voltage measurement is generally indicated in the overall
field test system Block Diagram attached to this report That overall Block Diagram also shows the audio, computer and ancillary items in the test bed. Included in the full report is a detailed Block Diagram of the final xonfiguration of the RF. sub-section of the test bed components with a tabulation of the gain and loss for each of the components in the test bed.
The RF. voltage was measured and recorded at each tic mark supplied by the shaft encoder, at each 1.171 cm 10.461 inch) of distance traveled This RF. data was collected at the shortest possible sample distance as determined by the shaft encoder and the vehicle wheel circumference (and at the fastest rate depending on vehicle velocity) of any of the data Other data as described below, was collected regularly but less frequently.
AUDIO EVENTS - The DAR Subcommittee adopted a description of two audio conditions which described audio
events to be reported during field testing, the events when the audio was muted or impaired. It was the task of two cbservers in the field test van to listen by headphones and monitor the received DAR audio, for each of the systems ever each path, and to respond by marking an "event" when either of the two audio conditions existed. The actual observer action was to press and hold either of two buttons when the corresponding audio conditions were detected
Computer Data Structure
Each tic mark initiated the collection of data with the sampling of RF. values. At each tic mark the RF. values were digitized and stored in temporary memory. At the same time a software timing loop was started to collect additional data Farh data record contains at least the RF. data, with the additional data being written to create a full record as each timing loop is completed. The full data records are thus interspersed at a more or less uniform
5 S

spacing among the RF. only records, with the spacing depending on the velocity of the vehicle. As computer memory was filled, the data was regularly written to disc storage.
The additional data in a full record includes the
observations of audio events, described above, and other factors associated with the path being measured such as environmental and physical conditions, landmark position and SMFTE Time Code from other data collection instruments. The timing loop required approximately 30 to 50 ins to complete, depending on other computer activity. Many distance tic marks, with only RF. values recorded, could pass before a full data record was written.
Non-computer Data
Various "analog" data was recorded in synchronization with the computer data and recorded on other media, specifically, DAT and VHS video tape. That data is not directly presented in the full report but has been used in part to extract and present some of the data in the report All data, including the additional data will be made available to all interested parties for further analysis and use as nerpcsary.
The audio that was received and recorded in the van is listed in Table 3.
Table 3. Material recorded onto DAT
TRACK CONTENTS
1-2 DAR Device Under Test digital to analog audio (stereo)
34 Analog FM receiver No. 1 off-air broadcast (stereo)
5-6 Analog FM receiver No. 2 off-air broadcast (stereo)
7 not used
8 "Cockpit Audio" crew comments
Data Format
The data collected in the computer was written in several records using standard PC-computer file formats. The records were composed as follows: a main data file consisting of a header followed by a string of data records, a landmark file and a comment file. The main data file header contained information regarding the system under
test, the route chosen, weather observations, operator identification time, date, etc. The measured data is organized after its header in a repeating 16 Byte string, one for each data point Table 4 indicates the data sequence and contents.
Table 4. Computer data structure
BYTE CONTENTS
1-2 RF. level, output from the NI hardware A-D converter.
34 Comment, index for text manually entered into the computer.
5-6 Weather, notes to the temperature, sky, wind, etc.
7 Landmark, the number of the next sequential landmark.
8 Event marks, indicating if observer 1 or 2 buttons are pressed.
9-16 Timecode, an 8 Byte ASCII representation of SMPTE timecode.
As described above, each tic mark of the shaft encoder caused one 16 Byte record to be written_ Most records contain only the 2 Byte representation of the RF. voltage level represented by the spectrum analyzer voltage, with the remaining 14 Bytes being set to zero. Approximately each 30 ins a full 16 Byte data record was written The timecode associated with each full data record confirms that the time between suorPssive full records usually is one video frame (33 ms) and occa.sionally two or more frames.
DATA PRESENTATIONS
Commercially available software was used to create a virtual test instrument in the computer for display on the computer monitor. Some of the data was displayed in real time as it was collected and recorded, to confirm the proper operation of the system_ Similar data displays were created to replay the data immediately after it was collected to assure the integrity of the data This virtual instrument was further expanded to create comprehensive data displays for presentations. Examples of those data displays follow this text.
In the full DAR Field Test Data Report, each of the six long routes were analyzed and displayed sequentially, from the first to the last landmarked segments, with each of the four systems that were tested being displayed for each route segment. Each of the displays represented the distance in meters between two consecutive landmarks.
60

Those absolute distances are different between each successive landmark along a route. However, within a particular span of landmarks on a particular route, the absolute distance in meters is identical for each of the four runs over a segment and is reported on the graphs as very nearly equal (where lancimarking errors did not occur), as expected
The minor differences in distance, typically within 1% of a particular path, are expected and due to minor variations of the actual marking of a landmark or minor variations in the actual path driven (for example a lane change forced by traffic conditions which would change over the several weeks the four systems were tested). Larger distance anomalies are due to missed or mis-marked landmarks and are noted on graphs where they occur.
The landmarks for each route were listed on an index page attached at the beginning of each of the sets of route data graphs. At each landmark the topography, urbanization and foliage (the "environment") within each route segment is described by a three letter code. The three letter environment codes are decoded and also listed on the landmark index page. Finally, a summary of audio events for each of the systems on a route is listed on the index pages. A detailed map of the particular route also precedes each route data set
Following the full report index pages are a series of graphs representing the computer data collected along each path. Each set of four graphs covers one landmark segment of one route for the four systems under test The graphs were positioned from top to bottom on the left and right pages in the order in which the systems were tested.
Fach graph contains a clear title for the system, route and landmark segment Graphs for route segments which have had landmark data corrected may be marked with beginning and end record numbers rather than landmarks. The top left and right comers of each graph, marked by the landmark number, indicates the landmark position. The three letter environment code, for the segment after the landmark, is printed after each of the landmark numbers. On the top of each graph the velocity of the van has been calculated in Kilometers Per Hour (kph) from the distance and elapsed time. It is plotted along the distance (meters) horizontal axis with divisions marked and labeled at 10% of the total landmark segment length. The velocity is calculated every 20 tirnecode records, or approximately every second of time.
Below the velocity graph is the main data graph with two major components, the RF. level and the observer event marks. The vertical axis is plotted in relative dB from 0 to -100 at 10 dB per division with the same horizontal scale distance in meters. The RF. level is plotted by a small dot for each measured value, approximately every 1.17 cm or 85+ points in each meter. Each graph, which covers from several hundred meters to several kilometers, contains thousands of points. An abbreviated sample of a data set from the full report is attached below.
A further example of the data that was collected, its structure and some unusual RF. events, is illustrated on several "expanded view" graphs attached below. In these, the structure of the RF. graphs and other information, for example the presence and severity of multipath propagation, becomes clear.
The various systems under test used passive or active antennas with different loss or gains. The test bed had different configurations for each system tested with different gain or loss for the different components, resulting in RF. values being measured differently.
For example, the S-Band system used an active antenna with a band pass filter and amplifier with approximate 43 dB net gain, and at the receiver used a linear gain block down converter with approximately 40 dB of gain. That system voltage was not measured at S-Band RF. but at the lown converted I.F. frequency of 65 MHz_ The I.F. level was therefore, approximately 40 dB higher than the RF. input because of the I.F. converter gain.
7..n the data presentation which follows, all RF. values have been shifted by an appropriate "gain" adjustment in the graphing software to place the average RF. trace near the center to bottom third of the graph. The "attenuation" added with the graphing software is 40 dB for the L-Band system, 30 dB for the VHF system and 50 dB for the S-Band system. Hence, all RF. levels displayed in this report are relative, not absolute. Further analysis may be applied to equate the RF. level to standard reference levels, such as system noise floor or absolute power in Watts. Attached to the full report is a block diagram and tabulation of the DAR test system power calibration to facilitate such analysis.
The event marks from the two observers are also indicated cn the graphs, by a series of dots, appearing as the heavy horizontal bands for a long string of sequential events positioned in the top two divisions of the graph The black
61

band indicates the muted event and the gray band indicates the impaired event.
As long as an observer pressed and held an event button a mark was placed in each succeeding record. The
computer-recorded-and-displayed event marks are not exclusive - both muted and impaired (black and gray) can be marked simultaneously and such marks, simultaneous or not, are indicative of the technique used by the particular observer. It is anticipated that observers using the "two thumb" method to press the two buttons might indicate a transition from one event to the other by
momentary simultaneous marks. Observers using a single finger can only indicate one event at a time with a distinct gap between events. As stated earlier the events are marked only for the full data records so there are usually several, and occasionally dozens of R.F. data points between each event mark. This is illustrated more clearly in the expanded plots attached at the end of this text
At the bottom of each graph is a listing of the event summaries. In this count of events if either observer marked an event muted or impaired, it is counted as a muted or impaired event for that record (a logical "OR" operation). The summary for the entire route for all proponents is contained at the beginning of the six route graphs on the landmark and environment index pages and is counted in this same way. A summary table of event observations is attached after this text
A general review of the graphs of events marked by the observers, showing the general near simultaneous occurrence of events or lack of events, indicate the general good agreement of the two independent observers.
OTHER MEASUREMENTS
VHF Co-Channel Interference
The experimental VHF FM station KEIA, used for the AT&T IBAC system testing was bracketed by two stations on the frequencies two channels above and below its assigned frequency. In addition, other FM stations in outlying areas ware operating on Co-Channel frequencies with KEIA. Consequently, the potential for interference existed where ever the desired KEIA signal may have been
unusually low and the interfering signal was unusually high, for example because of anomalous propagation due to intervening terrain.
To investigate this potential for interference, measurements were repeated along the test routes on the KEIA frequency, but with the test transmitter silent, recording the background RF. signal and looking for potential Co-Channel interfering signals. The results of those measurements are presented in the full report
FURTHER POTENTIAL PROCESSING AND
PRESENTATION
Several options exist for presentation of the DAR Field
Test Data The RF. values can be equated to a reference level, such as power at the input of the device under test, voltage at the antenna output terminals, as field strength or power density, etc. The RF. data points can be averaged over a sliding window to filter out short or longer term variations such as those due to modulation, multipath or short blockage fades
The measured RF. can be analyzed for indications of multipath propagation (a recurrent and repetitive fading cycle) and a multipath "rating" can be applied to route sub segments. The various measured and calculated parameters can be compared with each other, such as
comparing events to velocity or events to multipath presence and average longer term RF. level. For the shared VHF band system the background RF. can be compared to the device under test RF. to investigate failures due to insufficient C/I ratio.
It is anticipated that all of the test data can be made
available to interested parties (in a form represented by the level of processing evident in this report) for their own further analysis. The data consists of computer files in excess of 2 GB total size, 14 8-track DATs, more than 24 S-VHS video tapes and one Audio Test Source CD.
The data in this report has been presented to the proponents for their review and to the CEMA-DAR committee for its deliberations. Further analysis as outlined above can be conducted, if necessary, to clarify the data and provide an in depth interpretation of the performance of the various DAR systems.
CONCLUSIONS
The DAR field testing program has been completed and,
to a large extent, has fulfilled the original test plan. The long path measurements, the eventual primary goal of the project, has been totally completed. Minor data recording
62

and recovery errors, affecting a small percentage of the total data have been addressed as described above. The indoor measurements were made but transmission and reception equipment problems resulted in data of limited usefulness That data will be examined as time permits to attempt to extract useful information and to provide a future presentation Time did not permit any measurements or investigation of particular areas within the test city by way of the anticipated short path or spot measurements.
The audio events marked on the various long path graphs, together with the RF. level, give a clear indication of system operation along a path and hence over an area of similar propagation conditions. The presence or absence of audio events is a very good indicator of the expected level of reliable performance of a system under the conditions in which it was operated for this test It may be possible for proponents to use this information to diagnose causes of system failures or, with care, to extrapolate performance of a system under other operating conditions, for example with different transmitted power.
ACKNOWLEDGMENTS
The EIA-DAR Subcommittee acknowledges the valuable support and contnbutions of the CEMA-DAR Field Test Task Group members and additional support of Companies and individuals who participated in this project Specifically, thanks is extended to; AT&T Lucent Technologies, BEST Power Products, Bird Electric, Brown Broadcasting, Cablewave, CBS, Chancellor Broadcasting, Delco Electronics, Denon America, Dielectric, ERL, Family Stations, Ford Motor Company, Harris, Philip Kane, Lexicon NASA-Ames Research Center, NASA-Lewis Research Center, NPR - Bud Aiello, Shamrock Broadcasting, Shively Labs, Thomsen Consumer Electronics, Susquehanna Broadcasting - Bill Ruck, US-NPS The Presidio, and a host of others.
63

Attachment 1: Field Test Data Report Table of Contents
REPORT OF THE FIELD TEST TASK GROUP; FIELD TEST DATA COLLECTION AND PRESENTATION
CONTENTS
ABSTRACT INTRODUCTION PROPONENT SYSTEM TESTING FIELD TEST PLAN ROUTES AND DISTANCE REFERENCES DATA COLLECTED - COMPUTER DATA
R.F. SIGNAL LEVEL AUDIO EVENTS OTHER DATA - COMPUTER DATA RECORD STRUCTURE
DATA COLLECTION - NON COMPUTER DATA FIELD TEST PROCEDURES TRANSMISSION FACILITIES TEST AND DATA COLLECTION COMPUTER; SOFTWARE AND HARD WARE DATA FORMAT DATA PRESENTATIONS OTHER MEASUREMENTS; VHF CO-CHANNEL INTERFERENCE DATA PRESENTATION; GENERAL OBSERVATIONS FURTHER POTENTIAL PROCESSING AND PRESENTATION CONCLUSIONS ACKNO WLEDGMENTS
TEST ROUTE DATA (listed for reference only, see full report for data)
PATH "D" - SAN FRANCISCO DO WNTO WN PATH "P" - SAN FRANCISCO PERIMETER PATH "N" - NORTH BAY PATH "E" - EAST BAY PATH "S" - SOUTH BAY PATH "W' - PENINSULA
APPENDICES (listed for reference only, see full report for data)
APPENDIX A - APPENDIX B - APPENDIX C - APPENDIX D - APPENDIX E - APPENDIX F - APPENDIX G APPENDIX H-
EIA-DAR Field Test Plan - Audio Test Segments NRSC DAB Subcommittee - Long Path Test Routes Field Test R.F. Testbed data Audio Event Descriptions Field Test Step-by-step Procedure, Test Transmission Facilities - R.F. Graphical Events - expanded views VHF Interference Study
PAGE 1 PAGE 1 PAGE 2 PAGE 2 PAGE 2 PAGE 3 PAGE 3 PAGE 4 PAGE 4 PAGE 4 PAGE 6 PAGE 7 PAGE 7 PAGE 7 PAGE 8 PAGE 10 PAGE 11 PAGE 11 PAGE 12 PAGE 12
NOTE; Samples ONLY of Test Route Data and Appendices are attached to this text. The complete data and Appendices are contained in the full report available from Ralph Justus at CEMA, 2500 Wilson Boulevard, Arlington, Va 22201-3834. 703-907-7638
64

Attachment 2: Index of Appendices from Field Test Data Report
INDEX OF APPENDICES
APPENDIX A 1) EIA-DAR Field Test Plan, rev. 5.0, May 30, 1995 2) EIA Field Test, Audio Test Segments
APPENDIX B 1) NRSC DAB Subcommittee - Field Test Task Group "Long Path" test routes (final version December 11, 1996)
APPENDIX C
APPENDIX D
Field Test R.F. testbea data 1) As planned system block diagram 2) R.F. Voltage measurement system 3) As built R.F. system diagrams, gain & Loss. 4) DAB Field Test Project Antenna Characterization Report,
July 9, 1996, Ford Motor Company 5) DAR Power calibration block diagram & table 6) KEIA Transmitting antenna measurements
Audio Event descriptions 1) Description from DAR Subcommittee meeting 2) Observer training text Re: Audio Events
APPENDIX E 1) Field Test step-by-step operating procedure
APPENDIX F Field Test transmission facilities 1) FCC FM Band experimental application; October, 1995 2) FCC L-Band experimental application; January, 1995 3) VOA-JPL S-Band system description 4) Transmission site logs (samples)
APPENDIX G R.F. Graphical events - expanded views 1) VHF System; Route P Landmark 1-2 2) L-Band System; RoJte P Landmark 1-2 3) VHF System; Route D Landmark 18-19 4) L-Band System; Route S Landmark 2-3
APPENDIX H 1) VHF Interference Study
65

Attachment 3: Field test route maps
66

Electronic industries Association
NRSC DAB Subcommittee • Field Test Task Group "Long Path" Test Routes
HE
Novato
San Francisco Route P San Francisco Perimeter
Fig 2B
Route D San Francisco Downtown
Half Moon Bay
Route W Peninsula Fig 2C
©1995 Hammett & Edison. Inc.
HAM:METT & EDISON, INC CONSULTING ENGINEERS SAN FRANCISCO
— 580,
Sausalito
Vallejo
Martinez
Berkeley
Concord
Walnut Creek
Oakland Route E East Bay
Fig 2D
5 MI 0 5 10 15 2-5 20 15 10 5 0 KM 5
Fremont
San Jose
Figure 2A Revised June 26, 1996
67

Electronic Industries Association • Consumer Electronics Manufacturers Association
"Long Path" Test Routes
Routes D & P • San Francisco
HE HAMMETT & EDISON, INC CONSULTING ENGINEERS SAN FRANCISCO
Numbers denote route landmarks in Figure 3
961210 Figure 2B
68

Attachment 4: Typical graphed data from field test data report
69

1.
EUREKA-147 — Perimeter Route — Landmarks — za.,,.,e41;; ..: I0- 1(FSD)
'...!.::: 1.5. (MSD',
3
50 301
' c-r: MG; ,.7.- •it,7:..,.,:,..,-.:. ,
10 _ i.
1, 24 I
30
. • -.
40-
50-
507 ‘;''' k -....--....-.%-z.t ,-...,, i -,,e.71.: 1-....,,:.1e.: •
Do ' - ,:"•c,-.7:7-,:.: : • . . . . . .
•i 301
30-1, a ft 'I c .-,-,.. • ''.; .,•5 , '.,i...'....itlrr i«,,A4g6. ,.. r.'.'4.*,,,, i 4iiaallealf"'", 4,111111110 5t.;4;:421111
?,; L;sci,,,v! /1,1. :• • - • 'e •
Event Summarr jo,tal.:7083,;_Clear_6984 (98.6); Imp,a_ired_89 1L3X) ;_Mute,d 10 .
U. cr
30
07
•I0
20' .;
.30
40 I
.70-
EUREKA-147 (single) — Perimeter Route — Landmarks 1-2 • -
NOTE #1
........
• •
0.0
• - •
.0
, 300 - .0 600.0 .0 , '1800.0 2100:0 2400.1. 2) &1" ' 3610.1
Event Summary rota) 5314; Clear 5230 (97.8%); impaired 35 (0.3%); Muted 49 (0.9%).
, 900.0,
, ti TJAMG,,,Li,,. ,',..;' (FSD)
AT&T 7.413.r.725431:1 =1051440koVANNIIIIN
Lucent IBAC — Perimeter Route — Landmarks Allnalt _
1-2 1.-,.., -,' . . .:, 1.5.3314.,
2(HSO)
4 •
11,1: '1A.S, ri •.''.._
- _ t'_..."1112 "''''''2E,01 C '
, k ....-- • • .
l=t4i
15.
tA..
4"
, Iv 7
I .
•
1) r.:: '' 'Agia11111111111111 *.2111/1 W W'AM'Ski MiSSSAINNiii M MINg .8
:Event Summari: Total 4809; Clear 4488 (93.3*); Impaired 0 18,10%); Muted 321 (6.7%). ,
VO NJPL -- Perimeter Route — Landmarks 1-2
l(FSD) SO
.....-..immasuriaMier2T-MY,OOMEli ,X.- ...:0,. -26A .Sli)
.....0........."--
3°
o-M .O. •••••10•11 1111•1• M MIMMIMM• Mo zo
10
• • =IP
10
50-
50-
,
..
•
10 -
90
0.0 300.0 G00.1 9001 14014i:"., ' 1'561 4 1000.3 2100.3 2400.4 2A10.4
, . Event Summary: Total 4951; Clear 1167 (23.6X); Impaired S (0.1%); Muted 3779 (76.3%).
....... .............
5

120 90
a 60 30 0
1
.10
-20
.30
-60
70
-00
90
-100
EUREKA-147 - Perimeter Route - Landmarks 2-3
j7 (HSD) Xt ~ 10/11/144411/11/1/1,44•0.4.40"444.".....
1 T T YT !
-
1...1:';''V. •‘.;if'• ''''.. . .
-
•:., • , • . ' 1.•':41.•77:. -ct i
',. ' . '
,,,
e
1 • ,. , ;• -
. ' . , .,
.. • ''f'''''' v ,!... A ..?: •.•::0•11 ,i1;4;,..J.,,,•. ... ".0 .." • V.
,.. 4,14.- .4 ...4,1 ' - . ,4 ., , .. ,- ,
, x 0 : ,',1::' ..: Zt '4:1,:li'l,!'!:1:74210.i's'::'.4; ' ' e ga 3 1 ...' .1071'4 I2431 5 1A00 8 1711C ' Sale 7 1.
»11. Event Summary: Total 4383; Clear 4383 (100.0%); Impaired 0 (0.0%); Muted 0 (0.0%).
1
NOTE #1
EUREKA-117 (single) - Perimeter Route -- Landmarks 2-3
'" - 2(-6D) M
-.....
UHSQ
M ."....... M ........\ / 0,............
1 0,
0 -
I 0
M71- - -
M .
M.
m_, ,, ,:.. ,- , •,,,..1.,„ . ,,c-,,.-...
WIli... , , 2. ..6;.:-!,.r
''' • 1 i Ir r Wij r.79
, ... --./.
g I !ITIO W ,4.4111 iiii.: A I, .. . I: • .. .) •., .1. '
.,-,;......,4...,•.',.,:••••,;.-i--5.,,4,:,..,-., .., ,,o ,. ,.- . 10 [ . . , la
. •
le-, ,.... , . . U U I'Jf 517.J 8210 154.7 1368.3 16420
•• &slimes wee:2i '
I tal 5601; Clear 5593 (99.8%); Impaired 8 (0.1%); Muted 0 (0.0%).
1915.7 2109 4
8
2463.0 2736.7
-1
AT&T Lucent !SAC - Perimeter Route - Landmarks 2-3 2° -.20I46b; 90,,
..e-umi-e ....dIMMIIINIINIIIII1M1100MIIIIMMOXIMIE 1"--
304611 64 1
an
IA
e.;,--coK'''''.• .
?9,4
40
50-
R ' , ?et
.. ,.
90 .4
i
0.(/ • na 8 a.'i " i 3 . , .
Event Summary: Total 5262; Clear 5256 (99.9'4): Imlaired 6 (0.1%): Muted 0 (0.0%). _ _ _
CC
VO NJPL - Perimeter Route - Landmarks 2-3
-2(172(m80) - 90 30-43U
60 ,.........,•-e-
0, ....-y ,....---
97
T hy... .
20.7 7 ,____•••••• •m• • 4M. • . ......1.,,,. • .••••••••
- ••••• • •
.
e el
I - ' .
, .
•
9 0 "i
0 0 J ,
0.0 273.2 546.3 1319.5 1092.7 13 6.8 ' -lea() 136.2 2185.4 24 95 273
8
1.7 Oleinee
Event Summari: Total 4703: Clear 2113 (45.1%); impaired 33 (0 7%): Muted 2557 (54.6%).

NJ
_ ELJREKA.14J — Perimeter Route — Landmarks 3-4
id om ma • ,13(491..) 90
1 ....,';7.OPP.M1V.f/M1; 911181? 40361.)
,, 60-'
30 , V
lb
.2...._ ,:-.. 1_ • .'-.... , _ fi7_11 :::: ..2.,,r,. _ V
, 20 !
30 -
40
50-
60 '
.„•I' .. r.....
''' ' , • •
1
01 :l'7-:,;' '.- . •
70-, , o:, -
80 1,
. . '
SO '
OA * 967.19' . 001:1+ • 9',1, 'A M:Ai 1169.3 1336 . 15014 167
-1.4 W Event Summary: Total 3935; Clear 3935 (100.0%): Impaired ci (0.0%);_Muted_p
1
EKA-147 (single) — Porkastar Routs — Landmarks 3-4
30-4SO SO
. . • r . .-.. .4.r• • ' r ' , '• [..- l 70 * -
BO .
90
00 -, 0.0 165.5 33-1.0 496.4 661.3 82.4 9929 1158 4 13.719 W M 3 165
OASQ
60 30 0, 0-
10 _
30 ; 4q-
Oiet wortmolm4
Ev.,nt Summary: Total 5280; Clear 5273 (99.9, ); impaired 0 (0.0%) t+) ,,,i 7 (fl.1%).
.4
4.8
AT&T Lucent IBAC —PerftneierRoute — Lamdmarks3.4 .......
zu-o(H 'si..)' 90
................. ssesa werar096110GOINDIO16
4(H8L,1 GO 1 30
In '
- ,.2,,,,,,,,,,,,, _ _ . T r< '
20 ,
30 '
40- •
GO . -
. t i•
DO 1
90 .
DO-,
" . )6 " 330.0 '466.2 se-. , 827.0* :' N, “
(011eibis)
Event Summary: Total 3559: Clear 3549...199.7%)._; Impaired 10 (0.3%); Muted 0 (0.0%).
RI Level NB]
VOA/JPL — Parlmater Route — Landmarks 3-4 .)(1-1 L)
90 ;1039U
60 30
10 on .... . .. . 20 • A MID •
• = 0 O M in •
30
•40-
70 • 430
90 .
0.0 168.2 336.4 504.6 672.7 sulg lftO9A 1177 '1 11AK et mei 7 I a
, Distance (meters)
Ef, m, '.;ummary: Total 4235; Clear 3476 (82.1%); Impaired 9 (0.2%); Muted 750 (17.7%).

Attachment 5: Typical graphed data from field test data report - expansion detail
73

a
-1
AT&T Lucent MAC — Perimeter route — Landmarks 1-2
2° 7; ii-igoi 90
• - .. -73:1,1=7:7 =7.'r7177. ..e..7'.'"' 20-i51..)
GO -
111 .11. .111 . 4 1111 k1111k 30 .
10 , •
20 • • • ,
. ,.!., . i
70 ' -
an
90
000-, 0 .
na 2 i;:iker..4.1fmr. VirAiwirewiiiii, . „ Iiisi:i', ztgls - 2642 7' •‘;9.14
Event Summa Cleer 4488_(93 3%)i (0.0%); Muted 321 (6 7%)
'11
EXPANSION GRAPH - FULL SEGMENT
AT&T Lucent IBAC — Perimeter route — Records 260000-300000
. S gr-ittii - - - ,,,
,, .,., . ,-1, e.., ...,,,,,,.: I 47#•:.
wm gia tirma mo
. i
-çç a rri de:G ',', Atiligq,jiis.'r
- .... ...... _ ... .. ........ E nt Suiimary Clear 397 (59.2%), Impaired 0 (0.0%); Muted 274 (40.0%
FIRST EXPANSION
1
AT&T Lucent IBAC — Perimeter route — Records 270000-295000
(4SD)
.-- _..
7..,. .- m umwswi n T4Pper
9
, . , ...-
MM MM/Me =N NW. r • ell0
i
' t,..•
, 411 12,i
Event Suaaary: Clear 59
SECOND EXPANSION
AT&T Lucent IBAC — Perimeter rout. — Records 274000-279000 T&T Lucent IBAC — Perimeter rout. — Records 274000-279000 ,..7.:4 MYAMMMUUU,;..7 1 (HSD)
::46,31 ,18=4)

Attachment 6: Typical summary data sheet for one path
EIA-DAR FIELD TEST ROUTE DATA PATH "P" - PERIMETER
NO. ENV. DESCRIPTION
1 FSD Call Box on 19th before Tunnel 2 HSD 19th & RIHd Intersection of Fulton at Light 3 HSL Intersection of 19th & Noriega 4 HSL Intersection of 19th & Vincente
5 FUM Holloway & 19th Intersection (take Alemany east) 6 FUM Arch Stop Light (through Stop ) 7 FUL Stop Light Under Bart Track before 280 on ramp 8 HUL 1-280 Downtown Sign by Alamany Exit Take 101 North 9 FUL 1-80 Bay Bridge Downtown Sion on overpass 10 HUL 2nd St Stop Light through to Embarcadero turn Left 11 FUL Clock Tower World Trade Center Sign 12 FUM Stop Light at Battery (take left @ Bay & Pier 31) 13 HUL Stop Light @ Columbus & Bay 14 END 19th Avenue Exit sign
ENVIRONMENT THREE LETTER CODES
TERRAIN: Flat, Hilly, Mountainous, Valley
AREA: Downtown, Urban, Suburban, Rural, Bridge, Expressway, Tunnel
FOLIAGE: None, Light, Moderate, Heavy
PATH OBSERVATION SUMMARIES Number (%)
SYSTEM TOTAL CLEAR IMPAIRED MUTED
EU-147 59,134 58,652(99.2) 89(0.2) 393(0.7)
SEU-147 62,344 59,272(95.1) 1,453(2.3) 1,619(2.6)
AT&T 56,489 50,196(88.9) 112(0.2) 6,181(10.9)
VOA-JPL 61,156 43,687(71.4) 391(0.6) 17,078(27.9)
75

Attachment 7: Notes and comments regarding graphed data
NOTE AND COMMENTS EIA-DAR FIELD TEST ROUTE SEGMENT GRAPHS
NOTE #1 Distance Anomaly - Landmark(s) incremented at the wrong location on a route, too early or too late by a significant distance, more than a few percent of the segment length. The graph will be marked, reconstructed or both.
NOTE #2 Landmark Anomaly - Extraneous or missing Landmark(s). Where possible and significant the graph will be reconstructed to the proper landmark position(s).
NOTE #3 Data Corrupted - The data file, or portion of the file, is missing and/or the data is corrupted. Valid data from adjoining files will be substituted where possible.
NOTE #4 Velocity Anomaly - A velocity spike is created in its calculation, probably due to intermittent time code errors.
NOTE #5 Graph Detail - See Zoom graphs(s) in Appendix G (to be added with future reports). A detail is presented which helps in the understanding of the data or collection method.
NOTE #6 Graph Reconstruction - A graph or series of graphs have been reconstructed from proceeding and/or following Landmarks and/or files. Such graphs will be Labelled "Reconstructed Graph Landmark N-N"
76

Attachment 8: Field test testbed block diagram - RF SECTION (dotal°
RF Patch AES/E3u Patch
R2 >-65--> VOA/JPL <-57-4 C2 R3 >-66--> AT&T c---58-4 C3 R4 >-67--> AT&T/Amati <-59-< C4
From VHF Ant.
R-1-1
2-WAYI-SF 3-WAY
SF
AMP
From L&S Ant. Pre
4-WAY
L&S —< Band
--W-WAY —< 3-WAY 4.8 dB N Con
R8 r------>-71-150/75 -
L Cl D1 L
1- NVision 3 < . r-- IT A2 62 1XL I -r-
Receiver
R A3 63 < >--:IXLIX1. 1- DAR D/A 36
L ti < > XLIXL I-A4 84
IXLIXC--A5 65 , 1
>--5- XL1XL,-n : 86 < > XLIXLL-
87 1---H-Delco Auto 39 XLIXL7--Radio 41
ANALOG R9 • 7 - -
- >-72-150/75 - Ford Auto 43 1 Radio 5
IR
Kay Atten HP SPectrt21/ I R.F. VOLTAGE Analyzer — > DC to PC
VIDEO
Camera 01
Camera 02
Camera #3
R.F. SPECTRUM HP Spectrumi----V
Analyzer
4X1 ---V----- Panasonic
Video Mixer/SW
—v
F Al 81
A8 68
II II 1 UL.1-34 A! !9 A10 610
37---< 1 I 4 All 611 6---<-->--11
Al2 612 42---c-->-12
A13 613 44 1-->-1 A14 614
815 >--15
Pream h 47 — A16 616 p (8 < > 1
RS-232 to PC
F24 TC In
Timecode Reader/ Generator El
73-<IC out
E4 F4
E3 F3
F2 E2 — 75- -<
E1A-DAR FIELD TEST; TESTBED BLOCK DIAGRAM R.F. SECTION (DETAIL)
TC to DA-88 #2
IC to DA-88 #1
IC
74 -
77

Attachment 9: Field test testbed block diagram - AUDIO SECTION (detai0
A24>-10
824>-101
102 —
M F
XL XL
-XL XL
-XL XL
--XL XL
- XL XL
--1XL XL
-1XL
--XL XL
M F
-XL XL
Pre-
DA-88 #1
---11 DAR Left
---2 DAR Right
wired -3 Delco L
DA-88---.4 Delco R
Input -15 Ford L
Cable 16 Ford R
1 -
2 — Pre-
3 — Wired
4 —,DA-88
5 Output
6 — Cable
TC in--TC out -80 < > 110 Ohm >-
M F E5 F5
M
103
9L
9R 10L
1OR
MONITOR SWITCHER
#1
it.
A17 817
Heacset Hi Z
A18 818 Monitor
XL -20--2R -->--52 Amplifier Hi Z!
-21-3L
XL XL -23--i4L&R
XL 1XL I-24H 5L&R
-XL XL - --1Pre-
- XL XL wired
- XL DA-88
XL I rq6ut
-XL XL Cable
XL
XL
XL XL
XL XL
1 DAR Left 1 -1
2 DAR Right 2 — Pre-
3 Delco L 3 --,wired
4 Delco R 4 —DA-88
5 Ford L 5 ---Output
6 Ford R
7
8 Cockpit 81F--1
>-78 -1 TC in--TC outh-81-
Color Video
Monitor
-1-ZITL1-25-11
XLIXL1-26-11R
xL I xL1-27-]
xLinf-28-123t MONITOR R
_XL1XL L29H3L WITCHER
XL XL -3O-3L #2
XLIXLI-31 4L&R
XL XL -32 5L&R
Ohm E6 F6
A19 819
Hi Z
A20 620 54_< —>
Patch Letter Designators A Analog Audio B Analog Audio
C Digital AES/EBU D Digital AES/EBU E Timecode F Timecode
R Radio Frequency
EA-DAR HELD TEST, TESTBED BLOCK DIAGRAM
AUDIO SECTION (DETAIL)
Headset
Monitor
56- Amplifier Hi Z
I . SPKR
105 ---jMonitor SPKR1 1
78

Attachment 10: Test route data summaries
TEST ROUTE DATA PATH OBSERVATION SUMMARIES FROM ALL TEST ROUTES
Number of audio event observations and percentage (%) of total
Route "D" - DO WNTO WN
SYSTEM TOTAL CLEAR IMPAIRED MUTED EU-147 64,070 63,759(99.5) 97(0.2) 214(0.3) SEU-147 70,054 69,751(99.6) 164(0.2) 139(0.2) AT&T 68,777 63,704(92.6) 779(1.1) 4,294(6.2) VOA-JPL 44,275 17,927(40.5) 928(2.1) 25,420(57.4)
Route "P" - PERIMETER
SYSTEM TOTAL CLEAR IMPAIRED MUTED EU-147 59,134 58,652(99.2) 89(0.2) 393(0.7) SEU-147 62,344 59,272(95.1) 1,453(2.3) 1,619(2.6) AT&T 56,489 50,196(88.9) 112(0.2) 6,181(10.9) VOA-JPL 61,156 43,687(71.4) 391(0.6) 17,078(27.9)
Route "N" - NORTH
SYSTEM TOTAL CLEAR IMPAIRED MUTED EU-147 87,997 67,250(76.4) 3,972(4.5) 16,775(19.1) SEU-147 90,014 76,135(84.6) 3,267(3.6) 10,612(11.8) AT&T 85,669 55,859(65.2) 383(0.4) 29,427(34.4) VOA-JPL 88,623 83,065(93.7) 2,528(2.9) 3,030(3.4)
Route "E" - EAST
SYSTEM TOTAL CLEAR IMPAIRED MUTED EU-147 97,932 66,711(68 1) 2,717(2.8) 28,504(29.1) SEU-147 76,822 36,433(47 4) 1,140(1.5) 39,249(51.1) AT&T 88,991 49,333(55.4) 605(0.7) 39,053(43.9) VOA-JPL 90,442 72,403(80.1) 2,087(2.3) 15,952(17.6)
Route "S" - SOUTH
SYSTEM TOTAL CLEAR IMPAIRED MUTED EU-147 66,669 61,581(92.4) 3.174(4.8) 1,914(2.9) SEU-147 67,688 62,517(92.4) 3.614(5.3) 1,503(2.2) AT&T 71,795 19,726(27.5) 4,894(6.8) 47,175(65.7) VOA-JPL 68,704 64,955(94.5) 1,074(1.6) 2,675(3.9)
Route "W' - WEST
SYSTEM TOTAL CLEAR IMPAIRED MUTED EU-147 76,181 41,646(54.7) 2,731(3.6) 31,804(41.7) SEU-147 78,299 25,444(32.5) 7,179(9.2) 45,676(58.3) AT&T 76,968 28,701(37.3) 779(1.0) 47,458(61.7) VOA-JPL 71,416 59,492(83.3) 1262(1.8) 10,662(14.9)
79

80

DIGITAL TV: SIGNAL AND TRANSMISSION ISSUES Sunday, April 6, 1997 1:00 - 5:30 pm
Chairperson: Andy Butler, Public Broadcasting Service, Alexandria, VA
*DIGITAL ATV/HDTV FROM THE "GET GO" - THE CBS TRANSITION PLAN Joseph Flaherty CBS, Inc. New York, NY
MOVING FROM VHF-NTSC TO UHF-HDTV WITHOUT BANKRUPTING YOUR STATION 0. Bendov GS Dielectric Communications Cherry Hill, NJ
*ADVANCED DIGITAL TECHNOLOGIES FOR BROADCASTERS Mark A. Aitken Comark Southwick, MA
PLANNING YOUR DIGITAL TELEVISION TRANSMISSION SYSTEM Robert J. Plonka Harris Corporation Quincy, IL
A NEW HIGH POWER, MULTICHANNEL, UHF SLOTTED ANTENNA DESIGN FOR THE SIMULCAST NTSC/HDTV PERIOD Kerry W. Cozad Andrew Corporation Orland Park, IL
SIMULATION OF THE EFFECTS OF VARIOUS NON-IDEAL COMPONENTS OF A DIGITAL TV TRANSMISSION SYSTEM ON THE TRANSMISSION QUALITY Noel McDonald and Robin Blair Radio Frequency Systems Lonsdale, South Australia
DEMODULATION AND DEGHOSTING OF VSB SIGNALS Majid Chelehmal Cable Television Laboratories Inc. Louisville, CO
81

HDTV MODULATOR Steve Kuh K Tech Telecommunications, Inc. Mission Hills, CA
THE DEVELOPMENT OF A HDTV ENCODER Chai Yeol Rim Munhwa Broadcasting Corporation Seoul, Korea
•Papers not available at the time of publication
82

MOVING FROM VHF-NTSC TO UHF-HDTV WITHOUT BANKRUPTING YOUR STATION
0. Bendov Dielectric Communications Cherry Hill, NJ 08003
INTRODUCTION
Most stations that operate as NTSC channels 2-6 may face a staggering cost in trying to replicate their service when assigned a UHF-HDTV channel in accordance with planning factors as described in the FCC's 6th NPRM1.
Without a revision of the planning factors, the authorized Average Effective Radiated Power (AERP) for these UHF-HDTV stations would reach 5,000 KW. For 5000 KW AERP, a transmitter's peak power for omnidirectional service will be around 1 MW, almost four times that of the largest NTSC transmitter in the US. Whether it is possible to build a practical transmission plant that can safely and economically accommodate even half that AERP is an open question.
Almost 90% of this extreme power will be used to provide HDTV service to a very small portion of the population in the outlying areas whose present reception of over-the-air NTSC service is correspondingly poor. In fact, merely one-tenth of this extreme power, 500 KW, will provide reliable HDTV service in all cases at least to the Effective Radio Horizon'. By replacing the receive antenna in the planning factors with a "smart antenna,"
I Sixth Further Notice of Proposed Rule Making, FCC Docket No. 87-268, August 14,1996
2 Defined as the average of the longest 50% of N equally spaced radials to the radio horizon.
service equivalent to 5000 KW AERP can be attained given a practical and economic transmission facility. What's more, a "smart antenna" will permit connection of multiple receivers without loss of coverage contour -- a feature not possible given the planning factors in the FCC's 6th NPRM.
LIMITS TO NTSC REPLICATION
HDTV will be related to NTSC much as FM is to AM. In both cases there is a fundamental trade of range for quality. Replicating NTSC service with HDTV is a laudable goal but for most stations it will be proven impractical for the following reasons:
• Through equalization, would-be Tx-to-Rx
distortions are traded for perfect picture and sound with a reduced service contour.
• HDTV service to receivers with indoor antennas will be far more restricted than NTSC service is.
• The FCC/MSTV suggested service area replication assumes one receiver. At the fringe contour, loading a second receiver on the same downlead cable will typically reduce coverage by about 3 miles.
• Viewers will react more negatively to losing picture and sound a certain percentage of time than they do to similarly frequent fading effects in NTSC.
• For many VHF-NTSC stations moving to UHF-HDTV the implementation of
83

replication will prove impractical and costly.
The interference that extreme power will bring to adjacent channels and mobile radio
has not been fully researched. For example, the protection ratios published by the FCC should be applied at the receiver, not at the transmitter. Nor has the issue of average and peak RF hazard levels been adequately researched. The actual RF hazard levels may yet prove to be in conflict with the FCC's own guidelines. Once understood, the interference and RF levels may well impose additional constraints on service replication.
REPLICATION BY BRUTE PO WER
The most challenging case for replication is for NTSC channels 2-6 when assigned UHF channels for HDTV. The grade-B contours of the VHF channels extend well beyond the Radio Horizon and are therefore impractical to replicate at UHF frequencies without resorting to extreme power. Regardless of power, acceptable calculation of beyond - the - horizon coverage, supported by measured data, may not be possible. Section 73.683(b) of the FCC Code states that "...the F(50,50) curves when used for Channels 14-69 are not based on measured data at distances beyond 48.3 kilometers (30 miles)."
Calculation of NTSC replication has so far been based on the flawed mathematical model known as LR (Longley-Rice). The LR model is flawed in that it addresses a single carrier transmission, not a broadband transmission such as HDTV. Nevertheless, the LR model can serve as a good planning tool in the absence of a better propagation model.
To examine the limits of "brute power" on coverage replication and the associated implementation cost, two actual transmitter sites were chosen. One site, in Florida, is
surrounded by a flat terrain with an Effective Radio Horizon of 94.3 km. The second site, in Oregon, is in a mountainous terrain with an Effective Radio Horizon of 58.5 km. An NTSC channel 2 moving to HDTV channel 40 was assumed for each. The HDTV
coverage at both sites for AERP of 500-5000 KW is shown in Figure 1 for Florida and Figure 2 for Oregon. Conditions deemed practical for reliable service were used. For example, the receive antenna height was set at 5 meters and the percentage of time availability was set at 99%. The black shaded areas in Figures 1 and 2 show the increase in coverage for a tenfold increase in power.
The limits of "brute power" are demonstrated in a demographic analysis based on the 1990 Census:
FLORIDA AERP 500 KW 5000 KW
Population 2,115,900 2,488,900 Area 30,311 km' 39,753 lcm3
OREGON AERP 500 KW 5000 KW
Population 1,665,800 1,769,200 Area 10,019 lcm2 12,889 km2
The estimated minimum costs3 of ownership of the transmitter for the two levels of AERP assuming omnidirectional coverage are:
30. Bendov, "Planning Your HDTV Coverage Area," 3rd Annual Conference & Workshop sponsored by Broadcast Engineering, November 1996, Chicago. Copies available.
84

ok MSITE (trn): f 1 les\hdl
AI R MI
'k 'k Propagation model: Longley-Rice v1.2.2 Time: 99.00% Loc: 50.00% Margin: 10.0 dB Climate: Continental Temperate Gndcvr: Suburban Atm. factor: None K Factor: 1.333 RX Antenna: Omni Height: 5.0 mtrs AGL Gain: .0 dad
Average ERP (kW) _ 500 500 to 5000 > 5000
Minimum threshold level: -150.0 dBmW
Ant Ely AMSL ERPd Ant. Type
Site (mtrs) (c1BW) /Orient. Coordinates
lAiM p pI N
T PT #. • 4
r el,
.
...- i
•
I • .
_
t ,,.
• 4 - ' • 6.
• • .
"I 7 f f Rad i n i 7' 44 kin
, • HDTV40* 491.3 57.00 01441 N 28 56 17.00 grp: 1 629.0000 MHz W 81 18 58.00 J Nt
•
a.
i_ -,,
. •t• .--—,.--
----?'-.* " M 4
LI — o
—
.
a
•-
.•
--s— a..-
' . — KILOMETERS
• V% r.=-7- 20 0 20 40 60 BO
FL HDTV CHANNEL 40 NTSC CHANNEL 2
12-12-96 Figure 1
,
Ref • id 50 km

1
No'th MSITE (tm):FILES\HD2. Propagation model: Longley-Rice y1.2.2
Time: 99.00% Loc: 50.00% Margin: 10.0 dB Climate: Continental Temperate
Gndcyr: Suburban
Atm. factor: None
:1
. A.
K Factor: 1.333
RX Antenna: Omni
Height: 5.0 mtrs AGL Gain: .0 ded
Average ERP (kW) 500 500 to 5000 > 5000
Minimum threshold level: -150.0 dBmW
Ant Ely AMSL ERPd Ant. Type
Site (mtrs) (dBW) /Orient. Coordinates
42. , % .1
w 4lai -4 ,..if
—
---., te,. . .. " " 0 .:. -11. 4'
. -,...;•... vi-i .,-.l s: • s.s, 3 •-•! .,..
,!....
# ..4 •
"•
LZ -1. 1,..,
'
.. • lo" " .
, •
,e2c-' 0
.
• I .., ... • •
'. 51\ . . .. ''' •• -t.i.ti),-
4 1-4-'::A,--
.) ii V
r 'm 1"7(.-..:
f f Rad i
r . '' ' ,
../. ..:.• I
tit-
-
r . '' ' ,
../. ..:.• I
tit-
Is ,
. ''‘. .,-.. I
." • A i*.i.
.-.,'•
:1-'7 , .. 5 k •
• .
•
-,
--------- -
v
. ..
• , ,
L.,,F
•
, .1 • :. .
' • t if,• ,-----r... -e , , ....
4 - )' . .
. . . -, 1 • . _ . _
. r -,
'
. -4,t. "‘• 1 4 • j1.1
r 1 ,.. 14 , •
.. •
• •%. : . '
An.."- s.
e
, , •
:
.
. 1-IDTV4ON 555.0 57.00 0M-11 N 45 31 14.00 grp: 1 629.0000 MHz W122 4437.00
' F.5 %.
L
.-,.•
, s. • ikt _.. r% .'',
.... . '', I i
> . • . s
.0 / ..—
:.::: .,
!. W .-
1:„. •
r
•_,: : -
. .., KI L O METE RS
R
(... 5
,.,
Al
20 0 20 40 60 BO
OR HDTV CHANNEL 40 NTSC CHANNEL 2
12-12-96 Figure 2 )Ref. grid 50 km

AERP 500 KW 5000 KW Peak power/IOT 60 KW 80 KW Number of IOTs* 2 14 Tx cost** $600,000 $6,300,000
Operating expense*** /Yr. $80,000 $800,000
* Peak/Average power = 7 dB. ** Including tubes' combiner, AC supply, air conditioning, loads and backup generator. It is not clear if a practical combiner for 14 tubes can be built. *** Including tube replacement and electricity @ .08$/KWhr.
This analysis demonstrates that 85% of the population in the Florida case and 94% of the population in the Oregon case can be provided with reliable and economical HDTV service.
If 90% of the viewers can get reliable service with a 120 KW transmitter, can the remaining 10% of the viewers be provided with a service equivalent to a 1 MW transmitter without resorting to an impractical transmission plant? The answer is yes.
REPLICATION WITH AN OPTIONAL SMART RECEIVE ANTENNA
By replacing the receive antenna in the planning factors with a smart antenna, not only will the coverage be extended to the 5000 KW contour with only 500 KW of AERP but, the coverage contour will not shrink even when multiple receivers are loaded on the same downlead cable.
The smart antenna' contains an LNA which is controlled by the receiver. Depending on the level of the intercepted signals for each of the tuned channels, the receiver connected to the downlead cable either controls the bias and the front end filter of the LNA, or completely bypasses the LNA. The connecting cables' among the receivers and to the antenna pass both RF and control data.
By maintaining a constant system noise figure at the input of the LNA, multiple HDTV receivers can be loaded on one downlead without loss of coverage. The system's noise figure, assuming 50 feet of downlead cable and 10 dB for the receiver's noise figure, is shown in Figure 3. It demonstrates that for an LNA gain of 20 dB, the system's noise figure converges to a fixed value of 4-6 dB for several receivers.
Multiple benefits would be derived from including the smart antenna in the planning factors:
Maximum replication.
I Growth of HDTV service by lowering the cost of ownership and capital investment to practical and economic levels.
I Reduction of adjacent and cocharmel interference.
I Increase of spectrum availability. Allowing for multiple receiver connection
to a single antenna without loss of coverage.
A more detailed description can be found in the reply comments of the Association of Federal Communications Consulting Engineers to the FCC's Sixth Further Notice of Rule Making, Nov 22,1996. 'Either triaxial or coaxial. For coaxial, DC blocking capacitors are added at the end terminals.
87

V Reduction of RF hazards near short towers and towers with multiple antennas.
CONCLUSION
This paper has shown that the incremental increase in coverage for the last 10% of the viewers will require a tenfold increase of power from 500 KW to 5000 KW AERP. The last 10% of the viewers are typically in areas characterized by poor NTSC service and significant cable penetration. Even if transmitters can be built to deliver the high level power needed to reach the last 10% of the viewers, it will be uneconomical to operate them. The deployment of "Smart Antennas" will provide a rational and economical entry into the HDTV market without sacrificing long-term replication of service.
25.0
20.0
o 10.0
5.0
0.0 0 Cl
,
Figure 3: SYSTEM NOISE FIGURE
F= F„,,„ + N R -
1D G LIVA
= Downlead efficiency
Download attenuation tc-113 4 Receiver noise figure (dB) = 10
LNA noise figure(dB)= 4.00
0
-•„
N receivers with LNA at the antetma
Gu, = LNA gam
--s- TWO RECEIVERS WITH LNA
--a- THREE RECEIVERS WITH LNA
-e- FOUR RECEIVERS WITH LNA
— ONE RECEIVER WITHOUT LNA
. . . . „ . . .
.. .. .. .. .
. . . . ..
CO CO 0 CO 0
LNA GAIN (dB)
88

Planning Your Digital Television Transmission System
Robert J. Plonka, Principal Engineer Harris Corporation, Broadcast Division
Quincy, Illinois
Abstract
This paper will discuss the peak to average power ratio in 8VSB transmitter systems to determine what the power really is for planning purposes and how it relates to linearity issues, in particular, the proposed FCC 5th N MI radiation mask A series of waveform graphs showing the actual DTV RF envelope at various levels of compression will be correlated with out-of-band radiation components for selected levels of spectral spreading above and below the FCC mask The spectral spread at the FCC mask limit will be further examined for potential interference to NTSC stations operating with a DTV upper or lower adjacent channel. The latest ATTC test results for adjacent channel operation will be examined for effective planning purposes as it relates to adjacent channel combining systems. The combining system analysis will include the effect of the antenna horizontal and vertical pattern variations through out the service area as a planning guide. The use of precise frequency control for both DTV and NTSC signals will be shown to be effective planning item for interference reduction.
What's your DTV Power ?
This is a top level planning question for new DTV stations that is critically dependent on the FCC allocations table. The most significant item to be noted in the FCC 6th NRPM
allocation table, besides high power, are that ERP values are given as RMS watts. This has sometimes been referred to as average power, although not quite technically correct, the intent has been to mean true heating power or RMS watts of the total DTV signal averaged over a long period of time. The peak to average ratio is an example of this where the average value is the RMS power. The term average, in many cases, may be used interchangeably with RMS when referring to DTV power.
NTSC, traditionally, has been standardized on peak of sync power. This now sets the stage for possible confusion between current NTSC transmitter ratings and new DTV transmitter ratings. The topic of DTV transmitter power is further complicated by its peak to average ratio that has a significant impact on the size of transmitter to buy. A typical example of this is shown below in Figure 1.
DTV Transmitter Power Calculation Based on FCC Allocations Table.
Given FCC UHF DTV ERP = 405.2 Kw rms Assume Antenna power gain = 24 Transmission Line Efficiency = 70% DTV TX Po = (405.2y(24)/(.7) = 24.1Kw rms Noting that DTV Pk/Av ratio = X4
Then DTV TX Power Rating = 96.4 Kw Pk
Figure 1
89

In Figure 1, the 96.5 Kw DTV transmitter peak power is the required transmitter power size to purchase. It is 4 times greater than the 24.1 Kw average (rms) power to allow sufficient head room for the signal peaks due to the 4X (6dB) peak to average ratio. This shows how
important the Pk/Ave ratio is and the impact it has on planning DTV transmitter facilities. It is also a significant cost item. Because of this, the intent of this paper is to look at the Pk/Ave ratio a little more carefully to determine its characteristics and assess other characteristics (out-of-band IMD) that influence planning technical facilities for DTV transmission.
FCC mask
The peaks of the DTV signal, in addition to setting the PK/Ave ratio, also sets the amount of
out-of-band IMD products. This is due to the peaks extending into the high power compression zone of the transmitter. The peaks must be reduced or linearized to avoid interference to adjacent channels. The FCC has proposed a limit on this by issuing the following radiation mask, Figure 2, in their 5th NPRM.
FCC MASK
10
20
co -90
-40
-50
40 -10
-35 de
4 -2 2 8 10 isthz
FCC proposed radiation mask for DTV operation.
Figure 2. FCC RF mask showing -35dB limit.
The planning effort now becomes a balancing act between obtaining maximum useful output
power from the transmitter while at the same time minimizing the out of band IMD products, through the use of linearization and/or filtering, so as to fit the output spectrum comfortably under the mask.
Sizing up the DTV signal
The DTV signal is a highly filtered, 8VSB signal that has significant transient overshoots due to the pseudo random encoding of the source data. The randomization is thorough enough to make the composite signal have only one discernible parameter that can be easily measured without special decoding equipment and that is its RMS power. Hence, the FCC ERP values are in RMS watts instead of peak envelope power as is done with NTSC peak of sync ratings. The signal looks like noisy AM. This is shown in Figure 3.
DTV II1F ENVELOPE
. -43 De PWAVE De
—S De PEAK
Figure 3. DTV RF envelope operating at -43dB IMD, linear mode.
The waveform in Figure 3 shows the actual DTV signal operating through a transmitter IPA stage with a spectral spread level of -43 dB. This is considered to be a linear mode of operation which can allow the Pk/Ave ratio to reach levels above the nominal 6 dB point.
90

The accompanying IMD spectral spread at -43 dB IMD levels is shown below in Figure 4.
IIIICII k wasn wuer mum sireepoil Al m
• am
Loan
froo•-•-Ver..-
I
'
a i
a la
A
•I 7
I lo ..
, , in !Illi .., ... ...rum Im mo'.
Figure 4. 8VSB spectrum view with DAD products at -43 dB.
The exciter in the above setup was operating at a IMD spectral spread level of -50 dB and had measured 8VSB peaks as high as 11 dB. The slight amount of compression and other non-linearities in the IPA stage reduced the peaks to about 9 dB as shown above. This says the DTV Pk/Ave ratio is a function of the transmitter compression characteristics, as to be expected. To gain further insight into this function, the transmitter power was increased to observe the spectral spread at -35dB (the FCC mask limit).
DIV RP ENVELOPE
IMO • 45 Ds PK/A
1111111111EMIIIiii11111 1111111111111111111411q11111111111111 11,111119111111IFETIIIIII
PI'
I.. 111.1111.11, !di 11 LIIIIII1I JI1ifLi1ilI
111111111111111111111 111111•1111111111111111
...SOS PEAK
Figure 5. DTV RF envelope at -35 dB IMD.
In Figure 5, the high peaks above the 6 dB dotted line are nearly gone due to compression, yet the spectral spread level is at the FCC -35 dB limit. This is shown below in Figure 6.
M ORA;
• O n
MO W
II
nowalpreer Am.' I MOD IN ai m 0
'I\
I
f i 491,...........
...‘NNI.
Omenr S WI M Imam,
Figure 6. 8VSB spectrum view with IMD products at -35 dB, FCC limit.
The compression characteristics of the transmitter has limited the DTV peak excursions to 6 dB while creating IMD spectral spread levels at-35 dB. It an be both legal and produce useful output power. This will be examined later in this paper.
Next, the Pk/Ave ratio at -30 dB IMD is shown below in Figure 7.
OTV RP ENVELOPE
SAO .40 DB PK/AVE . SA OS
1111111111•1111111/A11111 111111111111111411111111911111111111 1•116111111191"11II ,1TRIO" III' ' i 11.111 ith 1 i Iii l...1:1 u
11111111111111111111111111111111 11111111111111111111111
SOS PEAK
Figure 7. DTV envelope at -30 dB IMD.
91
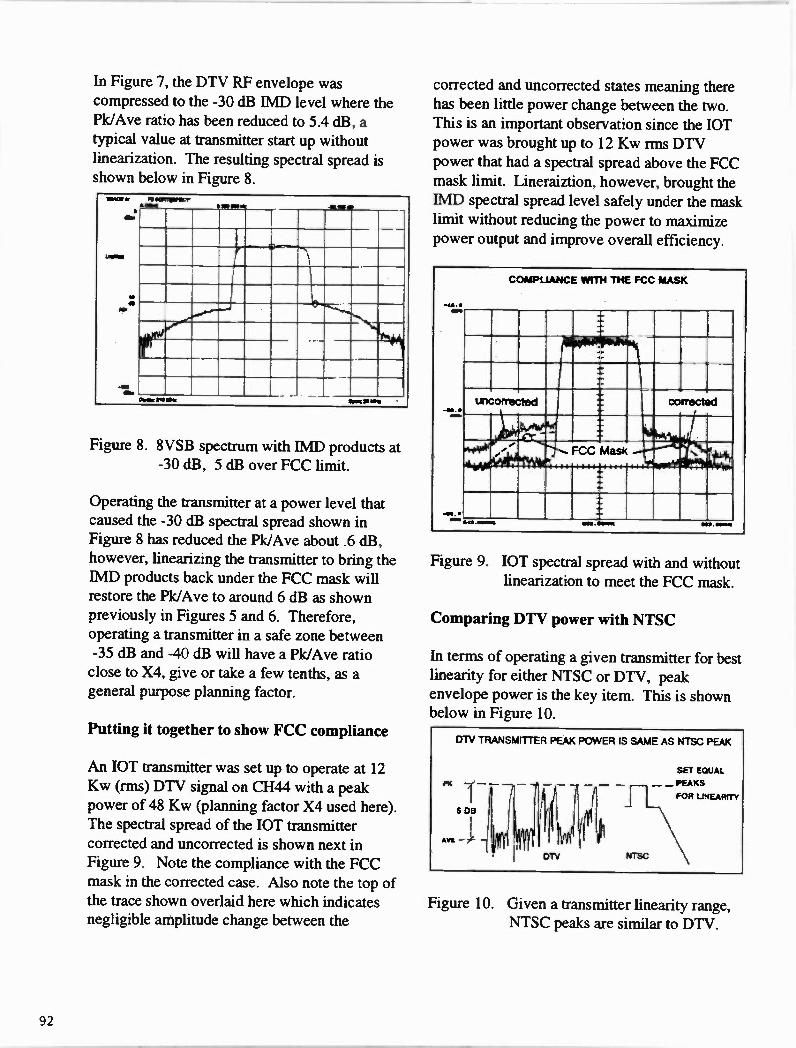
In Figure 7, the DTV RF envelope was compressed to the -30 dB IMD level where the Pk/Ave ratio has been reduced to 5.4 dB, a typical value at transmitter start up without linearization. The resulting spectral spread is shown below in Figure 8.
71•0014
• MO
1111 •
Mr
Ain Ms
PIIIIIIIIIMPECr A MMO W ISP * 40.1•1 0
_
OwarraOMNI 10 =2111/11. -
Figure 8. 8VSB spectrum with IMD products at -30 dB, 5 dB over FCC limit.
Operating the transmitter at a power level that caused the -30 dB spectral spread shown in Figure 8 has reduced the Pk/Ave about .6 dB, however, linearizing the transmitter to bring the IMD products back under the FCC mask will restore the Pk/Ave to around 6 dB as shown previously in Figures 5 and 6. Therefore, operating a transmitter in a safe zone between -35 dB and -40 dB will have a Pk/Ave ratio close to X4, give or take a few tenths, as a general purpose planning factor.
Putting it together to show FCC compliance
An IOT transmitter was set up to operate at 12 Kw (rms) DTV signal on CH44 with a peak power of 48 Kw (planning factor X4 used here). The spectral spread of the IOT transmitter corrected and uncorrected is shown next in Figure 9. Note the compliance with the FCC mask in the corrected case. Also note the top of the trace shown overlaid here which indicates negligible amplitude change between the
corrected and uncorrected states meaning there has been little power change between the two. This is an important observation since the IOT power was brought up to 12 Kw rms DTV power that had a spectral spread above the FCC mask limit. Lineraiztion, however, brought the IMD spectral spread level safely under the mask limit without reducing the power to maximize power output and improve overall efficiency.
den
.41111t. •
IAN .••••••
COMPIJANCE WITH THE FCC MASK
uncorrected T FCC Mask
corrected
4111111.••••• 0•11.••••••
Figure 9. IOT spectral spread with and without linearization to meet the FCC mask.
Comparing DTV power with NTSC
In terms of operating a given transmitter for best linearity for either NTSC or DTV, peak envelope power is the key item. This is shown below in Figure 10.
Figure 10. Given a transmitter linearity range, NTSC peaks are similar to DTV.
92

Figure 10 shows the transmitter rating is a peak value because the RF peak envelope excursions must transverse the linear operating range of the transmitter on a peak (PEP) basis to avoid high levels of IMD spectral spreading. In this regard, the DTV peak envelope (PEP) is similar to the familiar NTSC peak of sync rating for setting the trasntnitter power level by noting
that NTSC linearizes the PEP envelope from sync tip to zero carrier for best performance.
While it is true that many UHF transmitters use pulsed sync systems where the major portion of envelope linearization only extends from black level to maximum white, the DTV signal has no peak repetitive portion of the signal to apply a pulsing system, and must be linearized from the PEP value to zero carrier. Many tube type transmitters and solid state transmitters also linearize over the full NTSC amplitude range and as a result the above comparison between NTSC and DTV peak RF envelope values applies for setting the transmitter power. The NTSC comparison is just a familiar interim reference.
Honest watts analysis
Another key planning factor is to determine the AC input power to RF output power ratio. This is the overall transmitter efficiency necessary to evaluate operating expenses. NTSC has used a variety of methods built around various peak signal form factors such as figure of merit to relate AC input power to useful RF output power necessary for adequate coverage. This, however, was based on NTSC peak of sync power for which no such counterpart exists for DTV. DTV is based on RMS signal power since the peaks are pseudo random in nature. This means a new look at the AC input to RF output power ratio is necessary based on actual kilo-watts input to actual kilo-watts output with no form factors applied, or in other words, an "honest watts" approach.
To begin the honest watts analysis for DTV, two different types of transmitters were recently set up for power measurements. One was a solid state VHF10 Kw unit operating on CH13, the other was a IOT transmitter operating on CH44. In both cases, the DTV input drive signal was incremented in 5 dB levels to generate IMD components around the FCC -35dB point to analyze how efficiency various with spectral spread levels. The idea here was to determine the optimum operating point.
DTV Power Analysis AC Watts In - RF Watts Out
IMD AC(Kw rms) RF(Kw rms) Eff%
-25dB 16.6 -30 " 14.0 -35 " 12.0 -40 " 10.6 .8
10 Kw VHF Solid State transmitter
3.45 2.3 1.4
21% 16% 12% 8%
Figure 11. VHF DTV power analysis.
The overall efficiency in Figure 11 may seem low, however, a look at current NTSC operation with the same transmitter in a similar manner can serve as a comparison.
NTSC Power Analysis AC Watts In - RF Watts Out
Sig AC(Kw rms) RF(Kw rms) Eff%
BLK 21.6 5.52 26% 50%APL 15.7 2.83 18% 100%APL 11.6 1.66 14%
10 Kw VHF Solid State Transmitter
Figure 12. VHF NTSC power analysis.
93

Comparing Figure 11 with Figure 12 shows an interesting result where the DTV power and efficiency at a spectral spread level of -30 dB is very similar to standard NTSC operating powers with a 50% APL picture. In this case the DTV operation produced 2.3 Kw rms RF output with 16 % efficiency versus NTSC 2.83 Kw rms at 18% efficiency. This means there will be little change in operating expenses between NTSC and DTV through the same VHF transmitter.
It should be noted that in Figures 11 and 12, no linearization as used in the transmitter setup. This was an attempt to see what the transmitter would naturally do and then plan for an appropriate amount of linearization later.
Further notes to the above are necessary and that is the aural carrier was turned off for the NTSC tests. Also the NTSC rms RF power was measured without using any form factor, which is unusual for NTSC measurements. The input and output power levels were measured the same way for both NTSC and DTV and compared above, watt for watt.
Proceeding on to UHF for a similar test on a IOT trasnmitter the result are shown below.
DTV Power Analysis AC Watts In RF watts Out
BAD AC(Kw rms) RF(Kw rms) Eff%
-33dB 68.7 27.5 -34" 58.0 18.0 -35 " 49.3 10.8 -40 " 37.4 3.3
60 Kw IOT UHF transmitter
40% 31% 22% 9%
Figure 13. UHF DTV power analysis, IOT.
It is interesting to observe in Figure 13 very
little spectral spreading from -35 dB to -33 dB while the DTV output power increased nearly 2.5 times. This shows the very high peak capability of the tube. In this test, the overload settings for the tube were reached at a spectral spread level of -33 dB which did not allow testing beyond this point.
The performance in this setup was enhanced by using an efficient class AB driver with a feedforward linearization system.
For planning purposes at the time of this writing, an efficiency number for solid state VHF would be about 16% to 18% based on a spectral spread level of -30 db and with the assumption it would be linearized to point below the FCC mask while maintaining the same power level.
For the IOT, the efficiency number would be in the range of 22% to 31% and again with the assumption that linearization would be used to place the spectral spread safely under the FCC mask while maintaining the same operating power.
DTV and NTSC combining Systems
When DTV comes on line it will be necessary in many cases to consider a combining system. If the channel spacing between the NTSC and DTV channels is greater than 2, than a number of alternatives are possible between combining the channels into a common antenna, provided the bandwidth is great enough, or to feeding two separate antennas, provided there is enough antenna room.
A special case to the above are the adjacent channel assignments that can represent up to 20% of the expected DTV channel allocations. This situation will be studied in a little more detail here to determine planning guide lines.
94

First. examine Figure 14 to determine the channel occupancy and note the channel designations for upper and lower identification. This can be helpful to reduce confusion when discussing which channel is the low side of what channel.
Figure 14. TV N+1/N-1 channel assignments.
Note in Figure 14, both the N+1 and N-1 TV channels are shown at the correct -12 db power level relative to NTSC peak of sync. This shows the relative TV and NTSC spectrum levels when viewing both signals on a spectrum analyzer set to 300 kHz RBW.
The primary concern here is the potential interference to the NTSC station when adjacent DTV stations are located as shown above.
The spectral spreading beyond the TV channel edges can interfere with the NTSC parent station even if it is at the FCC -35 dB level due to several imbalancing mechanisms.
Figure 15 below shows a straight forward method of combining either N+1 or N-1 TV channels in a dual (co-linear) antenna system with the parent NTSC station.
ANTENNA COMBINING FOR UPPER OR LOWER DTV CHANNELS
DTV
NTSC
(Requires equal gain for correct DTV/NTSC ratio l, coverage area.
CO-LINEAR ANTENNA COMBINATION FOR ADJACENT CHANNEL COMBINING
Figure 15. Co-linear antenna combining.
The principal consideration here, besides cost,
is to carefully maintain the same horizontal and vertical patterns throughout the coverage area for both TV and NTSC.
This means side mounted antennas or antennas mounted at different locations in the co-located criteria zone will be faced with a difficult task of pattern matching.
As a starting point, the match between H/V patterns should be within +/- 2 dB. For levels outside this range, various combinations of filtering and linearization for both TV and NTSC signals will be required, particularly the N-1 assignment.
The N+1 assignment has only one viable option at this time and that is combining in the antenna system with various combinations of that shown above. The above antenna system , however, calls for doubling the aperture space and more than doubling the cost to provide the equal
95

pattern requirement to prevent upsetting the NTSC/TV 12 dB ratio.
Other N+1 combining techniques are currently being studied. A very promising approach for reducing the cost of doubling the antenna aperture space is to use the VHF technique of hybrid combining aural and visual signals in a batwing antenna. This method would diplex the aural and visual signals together first and then feed the composite signal to the previous visual port and fed the DTV signal to the former aural port.
A standard constant impedance combiner for N+1 applications calls for impractical cavity Q values to avoid the significant group delay and amplitude distortions in the very close frequency spacing between the NTSC aural and the DTV pilot. A tri-plexing approach is being studied at this time but again the filter cavity Q's are required to be extremely high
Figure 16. Constant impedance combiner for N-1 lower adjacent DTV channel.
The constant impedance combiner for N-1 DTV channels has a number of technical problems to solve for effective implementation. The NTSC bandpass filters are very sharp tuned to maximize the DTV pass band which calls for some narrowing up of the NTSC channel by
cutting away some of the lower sideband, about 200 to 300 kHz. The result of this is a significant increase in the equalization requirement of both DTV and NTSC transmitters to restore amplitude and group delay performance.
Figure 17. NTSC interference due to adjacent DTV channel spectral spread.
In Figure 17, the NTSC noise levels shown, due to DTV IMD spectral spreading are low and in most cases just below the point visibility. Recent test results at ATTC (Oct. 22, '96) shows that previous comfortable planning margins without spectral spreading have been significantly reduced with spectral spreading to a point where there is little margin left for the lower adjacent DTV assignment without causing NTSC interference. The upper adjacent DTV channel is in a better situation where about 7 dB margin was measured. Surprisingly, no BTSC stereo problems were noted for either upper or lower DTV assignments.
This means a lower DTV assignment will have to be linearized and/or filtered to suppress the IMD products another 5 dB below the FCC mask to prevent NTSC interference. The upper adjacent has a 7 dB margin so the additional
96

linearization can be reduced to 2 dB.
The additional 5 dB headroom is considered to be necessary to accommodate various
propagational factors that can change the 12 dB ratio of a DTV channel next to an NTSC and cause NTSC interference. The most likely variable is the antenna pattern if the DTV horizontal and vertical patterns do not closely match the NTSC pattern throughout the coverage area. Also, local reflections can significantly change the 12 dB ratio.
IFCC 5th NPRM FREQUENCY REQUIREMENTS-,
VIS
1
LOCK LO
LOCK I TMMEIASE COPIRECTolli
PEAT
I I I LOCK CLK
I I
/LOCK LO
MESS slOuRCLTS LOCRED TO COM MON REFOROME
4 FCC 5 th NPRM FREQUENCY STABIUTY REQUIREMENT ADDMONAL REQUIREMENTS FOR OVERALL NTSC AND DTV INTERFERENCE REDUCTION
Figure 18. Precise Frequency control.
Figure 18 shows that all principal carriers must be locked to a common high stability source, preferably Loran C or GPS 10 Mhz reference signals.
The required frequency relationship stated in the FCC 5th NPRM as shown in Figure 18 is between the NTSC visual carrier and the DTV
pilot. The 5th NPRM recommends a tolerance of +/- 3 Hz.
The DTV pilot also has a relationship to NTSC chroma which also requires the chroma subcarrier to be locked to the same high stability source which usually occurs in the studio. This says all principal frequency sources in both NTSC and DTV signal paths including various local oscillators should be locked as indicated above..
Refer to, "FCC Proposes Carrier Offset", Charled Rhodes, TV Technology, Oct 11, '96.
Conclusions
1. The FCC RF mask requiring the spectral spread level at -35 dB is a good practical compromise.
2. DTV transmitter peak power rating is 6 dB (4X) above the DTV average (rms) value.
3. True RMS AC power input to RF power output is very similar between NTSC average picture level and D IV.
4. Adjacent channel combining will require careful planning to avoid interference to its parent NTSC station.
5 Precise frequency control locked to GPS or Loran C can help reduce interference.
97

A NEW HIGH POWER, MULTICHANNEL, UHF ANTENNA DESIGN FOR THE SIMULCAST NTSC/HDTV PERIOD
Kerry W. Cozad Andrew Corporation
Orland Park, Illinois, U.S.A.
ABSTRACT
With the publication of the FCC's 6th NPRM regarding the introduction of digital television broadcasting, the need to reevaluate long held design guidelines for transmitting antennas is needed. This paper will describe a new design concept for slotted UHF antennas that allows the combining of a high power NTSC channel with an adjacent HDTV channel assignment using a single transmission line and antenna.
WHY A SLOTTED ANTENNA?
For UHF channels in the United States, slotted antenna designs have been used for nearly 50 years. A primary factor in their use has been the ability to make the support structure of the antenna an integral part of the transmitting components. Because the frequencies assigned to UHF allow the use of relatively small antenna elements, the removal of part of the pipe wall to create slots was possible with only a minimal impact on its structural integrity. This resulted in an antenna with low windload characteristics and was relatively economical to fabricate.
As television markets expanded, demographics changed and competitive pressures fostered the need for UHF
stations to increase their coverage. This required higher effective radiated powers (ERPs). And as higher power transmitters came to market in the 1970s and 1980s, other benefits unique to the slotted antenna design became evident: exceptional reliability even at extremely high input power levels and more precise control over the shaping of the elevation pattern. This performance was not present in other antenna designs and by 1985 the slotted array was the antenna of choice for UHF broadcasters in the U.S.
Most full service UHF broadcasters operate at power levels typically considered to be "high power". These stations have antenna input power levels of 60 kW (NTSC peak of sync) or more and use rigid coaxial transmission lines or waveguide as the main feeder between the transmitter and antenna. Based on the 6th NPRM, UHF broadcasters will be assigned another UHF channel for HDTV transmission that will require typical antenna input powers of approximately 20 kW (DTV average). If possible, it could be of tremendous benefit to the broadcaster if nearly the exact configuration presently in use for the NTSC channel could also be used for both the NTSC and HDTV transmission. This would result in minimal changes to the tower loading by the new transmission system and minimize any changes to the present
98
NTSC coverage due to compromises that may be required when changing antenna types.
WHEN TO USE A SLOTTED ANTENNA
Single channel use
First, if it has been determined that the tower can (or could) support another transmission line and antenna for the HDTV channel, then the same criteria used for NTSC choices can be used. If the available location for the antenna is at the top of the tower, then a slotted antenna design will probably provide superior electrical and structural performance. If the antenna is to be located on the side of the tower, then the coverage needs of the station must be reviewed prior to making a decision on the antenna type. Slotted antenna designs have been used extensively for directional side mounted antennas and recently for extremely high (200 kW NTSC) side mounted omnidirectional antennas.
Multichannel use
Slotted antennas have not been used for multichannel applications primarily because of their narrow bandwidth characteristics, particularly for low VSWR applications. For NTSC, the minimum bandwidth that would typically be required is 42 MHz (30 MHz between two channels). There has been little economic pressure to address the possibility of an acceptable design for this situation. However, with the allocation table proposed by the 6th NPRM, a new situation has been created where the slotted antenna design can be expanded to assist in the transition to digital television.
Adjacent channels
For UHF broadcasters, the proposed allocation table has 351 adjacent channel assignments. This is over 1/3 of the total UHF licenses. With the constraints on tower loading and industry resources for building and installing the new equipment that have been discussed over the past few years, it now seems prudent to review the slotted antenna design for these applications. An advantage that this condition provides is that the bandwidth required for operation is now limited to 12 MHz. If a satisfactory design can be developed, then there can be little doubt that the slotted antenna design will be the preferred component for these stations. Assuming no change in transmission line size, there can be a net zero change in tower loading and the elimination of costs associated with upgrading a tower for additional loading that would be required for other options. It may also eliminate the need for negotiating new space on the tower or sharing transmission components with a competitive station.
PERFORMANCE ISSUES
Typically, there are four principal antenna characteristics that are reviewed when choosing a broadcast transmitting antenna: azimuth pattern, power handling, VSWR and elevation pattern. For a 12 MHz bandwidth, the azimuth pattern will remain essentially constant across the band. This is due primarily to the small diameter of the antenna and the small percentage change in frequency across the band (a maximum of 2.6% across channels 14 and 15). This is in contrast to the bandwidth of a single VHF station on Channel 12 which is 2.9%.
99

As discussed previously, the power handling of the slotted antenna design can meet the adjacent channel requirements. Depending on the margins used in the NTSC system design, the transmission line size presently used may need to be reviewed. Also, since the digital channel is adjacent to the NTSC, the effect of flange reflections may not be a significant factor in rigid line lengths. This would allow use of the existing transmission line.
The VSWR across the two channels will have two different requirements. Ideally, the digital channel VSWR response should be flat across the band. It has been suggested that the level should be around a 1.10:1. The NTSC VSWR requirement has typically been 1.05:1 at the visual carrier with a worse case of 1.10:1 at other frequencies in the channel. The design criteria for an adjacent channel combined antenna could then be stated as a worse case VSWR of 1.10:1 with optimization of 1.05:1 at the visual carrier of the NTSC channel.
Elevation pattern response
The change of elevation pattern characteristics as a function of frequency has been a topic of discussion for digital television implementation for many years. It normally narrows down to a debate over how the input signal is distributed to the radiating elements. The types of distribution systems are typically called "end fed" or "center fed". Initially, discussions regarding the performance differences between the two types focused on changes in the electrical beam tilt as a function of frequency. It has been shown, however, that this effect is not sufficient to determine the quality of performance of the
antenna. In fact, a measure of merit sometimes called "antenna differential gain" presents a better understanding of the frequency response of the pattern. By analyzing the change of gain as functions of frequency and elevation angle, the response flatness can be determined. The criteria presently being used for NTSC transmissions is that the gain flatness should be better than 3 db from visual carrier through the color subcarrier, or over about 4 MHz. While it has been suggested that this gain flatness should be better than 0.5 db over 6 MHz for a digital channel, the results of numerous field tests seem to indicate that a gain flatness of 3 to 4 db is not unreasonable as a specification.
Finally, it is desirable to have the transmission of adjacent channels to occur from the same physical location to minimize interference compensation issues. Obviously, the use of a single antenna will accomplish this.
The next step is to determine if a slotted antenna array can be designed to meet these specification goals.
MULTICHANNEL SLOTTED ANTENNA DESIGN
To determine if the above design parameters can be realized in a production antenna, a design based on a full scale model was first investigated. Data taken on a single bay antenna was collected and then used in antenna array design software to produce calculated responses. A directional antenna with an RMS gain of 25 (14 dBd) operating on channels 31 and 32 was used as the model. Also, a standard (versus a "smooth") elevation pattern was chosen to determine a "worse" case condition for the differential gain.
100

The results of the design are shown in Tables 1 and 2 and Figures 1 through 6.
SUMMARY
The design parameters show an excellent possibility of using a slotted antenna design for adjacent channel combining of NTSC and digital television signals. Final testing on the full production antenna was not completed in time for data to be included with this paper. However, results from these tests will be presented at the 1997 NAB Engineering Conference. While some variations to the design are anticipated due to manufacturing and testing tolerances, close agreement is expected due to previous experience with the software and process that was utilized in the design.
ACKNOWLEDGEMENTS
I would like to thank Steve Brower and Ed Ostertag for their invaluable assistance in the presentation of this paper.
Freq(MHz) VSWR
572. 1.01 573. 1.03 574. 1.04 575. 1.04 576. 1.03 577. 1.02 578. 1.01 579. 1.01 580. 1.02 581. 1.02 582. 1.02 583. 1.03 584. 1.06
Table 1
Average Power Handling
6-1/8": 61 kW 8-3/16": 120 kW
WR1500: 240 kW (omni)
Table 2
101

N.*
A NDRE W. AZIMUTH PATIT_RN
Co co.
•••• •V
a wn.
ein e m
•••••••• =••••••••
•060.C., 60••••••••11 SONO IC 1 .4 SM .
001••• ••• no . IL L.. O MR
Figure 1 Azimuth pattern of the prototype antenna at midband of channel 31.
ommolupill lose mo usse neefi ll:11111
111:1111 111 :111:11 ;11 11 III IN. Ie. I0 II
1 111 1111111 III 111117 T Y :11 111 III 111 1111 IN 01 A feel us ms; III li ft,.. 111 0111 I I ISO III III III lllllll NI NI I lllll 111 III
1111 1111 ISO 11111 es111o111 1/11111 II NI 111 NI NI NIS III 1111 1111111 III m m ur ltuts II ems su m BSI il I
lllll 111 O II III 1111111 ISO l l 1 INN II III 1 111 MI NN NI 111
lounge 11 III III 1111111 III III IN 111111111111 llllll 11111111 r
SD 11111111 lllllll !1:11111 p m u m llllllll ire III 111 011 1111111 N ON 011111 11111111 lllllllllll III
us son nes III I sous s s nee susses so, sm nu mu mu nos Ise su ms ma nn a s no suus
1111111 BIB III 111111 III III 1111E11111 III
I III IN w orm llllllllll NI III INN lllllll 1111 III 1111111111110111111111:11111111111111 1 1 III 11111 lllllll lu ll1 III III II NI NI III 1111 IN III III peen ems so se mu II em s woon oil on Olean 111111211 0 ISO SR III BONUS ul hi Ul NIN
111111111111 11111111111111111 9: 21111111111 1111:11 III ile um su se quel mu su au son m son
--11 r1 NORE W ELEVATKNV PAITERN
k m •••••,
•••••••I
sem le
••••••••
S• ••••
LOME=
A m.. M C
51 - C•14 -
ST
211 1111 1111111i " 11 111111 U1111 lllll III
111 11 91111M M I 1eir M ill l i1111111 111111112 llllllllllll I 1111 III 1111111 1 II tou mo u rn
I 1121 III ONION I 1 INN lllllllllll BIN MISS IWO
4711 nuo u n u h uiell
Ill,d 211111
inuR ININI
al
UOINI A MIN
•
Abet,.
•
11111••••••••
• •
Ao•p••• S k ew A k etres ead, D eg e•se
• •
atee.e.
Figure 3 Elevation pattern for Channel 31
CO
ISO
.R OD SZO
230 110
1••••
A NDRE W. AZIMUTH PATTERN
illeo cok
••••••••
Necks a cne
m et .... ... •• • •• ••••••• • • cm, ow. wwq mo cimm
21 0 150
ROO 4 0
90 00 ..0
C O M M 0001• ••••1 .1114 ME N .' M ed * Ca
Came le e r eek/S A em112
Figure 2 Azimuth pattern of the protoype antenna at midband of channel 32.
I -5
III III III lllllll I' 1111 NO OBI III III BOO 111 1111 I 11 11 III hI
NISI III III 112 IN II NI III
III III SOO III III I l 11 IBS 1 III III III III 111 1 I III III
KNO WN ISO III up, I i 1 III ill 11111111 151 0111 III I NI III III 11 I I III mom III III IllI UIIPIU 1110151
5111111
111112211111 B111:I 11111111111111111111111111111111111111 III III III 211 II II 11 II OBI III NI 111 III 111 III us son III Ill III en on se son nonposepau nu nu Ill lllllll 1111 111 14 N U N BOB III IIIIIIIIIIIIIII III All 111, 1111 lol l::: 111 llllll 1111 III NB 111 III M I INNIS nu
N U NN NO N NI II I M IN SOK III III
111 4111 1110111 111 NI II III III ON III III III III IN
111 1111111i BOB III 101 OBI III III NI III Iii Iii NI NIB III l imp ess
11111 N UBS llllll mo m IIIIIIIIIIIIIII N ris me 111 1111 III 1111M
[
11111111 III 1111. 11111 1111111 111 1121111 111 1111 NI 1111 1111 III III III 1 1 1111 VI III 11111 111 III 111 I 1 III II sus us lllllllll m ann so u llllllllll ann um ID UI
pot III 111 Ill Pill 111 IN
11111:1111111:111p1111111111 MI TI:iiiiii MimulslU llt ei
mil:11:11111111111:11:141:1 01111s aisin11111111:11:11 III sou suns. s Inman mi llllll u au es 1111111 non nui lllll ut no re r ron lllllll ponionr us llllllll moon oup sou neer INNS III III 111 III lllllllllll NI III
IA III III MOIR 111111,11
llllllll ION 1111 onsensmum lllllll IN N 1111 IN II Issi usa makau m mu
N U llllllll 11111
111111111 lllll 1111111 lllllllll 110 lllllllllll isusum IONIANS
II III ? M I NN 1111
OBI asum nomenon llllllllllll eug uus nesens ules
I:1111 D 11111 N llllll lll NII PI 111111 l 4111 0
821111111
A NDRE W ELEVATION PA 7711AN
AO
11A _
50-
A..
••••••••
Abb e .
•
I A, . Fe re •••••••••••C Dee••••••
INIM/IP41111101111•••••
•••••••• 1••••14111. IMMO
•
Arse.
Figure 4 Elevation pattern for Channel 32
102

II 4: 1 H4 , s, 1 'till , , •
11 1 I'
1.1. I],, it I I i- [ I ii
-0:130
I
•
I .
. •
• • •
1 1 •
I • •
_ii, ,•••• Hi H ; i ' : : :
1 1 .
••• ' p.
' •
- ,_ • 1, : :
EiA Jii .! !
INE ,..: , .
• lif I •
.
;' , :
• .
.
. • I
• I ; '
f
; 1 I
0 '
1.••, 1
•
. , . ;
.
.
. - , , • • "
t
• .
, 1
; i . • '
r• il l
i I 1;
•
X •
• • •
' • 1
; i I i -,.. -
; i . • 4 •
- , , It
; ; 1 1 :
•
•
•
•
.1 41
1 ; ; ;
• • • •
• •
• i
. „
: i 11
•
4 : I • •
.li'
: I •' I 1
H. 01:60
I to
1 '
, •• , .-.
i , ,
,
1 : • •,. :.
' ' ' . • ; : : : : : •
.
. . :
'1i ;
. i . '
1
-1.. • 1 • • , ..
4 • •-•I
: .
• .
..• ... 1
• •- ; - --••: •-i• ••
• t •-• ;
ilit
•••• .
1 3 : 5 0
; r:-
.-t,
- 'iv
•
3.
• -
.
: ; 1 •• •
• •
. : - • • • i • •*- 11
' .1 • - I- •
• • - it,- -•-•!, •-4 4-
.144- ._r - - • - ----- . ... . • •••
'0740,- Ill• ...1.
, 1 , • -
•
•
- 0
•
I
_ _
• - .
itli _. -.- t • r
- T. 12.
-1.14, - - 7_,:r.r..: -;-4-4-;-
1T 4:7-r-
17:: -._...._.
- - I. -""--,- -- •-•--
tr.,"" '-•
1-,T3 • -,- '-it
• 1,1-1:: ' •-
_77: ''': - .11 - • t-
I : _,".". .., '
_ *
ii ii, 11-;
41 .'4:
TT----71- _4:-.7.
--I-.
DIIM MIRS
la
E Ila M r A "
..
•• NZ II -,- r-r 1- ..-.
-1 - as
• 151 sap
'1 _,
IMO
n I rr .. a • ma
: --. • E...... LT , _ i. a wl a a a
F ailito
• Pi ,....- i n
\ • •
, 4 1 'It+ .i. P a a • m asa m e m e am • • .._ .., .i. :_r_4 an n g ••
L't...., -..M.---- • III
• . ::.• Ea •
..., ii . E fi E NE :r a h • . E lla i g. ,Ifi ... :::. 7 1.
O ra•al:11••.-- 4:::: 1 • • .r. .. , ,..4 °---, r Aliimb li .....
ummliien t i
• N 'I Tt r:
.3 --,.. -..--. t _. "11:kak. M Eir.hd liiiiihi.1 1.. • Allii1 11185.1111ruffriglIVI‘Iii •
iii: ...•,1/4 . tit:. 4 1 :E ls .,0 . • • i . :k . . •••
V a ri Ner.: P • •
1 :____, .bpj.w ,:et,„;„!:: , t- I I 0 M ain L eit h. I L L 1,4 4
•EL.4 A . r i + "/-
Figure 5 Differential gain calculated for Channel 32, NTSC
Note: Calculation is from visual to color

-5
Figure 6 Differential gain calculated for Ch Si, DTV Note: Calculation is across 6 MHz channel

SIMULATION OF THE EttECTS OF VARIOUS NON-IDEAL COMPONENTS OF A
DIGITAL TV TRANS MISSION SYSTEM ON THE TRANSMISSION QUALITY
Dr Noel McDonald and Mr Robin Blair
Radio Frequency Systems
Australia
ABSTRACT
In a digital terrestrial TV transmission system, the effects of the inevitable departures from petfection in the components that go to make up the system are greatly different from those that occur in analog systems. In general, the results are not as
easy to either visualise or calculate, and the effects on the picture ultimately delivered may be negligible or catastrophic, and bear no relation whatsoever to how an analog system might behave. Accordingly, the system and component specifications for digital transmission may differ
greatly from the analog. Radio Frequency Systems Pty Limited (RFS) has established a computer
based simulation system to investigate the effects of these impeifections in a controlled and stable environment. This paper describes the simulation method and some of the concepts that are controlling the directions in which the work is proceeding.
IMPERFECTIONS IN DIGITAL AND
ANALOG TV
Analog TV transmission engineers have become used to specifying limits on system imperfections through a process that relates their magnitudes to the degree of visible impairment they produce in the received picture. For example, reflections in antenna systems produce visible "ghosts" on the screen. The extent to which these ghosts disturb viewers was established in pioneering work long ago and is directly related to their amplitudes and their time delays with respect to the main picture.
These parameters are, in turn, directly and arithmetically related to the degree of mismatch and the feed cable length in the transmitting antenna system. Hence, there is a direct and easily visualised correlation between the magnitude of the imperfection and its effects. This is certainly not so in a digital system. As we shall show, an antenna mismatch that would render an analog system unusable can easily have negligible effect in the digital environment. Conversely, a non-linear group delay characteristic that would not matter in an analog system may seriously affect the integrity of its digital counterpart. Therefore in determining what parameters of the latter would be worthwhile studying by simulation, it is necessary to analyse where the sensitivities to system imperfections are likely to be greatest.
W HICH DIGITAL SYSTEMS?
RFS is a world wide supplier to the Broadcasting Industry of all types of antennas, combiners and filters. The company recognises that in digital terrestrial broadcasting two different and essentially incompatible transmission standards seem about to become entrenched, namely 8 level vestigial sideband (8-VSB) (Ref. 1) in the USA and Coded Orthogonal Frequency Division Multiplex (COFDM) (Ref. 2) in Europe and Japan. Many uncommitted countries are still likely to adopt either. Hence, RFS believes its simulation system should embrace both, and is working towards achieving this. Nevertheless, the requirements for each can be quite different. The following paragraphs look at the most common types of
105
imperfections in transmission systems, and contain comments on their likely significance in the two digital schemes. In preparing this discussion, RFS has considered that many new digital systems will be built over the infrastructure of existing analog services. Hence some comments are included on how the analog designs would have controlled the magnitude of these non-ideal parameters in the past, and will now influence the digital environment.
ANTENNA REFLECTIONS
As mentioned above, the visibility of ghosts in an analog system has been a tightly controlling factor in determining the degree of impedance matching of antennas to feeder cables. This is hardly likely to be an issue in either of the digital environments. One of the strongest arguments for advocating the use of COFDM is its robustness in the face of multipath reflections on the external propagation path. These delayed signals, arising from reflections by buildings and rough terrain, are likely to exceed by orders of magnitude, in amplitude and time delay, the corresponding reflections occurring in even a poorly designed antenna system.
The 8-VSB system does not have the same inherent immunity to multipath propagation but the standard (Ref. 1) prescribes that the receivers be equipped with dynamic active equalisers to cater for quite severe multipath effects. Again, the contribution of the antenna systems to the overall problem will be very small compared to that which will arise in the external environment, and easily handled by the equalisers.
Simulating the effects of antenna mismatches is therefore not a high priority. RFS considers that in purely digital environments the impedance matching of the antenna does not need to be any more stringent than the traditional analog values, which are readily achieved in current designs.
PEAK TO AVERAGE SIGNAL LEVELS
Analog TV transmission systems have precisely defined carrier levels, and the designers of transmitters or high powered antenna and feed systems can be relatively certain of the peak voltage and maximum average power level they have to handle at any particular point.
This is partly true of the 8-VSB system also, as in effect the modulated signal occupies eight well defined levels. However, a word of caution may be in order. The filter which determines the overall system pulse shape (or more accurately the symbol shape) is split evenly between the transmitter and receiver and it would be incorrect to assume that the defined levels are fully maintained through the transmitter and antenna systems. For example, Sgrignoli (Ref. 3) shows that some signal excursions still occur beyond voltage levels up to 7dB above the average. The aim of the RFS simulations will be to take these studies further.
At present we do not know how the presence of other imperfections in the system may affect the results - in particular group delay pre-correction as discussed below. The RFS simulation is being specifically designed so that multiple impairments can be introduced or removed at will.
COFDM introduces a signal type that is quite new to the designers of high powered broadcasting equipment, in that the peak to average voltage ratio is virtually unconstrained. There have been a number of studies (Ref. 4) indicating that clipping in the power amplifiers at around 12dB above the average has little effect on performance. Again, RFS wishes to extend these studies by simulating systems with several additional imperfections.
GROUP DELAY VARIATIONS
One of the features that broadcasters find attractive about digital TV is the concept of adjacent channel working, in which the digital transmissions are run
106

in the frequency channel immediately adjacent to an existing analog service. In many cases this will be most economically achieved by diplexing together the analog and digital services and transmitting them from the same antenna. (Shared antenna working is quite common in Europe). This type of operation, however, requires the use of combining filters with extremely sharp cut-offs in the attenuation skirts, and accordingly introduces group delays at the channel edges that greatly exceed anything experienced in the analog world.
Some studies (Ref. 5) have shown that the group delay in suitable candidate filters can run into several microseconds. RFS is investigating the use of filters (Ref. 6) with real axis transmission zeros to partially compensate the group delay variation. The prototypes now being constructed show that a variation of around 500 nanoseconds (nsec) between band edges and band centre can be achieved.
To put this in perspective, the symbol period in 8-VSB is about 93 nsec and in COFDM about 224,000 nsec for the 2,000 carrier realisation. One of the high priority simulations will therefore be to study the effects of group delay variations on 8-VSB. The RFS simulator will readily accommodate the insertion of filters of many types into the transmission channel, and the merits of the newly partially compensated filters in comparison to the more traditional types should soon be established.
By comparison, analog signals are almost benign to the effects of group delay at the channel edges. Signal rise times are relatively slow, and well known test signals like the 2T and 20T pulses have comparatively little energy at the band edges. Hence, the digital era will see a new emphasis on group delay imperfections in transmission chains, and system simulation will contribute greatly to the derivation of realistic specifications.
GROUP DELAY PRE-CORRECTION
The preceding observations strongly suggest that some form of group delay correction will be necessary, and past practice suggests that this might logically be incorporated as pre-correction circuitry ahead of the power amplifiers. However, the immediate question arising is what effect this may have on the peak to average signal ratios in the amplifiers and the following rigid line and filter components. Is clipping in these stages, either deliberate or unintended, likely to significantly degrade performance? These are interesting questions, but as the phenomena involved are highly non-linear, accurate simulation may be the only way to obtain the answers.
PROPAGATION PATHS
Of all the parameters to be considered in choosing between 8-VSB and COFDM their relative immunity to multipath propagation has probably been the most contentious and received the most study. There is probably little point in revisiting this most carefully researched field with the RFS simulator. However, the simulator can readily incorporate multipath effects into the system model, and it will be possible to show the extent to which other system imperfections affect this important characteristic of the digital systems.
IMPLEMENTATION
The RFS simulator comprises a series of modules from the Hewlett Packard "Series IV" electronic design and analysis software. RFS engineers have incorporated two custom made elements from HP EEsof for Fast Fourier and Inverse Fast Fourier transforms (FFT and IFFI) into their in-house HP OmniSys System Simulator. The literature on COFDM (Ref. 7) indicates that using the IFFT for modulation and the FFT for demodulation is a very effective method of handling the very large number of carriers involved in real life systems. RFS has now successfully adapted the technique for the purposes of simulation.
107

The simulations are currently carried out on a Sun SPARC workstation IPX, using the Sun OS 4.1.3 operating system with Open Windows Vers. 3. The demand on computing power is enormous, particularly for COFDM simulations, and the initial runs now being undertaken to verify the system integrity are typically occupying 45 minutes to generate statistically meaningful data. Nevertheless, there is no question that the system is much more economic and flexible than would be the case with simulations with hardware.
INITIAL RESULTS
At the time of writing, one project has been
completed on the simulator, examining the effects of impedance mismatches in long antenna feeders in a 16 QAM system. This applies to the design of Earth Stations in the Direct Broadcasting Satellite service under the DVB recommendations, rather than to the two terrestrial standards otherwise addressed in this paper. However, it does illustrate the flexibility and potential usefulness of the system.
At this time also, early simulations of COFDM, as mentioned above, are giving promising results, with the formation of the spectral properties and error behaviour under simple Gaussian noise having been verified. The next step is to verify the 8-VSB model, but this is expected to be relatively straightforward.
CONCLUSIONS
As a major supplier of antennas, combiners and filters for high powered broadcasting stations, RFS recognises that the standards and practises that broadcasters have developed over many years have served the industry and public exceedingly well. We also believe that the knowledge base gained from implementing and running high powered analog services will be very useful in quickly establishing the initial digital services. However, digital transmission does introduce a valuable opportunity to refine our practises and techniques to take full advantage of the benefits it offers. Happily, in the face of this challenge, the
techniques of digital circuit and system simulation have advanced enormously, to the point where simulations of the complexity outlined in this paper are feasible, if not exactly routine.
The RFS philosophy is that the best solutions arise from a complete understanding of total systems. This has been the emphasis in developing the simulation system, and it is hoped that this paper has demonstrated the potential usefulness of our project in building the new knowledge base for the digital future.
REFERENCES
I. Grand Alliance HDTV System Specification. Submitted to ACATS Technical Subgroup, February 22, 1994.
2. Digital Broadcasting System for Television Sound and Data Services (Digital Terrestrial Television) Draft ETS 300 774, European Telecommunications Standards Institute, May 1996.
3. "Measuring Peak/Average Power Ratio of the Zenith/AT&T DSC-HDTV Signal with a Vector Signal Analyser", Gary Sgrignoli, IEEE Trans. on Broadcasting, Vol 39, No. 2, June 1993, pp 255-264.
4. "Experimental and Simulation Results on an OFDM Modem for TV Broadcasters", M Saito et al, SMPTE Journal, Jan. 1996, pp 39-45.
5. "Standard Reference Curves for ATV Filter Mask", Paul D Smith, Paper presented at 1996 NAB Engineering Conference Proceedings, Feb. 1996.
6. "Filters with Single Transmission Zeros at Real or Imaginary Frequencies", Ralph Levy, IEEE Trans. Microwave Theory and Techniques, Vol. MTT-24, No. 4, April 1976, pp 172-181.
7. "The COFDM Modulation System: the Heart of Digital Audio Broadcasting", P. Shellswell, Electronics and Communication Engineering Journal, June 1995, pp 127-136.
108

DEMODULATION AND DEGHOSTING OF VSB SIGNALS
Majid Chelehmal, Ph.D., and Tom Williams
Senior Members of Technical Staff,
CableLabs
Louisville, Colorado
Yasuhiro Ito, Ph.D.
NHK Science & Technical Research Labs
ABSTRACT
Frequency-domain echo cancellation and filtering techniques may be used to demodulate and
equalize vestigial side band (VSB) transmissions such as 8-VSB and NTSC signals. This is done by first demodulating a radio frequency (RF) carrier signal to baseband as in-phase (I) and quadrature (Q) signals, capturing a block of I and Q data, and then performing a complex discrete Fourier
transform to obtain frequency-domain data. VSB filtering and ghost cancellation is done in the
frequency domain on the data blocks. The corrected signal is inverse Fourier transformed back into the time domain. If a time-domain guard interval is utilized in conjunction with an
overlapped transform, and the echo is shorter than the guard interval, a perfect deghosting solution can be found. If the echo is longer than the guard interval, the overlapped transform will reduce the effect of the long echo.
BACKGROUND
Adaptive equalizers are filter structures that are useful for correcting linear distortions affecting transmission channels. Impairments such as in-home reflections on cable wiring, broadcast echoes or ghosts, and diplex filter group delay and amplitude non-flatness are examples of linear impairments that can be repaired. Figure 1 is a block diagram of a real-only adaptive equalizer. It consists of an analog-to-digital (A-D) converter,
time delay elements z-1, programmable coefficients, a summer, and a digital-to-analog (D-
A) converter. The equalizer filter performs the time domain convolution function:
y(n) = C(0)x(n) + C(1)x(n — 1) + + (1) C(N)x(n — N)
This equation may be restated as:
y(n) = (2)
k = 0
where C(k) is a tap coefficient, k is the tap number, N+1 is the number of taps, n is the time sample index, x(n) and y(n) are the input and output time samples respectively, assuming sample period is 1.
As mentioned earlier, this equalizer has real-only tap coefficients. If the echo is complex, then an equalizer with complex taps is required. Complex echoes occur when the impairment is added to an radio frequency (RF) or intermediate frequency (IF) modulated carrier. A complex equalizer structure consists of a real section, an imaginary section, and real-to-imaginary and imaginary-to-
real cross-coupled sections, as illustrated in Figure 2. The complex equalizer structure performs the functions:
y(n) = (3)
k = 0
for the real output voltage, and
y1(n) = Cr(k)xi(n — k) + Ci(k)x,.(n — k) (4) k = 0
109

E 1 In
A-D
I IN
Figure 1: Real-only Adaptive Equalizer Structure
X )
DIN Xi (n)
A D
A D
REAL FILTER
I MAG FILTER
I MAG. FILTER
REAL FILTER
E L
0— A I OUT
0— A
Yr-
OUT
Figure 2: A Complex Adaptive Equalizer Structure
for the imaginary output voltage, where yr(n) and
y1(n) are the in-phase and quathature output
voltages, Cr and Ci are real and imaginary tap
coefficients, and xr(n) and xi(n) are the in-phase
and quadrature sample voltages for input to the equalizer.
This deghosting process is illustrated in Figures 3-6. Figure 3 is an impulse response of a complex
echo that has a delay of td and an amplitude of 0.5 relative to the main impulse and at 90 degrees relative to the original direct-path signal. After this
Yl ( n
echo is accurately characterized at the receiver, and the coefficients are programmed into a finite
impulse response (FIR) filter, the tap coefficients would appear as displayed in Figure 4. Note that
the first tap coefficient occurs at a delay of 'Ed
samples with an amplitude of 0.5 and thereafter
tap coefficients reappear every "Ed units of delay
with amplitudes of 0.5n where n is the number of the echo recursion. The tap coefficient phase rotates 90 degrees on every recursion. There are an
infinite number of taps required to perfectly cancel an echo with a FIR filter. If the number of taps is
110

A' REAL
- T I ME 0
12.5 0°
•T IME
I MAG . - T I ME
- TI M E
R E AL_
I M A G .
Figure 3: A Complex Impulse Response
T
0
-r
+TIME
2 las 2 AI -r
. 2 5 Z . 1_21 ffil
0 12 5
- T I M E
0 . 5 Z2 ILL'1.'
Figure 4: Complex Taps Coefficients
limited, which it will certainly be for cost considerations, an imperfect solution is all that is possible. The quality of the solution is strongly deteriorated if there are an insufficient number of taps relative to the delay and strength of the echo. If the echo is long and strong the solution is poor.
If the impulse response of Figure 3 is transformed
into the frequency domain, the result is as shown in Figure 5. Note that the echo causes a ripple in the frequency response. The reciprocal of the delay of the echo shows up as the period of the frequency response ripple, and the amplitude of the echo as the amplitude of ripple in the frequency response. If this frequency response data is divided (complex division) into the
t I PI E
0 . 0 31 Z
transformed received data at every frequency point, the result is the corrected frequency response data. If this corrected frequency response data is inverse Fourier transformed back into the time domain, the deghosting function is accomplished.
In other words, if the transmitted signal is denoted as s(t), and it is received with an echo of
magnitude a, and delay td added, the resulting
received signal r(t) is:
r(t) = s(t)+ as(t — td) (5)
If the received signal r(t) is Fourier transformed into the frequency domain, it becomes R(f):
111

R E AL_
-
I M A O .
0. 5
-
Figure 5: Frequency Response of a Channel with an Echo
R(f) = S(f)(1+ ae-i2nftd ) = S(f)H(f) (6)
Where H(f) is the channel's frequency response. The channel's inverse frequency response is computed as the reciprocal of the channel's frequency response:
1 H (f) = H(f) (7)
The echo-corrected received signal can be obtained by multiplying the received signal by the channel's inverse frequency response:
S(f) = R(f)11 v(f) (8)
S(f) can be re-transformed back to s(t), to obtain the original transmitted signal without echo impairments.
There is also an opportunity in the frequency domain to easily do band-filtering as well as echo cancellation. The VSB response that would be required for NTSC receivers, for example, can be done by forcing the lower sideband coefficients to be set to all Os. This technique is discussed in reference [2]. An example of this filter response is shown in Figure 6. This technique works well for digital signals, such as 8-VSB as well as analog
signals. For 8-VSB, frequency domain filtering
can be used to provide the root-cosine response required around the pilot frequency as well as the roll-off at the band edge.
There is a problem, however, with this frequency domain equalization approach. The Fourier transform operates on one block of data at a time. For an exact echo correction, it is necessary that no extraneous energy be introduced into the block transform. Every symbol that is in the transform must have its expected echo, and every echo must
be accompanied by the signal that generated it. (An expected echo is the signal that would be anticipated, given the impulse response of the channel and the transmitted signal.) The solution to this requirement is to include a time-domain guard-interval which is a sample of data copied
from the back of the transform and appended to the period of time just before the start of the block capture period. If this is done, and the echo is shorter than the guard interval, the effect of the echo can be removed completely in a noise-free environment if the carrier is not cancelled completely. The use of a time-domain guard interval is mentioned in reference [1].
Figure 7 illustrates a signal that is impaired with expected echoes. Additionally, one unexpected alien impulse is received. This unexpected impulse may be electrical noise, or it may be the result of a
112

R E AL
0.
0
- F R E D 0
I M A G.
0 - F R E D
- 0 . 4
Figure 6: Frequency Response of a Filter that will VSB Fitter a Channel and Cancel the Echoes
very long echo. The impulse response of the
channel is similar to Figure 3, and Figure 8 shows the result of echo cancellation. Note that the expected echoes have been completely removed,
but the unexpected sample of energy has not been removed, and multiple echoes have been created by it, each with a differential delay equal to the delay in the impulse response. Since the echo was less than unity, each added echo is cumulatively multiplied by the echo amplitude (i.e., if the first is 0.5, the second is 0.25, the third is 0.125, etc.) and rotated by a phase angle. If the unexpected echo is the result of a long reflection, the remedy for this impairment is the use of the overlapped Fourier transform. The use of an overlapped transform
G
cr , AL I E N I G NAL
S L ECI-1 0
4
amounts to simply capturing more data than is desired, and discarding the first portion when the long echoes, which are longer than the guard interval, are dying out. Thus, a time-domain guard
interval, coupled with an overlapped transform, provides an excellent solution for both strong short delay echoes and weaker long delay echoes. These characteristics match the reality of both cable and
terrestrial television channels, where shorter echoes tend to be stronger.
In the case of NTSC, this technique allows the 10.4 µsec horizontal sync signal interval to be used as a time-domain guard interval which improves deghosting performance for signals shorter than
Ti Ti R E A L
B L OC K
EC HO
•
' Gi l
I M A( .
Figure 7: Signals with Echoes and an Alien Signal
T I ME
T I ME
113

10.4 µsec. In the NTSC, every other transmitted horizontal blanking is substantially identical. The overlapped transform technique may be
implemented by grabbing one more line than is needed. In the case of 8-VSB, frequency domain filtering allows the receiver's root cosine filter function to be performed with digital accuracy, as well as echo cancellation.
o x AL I EN
Figure 9 is the block diagram that was used to generate echoes, demodulate the carrier, and capture waveforms. The echoes were generated at IF, and demodulation was done with a complex (quadrature) demodulator using a synchronous carrier wave from the video generator. The NTSC signal was looped out of the modulator for ghosting and then looped back in for VSB and
A -- SIGNAL
ECHO GONE
REAL
III
NTSC V IMO GENERATOR
BLOCK
ECHOS CREATED FROM ALIEN I MAG
TIME
Figure 8: Echo Cancellation
NTSC MODULATOR SA6350
90°
HP GHOST --- SIMULATORT
LPF
LPF
ounoRATuRE pc moou_ A TOR
REAL CHI
I MAG C.H2
MP VS8 SAW FILTER IN MODULATOR
45 75 MHz
REFERENCE LO
TEK
TIDS420
DIGITAL
0-SCOPE
Figure 9: Echo Generation System
spurious filtering. After several tests, it was determined that the echoes could be accurately generated equally in software from an unimpaired signal.
GP I B
TIME
WORK - STAT ION
Figure 10 is an illustration of a captured unimpaired NTSC signal from the vertical blanking interval (VBI). Note that the low frequency energy is purely real, and the high frequency is both real and imaginary. If the
114

unimpaired signal is VSB filtered, using frequency domain filtering, the result is as shown in Figure
11. The imaginary part is discarded, and only the real part is used.
Figure 12 shows an NTSC signal that has been impaired with a 9 µsec echo at -3 dB and 225 degrees relative to the carrier. This delay echo was chosen to be less than the 10.4 µsec guard interval. Figure 13 is this signal deghosted by frequency domain filtering. The block of data used for the transform is two lines in duration. Note that the solution results in a full echo cancellation with all lines good.
Figure 14 shows an NTSC signal that has been
corrupted with a 20 µsec echo at -6 dB and 30 degrees. This case illustrates an echo that is longer than the 10.4 µsec guard interval. Figure 15 is this signal deghosted. The first line of the deghosted block is damaged in this transform: it is contaminated with the effect of energy extraneous to the block (successive recursions of the long echo dying out). The second line of the transform has a good result and may be used. Hence the transform is done once for each line using data from two lines. The first line is always discarded.
Applications
This technique may be used for either analog or digital signals. An immediate application is the recovery of the NTSC VBI data. Effective ghost cancellation can allow more data to be carried in the VBI by using more bits per symbol. If a computer is connected to the television, the computer can be used as a signal processor.
Conclusion
Frequency domain filtering can be used to cancel echoes, and provides frequency-shaping filtering. By using a time-domain guard interval with overlapped transform techniques, both long and short echoes can be removed automatically. This
technique works for both analog and digital transmissions.
References
[1] H. Sari, G. Karam, and I. Jeanclaude, "Transmission Techniques for Digital Terrestrial TV Broadcasting", IEEE Communications Magazine, Feb. 1995, Vol 33, No. 2.
[2] M. Chelehmal and T. Williams, "Using Orthogonal Frequency Division Multiplexing in the Vertical Interval of an NTSC TV Transmission", 1995 NAB Proceedings.
115

Real
Imag.
Real
3
Figure 10. 10. NTSC VBI Signals, Represented as I and 0 Baseband
Wafeforms. No Echo and No VSB Filtering.
3
Imag.
3
1 + GI TRANSFORM GI TRANSFORM 1 BLOCK 1 2 BLOCK 2
y It
Figure 11. NTSC VBI Signals, Represented as I and 0 Baseband Waveforms. No Echo. Frequency-Domain VSB Filtering Has Been Applied. 0 Part is Discarded.
116

3
Real
-
—
lmag.
Real
3
Figure 12. NTSC VBI Signals, Contaminated With a 9 is Echo at -3 dB at 250°. Echo Less Than Guard Interval.
3 -
-3
lmag.
3
111110... r Pligee.wpmem.••••••.6.4..* 111 •fter......... : 41
44111WIP
Figure 13. Signal of Figure 12 Deghosted with a Frequency-
Domain Filter. Note Both Halves of Transform Block are Good.
1 1 7

Real
3
Imag.
Real
-44-9j14 0, 01 .400 ,
Figure 14. NTSC VBI Signals, Contaminated with a 20 is Echo at
-6 dB at 250°. Echo Longer Than Guard Interval.
3
-3
Irnag.
3
BAD GOOD
411 . 4
BAD GOOD
4111.4
GI TRANSFORM 1 BLOCK 1
GI TRANSFORM 2 BLOCK 2
4t1111V-1 r ----- 146t"sigr-----r4-0141111.0 Figure 15. Signal of Figure 14 Deghosted with a Frequency-
Domain Filter. Note First Half of Transform Block is Bad, Second Half is Good.
118

HDTV Modulator
Steve K.Jh K Tech Telecommunications, Inc.
Mission Hills, CA 91345
ABSTRACT
As interests in 8-VSB modulation and demodulation process increase, there is a growing need for an 8-VSB modulator which meets the ATSC transmission specifications. KTech Telecom has developed an 8-VSB signal generator which meets ATSC signaling formats. The test equipment is useful for debugging and testing of an 8-VSB
demodulator. This paper discusses the performance of the 8-VSB Modulator and modulator generation techniques.
INTRODUCTION
The 8-VSB signaling format has been chosen by ATSC for transmission of HDTV signal. For receiver development and manufacturing, a test signal generator equipment can be a time saving instrument. The HDTV Modulator is developed by KTech Telecom and it includes such functions as randomizer, RS Encoder, Convolutional Interleaver, TCM Encoder, DC level insertion, and digital VSB filter. An RE module is also added for RE frequency translation capability.
8-VSB MODULATOR
The ATSC specification for digital transmission standard describe the details of the baseband digital frame formats. The overall block diagram is shown in Figure 1.
Input
Data Randomizer RS
Encoder
Cony
Inteneaver
TCM
Encoder
Seg_Sync
Frame_Sync
MOD
FILTER
1.25 (8 level)
2.5 (16 level)
DAC
Digital 3 58MHZ
I F. Camer
Figure 1 Overall Block Diagram
VSB MODULATOR SPECTRUM
LPF
Output
In order to verify signal performance, a computer simulation has been performed to predict waveform behavior and
spectrum analysis. The digital words at the input of the DAC is simulated using a computer and its spectrum is shown in Figure 2. This spectrum output is obtained by performing FFT on the simulation signal results from the VSB Modulator filter. Since this contains only the VSB digital filtering effect, the classical flat-top spectrum is visible. The pilot tone is also visible and serves as a reference signal to aid in the carrier demodulation in the 8-VSB receiver.
119

Mag [dB]
-10
-20
-30
-40
-50
-60
-70 +
-80 -
-90
3.58 Frequency [MHz]
Figure 2 Spectrum Based on FFT of Computer Simulation
However, the ATSC 8-VSB signal actually contains a comb filter characteristic due to the Convolutional Interleaving. This is primarily introduced to distribute burst error patterns such that they are randomly distributed across time. In addition, the Convolutional Interleaver introduces spectrum nulls to combat the NTSC into HDTV signal co-channel interference.
The 8-VSB signal generated by the HDTV Modulator exhibits spectrum nulls which are specifically designed to coinside with the video and audio carriers of the NTSC signal. The effect of the Convolutional Interleaver can be seen in the actual HW measurement of the HDTV Modulator as shown in Figure 3.
The front panel of the HDTV Modulator includes 8 level and 16 level modulation selector, by-pass buttons, and I/O BNC connectors, as shown in Figure 4.
X i..
Figure 3 Spectrum of HW Measurement
HDTV,DIDR'AL MODULATOR
CUCKOO' 1:41.A M U W O 0,
R 41 W../1
Figure 4 Front Panel Design
The by-pass buttons are particularly useful in testing individual sections of the 8-VSB demodulator. Since the by-pass buttons allow "connect / no-connect" capability for individual sections of the baseband functions such as Randomizer, RS Encoder, and Convolutional Interleaver, the demodulator can be tested for its individual functions.
CONCLUSION
An 8-VSB signal generator is described. This test signal generator can be used for testing 8-VSB demodulator.
120

Figure 5. HDTV Modulator
Reference
[1] Doc N53, ATSC Digital Television Standard
121
A DEVELOPMENT OF HDTV ENCODER
Chai Yeol Rim, Woo Sung Jeon, Kyung Won Lim*, Jong Beom Ra* Munhwa Broadcasting Company, Seoul, Korea.
*KAIST, Daejon, Korea
Abstract
A GA-HDTV encoder system was developed. The video encoder is based on the MPEG2 MP@HL and the transport encoder is
based on the MPEG2 System. We used the MPEG audio encoder from Philips and the AC-3 encoder from Dolby. The HDTV video encoder use the adaptive perceptual quantization algorithm for the effective video compression. The transport encoding algorithm was implemented in the Power PC CPU with the OS-9000 operating system. The transport encoder accepts the video / audio / data streams, and generates the multiplexed transport packets.
I. Introduction
We implemented the HDTV encoder which is based on the MPEG2 MP@HL[1], and MPEG2 transport encoder[2]. The whole HDTV encoding system is composed of video, audio and transport encoding parts. In this paper, we described the several core algorithms which are used in this developed HDTV encoder. This developed HDTV encoder follows the Grand Alliance's HDTV specification which was announced in October 1993 [3]. The GA-HDTV video encoder comply for the MPEG2 MP@ML and the main features of the encoding algorithms
are followings. For the SMPTE240M format, with 1125 total lines per frame and 2200 total samples per line, the sampling frequency will be 74.25MHz for the 30.00 frames per second (fps) frame rate and the compressed video data rate is
18.4Mbps. The transport encoder has a VME bus and OS-9000 operating system. For the data service, the transport encoder can accept the external data stream and insert it into the transport stream. The transport encoder generates the PSI (Program Specific Information) which is based on the MPEG2 and ETS 300 468 [4].
II. HDTV Video Encoding System This HDTV video encoding system follows
the Grand Alliance HDTV specification which is based on the MPEG2 MP@HL. Because the
MPEG2 standard focuses on the compressed data syntax and their decoding method, we can choose various encoding methods to implement the encoding algorithms. In this paper, we explained the methods which can reduce the hardware complexity and improve the image quality,
following the MPEG2 standard. To improve the image quality, we modified the adaptive quantization algorithm and motion estimation method which is over the half of the whole hardware. When we determine the quantization
parameter, we should consider the channel buffer status and the human visual characteristics [5,6].
1. Hierarchical Motion Estimation Algorithm MPEG2 video encoding algorithm uses the
BMA (block matching algorithm) and we must search the large area to find the motion of the block using the BMA. After the field / frame search are used together for the interlaced image, the better one is selected. To find more accurate
122

motion vectors, MAD (mean absolute difference)
should be calculated for each block in the whole image areas. But this is not possible to implement the hardware practically, then we used the efficient motion estimation algorithm which can find the almost exact motion vectors
sustaining the performance to implement it practically.
The main feature of the efficient motion estimation algorithm is hierarchical motion estimation. To find the motion vector, the hierarchical motion estimation algorithm uses the multi-step motion estimation. At first, we find the motion vector in the whole image area from the top level low resolution image and find the fine motion vector in the local area of the bottom level high resolution image using the motion vector found in the low resolution image. For the top level motion estimation, we reduced the resolution of the original image using the filtering and found the rough motion vector. For the bottom level motion estimation, we reduced
the search area based on the top level motion vector to find the fine motion vector. We used the 2 steps hierarchical motion estimation method in this HDTV video encoder. At the top level, we reduce the image resolution 4:1 in horizontal direction only considering that these images are interlaced ones. At the top level search, we look for the one motion vector for the even and the odd field each. At the bottom level search, we look for the one motion vector for the even and the odd field each also, and find the frame motion vector based on the motion vector
"0" together. The reason why we restricted the frame motion vector to the small motion vector area is that for the still area or the small motion area the frame motion vectors are selected and for the fast motion area the field motion vectors are selected. We can reduce the motion estimation hardware to 1/10 compared to the full search one, the performance is estimated that it will be within 0.1dB PSNR loss as shown in Table 1.
Table 1. PSNR comparison between the hierarchical method and the full search method Algorithms
Full search 2 step search
Average PSNR (dB) HD basketball HD girl HD tennis
28.8 27.9 29.7 28.3 27.8 29.6
2. Adaptive Quantization Method
We proposed adaptive quantization method considering the object boundary which is not expressed properly using the variance in the MPEG2 TM5, and the characteristics of the near macro-blocks to increase the perceptual image quality. This proposed method uses the following 3 steps to determine the quantization value.
Step 1. In order to exploit the human perceptual characteristics, the macroblock is classified into a certain class based on its characteristic. To classify the macroblock, each 8x8 block within the macroblock is classified into three types (smooth, edge, texture blocks) depending on its local activity. The energy
distribution of DCT-transformed coefficients is used to identify the spatial activity of the block.. For high activity blocks, the texture block is distinguished from edge blocks because the texture block has a relatively uniform energy distribution compared with edge blocks. In the edge block, the pixel values are smooth overally but it changes abruptly in some parts. After the classification of each block, the activity of a macroblock is determined depending on the distribution of the block types within it. Since each macroblock contains four 8x8 luminance blocks, the combination of the block types within the macroblock produces 15 different classes. The lower macroblock class number corresponds
123

to a smaller perceptual parameter and it implies that smaller quantization error is allowed, and vice versa. The class of a macroblock which is perceptually important has small value and the class of a macroblock which is not important has large value.
Step2. The visibility of coding artifacts in a macroblock depends not only on its own perceptual characteristics but also on its surroundings. For example, since the object boundary in the smooth background is sensitive to the HVS, it is more reasonable to assign this kind of macroblock to a lower class. Edge blocks are often misclassified as texture blocks. However this mistake can be alleviated if its neighboring macroblocks are examined. The coding artifact of the macroblock surrounded by a texture region is less visible. In this case, if the macroblock is not very sensitive to the HVS, it can be classified into a higher class without losing significant perceptual quality.
Step3. Considering the temporal activity and the perceptual characteristics, the quantization level would be adjusted. It is known that, if an object is in fast or complex motion, its detail would be less visible. If both the moving object and its background are smooth near the object boundary, however, its coding artifact becomes more sensitive to HVS. Therefore this
HDTV input— ° ' ND Preprocessing
•
U,V
Forward analyzer -
region, even if it is moving object, has to be finely quantified. In order to find this region, we select the macroblock which has a large variance of motion compensated errors, that means it includes an object in a fast or complex motion. If the selected macroblock includes the object boundary whose object and background regions are smooth, its perceptual parameter is lowered by half to compensate high human visual sensitivity. At first, using the MC error variance, we find the high active macroblock. And considering the selected macroblocks class and the 8 neighbored macroblocks class, determine whether the object and the background is important region or not and control the adjust the quantization levels.
The mquant values corresponding to each macroblock will be obtained by multiplying the perceptual weight, pweight, and reference quantization parameter. We will use the three step mentioned above to determine the quantization perceptual weight. pweight. And the final quantization levels are obtained by multiplying this scaling factor by frequency weights which is prepared on the basis of the fact that the HVS is more tolerant of quantization errors at high frequencies than at low or mid frequencies. Fig.1 shows the overall flow chart of the perceptual quantization.
Y Encoder RLC
Y Encoder RLC
Y Encoder RLC • Y Encoder RLC
U Encoder RLC
V Encoder RLC
VLC
VLC
Bit stream grabber
Postprocessing--s.
Figl. Overall block diagram of the video encoder
D/A
—4. Channel
Monitor
124

4. Implementation of the video encoder hardware
The HDTV video encoder system is composed of the video signal input part which accepts the video signal from the HDTV camera, the signal processing part which compresses the video image and generates bit stream, and the display part which can display the decoded HDTV image to the monitor without any special HDTV decoder. The video signal input part does the LPF, ADC and chrominance transformation and generates the YUV signal. For the I/P/B frames, we reorder the input frames in the video input part. Because the HDTV video sampling frequency is very high (74.25MHz), we implemented the signal processing part as 4-way partitioned parallel architecture. When we divide
IN Delay I Mode Control
Delay
the image, the Y component is divided by 2 in the horizontal and the vertical direction, but UV components are not divided because the number of pixel of the UV component is 1/4 of the Y component. The signal processing part is composed of the motion estimation / compensation part, the mode selector, WUN component encoders, the D/A and post processing part, VLC part, the forward analyzer part and the rate control part. The motion estimation / compensation part searches field / frame, forward / backward / interpolative motion vectors of the macroblocics depending on the picture type. Fig.2 shows the block diagram of the motion estimation part. The mode selector determines ME / MC mode, inter / intra mode, field / frame DCT mode as shown in Table2.
Delay
Motion Vector
V MC data
2nd ME
..01Address I calculator (HP)
sea l area I memory (HP) 4 -
1st ME
Motion Vector
41 Address calculator (2nd)
Motion Vector MV calculator
ISearch area memory (2nd)
Decimator
Fig2. Block diagram of the motion estimation part
Table 2. The mode types depending on the picture type
I-picture P-picture B-picture field / frame DCT frame / field ME
inter / intra
MC / noMC frame / field DCT
Frame 04_ memory
Frame memory 1
frame / field ME forward / backward / interpolative ME inter / intra frame / field DCT
125

The Y/UN component parts do DCT, quantization, IDCT and RLC. The D/A and post processing part does the frame reordering, the chrominance transformation and the D/A conversion of the decoded Y,U,V components. In
the VLC part, RLC data and motion vectors are coded as VLC and their result is combined into the video bit stream. The image is analyzed for the adaptive perceptual quantization explained above and the bit rate is controlled in both the forward analyzer part and the bit rate control part. The Fig.3 shows the overall video encoder block diagram.
III. HDTV Audio Encoder System We used a MPEG audio encoder of Philips and
AC-3 encoder of Dolby for HDTV audio encoding system. This audio encoders are integrated into the HDTV encoding system. For the synchronization, the audio encoder is reset together with the video encoder.
IV. Transport Encoding System TS encoding system is composed of power
Macroblock (Y)
Feature extraction
Motion
Local activity analysis
compensated erroi
Block classification
Temporal activity weighting
Class (1-15)
Spatial activity weighting
PC 3
main CPU board which is operating in the 0S9000 environment, AN encoder interface hardware, channel encoding interface which transfers the encoded transport stream into the channel encoder to be transmitted. TS encoding algorithm is implemented in the software for the
power PC CPU board. Following the MPEG-2 system standard, the encoded video and audio streams are packetized. First, after the compressed video / audio data stream are received, the TS encoder generates the PES streams. PES packets are composed of only one video / audio frame and the PES packets are loaded on the payload of the TS packet. This transport encoder generates the PCR and the time stamp to support the lip synchronization. The transport encoder generates the PSI (Program Specific Information) which is based on the MPEG2 and ETS 300 468. PSI is composed of PAT, PMT, CAT, NIT, EIT, SDT and TDT. The yntax and semantics of PAT, PMT, and CAT are described in MPEG2 System standard, but NIT, EIT, SDT and TDT are described in ETS 00 468.
Buffer status
Rate control
IQref(13 ) !C30
Perceptual mquant • weight (a )
Frequency weights for 8x8 DCT coefficients
Quantized DCT coefficient at (i,j)
[ DCT coefficient at (i,j) = Integer
a. p
Perceptual quantization weights
=
Frequency sensitivity
— 16 16 19 22 26 27 29 34-16 16 22 24 27 29 34 37 19 22 26 27 29 34 34 38 22 22 26 27 29 34 37 40 22 26 27 29 32 35 40 48 26 27 29 32 35 40 48 58 26 27 29 34 38 46 56 69 27 29 35 38 46 56 69 83
Fig3. Conceptual flow chart of the adaptive quantization
The transport encoder can accept several video and audio encoded streams and generate one
transport packet stream. Transport encoder can also insert the data streams into the transport
126
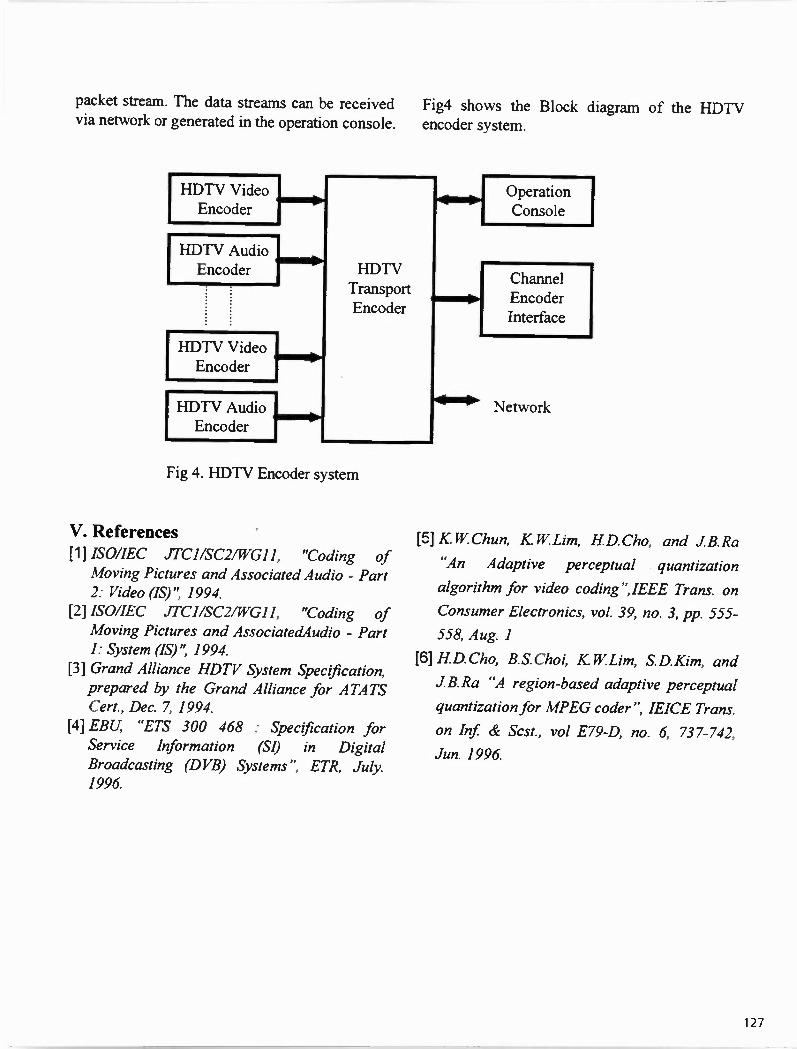
packet stream. The data streams can be received via network or generated in the operation console.
HDTV Video H Encoder
HDTV Audio Encoder
HDTV Video H Encoder
HDTV Audio H Encoder
Fig4 shows the Block diagram of the HDTV encoder system.
HDTV Transport Encoder
.--d
H Fig 4. HDTV Encoder system
V. References [1] ISO/IEC JTC1/SC2/WG11, "Coding of Moving Pictures and Associated Audio - Part 2: Video (IS)", 1994.
[2] ISO/IEC JTCHSC2/WG1 I, "Coding of Moving Pictures and AssociatedAudio - Part 1: System (IS)", 1994.
[3] Grand Alliance HDTV System Specification, prepared by the Grand Alliance for ATATS Cert., Dec. 7, 1994.
[4] EBU, "ETS 300 468 : Specification for Service Information (SI) in Digital Broadcasting (DVB) Systems", ETR, July. 1996.
Operation Console
Channel Encoder Interface
4•11 Network
[5] K W.Chun, K W.Lim, H.D.Cho, and J.B.Ra
"An Adaptive perceptual quantization
algorithm for video coding",IEEE Trans. on
Consumer Electronics, vol. 39, no. 3, pp. 555-
558, Aug. 1
[6] HD.Cho, B.S.Choi, KW.Lim, S.D.Kim, and
J.B.Ra "A region-based adaptive perceptual
quantization for MPEG coder", lEICE Trans.
on Inf. & Scst, vol E79-D, no. 6, 737-742,
Jun. 1996.
127

128

DIGITAL SOUND BROADCASTING: IMPLEMENTING NEW TECHNOLOGY Sunday, April 6, 1997 1:00 - 5:30 pm
Chairperson: Milford Smith, Greater Media, Inc., East Brunswick, NJ
*ON CARRIER DIGITAL FM TECHNOLOGY: A PROGRESS REPORT FOR DIGITAL AUDIO BROADCASTING AND MULTIMEDIA TRANSMISSION USING FM SUBCARRIERS David P. Maxson WCRB Waltham, MA David Murotake Sanders, a Lockheed Martin Company Nashua, NH
THE WORLDSPACE SYSTEM: ARCHITECTURE, PLANS AND TECHNOLOGIES D.K. Sachdev WorldSpace Washington, DC
*ADVANCES IN DIGITALLY MODULATED RF SYSTEMS Tim W. Dittmer Harris Corporation Quincy, IL
*ROBUST IN BAND - ON CHANNEL AM AND FM DIGITAL AUDIO BROADCAST TECHNOLOGY Brian W. Kroeger and Rick Martinson Westinghouse Wireless Solutions Company Linthicum, MD
DAB RECEIVER ISSUES - PANEL Thomas Lauterbach, Eureka 147/Bosch, Hildesheim, Germany; Jurgen Atthoff, Deutsche Telekom, Munster, Germany; Franc Kozamemick, European Broadcasting Union, Geneva, Switzerland; Masaoki Takai, Kenwood, Tokyo, Japan; Peter Shellswell, BBC, Tadworth, Surrey, U.K.
EUREKA 147 DEVELOPMENTS WORLDWIDE David Witherow World DAB Forum London, England
129

*DATA BROADCASTING IN GERMANY DAB AS A MULTIMEDIA SYSTEM Eberhard Siebert and Jurgen Althoff Deutsche Telekom Freiburg, Germany
*RETAINING LOCALISM WITH THE EUREKA DIGITAL AUDIO BROADCAST SYSTEM Scott Wright Delco Electronics Kokomo, IN
•Paper not available at the time of publication
130

The WorldSpace System: Architecture, Plans and Technologies
D.K.Sachdev, VP System Development & Planning WorldSpace
Washington DC
The WorldSpace System will bring modern digital radio technology to several parts of the world through three geostationary satellites to be launched progressively from June 1998 onwards. Through the use of onboard processing and powerful L-band Travelling Wave Tube Amplifiers (TVVTAs), the WorldSpace broadcasts will be received by portable hand-held or car radios. Broadcasters can uplink either from centralized hubs or individual feeder links located anywhere in the global coverages of the three planned satellites.
This paper presents the overall system architecture, coverages. operational arrangements and key technolo-gies in the space segment and for the radio receivers. Salient features of the spacecraft under manufacture and the ground network are also be described. The adaptability of the all-digital pipeline to the end-users for future services will also be touched upon.
In about 18 months from now, the WorldSpace sys-
tem will be a reality for the world to touch, feel and listen. Several hundred engineers and technicians
are at work in dedicated teams in different parts of
the world to ensure that everything happens on time and according to requirements. A few months after the first of the three especially designed WorldSpace
satellites is launched in June 1998, all of Africa, the
Middle East, and several neighboring countries will begin receiving radio broadcasts dramatically better
in quality and programming diversity than ever before. Within a year after this historic milestone, this new service will be extended to several other
regions, notably Asia Pacific, Latin America, and the
Caribbean. As we enter the next millennium, over 4 billion people, or 80% of the world's population, will
WorldSpace Offering - Far Beyond Existing Radio
Type of
Content
ne ws general financial
- other
music - popular - classical - modern - traditional
sports - events - ne ws
talk
public affairs
education - literacy - advisories (e.g., health, weather)
' WorldSpa ,
40 to 50 channels of digital quality
local national across several international countries
Source of Content Figure 1
131
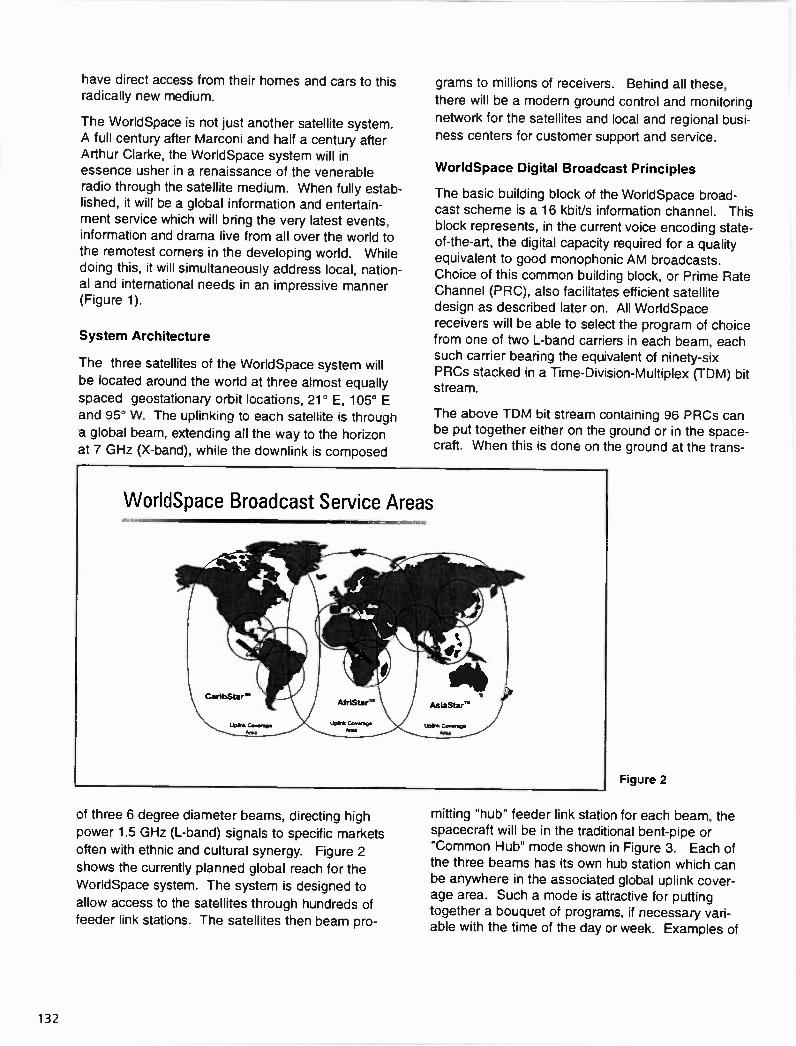
have direct access from their homes and cars to this radically new medium.
The WorldSpace is not just another satellite system. A full century after Marconi and half a century after
Arthur Clarke, the WorldSpace system will in essence usher in a renaissance of the venerable radio through the satellite medium. When fully estab-lished, it will be a global information and entertain-ment service which will bring the very latest events,
information and drama live from all over the world to the remotest corners in the developing world. While
doing this, it will simultaneously address local, nation-al and international needs in an impressive manner (Figure 1).
System Architecture
The three satellites of the WorldSpace system will
be located around the world at three almost equally
spaced geostationary orbit locations, 21° E, 105° E
and 95° W. The uplinking to each satellite is through
a global beam, extending all the way to the horizon at 7 GHz (X-band), while the downlink is composed
WorldSpace Broadcast Service Areas
of three 6 degree diameter beams, directing high
power 1.5 GHz (L-band) signals to specific markets
often with ethnic and cultural synergy. Figure 2
shows the currently planned global reach for the
WorldSpace system. The system is designed to
allow access to the satellites through hundreds of feeder link stations. The satellites then beam pro-
grams to millions of receivers. Behind all these,
there will be a modern ground control and monitoring
network for the satellites and local and regional busi-ness centers for customer support and service.
WorldSpace Digital Broadcast Principles
The basic building block of the WorldSpace broad-cast scheme is a 16 kbitis information channel. This block represents, in the current voice encoding state-of-the-art, the digital capacity required for a quality equivalent to good monophonic AM broadcasts.
Choice of this common building block, or Prime Rate Channel (PRC), also facilitates efficient satellite design as described later on. All WorldSpace
receivers will be able to select the program of choice from one of two L-band carriers in each beam, each such carrier bearing the equivalent of ninety-six
PRCs stacked in a Time-Division-Multiplex (TDM) bit stream.
The above TDM bit stream containing 96 PROs can be put together either on the ground or in the space-craft. When this is done on the ground at the trans-
Figure 2
miffing "hub" feeder link station for each beam, the
spacecraft will be in the traditional bent-pipe or "Common Hub" mode shown in Figure 3. Each of the three beams has its own hub station which can
be anywhere in the associated global uplink cover-age area. Such a mode is attractive for putting together a bouquet of programs, if necessary vari-able with the time of the day or week. Examples of
132

Common Hub Operation Concept
programs are shown in the left of Figure 3. In essence, any digital signal less than 1.5 Mbit/s can be transmitted. In actual practice, the range will be limited to the receiver capabilities, initially a maxi-mum of 128 Kbit/s. As is well known, such a com-mon hub mode provides the flexibility to manage the total package at one programming center, but does entail additional costs and other operational issues of bringing programs from their points of origin, often across national boundaries.
In addition to the above traditional mode, the WorldSpace system will usher a new mode enabling
Figure 3
direct access from the points of origin for the pro-grams. This principle is shown in Figures 4 and 5. Figure 4 shows the "FDMA up and TDM down" prin-ciple to achieve this objective. A feeder link station located anywhere in the associated global uplink for the complete satellite (Figure 1), will directly transmit to the satellite at a designated frequency in the 7 GHz band. For each PRC needed, one uplink carri-er will be used. In all 288 carriers (three times 96) will be transmitted to a single satellite.
In the satellite, each of these 288 carriers is digitally demodulated, a process made efficient due to the
Processed Transponder Principle
Prime Rale Chennuis
27 khz BaneM1dth
A - - - Fl F2 F2138
7050 IANz 7075 Mhz
Studio
Hub Ci?
*\dr .
Studio Studio
Brosdeast Channels
Uplink FDM access
Satellite TCM 7/77
Fs Fb Fe 1467 Mhz 1492 MHz
Users
Downlink TDM access
Figure 4
133
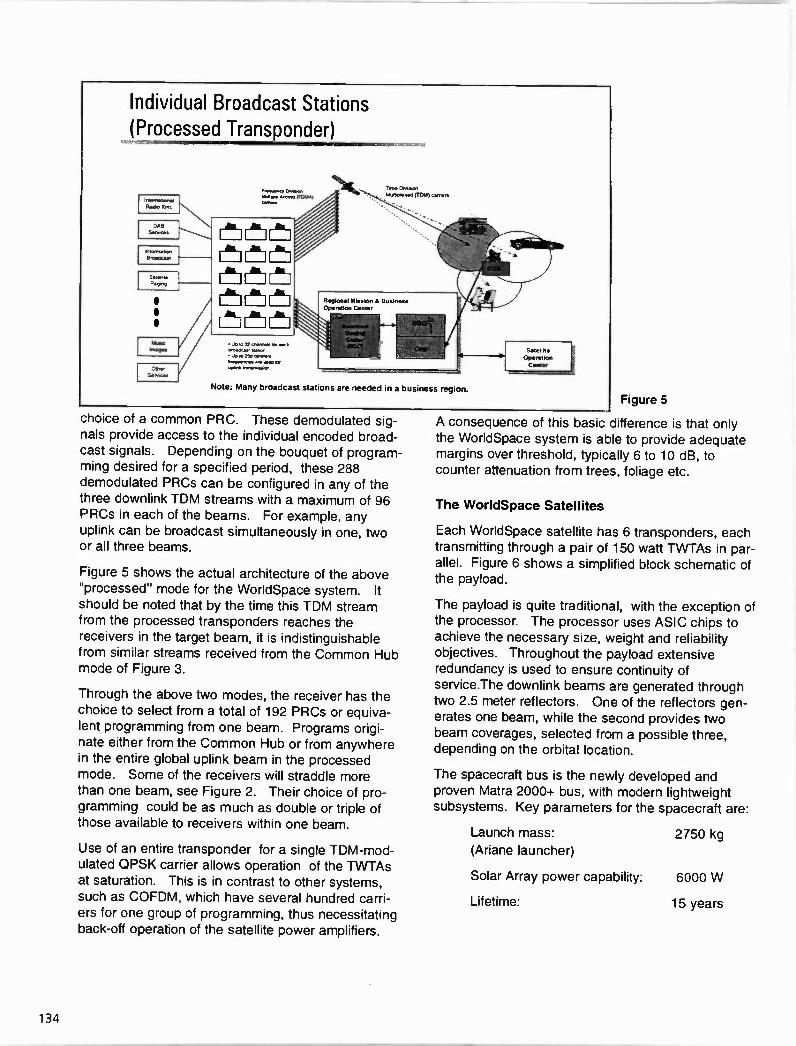
Individual Broadcast Stations (Processed Transponder)
Note: Many broadcast stations are needed in a business region.
choice of a common PRO. These demodulated sig-nals provide access to the individual encoded broad-cast signals. Depending on the bouquet of program-ming desired for a specified period, these 288 demodulated PROs can be configured in any of the three downlink TDM streams with a maximum of 96 PROs in each of the beams. For example, any uplink can be broadcast simultaneously in one, two or all three beams.
Figure 5 shows the actual architecture of the above "processed" mode for the WorldSpace system. It should be noted that by the time this TDM stream from the processed transponders reaches the
receivers in the target beam, it is indistinguishable from similar streams received from the Common Hub mode of Figure 3.
Through the above two modes, the receiver has the choice to select from a total of 192 PROs or equiva-lent programming from one beam. Programs origi-nate either from the Common Hub or from anywhere in the entire global uplink beam in the processed mode. Some of the receivers will straddle more than one beam, see Figure 2. Their choice of pro-gramming could be as much as double or triple of those available to receivers within one beam.
Use of an entire transponder for a single TDM-mod-
ulated QPSK carrier allows operation of the TWTAs at saturation. This is in contrast to other systems,
such as COFDM, which have several hundred carri-ers for one group of programming, thus necessitating back-off operation of the satellite power amplifiers.
Figure 5
A consequence of this basic difference is that only the WorldSpace system is able to provide adequate margins over threshold, typically 6 to 10 dB, to counter attenuation from trees, foliage etc.
The WorldSpace Satellites
Each WorldSpace satellite has 6 transponders, each transmitting through a pair of 150 watt TWTAs in par-
allel. Figure 6 shows a simplified block schematic of the payload.
The payload is quite traditional, with the exception of the processor. The processor uses ASIC chips to
achieve the necessary size, weight and reliability objectives. Throughout the payload extensive redundancy is used to ensure continuity of service.The downlink beams are generated through two 2.5 meter reflectors. One of the reflectors gen-erates one beam, while the second provides two beam coverages, selected from a possible three, depending on the orbital location.
The spacecraft bus is the newly developed and proven Matra 2000+ bus, with modern lightweight subsystems. Key parameters for the spacecraft are:
Launch mass:
(Ariane launcher)
Solar Array power capability:
Lifetime:
2750 kg
6000 W
15 years
134
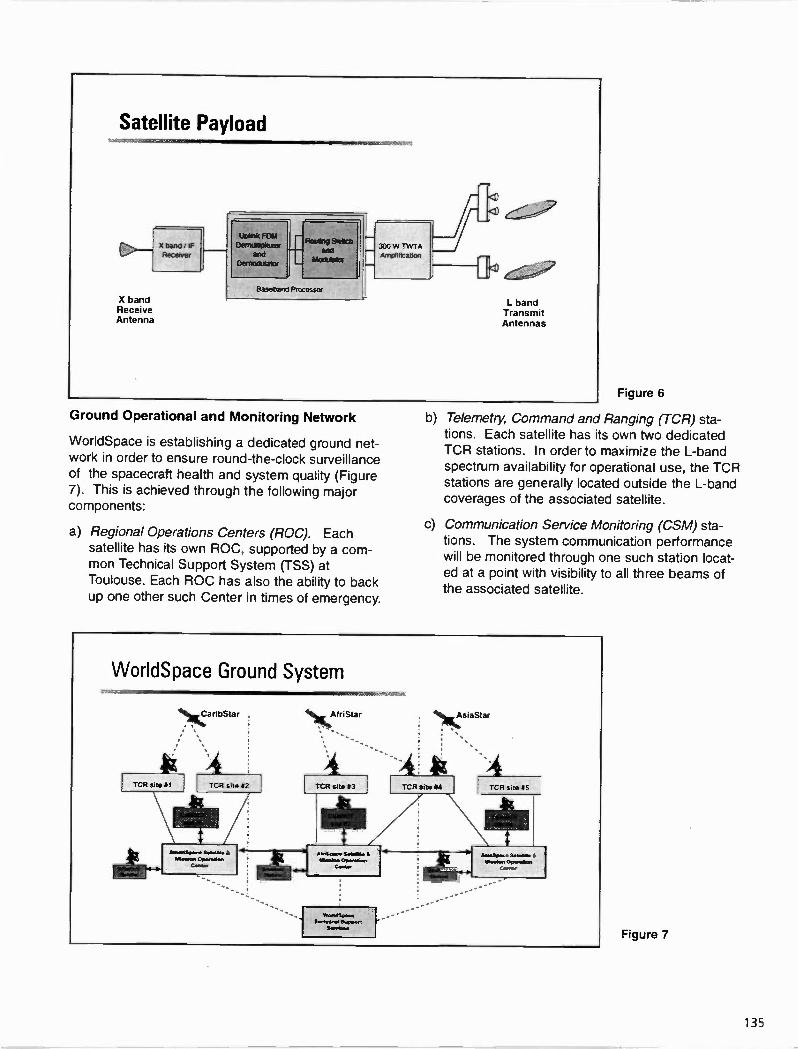
Satellite Payload
X Oand; Receiver
X band Receive Antenna
Doff* FOla Dernatentexer
and Demodulator
Rotatng Stench Azna
Modulator
Eta-,enand Processor
L band Transmit Antennas
Ground Operational and Monitoring Network
WorldSpace is establishing a dedicated ground net-work in order to ensure round-the-clock surveillance of the spacecraft health and system quality (Figure 7). This is achieved through the following major components:
a) Regional Operations Centers (ROC). Each
satellite has its own ROC, supported by a com-mon Technical Support System (TSS) at Toulouse. Each ROC has also the ability to back up one other such Center in times of emergency.
Figure 6
b) Telemetry, Command and Ranging (TCR) sta-
tions. Each satellite has its own two dedicated TCR stations. In order to maximize the L-band spectrum availability for operational use, the TCR stations are generally located outside the L-band coverages of the associated satellite.
C) Communication Service Monitoring (CSM) sta-tions. The system communication performance
will be monitored through one such station locat-ed at a point with visibility to all three beams of the associated satellite.
Figure 7
135
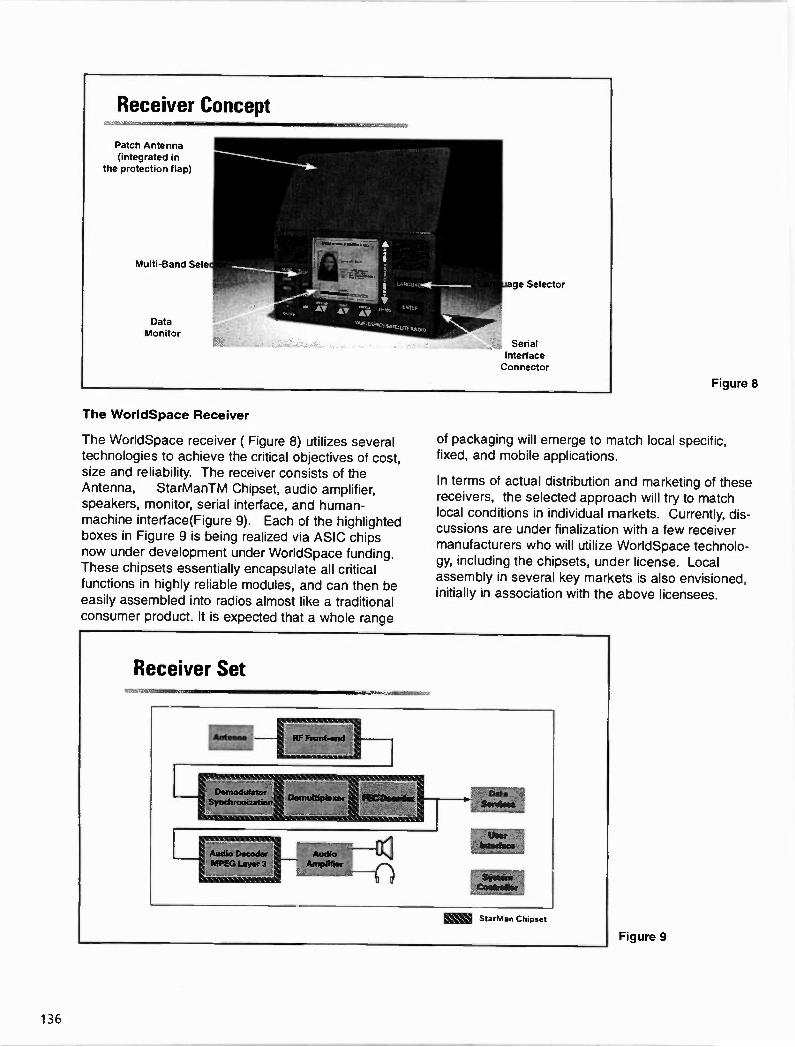
Receiver Concept
Patch Antenna
(integrated in the protection flap)
Multi-Band Sele
Data Monitor
age Selector
Serial Interlace Connector
The WorldSpace Receiver
The WorldSpace receiver ( Figure 8) utilizes several technologies to achieve the critical objectives of cost, size and reliability. The receiver consists of the Antenna, StarManTM Chipset, audio amplifier, speakers, monitor, serial interface, and human-machine interface(Figure 9). Each of the highlighted boxes in Figure 9 is being realized via ASIC chips
now under development under WorldSpace funding. These chipsets essentially encapsulate all critical functions in highly reliable modules, and can then be easily assembled into radios almost like a traditional consumer product. It is expected that a whole range
Figure 8
of packaging will emerge to match local specific, fixed, and mobile applications.
In terms of actual distribution and marketing of these receivers, the selected approach will try to match local conditions in individual markets. Currently, dis-cussions are under finalization with a few receiver manufacturers who will utilize WorldSpace technolo-gy, including the chipsets, under license. Local assembly in several key markets is also envisioned, initially in association with the above licensees.
Figure 9
136

Station Size Examples
Number Type Antenna Size
Power Amplifier
Primary Rate
Channels P3-4 Processed 2.4 m 60 Watts (SSPA) 4
PT-4 Processed 2.4 m (transportable) 60 Watts (SSPA) 4
P2-8 Processed 3.7 m 60 Watts (SSPA) 8
P1-16 Processed 4.5 m 125 Watts (SSPA) 16
T1-40 Hub 4.5 m 125 Watts (SSPA) 40
T1-96 Hub 4.5 m 300 Watts (TWTA) 96
Services
The WorldSpace system has been designed with the following broad service objectives:
• Satellite broadcast of radio programs with quality selec-table from mono-AM to CD
National, regional or global broadcasts
• Direct uplinking from where the action is
Easy transition to multi-media reception
Currently, the following bit rate needs are projected; as the coding techniques improve, higher bandwidth efficiencies can be expected to follow.
Quality kilobits/sec Number Per
Beam
Better Than Short Wave 16 192
FM Monaural 32 96
FM Stereo 64 48
CD Stereo 128 24
The WorldSpace system will be the first to utilize MPEG Layer 3's encoding. Layer 3's superiority to Layer 2 was recently confirmed by a major interna-
tional broadcaster, which equated a WorldSpace 16 kbit/s channel with a 32 kbit/s channel of Eureka 147, which uses Layer 2. This advantage directly trans-
lated to higher system efficiency and economics.
The key technical features of MPEG Layer 3 encod-ing include:
Figure 10
a) High Frequency Resolution. 576 frequency bands instead of only 32 (with Layer-2).
b) High Code Efficiency. Entropy coding exploits sta-tistical properties of audio signals.
c) "Bit Reservoir". Suppressing of artifacts in critical parts of the music signal.
d) Dynamic Bit rate Switching.
e) Flexible Joint Stereo Coding.
Feeder Link Stations
Figure 10 summarizes the range of earth stations envisioned for the WorldSpace system. As antici-pated, those for the processed transponder are smaller and could even be portable. While the bulk of the equipment is standard satellite earth station
subsystems, the encoding and decoding are special-ized items for the WorldSpace system. Multiple ven-dors will be selected for the initial range of earth sta-tions anticipated.
System Performance and Validation
Concurrent with the design and development of the major components of the WorldSpace system, a series of system simulations are being carried out to confirm and validate the key performance paramete -s and objectives. Recently, via a helicopter simulation of the satellite, several operational scenarios were tested. While quantitative results are being devel-oped, several operational modes were confirmed:
137

• Reception via relatively simple helix and patch
antennas under LOS conditions has been confirmed.
• The planned system margins were confirmed. The WorldSpace coverages are defined in such a way that even at the outermost perimeters of these cover-ages, adequate link margins will be available, typical-ly 6 to 10 dB. These margins ensure that even due to blockages with foliage and trees, the receivers will continue to operate satisfactorily.
• Indoor distribution within buildings was confirmed. No impairment due to multipath was encountered up to 50 meters.
• Indoor reinforcement was also confirmed.
Simultaneous reception was possible directly through a window and through rebroadcast inside a building equipped with a roof top antenna.
• Mobile reception was demonstrated under line-of-
site (LOS) conditions, even with margins down to 2 dB. For elevation angles higher than 70°, small flat patch or helix antennas with as little as 4 dBi of gain
mounted on the vehicle's roof operated very well.
• For mobile use at elevation angles between 30° and 70°, an 8 to 11 dBi antenna that stays pointed at the satellite as the vehicle moves along provided excel-lent line-of-sight reception.
Industrial Partners and Program Status
WorldSpace has contracts with major experienced industrial organizations around the world for the key components and system elements as captured in
Figure 11. As of the time of writing,
• Satellite program is in Critical Design Review Stage... on schedule
• Chipsets are under development and first set will be available in August 1997
• Launch vehicles ordered with Ariane
• Ground Network under implementation... on sched-ule
• System validation tests being completed using heli-copters and prototype receivers
All the major elements are on track for the first launch in June 1998.
Future Evolution
The WorldSpace system, as currently configured, will address the needs of about 4 billion population, pri-marily in developing countries. Recognizing that most of these areas are significantly underserved in terms of real time radio programming, it is expected that additional capacity beyond the two multiplexes per beam will be required in one or more parts of the world. WorldSpace is accordingly actively evaluat-ing the best means of achieving the extra capacity required. The most likely scenario is the use of a second colocated satellite at the relevant orbital loca-tion. As seen from the receiver, the colocated pair of satellites will appear as one, thus ensuring continuity of service during the expansion phase. Such colo-cated satellites may either have fully congruent cov-erages or staggered coverages, thus opening up new areas as well.
The Growing WorldSpace Family
International/National Broadcasters
Marketing Consultants
Radio Manufacturers and Distributors
ITT-Intermetall
WorldSpace
SOS-THOMSON
Matra Marconi
TIW
Arianespace
Fraunhofer Institute
Figure 11
138

The WorldSpace system concept is equally well applicable to all regions of the world, beyond the cur-rently targeted markets, in terms of capacity, quality and diversity desired by developed economies. As and when such market needs mature, appropriate expansion strategies will be implemented.
The satellites being procured have an expected life-time of at least 15 years. Given the ever accelerat-ing pace of technological advances, it is expected that users will require newer services during the life-time of the first generation system itself. The rela-tively wideband "pipeline" of over 1.5 Mbit/s capacity to all receivers, provides the necessary flexibility to cater to newer services as the market conditions so dictate. Among the candidate applications currently being watched closely are:
a) Data transmission. This could take a variety of forms, ranging from simple low speed information piggybacking on voice, to all the way to modern info-cast systems , providing periodically updated weather forecasts, stock market and other news broadcasts.
b) Ancillary Services. Modem compression technol-ogy is making such rapid strides that soon it would be possible to transmit limited motion information within the above 1.5 Mbit/s "pipeline" for display on miniature screens on the next generation of radios.
c) Interactive Services. The WorldSpace system is basically a one-way broadcast system. Therefore, straightforward interactivity applications are difficult to provide without significant increase in costs. However, hybrid schemes with other systems, e.g., little LEO store-and-forward systems, may well pro-vide a simple return path. This feature could open another set of applications ranging from customer polling to simple Internet operations in a broadcast mode.
Conclusion
The rapidly evolving WorldSpace system represents a confluence of an unfulfilled service gap with appro-priate technologies at the system, spacecraft and radio receiver levels. What initially started as a seri-ous sociological objective is now well on its way to becoming a global operation without diluting the original raison d'être.. Its success will not be easy, but when it does happen, it will be a vindication of the original inspiration of its founders and the dedica-tion of hundreds of professional around the world. The underlying system concept is expected to be flexible enough to withstand, and in fact grow with, the inevitable evolution of sociological and consumer needs.
139

DAB RECEIVER ISSUES
Thomas Lauterbach (Eureka 147/Bosch, Hildesheim, Germany) Jurgen Althoff (Deutsche Telekom, Munster, Germany)
Franc Kozamernik (European Broadcasting Union, Geneva, Switzerland) Peter Shellswell (British Broadcasting Corporation, Kingswood Warren, U.K.)
Masaoki Takai (Kenwood, Tokyo, Japan)
ABSTRACT
The paper gives a short overview of the major features of the Eureka 147 DAB system with special respect to receiver implementation, DAB programming and those features supported by the BBC, one of the first broadcasters who introduced DAB, will be described. First generation receivers have been developed by several manufacturers. The overall concept, the signal processing strategies, and the general features of one example of such a receiver (the Blaupunkt Hannover DAB 106) will be discussed in detail. Further to audio reception, DAB provides multimedia and data capacities, which are currently being studied in pilot projects in Germany. Furthermore, the state and perspective on DAB data terminals, PC card receivers etc. will be presented
1. DAB SYSTEM FEATURES
The DAB system is a wide-band transmission system with high bitrate intended for mobile, portable and stationary receivers. To allow for greatest flexibility, the systems employs a multiplex of up to 64 independent
"Subchannels" which can each carry audio programmes or data services.
To form the DAB multiplex, the data representing each of the programme and data services are subjected to channel coding, i.e. energy dispersal scrambling, convolutional coding and time interleaving.
The encoded data are fed to the Main Service Multiplexer where every 24 ms the data are gathered in sequences, called Common Interleaved Frames (CIFs). The combined bit-stream output from the multiplexer is known as the Main Service Channel (MSC) and has a gross capacity of 2.3 Mbit/s. Depending on the convolutional code rate, which can differ from one application to another, the net bit-rate ranges from approximately 0.6 to 1.8 Mbit/s, accommodated in a DAB signal with a 1.536 MHz bandwidth (Fig. 1).
To achieve the desired flexibility, the DAB system allows the Main Service Multiplex to be reconfigured from time to time. The precise information about the contents of the Main Service Multiplex is carried by the Fast Information Channel (FIC) to communicate to the receiver how to access the services. This information is known as the Multiplex Configuration Information (MCI). These data
are highly protected and repeated frequently to
140

ensure their ruggedness. When the multiplex configuration is about to change, the new information, together with the timing of the change, is transported via the MCI and details in advance what changes are going to take place. The FIC is also used to transmit service
information, e.g. labels, PTys and alternative frequencies.
Multplex Configuration Information Service Informafie
Audio programme service
Data services
Audio coding
Channel coding
providing similar choices on two other multiplexes. Supporting the programmes, we have the opportunity to transmit data services too. The data services may be directly related to broadcasting, or alternatively the data services could be totally separate services which may have no relationship with conventional sound broadcasting at all. Typical examples of data services related to the
FIC
Packet Multiplexer
Channel coding
Channel 1"—; coding
I Multi-plexer
"P T
other Subchannels - 01 '
COFDM Modulator --IPP", Transmitter
I
Fig. 1: Generation of the DAB signal
2. THE BBC's PERSPECTIVE ON DAB RECEIVERS
Digital Audio Broadcasting was publicly introduced in the United Kingdom on 27th September 1995. We have therefore had about 18 months of real broadcast experience on top of the 10 years of experimental development.
What became clear at the outset is that the Eureka 147 DAB system is very flexible. Each transmission is a multiplex which contains enough capacity for several services. In the UK, we are regularly transmitting between five and eight different programmes on the BBC's multiplex. The commercial radio services are
programme, are names of the channel, a playlist, more detailed information about the broadcast, or even pictures to accompany the sound. Unrelated data applications include information distribution such as Web pages, or navigation information for updating drivers about conditions on the roads.
The early days of DAB have been devoted to exploring the boundaries of this capacity. The initial view was that we had more than enough capacity for our needs. As we have gained experience, we have found that there is a variety of programme information which can be made available, often at little extra cost, and which has the potential of a positive audience response. All these extra services use up
141

capacity, and so we find that there is a real choice to be made about the scheduling of programmes for the maximum benefit. During the last year we have provided a range of new programme strands, over short periods, linked to market surveys to understand the needs of the public.
If we are going to broadcast a variety of programme services, there will be some which are not always available. For example, sports services will be broadcast when the game is being played. This means that the most likely time for the service to be available is in the afternoon or evening, but not in the morning. At that time, there may be other services present. Many listeners to the radio are optically disadvantaged: either blind or partially sighted, or car drivers who cannot look at a receiver. Simple operation is therefore important. Whereas many of the early receivers have been controlled by computer-based interfaces, the most popular of the current generation of commercial receivers are those which have an intuitive set of controls with clear indications of the selection or choice available.
This leads to a need for the broadcaster to be accurate in signaling the nature of the programmes available. The receiver must offer the listener a logical choice of programme from those available, especially when the multiplex is reconfigured to introduce or remove a service. With the flexibility and variety of signaling that is available in the Eureka DAB system, we need to ensure that there is a good understanding by both the programme providers and the receiver manufacturers about the way the system should be used to optimize the listener satisfaction. For example, what happens when a programme is not available? A listener may have a preset button on the
radio which would normally allow him or her to tune in to the programme. If the programme is not being broadcast, or if the car has driven out of the service area, is there a mechanism for providing a preferred alternative. This type of question has led to the idea of a conceptual receiver model, which offers a common
understanding of the use of the features in DAB.
No discussion of radio would be complete without some reference to the target audience. Much of the publicity about Eureka DAB emphasizes the quality of car reception.
However, the vast majority of listening in the UK is at home. The car radio audience only accounts for about 20% of listeners. Listeners are tuned in to a radio station for 20 hours per week on average, with 80% of reception indoors. We need to ensure that receivers are available for this home market too.
One consequence of providing more information than is normally broadcast is that we need to improve some of the facilities in our studios. Our studios were originally equipped for normal sound broadcasting. There were facilities available for data exchange, but these were largely part of the information technology facilities provided to the production office. More recently, we have seen the introduction of digital editing equipment in the studios which is capable of providing a little more than just editing facilities. There is the chance to
improve the script monitoring or the play list of music. All these features can be exploited in DAB if there is an adequate communication system within the studio. This information which is available naturally in the system, can be broadcast in a form which is of value to the listener. As time progresses we can see that producers of sound broadcasting and the producers of interne radio programmes (which
142

naturally offer a little more than the simple music or speech available on radio) are likely to develop more exciting uses of this new technology, and that the development of new creative programmes will be a spur to the availability of new production facilities. These
are still early days in this digital development.
Over the time that we have been broadcasting, we have taken the opportunity to explore the feelings of the public in the UK. The engineers of course talk about high quality and ruggedness of service, but the main advantage for the majority of the population is just how easy it is to use a DAB receiver. There is none of the twiddling with knobs, not being aware of which station you are listening to, but there is immediate provision of the programme of your choice. There is a choice to be made: DAB offers the chance for a variety of services to be provided, not restricted by the shortage of FM spectrum. Now that we are starting to travel more, even the British realise that people will want to take their radios around the world with them, and the fact that DAB is now starting in many countries is seen as a major incentive to acquire a receiver. DAB is truely a standard fit for the world.
3. A FIRST GENERATION CONSUMER DAB RECEIVER: THE BLAUPUNKT
HANNOVER DAB 106
DAB (Digital Audio Broadcasting) is the future standard of digital (audio) broadcasting. Due to its specific definition and standardisation, the DAB system provides high-quality, CD-like mobile audio reception. Additional data can be reliably transmitted, thus offering a variety of new services. In order to prepare the introduction of DAB, a large number of pilot projects has already been
started or is to be started. For this purpose, car radios designed for DAB were developed. Compared to former-generation DAB test receivers those radios present not only a higher integration level, but also extended performance characteristics. DAB-specific
functions are supplied by an extra device, which can be placed into the boot of the car. It can be operated almost the same way a CD changer is used. The control of the DAB device and the audio output are realised by an FM car radio. A CD changer can still be operated, when the DAB device is connected to the radio. To meet the different demands, two types of DAB receivers are available: a basic version called „Audio" and an extended version called „Audio and Data". Apart from this, an optional PC plug-in board is offered which allows the use of DAB services on the PC. By means of a graphic user interface a DAB device control can be optionally implemented.
The implemented functions in the DAB-receiver are corresponding to the ETS 300 401 DAB standard. The receivers can be operated at frequencies located in Band III (174 MHz - 240 MHz) and L-band (1,452 GHz - 1,492 GHz). The L-Band converter forms part of the HF input stage. A car antenna providing reception in both bands has also been developed.
3.1 DAB RECEIVER „AUDIO" VERSION
This basic version is primarily made for audio reception, but additionally permits the reception of a number of audio and data services up to a total data rate of approx. 500 kbit/s using a digital (optical) interface. This data can then be processes by means of external application devices. The interface has been standardised and is known as the Receiver Data Interface (RDI).
143

3.2 DAB RECEIVER "AUDIO AND DATA" VERSION
This extended "Audio and Data" version permits not only the reception of audio programmes, but also access to additional
services such as still pictures and texts on an additional colour display by means of which also those services making use of the entire data stream (up to 1,5 Mbit/s) may be used. At the digital (optical) interface mentioned above this bit-stream may be put at the disposal of further external application devices. Fig. 2 shows a photograph of this receiver.
Fig. 2: The Blaupunkt Hannover DAB 106 "Audio
and Data" Receiver Version
3.3 PC PLUG-IN BOARD
The data stream provided by the serial optical interface of the DAB receiver can be processed using a PC plug-in board. The data of a chosen application are first selected, then edited and made available at the internal PC bus (ISA bus) for further usage at the PC.
4.1 DEUTSCHE TELEKOM: DATA SERVICE CENTRE AND DATA
TERMINAL
For the German pilot projects, Deutsche Telekom are extensively experimenting with data services. A "Data service centre" was established in which data from all service providers are collected, processed to the format used in the DAB terminals, and finally checked for their integrity. As a last processing step, the
different data streams are multiplexed together to form a packet mode Subchannel which is transfered to the DAB ensemble transport multiplexers at the different sites.
DAB Receiver
Car radio
RDI
PC
Type B
, 0 .0
0 Type C
Fig. 3: Block diagram of the Deutsche
Telekom Data Terminal
144

Deutsche Telekom have also developed a mobile data terminal which can be connected to a DAB receiver through RDI by means of a specially designed PC plug-in card. This terminal handles the incoming data and runs the applications, e.g. an HTML browser. The concept of the data terminal is shown in Fig. 3.
A wide range of different applications is provided, including Lufthansa and Deutsche Bahn schedules, but also an electronic newspaper.
Two different terminals have been tested on these trials: one, called "Type B", is basically a DAB receiver with an integrated data decoder and a display (e.g. the one described in Section 3.2). "Type C" is a PC based terminal whcih is connected to the DAB receivers through the RDI.
CONCLUSIONS
Based on the requirements of broadcasters and consumers, a number of components have been developed both to set up DAB networks and to receive the signals: Audio programmes and multimedia data servives, programme-associated or idependent. The flexibility of the DAB system, and the variety of emerging receivers and data terminals will give listeners a great choice with respect what to listen to and how to listen to it. For the broadcasters, DAB offers many opportunities for novel programme concepts and for multimedia services - to remain competitive in the age of information technology.
145
EUREKA 147 DEVELOPMENTS WORLD- WIDE
by
David Witherow, President of the World DAB Forum
Abstract
1997 is a landmark year for digital audio broadcasting. Ten years after the original Eureka 147 grouping was formed,
many of the world's major receiver manufacturing companies will be exhibiting their first DAB consumer products at the International Consumer Electronics Fair in Berlin in late August. This event will signal the consumer launch of Eureka 147 DAB.
Much work has been going on across the broadcasting industry to ensure the best possible conditions for the commercial launch phase. Under the auspices of the World
DAB Forum (formerly EuroDab) there are specialist groups working on, among other subjects: data services, conditional access, PC receiver features, motor industry liaison, regulation issues, hybrid satellite/terrestrial DAB delivery, and promotion strategy.
Pilot services are now in operation or are planned in some 20 countries, not only in Europe and Canada, but for instance in Australia, South Africa, India and China.
As far as Europe is concerned, at least 100 million people should be within reach of DAB by the end of this year.
Introduction
A year ago in my report to the NAB Engineering Convention called "Bringing DAB to the Consumer" I expressed the belief that Eureka 147 DAB would be a success: the only question was how rapidly and widely it would spread. A year later I remain optimistic. To an extent the questions
about overall growth and speed of take-up cannot yet be answered. But my optimism has been reinforced by the progress which has been made during the past year, as I shall describe in this paper. In particular, I will deal with two main areas:
the extensive work being carried out under the auspices of the World DAB Forum to iron out implementation issues and set the best conditions for the successful consumer launch of DAB; and
the progress towards the introduction of DAB services in Europe and other parts of the world.
A forum for the world of DAB
It was to help reduce the risks and increase the likelihood of success that the European DAB Forum was founded in 1995.
It was a logical expansion of the technical co-operation which had characterised the development of the Eureka 147 system. While the E147 Project continues in existence, and indeed has itself greatly expanded its membership, the idea was to have an umbrella grouping which would include all who have an interest in the commercial development of
DAB. The rapid addition of members from other parts of the world led to a change of name and statutes at the beginning of this year. It is now the World DAB Forum (WorldDAB for short).
Co-operation v. competitiveness
The Forum was originally set up in the recognition that at this stage at least, there was more the various parties could do together than separately. Competitive instincts remain as keen as ever, and it is hardly likely that every company will be prepared to put every card on the table. On the other hand, we all want
a system that will work efficiently within operational areas and seamlessly across borders;
equipment that likewise will work in different countries and will have the right features for the services being broadcast;
146

a range of unique DAB broadcast services, data as well as audio, which will add value for the customer;
enough spectrum for DAB, and the kind of regulatory regime which will encourage its introduction; and
maximum promotion to make consumers want the services and features and go out and buy the sets.
All these things, and others, benefit from a co-ordinated approach. That is what the four Work Modules of EuroDab
and now WorldDAB have been set up to provide.
Service and feature issues
Module 1 was established to cover the very important area of DAB services and equipment, and brings together the interests of broadcasters, consumer electronics manufacturers, data service providers, and DAB multiplex and transmission operators. Because there is so much ground to cover, a number of smaller "ad hoc" groups were set up with specific tasks (see Figure I)
The main work of Ad Hoc Group 1, Features and Services, has been to define the "road map" for the introduction of DAB to Europe and elsewhere. This has been achieved by consideration of the huge range of features that DAB offers and then, through considerable debate, reaching consensus
on which are likely to be offered by service providers, and which could be implemented by manufacturers in their products. By June 1996 a "matrix" of features appropriate for the first generation of car receivers had been developed and agreed. This work is now continuing in the field of PC card receivers and hi-fl receivers.
Another group is examining the possibility of Conditional Access requirements for DAB as the technologies required and user friendly methods emerge. Pay-for data services are perhaps more likely than audio ones, but both are being investigated. A separate group is examining other issues to do with data provision via DAB, including text formats.
Finally under Module 1, a project has been set up to examine the human-machine interface for DAB. This is a huge and
vital subject, given the vast range of possible services which can be offered to the consumer, and the flexibility which allows services within a multiplex to be varied from day to day or even hour to hour. A financial contribution from the European Commission is helping to fund the project.
Regulation and spectrum issues.
Although entirely different in its nature, the task of Module 2 is not less demanding and not less vital for the successful
AHl: Features and Services
- Car Radio Features - PC Cards - Hi-Fi Tuners
AH4: Conditional Access
- Service Provider needs - Consumer reactions - Cards and back-channel
AH9: DAB Compliance
- Watching RDS implementations - Developing DAB Standards
7
WorldDAB Module 1
- solving implementation issues through consensus between
Broadcasters, Consumer Electronics Manufacturers, Service Providers and Transmission Operators
L AH5: Car Manufacturer Liaison
- Develop DAB awareness - Establish introduction years - ICE integration
AH6: HuMIDAB
- Human Machine interface - User friendliness - Multimedia access
AH8: DAB Compliance
- Transmissions - Consumer products
AH7: Value Added Data Services
- Initial services - Consumer interest - Data accessibility
Figure 1: WorldDAB Module 1: Active Working Groups
147

development of DAB as the future delivery system for radio. In the first place, it is essential that regulatory regimes help rather than hinder the growth of DAB. Some administrations (those in the UK and Canada, for instance) are well advanced in setting good regulatory structures, but many governments have hardly begun to address the issues. Module 2 is in the process of finding out what point has been reached in different countries, seeing whether any trends are emerging, and identifying impediments.
Similarly, Module 2 is in the course of exploring through questionnaires the likely demand for terrestrial DAB
spectrum over the next few years, and will then compare potential demand with likely availability. We should be prepared in WorldDAB to use our considerable lobbying power to press for what digital radio will need. Other
powerful commercial interests are not slow to fight their own corners.
Promoting DAB
Module 3 of WorldDAB has the responsibility for promotion and marketing strategy and for market research to inform it. Until now promotion activities have been aimed mainly at special interest groups rather than the general public, since there is little point in encouraging people to want something they cannot obtain - in this case a DAB receiver.
As already indicated, the Berlin Fair in late August will mark the start of marketing to the consumer. Apart from displays by manufacturers in their own areas, there will also be a major joint exhibition, led by the German DAB Platform with input from WorldDAB and the Eureka 147 Project. Beyond Berlin there will be national campaigns, depending on the roll-out timetables for services and the product marketing plans of the set makers.
As a major in-put to national and international marketing strategies, EuroDab commissioned the most extensive market research ever carried out in relation to DAB. This has been looking at what will drive the take-up of DAB in Europe - what do people find the most attractive features and facilities, what sorts of programmes appeal, what might they be prepared to pay either for different types of sets or for special services. Results are due in April.
Satellite delivery
Eureka 147 was conceived as being deliverable by satellite as well as by cable or terrestrial transmitters. So far, terrestrial implementation has led the way, but satellite
delivery, whether for direct reception or for complementary hybrid and mixed systems, is now being given more urgent attention. Complementarity or compatibility are important considerations for large countries like Canada, India or Australia, which may wish to have both terrestrial DAB for cities and satellite DAB for wide area coverage. And it may be highly relevant too for cross-border international or regional broadcasting where terrestrial in-filling for urban areas may also be required.
The WorldSpace proprietary system is not obviously suitable for this kind of hybridity. So Module 4, which deals with satellite DAB matters, has set up a special group to support the implementation of satellite/terrestrial compatible E 1 47, and one of its aims is a demonstration of a working system this year. Module 4 has also completed a document setting
out system and service requirements for satellite DAB, and has been studying the possibilities of different satellite orbits - LEOs and HE0s, as well as GEOs.
DAB in Europe
The WorldDAB target is for there to be at least 100 million people in Europe within reach of DAB by the end of 1997. There is every prospect of achieving that target, with operational, pilot or test transmissions already under way in thirteen countries.
In Germany - an important country for the success of DAB because of the size of its potential market - major pilot services are running in several of the regions, and these will be joined by more before the end of the year. Typically, these involve both private and public broadcasters, are in both Band III (for SFNs over larger areas) and L Band (within cities), provide varied audio and data services, and have associated market research programmes.
In the United Kingdom, legislation is in place for the regulation of DAB, with provision for seven multiplexes, all
in Band HI. One of these is for BBC national services, and the BBC is building up its transmitter network towards the target of covering 60% of the population by mid-1998. The BBC is also trying out potential new audio and data services, and Figure 2 shows how a number of such pilots were scheduled in July last year. There is also growing activity
by commercial broadcasters. Two test multiplexes carrying commercial stations are in operation in the London area (which means that with the BBC national multiplex, at least 18 stations can be heard at any one time). This activity comes in advance of the licensing of operators to run national and local services.
148

M- .. • 0.. .. • 0.. ,,glia0jVc........09:i --a69-,,, - -,4..-ifq:(L., tv op.:. ,.flyok: 0 6,00: 960 2000. '. 2100 - 20 : 2300
BBC Radio 1
BBC Radio 2
BBC Racio 3
BBC Radio 4
I
BBC Radio 5
I 1 II
5t.
II
I : II
,,,, ,, I Iii I
I I I I 1
I I ,
Comedy 1 1 1 1 I I 1 I I II ,, ,
Pan. ,, ,
, Parliament
World Service , 1 1
,
-;
1 World Serv.
Xtra , Xtra UK Top 40 Xtra
BBC Country 1 Opera , 1
,, BBC Jazz
, , 1
Country ,' , ,
BBC Now Wthr. , r
1 ,
, , ,,
Weather BBC Now ,
ere : pilots durlog July
In France there has been a new spurt of interest with the
decision to license three multiplexes in the greater Paris area for a period of five years. A fourth may be added. With Band DI taken up by other services, all of these are in the L Band. Among the groups involved are Radio France, the commercial stations RIZ and Europe 1, and the transmission
provider TDF. A pilot project during the Paris Motor Show in October last year received the punning accolade of the French President: "le DAB, c'est formidable". One could hardly ask for a better marketing slogan!
Services in these three major countries will probably account for about three-quarters of the 100 million population target. But some of the smaller countries are also well advanced with their plans for the introduction of DAB.
In Sweden 42% of the population of approximately 8.5 million was already covered by the end of 1996, and this will be extended to 75% by the end of this year. Both the public and commercial radio stations are involved.
In Norway, four transmitters have been operating in Band HI, three of them in a single frequency network for the Oslo area. Planning has been going on for the testing of L Band transmitters for local radio this year.
Denmark is committed to the introduction of DAB, and the transmitter network is being built up there. In the first few months of this year, under a project set up by Danish Radio with government support, 500 test receivers made by Bang
& Olufsen are being distributed to consumers for market research purposes. While the receiver itself has a large graphic display, the normal remote unit has been replaced
with a Newton Message Pad which can be used to access information and carry out control functions. Figures 3 and 4 illustrates the package.
In Finland, DAB frequency blocks for national and regional networks have been agreed, a three-transmitter test network is being operated by the Finnish Broadcasting Company in the Helsinki area, and it is planned to extend this to cover about 40% of the population in 1997/98.
BRTN, the public broadcasting company for the Flemish community in Belgium has bought 14 DAB transmitters and associated equipment. When installation is completed, about five million people will be covered, and a firmer extension is planned for 1998.
The Netherlands is also well advanced towards the introduction of DAB services, and a considerable amount of
testing of facilities and audio/data products has been going on for some years.
In Switzerland, public and private broadcasters, other content providers, and Swiss Telecom are co-operating in a number of pilots. In the project "Bern-Oberland" the area
is covered by three Band HE transmitters and twelve L Band ones, and about 200 receivers are being supplied to members of the public for market research; more will follow. A further pilot was set up at the end of last year in the Basle
149

Figure 3: Bang 8, Olufsen DAB Radio
area and a special service was being provided during the Geneva motor show in March.
In I_Lah, the public service broadcaster RAT has been very much involved in the development of DAB and for some time has been running a pilot facility in the Aosta Valley in the north of country. A second block is planned for Turin. Meanwhile, a group of commercial radio stations have announced plans to start transmissions in two major cities in Italy.
Finally in this brief European survey, I turn to eastern Europe, where two countries, Poland and Hungary have DAB pilots under way. Hungary has one Band DJ transmitter in Budapest, and work has been going on to
introduce a second transmitter to allow testing of n SFN. Poland formally announced last year its commitment to Eureka 147 DAB. Test transmissions are being carried out in the Warsaw area using Band II because Band Ill is not currently available.
DAB beyond Europe
Canada has remained at the forefront of E147 developments,
and last November commercial radio and CBC announced their plans for initial DAB services. A group of Toronto commercial broadcasters will establish full-time transmitters on Toronto's CN tower by mid-1997 to carry the programming of 15 radio stations. At the same time, CBC announced that it would bring DAB to 75% of the population over the next five years, starting this year in the Toronto and Montreal areas.
Australia also looks to be moving ahead towards formally adopting the Eureka 147 system. Last year the
Figure 4: Newton Message Pod
Government-appointed Digital Radio Advisory Committee expressed support for Eureka 147 as the appropriate delivery system for Australia. Pilot services are operating in three
major Australian cities. Tests have also been carried out of satellite-delivered DAB.
China has been assessing digital radio for some time and announced on 15th December the inauguration of a three-
station E147 network in Guangdong Province, the area near Hong Kong which is growing industrially and economically. The three sites are at Foshan, Guangzhou (formerly known as Canton) and Zhongshan and are transmitting a single ensemble on 85MHz of up to seven audio programmes. The project is the result of a co-operation agreement between the
European Commission and China. Some idea of its significance as seen in China itself can be gathered from the official Chinese news agency's description of the start of
DAB transmissions as "a watershed in the development of China's radio broadcasting system".
Another vast and populous nation looking to the Eureka 147
system as the future of radio is India. The public broadcaster, All India Radio, started preliminary studies and
experiments some time ago and set up a test transmission system in Delhi. Over the past year or so work has been oriented towards DAB service planning, satellite distribution of a DAB ensemble, and its relay in major cities.
In South Africa, a seminar last August on DAB organised by the South African Broadcasting Corporation and Sentech, the transmission provider, led to the formation of a South African DAB Association. Sentech plans to set up a test facility in Johannesburg this year to serve as a pilot and development system.
150

Conclusion: meeting expectations
This necessarily brief survey has left out digital radio in the United States, a whole subject area in itself. Suffice to say that in terms of Eureka 147, its successful showing in the laboratory tests in 1995 was followed last year by what
seems to have been a very good broadcast demonstration in San Francisco. While the doubts remain among U.S. stations about the suitability of eureka for their
circumstances, I hope that they can at least keep an open mind.
For the fact is that E147 DAB is an excellent and clever and highly flexible system. There is still a long way to go before its success in the market place is assured, and as I have
indicated, much hard work is still to be done. But wherever it is established - assuming it is used to its full potential - it will give the medium of radio a new lease of life. Consumers, especially those of the younger generations,
have come to expect certain qualities and features in their entertainment and information products - excellent sound quality; usability on the move; media flexibility as between audio, pictures and text; user-friendliness; access via different types of equipment; even the idea of digitalisation itself.
Those organisations which formed the Eureka 147 consortium ten years ago recognised those growing expectations, and they and the other pioneers have provided the opportunity for the implementers to fulfil them. Best get on with it now!
151

152

AUDIO PROCESSING: COMPETING WITH DIGITAL SERVICES Monday, April 7, 1997 10:30 am - 12:00 pm
Chairperson: Skip Pizzi, BE Radio/lntertec Publishing, Overland Park, KS
A ONE STOP SHOP FOR AUDIO DATA COMPRESSION Fred Wylie Audio Processing Technology Ltd. Belfast, Northern Ireland
DIGITAL BROADCAST AUDIO PROCESSING: FINALLY, THE NEW FRONTIER Frank Foti Cutting Edge Cleveland, OH
AUDIO SIGNAL PROCESSING FOR DIGITAL MEDIUMS Greg J. Ogonowski Modulation Index Diamond Bar, CA
153

154

A one stop shop for audio data compression
Fred Wylie Audio Processing Technology Belfast N Ireland
Abstract
Audio Processing Technology, a specialist company in the field of digital audio data compression opens a one stop shop for most digital audio applications involving data compression. apt-X100 based products are to be found in many areas of professional audio production ranging from capture and storage through to terrestrial and satellite distribution. Unique amongst an already well established APT family product base of1SDN networking and audio storage units is the latest design in RF Spread Spectrum Technology (SST) full duplex 2.5GHz S-band wireless audio data transceivers. How these "where the wires don't reach" linking units and other recently introduced STL, and Plug 'n' Play storage products can be safely interfaced into most high quality audio applications is the basis for this presentation.
Introduction
Digital audio data compression, sometimes referred to as bit rate reduction seeks to combine the allure of linear PCM digital audio with the economical advantages of reducing communication bandwidth and digital storage requirements. However, a balance has to be struck between the degree of compression being offered and the level of distortion and noise, unavoidably injected by any of the available compression processes.
Whether it is due to straightforward A/D conversions or single or multiple passes of compression there will be an accumulation of quantisation noise in the audio signal.
It is a fact of life that since the earliest days of audio recording and reproduction the various technical developments have had their limitations. Nothing has changed, the factors which control the level of quantisation noise should be appreciated. Compression of whatever ilk is a trade-off and in the end you get what you pay for, the final quality has to be measured against,
coding regime being ncM compression ratio/output bit rate and finally the processing delay due to the whole code/decode process.
The requirement of any real time compression system is therefore:
"to significantly reduce the bit rate of a linear PCM signal with a minimum of delay and perceived loss of quality, either through signal distortion or injected quantisation noise".
The perception then left with the listener is that of a transparent process which can be maintained, even after many passes of compression.
What is a safe bit rate?
In 1989 the R & D engineers at Audio Processing Technology, conscious of this quantisation noise problem also recognised that many professional audio users would require the digital audio signal to be compressed a number of times. The final outcome of their apt-X100 development programme was to fix the compression ratio at a modest 4:1. This was seen as being the safest and most robust formula and they also made the following recommendations or safeguards, subsequently supported by CCITT.
128kbits/s per mono channel (256kbits/s for stereo) as the minimum bit rate for any stage if further compression processing is anticipated or required.
192kbits/s per mono channel (384kbits/s for stereo) as the minimum bit rate for the first stage of compression in a complex audio chain.
155

The other important parameter to be considered when selecting an compression algorithm is the amount of processing delay incurred. If the requirement is for the straightforward capture of audio then this is not a factor.
The amount of processing delay introduced in a down the line interview or voice-over using an ISDN or other telecommunications hook-up is crucial. A delay of 20ms or more in a full duplex hook-up is quite noticeable and will cause problems for inexperienced users. Propagation delay on very long terrestrial or satellite circuits is another fact of life. Therefore the introduction of tens or even hundreds of milliseconds of extra delay into a long or more importantly a short haul duplex link only compounds the line echo problem. The apt-X algorithm has a processing delay of a minimum of 2.7ms at 481cHz sampling through to a maximum of 7.6ms at 16kHz.
apt-X100
apt-X100, a proprietary subband ADPCM (Adaptive Differential Pulse Code Modulation) algorithm has become a well established and popular high bit rate compression algorithm in the field of high quality audio storage or distribution. It is capable of delivering audio bandwidths ranging from 7IcHz mono at 56kbit/s up to 221cHz stereo or dual channel at 384kbit/s.
This combined encoder/decoder hardware based algorithm, with an access time of 25ns, is available for OEM use on a single AT&T masked-ROM DSP16A 84 pin PLCC package. Applications already in use include PC based storage systems for the broadcast related and cinema industries. ISDN and other terrestrial and satellite digital telecommunications audio distribution systems are also benefiting from using this chip.
Compression technique
The first stage of the apt-X100 process filters time blocks of the linear PCM signal into four equal width frequency subbands and this offers a considerable coding gain advantage over full band linear PCM systems. This provides the opportunity to substantially reduce the PCM bit rate for each subband while maintaining comparable audio quality.
A complex audio signal is highly repetitive by nature and therefore with a combination of linear prediction and adaptive differential coding or quantisation techniques these natural spectral redundancies can be exploited The process is therefore at its most efficient when dealing with signals with a high tonal content.
By comparing the absolute level of a subband PCM sample with a predicted level for that same sample a 16 bit difference or error signal is generated. A purely tonal signal would therefore generate a very small difference signal, if any.
The apt-X adaptive differential coding technique re-quantises and reduces the bit resolution for the error signals generated in each of the four subbands. Adaptive differential coding is dependent on the energy of the input signal. The step size of each subband quantiser is dynamically increased or decreased, the adaptation being controlled by the energy level of previous samples. In apt-X100 this equates to the so called backwards adaptation process and involves an analysis of the energy levels of 122 previous samples.
Time domain subband algorithms implicitly model the hearing process and indirectly exploit a degree of irrelevancy by accepting that the human ear is less sensitive at higher frequencies. Additionally the noise masking effect of the dominant signals in each subband is much more effective due the reduction in noise bandwidth.
The reduction of the bit rate in each subband is also governed by two other important factors. The first is the non-linear frequency characteristic of the human ear, being less sensitive at both low and high frequencies. Secondly, the fundamental frequency content of most complex audible sounds falls in the band below 4IcHz. Both of these facts are reflected in the apt-X re-quantising process by the allocation of more bits to the lower frequency subbands and fewer to the others. This is the only application of psychoacoustics exercised by the algorithm, all the information contained in the PCM signal is processed, audible or not, ie no attempt is made to remove other irrelevant frequency domain information.
The bit resolution for each of the four subbands is fixed and when these are finally multiplexed together a new 16bit word is generated at the coder output. This is representative of the content of the initial time block of 4 x PCM 16bit words at the input. Put another way, this is an output bit rate which is 1/4 of that at the input; a rate reduction of 4:1.
It is the unique allocation of bits to each of the four subbands coupled with the filtering characteristics of each individual listener's hearing system that achieves the satisfactory audible end result.
156

It is claimed that apt-X100 with its extremely accurate prediction technique loses as little as 2% of the original input audio in the process. Coupled with the extremely low processing delay characteristic makes apt-X100, for all intents and purposes, a lossless and transparent process.
Bit error resilience
An important feature of the algorithm is its inherent robustness to random bit errors, particularly in RF applications. No audible distortion is apparent for normal programme material at a bit error rate (BER) of 1:10,000 while speech is still intelligible down to a BER of 1:10.
Distortions introduced by bit errors are constrained within each of the four subbands and their impact on the corresponding decoder subband predictors and quantisers is proportional to the magnitude of the differential signal being decoded at that instant. Thus, if that signal is small, which will be the case for a low level input signal or for a resonant, highly predictable input signal, then any bit error will have minimal effect on either the predictor or quantiser.
Cascaded algorithms
Inappropriate use of data compression in a complex broadcast or post production chain can adversely affect the quality of the final audio output. This can be particularly true if the signal was subjected to multiple passes of the same algorithm or different algorithms in tandem, some of which were operating at very low bit rates.
An increase in the level of quantisation noise being injected into the audio signal will eventually compound itself in audible artefacts. In a complex audio chain the compression stage operating with the lowest bit rate will define the S/N floor and/or the audio bandwidth. Once these parameters are established then they cannot be improved upon by any later stages with higher bit rates.
The apt-X100 approach to compression meets the criteria necessary for the reliable transfer of an audio signal even through as many as 12 passes of compression, there are unsolicited claims of even more. Years of user experience throughout the world have identified this algorithm as a safe and robust standard. It can be used freely in any stage or stages of an audio chain, from audio capture through post production to final delivery.
APTX100ED Encode/Decode Chip
Figure 1 shows that a single chip carries two channels of both encode and decode processes. If 16bit linear PCM data is detected on the input pin then the device automatically switches to the encode cycle. The decode process is enabled by the presence of apt-X compressed data at the input.
A single device is capable of monophonic operation up to 48kHz sampling frequency and stereo/dual channel up to 32kHz sampling frequency per channel. Multi-channel applications with wider audio bandwidths and higher sampling frequencies, say 44.1 or 48kHz, will require one chip per channel (see Figure 2).
The basic or minimum clock frequency for both encode and decode processes in a mono application is 20MHz for a sampling frequency of 16kHz. This clock frequency increases in proportion to the sampling frequency and mono/stereo demands. For a stereo/dual channel application with a sampling frequency of 48kHz then the minimum clock frequency will be 120MHz (3x 20 x 2).
The hardware design around the processor is normally straightforward requiring only AID, D/A and basic timing logic to complete the compression or expansion process.
Synchronisation
To enable decoding to take place effectively the compressed data must be presented to the decoder exactly as it left the coder. A separate master clock paces a number of synchronous counters which in turn derive the various controlling signals for the chip. These initiate the serial inputting of the PCM samples, mono, dual or multi-channel, to the encoder and the outputting of one compressed data word for every four input samples.
In a data storage application then the same master clock can be used to synchronise the corresponding decoder bit and word timing devices to enable the reconstruction of the original PCM signal.
In a transmission application the encoder and decoder master clocks can be locked and multiplied up from the network bit clock using phase locked loops. If the compressed word boundaries can be communicated across a network then a word clock signal can be used to synchronously shift the compressed data into the decode sequence. If the word boundaries cannot be
157

communicated then a proprietary process of automatic synchronisation on board the apt-X chip can be enabled.
Automatic Synchronisation (AutoSync TM)
AutoSync is a facility which enables the compressed data stream to be decoded without prior knowledge of the compressed word boundaries. As a result the compressed data can be handled at both encoder and decoder using only bit timing, no word clock being required. No bandwidth overheads are incurred through the use of the AutoSync facility.
Synchronism is obtained by inserting a unique 10bit sync word once every 128 compressed words in the compressed data stream. This is searched for at the decoder and once found establishes the compressed word boundaries for specific multiplexed formats. Three consecutive sync words must be found before synchronisation can be achieved.
If loss of sync occurs or if sync words are not found in three consecutive data frames then this is flagged at the decoder and the PCM output is muted. Synchronisation is achieved within 2 to 3 frame periods, from either switching on the processor or after bit errors, while re-synchronisation is achieved within 4 to 6 frames from the instant of clock slip. The time taken to (re)synchronise is thus entirely dependent on the sampling rate.
In addition to synchronising a single channel, AutoSync also enables 2, 4 or 8 channels to be multiplexed/demultiplexed, again with no bandwidth implications. Only one encoder process is used to send a sync word, in stereo it's the left channel encoder. In a multi-channel application again only one encode process is used to ident the first channel in a group. With each decoder set to search for the same sync word then each channel can be identified and demwced from the bitstream using the appropriate channel select code on each chip.
AutoSync combines powerfully with the 16-bit word format of the compressed audio data stream, which is essentially identical to standard 16bit audio PCM. The AutoSync facility enables the direct replacement of a single 151cHz stereo digital audio link carrying linear 16-bit PCM, sampled at 32IcHz producing 1024 kbit/s (512 kbit/s per channel), by four stereo circuits, each consisting of two apt-X100 compressed channels (in one chip) at 256kbit/s (128kbit/s per channel).
Auxiliary Data
Auxiliary data, eg remote machine operation or timecode, may be transmitted between the encoder and decoder chips by "bit stealing" one of the audio data bits. This process can be initiated manually or dynamically through the use of the AutoSync which allows the encoder to remotely switch on the auxiliary data mode of the decoder. This unique placement of the auxiliary data bit has no subjective effect on the audio output. Timecode information is transmitted as a series of packets with information headers which define data speed and indicate any data delay caused by the data path or circuit.
The maximum data bit rate for transmission of auxiliary data per mono channel is 1/4 of the selected sampling rate. A standard 9600 baud data rate can be transmitted well within the capacity of a 321cHz sampled stereo audio link, and the chip has the capability to deliver up to 24 kbit/s of auxiliary data at 48kHz sampling. This opens up the possibility of a low grade talk-back facility during normal audio transmission between transceivers
PCM Threshold Level Detection
This stop/go facility continuously compares the absolute value of the input PCM signal averaged over 4 samples with one of 64 possible threshold levels held in a table within the encoding processor. The derived signals can be extended for the external control of, eg standby circuit facilities. Allowed threshold levels range from -96 dB in 1.5 dB steps and are set by applying the appropriate table address to the encoder device.
apt-X100 service record
The apt-X chip has been incorporated into a wide range of audio applications and equipment produced world-wide by over 100 OEM's including the APT company itself. The technology can be provided to these manufacturers either in chip form or on separate encode/decode sub-assembly boards or PC cards.
Transmission
• Digital telecoms
• Satellites • VHF, UHF RF links • Radio, TV
Basic and Primary rate ISDN Kilo/Megastream
Inter studio and OB/remote audio distribution.
158

Basic and Primary rate ISDN
Particularly popular are the products which interface with ever increasing national and international basic and primary rate ISDN and Switched 56 digital telecommunications networks. Broadcast, recording studios and film makers are cashing in on this very economical method of capturing and exchanging high quality audio by simply dialling on demand, a fully duplexed circuit from anywhere in the world within reach of a digital telephone exchange.
apt-X based transceivers or codecs can be configured to deliver a single 7kHz audio channel on one 64kbit/s channel (1/2 the capacity of one ISDN line). Similarly, 221cHz stereo/dual channel audio at 384kbitis can be delivered over six ISDN channels. Where more than one ISDN channel is required then inverse multiplexing (I-MUX) must be employed to combine the separate 64kbitis channels so that they act as one high bit rate channel.
On offer at the APT shop is their proprietary MUCASTM I-MUX system. This can be incorporated into the codec as with the DRT128 and DSM100 or separately in the Prolink ISDN line management unit.
In clear mode at 641cbit/s any apt-X100 based codecs by any manufacturer will talk to each other provided the data can be communicated For operations at higher data rates then the I-MUX's would have to be compatible.
Also essential for ISDN working is a locally approved telecom terminal adapter (TA), available as a stand alone unit or fully integrated as in most APT codecs. These units are icsinsible for the handshaking with the network and provide the channel dialling facility.
Primary rate ISDN on an E 1 (EUROPE) telecommunications channel with some 2.048Mbit/s capacity and Ti service (US) at 1.536Mbit/s offer the means to provide many more wideband audio channels on a single bearer. AFT's MCE and MCD800 coders and decoders will utilise 1.536Mbit/s to deliver anything from one to eight 151cHz or 20kHz uni-directional audio channels on a point to point, or point to multipoint basis.
Studio to Transmitter Links (STL)
Mono or stereo STL's can be provided either by RF links or on telecom networks. Manufacturers such as
APT. Moseley, Intraplex and TFT produce a range of units incorporating the apt-X100 algorithm.
Part of the RF spectrum in the S-band around 2.4GHz is now available for unlicensed use provided the equipment uses digital data and spread spectrum technology (SST). APT has designed two versions at 128kbit/s and 2561cbit/s, the latter capable of delivering 151cHz stereo. Limited to 100mW power output these units have a range capability of 30 milesbut are more likely to be used to bridge the gap between a remote audio source to the nearest ISDN inject point, even within a building.
SST, used by the military authorities for many years is a unique form of modulation use pseudo random (PN) codes mixed with the audio data to modulate the carrier signal, very different from AM and FM. It is a very secure and reliable platform with a high level of immunity from interference from other in-band SST and conventional narrcraband signals and multipath reflections. SST is much more spectrum efficient, many users can simultaneously access the same frequency channels provided they use different PN coding sequences. The efficiency is also increased by utilising the guard bands normally required to separate conventional AM and FM signals
Radio programme distribution networks
Customised versions of the DSM100 and other specialised units with X21 and RS449 data interfaces have been produced to deliver broadcast quality over STL and permanent inter studio networks. Some of these units have a built-in circuit protection module consisting of an I-MUX and TA which can be switched in to reroute the programme on ISDN in the event of a main circuit failure.
UK broadcaster Classic FM made use of a customised DSM100, at 256kbit/s with an RDS signal on the auxiliary data channel to establish a 15kHz stereo programme sustaining network for a chain of transmitters throughout Finland The bearer circuits were fibre optic linking a studio in Helsinki to a star point 100 miles away before distribution to the transmitters. The integrity of the network is continuously monitored and controlled from a network management centre in Helsinki using the Nmbridge 4602 control programme.
Systembase provided the apt-X coders and decoders to sustain the 7.5kHz mono distribution network for Talk UK's network of 29 medium wave transmitters. Other
159

transmitter and studio networks have been established in the US, Europe and Japan.
Audio data Storage
• Digital Audio Workstations • Station automation systems • Multimedia • Cinema Surround Sound • Personal Computing • Multi-channel video and audio tape
recording
Video tape recorders
Both Sony and Panasonic have produced audio multi-channel adapters to increase the number of channels on their Digital Betacam, D3 and D5 video tape recorders. Most modern recorders are standardised on four audio channels, however to support the increasing demand for multi-lingual programming then this is not enough. These apt-X100 based eight channel units can record direct to two of the VTR audio tracks, total tracks now available are ten and this could be easily increased to sixteen with the addition of another adapter. With a data frame resolution of 80s each compressed audio channel can be edited in the same manner as a non-compressed channel, neither does the 2.5ms processing delay cause any practical problems.
Cinema Surround Sound
The Digital Theatre Sound (DTS) has been a popular choice for cinema owners throughout the world who have been upgrading their theatres to surround sound. Most of the major movie makers are now slaving a 6 track audio CD-ROM record system to a timecode track placed between the picture frames and the standard optical audio tracks. A time code reader, readily fitted to virtually any 35nun movie projection equipment, is linked to a dual CD-ROM player holding the movies six discrete or matrixed audio tracks. The timecode ensures that the correct sound is played for each projected picture frame and this easily accommodates edits and non-digital film inserts. The optical sound tracks provide a fail-safe stereo audio backup system. Unlike the optical digital audio systems the DTS system ensures that the quality of the audio is not dependent on the quality of the print.
The apt-X100 chip is at the core of DTS. providing some 3hrs 20mins of playtime from the CD-ROM players. Five 20kHz and one 80Hz woofer audio playback channels with a dynamic range capability of 96dB provide the cinema audiences with virtual audio splendour.
Station Automation
Aiming at replacing obsolete cart record/playback machines many well known system integrators have developed audio production tools based on apt-X PC audio cards. Easily incorporated in PC based and Touchscreen operating systems these cards enabled four times as much high quality audio, programmes, music tracks, jingles and adverts to be stored, edited and played back from the gigabytes of hard disk space.
The latest ADK200 PC card allows simultaneous multi-channel playback and record of 16, 18 or 20bit PCM. Coupled with 4:1 data compression and available with multiple coding algorithms this Microsoft plug 'n' play and Windows 95 compatible card increases the efficiency and versatility of store and forward PC based systems.
The signal processing is supported by a 32bit floating point DSP. A facility to allow +10% variation in sampling frequency enables some time control of programme items to fit fixed schedule slots. A specified amount of onboard storage is available in the form of DRAM. 256k through to 4M capacity plug-in modules can store compressed data or 16,18 or 20bit PCM.
Conclusion
Time and space only allow a brief snapshot of the wide variation of the applications incorporating this low complexity algorithm. Since it was introduced in 1989 apt-X100 has become a well established and popular high bit rate compression system. ISO/MPEG Layer 2 compression standards have already been agreed in many parts of the world for DAB transmissions. The modest 4:1 compression ratio approach of apt-X100 is a safe and robust standard. Prospective DAB users can be reasonably confident that by using 4: lapt-X100 prediction based compression in audio capture and post production applications then the final. Layer 2 psychoacoustic link in the delivery chain to the listening audience will not be the straw that breaks the camel's back.
160

AUX DATA
PCM I/P 1 1DEMUX
ENCODE
ENCODE
Compressed Data I/P AUTO
1 DEMUX
SYNC
MUX
AUTO
SYNC
Compressed Data 0/P
AUX DATA"...
DECODE
DECODE
MUX
I PCM 0/P
Figure 1 Single apt-X100 chip 15kHz stereo implementation
1 STEREO
AUDIO I/P ADC
Fs - 48kHz
LEFT ENCODE
192kbit/s
AUDIO 0/P
STEREO
DAC
Fs - 48kHz
RIGHT ENCODE
LEFT DECODE
192kbit/s
RIGHT DECODE
DATA INTERFACE
384kbith, DATA INTERFACE
Figure 2 Simplified duplex implementation for 22kHz stereo with four apt-X100ED chips
161

DIGITAL BROADCAST AUDIO PROCESSING: FINALLY, THE NEW FRONTIER
Frank Foti Cutting Edge Cleveland, Ohio
ABSTRACT
DSP (Digital Signal Processing) based broadcast audio processors have been, at best, a digital clone of analog counterparts. DSP is a very powerful technology. Why then, has it been so difficult to create successful-sounding digital signal processors for broadcast? This paper addresses this issue and discusses advancing the signal processing art form. Induced aliasing distortion, time delay, and sampling rate were never a concern in the analog signal processor. With DSP however, these issues can create added audible distortion, propagation delay, and/or overshoots. Algorithms that intelligently conform to the natural dynamics of an audio waveform will also be examined. Finally, with the advent of DAB and Netcasting, we' II explore processing for these new and important mediums.
TO BOLDLY GO...
In borrowing part of a phrase from Capt. James T. Kirk of the Starship "Enterprise," processing in the digital domain meant going where it had never been before. The introduction of DSP for transmission processors for broadcast promised to open a new frontier. Although the first wave of digital processors became available almost seven years ago, this new territory remains largely unexploited. What happened?
Initial attempts at digital processing were mere clones' of established analog designs. To those versed in the technical 'black-magic' of audio processing, developing a digital processor requires more than just porting over an analog design into DSP. (More on this later.) If key issues aren't dealt with, the result will add audible distortion. The
following discussion is based on extensive experience developing a DSP-based processor.
In the quest for the fully digital broadcast facility, concerns involving transmission processors must be addressed. Codecs implementing an AES/EBU interface and used in digital STL systems can audibly degrade the transmission path. Depending on the coding algorithm and bit rate employed, codecs may be a source of distortion. While placement of the codec as well as the signal processor in the broadcast transmission path are critical, such discussion is beyond the scope of this paper. Suffice it to say, coded STL must be taken into account.
Also of concern are sample rate converters used in the AES/EBU interface. We will discuss the possible overshoot problems that may arise when transposing a sampling rate. Early research discovered that a processed signal that was properly peak controlled by the signal processor had the potential to cause modulation overshoots. Propagation delay can also become a problem with digital processing. This is related to the amount of time required to complete all of the processing tasks. During this period, there is an input to output delay. If this delay is too long, live monitoring off the air becomes quite difficult. For announcers especially, such delays can be very distracting. Further discussion will detail what is involved in resolving these issues.
Given the problems, is processing in the digital domain of any benefit? Yes. There are solutions along with a multitude of benefits from numeric-based processing.
162

Research and Design Criteria
To start, key performance criteria were established: • the digital system must operate in a transparent
manner in relation to the audio signal, • the digital processor must sound at least as good
as, or better than, its analog counterpart, • no additional coloration to the audio from A/D,
D/A, sample rate converts, jitter, and/or the AES/EBU interface must result.
To explore these issues, subjective listening and technical tests were needed. Analog and digital processing systems had to be compared, along with aural evaluations of the converter systems. Most important was evaluating analog to digital processors. Testing was meant to identify existing weaknesses, resolve such weaknesses, and help develop new algorithms.
Subjective Listening Tests
This phase of testing was conducted using the following listening conditions. The device under test was provided a clean program source from either a CD or DAT tape. Output was monitored either discrete left/right, or multiplex via a stereo monitor, amplified and heard through well known reference monitor speakers. For direct A/B processor comparison, a switching device was used that could select either multiplex A/B, or discrete A/B processors. Much the same as would be done in auditioning processing equipment by a radio station. Outputs of the units tested were peak monitored using both a modulation monitor and oscilloscope. For fair and honest evaluation, the peak levels of each system were always set at exactly the same level.
In direct comparisons of digital and analog processors, both operating with equal amounts of processing, listening tests revealed that digital systems seem to generate additional annoying distortion characteristics. In addition to the known artifacts generated in analog processors, there seems to be an added distortion signal. Where most processing artifacts can usually be described in some form of Total Harmonic Distortion, (THD) or Intermodulation Distortion, (IMD) this artifact appears as something completely different. In adjusting audio processing it is generally understood that an increase in IMD is derived from an increase in dynamic control characteristics. Items like increased release time of compressors/limiters, ratio, or amount of gain control will contribute to this. An increase in THD will usually result from an increase in hard limiting, or final clipping.
That "Digital Sound"
Further listening reveals that this artifact seems to produce a 'harsh' or 'metallic' effect on the 'presence' and 'brilliance' ranges of the audio spectrum. Almost as if some additional synthetic component is being added into the signal. With moderate amounts of processing, cymbals sound like 'nails on a blackboard', 'S' sounding material begins to sound like paper tearing, and high frequencies lose definition and detail! All of which has been characterized by engineers as 'that digital sound.'
For example, in the song 'Big Love' by Fleetwood Mac, at precisely eleven seconds into the song, there is a moderate crash of the cymbals. The digital processor repeatedly distorted these cymbals as compared to the analog system. Even a reduction in the amount of processing by the digital system only reduced this distortion effect, never eliminated it. To try and illustrate, this effect sounded like some form of 'smashing glass' instead of the crisp, detailed crash of the cymbals.
By contrast, the analog system did not have this problem. Only with the processing increased, would the cymbals distort, but it would happen in the known 'spitting' sound of THD generated from the increase in hard limiting. Even this form of distortion was 'easier on the ears' when directly compared to the digital distortion. The reader may want to use this song as a test source. In the listening tests done while researching this topic, there were multitudes of programs that would cause this effect. What is it? What causes it? Is it a question of primitive digital design, or is it a technological weakness? Considering the numerous attempts at digital processing, these questions had to be answered before any development could proceed!
This problem was perceived during tests performed on numerous digital processors in comparisons with numerous analog processors. In each case, 'that digital sound' was observed.
Technical Tests and Research Data
As a researcher, engineer, and designer working with signal processing, I have both respect for and skepticism of technical testing and research data. While the data gathered from research and conducted tests can be used to prove or disprove a theory, it offers a little subjective information about what may or may not 'sound' acceptable under real-world, dynamic processing conditions. Testing and research can be used as a tool to predict 'possible' benefits and answers. In the end, tests were
163

developed evaluate variables broken down to the smallest common denominators, so that dynamic performance could be monitored or judged.
The first phase of testing was an effort to discover the cause of that problem identified as 'that digital sound'.
Since most processors are dynamic in nature, there are not any specific, static tests that will provide common results. Most systems can be evaluated with weighted noise, timed pulse bursts, or IMD signals. Frequency
response can be measured, but usually with levels that are below the processing threshold to avoid generating leveling and phase errors due to the gain control action.
The Culprit
For this presentation, a digital processor operating with a 32 kHz sampling rate was evaluated. A system like that used in conventional FM broadcasting, and consisting of AGC/dynamic limiting, emphasis, and the final limiting low pass filtering function was employed In performing an audio sweep, an interesting item was noticed upon spectral analysis of the frequency range. A large level of aliasing components were observed above 4 kHz! These aliasing signals would fill the entire spectrum starting at 15 kHz, and work their way down the complete spectrum. This was beginning to get interesting! Figure-1 is an example of a 5 kHz tone that has been clipped in the digital domain, and now produces aliasing products.
As can be seen in the diagram, there are aliasing products sitting near the fundamental of 5 kHz. As
OdB
-25dB
-50dB
10.0 kHz
Figure-1
0.0 kHz 5.0 kHz
frequency increases, more products develop in quantity, and size. At 15 kHz the aliasing products are almost as
significant in value as the fundamental. Now try to consider what this picture will look like if music program were used in place of a single audio tone.
After making some adjustments to the processor with the frequency sweep applied, it appeared that reduction of the final limiting would reduce the aliasing substantially. Reducing the processing on the upper frequencies totally eliminated the problem. What was this indicating? Considering that aliasing distortion is caused by signal energy that is trying to exceed the Nyquist frequency, it would appear to indicate that the final limiting seemed to be the culprit Since the final limiting function does generate harmonic content, it is likely that energy exceeding the Nyquist frequency would result. Further spectral evaluation proved this to be true.
In a subjective test to confirm or reject the recearch data, music was applied to the processor. With the final
limiting operating in the 'normal' range, the 'metallic' sound was evident. Upon reducing the amount of final limiting, the 'metallic' sound disappeared! This seemed like the 'proof in the pudding' for the cause of 'that digital sound'. By contrast, in the analog processor, it is the final limiting function 'where the rubber meets the road' with regard to clarity and loudness. If for some reason the digital system could not utilize a moderate amount of final limiting without clarity, then no loudness benefit would result!
15.0 kHz 20.0 kHz
164

Further testing revealed that indeed the final limiting function generated the majority of the abasing distortion. However, a few other processing functions were found to be possible contributors as well. Certain cross-over designs and/or filter banks, along with system headroom are all areas that must be designed properly or processing induced abasing will occur.
Also observed were certain processing time constants. If a timing signal was operating at a rate that exceeded the Nyquist frequency, abasing would be generated. Given the system discussed here, any timing signal exceeding 62.5 !As (1/16000 kHz) would create an aliasing component. With the problem found, what are the options or remedy?
Sampling Rate: Can of Worms?
When discussing anything related to abasing, the sampling rate must be part of the equation. It is well known that increasing the sampling rate, will raise the point at which abasing will occur. The question now becomes, how far must the sampling rate be increased to eliminate processing induced abasing? Testing and research indicated that with a 32 kHz sampled system, a multiple of at least 4 times the sampling rate, 128 kHz, would be sufficient for broadcast transmission purposes.
Creating a 128 kHz sampling rate can be done in one of two ways: Using a high speed A/D converter operating at the 128 kHz rate, or up-sampling the 32 IcHZ rate by a factor of four to create the new higher rate. The latter is preferable as it allows use of the industry standard A/D conversions that support popular 32 kHz, 44.1 kHz, and 48 kHz rates. A converter at 128 KHz is available but is generally more expensive and requires additional ancillary input filtering, further adding to the cost. In addition, there is no need to operate the entire system at the higher sampling rate, since that would reduce the amount of machine cycles in the DSP.
This points up another problem: When a faster sampling rate is required to remove abasing distortion, how much DSP power is compromised to accomplish the goal? The obvious answer is 4x the power, but with all of the final filtering and overshoot control needed, is this the most efficient method to rectify the situation? Of importance here is the final low pass filter. Since it must provide ample bandstop rejection in the 16 kHz Nyquist region, a filter of high magnitude is required. This will take multiple machine cycles in itself at 32 kHz sampling, with 128 KHz, it will be 4x the requirement. Might there be an alternative to this
process that will save machine cycles, yet accomplish the same result, eliminate abasing?
Why 32 kHz Sampling Rate?
Another issue for discussion is the base sampling rate itself. Digital processors thus far have all used 32 kHz as a base sampling rate, which in turn sets the Nyquist at 16 kHz. Considering that conventional FM Stereo broadcasting requires 15 kHz of audio bandwidth, this leaves only 1 kHz of guard band spectrum before the Nyquist point. To facilitate this, a filter of very large magnitude must be employed in order to suppress all energy by at least 96 dB at the Nyquist, or abasing occurs. This can be done in DSP using a finite impulse response filter (FIR). The only drawback is that it will require many 'taps' within the filter to achieve this level of stopband rejection. The significance of the 'taps' is that for every two taps in the filter, it requires one sample to perform its duty. For a 15 kHz FIR filter of this magnitude, it will need 101 taps. This in turn results in 50 required samples which equates to 1.56 milliseconds of propagation delay through the filter.
It must be noted that even when up-sampling, where a 'new' Nyquist frequency would now preside at a multiple of the original, the problem still remains. This is due to the down stream requirements of the AES/EBU interface. With an up-sampled signal operating internally within a host system, higher speed D/A converters can be used in the conversion process to analog without overshoots and distortion. On the other hand, the AES/EBU is a standard protocol that will only support a system sampling rate up to 48 kHz. Therefore any filtering that must be done in the up-sampled domain must still adhere to the original Nyquist frequency or abasing will result. In the case of this discussion, that frequency remains 16 kHz. Still at a faster sampling rate, say 128 kHz (4x the original) the number of FIR filter taps remains the same as described above.
A broad question posed to the global processing forum is why the use of 32 kHz as a base sampling rate? I think, based on tests and research, that a base of 48 kHz would make all of the aforementioned problems much easier to deal with. The guard band to the Nyquist is much farther out, which in turn moves out the abasing point. This would also allow a final filter with less time restriction. Coupled with the fact that the propagation delay associated with 48 kHz is much faster in itself and makes this rate more desirable.
My best guess as to why 32 kHz sampling was chosen in the past, is that at that rate, there would
165

be more machine cycles available to handle the workload. That would be the only reason to possibly support a lower sampling rate.
Alternative Anti-A liasing Limiter Method
Since it is now apparent that abasing, sampling rate, and machine cycles are all of importance in digital processing, what alternative is there that might allow the best performance, and yield the most efficiency? The answer is within the method used to accomplish the final limiting function. Through a proprietary process researched and developed by the author, a mathematical analysis provided a means to accomplish the final limiting function, without aliasing, and at the base 48 kHz sampling rate!
Considering that the math involved exceeds the scope of this paper, and that an entire presentation could be based on explicit digital processing design alone, in depth discussion of this analysis is best suited for another forum. Suffice it to say that this alternative method removes all of the previously discussed problems of digital processing. Should the reader desire more detail of this analysis, please contact me for more information.
Confirmation of performance of this alternative method was achieved with spectral analysis and subjective auditioning of music with this new function employed. In aural monitoring it was decided that the 'metallic' digital aliasing distortion component mentioned earlier disappeared! Now it is possible to define what 'that digital sound' is, and more importantly how to eliminate it!
Sample Rate Converters
Another innovative device used in the digital realm is the sample rate converter. This function will transform one system sampling rate to another. This becomes necessary when interfacing digital devices that use different sampling rates, and thereby adding compatibility among different systems.
This function is accomplished by scaling up, or interpolating the original sampling rate, usually by a factor of ten. Then, at the 10x rate filtering the signal with a low pass filter that is set to the Nyquist of the new desired sampling rate. Finally, the signal is scaled down, or decimated by the factor needed to the achieve the new rate. While this sounds quite simple, and basically it is, there are a few issues to consider.
All transmission processors, both analog and digital apply some form of overshoot control to the output
filtering section. Our concern is not the method used, rather that control is achieved. In most designs, this function is a form of integrated protection clipper working around the final low pass filter to obtain control. In each case the overshoot component can be calculated as a product of what is known as the 'Gibbs Phenomenom'1, which states that an overshoot will occur at one-third the cut-off frequency of any low pass filter whenever a non-linear waveform is passed through it. In the case of broadcasting, the non-linear waveform would be that of a clipped waveform. Knowing that the audio bandwidth used in FM Stereo is 15 kHz, overshoot components will begin with any non-linear waveform above 5 kHz. In this example, this would effect any signal above 5 kHz that was clipped. Should the slope of the previously described up-sampled interpolation filter appear greater than the slope of the final filter in the audio processor, then output overshoots may result! Unfortunately, these overshoots are generated after the processing unit. To remove them would require another device.
This does not necessarily indicate that all sample rate converters will cause overshoots. But in most cases the filtering used in the sample rate converter will be of a large magnitude in the bandstop rejection area. In all probability it will be an FIR filter with at least 96 dB rejection in the stop band. Also of interest will be the direction of rate conversion. Should the host sampling rate be lower in value, than the transformed rate, chances of overshoot are small. This happens due to the up-sampled filter being set to a broader spectrum than the spectrum of the host signal. Potential problems may arise when transforming a larger sampling value to a lower rate. Then the details of the above description apply.
Processing and Coded STL Systems
A technique that is very popular is the use of the audio codec to reduce the data requirement for a digital STL system. These devices make use of lossy' data reduction algorithms to compress the bitrate down to a size that will fit within the existing bandwidth of the STL system. While there are a number of specific algorithms to choose from, most STL manufactures have made use of proprietary digital formats that are derivatives of prior development. Most common usage has been done with ISO/MPEG Layer-II, ISO/MPEG Layer-III, apt-x, and Dolby AC-2.
Detailed operation of the above mentioned algorithms is not needed for this discussion, as my focus is on the actual effects that data reduction
166

algorithms have upon signal-processed audio. Each system possesses many strengths and possible weaknesses for this application. It is not my intention to advocate any audio coding technique to be considered as a standard or preference when compared to one another.
Dealing with Pre-emphasis
All broadcast applications make use of some form pre-emphasis boost. For FM broadcasting, North American Countries utilize a 751.ts emphasis, whereas 50iis is used elsewhere the World over. Medium-wave, or AM makes use of an optional modified 751.ts emphasis.
overshoot, another limiter must be employed. Unfortunately, tests have shown that operating a transmission processor with an emphasized output into a codec will generate audible high frequency distortion. This occurs because the spectral balance to the codec masking process is not spectrally flat, which is what the masker signal wishes to operate on.
of A discussion of codecs in the transmission system exceeds the scope of this paper. For further reading, see a paper by the author presented at another industry fonnn3.
Transmission signal processors employ pre-emphasis within their system architecture. Since emphasized audio must also fit within the imposed modulation limits, the processor employs specialind high frequency control sections that provide both the emphasized boost and control of the high frequency energy. In this manner, efficient high levels of modulation are easily obtained since the processor is designed and set to limit any tradeoffs resulting from pre-emphasis and high frequency limiting requirements. Basically, these two sections work in concert with one another to allow pre-emphasis to be employed, and yet control the emphasized energy content.
One of the critical requirements of any codec is that the audio signal must be "flat" in spectral origin. The term "flat" is used here in the context of a signal where no additional EQ has been added to the original component. This is due to the operation of the masker signal used in the coding process. Any significant change, or imbalance of the frequency spectrum can cause the threshold curve of the coding system to possibly have a profound effect on the output of the coded audio'.
At issue here are what the coded STL encoder/decoder requires and what the processing system will provide. A paradox exists because the processor is designed to output a pre-emphasized signal, and the codec is designed to accept a "flat" signal. To accomplish this, the output of the processor must be de-emphasized so that the output signal is returned to a "quasi" flat form.
The weakness that this function creates, is that the output of the coded STL must restore the emphasis to the signal. Thus adding another generation of emphasis which might add some distortion, but in all probability will add modulation overshoot to the total transmission system. To eliminate the added
WHAT ABOUT THAT NEW FRONTIER?
So far, the focus has been on finding the weaknesses of and remedies for prior digital implementations. The most important of which was the discussion of the non-aliasing limiter. Although an accomplishment I believe that resolving this problem only brought the technology up to date. Now, how might this technology finally move forward?
Phase Linear Dynamically Flat Cross-Over
A topic of vast interest in any multiband signal processor is the cross-over network. The goal is to achieve maximal flat response, with gain control employed, and maintain as linear as possible phase response over the entire spectrum. Easier said than done!
In the analog derivative this was virtually impossible. With gain control active, phase errors between audio bands would develop due to the difference in propagation delay of each cross-over filter. As gain levels would shift near the cross-over frequency, additional gain or even loss would occur at the final summation point. This might result in possible 6 dB of gain or loss at this juncture. Some designs would offset phase at the cross-over region in an effort to minimize this problem. However, the compromise disrupted the linearity of the phase response over the whole spectrum.
The digital cross-over makes use of time aligning to each of the audio bands. In this manner, true phase linearity can be maintained, while maintaining dynamic flatness of the program signal. This in turn eliminates any added gain or loss at the final summation. This analogous to using time aligned loudspeakers.
167

Program Dependent RMS Calculation
Within the design of many AGC sections for compression, there is some function to calculate an average level. This in turn is used within the compressor's control function to alter the gain structure. It has been found that the use of RMS detection seems to produce a natural sound to the AGC operation. In essence, the RMS function calculates the averaged root mean square value of a signal as it occurs over a period of time. Within a block diagram, this average over time is achieved by the use of a simple time constant that is nested within the square root of the squares function. Figure-2 is a block diagram of the theoretical concept behind the RMS calculation.
Time Constant
Figure-2
This style of RMS detector has been implemented in numerous forms recently. All of which have found their place in processing applications. The drawback is that the averaging time is normalind for a broad range of control. This is sufficient for RMS calculation of static signals, but when processing any audio signal, there might be the need to alter the averaging time, as if to create a rolling average.
It is important in the design of the RMS detector, that the lowest frequency passed through the detector does not generate any AC ripple to the control signal. This is possible if the averaging filter is set too fast'. If this occurs, distortion and gain control errors will result. Therefore many RMS detectors must operate with a compromised averaging time to not generate distortion and control errors.
Using program material as content, there will be instances when certain audio frequencies would benefit from a rolling average, as compared to a compromised static value in the detector. This is easily done in DSP as the processor can calculate different averaging times, as well as insert them to create the rolling average. Also, rules can be implemented to allow this process to occur only during desired situations. Through the use of on board memory, it is easy to store a 'history' of what has transpired over time regarding a signals content. Then gain changes can be calculated based upon historic statistics, and figured into the processing algorithm.
Due to this paper's limitations, please accept that volumes can be generated about the subjective nature of controlling an audio signal. The point is that with the digital processing function, the realm of possibilities for control now becomes endless!
Intelligent Interactive Processors
This discussion of digital processing has centered on specific individualized operations. With this in mind, there are a few systematic operations that can be explored.
Part of the workload of a dynamic processor, compressor, limiter, or clipper, is to calculate a value for an audio signal and then use that as a control operation to alter the gain. The transmission system processor is usually made up of a combination of all of the aforementioned processes. Through that, it is possible to know the precise amount of RMS and peak level present. Along with having the historical values mentioned earlier. This information can be used on an interactive basis among the AGC, peak limiter, and clipper sections to systematically provide information to one-another.
An example of this would be the operation of the final clipper. Should significant clipping occur, information can be routed back to the previous AGC and limiter sections altering the gain in an effort to reduce the amount of clipping beyond a specific amount. Through this additional processing, induced distortion can be controlled. This can even be performed on a frequency dependent basis.
DAB and the WEB
Past designs for transmission system processors have focused on FM, AM, and television. It is time to enlarge the focus and assess the requirements of Digital Audio Broadcast (DAB) and Netcasting, transmitting audio via the World Wide Web. These new mediums have very specific needs, and in each case, signal processing can be used to augment their performance.
For DAB, processing can do more than create a radio station's signature sound and control overmodulation. It can be used to help minimize the effects of the data reduction algorithms that are required by digital transmission systems. Considering there is no need for an emphasized signal in the transmission path, this will further reduce the rigor set upon the processing system. That alone, will improve audio clarity and reduce distortion.
168

As for the Web, processing will play an even larger role. Knowing that the bit rate requirements for audio on the web are quite small, signal processors can be used to pre-condition the signal so that aural enhancement, and intelligibility, at the lowest bit rates, will improve. Here is a truly untapped area of potential in the world of communications.
Net Results
The goal was to review the progress of audio processing in the digital domain. In my opinion, quality digital processing was always possible, but early implementations were very primitive in nature, design, and most importantly in aural presentation. As we've seen, DSP dynamic processing has been given a 'bad name' because of its disappointing performance thus far. But, I believe through the implementations presented here, this technology may yet clear its name. Only time will tell!
REFERENCES
[1] Baher, H. AnsiVs.g_iLI)igitaLSioa ggoing, J. Wiley & Sons, 1990
[2] Mendenhall, G. Pre-emphasis and Limiting Considerations for Audio Processors and Digital Studio-to-Transmitter Link, White Paper, 1995
[3] Foti, F. Broadcast Signal Processing and Audio Coding: Are We Trying to Mix Oil with Water?, AES Pre-print #4203, 1996
[4] Kitchin, C. and Counts, L. RMS to DC Conversion Application Guide, Analog Devices, 1986
169

AUDIO SIGNAL PROCESSING FOR DIGITAL TRANSMISSION SYSTEMS
Greg J. Ogonowski
Modulation Index Diamond Bar, CA USA
INTRODUCTION
Audio signal processing for digital transmission systems
must follow a different set of rules than processing for
analog transmission systems. The peak modulation con-
straints differ from analog, and even differ among the various types of digital transmission systems. Special
care must be taken to ensure proper system integration
and interface to prevent potential system overload, and
possible system over-modulation, even when signals are
properly peak limited at either the input of the analog-to-digital converter or digital input of the system.
SYSTEM TYPES & USES
There are three type of digital transmission systems in common use in broadcast: non-bit-reduced, lossless bit-reduced, and lossy bit-reduced systems. Each system has
advantages and disadvantages depending on application.
The most common system, non-bit-reduced linear PCM,
is used on compact disc digital audio. Non-bit-reduced systems are capable of high accuracy allowing faithful
reproduction of peak controlled signals. This makes
these systems useful for broadcast studio-transmitter
links where the entire audio processing system may be
located ahead of the studio-transmitter link.
A lossless bit-reduced system removes redundancy and
irrelevancy in the signal to achieve compression that
may be as high as 3:1, but is typically in the order of 2:1.
After decoding, its output is bit-for-bit identical to the its input. Lossless systems are not widely used for transmis-
sion because the amount of data reduction depends
heavily on the nature of the program material. "Noise-
like" signals rarely achieve any reduction at all, while
extremely periodic signals (the most extreme example of
which is a sinewave) achieve large amounts of reduction.
This means that the data-reduced signal cannot be ac-commodated on a channel with a fixed capacity in bits
per second because the required data rate is unpredict-able and constantly changing. Nevertheless, they are
highly suited for reducing the size of audio data files stored on hard disks or other media because these can
read out data at a variable rate.
The lossy bit-reduced systems find their main applica-
tions where bandwidth and/or storage is at a premium,
particularly where the channel has a fixed capacity in
bits per second. Audio storage systems, digital audio broadcasting, broadcast studio-transmitter links, audio
over low bit-rate digital telephone lines, and certainly audio over the Internet are perfect examples. Anywhere
the proverbial elephant needs to be shoved through a
keyhole, non-linear lossy bit-reduced systems come to the rescue.
WAVEFORM DIGITAL SYSTEM PRESERVATION PROCESSING DELAY BIT RATE TRANSPARENCY
Linear PCM Non Bit-Reduced
Perfect None Highest Perfect Assuming no uncorrect-
able bit errors
Lossless
Bit-Reduced Perfect Minimal Approx. 50%
of Non-Bit Reduced Perfect
Assuming no uncorrect-able bit errors
Lossy Bit-Reduced
Overshoot Depending Upon
Bit-Reduction
Long Depending Upon
Bit-Reduction
Lowest Depending Upon
Bit-Reduction
High to Low
Depending Upon
Bit-Reduction
Fig. 1 Various Digital Audio Systems - Advantages/Disadvantages
170

There are two basic types of lossy data compression
systems. One type uses a psychoacoustic model of the ear to parcel out the bits so that the added quantization
noise in a given frequency band is psychoacoustically masked by the desired signal and is not heard. Typical systems of this type include the LSO/MPEG systems, Dolby AC-2 and AC-3, and AT&T/Lucent PAC.
The second type uses a simpler algorithm without a psy-
choacoustic model. The second system achieves far less data rate reduction than does the first, but also has far less round-trip encode/decode time delay. A typical sys-tem is APT-X .
SYSTEM INTERFACE & INTEGRATION
Because of their high-fidelity capability, the non-lossy
systems are the easiest for system interface and integra-tion, provided that a few rules are followed. If these systems are fed peak controlled signals into an analog-to-digital converter, the signal must be properly band-
limited. The analog-to-digital converter signal input circuitry must have essentially constant group delay throughout the signal passband, and have its -3dB low frequency cutoff point at least 0.16Hz for minimum
overshoot of the peak controlled signal. Likewise if the
digital peak controlled signal is passed through any suc-ceeding digital signal processing to remove any equiva-lent dc offsets. If these rules are followed, the linear non-bit reduced digital systems may be treated and sig-
nal-processed exactly like a typical transparent analog system.
Fig. 2 shows the minimum low frequency response re-quirement for less than 1% overshoot. Fig. 3 shows the
peak control ability of an audio signal processor passed through a system with a -3dB low frequency cutoff point of 0.16Hz. Fig. 4 shows the exact same signal passed through a system with a -3dB low frequency cutoff fre-quency of 5Hz. This would give the system a -0.5dB point of 20Hz, which most designers would consider to be adequate.
Nevertheless, as indicated in Fig. 4, the resulting over-shoot is unacceptable.
System interface and integration for lossy bit-reduced systems must be given careful consideration to obtain
optimum results. Because of the added quantization noise, these systems will add substantial level to peak controlled signals. If the peak controller is placed before the link, the increased peak level will force a reduction in
10
-40 0 1
FREQUENCY [Hz)
o
Fig. 2 Minimum Low-Frequency Response Requirement
115
ii. 110
z o i--- 105 5 2 i 100
95
100
. - -• C) IV u 1r
111, 1 1111 1 1111 111 11 11 “1111 ,1111/1 1 II II I II II II I1 1 ,111
0 10 20 30 40
TIME (Sec) so
Fig. 3 Peak Output Level - System LF Cutoff 0.16Hz
11
27' z o
5 0 0 0 2
30
TIME [Sac]
Fig.4 Peak Output Level - System LF Cutoff 5Hz
60
the average level to avoid peak overmodulation. This
reduces loudness. It is not a good idea to place an addi-tional limiter at the end of a lossy bit-reduced system in an attempt to locate the main signal processing before
the non-linear bit-reduced digital system. This will cre-ate unnecessary distortion, and possibly other gross processing artifacts.
171

Fig. 5 shows the resultant peak level at the output of an
APT-Km system at 256kbps in stereo.
150 3
145i
140,
z 13(>Cl
01. 125*
5 120-. '
CI lis t 0 2 110
105
100
41-
os I 11111 ,11111 ,111111IIIIIIIIIIII11 ,1111111,r1IITIIIIIIIII
10 20 30 40 50 60
TIME [Sec]
Fig. 5 Peak Output Level - APT- Vm 256kbps. Stereo
If this type of system is to be used for a broadcast studio-to-transmitter link, the best results will be obtained by placing the audio signal processing at the output of the
lossy bit-reduced digital system. The major potential
problem here is that multiband audio processors can sub-stantially re-equalize the spectral balance of the audio.
Lossy data reduction systems using psychoacoustic mod-
els assume that the output of the data reduction system
will be presented to the ear with essentially flat fre-
quency response. If the frequency response of the chan-
nel deviates significantly from "flat," it can cause quan-
tization noise to become unmasked and audible because the psychoacoustic model used for bit allocation is no
longer accurate. Such unmasked noise does not sound
like hiss. It can sound like distortion, "bubbling" sounds,
and the like because the noise occurs in narrow fre-quency bands and thus has a tonality.
The best way to avoid this problem is to use the highest
data rate possible. The higher the data rate, the more the
added quantization noise is moved below the hearing threshold and the less likely it is to become unmasked by
the transmission audio processor.
Signal processing for any of the digital broadcasting services, including any of the on-line services over the
Internet is a bit tricky. The traditional automatic gain
control, multi-band gain control and equalization may be applied to the signal with no problem or consideration.
However, by peak controlling the signal, especially ag-gressively, there is a possibility that digital clipping may
result at the decoder if sufficient headroom is not left at the encoder. This can happen for the same reason that
any of the lossy bit-reduced systems overshoot on peak
controlled signals. Upon decoding, the perceptual
coding algorithms add noise to the signal, thus raising the peak level. It is very important that this be taken into
consideration when standardizing on a digital broad-
casting system.
OTHER CONSIDERATIONS
All digital systems have some sort of delays attached to
them. The more digital signal processing, i.e., more bit-reduction, the longer the delay.
This can pose a problem for talent off-air monitoring.
Bone conduction comb filtering and echo are serious
considerations. The first notch frequency in bone-
conduction comb filtering occurs when the signal is 180
degrees out-of-phase with the original acoustic signal.
Many people are bothered by delays as little as 1ms. At
lms, the first notch is at 500Hz. At 2ms, the first notch is 250Hz, where there is substantial voice energy. Delays at 20ms are typically perceived as echo, provided the pro-gram material has significant transient content.
Digital system delays for ISO/MPEG Layer II are typi-
cally around 25-30ms. ISO/MPEG Layer HI are around
100ms. If there are more than one of these systems cas-
caded, the delays add up linearly. A digital audio signal processor will also have delay. (For example, an Orban
Optimode 8200 has 2.7ms delay if its analog inputs and outputs are used.). A digital FM exciter can have a delay
of anywhere from 1-2ms to tens of milliseconds, depend-ing on the technology used to generate the FM signal.
There comes a time in one's life when science marches
on. In order to advance forward, changes must be made.
This is one of those examples. Air talent off-air moni-
toring will no longer be possible the way it used to be. Fortunately, there are a large number of inexpensive
recording-studio-oriented compressors available. These are suitable for processing the program line audio into
the air talent's headphones so that the air talent can "feel" his/her performance.
The upside is that digital technology is providing quan-tum leaps in on-air quality that can easily be heard on the average auto or home receiver. Most previous analog
broadcast storage and transmission media were audibly compromised for the sake of convenience or ruggedness.
No one mourns the demise of the NAB tape cartridge! In
a world where CD quality has become the norm at the consumer level, digitization of the broadcast chain brings off-air quality up to a level where it is not embarrassed
by comparison.
172

EMERGENCY PLANNING: STAYING ON THE AIR Monday, April 7, 1997 10:30 am - 12:00 pm
Chairperson: Jerry Whitaker, Technical Press, Beaverton, OR
DISASTER PLANNING.... BEFORE AND AFTER THE FACT Thomas G. Osenkowsky Brookfield, CT
KEEP IT SIMPLE AND REDUNDANT Sanford B. Cchen KQNA / Prescott Valley Broadcasting Company Prescott Valley, AZ
STAYING ON THE AIR: CASE STUDIES IN EMERGENCY PLANNING - RADIO AND TV David C. Kobe Harris Corporation Quincy, IL
173

174

Disaster Planning...Before and After the Fact
Thomas G. Osenkowsky Radio Engineering Consultant
5 Beachwood Grove Brookfield, CT 06804
ABSTRACT
Many broadcast facilities are not fully prepared to deal with disasters, natural or manmade. Recovery from a catastrophic event begins with planning and strategies made long before the fact. This paper will examine from both a technical and business viewpoint how best to plan for and cope with catastrophic events
Starting At The Top
Virtually every broadcast facility utilizes a tower for transmission of their signal(s). While some towers may look alike, there are indeed differences in the load bearing capability and wind/ice ratings of the structure. A tower is perhaps the most exposed asset that a station owns. Its proper design and maintenance is crucial to the continuity of the operation. When a new tower is first erected, there are several considerations that will determine the final design. They are:
1. The overall height as dictated by technical factors such as HAAT for FM stations or vertical radiation characteristic for AM stations. FAA limitations may also apply.
2. The load bearing capability as specified by the station's engineer i.e. number of FM antennas and bays, number of auxiliary antennas and transmission lines plus any other appurtenances.
3. The windload and ice bearing capability for the region.
4. The guying and anchor design given the soil makeup and available real estate.
Proper tower planning is essential to both delivering a signal and the ability to do so in the face of inclement conditions. Towers and antennas are prone to the effects of the environment as well as manmade hamrds. Some varieties are:
1. Wind and/or ice related storms.
2. Vandalism.
3. Manmade or natural earthquakes, mud slides, or rock slides.
4. Antenna or appurtenance damages due to lightning strike.
5. Collapse due to improper or excessive loading.
6. Guy cable or anchor failure due to contact with vehicles or fire damage due to weeds.
7. Soil changes due to unstable earth causing anchor or base pier shifting.
8. Rust or corrosion due to neglect or growth covered hardware.
175
New or existing towers must be carefully analyzed to ensure they can withstand the forces of nature such as winds and structural icing given the present loading. Too often, towers may be overloaded or unevenly loaded which may lead to failure. Any additions or modifications to a tower should be approved by a competent structural engineer.
Guy cables and anchor hardware can be damaged by sliding ice or vandalism. All guy anchors should be enclosed in a locked fence and kept free of weeds which can suffocate the flow of free air and block sunlight which tends to dry the hardware, preventing unwanted rust and corrosion. Weeds can catch fire and cause cable failure due to excessive heat. Passage ways and parking areas should be routed away from anchors which minimizes the possibility of contact.
Earthquakes can cause tower failure by the stresses applied to the structure and guying system. Manmade quake activity such as nearby blasting should be carefully studied by a licensed structural engineer prior to commencement of that activity. Soil borings around the base pier and anchors will determine if the earth makeup is sufficiently stable to endure the effects of the blasting.
AM engineers are familiar with the importance of
a good ground system for radiation efficiency. Equally important is the ability of the ground system about any tower to dissipate the energy imposed by a lightning strike. Simply grounding a tower base is not sufficient to afford adequate lightning protection. The magnitude of energy in a lightning bolt must be dissipated quickly. The ability to do so is dependent on a ground radial or screen system constructed with that purpose in mind. Lightning energy not adequately dissipated in a ground system can find its way to the AC power mains or antenna cables, causing equipment damage. Guy cable insulators can also be damaged by arcing due to a lightning strike.
Studio and Transmitter Buildings
Many of the hazards previously described for towers apply equally to buildings. Ice falling from towers or guy wires can cause extensive damage to structures, vehicles or personnel. Antennas, transmission lines, waveguides and control cables not protected by ice bridges can be destroyed. Buildings and parking areas situated beneath a tower or guy cable should be adequately protected by ice breakers.
Every building should have adequate security considerations. A careful review of security should be performed with a consultant or the local police department in cooperation with the station's insurance company. Alarm systems should be installed to protect against intrusion, burglary, fire and carbon monoxide. Fire
extinguishing equipment should be carefully reviewed and maintained on a regular basis. Ensure that the extinguishing apparatus is the proper type for the contents of the room being protected. Often times, rooms are reassigned, ipxpanded or partitioned without regard to the safety mechanisms that are necessary to ensure the safety of their contents or occupants.
If buildings are located in high wind zones, the structure should be designed or buttressed to withstand the anticipated force. Roofs are especially prone to damage and should be of reinforced design. Water damage to equipment and contents can be severe if a roof is torn off during a hurricane. Placement of equipment should be such that exposure to the elements from ventilation ducts, ceiling fans and windows is minimized. All equipment should be raised off the floor with pressure treated wood or other material to prevent corrosion and water seepage in the event of a flood. All equipment racks should be bonded to the master ground strap and AC power mains protected by surge suppression gear.
176
Before the Fact...Insurance Coverage
Most broadcast facilities are insured against disaster. Many are not adequately insured. Before disaster strikes, the following steps should be taken to prepare for the worst:
1. A complete room by room inventory should be undertaken, listing every piece of equipment by model number, serial number, date of acquisition, purchase price and replacement cost. Don't forget furniture, soundproofing, carpeting, AJC, cabinetry, spare parts and other contents.
Some equipment might be off-site such as remote and test gear, tools, two hop STL equipment and the like. Other property such as ground straps, radials, underground cabling and satellite dishes often escape inventory. Be sure all of these are correctly listed.
2. A photograph of each room and equipment should accompany the inventory.
3. A review of your insurance coverage with your agent or underwriter should be undertaken annually. This ensures that coverage is adequate for the equipment and buildings presently in use and that the station is receiving a competitive premium.
4. Make sure you have a replacement cost policy. This will enable you to replace each item without considering depreciation.
Insurance coverage is usually provided by more than one underwriter. The tower, ATU, generator, transmission line and antenna might be covered by one underwriter (perhaps a marine contract) while the buildings and contents may be covered by a commercial underwriter.
Broadcast stations often have unique items such as extensive compact disc or vinyl music and production libraries. Promotional singles are usually irreplaceable. Although time consuming, a DAT or MiniDisc off-premises backup of these unique versions is advisable. Equally as unique are computer data banks. The best insurance for the latter is a daily off-premises tape backup. Make daily backups of your file server music, traffic, inventory, sales and accounting data files. This practice will protect the station from hard drive failure, fire, flood, theft or sabotage. Keeping a backup tape in the station will not suffice in all cases.
If you are in a flood zone, make sure your coverage affords this protection. Not only can tower guy or base anchors fall victim to flooding, so can underground cables, ground systems, ATU's, isocouplers, etc.
Insist that any outside contractors, tower workers especially, carry adequate liability insurance of their own. General liability insurance policies in the one to five million dollar range are usually required by most major companies. This will protect the station's property in the event of negligence or accident by a contractor. Any utility service work such as an electrician should only be performed by an individual licensed by the state.
Carefully examine your policy to determine if business interruption costs are covered. If, for example, your studio or transmitter building were destroyed by fire, what costs for temporary facilities are covered? For what length of time? What amount of coverage is afforded for lost commercial revenues?
No degree of insurance is 100% effective, however, every precaution and consideration should be taken in order to be made whole in the event of a disaster.
177

After the Fact...Up and Running
In the event of a disaster, the single most important task is to get back on the air. We'll start at the top again, focusing on tower failure. Coping with the lack of a tower from which to broadcast can be a challenge. An AM directional station that has at least one tower standing can reconfigure its feeder system to direct the transmitter power into one tower, bypassing the power divider and phase shifter networks. The tower ATU can be retuned to
properly match the transmission line. When the only tower fails, there are several possible ways to get up and running.
1. Construct a temporary antenna such as a dipole or construct a smaller tower such as a crank-up model. In the latter case, the tower may be a shunt fed, grounded base.
2. Diplex your signal on a neighboring station's tower. Diplexing allows two or more signals to be transmitted from a single antenna.
3. Use a nearby communications tower, smokestack, flagpole, etc. with a folded unipole antenna.
Whenever the station's licensed facilities become unusable, it is first necessary to notify the FCC of the circumstances and request Special Temporary Authority (STA) to operate with modified facilities pending replacement of equipment and structures. This includes any relocation of the main studio, transmitter site or operation with parameters at variance from licensed values.
A broadcast station may operate with facilities equal to or less than those licensed. A directional AM station may have to considerably reduce power if it cannot afford the required protection to other facilities.
The most obvious example would be omnidirectional operation where deep nulls cannot be achieved. The Commission will usually specify the temporary power levels it will allow during the emergency period.
I recall one recent disaster where a Class IV station on 1340 Khz lost its tower. A nearby Class III operating non-directional daytime, two tower directional nights on 1300 Khz 'loaned' it DA tower for use on 1340 Khz. Trap circuits were
hurriedly constructed to keep signals from entering each transmitter's final amplifier to
prevent intermodulation. The 1300 Khz station's standby Vanguard transmitter was crystaled and retuned to 1340 Khz (luckily the 1340 Khz station also had a Vanguard standby) and operations commenced from one site. An unused 950 Mhz STL antenna at the 1300 Khz site served to
receive 161 Mhz RPU transmissions from the 1340 Khz site, at a 90° off-azimuth at that. Another disaster that I was involved with was an AM/FM combo whose transmitter facility was destroyed by an arson fire. A temporary transmitter site was constructed in the rear of a U-Haul truck and served as such for four months while new construction was undertaken.
An FM station is more readily constructed than its AM counterpart. Many FM stations have replaced their antennas and maintain the old antenna as a backup. My personal philosophy in FM facility design is to have the standby transmitter feed the standby antenna thus providing one button instant backup. This, however, will not help in the case where a tower has fallen.
Construction of antennas from ordinary hardware is detailed in amateur radio and other publications and is beyond the scope of this paper. It is sufficient to say that copper piping can substitute for flexible coaxial feedline and also serve as fabrication material for an FM antenna bay.
178

If an FM tower fails, it may be prudent to erect a temporary tower or mast on a tall building or other location where the majority of audience can be adequately served. In most tower failures, there are at least one, two or more usable sections that can be put to some use if not at the same site, then at another. There are a number of manufacturers producing frequency agile solid state exciters and transmitters making a single transmitter an ideal candidate for multiple stations on a tight budget to use in the event of an emergency. A low powered transmitter and antenna might be located at the studio or other site as a standby in situations involving transmitter sites that might be
inaccessible in severe weather. One possibility is to use a communications or utility tower for this purpose.
If a nearby tower or vertical structure is detuned for an AM station, it may be possible to locate a simple ATU and switching relay to make the tower
usable for broadcast i.e. detuned/fed switching. This is an ideal arrangement for emergency situations as well as RFR rule compliance. This
same arrangement may be possible where co-owned AM/FM stations are operated from different transmitter sites.
From Here To There
Program delivery from studio to transmitter site(s) can be accomplished in a number of ways depending on the severity of a disaster. Common delivery methods involve STL systems, telephone lines, or even cable TV lines. When the usual methods are not available, we must press alternate plans into action. The most obvious would be a RPU system which is owned or borrowed. If this is not posible, an FM SCA subcarrier would be another choice. Digital telephone delivery systems which are commonly used for remote broadcasts, commercial continuity delivery, and other services can be used.
The local cable TV system may be able to render a signal delivery path or even partial path. As a last resort, a spare FM exciter was once pressed into service to serve as an emergency STL on an unused FM band frequency.
An Emergency Studio
Studio reconstruction can be as simple as a disco mixer, microphone, CD players and cassette decks all purchased locally. A DJ 'coffin' unit can serve
as an instant studio. If a studio building is destroyed, a motor home located at the transmitter site can serve as an instant studio. If your station is heavily dependent on satellite delivered materials, it may be necessary to erect a temporary
dish or rent dish space from a neighboring station, cable TV company or satellite service distributor.
I prefer to have standby transmitters fed from their own audio processor, usually an older piece of gear retired in favor of a newer vintage i.e. an analog processor replaced with a digital counterpart. When the standby is engaged it may not sound as hot, but the ability to switch to an entire backup audio system, transmitter and
antenna is sometimes more appealing in the long run. The mixture of old and new equipment has another advantage. If possible, keep some audio processing at each location. In the event of a disaster at the studio, you will have something to keep you up and running at the transmitter site and vice versa.
Be Prepared
Ok, this isn't the Boy Scouts but the motto is quite relevant. A little preparation can go a long way to maintaining an on air product while the competition sits idle in the wake of disaster. Consider your station's weak points, shore them up, review all relevant insurance coverages on a regular basis and always stay prepared.
179

KEEP IT SIMPLE AND REDUNDANT Sanford B. Cohen
KPPV 106.7 FM/KQNA 1130 AM Prescott Valley, AZ
As the title would indicate, our systems have been designed to give the operator multiple options in order to keep the stations on the air.
First, a little background on our sites. KPPV 106.7 FM broadcasts from Mount Francis, about 6 miles Southwest of Prescott, Arizona in the Prescott National Forest. The site may be desirable from an HAAT point of view, but is also the terminus for the utility power grid, making it vulnerable to outages.
KPPV receives its audio from the studio via a microwave hop on Glassford Hill. Glassford Hill is the station's former main transmitter site. A power upgrade in 1992 led to the relocation of the main facilities to Mount Francis.
However, recent changes in the Commissions' rules allowing formerly licensed facilities to function as auxiliary backup stations came into play for KPPV.
KQNA 1130 AM is located in Prescott Valley, Arizona, about a mile from the main studio. The site is on State land in a floodway which is a boon to the grounding system, however the annual monsoon season and it's daily lightning activity causes frequent power outages as well.
Our AM station uses a Gates 1 kW transmitter and is outfitted with a 100 watt solid state backup transmitter than can be called up in the event of an outage via remote control. Even our administrative staff has been trained in the operation of the remote and in the case of failure, the transmitter is only a five minute ride away for a hands-on restart.
The FM side is far more intriguing. At the Glassford Hill microwave hop, the site is powered by a 96 panel solar array that charges a bank of 16 deep cycle batteries. KPPV was recognized as the first solar powered FM radio station in the USA when the system debuted in 1986. The power generating capacity of the system, while overkill for its current application, was sufficient to run a 500 watt transmitter and five bay antenna from 1986 to 1992.
Remote control for the site was a Gentner VRC-1000 with radio modem interface. That remote has been moved to the main transmitter site at Mount Francis. On Glassford Hill, a standard 450 MHz two-way radio with touch tone decoder acts as remote control.
Furthermore, the solar array and battery bank are backed up with two propane powered generators. Generator #1 is a 12 kV Kohler and has the capacity of either charging the battery bank or, in the case of a system failure, power the equipment directly. Generator #2 is a 6 kV Onan and will start if the Kohler generator either fails to start or ceases to operate.
If a power outage is experienced at Mount
Francis, the Gentner VRC-1000 is powered with an emergency generator and will call out to the studio, then to my home phone, then to my pager, then to two employees' homes. I have the capability, once contacted, using a 450 MHz Motorola radio with touch tones built in, to turn to Glassford Hill in the event of a failure of the main transmitter.
If the emergency call ends up with one of the two employees, they have to go to the main
180
studio to perform the same function. Luckily, both live within a couple minutes drive to the studio.
In 1995, we suffered a loss of transmission in the second half of our microwave link. A silence alarm triggered the staff into action, even though we received no warning from the Gentner. Through use of a service monitor, we were able to locate the loss of signal and repair the defective STL transmitter. However, thanks to the back up transmitter on Glassford Hill, we experienced only a six-minute loss of programming.
KPPV will endure utility power outages 6-10 times a year, so it is very important that the solar site on Glassford be routinely maintained. The batteries are filled with distilled water and kept to near capacity, the generators are serviced every 200 hours of operation and the propane tank is filled at least once a month.
The system has performed reliably since it went on line in 1986. There was a massive blackout of Yavapai County and the entire Prescott area in 1992 in which KPPV was the only station remaining on the air, thanks to solar power at Glassford and an emergency 5.5 kW Yamaha generator at the studio. The outage also meant that no gasoline stations were able to pump gas. Time capacity with a full tank of fuel on the Yamaha is about six hours, we would have been scrambling for gasoline had the outage not ended in about four hours.
Our ability to stay on the air has garnered us some recognition in the local "letter to the Editor" in the daily newspaper. The development of the solar power site earned a number of State and National awards ranging from the U.S. Secretary of Energy to the Small Business Administration award for innovation.
Credit for the design of the solar power system goes to Gene Hitney of Hitney Solar Products in Chino Valley, Arizona and consulting engineer Dave Baron of Prescott Valley,
Arizona designed the 450 MHz touch tone remote control system. We have found both to be user friendly and very reliable under sometimes challenging weather and utility situations. Both have "saved our bacon" many, many times. I woulc highly recommend alternative power and remote control systems to anyone concerned with "Staying On The Air."
181

STAYING ON THE AIR: CASE STUDIES IN EMERGENCY PLANNING-RADIO AND TV
David C. Kobe Harris Corporation
Quincy, Illinois
ABSTRACT
Reliable facilities do not just happen, they are the result of careful planning. What you don't see CAN hurt you! It is hoped that this can be used as a
comprehensive guide for emergency planning for both radio and television stations. This guide is
prima * aimed at station managers, engineers, and technicians who are relatively new to the transmitter side of station operations. Much of this material is common sense and familiar to the seasoned broadcaster. Material included may be more pertinent to large stations and some more useful to the smaller or one person station.
CATEGORIZING EMERGENCY PLANNING
In categorizing emergency planning procedures within broadcasting organizations, there appears to be three groups of stations:
• Stations that can teach the rest of us how to do it right. This paper will discuss many of the issues that these stations do correctly.
• Stations that do a average/typical job of handling emergencies. This is middle ground where most of us are at.
• Stations that are struggling just to stay on the air. Struggling stations often use very old
transmitters and do not have spare parts or even minimum test equipment such as a scope
and VOM. Worse yet, some of these stations have not established a credit line for ordering parts. Case in point. Station X bought a used tube type FM transmitter. They interfaced it with a working but older solid state exciter that later failed and took them off the air. A field service trip revealed the exciter blower fan was burned out completely and packed with dirt, leaving the
blower out of commission for who knows how
long. Getting the station back on the air was slowed further by the fact the station had not
set up any credit in advance with the necessary dealers/manufacturers. The above scenario
would have played out differently if station engineers would have periodically checked the blowers and planned for an emergency.
PUTTING THINGS INTO PERSPECTIVE
Let us take a traveling business man who drives a new car for business purposes. If he drove an
average of four hours every work day, in 5 years he would rack up 5,000 hours of driving time putting about 100,000 miles on the car. If he can't afford any down time, he will have to implement good preventative maintenance procedures on the vehicle. And even then he may also have some repairs to make. On the other hand, if we take a new transmitter operating at 20 hours a day for 5 years, it would rack up 36,500 hours. That is over 7 times more hours than the car. However, many stations fall short when it comes to a good preventative maintenance plan for that transmitter. Maintenance must be addressed or it will cost you much more in the long run.
Interestingly, many stations operate on the ALL or NOTHING syndrome when it comes to maintenance work. The perception that money is being saved by not performing routine maintenance is false. Maintenance costs are greater when stations experience off air time due to inadequate upkeep and preventative maintenance.
STANDARD OPERATING PROCEDURES
Every station should have or immediately generate a Standard Operating Procedure manual. It should be periodically reviewed by all staff members, particularly new employees. Case studies show
182

many stations are losing on air time due to lack of a comprehensive plan to cover emergencies. Visits to the site often only occur when there is a problem.
General managers or assistants need to take periodic tours of the transmitting facility
Each station should have a key person assigned to maintaining a library of equipment documentation.
Keeping a library of documentation will help alleviate problems when change in personnel occurs. In addition, ensure that contract engineers
leave diagrams etc at the transmitter facility.
CROSS TRAINING FOR STAFF GREATER THAN ONE
When your chief engineer is absent, can the backup engineer handle the duties? Case studies show that too often they cannot due to lack of knowledge and proper training. Your Operations Plan needs to include scheduled training for station personnel.
A team effort is needed to handle emergencies and
takeover when others are out. You will never have a top notch team unless there is a cooperative effort and all employees are cross trained and adept in handling emergency situations. The chief engineer must realize that his/her job requires a smooth running facility with minimum problems and handling problems efficiently when they do occur. A good way to plan for emergencies is have the chief engineer schedule a meeting with the staff in a room with a marker board and set the stage with a few scenarios. This has proven to be effective.
• How are each of us handling emergencies now'? What problems are encountered and what are some of the frustrations'?
• If you are out for any reason, how are emergencies that involve you handled?
• We are all occasionally tasked with fielding problems in areas we are not familiar with.
• How many emergencies occurred last month'? • What is the average per month? • What was the average time to handle the
emergency'? • As a team, how can we reduce this? • Set goals which can be measured.
As we all know there is nothing more terrifying than dead air! The idea here is to handle emergencies smarter. Adding extra staff is not always the best
solution, as it raises costs to the station. In some cases. the addition of more equipment and facilities
may warrant additional staff members, but may not be an option at smaller stations, with limited staffing or use of contract engineers.
Operators or technicians usually have their own "quick fix to get by at the moment" procedure in an
emergency. In a team environment, it is not necessary for each team member to have a component level of expertise but if they know the quick fix emergency procedures. they can help restore operation in a hurry. Your Operators should
know how to do all bypass procedures that can be performed. Make sure they know which procedures could damage the equipment if done incorrectly. In the event a bypass procedure is required and the engineer is not on site, the operator could be coached how to do it over the telephone. No operator or non-technical person should ever perform emergency work when dangerous currents and voltages are present. Hands on practice will help in handling emergencies. Schedule "off air drills". That is when you will see just how vulnerable your facility is.
You must ask yourself the following questions:
• What catastrophes may the station be exposed too: flooding, hurricanes, tornadoes. earthquakes, ice storms, power outages and brown outs.
• What if studio loses power'? • Are master control operators prepared for an
emergency.
Remember too. if your VHF facility acquires a UHF transmitter, you still have to maintain the VHF transmitter for 10 years plus. More than likely you will have to maintain both systems without an increase to your staff. Dual UHF stations will have it a little easier than mixed VHF/UHF in terms of experience, test equipment, spares etc.
One law that should prevail at all stations: "Mandatory updating of site maintenance log." (refer to section tilted "Maintenance Log")
Activities In Summary • Build a maintenance team • Cross-train backup personnel • Take a tour of the transmitting facility with the
chief.
183

• Schedule routine visits to the transmitter facility. • Inspect station maintenance logs. • Schedule emergency "off air drills". • Budget for adequate test equipment • Who is authorized to order parts in an
emergency? • Who is the backup to the chief engineer? • Are phones numbers of all key personnel
posted'? • Are Phone numbers of equipment
manufacturers posted?
• Are medical emergency phone numbers posted'?
• Status of spare tubes, modules. parts. • Do you have a backup contract engineer'?
MAINTENANCE LOG
One of the most important functions at a transmitter site is the mandatory maintenance of the site MAINTENANCE LOG. If your station does not have a maintenance log, refer to the checklist below for a starting point. The log should be used to maintain factory data sheets, field service bulletins and your own data readings. Record all meter readings each time you visit the transmitter site. Check the log periodically for changes. When data is recent it is very valuable during an emergency. You also may
not know who will be working on the equipment. It could be one of several different employees, contract engineer, a manufacturer field service rep, etc. Therefore, it is critical that any and all changes/modifications be entered and dated. When calling the manufacturer for help, the log could be invaluable in helping to find the problem.
Surprisingly, transmitter sites often lack references as to who, when and why a change was made.
Log Entry Check List • Date of entry • Entry made by • Description of problem • Describe solution • Modifications/changes • Document changes on appropriate drawings
and technical manuals
• Date and initial ALL changes and/or additions. • Back of log, list names and contact phone
numbers of persons who have made entries.
Note: Use of ringed binders for a log may cause pages to be easily torn out and become lost. A spiral bound log works nice as it also lays flat. If you now use a ringed type binder, number every page at the top. In the event a page tears out, you can re-insert it where it belongs. Keep a roll of clear tape and a hole punch available for torn out page repair.
DOCUMENTATION
Familiarize yourself with transmitter documentation before a problem occurs. Look at the technical manual before you have a problem! During an emergency is not the time to be learning how the transmitter works. Keep a master library of station documentation at the site and make all notes. changes, additions in this master set. If you have two or more sets of documentation, separate the additional sets from the master set. Often changes get spread out across different manuals of the
same type with no one manual containing ALL of the changes.
Document equipment modifications. Among some of the most troublesome scenarios is the case when a transmitter was bought used, required a frequency change, and modifications were not documented correctly.
Contract engineers are often hired by radio stations who usually take care of multiple stations and generally are not as familiar with each station's equipment as permanent employees. Therefore, clear labeling of: cables and destinations,
interconnect drawings, main power breakers, patch panels and patch panel functions, external interlocks, audio feeds, remote control lines, etc. can reduce costly troubleshooting time. It would be more cost effective to pay a contract engineer to label all wiring, before there is an emergency. When an emergency occurs, time can be devoted to solving the problem, not tracing wires. Have a spare documentation set available.
TRAINING
When acquiring new transmitting equipment, station personnel should be trained by the factory on
maintenance and care. When compared to down time, factory training is very inexpensive. Product training at the factory has several advantages.
184

• You are trained by the manufacturer of the equipment.
• Factory trainers can demonstrate proper tuning, testing, and adjustments
• You make contacts on who to call if a problem Occurs
• You make contacts for ordering parts or sending something in for repair.
You can often meet and talk with some of the design engineers and field service engineers.
One trend that has occurred over the last 10 years is more and more studio personnel are being tasked with taking care of the station RF equipment including high power transmitters. They need more
training on RF systems, equipment adjustments. exciter adjustments and so on. Apprenticeship programs are virtually gone, even though they sorely needed as senior engineers retire. Schools
teaching RF courses are rare, and books on the subject are usually not comprehensive enough for beginning broadcasters. If studio technicians are to become part of the RF maintenance group, either apprenticeships or training must be made available. Broadcasting is not like audio frequency electronics where alot of expertise can be obtained as you go.
Digital and microprocessor technologies are now
part of control systems and that trend will continue. A fundamental knowledge in both of these disciplines is essential to effectively troubleshoot modern transmitting equipment. The good news here is there are numerous sources for this kind of training
Studio System Through Transmitter Antenna System
Radio and television stations are going all digital from the audio/video sources to the transmitter. In radio, many of the stations are operating virtually in the digital domain, including digital audio equipment, digital studio production, digital STL links to the transmitter, and even a digital FM exciter. The same is true in AM radio including a digitally modulated transmitter. For television, there are many varieties of digital equipment in use but DTV is going to require many changes throughout the studio to transmitter system such as digital routing switchers, digital STL's etc. Advanced training should start now and is imperative if station personnel are to
understand implementation and use of this equipment including maintenance with specialized test equipment such as Bit Error Rate Detectors. Your staff will need a good understanding of digital technology. For those stations acquiring an UHF transmitter, transmission line may now be wave guide with a different antenna system.
PREVENTATIVE MAINTENANCE PLAN
Preventive maintenance is many times more cost effective than being OFF THE AIR!
NEAT and CLEAN is the key in keeping your equipment on the air! Keeping equipment clean should be your number one priority
Stocking of Spares: Often overlooked is a full stock of fuses for everything from the main input panel to the transmitter and in a quantity to allow troubleshooting. Have several flashlights/batteries available and in good working order.
Often neglected but very important is keeping a stock of AIR FILTERS and changing periodically. In an environment where the filters get dirty rather quickly, a schedule should be adhered to such as the first of each month. One method to determine if the filter needs changing is to use a manometer and measure the air pressure difference through the filter. Take the readings with a new filter installed. Then take some cardboard and cover approximately half of the filter. Log the changed pressure reading. Remove the cardboard. As the filter gets dirty the pressure reading will change. When it approaches the reading you took with the cardboard in place, it's time to change the filters.
Periodically check antenna de-icers for operation. If they fail. VSVVR goes up and the transmitter must reduce output power or shut down. A simple current sensor can be used to determine if the de-icer is working.
In areas with severe winters, have a long broom on hand to sweep satellite dishes. In cold climates pipes freeze and break. An inspection of where pipes are and what damage could a leak cause can help in terms of planning steps to limit damage before an emergency occurs.
185

If your station is receiving programs using the KU Band, signals fade during heavy rain storms. Have a plan in place to cover that situation or you could be off air. Is the transmitting facility prone to voltage
surges and noise spikes? AC line conditioning can prevent costly damage to the equipment. MOV's
(metal oxide varistors) are very cost effective means of providing dangerous sharp spike AC protection. They do need to be inspected from time to time and should be replaced every two years as they do deteriorate with age.. For areas where AC surges are a severe problem then "Series Shunt Surge Suppression" is the best protection. Simple
shunt protection components do not protect against all types of surges where as adding the series elements provides another magnitude of protection.
It is essential to have good quality soldering irons, hand tools, tap and die set and the such at the transmitter site . The facilities need to be equipped to do basic circuit board repair including stocking of
sufficient spare parts. Repairing multilayer and surface mount boards is not recommended by anyone not experienced at this. If they are damaged by non factory repair, they can not be exchanged. Also note, alot of control circuitry has static sensitive devices and an anti-static mat is required to avoid damaging those devices.
One area field service engineers fight constantly are prior transmitting equipment problems that have
been neglected and not corrected causing an accumulation of multiple problems. For example, a current meter is nonfunctioning and the station puts off fixing it. Then something else fails and troubleshooting is now handi-capped because the meter is not working. Is the meter faulty or the sensor circuit faulty? The situation is worse when
the field service engineer was not told the meter was not working before the transmitter had its current problem
And of course the old expression of "The squeaky wheel gets the grease" seems, unfortunately. alive and well at the transmitter site. There is always plenty to do at the studio, but because the transmitter is somewhere else and assumed running fine, maintenance visits often are overlooked.
There are few transmitters sites where there is not a wealth of work waiting to be done. It's not always
practical to break one or two persons away from daily studio chores to spend an extended amount of time at the site taking care of all needed work, especially if it is not critical at the moment. One method that works well is to schedule monthly trips to the site with the intent of tackling an area that needs work. Each subsequent trip tackles another area and in the course of a year, every area has
been covered at least once and the potential of an off air emergency is greatly reduced.
Periodically check out equipment not on line. Equipment that sits for months without usage may not perform when needed. Part of your routine
maintenance should be to activate the off-line equipment and verify that it is performing to standards. The time to find out it isn't working right is not when you desperately need it.
Where does your station monitor the output signal? The monitoring point should be down line as far as possible. Put the directional coupler that feeds the demod after the last coaxial switch to the antenna system. AC power is lost, then returns, and the transmitter operator checks his monitor and the audio/video looks fine. Nonetheless, you're off the
air, but everything looks fine! For some reason the antenna coax switch, switched your transmitter to the station load and your monitoring point is before the switch, not the line going to the antenna.
Make sure all dampers and louvers in heat exchangers are working. Check at Fall/Winter and Spring/Summer time changes.
Note that many interconnections inside modern equipment use SMA and/or SMB connectors.
These are not heavy duty "rugged" connectors. Handle them carefully as they can be easily damaged.
Tubes require special considerations. If they sit on a shelf for a year they can become gassy and fail when you need them. You have the option of buying a new spare or a rebuild. Generally, the rebuilds work quite well and offer good savings. Spare tubes should be checked when first received to verify they work. Sometimes, a tube will not work at certain frequencies even though it checked fine at the factory. Cycle the spare in your transmitter periodically to:
186

• Insure it works • Prevent it from going to gas
Some tube companies offer a "Maintain a Spare for You" program to help manage spare tubes.
Filament management can extend the life of your tube. The most widely accepted method is to operate the tube at the nominal rated filament voltage for the first 200 hours. Then reduce the filament voltage to about 90% to 95% being careful to note no change in output power. As the tube ages, slowly increase it up to its rated value. NEVER exceed its rated value for any reason. A 10 )/0 increase in filament voltage over the rated value will reduce the tube life by 50%.
Switching power supplies are complicated and are becoming lower and lower in cost to the point where
many of them can be considered a consumable item. Ask anyone who has worked on them and they will recommend: "Replace, don't repair."
Is your equipment subject to salt air corrosion'? The best solution is a closed air system, that is, an air conditioned room which re-circulates the room air and does not bring in outside air. If you would not
run your studio in salt corrosive conditions, why run a transmitter in that environment?
If the transmitter site has exposed concrete floors, its best to seal them with a resin or tile. Concrete dust can create nasty problems with your equipment.
And then there are the UNCONTROLLABLE PROBLEMS such as weather/nature, climate changes, personnel turnover, etc. that must be anticipated with a plan. These are real issues and some thought should be put into the "what if' scenario.
EMERGENCY PROCEDURE PLAN
Every station should have a SOP (Standard Operating Procedure) written to cover emergency situations. (Emergencies dealing with bodily safety are covered in the Safety section).
Emergency phone numbers should include a local diesel fuel supplier for the backup generator system. If you don't have a backup generator
system, then make arrangements with a rental agency hat can deliver a portable generator set that will drive your transmitter in an emergency. Other numbers to have available: plumbers, electricians, hardware stores, including after hours
numbers also. Have phone numbers of equipment manufacturers handy at the site. Names and numbers of who you have had previous conversations with is helpful. If there is not a phone at the transmitter site, then use of a cell phone is recommended.
Do you have a back up generator system'? Do you know what AC outlets will be backed up by the generator system? If you have a remote control system be sure it is plugged into the backup generator power. Hold a -loss of AC power drill" and take your 3 phase power down to see if all critical systems come back up and put you on the air. This is the only way to test your system. Testing
the generator only will not reveal potential problems until an actual emergency occurs.
Don't forget keys! Keep keys to the entrance gate and building together. Have an extra set in the vehicle that usually travels to the site.
Is your staff prepared to handle a loss of a network feed'? What are the backup options. Can all of your operators handle this emergency?
In the event your PA fails, can you get your IPA on the air? If this is not a straight forward procedure for your equipment, get some training from the manufacturer on how to do this. Usually you can get back on the air in a reasonable amount of time. You can hit nearly 80% of your audience in many cases, and in FM markets, many listeners won't even know.
Very cold weather brings many problems: springs break on hangers and transmission line falls to ground. Because these events are rare, many stations are not prepared for this type of emergency. Your spares kits should include parts to cover restoring transmission line emergencies.
Familiarize yourself with the transmitter before a problem occurs. Understanding where your
overload/fault indicators sense at, is well worth the :ime. Make notes on your equipment documentation. Know what the front panel is telling
187

you and highlight this information in the equipment technical manual. When a transmitter runs many, many months with no problems, its difficult to remember just what each indicator means.
You may need customized cables to patch around failed equipment in an emergency. Don't be faced
with making cables at the time of the emergency. Have cables made in advance. Note that cables that hang/sag for many years can cause problems.
The inner conductor migrates toward the outer conductor causing impedance to change even though ohmmeter measurements look good. BNC connectors can oxidize and become lossy. Be careful when replacing coax cables inside transmitter systems that interconnect the exciter to the IPA, and the IPA to the PA etc. The length of some of those cables has been optimized at the factory to reduce such things as synchronous noise, reflected energy etc. A replacement cable should be the exact same length.
Again, one of the best things you can do is have an occasional drill on your emergency procedures. Plant a problem, create the emergency, let your staff resolve it. Of course this is never convenient to schedule, and usually has to be done at off times. But it should be done if your serious about staying on the air. Drills are effective at flushing out weak areas in your procedures.
A whole world of problems arise when external
conditions such as AC power outages. brown-outs, and severe weather conditions occur. If a blizzard is coming, will the news staff with the 4-wheel drive vehicles pick-up the on-air staff? (After all someone
has to run the master control switcher etc.) When lightning hits anything can happen from the antenna to the STL links to the AC power source. The more backup equipment you can afford, the better off you are. If your station is located in an area prone to ice storms, antenna de-icers are critical to staying on the air at full power. As mentioned before, check the operation of the de-icers periodically. Ice storms can bring antennas and/or transmission lines down. A large market station should weigh the advantages of having some type of an emergency
standby antenna/transmission line system.
As we all know, the exciter is the heart of the transmitter and if it fails, you are off the air. A difficult decision is to stock spare boards or a spare
exciter'? In large market areas where any off air time is critical, most broadcasters agree that a main/alternate exciter is the optimum way to go. With an alternate exciter you can be back on the air in seconds.
SAFETY PLAN
Most of your station personnel should be trained in CPR. Emergency phone numbers should include, paramedics, hospital, ambulance, fire department. police, doctor if special medication is involved, family, etc. and should be posted and easily accessible.
Do not ever work alone at the transmitter facility or allow anyone else to. The second person need not be technical, but should be trained in terms of
getting emergency help and knowing where the power switches are for power removal. If work is planned on the transmitter, then the second person
should be trained in CPR and know the quickest and safest way to get a person off a live circuit, etc. A good safety plan is essential. "Safety should always be the first consideration." A cell phone is not a stand in for that second person on site.
When turning off main breakers to work on equipment, use a lock to prevent anyone from accidentally turning it on. Always use a voltage sensor/meter to insure off power circuits are really off. Do not assume DC circuits have discharged down to zero. Always use the grounding sticks. Also be careful to ground output networks especially in AM transmitters. Static discharges and lightning can
often find its way into the transmitter.
Do not take foolish chances to avoid going off the air and never defeat equipment interlocks. Periodically check all overload and safety interlock circuits to insure that they have not been bypassed. This can create a life threatening situation
Some transmitter sites are placed at very rural locations and have no phones, no running water and no restroom.. Sometimes a trip to the site is
required during severe winter weather. Be prepared for this. as you may be stranded for several days. Stock the site with some non-perishable food and water to last several days plus a kerosene heater, and a cell-phone. If AC power is out, life can be at risk.
188

And lastly, using mouse traps at a site helps keep mice out of dangerous voltage areas. This also can introduce additional health risks during cleanup. Dust from mouse droppings could be hazardous
therefore clean carefully with wet rags to prevent airborne dust. Use plastic gloves and dispose of immediately.
REPAIR STRATEGY
Most broadcast facilities will not have the equipment
to troubleshoot microprocessor and high density digital circuit boards down to the component level. Most troubleshooting will be determining which
board is malfunctioning. Smart planning is recognizing that stocking and swapping boards is much more efficient than troubleshooting to component level and is obviously much faster, but is it more costly'? If you consider the time to troubleshoot down to the component level, ordering the part(s), delivery time, did those parts fix the problem, are there adjustments/alignments now to be made to the board and how are they handled, it makes sense to swap boards and send in the failed board for service or credit.
Building a working relationship with manufacturers by getting to know key internal people can help you resolve problems quicker. Establish a credit line in order to receive emergency parts quicker. Determine if training is available and get your staff trained. It is alot cheaper than down time.
What is your solid state module repair strategy'? They should be repaired as soon as they fail. If more than one fails, do not let them accumulate. It could be very costly to have them all repaired at one time. Some boards are repairable at station facilities but more and more are becoming much more difficult. Most stations will not have the facilities to properly test, repair, and adjust them to factory levels. This is not an area for cost cutting.. Failed boards can usually be sent in to manufacturers for some credit towards a replacement board. However, if the board is damaged due to an attempted repair, no credit will be given. Boards that are vulnerable to repair damage are the newer SMT (surface mount
technology), multi-layer boards, and RF boards with stripline techniques. Many of the traces are extremely small and easily damaged.
SERVICE PARTS
Service organizations provide a wide variety of functions and are generally pretty efficient. The
following paragraphs illustrate some common problems that often occur. Some situations require a call back from the service organization. For example, a module is returned for repair. If the damage is greater than perceived, the station needs to De notified and decide if the repair should be carried out or not. For vendor items the customer should keep a spares stock. If it's a transmitter manufacturer's part, they can usually fill an order immediately. The manufacturer is also a good source for hard to get items like specialized transistors, tubes, etc. as they have to maintain stock to support their products. However, keep in mind the manufacturer is at the mercy of these vendors when they decide to discontinue a part or change it's specification without notice. This puts a burden on the product maker to find a suitable substitute and sometimes this is a long process because of unique applications of certain parts. Worse case scenario is when a suitable substitute can't be found, then a newly designed module/assembly must be created and made available to the customer at a much higher price than the old component.
Spares kits are well worth the investment. The manufacturer is the best source to advise as they have a history of what is or could be vulnerable. Ask the manufacturer for a recommendation of spares. Sometimes, a full complement of spare boards is more costly than an entire unit. Take for example a TV exciter. The station may be better off purchasing a spare exciter than all of the individual boards. The set of boards may approach or exceed the cost of a new and fully tested exciter, plus you have a backup exciter to get you back on the air immediately. This gives you another option to either board swap to find the failed board or return the complete exciter for repair, tune, and test.
Every station should keep extra sets of parts lists for ordering parts. Keep an extra set at the site and at the studio/main office.
Most sites have a working phone. but it may be located in an area away from the transmitter and the ringer can not be heard. Some transmitter sites
189

do not have access to phone lines. A cellular phone can eliminate problems, however, a survey of companies working with station personnel using cellular phones on site revealed the two most common problems to be:
• The cellular phone gets turned off because the
engineer is where he believes there is a working land line.
• The phone gets left in the truck/car while they
are inside the transmitter facility.
Now and then manufacturers need to make a return call to the engineer at the transmitter site.
A FAX machine is handy at the site when ordering
parts. Engineers can FAX the manufacturer's part numbers or if necessary draw a sketch of the
identified part. Maybe a page is missing from the technical manual. The FAX can communicate information and pictures, saving both the engineer and the manufacturer time and money. If at all possible. the engineer needing a part should be the one requesting the part from the manufacturer.
Stations need to clarify which personnel have the authority to order parts, especially when contractors are ordering on behalf of the station. A part ordered by a contractor may arrive at a station and the station may refuse the package. The contract engineer returns, expecting the part and it is not there. Set up an internal communication link to identify what is coming, when, and how.
What is the address of the transmitter site? If the part is to go directly to the transmitter site, the
delivery service needs a formal address. Make sure the address is visible from the road and work if necessary with the local road commissioner to ensure that the road to the site is visibly marked. UPS will not deliver to a partial, missing or post office box
For overnight express services, you will need to provide a phone number that will be answered during the day.
Stations need to be familiar with the local airport's flight schedule of first flight baggage. Also, if the station is located near two airports, determine which one to use for parts delivery and inform your station
personnel and your contract engineer.
Coordinating in advance saves time and trouble.
Too often boxes come in manufacturer's facilities with no paperwork. Check with the manufacturer
on return procedures, some require an RA number, and note this in your technical manual. Always
include your station call letters, address, phone number and name, and a brief description of the problem. ALWAYS put a note in the box indicating the problem so the manufacturer will know what to do with the item, whether being returned for repair, a loaner, return on a RA (Return Authorization), etc. This will also help alleviate billing issues.
If calling the service facility is necessary, get the name of the person you are working with. It always helps when that person can go back and recall what arrangements were made because sometimes there are warranty issues involved or extended, or
trade-ins, discounts because, or a quoted price, so its best to talk with the same person to avoid misunderstandings.
When placing an order, there can be many valid reasons why a part is out of stock. It is in the best interest of both station personnel and the manufacturer to try to work with the technician on duty to obtain your parts as quickly as possible. Most manufacturer's support their products for many years but some components do become obsolete and are discontinued creating shortages. This is an industry wide problem, and most manufacturers begin locating substitutes when parts are discontinued.
Customer support centers generally receive a large volume of calls each day, providing support for a wide range of transmitters and associated equipment. It is both beneficial to you and the technician on call to provide him with the correct model number of the equipment and have a good idea of what issues need to be addressed and have ready a full set of meter readings/status indications. By cooperating together, you and the technician can come to a mutual solution to your technical problems
It is a good idea to visit the transmitter
manufacturing facility for the equipment you own, or are considering purchasing. Visit their factory,
familiarizing yourself with their services, their
190

philosophy on customer support, and meet the people that will be helping you with your equipment needs.
When considering purchase of large scale
equipment, take into consideration if the manufacturer has a reputation of jumping through
hoops to get you parts ASAP? Are they creative at finding shipping or routing solutions'?
THREE PHASE AC POWER
What type of AC power is being supplied to your transmitter building'? WYE or closed Delta? Your station engineers need to have a fundamental knowledge of 3 phase power. In a survey of over
250 radio and TV station engineers, only eight knew the answer to this question, In a closed delta power feed where the phase to phase voltage is 240V, what is the voltage from each phase to ground? Over half did not know if they had WYE power or closed delta or how to tell! If your station rents a generator to cover emergencies, you need to know this.
The answer is: one phase to ground is 120V. a second phase to ground is 120V, and the third phase to ground is 208V. The third phase to ground is found by multiplying 120V times the square root of 3 (1.73).
GROUNDING
Good grounding is essential beyond broadcasting performance. Have your ground system tested. Mountainous sites on rock require expensive work to achieve a good ground. There are numerous books and pamphlets written on this subject. It's important that the tower is properly earth grounded. If lightning should strike, it will take the straightest path to ground. This greatly reduces the energy that may go to the transmitter facility through the coax line. The transmitter facility should have a star ground arrangement and a ground line run to the antenna ground. Guy wires should be grounded to the radials from the tower along with chain link fences, metallic gates, and metallic ice bridges. It's not uncommon for wire and chain link fences to build up static charges. When opening a gate, a
potential difference can occur only to be discharged through the person touching the gate and the fence at the same time.
A GLIMPSE OF THE FUTURE HIGH DEFINITION TV CONSIDERATIONS
DTV stations are going to need the ability to interface :heir VIRs, digital switcher etc., with the transmitting system's "Transport Layer" by re-timing and re-clocking the digital signals to the transport layer clock rate in order to multiplex the various
signals into it. When transmitting HDTV signal, you will need a decoder which decodes the 8VSB
signal, which will require another adapter which takes the transport layer and pulls the digital information for the broadcast signal out of that.
Is your station infrastructure large enough to deal with dual UHF/VHF transmitting'? Can your present tower support the new channel assignment in terms of space, structural strength, wind loading. etc. One option getting major attention is a community tower system.
For stations going to DTV, an upgrade to your microwave system will be required. You will be required to have a way to transmit your digital data to the transmitter. A Digital Microwave System that will operate on 8VSB or 16VSB etc., will be required. Also, your satellite receiving systems will have to be upgraded to receive a digital signal instead of an analog signal, plus be capable of decoding whatever encoding scheme the syndicated networks will be using to uplink their signals. In most cases it will just involve down converting from the transport layer to the digital/video realm, re-sending it out through a digital microwave by a transport layer to be converted in the transmitter to RF.
On UHF Klystron transmitters, make sure your staff can do an emergency multiplex procedure. If you loose an aural tube. it's a quick easy way to get a signal out on your visual as a stand alone only.
A partial list of future issues that many DTV stations will be faced with
• VHF and UHF co-habitat. • Surface mount technology • Multi-layer boards • New test equipment, $45K to $85K • New procedures such as Bit Error Rate testing. • Main/Alternate Exciters
191
UHF TRANSMITTERS
If your station is acquiring an UHF transmitter for the first time, your staff will be facing many new challenges. Among the biggest UHF challenges facing new UHF engineers are: High Voltage, Water/Plumbing, and Cooling systems. The RF
output systems will now be more critical. Clamps can not be used, EIA bolt/flanges must be used. because you can not get a good seal with slip couplings and hose couplings. 8KV to 10KV power amplifier systems will now be up to 32KV or higher
for Klystron transmitters. Glycol and water cooling systems will now have to be maintained. The old expression "Cleanliness is next to Godliness" is especially valid now when running at 32KV. 32KV attracts dust quite well which leads to arcs.
Standard UHF maintenance philosophy will include water handling, acidity testing, weekly/monthly
performance checks, plus motor bearings checking, air handling systems, etc. Digital microwave STL's will be different than analog microwave STL's. Wider bandwidths will be required depending on encoding system used. (refer to "A Glimpse of the Future")
For most facilities, If staying on the air is very critical, then you must examine your UHF system and identify those components that would take you
off the air if they should fail. Many broadcaster, consider stocking a spare driver and PA module as the best way to insure quick return to full power. For modular solid state power amplifiers, a spare power amplifier module is not absolutely necessary as the transmitter is still on the air, just at a reduced power level_ In most situations, the receiving
audience will probably not even notice, allowing the station some time for a module exchange/repair.
Maintenance of solid state drivers and PA modules on site will require the following equipment:
• Specific supply voltage, for example: 32 volt at 1.6KW power supply
• Cooling for device being repaired • RF Monitoring devices • CW signal generator • Dummy load
• Directional Coupler for reject loads • Differential Power meter
• Plus a full complement of test equipment
In addition, the cooling systems for UHF transmitters will need to be maintained and knowledge of these systems is essential. Glycol systems are the most efficient and usually less trouble with a properly trained staff. When removing a Klystron for storage, purge the water in
the Klystron. If kept in cold storage. the water can freeze and destroy the tube.
Klystrons should be gassed checked every six months. See Varian and Eimac maintenance application bulletins for details.
New tubes need to be checked upon receipt. Be aware of the warranty period. If you fail to test the tube upon purchase, warranty may expire by the
time you use it. New tubes were probably fine when they left the factory, but they get jostled in shipment. Delivery service may not keep arrows
facing up which can create problems. Quite a few stations run without a spare klystron. If you are running a single klystron and it fails, can you temporarily put your driver on the air? Inquire about training from the transmitter manufacturer on how to put a driver on the air.
As stated before, put sealant on concrete floors to keep dust out of the 32KV supply. Electrostatic filters in the room and humidifiers also help. In fact, the humidity level should be above 50% to help prevent arcing. Also note that a 32KV environment will not tolerate bugs, mice, snakes etc.
CONCLUSION
The list of topics and precautions could go on forever in emergency planning. The above information sites cases that actually occurred at radio and TV facilities as reported by broadcasters and manufacturing support groups. The intent was to identify some of the more common problem areas. Many a broadcaster has said, "If you don't have a backup, you have planned to be off the air". If you do not have a backup, you need to take the information in this document and prepare a good preventive plan. Just like the business man and his car, if he does not have a second car, he has to
adhere to a thorough preventative maintenance plan especially if he can not afford to be out of commission from time to time.
192

BROADCAST TOWERS: MAXIMIZING YOUR VERTICAL REAL ESTATE Monday, April 7, 1997 1:00 - 5:00 pm
Chairperson: Robert Seidel, CBS, New York, NY
*BROADCAST TOWERS: MAXIMIZING YOUR VERTICAL REAL ESTATE Troy Conner Tower Maintenance Specialists Brasstown, NC
*HOW MUCH CAN YOU CHARGE FOR TOWER SPACE? Jim Crooks Broadcast Communications New Glarus, WI
ADDING ANTENNAS TO A TOWER: RF ISSUES Cris Alexander Crawford Broadcasting Irving, TX
CUSTOMER SERVICE: WHEN NEXT DAY SERVICE AND MONEY BACK GUARANTEES ARE NOT ENOUGH Steve Epstein Intertec Publishing Overland Park, KS
ENGINEERING OF EXISTING TV TOWERS FOR NEW A N ANTENNAS Madison J. Batt Tower Engineering Consultants, Inc. Seattle, WA
WHICH REVISION OF THE TIA/EIA 222 STANDARD SHOULD BE USED TO EVALUATE THE TRANSMITTER TOWER FOR A N? E. Mark Malouf Malouf Engineering International Richardson, TX
193

NEW CHANNEL COMBINING DEVICES FOR DTV Paul D. Smith Micro Communications, Inc. Manchester, NH
*A REPORT ON TELECOMMUNICATIONS TOWER FAILURES James S. Cohen James S. Cohen Consulting, PC Pennington, NJ
•Papers not available at the time of publication
194
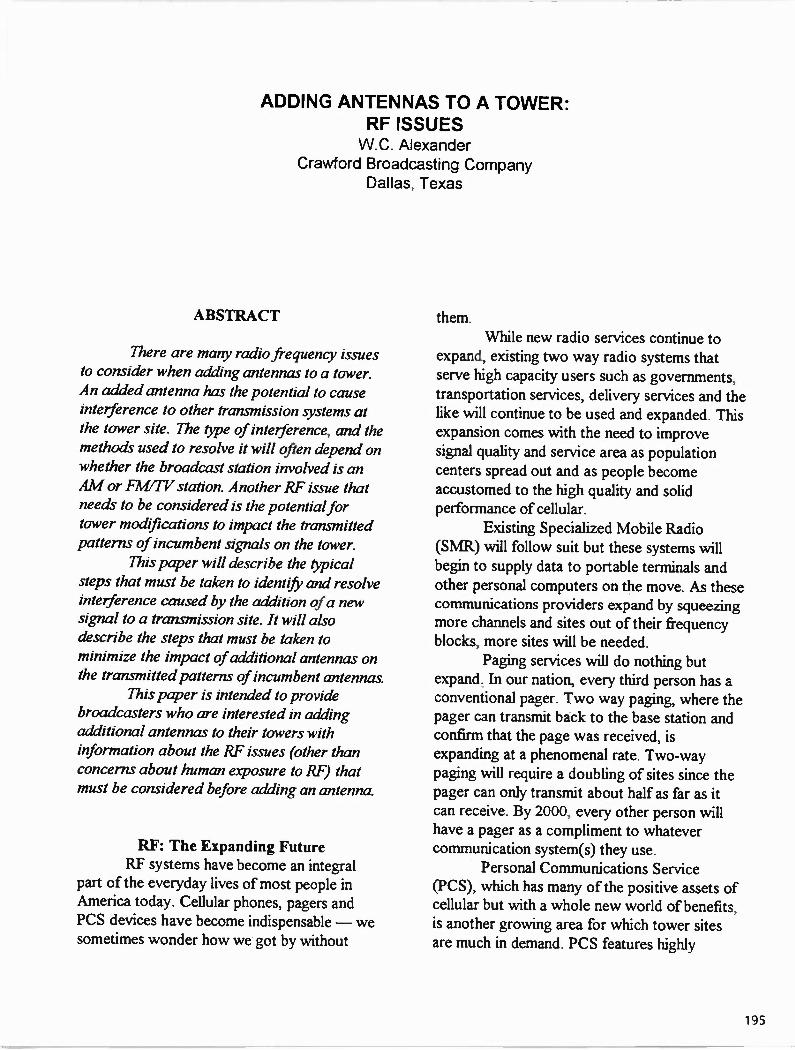
ADDING ANTENNAS TO A TOWER: RF ISSUES W.C. Alexander
Crawford Broadcasting Company Dallas, Texas
ABSTRACT
There are many radio frequency issues to consider when adding antennas to a tower. An added antenna has the potential to cause interference to other transmission systems at the tower site. The type of interference, and the methods used to resolve it will often depend on whether the broadcast station involved is an AM or FM/7V station. Another RF issue that needs to be considered is the potential for
tower modifications to impact the transmitted patterns of incumbent signals on the tower.
This paper will describe the typical steps that must be taken to identify and resolve interference caused by the addition of a new signal to a transmission site. It will also describe the steps that must be taken to
minimize the impact of additional antennas on the transmitted patterns of incumbent antennas.
This paper is intended to provide broadcasters who are interested in adding additional antennas to their towers with information about the RF issues (other than
concerns about human exposure to RF) that must be considered before adding an antenna.
RF: The Expanding Future RF systems have become an integral
part of the everyday lives of most people in America today. Cellular phones, pagers and PCS devices have become indispensable — we sometimes wonder how we got by without
them
While new radio services continue to expand, existing two way radio systems that
serve high capacity users such as governments, transportation services, delivery services and the like will continue to be used and expanded. This expansion comes with the need to improve signal quality and service area as population centers spread out and as people become accustomed to the high quality and solid performance of cellular.
Existing Specialized Mobile Radio (SMR) will follow suit but these systems will
begin to supply data to portable terminals and other personal computers on the move. As these communications providers expand by squeezing more channels and sites out of their frequency blocks, more sites will be needed.
Paging services will do nothing but expand. In our nation, every third person has a conventional pager. Two way paging, where the pager can transmit back to the base station and confirm that the page was received, is expanding at a phenomenal rate. Two-way
paging will require a doubling of sites since the pager can only transmit about half as far as it can receive. By 2000, every other person will have a pager as a compliment to whatever communication system(s) they use.
Personal Communications Service (PCS), which has many of the positive assets of cellular but with a whole new world of benefits, is another growing area for which tower sites are much in demand. PCS features highly
195

sophisticated computer supervision that will allow the system to follow the user around so that no matter his location, his phone will ring and get the message traffic through at a very economical price. To make the system work with 'wrist watch' phones and ear mounted telephones, the number of sites will be phenomenal. PCS is a town level or neighbor-hood technology with about six PCS suppliers scheduled to start up in the very near future nationwide. To maximize the initial coverage, the high technically excellent sites (such as many broadcast sites) will be built out first.
Adding non-broadcast communications users to a broadcast site is not as easy as simply hanging the antennas and transmission lines on existing towers. Certainly, this is done all the time, and in many instances those involved get away with it. The potential for serious problems, however, is great. To fail to plan is to plan to fail!
Adding Non-Broadcast Users to a Broadcast Tower
There are several things to consider before adding antennas to any tower. Foremost are the mechanical considerations, which cannot be ignored. Second are RF radiation safety issues. The location of antenna mounts, platforms and the like plus the procedures which must be followed during the installation, removal and maintenance of tower-mounted antennas and transmission lines depend on the power levels, frequencies and RF power densities produced by broadcast and other high-power entities on the tower. With these important items studied and the resulting planning out of the way, we are left with a myriad of RF issues to consider.
It has been said that interference started when the second radio signal took to the air. The principle this illustrates is very true in the case of transmission towers. As broadcasters,
we often occupy towers as solo users, with only our own transmission systems and STLs to consider. What happens when we begin to allow others to use our towers?
Mixing and Intermod The thing we all need to understand is
that RF signals from different sources can easily combine to produce other, unwanted RF signals. This effect is known as mixing. When two RF signals are combined in a non-linear device, four signals are produced — the two original signals plus new frequencies that are the sum and the difference of the two original signals. Here's an example:
A certain broadcast tower supports an FM antenna transmitting on 93.5 MHz. A paging transmitter on 152.240 MHz is added to the tower. If a non-linear device were present to mix the signals, present at that device would be the two original signals plus:
and:
152.240 - 93.5 = 58.74 MHz
152.240 + 93.5 = 245.74 MHz
A non-linear device can be a mixer in a receiver front-end, where mixing of the desired receive frequency with the signal from a local oscillator to produce a third, intermediate frequency (1F) signal. This is a desirable effect, and it is the basis upon which the superheterodyne receiver operates. Such receivers are employed almost universally today, in everything from automobile and
portable entertainment radios to televisions, pagers, cellular telephones and two-way radios.
It is not only the fundamental frequencies that can mix and cause problems. Multiples of the signal frequencies (harmonics) can be created in the non-linear devices or
196

elsewhere, and these harmonics can then mix with the fundamentals and harmonics of other frequencies to produce a whole slew other products.
Hardware Mixes This mixing effect becomes undesirable
when it occurs in an uncontrolled environment. A non-linear device can be a rusty hardware joint, a guy wire attachment with a poor electrical bond, an improperly installed coax connector or even an antenna whose joints are not properly bonded. In the presence of strong signals, such as are present on transmission towers, almost anything can act as a mixer.
When mixing occurs in hardware devices, although the transmitter powers are usually high enough to produce a significant current in the inadvertent non-linear device, the power of the product signals is typically quite low. Because of the low radiated fields of the product signals, this type of mixing causes more problems to others on the tower than it does those operating off-site. However, in some cases, antennas are involved in the mixing, and these antennas then radiate the undesired energy that then causes interference over a wide area. It is important to realize that a very weak signal from a high antenna elevation can cause a lot of interference over a wide area.
It is sometimes difficult to pinpoint and deal with mixes that occur on towers due to hardware problems. Using a field strength meter to locate the source of the mix can be just about impossible, because RF currents on the undesired frequencies flow in the conductors on the tower, making the signal seem to come from everywhere — and nowhere! One method that may work in some cases is to tune and DF a harmonic of the undesired signal. Currents from the harmonics will be much lower in intensity, and the harmonics will tend to be relatively strong right at the source.
Maintaining a clean tower is the best insurance against unwanted hardware mixes. This involves keeping the tower structure painted with all areas of corrosion repaired, careful and regular inspection of guy wires and associated hardware, proper installation and grounding of all antennas and transmission lines, and removal of unused antennas and transmission lines from the tower. This has the side benefit of better maintenance of the tower structure, improved lightning protection for al: users and lighter wind loading.
Transmitter Mixes An undesirable situation which often
occurs at multi-user tower sites is when the RE' energy from one transmitter is induced into the antenna connected to another transmitter, travels down the transmission line and enters the power amplifier of the other transmitter. There, it mixes with the RF from the other transmitter, is amplified (sometimes to a quite high level) and sent back up the transmission line to the antenna, from where it is radiated.
This type of mix is sometimes called transmitter intennod, and because the radiated power of the undesired signal is often within a few dB of the power of the desired signal, the potential for interference is tremendous. If the undesired signal falls on or close to the
frequency of another spectrum user in the same area, the other user's communications can be destroyed. This is particularly troublesome if paging transmitters are involved. They typically operate at high power and they are transmitting a high percentage of the time. When it occurs in two-way systems, the power is usually lower and transmissions much more intermittent. The potential for interference is still great, but not as pervasive as when paging transmitters are involved.
Filtering in most transmitters is designed to prevent unwanted signals from being
197

transmitted out. It seems that little thought is given to keeping unwanted strong signals from coming into the transmitter via the antenna
connector. Older power amplifiers were tuned devices, with relatively high-Q circuitry in the output network. This circuitry limited the
bandwidth of the power amplifier, but it tended to keep unwanted signals out of the power amplifier. Many modern power amplifiers are untuned, broadband devices. These devices have very little to keep unwanted signals from entering via the output port. External filtering
may be required to prevent transmitter mixes from occurring.
One of the best ways to prevent transmitter mixes is to insure adequate vertical
separation of antennas operating on frequencies in the same band. Upwards of 50 dB of isolation can be achieved with vertical separation, while horizontal separation will produce much less isolation. A good way to do this on a platform
mounting arrangement is to orient antennas on the same band upwards and downwards from the platform. This will allow much closer antenna horizontal spacing while maintaining a reasonable degree of isolation between signals.
There are filters and other devices available that are helpful in eliminating transmitter mixes. The cavity pass-reject filter, as its name implies, is designed to pass one frequency while rejecting others. A high degree of isolation, often more than 30 dB depending
on frequency band and spacing, is attainable through use of such filters. The disadvantages of such filters are cost and insertion loss. A
typical pass-reject filter costs several hundred dollars, and it will add 0.5 dB or more insertion loss to the system.
The three-port circulator is a device which, in essence, passes RF in only one direction, from port to port to port. The transmitter output is connected to one port, the antenna is connected to the next port and a
reject load to the third. RF from the transmitter is passed from the transmitter port to the antenna port, while RF coming down the
antenna port — either in the form of reflected power or unwanted signals from other
transmitters — are passed from the antenna port to the reject load port. In this manner, RF coming back down the line is prevented from entering the power amplifier of the transmitter. Circulators are quite effective at preventing transmitter mixes, but again, cost and insertion loss are disadvantages. At higher power levels, circulators can become quite expensive.
Receiver Mixes Undesired mixes can occur in the front
end circuitry of receivers. This occurs when
strong signals enter the receiver through the antenna and overload the circuitry in the front end and mix, producing unwanted signals. The good thing about this type of mix is that it usually affects only the receiver which the
strong signals are entering. The bad news is that receiver mixes can render a nearby communications system inoperative, through no apparent fault of the equipment or licensee of that system.
One day, the system is operating fine and without interference; the next, after a transmitter is added to a nearby
communications site, strong interference begins to plague the system to the point that it becomes impossible to hear the mobile units
Receiver mixes are generally reasonably easy to fix. Filters can be used to notch one or both of the offending signals (it is only necessary to remove one to stop the mix), the antenna can be reoriented or repositioned, or an attenuator can be used to reduce the overall level of RF entering the receiver. For fixed receivers, this is a fairly straightforward problem to deal with. For mobile receivers, it can be logistically difficult, as each mobile
198

receiver must be treated.
There is a rather famous case that occurred in Rochester, New York in the late 1980s involving two FM stations sharing a site. Receiver mixes between these two stations' strong signals rendered another FM station's signal unlistenable over a significant area of the city. Robert D. Greenberg, a supervisory engineer with the FM Branch of the FCC's Audio Services Division of the Mass Media Bureau, wrote an article on the phenomenon and coined the acronym "RITOIE" (Receiver-Induced Third Order Intermodulation Effects), which is pronounced ri-too-eyl. Perhaps the term "receiver-induced" is a poor choice to describe the phenomenon, since the effect is not
induced into the receiver but rather is generated within the receiver. It is simply the result of very strong signals entering and mixing in receivers not designed to handle strong input signals. The case described deals with powerful FM stations, but the same effect often occurs with lower powered communications stations. The affected areas are usually much smaller, however.
Generally speaking, little can be done on the transmitter site end to eliminate receiver mixes (short of reducing power or relocating). Treatment of the problem must be done at the receiver.
Intermod Studies Before allowing any new user to add a
new frequency to a site, it is prudent to run an intermod study. Computer programs are available that allow input of all transmitter frequencies to be considered and compute the third and fifth-order intermod products. The output of the program will identify likely trouble spots. If there is a known receiver operating nearby on one of the identified frequencies, it may be necessary to install filters on the affected receivers. The identification of a particular frequency as an 1M product does not necessarily indicate that a problem will be experienced on that frequency; it merely points out that
frequency as a potential trouble spot. The purpose of the intermod study is to identify potential trouble spots so that the new user can be prepared to deal with the interference.
Typical 3" Order Intermod Study Input Frequencies
m •.., ....... . .., . “••••••. ,......
Combination
1.•... 1,./.•
IM Product
(2 x 152.240) - 155.370 149.110
152.240 + 155.580 - 155.370 152.450
(2 x 155.580) - 155.370 155.790
(2 x 152.240) - 155.580 148.900
(2 x 155.58) - 152.240 158.920
152.240 - 155.580 + 155.370 152.030
155.580 + 155.370 - 152.240 158.710
(2 x 155.370) - 155.580 155.160
199

(2 x 155.370) - 152.240 I 158.500 1
AM Tower Considerations While FM and TV towers lend
themselves fairly well to shared use with communications services, AM towers present a whole new set of problems. Shunt-fed non-directional AM towers are fairly easy to use, as their bases are grounded and there is no special treatment required for transmission lines other than the usual grounding and bonding of the lines. It is important to realize that if a great number of transmission lines and antennas are added to a shunt-fed AM tower, the radiation efficiency will begin to suffer, and it may become necessary to make field strength measurements to show the efficiency with all antennas and lines on the tower. Should a noticeable deviation from the licensed efficiency be noted, a power increase application to restore the licensed radiated field may be needed.
Insulated towers present considerable difficulty in shared use. Some means of isolating the transmission lines as they cross the base insulator must be provided. This can be achieved in several ways.
Isocouplers, which pass the RF energy in the transmission line without shorting the tower base, are one means of getting the signal across the base insulator. The drawbacks of the isocoupler are cost and loss. Smaller isocouplers are also prone to damage by lightning, and many isocouplers are not designed to withstand the AM RF voltages that appear across the bases of tall (i.e. greater than 90° in electrical length). When placing an isocoupler on an element of a directional array, a partial directional proof of performance and license modification is required.
Another means of coupling across the base insulator involves winding the transmission
line into a tight coil that forms an inductor (isocoil) which presents a high impedance across the tower base insulator. A capacitor can be placed across this transmission line coil to parallel resonate the coil on the AM frequency, further raising the impedance of the isocoil. As with the case of the isocoupler, if an isocoil is used on a directional array element, a partial directional proof and license modification are required.
Yet another option is to convert an insulated base tower to a grounded base tower through use of skirt wires. Transmission lines are then routed onto the tower base, which is at ground potential, and run up the tower structure itself. Lines should be treated in the same manner as on any shunt-fed tower, with proper bonding of the transmission lines to the tower structure and ground. AM RF currents will flow on these lines, so proper bonding is essential.
All communications antennas must be mounted on the tower above the top of the skirt.
Modifying an insulated base tower to a skirted tower can be expensive, and FCC approval is required. This is generally no problem with a non-directional antenna, but skirting an element of a directional array can be problematic and very expensive.
A third common option is to ground the transmission line just below the base insulator, and then run the line up the tower leg on insulators, optimally to the quarter-wave point, where it is then bonded to the tower. A capacitor is then placed between the tower and transmission line (ground) at the tower base and adjusted for resonance. This method works well and has the advantages of low cost and low loss. The disadvantage is that the relatively heavy transmission line is being supported on ceramic insulators, and careful maintenance of
200

the supporting insulators and hardware are required.
There are other means of coupling a transmission line across an AM tower base insulator without significantly disturbing the base impedance at the AM frequency. It is essential that a qualified consulting engineer be retained to study each particular set of circumstances and design a coupling method that is economical and that will have the least impact on the AM station and its signal and/or directional pattern. He can them follow up with the required FCC applications and directional proof, if required.
Because of the difficulty involved in placing communications antennas on AM towers, if an AM tower is in a desirable location and has good rental potential, an excellent option is to install two broadband master antennas and two transmission lines, one each for both transmit and receive, on the tower. A combiner system can then be used to couple multiple users into the master antennas with good isolation. Bandpass splitters are also
available to permit use of a single transmission line to feed multiple antennas on different bands. All this has the advantage of greatly increasing capacity while making a one-time crossing of the base insulator with only two transmission lines.
It may seem that because of the large frequency difference between the AM band and communications frequencies, mixes and interrnod would not be a consideration. Such mixes are very much a problem, however, and close attention should be given to preventing them.
The most common problem occurs when some RF from the AM signal rides into the modulator of the communications transmitter, producing sidebands on either side of the desired communications frequency and spaced at the AM station's frequency. For
example, a transmitter operating on 453.500 MHz from an AM site where the AM station's frequency is 1050 kHz can easily produce sideband frequencies at 452.450 MHz and 454.550 MHz. These sidebands can contain a lot of energy, and after passing through all the transmitter and power amplifier stages and being radiated from an elevated antenna, can cover a large area. Close attention must be paid to shielding and bypassing of audio lines, power supply and control leads in such systems.
Besides communications users, other broadcasters occasionally have a need to mount an FM or TV antenna on an AM tower. While power levels and transmission lines are larger, all the other principles discussed herein apply equally. Large broadcast transmission antennas are more prone to provide a degree of top-loading to an AM radiator, and they are more likely to affect the self-impedance of the tower. Otherwise, FM/TV antennas can usually be mounted on sufficiently large AM towers without difficulty.
FM/TV Considerations Besides the potential for intermod and
mixes, another important consideration in shared use of FM and TV sites is the protection of the aperture of all the broadcast antennas on the tower. Generally speaking, all other antennas should be kept 20 feet from the nearest point of all broadcast transmission antennas. Closer spacing may be possible, but the manufacturer of the specific antenna should be consulted before mounting any antenna closer than 20 feet.
Besides potential radiation pattern distortion, RF power densities tend to be high close to broadcast transmission antennas. The potential for transmitter mixes is greatly increased in such circumstances. Chances are that whatever loss in coverage that will result from mounting the communications antenna a
201

few feet lower will be worth not having to deal with all the problems associated with operating in the high RF field of the FM or TV antenna.
FM and TV users usually make good neighbors on towers supporting other FM and TV antennas. The power levels involved and coupling between antennas certainly raise the potential for transmitter mixes and intermod, and careful periodic checks of the spectral purity of all broadcast stations at the site must be made. It is also important to identify potential RITOIE problems. Should RITOIE problems occur, each complaint will have to be dealt with individually. If there is a strong
potential for RITOLE interference falling on another local station's frequency, it is probably better that the stations causing the problem operate from separate sites.
Your Most Important Tool It might seem that the most important
tool engineers have to deal with RF problems on site is the spectrum analyzer or a box full of filters. This is not the case, however. These
devices can help, but they are secondary to the primary interference control tool. The most important tool that we have to deal with interference is the antenna site lease agreement.
The lease agreement which authorizes joint use of a broadcast tower by com-munications users must contain solid and workable language dealing with interference and interference resolution. This language must place the burden of resolving interference complaints that result when a new system is added on the owner or licensee of the new system. It must also deal with situations in which, because of malfunctions or other reasons, interference not related to a new installation is caused.
This language must provide for timely resolution of the interference, with a mechanism
that will cause the offending stations to cease transmission within a certain and reasonable period of time — say, 24 to 48 hours after notification — if the interference has not been resolved.
The designation of a site spectrum manager in the lease can be a valuable step at sites where there is the potential for many users This spectrum manager should be a professional engineer, preferably one with an office in the region where the site is located. His function will be to run intermod studies for any new users or existing users wishing to add new systems or frequencies to the site. The users pay for this service, as well as any services provided by the site spectrum manager in the resolution of specific interference problems. With no site spectrum manager, the coordination of frequencies and mediation of interference problems will become the tower owner's burden, and he and his engineer may be poorly equipped to deal with these issues.
AM stations must include lease language dealing with the specific method to be used to cross the base insulator as well as remedies for disturbance of directional patterns and partial proofs of performance. Without specific language dealing with these issues, a change made by a tenant can easily leave the AM station licensee holding the bag for a $20,000 directional tune-up and proof! Language must be specific and inclusive.
Conclusion There is much more to consider when
adding antennas to an existing broadcast site than structural and mechanical issues RF signals interact in sometimes unpredictable ways. Careful planning and good engineering can prevent most problems, but tower owners must be prepared and equipped to deal with a wide range of problems Owners must recognize that interference can be far reaching
202

and the results disastrous, and that poor planning will often result in big problems.
A good site plan, carefully written leases
and good supervision are key to a trouble-free, profitable shared-use site.
1. See Broadcast Engineering Magazine, December, 1991, pg. 58 - 62
203

CUSTOMER SERVICE: WHEN NEXT DAY SERVICE AND MONEY BACK GUARANTEES ARE NOT ENOUGH
Steve Epstein Intertec Publishing Inc. Overland Park KS, 66212
ABSTRACT
Broadcasters and video professionals rely on their equipment to get the job done. In the past. vendors have understood this and many have provided around-the-clock customer support. As new companies enter the professional video marketplace many do not fully understand or appreciate the demands placed on equipment and software. Many vendors feel the promise of next day service or a money back guarantee will insure customer satisfaction. Is the guarantee of next-day service adequate, when on the next business day a low-level technician simply verifies that, yes something is wrong, and a higher level tech will be out later to possibly fix the problem? Later, after six months of struggling with system bugs throughout your new on-air server do you really want your money back? At that point, getting your money back simply takes you back to square one—six or more months behind schedule. At this point, what you need is not your money, but for company to stand behind their product and make it work properly.
INTRODUCTION
In the past. the broadcast industry has enjoyed a high degree of customer support from vendors. Unfortunately, that level of support is becoming rare. There are a number of factors that contribute to this, including: an increased use of consumer electronics, increased dependence on microprocessor- and software-based systems, and fewer "traditional video" companies.
Years ago, the majority of research, development and therefore, technological advances occurred on products intended for the professional markets. Eventually these breakthroughs "trickled down" to the consumer. The videotape recorder is a good example. early 2" machines were huge. They cost more than $50,000 and were well
beyond the reach of consumers. Today. VCRs are compact, lightweight and available for under $100. In the marketplace of the '90s, economies of scale dictate that the majority of products are developed for the mass consumer marketplace. Those products that can be adapted to the professional marketplace are typically "hardened" for use in these environments. One example is the modification of the consumer DV format by both Panasonic and Sony. Although professional DV cameras and recorders are available, many video professionals are buying the consumer versions. Many times the picture quality of the consumer versions is sufficient, and the units are smaller, lighter and cost considerably less. There is nothing wrong with this as long as the customer understands the unlikelihood of receiving professional level support from the manufacturer. In many cases. professionals assume these products are "throw-away." If repairs are required, it is usually more cost-effective to simply purchase a new unit. In most cases, the specifications and feature set of the replacement unit are probably better than the original. The replacement may even cost less.
In addition to relying on a greater percentage of consumer electronics, microprocessors and computers are found
throughout many professional and semi-professional applications. The hardware involved in microprocessor-based systems is generally very reliable. Nearly all of the problems associated with these systems are a result of software or firmware. Today's software is extremely complex, and must run on a nearly infinite variety of hardware combinations. Much of today's software is written using C++ or other high level languages. Although they make the task far easier to manage the resulting software .can be bloated and inefficient. In many instances it is also error prone, depending entirely on the skill level of the developers. The fact that software works as well as it does is nothing short of amazing, when one
204

considers today's complex systems. However, within professional applications, a single crash can be extremely costly. in some cases the cost of downtime can exceed the cost of the failed system. Therefore, whenever possible. software written for these applications needs to be bulletproof, and combined with redundant hardware in mission critical environments.
Unfortunately, it is a fact of life that there are fewer "traditional video" companies around today. Many have fallen on hard times, left the industry, or gone out of . business. Many others have been swallowed up by even larger companies. What is left is somewhat of a battle
between a few well-entrenched old-guard "Goliaths" and armies of high-tech upstart "Davids". Although the "Goliaths" understand the industry. many are left with conservative equipment lines that are only beginning to address the rapid changes sweeping the industry. The "Davids" on the other hand are adapting to. and in many cases driving, these changes. Unfortunately, most of these new companies have only a vague understanding of the requirements of our industry, the task at hand and the extreme conditions their systems will be expected to operate under.
HOW MUCH SUPPORT IS ENOUGH?
What level of customer support is adequate? Until recently. I certainly felt that next-day service, coupled with a money-back guarantee was sufficient. However, a series of events took place that changed my mind. In truth, the manufacturer is not to blame as they held up their end of the bargain. Nonetheless, the incident left a few scars. Here's what happened:
• My wife operates a freelance graphics business from our home and identified an opportunity to profitably offer color laser printing in conjuction with several projects she was working on. In March '96. Hewlett-Packard's Color LaserJet 5M became available. With a price tag of just over $8000. it was their top-of-the-line, and was a good fit, given her needs and budget.
• When the printer was delivered, there were problems with the black printing mechanism. As this was the first unit of this model sold in the area, it was beyond the capability of the technicians that delivered it. HP was contacted and a technician arrived the next day and was able to make it work properly, despite never having seen one of these units. So far so good
• Over the course of the next several weeks it became apparent that the color output varied day to day. but always tended toward red. HP was contacted and suggested new drivers and other remedies. but would not dispatch a technician.
• Several more weeks passed and the problem remained. Additionally, my wife determined that when printing black-only images, there was a gray-scale problem that caused the images to appear posterized. At this point. I got involved, carefully eliminated as many of the variables as possible and was able to repeatedly demonstrate both the gray-scale and color consistency problem using a HP Deskjet scanner and some high quality photos. Through a series of tests that used considerable time. paper and printer supplies, it appeared as though the problem was either the printer or its software driver.
• About this same time the printer developed paper path problems when using the manual feed unit Once again HP was contacted. Both the paper feed problem and the output quality problems were noted and a technician was sent out. He arrived three days later. After coming inside, my wife had to point out which box in the kitchen was the printer. He also readily admitted having no knowledge of software and therefore was unable to deal with the output quality problem. He attempted to correct the paper path problem and managed only to rnisalign the manual feed tray, crack the mount and make the problem worse. After two hours he declared the unit fixed and left.
• Another call to HP and another technician was dispatched. A week later technician number two arrived and obviously knew what he was doing. Within an hour the paper path problems were corrected, but he stated that the output quality problems required further research. Two days later the senior HP technician in the Kansas City area came out. He looked at what we had, checked a few items and agreed there was indeed a print quality problem. It took only 15 minutes. and he left saying he would turn the problem over to HP's engineers.
• Within a few days we received a call from HP's engineers. They requested detailed information on the problem so they could determine the cause. We sent printouts, configuration files and directory lists. A few more days passed and we were told they had received the information and were working on the problem.
205

• Two days later HP called to say that they were not going to do anymore on the problem. We could have our money back or keep the printer and live with the problem.
We took the money. Getting the refund was also an ordeal, but in the end HP honored their guarantee and refunded the money. By that time, however, the refund was little consolation. Over six months of time and energy was invested in the printer, and none of that was returned
A year after buying her first color laser, my wife is still
looking for a suitable replacement. She still gets occasional requests for color printouts and must turn the business away. Incidentally, at one point in the process. one of the technicians informed me that had I been using anything other than a HP scanner, this problem would have been blamed on the scanner. Had that been the case, I am certain that a major round of finger pointing would have ensued
The point here is to consider carefully the amount of time you can invest in a getting a new system up and running. If it doesn't work out after several months, do you really want your money back? Consider insisting on a performance clause as part of the purchase. Get a conunitment of increased vendor support rather than abandonment if after a predetermined amount of time, the system (software) is not performing as advertised.. Not all vendors will agree to these types of guarantees, but those that really believe in their products and people are far more likely to work out some type of compromise. If everyone begins to demand some level of accountability from vendors, we could all benefit.
BUYING PROMISES INSTEAD OF PRODUCTS
Sometimes as customers, we make invalid assumptions when malcing a purchase. I once worked with a producer who bought into Sony's HIS format because it offered time code. He assumed that time code also guaranteed frame accurate editing; which it does not. Once we started editing, it became clear that frame accurate edits were happening only occasionally. A quick check of the specifications made it clear that the decks were only accurate to ±1 frame. That fact was also plainly stated in the literature when the purchase was made. He had made an incorrect assumption, and the mistake was his.
Other times. manufacturers promise far more than they can deliver. When was the last time you decided to buy
something based on the promise of a soon-to-be delivered feature? Today. it's very easy, especially when you're out on technology's "bleeding edge", to get burned by manufacturer promises. The reasons manufacturers fail to deliver can range from going out of business, to changing corporate directions, or even fraud Of these three, the change in corporate directions can be the most distressing for current customers. If for instance a manufacturer promises long term support and upgradeability for their product line, then shifts to an entirely new line of products, several things can be done to insure that existing customers are not alienated. One would be to offer those customers an upgrade path. If the older product cannot be upgraded the manufacturer could allow some trade-in value towards the purchase of the new line of products. If, however, they were to simply drop the old product line; offering no further support. current customers as well as potential customers are likely to be tuthappy and seriously reconsider any further investment into the company and its products. As a worst case. if sufficient evidence exists, existing customers may consider legal action.
Whether it's a promised upgrade. turnaround time for repairs, or even the discontinuance of a product's next generation, as consumers, we must take many promises with a grain of salt. Some promises constitute a written or verbal contract, however, most do not. And although contracts are enforceable in court, most customers decide its not worth the time and expense. Many times it's easier to cut their losses and move on. Besides, in most cases, the corporations can afford much better lawyers than their customers.
Horror stories about defunct tape formats, discontinued products and unavailable parts abound. With competition as fierce as ever, staying ahead of our competitors sometimes pushes all of us into buying the latest and greatest; taking a chance on new technology. When that happens, to avoid the pitfalls, look carefully at what you are buying. Base your decision on what is real, not what is promised. Take the time to carefully distinguish current features and products from vaporware. futureware and "virtual" features.
If the product you need is not available today, tell your salesperson to contact you when it is. If you must buy a product with a needed feature that isn't available immediately, get written contracts that detail when the feature will deliver, what is included and what it will cost. Make sure the contract protects you, your money and your current investment in the event the vendor fails to hold up their end. Whenever possible avoid paying for features
206

until they are delivered. If the feature you need will not be available for some time, consider not buying the product at all until its ready.
The software industry,' is one of the worst when it comes to unpredictable support and products that fail to deliver. In too many cases, despite money back guarantees. satisfaction with a software purchase tends to be relative
rather than complete. Compatibility with the wide variety of available hardware and software can be a nightmare for programmers, installers and operators alike. Marty consumer software outlets won't provide demos for users to look at, and also refuse to take back opened software. This catch-22 leaves the vendors in a much better position than the customer. Thankfully, in professional circles, it is typically better, as some form of a demo is usually available. Even if a program does everything it is supposed to, there is no guarantee that it will run on your hardware and/or not cause problems with other programs. Many guarantees do not cover compatibility issues.
CONCLUSION
Manufacturers that make promises and continually fail to deliver, run the risk of eroding their customer base. However, in the words of P.T. Barnum. "there's a sucker born every minute" and therefore, an entirely new batch of customers arrives on a regular basis, keeping many of the less responsible companies in business.
If we, as an industry, expect vendors to provide the level of customer service we have grown accustomed to, we must reward those companies that offer it, and penalize those companies that do not. Take some time to evaluate how well your vendors have delivered on promises they have made. Whenever possible, reinforce relationships with those that provide "over and above" service and support. Also, try to increase the distance between you and those vendors that consistently fall short of what they promise. Word of mouth can make or break a business. Use your networking skills to determine both the good and bad manufacturers and local vendors. This industry depends heavily on after-the-sale support. Companies that fail to support their customers need to get the message that poor customer service hurts everyone.
207

ENGINEERING OF EXISTING TV TOWERS FOR NEW ATV ANTENNAS
Madison J. Batt, P.E. Tower Engineering Associates
Seattle, WA
ABSTRACT
Television towers are valuable vertical real estate. In many communities TV towers will be difficult to replace due to cost, local ordinances, zoning, and siting issues. In addition. many are used for multiple communication antennas. To accommodate the new ATV antennas. TV
stations should consider using their existing towers before deciding to build a new tower. Differences in the design standards and how older towers were designed determine whether top- or side-mounted antennas can be installed. Modifications to existing guyed and self-supporting towers may enable them to support new antennas.
VALUABLE VERTICAL
REAL ESTATE
With the advent of High Definition Television, or ATV as it is now called, the focus has been on the electronic side of the development for delivery
purposes. One should not ignore the fact that any modifications to the broadcast facility require an assurance that the tower can support additional antenna loading. Recently, the devel-opment of stacked TV antennas for the broadcast of simulcast NTSC and ATV signals has allowed tower engineering specialists to focus on the evaluation of TV towers for the installation of these antennas. The feasibility of using panel antennas and side-mounted antennas is also being studied. The evaluation of the towers will involve an inspection of the tower and an analysis to determine the affect of adding or changing the
TV antenna on the tower. The analysis should consider the worst-case loading, because in the future the NTSC antennas will be removed and replaced with ATV antennas. The addition of large transmission lines also complicates the installation of these new antennas.
The large transmission lines should be aero-dynamic and should be placed behind legs or lead up the middle of the tower to reduce wind load-ing. They should not be installed on the outside of the tower, if at all possible.
In most cases, ATV antennas will add significant additional loading to towers that may already be replete with antennas. Many of the towers in use today have been in place for a long time and were not designed for their current antenna configura-tion. Certainly they were not designed for taller antennas or panel antennas. Many towers have FM antennas mounted on them, making it diffi-cult or impossible to side-mount another antenna or add antenna panels.
Hard choices may have to be made if new ATV antennas and transmission lines are to be installed. In many communities. TV towers will be difficult to replace for several reasons. One is the cost of implementing the new broadcast signal. Another may be the difficulty of getting a new tower built because of local ordinances and siting issues. Finally, many towers are used for multiple communication antennas. TV stations should first look at using their existing towers for the new ATV antennas. The differences in the previous design standards and how older towers
208

were designed will also determine whether new antennas can be installed.
EVALUATING EXISTING TOWERS
In order to determine if existing towers are capable of having new antennas installed on them, the towers will need to be evaluated. An evaluation of a tower should include an inspec-tion to look for any deficiencies and to verify or measure member sizes. The inspection should be done by the engineers doing the analysis. If this can't be done, the inspectors should coordinate closely with the engineers and provide close-up pictures of the tower members, connections, and antennas. When documentation about the member sizes is not available, the field measure-ments become very important. Any information about the manufacturer and date of construction should also be provided, if known. Once the inspection is complete and all member sizes, guy sizes, anchor locations, and member properties are known, an analysis can be performed.
The analysis of towers should be done using state-of-the-art software that incorporates the latest wind loading criteria from the EIA/TIA-222-F Standard.
Analysis
Past analyses have proven that there are ways to upgrade towers in order to allow installation of new antennas. In general, each tower must be evaluated for the proposed new antenna(s).
In many cases, existing guyed and self-supporting towers are capable of supporting new antennas. Existing towers can be classified into the following four categories:
1. No retrofit is required. 2. Minor retrofit is required. 3. Major retrofit is required. 4. Replacement of tower is better option.
Category 1 Towers: New antenna and transmis-sion line can be installed without the need to upgrade any of the tower components.
Category 2 Towers: Before a new antenna and transmission line are installed, bracing members may need to be replaced, upgrades may need to be made to the tower legs to reduce overstress conditions in the legs, or guy wires may need to be modified or replaced on guyed towers. The cost for this repair work should be less than $50,000.
Category 3 Towers: The towers that require major retrofit work to accommodate the new antenna and transmission line will generally be self-supporting towers built 20 to 50 years ago, or older guyed towers with undersized legs. Towers with other communication or broadcast antennas besides the primary TV antenna will also be in this category. Repairs may involve removing and rebuilding large portions of the tower, replacing or adding bracing members, and upgrading the tower legs. The cost to complete this work will range between $50,000 and $500,000. The upper-end amount will depend on the ability to replace the tower or may be based on a percentage of the cost of a new tower.
Category 4 Towers: Towers where the cost to upgrade exceeds the useful life of the tower, or exceeds the cost/value of a new tower fall into this category.
We have performed analyses on both guyed and self-supporting TV towers. Many towers are being analyzed with new taller antennas, such as the stacked antennas discussed above to replace the existing antennas. Even if the FAA allows for a height increase, some towers may not be able to support taller antennas.
SELF-SUPPORTING TOWERS
Evaluations of self-supporting TV towers with new top-mounted stacked antennas have found that most have overstressed members. The extent of overstress varies. Most of these towers have top sections that are narrowed for maximizing the omni-directional application of FM antennas. These reduced sections are generally overstressed due to the weight of new stacked and panel
209

antennas. Side-mounted slotted antennas in most cases do not overstress the tower members.
Increasing the height of the towers with taller antennas creates a much larger bending moment at the top of the tower. In addition, the increased height for the replacement antennas may not be allowed by local FAA administrators.
One alternative that has been investigated is removal of equivalent sections of the tower so the
top elevation stays the same. This may reduce the top bending moment force to a more accept-able level. Other ways to upgrade the tower involve increasing the capacity of the legs and bracing.
The foundations on self-supporting towers should also be checked for the increased overturning forces and shears generated when taller and heavier antennas are used.
Upgrades
Overstressed legs are the most expensive and most difficult part of upgrading a tower. The best ways to upgrade the capacity of solid round tower legs are: 1) weld half-round sections of pipe to the legs to increase their capacity (see Figure 1), and/or
2) reduce the unbraced length of the legs by installing additional horizontal bracing, or installing additional diagonal bracing in Z braced sections (see Figure 2).
Legs are generally in compression from the dead load (tower self weight, antennas, coax cables, ladder, etc.) wind load, and ice loading. Based on the engineering principles of the buckled column formulas, the capacity of a column decreases nonlinearly for longer unbraced lengths. Thus cutting the unbraced length in half will more than double the compression capacity. The drawback to adding bracing to reduce unbraced lengths is that the new members add wind loading area to the tower.
Figure 1. Leg Detail
210

EXISTING HORIZONTAL
<04, U-BOLTS
%Pq0,
NEW ANGLE X
EXISTING HORIZONTAL
ELEVATION N.T.S.
C CLAMP ASSEMEL',
C CLAMP
BOLTS
BOLTS
Figure 2. Elevation
For pipe leg towers, the same upgrades are available as above. In addition, pipe legs can be filled with high-strength concrete or grout. This adds capacity and stiffness to the legs and can dramatically add capacity to the tower. This is especially true for large-diameter legs.
For towers with angle member legs or unusual bent-plate legs, upgrades by welding or bolting plates, angles, or channels can increase capacity. This can be very expensive work. Reducing the unbraced lengths with added bracing may be a more desirable option for upgrading, where possible. Adding fiberglass or other premolded round covers to plate and angular legs will reduce the stress levels in the legs by 30 to 40
percent, due to the reduction of wind load on round sections.
Bracing that is overstressed will need to be replaced or changed from tension-only rod or undersized angle bracing to heavier angular bracing. With the proper design of new members, the capacity of a tower can be increased significantly.
Another option on most towers is to reduce the wind loading contribution of other antennas mounted on the tower. TV towers in most cities have large microwave antennas, many of which do not have aerodynamic radomes. By adding aerodynamic radomes to these antennas. the wind
211
loading contribution of the antenna can be reduced by as much as 45 percent.
Foundations should also be investigated and upgrades made on those that are overloaded. This will usually consist of adding weight or bearing area to the foundation system.
The results of analyses on towers with the ATV antenna have most self-supporting TV towers falling into Categories 2, 3, and 4. The majority of towers fall in the minor and major retrofit categories. There are some towers that will be in Category 4 and need to be replaced. This may be due to the age of the tower, the condition of the tower, and the cost of upgrading.
GUYED TO WERS
Most well-designed and maintained guyed towers will be capable of having new ATV antennas installed on them. The biggest problem with a guyed tower is that it is difficult to reduce the
height of the tower to match the current licensed height, if required by the FAA.
Guyed towers, in general, will be more capable than self-supporting towers to accommodate the added loading from new ATV antennas. The load from new antennas is usually a small percentage increase in the total load on the tower legs, because of the downward component of load of the guy wires.
Upgrades
The upgrades for guyed towers include leg strengthening, bracing replacement and/or addi-
tion, guy wire replacement, and re-spacing and addition of new guy wires and anchors.
Guyed towers can be modified at the top to accept new antennas. When the tower is guyed at the base of the antenna, temporary guys may be required. These can be installed below • section(s) that may need to be replaced or modified.
The solid round, pipe, and angle legs on guyed towers can be similarly modified as described for self-supporting towers in the section above. The same modifications can be made for reducing the unbraced length of the leg members.
The guy wires can be modified in several ways to allow for new antenna(s). The guy wires can be increased in size. The spacing of the guys on a tower can be changed. New anchors installed further out from the tower increase the capacity of the same size wire without increasing the downward load on the legs.
Guyed towers generally fall into Categories 1, 2,
and 3, with most falling in the minor retrofit category.
CONCLUSIONS
It is prudent for TV station owners to have their broadcast TV tower evaluated for replacement of the existing TV antenna by a new stacked antenna or evaluated for a side-mounted antenna system. The cost to do this analysis will be well worth the investment if the tower needs to be kept in service.
TV stations that need such an analysis should retain the services of an independent professional engineering firm experienced in inspecting and evaluating towers. These firms should demon-strate familiarity with the design standards and have state-of-the-art software to do the analysis. Tower manufacturers whose towers dot the landscape around the world are also capable of performing the analysis. There is one caution here: the tower manufacturer may be more interested in selling a new tower than proposing
upgrades to an existing tower.
On any tower that will require that the top elevation not be changed, sections may need to be removed to keep this elevation. Any FM antennas mounted on these sections will have to be lowered.
212

Which Revision Of The TIAIEIA 222 Standard Should Be Used to Evaluate The Transmitter Tower For ATV?
E. Mark Malouf, PE, IPF Malouf Engineering International, Inc.
Richardson. Texas
ABSTRACT
In planning for the ATV antenna installation, a structural analysis of the transmitter tower will be required to determine the tower capacity and, hence, to properly budget for any strengthening needed, or
for a new replacement tower. Most of these towers are more than 20 years old and were originally
designed based on the EIA RS-222 B or C version of the Standard code, with many of them having no ice loading consideration. This presentation will discuss
the major differences between the 'C' and 'F' revisions of the TIA/EIA 222 Standard [constant wind pressure (Rev. C) vs. escalating pressure (Rev. F) and ice loading] and their implications on the structural
analysis results. The eligibility of 'grand-fathering' the tower and its practical advantages and disadvantages will be discussed. The case for "updating" the tower to the latest version of the EIA Standard will be made.
INTRODUCTION
As part of the planning phase for the ATV antenna installation, a structural analysis will be performed on the TV station transmitter tower to determine its capacity with the new loading. The majority of these towers, most more than 20 years old, have been originally designed based either on the EIA RS-222-B or C version of the Standard code, with many of them
having no consideration for ice loading. The purpose of the article is to inform the TV station management
of the major differences between the different revisions of the TIA/EIA 222 Standard and their likely implication on the tower analysis results and therefore the extent of the structural modifications required and the dollar amount to be budgeted for tower rehabilitation. This article will help them make an informed decision on the approach to take when performing their feasibility studies and their budget planning for the advent of ATV.
LOADING CONSIDERATIONS
There are several key differences in the wind loading
calculations between the EIA RS-222 'C' version, which was in effect from March 1976 to November 1986, and the present version, the TIA/EIA 222 revision, which went into effect in June 1996.
When determining the wind loading in conformance to the EIA RS-222 'C' revision, the approach consisted of the following:
Wind PressureNelocity: The wind pressure is
determined based on the tower height and location. The pressure, in pounds per square foot (Psf), .5 treated either as a stepped uniform pressure for towers less than 650 feet (ft) in height (0 ft to 300 ft, then 300 ft to 650 ft), or as a constant pressure for towers greater than 650 ft in height. The United States was divided into three wind pressure zones (Zone A, B, & C) based on a wind map by H.C.S. Thom dated from April 1960. The wind pressure formula used was
simplified to 0.004.V2 where V is the wind velocity
used and is a 'gusting' type wind speed. There was no gust factor based on tower height or gradual escalation of the pressure with the tower height.
Cross-Sectional Shape Factor The cross sectional shape factor used to determine the wind force is 1.50 for triangular shaped towers and 1.75 for square shaped. The variation in solidity of the projected area of the tower is not accounted for.
Wind Drag Factor The wind drag factor used is 0.67 for round and cylindrical shaped members and appurtenances and 1.00 for flat shaped. The variation in the aspect ratio of the projected member or appurtenance is not accounted for. Structural Effective Projected Area: The structural effective projected area is determined by multiplying the flat or round drag shape factor by the respective
projected area and summing the two parts (1.0.Aflat -
0.67.A round ). There is no additional factors to account
213

for the different wind direction angles with respect to the members considered.
Miscellaneous: No 33% stress increase to the tower member allowable capacities is allowed due to transient wind loading. The minimum guy wire safety factor required is 2.50 for all towers. For the top cantilevered pole mast, there is no special connection
factor requirement. In addition, several of the towers designed under the 'C' revision accounted for only two main wind directions: face wind and apex wind.
In contrast, when determining the wind loading in
conformance to the TIA/EIA 222 'F' revision, the approach consists of the following:
Wind Pressure/Velocity : The wind pressure is
determined from the Basic Wind Speed in miles per hour (Mph), a sustained type of wind, for the site location and is based on the tower height and location. The wind pressure formula used is (0.00256.Kz.V2).Gh, where V is the Basic wind velocity used and is a 'sustained' type wind speed, Kz is the exposure coefficient, and Gh is the gust response factor. A county listing of the minimum Basic wind Speeds of the United States is provided in the Standard and is mainly based on the wind data from the ASCE 7-88 Standard. This pressure varies and escalates with the tower height (Kz factor). The gust response factor varies based on the tower total height. (Refer to Figure 1)
Wind Pressure
Rev C >650 Rev C <650' _6-- Rev F
70
tr) LU
30
20
10
0 0 0
U) CO
0
N-
Tower Elevation (ft)
Figure 1: Wind Pressures - Rev. C vs. Rev. F
Cross-Sectional Shape Factor The cross sectional shape factor used in determining the wind force is based on the structure force coefficient (CF). The
formula used is 3.4.e2-4.7e+3.4 for triangular shaped towers and is 4.0.e2-5.9e+4.0 for square shaped, where e is the solidity ratio. The 'e' coefficient accounts for the variation in the solidity of the projected area of the tower.
Wind Drag Factor The wind drag factor used varies between 0.80 to 1.20 for round and cylindrical shaped members and appurtenances and varies between 1.4
to 2.0 for flat shaped. The variation in the drag factor is dependent on the aspect ratio of the projected member or appurtenance.
Structural Effective Projected Area: The structural effective projected area is determined by multiplying the respective wind direction factor by the projected
area and by the reduction factor for the round members and summing the two parts (DF.Aflat
DR•RR•Around)• These factors account for the different wind direction angles with respect to the members considered.
Miscellaneous: A varying stress increase to the tower member allowable capacities is allowed due to transient wind loading. The percentage allowed varies based on the tower height: less than 700 ft --33%; greater than 1,200 ft - No increase; with linear
interpolations in between. The minimum guy wire safety factor required varies with the tower height: less than 700 ft - Min. 2.00; greater than 1,200 ft - Min. 2.50; with linear interpolations in between. For
the top cantilevered pole mast, the connections are increased 25% to account for dynamic type loading effects. Also, the towers analyzed under the 'F' revision are required to account for three main wind directions: face wind, apex wind and parallel wind.
There are several regions of the United States that have a significant difference in the minimum wind loading requirements between the revision 'C' and the revision 'F' of the EIA Standard. Some of the differences are attributed to more updated and longer monitoring weather data time spans which resulted in corrections/revisions to the minimum requirements as included in the 'C' version map. The other differences are due to the variance in the source of the wind requirements. Some of the states mostly affected by these differences are Colorado, Connecticut, Kansas, Massachusetts, Oklahoma, and Wyoming. As an example, a 1000 ft guyed tower in Kansas that was designed in accordance to the 'C' version would have been designed for a uniform wind pressure of 50 Psf, while the present code requirement, the 'F' version, is
214

for a basic wind speed of 85 Mph, an approximate 25% to 30% increase in the wind loading intensity.
Another consideration that is important is the ice loading, especially for tall guyed towers, where it can be one of the predominant applied loads. The majority of the old TV towers that have been originally designed based either on the EIA RS-222-B or C version of the Standard code, have no consideration for ice loading. The new revision of the standard stresses more the importance of ice loading and includes an appendix, Annex H, that discusses it, but it still does not make it a requirement. On the other hand, there are several states where the local code requires a minimum ice loading to be considered in the design/analysis. It should be noted that significant icing on towers, specially guyed towers, could result in
severe overstressing of critical structural members and could place the tower in serious distress. According to N.D. Mulherin, from the US Army Cold Regions Research and Engineering Laboratory, in a paper presented to the IWAIS workshop, since 1959,
over 140 tower collapses were ice-related based on the statistical research he has performed.
As an illustration of the above wind provisions discussion, five (5) guyed towers ranging in heights from 980 ft to 1,900 ft were analyzed as representative of the majority of the transmitter towers that would be candidates for ATV antenna installation. The structural analyses were performed using the same antenna loading configuration, for the minimum
code requirements, first in conformance to the EIA RS-222- C version, and second, in conformance to the TIA/EIA 222- F version of the Standard. The analyses results were tabulated and compared. The table below summarizes the findings. (Refer to Table 1). The results are reported for the lower half tower height and the upper half tower height to highlight the differences in the resulting stresses between the
version 'C', which uses a constant wind pressure throughout the tower height, and the 'F' version, which
graduates the wind pressure up to approximately 900 ft, then constant above that elevation.
From the analysis findings, in general, it can be expected to have about 20% to 30% more stress in all of the tower members in the upper half of the tower height and about the same stress, or about a 15% reduction in the member stress, in the lower half height. It is to be noted that there are exceptions to
the above generalization when the minimum wind requirement for the site location has changed due to an adjustment of the weather data records between the two versions. Then, a higher percentage change in the tower member stresses is to be expected.
Example Calculations using (5) Guyed Towers 980 ft to 1900 ft Tall
% Difference from Rev C to
Rev F
Guy Wires Stress Ratios UPPER 1/2 of Tower 136.4% LOWER 1/2 of Tower 104.8% Leg Members Stress Ratios UPPER 1/2 of Tower 121.0% LOWER 1/2 of Tower 112.4% Diagonal Members Stress Ratios UPPER 1/2 of Tower 121.5% LOWER 1/2 of Tower 81.3% Horizontal Members Stress Ratios UPPER 1/2 of Tower 118.1% LOWER 1/2 of Tower 81.9% Base Foundation Reactions 110.1%
Table 1: Stress Ratio Differences - Rev. C vs. Rev. F
GRANDFATHERING VS. UPDATING
There are several factors to consider in deciding whether to grandfather a tower or to update it to the latest revision of the Standard. Among them are the following:
Code Requirements: The TIA/EIA 222-F Standard states that "it is not its intention that existing towe-s
should be analyzed for each revision of the standard, however, structural analysis of existing structures should be performed by a qualified professional engineer using the latest edition of the standard when: a) there is a change in antennas, transmission lines, and/or appurtenances..., b) there is a change in the operational requirements..., c) there is a need to increase wind or ice loading". This statement is a recommendation and not a requirement. It should be evaluated and discussed with your structural tower consultant.
The local and state building codes, in general, do not address tower structures in depth and usually reference a national standard be used, such as the TIA/EIA 222. There are no specific provisions
215

regarding antenna changes and what requirements have to be met. However, there are states and localities that do have such provisions and requirements, among them are the states of Wisconsin, Ohio, and New Jersey. Therefore, you should check with your local building officials to insure that all of the local code requirements are met.
The insurance industry does not have a consistent policy when it comes to antenna changes or additions to existing towers. There are several insurance companies that have their own wind and ice requirements, however, most do follow the TIA/EIA
222 Standard requirements. The TV station insurance carrier should be consulted before the antenna addition to insure continuous coverage.
Advantages and Disadvantages of Grand-fathering: One of the first advantages of grand-fathering is that the structural modifications required, if any, to the tower structure will, in general, be less extensive, and therefore less costly under the revision 'C' than what would be required under the 'F' version. Another
advantage, which is related to the first point, is the installation time required would therefore also be less.
One of the points most often used to justify the use of the original code version is that the tower has been "standing" for many years and therefore, its original code requirement should be satisfactory and can still be used for evaluating the tower with the new antenna configuration. This may be a valid point to consider,
especially if the tower has been under a regular maintenance and inspection schedule and no deterioration or damage has occurred to its structural members. However, in other instances, some damage to the tower may have occurred but has not been noticed or detected, or the tower has not yet experienced the design wind loading that the analysis is considering. In some regions, the EIA 'B' and 'C'
editions had under-estimated the minimum wind requirements for that location when compared to the
new and more updated weather data now available and included in the 'F' revision. Therefore, each tower should be individually evaluated in consultation with
the structural professional engineer to insure that no under-estimation of the additional antenna loads, that would be causing possible distress to the tower, does
Advantages and Disadvantages of Updating: One of the advantages of updating the tower to the latest edition of the standard code is the confidence of
knowing that the tower has been analyzed to conform with the latest requirements and the most current
practice methods used. The structural analysis results would be indicating the stress condition of the tower members based on the current and most up-to-date engineering procedures and weather data
available. The 'F' revision accounts and reflects more accurately the actual wind behavior and those loads induced on the tower members. There are considerably less simplifications in the 'F' version versus the 'C' version when determining the wind loads.
This updating would also include a re-evaluation of the wind speed and ice loading requirements based on the site location. This would insure that all local
and national code requirements are met and eliminate potential questions or problems with the insurance carrier. By updating the tower to the latest requirements, the tower may require more extensive modifications and therefore more dollar amounts and more time would need to be budgeted.
CONCLUSIONS
The main wind provision differences were highlighted and, as previously discussed, show that a simplified approach was used in the EIA RS-222-C version when compared to the approach used in the TIA/EIA 222-F version. More updated engineering and weather data were incorporated in the latest 'F' edition.
Deciding on which version of the EIA standard to use when evaluating your transmission tower for the AN antenna installation should be a decision based on the knowledge of the differences in the wind provisions, on a discussion with the structural professional
engineer that would take into account the particularity of the subject tower, and on a consultation with the local authority to insure code compliance and with the station insurance carrier.
216

References:
TIA/EIA Standard: Structural Standards for Steel Antenna Towers and Antenna Supporting Structures, TIA/EIA-222-F June 1996, EIA RS-222-C March 1976. Telecommunications Industry Association, Washington, DC.
Mulherin, N.D. (1996) Atmospheric Icing and Tower Collapse in the United States. Presented at the 7th IWAIS '96.
217
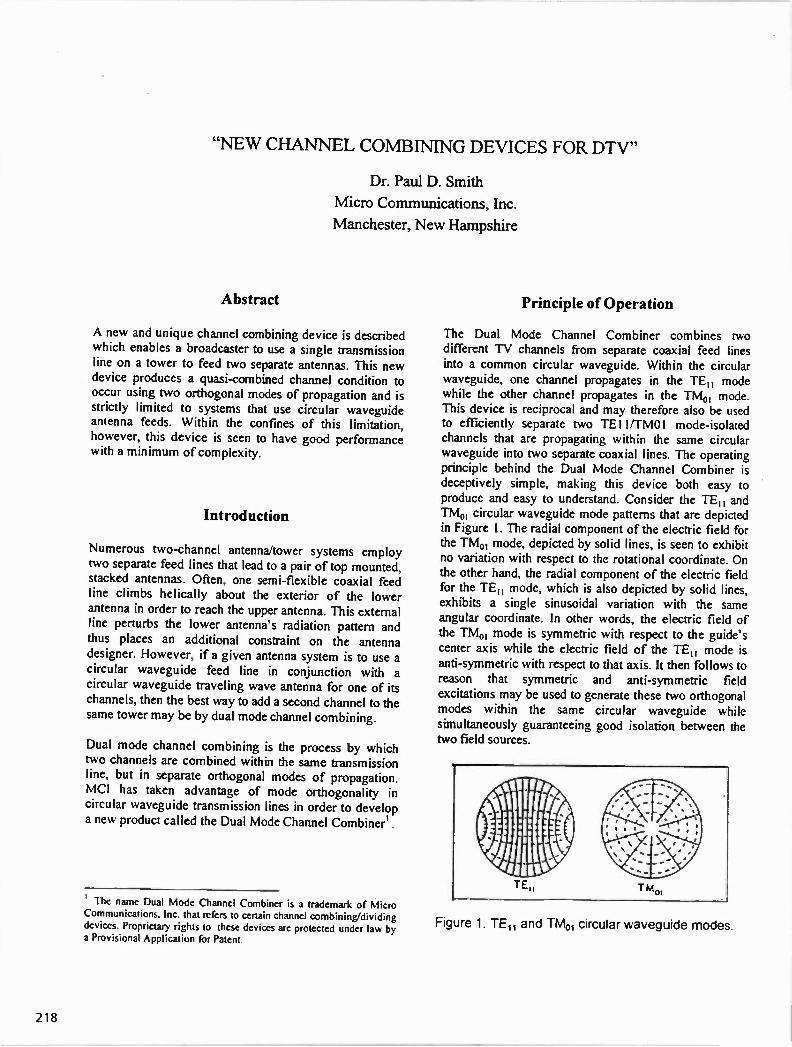
"NEW CHANNEL COMBINING DEVICES FOR DTV"
Dr. Paul D. Smith
Micro Communications, Inc.
Manchester, New Hampshire
Abstract
A new and unique channel combining device is described which enables a broadcaster to use a single transmission line on a tower to feed two separate antennas. This new device produces a quasi-combined channel condition to occur using two orthogonal modes of propagation and is strictly limited to systems that use circular waveguide antenna feeds. Within the confines of this limitation, however, this device is seen to have good performance with a minimum of complexity.
Introduction
Numerous two-channel antenna/tower systems employ two separate feed lines that lead to a pair of top mounted, stacked antennas. Often, one semi-flexible coaxial feed line climbs helically about the exterior of the lower antenna in order to reach the upper antenna. This external line perturbs the lower antenna's radiation pattern and thus places an additional constraint on the antenna designer. However, if a given antenna system is to use a circular waveguide feed line in conjunction with a circular waveguide traveling wave antenna for one of its channels, then the best way to add a second channel to the same tower may be by dual mode channel combining.
Dual mode channel combining is the process by which two channels are combined within the same transmission line, but in separate orthogonal modes of propagation. MCI has taken advantage of mode orthogonality in circular waveguide transmission lines in order to develop a new product called the Dual Mode Channel Combiner' .
lhe name Dual Mode Channel Combiner is a trademark of Micro Communications. Inc. that refers to certain channel combining/dividing devices Proprietary rights to these devices are protected under law by a Provisional Application for Patent
Principle of Operation
The Dual Mode Channel Combiner combines two different TV channels from separate coaxial feed lines into a common circular waveguide. Within the circular waveguide, one channel propagates in the TE" mode while the other channel propagates in the TM0, mode. This device is reciprocal and may therefore also be used to efficiently separate two TE11/TMOI mode-isolated channels that are propagating within the same circular waveguide into two separate coaxial lines. The operating principle behind the Dual Mode Channel Combiner is deceptively simple, making this device both easy to produce and easy to understand. Consider the TE" and IMO, circular waveguide mode patterns that are depicted in Figure I. The radial component of the electric field for the TMoi mode, depicted by solid lines, is seen to exhibit no variation with respect to the rotational coordinate. On the other hand, the radial component of the electric field for the TE„ mode, which is also depicted by solid lines, exhibits a single sinusoidal variation with the same angular coordinate. In other words, the electric field of the TMoi mode is symmetric with respect to the guide's center axis while the electric field of the TE" mode is anti-symmetric with respect to that axis. It then follows to reason that symmetric and anti-symmetric field excitations may be used to generate these two orthogonal modes within the same circular waveguide while simultaneously guaranteeing good isolation between the two field sources.
Figure 1. TEli and TM01 circular waveguide modes
218

Physical Description
The major components of the first Dual Mode Channel Combiner prototype are illustrated and pictured in Figures 2 and 3. An EIA 6 1/8 inch coaxial line is used as the input for the TMo, channel. This line connects to the circular waveguide at the center of the waveguide end plate. Its center conductor protrudes from the end plate into the waveguide interior where it is terminated with a capacitive disc. This disc serves to radiate a symmetric electric field within the waveguide. The electric and magnetic field patterns of the quasi-TEM coaxial mode match the circular waveguide TM0, mode patterns so well that TM°, mode purity is virtually guaranteed from this end launch.
For the TE„ channel, an EIA 3 1/8 inch coaxial input is used 2. This TEI, input leads to a 3 dB coaxial power splitter. The two power splitter outputs subsequently lead
through coaxial lines to diametrically opposing points on the waveguide sidewall located approximately three quarters of a wavelength down the waveguide from the end plate. Each one of these lines has a center conductor that protrudes into the waveguide to a capacitive disc. In order to launch the TE„ mode, there must be a 180 degree phase difference between the two TE„ disc excitations. This is accomplished by using different lengths of coaxial line between the tee junction and the discs. The combined out of phase (i.e. anti-symmetric) excitation of the two side-fired capacitive discs serves to excite the TE,, mode within the waveguide.
Two factors largely determine the overall isolation between the two input ports. One factor is the coupling of each mode within the waveguide to the discs that are intended to launch the other mode. The second significant factor is the cancellation at the coaxial tee junction of the TM0, field components that couple to the TE1, discs.
Isolation from the TE„ Port into the TM,„ Port is virtually guaranteed by phase/symmetry considerations. The two TE 11 discs are excited by equal amplitude signals that are 180 degrees out of phase thus creating an electric field within the waveguide that exhibits a null at the center of the waveguide. Therefore, this field of the so-called "TE I,
Channel" cannot induce a significantly large voltage onto the centrally located TM0, disc.
In the reverse case, the TMo, field can and does excite small signals within the side mounted TE„ coaxial feed lines. However, these signals are excited in-phase at the
two TE,, discs and are thus nominally 180 degrees out of phase by the time they interfere with each other at the tee junction of the power splitter. This out of phase excitation
2 The sizes of the various coaxial lines were chosen to match the expected power levels of the particular application and may easily be changed in subsequent applications
Figure 2. Schematic layout of the dual mode channel combiner
of the co-linear arms of the coaxial tee junction electrically decouples the tee junction's third port by a power factor that is equal to the square of the sine of the difference phase. When this difference phase is 130 degrees, the two undesired leakage field components simply pass by each other at the tee junction and re-enter the waveguide at the TE„ discs opposite to those of their respective origins. This component of the overall isolation is thus expected to degrade with increasing channel separation according to the square of the sine of the difference phase.
219

7 Figure 3. Dual Mode Channel Combiner Prototype.
Measured Performance
The first prototype unit combines Channel 55 via the TE I, Port with Channel 67 via the IMO, Port into a common \VC 1500 waveguide. The device was fairly straightforward to tune through adjustments to the disc launchers as well as by moving the end plate position. The measured data are shown below in Table I.
Insertion loss and group delay data were not taken, but these parameters are expected to be negligible. Additional data that are of interest, however, are the isolation values between individual arms of the coaxial tee and the TM0, Port. These data are listed below in Table 2.
Table 1 Measure data of the first prototype unit.
Channel 55 Channel 67 WC Mode TEu TMo, Return Loss 32 dB 29 dB Isolation at Fv 37 dB 30 dB Isolation at FA 29 dB 26 dB
Table 2. Isolation values at the visual and aural carrier frequencies between separate colinear arms of the coaxial tee junction and the TMol Port.
Channel 55 Channel 67 Arm A at Fv 11.0 dB 17.6 dB Arm B at Fy 11.2 dB 18.8 dB Arm A at F, 11.2 dB 15.0 dB Ann B at FA 11.2 dB 15.8 dB
The selective coupling/de-coupling of the tee junction colinear arms to its center arm is revealed by the two sets of isolation data in Tables I and 2. The design of the prototype Dual Mode Channel Combiner optimized the phase splitting arrangement for Channel 55 to the detriment of Channel 67. Whereas either tee junction arm alone only provided II dB of isolation to the TM°, Port at Channel 55, simultaneous excitation of both tee junction arms from the TE u port resulted in 29 to 37 dB of isolation to the TM,1 Port; a 21 to 29 dB improvement as compared to a worst case direct summation of the signals in the two co-linear arms. In contrast, the Channel 67 isolation between the TE„ Port and the TM0, Port was only 14.2 to 15.4 dB greater than the same worst case scenario. This result is largely due to the frequency difference between the two channels. A phase split of 180 degrees at Channel 55, that is due to differential lengths of coaxial line, is equivalent to a phase split of 198 degrees at Channel 67. As previously mentioned, the tee junction center port isolation varies with the square of the sine of the differential phase of the colinear arms. Therefore, taking the square of the sine of 198 degrees results in a first order prediction of isolation improvement due to phasing at the tee junction that is equal to 10 dB The observed improvement of 13 to 14 dB in the prototype unit indicates the existence of second order effects that are not yet fully understood.
220
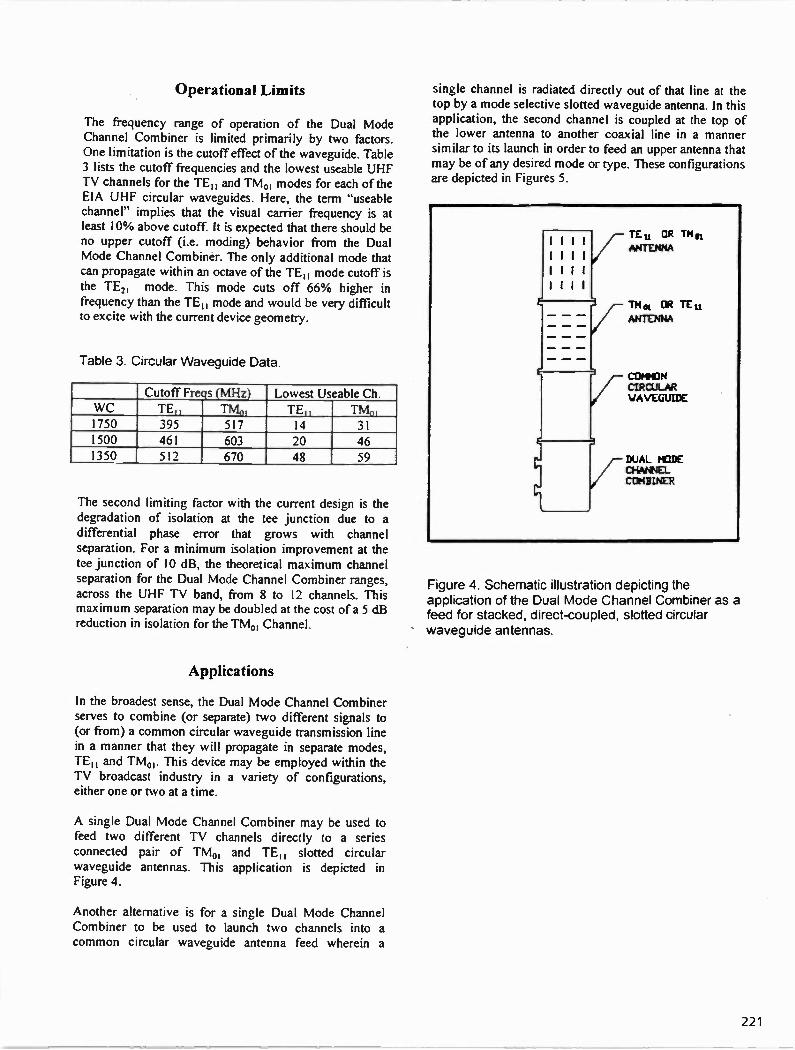
Operational Limits
The frequency range of operation of the Dual Mode Channel Combiner is limited primarily by two factors. One limitation is the cutoff effect of the waveguide. Table 3 lists the cutoff frequencies and the lowest useable UHF TV channels for the TE„ and TMc,, modes for each of the E1A UHF circular waveguides. Here, the term "useable channel" implies that the visual carrier frequency is at least 10% above cutoff. It is expected that there should be no upper cutoff (i.e. moding) behavior from the Dual Mode Channel Combiner. The only additional mode that can propagate within an octave of the TE, mode cutoff is the TE2, mode. This mode cuts off 66% higher in frequency than the TE,, mode and would be very difficult to excite with the current device geometry.
Table 3 Circular Waveguide Data.
Cutoff Freqs (MHz) Lowest Useable Ch. WC TE„ TM0, TE„ TM,), 1750 395 517 14 31 1500 461 603 20 46 1350 51 1 670 48 59
The second limiting factor with the current design is the degradation of isolation at the tee junction due to a differential phase error that grows with channel separation. For a minimum isolation improvement at the tee junction of 10 dB, the theoretical maximum channel separation for the Dual Mode Channel Combiner ranges, across the UHF TV band, from 8 to 12 channels. This maximum separation may be doubled at the cost of a 5 dB reduction in isolation for the TM0, Channel.
Applications
In the broadest sense, the Dual Mode Channel Combiner serves to combine (or separate) two different signals to (or from) a common circular waveguide transmission line in a manner that they will propagate in separate modes, TE1, and TM0,. This device may be employed within the TV broadcast industry in a variety of configurations, either one or two at a time.
A single Dual Mode Channel Combiner may be used to feed two different TV channels directly to a series connected pair of TM,„ and TE„ slotted circular waveguide antennas. This application is depicted in Figure 4.
Another alternative is for a single Dual Mode Channel Combiner to be used to launch two channels into a common circular waveguide antenna feed wherein a
single channel is radiated directly out of that line at the top by a mode selective slotted waveguide antenna. In this application, the second channel is coupled at the top of the lower antenna to another coaxial line in a manner similar to its launch in order to feed an upper antenna that may be of any desired mode or type. These configurations are depicted in Figures 5.
Figure 4. Schematic illustration depicting the application of the Dual Mode Channel Combiner as a feed for stacked, direct-coupled, slotted circular waveguide antennas.
221

Figure 5. Schematic illustration depicting the application of the Dual Mode Channel Combiner as a feed for stacked antennas wherein the lower
antenna is a slotted circular waveguide antenna.
Conclusions
The dual mode channel combiner is an interesting device that may prove to be the best way to channel combine in certain systems that use slotted circular waveguide antennas. If the mode selective antenna scenarios that are depicted in Figures 4 and 5 prove to be realizable, then they will most likely be more cost effective and perhaps higher performance solutions as compared with the currently popular spiraling semi-rigid coaxial cable solution.
The most significant limitation to this device, as it currently exists, is the close channel separation that is required due to the differential phase producing scheme
in the TE" Channel. Further work is needed in order to develop a compact 180 degree hybrid power splitter that has broadband performance characteristics.
An additional obstacle to industry acceptance of this device may be the popular usage of alignment pins within circular waveguide that maintain TE„ mode polarization. Although not yet tested, these pins are expected to cause significant reflection problems with the TN40, field. This difficulty may perhaps be circumvented by the removal of the alignment pins and the installation of a swivel flange at the circular waveguide port. The combiner might then
be rotated at the base of the tower in order to compensate for subsequent field rotation and thereby achieve acceptable polarization of the field at the antenna. Alternatively, the pins may be replace by four longitudinally oriented polarization maintaining ridges.
222

HYBRID STORAGE TECHNOLOGIES: DOWNLOADING THE MEGABYTES Monday, April 7, 1997 1:00 - 5:00 pm
Chairperson:
Jerry Butler, WETA-TV, Washington, D.C.
*NEW OPPORTUNITIES IN A STORAGE-CENTRIC WORLD Ted Goodlander Storage Computer Corporation Nashua, NH
SERVERS: DISTRIBUTED OR CENTRAL STORAGE? Jeff Stewart Quantel Newbury, Berkshire, England
*NETWORK TOPOLOGIES FOR VIDEO SERVERS Tim Slate Tektronix, Inc. Beaverton, OR
AUTOMATED INDEXING AND RETRIEVAL FROM LARGE DIGITAL VIDEO LIBRARIES Krishna Pendyala Informedia Digital Video Library Pittsburgh, PA
INSTALLATION OF INTEGRATED NEWS OPERATION SYSTEM USING MPEG-2 NON-LINEAR VIDEO SERVER Tomoyuki Okamura Fuji Television Network, Inc. Tokyo, Japan
MPEG-2 CUTS-EDITING Christopher D. Bennett Hewlett Packard Santa Clara, CA
THE REAL WORLD OF VIDEO NETWORKING Brad Gilmer Turner Broadcasting Atlanta, GA
DVDS BROADCAST PC Mel Gable lndigita Irving, CA
'Papers not availabe at the time of publication
223

224

SERVERS: DISTRIBUTED OR CENTRAL STORAGE?
Jeff Stewart Quantel Limited Newbury, England
ABSTRACT
The use of video servers is expanding and it is becoming clear that their effectiveness increases as they are extended to cover more operational areas. However, the ideal of the ever expanding server with limitless ports and storage supporting all needs is not practical or possible for the world of television.
As requirements grow, it is the server's storage capacity, number of channels and its fault tolerance which dictates the point at which additional servers are needed. Flexibility, performance and the level to which it can integrate with external management systems govern its success whether as a single central store or as a distributed storage system.
INTRODUCTION
Until recently tape has been the dominant medium for television recording - from acquisition, editing, programme distribution, transmission to archive. And while it continues to offer the lowest cost for practical storage, it will still be used. However, the advantages of disk-based systems - random access, lower maintenance and running costs - are recognised, resulting in their increased
usage in the broadcast chain. Inroads have primarily been made in the use of disk storage as a VTR replacement (e.g. as caches in transmission and post production) but as costs fall and technology advances, the number of possible applications is rapidly increasing. Using video servers is a much bigger step and the specification of the server itself heavily influences both the way the system can grow and how it operates.
STEP-BY-STEP APPROACH
Rather than committing to a totally disk-based system in one step, many users will assess the new technology by first installing it for a specific, isolated application. It is our experience that the benefits soon become apparent and there is a wish to extend the system - either in the size of the current application or to incorporate others.
For example, a simple transmission system (Fig 1) operates with material being loaded from tape on one server input and uses two outputs to access the stored material for transmission. Some form of automation is needed to control and keep track of material coming into the server and to control the output from the two transmission channels.
225

INPUT 1
AUTOMATION
TX 1
X 2
Fig 1 The initial system: one input is used to load material while two channels play out
Expansion - Channels and Storage
A typical requirement might be to add another transmission channel and perhaps be able to accept material from another source. Depending on the server technology employed there are now two widely differing next steps.
If the expansion can be accommodated while keeping to a single server, then disruption to the system is minimal (Fig 2). The process would involve providing more disk storage and additional input and output facilities, more external routing to cope for the extra channels and configuration changes to the controlling software. There should be no changes to system operation in terms of the completeness and speed of access to material as all channels could have equal access in an effectively monolithic store. Note that any material could be output from any channel at any time without the need to copy or re-organise the store.
If the original server cannot be expanded then further units have to be considered
AUTOMATION
INPUT 1
INPUT 2
Fig 2 System expansion with the one original server
resulting in the addition of, in this example, a second server (Fig 3a or 3b). Besides the extra routing needed to cope with the new inputs and outputs, the two servers have to be linked and the controlling software will need significant change to handle not only incoming and outgoing material but also its flow between the two servers. At the same time the extra server imposes limits on system operation. It can no longer be assumed that all stored material is immediately available for transmission, copying between servers may now be necessary, taking up bandwidth and storage space.
One of the headline specifications of a server is its number of channels. Although the scenario above offers the required inputs and outputs the need to connect the two servers has absorbed two channels for purely internal operations. Operating any channel takes bandwidth and access, both of which must be supplied by the disk system. Copying from one server to another uses valuable storage, as space must be available in both for the material. External system management/automation
226

AUTOMATION
INPUT 1
INPUT 2
111-AUTOMATION
TX 1
TX 2 INPUT 1
INPUT 2
AUTOMATION AUTOMATION
TX 3 Fig 3b System expansion via the addition of a second server
Fig 3a System expansion by the addition of a second server
must be aware of which material is needed for which channels and where items are stored - thus increasing the software overhead. Finally there is an imposed departure from the random access expected with disk systems as all stored material is not instantly available for all channels. Any operation involving the use of material from the other server must be planned ahead - thus limiting flexibility.
EDIT 1
INPUT 1
INPUT 2
EDIT 2
AUTOMATION
Fig 4 Adding new applications to the one original server
Expansion - More Applications
A next step in this example might be to introduce a new application, such as editing, onto the server. Again, if the server can accommodate the necessary increase in storage and channels then disruption to the system is minimal (Fig 4). Further facilities will be needed within the server itself
Routing to the edit suites will be required but no changes to the controlling software are needed. Assuming that the server itself has the necessary specification (see later), the benefits are immediate access to all material, simultaneous working and results available for direct-to-air playout the moment editing is completed.
To add editing facilities to the system using servers with limited expansion capabilities yet more units will be needed (Fig 5).
Multiple servers will further complicate the system's design, putting more pressure on the network connecting between servers.
227

EDIT 1
INPUT 1
INPUT 2
Fig 5 Adding new applications to a system based on small servers
This ups the task of the controlling software. It now not only has to cope with inputs and outputs to the system but also must control the flow of material between devices over a possibly congested, and so unpredictable network. Factors such as available bandwidth must be taken into account as well as the location of all material spread across the servers. The result is a more complex solution with the added overhead of a control system requiring extra development resources. At the same time system operation will be affected as there will be the need to copy material between servers so, as before, speed and range of access will be limited while extra bandwidth and storage are taken up with these internal activities.
It is clear, from using this very simplistic example, that the single central server approach has huge benefits and that compromises to system design and operation are minimised by keeping the number of servers to a minimum.
EDIT 2
THE BROADCAST ENVIRONMENT
Broadcast television has specific requirements that place particular demands on servers.
As a result the needs of video servers are very different to those for the file servers used for general purpose computer applications. The major differences are:-
1) It is a continuous medium In television there can be no breaks or pauses while some part of the systems catches-up or re-organises itself. A new picture must be output every 1/30 of a second, and that rate has to be sustained for anything from the length of a clip to 24 hours a day, every day.
2) It uses large files, high data rates and massive storage Using non-compressed video, each 525 line picture (coded to the ITR-
228
R 601 standard) will be 701 kbytes making, at 30 pictures per second, a continuous data rate of 21 Mbytes/second. This is quite unlike computer applications where files are more commonly only a few kbytes, access within less than a second is often acceptable and the next access may not be requested until sometime later. Although the use of compression for video reduces the storage and data rate requirements they are still massive - especially when operating with several channels. With non-compressed video taking 76 Gbytes/hour, total server storage may be several 100s of Gigabytes.
To be viable, a video server not only should meet these performance and storage requirements but also be reliable, able to integrate with a wide range of devices, flexible enough to service a variety of applications and support the required number of users.
The video Server in the Broadcast Environment
The step-by-step example, used earlier, concluded that keeping to a single server minimises system complexity and eases operation. At the same time there are practical limits to what technology can economically provide and it remains impractical to build a single server with limitless capacity to cope with all the demands of a broadcast television environment.
The attractions of starting small with a relatively modest commitment melt away if later expansion brings with it increased complexity and compromised operation.
The aim should be for a server that is as large as is practically possible, to avoid the need, wherever possible, for additional servers, with the performance to cope with the technical and operational demands of broadcast television, the flexibility to cater for a variety of applications and the reliability to support the central server role. Then, where system size, or the need for additional redundancy demands, it must operate comfortably within a multi-server environment.
How Big?
Technology dictates the maximum practical size for a single broadcast video server. Hard disk technology appears to be on a roll achieving year-on-year drive capacity increases of as much as 80% while unit prices remain essentially static. Using arrays of disks it is already economic to provide many hours of non-compressed server storage, so size in terms of storage, is no longer a serious limitation. Current capacity predictions for the year 2000 range from 50 to 90 Gbytes per drive making large scale storage yet more easily available and the need for video compression to conserve server space, less necessary.
A more testing requirement is the provision of ports (video and audio I/Os) to meet the requirements of broadcast television. The data rate and continuity required have already been mentioned. The more ports used the greater the need for bandwidth (data rate) which, ideally should be met under all operating conditions. As with storage capacity, bandwidth can generally be achieved by the use of enough disk drives. But under certain conditions the matter becomes far more complex. If the data for successive frames is recorded, or to be read, from successive disk tracks then
229

positioning time for the read/write heads is minimised and will typically be around 2ms (for a modern disk). If the frames are randomly scattered then positioning times will increase to an average of around 10 ms and allowance will also have to be made for the spin of the disk itself. At the high spindle speed of 7,200 rpm a disk takes 8 ms to rotate - adding an average of half that to the random access time. The average total random access time becomes approximately 14 ms - nearly half of the total television frame time of 33.3 ms. Clearly random accessing is far more difficult and most disk-based video systems are designed to limit or even avoid it. However, using a disk system that normally runs close to full, the repeated operations of recording, deleting, more recording and editing inevitably result in data fragmentation - thus increasing the need for random accesses. As the data rate must be maintained, such disk stores will require frequent defragmentation. This is a time and disk space consuming business. Operation of the system may be slower and more unpredictable as copies will need to be made to ease access time.
With its high data rate and frequency of pictures, the random access of disks for data does not translate directly to television operations. As the number of channels increases the need for randomly accessing material on the disk also increases and it is this that limits video server size. While some servers are designed to limit random accesses, more flexible operation, easier automation and simpler systemisation can only be achieved where every port has real-time random access to every frame of video - regardless of the activities of other ports. Only then can a port be expected to fully support a diskless' non-linear edit suite, a continuous 24-hours-a-day transmission
channel or provide the link to a newsroom computer system as well as carry out the more routine tasks of recording new material or playout of finished work or archives. This ably illustrates the difference between a traditional, linear channel and a real-time random access port.
CLIPBOX
The need for real-time random access ports has formed the basis for Quantel's Clipbox (Fig 6) where up to eight hours of non-compressed video material can be stored. Also compression at 5:1, 10:1 or 20:1 can be used to give up to 160 hours storage. The store can hold a mixture compressed and non-compressed material and support up to eight ports, or users, non-compressed or 14 with compression. This is as 'big' - in terms of storage and users - as current technology will allow - while each port delivers real-time random access.
How?
An array of 20 disk drives is used as the storage for one non-compressed channel. The arrangement is for one drive to provide redundancy, so that full operation continues and no data is lost if any single drive fails. The combined data rate of the remaining 19 drives amounts to some 95 Mbytes/second, sufficient to allow for continuous real-time random disk accesses and still delivering the 21 Mbytes/second needed.
In the context of the Clipbox video server up to eight of these stores are combined so that their capacity is shared between all ports. This way the operation can continue regardless of the extent to which the store is fragmented, or the order required for recording or replaying pictures. This
230

USERS
up to8 - 601
up to 14
- Compressed
VIDEO STORAGE
up to 8 Hours -601
up to 40 Hours •5 :1 up to 80 Hours -10:1
up to 160 Hours -20 :1 gi =
= ------ MIMI =
AUDIO STORAGE )_ 90 to 360 Hours Uncompressed
Fig 6 Quantel's Broadcast Video server
operation can continue regardless of the requirements of other ports.
To present a simple remote control protocol the internal management database addresses every frame and presents them as required as a clip, or sequence of clips. Thus external addressing is resolved to a simple matter of recalling a few large items rather than thousands of individual frames.
Clipbox Integration
The freedom of access creates independent ports, each can be used as a separate entity complete with its own remote control, allowing diverse activities on one server. Thus one server can accommodate whole production chains. For example in news, rushes can be recorded as stories are edited (by journalists and 'craft' non-linear editors), the results viewed and the running order loaded while playout continues
Keeping all activities centred on one server has a number of attractions: everyone has instant access to all material and, important for news, throughput can be fast as once material is loaded, it need never be copied.
Multi - Server Environment
There are times when system requirements, such as extra capacity, more users or a desire for additional system redundancy, may dictate that more than one server is used. Here the specification of the server itself is critical. Not only must its own local operations be maintained (e.g. post production, transmission, etc) but it must also handle the interface to outside servers.
Good design can eliminate operational compromises and greatly reduce system complexity by minimising the external control and management software, as well as easing the pressure on the interconnecting network. Clearly if the ports are
231

independent, the operations on interconnecting ports will not disturb other server-based work. Routines available in the remote control protocol can also help. For example, if the servers are intended to hold identical information, then flagging any changes in one enables them to be reflected in the others. Software to automate that process could be relatively simple.
Connections and Transfers
The ports must be high speed - sufficient to support digital video. The serial digital interface (SDI) has been chosen as it is a well developed standard widely used in television. This way much equipment can plug directly to the server without the need for extra interfaces or storage, and the signal can be handled by existing infrastructure. In addition, the 270 Mbits per second useful data rate will, in the future, allow compressed signals to be transferred at faster than real-time rates.
CONCLUSION
The decision whether to use central or distributed storage for any installation is important and should not be taken before the capabilities of the server (or servers) to be used has been fully explored.
The server is a vital part of the system, if it can withstand the pressures of playing the central role in the operation, then the need to add more servers becomes unnecessary.
When more than one server is required, the server's performance and specification can help minimise any operational compromises and simplify system design. The right design of server is the key to easier systemisation and more efficient operation.
232

AUTOMATED INDEXING AND RETRIEVAL FROM LARGE DIGITAL VIDEO LIBRARIES
Krishna V. Pendyala, Howard D. Wactlar, Mark J. Juliano IslipMedia Network, Inc.
Pittsburgh, PA
ABSTRACT
Video is widely used in broadcasting, as well as corporate, educational and government environments in applications ranging from training and video conferencing to the documentation of medical, legal and other procedures. Proper indexing or organizing of video information is the essential ingredient in order to provide fast, accurate, and easy to search video collections. The IslipMedia Library system enables search and discovery in the video medium. It provides access and retrieval from deep within the video, based on an advanced, automated indexing process and subsequent browsing and searching software. The distinguishing feature of this system is the integrated application of speech, language, and image understanding technologies for the analysis of the video's full audio and image content. This paper describes how IslipMedia Network brings to the video domain searching capabilities heretofore available only to textual information.
WHY USE VIDEO?
As we all know, video is an integral part of the broadcast and entertainment industries, and is increasingly becoming an integral part of corporate, education, and government communications strategies as well. Given the current trends of the mobile and remote office employee. corporate downsizing for productivity, and globalization, coupled with the increasing cost of travel, virtually all large organizations are already using alternative modes of communication, including video.
As a medium, video captures and communicates the actual experience of events, not just the written record or transcript. Documenting only the decisions makes us lose the wealth of reasoning and know-how behind the decision making process, as well as the non-verbal communication between the participants. Moreover, research has shown that retention increases when users actually see and hear the content.
For these reasons, among others, video is fast becoming an essential medium of communication. In addition to more traditional broadcast applications, video is now being used in a broad array of applications including desktop news, corporate training, conferencing. knowledge preservation. and documentation of medical, legal and other procedures
WHY INDEX VIDEO?
The ubiquity of the Internet and corporate Intranets have offered us multiple pathways to disseminate information in addition to the network broadcast and cable television channels. The main difference between the two is the notion between broadcast and on-demand. In order to serve the on-demand users, we need to quickly find and deliver the most relevant few minutes of the video and not a half hour or an hour. Therefore, it is necessary to consider effective ways and means to index and store video so that it can be retrieved instantly on-demand and shared
The effort and frustration involved in locating video information is enormous today. Given the onslaught of new tools and technologies to create and share even more information makes the magnitude of this data management problem even more difficult. The information architects of the future have to also focus on providing tools and methodologies to efficiently navigate the video information. Proper indexing is the core ingredient of this effort.
PHANTOM SOLUTIONS
Traditional video archiving processes have successfully used human attribution or keywords and manual computer assisted word-to-frame time coding to locate the necessary video clip for use in editing or research. However, these approaches cannot scale to the point where they can be used to archive the video currently available in the vaults of television studios, private and corporate networks, and the Internet. Furthermore, the cost, effort and time involved in order to index the video collections using these traditional techniques are prohibitive.
233

Today, the output from a number of mechanisms that create video information is not being captured due to the exorbitant costs involved in the physical storage, and the subsequent costs for the archiving, management and delivery of this information to others. The amount of manual processing currently necessary to archive video information using the traditional techniques of adding text attributes to the video makes the turnaround time of indexed video impractical for immediate use. We, therefore, find that many important briefings, training sessions, as well as videoconferences are not being captured for future use.
ISLIPMEDIATu LIBRARY SOLUTION
IslipMedia which stands for Integrated 5peech, Language and Image Processed Media, offers a new mechanism to efficiently process video in a format that addresses the time, effort and cost concerns associated with the traditional video archiving processes. The IslipMedia process has automated much of this time and labor intensive tasks so that large volumes can be processed quickly and completely. This process dramatically reduces the problems involved in accessing the relevant information without the addition of any complex cataloging procedures traditionally needed on the part of the video archivist.
The IslipMedia Library system was designed and commercialized by extending the research and prototype from the Informediami Digital Video Library project at Carnegie Mellon University, Pittsburgh. The Informedia project is one of six national digital library initiatives sponsored by the National Science Foundation (NSF), the Defense Advanced Research Projects Agency (DARPA), the National Aeronautics and Space Administration
(NASA), and a host of other leading corporations. The Informedia Digital Video Library is the only one of the six projects whose focus is on the indexing, segmentation, and retrieval of video information.
Indexing Process The IslipMedia process is comprised of five steps. The first step is to digitize the analog audio and video into a standards-based MPEG format. Second, the video and audio are sent to a fast processor that generates a time aligned full-content topical index using speech and language understanding. Third, the video is segmented into meaningful "video paragraphs" using language, image, and audio cues. Fourth_ image analysis on the video portion of the data creates the filmstrips and icons to include key scenes. Finally, a comprehensive full-content index of the video collection is built. IslipMedia's
automated indexing process demonstrates how the synergy between various cognitive technologies can create a meaningful index that helps in the information retrieval task.
Any additional material that is available such as close-captioning, scripts. production notes, annotations, etc., can be added to the index to provide additional clues for retrieving the relevant segment of video.
Library Creation Off-line
New Content
/\ CC Decoder
Video Capture
Existing Content
MPEG Encoder
Text! Audii Video!
PC
Text to Speech Video Scene Alignment Segmaitation Changes,
Index and Data Generation
'Video Abstraction
Indexed & Segmented Video and Metadata
Digital Alpha
Indexed video and Data * stored on a Library Server
Library Search and Retrieval On-line
Indexed & Segmented Video and Metadata
LAN Switch
NT Server
Natural Language Queries
Figure 1: The IslipMedia Library System Overview
234

The technologies used to perform the above indexing range from a variety of off-the-shelf hardware and software to proprietary speech recognition, language understanding, image analysis and retrieval engines. The digitization of the video is performed using off-the-shelf PC-based hardware. The subsequent processing to derive the index and the metadata (data describing the object) is performed through UNIX based proprietary algorithms running on fast Digital (DEC) Alphas or Intel Pentium Pro processors. Figure I illustrates the creation and searching phases of the IslipMedia Library system.
Since the hardware and software requirements to process the video is significant, a critical mass of users should collectively use a processing facility. It is also conceivable that service bureaus that specialize in performing the indexing and archiving are setup to process the video for corporate use and for video content providers.
Searching and Browsing Mechanisms Based upon the enhanced video indexing process, users
can view the information in a number of ways. First, videos are paragraphed into natural content sections which communicate complete thoughts as opposed to fixed length segments. Second, video libraries can be viewed using a "skimming" feature which allows automatic previewing of video in a fraction of the full viewing time. Third, users can search the indexed video using natural language queries.
In addition, a number of features are built into the user interface to enable the user to rapidly navigate and browse the video. There are two methods to rapidly browse the video, one is to go to the exact location of the first search word in the video and skip to every other occurrence of the search word(s). The other method is to use the filmstrip view and find out the exact location of the word that is of importance to you and view the video around that word.
In order to quickly get the essence of a video segment, the user can either view the dynamic skim which plays the most important sections of the video, or a static skim that provides an automatically generated storyboard of the video paragraph. The purpose of these features is to provide the user with functionality similar to flipping or thumbing through a book or as a "Video Cliff Notes".
Re-Use As a result of the Informedia project's research on how individuals use video as an information medium, it was discovered that merely accessing the relevant video clips was not enough and the users wanted to "re-use" the video
in reports and presentations in order to communicate the results to others. Therefore. IslipMedia has incorporated a re-use utility to embed either the entire segment or a portion into OLE compatible software applications with pointers. These embedded clips, however, are not self-contained and therefore not freely distributable to others. This feature enables us to keep track of the video and protect the video usage rights.
Server and Storage Mechanisms Improper design can place an excessive demand on the server's ability to reliably serve video to multiple clients. With the introduction of numerous video server products. this has become less of an issue. The cost of storage media and its configuration is yet another important consideration in the design. Even though the cost of storage is coming down rapidly, the media necessary for 100% on-line storage of video information makes it expensive.
It is therefore important to have an affordable storage solution in order to make widespread use of digital video libraries viable. The approach that IslipMedia has adopted is a hybrid solution involving RAID-based on-line storage in conjunction with a near on-line robotic tape library and an off-line computer controlled analog videotape player array. This combination of on-line, near on-line and off-line storage, managed by a hierarchical storage management software based on a pre-programmed priority or history of usage. makes it possible to contain the costs and access times involved in retrieving the video segments.
Delivery Mechanisms Due to the shear size of video files, the notion of large standalone video libraries is not very cost-effective. Given the nominal cost of 9 GB hard disks, and the data storage requirements of MPEG-1 video, it is conceivable to have a 20 hour digital video library in a standalone configuration.
The preferred method of accessing large digital video libraries is through a network. The network bandwidth requirement for MPEG-1 SW (352x240) resolution at 30 fps is only 1.2 Mbps. In a typical corporate environment, a switched 10BaseT Ethernet network with approximately four clients per segment combined with a 100EtaseT or FDDI connection between the server and the LAN switch is a very practical configuration. Higher resolution and bandwidth video can also be served by carefully segmenting the network and configuring the storage throughput.
235

The video and metadata can be stored on standard Microsoft NT servers. If more than 6 simultaneous video streams need to be delivered from one server, a video serving software like Starlight Network's StarWorksNT is reconunended The client software used to search and retrieve video currently runs in Microsoft Windows'95 and Windows NT environments.
IslipMedia processed video and data files are therefore compatible with most existing computer equipment and operating systems to support access via local, metropolitan and wide area networks. Access to large digital video libraries over the Internet will require better compression schemes or increased bandwidth. A number of companies are working to address these problems and effective solutions are eminent. In the meantime, scaled versions of the video that may deliver a few frames with continuous audio can be delivered to the clients through the use of existing 28.8 modems.
APPLICATIONS OF INDEXED VIDEO
Once any video information is indexed using IslipMedia technology, users can quickly search and find the relevant paragraphs on any given topic and better understand their meaning by getting exposed to the context for their rationale. One use of this technology now allows for the preservation and sharing of important findings, strategies and research approaches for generations to come, instead of losing it along with the people who created the knowledge.
Other applications of the IslipMedia Library, therefore, include broadcast video archiving and retrieval, news-on-demand libraries, corporate training video collections, Knowledge Preservation Interviews, archiving of video conferences, and documentation of medical, legal and other procedures.
ACKNOWLEDGMENT AND FURTHER READING
The authors wish to acknowledge the Informedia Digital Video Library project at Carnegie Mellon University's School of Computer Science whose work was supported by the National Science Foundation. Any opinions, findings. and conclusions or recommendations expressed in this material are those of the authors and do not reflect the views of the National Science Foundation or Carnegie Mellon University.
For further reading, please refer to the Informedia Digital Video Library Web site located at http://www.informedia. cs.cmu.echi.
IslipMedia Network, Inc. provides products and services for the creation and delivery of network-based searchable digital video collections to enable instant access to video information.
Contact: Krishna V. Pendyala, Vice Chairman IslipMedia Network Inc. 5618 Woodmont Street Pittsburgh, PA 15217 Tel. 412.680.0575 Fax: 412.%7.0445 [email protected]
236

Installation of Integrated News Operation System using MPEG 2 4:2:2 PROFILE@ML Non-Linear Video Server
Tomoyuki Olcamura Fuji Television Network, Inc.
Tokyo, Japan
ABSTRACT
The Fuji (Television) Integrated News Directing System or "FINDS" consists of Video Server system conformable to MPEG 2 4:2:2 PROFILE@ML. FINDS provides integrated environment for news production and direction. The system supports full GUI Operation using video stamp picture and graphic icons and is accessible to any member of the news
production stuff News directors can easily make changes within seconds during on-air operation, and non-linear editors can provide real time and non-destructive editing.
PREFACE
Fuji Television Network, Inc. installed FINDS in its new broadcasting center(Photo. 1) and plans to begin its operation in July, 1997. This paper will explain about details of FINDS, design concept, components, system and operation. The designing of FINDS began in 1994 for the purpose of developing a new news production system, which integrated the technology of video compression, non-linear editing, video server and computer networks.
Photo 1 Fujitelevision New Broadcasting Center
237

DESIGN CONCEPT
1. The style of news production is different according to the culture of each news network.
2. News production should not be rigid; it should be free rearrangement of news stories
in the line-up, and should take a minimum of
time from arrival of material to on-air.
3. Anyone in the news room should be able to use a combination of information and materials to improve news quality.
4. The non-linear editing machine is used in
conjunction with central video server in order
to utilize its full potential.
5. It should be assumed that working in tandem with a future digital archive that a system of certain size will be required.
FEATURES OF FINDS
HYBRID SYSTEM
FINDS is a hybrid system which makes possible
the gradual change to the non-linear world by
combining a non-linear editing machine and video
server with a VTR editing machine. At present, there are 6 non-linear editing booths, but as skill at operating non-linear editing machines improves more non-linear edit suites will be constructed. The video server has a capacity of
100 hours. During the course of some major news event, the number of clients who access the video server will decrease beyond three days
from the story happen. The Hybrid system non-linear conjunct with VTR is utilized to reduce the system costs.
GRAPHIC USER INTERFACE
All operation and display information is used Graphic User Interface(GUI) and drag & drop. News items in the line-up along with their respective details are displayed on the computer
screen with GUI, make it possible to
simultaneously access news production information. This allows the news program to be
understood in visual terms.
Also FINDS has a unique ID ordering system
which allows for easy line-up and the corresponding preparation of new video spots,
cyrons, graphics and all other material changes. FINDS adopted a 100 Base T ether-net to transport video icon picture data.
MPEG 2 4:2:2 PROFILE@ML
In order to minimize the decrease of video quality caused by repetition of encoding and
decoding, a single compression system will be used. FINDS introduced to the SONY-SX compression system, which is conformable to MPEG 2 4:2:2 PROFILE@ML.
Video data is able to record without transcording with the SX-camcorder.
CAPTURING TIME
For a stand alone, non-linear editing system, "capturing" time is a major problem. Usually,
the editor must wait for the completion of the transfer from VTR to disk. However, FINDS
solves the problem with the central server which has many I/O and excellent file manage system, giving the editor immediate access to file. Editors can start editing from the beginning of capturing.
CONSTITUTION OF FINDS
Block diagram of FINDS. (figure 1)
238

Server Room
News Computer Systens.44. 40. Cron R.r.W• signal center -4111 10...
Gateway FINDS DB Fk—m—vs loom
Cue sheet Terminal PrcduceiFerminal Sall store Teminal
News Video Room
••1 1, SMS Ma.chme SMS Castroler
••••••••••••.
Hi & seedport
Incomming from remote center Non-linear editor
Recorder Linear Editor
C li;j1 Recording Terminal
News Studio Control Room
Outgoing .ght seed to Studio
P°Tt —I.J Playback
Feeding Terminal
1;1 Cue sheet Terminal
H ;1 Assistant PD Terminal
Ole sheet Terminal
11J Assign Pad Assistant PD Terminal
Fl om I BLOCK DIAGRAM OF FINDS
. s i 4 "': .7,,.--. :". Et: , Gt..: ,, e •gro Ain:.
More than fifty computer terminals are connected with ether-net 100Base-T.
A FUNCTION OF EACH BLOCK
RECORDING TERMINAL
Recording and material information input is done at the recording terminal, and with the arrival of material FINDS will inform the news computer system. Cooperation between the recording operator and editing operator is possible, and the editing operator is able to receive the new material from the recording operator in the material choice window of the editing machine. (Photo. 2)
&Sit.
rA.P.
Jr* —ISMS r.••11••
. 1. Riga • ,VM:Ta.
• In1•0•12 ,
pqs 1 G 11,1111 M14.11 111.R •
1110,14
•
ft...! ...yg
wpm,: a! W 17. 0e, 3f1'
9/111Z, • !, J4,
FINDS -raj 41
Photo 2 Editor receive
239

In the case of an unedited video being put on-air
or a video that is still being recorded, a feed of material can be made to the studio control room.
Video Resource Server(VRS)
The VRS use SONY SX system based on
MPEG 2 4:2:2 PROF1LE@ ML. The sound is
non- compressed. A video taken with Betacam-SX can be recorded without transcoding. When
recorded with SX-VTR it is possible to increase playback speed to 4 times. The VRS consists of
disk arrays, router, 110 processors and management computer. Photo. 3 shows VRS.
Photo 3 VRS
240

BASIC DISK UNIT and BANK The basic disk unit has 6 port I10 and one high speed port with a disk array of RAID-3. In VRS, 2 ports of 6 are assigned as input, with the remaining 4 ports for output. I BANK consists of a pair of basic disk units which work like a mirror disk. Input ports are connected in parallel, and output ports are independent so I BANK has 2 input ports and 8 output ports (figure 2).
High speed port
Basic unit Bank
Figure 2 Basic Unit & Bank
The 110 processor has a built-in encoder and decoder, with the signal being transferred with Dl component format with SDI. The reason it doesn't transfer with compressed video format is that a standard interface to transfer compression signal is not made. Also, Dl component SDI is more general-purpose and is useful with non-compressed video, graphics, and other material. A basic disk unit has one high speed port, the interface is SDDI(Serial Digital Data Interface). high speed port allows compressed video format transfer and high seed transfer.
Make UP OF VRS VRS is equipped with four banks, and their I10 ports are connected with each other via a Dl router. The Server Management System (SMS) computer controls router and disks. As a result, VRS has 8 input ports and 32 output ports with 8 clients being able to simultaneously access material. Transferring a file between bank via high speed port, it is possible to increase the number of clients who can access the same material. (figure 3)
Figure 3 VRS
DI
EDITING TERMINAL
The editing machine has a local disk with 3 streams, 2 inputs and I output. three mix switcher with a single (figure 4).
It works as a channel DVE.
Figure 4 Non-linear Editing Machine It
supports two modes of editing; one is a non-destructive editing mode which edits files of VRS directly and does not make a new file in VRS or local disk. The other is a destructive
241

editing mode which edits VRS files or local disk
files making a new file on the local disk. The file which is edited is up-loaded to the Video Spots Server (VSS). In the case of the non-destructive editing mode, edited files are forwarded to VSS from VRS directly by EDL. With the destructive editing mode. up-load is done via an editing
machine. With visual effect editing the editing machine makes a new file on a local disk which causes the editing to be destructive. This
operation is handled in the background by an editing machine and when up-loaded, the editing operator refers to the GUI cue sheet to make the appropriate order.
CUE SHEET TERMINAL
The GUI cue sheet is made and displayed by the cue sheet terminal. Photo. 4 shows a sample of a
GUI cue sheet.
Photo. 4 GUI Cue Sheet
242

The line-up of news is displayed in left side and the stamp picture icon stands in line to the side of every story and represents the order and operation of material used. The news video material will feed to the news studio control room by order of this GUI cue sheet. The cue sheet terminal in the control room is able to change line-up with a touch panel. When the operator chooses an item and pushes the movement point on the GUI cue sheet, the line-up is changed and the order of the material preparation also changes automatically.
VIDEO SPOTS SERVER (VSS) The Video Spots Server (VSS) plays back the video spots when editing is finished. These spots are managed by program, category, date, purpose, etc., and are put into individual folders. VSS is assigned 3 ports for input and 3 ports for output out of 6 I/O in the basic unit. Therefore, a bank of VSS has 3 inputs and 6 outputs. VSS consists of 2 banks, 6 inputs and 12 outputs. Video spots are played back after a few seconds from the recordings beginning. There are 4 channels to feed video spots to the news studio control room, and it is put on automatic standby with the GUI cue sheet. It is also possible to feed simultaneously to other studios by manual operation. Video spots supplied by tape are recorded onto the VSS directly using a play back VTR. The VSS random feed of all material is much superior the VTR cart machine.
NEWS STUDIO CONTROL ROOM
The News studio control room has a traditional manual switcher. With FINDS supported information and material, on-air operations are conducted. FINDS uses 3 channels to feed video spots to the studio control room from VSS in accordance with the GUI cue sheet. There is one more channel, called the "pool channel" which is used as a utility channel. The news operation pool channel will be used for urgent video spots which can't be dealt with by using the automatic system. The three video spots which feed to the studio control room are able to play back from any channel. FINDS continues to prepare video spots according to the GUI cue sheet and preparation of video spots are according to the distribution rule interlocked with the studio switcher tally signal. Five seconds after of tally signal turns off, FINDS feeds the next desired
video spots to the studio control room. The pool channel is classified into a special category of VSS. As soon as the news making incident has been concluded the raw footage or material without background information is put into the pool by the editing or recording operator, which will then be easily handled in the studio control room. Photo. 5 shows terminal arrangement studio control room.
243

Photo. 5 Terminal arrangement studio control room
A news line-up which is currently on-air can be
rearranged in the studio control room. The cue sheet terminal and the assign pad indicates only the order of spots from VSS, and is set in the fist line of the control room. The assign pad is also used to control video spots in the pool, and at the time of operation is called the "Card Playing Mode". This mode is used to interrupt the usual GUI cue sheet operation, and can put stamp icons, similar to playing cards, representing news video spots items in the pool window. Then the video spot icons can be chosen at random to feed to the studio control room via 4 channels allowing the studio control room to supply up to four spots at the same time. The assistant program director terminal (figure I ) behind the program director in the control room functions to help the program director. Through this a preview of all material is possible in VRS and VSS. Changes to the cue up point of material, material layout in the pool channel window, emergency material changes, etc. can be conducted. The assistant program director
terminal is also is able to make a GUI cue sheet.
THE FUTURE OF FINDS
The first priority in designing finds was to make
a new style of news production which emphasized a smooth process of editing and making changes. In the future as well, as we become more accustomed in its use. It will be necessary to improve and revise the finds system.
The following are topics for consideration: 1. It is important to analyze the frequency of
material access by more than 12 editing clients.
2. Examination of the high speed transmission channel for connection with digital common carriers or digital FPU etc.
3. Combination with cheaper running costs for large near on-air archives.
244

CONCLUSION
With finds, even non-career operators will be able to conduct news operations, and it will be possible that all members of the news room will visually grasp the progress of any news situation. Also, news directors will be able to juggle the order of news stories and materials more freely. Through computer networks, arrangement of machinery and their operators will become more efficient. finds is a strategic tool which will lead news production into the future.
MORE INFORMATION
We are welcome to visit our new broadcasting
center to see the facilities, and if you need more information, please contact via e-mail. E-mail address; [email protected]
245

MPEG-2 Cuts-editing
Christopher D. Bennett Hewlett Packard Company
Santa Clara, CA
ABSTRACT
As disk-based video migrates from a variety of incompatible JPEG formats, the clear choice is the standards-based MPEG. While alternative compression schemes will continue to coexist, especially for acquisition, MPEG has emerged as the clear choice for distribution and play-
back There is much misinformation about the advantages and limitations of MPEG technology for broadcasters.
In particular, the conventional wisdom asserts with confidence that frame accurate MPEG editing is not possible. This paper challenges the conventional wisdom, and explains Hewlett Packard's techniques for manipulating standard, efficient MPEG video in a broadcast environment.
MPEG's Key Advantage
Efficiency
Because of inter-picture encoding, full IPB
MPEG-2 is typically three to five times more efficient than JPEG or I-picture MPEG, and two times more efficient than IB-only MPEG. This efficiency has many benefits, and is a key
reason for the broadcast industry's shift to MPEG.
For a given video quality, the number of chan-nels available from a single server increases substantially, since each channel uses much less bandwidth. Alternatively, Hewlett Packard's new MediaStream Disk Recorder demonstrates
the potential for packing more storage and more channels into a small package. Extended storage costs drop dramatically. The network bandwidth required to move programming greatly de-creases, increasing the speed of material move-ment. Off-line archive access speed increases significantly, changing the dynamics of archive from "cold storage" to true near-term access.
The Problem
Complexity
The benefits of full IPB MPEG-2 are compel-ling, but there must be a catch for anything that sounds so good. Actually there are three.
First, the complexity of real-time forward and backward prediction requires vast computational power. As a result, implementing MPEG encod-ing is more expensive, but this is rapidly changing. Computational power gets cheaper every day. Volumes and competition are increas-ing. Hewlett Packard's newest server features much lower cost per channel than the previous models.
Second, IPB MPEG is technically much more
difficult to implement than traditional JPEG schemes. This requires substantially more engineering investment, and is difficult to im-plement with high reliability.
Last, IPB MPEG is more complex to edit. Most manufacturers are not willing to even try, but cuts editing for broadcast applications is possi-ble.
246

Conventional Non-linear Editing
Playing random clip sequence
To understand how IPB editing is possible, we need to be clear how traditional non-linear editing happens today.
First consider the case of several clips stored on disk, and played at random (Figure 1). This
capability is useful for spot insertion, and is a basic form of non-linear access: the server must access the clips in a different sequence than the record sequence. Even Hewlett Packard's first-generation MPEG servers had this functionality, which conventional wisdom suggests should not
Creating effects
Next consider the creation of effects (Figure 2). Almost universally, the effect is created by: 1) decoding the stored data into analog or digital video for two or more clips, 2) manipulating the clips in video form to create the completed effect, and 3) re-encoding the new clip to store on the disk. Note that hardware or software rendering produces the effect with video, not compressed data.
Play "White" first, then "Gray" I then "Black"
Video Decoder
0110111
01101
0110111
01101 0110111
01101
0/10111
01101
Data
Continuous Video
-IMINIS
Video
Figure 1. Playing a random sequences of clips, a basic form of non-linear access.
be possible with IPB MPEG.
Figure 2. Creating effects. Note that the effect is almost always done in video (analog or digital).
247

Cuts editing
Last, consider the requirements for cuts editing (Figure 3). This is simply an extension of the
previous two examples. To perform cuts editing, the server must rapidly supply random se-quences of pictures (including any stored ef-
fects) to the video decoder to provide an arbi-trary but continuous video output.
The key requirement for a server to support this editing is access ("indexing") to individual pictures within a clip. Indexing is the require-ment that is more difficult to meet in IPB MPEG than JPEG.
Indexing to random pictures
The reason that indexing is more difficult with IPB MPEG is that usually the desired picture does not correspond with an I-picture. With a 15 picture GOP, the odds are only 1 in 15 that the desired picture is an I-picture! Consequently, depending on GOP structure, up to seven other I and P pictures must be decoded to re-create the desired picture (Figure 4).
This requires the server to have substantially more processing power. The server must rapidly pre-charge the decoder with the required picture data to keep the output running smoothly.
Figure 3. Cuts editing. This is a special case of playing random clip sequences.
If you want this picture
I b b P b b P b b P
You must first decode these I
Figure 4. Indexing to random MPEG pictures is more difficult.
248

The Solution
More engineering
The "orthodox" solution to this technical chal-lenge is to avoid the problem and use I or IB-only GOP's. This approach mimics JPEG, and largely eliminates any indexing issues. Unfortu-nately, this approach also eliminates the effi-ciency benefits gained by using MPEG!
Hewlett Packard's approach is to invest the engineering effort to create a server capable of rapid decoder pre-charge. This requires several clever software and hardware processing tech-
niques, and approaches JPEG or IB-MPEG in responsiveness. Best of all, this approach retains the efficiency of full IPB MPEG-2 but provides editing features for broadcast applications.
Key H/W and S/W techniques
The key hardware technique is the use of dual decoder chips in each decoder. This enables one segment to play while the subsequent segment loads into the "extra" decoder. Not only does this facilitate basic editing, it also results in exceptionally clean cuts between segments under any conditions.
The key software technique is less intuitive, but crucial. By adding a "picture index" to the video file, the file system gains the tools needed for instant access to random pictures (Figure 5).
Figure 5. A Picture Index facilitates fast random frame access.
I b b P b b P b b I
249

The Picture Index
Conceptually, for each I, P & B picture, the index contains three items: 1) key characteristics (type, size, etc.), 2) relative block-level location on the disk array and 3) most importantly, temporal relationships with other pictures.
Armed with this information, the file system quickly pre-charges the secondary decoder with only the necessary data. This selective informa-tion access significantly reduces frame buffer memory requirements on the decoders, prevents the file system from bogging down with unnec-essary data traffic, and vastly improves respon-siveness.
()Arbitrary Play eJog o Random indexing *Variable Rate
The picture index supports jogging by giving the file system quick access to both forward and reverse frame information (Figure 6). Rapid indexing to 1-pictures supports shuttle operations (Figure 7).
Rather than appending the picture index on the end of the video file, the file system inserts the index as an independent (but tightly coupled) layer in the file. This enables full access to partially recorded files only seconds after encod-ing begins. As a result, there is no need to wait until the record completes before starting to manipulate the video.
Figure 6. The picture index is key to good jog performance.
_
I b b P b b P b b I
e Arbitrary Play eJog o Random indexing • Variable Rate
41010
e Shuttle • 1-picture sampling
eso, Picture Index
I b b P b b P b b I
Figure 7. Fast access to I-pictures supports shuttle operations.
250

On-Air Applications
Superior performance
Combined with other more subtle techniques, the dual decoders and picture index enable arbitrary Mark In/Out, outstanding Jog perform-ance, and surprisingly good Shuttle capabilities.
On-air applications for cuts-editing capabilities
include: trimming encoded spots, trimming multi-spot feeds or tapes, and segmenting long-form programming (Figure 8). For these appli-cations, the overall performance in the IPB MPEG environment is superior to tape-based alternatives. Note that these techniques enable broadcasters to manipulate MPEG-based video without any generation loss.
Lossless satellite delivery
There is a clear trend towards satellite distribu-tion of MPEG-2 spots. In addition to better picture quality, these new services also hold the promise of substantially reducing the volume of (mostly unused) spots cluttering up the opera-tions area. With targeted "spots-on-demand," the on-site inventory will only contain active mate-rial, streamlining operations.
Hewlett Packard's MPEG editing capabilities enable broadcasters to digitally copy MPEG spots into a broadcast server, trim the video, and play to air without any generation loss.
Compelling benefits
The conventional wisdom is that editing MPEG-2 is not practicable. The reality is that while manipulating efficient MPEG implementations is more challenging, it simply requires more engineering. The benefits to broadcasters are profound, pervasive, and compelling.
Figure 8. Typical cuts-editing broadcast applications.
251

The Real World of Video Networking
Brad Gilmer Turner Broadcasting Systems
Atlanta, Georgia
What can be done in the real world with video and networks? What are the opportunities and limitations at this point? Where will the future take us? This presentation answers these questions from the user's perspective, combining a demonstration of an actual
application with a discussion of present and future issues. I address three main areas - the difference between video and other data applications, the importance of
interoperability, and things users can do now to implement video networks in their facilities.
Preview-
There are three things I would like to cover. • What is different about video • The importance of interoperability • What you can do now
What is different about video?
There are three aspects of video that make it challenging; it's big, it cannot wait, and it does not travel alone.
Video is big - The computer world has dealt with big files in the past. Large databases can approach several gigabytes, but there are only a few files of this size in a typical system. Video applications can produce hundreds of files this size or larger. When you start moving a number of large files through a computer or over a network, it's pretty easy to exceed the capabilities of a system.
Video is impatient — it cannot wait. Some people refer to this characteristic as being isochronous, meaning that it is
a continuous stream. For many applications, computer designers and programmers have been able to momentarily suspend one task while they dealt with another. The momentary suspension of processing is referred to as an interrupt. Interrupts have allowed computer designers to take care of critical housekeeping tasks such as refreshing the screen or updating the system clock. When the
programmer puts the computer on hold to take care of another task, it can produce a glitch in the video. This
glitch is easily seen by the average viewer. An interesting sidelight is that human beings are much more sensitive to glitches in audio than video. Unfortunately, issues of audio processing and switching seem to be much more difficult to resolve than issues with video.
Video seldom travels alone - It may be synchronized with multiple audio files, closed caption files, edit decision lists,
and other material. Because few computers truly multi-task, this synchronizing issue can be one of the most difficult to overcome.
The difficulty computers have with video is temporary. If computers become fast enough, they can put video and
audio on hold just as they do screen and print processes. If computer manufacturers and programmers develop new architectures and structures to deal with our medium, then the issues above will not be a problem. For the moment, computer and network hardware designers definitely have their hands full.
The importance of interoperability-Interoperability, the ability to connect two pieces of
equipment together and exchange information, is critical to our future. Today, it is almost impossible to connect two
pieces of equipment from different vendors together using a true computer network, put video into one, and get video
out of the other. You can create a network of fileservers, paint boxes, mass storage devices, and uplink compression units to exchange images, but the core of this network will be 601 digital. You may soon be able to interconnect these boxes using fibre channel, FDDI, or some other means, but when you get there you will not be able to exchange files. This is because images generated on one MPEG box are not necessarily interchangeable with another MPEG box. Even if the manufacturers are using the same bit rate, IBP structure, and ancillary data construction, you may still have difficulty.
252

Faster than real time transfers, central storage of images with non-linear editing on the desktop, and other wonders are supposed to be just around the corner. None of this will be possible if the issues surrounding interoperability are not resolved.
There are discussions in the Fibre Channel committee that
may result in a specific definition of a fibre channel video connection. This would be a great step forward, allowing vendors to design, and customers to purchase systems that are likely to work, even if they are composed of parts from different vendors. This is important to us. Broadcasters purchase equipment from different vendors because vendors frequently become specialists in producing
solution for particular tasks. Interoperability is key if we are to avoid building facilities that employ large amounts of digital technology, but exchange images at full bandwidth 601.
What you can do now-There are several things you can do now to begin the transition to true video networking. First, let vendors know that interoperability is important to you. Challenge them to make their equipment work across video networks with equipment from other vendors.
Second, begin building your video network now. Good
CAT-5 twisted pair installations can be made to support network speeds above 100 megabits per second — perhaps even up into the gigabit range. You can justify the higher cost of a top notch CAT-5 network by comparing this with the cost of installing a less expensive infrastructure now, but having to replace part or all of it over the next few years.
You may want to install fiber in areas that are likely to use video networking in the future, such as news rooms and post facilities. You should also think about how you will move your plant from existing slower speed networks to
the fiber and high quality CAT-5 networks of the future. A good network design will allow you to increase the speed of the network in some areas without forcing you to install high speed networking everywhere.
Third, you can begin preparing your people for changes that will undoubtedly come with new technology. Tell your employees that computer technology is coming fast. (They are probably already convinced of this.) Invest in training for your employees. Talk with them about the importance of these changes to them and to you. People are the key to implementing new technology successfully. Proper preparation of personnel is one of the best investments you can make in a new technology.
Fourth, look for places you can make use of existing, slower speed networking technology. At Turner, we have developed a system that runs on our existing 10BaseT
network. It makes video and audio available to the
desktop without replacing or changing a thing in our existing infrastructure. I would like to show it to you now
Recap-
Today I have presented three topics. • What is different about video • The importance of interoperability • What you can do now
Summary-
This story highlights some of the hazards of working with technology that moves faster than you do.
This is the tale of a poor soul who evidently got hold of a surplus JATO (Jet Assisted Take Off) unit. Being the enterprising and adventurous type, he attached it to his 1967 Chevy Impala, drove out to a deserted stretch of road in Arizona, pointed the car down the highway, and hit the ignition.
The authorities take it from there... "the JATO unit reached maximum thrust within about 5 seconds, causing the Chevy to reach speeds in excess of 350 mph, and continuing at full power for an additional 20-25 seconds." "The driver, soon to be pilot, most likely would have experienced G-forces usually reserved for dog-fighting F-14 jocks under full afterburners, basically causing him to become insignificant for the remainder of the event..."
After continuing on the straight highway for about 2.5 miles, the automobile became "airborne for an additional 1.4 miles before it impacted a cliff face at a height of 125 feet leaving a blackened crater 3 feet deep in the rock."
Sometimes I feel like the guy in this story. When it comes to video networking, we are strapping on a JATO unit, hitting the ignition and hanging on for dear life. Things are moving fast, and they are going to move faster.
The key is to not become "insignificant for the remainder
of the event". By talking with vendors and explaining your needs, and by realizing that people are the key behind any new technology, you can fly into the future while avoiding the cliffs.
253
DVDS BROADCAST PC
Mel Gable lndigita Corporation Irvine, California
ABSTRACT
The combined power of the personal computer connected to a direct broadcast satellite (DBS)
system or DSS receiver will allow consumers to receive on PCs digital video programming and a variety of new entertainment, multimedia and interactive data services. One key advantage will be the speed at which information and files can be downloaded - over a thousand times faster than today's standard modem connections. Users will be able to select program offerings they wish to view. The selected information will be transmitted at scheduled intervals and can be stored locally on a Digital Video Data Storage (DVDS) tape drive.
NEW ERA FOR DIGITAL STORAGE
Currently VCRs can record only analog video such as NTSC, PAL and SECAM formats. This was acceptable when digital video transmission, and the need to store it was uncommon. However, analog VCRs cannot satisfy the storage requirements that have emerged in the digital consumer marketplace.
While analog VCRs are inexpensive and useful for simple functions, they are too large and single purposed. Rather than using a standard interface with a well-designed user interface for easy programming, VCRs lack a standard design and have complex
programming interfaces. In addition, VCRs duplicate functionality that is already present in other devices, such as display, tuner, buttons and remotes.
The consumer electronics industry is moving forward on digital videocassette and player standards that show all the signs of neglecting the PC market
and failing to accommodate PC requirements. It appears that the new digital VCRs are simply digital forms of current analog VCRs, and among other things are designed to be video data specific
recording devices. The digital video stream formats that they store may not be universal and probably will not have any useful file structure.
Digital tape storage will be required to replace existing VHS analog cassette tapes. By building
upon existing tape backup technology, new devices can be developed which can meet the recording requirements for both interactive multimedia as well as digital video broadcasts.
By redirecting the purpose of the technology and rethinking existing storage norms, the future of storage in the consumer electronics and PC industries can be merged into one standard. As the need to store similar types of information converges in the two industries, a common mainstream storage device will emerge that satisfies the requirements for a standard interface that can be used in the PC/TV convergence marketplace.
TAPE STORAGE MEDIA
While we currently use tape as an analog video recording device in the home, or as a digital backup medium for computers, these two areas will rapidly converge as the computer transforms the home
theater entertainment system. Home users will want to store high quality digital video in its native MPEG format rather than record it in a lower quality analog form. No other media will meet the need for digital storage at the price-to-performance ratio of tape. While optical storage promises to provide the
necessary transfer rates for digital video, it will not
254

meet the capacity or price requirements for a number of years. Optical drive manufacturers are promising to demonstrate and ship 2.6 gigabyte drives this year. This capacity is about half the storage space required for handling a full-length movie broadcast in MPEG2 format. The advantage that optical storage provides is fast random access time for data, which is less important in the recording and playback of digital video. Although tape access times are relatively slow, tape can be used very effectively in
applications where streaming data such as digital video and audio is important. In addition, tape can function as data store for PCs connected to broadband networks. Tape is the only medium that promises to initially provide truly high-capacity digital storage with low-cost removable medium.
The widespread transmission of digital video will accelerate the need for high-capacity, low-cost
removable storage. It is likely that high-capacity fast transfer rate tape drives will quickly become
mainstream PC/TV storage. Consumers will use these new digital storage devices to store both digital video and multimedia interactive data.
DVDS TAPE DEVELOPMENT
Recent developments in both hardware and software have lead to the possibility for an inexpensive digital tape system for video recording and playback based upon the established 4mm Digital Audio Tape (DAT) technology. In mid-1995 an exciting new product development for Digital Video Data Storage (DVDS) was undertaken by Mitsumi Ltd. and Indigita Corporation. The combined resources and expertise of these two companies were set in motion to produce an improved low-cost, high performance 4mm tape drive to address the requirements of both the computer multimedia storage market and the emerging PC/TV convergence market.
As one of the world's leading suppliers of low-cost, high volume CD-ROM and floppy disk drives, Mitsumi has engineered a 4mm tape mechanism shown in Figure 1 targeted at these new market requirements. Utilizing its experienced engineering talent and know-how, Indigita has developed firmware and customized integrated circuit controller
technology to create a cost-effective DVDS tape drive solution to address the new market requirements for the digital information era.
Channel Amplifier
Mode Motor
Drum and Heads
Capstan
FEATURES: Auto Tape Recognition Time Tracking Servo Auto Head Cleaning Auto Load/Eject LED status indicators
Figure 1. DVDS Tape Mechanism
Digital Audio Tape (DAT) was initially developed for recording and playback of digitized audio signals, utilizing a 4mm tape cartridge. It maintains signal quality equal to that of a CD and, although not
embraced by the amateur audiophile, has become an accepted standard in the professional recording industry. With some modifications to the audio format, manufacturers such as Hewlett Packard and Sony developed a standard for storing digital data on DAT. This format known as DDS (digital data storage) has become an accepted media for data backup storage in midsize computer systems. Industry sources estimate that about 1 million units of DDS drives were sold in 1996.
MARKETPLACE REQUIREMENTS
The tape drive design must meet certain marketplace requirements to serve the consumer and PC storage applications. The drive cost should be under $500 to be competitive with other consumer electronics components. The form factor should be ideally suitable for internal mounting in a half-height 3.5 inch drive bay or mounted in an external enclosure smaller than today's VCRs. The drive must provide ejection notification to software and also provide software controlled ejection. The drive must also include asynchronous media insertion notification to
255

software. The mechanism has to accurately seek an arbitrary tape location in a high-speed search mode of operation. It must be able to update-in-place and be able to overwrite existing data. The drive should also be able to append data to the tape. For real-time recording of broadcasts, the drive should provide immediate error detection when writing data to the medium.
Product Life: Average Usage Model of 5 Years Max. Tape Pull 2 hours per day Cartridge Loads 1 per day Operating Cycle 5 days per week
50 weeks per year for 5 years
Mechanism Start/Stop Reposition Load /Eject Motors Heads
Requirements 100,000 cycles 1,000,000 cycles 5,000 cycles >2,500 hours >2,500 hours
Product Specifications 200,000 cycles 2,000,000 cycles 15,000 cycles 4,000 hours 4,000 hours
Table 1. Product Life Model and Specifications
The mechanism life requirements were determined by a usage model for the typical application of recording broadcast digital information. It was anticipated that the user would typically need a greater than 2:1 ratio in read-to-write operations. This is significantly different from the personal computer backup tape usage which is less than 1:1 for read-to-write operations. The requirements and final specifications for the mechanism using a five year life model are shown in Table 1.
TAPE CARTRIDGE
DVDS utilizes 4mm tape cartridges, which is one of the most economical and convenient solutions for storing large amounts of data. The DVDS format can achieve a cost of less than $2 per gigabyte for recording on the removable medium. The cartridge shown in Figure 2 has hub covers, and is completely
enclosed when removed from the mechanism to protect the tape from contamination. The small form factor of the cartridge makes it ideal for use in PC systems versus the traditional VHS tape cartridge. The low-power consumption of the
DVDS drive, as well as the small form-factor of the cartridge, allow it to be easily integrated into set-top boxes, IRDs, and PC/TV entertainment systems.
Tape Recognition Holes Erasure Protection
Alee ks * O .O . me m
R a m am.
•••••• •••••••••• leg megmei
11)•••• .• . 61
a
1R.I. 12I• 1.10 Nob 4••••••••••11•1
Figure 2. DVDS Tape Cartridge
4.1
Amo ry/. Sin I. 4
M b %Ms - - S e,
IRVIN .• III
••••••• - •••011•0•1 .1. dummy p.m* • lx••••••
Cartridge: 54 x 73 x 10.5 mm
This application requires a removable, write-protect cartridge design that is durable. The 3.5 inch form factor of the drive requires that the tape cartridge is smaller than today's VHS tape. Movies are typically recorded at an average MPEG2 data rate of 5 megabits per second which establishes the minimum storage capacity of 5 gigabytes on the cartridge. Typically, movies broadcast over DSS have a transmission rate of 6 megabits per second for Pay-per-View movies. A new 4mm recording format was needed to achieve a data cartridge capacity greater than 6 gigabytes on a 120 meter tape.
DVDS FORMAT
The DVDS tape format was designed to increase the storage capacity and transfer capabilities over that of the DDS standard, while using a standard 4mm tape cartridge. The DVDS technology can store 160% more data on a cartridge, and is 150% faster than DDS formats recorded on the same media. The DVDS Standard Definition (SD) format can record over 2 hours of MPEG2 broadcast quality video at greater than 6 Mbps on a 120 meter tape cartridge.
DVDS uses a helical scan recording technology to write data tracks and subcode groups on the tape at approximately a 6 degree angle to the tape edge as shown in Figure 3. The track pitch on the tape is 9.05 microns which is necessary to achieve the recording
256

capacity requirements of over 6 gigabytes per tape cartridge. The subcode field on each of the tracks is used to store filemarks, setmarks, and video time-stamp information. These fields in the subcode can be read during high-speed search. This capability is required in supporting fast-forward and file indexing into program material stored on the tape.
Track Format MPEG Transport Packets
ilarcvn 'Nab( od Packet Packet Packet FCC irgin
Track Pattern Tape Motion 163 mm/sec
Positive & Negative Azimuth Tracks
Figure 3. DVDS Tape Track Format
'''' .... 9.05 urn Pitch ..
6 degree Track Angle
One of the advantages of helical scan technology is the ability of a DVDS drive to read subcodes in a search mode of 200x its normal tape speed. The typical record and playback speed of the tape is 16.3 mm per second, which is twice the DAT recording rate. The drum operates at 6000 RPM (3x DAT) and allows the drive to record 200 tracks per second.
DATA RECORDING RELIABLITY
Unlike current analog VCRs, where losing some information simply results in display of noise or static upon playback, with digital recording and data storage every bit of information is important. Loss of a single bit can result in the loss of the data file and can easily disrupt MPEG2 video decompression during playback of the stream.
With rapid real-time transmission of huge video and data streams over high bandwidth networks and satellite systems, the drive must work together with the file system to assure that the original information can be read back without error.
Two methods are often used to assure data reliability on tape storage devices. Error detection codes (EDC) and error correction codes (ECC) can be used as algorithms to detect and correct errors on the recorded medium. These algorithms are typically used in combination with read-after-write technology
to guarantee data reliability. Read-after-write is normally used in higher end backup drives. Lower end backup drives reread the written records to assure data integrity after an entire data set has been recorded. Completely rereading a tape is not a viable storage solution for broadcast digital video and data services. In most cases, the original data may be coming off a live feed and probably will not be available for later comparison. If an extremely low error rate can be guaranteed through both error detection and correction, then this may be sufficient to satisfy the application requirements and read-after-write could be removed in order to lower the cost of the drive.
DVDS ERROR CORRECTION
Digital information, including MPEG transport packets are recorded on the tape in groups of 44 tracks with an appended set of ECC C3 tracks written in each group for error correction capability of the data group.
10-10
Corrected Error Rate
10-20
10-30
10-40
1 Symbol per year
DVDS 1 Symbol per 10,000 years
ECC Cl+C2+C3
ECC Cl+C2
Typical Error Rate
10-3 10-4
Uncorrected Bit Error Rate 10-5
Figure 4. Corrected Error Rate with Cl, C2 & C3 Codes
The DVDS technology utilizes three levels of Reed -Solomon error correction which provides for extremely low error rate during playback as shown in Figure 4. The error correction is done in real-time to ensure the data integrity of the MPEG recorded video while maintaining the high transfer rate necessary to not disrupt the digital video decoding process. A two symbol interleave of the first level of ECC is used to correct symbol errors within a block.
257
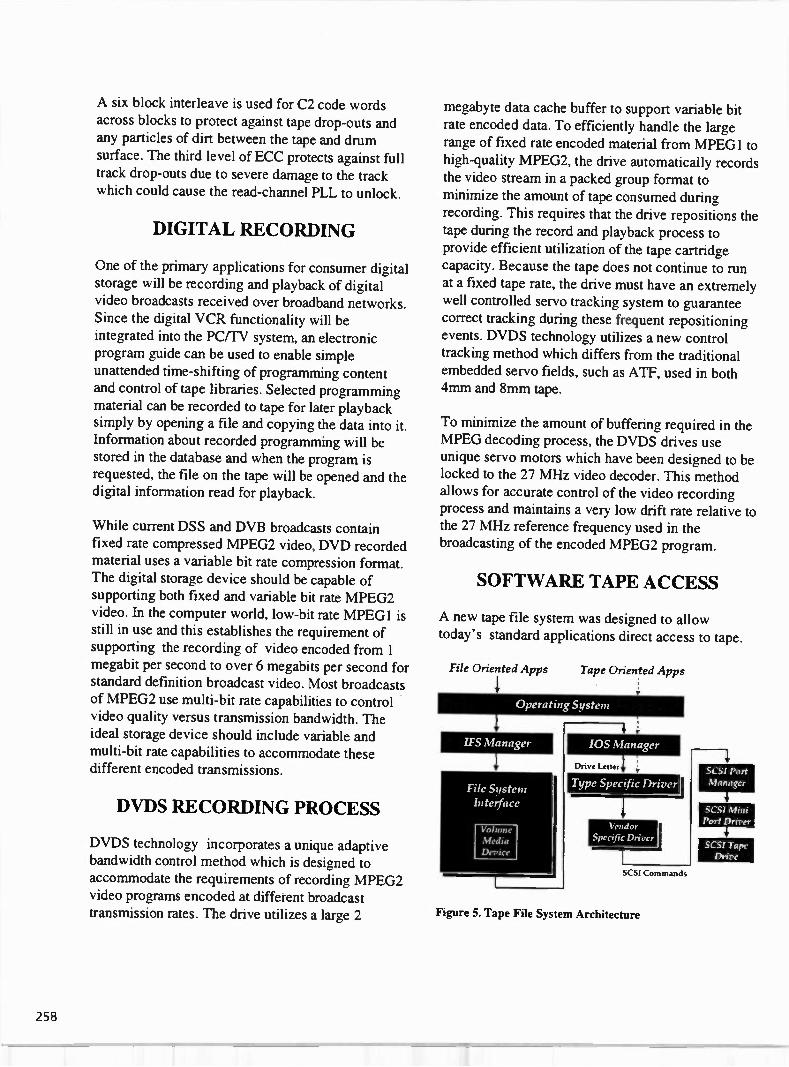
A six block interleave is used for C2 code words across blocks to protect against tape drop-outs and any particles of dirt between the tape and drum surface. The third level of ECC protects against full track drop-outs due to severe damage to the track
which could cause the read-channel PLL to unlock.
DIGITAL RECORDING
One of the primary applications for consumer digital storage will be recording and playback of digital video broadcasts received over broadband networks. Since the digital VCR functionality will be
integrated into the PC/TV system, an electronic program guide can be used to enable simple unattended time-shifting of programming content and control of tape libraries. Selected programming
material can be recorded to tape for later playback simply by opening a file and copying the data into it. Information about recorded programming will be stored in the database and when the program is requested, the file on the tape will be opened and the digital information read for playback.
While current DSS and DVB broadcasts contain
fixed rate compressed MPEG2 video, DVD recorded material uses a variable bit rate compression format. The digital storage device should be capable of
supporting both fixed and variable bit rate MPEG2 video. In the computer world, low-bit rate MPEG1 is still in use and this establishes the requirement of supporting the recording of video encoded from I megabit per second to over 6 megabits per second for standard definition broadcast video. Most broadcasts of MPEG2 use multi-bit rate capabilities to control video quality versus transmission bandwidth. The ideal storage device should include variable and multi-bit rate capabilities to accommodate these different encoded transmissions.
DVDS RECORDING PROCESS
DVDS technology incorporates a unique adaptive bandwidth control method which is designed to accommodate the requirements of recording MPEG2 video programs encoded at different broadcast transmission rates. The drive utilizes a large 2
megabyte data cache buffer to support variable bit rate encoded data. To efficiently handle the large
range of fixed rate encoded material from MPEG I to high-quality MPEG2, the drive automatically records the video stream in a packed group format to minimize the amount of tape consumed during
recording. This requires that the drive repositions the tape during the record and playback process to provide efficient utilization of the tape cartridge capacity. Because the tape does not continue to run at a fixed tape rate, the drive must have an extremely well controlled servo tracking system to guarantee correct tracking during these frequent repositioning events. DVDS technology utilizes a new control tracking method which differs from the traditional embedded servo fields, such as ATF, used in both 4mm and 8mm tape.
To minimize the amount of buffering required in the MPEG decoding process, the DVDS drives use unique servo motors which have been designed to be locked to the 27 MHz video decoder. This method allows for accurate control of the video recording process and maintains a very low drift rate relative to the 27 MHz reference frequency used in the broadcasting of the encoded MPEG2 program.
SOFTWARE TAPE ACCESS
A new tape file system was designed to allow
today's standard applications direct access to tape.
File Oriented Apps Tape Oriented Apps
Operating System
IFS Manager
File System Interface
Volume Media Device
Drive Letter
Type Specific Driver
Vendor
Specific nriocr
SCSI Commands
Figure 5. Tape File System Architecture
SCSI Port Manager
SCSI Mini Port Driver
SCSI Tape Drive
258

Tape backup applications typically use special application programming interface (API) calls to be able to read and write tape in a sequential access mode. The tape file system permits standard file access to the DVDS drive through file open and close commands, as well as random block read access. The architecture of the file system is shown in Figure 5.
TAPE POSITION MARKERS
Traditional methods of accessing tape for backup applications requires the use of tape markers called filemarks or setmarks. The area on a partition between setmarks or filemarks is available for recording data and digital video. The unit of data written to, or read from, a tape is a block. The tape file system works in conjunction with these tape markers to allow access to files stored on the medium. A tape volume consists of a recording medium and its physical cartridge. The entire length of tape in a volume is not available for recording data. A short section at the beginning of the tape is used to store format and system log data information used by the drive. The first position on the tape where data can be stored is marked as the logical beginning-of-tape (LBOT) and starts at Group 1. The last position on the tape cartridge uses a end-of-tape marker called EOT. The last recorded data on the tape is marked with an end-of-data marker (EOD).
Every tape volume can have one or more partitions. A partition is a portion of the volume with its own beginning and ending points that do not overlap any other portion of the volume. Each partition has three predefined positions. The first position in the partition in which data can be recorded, is the beginning-of-partition marker and the last is the end-of-partition marker. The early warning position is located immediately before the end-of-partition marker. The early warning position notifies the tape application to finish transferring buffered data to the tape before reaching the end-of-partition marker.
The area between a partition's beginning and ending points is typically divided into sections by filemarks or setmarks. The filemarks and setmarks are recorded as elements that do not contain user data.
They simply divide the partition into smaller areas to
provide a scheme for indexing to addresses on tape. Setmarks are used to provide faster positioning to data on a high-capacity tape drive.
Partition 0
Partition 1
Catalog X
EOD / EOP
EOD: End of Data EOP: End of Partition EOM: End of Media EOT: End of Tape
Head Catalog
Data Session 1
Catalog 1
Data Session N
Catalog N
EOD/ EOP/E0M/EOT
Figure 6. DVDS Data Session and Tape Markers
The DVDS tape devices support both filemarks and setmarks. This enables the tape to be formatted such that setmarks separate data from different recording sessions on the tape volume and filemarks separate data from individual files on a disk volume as shown in Figure 6.
The use of setmarks is also used to mark directory information which may be stored in each of the recording sessions. This allows for fast access to directory information which can be obtained by locating it in a high-speed catalog search for the directory information contained on a tape volume. This catalog information is accumulated into the total tape volume directory which later becomes cached in the system.
The benefits of using such a directory structure allows multimedia content pages (HTML) which reference image, audio and video information to store those pages on DVDS tape. Since each of these references are stored in files with appropriate name paths, standard applications can be used to access the information stored on a DVDS tape volume.
Utilizing partitioning and markers allows DVDS tape to be used in applications such as file managers, web browser software and multimedia player applications
259
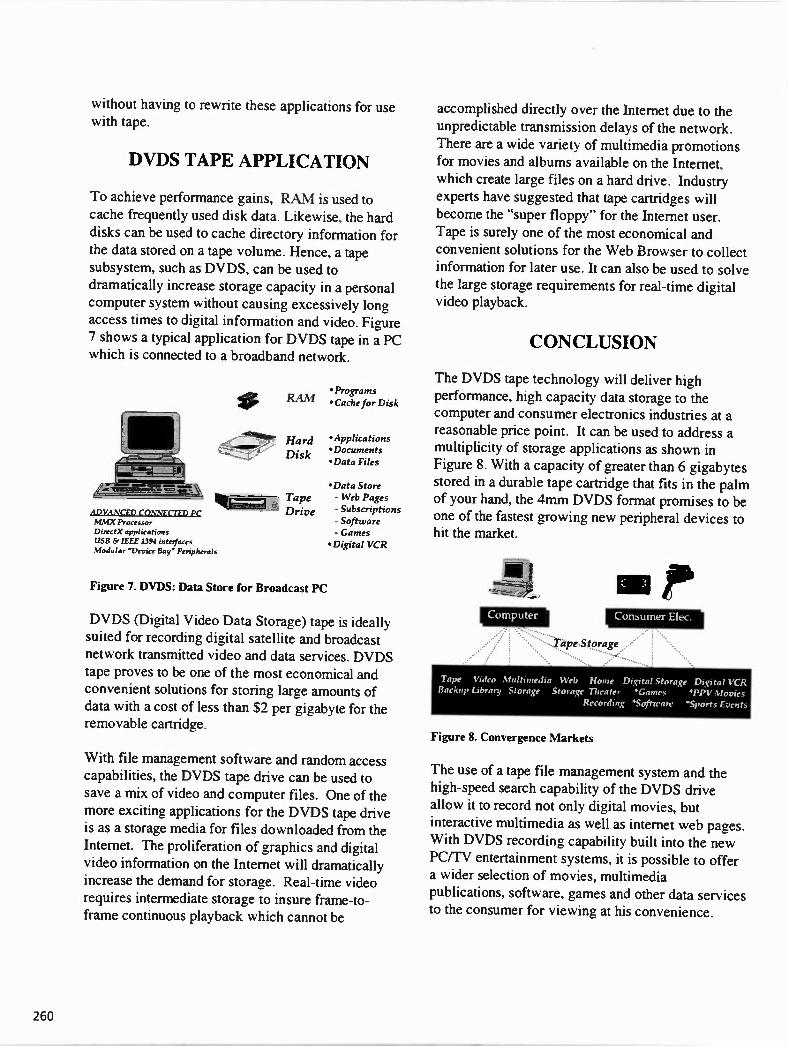
without having to rewrite these applications for use with tape.
DVDS TAPE APPLICATION
To achieve performance gains, RAM is used to cache frequently used disk data. Likewise, the hard disks can be used to cache directory information for the data stored on a tape volume. Hence, a tape subsystem, such as DVDS, can be used to dramatically increase storage capacity in a personal computer system without causing excessively long access times to digital information and video. Figure 7 shows a typical application for DVDS tape in a PC which is connected to a broadband network.
ADVANCED CONNYTTIll Pr M MX Processor DirectX applications EBB & IEEE 1394 interfaces Modular "Device Bay" Peripherals
• RAM
Hard Disk
Tapvee
Figure 7. DVDS: Data Store for Broadcast PC
• Programs • Cache for Disk
*Applications •Documents 'Data Files
*Data Store - Web Pages - Subscriptions - Software - Games •Digital VCR
DVDS (Digital Video Data Storage) tape is ideally suited for recording digital satellite and broadcast network transmitted video and data services. DVDS tape proves to be one of the most economical and convenient solutions for storing large amounts of data with a cost of less than $2 per gigabyte for the removable cartridge.
With file management software and random access capabilities, the DVDS tape drive can be used to save a mix of video and computer files. One of the more exciting applications for the DVDS tape drive is as a storage media for files downloaded from the Internet. The proliferation of graphics and digital
video information on the Internet will dramatically increase the demand for storage. Real-time video requires intermediate storage to insure frame-to-frame continuous playback which cannot be
accomplished directly over the Internet due to the unpredictable transmission delays of the network. There are a wide variety of multimedia promotions for movies and albums available on the Internet, which create large files on a hard drive. Industry experts have suggested that tape cartridges will become the "super floppy" for the Internet user. Tape is surely one of the most economical and convenient solutions for the Web Browser to collect
information for later use. It can also be used to solve the large storage requirements for real-time digital video playback.
CONCLUSION
The DVDS tape technology will deliver high performance, high capacity data storage to the computer and consumer electronics industries at a reasonable price point. It can be used to address a multiplicity of storage applications as shown in
Figure 8. With a capacity of greater than 6 gigabytes stored in a durable tape cartridge that fits in the palm of your hand, the 4inm DVDS format promises to be one of the fastest growing new peripheral devices to hit the market.
Computer Con umer Elec.
Tape Storage
Tape Video Multimedia Web Home Digital Storage Digital VCR liackup Library Storage Storage Theater 'Games •PPV Movies
Recording *Software 'Sports Events
Figure 8. Convergence Markets
The use of a tape file management system and the high-speed search capability of the DVDS drive allow it to record not only digital movies, but interactive multimedia as well as internet web pages. With DVDS recording capability built into the new PC/TV entertainment systems, it is possible to offer a wider selection of movies, multimedia publications, software, games and other data services to the consumer for viewing at his convenience.
260

DESIGNING TELEVISION FACILITIES: PART I Tuesday, April 8, 1997 9:00 am - 12:00 pm
Chairperson: Harvey Arnold, Center for Public Television - University of North Carolina, Research Triangle Park, NC
TUBE VERSUS SOLID STATE AMPLIFIERS Stephan Van Fleteren CPI Palo Alto, CA
USING A T1 SUBCARRIER ON A VIDEO MICROWAVE SYSTEM Robert L. Band Intraplex, Inc. Westford, MA
DESIGNING THE DIGITAL TELEVISION STATION OF THE FUTURE Shannon L. Skemp Advanced Television Technology Center Alexandria, VA
IMPLEMENTING DIGITAL TELEVISION - WRAL CASE STUDY David C. Danielsons Harris Corporation Quincy, IL
*CONVERTING FROM ANALOG TO DIGITAL VIDEO STLS David Glidden Microwave Radio Communications Chelmsford, MA
NO FAILURE TO COMMUNICATE DeWayne Gray M&C Systems Plano, TX
•Paper not available at the time of publication
26'

262

TUBE VERSUS SOLID STATE AMPLIFIERS
by Stephan Van Fleteren Communications & Power Industries
Palo Alto, California
ABSTRACT
A great deal has been written about the relative merits of tube based versus solid state based amplifiers, usually by authors who have a vested interest in one or the other technology. CPI now offers a complete state of the art product line using both technologies and has undertaken an effort to understand the performance differences between the two technologies in order to inform their customers which approach is best suited to their needs. This paper was written to address some of those issues.
04
60
VZC41027411 (707W ChIPA)
nsc.-300
58 -""
...-SSCI-21.0
56
WC-49244A (40:IW CMPA) ..---SSCI-200
4-
ssci-iso
54 /' ssci.ico
_V70410:15413 (20WV LPA) ' SSC‘12S
—4D — /2C-698212S (1 25W P .4) CPI TVVTA C-band Product Line
''' "Ar - CPI SSPA C-band Product Line 52 /
50
ssciao g VZC421111110 (7SW LPA)
Figure 1
Ill i I
0 500 1000 1500 2000 2500 3000 3500
Maximum Prime Power Consumption at Rated Power (VV)
Figure 1
There are several amplifier performance parameters which are important to a system designer. One of the most important is linearity. When specifying linearity two tone third order intermodulation measurements are usually taken
because the measurement is simple using readily available microwave equipment (noise power ratio and multitone tests are also a measure of linearity, but require specialized equipment). This parameter is usually specified as a minimum level in dBc at a given total output power for both tones. For comparison purposes two CPI amplifiers were chosen which have nearly identical performance characteristics. The VZC-6964A4 is a compact medium power TWT amplifier. The SSCI-200 is a CPI solid state power amplifier. Both operate at C-band (5.9 to 6.4 GHz)
but are representative of the entire CPI product line in both C-band and Ku-bands.
Tube amplifiers have twice the power added efficiency than SSPAs. Tube amplifiers have about 50 to 60% efficiency and SSPAs have 25 to 30%. The effects of this can be seen in the prime power consumed versus output intercept point. Output intercept point (01P3) is a figure of merit and is equal to the total output power of two tones when the third order intermodulation products are down 0 dBc. This effect can never be seen because the amplifier saturates before it is reached but it can be calculated from the intermodulation distortion levels when the amplifier is operating in its linear range. Figure 1 shows the results of plotting 01P, versus total prime power consumption. Notice that the TWTAs have typically higher linearity (higher 01133) than the SSPAs. This is an effect of their higher efficiency. When the 01P, falls below 56 dBm there really is no great difference between the two types of amplifiers. The reader will notice there is a slight difference between
the two amplifiers chosen for this comparison, however the differences are not significant The conclusion here is that for a given intermodulation requirement a tube amplifier above 56 dBm OLP, will consume less prime power than an
4000
263

equivalent SSPA. Below OIP,s of 56 dBm both amplifier types will consume about the same prime power. Figure 2 shows a comparison between the TWTA and the SSPA
Output Power (dBm)
SSPA Input Power (dBm) -43.5 -38.5 -33.5 -28.5 -23.5 -18.5 58
56
54
52
50
48
46
44
42
40
38
36
34
32
-13.5
1 dB gain compression point. In this case the SSPA is specified at 53 dBm or 200 W. SSPAs are typically operated below the P1,3. Because of this difference in the naming
convention for rated power for the two types of amplifiers the Satcom systems
-8.5 -3.5 engineer cannot specify linearity at a • _TWTA Rated Power = Minimum PSAT
SSPA Rated Power = Typical Pia
Measured SSPA Transfer Curve
Measured TWTA Transfer Curve
Linear Response
Figure 2
-50 -45 -40 -35 -30 -25
TWTA Input Power (dBm)
Figure 2
transfer curves for the amplifiers chosen which have the same linearity. What the transfer curves show is that both amplifiers have the same output power 1 dB gain compression point which is what was expected for two amplifiers with the same linearity. The point marked P,,„ shows both transfer curves deviating from the constant gain line by one dB at the point where the output power is 53 dBm. However, the similarity ends there. The SSPA transfer curve bends 5 - over sharply after the 1 dB compression point whereas the TWTA output power continues to rise saturating at about 56 dBm. This has been a source of some confusion to users of power amplifiers in the past. How is it that two amplifiers with the same intennodulation linearity can be rated as a 400 W TWTA and a 200 W SSPA? The answer is tradition as determined by the marketplace. Traditionally TWTAs have been used for FM applications where they have been operated in saturation thus the TWTA amplifier in this case which has a saturation output power of 56 dBm minimum is called a 400 W amplifier. In the SSPA case the naming convention is to use the typical output power at the
-20 -15 -10
specified output back off alone to determine the amplifier to use. To do so would result in comparing distortion of the TWTA at an output power 3 dB higher than the SSPA. He must also specify the absolute output power requirement at a given intemiodulation distortion level, or the OIP,, in order to
come up with the correct answer; which is that these are equivalent amplifiers. Before we leave Figure 2 it is also important to note that the SSPA has 3 dB
less "bum through" reserve for high path loss situations such as rain fade than the TWTA.
Figure 3 shows clearly that both amplifiers exhibit the same linearity. A theoretical line through the data with a slope of 2:1 intersects the x-axis (IM, =
0 dBc) at 59 dBm output power. This is the 01P, for both of the amplifiers. With this number and the known relationship between the fundamental signal slope and the intermodulation slope the designer can estimate the 1M, levels at any output power level up to 55 dBm for the TWTA
Two Tone Third Order IntermoduletIon Level (-dBe
0
10
15
20
25
30
35
40
45
50
55
60
Measured TWTA Third Order Intermodulation Levels
— Measured SSPA Third Order Intermodulation Levels
— Theoretical Response: 1M3 (dBc) = 2 x (01P3 - )
01P3
31 29
IFigure 3 I-33 35 37 39 41 43 45 47 49
Output Power Level of Each Tone (dBm)
Figure 3
51 53 55 57 59
264

and about 51 dBm for the SSPA.
Figure 4 is a plot of the final measure of linearity of the two types of amplifiers. AM to PM in dimensions of O/dB for the SSPA are slightly better than the TWTA up to about 50 dBm output power and then the TWTA is slightly better. As was the case for AM/AM earlier the TWTA characteristics hold for power levels above 53 dBm where the SSPA 2
amplifier saturates. With predistortion linearization used in either amplifier the 1 AM to PM characteristics can be improved.
Reliability is also a major concern for users of power amplifiers. The largest study performed on the relative MTBF's for the two types of amplifiers has been done on amplifiers used in all the Intelsat satellites. The failure rate of the SSPA population was higher than the TWTA amplifier population by about 15%'. Therefore the user should consider similar sparing philosophies for amplifiers when developing maintenance plans for Satcom systems.
AM to PM r/d8)
-1
-2
-3
-4
-5
- 41
•
.
b.
Ve l m O VINTIurepern
d A
I A
lf c'tStrawo4
aot, l a
‘INla v t,
4
I
!
• -
I 4
I Y a
- Figure 4
34 36 38
Cost is the fmal consideration. A good rule of thumb is that for amplifiers with the same linearity or intermodulation
distortion characteristics (the 01P,s are the same) SSPAs will be more cost effective below 57 dBm 01P, for C-band rack mount and 56 dBm 01P, for C-band hub mount. The numbers are 50 dBm for Ku-band rack mount and 46 dBm for hub mount. These tradeoff points are also valid for the size and weight of the amplifiers with TWTAs having the advantage at higher powers because of their higher power added efficiencies.
1 Strauss, Robert, "Reliability of SSPAs and TWTAs", IEEE Transactions on Electronic Devices, Volume 41, Number 4, April 1994.
40 42 44 46 48 50 52 54 56 58 60
Output Power (dBm)
Figure 5
265

Using a T1 Subcarrier on a Video Microwave System
Robert L. Band Intraplex, Inc.
Westford, Massachusetts
Abstract
This presentation describes how to maximize the efficiency of video microwave systems using a T I subcarrier.
Microwave radio systems carrying television signals use only a portion of the available baseband to carry the video signal itself. Audio, voice, and data channels can be inserted as subcarriers above the video signal. However, there are some practical limitations on the number of subcarriers a video microwave system can support. Combining multiple audio, voice and data applications into a single Ti subcarrier provides the ability to carry more traffic while eliminating the interference that could otherwise occur between separate subcarriers.
Overview
Competition for expensive and tightly allocated frequencies has driven microwave operators to find more efficient ways of using the available spectrum.
Analog microwave radio systems carrying television or other video signals use only a portion of the available baseband to carry the video signal itself. The remaining bandwidth offers a significant economic resource for the microwave user. This is especially true for existing installations, and for new installations where the video application provides the cost justification for the microwave equipment. Audio, voice, and data channels can be inserted as subcarriers above the video signal, taking advantage of what is effectively "free" transmission capacity on the microwave network.
Figure 1: Bandwidth Usage of Video Signal with Individual Subcarriers
+10 -
0
- 1 0 —
-20 —
-30 —
-40 —
Signal Level (dB)
Video Signal
Individual Subcarriers
A
3 5
Frequency (MHz)
7 9
266

Getting the most out of this excess bandwidth is the key to efficient system design. However, there are some practical limitations on the number of subcarriers a video microwave system can support.
For example, prudent microwave network design requires spacing individual subcarriers some distance apart within the overall carrier bandwidth, to insure that signals do not overlap and interfere with each other. This is inherently inefficient, since it uses up some bandwidth just to provide separation (see Figure 1).
Also, subcarriers must be kept well within the limits of the assigned channel bandwidth to prevent their outer lobes from creating unacceptable signal levels at the
fringes of the channel allocation.
And even with proper spacing, too many separate subcarriers may cause the radio front end to accentuate its non-linearities, creating intermodulation and other distortions. A typical video microwave system should contain no more than three 15 kHz audio subcarriers to minimize the risk of causing distortion.
On top of all this, if each individual subcarrier channel requires its own modulator and demodulator, the system cost increases quickly.
Digital Ti Multiplexing
Ti digital multiplexers work to maximize the
efficiency of video microwave systems by combining multiple audio, voice and data applications into a single T1 subcarrier.
With a QPSK modem, the T1 subcarrier requires an analog bandwidth of only about 800 kHz (see Figure 2).
This provides several advantages to video microwave
system designers:
• No individual subcarriers means no bandwidth wasted to separate them.
• The possibility of interference between subcarriers is completely eliminated.
• Each microwave link can carry more payload. A single T1 subcarrier may contain a dozen 15 kHz program audio channels, or an extensive combination of audio channels with voice (telephone) and data channels.
• Regardless of its contents, the Ti signal requires only one modulator and demodulator.
Implementing The System
A Ti multiplexer combines analog applications (such as program audio and voice) with computer data applications, and converts them into a single 1.5 Mbps
digital bitstream.
Figure 2: Bandwidth Usage of Video Signal with Single Ti Subcarrier
+10 -
0
-10 —
-20 t
-30--
-40 t
Signal Level (dB)
Video Signal
Ti Subcarrier
3 5
Frequency (MHz)
7 9
267

In Conclusion
To transmit this signal over an analog microwave link, the digital output of the multiplexer is converted to analog by a Ti modem, which modulates the Ti onto the appropriate subcarrier frequency (see Figure 3).
By combining multiple subcarriers into a single Ti, broadcasters can achieve improvements in the audio quality, reliability, and carrying capacity of their video microwave link, without affecting their video signal in any way.
268

Designing the Digital Television Station of the Future
Shannon L. Skemp and David Horowitz Advanced Television Technology Center
Alexandria, Virginia http://www.attc.org
ABSTRACT
The Federal Communications Commission (FCC) passed the digital television (DTV) standard on December 24, 1996. This paper is a discussion of the technical issues involved with implementing DTV in television stations across the country. It is designed to assist both station owners and equipment manufacturers with their questions concerning the conversion to this new technology.
THE DIGITAL TELEVISION CONVERSION
One of the foremost concerns of television station owners across the country is how to implement the conversion to digital television (DTV) now that the standard has been adopted. The new
world of DTV brings with it a vast array of uncharted territory in the areas of application and interconnection. In order to provide assistance to station owners, the Advanced Television Technology Center (ATTC) is currently working to address these new challenges.
The ATTC is a private, non-profit, state-of-the-art, multi-functional facility that performs Digital Television (DTV) testing and certification. The ATTC supports the needs of our members with regard to issues involving the FCC, the U.S. television industry, and private standards-setting bodies. The ATTC is dedicated to helping the industry as a whole to forward the implementation of the digital television standard.
DTV STATION MODELS
The DTV Station Models project is designed to assist station owners in planning their conversion
MODELI BASIC NET
PASS—THROUGH
MODEL 2 NET PASS
W/ AUDIO C
MODEL 3 NET PASS w/ LOCAL A/v 10
MODEL 3A NET PASS W/
(11-9°C.441.4)Ar is RC%) )
MODEL 4 NET PASS At BASIC LOCAL ORIGINATION
MODEL 4A NET PASS & BASIC LOCAL ORIGNATION
(19.4 W A RCD)
MODEL a MULTIPLE SERVICES SDTv
—10 MODEL 5 NET PASS LOCAL ORIG & EDIT
MODEL 9 VIDEO ON
DEMAND
Figure 1. DTV Station Models Hierarchy
MODEL 6 NET PASS. LOCAL PROD. OR & EDIT
MODEL 10 DATA
SERVICES
MODEL 7 RILL HDTV SERVICE INCL NEWS
269

to DTV. In order for the station owners to better understand the technical and monetary requirements they will be facing, a series of designs have been developed as illustrated in Figure 1. These designs range from a basic "pass-through" station to a fully operational HDTV station, including editing and production. In addition to current television applications, we are continuing to explore the full realm of additional data services that will be available with DTV.
In the following sections, Models 1 through 6 will be discussed in detail with respect to their functionality and design. Models 7 through 10 will be discussed in a future paper. The specifications, interface requirements and functional descriptions for each of the components within these models are still being determined, and a majority of the equipment has not yet been developed. In order to depict the components which are either undeveloped or are in the early development stage, each representative block for this equipment is annotated by a square in the upper right hand corner. For further reference, a preliminary equipment availability list is represented in Table 1 at the end of the paper. Due to the very nature of the emerging technology of HDTV, the scope of the Station Models Project continues to grow as new applications and prototype equipment are developed.
PASS-THROUGH STATION
Figure 2 illustrates the Basic Full-Time Network Pass-Through station. This design provides the lowest possible cost plan to allow a station to have a DTV presence in their coverage area. The system consists solely of a DTV downlink connected directly to the station's DTV transmitter. The station passes everything the network originates. There are no locally generated programs, commercials, promos, or other interstitial material. To service these stations, the network would generate generic station breaks listing every station operating in this (and perhaps every) capacity. Other stations with local origination equipment would be covering the generic break with their own identification. The signal at the station would remain at the 19.4 Mb/s transport stream rate.
In order to monitor the HDTV signal, the serial 19.4 Mb/s transport stream must be obtained from the output of the QPSK demodulator or the output of the VHF or UHF Off-Air Antenna and Receiver (8-VSB Demodulator). The breakdown of the transport stream into the MPEG-2 and AC-3 streams and subsequently to their basic analog components would require an ATSC Compliant HDTV Transport Full Decoder followed by an MPEG-2 Decoder Main Profile High Level and an AC-3 Audio Decoder.
KU BAND SATELLITE EARTH STATION DOWNLINK with
PLL LNB
RANO
VHF or UHF L OFF—AIR ANTENNA and
RECEIVER (8—VSB DEMOD)
NOTE 19.4 Mb/s Sarica Signal includes Data and Clock
L BAND to
70 MHz CONVERTER
70 N M OPSK DEMOD
SIRE -19.4 Mb/s
TRANSPORT S OCA-
19.• bb/4
19.4 Mb/b
MONITOR SWITCH
TRANSPORT STREAM
it. Mb/s ssr:si
INTER— FACILITY LINK
nom.
co..Ax)
ATSC COMPLIANT HDTV
TRANSPORT FULL
DECODER
TRAJOPORT MI KAN
19.4 WO/s
ATSC COMPUANT 8— VSB
MODULATOR
MPEG-2 L-DECODER
MAIN PROFILE HIGH LEVEL
AC-3 AUDIO DECODER
Figure 2. Basic Full-Time Pass-Through (Model 1)
V. Pr. Pb AAP A4144.0G
t M N, ANALOG NAOS
DIGITAL HDTV BROADCAST TRANSMITTER
HDTV PICTURE MONITOR
AUDIO MONITOR SYSTEM (Up to
5.1 Chnls)
270

.1•2•E COM M
CONVENTIONAL AUDIO SOURCE
MaaCC *00
KU BAND SATE W YE EARTH STATION DOWNLINK with
PLL INB
L
ALDO A/D
AN 00,AL ALC.)
L BAND to 70 M.Q OPSK
..70 MHz DEMOO CON VERTER
VHF or UHF L OFF- AN ANTENNA and
RECEIVER (11- VSB DEMO° )
AC-3 AUDIO CODER and
P ACKE GZER
PROGRAM CONTINUITY CONTROL SYSTEM
IRAVIKel KM KS lawrITIT
ME" ATSC RP ATSC swam '" ra "" COMPLIANT O oo LOCAL PoP COMPLIANT IIT. ft/. Sa
/•••HDTV PE._,_. b. PROGRAM AN TR SPORT vow - INSERTION ma ANSPOR DECODER ItY uNi T ,.. MVX & & DENUX ." ' ENCODER DOA DOA
.. .(.S._ ) •(_..10.
VANSPO W S WAN
1•••
Its 5/1 MONITOR SWITCH
IRM•FORT
*V. ATSC
COAPLIANT HDTV
TRANSPORT FULL
DECODER
IN TER - FACILI T Y LINK
•••..
S.
1R•••011, STION IS.. lib/. To_r _ 101“
ki nG-2 T. Mr.
DECODER MINCC MAIN PROFILE HIGH LEVEL
AC-3 AUDIO DECODER
C••••••• AN•LOC
A TSC COMPLIANT 8- VS8
MODULATOR
Ho w PIC TURE MONI TOR
NANO MONI TOR SYSTEM (Up to
5.1 Cants)
Figure 3. Full-Time Network Pass-Through with Audio Station ID (Model 2)
IF DOTAL HOT V
BROADCAST TRANSMITTER
STATION WITH AUDIO ID
The Full-Time Network Pass-Through with Audio Station Identification model is represented in Figure 3. This scenario is similar to the basic pass-through model except the local station would be able to insert an audio station ID or other audio material during the generic break. It is assumed that it will be less expensive to decode and re-encode just the DTV audio signal rather than the full audio, video, and data. The process of decoding and re-encoding the audio signal is accomplished by decoding and demultiplexing the serial 19.4 Mb/s transport stream in the ATSC compliant HDTV transport decoder and demultiplexer. The resultant audio, video, and data
Packetized Elementary Streams (PES) are sent to the Local Program Insertion Unit (Figure 4). In reference to this model, this specialized unit is designed to replace, when commanded, the audio
TRANSPORT
STREAM
Pregraw_www_le •
Le pocing
5. Video
Sou ce of program to be spliced in
1Program_map_PID
Program_map_tabeel update
Data
flow through
1. elementary bit stream termination
Figure 4. Local Program Insertion Unit [A variation of the unit shown in Reference 2]
TRANSPORT
STREAM
271

PES in the transport stream. The local audio originates from the Conventional Audio Source as analog or digital audio, and in the former case, is converted to AES digital audio in the Audio A/D, and then packetized into local audio PES in the AC-3 Audio Coder and Packetizer. The Program Continuity Control System would be used for machine control between the Conventional Audio Source and the Local Program Insertion Unit. The audio, video, and data PES are converted back to the serial 19.4Mb/s transport stream in the ATSC Compliant HDTV Transport Mux and Encoder.
from tape or server program stores recorded in conventional AN form on either a full bandwidth HDTV VTR, an Intermediate Level HDTV VCR, or even a prosumer HDTV VCR. The station would purchase this material from outside production houses. The station would only be able to switch between the network and their local storage devices. There would be no provision for any keying, crossfades, or other video effects. An HDTV Program Source with an Application Dependent Adapter and an MPEG-2 Video Coder and Packetizer would be the only additions of equipment from the previous model. The Local Program Insertion Unit must now splice in video and data as well as audio.
HDTV PROGRAM SOURCE
VIP
.AAO.0 Ca3“III01.
APPLICATION DEPENDENT ADAPTER
T. P. Pb 3p.c MIALCC
motoc AMA) 0 T0 MPIT005 )
Mt OKITAL ALCM
MPEG- 2 VIDEO CODER and
PACKETIZER
KU BAND SATELLITE EARTH STATION DOWNLINK Pith
Pa LNB
W AD ) to L RAND
70 lAHz CONVERTER
VHF or UHF L OFF - AIR ANTENNA and
RECEIVER (8 - VSB DEMOD)
TIONSPORT STREAM
ILA M A 70 wo °psi( Nino
DEMOD
AC-3 AUDIO CODER and
PACKETIZER
LOCAL A.CO3 PC5
PROGRAM CON TIN Ul TV CONTROL SYSTEM
LOCAL VICCO PCS
ATSC TRANSPORT M SC I MAM
COMPLIANT moo LOCAL AUDI/ COMPLIANT 111! M VP HDTV KS
TRANsper j ---). PROGRAM -ML), HO W _ _,...wwww '''' meta INSERTION woco TRANSPORT'
DECODER ._ ,PES UNIT 1.11 ÷K, MUX & & DEMUX - --- -..
OATS ENCODER P!:___ •:s .,
OPTS
ViMISPORT 511KAAA
11.4 ML A
19.A Sert0 MONITOR
SWITCH
TRA MPORT T WAY 111.4 Ilb/s Seriel
ATSC COMPUAN T HD Ty
TRANSPORT FULL
DECODER
INTER-FACILITY LINK
rem ecc:A4r
AC-3
MPEG - 2 DECODER
MAIN PROFILE HIGH LEVEL
IRMIS MIT STREAM
19A !At./. .01
V. Pr. Pb Spa AMALOC
ATSC IF DIGI TAL COMPLIANT HDTV 8 - VSB BROADCAST
MODULATOR TRANSMITTER
AC-3 AUDIO DECODER
InAA Lees. 1101V PGA swum •-
5• OLonnAls MIALOC AL OO
HDTV PICTURE MONITOR
FpLow Laical OC1TV AMA SOURCE• 0 — )IP
AUDIO MONITOR SYSTEM (Up to
5.1 Chn(s)
Figure Sa. Full-Time Network Pass-Through with Audio and Video Station ID (Model 3)
STATION WITH AUDIO AND VIDEO ID
Figure 5a illustrates Full-Time Network Pass-Through with Audio and Video Station Identification model. In this scenario the local station would be able to insert station IDs during the program day. All locally inserted material will be
Alternatively, in Figure 5b, the station may opt to originate its audio/video IDs from tape or server program stores recorded at the 19.4Mb/s rate. The station would again purchase this material from outside production houses that had the capability of encoding HDTV material at the 19.4 Mb/s rate. The station would still only be able to switch between the
272

11.0•44 CONTROL
19.4 Mb/s RECORDER
T1RAPOPCNT SOICAN ift/li SNAP
TRAISICAST M E M, 114 ARA/s TANN
KU BAND SATELLITE EAR TN STATION DOWNLINK pith
PLL LN
L
L BAND to
70 MHz CONVERTER
VHF Or UHF OFF-AIR ANTENNA onp
RECEIVER (5-v58 DEMOD)
'0 MN OPSK DEMOD
IRANIPORT STREAM 15.4 NR/A Oslo
PROGRAM CONTINUITY CONTROL SYSTEM
LOCAL PROGRAM INSERTION SWITCH
11. -SPORT S MAN I 5.4 NS A
AMPUFIER
M NSWI. ITTCOHR
114ANNORT ST E M Ito IN A So.40
10410-2 ATSC
COMPLIANT HDTV
TRANSPORT FULL
DECODER oc-3
INTER-FACILITY UNK
11RANSPORT Slifka
IRA Abis SA Y
MPEG-2 DECOOER
MAN PROFILE HIGH LEVEL
le a
ATSC IF DIGITAL COMPLIANT — lip HO W 8-1038 BROADCAST
MODULATOR TRANSMITTER
AC-3 AUDIO DECODER
5.1 D ess le
HO N PICTURE MONITOR
ALIENO MONITOR SYSTEM (Up to
5.1 Chnis)
Figure 5b. Optional Full-Time Network Pass Through with Audio and Video Station ID (Model 3A)
network and their local storage devices. There would be no provision for any keying, crossfades, or other video effects.
STATION WITH LOCAL ORIGINATION
The model for Network Pass-Through and Basic Local Origination is represented in Figure 6a and Figure 6b. These scenarios are expanded
KU BAND SATELLITE EARTH STATION DOWNLINK
with
Pt.t. LNB
44.1414 CONTROL
APPUCATION DEPENDENT ADAPTER
T. 14A Spa
w oo ..onom
KS a t lad010
L BAND to 70 NO
70 MHz CONVERTER
VHF or UHF L OFF-MR ANTENNA end
RECEIVER (s-vse DE 1400)
L.
L-MPEG-2 VIDEO CODER cowl
PACKETIZER
WS (TO 1,0•100) LOO N NAPO
- C1
PROGRAM CONTINUITY CONTROL SYSTEM
Loom reto
NTSC SOURCE
": 1101.KIT RISC to ITU R 601 CONVERTER
4:21
mglMOM
AUDIO A/D
PICITY
UP CONVERTER
MS ooTas. As.en
OPTIONAL HOTv PROGRAM SOURCE (INPUTS TO VIDEO AND DIGITAL AUDIO SVA TCHE RS SHOWN AT LEFT)
TRANSPORT 15 051 ST W.AN A isc
. - 15. ATSC S WAN '''' ".1. CONPUANT ‘05.5
DEMOD QPSK 1..... . HOTV ',--1 _1,1R . PPL OO GC RALAM ,--N LI,A" .' CDMAIPDUTVAN1 " 4 11/.
DECOOER .._z_S_u_ LIND. r_L,s, MU% & INSERTION pepp TRANSPOR = Ili - TRANSPORT , -
& DE FFLIX ".- ENCODER ...,__ _30., .o•TA
—M11.0. OA TA
TRANSPORT STKAA
vo/. MONITOR SWITCH
IRANSPLOT ROMAN It. woh
ATSC COMPLIANT HDTV
TRANSPORT FULL
DECODER
51 11-1
INTER-FACILITY UNK
ga-
TRAMPORT STREAM
1•A/s
AC-
MPEG -2 DEC 00ER
MAN PROFILE HIGH LEVEL
V. Pr. Pb. 5Pw M AU%
ATSC IF DIGITAL COMPU AN T HDTV 0- VSB BROADCAST
MODULATOR TRANSMITTER
AC-3 AUDIO DECODER
ewe (NAN 440ry RNA SCONCE
1.1 CNN, * ANALOC AZPZ
rm.. loop NOTT Pat SPIN= •
HO W PIC TURE MONITOR
AUDIO MONITOR SYSTEM (Up to
5.1 CMOs)
Figure 6a. Network Pass-Through and Basic Local Origination (Model 4)
273

RAN K CONTROL
19.
Mb/s
SOURCE 1
194L Mb/s
SOURCE
2
19.;
Mb/s
SOURCE
KU BAND SATELUTE EARTH
STATION
DOWNLINK
with
PLL LNB
a** *
VIDEO
SWR
TRANSPORT STREAM 194 ROA Ser
TRANSPORT STREAM 19.4 111/4 Sro:41
L BAND to
70 MHz
CONVERTER
VHF or UHF L OFF-MR ANTENNA
and RECEIVER
(13-VS13 DEMOD)
70 of t OPSK
DEMOD
PROGRAM
CONTINUITY
CONTROL
SYSTEM
TRANSPORT SIRE AV 194 1113/4 LOCAL
PROGRAM
INSERTION
SVITCH
NTSC
SOURCE
TRANSPORT STREAM 19 4 19/4 Said
NTSC
NTSC to ITU-R 601
CONVERTER
AUDIO A/D
41:2
PrOse7AL
HDTV UP
CONVERTER
AC-3 AUDIO
CODER
and
PACKETIZER
OPTIONAL HDTV PROGRAM SOURCE
(INPUTS TO SWITCHER SHOWN AT LEFT)
TRANSPCOT STREW
AMPLIFIER 12 :.41A
19INSPOR swum 19.4 Ws
10.4 1114/4
19.4 WA Serial
MONITOR
SWITCH
TRANSPORT STRUM 19.4 19/s SIlO
ATSC COMPLIANT
HDTV TRANSPORT
FULL DECODER Pt-
INTER-
FACILITY
LINK
Irk FIXR. or
TRANSPORT STREAM
194 WV,
MPEG-2
VIDEO
CODER and
PACKETIZER
V1XO
—0
AU X, KS
DATA PCS
mPEG-2 Fr, Pb. sr. DECODER NULOC
MAIN PROFILE HIGH LEVEL
AC-3
AUDIO
DECODER
5.1 Glo wls ANALOG 9010
ATSC
COAIPUANT
EI- VSB
MODULATOR
1RMSPCOT ATSC sTKAI,
COMPLIANT 194 19/4 HDTV swisi
TRANSPORI-
MUX
ENCODER
IF DIGITAL — 0 Him
BROADCAST
TRANSMITTER
HDTV
PICTURE MONITOR
AUDIO
MONITOR
SYSTEM (Up to
5.1 Chnts)
Figure 6b. Optional Network Pass-Through with Local Origination and Editing (Model 4A)
versions of the Figure 5 scenarios. The local station would be able to insert programs, station IDs, or other material during the program day. All locally inserted material will still be from tape or server program stores recorded in conventional AJV form (Figure 6a) or at the 19.4 Mb/s rate (Figure 6b). The station would again purchase the programming material from an outside production house. The station would only be able to switch between the network and their local storage devices. There would be no provision for any keying, crossfades, or other video effects.
To fill out the program schedule a station may wish to upconvert its NTSC output. This optional program source is shown in the upper right hand corner of Figure 6a and 6b. In Figure 6a, the upconversion is used directly as a program source. The NTSC video is first converted to component
digital video and then upconverted to HDTV. In Figure 6b, the upconversion must be coded and packetized to the 19.4 Mb/s Transport Stream. The
audio path would consist of the NTSC source followed by an Audio A/D into the AC-3 Audio Coder and Packetizer. It is important to note that all local Program Sources and Switchers will have to be locked to a common sync generator.
STATION WITH LOCAL ORIGINATION AND EDITING
Figure 7 illustrates the Network Pass-Through with Local Origination and Editing model. A station operating under this scenario would have the ability to edit and introduce limited effects in their
programming. No local live production is included. In this scenario, the station would use an Intermediate Level signal, a mild form of
274

NTSC SOURCE
: H14m0E0 NTSC to ITU-R 601 AID
Arn 4T *too AUDIO
A/D
HDTV F . UP
CONVERTER
OCTAL IWO* ANALOG
HD / IL COMPRESSOR
ATSC COMPLIANT HDTV
TRANSPORT FULL
DECODER Sc
IAPEG-2 L DECODER
MAJN PROFILE HIGH LEVEL
- AUDIO DECODER
V. ov. NA Sr. ANALOG
Sc
HD / OMPRESSOR
HO / IL COMPRESSOR
.4.1 IL k RECORDER
1.4.1 IL .12.4. RECORDER
t. 1.12÷1. SER vER
244 IL 4 4,,,t DEVICE
INTERMEDIATE LEVEL ROUTER A
II. AUDIO DEMUX
ntme:r0Cr StcrAu Its us/s SAn.,
0.1 ii. L. MPEG-2 w e CA, VIDEO
CODER and
PACKETIZER
ALS M ad.
KU BAND SATELLITE EARTH STATION DOWNLINK with
PLL LNB
111011 L BAND to
70 MHz CONVERTER
TRANO.0111 smut. ATSC - -90 "" 56/. COMPLIANT ou00 Son$ LOCAL Sc
'0 ". °PSI< __ _), TR HDTV .___ __Ip.NIS PR OGRAM- 9"DEMOD _mt14 . Sp „ I -,,,, INSERTION wco
DECO DER Pii UNIT & DE W%
O m PCS
AC-3 AUDIO CO DER and
PACKETTZER
UCAL VISO
PROGRAM CONTINUITY CONTROL SYSTEM
tcCa. vCCO
or the L OCT-AS ANTENNA end
RECEIVER • (8-VS8 DEI100)
44.0414, 40119149. Ma MUTER sal. Semen
TR
San ANALOG
D IL / H01 ECMPRSR )
41 IL / HDI DECMPRSR
Alt O WN. NJO0
FULL Bw HDTV
PRODUCTION EDIT
SWITCHER
—10 AfjC:171) MIXER
A1S LAYA,N. AMMO
TO OTHER AREAS IL / AS REQUIRED DECIAPRSR
VILIWNG FUTURE RASTER CTRL
NOTES 1. Not shown, but all local PGM SeurcoS and Switchers are locked to o eanfnon sync genenStor.
2. 19.4 140/4 Seriol Signal includeS Data & Clock.
3. INTERMEDIATE LEVEL ( IL ) ii a mild 4:1 form of compression at 270 or 360 Mbits/sec. It may include AES/EBU Embedded audio.
.1. Se/Adler, Router and Mixer ;nput quontit4s ;API DO greatsr than Om number shown on this drawing. Likewise. the numb*, of recorders. servers and other devices will vary according to the station's needs.
5. Monitoring not shown on this drawing.
INTER-FACILITY U W
IS% ACM 0,1 0
IsAus•ocr STIKNA 19.4 149/ ISIS
TO MONITOR SYSTEM
MONITOR SNITCH
91401141311 SIR-,.. 1./s
ATSC COMPLI ANT HDTV
TRANSPORT FULL
CECOCER
WEG-2 OECOCER
MAIN PROFILE ITCH LEVEL
AC-S AUDIO DECODER
19. 19. IS. 49.404
1
11 04m. MIA 04 too
ATSC COMPLIANT 111-VSEI
MODULATOR
/INV PICTURE MONITOR
AUCIACI MOMTOR SYSTEM (Up to 5.1 aims)
Figure 7. Network Pass-Through with Local Origination and Editing (Model 5)
DIGITAL 115 HDTV BROADCAST TRANSMITTER
compression, perhaps 4:1, as their main signal format. They would acquire programs in this compressed form. When editing or effects are required, the signal must be decompressed up to a full bandwidth HDTV signal, operated on, and recompressed. This scenario would require Intermediate Level to 19.4 Mb/s signal conversion ahead of the transmitter. A station at this level would be more likely to require an NTSC upconverter as described above, but the conversion may be to the Intermediate Level.
STATION WITH LOCAL ORIGINATION, EDITING, AND PRODUCTION
Figure 8 represents the model for Network Pass-Through with Local Origination, Editing, and Production. A station operating under this mode will likely have full HDTV bandwidth equipment including cameras, tape machines, switchers, and routers. The station will also require format converters to move back and forth betweer. full HDTV, the Intermediate Level, the 19.4 Mb/s signal, and NTSC. A station producing its own
275

NOTES
I. Not shown, but oll Neal PCAI Sources and Seashore ore looked to a common sync generator.
2. 16.4 146/s &Mot Sbinol includes Onto & Clock.
3. INTERMEOLATE LEVEL ( IL ) N o mad 41 Nom FIF Fon, PIKSWOw at 270 or 360 Mb4s/mc. It may Metude AES/E91.1 Embedded TAKAO.
4. SKUNK, Router and Weer input amontilies we be greater th an the number Mown OA this drawing. Litewiee. the number of recorders. servers and other derkes will vary occording to the station's needs.
S. Monitoring not shown on this Mowing.
6. Full Bandwidth HOTV I sheen in this model m amle9 WM, separate ckcuits too Y, Pr: Pb and pObbibly sync. A dbOld Format KIMKOI luCb 44 SPAWN," is SMPTE 2924 would all ., a single arcuit to carry lAs information.
NTSC SOURCE
— IP
NTSC to ITU- R 60
A/D
AL/010 4/0
AS, — 61
HDTV UP
CONVERTER
KS 11014 4 10
ASS DIGITAL AUDIO ROUTER I HOTV ROUTER
(FULL BANDWIDTH)
HoTv 17-110 --al RECORDER'''.
4 SiilicEvw . 4 ERHDIVc Ww.
Ms CKPA APO
AuDIO a VID t.. 4-0. SvALCHRONIZE
:=1 =1;.:13 W AUDIO & AID
CAMERA CHAIN(S)
Pt bre AMIGO
CTRL RLI AUDIO SOURCES
KS KOK MOO
"tilt EM HDTV
PRODUC T1ON STUDIO VA MUER
—b4 AUDIO STUDIO CCNSOLE
—611 HD / IL COMPRESSOR +
ATSC COYPUAN Holy
TRANSPORT FULL
DECODER
IMEG-2 DECODER
MARI PROFLE HIGH LEVEL
TO ATSC COMPLIAN T 110TV DECOOER (NETWORK SIGNAL VIA sATELuTE)
— 61
AC-3 AUDIO DECODER
u jao n a KAT
DEMUR
co 7pRis Isl 0. et t +
CO rFPRiSIS LORL h
Pr. Pt *PK
MD /ILL01001 61 C OMPRESSOR
ItS
L. LAREG-2 LALLEo CO WL/ 004
PACXETIZER
IL S DEVI
°MANSION
2 4I REc IL R 114
4.1RECOLR 4 RECORDER
SE IL Fk r+t
i i--14 ccct . rN-TE INC DIA TE LEVU.
ROUTER
KU 94/40 SATELLrit EARTH STATION DOWNUNK VI',
PU. LI413
L BAND
70 14H, CON VERTER
NW or UM, L OFF-AM ANTENNA and
RECEIVER (8-VS43 DEM00)
70 IN OpSX
AC-3 ALPO CODER and
PACKETIZER
KKK
PROGRAM CON/NUITr CCNTROL SYSTEM
LACK VOW Inn
— 61
/ 111,11- --DECAIPRSR
/ Hot-DECAIRRSR
— 61
IL / HOI-DECMPISI
mwerewn ATSC — 61 C w ereerCOANUANT LOCAL m a OUPUANT Wm
m non TRANSPORT I:S 5. PE TION '-'11 +.11C0 TRANSPIrnDATSCIV --S"""
e O ORAM
KTIKAK poly
.0. , LIE = UNIT sAle m ix &
104.11•0•1 TKAA. Inn K/0/.•
KA Mb/. mONITOR SNITCH
SWAY ie. MA ATSc
COMPLIANT HOTV
TRANSPORT FULL
DECODER
61 PACO-2
INTER-ACILITY LINK
Orn)
LiPtG-2 DECODER
MAN PROKILE HIGH LEVEL
-IP FULL BW HDTV
PRODUCTION EDIT
SNITCHER
AUDIO EDIT mxER
_J
To OTHER AREAS IL / AS REQUIRED DECMPRSR
VENING FUTURE MASTER CTRL
MAK Ar12_ 10N,
N NW& Near
T. P. Pk Ppee Arm/K
NoTv 0OwN
CONVERTER
ALCM 0/A
wise ei
SIMULCAST FEED TO EXISTING NTSC PLANT
M10:1
ATSC COmPuANT
Lm3OuLAToR
AG -1 AUDIO DECODER
nemin. APIALOO ala
HDTV PICTURE MONITOR
NANO semaTOR SYSTEM (Um Is
5.1 CARY)
It DOTAL HDTV
BROADCAST TRANSMITTER
Figure 8. Network Pass-Through with Local Origination, Editing, and Production (Model 6)
programs may wish to increase its audience by making the programs available on NTSC as well, thus requiring down conversion. Any station operating with full bandwidth HDTV will have to decide between an analog or digital system. Digital, with its 1.2 or 1.5 Gb/s rate, is the best long term
choice, but little equipment is presently available. 30 MHz bandwidth analog systems are more easily achieved, even though three or four signal paths are required.
276

Table 1. Equipment Availability
REQUIRED IN DTV STATION MODEL
EQUIPMENT ITEM 1 2 3 3A r 4 — 4A 5 6 CURRENT STATUS KU Band Satellite Earth Station x x x x x x x x Widely available Phase Lock Loop LNB x x x x x x x x Available 1.. Band to 70MHz Converter x x x x x x x x STS QPSK Demod x x x x x x x x Full Modem available from EFDATA
Interfacility Link x x x x x x x x Widely available
ATSC Compliant 8-VSB Modulator Exciter x x x x x x x x Harris Digital HDTV Transmitter x x x x x x x x Available from Conunark, Harris, Larcan Transmitting Antenna x x x x x x x x Dielectric
VHF/UHF Off-Air Antenna x x x x x x x x Widely available Receiver and 8-VSB Demodulator x x x x x x x x Under development Monitor Switch x x x x x x x x Widely available in allied fields
HDTV Transport Full Decoder x x x x x x x x Under development (Mitsubishi, ) HDTV Transport Decoder & Demux x x x x x Must be developed HDTV Transport Full Encoder Under development (Mitsubishi, ) HDTV Transport ?Aux and Encoder x x x x x x Must be developed Local Program Insertion Unit (Splicing) x x x x x Must be developed Local Program Insertion Switch x x Must be invented (Should be easy) Amplifier x x x Must be developed (Should be easy)
N1PEG-2 NIP(i-tHL Decoder x x x x x x x x Under development AC-3 Audio Decoder x x x x x x x x Dolby, Yamaha
HDTV Color Picture Monitor x x x x x x x x A few available (Sony. JVC, Ascaca ) HDTV Waveform Monitor x x x x x x x x Available from Tektronix Audio Monitor System x Widely available Audio Monitor System (5.1 Channels) x x x x x x x Widely available
Conventional Audio Source x x Widely available Audio AD (AES/EBU) x x x x x Widely available Audio D/A (AES/EBU) x x Widely available AC-3 Audio Coder & Packetizer x x x x x x Dolby Digital Audio Switcher x x Widely available Digital Audio Mixer x x Available from Crraharn Patten and Zaxcom
HDTV Program Source x x x Sony HDD1000 & Unihi: Panasonic D5: JVC WVHS Full Bandwidth HDTV Production Switcher x x A few available (Sony, ) HDTV Video Synchronizer x None available AES Digital Audio Synchronizer x None available HDTV Server x None available HDTV Graphics Devices x Not generally available
Intermediate Level Recorder x x Panasonic D5 HDTV to Intermediate Level Compressor x x 1/2 of available Panasonic Unit Intermediate Level to HDTV Decompressor x x 1/2 of available Panasonic Unit Intermediate Level Server x x None available Intermediate Level Device x x Undefined Intermediate Level Router x x Some 360 Mbit sec routers available (Philips, ) Intermediate Level Audio Demux x x Not invented yet Intermediate Level Audio Mux Not invented or used in Models 1-6. but will be needed
19.39 Nthit/sec Data Recorder x x Panasonic D3 VTR with Zenith Adapter (very few built) Video Swicher (an N by 1 selector) x Wide bandwidth analog & up to 360 Mb/s digital available
Application Dependent Adapter x x Dependent on HDTV video source manufacturer MPEG-2 Video Coder & Packetizer x x x x Under development
NTSC Source x x x x Any source in station NTSC to ITU-R 601 AD Converter x x x x Widely available NTSC to HDTV Up Converter x x x x Available from Snell & Wilcox HDTV to NTSC Down Converter x Available from Snell & Wilcox Program Continuity Control System x x x x x x x Widely available
277

CONCLUSION
Although the foundation for the process of implementation has been laid, the conversion to DTV does not end with a series of block diagrams. The completion of the chain of implementation is dependent upon the design and prototype of a number of essential undeveloped components. The advent of the standardization of DTV by the FCC on December 24, 1996, should give the equipment manufacturers the needed assurance to grasp this new technology and forge ahead with the development process. Through the design of the various scenarios in the DTV Station Models Project, we have helped to further this development by working to identify the functional descriptions, specifications, and interface requirements for each of the integral components.
In order to assure the success and compatibility of the prototype equipment, the development stage must be followed by a period of subjective testing and certification. The ATTC's state-of-the-art, multi-functional testing facility, located in Alexandria, Virginia, provides the superb environment for the "real world" implementation of the DTV Station Models. The prototype equipment, provided by the various equipment manufacturers, will be incorporated into the various design chains and tested against our performance criteria for functionality, specifications, and interfacing. This phase of testing will not only supply the manufacturers with invaluable information and certification, but will also help to further the advancement of DTV for pioneering broadcasters across the country.
The final stage of the DTV Station Models Project will be to compile a complete "Resource Book", consisting of the information needed to implement any of the DTV Station Models. Most importantly, this information will contain a list of available equipment for each model, including the manufacturers' names and model numbers, interface and cabling requirements, and estimated cost of completion. Tutorials and seminars will also be given in order to arm the television station owners with the tools and information needed to make the conversion to DTV.
REFERENCES
1. "ATSC Digital Television Standard," by Advanced Television Systems Committee, James C. McKinney, Chairman and Dr. Robert Hopkins, Executive Director, September 16, 1995.
2. "ATSC Guide to the Use of the ATSC Digital Television Standard," by Advanced Television Systems Committee, James C. McKinney, Chairman and Dr. Robert Hopkins, Executive Director, October 4, 1995.
278

IMPLEMENTING DIGITAL TELEVISION - WRAL CASE STUDY David C. Datielsons Harris Broadcast Quincy, IL
ABSTRACT
This paper documents the installation and test of WRAL-HD in Raleigh, North Carolina, the first licensed commercial on-air Digital TV station. Topics covered include transmitter installation and initial checkouts, transmitter setup and performance with NTSC, IOT tuning for 8VSB ATSC signal and power calibration of the system using liquid cooled glycol system. "on-air" transmitter performance with the DTV signal including out of band radiation and compliance testing with the Grand Alliance equipment.
May 9 1996 - It Begins
It all began when Capitol Broadcasting decided to have the first commercial DTV transmission system on the air, to be installed at their WRAL installation in Raleigh, North Carolina. There goal was to construct a facility that would operate in accordance with the Advanced Television Systems Committee's (ATSC) Digital Television Standard. They planned to broadcast actual program material to research the effects of propagation, coverage, transmission, and receiving characteristics.
Capitol Broadcast participated with the CBS Television Network in engineering studies and the licensing process for a proposed DTV station. Capitol Broadcast requested an experimental license from the Federal Communications Commission for a new channel with the call sign of WRAL-HD. If granted, the license would permit the station to operate on Channel 32 at 100 kW.
June 19 1996 - FCC Grants DTV License
The FCC granted WRAL-TV an experimental FCC license to transmit DTV signals on channel 32 with a digital average effective radiated power (DAERP) of 100 kW at an antenna height of 1736 feet above ground level (AGL). The license was subject that no interference to the following stations would occur: W32BA Channel 32, Lynchburg, Virginia; WRDC Channel 28, Durham, North Carolina; WNCN Channel 17, Goldsboro, North Carolina. Figure 1 shows a map of the area.
W 323 A CH 32
YNCEIBURG
VillbGE MA
NORTE CABOLMIL
Figure 1
Channel 32, W32BA Lynchburg, Virginia, is a low power station located 131.9 miles from the proposed site. The intervening terrain and the
279

relatively low ERP of 100 kW provided adequate protection from interference.
Another area of concern was interference to channel 17, WNCN Goldsboro, North Carolina. A NTSC signal on channel 32 can produce an interrnodulation product in a receiver's IF. However, since there is no visual carrier in the DTV signal there should be no interference to reception of channel 17.
A third area of concern was with regard to channel 28, WRDC Durham, North Carolina, which is co-located at the WRAL site. At four channels removed from channel 32 intermodulation products could interfere with reception of channel 28. This requires good linearity from the DTV transmitter in order to keep the out of band sidebands to a minimum. A band pass filter may be required to minimize the out of band sidebands.
With Capitol Broadcast's license for a new DTV station, they began to study the industry and chose a team that could supply them with the system they needed. Harris Broadcast was chosen to supply the DTV transmitter and exciter. Capitol believed that Harris would make a good partner because of the fact that Harris had demonstrated a new DTV exciter at NAB and their product support. Andrew was chosen to provide the DTV antenna based on a good working relationship in the past. They called several team meetings in Raleigh to work out the details of the transmission system and the timing of the installation.
Capitol Broadcasting had a lot of work ahead of them. Their current facility at Raleigh had to be made ready for the new equipment. An architecture firm specializing in broadcast, ARCHITEKTUR, was contracted to generate floor plans and station layout drawings. Once these drawings were approved, work on the facility started. Building changes that were required included additions to existing AC service to include the DTV transmitter and its support
equipment, an outdoor concrete pad to hold the beam supply, pump module and heat exchanger for the transmitter and an additional air conditioning unit for the increased heat load to the building.
Andrew's role was to provide the antenna_ They recommended their ALP -series television antenna. This slot antenna makes it relatively easy to change channels and the beam pattern is easily modified. With aluminum construction and radome the antenna is light weight, easy to install and weather resistant. A 24 bay antenna with a gain of 25 (13.98 dB) and a power rating of 20 kW max was chosen. The antenna was to be side mounted on the existing tower structure and a 6-1/8 inch heliax transmission line feeder was to be used. Electrical and mechanical characteristics of the antenna are:
Model
Bays Power Gain Input Power Input Type Pressurization Height Weight Wind load
ALP24M3-HSOC (modified) 24 25 (13.98dB) 20 kW max 6-1/8 " 50 Ohm 10 psig max 49 ft 330 lbs 1100 lbs
Transmission line loss was calculated to be 4 dB, coupled with the antenna gain of 13.98 dB and a ERP of 100 kW this required a transmitter power of 10 kW. Using a 6 dB peak to average ratio the transmitter would be required to handle peaks to 40 kW.
Harris Broadcast planned to provide a SigmaCD. This new JOT based transmitter was specifically designed for the 8VSB DTV signal. It incorporates feed forward correction of the IPA to produce a highly linear amplifier. These linearity improvements permit the 8VSB DTV signal to be amplified with minimum out of channel sidebands.
280

The transmitter was required to produce 40 kW peak. The EEV 1017395 amplifier, supplied with the Harris SigmaCD, would easily provide the power and linearity required. Previous tests with this transmitter and the 8VSB signal had yielded excellent results at the Harris facility.
Harris, also, supplied its new CD! Digital 8VSB exciter with the SigmaCD transmitter. Using a patent-pending digital modulation technique to generate the 8VSB DTV signal, this exciter implements the ATSC standard for DTV. Harris has also been actively participating in the generation of the digital interface specification between the exciter and the studio.
July 9 1996 - Tower crew goes to work
The tower crew arrived at the station and started the tedious process of installing the transmission line. The feeder chosen was an Andrew HJ9-50 6-1/8" heliax. Four days later the Andrew antenna arrived and its installation began.
July 17 1996 - Transmitter Installation
The building was ready and the transmitter arrived. Equipment was placed in position and interconnecting began. After three days the transmitter was ready for checkout.
July 21 1996 - Initial Transmitter Checkout
AC power was applied to the transmitter and check out of the interlock and control system began. The heat exchanger was flushed, checked for leaks and the system filled with a solution of ethylene glycol. The IPA's feed forward was optimized for channel 32. High voltage components were cleaned and high potted to 50 kV to ensure that all was well.
July 22 1996 - NTSC Data
Beam voltage was applied to the IOT and the tube
tuned to channel. Since this was the first time that this IOT and transmitter was turned on, a NTSC exciter was shipped with the transmitter to aid in the initial setup. Using the NTSC exciter the transmitter was operated into a dummy load to verify that all systems were functioning properly. A power calibration was performed to insure that the system would make 40 kW peak sync. Performance of the transmitter measured with results as follows:
Forward Power VSWR Drive Beam Volts Beam Current Focus Current Body Current Grid Volts Grid Current Heater Volts Ion Pump Current
NTSC Data 40 kW Peak Sync 1.02 220 W peak 32 kV 1.4 A 24 A 14 mA 68 V 0 rnA 7.0 V 2 pA
July 23 1996 - DTV Data
With the transmitter system operating with NTSC it was time to switch to DTV. The Harris CD-1 was patched into the transmitter and a power calibration was made to verify 10 kW average power into the load. Initial side band levels with out final optimization were at 38 - 40 dB and the IOT response was tilted by 1 dB as compared to its response with NTSC. This is due to the change in the equivalent average picture level. The IOT tuning was readjusted for a flat response. There was a interest to go "on the air", so the transmitter was patched to the antenna and at 10:14 am July 23,1996 WRAL-HD was born.
The next two days were spent optimizing the transmitter performance with the DTV signal. The IPA's feed forward correction was optimized for DTV and side band levels of 55 dB were obtained.
281
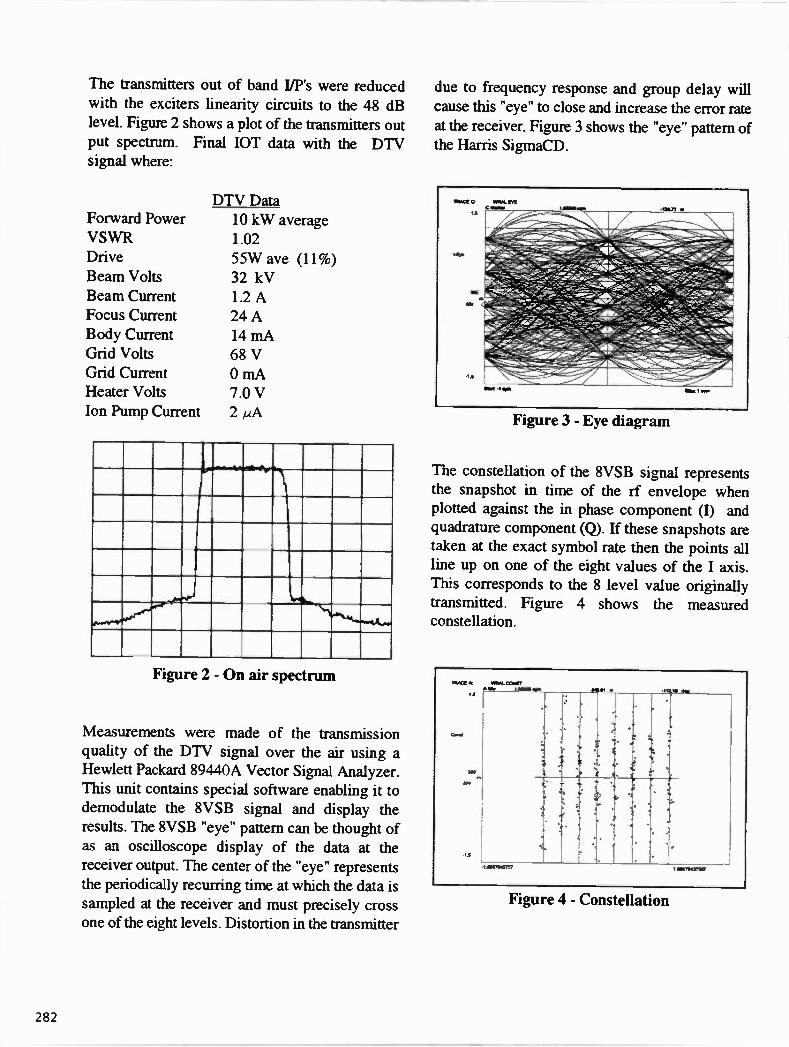
The transmitters out of band I/P's were reduced with the exciters linearity circuits to the 48 dB level. Figure 2 shows a plot of the transmitters out put spectrum. Final IOT data with the DTV signal where:
Forward Power VSWR Drive Beam Volts Beam Current Focus Current Body Current Grid Volts Grid Current Heater Volts Ion Pump Current
DTV Data 10 kW average 1.02 55W ave (11%) 32 kV 1.2 A 24 A 14 mA 68 V 0 mA 7.0 V 2 AzA
-I-7-06... 44*4.r#rdA'4-
,i 4._
Figure 2 - On air spectrum
Measurements were made of the transmission quality of the DTV signal over the air using a Hewlett Packard 89440A Vector Signal Analyzer. This unit contains special software enabling it to demodulate the 8VSB signal and display the results. The 8VSB "eye" pattern can be thought of as an oscilloscope display of the data at the receiver output. The center of the "eye" represents the periodically recurring time at which the data is sampled at the receiver and must precisely cross one of the eight levels. Distortion in the transmitter
due to frequency response and group delay will cause this "eye" to close and increase the error rate at the receiver. Figure 3 shows the "eye" pattern of the Harris SigmaCD.
Figure 3 - Eye diagram
The constellation of the 8VSB signal represents the snapshot in time of the rf envelope when plotted against the in phase component (I) and quadrature component (Q). If these snapshots are taken at the exact symbol rate then the points all line up on one of the eight values of the I axis. This corresponds to the 8 level value originally transmitted. Figure 4 shows the measured constellation.
Figure 4 - Constellation
282

Another very useful display is the Error Vector Magnitude (EVM). EVM is defined as the length
of a vector between the ideal state and the actual state measured. It is plotted versus time. The distance between ideal states is 28.6%. Any error exceeding 14.3% would be detected in the receiver at the next adjacent level and would constitute a real error in the transmission. Figure 5 shows the
measured EVM of the transmitter, 400 data points are shown. The average EVM is 3.5%.
WIVE It VO W. M I
Loll y
/11 •1•1! •
1 1 V ‘114 PI' 1 11F1 " 1!!
a m nal •••
Figure 5 - EVM
The HP 89440A can also display a tabular result of the demodulated data. Key parameters from this display are the nns value of the EVM, the maximum EVM, pilot level and Signal to Noise. Figure 6 shows the tabular output of the HP 89440A. As can be seen from the figure the rrns EVM is 3.5%, pilot level is 0.14 dB form optimum. S/N is 28.7 dB.
July 25 1996 - Testing with the Zenith Exciter
The only known picture source available where specially encoded D-3 tapes that would interface only with the Zenith modulator. Therefore, the only way to make an over the air picture test was to use the Zenith modulator.
The Zenith modulator outputs a 44 MHz IF. This IF was patched in to the Harris CD-1 IF to
upconvert to channel. Actual over the air test were made using the Grand Alliance field truck receiver and decoder.
EVM • 3.4933 % ma 10.419 % pc at rom 319 Mae Err 1.9280 lines 4.9216 % skaters 307 Phase Err 2.8913 deg -14.553 deg plc at am 324 Free Elf 473.02 Mx Piot Lel. 0.14 dB SNR 4213.707 dB
0 1010 '01110 01001000 1101110000000101 00001111 11 101000 480 10110100 10100000 01100001 01100011 00010001 98 01101001 01000001 11110101 11110101 01111110 11011010 14a 01101101 11001100 00111100 01001111 11010011 00101001 192 10010100 10011000 00000010 10101100 11101100 00111100 240 01010101 10101011 0 0 01111101 01111110130101101 288 0110011001010111 01110111 10100111 10100101 01101100 336 11000100 11100010 00010000 00001111 00010011 10100000 NM 01101 101 01001101 00110001 00000100 1 1000101 01001110 432 01101111 000011001 11110100 01010100 00010110 11111111 480 11010010 00100010 01111100 10001000 11111110 11110001 W6 10010110 11110010 00101010 10100100 11001110 11011101 576 01010010 10000011 01110101 00101000 00010100 00111000 924 olllolto0l0ololO 10111101 10110001 00100000 11010001 672 10110100 10011100 10000101 00100001 10001010 00101011 720 0101111000000101 01101101 0 10100110 11100001 768 10010000 10100100 11010100 11100011 01101000 11011000 816 01010010 00101000 11101000 11011110 00100111 11100001 es4 01110111 00101110 00011111 11110110 00001111 11010011 912 00110100 11110001 01110101 10000011 11011110 00001110 960 10100101 1010011001001011 10011110 11100001 01111010 1008 01111010 10100011 01011011 00100101 00110100 00011110 1066 11011111 01110100 01010101 00000011 01111100 00100000 1104 00010100 10010001 10010111 00110110 00011001 11010101 1152 11010100 10000001 00100110 10010000 00111111 00100
Figure 6
July 30 1996 - More Compliance Testing
With the field truck available it was an excellent opportunity to make more compliance tests on the Harris CD-1 with the receiver. The CD-1 was re-connected to the transmitter and extensive tests were made to verify that segment syncs and field syncs were inserted correctly. Each transmission layer sync must correspond with every transport layer sync.
Later tests were made using the field truck receiver to verify proper insertion of the pilot, Reed-Solomon encoder, data interleaver and trellis coding.
Nov 4 1996 - Mitsubishi Encoder Interface
Mitsubishi Electronics Corp has been developing an encoder and decoder to interface to the proposed transport layer. At the Advanced Television Test Center (ATTC) in Washington successful tests were conducted interfacing the Harris CD-1 exciter with the Mitsubishi encoder
283

and the field truck receiver.
Nov 6 1996 - Satellite Up/Down Link
With the cooperation of Harris, Mitsubishi, Capitol Broadcast, PBS and the ATTC a successful satellite up link was accomplished. DTV pictures were encoded by the Mitsubishi encoder, interfaced to a modem and sent to the PBS center in Washington. At the PBS center the transport layer was up linked to satellite. In Raleigh at WRAL, a satellite down link received the transport data and interfaced to the Harris CD-1 exciter which sent the original DTV picture over the air to be received by the field truck. This marked another major accomplishment in the calendar of events for DTV.
Conclusion
Capitol Broadcasting has paved the way for DTV. Their commitment and effort have paid off. From there initial application for a DTV license from the FCC to actual over the air broadcasts of DTV,
Capitol Broadcastings WRAL-HD has become the nations first commercial DTV station.
Capitol Broadcasting plans to continue its research by making actual propagation characteristics, coverage contours and other transmission and receiving characteristics. They will continue there work with major manufactures in the development of DTV equipment. With help from the CBS Television Network and PBS, Capitol Broadcasting plans to begin delivering DTV programming this year.
284

No Failure to Communicate Overlooking A Monitor and Control System May Prove Fatal
DeWayne Gray M&C Systems Inc. Plano, Texas
ABSTRACT
Communicate or fail. In today's world of
broadcasting, either your communications
capabilities are on the cutting edge, or you're
falling behind the competition. It also means
providing more links to more people doing
more things. For broadcasters dependent on a
world of satellites, one answer to improved
efficiency is through an automated monitor and
control system at the reception points of the
uplink and downlink feeds. The latest trend is
to install a PC-based monitor and control
system featuring an open architecture design.
This setup lets an operator handle the entire
satellite communications system from a single
computer. Without considering the important
pieces of the puzzle, no matter how small,
communications can be lost. A monitor and
control system is one such piece, and
overlooking this need may prove fatal.
WHAT IS A MONITOR AND CONTROL SYSTEM?
In the past, broadcast communications systems
did not necessarily include monitor and control
systems. Instead, it was easier for an engineer
to handle all the system configuration
requirements as well as assess and repair the
system should problems arise with the
broadcast link. The reason was simple: older
monitor and control methods, produced before
the PC became a reliable computing tool,
couldn't be connected to all the equipment in
the earth station because they were usually
vendor specific and had proprietary interfaces.
Since broadcasters couldn't afford a system to
monitor and control the entire link, older
equipment was left out. This meant only a
portion of the link was monitored. The only
alternative was equipping the earth station with
broadcast and monitoring components
purchased from a single vendor. However,
doing so would render the earth station
operator dependent on that vendor.
But broadcast communications have reached a
new level of sophistication through
technological innovation and demands on the
industry. It is no longer efficient or effective to
use manual or antiquated methods to monitor
and control the broadcast links. In fact, those
who rely on manual monitor and control, or
who only monitor and control a portion of their
equipment, are using only a fraction of today's
information gathering techniques.
285

In today's global marketplace, there is a
growing incentive to upgrade earth station
capabilities. In the broadcast world, that
means the capability to provide more links to more people from more places.
No matter the industry — broadcasting,
telecommunications, data networking —
operations are always more efficient when the
network providing the transmission links is
operating at the highest level of sophistication
available through modern technology. That's
why the data networking world developed
simple network management protocol, or
SNMP. That's also why the terrestrial-based telecommunications industry came up with
redundant architectures — synchronous
optical network, or SONET — for its
transmission method. For a broadcast
industry that reaches into the world of
satellite communications and the homes of
Figure 1
millions of people, the answer to efficiency is
automation, and reliable monitor and control
systems provide just that. Beyond the
technical aspects, integrators, installers and
operators also prefer affordability.
WHY DOES ONE NEED AN AUTOMATED MONITOR AND
CONTROL SYSTEM?
The easy answer is to keep the broadcast links
up and running to meet the increasing demands
being placed on the industry, while reducing
the potential for human error.
A more detailed answer requires a closer look
at today's earth station and the equipment used
to transmit in a complex environment. Further
inspection must be focused on specific
difficulties earth station operators face in
providing the level of service being requested,
and on what lies in
the future. Without
considering the
important, yet
often forgotten,
pieces of the
puzzle like a
monitor and
control system,
(Figure 1) vital
broadcast links can
be lost. And when
links are lost,
money is lost, too.
Every satellite
earth station is a
vital component in
the broadcast link.
286

The antennas
and associated
equipment —
such as
modems,
amplifiers, up
and down
converters, and
other similar
devices —
provide the
medium to
transmit and
receive
increasing video, voice and data traffic to
satellites hovering in geosynchronous orbit
23,000 miles in space.
Doesn't Know
Over $20 Million
$10.1 Million to $20 Million
$5.1 Million to $10 Million
$2.1 Million to $5 Million
$500,000 to $2 Million
Less Than $500,000
ESTI MATED EQUIP MENT INVEST MENT
0 2 4 6 8 10 12 14 16
Number of Responses Domestic
Recent industry trends show those involved in
satellite communications today are not afraid to
spend money for effective hardware and
software that stabilize and enhance their
Figure 2
interviewed reported spending between
$500,000 and $2 million on their system
equipment. And 10 percent of those surveyed
made an investment of more than $20 million
(Figure 2). This expense is an ongoing
proposition. The survey found that earth station
equipment is upgraded frequently, with 60
percent of worldwide earth station operations
planning to
update
their
equipment
within the
last few
months of
1996.
Doesn't Know
Over 50%
41% to 50%
31% to 40%
21% to 30%
11% to 20%
6% to 10%
0% to 5%
PERCENTAGE OF EQUIP MENT INVEST ME NT
DEDICATED TO WARD M ONITOR Sr CONTROL
•
grah' Aibiftk:k
••: "'
4 6 8 10 12
••:•:•:•sin • ,;,;t •
•
4. a:M .1 70 2 . 1.": T a N W R E Mi, • •
Number of Responses Domestic
Figure 3
ability to establish and control broadcast links.
In a 1996 survey conducted by the research
department of M/C/C, a high-tech marketing
agency, almost half the earth station managers
Of the
incredible
investment
in both
time and
money in earth station equipment, surprisingly
only 20 percent or less of that budget is spent
on monitor and control equipment (Figure 3).
Predictably, earth station managers reported
287

their monitor and control systems are upgraded
much less frequently than the communications
equipment.
The question, then, becomes why so little is
budgeted to ensure users can operate the
equipment most efficiently when so much
money is spent on equipment. The answer lies
in the level of computing equipment available
10 to 15 years ago.
Until the middle to late 1980s, the computers
available to earth station operators either were
prohibitively expensive mainframe systems or
extremely unsophisticated personal computers still in their developmental infancy. Neither
was an attractive option.
However, advancements in computer
technology have led earth station operators to
realize there are powerful and stable new
options available in terms of personal computer
platforms. PC technology during recent years
has opened the door to the means of
computerizing vital monitor and control
functions, while keeping the cost manageable.
Today's new automated PC-based monitor and
control system operating on a 32-bit platform
does just that.
That is why 60 percent of the international earth
station operators surveyed by M/C/C planned
to complete upgrading their monitor and control
equipment by the end of 1996, and another 20
percent said they have plans to upgrade in 1997
(Figure 4). But to what will they upgrade?
Getting into monitor and control
The monitor and control system is a vital part
of today's typical earth station operation.
Since the first satellite beamed signals from
one place on earth to another, it was obvious
that an improved method was needed to
monitor all the equipment and devices
sending signals from here to there. It was
equally obvious that an operator needed to
have the ability to control that equipment,
and arm himself with all available information with the greatest speed possible.
With price, flexibility and reliability becoming
primary issues in the high-tech industry,
monitor and control methods were incorporated
into today's automated systems that now can
give an operator the ability to perform all
functions from a standard personal computer.
With an off-the-shelf PC acting as the front end
controller/processor, the cost is lower for the
hardware and software used in the monitor and control system.
Compare this to a system that is UNIX-based.
With a UNIX system, the cost is greater for the
software, hardware and network interface
cards, or NICs. The PC also gives the
broadcaster a flexible hardware platform and
the security of knowing the equipment is easily replaced since millions of PCs are available.
Both issues can directly impact the bottom line.
Old systems cost new money
Before the development of PC-based systems,
though, earth station systems were monitored
and controlled by electronic subsystems such
as mimic panels inside the earth station and
connected to the antennas outside. The typical
satellite communications configuration with a
small antenna system required about five mimic
panels that would sound alarms or flash lights
when there was a problem.
Some of these outdated panels are still used to
288

ESTI MATE OF W HEN MONITOR Sr CONTROL EQUIP MENT
W OULD BE UPGRADED
Doesn't Know More Than Two Years From Now
7 Months to 1 Year Within the Next 6 Months
International
Figure 4
provide monitor and control for dozens of
components in a system configuration. In the
event a problem occurs with any device in the
broadcast link, operators are alerted through the
alarms and lights on the panels. An operator
must then determine where the problem is,
leave his station and move to the problem area,
and correct it.
Because broadcasting takes place 24 hours a
day, monitoring and controlling the earth
station system becomes a tedious, demanding
procedure. However, older technologies can't
support increasingly demanding broadcast
requirements. They have limited flexibility,
which makes it difficult to reconfigure the earth
station system.
It also is expensive to maintain an earth station
system with yesterday's technology. For
example, that small antenna system may have
five custom mimic control panels that cost
between $5,000 and $10,000 each. Every
antenna system also needs additional panels
that are $2,000 to $3,000 each for other
monitor and control functions.
Imagine the
cost and
complexity
to a
broadcaster
operating
multiple
stations,
each with
more than
one antenna
system, and
each varying
slightly in its
configuration. The costs begin to soar.
Trying to make the old new again
While the expense is one consideration, another
is when operators are forced to modify older
equipment by repainting, drilling new holes
and putting new labels on the front to reflect
any updates to the network configuration.
When manufacturers of earth station devices
began to develop computerized controller
modules for each piece of equipment they
made, some satellite earth station operators
began using a combination of mimic panels
with individual controllers for each device. The
combination of panels and controllers gave
them the capability to communicate with some
of the equipment through a computer terminal
or, alternately, controls on front panels.
Unfortunately, the mix of equipment from
multiple manufacturers required customized
interfaces. This made it impossible for one
computer to monitor and control an entire
system composed of such varied interfaces.
Newly developed front control panels on the
289

transmission equipment have helped make
monitor and control functions easier by
allowing an operator to enter specific
information or control specific devices through
a keypad. Readouts on the front control panel
provided the data to monitor and control the
earth station system. But this method was still
limited in its effectiveness because of the
multiple devices requiring the monitor and
control system, and the need for manual
intervention was still necessary.
As methods for monitor and control capabilities
progressed along with technological
improvements, some manufacturers created interfaces for computer-based monitor and
control systems. While this gave operators
access to some of the information via a
computer, the network configurations often
were proprietary and still couldn't monitor and
control the entire broadcast system because it
couldn't interface with some equipment without
custom-designed drivers.
By the end of the 1980s, earth station
integrators and installers began looking for
other methods of maintaining the necessary
monitor and control capabilities for their
systems. The automated, open architecture
system was the next logical step toward
efficiency.
WHAT IS THE IMPORTANCE OF AN OPEN ARCHITECTURE?
In today's market, each manufacturer of earth
station equipment provides a particular way of
interfacing to that equipment. There are no
standards to follow because of the low-volume,
high-cost nature of the business. Most
manufacturing companies will invest a
significant amount of time and money building
custom hardware to work with their equipment.
Compounding this lack of hardware standards
is the fact that most software used in earth
stations is difficult to reconfigure or program.
While there is off-the-shelf software available
for process control, it can be expensive,
particularly when licensing costs are
considered. In addition, these off-the-shelf
versions must be general in nature to cover all
applications, which makes it complicated to
configure and requires earth station users to
develop custom interfaces to their equipment.
With the PC quickly becoming a fixture in
standard satellite communications, there is an
obvious, growing need for PC-based systems
that provide monitor and control functions.
Comprehensive monitor and control software
that is based on an open architecture and,
therefore, capable of operating with multiple
systems, was not a reality until the late 1980s.
In 1989, a pair of satellite communications
consultants developed a software that could run
on a DOS-based PC. After immediate success,
they developed a Windows-based software for
monitor and control capabilities of earth station
systems. Once the Windows version of the
software debuted in 1994, monitor and control
systems became available that could operate
wherever Windows was installed — about four
out of every five PCs in the world.
An open architecture system gives integrators
new flexibility and replaces the outdated, error-
prone, proprietary methods of system monitor
and control functions at satellite earth stations
and other broadcast outlets. In addition to
290

eliminating errors, automated monitor and
control systems improve efficiency because
they can be customized to reflect a broadcast
network. Because system architecture is open,
they can run on the most common PC
platforms used today, including DOS, HP-UX,
OS/2, UNIX, and all versions of Windows
including Windows 95 and Windows NT.
An open architecture also means it can operate
on local and wide area networks, known as
LANs and WANs. With the network monitor
and control information available on a LAN,
users can access the system via a simple dial-up
modem or a WAN and conduct all monitor and
control functions of the broadcast system from
a remote location.
The importance
of having an
open architecture
is not limited to
the developers of
monitor and
control systems.
Every equipment
manufacturer
must base their
products on
open
architectures.
The time is
approaching
when
broadcasters
might become Figure 5
less inclined to purchase equipment that does
not provide an open architecture interface for
fear of not being able to include that device in
the overall monitor and control system. For a
broadcaster, the difference between working
with an automated system on a PC and a
proprietary method that is limiting can be
summed up in one word: efficiency.
WHAT MAKES A QUALITY MONITOR AND CONTROL SYSTEM?
With the importance of installing an advanced
monitor and control system clear, the
communications industry has begun searching
for the perfect system. Should it be UNIX-
based or work on Windows? Should it be
proprietary or feature an open architecture?
Should it work off of a mainframe or run on a
personal computer?
While there are
advantages and
disadvantages to
almost any
system, there are
definite
guidelines to use
when searching
for a monitor
and control
system to fit the
needs of the
broadcaster and
improve
operating
efficiencies.
First, it is vital
the monitor and
control system immediately reflects changes in
the real-time status of the broadcast links
through screen alarms (Figure 5). Without this
capability, the operator might as well return to
291

the days of manual monitor and control when
an engineer was reactive instead of proactive.
Second, a quality monitor and control system
should be able to be customized for specific
requirements of the broadcast system; and it
should allow users to control all primary and
subsystems levels through point-and-click
graphics. If the station's computer systems are
Windows based, how much sense would it
make to install a monitor and control system
based on a platform that might not be around in
five years, or perhaps invest heavily in a
completely different platform such as UNIX?
Based on the design of the broadcaster's
system and its requirements, it may be possible
to configure the monitor and control system to
run on a single controller. This gives the
operator systemwide monitor and control
capabilities from one location, or on multiple
PCs in a LAN-based architecture where
numerous work stations will monitor and
control the system.
In either case, a broadcaster should ensure the
monitor and control system has dial-up
capabilities to allow access to the information at
any time. This can be vital for remote system
monitoring.
The broadcast industry is respected for
providing continued service as well as service
on demand. In the telecommunications world,
technologies being installed rely on redundancy
and path protection architectures to ensure
communications are always running. For the
broadcasters, redundant architectures should also be a requirement.
Some monitor and control systems feature
redundancy capabilities as a safeguard. Instead
of one computer handling all monitor and
control functions, a backup computer is
configured into the system, allowing two PCs
to poll each other constantly. If one should fail
during operations, the second PC assumes the
monitor and control functions in less than one second.
Another characteristic of a well-designed
monitor and control system is configuration
tools that allow a user to add or delete system
devices. Additional features that are in
increasing demand and must be available with
any quality PC-based monitor and control system include:
• point-and-click simplicity;
• uplink power control systems to
compensate for rain fade;
• simple carrier monitoring capabilities to
measure signal carrier levels;
• complete macro capabilities to create
and run macro programs;
• event schedulers to allow local and
remote scheduling of transmissions;
• multiple password levels to provide
additional security for earth station operators; and
• graphics that accurately depict the
equipment being used in the broadcast
system.
WHAT ARE THE TRENDS FOR MONITOR AND CONTROL?
The broadcast industry is constantly changing.
In the world of satellite communications, video transmission is the primary function for most
earth stations, while internationally, data
communications is on the rise.
292

At the same time, the number of people
responsible for making sure those
communications go through is decreasing.
Making the most of the equipment and systems
providing the broadcast links is more important
now than it has ever been. An advanced
monitor and control system helps do just that.
Deregulation in telecommunications has not
only made it a multibillion dollar industry, it
has allowed broadcasters to consolidate
through acquisition. While it may be profitable
for one company to own multiple stations, it
does not make the monitor and control situation
easier. However, today's advanced systems
can be used to evaluate which stations are being
productive and which ones are not.
The combination of simple network
management protocol, known as SNMP, and
the shift toward open architecture design has
given operators increased capabilities. Now
they can use Hewlett-Packard Open View
software in the network, for example', and
manipulate the monitor and control system as
well as incorporate other functions such as
scheduling. The European version of the
SNMP standard, known as Q3, is already
being used for such functionality.
Developments in broadcast communications
have led to more automation and more serial
interfaces to make that possible. The evolution
in technology has reached the point where the
computers in the system are communicating
directly with another computer. And the
development of new drivers has helped lower
the cost of using a PC for monitor and control.
However, if the effort and investment devoted
to finding the right broadcast equipment is also
invested in finding the right monitor and
control system to make sure that equipment is
working the way it should, staying in the
forefront of the broadcast industry will be a
breeze. If not, the ramifications can be severe.
440
DeWayne Gray has 20 years experience in
satellite communications, has designed monitor
and control systems, managed construction of
some of the first commercial transportables,
and overseen the completion of a satellite
system installation for network television. He
formed M&C Systems in 1992 to develop
independent software for the monitor and
control of earth station systems.
293

294
DESIGNING RADIO FACILITIES: PART I Tuesday, April 8, 1997 9:00 am - 12:00 pm
Chairperson: Glynn Walden, CBS Radio, Philadelphia, PA
AN INNOVATIVE AM RADIATOR DESIGN EMPLOYING RADIATING GUY WIRES AND AM ANTENNA SYSTEM TECHNOLOGY UPDATE Clarence M. Beverage Communications Technologies, Inc. Marlton, NJ Al Christman Grove City College Grove City, PA
PERFORMANCE OF MODERN AM MODULATION METHODS INTO VARIED ANTENNA CONDITIONS John L. Delay and Hilmer I. Swanson Harris Corporation Quincy, IL
SIDELOBE-FREE ANTENNA ARRAYS - A NEW BREED IN FM BROADCAST ANTENNAS Ali Mahnad Micro-Tek Engineering Carmichael, CA
A NEW METHOD OF GENERATING THE FM AND TELEVISION STEREO COMPOSITE BASEBAND YIELDS IMPROVED BROADCAST PERFORMANCE William H. Gillman Salt Lake City, UT
IMPROVING IMMUNITY TO RF INTERMODULATION IN FM SOLID STATE BROADCAST: TRANSMITTERS FROM INTERFERING SIGNALS OF CO-LOCATED STATIONS Mukunda B. Shrestha Broadcast Electronics, Inc. Quincy, IL
STAYING ON THE AIR DURING ANTENNA SERVICE Timothy C. Cutforth P.E. Vir James P.C. Denver, CO
295

296

AN INNOVATIVE AM RADIATOR DESIGN EMPLOYING RADIATING GUY WIRES AND AM ANTENNA SYSTEM TECHNOLOGY UPDATE
Al Christman, Ph.D. Grove City College
Grove City, Pennsylvania
Clarence M. Beverage Communications Technologies, Inc.
Marlton, New Jersey
ABSTRACT
One of the greatest limiting factors in locating an AM broadcast tower is the sign cant land required for the ground system. The authors describe a novel method of feeding a grounded
tower, at least one quarter wave in height at the Alvf frequency, which overcomes this limitation since no land is required for the ground system. Computer-predicted values of radiated electric field strength for this design are competitive with those generated by conventional techniques. A scale model has been constructed and measured results are discussed as they compare to computed values. The paper concludes with a current status report on the use of elevated radial ground systems in the US. and FCC initiatives concerning new AM antenna designs.
INTRODUCTION
The goal of this project was to find a way to modify an existing communications tower located on a site with limited ground space so it could also serve as a medium-wave broadcast antenna. The tower is a 300-foot-tall Rohn [1] model SSVMWwith a face width of 36' 7" at the bottom tapering to 6 feet at the top. There are three 20-foot masts located at the apex of the tower, one on each comer, bringing the maximum tower height
7:o 320 feet. It is desired to utilize the tower as an AM-broadcast antenna operating at 1550 kHz, corresponding to a wavelength of 635 feet. At this frequency the overall tower height of 320 feet as equivalent to 0.504 wavelength.
BACKGROUND
A reference antenna was first modeled, with a NEC-2 software package called EZNEC [2], for use as a standard of comparison. A quarter-wave vertical monopole with four elevated quarter-wave horizontal radials was placed at a height of 10 meters above the ground. Figure 1 shows a perspective view of the antenna, including the short masts which support the radials and monopole. Ground constants which are appropriate for this geographical location (conductivity = 0.0015 S/m and dielectric constant = 15) were supplied as input data. The vertical component of the electric field was then calculated at a distance of 1 kilometer and a height of 50 inches (1.27 meters) above the ground. The field intensity predicted by EZNEC was 162.8 mV/m, for an input power of 1000 watts (this value was calculated bsah directly off the end of a radial, and at a point mid-way between two adjacent radials). The unattenuated field at the same distance and height was 324.2 mV/m directly off a radial end, and 324.1 mV/m midway between two radials. An identical
297
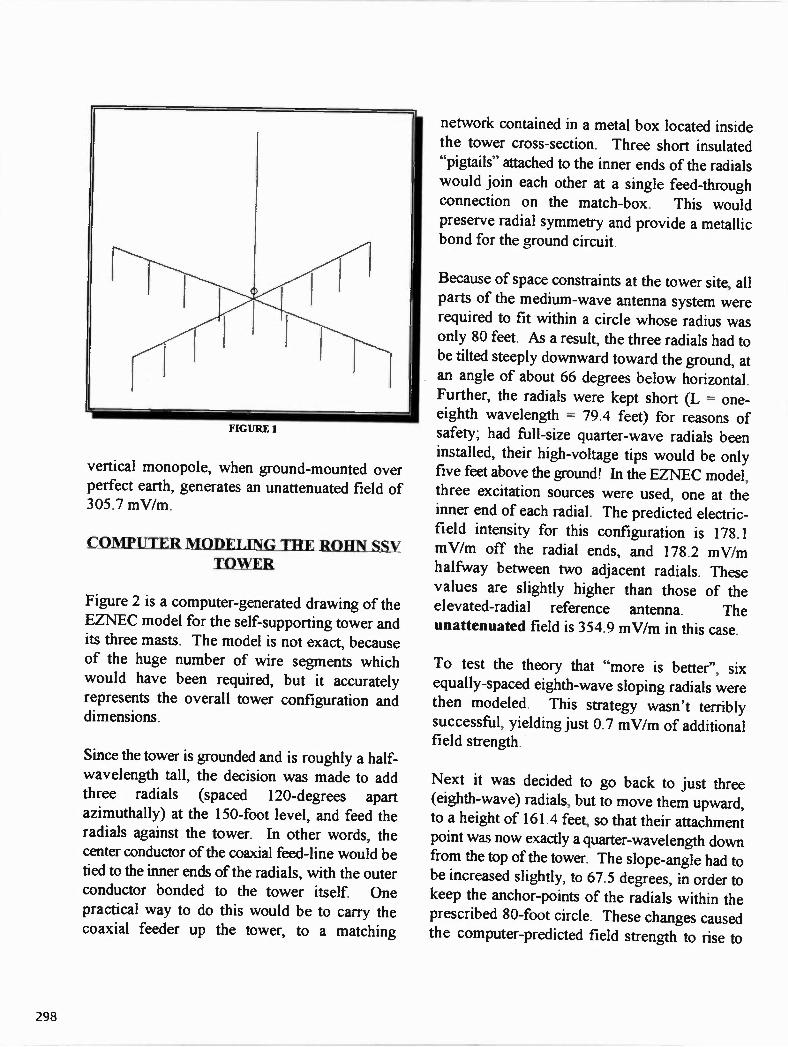
FIGURE I
vertical monopole, when ground-mounted over perfect earth, generates an unattenuated field of 305.7 mV/m.
COMPUTER MODELING THE ROHN SSV TOWER
Figure 2 is a computer-generated drawing of the EZNEC model for the self-supporting tower and its three masts. The model is not exact, because of the huge number of wire segments which would have been required, but it accurately represents the overall tower configuration and dimensions.
Since the tower is grounded and is roughly a half-wavelength tall, the decision was made to add three radials (spaced 120-degrees apart azimuthally) at the 150-foot level, and feed the radials against the tower. In other words, the center conductor of the coaxial feed-line would be
tied to the inner ends of the radials, with the outer conductor bonded to the tower itself One practical way to do this would be to carry the coaxial feeder up the tower, to a matching
network contained in a metal box located inside the tower cross-section. Three short insulated "pigtails" attached to the inner ends of the radials would join each other at a single feed-through connection on the match-box. This would
preserve radial symmetry and provide a metallic bond for the ground circuit.
Because of space constraints at the tower site, all parts of the medium-wave antenna system were required to fit within a circle whose radius was only 80 feet. As a result, the three radials had to be tilted steeply downward toward the ground, at an angle of about 66 degrees below horizontal. Further, the radials were kept short (L = one-eighth wavelength = 79.4 feet) for reasons of safety; had full-size quarter-wave radials been installed, their high-voltage tips would be only five feet above the ground! In the EZNEC model, three excitation sources were used, one at the inner end of each radial. The predicted electric-field intensity for this configuration is 178.1 mV/m off the radial ends, and 178.2 mV/m halfway between two adjacent radials. These values are slightly higher than those of the elevated-radial reference antenna. The unattenuated field is 354.9 mV/m in this case.
To test the theory that "more is better", six equally-spaced eighth-wave sloping radials were then modeled This strategy wasn't terribly successful, yielding just 0.7 mV/m of additional field strength
Next it was decided to go back to just three (eighth-wave) radials, but to move them upward, to a height of 161.4 feet, so that their attachment point was now exactly a quarter-wavelength down from the top of the tower. The slope-angle had to be increased slightly, to 67.5 degrees, in order to keep the anchor-points of the radials within the prescribed 80-foot circle. These changes caused the computer-predicted field strength to rise to
298
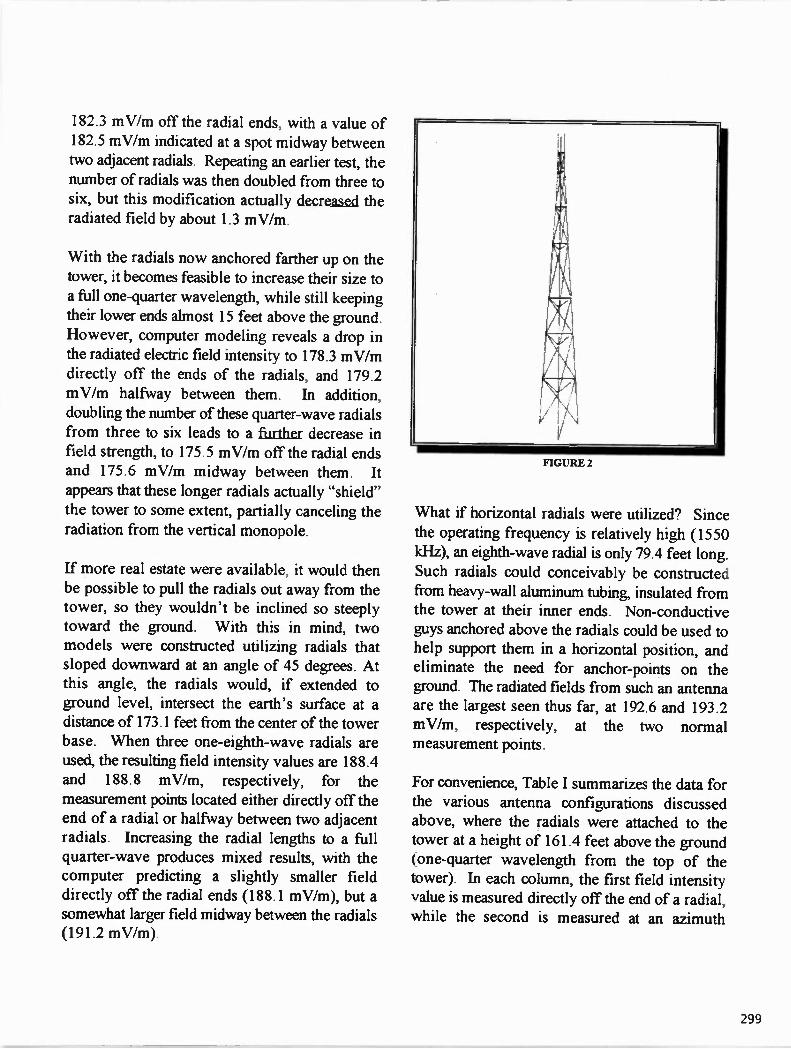
182.3 mV/m off the radial ends, with a value of 182.5 mV/m indicated at a spot midway between two adjacent radials. Repeating an earlier test, the number of radials was then doubled from three to six, but this modification actually decreased the radiated field by about 1.3 mV/m.
With the radials now anchored farther up on the tower, it becomes feasible to increase their size to a full one-quarter wavelength, while still keeping their lower ends almost 15 feet above the ground. However, computer modeling reveals a drop in the radiated electric field intensity to 178.3 mV/m directly off the ends of the radials, and 179.2 mV/m halfway between them. In addition, doubling the number of these quarter-wave radials from three to six leads to a further decrease in field strength, to 175.5 mV/m off the radial ends and 175.6 mV/m midway between them. It appears that these longer radials actually "shield" the tower to some extent, partially canceling the radiation from the vertical monopole.
If more real estate were available, it would then be possible to pull the radials out away from the tower, so they wouldn't be inclined so steeply toward the ground. With this in mind, two models were constructed utilizing radials that sloped downward at an angle of 45 degrees. At this angle, the radials would, if extended to ground level, intersect the earth's surface at a distance of 173.1 feet from the center of the tower base. When three one-eighth-wave radials are used, the resulting field intensity values are 188.4 and 188.8 mV/m, respectively, for the measurement points located either directly off the end of a radial or halfway between two adjacent radials. Increasing the radial lengths to a full quarter-wave produces mixed results, with the computer predicting a slightly smaller field directly off the radial ends (188.1 mV/m), but a somewhat larger field midway between the radials (191.2 mV/m)
FIGURE 2
What if horizontal radials were utilized? Since the operating frequency is relatively high (1550 kHz), an eighth-wave radial is only 79.4 feet long. Such radials could conceivably be constructed from heavy-wall aluminum tubing, insulated from the tower at their inner ends. Non-conductive guys anchored above the radials could be used to help support them in a horizontal position, and eliminate the need for anchor-points on the ground. The radiated fields from such an antenna are the largest seen thus far, at 192.6 and 193.2 mV/m, respectively, at the two normal measurement points.
For convenience, Table I summarizes the data for the various antenna configurations discussed above, where the radials were attached to the tower at a height of 161.4 feet above the ground (one-quarter wavelength from the top of the tower). In each column, the first field intensity value is measured directly off the end of a radial, while the second is measured at an azimuth
299

COMPARISON FOR
OF THE ROHN
TABLE CHARACTERISTICS SSV TOWER
OF RADIAL SYSTEMS
I
AND WITH
PERFORMANCE A VARIETY
Model # 1 2 3 4 5 6 7
Number of
Radials 3 6 3 6 3 3 3
Length of
Radials (A)
1/8 1/8 1/4 1/4 1/8 1/4 1/8
Slope Angle (0)
67.5 67.5 67.5 67.5 45 45 0
Atten. Field
Intensity (mV/m)*
182.3
182.5 181.1
181.1 178.3 179.2
175.5 175.6
188.4 188.8
188.1
191.2 192.6
193.2
—Nom-- All of the Radials are attached to the tower at a height of 161.4 feet above the ground (one-quarter wavelength down from the top).
In each column, the first field intensity value is measured directly off the end of the radial, while the second is measured at an azimuth midway between two adjacent radials, at a distance of 1 kilometer
and a height of 50" (1.27 m.) above the ground, for an input power of 1 kilowatt.
midway between two adjacent radials, at a distance of 1 1cM and a height of 50" (1.27 m.) above the ground, for an input power of 1 kW.
GUYED TO WERS OF UNIFORM CROSS-SECTION
For the second portion of the computer analysis, it was decided to test the elevated-radial concept utilizing a non-tapered tower. So, a 320-foot-tall uniform-cross-section vertical monopole was modeled, using EZNEC as before. We will assume that non-metallic guy wires are included, so there is no extraneous metal in the near field of the antenna. Three radials were incorporated, spaced at equal 120-degree intervals around the tower. All radials were attached to the tower at a
height of 161.4 feet, or one-quarter wavelength down from the top. Sloping radials were again modeled, but this time the tilt angle was reduced to 64 degrees. Since this tower is much "thinner" than the self-supporting Rohn SSV type, the radials don't have to be inclined quite as steeply as
before in order to satisfy the requirement that all portions of the antenna system fit inside a circle of 80-foot radius.
If one-eighth-wavelength radials are implemented, the computer-predicted electric-field intensities are 180.6 and 180.7 mV/m
respectively. Doubling the size of the radials to one-quarter wavelength
yields a slight reduction in signal strength, with values of 178.3 and 178.8 mV/m reported by EZNEC. Again, it is theorized that these longer radials produce a "shielding" effect on the lower portion of the tower, which leads to a slight reduction in performance.
If there are no space limitations, then the radials may be tilted outward away from the tower, so a series of tests was run ptilizing a slope angle of 45 degrees. Here, the use of three eighth-wave radials generated fields of 186.5 and 186.7 mV/m respectively, while longer quarter-wave radials produced values of 186.8 and 188.3 mV/m. In both cases, the radials are somewhat more effective at the larger included angles, and now the extra length of the longer radials yields a
300

COMPARISON
FOR A 320
WITH
OF CHARACTERISTICS
-FOOT TOWER
A VARIETY
TABLE
OF
OF
11
UNIFORM
RADIAL
Ni)A PERFORMANCE
CROSS-SECTION,
SYSTEMS
Model # 8 9 10 11 12
Numbers of
Radials
3 3 3 3 3
'
Length of
Radials (A)
1/8 1/4 1/8 1/4 1/8
Slope Angle
(0)
64 64 45 45 0
Alien. Field
Intensity
(mV/m)*
180.6
180.7
178.3
178.8
186.5
186.7
186.8
188.3
193.2
193.5
—Nom-- All of the Radials are attached to the tower at a height of 161.4 feet above the ground (one-quarter wavelength down from the top).
In each column, the first field intensity value is measured directly off the end of the radial, while the second is measured at an azimuth midway between two adjacent radials, at a distance of 1 kilometer and a height of 50" (1.27 m.) above the ground, for an input power of 1 kilowatt.
small increase in performance when compared with the shorter ones
Finally, three horizontal eighth-wave radials were
modeled, yielding predicted field intensities of
193.2 and 193.5 mV/m, the highest of all the
uniform cross-section configurations that were
examined. A summary of these results is shown in Table II.
SCALE MODEL CONSTRUCTION
In order to confirm theoretical radiation efficiency and impedance data developed in the computer analysis a physical scale model of the tower was constructed. The model was built to a scale of 69.6:1 (1.55 mHz equals 107.9 mHz) and was assembled from brass rod and tubing. The scale
model is 55" tall and 6.3" across at the base. Cross members and diagonals were constructed to duplicate the computer model wire list. Figure 3 is a photograph of the upper three quarters of the tower showing the N connector feed and three sloping 1/8 wave radiating elements slanted at a slope angle of 67.5 degrees. The model was mounted on a plexiglass base for structural stability.
SCALE MODEL MEASUREMENTS
The feed point impedance of the model was measured at D.W. Sargent Broadcast Service in Cherry Hill, New Jersey using a Hewlett Packard Model 8753B network analyzer. The model was mounted approximately ten feet above ground on a wooden platform and free from nearby metallic objects which would affect the antenna impedance.
Prior to taking readings, approximately 60 feet of coaxial cable was run from the network analyzer to the tower model and the coax run up inside the tower in the location that would be used for the actual measurements. The network analyzer was then calibrated with a precision short, open, and a 50 ohm termination. After calibration, the impedance at the tower model feed point was measured from 88 to 128 mHz in 1.6 mHz steps. This compares to a sweep from 1.26 mHz to 1.84 mHz in 22.1 kHz steps. The sweep data was printed out in resistance and reactance and may be found in Table 111.
Confirmation of the antenna system's radiation efficiency was desired and was obtained through the following process, A pair of 1/4 wave vertical radiators were constructed for the scale model frequency of 107.9 mHz using brass tube for the
301
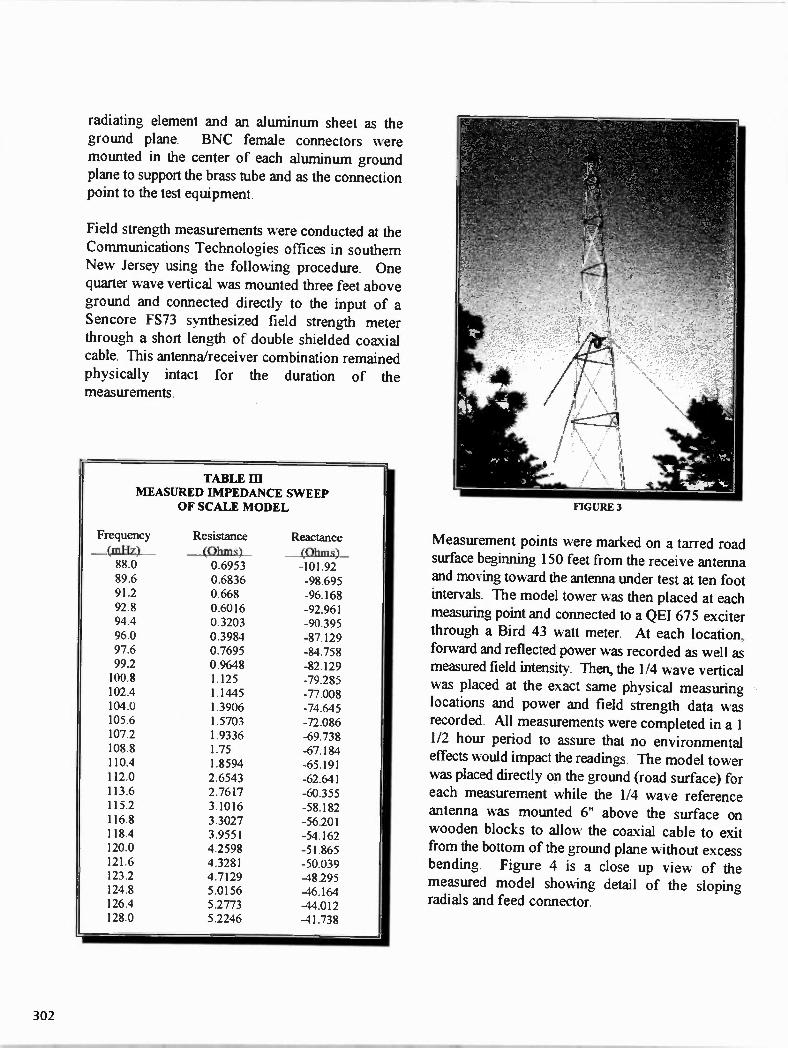
radiating element and an aluminum sheet as the ground plane BNC female connectors were mounted in the center of each aluminum ground plane to support the brass tube and as the connection point to the test equipment.
Field strength measurements were conducted at the Communications Technologies offices in southern New Jersey using the following procedure. One quarter wave vertical was mounted three feet above ground and connected directly to the input of a
Sencore FS73 synthesized field strength meter through a short length of double shielded coaxial cable. This antenna/receiver combination remained physically intact for the duration of the measurements
TABLE DI MEASURED IMPEDANCE SWEEP
OF SCALE MODEL
Frequency Resistance Reactance
(mY17) (Ohms) (Ohms) 88.0 0.6953 -101.92
89.6 0.6836 -98.695 91.2 0.668 -96.168 92.8 0.6016 -92.961 94.4 03203 -90.395 96.0 0.3984 -87.129 97.6 0.7695 -84.758 99.2 0.9648 -82.129 100.8 1.125 -79.285 102.4 1.1445 -77.008 104.0 1.3906 -74.645 105.6 1.5703 -72.086 107.2 1.9336 -69.738 108.8 1.75 -67.184 110.4 1.8594 -65.191 112.0 2.6543 -62.641
113.6 2.7617 -60.355 115.2 3.1016 -58.182 116.8 3.3027 -56.201 118.4 3.9551 -54.162 120.0 4.2598 -51.865 121.6 4.3281 -50.039 123.2 4.7129 -48.295 124.8 5.0156 -46.164 126.4 5.2773 -44.012 128.0 5.2246 -41.738
FIGURE 3
Measurement points were marked on a tarred road surface beginning 150 feet from the receive antenna
and moving toward the antenna under test at ten foot intervals. The model tower was then placed at each measuring point and connected to a QEI 675 exciter through a Bird 43 watt meter. At each location. forward and reflected power was recorded as well as
measured field intensity. Then, the 1/4 wave vertical was placed at the exact same physical measuring locations and power and field strength data was recorded. All measurements were completed in a 1 1/2 hour period to assure that no environmental
effects would impact the readings. The model tower was placed directly on the ground (road surface) for each measurement while the 1/4 wave reference antenna was mounted 6" above the surface on
wooden blocks to allow the coaxial cable to exit from the bottom of the ground plane without excess bending. Figure 4 is a close up view of the measured model showing detail of the sloping radials and feed connector.
302

FIGURE 4
COMPARISON_,_MEASURERDATA_TO CALCULATED DATA
At 1550 kHz, the feed point impedance of the tower was calculated using a modified EZNEC model containing only a single source. The antenna was modeled using either aluminum or copper and in free space or over real earth giving the impedance results found below:
Aluminum/Real Earth Aluminum/Free Space 6.42 - J88.3 1.1'0 - J87.7
Copper/Real Earth
6.2U - J88.5 Copper/Free Space
0.8'Q - J88.0
Given that the model was measured at a height of just over 1 wavelength above the earth, we would anticipate that the measured data would be close to, but slightly greater than, the free space value.
The measured value of 1.9D - J 68.6 gives very good correlation with the calculated values shown above
With regard to field intensity, a standard quarter wave radiator would be expected to have an unattenuated field of 306 mV/m/kW at one
kilometer versus the tower model at 355 mV/m. This equates to an anticipated 0.3 dB greater measured field intensity for the model. Analysis of the field measurement data showed that the average of the data points gave a 0.5 dB greater field intensity for the model than for the quarter wave reference antenna. These measurements confirm the computer predicted antenna model radiation efficiency but should not be construed to demonstrate an efficiency greater than the computer model as this would presume a greater accuracy than is believed to exist on the model range.
In the course of conducting the measurements additional tests were run to confirm the computer model. The scale model was rotated to determine if there was a measurable difference in field intensity on the radial ends when compared to a point midway between the radials. No change could be discerned. All impedance and field intensity measurements were made with each radial exiting the tower through the center of a face. All three radials were then turned clockwise to bring them closer to the tower legs. No effect on field strength was seen until the radials were less than an inch from the tower legs. The slope of the radials was decreased to 45° and the impedance of the tower was measured a second time. The lesser slope increases the feed point resistance by approximately 20% with little change in reactance.
UPDATE -ELEVATED_RADIALGRO nin SYSTEM
Sparse elevated radial ground systems were described to the broadcast community in the March 1988 issue of the IFFE Transactions On Broadcasting in an article titled, "AM Broadcast
303

STATIONS
Call Sign
OPERATING
City State
WITH
Frequency
(kHz) Power (kW)
TABLE IV
ELEVATED
Number Elevation
(m)
RADIAL GROUND
Elevated Radial Implementation
Radial Material
SYSTEMS
Number of
Towers
Feed Type Connection
WGNY Newburgh NY
1200 1
Four 5
Steel guy strand
1 series sloping
WCM:X Leominster
MA 1000
1 Six
5 Alumaweld 1 shunt
sloping
WWJZ Mt Holly NJ
640 50
Six 5
Coppenveld 4 series sloping
KGGN Gladstone MO
890 1
Six 5
Alumaweld 2 series sloping
WPCI Greenville SC
1490 1
Four 5
Copper 1 series straight
KVML Sonora CA
1450 1
Four 5
Copper 1 series straight
Antennas with Elevated Radial Ground Systems" [3]. In November of 1988, the first, full size,
antenna system with an elevated radial ground system was built in Newburgh, New York under FCC call sign KPI-204.
In the intervening nine years, elevated radial ground systems have been implemented at a number of broadcast stations. Table IV is a list of installations known to the authors and is not represented to include every elevated radial system in the United States. All facilities employ radials 90° in length and the radials are insulated from ground except at tower base. The connection type described as sloping refers to radials sloping up and away from the base pier at a 45° angle until the full radial elevation height is reached. Straight refers to radials which are horizontal for their entire length and are attached to the tower at the listed elevation with an insulator.
Current FCC policy states that all stations which implement an elevated radial ground system must conduct radial field intensity
measurements to confirm that the antenna system radiation efficiency conforms with the construction permit value. The FCC is now seeking input to determine if the policy should be modified to allow elevated radial systems, meeting certain basic standards, to be licensed without the need for field strength readings. Based on the
universe of constructed stations, to date, the following minimum standards are suggested in order to achieve FCC approval and forego the
need for proof-of-performance measurements.
SIJGGESTED MINI MUM INSTALLATION STANDARDS
- ELEVATED RADIAL GROUND SYSTEMS
All radials to be a minimum of 90° in length and permanently supported to prevent sagging and instability.
2 Radials to be constructed of alumaweld, copperweld or similar low loss material.
3. Minimum radial elevation height to be at least 5 meters above ground.
4 Elevated radial ground systems to
304

consist of 4 to 6 equally spaced radials all electrically bonded to one common point at tower base. Radials to be supported on low loss support posts with no other ground connections.
5. With directional arrays, elevated radials must be installed in such a fashion that the radials of adjacent towers do not come into physical contact with one another.
FCC AM RULE MAKINGS - AM ANTENNA SYSTEMS
Parties interested in any of the following topics
- elevated radial ground systems, MM Docket No. 93-177, "An Inquiry into the Commission's Policies and Rules Regarding AM Radio Service Directional Antenna Performance Verification", or RM 8883 "Amendment of AM Service Rules To Permit The Use Of Directional Antennas With Parasitic Elements And Slant Wire Elements" are encouraged to submit Comments to the FCC concerning these matters. The more interest that is shown in these antenna system innnovations, the more attention they will receive at the Commission.
Many of the innovations and Rule changes addressed above will result in significant dollar savings to broadcasters and an overall improvement in the quality of the AM band. Commenters are encouraged to communicate directly with the FCC engineer in charge of AM antenna cases, Mr. Joseph M. Johnson, FCC Mass Media Bureau, Room 568, 2000 M Street, NW, Washington, DC 20554.
CONCIALSIO_N
This paper has shown a simple way to add
medium-wave transmitting capabilities to an existing multiple-use commercial tower installation. Both free-standing, tapered and uniform cross-section guyed towers have been studied, and in each case the computer-predicted electric-field strengths are competitive with those generated by conventional installations. Scale model testing has confirmed the radiation efficiency of the computer generated model for the free standing, tower studied
In terms of practical implementation it should
be known that half wave towers are not required for this design. A half wave tower was chosen
to replicate an actual real world case. Tower heights as short as a quarter wave have been modeled with the sloping radials supported at the top of the tower resulting in radiated field intensity values which meet the FCC minimum radiation standard of 282 mV/m/kW at one kilometer. The model described herein had a low drive point impedance. The drive point impedance would be greater with longer radials and more easily matched. In the oral presentation of this paper FCC acceptance of this radiator design will be discussed in terms of nighttime operation.
REFERENCES
I. Rohn Corporation. 6718 W. Plank Road, P.O. Box 2000, Peoria. IL 61656
2. EZNEC is available from Roy Lewallen. W7EL, P.O. Box 6658, Beaverton, OR 97007
3 Richard Adler, Jim Breakall, Al Christman, Roger Radcliff, and Al Resnick, "AM Broadcast Antennas with Elevated Radial Ground Systems," IEEE Transactions On Broadcasting, March 1988.
305

PERFORMANCE OF MODERN AM MODULATION METHODS INTO VARIED ANTENNA CONDITIONS
Hilmer I. Swanson and John L. DeLay Harris Corporation Quincy, Illinois
ABSTRACT In order to achieve the best possible signal quality and maximum coverage it is important to understand how different modulation methods perform under varied antenna conditions. This paper examines the performance of PDM and Digital modulation into three different narrow band antenna conditions. Each narrow band antenna condition presented a 1.4:1 VSWR at the +/-10kHz sidebands. The digital transmitter used for the test is the Harris DX10 which uses a 12 bit digital synthesis modulation method The PDM transmitter used was a Harris Gates 2 which
uses Polyphase Pulse Duration Modulation. The most important difference between the two transmitter designs is that the DX transmitter does not require a PDM low pass filter between the modulator and power amplifier to eliminate the PDM switching frequencies.
DESIGN CONSIDERATIONS FOR THE IDEAL TRANSMITTER
An ideal transmitter does not cause changes in the 30-10,000Hz frequency range and does not require the signal to pass through a circuit with a non-constant group delay or non-flat frequency response. Any transmitter which has deviations in flatness and phase-
linearity will cause spurious modulation peaks because the shape of a peak limited waveform is changed. Any
peaks of this nature add nothing to the average modulation level. Thus, the average modulation level must be lowered to accommodate for undesirable overshoots or peaks to prevent the possibility of over-modulation.
To achieve maximum loudness and fidelity, the ideal transmitter should allow 100% negative modulation without increased distortion due to over shoot. Any transmitter which exhibits negative overshoot will require the average modulation (loudness) level to be
reduced to prevent over-modulation and the associated splatter.
For maximum performance, an ideal AM transmitting system is designed as a system from the audio input through the PA transistor to the antenna. When designed as a system, each part of the system can
complement the other parts. For instance, the selectivity of the transmitter output network can help broadband the antenna if the correct phase rotation is selected.
The ideal transmitter should exhibit low distortion regardless of the load conditions or modulation level. Several methods for measuring distortion are available, THD, SMPTE (IMD), CCIF (IMD) and TIM. The two distortion measurements which reveal the most about a transmitter are THD and (TIM). Transient intermodulation is the best measurement to determine a transmitter's ability to reconstruct a complex processed audio waveform.
The Basic Modulation Methods In the late 1960s Harris developed pulse duration
modulation (PDM), a technique that offered improved efficiency and audio quality. The design created a 70kHz pulse train with its pulse width rate of change being equal to the audio frequency. A single phase PDM design requires a filter with a sharp roll off to avoid transmission of the 70kHz switching frequency. This sharp filter causes overshoot from the inherent group delay characteristics.
PPDM Modulation
Harris Polyphase (PPDM) was an improvement over the single phase PDM approach. The design uses a 4
phase PDM generator which uses a switching frequency of 60kHz resulting in an effective switching rate of 240kHz. Since the PPDM design operates at
306

240kHz the group delay variation of the filter is less
than in a single phase PDM design. The phase linearity of the PPDM filter also minimizes the overshoot of the filter. The main advantage of PPDM design is that the
performance degradation due to the filter is less than in a single phase PDM design. Both PDM and PPDM transmitters operate as high level modulated RF generators requiring a filter between the modulator and PA. However, since the PA is the load for the PDM filter, the performance of the filter is affected by antenna impedance variations resulting in increased distortion.
A non symmetrical RF load on a PDM or PPDM transmitter does not affect the PDM filter if the average impedance between the upper and lower side bands is the same as the carrier value. However, the PA will generate distortion due to the non symmetrical load just like any transmitter.
Digital Modulation
In 1987 Harris introduced a design called "DX" which employees digital synthesis to generate the amplitude modulated waveform. The design is unique in that it does not have a modulator, the RF envelope and sidebands are generated by turning on and off RF amplifiers. Since Harris DX transmitters do not require a modulator or low pass filter between the modulator and PA, many of the problems inherent in a PDM transmitter are eliminated.
The DX10 digital transmitter operates similar to an ideal voltage source. Changes in the resistive value of the DX transmitter load impedance have almost no affect on the performance of the transmitter. During normal modulation, the load impedance for a DX RF amplifier module is constantly changing as part of the modulation process. At the negative peak of 100% modulation, all the amplifiers are off. The first amplifier of a DX10 that turns on sees an impedance of about 1200 ohms. When the next amplifier turns, on the current doubles. This causes the impedance to drop to 600 ohms. When the third amplifier turns on, it sees an impedance of 400 ohms. Therefore, it can be seen that changes in load impedance are not an inherent problem for DX transmitters.
Audio Processing for AM Transmitters AM performance is dependent on the high power RF stage of the transmitter and the antenna system. Broadcast facilities use audio processing to achieve optimum signal coverage and loudness. Most
processors use clipping, limiting and pre-emphasis to obtain the optimum signal. However; even today's modern processors cannot compensate for some RF related performance problems in a transmitting system which has not been optimized.
Performance Measurements Each transmitter was tested into four operating conditions, a 50 ohm load, Bandpass, PI , and TEE network. The Gates 2 and DX10 have (-45) degrees of phase shift from the output of the transistors to the output of the transmitter. The voltage and current are in phase at the output of the bandpass filter prior to the output tee matching network. ( Refer to Fig. 1) The distortion and response plots were measured at 4 different sampling points as follows:
1. The current sample I which is at the 0 Degree point and is in phase with the transistors. The voltage sample VO° which is at the 0 degree point and is in phase with the transistors.
3. The voltage sample V45° which is at the (-45) degree point, with respect to the transistors.
4. The DL sample which is at the dummy load.
The data clearly demonstrates the importance of using a correct sample point for different load conditions.
Gates and DX10 Output Network
T ; Y r ,
rit
T 3 e r.•+.e
Figure 1
Bandpass Network The bandpass network (refer to Fig. 2) is a series LC
circuit which is adjusted to series resonance with a 3dB bandwidth of +/-35kHz from the carrier.
Pi Network
The PI network was designed to add (+45) degrees to the bandpass network and is tuned to present a symmetrical load at the transistors. This presents a load which looks like a series RLC network at the
transistors. Therefore, a current sample that is in phase with the transistors was used for distortion measurements.
307
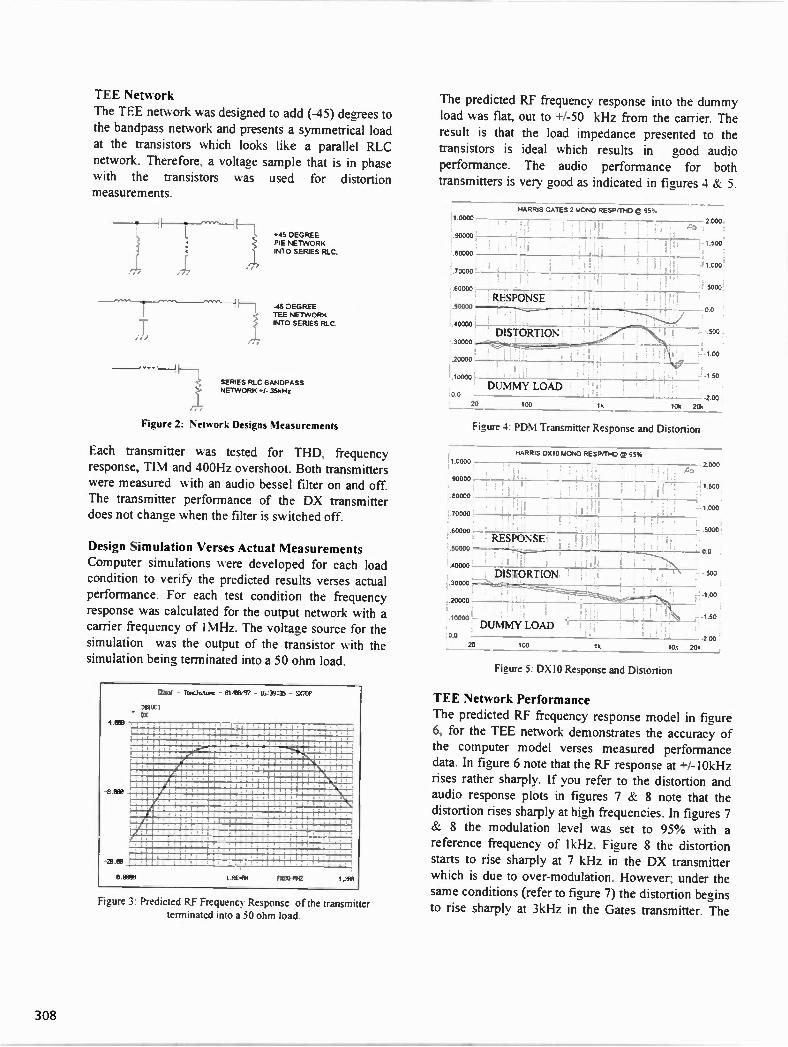
TEE Network
The TEE network was designed to add (-45) degrees to the bandpass network and presents a symmetrical load at the transistors which looks like a parallel RLC
network. Therefore, a voltage sample that is in phase with the transistors was used for distortion measurements.
v
/77
*45 DEGREE PIE NET WORK INTO SEFUES RLC.
-45 DEGREE TEE NETWORK INTO SERIES RLC.
SERIES RLC BANDPASS NETWORK *1- 35kHz
Figure 2: Network Designs Measurements
Each transmitter was tested for THD, frequency response. TIM and 400Hz overshoot. Both transmitters were measured with an audio bessel filter on and off. The transmitter performance of the DX transmitter does not change when the filter is switched off.
Design Simulation Verses Actual Measurements Computer simulations were developed for each load condition to verify the predicted results verses actual performance. For each test condition the frequency response was calculated for the output network with a carrier frequency of 1MHz. The voltage source for the simulation was the output of the transistor with the simulation being terminated into a 50 ohm load.
Figure 3: Predicted RF Frequency Response of the transmitter terminated into a 50 ohm load.
The predicted RF frequency response into the dummy load was flat, out to +1-50 kHz from the carrier. The
result is that the load impedance presented to the transistors is ideal which results in good audio performance. The audio performance for both transmitters is very good as indicated in figures 4 & 5.
1 0000
90000
.80000
70000
HARRIS GATES 2 MONO RESP/TMD (1 95%
60000
RESPONSE 50000
40000
DISTORTION 30000
20000 . I ' I
.10000
DUMMY LOAD 00 2.00
20 100 16 106 208
00
2.000
• 1.500
- 1.000
5000
Figure 4: PDM Transmitter Response and Distortion
1.0000
;90000
.1110000
HARRIS 0510 MONO RESP/THD C 95%
• .40000
RESPONSE
DISTORTION 30000 :-
20000
.10000 DUMMY LOAD
0.0
2 000
-1000
00
- 500
.1 95
29 100 200
18 106 208
Figure 5: DX10 Response and Distortion
TEE Network Performance
The predicted RF frequency response model in figure 6, for the TEE network demonstrates the accuracy of the computer model verses measured performance data. In figure 6 note that the RF response at +/-10kHz rises rather sharply. If you refer to the distortion and audio response plots in figures 7 & 8 note that the
distortion rises sharply at high frequencies. In figures 7 & 8 the modulation level was set to 95% with a
reference frequency of IkHz. Figure 8 the distortion starts to rise sharply at 7 kHz in the DX transmitter which is due to over-modulation. However; under the
same conditions (refer to figure 7) the distortion begins to rise sharply at 3kHz in the Gates transmitter. The
308

reason for this is that the PDM filter is no longer terminated into the correct impedance.
Figure 6: Predicted Amplitude Response of the PDM Transmitter and DX10 Connected to -45° and Bandpass Network Terminated
into a 50 ohm load.
HARRIS GATES 2 MONO RESPiTHD la 95% 2.0020
1
1 8000 --TEENE-Tit-ORK 2000
1 1 6000
• . " ,.. I , A • _1.500
1
1 A000 - - .- - —
1 I ' : ifliIk -1.000
I iF . .- 5000
R ESPONSE 1 0000 i5 0.0
40000 -- DISI OR n O N '
o
I
.-, . 1.00
• ....,..- . ...._..,_/ ;
_..--___,....... ,_ _______ .20000
_ _ 0 0 T 20 100 1k 10k 206
Figure 7: PDM Transmitter Response And Distortion
Under the same test conditions into the Tee network the PDM transmitter distortion is much worse than the DX10. (refer to figures 7 & 8) The maximum distortion at 7kHz for the DX10 is 0.4% while the PDM transmitter is 1.8%. The sharp rise in distortion above 7kHz in the DX transmitter is due to over-modulation which is a function of the load. In figure 9 the modulation level was readjusted to 95% referenced to 12kHz. The result is that the distortion due to over-modulation was eliminated. This demonstrates that the DX transmitter achieves good audio performance into a bad antenna system if you simply compensate for the
rising frequency response into this load. It is important to note that the correlation between the computer models and actual performance for the DX transmitter are quite good. However, the correlation of the computer model for the Gates transmitters is not as good due to the effects of the PDM filter.
3.0000 HARRIS DX10 MONO FtESP M-10 122 95%
TEE NETWORK 2.000
\ r
W I) 4 1 500 2 5030 c c
1.0000
50000 — - - -
20 100
L. -1.50 !
-2.00 16 10k 206
1111 '.
NOD
Figure 8: DX10 Response and Distortion
DIONOCFEEPIrg&AVIDIAIDaT. ERZ TEE NETWORK
RESPONSE
5101 DISPERITCJN - -L91
00 k _ _10c _2172°)
Figure 9: DX10 Distortion and Response Referenced to 12kHz.
Optimized TEE In figure 10, system performance was modeled for a DX10 transmitter to show that it is possible to compensate for an antenna which presents a load sim)lar to the (-45°) network described in figure 2. The modification required to achieve the flat frequency response was to increase the "Q" of the series tuned circuit in the output network of the transmitter by 4:1. This change results in a flat frequency response at +/-25kHz from the carrier.
309

Figure 10: Predicted RF Amplitude Response of the DX10 after optimization.
PI Network Performance:
In figure 11 note the RF frequency response of the transmitter into the PI network rolls off at high frequencies as is the case with the distortion and
response plots in figures 12 and 13. The computer models for the TEE & PI network have very good correlation with the measured data.
Figure 11: Predicted Amplitude Response of the PDM Transmitter and DX10 Connected to +45° and Bandpass Network Terminated
into a 50 ohm load.
Figure 12: PDM TRANSMITTER Response and Distortion
1-1FRSDIOKICHETIEDgF/0
gia y PIENE MORK_
.8310-
HOD ' DO' 0
V450
_
.4110- usiuuKxc -.51)
-103 -1110 -LD .10Et
00 - — -'CD 1CO k
Figure 13: DX10 Response and Distortion
Bandpass Network Performance As can be seen in figure 14 the RF frequency response of the transmitter is non symmetrical. Of the three load conditions, the non-symmetrical load has the most effect on both type transmitters. In figure 15 & 16 the
performance of both transmitters is affected by the network due to the non-symmetrical load presented to the transistors.
310

Figure 14: Predicted Amplitude Response of the PDM Transmitter and DX10 Connected to the +/-35kHz Bandpass Network
Terminated into a 50 ohm load.
Figure 15: PDM Transmitter Response and Distortion
HIRSINOMDCFEEFIH W/0 NOD 20:0 1.810 -_BANDPASS NETWORK 1510
MOD 14:0) 1(10
LTIO V45 0 4 RESPONSE
MX-- --
.ROD VO0 4
110D DISTORTION -10)
411D-
--1 1)
Figure 16: DX10 Response and Distortion
-L531
-2(:0
OVERSHOOT PERFORMANCE
Overshoot is a critical performance measurement since it determines the maximum achievable modulation level without exceeding the 100% negative and +125% positive peak modulation limits allowed by the FCC. Because sideband power is proportional to the square of the peak RF voltage of the transmitter, a 5% reduction in RF voltage, due to overshoot, results in a 10% reduction in sideband power. The ideal transmitter exhibits no overshoot and will result in more sideband power, sound louder and provide better signal coverage. Equally important, over modulation
on the negative peak, due to overshoots, causes spectral splatter.
It is also important to point out that PDM transmitters
use an audio input bessel filter which partially compensates for the effects of the PDM filter. Refer to figure 17 which demonstrates the response of the Harris PDM transmitter with the bessel filter switched on and off When the filter is switched on the high frequency information is attenuated therefore, the signal will not be as intelligible.
ICOD
00
-10D
_No)
-.30D
-40D
HifiSCAIMNOCEEP@IY/0
BESSE. FILTER OFF
BESSEL FILTER ON
alMVIY LOAD
1C0
Figure 17: PDM TRANSMITTER Frequency Response

Figure 18: PDM Transmitter 400Hz Overshoot Bessel Filter Off 95% Modulation.
Figure 19: PDM Transmitter 400Hz Overshoot Bessel Filter On 95% Modulation
DX10 400Hz OVERSHCOT BESSEL FILTER OFF M=95%
iniemems
PEAK TO PEAK OVERSHOOT = <02fP/o
. V
-2.36000 DUMMY LOAD
[PERSISTENCE SINGLE
• or SCREENS -1 MI 2 4
Off FRAM so.CS
COmn[C , Ows .1 ON
Figure 20: DX10 400Hz Overshoot Besse] Filter Off 95% Modulation.
The ideal transmitter can achieve 100% negative modulation without increased distortion or splatter. This is not possible if the transmitter has any overshoot. Figures 20, 23, 25, 29 demonstrate the superior performance of a digitally modulated transmitter which has virtually no overshoot. This means that the modulation level can be increased to 100% under any load condition without an increase in distortion or spectral splatter. In figures, 18 and 19 note there is a large reduction in the peak to peak overshoot in a PDM transmitter when the bessel filter is switched on while operated into an ideal load.
GATES2400Hz OVERSH OT BESSEL FILTER OFF M=95%
PEAK TO PEAK OVERSHOOT=92%
— .
-1.440'
PI NETWORK
[ CONNECT ooTs —I
oft
Figure 21: PDM Transmitter 400Hz Overshoot Bessel Filter Off 95% Modulation.
GATES 2 4001-1z OVERSHOOT BESSEL FILTER ON M=95%
PM DETECT j
PEAK TO PEAK OVERSHCOT = 92%
I•Pez•••,-.'•••••-•
-I.36000 as -300.00 u, 6 0.00 s3
' PI NETWORK
r CONNECT DOTS ON
Figure 22: PDM Transmitter 400Hz Overshoot Besse! Filter Off 95% Modulation.
312

DX10400Hz OVERSHOOT BESSEL FILTER OFF M=95%
PEW TO PEAK OVERSHCOT=<5cY0
PERSISIENCE
SI NGLE
[• OF SCREENS 7
MIN 2 4
PI NETWORK
orr FRAME
ARCS M E=
F CONNECT DOTS 7
ON !
Figure 23: DX10 400Hz Overshoot Bessel Filter Off 95%
Modulation.
GA 1 EN 2400Hz OVERSHCOT BESSEL FILTER ON M=80%
IZ MIR
ARRN i• PEAK TO PEAK OVERSHCOT =14%
BANDPASS NETWORK
PEAR DE TECT I
[PERSIS TENCE
SINGLE 1 .11- 111
orr rotorot 1
AIMS
r CONNEC T 03TE n
ON j
Figure 24: PDM Transmitter 400Hz Overshoot Bessel Filter Off 80% Modulation.
X10 400Hz OVERSHOOT BESSEL FILTER OFF M=95%
PEAK TO PEAK OVERSHOOT=<1%
PERSISIENCE
SINGLE
• [ 2 •
Orr FRAME
ARES M O M
BANDPASS NETWORK
CONNECT 00 ,1
Off
Figure 25: DX10 400Hz Overshoot Bessel Filter Off 95% Modulation.
GATES 2400Hz OVERSI-100T BESSEL FILTER OFF M=8CP/0
PERK OETECT
[PERSISTENCE SINGLE :ttt$,,n$JI lau
Of SCREENS —1
,11 ;74711ii =. 9 O M 2 4
1111
PEW TO PEAK OVERSHOOT =2CP/0 ONNECT POTS —1
BANDPASS NETWORK
Figure 26: PDM Transmitter 400Hz Overshoot Bessel Filter On 80% Modulation.
Figure 27: PDM Transmitter 400Hz Overshoot Bessel Filter Off
95% Modulation.
The only condition in which the DX transmitter exhibits overshoot (refer to figure 29) is when operated into the TEE network. This is due to the rapid rise in RF frequency response predicted in figure 6 which results in group-delay which causes overshoot. Figures 27 and 28 show the effects of operating a PDM transmitter into a load condition which mistunes the PDM filter.
313

Figure 28: PDM Transmitter 400Hz Overshoot Bessel Filter On 95% Modulation.
The data clearly indicates that the digitally modulated transmitter delivers superior overshoot performance into all antenna conditions. It is also apparent that overshoot performance can be improved in a PDM transmitter by limiting the audio frequency response to compensate for the high frequency group delay variations of the PDM filter. Broadcasters should understand the overshoot characteristics of a transmitter to insure they can achieve maximum benefit with their processing. It is important to measure the following parameters with the bessel filter off:
I. Peak negative overshoot which dictates the maximum average modulation level which can be achieved on the negative peak.
2. Peak positive overshoot which dictates the +125% limits which can be achieved.
3. Peak to Peak overshoot which dictates the limits for the total envelope power which can be achieved.
Slew Induced Distortion
The audio community has given much attention to transient intermodulation distortion (TIM) sometimes referred to as slew induced distortion. Slew induced distortion (SID) is caused by having an amplifier which has insufficient or asymmetrical available rate of change of its output wave form. Amplifiers exhibit slew induced distortion when the program waveforms try to force the output of the amplifier to change faster than the amplifiers slew rate limit. Transmitters which provide audio feedback for correction are very prone to this type of distortion.
DX10400Hz OVERSHOOT BESSEL FILTER IN M=95%
onemem. j
PEAK TOPEAK OVERSHOOT= 14%
"IEET•EIINORK
[PERS:SrENCE ---.
S1h4LE
• or SCREENS 7
OEM 2 4 j
Orr FRAmI I
A.ES M E M j
COMK[C, 03 ,3 - N
DM ,
Figure 29: DX10 400Hz Overshoot Bessel Filter On 9..)% Modulation.
It is not widely recognized that different modulation methods result in different levels of slew induced distortion. It is also not recognized that some transmitters measure good for THD but yet sound very bad due to slew induced distortion.
It is quite common for manufactures to perform TIM measurements with the bessel filter switched on which decreases the audio bandwidth of the transmitter. In the case of the PDM transmitter, when the bessel filter is switched on the high frequency components are
attenuated. Since TIM is a measurement which uses a 2.96kHz squarewave mixed with a 8kHz sinewave at an amplitude ratio 4:1, the high frequency components are attenuated, therefore; the measurements are invalid. Table 1 thru 4 compares the performance of a PDM transmitter and DX10 with the bessel filter on and off.
Table 1: Transient Intermodulation Into the RF Load
MOD. Level
PDM BESSEL FILTER
ON
PDM
BESSEL FILTER OFF
DX BESSEL AUDIO
ON
DX
BESSELL AUDIO OFF
20% 0.55 0.55 0.38 0.38 40% 0.29 0.30 0.17 0.17 60% 0.20 0.21 0.14 0.14 80% 0.18 0.38 0.10 0.10 90% 0.19 0.54 0.13 0.13 95% 0.27 0.70 0.16 0.16
314

Table 2: Transient intermodulation Into the PI Network
MOD. Level
PDM BESSEL FILTER ON
PDM BESSEL FILTER
OFF
DX BESSELL FILTER ON
DX BESSELL FILTER OFF
20% 0.62 0.63 0.33 0.33 40% 0.28 0.29 0.17 0.17 60% 0.22 0.23 0.13 0.13 80% 0.19 0.60 0.11 0.11 90% 0.18 0.73 0.13 0.13 95% 0.30 0.80 0.16 0.16
Table 3: Transient intermodulation Into the Bandpass Network
MOD. Level
PDM BESSEL
FILTER ON
PDM BESSEL FILTER OFF
DX AUDIO
FILTER ON
DX AUDIO FILTER OFF
20% 0.60 0.6 .38 .38 40% 0.27 0.3 .24 .24 60% 0.22 0.22 .24 .24 80% 0.17 0.36 .44 .44 90% 0.16 0.85 .51 .51 95% 0.27 1.5 .86 .86
Table 4: Transient intermodulation into the TEE Network.
MOD. Level
PDM BESSEL FILTER IN
PDM BESSEL FILTER OFF
DX AUDIO FILTER ON
DX AUDIO FILTER OFF
20% 0.58 0.60 0.39 0.39 40% 0.30 0.32 0.18 0.18 60% 0.22 0.35 0.14 0.14 80% 1.20 1.6 0.15 0.15 90% 1.91 2.03 0.15 0.15 95% 2.26 2.28 0.38 0.38
Test Condition: 95% Mod. 2.96/8 kHz 4:1
The data is quite conclusive that the digital transmitter results in superior TIM performance when measured under valid operating conditions which are with the audio bessel filter off. Transient intermodulation performance of the PDM transmitter is worse into the bandpass and tee network conditions. This is most likely due to the effects of the PDM filter being mistuned by the narrow band load conditions.
CONCLUSIONS Performance and the accurate measurement of performance requires that attention be paid to the following details: I. The impedance presented to the tube or transistor
should be "symmetrical".
Performance should be measured at a location along the transmission line where the impedance is also symmetrical.
3. Performance should be measured employing a
current sample or a voltage sample depending on the type of symmetry presented. If the impedance is similar to that of a series RLC circuit, a current sample should be employed. Because all the current flowing through a series circuit passes through the resistor independent of frequency. If
the impedance at the measuring point is similar to
that of a parallel RLC, a voltage sample should be employed. Because the parallel resistance,
component, stays constant with frequency, and all the voltage appears across the load resistor. Power is voltage squared divided by resistance at all frequencies. When measuring performance, the current and voltage should both be observed so that the modulation is not increased to the point where one of the samples shows clipping at the negative peak of modulation.
It is possible to model a total system and predict the performance with a high degree of accuracy. However, as noted earlier, developing a good model for a PDM system is much more complex than for a digital
transmitter. It is important that broadcasters and consultants work with manufactures to obtain the information necessary to develop good system models.
Both PDM and Digital modulation work well into a well designed load. However; the data verifies that the DX transmitter provides superior performance into a wide variety of loads.
References Jeffery Malec, Performance Measurements & Test Techniques for Modern Transmitters", IBC Proceedings, Sept. 1992.
Grant Bingman , C.V.Clarke, "AM Antenna System Bandwidth VS. Harmonic Distortion", IEE Transactions on Broadcasting, Vol. BC-23, No2, June, 1977.
Doherty, "Operation of AM Broadcast Transmitters into Sharply Tuned Antenna Systems", Proceedings of IRE. July, 1949
Harrison J. Klein P.E., -Modulation, Overrnodulation and Occupied Bandwidth NAB ENG. Proceedings, April, 1987.
315

Sidelobe-Free Antenna Arrays A New Breed in FM Broadcast Antennas
Ali R. Mahnad Ph.D.E.E. Micro-Tek Engineering
L. C. Granlund Z-Spanish Network
Abstract In recent years, broadcasters are confronted by an ever increasing number of complaints of interference from homes and
offices located near their transmit sites. Cities and counties are adapting new and more restrictve RF exposure &nits and guidelines that will eventually result in loss of antenna sites in
areas where, otherwise, would have been ideal for broadcast. With the shadow of the new ANSI RF standard hanging over their shoulders while dealing with the paranoia of communities over exposure to unknown levels of RF, broadcast engineets will soon
come to the realization that simple antenna designs of the past will not be satisfactory anymore.
In the past, FM antennas were designed with half wave ( or some other reduced) spacing to minimize sidelobe levels at extreme elevation angles in order to reduce RF radiation in the immediate vicinity of the tower. Even though effective to some extent,
radiation patterns of these arrays have sidelobes near the main beam. These sidelobes can be a source of high levels of RF in nearby communities. This is especially true, if the antenna is of
relative low gain and the mast is not more than a few hundred feet tall. The near in sidelobes can also interfere with the main beam and can create destructive interference in coverage area.
In this paper we propose a new approach to FM array design. This new design maintain the simplicity as well as the general features of the mainstream FM antenna and introduces a new feature which has been absent till now The new FM antenna is free of sidelobes.
Introduction
In most cases, a single antenna element does not provide sufficient gain to deliver the required ERP to a community. In these cases several elements are stacked in order to increase the gain to the required level. Stacking of antennas produces variation in the filed level as a function of elevation angle. These variations, when plotted, represent the elevation pattern of the antenna. Elements are usually spaced 1 or 1/2 wavelength apart and fed with equal power and proper phase to produce
a somewhat narrow beam on the horizon.
Regardless of spacing between elements, an elevation pattern has number of minor beams directed at elevation angles other than the horizon. These beams, which are normally weaker than the main beam, are referred to as sidelobes" of the array
Except for providing coverage in the close vicinity of sites, until recently, presence of these sidelobes has not been a concern. As communities moved closer to the sites and sites moved into the urban areas for better coverage, it became clear that the levels of RF produced by these sidelobes ,in and around sites, result in unacceptable environmental condition. Lack of data along with contrasting view points expressed by experts, created a paranoia that has resulted in continuos reduction of the allowable levels of RF in working and living spaces in the vicinity of sites.
To remedy the situation, the element spacing was reduced to 1/2 wavelength. This practically eliminated the high levels of RF in the close vicinity of sites, but the cost was reduction in the antenna gain or an increase in the number of elements. The short fall of this method is that other sidelobes especially ones near the main beam remain intact, though reduced in level. This is not an effective solution when antenna is low enough for these sidelobes
316

to produce high levels of RF in near by areas. Examples are antennas on building tops with adjacent high rises and antennas on hill tops with nearby communities. In these situations levels of RF produced by these sidelobes may create strong interference in electronic appliances. and in some cases make living spaces unsafe.
Aside from the RF Radiation and blanketing concerns, one should also consider these sidelobes as possible source of interference with the main beam. Clearly Broadcast antennas are not pointed toward space. They are rather low gain arrays which are close enough to ground to see it as a partial reflector. Ground reflection is not a subject that fits the scope of this paper. We can, however, consider the mechanism by which sidelobes can interfere with the main beam through simple reflection.
What is a "Sidelobe-Free Antenna"? The two popular types of FM arrays in the market are: Full wave and Half wave spaced antennas. Fig ( 1 ) shows a typical full wave spaced antenna on a pole. In this antenna, elements are spaced one wavelength apart. Figs.( 2-4 ) show elevation pattern of this type of antenna for 4. 6, and 8 bays. All elements are fed with equal voltages and linear progressive phase to produce beam tilt and null fill, as required. As the name implies, in the "half wave spaced antennas"( also known as RFR antennas) elements are stacked half wavelength apart. Figs (5-7 ) show typical elevation patterns of this type of antenna for 4. 6, 8 Bays. Once again, all elements are fed with equal voltages and progressive phase to produce the required beam tilt and null fill. By reducing the
spacing, the extreme sidelobes are eliminated and the main beam has widened slightly resulting in an overall gain loss of 30% ( w r. t. full wave version). This reduction in gain can be overcome by increasing the number of bays
Ai<
Micro-Tek Engineering
lAntenna Type 6 Bay CP FM Antenna On a Pole
60-
30*
-60*
0'
Micro-Tek Engineering
1 Elevation Pattern of a 4-Bay Full-Wave FM Antenna
Fig. 2
317

Micro-Tek Engineering
Elevation Pattern of a 6-Bay Full-Wave FM Antenna
Fig. 3
Micro-Tek Engineering
Elevation Pattern of a 4-Bay Half-Wave FM Antenna
Fig. 5
Micro-Tek Engineering
Elevation Pattern of a 8-Bay Full-Wave FM Antenna
Fig. 4
Micro-Tek Engineering
Elevation Pattern of a 6-Bay Half-Wave FM Antenna
Fig. 6
318

AS observed, in both cases sidelobes are present near the main beam, even though in RFR type antennas levels are slightly lower.
60'
a -40 -30 -20 -10 .11; 0'
-60*
Micro-Tek Engineering
1 Elevation Pattern of a 8-Bay Half-Wave FM Antenna
Fig. 7
A "Side lobe-Free" antenna is an advanced version of RFR type antenna. In this antenna, each element is designed to accept a different phase and amplitude. By controlling the phase and amplitude of each element, it is possible to eliminate all sidelobes such that the antenna possesses only a single lobe i.e. the main lobe. Unlike the other two types, in a Sidelobe-Free antenna, fields, gracefully, approach extremely low values of say -30 dB below the main lobe. Figs ( 8-10 ) show patterns of 4, 6,and 8 bays of this type of antenna. for a typical -30db suppression of the sidelobe, there is a modest 15% reduction in the gain. In practice this loss of gain can be overcome by increasing the number of bays.
-30 -20 i 0 dEi 0'
\ -
Micro-Tek Engineering
Elevation Pattern of a 4-Bay "Sidelobe-Free" Antenna
Fig. 8
60-
-30-
-60-
Micro-Tek Engineering
Elevation Pattern of a 6-Bay "Sidelobe-Free" Antenna
Fig. 9
319

-60'
Micro-Tek Engineering
Elevation Pattern of a 8-Bay "Sidelobe-Free" Antenna
Fig. 10
Why Use "Sidelobe-Free antennas" An obvious advantage of the "Sidelobe-Free" antenna is the considerable expansion of RF free area near the site facility. Elimination of near the beam
sidelobes are extremely helpful in roof top mounted antennas, where nearby high
rises are close and very susceptible to the radiation due to these sidelobes.
Another important. but rather obscure. reason for using Sidelobe-Free antenna is to minimize secondary radiation due to the ground reflection ( of sidelobes) and its interference with the main beam radiation.
t4.
U
20
15
10
0
I 0
• • • • O E • • • •
A . . .. . • • • •• • •••• • • • •• • = e s . . . . . . . :1 • •• • • • yo• a...0a. ... y y Sa y oil inali•ia M a yfl y
• •••••••• • • • • • •• •• N• y• y e Y y• • •• ••••• y• ••• y y y•••••••••••••••••••y•••••••••••••••••••••••••••••••••Ywa.........................e............. ..... .......
• • ••• •••• I n n = . .. : : . G M . . . .. . . Y e a• • ••
wa y . : • • ••/ •• M e a n.. • • : = . . . . . . . . . . . •
.. . .. .. . •• •
1 S
20
• •••••••• .•
•••••• •••••• • • • •• • • • •• •• •• •• • • • • ••••010,••••.•••• Y ymn y e y •••• ••••• •• :
•••••••••• ammo menuessomemm wommos W a y "
•• • " "" " " " " • • • "• •• * * * * * * ** * * • • •••• • •• * * * * * • • M b
.. . . .. . . . . . . . . • • • •• • • . . .
0 •141•• . .. .. . IN Y •• • • •• • • • • • ••••••
• • • ••• ••• ••
•• •• 0 041 o w e . .. .. . . •a• . . • • •.• •••• •••
•• • • • • 5••• • ••• • •• = = = =
M E M O y a malu• •• •: • ••. .. . .. ••0.00.111. ..... .1•••••••••••••••••••••••••......
• •• •• • •0 . . . . . . . . . . . . .. •• • • •• • • • • •
• •• •• •• • • • •••• . . . . . . . . m a n y.YnD•• ••11411Yek y
0 0• • •• 01•• • • ••••• s wa y
• •• • • •• • •• M OMI • • • •• • . . . . . . . . •• •• • • • • •• : • • •• 7 0• 4 • ••••••••••••YYY•••••• . . . . . .. Y a n a. . .
• ••• •• • •• • • • •• • . . . . . . ••• . . ••••• •• •••• •• ••• • • • •• •• •• • m ea r • ••••• •• •• •• • • ••• ••• ••• • •• •• y •• •• • • • •• •• •• • •• • • • • • • • • • • • ••• r ••••••••• •• ••••
••••• • •
= =.11111111 4 ••• • • .. . . . • ••••• •••
• •• •• •• =1: = 0 0•• • • • • • • M M USE M u. . . .. . • • • ••
• • • •• • •• • •• •• • • •• •• • • •II M MIN E S•••• Y Y Y Y M Y Y Y Y M Y
••• Yile y•• • •• • • Y O UV O ME Y• y el y •••••"•••••••••••••••••••••••••••••••••••• ••••••••••
• •••• •• ••••• • ••••1•0 . B M111. 0•11• • • ••1 .. . . . O SO Be r
••••• • • • • ,410.11• • • • • •• • S O W N = •4111 ...10•1• 0 SilF ... .101•041 .• • •
. . . . . . . •••• • am y y
••• • ••••• •• ••• • •• • . . . . . • • •• • •• • •••• = •••••• •••••• • _ _ _ _ _ . _ . . . . . . • • • • • • ••• • • •• -_••••••••• yummy yy•oyyyyy•y• so
•• •• ••••• • • •• •• ••• • •• • •• • • • • •• . .. . . .. . . . Y --••• m y y •• • ••• . . . . . . . . . .. 0 ,• • •••• •• • •••• ••• •••••••••••• • • • • • .. . . . . . . • • •• • •• , • •• • • • •• ••a y
••••••••
••• •• • •• •• • • • ••• •• •• • •• • •• ••• •••
•• = &MY
• • •• ••• • • W OO
= = •• . .. . .
• • •• ••••
20 I 0 • • • ••
0 -10
• • •• ••••• • •• 0 ••••••• • •••••••••
• • • • • •• • :: •••• •• • • •• •• ••
• •• • ••• • •••••
-20 .3o
Relative Strength of the Secondary Field
Micro-Tek Engineering
Possible Effect on the primary Field Strength Due to a Secondary Field
Fig. 11
320

To understand the significant of of this interference we should first understand the complexities that such interference can bring about.
The impact of the reflected (Secondary) signal on the Direct (Primary) signal depends on their relative phases and amplitudes. Let us begin by Fig ( 11 ). This figure indicates the severity of the damage a secondary reflected signal can do to the main beam signal. The horizontal axis is the ratios of secondary to primary power in dB. The vertical axis is the change in the primary
signal in dB. For example a -10 dB secondary signal can reduce or increase the level of the primary signal by almost 4 dB.
The resulting signal maintains the original phase, only if the phase difference is 0 or 180. All other phase differences will result in phase change of the primary signal also. Now lets take a look at the amplitude and phase profiles of an array pattern. An elevation pattern demonstrates amplitude variation of radiation as a function of elevation angle.
An "elevation phase profile", rarely documented, indicates how the phase of the radiation "phase front" change as a function of elevation angle.
Fig. (12 ) shows the phase profile of a
typical 8 bay full wave spaced antenna array. Notice that the phase changes by
Micro-Tek Engineering
Phase Profile of the Elevation Pattern of An 8-Bay Full Wave Array
Fig. 12
321

360 degrees from one side of the main beam to the other( between the first nulls).
Also notice that the phase changes by 180 degree each time the pattern goes
through a side lobe. The phase change is slower at extreme sidelobes. This indicates
the complex structure of the phase profile of sidelobes. It also demonstrates that if by any means any of these sidelobes are reflected toward horizon, they are capable of distorting the primary signal in a rather complicated manner. This is because of the non-constant phase and amplitude profiles of these sidelobes..
So far we have considered the out come under the assumption that there is a reflection environment wherein a sidelobe ( or several sidelobes)are reflected and redirected in the direction of the main
beam. In what follows we will examine such a possibility.
Lets take a brief tour of the subject of antennas above ground. To incorporate ground reflection at VHF and UHF. it is almost an standard procedure to assume a flat plane and introduce a correction factor for earth equivalent curvature. This assumption is made intentionally to
I. .! I "•:iff
Micro-Tek Engineering
Ground Reflection of Sidelobe Waves
Fig. 13
322

simplify an otherwise overly complicated RF propagation problem. It is further assumed that the radiation center of the antenna is high enough so that the ground effect on the antenna as a source can be ignored . Once we accept these
simplification as appropriate and accurate. we go one step further and assume that the propagating wave is a simple plane wave. The question is: under what condition such assumptions are valid? A model made based on these assumptions is accurate when the source is a highly focused beam ( For example a Dish Antenna) and only when sidelobe levels are well below -25 dB and only when we are concerned with a fraction of the main beam. It is for example under this type of assumption that Fresnel zones are typically established. Under these assumptions only reflections at near grazing angles are taken as contributors to multipath situation. Under flat ground assumption, all other reflections. if existed will bounce toward sky.
A typical FM( or broadcast) antenna, in general. is a relatively low gain antenna usually mounted few hundred feet ( some 20-30 wavelength) above ground and, usually. on hilly terrain. The antenna is typically full wave spaced array with sidelobes, some, as high as -10 dB. ( and some even higher: see paper by the same author in this proceedings). None of these are even close to the ideal condition under which normal ground reflection analysis is performed. A typical FM antenna most assuredly interact with its immediate terrain. In strictly flat lands sidelobes may play a minor role in creating possible multipath effect. In other complicated terrains, as we will show, sidelobes can
contribute significantly to creating multipath.
Without indulging into the math, it is possible to show that regardless of the details of a generally rolling and descending terrain, it is always possible for some sidelobe rays to be reflected toward horizon. In fact points of reflection lie on parabolas with the antenna phase center as their focal point Fig.(13). As long as a point on the terrain is tangent to any such parabola, that point will reflect the sidelobe beam toward horizon in the direction of the main beam.
considering the phase and amplitude characteristics of sidelobes, as discussed above, the result can be detrimental to the integrity of the main beam coverage.
To minimize such complications, it is logical to make an effort to eliminate sidelobes. "Sidelobe-Free" antennas are developed to address this need.
Design and manufacturing of these antennas are more complicated and costlier than regular 1/2 wavelength spaced antennas. But their performance. also, has (experimentally) proven to be superior to other antennas. Here is a report from the chief engineer of KZSA-FM (Placervill/Sacramento, CA. )one of the many stations now operating with Sidelobe-Free "Ultra Tracker" antenna introduced by Antenna Concepts: " In early 1995 Our engineering projects included several very difficult RFR and RFI problems. Close proximity of residents to tt-e tower as well as the tower height and terrain, would make an standard RFR antenna rather useless for the purpose .. Use of a Sidelobe-Free "Ultra Tracker" to replace our 2-bay antenna, promised to be
323

a great way to solve our RFR problem. In order to compare the "before and after" performance of the antenna, we made extensive field strength measurements in Sacramento area and in the vicinity of the tower. Once the antenna was replaced by a 4 bay sidelobe-Free antenna, all complaints of -R/ interference, " music on the phone line", etc.. were completely eliminated. The RF levels on the ground and in the vicinity dropped by almost 40 dB. A cheap clock radio at the transmit site could now tune to all other stations without slightest interference. The field intensity measurement had an interesting outcome:
Anyone who has made field intensity measurements on an FM broadcast signal
has discovered that variations of the order of +/- 10 dB over short distances is not unusual. That is why averaging criteria are used to come up with representative field strength at every location. This was the case before we switched to the new antenna. After the switch we discovered that moving the receive antenna over several wavelength resulted in variation of about +/- 2 dB.
we also observed that there was complete absence of multipath effects when listening to the new signal." This was happening without any change in azimuth pattern and ERP. In fact the measured levels before and after were the same as expected."
These findings support our theory of Sidelobe interference that is possibly present in an unknown number of stations. Even though sources of multipath may vary from one case to another, there are many cases in which the multipath is so prevasive every where that the nonsense term "Source induced multipath" has found a legitimate place in the RF vocabulary. It is believed that in many of these cases multiple sidelobe reflections may be the source of the problem. Replacing the antenna with a sidlobe-Free antenna, as was the case in the above example, may result in total elimination of multipath problem.
Authors can be reached at (916)488-3546
324

A New Method of Generating FM and Television Stereo Composite Baseband Yields Improved Broadcast Performance.
William H. Gillman Gentner Communications Corporation
Salt Lake City, Utah
ABSTRACT
A Digital Signal Processing technique now allows for the conversion of the L - R component of the stereophonic baseband from
double sideband AM to a single sideband (SSB) AM subcarrier When lower sideband operation
of the L - R subcarrier is employed, a reduction in the distortions to the L - R audio under the effects of multipath occurs. Additionally, much
lower crosstalk into the revenue bearing SCA channels is realized, while maintaining a stereo-
phonic transmission that is 100% compatible with existing receivers. Implementing an SSB demodulator in the stereo receiver yields a 4 dB
improvement in stereo signal to noise along with reducing the effects of multipath generated crosstalk from the SCA band into the stereo sub-channel.
BUILDING A CASE FOR SSB
A characteristic of Frequency Modulation (FM) detectors employed in FM broadcast and televi-sion receivers is that they exhibit a response to
noise that falls within the IF bandwidth of the receiver that increases at 6 dB per octave over the demodulated baseband frequency spectrum (figure 1).
Amplitude
6 dB / Octave ---- Noise Slope
0 Hz 99 kHz
Figure 1. FM Detector Noise Response
Frequency
In the 1930's when FM was developed, this rising noise was anticipated and compensated for by employing pre-emphasis at the transmitter and de-emphasis at the receiver.' The receiver de-emphasis rolled off the frequency response of the detected audio at a rate that complemented the
rising noise and flattened the detector's response to the noise. Pre-emphasis was then required at the transmitter to make the overall frequency response of the system flat for the transmission of high fidelity audio.
In the late 1950's as the transmission of stereo audio was being developed, a method of multi-plexing the FM carrier was derived that transmit-ted the monophonic sum (L+R) of the two
channels of audio as baseband intelligence to provide for compatibility with existing monopho-
325

nic FM receivers. It was determined that the Left and Right channels could be mathematically derived at the stereo receiver if the difference in the two audio channels (L-R) was also transmit-ted at the same time. This difference signal was linearly modulated on a supersonic subcarrier of 38 kHz employing double sideband suppressed carrier (DSBSC) amplitude modulation.
In addition to the two intelligence bearing signals described above, a 19 kHz pilot tone of tightly controlled frequency and phase is also broadcast as baseband audio at between 8 and 10 percent modulation. This tone allows the stereo receiver to synchronize a 38 kHz oscillator for the proper demodulation of the DSBSC L-R signal (figure 2, following page).
When we superimpose the FM detector's noise response over the composite FM baseband signal, we can see the linearly modulated L-R signal will suffer significant degradation from the effects of the FM noise (figure 3, following page). From this view we can also see that the upper sideband of the L-R suffers the most
degradation from the effects of FM detector noise. It has been generally accepted that this
method of broadcasting FM stereo suffers from a 23 dB penalty in signal to noise ratio when compared to monophonic FM.2
Another innate characteristic of FM stereo is that the amount of degradation suffered under the effects of multipath is proportional to the modu-lation index of the baseband component. As frequency in the baseband increases, modulation index decreases, for a given FM deviation. Thus, the upper sideband of the L-R has a much lowere modulation index when compared to the lower sideband.
A PROPOSAL
A new system is proposed employing SSB
modulation of the L-R sub-channel. Modulation of the L-R information is in the lower sideband
(LSB) only. The resulting sideband amplitude is twice the value when compared to the lower sideband in the DSBSC system to derive the correct mathematical sum for demodulation and re-matrixing of the left and right channels (figure 4, following page).
The transmitted baseband signal shown in figure 4, yields these main features:
Compatible with the product detectors used in current FM stereo demodulator chips, yielding compatibility with existing stereo and, of course, no degradation to monopho-nic receivers.
Lower stereophonic cross talk into the SCA portion of the baseband due to the addition of a 15 kHz guard band for better SCA perfor-mance.
Narrows the L-R occupied bandwidth and increases the modulation index in the LSB by a factor of two, providing for less L-R distortion due to the effects of FM signal multipath.
Narrows the overall FM transmission band-
width reducing the degradation in stereo-phonic performance caused by the finite bandwidth performance of transmitter cavi-ties, antennas, and RF mutiplexing systems.
A 38 kHz carrier broadcast in phase quadra-ture with the 38 kHz suppressed carrier, injected at 2% FM modulation to signal SSB L-R receivers to switch into the lower side-band mode for reduced noise and distortion
326

Amplitude
19 kHz 38 kHz Possible SCA Pilot Suppressed Carriers
Carrier I 53-99 kHz
L+R L-R LSB
L-R USB
0 lcHz 15 23 53
Amplitude
23 53 0 kHz 15
Amplitude
L+R
Figure 2. FM Stereophonic Baseband
Figure 3. FM Stereophonic Noise Contribution
19 kHz Pilot
L-R LSB Only
1 Frequency
99 kHz
Frequency
38 kHz Possible SCA Suppressed Carriers Carrier I 53-99 kHz
0 kHz 15 23 I
53 99 kHz
Figure 4. FM Stereophonic SSB L-R Baseband
Frequency
327
.1

reception. This quadrature carrier amplitude integrates to zero volts in the demodulation
process of existing stereophonic receivers.
The benefits listed above can be realized with or without SSB L-R receivers.
AN IMPLEMENTATION
Of the three common methods used to generate linear SSB amplitude modulation, The Weaver
Method,3 when realized with the perfect multipli-ers and linear phase filters available through
Digital Signal Processing, provides an efficient implementation algorithm that yields excellent stereo performance.
The circuit required by the transmitter to gener-ate the SSB L-R is shown in figure 5 (following page). The Weaver circuit uses dual carrier
quadrature oscillators for conversion and fre-quency shifting, for proper placement of the L-R lower sideband. Linear phase Finite Impulse Response (FIR) filters along with the finite time delay in the L+R channel provide for near perfect stereo separation in the generator.
MAXIMIZING THE BENEFITS
Again, all previously stated benefits can be
realized with no changes to the existing receiver base and is 100% compatible with receivers now
is use. Additional benefits could be realized if stereo decoder IC manufacturers would adopt SSB L-R into their designs. The single sideband
L-R receiver circuit also implemented as a DSP
algorithm is shown in figure 6 (following page). When combined with the above encoding at the
transmitter allows for the following benefits:
The receiver is compatible with existing DSBSC L-R transmissions. Switching to the
SSB mode upon detection of the 2% injected 38 kHz quadrature pilot signal.
Increases the L-R signal to noise ratio by 4 dB, increasing the useful stereophonic cover-
age range of the SSB L-R generating broad-cast station. A 4 dB improvement here is
equivalent to more than doubling the broad-cast station power.
Reduces significantly the SCA to L-R cross talk caused by the effects of multipath, improving stereo performance.
The employment of lower sideband DSB L-R increases the effects of de-emphasis in re-
moving high frequency noise and hiss from the re-matrixed left and right channels.
The receiver derives a better signal for controlling monophonic blending at the fringe
coverage areas by measuring the noise power in the now unused upper sideband of the 38
kHz subcarrier, combined with a relative amplitude and phase measurements between the 19 kHz and the 38 kHz quadrature pilot subcarriers.
The receiver achieves its SSB L-R performance again, using a DSP implemented Weaver de-
modulator (figure 6). Linear-phase, digital FIR low-pass filters employed in the Weaver circuit,
along with a finite time delay and FIR low pass filter in the L+R channel allow for near perfect stereo separation.
STEREO TELEVISION
Stereo for television has a big advantage over FM stereo. The designers of this system clearly
saw the noise problems and counteracted them
328

L+R In
L-R In
L+R Linear Time Delay
Q 7.5 kHz
Quad. OSC.
7.5 lcHz LPF Digital FIR
7.5 lcHz LPF Digital FIR
I Q 30.5 kHz Quad. OSC.
Weaver Modulator
Figure 5. LSB L-R Stereo Baseband Generator
L+R LPF FM Receiver
& Time Delay Detector
Digital FIR
I Q 30.5 kHz Quad. OSC.
7.5 kHz LPF Digital FIR
7.5 kHz LPF Digital FIR
Q 7.5 kHz
Quad. OSC.
Weaver Demodulator
Composite LSB L-R Output
Figure 6. LSB L-R Stereo Baseband Demodulator
Demodulated Left
Demodulated Right
Demodulated L-R
329
by adding signal gain compression to the L-R channel at the transmitter and then adding gain
expansion at the receiver. It is felt, however, that the SSB L-R system adds the possibility of further improvement of TV stereo through the reduction in cross talk from the L-R to Second
Audio Program (SAP) and Professional (PRO) channels, and from the SAP and PRO into the L-R. All of the distortion reduction benefits under
the effects of multipath would also be realized in a television implementation.
CONCLUSION
SSB modulation of the L-R appears to be a possible incremental engineering improvement
that could increase the performance and value of broadcast facilities. Of course improvement in
listener satisfaction is the ultimate goal.
The author wishes to acknowledge Brian W. Banks, Novell, Inc., Gary A. Smith, KISN-FM,
and Lewis Downey, KUER-FM, for their partici-pation in this endeavor.
REFERENCES
' E.H. Armstrong, "A Method for Reducting Disturbances in Radio Signalling by a System of Frequency Modulation." Proceedings of the
Institute of Radio Engineers, vol. 24, no. 5, May 1936, pp. 689-740.
2 Norman Parker and Donald W. Ruby, "Some
Notes on the Calculations of the Signal to Noise Ratio for an FM System Employing a Double Sideband AM Multiplex." IEEE Transactions on Broadcast Television Receivers, (International Convention Issue), vol. BTR-8, Apr. 1962, pp. 42-46.
3 D.K. Weaver, Jr., "A Third Method of Genera-
tion and Detection of Single Sideband Signals", Proceedings of the Institute of Radio Engineers, vol. 44, no. 12, Dec. 1956, pp. 1703-1705.
330

IMPROVING IM MUNITY TO RF INTERMODULATION IN FM SOLID STATE
BROADCAST TRANS MITTERS FRO M INTERFERING
SIGNALS OF COLOCATED STATIONS
Mulcunda B. Shrestha Broadcast Electronics, Inc.
Quincy, Illinois
ABSTRACT
When multiple signals are present, any nonlinear device in the transmitter power amplifier will generate RF intermodulation products due to mixing of these multiple signals. Interference to other FM stations or non-broadcast services can be caused by these intermodulation products. The degree of intermodulation interference generated is dependent on the mixing loss of the transmit-ter. Wideband solid state transmitters have lower mixing loss compared to tube transmitters that provide attenua-tion to interfering signals due to PA output selectivity. This paper describes a power amplifier combining tech-nique used to obtain improved immunity to RF inter-modulation. It also includes a description of the test setup used to measure the mixing loss of a 5 kW FM solid state broadcast transmitter.
RF INTERMODULATION IN FM TRANSMITTERS
The FM broadcast band is shared by many radio sta-tions. Two or more FM broadcast stations may be colo-cated by sharing either a common antenna through spe-cially designed filterplexer system, or a common tower. Also, two or more stations may be located in sites within close vicinity of each other. When multiple signals are present, the transmitter power amplifier operating in a nonlinear mode will generate RF intermodulation prod-ucts. The power amplifiers in FM transmitters usually operate in high efficiency class C mode. Any undesired RF signal coupled into the output device will mix with the desired transmitter carrier, modulation sidebands and the harmonics which result in the generation of out-of-band and in-band intermodulation product components. The in-band intermodulation product components are created near the carrier and its sidebands. The out-of-band in-termodulation product components are created near the harmonics. In general, nonlinearities in a transfer func-tion of a power amplifier can be expressed as a power se-ries about a zero-signal operating point [1, 4
i = K,, + e + K2 e2 + K3 e3 + K4 e4 + K5e5 (1)
he K0 and Ki e represent the linear transfer. The terms with powers of 2 to 5 represent the nonlinearities that contribute to the generation of intermodulation products.
In the case of two transmitters which are coupled to each other, the two-frequency signal is represented by:
e(t) = A1 Cos colt + A2 COS co2t (2)
where Ai = the amplitude of the carrier signal and A2 = the amplitude of the interfering signal
col = 271f, and (02 = 27rf2 fi = the carrier signal frequency and f2 = the interfering signal frequency
Substituting for e in Eq. (1) produces the following terms which are grouped in terms of product orders (only the fundamental, second order and third order components are listed below for simplicity):
The fundamental components with K1, K3, K5 coefficients are:
Cos wit; Cos co,t (3)
The second-order components with K2, K4 coefficients are:
Cos (co, + (i)2)t; Cos (wi - co2)t Cos (2coi)t; Cos (2o 2 )t (4)
The third-order components with K3, K5 coefficients are:
Cos (2co, + co2)t; Cos (2w1 - co2 )t COS ((ei + 20)2 )t; COS (Cili - 2(02 )t COS (3c 1 )t; COS (3°2 )t (5)
Grouping the frequencies in increasing frequency order shows which components are in-band and which are out-of-band. Table 1 shows the actual frequency positions of the various orders for illustration purposes with the transmitter carrier frequency, fi = 98.1 MHz and the interfering station frequency, f2 = 99.1 MHz.
331

Region MHz Frequency Compo- nents
Orders or Harmonics
Fundamental 97.1 2f, - f2 Third order region 98.1 f1 Fundam. (in-band) 99.1 f2 Fundam.
100.1 2f2 - f1 Third order Second harmonic
196.2 2f1 Second harmonic
region 197.2 fi + f2 Second order
198.2 2f2 Second harmonic
Third harmonic
294.3 3f1 Third harmonic
region 295.3 2f1+ f2 Third order 296.3 2f2+ f1 Third order 297.3 3f2 Third
harmonic
Table 1. Intermodulation Products Showing Orders and Harmonics
A.11 the frequencies shown, except fundamentals, are caused by nonlinearity of the power amplifier device. Only the odd orders show up around the fundamental and are in-band components. The frequency difference be-tween the components in any harmonic region is the same and equal to the frequency spacing between carrier and interfering signal. The second order product falls between the two second harmonic frequencies. The third order products fall between the two third harmonics. The above analysis is based on a simplified model where only ampli-tude changes were considered. The effects of phase changes will result in asymmetrical sideband components.
Level of Intermodulation products
The relative amplitude levels of the second order and second harmonic components as well as third order and third harmonic components can be determined from de-tailed analysis of terms shown in Eq. (4) and Eq. (5). As-suming equal amplitude of the carrier and interfering sig-nals in Eq. (2), AI = A2 = 1, it can be seen from the analysis of the amplitude coefficients of the second order and the second harmonic terms in Eq. (4) that the second order amplitude is two times (6 dB) greater than the sec-ond harmonic. Similarly, it can be seen by analyzing the amplitude coefficients of the third order and the third harmonic in Eq.(5) that the third order amplitude is three times (9.5 dB) greater than the third harmonic. These relative levels are shown graphically in Figure 1 [2]. It should be noted that the in-band third order and out-of-band third order components have the same magnitude.
Mixing Loss and Significant Spectral Components of RF Intermodulation in FM Solid State Broadcast Transmitters
When an interfering signal frequency (f2 ) from another transmitter mixes with the carrier (f1 ) and harmonic signals (2f1) of the desired transmitter in a colocated FM broadcast station, the spectral components of RF intermodulation generated are in-band third order frequencies 2f1 - f2 and 2f2 - fl as shown on the left and right sides of the carrier or interfering signal frequency in Figure 1. In this illustration the levels of the interfer-ing and desired signals are assumed to be equal. The mixing loss represents the net conversion loss associated with the mixing of the interfering signal with the carrier and its harmonics within the nonlinear active device of the transmitter power amplifier. The degree of nonline-arities in the transmitter power amplifier will affect the mixing loss as well as the second harmonic content at its output. The mixing loss quantifies the ratio of the interfering signal level to the resulting third order intermodulation product level. The mixing loss of 20 dB means that the intermodulation product fed back to the antenna system will be 20 dB below the interfering signal coupled into the transmitter's power amplifier output.
Frequency spectrum showing the mixing loss and the significant third order intermodulation product of a 5 kilowatt FM solid state transmitter with improved immunity to RF intermodulation is illustrated in Figure 2. In this illustration, the interference signal is assumed to be 60 dB below the carrier signal. The only signifi-cant spectral component of RF intermodulation is the third order frequency 2f1 - f2 at 90 dB below the carrier. The mixing loss is 30 dB. The second harmonic level of the interfering signal 2f2 is very low and therefore does not contribute to the generation of the third order
frequency 2f2 - f1. The harmonics of the carrier signal at the transmitter output are typically 80 dB below the carrier because of the attenuation provided by the low pass filter. The relative levels of other spectral compo-nents near harmonic frequencies are not measurable and therefore, not shown in the frequency spectrum of Figure 2.
IMPROVING IMMUNITY TO RF INTERMODULATION IN FM SOLID STATE
BROADCAST TRANSMITTERS
Wideband, FM solid state broadcast transmitters exhibit lower mixing loss compared to the tube transmit-ters. This is because the interfering signal is first attenuated by the selectivity of the narrowband tube power amplifier output circuit going into the nonlinear device, and then the intermodulation product is further
332

EEE
ATTENUATION, dB
ADN3110321d
2f1— f2
f
f2
2f2— fl
2f 1
f1+ f2
2f2
3f l
2f1— f2
2f2— fl
3f2
THIRD ORDER IM
THIRD ORDER IM
1E-- MIXING LOSS
SECOND HARMONIC
SECOND ORDER IM
SECOND HARMONIC
THIRD HARMONIC
THIRD ORDER IM
THIRD OROER IM
I THIRD HARMONIC

RELATIVE AMPLITUOE
OdB
-10d0 --
-20d8 --
-30d8
-40dB --
-50dB --
-Wide --
-70d8
-80d0 --
-gOde
-100dB
CARRIER SIGNAL
SIGNIFICANT THIRO ORDER INTERMOOULATION PRODUCT gOdB BELOW CARRIER
SIGNIFICANT THIRD ORDER INTERMOOULATION PRODUCT
1\
INTERFERING SIGNAL 60dB BELOW CARRIER
INTERFERING SIGNAL
MIXING LOSS = 30d8
\L
INSIGNIFICANT THIRD ORDER INTERMOOULATION PRODUCT
2 fi - f2 (97.1 MHz) f1(98.1 MHz)
FREQUENCY
f2(72.1 MHz) 2 f2 - fi (100.1 MHz)
Figure 2. Frequency Spectrum Showing Mixing Loss And Significant Third Order Intermodulation Product Of A Typical 5 kW FM Solid State Transmitter

attenuated as it comes back out through the frequency se-lective circuit [3,4]. Solid state, nonlinear, power amplifi-ers are typically very efficient mixing devices and because there is no output selectivity to attenuate interfering signal or RF intermodulation products, the mixing loss can be as little as 6 dB regardless of frequency separation. Addi-tional external bandpass filtering may usually be required at the output of a typical solid state transmitter to reduce RF intermodulation to acceptable levels.
Power Amplifier Combining Technique for Improved Immunity to RF Intermodulation
In solid state transmitters several low power RF modules are combined to obtain higher power output. An RF module typically comprises of two or more low power amplifiers due to limited power handling capability of the MOSFET devices currently available in the market. A 90° hybrid can be used to combine a pair of such power amplifiers to improve immunity to RF intermodulation. A 90° hybrid is a reciprocal four-port device with a unique relative phase relationship between the ports. It can be used either for splitting or combining RF sources over a wide frequency range [2,4]. When used as a splitter, a signal fed at the input port is divided into two equal amplitude components which are different in phase by 90° at the output ports. When used as a combiner, the two incoming signals at the input ports must be equal in magnitude and different in phase by 90°, for the resultant to appear only at the output port. The fourth port is con-nected to a resistive dummy load called the "reject load", since only the rejected power due to imbalance appears there.
An FM-5C RF module power amplifier containing a 90° hybrid splitter and combiner is shown in Figure 3. A signal at carrier frequency f1 from an RF source is fed into the input port of the 90° hybrid splitter. Two sig-nals, of 10 watts power with 90° phase difference, appear at output 1 and output 2 ports that drive the front and rear amplifiers of the RF module. The two amplifier out-put signals, of 250 watts power with 90° phase differ-ence, are fed to input 1 and input 2 ports of 90° hybrid combiner. The combined signal at carrier frequency f1, of 500 watts power appear at the output port. An inter-fering signal f2 appearing at the output port is split by the 90° hybrid combiner into equal magnitude components that have a 90° relative phase difference. The two signals f2, shown with dashed arrows in Figure 3, reach the RF module and are reflected back, fully or partially, depending on the output impedance of the module front and rear amplifiers. It is important to en-sure that the two amplifiers of the module have
identical output impedances so that the relative relation-ship of the signals does not change after reflection. This requirement is usually met because of repeatability achievable in modern manufacturing environment.
The reflected signals returned to the input ports of the 90° hybrid combiner remain equal in amplitude and phase difference. The 90° phase shifted signal is shifted another 90° by the hybrid combiner. The new phase difference results in destructive combining at the output port and constructive combining at the reject port. Since the recombined signal at interfering frequency is dissipated in the reject port, there is no reflected power returning to the source and only a small fraction of the interfering signal will be available for generation of intermodulation product in the module power ampli-fier. It will cause an apparent increase in the mixing loss thereby improving the immunity to RF intermodu-lation. Also, the output return loss of the 90° hybrid combiner at the interfering frequency will be high because most of the interfering signal power is dissi-pated in the reject load. The output return loss is a measure of the amount of interfering signal that is coupled into the output circuit versus the amount that is reflected back from the transmitter output circuit.
Figure 4 shows a block diagram of the Broadcast Electronics Model FM-5C, 5 kilowatt FM solid state broadcast transmitter utilizing ten RF modules. Each RF module has a 90° hybrid splitter and combiner described above. The FM-5C transmitter was used in the test setup to measure the mixing loss and to assess its immunity to RF intermodulation.
In solid state transmitters utilizing Wilkinson combining technique, immunity to RF intermodulation may be improved to some degree by utilizing Wilkinson combiner with quarter-wave offset [5]. The Offset Wilkinson combiner is formed by adding an extra quarter-wave line in series with one of the output ports of a standard Wilkinson combiner.
TEST SETUP USED TO MEASURE THE MIXING LOSS OF A 5 kW FM SOLID STATE BROADCAST TRANSMITTER
Figure 5 shows a perspective view of the test setup used to measure the mixing loss and output return loss of the Broadcast Electronics Model FM-5C, 5 kilowatt FM solid state broadcast transmitter. Broadcast Electronics Model FM-3C, 3 kilowatt FM solid state broadcast transmitter was used as a source for the interfering signal. Both transmitters have a built-in low pass filter. A capacitive RF coupler with -25 dB coupling was used
335

fi b!_ 20W
RF IN >
50 11+1 LOAD
gO° HYBRID SPLITTER
INPUT OUTPUT I
f ILO! IOW
f 1 LiT IOW
fi Lg Li
250W
---> INPUT I
RF MODULE FRONT AMPLIFIER
REJECT OUTPUT 2
f L gSr
25011 — --->
RF MOOULE REAR AMPLIFIER
INPUT 2
gO° HYBRID COMBINER
REJECT
50 OHM LOAD
f Lio° 500W
OUTPUT
4 - 12
- -> CARRIER SIGNAL fl
- - INTERFERING SIGNAL f2
> RF OUT
Figure 3. FM-5C RF Module Power Amplifier With 90° Hybrid Splitter And Combiner

FM-250C EXCITER
180W
I
AUDIO INPUT
20W
20W
10 10-WAY
RF DIVIDER
20W
POWER SUPPLIES 5
RF MODULE 1 500W
RF MODULE 2
500W
500W
— 0.
10-WAY RF COMBINER
RF MODULE 10
0.
— 0.
CONTROLLER &
METERING
TO
ANTENNA
•
5000W
LOW PASS FILTER &
DIR COUPLER
Figure 4. A simplified Block Diagram Of Broadcast Electronics Model FM-5C 5 kW Solid State Transmiter

Figure 5. Test Set—Up For Measurement Of Mixing Loss

to obtain a sample of the interfering signal from the FM-3C transmitter shown on the right side of the illustration. A similar coupler with -20 dB coupling factor was used to couple the interfering signal into the output circuit of the FM-5C transmitter. A 3 dB pad was used to provide an isolation between the two transmitters. A directional coupler with -45 dB coupling factor and 30 dB directivity was used to obtain RF signal samples.
The RF sample from the forward port of the directional coupler contains the desired carrier signal the third order intermodulation product 2f1- f2, and the interfering signal f2 reflected back from the transmitter. The RF sample from the reflected port of the directional coupler contains the interfering signal f2 being coupled into the FM-5C transmitter as well as the carrier and third order intermodulation product components reduced in level by the directivity of the directional coupler. The RF samples were fed into a Hewlett Packard Model 4390A spectrum analyzer to display spectral components.
FREQUENCY SPECTRUM PLOTS AND MEASURED DATA USING BROADCAST
ELECTRONICS MODEL FM-5C AND FM-3C TRANSMITTERS
The frequency spectrum plots and measured data of intermodulation products shown below were obtained at
carrier frequency of 98.1 MHz (in the center of the plot) with interfering signal frequencies of 88.1, 94.1, 98.3, and 107.9 MHz. Figures 6A, 6C, 7A, and 7C show the spectral components of the forward port sample contain-ing the carrier signal frequency, interfering signal frequencies reflected back from the transmitter output and the intermodulation products appearing at 108.1, 102.1, 97.9, and 88.3 MHz respectively. Figure 6B, 6D, 7B, and 7D show the spectral components of the reflected port sample containing the carrier signal frequency, interfering signal frequencies reflected back from the transmitter output and the intermodulation products at reduced levels due to directivity of the directional coupler. The mixing losses for the above four interfering signal frequencies are 31.5, 35.5, 31.4 and 28.0 dB
respectively. Table 2 shows the measured data for these as well as several other interfering signal frequencies.
Carrier Signal Freq.
Freq. Sepa- ration
Interfering Signal Freq.
Carrier Signal Level Out
Interfering Signal Level In
Interfering Signal Level Out
Transmitter Output Rtn. Loss
Interfering Signal Coupling
Intermo- dulation Level
Intermo- dulation Atten.
Mixing Loss
MHz MHz MHz dBm dBm dBm dB dB dBm dB dB
Fwd Rfl Fwd Fwd 98.1 -10.0 88.1 -3.6 -53.1 -80.2 -27.1 -49.5 -84.5 80.9 31.4 98.1 -8.0 90.1 -3.6 -44.4 -70.0 -25.6 -40.8 -77.5 73.9 33.1 98.1 -6.0 92.1 -3.6 -52.0 -71.8 -19.8 -48.4 -84.1 80.5 32.1 98.1 -4.0 94.1 -3.7 -43.5 -63.5 -20.0 -39.8 -79.0 75.3 35.5 98.1 -2.0 96.1 -3.7 -50.8 -74.5 -23.7 -47.1 -90.0 86.3 39.2 98.1 -1.0 97.1 -3.6 -48.4 -70.2 -21.8 -44.8 -86.0 82.4 37.6 98.1 -0.6 97.5 -3.6 -45.9 -66.9 -21.0 -42.3 -78.4 74.8 32.5 98.1 -0.4 97.7 -3.5 -44.9 -65.5 -20.6 -41.4 -76.4 72.9 31.5 98.1 -0.3 97.8 -3.6 -43.8 -64.0 -20.2 -40.2 -74.9 71.3 31.1 98.1 -0.1 98.0 -3.6 -42.8 -62.1 -19.3 -39.2 -72.6 69.0 29.8 98.1 0.2 98.3 -3.6 -43.0 -61.3 -18.3 -39.4 -74.3 70.7 31.3 98.1 0.6 98.7 -3.5 -45.5 -64.1 -18.6 -42.0 -80.3 76.8 34.8 98.1 0.8 98.9 -3.6 -46.8 -65.9 -19.1 -43.2 -82.2 78.6 35.4 98.1 1.0 99.1 -3.7 -48.3 -68.2 -19.9 -44.6 -84.7 81.0 36.4 98.1 2.0 100.1 -3.7 -50.2 -72.1 -21.9 -46.5 -87.7 84.0 37.5 98.1 4.0 102.1 -3.7 -42.1 -69.0 -26.9 -38.4 -80.1 76.4 38.0 98.1 6.0 104.1 -3.8 -49.0 -69.5 -20.5 -45.2 -82.4 78.6 33.4 98.1 8.0 106.1 -3.8 -41.3 -60.8 -19.5 -37.5 -70.0 66.2 28.7 98.1 9.8 107.9 -3.8 -48.2 -74.1 -25.9 -44.4 76.2 72.4 28.0
Table 2. Measured Data Using Broadcast Electronics Model FM-5C and FM-3C Solid State FM Transmitters
339

CH1 S Spectrum 10 dB/ REF 12 dBm
90. 072 5
- -
MHz
V 2
CENTER 09. 1 MHz
1
2
SWP PARAM
98. 0725 MHz
88. 09 MHz
108. 0825 MHz
10 dB SWP 4. 26 ea. SPAN 22 MHz
VAL
-3. 6347 dem
-80.199 dem
-84. 517 dBm
Figure 6A. Forward Port Sample With Interfering Frequency of 88.1 MHz
CHI S Spectrum 10 dB/ REF 0 dBm -3. 71 84 dBm
Be. 07 5 MHz
V
V
wm 300 Hz VBW 300 Hz ATN 10 dB SWP 56. 44 wac CENTER 96. 1 MHz
1
2
SWP PARAM
98. 075 MHz
94.1 MHz
102. 075 MHz
SPAN 20 MHz
VAL
-3. 7184 dBm
-63. 5 dBm
-79. 032 dem
Figure 6C. Forward Port Sample With Interfering Frequency of 94.1 MHz
CH1 S Spectrum 10 d13/ REF -1 0 dBm -26. 851 de,,,
99. 07'2 5 MHz
RBWOO 300 Hz VOW 300 Hz ATN CENTER 96. 1 MHz
SWP PARAM
1
2
98. 0725 MHz
88. 09 MHz
108. 0825 MHz
10 dB SWP 64. 26 me.
SPAN 22 MHz
VAL
-26. 851 dem
-53. 049 dBm
-100.13 dBm
Figure 6B. Reflected Port Sample With Interfering Frequency of 88.1 MHz
CH1 S Spectrum 10 dB/ REF -1 0 dBm -26. 754 dBm
98. 07 5 MHz
ROWOO 300 Hz VOW 300 Hz CENTER 98. 1 MHz
2
SWP PARAM
98. 075 MHz
94.1 MHz
102. 075 MHz
ATN 10 dB SWP 58. 44 elec SPAN 20 MHz
VAL
-26. 754 dem
-43. 513 dem
-101. 49 dBm
Figure 6D. Reflected Port Sample With Interfering Frequency of 94.1 MHz

CHI S Spectrum 10 dB/ REF 0 dBm -3. 553
96. 09725 MHz
2
7
LA•atdaib WelAvaKt " t#44 ".'ll# 4.i rti " "44"44 ".1144•44,tiobitm l,ma, & _ __ RBWO 10110. Hz VBW inn H s A TM in A O c wrs mos RA
CENTER 98. 1 MHz
SWP PARAM VAL SPAN 2. 2 MHz
98.09725 MHz -3.5539 dBm
1 98.298 MHz -61.268 dBm
2 97.89925 MHz -74.323 dBm
Figure 7A. Forward Port Sample With Interfering Frequency of 98.3 MHz
CHI S Spectrum 10 dB/ REF 0 dBm -3. 8152 dBm
98. 075 MHz
I
1 RBWW q00 H m V RW an W m A T M in A R C W R C R AA - - -
CENTER 98. 1 MHz
SWP PARAM
1 2
98.075 MHz
107.9 MHz
88.275 MHz
SPAN 20 MHz
VAL
-3.8152 dBm
-74.061 dBm
-76.16 dBm
Figure 7C. Forward Port Sample With Interfering Frequency of 107.9 MHz
CH1 S Spectrum 10 dB/ REF -1 0 dBm -26. 601 dBm
a .007 5 MHz
1.
RBWO 100 Hz VBW 100 Hz ATN 10 dB SW 26. 84 sec CENTER 98. 1 MHz SPAN 2. 2 MHz
SWP PARAM VAL
98.09725 MHz -26.601 dBm
1 98.298 MHz -42.972 dBm
2 97.89925 MHz -96.696 dBm
Figure 7B. Reflected Port Sample With Interfering Frequency of 98.3 MHz
CHI S Spectrum 10 dB/ REF -1 0 dBm -26. 92 dBm
i 963. 07 5 MHz
1
GI
" " " "liuiIcjl.ar*5"tPVPI "We. ""44 r rf ";' "Cll "" W" " 4 "V"4.4 "Vbaa" RBWO 300 Hz VBW 300 H m A T M In A R C W R A d ........
CENTER 98. 1 MHz
SWP PARAM
1 2
98. 075 MHz
107.9 MHz
88. 275 MHz
SPAN 20 MHz
VAL
-26. 92 dBm
-48.156 dBm
-101.27 dBm
Figure 7D. Reflected Port Sample With Interfering Frequency of 107.9 MHz

CONCLUSIONS
1. When multiple signals are present in a colocated station environment, any nonlinear device in the transmitter power amplifier will generate RF intermodulation products due to mixing of these multiple signals. Wideband, FM solid state broadcast transmitters containing nonlinear power amplifiers with standard Wilkinson type combiners, exhibit lower mixing loss compared to the tube transmitters. This is because there is no output selectivity to attenuate interfering signal and RF intermodulation products.
2. The most significant RF intermodulation component generated in the transmitter is the third order product at twice the desired transmitter's frequency minus the interfering transmitter's frequency (2f1- f2)-
3. The level of the third order intermodulation product is dependent on the mixing loss of the transmitter, which is a function of the nonlinear active device used in the power amplifier circuit.
4. Improved immunity to RF intermodulation in FM solid state broadcast transmitters can be obtained by utilizing a 90° hybrid to combine power amplifiers.
5. In a typical 5 kW FM solid state broadcast
transmitter utilizing a 90° hybrid to combine power amplifiers, the measured mixing loss is greater than 25 dB and is relatively insensitive to the frequency separation between the carrier and interfering signals.
ACKNOWLEDGMENTS
The author is grateful to Rick Carpenter for reviewing the paper.
The author also wishes to thank Larry Foster, Mike Earls and Audie Breeden for their assistance in illustrations.
Special thanks to Aaron Tally, Mark Hartman, and Ken Ruzicka for their assistance in test setup.
AUTHOR
Mr. Mulcunda B. Shrestha earned his Master of Science degree in electrical engineering from the Southern Illinois University at Carbondale, Illinois. He also has a Master of Science degree in radio broadcasting and communication engineering from the Moscow Electrical Communication Institute, Moscow, Russia.
Mr. Shrestha is Principal Engineer at Broadcast Electronics, Inc., Quincy, Illinois and is currently responsible for the design and development of FM solid state and high power tube transmitters. He has made numerous significant design contributions to the development and support of Broadcast Electronics FM high power tube transmitter line, AM solid state transmitter line and FM solid state transmitter line both as an individual contributor as well as the Project Team Leader over a period of twelve years.
Mr. Shrestha's practical experience involved engineering, operations, and management work as director of engineering for the National Radio Broadcasting Network of Nepal. His earlier experience includes several years of engineering and management work in broadcasting, as well as
aeronautical communications and navigational aid equipment.
The author holds a U.S. Patent for electronic design utilized in broadcast equipment and is an alumnus member of Tau Beta Pi and Phi Kappa Phi honor societies.
REFERENCES
1. Reference Data for Radio Engineers, Howard W. Sams & Co., Inc., New York, N.Y., Sixth Edition 1983.
2. William E. Sabin and Edgar 0. Schoenike (Editors), Single-Sideband Systems and Circuits, McGraw-Hill Book Company, New York, N.Y., 1987.
3. Geoffrey N. Mendenhall, "A Study of RF Intermodulation Between FM Broadcast
Transmitters Sharing Filterplexed or Co-located Antenna Systems," Broadcast Electronics Inc., Quincy, Illinois, (c)1983.
4. National Association of Broadcasters, Engineering Handbook, Eighth Edition, Washington D.C., 1992.
5. Earnest A. Franke and Ahamed E. Noorani, "Wilkinson Hybrid With Quarter-Wave Offset," RF Design, November/December 1981.
342

STAYING ON THE AIR DURING ANTENNA SERVICE Timothy C. Cutforth P.E.
Vir James Broadcast Engineering Consultants Denver, Colorado
and Rodger Tighe
Tribune Denver Radio, Inc. Denver, Colorado
ABSTRACT
The new RF exposure standards make it impossible to continue normal operation during antenna and tower maintenance. This paper will explore several of the practical methods of maintaining broadcast service to your market during tower maintenance and the pitfalls inherent in each method.
INTRODUCTION
There are many situations where it is now necessary to reduce power to levels that are the equivalent of taking the station off the air in order to limit the RF exposure levels to maintenance workers on your tower. With some planing it may be possible to set up alternate facilities for use during maintenance so that the service to your community will continue uninterrupted. The hardware for AM and FM systems are quite different but the methods for continuing service have much in common.
FM MAINTENANCE TECHNIQUES
Whenever it is necessary to do any tower work that requires climbing through the FM antenna apperature it is essential to minimize RF exposure. This can be accomplished in several ways.
1) Reduce transmitter power
2) Tower climbers can wear RF protective suits
to safe exposure levels
3) Switch to an Alternate antenna i) on the same tower ii) on a different tower
4) Switch to an alternate transmitting site
AM MAINTENANCE TECHNIQUES
When it is necessary to send a tower climber up your AM tower it will be necessary to do one of the following to maintain useable service:
1) Reduce power to safe exposure levels
2) Switch to an alternate tower
3) Switch to an alternate
transmitting site
343

POWER REDUCTION
Whether you are working on an AM or an FM station, reducing power at first sounds like the best and cheapest way to limit RF exposure but it is not without drawbacks. The allowable operating power will be extremely low. It is difficult to determine exactly what the maximum acceptable power level is without making RF power exposure measurements on the actual tower since the fields very near the antenna element are not easily modeled and predicted. Remember also that most older transmitters will not operate at very low power without serious modification. Another thing that must be considered is that some repairs or modifications on the antenna system cannot be made without dismantling or at least disconnecting the antenna. In the case of AM systems there is also the possibility that cables or equipment spanning the tower base will cause a short circuit taking you off the air. Because when you touch the tower at an AM station you are touching the driven antenna element it is also possible that workers touching cables or equipment being pulled up hot AM towers may receive rf burns even at very low powers. The voltages and impedances of odd bits of hardware and cable in close proximity to a hot AM tower are very hard to predict during such temporary operation.
ALTERNATE ANTENNAS
Operation with an alternate antenna is a much easier to predict method of limiting RF exposure. For FM systems the alternate antenna may be located on the same tower or on another tower nearby. RF exposures can be predicted rather accurately
from the Effective Radiated Power, the distance to the alternate antenna, and the antenna characteristics. When the alternate antenna is located on the same tower as the main antenna it may be necessary for the tower workers to climb up past the alternate antenna before the power can be switched to that antenna and it may be necessary to reduce power or cease operation from time to time as workers need to pass by the alternate antenna to take up tools, materials, and etc. If the alternate antenna can be mounted on another structure it is likely that work on the main tower can be accomplished with only one short interruption to switch antennas at the beginning and end of the work. If the two antennas are fed by separate transmitters it is likely that the switchover can take place without your listeners noticing any change on their receiver. If a patch bay is used to change antennas, the changeover time can be as short as 1 minute without requiring costly electrically operated RF relays. Changing coax cable flanges between different antenna feeds atop the transmitter in a rush is far more tricky and can take anywhere from 5 minutes up allowing for the .usual Murphy's Law effects.
ALTERNATE SITES
When the alternate antenna is at another site there is no need for continued operation to interfere with the tower work. There is also no need to have a noticeable interruption of the carrier since there must be a duplicate set of transmitter equipment at the alternate site. Any split site operation however does require a remote control system and audio delivery and processing system.
344

ALTERNATE AM TOWERS
Many AM stations already have more than one tower on the premesis in order to provide directional protections either daytime or nighttime. In most cases temporary nondirectional operation is acceptable at a reasonable power but few systems have been equipped to operate nondirectionally from more than one tower. That means that one of the towers stays hot at all times when the transmitter is on the air whatever the operating mode. Adding another antenna tuning unit for nondirectional operation on another tower allows grounding of any tower in the array one at a time for service work. In most AM directional phasors, all the directional to nondirectional switching is done in the phasor cabinet so most of the phasor cabinet has RF in it all of the time. If a switch to feed an alternate tower directly from the transmitter is mounted outside of the phasor cabinet it
then becomes possible to enter the phasor cabinet with all circuits cold (and grounded!) for testing and maintenance.
DUOPOLY CONSIDERATIONS AND MULTI-USER SITES
In the case of multiple stations on one tower the complexity of the needed alternate systems can multiply rapidly. With the increase in common components in a common antenna and diplexer the number of failures that can leave all stations off the air at once multiply as well. An antenna, feedline, or diplexer failure can leave all users "up the creek without a paddle" unless adequate alternate facilities are already in place. Patchbays to allow bypassing the diplexer, alternate antennas with their own feedline, alternate sites, or a combination of the above may be necessary to permit operation of all common stations during repairs of any such major component.
345

346

DESIGNING TELEVISION FACILITIES: PART II Tuesday, April 8, 1997 1:00 - 5:00 pm
Chairperson: Marvin Born, Dispatch Broadcast Group, Columbus, OH
DEVELOPMENT OF THE VIRTUAL STUDIO-SET SYSTEM AND ITS USE FOR TV PROGRAM PRODUCTION Kiyotaka Aoki NHK Tokyo, Japan
ANALOG TO DIGITAL VIDEO: TESTING THE SYSTEM Stephane Billat SENCORE, Inc. Sioux Falls, SD
DEVELOPMENT OF A SMPTE STANDARD FOR THE DIGITAL INTERFACE BETWEEN THE DTV
TRANSPORT MULTIPLEXER AND THE VSB TRANSMITTER Raymond Hauge Zenith Electronics Corporation Glenview, IL
DIGITAL TRANSMISSION MANAGEMENT Michael A. Ledwich Columbine JDS Systems, Inc. Golden, CO
THE ALL DIGITAL PC-BASED STUDIO NETWORK Alain Legault Matrox Quebec, Canada
ARCHITECTURE FOR TOTALLY DIGITAL NETVVORKS Adriano Barzaghi and Corrado Riccio Elettronica Industriale Lissone, Italy
NETWORKING AND MIXED-PLATFORM INTEGRATION: AN OPEN AND SHUT CASE? Tony Davis Quantel Newbury, Berkshire, England
PICTURE QUALITY ASSESSMENT TEST: CODING EFFICIENCY AND SERVICE BIT RATE OF 525-LINE PROGRESSIVE SCAN IMAGES Joji Urano Nippon Television Network Tokyo, Japan
•Paper not available at the time of Dublication
347

DEVELOPMENT OF THE VIRTUAL STUDIO SET SYSTEM AND ITS USE FOR TV PROGRAM PRODUCTION
Kiyotaka Aoki, Ryu Watanabe
NHK(Japan Broadcasting Corporation)
Tokyo,Japan
Abstract
The Virtual Studio Set System is a joint development project by NHK and Matsushita Electric Industrial Co., Ltd. It was installed in Studio CT-415 in 1996. The system produces three-dimensional CG images which are synchronized with the movements of three television cameras (panning, tilting, zooming, focusing, and iris operation), and composites them with the images of the studio performers . This enables real-time switching operation of
composite images. NHK now makes wide use of this system to produce programs that includes a regular weekly live broadcast. This paper explains this system and its use in program production.
1. Introduction Since the early 1980s, NHK has been
producing CG-based programs such as musical events and specials. Thanks to faster computers and NHK's advancements in applicated CG technology, a 2D-CG real time composite system called "SyntheVision" was developed and applied in program production. Further, by applying real time 3D-CG composite technology, NHK can now create real time CG composite images for live broadcasts, including election coverage programs.
The Virtual Studio Set System is the result of NHK's years in accumulating applied CG technology, and NHK's technological
experience in using "SyntheVision"in program production . Its operation satisfies the following three points which are essential in regular program production: 1)The system is fixed within the studio and does not need installation and adjustments during program production. 2) Easy operation that does not require a computer specialist. 3) Separation of CG production from studio program production. The 3D-CG data are recorded on a magnetic optical (MO) disk, and can be retrieved at the studio.
*1 : "Synthe Vision" A camera-synchronized2D- CG background
composite system developed by NHK. This system was introduced to the NHK news studio in 1988, and was first applied in the coverage of the Seoul Olympics. In 1992, after several improvements, it was installed in a production studio and is now being used in regular program production.
2. System composition and functions (see Fig. 1)
(1) Camera sensors (3 units)
Rotary encoders are attached to the pan/tilt axis of the camcra pan head and the outer ring of the camera lens . The camera information is transmitted to the control units described in (2).
348

(4) Operation
Terminal
Studio Floor ) f
Sub Control Room
M O Disk
RS 4::
(3)CG Generator
(2)Controller ((7) Cameraman Remote
Fig.l. Video & Control Block Diagram
(2) Control units (3 units) The CG data retrieved from the MO
disk on the operation terminal (explained in (4)) are stored in these units. The data will be transferred to the CG generators. These units receive information from the camera sensors every 1/60 sec to control the CG generator at field timing.
(3) CG generators (3 units) These are units which produce CG
images which will act as the background of the composite images and "depth keys" . Each unit carries out dispersed processing of coordinate transformation and perspective conversion, texture mapping, and brightness mapping. A "depth key" is a key signal used for CG props which are positioned in front of the studio performer within the 3D-CG space, when the performer moves behind a CG prop(such as a
CG table). The performer's position is measured by the position sensor described in (5). Because there is a two-frame delay for the CG video output, the camera video signal, which serves as the the foreground image, is also delayed.
(4) Operation terminal (1 unit) This terminal reads the CG data on the
Video Mixer A B C Line
MO disk, selects the CG images for each camera, and activates animation. The terminal controls all three control units through one personal computer. The 3D-CG data stored on the MO disk are produced by NHK's designer department using "Softimage," a software program available on the market. Data conversion is applied to the shape modeling data, texture data, and writing data of this software so that they can be used in this system.
(5) Position sensor (1 set) This is a magnetic sensor which measures
the position of the performer. It consists of a ball-shaped transmitter (46 cm in diameter) and one
3cm x 3cm square receiver which is attached to the performer. The measurement results are sent 20 times per second to each CG generator through the operation terminal and the control units.
(6) Chromakey units (3 units) Three Ultimatte 8 units are used to
composite the images of CG generators--camera video (FG), CG video (BG), and depth key (Ext. key). These outputs are the input material of the studio video switcher.
(7) Cameraman remote (3 units) The size and the spatial arrangement of
349

the CG set for the 3D-CG are designed with precision. Therefore, when compositing the studio and 3D-CG images, the viewpoint inside the 3D-CG space must be the same as the position of the actual cameras inside the studio. The cameraman remote is an operation panel attached to the camera head for adjusting the size and the camera position inside the 3D-CG space. The operation data and the information from the camera sensors are sent to the control terminal.
3. Features of the System
3-1. Compact design The main units of this system, which
consists of three CG generators, three control units, and the corresponding power sources, are set in two racks which are 2 meters in height and 57 cm in width. This compactness enables the system to be installed within a small space in the studio.
3-2. Video processing capability
(1) High polygon rate for real-time processing
Each CG generator has 12 built-in processing boards, which enables a processing capacity of 24,000 polygons per field.
(2) Large memory capacity Each CG generator holds a memory of
72 megabytes for texture mapping and brightness mapping. The memory can be expanded up to 96 megabytes.
(3) Use of external video signals The DVE board inside the CG unit rack
enables image capture of external still or moving images, and mapping them as moving-picture textures.
(4) Digital input/output All input/output signals of this system
are D1 serial format, in line with NHK's goal of total studio digitization. Because some cameras and other equipment in this studio are in analog format, A/D and D/A interface is used.
(5) Defocusing In addition to focus control data, iris
control data is also collected by this system, which enables defocusing in accordance with the depth of field.
3-3. Advantages of using three CG generators
(1) Advantages concerning the video console
• Dissolve, wipe, and DVE effects can be carried out between composite images at the video console.
• Composite images can be recorded on an
• The corresponding composite images for each camera are all shown at the same time on a preview monitor in the studio control room. The switcher operator(or Technical Director) can perform switching while watching the movements of the studio performer inside the 3D-CG space.
(2) Advantages concerning the cameraman
The composite images are sent to each camera as a camera return, so that the cameraman can determine his camera shots while seeing the composite images through the viewfinder while the studio is on the air.
(3) Advantages concerning the Lighting Director and Video Engineer
Fine lighting adjustment, color/level correction, and keying adjustments can be carried out by checking the select monitor images. Last minute adjustments can also be made even when the studio is on the air, just before the camera tally goes on.
350

(4) Backup measures for system trouble If one or even two CG generators are
disabled, the remaining generator can process video signals for all three cameras (see 4. (1) for the details).
3-4. User-friendly terminal operation (see Photo 1) The operation terminal runs on a user-
friendly interface, by using on-screen control panels with mouse-control. Because no keyboard control is necessary, even a non-computer expert can fully operate this system during program production.
•Cane
-qPr
my!!
ianotol uperation Terminal
Select Monitor Switcher
3-5. Instant switching of moving-picture texture
NTSC moving-picture textures can be allocated inside the 3D-CG space. The isolated-line switcher output of the video console is connected to the video material input of the CG generator at all times, enabling the instant switching of materials even when the studio is on the air.
3- 6. Efficient picture quality monitoring (see Photo 2 & Fig. 2) The remote panels for three Ultimatte
units. which are Chromakey units, are mounted
air o
‘WWWWWWw WWW , ea
d—
o et-
Photo2. The Ultimatte Operation Console
(on the Camera Control Table)
Conposite Image
Chroma-keyer A
Key Out 1
Conposite Image
Chroma-keyer B
Key Out I
X
Conposite
Image
Chroma-keyer C
Key Out 1
fiqf VTRs Telops,etc.
Master Monitor
ED 0 A
Key Signal Selector(on the Ultimatte Operation Console)
Fig.2. Video Diagram for Monitoring System
351

on a small rack (50-cm high) called the Ultimatte operation console which is installed in front of the camera control table. This operation console has a "key signal selector" which takes in the key signals of the Ultimatte. Keying adjustments are made while switch-monitoring this selector. There is also an SM (Select Monitor) switcher at the Camera
Control Table, with which all material inputs of the video console can be monitored.
Color/level correction of the composite images can be done by monitoring with this switcher.
3-7. Video system enhanced for post-
production (see Fig. 3) There are cases where the program
producer wishes to apply special effects on only the composite CG or on the video image of the studio performer before the editing process. In such cases, the producer must record the key signals in addition to the composite video signals. The system is supplied with a sub-switcher. The sub-switcher inputs are the key signals of the three Ultimatte units, and the switcher output is connected to a VTR. In this way, the key signals synchronized with the switching of the composite images can be recorded on VTR.
3-8. Others
One of the horizontal walls of the studio is painted blue and used as a blue-screen, which eliminates the trouble of setting up and removing large blue panels for composite
Video Mixer A B C
4? Tally Signal Chroma-keyer A ,
Key Key Out2 Out2
program production.
4. Backup measures for stable operation
In order to achieve stable program production, a number of backup measures are in effect for this system. The following are employed for a weekly live broadcast program (produced by NHK).
(1) 1 CG mode (see Fig. 4 & Fig. 1) The camera outputs, camera sensor data,
and cameraman remote data are cascade-connected to each of the three CG generators and control units. The camera tally signals from the video console are constantly transmitted to the
control units through the operation terminal. "1CG mode" is a backup mode that
enables a single CG generator to produce the
composite images for all three cameras when one or two CG generators are disabled, by using the video and control signals explained above.
The following explains the function of this mode by using an example where the CG generator for Camera A is disabled and is
recovered by the CG generator for Camera B. The CG unit for Camera B is set for "1CG
mode" from the operation terminal.
The input A material of the video console is switched to the same material as input B, by using a matrix located at the front of the video console.
Here, the inputs for Camera A and Camera B on the video console are the same composite images of Camera B. However, the CG unit B receives the tally signal for Camera A, which
Chroma-kever B
Chroma-keyer C
Key Out /
CIL Sub Switcher(synchronized Camera Tally) VrR
Fig.3. Key Signal Recording Diagram for Post-production
352

Operation
4Tally Signal
iCamera Sensor & iCameraman Remote A Cam - -0 B Cam C Cam
3D-CG Data A Cam B Cam C Cam 0
Controller B
FO Inputs A Cam - -. B Cam — • ----. C Cam — 0
0.1 CG(BG)&Depth Key Generator
CO Generator B
Fig.4. Video & Control
enables CO unit B to switch the camera input video, CG images, camerasensor data, and cameraman remote data to that of Camera A. Consequently, the operator can perform cut switching of the composite images A and B.
Also, the preview monitors A and B will display the same composite image of Camera B, making it impossible to follow the studio performer's movements before cut-switching to Camera A. By connecting the CO composite image to ch 1, and the blue-screen camera image to ch 2 for each preview monitor in advance, the studio performer's movements can be monitored during "1CG mode" by simply displaying ch 2 of each preview monitor.
Similarly, one CG unit can process the composite images for Cameras A, B. and C even if two CG units shut down at the same time.
(2) Extended cameraman remote
The operation terminal has the same functions as the cameraman remote. Therefore even if the cameraman remote is disabled, it can quickly be recovered by using the
Chroma Keyer B
Video Mixer A B C
X
A
MATRIX
Diagram for Back Up System
operation terminal.
(3) Auxiliary equipment
As stated above, program production would not be interrupted even if two of the three CG generators should be disabled. In order to shorten the recovery setup time during system trouble, the operation terminal has a backup unit which is installed with the same software as that of the original operation terminal. There are also backup units for the camera sensors and the Chromakey units or Ultimatte 8. Other peripheral equipment are general-purpose equipment which are frequently used within NHK.
(4) Secured power source Because the system is computer-
controlled, it is equipped with three UPS (Uninterrupted Power Supplier) to prevent memory loss or damage to the hard disk in the event of a power blackout or a momentary power loss. The UPS has an output of 3 kw--each of the three CO units is provided with a UPS unit to ensure power supply.
353

(5) Support service by the manufacturer
Matsushita Electric Industrial Co., Ltd., the co-developer of this system, provides NHK with a 24-hour, on-call support service throughout the year.
5. System operation in studio program production
The following explains how this system is used during studio setting, rehearsal, and on air.
5-1. System Setup
(1) MO data reading at the operation terminal
The operation terminal reads the 3D-CG data stored on a MO disk (reading time approx. 2 minutes). Immediately after this
process, the MO data is stored on the hard disk of the operation terminal, making it unnecessary to reread when reusing previous CG data.
(2) Setting the operation terminal CG operation such as CG image selection, CG animation pattern set up can be done by using the on-screen control panel. These conditions are monitored for each program. All the parameters used in the same program are saved; if the studio camera positions are the same as in the previous shooting, the previous camera movements can be reproduced.
(3) Camera adjustment and Ultimatte adjustment
After adjustment of the three cameras, the Ultimatte units are also adjusted for black, white, gamma and flare. Both the cameras and Ultimatte have memory--their operation conditions can be reproduced if the lighting conditions are the same as in the previous studio shooting.
(4) Background manipulation by the cameraman
The camera position is determined by the studio performers' standing positions. Because of
this, it is necessary to set the camera viewpoint of the 3D-CG to the same viewpoint as the actual studio camera.
This is done by the following method. A
2m x 2m square metal pipe is placed on the studio floor; in the three 3D-CG set, a CG square of the same size can be displayed on and off on the CG floor. With this square displayed on the CG floor, the three cameramen will shoot the actual square pipe on the studio floor. By watching the composite image through the viewfinder, each
cameraman can adjust the CG background so that the CG square precisely overlaps the actual square.
5-2. Rehearsal, studio on-air
During rehearsal, the performers' movements in the 3D-CG space are checked, lighting adjustments, Ultimatte key adjustments, and color/level adjustments for the composite images are made. When the studio is on the air, fine adjustments will have to be made on lighting and Ultimatte, for the performers' positions may slightly differ from those during rehearsal, or there may be unexpected ad-libbing.
5-3. Studio schedule in live broadcasting
An NHK educational program called "Tensai Terebi-kun" (You are Genius, Television Boys!) is a weekly variety show for elementary
school and junior high school students broadcast live between 18:00 and 18:25. In this interactive program, seventeen children chat in a CG setting with two comedians who host the show . General viewers can also take part in the program, through relayed video messages, videophone, and touch-tone telephone games.
The following is a studio schedule for a live broadcast.
354

12:00 Technical meeting 12:30 Camera set up, equipment adjustment 13:30 Lunch 14:30 Videophone and relay connection check 16:30 Rehearsal, adjustment 18:00 Live broadcast 18:25 End of program, clean up 19:00 Close studio
As this schedule shows, because the Virtual Studio Set System is a fixed studio system that does not need system construction or adjustments, it can broadcast live programs within the same production time as for normal programs.
6. Effectiveness and evaluation of this system applied in program production
(1) Flexible directing • Fantastic image expression can be created using 3D-CG.
• A virtual set which cannot be realized in an actual studio can be created. • The background can be moved freely.
• A large CO studio screen (up to 10 meters in size) can be created without actually installing a monitor inside the studio.
(2) Expense cuts in set scenes There is no need for stage construction
inside the studio, which eliminates expenses for maintenance and storage of large stage props.
(3) Less work time in studio Less time is needed for stage setup,
which is often carried out during late or early hours of the day.
(4) Flexible scheduling and safety for studio performers
• It is no longer necessary for the performers
to act in dangerous locations (such as cliff tops and construction sites). Similar images of such locations can be created in the studio.
• The system is a good substitute for outdoor shooting. A more flexible shooting schedule can be set for the performers. Night scenes can be shot during the day.
(5) Easy system operation
With a user-friendly operation terminal using an on-screen control panel, cameras with viewfinder monitoring of the composite images, and switching operation that is no different from that of normal program production, real-time 3D-CG composite images can be created without having to worry about complicated computer operation.
7. Summary In conventional 3D-CG composite image
production methods, foreground images of the performer which are shot in the studio, key signals recorded on VTR, and frame-by-frame computer images recorded on VTR were all composite during the editing process.
NHK's Virtual Studio Set System is an epoch-making system that realizes real-time 3D-CG image compositing during studio shooting.
Currently, NHK broadcasts television on 6 channels --GTV(General TV), ETV(Eclucational TV), BS1(Broadcasting Satellite 1), BS2(Broadcasting Satellite 2), TV-Japan (NHK International TV Broadcast), and Hi-Vision (HDTV). In addition, NHK's radio broadcast channels are R1(Radio 1), R2 (Radio 2), NHK-FM, and Radio Japan (NHK International Radio Broadcast), which makes NHK a broadcasting station of 10 broadcasting media. NHK's operations are financially supported by its general viewers. The network is therefore required, as a public broadcaster, to continue to supply quality programs at low cost in a short amount of time. In pursuing this policy, engineers at NHK are determined to make further improvements in television technology.
355

Analog to Digital Video: Testing The System Stephane Billat
Sencore Electronics Sioux Falls, South Dakota
ABSTRACT
As digital video becomes more and more predominant in video studios, broadcasting environments, and cable sys-
tems, operators are learning and dealing with new
technology everyday. Even though some format of digital video technology is making its way to nearly every facility, it is rare to see an analog system scraped and replaced by a completely digital system. Economical reasons and
facility downtime don't allow this type of luxury. As a
result facilities have a mixture of analog and digital equipment. In the digital domain, not every piece of equip-
ment is the same either and it is not reasonable to believe that non compressed SMPTE 259 (CCIR601) equipment
can be treated the same as MPEG equipment. The final result is engineers needing to deal with different equip-
ment and signals. As always, when new technologies come into place, there is some confusion and it may take awhile
to get the system completely stable. With signals being changed from analog to digital, then compressed, stored,
decompressed, and edited, it may not be easy to find the problem when something goes wrong. Maintaining and
troubleshooting the system can become a difficult task, if the right test equip ment and methods are not used. In this
paper, we will review different testing methods for the dif-ferent technologies and try to provide valuable
information to the engineer responsible for maintaining a reliable, working system,
ANALOG VIDEO
Analog video has been with us for many years, and the
methods of testing the analog system are well known. The
specifications for signal timings and voltage levels are
well understood and can be monitored with standard
equipment. A waveform monitor and a vectorscope can provide valuable information as to the quality of the video signal. Monitoring the analog voltage levels and system
timings such as the synchronization and the color subcarri-
LIM I
6.4•11
LIP\
11.led
IL If •
Lai
U MW LEMS.
SLICE Lral.
LEOL
V W LEVU. pg
Figure 1: Analog Video Timing Diagram
er frequency and phase are key elements of compliance. A
good determination of system integrity can be made from these measurements.
VIDEO TI MING DIAGRAM
One of the most common problems with the analog video system is noise. Induced noise can result in a degradation
of the picture quality. The amount of noise is proportional to the level of degradation and can be quantified by signal
to noise (SIN) measurements. This also allows us to quali-
fy the video signal by setting a minimum acceptable S/N ratio.
Even with the transition to digital video, it is still impor-tant that the integrity of the analog signal is maintained. In
many cases, an analog system such as a camera is still the signal source for the digital system. Degradation of this
signal will directly transfer into the digital domain.
Care must also be exercised in the analog to digital (A/D) conversion. This is another point in the system that can
easily be overlooked, as A/D converters are relatively inexpensive and their function is perceived to be well
understood. In reality, the function of the A/D converter is
356

critical, as it is responsible for providing a properly for-matted digital video steam for the rest of the system. In
addition, the A/D converter must also develop a precise
clock signal within the amplitude and jitter parameters established for the digital link. The amplitude and jitter requirements will be discussed in the next section, as they are key parameters for a successful transfer of the digital
signal.
IIL-Digital Video CCIR601-SMPTE259 (Non-Compressed)
Digital video in the non-compressed format has been
around for much less time than analog video, but is gradu-ally making its way into many post production houses and
broadcast facilities. There are several reasons for the tran-sition. Digital video provides higher quality, superb
editing capabilities, and greater flexibility for special effects to enhance the video.
The difficulty of working with digital video is trou-bleshooting and locating system problems. For example, initial problems may only be seen as an increase in BER
until the digital cliff is reached. This is a function of the
digital signal transfer, as single bit errors typically go unnoticed by the user. However, once the digital cliff is
reached, the engineer is faced with no picture and no real
starting point to begin troubleshooting the system. There is
no gradual degradation of signal as in an analog system.
There are 4 main formats for digital video (see Table 1)
M O RAL VIDEO FORMAT
le mplkrig I Lamm
Vampire Li re
Acta " Dr yDo
M O M Sado' Olt Plato
% Do pe Illaftlhold•
Tape Feemst W N W
525 Vo o ComP oro.
422 525 1716 1440 4/10 96 270 .40% 131-06
025 Vo o Co-Poona%
422 025 1724 IOC 6,10191 Z70 -40% D1-05
Ctn.. . M SC
4., 625 910 ne 10 OR 143 hi .
-20% 02-03
Conto••• t, 4,
(Sc 1125 1,36 946 ¶0 48 ¶ 77 02-03
Table 1: Digital Video Formats, Rates, And Picture Size
The myth of digital video is that it is error free and there
are no related problems. The truth however, is that digital produces high quality video, but is difficult to troubleshoot
and analyze.
The need for testing in the digital domain is as important as in analog video. When working or analyzing digital
video system(s) there are three specific areas of concern.
They are:
Electrical: Vpp, Vrp, Vav, jitter match graph for jitter. Data or Syntax: video range, reserved code, TRS structure.
Video Information: Back to analog parameter Y/C, Illegal RGB.
The parameters of the electrical signal that must be veri-fied include the amplitude and average voltage of the
"carrier", and the jitter present in the signal. Unlike ana-log video, problems with either the amplitude or jitter can produce the same visual effect. This makes it difficult to know where to begin the troubleshooting process. The
proper test equipment is essential for an efficient solution.
The electrical signal is only the carrier for the digital data. Once the data is received and decoded, it must also con-form to specified parameters. These specifications include
the valid range for the video data, reserved codes that are
used as flags for synchronization data, and the structure of the Timing Reference Signal (TRS). Again, errors of this
type can produce many of the same visual effects as the electrical errors.
SMPTE specifies the different parameters for confor-
mance. See (Table 2) for a list of some of these specifications:
P—P Amplitude 800 mV±10 )/0
DC Offset 0.0V ± 0.5V
Timing jitter lower band edge 10 Hz
Alignment jitter lower band edge 1kHz
Upper band edge >1/10 clock rate
Timing jitter 0.2 Ul p-p
Alignment jitter (UI = unit interval)
0.2 Ul p-p
Color bar test signal EG1
Serial clock divider #10
Table 2: SMPTE Spec. Chart
The last issue to remember is that the end use of most dig-ital video is for display on an analog monitor. For this reason, we must be aware of the problems that can arise during transcoding from one format to another. Each
color space has different limits for its valid range. Not all signals that can be produced in the 4:2:2 domain can be reproduced in the analog RGB domain. The same is true
357

for conversions into the composite domain. One needs to be aware of these limitations to ensure conformance at each level.
Conventional testing that would commonly be used for
analog troubleshooting is not comprehensive enough for digital video. The video information is encoded and
scrambled. A conventional oscilloscope can provide some information such as Vpp, Vrp, Vav and jitter, but
doesn't provide any information on the syntax or the video content.
An oscilloscope that is capable of measuring a 270 Mb/s signal would require a bandwidth of approximately I GHz.
It could only be used to troubleshoot portions of the
CCIR601 signal. In addition they are costly and are still subject to user interpretation. What is truly needed to ana-lyze, test and troubleshooting CCIR601 digital video are
test instruments that are strictly dedicated for digital video testing
Another way to stay on top of COR601 system problems
is to maintain strict methods of quality control in your facility. Some of these tests or methods include:
• EDH testing
• Syntax conformance checking.
• Electrical measurements of the operating system. • Monitoring pathological patterns.
When designing a CCIR601 digital system, careful con-sideration must be given to cable lengths, the quality of
equipment used, and termination of all transport paths.
Consideration should also be given to including built-in system testing and monitoring equipment.
All systems are not created equal. A system that has ins of jitter may not cause any problems today, but could cause
significant problems if additional equipment is added in the future. Also, before any new equipment is installed in
a currently working system, it should be completely tested for compatibility. The system should also be "stressed" in
order to evaluate the available "headroom" of the system. This can be accomplished by inserting system jitter,
increasing cable lengths, or changing the parameters of the system.
As the signal is processed or moved to a compressed for-
mat, conformance of the CCIR601 signals is crucial. The
performance of most MPEG-2 encoders will rely on a properly formatted CCIR601 digital signal.
DIGITAL VIDEO (COMPRESSED) MPEG2
(MOVING PICTURE GROUP EXPERT)
Who Is Using MPEG Technology?
MPEG has been around for several years and is rapidly being deployed in the video world. The successful use of
MPEG technology in DBS systems clearly contributed to the rapid expansion of this technology. We are beginning to see MPEG technology implemented in M MDS broad-casting, cable systems and soon ATSC digital broadcast systems. Another segment of the industry where MPEG is beginning to appear are the studios. Video servers are
being installed, and video data is being exchanged over telecommunication networks (DS3 and ATM for example).
Although MPEG is classified as digital video, people
could believe that the technology is similar to non-com-pressed CCIR601 (SMPTE) technology. The MPEG
technology is much different from CCIR601 technology. It is nearly as different as CCIR601 is to analog technology. The result is once again, the operator needs to learn a new technology.
The truth is, whatever part of the broadcast industry you
are involved with, you will be dealing with MPEG in the future. It has started with chip designers and equipment
manufacturers. It has moved to the transmission sites and the telcos are getting involved with it. Broadcasters and
post production houses will soon be involved with MPEG as well.
What Is MPEG?
MPEG is still a very new technology. In fact some aspects of MPEG aren't completely finished. For example, fram-ing of the MPEG packets into DS3 or 0C3 and then ATM hasn't really been standardized yet. We can expect MPEG
technology to evolve as it is used more and more in the future.
The standards are defined for MPEG-2 (see REFER-ENCES) but MPEG is a tool box which doesn't specify every parameter. For example, you can have an MPEG-2
compliant encoder and MPEG-2 compliant decoder that will not comply with one another.
These types of problems did trigger the DVB (Digital Video Broadcasting) group to close the parameters that
MPEG left open. The goal of the DVB group is to offer equipment that has a good quality/price ratio and also pro-vides easy interoperability between vendors. The DVB
specs (see REFERENCES) are a specific interpretation of
358

the MPEG specs. Most vendors now offer DVB compliant products.
Different Ways Of Using MPEG Technology. MPEG offers different quality and compression technolo-
gies depending upon the application. The DBS broadcaster doesn't have the same requirements as the studio where
the video needs to be edited. That is why MPEG offers
different Levels and Profiles for different applications. (See Table 3)
LEVEL PROFILE RI mpIR mei. me IR O
Nigh M O 27.77 116212••
X
ea. ton
12,14a R .
X
_Nhaothal
X 10014 04,4
M R W O on. 1162 477.•
X W Y O. W M RAY
X X S W . I MO R .
Mak. 720 p.m. FM Irma
MR bon M e RAM
ISM bin 104 RAY
16IX OW M R M Y
X 20.10.• MYR R .
I n 262 p .m RN ..
X 1.45 por. St RAM
ad N. St M Y
X I
No 8 Imam 420 WI a . .
B S. .
420 NIX a mt.
I Immo
420
" O MNI.
211147••• 420 N M X
.1241 •1 ai m .
8 44.7•44 420 2 VAR 4 O M X •••••1•7444
Table 3: MPEG Level And Profiles.
The most widely format used right now is the Main Level
Main Profile (or MP@ML) with a 4:2:0 sampling. It pro-vides a good compromise between quality, bandwidth and
price. In the future this may change as DTV and HDTV
are implemented. Also, studio applications require a derivative from MP@ML as they need to edit the video and se mi to prefer using a 4:2:2 sampling scheme.
MPEG also specifies the Transport Stream and the Program Stream. Presently these two layers are being used in the broadcast industry. The Transport Stream layer is the most commonly used. For that reason, we will focus on the application of the Transport Stream layer in the remainder of this paper.
How Does The Transport Stream Get Created? We can separate the compression/distribution process into
three main processes. The first layer is the compression
layer, where the video compression actually takes place.
Next the raw compression data is sent into Packetized
Elementary Streams (PES) that represent compressed video frames or audio frames. Then the PES packets are cut into Transport packets.
r.= 1.11••• NM . P..
Pve,
•14.44.0017121E07•CCINIen
v... r p m...
IPEC1-2 IMOVION• 05 SPEC . Tarpon a mmo
Figure 2: MPEG-2 System Layers.
At this point most problems are found in the PES layer and in the TS layer. The compression layer appears more reliable.
The Transport Stream Layer.
MPEG Transport Stream packets can be divided into the
header and the payload. The header provides information about the type of payload and the information embedded
in the Transport System layer.
The header syntax for the packets is defined by MPEG
and needs to meet certain requirements. These require-
ments are specified in the MPEG document (13818-4).
MPEC2 Test ()Vow, I
Tsamcat Facie ileade Sot. RtlartaRan Fold Sint.
sym_1:1025
N.,keicort_sted_racerator
P. PO
takvcr_strangir‘scniaci
atermk.r_twfr,cankci
P C:artruty
P adeccannivitienceh
,errksn_ec-4.:_n6cer.4
eareicet_ec,.e.tx_KR
jags
Egangc.0,1,,a4
SIRS C4ta
P CAC
Figure 3: MPEG2 - Transport Stream Compliance Parameters.
DVB also provides additional parameters that need to be tested in order to have a DVB compliant stream.
Tattibtoss I
Firm Norty - Second Amity - Irt Prot,
Trwspot_arra Nr_er.
P 5442 01/71,_61:24 FCR_et. Sia_awa
PAi..e. Por-keaxnacy_toor PErr_ento
P .7.arltruo_orosi_ews CALaas P M"Lcato
P PM T_s P C.adt4 Pr T01_2".
P PIG_Iars P SLfernonteard
1.1nrelaien.rd
Figure 4: DVB Transport Stream Compliance Parameters.
The truth is, that even if the stream is MPEG or DVB compliant, there is no assurance the user will have plug and play capabilities between the encoders and the
decoders. I am not claiming there won't be compatibility, but it will require the user to know the equipment fairly well in order to make them work together properly. Other settings like the table organization, and the PHD allocation, make it difficult to mix and match equipment. The ISOG organization has been working for almost a year on a method to have true plug and play capabilities between DVB decoders and encoders. The results are very promis-ing but there is still work to be done.
359

How The Problem Appears
As in non-compressed digital video, when a problem
occurs, the video goes away. It is even more dramatic with
MPEG as many seconds of video can disappear with only few errors. On the other hand, if those errors do not hap-pen at a critical time, nothing will appear on the monitor
screen. The need for testing is obvious, as critical errors can disturb the whole system. In the Transport layer, there are key points to look at:
Header Conformance
The header provides information on the packets and
allows the multiplexing of the videos, audio, and data. It is
important for the header to be properly formatted, other-wise the payload information can be lost.
I HC.E4Elt Payeagi Hracer#PAAakt Keades Peglotei
I
Figure 5: Transport Stream Header.
Table Content And Structures
The tables are the heart of the TS layer. They provide the decoder with the information it needs to find a certain pro-gram and properly decode it. There are 3 main MPEG
tables (PAT, PMT, CAT) and 7 extra DVB tables. Not all tables are required in the DVB stream. (See Table 4)
'APED-2 P10.0.1X00
PAT
FIC.06031
CAT
PID.P
PVT
DVB IININI••••1
REU4x0 M0
Hg
*Own
F10.0 0011
SOT
PID.C1‘0012
P10.116014
TOT
DVB Name
FID.OrC010
NIT
P1 0.011:011
BAT
PID.QtC014
SOT
MD.CM:1012 RD.CM:012
En En
I P10.04013
FtST
PID=OKOMO W0 0314
ST
PI NOLI:0:11
Nor . Int•••••••
Swu m, hass Men
Os olpan
bow., Odonmaion
livromp NNW
SWIM.
TOT
Table 4: MPEG-2 And DVB Table Structures.
Timing Issues (PCR's) That Provide Timing For The System.
The system requires the timing information in order to
recreate the video. The PCR provides the receiver with the
necessary information to properly time the decoded video. The PCR is a sampling of the master clock. The sampled
value is sent in the packets (adaptation field) and then is decoded by the receiver. The Decoder uses this value in
order to synchronize the local clock with the transmitter clock. The PCRs must to be sent every 100ms (40ms for
DVB) in order for the decoding PLL to stay on track. The
sampling accuracy of the master clock needs to be +/-50Ons for the decoding PLL to be able to adjust to the encoder frequency.
These parameters need to be monitored as a bad timing
system will result in problems during the decoding of the video and audio.
Jitter
Jitter is related to the PCR, but is different than the PCR inaccuracy. Jitter is a measurement of the delays of the PCR introduced by the transmission channel. It is espe-cially critical in an ATM network. Jitter can cause the
same types of problems that PCR inaccuracies do, and should be monitored especially in transmission facilities.
The PES Layer
At the PES level, conformance of the Header needs to be
360

verify as well as PTS (Presentation Time Stamps) and DTS (Detection Time Stamps).
DTS and PTS time stamps are important as they time the video as to when it is decoded and displayed. If the timing
is wrong, the video may not be synchronized or the audio might be out of phase with the video.
Bibs M u . .
0.4. term Alem Ulm
Figure 5: 5: PTS/DTS Timing Diagram.
Another parameter to monitor is the Video Buffer Underflow or Overflow. As the packets are decoded,
depending on the GOP (group of picture) sequence, the
buffer can be saturated resulting in a loss of information.
The difficulty, is the TS and the PES stream can be per-
fectly compliant. The video can still break-up if the decoding buffer happens to overflow. That is a why there
are methods to simulate the decoding buffer and monitor its state of the buffer.
Testing Is Important As a result a number of things can go wrong or that can be
set wrong, the need to test is obvious. At this time there are two different approaches to testing: Real time testing
and disk based testing. Both methods provide advantages and are needed. Almost all test instruments look at the TS layer and at the PES layer but not the compression layer. That is where a majority of the errors can be found.
Real time analyzing tools provide on line analysis and
require no operator attendance. This type of test instru-ment monitors non conforming streams and flags errors as they occur.(Compare to MPEG and DVB compliance parameters)
Disk based test instruments offer a detailed interpretation
of the TS as well as the PES level. They not only let the
user perform a conformance test on the TS and the PES but allow for a detailed analysis of the table structure and the payload if required. It also allows the user to save a MPEG file to disk. This function is useful to compare file structures (from different vendors for example) or to playback known good files or known bad files in order to test and stress the system.
Interoperability Is Vital
The customer neMs to have interoperability between
equipment. There are many reasons for this. First, most customers will need to be able, at one time or another, to receive or send MPEG TS to another part of the country or possibly the world. It is important for the user to feel con-fident that the system they are buying will work with most
equipment on the market. It is important to understand
that even though equipment is MPEG compliant and DVB compliant, there are still parameters that need to be tested
to insure they work together. This is one of the reasons why disk based test equipment has been more popular
than the real time equipment. It is much more difficult to
perform detailed analysis of the structure of the stream with a real time analyzer.
What To Look For When Looking For MPEG
Equipment
As mentioned earlier, everybody is buying or will be buy-
ing equipment that deals with MPEG. This equipment is often very expensive and great care should be taken in
selecting it. Almost all manufacturers claim to be MPEG
and DVB compliant. Reality dictates they might not be yet 100%, which can cause interoperability problems. It is a good idea to test equipment before making a buying deci-sion. There is no MPEG police to inform you that a manufacturer isn't compliant!
The interface between equipment is not specified by MPEG standards and if DVB did specs 3 interfaces (DVB
Parallel, ASI, SSI) , many vendors offer their own propri-
etary interface that do not facilitate interconnection of
equipment. People should be aware of this issue and make sure the system they are buying will be able to be connect-ed to other equipment.
CONCLUSION
Digital video is quickly making its way into the broadcast world. As new technologies arise, the user needs to be pre-pared to learn new concepts in order to make good
decisions in the development of his or her facility. With video being buried deep inside multiple layers of coding, it is getting harder and harder to access it for quality con-trol. The user needs to prepare their facility by selecting a?propriate test equipment for the different signals present in its facility. With CCER601 non-compressed video and
MPEG signals, it is the start of a new era where multiple layers of test equipment is needed. This trend will increase as ATM and HDTV make their way to the broadcast facili-
361

ty. These new technologies won't replace the old, but new types of signals will be added to the system. Testing will
be required at every step in order to insure a continuous, high quality video and audio signal to the customer.
REFERENCES
CCIR601 / ITU-R BT.656-3
/ FTU-R BT.601-5 Standards
REC.ITU-R BT.601-5
REC.ITU-R BT.656-3 SMF'TE 125M SMPTE 244M
SMPTE 259M
MPEG Standards ISO
13818 13818 13818
13818
DVB Standards
- 1 - 2 - 3 - 4
Systems Video Audio
Compliance Testing
ETS 300 468 : Digital broadcasting systems for television, sound and data services; Specification for Service infor-mation (SI) in Digital Video Broadcasting (DVB) systems.
ETR 154: Digital broadcasting systems for television, sound and data services; Framing structure, channel cod-ing and modulation for digital terrestrial television.
ETR 162: Digital broadcasting systems for television, sound and data services; Allocation of Service Information (SI) codes for Digital Video Broadcasting (DVB) systems.
ETR 211: Digital Video Broadcasting (DVB); Guidelines
on implementation and usage of service information.
Draft ETR 290: Measurement guidelines for DVB sys-tems.
prEN 50083-9: Interfaces for CATV/SMATV Headends and similar Professional Equipment.
362

Development of an SMPTE Standard for the Digital Interface between the DTV Transport Multiplexer and the VSB Transmitter
by
Raymond C. Hauge
Zenith Electronics Corp. Glenview, Illinois
Abstract
The ATSC Digital Television Standard defines the various subsystems that make up a complete digital television broadcast plant, but it does not provide standards for the intelfaces between these subsystems. An important interface is the one between the output of the studio multiplexer that creates the MPEG-2 compliant DTV transport stream and the input to the broadcast transmitter. In response to a request from ATSC, SMPTE has created an Ad Hoc Group to develop a standard for this interface. This paper will describe the various factors that influence the definition of this interface and present a report on the progress toward development of a standard.
The ATSC Digital Television Standard specifies the output of the transport multiplexer to be a continuous MPEG-2 transport stream at a constant rate of Tr Mbps when transmitted in an 8 VSB system and 2 Tr when transmitted in a 16 VSB system where:
Tr = 2 x (188/208) (312/ 313) (684/286) x 4.5 = 19.39...Mbps
The factor (684/286) x 4.5 = Sr = 10.76...MHz is the symbol rate specified by the ATSC Digital Television Standard for both the 8-VSB terrestrial broadcast mode and the 16-VSB high data rate mode. The ATSC Standard further requires that Tr and Sr be locked to each other in frequency. However, the ATSC Standard does not specify any further electrical or physical characteristics of the interface between the transport multiplexer and the transmitter. In
Bernard J. Lecluier
Consultant Princeton, New Jersey
fact, the Standard suggests that a voluntary standard for the interface may be developed by SMPTE.
In response to a request from ATSC to develop such an interface standard, the SMPTE Working Group on Packetized Television Interconnection created an Ad Hoc Group to study the issues and draft a standard. The Ad Hoc Group is chaired by Ray Hauge of Zenith Electronics Corp. and has held several meetings beginning in the summer of 1996. A first draft of the proposed interface was balloted to the members of the Working Group on October 23, 1996. This paper will discuss the various factors that influence the definition of the interface and provide a progress report on the standard as it works its way through the SMPTE approval process.
In the general case a wide variety of transmission links may be utilized to carry the output of the transport multiplexer to the input of the VSB transmitter. When the studio and transmitter are co-located, the link may be a short piece of cable. More commonly, it will be a microwave studio-to-transmitter link (STL). In other cases it may be over an ATM network or a satellite link. The Ad Hoc Group agreed that its task was not to develop standards for these links but to confine the interface standard to a direct point-to-point connection between the transport multiplexer and the transmitter. Other links interposed in the path between the transport multiplexer and the VSB transmitter, whatever their internal transmission
363

characteristics, would be required to meet the requirements of this interface standard at their input and output.
Although it might appear that the definition of such a point-to-point interface would be trivial, there are some important factors that needed consideration. First was the required frequency stability on the transport clock Tr. Since the ATSC standard requires the transmitter symbol clock, S„ to be locked to the transport clock T , and since it is widely expected that the VSB signal at the typical 45-MHz transmitter intermediate frequency (IF) will be generated digitally, the resulting RF pilot carrier frequency will be directly related to the symbol clock frequency, Sr. and thus to the transport clock frequency, Tr.
In order to minimize co-channel and adjacent-channel interference, both to and from NTSC and other DTV signals, the ATSC has proposed that certain frequency offsets be maintained between the DTV pilot carrier and other DTV pilot carriers and NTSC carriers. To be effective, these offsets must be maintained within certain tolerances. The most difficult case is for upper adjacent DTV interference into NTSC where the precision offset recommended by ATSC requires a tolerance of ±3 Hz between the DTV pilot carrier and the NTSC video carrier. Splitting the requirement between the two transmitters places a requirement of ±1.5 Hz on the DTV pilot carrier frequency. The Ad Hoc Group concluded that it was unreasonable to require such a tight tolerance on the transport clock frequency. A tolerance of ±54 Hz has been proposed for Tr and it will therefore be necessary to control the heterodyning oscillator in the transmitter with a phase-locked-loop against a precision reference, e.g., a GPS
reference, to maintain the broadcast pilot carrier within the tight tolerance required in certain cases. The ±54 Hz was chosen by scaling the current ±10 Hz stability requirement for the NTSC color subcarrier.
Another issue relating to the interface that has been considered by the Ad Hoc Group is whether to add an Error Correcting Code (ECC) to the transport stream. Since the interface is intended for point-to-point connection in a nominally noise-free environment, it would not appear that ECC is necessary. However, some members of the Ad Hoc Group feel that ECC should be included, either to protect against unanticipated noisy environments or to provide a means to monitor the quality of the physical interface, e.g., the condition of the cable and connectors. The first draft of the proposed interface includes a BCH (1526, 1504) t = 2 ECC. In early December, 1996 the Ad Hoc Group adopted a plan to conduct tests at a number of TV transmitter sites to characterize the noise environment in which the interface will be used.
A third issue considered by the Ad Hoc Group was that of clock recovery at the transmitter side of the interface. Since the ATSC transport stream allows null packets, the basic NRZ stream guarantees transitions only during the sync byte which occurs once every 188 bytes. To provide clock transitions on every bit, the Ad Hoc Group chose a bi-phase mark code for the interface. Although this doubles the bandwidth of the signal at the interface, it also eliminates any DC component from the signal.
The physical interface is presently specified as 75 ohm coaxial cable using BNC connectors. Other electrical parameters are scaled from SMPTE 259M.
Since this is an ongoing process, the most recent proposal on ECC and the resulting interface clock frequency will be discussed during the presentation of this paper.
364
DIGITAL TRANSMISSION MANAGEMENT
Michael A Ledwich BSc. BE. Phd. Columbine JDS Systems, Inc.
Golden, CO
ABSTRACT
The revolution that Digital Television will bring to the viewer has even more impact on the transmission companies. Digital Transmission Management brings a set of new challenges because it brings many new services to the viewer. Electronic program guides, selectable audio tracks and subtitles, variable quality and bandwidth, and conditional access control are but some of these new options to manage. Our paper and resulting presentation details these control issues and describes a new class of transmission planning and monitoring sys-tems designed to provide efficient control of the new processes.
DIGITAL SERVICES
Digital Television transmission brings new management challenges for a number of rea-sons. First, there are a variety of new viewer information services included in the DVB stan-dards that should be supported. Second, the implicit bandwidth flexibility provides both op-portunities and headaches for planning and delivery. Third, there are more participating modules from multiple vendors to be synchro-nized in the transmission room. Finally, there are planned to be many more channels being delivered to more countries in more languages from a single transmission point. All of these reasons contribute to the new requirements for reliable transmission management.
Viewer Services
Many of the new viewer services of digital tele-vision center around the Electronic Program Guide. The information normally covers all events up to 8 days in advance and can in-clude:
• Program Name
• Program Description
• Program Synopsis
• Program Credits
• Program Categories
• Program Censorship Ratings
• Program Copyrights
The transmission channels are transmitted as services which are grouped into Bouquets. Service information for the viewer includes:
• Audio tracks available
• Audio Languages and Quality
• Subtitles Available
• Subtitle Languages
• Videotext and other data
• Linked Services
Service selection can be with mosaic services that require linkage definition to the channels or other mosaics.
Conditional Access (CA)
Digital television transmission often has a so-phisticated Conditional Access system to con-
365

trol the reception of the services. One part of the system is the Subscriber Management system that generates the data stream of enti-tlement codes to the viewers. The other im-portant part of the system defines which parts of the transmission an entitlement code allows access to. This is often defined over whole channels but can be narrowed to a single pro-gram or even an audio or subtitle track.
Conditional access systems check that the viewer has at least one of the entitlements re-
quired to view a program but also allow control over the viewership by blackout controls. These can be selected by the smartcard coun-try, region or personal data of the viewer
The additional information of pricing is also de-fined for Pay-per-View services together with changing pricing policies for book in advance or late viewers.
Bandwidth Requirements
With the digital compression standards of MPEG2, the digital picture can be transmitted within a range of bandwidths for a corre-sponding range of viewing quality. For exam-ple, live sports programming requires more bandwidth than black & white movies for ac-ceptable clarity. Higher definition monitors in the future will allow the transmission in HDTV quality on a per program basis. It is even pos-sible to sell as a premium service the clarity of advertising in the form of band-width. Finally, the number of services transmitted will vary dur-ing the 24 hours of transmission to include part day services and out of hours data transfer services.
All of these technical issues com-bine with the commercial pressure to maximize the use of the avail-able bandwidth. A program plan-ning system should allow the vali-dation of the capacity of the transponders used and warn for the over use or under use by the scheduled services. Note that the actual transmission overruns
which occur with live sporting events need ad-ditional validation at run time. Statistical multi-plexing improves the delivered quality for the same average bandwidth but does not remove the planning capacity requirement.
Material Requirements
The wider international and multicultural deliv-ery plans have encouraged the inclusion of multiple audio tracks in different languages coupled with multiple subtitle streams in differ-ent languages and character sets. Viewer services are planned with a promised variety of such additional material. A management sys-tem is required to warn of the lack of such components of a program in the library and support the creation of the material to meet the planned service standards.
The mapping of the correct audio track on the original material to the correct component of the delivered service is required as an alterna-tive to multiple redubbing of tapes to swap the audio track locations. This requires the control of an audio switcher configuration as each program transitions.
Synchronization Requirements
Many processes contribute information packets to the full Digital Television data stream. These processes must know when the event being transmitted changes so that the trans-
Figure 1 - Synchronisation
366

milled information can change. Examples of processes that require to be synchronous with the video information include:
• Video Servers & Tape Players
• Digital Subtitle Insertion
• Conditional Access Definitions
• Event Information Packets
• Digital effect switches
• Source to Mux Routers
• Operator Monitors
Each of these processes must receive syn-chronizing information from the video source device.
Dynamic Source Routing
As the number of channels increase, the map-ping between the sources of these signals and the transponder outstreams can become com-plex. Any reallocation of services between transponders and temporary channels that maximize the use of bandwidth require syn-chronized rerouting between the sources and the multiplexers. Additional requirements in-clude the joint switching of the related audio and subtitle streams. Any dynamic mosaic
service or multiply transmitted service will need to have the different outputs also defined and managed through the router.
Video Server Requirements
A video server starts to support digital trans-mission by storing some of the transmission material in a digital format. In some configura-tions the video is stored without compression aid is encoded to MPEG in real time. An al-ternative is to store the video compressed in tf.e format for transmission. This currently does not allow video effects to be added to the transmission in real time. Such effects as lo-gos and super text can be added at the re-ceiving monitor using the DVB subtitle graphics and text. The new editable MPEG is planned to allow a compromise between storage com-pression and allowing limited video effects in real time.
Regardless of the configuration, the video servers must normally be loaded in advance with off line material to be ready for transmis-sion. This requires both the checking of the upcoming material requirements as well as the in-.elligent selection of material to be removed. Such a video staging system requires full ac-cess to the planned transmission logs to
Video Server
Tape Player
Video Server
Tape Player
Effect H Switcher
Effect Switcher H
Effect H Switcher
Video Router
PI Encoder 1-0
— 01 Encoder 1-00
Encoder ho
— 01 Encoder
04 Encoder F01
1••
} —*1 Encoder
Figure 2 - Video Routing
1.00.Multiplexer
1010.Multiplexer
367

achieve a good preloading strategy.
SYSTEM FEATURES
The requirements outlined in the first section for Digital Television go beyond the traditional computer management system. The system must include the standard modules for Pro-gram Planning, Commercial Traffic, and Media Library but new systems are required as well as enhancements to the traditional systems to support the additional required functionality. This section of the paper outlines this addi-tional required system functionality.
Automation Database
One important characteristic of the proposed system is to hold all transmission information in a common database for all equipment to read and follow. Because many devices must transmit parts of the same event, they must all follow the same instructions in synchronism. This database must hold all properties of the transmission events including transmission configurations and encoding instructions.
By centralizing the instructions (or playlists), any change can be made once and all trans-mission components will find the new correct instructions. Because each component is in-terested in different properties, each compo-nent reads the database itself to find out what to transmit. In fact, a forward window of many
1
NPlanning
Database .
•. 6
Replication
O S'..
II
111111
f(Au tomation) Database
• •
•
Planning Traffic Operations Monitoring
Figure 3 Redundancy
Transmission
hours should be read in advance to ensure transmission can continue to the plan even if the database fails. A trigger from the database warns each component of instruction changes in the pre-read window.
Planning database
An important consequence of the above re-quirements is the need for a close connection between the planning information base and the transmission system. A solution to this prob-lem is an integrated system that shares all the data between planning processes and opera-tion processes.
The structure of information required to com-pletely define transmission is used as the basis for the full planning database. This full plan-ning database is implemented in a separate database server and is a superset of the transmission information tables. Common ta-bles are kept identical between the databases to allow real time replication between the plan-ning decisions in the master database and the transmission instructions in the Automation database.
his architecture closely ties the planning sys em to the operations system. The significan enefits include the lack of any implicit cutof etween the business systems and the trans ission systems. Thus all changes to trans-ission are entered in the business context here for example, program rights and com-
mercial contracts are vali-dated. The most intangible benefit could be the exis-tence on one central transmission plan that all departments work from and contribute to. This includes the ability to monitor correct trans-mission progress from the business systems.
One compelling benefit is the potential removal of delays between planning and transmission, leading to a very flexible and effi-
368

cient business structure for transmission or-ganizations. The information sharing also al-
Transmission Synchronization
As descr bed in the requirements, many trans-
Sales Proposals
Figure 4 - System Modules
Program Planning
lows pre-checking and video pre-viewing of the transmission plan from all parts of the organi-zation allowing significant reduction of opera-tional errors.
Reliability
The reliability of any proposed system needs to be carefully analyzed. With a replication of the planning database to the automation database, a secure copy of the transmission information is assured. Also, the hardware configuration of the Automation database server can be made highly redundant with hot standby processors and RAID disk arrays. All of the critical com-ponents of the transmission system need to have high reliability. Even the Ethernet com-ponents should be redundant with automatic failover to the second network upon failure.
The system needs to be designed to allow a 24 hour downtime for the planning database with-out affecting transmission. During this time, the operations terminals can connect directly to the automation database for emergency modi-fications to the playlist. Finally, each of the transmission components must preread the automation database for 6 hours of transmis-sion instructions. This allows transmission to continue for up to 6 hours even if the Automa-tion database has failed for hardware or soft-ware reasons.
mission components must follow the program transmission timing to en-sure that the correct associated event information is being sent to the viewer. The pre-roll event from the video player is used to trigger a process to distribute the event identi-fication in a pre-roll message to all registered components.
The Event identification traditionally has been a log channel, transmission date, and a sequential number. Be-cause of the dynamic insertions and deletions to a day's transmission, the
system uses a nominal event time to identify the transmission instruction.
Program Planning Enhancements
The traditional program planning system man-ages the choice of programs for transmission using purchase rights and censorship con-straints. In a multicountry delivery mode, the blackout control by receiver can be used to meet local rights and censorship requirements. This involves the decision to transmit the pro-gram but to prevent reception either in geo-graphical or demographic subsets of the view-ers.
Censorship limits are defined for each country in their local timezones and religious calendars in the form of degrees of content, violence, language, nudity. and religious or political sen-sitivity. The assigned blackout instruction to each program is checked before a country rights or censorship problem is declared.
Note that the planned transmission quality (bitrate and format) should also be part of the program planning process and the capacity requirements checked by the system before the plan is released.
CA Entitlement Assignment
Another task required for digital transmission is the assignment to the planned channels and
369

programs of the conditional access entitlement codes. This process allows the mapping of purchased subscriptions to the available pro-gramming material. This function can be con-sidered a responsibility of the program plan-ning department or the subscriber services de-partment.
If the programs are going to be Pay-per-View (PPV), additional information of pricing by cur-rency needs to be added as well as any pre-
purchase or late viewing discounts. These services are often associated with Near-Video-on-Demand (NVOD) transmissions where transmission logs are replicated with a time delay.
Material Library
In the digital transmission environment, more information is required about the programs to manage the process. The descriptive informa-tion about the programs should be a superset of the information being sent to the viewer about the program. This includes multilingual names, descriptions, synopses, credits, and
Program Titles i Descriptions)
(Program Versions
Assignment
Tapes
Synopses
—( Categories
1 Copyrights
-- (Components)
-- (Censorships)
Timing
Figure 5 - Media Information
categorizations. This information is stored so that subsequent transmissions and program
changes simply retrieve the archived viewer information.
The quality of these services is a very visible promotion of the overall viewer service. The DVB specification includes the definition of text highlight, soft hyphen, and early truncation features of the viewer descriptions. Other in-formation that is required about the program is the assigned parental rating limits for every program with an override for each country. This is in addition to the censorship content information by violence, language, and nudity.
Another set of information required for digital transmission is the number, quality, and lan-guage of both the audio tracks and the subtitle files. The viewer is given this as a selection service.
Traffic Enhancements
The traffic log must contain all the information required for transmission, and therefore it must include all the presentation events and details. This includes logo generation, voice-overs, transition effects, and superimposed text. Also timing must be more accurate for automated transmission and all durations and calculations need to be accurate to the transmission frame.
The traffic system must centralize all the multi-ple channels for transmission to allow com-bined analysis of total bandwidth, log mirroring, and multiple copy requirements. Log mirroring can become common for both NVOD and du-plicated or delayed programming on multiple transponders for time-zone re asons.
Commercial transmission can be assigned demographic or geographic blackout instruct-ions to narrow the delivery focus of a cam-paign. This can dramatically increase the revenue value of an advertisement break at the expense of bandwidth and management com-plexity by allowing multiple commercials to be transmitted in the same break unit. Only with full integrated support of such use of the CA instructions would such a transmission be fea-sible.
370

Promotions Management
More information is needed in the traffic sys-tem for promotions because promotions can be used to in digital television to ask the viewer to book their intention to watch the program,. If the program is a PPV, then the linkage to the future pricing is required. If the program is con-current on another channel, then a channel jump is supported. If the settop box supports automatic power-on and alarm for booked pro-grams, then the pointer to the future program is also needed. Thus the promotions subsystem needs to have all promotions linked to the pro-gram in the schedule that they are promoting. This also allows the removal of all related pro-motions when a program is pulled from the schedule.
Configuration Management
Because of the complexity of routing the cor-rect video source to the planned transponder outstream synchronized to the channel events, computer control of the video router is ex-pected. This knowledge in the database also helps ensure that the playlists are being run on the correct source player to deliver the channel correctly to the viewer. The database should record the static connections from the sources to the router, the dynamic connections within the router, and the static connections to the encoders and multiplexers.
Electronic Program Guide
A digital transmission management system would not be complete without a simulation of the information available to the viewer as their Electronic Program Guide (EPG). This must use the font of the settop box and its graphical sizing and allow for the changing view as the viewer scrolls the guide. This must support the multiple languages available for the viewer and simulate the highlights, soft hyphening, and early truncation characteristics. This is used to improve the overall appearance of the user in-terface to the program information.
Time-zones
The DVB standard specifies that all transmis-sion timing is in GMT as the reference. Thus all program schedule times are defined in GMT date and time. The viewer settop box trans-lates to the chosen viewer time-zone. A full management system must allow the operator to view and modify all playlist information in any chosen time-zone.
Business Reviewers
With all the information for digital transmission defined in the planning database, many opera-tional checks can be performed both at plan-ning time and also rechecked just before transmission for the operators.
Bandwidth Management can be performed by accumulating the planned transmission quali-fies in comparison to the available transponder capacity. This check is also important al transmission time to check for slippage in rea transmission times and resulting new clashes.
Censorship Warnings can be raised by com-paring the program version values in the library against the defined country limits at the trans-mission time. The assigned CA blackouts must also be noted to validate if a country blackout has been used to achieve compliance.
Program Rights by country can also be checked between the Rights database and the program transponder country footprint. Again, any country blackouts need to be considered before a warning is raised.
Material Applicability checks are made be-tween the planned service components of audios and subtitles. If the library version does not have the planned content, then a warning can be raised to allow the component to be produced before transmission.
Warning Communication
Because of the power of the integrated infor-mation. many computer checks can be made for potential transmission errors inherent in the planning database. These warnings can be-come more than a local operator or report e"-
371
ror. They can become work orders to correct the detected omission. Almost all such busi-ness warnings can be translated into an action item for some staff member.
A powerful management system can be con-structed by defining operator routings for each class of warning and allowing these job re-quests to result in the problem correction and corrected database. This model of workflow is more efficient than batch error reports being
checked daily for errors and paper methods used to request action and correction.
FUTURE CONSIDERATIONS
Digital video transmission is a very young art and the technology concerned is changing rapidly. Following are some of the coming is-sues that will need to be addressed by the new television management systems.
Integrated Servers
Most video control equipment is today based upon computer software. More of the effect and control subsystems that today are sepa-rate physical components in the operations room could be integrated into the video server playout computer. This includes the routing, encoding, multiplexing, subtitling, and video effects. This simplification of the playout equipment configuration will need to be matched by the sophistication and integration of the computer management system and da-tabase.
Edit List Material
In the near future, the post production instruc-tions to edit the program video will be able to be implemented in real time. This will obviate the need for creating a transmission quality copy of the program before transmission. The library database will never manage a physical copy of the program but will still need to record all the new transmission characteristics such as length, censorship, and components.
Smart Receivers
The digital settop boxes will undergo most of the development over the next decade with potential merging with the home computer technology. This will likely include the support on all programs, promotions, and commercials the inclusion of an Internet URL page address for related interactive information. The variety of potential applications is only now being ex-plored.
Another benefit of smarter sets is the custom-ised video mixing at the receiver. This allows the MPEG compression of the program to be implemented offline while effects such as logos and text are added at the receiver. These ad-ditional effects can be different for language or geographical reasons.
SYSTEM BENEFITS
Apart from the necessary enhancements for digital attributes, the proposed system is tar-geted to bring new operational benefits.
Productivity of the staff is improved by the in-tegration between the information subsystems. The planning system includes all the data sup-port for automatic transmission and coupled with video servers, allows many channels to be controlled by one operator.
Business Control is extended by leaving the sales and program planning systems in control of changes up to transmission. This reduces mistakes as transmission changes are vali-dated against contract conditions.
Department Integration is supported by al-lowing presentation, sales, and programming specialists to directly monitor and even imple-ment the late changes.
Automated Monitoring is possible by opera-tions of the business rules because of the cen-tral storage of the transmission instructions and the original business constraints. This sup-ports more efficient cross-checking for potential problems before they become costly transmis-sion errors.
372

The overall goal of the recommended system architecture is to address the significant in-crease of services and complexity of digital television with a system that can also reduce the cost of operation of a channel. This will be essential in the increasing competitiveness of the hundreds of channels available to future viewers.
SUMMARY
This paper has explored the additional implica-tions of digital transmission on the computer management system. The many new require-ments have been described and the necessary features of the computer control system have been outlined.
Columbine JDS has been developing such a system and is currently in the process of in-stalling it at multiple test sites. Together with our client test partners, we believe the benefits of such integration will be significant and set the standard for television transmission sys-tems of the future. We look forward to our cli-ents realizing the projected benefits.
373

THE ALL-DIGITAL PC-BASED STUDIO NETWORK
Alain Legault Janet Matey
Matrox Video Products Group Dorval, Quebec, Canada
ABSTRACT
The desire to use economical PCs in all-digital networked studio environments continues to grow. Cost-effective hard-ware and software enabling technologies are now in place to allow this important evolution to occur in the way video professionals work together and collaborate on productions. This paper gives an overview of the various technologies that should be considered in PC-based, networked studio system design and illustrates how an all-digital studio can be configured from media acquisition to final distribution. After a discussion of the advantages of an all-digital studio environment, the paper highlights some important aspects of the relevant technologies. The high-peiformance features of PCs, professional video adapters , the Windows NT! ActiveMovielDirectX software architecture, and application software are described. Digital video formats for production (RGB, Digital Betacam, DVCPRO, M-JPEG, etc.) and delivery (versions of MPEG) are compared Networking and interconnect technologies such as SCSI, SSA, IEEE-1394, CSDI, Fibre Channel, and ATM are reviewed The typical uses of these key hardware and software component modules in the networked studio environment are explained
ADVANTAGES OF ALL-DIGITAL
The goal in an all-digital installation is to keep all of the steps in the video production process in the digital domain — from the CCD of the camera, all of the way to ultimate delivery to the viewer. All of the intermediate steps: storage, transfer, duplication, processing, editing, effects creation, and compositing are performed in a digital format. There are many advantages to staying digital all the way. Video quality, system performance, equipment portability, and cost effectiveness are optimized. In addition, an all-digital networked environment paves the way for easy workgroup collaboration and workflow automation in the production facility.
Consistent quality
Conventional analog gear degrades the signal-to-noise ratio, frequency response, and linearity of the video signal. Expensive high-quality video equipment is needed to limit these degradations. No matter how good the equipment, however, each dub or transfer results in generation loss, and each subsequent generation compounds the problem. With digital technology, video signals can be copied from one device to another with absolutely no degradation. Camcorders, digital VTRs and video hard drives are nothing but "bit buckets," and the bits can be identical generation-to-generation. An unlimited number of copies, and copies of copies, can be made — all identical.
Of course, even in the digital domain, video quality is an issue, but a different set of constraints applies. Analog-to-digital sampling resolution, compression scheme, and bit-precision and sophistication of processing algorithms have a definite influence on results. To some extent, video quality still depends on equipment quality, but vastly superior results can be obtained on a much smaller budget than with analog video equipment.
Faster than realtime performance
Serial digital interface technologies like SDI and IEEE-1394, combined with DV-DVCPRO, can be used to achieve transfer speeds four times faster than real time. Various compression schemes also reduce the time required to transfer video files.
Equipment portability
Digital technology enables a significant size, weight, and power consumption reduction in cameras, VTRs, and editing systems. Even tapes are much more compact than before. Camcorders as small as cigarette packs are available with serial digital interfaces that transfer video to other equipment or computers without degradation.
374

Cost effectiveness HIGH-PERFORMANCE PCs
Digital technology has the potential to minimize the costs of acquisition, upgrading, and maintenance. Purchase prices can be low because of the economies of scale generated through large-volume, mass-market use of the technologies. For example, DVCAM and DVCPRO are economical professional video formats derived from the industry-standard DV consumer format. Computer-based systems are much more economical than "black box," dedicated systems because of the millions of computers, hard disks, and network adapters sold every year for general-purpose applications.
In computer based systems, upgrading can be as simple as adding a software plug-in to get a new effects generator or more powerful character generator, for example.
Maintenance costs can be much lower in digital systems because the reduction in the number and complexity of mechanical components makes them inherently more reliable. Constant cleaning and tweaking are not required.
Workgroup facilitation
An all-digital studio provides an integrated environment in which a group can work on a digital media production from beginning to end. Video editors, graphics artists, animators, audio engineers, and other team members can all work together from their own PC on the network to create, edit, view, or listen to any part of their production at any time. Digital media assets are a collection of files stored on a media server. It is easy to send, receive, and share these assets within a facility or, using high-speed transmission services, even collaborate with distant out-side facilities. Experimentation is easy and a production team can achieve a high degree of creative synergy.
In addition, digital technology helps to protect and secure digital media assets. All copies are identical so damage to and loss of the "master" are no longer issues. The Windows NT operating system implements a protection mechanism that limits access to each file to authorized users.
Workflow automation
A networked facility eliminates the "sneakemet" approach of copying video tapes to transport them between recording, editing, and playback machines. In any environ-ment, this saves time and money. On a wider scale, it also eliminates sending tapes to multiple locations via courier. For example, commercials can be distributed to cable head-ends and stations through a multicast satellite transmission. In a broadcast environment, material can go directly from the server to air, thus avoiding last minute panic.
PCs are becoming ubiquitous in all facets of video produc-tion. The increase in processing power over the last few years has been phenomenal and this trend will continue. Multiprocessor 200 MHz Pentium Pro systems, MMX technology, and the Accelerated Graphics Port (AGP) will all contribute to provide the high data throughput demanded by professional video applications.
MMX brings three primary design enhancements to the Pentium processor that will accelerate multimedia, audio, video, and graphics performance. Parallel, repetitive operations that are characteristic of multimedia benefit from 57 new instructions designed to manipulate and process these media types. The Single Instruction Multiple Data (SIMD) process enables one instruction to perform the same function on multiple pieces of data, significantly reducing compute intensive-loops common to multimedia data processing. In addition, on-chip cache has been doubled to 32K, reducing the need to access slower, off-chip memory areas for instructions and data.
The AGP interconnect is an enhancement to the PCI bus to optimize 3D graphics performance. By providing substantial bandwidth improvement between the graphics accelerator and system memory, more advanced 3D rendering, texture mapping, and animation can be done on reasonably-priced 3D-enabled platforms.
Some of the most important benefits afforded by the use of the PC in video applications are the economies of scale available from widespread use of PCs, the wide availability of components like various network adapters and storage devices, and the open-architecture versatility that leads to multi-vendor interoperability of hardware and software.
PROFESSIONAL VIDEO ADAPTERS
Even with the expected processing power increases in the PC platform, for the foreseeable future, PCs will require the addition of video adapters to perform professional-level digital video production functions. Codec technolo-gies; analog and digital 110 interfaces; video/audio/graphics processing for DVE, keying, and mixing; and interconnect technologies need the specialized processing bandwidth that is provided by dedicated controllers. Because there are so many possible technology combinations that may be of use in a particular application, modularity and extensibility — such as that implemented in the Matrox DigiSuite product line — are important concepts in adapter design. The use of the open standard Movie-2 audio/video expansion bus allows the interconnection of a wide range of adapters from various manufacturers. Support for baseline and mathematically-lossless M-JPEG, DV-DVCPRO, MPEG-1, and MPEG-2 codec technologies and SDI, IEEE-1394,
375

CSDI, and Ultra SCSI interconnect technologies are implemented directly on the DigiSuite cards under the Windows NT operating system and ActiveMovie multi-media software architecture. The ActiveMovie software layer makes all the specifics of the hardware design transparent from application level software. Applications developers can easily support all the different technologies and take advantage of new hardware innovations.
WINDOWS NT-ACT!VEMOVIE-DIRECTX
The Windows NT operating system provides the system-level performance needed in professional video. The features that make it ideal in this environment include true 32-bit architecture, realtime responsiveness, preemptive multi-tasking, multi-processor support, and a high-performance file system (NTFS). In addition, networking is an integral part of Windows NT and is implemented in a client/server model. Users can access files on the server and on other workstations transparently, as if they were stored locally.
The architecture of Windows NT is very modular, offering a high level of inherent openness. Each important sub-system — storage, network, peripheral interface, graphics/ multimedia — provides a common interface to the operating system kernel independent of the specific technology used.
ActiveMovie and DirectX are components of the Windows NT multimedia architecture that provide a common application program interface for software developers to control multimedia services in a unified way. They isolate the application software from the complexity and specific implementation aspects of the underlying hardware technologies without compromising system performance.
APPLICATION SOFTWARE
Applications software ties all the technologies together and makes them work for the end-user. In many cases, the application vendor is the one who chooses the appropriate technology that will give the user the desired performance at an appropriate price point. Application software is designed to integrate all the tools that digital media creators require: NLE, compositing, paint, animation, titling, audio, content management, and networking.
DIGITAL VIDEO FORMATS
In the analog video arena there have always been a number of competing, largely-incompatible tape formats. So too, in the digital video arena, there are a number of competing, largely-incompatible digital video formats. In the ideal world, a universal digital video format would be desirable. In the real world though, price/performance considerations and varying application requirements have dictated the emergence of numerous technologies. Those of most importance to a networked studio facility include: uncompressed RGB, D5, Digital Betacam, baseline M-JPEG, mathematically lossless M-JPEG, DV-DVCPRO, Digital-S/DVCPRO 50, and Betacam SX for production (Figure 1), and MPEG-1, MPEG-2, and DVD for delivery (Figure 2).
Figure I. Typical uses of digital video production formats
376

1 !
Figure 2. Typical uses of digital video delivery formats
At the heart of these digital video formats (except for uncompressed RGB and D5) is a codec, a compression/ decompression algorithm. Codecs reduce storage and transfer bandwidth requirements by applying algorithms to the digital video stream to reduce redundancy in the video information. Each of these codec technologies has particular strengths, weaknesses, and areas of applicability. In many cases, more then a single format is needed to get the job done. Equipment vendors and users must choose among the formats and also make them interoperate.
In order to choose the specific technology that is best for a given application, a number of criteria must be evaluated — video quality, editability, audio and timecode support, transmission reliability, and relative cost.
Video quality
A number of factors affect video quality — sampling resolution, sampling frequency, the presence of spatial and temporal artifacts, and data rate.
Sampling resolution. Video can be sampled at various quantization resolutions. Most technologies in use today are based on 8-bit sampling (256 quantization levels). Superior video equipment uses 10-bit sampling (1024 quantization levels).
Sampling frequency. The native color space for ITU-601 television is YCRCB, which defines a luminance (Y) component of the video signal and two chrominance (CRCB)
components. The human eye has different sensitivity levels to luminance and chrominance, so tradeoffs can be made in codec algorithms since the components are separated. The most common sampling scheme used with YCRCB video is 4:2:2. Luminance samples are produced at four times the frequency of the sub-carrier (13.5 MHz) and chrominance samples are produced at half that frequency (6.75 MHz). Other formats include YCaCe 4:1:1, used in industrial applications, YCRCB 4:2:0, used in MPEG encoding, and RGB 4:4:4, used in the high-end film industry. The RGB color space is used primarily in computer graphics and film applications. Primary colors — red, green and blue — are the basis for this color space. Sampling frequency determines the spatial resolution of the video display.
Artifacts. Artifacts are visible degradations of the video image that result from the application of a codec algorithm. Spatial artifacts are image defects caused by intra-frame encoding, which uses the redundancy within a single video frame to compress the data. JPEG and DV-DVCPRO employ intra-frame encoding using an 8 x 8 pixel matrix for processing. At low bitrates, this results in a blocky effect around the edges of objects. Mathematically lossless M-JPEG is the only intra-frame encoding scheme that does not introduce spatial artifacts.
Temporal artifacts are image defects caused by inter-frame encoding which uses the redundancy between consecutive video frames to compress the data. In inter-frame encoding schemes like MPEG, video images are described using the differences between previous and/or subsequent frames. At low bitrates, motion sequences — where there are substantial changes between consecutive frames — will be more degraded.
Data rate. Each compression method has an effective bitrate or range of bitrates where performance is optimized for a particular application. DVCPRO, for example, has a fixed bitrate of 24.948 Mbits/sec. JPEG and MPEG allow varying bitrates so the quality vs. storage capacity and/or processing power tradeoff can be made by the user. Each compression method has a minimum data rate below which it is ineffective, producing unacceptable video quality. The upper range is generally bounded by processing capabilities. Appearance of temporal and/or spatial artifacts is inversely proportional to the bitrate associated with a digital video stream. The higher the bitrate, the less visible the artifacts will be.
Editability
In a post-production environment, editability of digital video streams is an important consideration. Compression method affects editability. It is relatively easy to ensure realtime frame-accurate access to intra-frame encoded
377

streams like M-JPEG or DV-DVCPRO. It is very difficult to provide realtime frame accurate access to inter-frame encoded material because most frames need to be reconstructed from previous and/or subsequent frames.
Audio and timecode support
Although we tend to focus primarily on the video signal in evaluating digital video formats, support for digital audio and time code are also considerations. The number of audio tracks, their sampling rate and resolution, and the use of a specific audio compression method are para-meters that may be important in particular applications. One of the inherent advantages of using a digital video technology that also supports audio, is the assurance of audio and video synchronization.
Reliability in transmission
Digital video streams can be transmitted by various com-munication means like networks and satellite transponders. Although the bit error rate (BER) can be relatively low in certain communication technologies, no transmission technology is error free. This is of particular concern because compressed video data is very sensitive to error. An error in a single bit can cause major distortions in a large number of frames. Digital video technologies that include error detection and/or correction capabilities are more suitable for communication purposes.
Relative cost of codecs
Some codecs, like M-JPEG, are designed with symmetrical complexity at both the compression and decompression stages. Others, like MPEG, have been optimized to simplify the complexity of decompression, at the expense of the complexity of the encoder. The former tend to be used in editing applications and the latter in applications were a large number of playback stations are expected per encoder. The relative costs of encoders and decoders are a function of their complexity. In general, cost is a function of video quality.
Uncompressed RGB
The RGB color space is used primarily in computer graphics and film applications. Images are sampled at up to 12-bits, at spatial resolutions as high as 4K x 4K with an RGB 4:4:4 pixel structure. The data rate to support realtime use of this format at such a high resolution would be about 1.8 GBytes /sec (4 K x4Kx 24 fps x 3 components x 12 bits/component), well beyond the range of any system. Instead, film editors use resolution-independent software and work at ITU-601 resolution which has a more reasonable throughput requirement of about 39.4 MBytelsec (720 x 243 x 60 fps x 3 components x 10 bits/component). Later, the software translates the lower-resolution images to the final format and outputs
them in a non-realtime process. Uncompressed RGB image quality is very high, since there are no compression artifacts. All frames are readily available so the format is editable. Audio and error detection or correction schemes are not defined. Uncompressed RGB is primarily used in the film industry for digital compositing using extremely expensive systems with large RAID storage devices and extremely high-bandwidth networks like Fiber Channel to transfer the digital video streams.
D5
D5 is a Panasonic digital tape format. Video is sampled at 10-bits, uncompressed, at ITU-601 spatial resolution with a 4:2:2 pixel structure resulting in internal data throughput of 26.2 MBytes/sec. D5 is the highest quality video tape format that exists. Four channels of 20-bit, 48 KHz PCM audio are supported. There are no compression artifacts. Linear editability is excellent with functions like insert, assemble and pre-read. High-end post production houses use D5 for high-budget projects like commercials that require top-quality image acquisition and multilayer digital compositing.
Digital Betacam
Digital Betacam is a Sony digital tape format. Video is sampled at 10-bits using a Sony proprietary 2:1 compression technique. rru-6o1 spatial resolution with a 4:2:2 pixel structure yields an internal throughput of approximately 13 MBytes/sec. Four channels of 20-bit, 48 ICHz PCM audio are supported. Video quality is extremely high. Artifacts exist, though they are extremely difficult to notice. Editability and typical uses are the same as for D5.
Baseline M-JPEG
The ISO 10918 standard defines M-JPEG. Video is usually sampled at 8-bits with ITU-601 or SIF (Source Input Format — 352 x 243 x 30 fields) spatial resolution and a 4:2:2 pixel structure. Data rate can vary widely from about 1 MByte/sec for VHS quality, all the way up to more than 15 MBytes/sec for better-than-Betacam SP quality. M-JPEG uses intra-frame compression making it suitable for editing. It is less useful for multilayer compositing that involves many passes through the codec, because each pass results in progressively more degradation unless the video adapter manufacturer has implemented an internal compositing path that avoids repeated passes through the codec, as in the case of Matrox DigiSuite. Spatial artifacts are apparent at data rates up to about 6 MBytes/sec; beyond that, the artifacts still exist but are not visible. No audio support is associated with the M-JPEG video format so system vendors have developed different audio solutions. M-JPEG is used in non-linear editing workstations for a wide range of off-line and on-line work in all market segments from multimedia production to high-end post-production. The cost of M-JPEG codecs is relatively low.
378

Mathematically Lossless M-JPEG
Mathematically lossless M-JPEG does not use the part of the M-JPEG algorithm where loss is introduced. Similarly to baseline M-JPEG, video is typically sampled at 8 bits with ITU-601 spatial resolution and a 4:2:2 pixel structure. Depending on the video content, the data rate ranges between approximately 9 and 15 MBytes/sec. The main advantage of mathematically lossless encoding is that it produces true Dl-quality video because there are no artifacts. Editability is the same as the baseline format but unlimited compositing is possible because there are no artifacts to propagate. High-performance non-linear editing products that support mathematically lossless M-JPEG have just been released to the market. The format is primarily used for high-quality on-line post-production.
DV-DVCPRO
DVC, an industry consortium of more than 55 companies, defined a codec technology and an associated audio/video digital stream format that could be stored on digital video tape. From this technology, Sony developed a consumer/ prosumer product line called MiniDV and a professional product line called DVCAM. Sony's generic name for the technology is DV. Panasonic developed a professional product line called DVCPRO. All of the different products from both companies share a compatible compressed bit-stream but the tape formats are different. DV-DVCPRO is sampled at 8-bits, with ITU-601 spatial resolution and a 4:1:1 pixel structure. It operates at a fixed bitrate of 24.948 Mbits/sec. Intra-frame encoding is used so the format is editable. Video quality is similar to analog Betacam SP and spatial artifacts are not easily visible. Two channels of I6-bit, 48 KHz PCM audio are supported. DV-DVCPRO is the first digital video format that can be used to transfer compressed digital video and audio streams among camcorders, VTRs, and non-linear video editing stations over serial digital interfaces such as IEEE-1394 and CSDI. The loss associated with multiple compression/decompression passes when transferring data from one device to another is eliminated. Another important benefit is the promise of support for compressed data stream transfers at four times faster than realtime. DV-DVCPRO's quality and price level make it a good choice for acquisition and editing in market segments ranging from prosumer up to midrange industrial and news. DV-DVCPRO is not appropriate for use in post-production that involves much compositing and chroma keying because of the 4:1:1 pixel structure.
Digital-S / DVCPRO 50
Digital-S from JVC and DVCPRO 50 from Panasonic are based around the same core technology as DV-DVCPRO but operate at 49.896 Mbits/sec instead of 24.948 Mbits/sec and provide four audio channels instead of two. Digital-S and DVCPRO 50 digital video streams are
compatible with each other, but the tape formats are different. The higher bitrate allows video to be sampled at 4:2:2 resolution instead of 4:1:1. These formats can, therefore, be used in more demanding post-production applications that involve compositing and chroma keying.
MPEG-1
ISO standard 11172 defines MPEG-1. MPEG-1 is an asymmetrical codec that compresses images using spatial and temporal compression algorithms. The MPEG standard defines three types of encoded frames: intra-frames (I), bi-directional frames (B), and forward predicted frames (P). I frames are intra-frame encoded in a manner similar to JPEG and provide random-access points within the bitstream. There is usually one I frame every 15 frames (1/2 second). B and P frames are compressed using temporal compression. To achieve a given video quality level, the use of temporal compression significantly reduces the bitrate requirement compared to the use of spatial compression alone. MPEG-1 samples video at 8-bits with spatial resolution at SW (352 x 240 x 30 fields) and a 4:2:0 pixel structure. MPEG-1 was designed to work at a constant bitrate that typically ranges between 1.2 Mbits/sec and 3 Mbit/sec. Video quality is similar to VHS tape. MPEG-1 supports two channels of 16-bit compressed audio with sampling rates of 32, 44.1 or 48KHz . Audio and video are maintained in sync. MPEG-1 streams do not include error detection or correction. Because of the I,B,P structure, random access needed for editing is difficult to achieve. A decoder must seek to an I frame and decode it first, then it must reconstruct any other frames (B,P) from that point. Editable MPEG-1 solutions exist that use only I frames in the bitstream but this offers no significant advantage over M-JPEG other than that the same system can be used for regular MPEG encoding. MPEG-1 is primarily used in multimedia, CD-ROM, and low-end VOD applications.
MPEG-2
ISO standard 13818 defines MPEG-2. MPEG-2 is designed to meet requirements that range from VHS-quality to HDTV through various algorithm "profiles" and image resolutions "levels". Relative to MPEG-1, MPEG-2 increases spatial resolution to ITU-601 and adds support for interlaced fields. At the user level, MPEG-2 defines program streams for use in conjunction with local storage as in multimedia applications and transport streams that are useful in error-prone environments like satellite transmission. MPEG-2 is primarily used for VOD applications and broadcasting.
Two versions of MPEG-2 are of particular interest to broadcasters: MPEG-2 MP@ML (Main Profile @ Main Level) and MPEG-2 PP@ML (Professional Profile @ Main Level).
379

MPEG-2 MP@ML has a 4:2:0 pixel structure. The effective bitrate range is between 5 Mbits/sec and 10 Mbits/sec, with a maximum limit of 15 Mbits/sec. Emerging DVD (Digital Video Disc) products use MPEG-2 MP@ML with Dolby AC-3 audio compression.
MPEG-2 PP@ML, also known as MPEG-2 PRO and MPEG-2 4:2:2, is a higher quality MPEG-2 implemen-tation designed for professional and post-production applications. It extends the bitrate to a maximum of 50 Mbits/sec and supports a 4:2:2 pixel structure. The higher data rate and better chroma resolution facilitate studio work over multiple generations. By redefining the IBP frame structure, frame-accurate editability becomes possible. Sony Betacam SX is a specific application of MPEG-2 PP@ML with an IB frame structure at 18 Mbits/sec that has been implemented on camcorders, VTRs, and non-linear editing stations. Compressed streams can be transferred between VTRs and editing stations using SDDI (Serial Digital Data Interface). MPEG-2 PP@ML can also be use in high-quality broadcast delivery applications with an IBBP structure at a bitrate of about 20 Mbits/sec. High-end post-production work can be done with I frame-only streams at about 50 Mbits/sec. MPEG-2 PP@ML has a better video quality factor then M-JPEG at the same bitrate. However, PP@ML codecs are significantly more expensive today than M-JPEG codecs.
Using multiple digital video formats
As much as possible, it is desirable to stay with one digital video format to avoid extra steps in conversion and potential loss in quality. Typically, however, at least a few formats will be encountered; M-JPEG for editing and MPEG for delivery, for example. To transfer from one format to another, file conversion or transcoding is required. File conversion, in this case, is a non-realtime process that may not be appropriate for professional use. The more efficient method is to output digital video from the M-JPEG editing station using SDI, then use an MPEG encoder that has an SDI input. There is potential to incorporate this process into one system. Technologies like Betacam SX hold promise to reduce the complexity of transcoding by keeping the entire acquisition-editing-delivery process in MPEG-2 PP@ML video format. It is less processing intensive to modify the frame structure inside an MPEG stream than to modify a digital video stream from one codec type to another.
INTERCONNECT TECHNOLOGIES
A wide variety of digital video interconnect solutions exist. There are two basic ways to communicate information between devices: channels and networks. A channel pro-vides a direct point-to-point connection between devices. It is a hardware-intensive data pipe designed to transport
Figure 3. Typical uses of interconnect technologies
data at very high speeds with limited software overhead, a very simple addressing scheme, and minimal burden on the host system. A network is an aggregation of nodes and switches that communicates data over shared connections by creating temporary links between devices. A network uses a sophisticated addressing scheme to provide more flexibility than a channel in establishing connections between devices. In general, networks are slower than channels because they require more software overhead. Solutions of both types have quite different characteristics and performance features. Users must consider the bandwidth available from a particular technology, the ease of installation, the maximum cable length supported, the maximum number of users allowed, scalability to support future growth and the cost of each node. An all-digital studio will typically integrate a num-ber of interconnect solutions (Figure 3).
• -g i C.) S a
• •
•
•
Small Computer System Interface (SCSI)
SCSI has a long history as an interface between computers and storage devices. SCSI-1 became an ANSI standard in 1986 and has undergone a series of performance improvements since then. SCSI uses a parallel transmission
380

scheme to create channels between devices. Wide Ultra SCSI provides a maximum transfer speed of 320 Mbits/sec. SCSI supports a maximum of 15 devices, with a maximum cable length of 25 meters for an entire installation. It is ideally suited to connect storage devices to a single work-station or a few workstations in close proximity.
Serial Storage Architecture (SSA)
SSA is designed for high-speed data transfer between computers and storage devices. It was proposed to the computer industry by IBM and is now supported by the SSA Industry Association. It is in the process of being approved as an ANSI standard. It allows up to 127 devices to be connected in a loop with a maximum distance of 25 meters between devices. Each SSA connection comprises two full-duplex serial links with 320 Mbit/sec throughput capability, for a total channel bandwidth of 640 Mbits/sec. SSA has definite advantages over SCSI as a storage interconnect but its limitations on distance coverage, data throughput, and maximum number of devices do not compare well with Fibre Channel-Arbitrated Loop (FC-AL). Fibre Channel can be used successfully in both storage interfaces and networking. In September 1996, groups representing FC-AL and SSA agreed to work together to define a new standard called FC-EL (Enhanced Loop), which will bring new advancements in technology in the 1999-2000 time frame.
IEEE 1394
IEEE 1394, also known as "FireWire", is a serial digital hardware and software standard for transporting data at 100,200 or 400 Mbits/sec. Apple Computer was the originator of 1394 in the late 80's. In 1994, the 1394 Trade Association was formed by leaders in the electronics, computer, and consumer products fields to support the technology. In 1995, the 1394 specification was formally adopted by IEEE. Its use in the new generation of DV/DVCPRO digital camcorders and VTRs makes it of interest to the professional video industry. IEEE 1394 is a hybrid channel and network interconnect with some features of both. It specifies two types of data transfer asynchronous, as is typically used in computer network applications; and isochronous, which provides guaranteed data transport at a pre-determined rate (25 Mbits/sec in the case of DV-DVCPRO). Isochronous mode, in effect, creates temporary channels.
IEEE 1394 was designed to address the consumer electronics market, so it is inexpensive and simple to use. The interface is a thin serial cable that supplies the serial data along with power. Because power is in the serial cable and 1394 employs a tree topology, live insertion and plug and play are supported. In addition, there is no
need for terminators, device IDs, or elaborate set up. Up to 63 devices can be connected on a 1394 bus with a maximum distance of 4.5 meters between each device.
Given the short distance between devices and the relatively low bandwidth capability, IEEE-1394 is primarily used to connect a few peripheral devices to a small number of workstations in close proximity. A typical use would be the transfer of video material among camcorders, VTRs, and editing stations.
Compressed Serial Digital Interface (CSDI)
CSDI is an evolving application of Serial Digital Interface (SDI) technology. SDI (SMPTE specification 259M) has been in use in video facilities for many years, carrying uncompressed digital video, audio, and ancillary data between video devices over coaxial cables of up to 300 meters. CSDI uses the same physical infrastructure as SDI — cables, transmitters, receivers, repeaters, routers, and switchers — to provide a unidirectional channel that transfers data at 270 or 360 Mbits/sec. Each CSDI device has one transmitter and one receiver that multiplex and de-multiplex the data and the data clock for transmission.
The only compatibility between SDI and CSDI is at the physical layer. The data structure of SDI uncompressed audio and video is fixed_ In CSDI, the data structure is variable and can accommodate numerous data types such as M-JPEG, MPEG, and DV-DVCPRO. CSDI channels have enough bandwidth to transfer compressed DV-DVCPRO streams at four times realtime. CSDI data structure includes data type, data count, packet length, packet type, the data payload and a Reed Solomon error detection and code. Currently, SMPTE committee PT20.04 is working to standardize the data structure of CSDI. An alternative, called Serial Digital Data Interface (SDDI), contains many similarities and is also under consideration by this committee. The specification is expected to be finalized in the first half of 1997.
Since an entire channel is reserved when a communication is established between two points, CSDI bandwidth availability is guaranteed. Repeaters can be used to increase distance over the 300-meter limit. SDI routers can be used to make complex CSDI configurations. The overall bandwidth of the such a configuration is the aggregate of all the channel bandwidths, yielding extremely high throughput For example, a 256 x 256 SDI router provides throughput of 69.12 Gbits/sec. Particularly in studios where the SDI infrastructure already exists, CSDI offers a relatively easy way to integrate digital technology. It can be used to communicate between many suites within a building.
381

Fibre Channel
Fibre Channel is an ANSI standard, high-speed data-transfer technology designed to interconnect desktop workstations, mass storage devices, peripherals, and host systems. In 1993, the Fiber Channel Association was formed by computer and communications industry leaders to foster development and implementation of the technology. Its performance and flexibility make it suitable for use in video applications.
A Fibre Channel adapter comprises two unidirectional interfaces: one transmitter and one receiver. Each of them multiplexes the data and the data clock. The current throughput capability is 1.062 Gbits/sec, but faster versions at 2.125 Gbits/sec and 4.25 Gbits/sec are planned for the future. Coaxial cables up to 25 meters or fiber optic cables up to 10 kilometers in length can be used to make inter-connections between nodes. Fiber Channel is topology independent and can be configured in many different ways. Simple installations can use point-to-point connections or arbitrated loops. An arbitrated loop can have a maximum of 126 nodes. Arbitration is used to establish a transfer between two nodes on the loop. The two nodes own the entire loop and all its bandwidth until the transfer is completed, in effect, establishing a temporary channel. When the nodes relinquish control, the arbitration process will establish another connection for the next requester.
More complex networks use an intelligent interconnection scheme called a fabric. A fabric is a switching mechanism that does the routing. The switching fabric creates point-to-point connections between nodes and loops attached to it. It uses unique addresses (similar to telephone numbers) to connect nodes.
Data is sent over Fibre Channel using packets called frames. Each frame contains start- and end-frame codes, transmitter and receiver node addresses, up to 2112 bytes of data payload, and a CRC error detection and correction code. Multiple frames can be sent consecutively when a connection is established. Fiber Channel can be used to implement various communication protocols such as SCSI, HIPPI, IP, IEEE 802, and ATM.
Fibre Channel offers a flexible, high speed interconnection for file transfers in video facilities that span multiple rooms or multiple buildings on a campus. A committee called FC-AV is currently working to define a new class of service optimized for realtime video applications. The ability to carry multiple protocols enables Fibre Channel to interface with other communication systems such as ATM.
Asynchronous Transfer Mode (ATM)
ATM is a high-bandwidth transmission, switching, and multiplexing technology that is being widely deployed in
private and public networks . It is an International Telecommunications Union -Telecommunication (ITU-T) standard designed to integrate a variety of data types — audio, video, graphics, data, and voice — on a single network. ATM is a connection-oriented technology that supports asynchronous and isochronous transmissions. It can be implemented in LANs and WANs.
ATM is based on a technique known as cell switching. An ATM interface accepts diverse digital media types from different sources such as workstations, media servers, and other LANs, at various bitrates and converts them into fixed length cells of 53 bytes for transmission. The cells consist of a 48-byte data payload and 5 bytes of control information. Basically, ATM slices the variable-length packets of data, audio, video, etc. into a multiplexed stream of cells at much higher speed for transmission and then reassembles the original packets or streams at the other end of the process. The cells are routed through high-bandwidth connections at speeds of 155 Mbits/sec (OC-3) and 622 Mbits/sec (OC-12). Speeds as high as 10 Gbits/sec will be supported in the future.
An ATM LAN can be designed to provide the bandwidth required in a studio environment. Dedicated channels can be set up between two points at specified bitrates.
ATM can also be used to allocate bandwidth on demand. It negotiates Quality of Service (QoS) contracts with users before their admission to the network to ensure that satisfactory performance in terms of bandwidth, latency, and delivery reliability can be achieved. Taking network traffic and available resources into account, ATM accepts or rejects the new user and determines the best way to allocate the requested bandwidth.
One of the major benefits of ATM in a studio environment is that it provides connectivity to the outside world. A studio needs to be able to exchange video, graphics, and other information with other studios and clients. ATM facilitates project collaboration across cities and countries over WANs and lets the studio capitalize on the world's advancing telecommunications infrastructure. There are industry organizations working on technical issues related to using ATM for video-specific applications including Digital Audio-Visual Industry Council (DAVIC) and the ATM Forum.
Using multiple interconnect technologies
Most studios will need to use more than one interconnect technology. Each has its merits depending on the type of work that is being done in a facility. In general, SCSI, SSA and Fibre Channel can be used to provide high-speed access to storage devices. CSDI and 1394 provide realtime or faster channels for digital video transfer within the facility. In addition to its use as a storage interconnect, Fibre Channel can also be used as the basis
382

for a LAN to support file transfers among multiple buildings using a variety of protocols. ATM provides connectivity to the outside world.
CONCLUSION
The advantages of an all-digital studio are undeniable. Video quality, system performance, equipment portability, workgroup collaboration, and workflow automation are optimized.
Cost-effective hardware and software enabling technologies are now in place to allow the evolution-to-digital to occur. High-performance PCs, professional video adapters, the Windows NT software architecture, various digital video formats, and interconnect technologies are all tied together by application software. Application software developers and system designers provide a framework that deals with the complexities of the various technologies and makes them transparent to the user.
Tools for all aspects of production — creation, post-production, and delivery — can be tightly integrated in the software environment and used across workstations, rooms, buildings, campuses and countries.
383

ARCHITECTURE FOR TOTALLY DIGITAL NETWORKS
Adriano M. Barzaghi, Giuseppe F. Burzi Elettronica Industriale spa - Research dept.
Lissone, Italy
ABSTRACT
The use of digital techniques is gaining momentum in the field of signal transport and switching. New network structure suitable for use in production and broadcasting will replace traditional environment. The network structure described in this paper is able to offer improved performances and flexibility. Many aspects related to the distribution of signals with different quality degree and by means of different media are explored.
Particular emphasis is pointed on the
flexibility of the MPEG-Transport Stream as an universal container for all broadcasting needs.
The implementation in the MEDIASET Digital Network is described.
TRADITIONAL NETWORKS
The first network used for broadcasting dates back the early days of radio. Different sources were fed through fixed links to the transmitter and the selection was accomplished by simple patch panels. Since than, very few has changed. The typical architecture of a network used in broadcasting is based on switching equipment interconnected with fixed bandwidth links. In order to get the maximum in term of performances, both, switches and links, are
optimized according to different bandwidth and peculiarity of signal type.
Signals carried in these networks can have also different type of electrical interconnection.
This means to have one physical network for every type of signal: analogue audio, analogue video, computer data, digital video with or without audio, compressed video, etc.. Electrical circuits for different types of signals are physically separated, also if sometime they share the same remote control. Signals of different type can be multiplexed in order to use all the bandwidth available on a link, but every signal will use always his own bandwidth.
This means that links cannot re-use with different type of signal the actually unused bandwidth.
And every time we need to handle a new type of signal, we have only one choice: create new
network with the electrical interfaces and the performances suitable for the new type of signal.
NE W DIGITAL-ONLY NETWORK
The superior quality allowed by digital circuitry, will soon push all interconnections to be of digital type.
Analogue type signals will be all digitized to take advantage of this superior quality and analogue switches and links will be phased out.
384

We are stepping in a new era where only digital signal will be handled.
The digital only network can use a different approach to signal transport and switching. Between the many possible architectures, one look to be more profitable than others.
This new network architecture is based on two elements: a link capable of handling a wide band digital signal stream in a transparent way and a new type of equipment, the drop/inserter terminal, capable of inserting and extracting a sub-stream from the main stream. This sub-stream is also a transparent structure and can have every type of bit rate. With this architecture, we have a total flexibility in the use of available resources; interconnection links and drop/inserter are no more bound to specific signal or bit rate. The link itself has no special requirements: every type of telecom standard digital link can be used as far as capable of handling the requested bit rate.
The drop/inserter is a new type of equipment for the broadcasting environment. The drop/inserter has been in use for several years in telecom applications, mainly in Fiber Optic Ring used to implement Metropolitan Area Networks. In these applications, the drop/inserter handles fixed bit rate data streams, hierarchically related to the main signal. In our broadcasting network, the drop/inserter will be capable of inserting and extracting into the wideband link a sub-stream with a variable bit rate as requested by the specific type of application. Once we have recovered the signal, some simple interface allow to convert into a traditional signal type.
With simple gateway, we can interface the new network with existing infrastructure.
NE W FEATURES
Once this type of architecture is installed, we are able to start implementing several new exciting features useful in broadcasting. A first step is done by adding some local computing power at every node. This will increase the raggedness of the network; in case of link or node failure, the network will automatically switch to different path.
By networking all computers, we can get an intelligent global network management. This means the ability to select the lowest cost
link or the best performing one, to reconfigure the network automatically in case of link or node failure, to bill usage to different budgets and many more.
One type of software we can use in an intelligent network, is the Scheduler. The Scheduler is a distributed piece of software capable of managing the needs of every user choosing the most reliable connection between those available at a stated time and making it available at correct time. But this is only the first step. Another great improvement comes from the addition of local mass storage. Mass storage is available today at low cost and suitable to wide scale deployment. The addition of local storage allows non real time feeds to be carried on. Part or all the feed is stored in local disks and then transferred to the next node or to the target server at variable bit rate; we can even use a fractional residual bandwidth. The scheduler will guarantee the completion of transfer on time. The producer will be able to use these virtual feeds without taking care on where they are actually stored on the network.
385

OUR PAYLOAD
We have a large array of signal types to carry in our network.
For compatibility reasons, we will be able to carry all types of existing digital signals, regardless of the actual location of the network which could suggest to limit to the most popular in that part of the world and convert to this standard all signals. This means to handle:
• serial video in component and composite form, 8 and 10 bit, 525 and 625 standard;
• AES/EBU digitized audio at sampling rate 32, 44.1 and 48 kSymb/s; • ancillary signal, like low quality audio for talkback, internal phone connection; • computer network will interface the network via bridges and routers, but we will
provide also the ability to interface directly serial ports at bit rate from 9600 to FDDI. HDTV is limited today to experimental islands, but will be the main signal in tomorrow networks.
The choice of formats for HDTV is very large: • 50, 60, 30, 59.44 and 24 frames per second;
• interlaced or progressive scan; • 1250, 1125 and many other possible line number;
and if we add component and composite, multiplexed or parallel, we get a huge array of possible formats.
Of course the system must be able to transfer everyone of these formats, even at studio quality and in 4:4:4:4 components. It is obvious that all these signal types can be also in compressed formats.
Compressed signals span today from ETSI 45MB to MPEG, but many more will come to support HDTV; yet we have another large set of different type signals.
THE MPEG TRANSPORT STREAM
A particular interest is bound to MPEG-Transport Stream (TS) type of signal. Every feed, both from a remote location or
from a different studio, is composed by several elementary streams: one or more video, one or
more audio, background sound, ancillary data, cue and intercom signals and many more according of type of program produced.
Keeping track of the route and timing of different components in a feed, is one major nightmare.
The MPEG-TS can help reduce this problem as is suitable to pack multiple video, audio and data streams in a single data stream. Putting all components together in a MPEG-TS transport stream means preserving proper timing and insure all-or-none delivery of signals.
Using MPEG-TS as a carrier for different signals, also reduces the number of drop/inserter required in the network.: instead of one drop/inserter per signal we have one drop/inserter per stream.
The possibility of inserting data streams in the MPEG-TS, is very powerful.
As we can transform every type of signal in a data stream and as this data can be inserted in
an MPEG-TS, we can state that we can insert every type of digital signal in the stream. We can even pack non compressed signals in an MPEG-TS with suitable bit rate; as this is a non-standard use of MPEG-TS, some extension to MPEG-TS standard must be allowed for this extent.
This extended use of MPEG-TS will also improve network flexibility.
THE MEDIASET DIGITAL IMPLEMENTATION
One of the first wide scale application of this type of network will be the Mediaset Digital
386

Network: that is a broadcasting platform for the private Italian communication Group. The first phase will link the 4 main locations involved in the operations of the Mediaset group in the Milan area. A fiber optic ring connects all 4 locations; 3 cables with 100 fiber each are used. The network will link an impressive number of different media and resources.
2 continuity studios provide the finished programs; continuity 1, produces 3 analogue programs (Canale 5, Italia 1, and Rete 4) which are distributed by the terrestrial fixed network and by the satellite feeds, in both analogue and compressed digital format. Continuity 2, produces 3 other analogue programs (Telepia 1, 2 and 3) which are distributed in analogue form by the terrestrial network and in compressed form via the satellite feeds. Continuity 2 produces also 42 different programs for compressed digital delivery via 7 different satellite transponder. Over 200 different feeds are made available at the continuity studios. The feeds link mobile production units via earth and satellite feeds. 12 regional studios, 20 local studios, over 100 editing and graphic islands, international networks and feeds, and some content providers. This is today situation, but the network has been planned with enough capacity to allows for future expansion.
THE FUTURE
Technology is moving so fast that any attempt to look at the future is highly risky. Nevertheless, we have a well defined vision of the near future. One first statement is related to the size of this type of network. Networks will grow to include external service and content providers, for an enhanced
synergy according to the vision of the global village. New services will start in the near future using the Internet as the distribution network. An important share of the capacity of the network will be used by this type of services. Today we have implemented our experimental networks with equipment built for telecom networks. These equipment are very rugged but at the same time not enough flexible and very expensive; a great effort will be required to our team and to our partners involved in the production of the equipment in order to get a new generation of equipment specially built for this type of application. Not only the network will require new type of equipment; a new class of equipment will be required also in production in order to get full advantage of this architecture. Another big challenge is the creation of ad hoc software. The network itself will need managing capabilities totally different from telecom and computer ones. The users, mostly creative people, will require new intelligent user interfaces, capable of more sophisticated applications with lower training needs in order to be able to focus their activity on the contents instead on the technology. At last, we see this network as the first step toward a worldwide network where the operation of different subjects can be merged for a smaller better global village.
Acknowledgment
We would like to acknowledge Mike Bargauan from M.B. International - Telecom Lab for the helpful discussion on hot topics and future analysis while preparing this paper.
387

Networking and Mixed-platform Integration - An Onen and Shut Case?
Tony Davis
Quantel Ltd
Newbury, Berkshire, England
ABSTRACT Networking has become the predominant theme in the media communications industries of broadcast and post production This paper will analyse the reasons for its dominance and explore a range of issues, both technical and creative, which affect users who create and deliver content, and the managers and engineers who keep these environments running.
SIMPLE AND COMPLEX The world is defined by polarities: North/South, Black/White, Success/Failure, Bad/Good, Fast/Slow. There are even industry specific ones which strike a chord: Open/Closed, Linear/Non-linear, Analogue/Digital, Standard/Dedicated. These seem naturally weighted to favour one direction or another. Anyone might think it easy to decide which was the winnerconcept-wise. But tread carefully.
The real world needs the black and white simplicity of these supposed 'opposites'. It is an abstraction which can focus decision-making, distil the real issues, or enable a choice of one direction or another. However, the real world is built on complexity. The real world is more colourful, it has more bit depth and variety. In fact, complexity reigns supreme and the real choices needed to manage this complexity need real thought.
One of these complexities which needs facing is networking. At its simplest technical level it involves linking hardware products together, integrating platforms. At its most efficient level networking requires linking the people driving these platforms and technologies in the most appropriate ways for the task in hand! Within the complex work environments of media communications this should be straightforward, shouldn't it? Plug 'n' play? As long as everything talks the same language, the same standards, everything will be fine, won't it?
Before answering these questions let's take a broad look at the convergence which is forcing everyone to address integration and networking.
INDUSTRY CONVERGENCE The broadcast industry, digital and analogue, is video and TV-signal based. The computer industry is Operating System, processor and hardware-platform based. It is clear that these two industries are converging to produce environments with a blend of hardware and software applications. The sole purpose of these systems is to deliver content to the ever hungry media communications audiences. Whether you are a broadcaster delivering news or a post-house editing the latest pop promo the correct mix of systems is critical in determining the performance, productivity and not least, the quality of the finished product.
388

If you imagine each of these systems as a different colour and then mix them with no thought to their individual functions the result is perfect mud. It is vital that the integrity, or individual functions of each platform, are maintained not taken to the lowest common denominator.
A look into the future of this convergence sees the lines of these two industries join - like a train track they appear to join on the horizon. It is an optical illusion. If you change the perspective and, instead of staring into the distance, fly above the track and follow it the two lines never actually join. However, both lines are connected and necessary for the 'content' train to roll and get to its audience/consumer destination.
DEDICATED AND STANDARD? It is clear you may need to balance product from both industries to do the job. You also need an awareness that those products perform and achieve completely different roles. If you're accessing, interacting with and manipulating digital video and graphics in real-time then you need a system designed to do that: create and deliver. The architectures of standard PCs and other platforms have their place but they're are not up to this job. Why?
It's almost a tradition to quote Dr. Gordon Moore's Law which says that computing power and speed will double every two/three years and computing cost/hardware size with halve in the same time period. This is all very well and has lead to smaller, cheaper, more powerful components like chips and disks. But industry commentators consider its truth universal and seem to apply it to everything. These components have not been assembled to produce computers which conform to the law. If they had been you should be able to buy a Mac for $78, a quarter of an inch high, and have it manage all graphics generation and transmission for a major broadcaster.
The Redundant CPU Obviously standard computer architectures have an important part to play in production but make sure its kept in perspective. One of the finally acknowledged weaknesses of 'standard platform' architecture (of whichever flavour: MacOS/MS-DOS/Unix) is the redundancy in design. This is not useful redundancy like back-up processors or fail-safe working (although Unix is supposedly famous for this!). It is literally too much hardware with too little to do. The move to develop the N.0 or Network Computer, stripped of most functions is a classic example of this acknowledgement. Ironically, it will be a dedicated platform designed to work only with Internet. The one or two person one-stop-shop which needs to word-process, send faxes, make spreadsheets, create graphics, has a perfect need for smaller, general purpose systems. As soon as businesses grow and specialised job functions increase so does the need for equipment to match the job. Take a look at any film, video, music, TV offering. How many people are involved with different functions and specialisation? We don't all do the same thing and neither does a production system.
There are dedicated systems, standard computer architectures, different hardware, different software all flung together to do a job of work in the broadcast and post production arenas On the face of it, it seems a natural and reasonable request to ask that all these products talk to each other.
THE NETWORK No product is an island. To get differing platforms to talk to each other they need a common physical means of connection. Some of the parameters which influence the physical connection choice are:
389

Physical Limits i) Bandwidth. How much data do wm have? How often do you need to transfer data? Does eveipme need equal access at maximum baikhi'idth?
Proximity. Where is your work done? Is it in the same Toon?, building, city, state? How can I cable these together? What potential is there for mixing LANs with WA Ns.
Availability Is the network option available on all the systems you wish 10 minted? Is it available now?
Compatibility Compatibility between different evolutions of the same 'standard'. SCSI-I, S( 7S1-2, ..SrS1-3? Are all your data types the same or do they fit to different standards eg RGI3 or ITU-I? 601.
History Can you integrate existing investments in equipment? Is it scaleable? Will it still be here in three years time?
The work What do you do? Edit, manipulate, transfer video in real-time? Generate thousands of stills graphics a vveek? Where are all the elements of your job made? Who needs access to them? Nth'. often? Is if easy 10 use?
There is no formula for designing the perfect integration solution. To answer these questions you need to understand your work environment If you don't really know what's being done, what needs doing or how the environment and its various users are evolving, you're unlikely to make the best choices for connections. Remember that every choice you make has to tread the fine line which runs between the simple objective of integration and the complex reality of varied platforms with different histories,
design and performance. But there are some standards to help light the way.
THE STANDARDS There are two major standards which dominate connections. For broadcast it's conformance to ITU CCIR-601 coding standard and the Serial Digital Interface (SDI). This allows digital connections between equipment to enable real-time transfers not only of stills (multiples of approximately 1 megabyte) but also live digital video. All at 270 Mbits/sec. It is tried and tested and works well.
For the computer industry there are so many different architectures and operating systems (Mac OS, MSDOS, Windows 3.1/95, DEC Alphas with Windows NT, Unix - all 65 flavours!) that the lowest common denominator supported for connecting devices is effectively IEEE 802.3 Ethernet. It benefits from being cheap and universal
Ethernet The most common flavours are 10 Base5 (Thickwire), 10 Base2 (Thinwire, Cheapernet), 10 Basel (Twisted pair) for data rates of 10 Mbit/sec - even on Unix platforms. Not all of that bandwidth is available for data content (image) transfers. Although flexible, with each workstation checking when it can transmit data (CS - Carrier Sense), or checking for collisions of packets (CDMA - Collision Detect Multiple Access) these overheads eat into Ethernet bandwidth. Send/receive speeds limits are also limited by the send/receive capabilities of each respective OS. In addition, the more workstations you add to this LAN the more potential collisions/re-sends and the slower overall performance for every node on the network. If all the bandwidth was usable then 1.2 megabytes/sec data transfers would be possible. Even if all 10 Mbits was available that's still only 3.7% of SDI capabilities.
390

NETWORKING TECHNOLOGIES I
800
,y, 600
9 400
200 155
10 BASE T SDI
100 BASE T
FUTURE? ATM
Figure I
'Fast' Ethernet at 100 Mbit/sec is an option, increasing bandwidth - up to 37% of SDI. All the previous potential problems remain and another has been added - 100 BaseTX is not yet widespread and can be expensive - particularly on more recent Unix-based systems like SGI. If the environment is likely to be a mixture of 10 and 100 Mbit the flexibility of Ethernet allows for relatively transparent links via switching hubs which support both standards.
The future holds the prospect of other networking technologies like ATM and Fibre channel. These may bring increased bandwidth and the ability to carry mixed data types. Currently deliverable ATM solutions are only 155 Mbit/sec - 57% of SDI. They are potential standards of the future but SDI is here today. Ethernet is here today. All of these technologies must be viewed with relevance to the task in hand and not chosen out of fashion.
Clearly SDI and ITU-R 601 conformance are both desirable and necessary in an environment which needs real-time access, interaction and manipulation of digital video and broadcast graphics It is also obvious that systems need to be designed specifically to handle this Job
elements may also originate on systems of a more general computer-based architecture. The universal nature of Ethernet make it a natural choice for connecting these different devices together providing you can sacrifice bandwidth for this flexibility.
Zones of productivity There instances where Ethernet can be used in a more specific way to enhance a network. For example, Quantel has used Picturenet and the Picturenet protocol for connecting native Quantel environments over 10 BaseT Ethernet since 1990. The protocol is designed for the efficient handling of ITU-R 601 format image data. Quantel's own published VPB format (which is based on this standard) has existed since 1989 as the common format for image data on all Quantel products encompassing film and print as well as video. On 10 Mbit/sec links the fastest television transfers took 3 seconds. The Picturenet Plus development, based on 100 BaseTX brings the same transfers in 0.5 second. The availability of Picturenet Plus has been extended to Post environments (with Editbox, Henry, Hal, Newsbox) giving all operators the ablity to transfer image files at speed, with ease. This is a native optimisation of a network connecting dedicated systems designed for real-time tasks with speed, quality and performance.
Bridging the Two worlds Two potentially distinct areas of production now exist and we need to connect them together. We need job elements which may originate on any one of the systems (Quante]. Mac etc) to transfer from one platform to another. For example, we have computer-generated 3D work which needs adding to digital video design. Or again there may be graphic elements done on a Mac which need adding to a video stills store? All these require is an open link between dedicated and computer-based systems.
391

Quante! has provided such a link with one of its OPEN technologies. Running on 100 BaseTX Ethernet and based on TCP/IP protocols this allows direct FTP transfers between Mac/PC/Unix platforms and Quante!. Any platform which supports the TCP/IP protocol and FTP applications can transfer graphics.
If we have a link such as this, are there any barriers to bridging the two worlds of broadcast and computer-based output together? There are some things which get in the way of clean data transfers: Colour space, Aspect ratio, Data File Formats
1 Colour Space Computers woi k in RGB. Digital television uses Y, Cb, Cr. The gamut (or colour range) of these two is different. In addition, ITU-R 601 specifies colour ranges from black at 16 to white at 235 value. RGB goes black at 0 to white at 255. Processing is required to translate images bi-directionally. Note I: While broadcast equipment companies supply conversions there is little evidence of computer system maniffacturers doing the same.
2 Aspect ratio Computers operate with a 1:1 aspect ratio - square pixels. Television does not. Television has non-square aspect ratios e.g. 1.11: I for 525 lines (1.01:1 for 625 lines). To solve the problem of
transfers someone needs to square the circle! Note 2: Again broadcast equipment companies supply automatic conversions but there is little sign qf computer application maniffacturers matching 7T: requirements.
3 Data File Formats There are numerous potential problems of pictures with the wrong orientation, corrupted data, incorrect colour space definition, no image filing information, poorly flagged files.
Data file formats is one of the most significant problems both technically and practically. At last count there were nearly 100 commonly used formats in graphic arts. From at least 1600 manufacturers of hardware and software products for graphic arts only 10% of these were specifically for broadcast. There are, unfortunately, very few 'standards' which hold for computer file formats. If there are enough machines using a format then it appears that makes it a standard. Macintosh PICT (native to the Macintosh screen draw routines!) and even SGI RGB have been described as 'standards'.
If there were just one or two file format standards, what would they be? A poll would probably have TIFF and TARGA on everyone's list. Let's just examine one - TIFF.
Header with descriptive fields, 'tags' and pointers.
ADD BA BBAA 0 Niafia:i i II ri 11 0 riM 0 El rit
0000000000(aA
0 AAVVIO MIIIKaa 000000 00fitA0.A
Ac cccwv 0 [JO QR a ii.AS 5'5: 05'5'
Image data
Figure 2
TIFF - Tag Image File Format
TIFF is one of the most widely used file formats. Originally released in 1986 by Aldus Corporation. It has gone through three major revisions in 1987 (TIFF 4.0), 1988 (TIFF 5.0), and 1992 (TIFF 6.0) What is interesting about the last revision is that support for CMYK (print) on the one hand and Y,Cb,Cr (broadcast) were added.
392

The Encyclopaedia of Graphic File Formats
states: "Usage: Used for data storage and interchange. The general nature of TIFF allows it to be used in any operating environment, and it is found on most platforms requiring image data
storage. Comments: The TIFF format is perhaps the most versatile and diverse bitmap format in existence. Its extensible nature and support for numerous data compression schemes allow developers to customize the TIFF format to fit any peculiar storage needs." It continues. "...because TIFF is so extensible and has many capabilities,...this format is probably the most confitsing.finmat to undelmand aid use". (Author's italics)
TIFF is not at fault obviously. It has no part in this. The fault lies with the developers writing variations on a theme of TIFF. TIFF is particularly prone to 'convenience revisions'
designed to accommodate coding errors or application program quirks. It probably ought to be called IFF as noone tags the files. There are probably as many variations of TIFF as there manufacturers. That puts it at around 1600! Whose responsibility is it to mop up this mess?
Quantel has made inroads into solving some of the computer industry's problems (aspect ratio, colour space) but there is only so far one company can go when a whole industry has problems. To design products for an industry they must be designed them to work in that industry. Since 1992 developers from the computer industry could have been writing TIFF (Y,Cb,Cr) files ready for broadcasters, post-houses and their engineers to use. But it has not.
To summarise, there are genuine technical issues which affect i) which physical network to use to connect systems together.
ii) which language of protocols, file formats and industry-specific requirements like ITU-R 601 are available. iii) what work we can do and where. If the system demands of SDI are too much then systems need to stay the other side of the fence
A Survey of the Industry A recent tour of over thirty facilities in the broadcast and post industries revealed none was a typical in their approach to networking. Some had written special applications, others used off-the-shelf solutions - all had varying degrees of success. Aims varied from big server schemes to creating remote links via Internet. Although not necessarily representative it showed an industry trying to manage connections between two completely different worlds undergoing the most
obvious dynamics of change
THE PEOPLE What about the people? Assuming that all technicalities are sorted out as well as can be. What about those working on, managing and maintaining these systems?. Some common threads emerged from a recent survey. For simplification these are grouped by two types of function: Creative, Technical. The creative category includes producers, editors, designers and anyone else responsible for managing and generating content. The technical category includes engineering managers, engineers, system and computer specialists, programmers.
The creatives were concerned that nothing prevented them from achieving their objective Most felt at ease with broadcast designed equipment and standard platforms like Macintosh (some to the level of technical support) Awareness of networking, TCP/IP and Unix was generally very low except amongst the 3D specialists If transfers between systems were too complicated it became an 'engineering' problem
393
The technicals mixed the fundamentals of broadcast engineering with a growing skill set in PCs predominantly. Much of the fundamental PC awareness which existed was located within MIS/IT departments and therefore potentially out of reach of engineering staff unless good internal communications stnictures existed. Awareness of Mac and Unix platforms was generally very low. Everyone was coming up to steam on TCP/IP and the implications, potential or otherwise, of Internet
In the mixed platform environment which now predominates in broadcast and post production 'ownership' of problems is in danger of falling between stools. As we have seen there could be many reasons for the failure of job elements to transfer successfully, system to system. The reasons for these failures has as much to do with education, training and cross-platform system awareness as the shortcomings of specific technologies.
CONCLUSIONS It is true that the reality of mixed product working with a common aim in broadcast and post is here to stay and that computer products still seem unable to deal with the 'meatier' parts of the industry in the form of SDI and live video operations. It is also true that it is possible to network systems together efficiently but only if an awareness is maintained of the true nature of job functions at every stage of design and implementation.
Some broadcast equipment manufacturers have taken steps to solve some of the networking problems and facilitate a smoother route to integration. Whether this takes the form 'focused' networks of SDI linked systems, 'native' optimisations of standards like Ethernet, or use of a 'universal' protocol like TCP/IP the choice is balanced between universal access and the most efficient way to get the job done
It is not true that media communications convergence, the vanishing point of the industry, will result in a grey future of sameness and computer-based lowest common denominator. As long as the depth and complexity of networking integration is understood the relative importance of standard platforms to the power and performance of dedicated systems will be clear.
References Encyclopaedia of Graphic File Formats - O'Reilly & Associates, Inc.
394
PICTURE QUALITY ASSESSMENT TEST: CODING EFFICIENCY AND
SERVICE BIT RATE OF 525-LINE PROGRESSIVE SCAN IMAGES
Joji Urano, Hironao Sakaguchi and Hideo Yamauchi
Nippon Television Network Corporation
Tokyo, JAPAN
ABSTRACT
Higher quality digital TV broadcast service using a
525-line progressive scan (525P) signal, which enables
cost effective high picture quality service, has been
planned as a "trial" service which will start shortly in
Japan. In order to define technical specifications of
digital 525P service, we carried out a picture quality
subjective assessment test regarding coding efficiency
and service bit rate of 525P images. This experiment
includes picture quality comparisons between 525P
and other picture format (1125-interlaced). As a result,
we found that a high quality 525P service is feasible at
a video bit rate of around 9Mbps with MPEG-2 video
coding. We also concluded that, at such bit rate, the
525P format is more advantageous than 1125-
interlaced in terms qfpicture quality.
1. INTRODUCTION
In 1996, Japan saw the launch of its first digital multi-
channel broadcasting service (called PerfecTV) using a
communication satellite (CS), and there are plans to
launch new satellite digital broadcasting services in
1997. On the whole, Japan is opening the door to a
genuine digital broadcasting era At present, however,
the multi-channel service offered by PerfecTV is NTSC
quality despite the fact that digital broadcasting in itself
features flexible service quality and can offer higher
picture quality in addition to multi-channel service. As a
first step, therefore, to achieve such a high-picture-
quality digital broadcasting service in Japan, a "trial"
digital broadcasting is set to begin this year using 525-
line progressive scan (525P), a high-picture-quality
television format having good cost performance.
The 525P format, while having the same number of
scan lines as NTSC (= 525 lines), is a progressive scan
format with a frame rate of 59.94 Hz, twice that of
NTSCP I. This format has been specified as one of the
production formats for EDTV-II (or "Wide Clear
Vision"), an NTSC-compatible high-picture-quality
terrestrial television system in Japan, and has been
adopted as one compression format for the Advanced
Television (ATV) standard in the United States121.
Because the 525P format is progressive scan, it has the
advantage over conventional interlaced scan format in
terms of picture quality due to the absence of line flicker
and other problems associated with the latter format.
The 525P format also has high correlation in the vertical
and temporal directions compared with interlaced scan,
and because motion estimation therefore becomes
relatively easy, 525P is better suited to coding with
MPEG-2131, the most popular video coding technology
in digital broadcasting. On the other hand, if we
compare 525P with the HDTV format (e.g., 1125-line
interlaced (11251)), 525P has less horizontal and
vertical pixels and therefore has a slight disadvantage in
terms of picture quality. At the same time, however, the
size of hardware required by 525P is relatively small,
which means that 525P excels in terms of
implementation period and cost. In short, there are high
expectations for 525P digital broadcasting service as a
cost-effective high-picture-quality television service.
This paper first provides a brief explanation of a 525P
digital broadcasting system. Then it describes subjective
assessment that we have performed to search out an
appropriate service bit rate for use in providing 525P
digital broadcasting services. This assessment test
consists of two parts: a verification experiment to
395

determine what bit rate satisfies "service quality" when
525P images are coded with MPEG-2, and a picture quality comparison experiment to compare 525P with the 11251 format at the service bit rate for 525P.
2. OVERVIEW OF 525P DIGITAL
BROADCASTING SYSTEME41
Before making plans for a "trial" 525P-digital-
broadcasting service, we developed a prototype 525P
digital broadcasting system at the end of 1995 and conducted several satellite transmission experiments. This work included the new development of a real-time MPEG-2 video encoder for 525P and an Integrated
Receiver Decoder (IRD). This section briefly describes the specifications for the 525P digital broadcasting
system as used in these transmission experiments. These specifications are expected to be adopted in the upcoming trial service in much the same form.
Figure 2-1 shows a conceptual diagram of the 525P
digital broadcasting system and Table 2-1 summarizes the system's technical specifications. The system conforms to Japan's CS digital broadcasting standard. Video coding in the system is MPEG-2, but in order to
525P Video
Audio
Encoder
F ..
(MPEG Layer-II)
525P Fe, Video Encoder
(A EG-2 AlPaH141-)
MUX
(M EG-2 Systems) Ts
Channel
Coder
RF
Tuner CIPSK
deal with the 525P format, the MPEG-2 encoder and
decoder employs the Main Profile at H-1440 Level
(MP@H14L), which is one level higher than the Main Profile at Main Level (MP@ML) used for NTSC/PAL
resolution. The newly developed 525P video encoder can vary its output bit rate in the range from 4 to 20 Mbps for experimental purpose. A video bit rate of from
9 to 10 Mbps (for live-camera material) and 4 Mbps (for film material), for example, has been used in satellite transmission experiments performed to date. Verifying
the most appropriate video bit rate is the objective of the
subjective assessment described in this paper.
3. EXPERIMENT #1 - VERIFICATION OF
525P SERVICE BIT RATE FOR DIGITAL BROADCASTING
The purpose of this experiment is to determine an appropriate service bit rate for 525P digital broadcasting
service by performing a subjective quality assessment Specifically, six 525P test sequences were selected, coded with MPEG-2 at several bit rates, and then based
on subjective assessment scores, a necessary and sufficient bit rate (= service bit rate) for satisfying
Communication T Satellite
Channel
Decoder
525P IRD*
-Se
rs
Demux
) Audio Decoder
525P H Video Decoder
'Integrated Receiver Decoder
Figure 2-1 Block diagram of 525P digital broadcasting system
oo
0 -00
Speaker
CD 525P Monitor
396

Table 2-1 Specification of the 525P digital broadcasting system
Video Coding Multiplexing
Pixels x lines 704 x 480 Output stream MPEG-2 Transport Stream
Field rate 59.94Hz Output bit rate 19.4414Mbps
Interlace ratio 1:1 (progressive scan) Channel Coding
Aspect ratio 9:16 Framing structure Inverse first Sync Byte of
every 8 transport packets Coding technology MPEG-2 MP@H 1 4L
Chroma format 4:2:0 Energy dispersal Addition of PN (X15+X14+1)
(period = 1503 bytes) GOP structure M=3, N=30
Output bit rate 4 - 20Mbps Outer coding RS (204, 188)
Audio Coding Inner coding convolutional (rate = 1/2)
Sampling frequency 48kHz Interleaving convolutional (depth = 12)
No. of channels 2 channel Modulation QPSK
Coding technology MPEG Layer-II Roll-of factor 0.35
Coding mode dual mono Output bit rate 42.192Mbps
Output bit rate 256kbps/2ch
* some parameters are subject to change.
"broadcast quality" was determined.
3.1 Assessment method and conditions
Table 3-1 shows the assessment conditions for this
experiment. Here, in order to assess the quality of each
coded image together with a reference (= the original
image before compression), the Double Stimulus
Continuous Quality Scale (DSCQS) method as
described in ITU-R Rec. BT.500-615) has been adopted
for carrying out this assfssment test.
The six sequences in Table 3-2 were selected for
evaluation. Each is a 10-second video sequence taken
with a 525P CCD camera Four bit rates were chosen: 6,
8, 10 and 12 Mbps. Encoding was performed by the
525P real-time MPEG-2 encoder introduced in the
previous section.
3.2 Results and considerations
The results of this assessment test (average of 15
assessors) are shown in Table 3-3 and Figure 3-1. Foch
score shown here is the difference between the
assessment score obtained for the reference sequence
and that for an assessment sequence. A large value
indicates a large difference with respect to the original,
i.e., highly degraded picture quality. The maximum
difference that can be obtained here is 100(%).
In our results, it is clearly shown that, as the bit rate
increased, the picture quality increased. At 6Mbps, the
average score of six sequences was about 15%, and two
sequences exceeded 20%. At 8 Mbps, however, no
sequences exceeded 20% and the average value was
about 13%. Then the average score fell about 11% at 10
Mbps. Finally, at 12 Mbps, all sequences except one
came in under 12% and the average was about 7.5%.
There are several technical reports describing the
relationship between subjective assessment score and
user requirement quality. Among them, ITU-R Rec.
BT.1122-1 161 specifies user requirement for emission
and secondary distribution of digital television.
According to the recommendation, "good reception
condition" is met if the average assessment score is
397

Table 3-1 Assessment conditions for Experiment #1
Assessment method 1 DSCOS method described in ITU-R Rec. BT 500-6
Sequences for evaluation 6 sequences (see Table 3-2)
Encoding Real-time MPEG-2 encoder for 525P
Bit rate 6Mbps, 8Mbps, 10Mbps. 12Mbps
Monitor used Studio-use 32' monitor (Shibasoku CM322H)
Viewing distance 4H
Number of assessors 15 non-experts
*DSCQS = Double Stimulus Continuous Quality Scale
Table 3-2 Test Sequences used for Experiment #1
Sequence Charactenstrcs
Bookshelf , Pan up, Detailed characters
Dance Zoom out. Random motion, Flush
Vanety Show Honzontal Pan, Detailed textures
Gymnastics I Fast motion
Fishing Boat Fix, Random motion
Autumn Leaves Fix. High saturation
Table 3-3 Experiment #1 - Overall results (average of 15 assessors)
Sequence 6 Mbps 8 Mbps 10 Mbps 12 Mbps reference
Bookshelf Score 15.7 10.3 8.7 1.7
,
0.3
S.D. 16.3 9.6 8.8 3.5 6.2
Dance Score 23.3 18.7 17.3 15.3 -2.3
S.D. 21.3 20.0 16.5 15.3 7.7
Variety show Score 12.0 14.7 12.7 6.7 2.3
S.D. 13.3 13.8 12.1 83 8.1
Gymnastics Score 11.3 7.9 6 0 4 3 -0.3
S.D. 14.3 11 3 8.2 9.5 7.9
Fishing Boat Score 22.0 17.7 17.0 7.3 4.3
S.D. 16.1 15.6 15.7 8.3 6.8
Autumn Leaves Score 7.3 7.0 4 3 1 0.0 5.3
S.D. 10.5 126 11.4 13.3 18.1
MEAN
I
Score 153 12.7 11.0 7.6 1.6
S.D. 16.7 I 14.9 13.5 11.3 10.4
• S D Standard Deviation
7 33
25
8 2°
15
10
5
0
-5
adbps 18Nbps EMONtses 1111121Naps • Ref
Dance Vanety Show Aubrnn Leaves Gyrnnasbcs Fishrog Boa! Bookshelf MEAN
Figure 3-1 Experiment #1 - Overall results
398

within 12% and scores of at least 75% of the sequences
are within 30%, when the specified assessment
sequences are used.
In general, the definition of "service quality" depends on
the service itself Considering the 525P service as a high
quality service, however, we therefore define service bit
rate for 525P here based on the criteria described in Rec.
BT.1122-1. Thus, on the basis of this definition, we can
say that 8 Mbps is slightly below the border line but that
the neighborhood of 9 Mbps is an appropriate service
bit rate.
4. EXPERI MENT #2 - COMPARISON
WITH ANOTHER FORMAT (11251)
Based on the results of the service bit rate verification
experiment (Experiment #1) described in the previous
section, this experiment aims to confirm the superiority
of 525P over 11251 by conducting a subjective
assessment experiment that compares picture quality
between 525P and 11251 at the service bit rate found
appropriate for 525P. The experiment uses four 525P
and 11251 sequences of about the same content, coded
each sequence with MPEG-2, and carries out subjective
picture quality assessment on both formats based on the
same evaluation criteria The subjective assessment
scores obtained here at the 525P service bit rate and
thereabouts are used to compare 525P and 11251
picture quality.
4.1 Assessment method and conditions
Table 4-1 shows the assessment conditions for this
experiment. As in Experiment #1, this experiment made
use of the DSCQS method. However, in order to display
the different two TV systems (525P and 11251) on one
monitor during one assessment session, the ITU-R Rec.
BT.500-6 was not strictly followed and some
modification is performed. For example, an original
11251 image was used as a common reference (both
525P and 11251). In addition, considering the nature of
this experiment in which 525P picture quality is
compared with that of 11251 for the purpose of realizing
525P service, the viewing distance here was chosen to
be 4H (a distance four times the screen height).
The four sequences in Table 4-2 were selected for
evaluation. Fach is a 4-second video sequence taken
with a 525P or 11251 CCD camera (during actual
assessment session, these were repeated twice). Two bit
rates were used for 525P: 9 and 15 Mbps; and three for
11251: 9, 15 and 20 Mbps. For 525P, encoding was
performed by the 525P real-time MPEG-2 encoder
introduced above, and for 11251, an MPEG-2 software
encoder was used.
4.2 Results and considerations
The results of this assessment test (average of 14
assessors) are shown in Table 4-3 and Figure 4-1. The
assessment scores here have the same meaning as those
in Experiment #1. All data of 1 assessor were excluded,
based on the screening criteria described in Rec. BT.
500-6.
In the results, it should be pointed out that the average
score for 525P at 9 Mbps were about 10%, which was
almost as same as that for 11251 at the same bit rate, the
service bit rate considered appropriate for 525P. This
means that there were no significant difference between
525P and 11251 at 9 Mbps, i.e., no difference in picture
quality, as far as the average score is concerned.
Looking at the results sequence by sequence, however,
we found some differences between two formats. For
example, 11251 demonstrated higher picture quality
than 525P at "Playing cards" and "Toys", most parts of
which are fixed scene and coding difficulties are
therefore considered easy. On the other hand, opposite
results were obtained at "A girl with a scarf' and
"Baseball". The sequence "Baseball", for example,
includes a lot of fast motion scenes and considered to be
difficult for digital coding. In such a case, 11251 needed
more compression rate than 525P and resulted in more
picture quality degradation, such as poor SNR, block
effects and so on. As a result, the score at "Baseball" for
11251 was about 24%, the worst score in this
experiment If we consider the worst score for
investigating service bit rate, for example, this fact will
slightly influence the relationship between 525P and
399

Table 4-1 Assessment conditions for Experiment #2
Assessment method Based on the DSCCIS method in ITU-R Rec. BT.500-6 with slight modifications'
Sequences for evaluation 4 sequences (see Table 4-2)
Reference 11251 original
Encoding (525P) Real-time MPEG-2 encoder for (11251) MPEG-2 software encoder
525P
Bit rate (525P) 9Mbps. 15Mbps (11251) 9Mbps. 15Mbps, 20Mbps
Monitor / Viewing distance / Number of assessors
same as Expenment #1
rvietnoa to p ay on one monitor dunng one assessment session. Selection of reference sequences(=11251 original). Selection of viewing distance etc
Table 4-2 Test sequences used for Experiment #2
Sequence . Charac-tenstics
Baseball Pan, Fast motion
Playing Cards FIX, Rarely moved
A Girl with a Scarf FIX. Fast motion & Slow motion
Toys FIX. Fast & Random motion. High Saturation
Table 4-3 Experiment #2 - Overall results (av erage of 14 assessors)
Sequence 525P 11251
9Mbps 15Mbps Original 9Mbps 15Mbps 20Mbps Onginal Baseball Score 13.9 8.2 1.1 23.9 22.5 5.0 -0.7
S.D. 19.2 15.4 11.4 18.1 13.5 5.4 3.7 Playing Cards Score 15 0 10.4 9.3 0.0 4 3 -0.4 -0.7
S.D. 11.2 5.8 12.4 7.1 8.6 3.0 5.3 A Girl with
a Scarf
Score 3.9 164 8.9 13.6 2.9 1 8 -0.4 S.D. 16.3 16.0 10.7 19.1 8.8 5.2 10.3
Toys Score 64 6.8 4.6 2.1 1 8 0.0 -04 S.D. 13.6 18.4 17.4 10.6 3.1 7.6 11.1
MEAN Score 9.8 104 69 9.9 7.9 1.6 - -0.5 S.D. 16.1 15.2 13.6 17.5 12.6 5.9 8.2
OuaItty Difference IS
30
25
20
-5
S D Standard Deviation
• 525P • 525P P 525P • 11251 Ii125i :7;11251 • 11251 9Ntps 15Nbps Orglnal 9Nbps 151,Apps 2CNbbs Ongmar
525P 125i 525P 1125 525P • 25,
Girt w/Scarf PlayIng Cards Toys
525P 1125
Baseball
525P 11251
MEAN
Figure 4-1 Experiment #2 - Overall Results
400

8 1-
6 -
-2 - 9Mbps 15Mbps
(Ref=11251 Originali
20Mbps Original
• • • • • 525P1
11251,
Figure 4-2 Experiment #2 - Comparison between 525P and 11251 (Average of 4 sequences)
11251. In other words, it can be said that, for a service
around at 9 Mbps, 525P is slightly better than 11251 in
terms of picture quality, even the average scores for both
formats are quite similar.
It is also noted that, as the bit rate increased, 11251
picture quality increased. At 15 Mbps, 11251 had a
smaller assessment score than 525P by about 3% for the
average of 4 sequences, and this trend became even
more remarkable at 20 Mbps. It should be pointed out
here that a difference of about 6% in average score was
found when comparing the original images for 525P and 11251, which indicates that without digital
encoding, 11251 picture quality is preferable in nature.
(see Figure 4-2)
The above results show that 525P picture quality is
comparable to that of 11251 at the 525P service bit rate,
and 525P is slightly preferable, if "the worst race" is
considered. Regarding this point, an additional
experiment is being planned, adding new test sequences
for evaluation.
5. CONCLUSION AND FUTURE ISSUES
With the goal of providing 525P digital broadcasting
service, a subjective picture quality assessment test has
been performed to verify the superiority of 525P picture
quality and to determine a necessary and sufficient
service bit rate. Results showed that broadcast quality
for 525P images can be achieved at a video bit rate of
around 9 Mbps, and that 525P has a comparable or
even better picture quality assessment than 11251 at that
bit rate. In short, this test has demonstiated that a digital
broadcasting service using 525P is one solution to
providing a high-picture-quality service at a relatively
low bit rate.
As a next step, we plan to collect even more data on
525P images through the 525P "trial" service and to
analyze feedback with the aim of providing a genuine
525P service. We also plan to engage in activities
promoting the spread of 525P digital broadcasting
service. Moreover, despite the fact that we have already
conducted a picture quality assessment test to compare
525P and 11251 images at the 525P service bit rate
(Experiment #2), we know that the conclusions reached
may vary somewhat depending on the test sequences
selected, assessment conditions, etc. For this reason, we
plan to continue with general tests that compare picture
quality between the 525P format and other broadcast
formats.
REFERENCES
[1] SMPTE Standard for Television - 293M, "720 x
483 Active Lines at 59.94 H: Progressive Scan
Production - Digital Representation'', 1996
[2] ATSC A/53, "ATSC Digital Television Standard",
401

1995
[3] ISO/IEC 13818, "information Technology -
Generic Coding of Moving Pictures and
Associated Audio", 1994
[4] J. Urano et. al. "525-line progressive scan digital
broadcasting system via satellite", SMPTE
Advanced Motion Imaging Conference,
Feb.1997
[5] Recommendation ITU-R BT.500-6, "Methodology
for the subjective assessment of the quality of
television pictures", 1994
[6] Recommendation ITU-R BT.1122-1, "User
requirements for emission and secondary
distribution systems for SDTV, HDTV and
hierarchical coding schemes", 1995
402

DESIGNING RADIO FACILITIES: PART II Tuesday, April 8, 1997 1:00 - 5:00 pm
Chairperson: Jerry Whitaker, Technical Press, Beaverton, OR
A COST-EFFECTIVE MASTER FM ANTENNA SYSTEM Jay M. Jacobsmeyer Pericle Communications Company Colorado Springs, CO
TOWERS, RF AND FM ANTENNAS Ali Mahnad Micro-Tek Engineering Carmichael, CA
BUILDING THE DIGITAL STUDIO AND TRANSMITTER PLANT W. Lee Simmons Adventure Technology, Inc. Hilton Head Island, SC
*MF AM ASYMMETRIC VERTICAL DIPOLE
MEASUREMENTS Valentin Trainotti Buenos Aires, Argentina
DIGITAL RADIO STUDIOS AT ANALOG PRICES- A COST EFFECTIVE APPROACH TO DESIGNING AND BUILDING A FULLY INTEGRATED DIGITAL
BROADCAST FACILITY Russ W Mundschenk WBEB-FM Bala Cynwyd, D A
DESIGNING AND BUILDING THE DIGITAL STUDIO FACILITY: RADIO & TELEVISION A 'NUTS AND
BOLTS' APPROACH Gary R. Hardwick Harris Corporation Richmond, IN
HIGH SPEED DIGITAL SUBCARRIER LABORATORY
TESTS (HSSC) Thomas B. Keller Consultant/CEMA Springfield, VA
Paper not available at the time of publication
403

404

A COST-EFFECTIVE MASTER FM ANTENNA SYSTEM
Jay M. Jacobsmeyer, P.E. Pericle Communications Company
Colorado Springs, CO
Jay S. Martin Dielectric Communications
Raymond, ME
ABSTRACT
Relaxed ownership rules for FM broadcast stations are driving a consolidation of RF transmission facilities. Traditionally, FM transmitters were combined in large expensive panel antennas. The breakeven number for these large master systems could be as high as six stations. The industry needs a low-cost alternative for combining a smaller number of stations. The cost of a tower, antenna, and transmission line can be shared by two to four stations by employing a high power version of a single station antenna. This paper describes a side-mount master FM antenna capable of supporting up to four Class C stations across a bandwidth of 13 MHz. We also address some of the unique design issues involved with master antenna systems.
1.0 INTRODUCTION
The FM broadcast industry has undergone many changes since station ownership rules have been relaxed. The consolidation of stations has led to shared transmission facilities to reduce operating costs. It is common practice for multiple FM transmitters to share a single antenna and transmission line. These Master FM Antenna Systems tend to fall into two categories: the large system and the small system.
A typical large master antenna system employs a panel antenna, nine inch rigid coaxial line, constant impedance combiner modules, and supports 10 stations across the entire 88-108 MHz FM band. The advantages of the large master antenna are wide bandwidth, nearly constant pattern, and high power. The main disadvantage is cost. The less expensive small master, on the other hand, is a side-mounted antenna capable of handling up to three stations over 5 MHz. The pattern may not be constant at all frequencies.
There is a significant gap in cost and performance between the small master and the large master. There are many situations where three or four stations wish to share a master antenna across 10 MHz, but the cost of a large master is prohibitive. In this paper, we describe a new master FM antenna system that bridges the gap between the large and small master and enables combining of up to four Class C stations over a bandwidth of 13 MHz. The cost of this antenna system is comparable to the cost of a small master antenna.
Master antenna systems introduce unique design issues.
Some of these issues include pattern optimization across a wide bandwidth, broadbanding, transmission line resonance, peak power limitations, and transmitter intermodulation. We address each of these topics in this paper.
The process of specifying, designing, and constructing a master FM antenna can best be illustrated through a real-world example. The following sections describe a four-station master FM antenna system recently installed on Cheyenne Mountain in Colorado Springs, Colorado.
2.0 A CASE STUDY — CHEYENNE MOUNTAIN
In Colorado Springs, all Class C FM stations broadcast from Cheyenne Mountain, located six miles southwest of the city. At 9,400 feet, Cheyenne Mountain is 3,400' above downtown Colorado Springs. The main advantage of the site is its ability to provide a 70 dBu signal level contour over Colorado Springs and Pueblo (see Figure I). The 60 dBu contour reaches a population of 866,000 (1990 U. S. Census). The site is owned by Cheyenne Propagation Company and managed by its Vice President for Operations, Mr. Mel Rauh.
In 1992, the company faced a problem. Because of an FCC frequency change, a Pueblo, Colorado FM station
405
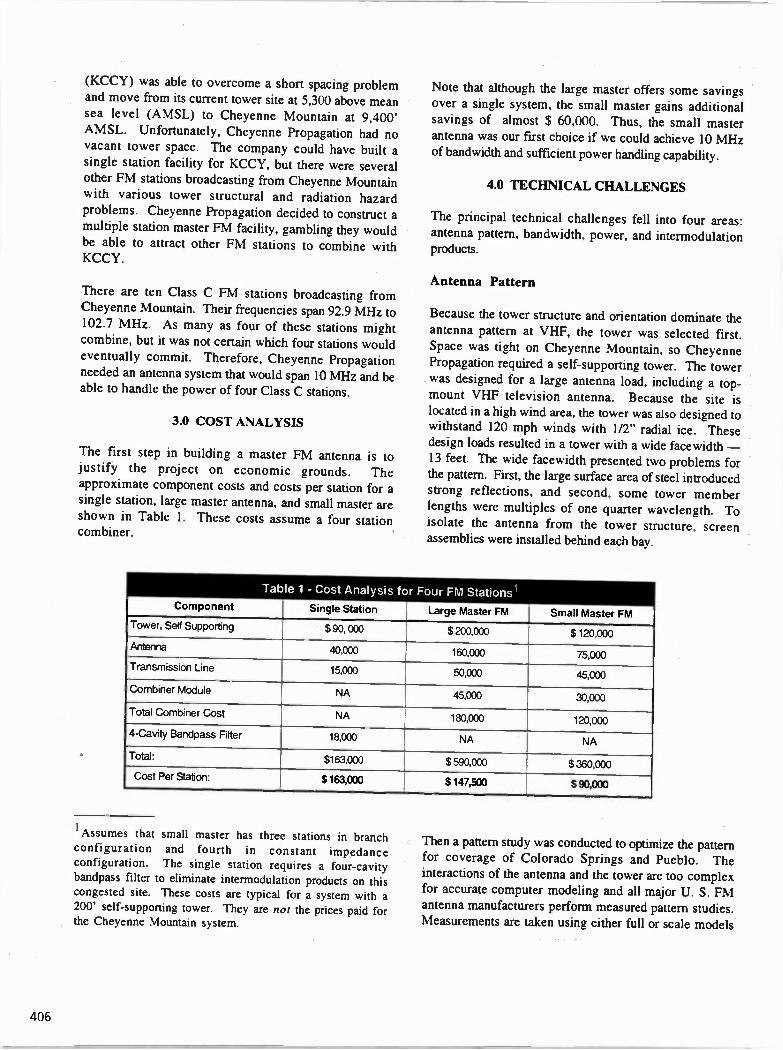
(KCCY) was able to overcome a short spacing problem and move from its current tower site at 5,300 above mean sea level (AMSL) to Cheyenne Mountain at 9,400' AMSL. Unfortunately, Cheyenne Propagation had no vacant tower space. The company could have built a single station facility for KCCY, but there were several other FM stations broadcasting from Cheyenne Mountain with various tower structural and radiation hazard problems. Cheyenne Propagation decided to construct a multiple station master FM facility, gambling they would be able to attract other FM stations to combine with KCCY.
There are ten Class C FM stations broadcasting from
Cheyenne Mountain. Their frequencies span 92.9 MHz to 102.7 MHz. As many as four of these stations might combine, but it was not certain which four stations would eventually commit. Therefore, Cheyenne Propagation
needed an antenna system that would span 10 MHz and be able to handle the power of four Class C stations.
3.0 COST ANALYSIS
The first step in building a master FM antenna is to justify the project on economic grounds. The
approximate component costs and costs per station for a single station, large master antenna, and small master are shown in Table I. These costs assume a four station combiner.
Note that although the large master offers some savings over a single system, the small master gains additional savings of almost $ 60,000. Thus, the small master antenna was our first choice if we could achieve 10 MHz of bandwidth and sufficient power handling capability.
4.0 TECHNICAL CHALLENGES
The principal technical challenges fell into four areas: antenna pattern, bandwidth, power, and intermodulation products.
Antenna Pattern
Because the tower structure and orientation dominate the antenna pattern at VHF, the tower was selected first. Space was tight on Cheyenne Mountain, so Cheyenne Propagation required a self-supporting tower. The tower was designed for a large antenna load, including a top-
mount VHF television antenna. Because the site is located in a high wind area, the tower was also designed to withstand 120 mph winds with 1/2" radial ice. These design loads resulted in a tower with a wide facewidth — 13 feet. The wide facewidth presented two problems for the pattern. First, the large surface area of steel introduced strong reflections, and second, some tower member lengths were multiples of one quarter wavelength. To isolate the antenna from the tower structure, screen assemblies were installed behind each bay.
Table
Component
1 - Cost Analysis for
Single Station
Four FM Stations l
Large Master FM Small Master FM Tower, Self Supporting $90,000 $200,000 $ 120,000 Antenna 40,000 160,000 75,000 Transmission Line 15,000 50,000 45,000
Combiner Module NA 45,000 30,000
Total Combiner Cost NA 180,000 120,000 4-Cavity Bandpass Fitter 18,000 NA NA Total: $163,000 $590,000 $360,000 Cost Per Station: $ 163,003 $ 147,500 $ 90,000
1 Assumes that small master has three stations in branch configuration and fourth in constant impedance configuration. The single station requires a four-cavity bandpass filter to eliminate intermodulation products on this congested site. These costs are typical for a system with a 200' self-supporting tower. They are not the prices paid for the Cheyenne Mountain system.
Then a pattern study was conducted to optimize the pattern for coverage of Colorado Springs and Pueblo. The interactions of the antenna and the tower are too complex for accurate computer modeling and all major U. S. FM antenna manufacturers perform measured pattern studies. Measurements are taken using either full or scale models
406

of the tower and antenna on outdoor ranges or in an anechoic chamber. The pattern study for the Cheyenne Mountain antenna was conducted in an anechoic chamber using 4.4 to 1 scale models of the antenna and tower. When under test, the scale models of the antenna and tower are rotated together 360 degrees while receiving a signal from a source antenna.2 The source antenna is a cavity-backed corner reflector that can be oriented to excite either the vertical or horizontal polarization. All RF reflections and noise are absorbed by RF absorbing material in the chamber. An HP 608 signal generator supplies the RF signal at 4.4 times the fundamental broadcast frequency and a directional coupler located at the
source antenna input feeds a reference signal to an HP 8505A Vector Voltmeter. The signal received by the antenna model is also supplied to the Vector Voltmeter and is converted to relative field or decibels (dB). The
signal is then made available to a personal computer (PC).
An optical encoder located at the antenna under test sends signals to the PC. The PC's software polls the Vector Voltmeter at intervals corresponding to one degree rotations of the tower and antenna under test. The signal magnitude and an azimuth value are sampled every degree
and the 360 samples are stored on a hard disk for later plotting. The process is repeated for the other polarization.
We found that the scale model and anechoic chamber were cost-effective solutions. Advocates of full-scale measurements argue that a model cannot accurately represent the real thing. We believe this is only true if the model is not constructed properly. In the hands of an expert model builder, one can achieve satisfactory results. If money is no object, then by all means perform a full-scale measurement on the actual tower and at the planned tower height.3
To optimize the pattern, we conducted 67 azimuth patterns at different antenna orientations on the tower. Once we were satisfied with the antenna pattern, we surveyed the tower legs and installed the tower foundation.
Bandwidth
For cost reasons, most side-mount antennas are fed from a single point, at the end or center of the antenna. This type of feed results in a relatively narrow bandwidth. The
2The reciprocity theorem guarantees the antenna will have an identical pattern whether it is transmitting or receiving.
3The FCC accepts predicted patterns from both full size and scale models.
key to achieving wide bandwidth is to use a branch feed where each bay is fed separately with its own transmission line. This configuration is shown in Figure 2. Line lengths are precision cut to achieve the proper beam tilt and null fill.
Tower Leg
2 1/4" Semi-Rigid — No-
Power Dividers
Main Feed 6 Rigid Line
4' Rigid Line — OP-
3/4 k
Four Additional Bays (Identical Configuration)
Figure 2 - Branch Fed 8-Bay Side Mount Antenna
The branch feed system is used in broadband arrays primarily to keep the relative phase and amplitude constant at each bay even as the frequency varies. With a standard feed, called a "tapped feed" system, the elements are mounted in full wavelength increments so that equal phase and amplitude are fed to each bay at one frequency only. On a tapped feed antenna (end fed or center fed), the phase discrepancy is cumulative from the feed point to the farthest bay. If the carrier wavelength varies significantly from the bay spacing, this cumulative phase discrepancy results in an impedance mismatch, distorted elevation pattern and an unacceptably high voltage standing wave ratio (VSWR). The branch feed, on the other hand, allows each bay to be fed from a common point so that the phase
407
change is not cumulative.
Another advantage of the branch feed system is the ability to reduce the physical bay spacing. For example, when the bay spacing is reduced to 3/4 wavelength, there is a partial cancellation of the signal at the zenith and the nadir. In other words, the downward radiation is reduced
significantly, lowering the personnel hazard from non-ionizing radiation [4]. This shorter spacing also reduces
the number of nulls in the antenna elevation pattern. Of course, these advantages aren't free. The antenna gain is less for shorter bay spacing. For example, an eight-bay
antenna with 3/4 wavelength spacing has a gain of 3.6 versus a gain of 4.3 for full wavelength spacing.4
Power
The master antenna and transmission line must be designed to handle both the average and peak power expected from four Class C FM stations at an elevation of 10,000' AMSL. Total average power is simply the sum of the transmitter powers of the four stations. Peak
power, on the other hand, is a random variable and depends on the instantaneous phase relationship between the
combined signals. In the worst case, all n signals are in phase and the peak voltage is n times the voltage of a single station for equal amplitude signals. Thus, the worst-case peak power is given by
P = n2 Pavg (1)
where n is the number of stations to be combined and Pavg is the average power of the highest power station.
On Cheyenne Mountain, the antenna height above average terrain is 695 meters, resulting in a Class C ERP of 72 kW. The antenna chosen has a gain of 3.3 (at 96.9 MHz), so the required average power at the antenna input is 88 kW for four stations. From Equation (1), the peak power requirement is 352 kW.
Intermodulation Products
Power amplifiers in FM broadcast transmitters are nonlinear devices and they will introduce strong intermodulation products, especially when external signals are introduced into the final amplifier stage. The most common intermodulation product in FM transmitters is the third order product created by the difference of the second harmonic of the carrier and the fundamental
4These are the gains before null fill, which will reduce gain further.
frequency of an interfering signal,
Ii = 2f1 -12
This product usually occurs in the FM band and is not attenuated by the transmitter's low-pass harmonic filter. The FCC requires that FM broadcast transmitters attenuate their emissions to at least 80 dB below carrier level at 600 kHz and greater spacing from the carrier frequency. In a combiner, some of this attenuation is provided by mixing loss in the transmitter called "turn-around loss," but turn-around loss is always less than the required 80 dB. In fact, at 800 kHz spacing, the turn-around loss can be less than 5 dB [6]. Filtering is required to provide additional attenuation.
There are two types of filter modules in FM combiners: branch modules and constant impedance modules. Both types can be band reject or bandpass, but bandpass modules are preferred [5]. The branch module is simply a
multiple cavity bandpass filter. Each branch module feeds a coaxial power combiner and the output of the combiner feeds the master antenna. The main drawback of a branch
combiner is the limited isolation between closely spaced frequencies. At 800 kHz spacing, the number of cavities required to achieve 40 dB isolation is five. The insertion loss and group delay of a five-cavity filter are higher than a four or three-cavity filter and may not be acceptable in many applications. Four-cavity filters are commonly used in branch combiners and they provide adequate isolation for frequencies spaced 1.4 MHz and greater.
As a rule, the level of the intermodulation product generated in the transmitter will be no greater than the level of the incoming interfering signal. In other words, turn-around loss in dB is always positive in practical situations. Figure 3 illustrates the attenuation of a 3rd order intermodulation product in a 4-cavity filter with 1.4 MHz spacing. The filter is connected to the output of transmitter and is tuned to 96.9 MHz. An interfering
signal at 98.3 MHz enters the filter at its output (going toward the transmitter) and is attenuated 40 dB. The interfering signal mixes with the transmitter's second harmonic and suffers another 9 dB turn-around loss. The outgoing 1M product is 1.4 MHz away on the other skirt of the filter and it is also attenuated 40 dB. The total attenuation is 89 dB, adequate to satisfy the FCC.
408
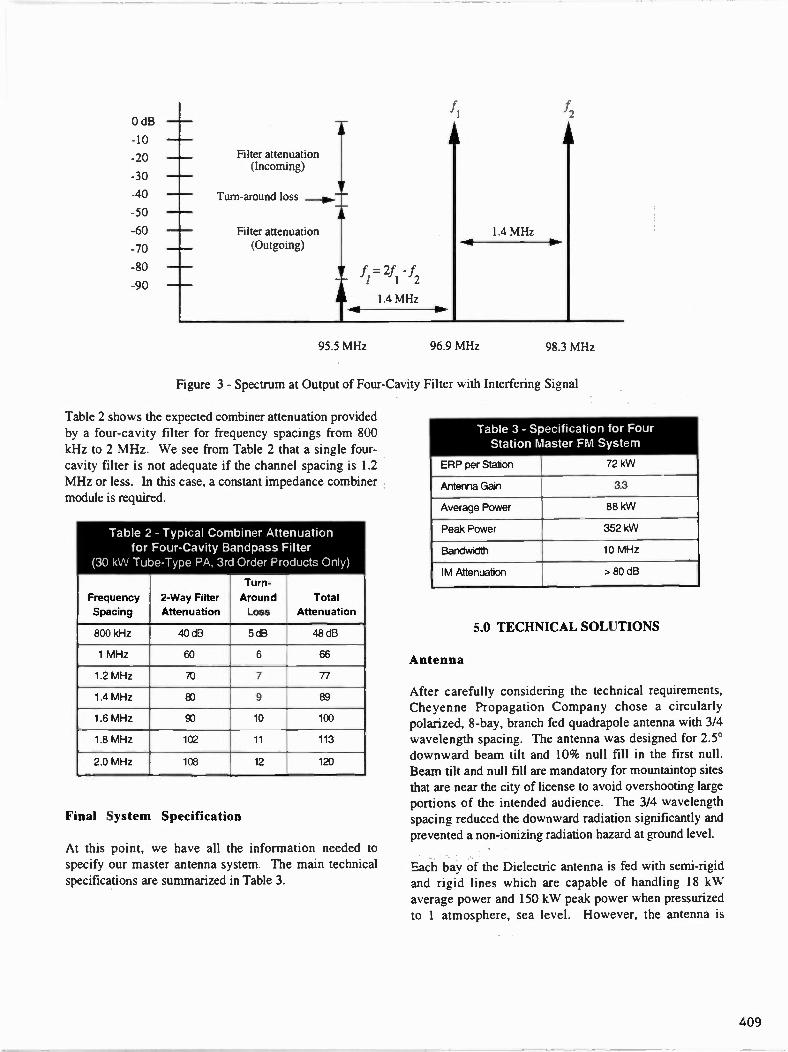
0 dB
-10
-20
-30
-40
-50
-60
-70
-80
-90
Filter attenuation (Incoming)
V Turn-around loss _pp =
A
Filter attenuation (Outgoing)
1.4 MHz
f =2f -f I 1 2
fl
1.4 MHz
f2
95.5 MHz 96.9 MHz 98.3 MHz
Figure 3 - Spectrum at Output of Four-Cavity Filter with Interfering Signal
Table 2 shows the expected combiner attenuation provided
by a four-cavity filter for frequency spacings from 800
kHz to 2 MHz. We see from Table 2 that a single four-
cavity filter is not adequate if the channel spacing is 1.2 MHz or less. In this case, a constant impedance combiner
module is required.
Table 2 for
(30 kW Tube
- Typical Combiner Four-Cavity Bandpass -Type PA. 3rd
Attenuation Filter
Order Products Only)
Frequency Spacing
2-Way Filter Attenuation
Turn-Around Loss
Total Attenuation
800 icHz 40 ce 5dB 48 cB
1 MHz 60 6 66
1.2 MHz 70 7 77
1.4 MHz 80 9 89
1.6 MHz 90 10 100
1.8 MHz 102 11 113
2.0 MHz 108 12 120
Final System Specification
At this point, we have all the information needed to specify our master antenna system. The main technical
specifications are summarized in Table 3.
Table 3 - Specification Station Master
ERP per Station
for Four FM System
72 kW
Antema Gain a3
Average Power 88 kW
Peak Power 352 kW
Bandwidth 10 MHz
IM Attenuation > 80dB
5.0 TECHNICAL SOLUTIONS
Antenna
After carefully considering the technical requirements, Cheyenne Propagation Company chose a circularly polarized, 8-bay, branch fed quacirapole antenna with 3/4
wavelength spacing. The antenna was designed for 2.5° downward beam tilt and 10% null fill in the first null.
Beam tilt and null fill are mandatory for mountaintop sites that are near the city of license to avoid overshooting large
portions of the intended audience. The 3/4 wavelength spacing reduced the downward radiation significantly and
prevented a non-ionizing radiation hazard at ground level.
Each bay of the Dielectric antenna is fed with semi-rigid and rigid lines which are capable of handling 18 kW
average power and 150 kW peak power when pressurized to 1 atmosphere, sea level. However, the antenna is
409

installed at 10,000' AMSL and the maximum peak power
ratings must be reduced to 46% of their sea level ratings. 5 After derating for altitude, each bay's maximum peak power rating is 69 kW peak. Because the power is shared equally by the eight bays, the antenna is capable of handling 552 kW peak. This is adequate to meet our 352 kW peak power requirement. In fact, the antenna could theoretically support five stations if the line was pressurized at all times.
The VS WR bandwidth of the Cheyenne Mountain antenna is shown in Figure 4 for laboratory measurements and field measurements with the antenna installed on the tower. If we define bandwidth as the frequency band where
the VS WR is less than 1.2, the bandwidth of this antenna spans 92 to 105 MHz or 13 MHz total. At the factory, without the effects of the tower members, the bandwidth was 15 MHz.
2.0 1.9
1.8 1.7
1.6 1.5
1.4
1.3 1.2
1.1 1.0
0.9
0.8 0.7
0.6 0.5
Electrical deicers are controlled by temperature and humidity sensors and operate only when conditions indicate a high likelihood of icing. Radomes are relatively trouble-free compared to deicers, but radomes increase the wind loading on the tower and may not be cost-effective when the cost of the stronger tower is included in the project cost. Because Cheyenne Mountain has a dry climate, the chance of severe icing is small and we eventually decided against deicers and radomes. In the unlikely event of severe icing, the transmitters will automatically power back and shut down when the VSWR exceeds 1.3.
Transmission Line
The transmission line is 6 1/8" rigid, capable of handling
180 kW average power and 1,200 kW peak power after derating for altitude and a VS WR of 1.15.6
— II-- Installed on tower
— 0-- At factory
Center Frequency (98.9 MHz)
88 1 ' I ' 1
90 92 94 96 98 100 102 104 106
Frequency in MHz
I I I
Figure 4 - Voltage Standing Wave Ratio (VSWR) Measurements (Dielectric DCR-M8DBR, Side Mount, 13' Face Width Tower, Branch Feed)
Another concern was icing. Ice will change the impedance of the antenna and in some cases, force a shut down of the transmitters due to high VS WR. Although factory tests have shown that the DCR-M can withstand 1/2" radial ice and maintain a VSWR of 1.5 over 5 MHz it is difficult to test for all possible icing conditions. There are two
methods to control icing: electrical heating or radomes.
5The breakdown voltage of air decreases with altitude. See manufacturer's catalog or [3].
I 108
Another important design issue for transmission line is high VSWR at critical frequencies. Small reflections under flanged areas may add in phase at critical frequencies, causing high VSWR. The critical frequencies are given by
= 490.4 m
(2)
6To derate for VSWR, we use an approximate formula, P(derated)= PNSVVR.
410

where m is any integer and L is the line length in feet. To avoid this problem, we chose a 17.5' line length which does not have a critical frequency in the FM band. The transmission line and antenna are pressurized with an automatic regenerative dehydrator.
Combiner
At the time of this writing, all four stations are operating on the combiner at full power. Their frequencies are 96.9 MHz (KCCY), 98.9 MHz (KICMG), 101.9 MHz (KKCS), and 102.7 MHz (KIICX). The combiner employs three 4-cavity filters in a branch configuration for KCCY,
KICMG, and KIICX plus one 5-cavity constant impedance module for KKCS. The constant impedance module is considerably more expensive than a branch module, but is was not possible to make a four station branch combiner work for two important reasons:
• First, it is very difficult to provide a correct match at the output of a four station branch combiner. Each frequency must see a short circuit into each port of the combiner except its own. This is straightforward for two stations, difficult for three, and nearly impossible for four.
• Second, because KKCS and KIKX are spaced just 800 kHz apart, a four-station branch combiner with four-cavity filters is not feasible. There simply is not enough isolation at 800 kHz separation to meet FCC requirements. The hybrids in the constant impedance combiner provide an additional 30 dB isolation that is not possible in the branch configuration.
Given these constraints, we chose a hybrid branch/constant impedance combiner module configuration. The first three stations are separated by at least 2 MHz and four-cavity filters provide adequate attenuation of IM products. The fourth station requires a constant impedance module. The output of the three station branch combiner is connected to the broadband input of the constant impedance module and the broadband output of the constant impedance module feeds the master antenna. The combiner configuration is shown in Figure 5. Note that the fourth station has a more reliable connection to the antenna because it is independent of the three station branch combiner. A failure on the branch combiner would force three stations to shut down, but the fourth station would remain on the air.
6.0 CONNECTION PROCESS
When a new station joins the combiner, it pays a connection fee comprising two parts: (1) its share of the antenna and transmission line costs, and (2) the cost of the combiner module. The combiner module cost varies depending on whether a branch module or constant impedance module is required. The station also pays monthly rent to help defray the cost of the tower, building, and operation of the site.
When a new station is added to the system, the combiner must be disconnected from the master antenna and the stations currently on the combiner must temporarily operate from standby antennas. The output transmission line lengths are calculated, cut to length, and the combiner is assembled. After assembly, insertion loss, isolation, return loss, and group delay are measured at the input to each combiner module.
The master antenna system is owned by the Cheyenne Propagation Company, not the stations. This arrangement eliminates many potential disputes between stations and ensures that the interests of the stations are protected equally.
•
7.0 CONCLUSIONS
A properly designed small master antenna system can
support 4 Class C FM stations over 13 MHz at 40% savings relative to an equivalent large master antenna.
This high performance small master antenna helps bridge the traditional gap in performance and cost between a small and large master antenna. At a multiple station site, the small master antenna can help solve many problems at significantly lower cost than a single station facility or a large master antenna. Some of these problems include the following:
• Poor antenna pattern • Non-ionizing radiation hazards • Tower structural deficiencies • Radio frequency interference • Zoning restrictions on number of towers
For more technical information on FM combining, consult references [1] and [5].
411

8.0 ACKNOWLEDGEMENTS
Clyde Still of Cheyenne Propagation Company and Ben Dawson of Hatfield and Dawson provided helpful advice throughput the project.
9.0 REFERENCES
[1] NAB Engineering Handbook. 8th Ed. National Association of Broadcasters, 1992.
[2] R.C. Johnson Antenna Engineering Handbook. 3rd , McGraw-Hill, 1993.
[3] Reference Data for Radio Engineers 6th Ed. Howard Sams & Co., 1982.
[4] OST Bulletin 65, "Evaluating Compliance with FCC-Specified Guidelines for Human Exposure to Radiofrequency Radiation," Oct. 1985.
[5] B. DeCormier, "Multiplexing FM Transmitters," Broadcast Engineering, pp. 84-105, May 1988.
[6] G.N. Mendenhall, "A Study of RF Intermodulation Between FM Broadcast Transmitters Sharing Filterplexed or Co-Located Antenna Systems," Broadcast Electronics, Quincy, IL.
412

Bald ciEDERLAND Mountain
b r C.17 9-1--ra ' • \ City
Golden
IDAHO SPRINGS Idaho -1:3
, Sprinis • ION .-)CLEAR CREEK
? EMPIRE. 1 _gILLa RE.. 2
E
Fairplay
iiRPLAY JEFFERSON
ARK
,
IMP G
Lake George LFA
• r , TELLER
EV
2
4
7 3
5
5,171,410i"
13
Id
REEN j
%RICHTON
Adam Brighton ADAMS
12 8 North Aurora East Adams
BENN M -If 171
1 AURORA sTRAysfiRG
) I .ii rfl utup -gurora A
Paiiet7
tral erson Do
outh jr ferson •
,ISe
Mo WO PA ivi EN NTA
aka
ment • '", LAND
ACA ° s:V\I I
r 4
CRIP -CREE -VI
Canon City
CANON CiTi Cotopaxi
. FREMONT
WESTCLIFFE c • •-..1--5,•:;ISIL
\ Westcliffe
38 CUSTER /
37
SEE .17 ,_/- cun-inhi
)03..
k
Flore
70 dBu CONTOUR 60 d8u CONTOUR
c,r KEY'
FREMONT COUNTY 1 LINCOLN PARK 2 BROOKSIDE 3 PROSPECT HEIGHTS 4 wiLLIAMSBURG 5 ROCK VALE
OTERO COUNTY 1 ROCKY FORD 2 NORTH LA JUNTA
a 6
Kiowa CASTLE ELIZ
Castle Rock
LARKSPUR
WASH1 GTON
Linden Cope
East Arapahoe Arapahoe _DEER TRAIL
BERT
7_7 thick- -Flire-si-TieTt-on RAMA
,8t4' FOREST C.ALHAN
-'Colorado S in s Ismere
, OR FORT:. — RSON 11'
FOUNTAIN
__Fou_ntain ! Penrose- k
,c• -4-Portland
COAL . Pueblo West 1-\--
CREEK.
ER CLIFF !
PUEBLO
t. Charles Mesa
E.
o orado City-Rye
NO
LA VETA 5
i\ La Veta
cIç
OLORADO SPRINGS
EL PASO Southeastern El Paso
PUEBLO, CO
Avo e
Northeast Pueblo
NE
FOwLE
PUEBLO
Huerfano
Walsenburg
• --..--...
./.
WALSENBURG
• Aguilar
•‘ AGUILAR f
Weston
COKEDAL
ey
SIMLA
Simla
CRO Ordway
i OR ; OLNEY !SPIV
Limon
• LIMON _> GENO
Arriba Flagler
ARRIBA SEIBERT
K1
Hugo
LIN Ole- 4 *
FIUGO
Ka al
LEY i
Sugar City! AY SUGAR
" CITY • i Las I
.1 ' Cheraw ! Animas McClave
CHERAW . = I LAS ANIMAS swiNK 2 I
LA UNTAI;
Kit Carsc
KIT
•1
ROWLEY
owler IMANZANO Manzanola
Rocky Ford
Model
Z31
La Junta
Timpas
OTERO
HASWELL K1OW
Haswell Eads
BENT
Purgatoire Valley
LAS ANIMI ? 0
TRINIDAD ,„; t ,STARKVILLE
Trinidad
Br
10 20 30
tO 20
SCALE
40 50 Kilometers
30 40 SO Miles
<1\41 r
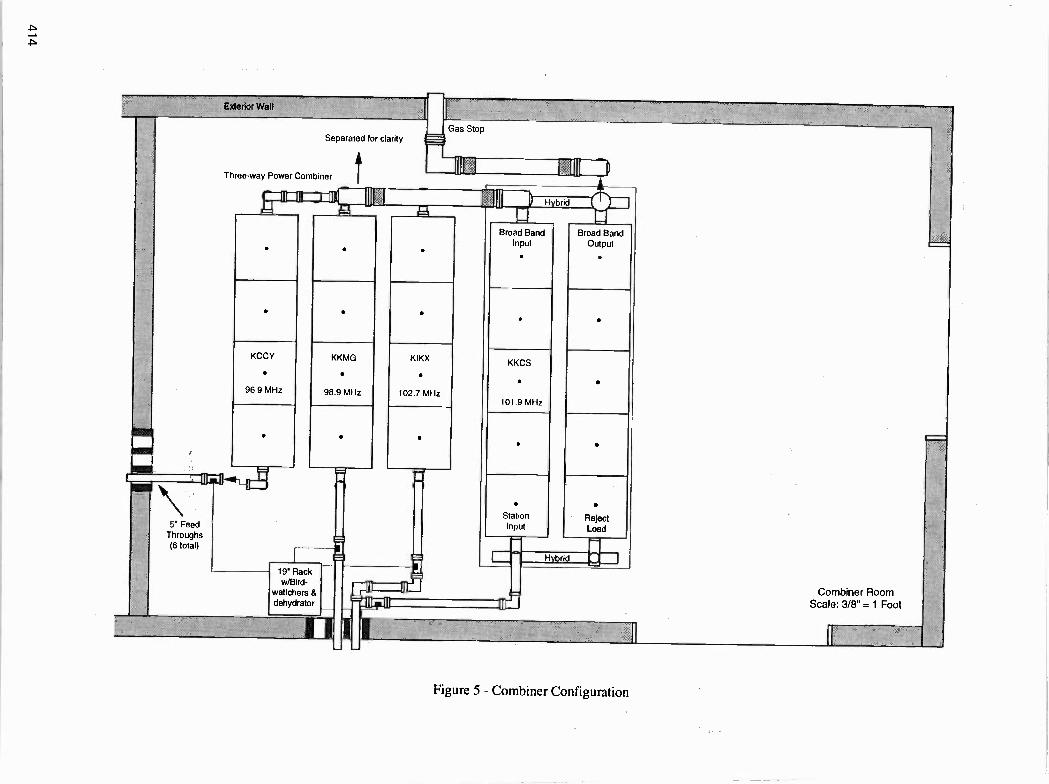
Exterior Wall
Gas Stop Separated for clarity
Tteemway Power Combiner
5" Feed Throughs (6 total)
KCCY
•
g69 MH/
KKMG
•
98.9 MHz
•
19 Rack w/Bird-
wattchers dehydrator
1
•
KIKX
•
102.7 MHz
•
r
a E3
111 III
Ill Hybrid
Broad Band Input
•
•
KKCS
•
101.9 MHz
•
Station Input
Broad Band Output
•
•
•
•
• Reject Load
Hybrid
[D1 Combiner Room
Scale: 3/8" = 1 Foot
Figure 5 - Combiner Configuration

Towers, RF and FM Antennas New Technology Reveals the Details
All R. Mahnad, PH.D.E.E. Micro-Tek Engineering
Carmichael, CA
ABSTRACT For decades, FM antennas have been utilized on poles and towers with many shapes and structural peculiarities. These antennas which are naturally omni-directional, provide well behaved elevation as well as azimuth radiation patterns. The effect of towers on the performance of these antennas, to date, has been either superficially understood or been "ignorantly' simplified, in representation, by deformation of the azimuth patterns. Unfcrtunately the verity of tower shapes and sizes as well as cost, have been prohibitive factors in the detail study of these effect by measurement techniques.
Present day's powerful computers, however, allow us to create a "virtual Antenna range" by which an antenna as well as the supporting tower are simulated using sophisticated techniques patterns of the combined structure is then presented by visually comprehensible objects. These new technologies are of fundamental importance to the understanding of problems of high RF levels at antenna sites as well as the anomalous re-radiation and scattering.
INTRODUCTION Decades has passed since the first sidemount circularly polarized antenna for FM broadcast, generally known as "FM Antenna"", was introduced to the market( see Fig.1) Despite the verities of shapes and construction of these antennas they all basically share a single geometrical shape and RF radiation properties.
For reasons beyond the scope of this paper, a rigorous analysis of this type of antenna was never undertaken nor published. It is generally known that this type of antenna has a fairly good CP. pattern in the azimuth plane. This may
suffice if the antenna is in an ideal free space environment with no support interference. Unfortunately this situation does not really exist.
Micro-Tek Engineering
Pattern Side-mount CP- "FM antenna" Types
c;,.
RF radiation is extremely complicated espebally in the close vicinity of a radiating element. In the case of "FM antennas", almost all supporting structures are in the immediate vicinity of the radiator. Since this type of antenna has omnidirectional radiation pattern, it interacts with the tower directly. This interaction is not limited to the radiation in the azimuth plane. In fact what happens in
415

the azimuth plane may be the least significant aspect of this interaction. As we will see later, antenna gain may be totally wiped out on the azimuth plane while the pattern directivity indicates highly directive antenna.
A few years ago EPA undertook a general study of these antennas by direct measurement 2S well 2S numerical techniques available at the time(2) . A
review of these documents indicates that the investigation was rather harried and heuristic by any engineering as well as scientific standard. Granted that the scope was limited to RFR Hazards near the tower. The outcome of the study does not do justice to the fact that there is no general signature to the problem of the tower antenna interaction. It rather permeate the erroneous notion that one can come up with certain benchmark situations that cover majority of present sites.ln fact, the total lack of one-to-one correspondence between measured and numerical data, as reported in these documents, supports the fact that minor differences result in major disparity of outcome. So there can not be any significant bench mark to go by.
The purpose of this paper is not only to expose the extent of the interaction of tower and antenna but also to emphasize the consequences of such interactions in characterization of performance of the antenna.
As stated before, there is no such a thing as a typical structure that represent any number of situations. If a realistic determination of any particular antenna-tower interaction is desired, one should consider the details before any attempt is made to come up with any credible result
or conclusion. Anything less than that will render worthless results. This is true because under majority of situations, tower or parts of it have critical dimensions which profoundly affect the radiation property of the entire structure
Pattern Measurements and Its
limitations
It is an accepted practice in the broadcast industry to provide two type of pattern in order to characterize the illumination pattern ( I propose to reserve the term Radiation for areas in close vicinity of the
antenna and the term Illumination for the far field ) of an antenna and the support structure. One is the azimuth pattern and the other is the elevation pattern. The azimuth pattern is measured in both polarizations ( vertical and Horizontal). Antenna is installed in a duplicate of a portion of the actual tower on a turntable and the structure's pattern is measured in a "farfielfd range' environment. The elevation pattern, however, is rarely ( if ever) measured. This is primarily due to the logistics, as well as costs, involved in performing such measurements, The azimuth pattern is normally performed on a single bay. The elevation, on the other hand, requires all bays. A six bay antenna, for instance, requires at least 75 feet of tower mounted on a horizontal position on a turntable. To minimi7e ( in ones dream!) the ground reflection the tower and the antenna need be elevated to prohibitive heiahts. Once the logistics are taken care of, the decision Rhniilri be made on the number and the heading of the elevation cuts. Cost consideration has resulted in an industry accepted and FCC approved ( nevertheless Outrageous) practice of assuming an ideal elevation
416

pattern for all headings which is, of course. unrealistic at best.
Virtual Ranae Cost and logistical problems associated with direct measurement techniques have resulted in erroneous and unrealistic characterization of FM antennas. These difficulties can be avoided in "virtual range" environment. Numerical Techniques, available now, allow us to create a vitual range in a computing environment. In this environment one can by direct use of common CAD formats, reconstruct an antenna and the entire tower structure in a virtual sense. then either simulate the pattern measurement by treating the structure as radiating or receivina.
We have used such an environment in this report to demonstrate the interaction of tower and a FM antennas.
FM antenna And its Support To demonstrate typical deterioration due to interference of the support structure lets first consider a single Typical FM antenna, in an ideal situation, where there is no support present. Fig.(1-a ) shows such an antenna. We also included Figs. ( 2-4 ) to show the patterns of this element in virtual range. As Noted. both V. Pol and H. Pol have almost circular azimuth patterns and a "figure 8" elevation patterns with definite nulls at Zenith and Nadir. The 3D pattern Fig. 4, shows a characteristically "doughnut shape" pattern for all polarizations, ie. Vertical, Horizontal and Circular. Under this ideal condition . the azimuth pattern of the antenna remains the same when several bays are staked in elevation plane. These figures demonstrate the symmetry that is a natural characteristic of this type of
antenna. And because of this symmetry it is accurate to assume that the elevation pattern of stacked antennas will be the same regardless of azimuth heading. The elevation pattern need not be measured. since under this ideal condition it can be calculated with reasonable accuracy.
30 7
270'
-zo
NN
-30 -40
30'
90'
/ 120'
Micro-Tek Engineering
!Pattern : Typical Azimuth pattern V. Pol / H. Pol.
Fig. 2
60'
----,,N 33 .
\
\
)-40-30 -20 -10 de
-60'
0'
Micro-Tek Engineering
lPattern : Typical Elevation pattern V. Pol / H. Pol.
Fig. 3
417

Micro-Tek Engineering
Pattern: Single Bay, free space , 3-D V Pol./H pol.
Fig. 4 For the sake of demonstration we assume a six bay full wave spaced antenna under all situations.
60'
30'
r Y-1 6 _10 di3 _
-30'
-60'
Micro-Tek Engineering
Pattern : 6-Bay free space Elevation V pd./ H pol.
Fig. 5 Fig(5 ) shows typical elevation pattern of the six bay antenna under the ideal condition. As stated before this elevation pattern may represent any heading. As we
will see, however, such a statement can not and should not be made in general. Notice the high levels of field at extreme elevation angles. This is due to the low directivity of this type of element in the elevation plane. It can be eliminated by !/2 wave spacing of the elements. All other sidelobes also may be eliminated by proper feed and spacing adjustments(see "Sidelobe-free Antenna Arrays" by this author in this proceedings).
To demonstrate the support/antenna interaction, we consider three typical situations. An FM antenna sidemounted on a pole Fig. (6) , an FM antenna sidemounted on a pole and directionalized Fig. 7, and finally a leg-mounted antenna on a triangular tower Fig 8. As a word of caution. It should be pointed out that none of these patterns are to be used as a bench mark. Each tower/antenna/ mounting has to be considered separately and according to the real configuration. configurations used in this report are not necessarily typical nor they are based on any specific site.
Figs( 9-11 ) show patterns of a single pole mounted antenna. The pole size is assumed to be 20". The scalloping in the azimuth pattern is as expected. The elevation pattern, however, indicates a beam tilt of almost 20 degrees on the 90 and 270 azimuth headings. This beam Tilt, can result in unusually high sidelobes in high pain antennas, we also see a substantial increase in the field in extreme angles which will translate into higher than usual levels of RF in the vicinity of the medium height towers. As indicated the effects are dependent on the size of the pole. These anomalies are not as pronounced in cases where the pole diameter is less than 16 inches.
418

Micro-Tek Engineering
Antenna Type. 6 Bay CP FM Antenna On a Pole
Fig 6
Micro-Tek Engineering
lAntenna Type 6 Bay Directional FM Antenna On a Pole
Micro-Tek Engineering
!Antenna Type 6 Bay FM Antenna On a Tower Leg
Fig. 8
270'
300'
240'
-10
-40
210 ISO.
60'
129'
Micro-Tek Engineering
Pattern : Single Bay On a Pole, Azimuth, H. Pol.
Fig. 7 Fig. 9
419

Micro-Tek Engineering
Pattern : Single Bay, On a pole, H poi. (Elevation ) At: 27')
Fig. 10
60'
-10-30 -20 -10
-30'
-60*
0-
Micro-Tek Engineering
Pattern : Single Bay, On a pole, H pol. (Elevation ) At: 9,9
Fig. 11 Fig. (12)shows an elevation pattern of a six bay pole mounted antenna. Noitce the high levels of field at extreme angles. Figs.(13-14) show patterns of directionalized antennas on a typical 8 inch pole. Notice the exceptionally high
level of the first side lobe. An increase in side lobe level will reduce the gain substantially. This reduction in gain is actually ignored if gain is calculated by simple multiplication of azimuth directivity and the" free space elevation gain". Obviously, in high gain antennas the error will be multiplied by the azimuth gain!.
This bad dream turns into nightmare when we look at the tower/ antenna interaction. Figs.(15-18) show some representative patterns of a six bay FM antenna on a triangular tower.These figures indicate the erratic "elevation pattern" changes as one goes from one heading to another. Notice the unwieldy elevation pattern at 0 degrees. It has no resemblance to the pattern of the antenna in free space. Yet in all gain calculations it is assumed that the two are the same. Also note that at this heading there is no main beam, there are extreme sidelobe levels that exceed the beam on the asimuth plane by 5 dB. It will take several papers to examine the nature and severity of the damage to the signal caused by these anomalies in the illumination pattern of the antenna. One can state that without a doubt none of these anomalies will help improve coverage. On the contrary they all will deteriorate the signal in many ways: Lack of coverage where one expects solid coverage, severe multipath, unexpected Fresnel zone effect, overshooting the coverage area, unexpected interference to
other stations, and the list goes on. None of these can be deduced from the azimuth patterns usually furnished by the manufacturers. In fact in majority of cases relying on these patterns results in un supportable claims in coverage. It sounds familiar, doesn't it?
420

60' 60'
Micro-Tek Engineering
Pattern : 6-Bay on a pole. Elevation H pot
Fig 12
270'
300'
240'
210 150'
60'
120'
Micro-Tek Engineering
Pattern : 6 Bay Directional On Pole, Azimuth H. Pol.
Fig. 13
30'
-30'
-60
MicroJek Engineering
Pattern : 6 Bay Directional On Pole, Elevation At: 0
Fig. 14
300'
270' I
240'
330'
210'
-10
-20
-30 -40
30'
60'
150'
Micro-Tek Engineering
'Pattern : 6-Bay, On a Tower Leg , H poi. (Azimuth)
Fig. 15
421

0-
Micro-Tek Engineering I
!Pattern : 6-Bay, On a Tower Leg , H pot (Elevation ) At: 0 I
Fig. 16
60'
Micro-Tek Engineering
Pattern : 6-Bay, On a Tower Leg , H poi. (Elevation ) At: a
Fa 17
-60'
Micro-Tek Engineering
! Pattern 6-Bay, On a Tower Leg , H pol. (Elevation ) At: p
Fia. 18
These eye openina results point to an inevitable reconsideration of the way things are done. Granted that at the time that these types of antennas were first introduced, the FM broadcast industry lacked the technology, the financial strength and the requirements to do a vigorous test of the antenna. The situation is quite different now. Stations are worth
millions of dollars and there is a lot at stake in achieving maximum allowable coverage. This can not be achieved by ignoring the facts nor by putting the antenna at the bottom of the list when considering the investment in the station. Unfortunately antenna has been the least concern of the industry for years. In the era of fierce competition. your station's antenna will ultimately be your winning card. so invest in it as you invest in the most important part of your station. In an
422

environment where investigating the total performance of an antenna can not be conducted. realistically and economically. by actual measurements, the utilization of "virtual range" is an option that no FM broadcaster can afford to ignore.
Author can be reached at (916)488-3546
E.Mail [email protected] References:
1) "ANTENNA ENGINEERING HANDBOOK. Third Edition". R.C. Johnson. 28-15. McGraw-Hill, 1993.
2) "Numerical Modeling Study of Gain and Downward Radiation For Selected Broadcast Antenna Systems" EPA -520/3-85-018. June 1985 Also: "Element Pattern Measurements on FM antennas", EPA -520/6-85-017 June 1985.
423
BUILDING THE DIGITAL STUDIO AND TRANSMITTER PLANT
W. Lee Simmons Adventure Technology, Inc. Hilton Head Island, SC
ABSTRACT
This paper will trace how a start with just one station and three studios has evolved into seven different stations with four digital and seven analog studios and a master
control room. This system feeds three multiple transmitter sites and three different studio locations along with their associated computer networks and .systems. I hope this paper will give you some insight into what problems were encountered in real world construction. As a fellow broadcaster, I will present some of the ways we have found to take a small staff and run seven different stations with six different formats out of the same building. I believe the result is a state of the art facility.
DESIGN & CONSTRUCTION START
To construct this type of a system the main goal was to operate many different types of stations out of the same facility using a smaller staff but putting a product on the air that would be of high broadcast quality and standards. We had been using the Media Touch Tm system and the first MEP" digital hard disk audio system for commercials since 1987 and were constantly doing R & D on the systems to try to keep up with the latest technology, but the system needed for this many types of stations had never been developed. I contacted Dave Scott who had
just started his new company, Scott Studios. This conversation lead to some new ideas on both sides. WLOW, the main station running an adults standards format, was going to have to be converted from its present system of reel to reel tapes over to a hard disk audio system. Here I need to point out that with this type of large system, choosing a recording system standard and staying with it is very important. The APT-Xml system was chosen for broadcast and linear audio for production. Then came the big job: dubbing the music from the best sources available to the system, but how? This is the start of the first system design.
First Things First I would like to address this very important, but often forgotten, first step. Put everything you are going to do on true Uninterruptable Power Supplies (UPS); computers, studios, everything. If you don't think your biggest problem is fluctuating power, think again. Most states will let the power companies fluctuate supply by as much as twenty percent. The problems cured by floating stations on UPS's will utterly astound you. Performing this step will provide a stable platform upon which to work.
This Is a Multiple Problem
We were using CBSIlm for traffic and billing on our NovellTM network. Running all the digital audio, traffic data and office work over an old ARCNET system would not work. The first building block was to
424

upgrade to a coax Ethernet. When we started this project Category 5 wire had not been released. I was not confident of the known effects of RF on networked computers, and for that reason, installed thin wire Ethernet. At the same time, WFXH-FM, running Classic Rock, and WFXH-AM, broadcasting all-talk, had been purchased and were to be added to the same building. It was decided that in order to make this work without network overloading problems, touch screen and traffic would be left on the Novell network. That would enable the billing and traffic system with the Scott Studio Systemni to control the stations on an event by event basis on-line and in real time. This choice was arrived at after trying to move audio, data, traffic, and other station functions with the NovellTM network. The Novell network slowed down to unacceptable levels, such as 15 to 20 minutes to move a production file from a studio to an air unit when the office was at it's peak work load. Remember this was the early 1990's and the 80486TM processor was new. For the audio portion, a peer to peer system, LansmartTM was selected, to move the audio around so that it would not slow the Novell network down.
Added Second Network When we unloaded the audio to its own network the audio file transfers went up to the 15 or 20 second range depending on work load. At this stage there were three stations. The Scott systems were designed to work independently from the Novell network. This is an approach that was wanted. As all of you are very aware in our business the problem is not if it will break, but when it will break. This type of design lets one station go down without taking them all. Some systems run their audio directly from the file server as opposed to running it off of the clients. What was
wanted was the ability to do both. The audio networks were designed so that the master production studio could reach all three air systems. The air digital playback systems were installed in a central equipment room, leaving only keyboards and touch screens in the studios via CybexTM extenders and cables. So far this is pretty standard studio design but here is a new twist to an old idea.
Dual Purpose Studios Our staff wanted to make each station's air studio a production studio. Why should you have that much useable production equipment sitting around when the automation system runs the station 90 percent of the time? So instead of bringing all the audio sources through the consoles and then routing them to the Scott Studios analog switcher, all equipment was run into the console in each studio except the Scott Studio analog playback outputs, and the console became a single source to the automation switcher. The system was then programmed to allow a touch screen button to turn on or off the entire console. Thus the live announcers could turn on an entire studio along with the three digital to analog sources for their drive time shows, and then simply turn off the entire studio after they went into automation. Fading for the digital sources, when needed, was relegated to the touch screens. The studio was then available for normal production use, and instead of running audio through a console and then back out, the digitally generated analog audio was switched straight to the main bus output. It makes for a much cleaner sound.
Digital Audio Production At the same time this was taking place we were trying to solve the production audio problems. At this stage we still had two stereo reels and two cart machines, harmonizers and all the other units needed
425

so that normal production could be done in every studio. After investigation into all the digital editors that were available at that time We settled on SA W". Let me stop a second here and tell you something that we engineers, already know but maybe the managers or owners do not. Get your staff one or more of these boxes. These units replace many pieces of trouble prone hardware. Once we installed the first unit in the first main production studio and taught the announcers how to use it, they completely quit using the tape units. I built my own SAWs. You can build a good one with a fast 2 gigabyte hard drive for under $2,000.00 with the software and audio card. This will give you a two hour linear audio record system with up to eight channels. It is worth every penny. Also do not get caught up in some sales idea that you can take one digital record unit and use it for editor, input, production and storage unit. At this stage of the game with the operating systems that are out there and working - keep them separate, or you will spend ten times the time and money trying to make the one unit work and will still end up having very flustered production people.
The Third FM We installed a "SA W' in each of the air/production studios. This gave each station the same equipment and the ability to do production for every other station, but as the saying goes, " The devil is in the details". This type of system worked well for the three stations, but when the third FM was added, an oldies format, under the same studio and network design, things started to change. It was now 1994 and to keep the local on air sound we added voice tracking to all the non-satellite stations. This created the ability to take four announcers and have them do air shifts on the three FMs. The Scott systems allowed us to put all the
formats on hard drives, schedule the music, get a print out of the schedule, give it to the announcers and let them cut different audio shifts on the other stations, all in about 30 minutes per shift. This gave a great new sound because the best people could be three places at once.
The Fourth FM Two months passed and then came the addition of the fourth FM. This was a soft rock FM and this is where we had to look at the re-design of the whole system, again. The Scott studios system was the easy part. Just keep adding them like building blocks. They are solid as a rock, but integrating the "other systems" became the challenge.
The Other Systems While adding all these stations we naturally had to add new traffic and accounting systems to take care of the stations and new people. Also, a simple thing like word processing will tie you up in knots when you have this many stations in the same operational area. A simple thing like available drive letters on the Lansmart system will drive you up a wall when you run out of them. Each station, depending on format, used up nine letters. Also the lovely words that should bring fear to any engineer, "How can I get to the Internet?" This called for a file server up-grade. We built a Pentium 100 with dual mirrored hard drives and retired an old 486 file server to a production unit. Novell will let you put four separate network cards into a file server and split up the network loads. Please use this feature. Let your air touch screens have their own port and then divide the other three for the rest of the data load. This is only on the Novell side of the system.
The Fifth FM In the middle of all this fun came the
426

addition of a fifth FM. This time we had to re-think the whole system design. It had taken five years to reach this level of confusion, so the answer maybe was not building a bigger and bigger system, but breaking the system down into different areas and then networking them together. At this time in the computer industry life, with all due deference to Bill Gates and 1BMTm, no one operating system can be everything to every body, and that the industry's biggest enemy is itself
Total System Redesign (Again) That being said the new system design goal was to develop a way for each system to do its job on the platform it was designed for and still be able to cross platform to any system. Also to find a way to give the staff access to the Internet, network faxes and provide a security firewall so some hacker could not bring the whole system down around our ears. Then we wanted to provide up-grade paths for new technology without bringing the whole broadcast plant to a halt. Does this sound familiar? After a year of testing we found the following: 1) DOS based systems do not like Windows NT 4.0.;
2) Novell 3.12 does like DOS systems. 3) You can control these systems with Windows 95Tu (with a lot of work);
4) IBM Warp does a lot of things, but if you don't have a degree in computers it is a pain to install;
And Windows 3.1 is not dead, yet. So what we did was let each platform do its thing. I built up a new Novell file server with a Pentium Pro 200 meg chip, plugged in 256 meg of memory and 56 gigabytes of hard drives and a new 100 megabit HP Anyland System for the Scott Studio Systems. All the Scott systems were up-graded to the new AMDTm 133 meg chip systems with the new 100 megabit network and category five wire.
This lets this system operate the stations without getting into anybody's way. We have integrated Scott Studios new voice tracking software on this file server which lets the jock call up a log, listen to the intro of the song, announce the title on the next and walk it up if they desire. This can be done in each studio for any station. The big file server also holds a copy of all the music and business systems for all the different formats. Remember, the system is designed for each station to operate on its own even if the file server is down. In this way the logs and voice tracks, are combined into a single file that is down loaded to its particular air unit twenty-four hours prior to broadcast. If this fails, the system will play audio from its own hard drives. We always have two copies of music and commercials in the system. This does not take into account the work bench copy of the production that is kept in the studio record unit for that particular station. The system now handles seven different stations and the file server utilization stays well below the fifty percent range.
The Other Systems (Again) After much anguish, we decided to let the systems operate on the platforms they were designed to operate on. The business system from CBSI had grown with the station expansion, but to trust this system to the audio file server 'was questionable. So we let it have its own Novell file server. It was integrated as a second file server that was backboned to the audio file server. This lets the traffic department and the accounting department have their own system. It is easy to path their departmental computers straight to this system if that is what you need. Security is much easier and it is much easier to back up the system when you only have the accounting system to back up. The entire business system is backed up to a hard
427

drive in the traffic department computers times two. Yes, look at backing up to a hard drive. If you compare the cost of a tape unit and tapes you will get a surprise. So there are four copies of the entire business and traffic system available at any one time in three separate systems.
The Third Server
This is where a new dual Pentium Pro SMP server running OS/2 warp server with Lotus Notes enters the picture. I turned this part of the system over to my son, David. These university kids eat and sleep these new innovations. This system was back boned to the other two Novell systems so it could access all the files in an upward path. This system operates as an application server from which clients can selectively connect to the Internet, send faxes on the net and through the Lotus Notes System E-mail can be sent to any department or the corporate offices via modem. Here is where we put a
firewall to the outside world to hopefully keep out the hackers. This is also where the major data base engine was installed for the sales department. This gives the staff full access to sales data that might be useful in sales presentations.
The Actual Studios After the computer system was put into place We then could concentrate on the studios. One of the major problems that was found in the digital studio design was that no system would stay in the digital domain completely. Digital audio that was recorded, first had to be put in from an analog console to a digital recorder unit, then uploaded to the air unit, then played back by turning it back to analog to be switched in the analog switcher, then back to digital in the STL's and out to the transmitter. What was needed was a way to stay in the digital domain, fade, and do production without having to
convert to analog. Along came the digital console, but you would need to sell the station to afford one. Then if you hooked up the digital output from the Aptex cards into a digital console the console would have to stay on line with the channels "potted up" all the time, thus you would have an expensive mixer tied up just to run the automation system. What was needed was an inexpensive way to switch the three output channels into a preset digital to digital system independent from the console and let the console be used for production, or in simple language, a one by four digital switcher. After investigating I found that no
one could do this at any kind of a reasonable price. I then talked to the guys at Fidelapac who had just introduced their new eight channel digital console. It would do what we wanted in an air/production board but this digital switcher was new to them. After conversations with their design people a way was found to put in this third digital fixed input, output buss as well as a way to mix this all together painlessly. So now we had found our console at a price that made sense, and would do what we wanted.
The Actual Nuts and Bolts of the Studio This was pretty straight forward. The studios were constructed by using the staggered stud walls insulated method. We also gave each studio a big glass window to the outside world and then put sound proof foam on the three remaining walls. This has proven to be very effective both for sound and cost. The furniture was custom built for each studio. This was easier and cheaper because each studio was going to have a minimum of three computers in them.
Studio Equipment Four of the studios now have a digital console with the special mix buss, digital saw editor, DAT tape unit , touch screen,
428

two RE-20's, two CD players with digital output and a Scott studios digital production unit that can record or play through the network to any other station. All of the units use digital I10 when possible, but this is still an analog world so there are three analog channels, including the mikes. With this design we are able to use any studio to do production for any of the stations. We have also found that for most production sessions the simpler the equipment the better. How many times have you built a huge sixteen by thirty-two production console with EQ on every channel and every bell and whistle on it and watch the production staff open up one mike and do a thirty second voice spot for the local grocery store straight to air unit. I do not mean that you should not have such a studio. We have a master production studio that is like the one described above, but have found that with the digital production units you can give the production staff what they want and more without the age old problem of someone leaving the EQ set wrong and half the production for the day sounds like Donald Duck, and the other like Smoky the Bear.
Master Control This room is in a constant design change. After the day is all over and the second shift has come in to run the stations, how do you keep them from going nuts running from one studio to another watching everything and still getting some work done. The answer was Master Control. The Scott Studios system has a unique feature that allows multiple touch screen inputs. We simply added a second touch screen to each station and mounted them into a central control room. We then designed a audio switcher to switch the output of the air signals to this room. This computer switches each input every thirty seconds so the operator can hear them and make sure they
are on the air. The operator can stop at a particular station, control it with the second touch screen, correct any problem, without having to leave the room. We also have a separate silence sense relay and a light panel on line to each station as a backup to the audio switcher. In addition the new digital optimods have a composite audio out that works great into a Gentner silence sense unit. If all else fails these units will call from the transmitter sites to alert the operators. This control room is equipped the same as all the others and still has reel to reels and cart machines as well as the SAW's. One of the night operator's jobs is to dub commercials for all the other stations. From this room they can do production, monitor everything and even write copy. The phone PBX is also available in this room at night so if anyone calls they get a live person.
Digital STL System After the signal leaves the particular control room it is routed to a central equipment room in the ABS/EBU format. I would like to interject here to make absolutely sure you are using wire that meets the ABS/EBU standard on all digital audio runs. I found that using a single run per channel from all the digital I10's saved many headaches. It takes a little longer to do, but trouble shooting is a lot easier. Console I/O's are cannon plugs. Please do not believe that you can use a short piece of 8451 for that one foot jumper. This cable needs to pass better than three megahertz. Some people recommend better than 6 megahertz. So you can kill a great system with five cents worth of wire in the wrong place.
The signal from its appropriate studio is then routed to one of three Mosley quad channel digital STL's using the ABS/EBU inputs. Then out to one of the three
429

transmitter sites.
Please do not forget to wire analog outputs from the studios to the master equipment room. It is very simple to do and it makes life a lot easier to be able to patch an analog signal to the air chain while you are trouble shooting a digital problem.
Main Transmitter Site A new 849 foot tower with four new ERI" high power antennas was designed and built. This new site gave me the opportunity to combine three of the class C FM's on one tower, and being on the coast we could also incorporate hurricane standard designs along with room for a full backup studio as well as full generator backup. The new system includes a full frequency agile backup transmitter and antenna system for five of the FM stations using Harris's PT-10 transmitter with its N+ I system.
Digital Backup Switcher Each signal from the studio is in ABS/EBU format out of the Mosley STL decoders and has been routed into a special switcher that was designed by our chief engineer C.B. Gaffney. This little unit, in normal mode, passes the signal to a digital optimod for each transmitter by means of a digital 1/0 card. Then the digital optimod is fed to the digital input port of a Harris Digital exciter which is rack mounted beside each transmitter. The unit also switches the sub carrier for one of the stations. Then the exciter output is matched and routed to the BE-FM 30 transmitters for each of the class C FM's. Using this system the proof of performance looks like a straight line for frequency response, and using a Sound Tech analyzer, distortion is in the low zero percent level. Each station has it own
equipment rack with its own UPS that runs the exciter, optimods and STL receivers.
Back-Up System The backup system for the site is unique. The Harris PT-10 is wired to be able to change to any one of eight frequencies at any power level. The special switcher that was built also will take the ABS/EBU output from the selected Mosley Optimod" unit, route it to the PT-10, change the frequency and come up to a preset power level on the standby antenna which was specially broadband modified by ERI. Also included is a spare digital channel that is wired into the switcher and can be hand patched at the studio if everything else fails. By calculating the contours of our other two FM's we can lower the power down to a level that can be used in an emergency if needed and not exceed the licensed coverage area for the two FM's that are not located at this site. This one system can backup five FM's. The system is also fully remote controlled with one turn on button for each station.
Special RF Patch Panel The transmitter plant also incorporates a special three inch transmission line patch panel. This allows the routing of any transmitter to the dummy load or to the auxiliary antenna so that repairs can be made during normal business hours when parts and assistance are available. Although it looks like a plumber's nightmare, C.B. Gaffney and Keith Bowman, the Chief engineer from our Bluefield West Virginia stations, enjoyed the -unique experience" of making it all work.
Second Transmitter Site The second of the three sites uses the same digital STLs with digital optimods and in this case, two Harris PT-10's with digital exciters. This site also has a full generator
430

back up.
Third Transmitter Site This site is located thirty miles away on an outlying coastal island. This site, a class A six kilowatt uses the same STL optimod digital exciter package that is used at all the other sites. It can be backed up from the main site by using the backup transmitter system already in place.
Wide Area Network To continue our walk through the digital experience, We are installing a new six (6) gig microwave system from our studios through the main transmitter plant and on to our Savannah, Georgia offices. In this system we are using some telephone technology. A three hop Western Digital Microwave system. This unit has four Ti carriers. This will give us the ability to transmit our digital audio down one of the four Ti channels, drop off signal paths at the main transmitter site, then route digital signals, our studio network, phone and e-mail to our Savannah location without the use of phone lines. We also demodulate the digital stream for the number six FM at this point. As this net is full duplex a combined morning show and news feeds are used.
CONCLUSION
Deregulation has enabled broadcasters to expand in the market The high tech explosion has enabled broadcasters to take full advantage by creating innovative systems to improve the bottom line while at the same time generating a digital quality over the air sound.
431

DIGITAL RADIO STUDIOS AT ANALOG PRICES
A Cost Effective Approach to Designing and Building a Fully Integrated Digital Broadcast Facility
Russ Mundschenk Chief Engineer
WBEB Philadelphia
ABSTRACT
Digital audio source devices deserve digital interconnection. Advances in DSP technology have made the totally integrated digital radio facility affordable. The digital radio console not only acts as a station-wide routing switcher, but also allows for discrete effects on every chcmnel. Making all the equipment talk to each other can be frustrating, however. Synchronization and conversion at high data rates require that care be taken in choosing equipment and wiring materials. The AES-EBU bit stream is subject to distortion inducing jitter from a number of sources, including cabling. This paper explains the considerations WBEB was faced with when building our digital studios.
WHY GO TOTALLY DIGITAL?
Digital audio devices can now be found
everywhere in a modern radio studio. Editors, storage, processing and transmission systems allow broadcasters unprecedented versatility, quality and reliability. Up until now, however, integrating those devices required mixing in the analog domain. Conversions from analog to digital and vica-versa are imprecise and non-repeatable. Analog mixing equipment uses complex signal paths and multiple amplification stages that may introduce noise and distortion. Switching, routing and processing are difficult
and not easily configurable. The precise, programmable nature of digital signal processors
makes them ideally suited to facility integration and processing in a modern radio console.
STUDIO REBUILDING
It was the summer of 1994 and it was time to rebuild WBEB's 15 year old FM studio facility. Production and on-air studios that were originally designed for beautiful music could no longer keep up with the demands of a fast-paced format and heavy commercial production load. Our goal was to rebuild the two existing studios and add another to handle overflow production and provide on-air back-up. With DAB on the horizon it seemed natural that our digital sources should follow a digital signal path.
DIGITAL MIXING
Integration of our CD players, DAT recorders, digital editors and hard-drive based storage system required a digital console. At the time,
however, mixers that could digitally tie all our sources together were expensive and designed primarily for the recording industry. There were a few affordable "digital" consoles available, but they either had only analog inputs or couldn't handle different digital sampling rates. We wanted a versatile, programmable console that took full advantage of new "high horsepower" digital signal processing chips. The console would have to accept and synchronize the AES-EBU dual channel digital audio transmission
432
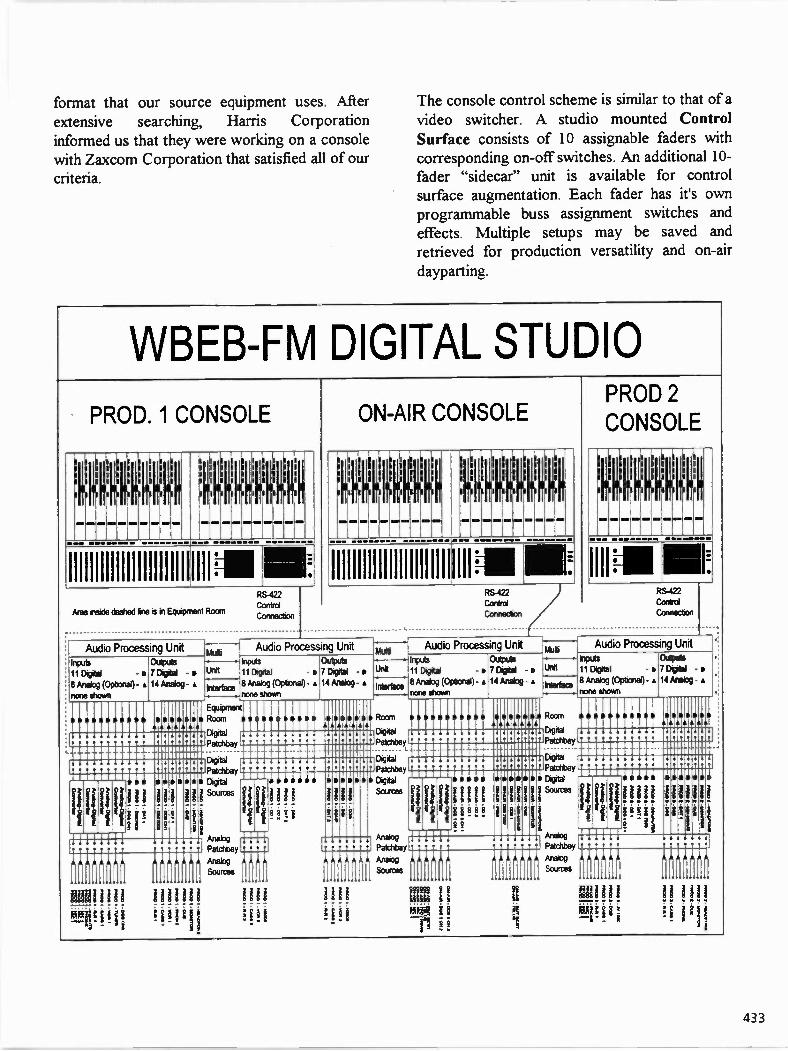
format that our source equipment uses. After extensive searching, Harris Corporation informed us that they were working on a console with Zaxcom Corporation that satisfied all of our criteria.
The console control scheme is similar to that of a video switcher. A studio mounted Control Surface consists of 10 assignable faders with corresponding on-off switches. An additional 10-fader "sidecar" unit is available for control surface augmentation. Each fader has it's own programmable buss assignment switches and effects. Multiple setups may be saved and retrieved for production versatility and on-air dayparting.
BEB-Fm DIGITAL STUDIO
PROD. 1 CONSOLE ON—AIR CONSOLE PROD 2 CONSOLE
Ili I. I 1, , i , 11 , ,
1 lill 1 1 1 1
"1lY
sel 111111
iirii
i
I 1
6 1111:
1 111111.
1'1 Ili
1 Ill
= WP M 1•1110 = M 1• 1410.• MI MIII .••• = = = = MI = = = = = = = = = MII MI NI MI .1•1
11111111111111111111011111• INI M ,•••••• = M14111.01= IMI M MI NIP • •• • =. = WIMP I M N11• 01 4M
. . M M M M M M M M
I 111111111111111111111111111• . . I Ili Ama inside &shad fne is in Equipment
Contrd Room
Connactist L
RS Control -422
.
RS-422 C.onird .
Audio Processing Unit Audio Processing Unit Km Audio Processing Unit klub Audio Processing Unit mut Iraxlis Outputs .
IrtPuti 11 DOI
Outputs
-0 7 DOW - Unit inral 11 Nita - s
Outputs 7 Digital - • UM
ktPis 11 DOW
Wads - • 7 Ocala - • Unk 11 COY - • 7 Digital .
. 8 Analog (Optional). • 14 Analog - kteciace 8 Analog (Opticnd)- a 14 Analog - • harks 8 Analog
none shown (Opriond)- a 14 Analog - • we ft . 8 Analog
none (Optional).
sham a 14 Analog a
4 none sham none sham
I
EquiPmere • Room •
I • aura
• Room DO II 1111101111
a I II
• PaIc ey , Digital • • .
• DOM Paldtbey,
. Digital
DOW Patch *
. . Digkil Paldtbay
• Diaitil
• 10 ====== [11111[1111 I i i fil
111 ir !!!50w g
DOW
' ppm! i iii9
SPSI 00810
1111 'Ail
'DOW
sources plipliii! i / ill!!!
p 11•
ii
001,811
!HMIs— iDOW
II
[ippiiiii I i ill!II
010 •
2 - i
IHI II. 11
H
111 111 1 " Analog
f ,tmiiiii E IP PII
1111 ! M g !!
mil
Patdtbay
11 sc--N . i
fill ---- ! PI
iiii ilil
1 11 ] ma
1
1 !!
i 111
0 i
4 q
11 mum iiq
1 H rt.
q 111 1 ''''' iglt
11
1
433
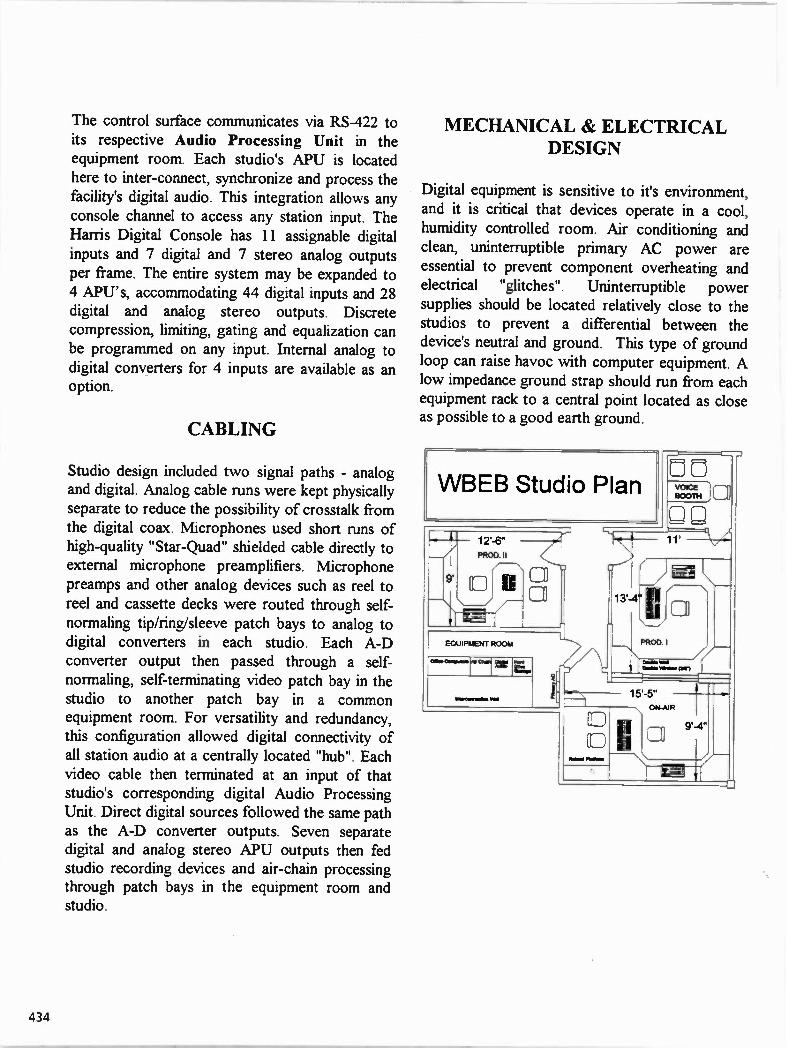
The control surface communicates via RS-422 to its respective Audio Processing Unit in the equipment room. Each studio's APU is located here to inter-connect, synchronize and process the facility's digital audio. This integration allows any console channel to access any station input. The Harris Digital Console has 11 assignable digital inputs and 7 digital and 7 stereo analog outputs per frame. The entire system may be expanded to 4 APU's, accommodating 44 digital inputs and 28 digital and analog stereo outputs. Discrete compression, limiting, gating and equalization can be programmed on any input. Internal analog to digital converters for 4 inputs are available as an option.
CABLING
Studio design included two signal paths - analog and digital. Analog cable runs were kept physically separate to reduce the possibility of crosstalk from the digital coax. Microphones used short runs of high-quality "Star-Quad" shielded cable directly to external microphone preamplifiers. Microphone preamps and other analog devices such as reel to reel and cassette decks were routed through self-normaling tip/ring/sleeve patch bays to analog to digital converters in each studio. Each A-D converter output then passed through a self-normaling, self-terminating video patch bay in the studio to another patch bay in a common equipment room. For versatility and redundancy, this configuration allowed digital connectivity of all station audio at a centrally located "hub". Each video cable then terminated at an input of that studio's corresponding digital Audio Processing Unit. Direct digital sources followed the same path as the A-D converter outputs. Seven separate digital and analog stereo APU outputs then fed studio recording devices and air-chain processing through patch bays in the equipment room and studio.
MECHANICAL & ELECTRICAL DESIGN
Digital equipment is sensitive to it's environment, and it is critical that devices operate in a cool, humidity controlled room. Air conditioning and clean, uninterruptible primary AC power are essential to prevent component overheating and electrical "glitches". Uninterruptible power supplies should be located relatively close to the studios to prevent a differential between the device's neutral and ground. This type of ground loop can raise havoc with computer equipment. A low impedance ground strap should run from each equipment rack to a central point located as close as possible to a good earth ground.
WBEB Studio Plan
••• 17-6" PROD. II
[0
EQUIPMENT ROM
CO
Ciii•Ceopulo• 0• 0• 1
6111100.11•0111•• 1111.1
13%4'
it
PROD. I //—
Orld• WAS 0•1111•11 NI MPIr)
11•1•11.111In
15'-5" \ ON-AIR
9,-4"
ii
434

DIGITAL TRANSMISSION FORMAT
All of WBEB's digital equipment uses a professional dual-channel audio transmission format known as AES-EBU or AES3. AES3 serial data bears many similarities to analog composite video. The serial bit-stream has a bandwidth in excess of 5 MHz and sources must be synchronized with each other to mix properly. Our console and A-D converters use a transmission hardware specification called AES3-ID. The "ID" suffix designates a relatively new 75 ohm unbalanced specification that allows the use of standard video cable, patch bays, non-clamping video distribution amplifiers and routing switchers. Other source equipment uses a format called AES3-1992. The "1992" spec calls for the use of
low-capacitance 110f2 balanced cable. The "ID" and "1992" formats are interchangeable with the use of a balun transformer.
AES3-1992
• Balanced • 11011 Source & Load Impedance • 2 to 7 Volts Peak to Peak • Uses XLR Male & Female Connectors • Requires Specific Cable and Hardware • Can Interface to AES3-ID with Balun
AES3-ID
• Unbalanced
• 75S1 Source & Load Impedance • .8 to 1.2 Volts Peak to Peak • Uses BNC Connectors • Can Use Video Cable and Some Hardware • Can Interface to AES3-1992 with Balun
AES3 serial data is sent in "packets" called blocks, frames and sub frames, left channel first and then right. These packets contain a 16 to 24 bit audio sample "word" that is surrounded by synchronizing and status bits.
Since the AES3 format also includes this control information, if the receiving device is too picky, it might not accept data properly because of formatting conflicts. This is especially true in older units.
Another widely used consumer format is the Sony-Philips Digital InterFace. SP-DIF is a 750 unbalanced format similar to AES3-1D. The audio data is sent in reverse order, however, so it is not interfaceable to AES3 without software conversion.
PHASE LOCKING
In order for two devices to communicate properly, they must "phase lock" or synchronize together at the same rate or the receiving device must provide for rate conversion and synchronization. Such data transformations are necessary even if both the source and receiving device are running at the "same" sampling rate but not locked to each other. Rate conversions are not only inclined to introduce data instabilities and audio distortion, but also require a lot of processing power.
HOUSE SYNCHRONIZATION
It is a good idea to establish a house AES3 synchronizing standard. The professional standard is 48 kHz, but if most of your sources are 44.1 or 32 kHz, then that might be the rate to pick. In most cases, you will run your consoles at this rate (synchronized to each other - of course!) It is critical that whatever source you pick exhibit extremely low phase noise and long term stability and accuracy. Unless you are able to synchronize your sources to the console, you must rate convert anyway! House sync. is analogous to video gen-lock and most equipment allows for multiple bridged loop throughs. Make sure, however, that you terminate the last output in the chain with a precision 75n load for AES3-1D or 110f1 load for AES3-1992. Older references such as word clock (which is simply the square-wave sampling rate)
435

and black burst video introduce more jitter are not able to provide the stability of an AES3 synchronization.
JITTER
Effective digital interconnection is dependent upon minimizing bit stream distortion. Since AES3 bit-status (1 or 0) is dependent upon the time of the data stream's state transitions (low to high and vica-versa), the quality of the received square-waveform is very important. Impedance
mismatches result in reflections that "confuse" the receiving device. Even a well matched high capacitance cable can cause timing errors by "rounding off' corners of the square wave. In each case, bit-errors will be introduced because the unit can't tell exactly when the state transition occurred. These problems are commonly referred to as jitter.
Most good 750 video cable will not cause jitter because of it's intrinsic high bandwidth and uniform impedance. Watch out, however for 110 1.2 balanced cable - It must be a low-capacitance, uniform impedance type specifically meant for AES3-1992. Also, disregard the criteria established for the earlier AES3-1984 format. The specification claims to be able to accept a wide range of load impedances - although it just doesn't work!
Source devices may introduce jitter as well - the bit-stream coming off a CD Player or DAT machine may suffer from mechanically produced jitter. If the disk or tape is exhibiting speed
variations, the data may not synchronize well to the receiving device or D-A converter. If the source device is capable of buffering and reclocicing the bit stream, so much the better.
DIGITAL CONSOLE
In addition to programmability and onboard processing and routing, the digital console should:
Maintain 20 bit quantization throughout
Use floating-point 32 bit DSP's.
• Maintains resolution at higher attenuation levels and prevents mix buss clipping.
Provide rate conversion and synchronization on each input.
Should phase lock to house AES3 Digital Audio Reference Signal synchronization
• Dual speed external synchronizing PLL should synchronize fast (< 1 second) and then slowly track DARS
• Should seamlessly auto-switch from external to internal sync (shouldn't affect bit-stream)
Meter all outputs with simultaneous peak-hold / RMS type multi-segment LED's or LCD's
Provide for remote control of source devices.
• Should be programmable to receive and transmit different serial protocols and control string formats.
• Should have multiple General Purpose Interface inputs and outputs for dumb-device control
436

Phase Locked Loop
ANALOG TO DIGITAL CONVERTERS
WBEB chose to use external studio mounted A-D converters and synchronize them to a console AES reference. This method minimizes the length and number of analog circuits and keeps all input wiring to the APU's digital. All facility inputs and outputs may then also be digitally hard patched at a central location. Input level should be set to provide at least 20 dB of headroom. Even though some compact discs have 15 dB or less headroom, they are often preprocessed and their level normalized in mastering so that the maximum level is just below the clip point. Raw unprocessed audio, however, may have very high peak excursions. It is better to throw away a little dynamic range than to hit a digital brick wall with a program peak. If the resolution of your A-D converter and console is 20 bits, you will have at least another 20 dB dynamic range over a 16 bit system. This extra may be used as headroom, as long as you normalize the recording with console digital gain before committing it to 16 bits in a DAT machine, Hard Drive or CD ROM.
A-D converters should satisfy the following criteria:
20 or more bits of quantization
• Even through most digital recording devices use 16 bit quantization. It is good practice to maintain a higher resolution up until that conversion.
Analog input
• High common mode and filtered RF rejection to 6 MHz to reject digital noise
• Minimum number of analog stages prior to A-D converter chip.
• Should synchronize fast (< I second) and then slowly track DARS
• Should seamlessly auto-switch external to internal sync (shouldn't bit-stream)
Metering should warn of clipping with:
• Long-term peak hold
• Weighted peak hold • Simultaneous RMS indication
MICROPHONE PREAMPS
from affect
Digital equipment (and the video monitors associated with them) generate an extreme amount of electrical noise. Some manufacturers have done a better job than others at suppressing it's radiation. Low level analog signals are particularly subject to stray pickup. It is very important that a microphone preamp be selected with high bandwidth common mode rejection and excellent low-pass filtering. It is good practice to use short runs of the best microphone cable.
DIGITAL RECORD / PLAYBACK DEVICES
• DAT Machines, micro-computer based editors and mini-disc recorders should all have the ability to synchronize to a house DARS AES3 reference. Unfortunately many of today's storage and transmission devices do not.
• Should also be capable of two-way serial remote control such as RS-232 /422 or simple contact closure.
• Should accept a wide range of AES3 formatting protocols.
437

CONCLUSION
The totally digital studio is now as affordable as analog. It is important, however to treat digital signals as if they were RF or video, since high data rates must be synchronized to work properly. Careful equipment and cable selection, along with good facility design are critical to success.
BIBLIOGRAPHY
Audio Engineering Society, 60 East 42'd St. New York, N.Y. 10165 Standards and Recommended Practices "AES Recommended Practice for Digital Audio Engineering - AES3-199X - ANSI S4.40-199X Revision of AES3-1985 - ANSI S4.40-1985"
Rumsey, Francis & Watkinson, John, "The Digital Interface Handbook," Focal Press, 1993
IEC Standard Publication 958, "Digital Audio Interface," International Electro-Technical Commission, 1989, 1993
Weiner Gabe, Pierce Dick et al, "Frequently Asked Questions" File for rec.audio.pro, V 0.8
438

BIOGRAPHY
Russ W. Mundschenk has been Chief Engineer of WBEB-FM in Philadelphia since 1983
Mr. Mundschenk attended Rensselaer Polytechnic Institute and has been employed as a Chief Engineer at a number of East Coast AM & FM stations since 1977.
During his professional career he has implemented and maintained numerous computer control and digital audio systems, including Media Touch Systems, Computer Concepts DCS, Fidelipac DCR-1000, Orban DSE-7000 and the Harris/Zaxcom DRC-1000 digital console.
439

HIGH SPEED DIGITAL SUBCARRIER LABORATORY TESTS (HSSC)
Thomas B. Keller David M. Londa
Robert W. McCutcheon Consultants/CEMA
INTRODUCTION
The High-Speed FM Subcommittee (HSSC) of the National Radio Systems Committee (NRSC) is evaluating proposed digital subcarrier systems for voluntary standardization. The NRSC Subcommittee is responsible for overseeing the laboratory and field tests for the three proposed HS Data subcarrier systems (HSSC). All three systems are intended to operate as a subcarrier of FM broadcast transmitters. The NRSC Subcommittee's December 15, 1993 request for high-speed FM subcarrier system descriptions specified that "the subcarrier must be compatible with the RBDS". The subcommittee later requested that the systems supplied by the proponents for the first phase of testing are also to be compatible with the 92 kHz analog subcarrier. The committee further requested that after the laboratory and field tests are completed, the proponents supply a second version of the original system that is compatible with the 67 kHz analog and 57 kHz RBDS subcarriers. No field tests of the 67 kHz compatible HSSC system are scheduled.
Three test phases:
I. 92 kHz Compatible Laboratory Tests (Complete) II. 92 kHz Compatible Field Tests HI. 67 kHz Compatible Laboratory Tests
The first phase (92 kHz compatible) of the HSSC laboratory tests was conducted in the Digital Audio Radio (DAR) laboratory located at the NASA Lewis Research Center (LeRC), Cleveland, Ohio. The tests at LeRC were conducted in two phases, digital performance and in-band compatibility. The digital performance phase evaluated the transmission quality and characterized the signal failure. Additionally, the digital tests included multipath, co-channel, and adjacent channel impairments. The compatibility phase included transmission tests to measure possible interference to the analog program service, 57 kHz
RBDS, or 92 kHz analog subcarrier, caused by the introduction of the HSSC digital subcarrier. The five receiver models used by the Digital Audio Radio Subcommittee for the in-band compatibility tests were used for the HSSC digital subcarrier to host analog compatibility tests [1].
Both the objective and subjective main program and analog subcarrier compatibility tests were conducted in the laboratory. The Subjective Expert Observation and Commentary (EO&C) listing tests were conducted by the lab specialist. Digital recordings were made of the main program and subcarrier compatibility tests for the test record. The main program channel compatibility DAT recordings were also used to make 218 FFT plots from the output of the five compatibility receivers. These plots are part of the laboratory report [2].
SYSTEM WAVEFORM
The three HSSC proponent system's digital signals differ in the placement of the center frequency and signal bandwidth in the FM baseband. The Digital DJ (DDJ) subcarrier operates with a center frequency of 76 kHz and is locked to the stereo pilot. DDJ recommends that this system be operated in the variable injection mode that is designed to reduce the crosstalk between the analog program audio and the HSSC subcarrier. The digital signal injection is varied between 4% and 10% and is dependent on the stereo audio. The DDJ baseband plot in Figure 1. shows the DDJ system set at a fixed 10% injection, RBDS at 3% injection, and a unmodulated 92 kHz subcarrier at 7% injection.
The second proponent (MITRE) system's subcarrier is operated with a center frequency of 72.2 kHz and is not locked to the stereo pilot. The proponent recommends 10% injection. During the system specific tests the system was also tested at 17% injection. The baseband plot, Figure 2, shows the system operating with RBDS at
440

1 L..1 (.. Lot Ilo A: 1.Z-3-95
J A r'EF - 14 dBm ...TIEN 10 dB
IN .10/
ti444440,,ett LENTER 50 kHz
PE, Bm 300 Hz SPAN 100 kHz
VOW 30 HZ SWP 30. 0 sec
Figure 1. Digital DJ
Ill I. e et. A: 1, —.2 ....M.
L ,‘ III. I 1.l I dbIII A 1 ft: 1'1 116 C18
1N .10
N ft, M t'0 kllj ke OW JOW H. VOW 30 Hz
Figure 2. MITRE
SE INA., Grout, •: 12-:6-96 E A REF -14. 9 00m ATTEN 10 CIS
SPAN 100 kHz SmP :50. 0 ssr.
Ida a 1
CENTER 50 kHz RES BM 300 Hz VOW 30 Hz
Figure 3. Seiko
SPAN 100 kHZ
5NR 30. 0 sac
441

3%, HSSC at 10%, and 92 kHz analog at 7%. This is the combined 20% legal maximum injection.
The Seiko system operates at a subcarrier center frequency of 66.5 kHz and is phase locked with the pilot and 57 kHz signals. The system's normal injection is 10%, but the proponent states that the system can be operated over a range of 5% to 20%. The system was tested at 10% for the standard tests and at 17% for the system specific tests. The baseband plot, Figure 3, shows the system operating with 3% RBDS, 10% HSSC, and 7% 92 kHz injection.
Subcarrier Groups
The two composite subcarrier groups shown in Table 1 were used for the HSSC laboratory tests. Subcarrier group A tested the HSSC systems for compatibility with the 92 kHz FM subcarrier and possible interference to the 3% RBDS. Subcarrier group B tested possible interference from the 10% injected 57 kHz digital subcarrier to the HSSC and the HSSC to the 57 kHz subcarrier. The total injection for each subcarrier group is 20%. Group A will be used for the field tests. Additionally, tests were conducted with just the proponent system or the proponent system and the RBDS.
Table 1. Test SubcarrierGroups Injection
Group 57 kHz HSSC Digital Subcarrier
92 kHz
A 3% RBDS 10% 7%
B 10% Paging 10% 0%
A comprehensive procedure for precisely verifying the digital and analog subcarrier injection levels was developed. The injection calibration procedures were approved by the HSSC Subcommittee. The injection calibration was certified several times during the laboratory tests. The calibration results were repeatable over the duration of the HSSC laboratory tests.
Table 2. is an outline of the test procedures for the HSSC laboratory tests. This is the fifth revision of the procedures developed by the HSSC Subcommittee. The detailed procedures are part of the Laboratory Test Report [2].
A. Calibration
The first part of the calibration procedure was intended to assure accurate and repeatable tests. The daily proponent system tests were conducted on each system prior to conducting each of the prescribed tests. The daily tests determined the system's readiness for testing. Other periodic calibration tests were conducted on the HSSC testbed.
B. Characterization of Signal Failure
This series of tests is designed to characterize the HSSC digital subcarrier failure with the following impairments; noise, co-channel, multipath, impulse noise, airplane flutter, and weak signal.
To characterize the system failure, message error and BER were measured. Up to three error measurements were recorded; BER, 20 byte message error, and 220 byte message error. To facilitate these tests each proponent supplied a test utility for conducting the measurements. The laboratory staff conducted extensive tests that certified the proponent's utility.
Noise B-1
For the first signal failure characterization tests, Additive White Gaussian Noise (AWGN)was added to the desired signal in 0.25 dB steps until the Onset of Message Errors (OME) was observed. The message error and BER were plotted versus Co/No. The message error measurement duration was five minutes. For the co-channel tests the undesired signal replaced the noise.
Co-channel B-2
The co-channel test compared the analog to analog D/U ratio that produced a 45 dB S/N ratio on the desired main program audio, with that of the same analog undesired signal with a digital subcarrier. The undesired signal level was adjusted to produce a 45 dB S/N. Changes in the undesired signal level would indicate changes in the test receiver's sensitivity to co-channel signals with HSSC digital subcarriers. Two of the five receivers described in D of this paper (Delco and Denon) were used for this test.
Analog to digital tests were also conducted where an analog co-channel signal (Undesired) was combined with an analog signal with HSSC (Desired), and the undesired signal increased until the OME was observed. The D/U was measured at OME.
442

Table 2. HSSC LABORATORY TEST PROCEDURES
A. Calibration E. Host Analog -> Digital Subcarrier
1. Check signal injection/power daily 1. Host analog to digital subcarriers 2. Plot RF spectrum daily 2. Host analog to digital subcarriers with 3. Noise check daily multipath 4. Weak signal check daily 5. Analog channel proof biweekly F. HS Data -> RBDS, Analog, and 57 kHz Paging 6. Calibrate modulation monitors monthly Subcarriers 7. Proponent self check (optional) 8. Calibrate test bed monthly 1. HS data to analog subcarriers
2. HS data to RBDS B. Characterization of Signal Failure 3. HS data to 57 kHz paging
1. Noise G Adjacent Channel 2. Co-channel 3. Multipath and noise 1. First adjacent 4. Impulse noise 2. Second adjacent 5. Airplane flutter 6. Weak signal failure H. System Specific
C. Reacquisition 1. Phase, digital to 19 kHz pilot 2. Nonstandard injection levels
1. Failure due to simulated weak signal 3. Variable injection 2. Failure due to multipath
I. Subcarrier Group Table D. Digital Subcarrier -> Host Analog
1. Interference to host analog 2. Interference to host analog with multipath
Multipath and Noise B-3
These tests were conducted four times each with a different multipath scenario. The multipath was simulated with two HP 11759C RF Channel Simulators and combined to produce a nine path Rayleigh simulation. The four Scenarios developed by the Digital Audio Radio Subcommittee for Multipath Simulations were used for these tests; urban slow, urban fast, rural fast, and terrain obstructed. The delay spreads are part of the HSSC report [2].
Using a -65 dBm signal level the HSSC system's error performance was observed with each of the four multipath scenarios. If errors were detected the error rates were recorded. If the simulation did not cause the HSSC system to produce message errors, noise was added until the OME was observed. At the OME the
Co\No and error rates were recorded.
Impulse Noise B-4
A 1.0 Volt, 10 nanosecond fast rise time pulse was used for this test. This signal produced harmonics in the FM band. The tests were conducted with five pulse repetition rates; 100 Hz, 200 Hz, 300 Hz, 600 Hz, and 1000 Hz. A 1.0 Volt pulse was applied to the input of the proponent's receiver, and message errors were observed. If no errors were observed this result was noted in the laboratory test record. If errors were observed the pulse was attenuated until no errors were observed, and the attenuation value was reported.
Airplane Flutter B-5
This test was designed to show the effects of airplane
443

flutter on the HSSC signal. For airplane flutter simulations one unimpaired desired path and one multipath impaired undesired path were used. The simulator was operated in the doppler mode. Three scenarios were used for this test series.
Weak signal failure B-6
The signal was reduced in 1 dB steps until the OME was observed. The signal level at OME is reported in dBm. The test was conducted with proponent only, subcarrier group A, and subcarrier group B. This test and the added noise test were very useful in ascertaining the HSSC system's health.
C. Reacquisition
This test measured the time it would take for the HSSC digital system to acquire data after the station was selected (tuned-in) or after a signal failure of at least 30 seconds. The test was conducted in two parts; reacquisition time after signal failure and reacquisition with simulated multipath and noise. Three reacquisition signal levels were used. The test measured the reacquisition times with four different multipath scenarios.
D. Digital Subcarrier -> Host Analog
The objective of this test was to measure possible interference from HSSC data subcarrier to a cross section of consumer analog receivers that are tuned to the HSSC host FM station. The tests were conducted at moderate -65 dBm and weak -75 dBm signal levels. For the test reference the compatibility receiver's signal to noise ratio was measured with the laboratory THE-1 transmitter. The HSSC digital data signal was then turned on, and any change in the audio S/N ratio measured. The tests were conducted with and without multipath.
During the laboratory tests, subjective tests were also conducted by the laboratory specialist for each of the 218 compatibility test segments. The audio output of each of the five FM radios was recorded on digital audio tape (DAT). The test segments were aRsPssed by rating changes between the reference and the test segment. The subjective effect of interference was rated using the seven point CCIR numerical comparison scale [3].
CCIR COMPARISON SCALE
Much Better 3 Better 2 Slightly Better 1 Same 0 Slightly Worse -1 Worse -2 Much Worse -3
FFT plots of each of the HSSC digital subcarrier to host analog compatibility tests were made from the DAT tapes. The FFT plots are part of the laboratory test report.
To establish a reference for the high speed digital compatibility tests, it was necessary to conduct a series of FM -> FM D/U measurements with a representative group of contemporary consumer FM stereo radios. The five FM radios selected represent a cross section of receivers in use in the United States. The selection was divided into four categories; auto, portable, high-end home Hi-Fi, and competitive Hi-Fi. The two automobile radios were selected because of their large population, selectivity, and their wide difference in the stereo blend implementation. The auto radios also showed excellent adjacent channel rejection. The portable and personal portable use similar circuitry and have much less adjacent channel rejection. The high-end home Hi-Fi radio had good 2nd adjacent channel rejection but exhibited similar first adjacent channel rejection characteristics to those found in the portable and home radios.
For the FM -> FM D/U measurement the undesired signal RF level was set for a 45 dB audio S/N ratio. The audio noise measurement used quasi-peak detection, a 15 kHz low pass filter, and the CCIR filter. A desired signal level of -65 dBm was used. Antenna matching networks were used where needed. The portable and home receivers were tested in a shielded box that eliminated interference from other electronic devices in the laboratory. The two auto radios did not need additional shielding.
E. Host Analog to HS Digital Subcarrier Tests
These tests were conducted to determine the effects of the analog main channel modulation on the performance of the HSSC subcarriers. The non-multipath tests were conducted with three types of program modulation; Clipped Pink Noise (CPN) L+R with pilot, unbalanced clipped pink noise (L only), and the ABBA cut from the EBU SQAM disk. Both subcarrier groups A & B were

used for the non-multipath tests.
The four multipath scenarios were used for the second part of this test, host analog to HSSC digital subcarrier tests. Pilot only and unbalanced CPN were the audio sources used for main channel modulation for the multipath tests. Subcarrier group A with the 92 kHz analog subcarrier was modulated with track 48 of the EBU SQAM disk. The error measurement duration was 5 minutes.
F. HS Data Subcarrier to RBDS, Analog 92 kHz, and 57 kHz Paging
This test series was to detect changes in 92 kHz analog subcarrier audio S/N with the presence of the HSSC data, changes in RBDS errors with HSSC, and changes in paging errors with HSSC data. For these tests subcarrier groups A and B were used. For the measurement of interference to RBDS and 92 kHz analog subcarriers, Group A was used. Subcarrier Group B was used to measure possible interference to the paging signal.
G. Adjacent Channel Interference
Changes in the first and second adjacent channel interference to the main program audio or analog subcarrier with the introduction of the HSSC subcarrier were measured. Measurements were also conducted using the first and second adjacent analog channels as the undesired and measuring the interference to the HSSC data. To compensate for in-balance in receiver upper and lower selectivity, measurements were conducted on both the upper and lower adjacent channels.
H. System Specific
These tests are designed to measure the characteristics that are not common to all three HSSC systems.
The DDJ and Seiko systems require lock to the 19 kHz stereo pilot. The first part of the system specific tests is to show any performance or compatibility degradation caused by the loss of lock to a common reference pilot. The unlock tests were conducted by locking the HSSC data generator to an second unlocked pilot generator. The second generator's frequency difference (about 1 Hz) is shown in the laboratory report.
The second part of the system specific test series "nonstandard injection levels" is to measure possible improvements that an increase in injection would produce. Changes in interference or compatibility were also measured. The MITRE and Seiko systems that operate with fixed injection were part of this test. These tests were conducted with the HSSC system operating at 17% and the RBDS at 3% injection.
The third part of the tests "variable injection" was only conducted for the DDJ system. This mode, the primary mode recommended by the proponent, is intended to minimize crosstalk to the analog program channel and from the analog to the digital subcarrier. This system varies the injection with program signal level. The injection varied from a high of 10% to a low of 4% without audio.
CONCLUSIONS
Laboratory tests were conducted in a controlled environment. The test transmitter is a broadcast exciter operating in a wideband linear mode. No attempt was made in the test laboratory to duplicate the distortions found in some high power FM transmitters.
REFERENCES
[1] Digital Audio Radio Laboratory Tests Report, Transmission Quality Failure Characterization and Audio Compatibility, Published by the CEMA, Electronic Industries Association, August 11, 1995.
[2] High-Speed Subcarrier (HSSC) Laboratory Test Report, Published by the Consumers Electronic Manufacturers Association a sector of the Electronics Industries Association.
[3] National Association of Broadcasters Engineering Handbook, Eight Edition, Section 2.11, Page 339 CCIR Comparative Scale.
445

446
TELEVISION TECHNICAL/REGULATORY ISSUES Wednesday, April 9, 1997 9:00 - 11:45 am
Chairperson: Dane Ericksen, Hammett & Edison, Inc.., San Francisco, CA
*BROADCAST AUXILIARY PANEL Richard Edwards TowerCom Ltd Ft. Lauderdale, FL James Hollansworth NASA Christopher Imlay Booth, Freret & Imlay Washington, DC Paul Lentz SBE Richard Rudman KF WB / KTWV Los Angeles, CA Mary Shultz FCC Gettysburg, PA Richard Smith FCC Washington, DC
*BLANKETING INTERFERENCE Robert Greenberg FCC Washington, DC
*TV DATA BROADCASTING Matt Cookson En Technology Corporation Milford, New Hampshire
ADJACENT CHANNEL INTERFERENCE REVISITED
Stanley J. Salamon Advanced Television Technology Center Alexandria, VA
•Papers not available at the time of pub.ication
447

448

ADJACENT CHANNEL INTERFERENCE REVISITED
Stanley J. Salamon Advanced Television Technology Center
Alexandria, Virginia
ABSTRACT
Adjacent channel interference tests were conducted to determine if the FCC RF Mask provides sufficient protection. A controlled amount of nonlinearity was introduced to a DTV signal which induced out of band emission that closely approximated the shape of the proposed RF Mask. The Threshold of Visibility was determined for both Upper and Lower adjacent channel interference. The results suggest that some DTV stations may need to take additional steps to minimize adjacent channel interference and equipment manufacturers need to provide solutions.
1. Introduction
The planning factors used by the FCC for advanced television are based on test results of the digital HDTV Grand Alliance System performed by the Advanced Television Test Center in strict accordance with the guidance of the Advisory Committee on Advanced Television Service. The results were published in October, 19951. The Grand Alliance system performed better than the target specifications on all terrestrial transmission interference tests.
However, the behavior of the upper adjacent channel DTV into NTSC interference raised some concerns which required further tests that were supplemental to the official tests.
Three tests were performed. First, it was determined that the audio of NTSC was more susceptible to DTV interference than the video. Listening tests verified the interference still met the target specification. Second, some NTSC receivers exhibited a color stripe artifact, caused by a beat between the pilot carrier and the color subcarrier, which might have been the predominant effect. It was demonstrated that precision offset of the two carriers would effectively mitigate the effect. Third, the FCC anticipated the need to protect adjacent NTSC channels and requested data to develop an RF Mask for out-of-band emission. The sensitivity of an NTSC signal to narrow-band noise as a function of frequency was determined.
All of the tests performed up to this point were done in a controlled environment with linear amplification. The DTV out-of-band emission was more than 50 dB down. In the real world, however, transmitter nonlinearity will create
449

intermodulation products in channels adjacent to the digital television (DTV) channel. Therefore, it was decided to repeat the adjacent channel interference tests using an 8-VSB signal with maximum permissible out of band emission.
Preliminary experiments by the Advanced Television Technology Center (ATTC) on July 19, 1996, suggested that there was little implementation margin with the FCC RF Mask as proposed in the Fifth Further Notice of Proposed Rule Making'. Furthermore, the Sixth Further Notice of Proposed Rule Makingd suggests that approximately
ten percent of broadcasters would be assigned an Upper Adjacent Channel and another ten percent a Lower Adjacent Channel. The implications of such a finding prompted a more formal study performed on August 30, 1996.
The purpose of this evaluation was to determine whether there is an implementation margin available with the proposed mask, and, if so, to quantify the result. The general approach was to assess the interference from a typical 8-VSB signal to typical program material on a representative sample of NTSC receivers. A further objective of these tests was to confirm that, with the precise carrier offset of the
10 MHz Ref.
Data Clock Generated by Frequency Synthesizer
19.4 MHz data in
10 MHz Ref. Attn.
Harris Corp.
8-VSB Exciter /A/
10 MHz Ref.
'D" Wavetek Synthesizer
Ch. 23: 562-250 000 0 MHz
Attn.
Non-Linearity Power 10 MHz Ref. Control Normalizer
Leitch NTSC Sync Pulse Generator
Black Burst baseband audio (L)
Sony D-2 DVTR
>
(R) Harris NTSC
Modulator
baseband NTSC
NI, 10 MHz Ref.
"U" Wavetek Synthesizer
Ch. 22: 565.022 698 4 MHz Ch. 24: 577.022 698 4 MHz
U in
ATTC
RF Test Bed
Din
Nil-SC Ch. 23 (D) 8-VSB: Ch. 22 or 24 (U)
Tek 1450 Demod
RF Sample Port
Distribution Network
Power Meter
R & S Spectrum Analyzer
Tek VM-700
24 TV Sets
A-1 (baseband NTSC video)
Sony D-2 DVTR
Figure 1 -- Block diagram of the ATTC test setup to precisely measure the interference from a DTV signal into an adjacent channel NTSC signal.
450
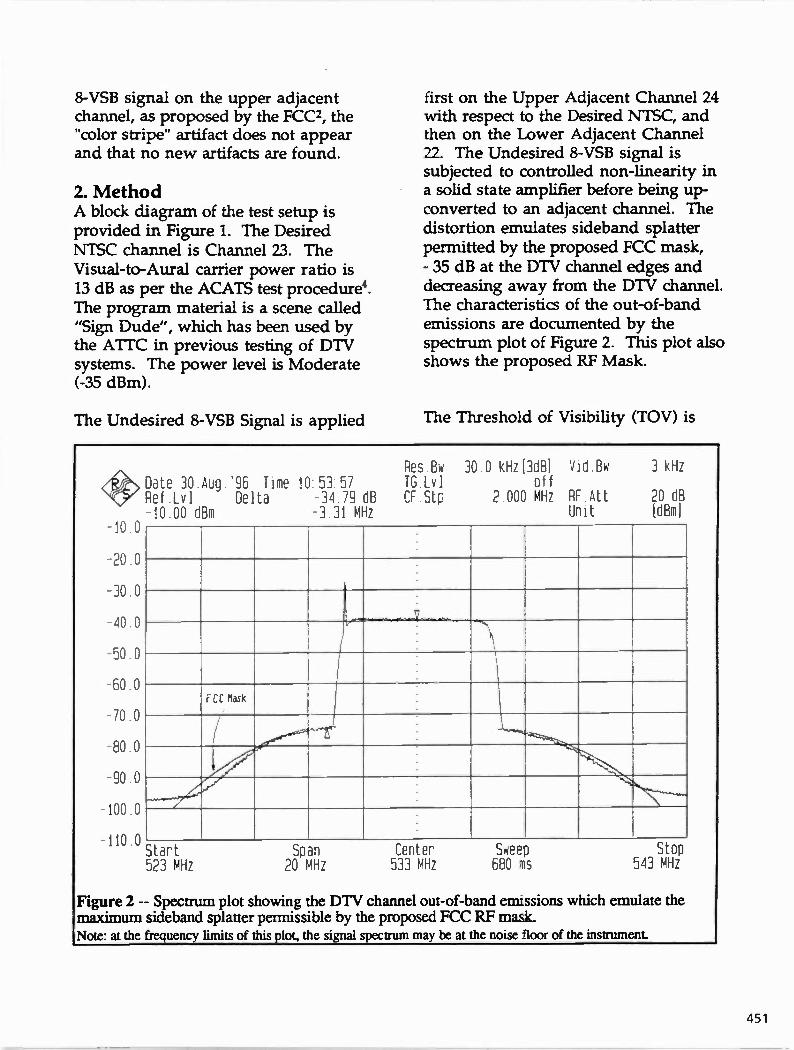
8-VSB signal on the upper adjacent channel, as proposed by the FCC2, the "color stripe" artifact does not appear and that no new artifacts are found.
2. Method A block diagram of the test setup is provided in Figure 1. The Desired NTSC channel is Channel 23. The Visual-to-Aural carrier power ratio is 13 dB as per the ACATS test procedure'. The program material is a scene called "Sign Dude", which has been used by the ATTC in previous testing of DTV systems. The power level is Moderate (-35 dBm).
The Undesired 8-VSB Signal is applied
first on the Upper Adjacent Channel 24 with respect to the Desired NTSC, and then on the Lower Adjacent Channel 22. The Undesired 8-VSB signal is subjected to controlled non-linearity in a solid state amplifier before being up-converted to an adjacent channel. The distortion emulates sideband splatter permitted by the proposed FCC mask, - 35 dB at the DTV channel edges and decreasing away from the DTV channel. The characteristics of the out-of-band emissions are documented by the spectrum plot of Figure 2. This plot also shows the proposed RF Mask.
The Threshold of Visibility (TOV) is
-10.0
-20.0
-30.0
-40.0
-50.0
-60.0
-70.0
-80.0
-90.0
-100.0
-110.0 Start 523 MHz
Date 30.Aug.96 Time 10•53:57 Ref.Lvl Delta -34.79 dB -10.00 dB m -3.31 MHz
Res Bw TG.Lvl CF Stp
30.0 kHz[3dB1 Vid.Bw off
2.000 MHz RF.Att Unit
3 kHz
20 dB idBmi
FCC Mask
Span 20 MHz
Center 533 MHz
Sweep 680 ms
Stop 543 MHz
Figure 2 -- Spectrum plot showing the DTV channel out-of-band emissions which emulate the maximum sideband splatter permissible by the proposed FCC RF ma.sk. Note: at the frequency limits of this plot, the signal spectrum may be at the noise floor of the instrument
451

determined as follows. Each of three expert observers is seated in front of three banks of NTSC receivers. First, the expert observers are shown the unimpaired picture. Next, the undesired power is increased until the interference is visible on all 24 receivers. The undesired power level is then reduced in 1 dB increments. The observers vote on the visibility of the interference at each power level until it disappears from all 24 receivers. The interference is toggled on and off continuously with a period of about 3 seconds in order to differentiate the interference from the desired program material.
In addition to video, the experts assess interference to BTSC Stereo sound at the Threshold of Visibility with the 8-VSB signal on the Upper Adjacent Channel. The audio material used for this test is titled "Male Speech" and is played repeatedly. The interference is toggled for this test also. The expert observers listen to the audio of each receiver in turn and vote on the presence or absence of audio impairment.
A stable frequency reference of 10.000 000 MHz is supplied by a LORAN-C receiver and distributed throughout the laboratory. The Harris 8-VSB Pilot Carrier, the NTSC Visual Carrier and Color Subcarrier frequencies are all referenced to the same 10 MHz reference. In order to minimize the "color stripe" artifact, the 8-VSB Pilot Carrier frequency was offset 5.082 139 MHz above the NTSC Visual Carrier frequency when doing Upper Adjacent Channel 8-VSB into NTSC tests.
3. Results
The results of the Lower and Upper Adjacent Channel TOV tests are determined by recording the relative power levels at which each of the NTSC receivers just show an impairment as judged by each expert observer. The TOV for each receiver is the average of three expert observers' assessments. The median is based on the TOV of 24 receivers. Interference from the 8-VSB signal on the Lower Adjacent channel was found to have a median TOV of 11.33 dB Desired-to-Undesired Ratio (D/U) and interference from the 8-VSB signal on the Upper Adjacent channel was found to have a median TOV of 7.33 dB D/U.
A digital video tape recording was made of the Desired NTSC video signal in the presence of a Lower Adjacent Channel 8-VSB signal slightly beyond TOV (6 dB below the NTSC peak of Sync). Six of the NTSC receivers have baseband video outputs and each of their outputs were recorded.
The results of the audio test are as follows. The 8-VSB signal was on the Upper Adjacent channel at 6 dB D/U with respect to the desired NTSC signal. The expert observers detected no audio impairment. Time did not permit conducting audio tests on Lower Adjacent channel interference.
The color stripe artifact was not observed at any D/U in these experiments. These experiments were conducted with the 8-VSB Pilot frequency 5.082 139 MHz above the NTSC visual carrier. On one receiver, a beat was visible between the Pilot
452

frequency and the aural subcarrier only in the absence of aural modulation. This was questioned by one expert observer. We were later able to show that this beat, which was only visible on one TV set of the ensemble of 24, was made much less visible when there was program audio present.
One TV set (C3) was noted as having a very soft or "out-of-focus" picture. This was traced to misadjustment of its "sharpness control" which resulted in reducing the visibility of the interference on that one set. All 24 receivers were used in these experiments.
4. Conclusions
The Threshold Of Visibility for interference from an Upper Adjacent Channel 8-VSB signal was found to have a median value of about 7 dB with little variance between observers. Consequently, there is a 5 dB implementation margin for Upper Adjacent Channel interference based upon the FCC "...assumption that the average DTV power in a 6 MHz channel
is 12 dB less than the NTSC station effective radiated power (ERP)''. Similarly, the median TOV for Lower Adjacent Channel interference was found to be about 11 dB D/U. Therefore, there is only 1 dB implementation margin for Lower Adjacent Channel interference.
Figures 3 and 4 illustrate the distribution of TOV for Upper and Lower Adjacent Channel interference in individual receivers. Although the median TOV for Lower Adjacent Channel interference indicates some implementation margin, there are a significant number of receivers adversely affected at 12 dB D/U, the proposed ERP ratio of NTSC to DTV as per the 5th NPRM. This suggests that some DTV stations may need to take additional steps to minimize adjacent channel interference.
A comparison of test results of 8-VSB signals with IM products and the Grand Alliance DTV signal without IM products is given in Table 1. This shows the effect of IM products which fall within the NTSC channel and may
453

be considered as co-channel interference. The appearance of this interference resembles random noise, while adjacent channel interference, as observed during Grand Alliance testing, appears primarily as impulsive noise.
Results of this evaluation suggest that at the median TOV, there is no impairment to the audio from Upper Adjacent Channel interference. Thus, the video remains more critical than audio for planning purposes, in spite of the proximity of the aural carrier to the DTV channel.
It was also confirmed that the Precise Pilot Carrier Offset as proposed by the FCC is effective in eliminating the "color stripe" artifact observed in previous tests.
5. Acknowledgments
The cooperation of the Harris Corporation in making available a Harris Corp. 8-VSB Exciter for these tests, and further, in making available Mr. Robert Plonka to assist in the setup and measurements made on these signals is gratefully acknowledged. Many thanks to Mr. Charles Rhodes for
Criterion Lower Adjacent Channel
D/U (dB) Upper Adjacen t Channe l
D/U (dB)
FCC Planning Value D . -55 dBm -17 .43 -11.95
8-VSB TOV D = -35 dBm +11.33 +7.33
TOV* D = -35 dBm - 0.77 -2.09
CCIR 3 * D = -35 dBm -1 2.04 -13.03
CCIR 4 Audio * D = -35 dBm ,
N/A -10.82
* Published Grand Affiance Test Results
Table 1 — Large differences in D/U exist between a DTV signal free of IM products and one with IM products limited as per the FCC proposed RF Mask.
providing a major contribution to the conception, planning, and conducting of this test. Thanks to the PBS engineering staff for their technical support. Further thanks are due to the three expert observers who participated in the actual tests throughout the day of August 30, 1996 and their employers who gave their support in permitting them to participate — Tom Hanlcinson (Capital Cities/ABC), Art Allison (NAB), and Bill Calder (CBS).
Author Biography
Stanley J. Salamon is a Project Manager of the Advanced Television Technology Center. He has primary responsibility for individual projects related to implementation of advanced television service. Typical projects include testing of interference between DTV and other services and the evaluation of HDTV
454

equipment. He has participated in the laboratory testing of the digital HDTV Grand Alliance System. Previously, he has conducted research on amorphous silicon solar cells and thin film transistors. He holds a Master of Science in Electrical Engineering from the University of Colorado and a Bachelor of Science in Physics from the University of West Chester.
References
digital HDTV Grand Alliance System. Record of Test Results, Federal Communications Commission,
Advisory Committee on Advanced Television Service, October, 1995.
2 Fifth Further Notice of Proposed Rule Making,
adopted May 9, 1996, FCC 96-207 (released May 20, 1996).
3 Sixth Further Notice of Proposed Rule Making,
adopted July 25, 1996, FCC 96-317 (released August 14, 1996).
4 Grand Alliance System Test Procedures - Part I: Transmission & Objective Tests, Section 3.7.2, FCC Advisory Committee on Advanced Television (SSWP2-1306).
s Fifth Further NPRM at paragraph 56.
455

456

RADIO TECHNICAL/REGULATORY ISSUES Wednesday, April 9, 1997 9:00 - 11:45 am
Chairperson: David Wilson, NAB, Washington, DC
*PIRATE RADIO Beverly Baker FCC Washington, DC John Devecka LPB Incorporated Frazer, PA William Ruck KFOG/KNBR San Francisco, CA Jack Goodman NAB Washington, DC
*GRANDFATHERED SHORT-SPACED FM STATIONS Robert du Treil, Sr. du Treil, Lundin & Rackley Sarasota, FL Thomas Keller T. Keller Corporation Springfield, VA
*AM TECHNICAL REGULATORY ISSUES Linda Blair and Robert Greenberg FCC Washington, DC Don Everist Cohen, Dippell and Everist Washington, DC Andy Laird Heritage Media Corporation
•Papers not available at the time of publica:ion
457

458

ENG/SNG: DIGITAL QUALITY IN THE FIELD Wednesday, April 9, 1997 2:00 - 5:00 pm
Chairperson: Marvin Born, D spatch Broadcast Group, Columbus, OH
HIGH ORDER DIGITAL MODULATION FOR BROADCAST NETWORKS Mark Weigel EFData Corporation Tempe, AZ
*INTELSAT DIGITAL VIDEO INTEROPERABILITY TESTING UPDATE W. Vincent Walisko Intelsat Washington, DC
*TERRESTRIAL MICROWAVE IN DIGITAL ENG
Rick Hollowell Microwave Radio Communications Chelmsford, MA
MOBILE DIGITAL SNG Haruhiko Mizuno NHK Tokyo, Japan
DIGITAL SATELLITE NEWS GATHERING IN THE DVB ENVIRONMENT Albert Morello RAI Radiotelevisione Italiana Turin, Italy
*THE DESIGN AND IMPLEMENTATION OF THE WNBC-TV REMOTE CAMERA SYSTEM Joseph J. Giardina DS! RF Systems, Inc. Somerset, NJ
• Papers not available at the time of publication
459

460

HIGH ORDER DIGITAL MODULATION FOR BROADCAST NETWORKS
Mark Weigel EFData Corporation Tempe, Arizona
ABSTRACT
The selection of a transmission scheme is a key decision affecting delivery of digital video over satellite. This paper examines tradeoffs and limitations for increasing capacity through satellite links, including the deployment of 8PSK and I6QAM.
Unique circumstances allow broadcasters to benefit from using transmission techniques that maximize capacity in satellite distribution applications. The increased capacity is especially applicable for the distribution of program material to network affiliates or cable headends. The results are also easily extended to digital TV (D711) distribution. The increased capacity yields more video channels per transponder and the possibility for new markets, resulting in additional sources of revenue.
INTRODUCTION
Digital compression has made great strides in reducing the data rate necessary to present full motion video programming. Delivery of six or eight video channels (instead of only one) via a satellite transponder is now common. Interest is steadily building to deliver even higher quality 4:2:2 video streams that withstand the rigors of editing and successive cascades, while maintaining material of pristine quality. There are fewer of these channels because the improved quality requires higher data rates. To satisfy these needs, higher order modulation schemes, like 8PSK or 16QAM, are chosen to increase the data rate through the existing transmission link. In these cases, a dramatic increase in the total bit rate passing through the satellite is realized. The increase ranges from 60 to 90 Mbit/s.
Applications where 8PSK or 16QAM transmission is an advantage include distribution of programming to
affiliate networks and cable headends. Even satellite news gathering can take advantage of high order operation to improve efficiency when the link connects back to a large antenna. Single and multi-carrier operation creates opportunities for various types of program material and multi-point program origination. As DTV (the successor to advanced television, or ATV) grows, so will the need for distribution using high order modulation techniques.
Power, bandwidth, and other tradeoffs are discussed in conjunction with criteria for selecting the modulation and coding scheme to maximize capacity. The effects of other elements influencing transmission, including the satellite transponder and receive terminal G/T, are also covered.
COMPRESSION AND TRANSMISSION
Because satellite bandwidth and power constraints are set by regulatory measures, and there are physical limitations, practical solutions that are cost effective to maintain in orbit are crucial. For applications using satellite transmission, the pursuit of increased capacity has developed along two fronts: compression and transmission. Compression is employed to reduce the bit rate required to represent the video stream, while transmission techniques are sought to max:mize the bit rate through a link constrained by limited bandwidth and power.
In general terms, the task for system designers is to juggle the elements that make up the delivery system and optimize its capacity for the application. This means making tradeoffs that affect compression and transmission (along with cost) and establishing the system design.
461

For a satellite distribution network, the main components affecting compression and transmission are:
• Compression • Video Encoder / Decoder
• Transmission
• Digital Modulator And Demodulator 0 Modulation & Coding
• Satellite Transponder • Earth Station G/T
Figure 1 is a simplified plot of capacity represented by the number of channels possible versus the amount of compression for several modes of transmission. Compression is plotted as the bit rate per channel (bits/s/Channel), and transmission is defined in bits/s/Hz. As expected, a lower
compression bit rate results in a more channels. The transmission parameter expresses how many bit/s are transported per unit bandwidth. So, a system with a higher bit/s/Hz factor transmits more bit/s through the same bandwidth as a system with a lower rating. Once the bandwidth is fixed, another way of describing transmission capacity is in bit/s.
2.5
1.5
0.5
0
Figure 1. Number of Channels Versus Compression
And Transmission
The tradeoff between compression and transmission is more complicated than the figure indicates, but the concept is correct. The figure provides no insight into video quality or how sensitive the system is to bits received in error. Also, it deals only with the bandwidth aspect of transmission, and the impact of power is unanswered. For now, the simple answer is that more power is required to transport more channels
when all other items are fixed. There are a number of tradeoffs in this area that are discussed later.
BROADCAST MODEL
The model for digital video delivery over satellite in a broadcast network is shown in Figure 2.
Figure 2. Broadcast Network Model
The topology is a hub type, with a network center that broadcasts information to many outlying sights, and the primary mode of communication is one way. There are other modes of delivery over fiber, cable, or microwave, but the satellite distribution system provides a good universal delivery system with few technical restrictions.
TRANSMISSION
The main elements of the transmission network are shown in Figure 3. Although compression is crucial for improving capacity, the video encoder and decoder are not included as part of the transmission model.
For transmission purposes, the video encoder is viewed as a data source. The data enters the modulator to start the transmission process, and the data leaves the demodulator to conclude transmission. Each of the components in the transmission link contributes to the performance of the link, and any signal impairments incurred during transmission degrade the overall performance of the link by allowing more erroneous bits to enter the video decoder.
462

Video Encoder
Modulator Up
Converter HPA LNB
De-modulator
Transmission Link
Video Decoder
Figure 3. Model For Transmission Link
The first step in the transmission process is the modulator, which operates on the data with modulation and coding to create the signal format transmitted to the satellite. The elements of the transmission link are
discussed further.
MODULATOR AND DEMODULATOR
The modulator establishes the bandwidth for the transmitted digital carrier, and the demodulator detects the received the signal and attempts to faithfully reproduce the original data steam. Between them, the modulator and demodulator (or modem) condition and recover the signal using error correction algorithms that greatly enhance the integrity of the data delivered to the video decoder. The modem is also responsible for the modulation and coding scheme used to transmit the digitized video signal over the satellite link. Together, the modulation and coding are a major influence on the two key components of transmission: power and
bandwidth.
The 3 dB bandwidth of the transmitted carrier is convenient to calculate and is given by:
DR = SR = ) , (1)
(BW 3dB m x CIRv x CRrs
BW3ds SR DR
CRv C R rS
3 dB Bandwidth Symbol Rate (sym/s)
= Data Rate (bit/s) = Modulation factor (order of modulation)
= 2 QPSK, 3 8PSK, 4 16QAM Viterbi code rate (i.e., 5/6)
= Reed Solomon code rate (i.e., 188/204)
For this class of signals, the 3dB bandwidth is also the same as the symbol rate, an important modem quantity.
The digital modulation schemes discussed here are ones that produce 2m states, where "m" is an integer. The value of "m" represents the order of the system, hence higher values of "m" are associated with higher orders of modulation.
In addition, "m" also represents the number of bits used to represent a single symbol or state, and this has a profound effect on the radiated bandwidth. Every time "m" increases, more bits are collected to represent a symbol, effectively lowering the rate at which symbols are produced and reducing the bandwidth of the carrier. Table 1 shows some modulation examples along with the influence of "m" on bandwidth.
Table 1. Modulation Examp es
Modulation Type
Order (bits/ symbol)
(2m) Number of States
Relative Radiated Bandwidth
BPSK 1 2 1.00 QPSK 2 4 0.50 8PSK 3 8 0.33 16PSK 4 16 0.25 16ASK 4 16 0.25 16QAM 4 16 0.25
As a first approximation, then, it is only necessary to increase the order of modulation until the desired capacity is obtained. However, there is a drawback to this approach. As the order of modulation is increased, a higher-power carrier is needed from the transmitter to maintain the same level of signal quality at the receiver. This means that the improved bandw idth efficiency is obtained at the expense of power which is also a limited resource within a satellite.
One way of counteracting the increased demand for power as bandwidth decreases (larger "m") is to add
463

coding or forward error correction. Coding adds information to the transmitted signal that permits the receiver to correct errors, and this improves the quality of the signal. A major benefit of improved signal quality is a reduction in the transmitted carrier level! This explains why
coding is universally used on satellite links.
The information added during the coding process increases the bandwidth of the transmitted signal. Generally, more powerful coding schemes add greater amounts of information to the signal, causing the transmitted carrier to occupy more bandwidth. The amount of coding is designated by the code rate (CR), which is a dimensionless ratio less than unity indicating how many signal bits go into the coder, as compared to how many "coded" bits exit the coder. For example, if CR = 3/4, then three bits enter and four bits exit the coder. When concatenated coding is used, there are two code rates, CRv (Viterbi or trellis) and CRrs (Reed Solomon). The combined code rate is the product of the two, and the overall impact is to increase the bandwidth by a factor of 1/(CRv x CRrs). Some examples of coding are presented in Table 2.
Figure 4. Power ( Eb/No ) And Bandwidth Versus Modulation And Coding
Table 2. Coding Examples
Viterbi Code Rate (CRv)
Reed-Solomon Code Rate (CRrs)
Relative Radiated Bandwidth
7/8 188/204 1.00 5/6 188/204 1.05 3/4 188/204 1.17 1/2 188/204 1.75
Some tradeoffs are required to secure the right
combination of modulation and coding. However, with careful design there are good combinations that yield
excellent results. There is no one magic combination for all cases, because the solution depends very much upon other pieces of the link. This includes the satellite power, earth station antenna, and other items in the transmission model. One way of viewing the power and bandwidth requirements is shown in Figure 4.
Here, power is represented by F,/No , a type of signal-to-noise ratio, and bandwidth is compared on a relative
basis. Notice the general trend, that as the order of modulation increases, from left to right, a higher Et/No is needed. This corresponds to transmitting more power from the satellite transponder to obtain the performance. Conversely, as the order of modulation increases, the bandwidth decreases. In the figure, the Et/No necessary to produce a bit error rate (BER) performance of 10-10 is shown for a modulator and demodulator in IF loopback.
SATELLITE TRANSPONDER
The modulated carrier is transmitted toward the
satellite where the signal is amplified and transmitted back to earth by a transponder in the satellite. A transmission model of a satellite transponder is depicted in Figure 5. The input to the transponder is an antenna that receives the signal from the earth station. The signal is amplified and passed through a filter to accept the signal for the assigned transponder and reject other frequencies. The incoming signal is translated to the output signal frequency by a mixer and local oscillator. Another filter selects the correct sideband from the mixer and passes the signal to the HPA (for amplification and routing to the antenna) and another filter (to limit any out-of-band emissions) before transmission of the signal back to earth.
Transponder Power Planning
Potentially, one of the chief limitations of a satellite transponder is its non-linearity. The impact of this is less in transponders having solid state power amplifiers (SSPAs) and is higher in those with tube-
464

Figure 6. Tube Amplifier: Power Out Versus Power In
Input Signal
Filter
Mixer
Local Oscillator
Filter Filter Output Signal
Figure 5. Satellite Transponder Model
type amplifiers. The newer C-Band transponders generally carry the SSPA type, while many Ku-Band transponders sport the non-linear tube type. A satellite with a solid state power amplifier may typically operate 1dB below the amplifier's 1dB compression point. This estimate is based upon experimental data obtained during satellite transponder tests using 8PSK and 16QAM modulation.
With tube-based amplifiers, the potential for signal distortion is high, due to the inherent non-linear nature of the tube. An example of a traveling wave tube (TWT) is shown in Figure 6.
TWT ft....
Linear Reference Line
The usual prescription to improve linearity is to operate the amplifier with greater buffer, but this reduces the available power for transmission and decreases capacity. When more power is demanded from a non-linear amplifier, greater distortion is caused to the signal, which has the effect of reducing the effective signal-to-noise ratio of the carrier. This effect becomes more pronounced as the order of modulation increases
with QPSK (the least sensitive), followed by 8PSK, and then 16QAM (the most sensitive).
In some cases, the performance of a link is limited by the carrier-to-distortion (CID) ratio, and not the carrier-to-noise in the system. In fact, under these circumstances the increasing size of the receive antenna provides no improvement. In essence, the system is CID-limited instead of noise-limited, as desired. Because of the distortion, increasing the transmit power out of the satellite transponder does not improve performance. Actually, decreasing the power results in some improvement, at least until this
effect is eventually offset by noise.
An additional effect with tube-type amplifiers is AM to PM conversion, which also distorts the modulated carrier. With AM/PM, signal amplitude variations produce different amounts of phase shift through the amplifier, altering the modulated carrier and effectively decreasing the signal-to-noise ratio.
Transponder Frequency Planning
Previously, the bandwidth of the signal from the modulator was described. The transponder is also a frequency device and it is necessary to contain the modulated carriers within the bounds imposed by the transponder. There are two scenarios to address for transmission: single and multiple carrier operation (as shown in Figure 7). Since the concern here is with high data rate carriers, only the one- and two-
carrier cases are shown. However, generalizing to more carriers is straightforward.
Figure 7 shows the carriers' positions within the transponder. In most cases, multiple carriers are spaced at 1.3 x SR to provide sufficient spacing between them, while a single carrier is centered within the transponder. The carriers are completely
465

Figure 7. Multiple and Single Carrier Operation
contained within the transponder. It is also necessary to add some space between the edge of the carrier and the edge of the transponder, where the amplitude
variation and group delay increase.
Because of these effects, the usable bandwidth is less than the full transponder bandwidth. In some cases, group delay and amplitude equalizers are needed to compensate for the amplitude and phase variation present near the band edges of the transponder. As a starting point, the usable bandwidth of the transponder is its bandwidth divided by 1.2. To summarize:
Carrier Spacing 1.3 x SR, (2) Useable Bandwidth BWxpndr / 1.2, (3)
where: SR = Symbol Rate
BWxpndr = 1dB Bandwidth of Transponder
DOWNLINK FIGURE OF MERIT, G/T
The most common way of sizing the downlink is based upon a figure of merit known as the Ga. This is the dB ratio of the receive antenna gain (G) to system noise temperature (T) in Kelvin. The antenna gain is proportional to the square of the diameter of the antenna, so antenna size directly relates to gain. The noise is established
by the antenna noise temperature, which is a function of sky noise, and the antenna elevation plus the equivalent noise of the low noise block
converter (LNB), that amplifies the signal collected by the antenna. Usually, the amount of power available from a
transponder is known. By selecting a candidate modulation scheme it is possible to estimate the
capacity as a function of the receive earth station G/T. Since antenna gain is proportional to the diameter of the antenna, the results are extended to estimate the capacity as the maximum attainable data rate versus antenna size, as shown in Figure 8.
The plots are made for both C-Band and Ku-Band transponders. Because rain fade is a significant factor for Ku-Band transmission, data is also plotted for an 8 dB fade. Figure 8 provides another means of estimating the size of the receive antenna for transmission. Note that it does not include other system impairments, so it is used as a starting point for a complete system analysis.
Several other tradeoffs are worth mentioning. First, if more transponder power is available, then the maximum capacity is also higher. This is tempered by knowing just how much buffer is needed to effectively operate the satellite transponder. When
Figure 8. Maximum Composite Data Rate Versus Antenna Diameter
466

more buffer is required, then the maximum sustainable data rate is reduced. If a different modulation scheme is used and the F,/No is reduced, then the maximum data increases because less power is needed to deliver the same level of performance.
Of particular interest are the 4.5 and 7.3 meter antennas that are prevalent at network affiliate sites and cable headends. From the diagram, it is apparent that a 4.5 meter antenna will support over 80 Mbit/s over a C-Band link. The Ku-Band link will support the same data rate if a fade margin is reduced slightly from 8 dB. Because the diagram represents a maximum level of performance, the overall capacity is less when the effects and impairments of other items in the link are taken into account. For example, satellite tests with tube-type transponder amplifiers have exhibited considerable degradation.
A 7.3 meter antenna appears to support an amazingly high data rate. However, if 8PSK R5/6 modulation and coding is selected, the data rate supported is 60 to 70 Mbit/s, due to the bandwidth of the carrier that fits a 36 MHz transponder.
An obvious alternative is to move to 16QAM modulation, but these links require more demanding performance from all of the components in the link. In several tests, operation was limited by CID impairments exceeding the effects due to noise. The main cause was the satellite transponder. In yet other links, especially those with solid state transponders, operation was significantly better.
CONCLUSION
The capacity of a digital video link is driven by compression and transmission considerations. The use of higher order modulation schemes like 8PSK and 16QAM in a transmission link increases capacity, and it is a viable alternative when the performance degradation of the components comprising the link is controlled. A broadcast network is an excellent candidate for taking advantage of higher order transmission in at least two ways: with a higher data rate over the satellite channel, either (1) the number of channels distributed is increased, or (2) it is possible to increase the data rate per channel and substantially improve the quality of the video signal.
467

M OBILE DIGITAL SNG
Haruhiko Mizuno Japan Broadcasting Corporation (NHK)
Tokyo, Japan
ABSTRACT
In order to transmit video signals by taking advantage of a CS while moving, NHK with NEC CORP. and TOKIMEC INC. developed a small-sized and lightweight monopulse antenna and small low-cost gyros as key devices for mobile transmission. On a basis of these developments, we newly developed a car-mounted type of mobile digital SNG.
This paper describes not only the new mobile digital SNG of our development and test results of traveling on the land and ship, but also use of this equipment at a relay broadcast of "the Eternal River Chang Jiang, its Three Canyons", which resulted in a successful program wholly assisted by the People's Republic of China.
TRACKING SCHEME
Selection of scheme
Different technologies have been developed for tracking a satellite at fixed earth stations. However, technology used for broadcasts at mobile stations has been developed only for recent years. The schemes now developed in Japan and comparison between them are shown in Table I.
For mobile transmission technology it is important how to track constantly a CS with smaller and lightweight equipment which may not impose a burden on the carrier. Furthermore, improving the tracking accuracy increases margins from the specified value of the out-of-axis radiation, thus enabling increase of transmission power, enlargement of transmission areas, and HDTV transmission.
In consideration of the above, we selected a monopulse tracking system which has high tracking accuracy on a moderate scale.
Tracking is of triaxial control type of the azimuth, elevation and polarization in a composite tracking of coarse tracking with an attitude heading reference equipment and precision tracking using a monopulse sensor, thus realizing a high-accuracy small-sized system.
Principle of the monopulse tracking scheme
This scheme detects directional deflection of the antenna from the CS as a tracking error signal produced from a single beacon wave (the reference signal sent from the CS informing the position of the CS), and tries to minimize the error while tracking the CS.
The detection scheme is classified into two groups, composite horn scheme and higher mode scheme, both of which have a beacon detector unit mounted on their primary radiators. The composite horn scheme, which necessitates plural horns mounted in the vicinity of the primary radiator, cannot secure enough gain because of the focal deviation of each horn from the CS direction. Besides, the scheme requires a large area for plural horns, thus increasing the weight of the equipment. On the other hand, though the higher mode scheme also posed problems to be solved, such as securement of the larger coupling factor and lightweight design, these problems were cleared up, and in anticipation of possible development of a compact and lightweight monopulse antenna, it was decided to adopt the higher mode scheme for the present plan.
468

Table 1 Tracking Scheme Developed in Japan and Their Features
Schemes Principle Features
Monopulse scheme
A sensor attached to the antenna detects in an instant the direction of the pilot signals from the CS, and the direction of antenna is adjusted with a mechanical system.
• Tracking accuracy of -±0.3° • Transmitted power can be increased. • An arbitrary transponder can be used.
Step-tracking scheme
A continuously oscillating antenna detects the direction of the pilot signal from the CS and adjusts its direction to raise the level of pilot signal with a mechanical system.
• Tracking accuracy of -±-0.8° • Transmitted power cannot be increased because of substantial tracking chanae.
• An arbitrary transponder can be used.
Planar antenna scheme
A sensor attached to the antenna detects the direction of the pilot signals from the CS, and electrically changes the direction of the antenna beam. The antenna is a compound of small elements.
• Tracking accuracy of -±0.05° • Transmitted power cannot be increased.
• A transponder of limited bandwidth can be used.
MOBILE DIGITAL SNG
Outline
1) Appearance Visual appearance of the mobile digital SNG is shown in Photo 1. The car measures 6,050 mm long, 2,180 mm wide, and 3,450 mm high. An antenna and antenna driving unit are mounted in a radome provided in the rear of the car (Photo 2). The monopulse sensor unit and the RF section are shown in Photos 3 and 4, respectively. The RF section consists of, in the order of from top to bottom, a wave-guide circuit, TWTA and up-converter.
2) System configuration The system configuration is illustrated in Fig. 1.
Anttena
0075m
14/C Polanzer OMT
Operation and specifications of the tracking system
1) Operation By means of a high-speed processor, the attitude heading reference equipment performs coordinate conversion processing of the output data from the gyro-sensor fitted directly to the mobile body, and outputs the attitude (pitch and roll) and azimuth angle of the mobile body. A gyrocompass is used as an attitude heading reference.
The azimuth, elevation and polarization angle from a point on the earth to the CS are computed on the basis of the latitude and longitude of the mobile body and the. inclination angle of the CS polarization. The location of the mobile body can be surveyed by the GPS etc.
Transmitted wave
Pilot signal receive level
Ivionopulse tracking receiver
Gyro compass Attitude heading reference equipment
Antenna dnver
Memory
LP Controller Tracking error signal
Attitude heading signal
Servo drive
HP
Stop wave Signal
Servo controller
TN/ EXCITER MOD &U/C NTSC CODER
IF101710
MC: Mode Coupler OMT. Orthomode Transducer HPA: High-Power Amplifier MOD Modulator 1..//C: Up Convener
Fig. 1 Mobile Digital SNG System Diagram
HDTV CODER
469

-40
Photo 1 Appearance of Mobile Digital SNG
Photo 2 Antenna and Antenna Driver
Photo 3 Monopulse Sensor
Photo 4 RF Part
470

Based on the computation results, the attitude heading reference equipment computes the azimuth, elevation and polarization angles to cause the antenna to head for the CS corresponding to the mobile body reference.
A servo control and an antenna driver control and drive these three directional axis angles of the antenna to head always for the CS.
Depending on the above-mentioned operation, the antenna can head for the CS on the whole, even if the mobile body jolts or rolls. However, for the purpose of securing higher tracking accuracy of the antenna in heading for the CS, the mobile digital SNG is designed to perform the monopulse tracking. The monopulse tracking receiver sends out the deflection angle from the direction of the CS as a voltage with a level that becomes 0 volt when the antenna is correctly directed to the CS.
By adding this output to the servo system, the antenna is headed for the CS with high accuracy.
2) Main specifications Main specifications of the tracking system are shown in Table 2.
Transmission system
Transmission by both NTSC and HDTV systems is possible by using a coder and modulator for each of both transmission systems.
Table 3 shows main specifications of the NTSC and HDTV.
LAND TRANSMISSION TEST
Basic performance test
1) Outline of test To verify the basic performance of the tracking and the transmission systems of the mobile digital SNG, preliminary running tests were conducted.
Three places selected for the tests were the premise of NFIK Broadcasting Center, where ups and downs are easy to be experimented, the metropolitan expressway, where many joints will cause many vibrations, and curved and sloped roads near Haneda Airport, where a wide view is available.
2) Test results Performance test data of the tracking system are shown in Fig. 2.
As shown in the figure, tracking performance of approximately -±-0.3° was obtained.
Table 2 Main Specifications of Tracking System
Items Specifications Antenna Offset Gregorian antenna: 75 cm dia Controlled axes Three-axis control: azimuth, elevation and polarization axes Tracking scheme Composite tracking of inertial sensor tracking and monopulse tracking
(Monopulse tracking uses azimuth and elevation axes only.) Tracking rate Heading accuracy: -±0.3°
Control accuracy of polarization axis : Within -±2° Drive range Azimuth axis: 360° free
Elevation axis: 45°±30° Polarization axis: Vertical polarization: 90°±30°
Horizontal polarization: 0°±30° Maximum rotation speed
Azimuth axis: 60°/s Elevation axis: 30°/s Polarization axis: 30°/s
Drive motor Direct servo torque Function to stop signal
A transmission-stop signal is generated when tracking deflects or an obstacle exists in the transmission path.
471

Table 3 Main Specifications of Transmission System
Specifications of COD items
Total bit Specifications of NTSC Specifications of HDTV rate Video
16.128/12.096/6.912 Mbps 44.736/59.648 Mbps
Audio
Sampling frequency 14.3 Mliz Y74.25, PB, PR37.125 MHz D/D conversion from 14.3 to 13.5 MHz
DID conversion by 4:3 over sampling
Encoded signal bandwidth Field
4.2 MHz (possible up to 5.5 MHz) Y:24 MHz, PB, PR 12 MHz frequency 60 Hz 60/59.94 Hz Active pixels 720 (pixels) x 483 (lines) 1440 (pixels) x 1035 (lines) Chroma format
Coding 4:2:2/4:2:0 (Switchable) 4:2:2/4:2.0 (switchable) method
Motion
Main profile @ Main level, corresponding to 4:2:2
Simple profile @ High-1440 level
compensation prediction DCT
Bidirectional prediction Unidirectional prediction Field DCT Frame, field DCT
Coding unit Field structure Frame structure input signal Analog/digital (conformable to AES/EB CStandard) x 2 CH
Ana log /digital (con formable to
AES/EBU Standard) x 4 CH
Multiplexing
Samplin," frequency Bandwidth
48 kHz 48 kHz
Coding 20 kHz 20 kHz
method MPEG 1 audio layer 2 MPEG 1 audio layer II/ No compression (Switchable)
Multiplexing scheme Packet
MPEG2 system, transport stream MPEG 2 system, transport stream size 188 bites 188 bites
Specifications of Modulator
Modulation scheme Convolution coding Roll off
Specifications of NTSC 8 TCM PSK/QPSK 8 TCM PSK (7/9) /QPSK (7/8 or 1/2) 40%
*TCM: Trellis-Coded Modulation
Specifications of HDTV 8 TCM PSK 8 TCM PSK (2/3) 30%
A AZ (Running test in the premise of NHK)
Uphill Downhill Uphill Downhill
-03
11.
-2 11350 11400 11450 11500 11550
Time (sec) 11600
A EL(Running test in the premise of NHK)
N-4.4
-21 11350 11400 114.50 11500
Time (sec) 11550 11600
Fig. 2 Performance Data of Tracking System
1 Great deviations of the amplitude are meaningless noise data produced when a shadow interrupted the reception of monopulses.
During the test, in the transmission system, no frequency jump nor damage to the traveling-wave tube amplifier (TWTA) ascribable to vibration was found.
In preparation for an obstacle which might present in the course of propagation or a fault in the tracking on a mobile body, it is indispensable for the tracking equipment to have a function to stop the transmission for avoiding an adverse effect on the human body and disturbance on the other communication systems. This function was also normally retained.
Link budgets for the NTSC and HDTV systems are shown in Table 4.
472

MOBILE TEST BY SHIP
Table 4 Link Budget of NTSC and HDTV Transmission
NTSC HDTV Transmitted power
dBW 16.3 21.3
Feeder loss dB /.9 /.9
Anntena gain dB 38.6 38.6 EIRPu dBW 52.0 57.0 Propagation loss dB 206.9 206.9 G/Ts dB/K 12.0 12.0 EIRPs dBW 37.0 41.9 Propagation loss dB 205.8 205.8 G/Td dB/K 34.5 34.5 C/Nu dB 17.3 17.2 C/Nd dB 25.9 25.7 C/Nud dB 16.7 16.6 C/I dB 25.0 25.0 C/N dB 16.1 16.0 Required bandwidth kHz 6912.0 22370 Required C/N dB 8.0 12 Margin dB 8.1 4.0
Long-time running test
1) Outline of test To assure the durability of the car-mounted equipment and the tracking performance in passage through a long shadow, such as a curved tunnel, a long circular course with many curved tunnels and wide views in a mountainous region was selected for the test. The travel distance was about 500 km and the transmission time about 10 hours.
2) Test results The test results proved that there is no problem in the durability of the mounted equipment and the tracking performance in passage through a long shadow. However, recovery from interruption of the transmission takes 2-5 sec. During the interruption, the picture received is kept frozen. Shortening the time of interruption will be a future subject.
Test form
Since it is clear that the car mounted type of mobile digital SNG, weighing about 7 tons, would need a larger ship and aggravate maneuverability in crane work for installation, a SNG framework for ship was constructed for the weigh and size reduction.
This SNG framework accommodates the transmission system and tracking control system and serves as a base of the radome. The radome part and mobile digital SNG frame weigh about 200 kg and 450 kg, respectively. The weight totals to approximately 700 kg, including the spot cooler for cooling inside the framework.
In the transfer and installation using a crane track a radome SNG was mounted on the framework provided with the same interface as the radome interface on the car.
Photo 5 Appearance of Mobil Ditital SNG on Ship
473

The visual appearance of ship-type mobile digital SNG constructed by combining the radome unit and the framework for ship use is shown in Photo 5. This photo was taken at the time of the relay broadcasting from the river, Chang Jiang in China via satellite. The device seen above the radome in the photo is for lifting purpose.
Mobile test by ship
1) Outline of test To simulate the transmission from a ship on the Chang Jiang of relatively less rolling (approx. ±4°), tests on the ship-type mobile digital SNG were conducted on a deck of a ship cruising the Tokyo Bay. At the same time interference tests between the ship-type mobile digital SNG and a VHF/UHF radio telephone were also conducted.
2) Test results As expected, even when the ship turned gradually while tracing the wake of a large arc, the mobile digital SNG operated with no problem with the deflection of -±3°.
Fig. 3 Mobile Digital SNG System Diagram
When the radio telephone is being operated, however, abnormal operation of the gyro system which may be ascribed to the interference by the radio telephone was observed. The gyro system restored normal operation by covering it with shield sheet
RELAY BROADCAST OF "THE ETERNAL RIVER CHANG JIANG
(YANGTZE), ITS THREE CANYONS"
Outline of transmission
1) Course of transmission The program was broadcast live throughout Japan by using the mobile digital SNG installed on the ship which navigated downstream the distance of 650 km from Chongqing, the starting place for navigation through three canyons of the river Chang Jiang, to Yichang, the final anchorage of the navigation, for four days from Nov. 1 to 4, 1996.
Fig. 3 illustrates configuration of the transmission system diagram.
Broadcasiting Center of NHK in JAPAN
474
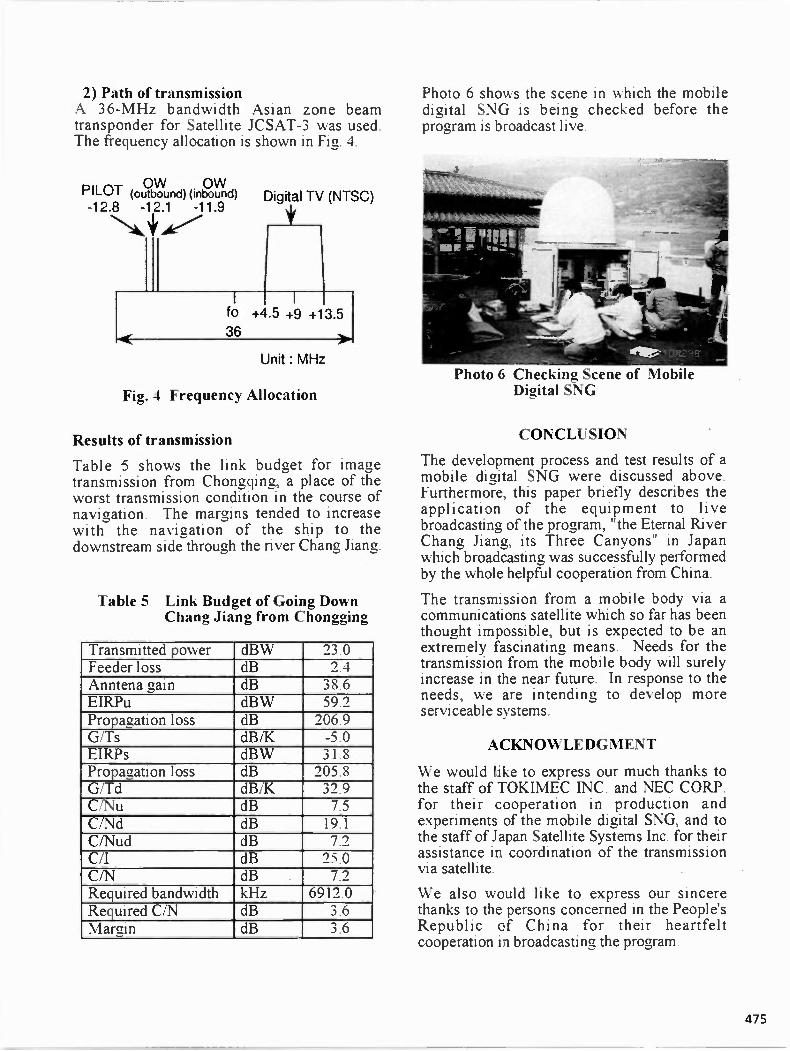
2) Path of transmission A 36-MHz bandwidth Asian zone beam transponder for Satellite JCSAT-3 was used. The frequency allocation is shown in Fig. 4.
-,- OW OW PILO! (outbound) (inbound) -12.8 -12.1 -11.9
+ AL/ Digital TV (NTSC)
fo +4.5 +9 +13.5 36
Unit: MHz
Fig. 4 Frequency Allocation
Results of transmission
Table 5 shows the link budget for image transmission from Chongqing, a place of the worst transmission condition in the course of navigation. The margins tended to increase with the navigation of the ship to the downstream side through the river Chang Jiang.
Table 5 Link Budget of Going Down Chang Jiang from Chongging
Transmitted power_ _ dBW 23.0 Feeder loss dB 2.4 Anntena gain dB 38.6 EIRPu dBW 59.1 Propagation loss dB 206.9 G/Ts dB/K -5.0 EIRPs dBW 31.8 Propagation loss dB 205.8 G/Td dB/K 32.9 C/Nu dB 7.5 CiNd dB 19.1 C/Nud dB 7.2 ClI dB 25.0 C/N dB 7.2 Required bandwidth kHz 6912.0 Required C/N dB 3.6 Margin dB 3.6
Photo 6 shows the scene in which the mobile digital SNG is being checked before the program is broadcast live.
Photo 6 Checking Scene of Mobile Digital SNG
CONCLUSION
The development process and test results of a mobile digital SNG were discussed above. Furthermore, this paper briefly describes the application of the equipment to live broadcasting of the program, "the Eternal River Chang Jiang, its Three Canyons" in Japan which broadcasting was successfully performed by the whole helpful cooperation from China.
The transmission from a mobile body via a communications satellite which so far has been thought impossible, but is expected to be an extremely fascinating means. Needs for the transmission from the mobile body will surely increase in the near future. In response to the needs, we are intending to develop more serviceable systems.
ACKNOWLEDGMENT
We would like to express our much thanks to the staff of TOKIMEC INC. and NEC CORP. for their cooperation in production and experiments of the mobile digital SNG, and to the staff of Japan Satellite Systems Inc. for their assistance in coordination of the transmission via satellite.
We also would like to express our sincere thanks to the persons concerned in the People's Republic of China for their heartfelt cooperation in broadcasting the program.
475

Digital Satellite News Gathering in the DVB Environment
Mario Cominetti, Alberto Morello, Roberto Vitalone RAI Radiotelevisione Italiana, Research Centre
Turin, Italy
ABSTRACT
Digital Satellite News Gathering (D-SNG), through light and portable up-link terminals, is becoming a vital part of modern broadcasting, since it provides a flexible way of conveying vision and sound material _from the location where "special events" take place directly to the broadcaster premises, without requiring a local access to the fixed telecom network
The European DVB Project has defined a harmonised family of E7SI Standards for broadcasting of multi-programme video over various media, such as satellites, cable TV networks, M MDS and terrestrial VHF/UHF channels. The DVB-S (satellite) system is primarily designed for Direct-To-Home (DTH) multi-programme
TV services but, in the SCPC (single channel per carrier) configuration, it is also suitable for DSNG applications, and can offer a range of different picture
quality levels by using the MPEG-2 MP@ML algorithm. For higher quality transmissions, the MPEG-2 professional profile (422P@ML) could be adopted without modifications to the DVB-S transmission scheme.
The paper gives an overview of the technical and operational issues relevant to the use of the DVB-S system for DSNG, in the framework of the applicable
ITU and DVB/E7SI standards. The interoperability with the terrestrial links, connecting the receiving satellite
station to the studios, is also taken into account. A typical DSNG transmission link is considered and evaluated in terms of service quality and availability.
INTRODUCTION
The current exploitation of satellite communication links, at "C" and "Ku" bands, in point-to-point transmission of television programmes, originated in the
studio and/or by outside broadcasting vans, leads to reliable and cost effective solutions for both service providers and broadcasters.
In modern day broadcasting, dominated by increasing competition, a real-time acquisition of news events (e.g., sport meetings, interviews, concerts, calamities), in both the domestic and international environments, is a major factor in the search for audience ratings. In this context, Satellite News Gathering (SNG) provided by
light weight transmit terminals with reduced size antennas (e.g. 90 to 150 cm) is the solution to establish rapid connections between outside broadcasting vans to
the TV studios, without requiring a local access to the
fixed telecom network.
In the co-ordinated effort to establish uniform technical
and operational procedures world-wide the ITU-R has
adopted the following definition of SNG [Rec. SNG.770-1]: "Temporary and occasional transmissions with short notice of television or sound for broadcasting
purposes, using highly portable or transportable uplink earth stations operating in the framework of the Fixed-Satellite Service (FSS)".
Analogue SNG systems for TV transmissions in PAL,
SECAM and_NTSC using frequency modulation (FM) are currently operated in both C and Ku bands.
Although with the progressive improvements in antenna and amplifier _design the original bulky and heavy analogue SNG equipment has been reduced, portability is a key issue still requiring adequate solutions. The commercial introduction of small digital equipment for video and sound compression, advanced error protection and modulation has recently enabled the development of operational digital SNG systems (DSNG)
with a number of advantages over the analogue solution. Among these, significant steps are the "miniaturisation" of the uplink terminal, the lower power (EIRP), the more efficient use of the frequency spectrum. This permits
more signals to be simultaneously transmitted through satellite transponders, significantly increasing the flexibility of transponder access and reducing the per-channel cost. The inherent flexibility of the digital solution allows to fulfil the different quality requirements of satellite transmission of news, sport events, and entertainment by operating the video/audio
compression algorithm at the appropriate bit-rates. Moreover, the digital system ruggedness against noise
and interference offers a constant picture and sound quality at the receiving site.
Video compression standards for digital TV have been adopted by the European Telecommunications Standard
Institute tEl-sIf according to ,CCIR Rec.723 (now ITU-T J.81) El], and the Motion Picture Expert Group [MPEG]. The ETSI/ITU television codec (ETSI 300174 standard) is designed for "contribution" applications at 34 and 45 Mbit/s over terrestrial and satellite links, according to ITU hierarchies. This codec is suitable for "full quality"
DSNG transmissions, while proprietary scaled versions at 17 Mbit/s and 8.5 Mbit/s have been developed in order to meet specific DSNG requirements.
The European Digital Video Broadcasting Project
476

(DVB) has developed the specification of a multi-programme digital television system (DVB-S) for satellite broadcasting (ETSI 300421 standard) [2], which makes use of MPEG-2 Main Profile-Main Level (MP@ML) picture coding, with 4:2:0 format. The DVB-S standard has been designed to provide Direct-To-Home TV services via satellite in the MCPC (multiple channels per carrier) mode of operation and is now world-wide adopted, for example in Europe, USA, Middle East, Japan. This standard can also be efficiently used for DSNG in the SCPC (single channel per carrier) mode, especially for applications where the quality requirements allow the adoption of bit-rates from 15 Mbit/s down to 2-3 Mbit/s. ITU-R Working Party 4SNG is recently discussing a new draft Recommendation for SNG applications based on the DVB-S system, which identifies a number of fixed parameters in order to facilitate the rapid deployment of the SNG terminal in the field. For example it is under discussion to set the coding rate at 3/4 and symbol rate at 6 Mbaud, corresponding to a useful bit-rate of 8.3 Mbit/s after the MPEG multiplexer. For higher quality DSNG transmissions, the professional profile (422P@ML) of MPEG-2 could be adopted without modifications to the DVB-S transmission scheme, allowing to achieve 4:2:2 format and improved post processing and editing facilities.
From the transmission point of view, the main feature of the DVB-S system is the flexibility of the modulation and channel coding scheme, allowing to select the symbol rate (i.e., the spectral occupation on the satellite transponder) and the coding rate (i.e., the power requirements) in order to optimise the satellite link performance on a case-by-case basis.
Successful applications of DSNG systems in both the ETSUITU and DVB-S standards have already been established. However, for the time being the term "standard", in the international context, is potentially misleading, since equipment still tend to be proprietary and market-led, and compatibility is achieved at the studio input at the level of decoded video/sound (e.g. analogue composite TV or digital component TV according to ITU Recs. 601 and 654). The role of ITU-R is then fundamental in the co-ordination of the standardisation process. Specific technical solutions have been defmed by DVB for the transport of the MPEG signals on the terrestrial telecom networks, such as PDH and SDH, by mapping the Transport Stream packets into ATM cells. These adapters can be used to connect the DSNG receiving stations to the TV studios.
Tables 1 and 2 summarise the normative schenario of DSNG within ITU and ETSI.
Table 1: ITU RECOMMENDATIONS
Recommendation Title
Draft 4SNG/temp/3 (January 1997)
Common operating parameters to ensure interoperability of MPEG-2 DVB-S transmission of television news gathering via satellite (SNG)
ITU-R SNG 770-1 Uniform operational procedures for satellite news gathering (SNG)
ITU-R SNG 771-1 Auxiliary co-ordination satellite circuits for SNG terminals
ITU-R SNG 1007-1 Uniform technical standards (digital) for satellite news gathering
ITU-R S 726-1 Technical characteristics for very small aperture terminals (VSATs)
ITU-R SNG 1152 Use of the digital transmission techniques for SNG (sound)
Table 2: ETSI STANDARDS
Standard Title
ETS 300 159 Transmit / receive Very Small Aperture Terminals (VSATs) used for data communication operating in the Fixed Satellite Service (FSS) 11 / 12 / 14 GHz frequency bands
ETS 300 160 Control and monitoring functions at a VSAT
prETS 300 327 Satellite News Gathering (SNG) Transportable Earth Stations (TES) (13-14 / 11-12 GHz)
dr ETR 030 (Technical Basis for Regulation)
ETS 300 174 (ref. 1TU-T Rec. J81)
Network Aspects; Digital coding for component television signals for contribution quality applications in the range 34 - 45 Mbit/s - - 7.-- .-.
ETS 300421 Digital broadcasting systems for television, sound and data services; Framing structure, channel coding and modulation for 11-12 GHz satellite services
pr ETS 300 813 DVB Interfaces to PDH Networks
pr ETS 300 814 DVB Interfaces to SDH Networks
BASIC REQUIREMENTS AND
TRANS MISSION ENVIRON MENT
A SNG "terminal" or "up-link" is a portable (or transportable) earth station which can be moved to a
remote location to transmit back material either "off-tape" or "live". It can be packaged in "fly-away" form (i.e. in cases suitable for air transportation) or integrated into a vehicle. The main operational requirements of a SNG uplink (U/L) terminal are:
477

• reduced size and weight,
• high intervention prompmess and reliability.
• adequate vision and sound quality under various operational conditions.
• ruggedness against noise and interferences and best exploitation of satellite capacity,
• at least one or two full-duplex auxiliary communication channels (e.g. by mobile phones or
by a 64kbitis satellite link) for co-ordination purposes, connected with the satellite operator, the receiving station and the studios
• if possible, small signal delay to allow live duplex interviews
• cost-effectiveness.
The evaluation of the transmission performance of a typical SNG system requires careful consideration of the
various components included in the satellite chain: • transmit earth station
• space segment (up link U/L and down links D/L)
• satellite transponder (IMUX and OMUX filters and TWTA)
• receive earth station
The satellite channel is basically non-linear, wide-band and power limited. The main signal impairments are
introduced by noise, rain attenuation and interference on the space segment and by incorrect alignment of
transmit and receive stations and equipment. The non-
linearity (amplitude and phase distortions) of the on board Travelling Wave Tube Amplifier (TWTA) is responsible of impairments on the overall system performance.
In the case of digital DTH services addressed to the general public, several programmes are time multiplexed
(TDM) on a single QPSK carrier (MCPC transmission mode) and, to achieve the maximum power efficiency, the satellite TWTA is usually operated close to
saturation. The effects of TWTA non-linearity are waveform distortion and side lobe regeneration of the power spectrum.
For SNG applications the usual method of accessing the transponders is Frequency Division Multiplexing
(FDM), where part of the transponder bandwidth is allocated to each individual up-link terminal, operating
in SCPC mode. In order to reduce the effect of intermodulation noise introduced on adjacent carriers occupying the same transponder, the TWTA must be
operated below the saturation point. In these cases the downlink level of any one signal does not noticeably
change as a function of total transponder load, making downlink EIRP setting and monitoring straightforward.
This more linear type of operation also provides more
protection against single uplink station drive fluctuations.
FROM ANALOGUE TO DIGITAL
Analogue SNG systems were introduced by several broadcasters around the early '80s, and currently most of
the SNG systems are still analogue. The uplinked signal
is conventional FM/TV with audio subcarriers and, in
some cases, digital sound (S1S = Sound-In-Sync). The frequency deviation of the RF carrier is currently in the
range 19+ 25 MHz1Volt for 625 line PAL signals (CCIR Rec. 405-1 pre-emphasis), with a corresponding bandwidth occupation of about 25 + 36 MHz. Noise is
currently the main source of impairment affecting the picture quality of FM/TV transmissions. For a good quality PAL programme the Carrier-to-Noise ratio (C/N)
available at the receiver filter output must be several dB above the demodulator "spike" threshold, which is typically reached at about 10 dB. with conventional FM demodulation.
In Europe, the frequency of the up-link signal is commonly in "Ku Band" (14+14.5 GHz transmit, 10.71-
12.75 GHz receive). The power level of the uplink FM/TV stations is 69+ 75 dBW (EIRP), depending on
the size of the antenna and HPA (Hid Power Amplifier)
and on the satellite up-link coverage. Antenna sizes vary from 1.5+ 2.4 m and HPA powers from 300+ 600W.
Digital techniques are rapidly emerging in all components of the broadcasting chain: production,
transmission and broadcasting, and are pushed by the need of harmonised integration between terrestrial digital networks (i.e., broadband ISDN) and satellite
links. The availability of efficient and reliable solutions
for "source coding" (picture and sound) and "channel coding" against transmission errors, allows to accelerate
the process of conversion from analogue FM to digital
TV in satellite communication offering good perspectives to the introduction of digital SNG systems. DSNG offers significant advantages over current FM/TV systems:
• small size, low weight cost-effective transmit equipment;
• power reduction with reliable operation at low up-link EIRP, in presence of noise and interferences
• high and constant technical quality
• high spectrum efficiency with optimum exploitation of the satellite capacity
• flexible service configuration (for video/audio/data)
• security of programme material with encryption
Conversely, the processing delays of D-SNG systems are
significantly.— longer (even exceeding one second),
especially with the sophisticated coding algorithms allowing high bit-rate compression ratios. This can have
an impact on live programme productions mixing SNG and studio contributions.
The concept of DSNG emerged during the latter part of
the 1980's. In Europe the EU-256 Project, with the participation of RAI, Telettra (Italy and Spain) and Retevision (Spain), gave an important contribution to the
development of bit-rate reduction techniques based on the hybrid DCT coding algorithm which was adopted in the ETSI/ITU standard. In 1991 a prototype DSNG
478

system at I 7 Mbit/s was developed by the RAI Research Centre and tested in experimental transmissions via satellite. In 1993-94 the European Digital Video Broadcasting Project (DVB) has developed the specification of a multi-programme digital television system (DVB-S) for
satellite broadcasting, under the direct responsibility of the RAI Research Centre [3]. The basic elements of the DVB-S system are shown in Fig. 1 and include: source
coding (video, audio and data), multiplexing, channel coding and digital modulation.
Video
Audio
Data
SI
MPEG-2 MP@ML
Source Coder
mux
Transport Stream
MUX Adaptatio
Energy
Dispersal
Outer
Coder
RS(204,188)
Outer Inter- . leaver
(1=12)
Outer adapter
Inner Convolutional
Coder
(1/2, ..,7/8)
Modulator
Channel adapter
Fig. 1 The DVB-S system for satellite digital television: channel coding and modulation
With the progress of the DVB-S technology and the wide availability of VLSI chips and complete equipment, the suitability of the DVB-S system also for DSNG applications became more and more evident. The overall quality of a digital television transmission by satellite depends jointly on the intrinsic performance of the sound and picture coding algorithms, spectrum occupation and service availability. The link optimisation requires a trade-off in the bit-rate allocation between source coding and channel coding to achieve the required picture/sound quality and service continuity, for a given available bandwidth. The inherent flexibility of the DVB-S system in terms of picture/sound bit-rate (in the range of 1.5 + 15 Mbit/s per programme), convolutional coding rate (five possible options) and transmitted symbol rate (no specific limitation in the standard) is a direct answer to the above requirements.
SOURCE CODING AND MULTIPLEX ING
The success of the DVB standards is also due to the adoption, on all media (e.g., satellite, CATV, terrestrial VHF/UHF and MMDS networks), of a "common solution" for video/audio coding and digital multiplexing, making possible the mass-production of VLSI chips for consumer IRDs (Integrated Receiver
Decoders). Depending on the actual physical channel, the main differences in the IRD are concentrated in the front end (i.e. in the tuner/demodulator) which operates in the appropriate frequency range using suitable modulations (QPSK, QAM, single carrier or OFDM). It is worth noting that a same satellite IRD, with L band
input at the first satellite IF (0.95+2.15 GHz), can be used in both satellite services. BSS and FSS.
Video Coding
The MPEG-2 Main Profile at Main Level (MP@ML) is adopted for picture coding. It allows high flexibility for DSNG applications, being able to operate with variable bit-rates from 1.5 to 15 Mbit/s. The MPEG-2 and ETSI/ITU codecs adopt similar principles, namely Hybrid DPCM / DCT algorithms with motion compensation, operating on I-frames (intra) and P-frames (predicted); in addition, the MPEG-2 algorithm makes use B-frames (bi-directional prediction). It should be noted that MPEG-2 MP@ML is a 4:2:0 system and was designed for distribution rather than contribution, whereas ETSUITU is a 4:4:2 system designed for contribution purposes at the transmission rates of 34 or 45 Mbit/s. Both standards expect 4:2:2 component format input signals according to ITU Rec.601 and Rec.656, while composite video signals need decoding prior to compression. MPEG-2 MP@ML at bit-rates of about 6 Mbit/s and 9 Mbit/s allows, for_ current programme material, a subjective quality equivalent to PAL and 4:2:2 pictures, respectively. Bit-rates of 4 to 5 Mbit/s for picture coding may be acceptable for the same material, while a bit-rate of about 2 Mbit/s is generally sufficient for films, news, educational, etc. At these raked bit-rates the use of B-frames in MPEG-2 MP@ML may offer an advantage over the scaled ETSI/ITU system at 8.5 Mbit/s in terms of operational flexibility with adequate picture quality.
In 1995, MPEG-2 has defined a picture coding "profile" to fulfil the requirements of the production environment, which is named 422P@ML. It offers a number of additional features compared to the MP@ML format: the coding rate can be increased up to 50 Mbit/s, the chroma components maintain the 4:2:2 format as the uncompressed stud)o format, the GOP (group of picture)
479

structure can be modified and all active video and VBI information is processed by the codec. This allows
higher picture quality, better chroma resolution, post-processing after co-decoding, short GOP to improve editability in compressed form.
Subjective quality tests (non-expert viewers, 4H distance) have been carried out by the RAI Research
Centre and other organisations [4, on computer simulated 422P@ML sequences, with single and multiple generations (8 co-decoding processes) and colour matte
post-processing. Different GOP structures have been analysed: (a) purely intra-frame configuration to allow one-frame editing precision but with low compression
efficiency, at 50 and 30 Mbitis (indicated as Ki50 and
ra-,30), (b) one I frame and one B frame, allowing a
good compromise between editing and compression ratio, at 30 Mbit/s and 20 Mbit/s (indicated as IBg30
and /Briz) 70), (c) traditional MP@ML GOP, with 15
IBBP frames, at 20 MbitIs (indicated as IBBP@20). With reference to the double-stimulus continuous quality
100 grades scale, the following quality levels are
arbitrarily defined in MPEG documents: "transparent" (0 to 12.5), "nearly-transparent- (12.5 to 20) and -good"
(20 to 40). The subjective test results indicate that after 8 co-decoding processes 102.50 (including chromakey) and
/B@30 coding structures fulfil the "transparency"
ratings, and after a single co-decoding process, cromakey can be -transparently" performed on I@30
and /B@20. In addition all the coding structures gave ratings well matching the "nearly transparent" quality,
apart few tests which moderately exceeded the 20% target. In addition, the tested sequences significantly
exceeded the quality of the "low anchor" algorithm
(MP@ML with a single co-decoding at 6 Mbit/s).
As a conclusion, to fulfil the wide range of picture quality levels and bit-rates required by DSNG, MPEG-2
MP@ML (as specified by the DVB-S system) at bit-rates from 1.5 to 15 Mbit/s can cover the applications where no (or very limited) post-processing is performed in the
studio before re-broadcasting, while MPEG-2 422P@ML at bit-rates from 15 to 30 Mbit's can cover the high quality applications, where post-production and cascaded co-decoding are required.
In any case it must be kept in mind that switching and
editing MPEG-2 transport streams in the studio without decoding can be very difficult, because of the problems related to clock handling and buffer overflow control.
Therefore in many cases the DSNG contributions (independently of the adopted compression scheme) are to be re-converted into 4:2:2 format in the studio, edited and then re-encoded for final broadcasting (in MP@ML format).
Audio Coding
As regards the sound. all the DVB systems, in line with the trend toward international standardisation, adopt the MPEG audio layer II coding method which allows a
wide range of bit-rates (e.g. from 64 Bit's to 256 Bit/s)
satisfying the various service requirements. Bit-rates as
low as 64 Bit/s may be applicable for some DSNG applications with mono channels.
Transport Multiplexing
The DVB-S system adopts a common framing structure, based on the MPEG-2 transport multiplex, with fixed
length packets of 188 bytes, including 1 sync byte, 3
header bytes and 184 useful bytes. This structure allows
easy interworking between broadcast channels and telecom networks using ATM protocols. The MPEG-2
multiplex is very flexible for merging in the transport
stream (TS) a variety of video, sound and data services, as well as additional information (e.g., Service
Information to implement Electronic Programme Guide, Conditional Access). Since no forward error correction
(FEC) protects the TS packet headers .a rugged "channel adapter" is required to provide an "error-free" data stream to the demultiplexer input.
CHANNEL CODING AND MODULATION
Efficient and reliable transmission of digital television signals over satellite channels is focused on the design of
the "channel adapter", which performs the adaptation of the multiplexed video/audio/data bit-stream to the physical channel, by adopting powerful channel coding and digital modulation techniques. The design target is
to minimise the effects of the various channel impairments, such as additive noise, interference from analogue and digital signals, linear and non-linear
distortions, rain attenuation, while maintaining a high
spectrum efficiency. In the receiver, the adoption of
coherent demodulation combined with powerful error
correction techniques is necessary to make the system rugged against errors.
Channel coding
The transmission frame is synchronous with the multiplex structure. The basic functions performed are: signal randomisation, error protection, interleaving and digital modulation.
In order to comply with Radio Regulation interference requirements and to facilitate clock-recovery in the
receiver, the data stream at the multiplexer output is scrambled bitzby-bit. This provides uniform and constant power spectrum at the QPSK modulator output,
independently of the data stream content.
A powerful "error-correction scheme" based on the
concatenation of a Reed Solomon code RS(204,188), applied to the uncoded packets of 188 bytes, and of a
Convolutional code with Viterbi decoding, associated to QPSK modulation, has been adopted. The residual errors at the output of the Viterbi decoder are not statistically independent, but are instead grouped in bursts which may overload the RS code correction capability. So, to
480

randomise the error distribution and improve the correction efficiency an interleaving process with depth 1=12 at byte level is introduced on the data stream carrying the packets protected by the RS code. The Convolutional code can operate at five possible rates: 1/2, 2/3, 3/4, 5/6 or 7/8, selectable according to the service requirements.
Digital Modulation
The coded bits are mapped in a QPSK constellation with Gray coding and filtered at baseband to generate a square-root raised cosine spectrum, with 35% roll-off
(a). The adoption of QPSK [2 bits/s Hz], instead of
more spectrum-efficient modulations, e.g. 16 QAM [4 bits/s Hz] or 64 QAM [6 bits/s Hz], was suggested by the need to operate the satellite transponder TWTA close to saturation, at its maximum power level, to achieve the best power efficiency. Under this severe non-linear condition the performance of high-level modulations is significantly reduced. On the other hand, QPSK with rate 1/2, 3/4, 7/8 convolutional coding is a well-established technology on satellite digital communications for IDR, IBS and SMS applications, as provided by EUTELSAT, INTELSAT and other satellite operators, for its ruggedness against noise and interference and for the simplicity and low-cost of the demodulator. The transmitted symbol-rate of the DVB-S system is fully flexible and, together with the 5 selectable coding rates, allow high operational flexibility.
DVB-S Performance in Presence of Noise
The DVB-S system has been designed to provide a quasi-error free quality target, i.e., less than one incorrect error-event per transmission hour,
corresponding to a BER = 10' 11 at the data stream at the input of the MPEG-2 demultiplexer. This target, achievable by interleaving and by RS error correction, corresponds to a BER of about 2.104 at the output of the Viterbi decoder.
Sensitivity to transmission errors is expressed, for the various rates of the convolutional code, by the E1,/N0 ratio required to achieve quasi error free reception. Eb is the energy per useful bit and No is the spectral density of the additive white Gaussian noise (AWGN). The E1,/N0 figures in Table 3 refer to the useful bit-rate Ru (including for simplicity RS redundancy) for the cases of uncoded and coded QPSK, with two rates of the convolutional code, i.e. 1/2 and 3/4, which are currently adopted in DSNG applications. The figures, taking into account of the typical degradations introduced by the satellite chain, have been obtained by computer simulations and are confirmed by experimental tests. The noise bandwidth of the QPSK receiver corresponds to the transmission symbol rate Rs (Mbaud). The band occupation of the r.f. signal on the satellite transponder is Brf = (1+a) Rs, where a= 0.35 is the roll-off. Thus, a 72 MHz satellite transponder could potentially accommodate Tip to nine QPSK-3/4 carriers at 8.5 Mbit/s. DSNG TV transmissions at 8.5 Mbit/s in QPSK-3/4 are currently operated on EUTELSAT satellites in the EBU Eurovision network. QPSK-1/2 is used to transmit high quality audio signals in the Euroradio service. As it can be seen from Table 3, QPSK-3/4 and QPSK-1/2 allow high coding gains over uncoded QPSK transmissions, i.e. 3.7 dB and 4.7 dB, respectively. The Table also shows the reduction of the required C/N (in 36 MHz) according to the bit-rate decrease.
Table 3. Satellite digital transmission: performance of systems using the DVB-S standard
System Eb/No(1)
IdB]
C/N in 36 MHz
[dB]
Useful bit-rate Ru
IMbps]
Symbol rate Rs
iMbaud] ,
Brf (a= 0.35)
[MHz]
QPSK (Uncoded) 9.7 9.5 , 34 17 2,
QPSK 3/4
,
6
5.8 34 22.7 30.6
2.8 17 11.3 15.3
-0.3
-
8.5_ 5.7 7.7
QPSK 1/2 5
1.8 17 17. 22
-1.3 8.5 8.5 11.5
-7.6 2 2 2.7
(1) at BER = 210-4 before RS, including 1.7 dB margin for modem implementation and channel distortions
The ruggedness against noise of digital TV (QPSK-3/4) and analogue PAL/FM on the satellite channel are shown in Fig. 2. The quality impairment is expressed in terms of the C/N ratio, assuming as reference an analogue receiver bandwidth Brx = 36 MHz, which is
typical of satellite FM/TV transmissions with 25 MHzN frequency deviation. The C/N ratio for the digital system is given by the relationship:
(1) C/N (dB) = E1,/N0 [dB] + 10 Log (Ru/Brx )
481

From Fig. 2 a DSNG signal at 17 Mbit/s, providing near-
contribution quality, would require about 3 dB C/N to operate quasi error-free against 12 13 dB required by analogue FM/PAL for an acceptable picture quality. If the transmission rate is reduced to 8.5 Mbit/s, which is
suitable for DSNG applications with PAL quality, the
required C/N ratio (in 36 MHz) would approach 0 dB!
CCIR impairment scale
Imperceptible 5
Perceptible but not annoying
Slightly annoying
Annoying
Very annoying
4
3
2
1
Thanks to this remarkable performance the digital solution is then capable to virtually deliver the picture
and sound quality of the source, provided that adequate
margin against rain attenuation is allowed by careful link budget design in order to operate above the service continuity threshold.
bit/ [ 7
-1 0 1 2
Mb it's 34 Mb
AL 25 ‘JV
3 4 5 -6 7 8 9 10 11 12
C/N (dB) in 36 MHz
Fig. 2 Picture impairment versus C/N: Digital TV (QPSK-3/4) and analogue FM/TV on a satellite channel
Exploitation of the DVB-S System Flexibility
In general, satellite transmissions are power limited and,
at Ku band, the rain attenuation is the main responsible
for service interruptions. For DTH satellite TV
broadcasting applications, it is not possible to choose, according to the actual weather conditions, the optimum trade-off between error protection (e.g. coding rates 1/2,
2/3, 3/4, 5/6 or 718) and useful transmitted bit-rate of the system, since (a) the receiving installations are millions
and are spread over a wide territory (with different
weather conditions), (b) the transmitting station has no information about the receiving conditions. Therefore to guarantee a large percentage of service availability (e.g. 99.9 % of the average year) large link margins are set-
up in clear sky conditions (e.g. 4-6 dB). This results in a large loss of transmission capacity, because heavy rain conditions are unlikely and limited in time and in
location. On the contrary, DSNG transmissions are point-to-point and of short duration, and the actual link
margin can be easily measured by the receiving station and transmitted back to the up-link station. These
principles have been exploited in the design of the Flash-TV system for HDTV-DSNG [5], which can automatically choose the optimum modulation and
coding scheme (QPSK or 8PSK), and carry-out real-time and error-free switching, under the control of a return channel. In the case of the DVB-S system, there is no automatic code-rate switching facility, but the same
principles could be applied by establishing a suitable procedure before the beginning of the transmission. In fact the actual link margin can be easily determined during the link line-up (e.g. by EIRP variations from the
DSNG terminal until the error threshold is reached at the receiving site). In addition, the weather conditions
affecting the up-link, which is usually the bottle-neck of the link budget, can be easily forecast over the "short"
period of time relevant to the transmission, so that a suitable link margin can be adjusted before starting the
transmission. Therefore the intrinsic flexibility of the DVB-S useful bit-rate and code-rate (1/2 to 7/8) could
be easily exploited to transmit case-by-case the maximum bit-rate compatibly with the available link budget.
Table 4 shows the required C/N of the DVB-S system at
various code-rates to deliver "quasi error free pictures",
when operated at the fixed symbol-rate of 8.5 Mbaud. The third column shows that, by changing the coding
rate, the required C/N can be varied by up to 4.3 dB. The last two columns assume that in an example
location the available up-link margin in clear sky is of 1 dB at 14.9 Mbit/s, with coding rate 7/8. These columns,
calculated by the ITU rain attenuation curves at 14 GHz for climatic zone K, show the percentage of time and the
hours in Ont -ear- for which the system could in principle operate correctly at each bit-rate. The hours reported in the rate 7/8 row are the total time per years for which the system can be operated at 14.9 Mbit/s, while the hours in the other rows indicate the additional service availability offered by reducing the code rate by one step (e.g. the
second row indicates that using rate 5/6 instead of 7/8 allows to extend the service continuity by 82.08 hours). These figures clearly indicate the potential bit-rate
advantages achievable by tuning the DVB-S system
configuration according to the weather/location conditions, instead of adopting a fixed configuration
482
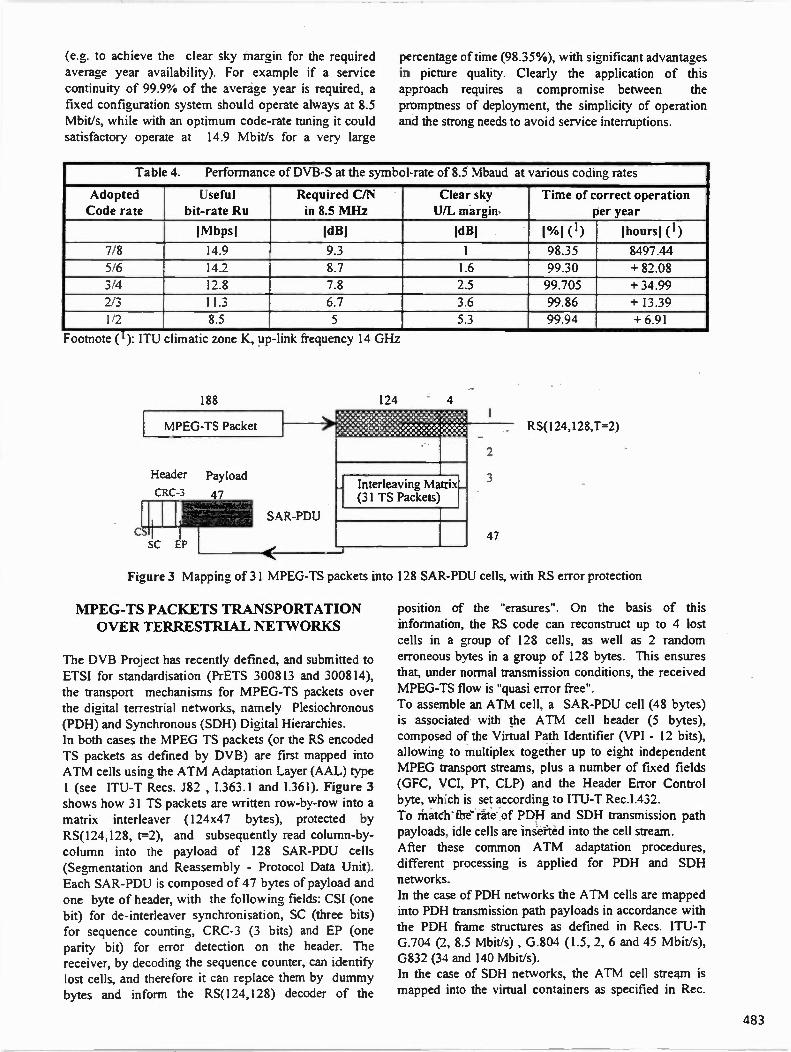
(e.g. to achieve the clear sky margin for the required average year availability). For example if a service continuity of 99.9% of the average year is required, a fixed configuration system should operate always at 8.5 Mbit/s, while with an optimum code-rate tuning it could satisfactory operate at 14.9 Mbit/s for a very large
percentage of time (98.35%), with significant advantages in picture quality. Clearly the application of this approach requires a compromise between the promptness of deployment, the simplicity of operation and the strong needs to avoid service interruptions.
Table 4. Performance of DVB-S at the symbol-rate of 8.5 Mbaud at various coding rates
Adopted Code rate
Useful bit-rate Ru
Required C/N in 8.5 MHz
Clear sky U/L margin,
Time of correct operation per year
IMbps1 ldB1 Id131 tom (1) ihours] (1)
7/8 14.9 9.3 1 98.35 8497.44
5/6 14.2 8.7 1.6 99.30 + 82.08 3/4 12.8 7.8 2.5 99.705 + 34.99 '7/3 11.3 6.7 3.6 99.86 + 13.39
1/2 8.5 5 5.3 99.94 + 6.91
Footnote ( ): ITU climatic zone K, up-link frequency 14 GHz
188
MPEG-TS Packet
Header Payload
CRC-3 47
Sc EP
SAR-PDU
124 4
2
Interleaving Ma (31 TS Packets)
1
3
47
RS(124,128,1=2)
Figure 3 Mapping of 31 MPEG-TS packets into 128 SAR-PDU cells, with RS error protection
MPEG-TS PACKETS TRANSPORTATION
OVER TERRESTRIAL NETWORKS
The DVB Project has recently defined, and submitted to ETSI for standardisation (PrETS 300813 and 300814), the transport mechanisms for MPEG-TS packets over the digital terrestrial networks, namely Plesiochronous (PDH) and Synchronous (SDH) Digital Hierarchies. In both cases the MPEG TS packets (or the RS encoded TS packets as defined by DVB) are first mapped into ATM cells using the ATM Adaptation Layer (AAL) type 1 (see ITU-T Recs. 182 , 1.363.1 and 1.361). Figure 3 shows how 31 TS packets are written row-by-row into a matrix interleaver (124x47 bytes), protected by RS(124,128, t=2), and subsequently read column-by-column into the payload of 128 SAR-PDU cells (Segmentation and Reassembly - Protocol Data Unit). Each SAR-PDU is composed of 47 bytes of payload and one byte of header, with the following fields: CSI (one bit) for de-interleaver synchronisation, SC (three bits) for sequence counting, CRC-3 (3 bits) and EP (one parity bit) for error detection on the header. The receiver, by decoding the sequence counter, can identify lost cells, and therefore it can replace them by dummy bytes and inform the RS(124,128) decoder of the
position of the "erasures". On the basis of this information, the RS code can reconstruct up to 4 lost cells in a group of 128 cells, as well as 2 random erroneous bytes in a group of 128 bytes. This ensures that, under normal transmission conditions, the received MPEG-TS flow is "quasi error free". To assemble an ATM cell, a SAR-PDU cell (48 bytes) is associated with the ATM cell header (5 bytes), composed of the Virtual Path Identifier (VPI - 12 bits), allowing to multiplex together up to eight independent MPEG transport streams, plus a number of fixed fields (GFC, VCI, PT, CLP) and the Header Error Control byte, which is set according to ITU-T Rec.1.432. To Match-the- rate of PDH and SDH transmission path payloads, idle cells are insetted into the cell stream. After these common ATM adaptation procedures, different processing is applied for PDH and SDH networks. In the case of PDH networks the ATM cells are mapped into PDH transmission path payloads in accordance with the PDH frame structures as defined in Recs. ITU-T G.704 (2, 8.5 Mbit/s) , G.804 (1.5, 2, 6 and 45 Mbit/s), G832 (34 and 140 Mbit/s). In the case of SDH networks, the ATM cell stream is mapped into the virtual containers as specified in Rec.
483

ITU-T G.707. Virtual containers VC-11 (1.6 Mbit/s capacity), VC-12 (2 Mbit/s capacity) and VC-2 (6.7
Mbitis capacity) can be multiplexed into a VC-3 (48
Mbiv's capacity), or directly into VC-4. The transmission bit-rate of the STM-1 (Synchronous
Transport Module) is 155520 kbit's. and is based on VC-
4. In addition, the Sub-STM-1 bit-rate of 51841 kbit/s is
adopted in PrETS 300814, based on VC-3. Table 5
shows examples of correspondence between the PDH (Rec. ITU-T G.702) and SDH capacities and the useful MPEG-TS bit rates.
Table 5 Correspondence between PDH and SDH rates and MPEG-TS bit-rates
PDH SDH link transmission
capacity [kbitls] MPEG-TS
capacity [kbitis] link transmission capacity [kbit/s]
container type
container capacity [kbit/s]
MPEG-TS
capacity [kbit/s] 2048 1649 C-12 2176 1869 6312 5279 - C--) 6784 5828 8448 7038 - - -
- 34368 29140 - - -
- 44736 37980 51841 (Sub-STM-1) C-3 48384 41566 139264 118759 155520 (STM-1) _ C-4 149760 128656 ,
RAI EXPERIENCE ON DSNG OPERATION
Since the early '80s RAI has been operating from the Italian territory several, vehicle mounted, Transportable Earth Stations (TES) using analogue FM modulation for
live injections, entertainment programmes, news reports
and sport events. The characteristics of the Stations comply with the technical and operational requirements of the TES operating in the Fixed Satellite Service (FSS) of EUTELSAT and INTELSAT.
The significant progress in digital technology occurred in the last five years has pushed the RAI Research
Centre to study, develop and operate a small Ku band
DSNG terminal [6] operating at bit-rates up to 17 Mbit/s which can be transported in flight cases or mounted on a small vehicle for DSNG operation on the above satellite
systems. The recent availability of the downscaled
version of the ETSI/ITU codec at 8.5 Mbit/s and of
DVB-S systems at variable bit-rates, allowed to start the experimental and pre-operational phases of the DSNG
terminal operation in a real satellite network environment.
Earth Stations for Digital SNG
The RAI "fly-away" DSNG terminal is currently operated at 8.448 Mbit/s (QPSK 3/4) on the Italian territory, in the framework of the EBU satellite network
for news exchange among Members, on the occasion of international events on the Italian territory. The terminal
makes use of a 90 cm antenna and 350 W TWTA with transmission capability of 64.5 dBW EIRP. Because of
the very small antenna, direct reception of the digital signal in the terminal is not possible and co-ordination with the Control Centre is necessary. The terminal is equipped with an FM/TV receiver which allows to establish the satellite link at the beginning of the operational phase.
Domestic use of the DSNG terminal is also provided in
the same satellite network for live injections of news and entertainment programmes from remote sites, when
operation 'With traditional analogue PAL/FM transportable earth stations is difficult or even impossible (mountainous sites, islands, etc.). An EIRP
of 60.5 dBW Tprovided by 125 W TWTA) is adequate for these purposes.
When the DSNG up-link terminals are operated in accordance with a transmission plan allowing closely
spaced digital carriers, the HPA must be operated in a
quasi-linear mode, i.e. with suitable Output Back Off
(OBO) in order to control the out of band radiated power due to sidelobe spectrum regeneration, which may be source of interference to adjacent carriers.
Digital SNG exploitation of the space segment
The use of limited EIRP DSNG terminals implies the adoption of medium - large fixed receiving stations at broadcaster premises with antenna diameters between 4
to 9 m, with G/T in the range 28+35 dB/°K. Nevertheless, the possibility of using medium-size
receiving antennas (4 m) not requiring tracking facilities is particularly attractive for Broadcasters.
DSNG transmissions within the European coverage of the EBU satellite network has been evaluated by link-
budget assessment, taking into account the various parametervaffetting the overall performance.
The powerful error correction scheme, adopted in the DVB-S system, determines a very steep failure characteristic against noise: less than 1 dB of C/N
variation from quasi-error free reception down to service
outage. The link-budget design should therefore provide adequate margin, both on the uplink and the down link,
against rain attenuation and other impairments to guarantee reliable transmission.
In the link budget, three 9 MHz slots are allocated to DSNG at 8.5 Mbit/s (QPSK-3/4) for transmission on a transponder of EUTELSAT II F4M, sharing the 72 MHz
484

bandwidth with one FM/TV carrier for analogue SNG. The U/L EIRP of the digital and analogue SNG up-link terminals are typically 67 dBW and 77 dBW (from locations where the satellite G/T is -0.5 dB/°K), corresponding to satellite 1130= 16 dB (OB0=14.1 dB) and 6 dB (OB0= 2.5 dB), respectively. The link-budgets for the DSNG carriers at 8.5 Mbitis have been derived under the following operational conditions:
• U/L from the border of the service area, i.e. at -0.5 dB/K satellite Gil- contour and from more favourable locations within the +2.5 dB/K G/T contour (e.g. Sicily)
• D/L satellite EIRP footprints:
45.0 dBW D/L coverage contour (e.g. Rome)
42.5 dBW D/L coverage contour (e.g. Sicily).
• reception by a standard EBU station (7 m antenna, G/T = 33.5 dB/K)
• U/L conditions: clear sky and 2.5 dB rain attenuation (corresponding to an availability of 99.7% of the time of the average year in climatic zone K);
• D/L conditions: clear sky and 1.5 dB rain attenuation (99.7% of the time in zone K);
• required E1,/No = 6 dB for quasi error free operation
Table 5 gives the required transmit EIRP of the DSNG terminal. The following conclusion can be drawn: • operation at the satellite edge of coverage (-0.5 dB/K, 42.5 dBW contours) would require the use of a DSNG terminal with transmit EIRP larger than 65 dBW, (67 dBW is the figure foreseen by the EBU transmission plan). This is the case of a typical vehicle mounted DSNG terminal (1.5 m antenna, 250-300W TWTA);
• a transmit EIRP of 64 dBW, as provided by the RAI DSNG terminal in the 350 W configuration, would be adequate to operate from the satellite up-link edge of coverage (-0.5 dB/°K), with reception within the 45 dBW satellite D/L contour (e.g. Rome and central Europe);
• in the same favourable receiving locations within the satellite coverage (e.g. Rome), a reduced EIRP of 60 dBW, as provided by the RAI DSNG terminal in the 125 W version, is sufficient to operate with adequate margins with up-links from the +2.5 dB/K contour (e.g. Sicily).
These results are applicable to the whole EBU satellite network taking into account that most European countries are located in more favourable .climatic zones (e.g. H and E) than K.
Table 5. Transmit EIRP of DSNG terminals for operation at 8.5 Mbps QPSK-3/4 in the EBU network (EUTELSAT II F4M). Standard EBU RX station (33.5 dB/K)
Satellite G/T contour
[ dB/K I
Satellite 45.0 dBW
EIRP 42.5 dBW
Clear sky
99.7% a.y. U/L fade
99.7% a.y. D/L fade
Clear sky
99.7% a.y. U/L fade
99.7% a.y. D/L fade
- 0.5 dB/K (edge of coverage)
61.0 61.8 63.0 61.5 62.3 65.0
+2.5 dB/K (e.g._ Sicily)
58.0 58.8 60.0 58.5 59.3 62.0
CONCLUSIONS
The DVB-S system, originally developed for DTI-! 3. digital TV broadcasting, offers very good performance also for DSNG applications, thanks to its wide availability, technical reliability and flexibility. This 4. allows the development of light and reliable digital SNG terminals, characterised by a significant reduction of the transmit power requirements (EIRP) with respect to the current FM/TV analogue SNG operation. 5.
REFERENCES
I. ETS 300 174: "Network Aspects, Digital Coding of component television signals for contribution quality applications in the range 34-45 Mbit/s", June 1991.
2. ETS 300 421: "Digital broadcasting systems for television, sound and data services; Framing
structure, channel coding and modulation for 11-12 GHz satellite services", March 1996. M. Cominetti, A. Morello, M. Visintin: "Digital Multiprogramme - TV/HDTV by satellite", EBU Technical Review, No. 256, summer 1993. M. Barbero et alii: "Towards Digital Production and Storage of Compressed Video: How to Find the Right Path?", Broadcast Asia '96 Conference Records,
A. Morello: "FlasherV: a flexible bit-rate transmission system for digital HDTV outside broadcasting by satellite" Globecom 93, Huston, USA
6. Moro, R. Vitalone: experimental portable transmit terminal for digital SNG", ESA Conference, Siviglia April 1993.
"An
485

486

RADIO/TELEVISION TECHNICAL REGULATORY ISSUES Wednesday, April 9, 1997
2:00 - 5:00 pm
Chairperson: Dane Ericksen, Hammett & Edison, Inc., . San Francisco, CA
NEW FCC RADIO FREQUENCY EXPOSURE PROTECTION GUIDELINES James B. Hatfield P.E. Hatfield & Dawson Consulting Engineers, Inc. Seattle, WA
*FCC RFR UPDATE Robert Cleveland, FCC, Washington, DC
*RFR ROUNDTABLE Robert Cleveland, FCC, Washington, DC Robert Greenberg, FCC, Washington, DC William Hammett, Hammett & Edison, San Francisco, CA Richard Tell, Richard Tell & Associates, Las Vegas, NV Christopher Imlay, Booth, Freret & Imlay, Washington, DC James B. Hatfield P.E., Hatfield & Dawson Consulting Engineers, Inc., Seattle, WA
*FCC/FAA PANEL John Allen, Airspace Consultant, John F.X. Browne John F.X. Browne & Associates, Robert Greenberg, FCC, Washington, DC Jerrold Sandors and Stephen Rohring, FAA Donald Everist, Dippell and Everist, P.C., Washington, DC
"EAS PANEL Leonard Charles, WISC-TV, Madison, WI, Larry Krudwig, National Weather Service, Kansas City, MO Frank Lucia, FCC, Washington, DC
•Papers not available at the time of publication
487

488

IMPACT OF NEW FCC NIER GUIDELINES UPON BROADCASTERS
James B. Hatfield. P.E. Hatfield & Dawson Consulting Engineers
Seattle, WA
ABSTRACT
Following the mandate of the Telecommunications Act of 1996 the Federal Communications Commission (FCC) has updated its guidelines for evaluating the environmental effects of radiofrequency emissions. These new guidelines, or maximum permissible exposures (MPE), are based upon the recommendations of the National Council on Radiation Protection and Measurement (NCRP) and IEEE/ANSI C95.1-1992, "Standard for Safety Levels with Respect to Human Exposure to Radio Frequency Electromagnetic Fields, 3 kHz to 300 GHz" (C95.1-1992). The new MPEs are more restrictive for the general public than for RF workers and are the lowest in the range offrequencies from 30 to 300 megahertz (MHz). The impact of the new standards on broadcasters will be minimal where local governmental authorities have imposed general population exposure limits modeled on C95.1-1992, but limits stricter than those of C95.1-1982 will apply to areas where the general public may be present that are not already covered by local RF exposure ordinances.
INTRODUCTION
In its Report No. DC 96-76 dated August 1. 1996 the FCC released ET Docket No. 93-62. This action implements provisions of the Telecommunications Act of 1996. The report states, "The Commission also incorporated in its rules provisions of Section 704 of the Telecommunications Act of 1996 which preempt State or local government regulation of personal wireless services facilities based on RF environmental effects, to the extent that such facilities comply with the Commission's rules concerning such RF emissions.- It further states.
"The new RF guidelines will apply to station applications filed after January 1, 1997.. ..The new guidelines for ...MPE will apply immediately to non-excluded applications for equipment authorization for portable, mobile, and unlicensed devices...". PCS and cellular facilities are required to comply with C95.1-1992 as of August 1, 1996. The report also states "...we will apply our new guidelines to amateur stations". On Dec. 23, 1996 the Commission extended the transition period for determining compliance with new requirements for evaluating the environmental effects of RF electromagnetic fields for most radio services to Sept. 1, 1997.
The new Iv..:PEs are based upon National Council on Radiation Protection and Measurements (NCRP): "Biological Effects and Exposure Criteria for Radiofrequency Electromagnetic Fields," NCRP Report No.86 and IEEE/ANSI C95.1-1992. "Standard for Safety Levels with Respect to Human Exposure to Radio Frequency Electromagnetic Fields, 3 kHz to 300 GHz". Specified methods for the measurement of RF fields are contained in ANSI/IEEE Std C95.3-1991, IEEE Recommended Practice for the Measurement of Potentially Hazardous Electromagnetic Fields—RF and Microwave and NCRP REPORT No. 119 "A PRACTICAL GUIDE TO THE DETERMINATION OF HU MAN EXP OSURE T 0 RADIOFREQUENCY FIELDS".
NEW MPE GUIDANCE LEVELS
There are two MPE levels, CONTROLLED ENVIRONMENTS. and UNCONTROLLED ENVIRONMENTS. for occupational and general
489

public exposures, respectively. These are defined in C95.1-1992 as follows:
controlled environment. Controlled environments are locations where there is exposure that may be incurred by persons who are aware of the potential for exposure as a concomitant of employment, by other cognizant persons, or as the incidental result of transient passage through areas where analysis shows the exposure levels may be above those shown in Table 1B but do not exceed those in Table 1A. The means for the identification of these areas is at the discretion of the operator of a source.
uncontrolled environment. Uncontrolled environments are locations where there is the exposure of individuals who have no knowledge or control of their exposure. The exposures may occur in living quarters or workplaces where there are no expectations that the exposure levels may exceed those shown in Table 1B. Transitory exposures are treated under Controlled Environments.
The FCC MPE limits are shown below in Tables lA and 1B. The Controlled Environment electric field MPE limits specified by the Commission are virtually unchanged from the C95.1-1982 limits that have been used by the Commission as guidance levels for more than ten years. The Uncontrolled MPE limits are one fifth of the Controlled limits from 3 MHz to 100 GHz. The VHF (30 to 300 MHz) portion of this frequency range includes broadcast TV and FM stations, two way communications, aeronautical and other services and is the frequency range of highest human absorption. Below 1340 kHz the Controlled and Uncontrolled Environment MPEs are the same. The time over which the average exposure can be at the MPE limit is six minutes for Controlled Environments and thirty minutes for Uncontrolled Environments. Thus, according to the Commission MPEs, the general public can be exposed to the same fields for a longer period of time than the workers.
With regard to induced and contact currents the report states, "...in view of the continuing questions and difficulties relating to evaluation of induced and contact currents, especially with regard to measurements, we are not adopting the
Table 1. LIMITS FOR MAXIMUM PERMISSIBLE EXPOSURE (MPE)
(A) Limits for Occupational/Controlled Exposure
Frequency Range (MHz)
Electric Field Strength (V/m)
Magnetic Field Strength
(A/m) (mW/cm2) (minutes) Power Density Averaging Time
0.3-3.0 3.0-30 30-300 300-1500 1500-100,000
614 1842/f 61.4
1.63 4.89/f 0.163
(100)* (900/f2)• 1.0 £300 5
f = frequency in MHz * = Plane-wave equivalent power density
(B) Limits for General Population/Uncontrolled Exposure
Frequency Range (MHz)
6 6 6 6 6
Electric Field Strength (V/m)
Magnetic Field Strength (A/m)
Power Density Averaging Time (mW/cm2) (minutes)
0.3-1.34 1.34-30 30-300 300-1500 1500-100,000
614 824/f 27.5
1.63 2.19/f 0.073
(100)* (180/e)* 0.2 f/1500 1.0
30 30 30 30 30
f = frequency in MHz • = Plane-wave equivalent power density
490

exposure guidelines for induced and contact currents at this time.-
EVAULATING COMPLIANCE
A revised guide to compliance with the new MPE limits has been issued in draft form by the FCC: OET BULLETIN No. 65, SECOND EDITION, "Evaluating Compliance With FCC-Specified Guidelines for Human Exposure to Radio Frequency Radiation". This document has recommendations for the measurement and computation of RF exposures from FCC licensed facilities. It also shows charts and graphs for determining distances from antennas where the MPE is exceeded.
These graphs and charts can be used to determine the distance at which fences must be placed around AM towers to enclose those areas where the MPEs are exceeded. The computations upon which the distances are based are much improved over the methods used to generate the same data for the original OST 65 of 1985.
1600
1400
1200
1000
800
400
200
0
COMPLYING WITH MPEs ON TOWERS
A graph of the power levels that can be maintained by AM stations so that their towers can be climbed without exceeding the MPE is shown below from the appendix of draft OET No.65.
A reliable current probe, that was not available when OET issued its report, is being produced by Holaday Industries. This device can be used to determine safe RF power levels for tower climbing by indicating the current flowing in the wrists or ankles of a person on a live tower. The MPE is generally not exceeded if the body current does not exceed 100 mA for frequencies from 30 kHz up to 110 MHz.
When towers are climbed where there is exposure to fields from FM or TV antennas the station power reduction that is necessary to not exceed the MPE can be determined by referring to the appendix of OET-65. For complex situations measurements may be necessary. In addition, personal RF detectors such as the Nardalert can be worn by tower climbers to assure that the MPE is not exceeded.
Projected AM Broadcast Power Levels to Meet Occupational/Controlled Limits
ron-towe(n exposure only)
FCC/EPA Study (without gloves)
1,--M 0.150 wavelength V • V 0.500 wavelength
A— u& 0.250 wavelength S —IP 0.625 wavelength
0-0 Tell Study 025-0.625 wavelength (without gloves)
0-0 Tell Study 0.25-0.625 wavelength (with gloves)
540 600 700 800 900 1000 1100 1200
Frequency (kHz)
1300 1400 1500 1600
491
CONCLUSION
The new guidance levels adopted by the FCC are not based upon the most recently enacted standards. NCRP REPORT No.86, which forms the basis of the new Commission MPEs, is six years older than ANSI C95.1-1992. NCRP has much tighter magnetic field limits for most AM stations than does C95.1-1992 with a limit of 1.63 amperes per meter (A/m) for frequencies up to 1340 kHz and lower than 1.63 Aim for higher AM frequencies. The entire AM band is, however covered by the same electric field limit.
Another effect of the new Commission NIER regulations is that the use of contact current measurements to help resolve the issue of RF hot spots is not included as a part of the Commission's new procedure. It is somewhat of a help tobroadcasters that that the new Commission regulations do not require routine contact and induced RF current measurements around broadcast transmission facilities.
492

THE MARRIAGE OF PC AND BROADCAST: A LOOK AT THE FUTURE Thursday, April 10, 1997 9:00 am - 12:00 pm
Chairperson: Andy Butler, Public Broadcasting Service, Alexandria, VA
DATA SERVICES IN DIGITAL DBS
Chai Yeol Rim Munhwa Broadcasting Corporation Seoul, Korea
*DEVELOPING THE DESTINATION BIG SCREEN
BROADCAST PC Susan Nail Gateway 2000 North Sioux City, SD
USE OF SERVER-INCLUDES FOR WEBSITE AUTOMATION Michael C. Rau Radio Data Group, Inc. Fairfax, VA
*SOFTWARE PROGRAMMABLE MULTI-FUNCTION WIRELESS MODULES: IMPLICATIONS FOR THE BROADCAST AND CONSUMER ELECTRONICS INDUSTRY David Murotake Sanders, a Lockheed Martin Company Nashua, NH
BROADCAST ON-LINE TV - A NEW ELECTRONIC MEDIUM FOR ThE DISTR.BUTION OF
INFORMATION Rudolf Werner Lorenz Deutsche Telekom AG
HOW SATELLITE TRANSPONDERS CAN BE USED IN DIGITAL BROADCASTING - MULTI-PROGRAM
BROADCASTING POSSIBILITIES Hideo Yamauchi Nippon Television Network Tokyo, Japan
•Paper not available at the time of pub.ication
493

494

Data services in digital DBS
Chai Yeol Rim, Woo Sung Jeon Munhwa Broadcasting Company, Seoul, Korea.
Abstract For the Korean DBS data services, we
analyzed the data services and proposed the data service broadcasting method. We analyzed that the data service can be categorized as the datal service which is closely related to the AN program, and the data2 service which is not related to the specific AN program but informative to the user like electronic program guide, and data3 service which is transmitted to only one receiver decoder like the VOD services.
I. Introduction There are many expert groups which study
the information communication. DAVIC (Digital Audio VIsual Council), ATM forum, MMCF (MultiMedia Communication Forum), and ITU's GII (Global Information Infrastructure) etc. are examples of such expert groups. Based on the several standard results, the data services can be easily integrated. DAVIC V1.0 Specification[1] integrates the VOD system based on the ATM network using the MPEG2 standard, and display the result on STU (Set Top Unit) according to the MHEG5. DAVIC V1.1 and V1.2 specification include the interne service and JABA VM (Virtual Machine).
The DAVIC, ATM forum and MMCF use the ATM network, but the service provider uses the satellite link to send the video / audio / data and uses the modem lines for the user interaction in the Korean DBS system. The data bandwidth of the transmission line from the service provider to the end user is wide, but the bandwidth of the
receiving line from the user is very narrow. Because the data communication environment and their communication methods used in the DAVIC, ATM forum and MMCF are different from the DBS system. It is some difficult to apply directly their data communication structures to the DBS. Data communication environment for DBS data service should be analyzed first.
II. Korean DBS Systems Features The main features of the Korean DBS
system is the digital TV services which is similar to the European DVB format. We use the MPEG2 audio / video coding, modified service information format of DVB for the electronic program guide and common DVB scrambling algorithm. We send the broadcasting signal through the 6 transponders for the broadcasting. The main features are expressed in Table 1. Fig. 1 shows the block diagram of the DBS receiver decoder.
Even though we started the digital DBS system, we focused only on the transmission of the video / audio through the statellite channel. We have neglected that the digital DBS data services can give various broadcasting services in addition to the video / audio services. NBC started the data services early in analog broadcasting system [2], i.e. the analog TV and the analog FM broadcasting system. The VCR reservation services, teletext and FM sub-data services are the examples of data services. But we feel some difficulties in delivering the data
495

services due to the low bit rate for the communication. We can start the real data services in the digital broadcasting system. Because the data and the audio / video data can be transmitted in the same format in digital
broadcasting system, it is more flexible to assign the data rate to the data services. We can overcome the limited data rate which we encounter in the data services on the analog broadcasting system.
Items Contents number of transponder 6 Tr. for BS number of channel per Tr. 4-8 Channels / Tr. Broadcasting services various services are possible but only the TV
service is defined video format 720x480x601, 4:3 or 16:9 video source
MPEG2 MP@ML encoding / decoding audio format 481(1-1z sampled source
MPEG1 encoding / decoding system MPEG2 transport packet electronics program guide the modified DVB SI (Service Information) pay TV service
T n kl . 1 T h.,. .........:... r _ _..__ _ _ _ _ c al TI•
use the common DVB scrambling algorithm, SMART card, modem . • • . •• - — uiani IcaLures 01 me orean digital UBS system
Service Provicder
I Moiem 1 User
CPU
INPUT SIGNAL
Channel Decoder
Memory
SMART Card
MPEG-2 Transport Decoder
• External Interface
MPEG-1,2 AN
Decoder
A/V OUTPUT
Fig. 1 Block diagram of the DBS receiver decoder
III. Classification of the Data Services The features of the data services are
DVB IDescrambler
followings. The data service in the broadcasting system is needed to be repeated with a certain
496

period, but it will be updated at some time. We know that the EPG (electronic program guide) is an example of such data service. The EPG service is repeated with a period but it will be updated at some time. If the receiver receives the EPG data once, the receiver does not need to receive the same EPG data again. The receiver checks EPG data version, and determines whether the EPG is updated or not.
We feel the need of the data service which can give additional information to the main TV or radio service. For example, additional information attached to drama programs, sport programs and travel guide programs etc. can give more information to the user. Using the data service, we can give information about the casting, the story of the drama, the actors, hotels, history of the nation and the travel agencies. The closed caption service is also one example of the data service. In the analog TV, the data services can be provided with the Intercasting method.
There is another type of data service which is independent of the video / audio program and informative to all users. That kind of data services are the electronic program guide, emergency data and pure data service streams.
When the specific user or specific receiver can request the data service, that service need not be notified to other users or receivers. While
PI P2
watching the TV program, the user may request more information to the service provider, and the service provider can send the requested data to the user through the broadcasting line. The request is done by the data modem line, and the interactive service can be built. We can apply that type of the data service for the VOD system, but it can not be used directly due to the cost.
The display of the data services can be done by two methods. One is that which can be displayed on the STU (Set Top Unit) without intervention of the user. The other is that which needs the users intervention to be displayed on the STU. For the last one, it is necessary that the STU notify the user when the new data service is arrived.
In this paper, we would like to propose the system reference model as shown in Fig.2 for the data service. We classify the three data service types as data 1, data2 and data3. When the data service is related to the specific audio / video program, we categorize it as datal. When the data service is not related to the specific audio / video program but it is informative to the user or subscriber management information to the user, we regard it as clata2. When the data service is related to the specific receiver decoder, we categorize as data3.
P3 P4 •• .... — —
Data 1 Audio MPEGI
Video MPEG2
RSMS
Data Data 2 Data 3
Private PES I
MPEG2 PES MPEG2 PSI
Private PES 2
Private PES 3
MPEG2 IS
FEC
QPSK Modulation
Antenna
Fig. 2 System Reference Model for the data services
497

We propose to send the P1 which is composed of video / audio / data services, P2 which is EPG service or RSMS (Resource Subscriber Management System) message, and P3 which is related to the specific receiver decoder. For the flexibility of the data format, it is more desirable to describe the content of the data service with the HTML or JABA language. The structure is very similar to the DAVIC V1.0 specification system reference model.
IV. Transmission Methods of the Data Services
The data packets may be composed of one file or several files according to the data service type. When the data is composed of several files, it should be integrated into one file using the TAR format. After the PES packetization process of private_stream1 which is similar to the one used in DAVIC V1.0 specification, load the PES data on the payload of transport packet and transmit the data packets. Table 1 shows the private streaml PES packet format which contains the integrated data file using the TAR format.
Syntax no. of bits defined values _ Private_ stream 1 _ PES_packet(){
private stream 1 PES_packet_header() _ _ data_identifier 8 x private_streamjd 8 x private_stream_version_number 8 x private PES_packet_data() _
}
able 1. The syntax of Private_stream_l_PES_packet
Sub_Data_descriptor syntax no. of bits Sub_Data _descriptor ° { descriptor_tag 8 descriptor_length 8 for (i=0; i<length; i-H-) {
reserved 2 direct_indirect 1 Sub data2 PID 13
)
}
Table 2. Syntax of the Sub Data Descriptor
Private_stream_l_PES_packet_header(), data_identifier, private_stream_id, and private_ PES__packet_data() are similar to the DAVIC
V1.0 specification, and private_stream_version_ number is inserted to show the version of the data service. Because the data packets are transmitted
498

repeatedly over a period for the data service, there should be a version number to indicate whether it is new or not.
Using the PSI information in MPEG2, the PID of the data packet and the data type are informed to the receiver decoder. The PID of the datal service packet is described in the PMT packet which includes the PID of video / audio packets. The PID of the data2 service is described in the sub _ data_ descriptor() included in the NIT of DVB service information. The sub _ data_ descriptor() is showed in Table2. We get to know the PID of the data3 service packet when the receiver decoder request the data
service to the service provider through the data modem line. Because the other user does not have to know the existence of the data3 service, there is no need to make the PSI structure to inform the PID of the data3 service packet to the receiver decoder.
V. References [1] Digital Audio-Visual Council, "DAVIC 1.0 Specification", Dec., 1995.
[2] Mill Freeman PSN INC., "NBC 's Intercast is Now", TV Broadcast, pp78, July 1996.
499

USE OF SERVER-INCLUDES FOR BROADCAST AUTOMATION
Michael C. Rau Radio Data Group Fairfax, Virginia
ABSTRACT
Integrating websites with broadcast station operations is one of the most challenging tasks of the coming years. It is well-settled that websites must be kept current and interesting, in order to continue to attract listeners and viewers. But stations in general
can not afford to hire specialist staff merely to maintain the website; therefore, software tools are called for that bring station operations to the website with little staff or expense overhead. The use of server-include technology forms one such possible foundation for suitable software programs. This
technology excels where website content must be generated in highly structured environments.
INTRODUCTION
An increasing number of radio and television stations are using websites as a way to leverage the information and content held by the station onto the world-wide web. Stations use websites to augment sales, undertake customized and inexpensive research projects, develop better ties with listeners, and as a way to make available popular station information
such as current contests, promotions and remote events.
Yet many station websites are seriously underused and undersupportecL Although the reasons for underuse may vary, one of the most popular reasons is that station personnel do not know how to update a website, or, if they do know how, they don't have the time or they are not the appropriate person to be doing the updating.
Using server-include technology, this paper shows
how a station can integrate its website into station operations without requiring any new people, or any new skills.
STATION BUSINESS CONSIDERATIONS
Naturally, a station can always hire a new person, or pay their hosting service in order to keep their site updated. Station information can be faxed, emailed or delivered to a third party with the necessary expertise and software tools.
But this clearly isn't an optimal situation for the station. For one thing, reliance on any third party to do site maintenance invariably introduces additional delay into the process and also the possibility of error. In fact, error becomes more
likely where the station's contractor doesn't possess broadcast experience.
Stations also could train a staff person in HTML, purchase or acquire the necessary software tools, and update the site internally. Developing expertise in HTML would clearly be an asset for most stations, and could lead to consistent and timely website updates.
But few stations can afford their own webmaster, and most station staffs are very busy doing the jobs they are supposed to be doing. Moreover, updating a website using raw HTML can be a cumbersome process. And if one is in a rush, errors can be made that disturb the look of the website. One typo or omission can seriously affect the page being worked on!
500

Finally, from a management perspective one would ideally prefer that the station's website be updated using the creative and content skills held in the various station departments. For example, one would prefer that the promotions director write the updated promotions copy; the music director prepare the updated playlist, etc. Frequently, even if a station has a staff person with some level of HTML expertise, that isn't the person that has the best information for the site. If the goal of updating a website is to put the best information up for station listeners, then the process of updating a site must be integrated into station operations; it should become a part of station operations, so that the site is a
natural extension of what is taking place on the
air.
What is clearly needed are inexpensive and useful
tools to allow any station staff person to update a section of a website without knowing anything about HTML, and to do so in an error-free manner. Such tools are now emerging, and an increasing number of radio station sites are using
them.
DESCRIPTION: SERVER-INCLUDE TECHNOLOGY
The basis of server-include technology is to build station websites whose pages have embedded code that performs a single and well-defined function:
A file is caused to be inserted whenever the page is pulled by a client web browser. The server parses the HTML page, sees that a file is called for as an include, and inserts the file on the fly as the web
page is served. See Fig. 1.
directory accessible via password protected web page. The software design accepts the desired input content and generates the necessary insertfile. Accompanying software performs related but necessary tasks, such as deleting out-
of-date events from a list of station promotions.
Perl was chosen for most of the software programs supporting server-includes. Perl is a tremendously flexible language with most of the capabilities of languages such as C and C++. Perl is easy to customize for individual stations or for specific unique needs. One of the negative aspects of Perl
-- that it is an interpreted language, and thus slower to execute than a compiled language --really doesn't apply in the situation of server-includes. These Perl programs are used for administrative purposes, and thus do not present much of a process load on the host computer. On nearly any x86 system or RISC processor, the load
is invisible.
Moreover, using server-includes insures that resulting web pages are visible by the maximum number of web browsers and operating systems. Unlike Microsoft ActiveX, Netscape JavaSript and others, the viewing web browser and platform does not have to be part of a proprietary web development environment; and Perl programs are portable to all web server platforms and processors. The universality of server-includes is helpful to the station wishing to reach the maximum audience for its website material. However, some web servers must be specifically
configured to support server-include capabilities.
<center> Here is our playlist for the week of <!--#include virtual="date.txt" --> : < /center>
<p> <hr width=70% align=center size=2> <p> <!--#include virtual = "music.txt" --> <p>
Fig. I: The files "date.txt" and "music.txt" are called as includes in this portion of HTML.
The insertfile itself is produced using dedicated software operated by station personnel. This software takes the form of advanced CGI scripts, written in Perl or C, and is installed in a secure
A SIMPLE SERVER-INCLUDE PROGRAM
By way of example, the following Perl program updates a single block of text on the station's home page (Fig. 2).
501

#!/usr/local/bin/perl
# Copyright 19%, Radio Data Group, Inc, Fairfax, VA, # For licensing information, contact: # [email protected]
################################## # GLOBAL VARIABLES ############ ##################################
print "Content-type: text/html": print "\n\n";
$path="/usr/local/WWW/WebSites/zspanish.corn"; $name="Z-Spanish"; $gif="/m0000005.gif"; $wid="218"; $hgt="150";
$background=" <body bgcolor= \" 4000099 \" > "; $title="Z-Spanish Text"; $pagename="/index.shtml"; $progname="/cgi-bin/textscroll.p1"; $homepage="/index.shtml"; $backups = "yes"; $sizetitlebox = "40"; $rowstextarea = "15"; Scolstextarea= "60"; $firsttext="firsttext.txt";
############################# # SUB PAGE #################
# This subroutine prints the input form for the updateable text
sub page (
print " <CENTER> <img src= \"$gin" alt= \"$name\""; print "width= \"$wid\"";
print "height= \ "Mgt\ ""; print "$background"; print " < /CENTER> <P>"; print " < H2> <CENTER> $title< P> "• print "ADMIN PAGE< /H2> <P> <H12>"; print " < /CENTER> <P> <P>";
print " <FORM METHOD= \ "POST\ " ACTION= \"$progname" > ";
print "Enter the information in the following dialog box."; print " <TEXTAREA Name= \"text\" ROWS =$rowstextarea"; print "COLS = Scolstextarea> < /TEXTAREA> <P> "; print " <P> ";
print " < INPUT TYPE= \ "submit\ " VALUE= \ "ENTER\ " > print " <INPUT TYPE= \"resen" VALUE= \ "RESET\ " > "; print " <P> <FONT SIZE = -2> Copyright, 1996 RDG, Inc. < /FONT> "; print " </FORM> ";
# End of sub page
hi this section, variables are set
up that control certain user
options such as name of the
client, their logo, background,
and other options.
The print "Content-type"
command is required for Perl
to know what kind of output is
being requested; in this case,
HTML capable of being carried
by HTTP protocols.
The variable $firsttext carries
the name of the file that will be
called as a server include.
The Page subroutine generates
the input form to accept user
data.
502

################################## N SUB SAVE ################################
# this sub routine does RDG standard form parsing
sub save (
if (SENV{'REQUEST_METHOD'} eq 'POST') ( # Get the query string, & decode it.
# Data have been presented as text between ampersands, # in the form name =value # make a list of keyword/value pairs
@pairs --= split(/&/, $buffer);
# cycle through each pair and decipher the values foreach $pair (@pairs) ( # Get the name/value pair strings ($name, $value) = split(/=/, $pair); # Convert plus's to spaces $value = — tr/+/ /; $value = — si% ([a-fA-F0-9] (a-fA-F0-9))/pack( " C " , hex($1))/eg; #add the pair to a list keyed on the name of the variable Scontents{Sname} = $value;
} }
# print form contents to database txt files.
$firstbase = join(",Spath,"/",$firsttext); unless (open(FIRSTBASE," > $firstbase")) (
} print FIRSTBASE (" < BR> $coments{'texe}");
close(DATABASE);
# Print confirmation screen to user
prim $background; print " <CENTER> <IMG SRC= \ "$gifr ALT= \ "Sname \ " "; print "WIDTH = Swid HEIGHT =Shgt > < /CENTER> <P>"; print " <CENTER> <h3 >Web Page has been Updated </h3 > </CENTER> <P>"; print " <CENTER> "; print " < A HREF= \ "Spagename \ " > <H3 >Check out the updated page. < /A> <P> "; print " < A HREF= \"Thomepage\"> < H3 > Return to Home Page. < /A> "; print " < /CENTER> "; print " <P> <P> <P> <FONT SIZE = -2> Copyright, 1996 RDG, Inc. < /FONT> ";
}
# End of sub save
The subroutine "Save" does
parsing of the input form. It
checks to make sure the proper
method is being used (the
"Post" method), then extracts
the data from the input form
according to the standard
interne Common Gateway
Interface ("CGI") protocol.
After parsing, the data entered
by the user is available to the
program in an associative array with the array value keyed on
the name of the input field.
The user's data is printed to the
file that will be called by its
host web page.
The program concludes by
printing a confirmation to the
user and links to related pages.
503

############################## # MAIN PROGRAM ############ ##############################
read (STDIN, $buffer, $ENVCCONTENT_LENGTH'));
if ($buffer eq "") {
&page(); } else {
&save();
# End of main program
#############################
These lines of code are the first lines of code. Basically, the program execution is altered depending on whether there is any input data present in the variable $buffer.
Fig. 2
LI MITATIONS OF SERVER-INCLUDE
TECHNOLOGY
The idea of using Pen l programs to facilitate the
updating of station websites works very well for simple
text, table or form updates where the formatting of the information is to remain constant. The software
programs embed formatting information in the context of the print subroutines; and these subroutines are not
intended to be changed by station personnel.
To perform more complex updating -- such as a change to an entire page, or adding new pages and new links --
there aren't any alternatives to editing the underlying
HTML of the station web pages. For these types of updating, a webinaster or web developer is needed.
Yet server-include technology can be taken quite far.
Using increasingly sophisticated programs, it is possible
to control more precisely the content of a web page. For
example, it is possible for a station to edit or remove a single event in an HTML table of events (Fig. 3), where
the supporting administrative program stores event information in a database and permits HTML-based
query and edit for any of the event information. In
addition, features can be added to the administrative programs that help reduce errors. For example, one can
make sure that a proper day, date and month combination is being entered by the station staff person.
Check Check to to remove! edit!
11
Please confirm!
Date I& Time
Wednesday, Febracry 5. 10.DO pm-'. 2 31 mid
• Thur3day. Fetruary 6, 9: )D m 12.00mi
Fig. 3
CONCLUSION
In conclusion, it is shown how simple server-includes can be used to provide website maintenance functions.
A simple program was provided and described. Some
of the limitations of server-includes are also described,
together with some sense of the limits to which this technology can be taken. In essence, server-includes
can be used effectively for routine, well-structured areas of website maintenance. These techniques fail where
the content to be updated requires entire re-organization and re-coding of the applicable web page.
504

Broadcast Online TV - A New Electronic Medium for Distribution of Information
R. W. Lorenz Deutsche Telekom AG. TZ Postfach 10 00 03
D-64276 Darmstadt, Germany [email protected]
Abstract Analog TV broadcasting offers a platform for digital data transmission which can be used for the evolution of new services without requirement of new radio frequencies. Data transmission in the vertical blanking interval of the TV picture signal is proposed for this purpose. However, it is not compatible with Teletext, which is transmitted in the large majority of the German TV programs. Broadcast Online TV (BOT) is transmitted in the horizontal blanking interval and does neither interfere with the TV picture nor with the TV tone nor with Teletext. BOT is transmitted at an error-protected data rate of 152 kbit/s and allows for very flexible multimedia broadcast services. The receiver is installed on a PC plug-in board. Feasibility tests of BOT where performed at several terrestrial television transmitters, via TV transposers and in cable channels. A pilot
project starts in Frankfurt. Germany, in 1997.
1 Digital terrestrial broadcasting for data
distribution systems
Several pilot projects were started for the terrestrial digital broadcasting system DAB in Germany. The terrestrial digital video broadcasting system DVB-T is evolving into the final phase of its development. DAB and DVB-T are characterized by a large flexibility in the composition of audio- and video-programs, respectively, with program- and non-program associated data (PAD and NPAD) for multi-media services. In the case of
A. Finger Technische Universitat Dresden Institut fur Nachrichtentechnik D-01069 Dresden, Germany
DAB these data can be received also by mobiles.
Only two frequency bands were allocated in Europe for DAB, one in the 230-MHz and the other one in the 1.5-GHz bands, respectively. This allows only for the coverage with two frequency blocks in a given region. In each block up to six audio programs can be transmitted as well as a few hundred kbit/s NPAD. The necessity for parallel broadcasting of audio programs in analog and digital platforms intensifies the shortage of radio frequencies. Because of the capability of mobile reception the NPAD were allocated primarily for services which are interesting for car-driving users. The restriction to one frequency block per band and region is limiting the evolution of radio data services for non-mobile users on the one hand and the small variety of programs does not initiate the production of low-cost receivers at large quantities. on the other hand. Therefore, DAB is not developing at a great pace
There has not yet been allocated any frequency band for DVB-T in Europe. Three frequency blocks are expected to be allocated by the end of the century. Therefore, difficulties impeding the fast evolution of DAB hold also for DVB-T.
The digital broadcasting systems DAB and DVB-T are offering evident advantages in comparison to FM-radio and analog TV: Improved transmission quality, more efficient utilization of the frequency spectrum, lower transmitter power, larger local probability of coverage and. in the case of DAB, a
505

reasonable improved quality of mobile reception. However, the majority of radio listeners is not appreciating these advantages to the consequence that they would invest a larger amount for the digital receiver compared to the analog set-up. The digital broadcasting systems should offer new services to make the advances evident to the listener.
The access to popular information in intemet is characterized by embarrassing delays because of queuing especially for up-to date information which is required by many users simultaneously. This problem of internet leads to the potential of large acceptance for distribution of up-to date information by digital broadcasting. However, due to the shortage of radio frequencies DAB and DVB-T and, in consequence the lack of highly integrated
low-cost digital receivers do not allow for the promotion of data broadcasting for the time being. An alternative solution is offered by additional transmission of digital data via analog broadcasting services. This may offer
a potential for data broadcasting without any requirement for new radio frequencies.
The Deutsche Telekom is promoting DAB by several pilot projects. This is done by the establishment of transmitter networks, subsidizing digital receivers and the provision of a "Data Service Center" to collect the data and process them for transmission.
2 Analog TV
The standard for analog TV was defined more than 60 years ago. Only a short time later efforts were spent to add signals which had to
be compatible to old receivers, The second sound channel, transmission of color, Teletext and an improvement of quality in PAL Plus were successful results. Other proposals were not realizable because they would have caused interference in old TV receivers. Moreover, the picture quality was improved continuously. The addition of spread spectrum signals at very low levels, e.g., was invisible in old TV sets, however, reasonable deterioration of pictures in high-quality
modern monitors can be observed. Therefore, the insertion of additional data should not cause any theoretical degradation of TV reception.
2.1 Data transmission in the vertical blanking interval
In the PAL standard 50 lines are allocated to the vertical blanking interval (vbi). Only 14 lines are used for the vertical hold control. The rest of 36 lines was allocated to measurement and testing of TV quality. The progress of measurement techniques made it possible to use some of these lines for other purposes. Therefore, special attention was recently drawn to additional data transmission in the vbi. The lntercast Interest Group is
introducing in the United States a system which is using the vbi for data transmission. However, in Europe the vbi has been occupied already in the late 70's by a service called in general "Teletext" and especially in Germany, Austria and Switzerland "Videotext". Up to 18 lines in the vbi are used
for Videotext which was introduced in Germany in 1980 for up-to-date information. Millions of TV sets are equipped with Videotext decoders and almost all public and private TV companies offer this service. Compared to Intercast the performance of Videotext is rather poor. The display consists of text and simple graphics constructed 24 lines having 40 pixels. Nevertheless, some very popular TV-programs use Videotext successfully. Combinations of brain twisting games and telephone replies as well as statistical estimation of Videotext users demonstrate a large acceptance. Therefore, no TV program provider will subsidize
Videotext by another system of data transmission in the vbi
2.2 Broadcast Online TV applies the horizontal blanking interval
The Technical University of Dresden, Ger-many, has developed in cooperation with the Technical Center of the Deutsche Telekom a method of additional data transmission which degenerates neither TV-picture nor audio quality nor Videotext in TV receivers. This
506

method is called "Broadcast Online TV (BOT) ". The error-protected data rate in BOT is 152 kbit/s, which are inserted into the horizontal blanking interval (hbi). The position of the additional data is in the bottom of the line synch pulse as well as the black level front and back porches (Fig.1).
r_ blanking signal
inserted data data
color picture signal
color synchronization signal
horizontal synchronization pulse
64 is
\I Fig.1 Positioning of the additional data within the TV picture line
Moderate spreading of six chip per bit is applied. The maximum base-band level is 20 mV. This value lies within the level tolerances recommended for the hbi. One of the main innovations of BOT are precise positioning of the additional data in the picture signal and reliable synchronization at the receiver site. More details are reported in [1].
Many efforts have been spent in the past to use the hbi for additional data transmission. A method called "sound in synch" was developed in the 70s. However, the level of the additional data in this method was so large that compatibility to TV sets was not achievable. Jitter of horizontal synchronization as well as luminance noise are caused by sound in synch. Therefore. sound in synch was applied only in the signaling of program transmission lines to the transmitters but not in the air or cable interface of terrestrial TV broadcasting. The hbi is reset at the transmitter for extinction of sound-in-synch signals. Recently, the analog transmission from the TV studio to the transmitters was
replaced by digital signaling. Digital program transmission to the transmitter does not include the hbi because it does not contain any infcrmation produced in the studio. The purpose of the hbi is line synchronization, DC restoration and reference for color definition. The hbi is reproduced in the digital-analog converter at the transmitter site. Therefore, it is not possible to insert the additional data into the hbi already at the studio. The data inserter has to be installed at the transmitter. One of the main conditions for the development of BOT was that no infringement was necessary to the high-cost transmitter. Only a separate low-cost unit to be inserted at an existirg interface was accepted.
The insertion of the additional data at the transmitter site implies the advantage that BOT is not restricted to PAD. NPAD to be iiserted to improve regional diversity of programs. The Deutsche Telekom, e.g., operates more than 100 high-power transmitters in Germany for one identical TV program. The additional data transmitted by BOT may easily differ at the transmitters even if the same TV program is distributed. Therefore BOT incorporates a new very flexible digital radio transmission channel without requiring any new radio frequency bands. Data providers who are active only in specific regions can restrict their programs to the transrritters operating there. This principle is depictec in Fig.2.
data inserter 2
data inserter 1
data source 2
data source 2
TV - studio
data inserter 3
data source 3
Fic.2 Regional coverage of additional data by Broadcast Online TV
507
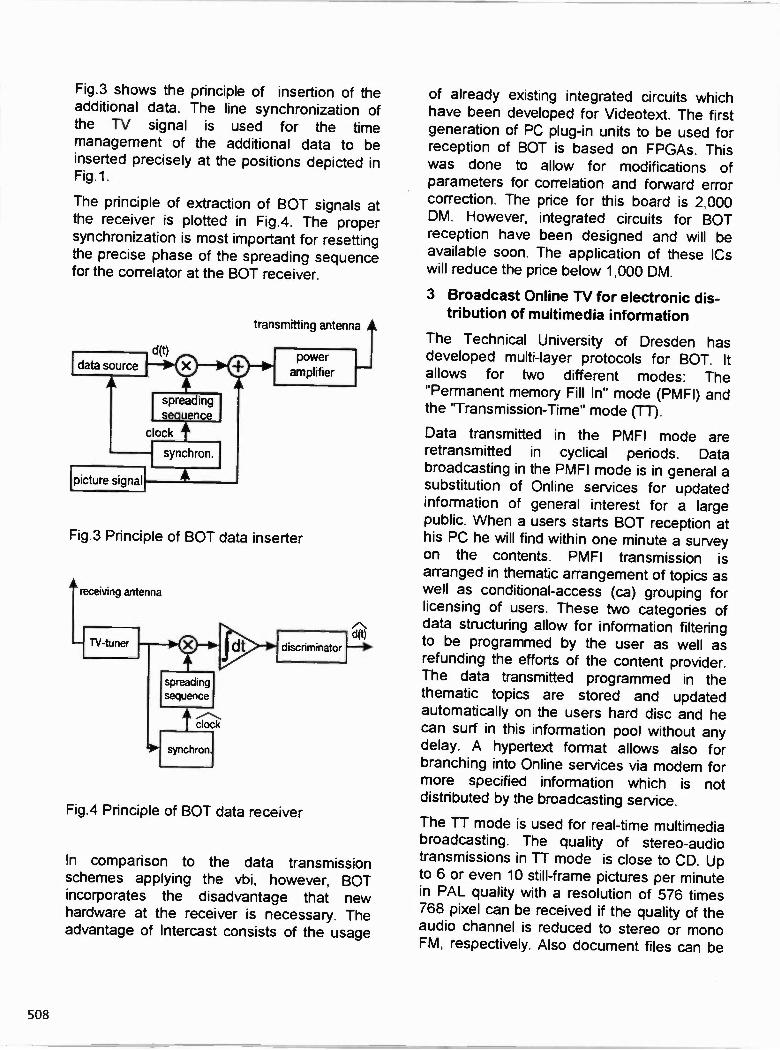
Fig.3 shows the principle of insertion of the additional data. The line synchronization of the TV signal is used for the time management of the additional data to be inserted precisely at the positions depicted in Fig.1.
The principle of extraction of BUT signals at the receiver is plotted in Fig.4. The proper synchronization is most important for resetting the precise phase of the spreading sequence for the correlator at the BUT receiver.
transmitting antenna
Fig.3 Principle of BUT data inserter
receiving antenna
Fig.4 Principle of BUT data receiver
In comparison to the data transmission schemes applying the vbi, however, BUT incorporates the disadvantage that new hardware at the receiver is necessary. The advantage of lntercast consists of the usage
of already existing integrated circuits which have been developed for Videotext. The first generation of PC plug-in units to be used for reception of BUT is based on FPGAs. This was done to allow for modifications of parameters for correlation and forward error correction. The price for this board is 2,000 DM. However, integrated circuits for BUT reception have been designed and will be available soon. The application of these ICs will reduce the price below 1,000 DM.
3 Broadcast Online TV for electronic dis-tribution of multimedia information
The Technical University of Dresden has developed multi-layer protocols for BUT. It allows for two different modes: The "Permanent memory Fill In" mode (PMFI) and the "Transmission-Time" mode (TT).
Data transmitted in the PMFI mode are retransmitted in cyclical periods. Data broadcasting in the PMFI mode is in general a substitution of Online services for updated information of general interest for a large public. When a users starts BOT reception at his PC he will find within one minute a survey on the contents. PMFI transmission is arranged in thematic arrangement of topics as well as conditional-access (ca) grouping for licensing of users. These two categories of data structuring allow for information filtering to be programmed by the user as well as refunding the efforts of the content provider.
The data transmitted programmed in the thematic topics are stored and updated automatically on the users hard disc and he can surf in this information pool without any delay. A hypertext format allows also for
branching into Online services via modem for more specified information which is not distributed by the broadcasting service.
The TT mode is used for real-time multimedia broadcasting. The quality of stereo-audio transmissions in TT mode is close to CD. Up to 6 or even 10 still-frame pictures per minute in PAL quality with a resolution of 576 times 768 pixel can be received if the quality of the audio channel is reduced to stereo or mono FM, respectively. Also document files can be
508

transmitted in the TT mode and can be stored on the hard disc. The quality of audio transmission and the frequency of still-frame pictures and file transmission can be allocated flexibly to the requirements of the content provider.
4 State of the development and perspec-tives for Broadcast Online TV
Field trials were performed successfully using 20-kW transmitters and several low-power transmitters by measurements of bit-error probability. The measurements were taken in areas covered directly by the transmitters as well as in valleys covered by TV transposers and also in cables systems. As expected, no degradation of the TV quality was observed. The inserted data were received reliably at all positions where the minimum level of the TV signal was received.
A pilot project starts in Frankfurt, Germany, in 1997. The Deutsche Telekom will provide 150 PC plug-in cards for this purpose. A 500- W transmitter of the Deutsche Telekom will be used which is transmits the commercial program RTL plus. The signal will be distributed also in several cable systems around Frankfurt. 700,000 inhabitants are living in the coverage area of the transmitter and the cable network is connected to 560.000 apartments.
RTL has approved the pilot project • if BOT disturbs neither TV picture nor tone nor Videotext which was proved and
• if the [PR, the regulation authority for broadcasting permits.
The LPR has published a request for a service provider. His task is to manage the data flow for BOT, to acquire content providers who offer a large variety of views and to allocate the data spectrum to them. Three different organizations have applied for becoming service provider and [PR will make a contract with one or a cooperation of them.
Several content providers were acquired who are very interested in BOT for developing new market segments in their business. The data management and the realization of the
transmission schedule according to the instructions of the service provider will be organized by the Data Service Center of the Deutsche Telekom.
According to conservative estimations the analog TV transmission will be operated at least for 15 years before it will be substituted by DVB-T. In the meantime DAB will evolve towards a full-area covering medium, because more frequency blocks will be allocated. In this con:ext BOT is a transition platform for distribution of digital data broadcasting. BOT offers for the time being the possibility to establish digital data broadcasting services using ar existing infrastructure with full area coverage. This service will be transferred later on the DAB and DVB-T platforms with improved performance.
5 Conclusions
Although the standard of analog TV is older than 60 years and a large number of zompatible amendments have been ntroduced since then the Technical University of Dresden has developed in cooperation with The Teclnologiezentrum of the Deutsche Telekom a new system for inserting digital data into the horizontal blanking interval (hbi). This new method evolved to "Broadcast Online TV" (BOT) which allows for digital data transmission at 152 kbit/s. BOT interferes neither with the TV picture, nor with the TV audio channels nor with Teletext. The latter point is most important because data transmission in the vertical blanking interval (vbi) is not compatible with Teletext which is widely spread in many countries of Europe. Millions of Teletext decoders as well as many popular TV programs which use Teletext as addition :o the program could not be used anymore if the vbi would be allocated to another data broadcasting transmission system like Intercast.
BOT allows for the introduction of a full-area covering digital broadcasting system by use of tle existing infra-structure of the Deutsche Telekom without any new radio frequencies.
5C9

Very flexible multi-media broadcasting can be transmitted by the BOT protocol which allows for a permanent-fill-in mode and a transmis-sion time mode. A pilot project starts in Frank-furt / Germany in 1997. BOT will be received by the use of PC plug-in boards and in a near future by TV sets equipped with PC inside.
References
[1] Finger. A. und Hiller, H.: Eine neue digi-tale Zusatzubertragung in analogen Fern-sehkanalen. 17. Jahrestagung der Fern-seh- und Kinotechnischen Gesellschaft (FKTG), Wien, 1996, pp. 476-485 (in German)
510

HOW SATELLITE TRANSPONDERS CAN BE USED IN DIGITAL BROADCASTING
- MULTI-PROGRAM BROADCASTING POSSIBILITIES -
Hideo Yamauchi Keiichi Saji
Nippon Television Network Corporation
Tokyo,Japan
Introduction
Developments in digital image compression
technology in recent years have lead to work
being undertaken, all over the world, towards
bringing about digital broadcasting. In
particular, digital broadcasting services using
satellites have already begun in some countries.
This has meant that tens to hundreds of
program services are now reaching viewers.
However, while the contents of these program
services tend to be more specialized, dramatic
changes away from the contents of conventional
programs have not been seen. In other words,
the current situation is that the widespread
belief is that "digital broadcasting equals multi-
channel services." Digital broadcasting by
nature, however, handles all information as
digital data, which leads us to foresee the
development of complex and flexible
applications that make no distinction between
media (e.g., image, sound, data). It is
envisaged that this will create unprecedented
forms of broadcast programs (that were not able
to be created before) and the possibilities for so-
called "multimedia-type program" production
will broaden.
We would like to report here that, in order to
explore the possibilities of such digital
broadcasting services, we have constructed a
system image model assuming the use of one
satellite transponder, and created the production
of multi-program applications (a single program
consisting of multiple channels). allowing users
to freely select the images they wish.
Digital Broadcasting Possibilities
Digital broadcasting has been pointed out as
having a number of advantages not enjoyed by
conventional analog broadcasting. These
advantages include the characteristic features of
existing digital broadcasting services such as
"multi-channel services (from several tens to
several hundreds of channels)" and -the
flexibility of programming" (Table 1) using
different image formats (such as Standard
Definition TV (SDTV), Enhanced Definition
TV (EDTV) and HDTV) on the same
transmission line. However, when one looks
at these in terms of each individual progr am,
one does not see contents that differ greatly
from existing analog broadcasting. In other
words. it can be said that these alone will not
dramatically change the viewers' styles of
viewing between analog and digital broadcasts.
511

Table 1 An example of programming flexibility
SDTV SDTV SDTV SDTV
HDTV SDTV
EDTV EDTV SDTV
SDTV SDTV SDTV Data service
SDTV SDTV SDTV SDTV
Band width
What can be said to be important about the
change between analog and digital is the
characteristic feature inherent to digital form,
that is the ability to handle all information such
as image, sound, and data as digital data
(represented as zeros and ones (0, 1)). This
ability makes it possible to create new, complex
and flexible applications that were not possible
before and that need not be aware of the type of
media, thus making broadcasting services that
are completely different from conventional
programs possible. For example, it is
anticipated that programs in a form that link
images and data or sound and data will be
developed. It is also anticipated that
unprecedented programs, the so-called
multimedia-type, interactive-type programs will
be developed that combine a variety of media,
such as single progr ams consisting of multiple
image channels (multi-programs). In other
words, depending on the development and
diffusion of applications, digital broadcasting
has the potential to completely transform
viewing styles as we know them.
Multi-program Broadcasting
Given the characteristic features of digital
broadcasting, as described above, we have
examined multi-program broadcasts that can be
regarded as having a great potential to develop
as a new progr am format. The concept of the
multi-progr am broadcasts system is shown in
Figure 1. Multi-progr ams refer to progr ams
that consist of multiple image channels.
Viewers' latent demand
In normal programs, multiple cameras are used
and the images that are switched from these
cameras are the images delivered to the viewers.
When this occurs, the cameras from which
images are not being taken continue to shoot the
subject, however, it has until now been regarded
512

Encoder &
Multiplexer
These images are linked for one program
Receiver (consists of Demultiplexer,
Decoder, Switching system and so on)
Figure I The concept of the multi-program broadcasts system
that, from the viewers point of view, from the
instant they are not taken these unused images
cease to exist. In other words, there is
absolutely no freedom for viewers to select what
and where they want to see. (passive viewing)
However, there are cases during sports
programs, music programs, and the like, where
what the multiple cameras (viewpoints) are
rapidly switching between is not necessarily the
viewpoint the viewer personally wants to see.
(Although of course the image switching is
carried out by professionals who are thinking
about the overall flow of the progr am and the
effect is highly polished.) There are probably
more than a few people who would like to be
able to switch the viewpoint when and where
they like. While such demands
(interactiveness) were impossible in the age of
analog broadcasting, they are entirely conducive
with the inherent features of digital
broadcasting, and it can be said that the
possibility of the establishment of systems that
meet such demands is extremely high.
Multi-program achievability
It is anticipated that digital broadcasting will, in
such ways, realize an interactive and
multimedia nature. So what about the
possibility of realization of multi-progr ams in
this scenario?
It is not very difficult to produce a number of
camera images using existing production
513

systems. This is because program production
is already being carried out on that scale and
images exist with different roles. Of course, it
is anticipated that if the role of each of the
cameras was further clarified and made more
distinct, with the premise of creating such
programs, this would broaden channel selection,
and combination of different channels would
make effective producing possible. For
example, with a baseball game broadcast, in
addition to the normal images, it would be
possible to have all manner of other channels,
such as a dedicated batter or pitcher channel, a
channel shooting the scene on the bench, a
channel following a certain player, and another
channel following the other team. Also, in a
concert broadcast, in addition to the overall
images, there could be a channel showing close
ups of the singer, a channel shooting the
musicians, a channel shooting the dancers, and
so on, and it can be envisaged that this could be
applied to a variety of other genres. The
potential for such multimedia-like production
effects is limitless.
On the other hand, from the viewer's point of
view systems are needed that allow efficient
switchover between these multiple related
channels while providing pleasant viewing,
enabling the viewer to gasp the overall picture.
It is thought that the use of current receivers for
this purpose will be difficult given the need for
screen switching, multiple-screen display, as
well as additional data display. It is predicted
that receivers will need to have a certain degree
of intelligence, namely that receivers combined
with personal computers will be necessary, and
there are many subjects that require
examination on the receiver side, including the
human interface issue.
Image Model Overview
The concepts expounded so far are merely
theoretical discussion and with few specifics on
the actual appearance of such application. In
particular, it is a reality that it is difficult for
people, who are not experts in digital
broadcasting technology, to grasp the image.
To make the image of multi-progr ams more
concrete, we have created the contents for
multi-program use as one test model, and
examined the accompanying viewing system
image.
Assumed conditions
We assumed that one transponder would be
used in satellite digital broadcasting services,
given the need to meet ordinary services other
than multi-progr ams and to progr am flexibly.
Thus, we decided on a system that would allow
for four SDTV image channels as well as
transmission of sound, data, and so on.
Contents
We considered sports for which we thought it
would be easy to represent the features of multi-
programs, and prepared the scenarios for the
four images from cameras at different angles as
well as slow replay for a broadcast of a baseball
game and four images from different holes in a t
golf match broadcast. Thus, allowing viewers
to freely select the images as they wish.
514

Table 2 An example of program time table using one satellite transponder
NTV1 NTV2 NTV3 NTV4 16:00
multi-program Baseball
18:00 quiz animation music news
19:00 multi-program Golf
20:30 variety show drama quiz news
Baseball
- Image 1: Ordinary OA image
- Image 2: A variety of images of the pitcher,
batter, and other positions as taken from the
third base side bench
- Image 3: A variety of images of the pitcher,
batter, and other positions as taken from the
first base side bench
- Image 4: Slow motion images of highlights
Golf
- Image 1:
- Image 2:
- Image 3:
- Image 4:
Ordinary OA image
Image of the 18th hole
Image of the 17th hole
Image of the 16th hole
Also, we allowed for the four channels to be
independently broadcasting separate programs,
according to the time slot. This can be
regarded as one example of flexible
programming. (Table 2)
Viewing system image
Our image of the receiver, as described above,
is of an intelligent television, and we have
created a contrivance by which viewers can
easily switch channels and carry out different
operations using a remote control. Based on
the premise of having selections made in
transponder units as with existing analog
satellite broadcasts, we allowed confirmation of
all of the available programs from a menu
screen (Figure 2). The viewer then clicks on
the desired screen and the selection screen
becomes the receiving screen (Figure 3). In
addition. it is also possible to access a timetable
and inGependent audio channels and data
channels. These systems consist of a switcher
and a personal computer for control purposes.
The systems were achieved with consideration
given to the overall balance while endeavoring
to make the display method and operation
method as easy to look at and operate as
possible. with in the restrictions of the system.
Conclusion
We constructed a multi-program image system
as one model case in order to explore the
possibilities of digital broadcasting services,
and in that process examined material selection
and specifications. We obtained many
opinions that from being able to actually
515

experience this system, this unprecedented form
of program will, from the point of view of both
producers and viewers, be greatly innovative
while also broadening program scope, and it is
possible that it will act as a business hint for
new broadcasting services (increased use of
multimedia in broadcasting). However, on the
other hand, there are aspects of difficulty of
operation and display format that can not
necessarily be called user friendly, and there is
still ample room for examination of
optimization of the human interface. Thus, it
can be said that operability is the major issue to
be addressed in future. At the same time,
other issues can also be cited in the area of
production, such as adding value to each image,
developing production methods to effectively
bring out the characteristic features of multi-
programs, how to allow effective use of data,
and so on. In future, we intend to grapple with
such issues and examine how to achieve such a
system.
Initiatives such as this can be seen as a
broadcasting station pioneering new
applications that make use of their merits
towards the digital broadcasting age, and as the
first step in ascertaining the possibilities of
different services that meet the needs of the
forthcoming multimedia age.
Figure 2 Menu screen of the multi-progr am baseball game
516

awEii liuqasEq wariloid-pintu aquo uaans papaps E altblu

518

DIGITAL TV: ALLOCATION AND POLICY ISSUES Thursday, April 10, 1997
9:00 -10:30 am
Chairperson: Joseph Fedele, Fedele & Associates, Inc., N. Miami,
FL
*DTV COVERAGE ANALYSIS Hank Brandenburg Dataworld Bethesda, MD
*DTV CHANNEL ALLOTMENTS - TRANSITION TO
THE FUTURE Richard Smith FCC Washington, DC
*DTV ALLOCATIONS: BROADCASTERS ISSUES Art Allison NAB Washington, DC
*Papers not available at the time of publication
519

520

DIGITAL TV: EMERGING RF TECHNOLOGIES Thursday, April 10, 1997 10:30 am -12:00 pm
Chairperson: Joseph Fedele, Fedele & Associates, Inc., N. Miami, FL
THE CONSTANT EFFICIENCY AMPLIFIER Robert S. Symons Litton Electron Devices San Carlos, CA
*THE 60 KW SINGLE TUBE DIACRODE NTSC
TRANSMITTER ADAPTED TO 8-VSB Timothy P. Hulick, Ph.D. Acrodyne Industries, Inc. Blue Bell, PA
A NEW HIGHER POWER, IOT SYSTEM FOR ANALOG AND DIGITAL UHF TELEVISION
TRANSMISSION Roy Heppinstall EEV, Ltd. Chelmsford, Essex, Encland
•Paper not available at the time of publication
521

522

THE CONSTANT EFFICIENCY AMPLIFIER
Robert S. Symons Litton Electron Devices Division
San Carlos, CA and Williamsport, PA
ABSTRACT
An Inductive Output Tube (I0T), modified by the addition of a multistage depressed collector, has the interesting property of providing linear amplification with very nearly constant efficiency. In UHF television broadcasting of either NTSC or 8-VSB ATV signals, such a tube will reduce the power requirements of a television transmitter by one-half. Assuming that about 1000 such tubes will be used in the United States (based on current UHF TV usage), the annual power savings to U.S broadcasters will be about $25,000,000. U. S. and foreign patents are pending.
INTRODUCTION
A constant-efficiency linear amplifier has been the "holy grail" for transmitter designers and active-element designers ever since DeForest and Fleming built the first electronic amplifiers. Various approaches (e.g. the Doherty amplifier) have been tried, but today, television broadcasting depends primarily upon class-B amplifiers such as tetrodes or inductive-output tubes (JOT), in which the power supply current varies in proportion to the radio-frequency output current produced by the amplifier, or multistage-depressed collector (MSDC) klystrons, in which the average voltage at which the electrons are collected varies approximately as the radio-frequency output voltage. As a result, both
class-B amplifiers and MSDC klystrons require prime power and produce radio-frequency power with an efficiency which varies as the square root of the instantaneous output power. Although these amplifiers require about twice the power of a hypothetical constant efficiency amplifier when used to amplify an NTSC signal, they reduce the broadcaster's power bill to an amount about one-half of that for a class-A amplifier.
With the advent of digital television, there has been discussion of modulation such as 32-state quadrature amplitude modulation (32-QAM) with a peak-to-average power ratio of 10:1 and 8-level vestigial-side-band modulation with a peak-to-average power ratio of 4:1. This compares to 3:1 for the present NTSC signal. After some study of these signal statistics, the author of this paper concluded that using present-day transmitters, even less of the prime power consumed would find its way to the antenna.
It then occurred to the author that by putting a multistage-depressed collector on an inductive-output tube, the current and the collection voltage might each be made to vary as the square root of the output power, and the prime power might be made proportional to the output power providing constant efficiency over a wide range of output powers
A computer program was written which showed that with the proper distribution of
523

collector voltages, such characteristics were possible. Although others have suggested that an MSDC might improve the efficiency of an IOT at full output power, they realized the efficiency improvement at that output power level would be small because the IOT would already be fairly efficient, but they failed to recognize the enormous power savings at reduced output
For 8-VSB modulation a Constant Efficiency Amplifier (CEA) should require only one-half the input power of a conventional IOT. The U.S. and foreign patents are pending on constant efficiency operation of an MSDC IOT, and such a tube is under development at Litton Electron Devices in our Williamsport, Pennsylvania operation.
At the present time, no known vacuum tube or solid-state amplifier can match the expected efficiency of the CEA. There is no solid state analogy to a depressed collector because of the collisional nature of the electron flow in semiconductors.
DESCRIPTION OF THE CONSTANT EFFICIENCY AMPLIFIER
Figure 1 shows a somewhat schematic representation of the constant efficiency amplifier. The cathode, control grid, anode and output gap, and external circuitry are essentially identical with those of the inductive output amplifiers in use today in many television transmitters. Drive power introduced into the input cavity produces an electric field between the control grid and cathode which draws current from the cathode during positive half-cycles of the radio-frequency signal. For operation as a linear amplifier the peak value of the current, or more accurately the fundamental component of the current, is made as nearly as possible proportional to the square root of the drive power, so the product of this current and the voltage it induces in the output cavity will be proportional to the drive power.
It is important to realize that the inductive output tube differs from a triode or tetrode.
Figure 1. Schematic representation of an Inductive Output Amplifier with a Multistage Depressed Collector
524

Conventional vacuum tubes act as valves which control the current, and as a result some of the power-supply voltage appears across the output circuit, thereby reducing the anode voltage so electrons are not accelerated to an energy corresponding to the full power supply voltage. In the inductive output tube, the anode of the electron gun, which precedes the output gap and cavity, accelerates all electrons to the full power supply energy, and the electrons then give up energy to electric fields they create in the output gap. As a result, electrons leave the output gap with an energy spread. The energy of each electron at this point is equal to the power supply voltage minus the integral of the electric field that existed across the gap during the time of its passage (i.e., voltage multiplied by a coupling coefficient which accounts for transit time).
Because of the similarity between the spent electron beam in an IOT and that of a klystron or traveling-wave tube, it is possible to consider the use of a multistage depressed collector on an IOT to improve the efficiency. This has been considered by Priest and Shrader[1] and by Gilmore[2], but the idea was rejected because of the complexity of multistage depressed collectors and because the IOT already exhibited fairly high efficiency (-50%). In addition, because the current in a class-B device goes up and down in proportion to the square root of the output power, the efficiency of a class-B device such as an IOT as a linear amplifier of an amplitude modulated signal such as the NTSC signal was fully competitive with that of the MSDC klystron. In the MSDC klystron, the average collection voltage of the electrons goes up roughly as the square root of the output power. Perhaps it is only because the author of this article started his engineering career working with tetrodes, and after switching to klystrons, did the early analysis of the MSDC
klystron[3] that the idea of combining an MSDC with an IOT seemed to be a likely path toward a constant efficiency amplifier.
Returning to figure 1, following the output cavity is a multistage depressed collector in which several typical electron trajectories are shown. These are identified by the letters a through e. The collector electrodes are connected to progressively lower potentials between the anode potential and the cathode potential so more and more energetic electrons penetrate more and more deeply into the collector structure and are collected on lower and lower potential electrodes.
In considering • the difference between an MSDC IOT and an MSDC klystron, it is important to realize that in a class-B device no current flows during the portion of the r-f cycle while the grid voltage is below cutoff and the output gap fields are accelerating. As a result, it is not necessary to have any collector electrode at a potential equal to or below cathode potential. At low output powers, when the r-f output gap voltage is just equal to the difference in potential between the lowest potential collector electrode and the cathode, then all the current will flow to that electrode. Full class-B efficiency will be achieved under these conditions. As the r-f output gap voltage increases with increased drive power, then some electrons will have lost enough energy to the gap fields so they cannot reach the lowest potential collector, and current to the next to lowest potential electrode will start increasing. The efficiency will drop slightly and then start increasing again until all the current is just barely collected by the two lowest potential collectors, and so forth. Maximum output power is reached when the current delivered to the output gap is sufficient to build up an electric field or voltage which will just stop a
525

few electrons. At this output power, the current is divided between all the collector electrodes and the efficiency will be somewhat higher than the efficiency of a single collector, class-B amplifier. By the use of a computer simulation program, it is possible to show that, by proper selection of the collector voltages, one can achieve very nearly constant efficiency from the MSDC IOT over a wide range of output powers. For this reason, and to save letters, we have named the device the Constant Efficiency Amplifier (CEA).
THE SIMULATION PROGRAM
In the analysis of an idealized class-B device, the current is assumed to be proportional to the instantaneous grid voltage and the current is assumed to be a half-sinusoid. Various linearizing schemes are used to improve the validity of this assumption. At full output power the fund amental component of r-f current in this half-sinusoid is just sufficient to make the peak r-f voltage in the output cavity, or circuit, equal to the power supply voltage so the electron at the peak of the current waveform arrives at the anode or the output side of the output interaction gap with no excess kinetic energy. Other electrons arrive with energy corresponding to the difference between the supply voltage and the instantaneous output gap voltage. It is with such assumptions one can calculate that the maximum theoretical efficiency of a class-B amplifier is 7c/4 or 78.5%.
For comparison purposes, we have calculated the efficiency of a class-B IOT with a multistage depressed collector using similar assumptions. That is, if Ib and Vb are the peak beam current and the beam voltage of an IOT, we assume that for a relative r-f output
voltage or current of A, the instantaneous beam current in the IOT will be
for i = Alb cos o.)t
-7r./2 it/2
and i = 0 for the remainder of the cycle. We also assume that the electron energy emerging from the output cavity is
V = Vb(1-A cos c)t)
In an idealized multi-stage depressed collector with stage voltages ranging from ground potential to some negative potential just above cathode potential such that
0 = Vo>V1>V2>...>Vr,>-Vb,
we have assumed that each electron will reach the lowest potential collector electrode it has sufficient energy to reach and will not be collected by an electrode at a higher potential. It has also been assumed that any secondary electron emitted as a result of the impact of a primary electron will return to the electrode from which it came. This is a fairly good assumption if the electrons are collected on the "downstream" side of the electrodes as taught by Kosmahl[4] and others and as shown in figure 1. The program also calculates the current that flows to each electrode and the power that is dissipated on it as well as the total dissipation on all collectors and the efficiency for each r-f output voltage level chosen. Figure 2 illustrates the efficiency of a constant efficiency amplifier compared with that of a conventional IOT with the same electron beam. Note the large difference in efficiency at one-quarter of the maximum power output. This is important because the average power of an 8-VSB digital television
526
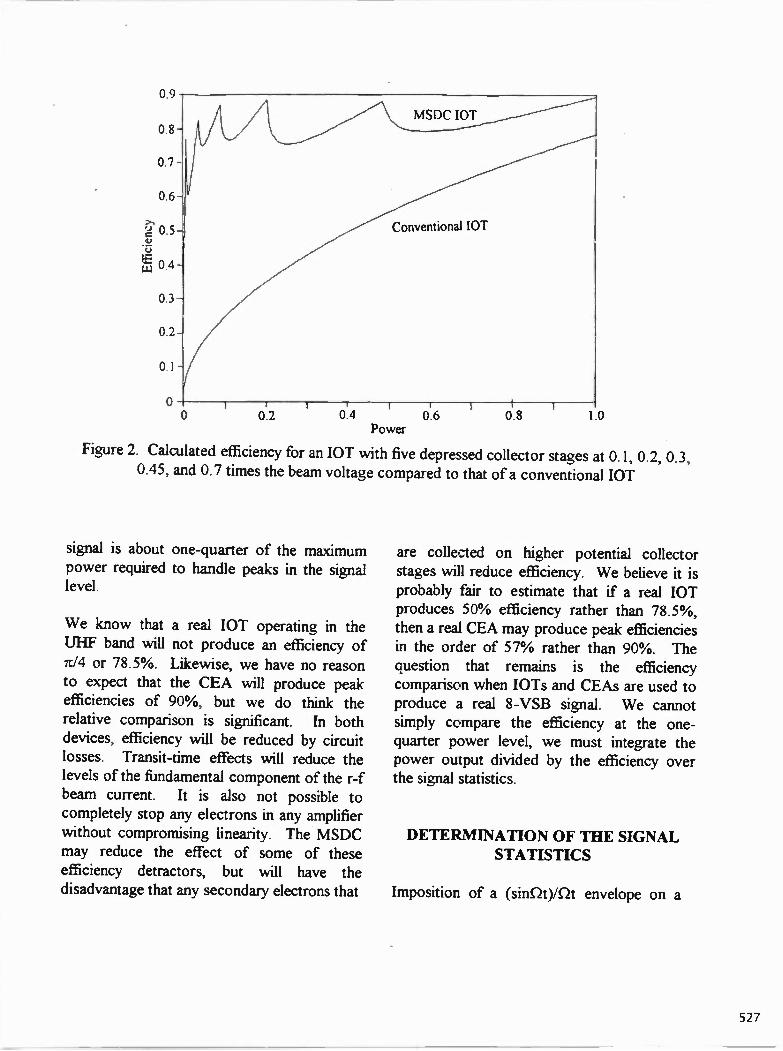
MSDC IOT
Conventional IOT
0.3-
0.2-
0.1-
0:2 0.4 0.6 Power
0.8 1.0
Figure 2. Calculated efficiency for an JOT with five depressed collector stages at 0.1, 0.2, 0.3, 0.45, and 0.7 times the beam voltage compared to that of a conventional IOT
signal is about one-quarter of the maximum power required to handle peaks in the signal level.
We know that a real IOT operating in the UHF band will not produce an efficiency of 7c/4 or 78.5%. Likewise, we have no reason to expect that the CEA will produce peak efficiencies of 90%, but we do think the relative comparison is significant. In both devices, efficiency will be reduced by circuit losses. Transit-time effects will reduce the levels of the fundamental component of the r-f
beam current. It is also not possible to completely stop any electrons in any amplifier without compromising linearity. The MSDC may reduce the effect of some of these efficiency detractors, but will have the disadvantage that any secondary electrons that
are collected on higher potential collector stages will reduce efficiency. We believe it is probably fair to estimate that if a real IOT produces 50% efficiency rather than 78.5%, then a real CEA may produce peak efficiencies in the order of 57% rather than 90%. The question that remains is the efficiency comparison when IOTs and CEAs are used to produce a real 8-VSB signal. We cannot simply compare the efficiency at the one-quarter power level, we must integrate the power output divided by the efficiency over the signal statistics.
DETERMINATION OF THE SIGNAL STATISTICS
Imposition of a (sinf2t)/f2t envelope on a
527
carrier with a balanced modulator will produce a double-sideband rectangular spectrum. Mixing this spectrum with a carrier of the original frequency and phase will reproduce the (sinf/t)/Qt modulation envelope, and if the phase of carrier is changed by 90° we will find that the amplitude of the detected envelope will fall to zero, indicating that there is no quadrature component contained in the spectrum. If we filter the spectrum to eliminate the lower sideband as is done in an 8-VSB ATV however, we will introduce a quadrature component. For our purposes we will consider a spectrum extending from co to W O), the components of which are represented by many small vectors of equal length arranged end to end, each rotating with an angular frequency slightly higher than the one nearer to the origin of the vector diagram as shown in figure 3. This whole vector diagram is rotating at the frequency to. At some point in time all the vectors are in line along the x axis to the right of the origin. This represents the phase relationship at the center of the (sin S20/S2t pulse. As time progresses each vector rotating slightly faster than the one to its left causes the array to form into a circular arc having the same length as the straight line along the x axis that existed previously. At a still later time the vectors wrap themselves into a smaller and smaller multi-turn circle in the upper half-plane. At earlier times, a small multi-turn circle in the lower half plane grows and stretches out into an arc and then the straight vector along the x axis. The projection of the array of vectors on the x axis is the amplitude of the in-phase component of the signal, and the projection on the y axis is the amplitude of the quadrature component of the signal. Figure 3 is actually a graphical representation of an inverse Fourier transform of the single sideband rectangular spectrum, and if we do the required
mathematics to find the values of x and y, we find that
and
V sin Slt x =
0.t
V(1 — cosnt)
in which V is the amplitude at t = 0. These functions are shown in figures 4 and 5 over the range -47c<f2t<47c. Figure 6 shows the locus of the tip of the modulation vector over the range -6/Ecnt<6n. Now that we know the in-phase and quadrature components of a single pulse, we can add together the amplitude of a large number, N, of pulses, each displaced by lin with -N/2 1/2 with amplitudes, V, of ±1, ±3, ±5 and ±7 individually chosen at random. We also add to the in-phase signal a pilot carrier of unit amplitude. We can now calculate the amplitude of the signal at a number (20) of equally spaced times in the interval -n<S2t<n. We have done this for 10,000 groups of 100 pulses of randomly chosen amplitudes. By counting the number of times the amplitude falls in any one of a number of equally spaced amplitude intervals, we can determine the signal statistics for an 8-VSB signal. These statistics are shown in figures 7 and 8. Figure 7 shows the probability, Pi(V), of the signal falling within an amplitude interval extending from V to V-1-0.1, and figure 8 shows the probability, P2(V), that the amplitude will be greater than V. Figure 8, of course, is the integral of figure 7 but is plotted on a logarithmic scale to make clear the number of pulses that will be modified if the amplitude is limited to some finite value. It turns out that if the peak voltage of an 8-VSB signal is limited
528

07
0.6
0.5
0 •
03
02
0.1
-o 1
-0.2
-0.3
-0 4
-0 5
-0 6
-07
1
01
0.8
07
0.6
0.5
0.•
0.3
0.2
0.1
-0.1
-0.2
0.3
05
0.7
0.6
0.5
0.•
0.3
0.2
o.,
-0. I
-0.2
-0 3
-0 •
-0 5
-0 6
-0.7
08
0.2
M•st
1 1 1
0.• 0.6 0.8 1.2 IS 1 a
Figure 3. Positions of sideband vectors at Qt=-71. C2 ), and flt=n for a rectangular SSB spectrum
-2* 2•7 -4a 4a
Figure 4. In-phase component of rectangular SSB spectrum vs. Clt
-4* .217 2,1 ax
Figure 5. Quadrature component of rectangular SSB spectrum vs. C2t
04
0.7
0.6
05
0.4
03
02
01
-0.1
-0_2
-03
-0 •
-0 5
-0 6
-0 7
0
-24 (17. Itt
2ita 01 att
4r• Osatla
-0.•
-4** 0'. -4*
-Craft< -27e
L 1. 1. 1 / 1 1 1 1 1
-C.2 0 0.2 0 • 0.6 0.8 I I 2 7 •
Figure 6. Locus of the tip of the modulation vector produced by a rectangular SSB spectrum
0.018
0.017
0.016
0.015
0.07•
0 013
0.012
0.071
0.01
0.009
0.008
0.007
0.006
0.005
0004
0.003
0.002
0.001
0
Voltage at Average Output Power
2 • 10 12 14 16
Figure 7. Probability, PI (V), that the voltage will be between V and V+0.1 vs. V for an 8-VSB signal
1 0030
0 IWO
0 0100
00010
00001
Voltage at Average Maput Power
4 O 2 4 6 a 10 12 14 16
Figure 8. Probability, P2(V), that the voltage will be less than V vs. V for an 8-VSB signal
529

to twice the voltage corresponding to the average power, the probability of limiting the amplitude of a pulse is very nearly three in one thousand. This limiting, of course, will occur in the interval between sampling times.
CONCLUSION
The data in figure 7 has been combined with the data in figure 2 to obtain the data in Table I. For a hypothetical IOT of maximum theoretical efficiency (78.5%), the average efficiency for an 8-VSB signal would be 40%. For the hypothetical CEA of figure 2, the average efficiency for 8-VSB modulation would be 80%. For a real IOT with a maximum efficiency of 50%, the average efficiency for an 8-VSB signal is calculated to be 26%. This is extremely close to the
experimental value determined by one transmitter manufacturer. If one assumes that the efficiency of a real IOT with a multistage depressed collector is reduced from the theoretical in the same proportion as that of a conventional IOT, then a "real" CEA should provide an average efficiency of 51% on an 8-VSB signal. However, one could argue that an MSDC might correct some of the problems that reduce the efficiency of a conventional IOT and one might legitimately hope for an 8-VSB efficiency higher than 51%. For the time being, we will leave that as a problem for the development engineers.
Table I
8-VSB Average Efficiency
Efficiency
Theoretical maximum
Practical
IOT CEA
41% 80%
26% 51%
REFERENCES
[I] D.H. Priest and M.B. Shrader, "The Klystrode - An Unusual Transmitting Tube with Potential for UHF-TV," Proc. IEEE, Vol. 70, No.11, pp. 1318-1325, Nov. 1982.
[2] A.S. Gilmore, "Microwave Tubes," pp. 196-200, Artech House, Dedham, MA (1986).
[3] R.S. Symons, "Depressed Collector Klystrons for High-Efficiency UHF Television," Proc. of the 36th Annual Broadcast Engineering Conference, pp. 90-95, NAB, Washington, DC (1982).
[4] H.G. Kosmahl, "Multistage Depressed Collectors -- A Review," Proc. IEEE, Vol. 70, No.11, pp. 1325-1334, Nov. 1982.
530

A New, Higher Power, JOT System For Analogue And Digital U.H.F. Television Transmission
Steve Aitken, David Carr, Geoffrey T. Clayworth, Dr. Roy Heppinstall, Alan Wheelhouse
EEV Limited, Chelmsford, England.
ABSTRACT
This paper describes the development of a 55 kW visual plus 5.5 kW aural common amplifier IOT system to satisfy the market need for higher powers. The new tube is based upon a successful lower power design, and the changes necessary to increase the output power whilst maintaining the established reliability and life potential of its predecessor are described.
Results of analogue tests on the new IOT are presented, but it is now recognised worldwide that the future of terrestrial u.h.f. TV lies with digital, not analogue, transmission. The paper presents results of a pro-gramme of experimental work aimed at the establish-ment of the digital performance of the new IOT system.
The results show that the new tube is capable of delivering peak digital powers in excess of 100 kW. It will therefore have a major impact on the USA digital TV scene as revealed by the FCC's Sixth Further Notice of Proposed Rule Making.
INTRODUCTION
A curious side-effect of the advent of digital TV (DTV) in the USA in the near future has been a significant demand for a series of very high power analogue u.h.f. television transmitters. This demand has led to the development of a new, higher power analogue TV IOT system which enables these high power transmitters to be constructed with fewer IOT systems operating in parallel than would otherwise have been necessary.
At the same time the debate surrounding the power levels likely to be required by DTV in the USA was further stimulated by the release in August 1996 of the FCC's Sixth Further Notice of Proposed Rule Making. Everyone involved in the business of DTV has analysed this document, trying to estimate how it may impact upon their particular interests. The authors are no exception and some results of their analysis are
presented. These support the view that a digital IOT system capable of at least 100 kW of peak output power is going to be required for DTV in the USA.
The linearity, efficiency and reliability of the IOT had already led to the development and widespread use in service of a range of IOT systems capable of providing output power in combined (visual plus aural) analogue TV service from 12 + 1.2 kW to 44 + 4.4 kW. The challenge of the present development was first to extend this to 55 + 5.5 kW and then to develop a digital version of the resulting analogue tube and circuit capable of producing digital peak output powers in excess of 100 kW with low signal-to-noise degradation at a defined bit error rate, and a good sideband performance. Tables la and 1 b detail the range of tubes available for analogue common amplifier and digital service, including in the final row of each the target parameters for the new higher power tube types.
In addition to the development of new tubes capable of producing higher powers than ever before, the market need for ever more linear systems was addressed by the development of a new ceramic insulated input cavity, which is described in the following section.
Beam Peak voltage sync. power
Tube typeA (kV) (kW)B
IOT9202R 26 22 IOT8202 26 22 IOT8303 28 33 IOT8303R 28 33 IOT8404 32 44 IOT8505 35 55
Peak envelope power (PEP) (kW)
38 38 57 57 76 95
Note A. R indicates air cooling. Note B. Peak sync. power corresponding to the PEP, assuming a 10:1 visual to aural ratio.
Table la. Range of common amplifier IOTs
531

Tube typec
IOTD140W 10TD14OR IOTD150W 10TD15OR 10TD270 10TD2100
Beam Voltage (kV)
26 26 30 30 32 36
Peak digital output power (kW)
42 42 55 55 77 110
Note C. R indicates air cooling, W water cooling.
Table lb. Range of digital 10Ts
DESIGN CONSIDERATIONS AND ANALOGUE PERFORMANCE
The design philosophy for the new tube was to draw upon the considerable accumulated experience that EEV has in the field of IOT TV amplifying devices. Consequently, familiar technologies and existing com-ponents have been used wherever possible. However, to achieve the increased output power, the design has departed from established 10Ts in several areas.
The collector has been redesigned to allow for the inevitable increase in power dissipation. Since much of the additional beam power is derived from a higher beam voltage, the collector has been lengthened to maintain a similar beam power dissipation density to that of proven 10Ts. The collector has also been given
CABLE TO GRID
R.F. INPUT LOOP
1.0.T.
a 'scrolled' outer surface to ensure efficient heat transfer between the coolant and the hot surface. Despite the increase in collector length, the new tube still maintains sufficient ground clearance to fit into existing designs of transmitter cubicle.
The r.f. output region has been redesigned so that for a given frequency, the primary cavity doors are now further from the tube than before. This ensures that the tube can be operated at a beam voltage of 35 kV without compromising the margin against r.f. voltage breakdown.
In parallel with the tube development, a novel input cavity has been designed. This incorporates a ceramic
dielectric in the construction of the coaxial r.f. choke system (see Figure la) instead of the previous rubber dielectric radial choke design (see Figure lb). The new cavity has a physical layout which allows for the introduction of r.f. and video decoupling assemblies close to the electron gun of the tube — an important factor in the improved performance obtained with this cavity. Investigations over the frequency range have also shown that improved uncorrected intermodulation products can be obtained if two variants of the input cavity are used. Figures 2a and 2b show the typical value of the worst intermodulation product as a function of frequency. These measurements were taken with a modulated ramp signal having a superimposed colour sub-carrier with a peak-to-peak amplitude of 250 mV and an aural carrier 10 dB down on peak sync.
z TOOTHED BELT
DRIVE SHAFT
TUNING DRIVE SCREW
CATHODE CONNECTION
CATHODE CHOKE
GRID CONNECTION
GRID CHOKE
Figure Ia. Schematic of input cavity incorporating a new ceramic dielectric choke
532

-64
—60
—56
0 —52 0 ce a.
O • 48
0 0 _44
cc
E-
-40 11)
-• 36 10 20 U.S. CHANNEL
CABLE TO GRID
R.F. INPUT LOOP
IOT TUBE
TOOTHED BELT
DRIVE SHAFT
TUNING DRIVE SCREW
TUNING DOOR
CATHODE CONNECTION
CATHODE R.F. CHOKE
GRID R.F. CHOKE
GRID CONNECTION
Figure lb. Schematic of input cavity incorporating a rubber dielectric radial choke
64
30 40 so 60
Figure 2a. Intermodulation products for the low channel input cavity
70
60
56
2 52 0 a.
O • 48
4C
O • 44 2 ce
I- • 413 cn ;LI
re
—• 36 10 20
U.S. CHANNEL
30 ao so 60
Figure 2b. Intermodulation products for the high channel input cavity
70
533

A majority of 10Ts operate in common amplifier mode but some users prefer to operate them as separate vision and sound amplifiers. The 10T8505 produced by this development can operate in common amplifier mode at peak envelope powers up to 95 kW, corresponding to the common amplifier powers of 55 kW peak sync. vision plus 5.5 kW aural. The corresponding vision-only tube, the IOT8700, can operate at peak sync. output powers up to 77 kW. Typical operating conditions are given in Tables 2 and 3 where it can be seen that linearity is easily correctable and Figure of Merit (FOM) performance is good.
Test channel
Nearest European channel Peak sync. output power (kW) Aural output (kW) Peak sync drive (W) Aural drive (W) Beam voltage (kV) Beam current (mid-grey) (A) Beam current (d.c.) (mA) 600 FOM (%) 111 L.F. linearity (°/0) 5 ICPM (°) 1 Differential phase (°) 2 Differential gain (°/0) 4 Intermodulation 55 products (dB)
US14 US33 US69
21 35 62
55 55 55
5.5 326 30 35 1.55
5.5 231 20 35 1.56
520 111 15 2 5 4 52
5.5 275 23 35 1.59
780 108 21 1 3 11 51
Table 2. Typical common amplifier performance IOT8505
Test channel Nearest European channel Peak sync. output power (kW) Peak drive power (W) Beam voltage (kV) Beam current (mid-grey) (A) Beam current (d.c.) (mA) 540 FOM (1'A) 143 L.F. linearity (°/0) 12 ICPM (°) 1 Differential phase (°) 5 Differential gain (/0) 1
US14 US33 21 35
75 75
350 247 35 35 1.5 1.69
520 128 20 2 5 3
US69 62
74
532 35 1.52
540 139 20
10 10
Table 3. Typical visual performance of IOT8700
DIGITAL PERFORMANCE REQUIREMENTS
The Sixth Further Notice of Proposed Rule Making
On August 14 1996, the FCC released the Sixth Further Notice of Proposed Rule Making. This comprehensive document provides a complete list of existing USA TV stations, together with, for each station, the channel being used for the present NTSC service and the allocated channel for the proposed digital service. The distribution of the stations between v.h.f. and u.h.f. bands is shown in Table 4, where it can be seen that 563 stations presently transmitting an NTSC service on a v.h.f. channel have been allocated a u.h.f. channel for their digital television service. The FCC document also gives the DTV power for each station. This is the computed average digital Effective Radiated Power (ERP) required to produce the same coverage area as the existing NTSC station. In some cases the computa-tion has estimated some extremely high values of average digital ERP, (up to 5 MW) particularly for those stations having a v.h.f. NTSC channel and a u.h.f. digital channel.
Service
V.H.F. U.H.F.
NTSC
694 969
Digital
131 1532
Table 4. Number of USA TV stations.
An average digital ERP of 5 MW corresponds to a peak digital ERP of 20 MW, assuming a peak-to-average ratio of 6 dB. Such power levels would require large, very expensive transmitters and it seems much
of more likely in these circumstances that the digital service will be provided by one reasonably powered
transmitter plus a number of lower power gap filler transmitters as required. Thus, in order to reach a view of the possible transmitter power requirements, it has been assumed that the maximum peak digital ERP out of any station will be 5 MW. This figure is also the maximum peak sync. ERP allowed for present NTSC operation. It is also necessary to assume an antenna gain and to allow for the feeder losses. In the absence of detailed information, an overall 13 dB gain figure has been used for this, along with a ratio of 6.3 dB for a peak-to-average ratio for an 8-VSB standard. Based on these assumptions, the number of stations involved as a function of digital peak power from the transmitter is quantified in Table 5. This clearly shows the value of extending the peak digital power capability of an individual IOT to more than 100 kW, to provide a 100 kW amplifier system for incorporation into the high power stations.
534
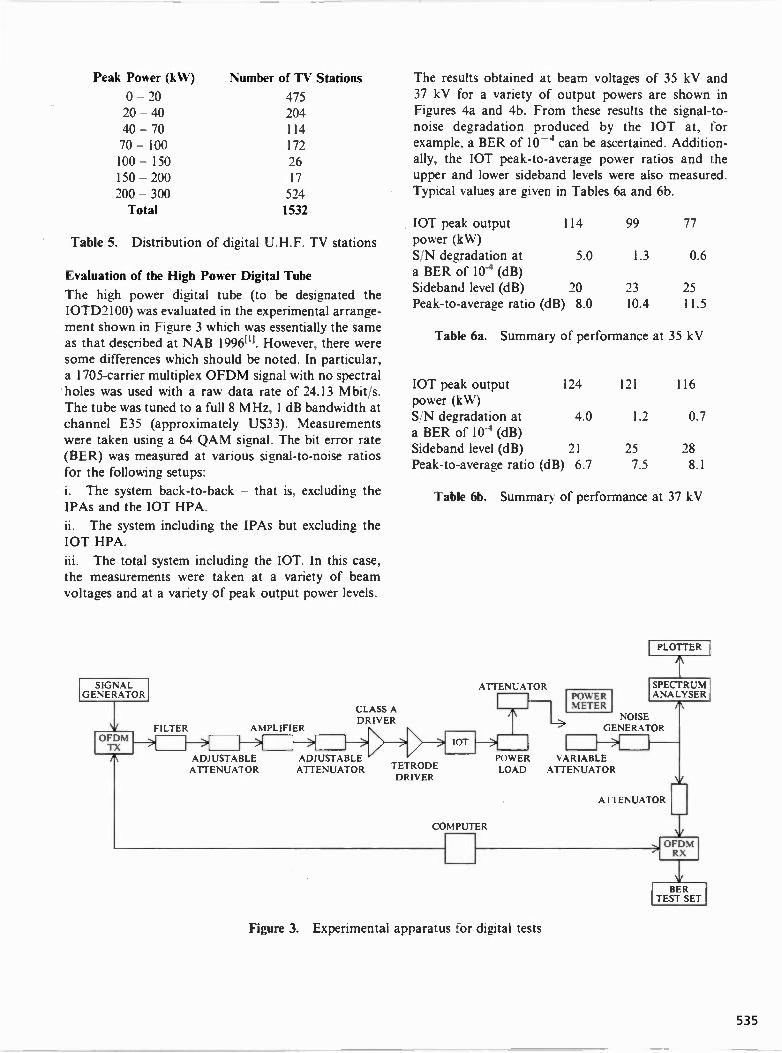
Peak Power (kW)
0 - 20 20 - 40 40 - 70 70 - 100 100 - 150 150 - 200 200 - 300 Total
Number of TV Stations
475 204 114 172 26 17 524 1532
Table 5. Distribution of digital U.H.F. TV stations
Evaluation of the High Power Digital Tube
The high power digital tube (to be designated the IOTD2100) was evaluated in the experimental arrange-ment shown in Figure 3 which was essentially the same as that described at NAB 19961U. However, there were some differences which should be noted. In particular, a 1705-carrier multiplex OFDM signal with no spectral holes was used with a raw data rate of 24.13 Mbit/s. The tube was tuned to a full 8 MHz, I dB bandwidth at channel E35 (approximately US33). Measurements were taken using a 64 QAM signal. The bit error rate (BER) was measured at various signal-to-noise ratios for the following setups:
i. The system back-to-back - that is, excluding the IPAs and the IOT HPA.
ii. The system including the IPAs but excluding the IOT HPA.
iii. The total system including the IOT. In this case, the measurements were taken at a variety of beam voltages and at a variety of peak output power levels.
SIGNAL GENERATOR
OFDM TX
FILTER AMPLIFIER
ADJUSTABLE ADJUSTABLE ATTENUATOR ATTENUATOR
CLASS A DRIVER
The results obtained at beam voltages of 35 kV and 37 kV for a variety of output powers are shown in Figures 4a and 4b. From these results the signal-to-noise degradation produced by the IOT at, for example, a BER of 10-4 can be ascertained. Addition-ally, the IOT peak-to-average power ratios and the upper and lower sideband levels were also measured. Typical values are given in Tables 6a and 6b.
JOT peak output power (kW) S,N degradation at a BER of 10-4 (dB) Sideband level (dB) Peak-to-average ratio (dB) 8.0 10.4 11.5
114 99 77
5.0 1.3 0.6
/0 23 25
Table 6a. Summary of performance at 35 kV
IOT peak output power (kW) S/N degradation at a BER of 104 (dB) Sideband level (dB) Peak-to-average ratio (dB) 6.7
124 121 116
4.0 1.2 0.7
21 25 28 7.5 8.1
Table 6b. Summary of performance at 37 kV
IOT
TETRODE DRIVER
ATTENUATOR
COMPUTER
POWER METER
PLOTTER
A
SPECTRUM ANALYSER '
NOISE GENERATOR
POWER VARIABLE VARIABLE LOAD ATTENUATOR
ATTENUATOR
Figure 3. Experimental apparatus for digital tests
OFDM RX
BER TEST SET
535

I0
10-
10-
10-
io-6
10 -8
S/N RATIO (dB)
10- I
I0
I0
10-6
c: 8 10-
SN RATIO (dB)
Figure 4b.
Figure 4a.
\ ....... \ ‘ S.
IOT 114 kW
- IOT 99 kW IOT 77 kW
— • • — • • — • • — • IOT INPUT
— — — — -BACK-TO-BACK N',
,
N
• • • N • \•.\ •‘
\ • \ \\ • •
• \ S. • •
‘ N \
\
\ •
S. \ ‘
\ ‘
%.. \ \ N
S :\ \
\ •. \ \ ‘
S. S.
N.
S.
\ • \ *,
\
N N.
•
N. .......
• • S. • ..5-.... ,
2- 24 26
BER versus S/N ratio at 35 kV beam voltage
28
•
„„,......s.
IOT 124 kW
IOT 121 kW IOT 116 kW — • • — • • — • • — • IOT INPUT
— — — — •BACK-TO-BACK
•:',"',*,..'• .t., ,
\ % v. ,..:,•,..
. N‘ v ss.........
,... N....N. ,.
••
\/‘
-.., •••
N , ‘ • N - • •.• •... •••• „...
N \• • \ -•
N 5.-.. ... N -- ..
N. — ..„
_
\ ‘ • \
N. ....„ •
N N
4 ..
-...
24 26
BER versus S/N ratio at 37 kV beam voltage
The results obtained give a good guide to the capability of the IOTD2100 for digital service. It is reasonable to assess this capability using an uncoded OFDM signal by examining its characteristics at a BER of 10-4 because this can readily be corrected using Reed-Solomon coding. It is expected that a signal-to-noise degradation of 1.5 dB and sideband levels of 25 dB can be corrected to produce a satisfactory system perfor-mance. The BER versus signal-to-noise ratio graphs show the characteristic tail-off due to the non-linearity
28
of the IOT at the highest digital peak power levels of 114 kW (35 kV) and 124 kW (37 kV). In both these cases the signal-to-noise degradation at a BER of 10-4 was 4 dB or more, and the sideband levels were relatively high (20 dB and 21 dB respectively). Further, the peak to average power ratio has been reduced appreciably by the tube from the 12.5 dB of the input signal to 8.0 dB and 6.7 dB respectively. In contrast, significant improvements were seen in all these areas when the peak power level was reduced.
536

CONCLUSIONS
The development work has resulted in an IOT for analogue u.h.f. TV service which significantly extends the upper power level capability of the existing range of tubes. Peak envelope powers of 95 kW can be obtained in common amplifier service. Further, the measure-ments reported here show that digital peak powers of over 100 kW can be obtained. These digital measure-ments were obtained using a 64 QAM OFDM signal and plans are in hand to do detailed characterisation of the tube for an 8-VSB signal. However, there is no doubt that the tube is suitable for amplifying 8-VSB signals, since these IOTs are presently being used for digital transmission in the USA.
ACKNOWLEDGEMENTS
The digital work reported in this paper was carried out using a modulator and receiver equipment manufac-tured by DigiMedia Vision Limited.
The authors wish to thank their many colleagues at EEV Limited in England and EEV Inc. in the USA for their valuable technical contributions to the work described, and also Geoff Gledhill and Neil McSparron of DigiMedia Vision Limited for valuable technical discussions.
The views expressed are those of the authors and not necessarily those of the General Electric Company of England.
INTELLECTUAL PROPERTY RIGHTS
This product is subject to one or more of the following US patents and corresponding patents in other countries: US 5548245 US 5239272 US 5536992
REFERENCES
I. An Inductive Output Tube and Circuit Optimised for Digital ATV G. T. Clayworth et al., NAB Broad-cast Engineering Conference, Las Vegas, April 1996.
537

538

FIBRE CHANNEL SEMINAR Wednesday, April 9, 1997 1:00 - 4:45 pm
Chairperson: Brad Dick Broadcast Engineering Magazine, Overland Park, KS
FIBRE CHANNEL RAID FOR THE DIGITAL STUDIO
Bill Moren Ciprico Plymouth, MN
TRANSPORT NG MULTIPLE STREAMS OF SERIAL DIGITAL OVER FIBRE CHANNEL Michael W. Pugh Digital Acoustics Grass Valley, CA Marc Friedmann Prisa Networks San Diego, CA
FIBRE CHANNEL AND TRADITIONAL VIDEO MERGE IN THE BROADCAST ENVIRONMENT TO FORM A POTENT SOLUTION Matthew H. Klein Hewlett Packard Company Santa Clara, CA
539

540

Fibre Channel RAID for the Digital Studio
Bill Moren Ciprico, Inc.
Plymouth, MN 55441
Abstract Fibre Channel is rapidly becoming an adopted high speed interconnection standard in the video and broadcast communities. Major vendors such as Tektronix, Hewlett-Packard, and Avid have endorsed the technology, legitimizing it for widespread adoption throughout the industry. One key application of Fibre Channel for the digital studio is in conjunction with RAID disk storage. This paper will introduce the use of Fibre Channel as a channel intetface for RAID devices. Fibre Channel technology basics will be covered as a foundation for the balance of the presentation. User benefits of Fibre Channel in the digital studio will be presented.
Visual computing and storage The likes of Jurassic Park and Toy Story have, in addition to providing entertainment to millions, generated mind share for the ever increasingly vogue world of visual computing. Compounding this is the popularity of the world-wide-web and surfing the net—visual computing for the masses. Behind the scenes of film and video production and other such data demanding applications (such as broadcast, medical imaging, prepress, and satellite telemetry), is an infrastructure with a foundation built on magnetic disk technology.
Without the disk foundation, there would be no way to store and move digitized representations of visual imagery at rates that provide an appearance that is natural in quality and speed. However, the performance and capacity of a
single high performance disk is far from adequate for performance-driven visual applications. As a result, dozens, or even hundreds of disks are used collectively to provide the performance and capacity for a large scale visual computing system. When large numbers of disks are put to use in a single site, the interface which is used to interconnect the storage subsystems and the host computers is the key to overall system performance.
Applications and their appetite for bandwidth
The bandwidth demands placed on a visual computing system stems from the nature of digitized visual data. In the simplest representation, an image is a three dimensional piece of data. A single image displayed on a computer or video monitor is a matrix of pixels with the total number of pixels determined by the height and width of the monitor (or other output medium). For instance, NTSC video is 640 pixels wide by 480 pixels high for a total of 307,200 pixels in the matrix. The third dimension is the amount of data used to color each pixel. It is common for 24-bits of data to be used per pixel. As a result, a single image (or frame) requires 7,372,800 bits ( 921,600 bytes) of data to digitally represent it. For other applications the analysis is similar in determining the natural storage requirement per image, though the actual values will vary greatly with application. Images based on color film (e.g. motion pictures, printed materials) are quite
541

large because the pixel matrix can range to a couple of thousand pixels per axis and 24-bits of color. Such high density images can easily
equire a few dozen megabytes of data per frame.
For many high bandwidth applications the
acquisition and playback of images require motion, as opposed to still imagery. To provide flicker-free viewing, images are typically transferred at between 24 (film) and 30 (video) frames per second (fps). Some applications may require half speed (15 fps) or double-speed (60
fps) depending on the application's sensitivity to motion and need for slow-motion and/or stepping a single frame at a time.
It is the combination of large individual frame sizes and the need to support motion that drives the need for high data transfer rate (both reading and writing) from digital storage.
Uncompressed NTSC format video with 24-bits of color per pixel requires a data rate of over 27 MB/second 1 (30 fps * 921,600 bytes/frame). Other high bandwidth applications will have natural data transfer rate requirements ranging
from around 15 MB/sec to well over 100 MB/sec (e.g. motion picture film).
Figure I depicts natural data rates for various frame sizes. The natural data transfer rate for digitized visual imagery is expressed as follows:
Data Transfer Ratemais. = (vert * horiz * color)I8* fps where: vert = number of vertical pixels per frame
horiz = number of horizontal pixels per frame color = number of bits of information per pixel fps = display rate in frames per second
State of the art disk technology does not
provide, in a single drive, the data rate needed for most visual computing applications. As of
late 1996, the fastest production 3.5" drives had sustainable transfer rates ranging from approximately 11 to 6 MB/sec, outer to inner zones. While advances in drive technology
1 MB/second = 1,000,000 bytes per second
typically result in a doubling of capacity every 18 months or so, the increases in performance are not as dramatic. The techniques used to increase capacity don't necessarily improve data rate performance (e.g. track density). Clearly, multiple drives will be required in any high bandwidth application to supply the needed transfer rate performance. For instance, at 6 MB/sec in the slowest zones of today's fastest drives, 5 drives are required to deliver
uncompressed NTSC video data rates (27.648 MB/sec).
Figure I - Natural data rates for various size frames.
125
100
al 75
M 50
25
0 100 200 300 400 500 500
Pixels per frame Maws.*
10 bes/pIxel 16 bltstplxel 24 bits/pbrel
700 800
32 Ms/pixel
Applications which use compression are not immune to the need for bandwidth. While compression can reduce the data rate for a single stream of video by a factor of 10 or so, many applications which employ compression do so to
support the delivery of many streams (e.g. movies-on-demand, commercial insertion and broadcast station automation, distance learning). In such applications the need to support
multiple streams drives the transfer rate requirement up, even though an individual stream may have modest transfer rate needs (< 10 MB/sec).
Network file transfer of visual data is another application for high bandwidth storage. Unlike transaction processing applications in which
networks tend to move small chunks of data per operation, visual computing applications must
542

move tremendously large files across networks. In the video production environment, for instance, it's not unusual for a single job to use dozens of gigabytes (GB) of storage (10 minutes of uncompressed video requires over 16 GB of storage). Conventional networking technologies can be prohibitively slow for moving a job between a central server and workstation. For example, the time to transfer a 16 GB job at 10 Mb/sec2 is over 3 hours. Of course, this example assumes the 10 Mb/sec network
was dedicated to the job-an unrealistic assumption. In practice, the actual time would be much higher. It is network performance
like this that has spawned the 'sneaker-net' in which the media in which a job is stored is physically moved from one system to another.
detriment of mirroring, the high cost of duplicating every drive in a subsystem, that was the impetus for the development of the other, more cost effective, RAID levels.
Figure 2 - RAID-3 stripes all user data to all the data drives in the array. The striping is in parallel, increasing data transfer rate performance.
High disk bandwidth from RAID
The ideal storage device for visual computing applications would have the sustained data transfer rate to satisfy the application, the capacity to hold the maximum possible content for any job, be so reliable as to never fail, and attach to the system as a single device for simple system integration. While these goals are excessive for a single disk drive they are attainable for RAID subsystems.
RAID, which is an acronym for Redundant Arrays of Independent Disks, is a set of architectural approaches to organizing sets of disks into single logical units. There are five different RAID 'levels' or architectures, each of which has unique properties and qualities. The first RAID level (RAID-1) is simple mirroring and was used as a reference model for all the other RAID levels. In fact, it was the main
2 Mb/second = 1,000,000 bits per second, or 125,000 bytes per second
RAI D MOVE User DAT A Data FA S T
Of the remaining RAID levels, two (RAID-2 and -3) provide excellent bandwidth performance while the other two (RAID-4 and -5) are targeted at transactional processing applications which tend to transfer small, randomly stored pieces of data. Of the bandwidth RAID levels, RAID-3 has become the de facto standard as it requires only a single disk per rank for redundancy, while RAID-2 requires multiple disks and therefore is more costly, with no performance benefit
RAID-3 offers transfer rate performance directly proportional to the number of drives in the array, provided the host interface has sufficient bandwidth. For example, a RAID-3 array with eight data drives will support sustained data transfer rates ranging from approximately 48 to 80 MB/sec when today's highest performance 3.5" drives are used (8 * 6 MB/sec and 8 * 11 MB/sec, inner to outer zones). Such performance is possible due to RAID-3's
543

striping architecture. User data is striped, in parallel, across all the drives in a RAID-3 array (see Figure 2). As a result, for any user data request (reads or writes) all the drives in a RAID-3 array will operate in parallel, with the subsystem's effective data transfer rate proportional to the number of data drives.
Another key attribute of RAID-3 is the ability to operate at full bandwidth after a single drive failure. While redundancy is a component of all RAID levels, RAID-3 is the only one in which performance after a drive has failed is no different than when all drives are operational. This feature is critical to any real-time environment, typical of most visual computing applications. Most integrators will specify their system's performance at the worst case operational conditions. Such specifications allow the end user to plan and load the system in such a fashion as to never have insufficient resources for the application. With RAID levels other than RAID-3, the worst case performance may be as much as 50% lower than the normal, or typical operating performance.
In addition, RAID-3 provides good isochronous performance, also crucial to real- time environments. While other RAID levels may provide good average performance, their instantaneous performance may be very unpredictable and unstable. Because RAID-3
operates all drives in parallel, there is no variance to the array's performance due to random positioning of individual drives. When large requests are made to a RAID-3 array, the best, typical, and worst case performance is very similar.
RAID-3's main performance attributes, bandwidth, failed drive performance, and isochronous operations, are ideally suited to applications which require either a few streams of uncompressed data or those that move a large number of compressed streams. Both paradigms typically move visual data in real-time, requiring
high bandwidth performance on-demand, under any operating condition.
A basic requisite for completely realizing the performance potential of RAID-3 is a host interface with sufficient bandwidth to move data at the drive's native rates. The most common peripheral interface today, Fast/Wide SCSI-2, is limited to 20 MB/sec. Most high performance RAID-3 arrays, whether they use four or eight drives in parallel, are able to saturate Fast/Wide SCSI-2, throwing away drive bandwidth. An extension to this interface, Fast-20 SCSI-3, doubles the interface rate to 40 MB/sec. While adequate for a number of applications, this interface doesn't provide sufficient bandwidth for operations at the limits of eight drives operating in parallel. Figure 3 illustrates how current drives easily saturate parallel SCSI interfaces when used in RAID disk arrays.
Figure 3 - Today's 7200 RPM drives can saturate popular parallel SCSI interfaces with typical RAID configurations (Le. 8 data drives).
Number of Drives to Saturate RAID Interfaces Typical 4 GB 7200 RPM Drives
100
ILCIMEMI
41ft.
IBITEto
-oh
2 3 4 5 6 7 8 9 10 11 Sustained Drive Data Rate
MB/secced
12
Rbre thannd 100 Medscand
40 lialisscsre Fed-20 SCSI
20 LIBIsssard SCS1-2
Fibre Channel, bandwidth for the future
Fibre Channel (FC) is an interface which has the capability to support the high bandwidth storage industry well into the next century. While relatively new to the marketplace, FC has been under development for a few years. In 1996 this interface garnered widespread acceptance in a variety of high bandwidth applications. During
544

1997, deployment of FC in production environments will be commonplace.
FC's name is a bit misleading. First, fiber optics are only one of the physical options of the interface. In fact, most of the initial implementations will use copper cabling for interconnections. Also, its use as a channel interface is only one possibility. FC is also well suited for use in networked environments.
FC is a serial interface, with data flowing a bit at a time through the media. By comparison, SCSI-2 is a parallel interface, with sixteen conductors in its cable, each carrying a bit of information in parallel. Being a serial interface does not make FC slow, however. In fact, FC is the fastest interface available. Full speed FC clocks data at 1 Gbitisec, with a net bandwidth on the interface of 100 MB/sec. There are slower speed options defined for FC as well, though they aren't gaining widespread acceptance.
Figure 4 - Fibre Channel is a multi-layered interface. Each layer provides a unique function. Layers are independent--e.g. the physical layer (FC-0) options are all valid for any software mapping (FC-4) option.
FC-4
FC-3
FC-2
FC-1
FC-0
CHANNELS
Fronting Protocol/Row Control
IP1 SCSI HIPP!
NETWORKS
B02,2
__L_
ATM
266 libitsts
531 MbItsts
1.062 Gettsts
Media Oplical-Laser, LED Copper-Coax, Twisted Pair
(Future)
FC-PH
The FC specification is layered (see Figure 4), with five main components. The lowest layer, FC-0, defines the physical options of FC. It is at this layer that the cabling and transmission options, as well as the connectors are defined.
The choice of media determines the highest possible transfer rate and maximum distances supported. For instance, the video coax cable option used in conjunction with ECL transceivers offer a maximum data rate of 100 MB/sec over a distance up to 25 meters. Alternatively, the 9-micrometer single mode fiber option supports 100 MB/sec transfer rates at up to 10 kilometers.
The next layer, FC-1, is the transmission protocol layer. This layer, like all FC layers, are independent of any of the other layers. FC-1 defines the byte synchronization and encode/decode scheme used to move data serially. FC has adopted an encoding scheme developed by IBM which encodes 8-bits of data in a 10- bit group.
FC-2, the signaling protocol, is layered above FC-1. This layer defines the protocol for moving commands, data, and status across FC. Within this layer the most basic unit of information is defined, called a frame. Frames consist of 36 bytes of header and control information and a payload of up to 2048 bytes. The payload component contains user data. With payloads of up to 2048 bytes, FC is very efficient, with only 36 out of 2084 total bytes per frame used for non-user data purposes (98%+ efficiency). FC-2 also defines other data structures such as sequences and exchanges which are comprised of frames and define complete data movement operations. Also embodied in FC-2 is the addressing scheme. The concept of ports is defined and is used to allow devices residing in a FC environment to have visibility of one another. The signaling protocol defines classes of service within FC. The different classes of service define methods of communication. Class 1 operations ensure a dedicated connection between two devices that are transferring data. No data can be transferred in Class 1 operations until an end-to-end link has been established between two devices. Once established, the link is not available to other
545

devices until the data transfer is complete. Further, this class of service also guarantees
delivery of the data with an acknowledgment of receipt. Class 2 operations also guarantee delivery of data with receipt acknowledgment,
but does not mandate a dedicated connection ("connectionless") between communicating
devices. Class 2 has lower overhead than Class 1, as the link between the communicating
devices isn't required to be established before an operation begins. Further, the link is not dedicated, allowing the link's bandwidth to be used for other operations. Class 3 operations are similar to Class 2, except that there is no confirmation of receipt. This type of service, also known as datagram, allows a device to
transfer data very efficiently by removing the acknowledgment requirement. This type of service is ideal for real-time operations, in which there is little value in resending the data if it didn't arrive on time.
Layers FC-0, FC-1, and FC-2 comprise the
physical layer of FC, called FC-PH. On top of FC-PH are the upper layers, which define higher level functions and software mappings.
FC-3 is the common services layer. Special functions are defined in this layer such as striping, hunt groups, and multicast. These services are defined to provide better overall performance by allowing a single port to have access to multiple ports, simultaneously.
The highest layer of FC is FC-4, in which upper layer protocols (ULP) are mapped to FC. It is at this layer that non-FC protocols are married to FC. For instance, the SCSI command set has an FC-4 mapping. Other mappings include
HIPPI, IF, and an ATM Adaptation Layer. This layer provides the personalization to a device, be it a peripheral such as a disk array (e.g. SCSI) or a network device (e.g. IP). A FC device
incorporating a SCSI ULP provides the systems integrator with a software environment which is very familiar. It is the marrying of the SCSI
command set through the FC-4 layer that allows FC to become one of the serial SCSI interfaces.
Channels and networks
Unlike virtually any other interface, FC has the built-in capabilities to be used both for channel
and network applications. It does this through
the support of differing topologies. The most basic topology supported is point-to-point. Thi
is the classic channel approach in which a link is dedicated to transferring data between two devices. This could be between a peripheral, such as a disk subsystem, and a computer. Or
possibly a high speed communications link between two computers. While providing extremely high performance between two
devices, point-to-point is restricted to supportin a single device.
Another topology supported is Arbitrated Loop. This topology spans both the channel and network environments. It allows up to 126 devices to coexist on a FC loop. Any devices on
the loop can move data between themselves. The devices can be a mixture of peripherals (e.g. channel) and computers (e.g. network). Arbitrated Loop essentially eliminates the single device restriction of point-to-point without requiring the use of network switches.
Through 1996, Arbitrated Loop became the most prominent implementation of FC, as most
disk drive and adapter vendors supported this topology. Further, because peripheral (and
adapter) implementations are the first to reach the market, most FC implementations are traditional channel applications, in which FC is used to interconnect disks and RAID subsystems to workstations and servers.
FC also supports a networking topology called fabrics. This topology in many ways resembles the telephone switching model for interconnecting devices. Unlike other
networking topologies in which devices must compete for network bandwidth, the fabric
546

topology of FC provides an architecture in which a virtually limitless amount of bandwidth can be implemented. Fabrics allow devices (peripheral, computer, or other fabrics) to have essentially a point-to-point connection to the fabric. Within the fabric (which is a hardware device) is the switching function which connects any two arbitrary devices (ports) on the fabric. Because each path between a device and the fabric is dedicated (the only exception being an Arbitrated Loop port connected to a fabric), the total available system bandwidth is only limited by the switching capacity of the fabrics themselves (in practice, specific products may have bandwidth limitations, but this is a limitation of the implementation, not the interface architecture). Figure 5 shows how all of Fibre Channel's topologies are able to communicate in a single operating environment.
Figure 5 - Fibre Channel supports a mix of point-to-point, Arbitrated Loop and fabric topologies. This allows a mixing of storage and networks in a single environment.
Fabric Nodes . .
Arbitrated Loop :Point-to-Point
Fibre Channel, RAID, and the Digital Studio
Without question, FC's strength for visual computing is performance. FC will first become adopted as a high speed peripheral interface, allowing RAID subsystems to deliver the entire bandwidth of their drives. With drive
technology readily available at the end of 1996, an eight drive RAID-3 array will be able to deliver over 80 MB/sec of sustained bandwidth, at least in the fastest zones of the drives. By late-1997, when the 10,000 rpm class of 3.5" drives are available, sustained transfer rates will have increased to over 90 MB/sec from a single disk array. This level of performance enables integrators to not only support uncompressed video, but multiple streams of uncompressed video from a FC environment. Further, film resolution operations may now become economically feasible using disk-based systems, as the total number of RAIDs required to provide 100+ MB/sec has been substantially reduced.
No other SCSI implementation, current or on the near horizon, has the potential to provide the level of performance FC currently offers. Fast-40 (80 MB/sec) SCSI-3 is only on the drawing board and its merits are still in doubt. The Serial Storage Architecture (SSA) claims bandwidth of 80 MB/sec, but these claims are somewhat misleading in the context of moving visual data. SSA, like FC, is a serial interface. However, the unidirectional bandwidth of SSA is only 20 MB/sec, the same as Fast/Wide parallel SCSI-2. To achieve 80 MB/sec total bandwidth on SSA, data must flow in both directions to a device (e.g. read and write simultaneously) to double the bandwidth to 40 MB/sec. Then, dual ports on a device must be implemented, further doubling the bandwidth to 80 MB/sec. However, it is not possible to transfer in a single direction between two devices at a rate greater than 20 MB/sec (actually a bit less when overheads are considered). As a result, not even one stream of uncompressed NTSC video could be sourced from a single SSA RAID subsystem.
Just as important as today's performance is FC's networking potential for tomorrow. With FC, the client/server storage model for high bandwidth environments may become a thing of the past. Because FC doesn't distinguish
547

between channel and network devices, the ability to make storage attach directly to a network is now possible. In the traditional client/server model, all main disk storage is attached (using a peripheral only interface) to one or more central servers. The server in turn is networked (using a networking interface) to some number of client workstations. To transfer files to or from a client, three layers of latency are involved. First there is the networking interface, which adds a layer of overhead to pass the appropriate commands between the client and server. Also, the network is typically quite slow in terms of
data bandwidth (<< 100 MB/sec). Second, the server adds a layer of latency as it processes the
client request and converts it into a series of disk I/O requests. The memory bandwidth of the server may also limit the performance of moving data through the server. Finally, the
performance of the peripheral interface may be limiting.
FC, if only applied as a channel interface,
improves the client/server model by eliminating any bottlenecks between the storage and the server. However, the network and server latencies still exist. By implementing FC across
the board, however, almost all of the latencies are eliminated.
A networked FC environment, in which the
storage devices reside directly on the network, allows a client to directly access the storage,
without going through a server. When dedicated connection transfers are used, the storage device is essentially owned by the client for the duration
of the transfer, appearing to the client as though the device were local. Returning to an earlier example in which current networking technology might require a few hours to transfer 16 GB of data, the FC alternative would take less than five minutes to perform the same transfer (at an average bandwidth of 60 MB/sec).
Unfortunately, the FC paradigm of direct network attached storage is not yet a reality.
A key technology that is missing today is the system software which supports the concept of storage residing directly on a network, and not on a server. However, now that FC is maturing in the marketplace, the development of such software is inevitable. Initial technology demonstrations will take place early in 1997.
Fibre Channel RAID- visual data storage for the nineties and beyond
The world of visual computing demands much from digital storage. Until now, many applications simply weren't feasible due to the lack of adequate disk storage, in terms of performance and capacity. Through the mid-1990's, the advent of RAID technology has
revolutionized the way digital, visual data is stored. However, the parallel SCSI interfaces, albeit very popular, have proven to be a
bottleneck for achieving the performance required of the most demanding visual applications cost effectively.
FC, when combined with RAID-3 disk
technology, eliminates the bottlenecks that many applications find prohibitive. With an interface bandwidth of 100 MB/sec, FC can handle almost
any visual computing storage needs. And for
those applications, such as motion picture film production, in which FC's 100 MB/sec bandwidth is still not quite enough, multiple FC implementations combined with RAID offer a cost effective solution which is quite attractive.
Even more important than performance is FC's long term appeal. Its ability to meld channel and networking operations into a single interconnection paradigm offer a migration path unique to FC. This path offers the potential for a revolutionary, not evolutionary improvement in the way digitized visual data is moved. With plans in the works for 2 and 4 Gbitisec FC, the future for FC looks very bright, well into the next century.
548

TRANSPORTING MULTIPLE STREAMS OF SERIAL
DIGITAL VIDEO OVER FIBRE CHANNEL
Michael W. Pugh Digital Acoustics
Abstract
Fibre Channel provides the required bandwidth to stream realtime uncompressed video. A clear migration path is emerging for facilities to evolve from SDI based routing to Networked Video, integrating both packetized networks and SDI routing.. This paper reviews revenue enhancing Fibre Channel applications in use in Post Production today, followed by an update on Fibre Channel Video standards. Finally a description of how an approach of integrating traditional video processing equipment with computer based applications enable professional video facilities to get continued financial return on their substantial investments in serial digital equipment and routing plant while moving toward a computer-based facility of the future.
Introduction
Digital technology and equipment is seeing wide deployment for both broadcast and post-production video applications. At the same time, computers are increasingly being applied to video creation, editing and control. The confluence of these forces is driving the need for a digital interface that can meet the requirements of synchronous, frame-based video and asynchronous, packetized computer environments. Fibre
Marc Friedmann Pnsa Networks
Channel is emerging as one of the enabling technologies for bridging these two worlds.
High-end post production applications are benefiting from Fibre Channel today. These post facilities are seeing significant productivity improvements, enhanced operating flexibility and revenue generation using the ability of Fibre Channel to move uncompressed video data files faster than real-time. A collaborative effort is now underway between ANSI and SMPTE to establish inter-operable standards for transporting streaming digital video over Fibre Channel. This effort is expected to result in a wave of products that enable "Networked Video" applications for DDR's, video servers, and computer-based broadcast and post-production studios.
FIBRE CHANNEL IN
POST-PRODUCTION
Computer-based high-end post production houses that generate special effects, do compositing and film/video editing, deal with file sizes ranging from a few megabytes to multiple gigabytes. Since moving files of this size between edit bays using traditional Ethernet or FDDI networks can require hours, most studios resort to spinning the file back to tape and walking it between bays. Overcoming this bottleneck,
549

525 Post (Hollywood, CA) has installed Prisa Networks NetFX gigabit/second Fibre Channel network among their four Flame systems (see Figure 1).
STONE
STONE
STONE'
STONE
I — I
Inferno
Inferno
• STONE I
'STONE :.
STONE :
Figure 1 Production Network at 525 Post
The 525 network incorporates:
• Fibre Channel adapters attached to each of the SGI Onyx RIO computer busses;
• A logical loop topology; • Fibre optic serial connections to a centralized hub that supports loop resiliency;
• A suite of high performance software supplied by Prisa.
In an installation with similar elements, Image Design (New York City, New York) has incorporated NetFX Fibre Channel into an extensive pre-existing network environment (see Figure 2).
M ao Randre 11•11.11.•
Figure 2 - Production Network at the Image Group
Fibre Channel has been introduced to the links requiring the highest bandwidth. These connections are between Flame and Inferno systems and to Indigo 2 servers (with NetFX Fibre Channel adapters for SGI's GIO computer bus). Present in the network hierarchy is FDDI, providing moderate bandwidth between the Indigo servers, and switched Ethernet connections to a stable of UNIX and Apple/MAC image processing, animation and video editing clients. The Indigo2 servers provide routing between Fibre Channel and FDDI. In this configuration streamed video is transported via SDI connections from the Flame/Inferno Sirius interface through a digital video and audio router to VTRs distributed throughout the facility.
Image Design uses Internet Protocol (IP) for small messaging traffic across all computers and networks in their system. This enables them to mount remote file systems and interchange data among all their workstations. However, for the large transfers between Flames, high performance software is essential. Both 525 Post and Image Design are using Prisa's DLivery and Transporter software to accomplish this task.
DLivery copies stored image data between Discreet Logic Stone® disk arrays attached to remote Flame workstations at NetFX Fibre Channel speeds. This makes it possible to have faster-than-real-time access to remote Framestores. All of the functions of DLivery are accessible through a standard graphical user interface, enabling local and remote file systems to be browsed and selected with point and click ease. Likewise, Framestores can be browsed and selected, allowing a user to choose individual clips which can be copied to a remote workstation's file system. With an
550

inline format conversion capability, the clip can be stored as a series of image files in SGI 8 or 16 bit or Cineon formats. This allows images created on the Flames to be directly accessed by Kodak Cineon and or other graphic applications.
To achieve faster-than-real-time transfers, DLivery combines the highest performance capabilities available on SGI systems: Transporter and DirectIO. Transporter is Prisa Networks' high-speed protocol that delivers the greatest performance available over a Fibre Channel connection. Transporter facilitates the transfer of large blocks of data between computers. It treats data transfers as solicited memory-to-memory I10 operations rather than as the more traditional data communications networking operations used in conventional LANs. Transporter avoids many of the software overheads and inefficiencies associated with standard IF-based protocols by utilizing the native capabilities of Fibre Channel, many of which are implemented in hardware for maximum throughput efficiency.
DirectIO is an SGI enhancement to the file system that moves data directly from a disk into the computer memory location specified by an application program. By avoiding the usual transfers into and out of a buffer cache memory, DirectIO significantly accelerates transfers to and from disk.
Utilizing NetFX Fibre Channel with DLivery and Transporter software, both 525 Post and Image Design are observing sustained network transfer rates between Flame and Inferno systems over 500 Mb/s (65 MB/s), equal to 2 streams of uncompressed video. Disk-to-disk transfer rates are limited by the Stone disks to about 34 MB/s (272 Mb/s), but utilization of the
Ciprico RF7000 RAID at 525 Post brings the transfer rate to disk up to the NetFX Fibre Channel rate of 65 MB/s for this system. The ability to transfer image data at these rates has altered the work flow at both facilities. Rather than spinning image files to tape and then using "sneaker net," 525 and Image Design now transfer files directly from Flame room to Flame room. This enables load balancing between Flames and sharing of jobs between rooms if necessary. Scheduling flexibility and greater edit bay utilization has been achieved, enhancing revenue generation.
FC STANDARDS UPDATE
The need for standards
Fibre Channel applications today use non-real-time transfers of video image data. To facilitate integration of Fibre Channel into existing environments, efforts are underway between ANSI X3T11 and SMPTE PT20.01 to establish interoperable standards for moving at least 2 streams of video, audio and control over Fibre Channel in real-time. This section reviews the key issues and proposals to the ANSI standards group (FC-AV) as of January 1997.
Key issues & what is proposed
In transporting uncompressed video over Fibre Channel (particularly 270 Mb/s SDI based on SMPTE 259), issues of encapsulating the video signal, transport schemes and bandwidth management exist. The proposed method of packing samples into Fibre Channel Transmission words, and video frames into Fibre Channel sequences are described below.
551
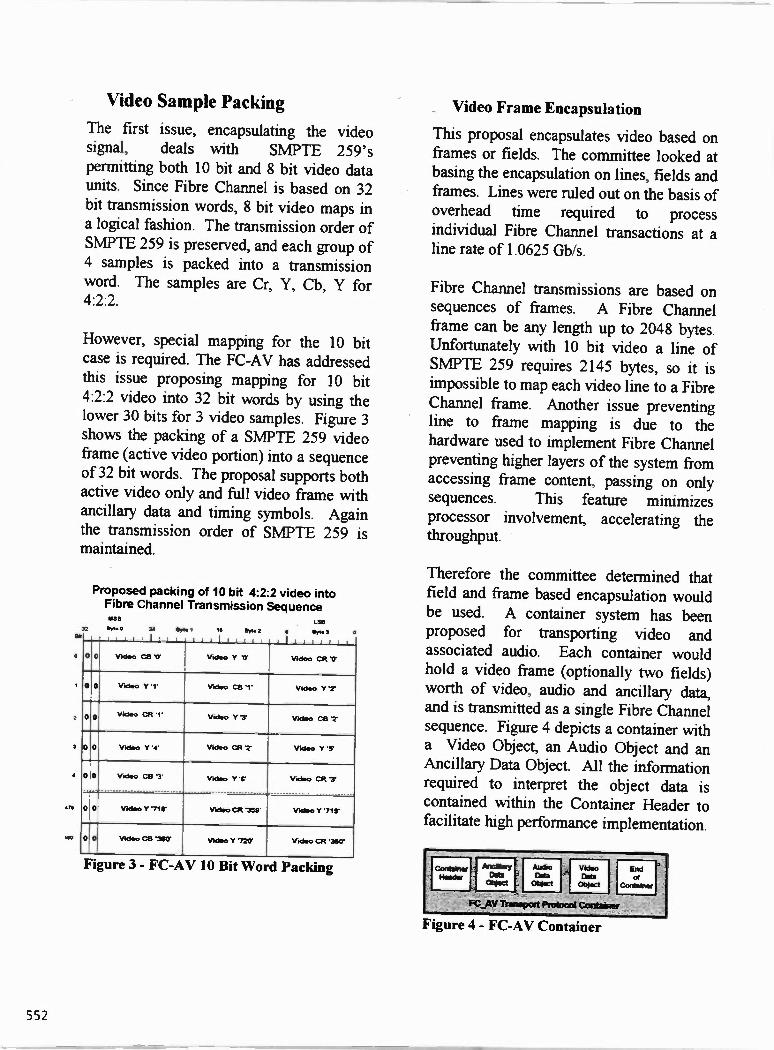
2
4
OS
Video Sample Packing
The first issue, encapsulating the video signal, deals with SMPTE 259's permitting both 10 bit and 8 bit video data units. Since Fibre Channel is based on 32 bit transmission words, 8 bit video maps in a logical fashion. The transmission order of SMPTE 259 is preserved, and each group of 4 samples is packed into a transmission word. The samples are Cr, Y, Cb, Y for 4:2:2.
However, special mapping for the 10 bit case is required. The FC-AV has addressed this issue proposing mapping for 10 bit 4:2:2 video into 32 bit words by using the lower 30 bits for 3 video samples. Figure 3 shows the packing of a SMPTE 259 video frame (active video portion) into a sequence of 32 bit words. The proposal supports both active video only and full video frame with ancillary data and timing symbols. Again the transmission order of SMPTE 259 is maintained.
Proposed packing of 10 bit 4:2:2 video into Fibre Channel Transmission Sequence MU LSO
32 113332 ai 223.i te 13032 • DP*
0 0 Video CO V
.. . . . . . . .
Video V V
1 1 1 1 1 1 1 1 1
Video CR V
0 0 Video I •1* Video C8 1' Video Y 7
0 0 Video CR '1' Video 'I 7* Video C8 "2*
0 0 Video 1'4' Video CR 7' Video Y 7
00 Video CB 3
-,
Video Y V Video CR 7
0 0 Video V 71f Video CR 7tif Video Y 7 W
0 0 Video C8 78IY Video I 720' Video CR '3 W
Figure 3 - FC-AV 10 Bit Word Packing
Video Frame Encapsulation
This proposal encapsulates video based on frames or fields. The committee looked at basing the encapsulation on lines, fields and
frames. Lines were ruled out on the basis of overhead time required to process individual Fibre Channel transactions at a line rate of 1.0625 Gb/s.
Fibre Channel transmissions are based on sequences of frames. A Fibre Channel frame can be any length up to 2048 bytes. Unfortunately with 10 bit video a line of SMPTE 259 requires 2145 bytes, so it is impossible to map each video line to a Fibre Channel frame. Another issue preventing line to frame mapping is due to the hardware used to implement Fibre Channel preventing higher layers of the system from accessing frame content, passing on only sequences. This feature minimizes processor involvement, accelerating the throughput.
Therefore the committee determined that field and frame based encapsulation would be used. A container system has been proposed for transporting video and associated audio. Each container would hold a video frame (optionally two fields) worth of video, audio and ancillary data, and is transmitted as a single Fibre Channel sequence. Figure 4 depicts a container with a Video Object, an Audio Object and an Ancillary Data Object. All the information required to interpret the object data is contained within the Container Header to facilitate high performance implementation.
Figure 4 - FC-AV Container
552

The Fibre Channel layered model:
Having video encapsulated for transport addresses how the video is carried physically but does not address larger network issues such as Quality of Service Guarantees. Fibre Channel has been designed to have a layered approach allowing the transport of widely varying content and protocols. The FC-AV is working at many levels within this layered model to address the issue of Quality of Service Guarantees. Figure 5 is a discussion document showing Fibre Channel layers, and how other applications and protocols may relate to it.
El .PutdanutFC5Irdrd .kidsonicnnFC AV
FILE , MT 'onto
W IN COO
This chat don not Inecabolhe Inle ftens Fbir durnel Audis M aw in to vstat Me knob prolo wl. %II in sioperlid In my Ilnel •I•nanl.
[_•_,'"14M11 .112.LL°1'' SW AOPEME0,11010f l'eal I Elandoldfh flovaffloollO PC4 IFE O M LI NO M PC4
FC•2
PC4
FC 4
!lams 14311111
CO M M U RVICIS SSISlVAiiON PoOTOCOL
CLASS I CLASS 2 CLA P 2 CLIES4
EFICOOLCIECODE
IMA M
OfF444,4 fnnffrosof
I al lilVe 1,44froY4 4s44swo tS,_ 1? L_Jeis
iro mino
t AN
RIFF Wools
CLASS N isi Tiro , Illiering / rte.*
alerts Outfit% of Ansi
ft■Minli
1101Codlne
IC as11171
Figure 5 - FC-AV Layer Diagram
Clearly it is essential that a video network provide adequate bandwidth at all times to deliver content without interruption. Fibre Channel contains a layer for Common Services (known as FC-3) where network services such as a reservation protocol and bandwidth reservation system will fit in.
At the FC-2 layer a new class of service, referred to as class 4, is being introduced. It provides fractional bandwidth and guaranteed latency services well suited to providing video transport at compressed and uncompressed rates.
Current systems do not support class 4, as the standard is in final approval stage, requiring a solution for providing bandwidth management with in the existing Class 1, 2 and 3 framework. This work is progressing in the FC-AV with very strong vendor support. It will most likely affect both the FC-3 layer and the application layer just above the FC-4 layer.
Bandwidth Management
The ability to deliver a guaranteed Quality of Service hinges on successful bandwidth management. Key issues in bandwidth management include timing and reservations.
In studio applications, real-time video must be synchronous to house black. Some of today's computer to SDI interfaces support house black at the video output. The FC-AV recognizes house timing as an essential element to the long term success of any standard for studio use. By writing house black into the proposed standard, FC-AV has addressed the timing problem when using networks to steam real-time video.
The tansport of multiple streams of uncompressed video will require reserving bandwidth over the network. The FC-AV is developing a standard method of accomplishing bandwidth reservations. Similar work is being done in the interne arena with ST-2 and RSVP.
With standards for Video timing, bandwidth management and bandwidth reservations in Fibre Channel we can look to seamless video networking in the near future.
553

FIBRE CHANNEL INTO THE VIDEO FUTURE
Networked Video
Networked video refers to integrated facility networks used for video creation, processing and production. These integrated networks are composed of multiple physical networks including Serial Digital (SMPTE 259), Fibre Channel, 10/100 Base T as well as FDDI and ATM. For example an uncompressed video stream may originate in a SMPTE 259 environment and via a bridge transition to a Fibre Channel environment. This video stream may subsequently be compressed and distributed via slower FDDI or ATM networks.
Networked video is the seamless integration of these multiple physical networks into a functional system providing the user with direct access to all the resources of the facility. Speed appropriate connections happen automatically. The network will use gigabit Fibre Channel for streamed and faster-than-real-time video clip transfers while routing other client/server communication on lower bandwidth paths such as 10 Base T. What Fibre Channel brings to full facility networking is the ability to carry 2 uncompressed video streams in real time on each connection. Lower speed networks provide useful control channels, and gateways to low cost platforms that may be used for applications such as single frame editing or clean-up.
Networked Video bridges the differing physical connections allowing full use of a facility's resources. The ability to transport SDI video over Fibre Channel opens the door to the use of today's on line video processing equipment with workstation based video creation software.
Non-Linear Editing with a Fibre Channel to SDI server
As an example of the extension of current applications that Networked Video over Fibre Channel enables consider the Non-Linear Editing Workgroup shown in Figure 6. A Fibre Channel to SDI server provides guaranteed Quality of Service video and audio streaming between tape machines, local disks and a RAID based video server. Video material on each of the storage devices is available in real-time to applications running on the workstations. Of course the server provides a direct path from the studio router allowing access to any SDI video source or sink in the plant.
Figure 6 - Non Linear Work Group
Fibre Channel support of house black as a timing system insures that video streams can be directly switched or mixed in real-time. This blurs the distinction between on line verses off line. Tasks that today require off line development of an edit list followed by on line production can be streamlined by giving workstation applications the ability to stream real-time video and control into the traditional SDI environment.
554

Combining Workstation solutions with Existing Video Networks
The work being done today in Fibre Channel will allow better integration of existing video systems with workstation applications. Figure 7 provides a picture of the future networked integrated video facility.
The video tape machine and video switcher represent a traditional SDI based video plant. New functionality is provided by Fibre Channel - SDI servers. These servers allow SDI video to be routed through Fibre Channel Switches and loops providing access to workstations and servers on the network. This connectivity, used in conjunction with SDI based video, supports real-time streaming. In effect, networked workstation applications can now fully utilize the video processing power of dedicated hardware elements such as switchers, routers, DVE's and tape drives.
Figure 7 - Networked Video Facility
The Fibre Channel SDI server also provides network extensions over the SDI plant. By
establishing connections through the SDI router, Fibre Channel Data can be transported over the existing SDI plant. This network extension provides a high speed connection to locations in the video plant that do not have fiber installed. The bandwidth is limited by the router capabilities of 270 or 360 Mb/s, yet is still three times that of 100 Base T solutions, and fully integrated with other Fibre Channel devices in the network. In Figure 7 the archive system and the RAID Array are shown as having Fibre Channel connections over SDI.
Conclusion
Fibre Channel supplies an extensible network with the capability today of streaming two SDI video channels. Significant time savings and increased revenue are already being realized at post facilities such as 525 and Image Design running Transporter and DLivery software operating on NetFX Fibre Channel. Based upon standards near completion workstations, devices with SDI interfaces and Video servers will be connected in ways offering unprecedented flexibility. This promises to facilitate a smooth migration from the digital studio to the fully Networked Video environment.
ACKNOWLEDGMENTS
C. Heuer, Director of Engineering Image Design, a division of the Image Group, New York, New York.
O.D. Welch III, VP Operations and A. Soto, Graphic Systems Engineer, 525 Post Production, Hollywood, CA
555

FIBRE CHANNEL AND TRADITIONAL VIDEO MERGE IN THE BROADCAST ENVIRONMENT TO FORM A POTENT SOLUTION
Matthew H. Klein Hewlett Packard Company
Santa Clara, CA
ABSTRACT
Fibre Channel can now make claims of in roads
in the broadcast environment. While fibre channel is not the only networking technology it certainly has its place in the emerging video server technologies being deployed in the broadcast environment. This paper will discuss fibre channel's strong primary role as well as
it's complimentary role with other video and networking standards to meet the needs of the broadcast and professional video industries today and in the future.
Hewlett-Packard's Media Stream Servers are
video servers employing real-time operating systems, MPEG II video compression, hard disk based RAID protected video storage, and fibre channel networking. As the needs of a video server go outside of a single server, the
networking between servers is critical. The networking plays several roles. One role is scalability and flexibility. Another is fault tolerance via connectivity to redundant systems.
A third is broad connectivity. Some of these roles are addressed directly by fibre channel, while others are complimented by other networks.
CAN FIBRE CHANNEL MEET BROADCAST APPLICATION NEEDS?
There are several factors that make fibre channel
a good choice for broadcast applications. They are affordability, high speed, flexibility, scalability, and reliability. Additionally, fibre channel is complimentary with standard video
connectivity as well as other networking technologies. Figure 1 shows some of the
requirements for networking in a broadcast environment and how they are provided for by fibre channel.
Broadcast Industry Needs Fibre Channel Provides
Mordable
fRerformance
Computes- Industry Leverage 1 Gb/s (Faster than real time)
Expandable/ Flexible
Channel & Network with Multiple Topologies
Reliable Guaranteed Delivery
.Inter-Facility Connectivity Emerging
Figure 1 - Key needs for the Broadcast Industry
A HIGH SPEED AFFORDABLE NETWORK
Fibre channel offers an affordable network because it is a technology with computer industry leverage. As fibre channel grows in market penetration, costs will come down
556

further. Fibre channel is a 1 Gb/s network (800 Mb/sec data throughput) which allows for faster than real time file transfers for most professional video applications, especially in the compressed video domain which can pertain to broadcast, editing, news, and production.
NETWORK RELIABILITY AND REDUNDANCY
Network Reliability - Comparison to SMPTE 259M
When thinking about reliability of a network or transmission media it is interesting to compare digital video (CCM 601, SMPTE 259M) in a broadcast or production facility to a fibre channel network. The above mentioned digital video does not constitute a network, but rather a source connected to one or many destinations. Also there is not any negotiation of the connections to be set up. Another difference is that digital video can not guarantee non-corrupt delivery of video from source to destination. Fibre channel as with other networks, guarantees delivery of non-corrupt data by verifying data packets and retransmitting when necessary.
System Redundancy - Don't put all of your eggs in one Basket
Another key concern in the reliability of a system for a mission critical application is not having a single point of failure. Having disk based storage and retrieval of video in several servers allows for replicating of record and playback channels. The high speed inter-server file transfer via fibre channel allows previously recorded material to be transferred between servers (see figure 2). It is the high speed network provided by fibre channel which enables the total system the ability to cache material from one server to another server, providing a significant redundancy benefit.
One more aspect to reliability is protecting the physical network itself against outages. This subject is covered later when the fibre channel hub is introduced in the context of the fibre channel loop topology and how that topology can be protected against single points of failure.
Play-to-Air V1000 110
HP ismer
.111. 1 22 coma
Fite Transfers
News Editing
Non-HP Server
%Woo 110
Vero 110
Video VO NIP
Figure 2 - Inter-server file transfers over fibre channel
FLEXIBILITY AND SCALABILITY
Fibre channels offers several areas where systems gain flexibility and offer scalability. These areas are in the physical transmission media and the different organizational topologies available for fibre channel.
Flexible Transmission Media allows Broad Connectivity Options
The first aspect to the flexibility of fibre channel is clear when one considers its physical media choices. By selecting coax, short wave laser, or long wave laser transmission distances of 30 m, 2 km, or 10 km respectively can be achieved. This allows for systems connectivities ranging from close cabinets for coax to intra-studio for short wave laser to inter-facility for long wave lasers (See figure 3). Conversions between
557
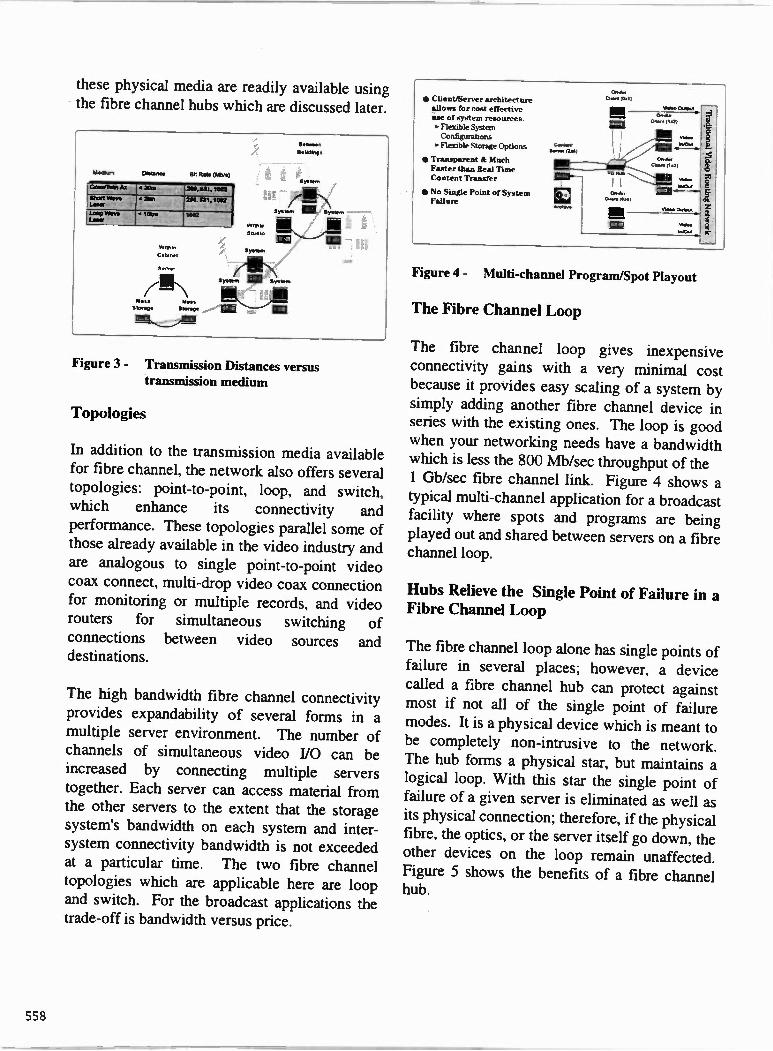
these physical media are readily available using
the fibre channel hubs which are discussed later.
laseurn Olean= IIN Rob N M)
Z--17—'771 57147[•;1-,,A;rA EifiliEg alifinit aZ2 EQ11421111
rena
Cabinet
Sorrer
Moss
Morro 1111
m a.
SO Wle
a —..
Moldings
Sysin.
/ 1 1. L 'Spam
111 11 M I
Syser m
7V. Sys lam System
Figure 3 - Transmission Distances versus transmission medium
Topologies
In addition to the transmission media available for fibre channel, the network also offers several
topologies: point-to-point, loop, and switch, which enhance its connectivity and performance. These topologies parallel some of those already available in the video industry and are analogous to single point-to-point video coax connect, multi-drop video coax connection for monitoring or multiple records, and video routers for simultaneous switching of connections between video sources and destinations.
The high bandwidth fibre channel connectivity provides expandability of several forms in a multiple server environment. The number of
channels of simultaneous video I/0 can be increased by connecting multiple servers together. Each server can access material from the other servers to the extent that the storage system's bandwidth on each system and inter-system connectivity bandwidth is not exceeded at a particular time. The two fibre channel topologies which are applicable here are loop and switch. For the broadcast applications the trade-off is bandwidth versus price.
• Client/Server architecture allows for cost effective use of system resources. • Flexible Systern
Co nfiguratims Flexible Storage Options
• Transparent & Much Faster than Real Thee Content Transfer
• No Single Point of System Failure
Cae re s w PAO
On-wir
Chem 104)
Vide. * ow •
Ornala Oh . O M
Figure 4 - Multi-channel Program/Spot Playout
The Fibre Channel Loop
The fibre channel loop gives inexpensive connectivity gains with a very minimal cost because it provides easy scaling of a system by
simply adding another fibre channel device in series with the existing ones. The loop is good when your networking needs have a bandwidth which is less the 800 Mb/sec throughput of the 1 Gb/sec fibre channel link. Figure 4 shows a typical multi-channel application for a broadcast facility where spots and programs are being played out and shared between servers on a fibre channel loop.
Hubs Relieve the Single Point of Failure in a Fibre Channel Loop
The fibre channel loop alone has single points of failure in several places; however, a device called a fibre channel hub can protect against most if not all of the single point of failure modes. It is a physical device which is meant to be completely non-intrusive to the network. The hub forms a physical star, but maintains a logical loop. With this star the single point of failure of a given server is eliminated as well as its physical connection; therefore, if the physical fibre, the optics, or the server itself go down, the other devices on the loop remain unaffected. Figure 5 shows the benefits of a fibre channel hub.
558

The Fibre Channel Switch • Relieves Single Point of Network Failure
• Modify Loop Without System Shutdown t. Add servers for growth without shutdown ▪ Remove Server for mamtanence
• Servers Remain On Air even with Hub failure.
• Hub can be swapped while system is live
Hub forms - Physical Star / Logical Loop 1.116 flreses ••••.• A
11 E941 - - 11 E—... To Al,
A .A . M IN
W AY SP•aon *prove •
To •Ir
11111
Figure 5 - Hub reduces risks of single points of failure
Modifying the Loop Without System Shutdown - The loop can be modified without shutting down the entire system. There are several very good reasons to have this feature in a system that is part of a broadcast or production facility. First, servers can be added for growth and expansion. Second, a server can be removed or shutdown for maintenance. It is a must for equipment to be added or removed without disturbing the normal operation of the rest of the system.
What about a Hub Failure ? - Two characteristics of the HP Media Stream Servers as they are used in the broadcast arena can aid in making a hub failure easy to accept. First, in the HP system material is not played live across the network. This means that a hub failure is not interrupting an on-air event. Second, turning off or removing the hub does not hinder the recording and playback going on at each video server. Because of the previously described characteristics the servers will remain on air even with hub failure. The hub can be swapped while the servers are doing file transfers and copying can be resumed after the new hub is present. The ability of the system to alert and operator of a hub failure resides in high level software.
The fibre channel switch is a device which allows increased bandwidth by giving each device a point-to-point connect with another device while simultaneously allowing other paths between other devices to exist. Although switches are more expensive than hubs they do provide for bandwidth scaling.
A Scaleable Bridge Between Operations - A hybrid of the loop and switch topologies can provide some of the advantages that each topology offers. Figure 6 depicts the hybrid system. A typical broadcast facility has several different operations going on simultaneously.
On-Air Operation
News Operation
Archive
Edit Suites
Figure 6 - Fibre Channel Switch A Scaleable Bridge Between Operations
Separating Functional Areas - It makes sense to separate different functional areas of a broadcast facility. For instance, On-Air operations and News Operations can be separate as can other operations. This provides the isolation necessary to give the largely independent areas the ability to work
559

independently, while still allowing for cross networking technologies such as ethernet and functional data transmission. ATM.
Using a switch to relieve bandwidth
needs in a large System - Another reason to have a switch is to group servers which share material frequently into a cluster on a loop and use a switch to connect to servers in group or cluster where media is exchanged periodically rather than constantly. The advantage of a switch here is that the interconnect bandwidth needs within a group could be less than the 800 Mb/sec data throughput of fibre channel, but the total bandwidth across groups could be greater
although only periodic transfers between groups are necessary. If groups of video servers can be
clustered and require less than the 800 Mb/sec they can be put on a fibre channel loop. A group of servers in another functional area of a broadcast facility may also be put on their own loop. During the times when media needs to be transferred between the functional areas of the facility the fibre channel switch can be employed. The individual loops need not always be burdened with the simultaneous bandwidth needs of the entire system, but the switch gives connectivity between functional areas when it is needed. This hybrid system only needs enough switch ports to accommodate each cluster rather than having a single port for each server in the system. In this way the bandwidth needs are met in a cost effective and flexible way.
CO MPLEMENTARY TECHNOLOGIES
Fibre channel is complimentary to standard video connectivity as well as other networking technologies. Using fibre channel as the video server's interconnect provides many advantages which have been discussed earlier; however, it is not the correct interconnect technology for everything. It is the strengths of fibre channel correctly applied which compliment the traditional video connections and other
Standard Video Connectivity
There are several types of connections or signals that are part of a broadcast facility. These are RS422 for machine control, genlock or black burst for video synchronization, composite analog and component digital video, and video routing. All of these have precise timing which
although they may be lower in bandwidth than fibre channel are well controlled in timing jitter and provide a synchronous means of moving live video from point A to point B. Some of this connectivity is shown in figure 7.
Figure 7 - Connections of video server to traditional video routing networks
Machine Control Via RS422 - There are millions of VTRs currently installed in facilities and they all have RS422 electrical connections with SONY machine protocol. This is used to control the frame accurate playout and record of VTRs. Although fibre
channel could handle the protocol, the 1/30th of a second controls are an unnecessary burden since the physical wiring and control protocol for RS422 are ubiquitous in broadcast facilities all over the world. The Media Stream Servers
560

from HP have RS422 control for each of the playout and record channels for this reason.
Synchronization of Video Playout and Black Burst or House Genlock - Black burst or house genlock is an analog video signal which is routed all over production and broadcast signals. It provides a reference for any device which is meant to produce video as to where a new field, frame, and line are meant to begin and also the phase of the color subcarrier. The signal is extremely precise in timing and is usually generated by a precision clock generator. This signal, as with RS422, has been an integral part of broadcast facilities for many years and provides the means of synchronizing video server playout with the rest of the facility.
Composite Analog and Component Digital Video and Video Routers - Two more traditional signals in a broadcast facility are the analog and digital video signals carried on 75 ohm coax. These signals also have very precise timing requirements which are specified by SMPTE. Video routers are essentially video switches which switch between two video sources. They controlled by RS422 and can switch between two or more video sources every frame of video and at precisely the same point in time relative to the house references. Again it should be the goal of video servers to play in the domain of these well known standards reserving the appropriate uses for fibre channel to those which it can best serve.
Ethernet Complements Fibre Channel
Ethernet can be complimentary to fibre channel in video servers. Ethernet is a very common network capable of providing a reliable robust means by which multiple servers can check status between each other as well as setup file transfers. Both the setup of file transfers and the checking of status between servers could be
done on fibre channel, but this traffic is purposely moved over ethernet so as not to burden the fibre channel with the inter-server control and status information, potentially reducing the high speed fibre channel connectivity.
Figure 8 - Ethernet Transfer of files received via Satellite
Another reason to select ethernet is to do video file transfers between PCs and the video server non-real time in order to load spots which have come via satellite from a service provider whose satellite receiver feeds a PC. Figure 8 above shows the connections for this transfer.
ATM Complements Fibre Channel for WAN
Fibre channel doesn't currently provide a means of wide area network connectivity, but ATM does. ATM also provides a reasonably high speed network with a good installed based for WAN (wide area network) connectivity. Since the server can be connected to a WAN via ATM, the ability to transfer material globally is provided, whereby remote servers can exchange media over lines already available from the Telco's.
561

The first use is to upload and download material from another server or other remote source, but in a non-real time fashion. This would be appropriate for transfer of MPEG encoded spots or program material. These spots can be received in MPEG format and be played out as normal composite or component video. The second use is to have a server provide content over an ATM network for VOD or NVOD applications. In this case the inputs and outputs are digital and the playout is real time.
The WAN connectivity described for ATM is complimentary to the fibre channel inter-server communications which occur more locally. In this way the benefits of each of ATM and fibre channel can be realized.
CONCLUSION
Fibre channel fits into existing broadcast environments to give a bridge to the all digital world that awaits us tomorrow. Fibre channel is the right networking technology to meet today's broadcast and production needs by providing a
flexible, reliable, high speed, scalable network which compliments other networking technologies as well as the standards for video already present today. Figure 9 shows the complete digital broadcast environment.
POST HOUSE
BROADCAST STATION
Figure 9 - Complete Digital Broadcast Environment
Hewlett Packard's Media Stream Servers are a part of today's solutions and will continue to provide solutions in the future for the wide ranging needs of video storage, retrieval, distribution, and production in the many areas served in the complete digital broadcast environment.
562

INDEX
Advanced Television Technology Center 269, 449 Adventure Technology, Inc. 424 Alexander, W.C. 195 Althoff, Jurgen 140 Andrew Corporation 98 Aoki, Kiyotaka 348 Audio Processing Technology Ltd. 155 Band, Robert L. 266 Barzaghi, Adriano 384 Batt, Madison J. 208 BBC 140 Bendov, 0. 83 Bennett, Christopher D. 246 Beverage, Clarence M. 297 Billat, Stephane 356 Blair, Robin 105 Bochent, Daniel 27 Broadcast Electronics, Inc. 331 Broadcast Engineering magazine 19 Bureau. Patrick 27 Cable Television Laboratories Inc. 109 CBS, Inc. 3 Chelehmal, Majid 109 Christman, Al 297 Ciprico 541 Cohen, Sanford B. 180 Columbine JDS Systems, Inc. 365 Communications Technologies, Inc. 297 Cominetti, Mario 476 Cozad, Kerry W. 98 CPI 263 Crawford Broadcasting 195 Culver, Robert 58 Cutforth, Timothy C. 343 Cutting Edge 162 Danielsons, David C. 279 David Horowitz 269 Davis, Tony 388 Delay, John L. 306 Deutsche Telekom AG 27, 505 Dick. Brad 19 Dielectric Communications 83 Digital Acoustics 549 EEV, Ltd. 531 EFData Corporation 461 Elettronica Industriale 384 Epstein, Steve 204 Eureka 147/Bosch 140 European Broadcasting Union 140 Finger, A. 505 Foti, Frank 162 Friedmann, Marc 549
Fuji Television Network, Inc. 237 Gable, Vlel 254 Gentne - Communications Company 325 Gillman, William H. 325 Gilmer, Brad 252 Gray, Ce Wayne 285 Grove City College 297 GS Die ectric Communications 83 Hammett & Edison, Inc. 49 Hanada, Manabu 13 Harris Corporation 89, 181, 279, 306 Hatfield & Dawson Consulting Engineers Inc. 489 Hatfield, James B. 489 Hauge, Raymond 363 Heppinstall, Roy 531 Hewlett Packard Company 246, 556 Hiranac Hideo 394 Horowitz, David 269 Indigita 254 lnformedia Digital Video Library 233 Intertec Publishing 204 Intraplex, Inc. 266 Ito, Yasuhiro 109 Jacobsmeyer, Jay M. 405 Juliano, Mark J. 233 Jeon, Woo Sung 122, 497 K Tech Telecommunications, Inc. 119 Keller, Thomas B. 440 Kenwocd 140 Klein, Matthew H. 556 Kobe, David C. 182 Kozamemick, Franc 140 KQNA / Prescott Valley Broadcasting Company 179 Kuh, Steve 119 Laurent, Pierre 27 Lauterbach, Thomas 140 Lechner, Bernard 363 Ledwich, Michael A. 365 Legault Alain 374 Lim, Kyung Won 122 Litton Electron Devices 523 Lohnes & Culver 58 Londa, David M. 440 Lorenz, Rudolf Werner 505 M&C Systems 285 Mahler, Henry W. 3 Mahnad, Ali 316, 415 Malouf Engineering International 213 Malouf, E. Mark 213 Mansergh, Daniel 49 Martin, Jay S. 405
563

Matey, Janet 374 Matrox Video Products Group 374 McCutcheon, Robert W. 440 McDonald, Noel 105 Messer, H. Donald 27 Micro Communications, Inc. 218 Micro-Tek Engineering 316, 415 Mizuno, Haruhiko 468 Modulation Index 170 Morello, Alberto 476 Moren, Bill 541 Mundschenk, Russ W. 432 Munhwa Broadcasting Corporation 122, 495 Nagano, Kenichiro 13 Nakae, Kohei 13 NHK 13, 109, 349, 468 Nippon Television Network 395, 511 Ogonowski, Greg J. 170 Okamura, Tomoyuki 237 Osenkowsky, Thomas G. 175 Pendyala, Krishna V. 233 Pericle Communications Company 405 Plonka, Robert J. 89 Prisa Networks 549 Pugh, Michael W. 549 Quantel 225, 388 Ra, Jong Beom 122 Radio Data Group Inc. 500 Radio Frequency Systems 105 RAI Radiotelevisione Habana 476 Rau, Michael C. 500 Riccio, Corrado 384 Rim, Chai Yeol 122, 495 Rudolph, Dietmar 27 Sachdev, D.K. 131 Saji, Keiichi 511 Sakaguchi, Hiranao 395 Salamon, Stanley J. 449 Salek, Stanley 49 SENCORE, Inc. 357 Shellswell, Peter 140 Shrestha, Mukunda B. 331 Simmons, W. Lee 424 Skemp, Shannon L. 269 Smith, Paul D. 218 Stewart, Jeff 225 Swanson, Hilmer I. 306 Symons, Robert S. 523 Takai, Masaoki 140 Technishe Universitat Dresden 505 TeleDiffusion de France 27 Thomcast 27 Tower Engineering Consultants, Inc. 208 Turner Broadcasting Systems 252 Urano, Joji 395 USIA 27
Van Fleteren, Stephan 263 Vir James P.C. 343 VitaIone, Roberto 476 Wactlar, Howard D. 233 Watanabe, Ryu 348 WBEB-FM 432 Weigel, Mark 461 Williams, Tom 109 Witherow, David 146 World DAB Forum 146 WorldSpace 131 Wylie, Fred 155 Yamauchi, Hideo 395, 511 Zenith Electronics 363
564


JOIN THE RESOLUTION DIGITAL HDTV
IT'S READY ARE YOU?
VISIT THE ATSC EXHIBIT NAB'97
MEETING ROOM N-109 IN THE LVCC
including
LIVE HDTV DEMONSTRATIONS
II *3,940*
Price. $75.00 EACH DESC ENG PROCEEDINGS 1997
ITEM #3840