New Avian tracks from the lower to middle Eocene at Fossil Hill, King George Island, Antarctica
Upload
independentCategory
view
0download
0
Published OnlineFirst November 7, 2014.Clin Cancer Res Edwin Chang, Hongguang Liu, Kerstin Unterschemmann, et al. inhibitor BAY 87-2243
Itumors in mice upon treatment with the mitochondrial complex 18F-FAZA PET imaging response tracks the reoxygenation of
Updated version
10.1158/1078-0432.CCR-14-0217doi:
Access the most recent version of this article at:
Material
Supplementary
http://clincancerres.aacrjournals.org/content/suppl/2014/11/08/1078-0432.CCR-14-0217.DC1.html
Access the most recent supplemental material at:
Manuscript
Authoredited. Author manuscripts have been peer reviewed and accepted for publication but have not yet been
E-mail alerts related to this article or journal.Sign up to receive free email-alerts
Subscriptions
Reprints and
To order reprints of this article or to subscribe to the journal, contact the AACR Publications
Permissions
To request permission to re-use all or part of this article, contact the AACR Publications
Research. on November 8, 2014. © 2014 American Association for Cancerclincancerres.aacrjournals.org Downloaded from
Author manuscripts have been peer reviewed and accepted for publication but have not yet been edited. Author Manuscript Published OnlineFirst on November 7, 2014; DOI: 10.1158/1078-0432.CCR-14-0217
1
18F-FAZA PET imaging response tracks the reoxygenation of tumors in mice upon treatment with
the mitochondrial complex I inhibitor BAY87-2243
Edwin Chang,1 Hongguang Liu,1 Kerstin Unterschemmann,2 Peter Ellinghaus,2 Shuanglong Liu,1 Volker Gekeler,3 Zhen Cheng,1 Dietmar
Berndorff,3 Sanjiv S Gambhir1 1Radiology, Molecular Imaging Program at Stanford, Canary Center for Early
Cancer Detection, Stanford University, Palo Alto, California, USA; 2Bayer Pharma AG, Global Drug Discovery, Wuppertal, Germany;
3Bayer Pharma AG, Global Drug Discovery, Berlin, Germany
Please send correspondences to:
Sanjiv S. Gambhir, MD, PhD
Virginia and D. K. Ludwig Professor Chairman, Departments of Radiology and Bioengineering
Director, Molecular Imaging Program at Stanford Director, Canary Center at Stanford for Cancer Early Detection
Head, Nuclear Medicine Phone: 650-725-2309
Fax: 650-724-4948 E-mail: [email protected]
Running Title: 18F-FAZA PET imaging of tumor xenografts treated with BAY 87-2243
Potential Conflict of Interests: K.U., P.E., V.G., and D.B. are employees of Bayer-HealthCare AG. E.C., H.L. and S.S.G. have received grant support from Bayer-HealthCare AG. No conflict of interests with S.L. and Z.C.
Funding Sources: This project was made possible by funding from Bayer Pharma AG.
Research. on November 8, 2014. © 2014 American Association for Cancerclincancerres.aacrjournals.org Downloaded from
Author manuscripts have been peer reviewed and accepted for publication but have not yet been edited. Author Manuscript Published OnlineFirst on November 7, 2014; DOI: 10.1158/1078-0432.CCR-14-0217

2
Abbreviations
18F-FAZA 18F-fluoroazomycin arabinoside tracer
18F-FDG 18F-Deoxyglucose tracer
18F-FLT 18F-Thymidine tracer
18F-Fpp(RGD)2 18F-Pegylated cyclic RGD peptide dimer tracer
786-0 Human Renal Cell Carcinoma Cell
ANGPTL4 Angiopoietin-like 4
BAY 87-2243 1-Cyclopropyl-4-{4-[(5-methyl-3-{3-[4-(trifluoromethoxy)phenyl]-1,2,4-oxadiazol-5-yl}-1H-pyrazol-1-yl)methyl]pyridin-2-yl}piperazine
CA9 Carbonic Anhydrase
H460 Human Lung Cancer Cell Line
HIF-1α Hypoxia-Inducible Factor 1-alpha
%ID/g % Injected Dose per gram of tissue
IHC Immunohistochemistry
EGLN-2 Prolyl hydroxylase-2
EGLN-3 HIF-1α prolyl hydroxylase-3
OCT Optimal Cutting Temperature Matrix
PBS Phosphate-Buffered Saline
PC3 Human Prostate Cancer Cell Line
PD Pharmacodynamic
PET Positron Emission Tomography
RT-PCR Real-time Polymerase Chain Reaction Technique
VHL Von Hippel-Lindau Tumor Suppressor
Research. on November 8, 2014. © 2014 American Association for Cancerclincancerres.aacrjournals.org Downloaded from
Author manuscripts have been peer reviewed and accepted for publication but have not yet been edited. Author Manuscript Published OnlineFirst on November 7, 2014; DOI: 10.1158/1078-0432.CCR-14-0217
3
Abstract
Purpose: We describe a non-invasive PET imaging method that monitors early therapeutic efficacy of BAY 87-2243, a novel small molecule inhibitor of mitochondrial complex I as a function of hypoxia-inducible factor-1α (HIF-1α) activity
Experimental Design: Four PET tracers (18F-FDG, 18F-Fpp(RGD)2, 18F-FLT and
18F-FAZA) were assessed for uptake into tumor xenografts of drug-responsive (H460, PC3) or drug-resistant (786-0) carcinoma cells. Mice were treated with BAY 87-2243 or vehicle. At each point, RNA from treated and vehicle H460 tumor xenografts (n=3 each) was isolated and analyzed for target genes.
Results: Significant changes in uptake of 18F-FAZA, 18F-FLT and 18F-Fpp(RGD)2 (p<0.01) occurred with BAY 87-2243 treatment with 18F-FAZA being the most prominent. 18F-FDG uptake was unaffected. 18F-FAZA tumor uptake declined by 55-70% (1.21±0.10 %ID/g to 0.35±0.1 %ID/g, n=6, vehicle vs. treatment) in both H460 (p<0.001) and PC3 (p<0.05) xenografts 1-3 days post-drug. 18F-FAZA uptake in 786-0 xenografts was unaffected. Decline occurred before significant differences in tumor volume, thus suggesting 18F-FAZA decrease reflected early changes in tumor metabolism. BAY 87-2243 reduced expression of hypoxia-regulated genes CA IX, ANGPTL4 and EGLN-3 by 99 %, 93 % and 83%, respectively (p<0.001 for all), which corresponds with reduced 18F-FAZA uptake upon drug treatment. Heterogeneous expression of genes associated with glucose metabolism, vessel density and proliferation was observed.
Conclusions: Our studies suggest suitability of 18F-FAZA-PET as an early pharmacodynamic monitor on the efficacy of anti-cancer agents that target the mitochondrial complex I and intra-tumor oxygen levels (e.g. BAY 87-2243).
Research. on November 8, 2014. © 2014 American Association for Cancerclincancerres.aacrjournals.org Downloaded from
Author manuscripts have been peer reviewed and accepted for publication but have not yet been edited. Author Manuscript Published OnlineFirst on November 7, 2014; DOI: 10.1158/1078-0432.CCR-14-0217

4
Translational Relevance The heterogeneous composition of cancers (especially hypoxic ones)
results in variability of therapeutic response to (currently rigid) clinical regimens.
We describe an innovative approach to individualize treatments by using a
mechanism-associated PET imaging tracer (18F-FAZA) to closely monitor the
efficacy of a novel anti-cancer drug, BAY 87-2243. By assessing the degree to
which the drug affects tracer uptake, one can then judge the effectiveness of the
drug and thereby adjust drug dosage at early time points before significant
changes in tumor volumes. The level of tracer uptake can also be used to
assess staging of the disease as well as evolution of resistance with treatment
before significant reduction in the rate of tumor shrinkage. The utility of 18F-FAZA
as a monitor of drug action also implies that in the future radiologists will have
more PET tracers in their toolbox (other than the non-specific 18F-FDG) to
monitor clinical conditions and therapies.
Research. on November 8, 2014. © 2014 American Association for Cancerclincancerres.aacrjournals.org Downloaded from
Author manuscripts have been peer reviewed and accepted for publication but have not yet been edited. Author Manuscript Published OnlineFirst on November 7, 2014; DOI: 10.1158/1078-0432.CCR-14-0217
5
Introduction Studies into the gene and protein expression profile on cancers(1) have
resulted in novel strategies to monitor anti-cancer therapies by radiotracers(2, 3).
Such approaches are important since clinical investigations show that expanding
tumors lead to heterogeneous patterns of tissue hypoxia(4-6). This has the initial
consequence of impeding growth but over time, there will be selection for tumor
subpopulations that grow even more aggressively and invasively under
hypoxia(7). Clinical investigations carried out over the last two decades have
demonstrated that the prevalence of hypoxic tissue areas [i.e., O2 tensions (pO2
values) ≤2.5 mmHg or %O2 of 0.3] is characteristic of locally advanced solid
tumors and is a relevant factor in the tumor’s patho-physiome(7). In addition,
hypoxic tumors are also known to be especially resistant to radiotherapy(8).
Thus, it is evident that hypoxia influences multiple, critical steps in the process of
tumorigenesis, often leading to a more malignant and metastatic stage. It is also
evident that additional monitoring tools, such as molecular imaging, are required
to adjust therapies such that they are more appropriate to the cancer profiles of
the individual patient. In order to achieve this, it is vital to understand how to
abrogate such a response. Ultimately, one also needs reagents that could
potentially resolve tumor hypoxia.
Recently, the experimental drug BAY 87-2243 has been identified that
acts by impacting the hypoxia-induced activity of the HIF-1α pathway, principally
by inhibiting the activity of mitochondrial complex I(9). A chemically related drug
candidate, BAY 84-7296, sensitizes tumors to radiotherapy through the same
Research. on November 8, 2014. © 2014 American Association for Cancerclincancerres.aacrjournals.org Downloaded from
Author manuscripts have been peer reviewed and accepted for publication but have not yet been edited. Author Manuscript Published OnlineFirst on November 7, 2014; DOI: 10.1158/1078-0432.CCR-14-0217
6
mechanism, that is, by resolving cancer hypoxia via inhibition of mitochondrial
complex I(10). HIF-1α is a transcription factor that plays a key role in initiating
and maintaining eukaryotic responses to hypoxic and free radical stress(7, 8, 11,
12). In cell culture and in preclinical tumor xenograft models (with fully functional
HIF-1α activity and wild type VHL), BAY 87-2243 has been reported to inhibit
growth(9). To image the processes underlying such inhibition, we employed PET
(Positron Emission Tomography) technology to monitor the efficacy of the drug,
BAY 87-2243, on growing xenografts of human lung cancer (H460) or human
prostate cancer (PC3). As a non-responding, negative control, we also tested
the drug on xenografts of human renal cell carcinoma (786-0) that possess
constitutive HIF2 activity that was initiated by loss of VHL expression(13).
To determine the feasibility of image monitoring on a drug, we selected
several 18F-labelled PET tracers that followed specific processes related to
carcinogenesis and cancer response to hypoxia. These processes (and their
corresponding tracers) include: tumor growth (18F-FLT), tumor energy
metabolism (18F-FDG), tumor angiogenesis (18F-FP(PRGD)2) and tumor hypoxia
(18F-FAZA). We compared the utility of these tracers to monitor the therapeutic
potency of BAY 87-2243. We conclude that 18F-FAZA is the best tracer to
monitor therapeutic response from the drug, BAY 87-2243.
Research. on November 8, 2014. © 2014 American Association for Cancerclincancerres.aacrjournals.org Downloaded from
Author manuscripts have been peer reviewed and accepted for publication but have not yet been edited. Author Manuscript Published OnlineFirst on November 7, 2014; DOI: 10.1158/1078-0432.CCR-14-0217
7
Materials and Methods
Pharmaceuticals
Unless otherwise specified all reagents were purchased from Sigma-Aldrich (St.
Louis, MO, USA). 1-Cyclopropyl-4-{4-[(5-methyl-3-{3-[4-
(trifluoromethoxy)phenyl]-1,2,4-oxadiazol-5-yl}-1H-pyrazol-1-yl)methyl]pyridin-2-
yl}piperazine or BAY 87-2243 (chemical structure disclosed in (9) and shown in
Supplemental Figure 4) was prepared as a suspension in a solution of 20%
Solutol and 10% Ethanol in PBS. Vehicle solution was 20% Solutol/10% Ethanol
in PBS.
Cell Culture of H460, PC3 and 786-0
The human cancer cell lines used in this study were: H460 lung carcinoma cells,
PC3 prostate cancer cells and 786-0 renal cell carcinomas. All lines were
purchased from the American Type Tissue Culture Collection (ATCC, Manassas,
VA) and pre-tested for the presence of endotoxins and mycoplasma. No other
authentication was done. H460 lung carcinoma cells were grown in RPMI-1640
(high glucose), 2mM GlutaMax, and 1mM Na Pyruvate, 1.5 g/L Na bicarbonate
(Gibco BRL/Invitrogen, Carlsbad, CA), 10% fetal bovine serum (FBS) and 1%
penicillin(100 U/mL)/streptomycin (100 mg/mL). PC3 prostate cancer cells were
propagated in F12/Kaighn’s medium with 2mM GlutaMax, 1.5 g/L Na
bicarbonate(Gibco BRL/Invitrogen, Carlsbad, CA), 10% FBS with 1%
penicillin(100 U/mL)/streptomycin (100 mg/mL). 786-0 renal cell carcinoma
Research. on November 8, 2014. © 2014 American Association for Cancerclincancerres.aacrjournals.org Downloaded from
Author manuscripts have been peer reviewed and accepted for publication but have not yet been edited. Author Manuscript Published OnlineFirst on November 7, 2014; DOI: 10.1158/1078-0432.CCR-14-0217

8
cultures were grown in RPMI 1640 medium, 10% FBS and 1% penicillin(100
U/mL)/streptomycin (100 mg/mL).
Mouse Tumor Xenograft Model
Animal protocols were approved by the Stanford Administrative Panel on
Laboratory Animal Care. 14-16 week-old, female nude mice (Charles River
Laboratories, Inc.) were inoculated subcutaneously on both scapular shoulder
blades with 5x10⁶ human cancer cells per side. The mice were anesthetized with
2% isoflurane in oxygen at 2 L/min during the injections. The tumor xenografts
were grown to at least 200 mm3 (3). For H460 cells, a period of 7-10 days post-
injection was needed while 786-0 and PC3 cells required 4-6 weeks.
The majority of xenografted mice were used for small animal PET studies.
Small animal PET scans were done before vehicle or drug treatment and at
defined times after treatment (see Results section). To associate tumor growth
kinetics with changes in radiotracer uptake, tumor volume measurements (taken
via calipers) were performed at various time points throughout the course of the
experiments. At the end of studies, the mice were sacrificed and the tumors
excised and frozen in OCT for immunohistochemical analysis. In one set of
experiments, the xenografts were used exclusively for real-time PCR studies and
selected tumors were isolated at various times pre- and post-drug or vehicle
delivery.
Pre-Clinical Experimental Protocols
(a) Time Dependency Experiment
Research. on November 8, 2014. © 2014 American Association for Cancerclincancerres.aacrjournals.org Downloaded from
Author manuscripts have been peer reviewed and accepted for publication but have not yet been edited. Author Manuscript Published OnlineFirst on November 7, 2014; DOI: 10.1158/1078-0432.CCR-14-0217
9
Small animal PET scans were performed 1 day before the oral
administration of either vehicle (20% solutol/10% EtOH in PBS) or BAY
87-2243 (9 mg/kg in vehicle solution). Scans were then performed 1, 3, 5
or 7 days after the initiation of the drug or vehicle treatments. Treatments
were given via oral gavage daily. Tumor size was also monitored daily
starting at Day -1 through the end of studies. Sample size was n=6
tumors in 3 mice. At the end of each study, mice were pre-treated with
pimonidazole (9 mg/kg, tail vein injection 1.5h prior to autopsy), sacrificed
and tumours frozen in OCT. Samples were then analysed via IHC and
RT-PCR to determine molecular response to treatment.
(b) Specificity Experiments
Time dependency of tumor growth and radiotracer uptake in the presence
of escalating concentrations of BAY 87-2243 was compared among the
treated groups and to the vehicle-control groups. Three separate cohorts
of mice (n=6 tumors in three mice per cohort) were given either vehicle-
control (20% solutol/10% EtOH in PBS), 3mg/kg BAY 87-2243 (in solutol
vehicle) or 9 mg/kg BAY 87-2243. Follow up specificity experiments at
1mg/kg BAY 87-2243 and at 9mg/kg BAY 87-2243 were also undertaken.
As a negative control, equivalent preclinical experiments were done on
786-O xenografts.
Radiotracer Production and Purification:
Research. on November 8, 2014. © 2014 American Association for Cancerclincancerres.aacrjournals.org Downloaded from
Author manuscripts have been peer reviewed and accepted for publication but have not yet been edited. Author Manuscript Published OnlineFirst on November 7, 2014; DOI: 10.1158/1078-0432.CCR-14-0217
10
Synthesis of 18F-Fpp(RGD)2
All chemicals obtained commercially were of analytical grade (Sigma-Aldrich, St.
Louis, MO, USA) and used without further purification. 18F-Fpp(RGD)2 was
synthesized as per a standardized protocol(14). Finished reaction products were
purified and analyzed via reversed phase HPLC as described in in a previous
publication (14). Radiochemical yield was 50 ± 14% (n =10) with specific activity
of 18.5x10⁹ Bq 18F/umole FPP(RGD)2. Radiochemical purity was 95%.
Synthesis of 18F-FDG:
The synthesis of [18F]FDG was performed according to a previous publication
(15). Tail vein injection of tracer was completed on 6-hour fasted athymic nude
mice (female, 14-16 weeks). Radiochemical yield was 63 ± 11% (n =10) with
specific activity of 5x10⁹ Bq 18F/umole FDG. Radiochemical purity was 95%.
Synthesis of 18F-FLT:
The synthesis of [18F]FLT was performed according to a previous publication (3) .
Radiochemical yield was 13 ± 1% (n =10) with specific activity of 37x109 Bq
18F/umole FLT. Radiochemical purity was 95%.
Synthesis of 18F-FAZA:
Research. on November 8, 2014. © 2014 American Association for Cancerclincancerres.aacrjournals.org Downloaded from
Author manuscripts have been peer reviewed and accepted for publication but have not yet been edited. Author Manuscript Published OnlineFirst on November 7, 2014; DOI: 10.1158/1078-0432.CCR-14-0217

11
18F-FAZA(Supplemental Figure 4) was synthesized as described previously(16-
19). Radiochemical yields were approximately 21% at end of the bombardment
with specific activity of 9.8x10⁹ Bq 18F/umole. Typically, 7–11 GBq of 18F-FAZA
were isolated with a radiochemical purity of generally more than 95%.
Small animal PET scanning
An R4 microPET (Siemens Medical Solutions USA, Inc.) was used for imaging,
which has an approximate resolution of 2 mm in each axial direction (20). After a
tail vein injection of (3.7+0.3) x 106 Bq of 18F-FP-PRGD2, 18F-FLT, 18F-FDG or
18F-FAZA in 100 µL of PBS, a 3-min prone acquisition scan was performed
approximately 60 min after injection (90 minutes for 18F-FAZA). A heating pad,
heat lamp, or hot water was used to dilate the tail veins for injections.
Except for those injected with 18F-FDG, the mice were maintained under
isoflurane anesthesia during the injection and scanning periods only. In
between, the mice were given ad libitum access to food and water. For mice
injected with 18F-FDG, the mice were fasted 6-hours before the injections and
were kept under anesthesia between the injection and scanning sessions. For all
experiments, the mice were kept warm using a heating pad or heat lamp while
under anesthesia to maintain a body temperature of around 350C. microPET
images were reconstructed with the ordered-subsets expectation-maximization
algorithm (OESM)(21) using 16 subsets and 4 iterations. Attenuation correction
was not performed.
Research. on November 8, 2014. © 2014 American Association for Cancerclincancerres.aacrjournals.org Downloaded from
Author manuscripts have been peer reviewed and accepted for publication but have not yet been edited. Author Manuscript Published OnlineFirst on November 7, 2014; DOI: 10.1158/1078-0432.CCR-14-0217

12
microPET Image Analysis
Ellipsoidal 3-dimensional regions of interest (ROI) were manually drawn around
the edge of the tumor xenograft activity by visual inspection using AMIDE
software(22).
Immunohistochemical Analysis
In nude mice bearing pre-established H460 tumor xenografts (80 mm3 in size,
n=3 per group), either a single or dual oral treatment was performed with vehicle
or BAY 87-2243 (9 mg/kg). One day after, pimonidazole (9 mg/kg, Natural
Pharmacia International) was injected via the tail vein. Mice were sacrificed 1.5
hours after the pimonidazole injection. Tumors were excised and processed for
pimonidazole staining according to the protocol provided by Natural Pharmacia
International(23).
Immunohistochemical assays for CD31 were done on H460 xenografts
after one, two, and four treatments of vehicle or BAY 87-2243 (9 mg/kg). Primary
antibody was a rat anti-mouse-CD 31 (MEC 13.3; Fa BD Pharmingen), diluted
1:250. Secondary antibody was a biotinylated goat anti-rat antibody (Fa BD
Pharmingen), diluted 1:100. All tissues were counterstained with hematoxylin.
Calculations of percent hypoxic fraction (PHF) and percent vascular fraction
(PVF) was determined by using ImageJ to trace and then to integrate the areas
of both positive staining and the total tumor. The hypoxic and vascular fractions
were then determined by obtaining the ratio for area of positive staining over total
tumor area.
Research. on November 8, 2014. © 2014 American Association for Cancerclincancerres.aacrjournals.org Downloaded from
Author manuscripts have been peer reviewed and accepted for publication but have not yet been edited. Author Manuscript Published OnlineFirst on November 7, 2014; DOI: 10.1158/1078-0432.CCR-14-0217

13
Real-time PCR Analysis
Nude mice bearing pre-established H460 tumor xenografts (grown for 10 days)
were treated orally with vehicle or BAY 87-2243 (9 mg/kg qd). RNA from
xenograft tumors was isolated from satellite animal groups either before
treatment or after 1 and 3 days of treatment with BAY 87-2243 according to
published methods(9). Expression levels of the HIF-1α target genes were
quantified by RT-PCR pursuant to established protocols(9). Data were
normalized to α-actin and were given in arbitrary units as the mean of n=3
animals/treatment group ± standard deviation.
Statistical Analysis
Statistical analysis was performed either with Excel 2011 (Microsoft) or with
Graph Pad Prism version 6.00 (Graph Pad Software, San Diego, CA). Paired t
tests were used when paired data from the same mouse were compared.
Unpaired t tests were used when 2 groups of data were compared. When
multivariate analyses for groups of more than 3 were needed, ANOVA
techniques were employed. Correlation coefficients were calculated when 2
groups of nominal variables were compared. A significance value of P<0.05 was
used. Data are reported as mean+SD.
Research. on November 8, 2014. © 2014 American Association for Cancerclincancerres.aacrjournals.org Downloaded from
Author manuscripts have been peer reviewed and accepted for publication but have not yet been edited. Author Manuscript Published OnlineFirst on November 7, 2014; DOI: 10.1158/1078-0432.CCR-14-0217

14
Results
BAY 87-2243 impacts growth of H460 and PC3 but not 786-0
Tumor xenografts of H460 (Figure 1A), PC3 (Figure 1B) and 786-0 (Figure
1C) were established as test models. For both H460 and PC3, the treatment
with BAY 87-2243 significantly abrogated tumor growth (P<0.001 vehicle vs
treatment, n=6 tumors per condition) when compared to the vehicle controls
(Figures 1A and 1B). BAY 87-2243 did not affect the kinetics of tumor growth for
786-0 xenografts (Figure 1C, n=6 tumors per condition) when compared to
vehicle controls. In no cases did oral administration of BAY 87-2243 affect the
total weight of any animal model that was studied (Supplemental Figure 1).
BAY 87-2243 reduces 18F-FAZA uptake and growth in H460 lung carcinoma xenografts in a dose dependent manner
To examine the concordance between tracer uptake and drug efficacy, we
examined uptake of [18F]-FDG, [18F]-FPP(RGD)2, [18F]-FLT, 18F-FAZA at time
points before, 1 day after and 3 days after vehicle or drug-treatment. In H460
xenografts, reduction of tracer uptake by BAY 87-2243 was most pronounced for
18F-FAZA (Figure 2A-B). One day post-drug treatment, 18F-FAZA uptake
declined by 50% compared to pre-scan controls (1.1±0.10 %ID/g to 0.55±0.1
%ID/g, n=6, p<0.001 vehicle vs. treatment). By Day 3, a significant difference
(P<0.01 vehicle vs. treatment, n=6 tumors in 3 mice per treatment) in tumor
volume between vehicle and treated groups became apparent and this occurred
with significantly (P<001) abrogated 18F-FAZA uptake in the tumors from the
Research. on November 8, 2014. © 2014 American Association for Cancerclincancerres.aacrjournals.org Downloaded from
Author manuscripts have been peer reviewed and accepted for publication but have not yet been edited. Author Manuscript Published OnlineFirst on November 7, 2014; DOI: 10.1158/1078-0432.CCR-14-0217

15
treated cohorts. Thus, changes in 18F-FAZA uptake occurred before significant
changes in tumor size.
To determine if BAY 87-2243 reduces both tumor growth and 18F-FAZA
uptake in a dose dependent manner, murine models of H460 tumor xenografts
were given escalating doses of the drug (3 and 15 mg/kg, respectively). At both
drug concentrations, tumor sizes started to be reduced 24-48 hours after initial
drug treatment. However, the degree of tumor shrinkage was positively related
to dosage of BAY 87-2243, namely, the percent reduction of tumor size was
greater for input of 15 mg/kg/day BAY 87-2243 than for a dosage of 3 mg/kg/day
(n=6 tumor per group, Figure 2E) however the differences were not significant.
In a second set of experiments where the effects of dosage 1 and 9 mg/kg BAY
87-2243 were examined, the dose dependent effect on tumor shrinkage with
drug treatment was more pronounced and significant(p<0.001, ANOVA vehicle
vs treatment group, n=6 tumors per group, Supplemental Figure 7B). Such
findings were consistent with separate investigations by Ellinghaus et al. (9).
When 18F-FAZA uptake was measured for those same cohorts, we observed that
reduction of uptake changed in parallel with increasing BAY 87-2243 dosage
(p<0.001 ANOVA for vehicle vs. different treatment concentrations, n=6 tumor
per group, Figure 2F and Supplemental Figure 7A). The data from Figures 2E-
2F and Supplemental 7A-7B as well as the findings of Ellinghaus et al. (9), all
suggest that BAY 87-2243 can act as an anti-tumorigenic agent (for H460
xenografts) in a dose-dependent manner. In addition, the metric of %IDmean/g
Research. on November 8, 2014. © 2014 American Association for Cancerclincancerres.aacrjournals.org Downloaded from
Author manuscripts have been peer reviewed and accepted for publication but have not yet been edited. Author Manuscript Published OnlineFirst on November 7, 2014; DOI: 10.1158/1078-0432.CCR-14-0217

16
18F-FAZA uptake can serve as an early indicator of dosage efficacy of BAY 87-
2243 even before significant changes in tumor volume.
BAY 87-2243 reduces 18F-FAZA uptake and growth in human PC3 prostate cancer xenografts
To determine if the initial 18F-FAZA findings from H460 could be extended
to other human cancer models, we performed similar studies in mice bearing
human PC3 xenografts. When time dependent 18F-FAZA uptake studies were
performed in the presence of vehicle vs. 9mg/kg/day BAY 87-2243 oral gavage,
18F-FAZA uptake was significantly reduced by nearly 70% in the drug-treated
cohorts (1.2±0.10 %IDmean/g to 0.50±0.1 %IDmean/g, n=6 tumors per group,
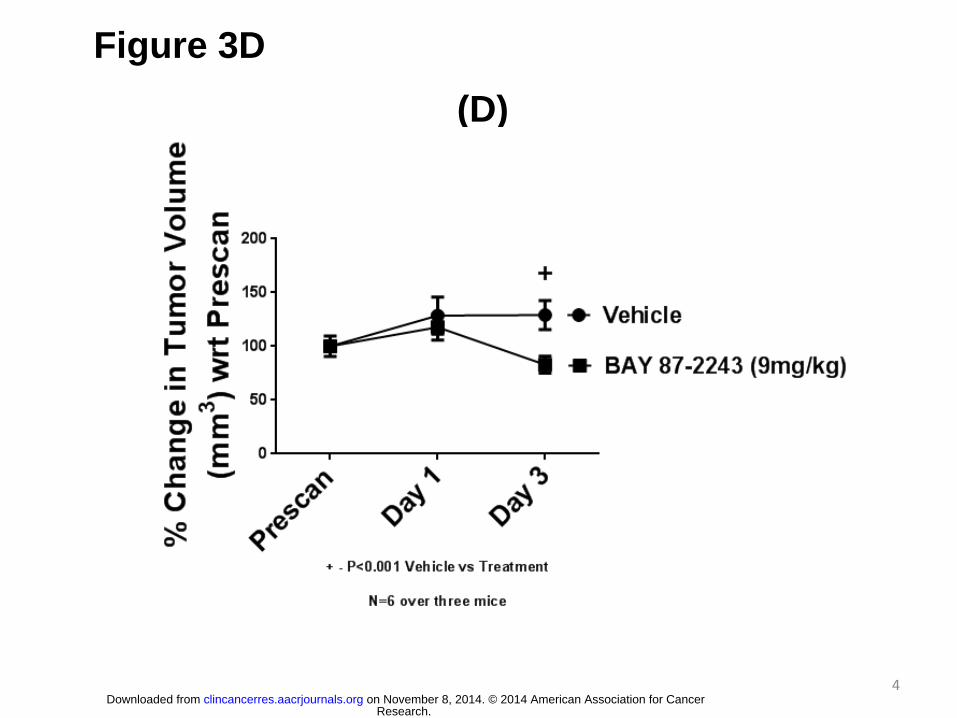
p<0.001 vehicle vs. treatment, Figure 3A-B). For PC3 xenografts, a significant
reduction (p<0.001) in 18F-FAZA uptake occurred as early as one day after
initiation of drug treatment, before any significant differences in tumor volume
appeared between vehicle and drug-treated animals (Figure 3C-D). Differences
in 18F-FAZA uptake persisted to day 3 post-initiation of drug treatment, at which
point there occurs a significant abrogation of tumor growth with BAY 87-2243 oral
gavage. In a similar finding to that with the H460 cohorts, the BAY 87-2243
reagent reduced both 18F-FAZA and tumor growth for PC3 xenografts in a dose-
dependent manner (Supplemental data Figure 2).
Drug treatment reduces neither 18F-FAZA uptake nor growth in BAY 87-2243-resistant human 786-0 renal cell carcinoma xenografts
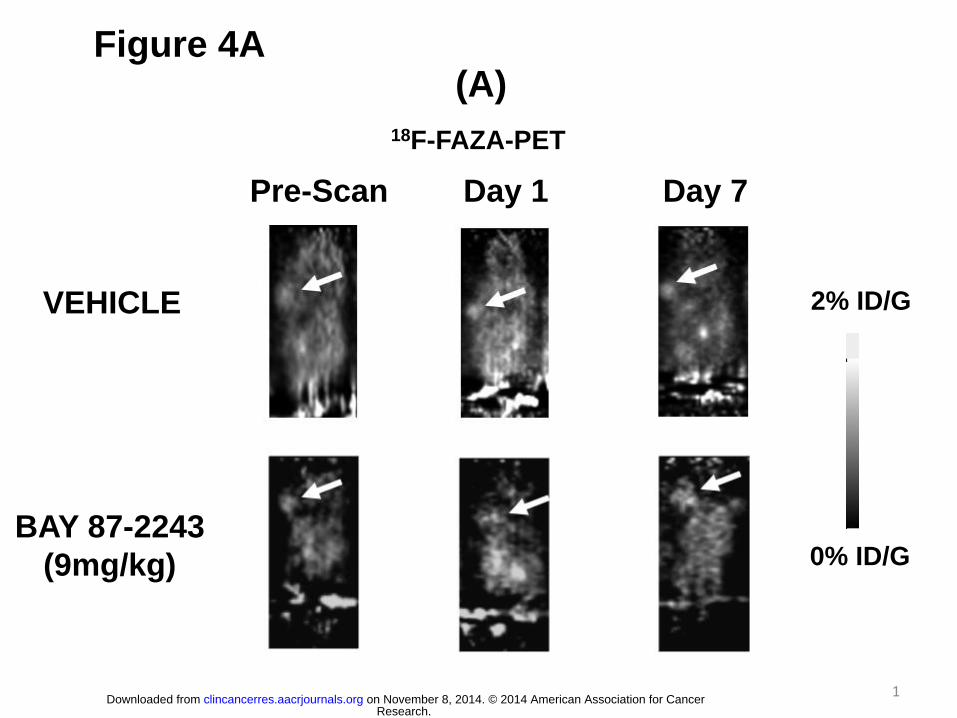
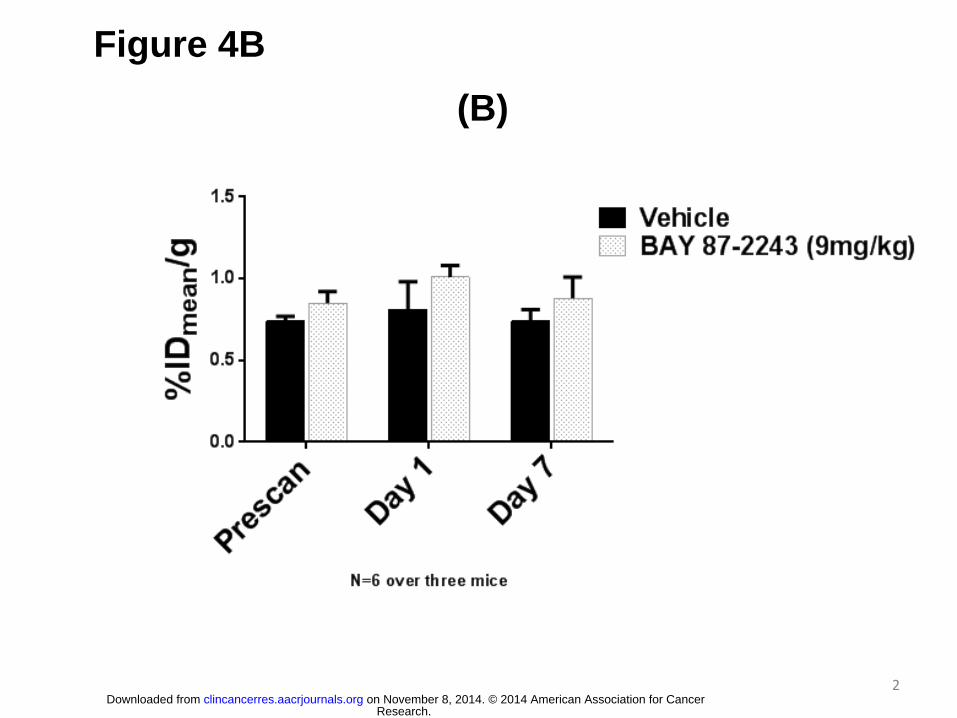
BAY 87-2243 did not inhibit the growth of 786-0 human renal cell
carcinoma xenografts (Figure 1C). When 18F-FAZA small animal PET was
performed on these animals, the scans revealed no significant difference in 18F-
Research. on November 8, 2014. © 2014 American Association for Cancerclincancerres.aacrjournals.org Downloaded from
Author manuscripts have been peer reviewed and accepted for publication but have not yet been edited. Author Manuscript Published OnlineFirst on November 7, 2014; DOI: 10.1158/1078-0432.CCR-14-0217
17
FAZA uptake between vehicle treated mice and those treated with BAY 87-2243
(oral gavage, 9mg/kg, Figure 1C, Figure 4).
Lack of effect by BAY 87-2243 on 18F-FDG uptake in murine models of H460
and PC3 xenografts
When BAY 87-2243 was administered to nude mice carrying H460 tumor
xenografts, no change in 18F-FDG uptake was observed (Figure 5A) between
vehicle- and BAY 87-2243 treated mice at 3 days post-treatment (scans for 1 day
post-treatment was not done). For mice carrying the human-derived PC3
xenografts, no significant difference in 18F-FDG was observed between vehicle-
and BAY 87-2243-treated mice at 1 day and 3 days post-treatment (Figure 5B).
BAY 87-2243 reduces 18F-FLT uptake in both H460 human lung cancer and
human PC3 prostate cancer xenografts
When the effect of BAY 87-2243 on 18F-FLT uptake was examined, by
Day 1 post-treatment, there was a 25% reduction in %IDmean/g in treated H460
xenografts compared to vehicles (4.3+0.3 vs. 3.0+0.3 vehicle vs. treatment,
p<0.01, n=6 tumors per group, Figure 5C) and there was a reduction by 26% of
18F-FLT uptake for PC3 xenografts (3.9+0.2 vs. 2.9+0.2 vehicle vs. treatment,
p<0.01, n=6 tumors per group, Figure 5D). The capacity of BAY 87-2243 to
reduce 18F-FLT uptake became more apparent by Day 5 when it was observed
that drug-treated H460 xenografts had %IDmean/g values that were reduced by
28% compared to vehicle-controls (4.1+0.3 vs. 3.0+0.3 vehicle vs. treatment,
p<0.01, n=6 tumors per group, Figure 5A) while in PC3 xenografts, the
Research. on November 8, 2014. © 2014 American Association for Cancerclincancerres.aacrjournals.org Downloaded from
Author manuscripts have been peer reviewed and accepted for publication but have not yet been edited. Author Manuscript Published OnlineFirst on November 7, 2014; DOI: 10.1158/1078-0432.CCR-14-0217

18
equivalent study yielded a reduction of 43% for drug-treated animals compared
to vehicle-treated animals (4.0+0.2 vs. 2.4+0.2 vehicle vs. treatment, p<0.01, n=6
tumors per group, Figure 5B). Neither drug nor vehicle treatment significantly
affected mouse weight during the time course of this study (data not shown).
Induction of 18F-FPP(RGD)2 uptake by BAY 87-2243 on H460 tumor
xenograft models
When the effect of BAY 87-2243 on 18F-FPP(RGD)2 uptake was examined
(Figure 5E), the drug increased %IDmean/g over vehicle-treated groups by 55% at
1 day after start of treatment (0.38+0.04 vs. 0.59+0.03, vehicle vs. drug, P<0.01,
Figure 5F) but only by 33% at 3 days after initiation of treatment (0.43+0.03 vs.
0.57+0.02, vehicle vs. drug, P<0.01, Figure 5F). Such increases are beyond the
boundaries of statistical reliability (corresponding to a coefficient of variation of
~11%) that was initially established by Chang et al. (24).
BAY 87-2243 (QD x 1) reduces pimonidazole and CD31 immunostaining in
the H460 tumor xenograft model but with different kinetics
In nude mice bearing pre-established H460 tumor xenografts (80 mm3 in
size), a single oral treatment was performed with vehicle or BAY 87-2243 (9
mg/kg). Pimonidazole staining (Figure 6A, arrows) occurred inhomogenously
throughout the tumor and tended to describe irregular, circular patterns. Such
patterns were consistent with previous observations (25, 26)of solid tumors.
Treatment with 9mg/kg BAY 87-2243 resulted in significant reduction in
Research. on November 8, 2014. © 2014 American Association for Cancerclincancerres.aacrjournals.org Downloaded from
Author manuscripts have been peer reviewed and accepted for publication but have not yet been edited. Author Manuscript Published OnlineFirst on November 7, 2014; DOI: 10.1158/1078-0432.CCR-14-0217

19
pimonidazole staining (Figure 6B), a result that is consistent with the reduction in
[18F]-FAZA uptake in BAY 87-2243 treated H460 xenografts.
The percent hypoxic fraction (PHF) of H460 xenografts at 80 mm3 declines
from 28.1+4.5% to 2.6+1.2% (Figure 6E, p<0.001, vehicle vs. treatment, n=3)
with one treatment of BAY 87-2243 (9mg/kg). Two to three administrations of
BAY 87-2243 are required to induce a significant decrease in percent vascular
fraction(PVH) (i.e. from 17.8+3% in vehicle-treated mice to 10.2+3.7% after two
treatments to 4.5+1.5% after four BAY 87-2243 treatments; Figure 6C-F,
p<0.005, n=3).
BAY 87-2243 suppresses HIF-1α target gene expression in the H460 tumor
xenograft model at both 1 day and 3 days post-drug delivery
Analysis of HIF-1α target gene expression by RT-PCR revealed that BAY
87-2243 reduced expression of the hypoxia-regulated genes CA IX, ANGPTL4
and EGLN-3 by 99 %, 93 % and 83% respectively (Figure 6G-I, p<0.001 for
three), which corresponds to reduced 18F-FAZA uptake upon drug treatment.
EGLN-2, a gene not controlled by HIF-1α, was unaffected (Figure 6J). Reduced
18F-FLT uptake was not accompanied by reduced expression of TK1
(Supplemental Figure 5). Expression levels of genes associated with glucose
metabolism did not fully match unchanged 18F-FDG uptake: GLUT-1 expression
and GLUT-3 expression were reduced while HK-2 decreased by 75 %
(Supplemental Figure 6, p<0.01). We detected low integrin beta-3 (ITGB3)
Research. on November 8, 2014. © 2014 American Association for Cancerclincancerres.aacrjournals.org Downloaded from
Author manuscripts have been peer reviewed and accepted for publication but have not yet been edited. Author Manuscript Published OnlineFirst on November 7, 2014; DOI: 10.1158/1078-0432.CCR-14-0217

20
expression in untreated xenografts but were unable to detect transcripts after
BAY 87-2243 treatment (Supplemental Figure 5).
Research. on November 8, 2014. © 2014 American Association for Cancerclincancerres.aacrjournals.org Downloaded from
Author manuscripts have been peer reviewed and accepted for publication but have not yet been edited. Author Manuscript Published OnlineFirst on November 7, 2014; DOI: 10.1158/1078-0432.CCR-14-0217
21
Discussion
BAY 87-2243 is effective in inhibiting the growth of human lung and
prostate cancer xenografts (H460 and PC3) in nude mice whereas the human
renal cell carcinoma 786-0 was shown to be resistant to BAY 87-2243 treatment.
Of the four tracers studied, BAY 87-2243 affected most dramatically the uptake
of 18F-FAZA (before significant changes in tumor volume). Thus, from a
pragmatic standpoint, 18F-FAZA appears to be the most promising of these
tracers for clinical translation. The decrease in 18F-FAZA uptake with BAY 87-
2243 challenge suggests that the drug exerts its action through a process of
reoxygenation. Indeed, tumor reoxygenation by BAY 87-2243 via inhibition of
mitochondrial complex I has been reported by previous investigators(9).
The dramatic change in 18F-FAZA uptake does not preclude the potential
success of other radiotracers that was studied to date. The known capability of
BAY 87-2243 and related compounds to resolve tumor hypoxia(9, 10) would
inevitably have downstream impact on the tumor microenvironment, on tumor
proliferation and on glucose metabolism(27-30). However, while BAY 87-2243
consistently down-regulated hypoxia-associated gene expression in parallel with
a diminution of 18F-FAZA tracer uptake, we did not observe such consistent
changes in the expression of gene targets associated with angiogenesis, glucose
metabolism or proliferation. In turn, the changes in uptake of the corresponding
tracers were not as consistent as we had originally surmised. These findings
illustrate the complex manner in which changes in the hypoxic status of a tumor
affects downstream biological processes. The mutational status of a tumor
Research. on November 8, 2014. © 2014 American Association for Cancerclincancerres.aacrjournals.org Downloaded from
Author manuscripts have been peer reviewed and accepted for publication but have not yet been edited. Author Manuscript Published OnlineFirst on November 7, 2014; DOI: 10.1158/1078-0432.CCR-14-0217

22
(Kras, GLUT1 etc.) most likely will affect a cancer cell’s response to hypoxia as
well(30). To tease out these complex interactions (and to assign appropriate
tracers to track such processes) will involve several careful studies in the future.
[18F]-FAZA belongs to a class of tracers known as nitroimidazoles. A
number of nitroimidzole-based tracers (e.g. misonidazole [MISO] or
fluoromisonidazole[FMISO]) have seen clinical PET utilization(18, 31, 32). 18F-
labelled fluoroazomycin arabinoside(Supplemental Figure 4) or [18F]-FAZA may
represent some advance upon pre-existing nitroimidazole tracers because it is
more readily diffusible across cell membrane yet more readily alkylating at
neutral pH(31). Consequently, this may yield greater signal to noise (i.e., hypoxic
tissue-to-normoxic tissue activity concentration) ratios than other nitroimidazoles
such as fluoromisonidazole (FMISO), intravenous iodoacetate (IAA) or
misonidazole (MISO) (16, 18, 33). Nevertheless, to establish translatability of
18F-FAZA, further studies on additional types of human hypoxic tumors are
needed.
With increasing hypoxia, superoxide anions accumulate. Nitroimidzoles
readily accept electrons from these highly reactive species and through a multi-
step process driven by hypoxia-activated nitroreductase (e.g. xanthine oxidase,
lipoxygenases and NADPH oxidases) the hydroxylamine moiety of
nitroimidazoles becomes reduced to a relatively inactive amine derivative(34).
However, intermediates along this pathway are known to be highly alkylating and
thus, readily form covalent bonds with resident macromolecules(31, 35). The
molecular construct is then trapped within the cell. Thus the level of trapping is
Research. on November 8, 2014. © 2014 American Association for Cancerclincancerres.aacrjournals.org Downloaded from
Author manuscripts have been peer reviewed and accepted for publication but have not yet been edited. Author Manuscript Published OnlineFirst on November 7, 2014; DOI: 10.1158/1078-0432.CCR-14-0217

23
reflective of the amount of nitroreductase activity in the cell and therefore of the
extent of hypoxia in tissue (31).
Changes in tumor oxygenation (i.e. pO2) are presumably related to
changes in tumor vascularity and accessibility of blood-borne tracers to
tumor(36). Thus, any abrogations in 18F-FAZA uptake as seen with BAY 87-2243
treatment may be a reflection of changes in accessibility by the nitroimidazole-
like tracer to the cancer’s vasculature (and consequently, accessibility to the
cancer tissue itself). If tracer accessibility would be truly compromised due to
disruption of vascular normality by BAY 87-2243 treatment, then one would
expect a general decline of all tracers employed in our studies. In fact, we
observe tracer uptake being either increased ([18F]-FPP(RGD)2), decreased
([18F]-FLT) or unchanged([18F]-FDG) following administration of BAY 87-2243.
Thus, the data in aggregate would suggest that changes in 18F-FAZA uptake
tracks biochemical and genomic changes induced by hypoxic- (or hypoxia-like)
stress occurring with BAY 87-2243 administration rather than a physiological
alteration of blood vessel patency that results in reduced accessibility of tracer to
tumor.
In assessing for the presence of pimonidazole immunostaining (an
established marker for hypoxia), histological sections show a marked decline
within one day after BAY 87-2243 treatment (Figure 6A-B). The reliability of such
histological observations has been confirmed by follow-up molecular expression
studies of HIF-1α-associated genes (carbonic anhydrase 9 (CA9), angiopoietin-
like 4 (ANGPTL4), and HIF-prolyl hydroxylase-3 (EGLN-3) (see Figure 6)), which
Research. on November 8, 2014. © 2014 American Association for Cancerclincancerres.aacrjournals.org Downloaded from
Author manuscripts have been peer reviewed and accepted for publication but have not yet been edited. Author Manuscript Published OnlineFirst on November 7, 2014; DOI: 10.1158/1078-0432.CCR-14-0217

24
demonstrated that BAY 87-2243 significantly inhibits the expression of the
corresponding genes. The subsequent loss in CD31 staining in H460 xenografts
would suggest that the process of reoxygenation eventually diminishes vessel
density within treated H460 xenografts. However, such an interpretation should
be taken with caution as no such result after hypoxia resolution occurred with
squamous cell carcinoma xenografts(10).
The contribution of BAY 87-243 to maintenance of prolyl hydroxylase
activity has been proposed previously(9) based upon the observations that: a)
BAY 87-2243 acts principally through inhibition of oxidative phosphorylation via
inhibition of the mitochondrial complex I of the respiratory chain and b) HIF-1α
stabilization was abrogated by inhibition of the complex I component of the
mitochondrial respiratory chain. Helbig et al. (10) showed that a chemically
similar drug, BAY-84-7296, resolved tumor hypoxia through the same
mechanism, namely, by inhibition of the mitochondrial complex I. With drug
challenge, hypoxia and hypoxic ROS activity are decreased and subsequently,
there is less degradation of prolyl hydroxylase which leads to destabilization of
HIF-1α. One consequence of reoxygenation is the loss of nitroreductase
activity(13), thereby leaving less nitroimadazolamine products to be metabolized.
As the FAZA tracer is a nitroimadozolamine, this would result in less 18F-FAZA
tracer being trapped in tumors. 18F-FAZA uptake is thus an effective monitor of
BAY 87-2243 efficacy as it can be argued that tracer uptake is related to the
drug’s ability to form mitochondrial ROS and thereby reflect the degree to which
HIF-1α activity (and hence response to hypoxia) has been compromised. This
Research. on November 8, 2014. © 2014 American Association for Cancerclincancerres.aacrjournals.org Downloaded from
Author manuscripts have been peer reviewed and accepted for publication but have not yet been edited. Author Manuscript Published OnlineFirst on November 7, 2014; DOI: 10.1158/1078-0432.CCR-14-0217

25
mechanism can also explain the lack of change in 18F-FAZA uptake with BAY 87-
2243 treatment for 786-0 xenografts as 786-0 cells have high glycolytic activity
and are not dependent upon oxidative phosphorylation(37, 38). Phenotypically,
786-0 cells present an oxygenated phenotype (as opposed to a hypoxic one) and
thus baseline 18F-FAZA uptake would also be low. Functional VHL-1 complexes
in 786-0 cells are lost(39), thus the lack of change in tracer uptake with BAY 87-
2243 treatment would be consistent with a drug that targets the functionality of
the VHL-1 complex in relation to O2 levels. In Ellinghaus et al. (9), BAY 87-2243
treatment of renal carcinoma RCC4 cells (that also possess a VHL loss-of-
function mutation) did not show any effect on the constitutively activated HIF-1α
pathway. This further supports our view of BAY 87-2243’s mode of action, that is,
no direct effect on HIF-1α or components of the HIF-1α pathway
Taken together, we present here evidence that BAY 87-2243 abrogates
hypoxia via complex I inhibition in responsive models such as H460 cells and
PC3 cells. Most observations such as reduced FAZA tracer uptake and HIF-1α
pathway suppression can be explained by such reoxygenation of the formerly
hypoxic tumor areas. Responsive tumors are thus characterized by the
occurrence of hypoxic areas, which is not fulfilled with the 786-O model, where
18F-FAZA uptake is unchanged. Furthermore, H460 and PC3 cells harbor
functional VHL, which means that HIF-1α pathway is activated upon hypoxia
thereby resulting in enhanced glycolysis that can contribute to ATP supply. Upon
inhibition of complex I by BAY 87-2243, ATP generation via oxidative
phosphorylation is diminished and at the same time reoxygenation abrogates
Research. on November 8, 2014. © 2014 American Association for Cancerclincancerres.aacrjournals.org Downloaded from
Author manuscripts have been peer reviewed and accepted for publication but have not yet been edited. Author Manuscript Published OnlineFirst on November 7, 2014; DOI: 10.1158/1078-0432.CCR-14-0217

26
HIF-1α pathway activation along with glycolysis-driven ATP generation. The
concurrent reduction of ATP supply by complex I inhibition and diminished
glycolysis together with suppression of growth promoting factors generated by an
activated HIF-1α pathway may explain, in part, the observed growth inhibition of
the H460 and PC3 xenograft models. However, the lack of significant alterations
of 18F-FDG uptake upon BAY 87-2243 treatment suggests that the impact on
diminished glycolysis/ATP supply remains uncertain. One needs to compare ATP
levels on drug treatment between responsive and non-responsive models to
resolve these conundrums.
One direction in future studies will involve delineating BAY 87-2243’s
impact subsequent to changes in hypoxic status. Promising avenues include:
effect of drug on entry of pentose into the Tri-carboxylic acid cycle, on glucose
transport, on thymidine salvage, and on integrin induction. Furthermore, the
inhibition of mitochondrial complex I (9, 10) by BAY 87-2243 might provide a new
approach for sensitization towards localized radiotherapy of formerly hypoxic
tumors that have now become reoxygenated (10). Such studies should provide
crucial insights on targeting select patient populations and on improving choice
and use of radiotracers for clinical monitoring of cancer therapies.
Acknowledgments
We thank the Stanford Small Animal Imaging Facility and the Stanford
Radiochemistry Facility for their invaluable technical support
Research. on November 8, 2014. © 2014 American Association for Cancerclincancerres.aacrjournals.org Downloaded from
Author manuscripts have been peer reviewed and accepted for publication but have not yet been edited. Author Manuscript Published OnlineFirst on November 7, 2014; DOI: 10.1158/1078-0432.CCR-14-0217
27
Funding Sources
This project was made possible by funding from Bayer Pharma AG.
Research. on November 8, 2014. © 2014 American Association for Cancerclincancerres.aacrjournals.org Downloaded from
Author manuscripts have been peer reviewed and accepted for publication but have not yet been edited. Author Manuscript Published OnlineFirst on November 7, 2014; DOI: 10.1158/1078-0432.CCR-14-0217

28
References
1. Gambhir SS. Molecular imaging of cancer with positron emission tomography. Nat Rev Cancer. 2002;2:683-93. 2. Tseng JR, Stuart D, Aardalen K, Kaplan A, Aziz N, Hughes NP, et al. Use of DNA microarray and small animal positron emission tomography in preclinical drug evaluation of RAF265, a novel B-Raf/VEGFR-2 inhibitor. Neoplasia. 2011;13:266-75. 3. Tseng JR, Dandekar M, Subbarayan M, Cheng Z, Park JM, Louie S, et al. Reproducibility of 3'-deoxy-3'-18F-fluorothymidine microPET studies in tumor xenografts in mice. J Nucl Med. 2005;46:1851-7. 4. Jiang L, Greenwood TR, Artemov D, Raman V, Winnard PT, Jr., Heeren RM, et al. Localized hypoxia results in spatially heterogeneous metabolic signatures in breast tumor models. Neoplasia. 2012;14:732-41. 5. Evans SM, Hahn SM, Magarelli DP, Koch CJ. Hypoxic heterogeneity in human tumors: EF5 binding, vasculature, necrosis, and proliferation. Am J Clin Oncol. 2001;24:467-72. 6. Kaanders JH, Wijffels KI, Marres HA, Ljungkvist AS, Pop LA, van den Hoogen FJ, et al. Pimonidazole binding and tumor vascularity predict for treatment outcome in head and neck cancer. Cancer Res. 2002;62:7066-74. 7. Finger EC, Giaccia AJ. Hypoxia, inflammation, and the tumor microenvironment in metastatic disease. Cancer metastasis reviews. 2010;29:285-93. 8. Chan DA, Giaccia AJ. Hypoxia, gene expression, and metastasis. Cancer metastasis reviews. 2007;26:333-9. 9. Ellinghaus P, Heisler I, Unterschemmann K, Haerter M, Beck H, Greschat S, et al. BAY 87-2243, a highly potent and selective inhibitor of hypoxia-induced gene activation has antitumor activities and regulates HIF-1a protein expression by inhibition of mitochondrial complex I. Cancer Medicine. 2013;2:611-24. 10. Helbig L, Koi L, Bruchner K, Gurtner K, Hess-Stumpp H, Unterschemmann K, et al. Hypoxia-inducible factor pathway inhibition resolves tumor hypoxia and improves local tumor control after single-dose irradiation. Int J Radiat Oncol Biol Phys. 2014;88:159-66. 11. Semenza GL. Life with Oxygen. Science. 2007;318:62-4. 12. Semenza GL. Targeting HIF-1 for cancer therapy. Nat Rev Cancer. 2003;3:721-32. 13. Kizaka-Kondoh S, Konse-Nagasawa H. Significance of nitroimidazole compounds and hypoxia-inducible factor-1 for imaging tumor hypoxia. Cancer Sci. 2009;100:1366-73. 14. Chin FT, Shen B, Liu S, Berganos RA, Chang E, Mittra E, et al. First experience with clinical-grade ([(1)(8)F]FPP(RGD(2)): an automated multi-step radiosynthesis for clinical PET studies. Molecular imaging and biology : MIB : the official publication of the Academy of Molecular Imaging. 2012;14:88-95. 15. Dandekar M, Tseng JR, Gambhir SS. Reproducibility of 18F-FDG microPET studies in mouse tumor xenografts. J Nucl Med. 2007;48:602-7. 16. Souvatzoglou M, Grosu AL, Roper B, Krause BJ, Beck R, Reischl G, et al. Tumour hypoxia imaging with [18F]FAZA PET in head and neck cancer patients: a pilot study. Eur J Nucl Med Mol Imaging. 2007;34:1566-75. 17. Reischl G, Ehrlichmann W, Bieg C, Solbach C, Kumar P, Wiebe LI, et al. Preparation of the hypoxia imaging PET tracer [18F]FAZA: reaction parameters and automation. Applied radiation and isotopes : including data, instrumentation and methods for use in agriculture, industry and medicine. 2005;62:897-901.
Research. on November 8, 2014. © 2014 American Association for Cancerclincancerres.aacrjournals.org Downloaded from
Author manuscripts have been peer reviewed and accepted for publication but have not yet been edited. Author Manuscript Published OnlineFirst on November 7, 2014; DOI: 10.1158/1078-0432.CCR-14-0217

29
18. Piert M, Machulla HJ, Picchio M, Reischl G, Ziegler S, Kumar P, et al. Hypoxia-specific tumor imaging with 18F-fluoroazomycin arabinoside. J Nucl Med. 2005;46:106-13. 19. Picchio M, Beck R, Haubner R, Seidl S, Machulla HJ, Johnson TD, et al. Intratumoral spatial distribution of hypoxia and angiogenesis assessed by 18F-FAZA and 125I-Gluco-RGD autoradiography. J Nucl Med. 2008;49:597-605. 20. Knoess C, Siegel S, Smith A, Newport D, Richerzhagen N, Winkeler A, et al. Performance evaluation of the microPET R4 PET scanner for rodents. Eur J Nucl Med Mol Imaging. 2003;30:737-47. 21. Hudson HM, Larkin RS. Accelerated image reconstruction using ordered subsets of projection data. IEEE Trans Med Imaging. 1994;13:601-9. 22. Loening AM, Gambhir SS. AMIDE: a free software tool for multimodality medical image analysis. Mol Imaging. 2003;2:131-7. 23. Pimonidazole_protocol:. http://searchcosmobiocojp/cosmo_search_p/search_gate2/docs/NPI_/HP210020080201pdf. 24. Chang E, Liu S, Gowrishankar G, Yaghoubi S, Wedgeworth JP, Chin F, et al. Reproducibility study of [(18)F]FPP(RGD)2 uptake in murine models of human tumor xenografts. Eur J Nucl Med Mol Imaging. 2011;38:722-30. 25. Hendriksen EM, Span PN, Schuuring J, Peters JP, Sweep FC, van der Kogel AJ, et al. Angiogenesis, hypoxia and VEGF expression during tumour growth in a human xenograft tumour model. Microvasc Res. 2009;77:96-103. 26. Young RJ, Moller A. Immunohistochemical detection of tumour hypoxia. Methods Mol Biol. 2010;611:151-9. 27. Harris AL. Hypoxia--a key regulatory factor in tumour growth. Nat Rev Cancer. 2002;2:38-47. 28. Bristow RG, Hill RP. Hypoxia and metabolism. Hypoxia, DNA repair and genetic instability. Nat Rev Cancer. 2008;8:180-92. 29. Masson N, Ratcliffe PJ. Hypoxia signaling pathways in cancer metabolism: the importance of co-selecting interconnected physiological pathways. Cancer Metab. 2014;2:3. 30. Yun J, Rago C, Cheong I, Pagliarini R, Angenendt P, Rajagopalan H, et al. Glucose deprivation contributes to the development of KRAS pathway mutations in tumor cells. Science. 2009;325:1555-9. 31. Krohn KA, Link JM, Mason RP. Molecular imaging of hypoxia. J Nucl Med. 2008;49 Suppl 2:129S-48S. 32. Chapman JD. Hypoxic sensitizers--implications for radiation therapy. N Engl J Med. 1979;301:1429-32. 33. Beck R, Roper B, Carlsen JM, Huisman MC, Lebschi JA, Andratschke N, et al. Pretreatment 18F-FAZA PET predicts success of hypoxia-directed radiochemotherapy using tirapazamine. J Nucl Med. 2007;48:973-80. 34. Nunn A, Linder K, Strauss HW. Nitroimidazoles and imaging hypoxia. European journal of nuclear medicine. 1995;22:265-80. 35. Miwa GT, West SB, Walsh JS, Wolf FJ, Lu AY. Drug residue formation from ronidazole, a 5-nitroimidazole. III. Studies on the mechanism of protein alkylation in vitro. Chem Biol Interact. 1982;41:297-312. 36. Jain RK. Normalization of tumor vasculature: an emerging concept in antiangiogenic therapy. Science. 2005;307:58-62. 37. Biswas S, Troy H, Leek R, Chung YL, Li JL, Raval RR, et al. Effects of HIF-1alpha and HIF2alpha on Growth and Metabolism of Clear-Cell Renal Cell Carcinoma 786-0 Xenografts. J Oncol. 2010;2010:757908.
Research. on November 8, 2014. © 2014 American Association for Cancerclincancerres.aacrjournals.org Downloaded from
Author manuscripts have been peer reviewed and accepted for publication but have not yet been edited. Author Manuscript Published OnlineFirst on November 7, 2014; DOI: 10.1158/1078-0432.CCR-14-0217

30
38. Hervouet E, Cizkova A, Demont J, Vojtiskova A, Pecina P, Franssen-van Hal NL, et al. HIF and reactive oxygen species regulate oxidative phosphorylation in cancer. Carcinogenesis. 2008;29:1528-37. 39. Jiang Y, Zhang W, Kondo K, Klco JM, St Martin TB, Dufault MR, et al. Gene expression profiling in a renal cell carcinoma cell line: dissecting VHL and hypoxia-dependent pathways. Mol Cancer Res. 2003;1:453-62.
Research. on November 8, 2014. © 2014 American Association for Cancerclincancerres.aacrjournals.org Downloaded from
Author manuscripts have been peer reviewed and accepted for publication but have not yet been edited. Author Manuscript Published OnlineFirst on November 7, 2014; DOI: 10.1158/1078-0432.CCR-14-0217

List of Figures Figure 1: Pharmacodynamic (PD) effects of vehicle ( ) and BAY 87-2243 (9mg/kg; ) on tumor growth kinetics in the murine xenograft models of (A) H460 human lung carcinomas (B) PC3 human prostate cancers and (C) 786-O human renal cell carcinomas. Vehicle and drug administered vial daily, oral gavages. N=6 tumor over three mice per cohort. MicroPET readings (shown as ) usually done on days -1, 1, and 3 of treatment. Xenograft tumors were grown to a volume size of 200 mm3 before initiation of treatment. * - denotes P<0.001, vehicle vs. treatment. Figure 2: PD effects of vehicle ( ) and BAY 87-2243 (9mg/kg, ) on reduction of 18F-FAZA uptake in the H460 tumor xenograft model in both single dose and dose-dependent manners. (A) Single voxel plane coronal microPET scans (tracer is 18F-FAZA) of nude mice containing H460 tumor xenografts. Scans performed on mice before treatment (left-most column) and 1 (middle column) and 3-days (right-most column) after treatment for either vehicle (upper panel) or 9 mg/kg BAY 87-2243 (lower panel). (B) Quantitative assessments of 18F-FAZA uptake of corresponding tumor xenografts. Uptake expressed in terms of %IDmean/g. Vehicle cohorts represented by solid bars while hatched, open bars represent uptake in tumors from drug-treated animals. (C) Significant (p<0.001 vehicle vs. treatment) percent loss in %IDmean/g values, 1 day after start of drug treatment. (D) Relative loss in uptake occurred before significant percent decline in tumor volume (p<0.001). N=6 tumor over three mice per cohort. * or + - denotes P<0.001, vehicle vs. treatment. Tumors indicated by white arrows. (E) Tumor growth kinetics of H460 xenografts for given oral gavages of vehicle or 3 and 15 mg/kg of BAY 87-2243. (F) Quantitative assessments of 18F-FAZA uptake of corresponding tumor xenografts. Uptake expressed in terms of %IDmean/g. N=6 tumor over three mice per cohort. * or + - denotes P<0.001, vehicle vs. treatment. Tumors indicated by white arrows. Figure 3: Pharmacodynamic (PD) effects of BAY 87-2243 on the reduction of 18F-[FAZA] uptake in the PC3 prostate carcinoma xenograft model: (A) Single voxel plane coronal uPET scans (tracer is 18F-FAZA) of nude mice containing H460 tumor xenografts. Scans performed on mice before treatment (left-most column) and 1 (middle column) and 3-days (right-most column) after treatment for either vehicle (upper panel) or for 9 mg/kg BAY 87-2243 (lower panel). (B) Quantitative assessments of 18F-FAZA uptake of corresponding tumor xenografts. Uptake expressed in terms of %IDmean/g. Vehicle cohorts represented by black bars while patterned bars represent uptake in tumors from drug-treated animals. (C) Significant (p<0.001 vehicle vs. treatment) percent loss in %IDmean/g values, 1 day after start of drug treatment. (D) Relative loss in uptake occurred before significant percent decline in tumor volume (p<0.001). N=6 tumor over three mice per cohort. * or + - denotes P<0.001, vehicle vs. treatment. Tumors indicated by white arrows. Figure 4: Pharmacodynamic (PD) effects of BAY 87-2243 on 18F-FAZA uptake in the 786-0 renal cell carcinoma xenograft model.
Research. on November 8, 2014. © 2014 American Association for Cancerclincancerres.aacrjournals.org Downloaded from
Author manuscripts have been peer reviewed and accepted for publication but have not yet been edited. Author Manuscript Published OnlineFirst on November 7, 2014; DOI: 10.1158/1078-0432.CCR-14-0217
(A) Single voxel plane coronal uPET scans (tracer is 18F-FAZA) of nude mice containing 786-O tumor xenografts. Scans performed on mice before treatment (left-most column) and 1 (middle column) and 3-days (right-most column) after treatment for either vehicle (upper panel) or for 9 mg/kg BAY 87-2243 (lower panel). (B) Quantitative assessments of 18F-FAZA uptake of corresponding tumor xenografts. Uptake expressed in terms of %IDmean/g. Vehicle cohorts represented by solid, black bars while open, spotted bars represent uptake in tumors from drug-treated animals. Tumors indicated by white arrows. Figure 5: Summary of the effects of BAY 87-2243 on the uptake of 18F-FDG, 18F-FLT and 18F-FPP(RGD)2 into H460 and PC3 tumor xenografts. BAY 87-2243 does not reduce the uptake of 18F-FDG in the (A) H460 human lung carcinoma and the (B) PC3 human prostate cancer xenograft models. Nude mice bearing pre-established H460 tumors (279 ± 54 mm3 in size) were injected with 18F-FDG (4.1 ± 0.2 MBq) via the tail vein before and 1 or 3 days after initial oral BAY 87-2243 treatment (9 mg/kg). PET imaging was performed 1 hour after the tracer injection. Quantitative tumor uptake of 18F-FDG was determined based on the PET scans. Data expressed as %IDmean/g and are given as the mean of n=6 tumors/treatment group ± SEM
BAY 87-2243 induces a modest reduction in uptake of 18F-FLT in the (C) H460 and the (D) PC-3 prostate carcinoma xenograft models. Nude mice bearing pre-established PC-3 tumors (177 ± 43 mm3 in size) were injected with 18F-FLT (4.1 ± 0.1 MBq) before and 1 and 4 days after initial BAY 87-2243 treatment (1 mg/kg and 9 mg/kg, respectively). PET imaging was performed 1 hour after the tracer injection. Quantitative tumor uptake of 18F-FLT was determined based on the microPET scans and expressed as %IDmean/g. Data are given as the mean of n=6 tumors/treatment group ± SEM.
Modest induction of 18F-FPP(RGD)2 uptake, by BAY-87-2243, on H460 tumor xenograft models. (E) Single voxel plane coronal uPET scans (tracer is 18F-FPP(RGD)2) of nude mice containing H460 tumor xenografts. Scans performed on mice before treatment (left-most column) and 1 (middle column) and 3-days (right-most column) after treatment for either vehicle (upper panel) or for 9 mg/kg BAY 87-2243 (lower panel). (F) Quantitative assessments of 18F-FPP(RGD)2 uptake of corresponding tumor xenografts. Uptake expressed in terms of %IDmean/g. Vehicle cohorts represented by solid, black bars while open, spotted bars represent uptake in tumors from drug-treated animals. N=6 tumor over three mice per cohort. * or + - denotes P<0.01, vehicle vs. treatment. Tumors indicated by white arrows. Figure 6: Pharmacodynamic effects on the effects of BAY87-2243 (qd x 1) on the reduction of pimonidazole immunostaining in the H460 lung carcinoma xenograft model. In nude mice, bearing pre-established H460 tumor xenografts (80 mm2 in size), a single oral treatment was performed with vehicle or BAY 87-2243 (9 mg/kg). One day after the treatment, hypoxyprobe (60 mg/kg, Natural Pharmacia International) was injected via the tail vein. Mice were sacrificed 1.5 hours after the hypoxyprobe injection. Tumors were excised and processed for pimonidazole staining according to the protocol provided by Natural Pharmacia International. Histological samples were processed for both (A) vehicle and (B) drug-treated H460 xenografts. BAY 87-2243 also promoted a
Research. on November 8, 2014. © 2014 American Association for Cancerclincancerres.aacrjournals.org Downloaded from
Author manuscripts have been peer reviewed and accepted for publication but have not yet been edited. Author Manuscript Published OnlineFirst on November 7, 2014; DOI: 10.1158/1078-0432.CCR-14-0217
decline in CD31 staining with respect to vehicle (C, D) but the kinetics is slower; in order to see a decrease, a dosage of qd x 4 was required. Kinetics of the loss of (E) percent hypoxia fraction (%PHF) and (F) percent hypoxia fraction (%PVF) was also calculated.
BAY 87-2243 suppresses HIF-1α target gene expression in the H460 lung carcinoma xenograft model at qd × 1 and qd × 3 dosing. Nude mice bearing pre-established H460 tumor xenografts (grown for 10 days) were treated orally with vehicle or BAY 87-2243 (9 mg/kg qd). RNA from xenograft tumors was isolated from satellite animal groups either before treatment or after 1 and 3 days of treatment with BAY 87-2243. Expression levels of the HIF target genes (G) carbonic anhydrase 9 (CA9), (H) angiopoietin-like 4 (ANGPTL4), and (I) HIF-prolyl hydroxylase-3 (EGLN-3) and (J) the non-HIF target gene HIF-prolyl hydroxylase-2 (EGLN-2; serving as a negative control) was quantified by RT-PCR. Data were normalized to β-actin and are given in arbitrary units as the mean of n=3 animals/treatment group ± standard deviation
Research. on November 8, 2014. © 2014 American Association for Cancerclincancerres.aacrjournals.org Downloaded from
Author manuscripts have been peer reviewed and accepted for publication but have not yet been edited. Author Manuscript Published OnlineFirst on November 7, 2014; DOI: 10.1158/1078-0432.CCR-14-0217
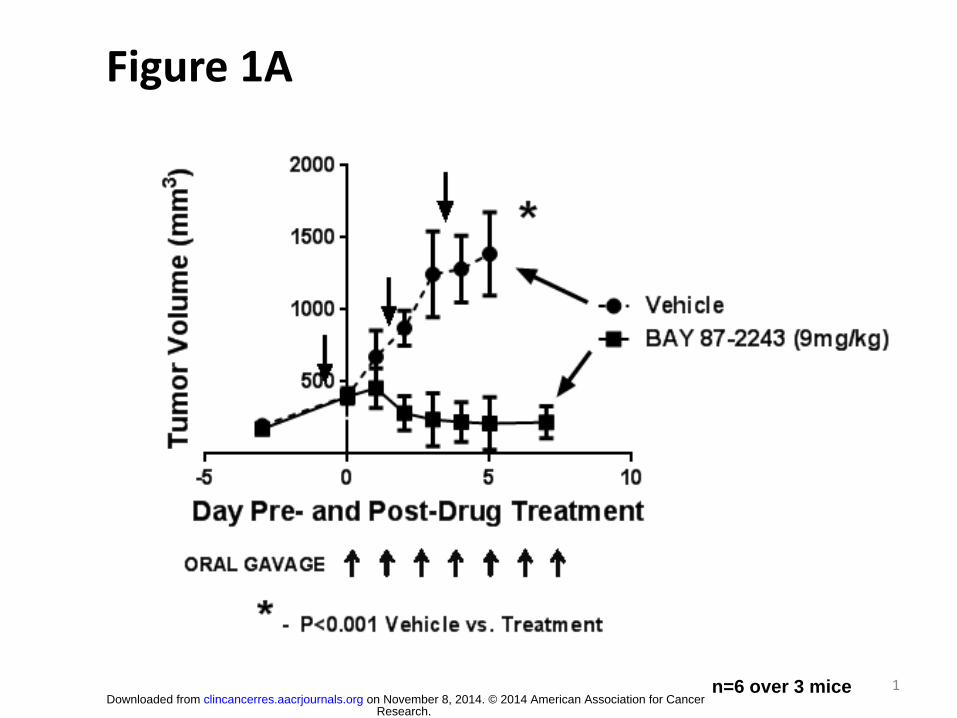
Figure 1A
1 n=6 over 3 mice
Research. on November 8, 2014. © 2014 American Association for Cancerclincancerres.aacrjournals.org Downloaded from
Author manuscripts have been peer reviewed and accepted for publication but have not yet been edited. Author Manuscript Published OnlineFirst on November 7, 2014; DOI: 10.1158/1078-0432.CCR-14-0217

Figure 1B
n=6 over 3 mice
Research. on November 8, 2014. © 2014 American Association for Cancerclincancerres.aacrjournals.org Downloaded from
Author manuscripts have been peer reviewed and accepted for publication but have not yet been edited. Author Manuscript Published OnlineFirst on November 7, 2014; DOI: 10.1158/1078-0432.CCR-14-0217

Figure 1C
3 n=6 over 3 mice
Research. on November 8, 2014. © 2014 American Association for Cancerclincancerres.aacrjournals.org Downloaded from
Author manuscripts have been peer reviewed and accepted for publication but have not yet been edited. Author Manuscript Published OnlineFirst on November 7, 2014; DOI: 10.1158/1078-0432.CCR-14-0217

18F-FAZA-PET
9 mg/kg
Figure 2A
(A)
1
Research. on November 8, 2014. © 2014 American Association for Cancerclincancerres.aacrjournals.org Downloaded from
Author manuscripts have been peer reviewed and accepted for publication but have not yet been edited. Author Manuscript Published OnlineFirst on November 7, 2014; DOI: 10.1158/1078-0432.CCR-14-0217

Figure 2B
(B)
2
Research. on November 8, 2014. © 2014 American Association for Cancerclincancerres.aacrjournals.org Downloaded from
Author manuscripts have been peer reviewed and accepted for publication but have not yet been edited. Author Manuscript Published OnlineFirst on November 7, 2014; DOI: 10.1158/1078-0432.CCR-14-0217
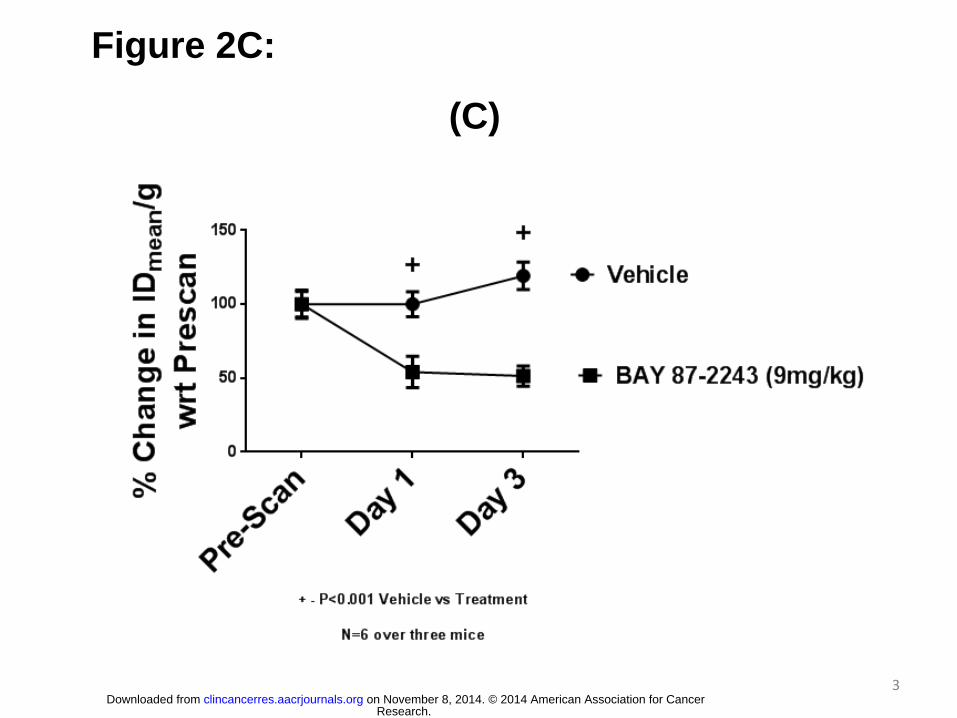
Figure 2C:
(C)
3
Research. on November 8, 2014. © 2014 American Association for Cancerclincancerres.aacrjournals.org Downloaded from
Author manuscripts have been peer reviewed and accepted for publication but have not yet been edited. Author Manuscript Published OnlineFirst on November 7, 2014; DOI: 10.1158/1078-0432.CCR-14-0217

INTRODUCTION
Figure 2D: (D)
4
Research. on November 8, 2014. © 2014 American Association for Cancerclincancerres.aacrjournals.org Downloaded from
Author manuscripts have been peer reviewed and accepted for publication but have not yet been edited. Author Manuscript Published OnlineFirst on November 7, 2014; DOI: 10.1158/1078-0432.CCR-14-0217
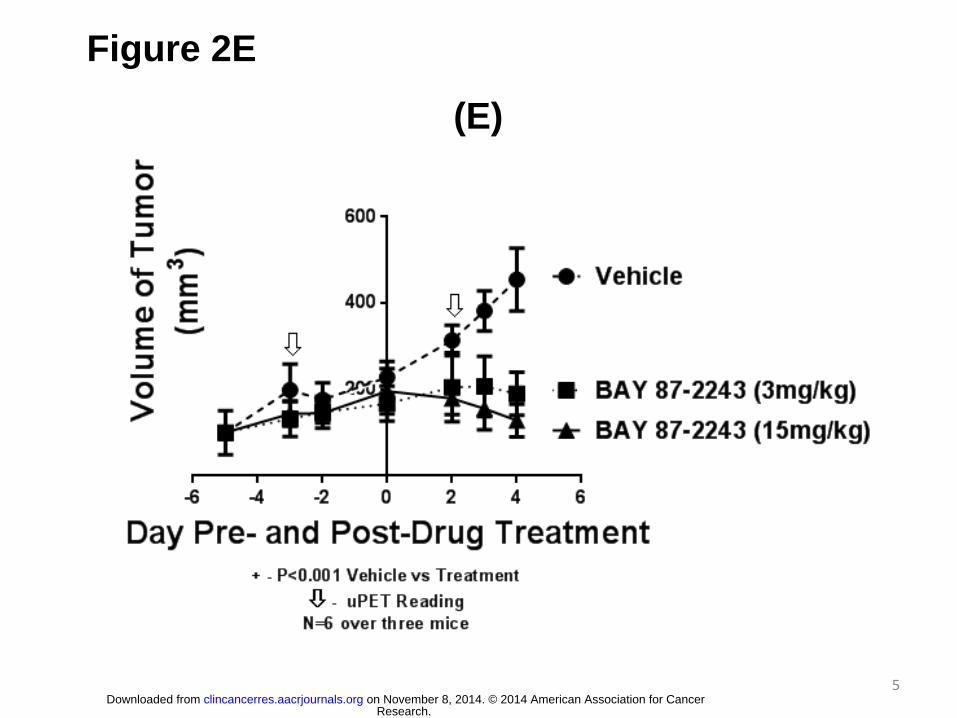
Figure 2E
(E)
5
Research. on November 8, 2014. © 2014 American Association for Cancerclincancerres.aacrjournals.org Downloaded from
Author manuscripts have been peer reviewed and accepted for publication but have not yet been edited. Author Manuscript Published OnlineFirst on November 7, 2014; DOI: 10.1158/1078-0432.CCR-14-0217
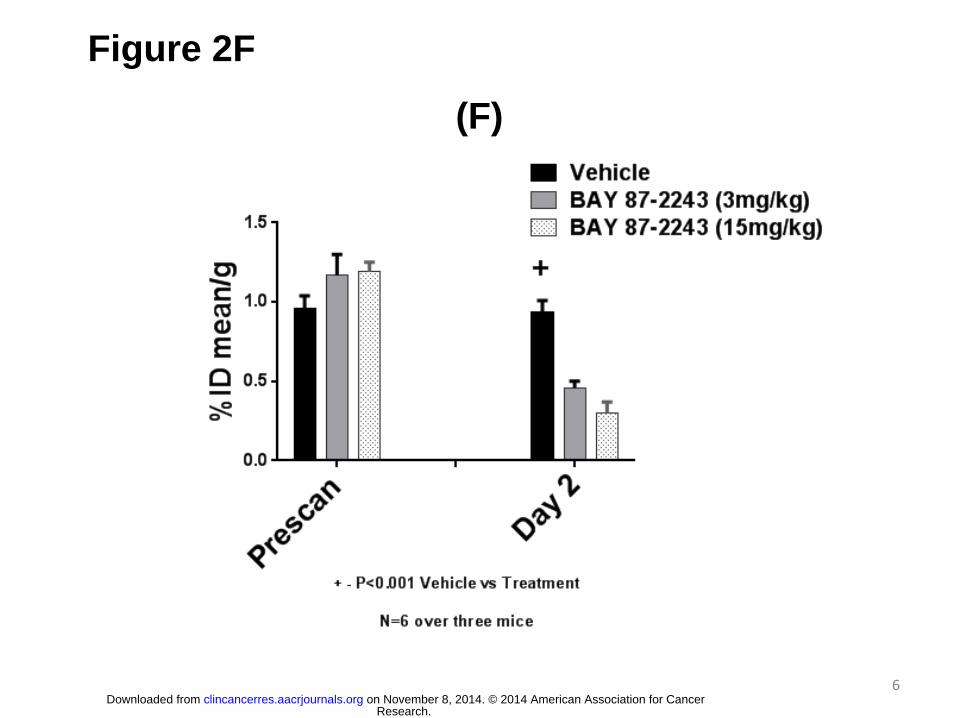
Figure 2F
(F)
6
Research. on November 8, 2014. © 2014 American Association for Cancerclincancerres.aacrjournals.org Downloaded from
Author manuscripts have been peer reviewed and accepted for publication but have not yet been edited. Author Manuscript Published OnlineFirst on November 7, 2014; DOI: 10.1158/1078-0432.CCR-14-0217

Figure 3A
18F-FAZA-PET
PRESCAN DAY 1 DAY 3
BAY 87-2243
(9mg/kg)
VEHICLE
(A)
1
Research. on November 8, 2014. © 2014 American Association for Cancerclincancerres.aacrjournals.org Downloaded from
Author manuscripts have been peer reviewed and accepted for publication but have not yet been edited. Author Manuscript Published OnlineFirst on November 7, 2014; DOI: 10.1158/1078-0432.CCR-14-0217

Figure 3B
(B)
2
Research. on November 8, 2014. © 2014 American Association for Cancerclincancerres.aacrjournals.org Downloaded from
Author manuscripts have been peer reviewed and accepted for publication but have not yet been edited. Author Manuscript Published OnlineFirst on November 7, 2014; DOI: 10.1158/1078-0432.CCR-14-0217
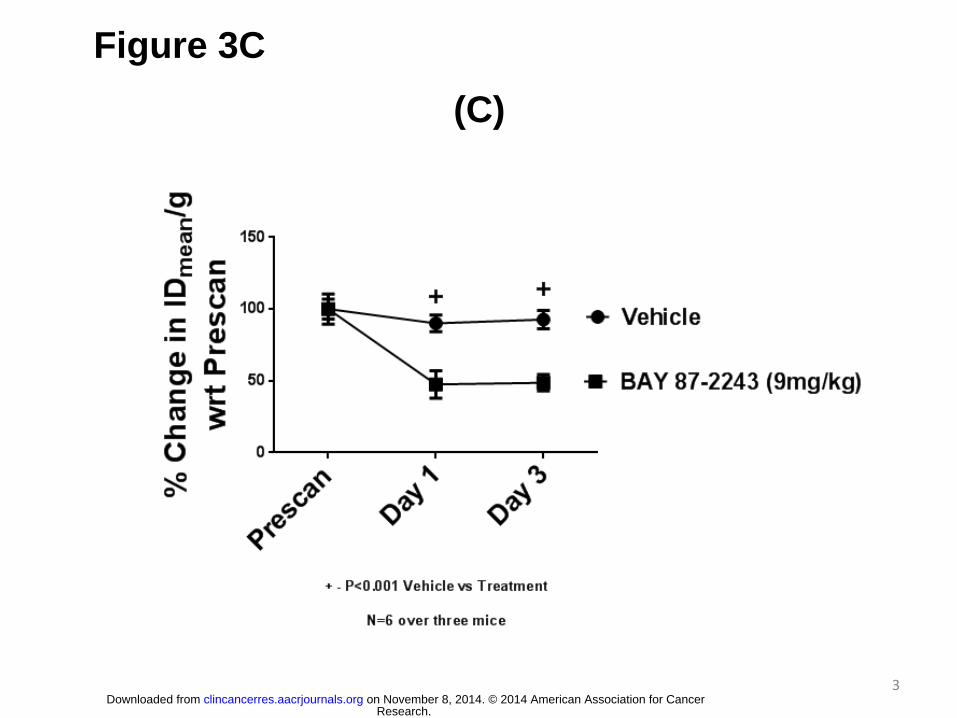
Figure 3C
(C)
3
Research. on November 8, 2014. © 2014 American Association for Cancerclincancerres.aacrjournals.org Downloaded from
Author manuscripts have been peer reviewed and accepted for publication but have not yet been edited. Author Manuscript Published OnlineFirst on November 7, 2014; DOI: 10.1158/1078-0432.CCR-14-0217
INTRODUCTION
Figure 3D
(D)
4
Research. on November 8, 2014. © 2014 American Association for Cancerclincancerres.aacrjournals.org Downloaded from
Author manuscripts have been peer reviewed and accepted for publication but have not yet been edited. Author Manuscript Published OnlineFirst on November 7, 2014; DOI: 10.1158/1078-0432.CCR-14-0217
18F-FAZA-PET
(A) Figure 4A
1
Pre-Scan Day 1 Day 7
VEHICLE
BAY 87-2243
(9mg/kg) 0% ID/G
2% ID/G
Research. on November 8, 2014. © 2014 American Association for Cancerclincancerres.aacrjournals.org Downloaded from
Author manuscripts have been peer reviewed and accepted for publication but have not yet been edited. Author Manuscript Published OnlineFirst on November 7, 2014; DOI: 10.1158/1078-0432.CCR-14-0217
(B)
Figure 4B
2
Research. on November 8, 2014. © 2014 American Association for Cancerclincancerres.aacrjournals.org Downloaded from
Author manuscripts have been peer reviewed and accepted for publication but have not yet been edited. Author Manuscript Published OnlineFirst on November 7, 2014; DOI: 10.1158/1078-0432.CCR-14-0217

Figure 5A:
(A)
1
Research. on November 8, 2014. © 2014 American Association for Cancerclincancerres.aacrjournals.org Downloaded from
Author manuscripts have been peer reviewed and accepted for publication but have not yet been edited. Author Manuscript Published OnlineFirst on November 7, 2014; DOI: 10.1158/1078-0432.CCR-14-0217
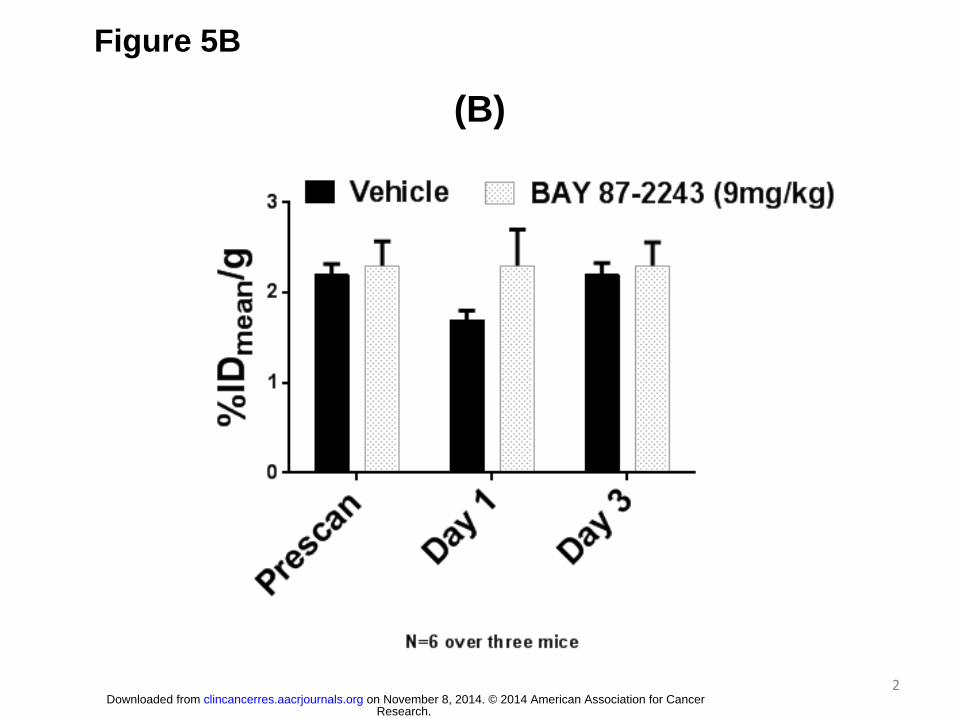
Figure 5B
(B)
2
Research. on November 8, 2014. © 2014 American Association for Cancerclincancerres.aacrjournals.org Downloaded from
Author manuscripts have been peer reviewed and accepted for publication but have not yet been edited. Author Manuscript Published OnlineFirst on November 7, 2014; DOI: 10.1158/1078-0432.CCR-14-0217
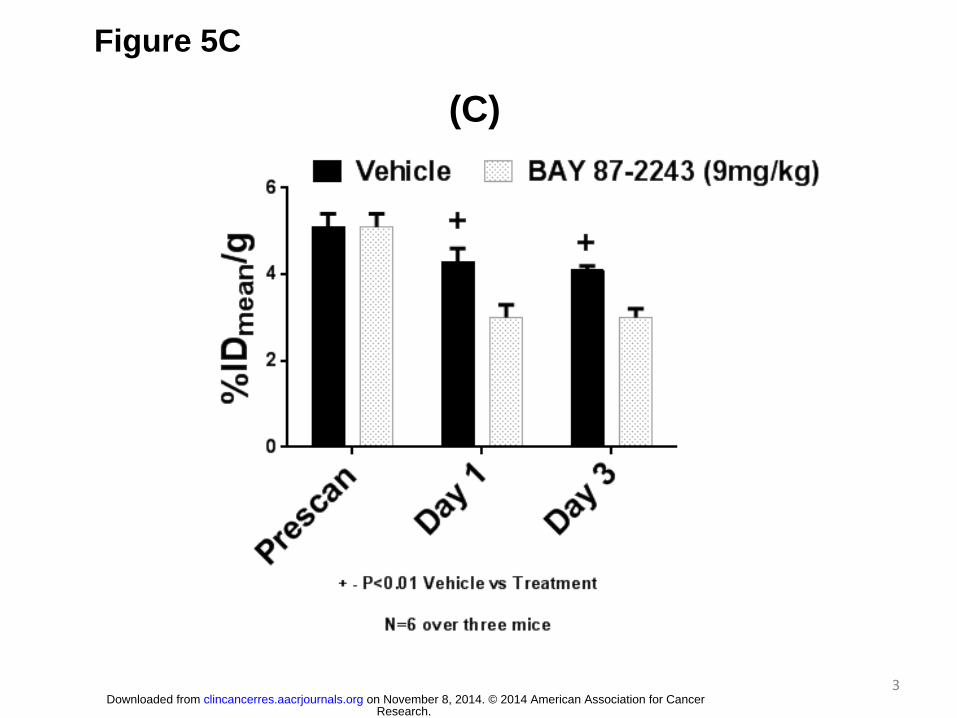
Figure 5C
(C)
3
Research. on November 8, 2014. © 2014 American Association for Cancerclincancerres.aacrjournals.org Downloaded from
Author manuscripts have been peer reviewed and accepted for publication but have not yet been edited. Author Manuscript Published OnlineFirst on November 7, 2014; DOI: 10.1158/1078-0432.CCR-14-0217

Figure 5D
(D)
4
Research. on November 8, 2014. © 2014 American Association for Cancerclincancerres.aacrjournals.org Downloaded from
Author manuscripts have been peer reviewed and accepted for publication but have not yet been edited. Author Manuscript Published OnlineFirst on November 7, 2014; DOI: 10.1158/1078-0432.CCR-14-0217
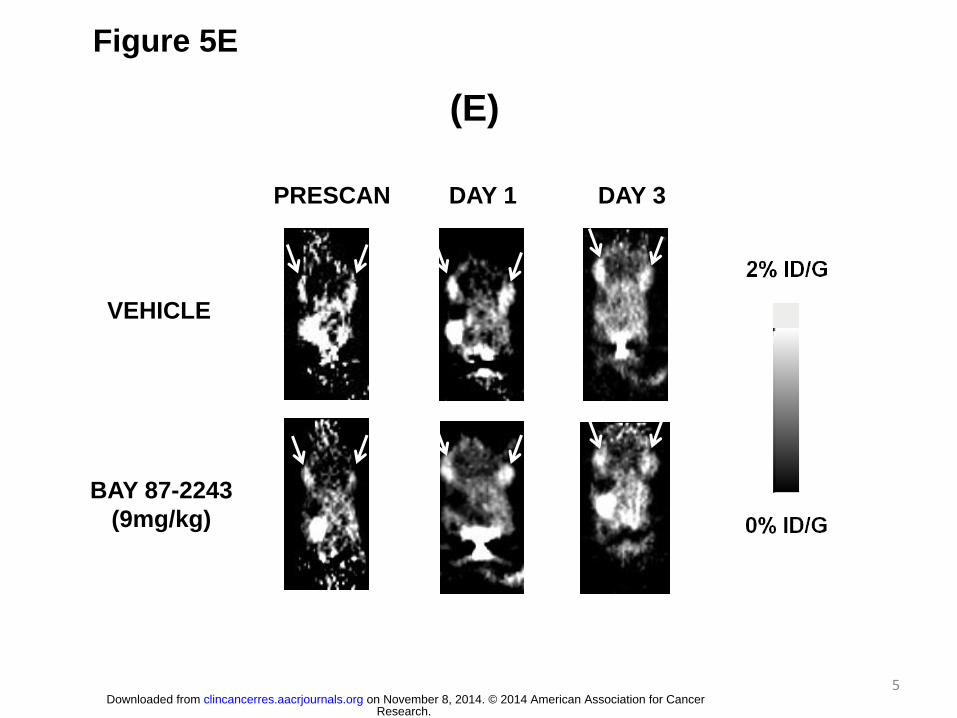
Figure 5E
(E)
BAY 87-2243
(9mg/kg)
VEHICLE
5
PRESCAN DAY 1 DAY 3
Research. on November 8, 2014. © 2014 American Association for Cancerclincancerres.aacrjournals.org Downloaded from
Author manuscripts have been peer reviewed and accepted for publication but have not yet been edited. Author Manuscript Published OnlineFirst on November 7, 2014; DOI: 10.1158/1078-0432.CCR-14-0217

Figure 5F
(F)
6
Research. on November 8, 2014. © 2014 American Association for Cancerclincancerres.aacrjournals.org Downloaded from
Author manuscripts have been peer reviewed and accepted for publication but have not yet been edited. Author Manuscript Published OnlineFirst on November 7, 2014; DOI: 10.1158/1078-0432.CCR-14-0217
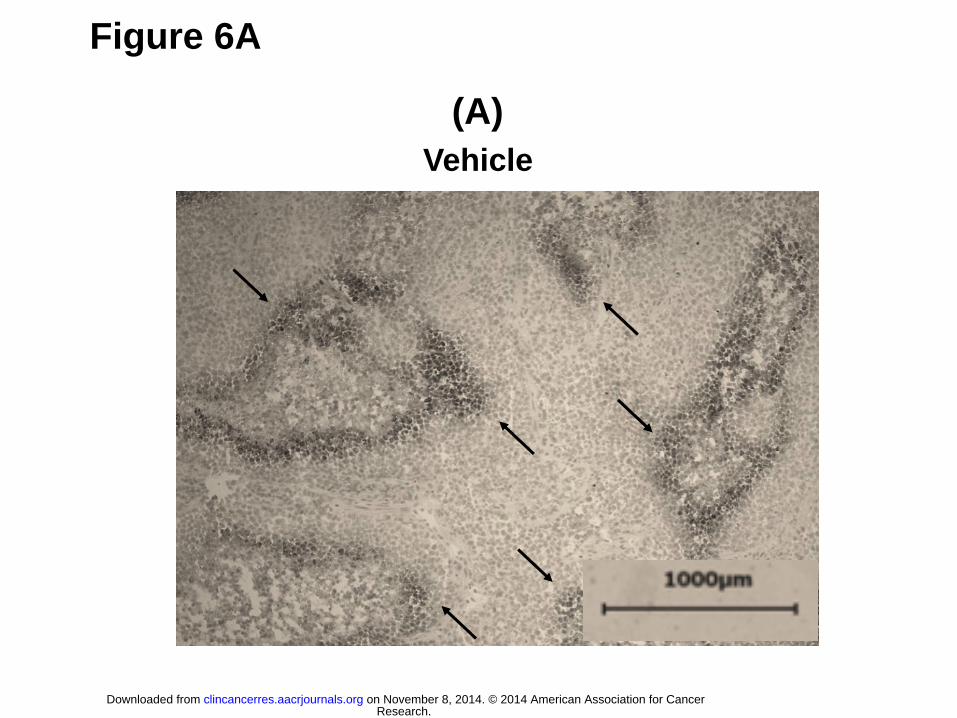
Figure 6A
Vehicle
(A)
Research. on November 8, 2014. © 2014 American Association for Cancerclincancerres.aacrjournals.org Downloaded from
Author manuscripts have been peer reviewed and accepted for publication but have not yet been edited. Author Manuscript Published OnlineFirst on November 7, 2014; DOI: 10.1158/1078-0432.CCR-14-0217

Figure 6B
BAY 87-2243
(B)
2
Research. on November 8, 2014. © 2014 American Association for Cancerclincancerres.aacrjournals.org Downloaded from
Author manuscripts have been peer reviewed and accepted for publication but have not yet been edited. Author Manuscript Published OnlineFirst on November 7, 2014; DOI: 10.1158/1078-0432.CCR-14-0217

Figure 6C
Vehicle
(C)
3
Research. on November 8, 2014. © 2014 American Association for Cancerclincancerres.aacrjournals.org Downloaded from
Author manuscripts have been peer reviewed and accepted for publication but have not yet been edited. Author Manuscript Published OnlineFirst on November 7, 2014; DOI: 10.1158/1078-0432.CCR-14-0217

Figure 6D
BAY 87-2243
(D)
4
Research. on November 8, 2014. © 2014 American Association for Cancerclincancerres.aacrjournals.org Downloaded from
Author manuscripts have been peer reviewed and accepted for publication but have not yet been edited. Author Manuscript Published OnlineFirst on November 7, 2014; DOI: 10.1158/1078-0432.CCR-14-0217
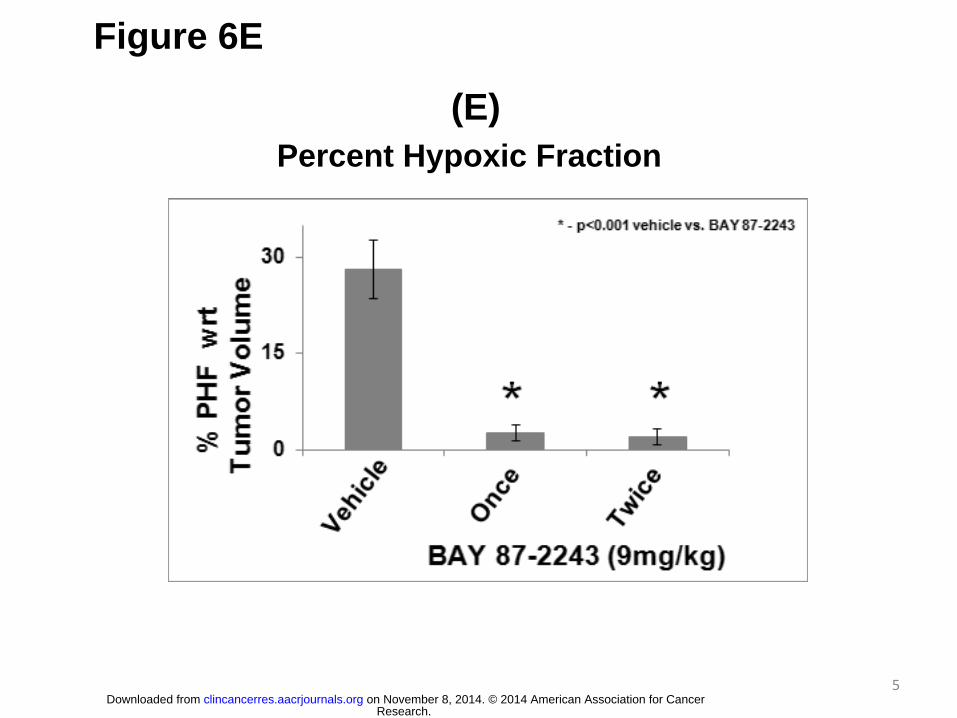
Figure 6E
Percent Hypoxic Fraction
(E)
5
Research. on November 8, 2014. © 2014 American Association for Cancerclincancerres.aacrjournals.org Downloaded from
Author manuscripts have been peer reviewed and accepted for publication but have not yet been edited. Author Manuscript Published OnlineFirst on November 7, 2014; DOI: 10.1158/1078-0432.CCR-14-0217

Figure 6F
Percent Vascular Fraction
(F)
6
Research. on November 8, 2014. © 2014 American Association for Cancerclincancerres.aacrjournals.org Downloaded from
Author manuscripts have been peer reviewed and accepted for publication but have not yet been edited. Author Manuscript Published OnlineFirst on November 7, 2014; DOI: 10.1158/1078-0432.CCR-14-0217

Figure 6G
CA IX
Pre
scan
Veh
icle
day
1
9 m
g/kg B
AY 8
7-22
43 d
ay 1
Veh
icle
day
3
9 m
g/kg B
AY 8
7-22
43 d
ay 3
0
500
1000
1500
mR
NA
ex
pre
ss
ion
[arb
itra
ry u
nit
s]
ANGPTL4
Pre
scan
Veh
icle
day
1
9 m
g/kg B
AY 8
7-22
43 d
ay 1
Veh
icle
day
3
9 m
g/kg B
AY 8
7-22
43 d
ay 3
0
200
400
600
800
1000
1200
1400
mR
NA
ex
pre
ss
ion
[arb
itra
ry u
nit
s]
EGLN-3
Pre
scan
Veh
icle
day
1
9 m
g/kg B
AY 8
7-22
43 d
ay 1
Veh
icle
day
3
9 m
g/kg B
AY 8
7-22
43 d
ay 3
0
100
200
300
400
500
600
700
800
mR
NA
ex
pre
ss
ion
[arb
itra
ry u
nit
s]
EGLN-2 [non-HIF target gene]
Pre
scan
Veh
icle
day
1
9 m
g/kg B
AY 8
7-22
43 d
ay 1
Veh
icle
day
3
9 m
g/kg B
AY 8
7-22
43 d
ay 3
0
50
100
150
200
250
300
350
400
450
mR
NA
ex
pre
ss
ion
[arb
itra
ry u
nit
s]
mR
NA
Exp
ressio
n
(arb
itra
ry u
nit
s)
(G) CA IX
7
Research. on November 8, 2014. © 2014 American Association for Cancerclincancerres.aacrjournals.org Downloaded from
Author manuscripts have been peer reviewed and accepted for publication but have not yet been edited. Author Manuscript Published OnlineFirst on November 7, 2014; DOI: 10.1158/1078-0432.CCR-14-0217

Figure 6H
CA IX
Pre
scan
Veh
icle
day
1
9 m
g/kg B
AY 8
7-22
43 d
ay 1
Veh
icle
day
3
9 m
g/kg B
AY 8
7-22
43 d
ay 3
0
500
1000
1500
mR
NA
ex
pre
ss
ion
[arb
itra
ry u
nit
s]
ANGPTL4
Pre
scan
Veh
icle
day
1
9 m
g/kg B
AY 8
7-22
43 d
ay 1
Veh
icle
day
3
9 m
g/kg B
AY 8
7-22
43 d
ay 3
0
200
400
600
800
1000
1200
1400
mR
NA
ex
pre
ss
ion
[arb
itra
ry u
nit
s]
EGLN-3
Pre
scan
Veh
icle
day
1
9 m
g/kg B
AY 8
7-22
43 d
ay 1
Veh
icle
day
3
9 m
g/kg B
AY 8
7-22
43 d
ay 3
0
100
200
300
400
500
600
700
800
mR
NA
ex
pre
ss
ion
[arb
itra
ry u
nit
s]
EGLN-2 [non-HIF target gene]
Pre
scan
Veh
icle
day
1
9 m
g/kg B
AY 8
7-22
43 d
ay 1
Veh
icle
day
3
9 m
g/kg B
AY 8
7-22
43 d
ay 3
0
50
100
150
200
250
300
350
400
450
mR
NA
ex
pre
ss
ion
[arb
itra
ry u
nit
s]
mR
NA
Exp
ressio
n
(arb
itra
ry u
nit
s)
(H) ANGPTL4
8
Research. on November 8, 2014. © 2014 American Association for Cancerclincancerres.aacrjournals.org Downloaded from
Author manuscripts have been peer reviewed and accepted for publication but have not yet been edited. Author Manuscript Published OnlineFirst on November 7, 2014; DOI: 10.1158/1078-0432.CCR-14-0217

Figure 6I
CA IX
Pre
scan
Veh
icle
day
1
9 m
g/kg B
AY 8
7-22
43 d
ay 1
Veh
icle
day
3
9 m
g/kg B
AY 8
7-22
43 d
ay 3
0
500
1000
1500
mR
NA
ex
pre
ss
ion
[arb
itra
ry u
nit
s]
ANGPTL4
Pre
scan
Veh
icle
day
1
9 m
g/kg B
AY 8
7-22
43 d
ay 1
Veh
icle
day
3
9 m
g/kg B
AY 8
7-22
43 d
ay 3
0
200
400
600
800
1000
1200
1400
mR
NA
ex
pre
ss
ion
[arb
itra
ry u
nit
s]
EGLN-3
Pre
scan
Veh
icle
day
1
9 m
g/kg B
AY 8
7-22
43 d
ay 1
Veh
icle
day
3
9 m
g/kg B
AY 8
7-22
43 d
ay 3
0
100
200
300
400
500
600
700
800
mR
NA
ex
pre
ss
ion
[arb
itra
ry u
nit
s]
EGLN-2 [non-HIF target gene]
Pre
scan
Veh
icle
day
1
9 m
g/kg B
AY 8
7-22
43 d
ay 1
Veh
icle
day
3
9 m
g/kg B
AY 8
7-22
43 d
ay 3
0
50
100
150
200
250
300
350
400
450
mR
NA
ex
pre
ss
ion
[arb
itra
ry u
nit
s]
mR
NA
Exp
ressio
n
(arb
itra
ry u
nit
s)
EGLN-3 (I)
9
Research. on November 8, 2014. © 2014 American Association for Cancerclincancerres.aacrjournals.org Downloaded from
Author manuscripts have been peer reviewed and accepted for publication but have not yet been edited. Author Manuscript Published OnlineFirst on November 7, 2014; DOI: 10.1158/1078-0432.CCR-14-0217

Figure 6J
CA IX
Pre
scan
Veh
icle
day
1
9 m
g/kg B
AY 8
7-22
43 d
ay 1
Veh
icle
day
3
9 m
g/kg B
AY 8
7-22
43 d
ay 3
0
500
1000
1500
mR
NA
ex
pre
ss
ion
[arb
itra
ry u
nit
s]
ANGPTL4
Pre
scan
Veh
icle
day
1
9 m
g/kg B
AY 8
7-22
43 d
ay 1
Veh
icle
day
3
9 m
g/kg B
AY 8
7-22
43 d
ay 3
0
200
400
600
800
1000
1200
1400
mR
NA
ex
pre
ss
ion
[arb
itra
ry u
nit
s]
EGLN-3
Pre
scan
Veh
icle
day
1
9 m
g/kg B
AY 8
7-22
43 d
ay 1
Veh
icle
day
3
9 m
g/kg B
AY 8
7-22
43 d
ay 3
0
100
200
300
400
500
600
700
800
mR
NA
ex
pre
ss
ion
[arb
itra
ry u
nit
s]
EGLN-2 [non-HIF target gene]
Pre
scan
Veh
icle
day
1
9 m
g/kg B
AY 8
7-22
43 d
ay 1
Veh
icle
day
3
9 m
g/kg B
AY 8
7-22
43 d
ay 3
0
50
100
150
200
250
300
350
400
450
mR
NA
ex
pre
ss
ion
[arb
itra
ry u
nit
s]
mR
NA
Exp
ressio
n
(arb
itra
ry u
nit
s)
EGLN-2 (non HIF-1a target gene) (J)
10
Research. on November 8, 2014. © 2014 American Association for Cancerclincancerres.aacrjournals.org Downloaded from
Author manuscripts have been peer reviewed and accepted for publication but have not yet been edited. Author Manuscript Published OnlineFirst on November 7, 2014; DOI: 10.1158/1078-0432.CCR-14-0217
Copyright © 2022 FDOKUMEN