
18349409.pdf - Leicester Figshare
291
1 MicroRNAs are novel biomarkers for the detection of colorectal neoplasia and high risk Dukes’ B cancers Thesis submitted for the degree of Doctorate of Philosophy at the University of Leicester by Mr Muhammad Imran Aslam Department of Cancer Studies and Molecular Medicine University of Leicester, UK May 2016
-
Upload
khangminh22 -
Category
Documents
-
view
5 -
download
0
Transcript of 18349409.pdf - Leicester Figshare

1
MicroRNAs are novel biomarkers for the detection of colorectal
neoplasia and high risk Dukes’ B cancers
Thesis submitted for the degree of Doctorate of Philosophy at
the University of Leicester
by
Mr Muhammad Imran Aslam
Department of Cancer Studies and Molecular Medicine
University of Leicester, UK
May 2016

2
1 Abstract
MicroRNAs are novel biomarkers for the detection of colorectal neoplasia and high
risk Dukes’ B cancers
Aims: This study aimed to identify which circulating miRNAs can be used for the early
detection of colorectal cancers (CRCs) and to assess the utility of tissue miRNAs
combined with common gene mutations, to predict the development of metastasis in
patients with Dukes’ B CRCs.
Methods: microRNA (miRNA) expression profiling was performed for total RNA
extracted from plasma samples (colonoscopy negative controls=11, adenomas=9,
carcinomas=12) and formalin-fixed paraffin embedded (FFPE) matched paired
cancerous with adjacent normal tissue (n=20, 5 cases from each group of Dukes’ A,
Dukes’ B with metastasis during 5 year follow up, Dukes’ B without metastasis during 5
year follow up, and Dukes’ C) using Taqman® MicroRNA Array, Megaplex™ RT and pre-
amplification primers Human Pool A v.2.1 and Pool B v.2.0. Discriminatory miRNAs
identified from plasma and tissue expression profiles were validated further on cohorts
of plasma (n=190) and FFPE tissues (n=72). Three common gene mutations (KRAS, BRAF
and PIK3CA) were analysed in DNA extracted from FFPE cancer tissue. miRNA
expression analysis was applied to circulating exosomes to quantify CRC-related
exosomal miRNAs.
Results: Receiver operating characteristics analysis showed miR-135b was associated
with an area under the curve value of 0.82 (95% CI: 0.71-0.92), with 80% sensitivity and
84% specificity for the detection of adenomas and carcinomas. miR-135b was also
detectable in immunoaffinity-isolated plasma exosomes from patients with CRC. No
significant differences were noted for mutation status and the development of
metastasis. Expression levels of miR-135b and miR-15b were significantly associated
with Dukes’ B cancers tissue and the development of metastasis.
Conclusions: miR-135b is a novel diagnostic and prognostic marker. Its expression levels
in blood and tissue can be used for the early detection of CRCs and to predict the
development of metastasis in Dukes’ B cancers.

3
2 Acknowledgements
I would like to express my deepest gratitude to my supervisors, Dr Howard Pringle, Mr
John Jameson and Mr Baljit Singh, for their excellent guidance, caring and patience, and
for providing me with an excellent atmosphere for doing research. I would specially like
to thank Dr Howard Pringle who has shown the attitude and the substance of a genius:
he continually and persuasively conveyed a spirit of adventure in regard to research and
scholarship, and an excitement in regard to teaching. Without his supervision and
constant help this dissertation would not have been possible. He let me experience the
research of biomarkers in colorectal cancers and practical issues beyond the textbooks,
patiently corrected my writing and financially supported my research. I would never
have been able to finish my dissertation without the guidance of my supervisors, help
from friends and support from my family.
I would like to thank Bowel Diseases Research Foundation, Midland Gastroenterology
Society and East Midlands Business Development Agency for their financial support for
work on CRC related miRNAs. I would also like to thank, National Bowel Cancer
Screening Project audit committee, staff at the Department of Cancer Studies and
Molecular Medicine, Clinical Sciences Unit at Glenfield Hospital, Research Laboratory
for Kidney transplant and operating theatres at Leicester General Hospital. I would like
to pay my special thanks to Mr. Jaganathan Venkatesh, Dr. Karen Page, Dr. Ankur
Karmokar, Dr. Christopher Boes, Dr. Shona Potter, Mrs Angie Gillies, Mrs Linda Potter,
Stefan Hyman and Professor Chris Binns for their technical support during my studies
at University of Leicester.
Words cannot express how grateful I am to my father and mother for all of sacrifices
that they have made on my behalf. Their prayers for me are what have sustained me
thus far. I would also like to thank my brothers and sisters who supported me while I
was writing, and encouraged me to strive towards my goals. Finally, I would like express
appreciation for my beloved wife Rabia Aslam, who spent sleepless nights with my two
lovely daughters Zoha and Eman while I was stuck in the laboratory running my
experiments. She was always my support in the moments when there was no one to
answer my queries. She was always there cheering me up and stood by me through the
good times and bad.
4
3 Contents
Abstract ............................................................................................................................ 2
Acknowledgements .......................................................................................................... 3
Contents……………………………………………………………………………………………………………………..4
List of Tables ................................................................................................................... 10
List of Figures .................................................................................................................. 12
List of Abbreviations …………………………………………………………………………………………………14
1 Introduction ............................................................................................................ 20
1.1 Incidence of colorectal cancer ......................................................................... 20
1.2 Risk of CRC ....................................................................................................... 20
1.2.1 Non-modifiable risk factors ...................................................................... 22
1.2.2 Modifiable risk factors .............................................................................. 22
1.3 CRC staging ...................................................................................................... 22
1.3.1 The TNM staging system .......................................................................... 23
1.3.2 Dukes’ stage ............................................................................................. 25
1.3.3 Survivals from CRC in the UK .................................................................... 25
1.3.4 Biomarkers for high risk features in Dukes’ B cancers ............................. 29
1.4 CRC development and progression ................................................................. 30
1.4.1 Chromosome instability pathway (CIS) .................................................... 31
1.4.2 K-ras and BRAF mutations ........................................................................ 32
1.4.3 Microsatellite instability pathway and mismatch repair ......................... 33
1.4.4 Cell surface receptors ............................................................................... 34
1.5 What are miRNAs? ........................................................................................... 36
1.6 miRNA biogenesis in human cells .................................................................... 38
1.7 Mechanism of action and cellular function of miRNAs ................................... 40
1.8 Methods of miRNA analysis and quantification .............................................. 40
1.9 Role of miRNAs in CRC development .............................................................. 43
1.10 The need for biomarkers for the detection of colorectal neoplasia ........... 48
1.11 Utility of circulating satellite miRNAs for CRC detection and tumour-derived miRNAs in body fluids ...................................................................... 50
1.11.1 Circulating miRNAs in CRC patients ......................................................... 50
1.11.2 Plasma miRNAs as biomarkers for the detection and screening of CRC . 51
1.12 Circulating exosomal miRNAs for CRC ......................................................... 52
1.13 Aims and objectives of this study ................................................................ 56
5
2 Methods ................................................................................................................. 58
2.1 Ethical permission ............................................................................................ 58
2.2 Recruitment ..................................................................................................... 59
2.2.1 Inclusion criteria ....................................................................................... 60
2.2.2 Exclusion Criteria ...................................................................................... 60
2.3 Blood sample collection ................................................................................... 60
2.4 Processing of whole blood samples ................................................................ 62
2.5 Extraction of RNA from 1 ml plasma ............................................................... 63
2.6 Plasma Total RNA quantification ..................................................................... 63
2.6.1 RNA concentration with RNA Clean & Concentrator™-100 ..................... 64
2.6.2 RNA concentration with SpeedVac® concentrators ................................. 64
2.7 Tissue collection, preparation and storage of fresh frozen tissue .................. 64
2.8 Extraction of total RNA from snap-frozen tissue ............................................. 65
2.9 Formalin-fixed paraffin-embedded tissue sample collection ......................... 66
2.9.1 RNA Extraction from FFPE Tissue ............................................................. 69
2.9.2 DNA Extraction from FFPE Tissue ............................................................. 69
2.9.3 Mutation analysis of FFPE tissue .............................................................. 69
2.10 miRNA expression profiling .......................................................................... 73
2.10.1 Chemistry overview for miRNA expression profiling ................................ 73
2.10.2 Expression Profiling for plasma samples: ................................................. 81
2.10.3 miRNA Expression Profiling for High Risk Dukes’ B .................................. 88
2.10.4 Tissue miRNA expression profiling with TaqMan® miRNA Arrays ........... 88
2.11 QRT-PCR for validation cohorts ................................................................... 89
2.12 Isolation of exosomes from harvested cell line culture media by ultracentrifugation ..................................................................................................... 91
2.12.1 Isolation of exosomes from plasma samples by ultracentrifugation ....... 91
2.12.2 Transmission electron microscopy ........................................................... 92
2.12.3 Dynamic Light Scattering ......................................................................... 92
2.12.4 Immunoprecipitation: antibody coupling ................................................. 93
2.12.5 Flow cytometry to assess coupling of antibody with beads ..................... 94
2.12.6 Immunoprecipitation of exosomes with antibody-coupled Dynabeads ... 95
2.12.7 Immunoprecipitation of cell line exosomes with antibody-coupled Dynabeads .............................................................................................................. 95
2.12.8 Extraction of total RNA from exosomes isolated from harvested media and plasma ............................................................................................................ 95

6
2.12.9 Extraction of RNA from immunoprecipitated exosomes and supernatants........................................................................................................... 96
2.12.10 Immunoprecipitation of plasma exosomes with GPA33-coupled antibody. ………………………………………………………………………………………………………………………….97
2.12.11 miRNA expression analysis for exosomal RNA ..................................... 97
2.12.12 Cell sorting for stem cell-related miRNAs. ............................................ 97
2.13 Statistical Analysis: ....................................................................................... 98
2.13.1 Analysis of expression profiling to identify target miRNAs ...................... 98
2.13.2 Validation of diagnostic plasma miRNAs ................................................. 99
2.13.3 Analysis of tissue miRNAs for high risk Dukes’ B cancer ........................ 100
2.13.4 Software used for analysis ..................................................................... 100
3 Results .................................................................................................................. 102
3.1 Summary of results ........................................................................................ 102
3.2 Concentrating RNA samples .......................................................................... 104
3.2.1 RNA Clean & Concentrator™-100 and SpeedVac® concentrator ........... 104
3.2.2 Different elution volumes of total RNA extracted with miRvanaTM RNA isolation kit ................................................................................................... 106
3.3 Discovery phase: expression profiling of plasma miRNAs to identify discriminatory miRNAs for the detection of adenomas and carcinomas ................ 108
3.3.1 Total RNA concentrations for use in the miRNA array ........................... 108
3.3.2 Expression profiling array for plasma miRNAs ....................................... 110
3.3.3 Validation of Novel Circulating miRNAs for CRC Detection: Initial Validation Phase ......................................................................................... 122
3.3.4 Validation of miR-135b in an independent cohort ................................. 137
3.4 Discussion ...................................................................................................... 143
3.4.1 Role of miR-135b in colorectal neoplasia initiation and progression .... 143
3.4.2 Specificity of miR-135b for CRCs ............................................................ 145
3.4.3 miR-34a in circulation............................................................................. 146
3.4.4 miR-431 .................................................................................................. 147
3.4.5 Other studies investigating role of miRNAs for CRC screening .............. 147
3.4.6 Strengths and weaknesses of study ....................................................... 151
3.4.7 Clinical application of plasma miRNA based detection of colorectal neoplasia .............................................................................................................. 153
3.4.8 Conclusion .............................................................................................. 155
4 Results: Analysis of exosomal miRNAs ................................................................ 157
4.1 Summary of Results ....................................................................................... 157
4.2 Identification of exosomes on Transmission Electron Microscopy ............... 159

7
4.3 Dynamic Light Scattering to assess the size of exosomes isolated by ultracentrifugation ................................................................................................... 160
4.4 Flow cytometry (FACS) for detection of exosomes isolated by ultracentrifugation ................................................................................................... 161
4.5 Comparison of total RNA and miRNA concentrations for different volumes of plasma used for ultracentrifugation ...................................................... 163
4.6 Comparison of exosomal miRNAs with source miRNAs ................................ 165
4.7 Assessment of CD133 and CD326 (EpCAM/ESA) antibody coupling with beads by FACS .................................................................................................. 167
4.8 Isolation of exosomes with antibody coupled Dynabeads with FACS .......... 171
4.9 Analysis of exosomal miRNAs isolated through immune isolation and FACS ………………………………………………………………………………………………………………….173
4.10 Direct immune isolation of exosomes by antibody coupled Dynabeads ...... 175
4.11 Analysis of plasma exosomal miRNAs from immunoprecipitated exosomes using CD133, CD326 and GPA33 coupled Dynabeads.............................................. 178
4.12 Discussion ................................................................................................... 181
4.12.1 Selection of miRNAs and antibodies for this feasibility study ............... 181
4.12.2 Specificity of immunoaffinity isolated exosomal miRNAs for CRCs ....... 182
4.12.3 Literature review of exosomal miR-21 ................................................... 182
4.12.4 Use of CD326 for circulating exosomal miRNA analysis in non CRCSs... 183
4.12.5 Total plasma vs exosomal miRNAs ......................................................... 184
4.12.6 Role of exosomal miRNAs in cancer development and progression ..... 185
4.12.7 Limitations of the study.......................................................................... 188
4.12.8 Conclusion .............................................................................................. 188
5 Results: Tissue miRNAs ......................................................................................... 191
5.1 Summary of results ........................................................................................ 191
5.2 miRNA expression signature for different Dukes’ stages .............................. 193
5.3 Confirmation of Expression Profiling data with QRT-PCR ............................ 196
5.4 Validation of selected miRNAs on second cohort ......................................... 198
5.4.1 Tumour versus normal tissue miRNAs .................................................... 198
5.4.2 Dukes’ stage ‘low risk B’ versus ‘high risk B’ .......................................... 200
5.4.3 Mutation Analysis for cancer tissue ....................................................... 204
5.4.4 Correlation with other clinico-pathological variables ............................ 207
5.5 Discussion ...................................................................................................... 210
5.5.1 miR-135b and APC. ................................................................................. 210
5.5.2 miR-135b in metastatic cancers ............................................................. 210
5.5.3 Role of miR-15b in CRCs ......................................................................... 211

8
5.5.4 miR-21 as a prognostic marker .............................................................. 211
5.5.5 Combinatorial approach for prognostic tissue miRNAs in CRC .............. 213
5.5.6 miR-34a and miR-125a-5p ...................................................................... 214
5.5.7 miR-708 and miR-182 ............................................................................. 215
5.5.8 BRAF mutations in right colonic cancers ................................................ 215
5.5.9 Role of miRNAs in CRC metastasis ......................................................... 215
5.5.10 Other potential prognostic markers for CRCs ........................................ 216
5.5.11 Limitation of study ................................................................................. 217
5.5.12 Conclusion .............................................................................................. 219
6 Final Discussion .................................................................................................... 221
6.1 Discussion ...................................................................................................... 221
6.2 Conclusion ..................................................................................................... 225
7 Appendices ........................................................................................................... 228
7.1 Appendix I: Patient Information Sheet for colorectal disease progression .. 228
7.2 Appendix II: Tissue bank patient information sheet ..................................... 232
7.3 Appendix III: Consent form ............................................................................ 235
7.4 Appendix IV: Consent form for Colorectal Tissue Bank ................................. 237
7.5 Appendix V: NBSCP Screening Approval ........................................................ 239
7.6 Appendix VI: Plasma Array Participants Characteristics ............................... 241
7.7 Appendix VII: Table of Z-Score calculated for both adenoma and carcinoma expressions from miRNA data .................................................................................. 242
7.8 Appendix VIII: Clinicopathological characteristics of individual participants in control, adenoma and cancer groups .................................................................. 243
7.9 Appendix IX: Subgroup of controls for initial validation cohort. ................... 246
7.10 Appendix X: Initial Validation Cohort: Concentrations of Total RNA as detected on Nanodrop ND-1000 Spectrophotometer ............................................. 247
7.11 Appendix XI: CT values based expression levels of different miRNAs analysed for initial validation cohort ....................................................................... 250
7.12 Appendix XII: ∆CT values for expression levels of different miRNAs analysed for initial validation cohort ....................................................................... 252
7.13 Appendix XIII: ∆∆CT values for expression levels of different miRNAs analysed for initial validation cohort ....................................................................... 254
7.14 Appendix XIV: ROC analysis for the detection of adenoma and carcinoma by using miR-191 ...................................................................................................... 255
7.15 Appendix XV: Patient Characteristics for the final validation cohort ............ 256
7.16 Appendix XVI: Total RNA concentrations for final validation cohort ............ 258
7.17 Appendix XVII: Table of miR-135b for Normal, Adenoma and Carcinoma ... 259

9
7.18 Appendix XVIII: List of publications, grants, awards and presentations ....... 262
8 References ............................................................................................................ 265

10
4 List of Tables
Table 1: Comparison of TNM and Dukes’ staging systems. ........................................... 27
Table 2: Different types of RNAs. ................................................................................... 37
Table 3: Comparison of different detection systems for miRNAs. ................................ 42
Table 4: Summary of commonly expressed miRNAs in CRC tissue in comparison to adjacent healthy colonic mucosa. .................................................................................. 47
Table 5: Screening programmes for different cancers, their accuracy of detection and percentage reduction in cancer-related mortality from cancer research UK................ 49
Table 6: Isolation and characterisation of CRC cell line exosomes. ............................... 55
Table 7: Ethical permission with details of study title, principle investigator, ethics committee and relevant consent form versions. ........................................................... 58
Table 8: Patient demographics and clinicopathological variables. ................................ 68
Table 9: Primers and probes used for mutation analysis. .............................................. 71
Table 10: Mutation analysis by RT-PCR. ......................................................................... 72
Table 11: Thermal profiles for PCRs for mutation analysis. ........................................... 72
Table 12: Reagent concentrations for reverse transcription, pre-amplification and Array used for miRNA Taqman miRNA Array ................................................................. 79
Table 13: Thermal profiles for different PCR reactions. ................................................ 80
Table 14: Characteristics of participants for plasma miRNA expression profiling ......... 81
Table 15: Reagents for RT+ and RT- master mix. ........................................................... 83
Table 16: -RT reaction Master Mix for reverse transcription reaction. ......................... 83
Table 17: Master mix for preamplification reaction. ..................................................... 85
Table 18: Master mix for TaqMan® Array RT-PCR. ........................................................ 86
Table 19: Characteristics of cancer patients used for expression analysis by using freshly frozen tissue. ...................................................................................................... 89
Table 20: Characteristics of participants used for first validation of plasma miRNA panel. .............................................................................................................................. 90
Table 21: Total RNA concentrations measured with Nanodrop ND-1000 Spectrophotometer. ..................................................................................................... 109
Table 22: Z-scores calculated from miRNA array data for both adenoma and carcinoma samples. ........................................................................................................................ 112
Table 23: Complimentary miRNAs and their detection rates for neoplasia. ............... 113
Table 24: Summary of median performance scores and errors for 6 discriminatory miRNAs identified with Bioinformatics analysis. ......................................................... 114
Table 25: P-values for inter-group differences in expression levels of miRNA for adenoma or carcinoma groups in comparison to the control group. .......................... 115
Table 26: Panel of 29 miRNAs selected for further validation. .................................... 121
Table 27: ROC analysis for detection of the collective group of adenoma and carcinoma. .................................................................................................................... 123
Table 28: ROC analysis for the detection of adenoma. ................................................ 124
Table 29: ROC analysis for the detection of carcinomas. ............................................ 125
Table 30: Inter-group comparison of miR-135b, miR-431 and miR-34a. ..................... 126
Table 31: Median expression levels of miR-135b with associated p-values for differences in expression levels in groups with adenoma, carcinoma, and adenoma and carcinoma. ............................................................................................................. 137

11
Table 32: Summary of detection rates of adenomas and carcinomas based on CT values of miR-135b. ...................................................................................................... 139
Table 33: Summary of detection rates of adenoma and carcinoma based on ΔCT values of miR-135b. ................................................................................................................. 141
Table 34: Summary of in vitro studies investigating the role of miR-135b in non-CRCs. ...................................................................................................................................... 145
Table 35: Comparison of the sensitivity and specificity of different miRNAs for their utility as biomarkers for detection of adenocarcinoma and adenoma*. .................... 149
Table 36: Faecal miRNAs for CRC detection and screening. ........................................ 151
Table 37: Total RNA concentration for exosomes from plasma and HT29 harvested media. ........................................................................................................................... 163
Table 38: Sample characteristics and RNA concentrations for CD133 and CD326 bound exosomes isolated by FACS. ......................................................................................... 173
Table 39: Expression levels of different miRNAs for exosomes isolated with CD133 and CD326 bound Dynabead and FACS. ............................................................................. 174
Table 40: Comparative concentrations of RNA extracted from exosomes. ................ 175
Table 41: Total RNA concentrations of immunoaffinity isolated exosomes. .............. 178
Table 42: Summary of PCR-based validation of selected miRNAs on samples used for array. ............................................................................................................................ 197
Table 43: Linear regression analysis of miRNA expressions for Dukes’ stages. ........... 203
Table 44: Frequency table for different positive mutations detected for BRAF, K-ras and PIK3CA mutations. ................................................................................................. 205
Table 45: P-values for inter-group and intra-group comparisons between the three mutated genes. ............................................................................................................ 206
Table 46: Summary of studies dealing with potential role of different miRNAs for identification of high risk CRCs. .................................................................................... 214
12
5 List of Figures
Figure 1: Risk of CRC development in the UK population. ............................................. 21 Figure 2: TNM staging for CRC. ...................................................................................... 24 Figure 3: The Dukes’ staging system for CRC. ................................................................ 26 Figure 4: Comparison of five year survival rates for CRCs based on cancer stage ....... 27 Figure 5: Age-adjusted one, five and ten year survivals for different cancers. ........... 28 Figure 6: Biogenesis, processing and function of miRNAs. ............................................ 39 Figure 7: The mechanism of biogenesis and function of oncomiRNAs. ......................... 45 Figure 8: The proposed mechanism of biogenesis and function of tumour suppressor miRNAs ........................................................................................................ 46 Figure 9: Formation and release of exosomes by human cells. ..................................... 53 Figure 10: Reverse transcription of miRNA. ................................................................... 74 Figure 11: Preamplification with miRNA specific forward and reverse primers. .......... 74 Figure 12: RT-PCR for miRNA expression study. ............................................................ 76 Figure 13: MicroRNA expression profiling protocol flow chart. .................................... 78 Figure 14: miRNA array for expression profiling. ........................................................... 87 Figure 15: Total RNA concentrations and expression levels (CT) of SnRNA RNU6B and miR-21. .................................................................................................................. 105 Figure 16: Concentrations of RNA extracted with miRvanaTM RNA isolation kit. ........ 106 Figure 17: CT values of SnRNA RNU6B and miR-21 in different elution volumes of RNA extracted with miRvanaTM RNA isolation kit. ................................................... 107 Figure 18: Hierarchical cluster analysis. ....................................................................... 110 Figure 19: Principle component analysis for discriminatory miRNAs .......................... 111 Figure 20: ∆CT-based expression analysis of plasma miR-135b detected in expression profiling. ..................................................................................................... 116 Figure 21: ∆CT-based expression analysis of plasma miR-192* detected in expression profiling. ..................................................................................................... 117 Figure 22: ∆CT-based expression analysis of plasma miR-502-5P detected in expression profiling. ..................................................................................................... 118 Figure 23: ∆CT-based expression analysis of plasma miR-564 detected in expression profiling. ..................................................................................................... 119 Figure 24: Expression levels of miRNA and their matched miRNA* in plasma and tumours ................................................................................................................. 120 Figure 25: Comparative expression of miR-135b for different groups of controls and neoplasia. .............................................................................................................. 127 Figure 26: Comparative expression of miR-431 for different groups of normal and neoplasia. .............................................................................................................. 128 Figure 27: Comparative expression of miR-34a in different groups of controls and neoplasia……….………………………………………………………………………………………………………..129 Figure 28: ∆CT-based expression analysis of plasma miR-135b detected in the validation cohort……………………………………………………………………………………………………..131 Figure 29: ∆CT-based expression analysis of plasma miR-431 detected in validation cohort. …………………………………………………………………………………………………………………….132 Figure 30: ∆CT-based expression analysis of plasma miR-34a detected validation cohort……………………………………………………………………………………………………………………..133

13
Figure 31: Logistic regression probability values for ROC analysis of panel of miRNAs….. ............................................................................................. ……………….. 135 Figure 32: Logistic regression probability values for ROC analysis of selected miRNAs………………………………………………………………………………………………………………… 136 Figure 33: CT-based expression analysis of plasma miR-135b detected in an independent cohort ………………………………………………………………………………………. 138 Figure 34: ∆CT-based expression analysis of plasma miR-135b detected in an independent cohort…………………………………………………………………………………………….. 140 Figure 35: Electron micrographs of exosomes isolated from plasma by combination of filtration (100 nm) and ultracentrifugation without sucrose gradient……………… 159 Figure 36: The size distribution of exosomes………………………………………………………….160 Figure 37: A comparison of events detected for exosomes coupled to fluorescence stained exosomes surface antibodies (CD44 & CD326). .............................................. 162 Figure 38: Comparison of total RNA concentration for volume of plasma used to isolate exosomes isolated by filtration with 100 nm filter and ultracentrifugation… 164 Figure 39: Comparison of miRNA expression levels for different volumes of plasma used to isolate exosomes. ............................................................................................ 165 Figure 40: Comparison of miRNA expression for plasma exosomes, whole plasma, HT29 cell line harvested exosomes and HT29 cell lysate. ............................................ 166 Figure 41: Relative expression levels (∆CT) of miRNAs isolated from plasma and HT29 cell line culture. ................................................................................................... 166 Figure 42: FACS analysis of unstained beads. No fluorescence activity was detected by FACS ......................................................................................................................... 168 Figure 43: FACS analysis for CD326 (EpCAM/ESA)-APC coupled Dynabeads. ............. 169 Figure 44: FACS analysis for CD326 (EpCAM/ESA)-APC coupled Dynabeads. ............. 170 Figure 45: Comparison of FACS analysis for CD133-PE coupled beads bound exosomes to control CD133-PE coupled beads stored in Aldefluor solution at 4°C. .. 172 Figure 46: Expression levels of exosomal miRNAs from plasma and cell line exosomes isolated by immunoprecipitation with GPA33 coupled Dynabeads. .......... 175 Figure 47: FACS analysis for GPA33 coupled Dynabead bound exosomes isolated from HT29 cell line culture harvested media. .............................................................. 177 Figure 48: RNU6B normalised expression levels for different miRNAs of exosomes isolated by different types of antibody coupled Dynabeads. ...................................... 179 Figure 49: Diagnostic utility of exosomal miR-21 isolated with CD326 coupled Dynabeads. ..................................................................................................... 180 Figure 50: Significance analysis for microarrays (SAM). .............................................. 194 Figure 51: Hierarchical cluster analysis of expression profiling data for different Dukes’ stages. ............................................................................................................... 195 Figure 52: Comparison of RNU6B normalized miRNA expression (ΔCT) in cancerous and adjacent normal tissue. ......................................................................................... 199 Figure 53: Comparison of miRNA expression levels of different stages. ..................... 201 Figure 54: Plot of miR-135b expression for paired adjacent normal and cancerous tissue ............................................................................................................................ 202 Figure 55: Plot of miR-34a expressions and tumour T stages as identified on pathological examination. ............................................................................................ 208 Figure 56: Comparison of miRNA expression levels for tumours with histological evidence of EMVI and Mutant KRAS gene. .................................................................. 209

14
6 List of Abbreviations
ACFs Aberrant crypt foci
ACPGBI Association of Coloproctology of Great Britain and Ireland
AFAP Attenuated FAP
ANOVA One way analysis of variance
APC Adenomatous polyposis coli
ASB-PCR Allele specific binding PCR
AUC Area under the curve
BAX Bcl-2 associated X protein
Bcl2 B-cell lymphoma 2
Bcl-XL B-cell lymphoma-extra large
BER Base excision repair
BLAST Basic local alignment search tool
BNIP2 BCL2/adenovirus E1B 19 kDa protein-interacting protein 2
BRAF v-Raf murine sarcoma viral oncogene homologue B1
CA19.9 carbohydrate antigen 19-9
Cadherins Calcium dependant adherins
CAGR Cancer associated genomic regions
Cdc25a Cell division cycle 25 homolog A
Cdc42 Cell division control protein 42 homolog
cDNA Complementary deoxyribonucleic acid
CEA Carcinoembryonic antigen
cfDNA Circulating free DNA
CIMP CpG islands methylation phenotype
CIS Chromosome instability
c-myc myelocytomatosis viral oncogene homolog
COX2 Cytochrome oxidase subunit 2
CRC Colorectal cancer
CSMM Cancer studies and molecular medicine
CT Threshold cycle
CT Computerised tomography

15
D2O Sucrosedeuterium oxide
DLS Dynamic light scattering
DNA Deoxyribonucleic acid
DNMT3A DNA methyltransferase 3A
DSB Double strand break repair system
E2F Transcription factor E2F
E2F1 Transcription factor E2F1
E2F3 Transcription factor E2F3
ECM Extracellular matrix
EDTA Ethylenediamine tetra acetic acid
EGF Epidermal growth factor
EGFR Epidermal growth factor receptor
EMVI Extramural vascular invasion
EpCAM Epithelial cell adhesion molecule
ER-β Estrogen receptor beta
EU European union
EVI5 Ecotropic viral integration site 5 protein homolog
FACS Fluorescence-activated cell sorting
FAM 6-Carboxyfluorescein
FAP Familial adenomatous polyposis
FDA Food and drug administration
FFPE Formalin fixed paraffin embedded
FIH-1 Hypoxia-inducible factor 1-alpha inhibitor
FITs Faecal immunochemical test
FLI1 Friend leukemia integration 1 transcription factor
FOBT Faecal occult blood test
FOXO1 Forkhead box protein O1
GBM Glioblastoma multiforme
GPA33 Glycoprotein 33
GSK3-β Glycogen synthase kinase 3 beta
GTP Guanosine triphosphatase

16
H&E Haematoxylin and Eosin
HIF-1 Hypoxia-inducible factor 1
HIV Human immunodeficiency virus
HNPCC Hereditary non-polyposis colon cancer
HoxA7 Homeobox protein A7
HoxB8 Homeobox protein B8
HoxC8 Homeobox protein C8
HoxD8 Homeobox protein D8
HSF1 Heat shock factor protein 1
HSPGs Heparan sulfate proteoglycans
IARC International agency for research on cancer
IBD Inflammatory bowel disease
ICAMs Intercellular adhesion molecule
IHC Immunohistochemistry
IL-4 Interleukin -4
IMS Industrial methylated spirit
KRAS Kirsten Rat sarcoma viral oncogene homologue
LEMD1 LEM domain-containing 1
LFA-1 Lymphocyte function-associated antigen
LNA Locked nucleic acid
LNNMC Lymph node negative metastatic cancer
LOH Loss of heterozygosity
MAP MutY Homolog associated polyposis
MAPK Mitogen-activated protein kinases
Mcl1 Induced myeloid leukaemia cell differentiation protein Mcl-1
MDM2 Mouse double minute 2 homolog
MeV Multi-experiment viewer
MGB Minor groove binder
MHCII Major histocompatibility complex
MID1 Mouse double minute 1 homolog
MIRNA Micro ribonucleic acid

17
miRNA MicroRNA
MLH1 Mutt homologue 1
MMR Mismatch repair
mRNA Messenger RNA
MSH2 Mismatch repair protein 2
MSI Microsatellite Instability
MSI-H Microsatellite instability high
MSI-L Microsatellite instability low
MSS Microsatellite stable
MTCH2 Mitochondrial carrier homolog 2
MUTYH MutY homolog
MVB Multivesicular body
NBCSP NHS bowel cancer screening programme
NER Nucleotide excision repair system
NFIB Nuclear factor 1 B-type
NFQ Non-fluorescent quencher
NF-κB Nuclear factor kappa-light-chain enhancer of activated B cells
NTC No template control
PBS Phosphate-buffered saline
PDCD4 Programmed cell death protein 4
PI3K Phosphatidylinositol 3-kinase
PIK3CA Phosphatidylinositol-4,5-bisphosphate 3-kinase gene
piRNA Piwi-interacting RNA
piwi P-element induced wimpy testis
PMS2 Mismatch repair endonuclease 2
pri-miRNA Primary transcripts of miRNA
PTEN Phosphotase and tensin homolog
QRTPCR Quantitative reverse transcriptase polymerase chain reaction
RB Retinoblastoma
RECK Reversion-inducing-cysteine-rich protein with kazal motifs
RhoA Ras homolog gene family, member A

18
RhoB Ras homolog gene family member B
RISC RNA induces silencing complex
RNP Ribonucleoprotein
ROC Receiver operating characteristics
rRNA Ribosomal RNA
RT Reverse transcription
RT-PCR Real time polymerase chain reactions
SAM Significance analysis for microarrays
SDS Sodium dodecyl sulphate
siRNA Small interfering RNA
SIRT1 Sirtuin 1
SMAD 7 Mothers against decapentaplegic homolog 7
SNPs Single nucleotide polymorphisms
snRNA Small nucleolar RNA
STAT3 Signal transducer and activator of transcription 3
TCF T-cell factor
TE Tris EDTA
TEMS Transanal endoscopic mucosal surgery
TGF-α Transforming growth factor alpha
TGF-β Transforming growth factor beta
TIMP3 Metalloproteinase inhibitor 3
TLR Toll-like receptors
TME Transmission electron microscopy
TNM Tumour, nodal & metastasis
TPM1 Tropomyosin 1
tRNAs Transfer RNA
TSG TNF-stimulated gene
TYMS Thymidylate synthetase
UTR Untranslated region
VEGFR Vascular endothelial growth factor
Wnt Wnt-signalling pathway

19
Chapter 1: Introduction
miRNAs are novel biomarkers of
colorectal cancer

20
1 Introduction
1.1 Incidence of colorectal cancer
Colorectal cancer (CRC) is the third most common neoplasm worldwide. According to
the International Agency for Research on Cancer (IARC), approximately 1.24 million new
cases of CRC were detected worldwide in 2008 (Ferlay et al, 2008). It is the third most
common cancer in men (10.0% of the total) and the second most common in women
(9.4% of the total) worldwide. IARC data have shown that more than half of all CRC cases
occur in the more developed regions of the world, including Europe, America and Japan
(Ferlay et al, 2008).
In the European Union (EU27) alone 334,000 new cases of CRC were detected in 2008,
whereas in the UK approximately 38,000 people were diagnosed with CRC (National UK
Statistics). The incidence of CRC is on rise in Europe, particularly in Southern and Eastern
Europe, where rates were originally lower than in western part of Europe (Coleman et
al, 1993 & Bray et al, 2004). Contrary to the current trend in Europe, the incidence rate
of CRC in the USA has fallen in the last two decades (National Cancer Institute –
Surveillance, Epidemiology & End Result data - 2006).
Epidemiological studies have identified that a rapid trend of ‘westernization’, involving
a change in diet and lifestyle, has resulted in increased incidence rates of CRC in
developing countries (Marchand et al, 1999, Flood et al, 2000, Boyle et al, 2008, & Ferlay
et al, 2010). The occurrence of CRC is strongly related to age, with nearly 80% of cases
arising in people who are 60 years or older, although there has also been a recent
increase in CRC incidence in people younger than 60 years.
1.2 Risk of CRC
The lifetime risk for developing CRC in men is 1 in 14, whereas in women it is 1 in 18.4
(National Statistics, UK). People under the age of 64 have significantly lower risk (men
1.58% and women 1.1%) of CRC development. The risk increases significantly after the
age of 64 years, with a lifetime risk of 7.18% for men and 5.43% for women (Figure 1).

21
Figure 1: Risk of CRC development in the UK population. Bar graph compares the risk
of CRC for different genders in UK (Cancer Research UK).
CRC can be subdivided into hereditary (<5%), familial (20-25%) and sporadic (75%)
disease. Several factors related to increasing or decreasing risk of CRC are divided into
modifiable and non-modifiable risk factors.

22
1.2.1 Non-modifiable risk factors
Non-modifiable risk factors include personal or family history of CRC or adenomatous
polyps, and a personal history of chronic inflammatory bowel disease. Typically, CRC
cases present sporadically, with a family history of CRC occurring in 25% of patients
(Migliore et al, 2011). However, inherited mutations in major CRC genes occur in 5-6%
of patients, and in the rest the familial forms and gene-environment interactions lead
to disease (Jasperson et al, 2010). Some inherited conditions which predispose an
individual to CRC development are familial adenomatous polyposis (FAP), attenuated
FAP (AFAP), MutY Homolog (MUTYH)-associated polyposis (MAP), and Lynch
syndrome/HNPCC (hereditary nonpolyposis CRC). Rare syndromes include
hamartomatous polyposis conditions (such as Peutz-Jeghers syndrome and juvenile
polyposis syndrome) and hyperplastic polyposis (Aaltonen et al, 1993, Hemminki et al.
1997 & Migliore et al, 2011).
1.2.2 Modifiable risk factors
Environmental factors (such as physical inactivity, obesity, high consumption of red or
processed meats, smoking and moderate-to-heavy alcohol consumption) are known as
modifiable risk factors (American Cancer Society, 2011). However, environmental
factors are suggested to be the risk factors which play a major role in the aetiology of
this disease (Boyle and Leon, 2002).
1.3 CRC staging
Colorectal tumours are of epithelial origin and pathologically classified into three major
categories, namely hyperplastic polyps, neoplastic polyps (premalignant adenomas)
and cancers. The cancer category represents 95% of all colorectal tumours. CRC is
staged for its extent into the bowel wall and its spread to lymph nodes and distant
organs. Two commonly used systems for staging of CRC are the TNM and Dukes’
classifications.

23
1.3.1 The TNM staging system
The TNM system is the universally accepted classification system for the anatomic
extent of CRC spread (Sobin and Fleming, 1997) (Figure 2). The TNM staging system
describes the local extent of the primary tumour (T), its spread to regional lymph nodes
(N) and spread to distant body organs (M).
1.3.1.1 T stage
There are four stages of tumour size in bowel cancer:
T1: the tumour is limited to the mucosal layer
T2: the tumour has spread to the muscularis layer
T3: the tumour has spread to the serosa layer
T4: the tumour has spread beyond the serosal layer and into another part of the
bowel or other nearby organs or structures
1.3.1.2 N stage
N stage describes spread of cancer cells to adjacent lymph nodes:
N0: there are no lymph nodes containing cancer cells
N1: one to three lymph nodes close to the bowel contain cancer cells
N2: there are cancer cells in four or more nearby lymph nodes
1.3.1.3 M stage
M stage describes the spread of the cancer to distant organs (metastasis):
M0: the cancer has not spread to other organs
M1: the cancer has spread to other parts of the body (most commonly, to liver
and lungs)

24
Figure 2: TNM staging for CRC. Illustration of TNM staging showing extent and spread
of cancer within bowel wall (T), to lymph nodes (N) and to distant organs (M).

25
1.3.2 Dukes’ stage
For many years, the Dukes classification system (Dukes and Bussey, 1958) was the gold
standard for tumour staging used by pathologists worldwide. The Dukes' staging system
is divided into four groups: A, B, C and D. Dukes' A is an early bowel cancer and Dukes'
D is advanced (Figure 3).
Dukes’ A: cancer limited to mucosal layer
Dukes’ B: cancer spread to muscularis layer
Dukes’ C: cancer spread to adjacent lymph nodes
Dukes’ D: cancer spread to distant body organs (e.g. liver or lungs)
It is also common practice to use both TNM and Dukes’ staging in the UK to stage CRC.
The Dukes’ stage, which is based on histological examination of the resected specimen,
is more commonly used to guide post-operative treatment (Table 1).
1.3.3 Survivals from CRC in the UK
The survival and prognosis of patients suffering from CRC depends on the stage of the
tumour at time of detection. Five year survival significantly reduces from 95% for
localized early cancerous lesions to <10% for advanced metastatic cancers (Figure 4).
One year survival rates for colonic and rectal cancers are 75% and 80%, respectively.
Five and ten year survivals for both colonic and rectal cancers are similar and have been
reported as 60% (Cancer Research UK). Age-adjusted one, five and ten years survivals
are 76%, 59% and 57%, respectively (Figure 5, Cancer Research UK).

26
Figure 3: The Dukes’ staging system for CRC. Histological classification of CRCs based
on the spread of cancer to bowel wall, lymph nodes and distant organs.

27
Dukes Stage Spread of CRC TNM Stage
A Submucosa T1, N0, M0
Muscularis propria T2, N0, M0
B Beyond muscularis propria T3, N0, M0
Adjacent organs T4, N0, M0
C 1-3 lymph node metastasis T1-4, N1, M0
≥ 4 lymph nodes metastasis T1-4, N2, M0
D Distant organ metastasis T1-4, N0-2, M1
Table 1: Comparison of TNM and Dukes’ staging systems.
Figure 4: Comparison of five year survival rates for CRCs based on cancer stage. Bar
chart shows overall survivals for Dukes’ B stage are 80%, Dukes’ C 63% and Dukes’ D are
7% (Cancer Research UK)

28
Figure 5: Age-adjusted one, five and ten year survivals for different cancers. Survivals
for bowel cancer are weighted average derived from data for colon and rectum cancers
(Cancer Research UK). Bowel cancer is ranked 11th for its overall survival in comparison
to other cancers. Age-adjusted one, five and ten year survival are 76%, 59% and 57%,
respectively.

29
1.3.3.1 High risk Dukes’ B CRCs
Approximately 25% of patients with CRC are diagnosed with Dukes’ B or Stage II disease
(localized to the primary tumour site, no lymph node or distant metastases) and have a
five-year survival of 75-80% when surgically resected (Cancer Research, UK). Despite
surgical resection being highly effective for patients with Dukes’ B or Stage II disease, a
significant proportion (20–25%) of these patients develop fatal metastatic disease. This
has led to uncertainty about the role of post-operative chemotherapy for Dukes’ B or
stage II disease, as has been highlighted in the recently published third edition of
“Guidelines for the Management of CRC 2007” from the Association of Coloproctology
of Great Britain and Ireland (ACPGBI).
1.3.3.2 Identification of high-risk features in Dukes’ B cancers
A number of poor risk features can be identified in Dukes’ B cancers, such as serosal
involvement (T4), perforated or obstructed tumours, poorly differentiated or mucinous
histology and perineural or extramural vascular invasion (Guidelines for the
Management of CRC 2007” from the Association of Coloproctology of Great Britain and
Ireland). A combination of these features may confer a poorer prognosis in a node-
negative tumour. This has led to oncologists often referring to Dukes’ B cancers as ‘good
B’s’ and ‘bad B’s’. Chemotherapy is frequently offered to patients with ‘bad B’s’ (Dukes’
B carcinoma and the presence of adverse risk features). However, patients with Dukes’
B without poor risk histological features may still develop metastatic disease (O` Connor
et al, 2011).
1.3.4 Biomarkers for high risk features in Dukes’ B cancers
It is not possible to accurately predict the development of metastasis in Dukes’ B
tumours based solely on histological examination of resected cancer specimens.
Therefore, molecular markers are required to identify high risk Dukes’ B patients who
may benefit from post-operative chemotherapy. The progression of CRC results from
the sequential accumulation of genetic alterations in oncogenic and tumour suppressor
genes in colonic epithelium. Common somatic mutations found in CRCs are Kirsten rat

30
sarcoma viral oncogene homolog (K-ras), B-Raf proto-oncogene (BRAF) and
phosphatidylinositol-4,5-bisphosphate 3-kinase gene (PIK3CA). Although the frequency
of common somatic mutations (K-ras 30-40%, BRAF 15%, PIK3CA ~15% of CRCs) are
independent of tumour stage, mutation-specific gene expression profiles in other
cancers have successfully identified aggressive carcinomas (De Roock et al, 2010).
Furthermore, studies have also reported accelerated metastatic progression in patients
with the K-ras mutation. However, no study so far has looked at molecular biomarkers
in Dukes’ B tumour tissue to identify markers that may predict the development of
metastases after a curative resection of Dukes’ B tumours.
1.4 CRC development and progression
The prevailing view is to see CRC development as a multistep carcinogenesis arising
from multiple mutations in oncogenes and tumour suppressor genes, which in turn
cause up- and down-stream effects and numerous changes in mitogenic signalling
pathways (Khare et al, 2012 & Pancione et al, 2012). Proliferation studies have shown
that the rapid turnover and immense number of mitoses in the colon results in tens of
thousands of mutations occurring in the normal colonic mucosa each day (Barnes and
Lindahl, 2004). Very efficient genomic repair systems (called caretakers) such as the
mismatch repair system (MMR), the base excision repair system (BER), the nucleotide
excision repair system (NER), and the double strand break repair system (DSB)
continuously scan the genome for replication errors and mutations, and in many
instances also repair the genome. If mutations are too large or extensive to repair, the
cell is directed to apoptosis through a complex signal pathway, eventually shutting
down mitochondrial function (Wang and El-Deiry, 2003). Nevertheless, genomic repair
systems are not perfect, and occasionally mutations slip through the control systems.
The development of CRC requires a long exposure (decades) to carcinogens and an
accumulation of several mutations in key oncogenes and tumour suppressor genes. In
the case of tumour suppressor genes, both alleles must be silenced. In contrast, only
one oncogene is required for accelerated gene function. Therefore, for sporadic CRC it
takes several decades to acquire two hits on the two loci on one of the key tumour

31
suppressor genes. In patients with a strong family history of bowel cancer, their pre-
existing inherited mutation means that they only need to acquire one hit to knockout
the gene (Blanpain et al, 2013). The two major and well-established genetic pathways
leading to CRC are the chromosome instability pathway (CIS), representing and
characterising sporadic CRC, and the microsatellite instability pathway (MSI), which is
the principle pathway of hereditary non-polyposis colon cancer (HNPCC).
1.4.1 Chromosome instability pathway (CIS)
Sporadic CRCs develop through an adenoma-carcinoma pathway characterised by an
accumulation of mutations in key genes (Fearon and Vogelstein, 1990). However, it
does not explain why the majority of adenomas never acquire an invasive potential to
subsequently develop into cancer. This leads to an assumption that invasive potential
is acquired through multiple environmental factors and luminal events to culminate in
a certain lethal combination. The adenoma-carcinoma pathway is initiated by
inactivation of adenomatous polyposis coli (APC) (5q21) in the normal epithelium,
resulting in an accumulation of β-catenin that subsequently increases during stepwise
development. The next genetic event involves hypomethylation and occurs in
hyperplastic polyps. K-ras mutations are identified in slightly larger adenomas following
the loss of the 18q-arm during the transition to late adenomas. Several TNF-stimulated
genes (TSGs), such as Mothers against decapentaplegic homolog 7 (SMAD7), which are
involved in transforming growth factor beta (TGF-β) and WNT-signalling (Broderick and
Carvajal-Carmona, 2007) have been suggested as target genes for 18q loss. Ultimately,
loss of the 17p-arm includes the tumour protein 53 (p53) gene in the final progression
from late adenoma to carcinoma (Fearon and Vogelstein, 1990).
1.4.1.1 Adenomatous polyposis coli mutation (APC)
The APC gene, known as “the gatekeeper gene”, is involved in intercellular
communication, cell orientation, transcription and proliferation. The APC mutation is
found in both sporadic CRC and in FAP. Individuals with FAP carry an inherited mutation
in one APC allele. A second hit in the remaining allele usually inactivates the gene within

32
the first 30 years of life, resulting in hundreds to thousands of adenomas and
subsequent carcinomas. The APC mutation is seldom found in aberrant crypt foci (ACFs)
but occurs increasingly in adenomas and carcinomas (Jass et al, 2002 & Worthley et al,
2007). The APC protein modulates intercellular communication between colonocytes
through calcium-dependant adherins (cadherins). APC binds to the cytoplasmic domain
of the cadherin molecule together with two other molecules, β-catenin and glycogen
synthase kinase 3 beta (GSK3-β). The binding of β-catenin to the cadherin complex
secures low levels of free β-catenin in the cytoplasm. Loss of APC leads to β-catenin
translocation into the nucleus and upregulation of signalling through the WNT-
pathway, which accelerates proliferation and impairs differentiation and apoptosis.
Also, the loss of functional APC appears to interfere with normal mitosis, since APC-
deficient cells do not adequately detect replication errors during metaphase and
continue into anaphase, ultimately contributing to CIS (Draviam et al, 2006).
Furthermore, the APC mutation increases cytochrome oxidase 2 (COX2) activity, which
occurs with a simultaneous upregulation in epidermal growth factor (EGF) activity.
1.4.1.2 p53, the "Guardian of the Genome"
p53 is an important gene for maintaining genome stability. A p53 replication error or
mutation stops or slows down the cell cycle in G1/S phase to allow the repair of DNA
damage. If the DNA damage is too extensive to be repaired, p53 induces apoptosis
through the caspase pathway by shutting down mitochondrial function (Amaral et al,
2010). In unstressed cells, p53 is kept at a low level by continuous degradation. The
mutation in p53 is crucial for carcinogenesis to transform from a non-invasive to an
invasive disease. p53 mutations are found in adenomas (5%), malignant polyps (50%)
and invasive CRC (75%) with increasing frequency correlating with the extent of
malignancy (Suppiah and Greenman, 2013 & Bahnassy et al, 2014).
1.4.2 K-ras and BRAF mutations
The K-ras mutation is found in 30-50% of CRCs and provides the colonocytes with a
growth advantage, as guanosine triphosphatase (GTP) activity is lost with K-ras

33
mutation. This increases levels of GTP to result in constant signalling through
downstream pathways. The K-ras gene product (K-ras protein) is responsible for the
transduction of mitogenic signals from the (EGF) receptor (EGFR) on the cell surface to
the cell nucleus (Dobre et al, 2013). A primary K-ras mutation generally leads to a self-
limiting hyperplastic or borderline lesion and may be implicated in the serrated pathway
(Bettington et al, 2013 & Leggett and Whitehall et al, 2010), through which serrated
adenomas and carcinomas may also develop. Alone, the K-ras mutation is neither
sufficient nor necessary to drive the malignant transformation; this would require
additional “drivers” (Moon et al, 2014). K-ras mutations are frequently found in up to
95% of early dysplasias including in ACFs and also in hyperplastic polyps (Otori et al,
1997, Alrawi et al, 2006 & Feng et al, 2011). The sequence in which the K-ras mutation
occurs in relation to the APC mutation is also important. If a K-ras mutation occurs after
an APC mutation, the dysplastic lesion often progresses to cancer (Vogelstein and
Kinzler, 2004). BRAF is another downstream effector molecule of the K-ras pathway.
Wild-type BRAF CRCs are typically microsatellite stable tumours displaying CIS. Studies
have shown that BRAF mutations, also known as V600E, appear to be a valid indicator
of poor prognosis in CIS/microsatellite stable CRC (Bond et al, 2014).
1.4.3 Microsatellite instability pathway and mismatch repair
MSI results from a failure of the mismatch repair system (MMR) to correct base errors
and maintain genomic stability. Consequently, cells with abnormally functioning MMR
accumulate errors rather than correcting those (Wimmer et al, 2014). In humans, nine
genes with MMR function have been identified. Five out of nine MMR genes are
involved in HNPCC. These five genes and the frequency in which they are mutated are
mutt homologue 1 (MLH1, 49%), mismatch repair protein homolog 2 (MSH2, 38%),
mismatch repair protein homolog 6 (MSH6, 9%), mismatch repair endonuclease 2
(PMS2, 2%) and mismatch repair endonuclease 1 (PMS1, 0.3%) (Carethers, 2014). CRCs
can be divided into microsatellite instability high (MSI-H) if two or more MMR genes are
mutated, and microsatellite instability low (MSI-L) if only one mutation is found, or
microsatellite stable (MSS) (Poulogiannis et al, 2010). At least two mechanisms can
34
result in a defective MMR. An MMR gene mutation can result in a malfunctioning gene
product (protein), as occurs in HNPCC.
Alternatively, a silenced or under-produced MMR gene product can be caused by
hypermethylation, which can be seen in sporadic CRC (usually by silencing of MLH1).
Hypermethylation of a gene often leads to under-expression or “silencing”, and is hence
referred to as an epigenetic event (Carethers, 2014).
99.5% of human DNA is identical, but it is the pattern of microsatellites that makes each
individual’s DNA profile unique enough to become a DNA fingerprint (Jeffreys et al,
1985). A microsatellite is a non-coding stretch of DNA in which short sequences of
nucleotides are repeated many times. The repeated sequence is naturally occurring and
often simple, consisting of two to four nucleotides and can be repeated 3 to 100 times.
Hundreds of thousands of microsatellites are scattered throughout the genome
(Jeffreys et al, 1985). With loss of function of MMR, the lengths of microsatellites are
not replicated reliably, meaning that base mismatches are not corrected and new
microsatellite fragments of different lengths may be created. MSI and defective MMR
also increase the risk of strand slippage. When the polymerase complex reaches a
nucleotide repeat, the enzyme is temporarily released from the template strand and
the strand slippage occurs. The new strand detaches from the template strand and pairs
again with a repeat further upstream. MSI and strand slippage increase the risk of
mutations in nearby coding areas (Viguera et al, 2001).
1.4.4 Cell surface receptors
Cells have thousands of surface receptors. Those of importance to CRC are the growth
factor receptors. A growth factor receptor consists of a minimum of one, but commonly
several, proteins which are products of different proto-oncogenes (Heinemann et al,
2009). A cell surface receptor has an extracellular, transmembrane and intracellular
domain. The extracellular domain is a stereo-chemical site that only binds to specific
molecules known as ligands (Heinemann et al, 2009 & Deller et al, 2000). The
transmembrane domain is merely an ion-channel, whereas the intracellular domain,
which often utilises the actions of tyrosine kinases, triggers an intracellular signalling
35
cascade to mediate downstream cellular effects. Currently, at least two cell surface
receptors are considered important in the treatment of CRC: the EGFR and the vascular
EGF receptor (VEGFR).
1.4.4.1 EGFR
EGFR is expressed on the cell surface and its downstream signalling to the nucleus is
triggered when an appropriate ligand binds to the receptor. The main ligands of EGFR
are EGF and transforming growth factor alpha (TGF-α). Signalling from EGFR is
transmitted to the nucleus via the signal transducer proteins known as SMAD (Lo et al,
2001). The effects of EGFR signalling protect the cell from apoptosis, facilitate invasion
and promote angiogenesis through the activation of the mitogen-activated protein
kinases (MAPK) pathway (Oda et al, 2005). Studies have shown that EGFR protein is
overexpressed in 20-80% of CRCs, caused in part by gene amplification and also, but
rarely, by gene mutation (Di Fiore et al, 2010). The most important effector molecule in
the EGFR pathway is K-ras. A K-ras mutation leads to constant signalling through this
pathway. Additionally, the APC mutation increases COX2 activity in CRC. Increased
levels of pro-inflammatory cytokines contribute to proliferation and antagonise GSK-
3β. As a result, EGF activity is upregulated alongside COX2 upregulation. Interestingly,
one of the three domains of the COX enzyme is identical to EGF. Whether this is
responsible for increased EGF activity is unknown.
1.4.4.2 VEGFR
A systematic review concluded that angiogenesis is closely regulated by a range of pro-
and anti-angiogenic factors in normal conditions (Adams et al, 2007). Within solid
tumours hypoxic areas develop due to insufficient blood supply. Part of the hypoxic cell
response involves the induction of the transcription factor hypoxia-inducible factor 1
(HIF-1), which directly upregulates VEGF to promote new blood vessel formation
(Carmeliet et al, 1998 and Dewhirst, 2009). Increased VEGFR signalling has been
demonstrated in CRC (Tebbutt et al, 2010).

36
The sequential progression of colorectal neoplasia from adenoma to carcinoma
highlights that opportunities exist to improve cancer-specific survival by altering the
natural course of disease development. Such interventions could potentially be
chemotherapy preventive for high risk individuals, facilitate the early detection of
colorectal neoplasia, allow chemotherapy to down-stage the cancer prior to surgical
resection, and be beneficial therapy for palliation of symptoms in advanced stage
cancer.
Recent advances in proteomics and genomics provide a vast amount of information
about the role of micro-molecules in several cancer-related pathways. These advances
have focused on the detection of micro-molecules released from tumour cells and their
role in different cancers. The discovery of tumour-specific microRNAs (miRNAs) has
opened a new era of biomarker research that holds great potential for future cancer
detection strategies.
1.5 What are miRNAs?
miRNAs are single-stranded, evolutionarily conserved, small (17–25 ribonucleotides)
non-coding RNA molecules (Lee et al, 1993). miRNAs act as negative regulators of target
genes by directing specific messenger RNA (mRNA) cleavage or translational inhibition
by mediating the activity of RNA induced silencing complex (RISC) (Bartel et al, 2004 &
2009). So far, approximately 1400 mature human miRNAs have been described in the
Sanger miRBase, version 17, an international registry and database for miRNA
nomenclature, targets, functions and their implications in different diseases. In the
database, each mature miRNA in human and non-human species is assigned a unique
identifier number for universal standardization. For example, human miRNA 21 is
referred to as hsa-miR-21. Table 2 summarizes the different types of RNAs and their
size, mode of action and function in the human cells.

37
Types of RNA Size Mode of action Function
miRNA
17-25 Directs RISC Translational inhibition of
mRNA and gene
expression
mRNA 900-1500 Conveys genetic information
from DNA to the ribosomes
Directs and induces
protein synthesis
Small interfering
RNA (siRNA)
20-25
RNA interference and related
pathways
Interference of gene
expression
Piwi-interacting
RNA (piRNA)
26-31 RNA-protein complex
formation with piwi proteins
Transcriptional gene
silencing of
retrotransposons and
other genetic elements in
germline cells
Small nucleolar
RNA (snRNA)
70-200 Act as ribonucleoprotein (RNP)
complexes to guide the
enzymatic modification of
target RNAs at sites
determined by RNA:RNA
antisense interactions
Chemical modifications of
other RNAs, e.g.
methylation,
pseudouridylation
Transfer RNA
(tRNAs)
73 to 93
Transfers a specific active
amino acid to a growing
polypeptide chain at the
ribosomal site of protein
synthesis
Amino acid carriers and
protein synthesis during
translation
Ribosomal RNA
(rRNA)
120-5050 Decode mRNA into amino
acids
Protein synthesis in
ribosomes
Long non-coding
RNA (lncRNA)
>200 Binds to complementary RNA
and affect RNA processing
Pre and post transcription
regulation of genes
Table 2: Different types of RNAs.
Table shows sizes (number of nucleotides), mode of action and functions of different
RNAs in the human cells.

38
1.6 miRNA biogenesis in human cells
miRNAs are mostly transcribed from intragenic or intergenic regions by RNA
polymerase II into primary transcripts (pri-miRNAs) of variable length (1-3 kb). In the
nucleus, pri-miRNA transcripts are processed further by the nuclear ribo-nuclease
enzyme Drosha. This results in hairpin intermediate of about 70–100 nucleotides, called
pre-miRNA. Pre-miRNA is then transported out of the nucleus by a transporting protein,
exportin-5. Once in the cytoplasm, pre-miRNA is processed by another ribonuclease
enzyme, Dicer, into mature double-stranded miRNA. The two strands of miRNA (known
as a miRNA/miRNA* complex) are separated by Dicer processing. After strand
separation, the mature miRNA strand (miRNA-, also called the guide strand) is
incorporated into a complex with RISC, at which point the passenger strand, denoted
with a star (miRNA*), is degraded (Hammond et al, 2000, Lee et al, 2003, Bohnsack et
al, 2004 & Thimmaiah et al, 2005). This miRNA/RISC complex is responsible for miRNA
function (Figure 6). If on miRNA cloning or array the passenger strand is found at low
frequency (less than 15% of the guide strand), it is named miR*. However, if both
passenger and guide strand are equal in distribution, these two strands are named 5p
or 3p depending on their location within either 5' or 3' segments of the miRNA molecule
respectively. In this case, both strands have the potential to be incorporated into a
complex with RISC and subsequently fulfil a biological role, and in many cases miRNA*
strands are conserved and play an important function in cell homeostasis. However, the
functional role of the miRNA* strand has only recently been focused on in miRNA
studies. Well-conserved miRNA* strands may prove to be important links in cancer
regulation networks and thus deserve further study (Stark et al, 2007, Okamura et al,
2008, Zhou et al, 2010 & Guo et al, 2010).

39
Figure 6: Biogenesis, processing and function of miRNAs.
Figure illustrates the biogenesis of miRNAs in the nucleus, their transport into the
cytoplasm and their processing by Drosha and Dicer enzymes. It also shows the
involvement of RISC and miRNAs in different pathways of translational inhibition or
activation.

40
1.7 Mechanism of action and cellular function of miRNAs
The specificity of miRNA targeting is defined by Watson–Crick complementarities
between positions two to eight of the 5’ end of miRNA sequence with the corresponding
positions of the 3′ untranslated region (UTR) of their target mRNAs. When miRNA and
its target mRNA sequence show perfect complementarities, RISC induces mRNA
degradation. Should an imperfect miRNA–mRNA target pairing occur, translation into
the protein is blocked (Bartel et al, 2004 & 2009). Regardless of which of these two
events occur, the net result is a decrease in the production of the proteins encoded by
the mRNA targets.
Each miRNA has the potential to target a large number of genes; on average
approximately 500 genes are targeted by each miRNA family. Conversely, an estimated
60% of mRNAs have one or more evolutionarily conserved sequences that are predicted
to interact with miRNAs (Friedman et al, 2009). miRNAs have been shown to bind to the
open reading frame or to the 5′ UTR of the target genes and, in some cases, activate
rather than to inhibit gene expression (Ørom et al, 2008). It has also reported that
miRNAs can bind to ribonucleoproteins in a seed sequence in a RISC-independent
manner and then interfere with their RNA-binding functions, resulting in decoy activity
(Eiring et al, 2010). miRNAs can also regulate gene expression at the transcriptional level
by binding directly to the DNA (Khraiwesh et al, 2010), as illustrated in Figure 6.
1.8 Methods of miRNA analysis and quantification
Numerous approaches have been developed to analyse and quantify miRNA. A
commonly adopted strategy is to perform mass scale expression profiling to identify
signatures of miRNAs within small cohorts of patients, and thus identify the most
significantly deregulated miRNAs. Expression profiling is usually followed by validation
of the selected miRNAs on an independent cohort using hybridization-microarrays, real
time polymerase chain reactions (RT-PCR) and deep-sequencing (Meyer et al, 2010).
Most of these approaches are developed alongside northern blotting, the gold
standard. Each approach has its own advantages and disadvantages such as throughput,
sensitivity, ease of use and cost. RT-PCR can detect miniscule concentrations of RNA
41
with superior sensitivity and is both cost and time-effective (Chen et al, 2005).
Microarray-based techniques have the advantages of being relatively cost-effective,
quick and simple to use (Pradervand et al, 2010). Ultra-high throughput miRNA
sequencing allows de novo detection and relative quantification of miRNAs, but is
expensive and time-consuming during data generation and analysis (Wang et al, 2007).
A key component of miRNA detection and quantification that must be addressed is the
selection of endogenous controls for relative quantification. In RT-PCR-based detection
systems, several small nuclear and small nucleolar RNAs such as RNU6B are
recommended for normalising miRNA expression signatures and profiles in tissues, cell
lines and body fluid samples. However, RNU6B is unstable in high temperatures and
rapidly degrades, resulting in poor reproducibility and repeatability of experiments.
Accordingly, many researchers have selected invariant and the most stable miRNAs as
endogenous controls instead (Meyer et al, 2010). To overcome this problem of
normalization in RT-PCR and other detection systems, researchers have used different
statistical strategies including global mean expression, quantile, scaling and normalizing
factors. Of note, some normalization methods have been challenged whereas others
have been adapted to suit the specific nature of miRNA profiling experiments. At
present, there is no gold standard normalization strategy for any of the methods of
detection. Table 3 provides a comparison between different detection systems for their
practical application, throughput and cost and time expenditure.

42
Detection system
miRNA RT-PCR
expression profiling
miRNA-Array miRNA-
Sequencing
Method PCR Hybridization Deep
sequencing
Initial RNA
concentration
10 ng 100 ng 250 ng
Time required < 24 hours 24-48 hours > 1 week
Cost Low-medium for pool
profiling. Even lower
for custom designed
individual assays.
Low-medium for
Pool Profiling
High
Throughput Medium-high High Ultra-high
Utility Relative and absolute
quantification of
miRNAs
Relative and
absolute
quantification of
miRNAs
Relative
quantification
of known
miRNAs.
Identification
of novel
miRNA
sequences.
Table 3: Comparison of different detection systems for miRNAs.
Different detection systems with their practical application, throughput, cost and time
expenditure.

43
1.9 Role of miRNAs in CRC development
miRNAs play important roles in colorectal tumour biology including oncogenesis,
progression, invasion, metastasis and angiogenesis (Esquela-Kerscher et al, 2006;
Huang et al, 2008; Liu et al, 2011 & Lee et al, 2007). The initiation and progression of
colorectal neoplasia result from sequential accumulation of genetic alterations in
oncogenic and tumour suppressor genes in the colonic epithelium (Fearon et al, 1990).
miRNAs interfere with genetic mutations and are involved in different hallmarks of
cancer development, progression, invasion and metastasis.
Slaby and colleagues summarized the role of different miRNAs in CRC development and
emphasized the importance of APC, TP53 mutations and WNT signalling (Slaby et al,
2009). The initiation of colonic neoplasia is strongly linked to inactivation of APC gene
and activation of WNT signalling. APC inactivation has been found in more than 60% of
colonic tumours and such inactivation is associated with up-regulation of miR-135a/b
in colonic epithelial cells (Fearon et al, 1990, Segditsas et al, 2006, Nagel et al, 2008).
An accumulation of any further somatic mutations leads to further dysregulation of
miRNAs and the activation of additional downstream pathways. For example, let-7,
miR-18a* and miR-143 are strongly linked to K-ras knockdown and activation of the
EGFR-MAPK pathway (Akao et al, 2006; Chen et al, 2009 & Tsang et al, 2009). In
contrast, miR-21 and miR-126 are associated with either the augmentation or
inactivation of the phosphatidylinositol-3-kinase (PI3K) pathway, respectively
(Krichevsky et al, 2009 & Guo et al, 2008). Activation of these downstream pathways
results in autonomous tumour cell growth, survival and angiogenesis. Loss of p53 is a
critical step in the transformation of adenoma to adenocarcinoma, as indicated by the
finding that nearly 50-70% of colonic adenocarcinomas are found to exhibit p53
mutations (Fearon et al, 1990). miR-34a has been identified as a direct downstream
target of p53 and experimental replacement of miR-34a achieves p53-induced effects
of apoptosis and cell cycle arrest (Chang et al, 2007). A commonly up-regulated miR-17-
92 cluster (containing miR-17, miR-18a, miR-19a, miR-20a, miR-19b and miR-92a) also
drives the progression of adenoma to adenocarcinoma by up-regulation of c-myc
(Diosdado et al, 2009).

44
Another cancer pathway, known as the second serrated neoplasia pathway, has
recently been acknowledged, and for the most part is considered independent of APC
and TP53 mutations. It involves distinct molecular features of somatic BRAF mutation
concordance with high CpG islands methylation phenotype (CIMP-H) and MSI-H
associated with MLH1 methylation (Spring et al, 2006, Casey et al, 2005). Involvement
of miRNAs in the latter pathway is slowing emerging and would require further
functional studies to find a precise role for miRNAs.
Functional and mechanistic studies of miRNAs have shown that the replacement or
knockdown of distinct miRNAs in vitro results in distinct cytogenetic abnormalities
leading to either tumour cell proliferation or apoptosis (Huang et al, 2008).
Consequently, it is believed that deregulation of miRNA genes that target mRNAs of
tumour suppressor genes or oncogenes contributes to tumour formation by inducing
cell proliferation, invasion, angiogenesis and decreased apoptosis (Esquela-Kerscher et
al, 2006).
This has led to the belief that over-expressed miRNAs in tumour cells function by
inhibiting different tumour suppressor genes, whereas miRNAs that are often silenced
in tumour cells down-regulate the expression of oncogenes in normal tissue.
Amplifications, translocations, pleomorphisms or mutations in miRNAs transcribing
genes results in over production miRNAs (Figure 7). In contrast, mutations, deletions,
promoter methylations or any other abnormalities in the miRNA biogenesis results in
silencing of miRNAs in tumour cells (Esquela-Kerscher et al, 2006), as shown in Figure
8. Different studies have identified dysregulated miRNAs in CRC tissue specimens. Table
4 shows summarises some dysregulated miRNAs in colorectal tumour tissue compared
to adjacent normal colonic mucosa.
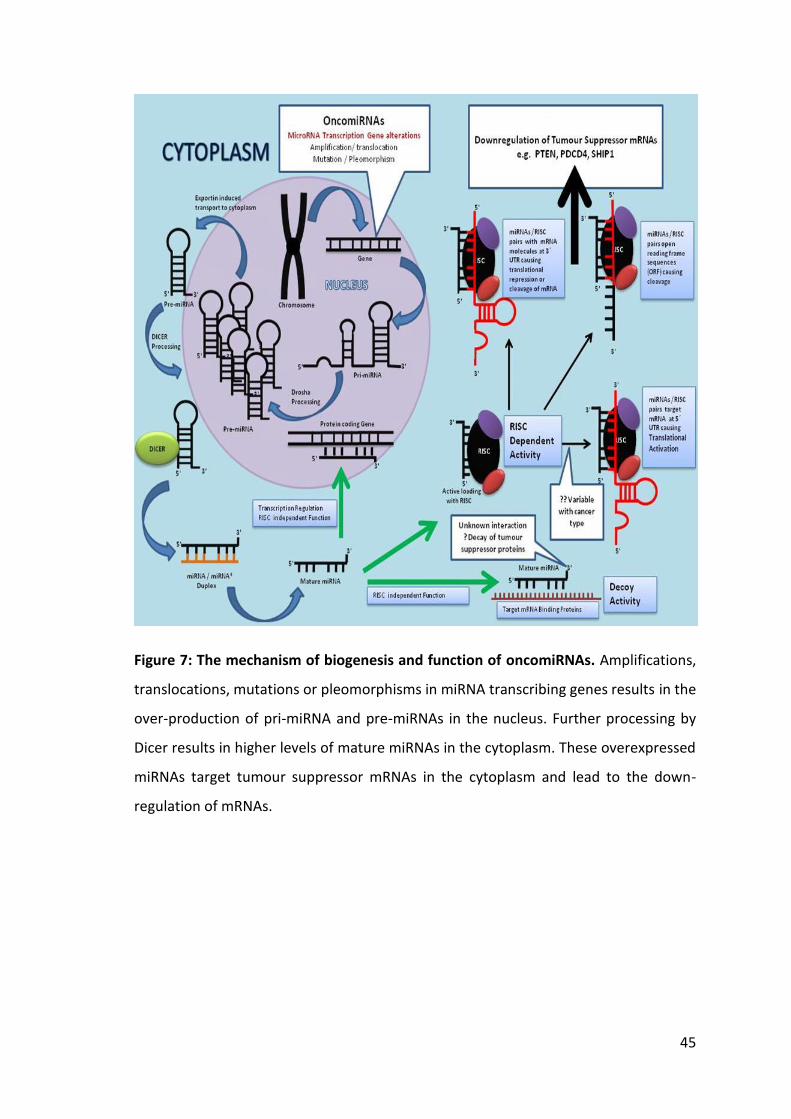
45
Figure 7: The mechanism of biogenesis and function of oncomiRNAs. Amplifications,
translocations, mutations or pleomorphisms in miRNA transcribing genes results in the
over-production of pri-miRNA and pre-miRNAs in the nucleus. Further processing by
Dicer results in higher levels of mature miRNAs in the cytoplasm. These overexpressed
miRNAs target tumour suppressor mRNAs in the cytoplasm and lead to the down-
regulation of mRNAs.

46
Figure 8: The proposed mechanism of biogenesis and function of tumour suppressor
miRNAs. Promotor hypermethylation/deactylation, homozygous/heterozygous
deletions, mutations or pleomorphisms in miRNA transcription genes result in under-
production or complete loss of pri-miRNAs. Defects in miRNA-processing machinery,
such as ineffective processing by Drosha/Dicer or defective pairing with RISC, can result
into inefficient levels of mature miRNAs in the cytoplasm. Low levels of tumour
suppressor miRNAs result in over expression of oncogenic mRNAs (Ras, Bcl2, Mcl1).

47
Studies Down-regulated miRNAs in CRC tissue
Up-regulated miRNAs in CRC tissue
Michael et al, 2003
let-7, miR-16, miR-24, miR-26a, miR-102, miR-143, miR-145, miR-200b
Volinia et al, 2006
let-7a-1, miR-9-3, miR-23b, miR-138, miR-218
miR-16, miR-17-5p, miR-20a, miR-21, miR-29b ,miR-141, miR-195, miR-199a
Xi et al, 2006 let-7b, let-7 g , miR-26a , miR-30a-3p, miR-132, miR-181a, miR-181b, miR-296, miR-320, miR-372
miR-10a, miR-15b ,miR-23a, miR-25, miR-27a, miR-27b, miR-30c, miR-107, miR-125a, miR-191, miR-200c, miR-339
Bandrés. et al, 2006
miR-133b, miR-145 miR-31, miR-96, miR-135b, miR-183
Akao et al, 2006
miR-143, miR-145, let -7
Nakajima et al, 2006
let-7 g, miR-181b, miR-200c
Lanza et al, 2007
miR-17-5p, miR-20, miR-25, miR-92, miR-93-1, miR-106a
Rossi et al, 2007
miR-200b, miR-210 , miR-224
miR-19a, miR-20, miR-21, miR-23a, miR-25, miR-27a, miR-27b, miR-29a, miR-30e, miR-124b, miR-132, miR-133a, miR-135b, miR-141, miR-147, miR-151, miR-152, miR-182, miR-185
Slaby et al, 2007
miR-31, miR-143, miR-145 miR-21
Monzo et al, 2008
miR-145 miR-17-5p ,miR-21, miR-30c, miR-106a, miR-107, miR-191, miR-221
Schepeler et al, 2008
miR-101, miR-145, miR-455, miR-484
miR-20a, miR-92, miR-510, miR-513
Schetter et al, 2008
miR-20a, miR-21, miR-106a, miR-181b, miR-203
Arndt et al, 2009
miR-1, miR-10b, miR-30a-3p, miR-30a-5p, miR-30c, miR-125a, miR-133a, miR-139, miR-143, miR-145, miR-195, miR-378*, miR-422a, miR-422b, miR-497
miR-17-5p, miR-18a, miR-19a, miR-19b, miR-20a, miR-21, miR-25, miR-29a, miR-29b, miR-31, miR-34a, miR-93, miR-95, miR-96, miR-106a, miR-106b, miR-130b, miR-181b, miR-182, miR-183, miR-203, miR-224
Slattery et al, 2011
miR-143, miR-145, miR-192, miR-215
miR-21, miR-21*, miR-183, miR-92a, miR-17, miR-18a, miR-19a, miR-34a
Table 4: Summary of commonly expressed miRNAs in CRC tissue in comparison to adjacent healthy colonic mucosa.

48
1.10 The need for biomarkers for the detection of colorectal neoplasia
Early detection and treatment is central for CRC management (Zlobec et al, 2008).
Therefore, recent emphasis has shifted towards bowel cancer screening (Walsh et al,
2003). A Cochrane systematic review of CRC screening using the faecal occult blood test
(FOBT) has shown that inviting men and women aged 45 to 74 for bowel cancer
screening using the FOBT could reduce the mortality rate of bowel cancer by 16.3%
(Hardcastle et al, 1996, Kronborg et al, 1996, UK CRC Screening Pilot Group, 2004,
Perkins et al, 2008). Based on the final evaluation report of the pilot and a formal
options appraisal, a national screening programme for bowel cancer was introduced in
UK. The programme in includes screening of men and women aged 60 to 70. It has been
estimated that by 2025, around 2,400 lives could be saved every year by the FOBT
testing element of the NHS Bowel Cancer Screening Programme (NBCSP). Other CRC
detection modalities available to clinicians for the detection of colorectal neoplasia
include flexible sigmoidoscopy, colonoscopy, barium enema, CT colonography, blood
and stool based biomarkers. A main stay of bowel cancer screening is the detection of
precancerous lesions (adenomas), and its cost effective detection potentially
determines the use of above mentioned detection modalities as a primary CRC
screening test. A comparative study of different screening modalities has shown the
sensitivity of detecting advanced adenomas of 20% for FOBT and 100% for colonoscopy
(Graser et al, 2008).
Despite its superior sensitivity for detection of both adenoma and carcinoma, the use
of colonoscopy for screening, however, is limited to high-risk individuals and for those
with a positive FOBT. Nnoaham and Lines analysed the cost projection and volume of a
screening programme (FOBT plus colonoscopy) for a hypothetical population of 500,000
individuals aged between 60 and 74 years in the South Central Strategic Health
Authority in the UK (Nnoaham and Lines, 2008). The projected cost of initial screening
by FOBT was £394,157 for the detection of 34 cancers. This cost, and the cost of
additional surveillance colonoscopies, would increase yearly. Table 5 compares
different aspects of the well-established screening programmes for breast and cervical
cancers to the recently established CRC screening programme in the UK. The significant
difference to note is the low sensitivity of detection of the FOBT.

49
Age of
population
screened
(years)
Reduction in
cancer-
related
mortality
Sensitivity
(%)
Specificity
(%)
Mammography for
breast cancer
(Blanks et al, 2000)
50–70 35 68–90 82–97
Cervical smear test
for cervical cancer
(Coste et al, 2003)
25–64 95 72 94
Faecal occult blood
test for bowel
cancer
(Hewitson et al,
2007)
60–69 16 40 (non-
hydrated)
*60 (hydrated)
> 90 (non-
hydrated),
< 90
(hydrated)
Table 5: Screening programmes for different cancers, their accuracy of detection and
percentage reduction in cancer-related mortality from cancer research UK.
Mortality from cervical cancer is comparatively low because of a screening test with a
high sensitivity (72%) and specificity (94%). The sensitivity of the faecal occult blood test
is only 40% with non-hydrated specimens. *The higher sensitivity (60%) with hydrated
specimens compromises specificity.

50
Currently, symptomatic CRC is primarily diagnosed through colonoscopy, a procedure
that is expensive, requires bowel preparation, sedation, and may be associated with
medical complications. Many patients delay or completely avoid having a colonoscopy
because of its invasive and unpleasant nature. Alternative, less-invasive diagnostic
methods such as FOBT are limited by low sensitivity. Zhu and colleagues have reported
that the Guaiac FOBT has 54% sensitivity and 80% specificity, and faecal immuno-
chemical test (FIT) has 67% sensitivity and 85% specificity for a cohort of symptomatic
patients (Zhu, et al 2011). Other potential diagnostic biomarkers include the
carcinoembryonic antigen (CEA) in blood (Duffy et al, 2001 & Fakih et al, 2006), but this
also has limited sensitivity and specificity (36-74% and 87%, respectively). Hence, a
more accurate and precise blood test that can diagnose CRC earlier is desirable.
1.11 Utility of circulating satellite miRNAs for CRC detection and tumour-derived
miRNAs in body fluids
miRNAs are present in body fluids, especially blood, and are potentially useful clinical
biomarkers. Recent studies have shown that tumour-derived miRNAs are present in
human serum in remarkably stable form and are protected from endogenous
ribonuclease activity (Mitchell et al, 2008). These tumour-derived miRNAs are present
in circulating blood at levels sufficient to be used as measurable biomarkers for the
detection of tumours (Mitchell et al, 2008 & Gilad et al, 2008). The levels of plasma and
serum miRNAs correlate strongly, suggesting that either plasma or serum can be used
for investigating these blood-based biomarkers. The detection of placental miRNAs in
maternal serum at levels that increase with gestational age reveals their potential to
act as biomarkers for diverse physiological and pathological conditions (Chim et al,
2008, Hromadníková et al, 2010, Kotlabova et al, 2011).
1.11.1 Circulating miRNAs in CRC patients
Given that aberrantly expressed miRNAs in CRC tissue are transported into blood,
circulating miRNAs can potentially serve as non-invasive markers for CRC detection. In
2008, Chen and colleagues used a high-throughput sequencing technique and
compared the miRNA expression profiles of patients with CRC and healthy controls

51
(Chen et al, 2008). miRNA expression profiles of CRC and healthy controls were
significantly different. However, more than 75% of the aberrantly expressed miRNAs
detected in the serum of CRC patients were also present in the serum of patients with
lung cancer. A similar trend was also observed in another study in which expression
profiles generated from plasma of breast cancer patients were compared with CRC and
other solid organ cancers (Heneghan et al, 2010). Identification and quantification of
cancer-related circulating miRNAs are associated with challenges in terms of sample
preparation, experimental design, pre-analytic variation, selection of diagnostic
miRNAs, data normalization and data analysis. Many of these obstacles have recently
been addressed and now act as a guide to help overcome these issues (Meyer et al,
2010 & Kroh et al, 2010).
1.11.2 Plasma miRNAs as biomarkers for the detection and screening of CRC
The universally applicable, simple, low cost and sensitive technique of RT-PCR for the
detection and quantification of miRNA (Chen et al, 2005) in the blood may be a more
efficient and reliable method of screening individuals with non-cancer diseases and
cancers. Once the accuracy of detection has been established, an assessment of cost
and acceptability by the population in terms of use as a mass screening technique is be
required. A model of RT–PCR for serum RNA analysis suggests that, when used for a
pool of 84 patients, costs was less than £1 per clinical specimen (Rouet et al, 2007). The
RT-PCR-based detection technique is used in hospitals for various viral screenings (such
as hepatitis C and human immunodeficiency virus) and genetic testing for genotyping.
With the addition of RNA extraction and modifications in the RT-PCR assay protocols,
the technique can be adapted for miRNA study. The time taken for a single RT-PCR run
is 4–6 hours (Chen et al, 2005) and multiple samples can be processed together (Rouet
et al, 2007). Thus, the results should be available within 24–48 hours. miRNAs can be
introduced into various aspects of the national bowel cancer screening programme. The
best option might be a yearly miRNA blood test in primary care, with colonoscopic
assessment for those with a positive result. At present, approximately 50% of
individuals with a positive FOBT subjected to colonoscopic examination have normal

52
findings. The replacement of the FOBT with the more sensitive miRNA test should
reduce the rate of negative colonoscopies.
Though the analysis of circulating miRNAs in CRC patients has identified several
diagnostic miRNAs, their diagnostic accuracy is still questionable. This has been due to
overlapping miRNA expression with other cancers, non-cancerous conditions and
variability of individual miRNA expression with stage and grade of tumour. It is possible
that common carcinogenesis-related miRNAs are shared by different types of tumours
and investigators are detecting cancer-related but not tissue specific miRNAs.
Another explanation of the findings is that miRNAs released into the circulation
originate from immune cells taking part in a systemic immune response to the tumour,
causing abnormal proliferation of colonic cells (Dong et al, 2011). This might also explain
the finding of commonly deregulated miRNAs in patients with CRC and ulcerative colitis
(Pekow et al, 2011). Furthermore, studies have focused on measuring circulating levels
of either single miRNAs or a subset of known miRNAs. Due to reasons mentioned above,
a single miRNA-based detection strategy would be ineffective, whereas a CRC tissue-
specific expression signature generated from plasma or serum of patients with CRC and
adenoma could be more informative and accurate.
1.12 Circulating exosomal miRNAs for CRC
The recent discovery of exosome-mediated transport of cancer-related miRNAs into the
circulation has shifted the focus of miRNA studies towards the isolation of tissue-
specific circulating exosomes and their encompassed miRNAs. Exosomes are
membrane-bound small vesicles (20-100 nm in diameter) and are released via
endocytosis by a variety of cells in both healthy and disease conditions (Théry et al,
2002, Keller et al, 2006). Exosomes correspond to internal vesicles of multivesicular
bodies (MVBs) and are released into the extracellular environment upon fusion of MVBs
with the plasma membrane, (Théry et al, 2002, Cocucci et al, 2009). Figure 9 shows the
formation and release of exosomes from human cell.

53
Since exosome formation involves two inward budding processes, exosomes maintain
the same topological arrangement as the cell, with membrane proteins on the outside
and some cytosol on the inside. Exosomes contain cytoplasmic proteins, miRNAs and
mRNA transcripts (Valadi et al, 2007). The topical orientation of the exosomal
membrane may help identify their source and could be achieved using surface antigen-
directed antibodies such as anti-MHCII. One drawback of this isolation method is that
unless all exosomes contain the specific surface antigen used for the isolation, only a
fraction of exosomes will be isolated.
Figure 9: Formation and release of exosomes by human cells.
Exosomes are formed by double invagination of cell membrane and are released by exocytosis.

54
Circulating exosomes can also be isolated based on their size, density and surface
proteins. A commonly used method of purifying exosomes involves removal of cells and
debris by either a filtration process or by a series of centrifugations (differential
centrifugation), followed by a final high-speed centrifugation (ultracentrifugation) to
pellet the exosomes. Exosomes have a specific density and can be purified by floatation
onto a sucrose density gradient or by sucrosedeuterium oxide (D2O) cushions. Another
purification method is based on exosome size and utilizes chromatography. The size and
characterisation of exosomes is performed using transmission electron microscopy,
immune-electron microscopy, flow cytometry and dynamic light scattering. There is,
however, a growing need for a fast and reliable method that yields a highly purified
exosome fraction.
Based on this immunoaffinity strategy, several groups have isolated exosomes from the
blood of patients with different cancers and have performed miRNA expression profiles
on total RNA isolated from these purified and probably tumour-specific exosomes
(Taylor et al, 2008, Logozzi et al, 2009, Rabinowits et al, 2009). Patients with cancer have
relatively higher quantities of exosomes and miRNAs in the circulation Rabinowits et al,
2009). For instance, the analysis of miRNAs extracted from circulating exosomes in
patients with ovarian cancer has been proven to be equivalent to ovarian tissue biopsies
(Taylor et al, 2008). By using a similar approach of isolation and analysis, exosomal
miRNAs in CRC can be evaluated for their diagnostic accuracy and may provide a
breakthrough in diagnostic modality. Table 6 summarizes the exosome isolation and
characterisation methods used by different groups to analyse exosomes specific to CRC
cells and methods of isolation of circulating exosomes for miRNA analysis of other
cancers (Simpson et al, 2009). There is, however, a growing need for a fast and reliable
method that yields a highly purified exosome fraction.

55
Studies CRC cell
lines
Isolation method Characterisation and
validation of exosomes
Huber et al,
2005
SW403
1869col
CRC28462
Differential
centrifugation
Transmission electron
microscopy
Immune electron microscopy
Fluorescence-activated cell
sorting (FACS)
Western Blotting
Mathivanan
et al,2010
LIM1215 Filtration,
diafiltration (5K)
ultracentrifugation
Immuoaffinity
Transmission electron
microscopy
Immune electron microscopy
Western blotting
Choi et al,
2007
HT29 Differential
centrifugation
Diafiltration(100k)
Density gradient
Transmission electron
microscopy
Western blotting
van Nigel et
al, 2001
HT29-19A
T84-
DRB1*0401/
CIITA
Differential
centrifugation
Density gradient
Transmission electron
microscopy
Immune electron microscopy
Western blotting
Isolation and characterisation of circulating exosomes for miRNA analysis
Studies Cancer type Isolation method Specific method/ technique
Logozzi et
al, 2009
Malignant
melanoma
Ultracentrifugation
and filtration
400 x g 20 min isolate plasma
1,200 x g 20 min
10,000 x g 30 min and filter
through 0.22 μm filter
1,00,000 x g 60 min
Rabinowits,
et al, 2009
Lung cancer Immunoaffinity
Ultracentrifugation
anti-EpCAM-coated
immunobeads
Taylor et
al, 2008
Ovarian
cancer
Immunoaffinity
Ultracentrifugation
anti-EpCAM antibody-coated
immunobeads
Table 6: Isolation and characterisation of CRC cell line exosomes.
Table shows different isolation techniques used in previous studies for exosomal
isolation in vitro. Table also shows isolation techniques for circulating exosomes in
patients with different cancers.

56
1.13 Aims and objectives of this study
This study aimed to:
1) Identify which circulating miRNAs can be used for the detection of colorectal
neoplasia.
The objectives were to:
a) Develop and compare miRNA expression profiles for RNA isolated from plasma
of participants with colorectal adenomas, carcinomas and participants without
any significant colonic pathology on colonoscopic examination.
b) Apply discriminatory miRNAs to a larger cohort to assess their diagnostic
accuracy for the detection of adenoma and carcinoma.
2) Examine the feasibility of using plasma exosomal miRNAs for the detection of CRCs.
The objective was to:
a) Evaluate different exosomes isolation techniques to isolate and analyse
exosomal miRNAs in the plasma of patients with CRC.
3) Examine the utility of tissue miRNAs combined with common gene mutations in
CRC as biomarkers to predict the development of metastasis in patients with high
risk Dukes’ B cancers.
The objectives were to:
a) Extract total RNA and DNA from formalin-fixed paraffin-embedded (FFPE)
cancer and adjacent normal tissue specimens.
b) Identify specific tissue miRNAs associated with different stages of CRC.
c) Screen for common gene mutations (K-ras, BRAF, PIK3CA) in primary CRC tissue.
d) Combine data to predict the development of metastasis in patients with Dukes’
B cancers.

57
Chapter 2: Methods
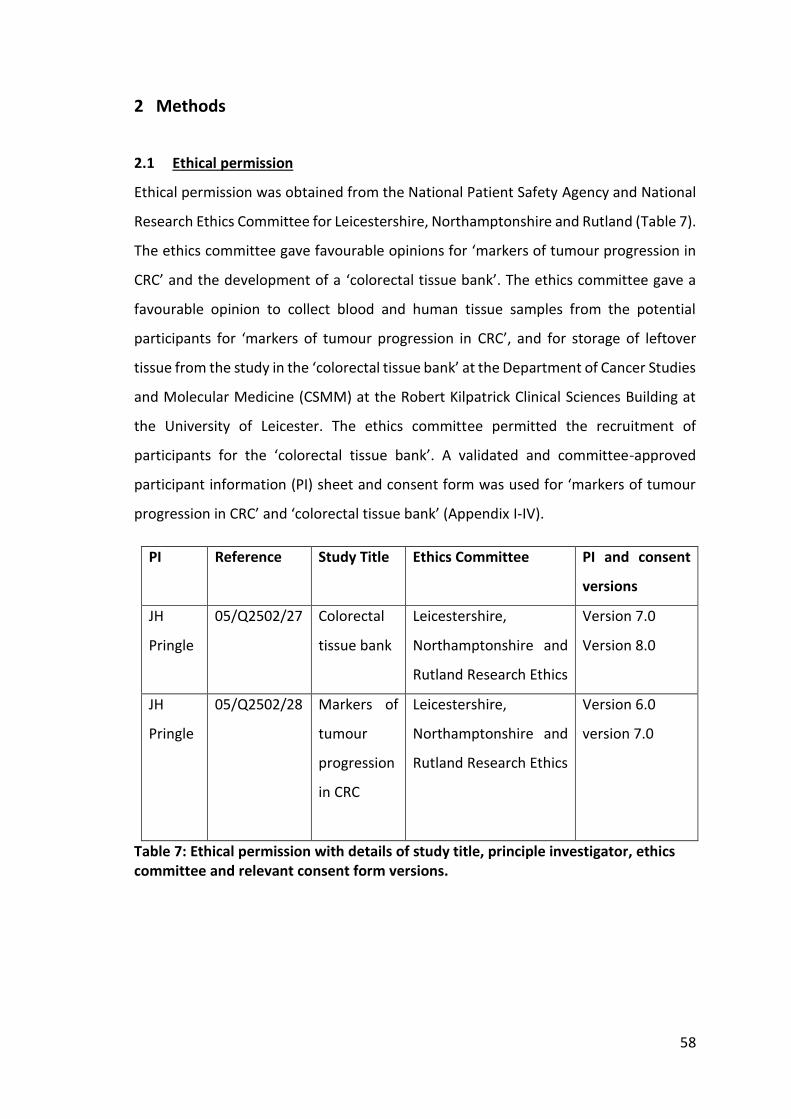
58
2 Methods
2.1 Ethical permission
Ethical permission was obtained from the National Patient Safety Agency and National
Research Ethics Committee for Leicestershire, Northamptonshire and Rutland (Table 7).
The ethics committee gave favourable opinions for ‘markers of tumour progression in
CRC’ and the development of a ‘colorectal tissue bank’. The ethics committee gave a
favourable opinion to collect blood and human tissue samples from the potential
participants for ‘markers of tumour progression in CRC’, and for storage of leftover
tissue from the study in the ‘colorectal tissue bank’ at the Department of Cancer Studies
and Molecular Medicine (CSMM) at the Robert Kilpatrick Clinical Sciences Building at
the University of Leicester. The ethics committee permitted the recruitment of
participants for the ‘colorectal tissue bank’. A validated and committee-approved
participant information (PI) sheet and consent form was used for ‘markers of tumour
progression in CRC’ and ‘colorectal tissue bank’ (Appendix I-IV).
PI Reference Study Title Ethics Committee PI and consent
versions
JH
Pringle
05/Q2502/27 Colorectal
tissue bank
Leicestershire,
Northamptonshire and
Rutland Research Ethics
Version 7.0
Version 8.0
JH
Pringle
05/Q2502/28 Markers of
tumour
progression
in CRC
Leicestershire,
Northamptonshire and
Rutland Research Ethics
Version 6.0
version 7.0
Table 7: Ethical permission with details of study title, principle investigator, ethics committee and relevant consent form versions.

59
2.2 Recruitment
For the plasma miRNA study, recruitment commenced in October, 2008, and finished
in December, 2011. A total of 265 participants agreed and contributed towards sample
collection. Participants were recruited from University Hospitals of Leicester NHS Trust.
Permission was obtained from Research Committee for National Bowel Cancer
Screening Programme (NBCSP) to include asymptomatic participants attending
screening colonoscopy at Glenfield General Hospital screening hub (Appendix V).
Symptomatic patients attending day case endoscopy unit for the diagnostic
colonoscopy for their bowel symptoms were also invited.
Patients with disease (CRC and polyps) were recruited from the Department of
Colorectal Surgery at Leicester General Hospital, University Hospitals of Leicester NHS
Trust. Potential participants were identified through colorectal specialist clinics, CRC
multidisciplinary team meetings and pre-assessment clinics. All consecutive patients
under the care of two consultant colorectal surgeons (Mr. John Jameson and Mr. Baljit
Singh) with histological diagnosis of CRC and undergoing curative resection of cancer
with laparoscopic/open or Transanal Microscopic Surgery (TEMS) at Leicester General
Hospital, University Hospital of Leicester NHS Trust, were invited to participate in the
study. Patients attending follow up outpatient clinic appointments after colonoscopy
examination were also invited to participate in the study.
Participants with normal colonoscopy or findings of diverticular disease, haemorrhoids
or mild colitis were used as controls. Participants with diagnosis of cancer, polyps of any
type (except with hyperplastic polyps) were used as the diseased group. All potential
participants were invited via a postal invite letter which included approved participant
information sheets.
Written consent was obtained from each participant in outpatient/endoscopy/pre-
assessment clinics on the day of procedure. Participants with language requirements
were explained the patient information in their native language (Hindi, Punjabi, Urdu)
and given extra time for decision making to participate. When necessary, official
translators and language lines were used to provide an explanation of the study and to
obtain consent for participation.

60
Blood specimens were taken 24 hours prior to surgery from patients undergoing
surgical resection of CRCs and large polyps. Blood samples were collected from
participants 1-2 hours prior to colonoscopy procedure in the endoscopy unit. Blood
samples were collected from participants in outpatient surgical clinic on the day of their
follow-up appointment.
2.2.1 Inclusion criteria
I. Patients aged 25-90 years
II. Patients undergoing surgical resection of colorectal neoplasia
III. Patients undergoing surgical resection of bowel diverticular disease
IV. Asymptomatic healthy controls without any bowel symptoms
V. Patients undergoing colonoscopic examination of large bowel for:
Family history of CRC or IBD
Surveillance after CRC and polyp resection
Surveillance for dysplasia in the background of IBD
Surveillance colonoscopy for FAP/HNPCC
Symptoms of bowel disease
Positive FOBT
2.2.2 Exclusion Criteria
I. Synchronous carcinoma of other body organ
II. Age >90 and <25 years
III. Pregnancy
IV. HIV
V. Hepatitis C with or without anti-viral treatment
VI. Patients with needle phobia
2.3 Blood sample collection
The blood sampling procedure was explained to all potential participants. Every
participant was informed that the procedure involved wiping an area of skin with
alcohol to sterilize and then puncturing a suitable vein with a 21 gauge needle.
Participants were explained that 10-15 ml whole blood would be drawn. Participants

61
uncomfortable with the procedure and/or allergic to alcohol swipes were not asked to
donate blood. Patient details were checked against details on the patient consent form
and blood sampling tubes were labelled with study number, participant unique
identification number, hospital number, and date and time of collection.
All blood samples were collected by the investigator (Mr Aslam) who had essential
training and prior experience in blood sampling from NHS patients. The investigator
wore latex/vinyl-free gloves in case of latex allergy throughout the procedure.
Participants were also informed of the local trust protocol for accidental needle stick
injury. During the blood sampling procedure, research participants were reminded that
they could ask any questions about the procedure and even withdraw their consent in
cases of difficult sampling. For the majority of patients the medial cubital vein was
sampled from, although other veins on the forearm and back of the hand were also
used in some patients. The skin superficial to the identified vein was cleaned with an
alcohol wipe and a tourniquet was applied 5-10 cm above the intended site of venous
puncture. Blood samples were collected using a closed, vacutainer system. The needle
attached to the vacutainer was unsheathed and inserted through the skin and into the
vein at an angle of 15-30°.
Two 7.5 ml blood sampling tubes containing ethylenediamine tetra acetic acid (EDTA)
as a preservative were used to collect 10-15 ml whole blood. Upon completion of blood
collection the tourniquet was removed, needle withdrawn and sterile cotton applied at
the site of venous puncture and secured with a Micropore (Micropore Technologies,
Derbyshire, UK). The participant was asked to apply pressure for up to five minutes to
stop the bleeding and reduce the risk of bruising. The vacutainer and needle were
disposed in the sharp incarceration bin and blood sampling tubes were gently inverted
to mix anticoagulant with the whole blood. Participants were thanked for their
participation and advised about reporting any complications arising from the blood
sampling procedure.
After completion of blood sampling, all non-sharp clinical waste was disposed of in the
clinical waste bin. Strict hand hygiene and aseptic techniques were used. Blood sample
tubes containing samples were stored at room temperature and processed within 2

62
hours of sampling time. Where blood samples were drawn from two or more
participants, extra caution was taken for sample labelling and storing the blood tubes
in different plastic carrier packs.
2.4 Processing of whole blood samples
Whole blood was separated into plasma and cellular fractions within 2 hours of blood
sampling. Whole blood samples in EDTA were processed at Clinical Sciences Buildings
of three different sites of University Hospitals of Leicester NHS Trust. The Clinical
Sciences Buildings are within five minutes walking distance from the clinical areas
where blood sampling was performed.
EDTA blood sampling tubes were placed in a Jouan centrifuge. The tubes were
centrifuged at 850 x g for 10 min at 10°C. The supernatant plasma layer from two EDTA
tubes for each participant was removed and decanted into a 15 ml BD Falcon 352096
polypropylene conical centrifuge tube (BD Bioscience, Bedford, USA). Isolated plasma
in Falcon tubes was centrifuged again at 850 x g for 10 min at 10°C. Supernatant plasma
was removed and aliquoted into 1 ml samples in multiple 1.5 ml eppendorfs. Buffy coat
was carefully aspirated and decanted into 1.5 ml eppendorfs. Packed red blood cells
(RBC) in the EDTA tube were removed and aliquoted in 1-2 1.5 ml eppendorfs.
Each eppendorf was labelled with a study number, participant’s unique identification
number and date of collection. Plasma, buffy coat and packed RBCs in eppendorf were
stored at -80°C for later use. Sample and aliquot numbers were recorded on a
spreadsheet of patient samples. All samples were placed in -80°C freezer in Room 304
of the Robert Kilpatrick Sciences Building at the University of Leicester. Freezer
temperature was checked on daily basis and recorded in the laboratory freezer recoding
data. When aliquots were removed the spreadsheet was updated accordingly.

63
2.5 Extraction of RNA from 1 ml plasma
1 ml plasma in 1.5 ml eppendorfs was thawed at room temperature. 100 μl 5 N acetic
acid (1 ml glacial acetic acid + 2.48 ml sterile ultrapure water) was added to 1 ml plasma.
The plasma was vortexed and 1.1 ml was transferred into a 15 ml BD Falcon centrifuge tube.
3750 μl of T9424 TRI Reagent® Solution (Sigma-Aldrich, USA) was added to the mixture in
the Falcon tube, vortexed and incubated at room temperature for 5 min. 1 ml of chloroform
was then added and the sample was vortexed and incubated at room temp for 3 min. The
sample in the Falcon tube was centrifuged at 4000 rpm for 15 min at 4⁰C. The aqueous
phase was transferred to a clean 15 ml Falcon tube. The volume of the aqueous phase
was measured and 1.25 times the volume of 100% ethanol (Hayman Speciality Products,
Essex, England) was added and vortexed.
The above volume was applied to a mirVana miRNA isolation column (Ambion®-
AM156), as per the manufacturer’s protocol. The column was centrifuged at 6500 rpm
for 15 sec. Flow through from the column was discarded. The column was filled with
700 μl of Wash Solution 1 (mirVana™ miRNA Isolation Kit), centrifuged at 6500 rpm for
15 sec and flow through was discarded. The column was washed twice with 500 μl of
Wash Solution 2/3 at 6500 rpm for 15 sec.
After discarding the flow through from the second wash, the column was transferred to
a clean eppendorf and centrifuged at 6500 rpm for 1 min to dry the membrane. The
column was transferred to a clean labelled eppendorf and 50 μl of pre-heated RNase-
free water (95⁰C) was added to the column. The column in the eppendorf was
centrifuged at 13000 rpm for 30 sec and total RNA was transferred to an eppendorf
before being stored at -20⁰C.
2.6 Plasma Total RNA quantification
A Nanodrop ND-1000 Spectrophotometer (Thermo Scientific, USA) was used to
measure the total RNA concentration in each sample. The pedestal was wiped with a
dry tissue paper before the start of measurement. The spectrophotometer was
initialised as per the user guide. 1.2 µl of RNAase-free water was used as a blank to
achieve a reading of 0.0 ng/l. For sample RNA quantification, the sample was mixed well
prior to measurement, pedestal and top were cleaned, 1.2 µl of sample was applied to

64
pedestal and the lid was closed. Sample ID was typed into the software. The instrument
provided a total RNA concentration in ng/l and 260/280 value for each sample. Sample
values were recorded with corresponding 260/280 values. Pedestal and top were wiped
with a dry tissue between each sample measurement. When finished, pedestal and top
were wiped with ultrapure water and dried with a tissue. The instrument was switched
off and log user was completed after each use.
2.6.1 RNA concentration with RNA Clean & Concentrator™-100
10 ng/µl total RNA in 50 µl volume was added to 100 µl RNA Binding buffer solution.
150 µl of ethanol was added and then the solution was mixed and applied to a Zymo-
Spin™ IC Column, as per manufacturer’s protocol. RNA was eluted in 15 µl
DNase/RNase-free water. RNA concentration was measured as described above and
stored at -20°C.
2.6.2 RNA concentration with SpeedVac® concentrators
10 ng/µl total RNA in 50 µl volume in 200 µl capacity eppendorf was applied to a Savant
SpeedVac DNA 110 Concentrator for 8 hours at 40°C, 1600 rpm and a vacuum of 5
Kilopascal (37.5 torr). Concentrated volume was removed to a clean eppendorf. RNA
concentration was measured as described above and stored at -20°C.
2.7 Tissue collection, preparation and storage of fresh frozen tissue
Postgraduate student, Mr. Aslam, was trained by consultant histopathologist, Dr. Kevin
West, and a pathology technician for sample collection, specimen dissection, tissue
selection and taking biopsies of freshly frozen cancer and adjacent normal tissues. On
the day of specimen collection, theatre staff, clinicians and laboratory technicians were
liaised with to coordinate tissue sampling.
Clinical details matching the consent form were confirmed with documentation in the
theatre log. Specimen pots were labelled with a participant identification number and
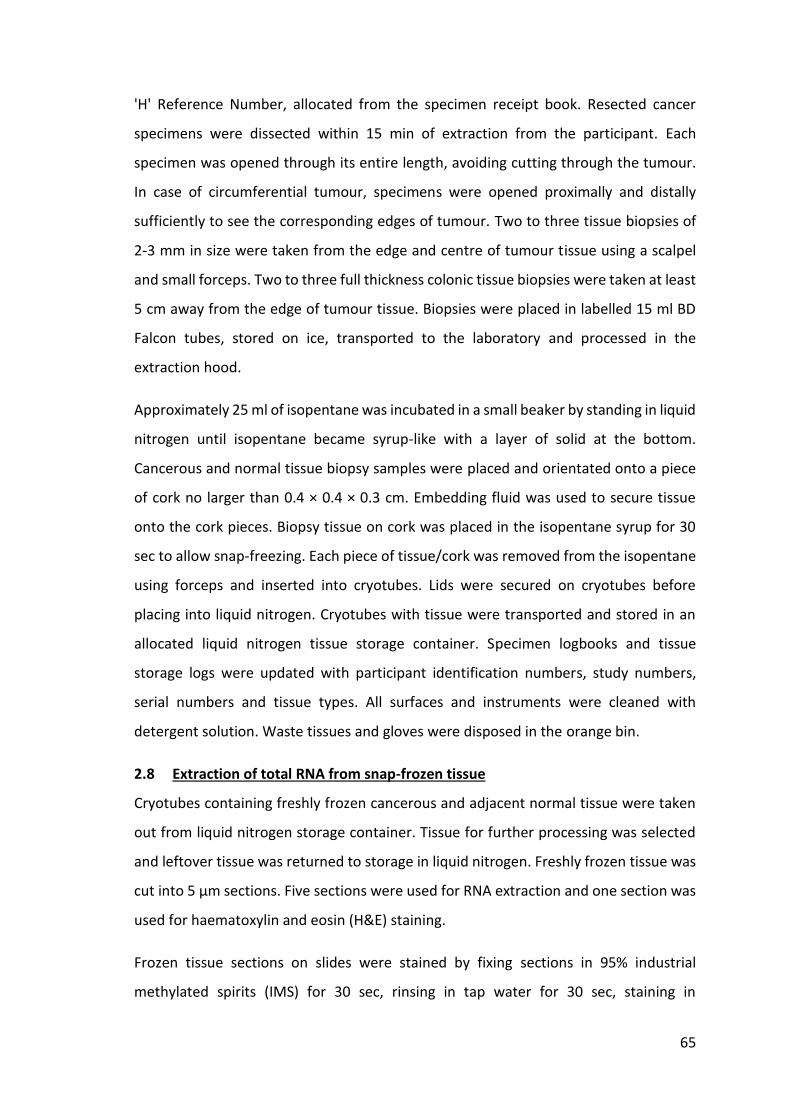
65
'H' Reference Number, allocated from the specimen receipt book. Resected cancer
specimens were dissected within 15 min of extraction from the participant. Each
specimen was opened through its entire length, avoiding cutting through the tumour.
In case of circumferential tumour, specimens were opened proximally and distally
sufficiently to see the corresponding edges of tumour. Two to three tissue biopsies of
2-3 mm in size were taken from the edge and centre of tumour tissue using a scalpel
and small forceps. Two to three full thickness colonic tissue biopsies were taken at least
5 cm away from the edge of tumour tissue. Biopsies were placed in labelled 15 ml BD
Falcon tubes, stored on ice, transported to the laboratory and processed in the
extraction hood.
Approximately 25 ml of isopentane was incubated in a small beaker by standing in liquid
nitrogen until isopentane became syrup-like with a layer of solid at the bottom.
Cancerous and normal tissue biopsy samples were placed and orientated onto a piece
of cork no larger than 0.4 × 0.4 × 0.3 cm. Embedding fluid was used to secure tissue
onto the cork pieces. Biopsy tissue on cork was placed in the isopentane syrup for 30
sec to allow snap-freezing. Each piece of tissue/cork was removed from the isopentane
using forceps and inserted into cryotubes. Lids were secured on cryotubes before
placing into liquid nitrogen. Cryotubes with tissue were transported and stored in an
allocated liquid nitrogen tissue storage container. Specimen logbooks and tissue
storage logs were updated with participant identification numbers, study numbers,
serial numbers and tissue types. All surfaces and instruments were cleaned with
detergent solution. Waste tissues and gloves were disposed in the orange bin.
2.8 Extraction of total RNA from snap-frozen tissue
Cryotubes containing freshly frozen cancerous and adjacent normal tissue were taken
out from liquid nitrogen storage container. Tissue for further processing was selected
and leftover tissue was returned to storage in liquid nitrogen. Freshly frozen tissue was
cut into 5 μm sections. Five sections were used for RNA extraction and one section was
used for haematoxylin and eosin (H&E) staining.
Frozen tissue sections on slides were stained by fixing sections in 95% industrial
methylated spirits (IMS) for 30 sec, rinsing in tap water for 30 sec, staining in

66
haematoxylin for 5 min, rinsing in running tap water for 5 min, staining in eosin for 20
sec and then rinsing in running tap water. Slides were dehydrated, cleared, dried and
mounted with DPX mountant and a glass coverslip. Five sections of each cancerous and
healthy adjacent tissue specimen were immersed in 1 ml of T9424 TRI Reagent®
Solution (Sigma-Aldrich, USA) in a 1.5 ml eppendorf. The resulting lysate was incubated
for 1 min, vortexed and stored at -20°C.
1 ml TRI Reagent/lysate was used for RNA extraction and the remainder was stored in
1 ml aliquots at -20°C. TRI-Reagent/lysate was incubated at room temperature for 5 min
and 200 ml chloroform was added and shaken vigorously to mix. The mixture was
incubated for 2-3 min at room temperature and centrifuged at 4000 rpm for 15 min at
4°C. The mixture was separated into an upper aqueous phase containing RNA, an
interphase, and a lower phenol red-chloroform phase containing DNA.
The upper aqueous phase containing RNA was transferred to a clean tube, without
disturbing the interface. 500 μl TRI Reagent was added to the aqueous phase. 100 μl
chloroform was added to mixture, vortexed, incubated at room temperature for 3 min
and centrifuged at 4000 rpm for 15 min at 4⁰C. The supernatant aqueous phase was
transfer to a clean 15 ml Falcon tube. The volume of aqueous phase was measured and
1.25 times the volume of 100% ethanol (Hayman Speciality Products, Essex, England)
was added and vortexed. RNA was extracted as described in the method above.
2.9 Formalin-fixed paraffin-embedded tissue sample collection
Patients who underwent curative resection for Dukes’ B CRC and subsequently
developed metastatic disease at some stage during the following five years (‘high risk
Bs’) were identified from the University Hospitals of Leicester NHS Trust CRC database,
a prospectively collected database of outcomes of patients treated for CRC in University
Hospitals of Leicester over the last 11 years. FFPE cancerous and adjacent normal tissue
specimen blocks were obtained from Department of Histopathology at University
Hospitals of Leicester NHS Trust. Histological diagnosis and Dukes’ stage was
reconfirmed by a consultant histopathologist. Archived FFPE cancerous and adjacent
normal tissue for case-matched controls (without metastases at five year follow up),

67
Dukes’ A, Dukes’ B ‘low risk B’ and Dukes’ C were obtained from the Department of
Pathology.
All patients with Dukes’ C CRC received postoperative chemotherapy and no patient
with ‘low risk B’ tumour had post-operative chemotherapy. In total, matched pairs of
surgically removed cancer and adjacent normal tissues for 100 patients were obtained.
Ethical permission was obtained from the Local Research Ethics Committee
(05/Q2502/28- ‘Markers of tumour progression in colorectal cancer’). Table 8 shows
the basic demographics and clinicopathological variables for all specimens. The table
summarises patient demographics and clinicopathological variables including tumour
type, stage, location, background, serosal involvement and extramural vascular
invasion.

68
Characteristics
Number Characteristics Number
Gender Male 60 Age Mean 71.6
Female 40 Range 37-96
Dukes' stage A 13 Tumour stage T1 5
B 50 T2 7
C1 31 T3 54
C2 6 T4 34
Tumour
location
Left 52 Extramural
vascular invasion
Present 57
Right 48 Absent 40
Tumour
background
Polyp 22 Serosal
involvement
Present 20
Diverticulitis 13 Absent 77
Ulcerated 3 Tumour type Mucinous 18
None 56 Adenocarcinoma 79
Table 8: Patient demographics and clinicopathological variables.
Patient demographics and clinicopathological variables including tumour type, stage,
location, background, serosal involvement and extramural vascular invasion.

69
2.9.1 RNA Extraction from FFPE Tissue
FFPE tissue blocks were cut into 5 µm sections with a microtome. H&E stained slides
were prepared for each tissue specimen. Marked out H&E stained sections for
corresponding tissue were used as a guide to manually micro-dissect the sections to
obtain mucosa or cancerous cells from unstained, de-waxed and rehydrated FFPE
sections for each specimen. Micro-dissected tissue was dissolved in 500 µl 0.05 Tris
buffer (pH 7.65) (TrisBase, Fisher Scientific Ltd, UK) and digested with 5 µl of proteinase-
K (10 mg/ml) (Roche Ltd, Hertfordshire, UK) by incubating overnight at 56°C. TRI-
Reagent/Chloroform and RNeasy® mini kit (Qiagen, UK) were used as per the
manufacturer’s protocol to extract total RNA. The concentration and integrity of RNA
samples were measured with the Agilent 2100 Bioanalyzer (Agilent Technologies, Santa
Clara, CA). RNA samples were stored at -20°C.
2.9.2 DNA Extraction from FFPE Tissue
Tissue from micro-dissected sections (as described above) were dissolved in 300 µl 0.05
Tris buffer pH 8 / 0.1% SDS (TrisBase, Fisher Scientific Ltd, UK) and digested with 25 µl
of proteinase K (10 mg/ml) (Roche Ltd, Hertfordshire, UK) for 72 h at 56°C. After two
repeat steps of phase isolation with 400 µl of phenol/chloroform/IAA, DNA was
precipitated with 1 M NaCl and ice cold 100% ethanol by incubating overnight at -20°C.
Precipitated DNA was washed with 500 µl 70% ethanol and sodium chloride and
resuspended in 50 µl of 1X Tris EDTA Buffer (EDTA Disodium salt AnalaR NORMAPUR,
VWR®, Leicester, UK). DNA concentration was measured with the Agilent 2100
Bioanalyzer and DNA samples were stored at -20°C.
2.9.3 Mutation analysis of FFPE tissue
Mutational analysis was performed using allele-specific binding PCR (ASB-PCR) to
identify the mutational status of PIK3CA, BRAF and K-ras oncogenes. Oligonucleotide
primers and probes were designed individually and ordered from Sigma-Genosys, UK.
All primer and probe sequences were generated using a combination of the Primer_3
software (Applied Biosystems) followed by sequence confirmation using NCBI

70
Nucleotide Basic Local Alignment Search Tool (BLAST). The mutations detected by
primer and probe sequences are summarized in Table 9.
Tumour DNA (10 ng), Taqman® Genotyping Mastermix (5 µl) (Applied Biosystems, UK)
mutant and wild-type probe (0.2 µl) (Applied Biosystems, UK) and 0.6 µl corresponding
forward and reverse primers (Sigma®, UK) for each gene of interest were used for each
10 µl PCR.
The reporter for the mutant probes was FAM-MGB, and for wild type was VIC-MGB.
PCR reactions were conducted using 7500 Fast Real-Time System (Applied Biosystems,
UK). DNA mutation analysis were performed under supervision by an M.Sc student Mr.
J Venkatesh. Probes, positive and negative control cell lines and annealing temperatures
used for mutation analysis are summarized in Table 10. The standard PCR profile was
carried out under the cycling conditions described in Table 11.

71
Table 9: Primers and probes used for mutation analysis.
Primers and probes sequences for wild type and mutant gene sequences of BRAF
(V600E), PIK3CA (A3140G, G1633A) and K-ras (KRAS122, KRAS123, KRAS133) genes.
Gene Mutation Primer type Primer sequence
BRAF V600E Forward primer 5'-TCATGAAGACCTCACAGTAAAAATAGGT-3'
Reverse primer 5'-ATCCAGACAACTGTTCAAACTGATG-3'
Wild type probe 5'-TAGCTACAGTGAAATC-3'
Mutant probe 5'-TAGCTACAGAGAAATC-3'
PIK3CA A3140G Forward primer 5'CAAGAGGCTTTGGAGTATTTCATG-3'
Reverse primer 5'-TGTTTAATTGTGTGGAAGATCCAATC-3'
Wild type probe 5'-ATGCACGTCATGGTG-3'
Mutant probe 5'-ATGCACATCATGGTGG-3'
G1633A Forward primer 5'-GCAATTTCTACACGAGATCCTCTCT-3'
Reverse primer 5'-CATTTTAGCACTTACCTGTGACTCCAT-3'
Wild type probe 5'-TGAAATCACTAAGCAGGA-3'
Mutant probe 5'-ATCACTGAGCAGGAGAA-3'
K-ras Forward primer 5'-AGGCCTGCTGAAAATGACTGA-3'
Reverse primer 5'-TGTATCGTCAAGGCAAGGCACTCTTGC-3'
Wild type probe 5'-CTACGCCACCAGCTC-3'
KRAS122 Mutant probe 5'-TACGCCADAGCTC-3'
KRAS123 Mutant probe 5'-TACGCCADCAGCTC-3'
KRAS133 Mutant probe 5'-CTACGTCACCAGCTC-3'

72
Table 10: Mutation analysis by RT-PCR.
Summary of mutant regions, probe annealing temperature, positive and wild type cell
lines controls for mutation analysis of BRAF, PIK3CA and K-ras genes.
Table 11: Thermal profiles for PCRs for mutation analysis.
Tabulated thermal profiles for different reactions including reverse transcription pre-
amplification, miRNA expression profiling, RT-PCR for validation cohort and RT-PCR for
mutational analysis.
Gene Mutation
region
Probe annealing
temperature (°C)
Positive control Wild type control
PIK3CA G1633A 60 MCF7 HCT116
A3140G 62 HCT116 MCF7
BRAF V600E 60 Skmel28 Tonsil
K-ras KRAS122 63 H358 H460
KRAS123 61 SW480 Tonsil
KRAS133 64 HCT116 Tonsil
Reaction Temperature
(°C)
Time Number of
cycles
Mutational analysis 50 2 min 1
95 10 min 1
95 15 sec
40 Probe annealing
temperature
(see Table 4)
1 min

73
2.10 miRNA expression profiling
miRNA expression analyses were performed using QRT-PCR TaqMan® miRNA Megaplex
QRT-PCR protocol for both miRNA expression profiling (700 miRNAs) and to validate
selected panel of miRNAs for both plasma and tissue analysis.
2.10.1 Chemistry overview for miRNA expression profiling
Relative quantitation using Megaplex™ Pools was accomplished using reverse
transcription, pre-amplification and real-time PCR steps.
2.10.1.1 Reverse transcription
In this step, cDNA was reverse transcribed from total RNA samples. The reverse
transcription used specific miRNA primers and reagents from the Megaplex Primers and
the TaqMan® MicroRNA Reverse Transcription Kit (Figure 10).
2.10.1.2 Pre-amplification
In the pre-amplification step, the reverse transcription product was uniformly
amplified from cDNA templates using the Megaplex PreAmp Primers and the
TaqMan® PreAmp Master Mix (Figure 11).

74
Figure 10: Reverse transcription of miRNA.
Illustration shows miRNA strand with RT loop primers leading to synthesis of first cDNA
strand with megaplex primers
Figure 11: Preamplification with miRNA specific forward and reverse primers.
Figure shows that miRNA-specific cDNA template was duplicated with forward primer
in first cycle and each cDNA strand was doubled with each further reaction.

75
2.10.1.3 Real-time PCR
During RT-PCR each TaqMan MGB probe annealed specifically to its complementary
sequence between the forward and reverse primer sites. The TaqMan MGB probes
contained a reporter dye (FAM™ dye) linked to the 5′ end of the probe, a minor groove
binder (MGB) at the 3´ end of the probe, which allowed the design of shorter probes
with greater specificity, and a non-fluorescent quencher (NFQ) at the 3′ end of the
probe. When the oligonucleotide probe was in intact, the proximity of the quencher
dye to the reporter dye quenched the reporter dye signal. AmpliTaq Gold® DNA
Polymerase extended the primers bound to the cDNA template. AmpliTaq Gold®
enzyme (containing 5´ nuclease activity) cleaved the probes that were hybridized to the
target sequence. When the hybridized probes were cleaved by AmpliTaq Gold® enzyme,
the quencher was separated from the reporter dye, increasing the fluorescence of the
reporter dye. Therefore, the fluorescence signal generated by PCR amplification
indicated the gene expression level (Figure 12).
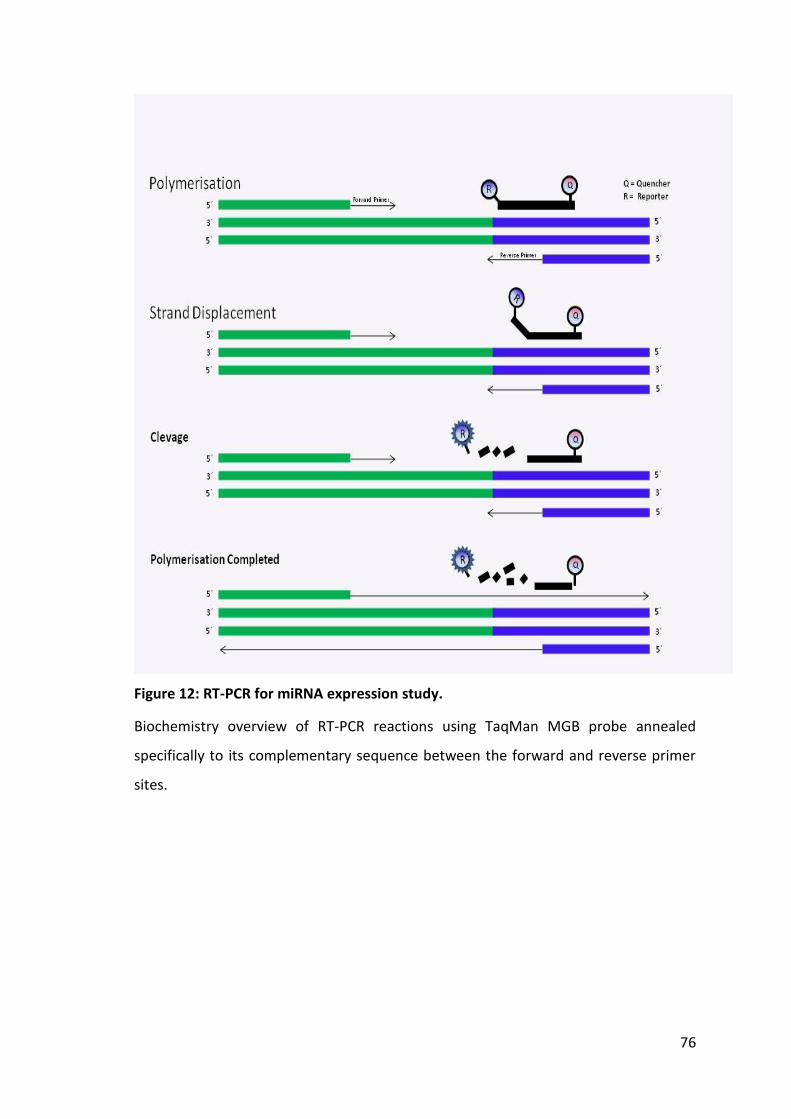
76
Figure 12: RT-PCR for miRNA expression study.
Biochemistry overview of RT-PCR reactions using TaqMan MGB probe annealed
specifically to its complementary sequence between the forward and reverse primer
sites.

77
2.10.1.4 miRNA Expression Profiling experiment with TaqMan® miRNA Arrays
miRNA expression profiles for RNA extracted from plasma, freshly frozen tissues and
FFPE tissues were developed according to Applied Biosystems® user protocol by using
the following products:
Megaplex™ RT Primers (Human pool A v2.1 and Pool B v2.0)
Megaplex™ PreAmp Primers (Human pool A v2.1 and Pool B v2.0)
TaqMan® MicroRNA Array (Human card A v2.1 & Card B v2.0)
7900HT Fast Real Time PCR system (Applied Biosystems)
The manufacturer had designed Megaplex™ Pools (A & B) to detect and quantitate up
to 380 human miRNAs per pool using TaqMan® MicroRNA Array Card A v2.1 & Card B
v2.0 on 7900HT Fast Real Time PCR system. Megaplex Primer Pools consist of
matching RT primers and PreAmp pools. Megaplex™ RT Primers were a set of two
predefined pools (Pool A and Pool B) of up to 380 stem-looped reverse transcription
(RT) primers per pool that enable the simultaneous synthesis of cDNA for mature
miRNAs. Megaplex™ PreAmp Primers were a set of two pools (Pool A and Pool B) of
gene-specific forward and reverse primers intended for use with very small quantities
of starting material. The primers enabled the unbiased pre-amplification of the miRNA
cDNA target by PCR prior to loading the TaqMan® MicroRNA Array. TaqMan® MicroRNA
Arrays were a set of two 384-well microfluidic cards (Array A and Array B) containing
dried TaqMan primers and probes. The array enabled quantitation of gene expression
levels of up to 380 miRNAs and controls. This was accomplished by loading the cDNA
product (with or without pre-amplification) onto the array for PCR amplification and
real time analysis. For each sample (and optional no template control), one Megaplex
RT reaction was run, followed by one pre-amplification reaction per array. This provided
sufficient sample to be loaded in one TaqMan MicroRNA array. For a full miRNA profiles,
two Megaplex RT reactions (Pool A and B), two pre-amplification reactions (Pool A and
B), and two TaqMan MicroRNA Arrays (Array A and B) were run for each sample. Figure
13 shows the protocol for Megaplex QRT-PCR used for miRNA expression profiling,
Table 12 shows the concentrations of reagents used for each reaction and Table 13
shows thermal profiles for each reaction.

78
Figure 13: MicroRNA expression profiling protocol flow chart.
TaqMan® MicroRNA Arrays and protocol as per guide from manufacturer.

79
Table 12: Reagent concentrations for reverse transcription, pre-amplification and miRNA Taqman miRNA Array.
Reaction Reagents Concentration
(µl)
Reverse transcription Total Plasma RNA 3.00
20X Taqman® Megaplex RT Primers 0.80
100 mM dNTP 0.25
10X RT buffer 0.80
MultiScribeTM Reverse Transcriptase
(50 units/µl)
1.50
RNase Inhibitor (20 units/µl) 0.125
MgCl2 1.03
Total reaction volume 7.50
Pre-amplification cDNA for Human Pool A or B 5.00
Taqman® Megaplex™ PreAmp Primer
Pool
2.50
Taqman® PreAmp MasterMix 12.5
RNAase/ DNAase free water 5.00
Total reaction volume 25.00
PCR check prior to array
1:20 diluted Pre-amplified cDNA 2.00
TaqMan® Universal PCR Master Mix
No AmpErase® UNG
5.00
RNAase/ DNAase free water 2.50
Taqman MicroRNA PCR Probe 0.50
Total reaction volume 10.00
Taqman MicroRNA
Array
Pooled 1:4 diluted pre-amplified
cDNA
9.00
TaqMan® Universal PCR Master Mix
No AmpErase® UNG
450.00
RNAase/ DNAase free water 441.00
Total reaction volume 900.00
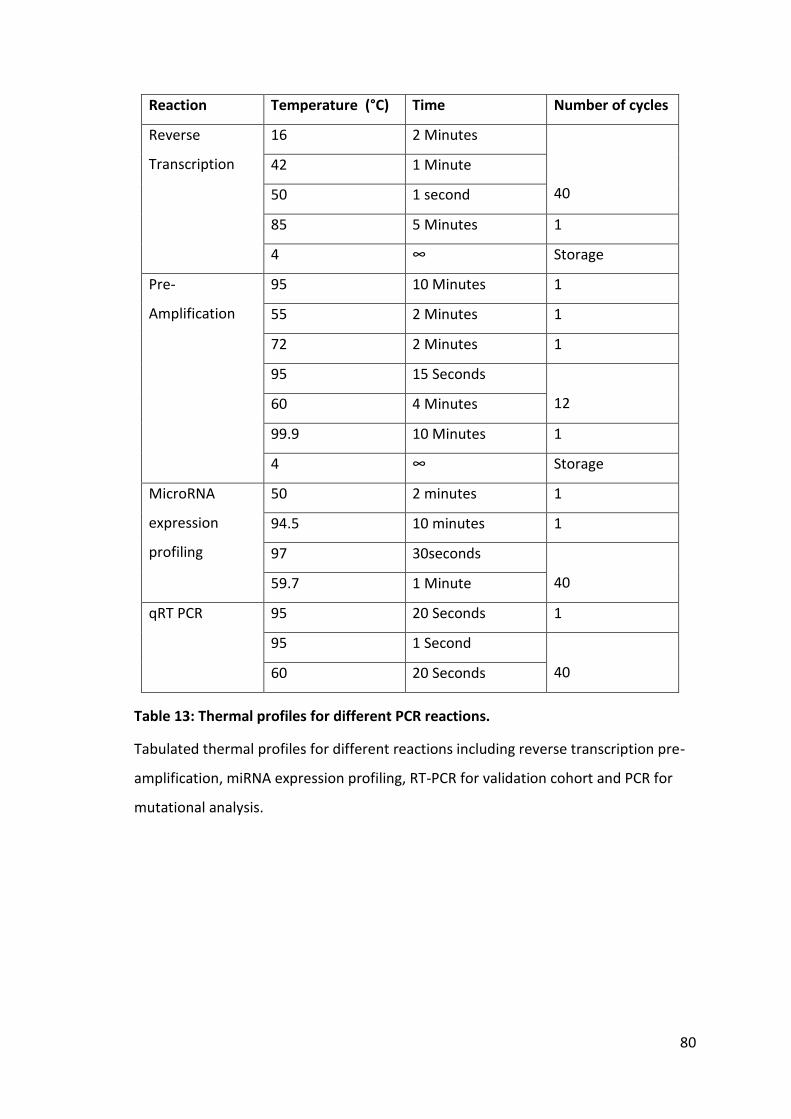
80
Table 13: Thermal profiles for different PCR reactions.
Tabulated thermal profiles for different reactions including reverse transcription pre-
amplification, miRNA expression profiling, RT-PCR for validation cohort and PCR for
mutational analysis.
Reaction Temperature (°C) Time Number of cycles
Reverse
Transcription
16 2 Minutes
40
42 1 Minute
50 1 second
85 5 Minutes 1
4 ∞ Storage
Pre-
Amplification
95 10 Minutes 1
55 2 Minutes 1
72 2 Minutes 1
95 15 Seconds
12 60 4 Minutes
99.9 10 Minutes 1
4 ∞ Storage
MicroRNA
expression
profiling
50 2 minutes 1
94.5 10 minutes 1
97 30seconds
40 59.7 1 Minute
qRT PCR 95 20 Seconds 1
95 1 Second
40 60 20 Seconds

81
2.10.2 Expression Profiling for plasma samples:
2.10.2.1 Participant groups and characteristics
Participants were grouped into CRC, benign adenoma and participants without
neoplasia, confirmed on colonoscopy. Patients were matched for age. Patients with CRC
were included to represent different sites and stages. Participants with benign polyps
included polyps with low grade dysplasia, moderate grade dysplasia and high grade
dysplasia. Patients who underwent colonoscopy for bowel symptoms and showed no
neoplastic disease at the time of colonoscopic examination were used as controls. Table
14 shows the characteristics of participants with neoplastic large bowel disease and
controls without any significant bowel disease seen on the colonoscopy. 3 µl RNA
extracted from plasma samples was for used in miRNA expression profiling by using
Taqman™ Array card. Table 14 compares the characteristics of participants in each
group of controls, adenomas and carcinomas. Appendix VI shows the characteristics for
participants used for plasma miRNA expression profiling.
Participant Characteristics Normal Adenoma Carcinoma
Number (n) 11 9 12
Gender M/F 6/5 5/4 7/5
Median Age (Years) 65 64 65.5
Dukes Stage N/A N/A A = (2)
B= (5)
C = (4)
D = (1)
Grade of Dysplasia N/A High= 2, Low =7
Location N/A Right =5, Left =4 Right = 5
Left = 7
Pre-operative
Chemotherapy/
Radiotherapy
N/A N/A 1
Previous Polyp / Carcinoma
Excision
3 1 1
Significant Background
Benign Disease
3 0 0
Table 14: Characteristics of participants for plasma miRNA expression profiling.
82
miRNA expression profiling was performed in two batches. The first run was performed
for 16 samples and second run was performed for another set of 16 samples following
the same protocol. Here is a description of the first run of 16 samples used for miRNA
expression profiling.
2.10.2.2 Reverse transcription reaction for cDNA of plasma miRNAs
TaqMan® MicroRNA Reverse Transcription Kit and the Megaplex™ RT Primers (mixture
volume of 4.5 µl) were used to synthesize single-stranded cDNA from plasma total RNA
samples (3 µl). The quantitative reverse transcription (QRT) reaction had a final volume
of 7.5 μl. Megaplex RT reactions were prepared and run on separate two occasions for
pool A and pool B.
Megaplex RT Primers, TaqMan® MicroRNA Reverse Transcription Kit component, MgCl2
and RNA samples were thawed on ice. A master mix was prepared for 18 reactions (to
account for pipetting loss) by combining the reagents (listed in Table 15) in a 1.5 ml
micro-centrifuge tube. A negative control (-RT) master mix solution was prepared for
three reactions by replacing the MultiScribe™ Reverse Transcriptase (50 U/μl) with
RNAase-free water (Table 16).

83
+RT reaction mix
components
Volume for
one sample
(μl)
Volume for 16 samples
(μl) (prepared for 18
reactions)
Megaplex™ RT Primers (10X) 0.80 14.4
dNTPs with dTTP (100 mM) 0.20 3.6
MultiScribe™ Reverse
Transcriptase (50 U/μl)
1.50 27
10X RT Buffer 0.80 14.4
MgCl2 (25 mM) 0.90 16.2
RNase Inhibitor (20 U/μl) 0.10 1.80
Nuclease-free water 0.20 3.60
Total 4.50 81
Table 15: Reagents for RT+ and RT- master mix.
-RT reaction mix
components
Volume for
one sample
(μl)
Volume for two samples
(μl) (prepared for 3
reactions)
Megaplex™ RT Primers (10X) 0.80 2.4
dNTPs with dTTP (100 mM) 0.20 0.60
10X RT Buffer 0.80 2.4
MgCl2 (25 mM) 0.90 2.7
RNase Inhibitor (20 U/μl) 0.10 0.30
Nuclease-free water 1.70 5.10
Total 4.50 13.5
Table 16: -RT reaction Master Mix for reverse transcription reaction.
84
Micro-centrifuge tube was inverted six times to mix, and then tubes were centrifuged
briefly. All MicroAmp® 8-Tube Strips were labelled with sample identification number.
4.5 μl RT reaction master mix (16 RT+ Reactions, 2 RT- Reactions) and one no template
control (NTC) master mix was pipetted into each of the labelled MicroAmp® 8-Tube
Strips tubes. 3 μl total plasma RNA was added into each corresponding labelled tube
containing RT reaction mix. 3 μl RNAase-free water was added to a tube labelled NTC.
MicroAmp® 8-Tube Strips tubes were sealed with MicroAmp® Optical Strip Caps. Tubes
were inverted six times to mix the solutions and were spun briefly. Tubes were
incubated on ice for 5 min. RT reaction was set up at Veriti® 96-Well Thermal Cycler
(Applied Biosystems, USA) for reaction volume of 7.5 μl and thermal-cycling conditions
as shown in the Table 1313. MicroAmp® 8-Tube strips tubes were loaded in the thermal
cycler and reaction was run. cDNA was stored at -20°C.
2.10.2.3 Megaplex pre-amplification reactions for plasma miRNAs
This step was used to pre-amplify specific cDNA targets to increase the quantity of
desired cDNA for microRNA expression analysis using TaqMan® MicroRNA Arrays. The
pre-amplification reaction had a final volume of 25 μl and contained 2.5 μl RT product
and 22.5 μl PreAmp reaction mix. The following steps were used in a run of Megaplex™
preamplification reactions. Megaplex™ PreAmp Primers were thawed on ice and mixed
by inverting six times and spinning briefly. TaqMan® PreAmp Master Mix (2X) was mixed
by swirling the Master Mix vial. A pre-amplification reaction master mix for 20 reactions
(to account for pipetting loss) was prepared by combining the reagents in a 1.5 ml
eppendorf (Table 17).

85
PreAmp reaction mix
components
Volume for
one Sample
(μl)
Volume for 19 Samples -
Prepare for 20 Reactions (μl)
TaqMan® PreAmp Master Mix
(2x)
12.5 250
Megaplex™ PreAmp Primers
(10x)
2.5 50
Nuclease-free water 7.5 150
Total 22.5 450
Table 17: Master mix for preamplification reaction.
2.5 μl of the pre-amplification master mix was pipetted into labelled MicroAmp® 8-Tube
Strips tubes (16 RT+ Reactions, 2 RT- Reactions) and one NTC. Strips tubes were mixed
and centrifuged briefly. In each of the labelled MicroAmp® 8-Tube Strips, 2.5 μL of
corresponding Megaplex RT reaction product was pipetted. MicroAmp® Optical Strip
Caps were used to seal the tubes and then invert six times to mix the solution and were
spun briefly. Tubes were incubated on ice for 5 min. Pre-amplification reaction was set
up on Veriti® 96-Well Thermal Cycler (Applied Biosystems, USA) for reaction volume of
25 μl, 9700Std ramp speed and the thermal-cycling conditions described in Table 7.
Prepared tubes were loaded and reaction was run. After removing the 8-tube strips
from the thermal cycler, tubes were centrifuged briefly. 75 μl 0.1X TE buffer pH 8.0 was
added to each tube and then sealed, inverted six times to mix and spun briefly. Diluted
pre-amplified product was stored at -20°C.
2.10.2.4 Assessment of pre-amplified cDNA with RT-PCR in 7500 Fast Real-Time
System
The pre-amplified cDNA for individual samples was assessed by RT-PCR in 7500 Fast
Real-Time System. This was to ensure that reverse transcription and pre-amplification
had been successful. 2.0 µl 1:20 diluted pre-amplified cDNA was used per reaction.
TaqMan® hsa-miR-21 assay (Catalogue no 4427975, Assay ID 002438) and SnRNA

86
RNU6B (Catalogue no 715680, Assay ID 001973) were used to assess the pre-amplified
product through RT-PCR reaction on StepOne 7500HT Fast Real Time PCR system
(Applied Biosystems).
2.10.2.5 TaqMan® miRNA Array and Real-Time PCR
During this step, DNA polymerase from the TaqMan® Universal PCR Master Mix and
TaqMan® MicroRNA Array amplify the target cDNA using sequence-specific primers and
probes. The following steps were used in a run of TaqMan® Array Real-Time PCR:
Stored and labelled PreAmp product was thawed on ice, mixed by inverting tube six
times and then centrifuged the tube briefly. TaqMan Universal PCR Master Mix was
mixed by swirling the vial and following were combined the in a 1.5 ml Eppendorf
(Table 18).
Component Volume for one array (μl)
TaqMan® Universal PCR Master Mix, No AmpErase®
UNG, 2X
450
Diluted PreAmp product 9
Nuclease-free water 441
Total 900
Table 18: Master mix for TaqMan® Array RT-PCR.
‡ Includes 12.5% excess for volume loss from pipetting.

87
The eppendorf was inverted six times to mix and then centrifuged briefly. The miRNA
Array card was loaded and run as per guide from the manufacturer (Applied Biosystems
TaqMan® Array User Bulletin -PN 4371129).100 μl PCR mix was dispensed into the
TaqMan MicroRNA Array card. Array card was sealed, centrifuged twice at 2000 rpm for
1 min at 4C° and then loaded on the 7900HT Fast Real Time PCR system (Applied
Biosystems) according to user bulletin –PN 4371129. Array was loaded and run using
the 384 well TaqMan Low Density Array default thermal-cycling conditions (Table 13).
Figure Figure 1414 shows the final step in miRNA Array reaction.
Figure 14: miRNA array for expression profiling.
Figure shows miRNA Array card with Megaplex Primers, 7900HT Fast Real Time PCR
system and amplification curves for miRNAs.

88
2.10.2.6 Data extraction from 7900HT Fast Real-Time PCR System:
miRNA Array data from RT-PCR on 7900HT Fast Real-Time PCR System was analysed for
Comparative CT (RQ) according to manufacturer protocol (Applied Biosystems 7900HT
Fast Real-Time PCR System Relative Quantitation Using Comparative CT Getting Started
Guide, PN 4364016). Raw data from 7900HT Fast Real Time PCR system was exported
into Microsoft Office Excel. Each array data was named and saved as a separate Excel
sheet.
2.10.3 miRNA Expression Profiling for High Risk Dukes’ B
20 cases of age and gender matched paired tumour and adjacent normal tissues, five
from each of Dukes’ Stage ‘A’, ‘low risk B’, ‘high risk B’ and ‘C’ were used for the
MicroRNA expression profiling as a training cohort . 100 ng RNA was reverse transcribed
to cDNA using Taqman® Megaplex™ RT Primers Human Pool A v2.1 & Pool B v2.0
(Applied Biosystems), according to manufacturers’ protocol. 5 µl cDNA for each sample
was pre-amplified using Taqman® Megaplex™ PreAmp Primers Human ‘Pool A v2.1’ and
‘Pool B v2.0’. Pre-amplified cDNA (25 µl) was diluted to 100 µl by adding 75 µl of 0.1X
Tris EDTA Buffer. After dilution, 20 µl of pre-amplified cDNA from each of the 5 samples
in a group was pooled to 100 µl. This volume was used for miRNA expression profiling
by using TaqMan® miRNA array.
2.10.4 Tissue miRNA expression profiling with TaqMan® miRNA Arrays
Freshly frozen cancerous and adjacent normal healthy colonic tissue from five
participants was used to develop tissue expression signature (Table 19). 100 ng/3 µl
total RNA extracted from freshly frozen tissue was used to run Megaplex reverse
transcription, Megaplex pre-amplification, TaqMan® MicroRNA Array Real Time PCR
reactions according to according to manufacturer’s - user protocol, as described above.
Pre-amplified cDNA (25 µl) was diluted to 100 µl by adding 75 µl of 0.1X Tris EDTA Buffer.
After dilution, 20 µl of pre-amplified cDNA from each of the five cancer samples and
five normal tissue samples were pooled to 100 µl. This volume was used for miRNA
expression profiling by using TaqMan® miRNA array.

89
Table 19: Characteristics of cancer patients used for expression analysis by using freshly frozen tissue.
2.11 QRT-PCR for validation cohorts
QRT-PCR was used to analyse a panel of miRNAs in the validation cohorts and for
exosomal miRNA analysis. For validation of miRNAs in plasma, total RNA was reverse
transcribed and pre-amplified using Megaplex™ RT and Pre-amplification Primers Pool
A & Pool B on Veriti® thermal cycler (Applied Biosystems, UK). Megaplex™ RT and Pre-
amplification Primers Pool A was used for the validation of miRNAs specific to high risk
Dukes’ B cancer tissue and final validation of a single plasma miRNA for the detection
of adenoma and carcinoma. 4.5 µl 1:20 diluted Pre-amplified cDNA was used in 10 µl
reaction volume to run real time PCR on 7500 fast Real-Time system (Applied
Biosystems). For the validation of a panel of miRNAs selected from plasma miRNA
expression profiling, a cohort of 94 participants (Table 20) was used. (Appendix VIII & IX
shows the subcategories of normal and detailed characteristics of participants.)
H Number Gender Age Diagnosis/Stage
H45/09 M 67
Sigmoid colon adenocarcinoma,
Duke's A pT2,pN0,rM0
H56/09 M 75
Sigmoid colon adenocarcinoma,
Duke's A pT2,pN0,rM0
H164/09 M 70
Ascending colon adenocarcinoma,
Dukes B, pT3 pN0, rM0
H175/09 M 58
Sigmoid adnenocarcinoma,
Dukes' C2, pT4, pN2, rM0,
H176/09 F 48
Ascending colon adenocarcinoma,
Dukes B, pT3 pN0, ?rM1

90
Table 20: Characteristics of participants used for first validation of plasma miRNA panel.
Controls Adenoma Carcinoma
Number (n) 32 28 34
Gender M:F 17:15 16:12 26:08
Median Age (Years) 62 68 67
Dukes Stage
N/A
N/A
A = (06)
B = (13)
C = (12)
D = (03)
Grade of Dysplasia N/A High = 5
Low = 21
N/A
Location N/A Right = 10
Left = 17
Right = 12
Left = 22
Pre-operative Chemotherapy/
Radiotherapy
N/A N/A 3
Previous Polyp / Carcinoma
Excision
8 3 2
Significant Background Benign
Disease
9 0 0

91
2.12 Isolation of exosomes from harvested cell line culture media by
ultracentrifugation
Extraction hood and incubator were cleaned prior to cell line culture. Incubator settings
were set up for the standard cell line culture requirements of temperature and CO2.
Settings were maintained and checked every 24 hours. 450 ml McCoy's 5A culture
media was mixed with 45 ml 10% foetal bovine serum (FBS) and 5 ml ampicillin in 50 ml
centrifuge tubes. McCoy's 5A media was warmed to 37°C for 30 min in a water bath.
HT29 cells stored in liquid nitrogen were defrosted in water bath at 37°C.
Defrosted cells were added to 10 ml McCoy's 5A media and centrifuged at 1000 rpm for
5 min. Supernatant was discarded and cell pellet was resuspended in 10 ml media. 10
ml media was dispensed into three 25 cc cell culture flasks and 3 ml of HT29 cells were
added to each flask. Flasks were incubated at 37°C with 95% air, 5% CO2. Cultures were
washed with PBS and media was replaced after 48 hours of culture. After 72 hours, 75-
80% confluence was achieved. Flasks were washed again and media was replaced with
serum-free media.
Media was harvested from flasks after 96 hours and centrifuged at 1000 x g and 10,000
x g to remove cells and cell debris, respectively. 10 ml harvested media was filtered
through 300 μm and 100 μm filters. 5 ml harvested media was stored for
immunoprecipitation. 5 ml filtered harvested media was centrifuged at 140,000 x g for
90 min at 4°C to pellet exosomes. 4.5 ml supernatant was removed from centrifuged
tube and discarded. A replacement volume of 4.5 ml PBS was added to the tube prior
and then centrifuged again at 140,000 x g for 90 min at 4°C to pellet the exosomes. 4.9
μl supernatant was discarded and 100 μl of leftover supernatant was stored at -80°C,
and is herein referred to as an exosome pellet.
2.12.1 Isolation of exosomes from plasma samples by ultracentrifugation
1 ml plasma stored in 1.5 ml eppendorf at -80°C was defrosted and centrifuged at
10,000 x g at 4°C for 10 min, followed by 30,000 x g at 4°C for 30 min. Supernatant was
transferred to another 1.5 ml eppendorf and filtered through 300 μm and 100 μm
filters. Filtrate was prepared for ultracentrifugation by adding PBS to bring the final

92
volume to 5 ml. Filtered and diluted plasma was centrifuged at 140,000 x g for 90 min
at 4°C to pellet the exosomes. 4.5 ml supernatant was removed from tube and
discarded. A replacement volume of 4.5 ml PBS was added to the tube and then
centrifuged again at 140,000 x g for 90 min at 4°C to pellet the exosomes. 4.9 μl of
supernatant was discarded and 100 μl of exosome pellet was stored at -80°C. Exosome
pellets were separated and stored at -80°C for further analysis. The presence of
exosomes was confirmed by flow cytometry, dynamic light scattering and electron
microscopy.
2.12.2 Transmission electron microscopy
Transmission electron microscopy was performed at the Department of Imaging and
Electron Microscopy at the University of Leicester. 100 μl exosome pellets isolated from
plasma and cell line culture harvested media were thawed to room temperature. 10 μl
exosomes were added to 490 μl PBS. 500 μl PBS was used as a control solution. 10 µl
exosome solution in PBS and control PBS solution was placed on Parafilm and a formvar
carbon-coated nickel grid was mounted on each drop for 30 to 60 min.
The grid was positioned with the coated side facing the drop containing exosomes or
control solution. Three drops of PBS, each 30 μl, were placed on the Parafilm to wash
the grid by sequentially positioning the grid on top of the droplets of PBS with absorbing
paper in between. Two samples were fixed with 2% paraformaldehyde on the Parafilm
and grids were placed on top of the drop for 10 min. Samples were washed with 10 µl
PBS and fixed with 2.5% glutaraldehyde in PBS for 30 min on ice. After rinsing, the pellet
was sequentially stained with osmium tetroxide and uranyl acetate, and then
dehydrated and embedded in Polybed 812. Tissue was sectioned on a Reichert-Jung
Ultracut, viewed on a Zeiss 902 electron microscope and recorded with Kodak E.M. film.
All electron microscopy reagents were purchased from Electron Microscopy Sciences.
2.12.3 Dynamic Light Scattering
Dynamic light scattering was performed at the Department of Physics at the University
of Leicester. The sizes of particles in exosomes eluted in PBS and exosome-free PBS
(control) were measured. PBS was filtered through a 100 µm filter. 10 µl plasma and

93
harvested media exosomes were eluted in 490 µl filtered PBS. Particle size distribution
was determined by a Nicomp 370 submicron particle sizer (Agilent Technologies Inc,
Particle Sizing Systems Division, Santa Barbara, CA, USA). Nicomp 370 instrument was
initiated in line with the departmental protocol. The samples were transferred to a
cuvette for size measurement using the following settings of dynamic light scattering
for two solutions: PBS viscosity 1.05cP, temperature 20°C and refraction index 1.33. All
measurements for buffer and samples were taken at room temperature. The Zetasizer
Nano software adjusted the channel width for each sample based on the fluctuation
rate of scattered light, and the final size distribution for each sample was calculated
using the number-weight Gaussian setting within the software.
2.12.4 Immunoprecipitation: antibody coupling
Invitrogen Antibody Coupling Kit with Dynabeads® M-270 Epoxy beads was used to
couple three different antibodies as per manufacturer protocol from Invitrogen. The
following antibodies were used for coupling to beads:
CD133 – PE conjugated (Miltenyi Biotec, MACS, UK) antibody (50 µg/ml)
CD326 (EpCAM) – APC conjugated (Miltenyi Biotec, MACS, UK) antibody (50 µg/ml)
Moisture on unused beads deactivates the reactive groups necessary for covalent
antibody coupling. To avoid condensation on unused beads, beads were stored at room
temperature prior to opening the bottle.
Magnet was disinfected to prevent accidental sample contamination. 5 mg Dynabeads®
M-270 Epoxy beads were washed with 1 ml of C1 solution by pipetting and vortexing in
an eppendorf. This eppendorf was labelled as ‘Antibody +ve’. In a second eppendorf
labelled as ‘Control’, 5 mg Dynabeads® M-270 Epoxy beads were washed with 1 ml C1
solution by pipetting and vortexing. Two eppendorfs were placed on the magnet for 1
min and beads were allowed to collect at the side of the tube. Supernatants from both
eppendorfs were removed. To the ‘Antibody +ve’ eppendorf, 100 µl antibody at 5
µg/100 µl, 150 µl C1 solution and 250 µl C2 solution were added and mixed by gentle
vortexing. To the ‘Control’ eppendorf, 250 µl C1 solution and 250 µl C2 solution were
added and mixed by gentle vortexing. Mixtures were incubated on a roller for 16 hours

94
at 4°C to ensure the fluid and beads were mixed well. After overnight incubation, each
eppendorf was placed on the magnet for 1 min and then supernatant was removed.
Beads were washed with 800 µl HB solution and 800 µl LB solution in two steps.
Beads in both ‘Antibody +ve’ and ‘control’ eppendorfs were washed twice with 800 µl
SB solution twice for 15 sec. Beads were washed with SB Wash for 1 min and incubated
on a roller at room temperature for 15 min. Eppendorfs were placed in the magnet for
1 min and then supernatant was removed. Control and antibody-coupled beads were
resuspended in 450 μl SB solution and 50 µl Aldefluor buffer solution. Resuspended
beads were stored at 4°C until required.
2.12.5 Flow cytometry to assess coupling of antibody with beads
Antibody-coupled Dynabeads suspended in 50 µl Aldefluor buffer and unstained non-
reactive Dynabeads (control) in Aldefluor buffer were used for flow cytometry
analysis:
a. CD133 – PE coupled Dynabeads
b. CD326 (EpCAM) – APC coupled Dynabeads
c. ‘Control’ unstained uncoupled Dynabeads
All FACS analysis and sorting was done using the BDFACS Aria II SORP. An 85 µm nozzle
was used for sorting or analysis of cells. The flow chamber, deflection plates and
sample loading area were all cleaned with 70% IMS prior to sorting. For triple colour
experiments, appropriate compensation was set up and applied to the sorting
experiment to avoid any crossover of fluorescence signals from respective
fluorochromes. The sorted beads were collected in a tube holder consisting of four
tubes filled with sample collection solution (PBS). The sorting gates were set up to
exclude any doublets. The minimum number of events recorded for any analysis was
10,000, provided there were enough cells for analysis.

95
2.12.6 Immunoprecipitation of plasma exosomes with antibody-coupled Dynabeads
3 ml plasma sample stored at -80°C (1 ml plasma per 1.5 ml eppendorf) was removed
from the freezer, defrosted at room temperature and centrifuged at 10,000 x g at 4°C
for 10 min, and 30,000 x g at 4°C for 30 min. The resultant supernatant was filtered
through a 100 µl filter. 1 ml filtrate was separated into two 1.5 ml eppendorfs. 100 µl
CD133 antibody-coupled Dynabeads and 100 µl CD326 (EpCAM) antibody-coupled
Dynabeads were added to 1 ml filtered plasma. 200 µl ‘Control’ unstained uncoupled
Dynabeads were added to 1 ml of filtered plasma. Plasma and Dynabeads solutions
were mixed by pipetting, and incubated at 4°C on a roller for 20 min. Each eppendorf
was placed on magnet to isolate Dynabeads. Supernatants were removed and stored at
-80°C. Precipitated Dynabeads were washed with 1 ml PBS and two washes with 500 µl
Aldefluor. Exosomes bound to Dynabeads were eluted in 100 µl of Aldefluor and stored
at -80°C.
2.12.7 Immunoprecipitation of cell line exosomes with antibody-coupled Dynabeads
5 ml harvested culture media from HT29 cultures was defrosted at room temperature.
2 ml media was transferred to two eppendorfs and centrifuged at 10,000 x g at 4°C for
10 min, and then 30,000 x g at 4°C for 30 min. Supernatants were filtered through 100
µl filters and then separated into two eppendorfs. 100 µl CD133 antibody-coupled
Dynabeads and 100 µl CD326 (EpCAM) antibody-coupled Dynabeads were added to 1
ml filtered media. 200 µl ‘Control’ unstained uncoupled Dynabeads were added to 1 ml
filtered media. Harvested media and Dynabeads solutions were mixed by pipetting and
incubated at 4°C on a roller for 20 min. Each eppendorf was placed on a magnet to
isolate Dynabeads. Supernatants were isolated and stored at -80°C. Precipitated
Dynabeads were washed twice with 1 ml PBS and exosomes bound to Dynabeads were
eluted in 100 µl PBS and stored at -80°C.
2.12.8 Extraction of total RNA from exosomes isolated from harvested media and
plasma
Exosomes previously isolated by ultracentrifugation were defrosted at room
temperature and 100 µl was transferred to an eppendorf. 10 μl 5 N acetic acid was
added to 100 µl exosomes and vortexed. 375 μl of Tri-reagent solution was added,
96
vortexed and incubated at room temperature for 5 min. Next, 100 µl chloroform was
added, solution was vortexed and incubated at room temperature for 3 min. The
solution was centrifuged at 4000 rpm for 15 min at 4⁰C and then the supernatant
aqueous layer was transferred to a clean 1.5 ml eppendorf, and the volume of the
aqueous layer was measured. 100% ethanol with 1.25 times the volume of aqueous
layer was added and vortexed. Total RNA extraction was completed as previously
described using a mirVana column. RNA was eluted in 50 μl of pre-heated RNAase-free
water. Total RNA concentration was measured and RNA was stored at -20⁰C.
2.12.9 Extraction of RNA from immunoprecipitated exosomes and supernatants
100 µl exosomes immunoprecipitated with antibody-coupled Dynabeads was mixed
with 10 μl 5 N acetic acid. 375 μl Tri-reagent solution was added, vortexed and
incubated at room temperature for 5 min. 100 µl of chloroform was then added,
solution was vortexed and incubated at room temperature for 3 min. Beads were
isolated by magnet and supernatant was removed and centrifuged at 4000 rpm for 15
min at 4⁰C. The aqueous layer was transferred to a clean 1.5 ml eppendorf and the
volume of the aqueous layer was measured. 100% ethanol with 1.25 times the volume
of aqueous layer was added and vortexed.
Total RNA was extracted using the previously described RNA isolation and miRvana
Total RNA extraction methods. RNA was eluted in 50 μl of pre-heated RNAase-free
water. Total RNA concentration was measured and RNA was stored at -20⁰C. 100 μl 5 N
acetic acid was added to 1 ml volume of supernatant plasma in 1.5 ml eppendorf. The
solution was vortexed and transferred into 15 ml conical centrifuge tubes (BD
Bioscience, Bedford, USA).
3750 μl of T9424 TRI Reagent® Soultion (Sigma-Aldrich, USA) was added to the Falcon
tube, vortexed and incubated at room temperature for 5 min. 1 ml chloroform was also
added, vortexed and incubated at room temperature for 3 min. Solution in the Falcon
tube was centrifuged at 4000 rpm for 15 min at 4⁰C. The aqueous phase was transfer
to a clean 15 ml BD Falcon tube. The volume of aqueous phase was measured and 1.25
97
times the volume of 100% ethanol (Hayman Speciality Products, Essex, England) was
added and vortexed. Total RNA was extracted and RNA was eluted and stored as
described above.
2.12.10 Immunoprecipitation of plasma exosomes with GPA33-coupled
antibody
GPA33 is a cell surface A33 antigen, also known as glycoprotein A33. GPA33 is expressed
in normal gastrointestinal epithelium and in 95% of colon cancers. The predicted
mature protein has a 213 amino acid extracellular region, a single transmembrane
domain and a 62 amino acid intracellular tail. Like CD326 (EpCAM), GPA33 can be a
potential cell surface protein marker for CRC-specific exosomes. GPA33 was evaluated
for its potential use in immunoprecipitation of plasma exosomes in patients with CRC.
GPA33 antibody coupling with Dynabeads was achieved using the antibody bead
coupling protocol described above with 5 µl of GPA33 antibody (1 µg/µl). Antibody-
coupled beads were stored in 500 μl SB solution at 4°C. The final concentration of
GPA33-coupled Dynabeads was 1 mg/100 µl.
2.12.11 miRNA expression analysis for exosomal RNA
Exosomal RNAs were quantified by Megaplex cDNA synthesis with reverse
transcription, pre-amplification and RT-PCR in line with methods described earlier.
Exosomal RNA from plasma and harvested media from HT29 cultures were assessed for
the presence of common miRNAs (miR-21, miR-192*, miR-369, miR-589) and SnRNA
RNU6B. Plasma samples from patients with CRC, adenoma and healthy controls were
evaluated for detection of miR-21, miR-135b and SnRNA RNU6B. Megaplex™ RT and
Pre-amplification Primers Pool A was used for the analysis of exosomal miRNAs and final
validation of a single plasma miRNA for the detection of adenoma and carcinoma.
2.12.12 Cell sorting for stem cell-related miRNAs.
The freshly collected and transported cancer and adjacent normal tissues were put into
5 ml media 199 and cut into pieces with sterile scissors until the suspension could easily

98
be pipetted through a 10 ml pipette. After mincing was complete, the volume of media
199 was made up to 10 ml and the required amount of collagenase type IV
(Worthington Chemicals) added to obtain a working concentration of 2000 U/ml.
The tissue suspension was incubated in a 37°C agitator for 60-90 min (the incubation
time needs to be optimised for each tissue type), pipetting cells every 15 min. Following
collagenase digestion, the cell suspension was filtered through a 100 µm filter to discard
any large lumps of undigested tissues. The cell suspension was then centrifuged at 350
x g for 5 min, supernatant removed and cells washed with HBSS for 5 min.
The cell suspension was filtered again through a 100 µm filter and washed twice with
HBSS. After the final wash, the cell suspension was filtered through a 40 µm filter. The
filtrate constituted a suspension of single cells. The following protocol is appropriate for
single or multiple staining using CD133 and ESA. The single cell suspension was washed
with 500 µl Aldeflour assay buffer and centrifuged at 1300 rpm (2017 x g) for 3 min. The
supernatant was discarded and the pellet resuspended in 100 µl Aldeflour assay buffer.
Following this, dual staining was carried out by addition of CD133 and CD326
fluorescence conjugated antibodies at a dilution of 1:10 in the 100 µl cell suspension.
The cells were incubated with the antibodies for 30 min at 4°C in dark. After incubation,
cells were washed and re-suspended in 500 µl of Aldeflour assay buffer and the
resulting cell suspension was analysed via flow cytometry as described above.
2.13 Statistical Analysis:
2.13.1 Analysis of expression profiling to identify target miRNAs
I. Raw data from 7900HT Fast Real Time PCR system was exported into Microsoft
Office Excel files. PCR based quantification values (CT) were plotted using
Applied Biosystems software. Only well-expressed miRNAs (CT <35) were
considered for further analysis. MicroRNA expression levels (CT) in array were
normalised to expression levels of endogenous controls (MammU6, snRNA
RNU6B, geNorm, global mean of expression profiling or most stable miRNA in
expression profiling) and relative expression levels (ΔCT) were calculated.

99
Normalisation calculations were carried out in Microsoft Office Excel (Microsoft
Software Corporation, Washington, USA). All fold changes were calculated as
power to base 2.
II. Comparative expression levels (ΔΔCT) for different groups were compared to
identify target miRNAs for:
a) Plasma samples of CRC, polyps and healthy controls with normal
colonoscopy
b) FFPE tissue miRNAs for high risk and low risk Dukes’ B CRC
c) Plasma miRNA expression profiles were compared to tissue
miRNA expression profiles to validate the source of plasma
miRNAs identified in the discovery panel
III. Principal component analysis (PCA), hierarchy cluster analysis (HCA),
Significance analysis for microarrays (SAM), Bioinformatics analysis and Z-Score
calculations were performed for MammU6 normalized data for individual
sample and for the average expression of each miRNA in different groups.
IV. Intergroup comparisons were also performed on profiling data using the Mann
Whitney-U-test, one-way analysis of variance (ANOVA) with Bonferroni
corrections and the Student’s t-test.
2.13.2 Validation of diagnostic plasma miRNAs
I. Receiver Operating Characteristic (ROC) analysis was applied to generate ROC
curves for expression of target miRNAs. Log rank analyses were performed to
compare the ROC curves.
II. Area under the curve (AUC) was used to evaluate the sensitivity and specificity
of studied target miRNAs for their use in detection of CRCs, adenomas and
controls.
III. Logistic regression analyses were performed on each panel of miRNAs to
calculate the probability value for disease status. These probability values were
further used to generate ROC curve for diagnostic panel.

100
2.13.3 Analysis of tissue miRNAs for high risk Dukes’ B cancer
I. For tissue miRNAs regression analysis were used to study for their association
with patient age, gender, tumour size, tumour location, differentiation grade or
dysplasia and Dukes’ stage, as demonstrated by preoperative imaging and the
histopathology diagnosis.
II. Comparative expression levels (ΔΔCT) for tumour to normal adjacent tissue were
calculated and intergroup comparisons were performed using the Mann-
Whitney-U-test, student’s-test, One way analysis of variance (ANOVA) with
Bonferroni test, and Wilcoxon signed-rank test. Fischer’s exact test was carried
out to identify significant frequency of mutations.
2.13.4 Software used for analysis
Statistical analysis were carried out with Microsoft Office Excel v.2010 & 2013
(Microsoft, Redmond, USA) Multi Experiment Viewer v4.4 (BioITeam, Texas, USA), SPSS
18.0 (IBM, Newyork, USA), Graphpad Pprism 5 (Graphpad Software Inc, San Diego, USA)
softwares. P<0.05 was considered significant. Expression graphs were created in
Graphpad Prism 5 (Graphpad Software Inc, San Diego, California).

101
Chapter 3: Results
Analysis of plasma miRNAs for the
detection of adenomas and carcinomas
102
3 Results
3.1 Summary of results
The current strategy for bowel cancer screening is based on the utility of FOBT.
Inaccuracy associated with FOBT has led to many misdiagnoses and unnecessary
invasive investigations. Recent studies have shown that tumour-derived miRNAs are
present in the blood at levels sufficient for their use as measurable biomarkers of
different tumours. The aim of this study was to identify which circulating miRNAs could
be used for the early detection of colorectal neoplasia. The objective was to develop
and compare miRNA expression profiles of RNA isolated from the plasma of participants
with colorectal adenomas and carcinomas with participants without any significant
colonic pathology on colonoscopic examination. The other objective was to apply
discriminatory miRNAs identified from expression profiling in a larger cohort to assess
their diagnostic accuracy for the detection of adenomas and carcinomas. miRNA
expression profiling was performed on 32 participants (controls=11, adenomas=9,
carcinomas=12) using Taqman® MicroRNA Array, Megaplex™ RT and pre-amplification
primers Human Pool A v.2.1 and Pool B v.2.0. MammU6 normalized profiling data was
analysed by Z-scores, principal component analysis, hierarchy cluster analysis,
bioinformatics and student’s t-test. A panel of 29 discriminatory miRNAs identified
from profiling data (miR-16, miR-23b, miR-34a, miR-92a, miR-95, miR-135b, miR-181c,
miR-181c*, miR-182, miR-182*, miR-191, miR-192*, miR-195, miR-200a*, miR-203,
miR-205, miR-369-5p, miR-410, miR-431, miR-486-3P, miR-486-5p miR-487b, miR-502-
5p, miR-532-5p, miR-564, miR-566, miR-589, miR-592 & miR-624*) was validated on an
initial cohort of 94 symptomatic participants (controls=32, adenoma=28,
carcinoma=34). Receiver operating characteristics (ROC) and logistic regression analysis
were performed to assess the diagnostic accuracy of individual miRNAs and different
groups/panels of miRNAs. A panel of 18 miRNAs (miR-135b, miR-34a, miR-431, miR-16,
miR-369-5p, miR-23b, miR-191, miR-21, miR-589, miR-487b, miR-95, miR-484, miR-195,
miR-181C*, miR-410, miR-532-5p, miR-192*, miR-203) was associated with an area
under the curve (AUC) value of 0.92 (95% CI: 0.85-1.00), with 92% sensitivity and 88%
specificity for the detection of adenomas and carcinomas. A panel of 3 miRNAs (miR-
135b, miR-431 and miR-34a) had AUC value of 0.92 (95% CI: 0.84 - 0.99) with 91%

103
sensitivity and 88% specificity. The individual values of AUCs for the detection of both
adenomas and carcinomas for miR-135b, miR-431 and miR-34a were 0.77, 0.78 and
0.79, respectively. Based on the highest diagnostic accuracy and ease of detection miR-
135b was selected and further validated on an independent final cohort of participants
(asymptomatic controls=25, adenomas =30, carcinoma=41). When validated in an
independent final cohort, miR-135b was associated with an AUC value of 0.82 (95% CI:
0.71-0.92), with 80% sensitivity and 84% specificity for the detection of adenomas and
carcinomas. This study has thus succeeded in identifying plasma miRNAs for the early
detection of CRC.

104
3.2 Concentrating RNA samples
Since RNA extraction using the miRvanaTM RNA isolation kit yielded low concentrations
of RNA, further investigations were conducted to increase the yield of total RNA from
samples.
3.2.1 RNA Clean & Concentrator™-100 and SpeedVac® concentrator
The concentration of total RNA extracted with miRvanaTM from freshly frozen CRC tissue
of 4 patients was 10 ng/µl. A comparison between the RNA Clean & Concentrator™-100
and the SpeedVac® concentrator was conducted to concentrate the final amount of
total RNA per sample. 50 µl total RNA was used for each concentration experiment. The
average concentration of RNA in four samples was increased to 25 ng/µl using the RNA
Clean & Concentrator™-100, and to 45 ng/µl with the SpeedVac® concentrator (Figure
1Figure 155).
The comparative analysis for SnRNA RNU6B expression showed 4-fold increase in
expression of RNA concentrated with the RNA Clean & Concentrator™-100, and 8-fold
increase with the SpeedVac® concentrator. miR-21 expression analysis showed a 2-fold
reduction in expression levels of RNA concentrated with RNA Clean & Concentrator™-
100 and a 16-fold reduction with the SpeedVac® concentrator.
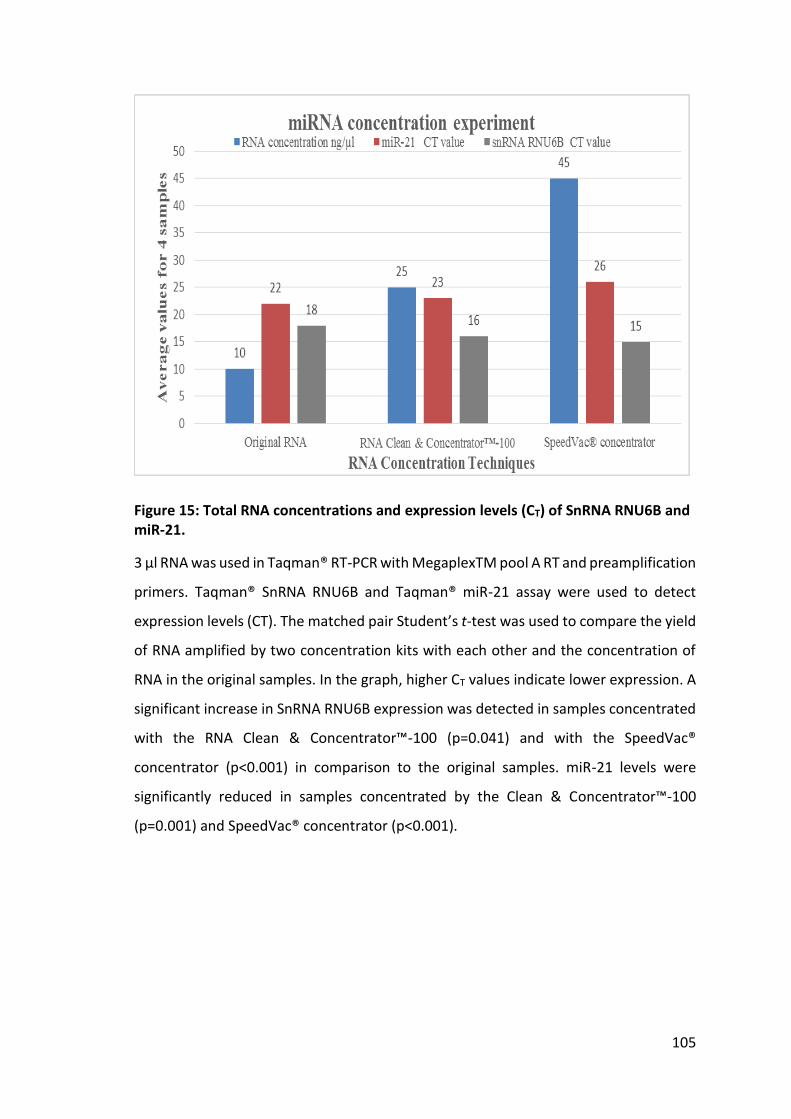
105
Figure 15: Total RNA concentrations and expression levels (CT) of SnRNA RNU6B and miR-21.
3 µl RNA was used in Taqman® RT-PCR with MegaplexTM pool A RT and preamplification
primers. Taqman® SnRNA RNU6B and Taqman® miR-21 assay were used to detect
expression levels (CT). The matched pair Student’s t-test was used to compare the yield
of RNA amplified by two concentration kits with each other and the concentration of
RNA in the original samples. In the graph, higher CT values indicate lower expression. A
significant increase in SnRNA RNU6B expression was detected in samples concentrated
with the RNA Clean & Concentrator™-100 (p=0.041) and with the SpeedVac®
concentrator (p<0.001) in comparison to the original samples. miR-21 levels were
significantly reduced in samples concentrated by the Clean & Concentrator™-100
(p=0.001) and SpeedVac® concentrator (p<0.001).

106
3.2.2 Different elution volumes of total RNA extracted with miRvanaTM RNA
isolation kit
Total RNA concentrations and expression levels of SnRNA RNU6B and miR-21 were
eluted in different volumes following extraction with the miRvanaTM RNA isolation kit.
3 µl RNA was used for Taqman® RT-PCR, as described above. Increases in the
concentration of total RNA were seen with reductions of elution volumes, which ranged
from 50 µl to 12.5 µls (Figure 16)
Figure 16: Concentrations of RNA extracted with miRvanaTM RNA isolation kit.
RNA concentrations of samples extracted from 1 ml of plasma were 3.52, 8.28 and
10.34 ng/μl in elution volumes of 50, 25 and 12.5 µl, respectively. 13.17 ng/µl RNA in
25µl of elution volume was extracted from 2 ml plasma using one filter cartridge.

107
Expression levels of SnRNA RNU6B increased with a reduction in elution volume, but
miR-21 expression levels reduced with a reduction in elution volume. This indicated that
miRNAs were lost when a smaller volume of eluent was used to elute RNA from the
glass fibre filter cartridge. The concentration of both miRNAs increased by 2-fold when
extracted from 2 ml plasma in comparison to 1 ml plasma with a reduced elution volume
of 25 µl (Figure 17) However, this required large volumes of filtrate – as much as 7 ml –
to be applied to the filtrate cartridge. Therefore, for this study, RNA extracted from 1
ml plasma was eluted in 50 µl water.
Figure 17: CT values of SnRNA RNU6B and miR-21 in different elution volumes of RNA extracted with miRvanaTM RNA isolation kit.
3µl RNA was used in Taqman® RT-PCR with MegaplexTM pool A RT and preamplification
primers. Taqman® SnRNA RNU6B and the Taqman® miR-21 assay were used to detect
expression levels. Higher CT values indicate lower expression. An increase in expression
levels of SnRNA RNU6B was seen with a concomitant reduction in elution volume.
Conversely, decreased expression levels of miR-21 were seen with an increase in elution
volume. Unlike RNA extracted from 1 ml plasma, which was eluted in 12.5, 25 or 50 µl,
an increase in expression of both SnRNA RNU6B and miR-21 was detected in RNA
extracted from 2 ml plasma used when eluted in 25 µl.

108
3.3 Discovery phase: expression profiling of plasma miRNAs to identify
discriminatory miRNAs for the detection of adenomas and carcinomas
3.3.1 Total RNA concentrations for use in the miRNA array
1 ml plasma taken from 32 participants (n = 11 controls, n = 9 adenoma, n = 12
carcinoma) was used for RNA extraction for the Taqman® MicroRNA expression
profiling experiment. The median concentrations of RNA extracted from control,
adenoma and carcinoma samples were 6.35, 4.5 and 6.65 ng/µl, respectively. Analysis
of RNA by spectrophotometry reported median values of the 260/280 ratio of 1.46, 1.41
and 1.48 for control, adenoma and carcinoma groups, respectively (Table 21).

109
Group Sample number RNA concentration (ng/µl) 260/280 value
Control
H333/08 7.2 1.84
H341/08 8.2 1.65
H398/08 6.4 1.24
H400/08 6.3 1.43
H400A/08 4.7 1.61
H515/08 8.5 1.17
H520/08/A 9.2 1.21
H57/09 2.4 1.49
H60/09 2.1 1.28
H174/09 5.9 1.63
H271/09 26.8 1.53
H274/09 13 1.84
Adenoma H339/08 4.4 1.46
H510/08 4.5 2.02
H516/08 11.9 0.91
H518/08 4.8 1.18
H58/09 6 1.49
H169/09 5.4 1.4
H170/09 2.6 1.57
H177/09 3.6 1.41
H180A/09 2.1 1.02
Carcinoma
H333/08 7.2 1.21
H399/08 7.7 1
H513/08 11.3 1.18
H43/09 5.2 1.14
H45/09 4.7 2.23
H56/09 4.2 1.4
H166/09 6.1 1.57
H175/09 5.1 1.23
H176/09 2.9 2.29
H276/09 12.8 1.56
H281/09 24.1 1.66
H287/09 16 1.69
Table 21: Total RNA concentrations measured with Nanodrop ND-1000 Spectrophotometer.
Concentration and 260/280 ratios of RNA extracted from individual samples of control,
adenoma and carcinoma groups. Sample numbers are indicated by H/number; RNA
concentrations are expressed as ng/µl.

110
3.3.2 Expression profiling array for plasma miRNAs
miRNA expression profiling data was analysed using different statistical tests to identify
discriminatory patterns of miRNA expressions in adenoma and carcinoma samples in
comparison with control samples.
3.3.2.1 Hierarchal cluster analysis
MammU6 normalised (∆CT) values were used for clustering and classification of cases
based on miRNA expression levels in the plasma samples of the three groups. Nearest
neighbouring based on miRNA clustering grouped six cases (n = 3 adenoma, n = 3
carcinoma) amongst controls. Similarly, three cases of controls were spread out in the
cluster of adenoma and carcinoma samples. Clustering of cases based on HCA is shown
in Figure 18.
Figure 18: Hierarchical cluster analysis.
Clustering analysis for proximity matrix based on agglomeration schedule and clustering
method of nearest neighbouring with euclidean distance measurement.
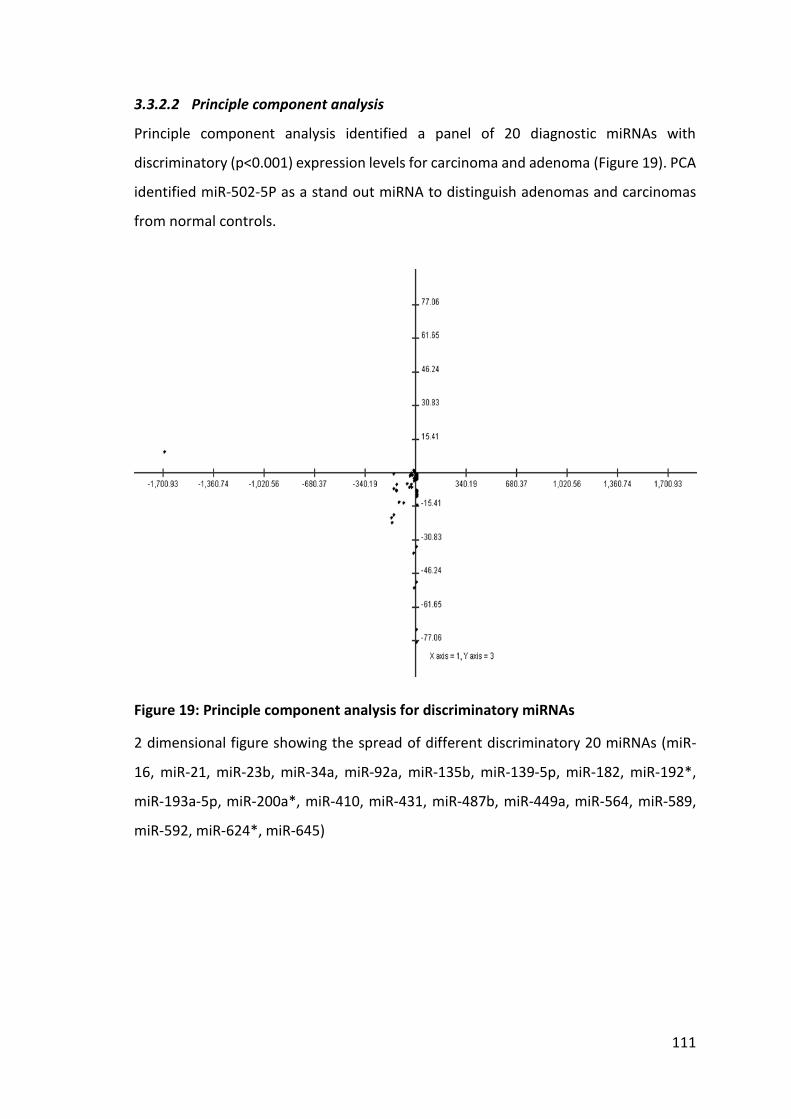
111
3.3.2.2 Principle component analysis
Principle component analysis identified a panel of 20 diagnostic miRNAs with
discriminatory (p<0.001) expression levels for carcinoma and adenoma (Figure 19). PCA
identified miR-502-5P as a stand out miRNA to distinguish adenomas and carcinomas
from normal controls.
Figure 19: Principle component analysis for discriminatory miRNAs
2 dimensional figure showing the spread of different discriminatory 20 miRNAs (miR-
16, miR-21, miR-23b, miR-34a, miR-92a, miR-135b, miR-139-5p, miR-182, miR-192*,
miR-193a-5p, miR-200a*, miR-410, miR-431, miR-487b, miR-449a, miR-564, miR-589,
miR-592, miR-624*, miR-645)
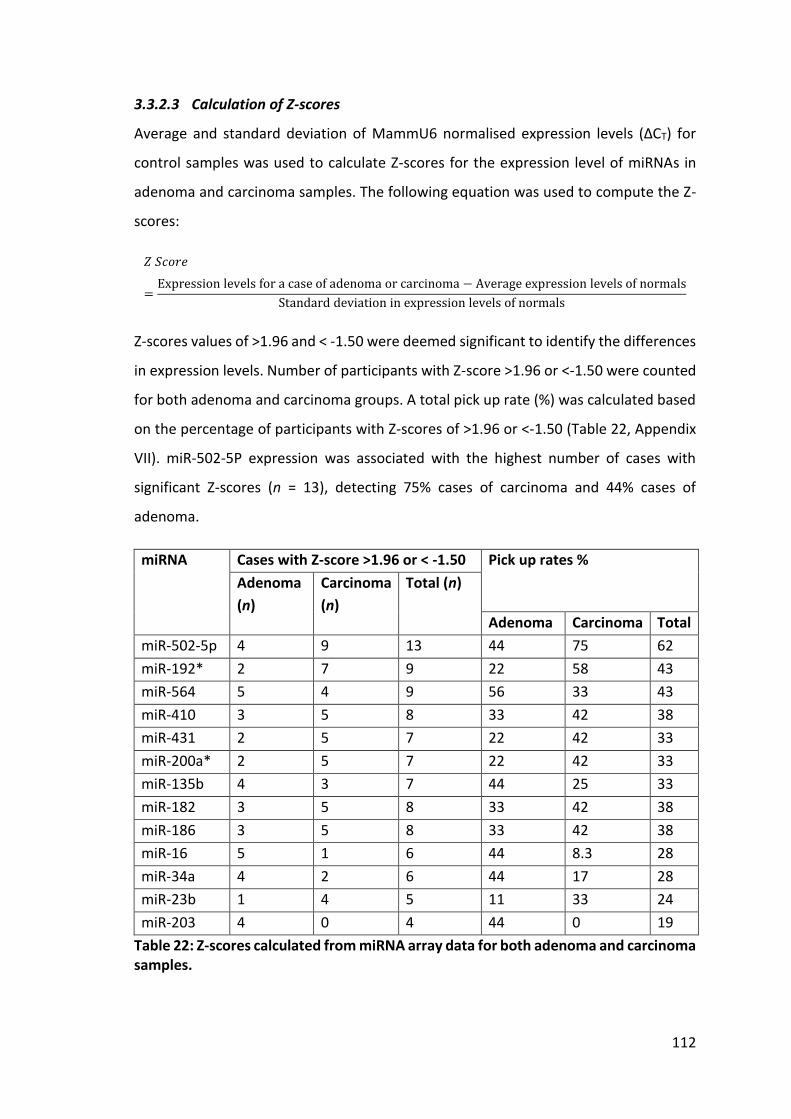
112
3.3.2.3 Calculation of Z-scores
Average and standard deviation of MammU6 normalised expression levels (∆CT) for
control samples was used to calculate Z-scores for the expression level of miRNAs in
adenoma and carcinoma samples. The following equation was used to compute the Z-
scores:
𝑍 𝑆𝑐𝑜𝑟𝑒
=Expression levels for a case of adenoma or carcinoma − Average expression levels of normals
Standard deviation in expression levels of normals
Z-scores values of >1.96 and < -1.50 were deemed significant to identify the differences
in expression levels. Number of participants with Z-score >1.96 or <-1.50 were counted
for both adenoma and carcinoma groups. A total pick up rate (%) was calculated based
on the percentage of participants with Z-scores of >1.96 or <-1.50 (Table 22, Appendix
VII). miR-502-5P expression was associated with the highest number of cases with
significant Z-scores (n = 13), detecting 75% cases of carcinoma and 44% cases of
adenoma.
miRNA Cases with Z-score >1.96 or < -1.50 Pick up rates %
Adenoma
(n)
Carcinoma
(n)
Total (n)
Adenoma Carcinoma Total
miR-502-5p 4 9 13 44 75 62
miR-192* 2 7 9 22 58 43
miR-564 5 4 9 56 33 43
miR-410 3 5 8 33 42 38
miR-431 2 5 7 22 42 33
miR-200a* 2 5 7 22 42 33
miR-135b 4 3 7 44 25 33
miR-182 3 5 8 33 42 38
miR-186 3 5 8 33 42 38
miR-16 5 1 6 44 8.3 28
miR-34a 4 2 6 44 17 28
miR-23b 1 4 5 11 33 24
miR-203 4 0 4 44 0 19
Table 22: Z-scores calculated from miRNA array data for both adenoma and carcinoma samples.

113
A combination of different miRNAs was used to identify complementary miRNAs for the
detection of more cases. For example, a combination of miR-502-5p, miR-192*, miR-
410 and miR-139-5p showed 100% identification rates for adenoma and carcinoma.
Table 23 shows different combinations of complimentary miRNAs and their pick up
rates based on Z-scores.
Complementary miRNA
combinations
Z-score-based detection rates for neoplasia
Adenoma Carcinoma Total
miR-502-5p, miR-192*, miR-410 and
miR-139 5P 100 100 100
miR-502-5p and miR-139 5P 89 83 86
miR-502-5p, miR192* and miR-564 89 83 86
miR-502-5p, miR-192* and miR-410 67 92 81
miR-502-5p, miR-192* and miR-
135b 78 83 81
miR-502-5p- and miR-192* 67 83 76
miR-502-5p, and miR-564 78 67 76
miR-502-5p and miR-410 56 83 71
miR-502-5p, and miR-135b 56 67 62
Table 23: Complimentary miRNAs and their detection rates for neoplasia.
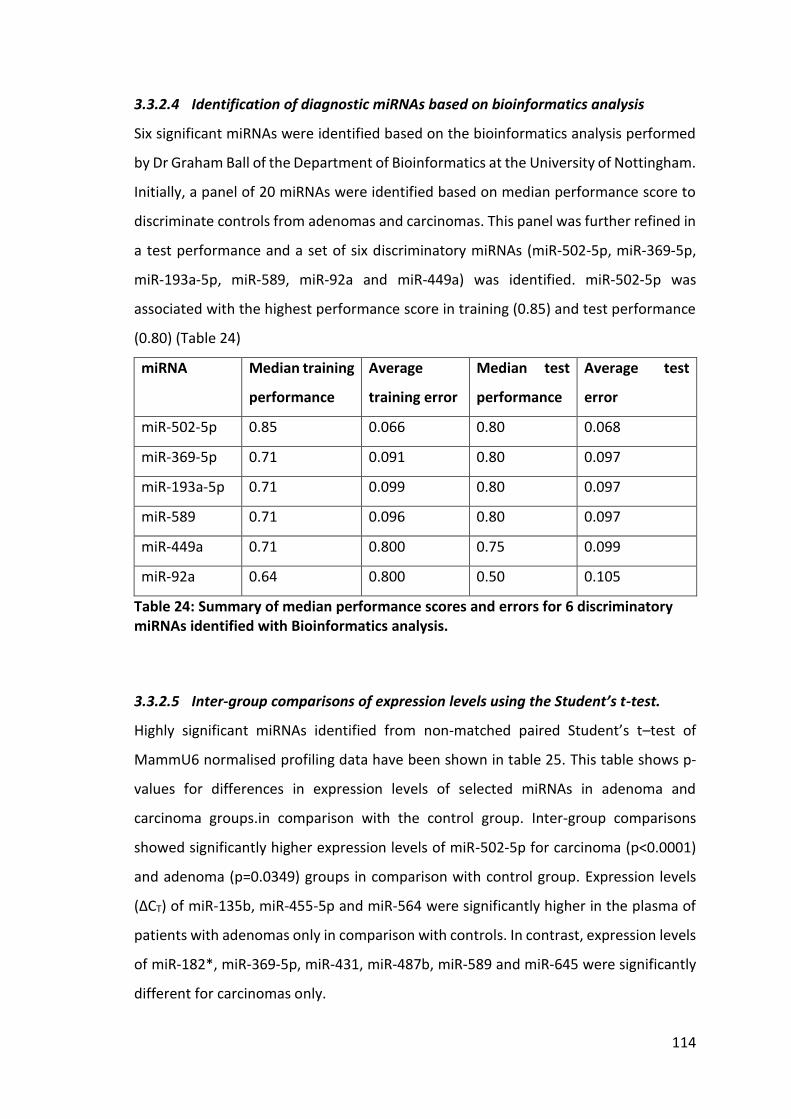
114
3.3.2.4 Identification of diagnostic miRNAs based on bioinformatics analysis
Six significant miRNAs were identified based on the bioinformatics analysis performed
by Dr Graham Ball of the Department of Bioinformatics at the University of Nottingham.
Initially, a panel of 20 miRNAs were identified based on median performance score to
discriminate controls from adenomas and carcinomas. This panel was further refined in
a test performance and a set of six discriminatory miRNAs (miR-502-5p, miR-369-5p,
miR-193a-5p, miR-589, miR-92a and miR-449a) was identified. miR-502-5p was
associated with the highest performance score in training (0.85) and test performance
(0.80) (Table 24)
miRNA Median training
performance
Average
training error
Median test
performance
Average test
error
miR-502-5p 0.85 0.066 0.80 0.068
miR-369-5p 0.71 0.091 0.80 0.097
miR-193a-5p 0.71 0.099 0.80 0.097
miR-589 0.71 0.096 0.80 0.097
miR-449a 0.71 0.800 0.75 0.099
miR-92a 0.64 0.800 0.50 0.105
Table 24: Summary of median performance scores and errors for 6 discriminatory miRNAs identified with Bioinformatics analysis.
3.3.2.5 Inter-group comparisons of expression levels using the Student’s t-test.
Highly significant miRNAs identified from non-matched paired Student’s t–test of
MammU6 normalised profiling data have been shown in table 25. This table shows p-
values for differences in expression levels of selected miRNAs in adenoma and
carcinoma groups.in comparison with the control group. Inter-group comparisons
showed significantly higher expression levels of miR-502-5p for carcinoma (p<0.0001)
and adenoma (p=0.0349) groups in comparison with control group. Expression levels
(∆CT) of miR-135b, miR-455-5p and miR-564 were significantly higher in the plasma of
patients with adenomas only in comparison with controls. In contrast, expression levels
of miR-182*, miR-369-5p, miR-431, miR-487b, miR-589 and miR-645 were significantly
different for carcinomas only.

115
Table 25: P-values for inter-group differences in expression levels of selected miRNA for adenoma or carcinoma groups in comparison to the control group.
3.3.2.6 ROC analysis for selected example miRNAs
ROC analysis for miR-135b, miR-192*, miR-502-5P and miR-645 were applied to assess
their diagnostic accuracy for adenomas, carcinomas and a combined group of both
adenomas and carcinomas. For the detection of both adenoma and carcinoma, the area
under the curve (AUC) values were 0.73, 0.60, 0.87 and 0.71 for miR-135b, miR-192*,
miR-502-5P and miR-645, respectively. For adenoma only, AUC values were 0.83, 0.58,
0.78 and 0.82 for miR-135b, miR-192*, miR-502-5p and miR-645, respectively. For
carcinoma only, AUCs were 0.65, 0.61, 0.93 and 0.64 for miR-135b, miR-192*, miR-502-
5p and miR-645, respectively. Relative expression levels of miR-135b, miR-192*, miR-
502-5p and miR-645 for the different groups are shown in Figures 20 to 23, respectively.
Figures also show ROC curves illustrating the diagnostic accuracy of each miRNA for
adenomas, carcinomas and a combined group of adenomas and carcinomas.
miRNA Non matched paired Student’s t-test (p-values)
Adenoma Carcinoma Adenoma + Carcinoma
miR-502-5P 0.0349 <0.0001 0.0006
miR-589 0.6292 0.0017 0.0360
miR-564 0.0064 0.2837 0.0510
miR-135b 0.0489 0.1476 0.0563
miR-455-5p 0.0149 0.3029 0.0819
miR-431 0.4670 0.0378 0.0880
miR-369-5p 0.8684 0.0091 0.1006
miR-645 0.5419 0.0077 0.1304
miR-487b 0.4299 0.0719 0.1378
miR-182* 0.5305 0.0489 0.8811

116
N o rm a l A d e n o m a C a rc in o m a A d e n o m a + C a rc in o m a
0
2 0
4 0
6 0
m iR -1 3 5 b
Ra
nk
s
0 5 0 1 0 0
0
5 0
1 0 0
m iR -1 3 5 b N o rm a l v s A d e n o m a + C a rc in o m a
1 0 0 % - S p e c if ic ity %
Se
ns
itiv
ity
%
0 5 0 1 0 0
0
5 0
1 0 0
m iR -1 3 5 b N o rm a l v s A d e n o m a
1 0 0 % - S p e c if ic ity %
Se
ns
itiv
ity
%
0 5 0 1 0 0
0
5 0
1 0 0
m iR -1 3 5 b N o rm a l v s C a rc in o m a
1 0 0 % - S p e c if ic ity %
Se
ns
itiv
ity
%
a
c
b
d
Figure 20: ∆CT-based expression analysis of plasma miR-135b detected in expression profiling.
MammU6 normalised expression levels (∆CT) of miR-135b were compared (Mann-
Whitney-U-Test) and displayed in box plots. The diagnostic accuracy for the detection
of adenomas, carcinomas and the combined group of adenomas and carcinomas was
evaluated by ROC analysis. (a) Significantly higher expression levels were detected for
the combined group of patients with adenomas and carcinomas in comparison to
controls (median difference = 2.53, 95%CI: 0.08 – 5.3, p=0.038). (b) ROC analysis for the
detection of both adenoma and carcinoma show an AUC value of 0.73 (95% CI: 0.54 -
0.92) with 62% sensitivity and 80% specificity at a likelihood ratio of 3.01. (c) ROC
analysis for the detection of adenomas shows an AUC value of 0.83 (95% CI: 0.64 – 1.01).
(d) ROC analysis for the detection of carcinomas shows an AUC value of 0.65 (95% CI:
0.42 - 0.89).

117
N o rm a l A d e n o m a C a rc in o m a A d e n o m a + C a rc in o m a
0
2 0
4 0
6 0
m iR -1 9 2 *
Ra
nk
s
0 5 0 1 0 0
0
5 0
1 0 0
m iR -1 9 2 * N o rm a l v s A d e n o m a + C a rc in o m a
1 0 0 % - S p e c if ic ity %
Se
ns
itiv
ity
%
0 5 0 1 0 0
0
5 0
1 0 0
m iR -1 9 2 * N o rm a l v s A d e n o m a
1 0 0 % - S p e c if ic ity %
Se
ns
itiv
ity
%
0 5 0 1 0 0
0
5 0
1 0 0
m iR -1 9 2 * N o rm a l v s C a rc in o m a
1 0 0 % - S p e c if ic ity %
Se
ns
itiv
ity
%
a
c
b
d
Figure 21: ∆CT-based expression analysis of plasma miR-192* detected in expression profiling.
MammU6 normalised expression levels (∆CT) of miR-192* were compared (Mann-
Whitney-U-Test) and plotted in scatter graphs. (a) Box plot shows higher expression
levels were detected for a combined group of patients with adenomas and carcinomas
(median difference = 1.87, 95% CI: 0.99 – 4.49, p=0.36) in comparison to controls. (b)
ROC curve for the detection of both adenoma and carcinoma shows an AUC value of
0.60 (95% CI: 0.40 - 0.80) with 52% sensitivity and 80% specificity at a likelihood ratio of
2.61. (c) ROC curve for the detection of adenomas shows an AUC value of 0.58 (95% CI:
0.31 – 0.86). (d) ROC curve for the detection of carcinomas shows an AUC value of 0.61
(95% CI: 0.35 – 0.88).

118
N o rm a l A d e n o m a C a rc in o m a A d e n o m a + C a rc in o m a
0
2 0
4 0
6 0
m iR -5 0 2 -5 P
Ra
nk
s
0 5 0 1 0 0
0
5 0
1 0 0
m iR -5 0 2 -5 P N o rm a l v s A d e n o m a + C a rc in o m a
1 0 0 % - S p e c if ic ity %
Se
ns
itiv
ity
%
0 5 0 1 0 0
0
5 0
1 0 0
m iR -5 0 2 -5 P N o rm a l v s A d e n o m a
1 0 0 % - S p e c if ic ity %
Se
ns
itiv
ity
%
0 5 0 1 0 0
0
5 0
1 0 0
m iR -5 0 2 -5 P N o rm a l v s C a rc in o m a
1 0 0 % - S p e c if ic ity %
Se
ns
itiv
ity
%
a b
c d
Figure 22: ∆CT based expression analysis of plasma miR-502-5p detected in expression profiling.
MammU6 normalised expression levels (∆CT) of miR-502-5p were compared (Mann-
Whitney-U-Test) and plotted in scatter graphs. (a) Significantly higher expression levels
were detected for a combined group of patients with adenomas and carcinomas
(median difference = 3.79, 95% CI: 2.02 – 5.38, p=0.0005, ANOVA with Bonferroni
correction) in comparison to controls. (b) ROC curve for the detection of both adenoma
and carcinoma shows an AUC value of 0.87 (95% CI: 0.74 - 0.99) with 86% sensitivity
and 80% specificity at a likelihood ratio of 4.28. (c) ROC curve for the detection of
adenomas shows an AUC value of 0.78 (95% CI: 0.55 – 1.02). (d) ROC curve for the
detection of carcinomas shows an AUC value of 0.93 (95% CI: 0.82 – 1.04).

119
N o rm a l A d e n o m a C a rc in o m a A d e n o m a + C a rc in o m a
0
2 0
4 0
6 0
m iR -5 6 4
Ra
nk
s
0 5 0 1 0 0
0
5 0
1 0 0
m iR -5 6 4 N o rm a l v s A d e n o m a + C a rc in o m a
1 0 0 % - S p e c if ic ity %
Se
ns
itiv
ity
%
0 5 0 1 0 0
0
5 0
1 0 0
m iR -5 6 4 N o rm a l v s A d e n o m a
1 0 0 % - S p e c if ic ity %
Se
ns
itiv
ity
%
0 5 0 1 0 0
0
5 0
1 0 0
m iR -5 6 4 N o rm a l v s C a rc in o m a
1 0 0 % - S p e c if ic ity %
Se
ns
itiv
ity
%
a
c
b
d
Figure 23: ∆CT-based expression analysis of plasma miR-564 detected in expression profiling.
MammU6 normalised expression levels (∆CT) of miR-564 were compared (Mann-
Whitney-U-Test) and plotted in scatter graphs. (a) Significantly higher expression levels
were detected for a combined group of patients with adenomas and carcinomas
(median difference = 2.30, 95% CI: 0.05 – 4.00, p=0.05) in comparison to controls. (b)
ROC curve for the detection of both adenomas and carcinomas shows an AUC value of
0.71 (95% CI: 0.54 - 0.90) with 52% sensitivity and 80% specificity at a likelihood ratio of
2.61. (c) ROC curve for the detection of adenomas shows an AUC value of 0.82 (95% CI:
0.63 – 1.01). (d) ROC curve for the detection of carcinomas shows an AUC value of 0.64
(95% CI: 0.40 – 0.88).

120
3.3.2.7 Upregulation of passenger strand miRNA* in plasma and tissue
Expression profiling on 32 plasma samples and pooled cDNA from cancerous and
adjacent normal tissue from five patients with CRC was compared to assess the
presence of diagnostic miRNAs in circulation. One novel finding was the upregulation of
passenger strand miRNA* in the cancer tissue in comparison to their counterpart
mature strand miRNA. The comparison of MammU6 normalised miRNA* and miRNA
expressions (∆∆CT) for cancer tissue and the corresponding plasma levels showed
significantly ∆∆CT values for miR-624* and miR-182* in cancer tissue and plasma
samples from CRC patients. No such change in expression levels was noted for adenoma
samples in comparison with control samples. Figure 24 shows the ∆∆CT values for
passenger strand miRNA* in comparison to their counterpart mature miRNA in CRC
tissue and matching plasma samples
Figure 24: Expression levels of miRNA and their matched miRNA* in plasma and tumours
Figure shows upregulation of miRNA* in comparison to their counterpart miRNAs in
tissue and plasma samples taken from patients with cancer.
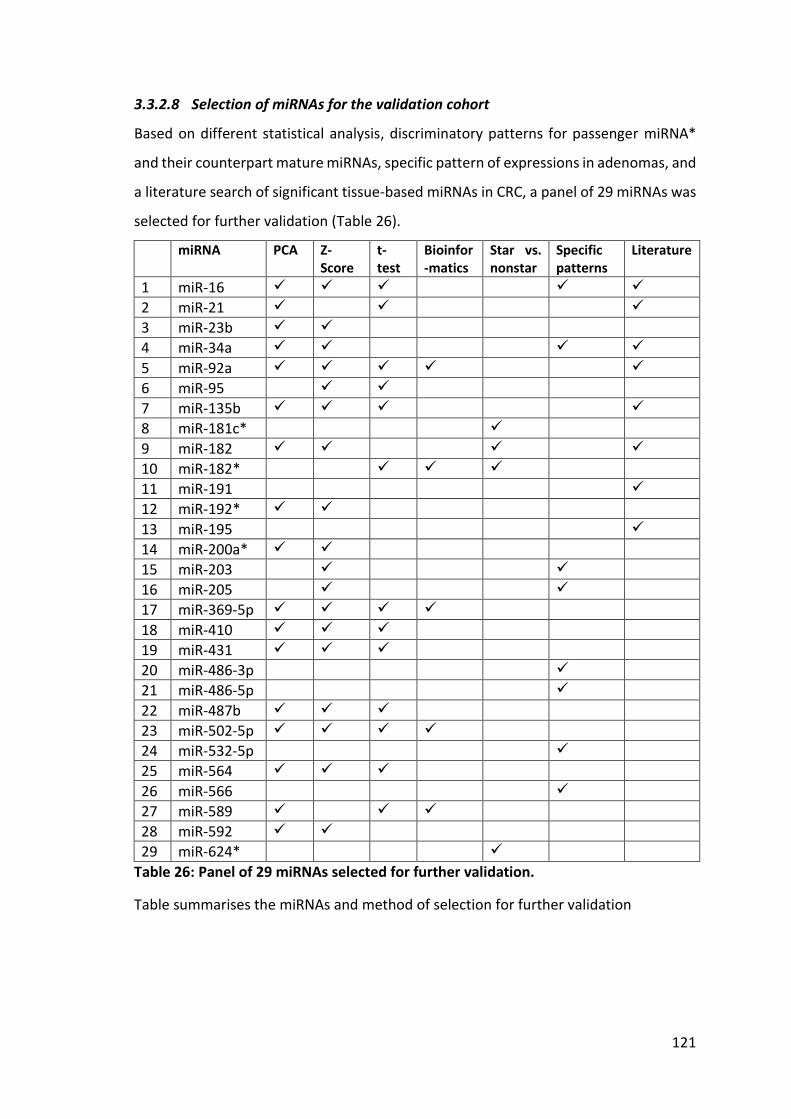
121
3.3.2.8 Selection of miRNAs for the validation cohort
Based on different statistical analysis, discriminatory patterns for passenger miRNA*
and their counterpart mature miRNAs, specific pattern of expressions in adenomas, and
a literature search of significant tissue-based miRNAs in CRC, a panel of 29 miRNAs was
selected for further validation (Table 26).
miRNA PCA Z-Score
t-test
Bioinfor-matics
Star vs. nonstar
Specific patterns
Literature
1 miR-16
2 miR-21
3 miR-23b
4 miR-34a
5 miR-92a
6 miR-95
7 miR-135b
8 miR-181c*
9 miR-182
10 miR-182*
11 miR-191
12 miR-192*
13 miR-195
14 miR-200a*
15 miR-203
16 miR-205
17 miR-369-5p
18 miR-410
19 miR-431
20 miR-486-3p
21 miR-486-5p
22 miR-487b
23 miR-502-5p
24 miR-532-5p
25 miR-564
26 miR-566
27 miR-589
28 miR-592
29 miR-624*
Table 26: Panel of 29 miRNAs selected for further validation.
Table summarises the miRNAs and method of selection for further validation
122
3.3.3 Validation of Novel Circulating miRNAs for CRC Detection: Initial Validation
Phase
A panel of 29 miRNAs was applied to a cohort of 94 participants (n = 32 controls, n = 28
adenoma, n = 34 carcinoma). All participants in the control group had no adenoma or
carcinoma at the time of blood sample collection. However, for the purpose of analysis,
participants with significant benign bowel disease (n = 9) and a history of neoplastic
disease (adenoma/carcinoma excised, n = 8) were excluded from the analysis. Appendix
X shows the total RNA concentrations for all the participants in the initial validation
cohort. Appendix XI - XIII show CT and ∆CT based analysis for validation cohort. Analysis
were also performed for miR-191 based normalized expressions and data is shown in
appendix XIV.
3.3.3.1 ROC analysis for the validation cohort
SnRNA RNU6B normalized expression levels (∆CT) of miRNAs were used to assess AUC
for the detection of adenomas, carcinomas and combined group of adenomas and
carcinomas. Tables 27 to 29 show AUC for different miRNAs for the detection of the
combined group of adenomas and carcinomas
Based on higher values of AUC and p-values, ROC curves for miR-135b, miR-34a and
miR-431 were selected for graphic presentation. Expressions levels for sub-categories
of controls (significant past history of neoplasia and significant benign bowel disease)
and participants with adenoma and carcinoma were compared by ANOVA with
Bonferroni corrections.

123
miRNAs
AUC
Standard Error p-value
95% CI for AUC - combined group
Lower bound Higher bound
miR-135b 0.793 0.054 <0.001 0.686 0.899
miR-34a 0.820 0.058 <0.001 0.706 0.935
miR-431 0.809 0.051 <0.001 0.710 0.908
miR-16 0.757 0.071 0.001 0.619 0.896
miR-369-5P 0.743 0.064 0.002 0.618 0.868
miR-23b 0.741 0.064 0.003 0.616 0.866
miR-191 0.731 0.064 0.004 0.606 0.855
miR-21 0.725 0.065 0.005 0.599 0.852
miR-589 0.722 0.064 0.006 0.596 0.848
miR-487b 0.719 0.065 0.006 0.592 0.847
miR-95 0.713 0.069 0.008 0.579 0.847
miR-484 0.707 0.068 0.010 0.574 0.840
miR-195 0.704 0.075 0.011 0.557 0.851
miR-181C* 0.698 0.065 0.014 0.571 0.825
miR-410 0.691 0.069 0.017 0.556 0.827
miR-532-5P 0.675 0.070 0.029 0.537 0.813
miR-192* 0.674 0.064 0.030 0.548 0.799
miR-203 0.665 0.074 0.040 0.520 0.809
miR-486-5P 0.646 0.081 0.069 0.487 0.805
miR-566 0.638 0.073 0.086 0.495 0.780
miR-502-5P 0.636 0.070 0.091 0.499 0.772
miR-624* 0.613 0.069 0.159 0.477 0.749
miR-205 0.600 0.078 0.215 0.447 0.753
miR-566 0.582 0.078 0.307 0.429 0.736
miR-200a* 0.563 0.068 0.429 0.430 0.696
miR-92a 0.550 0.081 0.533 0.391 0.709
miR-592 0.473 0.072 0.733 0.332 0.613
miR-182* 0.476 0.069 0.763 0.341 0.611
miR-486-3P 0.511 0.090 0.893 0.334 0.688
Table 27: ROC analysis for detection of the combined group of adenoma and
carcinoma.
Table shows AUC values for each miRNA with standard error, and 95% confidence
intervals for AUC. miRNAs are ranked based on statistical significance (p-value).

124
Table 28: ROC analysis for the detection of adenoma. AUC values for each miRNA with standard error and 95% confidence intervals. miRNAs
are ranked by their statistical significance (p-value). miR-135b, miR34a, miR-431, miR-
369-5P, miR-16 and miR-21 were statistically significant (P<0.05).
miRNAs AUC Standard
Error p-value
95% CI for AUC - adenoma group
Lower bound Higher bound
miR-34a 0.771 0.083 0.006 0.608 0.934
miR-135b 0.743 0.085 0.013 0.576 0.910
miR-431 0.721 0.085 0.023 0.555 0.888
miR-369-5P 0.715 0.088 0.028 0.543 0.887
miR-16 0.715 0.089 0.028 0.541 0.889
miR-21 0.697 0.089 0.044 0.522 0.871
miR-195 0.678 0.092 0.068 0.498 0.858
miR-566 0.678 0.092 0.068 0.497 0.859
miR-487b 0.659 0.092 0.103 0.480 0.839
miR-23b 0.656 0.092 0.110 0.475 0.837
miR-502-5P 0.653 0.095 0.117 0.467 0.840
miR-181C* 0.641 0.094 0.149 0.457 0.825
miR-191 0.638 0.093 0.159 0.456 0.820
miR-410 0.638 0.093 0.159 0.456 0.820
miR-589 0.635 0.095 0.168 0.448 0.822
miR-532-5P 0.635 0.094 0.168 0.450 0.819
miR-484 0.632 0.095 0.178 0.445 0.818
miR-486-5P 0.625 0.095 0.199 0.440 0.811
miR-95 0.619 0.095 0.222 0.433 0.805
miR-203 0.607 0.097 0.274 0.417 0.796
miR-192* 0.591 0.097 0.350 0.401 0.781
miR-624* 0.579 0.097 0.419 0.388 0.770
miR-200a* 0.542 0.099 0.669 0.348 0.736
miR-205 0.539 0.098 0.692 0.347 0.731
miR-182* 0.480 0.102 0.837 0.280 0.680
miR-566 0.520 0.098 0.837 0.327 0.713
miR-592 0.489 0.099 0.912 0.296 0.683
miR-486-3P 0.495 0.100 0.962 0.299 0.692
miR-92a 0.502 0.099 0.987 0.307 0.690

125
Table 29: ROC analysis for the detection of carcinomas.
AUC values for each miRNA with standard error and 95% confidence intervals. miRNAs
are ranked by their statistical significance (p-value). miR-135b, miR34a, miR-431, miR-
191 and miR-23b were statistically most significant (p≤0.001).
miRNAs AUC Standard
Error p-value
95% CI for AUC carcinoma group
Lower bound Higher bound
miR-135b 0.812 0.060 <0.001 0.694 0.931
miR-34a 0.843 0.060 <0.001 0.725 0.960
miR-431 0.849 0.051 <0.001 0.749 0.949
miR-191 0.771 0.067 0.001 0.640 0.902
miR-23b 0.777 0.067 0.001 0.647 0.908
miR-16 0.774 0.072 0.001 0.633 0.916
miR-589 0.760 0.068 0.002 0.626 0.894
miR-369-5p 0.750 0.068 0.003 0.617 0.883
miR-95 0.757 0.071 0.003 0.618 0.896
miR-484 0.738 0.072 0.005 0.597 0.878
miR-487b 0.742 0.068 0.005 0.609 0.876
miR-21 0.733 0.070 0.006 0.595 0.870
miR-181C* 0.719 0.072 0.010 0.578 0.860
miR-195 0.709 0.078 0.014 0.555 0.863
miR-410 0.711 0.072 0.014 0.569 0.853
miR-192* 0.707 0.073 0.015 0.565 0.850
miR-203 0.688 0.076 0.027 0.538 0.838
miR-532-5P 0.688 0.076 0.027 0.540 0.837
miR-486-5P 0.649 0.086 0.082 0.481 0.816
miR-205 0.626 0.084 0.139 0.462 0.790
miR-624* 0.622 0.076 0.154 0.473 0.771
miR-502-5P 0.620 0.078 0.160 0.466 0.774
miR-566 0.614 0.079 0.183 0.458 0.769
miR-566 0.612 0.082 0.189 0.451 0.773
miR-200a* 0.568 0.077 0.429 0.416 0.719
miR-92a 0.563 0.086 0.462 0.394 0.731
miR-592 0.459 0.078 0.635 0.306 0.613
miR-182* 0.463 0.079 0.662 0.308 0.618
miR-486-3P 0.512 0.094 0.889 0.327 0.697

126
3.3.3.2 Comparison of expressions in different groups
SNRNA RNU6B normalized expression of each miRNA (miR-135b, miR-431, miR-34a)
was used to calculate the average expression of that miRNA. This average expression
was then used to compare the difference in expression levels between each case and
compared with the control group. Inter-group comparisons by ANOVA with Bonferroni
corrections showed statistically significant differences in expression levels (Table 30)
Comparisons
Mean difference
95% CI p-value
miR-135b
Controls versus past neoplasia 4.349 1.055 to 7.643 0.0037
Controls versus significant benign disease 2.577 -0.4845 to 5.639 0.1479
Controls versus adenoma 2.467 -0.09803 to 5.031 0.0658
Controls versus carcinoma 3.233 0.9722 to 5.494 0.0014
Controls versus adenoma and carcinoma 2.968 0.8364 to 5.100 0.0019
miR-431
Controls versus past neoplasia -2.666 -7.280 to 1.949 0.6693
Controls versus significant benign disease
-3.793 -8.254 to 0.6681 0.1402
Controls versus adenoma -2.603 -6.255 to 1.049 0.3246
Controls versus carcinoma -4.798 -8.051 to -1.545 0.0009
Controls versus adenoma and carcinoma
-4.030 -7.105 to -0.9541 0.0041
miR-34a
Controls versus past neoplasia 4.045 0.6538 to 7.437 0.0044
Controls versus significant benign disease
4.080 0.8015 to 7.359 0.0043
Controls versus adenoma 3.038 0.3539 to 5.722 0.0044
Controls versus carcinoma 3.968 1.577 to 6.359 0.0001
Controls versus adenoma and carcinoma
3.643 1.382 to 5.903 0.0002
Table 30: Inter-group comparison of miR-135b, miR-431 and miR-34a.
Table shows comparison of expression levels normalized to average of expression for
controls, mean differences in expression levels with 95% CI and p-values.

127
Significantly higher expression levels of miR-135b were noted for controls with a past
history of neoplasia, participants with carcinoma and a cumulative group of participants
with adenoma and carcinoma (ANOVA with Bonferroni correction, p<0.0034) (Figure
25).Inter-group comparisons of miR-431 expression levels showed significantly higher
expression in a carcinoma group and a combined group of adenomas and carcinomas.
No statistically significant differences were noted for patients with adenoma, significant
benign disease or a history of neoplasia. There was increase in expression levels for
these groups but the differences did not reach statistical significance (Figure 26).
ANOVA showed a significantly higher level of miR-34a expression in all groups in
comparison with controls (p<0.0008) (Figure 27).
N o rm a l P a s t N e o p la s ia S ig n if ic a n t B e n ig n d is e a s e A d e n o m a C a rc in o m a A d e n o m a + C a rc in o m a
-1 0
-5
0
5
R e la t iv e e x p re s s io n o f c a s e s n o rm a lis e d to a v e ra g e e x p re s s io n o f m iR -1 3 5 b in n o rm a ls
C a s e s
De
lta
CT
va
lue
s
Figure 25: Comparative expression of miR-135b for different groups of controls and
neoplasia.
Significantly higher expression levels were noted for controls with a past history of
neoplasia, participants with carcinoma and a cumulative group of participants with
adenoma and carcinoma (ANOVA with Bonferroni correction, p<0.0034).

128
N o rm a l P a s t N e o p la s ia S ig n if ic a n t B e n ig n d is e a s e A d e n o m a C a rc in o m a A d e n o m a + C a rc in o m a
-1 0
-5
0
5
1 0
R e la t iv e e x p re s s io n o f c a s e s n o rm a lis e d to a v e ra g e e x p re s s io n o f m iR -4 3 1 in n o rm a ls
C a s e s
De
lta
CT
va
lue
s
Figure 26: Comparative expression of miR-431 for different groups of normal and
neoplasia.
Significantly higher expression levels were noted for carcinoma and a cumulative group
of participants with adenoma and carcinoma (ANOVA with Bonferroni correction,
p<0.0059).

129
N o r m a l P a s t N e o p la s ia S ig n if ic a n t B e n ig n d is e a s e Ad e n o m a C a r c in o m a Ad e n o m a + C a r c in o m a
-1 0
-5
0
5
R e la t iv e e x p re s s io n o f c a s e s n o rm a lis e d to a v e ra g e e x p re s s io n o f m iR -3 4 a in n o rm a ls
C a s e s
De
lta
C
T v
alu
es
Figure 27: Comparative expression of miR-34a in different groups of controls and
neoplasia.
Significantly higher expression levels were noted for carcinoma and a cumulative group
of participants with adenoma and carcinoma (ANOVA with Bonferroni correction,
p=0.0008).

130
3.3.3.3 ROC analysis for miR-34a, miR-135b and miR-431
For three selected miRNAs, the ROC analyses and curves are displayed with AUC,
sensitivities, specificities and likelihood ratios in figures 28-30. miR-135b ∆CT values
were compared (Mann Whitney U Test) for different groups and plotted in scatter
graphs. The diagnostic accuracy for the detection of adenoma, carcinoma and
combined group of adenoma and carcinoma was evaluated with ROC analysis.

131
0 5 0 1 0 0
0
5 0
1 0 0
m iR -1 3 5 b N o rm a l v s A d e n o m a + C a rc in o m a
1 0 0 % - S p e c if ic ity %
Se
ns
itiv
ity
%
0 5 0 1 0 0
0
5 0
1 0 0
m iR -1 3 5 b N o rm a l v s A d e n o m a
1 0 0 % - S p e c if ic ity %
Se
ns
itiv
ity
%
0 5 0 1 0 0
0
5 0
1 0 0
m iR -1 3 5 b N o rm a l v s C a rc in o m a
1 0 0 % - S p e c if ic ity %
Se
ns
itiv
ity
%
N o rm a l A d e n o m a + C a rc in o m a
0
2 0
4 0
6 0
8 0
Ra
nk
s
m iR -1 3 5 b N o rm a l v s A d e n o m a + C a rc in o m a
N o rm a l A d e n o m a
0
1 0
2 0
3 0
4 0
m iR -1 3 5 b N o rm a l v s A d e n o m a
Ra
nk
s
N o rm a l C a rc in o m a
0
2 0
4 0
6 0
m iR -1 3 5 b N o rm a l v s C a rc in o m a
Ra
nk
s
a
b d
c e
f
Figure 28: ∆CT-based expression analysis of plasma miR-135b detected in the
validation cohort.
miR-135b ∆CT values were compared (Mann-Whitney-U-Test) for different groups and
plotted in scatter graphs. (a) Significantly higher expression levels were detected for a
combined group of patients with adenomas and carcinomas (median difference = 3.52,
95% CI: 1.28 – 4.97, p=0.0004) in comparison to controls. (b) ROC analysis for the
detection of both adenomas and carcinomas show AUC value of 0.77 (95% CI: 0.66 to
0.88) with 74% sensitivity and 88% specificity (likelihood ratio = 6.33). (c) Significantly
higher expression levels were detected in the adenoma group in comparison to controls
(median difference = 2.77, 95% CI: 0.33 - 4.99, p=0.0275). (d) ROC analysis for the
detection of adenomas shows an AUC value of 0.71 (95% CI: 0.53 - 0.89) with 63%
sensitivity and 88% specificity (likelihood ratio = 5.36). (e) Significantly higher expression
levels were detected in the carcinoma-only group in comparison with controls (median
difference = 3.90, 95% CI: 1.37 - 5.92, p=0.0002). (f) ROC analysis for the detection of
carcinoma shows an AUC value of 0.80 (95% CI: 0.68 - 0.92) with 80% sensitivity and
88% specificity (likelihood ratio = 6.84).
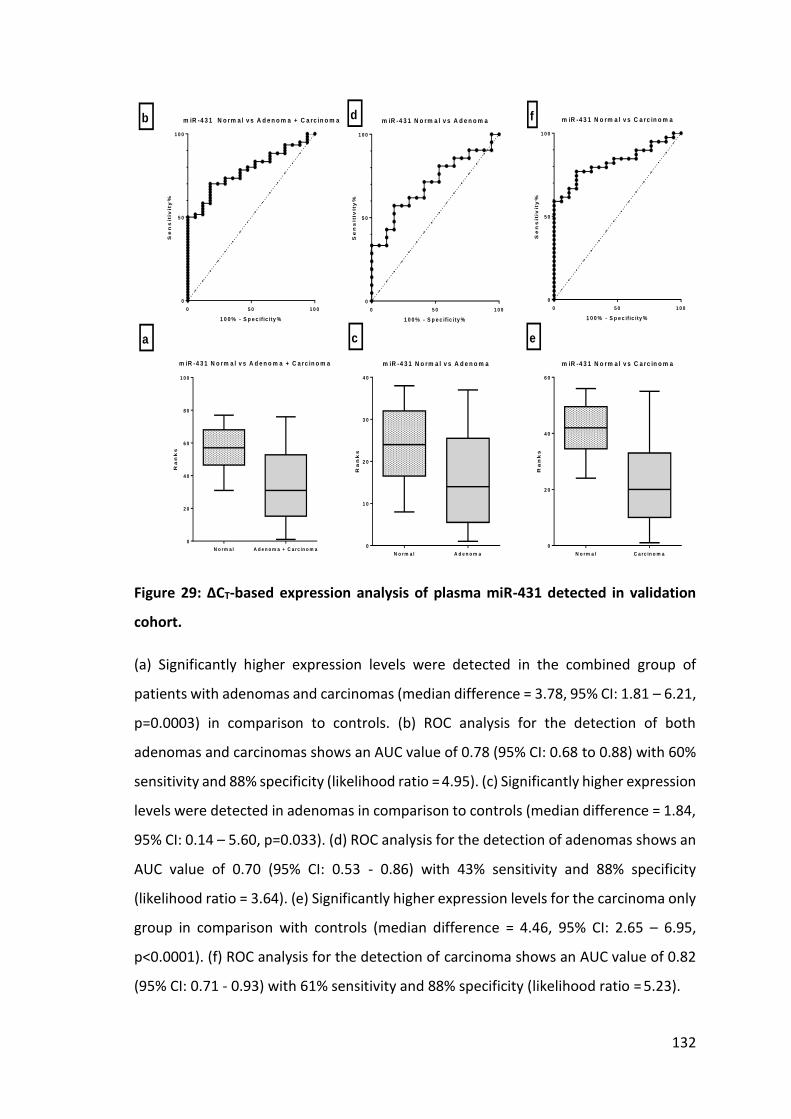
132
0 5 0 1 0 0
0
5 0
1 0 0
m iR -4 3 1 N o rm a l v s A d e n o m a + C a rc in o m a
1 0 0 % - S p e c if ic ity %
Se
ns
itiv
ity
%
0 5 0 1 0 0
0
5 0
1 0 0
m iR -4 3 1 N o rm a l v s A d e n o m a
1 0 0 % - S p e c if ic ity %
Se
ns
itiv
ity
%
0 5 0 1 0 0
0
5 0
1 0 0
m iR -4 3 1 N o rm a l v s C a rc in o m a
1 0 0 % - S p e c if ic ity %
Se
ns
itiv
ity
%
N o rm a l A d e n o m a + C a rc in o m a
0
2 0
4 0
6 0
8 0
1 0 0
Ra
nk
s
m iR -4 3 1 N o rm a l v s A d e n o m a + C a rc in o m a
N o rm a l A d e n o m a
0
1 0
2 0
3 0
4 0
m iR -4 3 1 N o rm a l v s A d e n o m a
Ra
nk
s
N o rm a l C a rc in o m a
0
2 0
4 0
6 0
m iR -4 3 1 N o rm a l v s C a rc in o m a
Ra
nk
s
a
b
c
d
e
f
Figure 29: ∆CT-based expression analysis of plasma miR-431 detected in validation
cohort.
(a) Significantly higher expression levels were detected in the combined group of
patients with adenomas and carcinomas (median difference = 3.78, 95% CI: 1.81 – 6.21,
p=0.0003) in comparison to controls. (b) ROC analysis for the detection of both
adenomas and carcinomas shows an AUC value of 0.78 (95% CI: 0.68 to 0.88) with 60%
sensitivity and 88% specificity (likelihood ratio = 4.95). (c) Significantly higher expression
levels were detected in adenomas in comparison to controls (median difference = 1.84,
95% CI: 0.14 – 5.60, p=0.033). (d) ROC analysis for the detection of adenomas shows an
AUC value of 0.70 (95% CI: 0.53 - 0.86) with 43% sensitivity and 88% specificity
(likelihood ratio = 3.64). (e) Significantly higher expression levels for the carcinoma only
group in comparison with controls (median difference = 4.46, 95% CI: 2.65 – 6.95,
p<0.0001). (f) ROC analysis for the detection of carcinoma shows an AUC value of 0.82
(95% CI: 0.71 - 0.93) with 61% sensitivity and 88% specificity (likelihood ratio = 5.23).
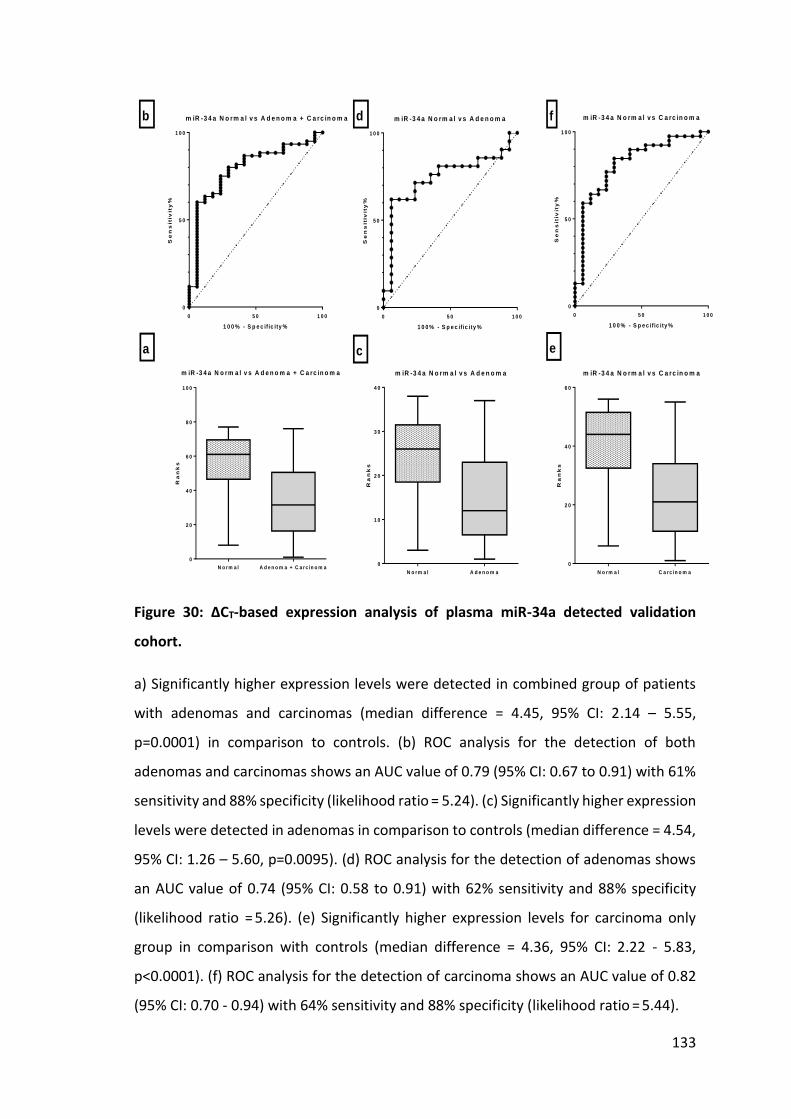
133
0 5 0 1 0 0
0
5 0
1 0 0
m iR -3 4 a N o rm a l v s A d e n o m a + C a rc in o m a
1 0 0 % - S p e c if ic ity %
Se
ns
itiv
ity
%
0 5 0 1 0 0
0
5 0
1 0 0
m iR -3 4 a N o rm a l v s A d e n o m a
1 0 0 % - S p e c if ic ity %
Se
ns
itiv
ity
%
0 5 0 1 0 0
0
5 0
1 0 0
m iR -3 4 a N o rm a l v s C a rc in o m a
1 0 0 % - S p e c if ic ity %
Se
ns
itiv
ity
%
N o rm a l A d e n o m a + C a rc in o m a
0
2 0
4 0
6 0
8 0
1 0 0
Ra
nk
s
m iR -3 4 a N o rm a l v s A d e n o m a + C a rc in o m a
N o rm a l A d e n o m a
0
1 0
2 0
3 0
4 0
m iR -3 4 a N o rm a l v s A d e n o m aR
an
ks
N o rm a l C a rc in o m a
0
2 0
4 0
6 0
m iR -3 4 a N o rm a l v s C a rc in o m a
Ra
nk
s
a
b d
c
f
e
Figure 30: ∆CT-based expression analysis of plasma miR-34a detected validation
cohort.
a) Significantly higher expression levels were detected in combined group of patients
with adenomas and carcinomas (median difference = 4.45, 95% CI: 2.14 – 5.55,
p=0.0001) in comparison to controls. (b) ROC analysis for the detection of both
adenomas and carcinomas shows an AUC value of 0.79 (95% CI: 0.67 to 0.91) with 61%
sensitivity and 88% specificity (likelihood ratio = 5.24). (c) Significantly higher expression
levels were detected in adenomas in comparison to controls (median difference = 4.54,
95% CI: 1.26 – 5.60, p=0.0095). (d) ROC analysis for the detection of adenomas shows
an AUC value of 0.74 (95% CI: 0.58 to 0.91) with 62% sensitivity and 88% specificity
(likelihood ratio = 5.26). (e) Significantly higher expression levels for carcinoma only
group in comparison with controls (median difference = 4.36, 95% CI: 2.22 - 5.83,
p<0.0001). (f) ROC analysis for the detection of carcinoma shows an AUC value of 0.82
(95% CI: 0.70 - 0.94) with 64% sensitivity and 88% specificity (likelihood ratio = 5.44).
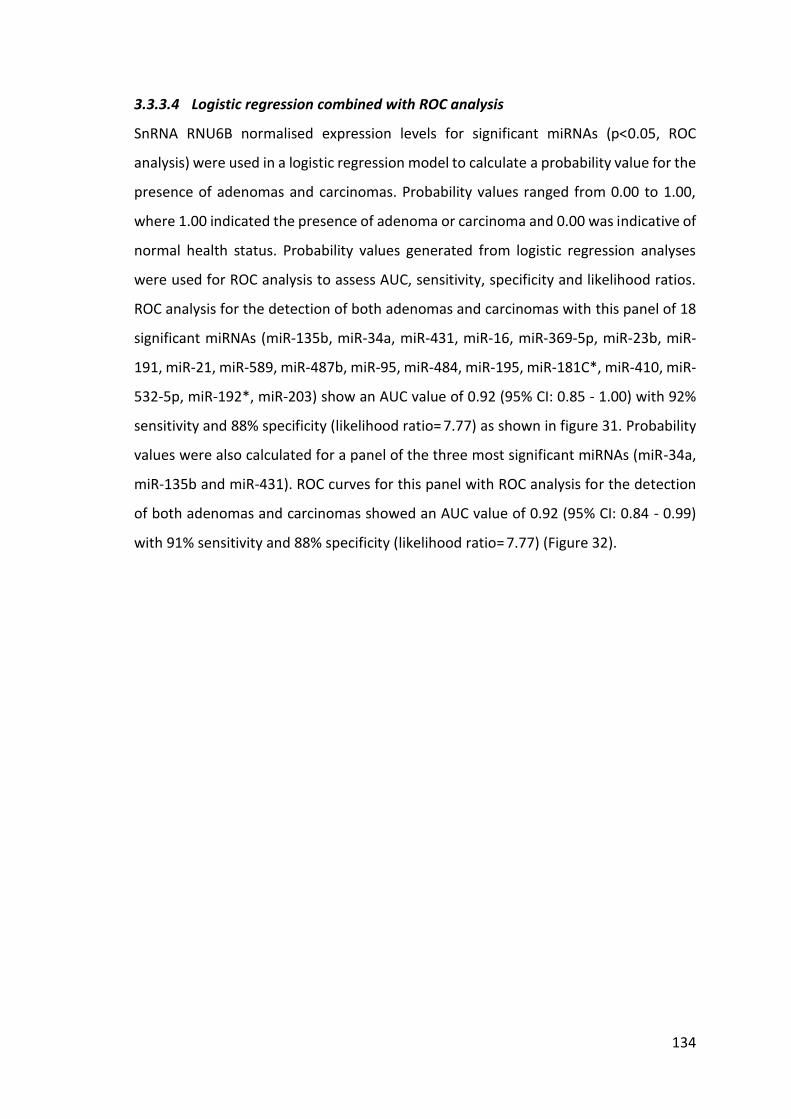
134
3.3.3.4 Logistic regression combined with ROC analysis
SnRNA RNU6B normalised expression levels for significant miRNAs (p<0.05, ROC
analysis) were used in a logistic regression model to calculate a probability value for the
presence of adenomas and carcinomas. Probability values ranged from 0.00 to 1.00,
where 1.00 indicated the presence of adenoma or carcinoma and 0.00 was indicative of
normal health status. Probability values generated from logistic regression analyses
were used for ROC analysis to assess AUC, sensitivity, specificity and likelihood ratios.
ROC analysis for the detection of both adenomas and carcinomas with this panel of 18
significant miRNAs (miR-135b, miR-34a, miR-431, miR-16, miR-369-5p, miR-23b, miR-
191, miR-21, miR-589, miR-487b, miR-95, miR-484, miR-195, miR-181C*, miR-410, miR-
532-5p, miR-192*, miR-203) show an AUC value of 0.92 (95% CI: 0.85 - 1.00) with 92%
sensitivity and 88% specificity (likelihood ratio= 7.77) as shown in figure 31. Probability
values were also calculated for a panel of the three most significant miRNAs (miR-34a,
miR-135b and miR-431). ROC curves for this panel with ROC analysis for the detection
of both adenomas and carcinomas showed an AUC value of 0.92 (95% CI: 0.84 - 0.99)
with 91% sensitivity and 88% specificity (likelihood ratio= 7.77) (Figure 32).

135
0 5 0 1 0 0
0
5 0
1 0 0
N o rm a l v s A d e n o m a + C a rc in o m a
1 0 0 % - S p e c if ic ity %
Se
ns
itiv
ity
%
0 5 0 1 0 0
0
5 0
1 0 0
N o rm a l V s A d e n o m a
1 0 0 % - S p e c if ic ity %S
en
sit
ivit
y%
0 5 0 1 0 0
0
5 0
1 0 0
N o rm a l v s C a rc in o m a
1 0 0 % - S p e c if ic ity %
Se
ns
itiv
ity
%
N o rm a l A d e n o m a + C a rc in o m a
0 .0
0 .5
1 .0
N o rm a l v s . A d e n o m a + C a rc in o m a
C a s e s
Pro
ba
bil
ity
N o rm a l A d e n o m a
0 .0
0 .5
1 .0
N o rm a l v s A d e n o m a
C a s e s
Pro
ba
bil
ity
N o rm a l C a rc in o m a
0 .0
0 .5
1 .0
N o rm a l v s C a rc in o m a
C a s e s
Pro
ba
bil
ity
a
b
c
d
e
f
Figure 31: Logistic regression combined with ROC analysis for a panel of 18 miRNAs.
(a) A median probability value of 0.67 (95%CI: 0.53 – 0.69, p<0.0001) for the combined
group of patients with adenomas and carcinomas was detected. (b) ROC analysis for the
detection of both adenomas and carcinomas shows an AUC value of 0.92 (95% CI: 0.85
- 1.00) with 92% sensitivity and 88% specificity (likelihood ratio= 7.77). (c) A median
probability value of 0.67 (95% CI: 0.43 – 0.69, p<0.0001) was calculated for the
detection of adenomas. (d) ROC analysis for the detection of adenomas shows an AUC
value of 0.90 (95% CI: 0.80 - 1.00) with 90% sensitivity and 88% specificity (likelihood
ratio= 7.60). (e) A median probability value of 0.68 (95%CI: 0.54 – 0.70, Mann-Whitney-
U-Test, p<0.0001) was calculated for the detection of adenomas. (f) ROC analysis for
the detection of carcinoma shows AUC value of 0.93 (95% CI: 0.86 - 1.00) with 92.5%
sensitivity and 88% specificity (likelihood ratio= 7.86).

136
0 5 0 1 0 0
0
5 0
1 0 0
N o rm a l v s A d e n o m a + C a rc in o m a
1 0 0 % - S p e c if ic ity %
Se
ns
itiv
ity
%
0 5 0 1 0 0
0
5 0
1 0 0
N o rm a l V s A d e n o m a
1 0 0 % - S p e c if ic ity %
Se
ns
itiv
ity
%
0 5 0 1 0 0
0
5 0
1 0 0
N o rm a l v s C a rc in o m a
1 0 0 % - S p e c if ic ity %
Se
ns
itiv
ity
%
N o rm a l A d e n o m a + C a rc in o m a
0 .0
0 .5
1 .0
N o rm a l v s . A d e n o m a + C a rc in o m a
C a s e s
Pro
ba
bil
ity
N o rm a l A d e n o m a
0 .0
0 .5
1 .0
N o rm a l v s A d e n o m a
C a s e s
Pro
ba
bil
ity
N o rm a l C a rc in o m a
0 .0
0 .5
1 .0
N o rm a l v s C a rc in o m a
C a s e s
Pro
ba
bil
ity
a
b
c
d
e
f
Figure 32: Logistic regression combined with ROC analysis for a panel of 3 miRNAs
(miR-34a, miR-135b & miR-431).
(a) A median probability value of 0.56 (95% CI: 0.45 – 0.72, p<0.0001) was calculated
for a combined group of patients with adenomas and carcinomas. (b) ROC analysis for
the detection of both adenomas and carcinomas shows an AUC value of 0.92 (95% CI:
0.84 - 0.99) with 91% sensitivity and 88% specificity (cut-off value = 7.77). (c) A median
probability value of 0.54 (95% CI: 0.34 – 0.65, p<0.0001) was calculated for the
detection of adenomas. (d) ROC analysis for the detection of adenomas shows an AUC
value of 0.90 (95% CI: 0.79 - 1.01) with 90% sensitivity and 88% specificity (likelihood
ratio= 7.65). (e) A median probability value of 0.57 (95% CI: 0.45 – 0.65, p<0.0001) was
calculated for the detection of adenomas. (f) ROC analysis for the detection of
carcinoma shows an AUC value of 0.93 (95% CI: 0.85 - 1.00) with 90% sensitivity and
88% specificity (likelihood ratio= 7.65).

137
3.3.4 Validation of miR-135b in an independent cohort
Based on superior diagnostic accuracy, miR-135b was validated in a second
independent cohort of 30 adenomas, 41 carcinoma and 25 controls (Appendix XV &
XVI). RT-PCR was conducted in the same way as conducted in the previous validation
work. The non-matched paired Student’s t-test was performed to assess the differences
in expression levels of miR-135b for participants with adenoma and carcinoma.
Expression levels of miR-135b were not detectable in the majority of control cases
(median CT values = 38.13) (Appendix XVII). However, the presence of detectable levels
of miR-135b correlated with the presence of both adenomas and carcinomas. Analysis
of miR-135b expression levels normalised with snRNA RNU6B (∆CT) showed
upregulation in expression in participants with adenoma in comparison with controls,
but this did not reach statistical significance (p=0.109). However, the difference in
expression levels (∆CT) for carcinomas remained statistically significant in comparison
with expression levels (∆CT) for controls. Table 31 summarises the median expression
levels of miR-135b (CT and SnRNA RNU6B normalised ∆CT) for adenoma, carcinoma and
control groups.
Table 31: Median expression levels of miR-135b with associated p-values for differences in expression levels in groups with adenoma, carcinoma, and adenoma and carcinoma.
Expression levels (CT) and snRNA RNU6B normalised (∆CT) for miR-135b were compared
(Mann-Whitney-U-Test) for different groups and plotted in box plots. The diagnostic
accuracy for the detection of adenoma, carcinoma and combined group of adenoma &
carcinoma was evaluated with ROC analysis (Figure 33 & Figure 34). Tabulated ROC
analysis with AUC, sensitivity, specificity, cut off and likelihood ratios are given in Table
32 and Table 33.
miR-135b Median expression levels
of miR-135b
p-values
(non-matched paired Student’s t-test )
Control
Adenoma
Carcinoma
Control
vs.
Adenoma
Control
vs.
Carcinoma
Control Vs.
Adenoma +
Carcinoma
CT 38.13 34.07 29.49 0.0025 p<0.0001 P<0.0001
∆CT -6.74 -4.85 -0.73 0.1093 P<0.001 p<0.0001

138
0 5 0 1 0 0
0
5 0
1 0 0
N o rm a l v s . A d e n o m a + C a rc in o m a
1 0 0 % - S p e c if ic ity %
Se
ns
itiv
ity
%
0 5 0 1 0 0
0
5 0
1 0 0
N o rm a l v s . A d e n o m a
1 0 0 % - S p e c if ic ity %
Se
ns
itiv
ity
%
0 5 0 1 0 0
0
5 0
1 0 0
R O C c u rv e : R O C o f N o rm a l v s . C a rc in o m a
1 0 0 % - S p e c if ic ity %
Se
ns
itiv
ity
%
N o rm a l A d e n o m a + c a rc in o m a
2 0
2 5
3 0
3 5
4 0
N o rm a l v s A d e n o m a + C a rc in o m a
C a s e s
CT
va
lue
s
N o rm a l A d e n o m a
2 0
2 5
3 0
3 5
4 0
N o rm a l v s . A d e n o m a
C a s e s
CT
va
lue
s
N o rm a l C a rc in o m a
2 0
2 5
3 0
3 5
4 0
N o rm a l v s . C a rc in o m a
C a s e s
CT
va
lue
s
a
b
c
d
e
fS e n s itiv ity % Id e n t ity %
S e n s itiv ity %
Figure 33: CT-based expression analysis of miR-135b in an independent cohort.
(a) Significantly higher expression levels were detected for combined group of patients
with adenomas and carcinomas (median difference = 10.9, 95% CI: 5.12 – 10.52,
p<0.0001) in comparison to controls. (b) ROC analysis for the detection of both
adenomas and carcinomas shows an AUC value of 0.82 (95% CI: 0.71 to 0.92) with 80%
sensitivity and 84% specificity (likelihood ratio= 5.018). (c) Significantly higher
expression levels were detected in adenomas in comparison to controls (median
difference = 5.45, 95% CI: 0.00 - 7.18, p=0.0007). (d) ROC analysis for the detection of
adenomas shows an AUC value of 0.74 (95% CI: 0.6 to 0.88) with 70% sensitivity and
84% specificity (likelihood ratio= 4.37). (e) Significantly higher expression levels for
carcinoma-only group in comparison with controls (median difference =10.72, 95% CI:
10.00 - 11.88, p<0.0001). (f) ROC analysis for the detection of carcinomas shows an AUC
value of 0.87 (95% CI: 0.77 - 0.97) with 90% sensitivity and 84% specificity (likelihood
ratio = 5.64).

139
Table 32: Summary of detection rates of adenomas and carcinomas based on CT values of miR-135b.
Sensitivity, specificity, 95% confidence intervals and likelihood ratios are given with
cut-off values.
Cutoff Sensitivity 95% CI Specificity 95 %CI Likelihood ratio
< 25.86 7.042 2.326 to 15.67 96 79.65 to 99.90 1.761
< 26.01 8.451 3.165 to 17.49 96 79.65 to 99.90 2.113
< 26.28 9.859 4.057 to 19.26 96 79.65 to 99.90 2.465
< 26.50 11.27 4.992 to 21.00 96 79.65 to 99.90 2.817
< 26.96 18.31 10.13 to 29.27 96 79.65 to 99.90 4.577
< 27.14 19.72 11.22 to 30.86 96 79.65 to 99.90 4.93
< 27.20 21.13 12.33 to 32.44 96 79.65 to 99.90 5.282
< 27.27 22.54 13.46 to 34.00 96 79.65 to 99.90 5.634
< 27.77 29.58 19.33 to 41.59 96 79.65 to 99.90 7.394
< 27.96 29.58 19.33 to 41.59 92 73.97 to 99.02 3.697
< 28.15 30.99 20.54 to 43.08 92 73.97 to 99.02 3.873
< 28.94 39.44 28.03 to 51.75 92 73.97 to 99.02 4.93
< 29.07 40.85 29.32 to 53.16 92 73.97 to 99.02 5.106
< 29.17 42.25 30.61 to 54.56 92 73.97 to 99.02 5.282
< 29.23 42.25 30.61 to 54.56 88 68.78 to 97.45 3.521
< 29.38 43.66 31.92 to 55.95 88 68.78 to 97.45 3.638
< 29.56 45.07 33.23 to 57.34 88 68.78 to 97.45 3.756
< 29.72 47.89 35.88 to 60.08 88 68.78 to 97.45 3.991
< 29.82 49.3 37.22 to 61.44 88 68.78 to 97.45 4.108
< 29.94 50.7 38.56 to 62.78 88 68.78 to 97.45 4.225
< 29.98 52.11 39.92 to 64.12 88 68.78 to 97.45 4.343
< 30.08 53.52 41.29 to 65.45 88 68.78 to 97.45 4.46
< 30.18 54.93 42.66 to 66.77 88 68.78 to 97.45 4.577
< 30.28 56.34 44.05 to 68.09 88 68.78 to 97.45 4.695
< 30.55 56.34 44.05 to 68.09 84 63.92 to 95.46 3.521
< 30.73 57.75 45.44 to 69.39 84 63.92 to 95.46 3.609
< 30.96 60.56 48.25 to 71.97 84 63.92 to 95.46 3.785
< 31.66 64.79 52.54 to 75.76 84 63.92 to 95.46 4.049
< 32.87 67.61 55.45 to 78.24 84 63.92 to 95.46 4.225
< 33.36 70.42 58.41 to 80.67 84 63.92 to 95.46 4.401
< 34.00 71.83 59.90 to 81.87 84 63.92 to 95.46 4.489
< 34.55 73.24 61.41 to 83.06 84 63.92 to 95.46 4.577
< 34.75 74.65 62.92 to 84.23 84 63.92 to 95.46 4.665
< 35.84 77.46 66.00 to 86.54 84 63.92 to 95.46 4.842
< 36.23 78.87 67.56 to 87.67 84 63.92 to 95.46 4.93
< 36.64 80.28 69.14 to 88.78 84 63.92 to 95.46 5.018
< 38.51 81.69 70.73 to 89.87 84 63.92 to 95.46 5.106
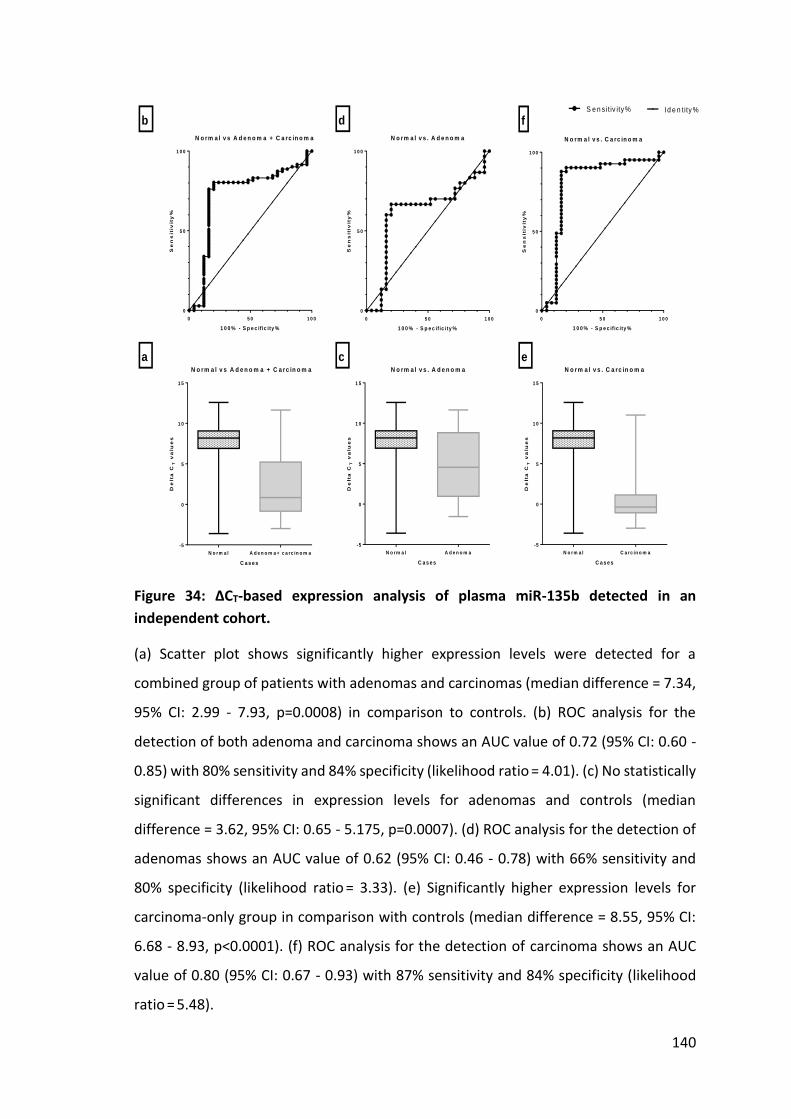
140
0 5 0 1 0 0
0
5 0
1 0 0
N o rm a l v s A d e n o m a + C a rc in o m a
1 0 0 % - S p e c if ic ity %
Se
ns
itiv
ity
%
0 5 0 1 0 0
0
5 0
1 0 0
N o rm a l v s . A d e n o m a
1 0 0 % - S p e c if ic ity %
Se
ns
itiv
ity
%
0 5 0 1 0 0
0
5 0
1 0 0
N o rm a l v s . C a rc in o m a
1 0 0 % - S p e c if ic ity %
Se
ns
itiv
ity
%
N o rm a l A d e n o m a + c a rc in o m a
-5
0
5
1 0
1 5
N o rm a l v s A d e n o m a + C a rc in o m a
C a s e s
De
lta
CT
va
lue
s
N o rm a l A d e n o m a
-5
0
5
1 0
1 5
N o rm a l v s . A d e n o m a
C a s e s
De
lta
CT
va
lue
s
a
b
c
d
e
f
N o rm a l C a rc in o m a
-5
0
5
1 0
1 5
N o rm a l v s . C a rc in o m a
C a s e s
De
lta
CT
va
lue
s
Id e n t ity %S e n s itiv ity %
Figure 34: ∆CT-based expression analysis of plasma miR-135b detected in an
independent cohort.
(a) Scatter plot shows significantly higher expression levels were detected for a
combined group of patients with adenomas and carcinomas (median difference = 7.34,
95% CI: 2.99 - 7.93, p=0.0008) in comparison to controls. (b) ROC analysis for the
detection of both adenoma and carcinoma shows an AUC value of 0.72 (95% CI: 0.60 -
0.85) with 80% sensitivity and 84% specificity (likelihood ratio = 4.01). (c) No statistically
significant differences in expression levels for adenomas and controls (median
difference = 3.62, 95% CI: 0.65 - 5.175, p=0.0007). (d) ROC analysis for the detection of
adenomas shows an AUC value of 0.62 (95% CI: 0.46 - 0.78) with 66% sensitivity and
80% specificity (likelihood ratio = 3.33). (e) Significantly higher expression levels for
carcinoma-only group in comparison with controls (median difference = 8.55, 95% CI:
6.68 - 8.93, p<0.0001). (f) ROC analysis for the detection of carcinoma shows an AUC
value of 0.80 (95% CI: 0.67 - 0.93) with 87% sensitivity and 84% specificity (likelihood
ratio = 5.48).

141
Table 33: Summary of detection rates of adenoma and carcinoma based on ΔCT values of miR-135b.
Sensitivity, specificity, 95% confidence intervals and likelihood ratios are given with
cut-off values.
Cutoff Sensitivity 95% CI Specificity 95% CI Likelihood ratio
< -2.930 1.408 0.0356 to 7.599 96 79.65 to 99.90 0.3521
< -2.690 2.817 0.3430 to 9.808 92 73.97 to 99.02 0.3521
< -2.065 7.042 2.326 to 15.67 88 68.78 to 97.45 0.5869
< -1.680 9.859 4.057 to 19.26 88 68.78 to 97.45 0.8216
< -1.405 11.27 4.992 to 21.00 88 68.78 to 97.45 0.939
< -1.045 19.72 11.22 to 30.86 88 68.78 to 97.45 1.643
< -0.980 22.54 13.46 to 34.00 88 68.78 to 97.45 1.878
< -0.515 30.99 20.54 to 43.08 88 68.78 to 97.45 2.582
< -0.480 33.8 23.00 to 46.01 88 68.78 to 97.45 2.817
< -0.290 35.21 24.24 to 47.46 84 63.92 to 95.46 2.201
< 0.125 40.85 29.32 to 53.16 84 63.92 to 95.46 2.553
< 0.310 43.66 31.92 to 55.95 84 63.92 to 95.46 2.729
< 0.660 49.3 37.22 to 61.44 84 63.92 to 95.46 3.081
< 0.915 50.7 38.56 to 62.78 84 63.92 to 95.46 3.169
< 1.020 53.52 41.29 to 65.45 84 63.92 to 95.46 3.345
< 1.245 56.34 44.05 to 68.09 84 63.92 to 95.46 3.521
< 1.970 60.56 48.25 to 71.97 84 63.92 to 95.46 3.785
< 3.525 67.61 55.45 to 78.24 84 63.92 to 95.46 4.225
< 3.975 70.42 58.41 to 80.67 84 63.92 to 95.46 4.401
< 5.210 74.65 62.92 to 84.23 84 63.92 to 95.46 4.665
< 5.710 76.06 64.46 to 85.39 84 63.92 to 95.46 4.754
< 6.600 78.87 67.56 to 87.67 80 59.30 to 93.17 3.944
< 6.845 80.28 69.14 to 88.78 80 59.30 to 93.17 4.014
< 6.915 80.28 69.14 to 88.78 76 54.87 to 90.64 3.345
< 7.215 80.28 69.14 to 88.78 68 46.50 to 85.05 2.509
< 7.305 80.28 69.14 to 88.78 64 42.52 to 82.03 2.23
< 7.595 80.28 69.14 to 88.78 60 38.67 to 78.87 2.007
< 7.840 80.28 69.14 to 88.78 56 34.93 to 75.60 1.825
< 8.075 81.69 70.73 to 89.87 52 31.31 to 72.20 1.702
< 8.280 81.69 70.73 to 89.87 48 27.80 to 68.69 1.571
< 8.400 83.1 72.34 to 90.95 44 24.40 to 65.07 1.484
< 8.415 83.1 72.34 to 90.95 36 17.97 to 57.48 1.298
< 8.645 85.92 75.62 to 93.03 28 12.07 to 49.39 1.193
< 8.685 87.32 77.30 to 94.04 28 12.07 to 49.39 1.213
< 9.450 88.73 79.00 to 95.01 20 6.831 to 40.70 1.109
< 9.650 90.14 80.74 to 95.94 16 4.538 to 36.08 1.073
< 9.915 91.55 82.51 to 96.84 12 2.547 to 31.22 1.04

142
In this feasibility study miRNA expression profiles of more than 700 mature miRNAs in
blood samples collected from symptomatic patients (n = 32) diagnosed with CRC,
adenoma or neoplasia-free healthy controls were established. In this discovery phase,
a panel of 29 miRNAs was selected and applied to a cohort of symptomatic patients (n
= 94) undergoing surgical or endoscopic resection of CRC or adenoma compared with
colorectal neoplasia-free controls. For a set of three miRNAs (miR-34a, miR-135b and
miR-431), ROC analysis showed 91% sensitivity and 88% specificity for the detection of
adenomas and carcinomas. In this set, miR-135b had superior detection rates for
adenomas and carcinomas (Figure 28), with 74% sensitivity and 88% specificity to detect
both adenomas and carcinomas. Hence, miR-135b was validated further on an
independent cohort of patients (n = 96) with adenomas, carcinomas and asymptomatic
controls undergoing colonoscopy after a positive FOBT or healthy controls with no
bowel symptoms. For this cohort, ROC analysis showed 80% sensitivity and 84%
specificity in detection of adenomas and carcinomas. The detection rates were far
superior for carcinomas, with 90% sensitivity and 84% specificity being achieved. The
diagnostic accuracy of this method should undergo further evaluation in a larger cohort
of asymptomatic patients before introducing it as novel biomarker for CRC screening.

143
3.4 Discussion
This study has shown that miR-135b is a potential novel biomarker for the early
detection of colorectal neoplasia. This is the first study that has shown the upregulation
of miR-135b in the blood of patients with adenomas and carcinomas. Its upregulation
in colorectal adenomas and carcinoma tissue has previously been reported in different
studies (Akao et al, 2006, Bandrés. et al, 2006, Rossi et al, 2007 & Nagel et al, 2008).
However, this is the first study evaluating the diagnostic utility of miR-135b in an
independent cohort of patients with colorectal neoplasia.
3.4.1 Role of miR-135b in colorectal neoplasia initiation and progression
As miR-135b is strongly linked to in CRCs, its use in the detection of adenomas and
carcinomas based on a blood assay is supported by its role in tumour initiation and
progression.Studies evaluating the role of miR-135b in tumour initiation have found
higher levels of miR-135b in adenoma and carcinoma tissue and have associated it with
the loss of APC expression (Nagel et al, 2008 & Aslam et al, 2015). It is well-established
that bi-allelic mutations in the APC gene are primary initiating events in the
transformation of adenoma to carcinoma through deregulation of the β-catenin
pathway (Fearon and Vogelstein, 1990, Segditsas and Tomlinson, 2006). These
mutations are typically the result of premature stop codons in the APC transcript and
are detected in more than two thirds of CRC tissues (Nagel et al, 2008). Elevated
expression of miR-135b with loss of APC suggests that miR-135b is a direct target of APC
(Nagel et al, 2008, Maragkakis et al, 2009 & Aslam et al, 2015). It is well-established that
APC loss and associated lack of β-catenin degradation results in free cytoplasmic β-
catenin that enters the nucleus and activates Wnt-regulated genes (Segditsas and
Tomlinson, 2006). This Wnt activation results in interaction with the T-cell factor (TCF)
family of transcription factors and a concomitant recruitment of coactivators (Survivin,
c-Myc and Cyclin D1). Consequently, there is lack of apoptosis and increased
proliferation of abnormal cells resulting in autonomous growth and the formation of an
adenoma. Association of miR-135b with APC is further supported by a confirmation of
a miR-135b binding site at the APC 3′ untranslated region. This suggests that miR-135b
upregulation leads to a more penetrant effect of APC derangement (Nagel et al, 2008)
and causes an increase in the size of the adenoma.

144
In the last decade, miR-135b has generated interest in multiple functional studies due
to its role in epigenetics. miR-135b is located on 1q32.1, which shows a DNA copy
number gain in CRCs (Nagel et al, 2008). miR-135b is encoded in the first intron of
LEMD1 gene that is aberrantly expressed in colonic cancers (Yuki et al, 2004). In vitro
investigations have shown a demethylation-associated increase in expressions of
LEMD1 and miR-135b, suggesting there is an epigenetic control of miR-135b in cancer
cells. Furthermore, investigators have predicted that the transcription factor NF-κB has
a potential binding site on the miR-135b promoter region. After demethylation, TNFα,
a known potentiator of NF-κB transcription, increased expression of miR-135b,
suggesting a potential link between inflammatory signals and miR-135b transcription
(Lin et al, 2013). miR-135b upregulation may be the common initiating pathway
between malignancy derived from somatic mutations and those derived from
inflammatory backgrounds where Wnt derangement is typically a later event. miR-135b
expressions are elevated in tumours generated in mouse models of APC mutations as
well as inflammatory bowel disease (Necela et al, 2013). Furthermore, the expression
of miR-135b is inversely correlated with serum E2 level and ER-β mRNA expression in
cancer tissues of CRC patients (He et al, 2012).
In a recently published study, there are significantly higher expressions of miR-135b in
tumours with mutant K-ras gene expression. These findings might suggest that in cases
where somatic mutations are present, miR-135b upregulation may suppress any
residual β-catenin regulation-driven tumour suppressive activity. This would explain a
progressive increase in miR-135b-driven proliferation in adenomas, where an early
event of miR-135b upregulation by loss of APC is further amplified by a second hit
mutation, leading to further proliferation in adenomas with dysplasia (Nagel et al,
2008).
Studies also have shown that miR-135b expression are controlled by STAT3 regulation
(Yu et al, 2009, Yue et al, 2009). STAT3 is an activator of anti-apoptotic pathways and
proliferative behaviours in different cancers (Corvinus et al, 2005 & Yu et al, 2009).
STAT3 is activated by epidermal growth factor receptor (EGFR) and consequently
multiple anti-EGFR drugs have been used to treat CRCs. It has been shown that higher
expression levels of miR-135b in CRCs are associated with increased activity of STAT3,

145
resulting in inhibition of tumour suppressors (Yu et al, 2009 & Yue et al, 2009). A screen
for miRNAs deregulated in CSCs has identified miR-135b as highly expressed in the stem
cell-enriched cell population (Lin et al, 2011 & Sanchez-Diaz et al, 2013). Mechanistic
studies have shown implications for miR-135b being an important driver in maintaining
cell oncogenicity in the self-renewing behaviours of CSCs (Lin et al, 2011, Sanchez-Diaz
et al, 2013).
3.4.2 Specificity of miR-135b for CRCs
miR-135b is not specific to CRC. It is upregulated in other cancers such as lung, breast,
liver, bone and blood cancer, and in vitro studies have confirmed its role in cancer cell
proliferation, invasion, migration, metastasis and drug resistance (Li et al, 2014, Pei et
al, 2015, Umezu et al, 2014, Xio et al, 2014 & Jung et al, 2014) ( Table 34).
Studies Cancer type Significant findings Target Mechanism
Li et al, 2014
Hepatocellular HSF1/miR-135b/RECK&EVI5 axis
HSF1, RECK, EVI5
Cell migration and invasion in vitro, metastasis in vivo
Pei et al, 2015
Osteosarcoma Upregulation of miR-135b in osteosarcoma tissue
FOXO1 Proliferation and invasion in vitro
Umezu et al, 2014
Multiple myeloma
Upregulation of miR-135b in exosomes from hypoxia resistant multiple myeloma cell line
FIH-1 Promotes angiogenesis
Xio et al, 2014
Glioblastoma Multiforme
miR-135b-GSK3β axis in radio resistant human GBM cell line U87R
GSK3β Reversal of radio-resistance by restoration of GSK3β
Jung et al, 2014
Hepatocellular Gα12gep inhibits FOXO1 resulting in the inhibition of FOXO1 de novo synthesis by miR-135b
MDM2 Knockdown of JunB (or c-Jun) decreased miR-135b levels, thereby increasing FOXO1.
Arigoni, et al, 2013
Breast Cancer Lung Cancer
miR-135b coordinates progression of ErbB2-driven mammary carcinomas
MID1 MTCH2
Stemness and anchorage-independent growth in vitro
Table 34: Summary of in vitro studies investigating the role of miR-135b in non-CRCs.

146
Upregulation of miR-135b in non-CRCs raises the issue about the specificity of a miR-
135b-based blood assay for CRCs. miR-135b levels in circulation have been found to be
raised in circulation in patients with bladder cancer, endometrial cancer, in maternal
circulation of pregnant women (Chim et al, 2008, Scheffer et al, 2014, Tsukamoto et al,
2014). In this respect, the most significant study has used circulating miR-135b for the
early detection and follow-up of endometrioid endometrial carcinoma (Tsukamoto et
al, 2014). This study has reported AUC of 0.97 for the detection of endometrioid
endometrial carcinoma. If used as screening test for CRC, plasma miR-135b might yield
a significant number of false positive results leading to patients with inaccurate
modality of investigations. A recent study by Faltejskova and colleagues has questioned
the utility of circulating miR-135b in the detection of CRCs (Faltejskova et al, 2012). In
that study, total RNA extracted from the serum of 100 CRC patients and 30 healthy
controls was analysed by QRT-PCR to quantify miR-17-3p, miR-29a, miR-92a and miR-
135b. Comparative analysis of miR-16-based normalised expression of miR-17-3p, miR-
29a and miR-92a showed no significant differences for patient with cancers and healthy
controls. The levels of miR-135b in serum were too low to be quantified accurately in
that study. This did not dismiss the case of miR-135b as potential biomarker for CRCs.
This suggests that work done in this study has been associated with a superior methods
of RNA isolation, pre-amplification and detection of miR-135b.
3.4.3 miR-34a in circulation
miR-34 is a well-recognised tumour suppressor miRNA. Its expression has been found
to be downregulated in the one third of patients of CRC in comparison to healthy
controls. This downregulation of miR-34a expression has been linked to upregulation of
the E2F pathway and the downregulation of the p53/ p21 pathway (Tazawa et al, 2007).
miR-34a is a direct transcriptional target of p53; the promoter region of miR-34a
contains a canonical p53 binding site (Yamakuchi & Lowenstein et al, 2009). p53-driven
tumour suppression involves the coordinated activation of multiple transcriptional
targets including miR-34a, leading to inhibition of cell proliferation and activation of
apoptosis. In contrast to the above, miR-34a indirectly deacetylates p53 via activation
of SIRT1 and decreases p53 transcriptional activation. Activation of SIRT1 mediates the
survival of cells during periods of severe stress through the inhibition of apoptosis

147
(Tazawa et al, 2007). Perhaps, in response to stress in adjacent normal tissue of colonic
cancer there is higher production of miR-34a from adjacent normal tissue, resulting in
a high influx of miR-34a into circulation.
In a study by Eichelser and colleagues, higher levels of miR-34a were associated with
AUC of 0.63 for its utility in the of breast cancer (Eichelser et al, 2013). In another study,
serum levels of miR-34a were significantly elevated in patients with breast cancer
compared to healthy controls (Roth et al, 2010) and its high levels correlated with
advanced tumour stages. In contrast to these two studies, other studies have reported
significantly reduced levels of miR-34a in patients with lymphoma, breast and colon
cancers (Nugent et al, 2012 & Fang et al, 2012).
3.4.4 miR-431
miR-431 is another miRNA deemed significant in this study. Its role in CRC is not well
studied, but a recent publication investigating the identification of a relevant group of
miRNAs in cancer using fuzzy mutual information has identified miR-431 as a primary
miRNA linked to lung cancer, targeting 14 genes (Pal et al, 2015). Two other studies
(Tanaka et al, 2014, Tanaka et al, 2014) have explored the role of the miR-431 cancer
pathway in medulloblastoma and have suggested a strong link of miR-431 in MAPK
signalling pathway.
3.4.5 Other studies investigating role of miRNAs for CRC screening
Various studies have been conducted in the last decade to investigate the role of
circulating miRNAs for the detection of colorectal neoplasia (Table 35). These studies
used either whole plasma or total RNA extracted from a defined amount of plasma
samples collected from healthy controls and diseased patients. RT-PCR based detection
systems were applied to detect selected circulating miRNAs. The selection of miRNAs
was based either on results of plasma miRNA expression profiling experiments
performed on relatively small cohorts of healthy and diseased patients or highly
upregulated miRNAs in CRC tissues. Different studies have reported different sets of
miRNAs and varying degrees of diagnostic accuracy. Pu and colleagues have used whole
plasma and bypassed the total RNA extraction step in RT-PCR. They have reported
higher levels of miR-221 in the plasma samples of patients with CRCs and an AUC value

148
of 0.606 with 86% sensitivity and 41% specificity to detect CRCs (Pu et al, 2010). Ng and
colleagues have studied miR-17-3p and miR-92 and have reported 89% sensitivity and
70% specificity of miR-92 for the detection of CRCs (Ng et al, 2009). In another study, a
panel of 12 miRNAs including miR-29a and miR-92a has been found to be associated
with a combined AUC of 0.883 with 83% sensitivity and 84.7% specificity to detect both
adenomas and carcinomas (Huang et al, 2010). However, their detection rates were
significantly lower for adenomas only, with sensitivities of approximately 60% and
specificities of approximately 80%. A study by Cheng and colleagues has investigated
the diagnostic and staging potential of circulating miR-141. In addition to its sensitivity
of 66.7% and specificity of 80.8% to discriminate controls from CRC patients, the higher
levels of plasma miR-141 predicted poor survival and was an independent prognostic
factor for advanced CRC (Cheng et al, 2011). Other researchers used a panel of miRNAs
to improve the diagnostic accuracy of circulating miRNAs for CRC and adenoma
detection. Kanaan and colleagues have performed a study evaluating 380 plasma
miRNAs and found that a panel of 8 miRNAs (miR-15b, miR-17, miR-142-3p, miR-532-
3p, miR-195, miR-331, miR-532 and miR-652) was associated with 91% sensitivity and
57% specificity to detect carcinomas and 88% sensitivity and 64% specificity to detect
adenomas.
By following the strategy of using miRNA panels, a panel of six miRNAs (miR-18a, miR-
19a, miR-19b, miR-15b, miR-29a and miR-335) was applied to a cohort twice the size of
cohort used by Kanann and colleagues (Giraldez et al, 2013). The results of this panel
have been very encouraging, with sensitivity and specificity for the detection of
adenomas and carcinomas reported as approximately 80%. Giraldez and colleague also
found significantly upregulated levels of miR-18a in patients with advanced adenomas.
In a recent study (Wang et al. 2014), researchers compared the diagnostic accuracy of
a panel of serum-based miRNAs with CEA and CA19-9. Researchers reported
sensitivities of 23, 35 and 93% for CEA, CA19.9 and the evaluated panel of miRNAs. The
specificity of detecting CRCs for panel was 91%.
149
Tissue type
Studies Participant number
Target miRNAs Diagnostic accuracy
Sensitivity% Specificity%
Whole plasma
Pu et al, 2010
CRC (103) Controls (37)
miR-221 86 41
Plasma /serum RNA
Ng et al, 2009
CRC (90) Controls (40)
miR-17-3p 64 70
miR-92 89 70
Huang et al, 2010
CRC (100) Adenomas* (37) Controls (59)
miR-29 69 62.2*
89.1 84.7*
miR-92a 84 64.9*
71 81.4*
Cheng et al, 2011
CRC I-IV (102) Controls (48)
miR-141 66.7 80.8
Kanaan et al, 2012
CRC (50) Controls (50)
miR-21 90 90
Kanaan, al, 2013
CRC (45) Adenoma* (16) Control (26)
miRNA panel: miR-15b, miR-17, miR-142, miR-195, miR-331,miR-532,
91 88*
57 64*
Giráldez et al, 2013.
CRC (63) Adenoma* (60) Control (73)
miRNA panel: miR-15b, miR-18a, miR-19a, miR-19b, miR-29a,miR-335
78 80*
79 80*
Wang et al, 2014
CRC (83) Control (59)
miRNA panel: let-7g, miR-21, miR-31, miR-92a, miR-203
93 91
Table 35: Comparison of the sensitivity and specificity of different miRNAs for their utility as biomarkers for detection of adenocarcinoma and adenoma*.
RT-PCR based quantification of miRNAs has been the preferred method of study in
majority of the above mentioned studies.
Colonic epithelium contains the most dynamic population of human cells. Highly
differentiated colonocytes are continuously shed into the colon of healthy individuals
and patients with CRC (Brittan et al, 2004 & Loktionov et al, 2007). Exfoliated
colonocytes from the healthy colon and neoplastic lesions carry important genetic and
epigenetic information that could be utilized for subsequent testing, such as detection
of mutant genes or dysregulated mRNAs, proteins and miRNAs (Loktionov et al, 2009).
It is proposed that even small neoplastic loci can alter the rate of colonic cell exfoliation

150
and may aid early detection of these lesions (Loktionov et al, 2007). The effectiveness
of an exfoliated colonocyte-based detection system requires efficient isolation of
colonocytes while minimizing the amount of background faecal debris. Strategies such
as density gradient centrifugation and/or immunoaffinity on either homogenized stool
samples or scrapings from the stool surface are used to try to maximise retrieval of
colonocytes (Loktionov et al, 2007). Nonetheless, cell yields are often still very low with
conspicuous background debris, making cell identification difficult and time consuming
(Deuter et al, 1995). Such preparations would be unsuitable for high-throughput
population screening programs (White et al, 2009). Furthermore, colonocytes shed
from a proximal colonic region travel further and are more exposed to cytolytic agents,
making them less likely to be preserved for sampling. If this does prove to be a common
problem, stool miRNA markers for right-sided CRC will be less effective. There is
evidence that this is indeed the case (Koga et al, 2010). In this study, immunomagnetic
beads were conjugated with EpCAM monoclonal antibodies to isolate colonocytes from
stool. Despite the selection of two highly upregulated miRNAs in CRC cells, the
sensitivity of detection was approximately 70% (Table 36).
However, the detection rate for left-sided colonic and rectal tumours was significantly
higher, suggesting the potential utility of exfoliated colonocyte-based miRNA assays as
an alternative to flexible sigmoidoscopy. Profound deregulation of apoptosis is known
to be a characteristic feature of cancer. As a result of apoptosis, tumour-specific
proteins and genetic information in the form of DNA, RNA and miRNA are released into
the colon lumen (Ahlquist et al, 2010). The stool environment is much more complex
and hostile than plasma, and human RNAs are rapidly degraded and constitute <1% of
total stool RNA (Ahlquist et al, 2010). In contrast with the rapid degradation of mRNA,
human miRNAs are packaged into microvesicles and are well protected from
degradation. The available data indicates that stool miRNA analysis can distinguish
between patients with adenomas and carcinomas from healthy controls (Link et al,
2010). The detection of miRNAs from stool specimens requires efficient protocols for
stool preparation, miRNA extraction and quantitative analysis (Ahmed et al, 2009). The
utility of stool miRNAs as biomarkers is still in its infancy; further studies of stool miRNA
are needed on larger cohorts to validate its diagnostic accuracy.

151
Table 36: Faecal miRNAs for CRC detection and screening.
RT-PCR based quantification of miRNAs has been the preferred method of study in
majority of the above studies.
3.4.6 Strengths and weaknesses of study
RNA concentration experiments suggest it is extremely difficult to enrich and
concentrate miRNAs due to their size. However, recent advances in RNA isolation and
purification technologies have made detection of small concentrations of miRNAs
possible. A comparative study of five commercial kits reported comparable quantities
of miRNA were extracted (Brunet-Vega et al, 2015). However, this did change
significantly with or without the spike of exogenous control RNA or miRNA. In this study,
concentration columns and the heat vacuum effectively concentrated large RNAs but
might have facilitated miRNA degradation during heating steps. Heating-associated
degradation has raised concerns about the optimum storage temperature for RNA
samples used in miRNA analysis. In light of this, total RNA should be stored at -80°C.
It is an intriguing finding that miR-135b was not sufficiently significant to allow
discrimination of both CRC and adenoma cases in the expression profiling analysis.
Interpenetration of the array data is complex and requires normalisation techniques,
and previous studies have focused on identifying novel miRNAs for the early detection
Tissue type Studies Participant
numbers
Target
miRNAs
Diagnostic accuracy
Sensitivity
%
Specificity %
Exfoliated
colonocytes
Koga et
al, 2010
CRC (197)
Control (119)
miR-17-92
69.5
81.5
miR-135 46.2
95
Faeces
Wu et
al, 2014
CRC (104)
Adenoma (169)
Control (109)
miR-135b 78 (CRC)
65
(Adenoma)
68
Link et
al, 2010
CRC (10)
Adenoma (9)
Control (10)
miR-21
miR-106
Distinguished adenoma and
carcinoma from healthy
controls P<0.05
152
of colorectal neoplasia. Because miR-135b is the most studied miRNA in CRC initiation
and progression, its role should have been thoroughly investigated in early detection of
CRCs. Until the role of a miRNAs is more established, the focus of biomarker studies
should be on miRNAs with a clear role in cancer pathway. However, this strategy might
hinder the inquisitive nature of clinical translational studies for biomarker
development, since this would prevent the pursuit and discovery of novel markers and
their potential roles.
An alternative diagnosis of patients with bowel symptoms rests on a wide spectrum of
benign diseases, varying from minor haemorrhoids to life-impairing inflammatory
bowel diseases. It is important to detect the presence of significant benign diseases too
since their existence will eventually require confirmation by colonoscopy. This study
found discriminatory levels of circulating miRNAs in patients with significant benign
disease. However, future studies should assess a cohort of patients with minor and non-
significant bowel diseases such as haemorrhoids, non-complicated diverticular diseases
and irritable bowel syndrome. A miRNA-based blood test associated with false positive
cases for such a cohort would make the screening test unsuitable. Recently, a panel of
circulating miRNAs have been shown to significantly differentiate colonic adenomas
and carcinomas from haemorrhoids and other benign diseases (Verma et al, 2015).
Another limitation of this study is the characterisation of adenomas based on the size
and grade of adenomas. It is probably difficult to detect small, low grade adenomas on
blood tests, and the natural history of colonic neoplasia progression suggests that it
might take years for such adenomas to develop into cancers. Detection of diseases such
as complicated diverticular disease and inflammatory bowel disease is also of a
paramount significance. Patients with this spectrum of disease would usually require
further assessment and frequent treatments. miR-135b has also been found elevated
in the plasma of patients with ulcerative colitis, and a panel of miRNAs has been found
to have the potential to monitor the severity of ulcerative colitis and detect the
presence of colitis associated dysplasia (Patel et al, 2015).
Significantly, discriminatory levels of miR-135b, miR-34a and miR-431 in patients with
previous colorectal neoplasia might be attributable to the presence of cell-free cancer-
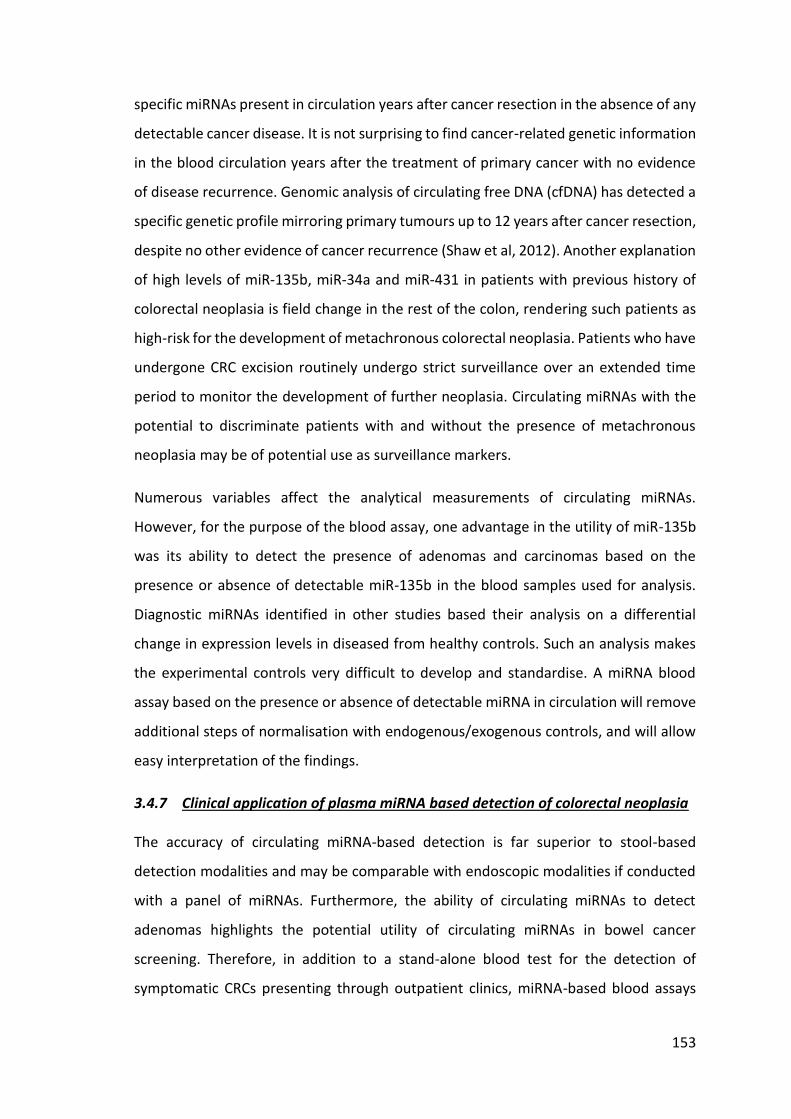
153
specific miRNAs present in circulation years after cancer resection in the absence of any
detectable cancer disease. It is not surprising to find cancer-related genetic information
in the blood circulation years after the treatment of primary cancer with no evidence
of disease recurrence. Genomic analysis of circulating free DNA (cfDNA) has detected a
specific genetic profile mirroring primary tumours up to 12 years after cancer resection,
despite no other evidence of cancer recurrence (Shaw et al, 2012). Another explanation
of high levels of miR-135b, miR-34a and miR-431 in patients with previous history of
colorectal neoplasia is field change in the rest of the colon, rendering such patients as
high-risk for the development of metachronous colorectal neoplasia. Patients who have
undergone CRC excision routinely undergo strict surveillance over an extended time
period to monitor the development of further neoplasia. Circulating miRNAs with the
potential to discriminate patients with and without the presence of metachronous
neoplasia may be of potential use as surveillance markers.
Numerous variables affect the analytical measurements of circulating miRNAs.
However, for the purpose of the blood assay, one advantage in the utility of miR-135b
was its ability to detect the presence of adenomas and carcinomas based on the
presence or absence of detectable miR-135b in the blood samples used for analysis.
Diagnostic miRNAs identified in other studies based their analysis on a differential
change in expression levels in diseased from healthy controls. Such an analysis makes
the experimental controls very difficult to develop and standardise. A miRNA blood
assay based on the presence or absence of detectable miRNA in circulation will remove
additional steps of normalisation with endogenous/exogenous controls, and will allow
easy interpretation of the findings.
3.4.7 Clinical application of plasma miRNA based detection of colorectal neoplasia
The accuracy of circulating miRNA-based detection is far superior to stool-based
detection modalities and may be comparable with endoscopic modalities if conducted
with a panel of miRNAs. Furthermore, the ability of circulating miRNAs to detect
adenomas highlights the potential utility of circulating miRNAs in bowel cancer
screening. Therefore, in addition to a stand-alone blood test for the detection of
symptomatic CRCs presenting through outpatient clinics, miRNA-based blood assays

154
can be used as primary screening tools in bowel cancer screening programmes. With its
higher sensitivity and specificity, this may prove to be cost-effective and help reduce
the need for unnecessary colonic investigations. This study investigated the role of
circulating miRNAs for their utility in CRC screening, and hence it is essential to have an
update on current in use modalities for bowel cancer screening. This can provide insight
into the use of miRNA-based blood tests as stand-alone screening tests or an adjuvant
to existing modalities. A key requirement of a biomarker for early detection of CRC is
high sensitivity and specificity. Colonoscopies remain the gold standard for screening
but are associated with high costs and invasiveness, so has limited use as a primary
screening test in most countries, including the UK. Many studies have now successfully
investigated and reported the potential of miRNAs as diagnostic biomarkers for CRC
screening, but more work is required to produce a highly efficient, robust and
standardized method for miRNA detection in clinical practices. Until the development
of a non-invasive biomarker began to be investigated, studies have focused on the
effective use of currently available stool-based diagnostic modalities of FOBT or FITs. A
multi-target stool DNA test, which combines mutant and methylated DNA markers and
a faecal immunochemical test, recently performed favourably in a large cross-sectional
validation study and has been approved by the US Food and Drug Administration (FDA)
for the screening of asymptomatic, average-risk individuals (Dickinson et al, 2015). Such
stool or blood DNA-based testing are also being considered as screening modalities in
the UK.
Recently, 60% of UK screening centres have participated in the ‘Bowel Scope’
programme with single-stop flexible sigmoidoscopy for participants aged 55 to 64 years.
‘Bowel scope’ screening is an alternative and complementary bowel screening
methodology to FOBT. Evidence shows men and women aged 55 to 64 years attending
a one-off bowel scope screening test for bowel cancer can reduce cancer-related
mortality and incidence of CRC (Atkins et al, 2010 & Holme et al, 2014). Flexible
sigmoidoscopies do not require sedation and are a more simple procedure to perform
but provide no screening of lesions in the proximal colon. Because proximal advanced
adenomas can often exist in the absence of distal lesions, flexible sigmoidoscopies may
yield misleading test results and give patients a false sense of security. Perhaps when
155
used as an adjuvant to ‘Bowel Scope’ miRNA-based blood tests, this will not only
increase the detection rates for right-sided bowel lesions, but will also alleviate the risk
of missing any significant bowel pathology. Although individual miRNA markers have
shown promise in detecting both early adenomas and carcinomas, effective screening
tests will likely employ a panel of miRNAs to improve reliability and consistency.
However, this will likely be more expensive than measuring single miRNAs, and will
require further studies to ensure that the optimal panel is selected to maximize
sensitivity and specificity.
3.4.8 Conclusion
This study has met its aim: to identify circulating miRNAs that can be used for the
detection of colorectal neoplasia. Plasma miRNA expression profiles for different
participants were successfully developed and discriminatory miRNAs were applied to a
larger cohort to assess their diagnostic accuracy for the detection of adenomas and
carcinomas. miR-135b was identified as a plasma miRNA with superior diagnostic
accuracy and detectability for both adenomas and carcinomas. Megaplex™ RT and pre-
amplification primers pools have allowed the detection and quantification of multiple
miRNAs even when present at low levels. The selection of asymptomatic controls with
positive FOBT in NBCSP and symptomatic controls with benign bowel disease attending
endoscopy unit has ensured controls with wide spectrum of benign diseases were used.
Low detection rates for adenomas and an inability to discriminate benign from
neoplastic disease have been the limitations of this study. In addition, although
individual miRNAs such as miR-135b have shown promise in detecting both early
adenomas and carcinomas, effective bowel cancer screening tests based on blood
miRNAs will likely employ a panel of miRNAs to improve reliability and consistency. A
panel of miRNAs for bowel cancer screening will probably be more expensive than a
single miRNA, and will require further studies to ensure the optimal panel is selected,
and sensitivity and specificity are maximised. An additional validation study in
conjunction with national bowel cancer screening programme should be designed and
conducted to validate the diagnostic accuracy of selected miRNAs in larger cohorts
before miRNA-based blood tests are incorporated into cancer screening programmes.

156
Chapter 4: Results
Analysis of exosomal miRNAs for the
detection of colorectal neoplasia

157
4 Results: Analysis of exosomal miRNAs
4.1 Summary of Results
Previous studies have shown that miRNAs extracted from circulating exosomes of
patients with non-gastrointestinal cancers are similar to those extracted from tissue
biopsies. Using a similar approach, exosomal miRNAs in CRC can be evaluated for their
diagnostic accuracy and may provide a breakthrough for diagnostic modality. The aim
of this study was to examine the feasibility of using plasma exosomal miRNAs for the
detection of CRCs. The objective was to evaluate different techniques to isolate and
analyse exosomal miRNAs from the plasma of patients with CRCs. Ultracentrifugation
and immunoaffinity isolation techniques were assessed for the isolation of exosomes
from the plasma of patients with CRCs, healthy controls, and from media harvested
from CRC cell line cultures. CD133, CD326 and GPA33 antibodies were assessed for their
suitability for antibody-coupled Dynabead-based immunoaffinity isolation of plasma
exosomes. Size distribution of exosomes was assessed by transmission electron
microscopy, dynamic light scattering and flow cytometery. miRNA expression levels in
total RNA extracted from exosomes was analysed by Megaplex™ QRT-PCR. Selected
miRNAs were analysed and their expression levels were compared between healthy
controls and patients with adenomas and carcinomas. miRNA expression analysis for
exosomes isolated by ultracentrifugation showed an enrichment of miRNAs (miR-21,
miR-192*, miR-369, miR-502-5P and miR-589 miRNAs) in exosomes representing the
miRNA patterns of their source sample. Analysis of miRNAs (miR-21, miR-31, miR-135b,
miR-192*, miR-502) in CD326 immunoaffinity-isolated plasma exosomes showed
detectable expression levels of miR-135b in 83% of cases with adenomas and
carcinomas. 50% of cases with adenomas and carcinomas showed detectable
expression levels for miR-135b in plasma exosomes isolated via the GPA33
immunoaffinity method. Intergroup comparison of expression levels of miR-21 in
plasma exosomes isolated by CD326 immunoaffinity showed significantly higher
expressions in the combined adenoma and carcinoma group in comparison with healthy
controls. ROC analysis of CD326 immunoaffinity-isolated exosomal miR-21 showed an
AUC value of 0.97 (95% CI= 0.87 - 1.07; p=0.028) for the detection of adenoma and
carcinoma. A similar trend of higher expression levels of miR-31 in CD133

158
immunoaffinity-isolated exosomes from patients with adenoma and carcinoma in
comparison to healthy controls was observed. Thus, this study successfully developed
a protocol for the isolation of circulating exosomes by immunoaffinity, and also
successfully analysed exosomal miRNAs in plasma from patients with CRCs.

159
4.2 Identification of exosomes on Transmission Electron Microscopy
Exosomes isolated by a combination method of filtration and ultracentrifugation of
HT29 colorectal cancer cell line culture harvested media, and plasma from a patient
with colorectal cancer (H276/09) and a healthy control (H400/08), were evaluated with
Transmission Electron Microscopy (Figure 35). The particle size varied from 40-80 nm.
However, a significant number of particles ranging from 81-100 nm were also seen on
TME. As a 100 nm filter was used to filter plasma and harvested media, the
ultracentrifugation technique of exosome precipitation precipitated all microvesicles
less than 100 nm.
Figure 35: Electron micrographs of exosomes isolated from plasma by combination of filtration (100 nm) and ultracentrifugation without sucrose gradient.
The TME figure shows a typical morphology of multiple particles sizes (40-100
nm).Particles of 40-60 nm are non-immune stained exosomes fixed with 2%
gluteraldehyde, as seen on transmission electron microscopy.

160
4.3 Dynamic Light Scattering to assess the size of exosomes isolated by
ultracentrifugation
Exosomes from two plasma samples (H400/08 & H276/09) and HT29 colorectal cell line
culture harvested media were diluted with PBS solution. PBS was used as control
solution with a viscosity of 1.05cP, temperature of 20°C & refraction index of 1.33. All
the measurements for the buffer and samples were taken at room temperature of 37°C.
The plot of size distribution to volume of sample showed a peak of particle size at 21.4
nm and made up 20.8% of total particles (Figure 36). For PBS, this made up to 80% of
same-sized particles. The fraction of particles ranging from 40-60 nm was nearly
undetectable in control PBS. Most DLS measurements were carried out at 20°C using
Malvern© Zeta Nanosizer software. This instrument operates at 4 mW He-Ne laser
power, scattering angle of 173° and wavelength of 633 nm.
Figure 36: The size distribution of exosomes (b) as measured on Malvern© Zetasizer
Nano (a) by Dynamic Light Scattering. The Zetasizer Nano software reported the size
and volume distribution of nanoparticles in a sample. The peak intensity was seen at
21.4 nm and constituted 20.8% of the particles representing nonspecific particles.

161
4.4 Flow cytometry (FACS) for detection of exosomes isolated by
ultracentrifugation
Exosomes isolated from the plasma of a patient with CRC (H276/09) and a colonoscopy
negative healthy control (H400/08) were only detectable on coupling of vesicles with
fluorescence conjugated surface antibodies for exosomes surface ligands. One of the
limitations of FACS was an inability to detect unstained particles smaller than 300 nm.
The FACS showed no detectability for unstained and uncoupled exosomes. There was a
4.6% detection rate for fluorescent antibody-coupled exosomes, whereas no events
were detectable for unstained exosomes preparations (Figure 37).

162
Figure 37: A comparison of events detected for exosomes coupled to fluorescence
stained exosomes surface antibodies (CD44 & CD326). The FACS showed no
detectability for unstained and uncoupled exosomes. 10 µl of exosome preparation
from H400/08 and H276/09 was diluted with 90µl of PBS containing with CD44–PE
conjugated antibody and CD326 (EpCAM)–APC conjugated antibody. One of the
limitations of FACS was an inability to detect unstained particles smaller than 300 nm.

163
4.5 Comparison of total RNA and miRNA concentrations for different volumes of
plasma used for ultracentrifugation
Total RNA concentration for exosomes isolated by ultracentrifugation of plasma
samples was low for H400/08 and H276/09. A significant enrichment of RNA extracted
from cell line harvested media was noticed due to large volume of harvested media
directly used for exosome isolation (Table 37).
Sample Volume of
specimen
RNA concentration
(ng/µl)
260/280
H400/08 – Healthy control 1 ml of Plasma 1.53 0.32
H276/09 - Cancer 1 ml of Plasma 2.32 0.29
HT29 harvested media 10 ml 10.5 1.44
HT29 culture cells 1 ml of stored
lysate
908 1.65
Table 37: Total RNA concentration for exosomes from plasma and HT29 harvested media.
Table shows exosomal RNA concentrations extracted from 1 ml plasma samples from
healthy controls and patient with CRC. Table also shows RNA concentrations for HT29
cell line culture harvested media and RNA concentration for HT29 lysate.

164
A comparison was made between the total concentration of RNA extracted from 1 and
3 ml plasma and the corresponding concentration of miR-21 and snRNA RNU6B. The
concentration of RNA extracted from plasma increased once plasma volume was
increased to 3mls. (Figure 38) An approximate 2 to 4 fold increase in expression levels
of miR-21 was found when the volume of plasma was increased from 1 to 3 ml (Figure
39).
Figure 38: Comparison of total RNA concentration for volume of plasma used to
isolate exosomes isolated by filtration with 100 nm filter and ultracentrifugation. The
concentration of total RNA increased with the increase in volume (H274/09: 3.88 to
9.44 ng/µl, H287/09: 4.6 to 12.4 ng/µl).
0
2
4
6
8
10
12
14
H274/09 H287/09Tota
l R
NA
con
cen
tra
tio
n n
g/µ
l
Volume of plasma used for isolation of microvesicles
Total RNA concentration for different volumes of Plasma used
for Ultracentrifugation
RNA from 1ml of Plasma RNA from 3ml of Plasma

165
Figure 39: Comparison of miRNA expression levels for different volumes of plasma
used to isolate exosomes isolated by filtration with 100 nm filter and
ultracentrifugation. An approximate 2 to 4 fold increase in expression levels of miR-21
was found when the volume of plasma was increased from 1 to 3 ml.
4.6 Comparison of exosomal miRNAs with source miRNAs
Plasma exosomes were isolated from 3 ml of plasma sample collected from a patient
with colorectal cancer. RNA extracted from exosomes isolated from 10mls of harvested
media and 1 ml lysate of cell line lysate were used for comparisons. Megaplex QRT-PCR
protocol was used for the quantification of expressions (CT) of miR-21, miR-192*, miR-
369, miR-502-5P and miR-589 miRNAs. SnRNA RNU6B was used as a control gene for
the relative expression (∆CT) of each miRNA. CT values based expression analysis
showed miR-21, miR-192*, miR-502-5P were detectable in HT29 cell line lysate, HT 29
exosomes, plasma samples and exosomes isolated from plasma samples. miR-369 was
not detectable in any of the samples and miR-589 was not detectable in plasma
exosomes and plasma despite its enrichment in cell lines exosomes. Though higher
levels of expression for miR-21(∆CT = -4) were identified from 3 ml plasma, the protocol
for exosome isolation was long and was inconvenient. Figure 40 and 41 show CT & ∆CT
based expression analysis of different miRNAs studied for different samples.
15
17
19
21
23
25
27
29
31
H274/09 - miR-21 H287/09 - miR-21 H274/09 - SnRNA
RNU6B
H287/09 - SnRNA
RNU6B
Exp
ress
ion
lev
els
(CT
) v
alu
es o
n Q
RT
-PC
R
miR-21 and SnRNA RNU6B for 1ml and 3mls of plasma
miRNA expression levels (CT) for different volumes of plasma
RNA from 1ml of Plasma RNA from 3ml of Plasma

166
Figure 40: Comparison of miRNA expression for plasma exosomes, whole plasma,
HT29 cell line harvested exosomes and HT29 cell lysate.
Bar graph shows expression levels of miR-21, miR-192*, miR-369, miR-502-5P, miR-589
and snRNA RNU6B.
Figure 41: Relative expression levels (∆CT) of miRNAs isolated from plasma and HT29
cell line culture.
Bar graph shows SnRNA RNU6B normalised expressions (∆CT) for miR-21, miR-192* and
miR-502-5P.
0
5
10
15
20
25
30
35
40
45
miR-21 SnRNA
RNU6B
miR-192* miR-369 miR-502-5P miR-589
Exp
ress
ion
Lev
els
of
miR
NA
s (C
T) V
alu
es
Megaplex QRT-PCR relative quantification of selected miRNAS
Comparison of exosomal miRNAs with Source of Isolation
H274/09 - Exosomes H274/09 - Whole Plasma HT29 - Exosomes HT29 - Cell Lysate
-5
0
5
10
15
20
25
30
miR-21 miR-192* miR-502-5P
Sn
RN
A R
NU
6B
ba
sed
rela
tiv
e ex
pre
ssio
ns
(∆CT)
Expression levels for miRNAs in exosomes and their isolation source
Relative Expression levels of Exosomal miRNAs
H274/09 - Exosomes H274/09 - Whole Plasma
HT29 - Exosomes HT29 - Cell Lysate

167
4.7 Assessment of CD133 and CD326 (EpCAM/ESA) antibody coupling with beads by
FACS
Beads coated with fluorescently labelled antibodies specific for CD133 and CD326, and
unstained beads were analysed to assess the coupling of beads with antibody by the
locally available FACS facility in the department of Cancer Studies and Molecular
Medicine. For unstained beads, no fluorescence was detected for events counted
through FACS (Figure 42). For antibody coupled fluorescence conjugated CD133-PE
(65%) and CD326-APC beads, 43% of total events were associated with detection of
specific fluorescence. This suggested that approximately 50% beads were coupled with
antibody (Figure 43 and Figure 44).

168
Figure 42: FACS analysis of unstained beads. No fluorescence activity was detected by
FACS on P3 gate. The number and size of the particles were identical to other
measurements for fluorescence conjugated antibody coupled beads.

169
Figure 43: FACS analysis for CD326 (EpCAM/ESA)-APC coupled Dynabeads.
FACS analysis show 43% of beads were associated with fluorescence, suggesting
effective coupling with antibody.
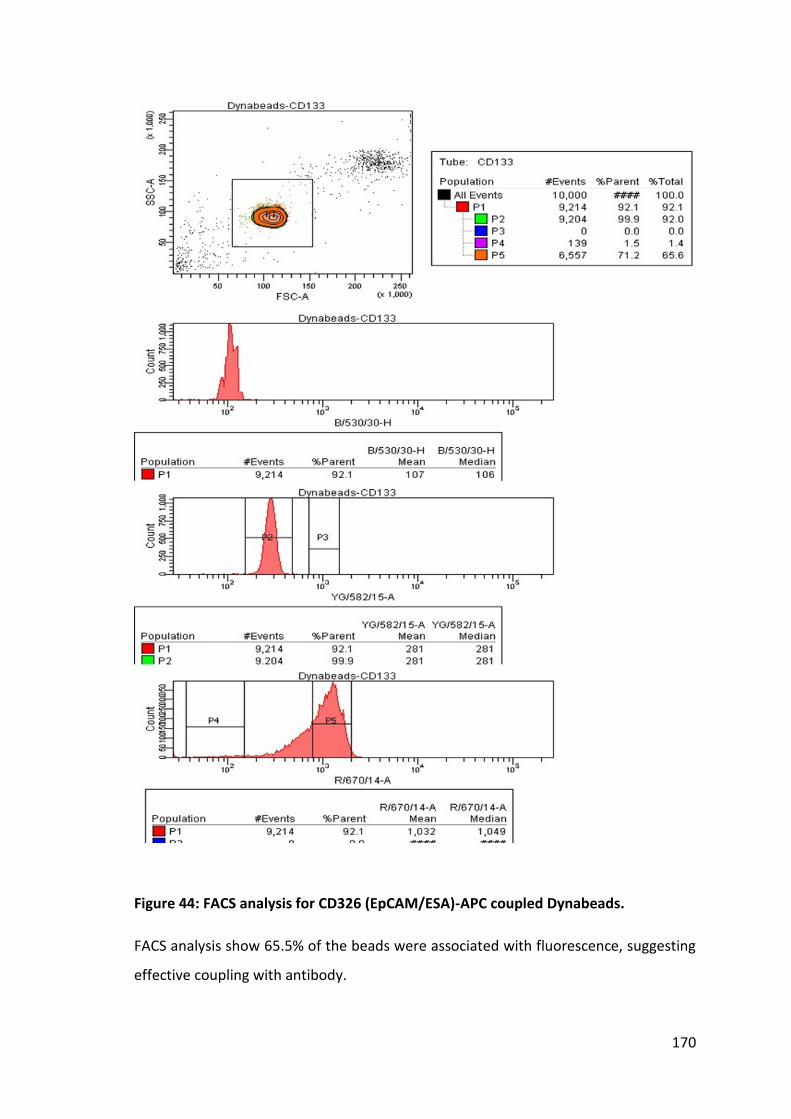
170
Figure 44: FACS analysis for CD326 (EpCAM/ESA)-APC coupled Dynabeads.
FACS analysis show 65.5% of the beads were associated with fluorescence, suggesting
effective coupling with antibody.

171
4.8 Isolation of exosomes with antibody coupled Dynabeads with FACS
Plasma exosomes were isolated from 4 samples by immune-coupling of exosomes with
antibody coupled beads. The fluorescence conjugated to these antibodies was used to
isolate exosomes attached to antibody coupled beads. For FACS analysis, the number
of events representing bound exosomes with antibody coupled beads was compared
with events associated with control unbound antibody coupled beads. Figure 45 shows
the comparison between events for CD133-PE coupled beads bound to exosomes and
CD133-PE coupled beads only.

172
Figure 45: Comparison of FACS analysis for CD133-PE coupled beads bound exosomes
to control CD133-PE coupled beads stored in Aldefluor solution at 4°C.
For isolation of plasma exosomes from plasma (H59/09, H179/09, H260/10, H275/10
and H276/10), 1 ml of plasma was filtered through a 100 nm filter. 45 µl of ED133-PE
and CD326-APC antibody coupled beads was added to filtrate and incubated for 2 hours
at 4°C on a roller. Beads were washed using a magnet with PBS and analysed by FACS.

173
4.9 Analysis of exosomal miRNAs isolated through immune isolation and FACS
Plasma samples from 5 participants representing a wide spectrum of colorectal disease
were analysed for the detection of miR-21, miR-31, miR-135b, miR-192*, and miR-502.
Total RNA concentrations for CD133 and CD326 bead bound exosomes are shown in
table 38. QRT-PCR showed that miR-192* and miR-502 were not detected in both types
of exosomes isolated from all 5 samples (Table 39). miR-135b was only detected in
CD326 exosomes isolated from plasma of patients with Ulcerative colitis. miR-21 was
detected in all samples for both CD133 and CD326 bound exosomes. The differential
expression (∆CT) of miR-21 in exosomes isolated with CD326 bound exosomes could
differentiate between caecal cancer and rectal polyp cases from 3 other cases.
Expression levels of miR-21 in CD133 bound exosomes isolated from plasma of patients
with caecal cancer were 2 fold higher in comparison to other controls. A trend similar
to miR-21 was present for miR-31 and could differentiate caecal carcinoma from
control, but it failed to differentiate a rectal adenoma case.
Sample Specimen characteristic Total RNA concentration
CD133-exosomes CD326-exosomes
H59/09 Normal Colonoscopy 0.96 1.22
H179/09 Normal Colonoscopy 1.02 1.34
H260/10 Large Rectal Polyp 1.26 1.38
H276/10 Pan Ulcerative Colitis with
Dysplasia
1.48 1.58
H275/10 Caecal Carcinoma 1.09 1.22
Table 38: Sample characteristics and RNA concentrations for CD133 and CD326 bound exosomes isolated by FACS.
Total RNA extracted through a Tri-Reagent and mirVana column was quantified using a
spectrophotometer.

174
Sample miR-21 miR-31 miR-135b miR-192* miR-502 RNU6B
Exosomes Isolated with CD133-PE coupled Dynabeads
H59/09 36 (4) 40 (8) 40 40 40 32
H179/09 35 (3) 40 (8) 40 40 40 32
H260/10 34 (4) 40 (10) 40 40 40 30
H276/10 28 (4) 34 (10) 40 40 40 24
H275/10 32 (2) 36 (6) 40 40 40 30
Exosomes Isolated with CD326-APC coupled Dynabeads
H59/09 34 (3) 38 (7) 40 40 40 31
H179/09 35 (3) 40 (8) 40 40 40 32
H260/10 32 (1) 34 (3) 40 40 40 31
H276/10 27 (5) 31 (11) 34 40 40 22
H275/10 29 (1) 32 (1) 40 40 40 28
Table 39: Expression levels of different miRNAs for exosomes isolated with CD133 and CD326 bound Dynabead and FACS.
Table shows expression levels for each miRNA (CT) and snRNA RNU6B normalised
expression levels (∆CT) of miR-21 and miR-31. CT values of 40 means no detectable
expression levels for miR-135b, miR-192* and miR-502.

175
4.10 Direct immune isolation of exosomes by antibody coupled Dynabeads
HT29 colorectal cancer cell line culture harvested media and a plasma sample from a
patient with caecal cancer (H275/09) was used for direct immunoprecipitation of
exosomes using a bench magnet. Total RNA extracted from 2 samples for each type of
antibody bound beads is given in table 40, and Figure 46 shows expression levels of
miRNAs isolated with GPA33 antibody coupled beads.
Sample Type RNA concentration (ng/µl)
CD133 CD326 GPA33
HT29 Harvested Media 3.6 4.81 5.10
H275/10 1.12 2.29 1.78
Table 40: Comparative concentrations of RNA extracted from exosomes.
RNA concentration are shown for exosomes isolated through direct
immuneoprecipitation by CD133, CD326 and GPA33 antibody coupled Dynabeads.
Figure 46: Expression levels of exosomal miRNAs from plasma and cell line exosomes
isolated by immunoprecipitation with GPA33 coupled Dynabeads. Expression levels
(CT) of miR-135b, miR-31 miR-31 are plotted to show the differences of exosomes
isolated from HT29 cell line culture harvested media and plasma from a patient with
colonic cancer.
15
20
25
30
35
40
miR-21 miR-31 miR-135b SnRNA RNU6B
Exp
ress
ion
Lev
els
of
miR
NA
s (C
T)
Expression levels of miRNAs for plasma and Cell line harvested media
Exosomal miRNAs isolated with GPA33 coupled Dynaeneads
HT29 Harvested Media H275/10 Plasma

176
GPA33 coupled beads were assessed for their coupling efficiency, and the isolation of
exosomes was similar to the method used for the assessment of CD133-PE and CD326-
APC coupled beads. FACS assessment of antibody coupling was achieved by detecting
the fluorescence of anti-goat antigen conjugated with APC. Figure 47 shows the FACS
analysis for GPA33 coupled Dynabeads assessed for bound fluorescence and number of
events detected over 6 seconds.

177
Figure 47: FACS analysis for GPA33 coupled Dynabead bound exosomes isolated from
HT29 cell line culture harvested media.
GPA33 coupled beads were conjugated with Aldefluor-488 anti-goat antibody for FACS
analysis.

178
4.11 Analysis of plasma exosomal miRNAs from immunoprecipitated exosomes using
CD133, CD326 and GPA33 coupled Dynabeads
Plasma samples from nine participants (n = 3 controls, n = 3 adenomas and n = 3
carcinomas) were analysed for exosomal miRNAs isolated by immunoprecipitation
using antibody coupled Dynabeads. A total of 3 ml (1 ml of plasma for each set of
antibody coupled beads: CD133, CD326 and GPA33) was used for the direct isolation of
exosomes. RNA isolated was quantified by spectrophotometry. The concentrations of
total RNA isolated from each sample for different antibodies are shown in Table 41.
Sample
Number
Sample ID RNA concentration (ng/µl)
CD133 CD326 (EpCAM) GPA33
Control 1 H335/08 1.08 1.26 0.76
Control 2 H339/08 0.88 1.02 0.92
Control 3 H515/08 1.23 1.43 1.06
Adenoma 1 H334/08 0.92 0.84 0.84
Adenoma 2 H170/09 1.02 1.08 0.88
Adenoma 3 H273/10 1.25 1.56 1.32
Carcinoma 1 H660/10 1.65 1.52 1.43
Carcinoma 2 H265/10 0.82 1.34 1.12
Carcinoma 3 H268/10 1.13 1.32 1.04
Table 41: Total RNA concentrations of immunoaffinity isolated exosomes.
RNA concentrations for CD133, CD326 and GPA33 immunoaffinity isolated exosomes
are compared in the table.
miR-182 was not detectable for exosomes isolated with the 3 different types of
antibodies. miR-135b was not detected for all cases of exosomes isolated with CD133
antibody coupled beads (Figure 48). Exosomes isolated with CD326 and GPA33
coupled beads showed no expression of miR-135b in healthy controls. However, miR-
135B expression was detected for 5 out of 6 adenoma and carcinoma cases for CD326,
and 3 out of 6 adenoma and carcinoma cases for GPA33. Intergroup comparison of
controls and the adenoma/carcinoma combined group showed significantly higher

179
relative expressions of CD326 isoltaed exosomal miR-21 for the adenoma/carcinoma
group (2 tailed student t-test, p=0.03, 95% CI: 0.24 – 5.4). ROC analysis for miR-21
expressions showed AUC of 0.97 for adenoma and carcinoma (Figure 49).
Figure 48: RNU6B normalised expression levels for different miRNAs of exosomes
isolated by different types of antibody coupled Dynabeads.
The differential expression of miR-21 in CD326 isolated exosomes from controls and
groups of adenoma and carcinoma showed significantly higher expression levels (2
tailed student t-test, p=0.03, 95% CI: 0.24 – 5.4). A similar trend of miR-31 expression
was seen for exosomes isolated with CD133 coupled Dynabeads (2 tailed student t-test,
p=0.038, 95% CI: 0.11 – 3.2). No statistically significant differences in expression levels
(∆CT) of different miRNAs were seen for GPA33 bound exosomes. The expression of
miR-135b (CT) was detectable in exosomes isolated with GPA33 coupled beads from 2
cancer patients and 1 adenoma case.

180
Figure 49: Diagnostic utility of exosomal miR-21 isolated with CD326 coupled
Dynabeads. The box plot shows differences in mean expression levels for controls and
participants with adenoma and carcinoma. ROC analysis show AUC of 0.97 (95% CI=
0.87 to 1.07 and p=0.028).

181
4.12 Discussion
It is feasible to develop a protocol and detect exosomal miRNAs from plasma samples
of patients with colorectal neoplasia. The antibody coupled Dynabeads-based immune-
affinity isolation method is an efficient way of isolating exosomes circulating in the
blood of patients with adenomas and carcinomas. Other methods of filtration and
ultracentrifugation are time consuming, and the isolation of exosomes may not be
cancer-specific, hence fail to override the existing protocol of plasma miRNAs analysis
by direct extraction of RNA from whole plasma. A recent review (Sato-Kuwabara et al,
2015) on exosomal miRNAs in the literature has summarised exosomal miRNAs isolation
techniques and significant miRNAs for cell lines and body fluid related to different
cancers. Most of these reports summarised in this review were based on exosomal
isolation by ultracentrifugation for a variety of cancer cell lines including leukaemia,
melanoma, glioblastoma and cancers of solid organs including breast, lungs, prostate,
ovary and gastrointestinal tract. From the summary, it is clear that ultracentrifugation
is a preferred method of isolation of exosomes harvested from cell line culture.
Whereas, for body fluids, immunoaffinity isolation yields tumour-related miRNAs for
their utility in diagnosis of different cancers (Sato-Kuwabara et al, 2015).
4.12.1 Selection of miRNAs and antibodies for this feasibility study
This feasibility study for the analysis of exosomal miRNAs used a known panel of cancer
related miRNAs (miR-21, miR-31, miR-135b and miR-182). Expression levels of these
miRNAs were found to be upregulated in plasma samples of a significant number of
patients with colorectal neoplasia in our previous validation cohort using whole plasma
for total RNA isolation. The selection of CD326 (EpCAM) and CD133 antibody for
Dynabead coupling was based on their utility in isolation of cancer stem cells from
cancer tissue specimens taken at the time of resectional surgery. CD326 (EpCAM) and
CD133 surface markers remain 2 potent markers for CRC stem cells isolation (Fanali et
al, 2014) and CD326 (EpCAM) has recently been studied for its role in cancer initiation
and progression (Failli et al, 2014). A previous study has shown that the isolation of CRC
specific highly purified exosomes is possible by using GPA33 antibody for
immunoaffinity capture (Mathivanan et al, 2010). GPA33 is exquisitely restricted to
epithelial cells lining the entire gastrointestinal tract. Its expression has been observed

182
in over 95% of CRCs and associated metastases (Garinchesa et al, 1996). Its use has been
investigated as a therapeutic target for the treatment of locally advanced and
metastatic colorectal cancers (Ciprotti et al, 2014 & Infante et al, 2013).
4.12.2 Specificity of immunoaffinity isolated exosomal miRNAs for CRCs
The use of CD326 (EpCAM), CD133 and GPA33 antibodies coupled with Dynabeads was
studied for the isolation of exosomes from HT29 cell line culture harvested media and
plasma samples from patients with CRC. Detection of commonly upregulated miRNAs
in CRC tissue (miR-21, miR-31 & miR-135b) in exosomes isolated from culture harvested
media and plasma samples of patients with CRC was suggestive of cancer-related
miRNAs in exosomes and their transport to body fluids.
Though detection of circulating exosomal miR-135b and miR-31 was not statistically
significant, miR-135b remains a primary focus of early detection due to its role in
adenoma initiation and progression.
4.12.3 Literature review of exosomal miR-21
Detection of miR-21 has been found significant in this feasibility study but is
upregulated in a wide range of solid tumours including CRCs (Volinia et al, 2006). It has
been secreted in plasma exosomes from patients affected by different cancer types,
such as ovarian, lung and colon carcinomas and pancreatic cancers (Wang et al, 2012,
Cappellesso et al, 2014, Leidinger et al, 2014, Ogata-Kawata et al, 2014 & Que et al,
2014).
Upregulation of miR-21 has been shown to promote cellular proliferation, survival,
invasion and migration in different cancer cell lines (Lu et al, 2008), while its knockdown
decreased tumour cell survival in vitro and tumour growth in vivo in a murine xenograft
model, accompanied by enhanced apoptosis (Yan et al, 2011). Interestingly, miR-21 and
-29a secreted by tumour cells via exosomes have been shown to bind to toll-like
receptors (TLR) on immune cells, leading to TLR-mediated (nuclear factor kappa-light-
chain enhancer of activated B cells) NF-κB activation and secretion of pro-metastatic
inflammatory cytokines that may ultimately lead to tumour growth and metastasis
(Fabbri et al, 2013).

183
miR-21 has been found to be a potential diagnostic exosomal miRNA, and has also been
identified in circulation for exosomes in glioblasmatoma (Skog et al, 2008), and ovarian
(Taylor et al, 2008), lung (Rabinowits et al, 2009) and oesophageal (Tanaka et al, 2013)
cancers. In another study (Ogata-Kawata et al, 2014), Ogata-Kawata and colleagues
performed a microarray-based profiling of exosomal miRNAs isolated by
ultracentrifugation of 750 µl of serum from patients with CRC and harvested media
collected from colon cancer cell lines. In this study, exosomal miRNA expression
profiling identified a panel of 8 upregulated miRNAs (let-7a, miR-21, miR-23a, miR-150,
miR-1224-5p, miR-1229 and miR-1246) in the plasma of CRC patients in comparison to
healthy controls. Expression levels of these exosomal miRNAs are significantly reduced
in the circulation once patients have gone through resectional surgery. Their analysis
for miR-21 showed a true positive detection rate at 61.4% and false positive detection
rates lower than 10%. They also noted that a combined usage of 8 miRNAs did not
provide more diagnostic power.
4.12.4 Use of CD326 (EpCAM) for circulating exosomal miRNA analysis in non CRCSs
Magnet-activated cell sorting (MACS) for CD326 (EpCAM) was used to isolate plasma
exosomes by immunoaffinity for both ovarian and lung cancers (Taylor et al, 2008 and
Rabinowits et al, 2009). EpCAM-positive exosomes were detectable in patients with
benign ovarian disease, ovarian cancer and healthy controls. miRNA expression analysis
for exosomes isolated by immunoaffinity identified a panel of miRNAs including miR-
21, miR-141, miR-200a, miR-200c, miR-200b, miR-203, miR-205 and miR-214. While
exosomal miRNAs from ovarian cancer patients exhibited similar profiles, these profiles
were significantly distinct from benign diseases and normal controls.
In a second study (Rabinowits et al, 2009), researchers measured total exosomal and
miRNA concentrations for EpCAM immunoaffinity isolated exosomes in plasma of
patients with stage I-IV lung adenocarcinoma and healthy controls. The mean exosome
concentration was 2.85 mg/ml (95% CI, 1.94–3.76) for the lung adenocarcinoma group
versus 0.77 mg/ml (95% CI, 0.68–0.86) for the control group (P < 0.001). The mean
miRNA concentration was 158.6 ng/ml (95% CI, 145.7–171.5) for the lung
adenocarcinoma group versus 68.1 ng/ml (95% CI, 57.2–78.9) for the control group (P

184
< 0.001). A panel of exosomal miRNAs (miR-17-3p, miR-21, miR-106a, miR-146, miR-
155, miR-191, miR-192, miR203, miR-205, miR-210, miR-212, and miR-214) was found
to be elevated in patients with lung cancer in comparison to healthy controls. An
elevated level of miR-21 in EpCAM immunoaffinity isolated exosomes suggests that its
use as diagnostic biomarker may not be suitable as a screening test for a CRC.
4.12.5 Total plasma vs exosomal miRNAs
Several other reports have suggested the use of circulating miRNAs in whole plasma or
serum, including miR-141, miR-21, miR-221, miR-29, and miR92a, as diagnostic
biomarkers of CRC (Ng et al, 2009, Huang et al, 2010, Pu et al, 2010, Cheng et al, 2011
& Toiyama et al, 2013). These miRNAs were shown to display sensitivities and
specificities comparable to those of the colon cancer markers currently in use. Notably,
miR141, miR-221, and miR-21 were reported to be upregulated in cancer tissues
(Scheffer et al, 2012, Kawaguchi et al, 2013 & Si et al, 2013); the total miRNA set from
whole plasma or serum may include endogenous cellular miRNAs derived from broken
or circulating tumour cells (Swarup et al, 2007 & Madhavan et al, 2012), which may
explain why miR-141, miR-221, and miR-21 are present at high levels in whole serum or
plasma samples from cancer patients. In addition, serum/plasma miRNAs, which are not
associated with vesicles, were reported to show differential stability in response to
treatment by RNase (Koberle et al, 2013), suggesting that exosomal miRNAs are more
preferable as biological specimens for developing diagnostic biomarkers because of
their stability in serum/plasma. In fact, the results presented here demonstrate that
exosomal miRNA levels also reflect cancer-bearing status and pathological changes of
patients. Exosomes are actively released from cancer cells and their specific
constituents depend on the cell from which they originate. Indeed, cancer cells may use
an as yet unidentified mechanism to embed a subset of miRNAs into exosomes.
In fact, exosomal miRNAs are more stable and resistant to degradation than cellular
miRNAs (Hu et al, 2012). In addition, exosomes can deliver multiple messages
simultaneously, which make them an attractive way of exchanging specific subsets of
mRNA, miRNA, or proteins between donor and recipient cells, also at a distance. Their
specific mechanism of distant communication and their mode of transport in circulation

185
are still unclear. Exosomes display exquisite target cell selectivity in vitro and in vivo,
based, at least in part, on target cell ligand interactions with exosomal tetraspanin-
associated receptors. Maintenance of internalization complexes and reuse of these
complexes for exosome uptake appear to be a common theme. Importantly, the
engagement of protein complexes in internalization-prone membrane domains
provides an explanation for the target cell selectivity, which is unlikely to rely exclusively
on single adhesion molecules, which are frequently expressed on many cells.
The binding of exosomes to the surface of recipient cells is mediated by classical
adhesion molecules involved in cell–cell interactions, such as integrins and ICAMs
including CD326 (EpCAM). However, other molecular pairs more specific to the
exosome membrane, such as TIM-binding phosphatidylserines, carbohydrate/ lectin
receptors and heparan sulfateproteoglycans (HSPGs), could be involved as well (Thuma
et al, 2014). This opens a new search for surface markers to identify cancer specific
markers to isolate these exosomes by immunoaffinity. GPA33 is expressed in >95% of
CRCs and holds immense potential for the isolation of CRC specific exosomes in
circulation.
Accumulating evidence from the literature supports the idea that exosomal miRNAs can
act as regulators of gene expression in distant cells. Particularly in cancer, exosomes
have multiple functions including the promotion of local and systemic processes that
lead to cell growth and dissemination, or impairment of the immune system response.
miRNAs can act either as tumour suppressors or oncogenes (oncomiRs), depending on
target genes and cancer types. Furthermore, a particular miRNA can exploit both
tumour-suppressive and oncogenic functions depending on the cellular context of its
target genes in different cancers (Chen et al, 2012).
4.12.6 Role of exosomal miRNAs in cancer development and progression
Exosomal miRNAs play important roles in tumour development, progression and
metastasis. Their role in the alteration of the immune system in patients with cancer
has been studied in detail. It has been postulated that they confer suppressive effects
on anti-tumour immune responses (Taylor et al, 2011 & Filipazzi et al, 2012). For
example, inhibition of MHC class I gene transcription by overly expressed miR-9 in many

186
cancers leads to a failure to recognise tumour cells by the host’s immune system (Gao
et al, 2013). Similarly, miR-222 down-regulates the expression of intracellular cell
adhesion molecule 1 (ICAM-1) on surfaces of tumour cells, and binding of ICAM-1 to
lymphocyte function-associated antigen (LFA-1) is essential for optimal activation of
cytotoxic T cells, which in turn mediate tumour cell lysis (Ueda et al, 2009).
In some cases, exosomal pathways might discard tumour-suppressor miRNAs or enrich
tumour-promoting miRNAs to enhance their metastatic potential. For example,
enrichment of let-7 miRNA family in exosomes derived from metastatic gastric cancer
cells in comparison with non-metastatic parental cells leads to their aggressive
behaviour (Ohshima et al, 2010). Similarly, metastatic cells from bladder carcinoma
secrete exosomes associated with higher levels of miRNAs associated with invasion,
angiogenesis, and metastasis (Ostenfeld et al, 2014).
Recently, IL-4-activated macrophages have been found to regulate the invasiveness of
breast cancer cells through exosome-mediated delivery of the miR-223, highlighting a
novel communication mechanism between tumour-associated macrophages and
cancer cells (Yang et al, 2011). The pivotal role of exosomes in tumour progression has
recently been highlighted by the discovery that breast cancer exosomes cause cell-
independent miRNA biogenesis and stimulate non-tumorigenic epithelial cells to form
tumour colonies at a distance (Melo et al, 2014).
It has been reported that melanoma-released exosomes can modify distant lymph
nodes to facilitate melanoma growth and metastasis (Hood et al, 2011). Exosomal
mRNAs and miRNAs derived from tumour cells were recovered in lymph node stroma
and lung fibroblasts (Rana et al, 2013). In addition to stromal modification, cancer cell–
derived exosomes modulate protease-induced degradation of extracellular matrix
(ECM) proteins including collagens, laminin, and fibronectin. This in turn leads to loss of
cell adhesion, an increase in cell motility, and invasiveness (Mu et al, 2013).
Exosomal miRNAs, such as miR-105, play important role in the promotion of cancer cell
migration by targeting tight junction proteins at endothelial monolayers in metastatic
breast cancer cells. In vitro experiments have shown that over expression of miR-105 in
non-metastatic cancer cells can induce metastasis and vascular permeability in distant

187
organs, whereas inhibition of miR-105 in highly metastatic tumours can reverse these
effects (Zhu et al, 2014).
Exosomal miRNAs from the miR-200 family, responsible for epithelial-mesenchymal
transition, can transfer the molecules from highly metastatic tumour cells to weakly
metastatic cells by internalisation of exosomes (Epstein et al, 2014 & Le et al, 2014). It
has also been identified that miRNA-enriched exosomes released by CD105 cancer stem
cells from renal carcinomas can modify the tumour microenvironment by triggering
angiogenesis (Grange et al, 2011). Specific exosomal miRNAs, such as those of the miR-
17-92 cluster, have an important role in neoplasia-to-endothelial cell communication
for regulating endothelial gene expression during tumour angiogenesis in leukaemia
cells (Umezu et al, 2013).
It has also been shown that tumour-secreted miR-9 encapsulated into exosomes
promotes endothelial cell migration and tumour angiogenesis participating in
intercellular communication and function (Zhuang et al, 2012). Moreover, exosome
angiogenic miR-210, known to be increased in the serum of cancer patients with
malignant breast cancer, regulates the metastatic ability of cancer cells through
suppression of specific target genes, resulting in enhanced angiogenesis (Kosaka et al,
2013). These findings suggest that the horizontal transfer of exosomal miRNAs from
cancer cells can dictate the micro-environment needed for cancer progression.
The exosomal miRNA profiling from blood of cancer patients and healthy controls has
often revealed important differences in relation to tumour progression, highlighting a
possible use of these miRNAs as disease prognostic biomarkers (Ye et al, 2014). In
addition, many tumours displaying drug resistance show alterations in the expression
of miRNAs. The up- or down-regulation of miRNAs affects the expression of several
target proteins associated with drug sensitivity (Migliore et al, 2013).
Moreover, different studies indicate that exosomes act as vehicles for the exchange of
genetic cargo between heterogeneous populations of tumour cells, generating a way of
transmitting drug resistance (Corcoran et al, 2012 and O'Brien et al, 2013). Recently
Chen and colleagues reported that exosomes from breast cancer cells are capable of
delivering a subset of miRNAs associated with drug resistance (miR-100, miR-222 and

188
miR-30a) to drug sensitive cells (Chen et al, 2014). In contrast, exosomes vesicles can
be used to alter drug resistance by delivering miRNAs essential for drug sensitivity
(Munoz et al, 2013).
4.12.7 Limitations of the study
The limitations of this feasibility study include small sample size and low total RNA
concentrations extracted from immunoaffinity isolated exosomes. Such a small
concentration of RNA is associated with loss of some important diagnostic miRNAs
expressed at low levels, such as miR-135b and miR-182. This could potentially explain
why only 3 out of 5 adenomas and carcinoma with miR-135b were detected.
GPA33 antibody was used without its prior validation on human CRC tissues by
immunostaining and comparison with controls. There is a possibility that miRNAs or
exosomes might have attached to active beads directly rather through an antigen-
antibody reaction for immune isolation. Therefore, assessment and measurement of
surface marker proteins may be used in future to identify whether a direct reaction with
beads has occurred.
4.12.8 Conclusion
This study has met its aim: to examine the feasibility of using plasma exosomal miRNAs
for the detection of CRCs. In this study, different isolation techniques for circulating
exosomes were successfully evaluated and exosomal miRNAs for patients with CRC
were analysed. Unique surface membrane properties and enrichment with cancer-
related miRNAs has permitted immunoaffinity isolation of exosomes in plasma samples
and detection of cancer-related miRNAs by QRT-PCR. In future studies, CD133, CD326
and GPA33 antibody-coupled Dynabeads should be used for the immunoaffinity
isolation of plasma exosomes. Low RNA concentrations extracted from immunoaffinity-
isolated exosomes may have caused a loss of important diagnostic miRNAs. Therefore,
the development of miRNA expression signature for participants with adenomas,
carcinomas and healthy controls might help identify cancer-related miRNAs encased in
circulating exosomes. Since the total RNA yield from immunoaffinity-isolated exosomes
is low, the use of Megaplex™ RT and pre-amplification primers should be continued for
QRT-PCR-based detection. Once adenoma and carcinoma-related exosomal miRNAs are

189
identified for expression profiling, their diagnostic accuracy should be validated in an
independent cohort of participants with adenomas and carcinomas, compared with
healthy controls.

190
Chapter 5: Results
miRNA expression profiling-based
identification of high risk Dukes’ stage B
CRCs

191
5 Results: Tissue miRNAs
5.1 Summary of results
Despite surgical resection being highly effective for patients with Dukes’ stage B CRCs,
approximately 25% of these patients develop metastatic disease during the follow up
period. This has led to uncertainty about the suitability of post-operative chemotherapy
for Dukes’ B CRCs. It is not possible to accurately predict the development of metastasis
in this group of CRCs by histological examination of resected cancer specimens alone.
Therefore, molecular markers are required to identify which high risk Dukes’ B cancer
patients may benefit from post-operative chemotherapy.
The aim of this study was to examine the utility of tissue miRNAs combined with
common gene mutations in CRCs as biomarkers for the prediction of metastasis
development in patients with high risk Dukes’ B cancers. The objectives were: (i) to
identify specific tissue miRNAs associated with different stages of CRCs, (ii) screen for
common gene mutations (KRAS, BRAF, PIK3CA) in formalin-fixed paraffin-embedded
(FFPE) CRC tissue, and (iii) combine all data to predict the development of metastasis in
patients with Dukes’ B cancers.
Patients who underwent curative bowel resection for Dukes’ A, Dukes’ C or ‘low-risk B’
(patients without distant metastases at 5-year follow-up) were compared with case-
matched ‘high-risk B’ (patients who developed metastatic disease at some stage during
the following 5 years). miRNAs from tumour and adjacent normal tissue and common
gene mutations (KRAS, BRAF, PIK3CA) in primary cancer tissue were analysed to identify
prognostic tissue markers for the development of metastasis in patients with Dukes’ B
CRCs. Twenty age- and gender-matched paired tumour and adjacent normal tissues,
five from Dukes A, ‘low-risk B’, ‘high-risk B’ and Dukes’ C groups were used for miRNA
expression profiling, described as a training cohort, using Taqman Megaplex™ RT and
pre-amplification primers Human Pool A v.2.1 and Pool B v.2.0. A panel of
discriminatory miRNAs for ‘high risk B’ (miR-15b, miR-21, miR-32, miR-34a, miR-125a-
5p, miR-135b, miR-182, miR-184, miR-302b, miR-330-3p, miR-330-5p, miR-381, miR-
483, mR-508, miR-708) was selected and confirmed with QRT-PCR on individual array
samples. A panel significantly discriminating 8 miRNAs was further analysed in a

192
validation cohort (n=72). Expression levels of miR-15b and miR-135b were significantly
downregulated (p < 0.001) in ‘high-risk B’ cancers compared with Dukes A, ‘low-risk B’
and Dukes’ C without metastasis. 97 cancer tissue specimens were analysed for
mutation status. The KRAS oncogene was found to be mutated in 28 cases, whereas
BRAF mutations were detected in 19 cases, and PIK3CA mutations were detected in 9
cases. No significant differences of mutation status and the development of metastasis
were observed. These results suggest that expression analysis of miR-15b and miR-135b
in FFPE tissue specimens can predict the development of metastasis in Dukes’ B cancers,
but by this requires further validation in a larger cohort.

193
5.2 miRNA expression signature for different Dukes’ stages
Not all miRNAs in the array were expressed in colorectal tissue. miRNAs with expression
levels of (CT) < 35 and present in at least one pooled sample of normal or cancerous
tissue were included for further analysis. Significance analysis for microarrays (SAM) of
RNU6B normalised expression profiling data showed significantly different miRNAs for
‘low risk B’ and “high risk B” tumours (Figure 50). These differentially expressed miRNAs
were selected and compared further for paired pools of adjacent normal and cancerous
tissue to identify deregulated miRNAs in tumour tissue (paired Student’s t-test, p<0.05).
The miRNA expression signature derived from Multiexperiment Viewer v4.4 (MeV)
software shows miRNAs are deregulated in tumour tissue and Dukes’ stage B (Figure
51). miRNAs which were deregulated in tumour tissue in comparison with adjacent
normal tissue and significantly different from “high risk B” tumours were selected from
TaqMan® MicroRNA Array Card A v2.1 for further validation, and included miR-15b,
miR-21, miR-32, miR-125a-5p, miR-135b, miR-182, miR-302b, miR-330-3p, miR-330-
5p,miR-381, miR-483, mR-508 and miR-708. miR-34a was selected due to its strong
relation with p53, and miR-184 and RNU6B were selected as endogenous controls for
normalization purposes.

194
Figure 50: Significance analysis for microarrays (SAM).
SAM measured the strength of the relationship between miRNA expression in ‘high risk
B’ and ‘low risk B’, and in Dukes’ C and A. Repeated permutations of RNU6B normalised
data were used to identify miRNAs which were significantly different for ‘high risk B’.

195
Figure 51: Hierarchical cluster analysis of expression profiling data for different Dukes’ stages.
A hierarchical cluster dendrogram of 41 differentially expressed miRNAs in either
tumour or normal tissue, determined using the Multiexperiment Viewer v4.4 software
using miRNA expression profiles derived from TaqMan® MicroRNA Array cards. 20 cases
of CRC were profiled representing Dukes’ A, Dukes’ ‘low-risk B’ (represented as Good
B), Dukes’ ‘high-risk B’ (represented as Bad B) and Dukes’ C. and miRNAs with CT < 35
that were present in the majority of samples were analysed statistically.

196
5.3 Confirmation of Expression Profiling data with QRT-PCR
Further confirmation of selected miRNAs from 20 tumour and paired micro-dissected
adjacent normal tissues used in Taqman® MicroRNA Array, and showed that miR-21,
miR-34a, miR-135b and miR-708 were significantly up regulated in cancer tissue
compared to adjacent normal tissue (paired Student’s t-test, p≤0.05). Levels of miR-
135b in tumour tissue were 1525-fold higher compared to adjacent normal tissue
(Student’s t-test, p<0.05). The average expression levels of miR-15b, miR-32, miR-125a-
5p, miR-302b, miR-182 and miR-708 in cancer tissue were higher than that detected in
normal tissue. There were no significant differences in the expression levels of miR-330-
3p or miR-330-5p in tumour and adjacent normal tissue. The comparison of ‘high risk B’
with ‘low risk B’ tumour tissue (analysed by Mann-Whitney U test, Z-Score and a direct
comparison of CT values of both groups) identified that miR-15b, miR-21, miR-34a, miR-
125a-5p, miR-135b, miR-182, miR-508 and miR-708 were differentially expressed
between the two groups (Mann-Whitney U test, p≤0.10). Analysis of variance (ANOVA)
for RNU6B normalized expression levels of miRNAs in tumour tissue relative to adjacent
normal tissue (ΔΔCT) for 4 tumour groups showed no significant difference in
expressions of miR-32, miR-302b, miR-330-3p, miR-330-5p, miR-387 and miR-483.
Expression levels of miR-15b and miR-125a-5p were significantly lower, whereas
expression levels of miR-21, miR-135b, miR-182 and miR-708 were significantly higher
in ‘high risk B’ tumours in comparison to ‘low risk B’ tumours (Mann-Whitney U test,
p<0.05). Table 42 summarizes the PCR validation of selected miRNAs identified from
array with 20 paired tumours and normal tissue samples. Based on the p-value obtained
(Mann-Whitney U test, p≤0.05) seven miRNAs (miR-15b, miR-21, miR-34a, miR-135b,
miR-125a-5p, miR-182 and miR-708) were selected for further validation on an
independent cohort of 72 paired tumour and adjacent normal tissue.

197
miRNA Expression in
tumour
tissue
Tumour vs.
normal
(fold change)
p-value Low risk B vs.
high risk B
(fold change)
p-value
miR-135b Up regulated 1525.29 0.0002 5.29 0.04
miR-21 Up regulated 10.65 0.01 1.53 0.05
miR-708 Up regulated 7.04 0.01 2.33 0.02
miR-32 Up regulated 5.11 0.28 0.02 0.26
miR-15b Up regulated 5.01 0.33 0.01 0.07
miR-302b Up regulated 4.43 0.33 2.71 0.86
miR-508 Up regulated 4.15 0.40 0.18 0.09
miR-483 Up regulated 4.00 0.34 3.53 0.92
miR-381 Up regulated 3.75 0.43 0.32 0.40
miR-125a-5p Up regulated 2.59 0.45 0.04 0.10
miR-34a Up regulated 2.50 0.05 0.78 0.10
miR-184 Up regulated 1.21 0.90 0.58 0.61
miR-330-3p No Change 0.48 0.12 0.43 0.30
miR-330-5p No Change 0.39 0.14 0.26 0.56
Table 42: Summary of PCR-based confirmation of selected miRNAs on samples used for array.
Changes in expression levels of miRNAs in tumour and normal tissue are expressed as
fold changed generated from ∆∆CT values with corresponding p-values (paired
Student’s t-test). Expression levels of each miRNA, both direct CT values and RNU6B
normalized ∆CT were compared between ‘high risk B’ and ‘low risk B’ tumours.
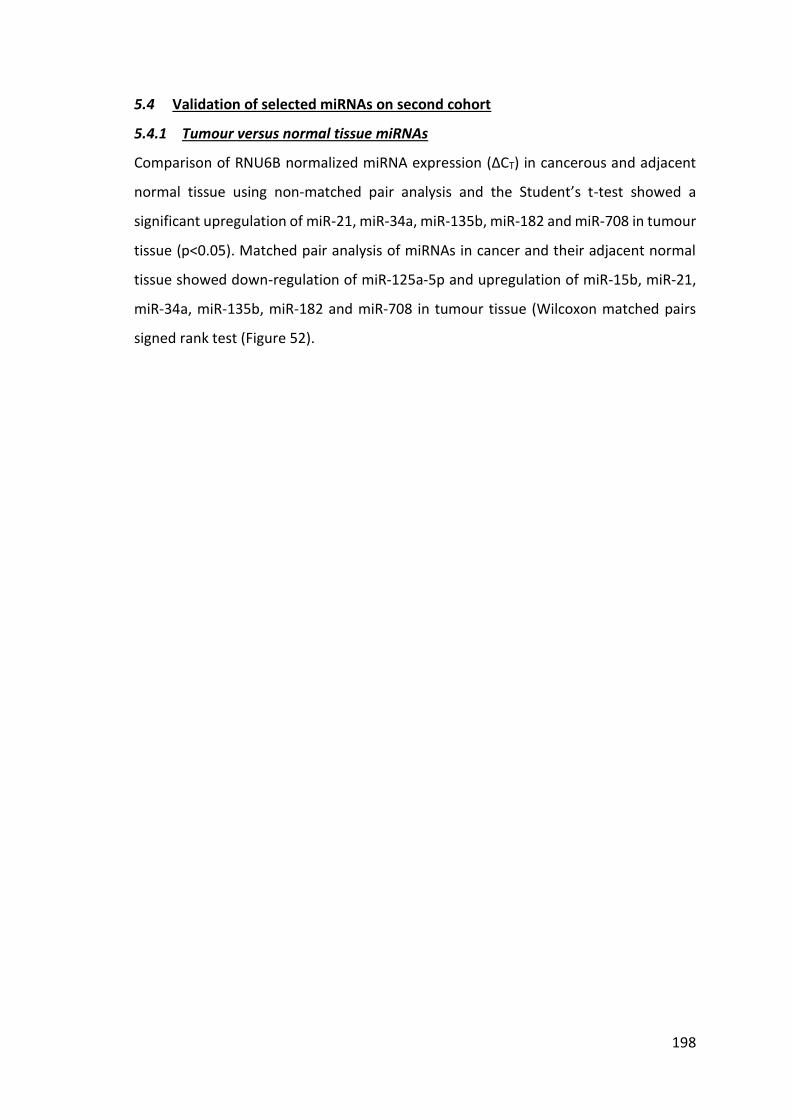
198
5.4 Validation of selected miRNAs on second cohort
5.4.1 Tumour versus normal tissue miRNAs
Comparison of RNU6B normalized miRNA expression (ΔCT) in cancerous and adjacent
normal tissue using non-matched pair analysis and the Student’s t-test showed a
significant upregulation of miR-21, miR-34a, miR-135b, miR-182 and miR-708 in tumour
tissue (p<0.05). Matched pair analysis of miRNAs in cancer and their adjacent normal
tissue showed down-regulation of miR-125a-5p and upregulation of miR-15b, miR-21,
miR-34a, miR-135b, miR-182 and miR-708 in tumour tissue (Wilcoxon matched pairs
signed rank test (Figure 52).

199
Figure 52: Comparison of RNU6B normalized miRNA expression (ΔCT) in cancerous and adjacent normal tissue.
Matched pairs of cancerous and adjacent normal tissue were compared with Wilcoxon
matched pairs signed rank test and showed upregulation of miR-21, miR-34a, miR-135b,
miR-182 and miR-708.

200
5.4.2 Dukes’ stage ‘low risk B’ versus ‘high risk B’
RNU6B normalized expressions (∆CT) of 8 selected miRNAs in tumour tissue of different
Dukes’ stages were compared using ANOVA with Bonferroni’s correction. For ‘low risk
B’ and ‘high risk B’ tumours there was no significant difference in expression levels (∆CT)
of miR-21, miR-34a, miR-125a, miR-182, miR-508 and miR-708 in tumour tissues.
Expression levels of miR-135b were significantly lower in ‘high risk B’ tumours compared
to Dukes’ A and Dukes’ C (p=0.0001) and ‘low risk B’ (p=0.0003) tumours. Similarly,
expression levels of miR-15b were significantly lower in ‘high risk B’ tumour tissue
compared with Dukes’ stage A, C and ‘low risk B’ tumour tissue (p<0.001; Figure 53).

201
Figure 53: Comparison of miRNA expression levels of different stages.
Expression levels (∆CT) of miR-15b and miR-135b were significantly lower for ‘high risk
B’ tumours (p<0.001) in comparison with ‘low risk B’ and Dukes’ C tumours (ANOVA
with Bonferroni’s correction).a) Expression levels of miR-15b in ‘high risk B’ in
comparison to ‘low risk B’ tumour tissue (mean difference in ∆CT = 3.29, 95% CI = 0.37-
6.03) and Dukes’ stage C tumours (mean difference in ∆CT = 3.95, 95% CI = 1.11-6.79).
b) Expression levels of miR-135b in ‘high risk B’ tumour tissue in comparison to ‘low risk
B’ tumour (mean difference in ∆CT = 7.36, 95% CI = 3.47-11.25) and Dukes’ stage C
tumours (mean difference in ∆CT = 8.23, 95% CI = 4.31-12.16).

202
The expression levels of miR-135b in tumour and adjacent normal tissue showed
relatively lower expressions in comparison to Dukes’ C and “low-risk” Dukes’ B (Figure
54).
Figure 54: Plot of miR-135b expression for paired adjacent normal and cancerous tissue.
Non-normalized expression levels of miR-135b are plotted for both tumour and paired
normal tissue. Both ‘low risk B’ and Dukes’ C tumour have two distinct subpopulation
of tumour. One group has no detectable expression of miR-135b in micro-dissected
adjacent normal tissue similar to ‘high risk B’ tumours. However, expression level of
miR-135b in ‘high risk B’ tumours are much lower (Wilcoxon matched pairs signed rank
test, p<0.001). In other subgroups of ‘low risk B’ and Dukes’ C tumours, miR-135b is well
expressed in adjacent normal tissue too.

203
Trend analysis of ΔCT of tumour miRNA expression for Dukes’’ stage A, B and C revealed
a linear trend for expression levels of miR-15b, miR-125a-5p and miR-135b from Dukes’
stage A to Dukes’’ C (p<0.05) (Table 43). Further analysis for left sided tumours showed
that miR-15b, miR-21 and miR-34a had linear trend of progression for their levels of
expression with increasing cancer stage.
miRNAs All tumours Left-sided tumours
R square P- value R square P- value
miR-15b 0.26 0.027 0.41 0.0167
miR-21 0.02 0.9572 0.23 0.04
miR-34a 0.10 0.3837 0.36 0.0398
miR-125a-5p 0.28 0.0189 0.30 0.0985
miR-135b 0.23 0.0439 0.24 0.1738
miR-182 0.16 0.1863 0.30 0.0901
miR-708 0.14 0.2435 0.30 0.0948
Table 43: Linear regression analysis of miRNA expressions for Dukes’ stages.
Expression levels of miRNAs were analysed for increasing expressions for higher tumour
stages and correlations were expressed as R square and p-values.

204
5.4.3 Mutation Analysis for cancer tissue
97 cancer tissue specimens were analysed for their K-ras, BRAF and PIK3CA mutation
status, whereas 3 cancer tissue specimens could not be analysed due to poor quality
DNA. The K-ras oncogene was mutated in 28 cases, whereas 19 and 9 occurred in BRAF
and PIK3CA, respectively. The K-ras mutation was more prevalent in left-sided tumours
(n=16, 32.5%) and the BRAF mutation was more prevalent in right-sided cancers (n=17,
35.5%). 43 (56.5%) cancer specimens without a background of polyp had mutated genes
(BRAF 15, KRAS 21 PIK3CA 7) whereas 13 (62%) specimens with cancer polyps were
found to have mutated genes (BRAF 4, KRAS 7, PIK3CA 2). 8 (20%) of cancer specimens
from the ‘low risk B’ group had a mutated BRAF gene, and only 1 (5%) of cancer
specimen from the ‘high risk B’ group had a mutated BRAF gene. For frequency of
mutated K-ras genes, in the ‘low risk B’ group 12 (31%) specimens exhibited mutated
status, and in the ‘high risk B’ group 6 (40%) specimens had mutated status. The
frequency of different mutated genes detected in different groups of patients is
tabulated in Table 44.
Mutation comparisons for all 3 oncogenes revealed no significant difference between
‘low risk B’ and “high- risk B” cancer tissue. K-ras mutations were significantly higher in
Dukes’ stage A compared to Dukes’ stage C (p=0.011). BRAF and K-ras were mutually
exclusive, except in two subjects where complex mutation was observed. Similarly, in
two subjects mutations were observed in both K-ras codon 12 and codon 13. The BRAF
mutation was significantly higher in right-sided cancers (p=0.0001) and cancerous tissue
resected from female patients (p=0.02). No significant difference was observed with
tumour background. The comparative analysis of mutation status with significance in
differences (p-values) for clinical variables is shown in Table 45.

205
Clinical
parameter
Subgroups
Total number
of samples (n)
Frequency of mutations
detected (n)
Dukes’
Stage
BRAF K-ras PIK3CA
A 7 1 5 2
Low risk B 39 8 12 3
High risk B 15 1 6 1
C 36 3 5 3
Gender Male 59 5 16 3
Female 38 14 12 6
Location Left sided 49 2 16 5
Right sided 48 17 12 4
Background No polyps 76 15 21 7
Polyps 21 4 7 2
T-Stage T1 + T2 12 2 6 2
T3 51 8 12 3
T4 34 9 10 4
Table 44: Frequency table for different positive mutations detected for BRAF, K-ras and PIK3CA mutations.
Frequencies of mutations are given for different clinicopathological features and
subgroups of participants with CRC.

206
Clinical
parameter
Subgroups P-values for inter-group and intra-group
comparisons of mutant genes
BRAF K-ras PIK3CA
Dukes’ Stage
A vs low-risk B 0.701 0.075 0.309
A vs high-risk B 0.641 0.189 0.298
A vs C 0.52 0.01 0.324
Low-risk B vs C 0.649 0.08 0.92
Low-risk B vs high-risk B 0.146 0.546 0.989
High-risk B vs C 0.071 0.084 0.839
Gender
Male vs. Female 0.002 0.644 0.113
Location
Left vs. Right 0.0001 0.342 0.746
Background
No polyps vs. polyps 0.945 0.631 0.966
T -Stage T2 vs T3 0.929 0.041 0.269
T3 vs T4 0.248 0.556 0.371
T4 vs T2 0.47 0.068 0.412
Table 45: P-values for inter-group and intra-group comparisons between the three mutated genes.
P-values are tabulated for BRAF, K-ras and PIK3CA mutant genes with comparisons for
different clinical variables.

207
5.4.4 Correlation with other clinico-pathological variables
No significance was observed in miRNA expressions that correlated with age, gender,
background, tumour location, BRAF and PIK3CA mutation status. Analysis of miR-182
expression in tumour tissue showed higher expressions levels in Dukes’ stage C
(p=0.02), T3 tumour (p=0.006) and left sided tumours (p=0.001). Furthermore, the
expression levels of miR-182 were significantly lower in PIK3CA (p=0.004), BRAF
(p=0.0064) and K-ras (p=0.012) mutant tumours. The expression levels of miR-34a
increased with higher T stages (Figure 55).Linear trend analysis of the expression levels
of miR-34a showed a progressive increase of expression from T2 staged tumours to T3
and T4 staged tumours (p=0.038). Furthermore, in the presence of extramural vascular
invasion (EMVI), expression levels of miR-125a-5p, miR-135b, miR-182 and miR-708
were significantly different (p<0.05) in tumours without EMVI (Figure 56). The Mann-
Whitney-U-Test reported significantly lower expression levels of miR-34a (p=0.028) and
miR-708 (p=0.023) in K-ras mutated tumour tissues when compared with wild-type
tumours (Figure 56). The expression levels of miR-21 in both high risk Dukes’ B and C
tumours were significantly higher especially in left-sided tumours in comparison to their
adjacent normal tissue (p<0.05).

208
Figure 55: Plot of miR-34a expressions and tumour T stages as identified on pathological examination.
There was no significant difference in the expression levels of miR-34a between T1 and
T2 staged tumour tissues. T1 and T2 staged tumours were combined for comparison
with T3 and T4 tumours. One-way analysis of variance with Bonferroni's correction
showed significantly higher expression levels of miR-34a in T3 (mean difference in ∆CT
= -1.949, 95% CI = 3.245 to -0.6523; p=0.001) and T4 (mean difference in ∆CT = -1.933,
95% CI = -3.332 to -0.5345) tumour tissue compared to T1 and T2 tumours. There was
no significant difference in the expression levels of miR-34a between T3 and T4 staged
tumours.

209
Figure 56: Comparison of miRNA expression levels for tumours with histological evidence of EMVI and Mutant KRAS gene.
Expression levels for EMVI positive and negative tumours of (a) miR-125a (median
difference in ∆CT = -1.56, 99% CI = -1.354 to -1.699), (b) miR-135b (median difference
in ∆CT = -2.76, 99%CI = -2.69 to -2.85), (c) miR-182 (median difference in ∆CT = -2.96,
99% CI = -2.75 to-3.14) and (d) miR-708 (median difference in ∆CT = 0.96, 99% CI = 0.7
to 1.21). Expression levels of miR-34a and miR-708 were significantly higher for K-ras
mutated tumours (p<0.05) in comparison with tumours with wild-type K-ras (Mann-
Whitney U test). e) Differential expression of miR-34a (median difference in ∆CT = -
0.885, 99% CI = -0.661 to -1.11) for K-ras mutant and wild-type genes f) Comparison of
expression levels of miR-708 (median difference in ∆CT = -1.13, 99%CI = -0.84 to -1.42)
for mutant and wild-type K-ras.

210
5.5 Discussion
The results of this study show that miR-135b is overexpressed in micro-dissected CRC
tissue in comparison to the matched adjacent normal mucosal tissue. These findings are
in line with the previously published studies (Motoyama et al, 2009, Sarver et al, 2009,
Wang et al, 2010, Bandres et al, 2006). However, no studies have co-related levels of
miR-135b with cancer stage or identified the prognostic significance of miR-135b for
Dukes’ stage. In this study, these results have shown no difference in expression levels
of miR-135b for Dukes’ stage B or C. However, lower expressions levels of miR-135b
significantly differentiate between ‘high-risk’ and ‘low-risk’ B cancers.
5.5.1 miR-135b and APC.
Inactivation of the APC gene is a major initiating event in colorectal carcinogenesis
(Salby et al, 2009), leading to stimulation of the Wnt pathway via free β-catenin
(Segditsas et al, 2006). APC inactivation has been found in more than 60% of colonic
tumours (Fearon &Vogelstein, 1990), and is associated with upregulation of miR-135b
in CRC cells (Nagel et al, 2008). miR-135b levels are upregulated in colorectal adenomas
and carcinomas and correlate with low APC levels (Aslam et al, 2015). These
observations suggest that alteration in the miR-135 family can be one of the early
events in the molecular pathogenesis of CRC. In this study using matched pair analysis,
it was observed that in ‘high-risk’ Dukes’ B cancers the expression levels of miR-135b
were not significantly different for tumour and paired normal adjacent mucosal tissue.
These findings suggest an alternative mechanism of tumour initiation in ‘high-risk’
Dukes’ B tumours may exist. Although the initial validation of array with RT-PCR showed
higher levels of miR-135b in high-risk Dukes’ B tumours, the results were skewed by
relatively higher expressions of one sample in the pooled group. The validation using
the second cohort also identified a similar trend for two cases.
5.5.2 miR-135b in metastatic cancers
For the validation cohort, no differences in miR-15b levels were noted for cancerous
and adjacent normal tissue. A previously published expression profiling study by Xi and
colleagues has shown similar results for miR-15b in CRC (Xi et al, 2006). In that study,
the levels of miR-15b were found to be significantly lower for patients who developed

211
metastatic diseases after surgical resection of Dukes’ B tumour. A prognostic study of
miR-15b in hepatocellular carcinoma has shown a similar trend where lower expression
levels of miR-15b are associated with higher risk of recurrence (Chung et al, 2010). In
another study, miR-15b was found to be down-regulated in CRC tissue but did not
correlate with the presence of lymph node metastasis and disease-free survival (Wang
et al, 2012).
5.5.3 Role of miR-15b in CRCs
The exact role of miR-15b in CRC development and progression is yet not fully
understood. However, the mechanistic studies have shown that the miR-15b correlates
with E2F-regulated genes and appears to be part of the E2F-regulatory network (Ofir et
al, 2011). E2F1, miR-15b and cyclin E constitute a feed-forward loop that modulates E2F
activity and cell-cycle progression, where inhibition of miR-15b expression results in
enhanced E2F1-induced cyclin E and G(1)/S transition (Ofir et al, 2011). In another in
vitro study, knockdown of HPV E7 down-regulated the expression levels of miR-15b in
colorectal cell lines (Myklebust et al, 2011). Bcl-2 has been also shown to be a target of
miR-15b in gastric cancer, however miR-15b knockdown in CRC cell lines did not show
any change in expression levels of Bcl-2 (Davidson et al, 2009).
5.5.4 miR-21 as a prognostic marker
In this study, the results show that miR-21 levels were not significantly different for low-
risk and high-risk Dukes’ B CRCs. However, the expressions levels were higher in high-
risk Dukes’ B and C and especially in left-sided tumours, suggesting that miR-21 is
significantly involved in tumour metastasis. It has already been established that
elevated miR-21 expression leads to reduced apoptosis and increased cell proliferation,
cell migration, intravasation and metastasis by targeting several tumour suppressor
genes such as programmed cell death 4 (PDCD4), phosphatase and tensin homolog
(PTEN), tropomyosin 1 (TPM1), cell division cycle 25 homolog A (Cdc25a), reversion-
inducing-cysteine-rich protein with kazal motifs (RECK), TIMP3, maspin, nuclear factor
1 B-type, and Ras homolog gene family member B (RHOB) (Schetter et al, 2012). The
role of miR-21 in cell migration and intravasation has already led to studies exploring its
role as prognostic marker for high-risk stage II CRCs

212
It has been reported that miR-21 might play a role in intravasation through down-
regulation of the tumour suppressor Pdcd4 (Asangani et al, 2008). Higher expression of
miR-21 has been noted in metastatic CRC compared to non-metastatic CRC, and miR-
21 has been associated with lymph node metastasis (Vickers et al, 2012 & Slaby et al,
2007). Upregulation of miRNA-21 has initiated tumour formation but also increased
cancer invasion, intravasation and metastatic potential (Asangani et al, 2008, Wang et
al, 2009a). Schetter and colleagues have detected miR-21 expression in primary tumour
tissues and identified this as a prognostic marker in stage II CRC (Schetter et al, 2008).
This group subsequently extended their study to evaluate the expression status of 23
inflammatory genes and discovered that a combination of inflammatory risk score and
miR-21 expression was a better predictor of prognosis than either of these when
applied individually (Schetter et al, 2009). It has also been proposed that when used in
combination with other prognostic parameters such as staging, MSI status, genotyping
and mRNA profiling, miR-21 expression may improve risk stratification to help guide the
right treatment strategies and may result in much improved survival rates (Schetter et
al, 2012).
Kjaer-Frifeldt and colleagues have reported results of in situ hybridization using FFPE
specimens from 520 patients with stage II colon cancer, and showed that increased miR-
21 expression levels in tumour tissue correlates significantly with poor disease-free
survival rates (Kjaer-Frifeldt et al, 2012). In another study, array-based profiling of 40
samples of paired stage II CRC and adjacent normal mucosal tissues was followed by RT-
PCR based validation of miRNAs in 138 stage II cancer specimens (Zhang et al, 2013).
This study has identified a panel of 6 miRNAs (miR-20a-5p, miR-21-5p, miR-103a-3p,
miR-106b-5p, miR-143-5p and miR-215) that can be used as prognostic and predictive
markers of disease recurrence in patients with stage II CRC. It has been established that
higher expression levels of miR-21 in CRC tissue are linked to a worse prognosis and
poor therapeutic outcomes. This highlights its potential use as prognostic and predictive
biomarkers for CRCs (Shibuya et al, 2010, Kulda et al, 2010, Nielson et al, 2011, Zhang
et al, 2009).

213
5.5.5 Combinatorial approach for prognostic tissue miRNAs in CRC
It has also been proposed that when used in combination with other prognostic
parameters such as staging, MSI status, genotyping and mRNA profiling, it may improve
risk stratification to help guide the right treatment strategies and may result in
improved survival rates (Schetter et al, 2012).
In a recently published study researchers have analysed miR-320e expression in stage II
and stage III CRCs to predict cancer recurrence and disease-free survival (Perez-
Carbonell et al, 2015). It has been identified that higher levels of miR-320e expression
was associated with poor disease-free survival. Another study has shown that lower
levels of miR-29a expression in CRC tissue specimens is associated with higher risk of
disease recurrence in patients with stage II CRCs (Weissmann-Brenner et al, 2012).
In a prognostic study of miR-203 for patient ethnicity and tumour stage, Bovel and
colleagues have found poor survival for black ethnic patients with stages II CRCs (Bovel
et al, 2013). To help develop a miRNA based prognostic biomarker, Schepeler and
colleagues have analysed 315 miRNAs profiles in stage II CRC tissue specimens
exhibiting features such as microsatellite stability and microsatellite instability
(Schepeler et al, 2008). These authors have identified four miRNAs (miR-142-3p, miR-
212, miR-151, and miR-144) capable of accurately (sensitivity 92%, specificity 81%)
discriminating the microsatellite instability status of patients. In addition, a significant
correlation with recurrence-free survival for expression levels of miR-320 and miR-498
has indicated their potential use as prognostic marker in CRC (Schepeler et al, 2008). In
another study of miR143, lower expression levels of miRNA-143 served as an
independent prognostic biomarker for CRC tissue with wild type K-ras (Pichler et al,
2012). Table 46 summarises the findings of studies for the purpose of identification of
high-risk CRCs based on tissue expressions.

214
Studies miRNA Tissue miRNA
expression
Zhang et al, 2013 miR-20a Up regulation
Schetter et al, 2008, Schetter
et al, 2009, Kjaer-Frifeldt et al,
2012 & Oue et al, 2014
miR-21 Up regulation
Weissmann-Brenner et al,
2012
miR-29a Down regulation
Zhang et al, 2013 miR-20a-5p, miR-21-5p,
miR-103a-3p miR-106b-
5p, miR-143-5p, miR-215
Up regulation
Bovell et al, 2013 miR-203 Up regulation
Schepeler et al, 2008 miR-320, miR-498 Down regulation
Perez-Carbonell et al, 2015 miR-320e Up regulation
Pichler et al, 2012 miR-143 Down regulation
Table 46: Summary of studies dealing with potential role of different miRNAs for identification of high risk CRCs.
5.5.6 miR-34a and miR-125a-5p
In this study, the levels of miR-34a were significantly higher in cancerous tissue in
comparison with adjacent normal tissue. Such over expression of miR-34a in cancer
tissue has also been identified by other researchers (Slattery et al, 2011). The
downregulation of miR-125a-5p has also been reported for CRC and lung cancer (Zhang
et al, 2009 & Jiang et al, 2011). Studies in lung cancer have shown that miR-125a-5p acts
as tumour suppressor by inducing apoptosis mediated by p53 (Jiang et al, 2011) but the
exact role of miR-125a-5p in CRC is still unknown. Overexpression of p53-dependent
miR-34a and down-regulation of miR-125a-5p suggests there are complex interactions
between these two miRNAs in the p53-driven cancer pathway.

215
5.5.7 miR-708 and miR-182
Upregulation of miR-708 in APC knockdown tumours and colitis-associated tumours in
mouse colon highlights its role in tumour initiation and transformation via known
cancer signalling pathways (Necela et al, 2011). miR-182 upregulation in CRC tissue has
been shown by Liu and colleagues (Liu et al, 2013). Other in vitro studies have identified
miR-182 as an inhibitor of apoptosis associated with increased cancer cell survival and
cancer progression (Ma et al, 2011, Cekaite et al, 2012). More importantly, the miR-
183-96-182 gene cluster is located in the 7q32 genomic region and its amplification has
been detected in 26% of primary solid organ tumours and 30% of liver metastases
(Midgley and Kerr D, 1999). The higher expression of miR-182 in T3 tumours in
comparison to T1 and T2, EMVI-positive tumours and Dukes’ stage C tumours suggests
that miR-182 is a driving force in the development of metastasis.
5.5.8 BRAF mutations in right colonic cancers
Currently, there is a widespread belief that the mechanism of tumour spread in the
colon varies based on the tumour location. Even in familial cancers almost 100% of FAP
is diagnosed on the left side and approximately 70% of the other familial syndrome,
HNPCC, is observed on the right side (Brim et al, 2008). BRAF mutations were also found
to significantly higher in right-sided tumours. BRAF mutations have been shown to drive
microsatellite instability (Bufill et al, 1990). Although in this study no miRNA showed
any differences in terms of location, when analysed within the location groups
significant expression changes were observed. This suggests that location-specific
miRNA expression levels could predict prognosis.
5.5.9 Role of miRNAs in CRC metastasis
The development and refinement of a prognostic or predictive marker requires a
detailed understanding of the exact mechanism of cancer cell dissociation from primary
tumour mass, movement through the basement membrane and into the blood and
lymph vessels in CRC. miRNAs are thought to control CRC metastasis at least at the level
of tumour growth, invasion and intravasation (Tokarz and Blasiak, 2012). Different
miRNAs including miR-135b have been associated with essential features of tumour
growth such as cancer cell proliferation and reduced apoptosis. Once they have entered

216
the bloodstream, cancer cells are attacked by the immune system and may result in
cancer cell degradation (Bockhorn et al, 2007). A number of miRNAs have been
discovered to play critical roles in modulation of innate and adaptive immune responses
in initial and advanced stages of cancer (Harris et al, 2008, Lu and Liston, 2009).
Although the exact role of miRNA in cancer cell intravasation is unknown, it seems that
miRNAs help cancer cells to evade recognition by the immune system in the blood and
lymph vessels. The escape of cancer cells from capillaries to invade the parenchyma is
one step prior to the development of cancer cell colonies in a site distant to primary
tumour. Here again, the role of miRNAs in this process is unknown, but it is
hypothesized that these molecules may influence cancer cell extravasation. (Tokarz and
Blasiak, 2012). The final step in cancer metastasis is colonization of distant organs by
cancer cells and the formation of secondary tumours. It is known that circulating cancer
cells from different body organs show an affinity for particular organs (Paget, 1989).
This organ-specific targeting is explained by the “seed and soil” hypothesis; cancer cells
are the “seed” and the specific organ microenvironment is the “soil”. Metastatic
colonization of this microenvironment may depend upon the ability of certain cancer
cells to proliferate and adapt to new conditions, an ability possessed by cancer stem
cells. miRNAs may regulate the pathways required for the cancer cells to obtain this
stem cell-like phenotype and consequently may play a role in CRC metastasis (Dieter et
al, 2011).
5.5.10 Other potential prognostic markers for CRCs
Commercially, there has been an emergence of several new predictive tests including
ColoGuideEx, ColoPrint, OncoDefender-CRC and Oncotype DX. These tests follow the
principle of measuring multiple gene expressions to distinguish between high- and low-
risk tumours (Agesen et al, 2012, Tan and Tan, 2011, Webber et al, 2010, Kelley and
Venook, 2011). The main drawback associated with these new tests is the need for CRC
tissue samples. Consequently, these tests can only be conducted after cancer resection
surgery or endoscopic biopsy. There therefore remains a need for non-invasive blood
or stool-based prognostic and predictive biomarkers and for this purpose miRNAs in
plasma, serum and faecal matter of patients with CRC have been studied (Pu et al, 2010,
Cheng et al, 2011, Kalimutho et al, 2011 & Wang and Gu, 2012a). Researchers have

217
identified higher levels of miR-221 and miR-141 in plasma as an independent prognostic
factor for poor overall survival in CRC patients (Pu et al, 2010, Cheng et al, 2011).
Researchers have also shown that miR-29a and miR-141 are significantly higher in
Dukes’ stage D, and this allows discrimination between metastatic and non-metastatic
tumours (Cheng et al, 2011 & Wang and Gu, 2012a). Other blood or stool-based
potential prognostic or predictive biomarkers include single nucleotide polymorphisms
(SNPs) associated with miRNA. It has been postulated that the presence of SNPs in pri-
, pre- and mature miRNAs can modulate gene expression by altering miRNA function.
SNPs in pre-miR-423 (rs6505162) and pre-miR-608 (rs4919510) variant genotypes of
these SNPs have been significantly associated with recurrence-free survivals in patients
with CRC (Xing et al, 2012).
5.5.11 Limitation of study
There are a few limitations associated with tissue miRNA analysis work. The sample size
of Dukes’ stage A and ‘high-risk’ Dukes’ B tumours used in the validation cohort were
smaller than those of ‘low-risk’ Dukes’ stage B and Dukes’ C tumours. Although almost
an equal number of left- and right-sided cancers were analysed in the study, there was
a certain amount of bias towards the right-sided cancers; the right-sided cancer group
contained more non-metastatic than metastatic cancers. Although clinicopathological
variables data was collected retrospectively by two independent observers, like many
other retrospective studies there remains a chance of bias in the accuracy of data for
clinicopathological variables.
One of the arguable limitations in the method of studying miRNAs is the use of FFPE
tissues. It has been proven that in FFPE tissues, due to tissue sample processing, fixation
and storage, RNA degradation occurs. Hence, RNA quantification poses difficult
challenge for researchers (Macabeo-Ong et al, 2002 & Cronin et al, 2004). In contrast,
due to their stability and small size, miRNAs are better preserved and be readily
extracted from FFPE samples (Hui et al, 2009). Historically, FFPE tissue has been a widely
used archive material for biomarker discovery and validation (Lewis et al, 2001).
Furthermore, the availability of clinicopathological data associated with these samples
is of enormous use for its correlation with disease recurrence, development of

218
metastasis and survival. This therefore greatly enhances our ability to assess miRNAs as
cancer biomarkers. A possible explanation of the discordance of the results of this study
and the heterogeneity of these findings when compared with those of previous similar
studies are technical differences associated with the components of the multistep
process of the isolation and analysis of miRNAs. It is also strikingly important that other
prognostic and predictive marker studies have used different endpoints against which
the miRNA expressions have been tested. Some studies have explored correlations
between primary cancer tissue miRNAs and nodal involvement or microscopic features
of poor outcomes. In contrast, other studies have evaluated correlations of miRNA
expressions with outcome endpoints such as development of metastasis, disease
recurrence, disease-free and overall survival.
During the expression profiling it would have been ideal to run the array on individual
samples rather than pooling the cases together. However, this was done because it was
cost-effective. The use of a standard protocol of cDNA preparation for both the
validation and array cohorts would have been a better way of analysing all samples
together. Additionally, RNU6B is not an ideal housekeeping gene when used alone.
RNU6B levels are so high that they are amplified even when RNA concentrations are
low, thereby nullifying the difference in expression.
Another limitation is the characterisation of normal tissue. Although the normal tissue
used in this study was referred as adjacent normal, the exact location of the tissue with
respect to tumour is not known and it could have possible caused changes, and could
thus explain why no significant difference was observed when data were normalised.
For future studies, it may be preferable to have access to tissues from microscopically
and macroscopically normal colons confirmed on colonoscopic examination and
biopsies. Previously, colonic biopsy tissues were deemed inadequate for miRNA analysis
due to poor yield of total RNA from such samples. Now, with improved protocols and
more efficient RNA extraction kits, small colonic biopsies will be adequate for tissue
miRNA analysis.

219
5.5.12 Conclusion
This study has met its aim: to examine the utility of miRNAs and common gene
mutations in FFPE cancer tissue specimens as biomarkers to predict the development
of metastasis in patients with high risk Dukes’ B cancer. Common gene mutations such
as KRAS, BRAF, PIK3CA, and discriminatory miRNAs identified from expression profiling
were successfully analysed in different stages of CRC. This study has identified that the
expression levels of miR-135b and miR-15b were significantly lower in high risk Dukes’
B cancers in comparison with low risk Dukes’ B cancers. These differential expressions
of miR-135b and miR-15b is useful, and allows these miRNAs to be used as biomarkers
for the prediction of metastasis development in patients with high risk Dukes’ B cancers.
Pooling of cDNAs for expression profiling, identification of normal healthy tissue
adjacent to cancer tissue and a small number of patients in high risk Dukes’ B group
were weaknesses of this study. In future, a large scale evaluation should be performed
to assess miR-15b and miR-135b expression in FFPE cancer and in defined paired normal
tissue specimens. Expression levels of these miRNAs should be correlated with a
prospectively maintained database with details of CRC treatments, follow ups and
outcomes.

220
Chapter 6: Final Discussion
221
6 Final Discussion
6.1 Discussion
This study has met the following aims: (i) to identify circulating miRNAs for the early
detection of colorectal neoplasia; (ii) to analyse exosomal miRNAs in the plasma of
patients with CRC; and (iii) to evaluate the utility of tissue miRNAs combined with
common gene mutations in CRC for the prediction of metastasis development in
patients with high risk Dukes’ B cancers. Strengths, weaknesses and limitations of this
study have been discussed previously in Chapters 3, 4 and 5. In this final chapter, the
discussion mainly focuses on issues surrounding the miRNA detection method and
linked strategies, and how these detection methods can be improved in future studies.
In this study, the preferential utility of plasma samples collected in heparin-free blood
collection tubes ensured that plasma remained a more suitable source of miRNAs for
detection by QRT-PCR (Mitchell et al, 2008). This is primarily due to the fact that the
coagulation process in serum can cause haemolysis, which causes additional RNA to be
released. Studies have also reported significantly higher concentrations of miRNAs in
the serum in comparison to plasma samples collected from the same individual (Wang
et al, 2012). Although extraction of miRNAs from plasma was a relatively
straightforward process, differences in the processing of blood samples to isolate
plasma may have caused haemolysis or higher concentrations of residual blood cells
which, in turn, may have contributed to artificially higher levels of miRNA levels in
samples, as shown in previous studies (Cheng et al, 2013 & Kroh et al, 2010). This is
particularly important in exosomes isolated by immunoaffinity for miRNA analysis
because other blood cells and microvesicles might carry the same surface antigens, and
could subsequently cause their precipitation and an increase in the concentration of
non-specific miRNAs. Thus, quality control mechanisms such as additional
centrifugation, the rejection of samples with platelet counts above a certain threshold
and the measurement of haemolysis have been recommended to control for biases that
might confound the measurement of miRNA levels.
FFPE tissues are widely used archive material for biomarker discovery and validation
(Lewis et al. 2001). These types of samples represent a challenge for mRNA profiling

222
because RNA degradation occurs during fixation (Macabeo-Ong et al, 2002) and storage
(Cronin et al. 2004). However, due to their stability and small size, miRNAs are better
preserved than mRNA and can be readily extracted from FFPE samples (Hui et al. 2009).
Additionally, accurate miRNA detection does not require large tissue specimens and
miRNA expression can be measured easily in biopsy specimens. Given the invasive
nature of fresh or frozen tissue collection and the availability of FFPE tissues, this
method makes measurement of miRNA levels for diagnostic purposes more feasible.
This applies specifically to specimens collected from participants undergoing NBCSP,
where making a correct diagnosis and assessing the completeness of excision of a lesion
are prioritised. Any tissue collected for snap-freezing might lead to these NBCSP
priorities becoming compromised. In this study, microdissection of FFPE tissue has been
used with tissues of interest marked by a histopathologist. Accordingly, for large cohort
studies dealing with FFPE tissue, tissue processing for miRNA analysis will need a
dedicated specialist who can review and mark FFPE tissue samples.
Before miRNAs can be used as biomarkers they must first be isolated from either plasma
or FFPE tissue sections. Total RNA extraction techniques used for blood and tissue
samples were dissimilar in this study, but both required the use of different commercial
RNA extraction kits and Tri-reagent phenol-chloroform for extraction. Several studies
have found variations in the amount and quality of RNA extracted using different kits.
Three different studies comparing three commercial kits, Qiagen’s miRNeasy, Ambion’s
miRVana Kit and Norgen’s Purification Kit, have reported a preference for the Qiagen’s
miRNeasy kit due to a higher quality and yield of miRNAs (Kroh et al, 2010, Monleau et
al, 2014, Li et al, 2012). Although the miRNeasy kit was used for RNA extraction from
FFPE tissues in this study, it has been recommended that switching to this kit for future
plasma sample processing would be useful. However, another determining factor for
selecting the isolation kit is the volume of the donor sample. There has been rapid rise
in the availability of commercial kits for miRNA extraction that allow smaller volumes
of starting material. Their efficacy and cost effectiveness must be questioned before
their use in large scale validation studies in the future. For studies in the near future,
total RNA should be extracted from 1 ml plasma sample and purified by using Tri-

223
reagent and Qiagen’s miRNeasy RNA isolation kit, and RNA quality and quantity should
be assessed with a Thermo Scientific NanoDrop 2000c spectrophotometer.
Relative quantification of miRNAs by QRT-PCR was the method of choice in this study,
with Megaplex QRT-PCR also being used with an additional step of pre-amplification.
Unlike standard QRT-PCR, this pre-amplification step allowed very low concentrations
of miRNAs to be detected. Pre-amplification and Megaplex QRT-PCR also allowed
multiple miRNAs to be studied simultaneously. Disadvantages of this strategy was that
any technical noise introduced during cDNA synthesis could cause up to 100-fold
variations in cDNA yields (Baker, 2010, Benes et al, 2010, Chugh et al, 2012, Stahlberg
et al, 2004 & Vandesompele et al, 2002). Previous studies have relied heavily upon the
use of microarray-based technologies, which often do not include the growing list of
miRNAs, and hybridization-based non-quantitative techniques can yield data that may
fail subsequent validation steps (Ng et al, 2009, Hofsli et al, 2013, Giraldez et al, 2013).
Sequencing technologies such as next-generation sequencing (NGS) for miRNA profiling
in biomarker research now facilitate the measurement of absolute abundance over
dynamic range, which was not possible using conventional microarray technology in the
past. In addition, the use of NSG will aid the identification of novel miRNAs, miRNA
sequence changes and miRNA variants such as isomiRs (Kuchenbauer et al, 2008, Guo
et al, 2011, Llorens et al, 2013, Landgraf et al, 2007, Lee et al, 2010 & Morin et al, 2008).
A recent study has reported the absolute quantities of circulating miRNAs in classical
Hodgkin lymphoma as copy numbers, which were calculated from known copy numbers
of cel-miR-39 spiked-in in plasma (Jones et al, 2014). Jones and colleagues have shown
a high correlation between relative and absolute quantification values for all evaluated
miRNAs. In future studies, this method will allow absolute values of plasma miRNAs to
be quantified by eliminating the technical bias of RNA extraction. Furthermore, Droplet
Digital PCR, a next generation RT-PCR method, provides absolute quantification of
nucleic acids without producing a standard curve, and detects copy number changes of
DNA and RNA targets with high sensitivity in comparison to RT-PCR methods (Day et al,
2013). In future studies, combining the cel-miR-39 spiking approach and new Droplet
Digital PCR technology may allow quantification of miRNA levels to almost absolute
224
values leading to identification of low abundance miRNA in whole plasma and
exosomes.
The biggest obstacle of RT-PCR-based detection of miRNAs was achieving successful
normalisation of miRNA expression with an endogenous control. Previous studies have
used miR-16, snRNA RNU6B, snRNA SNORD43, or synthetic versions of Caenorhabditis
elegans miRNAs such as cel-miR-39, cel-miR-54 and cel-miR-238, as control genes
(Kawamura et al, 2014). The spike-in C. elegans synthetic miRNAs are often used to
account for technical variability during extraction rather than for biological variability,
and thus cannot be used as endogenous controls (Kroh et al, 2010). A study evaluating
seven candidate reference genes (let-7a, miR-16, miR-93, miR-103, miR-192, miR-451,
and RNU6B) concluded that miR-16 and miR-93 are good reference genes, but deemed
RNU6B unsuitable due to its low expression levels in the serum of cancer patients (Song
et al, 2012). In this study, optimum levels of expressions for RNU6B control for both
tissue and plasma miRNAs were found. However, RNU6B expressions were significantly
lower in exosomal miRNA analysis. This might have been due to low yield of total RNA
during extraction. For miR-16, the use of RNU6B as a control gene is inappropriate
because its expression levels can be significantly affected by haemolysis and in disease
(Pritchard et al, 2012 & McDonald et al, 2011).
In this study a uniform volume of plasma samples and an equal number of tissue
sections and RNA were used for normalisation. It is worth noting that some studies have
selected their endogenous control by evaluating comparative expression of several
control candidates in sample populations (Nugent et al, 2012). Of particular concern
regarding the selection of endogenous controls is the observation that two miRNAs
selected in a pilot study as candidate endogenous controls were differentially expressed
in the validation study (Kjersem et al, 2013). Thus, it is clear that selecting a reliable
endogenous control is important for the reliability and accuracy of miRNA
quantification. This is a challenge that is well understood in the field as many studies,
including those studying circulating miRNA biomarkers, recognise this as a possible
limitation. These issues must be dealt with carefully in the discovery phase of future
projects as well as in future clinical settings to ensure miRNA quantification is accurate
(Cortez et al, 2009, Jung et al, 2012).

225
A significant challenge of using miR-135b as a biomarker is its disease specificity. Like
many other tissue and blood miRNAs (Chen et al, 2013, Ng et al, 2009, Ren et al, 2013,
Toiyama et al, 2013 & Wang et al, 2012), miR-135b lacks specificity for CRCs. This study
has made an attempt to address this limitation by directly comparing its expression in
tumour tissue and blood to clarify the interaction and origin of circulating miRNAs.
However, developing miRNA expression profiles limited to CRCs and its relevant
controls did not yield miRNAs specific for CRCs alone. This implies that in order to
increase confidence in the specificity of a miRNA-based biomarker, controls for other
cancer types need to be included in expression profiling studies (Kanaan et al, 2013). In
addition, investigations aimed at understanding the mechanism by which certain
circulating miRNAs become differentially expressed may also help pinpoint miRNAs
which are suitable markers for specific cancer types. This type of investigation would
likely provide more insight into understanding the discrepancies observed between the
levels of particular miRNAs in tumour tissue and corresponding blood samples. (Wang
et al, 2012 & Toiyama et al, 2013). Although recent studies have suggested that miRNA
expression profiles are likely influenced by age, sex and race (Takahashi et al, 2013, Bala
et al, 2012, & Witwer et al, 2012), future studies should also analyse miRNAs for
variations in lifestyle factors, such as diet, smoking and alcohol consumption, all of
which may have a profound effect on miRNA expression.
6.2 Conclusion
This study has successfully investigated the potential use of miRNAs for the early
detection of CRCs and the prediction of metastasis in high risk Dukes’ B cancers.
However, the road to producing a highly efficient, robust and standardized method for
miRNA detection in clinical practices remains a long one. Although individual miRNAs
have shown promise in the early detection of CRCs and Dukes’ B cancers at risk of
developing metastasis, an effective diagnostic, screening or prognostic test will likely
require a panel of miRNAs to improve accuracy, reliability and consistency. Circulating
and tissue miRNA-based biomarkers will eventually benefit patients after thorough
validation by multi-centre prospective studies using the most robust and uniform
methodology, including optimum sample handling, RNA isolation, quantification
protocols, reference standards and statistical analyses.

226

227
Appendices

228
7 Appendices
7.1 Appendix I: Patient information sheet for colorectal disease progression
STUDY TITLE: MARKERS OF COLORECTAL DISEASE
Local Investigators: Dr J H Pringle / Mr. Muhammad Imran Aslam
Department of Cancer Studies and Molecular Medicine
Leicester Royal Infirmary
You are being invited to take part in a research study. Before you decide it is important
for you to understand why the research is being done and what it will involve. Please
take time to read the following information carefully and discuss it with others if you
wish. Ask us if there is anything that is not clear or if you would like more information.
Take time to decide whether or not you wish to take part.
1. Why have I been chosen?
You have been chosen because you have been recently diagnosed with a cancer We are
requesting your agreement to allow us to study a portion cancer tissue that will be
removed as part of your surgical procedure as well as a sample of your blood to be taken
around the time of your procedure
2. What is the purpose of the study?
We are studying changes that occur in the bowel from a range of diseases including
inflammatory conditions and bowel tumours. We are comparing this to changes
observed in patients who have cancers of other body parts i.e lungs, pancreas, stomach,
ovaries, prostate, kidneys, bladder and breast We hope this will aid diagnosis, identify
mechanisms that are important in the development of cancers, detection of cancer and
help understand the factors that make cancers spread. This is with the aim that we can
develop diagnostic tests and new treatments to prevent spread and improve cure rates.
3. Do I have to take part?

229
It is up to you to decide whether or not to take part. If you do decide to take part you
will be given this information sheet to keep and be asked to sign a consent form. If you
decide to take part you are still free to withdraw at any time and without giving a
reason. In practice, withdrawal would mean destruction of any donated tissue samples
or blood samples and, should you also wish, any associated data. A decision to withdraw
at any time, or a decision not to take part, will not affect the standard of care you
receive.
4. What will happen to me if I take part?
The tissue removed during your procedure is always examined by a pathologist to
identify the changes present. If you agree to take part in our studies, following this
routine examination, further small pieces of tissue will be selected for our studies, with
4 to 6 samples collected in total. This tissue would otherwise be discarded, and its
selection will not alter the routine assessment of your tissue. Since not all of the sample
will be used in this study we also request that we can store the sample for further similar
studies (see attached ‘Tissue Bank Information Sheet’). Some tissue will also be used
from archived material in a tissue bank in order to make sure that there is a
representative sample size for each aspect of disease. Use of archived tissue also allows
us to gather samples for which we have long term follow up data that would otherwise
not be possible if all samples were collected prospectively. The blood samples will be
collected in small tubes in the usual way and will be destroyed when the study is
complete and you have not consented for its storage in the Tissue Bank.
5. What are the possible disadvantages and risks of taking part?
If you chose to take part, the study will involve selecting samples of the diseased tissue
that has been removed as a part of your procedure. This will take place following the
examination that is always carried out on surgically removed tissue and will in no way
alter how your tissue will be treated.
Because we also require a blood test, the risks are limited to discomfort at the site from
where the blood is taken.
6. What are the possible benefits of taking part?
There is no benefit to you personally from taking part in this study. However, we hope
that the information we get may allow us to develop new treatments to prevent spread
and improve cure rates for bowel cancer.

230
7. What if new information becomes available?
We will not be performing any tests that have an influence on your care. It is therefore
unlikely that the study will yield any new information that will affect you personally.
8. What if something goes wrong?
The chance of any problem arising because of your inclusion in the study is very small.
However, if you are harmed by taking part in this research project, there are no special
compensation arrangements. If you are harmed due to someone’s negligence, then
you may have grounds for a legal action but you may have to pay for it. Regardless of
this, if you wish to complain, or have any concerns about any aspect of the way you
have been approached or treated during the course of this study, the normal National
Health Service complaints mechanisms would be available to you.’
9. Will my taking part in this study be kept confidential?
All information which is collected about you during the course of the research will be
kept strictly confidential. Any information about you which leaves the hospital will have
your name and address removed so that you cannot be recognised from it.
10. What will happen to the results of the research study?
The results from this study will be presented at scientific meetings and be published in
scientific journals. You will not be identified in any report/publication.
11. Who is organising and funding the research?
This study is a small-scale study that is being supported by the researchers University
departmental funds. The researchers will not receive extra payments for performing
this study.
12. Who has reviewed the study?
All research that involves NHS patients or staff, information from NHS medical records
or uses NHS premises or facilities must be approved by an NHS Research Ethics

231
Committee before it goes ahead. Approval does not guarantee that you will not come
to any harm if you take part. However, approval means that the committee is satisfied
that your rights will be respected, that any risks have been reduced to a minimum and
balanced against possible benefits and that you have been given sufficient information
on which to make an informed decision’.
13. Contact for Further Information
For further information, please contact:
Dr. Howard Pringle,
Department of Cancer Studies and Molecular Medicine,
University of Leicester,
Leicester
LE2 7LX
E-mail: [email protected]
Phone: 0116 252 3227
Thank you for reading this.
Please keep this copy of the Information Sheet to refer to in future. If you agree to take
part in the study, you will also receive a copy of the signed consent form to keep.

232
7.2 Appendix II: Tissue bank patient information sheet
Title of the proposed tissue bank: Colorectal Tissue Bank
Location tissue bank:
RKCSB
Leicester Royal Infirmary
Infirmary Square Leicester
LE2 7LX
What is a tissue bank?
A tissue bank is a collection of tissue and blood samples being stored long term that will
be used to assist in future research into a specific disease or group of diseases or
investigate disease processes and their treatment. Tissue banks are a valuable research
resource and are increasingly being established at local, regional and national level.
Why have I been chosen?
You have been asked to participate with the Colorectal tissue bank because you are
recently diagnosed with a bowel cancer or a cancer of other part of body.As you are
due to undergo an either an investigation or surgical procedure as part of the
management recommended by the consultant surgeon responsible for your care. We
use this opportunity to invite you to donate your tissue and blood samples to colorectal
tissue bank.
What will the tissues in the tissue bank be used for?
The tissues will be used to help increase our understanding of bowel cancer and to more
accurately predict how the different individual tumours will behave. We will be studying
how tumours spread and how this may be blocked. We will study other diseases that
occur in the bowel to understand what factors are unique to cancer, and whether new
treatments could be produced against them.All research that involves NHS patients or
staff, information from NHS medical records or uses NHS patients or staff, information
from NHS medical records or uses NHS premises or facilities must be approved by an

233
NHS Research Ethics Committee before it goes ahead. Approval does not guarantee
that you will not come to any harm if you take part. However, approval means that the
Committee is satisfied that your rights will be respected, that any risks have been
reduced to a minimum and balanced against possible benefits and that you have been
given sufficient information on which to make an informed decision to take part or not.
How much of my tissue will be taken?
During your surgical procedure the diseased tissue will be removed by the surgeon.
Following a routine examination by the pathologist, further small pieces of tissue will
be selected for our tissue bank with 4 to 6 samples collected in total. This tissue would
otherwise be discarded, and its selection will not alter the routine assessment of your
tissue. We will also store any blood samples collected at the time of this procedure.
Will I be contacted again in the future?
If, as a result of any research carried out on your tissue, new information becomes
available which may have an impact on your care, this information will be discussed
with you either by your hospital Consultant or General Practitioner. We will contact you
again to seek permission to use your tissue samples if an unanticipated use emerges in
the future, which is not described in this information sheet.
Who will have access to my tissue and how will confidentiality be maintained?
Access to your tissue samples will be only available through the Colorectal Tissue Bank,
controlled by the University Hospitals of Leicester NHS Trust.
The handling of your tissue samples will be treated with the usual degree of
confidentiality under the data protection act. All samples will be anonymised before
transfer to other research partners - you will not be identified in any way from your
tissue and blood sample. Basic clinical information regarding the reason for your
procedure, you age, sex and the results of the pathological examination of the tissue
will be linked to the samples. This will not involve using your name or address.
Will I receive payment for the tissue that I donate to the tissue bank?

234
You will not receive any payment for the tissue or blood. The tissue is a gift - neither
yourself nor your relatives will benefit from any inventions that result from the use of
the tissue.
What happens if I wish to have my tissue removed from the tissue bank?
If you do not wish your tissues and blood to be held in the tissue bank you withdraw
them without justifying your decision and your future treatment will not be affected.
If you wish to have your tissue removed from the tissue bank please contact:
Mr Muhammad Imran Aslam or Dr. J.H. Pringle
Department of Cancer Studies
Robert Kilpatrick Clinical Sciences Building
Leicester Royal Infirmary
Leicester LE2 7LX
Tel: +44 116 2523227
Or:
Research Office
Directorate of Research & Development
University Hospitals of Leicester NHS Trust,
Leicester General Hospital,
Gwendolen Road,
Leicester LE5 4PW
Tel: 0116 258 4109

235
7.3 Appendix III: Consent form
Centre Number: __________
Study Number: ___________
Patient Identification Number for this trial: _________
CONSENT FORM
Title of Project: MARKERS OF COLORECTAL DISEASE
Name of Researcher / Principal Investigator:
Mr Muhammad Imran Aslam / Dr James Howard Pringle
This form should be read in conjunction with the Patient Information
Leaflet, version no 6 dated 08.12.2009
Please initial box
1. I confirm that I have read and understand the information sheet for the above study and have had the opportunity to ask questions.
2. I understand that I may withdraw my consent to my tissue and blood sample being used at any time without justifying my decision and without affecting my normal care and medical management.
1.1.1.1.1.1.1 Patient name, address, DOB (or
ID label)

236
3. I agree to donate tissue from my procedure and blood samples and allow their use in medical research as described in the Patient Information Leaflet.
4. I understand that the tissue and blood sample are gifts and that I will not benefit from any intellectual property that results from its use.
5. I understand that the tissue or blood sample will not be used to undertake any genetic tests whose results may have adverse consequences on my or my families insurance or employment.
6. I understand that if research using my tissue or blood sample produces information, which has immediate clinical relevance to me, I will be contacted by my hospital consultant or GP to discuss how this may affect my treatment or follow up.
7. I understand that blood samples and associated clinical data may be transferred to commercial / non-commercial research partners of the University Hospitals of Leicester NHS Trust, but that the information will be coded prior to transfer.
8. I agree to take part in the above study.
________________________ ________________ ___________________
Name of Patient Date Signature
_________________________ ________________ ___________
Researcher Date Signature
1 for patient; 1 for researcher; 1 to be kept with hospital notes

237
7.4 Appendix IV: Consent form for colorectal tissue bank
PATIENT CONSENT FORM
Colorectal Tissue Bank
Tissue Bank Custodian: Dr. C Richards and Mr J Jameson
Patient’s details:
Name:
D.O.B.
Address:
Hospital No.
This form should be read in conjunction with the Patient Information
Leaflet, version no 7 dated 08.12.2009 Please initial box
9. I agree to donate the tissue samples as identified below to the Colorectal Tissue Bank and allow their use in medical research as described in the Patient Information Sheet entitled Colorectal Tissue Bank, Version 6 dated 1.10.2008
10. I understand that I may withdraw my consent to my tissue and blood sample being used at any time without justifying my decision and without affecting my normal care and medical management.
11. I understand that members of University Hospitals of Leicester NHS Trust and Leicester University research teams may wish to view relevant sections of my medical records, but that all the information will be treated as confidential.
12. I understand that samples from the tissue bank and associated clinical data may be transferred to non-commercial research partners of the University Hospitals of Leicester NHS Trust and Leicester University, but that the information will be anonymised prior to transfer.

238
13. I understand medical research is covered for mishaps in the same way, as for patients undergoing treatment in the NHS i.e. compensation is only available if negligence occurs.
14. I understand that samples from the tissue bank will not be used to undertake any genetic tests whose results may have adverse consequences on my or my families insurance or employment.
15. I understand that if research using my tissues produces information, which has immediate clinical relevance to me, I will be informed by my hospital consultant or GP and be given an opportunity to discuss the results.
16. I understand that the tissue is a gift and that I will not benefit from any intellectual property that results from the use of the tissue.
17. I would be willing to be contacted again regarding future use of this tissue for purposes not foreseen at the present time.
I have read the patient information leaflet relating to the Colorectal Tissue Bank
and have had the opportunity to ask any questions.
Signature of patient
........................................………………………......Date......................................
(Name in BLOCK LETTERS)
..................................................................................................………………….I
confirm I have explained the purpose of the tissue bank, as detailed in the
Patient Information Sheet, in terms, which in my judgement are suited to the
understanding of the patient.
Signature of individual taking consent
...........................................…………………………Date......................................
(Name in BLOCK LETTERS)

239
7.5 Appendix V: NBSCP screening approval
Bowel Cancer Screening Programme
17 July 2011
Dear Mr Aslam The Bowel Cancer Screening Programme (BCSP) Research Committee met on 29 June
2011 to discuss your research plans: Circulating MicroRNAs are Novel Biomarker
for Colorectal Cancer Screening.
The Research Committee considered this project to be exciting.
The Committee give their support to the project.
The Committee would like you to be aware that as a trial called seAFOod is taking place
at the same centre, careful management should be undertaken so as not to overburden
patients. You should also manage the risk of contamination from this chemoprevention
study.
This letter of support can be used as permission to gain the relevant access to the Screening Programme.
As a condition of our support, the BCSP Research Committee require you to keep us
informed of developments with the project including
• when the research project has started • which (if any) Bowel Cancer Screening Centres are taking part in the
project • when fully recruited • any change of status
Research Committee
Professor John Scholefield Gillian Liddington Chair Administrator Mr. M. I. Aslam [email protected]
NCRI Clinical Studies Groups Secretariat Angel Building
407 St John Street London
EC1V 4AD
Tel: 020 3469 8533

240
• any significant adverse reactions • when complete and • when written up (including a copy of your findings for the Committee)
The Research Committee requires that you notify them of any incidents that would be
recorded on the National Research Ethics Service (NRES) Breaches Register.
Undertaking research within the Screening Programme further to this letter of support
assumes your agreement to fulfil this obligation. NRES will share information with
BCSP Research Committee regarding any breaches. We wish you well with your
research.
Yours sincerely
Gillian Liddington
On behalf of the NHS Bowel Cancer Screening Programme Research Committee

241
7.6 Appendix VI: Plasma array participants characteristics
H45/09 M 67 Duke's A Sigmoid Adenocarcinoma, pT2,pN0,RM0
H56/09 M 75 Duke's A Sigmoid Adenocarcinoma,pT2,pN0,RM0
H276/09 M 60 Dukes' A Rectal Adenocarcinoma , pT3,pN2,pM1
H43/09 F 73 Dukes' B Caecal Adenocarcinoma,pT3,pN0,RMo
H333/08 F 86 Dukes' B, Rectal Adenocarcinoma rectum ,pT2, pN0,M0
H166/09 M 73 Dukes' B, Rectal Adenocarcinoma, pT3, pN0, pMx,
H281/09 F 77 Duke's B, Ascending Colon Adenocarcinoma,pT3 pN0pMx
H176/09 F 48 Dukes B, Asecending Colon adenocarcinoma, pT3 pN0? pM1
H513/08 M 72 Dukes' C1, Caecal Adenocarcinoma T4N2Mx
H399/08 F 83 Dukes' C1, Rectal Adenocarcinoma,pT3,pN2,RMx
H287/09 M 69 Dukes' C2, Caecal Adenocarcinoma,pT3,pN2,pM1
H175/09 M 58 Dukes' C2, Sigmoid Adnenocarcinoma, pT4, pN2 pMx,
H339/08 M 62 Tubular adenoma with low grade dysplasia
H510/08 F 92 Tubulovillous adenoma low grade dysplasia
H516/08 F 72 Tubular adenoma with low grade dysplasia
H58/09 M 47 Multiple tiny tubular adenomas with low grade dysplasia
H169/09 M 64 Tubulovillous with low grade dysplasia
H170/09 F 56 Tubular Adenoma with low grade dysplasia
H180A/09 F 80 Tubulovillous adenoma with moderate dysplasia
H177/09 M 74 Tubulovillous adenoma with high-grade dysplasia
H518/08 M 58 Tubulovillous adenoma with severe dysplasia
H341/08 M 79 No Polyp or Cancer on Colonoscopy
H400A/08 F 80 No Polyp or Cancer on Colonoscopy
H400/08 M 45 No Polyp or Cancer on Colonoscopy
H515/08 F 86 No Polyp or Cancer on Colonoscopy
H520A /08 M 79 No Polyp or Cancer on Colonoscopy
H396/08 F 66 No Polyp or Cancer on Colonoscopy
H174/09 F 52 No Polyp or Cancer on Colonoscopy
H271/09 F 83 No Polyp or Cancer on Colonoscopy
H274/09 M 63 No Polyp or Cancer on Colonoscopy
H60/09 M 71 No Polyp or Cancer on Colonoscopy
H400A/08 F 80 No Polyp or Cancer on Colonoscopy
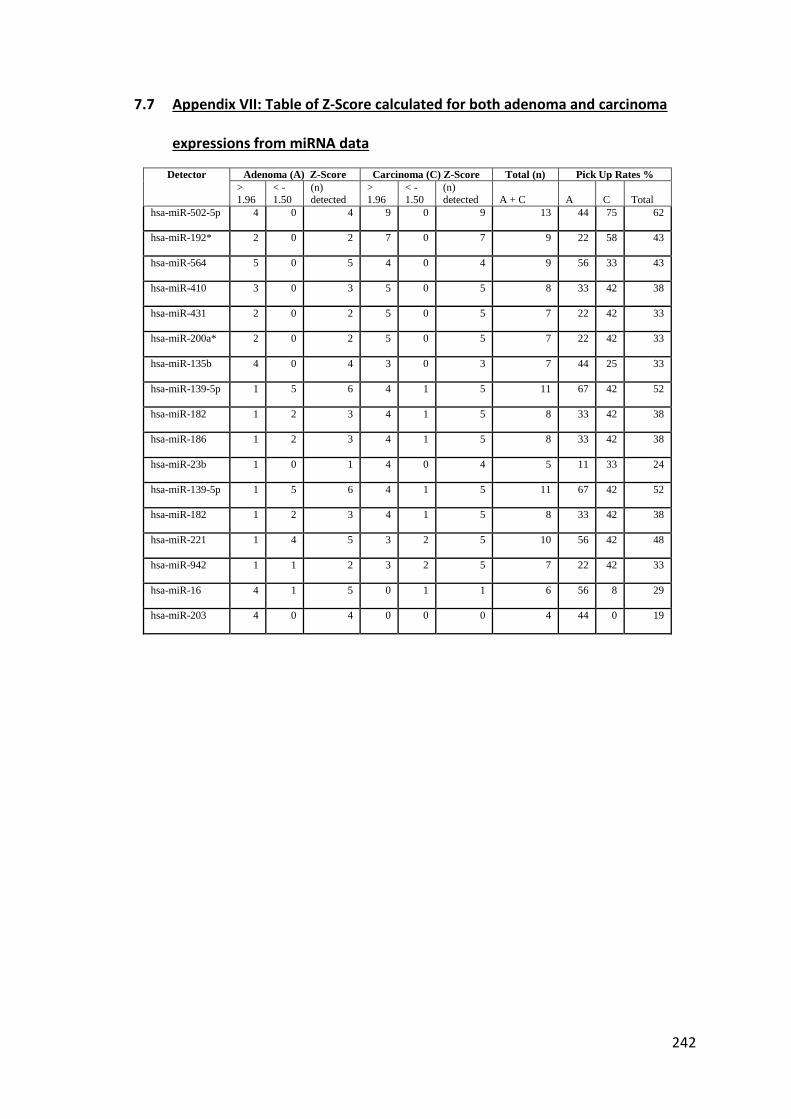
242
7.7 Appendix VII: Table of Z-Score calculated for both adenoma and carcinoma
expressions from miRNA data
Detector Adenoma (A) Z-Score Carcinoma (C) Z-Score Total (n) Pick Up Rates %
>
1.96
< -
1.50
(n)
detected
>
1.96
< -
1.50
(n)
detected A + C A C Total
hsa-miR-502-5p 4 0 4 9 0 9 13 44 75 62
hsa-miR-192* 2 0 2 7 0 7 9 22 58 43
hsa-miR-564 5 0 5 4 0 4 9 56 33 43
hsa-miR-410 3 0 3 5 0 5 8 33 42 38
hsa-miR-431 2 0 2 5 0 5 7 22 42 33
hsa-miR-200a* 2 0 2 5 0 5 7 22 42 33
hsa-miR-135b 4 0 4 3 0 3 7 44 25 33
hsa-miR-139-5p 1 5 6 4 1 5 11 67 42 52
hsa-miR-182 1 2 3 4 1 5 8 33 42 38
hsa-miR-186 1 2 3 4 1 5 8 33 42 38
hsa-miR-23b 1 0 1 4 0 4 5 11 33 24
hsa-miR-139-5p 1 5 6 4 1 5 11 67 42 52
hsa-miR-182 1 2 3 4 1 5 8 33 42 38
hsa-miR-221 1 4 5 3 2 5 10 56 42 48
hsa-miR-942 1 1 2 3 2 5 7 22 42 33
hsa-miR-16 4 1 5 0 1 1 6 56 8 29
hsa-miR-203 4 0 4 0 0 0 4 44 0 19

243
7.8 Appendix VIII: Clinicopathological characteristics of individual participants in
control, adenoma and cancer groups
Groups H / number Age Gender Diagnosis/Characteristics
Controls
H334/08/MIA 74 F Normal Colonoscopy and biopsies
H335/08 65 F Normal Colonoscopy and biopsies
H338/08 39 F Normal Colonoscopy and biopsies
H339/08 61 M Normal Colonoscopy
H341/08 80 M Normal Colonoscopy
H340/08 72 M Normal Colonoscopy and biopsies
H391/08 69 M Normal Colonoscopy and biopsies
H396/08 65 F Normal Colonoscopy and biopsies
H400A/08 79 F Normal Colonoscopy
H400/08 44 M Normal Colonoscopy
H515/08 85 F Normal Colonoscopy
H518/08 57 M Normal FOS -Post Total colectomy 2000, iloanal
pouch,
H519/08 66 F Normal Colonoscopy
H520/08/A 78 M Normal Colonoscopy and biopsies
H48/09 58 M Excision of polyp 1/12ago, Now Colonoscopy
normal
H54/09 63 M Normal Colonoscopy
H57/09 69 M Normal Colonoscopy
H59/09 74 F Normal Colonoscopy
H60/09 71 M Normal Colonoscopy
H171/09 58 F Normal Colonoscopy – mild erythema
H174/09 52 F Normal Colonoscopy
H179/09 57 F Normal Colonoscopy
H180/09 54 M Normal Colonoscopy
H271/09 83 F Normal Colonoscopy
H272/09 54 M Normal Colonoscopy
H273/09 48 M Normal Colonoscopy
H274/09 63 M Normal Colonoscopy
H275/09 46 M Normal Colonoscopy, Previous Right
Hemicolectomy
H276/10 23 F Ulcerative Colitis

244
H659/10 72 M Colovesical Fistula
H956/10 74 M Diverticular abscess – follow up colonoscopy
normal
Adenomas
H334/08 56 M Colonic Tubular adenoma with low grade
dysplasia
H393/08 77 F Colonic Hyperplastic polyp
H395/08 72 M Colonic Hyperplastic polyp
H398/08 66 M Tubulovillous Adenoma
H510/08 90 F Tubulovillous Adenoma
H514/08 72 M Sigmoid Tubulovillous adenoma with low grade
dysplasia
H516/08 71 F Caecal Tubular Adenoma with low grade
dysplasia
H520/08/B 75 F Rectal Tubulovillous Adenoma with low grade
dysplasia
H46/09 52 M Rectal Adenoma with low grade dysplasia
H58/09 47 M Multiple tiny tubular Adenomas with low grade
dysplasia
H167/09 86 M Rectal Tubulovillous Adenoma with low garde
dysplasia
H169/09 64 M Tubulovillous Adenoma with low grade dysplasia
H170/09 56 F Tubular Adenoma with low grade dysplasia
H172/09 67 M Sigmoid tubular Adenoma with low grade
dysplasia
H177/09 74 M Tubulovillous adenoma with high-grade dysplasia
H178/09 67 M Descending colonic Adenomas with low grade
dysplasia
H180A/09 80 F Tubulovillous Adenoma with moderate dysplasia
H260/10 79 M Rectal Adenoma with low grade dysplasia
H261/10 88 F Rectal Adenoma with low grade dysplasia
H267/10 78 F Rectal Adenoma with low grade dysplasia
H273/10 57 F Rectal Adenoma with low grade dysplasia
H658/10 56 M Rectal Adenoma with low grade dysplasia
H663/10 60 M Rectal Adenoma with low grade dysplasia
H666/10 63 F Rectal Adenoma with low grade dysplasia
H672/10 82 F Rectal Adenoma with moderate to high grade
dysplasia
H679/10 62 M Sigmoid Adenoma with high grade Dysplasia
H950/10 38 F Sigmoid Adenoma with high grade Dysplasia
H960B/10 68 M Rectal Adenoma with low grade dysplasia
Carcinomas
H513/08 71 M rT4,N2,M0, Caecal Carcinoma
H399/08 82 F rT3,N2,M0, Rectal Carcinoma,
H43/09 73 F rT3,N0,M0 , Caecal carcinoma,

245
H45/09 67 M rT2,N0,M0 , Sigmoid Colon Carcinoma ,
H56/09 74 M rT2,N0,M0 ,.Sigmoid Colon Carcinoma,
H164/09 70 M rT3,N0,M0., Ascending Colon Carcinoma
H166/09 73 M rT3,N0,M0 , Rectal Carcinoma, ,
H175/09 58 M rT4,N2,M0 , Sigmoid Colon Carcinoma, ,
H176/09 47 F rT3 N0?M1 , Ascending Colon Carcinoma,
H276/09 60 M rT3,N2,M1 , Rectal Carcinoma
H279/09 78 M rT3,N0,M0 , Sigmoid Colon Carcinoma
H281/09 77 F rT3,N0,M0 , Caecal/Ascending Colon Carcinoma
H287/09 69 M rT3,N2,M1 , Caecal Carcinoma
H293/09 50 M rT2,N0,M0 , Rectal Carcinoma - short course
radiotherapy
H265/10 87 M rT2,N0,M0 , Caecal Carcinoma
H266/10 65 M rT3,N1/N2,M0 , Recto-Sigmoid Carcinoma
H268/10 64 M rT2,N0,M0 , Ascending Colon Carcinoma
H275/10 76 M rT3,?N1,M0 , Ascending Colon Carcinoma
H277/10 66 M rT3,N1,M0 , Recto-Sigmoid Colon
H278/10 69 F rT3,N1,M0 , Caecal Carcinoma
H279/10 60 M rT3,N1,M0 , Rectal Carcinoma
H288/10 64 M rT2,N0,M0 ., Rectal Carcinoma- post
radiotherapy
H300B/10 82 M rT3,N0,M0 , Caecal/Ascending Colonic carcinoma
H300A/10 69 M rT3,N1,M0 , Sigmoid Colon Carcinoma
H660/10 75 M rT2,N0,M0., Rectal Carcinoma
H662/10 48 F rT2,N1,M0., Rectal Carcinoma, short course
radiotherapy
H664/10 68 M rT3,N1, M0 , Transverse Colon Carcinoma
H673/10 64 F rT3,N1MO , Sigmoid Colon Carcinoma
H674/10 69 M rT3,N1MO , Rectal Carcinoma
H678/10 66 M rT3,N1,M0 , Rectal Carcinoma- long course
radiotherapy
H680/10 82 F rT3,N0,M0 , Recto-Sigmoid carcinoma
H680A/10 71 M rT3,N1,M1 , Ascending Colonic carcinoma
H951/10 63 M rT3,N0,M0., Rectal Carcinoma
H952/10 73 M rT3/T4,N1,M0 , Sigmoid Colon Carcinoma

246
7.9 Appendix IX: Subgroup of controls for initial validation cohort.
Grouping is based on previous significant history of neoplasia, or non-neoplastic disease.
Symptomatic, Normal Colonoscopy ,No Significant Bowel Disease History
Specimen No Patient Characteristics
H339/08 Normal Colonoscopy & Biopsy
H519/08 Normal Colonoscopy & Biopsy
H334/08/MIA Normal Colonoscopy & Biopsy,
H335/08 Normal Colonoscopy & Biopsy
H179/09 Normal Colonoscopy & Biopsy
H338/08 Normal Colonoscopy & Biopsy
H272/09 Normal Colonoscopy & Biopsy
H400/08 Normal Colonoscopy & Biopsy
H515/08 Normal Colonoscopy & Biopsy
H520/08/A Normal Colonoscopy & Biopsy
H57/09 Normal Colonoscopy & Biopsy
H396/08 Normal Colonoscopy & Biopsy,
H400A/08 Normal Colonoscopy & Biopsy
H391/08 Normal Colonoscopy & Biopsy
H518/08 Iloanal Pouch – flexible sigmoidoscopy normal
Symptomatic, Normal Colonoscopy, A Significant Bowel Neoplasia Disease History
H275/09 Previous Right Hemicolectomy +Chemotherapy
H395/08 Severely dysplastic Rectal Adenoma excised 18 months prior to colonoscopy
H54/09 Sigmoid volvulous
H180/09 Right Hemicolectomy 18 years ago, APC mutation +ve
H60/09 Right Hemicolectomy 9 years ago for severely dysplastic polyp.
H174/09 Polyp excised 5 years ago
H48/09 Excision of polyp 1 month ago, now completion colonoscopy normal.
H271/09 APER for rectal Cancer 5 Years ago
Symptomatic, Normal Colonoscopy, Current/Previous Significant Bowel Disease
H341/08 Diverticulitis, diverticulosis, AAA repair
H273/09 Colonoscopy after diverticular abscess
H393/08 History of colitis -? Crohn’s colitis
H59/09 Previous collageneous colitis 15 years ago
H276/10 Ulcerative Colitis
H659/10 Colovesical Fistula
H171/09 Collageneous collitis + strong FH of CRC
H340/08 Severe Diverticular disease
H956/10 Diverticular Disease with abscess

247
7.10 Appendix X: Initial Validation Cohort: Concentrations of Total RNA as detected
on Nanodrop ND-1000 Spectrophotometer
Serial Number H / Number Total RNA concentration 260/280 Peak
1 H334/08 4.9 1.15 270
2 H393/08 8.6 1.06 275
3 H395/08 9.8 1.24 270
4 H398/08 6.4 1.05 275
5 H510/08 4.5 2.02 270
6 H514/08 9.2 0.92 270
7 H516/08 11.9 0.91 275
8 H520/08/B 7.2 1.18 270
9 H46/09 5 1.04 270
10 H58/09 6 1.49 265
11 H167/09 3.5 1.47 270
12 H169/09 5.4 1.4 270
13 H170/09 2.6 1.57 270
14 H172/09 15.9 1.4 265
15 H177/09 3.6 1.41 270
16 H178/09 13.9 1.29 270
17 H180A/09 2.1 1.02 270
18 H260/10 13.5 1.51 270
19 H261/10 25.9 1.47 270
20 H267/10 4.6 1.55 275
21 H273/10 14.1 1.53 270
22 H658/10 3.9 2.18 275
23 H663/10 3 0.95 275
24 H666/10 5.6 1.42 270
25 H672/10 26.1 1.39 270
25 H679/10 21.8 1.44 270
27 H950/10 5.6 1.4 265
28 H960B/10 15.9 1.32 270
29 H334/08/MIA 2.3 1.52 270
30 H335/08 7 1.15 270
31 H338/08 6.5 1.24 270
32 H339/08 4.4 1.46 270
33 H341/08 8.2 1.84 265
34 H340/08 4.9 1.65 265
35 H391/08 4.6 1.22 270
36 H396/08 15.2 0.73 275
37 H400A/08 4.7 0.93 270
38 H400/08 6.3 1.24 270
39 H515/08 8.5 1.1 265
40 H518/08 4.8 1.18 270
41 H519/08 3.3 0.99 275
42 H520/08/A 9.2 1.17 270

248
Serial Number H / Number Total RNA concentration 260:280 Peak
43 H48/09 3.1 1.72 270
44 H54/09 25.1 1.31 270
45 H57/09 2.4 1.21 270
46 H59/09 17.1 1.15 270
47 H60/09 2.1 1.49 270
48 H171/09 16 1.47 270
49 H174/09 5.9 1.28 270
50 H179/09 16.2 1.2 265
51 H180/09 2.7 1.66 270
52 H271/09 26.8 1.63 270
53 H272/09 22.7 1.3 270
54 H273/09 24.3 1.37 270
55 H274/09 13 1.53 270
56 H275/09 13.5 1.31 270
57 H276/10 12.6 1.32 270
58 H659/10 4.2 2.37 275
59 H665/10 3.1 1.37 260
60 H956/10 5 1.47 265
61 H513/08 11.3 1.18 270
62 H399/08 7.7 1 275
63 H43/09 5.2 1.14 270
64 H45/09 4.7 2.23 270
65 H56/09 4.2 1.4 270
66 H164/09 8.9 1.65 270
67 H166/09 6.1 1.57 270
68 H175/09 5.1 1.23 270
69 H176/09 2.9 2.29 265
70 H276/09 12.8 1.56 270
71 H279/09 1.9 1.98 265
72 H281/09 24.1 1.66 270
73 H287/09 16 1.69 270
74 H293/09 11.6 1.55 265
75 H265/10 7.4 1.04 270
76 H266/10 13.8 1.54 270
77 H268/10 3.5 1.39 275
78 H275/10 12.7 1.63 270
79 H277/10 11.7 1.54 270
80 H278/10 6.9 0.94 260
81 H279/10 2.8 1.98 270
82 H288/10 3.2 1.67 270
83 H300B/10 11.2 1.57 270
84 H300A/10 25.1 1.7 270
85 H660/10 3 2.23 275
86 H662/10 5.4 1.35 270
87 H664/10 4.9 1.31 270

249
Serial Number H / Number Total RNA concentration 260:280 Peak
88 H673/10 3.6 1.71 270
89 H674/10 3.9 1.44 270
90 H678/10 4.5 0.97 265
91 H680/10 3.1 2.62 270
92 H680A/10 4.6 1.75 260
93 H951/10 5 0.78 270
94 H952/10 28.1 1.2 270

250
7.11 Appendix XI: CT values based expression levels of different miRNAs analysed
for initial validation cohort
Average expression levels and standard deviations are given for control, adenoma and
carcinoma groups. 2 tailed non matched pairs student’s t test is used for calculation of
p-values.
miRNAs
Normal/ Controls Average
STD Adenoma Average
STD Carcinoma Average
STD
Normal vs. Carcinoma
Normal vs. Adenoma
T-Test T-Test
(p-value) (p-value)
Megaplex Pool A miRNA miRNA expressions
miR-135b 39.59 1.70 36.81 3.15 34.98 3.47 <0.0001 0.0030
miR-191 19.04 2.61 17.46 2.86 15.65 2.45 0.0001 0.0956
miR-369-5p 37.30 3.70 34.48 4.17 32.05 4.63 0.0001 0.0415
miR-502-5P 30.57 2.18 29.52 3.56 29.12 3.82 0.0780 0.2970
miR-203 30.99 2.81 29.93 3.51 28.32 2.68 0.0024 0.3297
miR-34a 35.68 3.09 32.07 4.02 30.11 3.10 <0.0001 0.0054
miR-17 23.10 4.10 20.06 3.40 17.92 3.03 0.0001 0.0234
miR-484 21.38 2.64 20.00 2.91 18.21 2.54 0.0002 0.1526
miR-95 36.82 3.79 34.70 4.71 32.02 3.69 0.0001 0.1514
miR-195 27.78 3.18 25.66 2.80 24.56 2.75 0.0012 0.0450
miR-205 37.31 3.46 36.37 4.32 34.44 3.83 0.0092 0.4781
miR-23b 32.04 5.24 29.00 5.25 26.23 4.74 0.0005 0.0958
miR-21 21.85 2.69 19.65 2.97 18.40 2.56 0.0001 0.0283
miR-566 38.63 2.64 36.41 3.52 35.68 4.16 0.0025 0.0418
miR-486-5P 28.76 4.39 26.56 3.63 25.19 3.33 0.0061 0.1161
miR-589 34.85 3.77 33.26 4.63 30.47 3.39 0.0003 0.2737
miR-431 30.29 4.44 27.04 4.53 23.75 4.35 <0.0001 0.0396
miR-92a 19.27 2.12 18.65 2.22 17.56 1.88 0.0079 0.3983
miR-410 30.08 3.76 27.98 3.07 26.09 2.81 0.0006 0.0806
miR-487b 32.15 4.08 29.55 4.17 27.23 3.48 0.0002 0.0711
miR-16 26.23 4.39 23.15 3.79 21.40 3.43 0.0005 0.0340
miR-486-3P 25.64 3.12 25.09 3.25 23.83 2.77 0.0482 0.6086

251
miR-532-5P 29.97 3.38 28.10 3.73 26.66 3.47 0.0021 0.1295
RNU6B 23.36 1.08 22.84 1.27 22.20 1.34 0.0016 0.2030
Sample Name
Normal/ Controls Average
STD Adenoma Average
STD Carcinoma Average
STD
Normal vs.
Carcinoma
Normal vs.
Adenoma
T-Test T-Test
(p-value) (p-value)
Megaplex Pool B miRNA expressions
miR-192* 39.23 2.23 37.54 3.80 35.42 3.80 <0.0001 0.1181
miR-200a* 39.90 0.40 39.05 1.92 37.78 2.85 <0.0001 0.0798
miR-624* 34.33 2.11 33.37 2.76 32.28 2.61 0.0036 0.2564
miR-181C* 34.36 4.83 31.92 5.96 29.80 5.06 0.0031 0.1917
miR-182* 39.95 0.19 39.07 2.20 38.57 2.48 0.0013 0.1086
miR-592 38.84 2.00 38.53 2.73 37.67 3.23 0.1060 0.7034
miR-566 32.53 3.33 31.72 3.45 30.53 2.46 0.0357 0.4876
RNU6B 23.17 1.00 22.66 1.17 22.27 1.34 0.0083 0.1797

252
7.12 Appendix XII: ∆CT values for expression levels of different miRNAs analysed for
initial validation cohort
Average expression levels and standard deviations are given for control, adenoma and
carcinoma groups. 2 tailed non matched pairs student’s t test is used for calculation of
p-values.
miRNAs
Normal/ Controls Average
STD Adenoma Average
STD Carcinoma Average
STD
Normal vs.
Carcinoma
Normal vs.
Adenoma
T-Test T-Test
(p-value) (p-value)
Megaplex Pool A miRNA miRNA expressions
miR-135b 18.33 -2.78 -4.61 0.00 0.00 3.47 <0.0001 0.0030
miR-191 -2.22 -1.59 -3.39 0.00 0.10 2.45 0.0001 0.0956
miR-369-5p 16.04 -2.82 -5.25 0.00 0.04 4.63 0.0001 0.0415
miR-502-5P 9.31 -1.05 -1.45 0.08 0.30 3.82 0.0780 0.2970
miR-203 9.73 -1.06 -2.67 0.00 0.33 2.68 0.0024 0.3297
miR-34a 14.42 -3.61 -5.57 0.00 0.01 3.10 <0.0001 0.0054
miR-17 1.84 -3.04 -5.18 0.00 0.02 3.03 0.0001 0.0234
miR-484 0.12 -1.37 -3.17 0.00 0.15 2.54 0.0002 0.1526
miR-95 15.56 -2.12 -4.80 0.00 0.15 3.69 0.0001 0.1514
miR-195 6.52 -2.12 -3.22 0.00 0.04 2.75 0.0012 0.0450
miR-205 16.05 -0.95 -2.88 0.01 0.48 3.83 0.0092 0.4781
miR-23b 10.78 -3.04 -5.81 0.00 0.10 4.74 0.0005 0.0958
miR-21 0.59 -2.20 -3.44 0.00 0.03 2.56 0.0001 0.0283
miR-566 17.37 -2.22 -2.95 0.00 0.04 4.16 0.0025 0.0418
miR-486-5P 7.50 -2.21 -3.57 0.01 0.12 3.33 0.0061 0.1161
miR-589 13.59 -1.59 -4.38 0.00 0.27 3.39 0.0003 0.2737
miR-431 9.03 -3.25 -6.54 0.00 0.04 4.35 <0.0001 0.0396
miR-92a -1.99 -0.63 -1.71 0.01 0.40 1.88 0.0079 0.3983
miR-410 8.82 -2.10 -3.98 0.00 0.08 2.81 0.0006 0.0806
miR-487b 10.89 -2.60 -4.92 0.00 0.07 3.48 0.0002 0.0711
miR-16 4.97 -3.08 -4.82 0.00 0.03 3.43 0.0005 0.0340

253
miR-486-3P 4.39 -0.56 -1.81 0.05 0.61 2.77 0.0482 0.6086
miR-532-5P 8.71 -1.87 -3.31 0.00 0.13 3.47 0.0021 0.1295
Sample Name
Normal/ Controls Average
STD Adenoma Average
STD Carcinoma
Average STD
Normal vs.
Carcinoma
Normal vs.
Adenoma
T-Test T-Test
(p-value) (p-value)
Megaplex Pool B miRNA expressions
miR-192* 18.03 -0.52 -1.15 0.00 0.20 1.34 0.0016 0.2030
miR-200a* 18.71 -1.69 -3.80 0.00 0.12 3.80 <0.0001 0.1181
miR-624* 13.14 -0.86 -2.12 0.00 0.08 2.85 <0.0001 0.0798
miR-181C* 13.16 -0.96 -2.05 0.00 0.26 2.61 0.0036 0.2564
miR-182* 18.76 -2.44 -4.56 0.00 0.19 5.06 0.0031 0.1917
miR-592 17.64 -0.88 -1.38 0.00 0.11 2.48 0.0013 0.1086
miR-566 11.33 -0.31 -1.17 0.11 0.70 3.23 0.1060 0.7034

254
7.13 Appendix XIII: ∆∆CT values for expression levels of different miRNAs analysed
for initial validation cohort
Average expression levels and standard deviations are given for control, adenoma and
carcinoma groups. 2 tailed non matched pairs student’s t test is used for calculation of
p-values.
Sample Name Adenoma vs. Normal ∆∆CT
Cancer vs. Normal ∆∆CT
Normal vs. Tumour T-Test
(p-value)
Normal vs. Adenoma T-Test
(p-value)
miR-135b -2.78 -4.61 <0.0001 0.0030
miR-191 -1.59 -3.39 0.0001 0.0956
miR-369-5p -2.82 -5.25 0.0001 0.0415
miR-502-5P -1.05 -1.45 0.0780 0.2970
miR-203 -1.06 -2.67 0.0024 0.3297
miR-34a -3.61 -5.57 <0.0001 0.0054
miR-17 -3.04 -5.18 0.0001 0.0234
miR-484 -1.37 -3.17 0.0002 0.1526
miR-95 -2.12 -4.80 0.0001 0.1514
miR-195 -2.12 -3.22 0.0012 0.0450
miR-205 -0.95 -2.88 0.0092 0.4781
miR-23b -3.04 -5.81 0.0005 0.0958
miR-21 -2.20 -3.44 0.0001 0.0283
miR-566 -2.22 -2.95 0.0025 0.0418
miR-486-5P -2.21 -3.57 0.0061 0.1161
miR-589 -1.59 -4.38 0.0003 0.2737
miR-431 -3.25 -6.54 <0.0001 0.0396
miR-92a -0.63 -1.71 0.0079 0.3983
miR-410 -2.10 -3.98 0.0006 0.0806
miR-487b -2.60 -4.92 0.0002 0.0711
miR-16 -3.08 -4.82 0.0005 0.0340
miR-486-3P -0.56 -1.81 0.0482 0.6086
miR-532-5P -1.87 -3.31 0.0021 0.1295
miR-192* -0.52 -1.15 0.0016 0.2030
miR-200a* -1.69 -3.80 <0.0001 0.1181
miR-624* -0.86 -2.12 <0.0001 0.0798
miR-181C* -0.96 -2.05 0.0036 0.2564
miR-182* -2.44 -4.56 0.0031 0.1917
miR-592 -0.88 -1.38 0.0013 0.1086
miR-566 -0.31 -1.17 0.1060 0.7034
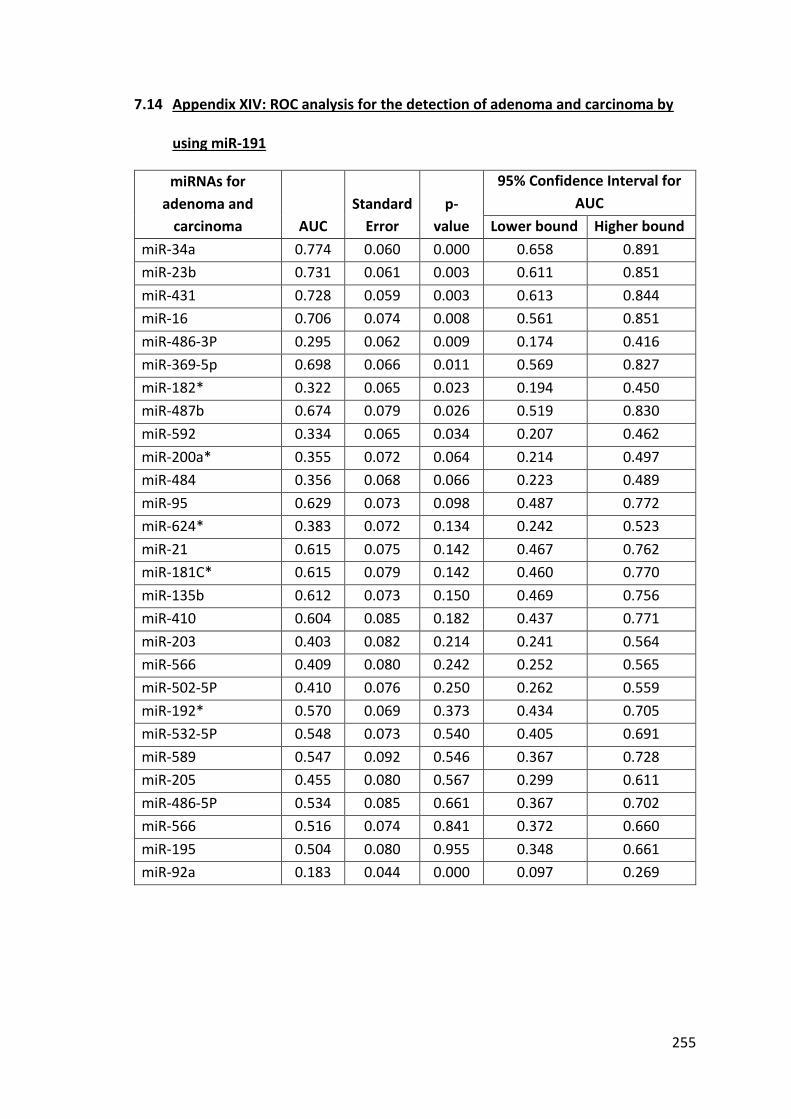
255
7.14 Appendix XIV: ROC analysis for the detection of adenoma and carcinoma by
using miR-191
miRNAs for
adenoma and
carcinoma AUC
Standard
Error
p-
value
95% Confidence Interval for
AUC
Lower bound Higher bound
miR-34a 0.774 0.060 0.000 0.658 0.891
miR-23b 0.731 0.061 0.003 0.611 0.851
miR-431 0.728 0.059 0.003 0.613 0.844
miR-16 0.706 0.074 0.008 0.561 0.851
miR-486-3P 0.295 0.062 0.009 0.174 0.416
miR-369-5p 0.698 0.066 0.011 0.569 0.827
miR-182* 0.322 0.065 0.023 0.194 0.450
miR-487b 0.674 0.079 0.026 0.519 0.830
miR-592 0.334 0.065 0.034 0.207 0.462
miR-200a* 0.355 0.072 0.064 0.214 0.497
miR-484 0.356 0.068 0.066 0.223 0.489
miR-95 0.629 0.073 0.098 0.487 0.772
miR-624* 0.383 0.072 0.134 0.242 0.523
miR-21 0.615 0.075 0.142 0.467 0.762
miR-181C* 0.615 0.079 0.142 0.460 0.770
miR-135b 0.612 0.073 0.150 0.469 0.756
miR-410 0.604 0.085 0.182 0.437 0.771
miR-203 0.403 0.082 0.214 0.241 0.564
miR-566 0.409 0.080 0.242 0.252 0.565
miR-502-5P 0.410 0.076 0.250 0.262 0.559
miR-192* 0.570 0.069 0.373 0.434 0.705
miR-532-5P 0.548 0.073 0.540 0.405 0.691
miR-589 0.547 0.092 0.546 0.367 0.728
miR-205 0.455 0.080 0.567 0.299 0.611
miR-486-5P 0.534 0.085 0.661 0.367 0.702
miR-566 0.516 0.074 0.841 0.372 0.660
miR-195 0.504 0.080 0.955 0.348 0.661
miR-92a 0.183 0.044 0.000 0.097 0.269

256
7.15 Appendix XV: Patient Characteristics for the final validation cohort
Sample No Diagnosis Sample No Diagnosis Sample No Diagnosis
H1103/10 Gall stones
H1110B/10
Adenoma
H278/09 Hepatic flexure carcinoma
H1104/10 Gall stones
H1110E/10 Adenoma
H286/09 Hepatic flexure carcinoma
H1109F/10 Gall stones
H1110G/10
Adenoma
H298/09 Hepatic flexure carcinoma
H1110F/10 Gall stones
H1110I/10 Adenoma
H957/10 Hepatic flexure carcinoma
H1138C/10 Gall stones
H1110K/10 Adenoma
H280/09 Transverse colonic carcinoma
H1138D/10 Gall stones
H1110L/10 Adenoma
H296/09 Transverse colonic carcinoma
H1138G/10 Gall stones
H1113/10 Adenoma
H669/10 Transverse colonic carcinoma
H47/09 Normal colonoscopy
H1114/10 Adenoma
H168/09 Splenic flexure carcinoma
H1107/10 Normal colonoscopy
H1114C/10 Adenoma
H959/10 Desceding colonic carcinoma
H1109C/10 Normal colonoscopy
H1114H/10 Adenoma
H264/10
Sigmoid colonic carcinoma
H1109J/10 Normal colonoscopy
H1114I/10 Adenoma
H282/09
Sigmoid colonic carcinoma
H1110C/10 Normal colonoscopy
H1115/10 Adenoma
H283/09
Sigmoid colonic carcinoma
H1110J/10 Normal colonoscopy
H1116/10 Adenoma
H297/09
Sigmoid colonic carcinoma
H1112/10 Normal colonoscopy
H1117/10 Adenoma
H668/10
Sigmoid colonic carcinoma
H1114B/10 Normal colonoscopy
H1119/10 Adenoma
H671/10
Sigmoid colonic carcinoma
H1114F/10 Normal colonoscopy
H1120/10 Adenoma
H675/10
Sigmoid colonic carcinoma
H1118/10 Normal colonoscopy
H1138/10 Adenoma
H954/10
Sigmoid colonic carcinoma
H1138A/10 Normal colonoscopy
H1138B/10 Adenoma
H1111/10 Rectosigmoid carcinoma
H1138E/10 Normal colonoscopy
H1138I/10 Adenoma
H263/10 Rectosigmoid carcinoma
H1138F/10 Normal colonoscopy
H1138J/10 Adenoma
H284/09 Rectosigmoid carcinoma

257
H1138L/10 Normal colonoscopy
H1139/10 Adenoma
H159/09 Rectal carcinoma
H1140/10 Normal colonoscopy
H1140A/10 Adenoma
H165/09 Rectal carcinoma
H519/08/A Normal colonoscopy
H1140B/10 Adenoma
H262/10 Rectal carcinoma
H520/08 Normal colonoscopy
H277/09 Caecal carcinoma
H270/10 Rectal carcinoma
H161/09 Normal colonoscopy
H269/10 Caecal carcinoma
H280/10 Rectal carcinoma
H1106/10 Adenoma
H274/10 Caecal carcinoma
H290/09 Rectal carcinoma
H1109A/10 Adenoma
H289/09 Caecal carcinoma
H292/09 Rectal carcinoma
H1109E/10 Adenoma
H677/10 Caecal carcinoma
H299/09 Rectal carcinoma
H1109I/10 Adenoma
H958/10 Caecal carcinoma
H670/10 Rectal carcinoma
H1109L/10 Adenoma
H676/10 Ascending colonic carcinoma
H960/10 Rectal carcinoma
H1110/10 Adenoma
H1106/10 Ascending colonic carcinoma
H960A/10 Rectal carcinoma
H1110A/10 Adenoma H1107/10 Hepatic flexure carcinoma
H960C/10 Rectal carcinoma

258
7.16 Appendix XVI: Total RNA concentrations for final validation cohort
Sample No Concentration ng/µl
Sample No Concentration ng/µl
Sample No Concentration ng/µl
H1103/10 3.8 H1110B/10 13.5 H278/09 5.9
H1104/10 10.4 H1110E/10 8.4 H286/09 7.4
H1109F/10 2.6 H1110G/10 4.8 H298/09 4.6
H1110F/10 12.9 H1110I/10 12.3 H957/10 3.6
H1138C/10 13.6 H1110K/10 14.2 H280/09 13.8
H1138D/10 6.9 H1110L/10 4.8 H296/09 4.1
H1138G/10 4.1 H1113/10 3.9 H669/10 12.3
H47/09 13.5 H1114/10 16.8 H168/09 11.7
H1107/10 15.9 H1114C/10 12.8 H959/10 2.8
H1109C/10 4.6 H1114H/10 18.1 H264/10 3.2
H1109J/10 4.2 H1114I/10 8.8 H282/09 11.6
H1110C/10 3.9 H1115/10 6.4 H283/09 15.1
H1110J/10 4.5 H1116/10 8.9 H297/09 3.9
H1112/10 5.2 H1117/10 4.8 H668/10 4.2
H1114B/10 11.2 H1119/10 14.6 H671/10 3.0
H1114F/10 6.3 H1120/10 8.4 H675/10 5.4
H1118/10 6.8 H1138/10 10.6 H954/10 3.1
H1138A/10 6.5 H1138B/10 14.4 H1111/10 6.6
H1138E/10 11.2 H1138I/10 8.6 H263/10 4.8
H1138F/10 6.4 H1138J/10 9.6 H284/09 4.6
H1138L/10 12.3 H1139/10 14.8 H159/09 14.2
H1140/10 16.4 H1140A/10 12.8 H165/09 15.9
H519/08/A 12.8 H1140B/10 8.6 H262/10 22.3
H520/08 10.4 H277/09 5.0 H270/10 15.8
H161/09 8.6 H269/10 28.1 H280/10 6.2
H1106/10 12.3 H274/10 5.2 H290/09 13.2
H1109A/10 16.6 H289/09 15.9 H292/09 7.1
H1109E/10 8.4 H677/10 12.6 H299/09 4.8
H1109I/10 6.4 H958/10 4.6 H670/10 13.5
H1109L/10 2.8 H676/10 5.6 H960/10 6.7
H1110/10 8.2 H1106/10 3.8 H960A/10 8.7
H1110A/10 5.6 H1107/10 13.5 H960C/10 11.2

259
7.17 Appendix XVII: Table of miR-135b expressions for Normal, Adenoma and Carcinoma
miR-135b expressions (CT), endogenous control snRNA RNU6B expression (CT) and normalised expression of miR-135b (∆CT)
Groups Sample ID CT miR-135b CT SnRNA RNU6B ∆CT miR-135b
Normal
H1103/10 40 33.02 6.98
H1104/10 40 31.59 8.41
H1109F/10 40 33.81 6.19
H1110F/10 40 29.93 10.07
H1138C/10 40 33.15 6.85
H1138D/10 40 31.58 8.42
H1138G/10 40 30.17 9.83
H47/09 40 31.45 8.55
H1107/10 40 32.61 7.39
H1109C/10 40 30.57 9.43
H1109J/10 40 32.2 7.8
H1110C/10 40 32.12 7.88
H1110J/10 25.84 29.44 -3.6
H1112/10 40 32.79 7.21
H1114B/10 40 30.53 9.47
H1114F/10 40 31.59 8.41
H1118/10 40 32.78 7.22
H1138A/10 40 31.82 8.18
H1138E/10 40 30.03 9.97
H1138F/10 40 31.61 8.39
H1138L/10 29.17 29.64 -0.47
H1140/10 30.37 32.97 -2.61
H519/08/A 40 31.28 8.72
H520/08 40 27.42 12.58
H161/09 27.79 30.56 -2.77
Adenoma
H1106/10 40 30.14 9.86
H1109A/10 31.18 28.79 2.39
H1109E/10 28.46 27.47 0.99
H1109I/10 31.6 29.62 1.98
H1109L/10 32.82 29.31 3.51
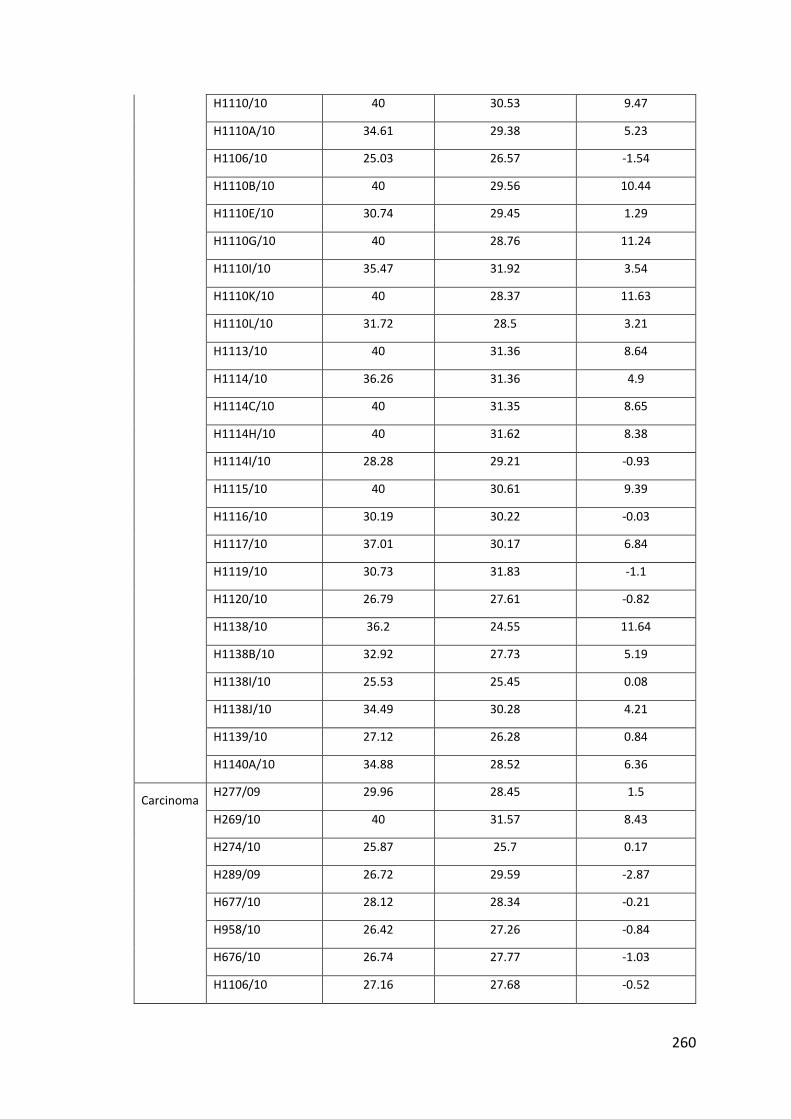
260
H1110/10 40 30.53 9.47
H1110A/10 34.61 29.38 5.23
H1106/10 25.03 26.57 -1.54
H1110B/10 40 29.56 10.44
H1110E/10 30.74 29.45 1.29
H1110G/10 40 28.76 11.24
H1110I/10 35.47 31.92 3.54
H1110K/10 40 28.37 11.63
H1110L/10 31.72 28.5 3.21
H1113/10 40 31.36 8.64
H1114/10 36.26 31.36 4.9
H1114C/10 40 31.35 8.65
H1114H/10 40 31.62 8.38
H1114I/10 28.28 29.21 -0.93
H1115/10 40 30.61 9.39
H1116/10 30.19 30.22 -0.03
H1117/10 37.01 30.17 6.84
H1119/10 30.73 31.83 -1.1
H1120/10 26.79 27.61 -0.82
H1138/10 36.2 24.55 11.64
H1138B/10 32.92 27.73 5.19
H1138I/10 25.53 25.45 0.08
H1138J/10 34.49 30.28 4.21
H1139/10 27.12 26.28 0.84
H1140A/10 34.88 28.52 6.36
Carcinoma
H277/09 29.96 28.45 1.5
H269/10 40 31.57 8.43
H274/10 25.87 25.7 0.17
H289/09 26.72 29.59 -2.87
H677/10 28.12 28.34 -0.21
H958/10 26.42 27.26 -0.84
H676/10 26.74 27.77 -1.03
H1106/10 27.16 27.68 -0.52

261
H1107/10 29.91 29.6 0.3
H278/09 27.67 27.19 0.48
H286/09 40 32.03 7.97
H298/09 26.14 29.13 -2.99
H957/10 30 29.55 0.46
H280/09 29.64 30.01 -0.37
H296/09 25.59 26.33 -0.74
H669/10 27.45 27.94 -0.49
H168/09 29.71 27.75 1.96
H959/10 31.17 30.76 0.41
H264/10 27.3 29.55 -2.25
H282/09 25.03 27.13 -2.09
H283/09 26.58 27.67 -1.08
H297/09 27.24 27.34 -0.1
H668/10 28.91 29.94 -1.03
H671/10 27.35 29.58 -2.22
H675/10 29.16 30.34 -1.17
H954/10 24.23 26.27 -2.04
H1111/10 27.74 26.75 0.99
H263/10 29.48 29.99 -0.51
H284/09 28.18 29.24 -1.06
H159/09 40 28.99 11.01
H165/09 33.51 29.77 3.74
H262/10 29.73 27.61 2.12
H270/10 28.79 28.46 0.32
H280/10 29.28 28.08 1.2
H290/09 30.72 29.68 1.05
H292/09 33.21 26.98 6.23
H299/09 28.97 30.07 -1.1
H670/10 26.78 28.6 -1.82
H960/10 28.32 29.59 -1.27
H960A/10 40 29.92 10.08
H960C/10 30.16 30.82 -0.67
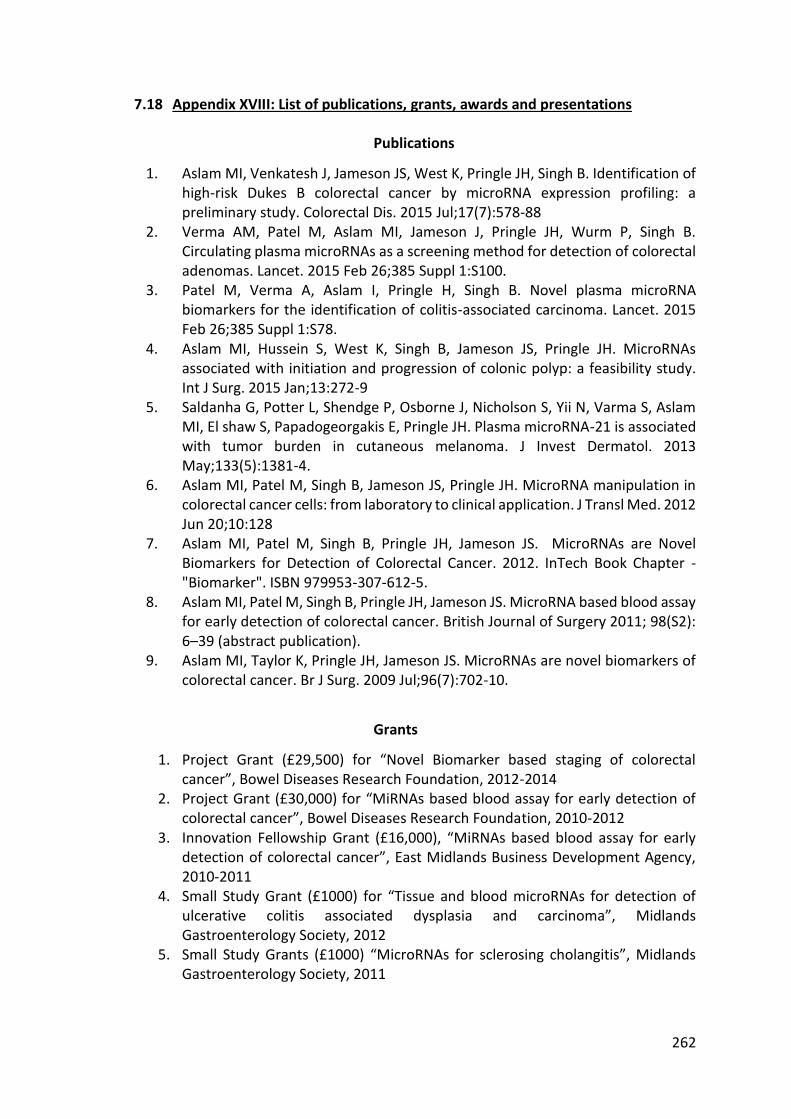
262
7.18 Appendix XVIII: List of publications, grants, awards and presentations
Publications
1. Aslam MI, Venkatesh J, Jameson JS, West K, Pringle JH, Singh B. Identification of high-risk Dukes B colorectal cancer by microRNA expression profiling: a preliminary study. Colorectal Dis. 2015 Jul;17(7):578-88
2. Verma AM, Patel M, Aslam MI, Jameson J, Pringle JH, Wurm P, Singh B. Circulating plasma microRNAs as a screening method for detection of colorectal adenomas. Lancet. 2015 Feb 26;385 Suppl 1:S100.
3. Patel M, Verma A, Aslam I, Pringle H, Singh B. Novel plasma microRNA biomarkers for the identification of colitis-associated carcinoma. Lancet. 2015 Feb 26;385 Suppl 1:S78.
4. Aslam MI, Hussein S, West K, Singh B, Jameson JS, Pringle JH. MicroRNAs associated with initiation and progression of colonic polyp: a feasibility study. Int J Surg. 2015 Jan;13:272-9
5. Saldanha G, Potter L, Shendge P, Osborne J, Nicholson S, Yii N, Varma S, Aslam MI, El shaw S, Papadogeorgakis E, Pringle JH. Plasma microRNA-21 is associated with tumor burden in cutaneous melanoma. J Invest Dermatol. 2013 May;133(5):1381-4.
6. Aslam MI, Patel M, Singh B, Jameson JS, Pringle JH. MicroRNA manipulation in colorectal cancer cells: from laboratory to clinical application. J Transl Med. 2012 Jun 20;10:128
7. Aslam MI, Patel M, Singh B, Pringle JH, Jameson JS. MicroRNAs are Novel Biomarkers for Detection of Colorectal Cancer. 2012. InTech Book Chapter - "Biomarker". ISBN 979953-307-612-5.
8. Aslam MI, Patel M, Singh B, Pringle JH, Jameson JS. MicroRNA based blood assay for early detection of colorectal cancer. British Journal of Surgery 2011; 98(S2): 6–39 (abstract publication).
9. Aslam MI, Taylor K, Pringle JH, Jameson JS. MicroRNAs are novel biomarkers of colorectal cancer. Br J Surg. 2009 Jul;96(7):702-10.
Grants
1. Project Grant (£29,500) for “Novel Biomarker based staging of colorectal cancer”, Bowel Diseases Research Foundation, 2012-2014
2. Project Grant (£30,000) for “MiRNAs based blood assay for early detection of colorectal cancer”, Bowel Diseases Research Foundation, 2010-2012
3. Innovation Fellowship Grant (£16,000), “MiRNAs based blood assay for early detection of colorectal cancer”, East Midlands Business Development Agency, 2010-2011
4. Small Study Grant (£1000) for “Tissue and blood microRNAs for detection of ulcerative colitis associated dysplasia and carcinoma”, Midlands Gastroenterology Society, 2012
5. Small Study Grants (£1000) “MicroRNAs for sclerosing cholangitis”, Midlands Gastroenterology Society, 2011

263
Awards
1. Winner of NHS Innovation Award (£4,000), “Plasma miRNAs based detection of colorectal cancer”, Medipex Medical Diagnostics & Devices category Awards 2011
2. Best Oral Presentation Award (£100), “Detection of colorectal cancer based on miRNA blood test”, Midlands Gastroenterology Society meeting 2011.
Presentations
1. Aslam MI, Hussein S, Patel M, West K, Jameson JS, Pringle JH,Singh B. hsa-miR-135b is Associated with the Initiation and Progression of Colorectal Neoplasia. American College of Surgeons, Clinical Congress 2014, San Francisco, USA.
2. Aslam MI, Patel M, Taylor K, Potter L, West K, Pringle JH, Jameson JS, Singh B. MicroRNA expression profiling based identification of high risk Dukes’ stage B colorectal cancer. The American society of colon and rectal surgeons USA. Annual scientific meeting. June 2-6 2012
3. Aslam MI, Patel M, Singh B, Pringle JH, Jameson JS. MicroRNA expression profiling based identification of high risk Dukes’ stage B colorectal cancers. Travelling surgical society of Great Britain and Ireland. Trainees’ Paper Prize 2012, Leicester Royal Infirmary, 21 Sep, 2012
4. Aslam MI, Patel M, Singh B, Pringle JH, Jameson JS. Blood based assay for early detection of colorectal adenoma and carcinoma. Society of academic & research surgery university of nottingham 4-5 January 2012 Oral presentation in a plenary session for the Patey Prize
5. Aslam MI, Patel M, Singh B, Pringle JH, Jameson JS. Identification of novel MicroRNAs associated with colorectal cancer. ASGBI 2011
6. Aslam MI, Patel M, Singh B, Pringle JH, Jameson JS. MicroRNAs based blood assay for early detection of colorectal cancer. Association of Coloproctology- Trent Chapter Meeting. 1st November 201
7. Aslam MI, Patel M, Singh B, Pringle JH, Jameson JS. Utility of circulating small RNAs for colorectal cancer detection. Midland Gastroenterology Society. Annual Meeting. 17 June 2011. Worcester.
8. Aslam MI, Patel M, Singh B, Pringle JH, Jameson JS. “Plasma miRNAs based detection of colorectal cancer”. SET for Britain Exhibition of Posters by early-stage and early-career research scientists, engineers and technologists. Westminster, UK Parliament, March 2011
9. Aslam MI, Singh B, Pringle JH, Jameson JS. MicroRNA based blood assay for early detection of colorectal cancer. Society for academic and research surgery (SARS), Dublin. 5-6 January 2011
10. Aslam MI, Singh B, Pringle JH, Jameson JS. MicroRNAs are novel biomarkers of colorectal cancer. MicroRNAs-Europe, University of Oxford. 1-2 November 2010
11. Aslam MI, Pringle JH, Jameson JS. Circulating novel biomarkers for colorectal cancer screening. East Midlands Surgical Society- annual meeting. Leicester General Hospital. 16 May 2010

264
References

265
8 References
1. Aaltonen LA, Peltomäki P, Leach FS, Sistonen P, Pylkkänen L, Mecklin JP, Järvinen H, Powell SM, Jen J, Hamilton SR. Clues to the pathogenesis of familial colorectal cancer. Science. 1993 May 7;260(5109):812-6.
2. Adams RH, Alitalo K. Molecular regulation of angiogenesis and lymphangiogenesis. Nat Rev Mol Cell Biol 2007; 8: 464-478
3. Agesen TH, Sveen A, Merok MA, Lind GE, Nesbakken A, Skotheim RI, Lothe RA ColoGuideEx: a robust gene classifier specific for stage II colorectal cancer prognosis. Gut. 2012 Nov;61(11):1560-7
4. Ahlquist DA. Molecular detection of colorectal neoplasia. Gastroenterology.2010;138: 2127– 2139
5. Ahmed FE, Jeffries CD, Vos PW, Flake G, Nuovo GJ, Sinar DR, Naziri W, Marcuard SP. Diagnostic microRNA markers for screening sporadic human colon cancer and active ulcerative colitis in stool and tissue. Cancer Genomics Proteomics. 2009;6(5):281-95.
6. Akao Y, Nakagawa Y, Naoe T. MicroRNAs 143 and 145 are possible common oncomicroRNAs in human cancers. Oncol Rep. 2006;16(4):845-50
7. Akao Y, Nakagawa Y, Naoe T. let-7 microRNA functions as a potential growth suppressor in human colon cancer cells. Biol Pharm Bull. 2006;29(5):903-6.
8. Akao Y, Noguchi S, Iio A, et al: Dysregulation of microRNA-34a expression causes drug-resistance to 5-FU in human colon cancer DLD-1 cells. Cancer Lett 2011, 300(2):197–204.
9. Alrawi SJ, Schiff M, Carroll RE, Dayton M, Gibbs JF, Kulavlat M, Tan D, Berman K, Stoler DL, Anderson GR. Aberrant crypt foci. Anticancer Res 2006; 26: 107-119
10. Amaral JD, Xavier JM, Steer CJ, Rodrigues CM. The role of p53 in apoptosis. Discov Med 2010; 9: 145-152
11. American Cancer Society. Colorectal cancer risk factors. http://www.cancer.org/cancer/colonandrectumcancer/detailedguide/colorectal-cancer-risk-factors (Accessed on 30 January, 2016)
12. Arigoni M, Barutello G, Riccardo F, Ercole E, Cantarella D, Orso F, Conti L, Lanzardo S, Taverna D, Merighi I, Calogero RA, Cavallo F, Quaglino E. miR-135b coordinates progression of ErbB2-driven mammary carcinomas through suppression of MID1 and MTCH2. Am J Pathol. 2013 Jun;182(6):2058-70.
13. Arndt GM, Dossey L, Cullen LM, Lai A, Druker R, Eisbacher M, Zhang C, Tran N, Fan H, Retzlaff K, Bittner A, Raponi M. Characterization of global microRNA expression reveals oncogenic potential of miR-145 in metastatic colorectal cancer. BMC Cancer. 2009 Oct 20;9:374.

266
14. Asangani IA, Rasheed SA, Nikolova DA, et al: MicroRNA-21 (miR-21) post-transcriptionally downregulates tumor suppressor Pdcd4 and stimulates invasion, intravasation and metastasis in colorectal cancer. Oncogene 2008, 27(15):2128–2136.
15. Atkin W, Edwards R, Kralj-Hans I. Once-only flexible sigmoidoscopy screening in prevention of colorectal cancer: a multicentre randomised controlled trial. The Lancet, 2010, 375(9726):1624-1633
16. Bahnassy AA, Zekri AR, Salem SE, Abou-Bakr AA, Sakr MA, Abdel-Samiaa AG, Al-Bradei M. Differential expression of p53 family proteins in colorectal adenomas and carcinomas: Prognostic and predictive values. Histol Histopathol 2014; 29: 207-216
17. Baker, M. MicroRNA profiling: Separating signal from noise. Nat. Publ. Group 2010, 7, 687–692.
18. Bala S, Petrasek J, Mundkur S, et al. Circulating microRNAs in exosomes indicate hepatocyte injury and inflammation in alcoholic, drug-induced, and inflammatory liver diseases. Hepatology. 2012; 56:1946–1957
19. Bandrés E, Cubedo E, Agirre X, Malumbres R, Zárate R, Ramirez N, Abajo A, Navarro A, Moreno I, Monzó M, García-Foncillas J. Identification by Real-time PCR of 13 mature microRNAs differentially expressed in colorectal cancer and non-tumoral tissues. Mol Cancer. 2006.19;5:29
20. Barnes DE, Lindahl T. Repair and genetic consequences of endogenous DNA base damage in mammalian cells. Annu Rev Genet. 2004;38:445-76.
21. Bartel DP. MicroRNAs: genomics, biogenesis, mechanism, and function. Cell. 2004 23;116(2):281-97
22. Bartel DP. MicroRNAs: target recognition and regulatory functions.Cell: 2009;136, 215–233.
23. Benes, V.; Castoldi, M. Expression profiling of microRNA using real-time quantitative PCR, how to use it and what is available. Methods 2010, 50, 244–249.
24. Bettington M, Walker N, Clouston A, Brown I, Leggett B, Whitehall V. The serrated pathway to colorectal carcinoma: current concepts and challenges. Histopathology 2013; 62: 367-386.
25. Blanks RG, Moss SM, McGahan CE, Quinn MJ, Babb PJ. Effect of NHS breast screening programme on mortality from breast cancer in England and Wales, 1990–8: comparison of observed with predicted mortality. BMJ 2000; 321: 665–669.
26. Blanpain C. Tracing the cellular origin of cancer. Nat Cell Biol 2013; 15: 126-134
27. Bockhorn M, Jain RK, Munn LL. Active versus passive mechanisms in metastasis: do cancer cells crawl into vessels, or are they pushed? Lancet Oncol 2007;8: 444–448.
28. Bohnsack M T, Czaplinski K & Gorlich D. Exportin 5 is a RanGTP-dependent dsRNAbinding protein that mediates nuclear export of pre-miRNAs. RNA: 2004(10);185– 191

267
29. Bond CE, Nancarrow DJ, Wockner LF, Wallace L, Montgomery GW, Leggett BA, Whitehall VL. Microsatellite stable colorectal cancers stratified by the BRAF V600E mutation show distinct patterns of chromosomal instability. PLoS One 2014; 9: e91739
30. Boni V, Bitarte N, Cristobal I, et al: miR-192/miR-215 influence 5-fluorouracil resistance through cell cycle-mediated mechanisms complementary to its post-transcriptional thymidilate synthase regulation. Mol Cancer Ther 2010, 9(8):2265–2275.
31. Bovell LC, Shanmugam C, Putcha BD. The prognostic value of microRNAs varies with patient race/ethnicity and stage of CRC. Clinical cancer research an official journal of the American Association for Cancer Research. 2013; 19:3955–396
32. Boyle P, Langman J. ABC of colorectal cancer Epidemiology.BMJ.2000; 321:805-808.
33. Boyle P, Leon ME. Epidemiology of colorectal cancer. Br Med Bull. 2002;64:1-25.
34. Bray F, Atkin W. International cancer patterns in men: geographical and temporal variations in cancer risk and the role of gender. JMHG.2004;1(1):38-46
35. Brim H, Mokarram P, Naghibalhossaini F et al. Impact of BRAF, MLH1 on the incidence of microsatellite instability high colorectal cancer in populations based study. Mol Cancer 2008; 7: 68.
36. Brittan M, Wright NA. Stem cell in gastrointestinal structure and neoplastic development. Gut 2004;53:899–910
37. Broderick P, Carvajal-Carmona L, Pittman AM, Webb E, Howarth K, Rowan A, Lubbe S, Spain S, Sullivan K, Fielding S, Jaeger E, Vijayakrishnan J, Kemp Z, Gorman M, Chandler I, Papaemmanuil E, Penegar S, Wood W, Sellick G, Qureshi M, Teixeira A, Domingo E, Barclay E, Martin L, Sieber O; CORGI Consortium, Kerr D, Gray R, Peto J, Cazier JB, Tomlinson I, Houlston RS. A genome-wide association study shows that common alleles of SMAD7 influence colorectal cancer risk. Nat Genet. 2007 Nov;39(11):1315-7.
38. Brunet-Vega A, Pericay C, Quílez ME, Ramírez-Lázaro MJ, Calvet X, Lario S Variability in microRNA recovery from plasma: Comparison of five commercial kits. Anal Biochem. 2015 Nov 1;488:28-35.
39. Bufill JA. Colorectal cancer: evidence for distinct genetic categories based on proximal or distal tumor location. Ann Intern Med 1990; 113: 779–88.
40. Cancer Research UK. Statistics and Outlook for Bowel Cancer – Prognosis by Stage.http://cancerhelp.cancerresearchuk.org/type/bowel- cancer/treatment/statistics -and-outlook-for-bowel-cancer#2 (accessed October 2011)
41. Cappellesso R, Tinazzi A, Giurici T, Simonato F, Guzzardo V, Ventura L. Programmed cell death 4 and microRNA 21 inverse expression is maintained in cells and exosomes from ovarian serous carcinoma effusions. Cancer Cytopathol. 2014;122:685–93.

268
42. Carethers JM. Differentiating Lynch-like from Lynch syndrome. Gastroenterology 2014; 146: 602-604.
43. Carina Roth, Brigitte Rack, Volkmar Müller, Wolfgang Janni, Klaus Pantel, Heidi Schwarzenbach. Circulating microRNAs as blood-based markers for patients with primary and metastatic breast cancer. Breast Cancer Res. 2010; 12(6):R90
44. Carmeliet P, Dor Y, Herbert JM, Fukumura D, Brusselmans K, Dewerchin M, Neeman M, Bono F, Abramovitch R, Maxwell P, Koch CJ, Ratcliffe P, Moons L, Jain RK, Collen D, Keshert E. Role of HIF-1alpha in hypoxia-mediated apoptosis, cell proliferation and tumour angiogenesis. Nature 1998; 394: 485-490
45. Casey G, Lindor NM, Papadopoulos N, Thibodeau SN, Moskow J, Steelman S, Buzin CH, Sommer SS, Collins CE, Butz M, Aronson M, Gallinger S, Barker MA, Young JP, Jass JR, Hopper JL, Diep A, Bapat B, Salem M, Seminara D, Haile R; Colon Cancer Family Registry.Conversion analysis for mutation detection in MLH1 and MSH2 in patients with colorectal cancer. JAMA. 2005.16;293(7):799-809
46. Cazzoli R, Buttitta F, Di Nicola M, Malatesta S, Marchetti A, Rom WN, Pass HI. microRNAs derived from circulating exosomes as noninvasive biomarkers for screening and diagnosing lung cancer. J Thorac Oncol. 2013;8:1156–1162
47. Cekaite L, Rantala JK, Bruun J et al. MiR-9, -31, and -182 deregulation promote proliferation and tumor cell survival in colon cancer. Neoplasia 2012; 14: 868–79.
48. Chai H, Liu M, Tian R, Li X, Tang H. miR-20a targets BNIP2 and contributes chemotherapeutic resistance in colorectal adenocarcinoma SW480 and SW620 cell lines. Acta Biochim Biophys Sin (Shanghai) 2011, 43(3):217–225.
49. Chan M, Liaw CS, Ji SM, et al. Identification of circulating microRNA signatures for breast cancer detection. Clinical cancer research: an official journal of the American Association for Cancer Research. 2013; 19:4477–4487.
50. Chang KH, Miller N, Kheirelseid EA, Ingoldsby H, Hennessy E, Curran CE, Curran S, Smith MJ, Regan M, McAnena OJ, Kerin MJ. MicroRNA-21 and PDCD4 expression in colorectal cancer. Eur J Surg Oncol. 2011 Jul;37(7):597-603.
51. Chen C, Ridzon DA, Broomer AJ, Zhou Z, Lee DH, Nguyen JT et al. Real-time quantification of microRNAs by stem–loop RT–PCR. Nucleic Acids Res 2005; 33: 179
52. Chen C, Ridzon DA, Broomer AJ, Zhou Z, Lee DH, Nguyen JT, Barbisin M, Xu NL, Mahuvakar VR, Andersen MR, Lao KQ, Livak KJ, Guegler KJ.Real-time quantification of microRNAs by stem-loop RT-PCR. Nucleic Acids Res.2005; 33:e179
53. Chen PS, Su JL, Hung MC. Dysregulation of microRNAs in cancer. J Biomed Sci. 2012;19:90
54. Chen WX, Liu XM, Lv MM, Chen L, Zhao JH, Zhong SL, et al. Exosomes from drug-resistant breast cancer cells transmit chemoresistance by a horizontal transfer of microRNAs. PLoSOne. 2014;9:e95240.

269
55. Chen X, Ba Y, Ma L, Cai X, Yin Y, Wang K, Guo J, Zhang Y, Chen J, Guo X, Li Q, Li X, Wang W, Zhang Y, Wang J, Jiang X, Xiang Y, Xu C, Zheng P, Zhang J, Li R, Zhang H, Shang X, Gong T, Ning G, Wang J, Zen K, Zhang J, Zhang CY. Characterization of microRNAs in serum: a novel class of biomarkers for diagnosis of cancer and other diseases. Cell Res. 2008;18(10):997-1006.
56. Chendrimada TP, Gregory RI, Kumaraswamy E, Norman J, Cooch N, Nishikura K, Shiekhattar R. TRBP recruits the Dicer complex to Ago2 for microRNA processing and gene silencing. Nature. 2005;436(7051):740-4.
57. Cheng H, Zhang L, Cogdell DE, Zheng H, Schetter AJ, Nykter M, Harris CC, Chen K, Hamilton SR, Zhang W. Circulating plasma MiR-141 is a novel biomarker for metastatic colon cancer and predicts poor prognosis. PLoS One. 2011.17;6(3):e17745
58. Cheng HH, Yi HS, Kim Y, Kroh EM, Chien JW, Eaton KD, Goodman MT, Tait JF, Tewari M, Pritchard CC. Plasma processing conditions substantially influence circulating microRNA biomarker levels. PLoS One. 2013 Jun 7;8(6):e64795.
59. Chim SS, Shing TK, Hung EC, Leung TY, Lau TK, Chiu RW, Lo YM. Detection and characterization of placental microRNAs in maternal plasma. Clin Chem. 2008 Mar; 54(3):482-90.
60. Chim SS, Shing TK, Hung EC, Leung TY, Lau TK, Chiu RW, Lo YMDetection and characterization of placental microRNAs in maternal plasma. Clin Chem. 2008 Mar;54(3):482-90.
61. Choi DS, Lee JM, Park GW, Lim HW, Bang JY, Kim YK, Kwon KH, Kwon HJ, Kim KP, Gho YS. Proteomic analysis of microvesicles derived from human colorectal cancer cells. J Proteome Res. 2007;6(12):4646-55
62. Chugh, P.; Dittmer, D.P. Potential pitfalls in microRNA profiling. Wiley Interdiscip. Rev. RNA 2012, 3, 601–616.
63. Chung GE, Yoon JH, Myung SJ et al. High expression of microRNA-15b predicts a low risk of tumor recurrence following curative resection of hepatocellular carcinoma. Oncol Rep 2010; 23: 113–9.
64. Ciprotti M, Chong G, Gan HK, Chan A, Murone C, MacGregor D, Lee FT, Johns TG, Heath JK, Ernst M, Burgess AW, Scott AM.. Quantitative intratumoural microdistribution and kinetics of (131)I-huA33 antibody in patients with colorectal carcinoma. EJNMMI Res. 2014 May 30;4:22.
65. Circulating microRNAs as biomarkers of colorectal cancer: results from a genome-wide profiling and validation study. Clin Gastroenterol Hepatol. 2013 Jun;11(6):681-8.e3.
66. Cocucci E, Racchetti G, Meldolesi J. Shedding microvesicles: artefacts no more. Trends Cell Biol. 2009;19(2):43-51
67. Coleman MP, Estève J, Damiecki P, Arslan A, Renard H. Trends in cancer incidence and mortality. IARC Sci Publ. 1993; (121):1-806.

270
68. Cooper GM. The Cell: A Molecular Approach. 2nd ed. Sunderland (MA): Sinauer Associates, 2000.
69. Corcoran C, Rani S, O'Brien K, O'Neill A, Prencipe M, Sheikh R, et al. Docetaxel-resistance in prostate cancer: evaluating associated phenotypic changes and potential for resistance transfer via exosomes. PLoSOne. 2012;7:e50999.
70. Cortez MA, Calin GA. MicroRNA identification in plasma and serum: a new tool to diagnose andmonitor diseases. Expert opinion on biological therapy. 2009; 9:703–11.
71. Corvinus FM, Orth C, Moriggl R, Tsareva SA, Wagner S, Pfitzner EB, Baus D, Kaufmann R, Huber LA, Zatloukal K, Beug H, Ohlschläger P, Schütz A, Halbhuber KJ, Friedrich K. Persistent STAT3 activation in colon cancer is associated with enhanced cell proliferation and tumor growth. Neoplasia. 2005 Jun;7(6):545-55.
72. Coste J, Cochand-Priollet B, de Cremoux P, Le Gales C, Cartier I, Molinie V. Cross sectional study of conventional cervical smear, monolayer cytology, and human papillomavirus DNA testing for cervical cancer screening. BMJ 2003; 326: 733.
73. Cronin M, Pho M, Dutta D, Stephans JC, Shak S, Kiefer MC, Esteban JM, Baker JB. 2004. Measurement of gene expression in archival paraffin-embedded tissues: development and performance of a 92-gene reverse transcriptase-polymerase chain reaction assay. Am J Pathol 164:35- 42.
74. Davidson LA, Wang N, Shah MS, Lupton JR, Ivanov I, Chapkin RS. n-3 Polyunsaturated fatty acids modulate carcinogen-directed non-coding microRNA signatures in rat colon. Carcinogenesis 2009; 30: 2077–84.
75. Day E, Dear PH, McCaughan F. Digital PCR strategies in the development and analysis of molecular biomarkers for personalized medicine. Methods. 2013; 59:101–107
76. De Roock W, Claes B, Bernasconi D, De Schutter J, Biesmans B, Fountzilas G, Kalogeras KT, Kotoula V, Papamichael D, Laurent-Puig P, Penault-Llorca F, Rougier P, Vincenzi B, Santini D, Tonini G, Cappuzzo F, Frattini M, Molinari F, Saletti P, De Dosso S, Martini M, Bardelli A, Siena S, Sartore-Bianchi A, Tabernero J, Macarulla T, Di Fiore F, Gangloff AO, Ciardiello F, Pfeiffer P, Qvortrup C, Hansen TP, Van Cutsem E, Piessevaux H, Lambrechts D, Delorenzi M, Tejpar S. Effects of KRAS, BRAF, NRAS, and PIK3CA mutations on the efficacy of cetuximab plus chemotherapy in chemotherapy-refractory metastatic colorectal cancer: a retrospective consortium analysis. Lancet Oncol. 2010 Aug;11(8):753-62.
77. Deller MC, Yvonne Jones E. Cell surface receptors. Curr Opin Struct Biol 2000; 10: 213-219.
78. Deuter R, Pietsch S, Hertel S, Muller O. A method for preparation of fecal DNA suitable for PCR. Nucleic Acids Res 1995;23:3800–1
79. Dewhirst MW. Relationships between cycling hypoxia, HIF-1, angiogenesis and oxidative stress. Radiat Res. 2009 Dec;172(6):653-65.

271
80. Di Fiore F, Sesboüé R, Michel P, Sabourin JC, Frebourg T. Molecular determinants of anti-EGFR sensitivity and resistance in metastatic colorectal cancer. Br J Cancer 2010; 103: 1765-1772
81. Dias N, Stein CA: Antisense oligonucleotides: basic concepts and mechanisms. Mol Cancer Ther 2002, 1(5):347–355.
82. Dickinson BT, Kisiel J, Ahlquist DA, Grady WM. Molecular markers for colorectal cancer screening. Gut. 2015 Sep;64(9):1485-94.
83. Dieter SM, Ball CR, Hoffmann CM, Nowrouzi A, Herbst F, Zavidij O, Abel U, Arens A, Weichert W, Brand K, Koch M, Weitz J, Schmidt M, von Kalle C, Glimm H. Distinct types of tumor-initiating cells form human colon cancer tumors and metastases. Cell Stem Cell.2011; 9: 357–365.
84. Diosdado B, van de Wiel MA, Terhaar Sive Droste JS, Mongera S, Postma C, Meijerink WJ, Carvalho B, Meijer GA. MiR-17-92 cluster is associated with 13q gain and c-myc expression during colorectal adenoma to adenocarcinoma progression. Br J Cancer. 2009 Aug 18;101(4):707-14.
85. Dobre M, Comănescu M, Arsene D, Iosif C, Bussolati G. K-ras gene mutation status in colorectal cancer: comparative analysis of pyrosequencing and PCR-RFLP. Rom J Morphol Embryol 2013; 54: 567-574
86. Dong Y, Wu WK, Wu CW, Sung JJ, Yu J, Ng SS. MicroRNA dysregulation in colorectal cancer: a clinical perspective. Br J Cancer. 2011.15;104(6):893-8
87. Draviam VM, Shapiro I, Aldridge B, Sorger PK. Misorientation and reduced stretching of aligned sister kinetochores promote chromosome missegregation in EB1- or APC-depleted cells. EMBO J 2006; 25: 2814-2827
88. Duffy MJ. Carcinoembryonic antigen as a marker for colorectal cancer: is it clinically useful? Clin Chem. 2001;47:624–630.
89. Dukes CE, Bussey HJ. The spread of rectal cancer and its effect on prognosis. Br J Cancer. 1958 Sep;12(3):309-20.
90. E.R. Fearon, B. Vogelstein, A genetic model for colorectal tumorigenesis, Cell 61 (1990) 759e767.
91. Eichelser C, Flesch-Janys D, Chang-Claude J, Pantel K, Schwarzenbach H. Deregulated serum concentrations of circulating cell-free microRNAs miR-17, miR-34a, miR-155, and miR-373 in human breast cancer development and progression. Clin Chem. 2013; 59, 1489-96.
92. Eiring AM, Harb JG, Neviani P, Garton C, Oaks JJ, Spizzo R, Liu S, Schwind S, Santhanam R, Hickey CJ, Becker H, Chandler JC, Andino R, Cortes J, Hokland P, Huettner CS, Bhatia R, Roy DC, Liebhaber SA, Caligiuri MA, Marcucci G, Garzon R, Croce CM, Calin GA, Perrotti D. miR-328 functions as an RNA decoy to modulate hnRNP E2 regulation of mRNA translation in leukemic blasts. Cell. 2010.5;140(5):652-65.

272
93. Epstein DM. Special delivery: microRNA-200-containing extracellular vesicles provide metastatic message to distal tumor cells. J Clin Invest. 2014;124:5107–8.
94. Esquela-Kerscher A, Slack FJ. Oncomirs - microRNAs with a role in cancer. Nat Rev Cancer. 2006;6(4):259-69
95. Fabbri M, Paone A, Calore F, Galli R, Croce CM. A new role for microRNAs, as ligands of Toll-like receptors. RNABiol. 2013;10:169–74.
96. Failli, Alessandra, Annalisa Legitimo, Francesca Migheli, Fabio Coppedè, John C. Mathers, Roberto Spisni, Paolo Miccoli, Lucia Migliore, Rita Consolini. Efficacy and Feasibility of the Epithelial Cell Adhesion Molecule (EpCAM) Immunomagnetic Cell Sorter for Studies of DNA Methylation in Colorectal CancerInt J Mol Sci. 2014 January; 15(1): 44–57.
97. Fakih MG, Padmanabhan A. CEA monitoring in colorectal cancer. What you should know. Oncology. 2006;20:579–587.
98. Faltejskova P, Bocanek O, Sachlova M, Svoboda M, Kiss I, Vyzula R, Slaby O.Circulating miR-17-3p, miR-29a, miR-92a and miR-135b in serum: Evidence against their usage as biomarkers in colorectal cancer. Cancer Biomark. 2012;12(4):199-204
99. Faltejskova P, Bocanek O, Sachlova M, Svoboda M, Kiss I, Vyzula R, Slaby O. Circulating miR-17-3p, miR-29a, miR-92a and miR-135b in serum: Evidence against their usage as biomarkers in colorectal cancer. Cancer Biomark. 2012;12(4):199-204
100. Fanali, C, Donatella L, Marisa F, Maddalena C, Valerio C, Achille C, Alessandro S. Cancer stem cells in colorectal cancer from pathogenesis to therapy: Controversies and perspectives World J Gastroenterol. 2014 January 28; 20(4): 923–942.
101. Fang C, Zhu DX, Dong HJ, Zhou ZJ, Wang YH, Liu L, Fan L, Miao KR, Liu P, Xu W, Li JY. Serum microRNAs are promising novel biomarkers for diffuse large B cell lymphoma. Ann Hematol 2012; 91, 553-9.
102. Fearon ER, Vogelstein B. A genetic model for colorectal tumorigenesis. Cell 1990; 61: 759–67.
103. Feng Y, Bommer GT, Zhao J, Green M, Sands E, Zhai Y, Brown K, Burberry A, Cho KR, Fearon ER. Mutant KRAS promotes hyperplasia and alters differentiation in the colon epithelium but does not expand the presumptive stem cell pool. Gastroenterology 2011; 141: 1003-1013.e1-10
104. Ferlay J, Parkin DM, Steliarova-Foucher E. Estimates of cancer incidence and mortality in Europe in 2008. Eur J Cancer. 2010;46(4):765-81.
105. Filipazzi P, Burdek M, Villa A, Rivoltini L, Huber V. Recent advances on the role of tumor exosomes in immunosuppression and disease progression. Semin Cancer Biol. 2012;22:342–9

273
106. Flood DM, Weiss NS, Cook LS, Emerson JC, Schwartz SM, Potter JD. Colorectal cancer incidence in Asian migrants to the United States and their descendants. Cancer Causes Control. 2000;11(5):403-11
107. Friedman RC, Farh KK, Burge CB, Bartel DP. Most mammalian mRNAs are conserved targets of microRNAs. Genome Res. 2009;19(1):92-105.
108. Gao F, Zhao ZL, Zhao WT, Fan QR, Wang SC, Li J, et al. miR-9 modulates the expression of interferon-regulated genes and MHC class I molecules in human nasopharyngeal carcinoma cells. Biochem Biophys Res Commun. 2013;431:610–6.
109. Gao HJ. Initial study of microRNA expression profiles of colonic cancer without lymph node metastasis. J Dig Dis 2010; 11: 50–4.
110. Garinchesa P, Sakamoto J, Welt S, Real F, Rettig W. Old L. Organ-specific expression of the colon cancer antigen A33, a cell surface target for antibody-based therapy. Int. J. Oncol 1996; 9, 465-471. 10.
111. Gilad S, Meiri E, Yogev Y, Benjamin S, Lebanony D, Yerushalmi N, Benjamin H, Kushnir M, Cholakh H, Melamed N, Bentwich Z, Hod M, Goren Y, Chajut A. Serum microRNAs are promising novel biomarkers. PLoS One. 2008.5; 3(9):e3148
112. Giraldez MD, Lozano JJ, Ramirez G. Circulating microRNAs as biomarkers of colorectal cancer: results from a genome-wide profiling and validation study. Clinical gastroenterology and hepatology: the official clinical practice journal of the American Gastroenterological Association. 2013; 11:681–688. e683
113. Grange C, Tapparo M, Collino F, Vitillo L, Damasco C, Deregibus MC, et al. Exosomes released from human renal cancer stem cells stimulate angiogenesis and formation of lung premetastatic niche. Cancer Res. 2011;71:5346–56.
114. Graser A, Stieber P, Nagel D, Schafer C, Horst D, Becker CR et al. Comparison of CT colonography, colonoscopy, sigmoidoscopy and faecal occult blood tests for the detection of advanced adenoma in an average risk population. Gut 2008; 58: 241–248.
115. Graser A, Stieber P, Nagel D, Schafer C, Horst D, Becker CR, Nikolaou K, Lottes A, Geisbüsch S, Kramer H, Wagner AC, Diepolder H, Schirra J, Roth HJ, Seidel D, Göke B, Reiser MF, Kolligs FT. Comparison of CT colonography, colonoscopy, sigmoidoscopy and faecal occult blood tests for the detection of advanced adenoma in an average risk population. Gut. 2009; 58(2):241-8.
116. Guidelines for Management of Colorectal Cancer. Association of Coloproctology of Great Britain and Ireland (ACPGBI), 3rd edn. 2007. http://www.acpgbi.org.uk/ resources/guidelines (accessed September 2014)
117. Guo L, Lu Z. The fate of miRNA* strand through evolutionary analysis: implication for degradation as merely carrier strand or potential regulatory molecule? PLoS One. 2010.30; 5(6):e11387

274
118. Guo L, Yang Q, Lu J, et al. A comprehensive survey of miRNA repertoire and 3′ addition events in the placentas of patients with pre-eclampsia from high-throughput sequencing. PloS one. 2011; 6:e21072.
119. Hammond SM, Bernstein E, Beach D, Hannon GJ. An RNA-directed nuclease mediates posttranscriptional gene silencing in Drosophila cells. Nature. 2000.16; 404(6775):293-6.
120. Hardcastle JD, Chamberlain JO, Robinson MH, Moss SM, Amar SS, Balfour TW, James PD, Mangham CM. Randomised controlled trial of faecal-occult-blood screening for colorectal cancer. Lancet. 1996 Nov 30;348(9040):1472-7.
121. Harris TA, Yamakuchi M, Ferlito M, Mendell JT, Lowenstein CJ (2008) MicroRNA-126 regulates endothelial expression of vascular cell adhesion molecule 1. Proc Natl Acad Sci USA 105: 1516–1521.
122. He YQ, Sheng JQ, Ling XL, Fu L, Jin P, Yen L, Rao J. Estradiol regulates miR-135b and mismatch repair gene expressions via estrogen receptor-β in colorectal cells. Exp Mol Med. 2012 Dec 31;44(12):723-32.
123. Heinemann V, Stintzing S, Kirchner T, Boeck S, Jung A. Clinical relevance of EGFR- and KRAS-status in colorectal cancer patients treated with monoclonal antibodies directed against the EGFR. Cancer Treat Rev 2009; 35: 262-271
124. Heneghan HM, Miller N, Kelly R, Newell J, Kerin MJ. Systemic miRNA-195 differentiates breast cancer from other malignancies and is a potential biomarker for detecting noninvasive and early stage disease. Oncologist. 2010; 15(7):673-82
125. Hewitson P, Glasziou P, Irwig L, Towler B, Watson E. Screening for colorectal cancer using the faecal occult blood test Hemoccult. Cochrane Database Syst Rev.2007; 24(1):CD001216.
126. Hofsli E, Sjursen W, Prestvik WS, et al. Identification of serum microRNA profiles in colon cancer. British journal of cancer. 2013; 108:1712–1719
127. Holme O, Løberg M, Kalager M, Bretthauer M, Hernán M, Aas E, Eide T, Skovlund E, Schneede J, Tveit K, & Hoff G. Effect of Flexible Sigmoidoscopy Screening on Colorectal Cancer Incidence and Mortality. JAMA 2014; 312 (6)
128. Hood JL, San RS, Wickline SA. Exosomes released by melanoma cells prepare sentinel lymph nodes for tumor metastasis. Cancer Res. 2011;71:3792–801.
129. Hromadníková I, Kotlabová K, Jirásek JE, Doucha J. Detection of placenta-specific microRNAs in maternal circulation. Ceska Gynekol. 2010 May; 75(3):252-6.
130. Hu G, Chen D, Li X, Yang K, Wang H, Wu W. miR-133b regulates the MET proto-oncogene and inhibits the growth of colorectal cancer cells in vitro and in vivo. Cancer Biol Ther 2010, 10(2):190–197.
131. Hu G, Drescher KM, Chen XM. Exosomal miRNAs: Biological Properties and Therapeutic Potential. Front Genet. 2012;3:56.

275
132. Huang Q, Gumireddy K, Schrier M, le Sage C, Nagel R, Nair S, Egan DA, Li A, Huang G, Klein-Szanto AJ, Gimotty PA, Katsaros D, Coukos G, Zhang L, Puré E, Agami R. The microRNAs miR-373 and miR-520c promote tumour invasion and metastasis. Nat Cell Biol. 2008; 10(2):202-10.
133. Huang Z, Huang D, Ni S, Peng Z, Sheng W, Du X. Plasma microRNAs are promising novel biomarkers for early detection of colorectal cancer. Int J Cancer. 2010.1; 127(1):11826
134. Huang Z, Huang S, Wang Q, et al: MicroRNA-95 promotes cell proliferation and targets sorting Nexin 1 in human colorectal carcinoma. Cancer Res 2011, 71(7):2582–2589.
135. Huber V, Fais S, Iero M, Lugini L, Canese P, Squarcina P, Zaccheddu A, Colone M, Arancia G, Gentile M, Seregni E, Valenti R, Ballabio G, Belli F, Leo E, Parmiani G, Rivoltini. Human colorectal cancer cells induce T-cell death through release of proapoptotic microvesicles: role in immune escape. Gastroenterology. 2005; 128(7):1796-804
136. Hui AB, Shi W, Boutros PC, Miller N, Pintilie M, Fyles T, McCready D, Wong D, Gerster K, Waldron L, Jurisica I, Penn LZ, Liu FF. 2009. Robust global micro-RNA profiling with formalinfixed paraffin-embedded breast cancer tissues. Lab Invest 89:597-606
137. Identification of N10-substituted phenoxazines as potent and specific inhibitors of Akt signaling. J Biol Chem. 2005 Sep 9;280(36):31924-35.
138. Infante JR, Bendell JC, Goff LW, Jones SF, Chan E, Sudo T, Burris HA, Berlin JD. Safety, pharmacokinetics and pharmacodynamics of the anti-A33 fully-human monoclonal antibody, KRN330, in patients with advanced colorectal cancer. Eur J Cancer. 2013 Apr;49(6):1169-75.
139. Shaw JA, Page K, Blighe K, Hava N, Guttery D, Ward B, Brown J, Ruangpratheep C, Stebbing J, Payne R, Palmieri C, Cleator S, Walker RA, Coombes RC. Genomic analysis of circulating cell-free DNA infers breast cancer dormancy. Genome Res. 2012 Feb;22(2):220-31.
140. Jasperson KW, Tuohy TM, Neklason DW, Burt RW. Hereditary and familial colon cancer.Gastroenterology. 2010 Jun;138(6):2044-58.
141. Jass JR. Pathogenesis of colorectal cancer. Surg Clin North Am 2002; 82: 891-904
142. Jeffreys AJ, Wilson V, Thein SL. Hypervariable ‘minisatellite’ regions in human DNA. Nature 1985; 314: 67-73
143. Jiang L, Huang Q, Chang J, Wang E, Qiu X. MicroRNA HSA-miR-125a-5p induces apoptosis by activating p53 in lung cancer cells. Exp Lung Res 2011; 37: 387–98.
144. Jones K, Nourse JP, Keane C, Bhatnagar A, Gandhi MK. Plasma microRNA are disease response biomarkers in classical Hodgkin lymphoma. Clinical cancer research : an official journal of the American Association for Cancer Research. 2014; 20:253–264

276
145. Jung EJ, Santarpia L, Kim J, Esteva FJ, Moretti E, Buzdar AU. Plasma microRNA 210 levelscorrelate with sensitivity to trastuzumab and tumor presence in breast cancer patients. Cancer.2012; 118(10):2603–14.
146. Jung HS, Seo YR, Yang YM, Koo JH, An J, Lee SJ, Kim KM, Kim SG. Gα12gep oncogene inhibits FOXO1 in hepatocellular carcinoma as a consequence of miR-135b and miR-194 dysregulation. Cell Signal. 2014 Jul;26(7):1456-65.
147. Kalimutho M, Del Vecchio Blanco G, Di Cecilia S, Sileri P, Cretella M, Pallone F, Federici G, Bernardini S. Differential expression of miR-144* as a novel fecal-based diagnostic marker for colorectal cancer. J Gastroenterol 2011;46: 1391–1402.
148. Kanaan Z, Rai SN, Eichenberger MR, Roberts H, Keskey B, Pan J, Galandiuk S.Plasma miR-21: a potential diagnostic marker of colorectal cancer. Ann Surg. 2012 Sep;256(3):544-51
149. Kanaan Z, Roberts H, Eichenberger MR, Billeter A, Ocheretner G, Pan J. A plasma microRNA panel for detection of colorectal adenomas: a step toward more precise screening for colorectal cancer. Annals of surgery. 2013; 258(3):400–8.
150. Kawaguchi T, Komatsu S, Ichikawa D, Morimura R, Tsujiura M. Clinical impact of circulating miR-221 in plasma of patients with pancreatic cancer. Br J Cancer 2013; 108: 361–369.
151. Kawamura M, Toiyama Y, Tanaka K, Inoue Y, Mohri Y, Kusunoki M. Can circulating microRNAs become the test of choice for colorectal cancer? Curr. Colorectal Cancer Rep. 2014, 10, 403–410
152. Keller S, Sanderson MP, Stoeck A. Altevogt P. Exosomes: from biogenesis and secretion to biological function. Immunol Lett. 2006; 107: 102–108
153. Kelley RK, Venook AP. Prognostic and predictive markers in stage II colon cancer: is there a role for gene expression profiling? Clin Colorectal Cancer 2011; 10: 73–80.
154. Khare S, Verma M. Epigenetics of colon cancer. Methods Mol Biol 2012; 863: 177-185
155. Khraiwesh B, Arif MA, Seumel GI, Ossowski S, Weigel D, Reski R, Frank W. Transcriptional control of gene expression by microRNAs. Cell. 2010.8; 140(1):111-22.
156. Kjaer-Frifeldt S, Hansen TF, Nielsen BS. The prognostic importance of miR-21 in stage II colon cancer: a population-based study. British journal of cancer. 2012; 107:1169–1174.
157. Kjersem JB, Ikdahl T, Lingjaerde OC, Guren T, Tveit KM, Kure EH. Plasma microRNAs predicting clinical outcome in metastatic colorectal cancer patients receiving first-line oxaliplatin-based treatment. Mol Oncol. 2014 Feb;8(1):59-67.
158. Köberle V, Pleli T, Schmithals C, Augusto Alonso E, Haupenthal J, Bönig H, Peveling-Oberhag J, Biondi RM, Zeuzem S, Kronenberger B, Waidmann O, Piiper A.

277
Differential stability of cell-free circulating microRNAs: implications for their utilization as biomarkers. PLoS One. 2013 Sep 20;8(9):e75184.
159. Koga Y, Yasunaga M, Takahashi A, Kuroda J, Moriya Y, Akasu T, Fujita S, Yamamoto S, Baba H, Matsumura Y MicroRNA expression profiling of exfoliated colonocytes isolated from feces for colorectal cancer screening. Cancer Prev Res (Phila). 2010; 3(11):1435-42
160. Kosaka N, Iguchi H, Hagiwara K, Yoshioka Y, Takeshita F, Ochiya T. Neutral sphingomyelinase 2 (nSMase2)-dependent exosomal transfer of angiogenic microRNAs regulate cancer cell metastasis. J Biol Chem. 2013;288:10849–59.
161. Kotlabova K, Doucha J, Hromadnikova I. Placental-specific microRNA in maternal circulation--identification of appropriate pregnancy-associated microRNAs with diagnostic potential. J Reprod Immunol. 2011 May;89(2):185-91.
162. Krichevsky AM1, Gabriely G. miR-21: a small multi-faceted RNA. J Cell Mol Med. 2009 Jan;13(1):39-53.
163. Kroh EM, Parkin RK, Mitchell PS, Tewari M. Analysis of circulating microRNA biomarkers in plasma and serum using quantitative reverse transcription-PCR (qRTPCR).Methods. 2010; 50(4):298-301.
164. Kronborg O, Fenger C, Olsen J, Jørgensen OD, Søndergaard O. Randomised study of screening for colorectal cancer with faecal-occult-blood test. Lancet. 1996 Nov 30;348(9040):1467-71.
165. Kuchenbauer F, Morin RD, Argiropoulos B. In-depth characterization of the microRNA transcriptome in a leukemia progression model. Genome research. 2008; 18:1787–1797.
166. Kulda V, Pesta M, Topolcan O. Relevance of miR-21 and miR-143 expression in tissue samples of colorectal carcinoma and its liver metastases. Cancer Genet Cytogenet 2010; 200: 154–60.
167. Landgraf P, Rusu M, Sheridan R. A mammalian microRNA expression atlas based on small RNA library sequencing. Cell. 2007; 129:1401–1414.
168. Lanza G, Ferracin M, Gafà R, Veronese A, Spizzo R, Pichiorri F, Liu CG, Calin GA, Croce CM, Negrini M mRNA/microRNA gene expression profile in microsatellite unstable colorectal cancer. Mol Cancer. 2007. 23; 6:54
169. Le MT, Hamar P, Guo C, Basar E, Perdigao-Henriques R, Balaj L, et al. miR200-containing extracellular vesicles promote breast cancer cell metastasis. J Clin Invest. 2014;124:5109–28.
170. Lee DY, Deng Z, Wang CH, Yang BB. MicroRNA-378 promotes cell survival, tumor growth, and angiogenesis by targeting SuFu and Fus-1 expression. Proc Natl Acad Sci U S A. 2007.18; 104(51):20350-5

278
171. Lee LW, Zhang S, Etheridge A. Complexity of the microRNA repertoire revealed by nextgeneration sequencing. Rna. 2010; 16:2170–2180.
172. Lee RC, Feinbaum RL, Ambros V. The C. elegans heterochronic gene lin-4 encodes small RNAs with antisense complementarity to lin-14. Cell. 1993.3; 75(5):843-54.
173. Lee Y, Ahn C, Han J, Choi H, Kim J, Yim J, Lee J, Provost P, Rådmark O, Kim S, Kim VN. The nuclear RNase III Drosha initiates microRNA processing. Nature. 2003.25; 425(6956):415-9.
174. Leggett B, Whitehall V. Role of the serrated pathway in colorectal cancer pathogenesis. Gastroenterology 2010; 138: 2088-2100
175. Leggett B, Whitehall V. Role of the serrated pathway in colorectal cancer pathogenesis. Gastroenterology. 2010 Jun;138(6):2088-100.
176. Leidinger P, Backes C, Dahmke IN, Galata V, Huwer H, Stehle I, et al. What makes a blood cell based miRNA expression pattern disease specific? - A miRNome analysis of blood cell subsets in lung cancer patients and healthy controls. Oncotarget. 2014;5:9484–97.
177. Li LN, Zhang HD, Zhi R. Down-regulation of some miRNAs by degrading their precursors contributes to anti-cancer effect of mistletoe lectin-I. Br J Pharmacol 2011, 162(2):349–364.
178. Li Y, Xu D, Bao C, Zhang Y, Chen D, Zhao F, Ding J, Liang L, Wang Q, Liu L, Li J, Yao M, Huang S, He X. MicroRNA-135b, a HSF1 target, promotes tumor invasion and metastasis by regulating RECK and EVI5 in hepatocellular carcinoma. Oncotarget. 2015 Feb 10;6(4):2421-33.
179. Li YC, Korol AB, Fahima T, Beiles A, Nevo E. Microsatellites: genomic distribution, putative functions and mutational mechanisms: a review. Mol Ecol 2002; 11: 2453-2465
180. Li Y, Kowdley KV. Method for microRNA isolation from clinical serum samples. Anal. Biochem. 2012, 431, 69–75
181. Libby G, Brewster DH, McClements PL, Carey FA, Black RJ, Birrell J, Fraser CG, Steele RJ. The impact of population-based faecal occult blood test screening on colorectal cancer mortality: a matched cohort study. Br J Cancer. 2012 Jul 10;107(2):255-9.
182. Lin L, Fuchs J, Li C, Olson V, Bekaii-Saab T, Lin J. STAT3 signaling pathway is necessary for cell survival and tumorsphere forming capacity in ALDH⁺/CD133⁺ stem cell-like human colon cancer cells. Biochem Biophys Res Commun. 2011 Dec 16;416(3-4):246-51
183. Link A, Balaguer F, Shen Y, Nagasaka T, Lozano JJ, Boland CR, Goel A. Fecal MicroRNAs as novel biomarkers for colon cancer screening. Cancer Epidemiol Biomarkers Prev. 2010;19(7):1766-74

279
184. Liu H, Du L, Wen Z et al. Up-regulation of miR-182 expression in colorectal cancer tissues and its prognostic value. Int J Colorectal Dis 2013; 28: 697–703.
185. Liu L, Chen L, Xu Y, Li R, Du X. microRNA-195 promotes apoptosis and suppresses tumorigenicity of human colorectal cancer cells. Biochem Biophys Res Commun 2010, 400(2):236–240.
186. Liu M, Lang N, Chen X, Tang Q, Liu S, Huang J, Zheng Y, Bi F. miR-185 targets RhoA and Cdc42 expression and inhibits the proliferation potential of human colorectal cells. Cancer Lett 2011, 301(2):151–160.
187. Liu M, Lang N, Qiu M, Xu F, Li Q, Tang Q, Chen J, Chen X, Zhang S, Liu Z, Zhou J, Zhu Y, Deng Y, Zheng Y, Bi F. miR-137 targets Cdc42 expression, induces cell cycle G1 arrest and inhibits invasion in colorectal cancer cells. Int J Cancer. 2011.15; 128(6):1269-79.
188. Llorens F, Banez-Coronel M, Pantano L, del Río JA, Ferrer I, Estivill X, Martí E. A highly expressed miR-101 isomiR is a functional silencing small RNA. BMC genomics. 2013; 14:104.
189. Lo RS, Wotton D, Massagué J. Epidermal growth factor signaling via Ras controls the Smad transcriptional corepressor TGIF. EMBO J 2001; 20: 128-136.
190. Logozzi M, De Milito A, Lugini L, Borghi M, Calabrò L, Spada M, Perdicchio M, Marino ML, Federici C, Iessi E, Brambilla D, Venturi G, Lozupone F, Santinami M, Huber V, Maio M, Rivoltini L, Fais S. High levels of exosomes expressing CD63 and caveolin-1 in plasma of melanoma patients. PLoS One. 2009; 4(4):e5219
191. Loktionov A, Bandaletova T, Llewelyn AH, Dion C, Lywood HG, Lywood RC, Rockall TA, Stebbing JF, Broughton M, Caffarey S, Marks CG. Colorectal cancer detection by measuring DNA from exfoliated colonocytes obtained by direct contact with rectal mucosa. Int J Oncol. 2009; 34(2):301-11.
192. Loktionov A. Cell exfoliation in the human colon: myth, reality and implications for colorectal cancer screening. Int J Cancer. 2007.1; 120(11):2281-9.
193. Lu LF, Liston A. MicroRNA in the immune system, microRNA as an immune system. Immunology 2009; 127: 291–298.
194. Lu Z, Liu M, Stribinskis V, Klinge CM, Ramos KS, Colburn NH, et al. MicroRNA-21 promotes cell transformation by targeting the programmed cell death 4 gene. Oncogene. 2008;27:4373–9.
195. Maragkakis M, Alexiou P, Papadopoulos GL, Reczko M, Dalamagas T, Giannopoulos G, Goumas G, Koukis E, Kourtis K, Simossis VA, Sethupathy P, Vergoulis T, Koziris N, Sellis T, Tsanakas P, Hatzigeorgiou AG. Accurate microRNA target prediction correlates with protein repression levels. BMC Bioinformatics. 2009 Sep 18;10:295.
196. Ma Q, Yang L, Wang C, Yu YY, Zhou B, Zhou ZG. Differential expression of colon cancer microRNA in microarry study. Sichuan Da Xue Xue Bao Yi Xue Ban 2011; May;42(3):344-8

280
197. Macabeo-Ong M, Ginzinger DG, Dekker N, McMillan A, Regezi JA, Wong DT, Jordan RC. 2002. Effect of duration of fixation on quantitative reverse transcription polymerase chain reaction analyses. Mod Pathol 15:979-987.
198. Madhavan D, Zucknick M, Wallwiener M, Cuk K, Modugno C, et al. (2012) Circulating miRNAs as surrogate markers for circulating tumor cells and prognostic markers in metastatic breast cancer. Clin Cancer Res 18: 5972–5982
199. Marchand L. Combined influence of genetic and dietary factors on colorectal cancer incidence in Japanese Americans. J Natl Cancer Inst Monogr, 1999. 26: p. 101-105.
200. Marsh DJ, Roth S, Lunetta KL, Hemminki A, Dahia PL, Sistonen P, Zheng Z, Caron S, van Orsouw NJ, Bodmer WF, Cottrell SE, Dunlop MG, Eccles D, Hodgson SV, Järvinen H, Kellokumpu I, Markie D, Neale K, Phillips R, Rozen P, Syngal S, Vijg J, Tomlinson IP, Aaltonen LA, Eng C. Exclusion of PTEN and 10q22-24 as the susceptibility locus for juvenile polyposis syndrome. Cancer Res. 1997 Nov 15;57(22):5017-21.
201. Mathivanan S, Lim JW, Tauro BJ, Ji H, Moritz RL, Simpson RJ. Proteomics analysis of A33 immunoaffinity-purified exosomes released from the human colon tumor cell line LIM1215 reveals a tissue-specific protein signature. Mol Cell Proteomics. 2010 Feb;9(2):197-208
202. McDonald JS, Milosevic D, Reddi HV, Grebe SK, Algeciras-Schimnich A. Analysis of circulating microRNA: preanalytical and analytical challenges. Clin Chem. 2011 Jun;57(6):833-40
203. Melo SA, Sugimoto H, O'Connell T, Noritoshi K, Villanueva A, Vidal A, et al. Cancer Exosomes Perform Cell-Independent MicroRNA Biogenesis and Promote Tumorigenesis. Cancer Cell. 2014;26:707–21
204. Meyer SU, Pfaffl MW, Ulbrich SE. Normalization strategies for microRNA profiling experiments: a 'normal' way to a hidden layer of complexity? Biotechnol Lett. 2010 ;32(12):1777-88
205. Michael MZ, O' Connor SM, van Holst Pellekaan NG, Young GP, James RJ. Reduced accumulation of specific microRNAs in colorectal neoplasia. Mol Cancer Res. 2003 ;1(12):882-91.
206. Midgley R, Kerr D. Colorectal cancer. Lancet 1999; 353: 391–9.
207. Migliore C, Giordano S. Resistance to targeted therapies: a role for microRNAs? Trends Mol Med. 2013;19:633–42.
208. Mitchell PS, Parkin RK, Kroh EM, Fritz BR, Wyman SK, Pogosova-Agadjanyan EL, Peterson A, Noteboom J, O’Briant KC, Allen A, Lin DW,Urban N, Drescher CW, Knudsen BS, Stirewalt DL, Gentleman R,Vessella RL, Nelson PS, Martin DB, Tewari M. Circulating microRNAs as stable blood-based markers for cancer detection. Proc Natl Acad Sci USA 2008; 105: 10513–10518

281
209. Monleau M, Bonnel S, Gostan T, Blanchard D, Courgnaud V, Lecellier CH. Comparison of different extraction techniques to profile microRNAs from human sera and peripheral blood mononuclear cells. BMC Genomics. 2014 May 23;15:395
210. Monzo M, Navarro A, Bandres E, Artells R, Moreno I, Gel B, Ibeas R, Moreno J, Martinez F, Diaz T, Martinez A, Balagué O, Garcia-Foncillas J. Overlapping expression of microRNAs in human embryonic colon and colorectal cancer. Cell Res. 2008 Aug;18(8):823-33.
211. Moon BS, Jeong WJ, Park J, Kim TI, Min do S, Choi KY. Role of oncogenic K-Ras in cancer stem cell activation by aberrant Wnt/β-catenin signaling. J Natl Cancer Inst 2014; 106:373
212. Morin RD, O'Connor MD, Griffith M, Kuchenbauer F, Delaney A, Prabhu AL, Zhao Y, McDonald H, Zeng T, Hirst M, Eaves CJ, Marra MA. Application of massively parallel sequencing to microRNA profiling and discovery in human embryonic stem cells. Genome Res. 2008 Apr;18(4):610-21
213. Motoyama K, Inoue H, Takatsuno Y. Over- and under-expressed microRNAs in human colorectal cancer. Int J Oncol 2009; 34: 1069–75.
214. Mu W, Rana S, Zoller M. Host matrix modulation by tumor exosomes promotes motility and invasiveness. Neoplasia. 2013;15:875–87.
215. Mudduluru G, Ceppi P, Kumarswamy R. Regulation of Axl receptor tyrosine kinase expression by miR-34a and miR-199a/b in solid cancer. Oncogene 2011, 30(25):2888-99
216. Munoz JL, Bliss SA, Greco SJ, Ramkissoon SH, Ligon KL, Rameshwar P.Delivery of Functional Anti-miR-9 by Mesenchymal Stem Cell-derived Exosomes to Glioblastoma Multiforme Cells Conferred Chemosensitivity. Mol Ther Nucleic Acids. 2013;2:e126.
217. Myklebust MP, Bruland O, Fluge Ø, Skarstein A, Balteskard L, Dahl O. MicroRNA-15b is induced with E2F-controlled genes in HPV-related cancer. Br J Cancer 2011; 105: 1719–25.
218. Nagel R, le Sage C, B et al. Regulation of the adenomatous polyposis coli gene by the miR-135 family in colorectal cancer. Cancer Res 2008; 68: 5795–802.
219. Nakajima G, Hayashi K, Xi Y, Kudo K, Uchida K, Takasaki K, Yamamoto M, Ju J. Noncoding MicroRNAs hsa-let-7g and hsa-miR-181b are Associated with hemoresponse to S-1 in Colon Cancer. Cancer Genomics Proteomics. 2006;3(5):317324
220. National Statistics UK. Colorectal Cancer England 2009. http://www.ons.gov.uk/ons/rel/cancer-unit/bowel-cancer-in-england/2009/sum-colorectal.html. (Accessed on 30 January, 2016)
221. NCI-SEER, 2006. Incidence of colon and rectum cancer. http://seer.cancer.gov/archive/csr/1975_2006/results_merged/sect_06_colon_rectum.pdf. (Accessed on 30 January, 2016).

282
222. Necela BM, Carr JM, Asmann YW, Thompson EA. Differential expression of microRNAs in tumors from chronically inflamed or genetic (APC(Min/+)) models of colon cancer. PLoS ONE. 2011;6:e18501.
223. Ng EK, Chong WW, Jin H, Lam EK, Shin VY, Yu J, Poon TC, Ng SS, Sung JJ. Differential expression of microRNAs in plasma of patients with colorectal cancer: a potential marker for colorectal cancer screening. Gut. 2009;58(10):1375-81
224. Ng EK, Chong WW, Jin H, Lam EK, Shin VY, Yu J, Poon TC, Ng SS, Sung JJ. Differential expression of microRNAs in plasma of patients with colorectal cancer: a potential marker for colorectal cancer screening. Gut. 2009;58(10):1375-81
225. Ng EK, Tsang WP, Ng SS. MicroRNA-143 targets DNA methyltransferases 3A in colorectal cancer. Br J Cancer 2009, 101(4):699–706.
226. Nielsen BS, Jørgensen S, Fog JU. High levels of microRNA-21 in the stroma of colorectal cancers predict short disease-free survival in stage II colon cancer patients. Clin Exp Metastasis 2011; 28: 27–38.
227. Nnoaham KE, Lines C. Modelling future capacity needs and spending on colonoscopy in the English bowel cancer screening programme. Gut 2008; 57: 1238–1245.
228. Nugent M, Miller N, Kerin MJ. Circulating miR-34a levels are reduced in colorectal cancer. Journal of surgical oncology. 2012; 106(8):947–52.
229. O'Brien K, Rani S, Corcoran C, Wallace R, Hughes L, Friel AM. Exosomes from triple-negative breast cancer cells can transfer phenotypic traits representing their cells of origin to secondary cells. Eur J Cancer.2013;49:1845–59.
230. O'Connor ES, Greenblatt DY, LoConte NK, Gangnon RE, Liou JI, Heise CP, Smith MA. Adjuvant chemotherapy for stage II colon cancer with poor prognostic features. J Clin Oncol. 2011 Sep 1;29(25):3381-8.
231. Oda K, Matsuoka Y, Funahashi A, Kitano H. A comprehensive pathway map of epidermal growth factor receptor signaling. Mol Syst Biol 2005; 1: 2005.0010
232. Ofir M, Hacohen D, Ginsberg D. MiR-15 and miR-16 are direct transcriptional targets of E2F1 that limit E2Finduced proliferation by targeting cyclin E. Mol Cancer Res 2011; 9: 440–7.
233. Ogata-Kawata H, Izumiya M, Kurioka D, Honma Y, Yamada Y, Furuta K. Circulating exosomal microRNAs as biomarkers of colon cancerPLoS One. 2014 Apr 4;9(4):e92921.
234. Ohshima K, Inoue K, Fujiwara A, Hatakeyama K, Kanto K, Watanabe Y, et al. Let-7 microRNA family is selectively secreted into the extracellular environment via exosomes in a metastatic gastric cancer cell line. PLoSOne. 2010;5:e13247.

283
235. Okamura K, Phillips MD, Tyler DM, Duan H, Chou YT, Lai EC. The regulatory activity of microRNA* species has substantial influence on microRNA and 3' UTR evolution. Nat Struct Mol Biol. 2008;15(4):354-63
236. Ørom UA, Nielsen FN, & Lund AH. MicroRNA-10a binds the 5′UTR of ribosomal protein mRNAs and enhances their translation. Mol. Cell: 2008(4); 460–471
237. Ostenfeld MS, Jeppesen DK, Laurberg JR, Boysen AT, Bramsen JB, PrimdalBengtson B, et al. Cellular Disposal of miR23b by RAB27-Dependent Exosome Release Is Linked to Acquisition of Metastatic Properties. Cancer Res. 2014;74:5758–71.
238. Otori K, Oda Y, Sugiyama K, Hasebe T, Mukai K, Fujii T, Tajiri H, Yoshida S, Fukushima S, Esumi H. High frequency of K-ras mutations in human colorectal hyperplastic polyps. Gut 1997; 40: 660-663
239. Oue N, Anami K, Schetter AJ, Schetter AJ, Moehler M, Okayama H, Khan MA, Bowman ED, Mueller A, Schad A, Shimomura M, Hinoi T, Aoyagi K, Sasaki H, Okajima M, Ohdan H, Galle PR, Yasui W, Harris CC. High miR-21 expression from FFPE tissues is associated with poor survival and response to adjuvant chemotherapy in colon cancer. International journal of cancer 2014; 134:1926–1934
240. Paget S. The distribution of secondary growths in cancer of the breast. Cancer Metastasis Rev 1998; 8: 98–101.
241. Pal JK, Ray SS, Pal SK. Identifying relevant group of miRNAs in cancer using fuzzy mutual information. Med Biol Eng Comput. 2015 Aug 12
242. Pancione M, Remo A, Colantuoni V. Genetic and epigenetic events generate multiple pathways in colorectal cancer progression. Patholog Res Int 2012; 2012: 509348
243. Pei H, Jin Z, Chen S, Sun X, Yu J, Guo W. MiR-135b promotes proliferation and invasion of osteosarcoma cells via targeting FOXO1.Mol Cell Biochem. 2015 Feb;400(1-2):245-52
244. Pekow JR, Dougherty U, Mustafi R, Zhu H, Kocherginsky M, Rubin DT, Hanauer SB, Hart J, Chang EB, Fichera A, Joseph LJ, Bissonnette M. miR-143 and miR-145 are downregulated in ulcerative colitis: putative regulators of inflammation and protooncogenes. Inflamm Bowel Dis. 2012 Jan;18(1):94-100.
245. Perez-Carbonell L1, Sinicrope FA2, Alberts SR2, Oberg AL3, Balaguer F4, Castells A4, Boland CR1, Goel A1. MiR-320e is a novel prognostic biomarker in CRC. Br J Cancer. 2015 Jun 30;113(1):83-90
246. Perkins A, Nicholls K, Shaw T, Liu G, Molokhia E. Attitudes toward colorectal cancer screening in the digital age: a survey of practices and attitudes among screening-eligible Alabamians. South Med J. 2013 Aug;106(8):462-7.
247. Petersen VC, Baxter KJ, Love SB et al. Identification of objective pathological prognostic determinants and models of prognosis in Dukes’ B colon cancer. Gut 2002; 51: 65– 9.

284
248. Pichler M, Winter E, Stotz M, Eberhard K, Samonigg H, Lax S, Hoefler G. Down-regulation of KRAS-interacting miRNA-143 predicts poor prognosis but not response to EGFR-targeted agents in colorectal cancer. Br J Cancer 2012; 106: 1826–1832.
249. Pinar G, Ayhan A. Carcinomas associated with Lynch syndrome: a family history. Int Surg. 2011 Oct-Dec;96(4):286-90.
250. Poulogiannis G, Frayling IM, Arends MJ. DNA mismatch repair deficiency in sporadic colorectal cancer and Lynch syndrome. Histopathology 2010; 56: 167-179
251. Pradervand S, Weber J, Lemoine F, Consales F, Paillusson A, Dupasquier M, Thomas J, Richter H, Kaessmann H, Beaudoing E, Hagenbuchle O, Harshman K. Concordance among digital gene expression, microarrays, and qPCR when measuring differential expression of microRNAs. Biotechniques.2010;48:219–222
252. Pritchard CC, Kroh E, Wood B, Arroyo JD, Dougherty KJ, Miyaji MM, Tait JF, Tewari M. Blood cell origin of circulating microRNAs: a cautionary note for cancer biomarker studies. Cancer Prev Res (Phila). 2012 Mar;5(3):492-7.
253. Pu XX, Huang GL, Guo HQ, Guo CC, Li H, Ye S, Ling S, Jiang L, Tian Y, Lin TY. Circulating miR-221 directly amplified from plasma is a potential diagnostic and prognostic marker of colorectal cancer and is correlated with p53 expression. J Gastroenterol Hepatol. 2010 Oct;25(10):1674-80.
254. Que R, Ding G, Chen J, Cao L. Analysis of serum exosomal microRNAs and clinicopathologic features of patients with pancreatic adenocarcinoma. World J Surg Oncol. 2013;11:219.
255. Rabinowits G, Gerçel-Taylor C, Day JM, Taylor DD, Kloecker GH. Exosomal microRNA: a diagnostic marker for lung cancer. Clin Lung Cancer. 2009;10(1):42-6
256. Rana S, Malinowska K, Zoller M. Exosomal tumor microRNA modulates premetastatic organ cells. Neoplasia. 2013;15:281–95.
257. Ren J, Zhang J, Xu N, Han G, Geng Q, Song J, Li S, Zhao J, Chen H. Signature of circulating microRNAs as potential biomarkers in vulnerable coronary artery disease. PLoS One. 2013 Dec 5;8(12):e80738.
258. Rossi L, Bonmassar E, Faraoni I. Modification of miR gene expression pattern in human colon cancer cells following exposure to 5-fluorouracil in vitro. Pharmacol Res. 2007;56(3):248-53
259. Rouet F, Rouzioux C. HIV-1 viral load testing cost in developing countries: what’s new? Expert Rev Mol Diagn 2007; 7: 703–707.
260. Salby O, Svoboda M, Michalek J, Vyzula R. MicroRNAs in colorectal cancer: translation of molecular biology into clinical application. Mol Cancer 2009; 14: 8–102
261. Sanchez-Diaz PC, Hsiao TH, Chang JC, Yue D, Tan MC, Chen HI, Tomlinson GE, Huang Y, Chen Y, Hung JY. De-regulated microRNAs in pediatric cancer stem cells target

285
pathways involved in cell proliferation, cell cycle and development. PLoS One. 2013 Apr 17;8(4):e61622
262. Sarver AL, French AJ, Borralho PM, Thayanithy V, Oberg AL, Silverstein KA, Morlan BW, Riska SM, Boardman LA, Cunningham JM, Subramanian S, Wang L, Smyrk TC, Rodrigues CM, Thibodeau SN, Steer CJ. Human colon cancer profiles show differential microRNA expression depending on mismatch repair status and are characteristic of undifferentiated proliferative states. BMC Cancer. 2009 Nov 18;9:401
263. Sato-Kuwabara Y, Melo SA, Soares FA, Calin GA. The fusion of two worlds: non-coding RNAs and extracellular vesicles--diagnostic and therapeutic implications (Review). Int J Oncol. 2015 Jan;46(1):17-27.
264. Scheffer AR, Holdenrieder S, Kristiansen G, von Ruecker A, Müller SC, Ellinger J. Circulating microRNAs in serum: novel biomarkers for patients with bladder cancer? World J Urol. 2014 Apr;32(2):353-8.
265. Schepeler T, Reinert JT, Ostenfeld MS, Christensen LL, Silahtaroglu AN, Dyrskjøt L, Wiuf C, Sørensen FJ, Kruhøffer M, Laurberg S, Kauppinen S, Ørntoft TF, Andersen CL. Diagnostic and prognostic microRNAs in stage II colon cancer. Cancer Res. 2008.1;68(15):6416-24.
266. Schetter AJ, Leung SY, Sohn JJ, Zanetti KA, Bowman ED, Yanaihara N, Yuen ST, Chan TL, Kwong DL, Au GK, Liu CG, Calin GA, Croce CM, Harris CC. MicroRNA expression profiles associated with prognosis and therapeutic outcome in colon adenocarcinoma. JAMA. 2008.30;299(4):425-36
267. Schetter AJ, Nguyen GH, Bowman ED, Mathé EA, Yuen ST, Hawkes JE, Croce CM, Leung SY, Harris CC. Association of inflammation-related and microRNA gene expression with cancer-specific mortality of colon adenocarcinoma. Clin Cancer Res. 2009 Sep 15;15(18):5878-87.
268. Schetter AJ, Okayama H, Harris CC. The role of microRNAs in colorectal cancer. Cancer J 2012; 18: 244– 52.
269. Schimanski CC, Frerichs K, Rahman F, Berger M, Lang H, Galle PR, Moehler M, Gockel I. High miR-196a levels promote the oncogenic phenotype of colorectal cancer cells. World J Gastroenterol. 2009 May 7;15(17):2089-96.
270. Segditsas S, Tomlinson I. Colorectal cancer and genetic alterations in the Wnt pathway. Oncogene. 2006.4;25(57):7531-7
271. Shibuya H, Iinuma H, Shimada R, Horiuchi A, Watanabe T. Clinicopathological and prognostic value of microRNA21 and microRNA-155 in colorectal cancer. Oncology 2010; 79: 313–20.
272. Si H, Sun X, Chen Y, Cao Y, Chen S, Wang H, Hu C. Circulating microRNA-92a and microRNA-21 as novel minimally invasive biomarkers for primary breast cancer. J Cancer Res Clin Oncol. 2013 Feb;139(2):223-9.

286
273. Simpson RJ, Lim JW, Moritz RL, Mathivanan S. Exosomes: proteomic insights and diagnostic potential. Expert Rev Proteomics. 2009;6(3):267-83
274. Skog J, Würdinger T, van Rijn S, Meijer DH, Gainche L, Sena-Esteves M, Curry WT Jr, Carter BS, Krichevsky AM, Breakefield XO. Glioblastoma microvesicles transport RNA and proteins that promote tumour growth and provide diagnostic biomarkers. Nat Cell Biol. 2008;10:1470–1476.
275. Slaby O, Svoboda M, Fabian P, Smerdova T, Knoflickova D, Bednarikova M, Nenutil R, Vyzula R.Altered expression of miR-21, miR-31, miR-143 and miR-145 is related to clinicopathologic features of colorectal cancer. Oncology. 2007;72(5-6):397-402
276. Slattery ML, Wolff E, Hoffman MD, Pellatt DF, Milash B, Wolff RK MicroRNAs and colon and rectal cancer: differential expression by tumor location and subtype. Genes Chromosomes Cancer. 2011;50(3):196-206
277. Sobin LH, Fleming ID. TNM Classification of Malignant Tumors, fifth edition. Union Internationale Contre le Cancer and the American Joint Committee on Cancer. Cancer. 1997 Nov 1;80(9):1803-4.
278. Song J, Bai Z, Han W, Zhang J, Meng H, Bi J, Ma X, Han S, Zhang Z. Identification of suitable reference genes for qPCR analysis of serum microRNA in gastric cancer patients. Dig Dis Sci. 2012 Apr;57(4):897-904.
279. Spring KJ, Zhao ZZ, Karamatic R, Walsh MD, Whitehall VL, Pike T, Simms LA, Young J, James M, Montgomery GW, Appleyard M, Hewett D, Togashi K, Jass JR, Leggett BA. High prevalence of sessile serrated adenomas with BRAF mutations: a prospective study of patients undergoing colonoscopy. Gastroenterology.2006; 131(5):1400-7.
280. Stahlberg A, Kubista M, Pfaffl M. Comparison of reverse transcriptases in gene expression analysis. Clin. Chem. 2004, 50, 1678–1680.
281. Stark A, Kheradpour P, Parts L, Brennecke J, Hodges E, Hannon GJ, Kellis M. Systematic discovery and characterization of fly microRNAs using 12 Drosophila genomes. Genome Res. 2007;17(12):1865-79
282. Suppiah A, Greenman J. Clinical utility of anti-p53 autoantibody: systematic review and focus on colorectal cancer. World J Gastroenterol 2013; 19: 4651-4670
283. Swarup V, Rajeswari MR. Circulating (cell-free) nucleic acids—a promising, non-invasive tool for early detection of several human diseases. FEBS Lett 2007;581: 795–799.
284. Takahashi K, Yokota S, Tatsumi N, Fukami T, Yokoi T, Nakajima M. Cigarette smoking substantially alters plasma microRNA profiles in healthy subjects. Toxicology and applied pharmacology. 2013; 272:154–160.
285. Tan IB, Tan P. Genetics: an 18-gene signature (ColoPrint®) for colon cancer prognosis. Nat Rev Clin Oncol 2011;8: 131–133.

287
286. Tanaka T, Arai M, Jiang X, Sugaya S, Kanda T, Fujii K, Kita K, Sugita K, Imazeki F, Miyashita T, Kaneda A, Yokosuka O Downregulation of microRNA-431 by human interferon-β inhibits viability of medulloblastoma and glioblastoma cells via upregulation of SOCS6. Int J Oncol. 2014 May;44(5):1685-90.
287. Tanaka T, Sugaya S, Kita K, Arai M, Kanda T, Fujii K, Imazeki F, Sugita K, Yokosuka O, Suzuki N. Inhibition of cell viability by human IFN-β is mediated by microRNA-431. Int J Oncol. 2012 May;40(5):1470-6.
288. Tanaka Y, Kamohara H, Kinoshita K, Kurashige J, Ishimoto T, Iwatsuki M, Watanabe M, Baba H. Clinical impact of serum exosomal microRNA-21 as a clinical biomarker in human esophageal squamous cell carcinoma. Cancer. 2013 Mar 15;119(6):1159-67.
289. Taylor DD, Gercel-Taylor C. Exosomes/exosomes: mediators of cancerassociated immunosuppressive microenvironments. Semin Immunopathol. 2011;33:441–54
290. Taylor DD, Gercel-Taylor C. MicroRNA signatures of tumor-derived exosomes as diagnostic biomarkers of ovarian cancer. Gynecol Oncol. 2008;110(1):13-21
291. Tazawa H, Tsuchiya N, Izumiya M, Nakagama H. Tumor-suppressive miR-34a induces senescence-like growth arrest through modulation of the E2F pathway in human colon cancer cells. Proc Natl Acad Sci USA 2007; 104: 15472–15477
292. Tebbutt NC, Wilson K, Gebski VJ, Cummins MM, Zannino D, van Hazel GA, Robinson B, Broad A, Ganju V, Ackland SP, Forgeson G, Cunningham D, Saunders MP, Stockler MR, Chua Y, Zalcberg JR, Simes RJ, Price TJ. Capecitabine, bevacizumab, and mitomycin in first-line treatment of metastatic colorectal cancer: results of the Australasian Gastrointestinal Trials Group Randomized Phase III MAX Study. J Clin Oncol 2010; 28: 3191-3198
293. Théry C, Zitvogel L, Amigorena S. Exosomes: composition, biogenesis and function. Nat Rev Immunol. 2002; 2: 569–579
294. Thimmaiah KN, Easton JB, Germain GS, Morton CL, Kamath S, Buolamwini JK, Houghton PJ, Thuma F, Zoller M. Outsmart tumor exosomes to steal the cancer initiating cell its niche. Semin Cancer Biol. 2014;28:39–50.
295. Toiyama Y, Takahashi M, Hur K, Nagasaka T, Tanaka K, Inoue Y, et al. Serum miR-21 as adiagnostic and prognostic biomarker in colorectal cancer. Journal of the National Cancer Institute.2013; 105(12):849–59
296. Tsang WP, Ng EK, Ng SS, Jin H, Yu J, Sung JJ, Kwok TT. Oncofetal H19-derived miR-675 regulates tumor suppressor RB in human colorectal cancer. Carcinogenesis. 2010 Mar;31(3):350-8.
297. Tsukamoto O, Miura K, Mishima H, Abe S, Kaneuchi M, Higashijima A, Miura S, Kinoshita A, Yoshiura K, Masuzaki H. Identification of endometrioid endometrial carcinoma-associated microRNAs in tissue and plasma. Gynecol Oncol. 2014 Mar;132(3):715-21.

288
298. Ueda R, Kohanbash G, Sasaki K, Fujita M, Zhu X, Kastenhuber ER, McDonald HA, Potter DM, Hamilton RL, Lotze MT, Khan SA, Sobol RW, Okada H. Dicerregulated microRNAs 222 and 339 promote resistance of cancer cells to cytotoxic T-lymphocytes by down-regulation of ICAM-1. Proc Natl Acad Sci U S A. 2009;106:10746–51.
299. Umezu T, Ohyashiki K, Kuroda M, Ohyashiki JH. Leukemia cell to endothelial cell communication via exosomal miRNAs. Oncogene. 2013;32:2747–55.
300. Umezu T, Tadokoro H, Azuma K, Yoshizawa S, Ohyashiki K, Ohyashiki JH. Exosomal miR-135b shed from hypoxic multiple myeloma cells enhances angiogenesis by targeting factor-inhibiting HIF-1. Blood. 2014 Dec 11;124(25):3748-57.
301. Valadi H, Ekström K, Bossios A, Sjöstrand M, Lee JJ, Lötvall JO. Exosome-mediated transfer of mRNAs and microRNAs is a novel mechanism of genetic exchange between cells. Nat Cell Biol. 2007; 9(6):654-9
302. Valeri N, Gasparini P, Braconi C, et al: MicroRNA-21 induces resistance to 5-fluorouracil by down-regulating human DNA MutS homolog 2 (hMSH2). Proc Natl Acad Sci USA 2010, 107(49):21098–21103.
303. Valeri N, Braconi C, Gasparini P, Murgia C, Lampis A, Paulus-Hock V, Hart JR, Ueno L, Grivennikov SI, Lovat F, Paone A, Cascione L, Sumani KM, Veronese A, Fabbri M, Carasi S, Alder H, Lanza G, Gafa' R, Moyer MP, Ridgway RA, Cordero J, Nuovo GJ, Frankel WL, Rugge M, Fassan M, Groden J, Vogt PK, Karin M, Sansom OJ, Croce CM. MicroRNA-135b promotes cancer progression by acting as a downstream effector of oncogenic pathways in colon cancer. Cancer Cell. 2014 Apr 14;25(4):469-83.
304. van Niel G, Raposo G, Candalh C, Boussac M, Hershberg R, Cerf-Bensussan N, Heyman M. Intestinal epithelial cells secrete exosome-like vesicles. Gastroenterology. 2001 ;121(2):337-49
305. Vandesompele J, De Preter K, Pattyn F, Poppe B, Van Roy N, De Paepe A, Speleman F. Accurate normalization of real-time quantitative RT-PCR data by geometric averaging of multiple internal control genes. Genome Biol. 2002 Jun 18;3(7):RESEARCH0034.
306. Verma AM, Patel M, Aslam MI, Jameson J, Pringle JH, Wurm P, Singh B. Circulating plasma microRNAs as a screening method for detection of colorectal adenomas. Lancet. 2015 Feb 26;385 Suppl 1:S100.
307. Vickers MM, Bar J, Gorn-Hondermann I, Yarom N, Daneshmand M, Hanson JE, Addison CL, Asmis TR, Jonker DJ, Maroun J, Lorimer IA, Goss GD, Dimitroulakos J. Stage-dependent differential expression of microRNAs in colorectal cancer: potential role as markers of metastatic disease. Clin Exp Metastasis 2012; 29: 123–132.
308. Viguera E, Canceill D, Ehrlich SD. Replication slippage involves DNA polymerase pausing and dissociation. EMBO J 2001; 20: 2587-2595
309. Vogelstein B, Fearon ER, Hamilton SR, Kern SE, Preisinger AC, Leppert M, Nakamura Y, White R, Smits AM, Bos JL. Genetic alterations during colorectal-tumor development. N Engl J Med. 1988; 319(9):525-32

289
310. Vogelstein B, Kinzler KW. Cancer genes and the pathways they control. Nat Med 2004; 10: 789-799
311. Volinia S, Calin GA, Liu CG, Ambs S, Cimmino A, Petrocca F, Visone R, Iorio M, Roldo C, Ferracin M, Prueitt RL, Yanaihara N, Lanza G, Scarpa A, Vecchione A, Negrini M, Harris CC, Croce CM. A microRNA expression signature of human solid tumors defines cancer gene targets.Proc Natl Acad Sci U S A. 2006.14;103(7):2257-61
312. Walsh JM, Terdiman JP. Colorectal cancer screening: scientific review. JAMA. 2003;289:1288–1296.
313. Wang B, Zhang Q. The expression and clinical significance of circulating microRNA-21 in serum of five solid tumors. J Cancer Res Clin Oncol. 2012;138:1659–66.
314. Wang CJ, Stratmann J, Zhou ZG, Sun XF. Suppression of microRNA-31 increases sensitivity to 5-FU at an early stage, and affects cell migration and invasion in HCT-116 colon cancer cells. BMC Cancer. 2010 Nov 9;10:616.
315. Wang H, Ach RA, Curry B. Direct and sensitive miRNA profiling from low-input total RNA. RNA. 2007;13:151–159.
316. Wang J, Huang SK, Zhao M, Yang M, Zhong JL, Gu YY, Peng H, Che YQ, Huang CZ. Identification of a circulating microRNA signature for colorectal cancer detection. PLoS One. 2014 Apr 7;9(4):e87451.
317. Wang K, Zhang S, Marzolf B, Troisch P, Brightman A, Hu Z, Hood LE, Galas DJ. Circulating microRNAs, potential biomarkers for drug-induced liver injury. Proc Natl Acad Sci USA 2009;106: 4402– 4407.
318. Wang LG, Gu J.Serum microRNA-29a is a promising novel marker for early detection of colorectal liver metastasis. Cancer Epidemiol 2012a: 36: e61–7.
319. Wang Q, Huang Z, Ni S, Xiao X, Xu Q, Wang L, Huang D, Tan C, Sheng W, Du X. Plasma miR-601 and miR-760 are novelbiomarkers for the early detection of colorectal cancer. PloS one. 2012; 7(9):e44398.
320. Wang S, El-Deiry WS. Requirement of p53 targets in chemosensitization of colonic carcinoma to death ligand therapy. Proc Natl Acad Sci USA 2003; 100: 15095-15100
321. Wang X, Wang J, Ma H, Zhang J, Zhou X. Downregulation of miR-195 correlates with lymph node metastasis and poor prognosis in colorectal cancer. Med Oncol 2012; 29: 919–27.
322. Wang YX, Zhang XY, Zhang BF, Yang CQ, Chen XM, Initial study of microRNA expression profiles of colonic cancer without lymph node metastasis. J Dig Dis. 2010 Feb;11(1):50-4.
323. Wang K, Yuan Y, Cho JH, McClarty S, Baxter D, Galas DJ. Comparing the MicroRNA spectrum between serum and plasma. PLoS One. 2012;7(7):e41561.

290
324. Webber EM, Lin JS, Evelyn P Whitlock. Oncotype DX tumor gene expression profiling in stage II colon cancer. Application: prognostic, risk prediction. PLoS Curr. 2010 Sep 2;2. pii: RRN1177.
325. Weissmann-Brenner A, Kushnir M, Lithwick Yanai G, Aharonov R, Gibori H, Purim O, Kundel Y, Morgenstern S, Halperin M, Niv Y, Brenner B. Tumor microRNA-29a expression and the risk of recurrence in stage II colon cancer. Int J Oncol. 2012 Jun;40(6):2097-103.
326. White V, Scarpini C, Barbosa-Morais NL, Ikelle E, Carter S, Laskey RA, Miller R, Coleman N. Isolation of stool-derived mucus provides a high yield of colonocytes suitable for early detection of colorectal carcinoma. Cancer Epidemiol Biomarkers Prev. 2009 ;18(7):2006-13
327. Wimmer K, Kratz CP, Vasen HF, Caron O, Colas C, EntzWerle N, Gerdes AM, Goldberg Y, Ilencikova D, Muleris M, Duval A, Lavoine N, Ruiz-Ponte C, Slavc I, Burkhardt B, Brugieres L. Diagnostic criteria for constitutional mismatch repair deficiency syndrome: suggestions of the European consortium ‘care for CMMRD’ (C4CMMRD). J Med Genet 2014; 51: 355-365.
328. Witwer KW. XenomiRs and miRNA homeostasis in health and disease: evidence that diet and dietary miRNAs directly and indirectly influence circulating miRNA profiles. RNA Biol. 2012 Sep;9(9):1147-54.
329. Worthley DL, Whitehall VL, Spring KJ, Leggett BA. Colorectal carcinogenesis: road maps to cancer. World J Gastroenterol 2007; 13: 3784-3791
330. Wu CW, Ng SC, Dong Y, Tian L, Ng SS, Leung WW, Law WT, Yau TO, Chan FK, Sung JJ, Yu J. Identification of microRNA-135b in stool as a potential noninvasive biomarker for colorectal cancer and adenoma. Clin Cancer Res. 2014 Jun 1;20(11):2994-3002
331. Xi Y, Formentini A, Chien M, Weir DB, Russo JJ, Ju J, Kornmann M, Ju J. Prognostic Values of microRNAs in Colorectal Cancer. Biomark Insights. 2006;2:113-121
332. Xiao S, Yang Z, Lv R, Zhao J, Wu M, Liao Y, Liu Q. miR-135b contributes to the radioresistance by targeting GSK3β in human glioblastoma multiforme cells. PLoS One. 2014 Sep 29;9(9):e108810.
333. Xing J, Wan S, Zhou F, Qu F, Li B, Myers RE, Fu X, Palazzo JP, He X, Chen Z, Yang H. Genetic polymorphisms in pre-microRNA genes as prognostic markers of colorectal cancer. Cancer Epidemiol Biomarkers Prev 2012; 21: 217–227.
334. Yamakuchi M and Lowenstein CJ. MiR-34, SIRT1 and p53: the feedback loop. Cell Cycle 2009; 8: 712–715
335. Yan LX, Wu QN, Zhang Y, Li YY, Liao DZ, Hou JH, Fu J, Zeng MS, Yun JP, Wu QL, Zeng YX, Shao JY. Knockdown of miR-21 in human breast cancer cell lines inhibits proliferation, in vitro migration and in vivo tumor growth. Breast Cancer Res. 2011 Jan 10;13(1):R2.

291
336. Yang M, Chen J, Su F, Yu B, Su F, Lin L, Liu Y, Huang JD, Song E.Microvesicles secreted by macrophages shuttle invasion-potentiating microRNAs into breast cancer cells. Mol Cancer. 2011 Sep 22;10:117.
337. Ye SB, Li ZL, Luo DH, Huang BJ, Chen YS, Zhang XS, Cui J, Zeng YX, Li J. Tumor-derived exosomes promote tumor progression and T-cell dysfunction through the regulation of enriched exosomal microRNAs in human nasopharyngeal carcinoma. Oncotarget. 2014 Jul 30;5(14):5439-52.
338. Yu H, Pardoll D, Jove R. STATs in cancer inflammation and immunity: a leading role for STAT3. Nat Rev Cancer. 2009 Nov;9(11):798-809.
339. Yuki D, Lin YM, Fujii Y, Nakamura Y, Furukawa Y. Isolation of LEM domain-containing 1, a novel testis-specific gene expressed in colorectal cancers. Oncol. Rep. 2004;12:275–280.
340. Zhang J, Guo H, Zhang H, Wang H, Qian G, Fan X, Hoffman AR, Hu JF, Ge S. Putative tumor suppressor miR-145 inhibits colon cancer cell growth by targeting oncogene Friend leukemia virus integration 1 gene. Cancer. 2011 Jan 1;117(1):86-95.
341. Zhang JX, Song W, Chen ZH, Wei JH, Liao YJ, Lei J, Hu M, Chen GZ, Liao B, Lu J, Zhao HW, Chen W, He YL, Wang HY, Xie D, Luo JH. Prognostic and predictive value of a microRNA signature in stage II colon cancer: a microRNA expression analysis. Lancet Oncol. 2013 Dec;14(13):1295-306.
342. Zhang Y, Zhou ZG, Wang L, Zhang P, Wang MJ, Cui CF, Guan JT, Chen KL, Zhan L. Clinicopathological significance of microRNA-21 and miR-125 expression in colorectal cancer. Zhonghua Wei Chang Wai Ke Za Zhi. 2009 Nov;12(6):623-6.
343. Zhou H, Huang X, Cui H, Luo X, Tang Y, Chen S, Wu L, Shen N. miR-155 and its star-form partner miR-155* cooperatively regulate type I interferon production by human plasmacytoid dendritic cells. Blood. 2010.23;116(26):5885-94.
344. Zhou W, Fong MY, Min Y, Somlo G, Liu L, Palomares MR, Yu Y, Chow A, O'Connor ST, Chin AR, Yen Y, Wang Y, Marcusson EG, Chu P, Wu J, Wu X, Li AX, Li Z, Gao H, Ren X, Boldin MP, Lin PC, Wang SE. Cancer-secreted miR-105 destroys vascular endothelial barriers to promote metastasis. Cancer Cell. 2014 Apr 14;25(4):501-15.
345. Zhu MM, Xu XT, Nie F, Tong JL, Xiao SD, Ran ZH. Comparison of immunochemical and guaiac-based fecal occult blood test in screening and surveillance for advanced colorectal neoplasms: a meta-analysis. J Dig Dis. 2010 Jun;11(3):148-60.
346. Zhuang G, Wu X, Jiang Z, Kasman I, Yao J, Guan Y, Oeh J, Modrusan Z, Bais C, Sampath D, Ferrara N. Tumour-secreted miR-9 promotes endothelial cell migration and angiogenesis by activating the JAK-STAT pathway. EMBO J. 2012 Aug 29;31(17):3513-23.
347. Zlobec I, Lugli A. Prognostic and predictive factors in colorectal cancer. J Clin
Pathol. 2008;61:561–569.