The Bill Blackwood Law Enforcement Management Institute of Texas ...
Upload
khangminh22Category
view
1download
0
Technical Report Documentation Page 1. Report No.
FHWA/TX-03/1519-3
2. Government Accession No.
3. Recipient's Catalog No.
4. Title and Subtitle
YEAR 3 REPORT ON THE TECHNICAL AND ECONOMIC FEASIBILITY OF A FREIGHT PIPELINE SYSTEM IN TEXAS
5. Report Date
October 2002
6. Performing Organization Code
7. Author(s)
Stephen S. Roop, Craig E. Roco, Curtis A. Morgan, Leslie E. Olson, Jeffery E. Warner, Dong-Hun Kang, David H. Bierling
8. Performing Organization Report No.
Report 1519-3
10. Work Unit No. (TRAIS)
9. Performing Organization Name and Address
Texas Transportation Institute The Texas A&M University System College Station, Texas 77843-3135
11. Contract or Grant No.
Project No. 0-1519 13. Type of Report and Period Covered
Research: September 2001 – August 2002
12. Sponsoring Agency Name and Address
Texas Department of Transportation Research and Technology Implementation Office P. O. Box 5080 Austin, Texas 78763-5080
14. Sponsoring Agency Code
15. Supplementary Notes
Research performed in cooperation with the Texas Department of Transportation and U.S. Department of Transportation, Federal Highway Administration. Research Project Title: Freight Pipeline Feasibility Study 16. Abstract
Planning for increased freight transportation has become a major issue in the US in its own right. Tremendous quantities of goods now flow between the US and Mexico, mostly transported by truck. In fact, Texas, because of its geographic location, serves as the principal land-side gateway to Mexico, and, as a consequence, hosts truck traffic from all over the U.S., Mexico, and Canada. This truck traffic is beginning to dominate certain Texas highways with adverse ramifications that include diminished safety, decreased roadway life, and increased congestion and air pollution. The current research is aimed at determining whether freight-conveying pipelines can offer an improved alternative to the existing surface modes. This third year report addresses key technical issues and the economics of freight pipeline construction, operation, and maintenance. Results suggest that an underground system is technically feasible and cost, while substantial in terms of the initial investment, may prove low in the long term, with significant social benefits accruing through avoided costs. 17. Key Words
Freight, Pipeline, Underground, Freight Movement
18. Distribution Statement
No restrictions. This document is available to the public through NTIS: National Technical Information Service 5285 Port Royal Road Springfield, Virginia 22161
19. Security Classif.(of this report) Unclassified
20. Security Classif.(of this page) Unclassified
21. No. of Pages
180
22. Price
Form DOT F 1700.7 (8-72) Reproduction of completed page authorized

YEAR 3 REPORT ON THE TECHNICAL AND ECONOMIC FEASIBILITY OF A FREIGHT PIPELINE SYSTEM IN TEXAS
by
Stephen S. Roop, Ph.D. Research Scientist
Texas Transportation Institute Craig E. Roco
Associate Transportation Researcher Texas Transportation Institute
Leslie E. Olson Associate Research Scientist
Texas Transportation Institute Curtis A. Morgan
Associate Transportation Researcher Texas Transportation Institute
Jeffery E. Warner Engineering Research Associate Texas Transportation Institute
Dong-Hun Kang Graduate Research Assistant
Texas Transportation Institute
David H. Bierling Associate Transportation Researcher
Texas Transportation Institute
Report 1519-3 Project Number 0-1519
Research Project Title: Freight Pipeline Feasibility Study
Sponsored by the Texas Department of Transportation
In Cooperation with the U.S. Department of Transportation Federal Highway Administration
October 2002
TEXAS TRANSPORTATION INSTITUTE The Texas A&M University System College Station, Texas 77843-3135

Texas Transportation Institute v Multimodal Freight Transportation Programs
DISCLAIMER
The contents of this report reflect the views of the authors, who are responsible for the facts and the accuracy of the data presented herein. The contents do not necessarily reflect the official view or policies of the Federal Highway Administration or the Texas Department of Transportation. This report does not constitute a standard, specification, or regulation.
Texas Transportation Institute vi Multimodal Freight Transportation Programs
ACKNOWLEDGMENTS The authors wish to express their appreciation for their forward-thinking sponsors at the U.S. Department of Transportation, Federal Highway Administration, and the Texas Department of Transportation, including the project director, Michele Conkle, and the project monitoring committee. The authors would also like to thank U.S. Representative Eddie Bernice Johnson of Texas for her support.
Texas Transportation Institute vii Multimodal Freight Transportation Programs
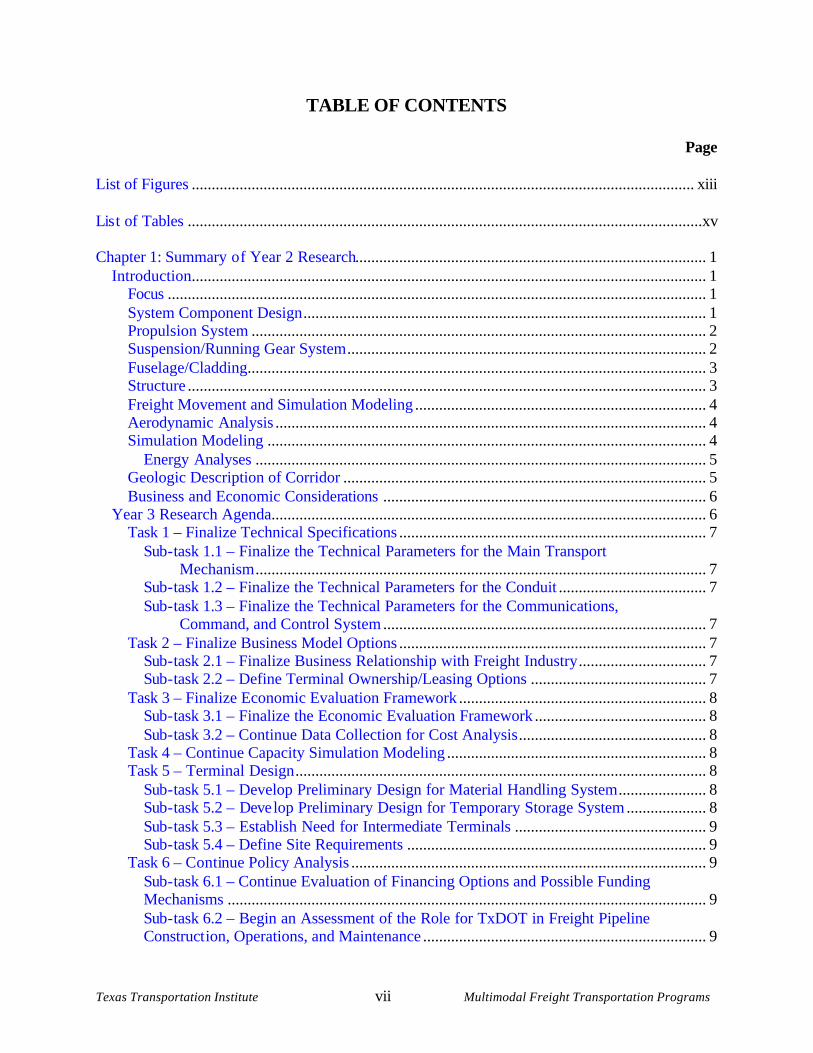
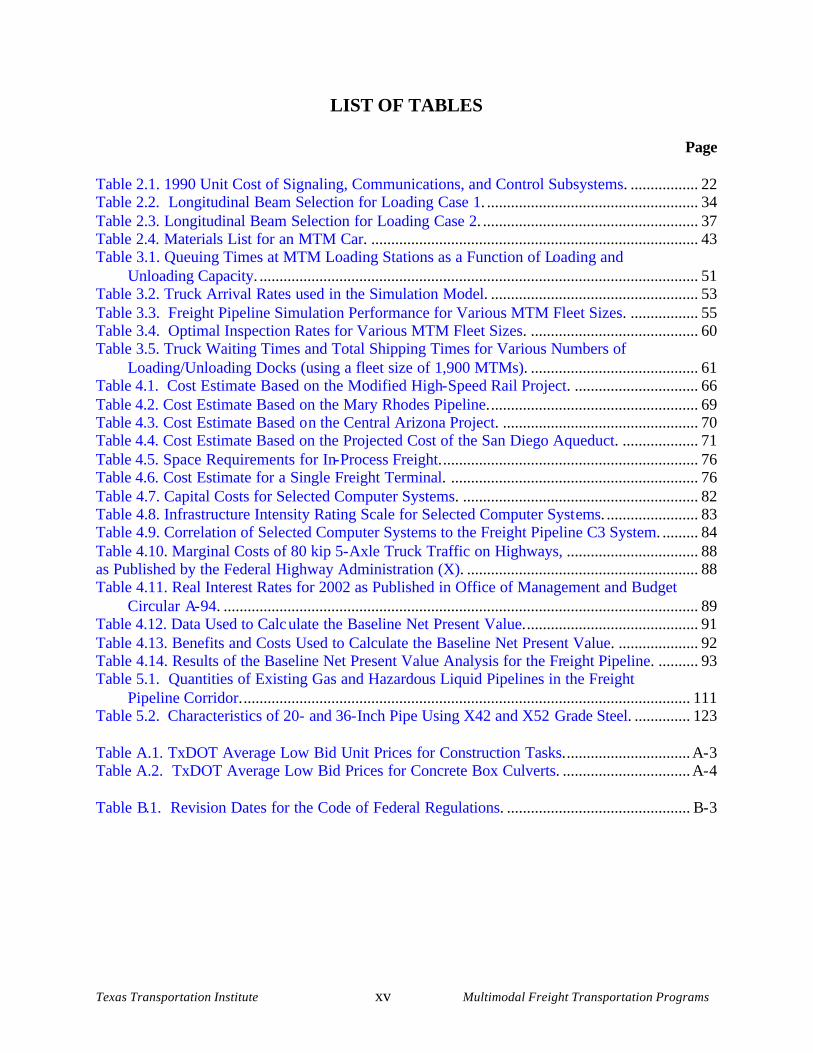
TABLE OF CONTENTS
Page List of Figures .............................................................................................................................. xiii Lis t of Tables .................................................................................................................................xv Chapter 1: Summary o f Year 2 Research........................................................................................ 1
Introduction................................................................................................................................. 1 Focus ....................................................................................................................................... 1 System Component Design ..................................................................................................... 1 Propulsion System .................................................................................................................. 2 Suspension/Running Gear System .......................................................................................... 2 Fuselage/Cladding................................................................................................................... 3 Structure .................................................................................................................................. 3 Freight Movement and Simulation Modeling ......................................................................... 4 Aerodynamic Analysis ............................................................................................................ 4 Simulation Modeling .............................................................................................................. 4
Energy Analyses ................................................................................................................. 5 Geologic Description of Corridor ........................................................................................... 5 Business and Economic Considerations ................................................................................. 6
Year 3 Research Agenda............................................................................................................. 6 Task 1 – Finalize Technical Specifications ............................................................................. 7
Sub - task 1.1 – Finalize the Technical Parameters for the Main Transport Mechanism ................................................................................................................. 7 Sub - task 1.2 – Finalize the Technical Parameters for the Conduit ..................................... 7 Sub - task 1.3 – Finalize the Technical Parameters for the Communications, Command, and Control System ................................................................................. 7
Task 2 – Finalize Business Model Options ............................................................................. 7 Sub - task 2.1 – Finalize Business Relationship with Freight Industry ................................ 7 Sub - task 2.2 – Define Terminal Ownership/Leasing Options ............................................ 7
Task 3 – Finalize Economic Evaluation Framework .............................................................. 8 Sub - task 3.1 – Finalize the Economic Evaluation Framework ........................................... 8 Sub - task 3.2 – Continue Data Collection for Cost Analysis ............................................... 8
Task 4 – Continue Capacity Simulation Modeling ................................................................. 8 Task 5 – Terminal Design ....................................................................................................... 8
Sub - task 5.1 – Develop Preliminary Design for Material Handling System ...................... 8 Sub - task 5.2 – Deve lop Preliminary Design for Temporary Storage System .................... 8 Sub - task 5.3 – Establish Need for Intermediate Terminals ................................................ 9 Sub - task 5.4 – Define Site Requirements ........................................................................... 9
Task 6 – Continue Policy Analysis ......................................................................................... 9 Sub - task 6.1 – Continue Evaluation of Financing Options and Possible Funding Mechanisms ........................................................................................................................ 9 Sub - task 6.2 – Begin an Assessment of the Role for TxDOT in Freight Pipeline Construct ion, Operations, and Maintenance ....................................................................... 9
Texas Transportation Institute viii Multimodal Freight Transportation Programs
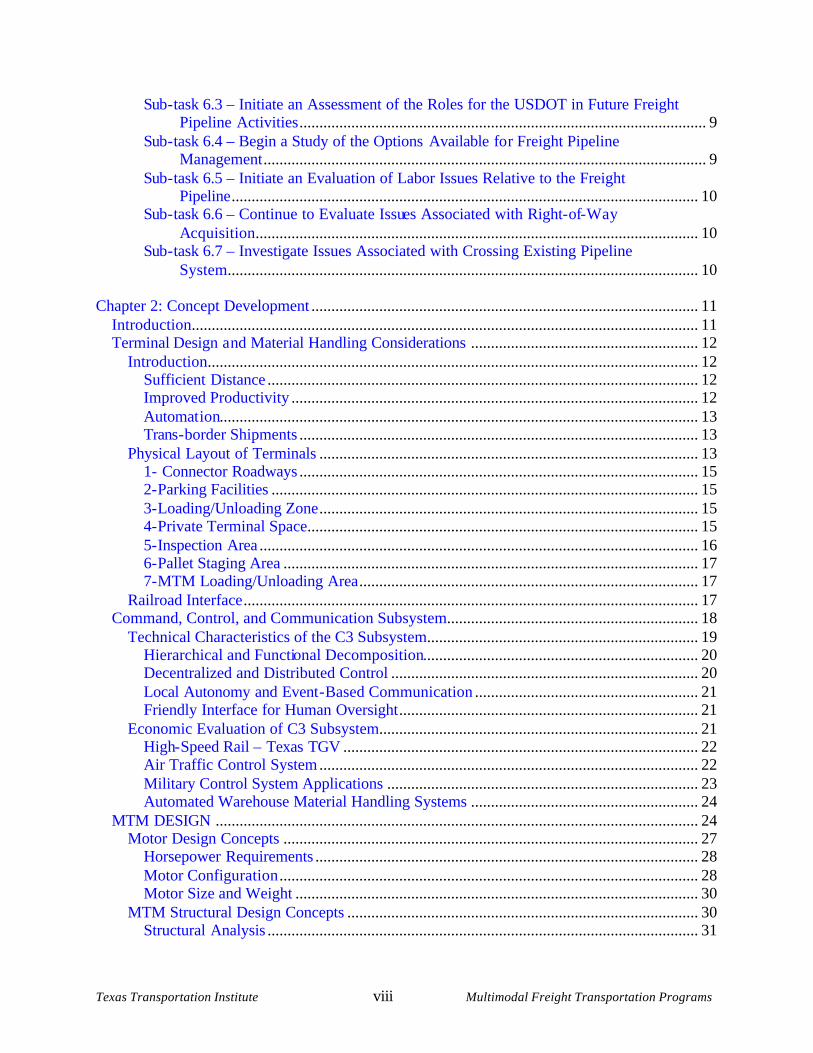
Sub - task 6.3 – Initiate an Assessment of the Roles for the USDOT in Future Freight Pipeline Activities ...................................................................................................... 9 Sub - task 6.4 – Begin a Study of the Options Available fo r Freight Pipeline Management ............................................................................................................... 9 Sub - task 6.5 – Initiate an Evaluation of Labor Issues Relative to the Freight Pipeline ..................................................................................................................... 10 Sub - task 6.6 – Continue to Evaluate Issues Associated with Right- of- Way Acquisition............................................................................................................... 10 Sub - task 6.7 – Investigate Issues Associated with Crossing Existing Pipeline System...................................................................................................................... 10
Chapter 2: Concept Development ................................................................................................. 11
Introduction............................................................................................................................... 11 Terminal Design a nd Material Handling Considerations ......................................................... 12
Introduction........................................................................................................................... 12 Sufficient Distance ............................................................................................................ 12 Improved Productivity ...................................................................................................... 12 Automat ion........................................................................................................................ 13 Trans - border Shipments .................................................................................................... 13
Physical Layout of Terminals ............................................................................................... 13 1- Connector Roadways .................................................................................................... 15 2- Parking Facilities ........................................................................................................... 15 3- Loading/Unloading Zone ............................................................................................... 15 4- Private Terminal Space.................................................................................................. 15 5- Inspection Area .............................................................................................................. 16 6- Pallet Staging Area ........................................................................................................ 17 7- MTM Loading/Unloading Area ..................................................................................... 17
Railroad Interface .................................................................................................................. 17 Command, Control, and Communication Subsystem............................................................... 18
Technical Characteristics of the C3 Subsystem.................................................................... 19 Hierarchical and Functional Decomposition..................................................................... 20 Decentralized and Distributed Control ............................................................................. 20 Local Autonomy and Event - Based Communication ........................................................ 21 Friendly Interface for Human Oversight ........................................................................... 21
Economic Evaluation of C3 Subsystem................................................................................ 21 High- Speed Rail – Texas TGV ......................................................................................... 22 Air Traffic Control System ............................................................................................... 22 Military Control System Applications .............................................................................. 23 Automated Warehouse Material Handling Systems ......................................................... 24
MTM DESIGN ......................................................................................................................... 24 Motor Design Concepts ........................................................................................................ 27
Horsepower Requirements ................................................................................................ 28 Motor Configuration ......................................................................................................... 28 Motor Size and Weight ..................................................................................................... 30
MTM Structural Design Concepts ........................................................................................ 30 Structural Analysis ............................................................................................................ 31
Texas Transportation Institute ix Multimodal Freight Transportation Programs
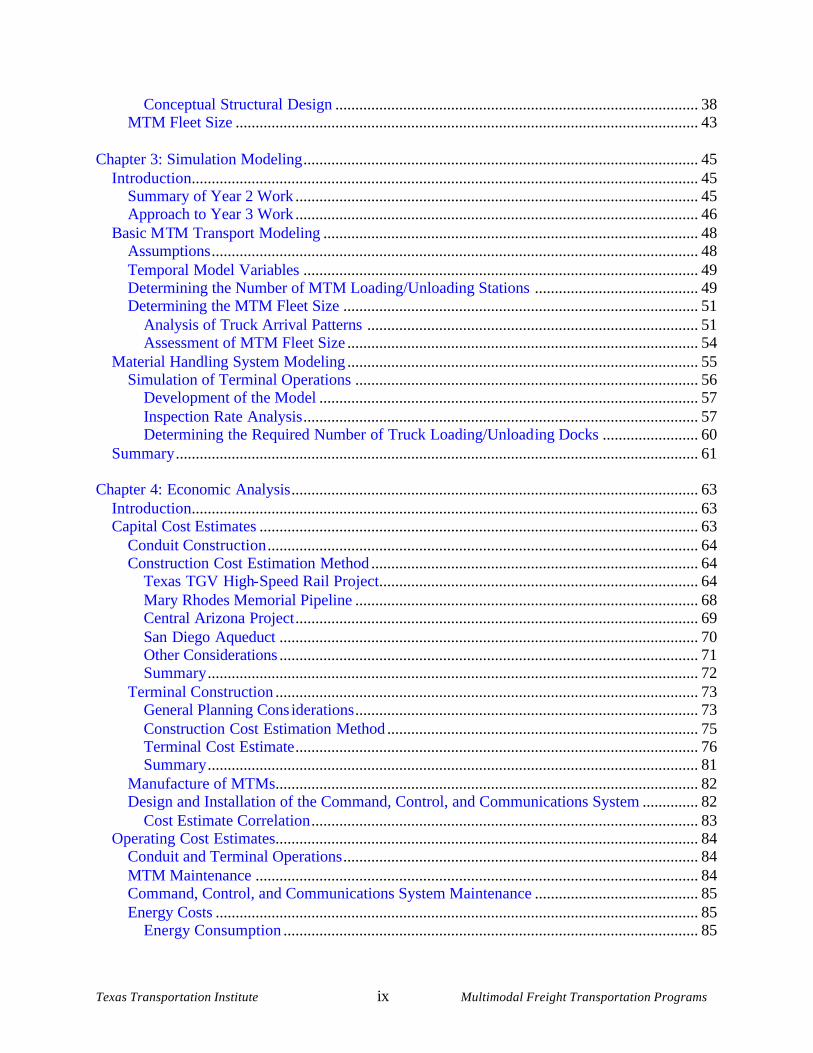
Conceptual Structural Design ........................................................................................... 38 MTM Fleet Size .................................................................................................................... 43
Chapter 3: Simulation Modeling ................................................................................................... 45
Introduction............................................................................................................................... 45 Summary of Year 2 Work ..................................................................................................... 45 Approach to Year 3 Work ..................................................................................................... 46
Basic M TM Transport Modeling .............................................................................................. 48 Assumptions .......................................................................................................................... 48 Temporal Model Variables ................................................................................................... 49 Determining the Number of MTM Loading/Unloading Stations ......................................... 49 Determining the MTM Fleet Size ......................................................................................... 51
Analysis of Truck Arrival Patterns ................................................................................... 51 Assessment of MTM Fleet Size ........................................................................................ 54
Material Handling System Modeling ........................................................................................ 55 Simulation of Terminal Operations ...................................................................................... 56
Development of the Model ............................................................................................... 57 Inspection Rate Analysis ................................................................................................... 57 Determining the Required Number of Truck Loading/Unload ing Docks ........................ 60
Summary ................................................................................................................................... 61 Chapter 4: Economic Analysis ...................................................................................................... 63
Introduction............................................................................................................................... 63 Capital Cost Estimates .............................................................................................................. 63
Conduit Construction ............................................................................................................ 64 Construction Cost Estimation Method .................................................................................. 64
Texas TGV High- Speed Rail Project................................................................................ 64 Mary Rhodes Memorial Pipeline ...................................................................................... 68 Central Arizona Project ..................................................................................................... 69 San Diego Aqueduct ......................................................................................................... 70 Other Considerations ......................................................................................................... 71 Summary ........................................................................................................................... 72
Terminal Construction .......................................................................................................... 73 General Planning Cons iderations ...................................................................................... 73 Construction Cost Estimation Method .............................................................................. 75 Terminal Cost Estimate ..................................................................................................... 76 Summary ........................................................................................................................... 81
Manufacture of MTMs.......................................................................................................... 82 Design and Installation of the Command, Control, and Communications System .............. 82
Cost Estimate Correlation ................................................................................................. 83 Operating Cost Estimates.......................................................................................................... 84
Conduit and Terminal Operations ......................................................................................... 84 MTM Maintenance ............................................................................................................... 84 Command, Control, and Communications System Maintenance ......................................... 85 Energy Costs ......................................................................................................................... 85
Energy Consumption ........................................................................................................ 85
Texas Transportation Institute x Multimodal Freight Transportation Programs
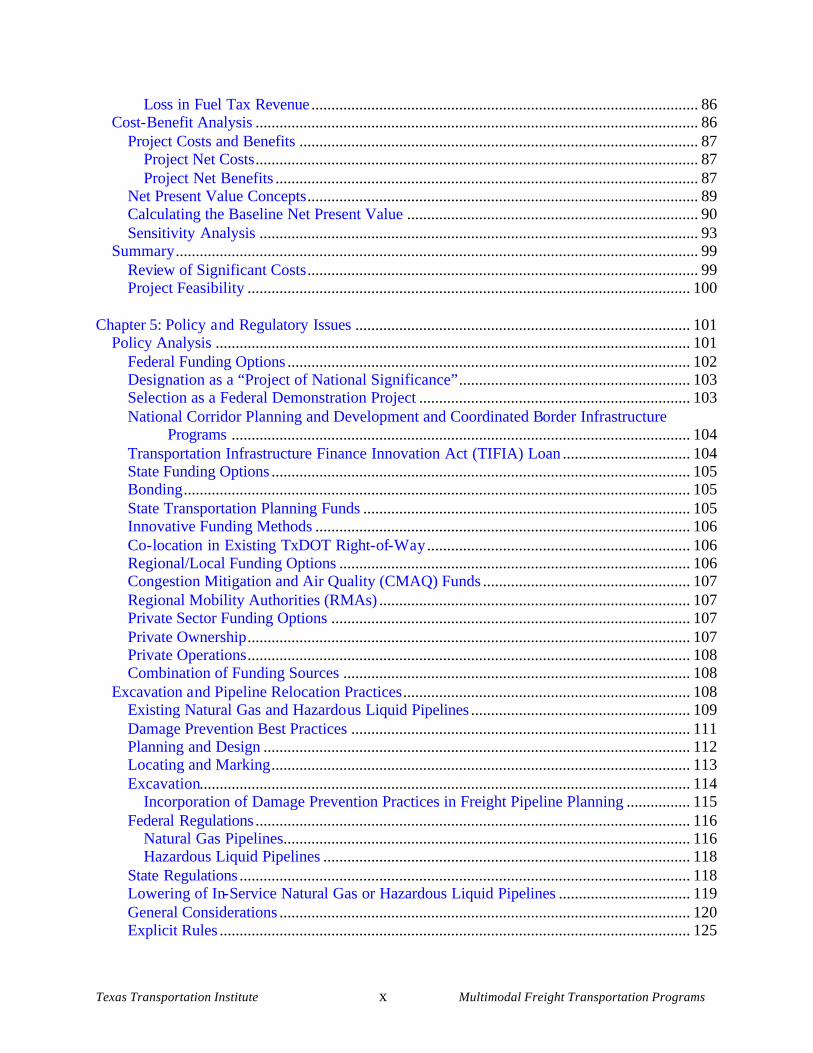
Loss in Fuel Tax Revenue ................................................................................................. 86 Cost- Benefit Analysis ............................................................................................................... 86
Project Costs and Benefits .................................................................................................... 87 Project Net Costs ............................................................................................................... 87 Project Net Benefits .......................................................................................................... 87
Net Present Value Concepts .................................................................................................. 89 Calculating the Baseline Net Present Value ......................................................................... 90 Sensitivity Analysis .............................................................................................................. 93
Summary ................................................................................................................................... 99 Review of Significant Costs .................................................................................................. 99 Project Feasibility ............................................................................................................... 100
Chapter 5: Policy a nd Regulatory Issues .................................................................................... 101
Policy Analysis ....................................................................................................................... 101 Federal Funding Options ..................................................................................................... 102 Designation as a “Project of National Significance” .......................................................... 103 Selection as a Federal Demonstration Project .................................................................... 103 National Corridor Planning and Development and Coordinated Border Infrastructure Programs ................................................................................................................... 104 Transportation Infrastructure Finance Innovation Act (TIFIA) Loan ................................ 104 State Funding Options ......................................................................................................... 105 Bonding ............................................................................................................................... 105 State Transportation Planning Funds .................................................................................. 105 Innovative Funding Methods .............................................................................................. 106 Co- location in Existing TxDOT Right- of- Way .................................................................. 106 Regional/Local Funding Options ........................................................................................ 106 Congestion Mitigation and Air Quality (CMAQ) Funds .................................................... 107 Regional Mobility Authorities (RMAs) .............................................................................. 107 Private Sector Funding Options .......................................................................................... 107 Private Ownership ............................................................................................................... 107 Private Operations ............................................................................................................... 108 Combination of Funding Sources ....................................................................................... 108
Excavation a nd Pipeline Relocation Practices ........................................................................ 108 Existing Natural Gas and Hazardo us Liquid Pipelines ....................................................... 109 Damage Prevention Best Practices ..................................................................................... 111 Planning and Design ........................................................................................................... 112 Locating and Marking ......................................................................................................... 113 Excavation........................................................................................................................... 114
Incorporation of Damage Prevention Practices in Freight Pipeline Planning ................ 115 Federal Regulations ............................................................................................................. 116
Natural Gas Pipelines...................................................................................................... 116 Hazardous Liquid Pipelines ............................................................................................ 118
State Regulations ................................................................................................................. 118 Lowering of In- Service Natural Gas or Hazardous Liquid Pipelines ................................. 119 General Considerations ....................................................................................................... 120 Explicit Rules ...................................................................................................................... 125
Texas Transportation Institute xi Multimodal Freight Transportation Programs
Cost Considerations ............................................................................................................ 126 Summary ................................................................................................................................. 127
Chapter 6: Fy 2003 Work Plan .................................................................................................. 129
Fy 2003 Work Plan ................................................................................................................. 129 Task 1 – Review Technical Specifications and Complete the Conceptual Design ............ 129
Sub - task 1.1 – Review the Technical Parameters for the Main Transport Mechanism (MTM) ............................................................................................................................ 129 Sub - task 1.2 – Review the Technical Parameter s for the Conduit ................................. 129 Sub - task 1.3 – Review the Technical Parameters for the Communications, Command, and Control System ............................................................................. 129 Sub - task 1.4 – Review the Technical Parameters for the Terminal and Material Handling System .................................................................................................... 130
Task 2 – Identify and Discuss Design Elements Enhancing System Viability................... 130 Sub - task 2.1 – Examine the Value of Intermediate Terminal Locations ........................ 130 Sub - task 2.2 – Describe the Opportunities for Railroad Participation and the Resulting Terminal Design Issues ......................................................................... 130
Task 3 – Refine and Complete Economic Evaluation ........................................................ 130 Sub - task 3.1 – Refine t he Economic Evaluation Framework ......................................... 130 Sub - task 3.2 – Continue Data Collection for Cost Analysis ........................................... 130
Task 4 – Establish the Estimated Marginal Cost of Operation and Resultant User Fees ........................................................................................................................... 131 Task 5 – Complete Policy Assessments .............................................................................. 131
Sub - task 5.1 – Define Preferred Public- Private Ownership and Operations Options .... 131 Sub - task 5.2 – Establish the Desirability and Feasibility of Bi- national Cooperation with Mexico on Freight Pipeline Construction and Operations ........ 131
Task 6 – Evaluate Constructability ..................................................................................... 132 Sub - task 6.1 – Examine Construction Methods and Cost Reduction Strategies ............ 132 Sub - task 6.2 – Evaluate Regulatory Issues Associated with Freight Pipeline Construction........................................................................................................... 132 Sub - task 6.3 – Discuss Potential Construction Time Lines and Scheduling Issues ....... 132 Sub - task 6.4 – Identify Potential Impediment s to, and Implementation Issues with Freight Pipeline Construction ........................................................................ 132 Sub - task 6.5 – Continue to Evaluate Issues Associated with Right- of- Way Acquisition............................................................................................................. 132
Task 7 – Define Potential Next Steps in Underground Freight Transportation.................. 133 Sub - task 7.1 – Establish the Potential for a Demonstration Project of Freight Pipeline Technology .............................................................................................. 133
Task 8 – Document the Results of Year 4 in a Final Report .............................................. 133 Sub - task 8.1 – Document the Results of Year 4 Research in a Comprehensive Research Report ..................................................................................................... 133 Sub - task 8.2 – Develop Animation Showing Freight Pipeline Operations .................... 133 Sub - task 8.3 – Develop a PowerPoint Presentation on the Freight Pipeline Research Effort and Results ................................................................................................... 133 Sub - task 8.4 – Develop, as a Major Deliverable, CD Containing Animation, PowerPoint, and Year 1 to Year 4 Reports ............................................................ 133
Texas Transportation Institute xii Multimodal Freight Transportation Programs
Chapter 7: Summary a nd Conclusions ....................................................................................... 135 Summary ................................................................................................................................. 135 Conclusions ............................................................................................................................. 136
References ................................................................................................................................... 137 Appendix A – Average Low Bid Unit Prices For Conduit Construction Activities ................... A- 1 Appendix B – Rules Pertaining to Pipeline Relocations within t he Code o f Federal Regulations ...................................................................................................................... B- 1
Texas Transportation Institute xiii Multimodal Freight Transportation Programs
LIST OF FIGURES Page Figure 2.1. Sequence of Project Development for the Freight Pipeline. ...................................... 11 Figure 2.2. Conceptual Layout of Freight Pipeline Terminal. ..................................................... 14 Figure 2.3. Preliminary Interface Diagram. .................................................................................. 19 Figure 2.4. Control System Communication Flow. ...................................................................... 20 Figure 2.5. Conceptual Design of the Guideway- Mounted MTM with Partially Exposed Interior. .................................................................................................................................. 25 Figure 2.6. Fully Loaded MTM with a Partially Exposed Interior. .............................................. 26 Figure 2.7. Positioning of Wheel Assemblies, Motors, and Cargo of Linked MTM Cars. .......... 27 Figure 2.8. Positioning of Linear Induction Motors of an MTM Relative to the Guideway. ....... 28 Figure 2.9. Arrangement of Linear Induction Motors Under the Frame of an MTM. ................. 30 Figure 2.10. Loading of an MTM with 1,667- Pound Pallets. ...................................................... 31 Figure 2.11. Shear and Moment Diagrams for Loading Case 1. ................................................. 32 Figure 2.8. Loading of an MTM with 4,000- lb Pallets. ................................................................ 35 Figure 2.9. Shear and Moment Diagrams for Loading Case 2. ................................................... 36 Figure 2.10. Structural Frame of an MTM. .................................................................................. 39 Figure 2.11. Socket and Carriage Pin Connectors. ....................................................................... 39 Figure 2.12. Plug and Pin for Socket Connector. ......................................................................... 40 Figure 2.13. Complementary Socket and Plug Connectors. ......................................................... 40 Figure 2.14. Roll- Up Door of an MTM. ....................................................................................... 41 Figure 3.1. Simulation Mode l Components of a Freight Pipeline Terminal. ............................... 46 Figure 3.2. Simulation of Freight Pipeline Operations with a Model that Includes Truck
Loading/Unloading Bays, Warehouses, Inspection Stations, MTM Loading/Unloading Stations, and a Main Conduit. ............................................................................................... 47
Figure 3.3. Freight Pipeline Simulation Model with One MTM Loading and Unloading Dock at Each Terminal. ........................................................................................................ 50 Figure 3.4. Freight Pipeline Simulation Model with Two MTM Loading and Unloading Docks at Each Terminal. ....................................................................................................... 51 Figure 3.5. Conceptual Truck Arrival Patterns Considered for Simulation Modeling. ................ 52 Figure 3.6. Truck Arrival Rates used in Freight Pipeline Simulation Models. ............................ 53 Figure 3.7. Simulation Process of Initial Freight Pipeline Models. .............................................. 56 Figure 3.8. Basic Simulation Process using a Freight Pipeline Model that Includes Terminal
Operations. ............................................................................................................................ 57 Figure 3.9. Simulation of Terminal Operations using Inspection Stations to Regulate the Flow of Pallets. ..................................................................................................................... 57 Figure 3.10. Minimum Number of MTMs and Maximum Queue Length versus Inspection Rate for 1,900 MTMs. .......................................................................................................... 58 Figure 3.11. Total Time in the System versus Inspection Rate for 1,900 MTMs. ....................... 59 Figure 4.1. Projected Unit Price for a 20 ft × 10 ft Concrete Box Culvert. .................................. 67 Figure 4.2. S ummary of Construction Cost Estimates for the Freight Pipeline Conduit. ............. 72 Figure 4.3. Conceptual Spacing Allowance for Truck Loading/Unloading. ................................ 78 Figure 4.4. Conceptual Spacing Allowance for Palle t Inspection. ............................................... 79 Figure 4.5. Conceptual Spacing Allowance for MTM Loading. .................................................. 79 Figure 4.6. Plot of Net Present Values for the Case of 1,000 Initial Trucks/Day. ........................ 94
Texas Transportation Institute xiv Multimodal Freight Transportation Programs
Figure 4.7. Plot of Net Present Value as a Function of Initial Freight Pipeline Traffic. .............. 95 Figure 4.8. Plot of Net Present Value as a Function of Cost Using at an Initial Traffic Volume of 500 Trucks/Day. .................................................................................................. 96 Figure 4.9. Plot of Net Present Value as a Function o f Cost Using an Initial Traffic Volume of 1,000 Trucks/Day. .............................................................................................. 97 Figure 4.10. Plot of Net Present Value as a Function of Cost Using an Initial Traffic Volume of 1,500 Tr ucks/Day. .............................................................................................. 98 Figure 4.11. Plot of Net Present Value as a Function of Cost Using an Initial Traffic Volume of 2,000 Trucks/Day. .............................................................................................. 99 Figure 5.1. Natural Gas and Hazardous Liquid Pipelines in the Interstate 35 Corridor. ........... 110 Figure 5.2. A Class Location Unit as Defined Under 49 CFR 192.5. ....................................... 117 Figure 5.3. Pipeline Relocation Profile within the Freight Pipeline Corridor. .......................... 122 Figure 5.4. Profile of a Relocated Pipeline for Various Pipe Diameters and Strengths. ........... 124 Figure 5.5. Required Excavation Length of Pipeline Relocations for Selected Pipe
Characteristics. .................................................................................................................... 126
Texas Transportation Institute xv Multimodal Freight Transportation Programs
LIST OF TABLES Page Table 2.1. 1990 Unit Cost of Signaling, Communications, and Control Subsystems. ................. 22 Table 2.2. Longitudinal Beam Selection for Loading Case 1. ..................................................... 34 Table 2.3. Longitudinal Beam Selection for Loading Case 2. ...................................................... 37 Table 2.4. Materials List for an MTM Car. .................................................................................. 43 Table 3.1. Queuing Times at MTM Loading Stations as a Function of Loading and Unloading Capacity. .............................................................................................................. 51 Table 3.2. Truck Arrival Rates used in the Simulation Model. .................................................... 53 Table 3.3. Freight Pipeline Simulation Performance for Various MTM Fleet Sizes. ................. 55 Table 3.4. Optimal Inspection Rates for Various MTM Fleet Sizes. .......................................... 60 Table 3.5. Truck Waiting Times and Total Shipping Times for Various Numbers of
Loading/Unloading Docks (using a fleet size of 1,900 MTMs). .......................................... 61 Table 4.1. Cost Estimate Based on the Modified High- Speed Rail Project. ............................... 66 Table 4.2. Cost Estimate Based on the Mary Rhodes Pipeline. .................................................... 69 Table 4.3. Cost Estimate Based o n the Central Arizona Project. ................................................. 70 Table 4.4. Cost Estimate Based on the Projected Cost of the San Diego Aqueduct. ................... 71 Table 4.5. Space Requirements for In- Process Freight. ................................................................ 76 Table 4.6. Cost Estimate for a Single Freight Terminal. .............................................................. 76 Table 4.7. Capital Costs for Selected Computer Systems. ........................................................... 82 Table 4.8. Infrastructure Intensity Rating Scale for Selected Computer Syst ems. ....................... 83 Table 4.9. Correlation of Selected Computer Systems to the Freight Pipeline C3 System. ......... 84 Table 4.10. Marginal Costs of 80 kip 5- Axle Truck Traffic on Highways, ................................. 88 as Published by the Federal Highway Administration (X). .......................................................... 88 Table 4.11. Real Interest Rates for 2002 as Published in Office of Management and Budget
Circular A- 94. ....................................................................................................................... 89 Table 4.12. Data Used to Calc ulate the Baseline Net Present Value. ........................................... 91 Table 4.13. Benefits and Costs Used to Calculate the Baseline Net Present Value. .................... 92 Table 4.14. Results of the Baseline Net Present Value Analysis for the Freight Pipeline. .......... 93 Table 5.1. Quantities of Existing Gas and Hazardous Liquid Pipelines in the Freight Pipeline Corridor. ................................................................................................................ 111 Table 5.2. Characteristics of 20- and 36- Inch Pipe Using X42 and X52 Grade Steel. .............. 123 Table A.1. TxDOT Average Low Bid Unit Prices for Construction Tasks. ............................... A- 3 Table A.2. TxDOT Average Low Bid Prices for Concrete Box Culverts. ................................ A- 4 Table B.1. Revision Dates for the Code of Federal Regulations. .............................................. B- 3

Texas Transportation Institute 1 Multimodal Freight Transportation Programs
CHAPTER 1: SUMMARY OF YEAR 2 RESEARCH
INTRODUCTION
This investigation into the feasibility of underground freight transportation marks an important point in freight planning and assessment. The growing demands placed on the nation’s highways by both passenger and freight traffic, coupled with projected increases in trade suggest that the economics – both public and private – upon which freight transportation is based may be deteriorating to the point where new approaches to moving freight may become viable. The work performed in Year 2 of this project, summarized in the following sections, concentrated on technical design. The Year 3 work plan completed much of the technical design and extended the research to the question of economic viability.
Focus
The second year report focused on the identification of operational criteria and physical constrains that now serve as the basis for the conceptual design of the freight pipeline. These standards reflect the original statement of needs for this project, which was stated in the first year report as being:
To transport palletized freight in an efficient, reliable, and environmentally friendly manner. This freight transportation system must be automated, subterranean, and economically feasible.
The research team identified priority elements of the freight pipeline concept that required in-depth analyses in order to determine the feasibility of such a facility. The most important areas of research were considered to be:
1. system component design, 2. freight movement and simulation modeling, 3. energy analyses, 4. geologic description of corridor, and 5. business and economic considerations.
System Component Design
As part of the ongoing research for the freight pipeline, the researchers established operational criteria that would guide in the development of conceptual designs for the facility. For the freight pipeline to serve in its intended capacity, each of the operationa l criteria below must be satisfied:
• The system will provide an alternate transportation system for moving palletized freight (48 in. × 48 in. × 60 in.) between Dallas and Laredo.
• The system should be composed of existing, proven technologies. • The proposed system must be automated (driver-less).
Texas Transportation Institute 2 Multimodal Freight Transportation Programs
• The marginal cost of operation must be very competitive with the costs of trucking freight between the same markets (<$0.10 per ton-mile).
• The system’s performance must provide a high speed (45 mph +), high capacity substitute for trucking.
• The overall system must be environmentally sound. • The system should be subterranean where possible so as to optimize land use and
minimize contention with other transportation modes. • The system must offer 24-hour-per-day service. • Material handling at terminal locations should be as automated as possible.
In the second year report, the researched developed specifications that define the functional and performance criteria that must be satisfied in order for the above goals to be met. These criteria served as guidelines for subsequent conceptual designs and research methodologies. A substantial portion of this work was dedicated to the conceptual design of a Main Transport Mechanism (MTM), which focused on issues related to the propulsion and suspension/running gear systems, the fuselage, and the MTM structure. The following subsections provide a brief summary of second-year investigations on these issues.
Propulsion System
As a result of this study, a linear induction motor was chosen as the propulsion system that, while less conventional than other systems, will provide benefits such as:
• the absence of moving parts (and the elimination of motor wear), • a reduced occurrence of electrical breakdown when compared to conventional rotating
motors, • no adhesion is not required for the provision of tractive forces, • more liberal grade restrictions, and • an MTM speed is not limited by motor speed.
MTMs propelled by linear induction motors have the advantage of shifting the generation of power from a motor that fails to the remaining motors on an MTM train, thereby eliminating the potential for forced stops within the freight pipeline. Also, MTMs can be slowed or stopped by converting the potential energy of a moving MTM into electricity, thereby allowing this energy to be transferred back to the distribution system for reuse.
Suspension/Running Gear System
MTMs must provide a ride quality that is comparable to freight traveling by truck at 60 to 70 mph, requiring a reliable and well-designed suspension/running gear system. The researchers evaluated several running gear systems for reliability, ride quality, and cost; including the:
• Mag-lev system, • rubber tire system, and
Texas Transportation Institute 3 Multimodal Freight Transportation Programs
• steel wheel/steel rail system. Preliminary investigations indicated that performance and economic criteria could best be met using steel wheel/steel rail running gear. Design issues for a suitable suspension system were then identified as being:
• ride quality, • material durability, • required maintenance, • capital and operating costs, and • compatibility with wheel configuration.
The performance of both two-wheel single-axle and four-wheel bogie suspension systems were evaluated with respect to these criteria to establish a set of considerations and key issues that should be addressed in preliminary designs. An initial assessment of such issues has identified the four-wheel bogie suspension system as having substantial promise in future analyses.
Fuselage/Cladding
The fuselage or cladding system must encapsulate and protect the MTM cargo while enhancing aerodynamic performance of MTMs in transit. This system can be designed to serve as a structural component of the frame, or it can be designed to only protect cargo and improve aerodynamic performance. Issues associated with these alternatives were identified so that an optimal design can be selected, including:
• Using the cladding as part of the structural framework can reduce MTM weight. • Loading/unloading operations may induce fatigue stresses on cladding system. • Structural cladding may limit methods of loading/unloading cargo. • Nonstructural cladding is easily replaceable.
Structure
The structural frame of the MTMs must withstand all static and dynamic forces to which it is subjected throughout the design life. A steel structure will weigh approximately twice the weight required for span support in order to minimize deflections, vibrations, and fatigue. Each MTM will be approximately 30 ft long and subject to the following loads:
• distributed live load of 500 lb/ft, • frame weight of 1000 lb, and • propulsion and control system weight of 2000 lb.
Using these loading conditions, the frame of a fully loaded MTM will be required to resist a maximum bending moment of 60 k-ft. However, the design moment should be approximately
Texas Transportation Institute 4 Multimodal Freight Transportation Programs
120 k-ft (twice the maximum bending moment) in order to provide the strength required to limit deflection, vibration, and fatigue.
Freight Movement and Simulation Modeling
The feasibility of a freight pipeline will depend upon the system’s capacity to move cargo through the conduit in a way that provides the timely delivery of MTMs and minimizes the power required for their movement. Therefore, much of the second year report focused on an aerodynamic analysis of MTMs and on the simulation modeling of system operations.
Aerodynamic Analysis
The researchers performed a study to minimize drag on the MTMs during transport through the freight pipeline for the purpose of minimizing energy expenditures. This investigation showed that aerodynamic drag minimization is primarily associated with a reduction in skin friction and pressure drag. Consequently, computational tools were used to perform an aerodynamic analysis of MTM configurations that would minimize these parameters. The study produced the following recommendations to minimize drag:
• Use a continuous MTM configuration with the surface of the separate MTMs blended. • Use a rectangular MTM (in cross section) with curvature in profile. A suitable low-drag
profile is formed from two circular arcs joined by a flat section. • Blockage ratios (β) should be kept below 0.3. • Clearance between the upper surface of the MTM and the tunnel roof should be greater
than 3 ft. • Clearance between the tunnel sidewall and the train should be greater than 3 ft.
Simulation Modeling
In addition to aerodynamic performance, the freight pipeline must be evaluated by criteria such as transportation time, system reliability, and system capacity. Part of the second year report focused on the analysis of these features by modeling freight pipeline operations using Arena (a simulation software). The system was modeled as separate northbound and southbound pathways that link directly to the Dallas and Laredo terminals, based on initial assumptions of the following:
• Each MTM car can transport six standard pallets. • MTMs will travel as a set of five linked cars. • MTMs travel at a speed of 60 mph. • A set of five linked cars are loaded in 30 seconds. • All MTMs are initially located in MTM storage.
In this preliminary model, the researchers obtained results for average length and time of MTM queues, and average lengths of time in the system, by assuming a time-dependent arrival rate
Texas Transportation Institute 5 Multimodal Freight Transportation Programs
function. This work served as the base model for more detailed analyses that were carried out in the third year report.
Energy Analyses
By selecting a linear induction propulsion system, the freight pipeline is committed to operating on electrical energy. An interruption in the delivery of electricity would prevent the system from operating and, as a result, reduce the reliability of the system. Considering events such as the recent deregulation of the electric utility industry and the California power shortages of 2001, electrical power deliverability was identified as an important area of investigation. Furthermore, this study needed to consider the electricity demands of the freight pipeline in order to offer any conclusions on the feasibility of an electrical powered propulsion system. An inventory was prepared on the electrical generation capacity of power plants in Texas, including those that have been built, those that are currently being constructed, and those that are currently being planned. The findings are as follows:
• Power plants built since 1995 produce a total of 8,652 MW. • Power plants being built will produce a total of 12,745 MW. • Power plants that are currently being planned would produce 16,385 MW.
Also, the researchers performed a study to determine the amount of energy consumed by MTMs during operations. The simulation model’s freight transportation data were applied to the resulting energy equations so that a peak energy demand could be forecasted. Based on this approach, the freight pipeline will require a peak demand of no more than 5 MW, which is 0.039 percent of the generating capacity of power plants currently being built.
Geologic Description of Corridor
As mentioned in the statement of goals, the freight pipeline is being planned as a subterranean facility, suggesting that considerable earthwork will be required throughout the 450-mile corridor. Variations in geology from Laredo to Dallas were anticipated to be substantial, so part of the second year report is comprised of a preliminary investigation into the physical characteristics that should be considered during planning and design of the pipeline. The geologic report is comprised of technical descriptions and rankings (by county) of the following categories:
• hydrologic factors: climate, water table depth, and aquifer locations and recharge zones; • topographic factors: slope, slope continuity, landform type, and landform characteristics; • geologic factors: stratigraphic uniformity, slope stability, permeability, shrink-swell
potential, and structural uniformity; and • soil parameters: pH, thickness, uniformity, shrink-swell potential, stability, and
accessibility.
Texas Transportation Institute 6 Multimodal Freight Transportation Programs
In addition to the above information, geologic descriptions of aquifers and formations that exist within the pipeline corridor were included. The research team prepared all of this information to provide a reasonable understanding of existing conditions, and to identify specific geologic issues that warrant further investigation.
Business and Economic Considerations
A systematic approach to the technical feasibility of a freight pipeline must be accompanied by a consideration for how this system can actually be integrated into current business operations. The second year report researched this aspect of the project by identifying the needs of the public, the Texas Department of Transportation (TxDOT), shippers, and the freight industry. This effort resulted in two important criteria by which the feasibility of the pipeline should be evaluated; namely, the pipeline should operate at a target speed of 60 mph and should operate within a cost structure that justifies a user fee of less than $0.10 per ton-mile. Operating speeds of at least 60 mph and user fees of no more than $0.10 per ton-mile, which have been incorporated into the pipeline model, primarily address the needs of the freight industry. However, the freight pipeline must also be of substantial benefit to the public if this project is to be implemented. This study has determined that reductions in the following parameters should be recognized as having value to the public and to TxDOT:
• air pollution, • noise pollution, • highway congestion, • driving time, • automobile accidents, and • highway lane construction.
The second year report has established a framework for the economic evaluation of these factors using benefit/cost analysis. This analysis compares all costs, such as construction and operating costs, to the net benefits received through the project’s implementation. The results of this work are included as part of the third year report.
YEAR 3 RESEARCH AGENDA
The work plan for FY 2002 continued the approach established in prior years by seeking a design and operational strategy that produces a freight movement system that wins for each stakeholder group – Texas citizens, TxDOT, shippers, and the existing freight transportation industry. The work plan moved the evaluation toward an economic assessment that established, based on the scenario tested, whether underground freight movement is of sufficient a transportation value to warrant the significant investment necessary to see it to fruition. The FY 2002 work plan undertakes an examination of several policy issues affecting the viability of underground freight movement. Among these issues is the potential role of the public sector
Texas Transportation Institute 7 Multimodal Freight Transportation Programs
relative to that of private sector users or beneficiaries. The operational model options for the freight pipeline, which are related to the business model discussed in this report, are studied with particular attention to management and control issues.
Task 1 – Finalize Technical Specifications
Sub-task 1.1 – Finalize the Technical Parameters for the Main Transport Mechanism
The final technical design for the MTM will be undertaken in this task to allow for estimations of performance, weight, and cost. Several design issues remain challenging, among them being the approach taken to fastening the outer skin to the MTM in a manner that allows opening and closing.
Sub-task 1.2 – Finalize the Technical Parameters for the Conduit
The technical design parameters for the conduit relate primarily to final dimensions, reinforcing requirements, prefabrication approaches, weight, and construction techniques. The research team will consider the need for a built- in guide way, but will leave detailed designs to those charged with building the system.
Sub-task 1.3 – Finalize the Technical Parameters for the Communications, Command, and Control System
The communications, command, and control system will be approached functionally – the specific functions and interactions with other system elements will be defined at a level of detail sufficient to define system scope. The evaluation of the resulting system relative to cost will likely be by comparing it to an already existing, similar system.
Task 2 – Finalize Business Model Options
Sub-task 2.1 – Finalize Business Relationship with Freight Industry
The interaction of the freight pipeline with existing trucking and rail operations will be detailed in this sub-task with an emphasis on determining the roles, responsibilities, and opportunities for each participating party.
Sub-task 2.2 – Define Terminal Ownership/Leasing Options
The efficient operation of the freight pipeline terminals is key to establishing material throughput sufficient enough to warrant construction of the system. The ownership and operational arrangement for the terminal is central to effective material handling and business coordination.
Texas Transportation Institute 8 Multimodal Freight Transportation Programs
In this sub-task researchers will examine options and define the optimal arrangement for terminal ownership.
Task 3 – Finalize Economic Evaluation Framework
Sub-task 3.1 – Finalize the Economic Evaluation Framework
The form of the economic evaluation framework will be defined in this sub-task to allow the comparison of traditional highway options with the freight pipeline system. The prior work in the area has suggested that the ana lysis should focus on two related elements – capital costs per unit of freight moved and the marginal costs of operation, or user costs. The framework will establish the elements that will be compared between the alternative approaches and the metrics to be employed.
Sub-task 3.2 – Continue Data Collection for Cost Analysis
The economic evaluation of the freight pipeline system requires cost data from a wide variety of sources. These sources range from component and construction costs for the freight pipeline to construction and maintenance costs for highways. Included, too, are social costs such as transportation safety, emissions, and land use. The cataloging of these data is essential to a full and accurate appraisal of the economics of transportation alternatives.
Task 4 – Continue Capacity Simulation Modeling
Task 4 will be a continuation of the capacity simulation modeling initiated in Year 2. The model will allow the research team to assess the infrastructure and performance needs of the systems put in place to effect the transfer of goods through the underground system. The model will include a terminal design component to address the parameters determining terminal size, layout, and functionality.
Task 5 – Terminal Design
Sub-task 5.1 – Develop Preliminary Design for Material Handling System
Based in part on inputs from Task 4, in this sub-task the researchers will work toward a design of the material handling needs and requirements of the terminal. The sub-task may require direct input from firms dedicated to the development of similar systems, and research plans will be adjusted according to the requirements of this circumstance.
Sub-task 5.2 – Develop Preliminary Design for Temporary Storage System
The freight pipeline system is evolving into a first- in/first-out system with little provision for storage of material on-site. The reality of transportation logistics, however, suggests that some
Texas Transportation Institute 9 Multimodal Freight Transportation Programs
provision will have to be made to temporarily hold material. The simulation in Task 4 will assist in defining the quantity of material falling into this category, and terminal layout requirements will guide where temporary storage is best located.
Sub-task 5.3 – Establish Need for Intermediate Terminals
In sub-task 5.3 the researchers will establish, based in part on interviews with trucking interests, whether intermediate terminals are required to accomplish the mission of the freight pipeline system.
Sub-task 5.4 – Define Site Requirements
The location of the terminal and the amount of property required at the terminal site will be evaluated in this task based on input from preceding tasks.
Task 6 – Continue Policy Analysis
Sub-task 6.1 – Continue Evaluation of Financing Options and Possible Funding Mechanisms
The process of financing a major capital project is complex at best. The potential magnitude of investment required for this system in conjunction with the innovative nature of the infrastructure may introduce additional considerations that must be fully understood as operational parameters are established. A review of comparable projects will be continued to gain an understanding of the broad requirements and approaches attempted in other efforts. The information gained will help establish the recommended approach to system implementation.
Sub-task 6.2 – Begin an Assessment of the Role for TxDOT in Freight Pipeline Construction, Operations, and Maintenance
In this sub-task the researchers will initiate an evaluation of the potential role of the Department in system design and construction, operations, and maintenance.
Sub-task 6.3 – Initiate an Assessment of the Roles for the USDOT in Future Freight Pipeline Activities
In this sub-task researchers will initiate an assessment of the roles that the USDOT could fill in freight pipeline planning, financing, or operations.
Sub-task 6.4 – Begin a Study of the Options Available for Freight Pipeline Management
The freight pipeline will require a managing body or board of directors that will assume responsibility for the operation of the system over time as well as on a day-by-day basis. The possibilities for the form of this managing body range from a port authority model to a corporate
Texas Transportation Institute 10 Multimodal Freight Transportation Programs
model with executive management. In this sub-task the researchers will evaluate the range of possibilities for an effective management structure and report on the pros and cons of each option.
Sub-task 6.5 – Initiate an Evaluation of Labor Issues Relative to the Freight Pipeline
In sub-task 6.5 the researchers will initiate an assessment of the labor issues that may affect facets of the system. The issues range from construction to operation, and they may impact decisions regarding management structure and ownership decisions.
Sub-task 6.6 – Continue to Evaluate Issues Associated with Right-of-Way Acquisition
The use of existing, publicly owned right of way to construct a freight pipeline could improve the feasibility of the project by reducing cost and contention with private concerns. In this sub-task the researchers will continue the collection of information concerning the possibility of system placement in publicly owned corridors as well as in new or planned rights of way. They will also explore the issue of acquisition of property through eminent domain versus obtaining an easement.
Sub-task 6.7 – Investigate Issues Associated with Crossing Existing Pipeline System
Texas is home to an extensive pipeline network dedicated to transporting petrochemicals and natural gas. These underground systems will be affected by the need to construct the freight pipeline across pipeline rights of way. The research team has estimated that a Dallas to Laredo underground system may impact approximately 100 gas and petrochemical pipelines. In this sub-task the researchers will continue the assessment of the policy and cost ramifications of this issue.
Texas Transportation Institute 11 Multimodal Freight Transportation Programs
CHAPTER 2: CONCEPT DEVELOPMENT
INTRODUCTION
The feasibility study of an innovative facility such as the freight pipeline requires the examination of all available technology that can be incorporated into its design. Consequently, the formulation of a conceptual design for the freight pipeline has involved investigation into the cost and capability of some very basic performance features, such as:
• coordination of facility operations , • transfer and inspection of palletized freight, • control of MTM operations, and • reliability of MTMs.
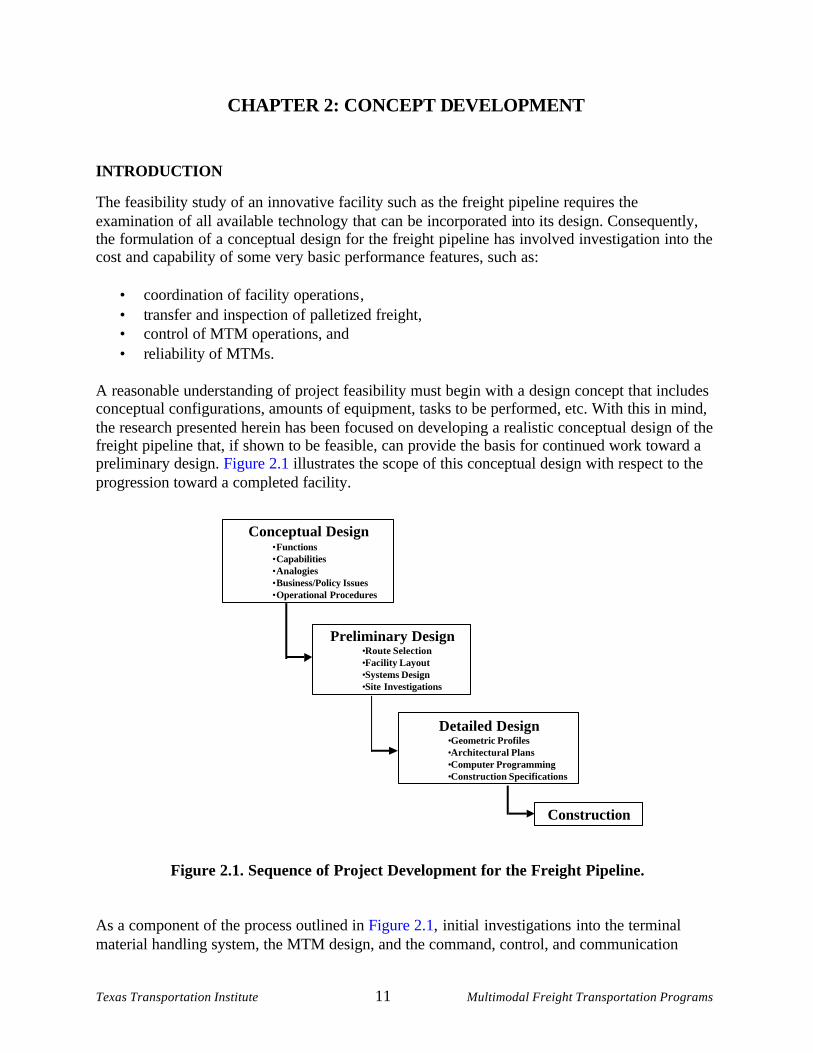
A reasonable understanding of project feasibility must begin with a design concept that includes conceptual configurations, amounts of equipment, tasks to be performed, etc. With this in mind, the research presented herein has been focused on developing a realistic conceptual design of the freight pipeline that, if shown to be feasible, can provide the basis for continued work toward a preliminary design. Figure 2.1 illustrates the scope of this conceptual design with respect to the progression toward a completed facility.
Figure 2.1. Sequence of Project Development for the Freight Pipeline.
As a component of the process outlined in Figure 2.1, initial investigations into the terminal material handling system, the MTM design, and the command, control, and communication
Detailed Design•Geometric Profiles•Architectural Plans•Computer Programming•Construction Specifications
Construction
Conceptual Design•Functions•Capabilities•Analogies•Business/Policy Issues•Operational Procedures
Preliminary Design•Route Selection•Facility Layout•Systems Design•Site Investigations
Texas Transportation Institute 12 Multimodal Freight Transportation Programs
system have been conducted as part of the third year work. Investigations into these more technical aspects of the freight pipeline are discussed within the sections that follow.
TERMINAL DESIGN AND MATERIAL HANDLING CONSIDERATIONS
Introduction
The two previous research reports on the freight pipeline (1519-1 and 1519-2) identified terminal design and layout as critical to the functioning of the overall system. The terminals (whether there are two or more) will define the form and scope of system operations, system throughput, and, in a practical sense, customer interactions with the freight pipeline. This section of the report will address several significant aspects of terminal design and material handling and attempt to identify additional design considerations to be attuned to in the final year’s work plan. One major challenge of freight pipeline design has been how to overcome the requirement for trans- loading material from trucks to the freight pipeline and then back again. Normally, handling material more than is absolutely necessary is avoided due to the added time and expense. Additional handling would, under normal circumstances, drive costs above the thin profit margins associated with freight transportation – clearly a fatal business practice. The selection of pallets as the unit of freight to be moved by the system necessarily requires what has traditionally been a time consuming and labor- intensive process – extracting from the truck trailer 30 or more pallets, one at a time, by forklift. In order for this trans- loading requirement to pose a reasonable investment in time and effort (and thus, money), the research team has relied on four related considerations:
1. a freight system operating beyond the distance a driver can normally operate in a 10-hour shift,
2. improved productivity – return loads and lower unit costs, 3. automated terminal design, and 4. trans-border shipment.
Sufficient Distance
The first consideration is a freight conveyance operating over sufficient distance to allow the extra investment in trans- loading to be recaptured. The normal distance over which a truck driver may operate in a day is generally considered to be in the 400- to 500-mile range. The freight pipeline must operate at distances over this range to allow consideration of additional material handling.
Improved Productivity
The second consideration, as discussed in the report material focusing on the system’s business model, is that the freight pipeline operates as an extension of the trucking company and provides, simultaneously, a return load for the off- loading truck and completion of the original trip at a rate
Texas Transportation Institute 13 Multimodal Freight Transportation Programs
lower than that possible in over- the - road transport. In this way, the investment in additional handling is offset by both a lower cost for the leg completed by the freight pipeline and by an expeditious return load, which effectively doubles the productivity of the truck – at least for that portion of the trip matched by the freight pipeline.
Automation
The third factor that the research team included in the terminal design to mitigate the added cost of material handling is automation. It is envisioned that the freight pipeline will rely on automated co nveyors, lifts, and robotics to assist in the challenge of moving pallets to and from the transport mechanisms. The automated systems will extend from the loading/unloading docks, through the inspection stations, and to the staging areas.
Trans-border Shipments
The fourth consideration that mitigates the cost associated with additional material handling is the potential time savings benefit of a freight system that moves material in a seamless and secure manner from the interior of one country to the interior of another. If the freight pipeline was to extend from a terminal in North Texas to a terminal in Monterey, Mexico, and inspections and pre- clearance were undertaken prior to shipment, then dramatic time savings could be achieved and the trans- ship ment taking place at the terminal ends would merely replace the tedious handling that currently takes place at the border.
The combination of these factors should offset the cost imposed by additional handling. When these factors are coupled with the savings that result from reduced wear on equipment, reduced delays from traffic and weather, and driver unreliability, trans- loading becomes a means to a desirable end. Therefore, the design of the terminal is critically important to the successful operation of the overall system. Among the topics to be addressed in this section are:
• physical layout of terminals, • areas of private ownership, • inspection and clearance stations, • security, • equipment needs for automated handling of pallets, • highway connections, • driver rest areas, and • railroad interface.
Physical Layout of Terminals
The physical layout of the terminals is critical to achieving cost-effective movement of material through the system. The flow of goods must be maintained at a rate sufficient to avoid backlogs
Texas Transportation Institute 14 Multimodal Freight Transportation Programs
and achieve economic advantage for the customer. The terminal is the point at which key elements in the freight transportation logistics chain interface and achieve the goals intended for the system – the shifting of truck traffic from highways to an alternative system. The system elements that interface and operate in concert at the terminal include the:
• highway system and freight pipeline system, • truck and parking facility, • truck and loading/unloading facility, • truck driver and terminal operating staff, • truck driver and rest facilities, • terminal operating staff and freight pipeline inspectors, • pallets and forklift, • forklift and conveyor system, • pallets and conveyor system, • pallets and inspection staff, and • pallets and MTM s.
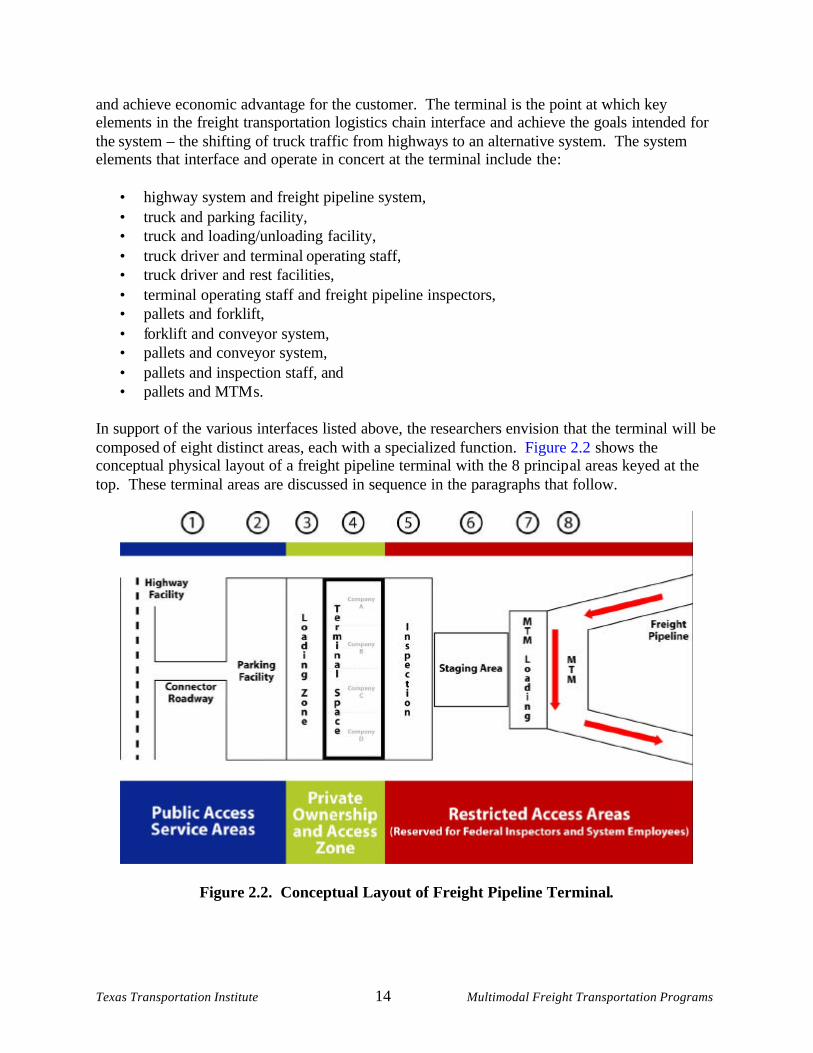
In support o f the various interfaces listed above, the researchers envision that the terminal will be composed of eight distinct areas, each with a specialized function. Figure 2.2 shows the conceptual physical layout of a freight pipeline terminal with the 8 principal areas keyed at the top. These terminal areas are discussed in sequence in the paragraphs that follow.
Figure 2.2. Conceptual Layout of Freight Pipeline Terminal.
Texas Transportation Institute 15 Multimodal Freight Transportation Programs
1- Connector Roadways
As shown in Figure 2.2, the terminal layout comprises eight distinct functional areas. Area 1 is the connector roadway system that must be put into place to support the ingress and egress of truck traffic. The connector roadway should be designed to support traffic loads of 80,000 lb , 5-axle vehicles. The annua l traffic counts across these facilities may exceed 500,000 trucks and thus require engineering sufficient to withstand the extreme loads that result. In addition, the connector facilities will require sufficient width and turning radii to accommodate lar ge vehicles.
2-Parking Facilities
Area 2 depicted in Figure 2.2 is the parking facility for vehicles not actively loading or unloading. The amount of parking required will be a function of the projected traffic loading of the facility and has been included in the cost estimates for the terminal covered in Chapter 4 of this report. Design considerations for this facility include: (1) sufficient additional space to accommodate peaks in traffic arriving at the terminal, (2) pavement thickness sufficient to withstand the expected loads, (3) adequate space to allow safe maneuvering, and (4) rest facilities for drivers.
3-Loading/Unloading Zone
Trucks will have to interface with the terminal building to affect the transfer of material on or off of the truck. The specific design of the loading/unloading facility will be important to the throughput of the system, and there are innovations occurring in this facet of freight transportation. However, at this time, the standard American approach to loading 54-ft trailers is for the driver to back the tractor and trailer into place, “bumping” the dock, which is at the same height as the trailer, with the end of the trailer. Forklifts are then used to manually extract pallets, one at a time, from the interior of the trailer. The pallets are thus moved to a location within the company’s leased terminal space (Area 4) and prepared for transfer to the MTM-loading facility via conveyor systems.
4-Private Terminal Space
The business model for the freight pipeline (addressed in Chapter 3 of the Year 2 report) identified opportunities for public-private cooperation. The researchers suggested that a potentially effective approach to freight pipeline operations could be found in providing private carriers the opportunity to lease terminal space that would be used by the private carrier to dispatch and receive material to and from the freight pipeline. These leased areas would be staffed by employees of the leasing company, who would deal with its own loading or unloading of trucks. The organization and efficiency of this operation would be left entirely to the discretion of the leasing company with the exception of key procedural requirements such as tagging pallets in the prescribed fashion with the prescribed devices and interacting with the communications and control systems so that loads are prepared and scheduled for shipping in the appropriate fashion.
Texas Transportation Institute 16 Multimodal Freight Transportation Programs
The amount of space leased to each carrier and the specific functions performed within the confines of this proprietary space have not been addressed in detail in this evaluation since the primary purpose for the area under discussion is the receipt and dispatching of material from over-the-road transports. The detail of what arrangement would work best will be left for a subsequent analysis. It should suffice within this assessment to determine what material handling activities are required at a minimum to deliver pallets to the MTM and, conversely upon receipt, to deliver material to waiting trucks. As a case in point, the use of the facility as a sorting and distribution point seems to the research staff to be a misuse of the system. Rather, given that the freight pipeline has been construed as an extension of the freight carrier’s activities, truckload operations where the contiguous load remains together appears to make more sense. In this manner, a full truckload of pallets arrives at the terminal, is tagged, inspected, and loaded to an awaiting MTM for transfer. The relatively simpler operations might thus require less in terms of space and personnel.
5-Inspection Area
The research team envisions two kinds of inspections depending on where the freight pipeline terminates. For strictly domestic shipments, freight pipeline operations would require inspection for load conformity and inspection for security. The inspection for load conformity would include:
• a check for acceptable goods or commodity type (hazardous materials should not be accepted),
• completeness of bill-of- lading, • a check for weight conformity (pallets exceeding a maximum allowable), and • a check for size and shape conformity (pallets exceeding a maximum allowable height,
pallets off center, or pallets with material extending over the edge beyond an allowable limit).
The freight pipeline inspection area should contain as much support automation as possible to speed the process along and increase the accuracy of the measurements. The weight, shape, and height assessment should be undertaken by instrumented machines employing lasers, among other systems, while the check for completeness of paperwork should be accomplished at the time of load submission by the C3 system.
The security inspection would include checks for material endangering personnel or the freight pipeline system itself. The equipment that could be employed in this capacity would include many of the types of systems being used today at borders or airports to screen for explosive devices or other harmful materials. These systems could include gamma ray or x-ray systems, olfactory sniffing systems, or spectral analyzers.
For those shipments exiting the borders of the US, an additional set of inspection issues arise. The federal government, under the auspices of several agencies, currently performs an array of inspections. The agencies involved include:
• Customs,
Texas Transportation Institute 17 Multimodal Freight Transportation Programs
• The US Department of Agriculture (USDA), and • The Drug Enforcement Administration (DEA).
The reason for the inspections carried out at US borders is self evident – there are restrictions on the type and quantity of goods that can be imported (legally or otherwise), and the federal government is charged with establishing the system that offers maximum enforcement of those provisions. The freight pipeline, if it was extended into Mexico and the border effectively moved to the terminal ends of the system, could be established as a zone where pre-clearance of material was accomplished by the responsible agencies. This approach would remove the border as a major impediment to trade and dramatically reduce the congestion at international gateways.
6-Pallet Staging Area
Following inspection, the pallet load would be transported via conveyor to the staging area where it would await movement to the MTM loading area. The pallet staging area is seen as a temporary storage zone that would provide the physical space necessary to absorb any loads queuing for the loading facility.
7-MTM Loading/Unloading Area
The design and layout of the MTM loading area is central to the throughput of the freight pipeline. The capacity simulations undertaken in this research have suggested that two such loading and two unloading locations will be required to achieve the maximum daily throughput of approximately 3,000 truckloads per day. The design of the loading facility and its seamless interaction with the MTM is paramount to achieving target levels. The loading system has been described as a series of robotic forklifts that load (or unload) an entire MTM in one, continuous motion requiring approximately 30 seconds from beginning to end. Thus, this portion of the terminal, highly automated and choreographed to achieve rapid movement of material from the staging area to the loading dock, will require significant design attention. The concept design for the loading facility calls for the alignment, via conveyor system, of a pallet load in precise correspondence to the pallet bays of an MTM, which is also staged in a linear arrangement. The aerodynamic covering of the MTM will be retracted as it sits in place by lifting one-half of a hinged, lid-type mechanism. The hinge system will be located on the top of the MTM and run the length of the MTM with the exception of the nose and tail cones. A series of 30 robotic forklifts will then lift and place all 30 pallets into the MTM in one continuous motion. The forklifts will set the pallets into place and retract, allowing the lid to the MTM to shut and latch.
Railroad Interface
Terminal design is not complete until the interface with freight railroads is included. The research team believes that railroads, which are a central element in the freight transportation mix, can benefit from freight pipeline operations by becoming the recipient of freight that would otherwise travel by truck in Mexico and likely continue with the trucking mode upon entry into
Texas Transportation Institute 18 Multimodal Freight Transportation Programs
the US. By employing the freight pipeline as a conduit to a Northern terminus in Dallas, the railroads could benefit directly, and the public sector indirectly, by shifting what is normally highway- destined material off of over- used facilities to railroads. Three components suggest that the above proposal is feasible and worth pursuing. First, by significantly reducing the transit time from Mexico to an inland location (Dallas), the service time competitiveness of rail is enhanced to a point where it becomes attractive for a subset of shipments that were previously not amenable to transport by rail. Second, moving material away from congested border regions where the focus is on intermodal movements, frees resources – both infrastructure and rolling stock – for other uses. Third, the technical requirements that may be associated with a terminal design dedicated to converting pallets to containers and then double- stacking containers on a railcar are well within the reach of designers and engineers. The fact that destination- specific shipments would require consolidation is a detail that could be handled by moving the initial intermodal train to another rail facility for final assembly. The fo urth year research plan will address in greater detail the design parameters of the freight pipeline terminal relative to the needs of rail.
COMMAND, CONTROL, AN D COMMUNICATION SUBS YSTEM
Command, control, and communications refer to an automated system that is designed to control complex interactions among individual elements of a larger system configuration. The scope of this research does not include the design of a working control system but rather is to establish the requirements necessary for development of a system design that will control operations within the freight pipeline and thereby provide a preliminary cost estimate. The C3 system serves as the overall control grid for the freight pipeline. Composed of several major subsystems, no single subsystem will correctly operate without proper commands and proper interaction between the other components. Basic functions of this system have been identified that represent the necessary actions required for the levels of service and reliability that are required for this project. These functions fall into three major function areas as shown below:
• terminal functions : o direct trucks/railcars to the proper loading bay, o direct each pallet through the pipeline, and o monitor pallet movement through the pipeline.
• MTM functions : o direct loading/unloading of MTMs, o control terminal arrivals/departures of MTMs, and o control speed and spacing of MTMs; and
• power functions : o control power distribution through the pipeline.
The following section describes the technical characteristics of the C3 system developed for this research project.
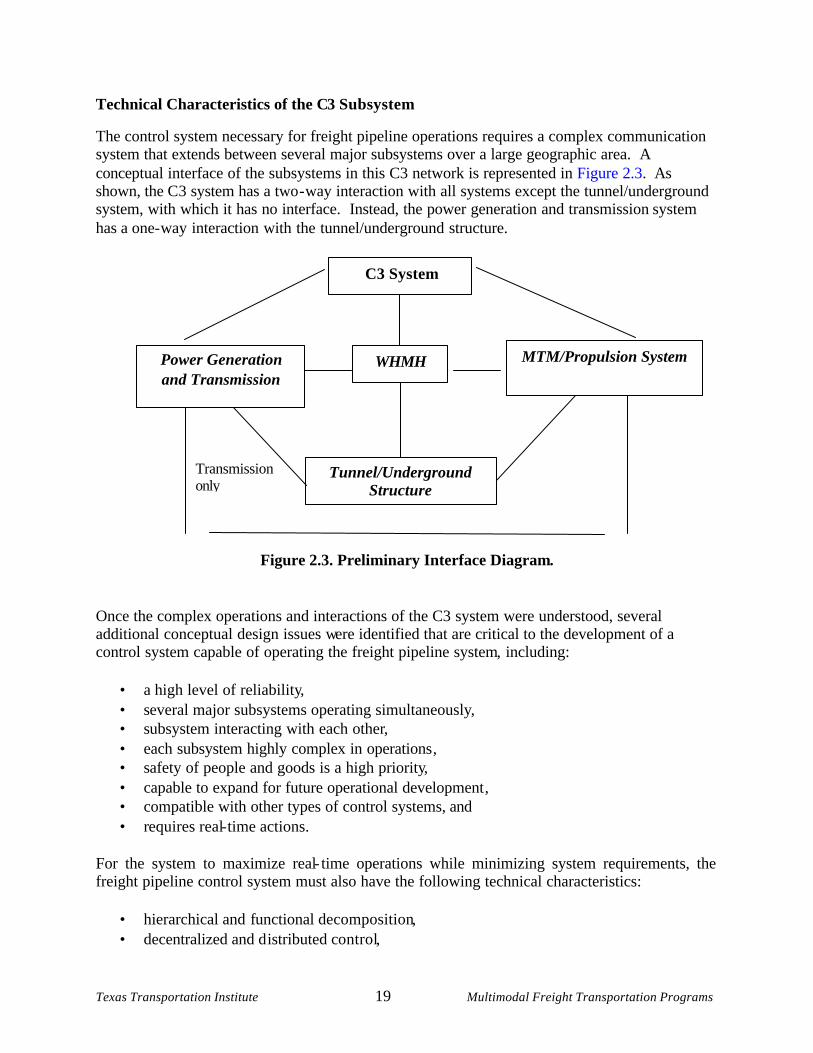
Texas Transportation Institute 19 Multimodal Freight Transportation Programs
Technical Characteristics of the C3 Subsystem
The control system necessary for freight pipeline operations requires a complex communication system that extends between several major subsystems over a large geographic area. A conceptual interface of the subsystems in this C3 network is represented in Figure 2.3. As shown, the C3 system has a two-way interaction with all systems except the tunnel/underground system, with which it has no interface. Instead, the power generation and transmission system has a one-way interaction with the tunnel/underground structure.
Figure 2.3. Preliminary Interface Diagram.
Once the complex operations and interactions of the C3 system were understood, several additional conceptual design issues were identified that are critical to the development of a control system capable of operating the freight pipeline system, including:
• a high level of reliability, • several major subsystems operating simultaneously, • subsystem interacting with each other, • each subsystem highly complex in operations, • safety of people and goods is a high priority, • capable to expand for future operational development, • compatible with other types of control systems, and • requires real-time actions.
For the system to maximize real- time operations while minimizing system requirements, the freight pipeline control system must also have the following technical characteristics:
• hierarchical and functional decomposition, • decentralized and distributed control,
Transmission only
C3 System
Tunnel/Underground Structure
MTM/Propulsion System WHMH Power Generation and Transmission
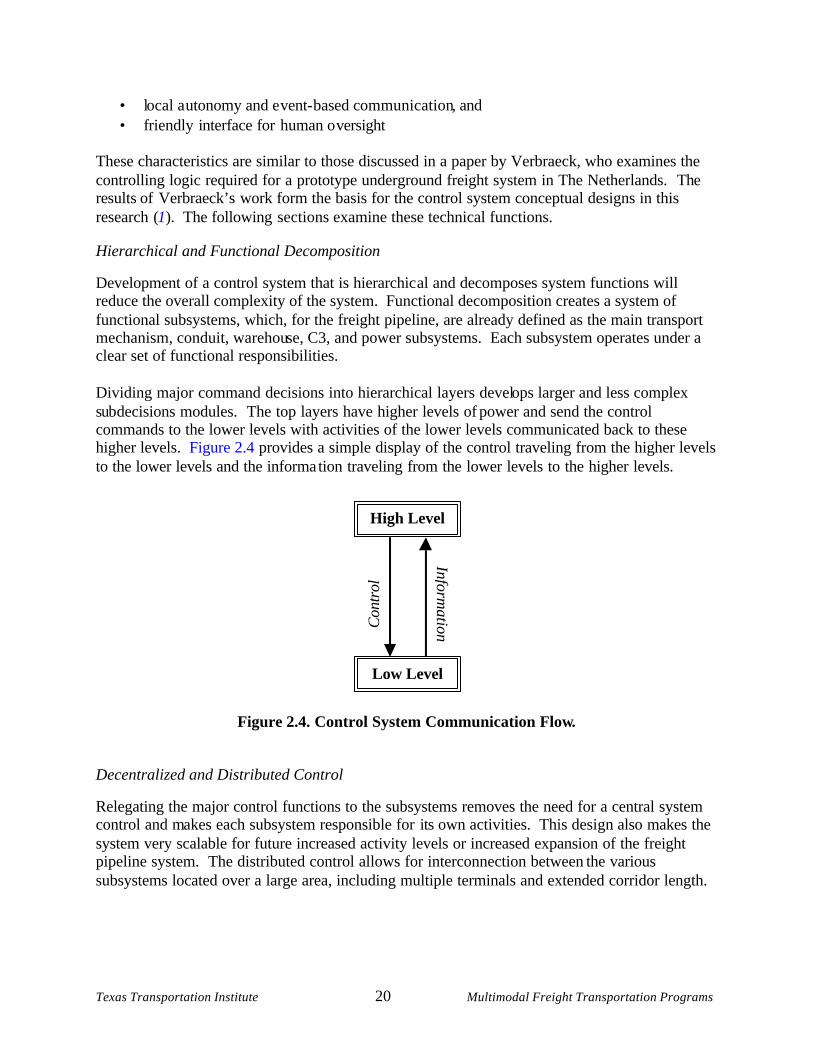
Texas Transportation Institute 20 Multimodal Freight Transportation Programs
• local a utonomy and e vent- based communication, and • friendly interface for human o versight
These characteristics are similar to those discussed in a paper by Verbraeck, who examines the controlling logic required for a prototype underground freight system in The Netherlands. The results of Verbraeck’s work form the basis for the control system conceptual designs in this research (1). The following sections examine these technical functions.
Hierarchical and Functional Decomposition
Development of a control system that is hierarchic al and decomposes system functions will reduce the overall complexity of the system. Functional decomposition creates a system of functional subsystems, which, for the freight pipeline, are already defined as the main transport mechanism, conduit, warehouse, C3, and power subsystems. Each subsystem operates under a clear set of functional responsibilities. Dividing major command decisions into hierarchical layers develops larger and less complex sub decisions modules. The top layers have higher levels of power and send the control commands to the lower levels with activities of the lower levels communicated back to these higher levels. Figure 2.4 provides a simple display of the control traveling from the higher levels to the lower levels and the information traveling from the lower levels to the higher levels.
Figure 2.4. Control System Communication Flow.
Decentralized and Distributed Control
Relegating the major control functions to the subsystems removes the need for a central system control and makes each subsystem responsible for its own activities. This design also makes the system very scalable for future increased activity levels or increased expansion of the freight pipeline system. The distributed control allows for interconnection between the various subsystems located over a large area, including multiple terminals and extended corridor length.
High Level
Low Level
Con
trol
Inform
ation
Texas Transportation Institute 21 Multimodal Freight Transportation Programs
Local Autonomy and Event -Based Communication
With each subsystem responsible for its own activities, the need for external control is greatly reduced. Local autonomy also allows each subsystem to continue functioning if one component of the system breaks down or is shut down. With a central controller, the whole system would likely shut down in that scenario. Perhaps the most important aspect related to local autonomy is the reduction in communication by removing the need for each subsystem to communicat e with a central controller. Local control also minimizes communication between subsystems because it occurs only when required. This event - based communication takes place in real- time and only occurs when required, which greatly reduces communication loading within the entire system.
Friendly Interface for Human Oversight
Although the control system is highly automated, the need for human monito ring and intervention exists. A central monitoring center with a user- friendly interface provides a means to view system conditions and performance levels and to make adjustments if needed. Scenarios are likely to exist where human intervention is necessary to override control system operations, either for a particular subsystem or for the entire freight pipeline system. These scenarios may include ordinary situations such as maintenance or severe situations such as a break down within the system.
Econo mic Evaluation of C3 Subsystem
The C3 subsystem represents a highly sophisticated system made up of many components over a large geographic area. In order to analyze the cost associated with such a system, the ability to evaluate each component of the sys tem would occur in a final design stage. In this research, the cost is estimated by analogy to other types of major control system applications that include:
• train control, • automated warehouse material handling, • missile guidance, • automated guided vehicle s, • a ir traffic control, • missile defense, and • automated production lines.
The following represents selected control system applications and projects chosen for the capital cost estimate of the C3 system. The economic evaluation of the C3 subsystem uses these examples to calculate the capital cost for this system. This analysis transpires in Chapter 4.
Texas Transportation Institute 22 Multimodal Freight Transportation Programs
High-Speed Rail – Texas TGV
The Texas TGV Consortium franchise application submitted in 1991 provides insightful cost estimates of the train control and communication systems, designated as the Signaling, Communication, and Control (SCC) subsystems in the application (2). The four- phased Texas TGV network included three high- speed segments between location pairs D/FW Airport- Houston, San Antonio - Navarro Junction, and San Marcos Junction to Hockley Junction and one commuter rail segment between D/FW Airport and Fort Worth. The commuter rail segment was examined at a concept level for cost estimation but would be constructed by local and regional planning agencies. Table 2.1 displays the different unit costs per technology considered in the Texas TGV project.
Table 2.1. 1990 Unit Cost of Signaling, Communications, and Control Subsystems . Technology Unit Cost
High-Speed Rail (HSR) $600,000/mi Commuter Rail (CR) $300,000/mi Source: Texas TGV Consortium (2).
High-speed rail similarities to this project include the following:
• Advanced train control systems used for high-speed rail require continuous monitoring of train sets, providing guidance to the train operator and also automatically controlling speeds if necessary.
• Power is monitored along the route. High-speed rail differences to this project include:
• human control of train operations with automated override actions, and • extensive communication infrastructure.
Air Traffic Control System
Air traffic control (ATC) systems represent another highly complex control system. Monitoring and controlling the actions of a large fleet of airplanes, both in the air and at the terminals, represents a robust system designed for both efficient operations and safety. Air traffic control similarities to this project include:
• sophisticated monitoring and control systems; and • interconnections between:
o airplane systems, o airport systems, and o air traffic control.
Differences between this project and air traffic control systems include:
Texas Transportation Institute 23 Multimodal Freight Transportation Programs
• higher complexity on spacing between aircraft (three- dimensional), and • high dependence on human control.
In examining the implementation of ATC systems around the world, two examples provided adequate information for this purpose. Both cases involve the incorporation of systems developed by the Raytheon Company.
• Air Traffic Management and Radar Systems – Abu Dhabi and Al Ain Airports: The $30 million contract for the implementation o f the system includes Raytheon’s AutoTrac II air traffic management automation system for both airports, several radar systems, communication systems, and support (3).
• Very Advanced Air Traffic Control Automation System (VATCAS) – Germany:
Raytheon’s contract in excess of $20 million with Deutsche Flugsicherung GmbH (DFS) will manage the growing air traffic levels and provide the transition to a higher level system (4).
Military Control System Applications
The military offers a wide range of logic contro l systems that correlate to the freight pipeline system. Some of the applications are narrow in scope and location, while other relate to broad implementation over a large area. M ilitary control applications described from contracts awarded for specific projects include:
• Navy contract for a contract maximum order limitation of $98.1 million to install an integrated command, control, communications, computers and intelligence (C4I) suite into new construction ships and to update and modernize ships of the active fleet (5 );
• Army contract for a potential maximum $300 million for a wide range of command,
control, communications, computer, information, intelligence, surveillance and reconnaissance (C4I2SR) systems for North American Aerospace Defense Command (NORAD), United States Space Command (US SPACE COM), and Air Force Space Command (AF SPC) (6);
• Army contract of $59.1 million for the missile defense C3 system integration in the Royal
Saudi Arabian Air Force (7) ;
• Navy contract of $82.3 million to BAE Systems for production, lifetime support engineering, and in-service engineering for radio communication systems (RCS) and C4I systems aboard Navy surface combatants, submarines, and at associated shore sites (8) ; and
• Marine Corps contract worth a potential maximum of $160 million to Raytheon
Company for the next generation Common Aviation Command and Control System (CAC2S) (9).
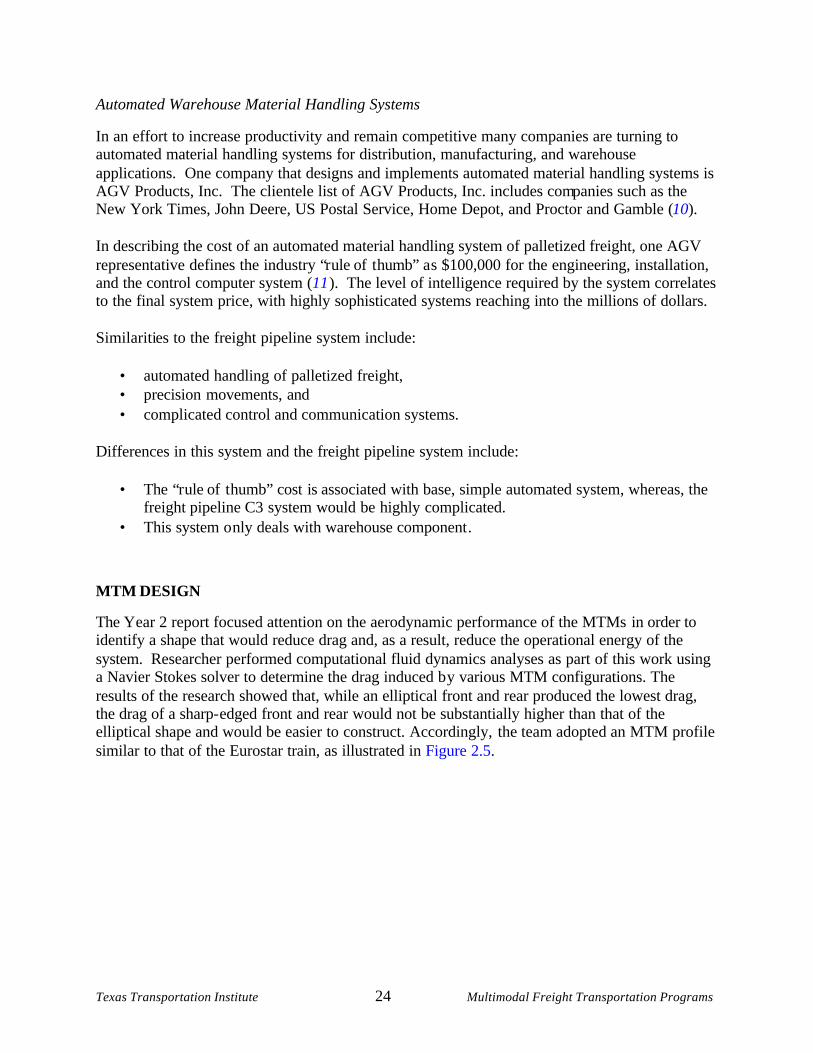
Texas Transportation Institute 24 Multimodal Freight Transportation Programs
Automated Warehouse Material Handling Systems
In an effort to increase productivity and remain competitive many companies are turning to automated material handling systems for distribution, manufacturing, and warehouse applications. One company that designs and implements automated material handling systems is AGV Products, Inc. The clientele list of AGV Products, Inc. includes companies such as the New York Times, John Deere, US Postal Service, Home Depot, and Proctor and Gamble (10). In describing the cost of an automated material handling system of palletized freight, one AGV representative defines the industry “r ule of t humb” a s $100,000 for the engineering, installation, and the control computer system (11 ). The level of intelligence required by the system correlates to the final system price, with highly sophisticated systems reaching into the millions of dollars. Similarities to the freight pipeline system include:
• automated handling of palletized freight, • precision movements, and • complicated control and communication systems.
Differences in this system and the freight pipeline system include:
• The “r ule of t humb” cost is associated with base, simple automated system, whereas, the freight pipeline C3 system would be highly complicated.
• This system o nly deals with warehouse component .
MTM DESIGN
The Year 2 report focused attention on the aerodynamic performance of the MTMs in order to identify a shape that would reduce drag and, as a result, reduce the operational energy of the system. Researcher performed computational fluid dynamics analyses as part of this work using a Navier Stokes solver to determine the drag induced b y various MTM configurations. The results of the research showed that, while an elliptical front and rear produced the lowest drag, the drag of a sharp- edged front and rear would not be substantially higher than that of the elliptical shape and would be easier to construct. Accordingly, the team adopted an MTM profile similar to that of the Eurostar train, as illustrated in Figure 2.5.
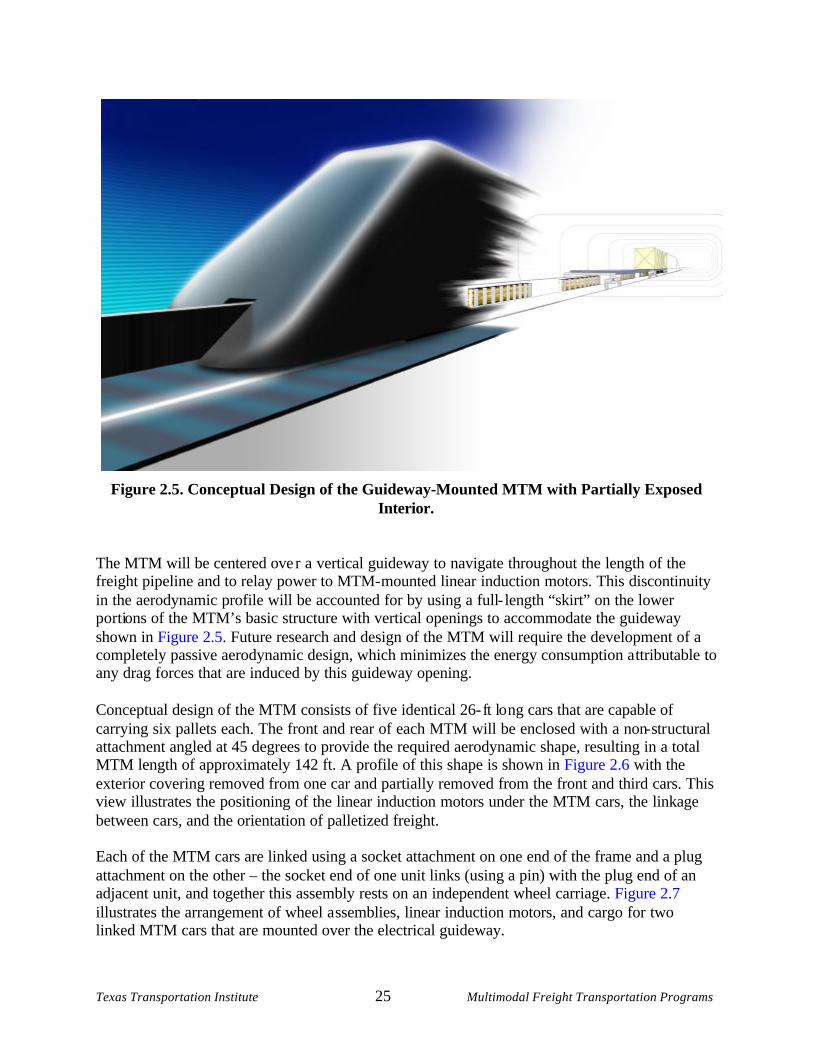
Texas Transportation Institute 25 Multimodal Freight Transportation Programs
Figure 2.5. Conceptual Design of the Guideway-Mounted MTM with Partially Exposed Interior.
The MTM will be centered ove r a vertical guideway to navigate throughout the length of the freight pipeline and to relay power to MTM- mounted linear induction motors. This discontinuity in the aerodynamic profile will be accounted for by using a full- length “skirt” on the lower portions of the MTM’s basic structure with vertical openings to accommodate the guideway shown in Figure 2.5. Future research and design of the MTM will require the development of a completely passive aerodynamic design, which minimizes the energy consumption a ttributable to any drag forces that are induced by this guideway opening. Conceptual design of the MTM consists of five identical 26- ft lo ng cars that are capable of carrying six pallets each. The front and rear of each MTM will be enclosed with a non- str uctural attachment angled at 45 degrees to provide the required aerodynamic shape, resulting in a total MTM length of approximately 142 ft. A profile of this shape is shown in Figure 2.6 with the exterior covering removed from one car and partially removed from the front and third cars. This view illustrates the positioning of the linear induction motors under the MTM cars, the linkage between cars, and the orientation of palletized freight. Each of the MTM cars are linked using a socket attachment on one end of the frame and a plug attachment on the other – the socket end of one unit links (using a pin) with the plug end of an adjacent unit, and together this assembly rests on an independent wheel carriage. Figure 2.7 illustrates the arrangement of wheel assemblies, linear induction motors, and cargo for two linked MTM cars that are mounted over the electrical guideway.
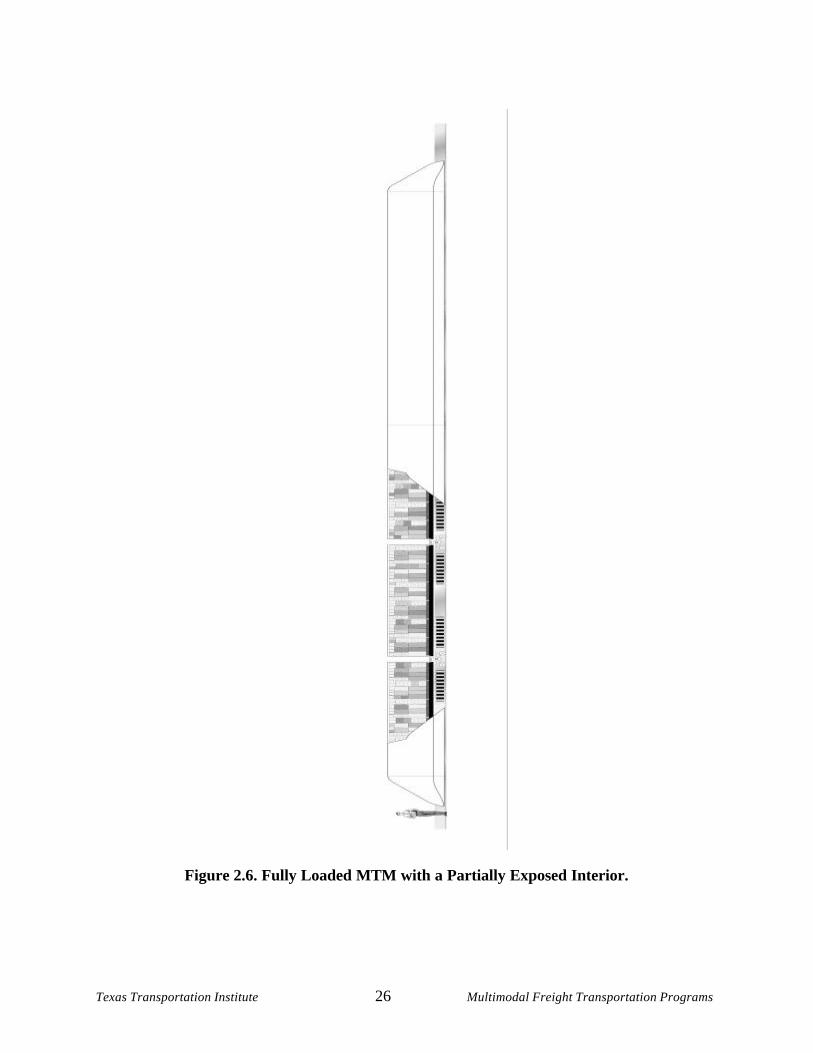
Texas Transportation Institute 26 Multimodal Freight Transportation Programs
Figure 2.6. Fully Loaded MTM with a Partially Exposed Interior.
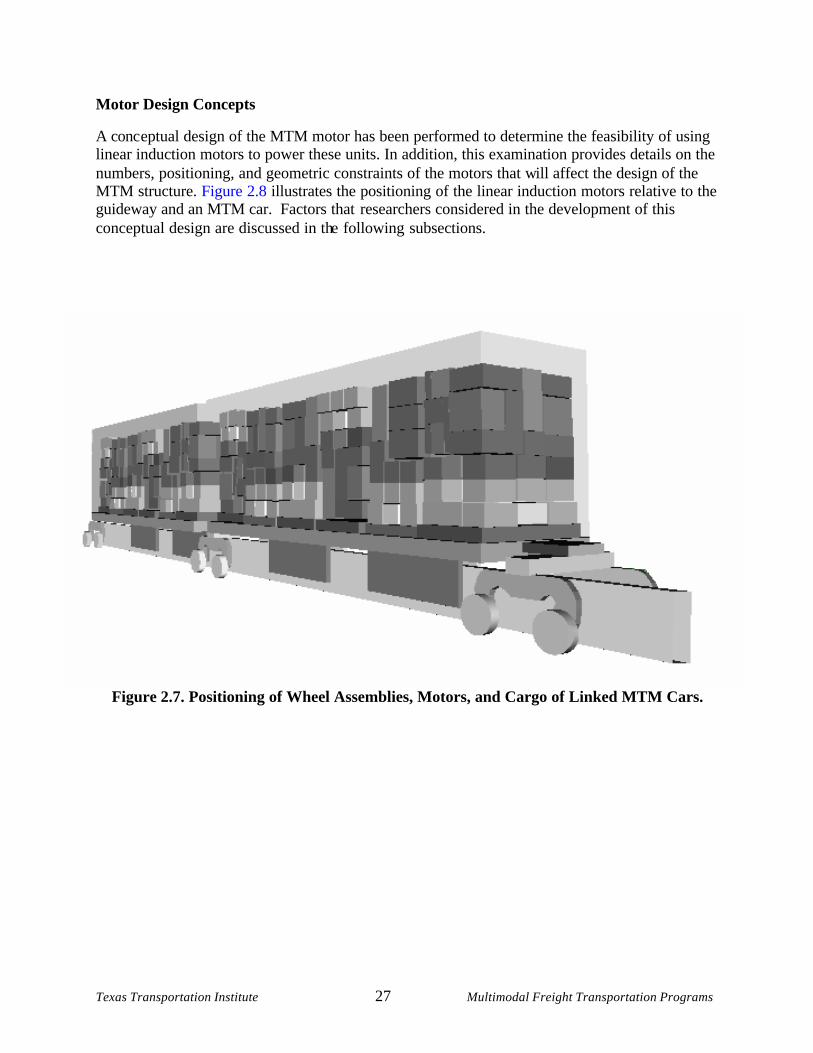
Texas Transportation Institute 27 Multimodal Freight Transportation Programs
Motor Design Concepts
A conc eptual design of the MTM motor has been performed to determine the feasibility of using linear induction motors to power these units. In addition, this examination provides details on the numbers, positioning, and geometric constraints of the motors that will affect the design of the MTM structure. Figure 2.8 illustrates the positioning of the linear induction motors relative to the guideway and an MTM car. Factors that researchers considered in the development of this conceptual design are discussed in the following subsections.
Figure 2.7. Positioning of Wheel Assemblies, Motors, and Cargo of Linked MTM Cars.
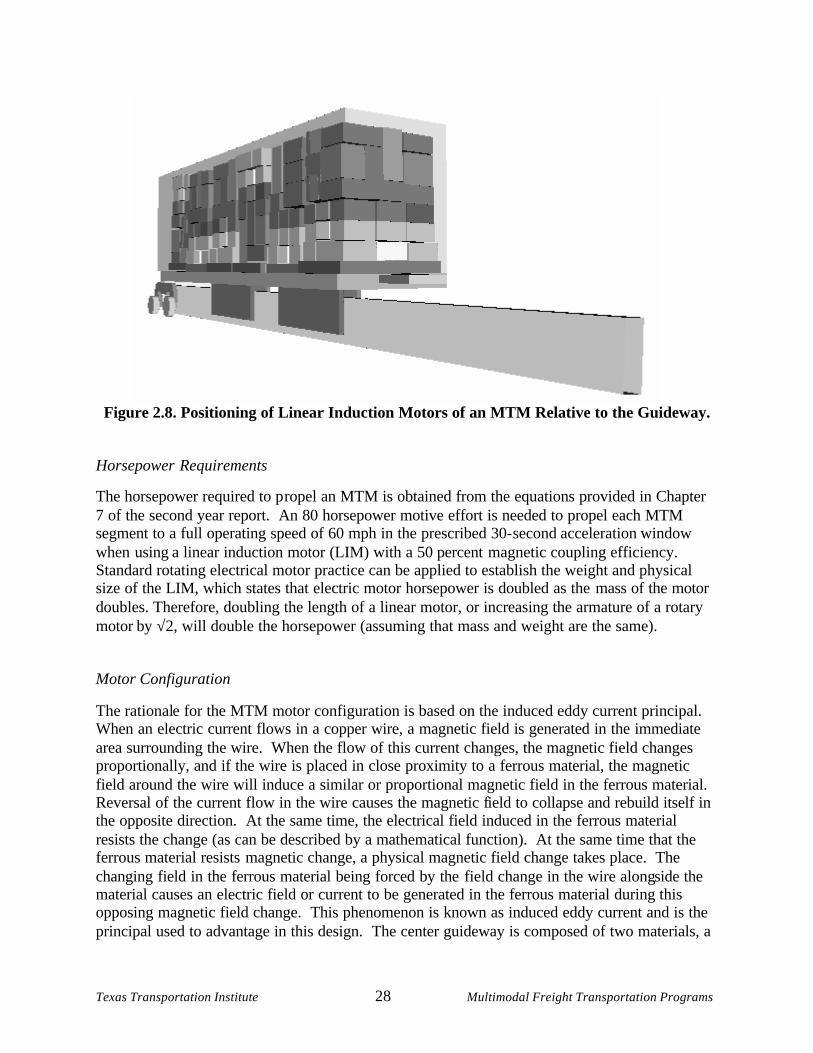
Texas Transportation Institute 28 Multimodal Freight Transportation Programs
Figure 2.8. Positioning of Linear Induction Motors of an MTM Relative to the Guideway.
Horsepower Requirements
The horsepower required to propel an MTM is obtained from the equations provided in Chapter 7 of the second year report. An 80 horsepower motive effort is needed to propel each MTM segment to a full operating speed of 60 mph in the prescribed 30-second acceleration window when using a linear induction motor (LIM) with a 50 percent magnetic coupling efficiency. Standard rotating electrical motor practice can be applied to establish the weight and physical size of the LIM, which states that electric motor horsepower is doubled as the mass of the motor doubles. Therefore, doubling the length of a linear motor, or increasing the armature of a rotary motor by √2, will double the horsepower (assuming that mass and weight are the same).
Motor Configuration
The rationale for the MTM motor configuration is based on the induced eddy current principal. When an electric current flows in a copper wire, a magnetic field is generated in the immediate area surrounding the wire. When the flow of this current changes, the magnetic field changes proportionally, and if the wire is placed in close proximity to a ferrous material, the magnetic field around the wire will induce a similar or proportional magnetic field in the ferrous material. Reversal of the current flow in the wire causes the magnetic field to collapse and rebuild itself in the opposite direction. At the same time, the electrical field induced in the ferrous material resists the change (as can be described by a mathematical function). At the same time that the ferrous material resists magnetic change, a physical magnetic field change takes place. The changing field in the ferrous material being forced by the field change in the wire alongside the material causes an electric field or current to be generated in the ferrous material during this opposing magnetic field change. This phenomenon is known as induced eddy current and is the principal used to advantage in this design. The center guideway is composed of two materials, a
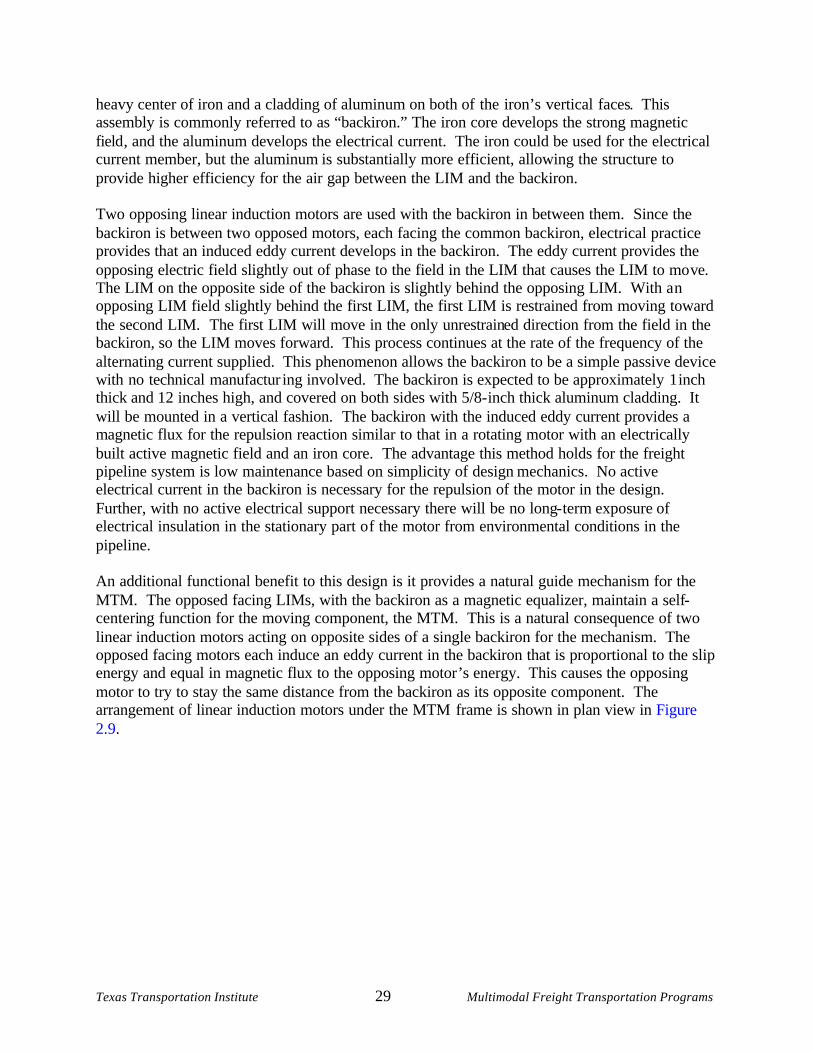
Texas Transportation Institute 29 Multimodal Freight Transportation Programs
heavy center of iron and a cladding of aluminum on both of the iron’s vertical faces. This assembly is commonly referred to as “backiron.” The iron core develops the strong magnetic field , and the aluminum develops the electrical current. The iron could be used for the electrical current member, but the aluminum is substantially more efficient, allowing the structure to provide higher efficiency for the air gap between the LIM and the backiron.
Two opposing linear induction motors are used with the backiron in between them. Since the backiron is between two opposed motors, each facing the common backiron, electrical practice provides that an induced eddy current develops in the backiron. The eddy current provides the opposing electric field slightly out of phase to the field in the LIM that causes the LIM to mo ve. The LIM on the opposite side of the backiron is slightly behind the opposing LIM. With a n opposing LIM field slightly behind the first LIM, the first LIM is restrained from moving toward the second LIM. The first LIM will move in the only unrestrained direction from the field in the backiron, so the LIM moves forward. This process continues at the rate of the frequency of the alternating current supplied. This phenomenon allows the backiron to be a simple passive device with no technical manufactur ing involved. The backiron is expected to be approximately 1 inch thick and 12 inches high, and covered on both sides with 5/8- inch thick aluminum cladding. It will be mounted in a vertical fashion. The backiron with the induced eddy current provides a magnetic flux for the repulsion reaction similar to that in a rotating motor with an electrically built active magnetic field and an iron core. The advantage this method holds for the freight pipeline system is low maintenance based on simplicity of design mechanics. No active electrical current in the backiron is necessary for the repulsion of the motor in the design. Further, with no active electrical support necessary there will be no long- term exposure of electrical insulation in the stationary part o f the motor from environmental conditions in the pipeline.
An additional functional benefit to this design is it provides a natural guide mechanism for the MTM. The opposed facing LIMs, with the backiron as a magnetic equalizer, maintain a self-centering function for the moving component, the MTM. This is a natural consequence of two linear induction motors acting on opposite sides of a single backiron for the mechanism. The opposed facing motors each induce an eddy current in the backiron that is proportional to the slip energy and equal in magnetic flux to the opposing motor ’s energy. This causes the opposing motor to try to stay the same distance from the backiron as its opposite component. The arrangement of linear induction motors under the MTM frame is shown in plan view in Figure 2.9.
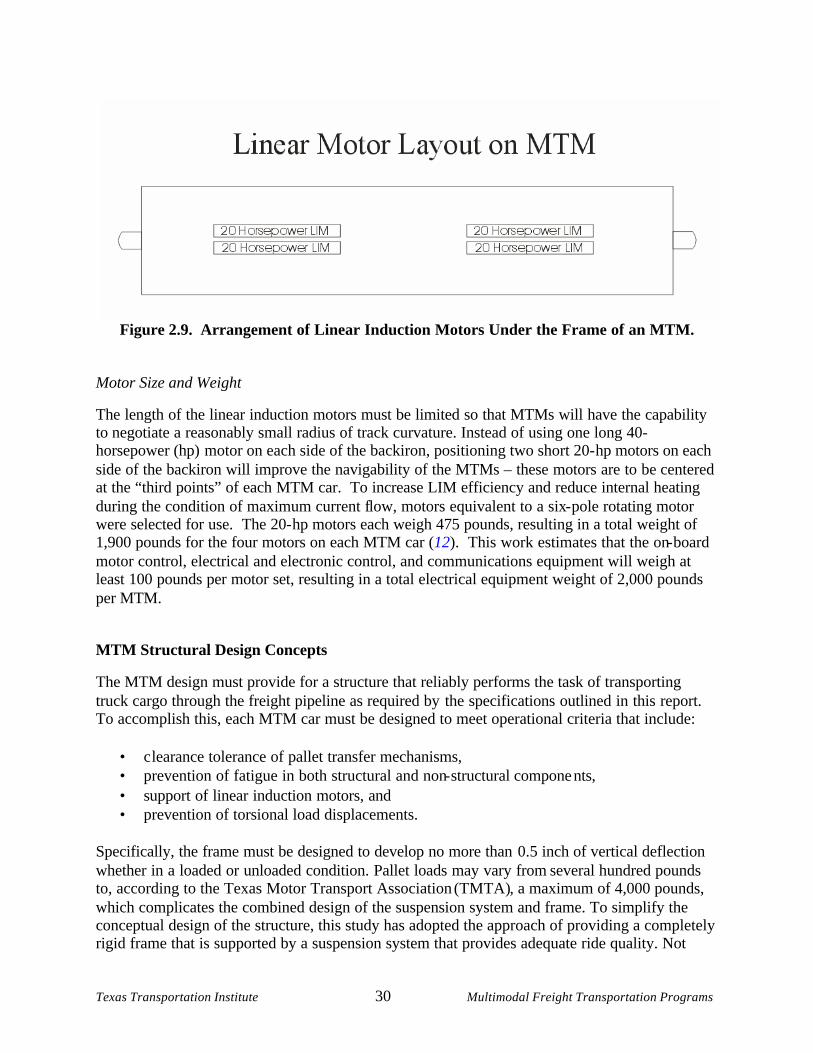
Texas Transportation Institute 30 Multimodal Freight Transportation Programs
Figure 2.9. Arrangement of Linear Induction Motors Under the Frame of an MTM.
Motor Size and Weight
The length of the linear induction motors must be limited so that MTMs will have the capability to negotiate a reasonably small radius of track curvature. Instead of using one long 40-horsepower (hp) motor on each side of the backiron, positioning two short 20- hp motors on each side of the backiron will improve the navigability of the MTMs – these motors are to be centered at the “third points” of each MTM car. To increase LIM efficiency and reduce internal heating during the condition of maximum current flow, motors equivalent to a six- pole rotating motor were selected for use. The 20- hp motors each weigh 475 pounds, resulting in a total weight of 1,900 pounds for the four motors on each MTM car (12). This work estimates that the on- board motor control, electrical and electronic control, and communications equipment will weigh at least 100 pounds per motor set, resulting in a total electrical equipment weight of 2,000 pounds per MTM.
MTM Structural Design Concepts
The MTM design must provide for a structure that reliably performs the task of transporting truck cargo through the freight pipeline as required by the specifications outlined in this report. To accomplish this, each MTM car must be designed to meet operational criteria that include:
• clearance tolerance of pallet transfer mechanisms, • prevention of fatigue in both structural and non-structural components, • support of linear induction motors, and • prevention of torsional load displacements.
Specifically, the frame must be designed to develop no more than 0.5 inch of vertical deflection whether in a loaded or unloaded condition. Pallet loads may vary from several hundred pounds to, according to the Texas Motor Transport Association (TMTA), a maximum of 4,000 pounds, which complicates the combined design of the suspension system and frame. To simplify the conceptual design of the structure, this study has adopted the approach of providing a completely rigid frame that is supported by a suspension system that provides adequate ride quality. Not
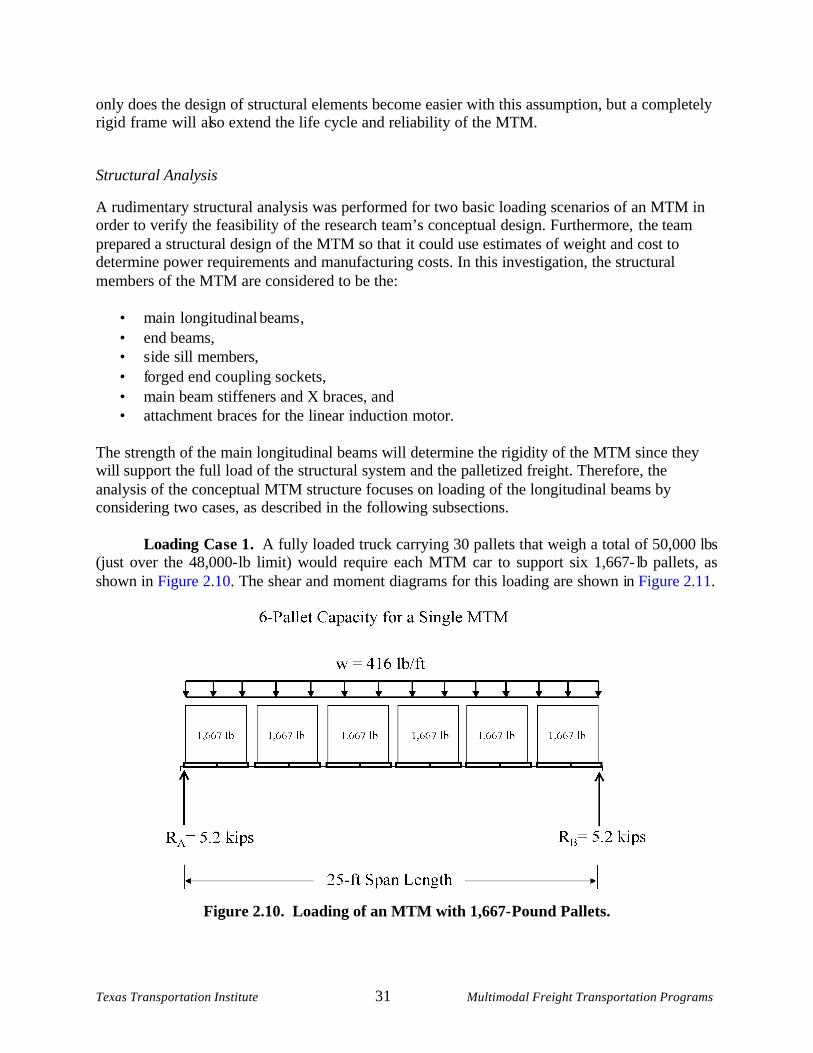
Texas Transportation Institute 31 Multimodal Freight Transportation Programs
only does the design of structural elements become easier with this assumption, but a completely rigid frame will also extend the life cycle and reliability of the MTM.
Structural Analysis
A rudimentary structural analysis was performed for two basic loading scenarios of an MTM in order to verify the feasibility of the research team’s conceptual design. Furthermore, t he team prepared a structural design of the MTM so that it could use estimates of weight and cost to determine power requirements and manufacturing costs. In this investigation, the structural members of the MTM are considered to be the:
• main longitudinal beams , • end beams, • s ide sill members, • forged end coupling sockets, • main beam stiffeners and X braces, and • attachment braces for the linear induction motor.
The strength of the main longitudinal beams will determine the rigidity of the MTM since they will support the full load of the structural system and the palletized freight. Therefore, the analysis of the conceptual MTM structure focuses on loading of the longitudinal beams by considering two cases, as described in the following subsections.
Loading Ca se 1. A fully loaded truck carrying 30 pallets that weigh a total of 50,000 lbs (just over the 48,000- lb limit) would require each MTM car to support six 1,667- lb pallets, as shown in Figure 2.10. The shear and moment diagrams for this loading are shown in Figure 2.11.
Figure 2.10. Loading of an MTM with 1,667-Pound Pallets.
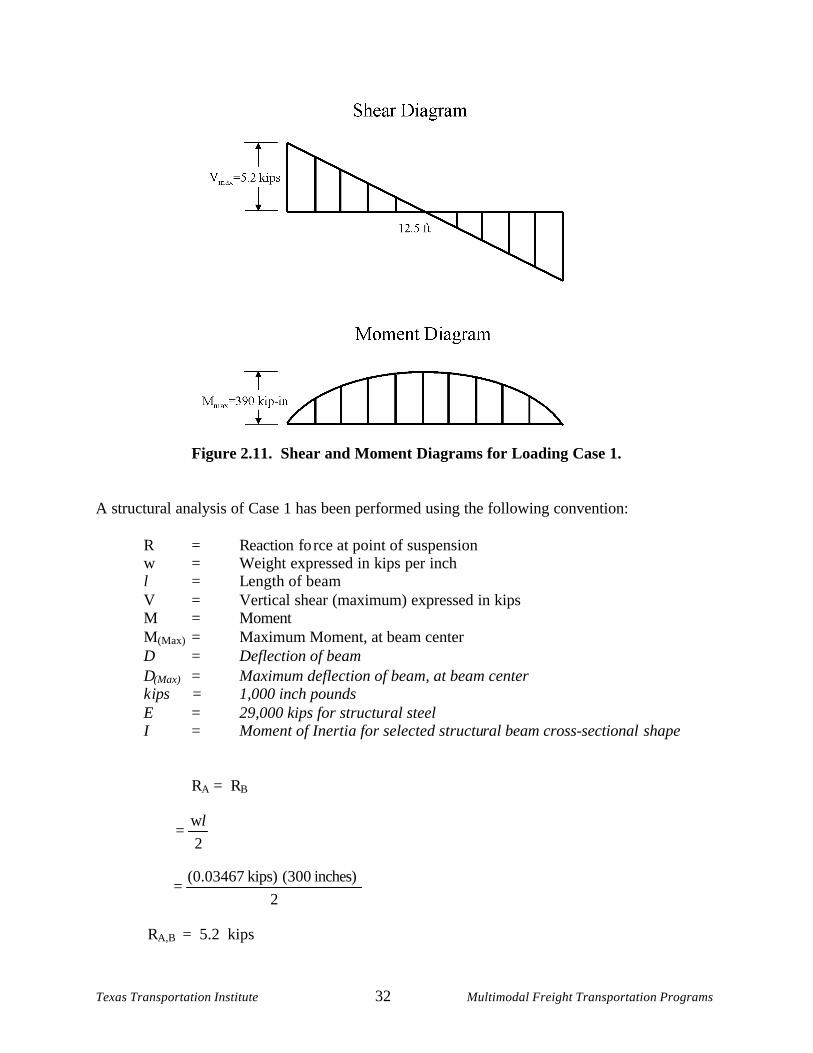
Texas Transportation Institute 32 Multimodal Freight Transportation Programs
Figure 2.11. Shear and Moment Diagrams for Loading Case 1.
A structural analysis of Case 1 has been performed using the following convention: R = Reaction force at point of suspension w = Weight expressed in kips per inch l = Length of beam V = Vertical shear (maximum) expressed in kips M = Moment M(Max) = Maximum Moment, at beam center ∆ = Deflection of beam ∆(Max) = Maximum deflection of beam, at beam center kips = 1,000 inch pounds E = 29,000 kips for structural steel I = Moment of Inertia for selected structural beam cross-sectional shape
RA = RB
RA,B = 5.2 kips
2wl
=
2inches) (300 kips) (0.03467
=
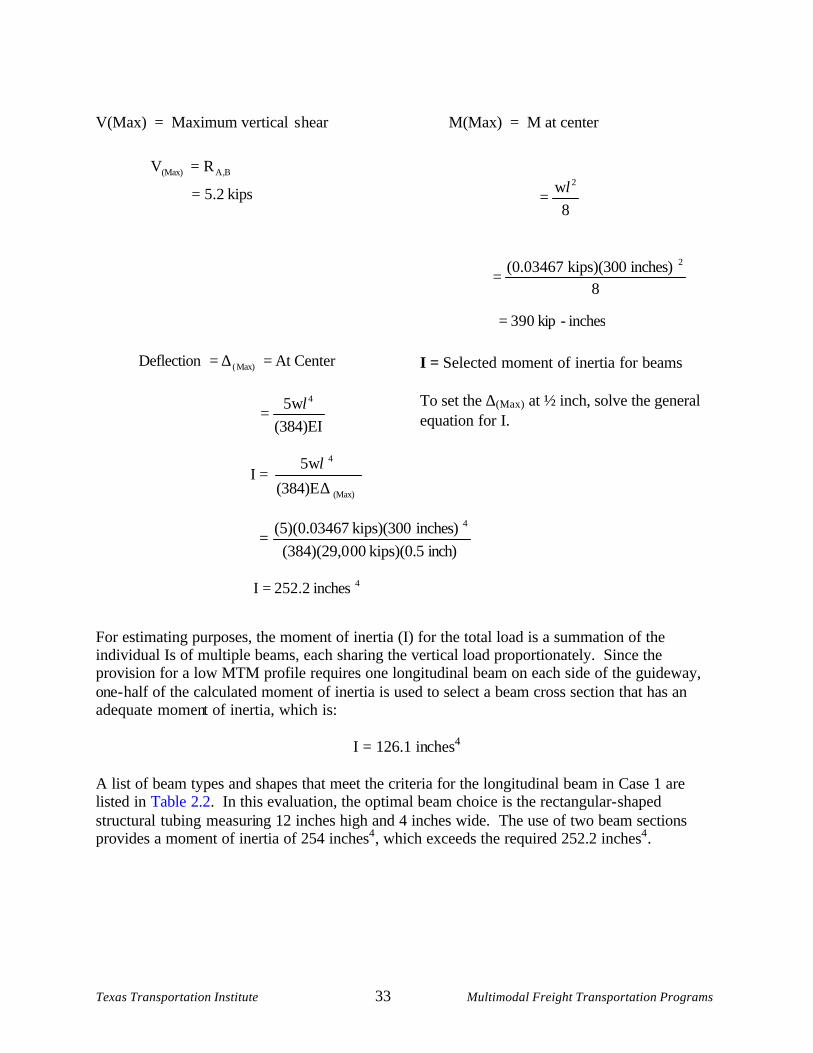
Texas Transportation Institute 33 Multimodal Freight Transportation Programs
V(Max) = Maximum vertical s hear M(Max) = M at center For estimating purposes, the moment of inertia (I) for the total load is a summation of the individual Is of multiple beams, each sharing the vertical load proportionately. Since the provision for a low MTM profile requires one longitudinal beam on each side of the guideway, one - half of the calculated moment of inertia is used to select a beam cross section that has an adequate moment of inertia, which is:
I = 126.1 inches4
A list of beam types and shapes that meet the criteria for the longitudinal beam in Case 1 are listed in Table 2.2. In this evaluation, the optimal beam choice is the rectangular- shaped structural tubing measuring 12 inches high and 4 inches wide. The use of two beam sections provides a moment of inertia of 254 inches4, which exceeds the required 252.2 inches4.
8w 2l
=
8inches) kips)(300 (0.03467 2
=
BA,(Max) RV =
kips 2.5=
inches - kip 390 =
CenterAt Deflection Max)( =∆=
(384)EI5w 4l
=
I = Selected moment of inertia for beams To set the ∆(Max) at ½ inch, solve the general equation for I.
(Max)
4
(384)E
5w I
∆=
l
inch) kips)(0.5 00(384)(29,0inches) kips)(300 7(5)(0.0346 4
=
4inches 252.2 I =
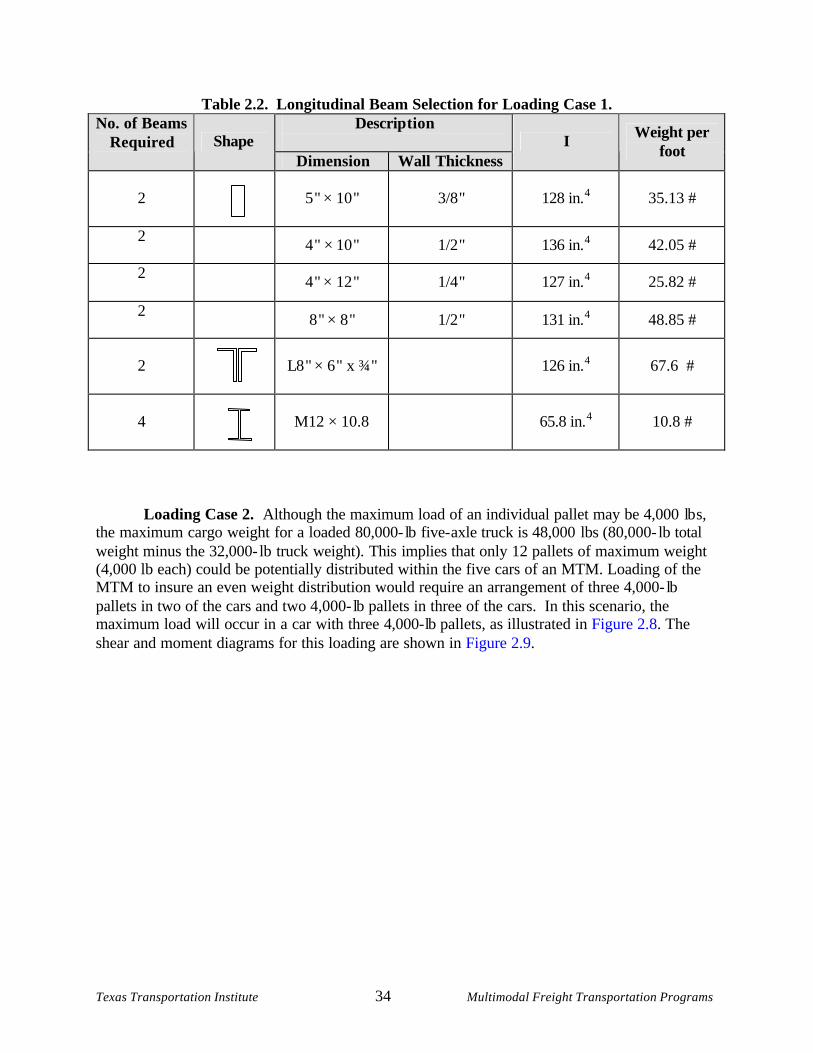
Texas Transportation Institute 34 Multimodal Freight Transportation Programs
Table 2.2. Longitudinal Beam Selection for Loading Case 1. Descrip tion
No. of Beams
Required
Shape Dimension Wall Thickness
I Weight per foot
2
5 " × 10 " 3/8 " 128 in.
4 35.13 #
2 4 " × 10 " 1/2 " 136 in.
4 42.05 #
2
4 " × 12 " 1/4 " 127 in.
4 25.82 #
2 8 " × 8 " 1/2 " 131 in.
4 48.85 #
2
L8 " × 6 " x ¾ " 126 in.
4 67.6 #
4
M12 × 10.8 65.8 in.
4 10.8 #
Loading Case 2. Although the maximum load of an individual pallet may be 4,000 lb s, the maximum cargo weight for a loaded 80,000- lb five- axle truck is 48,000 lbs (80,000- lb total weight minus the 32,000- lb truck weight). This implies that only 12 pallets of maximum weight (4,000 lb each) could be potentially distributed within the five cars of an MTM. Loading of the MTM to insure an even weight distribution would require an arrangement of three 4,000- lb pallets in two of the cars and two 4,000- lb pallets in three of the cars. In this scenario, the maximum load will occur in a car with three 4,000- lb pallets, as illustrated in Figure 2.8. The shear and moment diagrams for this loading are shown in Figure 2.9.
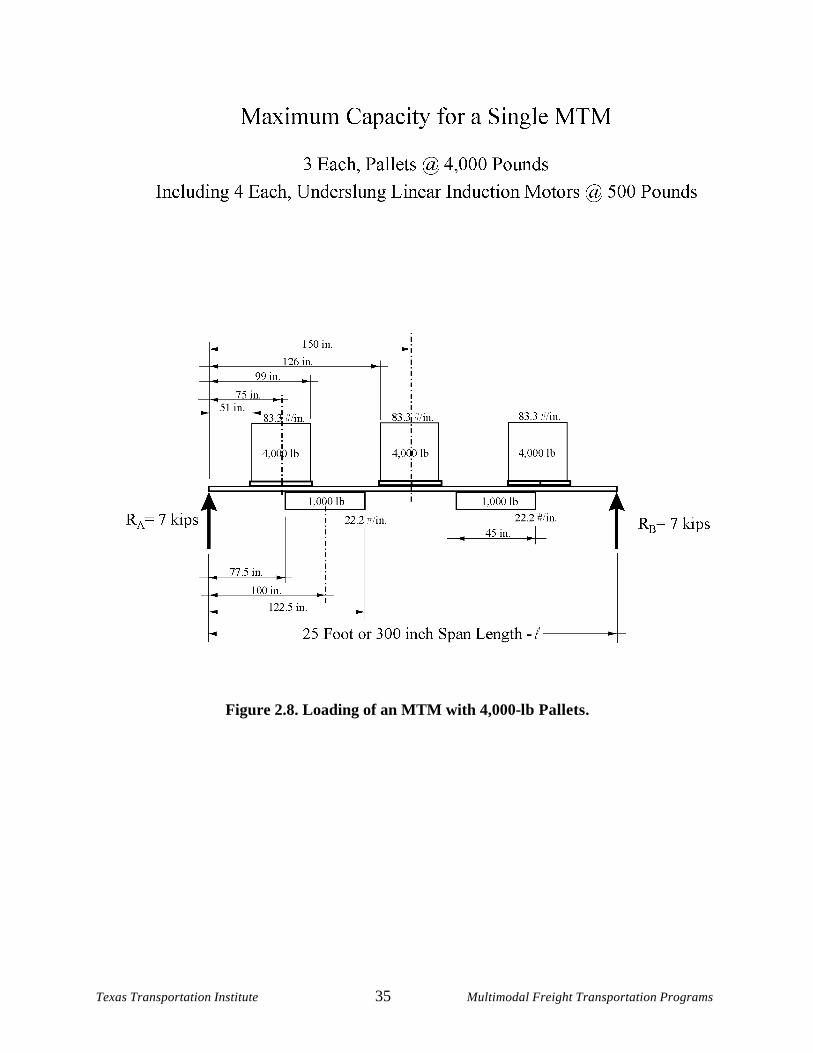
Texas Transportation Institute 35 Multimodal Freight Transportation Programs
Figure 2.8. Loading of an MTM with 4,000-lb Pallets.
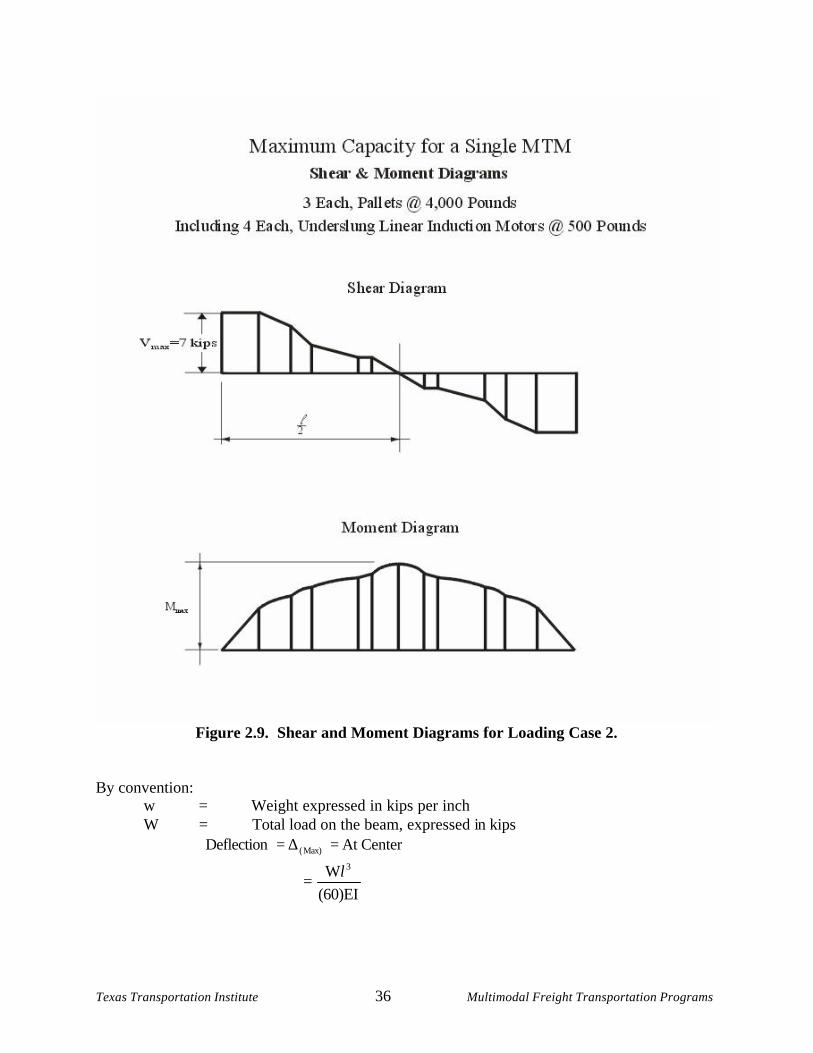
Texas Transportation Institute 36 Multimodal Freight Transportation Programs
Figure 2.9. Shear and Moment Diagrams for Loading Case 2. By convention:
w = Weight expressed in kips per inch W = Total load on the beam, expressed in kips
CenterAt Deflection Max)( =∆=
(60)EIW 3l
=
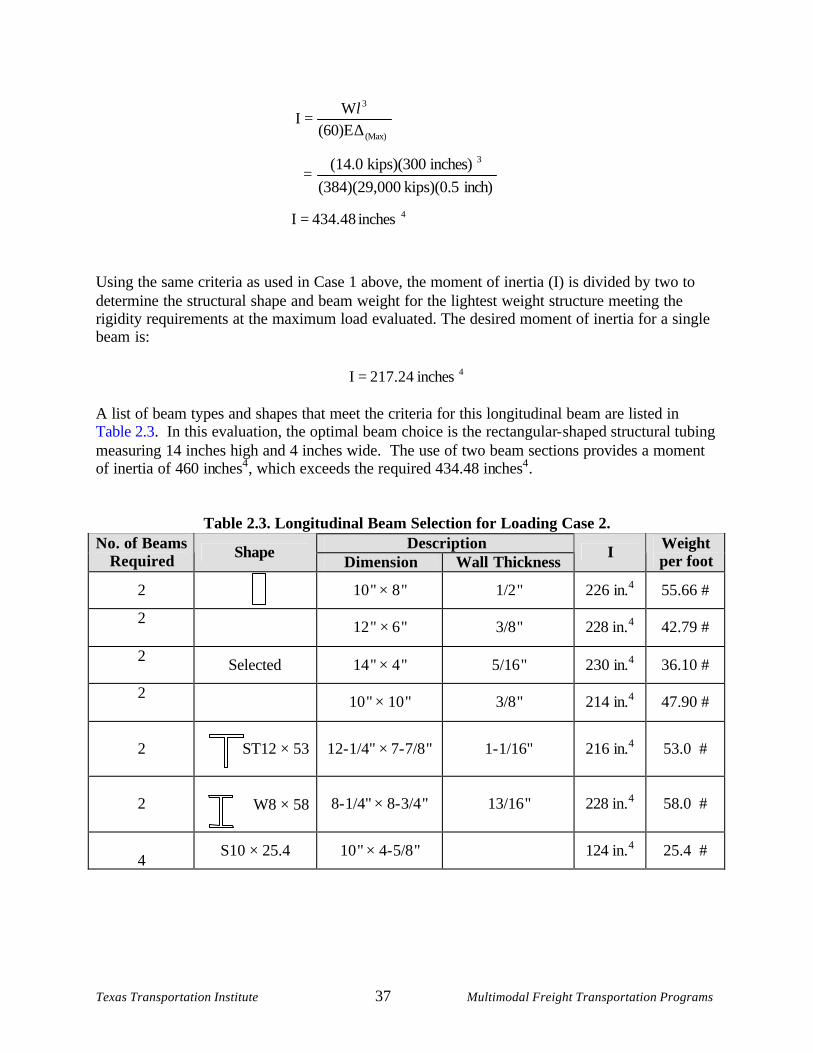
Texas Transportation Institute 37 Multimodal Freight Transportation Programs
(Max)
3
(60)EW
I∆
=l
inch) kips)(0.5 00(384)(29,0
inches) kips)(300 (14.0
3
=
4inches 434.48 I =
Using the same criteria as used in Case 1 above, the moment of inertia (I) is divided by two to determine the structural shape and beam weight for the lightest weight structure meeting the rigidity requirements at the maximum load evaluated. The desired moment of inertia for a single beam is:
4inches 217.24 I = A list of beam types and shapes that meet the criteria for this longitudinal beam are listed in Table 2.3. In this evaluation, the optimal beam choice is the rectangular- shaped structural tubing measuring 14 inches high and 4 inches wide. The use of two beam sections provides a moment of inertia of 460 inches4, which exceeds the required 434.48 inches4.
Table 2.3. Longitudinal Beam Selection for Loading Case 2. Description No. of Beams
Required Shape Dimension Wall Thickness
I Weight per foot
2 10" × 8" 1/2" 226 in.4 55.66 #
2
12" × 6" 3/8" 228 in.4 42.79 #
2 Selected 14" × 4" 5/16" 230 in.4 36.10 #
2
10" × 10" 3/8" 214 in.4 47.90 #
2
ST12 × 53
12-1/4" × 7-7/8" 1-1/16" 216 in.4 53.0 #
2 W8 × 58
8-1/4" × 8-3/4" 13/16" 228 in.4 58.0 #
4
S10 × 25.4 10" × 4-5/8" 124 in.4 25.4 #
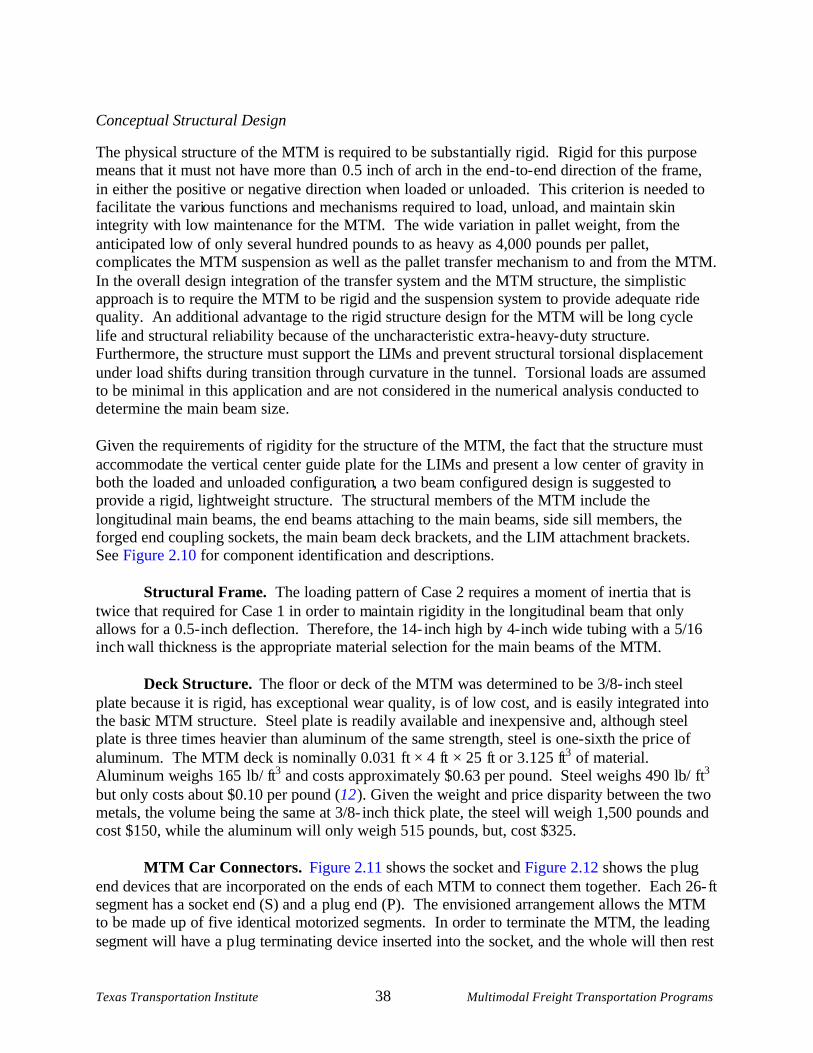
Texas Transportation Institute 38 Multimodal Freight Transportation Programs
Conceptual Structural Design
The physical structure of the MTM is required to be subs tantially rigid. Rigid for this purpose means that it must not have more than 0.5 inch of arch in the end - to- end direction of the frame, in either the positive or negative direction when loaded or unloaded. This criterion is needed to facilitate the various functions and mechanisms required to load, unload, and maintain skin integrity with low maintenance for the MTM. The wide variation in pallet weight, from the anticipated low of only several hundred pounds to as heavy as 4,000 pounds per pallet, complicates the MTM suspension as well as the pallet transfer mechanism to and from the MTM. In the overall design integration of the transfer system and the MTM structure, the simplistic approach is to require the MTM to be rigid and the suspension system to provide adequate ride quality. An additional advantage to the rigid structure design for the MTM will be long cycle life and structural reliability because of the uncharacteristic extra- heavy- duty structure. Furthermore, the structure must support the LIMs and prevent structural torsional displacement under load shifts during transition through curvature in the tunnel. Torsional loads are assumed to be minimal in this application and are not considered in the numerical analysis conducted to determine the main beam size. Given the requirements of rigidity for the structure of the MTM, the fact that the structure must accommodate the vertical center guide plate for the LIMs and present a low center of gravity in both the loaded and unloaded configuration, a two beam configured design is suggested to provide a rigid, lightweight structure. The structural members of the MTM include the longitudinal main beams, the end beams attaching to the main beams, side sill members, the forged end coupling sockets, the main beam deck brackets, and the LIM attachment brackets. See Figure 2.10 for component identification and descriptions.
Structural Frame. The loading pattern of Case 2 requires a moment of inertia that is twice that required for Case 1 in order to maintain rigidity in the longitudinal beam that only allows for a 0.5- inch deflection. Therefore, the 14- inch high by 4- inch wide tubing with a 5/16 inch wall thickness is the appropriate material selection for the main beams of the MTM.
Deck Structure. The floor or deck of the MTM was determined to be 3/8- inch steel plate because it is rigid, has exceptional wear quality, is of low cost, and is easily integrated into the basic MTM structure. Steel plate is readily available and inexpensive and, although steel plate is three times heavier than aluminum of the same strength, steel is one- sixth the price of aluminum. The MTM deck is nominally 0.031 ft × 4 ft × 25 ft or 3.125 ft3 of material. Aluminum weighs 165 lb/ ft
3 and costs approximately $0.63 per pound. Steel weighs 490 lb/ ft3
but only costs about $0.10 per pound (12 ). Given the weight and price disparity between the two metals, the volume being the same at 3/8- inch thick plate, the steel will weigh 1,500 pounds and cost $150, while the aluminum will only weigh 515 pounds, but, cost $325.
MTM Car Connectors. Figure 2.11 shows the socket and Figure 2.12 shows the p lug end devices that are incorporated on the ends of each MTM to connect them together. Each 26-ft segment has a socket end (S) and a plug end (P). The envisioned arrangement allows the MTM to be made up of five identical motorized segments. In order to terminate the MTM, the leading segment will have a plug terminating device inserted into the socket, and the whole will then rest
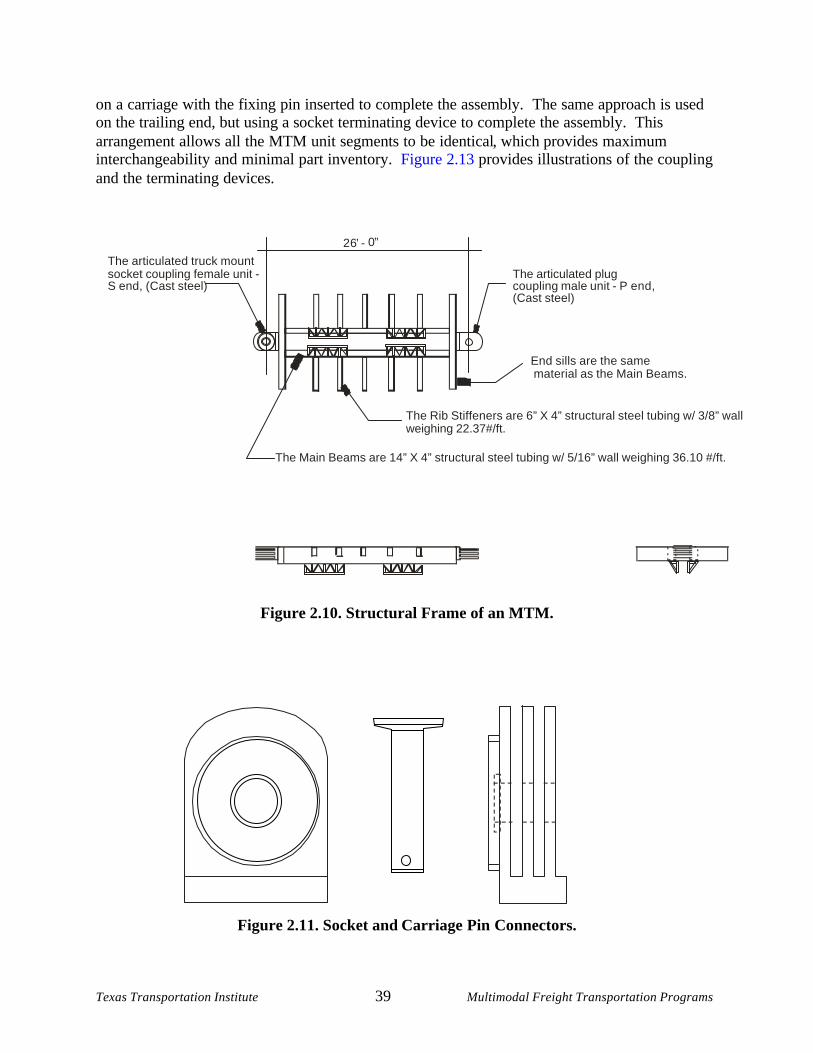
Texas Transportation Institute 39 Multimodal Freight Transportation Programs
on a carriage with the fixing pin inserted to complete the assembly. The same approach is used on the trailing end, but using a socket terminating device to complete the assembly. This arrangement allows all the MTM unit segments to be identical, which provides maximum interchangeability and minimal part inventory. Figure 2.13 provides illustrations of the coupling and the terminating devices.
Figure 2.10. Structural Frame of an MTM.
Figure 2.11. Socket and Carriage Pin Connectors.
2 6 ’ - 0 ’ ’
The Rib Stiffeners are 6” X 4” structural steel tubing w/ 3/8” wall weighing 22.37#/ft.
The Main Beams are 14” X 4” structural steel tubing w/ 5/16” wall weighing 36.10 #/ft.
The articulated truck mount socket coupling female unit - S end, (Cast steel)
The articulated plug coupling male unit - P end, (Cast steel)
End sills are the same material as the Main Beams.
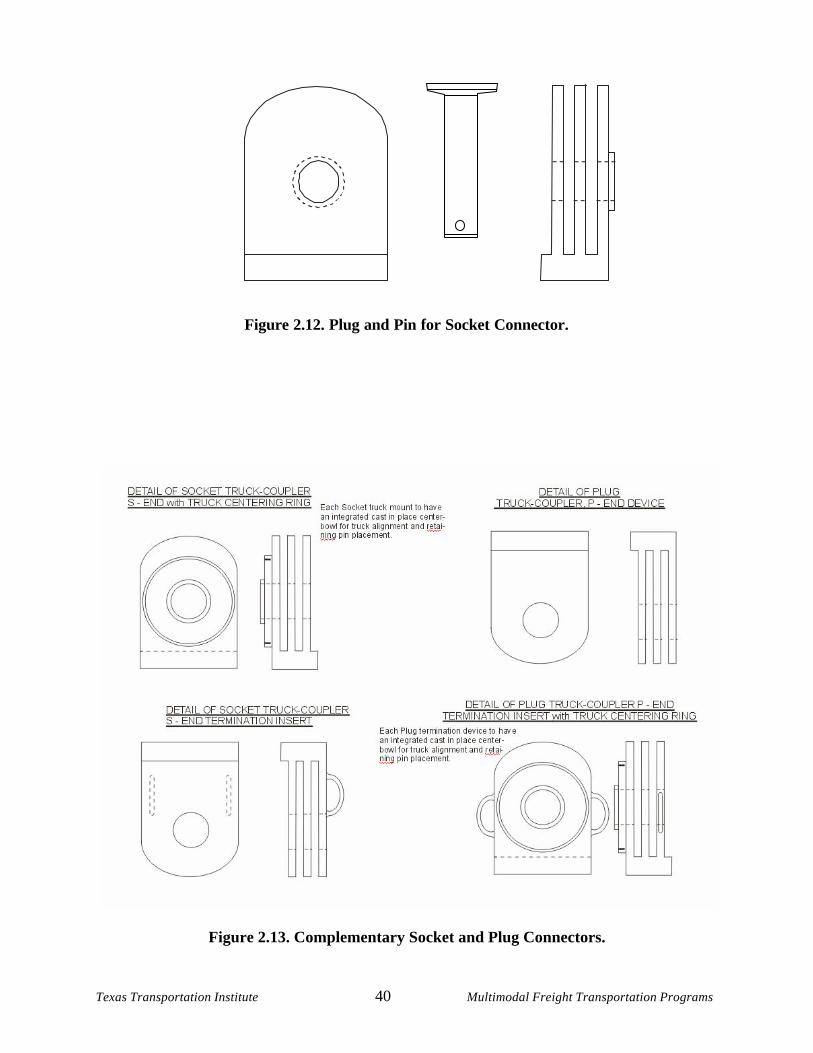
Texas Transportation Institute 40 Multimodal Freight Transportation Programs
Figure 2.12. Plug and Pin for Socket Connector.
Figure 2.13. Complementary Socket and Plug Connectors.
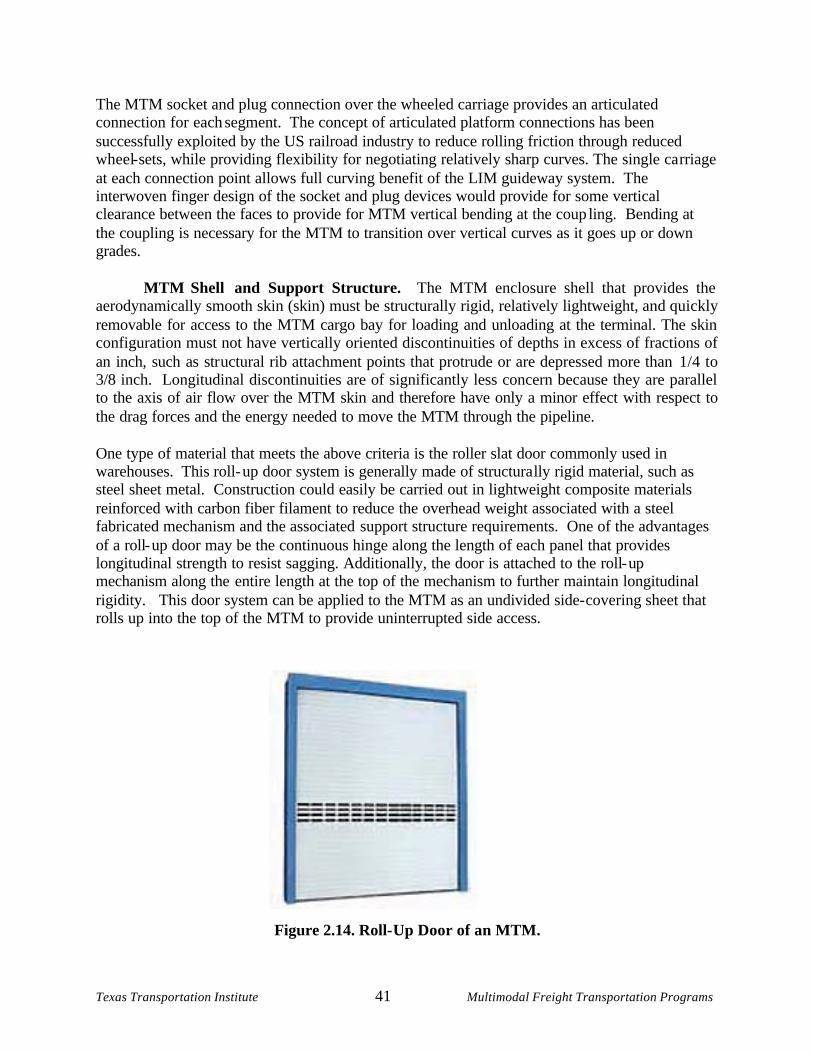
Texas Transportation Institute 41 Multimodal Freight Transportation Programs
The MTM socket and plug connection over the wheeled carriage provides an articulated connection for each segment. The concept of articulated platform connections has been successfully exploited by the US railroad industry to reduce rolling friction through reduced wheel-sets, while providing flexibility for negotiating relatively sharp curves. The single carriage at each connection point allows full curving benefit of the LIM guideway system. The interwoven finger design of the socket and plug devices would provide for some vertical clearance between the faces to provide for MTM vertical bending at the coup ling. Bending at the coupling is necessary for the MTM to transition over vertical curves as it goes up or down grades.
MTM Shell and Support Structure. The MTM enclosure shell that provides the aerodynamically smooth skin (skin) must be structurally rigid, relatively lightweight, and quickly removable for access to the MTM cargo bay for loading and unloading at the terminal. The skin configuration must not have vertically oriented discontinuities of depths in excess of fractions of an inch, such as structural rib attachment points that protrude or are depressed more than 1/4 to 3/8 inch. Longitudinal discontinuities are of significantly less concern because they are parallel to the axis of air flow over the MTM skin and therefore have only a minor effect with respect to the drag forces and the energy needed to move the MTM through the pipeline.
One type of material that meets the above criteria is the roller slat door commonly used in warehouses. This roll-up door system is generally made of structurally rigid material, such as steel sheet metal. Construction could easily be carried out in lightweight composite materials reinforced with carbon fiber filament to reduce the overhead weight associated with a steel fabricated mechanism and the associated support structure requirements. One of the advantages of a roll-up door may be the continuous hinge along the length of each panel that provides longitudinal strength to resist sagging. Additionally, the door is attached to the roll-up mechanism along the entire length at the top of the mechanism to further maintain longitudinal rigidity. This door system can be applied to the MTM as an undivided side-covering sheet that rolls up into the top of the MTM to provide uninterrupted side access.
Figure 2.14. Roll-Up Door of an MTM.
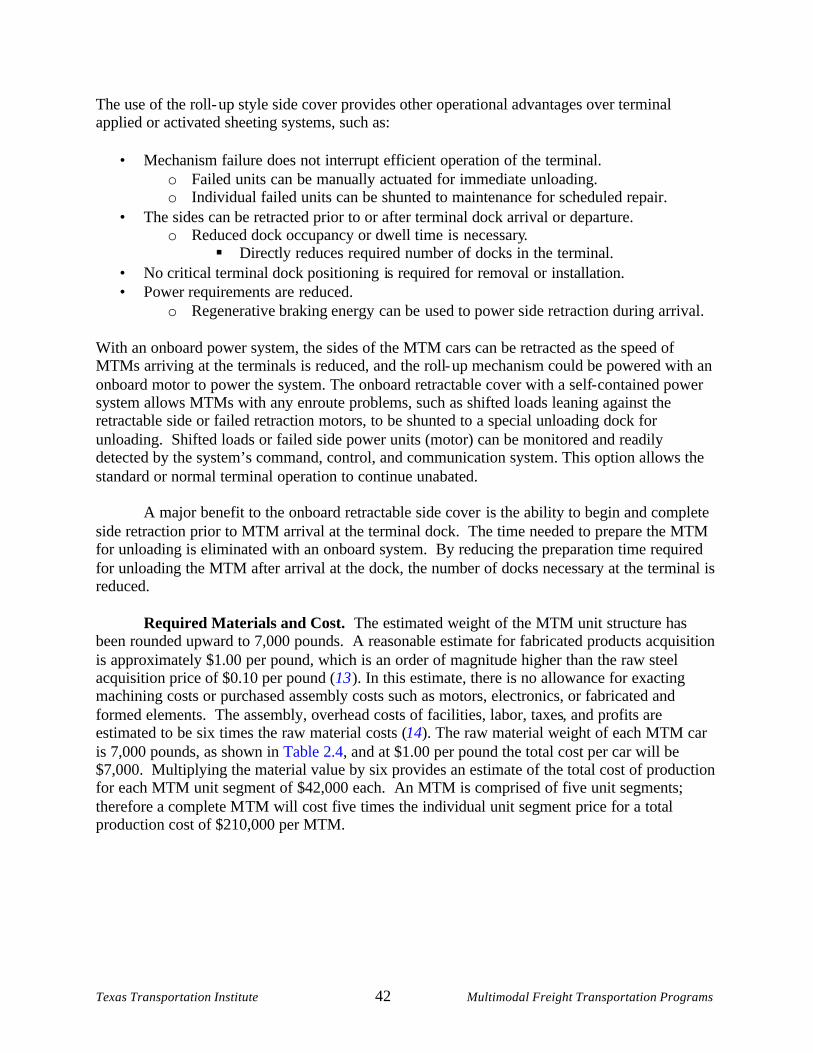
Texas Transportation Institute 42 Multimodal Freight Transportation Programs
The use of the roll- up style side cover provides other operational advantages over terminal applied or activated sheeting systems, such as:
• Mechanism failure does not interrupt efficient operation of the terminal.
o Failed units can be manually actuated for immediate unloading. o Individual failed units can be shunted to maintenance for scheduled repair.
• The sides can be retracted prior to or after terminal dock arrival or departure. o Reduced dock occupancy or dwell time is necessary.
§ Directly reduces required number of docks in the terminal. • No critical terminal dock positioning is required for removal or installation. • Power requirements are reduced.
o Regenerative braking energy can be used to power side retraction during arrival. With an onboard power system, the sides of the MTM cars can be retracted as the speed of MTMs arriving at the terminals is reduced, and the roll- up mechanism could be powered with an onboard motor to power the system. The onboard retractable cover with a self- contained power system allows MTMs with any enroute problems, such as shifted loads leaning against the retractable side or failed retraction motors, to be shunted to a special unloading dock for unloading. Shifted loads or failed side power units (motor) can be monitored and readily detected by the system’s command, control, and communication system. This option allows the standard or normal terminal operation to continue unabated. A major benefit to the onboard retractable side cover is the ability to begin and complete side retraction prior to MTM arrival at the terminal dock. The time needed to prepare the MTM for unloading is eliminated with an onboard system. By reducing the preparation time required for unloading the MTM after arrival at the dock, the number of docks necessary at the terminal is reduced.
Required Materials and Cost. The estimated weight of the MTM unit structure has been rounded upward to 7,000 pounds. A reasonable estimate for fabricated products acquisition is approximately $1.00 per pound, which is an order of magnitude higher than the raw steel acquisition price of $0.10 per pound (13 ). In this estimate, there is no allowance for exacting machining costs or purchased assembly costs such as motors, electronics, or fabricated and formed elements. The assembly, overhead costs of facilities, labor, taxes, and profits are estimated to be six times the raw material costs (14). The raw material weight of each MTM car is 7,000 pounds, as shown in Table 2.4, and at $1.00 per pound the total cost per car will be $7,000. Multiplying the material value by six provides an estimate of the total cost of production for each MTM unit segment of $42,000 each. An MTM is comprised of five unit segments; therefore a complete MTM will cost five times the individual unit segment price for a total production cost of $210,000 per MTM.
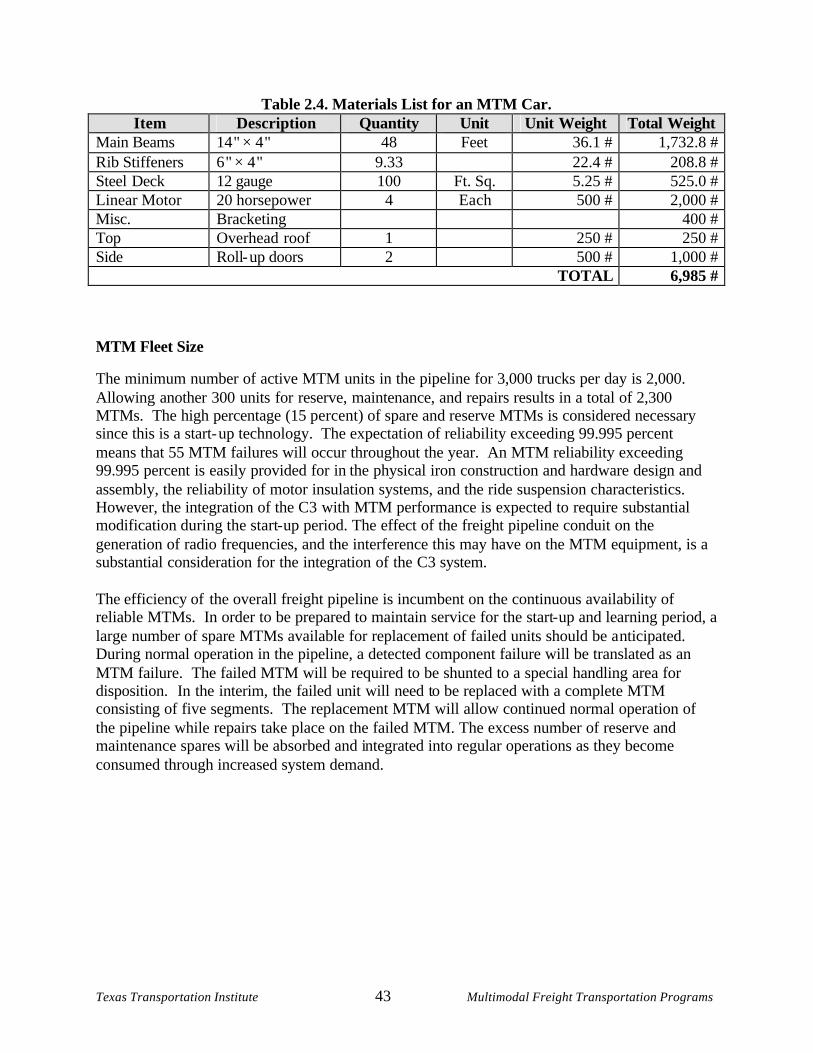
Texas Transportation Institute 43 Multimodal Freight Transportation Programs
Table 2.4. Materials List for an MTM Car. Item Description Quantity Unit Unit Weight Total Weight
Main Beams 14" × 4" 48 Feet 36.1 # 1,732.8 # Rib Stiffeners 6" × 4" 9.33 22.4 # 208.8 # Steel Deck 12 gauge 100 Ft. Sq. 5.25 # 525.0 # Linear Motor 20 horsepower 4 Each 500 # 2,000 # Misc. Bracketing 400 # Top Overhead roof 1 250 # 250 # Side Roll-up doors 2 500 # 1,000 #
TOTAL 6,985 #
MTM Fleet Size
The minimum number of active MTM units in the pipeline for 3,000 trucks per day is 2,000. Allowing another 300 units for reserve, maintenance, and repairs results in a total of 2,300 MTMs. The high percentage (15 percent) of spare and reserve MTMs is considered necessary since this is a start-up technology. The expectation of reliability exceeding 99.995 percent means that 55 MTM failures will occur throughout the year. An MTM reliability exceeding 99.995 percent is easily provided for in the physical iron construction and hardware design and assembly, the reliability of motor insulation systems, and the ride suspension characteristics. However, the integration of the C3 with MTM performance is expected to require substantial modification during the start-up period. The effect of the freight pipeline conduit on the generation of radio frequencies, and the interference this may have on the MTM equipment, is a substantial consideration for the integration of the C3 system.
The efficiency of the overall freight pipeline is incumbent on the continuous availability of reliable MTMs. In order to be prepared to maintain service for the start-up and learning period, a large number of spare MTMs available for replacement of failed units should be anticipated. During normal operation in the pipeline, a detected component failure will be translated as an MTM failure. The failed MTM will be required to be shunted to a special handling area for disposition. In the interim, the failed unit will need to be replaced with a complete MTM consisting of five segments. The replacement MTM will allow continued normal operation of the pipeline while repairs take place on the failed MTM. The excess number of reserve and maintenance spares will be absorbed and integrated into regular operations as they become consumed through increased system demand.

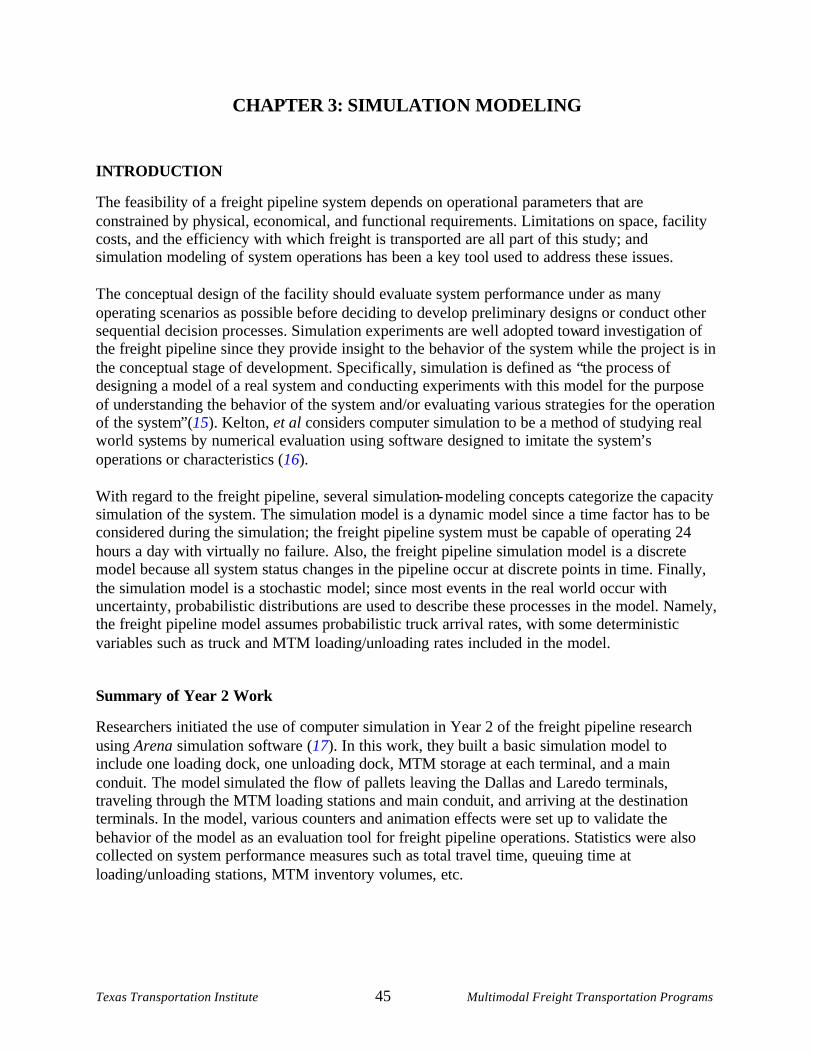
Texas Transportation Institute 45 Multimodal Freight Transportation Programs
CHAPTER 3: SIMULATIO N MODELING
INTRODUCTION
The feasibility of a freight pipeline system depends on operational parameters that are constrained by physical, economical, and functional requirements. Limitations on space, facility costs, and the efficiency with which freight is transported are all part of this study; and simulation modeling of system operations has been a key tool used to address these issues.
The conceptual design of the facility should evaluate system performance under as many operating scenarios as possible before deciding to develop preliminary designs or conduct other sequential decision processes. Simulation experiments are well adopted toward investigation of the freight pipeline since they provide insight to the behavior of the system while the project is in the conceptual stage of development. Specifically, simulation is defined as “the process of designing a model of a real system and co nducting experiments with this model for the purpose of understanding the behavior of the system and/or evaluating various strategies for the operation of the system”(15). Kelton, et al considers computer simulation to be a method of studying real world systems by numerical evaluation using software designed to imitate the system’s operations or characteristics (16). With regard to the freight pipeline, several simulation- modeling concepts categorize the capacity simulation of the system. The simulation model is a dynamic model since a time factor has to be considered during the simulation; the freight pipeline system must be capable of operating 24 hours a day with virtually no failure. Also, the freight pipeline simulation model is a discrete model because all system status changes in the pipeline occur at discrete points in time. Finally, the simulation model is a stochastic model; since most events in the real world occur with uncertainty, probabilistic distributions are used to describe these processes in the model. Namely, the freight pipeline model assumes probabilistic truck arrival rates, with some deterministic variables such as truck and MTM loading/unloading rates included in the model.
Summary of Year 2 Work
Researchers initiated t he use of computer simulation in Year 2 of the freight pipeline research using Arena simulation software (17). In this work, they built a basic simulation model to include one loading dock, one unloading dock, MTM storage at each terminal, and a main conduit. The model simulated the flow of pallets leaving the Dallas and Laredo terminals, traveling through the MTM loading stations and main conduit, and arriving at the destination terminals. In the model, various counters and animation effects were set up to validate the behavior of the model as an evaluation tool for freight pipeline operations. Statistics were also collected on system performance measures such as total travel time, queuing time at loading/unloading stations, MTM inventory volumes, etc.
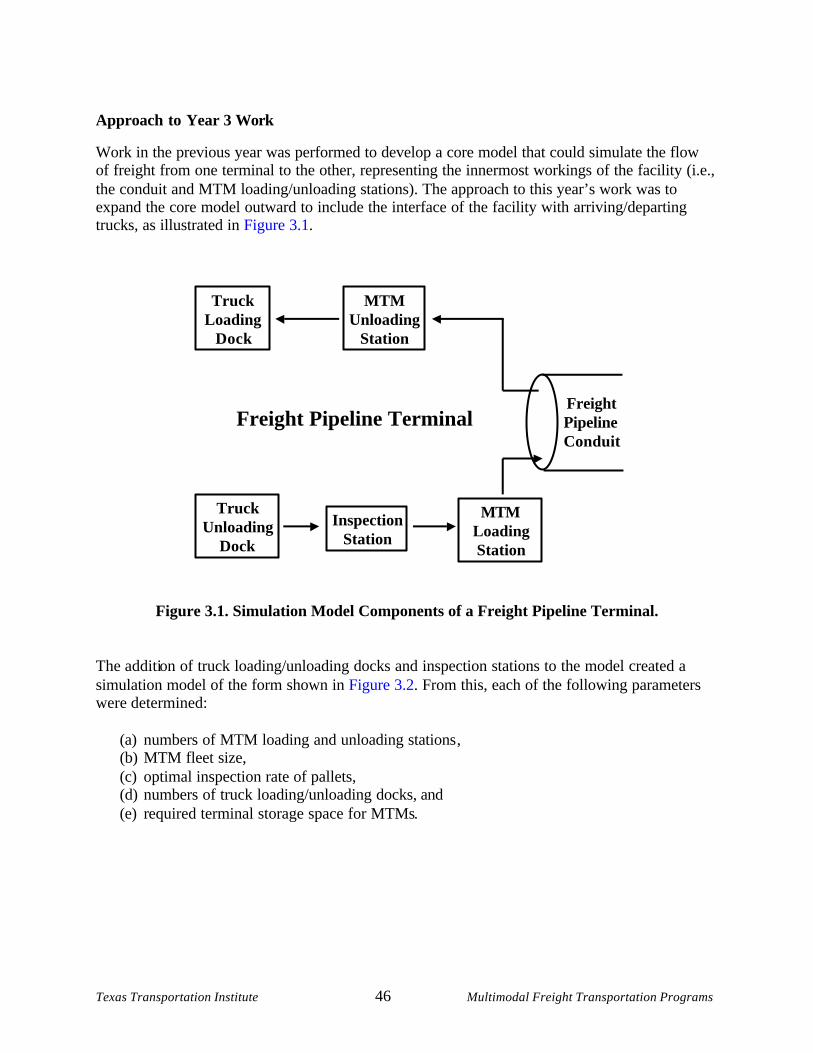
Texas Transportation Institute 46 Multimodal Freight Transportation Programs
Approach to Year 3 Work
Work in the previous year was performed to develop a core model that could simulate the flow of freight from one terminal to the other, representing the innermost workings of the facility (i.e., the conduit and MTM loading/unloading stations). The approach to this year’s work was to expand the core model outward to include the interface of the facility with arriving/departing trucks, as illustrated in Figure 3.1.
Figure 3.1. Simulation Model Components of a Freight Pipeline Terminal. The addition of truck loading/unloading docks and inspection stations to the model created a simulation model of the form shown in Figure 3.2. From this, each of the following parameters were determined:
(a) numbers of MTM loading and unloading stations, (b) MTM fleet size, (c) optimal inspection rate of pallets, (d) numbers of truck loading/unloading docks, and (e) required terminal storage space for MTMs.
TruckUnloading
Dock
InspectionStation
MTMLoadingStation
FreightPipelineConduit
MTMUnloading
Station
TruckLoading
Dock
Freight Pipeline Terminal
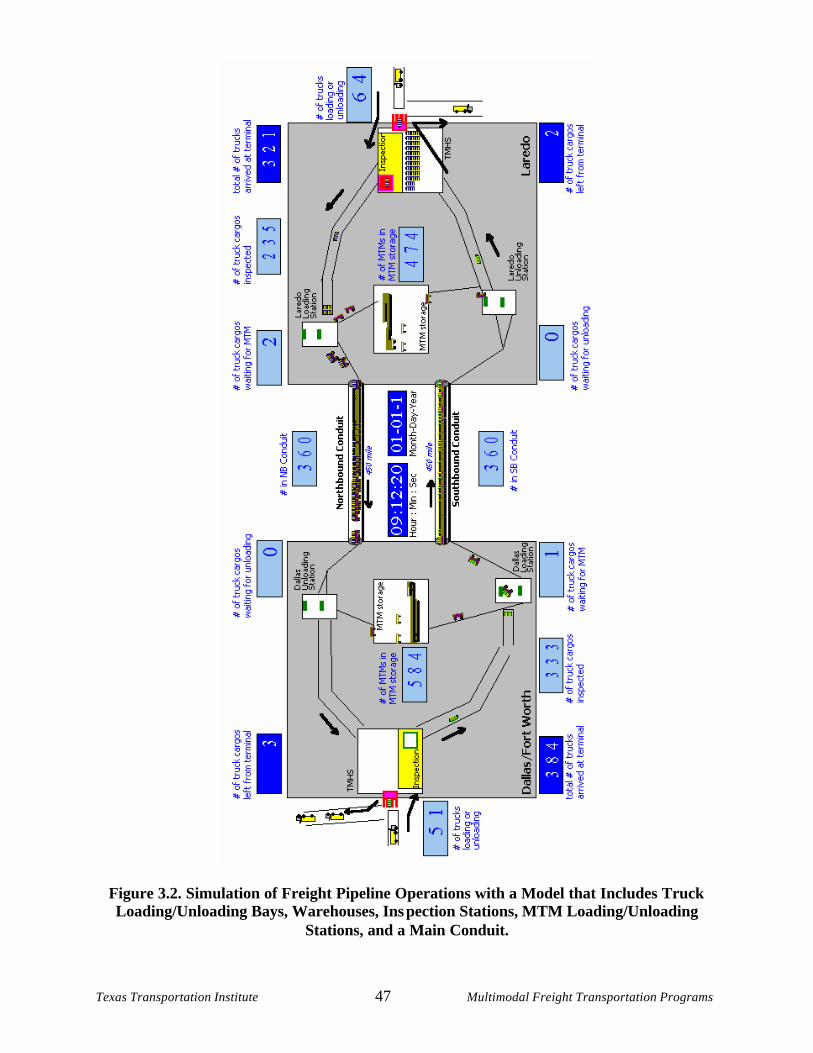
Texas Transportation Institute 47 Multimodal Freight Transportation Programs
Figure 3.2. Simulation of Freight Pipeline Operations with a Model that Includes Truck Loading/Unloading Bays, Warehouses, Inspection Stations, MTM Loading/Unloading
Stations, and a Main Conduit.
Texas Transportation Institute 48 Multimodal Freight Transportation Programs
The research team performed s imulations of freight pipeline operations to acquire output that is useful for:
• observing the overall process under various operating conditions, • analyzing throughput (or number of pallets transferred), • detecting bottlenecks, • measuring queue lengths, and • understanding the interactions between system components using animation.
Details on the simulation model are reported within the two main sections of this chapter – “Basic MTM Transport Modeling,” and “Material Handling System Modeling.” The first section describes how the number of required MTM loading/unloading docks and MTM fleet size were determined. The second section describes the addition of truck loading/unloading docks and inspection stations to the model, and how an optimal pallet inspection rate and number of required truck loading/unloading bays were determined.
BASIC MTM TRANSPORT MODELING
One of the main goals of a simulation model is to optimize system configurations by running the computer program using various operating scenarios. As shown in the previous sections, the freight pipeline consists of several subsystems such as the main conduit, terminal/warehouse systems, and MTM systems. This section discusses the incorporation of these systems in the development of a basic freight pipeline model, and it describes the expansion of this model to include the means by which researchers determined the number of MTM loading stations and the MTM fleet size. For purposes of clarity, an MTM has a cargo capacity equivalent to that one freight truck (30 pallets), with each of the five cars that make up an MTM having the capacity to transport six pallets.
Assumptions
In order to determine the appropriate number of MTM loading docks and total number of MTMs, a basic simulation model was developed. Although the freight pipeline is a conceptual system that begins with minimal constraints in physical or logical layout, the simulation model is based on initial assumptions that correspond to expected system behavior and performance; therefore, some system parameters are assumed as fixed constants during the simulation experiments. The following assumptions are employed during the design stage of the simulation modeling:
• The conduit forms a closed loop system between the two terminals. • An MTM unit has a carrying capacity of 30 pallets (one MTM). • MTMs will travel as a set of five linked cars. • Each MTM car can transport six standard pallets. • MTMs travel the 450-mile main conduit with a steady speed of 60 mph.
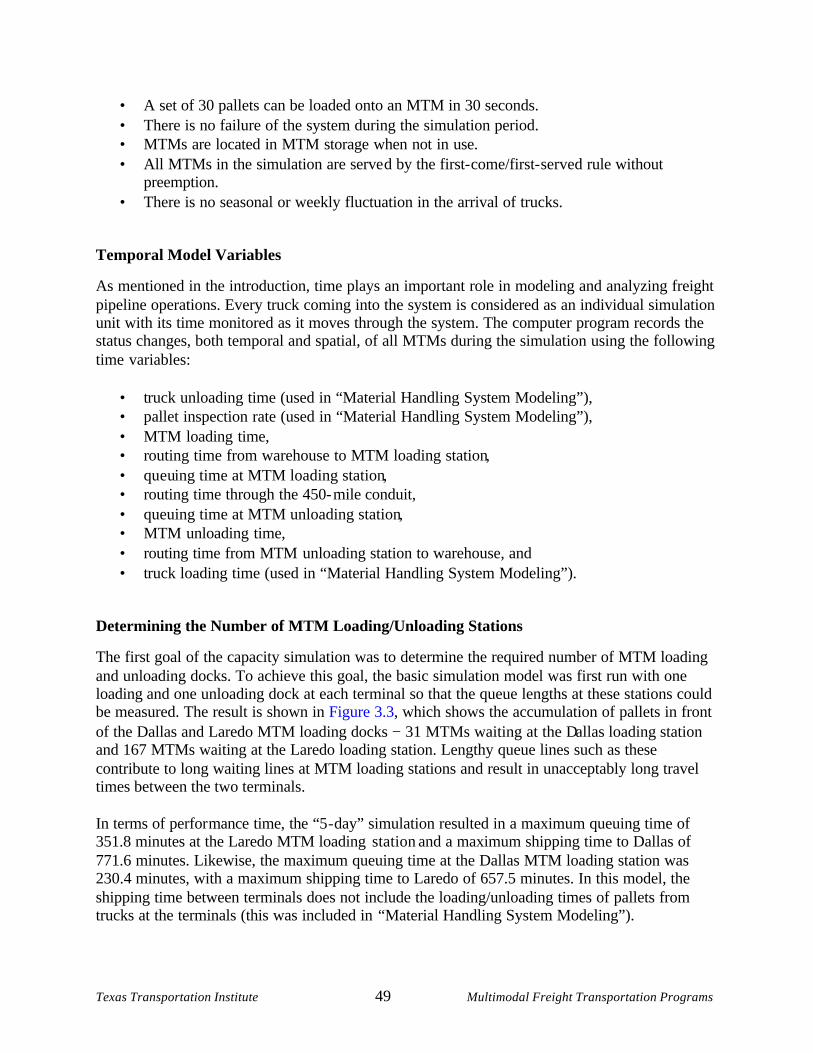
Texas Transportation Institute 49 Multimodal Freight Transportation Programs
• A set of 30 pallets can be loaded onto an MTM in 30 seconds. • There is no failure of the system during the simulation period. • MTMs are located in MTM storage when not in use. • All MTMs in the simulation are serve d by the first- come/first- served rule without
preemption. • There is no seasonal or weekly fluctuation in the arrival of trucks.
Temporal Model Variables
As mentioned in the introduction, time plays an important role in modeling and analyzing freight pipeline operations. Every truck coming into the system is considered as an individual simulation unit with its time monitored as it moves through the system. The computer program records the status changes, both temporal and spatial, of all MTMs during the simulation using the following time variables:
• truck unloading time (used in “Material Handling System Modeling”), • pallet inspection rate (used in “Material Handling System Modeling”), • MTM loading time, • routing time from warehouse to MTM loading station, • queuing time at MTM loading station, • routing time through the 450- mile conduit, • queuing time at MTM unloading station, • MTM unloading time, • routing time from MTM unloading station to warehouse, and • truck loading time (used in “Material Handling System Modeling”).
Determining the Number of MTM Loading/Unloading Stations
The first goal of the capacity simulation was to determine the required number of MTM loading and unloading docks. To achieve this goal, the basic simulation model was first run with one loading and one unloading dock at each terminal so that the queue lengths at these stations could be measured. The result is shown in Figure 3.3, which shows the accumulation of pallets in front of the Dallas and Laredo MTM loading docks − 31 MTMs waiting at the Dallas loading station and 167 MTMs waiting at the Laredo loading station. Lengthy queue lines such as these contribute to long waiting lines at MTM loading stations and result in unacceptably long travel times between the two terminals.
In terms of performance time, the “5-day” simulation resulted in a maximum queuing time of 351.8 minutes at the Laredo MTM loading station and a maximum shipping time to Dallas of 771.6 minutes. Likewise, the maximum queuing time at the Dallas MTM loading station was 230.4 minutes, with a maximum shipping time to Laredo of 657.5 minutes. In this model, the shipping time between terminals does not include the loading/unloading times of pallets from trucks at the terminals (this was included in “Material Handling System Modeling”).
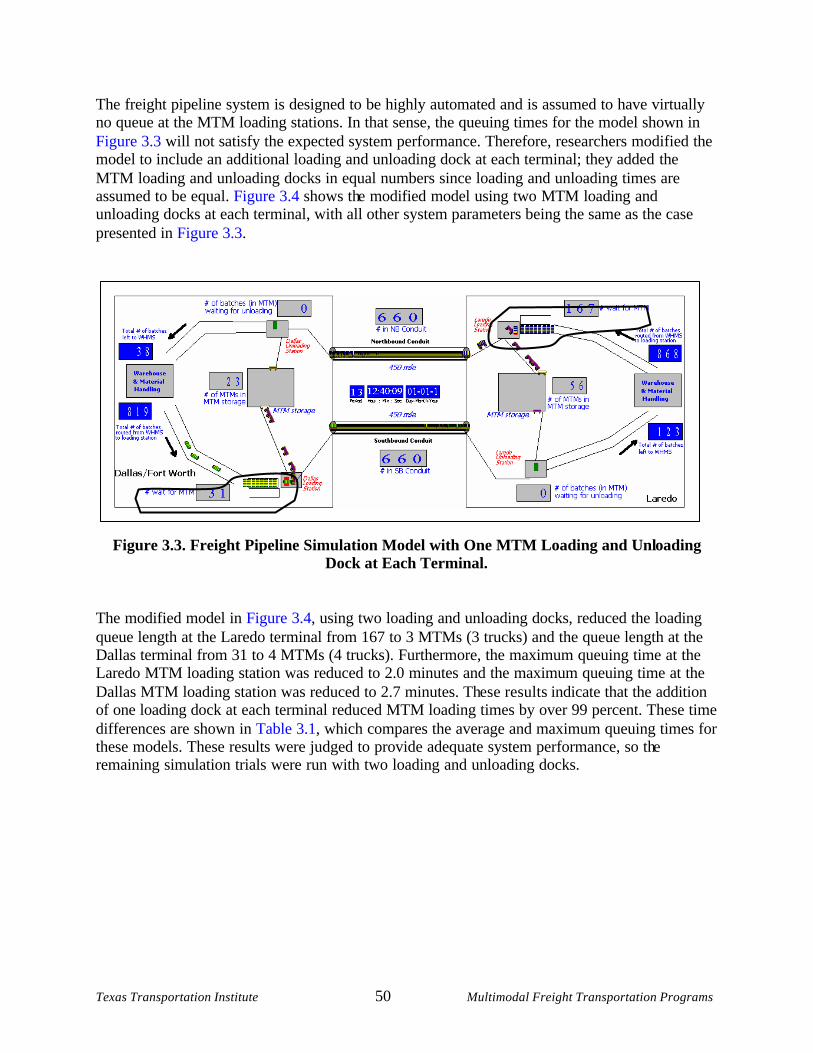
Texas Transportation Institute 50 Multimodal Freight Transportation Programs
The freight pipeline system is designed to be highly automated and is assumed to have virtually no queue at the MTM loading stations. In that sense, the queuing times for the model shown in Figure 3.3 will not satisfy the expected system performance. Therefore, researchers modified the model to include an additional loading and unloading dock at each terminal; they added the MTM loading and unloading docks in equal numbers since loading and unloading times are assumed to be equal. Figure 3.4 shows the modified model using two MTM loading and unloading docks at each terminal, with all other system parameters being the same as the case presented in Figure 3.3.
Figure 3.3. Freight Pipeline Simulation Model with One MTM Loading and Unloading Dock at Each Terminal.
The modified model in Figure 3.4, using two loading and unloading docks, reduced the loading queue length at the Laredo terminal from 167 to 3 MTMs (3 trucks) and the queue length at the Dallas terminal from 31 to 4 MTMs (4 trucks). Furthermore, the maximum queuing time at the Laredo MTM loading station was reduced to 2.0 minutes and the maximum queuing time at the Dallas MTM loading station was reduced to 2.7 minutes. These results indicate that the addition of one loading dock at each terminal reduced MTM loading times by over 99 percent. These time differences are shown in Table 3.1, which compares the average and maximum queuing times for these models. These results were judged to provide adequate system performance, so the remaining simulation trials were run with two loading and unloading docks.
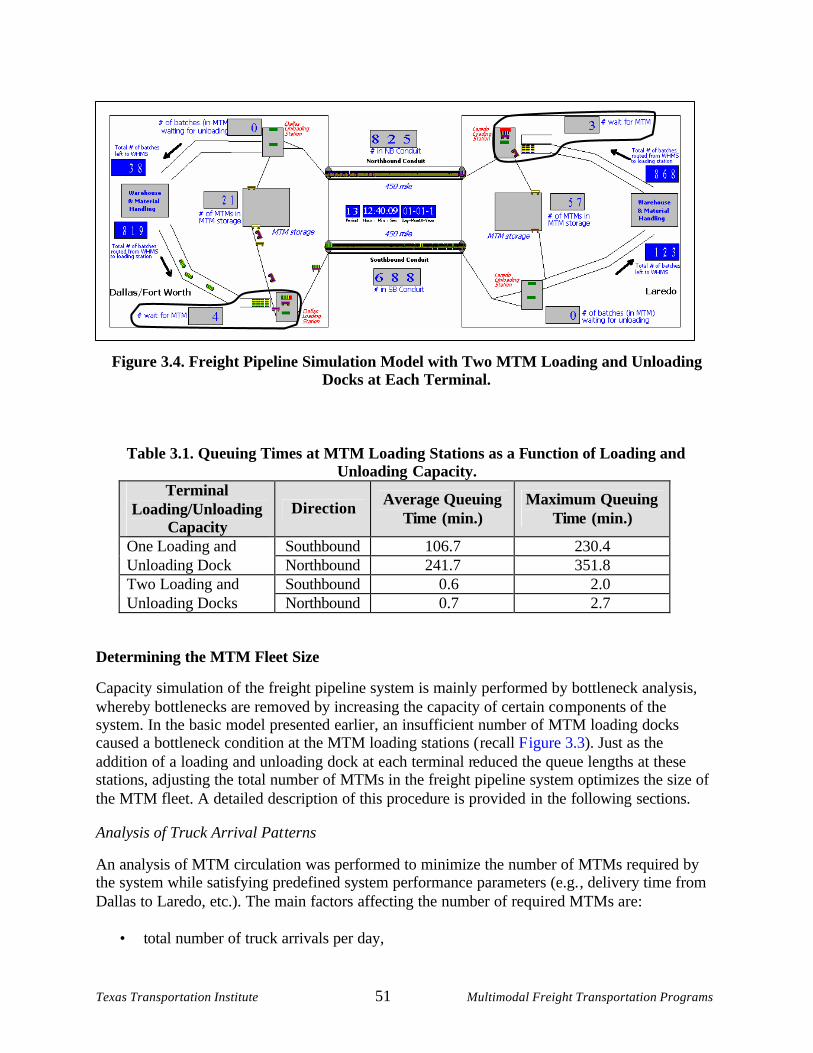
Texas Transportation Institute 51 Multimodal Freight Transportation Programs
Figure 3.4. Freight Pipeline Simulation Model with Two MTM Loading and Unloading Docks at Each Terminal.
Table 3.1. Queuing Times at MTM Loading Stations as a Function of Loading and Unloading Capacity.
Terminal Loading/Unloading
Capacity Direction Average Queuing
Time (min.) Maximum Queuing
Time (min.)
Southbound 106.7 230.4 One Loading and Unloading Dock Northbound 241.7 351.8
Southbound 0.6 2.0 Two Loading and Unloading Docks Northbound 0.7 2.7
Determining the MTM Fleet Size
Capacity simulation of the freight pipeline system is mainly performed by bottleneck analysis, whereby bottlenecks are removed by increasing the capacity of certain co mponents of the system. In the basic model presented earlier, an insufficient number of MTM loading docks caused a bottleneck condition at the MTM loading stations ( recall F igure 3.3). Just as the addition of a loading and unloading dock at each terminal reduced the queue lengths at these stations, adjusting the total number of MTMs in the freight pipeline system optimizes the size of the MTM fleet. A detailed description of this procedure is provided in the following sections.
Analysis of Truck Arrival Patterns
An analysis of MTM circulation was performed to minimize the number of MTMs required by the system while satisfying predefined system performance parameters (e.g., delivery time from Dallas to Laredo, etc.). The main factors affecting the number of required MTMs are:
• total number of truck arrivals per day,
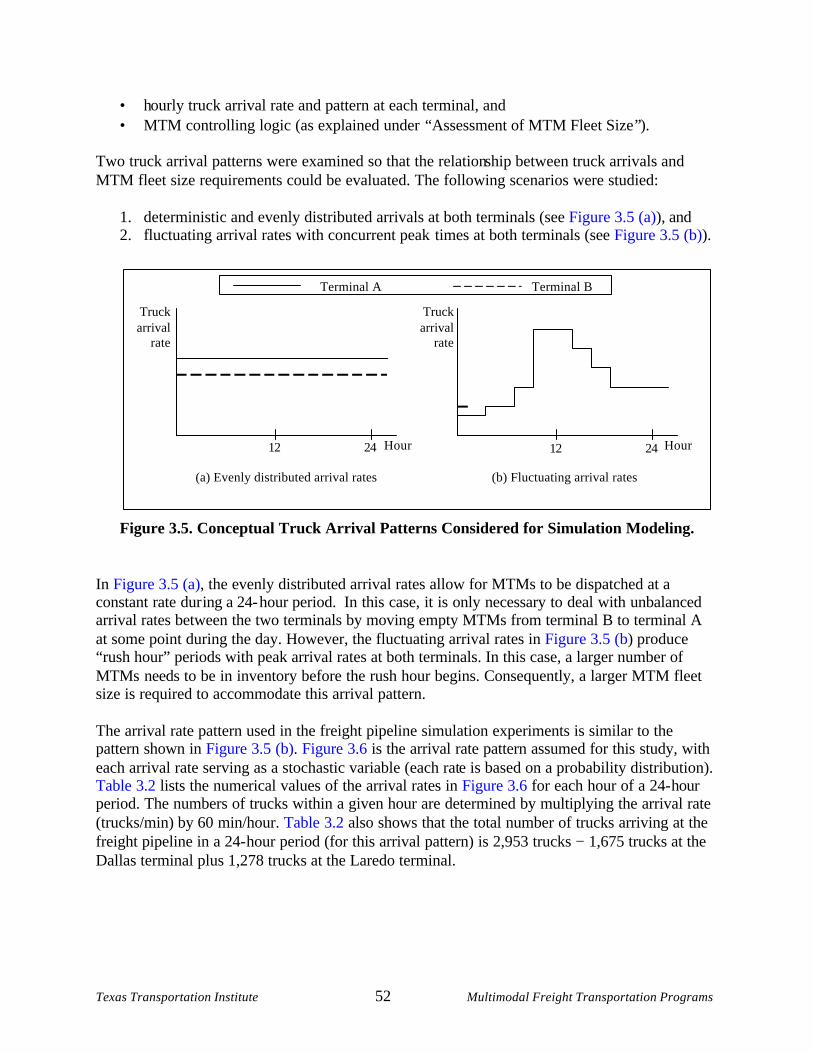
Texas Transportation Institute 52 Multimodal Freight Transportation Programs
• hourly truck arrival rate and pattern at each terminal, and • MTM controlling logic (as explained under “Assessment of MTM Fleet Size ”).
Two truck arrival patterns were examined so that the relationship between truck arrivals and MTM fleet size requirements could be evaluated. The following scenarios were studied:
1. deterministic and evenly distributed arrivals at both terminals (see Figure 3.5 (a)), and 2. fluctuating arrival rates with concurrent peak times at both terminals (see Figure 3.5 (b)).
Figure 3.5. Conceptual Truck Arrival Patterns Considered for Simulation Modeling. In Figure 3.5 (a), the evenly distributed arrival rates allow for MTMs to be dispatched at a constant rate dur ing a 24- hour period. In this case, it is only necessary to deal with unbalanced arrival rates between the two terminals by moving empty MTMs from terminal B to terminal A at some point during the day. However, the fluctuating arrival rates in Figure 3.5 (b) produce “rush hour” periods with peak arrival rates at both terminals. In this case, a larger number of MTMs needs to be in inventory before the rush hour begins. Consequently, a larger MTM fleet size is required to accommodate this arrival pattern. The arrival rate pattern used in the freight pipeline simulation experiments is similar to the pattern shown in Figure 3.5 (b). Figure 3.6 is the arrival rate pattern assumed for this study, with each arrival rate serving as a stochastic variable (each rate is based on a probability distribution). Table 3.2 lists the numerical values of the arrival rates in Figure 3.6 for each hour of a 24- hour period. The numbers of trucks within a given hour are determined by multiplying the arrival rate (trucks/min) by 60 min/hour. Table 3.2 also shows that the total number of trucks arriving at the freight pipeline in a 24-hour period (for this arrival pattern) is 2,953 trucks − 1,675 trucks at the Dallas terminal plus 1,278 trucks at the Laredo terminal.
(a) Evenly distributed arrival rates
Hour
Truck arrival
rate
(b) Fluctuating arrival rates
Hour 12 24 12 24
Truck arrival
rate
Terminal A Terminal B
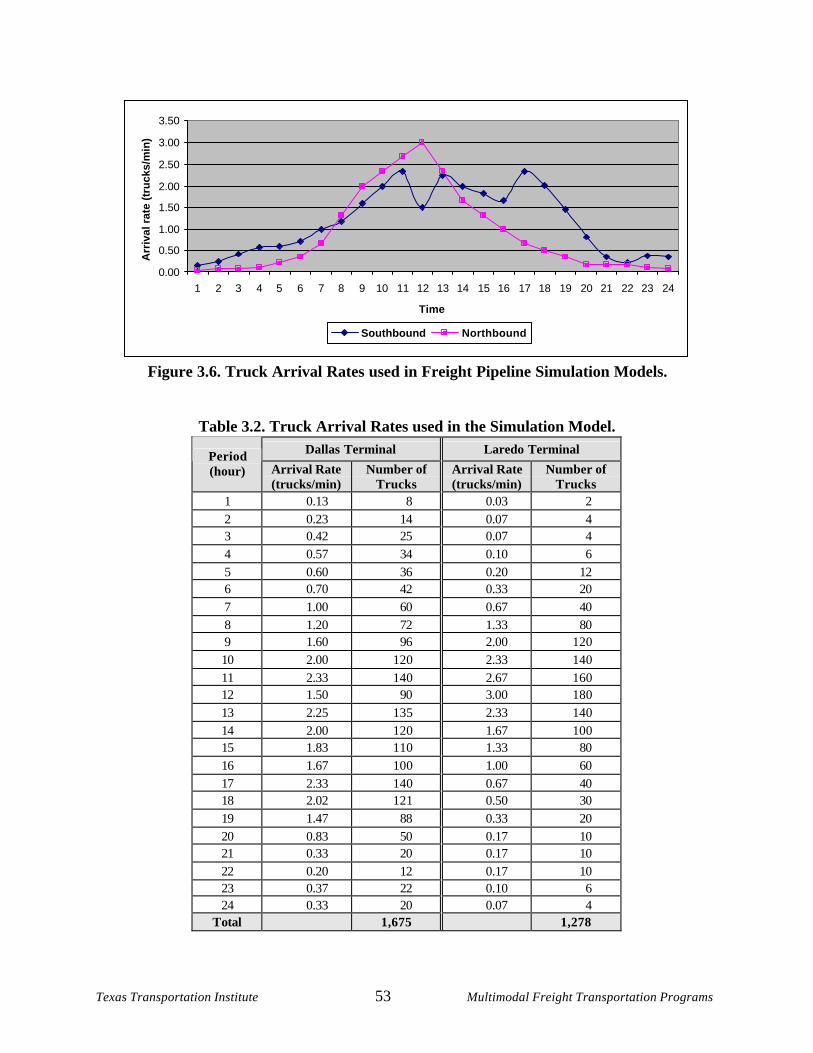
Texas Transportation Institute 53 Multimodal Freight Transportation Programs
0.00
0.50
1.00
1.50
2.00
2.50
3.00
3.50
1 2 3 4 5 6 7 8 9 10 11 12 13 14 15 16 17 18 19 20 21 22 23 24
Time
Arr
ival
rat
e (t
ruck
s/m
in)
Southbound Northbound
Figure 3.6. Truck Arrival Rates used in Freight Pipeline Simulation Models.
Table 3.2. Truck Arrival Rates used in the Simulation Model. Dallas Terminal Laredo Terminal Period
(hour) Arrival Rate (trucks/min)
Number of Trucks
Arrival Rate (trucks/min)
Number of Trucks
1 0.13 8 0.03 2 2 0.23 14 0.07 4 3 0.42 25 0.07 4 4 0.57 34 0.10 6 5 0.60 36 0.20 12 6 0.70 42 0.33 20 7 1.00 60 0.67 40 8 1.20 72 1.33 80 9 1.60 96 2.00 120 10 2.00 120 2.33 140 11 2.33 140 2.67 160 12 1.50 90 3.00 180 13 2.25 135 2.33 140 14 2.00 120 1.67 100 15 1.83 110 1.33 80 16 1.67 100 1.00 60 17 2.33 140 0.67 40 18 2.02 121 0.50 30 19 1.47 88 0.33 20 20 0.83 50 0.17 10 21 0.33 20 0.17 10 22 0.20 12 0.17 10 23 0.37 22 0.10 6 24 0.33 20 0.07 4
Total 1,675 1,278
Texas Transportation Institute 54 Multimodal Freight Transportation Programs
Assessment of MTM Fleet Size
All MTM operations in the freight pipeline are to be controlled by the C3 system. In actual operations, this system would provide the controlling logic to continuously allocate portions of the MTM fleet to each terminal so that operations can be sustained indefinitely. However, the controlling logic required for this to occur is beyond the scope of the current simulation study. The absence of any method of reallocating MTMs in the model would eventually result in one terminal becoming deficient in MTMs due to the differences in arrival rate patterns shown in Figure 3.6. Therefore, a simple heuristic algorithm is used in the model to transfer empty MTMs from a surplus terminal to a terminal in need of MTMs so that system performance is not diminished. With the controlling algorithm in place, simulation experiments were conducted using different numbers of MTMs to determine the minimum number of MTMs that would prevent degradation of the system’s performance. The results are summarized in Table 3.3, which shows the results from models using fleet sizes of 1,800; 1,900 ; 2,000; 2,100 ; and 2,200 MTMs. The termination time of these simulation experiments was set to 7,200 minutes (end of the fifth day). All data shown in Table 3.3 are averages of the results obtained over this five- day period.
As shown in Table 3.3, the maximum MTM loading queue time at the Laredo terminal decreases rapidly as the number of MTMs increases. Models with 1,800 MTMs and 1,900 MTMs have unacceptably long waiting times, which is due to a lack of sufficient numbers of MTMs in storage at the Laredo terminal during some portion of the simulation period. Notice that less than one MTM in storage indicates that no MTMs are available when pallets arrive at the MTM loading station and an MTM from storage is requested. The model with 2,000 MTMs shows improved performance in terms of MTM loading queue times and numbers of MTMs in storage, but shows a long maximum loading queue of 50.53 MTMs. However, the models with 2,100 and 2,200 MTMs demonstrate an acceptable performance in all criteria. These models have no bottlenecks in the system, and it is reasonable to conclude that the system requires at least 2,100 MTMs to sustain operations indefinitely.
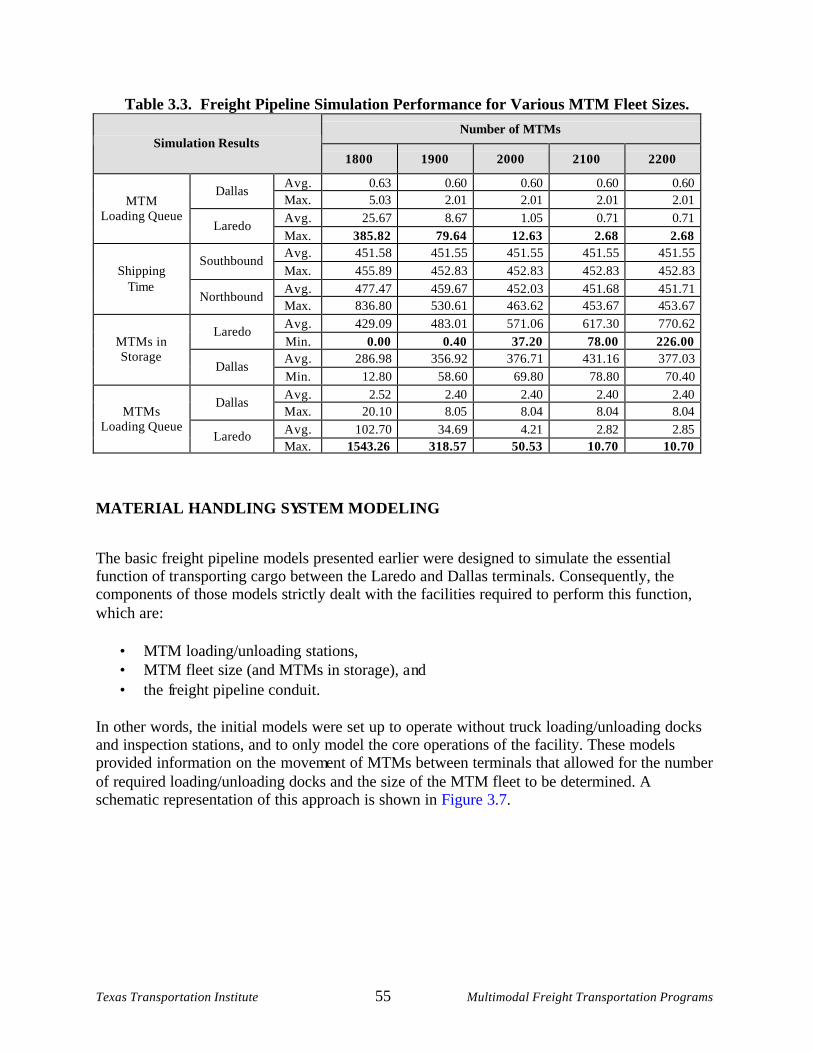
Texas Transportation Institute 55 Multimodal Freight Transportation Programs
Table 3.3. Freight Pipeline Simulation Performance for Various MTM Fleet Sizes. Number of MTMs
Simulation Results 1800 1900 2000 2100 2200
Avg. 0.63 0.60 0.60 0.60 0.60 Dallas
Max. 5.03 2.01 2.01 2.01 2.01 Avg. 25.67 8. 67 1.05 0.71 0.71
MTM Loading Queue
Laredo Max. 385.82 79.64 12.63 2.68 2.68 Avg. 451.58 451.55 451.55 451.55 451.55
Southbound Max. 455.89 452.83 452.83 452.83 452.83 Avg. 477.47 459.67 452.03 451.68 451.71
Shipping Time
Northbound Max. 836.80 530.61 463.62 453.67 45 3.67 Avg. 429.09 483.01 571.06 617.30 770.62
Laredo Min. 0.00 0.40 37.20 78.00 226.00 Avg. 286.98 356.92 376.71 431.16 377.03
MTMs in Storage
Dallas Min. 12.80 58.60 69.80 78.80 70.40 Avg. 2.52 2.40 2.40 2.40 2.40
Dallas Max. 20.10 8.05 8.04 8.04 8.04 Avg. 102.70 34.69 4.21 2.82 2.85
MTMs Loading Queue
Laredo Max. 1543.26 318.57 50.53 10.70 10.70
MATERIAL HANDLING SYSTEM MODELING
The basic freight pipeline models presented earlier were designed to simulate the essential function of tr ansporting cargo between the Laredo and Dallas terminals. Consequently, the components of those models strictly dealt with the facilities required to perform this function, which are:
• MTM loading/unloading stations, • MTM fleet size (and MTMs in storage), a nd • the freight pipeline conduit.
In other words, the initial models were set up to operate without truck loading/unloading docks and inspection stations, and to only model the core operations of the facility. These models provided information on the movement of MTMs between terminals that allowed for the number of required loading/unloading docks and the size of the MTM fleet to be determined. A schematic representation of this approach is shown in Figure 3.7.
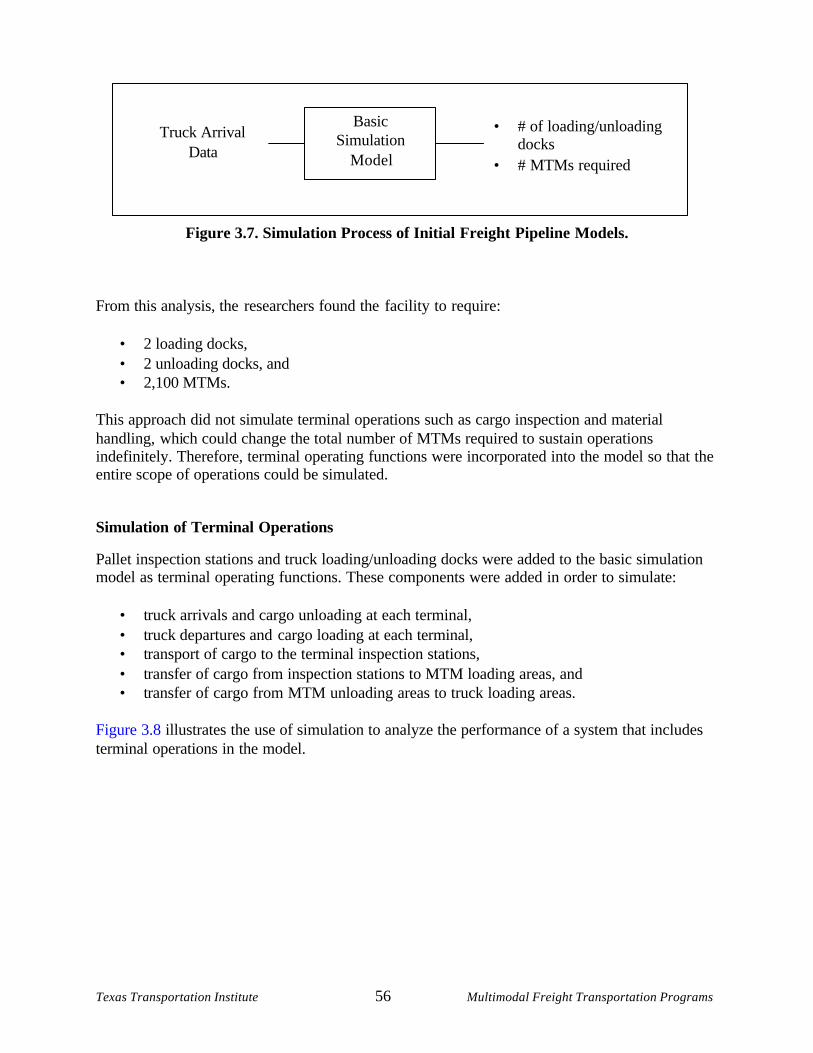
Texas Transportation Institute 56 Multimodal Freight Transportation Programs
Figure 3.7. Simulation Process of Initial Freight Pipeline Models. From this analysis, the researchers found the facility to require:
• 2 loading docks, • 2 unloading docks, and • 2,100 MTMs.
This approach did not simulate terminal operations such as cargo inspection and material handling, which could change the total number of MTMs required to sustain operations indefinitely. Therefore, terminal operating functions were incorporated into the model so that the entire scope of operations could be simulated.
Simulation of Terminal Operations
Pallet inspection stations and truck loading/unloading docks were added to the basic simulation model as terminal operating functions. These components were added in order to simulate:
• truck arrivals and cargo unloading at each terminal, • truck departures and cargo loading at each terminal, • transport of cargo to the terminal inspection stations, • transfer of cargo from inspection stations to MTM loading areas, and • transfer of cargo from MTM unloading areas to truck loading areas.
Figure 3.8 illustrates the use of simulation to analyze the performance of a system that includes terminal operations in the model.
Basic Simulation
Model
• # of loading/unloading docks
• # MTMs required
Truck Arrival Data
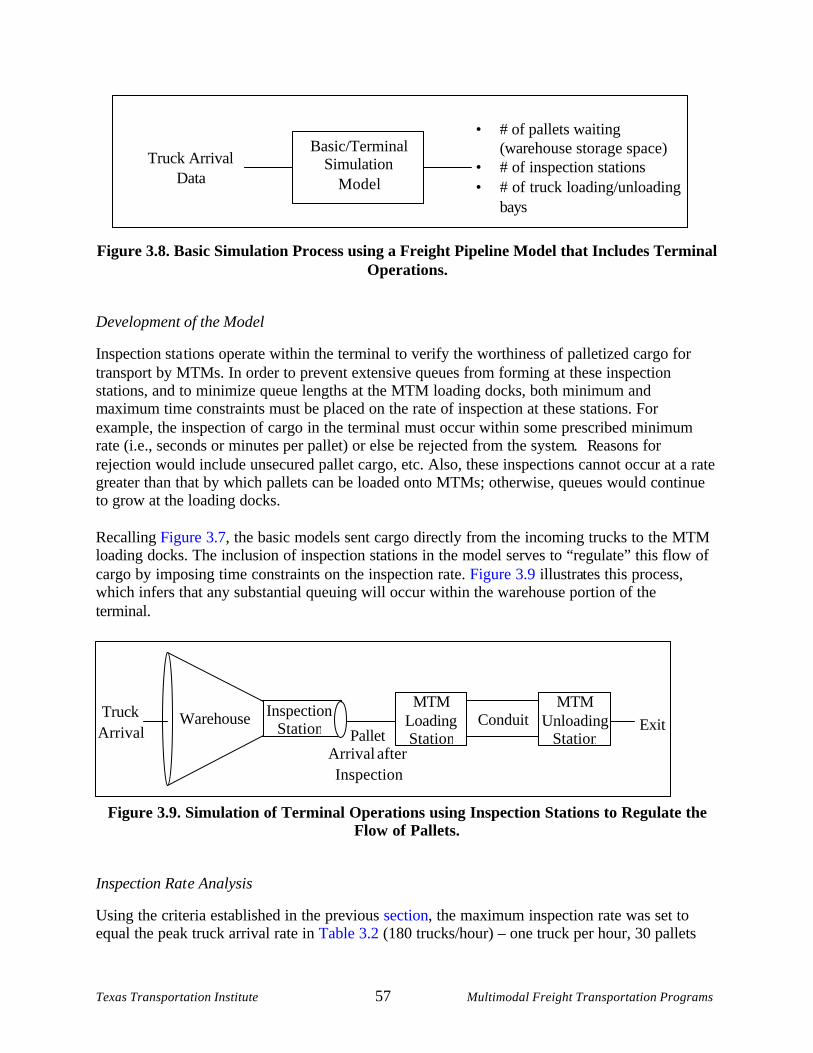
Texas Transportation Institute 57 Multimodal Freight Transportation Programs
Exit
Figure 3.8. Basic Simulation Process using a Freight Pipeline Model that Includes Terminal
Operations.
Development of the Model
Inspection sta tions operate within the terminal to verify the worthiness of palletized cargo for transport by MTMs. In order to prevent extensive queues from forming at these inspection stations, and to minimize queue lengths at the MTM loading docks, both minimum and maximum time constraints must be placed on the rate of inspection at these stations. For example, the inspection of cargo in the terminal must occur within some prescribed minimum rate (i.e., seconds or minutes per pallet) or else be rejected from the system. Reasons for rejection would include unsecured pallet cargo, etc. Also, these inspections cannot occur at a rate greater than that by which pallets can be loaded onto MTMs; otherwise, queues would continue to grow at the loading docks. Recalling Figure 3.7, the basic models sent cargo directly from the incoming trucks to the MTM loading docks. The inclusion of inspection stations in the model serves to “regulate” this flow of cargo by imposing time constraints on the inspection rate. Figure 3.9 illustrates this process, which infers that any substantial queuing will occur within the warehouse portion of the terminal.
Figure 3.9. Simulation of Terminal Operations using Inspection Stations to Regulate the Flow of Pallets.
Inspection Rat e Analysis
Using the criteria established in the previous section, the maximum inspection rate was set to equal the peak truck arrival rate in Table 3.2 (180 trucks/hour) – one truck per hour, 30 pallets
Truck Arrival Pallet
Arrival after Inspection
Basic/Terminal Simulation
Model
Truck Arrival Data
• # of pallets waiting (warehouse storage space)
• # of inspection stations • # of truck loading/unloading
bays
MTM Loading Station
Conduit MTM
Unloading Station
Inspection Station
Warehouse
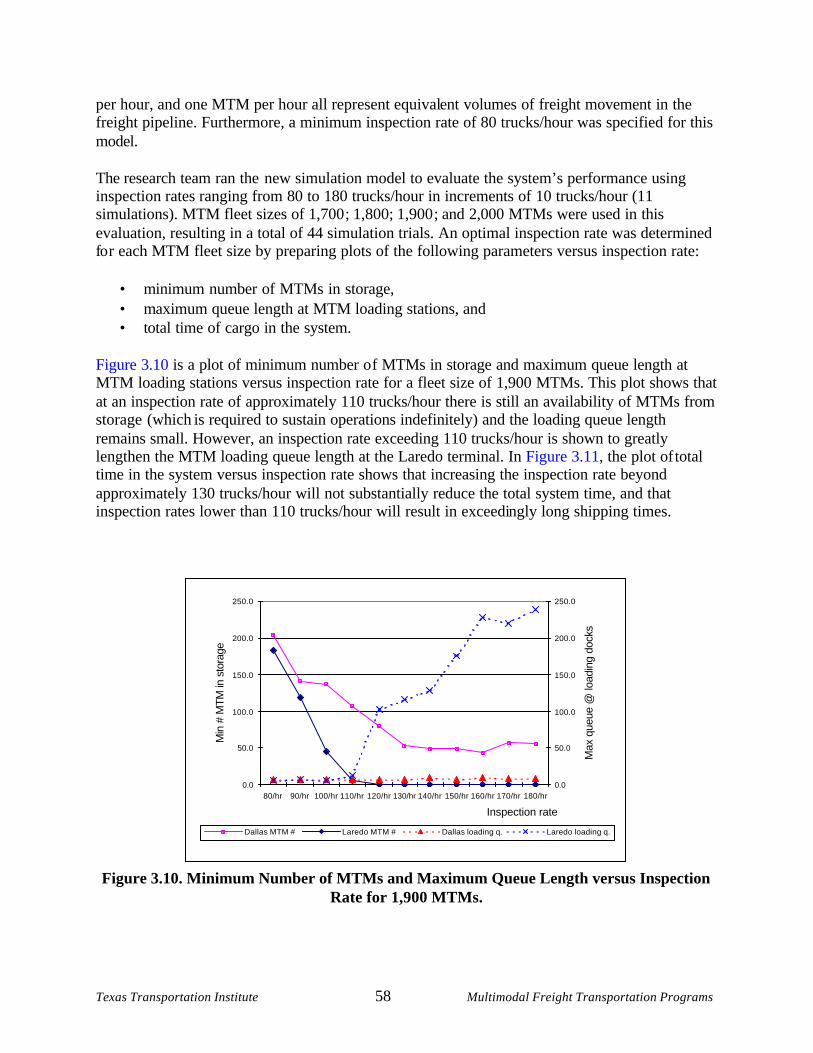
Texas Transportation Institute 58 Multimodal Freight Transportation Programs
per hour, and one MTM per hour all represent equivalent volumes of freight movement in the freight pipeline. Furthermore, a minimum inspection rate of 80 trucks/hour was specified for this model. The research team ran the new simulation model to evaluate the system’s performance using inspection rates ranging from 80 to 180 trucks/hour in increments of 10 trucks/hour (11 simulations). MTM fleet sizes of 1,700 ; 1,800; 1,900 ; and 2,000 MTMs were used in this evaluation, resulting in a total of 44 simulation trials. An optimal inspection rate was determined fo r each MTM fleet size by preparing plots of the following parameters versus inspection rate:
• minimum number of MTMs in storage, • maximum queue length at MTM loading stations, and • total time of cargo in the system.
Figure 3.10 is a plot of minimum number o f MTMs in storage and maximum queue length at MTM loading stations versus inspection rate for a fleet size of 1,900 MTMs. This plot shows that at an inspection rate of approximately 110 trucks/hour there is still an availability of MTMs from storage (which is required to sustain operations indefinitely) and the loading queue length remains small. However, an inspection rate exceeding 110 trucks/hour is shown to greatly lengthen the MTM loading queue length at the Laredo terminal. In Figure 3.11, the plot of total time in the system versus inspection rate shows that increasing the inspection rate beyond approximately 130 trucks/hour will not substantially reduce the total system time, and that inspection rates lower than 110 trucks/hour will result in exceedingly long shipping times.
Figure 3.10. Minimum Number of MTMs and Maximum Queue Length versus Inspection
Rate for 1,900 MTMs.
0.0
50.0
100.0
150.0
200.0
250.0
80/hr 90/hr 100/hr 110/hr 120/hr 130/hr 140/hr 150/hr 160/hr 170/hr 180/hr
Inspection rate
Min
# M
TM in
sto
rage
0.0
50.0
100.0
150.0
200.0
250.0M
ax q
ueue
@ lo
adin
g do
cks
Dallas MTM # Laredo MTM # Dallas loading q. Laredo loading q.
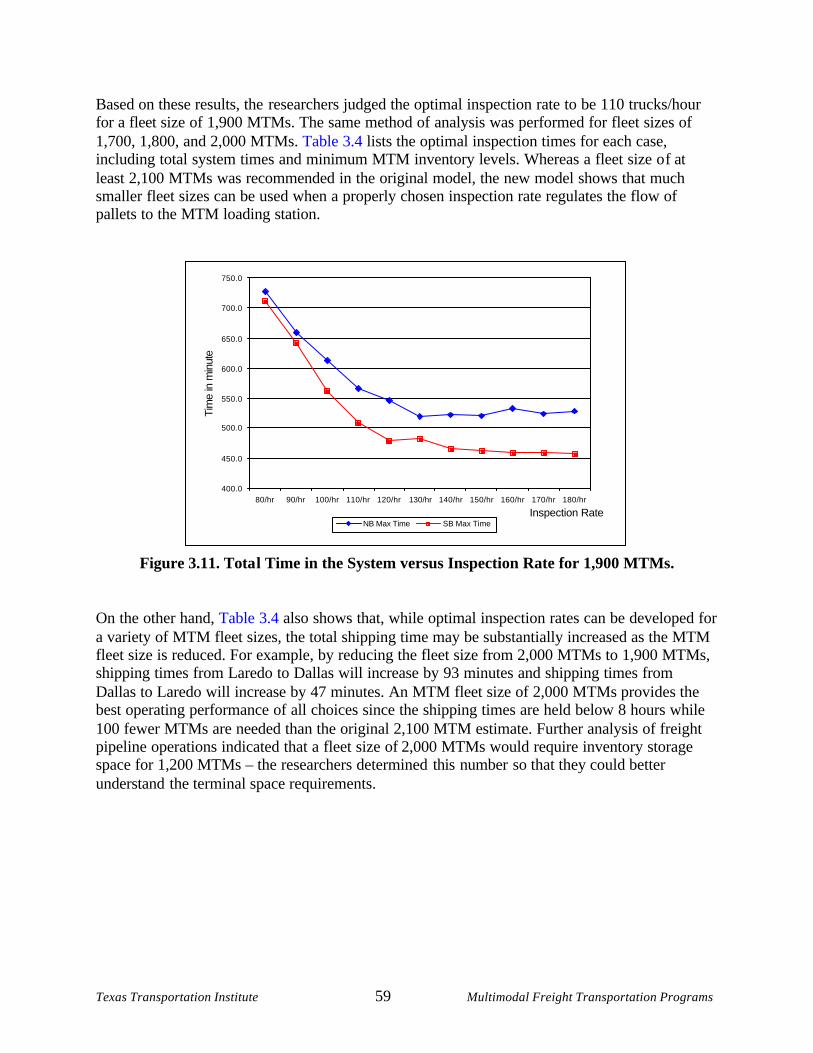
Texas Transportation Institute 59 Multimodal Freight Transportation Programs
Based on these results, the researchers judged the optimal inspection rate to be 110 trucks/hour for a fleet size of 1,900 MTMs. The same method of analysis was performed for fleet sizes of 1,700, 1,800, and 2,000 MTMs. Table 3.4 lists the optimal inspection times for each case, including total system times and minimum MTM inventory levels. Whereas a fleet size o f at least 2,100 MTMs was recommended in the original model, the new model shows that much smaller fleet sizes can be used when a properly chosen inspection rate regulates the flow of pallets to the MTM loading station.
Figure 3.11. Tota l Time in the System versus Inspection Rate for 1,900 MTMs. On the other hand, Table 3.4 also shows that, while optimal inspection rates can be developed for a variety of MTM fleet sizes, the total shipping time may be substantially increased as the MTM fleet size is reduced. For example, by reducing the fleet size from 2,000 MTMs to 1,900 MTMs, shipping times from Laredo to Dallas will increase by 93 minutes and shipping times from Dallas to Laredo will increase by 47 minutes. An MTM fleet size of 2,000 MTMs provides the best operating performance of all choices since the shipping times are held below 8 hours while 100 fewer MTMs are needed than the original 2,100 MTM estimate. Further analysis of freight pipeline operations indicated that a fleet size of 2,000 MTMs would require inventory storage space for 1,200 MTMs – the researchers determined this number so that they could better understand the terminal space requirements.
400.0
450.0
500.0
550.0
600.0
650.0
700.0
750.0
80/hr 90/hr 100/hr 110/hr 120/hr 130/hr 140/hr 150/hr 160/hr 170/hr 180/hr
Inspection Rate
Tim
e in
min
ute
NB Max Time SB Max Time
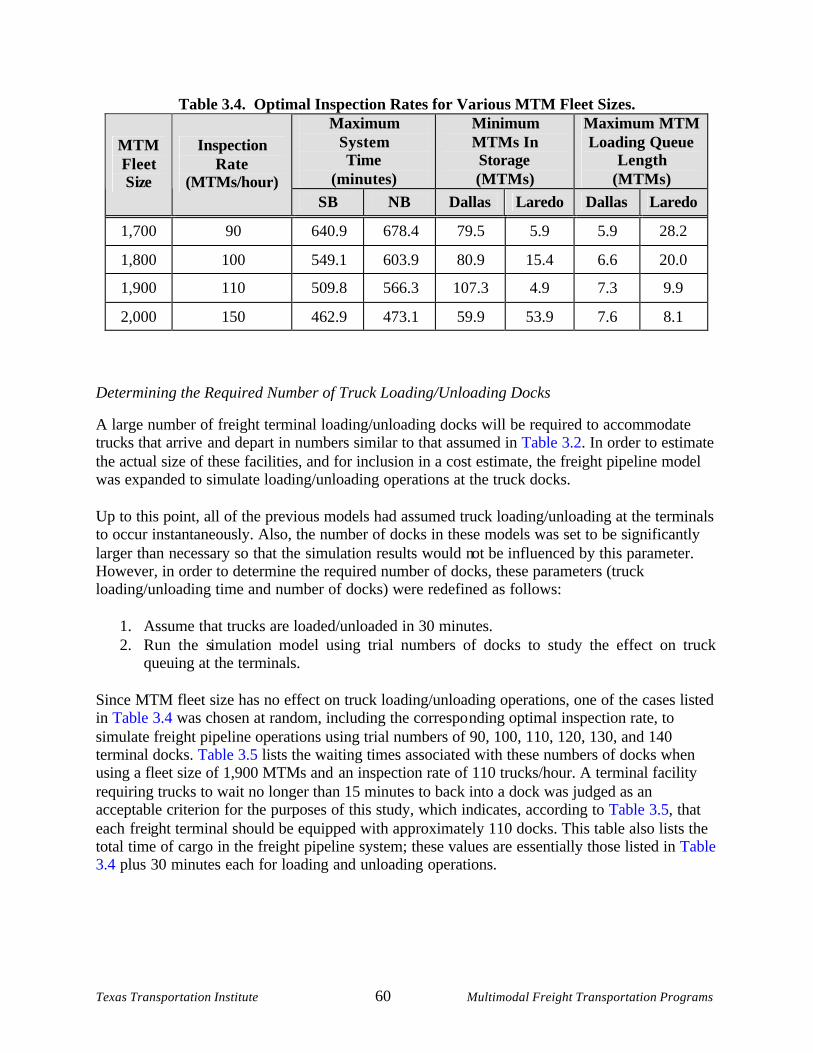
Texas Transportation Institute 60 Multimodal Freight Transportation Programs
Table 3.4. Optimal Inspection Rates for Various MTM Fleet Sizes. Maximum
System Time
(minutes)
Minimum MTMs In Storage (MTMs)
Maximum MTM Loading Queue
Length (MTMs)
MTM Fleet Size
Inspection Rate
(MTMs/hour) SB NB Dallas Laredo Dallas Laredo
1,700 90 640.9 678.4 79.5 5.9 5.9 28.2
1,800 100 549.1 603.9 80.9 15.4 6.6 20.0
1,900 110 509.8 566.3 107.3 4.9 7.3 9.9
2,000 150 462.9 473.1 59.9 53.9 7.6 8.1
Determining the Required Number of Truck Loading/Unloading Docks
A large number of freight terminal loading/unloading docks will be required to accommodate trucks that arrive and depart in numbers similar to that assumed in Table 3.2. In order to estimate the actual size of these facilities, and for inclusion in a cost estimate, the freight pipeline model was expanded to simulate loading/unloading operations at the truck docks. Up to this point, all of the previous models had assumed truck loading/unloading at the terminals to occur instantaneously. Also, the number of docks in these models was set to be significantly larger than necessary so that the simulation results would not be influenced by this parameter. However, in order to determine the required number of docks, these parameters (truck loading/unloading time and number of docks) were redefined as follows:
1. Assume that trucks are loaded/unloaded in 30 minutes. 2. Run the simulation model using trial numbers of docks to study the effect on truck
queuing at the terminals. Since MTM fleet size has no effect on truck loading/unloading operations, one of the cases listed in Table 3.4 was chosen at random, including the correspo nding optimal inspection rate, to simulate freight pipeline operations using trial numbers of 90, 100, 110, 120, 130, and 140 terminal docks. Table 3.5 lists the waiting times associated with these numbers of docks when using a fleet size of 1,900 MTMs and an inspection rate of 110 trucks/hour. A terminal facility requiring trucks to wait no longer than 15 minutes to back into a dock was judged as an acceptable criterion for the purposes of this study, which indicates, according to Table 3.5, that each freight terminal should be equipped with approximately 110 docks. This table also lists the total time of cargo in the freight pipeline system; these values are essentially those listed in Table 3.4 plus 30 minutes each for loading and unloading operations.
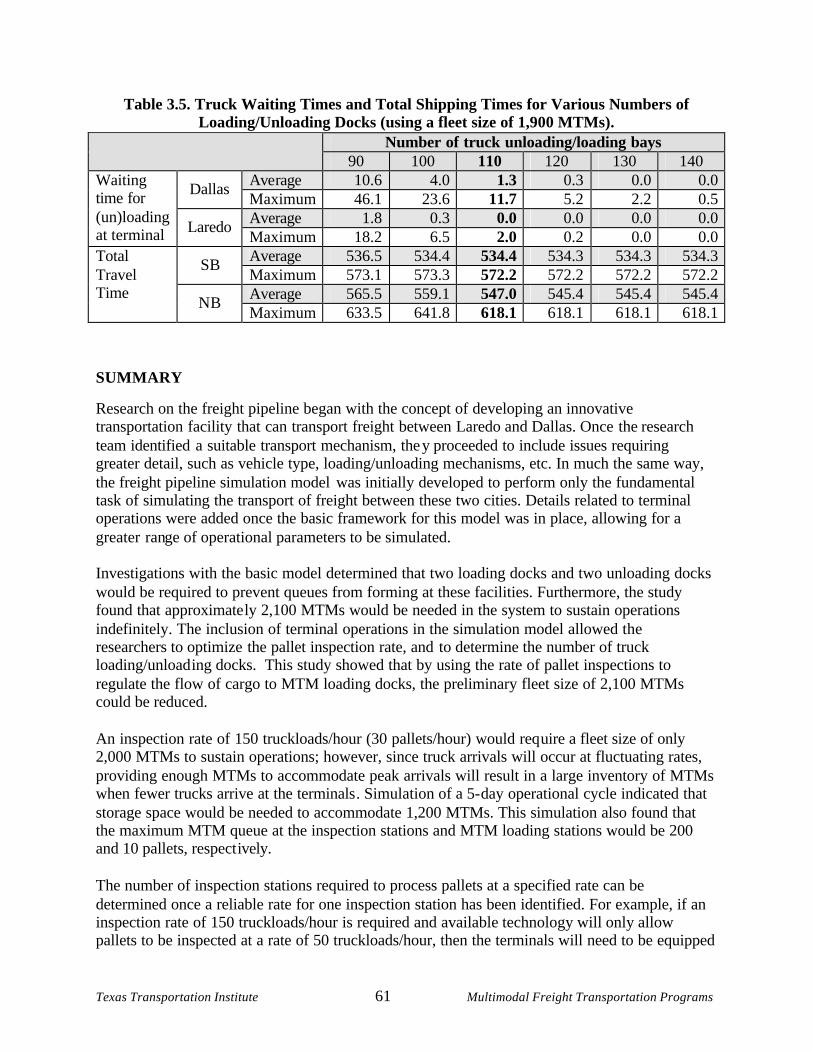
Texas Transportation Institute 61 Multimodal Freight Transportation Programs
Table 3.5. Truck Waiting Times and Total Shipping Times for Various Numbers of Loading/Unloading Docks (using a fleet size of 1,900 MTMs).
Number of truck unloading/loading bays 90 100 110 120 130 140
Average 10.6 4.0 1.3 0.3 0.0 0.0 Dallas Maximum 46.1 23.6 11.7 5.2 2.2 0.5 Average 1.8 0.3 0.0 0.0 0.0 0.0
Waiting time for (un)loading at terminal Laredo
Maximum 18.2 6.5 2.0 0.2 0.0 0.0 Average 536.5 534.4 534.4 534.3 534.3 534.3 SB Maximum 573.1 573.3 572.2 572.2 572.2 572.2 Average 565.5 559.1 547.0 545.4 545.4 545.4
Total Travel Time
NB Maximum 633.5 641.8 618.1 618.1 618.1 618.1
SUMMARY
Research on the freight pipeline began with the concept of developing an innovative transportation facility that can transport freight between Laredo and Dallas. Once the research team identified a suitable transport mechanism, they proceeded to include issues requiring greater detail, such as vehicle type, loading/unloading mechanisms, etc. In much the same way, the freight pipeline simulation model was initially developed to perform only the fundamental task of simulating the transport of freight between these two cities. Details related to terminal operations were added once the basic framework for this model was in place, allowing for a greater range of operational parameters to be simulated. Investigations with the basic model determined that two loading docks and two unloading docks would be required to prevent queues from forming at these facilities. Furthermore, the study found that approximately 2,100 MTMs would be needed in the system to sustain operations indefinitely. The inclusion of terminal operations in the simulation model allowed the researchers to optimize the pallet inspection rate, and to determine the number of truck loading/unloading docks. This study showed that by using the rate of pallet inspections to regulate the flow of cargo to MTM loading docks, the preliminary fleet size of 2,100 MTMs could be reduced. An inspection rate of 150 truckloads/hour (30 pallets/hour) would require a fleet size of only 2,000 MTMs to sustain operations; however, since truck arrivals will occur at fluctuating rates, providing enough MTMs to accommodate peak arrivals will result in a large inventory of MTMs when fewer trucks arrive at the terminals. Simulation of a 5-day operational cycle indicated that storage space would be needed to accommodate 1,200 MTMs. This simulation also found that the maximum MTM queue at the inspection stations and MTM loading stations would be 200 and 10 pallets, respectively. The number of inspection stations required to process pallets at a specified rate can be determined once a reliable rate for one inspection station has been identified. For example, if an inspection rate of 150 truckloads/hour is required and available technology will only allow pallets to be inspected at a rate of 50 truckloads/hour, then the terminals will need to be equipped
Texas Transportation Institute 62 Multimodal Freight Transportation Programs
with three inspection stations. The simulation of terminal operations also indicated that approximately 110 truck loading/unloading docks would be required at each terminal in order to keep truck queue times under 15 minutes. Much of the above information has been used to estimate costs of the freight pipeline terminals. MTM storage space, numbers of manufactured MTMs, truck loading/unloading docks and floor space, and pallet queue space are all used in Chapter 4 to estimate capital construction costs for the freight pipeline.
Texas Transportation Institute 63 Multimodal Freight Transportation Programs
CHAPTER 4: ECONOMIC ANALYSIS
INTRODUCTION
The rationale for constructing a freight pipeline should be supported by a cost- benefit analysis that compares favorably to that of competing transportation modes. Specifically, the approach to this analysis should compare the value of a freight pipeline to the value of constructing additional highway lanes that would support the same truck traffic. In order to develop such an analysis, the costs and benefits for each aspect of the freight pipeline must be quantified by considering factors such as construction/operating costs, environmental impacts, freight transport capacities, and related improvements in the mobility and safety of passenger vehicles.
This chapter describes the means by which the research team prepared the economic analysis and presents the initial findings of this work. The analysis concludes with a “most likely” estimate of the freight pipeline’s value as a transportation facility, and it provides a preliminary risk analysis that is based on selected cost and operational scenarios. The chapter is arranged into three main sections, which are:
• capital cost estimates • operating cost e stimates • cost- benefit a nalysis
The section on capital cost estimates describes how initial costs have been prepared, and the second section provides estimates of the annual costs incurred during freight pipeline operations. Finally, the section on cost- benefit analysis presents the computational methods and results of the economic analysis.
CAPITAL COST ESTIMAT ES
The estimate of capital costs for the freight pipeline must be considered as “early” cost estimates, or even “conceptual screening,” since the scope of this research is to determine its economic value based on a conceptual rather than detailed design. The expected accuracy of early estimates are defined by the Association for Advancement of Cost Engineering as –50 percent to +100 percent for concept screening, and –30 percent to +50 percent for feasibility studies (18 ). The Construction Industry Institute defines the accuracy of cost estimates for feasibility studies (order- of- magnitude estimates) as –30 percent to +50 percent (18). Early cost estimates may be developed from historical data, or by loosely comparing major equipment, materials, and construction operations to available unit costs. Given the scope of this underground freight facility, cost comparisons were made to the most analogous construction case histories available and/or current unit costs available from industry.
Texas Transportation Institute 64 Multimodal Freight Transportation Programs
Conduit Construction
The dimensions of the conduit are governed by the size of freight (or pallets) to be transported thro ugh the pipeline, by the size required for a running surface, and by the clearance required to minimize drag between the structure and MTM. In compliance with capacity and aerodynamic specifications, the freight pipeline is proposed to contain three operating tracks, each capable of transporting a 52- inch wide MTM that requires a 36- inch clearance from the sidewalls of the conduit. The 72- inch tall MTM is assumed to be elevated a maximum of 12 inches above the conduit floor, with a 36- inch clearance required between the top of the MTM and the roof of the conduit (19). As a result, the conduit dimensions will have an approximate 20- ft width and 10- ft height.
Construction Cost Estimation Method
This early estimate was developed using a generalized method o f factored estimating that incorporates the use of historical costs from other large - scale projects. Part of the real cost will depend upon details such as pipeline location, special geologic features, decisions to construct over or under waterways, etc., but the substantial portion of this cost will be based on basic material costs, earthwork quantities, and constructability of the 450- mile corridor. Considering the early conceptual stage of design, the research team examined four major transmission projects to aid in identifying the costs associated with this unique pipeline facility. Two of these projects, the proposed TGV High- Speed Rail project and the Mary Rhodes Memorial Pipeline, were designed for construction in Texas. The Central Arizona Project and the proposed San Diego Aqueduct are Western projects that have been selected for review due to their vast length and project scope. The application of each project to this study will be discussed in the following sections.
Texas TGV High-Speed Rail Project
In 1991, the Texas TGV Consortium submitted a franchise application to the Texas High- Speed Rail Authority seeking approval to construct and operate a high- speed rail facility throughout the corridors between Dallas, Houston, and San Antonio (2 ). The preliminary engineering designs and cost estimates, prepared as part of this application, provide useful information on the anticipated needs for rail construction along the Interstate 35 corridor. In particular, quantity estimates of earthwork, trackwork, and right-of-way purchases provide a reasonable estimate of quantities that may be required for construction of the freight pipeline. The scope of the freight pipeline is similar to this project in the following ways:
• construction and grading of a vertical alignment for rail facilities, • topographic and geotechnical features, • population densities along the I-35 corridor, • pipeline utility relocation requirements, and • location of project facilities in Texas.
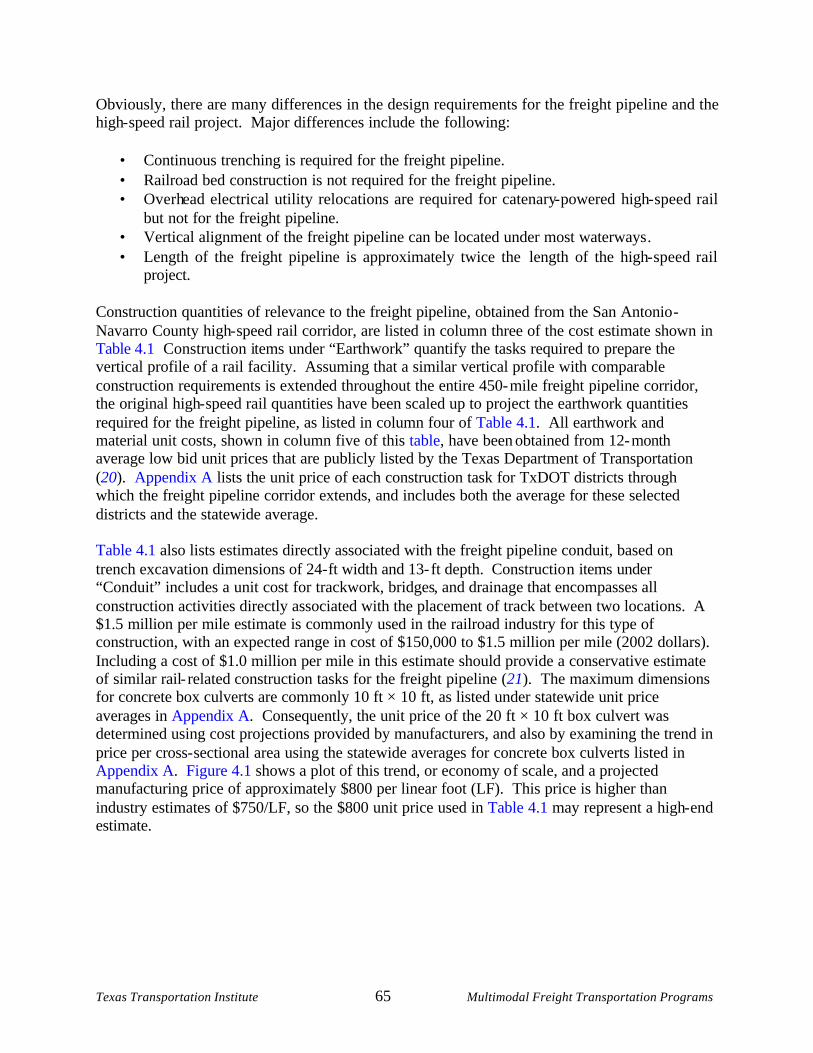
Texas Transportation Institute 65 Multimodal Freight Transportation Programs
Obviously, there are many differences in the design requirements for the freight pipeline and the high- speed rail project. Major differences include the following:
• Continuous trenching is required for the freight pipeline. • Railroad bed construction is not required for the freight pipeline. • Overhead electrical utility relocations are required for catenary- powered high- speed rail
but not for the freight pipeline. • Vertical alignment of the freight pipeline can be located under most waterways . • Length of the freight pipeline is approximately twice the length of the high- speed rail
project. Construction quantities of relevance to the freight pipeline, obtained from the San Antonio -Navarro County high- speed rail corridor, are listed in column three of the cost estimate shown in Table 4.1 Construction items under “Earthwork” quantify the tasks required to prepare the vertical profile of a rail facility. Assuming that a similar vertical profile with comparable construction requirements is extended throughout the entire 450- mile freight pipeline corridor, the original high- speed rail quantities have been scaled up to project the earthwork quantities required for the freight pipeline, as listed in column four of Table 4.1. All earthwork and material unit costs, shown in column five of this table, have been obtained from 12- month average low bid unit prices that are publicly listed by the Texas Department of Transportation (20). Appendix A lists the unit price of each construction task for TxDOT districts through which the freight pipeline corridor extends, and includes both the average for these selected districts and the statewide average. Table 4.1 also lists estimates directly associated with the freight pipeline conduit, based on trench excavation dimensions of 24- ft width and 13- ft depth. Constructio n items under “Conduit” includes a unit cost for trackwork, bridges, and drainage that encompasses all construction activities directly associated with the placement of track between two locations. A $1.5 million per mile estimate is commonly used in the railroad industry for this type of construction, with an expected range in cost of $150,000 to $1.5 million per mile (2002 dollars). Including a cost of $1.0 million per mile in this estimate should provide a conservative estimate of similar rail- related construction tasks for the freight pipeline (21). The maximum dimensions for concrete box culverts are commonly 10 ft × 10 ft, as listed under statewide unit price averages in Appendix A. Consequently, the unit price of the 20 ft × 10 ft box culvert was determined using cost projections provided by manufacturers, and also by examining the trend in price per cross- sectional area using the statewide averages for concrete box culverts listed in Appendix A. Figure 4.1 shows a plot of this trend, or economy o f scale, and a projected manufacturing price of approximately $800 per linear foot (LF). This price is higher than industry estimates of $750/LF, so the $800 unit price used in Table 4.1 may represent a high- end estimate.
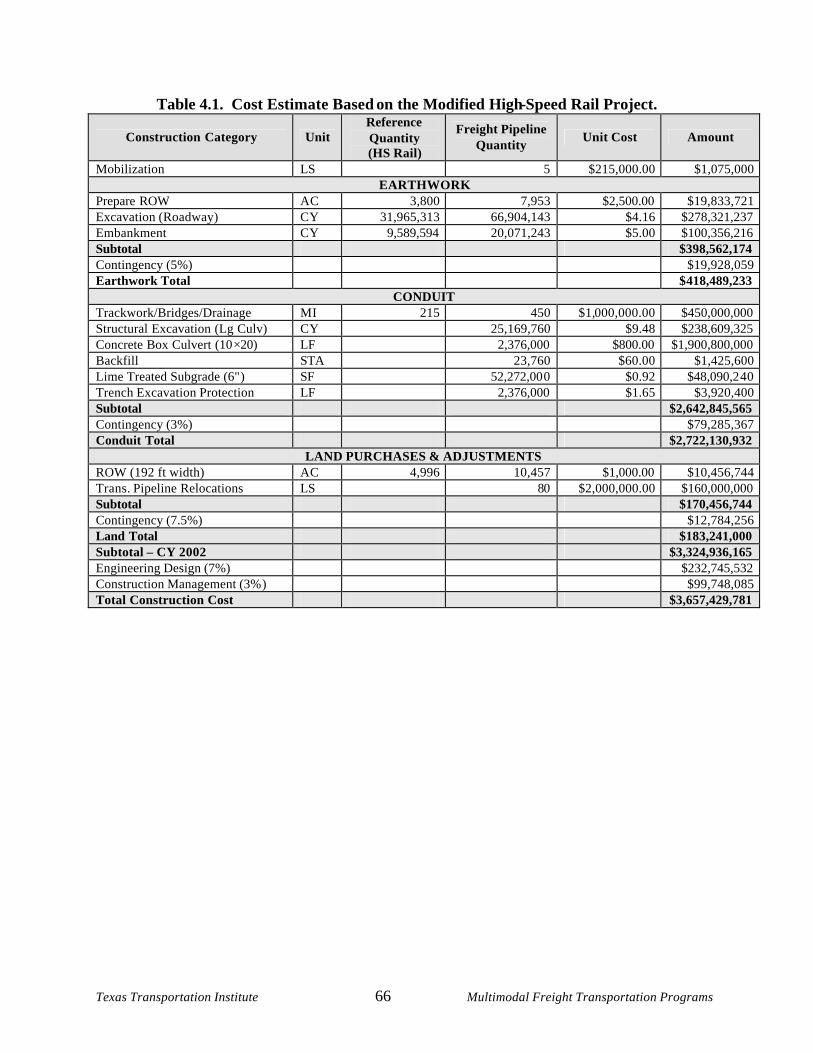
Texas Transportation Institute 66 Multimodal Freight Transportation Programs
Table 4.1. Cost Estimate Based on the Modified High-Speed Rail Project.
Construction Category Unit Reference Quantity (HS Rail)
Freight Pipeline Quantity
Unit Cost Amount
Mobilization LS 5 $215,000.00 $1,075,000 EARTHWORK
Prepare ROW AC 3,800 7,953 $2,500.00 $19,833,721 Excavation (Roadway) CY 31,965,313 66,904,143 $4.16 $278,321,237 Embankment CY 9,589,594 20,071,243 $5.00 $100,356,216 Subtotal $398,562,174 Contingency (5%) $19,928,059 Earthwork Total $418,489,233
CONDUIT Trackwork/Bridges/Drainage MI 215 450 $1,000,000.00 $450,000,000 Structural Excavation (Lg Culv) CY 25,169,760 $9.48 $238,609,325 Concrete Box Culvert (10×20) LF 2,376,000 $800.00 $1,900,800,000 Backfill STA 23,760 $60.00 $1,425,600 Lime Treated Subgrade (6") SF 52,272,000 $0.92 $48,090,240 Trench Excavation Protection LF 2,376,000 $1.65 $3,920,400 Subtotal $2,642,845,565 Contingency (3%) $79,285,367 Conduit Total $2,722,130,932
LAND PURCHASES & ADJUSTMENTS ROW (192 ft width) AC 4,996 10,457 $1,000.00 $10,456,744 Trans. Pipeline Relocations LS 80 $2,000,000.00 $160,000,000 Subtotal $170,456,744 Contingency (7.5%) $12,784,256 Land Total $183,241,000 Subtotal – CY 2002 $3,324,936,165 Engineering Design (7%) $232,745,532 Construction Management (3%) $99,748,085 Total Construction Cost $3,657,429,781
Texas Transportation Institute 67 Multimodal Freight Transportation Programs
$0.00
$2.00
$4.00
$6.00
$8.00
$10.00
$12.00
$14.00
$16.00
$18.00
$20.00
0 50 100 150 200
Cross-Sectional Area of Culvert (SF)
Cos
t ($)
200 Sq. Ft. Box Culvert ~ $4.00/sq.ft.($800.00/LF)
Figure 4.1. Projected Unit Price for a 20 ft × 10 ft Concrete Box Culvert. Construction items under “Land Purchases and Adjustments” in Table 4.1 include the cost of purchasing right - of- way ROW and the cost of relocating petroleum transmission lines that cross the anticipated freight pipeline corridor (see Chapter 5 for a description of pipeline relocation issues). The ROW unit price is based on average land prices provided by the Texas A&M Real Estate Center, and the required average width is based on the estimated needs for the high- speed rail project (22). While the width of ROW required for the freight pipeline may be much less than 192 ft, this width is used to compensate for cases when purchase agreements can only be obtained for larger acreage. Contingencies have been applied to the subtotal for each construction cost category, and engineering design and construction management fees are calculated as a perce ntage of the base cost estimate. The total construction cost for the freight pipeline was estimated to be $3.66 billion, as shown in Table 4.1. The following are considerations to be used in determining the validity of this estimate:
• Trackwork and bridges for rail facilities are usually valued together in lump sums at $1 million per mile. While the ballast and subballast work associated with this cost are not relevant to pipeline construction, any discrepancies in this rate should be offset by unforeseen costs associated with the unique design requirements of the conduit structure (i.e., arched rather than square structure and related additions to earthwork volumes, additional reinforcing requirements of the concrete structure, drainage allowances of the pipeline, etc.).
Texas Transportation Institute 68 Multimodal Freight Transportation Programs
• The vertical alignment of the freight pipeline will not have the stringent grade restrictions of the high- speed rail. Even though, reductions in actual earthwork quantities cannot be determined until an actual pipeline profile is designed for comparison to the existing topography.
Mary Rhodes Memorial Pipeline
In 1993, construction began on a 66- inch water pipeline from Lake Texana to Corpus Christi following the city’s purchase of 41,840 acre- feet of water per year from the Lavaca- Navidad River Authority. The 101- mile pipeline was completed in one year at a cost of $127 million, and it is designed to meet Corpus Christi’s projected growth in water demand through the year 2050 (23). Based on the construction requirements and project scope of the Mary Rhodes pipeline, and since the project has been built in Texas, this facility is a reasonable choice to provide an order-of-magnitude estimate for the freight pipeline. For example, many of the same rivers that will need to be crossed by the freight pipeline were crossed by the Mary Rhodes facility using an open cut construction method. The similarities in scope for these two projects are summarized below:
• Both projects are Texas facilities. • Mary Rhodes pipeline required seven open river cuts; an approach that may be required
for the freight pipeline. • Construction of an underground concrete conduit is required. • Permitting and regulatory compliance standards will be the same
Differences in the design of a freight pipeline and the Mary Rhodes Pipeline include:
• Mary Rhodes pipeline uses a 5.5-ft diameter circular concrete pipe, while the freight pipeline will require a 10 ft × 20 ft box culvert.
• Geotechnical properties along the Texas coast will differ from those along the freight pipeline corridor.
• Grade requirements of the vertical profile are different for freight transport and water transmission projects.
• Rivers along the Texas coast are more broad and shallow than may be expected throughout the Interstate 35 Laredo-Dallas corridor.
• Participation by a larger number of construction firms will be required for the 450-mile freight pipeline than was used by the 101-mile Mary Rhodes pipeline.
The researcher calculated the cost estimate in this scenario using a factor by which the scope of the Mary Rhodes project could be scaled up to match the scope of the freight pipeline. This factor was determined by comparing differences in the cost of concrete structures and excavation costs. Considering a $200/LF unit price of a 66- inch concrete pipe, material costs for the freight pipeline should be approximately four times that of the water pipeline ($800/LF for a 10 ft × 20 ft concrete box culvert). Similarly, structural excavation for the water pipeline is approximately
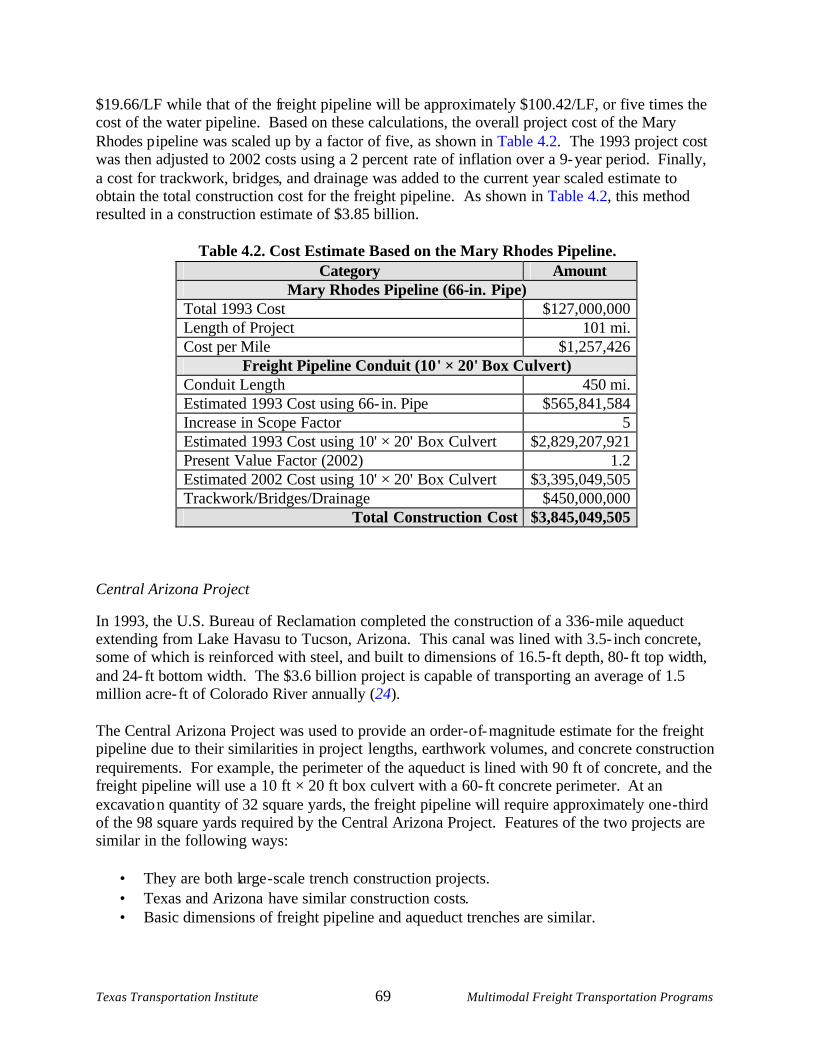
Texas Transportation Institute 69 Multimodal Freight Transportation Programs
$19.66/LF while that of the freight pipeline will be approximately $100.42/LF, or five times the cost of the water pipeline. Based on these calculations, the overall project cost of the Mary Rhodes p ipeline was scaled up by a factor of five, as shown in Table 4.2. The 1993 project cost was then adjusted to 2002 costs using a 2 percent rate of inflation over a 9- year period. Finally, a cost for trackwork, bridges, and drainage was added to the current year scaled estimate to obtain the total construction cost for the freight pipeline. As shown in Table 4.2, this method resulted in a construction estimate of $3.85 billion.
Table 4.2. Cost Estimate Based on the Mary Rhodes Pipeline. Category Amount
Mary Rhodes Pipeline (66-in. Pipe) Total 1993 Cost $127,000,000 Length of Project 101 mi. Cost per Mile $1,257,426
Freight Pipeline Conduit (10 ' × 20' Box Culvert) Conduit Length 450 mi. Estimated 1993 Cost using 66- in. Pipe $565,841,584 Increase in Scope Factor 5 Estimated 1993 Cost using 10' × 20' Box Culvert $2,829,207,921 Present Value Factor (2002) 1.2 Estimated 2002 Cost using 10' × 20' Box Culvert $3,395,049,505 Trackwork/Bridges/Drainage $450,000,000
Total Construction Cost $3,845,049,505
Central Arizona Project
In 1993, the U.S. Bureau of Reclamation completed the co nstruction of a 336- mile aqueduct extending from Lake Havasu to Tucson, Arizona. This canal was lined with 3.5- inch concrete, some of which is reinforced with steel, and built to dimensions of 16.5- ft depth, 80- ft top width, and 24- ft bottom width. The $3.6 billion project is capable of transporting an average of 1.5 million acre- ft of Colorado River annually (24). The Central Arizona Project was used to provide an order-of-magnitude estimate for the freight pipeline due to their similarities in project lengths, earthwork volumes, and concrete construction requirements. For example, the perimeter of the aqueduct is lined with 90 ft of concrete, and the freight pipeline will use a 10 ft × 20 ft box culvert with a 60-ft concrete perimeter. At an excavation quantity of 32 square yards, the freight pipeline will require approximately one-third of the 98 square yards required by the Central Arizona Project. Features of the two projects are similar in the following ways:
• They are both large-scale trench construction projects. • Texas and Arizona have similar construction costs. • Basic dimensions of freight pipeline and aqueduct trenches are similar.
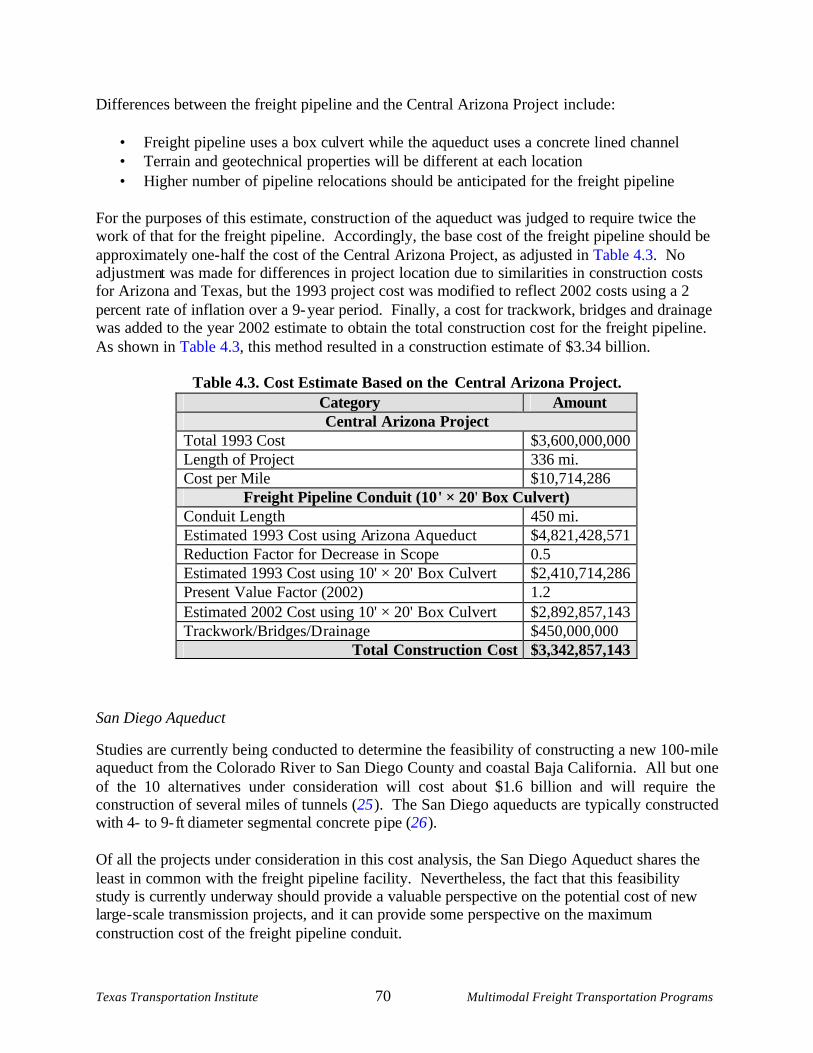
Texas Transportation Institute 70 Multimodal Freight Transportation Programs
Differences between the freight pipeline and the Central Arizona Project include:
• Freight pipeline uses a box culvert while the aqueduct uses a concrete lined channel • Terrain and geotechnical properties will be different at each location • Higher number of pipeline relocations should be anticipated for the freight pipeline
For the purposes of this estimate, construct ion of the aqueduct was judged to require twice the work of that for the freight pipeline. Accordingly, the base cost of the freight pipeline should be approximately one- half the cost of the Central Arizona Project, as adjusted in Table 4.3. No adjustment was made for differences in project location due to similarities in construction costs for Arizona and Texas, but the 1993 project cost was modified to reflect 2002 costs using a 2 percent rate of inflation over a 9- year period. Finally, a cost for trackwork, bridges and drainage was added to the year 2002 estimate to obtain the total construction cost for the freight pipeline. As shown in Table 4.3, this method resulted in a construction estimate of $3.34 billion.
Table 4.3. Cost Estimate Based on the Central Arizona Project. Category Amount Central Arizona Project
Total 1993 Cost $3,600,000,000 Length of Project 336 mi. Cost per Mile $10,714,286
Freight Pipeline Conduit (10 ' × 20' Box Culvert) Conduit Length 450 mi. Estimated 1993 Cost using Arizona Aqueduct $4,821,428,571 Reduction Factor for Decrease in Scope 0.5 Estimated 1993 Cost using 10' × 20' Box Culvert $2,410,714,286 Present Value Factor (2002) 1.2 Estimated 2002 Cost using 10' × 20' Box Culvert $2,892,857,143 Trackwork/Bridges/D rainage $450,000,000
Total Construction Cost $3,342,857,143
San Diego Aqueduct
Studies are currently being conducted to determine the feasibility of constructing a new 100- mile aqueduct from the Colorado River to San Diego County and coastal Baja California. All but one of the 10 alternatives under consideration will cost about $1.6 billion and will require the construction of several miles of tunnels (25 ). The San Diego aqueducts are typically constructed with 4- to 9- ft diameter segmental concrete p ipe (26 ). Of all the projects under consideration in this cost analysis, the San Diego Aqueduct shares the least in common with the freight pipeline facility. Nevertheless, the fact that this feasibility study is currently underway should provide a valuable perspective on the potential cost of new large-scale transmission projects, and it can provide some perspective on the maximum construction cost of the freight pipeline conduit.
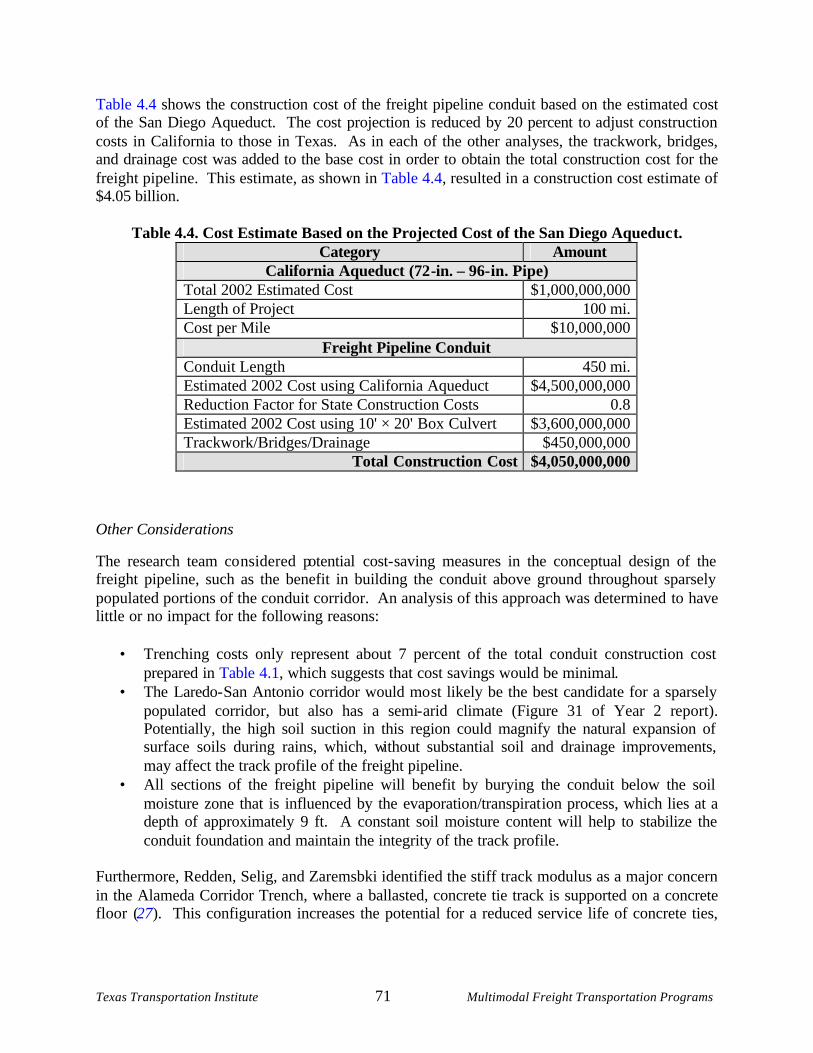
Texas Transportation Institute 71 Multimodal Freight Transportation Programs
Table 4.4 shows the construction cost of the freight pipeline conduit based on the estimated cost of the San Diego Aqueduct. The cost projection is reduced by 20 percent to adjust construction costs in California to those in Texas. As in each of the other analyses, the trackwork, bridges, and drainage cost was added to the base cost in order to obtain the total construction cost for the freight pipeline. This estimate, as shown in Table 4.4, resulted in a construction cost estimate of $4.05 billion.
Table 4.4. Cost Estimate Based on the Projected Cost of the San Diego Aqueduc t.
Category Amount California Aqueduct (72 -in. – 96- in. Pipe)
Total 2002 Estimated Cost $1,000,000,000 Length of Project 100 mi. Cost per Mile $10,000,000
Freight Pipeline Conduit Conduit Length 450 mi. Estimated 2002 Cost using California Aqueduct $4,500,000,000 Reduction Factor for State Construction Costs 0.8 Estimated 2002 Cost using 10' × 20' Box Culvert $3,600,000,000 Trackwork/Bridges/Drainage $450,000,000
Total Construction Cost $4,050,000,000
Other Considerations
The research team co nsidered potential cost- saving measures in the conceptual design of the freight pipeline, such as the benefit in building the conduit above ground throughout sparsely populated portions of the conduit corridor. An analysis of this approach was determined to have little or no impact for the following reasons:
• Trenching costs only represent about 7 percent of the total conduit construction cost prepared in Table 4.1, which suggests that cost savings would be minimal.
• The Laredo- San Antonio corridor would mo st likely be the best candidate for a sparsely populated corridor, but also has a semi- arid climate (Figure 31 of Year 2 report). Potentially, the high soil suction in this region could magnify the natural expansion of surface soils during rains, which, without substantial soil and drainage improvements, may affect the track profile of the freight pipeline.
• All sections of the freight pipeline will benefit by burying the conduit below the soil moisture zone that is influenced by the evaporation/transpirat ion process, which lies at a depth of approximately 9 ft. A constant soil moisture content will help to stabilize the conduit foundation and maintain the integrity of the track profile.
Furthermore, Redden, Selig, and Zaremsbki identified the stiff track modulus as a major concern in the Alameda Corridor Trench, where a ballasted, concrete tie track is supported on a concrete floor (27). This configuration increases the potential for a reduced service life of concrete ties,
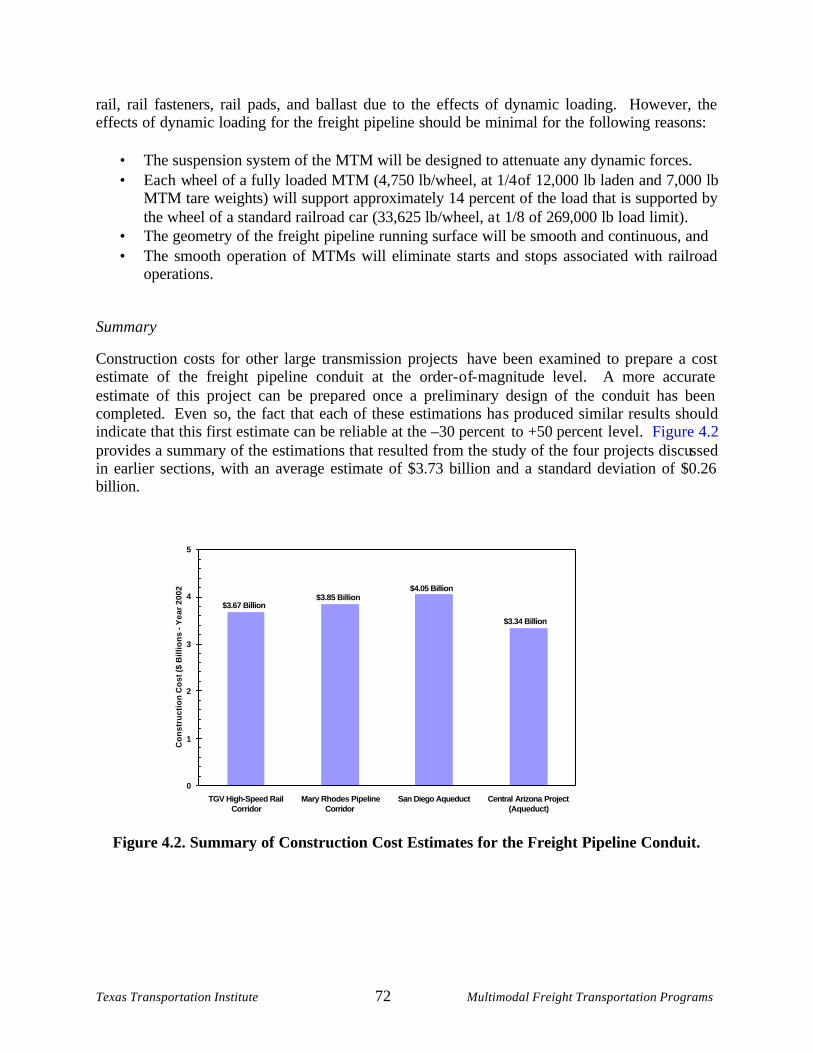
Texas Transportation Institute 72 Multimodal Freight Transportation Programs
rail, rail fasteners, rail pads, and ballast due to the effects of dynamic loading. However, the effects of dynamic loading for the freight pipeline should be minimal for the following reasons:
• The suspension system of the MTM will be designed to attenuate any dynamic forces. • Each wheel of a fully loaded MTM (4,750 lb/wheel, at 1/4 of 12,000 lb laden and 7,000 lb
MTM tare weights) will support approximately 14 percent of the load that is supported by the wheel of a standard railroad car (33,625 lb/wheel, a t 1/8 of 269,000 lb load limit).
• The geometry of the freight pipeline running surface will be smooth and continuous, and • The smooth operation of MTMs will eliminate starts and stops associated with railroad
operations.
Summary
Construction costs for other large transmission projects have been examined to prepare a cost estimate of the freight pipeline conduit at the order- of- magnitude level. A more accurate estimate of this project can be prepared once a preliminary design of the conduit has been completed. Even so, the fact that each of these estimations ha s produced similar results should indicate that this first estimate can be reliable at the –30 percent to +50 percent level. Figure 4.2 provides a summary of the estimations that resulted from the study of the four projects discussed in earlier sections, with an average estimate of $3.73 billion and a standard deviation of $0.26 billion.
Figure 4.2. Summary of Construction Cost Estimates for the Freight Pipeline Conduit.
0
1
2
3
4
5
TGV High-Speed RailCorridor
Mary Rhodes PipelineCorridor
San Diego Aqueduct Central Arizona Project(Aqueduct)
Co
nst
ruct
ion
Co
st ($
Bill
ion
s - Y
ear
2002
)
$3.67 Billion$3.85 Billion
$4.05 Billion
$3.34 Billion
Texas Transportation Institute 73 Multimodal Freight Transportation Programs
Terminal Construction
Freight terminals will be located at each end, and possibly at intermediate locations, of the freight pipeline for the purpose of receiving and discharging palletized cargo. These facilities must operate in a way that accommodates the projected peak arrival and departure rates of MTMs within the conduit, and loads/unloads MTM cargo in 30 seconds. Inasmuch, each of the terminals’ functional requirements (page 11 of the Year 2 report) must be designed to meet these criteria. As review, the functional requirements of the terminal facilities are to:
• provide terminal roadways, terminal sidings, or rail yardage to reach terminal loading/unloading areas;
• provide truck and rail parking areas for access to terminal loading bays; • inspect and classify the security condition of each pallet that enters the pipeline; • adequately queue each pallet to the MTM for transport through the conduit system; • identify pallets unloaded from the MTM and distribute them to the correct truck or rail
loading areas; • provide storage and maintenance facilities for MTM units; • provide rest facilities for truck operators; and • provide temporary warehousing for cargo.
A reliable cost estimate of the freight terminals must consider each of these functional requirements; although, many of these issues will have a relatively small impact on the overall cost of the freight pipeline. In addition, the need for some terminal components, such as rail yardage and terminals located at intermediate locations, cannot be established without further input from industry.
General Planning Considerations
A large number of planning scenarios can be developed to accomplish the goals of the freight pipeline, but many of these ideas may be most valuable as expansions or secondary alternatives to the initial pipeline facility concept. For example, multiple smaller terminals may best serve the freight distribution needs in the Dallas area, but additional costs would also be incurred by increasing the length of conduit construction to provide service to these additional facilities. The following subsections discuss some major planning considerations for the freight pipeline.
Rail Access. Depending on the demand by railroad companies for access to the freight terminals, significantly larger areas of land would be required to construct railroad spurs that adjoin warehouses. The industrial development division of prospective railroad companies would need to be consulted for proper planning on the size and location of the terminal facility. Several issues that would need to be addressed are:
• the number of participating railroad companies; • shipping volume projections of each railroad company; • track spacing, clearance, and alignment design standards of each railroad company;
Texas Transportation Institute 74 Multimodal Freight Transportation Programs
• terminal locations in areas that minimize at-grade railroad crossings, yet provide access to main lines;
• requirements for switching tracks, sidings, and yards; and • acquisition of railroad ROW
The access needs of railroad companies would be used in the terminal design to determine the required amount of terminal loading/unloading space that is to be dedicated to rail, and to estimate the additional land required for rail service. Each of these factors could have a significant impact on the cost of the terminal facility.
Multiple Terminals. The use of multiple smaller terminals, rather than one large
terminal, may be a preferred alternative at either end of the freight pipeline; although, the enormous size of the Dallas-Fort Worth area makes this terminus the most likely candidate for such a scenario. Individual terminals may be located near rail or trucking facilities, manufacturing and distribution facilities, or highways. Furthermore, the area encompassed by the multiple terminals could consist of a small area, such as a large industrial park, or throughout an entire city. To more thoroughly present the potential of the multiple-terminal concept, the following cases are considered:
• The Fort Worth Alliance Industrial Park is a master-planned development that caters to
businesses involved in international trade and logistics by providing air, rail, and highway access. Freight pipeline terminals could be constructed at manufacturing and distribution facilities within the park so that shipments bound for Mexico could be sent directly to Laredo or, if the pipeline were extended, to assembly plants in Monterrey, Mexico. A separate terminal for freight not associated with the industrial park could be constructed to process shipments arriving from, or destined for, other regions of the United States.
• Freight terminals could be constructed throughout the Dallas-Fort Worth area in locations that best suit the needs of individual trucking companies. The development of multiple terminals within this area could also serve as an intra-urban distribution system, whereby freight is transported within the confines of the Metroplex. Alternatively, the location criteria could be based on the direct access to facilities of different railroad companies.
• Multiple terminals could be constructed within one freight terminal site. This design would provide a great deal of autonomy to participating trucking companies while minimizing the operational complexity of the freight pipeline terminals.
Intermediate Terminals. The scope of services provided by the freight pipeline will
determine the need for terminals located at intermediate sites, such as Austin, San Antonio, or Waco. This level of service will be dependent upon the needs of the trucking industry and the economics of constructing these terminals.
Site Characteristics. The freight terminal should be located near an Interstate or other
major transportation corridor, with terminal roadways and loading/unloading facilities compatible with the operation of 53-ft trucks. The site should also have relatively constant topography and require little grade change to access the transportation corridor. In the Development Profile for Warehouse/Distribution Sites, prepared on behalf of the State of New York Governor’s Office of Regulatory Reform by Flour Daniel Consulting, a profile was
Texas Transportation Institute 75 Multimodal Freight Transportation Programs
prepared on typical features of distribution facilities (28). Among these features are building sizes between 250,000 to 1,500,000 square feet (sf) on lots no smaller than 50 acres, having an average capital investment of $55 million.
Storage. Terminal management conditions may infrequently exist when freight arrivals
cannot be immediately loaded onto MTMs, or when freight that has been unloaded from MTMs cannot be immediately loaded onto trucks. Such situations will require terminal storage space to hold pallets until they can be processed. There may also be rare cases when a trucking company mismanages truck arrivals and departures, or loading/unloading tasks, requiring more storage space than has been allotted to the company. A shared storage area should be developed to handle this possibility, with demurrage charged to the offending company as a penalty for its use.
Customs Inspection. Innovative alternatives to the inspection of transnational freight
shipments may require additional facilities at the freight terminals. Pre- clearance inspection methods or a “sealed corridor” designation must be included within the project scope during early stages of terminal design in order to minimize the time and expense associated with accommodating these customs inspection facilities.
Construction Cost Estimation Method
As with the costs associated with conduit construction, part of the terminal construction cost will depend upon details not available at the conceptual design level. Precise knowledge of the real estate pric e, the geotechnical conditions and foundation requirements, and the complexity of required rail or roadway approaches would increase the accuracy of this estimate, but they are not necessary to prepare an early estimate. The Time, Space & Cost Guide to Be tter Warehouse Design, by Napolitano et al, was used as a guide to space requirements and costs for the terminal facilities, while the Arena capacity simulation model (Chapter 9 of Year 2 report) was used to determine the terminal design criteria, such as the maximum number of pallets in process, the maximum number of MTMs in storage, and MTM queue lengths (29 ). As review, the simulation performance parameters of relevance to the terminal spatial analysis are:
• MTMs travel as a set of five linked cars. • MTM s travel at a speed of 60 mph. • A set of five linked cars are loaded in 30 seconds. • Trucks are loaded/unloaded within 30 minutes.
Additionally, this model incorporates a time- dependent arrival rate function, shown in Figure 3.5 of Chapter 3, which describes the anticipated levels of freight arrival at the Dallas and Laredo terminals. The arrival function is used with the above parameters in the simulation of freight pipeline operations to generate the maximum number of MTMs and pallets in the freight terminal. These numbers are then used to calculate the approximate floor space required in a conceptual design of the terminal.
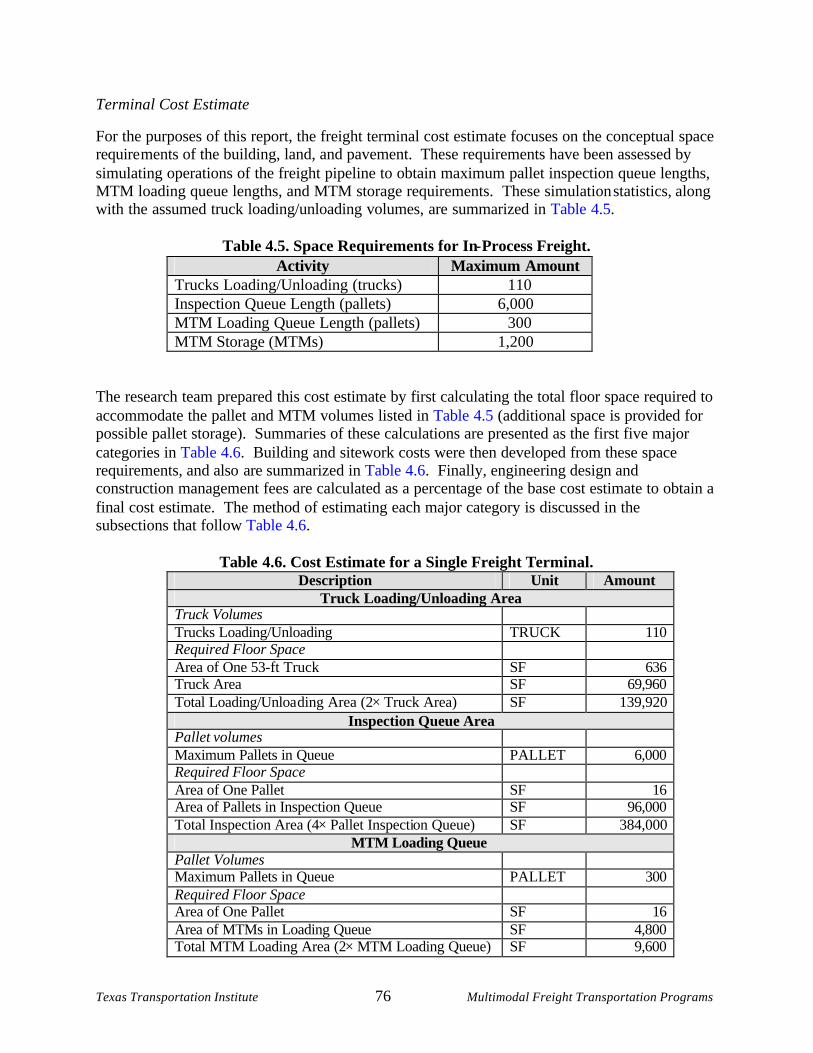
Texas Transportation Institute 76 Multimodal Freight Transportation Programs
Terminal Cost Estimate
For the purposes of this report, the freight terminal cost estimate focuses on the conceptual space require ments of the building, land, and pavement. These requirements have been assessed by simulating operations of the freight pipeline to obtain maximum pallet inspection queue lengths, MTM loading queue lengths, and MTM storage requirements. These simulation statistics, along with the assumed truck loading/unloading volumes, are summarized in Table 4.5.
Table 4.5. Space Requirements for In- Process Freight.
Activity Maximum Amount Trucks Loading/Unloading (trucks) 110 Inspection Queue Length (pallets) 6,000 MTM Loading Queue Length (pallets) 300 MTM Storage (MTMs) 1,200
The research team prepared this cost estimate by first calculating the total floor space required to accommodate the pallet and MTM volumes listed in Table 4.5 (additional space is provided for possible pallet storage). Summaries of these calculations are presented as the first five major categories in Table 4.6. Building and sitework costs were then developed from these space requirements, and also are summarized in Table 4.6. Finally, engineering design and construction management fees are calculated as a percentage of the base cost estimate to obtain a final cost estimate. The method of estimating each major category is discussed in the subsections that follow Table 4.6.
Table 4.6. Cost Estimate for a Single Freight Terminal.
Description Unit Amount Truck Loading/Unloading Area
Truck Volumes Trucks Loading/Unloading TRUCK 110 Required Floor Space Area of One 53-ft Truck SF 636 Truck Area SF 69,960 Total Loading/Unloading Area (2× Truck Area) SF 139,920
Inspection Queue Area Pallet volumes Maximum Pallets in Queue PALLET 6,000 Required Floor Space Area of One Pallet SF 16 Area of Pallets in Inspection Queue SF 96,000 Total Inspection Area (4× Pallet Inspection Queue) SF 384,000
MTM Loading Queue Pallet Volumes Maximum Pallets in Queue PALLET 300 Required Floor Space Area of One Pallet SF 16 Area of MTMs in Loading Queue SF 4,800 Total MTM Loading Area (2× MTM Loading Queue) SF 9,600
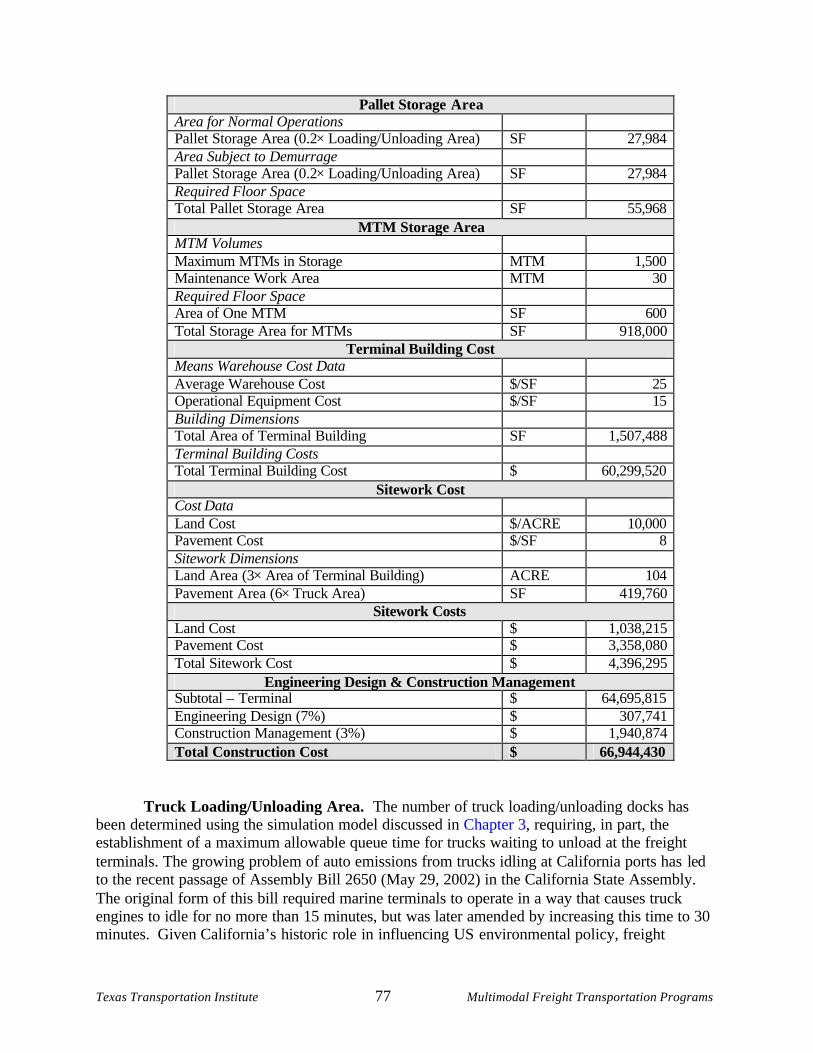
Texas Transportation Institute 77 Multimodal Freight Transportation Programs
Pallet Storage Area Area for Normal Operations Pallet Storage Area (0.2× Loading/Unloading Area) SF 27,984 Area Subject to Demurrage Pallet Storage Area (0.2× Loading/Unloading Area) SF 27,984 Required Floor Space Total Pallet Storage Area SF 55,968
MTM Storage Area MTM Volumes Maximum MTMs in Storage MTM 1,500 Maintenance Work Area MTM 30 Required Floor Space Area of One MTM SF 600 Total Storage Area for MTMs SF 918,000
Terminal Building Cost Means Warehouse Cost Data Average Warehouse Cost $/SF 25 Operational Equipment Cost $/SF 15 Building Dimensions Total Area of Terminal Building SF 1,507,488 Terminal Building Costs Total Terminal Building Cost $ 60,299,520
Sitework Cost Cost Data Land Cost $/ACRE 10,000 Pavement Cost $/SF 8 Sitework Dimensions Land Area (3× Area of Terminal Building) ACRE 104 Pavement Area (6× Truck Area) SF 419,760
Sitework Costs Land Cost $ 1,038,215 Pavement Cost $ 3,358,080 Total Sitework Cost $ 4,396,295
Engineering Design & Construction Management Subtotal – Terminal $ 64,695,815 Engineering Design (7%) $ 307,741 Construction Management (3%) $ 1,940,874 Total Construction Cost $ 66,944,430
Truck Loading/Unloading Area. The number of truck loading/unloading docks has been determined using the simulation model discussed in Chapter 3, requiring, in part, the establishment of a maximum allowable queue time for trucks waiting to unload at the freight terminals. The growing problem of auto emissions from trucks idling at California ports has led to the recent passage of Assembly Bill 2650 (May 29, 2002) in the California State Assembly. The original form of this bill required marine terminals to operate in a way that causes truck engines to idle for no more than 15 minutes, but was later amended by increasing this time to 30 minutes. Given California’s historic role in influencing US environmental policy, freight
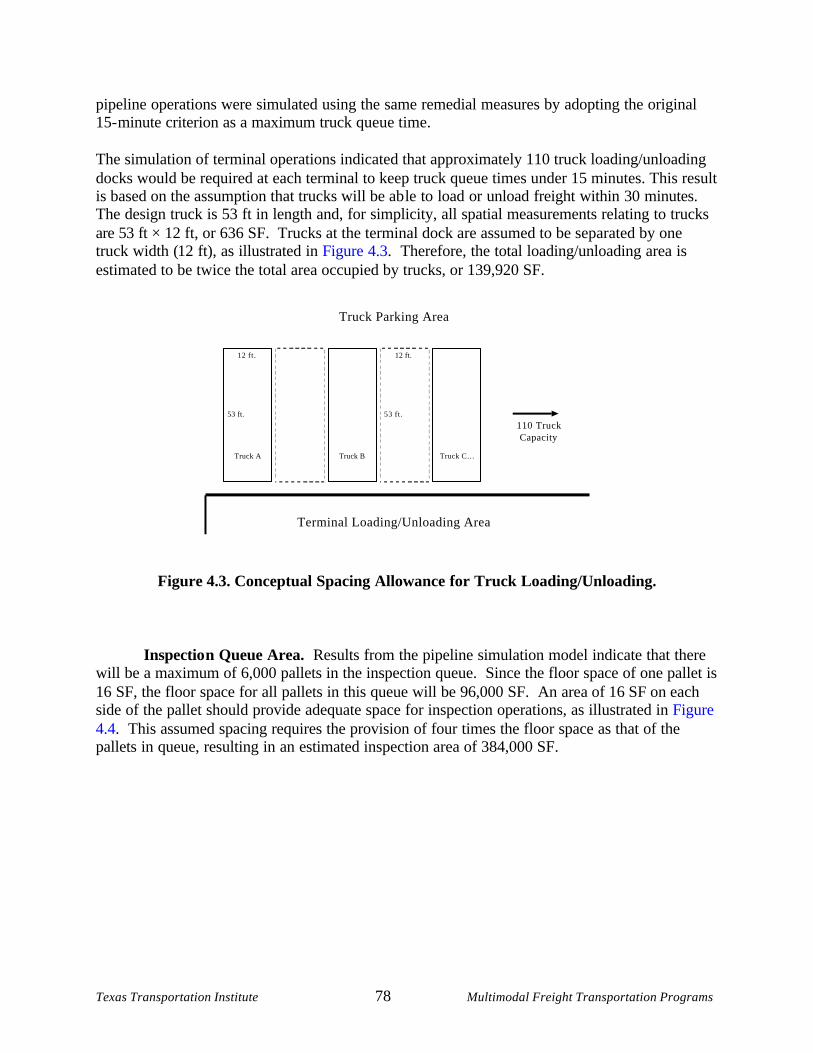
Texas Transportation Institute 78 Multimodal Freight Transportation Programs
12 ft.
53 ft.
12 ft.
53 ft.
Truck A Truck B Truck C…
Terminal Loading/Unloading Area
110 TruckCapacity
Truck Parking Area
pipeline operations were simulated using the same remedial measures by adopting the original 15- minute criterion as a maximum truck queue time.
The simulation of terminal operations indicated that approximately 110 truck loading/unloading docks would be required at each terminal to keep truck queue times under 15 minutes. This result is based on the assumption that trucks will be ab le to load or unload freight within 30 minutes. The design truck is 53 ft in length and, for simplicity, all spatial measurements relating to trucks are 53 ft × 12 ft, or 636 SF. Trucks at the terminal dock are assumed to be separated by one truck width (12 ft), as illustrated in Figure 4.3. Therefore, the total loading/unloading area is estimated to be twice the total area occupied by trucks, or 139,920 SF.
Figure 4.3. Conceptual Spacing Allowance for Truck Loading/Unloading.
Inspectio n Queue Area. Results from the pipeline simulation model indicate that there will be a maximum of 6,000 pallets in the inspection queue. Since the floor space of one pallet is 16 SF, the floor space for all pallets in this queue will be 96,000 SF. An area of 16 SF on each side of the pallet should provide adequate space for inspection operations, as illustrated in Figure 4.4. This assumed spacing requires the provision of four times the floor space as that of the pallets in queue, resulting in an estimated inspection area of 384,000 SF.
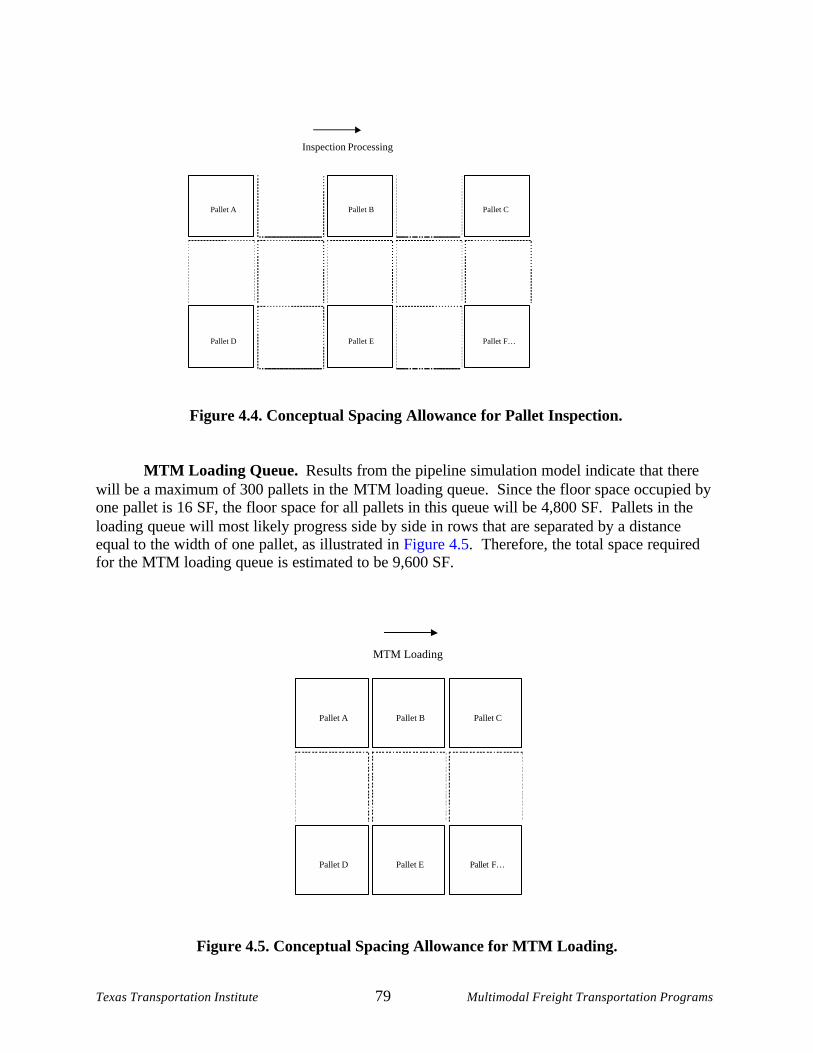
Texas Transportation Institute 79 Multimodal Freight Transportation Programs
Pallet A Pallet B Pallet C
Pallet D Pallet E Pallet F…
Inspection Processing
Figure 4.4. Conceptual Spacing Allowance for Pallet Inspection.
MTM Loading Queue. Results from the pipeline simulation model indicate that there will be a maximum of 300 pallets in the MTM loading queue. Since the floor space occupied by one pallet is 16 SF, the floor space for all pallets in this queue will be 4,800 SF. Pallets in the loading queue will most likely progress side by side in rows that are separated by a distance equal to the width of one pallet, as illustrated in Figure 4.5. Therefore, the total space required for the MTM loading queue is estimated to be 9,600 SF.
Pallet A Pallet B Pallet C
Pallet D Pallet E Pallet F…
MTM Loading
Figure 4.5. Conceptual Spacing Allowance for MTM Loading.
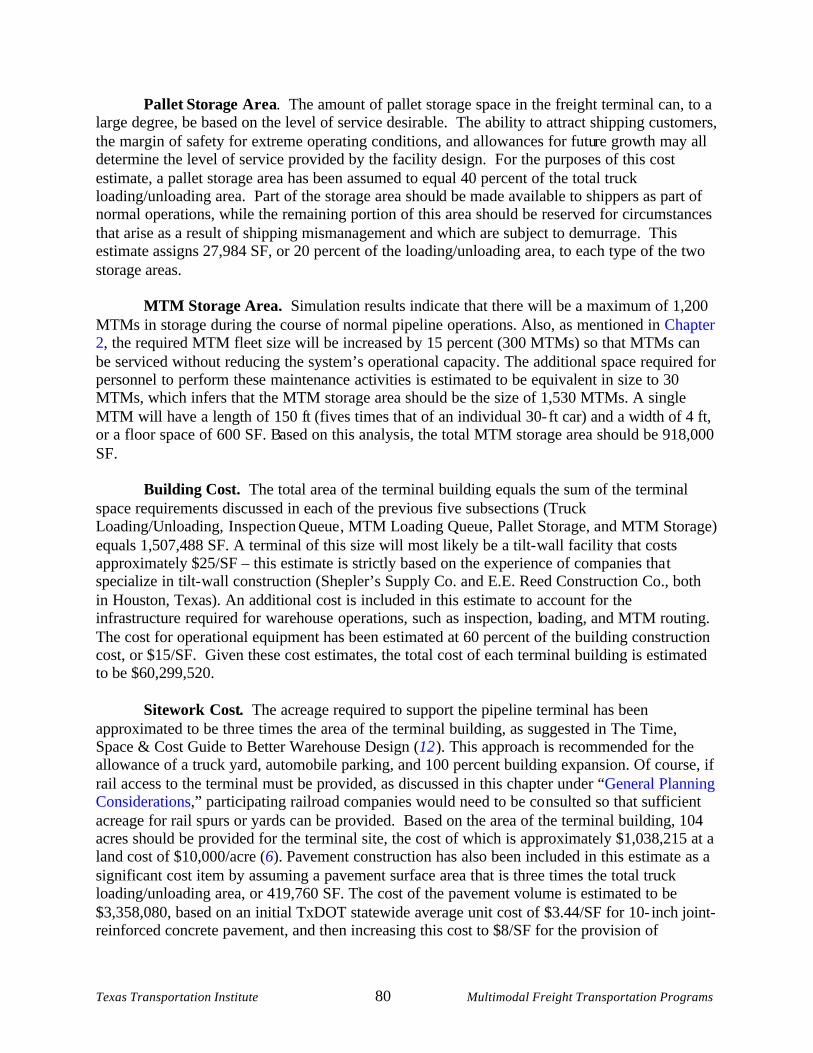
Texas Transportation Institute 80 Multimodal Freight Transportation Programs
Pallet Storage Area. The amount of pallet storage space in the freight terminal can, to a large degree, be based on the level of service desirable. The ability to attract shipping customers, the margin of safety for extreme operating conditions, and allowances for future growth may all determine the level of service provided by the facility design. For the purposes of this cost estimate, a pallet storage area has been assumed to equal 40 percent of the total truck loading/unloading area. Part of the storage area should be made available to shippers as part of normal operations, while the remaining portion of this area should be reserved for circumstances that arise as a result of shipping mismanagement and which are subject to demurrage. This estimate assigns 27,984 SF, or 20 percent of the loading/unloading area, to each type of the two storage areas.
MTM Storage Area. Simulation results indicate that there will be a maximum of 1,200 MTMs in storage during the course of normal pipeline operations. Also, as mentioned in Chapter 2, the required MTM fleet size will be increased by 15 percent (300 MTMs) so that MTMs can be serviced without reducing the system’s operational capacity. The additional space required for personnel to perform these maintenance activities is estimated to be equivalent in size to 30 MTMs, which infers that the MTM storage area should be the size of 1,530 MTMs. A single MTM will have a length of 150 ft (fives times that of an individual 30- ft car) and a width of 4 ft, or a floor space of 600 SF. Based on this analysis, the total MTM storage area should be 918,000 SF.
Building Cost. The total area of the terminal building equals the sum of the terminal space requirements discussed in each of the previous five subsections (Truck Loading/Unloading, Inspection Queue , MTM Loading Queue, Pallet Storage, and MTM Storage) equals 1,507,488 SF. A terminal of this size will most likely be a tilt- wall facility that costs approximately $25/SF – this estimate is strictly based on the experience of companies tha t specialize in tilt- wall construction (Shepler’s Supply Co. and E.E. Reed Construction Co., both in Houston, Texas). An additional cost is included in this estimate to account for the infrastructure required for warehouse operations, such as inspection, loading, and MTM routing. The cost for operational equipment has been estimated at 60 percent of the building construction cost, or $15/SF. Given these cost estimates, the total cost of each terminal building is estimated to be $60,299,520.
Sitework Cost. The acreage required to support the pipeline terminal has been approximated to be three times the area of the terminal building, as suggested in The Time, Space & Cost Guide to Better Warehouse Design (12 ). This approach is recommended for the allowance of a truck yard, automobile parking, and 100 percent building expansion. Of course, if rail access to the terminal must be provided, as discussed in this chapter under “General Planning Considerations,” participating railroad companies would need to be co nsulted so that sufficient acreage for rail spurs or yards can be provided. Based on the area of the terminal building, 104 acres should be provided for the terminal site, the cost of which is approximately $1,038,215 at a land cost of $10,000/acre (6). Pavement construction has also been included in this estimate as a significant cost item by assuming a pavement surface area that is three times the total truck loading/unloading area, or 419,760 SF. The cost of the pavement volume is estimated to be $3,358,080, based on an initial TxDOT statewide average unit cost of $3.44/SF for 10- inch joint-reinforced concrete pavement, and then increasing this cost to $8/SF for the provision of
Texas Transportation Institute 81 Multimodal Freight Transportation Programs
earthwork and soil stabilization tasks (20). Given these assumed costs, the total sitework cost has been estimated to be $4,396,295.
Engineering Design and Construction Management. The cost estimate for engineering design is calculated as a percentage of the total construction cost. While other methods of compensation for design services may be more common, this is a reasonable approach to calculating fees for innovative facilities such as the freight pipeline. The percentage is typically based on a sliding scale that ranges from 5 to 12 percent, with lower portions of the scale being used as the construction cost increases (18). This freight terminal estimate calculates the cost of engineering design at 7 percent of the total costs for building and sitework construction. The total cost for building and sitework, listed in Table 4.6 as “Subtota l – Terminal,” is $64,695,815; and the engineering design cost at 7 percent of the sitework cost is $307,741. In addition, a construction management fee has been included at 3 percent of the $64,695,815 subtotal, for a cost of $1,940,874.
To tal Construction Cost. The total construction cost of a single freight terminal equals the sum of the costs for building and sitework, engineering design, and construction management. As shown in Table 4.6, this cost is $66,944,430.
Summary
The cost estimate for a single freight terminal considers the space and facilities required for 53- ft trucks that arrive at a rate of 140 trucks/hour to transfer pallets from the loading/unloading dock to MTMs in the pipeline facility. The conceptual building requirements account for each of the following:
• loading/unloading dock space, • inspection and MTM loading queues that develop during normal pipeline operations, • working space for pallet inspection, • pallet processing equipment, • MTM storage, and • short- term pallet storage.
Furthermore, this estimate considers the acreage and sitework that is required to support terminal operations. The conceptual site requirements account for each of the following:
• sufficient acreage for building and parking areas, • pavement area to simultaneously support the arrival or departure of 140 trucks • additional acreage to accommodate future expansion, and • pavement volume for truck access to the terminal.,
The research team estimated each freight terminal to be a 1.5 million SF facility s ituated on 104 acres of land at a total cost of $65 million. In comparison, the Development Profile for Warehouse Distribution Sites describes the typical distribution facility as 0.25 to 1.5 million SF facilities situated on at least 50 acres of land at an average total cost of $55 million (28 ). The
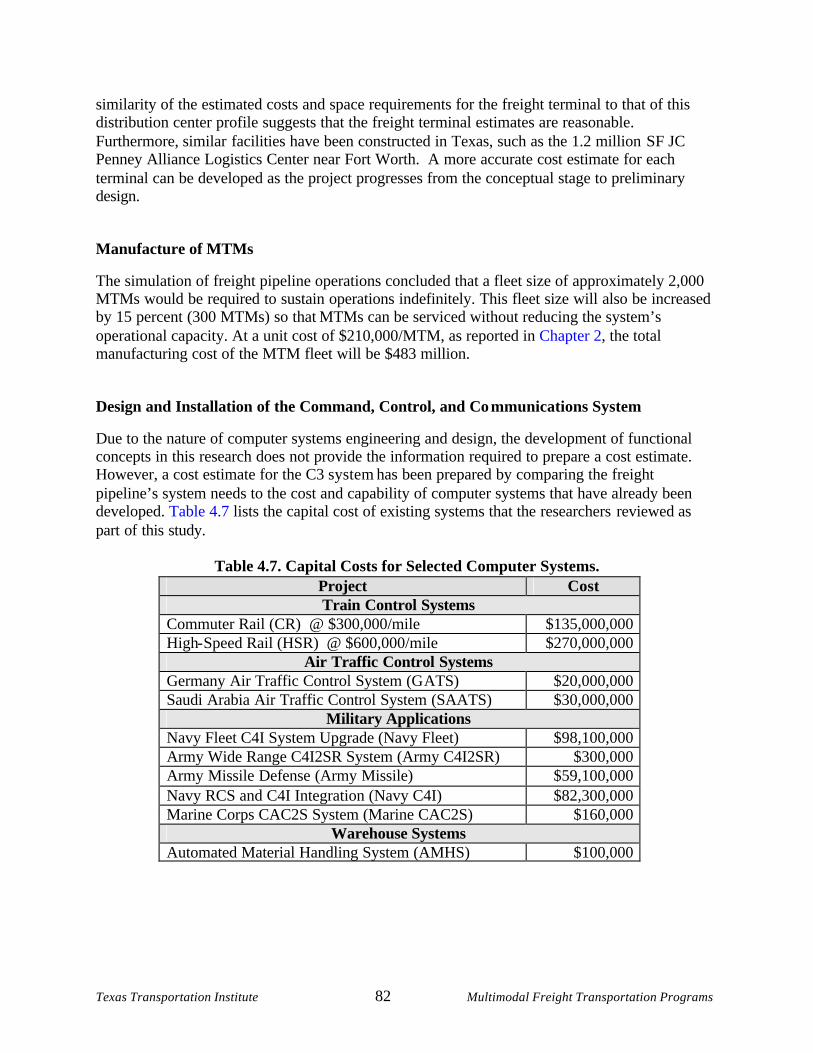
Texas Transportation Institute 82 Multimodal Freight Transportation Programs
similarity of the estimated costs and space requirements for the freight terminal to that of this distribution center profile suggests that the freight terminal estimates are reasonable. Furthermore, similar facilities have been constructed in Texas, such as the 1.2 million SF JC Penney Alliance Logistics Center near Fort Worth. A more accurate cost estimate for each terminal can be developed as the project progresses from the conceptual stage to preliminary design.
Manufacture of MTMs
The simulation of freight pipeline operations concluded that a fleet size of approximately 2,000 MTMs would be required to sustain operations indefinitely. This fleet size will also be increased by 15 percent (300 MTMs) so that MTMs can be serviced without reducing the system’s operational capacity. At a unit cost of $210,000/MTM, as reported in Chapter 2, the total manufacturing cost of the MTM fleet will be $483 million.
Design and Installation of the Command, Control, and Co mmunications System
Due to the nature of computer systems engineering and design, the development of functional concepts in this research does not provide the information required to prepare a cost estimate. However, a cost estimate for the C3 system has been prepared by comparing the freight pipeline’s system needs to the cost and capability of computer systems that have already been developed. Table 4.7 lists the capital cost of existing systems that the researchers reviewed as part of this study.
Table 4.7. Capital Costs for Selected Computer Systems.
Project Cost Train Control Systems
Commuter Rail (CR) @ $300,000/mile $135,000,000 High-Speed Rail (HSR) @ $600,000/mile $270,000,000
Air Traffic Control Systems Germany Air Traffic Control System (GATS) $20,000,000 Saudi Arabia Air Traffic Control System (SAATS) $30,000,000
Military Applications Navy Fleet C4I System Upgrade (Navy Fleet) $98,100,000 Army Wide Range C4I2SR System (Army C4I2SR) $300,000 Army Missile Defense (Army Missile) $59,100,000 Navy RCS and C4I Integration (Navy C4I) $82,300,000 Marine Corps CAC2S System (Marine CAC2S) $160,000
Warehouse Systems Automated Material Handling System (AMHS) $100,000
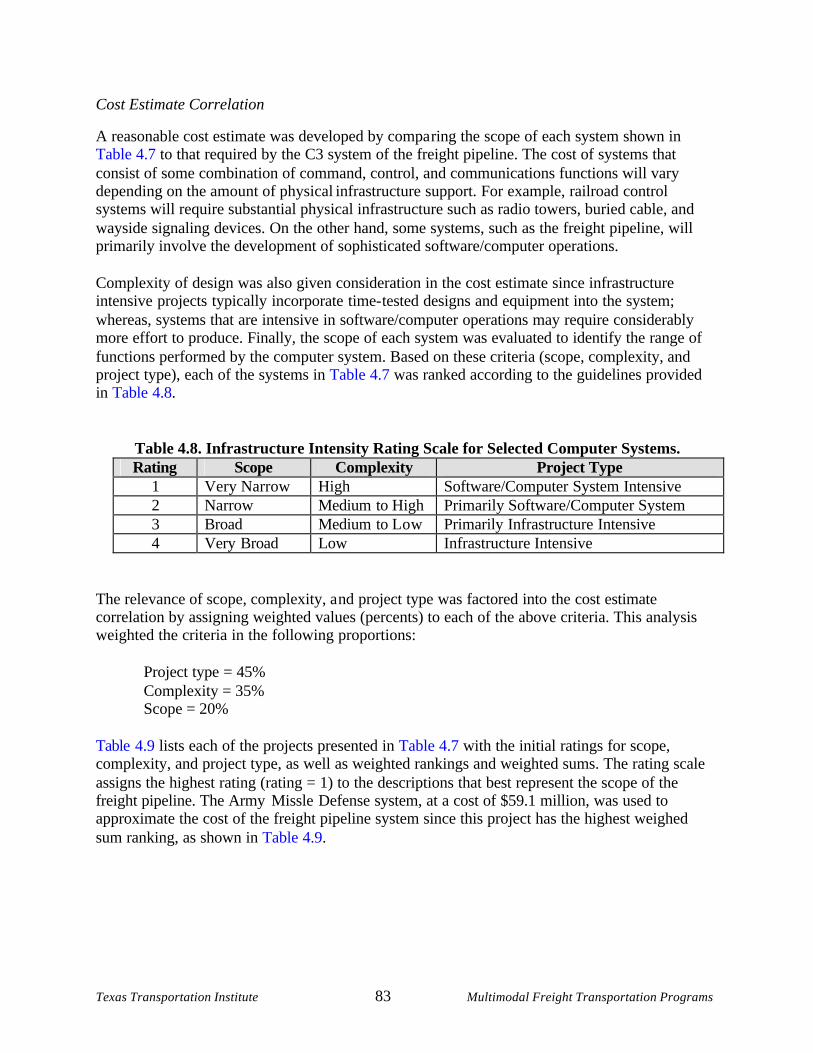
Texas Transportation Institute 83 Multimodal Freight Transportation Programs
Cost Estimate Correlation
A reasonable cost estimate was developed by compa ring the scope of each system shown in Table 4.7 to that required by the C3 system of the freight pipeline. The cost of systems that consist of some combination of command, control, and communications functions will vary depending on the amount of physical infrastructure support. For example, railroad control systems will require substantial physical infrastructure such as radio towers, buried cable, and wayside signaling devices. On the other hand, some systems, such as the freight pipeline, will primarily involve the development of sophisticated software/computer operations. Complexity of design was also given consideration in the cost estimate since infrastructure intensive projects typically incorporate time- tested designs and equipment into the system; whereas, systems that are intensive in software/computer operations may require considerably more effort to produce. Finally, the scope of each system was evaluated to identify the range of functions performed by the computer system. Based on these criteria (scope, complexity, and project type), each of the systems in Table 4.7 was ranked according to the guidelines provided in Table 4.8.
Table 4.8. Infrastructure Intensity Rating Scale for Selected Computer Systems. Rating Scope Complexity Project Type
1 Very Narrow High Software/Computer System Intensive 2 Narrow Medium to High Primarily Software/Computer System 3 Broad Medium to Low Primarily Infrastructure Intensive 4 Very Broad Low Infrastructure Intensive
The relevance of scope, complexity, a nd project type was factored into the cost estimate correlation by assigning weighted values (percents) to each of the above criteria. This analysis weighted the criteria in the following proportions:
Project type = 45% Complexity = 35% Scope = 20%
Table 4.9 lists each of the projects presented in Table 4.7 with the initial ratings for scope, complexity, and project type, as well as weighted rankings and weighted sums. The rating scale assigns the highest rating (rating = 1) to the descriptions that best represent the scope of the freight pipeline. The Army Missle Defense system, at a cost of $59.1 million, was used to approximate the cost of the freight pipeline system since this project has the highest weighed sum ranking, as shown in Table 4.9.
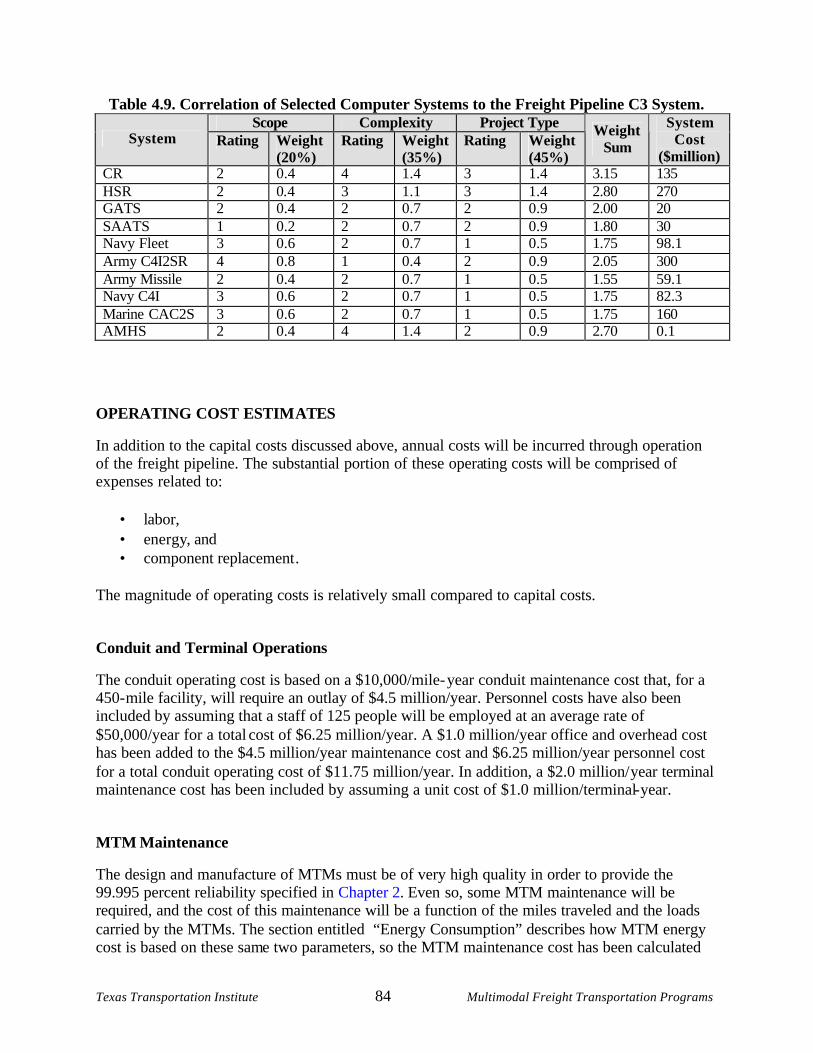
Texas Transportation Institute 84 Multimodal Freight Transportation Programs
Table 4.9. Correlation of Selected Computer Systems to the Freight Pipeline C3 System. Scope Complexity Project Type
System Rating Weight (20%)
Rating Weight (35%)
Rating Weight (45%)
Weight Sum
System Cost
($million) CR 2 0.4 4 1.4 3 1.4 3.15 135 HSR 2 0.4 3 1.1 3 1.4 2.80 270 GATS 2 0.4 2 0.7 2 0.9 2.00 20 SAATS 1 0.2 2 0.7 2 0.9 1.80 30 Navy Fleet 3 0.6 2 0.7 1 0.5 1.75 98.1 Army C4I2SR 4 0.8 1 0.4 2 0.9 2.05 300 Army Missile 2 0.4 2 0.7 1 0.5 1.55 59.1 Navy C4I 3 0.6 2 0.7 1 0.5 1.75 82.3 Marine CAC2S 3 0.6 2 0.7 1 0.5 1.75 160 AMHS 2 0.4 4 1.4 2 0.9 2.70 0.1
OPERATING COST ESTIM ATES
In addition to the capital costs discussed above, annual costs will be incurred through operation of the freight pipeline. The substantial portion of these operating costs will be comprised of expenses related to:
• labor, • energy, and • component replacement .
The magnitude of operating costs is relatively small compared to capital costs.
Conduit and Terminal Operations
The conduit operating cost is based on a $10,000/mile- year conduit maintenance cost that, for a 450- mile facility, will require an outlay of $4.5 million/year. Personnel costs have also been included by assuming that a staff of 125 people will be employed at an average rate of $50,000/year for a total cost of $6.25 million/year. A $1.0 million/year office and overhead cost has been added to the $4.5 million/year maintenance cost and $6.25 million/year personnel cost for a total conduit operating cost of $11.75 million/year. In addition, a $2.0 million/ year terminal maintenance cost has been included by assuming a unit cost of $1.0 million/terminal- year.
MTM Maintenance
The design and manufacture of MTMs must be of very high quality in order to provide the 99.995 percent reliability specified in Chapter 2. Even so, some MTM maintenance will be required, and the cost of this maintenance will be a function of the miles traveled and the loads carried by the MTMs. The section entitled “Energy Consumption” describes how MTM energy cost is based on these same two parameters, so the MTM maintenance cost has been calculated
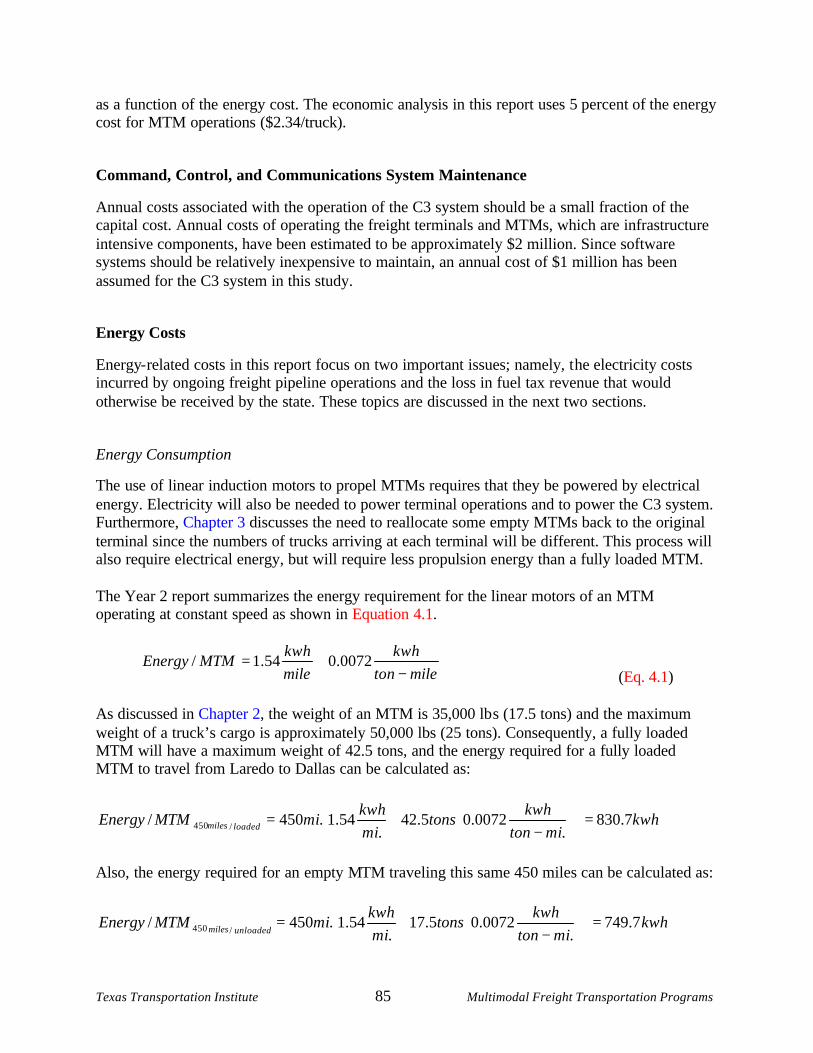
Texas Transportation Institute 85 Multimodal Freight Transportation Programs
as a function of the energy cost. The economic analysis in this report uses 5 percent of the energy cost for MTM operations ($2.34/truck).
Command, Control, and Communications System Maintenance
Annual costs associated with the operation of the C3 system should be a small fraction of the capital cost. Annual costs of operating the freight terminals and MTMs, which are infrastructure intensive components, have been estimated to be approximately $2 million. Since software systems should be relatively inexpensive to maintain, an annual cost of $1 million has been assumed for the C3 system in this study.
Energy Costs
Energy- related costs in this report focus on two important issues; namely, t he electricity costs incurred by ongoing freight pipeline operations and the loss in fuel tax revenue that would otherwise be received by the state. These topics are discussed in the next two sections.
Energy Consumption
The use of linear induction motors to propel MTMs requires that they be powered by electrical energy. Electricity will also be needed to power terminal operations and to power the C3 system. Furthermore, Chapter 3 discusses the need to reallocate some empty MTMs back to the original terminal since the numbers of trucks arriving at each terminal will be different. This process will also require electrical energy, but will require less propulsion energy than a fully loaded MTM. The Year 2 report summarizes the energy requirement for the linear motors of an MTM operating at constant speed as shown in Equation 4.1.
miletonkwh
milekwh
MTMEnergy−
+= 0072.054.1/ (Eq. 4.1)
As discussed in Chapter 2, the weight of an MTM is 35,000 lb s (17.5 tons) and the maximum weight of a truck’s cargo is approximately 50,000 lbs (25 tons). Consequently, a fully loaded MTM will have a maximum weight of 42.5 tons, and the energy required for a fully loaded MTM to travel from Laredo to Dallas can be calculated as:
kwhmiton
kwhtons
mikwh
miMTMEnergy loadedmiles 7.830.
0072.05.42.
54.1.450/ /450 =
−+=
Also, the energy required for an empty MTM traveling this same 450 miles can be calculated as:
kwhmiton
kwhtons
mikwh
miMTMEnergyunloadedmiles 7.749
.0072.05.17
.54.1.450/
/450 =
−+=
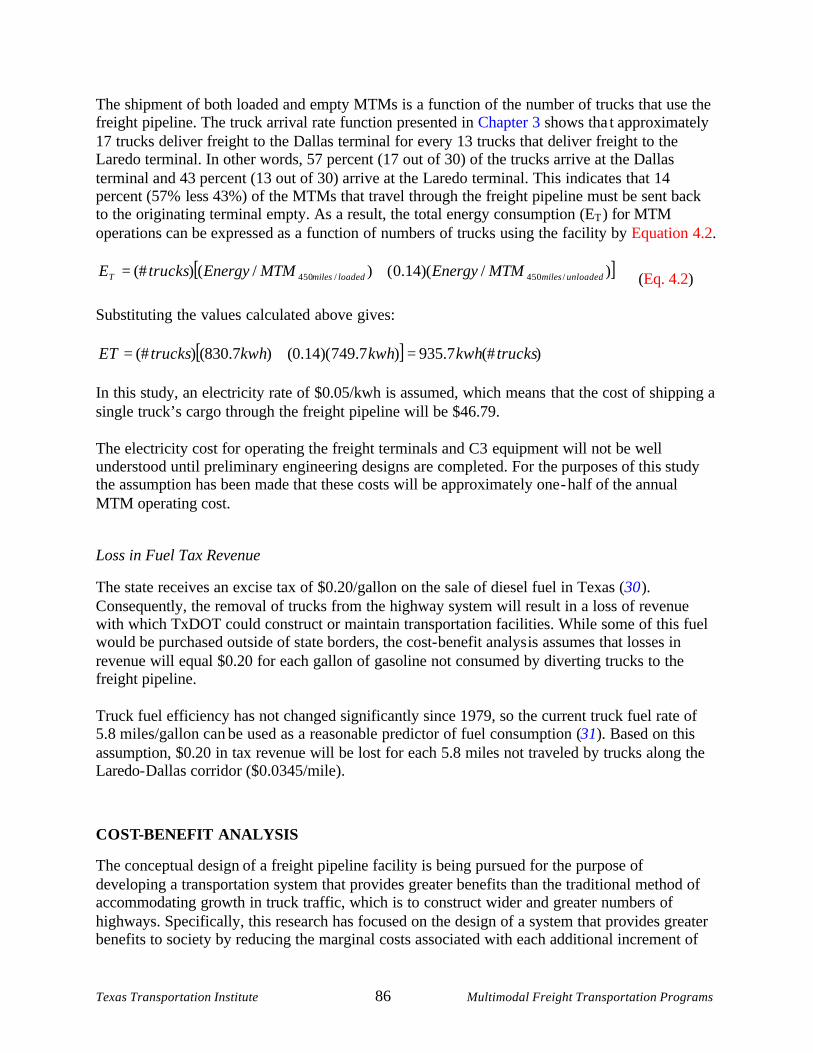
Texas Transportation Institute 86 Multimodal Freight Transportation Programs
The shipment of both loaded and empty MTMs is a function of the number of trucks that use the freight pipeline. The truck arrival rate function presented in Chapter 3 shows tha t approximately 17 trucks deliver freight to the Dallas terminal for every 13 trucks that deliver freight to the Laredo terminal. In other words, 57 percent (17 out of 30) of the trucks arrive at the Dallas terminal and 43 percent (13 out of 30) arrive at the Laredo terminal. This indicates that 14 percent (57% less 43%) of the MTMs that travel through the freight pipeline must be sent back to the originating terminal empty. As a result, the total energy consumption (ET
) for MTM operations can be expressed as a function of numbers of trucks using the facility by Equation 4.2.
[ ])/)(14.0()/()(# /450/450 unloadedmilesloadedmilesT
MTMEnergyMTMEnergytrucksE += (Eq. 4.2) Substituting the values calculated above gives:
[ ] )(#7.935)7.749)(14.0()7.830()(# truckskwhkwhkwhtrucksET =+= In this study, an electricity rate of $0.05/kwh is assumed, which means that the cost of shipping a single truck’s cargo through the freight pipeline will be $46.79. The electricity cost for operating the freight terminals and C3 equipment will not be well understood until preliminary engineering designs are completed. For the purposes of this study the assumption has been made that these costs will be approximately one - half of the annual MTM operating cost.
Loss in Fuel Tax Revenue
The state receives an excise tax of $0.20/gallon on the sale of diesel fuel in Texas (30 ). Consequently, the removal of trucks from the highway system will result in a loss of revenue with which TxDOT could construct or maintain transportation facilities. While some of this fuel would be purchased outside of state borders, the cost- benefit analys is assumes that losses in revenue will equal $0.20 for each gallon of gasoline not consumed by diverting trucks to the freight pipeline. Truck fuel efficiency has not changed significantly since 1979, so the current truck fuel rate of 5.8 miles/gallon can be used as a reasonable predictor of fuel consumption (31). Based on this assumption, $0.20 in tax revenue will be lost for each 5.8 miles not traveled by trucks along the Laredo-Dallas corridor ($0.0345/mile).
COST-BENEFIT ANALYSIS
The conceptual design of a freight pipeline facility is being pursued for the purpose of developing a transportation system that provides greater benefits than the traditional method of accommodating growth in truck traffic, which is to construct wider and greater numbers of highways. Specifically, this research has focused on the design of a system that provides greater benefits to society by reducing the marginal costs associated with each additional increment of
Texas Transportation Institute 87 Multimodal Freight Transportation Programs
truck travel (i.e., reducing pollution, congestion, etc.), and the success with which this is done requires a suitable means of evaluating the proposed solution. The Office of Management and Budget recommends the use of cost- benefit analysis in the evaluation of government projects, where the net benefits to society, not just the costs and benefits to the government, are the basis for evaluation (32). The cost- benefit analysis should determine the “net present value” of an alternative to identify its worth, and this method is therefore the method adopted in this research. Whereupon, each of the sections below contributes to the understanding of how net present value calculations were prepared in this report.
Project Costs and Benefits
Cost-benefit analyses are commonly used to estimate and evaluate the net benefits associated with infrastructure projects such as the freight pipeline facility (33). In public projects, this type of analysis should examine the change in social well-being created by the decision to implement a project relative to some baseline scenario (e.g., the decision to do nothing). This determination requires that net changes in costs and benefits between the proposed project and the baseline scenario be used in cost-benefit calculations – the following sections discuss the means by which these parameters are applied to the economic analysis of the freight pipeline.
Project Net Costs
An accurate appraisal of net costs for the freight pipeline would include postponement of the cost of constructing new highways and/or widening existing highways due to the removal of trucks from the Interstate 35 corridor. This appraisal would first require knowledge of TxDOT’s construction plans to accommodate I-35 traffic over the 50-year design life of the freight pipeline project, with a cost estimate assigned to this construction. Furthermore, the number of trucks diverted to the freight pipeline would need to be deducted from truck traffic forecasts over the 50-year period, and a new cost estimate prepared based on TxDOT’s modified construction schedule. The difference between these two cost estimates would be the actual highway construction cost savings attributable to the operation of a freight pipeline. The researchers adopted a more practical approach to the cost-benefit analysis in this study that ignores the cost savings due to a modified highway construction schedule, and simply adds the cost of constructing a freight pipeline to the “unmodified” cost of highway construction over the next 50 years. This approach bases the determination of project feasibility on the assumption that there are no avoided highway construction costs, which provides a worst-case benchmark for the evaluation.
Project Net Benefits
The net benefits used in this analysis are those benefits (i.e., avoided costs) accrued by the removal of trucks from Interstate 35. The diversion of truck freight from Texas highways to the freight pipeline will produce several benefits that can be generally classified as:
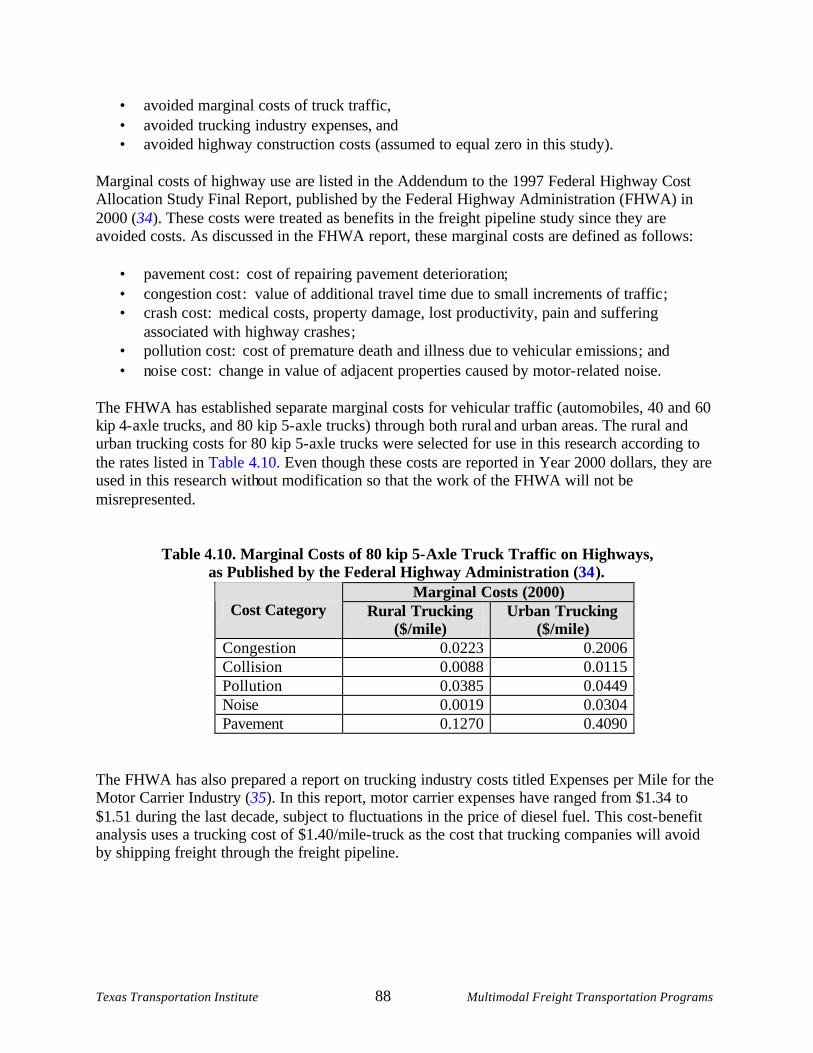
Texas Transportation Institute 88 Multimodal Freight Transportation Programs
• avoided marginal costs of truck traffic, • avoided trucking industry expenses, and • avoided highway construction costs (assumed to equal zero in this study).
Marginal costs of highway use are listed in the Addendum to the 1997 Federal Highway Cost Allocation Study Final Report, published by the Federal Highway Administration (FHWA) in 2000 (34). These costs were treated as benefits in the freight pipeline study since they are avoided costs. As discussed in the FHWA report, these marginal costs are defined as follows:
• pavement cost : cost of repairing pavement deterioration; • congestion cost : value of additional travel time due to small increments of traffic ; • crash cost: medical costs, property damage, lost productivity, pain and suffering
associated with highway crashes ; • pollution cost: cost of premature death and illness due to vehicular e missions ; and • noise cost: change in value of adjacent properties caused by motor- related noise.
The FHWA has established separate marginal costs for vehicular traffic (automobiles, 40 and 60 kip 4- axle trucks, and 80 kip 5- axle trucks) through both rural and urban areas. The rural and urban trucking costs for 80 kip 5- axle trucks were selected for use in this research according to the rates listed in Table 4.10. Even though these costs are reported in Year 2000 dollars, they are used in this research without modification so that the work of the FHWA will not be misrepresented.
Table 4.10. Marginal Costs of 80 kip 5- Axle Truck Traffic on Highways, as Published by the Federal Highway Administration (34 ).
Marginal Costs (2000) Cost Category Rural Trucking
($/mile) Urban Trucking
($/mile) Congestion 0.0223 0.2006 Collision 0.0088 0.0115 Pollution 0.0385 0.0449 Noise 0.0019 0.0304 Pavement 0.1270 0.4090
The FHWA has also prepared a report on trucking industry costs titled Expenses per Mile for the Motor Carrier Industry (35). In this report, motor carrier expenses have ranged from $1.34 to $1.51 during the last decade, subject to fluctuations in the price of diesel fuel. This cost-benefit analysis uses a trucking cost of $1.40/mile-truck as the cost that trucking companies will avoid by shipping freight through the freight pipeline.
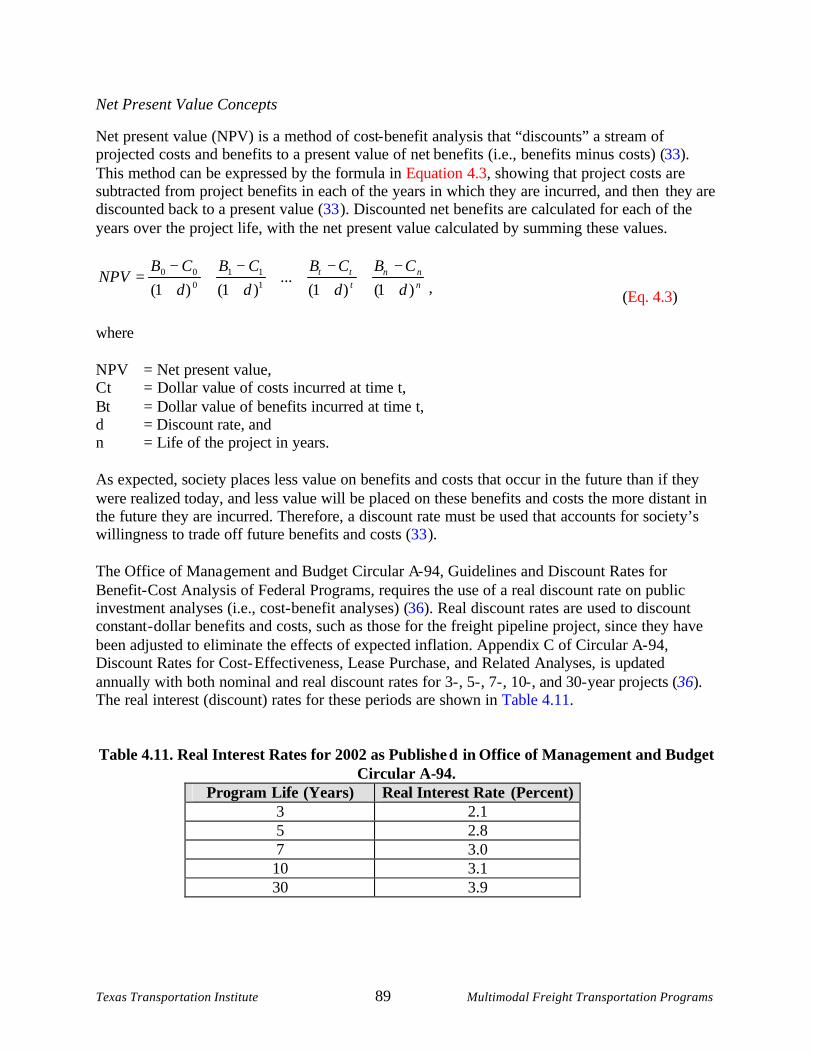
Texas Transportation Institute 89 Multimodal Freight Transportation Programs
Net Present Value Concepts
Net present value (NPV) is a method of cost- benefit analysis that “discounts” a stream of projected costs and benefits to a present value of net benefits (i.e., benefits minus costs) (33). This method can be expressed by the formula in Equation 4.3, showing that project costs are subtracted from project benefits in each of the years in which they are incurred, and then they are discounted back to a present value (33 ). Discounted net benefits are calculated for each of the years over the project life, with the net present value calculated by summing these values.
nnn
ttt
dCB
dCB
dCB
dCB
NPV)1()1(
...)1()1(
111
000
+−
++−
+++−
++−
=’ (Eq. 4.3)
where NPV = Net present value, Ct = Dollar value of costs incurred at time t, Bt = Dollar value of benefits incurred at time t, d = Discount rate, and n = Life of the project in years. As expected, society places less value on benefits and costs that occur in the future than if they were realized today, and less value will be placed on these benefits and costs the more distant in the future they are incurred. Therefore, a discount rate must be used that accounts for society’s willingness to trade off future benefits and costs (33 ). The Office of Mana gement and Budget Circular A- 94, Guidelines and Discount Rates for Benefit- Cost Analysis of Federal Programs, requires the use of a real discount rate on public investment analyses (i.e., cost- benefit analyses) (36). Real discount rates are used to discount constant - dollar benefits and costs, such as those for the freight pipeline project, since they have been adjusted to eliminate the effects of expected inflation. Appendix C of Circular A- 94, Discount Rates for Cost- Effectiveness, Lease Purchase, and Related Analyses, is updated annually with both nominal and real discount rates for 3- , 5- , 7- , 10- , and 30- year projects (36). The real interest (discount) rates for these periods are shown in Table 4.11. Table 4.11. Real Interest Rates for 2002 as Published in Office of Management and Budget
Circular A-94. Program Life (Years) Real Interest Rate (Percent)
3 2.1 5 2.8 7 3.0 10 3.1 30 3.9
Texas Transportation Institute 90 Multimodal Freight Transportation Programs
The Office of Management and Budget recommends that the analysis of projects with terms different than those shown in Table 4.11 use linear interpolation to determine the appropriate interest rate, and recommends that projects exceeding 30 years in duration use the 30- year interest rate (36 ). Based on these guidelines, the 50- year freight pipeline project uses a rate of 3.9 percent to discount net benefits in future years back to the current year (2002).
Calculating the Baseline Net Present Value
This research has prepared net present value calculations with the understanding that cost estimates for conceptual designs are inaccurate. Truly, no cost estimate can be judged as accurate until the project is completed and the final bill is submitted; nor can the actual value of a project’s benefits be known until they are realized. Therefore, a “baseline” net present value (i.e., the NPV based on costs, benefits, and facility utilization rates presented in this chapter) is supplemented with net present values obtained from a sensitivity analysis. The sensitivity analysis was performed to examine the risk associated with erro rs in:
• capital and annual cost estimates, • estimated initial freight pipeline traffic, and • assumed rate of growth in freight pipeline traffic .
The approach to calculating both baseline and risk- based net present values in this research can be described as simply performing the following steps:
• Select the appropriate discount rate (as discussed in the previous section). • Identify project benefits and costs (as discussed throughout this chapter). • Determine the years in which these benefits and costs are incurred. • Calculate net present value using Equation 4.3.
The researchers incorporated the se into an Excel spreadsheet to provide a convenient means of performing the sensitivity analysis, whereby an array of net present values were calculated by upward or do wnward adjustment of the base cost estimate, the initial freight pipeline traffic, or the rate of growth rate in freight pipeline traffic. The subsections that follow discuss the development/results of the baseline NPV calculation; a subsequent section dis cusses the methodology and results of the sensitivity analysis.
Compilation of Baseline Data. A review was performed of literature pertaining to traffic projections along the I- 35 Laredo- Dallas corridor for the purpose of establishing a plausible utilization rate for the freight pipeline facility. In the TxDOT- sponsored study titled Effect of the North American Free Trade Agreement on the Texas Highway System, 43 percent of I- 35 international truck traffic at Laredo was determined to be bound for states other than Texas in 1996 (37). Another TxDOT- sponsored report, The I- 35 Trade Corridor Study: Recommended Corridor Investment Strategies, projected this international truck traffic to equal 3,700 trucks per day by 2025 (38). By considering factors such as the contribution to southbound traffic by North Texas shippers and the potential for growth in the percent of international traffic,
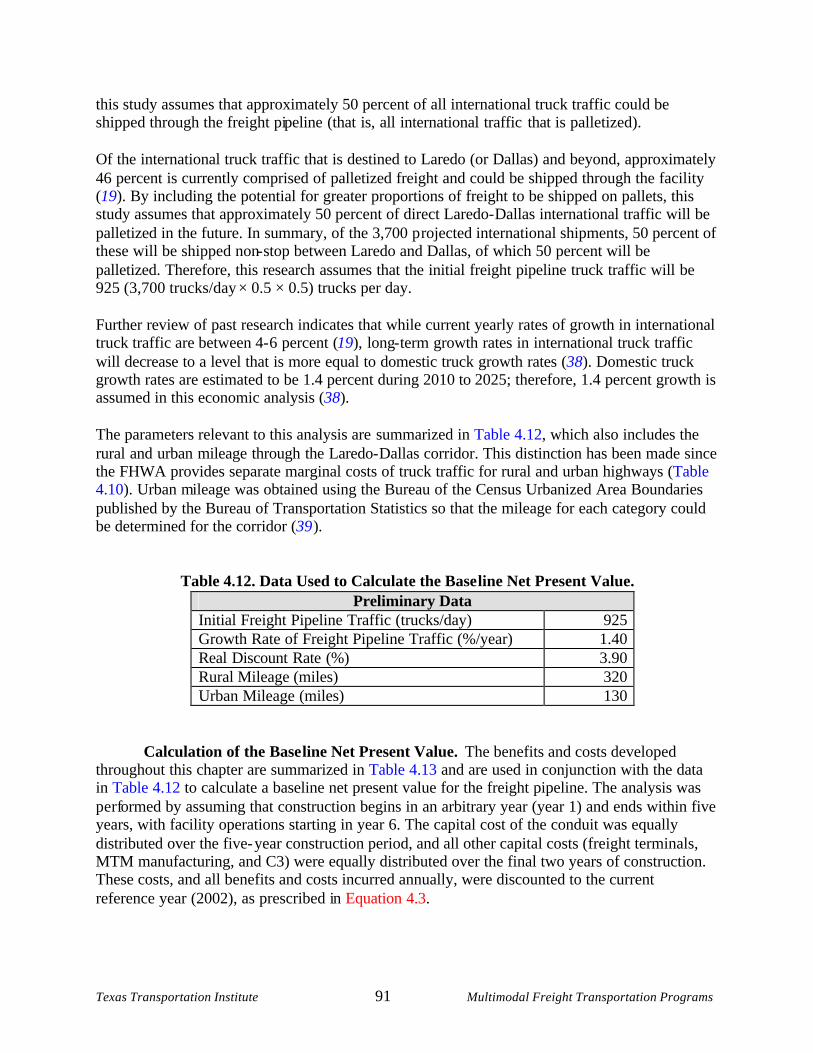
Texas Transportation Institute 91 Multimodal Freight Transportation Programs
this study assumes that approximately 50 percent of all international truck traffic could be shipped through the freight pipeline (that is, all international traffic that is palletized). Of the international truck traffic that is destined to Laredo (or Dallas) and beyond, approximately 46 percent is currently comprised of palletized freight and could be shipped through the facility (19). By including the potential for greater proportions of freight to be shipped on pallets, this study assumes that approximately 50 percent of direct Laredo- Dallas international traffic will be palletized in the future. In summary, of the 3,700 p rojected international shipments, 50 percent of these will be shipped non- stop between Laredo and Dallas, of which 50 percent will be palletized. Therefore, this research assumes that the initial freight pipeline truck traffic will be 925 (3,700 trucks/day × 0.5 × 0.5) trucks per day. Further review of past research indicates that while current yearly rates of growth in international truck traffic are between 4- 6 percent (19), long- term growth rates in international truck traffic will decrease to a level that is more equal to domestic truck growth rates (38). Domestic truck growth rates are estimated to be 1.4 percent during 2010 to 2025; therefore, 1.4 percent growth is assumed in this economic analysis (38). The parameters relevant to this analysis are summarized in Table 4.12, which also includes the rural and urban mileage through the Laredo- Dallas corridor. This distinction has been made since the FHWA provides separate marginal costs of truck traffic for rural and urban highways (Table 4.10). Urban mileage was obtained using the Bureau of the Census Urbanized Area Boundaries published by the Bureau of Transportation Statistics so that the mileage for each category could be determined for the corridor (39 ).
Table 4.12. Data Used to Calculate the Base line Net Present Value. Preliminary Data
Initial Freight Pipeline Traffic (trucks/day) 925 Growth Rate of Freight Pipeline Traffic (%/year) 1.40 Real Discount Rate (%) 3.90 Rural Mileage (miles) 320 Urban Mileage (miles) 130
Calculation of the Base line Net Present Value. The benefits and costs developed throughout this chapter are summarized in Table 4.13 and are used in conjunction with the data in Table 4.12 to calculate a baseline net present value for the freight pipeline. The analysis was performed by assuming that construction begins in an arbitrary year (year 1) and ends within five years, with facility operations starting in year 6. The capital cost of the conduit was equally distributed over the five- year construction period, and all other capital costs (freight terminals, MTM manufacturing, and C3) were equally distributed over the final two years of construction. These costs, and all benefits and costs incurred annually, were discounted to the current reference year (2002), as prescribed in Equation 4.3.
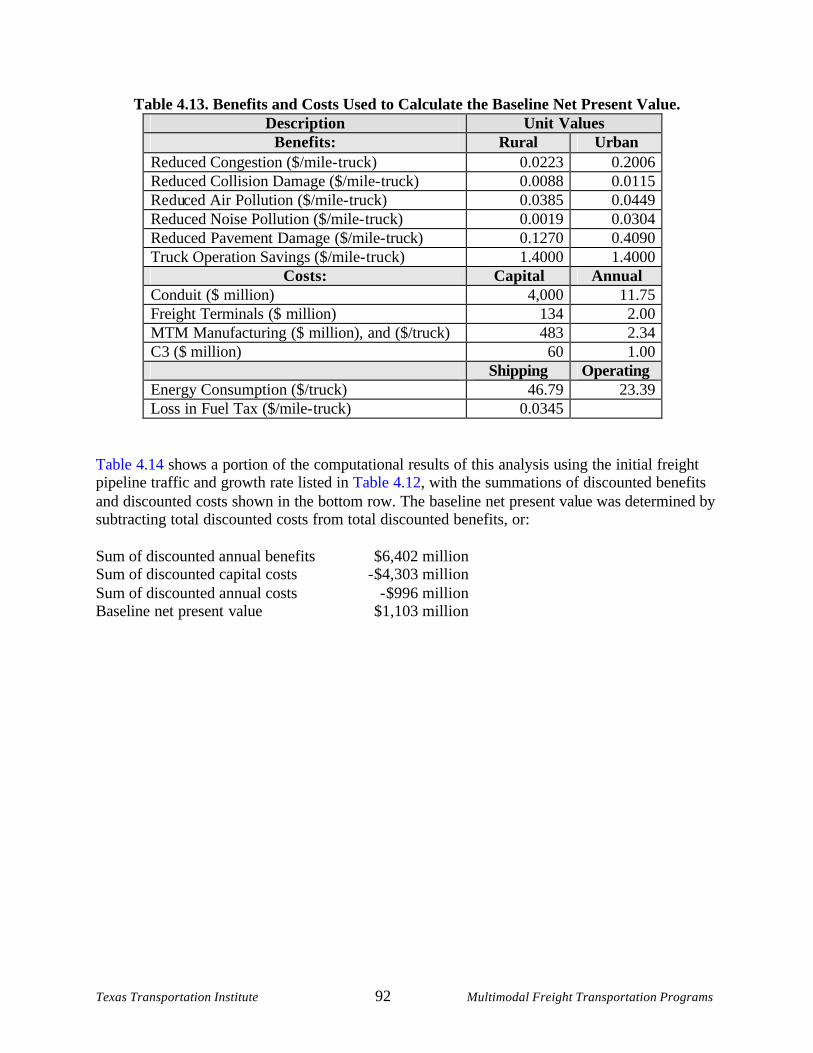
Texas Transportation Institute 92 Multimodal Freight Transportation Programs
Table 4.13. Benefits and Costs Used to Calculate the Baseline Net Present Value. Description Unit Values
Benefits: Rural Urban Reduced Congestion ($/mile- truck) 0.0223 0.2006 Reduced Collision Damage ($/mile- truck) 0.0088 0.0115 Reduced Air Pollution ($/mile- truck) 0.0385 0.0449 Reduced Noise Pollution ($/mile- truck) 0.0019 0.0304 Reduced Pavement Damage ($/mile- truck) 0.1270 0.4090 Truck Operation Savings ($/mile- truck) 1.4000 1.4000
Costs: Capital Annual Conduit ($ million) 4,000 11.75 Freight Terminals ($ million) 134 2.00 MTM Manufacturing ($ million), and ($/truck) 483 2.34 C3 ($ million) 60 1.00
Shipping Operating Energy Consumption ($/truck) 46.79 23.39 Loss in Fuel Tax ($/mile- truck) 0.0345
Table 4.14 shows a portion of the computational results of this analysis using the initial freight pipeline traffic and growth rate listed in Table 4.12, with the summations of discounted benefits and discounted costs shown in the bottom row. The baseline net present value was determined by subtracting total discounted costs from total discounted benefits, or: Sum of discounted annual benefits $6,402 million Sum of discounted capital costs -$4,303 million Sum of discounted annual costs -$996 million Baseline net present value $1,103 million
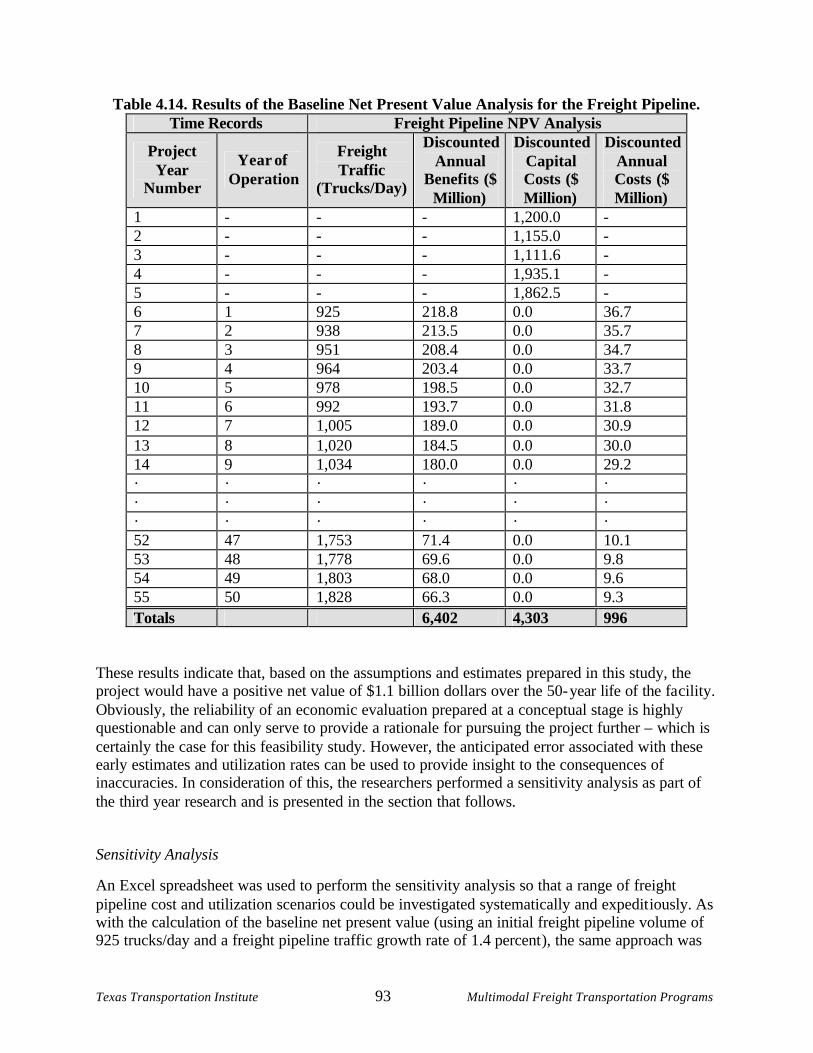
Texas Transportation Institute 93 Multimodal Freight Transportation Programs
Table 4.14. Results of the Baseline Net Present Value Analysis for the Freight Pipeline. Time Records Freight Pipeline NPV Analysis
Project Year
Number
Year of Operation
Freight Traffic
(Trucks/Day)
Discounted Annual
Benefits ($ Million)
Discounted Capital Costs ($ Million)
Discounted Annual Costs ($ Million)
1 - - - 1,200.0 - 2 - - - 1,155.0 - 3 - - - 1,111.6 - 4 - - - 1,935.1 - 5 - - - 1,862.5 - 6 1 925 218.8 0.0 36.7 7 2 938 213.5 0.0 35.7 8 3 951 208.4 0.0 34.7 9 4 964 203.4 0.0 33.7 10 5 978 198.5 0.0 32.7 11 6 992 193.7 0.0 31.8 12 7 1,005 189.0 0.0 30.9 13 8 1,020 184.5 0.0 30.0 14 9 1,034 180.0 0.0 29.2 · · · · · · · · · · · · · · · · · · 52 47 1,753 71.4 0.0 10.1 53 48 1,778 69.6 0.0 9.8 54 49 1,803 68.0 0.0 9.6 55 50 1,828 66.3 0.0 9.3 Totals 6,402 4,303 996
These results indicate that, based on the assumptions and estimates prepared in this study, the project would have a positive net value of $1.1 billion dollars over the 50- year life of the fa cility. Obviously, the reliability of an economic evaluation prepared at a conceptual stage is highly questionable and can only serve to provide a rationale for pursuing the project further – which is certainly the case for this feasibility study. However, the anticipated error associated with these early estimates and utilization rates can be used to provide insight to the consequences of inaccuracies. In consideration of this, the researchers performed a sensitivity analysis as part of the third year research and is presented in the section that follows.
Sensitivity Analysis
An Excel spreadsheet was used to perform the sensitivity analysis so that a range of freight pipeline cost and utilization scenarios could be investigated systematically and expeditiously. As with the calculation of the baseline net present value (using an initial freight pipeline volume of 925 trucks/day and a freight pipeline traffic growth rate of 1.4 percent), the same approach was
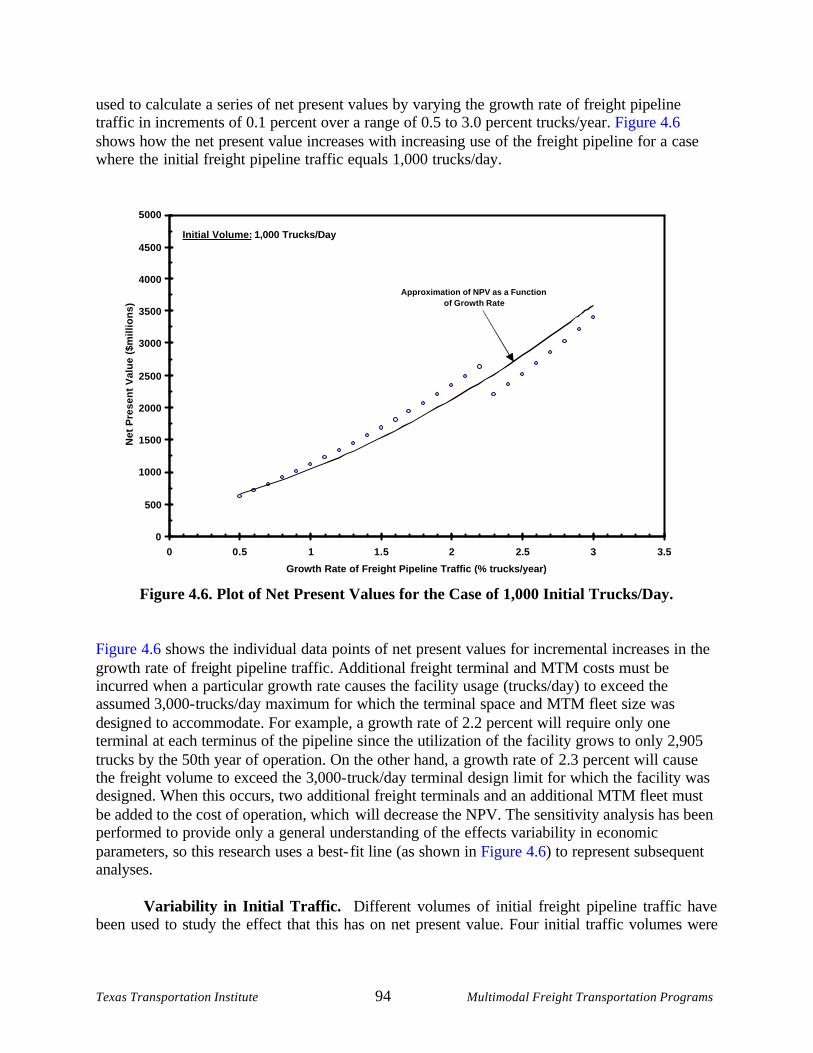
Texas Transportation Institute 94 Multimodal Freight Transportation Programs
used to calculate a series of net present values by varying the growth rate of freight pipeline traffic in increments of 0.1 percent over a range of 0.5 to 3.0 percent trucks/year. Figure 4.6 shows how the net present value increases with increasing use of the freight pipeline for a case where the initial freight pipeline traffic equals 1,000 trucks/day.
Figure 4.6. Plot of Net Present Values for the Case of 1,000 Initial Trucks/Day.
Figure 4.6 shows the individual data points of net present values for incremental increases in the growth rate of freight pipeline traffic. Additional freight terminal and MTM costs must be incurred when a particular growth rate causes the facility usage (trucks/day) to exceed the assumed 3,000-trucks/day maximum for which the terminal space and MTM fleet size was designed to accommodate. For example, a growth rate of 2.2 percent will require only one terminal at each terminus of the pipeline since the utilization of the facility grows to only 2,905 trucks by the 50th year of operation. On the other hand, a growth rate of 2.3 percent will cause the freight volume to exceed the 3,000-truck/day terminal design limit for which the facility was designed. When this occurs, two additional freight terminals and an additional MTM fleet must be added to the cost of operation, which will decrease the NPV. The sensitivity analysis has been performed to provide only a general understanding of the effects variability in economic parameters, so this research uses a best- fit line (as shown in Figure 4.6) to represent subsequent analyses.
Variability in Initial Traffic. Different volumes of initial freight pipeline traffic have
been used to study the effect that this has on net present value. Four initial traffic volumes were
0
500
1000
1500
2000
2500
3000
3500
4000
4500
5000
0 0.5 1 1.5 2 2.5 3 3.5
Growth Rate of Freight Pipeline Traffic (% trucks/year)
Net
Pre
sen
t V
alu
e ($
mill
ion
s)
Approximation of NPV as a Function of Growth Rate
Initial Volume: 1,000 Trucks/Day
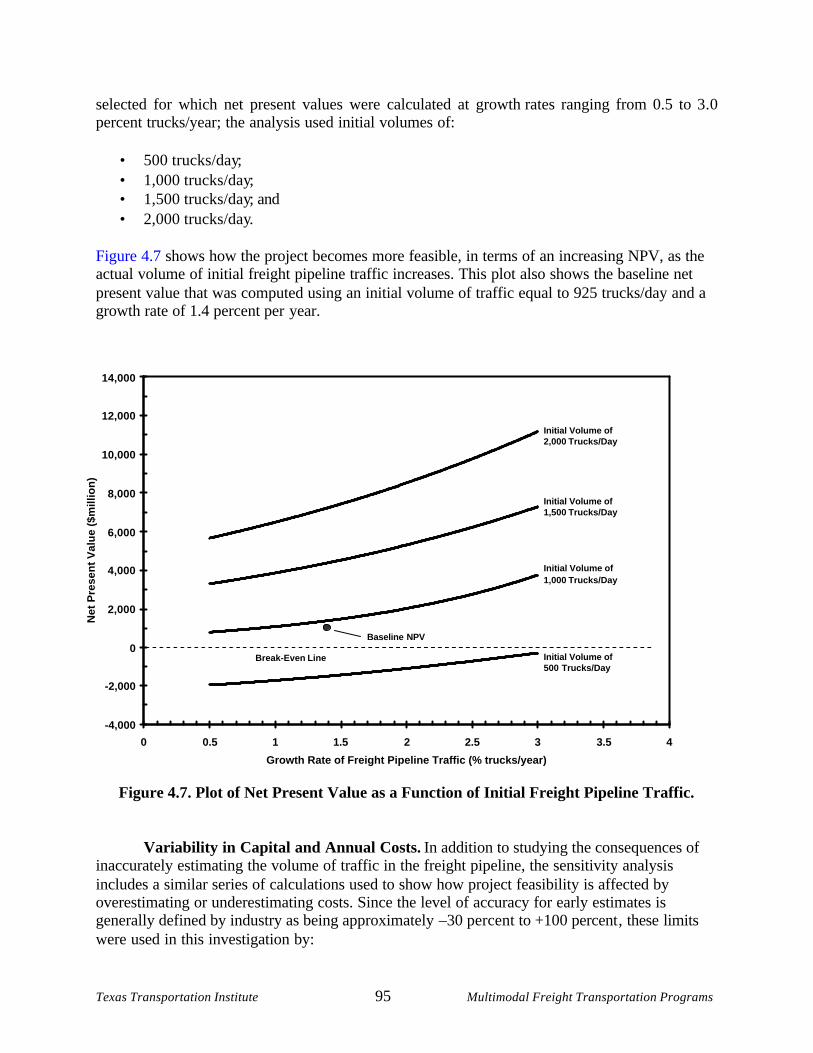
Texas Transportation Institute 95 Multimodal Freight Transportation Programs
selected for which net present values were calculated at growth rates ranging from 0.5 to 3.0 percent trucks/year; the analysis used initial volumes of:
• 500 trucks/day; • 1,000 trucks/day; • 1,500 trucks/day; and • 2,000 trucks/day.
Figure 4.7 shows how the project becomes more feasible, in terms of an increasing NPV, as the actual volume of initial freight pipeline traffic increases. This plot also shows the baseline net present value that was computed using an initial volume of traffic equal to 925 trucks/day and a growth rate of 1.4 percent per year.
-4,000
-2,000
0
2,000
4,000
6,000
8,000
10,000
12,000
14,000
0 0.5 1 1.5 2 2.5 3 3.5 4
Growth Rate of Freight Pipeline Traffic (% trucks/year)
Net
Pre
sen
t V
alu
e ($
mill
ion
)
Break-Even Line
Initial Volume of2,000 Trucks/Day
Initial Volume of1,500 Trucks/Day
Initial Volume of 1,000 Trucks/Day
Initial Volume of500 Trucks/Day
Baseline NPV
Figure 4.7. Plot of Net Present Value as a Function of Initial Freight Pipeline Traffic.
Variability in Capital and Annual Costs. In addition to studying the consequences of inaccurately estimating the volume of traffic in the freight pipeline, the sensitivity analysis includes a similar series of calculations used to show how project feasibility is affected by overestimating or underestimating costs. Since the level of accuracy for early estimates is generally defined by industry as being approximately –30 percent to +100 percent, these limits were used in this investigation by:
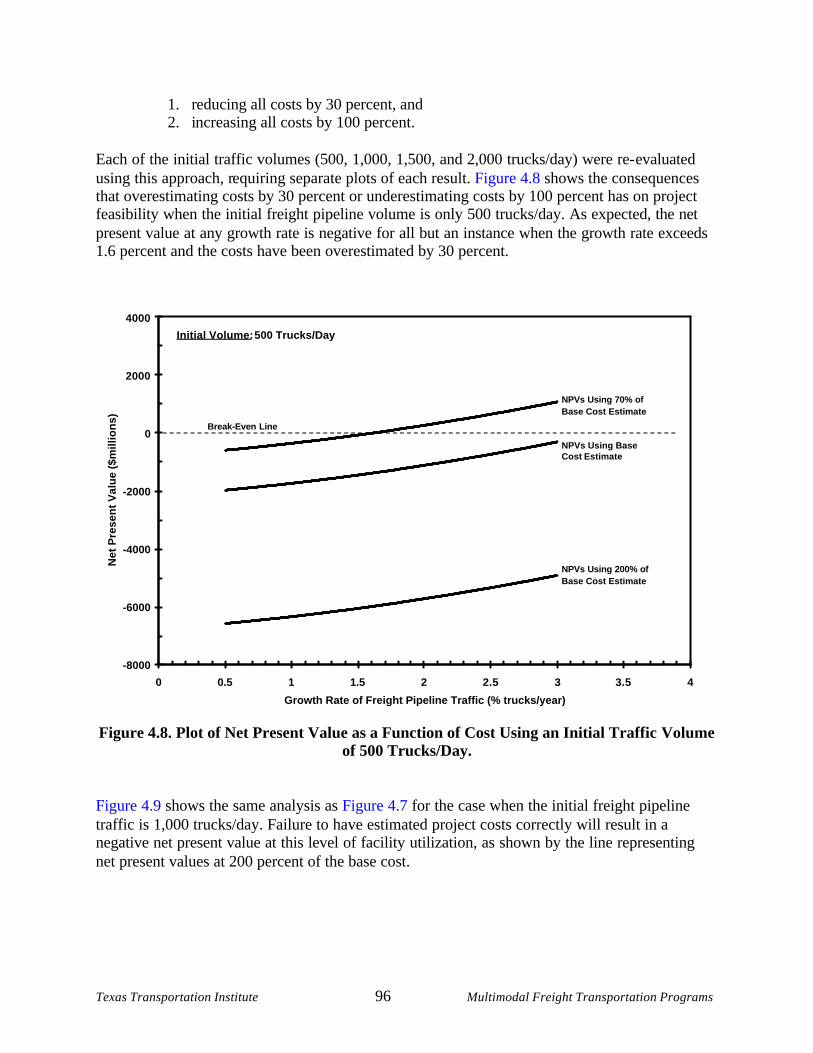
Texas Transportation Institute 96 Multimodal Freight Transportation Programs
1. reducing all costs by 30 percent, and 2. increasing all costs by 100 percent.
Each of the initial traffic volumes (500, 1,000, 1,500, and 2,000 trucks/day) were re- evaluated using this approach, requiring separate plots of each result. Figure 4.8 shows the consequences that overestimating costs by 30 percent or underestimating costs by 100 percent has on project feasibility when the initial freight pipeline volume is only 500 trucks/day. As expected, the net present value at any growth rate is negative for all but an instance when the growth rate exceeds 1.6 percent and the costs have been overestimated by 30 percent.
-8000
-6000
-4000
-2000
0
2000
4000
0 0.5 1 1.5 2 2.5 3 3.5 4
Growth Rate of Freight Pipeline Traffic (% trucks/year)
Net
Pre
sen
t V
alu
e ($
mill
ion
s)
Break-Even Line
Initial Volume: 500 Trucks/Day
NPVs Using 70% ofBase Cost Estimate
NPVs Using 200% ofBase Cost Estimate
NPVs Using BaseCost Estimate
Figure 4.8. Plot of Net Present Value as a Function of Cost Using an Initial Traffic Volume
of 500 Trucks/Day. Figure 4.9 shows the same analysis as Figure 4.7 for the case when the initial freight pipeline traffic is 1,000 trucks/day. Failure to have estimated project costs correctly will result in a negative net present value at this level of facility utilization, as shown by the line representing net present values at 200 percent of the base cost.
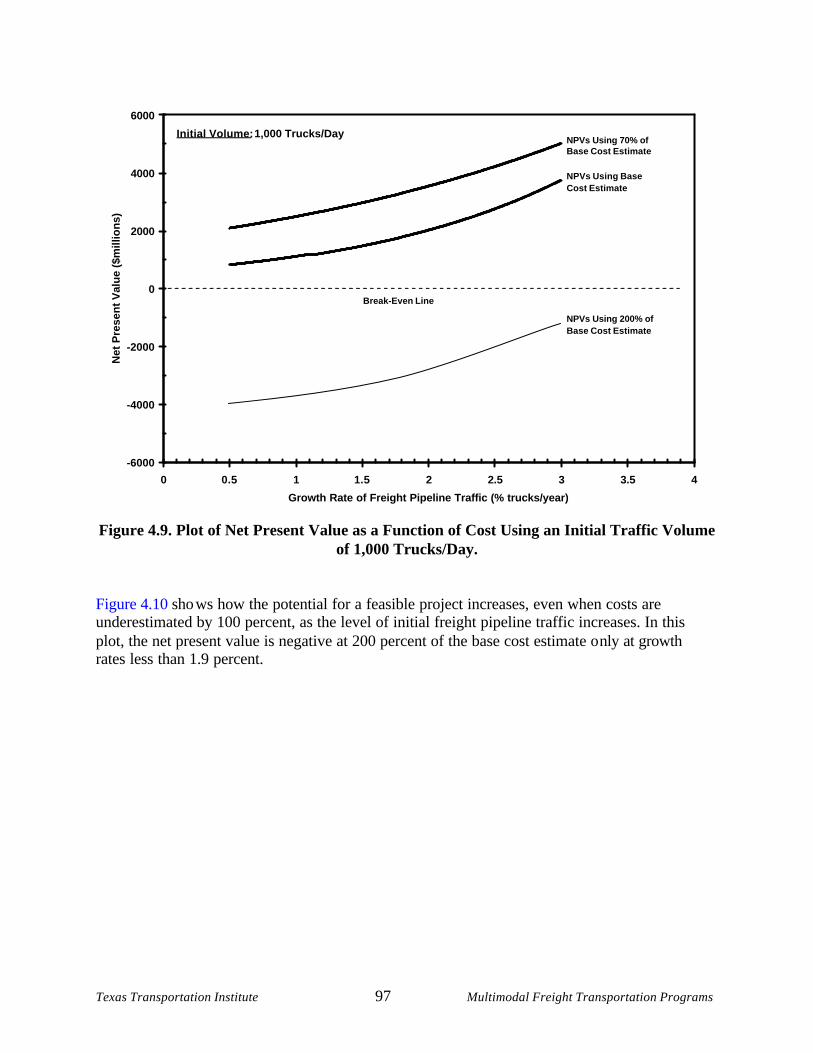
Texas Transportation Institute 97 Multimodal Freight Transportation Programs
-6000
-4000
-2000
0
2000
4000
6000
0 0.5 1 1.5 2 2.5 3 3.5 4
Growth Rate of Freight Pipeline Traffic (% trucks/year)
Net
Pre
sen
t V
alu
e ($
mill
ion
s)
Break-Even Line
Initial Volume: 1,000 Trucks/DayNPVs Using 70% ofBase Cost Estimate
NPVs Using 200% ofBase Cost Estimate
NPVs Using BaseCost Estimate
Figure 4.9. Plot of Net Present Value as a Function of Cost Using an Initial Traffic Volume
of 1,000 Trucks/Day. Figure 4.10 sho ws how the potential for a feasible project increases, even when costs are underestimated by 100 percent, as the level of initial freight pipeline traffic increases. In this plot, the net present value is negative at 200 percent of the base cost estimate only at growth rates less than 1.9 percent.
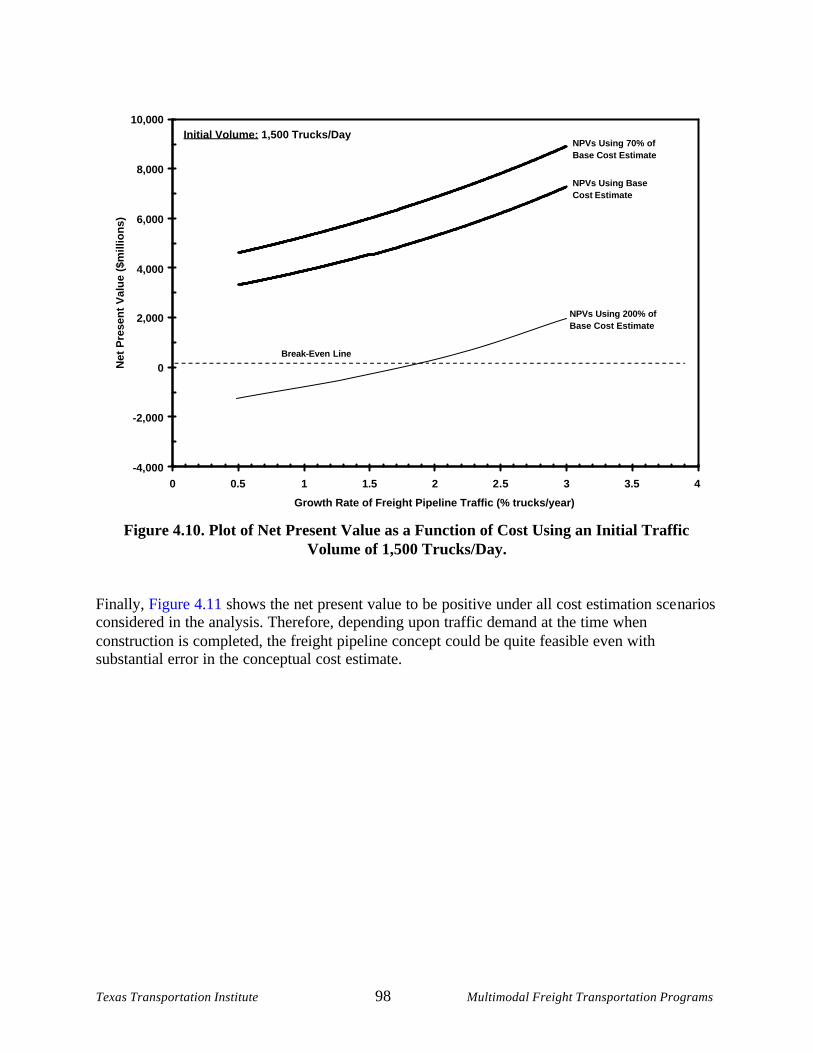
Texas Transportation Institute 98 Multimodal Freight Transportation Programs
-4,000
-2,000
0
2,000
4,000
6,000
8,000
10,000
0 0.5 1 1.5 2 2.5 3 3.5 4
Growth Rate of Freight Pipeline Traffic (% trucks/year)
Net
Pre
sen
t V
alu
e ($
mill
ion
s)
Break-Even Line
Initial Volume: 1,500 Trucks/DayNPVs Using 70% ofBase Cost Estimate
NPVs Using BaseCost Estimate
NPVs Using 200% ofBase Cost Estimate
Figure 4.10. Plot of Net Present Value as a Function of Cost Using an Initial Traffic
Volume of 1,500 Trucks/Day. Finally, Figure 4.11 shows the net present value to be positive under all cost estimation sce narios considered in the analysis. Therefore, depending upon traffic demand at the time when construction is completed, the freight pipeline concept could be quite feasible even with substantial error in the conceptual cost estimate.
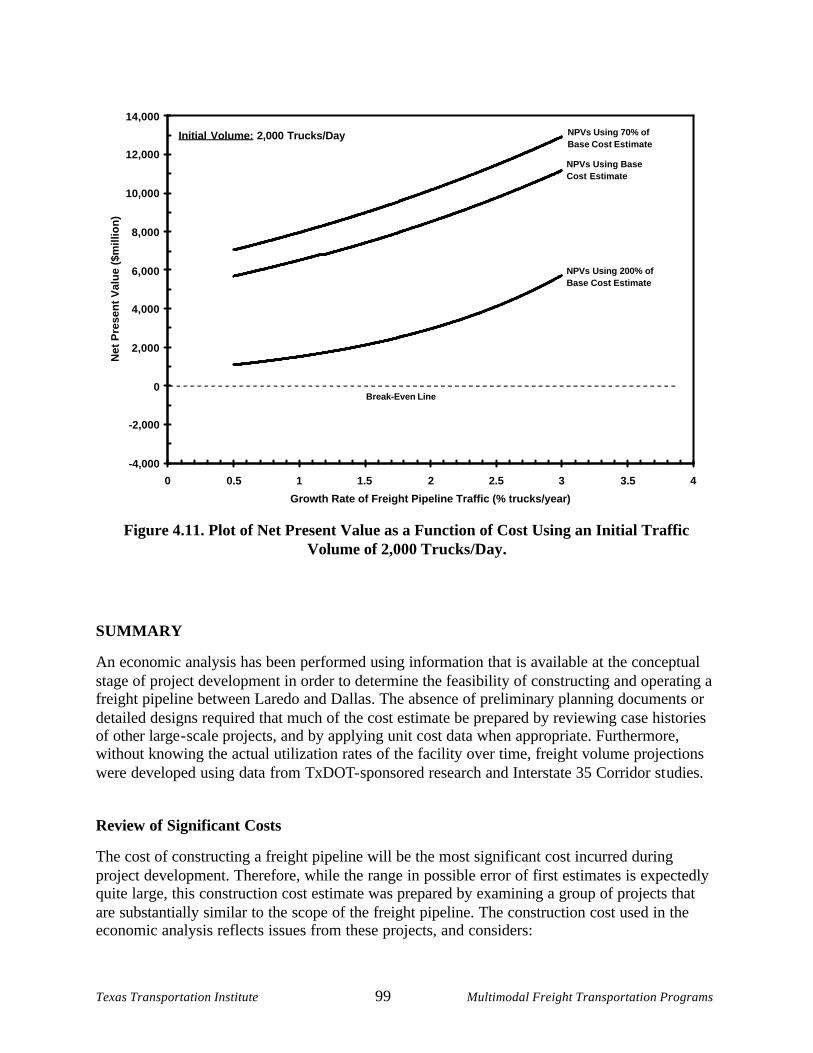
Texas Transportation Institute 99 Multimodal Freight Transportation Programs
-4,000
-2,000
0
2,000
4,000
6,000
8,000
10,000
12,000
14,000
0 0.5 1 1.5 2 2.5 3 3.5 4
Growth Rate of Freight Pipeline Traffic (% trucks/year)
Net
Pre
sen
t V
alu
e ($
mill
ion
)
Break-Even Line
Initial Volume: 2,000 Trucks/Day NPVs Using 70% ofBase Cost Estimate
NPVs Using BaseCost Estimate
NPVs Using 200% ofBase Cost Estimate
Figure 4.11. Plot of Net Present Value as a Function of Cost Using an Initial Traffic
Volume of 2,000 Trucks/Day.
SUMMARY
An economic analysis has been performed using information that is available at the conceptual stage of project development in order to determine the feasibility of constructing and operating a freight pipeline between Laredo and Dallas. The absence of preliminary planning documents or detailed designs required that much of the cost estimate be prepared by reviewing case histories of other large-scale projects, and by applying unit cost data when appropriate. Furthermore, without knowing the actual utilization rates of the facility over time, freight volume projections were developed using data from TxDOT-sponsored research and Interstate 35 Corridor studies.
Review of Significant Costs
The cost of constructing a freight pipeline will be the most significant cost incurred during project development. Therefore, while the range in possible error of first estimates is expectedly quite large, this construction cost estimate was prepared by examining a group of projects that are substantially similar to the scope of the freight pipeline. The construction cost used in the economic analysis reflects issues from these projects, and considers:
Texas Transportation Institute 100 Multimodal Freight Transportation Programs
• Project lengths of 100-336 miles, • Texas water crossings, • Interstate 35 Corridor rail construction, • Large open-cut excavations, and • Rolling terrain with possible tunneling.
Also, the approach adopted in this analysis includes many costs that likely exceed the actual cost for the explicit purpose of erring on the side of caution. Reasons why the project cost may be overstated include:
• An average railroad construction cost of $1 million/mile is added to the conduit construction cost estimate
• Capital costs are assumed to be incurred in early years (years 1-5) • Avoided highway construction costs are not included as benefits in the economic analysis • Additional terminal and MTM fleet costs (due to increases in facility utilization) are
assumed to be incurred during early years (years 3-5)
Project Feasibility
Following guidelines provided by the Office of Management and Budget for the evaluation of government projects, the freight pipeline was evaluated by using cost-benefit analysis. A net present value was obtained by discounting costs incurred and benefits received over the life of the project back to the current year (2002) using a discount rate of 3.9 percent. A “baseline” net present value was obtained by assuming that the initial freight pipeline truck traffic will equal 925 trucks, and that this amount of traffic will grow at 1.4 percent per year. These assumptions resulted in a net present value of $1.1 billion, implying that the project would be feasible under these conditions. Due to the uncertainty of estimates associated with conceptual studies, the traffic projections and capital/annual costs were then varied as part of a sensitivity analysis. The sensitivity analysis showed that benefits grow at a substantially greater rate than incurred costs as the volume of freight pipeline truck traffic increases. Of course, these results are offset by the fact that project feasibility becomes less favorable as the degree of underestimating total costs increases. For example, the project will be feasible at an initial utilization of 1,000 trucks/day and virtually no growth in traffic if costs are as expected, but will only be feasible at an initial utilization of approximately 1,500 trucks/day if costs are actually twice the expected cost. The feasibility of constructing a freight pipeline to reduce highway truck traffic will only become more certain as the concept is studied in greater detail. However, the results of this analysis are promising, and suggest that further research on this topic will be worthwhile.
Texas Transportation Institute 101 Multimodal Freight Transportation Programs
CHAPTER 5: POLICY AND REGULATORY ISSUES
POLICY ANALYSIS
The state of Texas is facing a “transportation crisis ” during the next few decades as increased trade places more and more traffic on the existing transportation systems of the state. Congestion and safety concerns caused by freight traffic using the same general purpose lanes as private vehicles, the damage inflicted upon the condition of the highway system, and the rapid population growth in the state over the next 50 years requires that state policymakers consider all options to meet these challenges. In evaluating this particular project, it is important to remember that, while the “no-build option” must be evaluated for every proposed project under federal planning rules, in reality, doing nothing about freight traffic in the study corridor is not an option. In fact, massive capital investments will be made during the next 50 years by federal, state, and local governments to deal with increasing amounts of freight traveling through the state of Texas. If only traditional highway planning options are to be considered, billions will be spent on traditional highway expansion projects or other improvements that can temporarily alleviate congestion in only limited areas. This option has been effective in the past, but the costs of right-of-way acquisition in urban areas for highway expansion combined with the environmental and social costs associated with these methods are making them much less desirable options than they were during the last 30 to 40 years. Moving beyond these options to deal with the emerging problem would require, alternatively, that those same billions be spent on constructing and maintaining freight-only highway lanes that are either directly adjacent to current facilities or in their own separate ROW. These freight-only lane/highway options have many of the same disadvantages related to right-of-way acquisition and political opposition. A third and possibly better way to proceed is to move some of this freight by other transportation modes – thus alleviating the highway system without incurring greater costs to the public sector for construction, maintenance, and rehabilitation. Because Texas lacks an extensive inland waterway system like that of some eastern states and much of Europe, waterborne freight cannot be widely used in place of highway freight outside its coastal areas. Freight transportation by air, while growing in importance, is still largely limited to high-value and very time-sensitive shipments due to its higher costs. This limitation leaves freight rail transportation as the only other current option for diverting large amounts of freight traffic from the highway system. No doubt, the private railroad companies would gratefully accept increased business, but they,too, will become capacity- limited at some point due to their mainly single-track system and insufficient capital to rapidly add additional trackage, even along routes where they may already own and hold available ROW. Combating this limitation will require greater participation by the public sector in funding rail infrastructure. Additionally, more locomotive power and other rail equipment would also be a short-term limitation on how quickly the railroad companies could react. Even if the railroad companies could quickly respond to greatly increased demand or begin to more readily accept public assistance in providing infrastructure, it is generally accepted that the economics of rail transportation make rail shipment less desirable at distances of less
Texas Transportation Institute 102 Multimodal Freight Transportation Programs
than 450 miles. It is the need for options other than trucks in this short- haul freight market that the underground freight pipeline system described in this feasibility study seeks to address. The process of financing any major capital transportation project is complex at best. Making it even more complex is the ever- changing nature of government policy and programs that are applicable to fund a large project such as that envisioned by this feasibility study. The potential magnitude of the initial investment required for this system in conjunction with the innovative nature of the infrastructure introduces additional uncertainty considerations that must be fully explored even before operational funding needs are considered. Earlier chapters of this report and the previous year’s reports have reviewed comparable projects in order to gain an understanding of the broad requirements and approaches attempted in other efforts involving similar issues and scope. Based upon these calculations of the estimated costs for design and construction, and the various estimated study corridor traffic forecasts shown in Chapter 4, the initial capital outlay to build and operate such a system would be approximately $5 billion. Annual operation and maintenance (O&M) costs are estimated to be in the range of $17-18 million. Given these levels of needed funding, it quickly becomes clear that such an investment is beyond what any one entity or level of government can reasonably fund, and it will likely require a partnership to achieve – either public-public, between different levels of government, or public-private, using both government and private sector funds. Below are listed several individual funding sources from both public and private sources.
Federal Funding Options
Provisions of the most recent federal transportation authorization legislation determine the available government transportation funding at the federal level. These “authorization bills” are considered every six years and outline the amounts of transportation funding that will be available over the subsequent six-year period. The two most recently passed bills have been the Intermodal Surface Transportation Efficiency Act (ISTEA) passed in 1991 for FY 1992 to 1997 and the Transportation Equity Act for the 21st Century (TEA-21) passed in 1998 for the FY 1998 to 2003 period. At the time of this report, another bill for the following six-year period, FY 2004 to 2009, is being crafted. These bills outline specific programs and policies, allocate funding levels to each transportation mode, and specify the authorized, maximum amount of funding that may be appropriated by future Congressional actions during the six-year period covered by the bill. While these bills give “permission” to fund specific programs at a certain level, the actual appropriation of funds takes place each year in the transportations appropriations bill. One way to fund construction of the freight pipeline would be to get it named as a specific project in one of these authorization bills along with determined funding levels over a period of years. While each authorization bill is written independently, they tend to draw largely from the policies and programs that have been put into place in previous legislative efforts. Programs funded under TEA-21 demonstrate precedence for inclusion of large projects such as the freight pipeline directly in the authorization bill as a method for funding.
Texas Transportation Institute 103 Multimodal Freight Transportation Programs
Below are listed several examples of current programs in TEA-21 that could be built upon or expanded to fund construction and operation of the freight pipeline:
Designation as a “Project of National Significance”
One recent major transportation project that benefited from specific provisions in TEA-21 was the Alameda Corridor Project in Southern California. The Alameda Corridor Project links the Ports of Los Angeles and Long Beach with rail yards located in downtown Los Angeles. The intent of the project was to consolidate 90 miles of existing rail line from three different routes into a 20-mile long, partially depressed, double tracked “railroad trench” within the existing right of way along Alameda Street between the ports and the rail yards. By placing the tracks below ground level for much of the corridor, truck and automobile traffic can cross the rail corridor at surface level unimpeded by train movement. Now that operations are shifted to the new route, 200 at-grade rail crossings can be eliminated, thereby enhancing local traffic circulation, safety, and quality of life for citizens in Los Angeles and the surrounding cities. The Alameda Corridor received special consideration in TEA-21 and was designated as a “project of national significance.” Its designation as “nationally significant” was granted due to the large number of freight containers that enter the Ports of Los Angeles and Long Beach bound for destinations throughout the United States by rail. Recognition that the rail and truck bottleneck between Southern California ports and the rail classification yards in downtown Los Angeles was affecting the freight transportation system of the entire nation, this problem, while seemingly localized within one relatively small urban area, became a national priority. Because of its downstream impact, special attention in the national transportation authorization bill and subsequent appropriations bills was provided. In a similar manner, the freight corridor between Laredo and Dallas under consideration in this feasibility study could be evaluated and designated of national significance since it carries such a large percentage of the truck traffic between the U.S. and Mexico. Just as the shorter freight bottleneck between the ports and urban rail yards in Southern California affected mobility, safety, economic well-being, and quality of life in that corridor, increases in freight traffic along I-35 through Texas affect the same factors over a longer 450-mile route. The forecast need for additional lanes and/or other freight facilities identified in the 1999 I-35 Trade Corridor Study conducted by TxDOT and several other state DOTs requires that this corridor, too, be considered as a “nationally significant” route that deserves special consideration in future federal funding authorizations.
Selection as a Federal Demonstration Project
In addition to general funding levels appropriated to the state DOTs each six years by the federal transportation authorization bill, dozens of projects are expressly mentioned as “line items” with specified funding levels that must be dedicated to that project. These designated funds and projects are known as “demonstration projects.” Many studies and projects in Texas have been funded in this manner under provisions of both ISTEA and TEA-21. Inclusion of projects as demonstration projects has been a popular method for members of Congress to ensure that
Texas Transportation Institute 104 Multimodal Freight Transportation Programs
projects in their district are funded since funds allocated in this manner may only be spent on a specific project. TxDOT has generally preferred not to have demonstration projects. Instead, TxDOT has preferred to ha ve greater flexibility in where it may spend all federal funds flowing to the state by allowing its Unified Transportation Plan (UTP) planning process to determine the prioritization of a project. Nonetheless, having the freight pipeline specifically fund ed as a federal demonstration project over a period of years is an option that must be considered.
National Corridor Planning and Development and Coordinated Border Infrastructure Programs
These special programs under TEA- 21 were set aside to assist in p lanning and development of interregional corridors within the U.S. and international trade corridors between both the U.S. and Mexico and the U.S. and Canada. The monies from these programs may only be spent on specific international and regional corridors that were named in ISTEA and subsequent legislation as essential to trade flow in North America, especially those that experienced increased demand following implementation of the North American Free Trade Agreement (NAFTA). Both programs are “discretio nary programs” that allow the Secretary of Transportation to set rules for determining how the money will be distributed and set an authorization limit of $140 million for the last four fiscal years of the TEA- 21 period. Unfortunately, the funding for the se programs has become subject to powerful members of Congress setting aside large portions of the appropriations for this program each year to projects in their home state or district instead of allowing the entire appropriation to be distributed on a competitive basis by the Department of Transportation. This process has led to great disappointment in Texas as more funds from this program have been awarded to non- border states than to address the emergent needs of this state. If this program were to be altered in subsequent transportation authorization bills to address specific international trade corridors such as the I- 35 corridor, it is possible that a project such as the freight pipeline could be eligible by reducing freight traffic moving by truck. Funding levels would also need to be greatly increased in a discretionary program for trans - border infrastructure if it were to have an impact on the substantial construction costs associated with building a freight pipeline.
Transportation Infrastructure Finance Innovation Act (TIFIA) Loan
TEA-21 has provided a means to grant federally guaranteed loans to construct major transportation projects. In order to qualify for this program, the project must have a total cost of over $100 million dollars or greater than 50 percent of a state’s annual apportionment of federal-aid funds, whichever is less, but TIFIA funds may not exceed 33 percent of the total project costs. The program is limited to transportation projects of “critical national importance, such as intermodal facilities, border crossing infrastructure, expansion of multi-state highway trade corridors, and other investments with regional and national benefits (40).” Specifically mentioned as eligible projects are:
• any type of project that is eligible for Federal assistance through surface transportation programs under Title 23 or chapter 53 of Title 49 U.S.C. (highway projects and transit capital projects);
• international bridges and tunnels;
Texas Transportation Institute 105 Multimodal Freight Transportation Programs
• inter- city passenger bus and rail facilities and vehicles (including Amtrak and magnetic levitation systems); and
• publicly owned intermodal freight transfer facilities (except seaports or airports) on or adjacent to the National Highway System (40).
In addition to direct federal loans, the TIFIA program alternatively provides loan guarantees that can encourage private investment and standby lines of credit that can supplement project revenues during the first 10 years of project operations (40). A program of this type could provide up to one-third of the cons truction costs associated with building the freight pipeline, and then revenue from operations could be used to repay the loan.
State Funding Options
Several funding options at the state level are available to assist with major transportation projects. State funding is limited in comparison to that available at the federal level, although these resources can be very critical in providing matching funds to augment or “pull down” additional federal dollars. Based upon several recent or current projects in the state, the options listed below would be expected to play a role in financing the construction of the freight pipeline.
Bonding
One of the most likely means of raising the large amount of capital needed for construction of the freight pipeline would be issuance by the state of project bonds for purchase by the public. The bonds would be serviced based upon revenue from operations of the facility once it was built and service began. This funding option has recently been used to make possible accelerated construction of the SH-130 corridor between Georgetown and San Antonio based upon anticipated revenues from toll to be collected on the roadway. Likewise, fees for moving palletized freight through the pipeline could potentially act as a revenue stream for redemption of bonds issued to fund construction of the freight pipeline.
State Transportation Planning Funds
Federal funds that are allocated to the state for planning studies could be used for funding of more preliminary and detailed design stud ies of the freight pipeline prior to construction. Once the project is included in the state’s transportation plan and moves up in priority status in the Unified Transportation Program other state funds could become available for use; however, current limitations of state transportation funding largely to highway projects only could be problematic. Changing these restrictions could require legislative action and/or an amendment to the state constitution.
Texas Transportation Institute 106 Multimodal Freight Transportation Programs
Innovative Funding Methods
Several creative funding mechanisms have been mentioned for the Trans Texas Corridor system of high-speed road and rail corridors that have recently been considered by the Texas Transportation Commission and state government leaders. These methods include the use of concessions in which one or more companies own the rights to all or a segment of the facility. They would receive payments for freight that traverses that section and have the potential of using funds from the Texas Mobility Fund should that mechanism (created following the 77th Legislature) receive appropriations from future legislative action. Each of these creative funding methods would likely play a role in construction of a freight pipeline system to the extent that the public or private management model selected will allow.
Co-location in Existing TxDOT Right-of-Way
There are two major ways in which costs could be reduced by co- locating the freight pipeline adjacent and parallel to highways in an existing ROW. First, the state could drastically reduce the costs associated with construction of a freight pipeline system if it could be built within an existing ROW, i.e. one already owned by the state. This would reduce the costs of new right-of-way acquisition and should ease some of the costs associated with gaining environmental clearance for construction compared to building in a new corridor. Such sharing of ROW could be in the current interstate highway corridors or planned in conjunction with future Trans Texas Corridor routes. The second opportunity for cost savings in this scenario is the possibility that some segments of the conduit would not need to be placed underground if built alongside existing roadways. An enclosed box culvert above ground using the median of a highway could contain the operating elements of the freight pipeline and save the effort and cost of grade separating the structure by placing the system underground. Underground placement, as envisioned in this study, was for the purpose of preserving surface ROW and eliminating at-grade conflicts. If surface ROW was made available and bridge structures for parallel highways were already planned or in place, subterranean placement might not be necessary to gain the benefits associated with the freight pipeline.
Regional/Local Funding Options
Regional and local funding can play a role in funding of specific segments of the freight pipeline. This funding may take place in several ways. In many highway construction projects, local authorities assist in project development by purchasing ROW for the segment that passes through their area of authority. This type of local participation in major projects that impact longer corridors sets precedence for the project considered in this feasibility study. Two such funding sources controlled by local authorities that could potentially be applied to the freight pipeline are discussed below.
Texas Transportation Institute 107 Multimodal Freight Transportation Programs
Congestion Mitigation and Air Quality (CMAQ) Funds
Although CMAQ funds originate from federal sources, local metropolitan planning organizations (MPOs) allocate how CMAQ funds are spent within their planning area. CMAQ funding goes to those MPOs that are designated as non-attainment areas for federal air quality goals. Current laws limit the use of CMAQ funds to within the boundaries of the MPO that has been so designated. While this greatly limits the areas of the freight pipeline that could potentially benefit, certainly those segments of it that traverse MPOs in non-attainment status could benefit from this funding source. MPO boards could choose to participate based upon the environmental benefits that would be gained by moving goods in this manner over increased truck traffic on the surface streets and highways.
Regional Mobility Authorities (RMAs)
The creation of RMAs was authorized by actions of the 77th Texas Legislature. The legislation allows one or more counties to form a RMA, raise funds, and, with the approval of the Texas Transportation Commission, to plan for and address mobility issues on a regional basis rather than work through the statewide TxDOT planning process. RMAs along the route of the freight pipeline could potentially fund local segments as a method to divert some freight off of local roadways.
Private Sector Funding Options
Depending on the business model selected for final operation of the freight pipeline, several possibilities for private sector investment in funding the project exist. Several of these options are listed below.
Private Ownership
Based upon further analysis, it may prove that such a freight pipeline sys tem could be profitable enough that either a single company or a consortium of private-sector firms might choose to fund and operate the freight pipeline. Private-sector methods could include either borrowing directly from financial institutions or by issuing bonds to finance construction. The costs of construction and operation would then be borne by that company or group of companies in exchange for the revenues from moving freight through the system. Revenues would service the long-term debt and provide for operations and maintenance requirements. This funding method, while possible, is highly unlikely to be done completely by the private sector due to the risk involved in acquiring financing for this purpose. One possibility is that the public sector would act to guarantee the private sector investment, thus limiting the risk inherent in total private-sector funding of the project.
Texas Transportation Institute 108 Multimodal Freight Transportation Programs
Private Operations
Another funding scenario would be public construction of the pipeline system with private operations once construction was complete. This method would have a private company operate the pipeline with a portion of the revenues going back to the public sector to repay loans and/or service any bonds. The remainder of the revenues would go to the operating company to cover expenses and pay for maintenance of the system. The remaining revenue would be profit for the private-sector firm.
Combination of Funding Sources
As stated previously, due to the magnitude of the funds needed for construction and operations for this project, it is likely that no one source of funds will provide for the entire need. Project funding is most likely to come from a combination of sources. The recently completed Alameda Corridor Project resulted from a combination of both public and private expenditures. These sources included a $400 million TIFIA loan from the US DOT, $400 million in private funding from the Port of Los Angeles and the Port of Long Beach, $700 million from local project revenue bonds, and $350 million in state and local funds. The Alameda Corridor Transportation Authority (ACTA) collects $30 per loaded container and $8 per loaded rail car or empty container moving along the corridor. ACTA will use this revenue stream to repay the TIFIA loan and service its long-term revenue bond debt. This type of multifaceted funding partnership between several levels of government and the private sector provides a model for future planning with regards to financing of any freight pipeline project. Innovative funding sources, along with proven methods from other transportation modes, along with special legislative appropriations will most likely form the basis for local and regional funding participation in certain sections. The long-term life cycle costs and benefits of the project, explained elsewhere in this report, explain the rationale for making such an investment.
EXCAVATION AND PIPELINE RELOCATION PRACTICES
As a production and transportation center for petroleum and refined products, Texas has one of the most extensive networks of natural gas and hazardous liquid pipelines in the country. As the nation’s population and economic growth leads to greater demands for energy, this 270,000-mile network will continue to expand. Likewise, population growth in Texas will also require a more extensive and innovative transportation infrastructure throughout the state, such as that provided by a freight pipeline through the Interstate 35 Laredo-Dallas corridor. Unfortunately, statistics provided by the Department of Transportation’s Office of Pipeline Safety show that construction activity near in-place pipelines are now one of the most costly causes of pipeline-related property damage. Growth in the state’s transportation infrastructure, combined with a large and increasing pipeline network, suggests that damage to in-place pipelines from construction activities will continue to increase unless safety precautions are implemented.
Texas Transportation Institute 109 Multimodal Freight Transportation Programs
Not only will construction of the freight pipeline require trench excavations near existing pipelines, but this project will also require that some pipelines be relocated (lowered) to allow for burial of the pipeline conduit. Furthermore, both corridor selection and engineering design of the freight pipeline will require consideration of these issues. Therefore, this chapter is devoted to excavation and pipeline relocation practices that researchers and designers should be consider during all phases of this project, including planning, design, and construction of the freight pipeline.
Existing Natural Gas and Hazardous Liquid Pipelines
The Texas Railroad Commission database was reviewed to identify the natural gas and hazardous liquid pipelines that exist within the freight pipeline corridor. The state map in Figure 5.1 illustrates the complex pattern of this network in relation to Interstate 35. Shown in this figure are both natural gas and hazardous liquid pipelines, with hazardous liquid pipelines being comprised of those transporting either crude or refined products. The planning, design, and construction of a subterranean facility such as the freight pipeline will require consideration of characteristics and locations of these pipelines at the earliest stages of development. The Railroad Commission’s database includes several attributes of pipelines that exist within the state, such as:
• fluid type, • nominal diameter, • intrastate or interstate, • system operator, • function, and • length.
A coordinated planning effort should use this information to identify cost and corridor selection issues re lated to the existence of these pipelines, and to provide a safe working environment in which to construct the freight pipeline facility. The Geographical Information System ( GIS ) database can be accessed through the Railroad Commission website (www.rrc.state.tx.us).
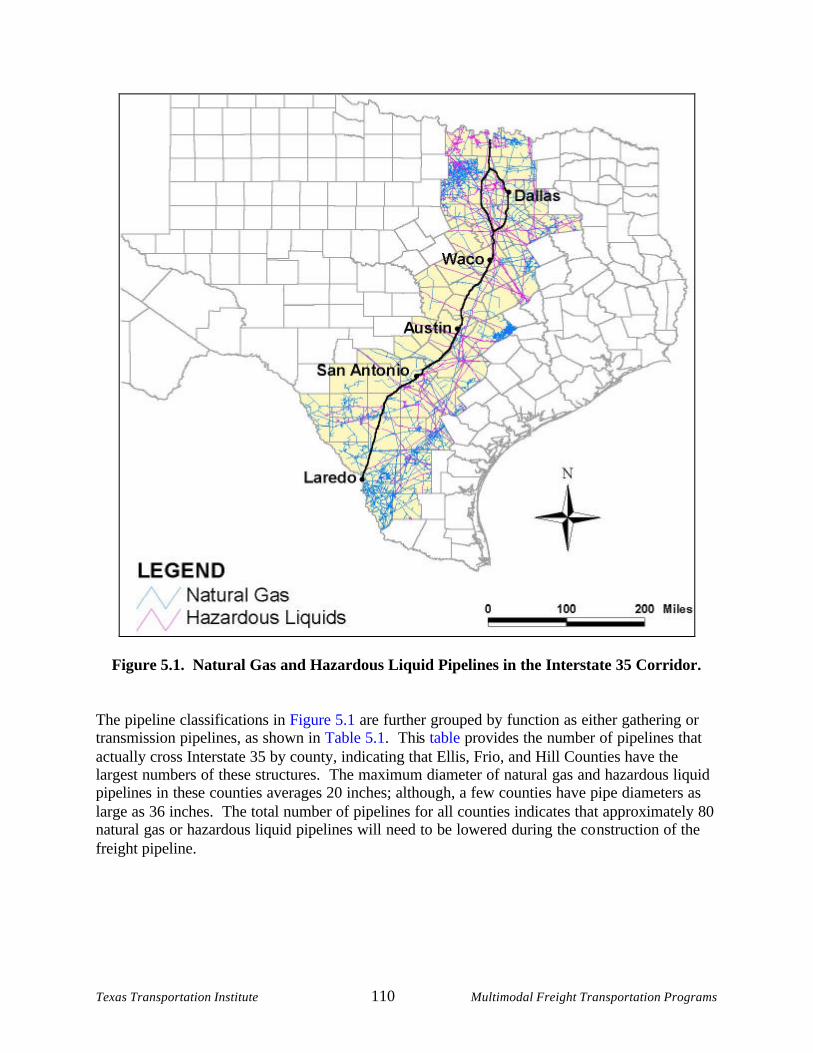
Texas Transportation Institute 110 Multimodal Freight Transportation Programs
Figure 5.1. Natural Gas and Hazardous Liquid Pipelines in the Interstate 35 Corridor. The pipeline classifications in Figure 5.1 are further grouped by function as either gathering or transmission pipelines, as shown in Table 5.1. This table provides the number of pipelines that actually cross Interstate 35 by county, indicating that Ellis, Frio, and Hill Counties have the largest numbers of these structures. The maximum diameter of natural gas and hazardous liquid pipelines in these counties averages 20 inches; although, a few counties have pipe diameters as large as 36 inches. The total number of pipelines for all counties indicates that approximately 80 natural gas or hazardous liquid pipelines will need to be lowered during the construction of the freight pipeline.
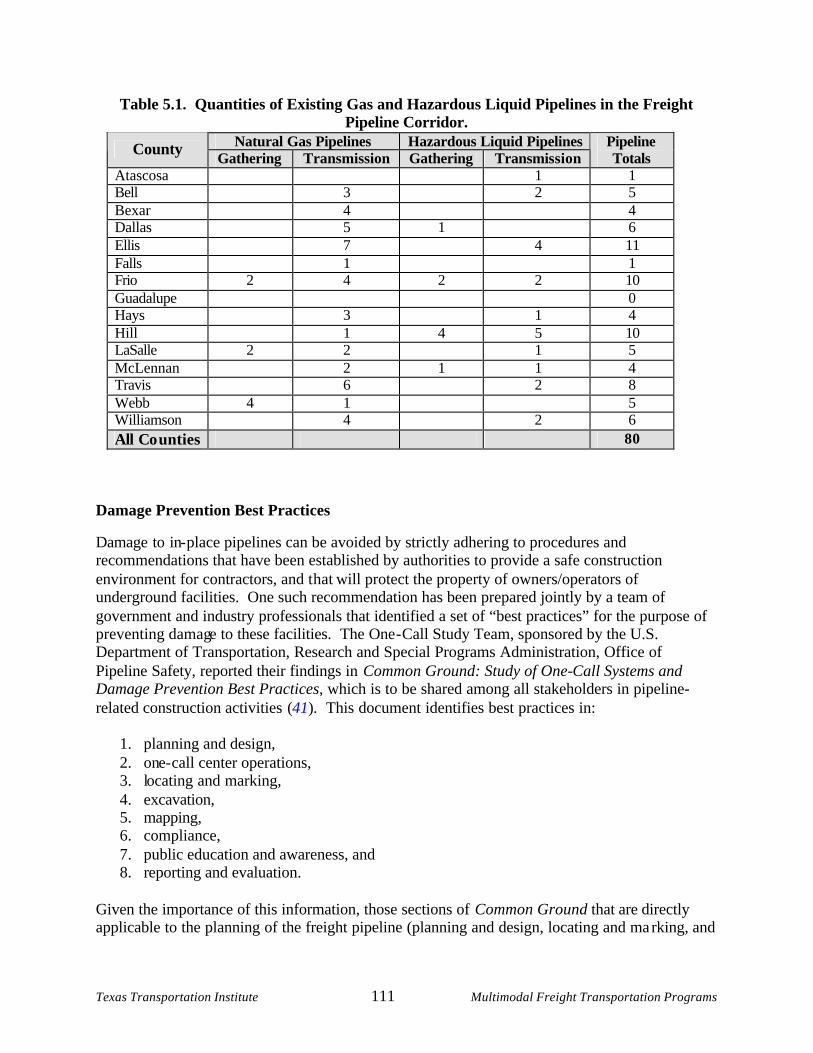
Texas Transportation Institute 111 Multimodal Freight Transportation Programs
Table 5.1. Quantities of Existing Gas and Hazardous Liquid Pipelines in the Freight Pipeline Corridor.
Natural Gas Pipelines Hazardous Liquid Pipelines County Gathering Transmission Gathering Transmission Pipeline Totals
Atascosa 1 1 Bell 3 2 5 Bexar 4 4 Dallas 5 1 6 Ellis 7 4 11 Falls 1 1 Frio 2 4 2 2 10 Guadalupe 0 Hays 3 1 4 Hill 1 4 5 10 LaSalle 2 2 1 5 McLennan 2 1 1 4 Travis 6 2 8 Webb 4 1 5 Williamson 4 2 6 All Co unties 80
Damage Prevention Best Practices
Damage to in- place pipelines can be avoided by strictly adhering to procedures and recommendations that have been established by authorities to provide a safe construction environment for contractors, and t hat will protect the property of owners/operators of underground facilities. One such recommendation has been prepared jointly by a team of government and industry professionals that identified a set of “best practices” for the purpose of preventing damage to these facilities. The One - Call Study Team, sponsored by the U.S. Department of Transportation, Research and Special Programs Administration, Office of Pipeline Safety, reported their findings in Common Ground: Study of One-Call Systems and Damage Prevention Best Practices, which is to be shared among all stakeholders in pipeline-related construction activities (41). This document identifies best practices in:
1. planning and design, 2. one-call center operations, 3. locating and marking, 4. excavation, 5. mapping, 6. compliance, 7. public education and awareness, and 8. reporting and evaluation.
Given the importance of this information, those sections of Common Ground that are directly applicable to the planning of the freight pipeline (planning and design, locating and marking, and
Texas Transportation Institute 112 Multimodal Freight Transportation Programs
excavation) are summarized in the following three subsections. The last subsection discusses how these recommendations should be incorporated into the planning process.
Planning and Design
Damage prevention to underground facilities must begin with the incorporation of safe practices into the planning and design of the freight pipeline. Adopting these practices at the earliest phase of the project will result in a design that minimizes conflicts between facilities, prepares for safe excavatio ns, and controls work and cost schedules. Among the best practices related to planning and design are:
• Identification of underground facility easements on plats : o Owners/operators of underground facilities are alerted to the intended
development of land upon notification of a plat being filed; • Acquisition of important information by designers :
o Maps of existing, abandoned, and out- of- service facilities, cathodic protection and grounding systems, as- built drawings, proposed project designs , and existing work in the area should be gathered during the planning phase ;
• Identification of existing facilities on preliminary design plans : o Preliminary plans for the freight pipeline should show proposed corridors together
with the information available on underground facilities ; • Utility coordination:
o Regular discussions between public and private entities on the planning, design, and construction of the freight pipeline promotes cooperation among pipeline operators, government agencies, and contractors ;
• Markers for underground facilities : o Color- coded markers should be used in accordance with the American Public
Works Association, “Guidelines for Uniform Temporary Marking of Underground Facilities ” (42 );
• Adherence to codes, statutes and facility owner/operator standards: o Designers of the freight pipeline should consider all codes and regulations, such
as 49 Code of Federal Regulations (CFR) Parts 192 and 195, Occupational Health and Safety Association (OSHA), and Title 5 of the Texas Utilities Code, so that potential conflicts are minimized;
• Use qualified contractors: o Only contractors with a proven record of safely excavating near underground
facilities should be used; • Mandatory pre-bid conferences:
o The project owner of the freight pipeline should require potential contractors to attend a pre-bid conference that includes the owners/operators of underground facilities;
• Communication between designer and potential contractor (pre-construction) : The designer should be continuously involved with potential contractors during pre-bid/bid phases to clarify the project scope and to identify contractors with suitable expertise; and
Texas Transportation Institute 113 Multimodal Freight Transportation Programs
• Communication between designer and contractor (construction) : o The designer should hold pre- construction conferences to discuss unforeseen
conditions and design changes, and should then follow up with post- construction conferences.
Locating and Marking
Whether excavating near underground facilities or excavating to relocate an existing pipeline, these facilities must be located and marked appropriate ly during construction of the freight pipeline. Among the best practices related to locating and marking are:
• Full use of facility records : o Owners/operators maintain information on location, type, and access points for
buried facilities, which should be used in the locating process; • Update facility records:
o Errors or omissions may be encountered during the locating process and should be brought to the attention of the facility owner/operator;
• Uniform color codes and marking symbols : o The National Transportation Safety Board recommends using the American
Public Works Association color code standard; • Use of a single locator for locating multiple facilities:
o For cases of multiple facilities with one owner, or multiple facilities with the same markings, the use of one locator can reduce the likelihood of errors;
• Proper training and documentation of locators : o Minimum training guidelines, such as those established in the National Utility
Locating Contractors Association’s Locator Training Standards and Practices, should be adopted (43) ;
• Safe performance of locates: o Obstructions, traffic, and physical site characteristics should be reviewed with
locators so that they can be prepared for on-site locates; • Visual inspection of site:
o Site inspection should be performed to determine if there are facilities in place that are not on record;
• Marking of facilities for surface conditions : o Facility locators should be properly trained to identify and mark varying surface
and environmental conditions; • Positive response to facility locate requests:
o Owners/operators should respond in a way that lets the excavator know whether the requested area has been marked prior to excavation;
• Each of multiple facilities are marked separately: o The number of lines marked on the surface should equal the number of lines tha t
are buried in a common trench; • Information on abandoned facilities:
o Abandoned facilities should be treated as live facilities;
Texas Transportation Institute 114 Multimodal Freight Transportation Programs
• Method of location: o Direct connection is the preferred method of actively applying a signal onto a
facility; • Identification of owner/operator:
o Owners/operators of located facilities should be marked when feasible; • Communication between all parties:
o Pre-location meetings should be scheduled between all parties when the complexity of the project complicates the conveyance of site information;
• Maintain work performance documentation: o Careful and complete documentation of all work performed by the locator
eliminates confusion over which requests have been performed; • Investigate damaged facility immediately:
o Information collected from damage investigations is essential in preventing future damages; and
• Forecasting/planning for workload fluctuations : o Owners/operators must develop scheduling methods to complete all locate
requests in a timely manner.
Excavation
Damage to existing pipelines primarily occurs during the excavation phase of construction. As part of the construction of the freight pipeline, pipelines may be encountered when trenching activities encroach upon existing pipelines, or when an in-place pipeline is intentionally uncovered to be relocated. Among the best practices related to excavation are:
• One-call facility locate request: o Owners/operators are notified of the need to locate underground facilities near
freight pipeline excavation activities through a one-call system; • White lining:
o Pre-marking of the excavation site with white paint, flags, or stakes allows the excavators to communicate to the owners/operators where excavation is to occur;
• Locate reference number: o A unique reference number is attached to all locate requests made by excavators
as proof of notification; • Pre-excavation meeting:
o Pre-location meetings should be scheduled between all parties when the complexity of the project complicates the conveyance of site information;
• Facility relocations : o Temporary or permanent interruption of a facility owner/operator’s service
requires active participation in a pre-planning meeting by the facility owner/operator and the excavator in order to protect facilities;
• Separate locate requests: o Each of multiple excavators sharing a job site has separate one-call reference
numbers;
Texas Transportation Institute 115 Multimodal Freight Transportation Programs
• One-call access: o Excavators have access to a one-call center at any hour of any day;
• Positive response: o Owners/operators should respond in a way that lets the excavator know whether
the requested area has been marked prior to excavation; • Locate verification:
o Verification that the excavation site matches the one-call request, and that all facilities have been marked, mus t precede excavation activities;
• Work site review: o Excavators should review the location of underground facilities at the site with
excavation crewmembers; • Marking Preservation:
o Staking, marking, and other designations for underground facility locations should be protected, or remarked, until no longer required;
• Excavation observer: o Excavation should be performed with a worker observing the excavation activity
to warn the equipment operator of any safety concerns that develop; • Excavation within the tolerance zone :
o Manual methods of excavation, such as hand digging, must be used within 18 inches of the outside edge of underground facilities;
• Exposed facility protection: o Protection to underground facilities should be implemented to comply with the
rule established by OSHA, 29 CFR 1926.651 (b)(4), which states: “While the excavation is open, underground installations shall be protected, supported, or removed as necessary to safeguard employees”;
• Backfilling: o Sharp or hard objects, such as rocks or chunks of hard clay, should be removed
from the backfill material prior to backfilling the trench; and • As-built documentation:
o Contractors must provide deviations to planned construction to the owner/operator of underground facilities so that accurate records of facility locations can be maintained.
Incorporation of Damage Prevention Practices in Freight Pipeline Planning
The damage prevention practices described in Common Ground should be incorporated into freight pipeline planning activities at the earliest stages. In particular, recommended practices for this project include the following:
1. Accurate and complete documentation of in-service and abandoned pipelines should be acquired from owners/operators and incorporated into planning and design documents.
2. Freight pipeline designs should consider recommendations from owners/operators, and should adhere to the rules established under both 49 CFR Parts 192 and 195 and Title 5 of the Texas Utilities Code (as discussed in subsequent sections).
Texas Transportation Institute 116 Multimodal Freight Transportation Programs
3. Qualified contractors should only be selected afte r the project scope has been clarified through pre- bid conferences, etc., with the actual construction following pre- construction conferences between contractors and designers.
4. Pipeline locations should be based on owner/operator records and site inspectio ns, and any errors or omissions should be updated on project design documents and owner/operator records.
5. Construction activities should be guided by clearly marked locations of each separate pipeline, which should include a description of owner/operator identification.
6. Construction planning should consider the need for owner/operator representatives to conduct on- site locations and to participate in pre- excavation meetings.
7. Following a worksite review by the contractor, excavations near pipelines should be performed by experienced personnel, including an excavation observer, with only manual methods used within 18 inches of the outside edge of the pipe.
8. Excavated trenches should be backfilled with suitable material, and as- built documents should be provided to owners/operators that include any deviations to the original construction plans .
Federal Regulations
In this report, discussions on governmental regulations of natural gas and hazardous liquid pipelines pertain specifically to the relocation of these facilities during construction of the freight pipeline. A more comprehensive discussion of pipeline regulations can be found in The Value of Pipelines to the Transportation System of Texas: Year Two Report (44). Appendix B provides a quick reference to r ules issued by the Office of Pipeline Safety that should be considered when determining the scope of pipeline relocations. These rules are federal regulations, which are divided into two main parts: 49 CFR Part 192 – Transportation of Natural Gas and Othe r Gas by Pipeline, and 49 CFR Part 195 – Transportation of Hazardous Liquids by Pipeline. Each of these areas will be discussed separately in the following subsections.
Natural Gas Pipelines
The Texas Railroad Commission establishes 49 CFR Part 192 as the minimum safety standards for the transportation of gas through intrastate pipelines, as prescribed in the Texas Administrative Code (TAC) Title 16, Rule 7.70. The transportation of gas through interstate pipelines is subject to the Federal Energy Regula tory Commission under the Natural Gas Act (15 U.S.C. 717 et seq.), and therefore falls under exclusive federal jurisdiction.
Pipeline Classifications. Some safety rules apply specifically to a certain class of natural gas pipeline. These classifications are based on population and building densities within “class location units,” which are 440- yard strips of land centered along a pipeline over a distance of one continuous mile. Figure 5.2 provides an illustration of a class location unit with descriptions of Class 1 through Class 4 pipelines, as defined in Section 192.5.
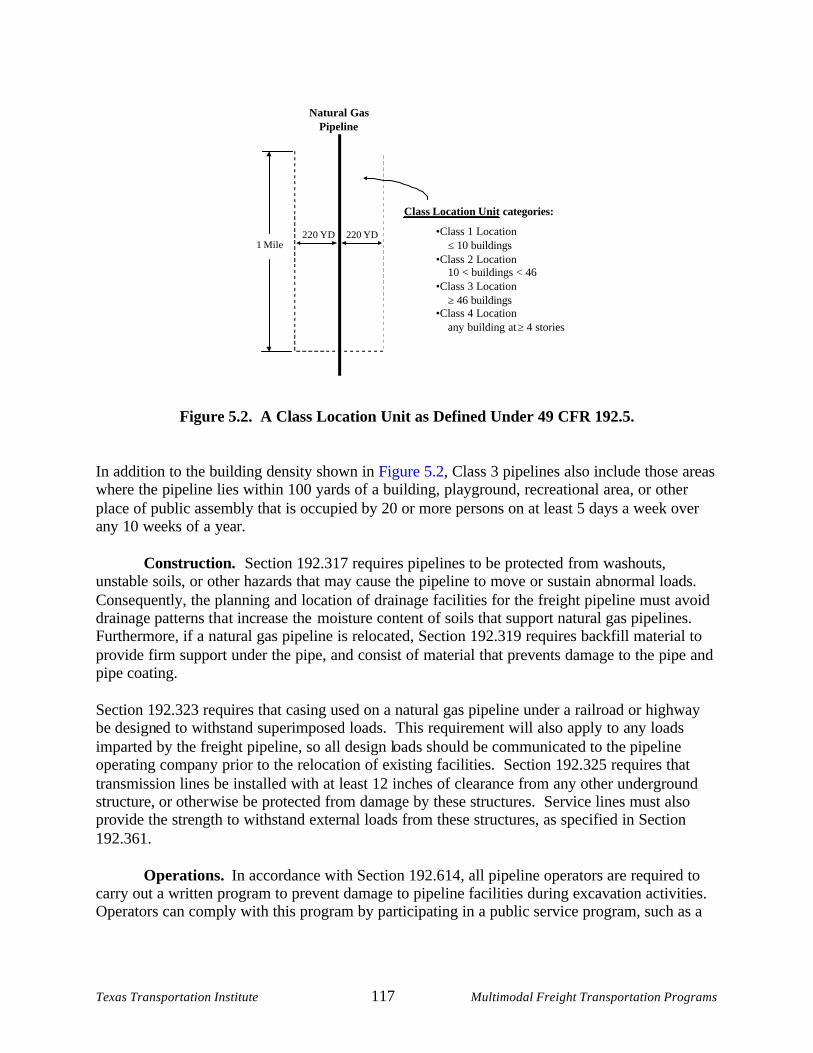
Texas Transportation Institute 117 Multimodal Freight Transportation Programs
Figure 5.2. A Class Location Unit as Defined Under 49 CFR 192.5.
In addition to the building density shown in Figure 5.2, Class 3 pipelines also include those areas where the pipeline lies within 100 yards of a building, playground, recreational area, or other place of public assembly that is occupied by 20 or more persons on at least 5 days a week over any 10 weeks of a year.
Construction. Section 192.317 requires pipelines to be protected from washouts,
unstable soils, or other hazards that may cause the pipeline to move or sustain abnormal loads. Consequently, the planning and location of drainage facilities for the freight pipeline must avoid drainage patterns that increase the moisture content of soils that support natural gas pipelines. Furthermore, if a natural gas pipeline is relocated, Section 192.319 requires backfill material to provide firm support under the pipe, and consist of material that prevents damage to the pipe and pipe coating.
Section 192.323 requires that casing used on a natural gas pipeline under a railroad or highway be designed to withstand superimposed loads. This requirement will also apply to any loads imparted by the freight pipeline, so all design loads should be communicated to the pipeline operating company prior to the relocation of existing facilities. Section 192.325 requires that transmission lines be installed with at least 12 inches of clearance from any other underground structure, or otherwise be protected from damage by these structures. Service lines must also provide the strength to withstand external loads from these structures, as specified in Section 192.361.
Operations. In accordance with Section 192.614, all pipeline operators are required to
carry out a written program to prevent damage to pipeline facilities during excavation activities. Operators can comply with this program by participating in a public service program, such as a
220 YD220 YD1 Mile
Natural GasPipeline
•Class 1 Location≤ 10 buildings
•Class 2 Location10 < buildings < 46
•Class 3 Location≥ 46 buildings
•Class 4 Locationany building at ≥ 4 stories
Class Location Unit categories:
Texas Transportation Institute 118 Multimodal Freight Transportation Programs
one - call system, and fulfilling each of the obligations required in paragraph (c)(3) of this section. In Texas, this program is implemented by the Texas Underground Notification Corporation. Service to a natural gas pipeline may need to be temporarily discontinued in order to relocate the facility through the freight pipeline corridor. In the case where the pipeline must be purged of gas, Section 192.629 requires that either a moderately rapid and continuous flow of air or a slug of inert gas be used to purge this gas from the line.
Maintenance. Pipeline operators are responsible for protecting their facilities from
vibrations caused by construction and vehicular movement, as described in Section 192.755. By including pipeline companies in the planning and design phases, they will be able to implement long- term measures that will protect against external loads.
Hazardous Liquid Pipelines
The Texas Railroad Commission adopts by specific reference 49 CFR Part 195 as the safety standards for the transportation of hazardous liquids through intrastate pipelines, as prescribed in TAC Title 16, Rule 7.81. Likewise, all interstate hazardous liquid pipelines are subject to 49 CFR Part 195.
Construction. Section 195.250 requires liquid pipelines to have 12 inches of clearance between the outside of the p ipe and the extremity of any other underground structure. However, the American Petroleum Institute (API) has published “Steel Pipelines Crossing Railroads and Highways,” API Recommended Practice 1102, which recommends more conservative standards for thes e structures (45). This publication suggests using 6 ft of cover over a pipeline that lies directly under railroad track, and 4 ft of cover over a pipeline that lies directly beneath a highway. Furthermore, Section 195.256 stipulates that the pipe at each railroad or highway crossing must be installed in a way that withstands the dynamic forces of traffic loads.
All construction details, such as depth of cover, proximity to other pipelines, etc. must be recorded as required in Section 195.266. This rule provides for the use of these records during the planning and design of the freight pipeline, but also requires that the development of as-built drawings and records be included as part of the scope of the facility’s construction.
Operation and Maintenance. In addition to the procedural rules for pipeline operators
in Section 195.402, Section 195.424 defines the rules that must be followed when moving liquid pipelines. This section requires reductions in operating pressure during the relocation process, and it describes the procedure for handling highly volatile liquid pipelines (described further in the next section of this report).
State Regulations
The Texas Railroad Commission regulates the safety of intrastate natural gas and hazardous liquid pipelines in the state of Texas. The commission addresses the safety of these facilities by adopting the rules established in 49 CFR Parts 192 and 195 (discussed in the previous section).
Texas Transportation Institute 119 Multimodal Freight Transportation Programs
Texas safety regulations on the transportation of natural gas are addre ssed in Texas Administrative Code Title 16, Part 1, Chapter 7, Subchapter B, Rule §7.70, which requires pipeline facilities that transport gas within the state of Texas to:
“…be designed, constructed, maintained and operated in accordance with the Minimum Safety Standards for Natural Gas, 49 Code of Federal Regulations (CFR) Part 192, …”
Likewise, safety regulations on the transportation of hazardous liquids are addressed in Texas Administrative Code Title 16, Part 1, Chapter 7, Subchapter B, Rule §7.81, whereby the Railroad Commission adopts:
“by specific reference the provisions (except as modified herein or hereafter) established by the United States Secretary of Transportation under the Pipeline Safety Act 49 U.S.C.A. §60101 et seq. and set forth in 49 CFR Part 195, Regulations for Transportation of Hazardous Liquids by Pipeline, …”
In addition to these rules, Texas Utilities Code Title 5, Chapter 251, Underground Facility Damage Prevention and Safety, appoints the Texas Underground Notification Corpo ration to administer the state’s one - call system, thereby establishing this system as that which will coordinate the information- sharing activities between pipeline operators, freight pipeline planners and designers, and construction contractors.
Lowering of In-Service Natural Gas or Hazardous Liquid Pipelines
Most, if not all, existing gas and hazardous liquid pipelines will require relocation if the freight pipeline is set at an assumed 13 ft below grade and, as noted in Sec. 195.250 of the Code of Federal Regulations (Appendix B), any pipe installed underground must have at least 12 inches of clearance between the outside of the pipe and the extremity of any other underground structure. Consequently, planning of the freight pipeline corridor should consider the likelihood that intersecting pipelines will be lowered to a total depth of approximately 14 ft. These pipelines can often be safely relocated while “in-service” to provide a cost-effective means of accommodating new structures, such as roads, railroads, or other foreign utilities. However, historical records of pipeline relocations include a few accidents that occurred while using this procedure. Such incidents prompted the American Society of Mechanical Engineers (ASME), the U.S. Department of Transportation’s Office of Pipeline Safety (OPS), and API to sponsor a study in 1978 that resulted in the development of recommended guidelines for lowering in-service pipelines by Battelle Columbus Laboratories. As a follow-up, API solicited the expertise of pipeline engineers to prepare a recommended practice on the safe movement of in-service pipelines. The following sections discuss these recommendations as they may pertain to the freight pipeline facility.
Texas Transportation Institute 120 Multimodal Freight Transportation Programs
General Considerations
The second edition of “Movement of In- Service Pipelines,” API Recommended Practice 1117, was released by API in 1996 for the purpose of addressing the criteria, methods, values, and recommendations that should be considered for the safe movement of in- service pipelines (46). The practice recommended by API applies to the movement of pipelines operating under conditions that are normally encountered in the pipeline industry. Furthermore, API specifically addresses onshore steel pipelines, and it does not consider any of the fo llowing:
• offshore pipelines; • pipelines with valves, flanges, fittings, concrete coatings, or attached appurtenances in
the section to be lowered; or • pipelines joined by oxyacetylene welds, mechanical joints, or girth welds of known poor
quality (unless re inforced by acceptable means). While this work serves only as a guideline to the designers and contractors involved in this procedure, the recommendations provide insight to important considerations, such as those discussed in the following subsections.
Pipe Stresses. Longitudinal stresses can exist in steel pipelines due to pressure, temperature, bending, or elongation. The safe relocation of these pipelines requires that the combined total of existing and induced stresses not exceed the pipeline strength. Therefore, a series of stress calculations must be performed for comparison to the yield strength of the pipe before a pipeline is to be moved. Longitudinal stress calculations include:
• Longitudinal Tensile Stress due to Internal Pressure (SP
)
tPD
SP 2µ
= (Eq. 5.1)
• Longitudinal Tensile Stress due to Temperature Change (ST
)
)( 21 TTEST −= α (Eq. 5.2)
• Existing Longitudinal Stress of the Pipe (SE)
CTPE SSSS ++= (Eq. 5.3)
• Longitudinal Stress due to Elongation (SS)
2
67.2
∆
=L
ESS (Eq. 5.4)
Texas Transportation Institute 121 Multimodal Freight Transportation Programs
• Available Longitudinal Bending Stress (SA)
SEDA
SSSMYSFS −−= (Eq. 5.5)
where, P = Maximum internal operating pressure, psi D = Outside diameter of the pipe, inches µ = Poisson’s Ratio for steel, 0.3 t = Nominal wall thickness of the pipe, inches E = Modulus of elasticity of steel, 29×106 psi α = Linear coefficient of thermal expansion of steel, 6.5×10- 6 inches/inch⋅° F T1 = Pipe temperature at the time of installation, ° F T2 = Operating temperature of the pipe during movement, ° F ∆ = Mid - span deflection of the pipe, feet L = Minimum trench length required to teach the mid- span deflection of the pipe, feet FD = Pipe design factor SMYS = Specified minimum yield strength of the pipe, psi
Excavation. The pipeline should be excavated in a way that minimize s that chance of
the pipe being damaged. As previously discussed, Common Ground is a report sponsored by OPS that identifies damage prevention best practices related to excavations near pipelines. Also, Sec. 192.614 of the Code of Federal Regulations requires pipeline operators to provide a written program to prevent damage to pipelines during excavations. Requirements for a one - call program, also discussed in Common Ground, are also established in this section.
Figure 5.3 shows a profile of a petroleum pipeline that has been moved to allow the freight pipeline conduit to be constructed overhead. The midspan pipe deflection is the depth by which the petroleum pipeline has been lowered.
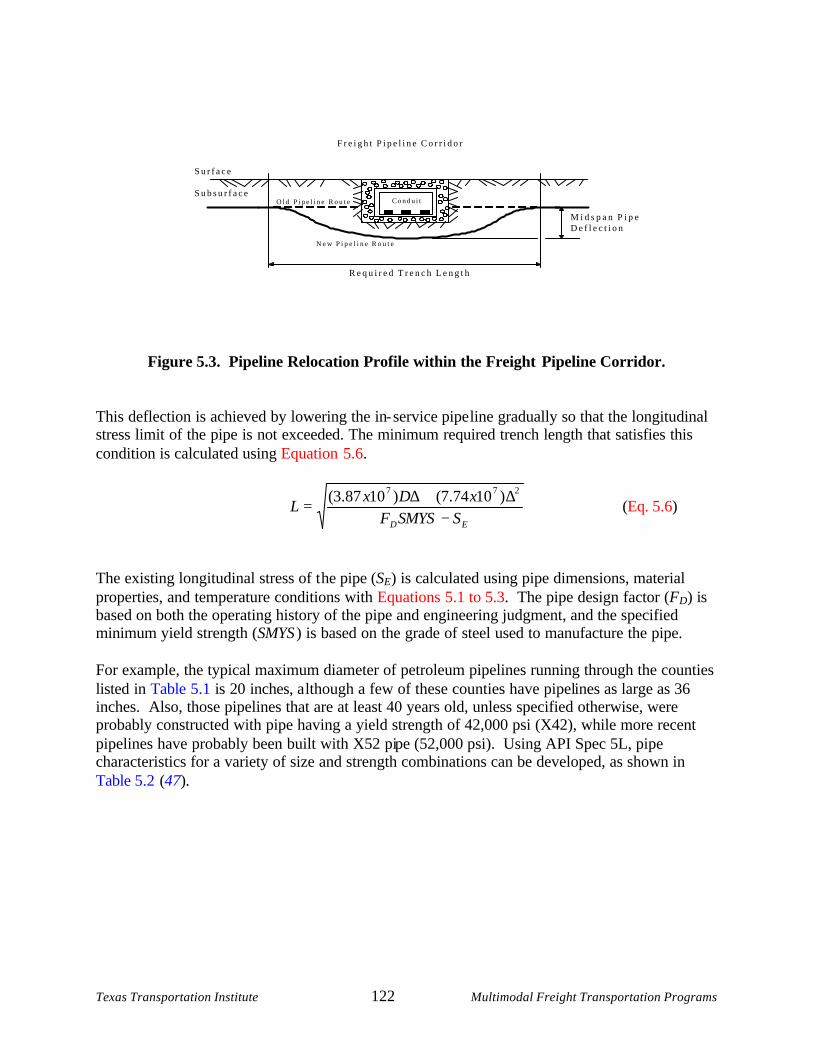
Texas Transportation Institute 122 Multimodal Freight Transportation Programs
Figure 5.3. Pipeline Relocation Profile within the Freight Pipeline Corridor.
This deflection is achieved by lowering the in- service pipe line gradually so that the longitudinal stress limit of the pipe is not exceeded. The minimum required trench length that satisfies this condition is calculated using Equation 5.6.
ED
SSMYSFxDx
L−
∆+∆=
277 )1074.7()1087.3( (Eq. 5.6)
The existing longitudinal stress of t he pipe (SE) is calculated using pipe dimensions, material properties, and temperature conditions with Equations 5.1 to 5.3. The pipe design factor (FD) is based on both the operating history of the pipe and engineering judgment, and the specified minimum yield strength (SMYS ) is based on the grade of steel used to manufacture the pipe. For example, the typical maximum diameter of petroleum pipelines running through the counties listed in Table 5.1 is 20 inches, a lthough a few of these counties have pipelines as large as 36 inches. Also, those pipelines that are at least 40 years old, unless specified otherwise, were probably constructed with pipe having a yield strength of 42,000 psi (X42), while more recent pipelines have probably been built with X52 pipe (52,000 psi). Using API Spec 5L, pipe characteristics for a variety of size and strength combinations can be developed, as shown in Table 5.2 (47).
C o n d u i t
R e q u i r e d T r e n c h L e n g t h
M i d s p a n P i p eD e f l e c t i o n
S u r f a c e
S u b s u r f a c eO l d P i p e l i n e R o u t e
N e w P i p e l i n e R o u t e
F r e i g h t P i p e l i n e C o r r i d o r
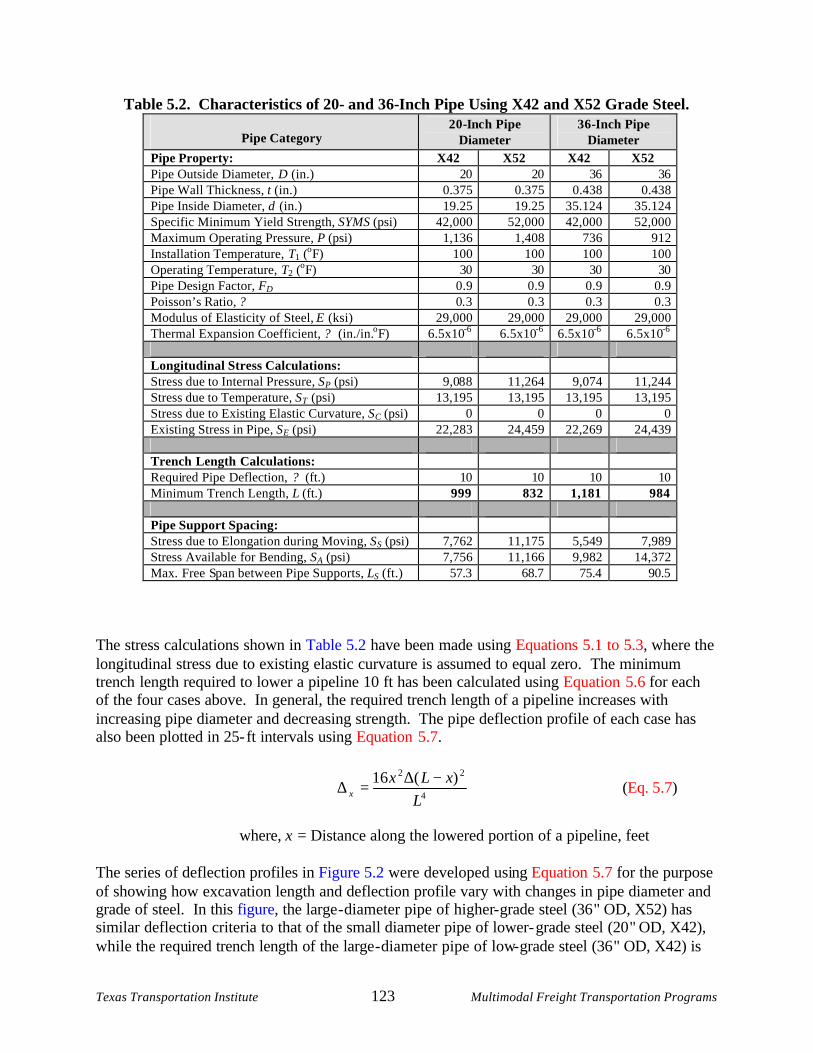
Texas Transportation Institute 123 Multimodal Freight Transportation Programs
Table 5.2. Characteristics of 20- and 36-Inch Pipe Using X42 and X52 Grade Steel.
Pipe Category 20-Inc h Pipe
Diameter 36-Inch Pipe
Diameter Pipe Property: X42 X52 X42 X52 Pipe Outside Diameter, D (in.) 20 20 36 36 Pipe Wall Thickness, t (in.) 0.375 0.375 0.438 0.438 Pipe Inside Diameter, d (in.) 19.25 19.25 35.124 35.124 Specific Minimum Yield Strength, SYMS (psi) 42,000 52,000 42,000 52,000 Maximum Operating Pressure, P (psi) 1,136 1,408 736 912 Installation Temperature, T1 (oF) 100 100 100 100 Operating Temperature, T2 (oF) 30 30 30 30 Pipe Design Factor, FD 0.9 0.9 0.9 0.9 Poisson’s Ratio, ? 0. 3 0.3 0.3 0.3 Modulus of Elasticity of Steel, E (ksi) 29,000 29,000 29,000 29,000 Thermal Expansion Coefficient, ? (in./in.oF) 6.5x10⁻⁶ 6.5x10⁻⁶ 6.5x10⁻⁶ 6.5x10⁻⁶ Longitudinal Stress Calculations: Stress due to Internal Pressure, SP (psi) 9,088 11,264 9,074 11,244 Stress due to Temperature, ST (psi) 13,195 13,195 13,195 13,195 Stress due to Existing Elastic Curvature, SC (psi) 0 0 0 0 Existing Stress in Pipe, SE (psi) 22,283 24,459 22,269 24,439 Trench Length Calculations: Required Pipe Deflection, ? (ft.) 10 10 10 10 Minimum Trench Length, L (ft.) 999 832 1,181 984 Pipe Support Spacing: Stress due to Elongation during Moving, SS (psi) 7,762 11,175 5,549 7,989 Stress Available for Bending, SA (psi) 7,756 11,166 9,982 14,372 Max. Free Span between Pipe Supports, LS (ft.) 57.3 68.7 75.4 90.5
The stress calculations shown in Table 5.2 have been made using Equations 5.1 to 5.3, where the longitudinal stress due to existing elastic curvature is assumed to equal zero. The minimum trench length required to lower a pipeline 10 ft has been calculated using Equation 5.6 for each of the four cases above. In general, the required trench length of a pipeline increases with increasing pipe diameter and decreasing strength. The pipe deflection profile of each case has also been plotted in 25- ft intervals using Equation 5.7.
4
22 )(16L
xLxx
−∆=∆ (Eq. 5.7)
where, x = Distance along the lowered portion of a pipeline, feet
The series of deflection profiles in Figure 5.2 were developed using Equation 5.7 for the purpose of showing how excavation length and deflection profile vary with changes in pipe diameter and grade of steel. In this figure, the large - diameter pipe of higher- grade steel (36 " OD, X52) has similar deflection criteria to that of the small diameter pipe of lower-grade steel (20" OD, X42), while the required trench length of the large-diameter pipe of low-grade steel (36" OD, X42) is
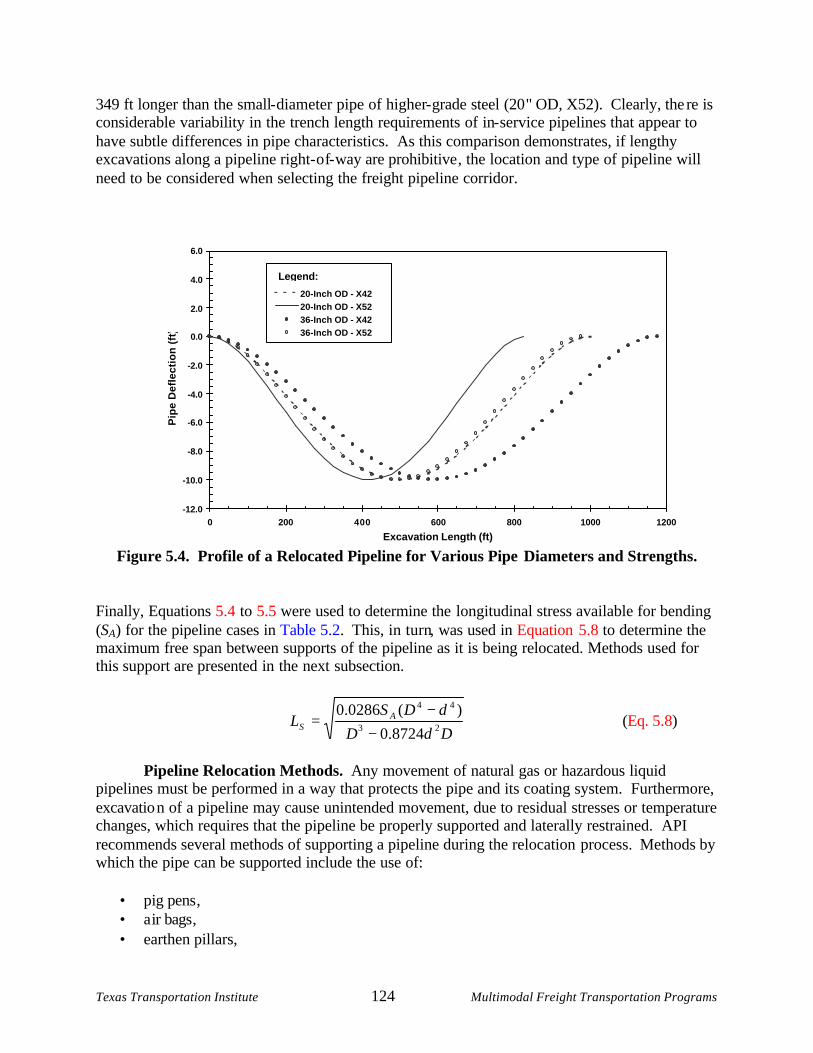
Texas Transportation Institute 124 Multimodal Freight Transportation Programs
349 ft longer than the small- diameter pipe of higher- grade steel (20 " OD, X52). Clearly, the re is considerable variability in the trench length requirements of in- service pipelines that appear to have subtle differences in pipe characteristics. As this comparison demonstrates, if lengthy excavations along a pipeline right- of- way are prohibitive , the location and type of pipeline will need to be considered when selecting the freight pipeline corridor.
Figure 5.4. Profile of a Relocated Pipeline for Various Pipe Diameters and Strengths.
Finally, Equations 5.4 to 5.5 were used to determine the longitudinal stress available for bending (SA) for the pipeline cases in Table 5.2. This, in turn, was used in Equation 5.8 to determine the maximum free span between supports of the pipeline as it is being relocated. Methods used for this support are presented in the next subsection.
DdDdDS
L
AS 23
44
8724.0)(0286.0
−−
= (Eq. 5.8)
Pipeline Relocation Methods. Any movement of natural gas or hazardous liquid
pipelines must be performed in a way that protects the pipe and its coating system. Furthermore, excavatio n of a pipeline may cause unintended movement, due to residual stresses or temperature changes, which requires that the pipeline be properly supported and laterally restrained. API recommends several methods of supporting a pipeline during the relocation process. Methods by which the pipe can be supported include the use of:
• pig pens , • a ir bags , • earthen pillars,
-12.0
-10.0
-8.0
-6.0
-4.0
-2.0
0.0
2.0
4.0
6.0
0 200 400 600 800 1000 1200
Excavation Length (ft)
Pip
e D
efle
ctio
n (
ft)
20-Inch OD - X4220-Inch OD - X5236-Inch OD - X4236-Inch OD - X52
Legend:
Texas Transportation Institute 125 Multimodal Freight Transportation Programs
• beam-supported slings, • side booms, and • spoils from excavation.
Regardless of the method used, the differential heights of these supports should be controlled so that the expected final curvature of the pipeline is not exceeded during movement.
Inspection. As previously mentioned, the procedure for designing the relocation of a
pipeline does not apply to pipelines joined by oxyacetylene welds, mechanical joints, or girth welds of known poor quality. Furthermore, pipes having corrosion or mechanical damage exhibit a loss of section or weakening of the steel, both of which will concentrate stresses within the material. Therefore, the exposed portion of the pipeline must be inspected at the welds and along its length to detect any external corrosion or mechanical damage.
Cleanup. Backfilling and surface restoration are important tasks related to the
movement of pipelines. As previously mentioned, Sec. 195.252 of the Code of Federal Regulations requires backfilling to be performed in a manner that protects the pipe coating and provides firm support for the pipe. This protection can be done by using backfill material that is free of rocks or other hard objects, and by ensuring that the pipe rests firmly on the bottom of the trench with sand or soft fill used as padding. Sec. 192.317 requires that operators take all practicable steps to protect pipelines from washouts or other hazards. Such hazards can be prevented by restoring right-of-way contours to the original grade, crowning the excavation with backfill material in anticipation of soil settling, and installing water diversions.
Explicit Rules
The CFR provides rules that are specific to the movement of in-service hazardous liquid pipelines in Sec. 195.424. This rule requires pipeline operators to reduce the line pressure in a pipeline to no more than 50 percent of its maximum operating pressure prior to movement. Also, pipelines that are joined by welding and contain highly volatile liquids cannot be moved unless:
1. movement when the pipeline does not contain highly volatile liquids is impractical; 2. the procedures of the operator (their Procedural Manual for Operations, Maintenance, and
Emergencies) contains precautions to protect the public against the hazard associated with movement of the pipeline; and
3. the pressure in the pipeline is reduced to the lower of: (a) no more than 50 percent of the maximum operating pressure; or (b) the lowest practical level that will keep the highly volatile liquid in a liquid state
with continuous flow, but maintaining at least 50 psi gage above its vapor pressure.
There are no explicit regulations in 49 CFR Part 192 on the relocation of in-service natural gas pipelines.
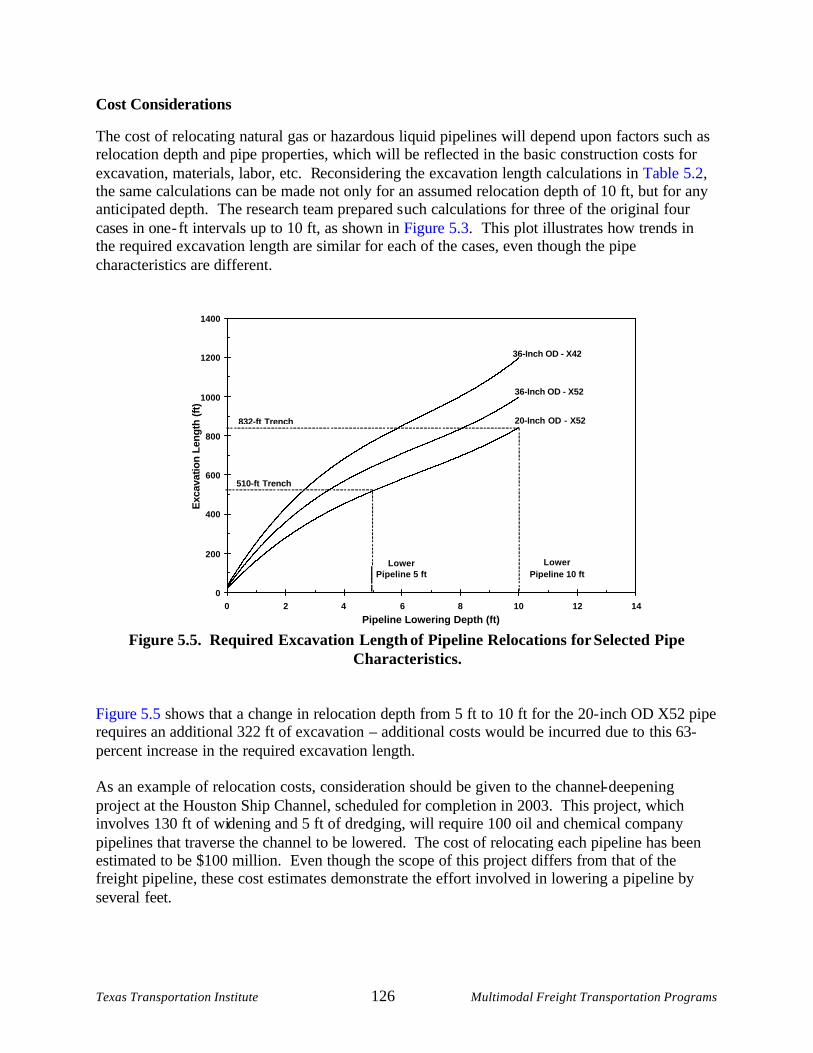
Texas Transportation Institute 126 Multimodal Freight Transportation Programs
Cost Considerations
The cost of relocating natural gas or hazardous liquid pipelines will depend upon factors such as relocation depth and pipe properties, which will be reflected in the basic construction costs for excavation, materials, labor, etc. Reconsidering the excavation length calculations in Table 5.2, the same calculations can be made not only for an assumed relocation depth of 10 ft, but for any anticipated depth. The research team prepared s uch calculations for three of the original four cases in one - ft intervals up to 10 ft, as shown in Figure 5.3. This plot illustrates how trends in the required excavation length are similar for each of the cases, even though the pipe characteristics are different.
Figure 5.5. Required Excavation Length of Pipeline Relocations for Selected Pipe Characteristics.
Figure 5.5 shows that a change in relocation depth from 5 ft to 10 ft for the 20- inch OD X52 pipe requires an additional 322 ft of excavation – additional costs would be incurred due to this 63-percent increase in the required excavation length. As an example of relocation costs, consideration should be given to the channel-deepening project at the Houston Ship Channel, scheduled for completion in 2003. This project, which involves 130 ft of widening and 5 ft of dredging, will require 100 oil and chemical company pipelines that traverse the channel to be lowered. The cost of relocating each pipeline has been estimated to be $100 million. Even though the scope of this project differs from that of the freight pipeline, these cost estimates demonstrate the effort involved in lowering a pipeline by several feet.
0
200
400
600
800
1000
1200
1400
0 2 4 6 8 10 12 14
Pipeline Lowering Depth (ft)
Exc
avat
ion
Leng
th (f
t)
20-Inch OD - X52
36-Inch OD - X42
36-Inch OD - X52
LowerPipeline 5 ft
LowerPipeline 10 ft
832-ft Trench
510-ft Trench
Texas Transportation Institute 127 Multimodal Freight Transportation Programs
Summary
Planning, design, and construction of the freight pipeline will require consideration of the natural gas and hazardous liquid pipelines that exist throughout the Interstate 35 Laredo-Dallas corridor. The section on “Excavation and Pipeline Relocation Practices” has been prepared to identify issues related to the relocation of these facilities in terms of:
1. safety, and 2. project feasibility
Approximately 80 of these pipelines will need to be relocated to accommodate the subterranean freight pipeline. While these relocation efforts may seem small in comparison to the full scope of this project, the importance of safety and the need to base decisions on complete information demands the consideration of excavation and relocation issues at the earliest stages of project development. For this process to be effective, the project must involve complete cooperation between:
• TxDOT, • consulting firms, • pipeline owners/operators, and • construction contractors.
Operators of both intrastate and interstate pipelines are required to participate in the state one-call system, as prescribed in 49 CFR Parts 192 and 195. To comply with these rules, operators must make available the information that is needed for the safe and effective relocation of each pipeline facility. The extent to which relocation costs vary will depend upon the existing conditions of the pipelines (depth, diameter, material, etc.) and the depth to which they must be lowered.

Texas Transportation Institute 129 Multimodal Freight Transportation Programs
CHAPTER 6: FY 2003 WORK PLAN
FY 2003 WORK PLAN
The work plan for FY 2003 will finalize the Texas Transportation Institute’s (TTI) assessment of the technical and economic feasibility of an underground freight system. As in prior years, the work plan will seek a design and operational strategy that produces a freight movement system that wins for each stakeholder group – Texas citizens, TxDOT, shippers, and the existing freight transportation industry. The work plan will also finalize the evaluation of the economics of the freight pipeline and establish whether underground freight movement is of sufficient a transportation value to warrant the significant investment necessary to see it to fruition. The FY 2003 work plan will complete the examination of several policy issues affecting the viability of underground freight movement. Among these issues will be the potential role of the public sector relative to that of private sector users or beneficiaries. The operational model for the freight pipeline, which is predicated on the business model established in Year 2 and discussed in this report, will be completed with particular attention to management and control issues.
Task 1 – Review Technical Specifications and Complete the Conceptual Design
Sub-task 1.1 – Review the Technical Parameters for the Main Transport Mechanism (MTM)
The final technical design for the MTM will be reviewed to determine if the proposed design meets the functional and performance specifications established initially and if modifications are required. The design issues that remain, such as door design, will be addressed in sufficient detail to allow adjustments to costing to be included in the final economic evaluation.
Sub-task 1.2 – Review the Technical Parameters for the Conduit
The technical design parameters for the conduit relate primarily to final dimensions, reinforcing requirements, prefabrication approaches, weight, and construction techniques. The need for a built- in guide way will be considered, but detailed designs will be left to those charged with building the system.
Sub-task 1.3 – Review the Technical Parameters for the Communications, Command, and Control System
The communications, command, and control system will be approached functionally – the specific functions and interactions with other system elements will be defined at a level of detail sufficient to define system scope. The evaluation of the resulting system relative to cost will likely be by comparing it to an already existing, similar system.
Texas Transportation Institute 130 Multimodal Freight Transportation Programs
Sub-task 1.4 – Review the Technical Parameters for the Terminal and Material Handling System
FY 2003 efforts relative to the terminal and material handling system will focus primarily on material handling requirements and needs. The work in FY 2002 examined the needs of the terminal and its functional layout without a detailed assessment of material handling needs. The complexity of the material handling system, its reliability, and its cost are facets that will be reviewed in the proposed work plan.
Task 2 – Identify and Discuss Design Elements Enhancing System Viability
Sub-task 2.1 – Examine the Value of Intermediate Terminal Locations
The viability of the freight pipeline rests on its ability as a system to add value to the operations of existing freight transportation companies. The number and location of terminals is a component of the overall logistical role the system might play for freight transportation as trade with Mexico continues to increase. In addition, the distribution of more, smaller terminals may alleviate some of the truck pressure that could potentially be placed on terminal access facilities not designed for extreme truck traffic levels. In this sub-task the researchers will extend the capacity simulation work undertaken in prior years to assess the need for and the role of additional terminal locations and the impact on MTM distribution and utilization.
Sub-task 2.2 – Describe the Opportunities for Railroad Participation and the Resulting Terminal Design Issues
The freight pipeline has been designed as an extension of the existing freight transportation industry. This extension includes freight railroads, which, from a policy perspective, are central to the public sector’s efforts to mitigate the effects on the highway transportation system of growing truck traffic. The business case for railroad participation in the freight pipeline will be made in this sub-task and the impact on terminal design discussed.
Task 3 – Refine and Complete Economic Evaluation
Sub-task 3.1 – Refine the Economic Evaluation Framework
The form of the economic evaluation framework will be reviewed and refined in this sub-task to allow the determination of costs relative to benefits for the freight pipeline system. The prior work in the area has focused on two related elements – initial capital and annual costs relative to the accrued benefits and avoided costs of transport by the freight pipeline.
Sub-task 3.2 – Continue Data Collection for Cost Analysis
In this sub-task the researchers will continue to collect and refine data on the costs comprising the economic evaluation. The economic evaluation of the freight pipeline system requires cost
Texas Transportation Institute 131 Multimodal Freight Transportation Programs
data from sources ranging from component and construction costs for the freight pipeline to avoided transportation and social costs such as pavement wear, transportation safety, emissions, and land use. The accurate cataloging of these data is essential to a full and accurate appraisal of the economics of transportation alternatives relative to the benefits and the new present value represented by the investment. In this sub-task the researchers will continue to develop the most precise cost and benefit estimates possible for the operational case or cases deemed most likely.
Task 4 – Establish the Estimated Marginal Cost of Operation and Resultant User Fees
Task 4 will be dedicated to determining the unitized cost of moving freight through the freight pipeline and the required user fees that result from this assessment. The task will define the freight pipeline shipment rate relative to the cost of over-the-road transport to determine the economic attractiveness of the freight pipeline as an alternative to trucking companies.
Task 5 – Complete Policy Assessments
Sub-task 5.1 – Define Preferred Public-Private Ownership and Operations Options
The freight pipeline, depending entirely on whether the system appears economically viable, may be evaluated as a potential investment for private enterprise or as an investment that requires joint participation of public and private entities. In this sub-task the researchers will examine the ownership and operations options depending on the degree of financial attractiveness and assess financing or funding options. In addition, the freight pipeline will require a managing body or board of directors that assumes responsibility for the operation of the system over time as well as on a day-by-day basis. The possibilities for the form of this managing body range from a port authority model to a corporate model with executive management. In this sub-task the researchers will complete the evaluation of the range of possibilities for an effective management structure and report on the pros and cons of each option.
Sub-task 5.2 – Establish the Desirability and Feasibility of Bi-national Cooperation with Mexico on Freight Pipeline Construction and Operations
The economic viability of the freight pipeline will be a function of the amount of traffic it can induce from the trucking industry. In this sub-task the researchers will assess the added benefits in terms of time savings and costs of extending the southern terminus into the interior of Mexico to a significant market location such as Monterey. These benefits will be contrasted to the costs and bureaucratic impediments associated with pre-clearance by customs, US DOT, DEA, and others. Discussions with appropriate Mexican authorities in Monterey or Mexico City will be undertaken as a part of this sub-task.
Texas Transportation Institute 132 Multimodal Freight Transportation Programs
Task 6 – Evaluate Constructability
Sub-task 6.1 – Examine Construction Methods and Cost Reduction Strategies
In sub-task 6.1 the researchers will identify the issues pertinent to the construction methods that will be required to build the underground freight system. An integral part of this sub-task will be to seek the best, most current, and most cost effective construction methods appropriate to the design.
Sub-task 6.2 – Evaluate Regulatory Issues Associated with Freight Pipeline Construction
In sub-task 6.2 the researchers will document the regulatory issues potentially impacting freight pipeline construction or operations. These issues may include land acquisition issues, international trade issues, or transportation-related topics.
Sub-task 6.3 – Discuss Potential Construction Time Lines and Scheduling Issues
The time required to construct the freight pipeline would depend on many factors, ranging from the initial length of the system to the number of construction locations working on building the system. In this sub-task the researchers will discuss some of the issues affecting the construction schedule.
Sub-task 6.4 – Identify Potential Impediments to, and Implementation Issues with Freight Pipeline Construction
The construction process fo r most major projects is subject to the unexpected or unpredicted influence of highly variable factors that can delay the completion or escalate the cost of the effort. In sub-task 6.4 the researchers will examine those factors that can be identified as potential impediments and describe the possible impacts.
Sub-task 6.5 – Continue to Evaluate Issues Associated with Right-of-Way Acquisition
The use of existing, publicly owned ROW to construct a freight pipeline could improve the feasibility of the project by reducing cost and contention with private concerns. In this sub-task the researchers will continue the collection of information concerning the possibility of system placement in publicly owned corridors as well as in new or planned rights of way. The issue of acquisition of property through eminent domain versus obtaining an easement will also be explored.
Texas Transportation Institute 133 Multimodal Freight Transportation Programs
Task 7 – Define Potential Next Steps in Underground Freight Transportation
Sub-task 7.1 – Establish the Potential for a Demonstration Project of Freight Pipeline Technology
If the economics warrant, in sub-task 7 the researchers will assess the possibilities for testing and demonstrating the freight pipeline system in an operational setting that supports a cost effective project. This sub-task will include early discussions with the Federal Highway Administration’s Office of Intermodalism and Office of Freight Management. A presentation to these groups on the research accomplishments to date will be planned for as early in FY 2003 as possible.
Task 8 – Document the Results of Year 4 in a Final Report
Sub-task 8.1 – Document the Results of Year 4 Research in a Comprehensive Research Report
The results of the Year 4 work plan will be documented in a final research report.
Sub-task 8.2 – Develop Animation Showing Freight Pipeline Operations
The freight pipeline system’s design and operations will be illustrated in a 6 to 10-minute animation produced by TTI’s Information and Technology and Exchange Center. The animation will be paid for by project implementation funds.
Sub-task 8.3 – Develop a PowerPoint Presentation on the Freight Pipeline Research Effort and Results
A PowerPoint presentation detailing the projects impetus, sponsors, goals, and outcome will be developed as a deliverable to accompany the animation described in sub-task 8.2.
Sub-task 8.4 – Develop, as a Major Deliverable, CD Containing Animation, PowerPoint, and Year 1 to Year 4 Reports
The animation, PowerPoint presentation, and Research Reports 1 to 4 will be stored on CD-ROM as an additional product to facilitate communications.

Texas Transportation Institute 135 Multimodal Freight Transportation Programs
CHAPTER 7: SUMMARY AND CONCLUSIONS
SUMMARY
The research undertaken in Year 3 has concluded much of the conceptual design work for several key technical areas of the freight pipeline system including the main transport mechanism (MTM), the terminal system, and the communications, command, and control elements. In addition, the year saw significant enhancements to the simulation modeling that, in turn, assisted in establishing the size of the terminals required to serve the number of customers expected during initial phases of pipeline operations.
Perhaps most importantly, this report initiates the assessment of the economic issues associated with constructing and operating the freight pipeline. The economic evaluation framework developed includes the order-of-magnitude estimates for the capital expenditures required to provide the underground infrastructure, estimates of the cost of operations, and estimates for cost of MTMs. In addition, the economic evaluation framework provides an assessment of the benefits that accrue through costs avoided by removing truck-borne freight from the highway system. This element of the evaluation is among the most significant contributors to system viability and provides the public-sector stakeholders with the return on investment that justifies the departure from more routine transportation expenditures. A second component of the economic evaluation is the determination of the marginal cost of operation. This assessment is the second key to the operational viability of the system and central to the system’s ability to induce use by the identified user groups – the established freight transportation industry.
The marginal cost of operations, which will be fully determined in Year 4, will estimate the cost to move 1 ton of freight 1 mile for the freight pipeline. This cost will be compared to the same cost figure for over-the-road shipment by truck. The efficiency with which the freight pipeline can perform this function will determine the level of use by the trucking industry and, through pricing policy, determine the rate at which the system can address capital expenditures.
Operationally, the freight pipeline has been positioned as an extension of the existing freight transportation industry through a business model that passes a portion of the transportation cost savings back to the user. This approach has met with initial approval by the trucking industry, which would be among the principal beneficiaries of this system. This business model formulation is proposed in explicit recognition of the partnership that exists between Texas, TxDOT, the shippers, and the freight transportation industry. The working premise guiding the current research is based on the notion that, to be viable as an alternative to traditional freight transportation approaches, a non-traditional freight system should provide tangible benefits to all stakeholders.
In Year 4 attention will be paid to the possibility of extending the freight pipeline beyond the Texas border into Mexico. The extension into Mexico could significantly improve the performance advantage of the system over traditional transport by pre-screening and pre-clearing shipments at the terminal locations, bypassing the normal border impediments, and expressing goods to the receiver far faster than the alternatives. Since the system is closed, once goods are screened there would be no opportunity to tamper with the shipment. The logical location for a
Texas Transportation Institute 136 Multimodal Freight Transportation Programs
southern terminus would be in the vicinity of Monterey, Mexico. In addition to improving the performance of the system, the extension would enhance national security by providing a better controlled import and export mechanism and it would serve to reduce pressure for bilateral trucking operations in the US and Mexico as called for by NAFTA. Also in Year 4, research will explore the benefits associated with scaling up the system to accommodate containers, thereby allowing a direct transfer between trucks and MTMs or between MTMs and intermodal rail cars. Several factors contribute to this expanded focus. First, for economic reasons, the initial research approach centered on constructing the smallest possible conduit in order to minimize capital expenditures. Preliminary results from the economic analysis indicate that substantial public benefits accrue as a function of truck traffic levels diverted to the pipeline and that cost minimization concerns may not be the most important consideration, or at least may be overcome by the benefits achieved. Second, with a pallet-based system, concerns arose regarding the material handling challenge posed by trans-loading thousands of individual pallets each day. The use of containers forestalls the need to handle pallets at any time. Third, eliminating trans- loading reduces the need for terminal infrastructure and potentially improves system throughput. Given the potential for system enhancement, each of these issues will be explored in detail during the final year of investigation.
CONCLUSIONS
The preliminary conclusion resulting from the third year of work on the freight pipeline concept is that the system appears to offer substantial benefits to stakeholders in the form of avoided costs – even under what the research team believes is a conservative economic assessment of both costs and levels of use. The Year 4 Work Plan, while moving toward a final economic assessment, will also focus on the policy issues that affect system feasibility. Data collection efforts will attempt to refine the costs estimates for the underground freight pipeline system to provide the best estimate of system cost possible under the constraints associated with a conceptual design study of this type. As in Year 2, the preliminary results led the research team to the conclusion that, while unconventional, underground freight movement may offer such a wide array of benefits that its high initial cost is quickly offset by a steady stream of tangible benefits. The benefits are both in the form of avoided costs and transportation efficiencies. The design goal of a 50-year system life greatly extends the timeframe over which benefits accrue and thus creates a more than ample opportunity for the initial investment to pay back a premium in the form of saved lives, improved air quality, lessened congestion and pavement wear. The final year of research will bring to completion a research project intended to test whether underground freight transport is feasible and economically viable. The research team has attempted to establish design requirements that specify a system which makes a difference in the levels of freight transported on the Texas portion of I-35 – a difference that warrants a closer look at a new way to view freight transportation. The concluding year of work will determine if the economics of freight movement will support a radical departure from the status quo and call for a closer look at moving goods underground.
Texas Transportation Institute 137 Multimodal Freight Transportation Programs
REFERENCES 1. Verbraeck, Alexander and Corne Versteegt. “Logic Control for Fully Automated Large-Scale
Freight Transport Systems.” Delft University of Technology. Delft, The Netherlands. 2. Texas TGV Consortium, Franchise Application to Construct, Operate, Maintain and
Finance a High-Speed Rail Facility, Vol. III, Texas High Speed Rail Authority, Austin, Texas, 1991.
3. “Raytheon Signs $30 Million Contract with Abu Dhabi to Provide Air Traffic Management and Radar Systems for Abu Dhabi and Al Ain Airports,” Raytheon Company. Marlboro, Mass., July 10, 2002. PRNewswire. www.prnewswire.com.
4. “Raytheon Awarded German Very Advanced Air Traffic Control Automation System (VATCAS) Contract Valued in Excess of $20 Million,” Raytheon Company. Paris, June 22, 2001. PRNewswire. www.prnewswire.com.
5. U.S. Department of Defense. Office of Assistant Secretary of Defense, Public Affairs. News Release. No. 422-97. August 7, 1997. Washington, D.C. Accessed through the Federation of American Scientist website: www.fas.org.
6. U.S. Department of Defense. Office of Assistant Secretary of Defense, Public Affairs. News Release. No. 411-97. July 30, 1997. Washington, D.C. Accessed through the Federation of American Scientist website: www.fas.org.
7. U.S. Department of Defense. Office of Assistant Secretary of Defense, Public Affairs. News Release. No. 428-98. August 13, 1998. Washington, D.C. Accessed through the U.S. Department of Defense, DefenseLINK website: www.defenselink.mil.
8. “BAE Systems Unit Wins $82.3 Million Contract from U.S. Navy,” AFX News. June 21, 2002. Accessed through Ananova website: www.ananova.com.
9. “Raytheon Awarded Contract for New Marine Corps Aviation Command and Control System with a Potential Value of $160 Million,” Raytheon Company. Portsmouth, Rhode Island, June 15. PRNewswire. www.prnewswire.com.
10. “Corporate Profile,” AGV Products, Inc. www.agvp.com. AGVP Document No. A01001003-EA1. Letter written by Mats Herrstromer, AGVP President.
11. “Smart Moves – AGV Products, Inc. Automatically Boosts Industrial Bottom Lines,” AGV Products, Inc. Feature Story: March 1998. www.agvp.com. Document No. PR013. Galles Communications Group, Inc. 2001: Article reprinted with permission from the Greater Charlotte Biz. Author Nan Bauroth.
12. TECO-Westinghouse Motor Company; MAX-E2 Premium Efficiency Severe Duty Motor. Brochure obtained from: www.tecowestinghouse.com.
13. World Steel Dynamics Inc., Englewood Cliffs, New Jersey 07632, January 31, 2002, The Steel Sheet Marketplace as of Jan. 2002. http://www.amm.com/index2.htm
14. Interview on July 18, 2002, with Mr. P. D. Jensen, President, Commercial Sales, Inc., a manufacturer and supplier of fabricated assemblies, Tacoma, Washington.
15. C. Dennis Pegden, Robert E. Shannon, and Randall P. Sadowski, Introduction to Simulation Using SIMAN, McGraw-Hill, 1995.
16. W. David Kelton, Randall P. Sadowski, and Deborah A. Sadowski, Simulation with Arena, McGraw-Hill, 1998.
17. Arena User’s Guide, Rockwell Software Inc., 2000. 18. Oberlender, G.D. Project Management for Engineering and Construction, 2nd ed., McGraw-
Hill Companies, Inc., New York, 2000.
Texas Transportation Institute 138 Multimodal Freight Transportation Programs
19. Roop, S.S., et al., The Technical and Economic Feasibility of a Freight Pipeline System in Texas – Year 2 Report, Report No. 1519-2, TTI, College Station, Texas, 2001.
20. Texas Department of Transportation [Internet]. Austin, Texas: Average Low Bid Unit Price for Construction and Maintenance; [cited 2002 Mar 10]. Available from: http://www.dot.state.tx.us/
21. Hay, W.W., Railroad Engineering, 2nd ed., John Wiley & Sons, New York, 1982. 22. Texas A&M Real Estate Center [Internet]. College Station, Texas: Rural Land Values; [cited
2002 Mar 20]. Available from: http://www.recenter.tamu.edu/ 23. Texas Natural Resource Conservation Commission [Internet]. Austin, Texas: Corpus Christi:
Lay Down the Line for Water; [updated Fall 1998, cited 2002 Feb 11]. Available from: http://www.tnrcc.state.tx.us/
24. Central Arizona Project [Internet]. Phoenix, Arizona : Frequently Asked Questions; [cited 2002 Feb 8]. Available from http://www.cap-az.com/
25. LaRue, S. Decision on building aqueduct to San Diego unlikely for months. Union-Tribune [Internet]. 2002 Jan 26 [cited 2002 Feb 8]: Available from: http://www.uniontrib.com/news/metro/20020126-9999_7m26aqueduct.html
26. San Diego County Water Authority [Internet]. San Diego, California : Infrastructure; [cited 2002 Mar 30] Available from: http://www.sdcwa.org/
27. Redden, J.W.P., Selig, E.T., and Zaremsbki, A.M., Stiff Track Modulus Considerations, Railway Track & Structures, Feb. 2002.
28. Governor’s Office of Regulatory Reform [Internet]. New York, N.Y.: Warehouse Distribution Profile; [cited 2002 Apr 25]. Available from: http://www.gorr.state.ny.us/gorr/warehouse_distribution_profile.html
29. Napolitano, M., et al., The Time, Space & Cost Guide to Better Warehouse Design, Distribution Center Management, New York, 1994.
30. Federal Transit Administration [Internet]. Washington, D.C.: Motor Fuel Excise Tax Rates; [updated 2002, Jan. 1; cited 2002, May 10]. Available from http://www.taxadmin.org/fta/rate/motor_fl.html
31. Bureau of Transportation Statistics [Internet]. Washington, D.C.: Average Motor Vehicle Miles per Gallon; [updated 2002, September; cited 2002, June 15]. Available from: http://www.bts.gov/transtu/indicators/Environmental/html/Average_Motor_Vehicle_Miles_ Per_Gallon
32. Office of Management and Budget [Internet]. Washington, D.C.: OMB Circular No. A-94, Guidelines and Discount Rates for Benefit-Cost Analysis of Federal Programs; [updated 2002 Jan 22; cited 2002 Aug 20]. Available from: http://www.whitehouse.gov/omb/circulars
33. Sassone, P.G., Schaffer, W.A., Cost-Benefit Analysis: A Handbook, Academic Press, Inc., New York, 1978.
34. Federal Highway Administration [Internet]. Washington, D.C.: Addendum to the 1997 Federal Highway Cost Allocation Study Final Report; [updated 2000, June 20; cited 2002, March 21]. Available from: http://www.fhwa.dot.gov/policy/hcas/addendum.htm
35. Expenses Per Mile for the Trucking Industry: 1990-2000, Federal Highway Administration Office of Freight Management, 2001.
36. Office of Management and Budget [Internet]. Washington, D.C.: OMB Circular No. A-94, Appendix C, Discount Rates for Cost-Effectiveness, Lease Purchase, and Related Analyses; [updated 2002 Feb 27; cited 2002 Aug 20]. Available from: http://www.whitehouse.gov/omb/circulars
Texas Transportation Institute 139 Multimodal Freight Transportation Programs
37. Louis Berger & Associates, Effect of the North American Free Trade Agreement on the Texas Highway System, Texas Department of Transportation, Austin, Texas, 1998.
38. HNTB Corporation, I-35 Trade Corridor Study: Recommended Corridor Investment Strategies, Texas Department of Transportation, Austin, Texas, 1999.
39. Bureau of Transportation Statistics, Bureau of the Census Urbanized Area Boundaries, National Transportation Atlas, 2001.
40. Federal Highway Administration [Internet]. Washington, D.C.: TEA-21 Fact Sheet, Transportation Infrastructure Finance and Innovation Act; [updated 1998, September 14; cited 2002, October 4]. Available from: http://www.fhwa.dot.gov/tea21/factsheets/tifia.htm
41. Common Ground: Study of One-Call Systems and Damage Prevention Best Practices, U.S. Department of Transportation, Washington, D.C., 1999.
42. Guidelines for Uniform Temporary Pavement Marking of Underground Facilities, American Public Works Association, Washington, D.C., 1999.
43. Locator Training Standards and Practices, National Utility Locating Contractors Association, Spooner, WI, 1996.
44. Roop, S.S., et al., The Value of Pipelines to the Transportation System of Texas: Year 2 Report, Research Report 1858-2, TTI, College Station, Texas, 2001.
45. Steel Pipelines Crossing Railroads and Highways: API Recommended Practice 1102, 6th ed., American Petroleum Institute, Washington, D.C., 1993.
46. Movement of In-Service Pipelines: API Recommended Practice 1117, 2nd ed., American Petroleum Institute, Washington, D.C., 1996.
47. Kennedy, J.L., Oil and Gas Pipeline Fundamentals, PennWell Publishing Company, Tulsa, Oklahoma, 1993.
48. Code of Federal Regulations: Pipeline Safety Regulations, U.S. Department of Transportation, Washington, D.C., 2001.

Texas Transportation Institute A-1 Multimodal Freight Transportation Programs
APPENDIX A – AVERAGE LOW BID UNIT PRICES FOR CONDUIT CONSTRUCTION ACTIVITIES

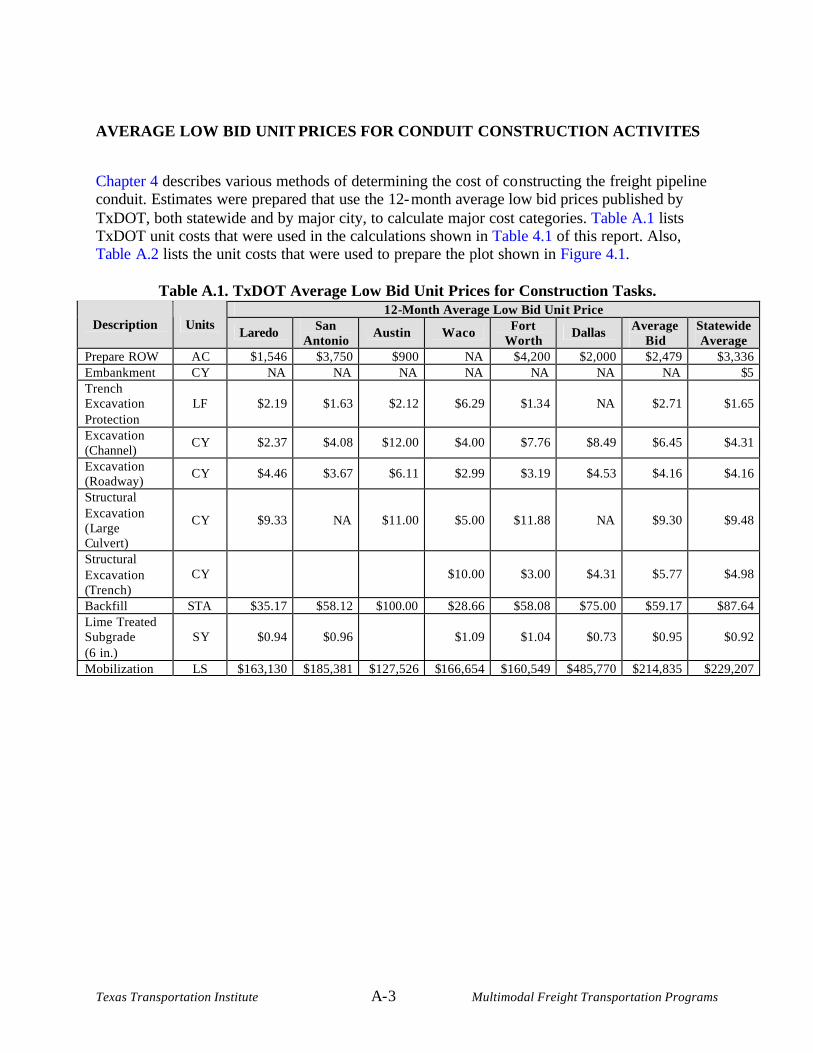
Texas Transportation Institute A- 3 Multimodal Freight Transportation Programs
AVERAGE LOW BID UNIT PRICES FOR CONDUIT CONSTRUCTION ACTIVITES
Chapter 4 describes various methods of determining the cost of co nstructing the freight pipeline conduit. Estimates were prepared that use the 12- month average low bid prices published by TxDOT, both statewide and by major city, to calculate major cost categories. Table A.1 lists TxDOT unit costs that were used in the calculations shown in Table 4.1 of this report. Also, Table A.2 lists the unit costs that were used to prepare the plot shown in Figure 4.1.
Table A.1. TxDOT Average Low Bid Unit Prices for Construction Tasks. 12-Month Average Low Bid Unit Price
Description Units Laredo San
Antonio Austin Waco Fort
Worth Dallas Average
Bid Statewide Average
Prepare ROW AC $1,546 $3,750 $900 NA $4,200 $2,000 $2,479 $3,336 Embankment CY NA NA NA NA NA NA NA $5 Trench Excavation Protection
LF $2.19 $1.63 $2.12 $6.29 $1.34 NA $2.71 $1.65
Excavation (Channel)
CY $2.37 $4.08 $12.00 $4.00 $7.76 $8.49 $6.45 $4.31
Excavation (Roadway)
CY $4.46 $3.67 $6.11 $2.99 $3.19 $4.53 $4.16 $4.16
Structural Excavation (Large Culvert)
CY $9.33 NA $11.00 $5.00 $11.88 NA $9.30 $9.48
Structural Excavation (Trench)
CY $10.00 $3.00 $4.31 $5.77 $4.98
Backfill STA $35.17 $58.12 $100.00 $28.66 $58.08 $75.00 $59.17 $87.64 Lime Treated Subgrade (6 in.)
SY $0.94 $0.96 $1.09 $1.04 $0.73 $0.95 $0.92
Mobilization LS $163,130 $185,381 $127,526 $166,654 $160,549 $485,770 $214,835 $229,207
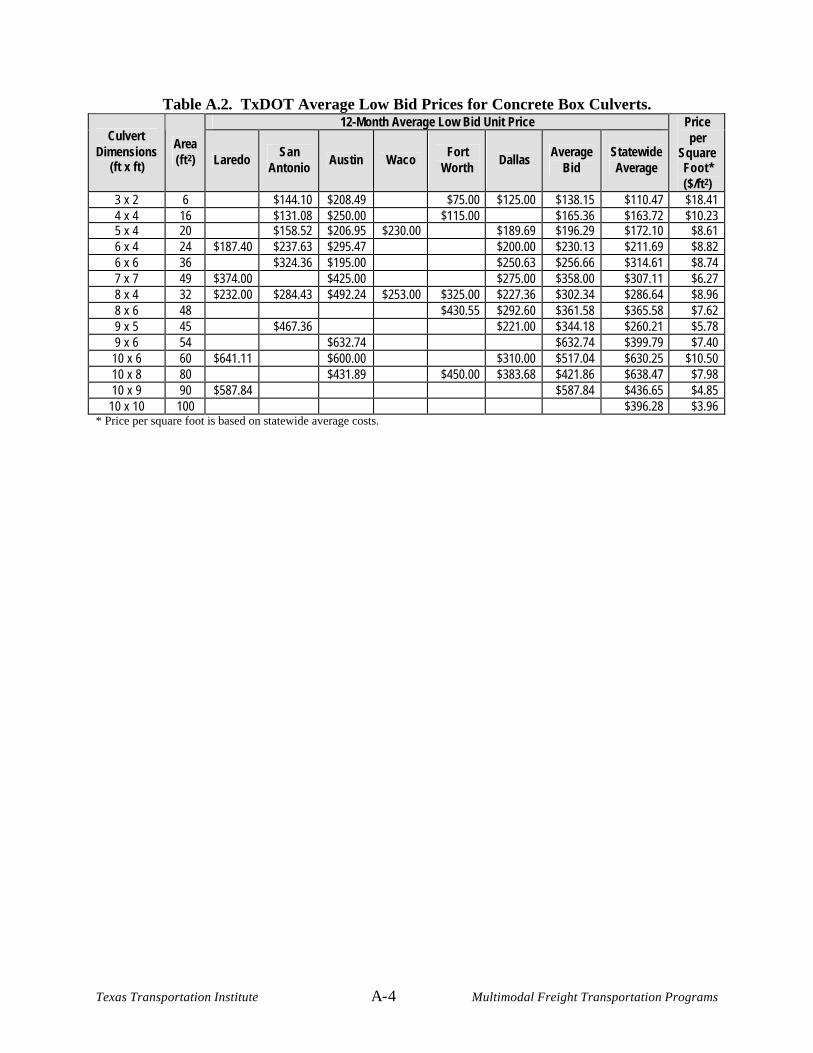
Texas Transportation Institute A-4 Multimodal Freight Transportation Programs
Table A.2. TxDOT Average Low Bid Prices for Concrete Box Culverts. 12-Month Average Low Bid Unit Price
Culvert Dimensions
(ft x ft)
Area (ft2) Laredo
San Antonio
Austin Waco Fort
Worth Dallas
Average Bid
Statewide Average
Price per
Square Foot* ($/ft2)
3 x 2 6 $144.10 $208.49 $75.00 $125.00 $138.15 $110.47 $18.41 4 x 4 16 $131.08 $250.00 $115.00 $165.36 $163.72 $10.23 5 x 4 20 $158.52 $206.95 $230.00 $189.69 $196.29 $172.10 $8.61 6 x 4 24 $187.40 $237.63 $295.47 $200.00 $230.13 $211.69 $8.82 6 x 6 36 $324.36 $195.00 $250.63 $256.66 $314.61 $8.74 7 x 7 49 $374.00 $425.00 $275.00 $358.00 $307.11 $6.27 8 x 4 32 $232.00 $284.43 $492.24 $253.00 $325.00 $227.36 $302.34 $286.64 $8.96 8 x 6 48 $430.55 $292.60 $361.58 $365.58 $7.62 9 x 5 45 $467.36 $221.00 $344.18 $260.21 $5.78 9 x 6 54 $632.74 $632.74 $399.79 $7.40
10 x 6 60 $641.11 $600.00 $310.00 $517.04 $630.25 $10.50 10 x 8 80 $431.89 $450.00 $383.68 $421.86 $638.47 $7.98 10 x 9 90 $587.84 $587.84 $436.65 $4.85
10 x 10 100 $396.28 $3.96 * Price per square foot is based on statewide average costs.
Texas Transportation Institute B-1 Multimodal Freight Transportation Programs
APPENDIX B – RULES PERTAINING TO PIPELINE RELOCATIONS WITHIN THE CODE OF FEDERAL REGULATIONS

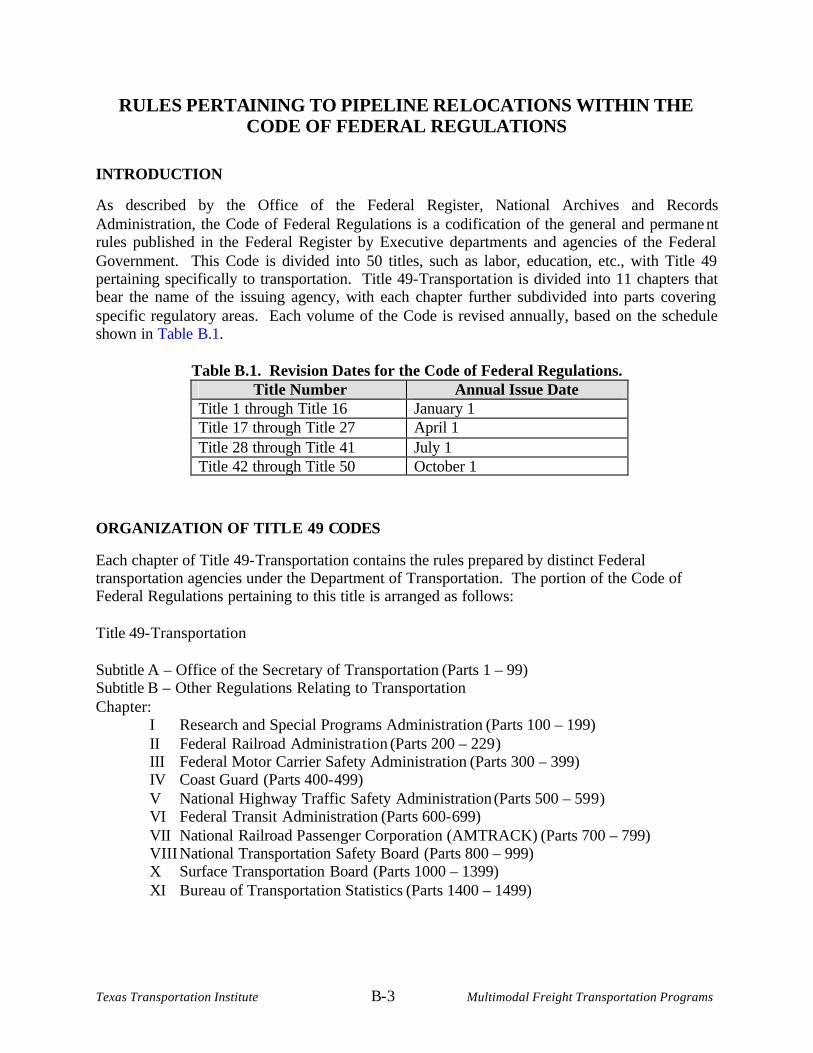
Texas Transportation Institute B- 3 Multimodal Freight Transportation Programs
RULES PERTAINING TO PIPELINE RE LOCATIONS WITHIN THE CODE OF FEDERAL REGULATIONS
INTRODUCTION
As described by the Office of the Federal Register, National Archives and Records Administration, the Code of Federal Regulations is a codification of the general and permane nt rules published in the Federal Register by Executive departments and agencies of the Federal Government. This Code is divided into 50 titles, such as labor, education, etc., with Title 49 pertaining specifically to transportation. Title 49- Transportat ion is divided into 11 chapters that bear the name of the issuing agency, with each chapter further subdivided into parts covering specific regulatory areas. Each volume of the Code is revised annually, based on the schedule shown in Table B.1.
Table B.1. Revision Dates for the Code of Federal Regulations. Title Number Annual Issue Date
Title 1 through Title 16 January 1 Title 17 through Title 27 April 1 Title 28 through Title 41 July 1 Title 42 through Title 50 October 1
ORGANIZATION OF TITLE 49 CODES
Each chapter of Title 49-Transportation contains the rules prepared by distinct Federal transportation agencies under the Department of Transportation. The portion of the Code of Federal Regulations pertaining to this title is arranged as follows: Title 49-Transportation Subtitle A – Office of the Secretary of Transportation (Parts 1 – 99) Subtitle B – Other Regulations Relating to Transportation Chapter:
I Research and Special Programs Administration (Parts 100 – 199) II Federal Railroad Administration (Parts 200 – 229) III Federal Motor Carrier Safety Administration (Parts 300 – 399) IV Coast Guard (Parts 400-499) V National Highway Traffic Safety Administration (Parts 500 – 599) VI Federal Transit Administration (Parts 600-699) VII National Railroad Passenger Corporation (AMTRACK) (Parts 700 – 799) VIII National Transportation Safety Board (Parts 800 – 999) X Surface Transportation Board (Parts 1000 – 1399) XI Bureau of Transportation Statistics (Parts 1400 – 1499)
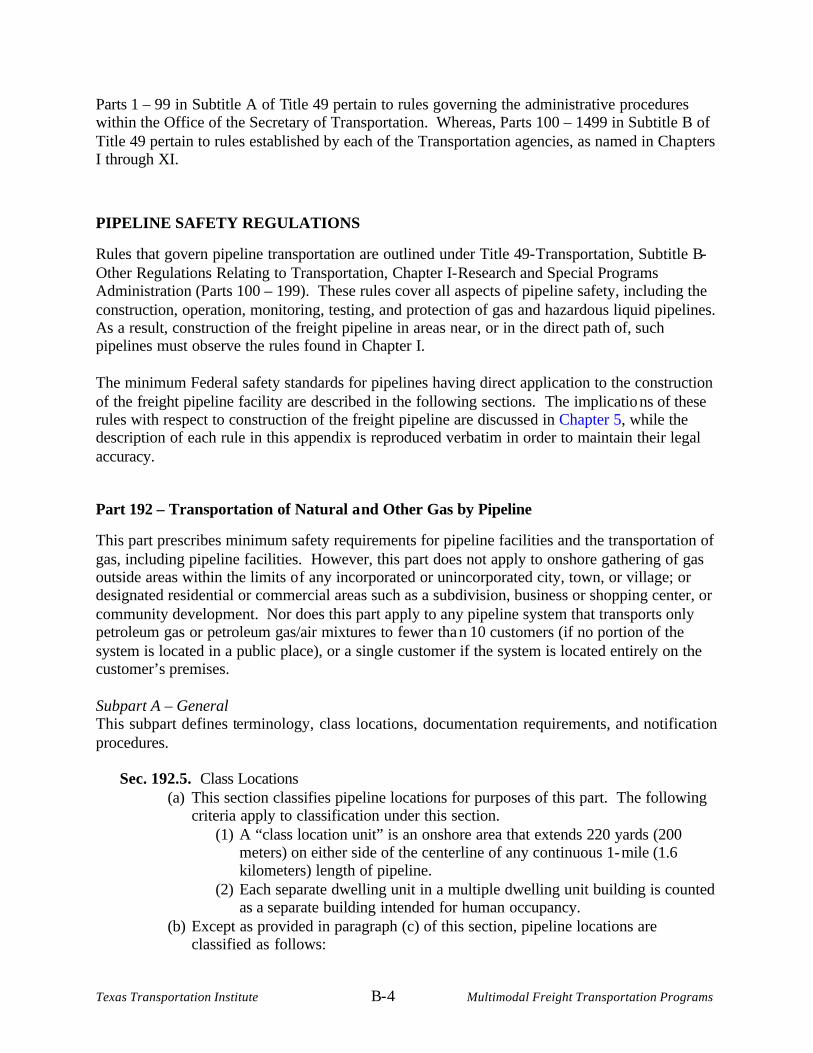
Texas Transportation Institute B- 4 Multimodal Freight Transportation Programs
Parts 1 – 99 in Subtitle A of Title 49 pertain to rules governing the administrative procedures within the Office of the Secretary of Transportation. Whereas, Parts 100 – 1499 in Subtitle B of Title 49 pertain to rules established by each of the Transportation agencies, as named in Cha pters I through XI.
PIPELINE SAFETY REGULATIONS
Rules that govern pipeline transportation are outlined under Title 49- Transportation, Subtitle B-Other Regulations Relating to Transportation, Chapter I- Research and Special Programs Administration (Parts 100 – 199). These rules cover all aspects of pipeline safety, including the construction, operation, monitoring, testing, and protection of gas and hazardous liquid pipelines. As a result, construction of the freight pipeline in areas near, or in the direct path of, such pipelines must observe the rules found in Chapter I. The minimum Federal safety standards for pipelines having direct application to the construction of the freight pipeline facility are described in the following sections. The implicatio ns of these rules with respect to construction of the freight pipeline are discussed in Chapter 5, while the description of each rule in this appendix is reproduced verbatim in order to maintain their legal accuracy.
Part 192 – Transportation of Natural and Other Gas by Pipeline
This part prescribes minimum safety requirements for pipeline facilities and the transportation of gas, including pipeline facilities. However, this part does not apply to onshore gathering of gas outside areas within the limits of any incorporated or unincorporated city, town, or village; or designated residential or commercial areas such as a subdivision, business or shopping center, or community development. Nor does this part apply to any pipeline system that transports only petroleum gas or petroleum gas/air mixtures to fewer than 10 customers (if no portion of the system is located in a public place), or a single customer if the system is located entirely on the customer’s premises.
Subpart A – General This subpart defines terminology, class locations, documentation requirements, and notification procedures.
Sec. 192.5. Class Locations
(a) This section classifies pipeline locations for purposes of this part. The following criteria apply to classification under this section.
(1) A “class location unit” is an onshore area that extends 220 yards (200 meters) on either side of the centerline of any continuous 1-mile (1.6 kilometers) length of pipeline.
(2) Each separate dwelling unit in a multiple dwelling unit building is counted as a separate building intended for human occupancy.
(b) Except as provided in paragraph (c) of this section, pipeline locations are classified as follows:
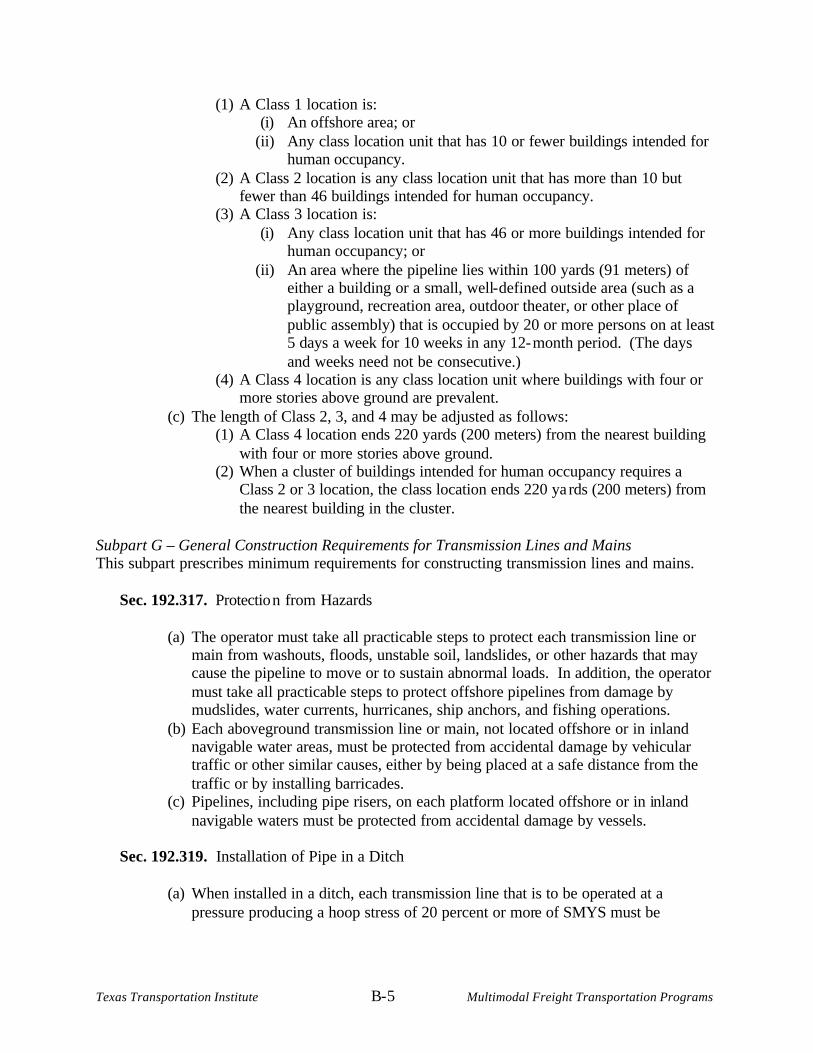
Texas Transportation Institute B-5 Multimodal Freight Transportation Programs
(1) A Class 1 location is: (i) An offshore area; or
(ii) Any class location unit that has 10 or fewer buildings intended for human occupancy.
(2) A Class 2 location is any class location unit that has more than 10 but fewer than 46 buildings intended for human occupancy.
(3) A Class 3 location is: (i) Any class location unit that has 46 or more buildings intended for
human occupancy; or (ii) An area where the pipeline lies within 100 yards (91 meters) of
either a building or a small, well-defined outside area (such as a playground, recreation area, outdoor theater, or other place of public assembly) that is occupied by 20 or more persons on at least 5 days a week for 10 weeks in any 12-month period. (The days and weeks need not be consecutive.)
(4) A Class 4 location is any class location unit where buildings with four or more stories above ground are prevalent.
(c) The length of Class 2, 3, and 4 may be adjusted as follows: (1) A Class 4 location ends 220 yards (200 meters) from the nearest building
with four or more stories above ground. (2) When a cluster of buildings intended for human occupancy requires a
Class 2 or 3 location, the class location ends 220 ya rds (200 meters) from the nearest building in the cluster.
Subpart G – General Construction Requirements for Transmission Lines and Mains This subpart prescribes minimum requirements for constructing transmission lines and mains.
Sec. 192.317. Protection from Hazards
(a) The operator must take all practicable steps to protect each transmission line or main from washouts, floods, unstable soil, landslides, or other hazards that may cause the pipeline to move or to sustain abnormal loads. In addition, the operator must take all practicable steps to protect offshore pipelines from damage by mudslides, water currents, hurricanes, ship anchors, and fishing operations.
(b) Each aboveground transmission line or main, not located offshore or in inland navigable water areas, must be protected from accidental damage by vehicular traffic or other similar causes, either by being placed at a safe distance from the traffic or by installing barricades.
(c) Pipelines, including pipe risers, on each platform located offshore or in inland navigable waters must be protected from accidental damage by vessels.
Sec. 192.319. Installation of Pipe in a Ditch
(a) When installed in a ditch, each transmission line that is to be operated at a pressure producing a hoop stress of 20 percent or more of SMYS must be
Texas Transportation Institute B-6 Multimodal Freight Transportation Programs
installed so that the pipe fits the ditch so as to minimize stresses and protect the pipe coating from damage.
(b) When a ditch for a transmission line or main is backfilled, it must be backfilled in a manner that:
(a) Provides firm support under the pipe; and (b) Prevents damage to the pipe and pipe coating from equipment or from the
backfill material. (c) All offshore pipe in water at least 12 feet (3.7 meters) deep but not more than 200
feet (61 meters) deep, as measured from the mean low tide, except pipe in the Gulf of Mexico and its inlets under 15 feet (4.6 meters) of water, must be installed so that the top of the pipe is below the natural bottom unless the pipe is supported by stanchions, held in place by anchors or heavy concrete coating, or protected by an equivalent means. Pipe in the Gulf of Mexico and its inlets under 15 feet (4.6 meters) of water must be installed so that the top of the pipe is 36 inches (914 millimeters) below the seabed for normal excavation or 18 inches (457 millimeters) for rock excavation.
Sec. 192.323. Casing
Each casing used on a transmission line or main under a railroad or highway must comply with the following: (a) The casing must be designed to withstand the superimposed loads. (b) If there is a possibility of water entering the casing, the ends must be sealed. (c) If the ends of an unvented casing are sealed and the sealing is strong enough to
retain the maximum allowable operating pressure of the pipe, the casing must be designed to hold this pressure at a stress level of not more than 72 percent of SMYS.
(d) If vents are installed on a casing, the vents must be protected from the weather to prevent water from entering the casing.
Sec. 192.325. Underground Clearance
(a) Each transmission line must be installed with at least 12 inches (305 millimeters) of clearance from any other underground structure not associated with the transmission line. If this clearance cannot be attained, the transmission line must be protected from damage that might result from the proximity of the other structure.
(b) Each main must be installed with enough clearance from any other underground structure to allow proper maintenance and to protect against damage that might result from proximity to other structures.
(c) In addition to meeting the requirements of paragraph (a) or (b) of this section, each plastic transmission line or main must be installed with sufficient clearance, or must be insulated, from any source of heat so as to prevent the heat from impairing the serviceability or the pipe.
(d) Each pipe-type or bottle-type holder must be installed with a minimum clearance from any other holder as prescribed in Sec 192.175 (b).
Texas Transportation Institute B-7 Multimodal Freight Transportation Programs
Subpart H – Customer Meters, Service Regulators, and Service Lines This subpart prescribes minimum requirements for installing customer meters, service regulators, service lines, service line valves, and service line connections to mains.
Sec. 192.361. Service Lines: Installation
(a) Depth. Each buried service line must be installed with at least 12 inches (305 millimeters) of cover in private property and at least 18 inches (457 millimeters) of cover in streets and roads. However, where an underground structure prevents installation at those depths, the service line must be able to withstand any anticipated external load.
(b) Support and Backfill. Each service line must be properly supported on undisturbed or well-compacted soil, and material used for backfill must be free of materials that could damage the pipe or its coating.
(c) Grading for drainage. Where condensate in the gas might cause interruption in the gas supply to the customer, the service line must be graded so as to drain into the main or into drips at the low points in the service line.
(d) Protection against piping strain and external loading. Each service line must be installed so as to minimize anticipated piping strain and external loading.
(e) Installation of service lines into buildings. Each underground service line installed below grade through the outer foundation wall of a building must:
(1) In the case of a metal service line, be protected against corrosion; (2) In the case of a plastic service line, be protected from shearing action and
backfill settlement; and (3) Be sealed at the foundation wall to prevent leakage into the building.
(f) Installation of service lines under buildings. Where an underground service line is installed under a building:
(1) It must be encased in a gas tight conduit; (2) The conduit and the service line must, if the service line supplies the
building it underlies, extend into a normally usable and accessible part of the building; and
(3) The space between the conduit and the service line must be sealed to prevent gas leakage into the building and, if the conduit is sealed at both ends, a vent line from the annular space must extend to a point where gas would not be a hazard, and extend above grade, terminating in a rain and insect resistant fitting.
Subpart L – Operations This subpart prescribes minimum requirements for the operation of pipeline facilities.
Sec. 192.614. Damage Prevention Program
(a) Except as provided in paragraphs (d) and (e) of this section, each operator of a
buried pipeline must carry out, in accordance with this section, a written program to prevent damage to that pipeline from excavation activities. For the purposes of this section, the term “excavation activities” includes excavation, blasting, boring,
Texas Transportation Institute B-8 Multimodal Freight Transportation Programs
tunneling, backfilling, the removal of aboveground structures by either explosive or mechanical means, and other earthmoving operations.
(b) An operator may comply with any of the requirements of paragraph (c) of this section through participation in a public service program, such as a one-call system, but such participation does not relieve the operator of responsibility for compliance with this section. However, an operator must perform the duties of paragraph (c)(3) of this section through participation in a one-call system, if that one-call system is a qualified one-call system. In areas that are covered by more than one qualified one-call system, an operator need only join one of the qualified one-call systems if there is a central telephone number for excavators to call for excavation activities, or if the one-call systems in those areas communicate with one another. An operator’s pipeline system must be covered by a qualified one-call system where there is one in place. For the purpose of this section, a one-call system is considered a “qualified one-call system” if it meets the requirements of section (b)(1) or (b)(2) of this section.
(1) The state has adopted a one-call damage prevention program under Sec. 198.37 of this chapter; or
(2) The one-call system: (i) Is operated in accordance with Sec. 198.39 of this chapter;
(ii) Provides a pipeline operator an opportunity similar to a voluntary participant to have in management responsibilities; and
(iii) Assesses a participating pipeline operator a fee that is proportionate to the costs of the one-call system’s coverage of the operator’s pipeline.
(c) The damage prevention program required by paragraph (a) of this section must, at a minimum:
(1) Include the identity, on a current basis, of persons who normally engage in excavation activities in the area in which the pipeline is located.
(2) Provide for notification of the public in the vicinity of the pipeline and actual notification of the persons identified in paragraph (c)(1) of this section of the following as often as needed to make them aware of the damage prevention program:
(i) The program’s existence and purpose; and (ii) How to learn the location of underground pipelines before
excavation activities are begun. (3) Provide a means of receiving and recording notification of planned
excavation activities. (4) If the operator has buried pipelines in the area of excavation activity,
provide for actual notification of persons who give notice of their intent to excavate of the type of temporary marking to be provided and how to identify the markings.
(5) Provide for temporary marking of buried pipelines in the area of excavation activity before, as far as possible, the activity begins.
(6) Provide as follows for inspection of pipelines that an operator has reason to believe could be damaged by excavation activities:
Texas Transportation Institute B-9 Multimodal Freight Transportation Programs
(i) The inspection must be done as frequently as necessary during and after the activities to verify the integrity of the pipeline; and
(ii) In the case of blasting, any inspection must include leakage surveys.
(d) A damage prevention program under this section is not required for the following pipelines:
(1) Pipelines located offshore. (2) Pipelines other than those located offshore, in Class 1 or 2 locations until
September 20, 1995. (3) Pipelines to which access is physically controlled by the operator.
(e) Pipelines operated by persons other than municipalities (including operators of master meters) whose primary activity does not include the transportation of gas need not comply with the following:
(1) The requirement of paragraph (a) of this section that the damage program be written; and
(2) The requirements of paragraphs (c)(1) and (c)(2) of this section.
Sec. 192.629. Purging of Pipelines
(a) When a pipeline is being purged of air by use of gas, the gas must be released into one end of the line in a moderately rapid and continuous flow. If gas cannot be supplied in sufficient quantity to prevent the formation of a hazardous mixture of gas and air, a slug of inert gas must be released into the line before the gas.
(b) When a pipeline is being purged of gas by use of air, the air must be released into one end of the line in a moderately rapid and continuous flow. If air cannot be supplied in sufficient quantity to prevent the formation of a hazardous mixture of gas and air, a slug of inert gas must be released into the line before the air.
Subpart M – Maintenance This subpart prescribes minimum requirements for maintenance of pipeline facilities.
Sec. 192.755. Protecting Cast-Iron Pipelines
When an operator has knowledge that the support for a segment of a buried cast- iron pipeline is disturbed: (a) That segment of the pipeline must be protected, as necessary, against damage
during the disturbance by: (1) Vibrations from heavy construction equipment, trains, trucks, buses, or
blasting; (2) Impact forces by vehicles; (3) Earth movement; (4) Apparent future excavations near the pipeline; or (5) Other foreseeable outside forces which may subject that segment of the
pipeline to bending stress. (b) As soon as feasible, appropriate steps must be taken to provide permanent
protection for the disturbed segment from damage that might result from external
Texas Transportation Institute B-10 Multimodal Freight Transportation Programs
loads, including compliance with applicable requirements of Secs. 192.317(a), 192.319, and 192.361(b) – (d).
Definitions Specific terms used in Part 192 are defined below:
Distribution Line – a pipeline other than a gathering or transmission line. Gas – natural gas, flammable gas, or gas that is toxic or corrosive. Gathering Line – a pipeline that transports gas from a current production facility to a
transmission line or main. Main – a distribution line that serves as a common source of supply for more than one
service line. Municipality – a city, county, or any other political subdivision of a State. Operator – a person who engages in the transportation of gas Pipe – any pipe or tubing used in the transportation of gas, including pipe-type holders. Pipeline – all parts of those physical facilities through which gas moves in transportation,
including pipe, valves, and other appurtenance attached to pipe, compressor units, metering stations, regulator stations, delivery stations, holders, and fabricated assemblies.
Pipeline Facility – new and existing pipelines, rights-of-way, and any equipment, facility, or building used in the transportation of gas or in the treatment of gas during the course of transportation.
Service Line – a distribution line that transports gas from a common source of supply to (1) a customer meter or the connection to a customer’s piping, whichever is farther downstream, or (2) the connection to a customer’s piping if there is no customer meter. A customer meter is the meter that measures the transfer of gas from an operator to a consumer.
SMYS – the specified minimum yield strength, which is: (1) For steel pipe manufactured in accordance with a listed specification, the
yield strength specified as a minimum in that specification; or (2) For steel pipe manufactured in accordance with an unknown or unlisted
specification, the yield strength determined in accordance with Sec. 192.107 (b).
Transmission Line – a pipeline, other than a gathering line, that: (a) Transports gas from a gathering line or storage facility to a
distribution center, storage facility, or large volume customer that is not downstream from a distribution center;
(b) Operates at a hoop stress of 20 percent or more of the specified minimum yield strength; or
(c) Transports gas within a storage field. A large volume customer may receive similar volumes of gas as a distribution center, and includes factories, power plants, and institutional users of gas.
Transportation of Gas – the gathering, transmission, or distribution of gas by pipeline or the storage of gas, in or affecting interstate or foreign commerce.
Texas Transportation Institute B-11 Multimodal Freight Transportation Programs
Part 195 – Transportation of Hazardous Liquids by Pipeline This part prescribes safety standards and reporting requirements for pipeline facilities used in the transportation of hazardous liquids or carbon dioxide. Each of the rules pertain to the transport of fluids in other than low-stress pipelines, and which contain highly volatile liquids, other hazardous liquids not in a gaseous state, and carbon dioxide.
Subpart D – Construction This subpart prescribes minimum requirements for constructing new pipeline systems with steel pipe, and for relocating, replacing, or otherwise changing existing pipeline systems that are constructed with steel pipe. However, this subpart does not apply to the movement of pipe covered by Sec. 195.424.
Sec. 195.250. Clearance Between Pipe and Underground Structures
Any pipe installed underground must have at least 12 inches (305 millimeters) of clearance between the outside of the pipe and the extremity of any other underground structure, except that for drainage tile the minimum clearance may be less than 12 inches (305 millimeters) but not less than 2 inches (51 millimeters). However, where 12 inches (305 millimeters) of clearance is impracticable, the clearance may be reduced if adequate provisions are made for corrosion control.
Sec. 195.252. Backfilling
Backfilling must be performed in a manner that protects any pipe coating and provides firm support for the pipe.
Sec. 195.256. Crossing of Railroads and Highways
The pipe at each railroad or highway crossing must be installed so as to adequately
withstand the dynamic forces exerted by anticipated traffic loads.
Sec. 195.266. Construction Records
A complete record that shows the following must be maintained by the operator involved for the life of each pipeline facility: (a) The total number of girth welds and the number nondestructively tested, including
the number rejected and the disposition of each rejected weld. (b) The amount, location, and cover of each size of pipe installed. (c) The location of each crossing of another pipeline. (d) The location of each buried utility crossing. (e) The location of each overhead crossing. (f) The location of each valve and corrosion test station.
Texas Transportation Institute B-12 Multimodal Freight Transportation Programs
Subpart F – Operation and Maintenance This subpart prescribes minimum requirements for operating and maintaining pipeline systems constructed with steel pipe.
Sec. 195.402. Procedural Manual for Operations, Maintenance, and Emergencies
(a) General. Each operator shall prepare and follow for each pipeline system a manual of written procedures for conducting normal operations and maintenance activities and handling abnormal operations and emergencies. This manual shall be reviewed at intervals not exceeding 15 months, but at least once each calendar year, and appropriate parts shall be kept at locations where operations and maintenance activities are conducted.
(b) The Administrator or the State Agency that has submitted a current certification under the pipeline safety laws (49 U.S.C. 60101 et seq.) with respect to the pipeline facility governed by an operator’s plans and procedures may, after notice and opportunity for hearing as provided in CFR 190.237 or the relevant State procedures, require the operator to amend its plans and procedures as necessary to provide a reasonable level of safety.
(c) Maintenance and normal operations. The manual required by paragraph (a) of this section must include procedures for the following to provide safety during maintenance and normal operations:
(1) Making construction records, maps, and operating history available as necessary for safe operation and maintenance.
(2) Gathering of data needed for reporting accidents under subpart B of this part in a timely and effective manner.
(3) Operating, maintaining, and repairing the pipeline system in accordance with each of the requirements of this subpart.
(4) Determining which pipeline facilities are located in areas that would require an immediate response by the operator to prevent hazards to the public if the facilities failed or malfunctioned.
(5) Analyzing pipeline accidents to determine their causes. (6) Minimizing the potential for hazards identified under paragraph (c)(4) of
this section and the possibility of recurrence of accidents analyzed under paragraph (c)(5) of this section.
(7) Starting up and shutting down any part of the pipeline system in a manner designed to assure operation within the limits prescribed by Sec. 195.406, consider the hazardous liquid or carbon dioxide in transportation, variations in altitude along the pipeline, and pressure monitoring and control devices.
(8) In the case of a pipeline that is not equipped to fail safe, monitoring from an attended location pipeline pressure during startup until steady state pressure and flow conditions are reached and during shut- in to assure operation within limits prescribed by Sec. 195.406.
(9) In the case of facilities not equipped to fail safe that are identical under paragraph 195.402 (c)(4) or that control receipt and delivery of the hazardous liquid or carbon dioxide, detecting abnormal operating
Texas Transportation Institute B-13 Multimodal Freight Transportation Programs
conditions by monitoring pressure, temperature, flow or other appropriate operational data and transmitting this data to an attended location.
(10) Abandoning pipeline facilities, including safe disconnection from an operating pipeline system, purging of combustibles, and sealing abandoned facilities left in place to minimize safety and environmental hazards. For each abandoned onshore pipeline facility that crosses over, under or through commercially navigable waterways the last operator of that facility must file a report upon abandonment of that facility in accordance with Sec. 195.59 of this part.
(11) Minimizing the likelihood of accidental ignition of vapors in areas near facilities identified under paragraph (c)(4) of this section where the potential exists for the presence of flammable liquids or gases.
(12) Establishing and maintaining liaison with fire, police, and other appropriate public officials to learn the responsibility and resources of each government organization that may respond to a hazardous liquid or carbon dioxide pipeline emergency and acquaint the officials with the operator’s ability in responding to a hazardous liquid or carbon dioxide pipeline emergency and means of communication.
(13) Periodically reviewing the work done by operator personnel to determine the effectiveness of the procedures used in normal operation and maintenance and taking corrective action where deficiencies are found.
(14) Taking adequate precautions in excavated trenches to protect personnel from the hazards of unsafe accumulations of vapor or gas, and making available when needed at the excavation, emergency rescue equipment, including a breathing apparatus and a rescue harness and line.
(d) Abnormal operation. The manual required by paragraph (a) of this section must include procedures for the following to provide safety when operating design limits have been exceeded:
(1) Responding to, investigating, and correcting the cause of: (i) Unintended closure of valves or shutdowns;
(ii) Increase or decrease in pressure or flow rate outside normal operating limits;
(iii) Loss of communications; (iv) Operation of any safety device; (v) Any other malfunction of a component, deviation from normal
operation, or personnel error which could cause a hazard to persons or property.
(2) Checking variations from normal operation after abnormal operation has ended at sufficient critical locations in the system to determine continued integrity and safe operation.
(3) Correcting variations from normal operation of pressure and flow equipment and controls.
(4) Notifying responsible operator personnel when notice of an abnormal operation is received.
Texas Transportation Institute B-14 Multimodal Freight Transportation Programs
(5) Periodically reviewing the response of operator personnel to determine the effectiveness of the procedures controlling abnormal operation and taking corrective action where deficiencies are found.
(e) Emergencies. The manual required by paragraph (a) of this section must include procedures for the following to provide safety when an emergency condition occurs:
(1) Receiving, identifying, and classifying notices of events which need immediate response by the operator or notice to fire, police, or other appropriate public officials and communicating this information to appropriate operator personnel for corrective action.
(2) Prompt and effective response to a notice of each type emergency, including fire or explosion occurring near or directly involving a pipeline facility, accidental release of hazardous liquid or carbon dioxide from a pipeline facility, operational failure causing a hazardous condition, and natural disaster affecting pipeline facilities.
(3) Having personnel, equipment, instruments, tools, and material available as needed at the scene of an emergency.
(4) Taking necessary action, such as emergency shutdown or pressure reduction, to minimize the volume of hazardous liquid or carbon dioxide that is released from any section of a pipeline system in the event of failure.
(5) Control of released hazardous liquid or carbon dioxide at an accident scene to minimize the hazards, including possible intentional ignition in the cases of flammable highly volatile liquid.
(6) Minimization of public exposure to injury and probability of accidental ignition by assisting with evacuation of residents and assisting with halting traffic on roads and railroads in the affected area, or taking other appropriate action.
(7) Notifying fire, police, and other appropriate public officials of hazardous liquid or carbon dioxide pipeline emergencies and coordinating with them preplanned and actual responses during an emergency, including additional precautions necessary for an emergency involving a pipeline system transporting a highly volatile liquid.
(8) In the case of failure of a pipeline system transporting a highly volatile liquid, use of appropriate instruments to access the extent and coverage of the vapor cloud and determine the hazardous areas.
(9) Providing for a post accident review of employee activities to determine whether the procedures were effective in each emergency and taking corrective action where deficiencies are found.
(f) Safety-related condition reports. The manual required by paragraph (a) of this section must include instructions enabling personnel who perform operational and maintenance activities to recognize conditions that potentially may be safety-related conditions that are subject to the reporting requirements of Sec. 195.55.
Texas Transportation Institute B-15 Multimodal Freight Transportation Programs
Sec. 195.424. Pipe Movement
(a) No operator may move any line pipe, unless the pressure in the line section involved is reduced to not more than 50 percent of the maximum operating pressure.
(b) No operator may move any pipeline containing highly volatile liquids where materials in the line section involved are joined by welding unless:
(1) Movement when the pipeline does not contain highly volatile liquids is impractical;
(2) The procedures of the operator under Sec. 195.402 contain precautions to protect the public against the hazard in moving pipelines containing highly volatile liquids, including the use of warnings, where necessary, to evacuate the area close to the pipeline; and
(3) The pressure in that line section is reduced to the lower of the following: (a) Fifty percent or less of the maximum operating pressure; or (b) The lowest practical level that will maintain the highly volatile
liquid in a liquid state with continuous flow, but not less than 50 p.s.i. (345 kPa) gage above the vapor pressure of the commodity.
(c) No operator may move any pipeline containing highly volatile liquids where materials in the line section involved are not joined by welding unless:
(1) The operator complies with paragraphs (b) (1) and (2) of this section; and (2) That line section is isolated to prevent the flow of highly volatile liquid.
Definitions Specific terms used in Part 195 are defined below:
Administrator – the Administrator of the Research and Special Programs Administration or
any person to whom authority in the matter concerned has been delegated by the Secretary of Transportation.
Breakout Tank – a tank used to (a) relieve surges in a hazardous liquid pipeline system or (b) receive and store hazardous liquid transported by a pipeline for reinjection and continued transportation by pipeline.
Carbon Dioxide – a fluid consisting of more than 90 percent carbon dioxide molecules compressed to a supercritical state.
Component – any part of a pipeline which may be subjected to pump pressure including, but not limited to, pipe, valves, elbows, tees, flanges, and closures.
Gathering Line – a pipeline 219.1 mm (8 5/8 in.) or less nominal outside diameter that transports petroleum from a production facility.
Hazardous Liquid – petroleum, petroleum products, or anhydrous ammonia. Highly Volatile Liquid (HVL) – a hazardous liquid which will form a vapor cloud when
released to the atmosphere and which has a vapor pressure exceeding 276 kPa (40 psia) at 37.8°C (100°F).
Interstate Pipeline – a pipeline or that part of a pipeline that is used in the transportation of hazardous liquids or carbon dioxide in interstate or foreign commerce.
Intrastate Pipeline – a pipeline or that part of a pipeline to which this part applies that is not an interstate pipeline.
Texas Transportation Institute B-16 Multimodal Freight Transportation Programs
Line Section – a continuous run of pipe between adjacent pressure pump stations, between a pressure pump station and terminal or breakout tanks, between a pressure pump station and a block valve, or between adjacent block valves.
Low-Stress Pipeline – a hazardous liquid pipeline that is operated in its entirety at a stress level of 20 percent or less or the specified minimum yield strength of the line pipe.
Operator – a person who owns or operates pipeline facilities. Person – an individual, firm, joint venture, partnership, corporation, association, State,
municipality, cooperative association, or joint stock association, and includes a trustee, receiver, assignee, or personal representative thereof.
Petroleum – crude oil, condensate, natural gasoline, natural gas liquids, blend stocks and other miscellaneous hydrocarbon compounds.
Pipe or Line Pipe – a tube, usually cylindrical, through which a hazardous liquid or carbon dioxide flows from one point to another.
Pipeline or Pipeline System – all parts of a pipeline facility through which a hazardous liquid or carbon dioxide moves in transportation, including, but not limited to, line pipe, valves, and other appurtenances connected to line pipe, pumping units, fabricated assemblies associated with pumping units, metering and delivery stations and fabricated assemblies therein, and breakout tanks.
Pipeline Facility – new and existing pipe, rights-of-way and any equipment, facility, or building used in the transportation of hazardous liquids or carbon dioxide.
Rural Area – areas outside the limits of any incorporated or unincorporated city, town, village, or any other designated residential or commercial area such as a subdivision, a business or shopping center, or community development.
Specified Minimum Yield Strength – the minimum yield strength, expressed in p.s.i. (kPa) gage, prescribed by the specification under which the material is purchased from the manufacturer.
Surge Pressure – pressure produced by a change in velocity of the moving stream that results from shutting down a pump station or pumping unit, closure of a valve, or any other blockage of the moving stream.
Part 198 – Regulations for Grants to Aid State Pipeline Safety Programs This part prescribes regulations governing grant- in-aid for State pipeline safety compliance programs. Subpart C – Adoption of One-Call Damage Prevention Program This subpart implements parts of the pipeline safety laws (49 U.S.C. 60101 et seq.), which direct the Secretary to require each state to adopt a one-call damage prevention program as a condition to receiving a full grant- in-aid for its pipeline safety compliance program.
Sec. 198.35. Grants Conditioned on Adoption of One-Call Damage Prevention Program
In allocating grants to State agencies under the pipeline safety laws, (49 U.S.C. 60101 et
seq.), the Secretary considers whether a State has adopted or is seeking to adopt a one-call damage prevention program in accordance with Sec. 198.37. If a State has
Texas Transportation Institute B-17 Multimodal Freight Transportation Programs
not adopted or is not seeking to adopt such program, the State agency may not receive full reimbursement to which it would otherwise be entitled.
Sec. 198.37. State One-Call Damage Prevention Program.
A State must adopt a one-call damage prevention program that requires each of the following at a minimum: (a) Each area of the State that contains underground pipeline facilities must be
covered by a one-call notification system. (b) Each one-call notification system must be operated in accordance with Sec.
198.39. (c) Excavators must be required to notify the operational center of the one-call
notification system that covers the area of each intended excavation activity and provide the following information:
(1) Name of the person notifying the system. (2) Name, address and telephone number of the excavator. (3) Specific location, starting date, and description of the intended excavation
activity.
However, an excavator must be allowed to begin an excavation activity in an emergency but, in doing so, required to notify the operational center at the earliest practicable moment.
(d) The State must determine whether telephonic and other communications to the operational center of a one-call notification system under paragraph (c) of this section are to be toll free or not.
(e) Except with respect to interstate transmission facilities as defined in the pipeline safety laws (49 U.S.C. 60101 et seq.), operators of underground pipeline facilities must be required to participate in the one-call notification systems that cover the areas of the State in which those pipeline facilities are located.
(f) Operators of underground pipeline facilities participating in the one-call notification systems must be required to respond in the manner prescribed by Sec. 192.614 (b)(4) through (b)(6) of this chapter to notices of intended excavation activity received from the operational center of a one-call notification system.
(g) Persons who operate one-call notification systems or operators of underground pipeline facilities participating or required to participate in the one-call notification systems must be required to notify the public and known excavators in the manner prescribed by Sec. 192.614 (b)(1) and (b)(2) of this chapter of the availability and use of one-call notification systems to locate underground pipeline facilities. However, this paragraph does not apply to persons (including operator’s master meters) whose primary activity does not include the production, transportation or marketing of gas or hazardous liquids.
(h) Operators of underground pipeline facilities (other than operators of interstate transmission facilities as defined in the pipeline safety laws (49 U.S.C. 60101 et seq.), and interstate pipelines as defined in Sec. 195.2 of this chapter), excavators and persons who operate one-call notification systems who violate the applicable requirements of this subpart must be subject to civil penalties and injunctive relief
Texas Transportation Institute B-18 Multimodal Freight Transportation Programs
that are substantially the same as are provided under the pipeline safety laws (49 U.S.C. 60101 et seq.).
Sec. 198.39. Qualifications for Operation of One-Call Notification System
A one-call notification system qualifies to operate under this subpart if it complies with
the following: (a) It is operated by one or more of the following:
(1) A person who operates underground pipeline facilities or other underground facilities,
(2) A private contractor, (3) A State or local government agency, or (4) A person who is otherwise eligible under State law to operate a one-call
notification system. (b) It receives and records information from excavators about intended excavation activities. (c) It promptly transmits to the appropriate operators of underground pipeline
facilities the information received from excavators about intended excavation activities.
(d) It maintains a record of each notice of intent to engage in an excavation activity for the minimum time set by the State or, in the absence of such time, for the time specified in the applicable State statute of limitations on tort actions.
(e) It tells persons giving notice of an intent to engage in an excavation activity the names of participating operators of underground pipeline facilities to whom the notice will be transmitted.
Definitions Specific terms used in Part 198 are defined below:
Adopt – establish under State law by statute, regulation, license, certification, order, or any combination of these legal matters.
Excavation Activity – an excavation activity defined in Sec. 192.614(a) of this chapter, other than a specific activity the State determines would not be expected to cause physical damage to underground facilities.
Excavator – any person intending to engage in an excavation activity. One-Call Notification System – a communication system that qualifies under this part and
the one-call damage prevention program of the State concerned in which an operational center receives notices from excavators of intended excavation activities and transmits the notices to operators of underground pipeline facilities and other underground facilities that participate in the system.
Person – any individual, firm, joint venture, partnership, corporation, association, state, municipality, cooperative association, or joint stock association, and including any trustee, receiver, assignee, or personal representative thereof.
Underground Pipeline Facilities – buried pipeline facilities used in the transportation of gas or hazardous liquid subject to the pipeline safety laws (49 U.S.C. 60101 et seq.).
Texas Transportation Institute B-19 Multimodal Freight Transportation Programs
Secretary – the Secretary of Transportation or any person to whom the Secretary of Transportation has delegated authority in the matter concerned.
State – each of the several states, the District of Columbia, and the Commonwealth of Puerto Rico.
Copyright © 2022 FDOKUMEN