12th International Symposium on Computer Music ...
358
-
Upload
khangminh22 -
Category
Documents
-
view
0 -
download
0
Transcript of 12th International Symposium on Computer Music ...


Proceedings of the
12th International Symposium on Computer Music Multidisciplinary Research
5 – 8 July, 2016 São Paulo, Brazil
Organized by
The Computer Music Research Group
& The NuSom - Research Centre on Sonology
São Paulo, Brazil
in collaboration with
The Laboratory of Mechanics and Acoustics, Marseille, France

Published by
The Laboratory of Mechanics and Acoustics, 4 impasse Nikola Tesla, CS 40006,
F-13453 Marseille Cedex 13 - France
June, 2016
All copyrights remain with the authors. Proceedings Editors: M. Aramaki, R. Kronland-Martinet, S. Ystad
ISBN 978-2-909669-25-0 ISSN 1159 - 0947 (PUBLICATIONS OF THE L.M.A.) Publications of the LMA Listed in the Pascal base of the INIST N° 159 (23/06-2016/)

Welcome
Dear participant,
welcome to Sao Paulo, and welcome to CMMR 2016 – Bridging People andSound! We hope that this edition will create a venue for fruitful discussion andplenty of opportunities for interaction, with good outcomes both for your workand for everyone else’s.
The 12th International Symposium on Computer Music MultidisciplinaryResearch (CMMR) encouraged submissions related to the theme “Bridging Peo-ple and Sound”. Moving away from the traditional emphasis on technology, weinvited researchers, scholars, and professionals to reflect on the contexts andprocesses that make possible the connections between artists and listeners onthe one side and audio and music technologies on the other. Music technology ismuch more than the tools or the instruments we use to make music: around it wesee the emergence of user communities, the development of aesthetic concepts,the establishment of new listening habits, and the expansion of musical forms,genres and styles. Given that musical practices are becoming increasingly medi-ated by technology, this year’s theme proposed the investigation on how thesepractices have been directed, influenced or restricted by the devices, techniquesand tools that have been applied in music production.
Sao Paulo, capital of the Brazilian state with the same name, is Brazil’slargest city and the main financial center in Latin America. It is characterizedby the huge confluence of immigrants, throughout its entire history, coming fromother parts of Brazil and from abroad, and contributing with their traditions,their music, their food, their work and their lives. This cultural melting pot isreflected in the plurality of artistic, social, and political expressions that occupythe city from end to end, overflowing its streets, squares and buildings.
CMMR 2016 - Bridging People and Sound - is being held in the main campusof the University of Sao Paulo located at the University City, one of the fewprivileged extensive green areas of the city. Activities are taking place at theComputer Science Department and the Concert Hall of the Brasiliana Library.The symposium is jointly organized by the Computer Music Research Group,the NuSom - Research Centre on Sonology, and the CNRS - Laboratoire deMecanique et d’Acoustique (France).
The Computer Music and the Sonology research groups at the University ofSao Paulo are honoured with your visit, and we hope we’re able to provide youwith the things you’ll need to make the most out of the next four days. Enjoyyour stay!
Marcelo QueirozFernando Iazzetta
CMMR 2016 Chairs
Proc. of the 12th International Symposium on CMMR, Sao Paolo, Brazil, July 5-8, 2016
1

Organization
The 12th International Symposium on Computer Music Multidisciplinary Re-search CMMR2016 “Bridging People and Sound” is organized by the ComputerMusic Research Group, the NuSom - Research Centre on Sonology (Sao Paolo,Brazil) and the Laboratoire de Mecanique et d’Acoustique (Marseille, France).
Symposium Chairs
Marcelo Queiroz, IME/USP, Sao Paulo, BrazilFernando Iazzetta, ECA/USP, Sao Paulo, Brazil
Proceedings Chairs
Richard Kronland-Martinet, CNRS-LMA, FranceSølvi Ystad, CNRS-LMA, FranceMitsuko Aramaki, CNRS-LMA, France
Paper and Program Chairs
Richard Kronland-Martinet, CNRS-LMA, FranceSølvi Ystad, CNRS-LMA, FranceMitsuko Aramaki, CNRS-LMA, FranceMarcelo Queiroz, IME/USP, Sao Paulo, Brazil
Music Chair
Fernando Iazzetta, ECA/USP, Sao Paulo, Brazil
Demonstration Chair
Regis Faria, FFCLRP/USP, Ribeirao Preto, Brazil
Local Organizing Committee
Marcelo Queiroz, IME/USP, Sao Paulo, BrazilFernando Iazzetta, ECA/USP, Sao Paulo, BrazilRegis Faria, FFCLRP/USP, Ribeirao Preto, Brazil
Proc. of the 12th International Symposium on CMMR, Sao Paolo, Brazil, July 5-8, 2016
2

Paper Committee
Mitsuko Aramaki, CNRS-LMA Marseille, FranceFederico Avanzini, University of Padova, ItaliaMathieu Barthet, Centre for Digital Music, QMUL, UKFrederic Bevilacqua, IRCAM Paris, FranceMarta Bienkiewicz, Aix-Marseille University, FranceChristophe Bourdin, Aix-Marseille University, FranceLionel Bringoux, Aix-Marseille University, FranceJohn Ashley Burgoyne, ILLC, Universiteit van Amsterdam, The NetherlandsMarcelo Caetano, INESC TEC, PortugalEmilios Cambouroupoulos, Aristotle University of Thessaloniki, GreeceAmilcar Cardoso, University of Coimbra, PortugalOlivier Derrien, CNRS-LMA Marseille, FranceJoel Eaton, University of Plymouth, UKGeorg Essl, University of Michigan, USARegis R.A. Faria, Universidade de Sao Paulo, BrazilBruno Giordano, University of Glasgow, UKRolf Inge Gødoy, University of Oslo, NorwayBrian Gygi, Veterans Affairs Northern California Health Care Service, USAKristoffer Jensen, Independent researcher, DenmarkLuis Jure, Universidad de la Republica, UruguayMaximos Kaliakatsos-Papakostas, University of Thessaloniki, GreeceTimour Klouche, SIM Berlin, GermanyRichard Kronland-Martinet, CNRS-LMA Marseille, FranceDarius Kucinskas, Kaunas University of Technology, LithuaniaFernando Iazzetta, Universidade de Sao Paulo, BrazilThor Magnusson, University of Sussex, UKJonatas Manzolli, Universidade Estadual Campinas, BrazilSylvain Marchand, University of Brest, FranceJean-Arthur Micoulaud-Franchi, CNRS USR Sanpsy, Bordeaux, FranceMarcelo Queiroz, Universidade de Sao Paulo, BrazilDavide Rocchesso, Universita Iuav di Venezia, ItaliaMatthew Rodger, Queen’s University Belfast, UKFlavio Schiavoni, Federal University of Sao Joao Del Rey, BrazilDiemo Schwarz, IRCAM Paris, FranceStefania Serafin, Aalborg University Copenhagen, DanmarkJulius Smith, Stanford University, USATiago Tavares, State University of Campinas (UNICAMP), BrazilMarcelo Wanderley, McGill University, CanadaIan Whalley, University of Waikato, New ZealandDuncan Williams, University of Plymouth, UKSølvi Ystad, CNRS-LMA Marseille, France
Proc. of the 12th International Symposium on CMMR, Sao Paolo, Brazil, July 5-8, 2016
3

Table of Contents
I - Music structure analysis - Music InformationRetrieval
deepGTTM-I: Local Boundaries Analyzer based on a Deep LearningTechnique . . . . . . . . . . . . . . . . . . . . . . . . . . . . . . . . . . . . . . . . . . . . . . . . . . . . . . . . 8
Masatoshi Hamanaka, Keiji Hirata, and Satoshi Tojo
Visualizing Interval Patterns in Pitch Constellation . . . . . . . . . . . . . . . . . . . . 21
Guillaume Blot, Pierre Saurel, and Francis Rousseaux
Exploring Multi-Task Feature Learning: Learning Specific Features forMusic Genre Classification . . . . . . . . . . . . . . . . . . . . . . . . . . . . . . . . . . . . . . . . . 37
Yao Cheng, Xiaoou Chen, and Deshun Yang
Copista - OMR System for Historical Musical Collection Recovery . . . . . . 51
Marcos Laia, Flavio Schiavoni, Daniel Madeira, Darlinton Carvalho,Joao Pedro Moreira, Avner de Paulo, and Rodrigo Ferreira
II - Sound, Motion and Gesture
Sound and Posture: an Overview of Recent Findings . . . . . . . . . . . . . . . . . . . 66
Lennie Gandemer, Gaetan Parseihian, Christophe Bourdin, andRichard Kronland-Martinet
Investigating the Effects of a Postural Constraint on the Cellists’Bowing Movement and Timbral Quality . . . . . . . . . . . . . . . . . . . . . . . . . . . . . 83
Jocelyn Roze, Richard Kronland-Martinet, Mitsuko Aramaki,Christophe Bourdin, and Sølvi Ystad
Eclipse: A Wearable Instrument for Performance Based Storytelling . . . . . 99
Ezgi Ucar
III - Music Composition, Public Spaces and Mobility
Sound Interaction Design and Creation in the Context of Urban Space . . . 109
Julian Jaramillo Arango
Towards a New Approach to Design Sounds in Public Transport . . . . . . . . 117
Gaetan Parseihian, Emmanuelle Delgrange, Christophe Bourdin,Vincent Brejard, Damien Arpaja, Francois Agier, and RichardKronland-Martinet
Proc. of the 12th International Symposium on CMMR, Sao Paolo, Brazil, July 5-8, 2016
4

Social Filters on the Use of Public Spaces: the Electroacoustic MusicStudio of Sweden . . . . . . . . . . . . . . . . . . . . . . . . . . . . . . . . . . . . . . . . . . . . . . . . . 130
Tiago de Mello
IV - Computer-supported Interactive Systems forMusic Production, Performance and Listening
Using Pure Data for Real-Time Granular Synthesis Control throughLeap Motion . . . . . . . . . . . . . . . . . . . . . . . . . . . . . . . . . . . . . . . . . . . . . . . . . . . . . 139
Damian Anache
Angkasa: A Software Tool for Spatiotemporal Granulation . . . . . . . . . . . . . 147
Muhammad Hafiz Wan Rosli and Andres Cabrera
Subjective Experience in an Interactive Music Virtual Environment: anExploratory Study . . . . . . . . . . . . . . . . . . . . . . . . . . . . . . . . . . . . . . . . . . . . . . . . 159
Thomas Deacon, Mathieu Barthet, and Tony Stockman
V - Image/Sound Interaction - Digital Games
An Extensible and Flexible Middleware for Real-Time Soundtracks inDigital Games . . . . . . . . . . . . . . . . . . . . . . . . . . . . . . . . . . . . . . . . . . . . . . . . . . . . 175
Wilson Kazuo Mizutani and Fabio Kon
New Atlantis: A Shared Online World Dedicated to Audio Experimentation 183
Peter Sinclair, Roland Cahen, Jonathan Tanant, and Peter Gena
Estilhaco 1 & 2: Conversations between Sound and Image in theContext of a Solo Percussion Concert . . . . . . . . . . . . . . . . . . . . . . . . . . . . . . . . 201
Fernando Rocha and Eli Stine
VI - Interactive Music Production
Interaction, Convergence and Instrumental Synthesis in Live ElectronicMusic . . . . . . . . . . . . . . . . . . . . . . . . . . . . . . . . . . . . . . . . . . . . . . . . . . . . . . . . . . . 209
Danilo Rossetti
Musical Communication Modeling Methodology (MCMM): ATheoretical Framework for Event-Based Ubiquitous Music Interaction . . . 217
Flavio Luiz Schiavoni
VII - New Digital Instruments - MultisensoryExperiences
A Virtual Musical Instrument for 3D Performance with Short Gestures . . 233
Andre Montes Rodrigues, Marcelo Knorich Zuffo, Olavo da RosaBelloc, and Regis Rossi Alves Faria
Proc. of the 12th International Symposium on CMMR, Sao Paolo, Brazil, July 5-8, 2016
5
Using Sound to Enhance Taste Experiences: An Overview . . . . . . . . . . . . . . 241Felipe Reinoso Carvalho, Abdellah Touhafi, Kris Steenhaut,Raymond van Ee, and Carlos Velasco
Revolt and Ambivalence: Music, Torture and Absurdity in the DigitalOratorio The Refrigerator . . . . . . . . . . . . . . . . . . . . . . . . . . . . . . . . . . . . . . . . . . 253
Paulo C. Chagas
VIII - Poster Session
Dynamic Mapping Strategies using Content-based Classification: aProposed Method for an Augmented Instrument . . . . . . . . . . . . . . . . . . . . . . 270
Gabriel Rimoldi and Jonatas Manzolli
The Mitt: Case Study in the Design of a Self-contained Digital MusicInstrument . . . . . . . . . . . . . . . . . . . . . . . . . . . . . . . . . . . . . . . . . . . . . . . . . . . . . . . 278
Ivan Franco and Marcelo M. Wanderley
Music Generation with Relation Join . . . . . . . . . . . . . . . . . . . . . . . . . . . . . . . . 286Xiuyan Ni, Ligon Liu, and Robert Haralick
Retrograde of Melody and Flip Operation for Time-Span Tree . . . . . . . . . . 298Keiji Hirata and Satoshi Tojo
DataSounds: Sonification Tool for Scientific Data Analysis . . . . . . . . . . . . . 306Arnaldo D’Amaral Pereira Granja Russo and Luiz Carlos IrberJunior
Life-like Behaviour in a Gestural Interface for Interacting with Sound . . . . 315Peter Beyls
Lowering Dissonance by Relating Spectra on Equal Tempered Scales . . . . 323Micael Antunes da Silva and Regis Rossi A. Faria
Development of a Sound Reproduction Four-Channel System with 360◦
Horizontal Sound Image applied to Music, Sound Arts, and Bioacoustics . 331Jose Augusto Mannis, Tato Taborda, and Djalma de CamposGoncalves Junior
Graphic Interfaces for Computer Music: Two Models . . . . . . . . . . . . . . . . . . 338Ariane de Souza Stolfi
On the Symbolic Transmission of Meaning Through Music . . . . . . . . . . . . . 346Bernardo Penha and Jose Fornari
Author Index . . . . . . . . . . . . . . . . . . . . . . . . . . . . . . . . . . . . . . . . . . . . . . . . 354
Proc. of the 12th International Symposium on CMMR, Sao Paolo, Brazil, July 5-8, 2016
6

Proc. of the 12th International Symposium on CMMR, Sao Paolo, Brazil, July 5-8, 2016
7

deepGTTM-I: Local Boundaries Analyzer based on A
Deep Learning Technique
Masatoshi Hamanaka1 Keiji Hirata2, and Satoshi Tojo3
1 Kyoto University,
[email protected], 2 Future University Hakodate,
[email protected], 3 JAIST,
http://gttm.jp/
Abstract. This paper describes a method that enables us to detect the local
boundaries of a generative theory of tonal music (GTTM). Although systems that
enable us to automatically acquire local boundaries have been proposed such as a
full automatic time-span tree analyzer (FATTA) or σGTTM, musicologists have to
correct the boundaries because of numerous errors. In light of this, we propose a
novel method called deepGTTM-I for detecting the local boundaries of GTTM by
using a deep learning technique. The experimental results demonstrated that
deepGTTM-I outperformed the previous analyzers for GTTM in an F-measure of
detecting local boundaries.
Keywords: A generative theory of tonal music (GTTM), local grouping
boundary, deep learning.
1 Introduction
We propose a method of automatically acquiring local grouping boundaries based on
a generative theory of tonal music (GTTM) [1]. GTTM is composed of four modules,
each of which assigns a separate structural description to a listener’s understanding of
a piece of music. These four modules output a grouping structure, metrical structure,
time-span tree, and prolongational tree. As the acquisition of local grouping
boundaries is the first step in GTTM, an extremely accurate analyzer makes it
possible to improve the performance of all the later analyzers.
We previously constructed several analyzers or methods that enabled us to acquire
local grouping boundaries such as: an automatic time-span tree analyzer (ATTA) [5],
a fully automatic time-span tree analyzer (FATTA) [6], a GTTM analyzer by using
statistical learning (σGTTM) [7], and a GTTM analyzer based on clustering and
statistical learning (σGTTMII) [8]. However, the performance of these analyzers or
methods was inadequate in that musicologists had to correct the boundaries because
of numerous errors.
We propose deepGTTM-I in which we attempted to use deep learning [9] to
improve the performance of acquiring local grouping boundaries to detect them.
Proc. of the 12th International Symposium on CMMR, Sao Paolo, Brazil, July 5-8, 2016
8

2 Masatoshi Hamanaka, Keiji Hirata, and Satoshi Tojo
Unsupervised training in the deep learning of deep layered networks called pre-
training helps supervised training, which is called fine-tuning [10].
Our goal was to develop a GTTM analyzer that enabled us to output the results
obtained from analysis that were the same as those obtained by musicologists based
on deep learning by learning the results of analysis obtained by musicologists. We
had to consider three issues in constructing a GTTM analyzer based on deep learning.
Multi-task Learning
A model or network in a simple learning task estimates the label from an input
feature vector. However, local grouping boundaries can be found in many note
transitions. Therefore, we consider a single learning task as estimating whether
one note transition can be a boundary or not. Then, a problem in detecting local
grouping boundaries can be solved by using multi-task learning.
Subsection 4.3 explains multi-task learning by using deep learning.
Large scale training data
Large scale training data are needed to train a deep layered network. Labels are
not needed in pre-training the network. Therefore, we collected 15,000 pieces of
music formatted in musicXML from Web pages that were introduced in the
MusicXML page of MakeMusic Inc. [11]. We needed labeled data to fine-tune
the network. Although we had 300 pieces with labels in the GTTM database [12],
this number was too small to enable the network to learn.
Subsection 4.1 explains how we collected the data and how we got the network
to learn effectively with a small dataset.
GTTM rules
GTTM consists of multiple rules and a note transition that is applied to many
rules tends to be a local grouping boundary in the analysis of local grouping
boundaries. As a result of analysis by musicologists, 300 pieces in the GTTM
database were not only labeled with local grouping boundaries, but also labeled
with applied positions of grouping preference rules. Therefore, the applied
positions of grouping preference rules were helpful clues in detecting local
grouping boundaries.
Subsection 4.3 explains how the network learned with the grouping preference
rules.
The results obtained from an experiment demonstrated that multi-task learning using
the deep learning technique outperformed the previous GTTM analyzers in grouping
boundaries.
The paper is organized as follows. Section 2 describes related work and Section 3
explains our method called deepGTTM-I. Section 4 explains how we evaluated the
performance of deepGTTM-I and Section 5 concludes with a summary and an
overview of future work.
Proc. of the 12th International Symposium on CMMR, Sao Paolo, Brazil, July 5-8, 2016
9
deepGTTM-I 3
2 Related work
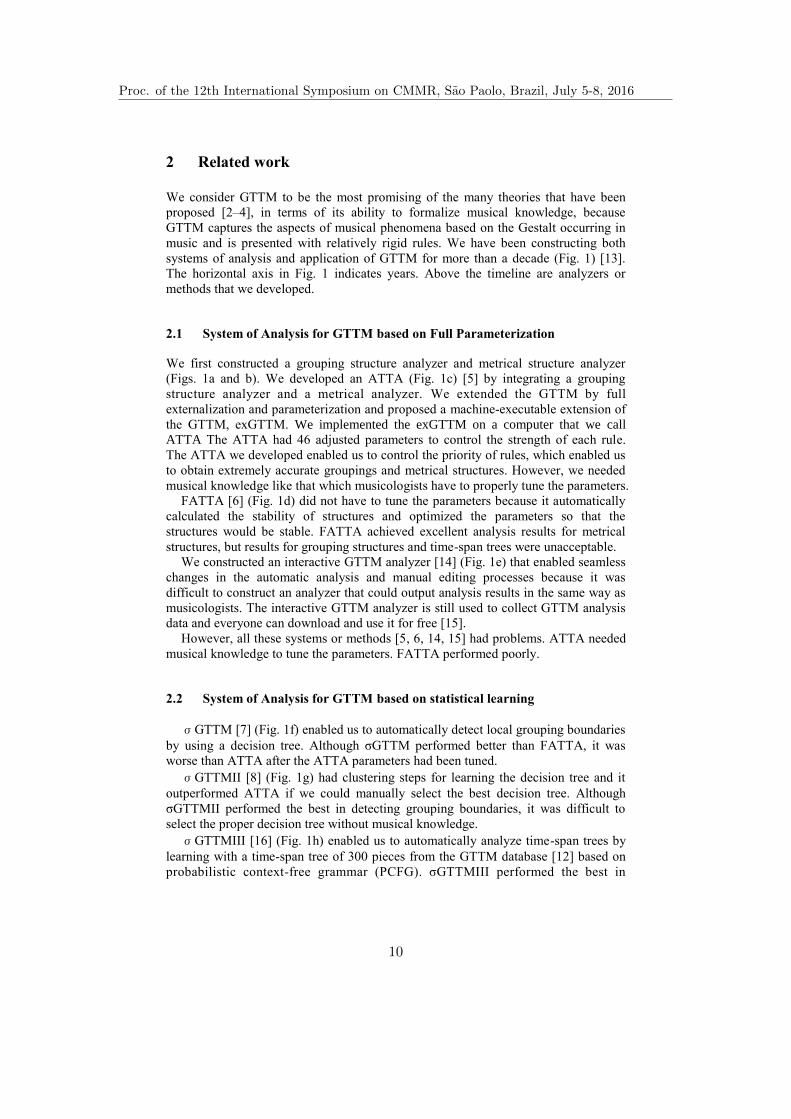
We consider GTTM to be the most promising of the many theories that have been
proposed [2–4], in terms of its ability to formalize musical knowledge, because
GTTM captures the aspects of musical phenomena based on the Gestalt occurring in
music and is presented with relatively rigid rules. We have been constructing both
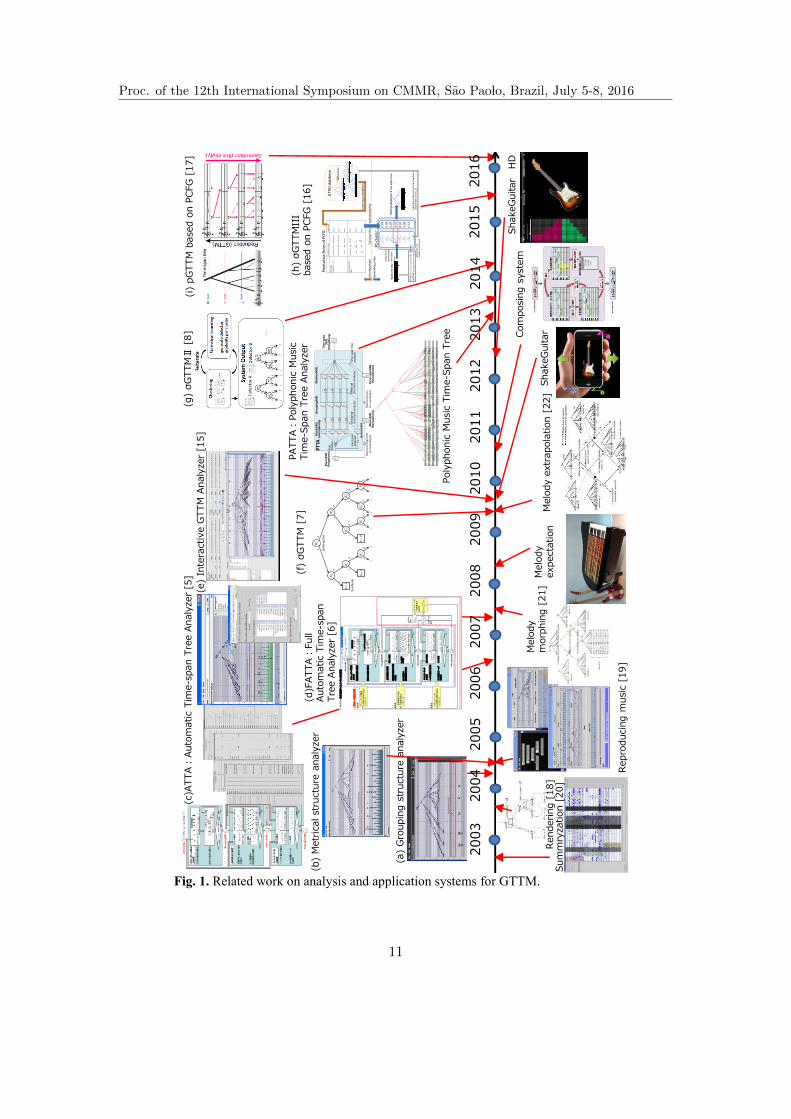
systems of analysis and application of GTTM for more than a decade (Fig. 1) [13].
The horizontal axis in Fig. 1 indicates years. Above the timeline are analyzers or
methods that we developed.
2.1 System of Analysis for GTTM based on Full Parameterization
We first constructed a grouping structure analyzer and metrical structure analyzer
(Figs. 1a and b). We developed an ATTA (Fig. 1c) [5] by integrating a grouping
structure analyzer and a metrical analyzer. We extended the GTTM by full
externalization and parameterization and proposed a machine-executable extension of
the GTTM, exGTTM. We implemented the exGTTM on a computer that we call
ATTA The ATTA had 46 adjusted parameters to control the strength of each rule.
The ATTA we developed enabled us to control the priority of rules, which enabled us
to obtain extremely accurate groupings and metrical structures. However, we needed
musical knowledge like that which musicologists have to properly tune the parameters.
FATTA [6] (Fig. 1d) did not have to tune the parameters because it automatically
calculated the stability of structures and optimized the parameters so that the
structures would be stable. FATTA achieved excellent analysis results for metrical
structures, but results for grouping structures and time-span trees were unacceptable.
We constructed an interactive GTTM analyzer [14] (Fig. 1e) that enabled seamless
changes in the automatic analysis and manual editing processes because it was
difficult to construct an analyzer that could output analysis results in the same way as
musicologists. The interactive GTTM analyzer is still used to collect GTTM analysis
data and everyone can download and use it for free [15].
However, all these systems or methods [5, 6, 14, 15] had problems. ATTA needed
musical knowledge to tune the parameters. FATTA performed poorly.
2.2 System of Analysis for GTTM based on statistical learning
σGTTM [7] (Fig. 1f) enabled us to automatically detect local grouping boundaries
by using a decision tree. Although σGTTM performed better than FATTA, it was
worse than ATTA after the ATTA parameters had been tuned.
σGTTMII [8] (Fig. 1g) had clustering steps for learning the decision tree and it
outperformed ATTA if we could manually select the best decision tree. Although
σGTTMII performed the best in detecting grouping boundaries, it was difficult to
select the proper decision tree without musical knowledge.
σGTTMIII [16] (Fig. 1h) enabled us to automatically analyze time-span trees by
learning with a time-span tree of 300 pieces from the GTTM database [12] based on
probabilistic context-free grammar (PCFG). σGTTMIII performed the best in
Proc. of the 12th International Symposium on CMMR, Sao Paolo, Brazil, July 5-8, 2016
10
4 Masatoshi Hamanaka, Keiji Hirata, and Satoshi Tojo
MelodyA
MelodyB
TA
TB
TATB
(1)Lin
king
the
com
mon
info
rmat
ion
ofm
elo
dies
(2)M
elo
dydi
visi
on
redu
ction
TC
(3)C
om
binin
gtw
om
elo
dies
TC
TD
MelodyC
TD
TC
MelodyD
TD
MelodyE
LA
LB
Mu
sicX
ML
(Po
lyp
ho
ny)
Part
d
ivid
er
Mu
sicX
ML
(mo
no
ph
on
y)
. . . .G
rou
pin
g st
ruct
ure
an
alyz
er
Gro
up
ingX
ML
Me
tric
alX
ML
Met
rica
l st
ruct
ure
an
alyz
er
Tim
e-s
pan
tre
e
anal
yze
r
Tim
e-s
pan
XM
L(P
oly
ph
on
y)
. . . .. . . .
Har
mo
nic
an
alyz
er
Har
mo
nic
XM
L
PT
TA
Man
ual
arr
ange
me
nt
by
mu
sico
logi
sts
Mu
sicX
ML
(ho
mo
ph
on
y)
Man
ual
an
alys
is
by
mu
sico
logi
sts
Tim
e-s
pan
XM
L(h
om
op
ho
ny)
(a)
Gro
upin
g s
tructu
re a
naly
zer
(b)
Metr
ical st
ructu
re a
naly
zer
Melo
dy
expecta
tion
Mu
sic
XM
L
局所的境界
[tim
e]境界の深さ
局所的境界の検出
高次の境界の検出 G
rou
pin
gX
ML
トップダウンによる分割
GP
R1
, 2
, 3
, 6
の適用
GP
R1
, 2
, 3
, 4
, 5
, 6
の適用
(
)
Bi
局所的な拍点の強さ
の算出
次の階層の
拍節構造の選択
Me
tric
alX
ML
[tim
e]D
ilow
-lev
el
(拍点の強さ
)M
PR
1,2
,3,4
,5の適用
現在の構造
次の階層
の候補
MP
R1
0の適用、構造の選択 Y
esN
o
拍点が
2つ以上
ヘッドの強さの算出
次の階層のヘッド
の選択
Diti
me-
spa
n
(ヘッドの強さ
)T
SR
PR
1,3
,4,8
,9の適用
現在の構造
次の階層
Tim
e-s
pan
XM
L
Yes
No
ヘッドが
2つ以上
Yes
No
グループ中に局所的境界がある
グルーピング構造
グルーピング構造
分析器
分析器
拍節構造分析器
拍節構造分析器
タイムスパン木
タイムスパン木
分析器
分析器
AT
TA
: タイムスパン木分析器
グルーピング構造
分析器の調節可能な
パラメータ
拍節構造分析器
の調節可能な
パラメータ
タイムスパン木
分析器の調節可能な
パラメータ
DT
SR
PR
5
DG
PR
7
DT
SR
PR
5 +
DG
PR
7
2
タイムスパン木
・拍節構造の
安定度
FA
TT
A:完全自動タイムスパン木分析器
パラメータ最適化部
最適化
最適化
最適化
GP
R7の
適用
TS
RP
R5の
適用
1
m
4
m3
m
5
m
2
m
Melo
dy
morp
hin
g [
21]
Melo
dy e
xtr
apola
tion [
22]
(f) σGTTM
[7]
(e)
Inte
ractive G
TTM
Analy
zer
[15]
Com
posi
ng s
yst
em
ViolinI
ViolinII
Viola
Basso
All
egro
Poly
phonic
Musi
c T
ime-S
pan T
ree
PATTA:
Poly
phonic
Musi
c
Tim
e-S
pan T
ree A
naly
zer
ShakeG
uitar
ShakeG
uitar
HD
(c)A
TTA:
Auto
matic T
ime-s
pan T
ree A
naly
zer
[5]
Split
tin
g Te
st
End
No
de
…
…
…
……
…
…
…
1
1
1
1
1
1
1
1
1
1
0
0
0
0
00
00
0
0
n aB
2
n bB
2
1
3
n c
B1
2
n a
Bn d
B3
1
2
n b
Bn d
B3
1
b
n bB
2
1
3
n c
Bn c
B3
0
b0
b
n aB
2
The
po
siti
on
bet
wee
n n
ote
s
The
kin
d o
f G
PR
1
3
1
3
1
3
1
3
1
2
1
2
1
3
1
3
1
3
1
3
1
2
1
2
33
33
22
,,
,,
,
,,
,,
,,
,,
,,
,,
n d
n c
n b
n a
n b
n a
n d
n c
n b
n a
n b
n a
n d
n c
n b
n a
n b
n a
BB
BB
BB
BB
BB
BB
BB
BB
BB
Co
nd
itio
nal
Att
rib
ute
Targ
et A
ttri
bu
te b
If a
loca
l gro
up
ing
bo
un
dar
y is
bet
wee
n n
ote
s, b
= 1
, oth
erw
ise
b=
0.
(h) σGTTMIII
base
d o
n P
CFG
[16]
(i)
pG
TTM
base
d o
n P
CFG
[17]
Rendering [
18]
Repro
ducin
g m
usi
c [
19]
Sum
mry
zation
[20]
(d)F
ATTA:
Full
Auto
matic T
ime-s
pan
Tre
e A
naly
zer
[6]
2004
2007
2006
2005
2008
2009
2012
2011
2010
2013
2014
2015
2016
2003
(g) σGTTMⅡ
[8]
Fig. 1. Related work on analysis and application systems for GTTM.
Proc. of the 12th International Symposium on CMMR, Sao Paolo, Brazil, July 5-8, 2016
11
deepGTTM-I 5
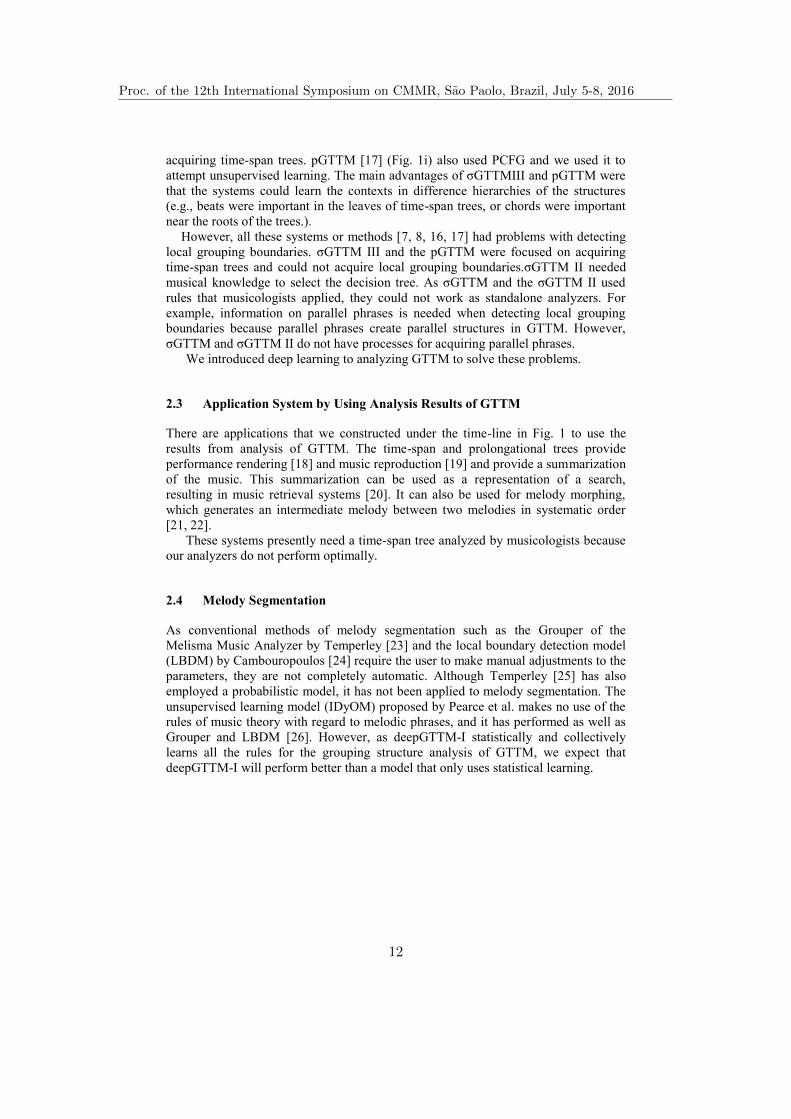
acquiring time-span trees. pGTTM [17] (Fig. 1i) also used PCFG and we used it to
attempt unsupervised learning. The main advantages of σGTTMIII and pGTTM were
that the systems could learn the contexts in difference hierarchies of the structures
(e.g., beats were important in the leaves of time-span trees, or chords were important
near the roots of the trees.).
However, all these systems or methods [7, 8, 16, 17] had problems with detecting
local grouping boundaries. σGTTM III and the pGTTM were focused on acquiring
time-span trees and could not acquire local grouping boundaries.σGTTM II needed
musical knowledge to select the decision tree. As σGTTM and the σGTTM II used
rules that musicologists applied, they could not work as standalone analyzers. For
example, information on parallel phrases is needed when detecting local grouping
boundaries because parallel phrases create parallel structures in GTTM. However,
σGTTM and σGTTM II do not have processes for acquiring parallel phrases.
We introduced deep learning to analyzing GTTM to solve these problems.
2.3 Application System by Using Analysis Results of GTTM
There are applications that we constructed under the time-line in Fig. 1 to use the
results from analysis of GTTM. The time-span and prolongational trees provide
performance rendering [18] and music reproduction [19] and provide a summarization
of the music. This summarization can be used as a representation of a search,
resulting in music retrieval systems [20]. It can also be used for melody morphing,
which generates an intermediate melody between two melodies in systematic order
[21, 22].
These systems presently need a time-span tree analyzed by musicologists because
our analyzers do not perform optimally.
2.4 Melody Segmentation
As conventional methods of melody segmentation such as the Grouper of the
Melisma Music Analyzer by Temperley [23] and the local boundary detection model
(LBDM) by Cambouropoulos [24] require the user to make manual adjustments to the
parameters, they are not completely automatic. Although Temperley [25] has also
employed a probabilistic model, it has not been applied to melody segmentation. The
unsupervised learning model (IDyOM) proposed by Pearce et al. makes no use of the
rules of music theory with regard to melodic phrases, and it has performed as well as
Grouper and LBDM [26]. However, as deepGTTM-I statistically and collectively
learns all the rules for the grouping structure analysis of GTTM, we expect that
deepGTTM-I will perform better than a model that only uses statistical learning.
Proc. of the 12th International Symposium on CMMR, Sao Paolo, Brazil, July 5-8, 2016
12

6 Masatoshi Hamanaka, Keiji Hirata, and Satoshi Tojo
3 GTTM and Its Implementation Problems
Figure 2 Shows local grouping boundaries, a grouping structure, a metrical structure,
a timespan tree, and a prolongational tree (Fig. 2). The detection of local grouping
boundaries in the grouping structure corresponds to melody segmentation.
Fig. 2. Local grouping boundaries, grouping structure, metrical structure, time-span
tree, and prolongational tree.
3.1 Grouping Preference Rules
The grouping structure is intended to formalize the intuitive belief that tonal music is
organized into groups that are in turn composed of subgroups. These groups are
presented graphically as several levels of arcs below a music staff. There are two
types of rules for grouping in GTTM, i.e., grouping well-formedness rules (GWFRs)
and grouping preference rules (GPRs). GWFRs are necessary conditions for the
assignment of a grouping structure and restrictions on these structures. When more
than one structure can satisfy the well-formedness rules of grouping, GPRs indicate
the superiority of one structure over another. The GPRs consist of seven rules: GPR1
(alternative form), GPR2 (proximity), GPR3 (change), GPR4 (intensification), GPR5
(symmetry), GPR6 (parallelism), and GPR7 (time-span and prolongational stability).
GPR2 has two cases: (a) (slur/rest) and (b) (attack-point). GPR3 has four cases: (a)
(register), (b) (dynamics), (c) (articulation), and (d) (length).
3.2 Conflict Between Rules
Because there is no strict order for applying GPRs, a conflict between rules often
occurs when applying GPRs, which results in ambiguities in analysis. Figure 3
outlines a simple example of the conflict between GPR2b (attack-point) and GPR3a
(register). GPR2b states that a relatively greater interval of time between attack points
Grouping structure
Metrical structure
Time-span tree
Prolongation tree
Local grouping boundary
Proc. of the 12th International Symposium on CMMR, Sao Paolo, Brazil, July 5-8, 2016
13

deepGTTM-I 7
initiates a grouping boundary. GPR3a states that a relatively greater difference in
pitch between smaller neighboring intervals initiates a grouping boundary. Because
GPR1 (alternative form) strongly prefers that note 3 alone does not form a group, a
boundary cannot be perceived at both 2-3 and 3-4.
Fig. 3. Simple example of conflict between rules.
3.3 Ambiguity in defining GPR4, 5, and 6
GTTM does not resolve much of the ambiguity that exists in applying GPR4, 5, and 6.
For example, GPR6 (Parallelism) does not define the decision criteria for construing
whether two or more segments are parallel or not. The same problems occur with
GPR4(Intensification)and GPR5 (Symmetry).
4 deepGTTM-I: local grouping boundary analyzer based on
deep learning
We introduced deep learning to analyze the structure of GTTM and solve the
problems described in Subsections 3.2 and 3.3. There were two main advantages of
introducing deep learning.
Learning rules applications
We constructed a deep layered network that could output whether each rule was
applicable or not on each note transition by learning the relationship between the
scores and positions of applied grouping preference rules with the deep learning
technique.
Previous analysis systems based on GTTM were constructed by a human
researcher or programmer. As described in Subsection 3.3, some rules in GTTM
are very ambiguous and the implementations of these rules might differ
depending on the person.
However, deepGTTM-I is a learning based system where the quality of the
analyzer depends on the training data and trained network.
Learning priority of rules
σGTTM and σGTTMII do not work well because they only determine the
priority of rules from applied rules because the priority of rules depends on the
3a 2bCandidate 1
Candidate 2
Violate GPR1
Proc. of the 12th International Symposium on CMMR, Sao Paolo, Brazil, July 5-8, 2016
14
8 Masatoshi Hamanaka, Keiji Hirata, and Satoshi Tojo
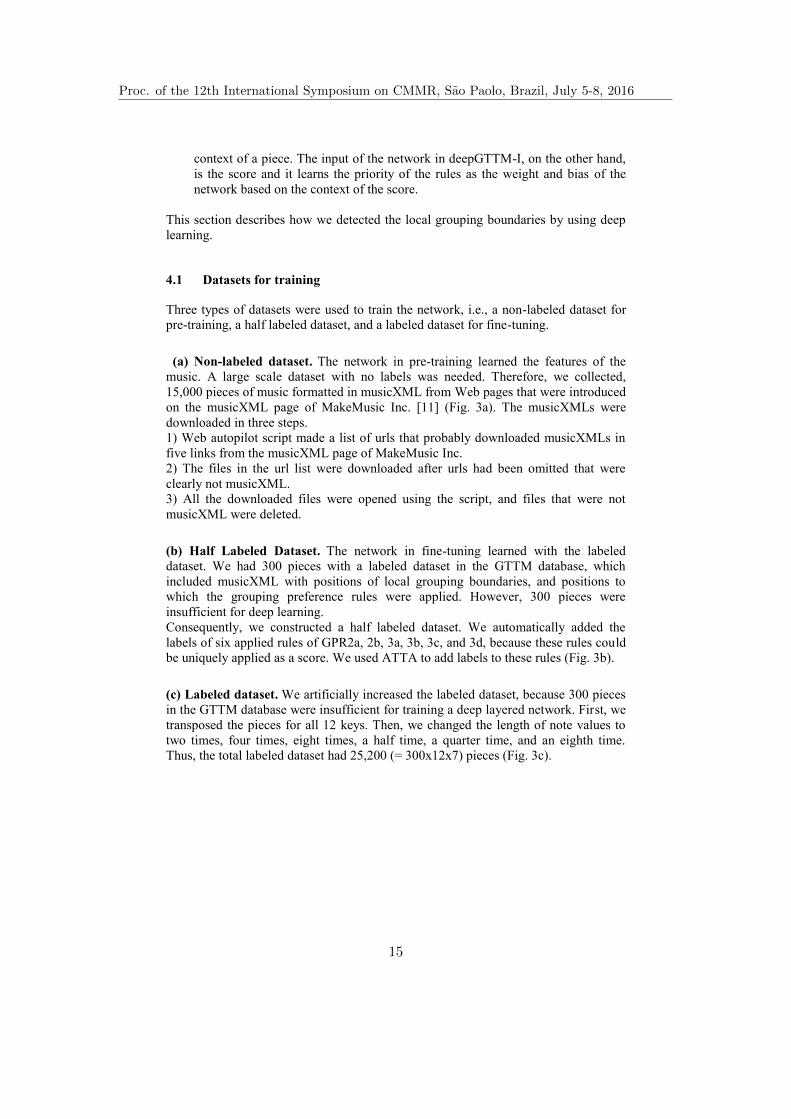
context of a piece. The input of the network in deepGTTM-I, on the other hand,
is the score and it learns the priority of the rules as the weight and bias of the
network based on the context of the score.
This section describes how we detected the local grouping boundaries by using deep
learning.
4.1 Datasets for training
Three types of datasets were used to train the network, i.e., a non-labeled dataset for
pre-training, a half labeled dataset, and a labeled dataset for fine-tuning.
(a) Non-labeled dataset. The network in pre-training learned the features of the
music. A large scale dataset with no labels was needed. Therefore, we collected,
15,000 pieces of music formatted in musicXML from Web pages that were introduced
on the musicXML page of MakeMusic Inc. [11] (Fig. 3a). The musicXMLs were
downloaded in three steps.
1) Web autopilot script made a list of urls that probably downloaded musicXMLs in
five links from the musicXML page of MakeMusic Inc.
2) The files in the url list were downloaded after urls had been omitted that were
clearly not musicXML.
3) All the downloaded files were opened using the script, and files that were not
musicXML were deleted.
(b) Half Labeled Dataset. The network in fine-tuning learned with the labeled
dataset. We had 300 pieces with a labeled dataset in the GTTM database, which
included musicXML with positions of local grouping boundaries, and positions to
which the grouping preference rules were applied. However, 300 pieces were
insufficient for deep learning.
Consequently, we constructed a half labeled dataset. We automatically added the
labels of six applied rules of GPR2a, 2b, 3a, 3b, 3c, and 3d, because these rules could
be uniquely applied as a score. We used ATTA to add labels to these rules (Fig. 3b).
(c) Labeled dataset. We artificially increased the labeled dataset, because 300 pieces
in the GTTM database were insufficient for training a deep layered network. First, we
transposed the pieces for all 12 keys. Then, we changed the length of note values to
two times, four times, eight times, a half time, a quarter time, and an eighth time.
Thus, the total labeled dataset had 25,200 (= 300x12x7) pieces (Fig. 3c).
Proc. of the 12th International Symposium on CMMR, Sao Paolo, Brazil, July 5-8, 2016
15
deepGTTM-I 9
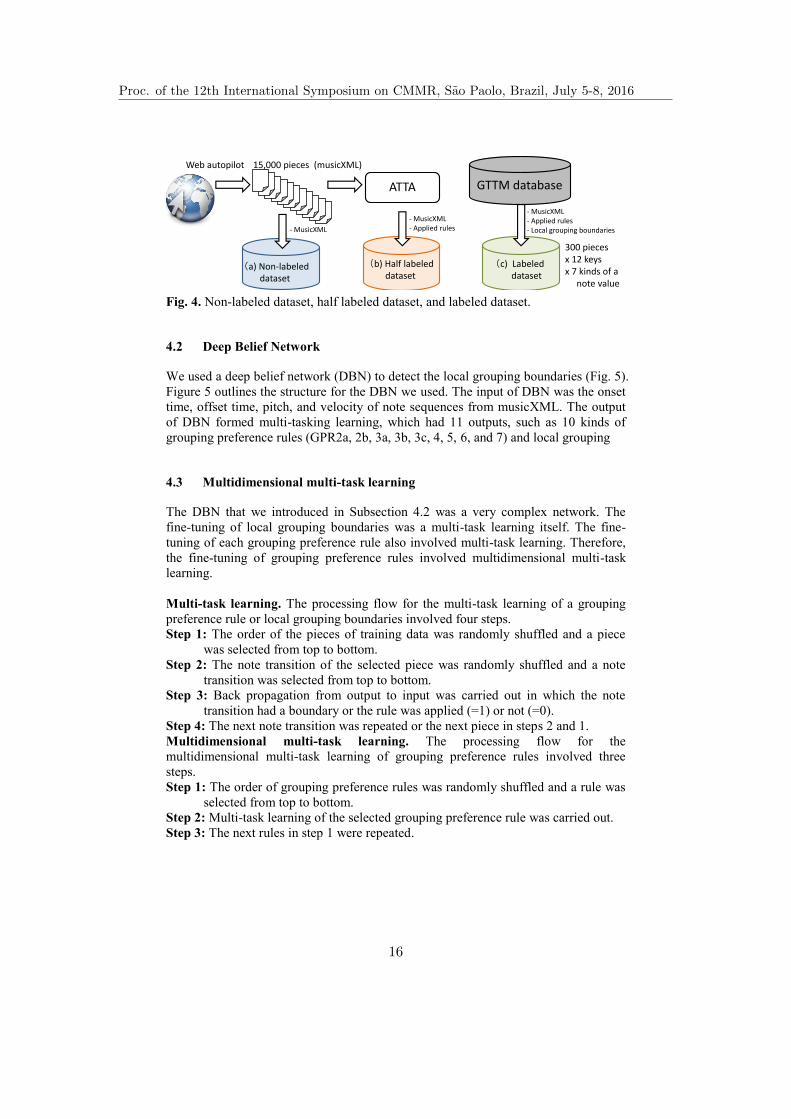
Fig. 4. Non-labeled dataset, half labeled dataset, and labeled dataset.
4.2 Deep Belief Network
We used a deep belief network (DBN) to detect the local grouping boundaries (Fig. 5).
Figure 5 outlines the structure for the DBN we used. The input of DBN was the onset
time, offset time, pitch, and velocity of note sequences from musicXML. The output
of DBN formed multi-tasking learning, which had 11 outputs, such as 10 kinds of
grouping preference rules (GPR2a, 2b, 3a, 3b, 3c, 4, 5, 6, and 7) and local grouping
4.3 Multidimensional multi-task learning
The DBN that we introduced in Subsection 4.2 was a very complex network. The
fine-tuning of local grouping boundaries was a multi-task learning itself. The fine-
tuning of each grouping preference rule also involved multi-task learning. Therefore,
the fine-tuning of grouping preference rules involved multidimensional multi-task
learning.
Multi-task learning. The processing flow for the multi-task learning of a grouping
preference rule or local grouping boundaries involved four steps.
Step 1: The order of the pieces of training data was randomly shuffled and a piece
was selected from top to bottom.
Step 2: The note transition of the selected piece was randomly shuffled and a note
transition was selected from top to bottom.
Step 3: Back propagation from output to input was carried out in which the note
transition had a boundary or the rule was applied (=1) or not (=0).
Step 4: The next note transition was repeated or the next piece in steps 2 and 1.
Multidimensional multi-task learning. The processing flow for the
multidimensional multi-task learning of grouping preference rules involved three
steps.
Step 1: The order of grouping preference rules was randomly shuffled and a rule was
selected from top to bottom.
Step 2: Multi-task learning of the selected grouping preference rule was carried out.
Step 3: The next rules in step 1 were repeated.
(a) Non-labeled dataset
(b) Half labeled dataset
(c) Labeled dataset
Web autopilot 15,000 pieces (musicXML)
ATTA
- MusicXML- Applied rules
GTTM database
- MusicXML
- MusicXML- Applied rules- Local grouping boundaries
300 piecesx 12 keysx 7 kinds of a
note value
Proc. of the 12th International Symposium on CMMR, Sao Paolo, Brazil, July 5-8, 2016
16

10 Masatoshi Hamanaka, Keiji Hirata, and Satoshi Tojo
On
set
tim
eO
ffse
t ti
me
Pit
ch
Vel
oci
ty
Hid
den
La
yer
1
・・・・・・・・・・・・・・・・・・・・・・・・・・・・・・・・・・・・・・・・・・・・・・・・・・・・・
・・・・・
・・・・・・・・・・・・・・・・・・・・
・・・・・
・・・・・・・・・・・・・・・・・・・・
・・・・・・・・・・
・・・・・・・・・・・・・・・・・・・・・・・・・・・・・・
Hid
de
n
Laye
r 2
・・・・・・・・・・・・・・・・・・・・・・・・・・・・・・・・・・・・・・・・・・・・・・・・・・・・・
Hid
den
La
yer
n -
1
・・・・・・・・・・・・・・・・・・・・・・・・・・・・・・・・・・・・・・・・・・・・・・・・・・・・・
Hid
de
n
Laye
r n
・・・・・・・・・・・・・・・・・・・・・・・・・・・・・・・・・・・・・・・・・・・・・・・・・・・・・
・・・・・
・・・・・
Fully
-co
nn
ect
ed
Bo
un
dar
yG
PR
2a
GP
R6・・・
・・・
・・・・・・・・・・・・
・・・
・・・・・・・・・
・・・
・・・・・・
・・・・・・・・・・・・・・・・・・
・・・・
・・・・・・・・・・・・・・・・
・・・・
・・・・・・・・・・・・・・・・
・・・・・・・・
・・・・・・・・・・・・・・・・・・・・・・・・
Fig. 5. Deep belief network for detect local grouping boundaries.
Proc. of the 12th International Symposium on CMMR, Sao Paolo, Brazil, July 5-8, 2016
17

deepGTTM-I 11
5 Experimental Results
We evaluated the performance of deepGTTM-I by using 100 pieces from the GTTM
database where the remaining 200 pieces were used to train the network. Table 1
summarizes the results for a network that had 11 layers with 3000 units.
Table 1. Performance of ATTA, σGTTM, σGTTMII, and deepGTTM-I.
Precision P Recall R F measure
ATTA with manual editing of parameters 0.737 0.441 0.552
σGTTM 0.467 0.736 0.571
σGTTMII with manual selection of decision tree 0.684 0.916 0.783
deepGTTM-I 0.784 0.814 0.799
The results indicate deepGTTM-I outperformed the previous analyzers in the F-
measure. ATTA had adjustable parameters and σGTTMII could select the decision
tree. The performance of ATTA and σGTTMII changed depending on the parameters
or decision trees. Table 1 indicates the best performance was achieved by manual
editing. However, as σGTTM and deepGTTM-I had no parameters for editing,
deepGTTM-I performed extremely robustly.
6 Conclusion
We developed a local grouping boundaries analyzer called deepGTTM-I that was
based on deep learning. We proposed multidimensional multi-task learning that
efficiently learned local grouping boundaries and grouping preference rules by
sharing the network. We prepared three kinds of datasets to learn the network, such as
non-labeled, half labeled, and labeled datasets because labeled datasets were very
limited and some labels of GPR2 and 3 could automatically acquire the previous
analyzer of GTTM. After a network that had 11 layers with 3000 units had been
trained, deepGTTM-I outperformed the previously developed analyzers for local
grouping boundaries in the F measure.
This work was the first step in implementing GTTM by using deep learning. We
plan to implement a complete analysis of GTTM by using deep learning. We also plan
to analyze the network after local grouping boundaries are learned.
Acknowledgements
This work was supported by JSPS KAKENHI Grant Number 25700036, 16H01744,
23500145.
Proc. of the 12th International Symposium on CMMR, Sao Paolo, Brazil, July 5-8, 2016
18

12 Masatoshi Hamanaka, Keiji Hirata, and Satoshi Tojo
References
1. Lerdahl, F. and Jackendoff, R.: A Generative Theory of Tonal Music. MIT Press (1985)
2. Cooper, G. and Meyer, L. B. The Rhythmic Structure of Music. The University of Chicago
Press (1960)
3. Narmour, E. The Analysis and Cognition of Basic Melodic Structure. The University of
Chicago Press (1990)
4. Temperley, D. The Cognition of Basic Musical Structures. MIT press, Cambridge (2001)
5. Hamanaka, M., Hirata, K., and Tojo, S.: Implementing ‘a generative theory of tonal
music’, Journal of New Music Research, 35(4), 249–277 (2006)
6. Hamanaka, M., Hirata, K., and Tojo, S.: FATTA: Full automatic time-span tree analyzer,
In: Proceedings of the 2007 International Computer Music Conference (ICMC2007), pp.
153–156 (2007)
7. Miura, Y., Hamanaka, M., Hirata, K., and Tojo, S.: Decision tree to detect GTTM group
boundaries, In: Proceedings of the 2009 International Computer Music Conference
(ICMC2009), pp. 125–128 (2009)
8. Kanamori, K. and Hamanaka, M.: Method to Detect GTTM Local Grouping Boundaries
based on Clustering and Statistical Learning, In: Proceedings of the 2014 International
Computer Music Conference (ICMC2014), pp. 125–128 (2014)
9. Hinton, G. E., Osindero, S., and The Y. W.: A fast learning algorithm for deep belief nets,
Neural computation, Vol. 18, No. 7, pp. 1527–1554 (2006)
10. Erhan, D., Bengio, Y., Courville, A., Manzagol, A. P., Vincent, P., and Bengio, S.: Why
does Unsupervised Pre-training Help Deep Learning?, Journal of Machine Learning
Research, pp. 626–660 (2010)
11. MakeMusic Inc.: Music in MusicXML Format, url: http://www.musicxml.com/music-in-
musicxml/, accessed on 2016-2-28.
12. Hamanaka, M., Hirata, K., and Tojo, S.: Musical Structural Analysis Database Based on
GTTM, In: Proceeding of the 2014 International Society for Music Information Retrieval
Conference (ISMIR2014), pp. 325–330 (2014)
13. Hamanaka ,M., Hirata, K., and Tojo, S.: Implementing Methods for Analysing Music
Based on Lerdahl and Jackendoff’s Generative Theory of Tonal Music, Computational
Music Analysis (pp. 221–249), Springer (2016)
14. Hamanaka, M., Hirata, K., and Tojo, S.: Interactive GTTM Analyzer, In: Proceedings
of the 10th International Conference on Music Information Retrieval Conference
(ISMIR2009), pp. 291–296 (2009)
15. Hamanaka, M.: Interactive GTTM Analyzer/GTTM Database, url http://gttm.jp, see at
2016-2-28.
16. Hamanaka, M., Hirata, K., and Tojo, S.: σGTTM III: Learning-based Time-span Tree
Generator Based on PCFG, In: Proceedings of the 11th International Symposium on
Computer Music Multidisciplinary Research (CMMR 2015), pp. 303–317 (2015)
17. Nakamura E., Hamanaka M., Hirata K., and Yoshii K.: Tree-Structured Probabilistic
Model of Monophonic Written Music Based on the Generative Theory of Tonal Music, In:
Proceedings of 41st IEEE International Conference on Acousitcs, Speech and Signal
Processing (ICASSP2016), 2016.
18. Hirata, K. and Hiraga R.: Ha-Hi-Hun plays Chopin's Etude, In Working Notes of IJCAI-03
Workshop on methods for automatic music performance and their applications in a public
rendering contest (2003)
Proc. of the 12th International Symposium on CMMR, Sao Paolo, Brazil, July 5-8, 2016
19
deepGTTM-I 13
19. Hirata, K., Matsuda, S., Kaji K., and Nagao K.: Annotated Music for Retrieval,
Reproduction, and Sharing, In: Proceedings of the 2004 International Computer Music
Conference (ICMC2004), pp. 584–587 (2004)
20. Hirata K. and Matsuda S.: Interactive Music Summarization based on GTTM, In:
Proceeding of the 2002 International Society for Music Information Retrieval Conference
(ISMIR2002), pp. 86–93 (2002)
21. Hamanaka, M., Hirata, K., and Tojo, S.: Melody Morphing Method based on GTTM. In:
Proceedings of the 2008 International Computer Music Conference (ICMC2008), pp.
155–158 (2008)
22. Hamanaka, M., Hirata, K., and Tojo, S.: Melody Extrapolation in GTTM Approach. In:
Proceedings of the 2009 International Computer Music Conference (ICMC2009), pp. 89–
92 (2009)
23. Temperley, D. The Melisma Music Analyzer. http://www.link.cs.cmu.edu/music-analysis/
(2003)
24. Cambouropoulos, E. :The Local Boundary Detection Model (LBDM) and its application
in the study of expressive timing, In: Proceedings of the International Computer Music
Conference (ICMC2001), pp. 290–293 (2001)
25. Temperley, D. Music and Probability. Cambridge: The MIT Press (2007)
26. Pearce, M. T., Müllensiefen, D., and Wiggins, G. A.: A comparison of statistical and rule-
based models of melodic segmentation, In: Proceedings of the International Conference
on Music Information Retrieval (ISMIR2008), pp. 89–94 (2008)
Proc. of the 12th International Symposium on CMMR, Sao Paolo, Brazil, July 5-8, 2016
20
Visualizing Interval Patterns in PitchConstellation
Guillaume Blot, Pierre Saurel, and Francis Rousseaux
Paris-Sorbonne University & CNRSSND Laboratory ”Sciences, Normes, Decision” - FRE 3593
Paris, 28 rue Serpente 75006, [email protected],[email protected],
Abstract. Halfway between music analysis and graph visualization, wepropose tonal pitch representations from the chromatic scale. A 12-nodegraph is connected as a Rhythm Network and visualized with a CircularLayout, commonly known as Pitch constellation. This particular graphtopology focuses on node presence and connections rather than nodeoccurrence. Where usual Pitch constellations focus on chords, we connectsuccessive pitch intervals. We unveil the Singularity Threshold, givingan opportunity to isolate structure from singular parts of melodies. Ourexperiment features 6 melodies that we propose to visualize using Gephiand a Circular Layout plugin.
Keywords: Rhythm Network, Graph Visualization, Circular Layout,Geometry of Music, Pitch Interval, Key-finding, Singularity
1 My Eyes, my Ears
When music turns visual, it gives artists and listeners new senses to express them-selves. Sciences and artistic movements have always bridged eyes and ears. But,more recent practices are further accelerating the relationship. Video-sharingplatforms, social network posting tools, music streaming and podcast: multime-dia is a ubiquitous phenomenon in the web. Hence, before it is shared, a musicalcomposition is already altered by vision. At the first steps of their lives, moreand more musical objects are manipulated with the help of computers. Artists,musicians, remixers, producers or djs rely on user interfaces to manipulate Music.
In this paper, we study a graph topology and a visualization algorithm repre-senting pitch patterns of a Melody. As Score remains the official written musicallanguage, visual representations of music can take other shapes. In musical tun-ing and harmony, graphs are interesting to represent pitch connections: bipar-tite network[25], Tonetz[17], pitch constellation[7], simplical complex[3], Bird-cage[18] or Self-organizing maps[24]. Visualization algorithms vary dependingon the graph structure and the message it is supposed to deliver. In the scopeof Pitch Constellation or Krenek diagram, our experiment focuses on Pitch In-tervals represented using circular layouts. Where usual implementations of pitch
Proc. of the 12th International Symposium on CMMR, Sao Paolo, Brazil, July 5-8, 2016
21

2 Visualizing Interval Patterns in Pitch Constellation
constellation, concern the study of harmony [20] [11] [23], we deliver an explo-ration of successive pitches.
The graph structure is explained in next section 2.1. It is called RhythmNetwork, but in this experiment we focus on structural aspects rather than ontemporal metrics. Rhythm Network is a graph structure focusing on time intervalbetween events. It was first designed by Guillaume Blot in the context of a digitalagenda where correlations between events were identified. It was also studied inother contexts such as E-learning systems and Road Traffic Management [5] [4].Following the paradigm strength of weak ties [19], the network is composing withpitches, rewarding node presence before node occurrence. As a result, a patternappearing once has the same impact on the structure, than a repeated pattern.Hence, successive occurrences of the same pitch are not considered. Moreover, aswe are dealing with temporal metrics, Rhythm Network keeps no record of pitchoccurrences. In this context, analyzing and representing a melody, comes alongwith specific computational and visual techniques, that we explain in section 3. Insubsection 3.2, we present a method to extract singularities from a composition.Singularity is to be understood as a particular behavior in a piece of music, butno attempt is made to treat the concept in the mathematical way. Then we relyon key-finding techniques to validate our representations 3.3.
2 Pitch Interval Topology
2.1 Rhythm Network: our Melody Structure
The Rhythm Network is a single-mode directed and weighted graph. A Graph(or Network) is a mathematical structure composed by a set N of n Nodes and aset E of e Edges. In a single-mode graph, nodes belong to only one class, whichin our context will be pitches from the chromatic scale. That is a set of n=12nodes (C, C#, D, D#, E, F , F#, G, G#, A, A#, B), connected to each otherby edges. An edge (eA, eB) means that a connection exists between the sourcenote A and the destination note B (and no connection from B toward A, as weare in a directed graph). What makes a graph special is its topology: when andhow do we connect edges? This great freedom of action allows various degree ofcustomization.
Edge creation is simple with Rhythm Network: we connect two successivenodes and measure the resulting edge with the interval of time between the twonodes. Lets try it with a three notes melody: C-A-D. Here the Rhythm Networkhas 3 nodes (C, A, D) and 2 edges (eC , eA) and (eA, eD). Now lets consider thatC is a half-note and A, D are quarters, all played legato. Then (eC , eA) = 1/2and (eA, eD) = 1/4; or with a 60 bpm tempo: (eC , eA) = 1sec and (eA, eD) =0.5sec. Our experiment is based on the second notation.
2.2 The Experiment Workflow
Realizing a Rhythm Network is a simple process. Nevertheless, (re)producingour experiment implies a typical data treatment starting with a MIDI file andending with an interoperable graph format: GEXF.
Proc. of the 12th International Symposium on CMMR, Sao Paolo, Brazil, July 5-8, 2016
22

Visualizing Interval Patterns in Pitch Constellation 3
MIDI file is divided in channels and for each channel events are declared.The event we are interested in is ”Note on” (x9 hexa, which comes along witha x8 ”Note off”) associated with a key and a timestamp. Data ”Note, Time,Channel” are all what is considered in this experiment, even though other in-structions might refine the composition of the sound: Modulation Wheel, BreathController, Portamento Time, Channel Volume, Balance or also Pan. Metadataare also available: Sequence Name, Tempo Setting or also Key Signature. For afull understanding, MIDI files format specifications 1.1 are published [2].
A MIDI file is our input dataset, but it needs to be manipulated in order tobe visualized as a Rhythm Network. In this section, we present all 4 steps of theprocess: Format, Organize, Connect and Visualize (Figure 1).
Fig. 1. Experiment workflow: format, organize and connect. We take a MIDI file as aninput and produce a GEXF graph document.
– Format: The goal of this first step is to transform the binary MIDI file intoa more readable text format. We use MIDICSV a program developed byJohn Walker in 2004 and revised in 2008 1. This program takes the MIDIfile as an argument and produces a CSV file with the details of the eventsfor each channel. For example a ”Note on” event looks like this: track, time,Noteonc, channel, note, velocity. Using this representation a C played 30seconds after the start of the song will be written as follow: 2, 30, Noteonc,0, 60, 127. Middle C is a 60 and all other notes are sequentially relatives tothis point on a chromatic scale. Once we know that a C is played on channel0 at 30 seconds, we do not use the first and the last arguments: track andvelocity.
– Organize: This step sorts all ”Note on” events in a descending chronologicalorder. Organization also comes along with a cleaning sub-task with two axes:keeping only ”Note on” events and advancing in an octave-free mode. At theend of this sequence, the CSV file only contains lines of triples (time, note,
1 http://www.fourmilab.ch/webtools/midicsv/
Proc. of the 12th International Symposium on CMMR, Sao Paolo, Brazil, July 5-8, 2016
23

4 Visualizing Interval Patterns in Pitch Constellation
channel), where notes are numbers between 0 and 11 (0 is a C and 11 is aCb). The PHP script that we developed has been made available with datain a public package 2. Two scripts are used: (1) organizing a specific channel(organizeone.php) and (2) organizing all channels (organizeall.php). In thesecond mode, we keep the chronological descending organization, then twonotes played at the same time on different channels will be written one afteranother in the output CSV (unlike input CSV where events are still organizedin channels).
– Connect: Now we produce a graph respecting the topology of the RhythmNetwork. Guillaume Blot is currently developing a Python/Rpy2 program,which has been used to generate Rhythm Networks. The program is not yetfully featured, but a documented version is still published in the contextof this experiment. The program takes the CSV log file from the previousstep and connect successive pitches using a time-based metric: the intervalof time between the two pitches. A G played 2 seconds after a A adds a con-nection between A and G. If the connection already exists, a mean interval iscalculated with all intervals. Successive events of the same pitch are not con-sidered. The result is a directed graph dealing with a set of N nodes (up to12 nodes/pitches). For a full understanding of Rhythm Network, please referto other experiments where the data structure has been studied followingthe same process [6] [5].
Graph Exchange XML Format (GEXF) is an open and extensible XML doc-ument used to write network topologies. GEXF 1.2 specifications are publishedby GEXF Working Group [1]. The last step of our workflow is producing a GEXFfile with 12 nodes and a variable number of weighted and directed connections.
3 Geometry of the Circle in Western Tonal Music
3.1 Chromatic Scale and Circular Layout
Musicians have a good command of circle representations. The most significant isthe circle of fifths: a 12-tone circle where 2 successive pitches have 7 semi-tonesdifferential. Most of occidental tonal music practitioners rely on this featureto get a partial image of a scale, ascending fifths by reading it clockwise anddescending fifths reading it counterclockwise. Getting the fundamental and thefifth at a glance gives a quick and concrete idea of a chord or an entire scale. Ifwe had to describe the circle of fifths with a graph terminology, we would saythat it is a perfect cycle graph with a set N of 12 nodes and a set E of 12 edges,sometimes known as a 12-cycle. This graph has a unique Eulerian cycle, startingand ending at the same node and crossing all edges exactly once. The chromaticnumber of the graph is 2, which is the smallest number of colors needed to drawnodes in a way that neighbors don’t share the same color.
The circular layout commonly used to draw the graph of fifths employs a veryspecific order of nodes, with 7 semi-tones differential between 2 successive notes.
2 http://www.gblot.com/BLOTCMMR2016.zip
Proc. of the 12th International Symposium on CMMR, Sao Paolo, Brazil, July 5-8, 2016
24

Visualizing Interval Patterns in Pitch Constellation 5
Fig. 2. Two graph representations of the circle of fifths drew using Gephi. The twographs share same properties but node order is diverging (a) 7 semi-tones interval (b)chromatic order.
That is the foundation of the concept. But, we can draw other representationsof the same graph. For example, figure 2 (b) is a chromatic representation of thegraph of fifths. With the chromatic order, the circle becomes a regular dodeca-gram, but the graph keeps all its properties. The dodecagram graph (chromaticrepresentation of the graph of fifths) is isomorphic to the cycle graph (classicalrepresentation of the graph of fifths figure 2 (a)).
Switching from a circle to a dodecagram sends to the musician another mentalprojection of the circle of fifths, based on the division of the chromatic scale. As amatter of fact, the chromatic order (the order of the 12 notes of an octave on a pi-ano) is widely spread in musician minds. Less spread is the circlar representationof the octave, which goes by the name of Krenek diagram, pitch constellation,pitch-class space, chromatic circle or clock diagrams. As in McCartin article, thiscircular representation of the octave bears the name of Ernest Krenek, after thecomposer has represented scales using polygons [7] [14]. This major feature of theresearch field Geometry of Music, addresses issues in either music analysis andmusic practice: pointing out nuances between playing modes [11], appreciatingdistance between notes and between harmonics [15] [17] or finding symmetricscales [20]. In the figure 3, we see the polygon shape of diatonic scales: (a) Cscale or Ionian mode and (b) A# scale. (c) and (d) focus on C, A#, Cm andA#m chords. A simple look at the graphs informs that all major chords (c) aretriangle with the exact same distances and angles, differing from minor chordstriangle shape (d). In this configuration, pitch intervals have specific distanceand orientation. With some practice, it can be very simple to retrieve particularconnections between pitches, find relevant chords, operate chord inversions orwalking on a scale.
Using Gephi and Circular Layout plugin developed by Matt Groeninger3, wepropose to visualize 6 songs structured with the Rhythm network topology. Forall tracks we have been through the process explained in subsection 2.2. But, in
3 https://marketplace.gephi.org/plugin/circular-layout
Proc. of the 12th International Symposium on CMMR, Sao Paolo, Brazil, July 5-8, 2016
25

6 Visualizing Interval Patterns in Pitch Constellation
Fig. 3. Krenek diagrams, pitch constellations, pitch-class spaces, chromatic circles orclock diagrams: intervals between pitches are represented as convex polygons. (a) Cscale (b) A scale (c) Major chords (d) minor chords. Note that usual representation ofKrenek diagrams start with a C as the top center node. But, we have decided to leaveit the way it is realized with Gephi.
order to go deeper in our discovery, we have divided tracks in several subtracks.This selection is not arbitrary, but is based on MIDI channels: Lead melody(LM), Arpeggio (ARP) or Bass (BASS). Column Channel(s) of table 1 informsthe Midi channels that we have requested to produce each subtrack. The LeadMelody Main Sequence (LMS) is a sample of the Lead Melody (column Eventsin table 1 presents the number of notes which composed the LMS subtrack).All samples are starting at the beginning of the song. In addition, we haveaggregated all subtracks into a specific piece of music entitled ALL or Song.Each piece of track can be verified downloading the dataset published alongwith our experiment. Of course, final Graph GEXF is the workable outcome,but one can find the piece of data at every stage of its treatment4.
With circular layouts, node position is fixed. Therefore distance betweennodes does not depend on rhythm. That will be the case in further work 4. Buthere, we introduce a visual effect giving a clue about the rhythm: the more aconnection is thick, the longer is the time interval between notes, and recipro-cally.
3.2 Musical Singularity
The second effect we introduce is the Singularity Threshold (ST). In the melodypattern context, we use ST in order to bypass some accidental notes. As we men-tioned in section 2.2, connections are made between successive notes, occurringin the melody pattern. ST is a count of the minimum occurrence for a connec-tion to be considered. The higher ST is, the less chance an exception to the keysignature could be part of the structure. Figure 4 presents 4 chromatic RhythmNetworks realized from full Lead Melody Memory (1LM), where each graph is asub-graph of the previous. Afterwards in this section we will discuss how to read
4 http://www.linktodata
Proc. of the 12th International Symposium on CMMR, Sao Paolo, Brazil, July 5-8, 2016
26

Visualizing Interval Patterns in Pitch Constellation 7
Piece of Music ID Events Channel KS CBMS RN1LM 21 0 Bb Bb Bb
Memory 1LMS 194 0 Bb Db BbCats 1ARP 288 1 Dm Db Bb
1ALL 482 0-1 Bb Db Bb2LM 296 2 D Bm Bm, D, Em
Cocaine 2LMS 12 2 D Am DEric Clapton 2BASS 376 1 Am Bm Em
2ALL 672 1;2 D Am Em3LM 348 3 C G D
Talkin about 3LMS 16 3 G G G,Ama revolution 3BASS 250 8 G C GTracy Chapman 3ALL 679 3;8 G G G
4LM 645 1;4 F#m A F#mMy band 4LMS 11 1;4 A F#m F#mD12 4BASS 238 2 F#m Bbm A
4ALL 883 1;2;4 F#m A F#m5LM 696 2 Gm Gm Bb, Gm
Forgot about Dre 5LMS 6 2 Gm Gm Bb, GmDr DRE 5BASS 256 1 Eb Eb Bb, Gm
5ALL 952 1;2 Gm Eb Gm6LM 282 3 Bb Bb Bb
Love is All 6LMS 13 3 Gm Eb CmRoger Glover 6BASS 382 1 Bb Bb Bb
6ALL 690 1;3 Bb Bb Bb
Table 1. Six pieces of music divided in subtracks: Lead Melody (LM), Lead MelodySample (LMS), Arpeggio (ARP), Bass (BASS) and Song (ALL). Column Events is thenumber of note occurrences. Colum Channel is the MIDI channel(s) requested. Lastthree columns are key-finding results presented in section 3.3
Proc. of the 12th International Symposium on CMMR, Sao Paolo, Brazil, July 5-8, 2016
27

8 Visualizing Interval Patterns in Pitch Constellation
the graph melodies, but first we wish to give a full account on ST. Obviously,amount of connections is decreasing when ST is rising. That’s what we observein Figure 4 and Table 2, highlighting the variation of connections depending onST.
Fig. 4. Representations of the same 1LM Rhythm Network while Singularity Threshold(ST) is evolving. Number of connections is going down, when ST is rising. With ST =2, a connection must be present at least twice in 1LM to be considered.
Fig. 5. Singularity networks: representations of melody 1LM, exclusively composedwith connections bypassed by ST. We notice an amount of connections inversely pro-portional to figure 4.
For each subtrack, we have created 6 Rhythm Networks with ST growing from0 to 5. That makes 6 versions of 24 subtracks, leading to 144 GEXF files. Table3 presents the number of connections or edges for the 144 graphs. Some melodieshave much more connections than others. For example, Memory 1ALL has 59connections with ST=0 and My Band 4ALL has 41 connections with ST=0,respectively density D1ALL = 0.44 and D4ALL = 0.31 , unlike less dense melodiesof the dataset: Cocaine D2LM = 0, 038 (ST=0), D2ALL = 0, 081 (ST=0), Forgotabout Dre D5ALL = 0.098. Using ST feature, our goal is to reveal the structureof a melody. It makes no doubt that highly connected melodies density quickly
Proc. of the 12th International Symposium on CMMR, Sao Paolo, Brazil, July 5-8, 2016
28
Visualizing Interval Patterns in Pitch Constellation 9
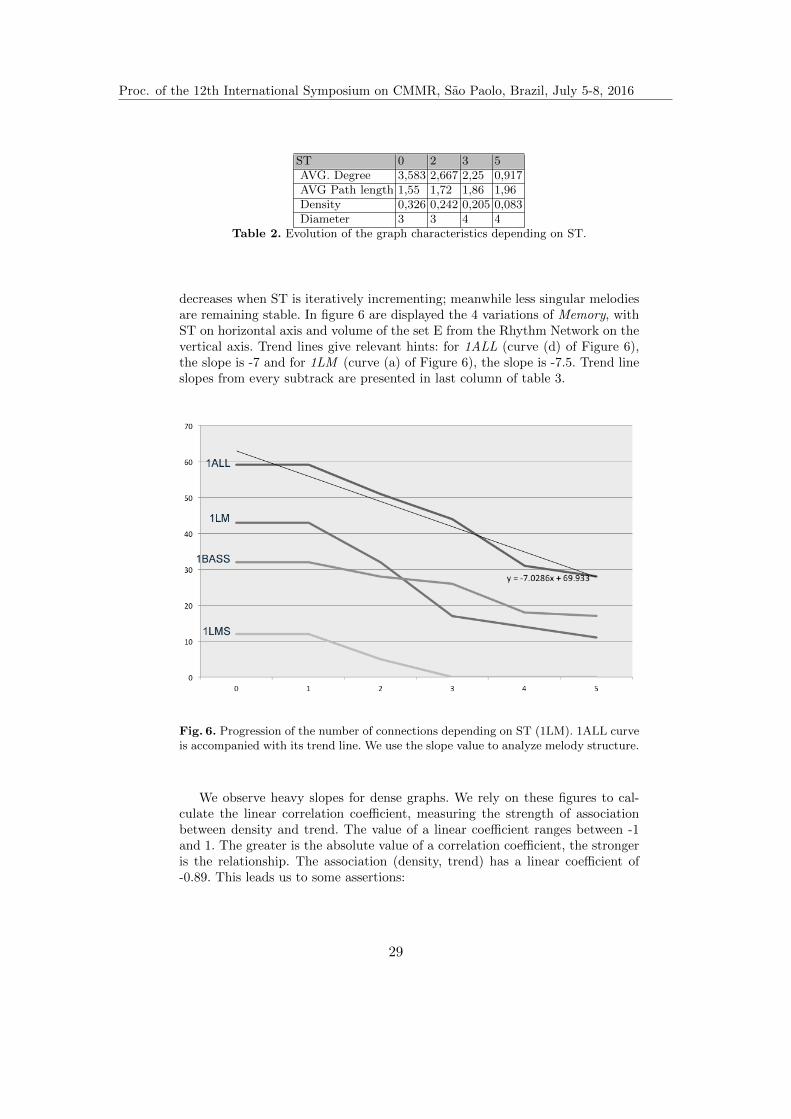
ST 0 2 3 5AVG. Degree 3,583 2,667 2,25 0,917AVG Path length 1,55 1,72 1,86 1,96Density 0,326 0,242 0,205 0,083Diameter 3 3 4 4
Table 2. Evolution of the graph characteristics depending on ST.
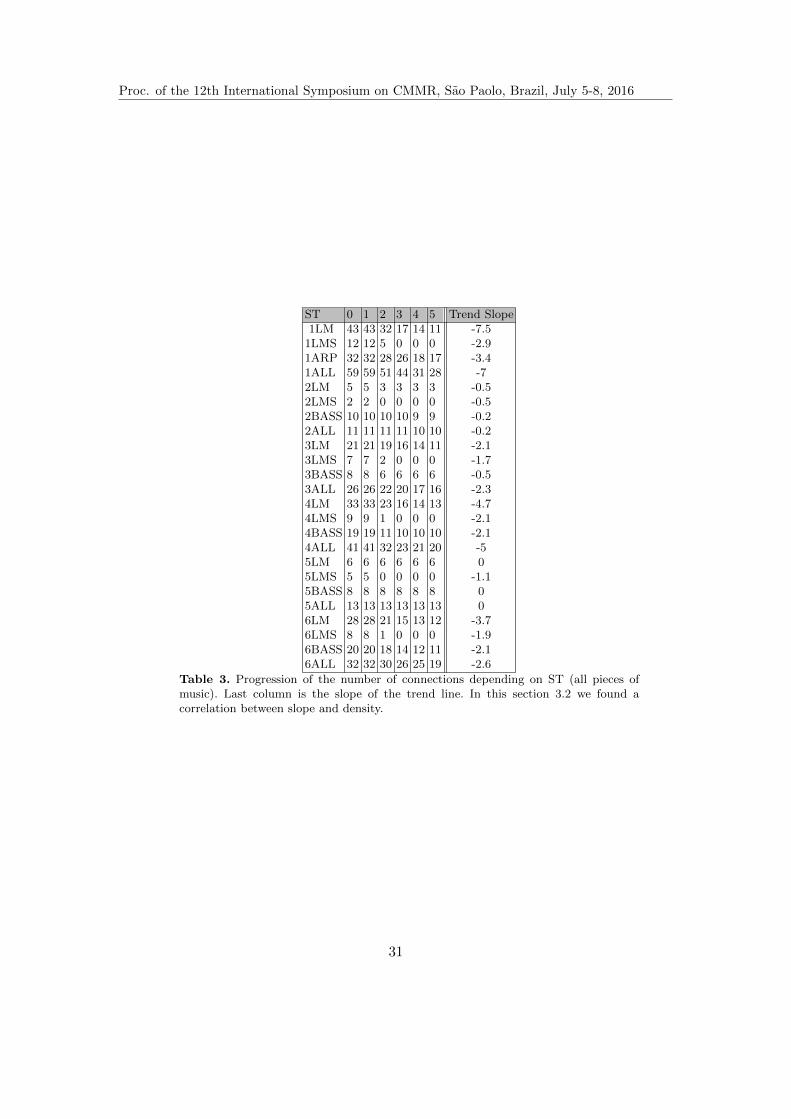
decreases when ST is iteratively incrementing; meanwhile less singular melodiesare remaining stable. In figure 6 are displayed the 4 variations of Memory, withST on horizontal axis and volume of the set E from the Rhythm Network on thevertical axis. Trend lines give relevant hints: for 1ALL (curve (d) of Figure 6),the slope is -7 and for 1LM (curve (a) of Figure 6), the slope is -7.5. Trend lineslopes from every subtrack are presented in last column of table 3.
Fig. 6. Progression of the number of connections depending on ST (1LM). 1ALL curveis accompanied with its trend line. We use the slope value to analyze melody structure.
We observe heavy slopes for dense graphs. We rely on these figures to cal-culate the linear correlation coefficient, measuring the strength of associationbetween density and trend. The value of a linear coefficient ranges between -1and 1. The greater is the absolute value of a correlation coefficient, the strongeris the relationship. The association (density, trend) has a linear coefficient of-0.89. This leads us to some assertions:
Proc. of the 12th International Symposium on CMMR, Sao Paolo, Brazil, July 5-8, 2016
29

10 Visualizing Interval Patterns in Pitch Constellation
– Dense melodies have precarious connections between pitches. In anutshell, all musical patterns that are not repeated might create precariousconnections. This can also be understood with a look to Lead Melody Samplefigures: as soon as we reach ST = 2, samples lost all their connections, whichmeans no pattern is repeated more than twice. Moreover, it is interesting touse the feature to draw Singularity Networks (figure 5). With an exclusionoperator between 2 set E (graph) and E’ (subgraph), E” is a graph keepingconnections appearing only in one set and displays only singularities. Thisway we split structure and singularities. Figure 5 presents 4 Singularity Net-works composed with the exclusion set of precarious connections. Of course,the 4 representations are inversely proportional to those from Figure 4. Thefirst representation (a) has no connection (ST is 0). It is very difficult to un-derstand a clear structure for other three networks. In (b) we already noticethe presence of accidental nodes with high degrees, not present in what isconsidered to be the scale (see 1) A# (F#, C#, G#). In the same graph(b), we notice the very small or null degree for pitches of the A# scale: C,D ,D# , G, A. We also visualize in Figure 5 (d), that the melody is comingcloser from Figure 4 (a): scale structure is present and accidental degrees isproportionally decreasing.
– Withdrawing precarious connections from a melody helps to iden-tify a more robust foundation. Figure 4 shows evolution of connectionswhen ST is growing. We are able to identify key of a track using a pertinentST (see next subsection 3.3).
– ST alters the melody structure. So it is to be used wisely. The lastgraph from Figure 4 presents a poorly connected graph where we had lostimportant information compared to the first 3 representations. We see in thelast representation that D is not connected anymore to other notes, whenkey of the melody appears to be A#, with a D as the major third (againsee next subsection 3.3). In the same direction, the first graph might beconnected far to densely to render reliable visual information. Table 2 givesidentical conclusion, with a high density for ST=0 and a clear gap betweenthird and last column: AVG. degree falling from 2.25 to 0.917 and densityfalling from 0.205 to 0.0803.
3.3 A visual Key-finding Technique
Considering previous conclusions, we experiment key-finding techniques withST=2 (except for Melody samples where we kept ST=0). In this section we givea key-finding method, visualizing circular Rhythm Networks and we compareour results with proven key-finding algorithms (KS and CBMS).
Reckoning the key of a song is a considerable feature of audio applications.Find it by ear is a musical skill sought by producers, remixers, dj, teachers oralso musical students. Estimating it with eyes may imply interesting support forboth machines and humans. Automatic key-finding methods are divided in two
Proc. of the 12th International Symposium on CMMR, Sao Paolo, Brazil, July 5-8, 2016
30
Visualizing Interval Patterns in Pitch Constellation 11
ST 0 1 2 3 4 5 Trend Slope1LM 43 43 32 17 14 11 -7.5
1LMS 12 12 5 0 0 0 -2.91ARP 32 32 28 26 18 17 -3.41ALL 59 59 51 44 31 28 -72LM 5 5 3 3 3 3 -0.52LMS 2 2 0 0 0 0 -0.52BASS 10 10 10 10 9 9 -0.22ALL 11 11 11 11 10 10 -0.23LM 21 21 19 16 14 11 -2.13LMS 7 7 2 0 0 0 -1.73BASS 8 8 6 6 6 6 -0.53ALL 26 26 22 20 17 16 -2.34LM 33 33 23 16 14 13 -4.74LMS 9 9 1 0 0 0 -2.14BASS 19 19 11 10 10 10 -2.14ALL 41 41 32 23 21 20 -55LM 6 6 6 6 6 6 05LMS 5 5 0 0 0 0 -1.15BASS 8 8 8 8 8 8 05ALL 13 13 13 13 13 13 06LM 28 28 21 15 13 12 -3.76LMS 8 8 1 0 0 0 -1.96BASS 20 20 18 14 12 11 -2.16ALL 32 32 30 26 25 19 -2.6
Table 3. Progression of the number of connections depending on ST (all pieces ofmusic). Last column is the slope of the trend line. In this section 3.2 we found acorrelation between slope and density.
Proc. of the 12th International Symposium on CMMR, Sao Paolo, Brazil, July 5-8, 2016
31

12 Visualizing Interval Patterns in Pitch Constellation
families: pitch profile and interval profile. Historically, Krumhansl and Schmuck-ler have set up a correlation formula between 2 vectors: a key-preference profileand the occurrences of pitches occurring in a piece of music [8]. David Temper-ley has published a similar pitch profile algorithm [13] [12]. Lately, Madsen et alfocused on interval between pitches. Highlighting the importance of connections,this method makes correlation using a matrix of size 12, composed by all possibletone intervals [22]. Our method is following interval profile paradigm, focusingon connections between notes and reducing the influence of note occurrences.The major difference is that we do not use profiles, but visual representations.
It is important to keep in mind that we do not plan to publish a new key-finding algorithm, able to retrieve information from polyphonic audio files. Wework on MIDI file and do not worry about signal processing parts. Moreover,we are aware that many techniques have optimized pitch profile methods [9][10] and interval profile methods [21]. But, here we merely give a visual exerciseintended to give clues about the song structure and the node connections. But,that is implying a concrete validation of our technique. In our case, key-findingget visual. For most of the melodies, it can be observed almost instantly, with3 basic rules: (1) selecting most connected nodes, (2) finding the polygon shapeand (3) Tie-breaking.
STEP 1: Selecting most connected nodes: we introduce 2 visual effects tofacilitate selection, which are node size and color. Gephi can change size andcolor of nodes depending on the topology. Here, our objective is to show thatimportant notes are highly connected nodes. As a consequence, we choose tomake colors and sizes fluctuating depending on the degree of the node. Colorgoes from light yellow to dark blue, and size goes from small to bigger. A melodycan have more or less connected nodes, while a scale is always composed with 7distinct notes. If the set of connected nodes is greater than 7, we simply choosethe 7 biggest. If lesser than 7, see next step. In some cases, there are not enoughnodes to clearly retrieve a scale. Step 3, can help, but some marginal case canstill be ambiguous (see step 3).
Fig. 7. Major and minor scales convex polygons: these two shapes are used in ourvisual key-finding technique.
Proc. of the 12th International Symposium on CMMR, Sao Paolo, Brazil, July 5-8, 2016
32

Visualizing Interval Patterns in Pitch Constellation 13
STEP 2: Among major and minor scales, finding which polygon shape isfitting the best: visualizing the 2 usual shapes major and minor (figure 7), androtating it around the melody graph until it fits. At first, it might be tricky, asthe 2 shapes are not perfectly printed in mind. Then starting with this, one cancount intervals of major scales (TTSTTTS) and minor scales (TSTTSTT). Thismight help brain to print shapes. The first Rhythm Network of figure 8 (top left)represents the first 21 notes of Memory (Lead Melody sample). Juxtaposing theMajor scale polygon, while crossing all connected notes must be done with A#as a starting note. But Gm, the enharmonic equivalent is fitting the graph inthe same way. Then, up to this point two answers are possible: A# and Gm.
STEP 3: Breaking eventual ties: in order to discriminate A# and Gm, wechoose the most connected node. Then, following our visual key-finding method,one should answer that the key of the lead melody sample Memory is A#. If atstep 2, the low density of the graph leads to more than 2 possibilities, this lasttie-breaking step should end up with a solution. For the bass channel of Takinabout a revolution, possible keys are G, Em, C, but we select key G. It is thesame process for the full song Cocaine, where we had to tie-break E and Am. Wehave 2 examples where we were not able to decide. Cocaine lead melody patternonly connects 3 nodes, and each node has the same degree. Same conflict forForgot about Dre, with a Lead melody in Gm or A#.
We have experimented our method through the 24 graphs and then compareour results with other proven key-finding techniques. We used the Melisma MusicAnalyzer to run KS and CBMS algorithms5. Before going further, we wish topoint out that the two techniques KS and CBMS do not retrieve always thesame results. As a matter of fact, these algorithms have to deal with ambiguouscompositions as well. KS and CBMS have retrieved the same answer with aratio of 33%. Our method retrieves either KS or CBMS result with a ratio of70%. This is a conclusive step of our experiment, where we highlight the factthat connections between pitches render the melody structure. Once RhythmNetwork is created with the relevant configuration, a simple visual analysis ofthe melody agrees with one the proven key-finding techniques in more than 2 of3 cases.
But it does not imply that the last third is flawed. We even think that theseare pertinent results. Key-finding methods are tricky because it faces severallevel of complexity: scale could change anytime during the song, melody couldbe simple and present poor information to work on, musicians and composersmight play out of a scale or take upon themself the fact they play or writeaccidental notes. However, a scale is a scale for a reason, then whatever happens,if a musician does not work on the scale or if he thinks he is working on a scalebut making accidentals, the resulting melody will inevitably have a scale or willcome close from an existing scale. Considering the 6 melodies where we do notagree with proven techniques, our method is the one having less accidental note(first three column of table 4). To make last comments, we see in table 4 that formost of the results all 3 methods have close information in terms of composition
5 http://www.link.cs.cmu.edu/melisma/
Proc. of the 12th International Symposium on CMMR, Sao Paolo, Brazil, July 5-8, 2016
33

14 Visualizing Interval Patterns in Pitch Constellation
Fig. 8. A selection of circular representations of melodies rendered as Rhythm Net-works. ST is 2 excepted for LMS (ST=0). Node shape and color varies depending onits degree. Most connected nodes are big and filled with dark blue. For some cases, wejuxtapose major or minor scale polygon.
of scales. Moreover, we notice conflicts for these 6 examples, as almost all havedifferent results for the 3 techniques. The bassline of Forgot about Dre, is theonly example where KS and CBMS return same results (last column of table 4).
4 Discussion
Through this article, we have studied a Pitch Interval-based method to visual-ize melody structures. We have explored the versatility of dense melodies andexperimented techniques to separate singular pieces from structural patterns.
Proc. of the 12th International Symposium on CMMR, Sao Paolo, Brazil, July 5-8, 2016
34

Visualizing Interval Patterns in Pitch Constellation 15
KS acc. CBMS acc. RN acc. KS vs RN KS vs RN PTA1ARP D#, G#, C# D, G, A C#, G# A#, D# D, G, A no2BASS C F# C# no2ALL C C# F# no3LM C, F# F#, C# C# no4BASS A# A# A# A, B, D, E no5BASS A A G# Eb, A or A yes6LMS Ab no
Table 4. For these 6 examples, our visual key-finding technique does not share thesame answer with at least one proven algorithm. In first three columns we give whatis considered as accidental notes, by the given results (table 1). The two followingcolumns (VS) show notes present in our result scales, but not in the proven technique,in a sense that we can understand how close it is. Last column tells if KS and CBMSdid agree.
The visual key-finding technique given in last section ?? validates the RhythmNetwork use in melodic context.
Because giving visual proof is not reliable enough, we also analyzed our workon a structural basis (average degree, density, trend). We were unable to repro-duce some visual effects in the context of a written presentation. We encourageto discover all interactive features powered by Gephi, using GEXF melodiespublished along with our experiment: select pitch neighbors, have a walk onmelodic paths or also enjoy layout personalization. Going further, Rhythm Net-work might be applicable to various music analysis and practices: music infor-mation retrieval, interactive learning, music recommendation tools, augmentedmusical instruments, auditory perception and cognition, music interface design,production and composition tools or also intelligent music tutoring systems.
Here, we validate the structural part of the model. Yet, this is the first stepof a more complete experiment. Several aspects have not been exploited, asRhythm Network is an oriented and weighted graph. In the next step, we planto visualize melodies using Force-directed layouts. Following an Attraction -Repulsion algorithm, node position is fluctuating depending on the force of theirconnections [16]. Going through Force-directed methods, we wish to render whatPitch constellation is unable to show: the Rhythm.
References
1. GEXF 1.2draft Primer. Gexf working group. march 2012.
2. The International MIDI Association. Standard midi-file format spec. 1.1. 2003.
3. Louis Bigo, Jean-Louis Giavitto, Moreno Andreatta, Olivier Michel, and AntoineSpicher. Computation and visualization of musical structures in chord-based sim-plicial complexes. In Jason Yust, Jonathan Wild, and John Ashley Burgoyne,editors, MCM 2013 - 4th International Conference Mathematics and Computationin Music, volume 7937 of Lecture notes in computer science, pages 38–51, Montreal,Canada, Jun 2013. Springer.
Proc. of the 12th International Symposium on CMMR, Sao Paolo, Brazil, July 5-8, 2016
35
16 Visualizing Interval Patterns in Pitch Constellation
4. Guillaume Blot, Hacene Fouchal, Francis Rousseaux, and Pierre Saurel. An exper-imentation of vanets for traffic management. In IEEE International Conference onCommunications, Kuala Lumpur, Malaysia, may 2016. IEEE.
5. Guillaume Blot, Francis Rousseaux, and Pierre Saurel. Pattern discovery in e-learning courses : a time based approach. In CODIT14 2nd International Confer-ence on Control, Decision and Information Technologies, Metz, France, nov 2014.IEEE.
6. Guillaume Blot, Pierre Saurel, and Francis Rousseaux. Recommender enginesunder the influence of popularity. In 6th International MCETECH Conference,Montreal, Canada, may 2015. IEEE.
7. McCartin Brian J. Prelude to musical geometry, 1998.8. Krumhansl Carol L. chapter A key-finding algorithm based on tonal hierarchies.
Oxford University Press, New York, USA, 1990.9. Chuan Ching-Hua and Selene E. Chew. Polyphonic audio key finding using the
spiral array ceg algorithm. In ICME, pages 21–24. IEE, july 2005.10. Stuart Craig. Visual hierarchical key analysis. In Computers in Entertainment
(CIE) - Theoretical and Practical Computer Applications in Entertainment, vol-ume 3, pages 1–19, New York, NY, USA, october 2005. ACM.
11. Rappaport David. Geometry and harmony. In 8th Annual international conferenceof bridges: Mathematical Connections in Art, Music, and Science, pages 67–72,Alberta, august 2005.
12. Temperley David. The Cognition of Basic Musical Structures, page 404. MITpress, august 2001.
13. Temperley David. A bayesian approach to key-finding. In ICMAI, pages 195–206.Springer, august 2002.
14. Krenek Ernest. Uber neue musik, 1937.15. Lerdahl Fred. Tonal Pitch Space. Oxford University Press, august 2001.16. Mathieu Jacomy, Tommaso Venturini, Sebastien Heymann, and Mathieu Bastian.
Forceatlas2, a continuous graph layout algorithm for handy network visualizationdesigned for the gephi software, june 2014.
17. Burgoyne John Ashley and Saul Lawrence K. Visualization of low dimensionalstructure in tonal pitch space. In Proceedings of the 2005 International ComputerMusic Conference, Barcelona, Spain, September 2005.
18. Rockwell Joti. Birdcage flights: A perspective on inter-cardinality voice leading,2009.
19. Granovetter M, Hirshleifer D, and Welch I. The strength of weak ties, 1973.20. Yamaguchi Masaya. Masaya Music, New York, USA, May 2006.21. Robine Matthias, Rocher Thomas, and Hanna Pierre. Improvements of symbolic
key finding methods. In International Computer Music Conference, 2008.22. Madsen Soren Tjagvad and Widmer Gerhald. Key-finding with interval profiles.
In International Computer Music Conference, august 2007.23. Godfried Toussaint. Computational geometric aspects of rhythm, melody, and
voice-leading. Comput. Geom. Theory Appl., 43(1):2–22, jan 2010.24. George Tzanetakis, Manjinder Singh Benning, Steven R. Ness, Darren Minifie, and
Nigel Livingston. Assistive music browsing using self-organizing maps. In Proceed-ings of the 2Nd International Conference on PErvasive Technologies Related toAssistive Environments, PETRA ’09, pages 3:1–3:7, New York, NY, USA, 2009.ACM.
25. Szetoa Wai Man and Man Hon Wonga. A graph-theoretical approach for patternmatching in post-tonal music analysis, 2006.
Proc. of the 12th International Symposium on CMMR, Sao Paolo, Brazil, July 5-8, 2016
36

Exploring Multi-Task Feature Learning:Learning Specific Features For Music Genre
Classification
Yao Cheng, Xiaoou Chen, Deshun Yang
Institute of Computer Science and TechnologyPeking University, Beijing, China
{chengyao, chenxiaoou, yangdeshun} @pku.edu.cn ⋆⋆
Abstract In this paper, we propose a novel approach to music genreclassification. Support Vector Machine (SVM) has been a widely usedclassifier in existing approaches. These approaches often transform a multi-class genre classification problem into independent binary classificationtasks, and then train each task separately, thus ignoring the correlationof tasks. To exploit the correlation of tasks, we introduce the Multi-TaskFeature Learning (MTFL). Previous MTFL usually learns feature at afeature component level. However, considering that features fall naturallyinto groups, we revise MTFL to learn features at a feature group level. Inthis work, we tackle two different correlations of tasks, including positivecorrelation and negative competition. To exploit the positive correlation oftasks, we propose Multi-Task Common Feature Learning. Besides, we alsopropose Multi-Task Specific Feature Learning to learn specific features foreach genre by exploiting the negative competition of tasks. Experimentalresults demonstrate our approach outperforms the state-of-art method.
Keywords: Multi-Task Feature Learning, Music Genre Classification
1 Introduction
With the rapid development of Internet, the quantity of digital music databaseshas been increasing sharply over the past decades. To meet the demands ofmanaging massive music databases, people try to develop more efficient MusicInformation Retrieval (MIR) techniques. Among all the MIR techniques, automat-ically classifying collections of music by genre, called music genre classification,plays a significant role.
In the past decades, some classifiers have been applied to music genre classi-fication. The most commonly used classifiers [15] are Support Vector Machine⋆⋆ This work was supported by National Hi-Tech Research and Development Pro-
gram (863 Program) of China under Grant 2014AA015102 and the Natural ScienceFoundation of China (Multimodal Music Emotion Recognition technology researchNo.61170167).
Proc. of the 12th International Symposium on CMMR, Sao Paolo, Brazil, July 5-8, 2016
37

2 Yao Cheng, Xiaoou Chen, Deshun Yang
(SVM) [7,8, 10, 11, 15], k-Nearest-Neighbor (k-NN) [8, 10, 11] and Gaussian Mix-ture Model (GMM) [6, 11]. In the early years, k-NN was widely used becauseof its effective classification performance, but it suffered from the scalabilityproblem [10]. Afterwards, SVM has been increasingly becoming popular [10] dueto its discriminative power in classification problems.
To apply SVM to multi-class classification problems, existing approachesusually transform the original multi-class classification problems into independentbinary classification tasks [7], and then train each task separately, regardlessof the correlation of tasks. To take the correlation of tasks into consideration,we introduce the Multi-Task Feature Learning (MTFL) [5, 12], hoping to makefurther improvement on classification performance. MTFL learns a problem withother related tasks together using a shared representation, and it often producesa better result. MTFL has achieved success in Natural Language Process (NLP)including email-spam filters [1] and web search [4], however it has never beenapplied to music genre classification.
Previous MTFL often performs feature learning at a feature componentlevel [5]. In practice, features fall naturally into groups. For example, MFCC isone of such groups, containing multiple feature components. The components ina feature group work together to make sense, so they should be considered as awhole and treated in the same way. Specifically, in a learning process, featureweighting should be done at a group level, rather than at a feature componentlevel.
Besides feature grouping, we also tackle two different correlations of tasks,namely positive correlation and negative competition. To exploit the positivecorrelation of tasks, we propose Multi-Task Common Feature Learning (MTL-CF), which captures the commonality among tasks. Moreover, to exploit thenegative competition of tasks, we propose Multi-Task Specific Feature Learning(MTL-SF), which learns specific features for each genre.
In this paper, we have the following contributions: (a) We propose two novelapproaches MTL-CF and MTL-SF based on MTFL, aiming at learning commonfeatures and specific features respectively. (b) Specific features, learned fromMTL-SF, also strengthen the understanding of characteristics of each genre.
2 Related Work
2.1 Multi-Task Feature Learning
Multi-Task Feature Learning (MTFL) [5, 12], one type of inductive transferlearning approach, learns a problem with other related tasks together using ashared representation. It often produces a better classification model as exploitingthe commonality among tasks. Over the past few years, Multi-Task FeatureLearning has been successfully applied in email-spam filtering [1], web search [4],computer vision [3, 16, 19] and music emotion recognition [17, 18], but has neverbeen applied to music genre classification. In practice, there are different ways torealize MTFL. In our work, we tackle MTFL via structural regularization [12].
Proc. of the 12th International Symposium on CMMR, Sao Paolo, Brazil, July 5-8, 2016
38
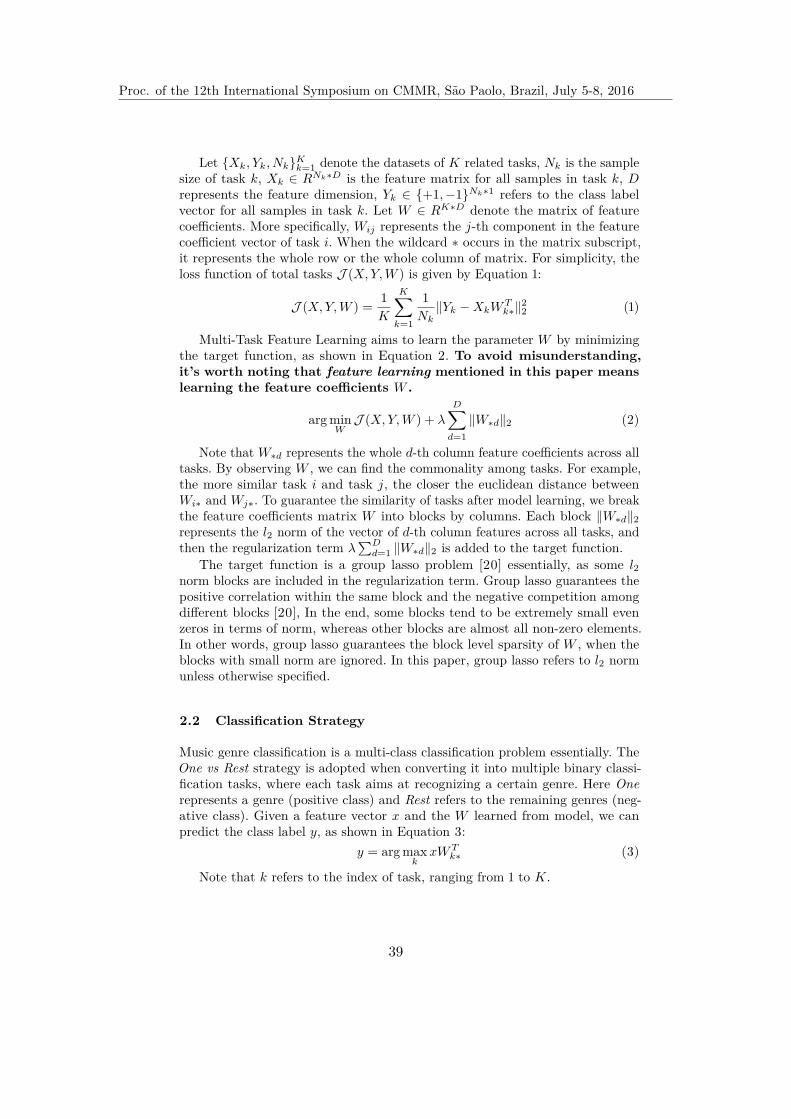
Learning Specific Features For Music Genre Classification 3
Let {Xk, Yk, Nk}Kk=1 denote the datasets of K related tasks, Nk is the sample
size of task k, Xk ∈ RNk∗D is the feature matrix for all samples in task k, Drepresents the feature dimension, Yk ∈ {+1, −1}Nk∗1 refers to the class labelvector for all samples in task k. Let W ∈ RK∗D denote the matrix of featurecoefficients. More specifically, Wij represents the j-th component in the featurecoefficient vector of task i. When the wildcard ∗ occurs in the matrix subscript,it represents the whole row or the whole column of matrix. For simplicity, theloss function of total tasks J (X, Y, W ) is given by Equation 1:
J (X, Y, W ) = 1K
K∑
k=1
1Nk
∥Yk − XkW Tk∗∥2
2 (1)
Multi-Task Feature Learning aims to learn the parameter W by minimizingthe target function, as shown in Equation 2. To avoid misunderstanding,it’s worth noting that feature learning mentioned in this paper meanslearning the feature coefficients W .
arg minW
J (X, Y, W ) + λD∑
d=1∥W∗d∥2 (2)
Note that W∗d represents the whole d-th column feature coefficients across alltasks. By observing W , we can find the commonality among tasks. For example,the more similar task i and task j, the closer the euclidean distance betweenWi∗ and Wj∗. To guarantee the similarity of tasks after model learning, we breakthe feature coefficients matrix W into blocks by columns. Each block ∥W∗d∥2represents the l2 norm of the vector of d-th column features across all tasks, andthen the regularization term λ
∑Dd=1 ∥W∗d∥2 is added to the target function.
The target function is a group lasso problem [20] essentially, as some l2norm blocks are included in the regularization term. Group lasso guarantees thepositive correlation within the same block and the negative competition amongdifferent blocks [20], In the end, some blocks tend to be extremely small evenzeros in terms of norm, whereas other blocks are almost all non-zero elements.In other words, group lasso guarantees the block level sparsity of W , when theblocks with small norm are ignored. In this paper, group lasso refers to l2 normunless otherwise specified.
2.2 Classification Strategy
Music genre classification is a multi-class classification problem essentially. TheOne vs Rest strategy is adopted when converting it into multiple binary classi-fication tasks, where each task aims at recognizing a certain genre. Here Onerepresents a genre (positive class) and Rest refers to the remaining genres (neg-ative class). Given a feature vector x and the W learned from model, we canpredict the class label y, as shown in Equation 3:
y = arg maxk
xW Tk∗ (3)
Note that k refers to the index of task, ranging from 1 to K.
Proc. of the 12th International Symposium on CMMR, Sao Paolo, Brazil, July 5-8, 2016
39

4 Yao Cheng, Xiaoou Chen, Deshun Yang
3 Proposed Method
In section 3.1, we provide the overview of proposed methods and make a compar-ison, and then define some important notations. In section 3.2, we illustrate theimportance of feature grouping. In section 3.3, 3.4 and 3.5, we propose threefeature learning methods respectively, namely STL-GF, MTL-CF and MTL-SF.
3.1 Overview and Notation
Overview There are two motivations for the proposed methods. (a) Multi-taskfeature learning usually produce a better result than learning each task separately,which was interpreted in the related work. (b) Learning features at a group levelcan improve the classification performance, which will be discussed in the latersection.
Task 1
Task 2
Task 3
Task 4
Task 5
G1 G2 G3
G3
G3
G3
G3
G2
G2
G2
G2
G1
G1
G1
G1
Single-Task Feature Group Learning
Task 1
Task 2
Task 3
Task 4
Task 5
G1 G2 G3
Multi-Task Common Feature Learning
Training
together
Task 1
Task 2
Task 3
Task 4
Task 5
G1 G2 G3
G4 G5
G8G7
G6
G9
G10
G13
G11
G14
G12
G15
Multi-Task Specific Feature Learning
Training
together
Task 1
Task 2
Task 3
Task 4
Task 5
G1 G2 G3 G4 G5 G6 G7 G8 G9
Multi-Task Feature Learning
Training
together
Figure 1. Feature coefficients matrix W of proposed methods. Each row represents atask. Eeah column represents a feature component. Proposed methods differs in theway to break W into blocks, as shown in red boxes. The wider red boxes involve featuregrouping information, not the other way around. Except for STL-GF, other methodstrain all tasks together.
The motivations lie in the diagram of proposed methods (see Figure 1). Inthe diagram, we present the characteristics of each feature learning method bytheir feature coefficient matrix W . Proposed methods differ in the way to breakW into blocks and whether all tasks are trained together. The further analysis ofFigure 1 is as follows:
Proc. of the 12th International Symposium on CMMR, Sao Paolo, Brazil, July 5-8, 2016
40

Learning Specific Features For Music Genre Classification 5
(a) Multi-Task Feature Learning breaks W into blocks by columns regardlessof feature grouping information, and trains all the tasks together. On the contrary,Single Task Feature Group Learning allows for feature grouping when breakingblocks, however, the same feature groups across tasks are divided into differentblocks, and each task is trained separately. In summary, neither of them takeboth multi-task feature learning and feature grouping into consideration.
(b) On the contrary, Multi-Task Common Feature Learning and Multi-TaskSpecific Feature Learning both take the two motivations into consideration.Nevertheless, they still have significant difference, which directly leads to theirdifferent classification performance. Multi-Task Common Feature Learning takesthe same feature group across all tasks as a whole, and divide them into the sameblock, whereas Multi-Task Specific Feature Learning breaks them into differentblocks.
Notation For easy understanding, we clarify some important notations asfollows:
(a) ∥ · ∥2 represents the l2 norm of vector, ∥ · ∥F denotes the Frobenius normof matrix, as shown in Equation 4 and Equation 5. ∥ · ∥2
2 and ∥ · ∥2F refer to the
square of l2 norm and Frobenius norm respectively.(b) In the regularization term, elements within the same block are assembled
by the form of l2 norm or Frobenius norm. Note that group lasso refers to thesum of l2 norm or Frobenius norm.
(c) Gi represents a vector of indices of features within the i-th feature group.When it appears in the subscript of W , for instance WkGi
, it refers to the submatrix of W , made up of the i-th feature group in task k. In addition, thewildcard ∗ in the matrix subscript represents a whole row or column.
∥a∥2 =
√√√√n∑
i=1a2
i (4)
∥A∥F =
√√√√m∑
i=1
n∑
j=1A2
ij (5)
3.2 Feature Grouping
Features fall naturally into groups. For example, MFCC is one of such groups,containing multiple feature components. The components in a feature group worktogether to make sense, so they should be considered as a whole and treated inthe same way. Specifically, in a learning process, feature weighting should bedone at a group level, rather than at a feature component level. Based on thisidea, we devise learning methods which try to weight the feature components ina group uniformly.
Before that, we divide features into groups manually, where features in thesame group represent the same type of features, such as melody or rhythm and
Proc. of the 12th International Symposium on CMMR, Sao Paolo, Brazil, July 5-8, 2016
41

6 Yao Cheng, Xiaoou Chen, Deshun Yang
so on, as shown in Table 1. Let G = [G1, G2, ..., Gg] denote the feature groupinginformation, Gi represents a vector of indices of features within the i-th featuregroup.
For the better understanding of feature grouping, we arrange the featuregrouping information in advance. For the details of feature information, seeSection 4.1.
Table 1. Information about feature groups
Group ID Group Name Group Features (522)
G1 Spectral Energy (72)
spectral centroid (6)spectral rolloff (6)spectral flux (6)
spectral spread (6)spectral kurtosis (6)spectral skewness (6)spectral roughness (6)spectral flatness (6)
spectral brightness (6)spectral entropy (6)
spectral irregularity (6)spectral compactness (6)
G2 Timbre (40)zero crossing rate (24)
low energy(2), fluctuation (2)fraction of low energy windows (12)
G3 Tonal (10) keyclarity (4), mode (6)G4 MFCC (232) mfcc (76), dmfcc (78), ddmfcc (78)G5 LPC (40) lpc (20), dlpc (20)
G6 Rhythm (30)
attack slope (4), attack time (4)tempo (4), beat sum (6)
strongest beat (6)strength of strongest beat (6)
G7 Chords(6) hcdf (6)G8 Melody (12) chromagram (12)
G9 Others (80)area method of moments (40), rms (16)
relative difference function (12)peak based spectral smoothness (12)
3.3 Single-Task Feature Group LearningTo validate the benefits of dealing with features as their natural groups, weintroduce a Single-Task Learning scheme based on Linear Regression (LR). Thenwe change the regularization term of LR to λ
∑gi=1 ∥WkGi
∥2 to involve enforcingfeature grouping, where k becomes a constant when given a certain task. Becauseeach task is trained separately, we call the revised method Single-Task FeatureGroup Learning (STL-GF). The formulation of STL-GF is given by Equation 6:
Proc. of the 12th International Symposium on CMMR, Sao Paolo, Brazil, July 5-8, 2016
42

Learning Specific Features For Music Genre Classification 7
arg minWk∗
1Nk
∥Yk − XkW Tk∗∥2
2 + λ
g∑
i=1∥WkGi
∥2 (6)
In addition, λ controls the group sparsity, 1Nk
∥Yk − XkW Tk∗∥2
2 represents theloss function. We train each task k separately to learn Wk∗. In the end, weconcatenate K different Wk∗ to obtain W .
3.4 Multi-Task Common Feature Learning
STL-GF learns features at a feature group level, but it fails to capture thecorrelation of tasks, since it trains each task separately. As we know, MTFLcan learn multiple related tasks together to capture the commonality of tasks,therefore leading to the superior performance. Multi-Task Common FeatureLearning (MTL-CF) incorporates feature grouping information into MTFL,consequently it combines the advantages of MTFL and STL-GF together.
To achieve the fusion, we revise the regularization term λ∑D
d=1 ∥W∗d∥2 inMTFL to λ
∑gi=1 ∥W∗Gi∥F . As MTL-CF divides the same feature groups across
all tasks into one block, the competition only occurs among different featuregroups. On the contrary, feature groups across all tasks, all of which are in thesame block, exhibit the positive correlations. In the end, the commonality oftasks can be captured, and common features across tasks can be learned.
In addition, we also add the µ∥W∥2F term to control the complexity of model.
The target function of MTL-CF is given by Equation 7:
arg minW
J (X, Y, W ) + λ
g∑
i=1∥W∗Gi
∥F + µ∥W∥2F (7)
3.5 Multi-Task Specific Feature Learning
For the recognition of disco music, rhythm features are more discriminative thanothers, as disco music usually has strong beats and clear rhythmic patterns.Therefore, in the disco classification model, rhythm features should be weightedmore than other features. In contrast to disco music, reggae music exhibits verydifferent characteristics, the latter often has strange chords, so chord relatedfeatures should be assigned higher weights than other features. In summary, foreach binary classification task, features should be learned in accordance with itsspecific genre characteristics.
However, our approach MTL-CF only captures the commonality among tasks,and learn common features for all tasks. To learn specific features for each task,Multi-Task Specific Feature Learning (MTL-SF) breaks each block ∥W∗Gi
∥F
of MTL-CF into K smaller blocks ∥WkGi∥2, where k ranges from 1 to K. In
comparison with MTL-CF, not only different feature groups compete with eachother, but also the same feature groups across tasks do. In the end, only the mostvaluable features can survive. Therefore specific features can be learned from the
Proc. of the 12th International Symposium on CMMR, Sao Paolo, Brazil, July 5-8, 2016
43
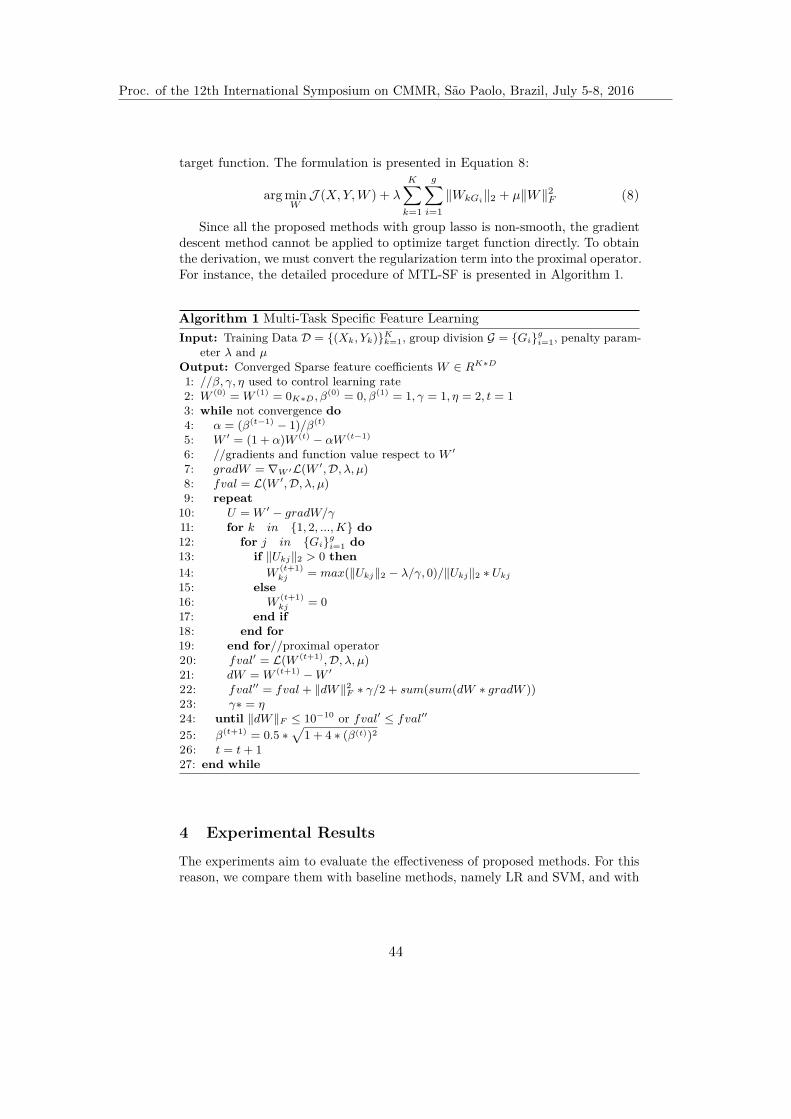
8 Yao Cheng, Xiaoou Chen, Deshun Yang
target function. The formulation is presented in Equation 8:
arg minW
J (X, Y, W ) + λK∑
k=1
g∑
i=1∥WkGi
∥2 + µ∥W∥2F (8)
Since all the proposed methods with group lasso is non-smooth, the gradientdescent method cannot be applied to optimize target function directly. To obtainthe derivation, we must convert the regularization term into the proximal operator.For instance, the detailed procedure of MTL-SF is presented in Algorithm 1.
Algorithm 1 Multi-Task Specific Feature LearningInput: Training Data D = {(Xk, Yk)}K
k=1, group division G = {Gi}gi=1, penalty param-
eter λ and µOutput: Converged Sparse feature coefficients W ∈ RK∗D
1: //β, γ, η used to control learning rate2: W (0) = W (1) = 0K∗D, β(0) = 0, β(1) = 1, γ = 1, η = 2, t = 13: while not convergence do4: α = (β(t−1) − 1)/β(t)
5: W ′ = (1 + α)W (t) − αW (t−1)
6: //gradients and function value respect to W ′
7: gradW = ∇W ′ L(W ′, D, λ, µ)8: fval = L(W ′, D, λ, µ)9: repeat
10: U = W ′ − gradW/γ11: for k in {1, 2, ..., K} do12: for j in {Gi}g
i=1 do13: if ∥Ukj∥2 > 0 then14: W
(t+1)kj = max(∥Ukj∥2 − λ/γ, 0)/∥Ukj∥2 ∗ Ukj
15: else16: W
(t+1)kj = 0
17: end if18: end for19: end for//proximal operator20: fval′ = L(W (t+1), D, λ, µ)21: dW = W (t+1) − W ′
22: fval′′ = fval + ∥dW ∥2F ∗ γ/2 + sum(sum(dW ∗ gradW ))
23: γ∗ = η24: until ∥dW ∥F ≤ 10−10 or fval′ ≤ fval′′
25: β(t+1) = 0.5 ∗√
1 + 4 ∗ (β(t))2
26: t = t + 127: end while
4 Experimental ResultsThe experiments aim to evaluate the effectiveness of proposed methods. For thisreason, we compare them with baseline methods, namely LR and SVM, and with
Proc. of the 12th International Symposium on CMMR, Sao Paolo, Brazil, July 5-8, 2016
44

Learning Specific Features For Music Genre Classification 9
the related work of recent years. For easy notation, the proposed approachespresented in Section 3.3, 3.4, 3.5 are denoted by STL-GF, MTL-CF and MTL-SFrespectively.
4.1 Experimental Settings
Dataset The GTZAN has been widely used in music genre classification research.To make a comparison with the state-of-art methods, we choose GTZAN asthe experimental dataset. It is composed of 10 different musical genres: blues,classical, country, disco, hiphop, jazz, metal, pop, reggae, and rock. Each genreconsists of 100 music pieces of 30s.
Features We use MIRToolbox [9] and jAudio [13] to extract features. First ofall, music pieces are framed with 2048ms Hamming windows and 1024ms hopsize.Then multiple raw features are extracted, including MFCC, LPC, Chroma,Rhythm, Timbre, Spectral Energy and so on. For details, see Table 1. Finally,some aggregators are used to calculate the statistics of sequence features. Forfeatures extracted by jAudio, aggregators consists of Overall Standard Deviation,Derivative of Overall Standard Deviation, Running Mean of Overall StandardDeviation, Standard Deviation of Overall Standard Deviation, Derivative ofRunning Mean of Overall Standard Deviation and so on. As for MIRToolboxfeatures, we use Mean, Standard Deviation, Slope and Period Entropy. Note thatfeature normalization are also necessary after feature extraction.
Model Details We use the One vs Rest strategy to transform 10-class musicgenre classification problem into 10 binary classification tasks. For each task, thecorresponding class is positive class and other classes are all negative. To balancethe positive samples and negative samples, we decrease the number of negativesamples by selecting 11 random samples from each negative class. Finally, thereare 100 positive samples and 99 negative samples in all for each task. Moreover,we adopt 10-fold cross-validation to decrease the experiment errors caused byover-fitting. Note that the downsampling and cross-validation are also applied toLR and SVM.
4.2 Baseline Methods
LR Linear Regression (LR) is taken as a baseline method to compare withSTL-GF. The loss function of LR is composed of the average of least squareerrors and l2 norm regularization term. To apply LR to classification problem,we take zero as the boundary of positive and negative samples. When predictionis greater than zero, it belongs to positive class, otherwise negative class.
SVM To demonstrate the effectiveness of our approaches, we compare with oneof the state-of-art classifiers, namely SVM. In the experiment, we choose RadialBasis Function (RBF), which is considered as the best kernel function in practice.
Proc. of the 12th International Symposium on CMMR, Sao Paolo, Brazil, July 5-8, 2016
45
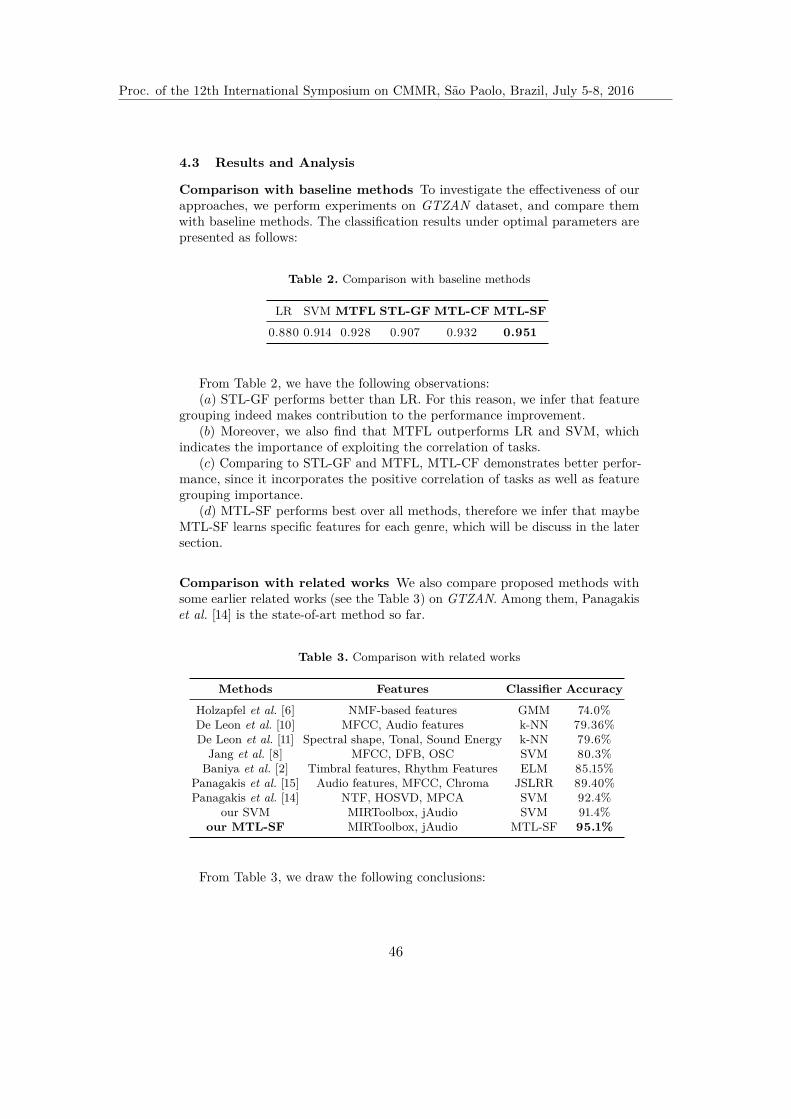
10 Yao Cheng, Xiaoou Chen, Deshun Yang
4.3 Results and Analysis
Comparison with baseline methods To investigate the effectiveness of ourapproaches, we perform experiments on GTZAN dataset, and compare themwith baseline methods. The classification results under optimal parameters arepresented as follows:
Table 2. Comparison with baseline methods
LR SVM MTFL STL-GF MTL-CF MTL-SF0.880 0.914 0.928 0.907 0.932 0.951
From Table 2, we have the following observations:(a) STL-GF performs better than LR. For this reason, we infer that feature
grouping indeed makes contribution to the performance improvement.(b) Moreover, we also find that MTFL outperforms LR and SVM, which
indicates the importance of exploiting the correlation of tasks.(c) Comparing to STL-GF and MTFL, MTL-CF demonstrates better perfor-
mance, since it incorporates the positive correlation of tasks as well as featuregrouping importance.
(d) MTL-SF performs best over all methods, therefore we infer that maybeMTL-SF learns specific features for each genre, which will be discuss in the latersection.
Comparison with related works We also compare proposed methods withsome earlier related works (see the Table 3) on GTZAN. Among them, Panagakiset al. [14] is the state-of-art method so far.
Table 3. Comparison with related works
Methods Features Classifier AccuracyHolzapfel et al. [6] NMF-based features GMM 74.0%De Leon et al. [10] MFCC, Audio features k-NN 79.36%De Leon et al. [11] Spectral shape, Tonal, Sound Energy k-NN 79.6%
Jang et al. [8] MFCC, DFB, OSC SVM 80.3%Baniya et al. [2] Timbral features, Rhythm Features ELM 85.15%
Panagakis et al. [15] Audio features, MFCC, Chroma JSLRR 89.40%Panagakis et al. [14] NTF, HOSVD, MPCA SVM 92.4%
our SVM MIRToolbox, jAudio SVM 91.4%our MTL-SF MIRToolbox, jAudio MTL-SF 95.1%
From Table 3, we draw the following conclusions:
Proc. of the 12th International Symposium on CMMR, Sao Paolo, Brazil, July 5-8, 2016
46
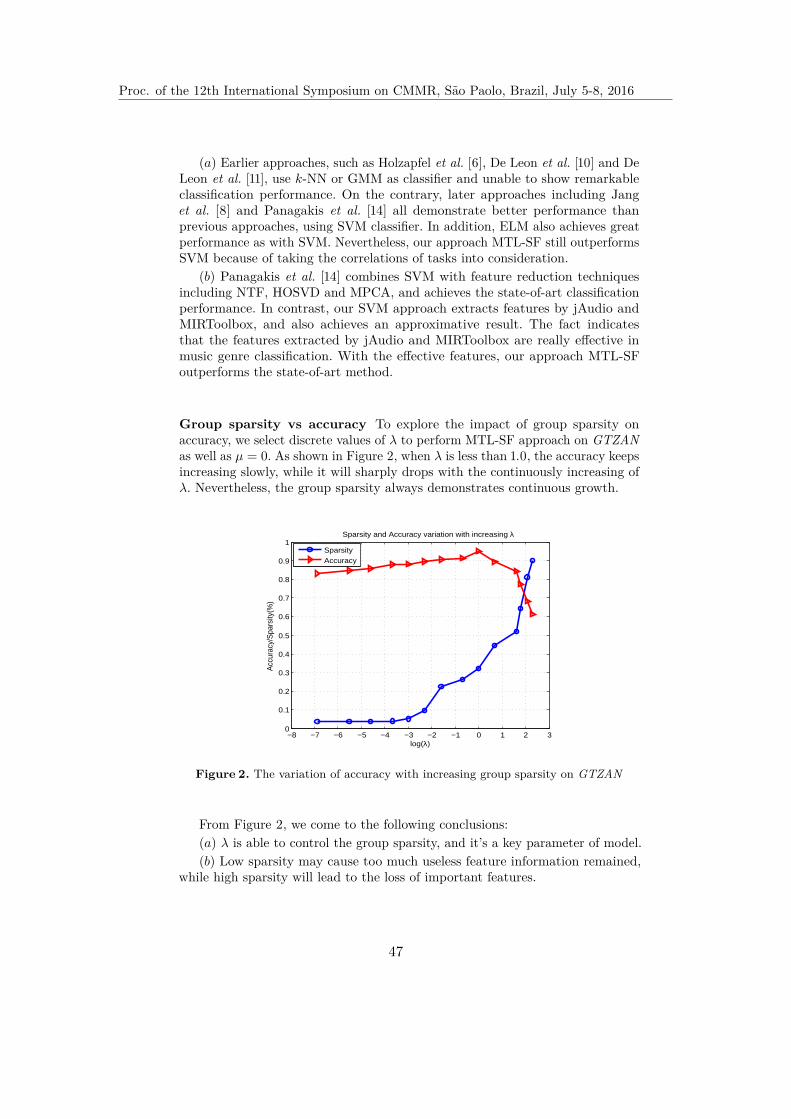
Learning Specific Features For Music Genre Classification 11
(a) Earlier approaches, such as Holzapfel et al. [6], De Leon et al. [10] and DeLeon et al. [11], use k-NN or GMM as classifier and unable to show remarkableclassification performance. On the contrary, later approaches including Janget al. [8] and Panagakis et al. [14] all demonstrate better performance thanprevious approaches, using SVM classifier. In addition, ELM also achieves greatperformance as with SVM. Nevertheless, our approach MTL-SF still outperformsSVM because of taking the correlations of tasks into consideration.
(b) Panagakis et al. [14] combines SVM with feature reduction techniquesincluding NTF, HOSVD and MPCA, and achieves the state-of-art classificationperformance. In contrast, our SVM approach extracts features by jAudio andMIRToolbox, and also achieves an approximative result. The fact indicatesthat the features extracted by jAudio and MIRToolbox are really effective inmusic genre classification. With the effective features, our approach MTL-SFoutperforms the state-of-art method.
Group sparsity vs accuracy To explore the impact of group sparsity onaccuracy, we select discrete values of λ to perform MTL-SF approach on GTZANas well as µ = 0. As shown in Figure 2, when λ is less than 1.0, the accuracy keepsincreasing slowly, while it will sharply drops with the continuously increasing ofλ. Nevertheless, the group sparsity always demonstrates continuous growth.
−8 −7 −6 −5 −4 −3 −2 −1 0 1 2 30
0.1
0.2
0.3
0.4
0.5
0.6
0.7
0.8
0.9
1
log(λ)
Acc
urac
y/S
pars
ity(%
)
Sparsity and Accuracy variation with increasing λ
SparsityAccuracy
Figure 2. The variation of accuracy with increasing group sparsity on GTZAN
From Figure 2, we come to the following conclusions:(a) λ is able to control the group sparsity, and it’s a key parameter of model.(b) Low sparsity may cause too much useless feature information remained,
while high sparsity will lead to the loss of important features.
Proc. of the 12th International Symposium on CMMR, Sao Paolo, Brazil, July 5-8, 2016
47

12 Yao Cheng, Xiaoou Chen, Deshun Yang
Exploring specific features among genres Finally, we explore which featuresare actually learned by MTL-SF. To achieve this goal, we rearrange the learnedW from MTL-SF under optimal parameters, and demonstrate the result by ablack-gray matrix, as shown in Figure 3:
G5G4 G9G7G6 G8G2G1 G3
blues
classical
country
disco
hiphop
jazz
metal
pop
reggae
rock
Figure 3. Sparsity matrix of W . Black elements represent non-zero feature groups, andgray ones refer to feature groups with small norm (below 10−6 in our case). Each rowrepresents the task of recognizing a certain genre. Each column represents a featuregroup.
From Figure 3, we draw the following conclusions:(a) Interestingly, common features are also learned by our model. For example,
Spectral Energy, MFCC and Chroma are learned across all genres.(b) Each genre indeed learns different features and exhibits specific character-
istics. Especially, disco learns rhythm features, whereas reggae, jazz, rock learnchord features, these results are in accordance with domain knowledge.
(c) Our approach MTL-SF can be used as a guide to learn the specific featuresof each genre, and explore which features play an important role in music genreclassification.
5 Conclusion
In this work, we consider music genre classification as an application scenarioof Multi-Task Feature Learning to explore the effectiveness of several novelapproaches. In comparison with baseline methods such as LR and SVM, MTL-CFand MTL-SF both demonstrate superior performance as exploiting the correlationof tasks. Specifically, MTL-CF captures the commonality among tasks, and MTL-SF learns specific features for each genre as exploiting the competition of tasks.
Proc. of the 12th International Symposium on CMMR, Sao Paolo, Brazil, July 5-8, 2016
48
Learning Specific Features For Music Genre Classification 13
Moreover, in comparison with state-of-art method, MTL-SF and MTL-CF stilldemonstrate superior classification performance. In addition, our approach can bealso applied to other classification problems, such as music emotion classificationand so on.
References
1. Attenberg, J., Weinberger, K., Dasgupta, A., Smola, A., Zinkevich, M.: Collaborativeemail-spam filtering with the hashing trick. In: Proceedings of the Sixth Conferenceon Email and Anti-Spam (2009)
2. Baniya, B.K., Ghimire, D., Lee, J.: A novel approach of automatic music genreclassification based on timbrai texture and rhythmic content features. In: AdvancedCommunication Technology (ICACT), 2014 16th International Conference on. pp.96–102. IEEE (2014)
3. Cabral, R.S., Torre, F., Costeira, J.P., Bernardino, A.: Matrix completion for multi-label image classification. In: Advances in Neural Information Processing Systems.pp. 190–198 (2011)
4. Chapelle, O., Shivaswamy, P., Vadrevu, S., Weinberger, K., Zhang, Y., Tseng,B.: Multi-task learning for boosting with application to web search ranking. In:Proceedings of the 16th ACM SIGKDD international conference on Knowledgediscovery and data mining. pp. 1189–1198. ACM (2010)
5. Evgeniou, A., Pontil, M.: Multi-task feature learning. Advances in neural informationprocessing systems 19, 41 (2007)
6. Holzapfel, A., Stylianou, Y.: Musical genre classification using nonnegative ma-trix factorization-based features. Audio, Speech, and Language Processing, IEEETransactions on 16(2), 424–434 (2008)
7. Huang, Y.F., Lin, S.M., Wu, H.Y., Li, Y.S.: Music genre classification based onlocal feature selection using a self-adaptive harmony search algorithm. Data &Knowledge Engineering 92, 60–76 (2014)
8. Jang, D., Jang, S.J.: Very short feature vector for music genre classiciation basedon distance metric lerning. In: Audio, Language and Image Processing (ICALIP),2014 International Conference on. pp. 726–729. IEEE (2014)
9. Lartillot, O., Toiviainen, P., Eerola, T.: A matlab toolbox for music informationretrieval. In: Data analysis, machine learning and applications, pp. 261–268. Springer(2008)
10. de Leon, F., Martinez, K.: Towards efficient music genre classification using fastmap.In: Proceedings of International Conference on Digital Audio Effects (2012)
11. de Leon, F., Martinez, K., et al.: Music genre classification using polyphonic timbremodels. In: Digital Signal Processing (DSP), 2014 19th International Conferenceon. pp. 415–420. IEEE (2014)
12. Liu, J., Ji, S., Ye, J.: Multi-task feature learning via efficient l 2, 1-norm minimization.In: Proceedings of the twenty-fifth conference on uncertainty in artificial intelligence.pp. 339–348. AUAI Press (2009)
13. McKay, C., Fujinaga, I., Depalle, P.: jaudio: A feature extraction library. In: Pro-ceedings of the International Conference on Music Information Retrieval. pp. 600–3(2005)
14. Panagakis, I., Benetos, E., Kotropoulos, C.: Music genre classification: A multilinearapproach. In: ISMIR. pp. 583–588 (2008)
Proc. of the 12th International Symposium on CMMR, Sao Paolo, Brazil, July 5-8, 2016
49

14 Yao Cheng, Xiaoou Chen, Deshun Yang
15. Panagakis, Y., Kotropoulos, C.L., Arce, G.R.: Music genre classification via jointsparse low-rank representation of audio features. Audio, Speech, and LanguageProcessing, IEEE/ACM Transactions on 22(12), 1905–1917 (2014)
16. Yuan, X.T., Liu, X., Yan, S.: Visual classification with multitask joint sparserepresentation. Image Processing, IEEE Transactions on 21(10), 4349–4360 (2012)
17. Zhang, B., Essl, G., Provost, E.M.: Recognizing emotion from singing and speakingusing shared models. In: Affective Computing and Intelligent Interaction (ACII),2015 International Conference on. pp. 139–145. IEEE (2015)
18. Zhang, B., Provost, E.M., Essl, G.: Cross-corpus acoustic emotion recognition fromsinging and speaking: A multi-task learning approach. International Conference onAcoustics, Speech and Signal Processing (ICASSP) (2016)
19. Zhong, L., Liu, Q., Yang, P., Liu, B., Huang, J., Metaxas, D.N.: Learning activefacial patches for expression analysis. In: Computer Vision and Pattern Recognition(CVPR), 2012 IEEE Conference on. pp. 2562–2569. IEEE (2012)
20. Zhou, Y., Jin, R., Hoi, S.: Exclusive lasso for multi-task feature selection. In:International Conference on Artificial Intelligence and Statistics. pp. 988–995(2010)
Proc. of the 12th International Symposium on CMMR, Sao Paolo, Brazil, July 5-8, 2016
50

Copista - OMR System for Historical MusicalCollection Recovery
Marcos Laia, Flavio Schiavoni, Daniel Madeira, Darlinton Carvalho,Joao Pedro Moreira, Avner de Paulo, and Rodrigo Ferreira
Computer Science DepartmentFederal University of Sao Joao del-Rei
Sao Joao Del Rei – MG – [email protected], {fls,dmadeira,darlinton}@ufsj.edu.br
[email protected], [email protected],
Resumo Optical Music Recognition (OMR) is a Computer Science fieldapplied to Music that deals with problems like recognition of handwrit-ten scores. This paper presents a project called “Copista” proposed toinvestigate techniques and develop a software to recognize handwrittenscores especially regarding a historical musical collection. The proposedsystem is useful to collection preservation and as supporting further de-velopment based on OMR. “Copista” is the Brazilian word for Scribe,someone who writes music scores.
1 Introduction
Some of the most important music collections in Brazil, dated from the beginningof 18th century, are located in Sao Joao Del Rei, Tiradentes and Prados. Thesecollections include several musical genre and are the work of hundred composersfrom this historical Brazilian region.
The Music Department of Federal University of Sao Joao Del Rei started aprogram to describe and catalog these collections, called “Memoria Viva” (Li-ving Memory), trying to provide these collections to public audience. The mainaspect regarding these collections is that the old sheets have several marks ofdegradation like folding, candle wax, tears and even bookworm holes, as depictedin Fig. 1.
In order to help the processing of these music papers, a partnership of Mu-sic Department with the Computer Science Department in the same Universityarose. This partnership involved several researchers on the creation of an ap-plication called Copista, a software to help musicians to rewrite music scorescollections based on a digital copy of them. The project Copista comprises thedigital image acquisition from the original files, digitally recovery of the files andtranscript the music files to a symbolic music representation.
Each step on this process would return partial results that are importantto preserve these historical collections. The scanned original files are valuable tomusicology since they keep historical features of each sheet. The digital recovered
Proc. of the 12th International Symposium on CMMR, Sao Paolo, Brazil, July 5-8, 2016
51

2 Laia et al.
Fig. 1: Example of music score present in the collections
files are also important since it can be easier to read and distributed them. Thesymbolic music representation is another important artifact since it is easier towork with these files to check and correct some transcription problem.
The remainder of this paper is organized as follows: Section 2 presents theCopista system, Section 3 presents some Partial Results and Section 4 presentsthis article Conclusion.
2 The Copista
The Copista system is proposed as a tool to convert handwriting scores into adigital music representation. The applications used to interpret music scores arecalled Optical Music Recognition (OMR) [26] [5]. These applications are similarto Optical Character Recognition (OCR) tools but they should be able to converthandwriting scores into symbolic music. In spite of existing tools that convertshandwriting scores into editable scores, most of these tools a) do not work withmanuscript scores[5], b) are very expensive and c) are not open source, beingimpossible to adapt them to this project. All these reasons helped us to decideto build a brand new tool on the OMR field.
To develop such tool, we divided the OMR process into some distinct parts:the image acquisition, image preprocessing and digital image recovery, the re-cognition of musical Symbols with Computer Vision, the Music Notation Re-construction and the symbolic music output, as depicted in Fig. 2.
2.1 Image Acquisition
The Copista input is a handwriting score from regional historical collections. Inthese collections, it is common for the scores, many of them centuries old, have
Proc. of the 12th International Symposium on CMMR, Sao Paolo, Brazil, July 5-8, 2016
52
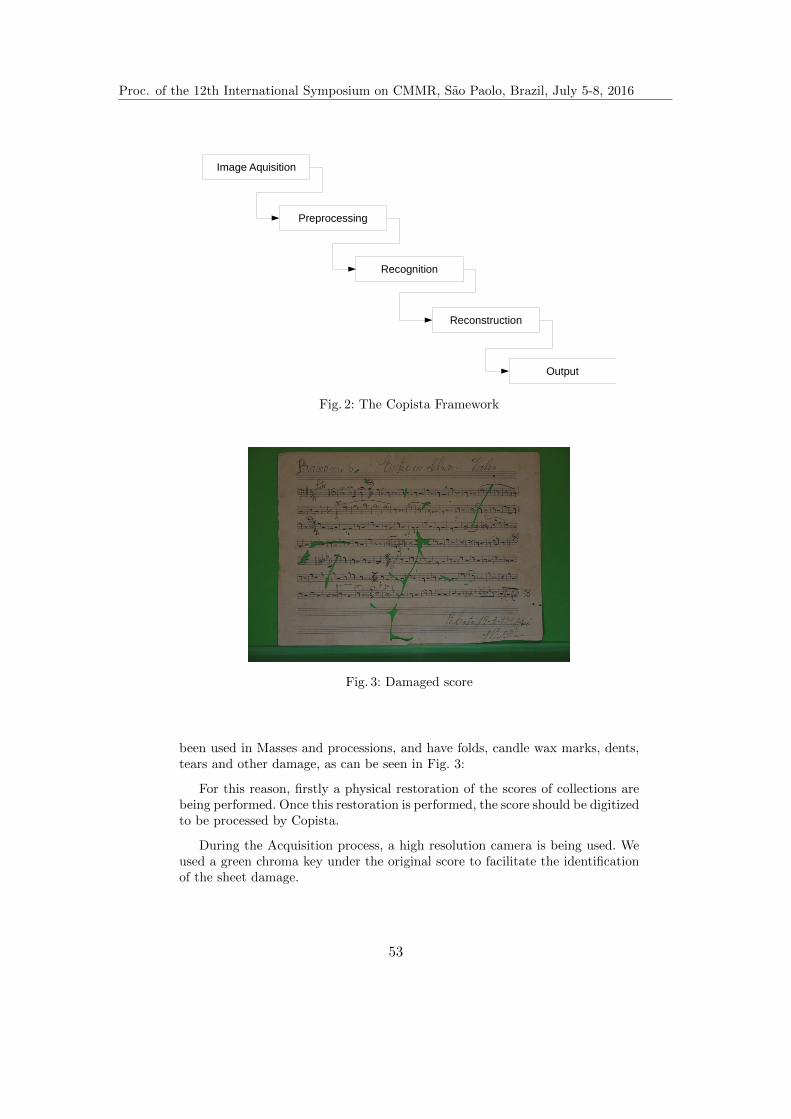
Copista - OMR System for Historical Musical Collection Recovery 3
Image Aquisition
Preprocessing
Recognition
Reconstruction
Output
Fig. 2: The Copista Framework
Fig. 3: Damaged score
been used in Masses and processions, and have folds, candle wax marks, dents,tears and other damage, as can be seen in Fig. 3:
For this reason, firstly a physical restoration of the scores of collections arebeing performed. Once this restoration is performed, the score should be digitizedto be processed by Copista.
During the Acquisition process, a high resolution camera is being used. Weused a green chroma key under the original score to facilitate the identificationof the sheet damage.
Proc. of the 12th International Symposium on CMMR, Sao Paolo, Brazil, July 5-8, 2016
53

4 Laia et al.
2.2 Preprocessing
It is common that ancient papers and manuscripts suffer degradation over time.Constant handling can rub the ink out, creating differences in shades or variousmarks. In the example of sheet music, candle wax drippings and sweaty handscreates marks in each document in several cases. In addition, improper storagecaused folds, wrinkles, tears and holes caused by bookworms in the sheet music.All these marks are not relevant and need to be removed to make the recognitionprocess more adequate.
There is no universal technique available for preprocessing, as for each do-cument a specific treatment set may be required. Nonetheless, two steps can behighlighted as the basic pre-processing process for the Copista:
1. artifacts removal
2. color thresholding
The first step involves removing all artifacts (i.e. marks) non-important tothe recognition process. These artifacts, which become noise in the acquiredimage, cover the stains, rips, holes and all marks that are not part of the score.The paper itself can be considered noise, because it is not part of the score itself.Holes and rips on the paper are the hardest artifacts presented, because theyalter the paper format, while erasing the data on the score.
Therefore, this step comprises a set of algorithms. Image filtering [10,31] andhole filling [3] are necessary. The chroma key used in acquisition step helps tomake holes easier to spot. Consequently, the hole-filling algorithm needs it inorder to remove all of them efficiently. At the end of this step, the brightnessand contrast are enhanced in order to clarify the acquired image, passing it alongto the next step.
With noise removed, the score needs to be converted to a black and white for-mat. After the color conversion a two-level thresholding processing (binarization)is employed in order to achieve the final objective. This process simplifies scorerepresentation, cutting off color and grey variations. The thresholding processcan be classified into two categories: global or local thresholding.
Global methods use only one value to classify all pixels on the image, regar-dless of whether the area it belongs has more or less noise. Values higher thanthe threshold become white, while lower values become black. By using only onethreshold, global methods tend to be easier to implement and computationallycheaper. However, noises that occur in only one part of the image will influencethe decision-making algorithm, which can lead to undesirable results.
To work around this problem, the local thresholding methods work with inputimage subsets, calculating the optimal threshold by region. Higher adaptivity areachieved by local methods, by allowing the decision-making in a region dependonly in it, regardless of it neighborhood. Better results are expected on caseswhere different noises appear on different areas of the input image, but at ahigher computational cost.
Proc. of the 12th International Symposium on CMMR, Sao Paolo, Brazil, July 5-8, 2016
54
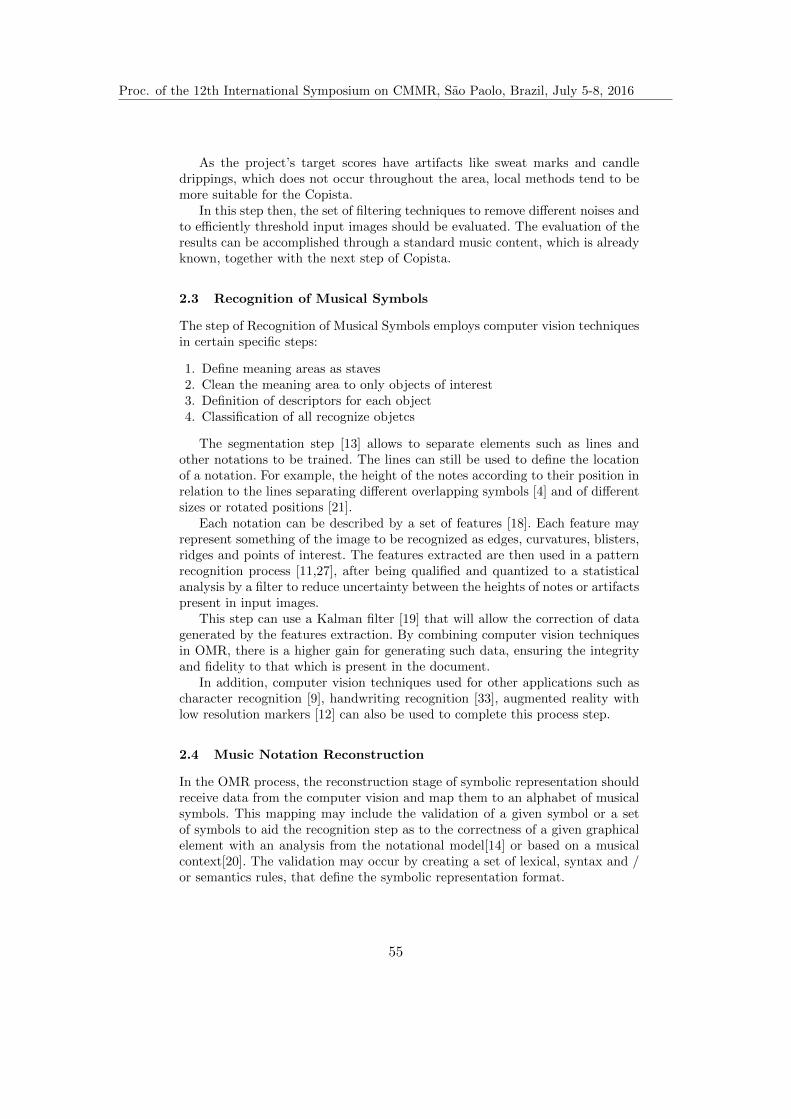
Copista - OMR System for Historical Musical Collection Recovery 5
As the project’s target scores have artifacts like sweat marks and candledrippings, which does not occur throughout the area, local methods tend to bemore suitable for the Copista.
In this step then, the set of filtering techniques to remove different noises andto efficiently threshold input images should be evaluated. The evaluation of theresults can be accomplished through a standard music content, which is alreadyknown, together with the next step of Copista.
2.3 Recognition of Musical Symbols
The step of Recognition of Musical Symbols employs computer vision techniquesin certain specific steps:
1. Define meaning areas as staves2. Clean the meaning area to only objects of interest3. Definition of descriptors for each object4. Classification of all recognize objetcs
The segmentation step [13] allows to separate elements such as lines andother notations to be trained. The lines can still be used to define the locationof a notation. For example, the height of the notes according to their position inrelation to the lines separating different overlapping symbols [4] and of differentsizes or rotated positions [21].
Each notation can be described by a set of features [18]. Each feature mayrepresent something of the image to be recognized as edges, curvatures, blisters,ridges and points of interest. The features extracted are then used in a patternrecognition process [11,27], after being qualified and quantized to a statisticalanalysis by a filter to reduce uncertainty between the heights of notes or artifactspresent in input images.
This step can use a Kalman filter [19] that will allow the correction of datagenerated by the features extraction. By combining computer vision techniquesin OMR, there is a higher gain for generating such data, ensuring the integrityand fidelity to that which is present in the document.
In addition, computer vision techniques used for other applications such ascharacter recognition [9], handwriting recognition [33], augmented reality withlow resolution markers [12] can also be used to complete this process step.
2.4 Music Notation Reconstruction
In the OMR process, the reconstruction stage of symbolic representation shouldreceive data from the computer vision and map them to an alphabet of musicalsymbols. This mapping may include the validation of a given symbol or a setof symbols to aid the recognition step as to the correctness of a given graphicalelement with an analysis from the notational model[14] or based on a musicalcontext[20]. The validation may occur by creating a set of lexical, syntax and /or semantics rules, that define the symbolic representation format.
Proc. of the 12th International Symposium on CMMR, Sao Paolo, Brazil, July 5-8, 2016
55

6 Laia et al.
A major issue of defining a symbolic musical representation is to find a suf-ficient generic representation, very flexible but at the same time restricted inrelation to its rules to allow a validation of the musical structure as a whole[30].
Most of the existing models is part of a hierarchical musical structure[7]where there is an overview of the music divided into several staves (lines), whichare divided into bars and these bars time to time and notes. For this project, itwill be added to the model an even deeper hierarchy which will include infor-mation on the scores and the page of the score. A computational possibility toachieve such representation is to use an object-oriented model [32], to define therepresentation of a set of objects with attributes valued.
Such valued attributes should store the musical notation of a symbol as wellas register symbol information within the image. For this reason, we divide themusical symbolic representation for OMR in two parts, one that represents themusic information and another that represents the image information.
The valued data of the original image that was found a musical symbol arenecessary to allow a reassessment of erroneously recognized data. This wouldrequest the computer vision to remade a given symbol validation conferenceautomatically.
Other original image data may be stored relate to the initial processing madein the image. Information such as brightness, contrast, color, rotation, transla-tion, histogram and what steps were performed to remove the artifacts becomesnecessary for preprocessing can be adjusted by changing these parameters in anattempt to improve the quality of page reading.
2.5 Output
This last step generates a file representing the original score using a Symbolicrepresentation. The definition of the symbolic representation format is a criticaltask in the development of this tool. This setting will influence the tool develop-ment since the validation of recognized symbols in the representation model canassist the learning algorithm of computer vision stage and thus reduce the needfor human intervention in the process of transcription of digitized music.
The output of the tool should be as interoperable as possible in order to allowany possibility of editing and human intervention to correct a generated score,if this is necessary. Human correction performed in a score with identificationproblems can serve as a new entry in the system as it would enable a new learningstep for the proposed algorithms.
The evaluation of adaptation takes into account a) the symbols used in thesescores b) the hierarchical computational representation of this set of symbols,c) the lexical, syntactic and semantic rules to allow scores correction in thesymbolic format and d) converting this set of symbols to commonly used formatsin musical applications.
Proc. of the 12th International Symposium on CMMR, Sao Paolo, Brazil, July 5-8, 2016
56

Copista - OMR System for Historical Musical Collection Recovery 7
3 Partial Results
The recognition process of musical scores is done through steps that includeimage preprocessing (removal of possible noise and artifacts), segmentation (se-paration of elements in the images), detection, classification and recognition ofmusical elements.
This functionality separation created a chain of processes that may be chan-ged individually based on successes and errors. Based on this chain, our firstimplementation separated each step of processing independently allowing eachpart to use a different programming language and exchanging data through fileexchange.
Next, we present separated outcome from every phase of our process chain.
3.1 Image acquisition
The first issue faced during the Image Acquisition step regards the paper size.The music sheets are bigger than A4 sheet, so they do not fit in a regulartable scanner. Moreover, considering the popularization of smartphones withhigh-resolution cameras, we decided to establish a camera-based setup for imageacquisition. Consequently, the generated dataset is built taking into the accountthe use of the proposed approach in a more dynamic environment, leveragingfrom commonly available new technologies.
Nevertheless, it is also important to identify accurately the page borders andcontours in order to verify how consistent the dataset is. Therefore, the imageacquisition step uses a set of predefined rules to scan like keep image proportion,scan all files with the same distance, use the same chroma key under music files,and scan both side of paper independently if there are information on both side.Fig. 4 illustrates the built setup to accomplish the image acquisition.
Fig. 4: Image acquisition setup
Proc. of the 12th International Symposium on CMMR, Sao Paolo, Brazil, July 5-8, 2016
57
8 Laia et al.
The Acquisition phase generates image files to the Preprocessing phase. Thesefile libraries are also considered a first outcome of the project because we keeporiginal data as it is.
3.2 Preprocessing
The input of the preprocessing phase is the acquired digital image. This stepprepares the image for computer vision process. For this step, initially the inputfile pass through a crop algorithm, to eliminate the area outside the score. Thisis done to erase the chroma key area outside the paper. After that, next stepinvolves detecting holes inside score and classify the images according to thesize of their most visible defects. Handling efficiently the holes are the hardestchallenge on preprocessing. So, after the crop, these holes are measured using aconnected components detection algorithm, using the easily spotted chrome keycolor to find the components.
With all holes measured, one can classify the scores according to the degreeof degradation suffered. Scores with higher count of holes or with bigger holesare classified as highly damaged. Smaller holes classifies the input score as milddamaged. Finally, if the scores has minimum holes or no holes, it is classified asno damaged. Thus, it is possible to analyze if the score has to pass through allpreprocessing steps or if it can skip some. In this initial stage, only the scoresclassified as no damaged are being processed, while the team investigates howto handle the holes with context-aware filling techniques. This classification isalso a partial outcome and can help to evaluate how damage is a collection.
After classification, the scores are converted to grayscale and after that, theimage contrast is increased using histogram equalization. The high contrast in-creases the difference between the shades in each region and help the binarizationto better decide if each pixel is background or object. Fig. 5 show the results ofsame method, with and without histogram equalization. Using histogram equa-lization allowed to erase less information from the image, keeping almost all thelines.
Using histogram equalized inputs, three binarization algorithms have alreadybeen tested: Niblack, Savuola and Wolf. All three methods works locally and theresults are shown in Fig. 6. These are the final images in this stage of the Copistaflow, and will be the inputs for the next step.
3.3 Recognition and Description
The initial algorithms on Recognition step used image comparison to identifythe music elements on the score. To ensure an initial sample of elements, a setof non-manuscript figures was used in our preliminary tests. We choose to usenon-manuscript scores despite the fact of these images have good contours anda predictable shapes. Since we did not use scanned files in this stage, we did notuse preprocessing in our initial tests. After these tests, it will be possible to useour algorithms on the target collections, adapting the algorithms if necessary.
Proc. of the 12th International Symposium on CMMR, Sao Paolo, Brazil, July 5-8, 2016
58

Copista - OMR System for Historical Musical Collection Recovery 9
(a) Niblack without histogram equaliza-tion
(b) Niblack after histogram equaliza-tion
Fig. 5: Difference between binarization without and with histogram equalization
(a) Niblack (b) Savuola (c) Wolf
Fig. 6: Tested methods with same score
We started the elements recognition, performing a search for the staves onthe image. The staves are considered the meaning area on this step since itslocation can be used to delimit the boundary of notes and marks. To discoverthe staves we used the pixels projection of the image, depicted in Fig. 7
The staves are defined as pentagrams, which are five peak at the graphic,representing the five lines in each stave [34]. As it is possible to have notesand other graphical elements above or below the staves, we considered as ourmeaning area an vertical extension of the staves, as presented in Fig. 8.
After the definition of the staves, the five lines used to define the pentagramsare eliminated from the image, taking care to not remove or damage any elementlocated over the line. Once the line is removed, it is easier to search for objectson the staff, as notice in Fig. 9
Once we have a score without lines, algorithms to recognize objects is appliedto find music notes and marking. These algorithms will detach every element ofthe stave for future recognition, description and classification as illustrated inFig. 10.
The detached elements will have an associated value as a unique identifierduring the recognition process. The background image is displayed with the
Proc. of the 12th International Symposium on CMMR, Sao Paolo, Brazil, July 5-8, 2016
59
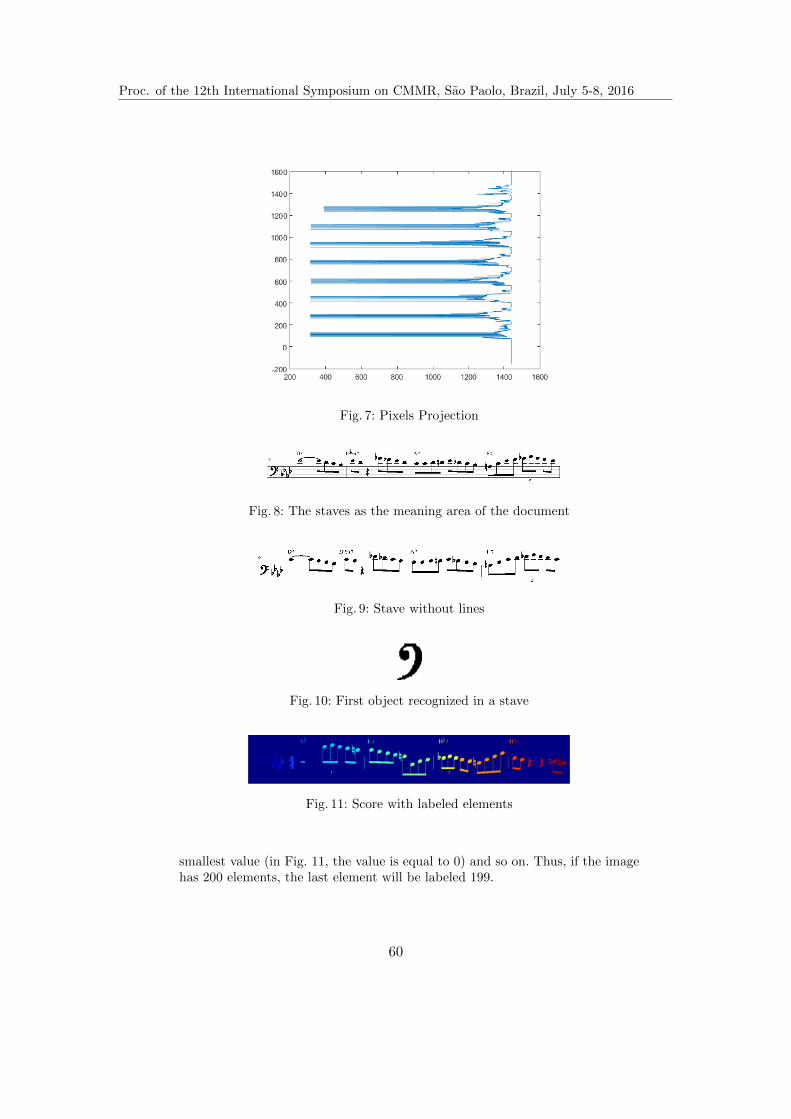
10 Laia et al.
Fig. 7: Pixels Projection
Fig. 8: The staves as the meaning area of the document
Fig. 9: Stave without lines
Fig. 10: First object recognized in a stave
Fig. 11: Score with labeled elements
smallest value (in Fig. 11, the value is equal to 0) and so on. Thus, if the imagehas 200 elements, the last element will be labeled 199.
Proc. of the 12th International Symposium on CMMR, Sao Paolo, Brazil, July 5-8, 2016
60
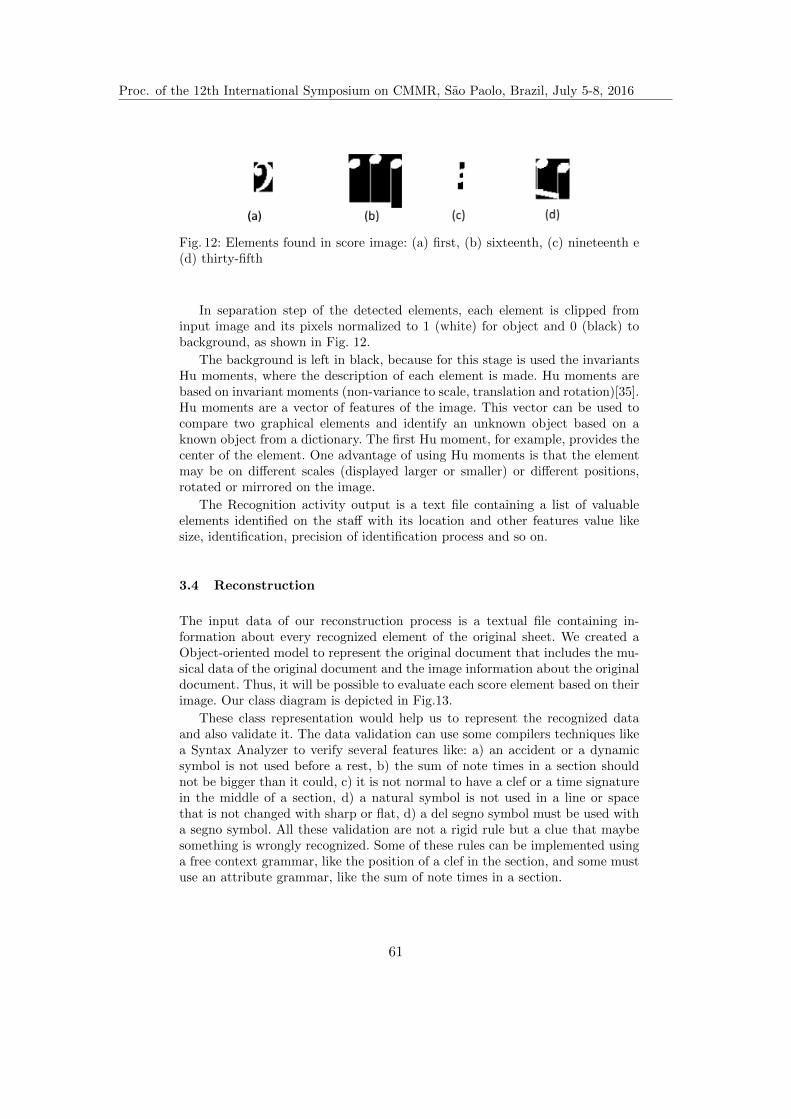
Copista - OMR System for Historical Musical Collection Recovery 11
Fig. 12: Elements found in score image: (a) first, (b) sixteenth, (c) nineteenth e(d) thirty-fifth
In separation step of the detected elements, each element is clipped frominput image and its pixels normalized to 1 (white) for object and 0 (black) tobackground, as shown in Fig. 12.
The background is left in black, because for this stage is used the invariantsHu moments, where the description of each element is made. Hu moments arebased on invariant moments (non-variance to scale, translation and rotation)[35].Hu moments are a vector of features of the image. This vector can be used tocompare two graphical elements and identify an unknown object based on aknown object from a dictionary. The first Hu moment, for example, provides thecenter of the element. One advantage of using Hu moments is that the elementmay be on different scales (displayed larger or smaller) or different positions,rotated or mirrored on the image.
The Recognition activity output is a text file containing a list of valuableelements identified on the staff with its location and other features value likesize, identification, precision of identification process and so on.
3.4 Reconstruction
The input data of our reconstruction process is a textual file containing in-formation about every recognized element of the original sheet. We created aObject-oriented model to represent the original document that includes the mu-sical data of the original document and the image information about the originaldocument. Thus, it will be possible to evaluate each score element based on theirimage. Our class diagram is depicted in Fig.13.
These class representation would help us to represent the recognized dataand also validate it. The data validation can use some compilers techniques likea Syntax Analyzer to verify several features like: a) an accident or a dynamicsymbol is not used before a rest, b) the sum of note times in a section shouldnot be bigger than it could, c) it is not normal to have a clef or a time signaturein the middle of a section, d) a natural symbol is not used in a line or spacethat is not changed with sharp or flat, d) a del segno symbol must be used witha segno symbol. All these validation are not a rigid rule but a clue that maybesomething is wrongly recognized. Some of these rules can be implemented usinga free context grammar, like the position of a clef in the section, and some mustuse an attribute grammar, like the sum of note times in a section.
Proc. of the 12th International Symposium on CMMR, Sao Paolo, Brazil, July 5-8, 2016
61

12 Laia et al.
Sheet+Orientation
ImageInformation+size+position+color+bright
Header+title: String+author: String+date: String
Body
Staff Line+text: String
Sections+bar: typeBar+timeSignature: typeTimeSignature+keySignature: typeKeySignature+dynamics: typeDynamics+octaveSigns: typeOctaveSigns+repetitions: typeRepetitions+pedalMarks: typePedalMarks
Note+typeNote+timeNote+articulation: typeArticulation+ornaments: typeOrnaments+noteRelantionship: typeNoteRelantionship
Accidentals+typeAccidentals = flat, sharp, natural, double flat, double sharp
1..*
0..1
5
1
1..*
1
*
Rests+typeRest+timeRest
*
Fig. 13: Object-oriented representation of a Symbolic Music
Another important aspect of our Object model is the possibility to convertit into a common Symbolic Music format file. Next section will present a list ofresearched formats that can be used to this task.
3.5 Output
The tool output must be compatible with some existent tool to allow score editi-ons and corrections. For this reason, we listed several Symbolic Music Notationfile formats that could aim a good output choice.
The researched file formats that can be used as an output format are:
– ABC[23]– MusicXML[14]– Lilypond[22]– Music21[1][8]– GUIDO[17]
All these formats are ASCii and are input file format for several Score Editors.Also, there are several tools to convert one format to other and they are a kindof interchangeable music formats. We also researched other formats like MIDI[2]and NIFF (Notation Interchange File Format)[15] that were discarded since theyuse a binary file format.
4 Conclusion
This project triggered the joint research collaboration from different areas ofComputer Science like Computer Vision, Image Processing, Computer Music,Artificial Intelligence and Compilers. The union of these areas should help the
Proc. of the 12th International Symposium on CMMR, Sao Paolo, Brazil, July 5-8, 2016
62

Copista - OMR System for Historical Musical Collection Recovery 13
development of the desired tool in the project and bringing gains for interdisci-plinary research in the area of Computer Science. In addition to collaboratingas interdisciplinary research in science, the project will also assist in the area ofmusic creating an open-source tool for recognition and rewriting scores.
The first steps of this project involved the research of techniques and com-putational tools to be used in each step of Copista flow. The survey of thesealgorithms allowed preliminary tests in every planned activity with good initialresults. The next steps of the project should merge the raised techniques and co-des through individual steps of this research in a first functional prototype. Pos-sibly, this first prototype will still work with digital music and non-handwrittenfor training recognition of a neural network to be used for decision-making inrelation to the correctness of an identified symbol.
Another step that should be taken soon is to integrate the data representationwith the Computer Vision step and to verify all elements identified by a symbolicmusic compiler. This step should also assist in the training tool, being anotherstep in seeking a more suitable result for the proposed objective.
Referencias
1. Ariza, C. and Cuthbert, M. (2011). The music21 stream: A new object model forrepresenting, filtering, and transforming symbolic musical structures. Ann Arbor,MI: MPublishing, University of Michigan Library.
2. Association, M. M. et al. (1996). The complete MIDI 1.0 detailed specification:incorporating all recommended practices. MIDI Manufacturers Association.
3. Avidan, S. and Shamir, A. (2007). Seam carving for content-aware image resizing.InACM Transactions on graphics (TOG), volume 26, page 10. ACM.
4. Bainbridge, D. and Bell, T. (1997). Dealing with superimposed objects in opticalmusic recognition.
5. Bainbridge, D. and Bell, T. (2001). The challenge of optical music recognition.Computers and the Humanities, 35(2):95–121.
6. Bernsen, J. (1986). Dynamic thresholding of gray-level images. In InternationalConference on Pattern Recognition.
7. Buxton, W., Reeves, W., Baecker, R., and Mezei, L. (1978). The use of hierarchyand instance in a data structure for computer music. Computer Music Journal,pages 10–20.
8. Cuthbert, M. S. and Ariza, C. (2010). music21: A toolkit for computer-aided musi-cology and symbolic music data.
9. Dori, D., Doerman, D., Shin, C., Haralick, R., Phillips, I., Buchman, M., and Ross,D. (1996). Handbook on optical character recognition and document image analysis,chapter the representation of document structure: a generic object-process analysis.
10. Fujinaga, I. (2004). Staff detection and removal. Visual perception of music nota-tion: on-line and off-line recognition, pages 1–39.
11. Fukunaga, K. (2013). Introduction to statistical pattern recognition. Academicpress.
12. Furht, B. (2011). Handbook of augmented reality. Springer Science & BusinessMedia.
13. Gonzalez, R. C., Woods, R. E., and Eddins, S. L. (2004). Digital image processingusing MATLAB. Pearson Education India.
Proc. of the 12th International Symposium on CMMR, Sao Paolo, Brazil, July 5-8, 2016
63

14 Laia et al.
14. Good, M. (2001). Musicxml for notation and analysis. The virtual score: represen-tation, retrieval, restoration, 12:113–124.
15. Grande, C. (1997). The notation interchange file format: A windows-compliantapproach. In Beyond MIDI, pages 491–512. MIT Press.
16. Hewlett, W. B. (1997). Beyond midi. chapter MuseData: Multipurpose Represen-tation, pages 402–447. MIT Press, Cambridge, MA, USA.
17. Hoos, H. H., Hamel, K. A., Renz, K., and Kilian, J. (1998). The guido notationformat – a novel approach for adequately representing score-level music.
18. Koendrik, J. J. (1992). Computational vision (book). Ecological Psychology,4(2):121–128.
19. Laia, M. A. d. M. (2013). Filtragem de Kalman nao linear com redes neuraisembarcada em uma arquitetura reconfiguravel para uso na tomografia de Raios-Xpara amostras da fısica de solos. PhD thesis, Universidade de Sao Paulo.
20. Medina, R. A., Smith, L. A., and Wagner, D. R. (2003). Content-based indexingof musical scores. In Proceedings of the 3rd ACM/IEEE-CS Joint Conference onDigital Libraries, JCDL ’03, pages 18–26, Washington, DC, USA. IEEE ComputerSociety.
21. Mundy, J. L., Zisserman, A., et al. (1992). Geometric invariance in computer vision,volume 92. MIT press Cambridge.
22. Nienhuys, H.-W. and Nieuwenhuizen, J. (2003). Lilypond, a system for automatedmusic engraving. In Proceedings of the XIV Colloquium on Musical Informatics(XIV CIM 2003), volume 1. Citeseer.
23. Oppenheim, I., Walshaw, C., and Atchley, J. (2010). The abc standard 2.0.24. Otsu, N. (1975). A threshold selection method from gray-level histograms. Auto-
matica, 11(285-296):23–27.25. Pinto, T., Rebelo, A., Giraldi, G., and Cardoso, J. S. (2011). Music score binariza-
tion based on domain knowledge. In pattern recognition and image analysis, pages700–708. Springer.
26. Rebelo, A., Fujinaga, I., Paszkiewicz, F., Marcal, A., Guedes, C., and Cardoso,J. (2012). Optical music recognition: state-of-the-art and open issues. InternationalJournal of Multimedia Information Retrieval, 1(3):173–190.
27. Ripley, B. D. (1996). Pattern recognition and neural networks. Cambridge univer-sity press.
28. Sauvola, J. and Pietikainen, M. (2000). Adaptive document image binarization.PATTERN RECOGNITION, 33:225–236.
29. Seixas, F. L., Martins, A., Stilben, A. R., Madeira, D., Assumpcao, R., Mansur,S., Victer, S. M., Mendes, V. B., and Conci, A. (2008). Avaliacao dos metodospara a segmentacao automatica dos tecidos do encefalo em ressonancia magnetica.Simposio de Pesquisa Operacional e Logıstica da Marinha SPOLM.
30. Selfridge-Field, E. (1997). Beyond codes: issues in musical representation. InBeyond MIDI, pages 565–572. MIT Press.
31. Szwoch, M. (2007). Guido: A musical score recognition system. In icdar, pages809–813.
32. Travis Pope, S. (1996). Object-oriented music representation. Organised Sound,1(01):56–68.
33. Xu, L., Krzyzak, A., and Suen, C. (1992). Methods of combining multiple classifiersand their applications to handwriting recognition. Systems, Man and Cybernetics,IEEE Transactions on, 22(3):418–435.
34. A. G. S. e Thiago Margarida, Reconhecimento automatco de smbolos em partiturasmusicais
Proc. of the 12th International Symposium on CMMR, Sao Paolo, Brazil, July 5-8, 2016
64

Copista - OMR System for Historical Musical Collection Recovery 15
35. M.-K. Hu, Visual pattern recognition by moment invariants, InformationTheory,IRE Transactions on, vol. 8, no. 2, pp. 179187, 1962.
Proc. of the 12th International Symposium on CMMR, Sao Paolo, Brazil, July 5-8, 2016
65

Sound and Posture: an Overview of RecentFindings
Lennie Gandemer1,2, Gaetan Parseihian1, Christophe Bourdin2, and RichardKronland-Martinet1 ?
1 LMA, CNRS, UPR 7051, Aix-Marseille Univ, Centrale Marseille, 13402 Marseille,France
2 Aix Marseille Univ, CNRS, ISM UMR 7287, 13288, Marseille, [email protected]
Abstract. Even if it has been neglected for a long time, the soundand posture domain seemed to arouse an increasing interest in recentyears. In the present position paper, we propose to present an overviewof our recent findings on this field and to put them in perspective withthe literature. We will bring evidence to support the view that spatialcues provided by auditory information can be integrated by human fora better postural control.
Keywords: Posture, Sound spatialization, Auditory Perception, Acous-tic Space
1 Introduction
It is well known that human upright stance control leans on the integration bycentral nervous system of various sensory cues [1]. The role of visual, vestibu-lar and proprioceptive inputs has been well documented, leading to complexmultisensory models of postural control (e.g., the Disturbance Estimation andCompensation model, [2]). The role of audition in postural control received lessinterest, in spite of a couple of earlier studies on this issue tending to exhibit aneffect of sound on posture [3, 4]. However, this topic seems from now on to arousean increasing interest, as a couple of studies emerged in the last years [5–10]. Allthese studies, which were conducted in different contexts, tended to show thatsound can influence posture, and more precisely that auditory information canbe integrated by human subjects to decrease their postural sway.
In the framework of a project involving two laboratories, one specializedin acoustics and the other in movement sciences, we conducted several studieson the role of auditory perception in postural control. In the present paper, wepropose to present these studies and to put them on perspective with the existingliterature, to better understand how sound is integrated in the postural control
? This work was funded by the French National Research Agency (ANR) under theSoniMove: Inform, Guide and Learn Actions by Sounds project (ANR-14-CE24-0018-01).
Proc. of the 12th International Symposium on CMMR, Sao Paolo, Brazil, July 5-8, 2016
66
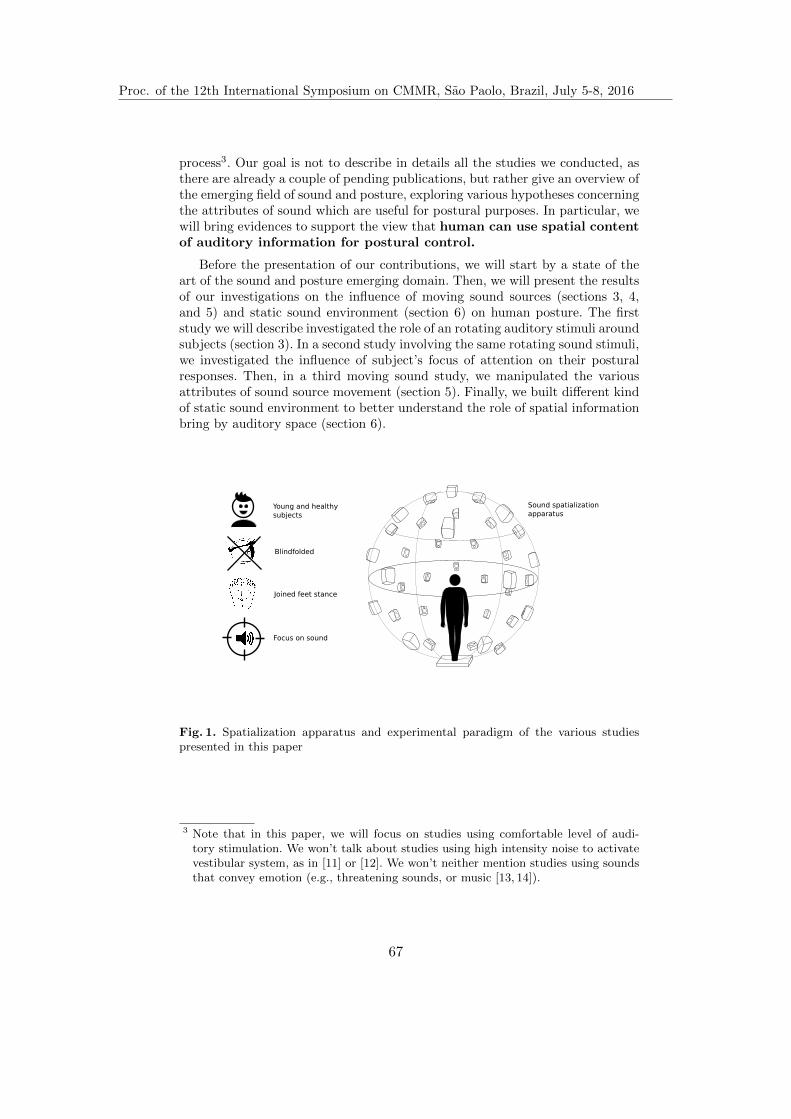
2 Gandemer et al.
process3. Our goal is not to describe in details all the studies we conducted, asthere are already a couple of pending publications, but rather give an overview ofthe emerging field of sound and posture, exploring various hypotheses concerningthe attributes of sound which are useful for postural purposes. In particular, wewill bring evidences to support the view that human can use spatial contentof auditory information for postural control.
Before the presentation of our contributions, we will start by a state of theart of the sound and posture emerging domain. Then, we will present the resultsof our investigations on the influence of moving sound sources (sections 3, 4,and 5) and static sound environment (section 6) on human posture. The firststudy we will describe investigated the role of an rotating auditory stimuli aroundsubjects (section 3). In a second study involving the same rotating sound stimuli,we investigated the influence of subject’s focus of attention on their posturalresponses. Then, in a third moving sound study, we manipulated the variousattributes of sound source movement (section 5). Finally, we built different kindof static sound environment to better understand the role of spatial informationbring by auditory space (section 6).
Joined feet stance
Blindfolded
Focus on sound
Young and healthy subjects
Sound spatializationapparatus
Fig. 1. Spatialization apparatus and experimental paradigm of the various studiespresented in this paper
3 Note that in this paper, we will focus on studies using comfortable level of audi-tory stimulation. We won’t talk about studies using high intensity noise to activatevestibular system, as in [11] or [12]. We won’t neither mention studies using soundsthat convey emotion (e.g., threatening sounds, or music [13, 14]).
Proc. of the 12th International Symposium on CMMR, Sao Paolo, Brazil, July 5-8, 2016
67

Sound and Posture 3
2 State of the art
In this section, we propose to give a quick overview of the sound and posture lit-erature. This literature is not large and may at first glance appear contradictory.Here, we will show that different approaches are responsible of the differences inthe various studies.
Loss of hearing
To our knowledge, the first studies concerning the role of audition in the posturalcontrol concerned the influence of auditory loss on postural sway. In 1985, Eraand Heikkinen [4] showed that the postural sway of young adults who had beenexposed to noise in their work was more pronounced than those who had notbeen exposed. This results was confirmed two years later, in a study by Jununtenet al. [3] investigating the influence auditory loss in soldiers on their posturalcontrol. The soldiers, who had been exposed to high-energy intermittent noisefrom firearms, showed significantly more body sway than the control group;moreover, subjects with more severe hearing loss exhibited more sway than thosewith less severe hearing loss.
Similar results were obtained later, with workers [15] and congenitally deafchildren [16] or adults [10]. But the most numerous studies concerned hearingloss in the elderly and its association with an increased risk of falling (e.g. [17]and [18]). Some authors suggested that this association might be explained bya global age-related loss of vestibular function, in which auditory loss is simplya marker for vestibular losses leading to imbalance. However, a recent study byRumalla et al. [7] compared the postural sway of hearing-aid users, in aided (aidswitched on) or unaided (aid switched off) conditions. Postural performance ofsubjects was significantly better in the aided than the unaided condition whichproves the benefits of having auditory input fully available.
Finally, a study conducted by Kanegaonkar et al. [19] compared the posturalsway of subjects in various auditory environment: normal room vs soundproofroom, wearing ear defenders or not, eyes closed vs eyes open. With their eyesopen, subjects exhibited a greater sway when there were set in the soundproofroom vs in a normal room, or wearing ear defenders vs without ear defenders.
Thus, all these studies tend to show that the lack of auditory input resultsin subjects exhibiting a poorer postural control. It suggests that humansintegrate sound in their postural control process, opening the way to studies onsound and posture interactions. However, we will see in the following that theinfluence of sound on posture has been little studied to date.
The sound helps to stabilize...
Firstly, a couple of studies involving static sound stimulation exhibited a decreaseof sway in presence of sound stimuli. In a study conducted by Easton et al. [20],subjects were set in a tandem Romberg stance (heel-to-toe position) with twosound sources on both sides of their head, eyes open vs eyes closed. Authors
Proc. of the 12th International Symposium on CMMR, Sao Paolo, Brazil, July 5-8, 2016
68
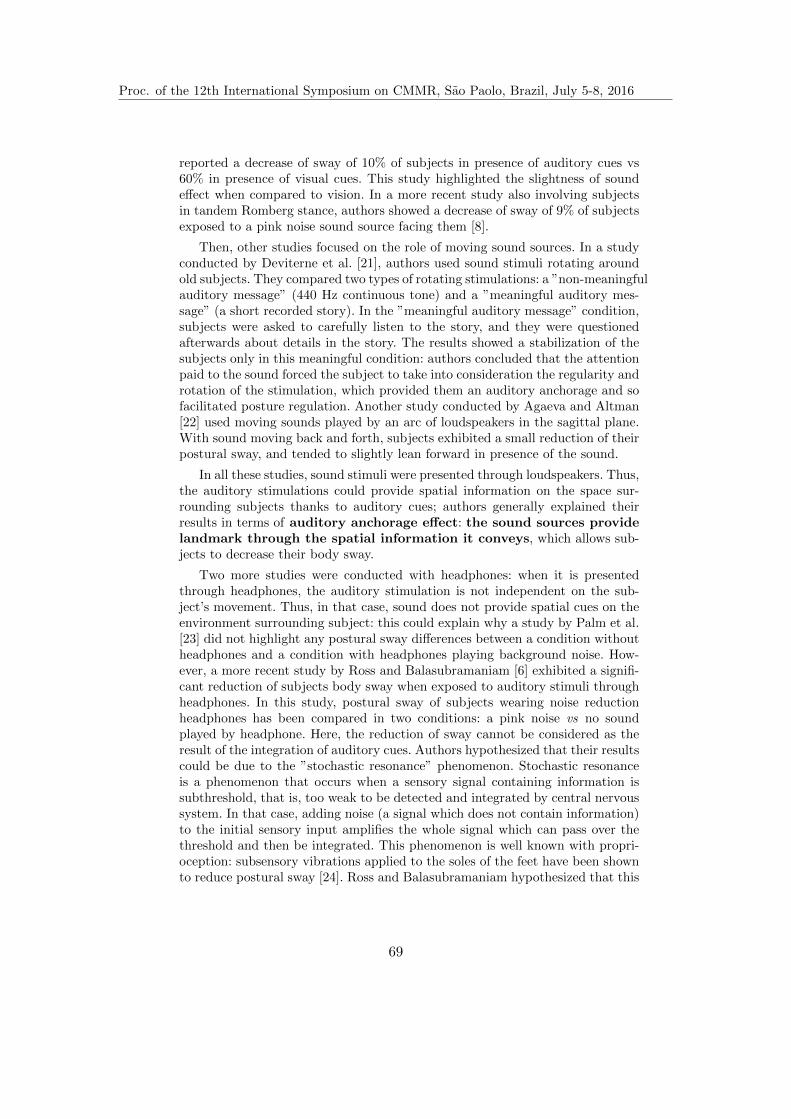
4 Gandemer et al.
reported a decrease of sway of 10% of subjects in presence of auditory cues vs60% in presence of visual cues. This study highlighted the slightness of soundeffect when compared to vision. In a more recent study also involving subjectsin tandem Romberg stance, authors showed a decrease of sway of 9% of subjectsexposed to a pink noise sound source facing them [8].
Then, other studies focused on the role of moving sound sources. In a studyconducted by Deviterne et al. [21], authors used sound stimuli rotating aroundold subjects. They compared two types of rotating stimulations: a ”non-meaningfulauditory message” (440 Hz continuous tone) and a ”meaningful auditory mes-sage” (a short recorded story). In the ”meaningful auditory message” condition,subjects were asked to carefully listen to the story, and they were questionedafterwards about details in the story. The results showed a stabilization of thesubjects only in this meaningful condition: authors concluded that the attentionpaid to the sound forced the subject to take into consideration the regularity androtation of the stimulation, which provided them an auditory anchorage and sofacilitated posture regulation. Another study conducted by Agaeva and Altman[22] used moving sounds played by an arc of loudspeakers in the sagittal plane.With sound moving back and forth, subjects exhibited a small reduction of theirpostural sway, and tended to slightly lean forward in presence of the sound.
In all these studies, sound stimuli were presented through loudspeakers. Thus,the auditory stimulations could provide spatial information on the space sur-rounding subjects thanks to auditory cues; authors generally explained theirresults in terms of auditory anchorage effect: the sound sources providelandmark through the spatial information it conveys, which allows sub-jects to decrease their body sway.
Two more studies were conducted with headphones: when it is presentedthrough headphones, the auditory stimulation is not independent on the sub-ject’s movement. Thus, in that case, sound does not provide spatial cues on theenvironment surrounding subject: this could explain why a study by Palm et al.[23] did not highlight any postural sway differences between a condition withoutheadphones and a condition with headphones playing background noise. How-ever, a more recent study by Ross and Balasubramaniam [6] exhibited a signifi-cant reduction of subjects body sway when exposed to auditory stimuli throughheadphones. In this study, postural sway of subjects wearing noise reductionheadphones has been compared in two conditions: a pink noise vs no soundplayed by headphone. Here, the reduction of sway cannot be considered as theresult of the integration of auditory cues. Authors hypothesized that their resultscould be due to the ”stochastic resonance” phenomenon. Stochastic resonanceis a phenomenon that occurs when a sensory signal containing information issubthreshold, that is, too weak to be detected and integrated by central nervoussystem. In that case, adding noise (a signal which does not contain information)to the initial sensory input amplifies the whole signal which can pass over thethreshold and then be integrated. This phenomenon is well known with propri-oception: subsensory vibrations applied to the soles of the feet have been shownto reduce postural sway [24]. Ross and Balasubramaniam hypothesized that this
Proc. of the 12th International Symposium on CMMR, Sao Paolo, Brazil, July 5-8, 2016
69
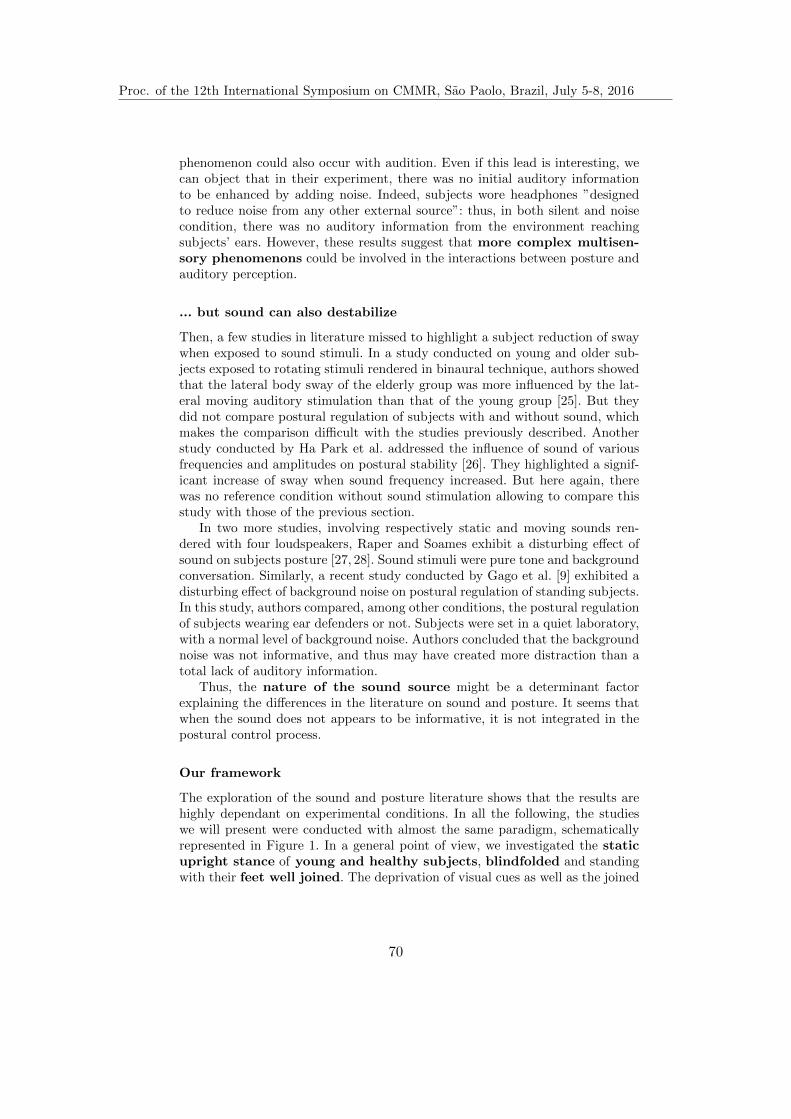
Sound and Posture 5
phenomenon could also occur with audition. Even if this lead is interesting, wecan object that in their experiment, there was no initial auditory informationto be enhanced by adding noise. Indeed, subjects wore headphones ”designedto reduce noise from any other external source”: thus, in both silent and noisecondition, there was no auditory information from the environment reachingsubjects’ ears. However, these results suggest that more complex multisen-sory phenomenons could be involved in the interactions between posture andauditory perception.
... but sound can also destabilize
Then, a few studies in literature missed to highlight a subject reduction of swaywhen exposed to sound stimuli. In a study conducted on young and older sub-jects exposed to rotating stimuli rendered in binaural technique, authors showedthat the lateral body sway of the elderly group was more influenced by the lat-eral moving auditory stimulation than that of the young group [25]. But theydid not compare postural regulation of subjects with and without sound, whichmakes the comparison difficult with the studies previously described. Anotherstudy conducted by Ha Park et al. addressed the influence of sound of variousfrequencies and amplitudes on postural stability [26]. They highlighted a signif-icant increase of sway when sound frequency increased. But here again, therewas no reference condition without sound stimulation allowing to compare thisstudy with those of the previous section.
In two more studies, involving respectively static and moving sounds ren-dered with four loudspeakers, Raper and Soames exhibit a disturbing effect ofsound on subjects posture [27, 28]. Sound stimuli were pure tone and backgroundconversation. Similarly, a recent study conducted by Gago et al. [9] exhibited adisturbing effect of background noise on postural regulation of standing subjects.In this study, authors compared, among other conditions, the postural regulationof subjects wearing ear defenders or not. Subjects were set in a quiet laboratory,with a normal level of background noise. Authors concluded that the backgroundnoise was not informative, and thus may have created more distraction than atotal lack of auditory information.
Thus, the nature of the sound source might be a determinant factorexplaining the differences in the literature on sound and posture. It seems thatwhen the sound does not appears to be informative, it is not integrated in thepostural control process.
Our framework
The exploration of the sound and posture literature shows that the results arehighly dependant on experimental conditions. In all the following, the studieswe will present were conducted with almost the same paradigm, schematicallyrepresented in Figure 1. In a general point of view, we investigated the staticupright stance of young and healthy subjects, blindfolded and standingwith their feet well joined. The deprivation of visual cues as well as the joined
Proc. of the 12th International Symposium on CMMR, Sao Paolo, Brazil, July 5-8, 2016
70

6 Gandemer et al.
feet stance allowed to set subjects in a slightly uncomfortable postural situation,inducing increased postural sways and the need to actively control the posture.This also allows to better observe the expected effects of the auditory stimuliexposure. Subjects’ postural sway was measured using a force platform, andsound stimuli were produced using sound spatialization techniques in anauditory CAVE (a spherical loudspeakers array surrounding the subjects pre-sented in [29]). Subjects were asked to stand still, and their task was to focuson sound stimuli.
3 First experiment: when a moving sound stabilizes
In a first experiment described in [5], we addressed the role of a rotating soundsource on the postural sway of standing subjects. Twenty young subjects, stand-ing in the dark on a force platform, were exposed to a pink noise sound sourcerotating around them at various speeds. Subjects were asked to stay still whilefocusing on the moving sound itself (counting the number of laps completed bythe sound source).
Our first hypotheses were based on studies manipulating visual informa-tion for postural control. Moving visual stimuli are known to induce posturalresponses [30]. Similarly, we thought that a moving auditory stimulus could in-duce postural sway. Moreover, a rotating sound can possibly induce circularvection (illusory self-motion) [31]. We wanted to explore the postural responseof subjects exposed to circular vection, as it is known that vection go along withpostural responses [32].
However, subjects did not experience any vection. On the contrary, our resultsdemonstrated that they rather decreased their postural sway when con-fronted to rotating auditory stimuli. Indeed, subjects’ amplitude of sway aswell as mean sway velocity decreased in presence of rotating sound, when com-pared to the reference conditions (without sound or with a static sound sourcefacing them). The decrease of the sway went to 30% with the quickest rotat-ing sound. These counter-intuitive results suggests that auditory information,which is by nature very different from visual information, may be processed andintegrated in a different way.
Then, these results raised numerous questions and hypotheses: Did the sub-jects build a more stable representation of acoustic space using this surroundingrotating sound source? If so, what would have happened with less regular dis-placements of the sound? What about the role of subjects counting task andsound-focus task? Did the perception of moving auditory sources activate move-ment control centers? Could we get the same results with a rich static soundenvironment?
The first question we chose to address is the role of the subjects’ focus ofattention in the effects observed with a rotating sound. Indeed, the instructedfocus of attention of subjects is known to play a role on their postural responses[33]. In our rotating sound study, subjects were asked to focus on sound sourcedisplacement and to count number of laps completed by the sound source. Thus,
Proc. of the 12th International Symposium on CMMR, Sao Paolo, Brazil, July 5-8, 2016
71

Sound and Posture 7
the reduction of postural sway could have been due to this task implying anexternal focus of attention and a slight cognitive load.
4 Focus on sound: a tree hidding the wood
In a second study (currently under review), we addressed the role of attentionalfocus in the integration of dynamic sound information for postural purposes. Tothis end, we followed a procedure very similar to the first rotating sound studydescribed section 3: we produced the same rotating auditory stimuli aroundblindfolded subjects (n=17) in the same stance, and the same reference auditoryconditions (without sound and with one static sound source facing subjects). Wethen compared their postural regulation when completing three different tasks:
– a postural-focus task: stay still, focusing on postural control (a single ref-erence postural task)
– a sound-focus task: stay still, focusing on sound (dual-task: the same thanin section 3)
– a mental arithmetic task: stay still while counting backward by 7 (purelycognitive dual-task)
Unsurprisingly, the effect of sound condition on postural sway described inthe previous experiment was observed again in the sound-focus task, which cor-responds exactly to the same task than the first experiment (see the gray barsFigure 2.a). However, in the two other tasks (postural-focus task and mentalarithmetic task), results showed that sound conditions have no longer signifi-cant effect on postural control. This could have been explained in two ways: 1-subjects necessitated to allocate more attention to sound to be able to integrateauditory information or 2- subjects did not integrate sound and their decreaseof sway in the sound-focus task is only due to the cognitive counting task, notpresent in the two reference conditions without sound and with a static sound.The results obtained in the two other tasks support the first explanation. Indeed,in the mental arithmetic task (which is purely cognitive) the subjects exhibiteda significantly higher sway velocity than in the two other tasks (see Figure 2.b),associated with a small amplitude of sway, whatever the sound condition. This”freezing” behavior, different from subjects’ behavior in the two other tasks, isconsistent with what have been observed in the literature when subjects are ex-posed to cognitive loads [34]. Moreover, subjects exhibited a significantly smallervelocity of sway in the sound-focus task than in the reference postural-focus task,which proves that they integrated the auditory information in the former andnot in the latter.
Thus, with this second experiment, we showed that the subjects stabi-lization observed in our first rotating study(section 3) was not due to theircounting task, but rather to the integration of auditory information. We alsoshowed that focus on sound is necessary to allows subjects to integratethis auditory information. The results of our two first rotating sound studiescould be related to the results of the earlier study by Deviterne et al. [21] in
Proc. of the 12th International Symposium on CMMR, Sao Paolo, Brazil, July 5-8, 2016
72

8 Gandemer et al.
Static Sound 20°/s 60°/s 180°/s3
4
5
6
7
8
9
10
11
12
Sound stimulus
Are
a w
ith
in t
he s
way p
ath
(cm
2)
Postural focus taskSound focus taskMental arithmetic task
1.5
2
2.5
3
Task
Mean s
way v
elo
city
(cm
/s)
**
***
**
*
*
a. b.
Fig. 2. Results of the rotating sound study with various focus of attention of subjects.Mean on 17 subjects. a. Area within the sway path across the five sound conditionsand the three tasks. b. Mean sway velocity across the three tasks. Bars represent the95% confidence interval.
which authors compared the effect of two types of rotating stimulations aroundsubjects: a ”non-meaningful auditory message” (440 Hz continuous tone) anda ”meaningful auditory message” (a short recorded story). In ”meaningful au-ditory message” condition, subjects had a similar sound-focus task: they wereasked to carefully listen to the story. Similarly to our study, their results showeda stabilization of the subjects only in this sound-focus task. Authors concludedthat the attention paid to the rotating sound forced the subject to take into con-sideration the regularity and rotation of the stimulation, which provided theman auditory anchorage allowing to improve their posture regulation. Similarly,we postulate that allocating more attention to the sound favors the in-tegration of auditory information for postural purpose. For that purpose,to stimulate the potential effects of sound on posture, we chose to give subjectsa sound-focus task in all the following studies.
Of course, this very interesting and new effect of sound stimulation on postu-ral control remains of small amplitude, mainly when referred to possible effectsof vision on posture. For example, in the study by Easton et al. [20] conductedwith subjects standing in between two static sound sources, eyes closed versuseyes open, authors showed a decrease of sway of 10% with auditory cues against60% with the visual cues. In comparison, our results suggesting a decrease ofsway amplitude of about 30% with sounds appears as the only study which suchresults. The explanation may lead to the typology of the sounds used and to theway we produced the auditory stimulation. It is now clear that the quality of ourinnovating experimental device could be part of the explanation. The following
Proc. of the 12th International Symposium on CMMR, Sao Paolo, Brazil, July 5-8, 2016
73

Sound and Posture 9
experiments will question these points, exploring the various attributes of soundpossibly involved in the stabilization.
5 Dissecting movement: space vs morphology
A sound source which is moving in space provokes variations of the acoustic cues(interaural time difference, interaural level difference and head related transferfunction) human uses to localize it [35]. Such variations represent what is tra-ditionally labeled as the spatial attributes of a moving sound. But a movingsound source also intrinsically contains information on its own movement: itsspectral content will be modified by the Doppler effect, filtering due to the airabsorption, or changes in the ratio between direct sound and reverberate sound[36]. It is what we will call here the morphological features of a moving soundsource.
In real world, dynamic as well as morphological features of a moving soundsource are mixed up. A sound source moving in space induces modifications ofits spatial and morphological attributes. Experimentally, we can separately syn-thesize these both attributes. We can then apply various attributes to a staticsource to evoke movement. On the one hand, there are various sound spatial-ization techniques allowing to control the spatial displacement of virtual soundsources. In our rotating sound studies we used a sound spatialization techniquecalled High Order Ambisonics (see [29]). On the other hand, it is possible toimplement separately each morphological feature linked to one movement. Forexample, by applying the equivalent Doppler effect of a moving sound source toa static sound rendered in mono, we can easily create a strong source movementimpression [37].
In our first rotating sound study, we showed that a rotating sound sourcearound subjects induced a decrease of their body sway. To explain this stabiliza-tion, we can formulate two hypotheses:
– the stabilization provoked by the rotating sound could be due to changesin the spatial cues, which are integrated by our auditory system andgive spatial landmarks which can be used to stabilize. In this case, we canwonder in what extend the regularity and predictability of the trajectory isimportant to allow stabilization.
– more simply, postural responses to the rotating sound could be due to themotion perception in general. As our postural control is managed by motorcontrol areas, a moving sound perception could possibly activate brain areaslinked to the movement. In this latter case, the only evoked movement simplyby morphological treatments of sound could be sufficient to induce posturalchanges.
To explore concomitantly these two hypotheses, we decided to dissect therotating sound scenario which produced the better stabilization in our first stud-ies, separating spatial from morphological features of sound. For that purpose,
Proc. of the 12th International Symposium on CMMR, Sao Paolo, Brazil, July 5-8, 2016
74
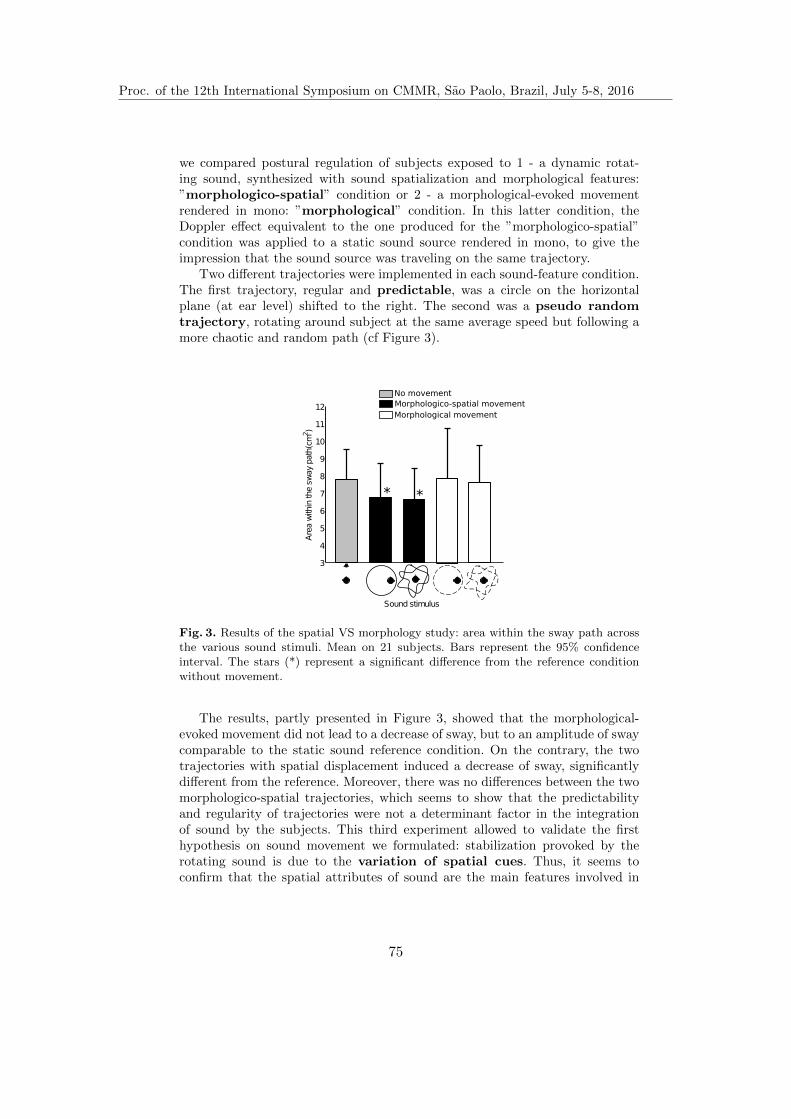
10 Gandemer et al.
we compared postural regulation of subjects exposed to 1 - a dynamic rotat-ing sound, synthesized with sound spatialization and morphological features:”morphologico-spatial” condition or 2 - a morphological-evoked movementrendered in mono: ”morphological” condition. In this latter condition, theDoppler effect equivalent to the one produced for the ”morphologico-spatial”condition was applied to a static sound source rendered in mono, to give theimpression that the sound source was traveling on the same trajectory.
Two different trajectories were implemented in each sound-feature condition.The first trajectory, regular and predictable, was a circle on the horizontalplane (at ear level) shifted to the right. The second was a pseudo randomtrajectory, rotating around subject at the same average speed but following amore chaotic and random path (cf Figure 3).
3
4
5
6
7
8
9
10
11
12
Sound stimulus
Are
aw
ithin
the
sway
path
(cm
2 )
No movementMorphologico-spatial movementMorphological movement
* *
Fig. 3. Results of the spatial VS morphology study: area within the sway path acrossthe various sound stimuli. Mean on 21 subjects. Bars represent the 95% confidenceinterval. The stars (*) represent a significant difference from the reference conditionwithout movement.
The results, partly presented in Figure 3, showed that the morphological-evoked movement did not lead to a decrease of sway, but to an amplitude of swaycomparable to the static sound reference condition. On the contrary, the twotrajectories with spatial displacement induced a decrease of sway, significantlydifferent from the reference. Moreover, there was no differences between the twomorphologico-spatial trajectories, which seems to show that the predictabilityand regularity of trajectories were not a determinant factor in the integrationof sound by the subjects. This third experiment allowed to validate the firsthypothesis on sound movement we formulated: stabilization provoked by therotating sound is due to the variation of spatial cues. Thus, it seems toconfirm that the spatial attributes of sound are the main features involved in
Proc. of the 12th International Symposium on CMMR, Sao Paolo, Brazil, July 5-8, 2016
75
Sound and Posture 11
subjects stabilization. We explore this hypothesis more in detail in the nextsection.
6 Static sound environment for postural stabilization
In the previous sections, we showed that a moving sound source around a subjectcan help him to stabilize, but that the precise movement of the trajectory is notof interest. Thus, we can hypothesize that subjects use the spatial cues they canget from the moving source. Therefore, we wonder to what extent the movingsound could be replaced by several static sources surrounding subjects. Indeed,static sources also provide spatial cues, and we can imagine that it would beat least as easy for subjects to build their representation or spatial surroundingenvironment from static spatial cues than from changing cues.
In this section, we will present two studies we conducted with static soundstimuli. The main idea behind these two studies was to investigate if subjectswere able to construct a putative ”auditory landmark” using spatial cues fromstatic sound sources, and then reach the same stabilization effects than thoseobserved with rotating sounds.
Construction of an auditory environment
In our first studies, we showed that one static sound source facing subjects wasnot sufficient to provide an important decrease of sway of subjects. Thus, webuilt a richer auditory environment with three recordings of ecological sources4: amotor, a fountain and a cicada. These 3 sources were positioned around subjects,and we compared postural sway of subjects (n=35) exposed to 1, 2 or 3 sources,and in the absence of sound. Subjects were asked to focus on sound, counting thenumber of sources surrounding them. This study was conducted in a normal roomand in an anechoic soundproof room. Indeed, in an soundproof environment,there is no background noise: the reference condition is perfectly silent. Moreover,a single source provides more spatial information in a normal room (thanks tosound reflection in the space) than in an anechoic room. We wanted to know if thereduced information provided by sound in the anechoic soundproof environmentcould result in subjects exhibiting greater postural sway than in a normal room.
Subjects exhibited a decrease of their postural sway in presence of staticsound sources, when compared to the reference condition without sound (Figure4.a). Moreover, adding sources seemed to reinforce the decrease of sway, althoughthis tendency was not found to be significant. The decrease of sway went to 10%with 3 static sources. This result is in accordance with other studies involvingstatic sound stimuli. As mentioned before, Easton et al. [20] have reported adecrease of sway of 10% of subjects in tandem Romberg stance (heel-to-toe po-sition) with two sound sources on both sides of subject head. In a more recent
4 The sources are labelled ”ecological” because they represent sounds which exist innature, in contrast to more abstract sound source as pink noise
Proc. of the 12th International Symposium on CMMR, Sao Paolo, Brazil, July 5-8, 2016
76
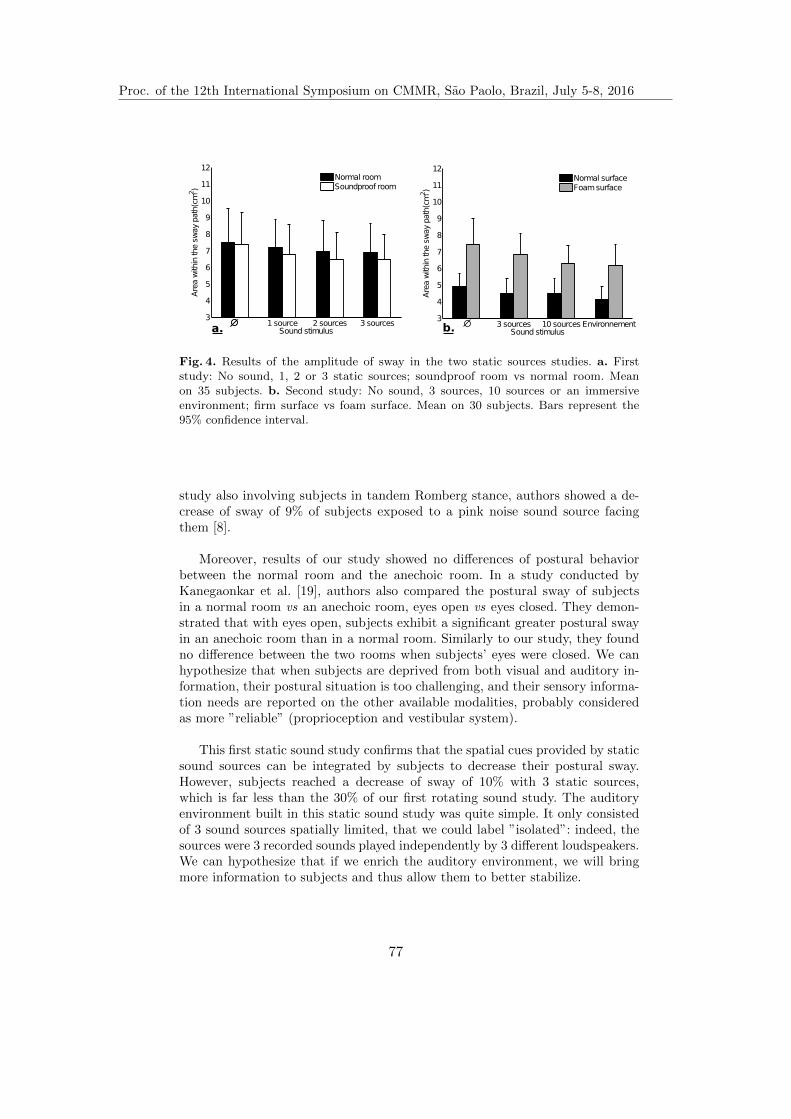
12 Gandemer et al.
1 source 2 sources 3 sources3
4
5
6
7
8
9
10
11
12
Sound stimulus
Areawithintheswaypath(cm2 )
Normal roomSoundproof room
3 sources 10 sources Environnement3
4
5
6
7
8
9
10
11
12
Sound stimulus
Areawithintheswaypath(cm2 )
Normal surfaceFoamsurface
a. b.
Fig. 4. Results of the amplitude of sway in the two static sources studies. a. Firststudy: No sound, 1, 2 or 3 static sources; soundproof room vs normal room. Meanon 35 subjects. b. Second study: No sound, 3 sources, 10 sources or an immersiveenvironment; firm surface vs foam surface. Mean on 30 subjects. Bars represent the95% confidence interval.
study also involving subjects in tandem Romberg stance, authors showed a de-crease of sway of 9% of subjects exposed to a pink noise sound source facingthem [8].
Moreover, results of our study showed no differences of postural behaviorbetween the normal room and the anechoic room. In a study conducted byKanegaonkar et al. [19], authors also compared the postural sway of subjectsin a normal room vs an anechoic room, eyes open vs eyes closed. They demon-strated that with eyes open, subjects exhibit a significant greater postural swayin an anechoic room than in a normal room. Similarly to our study, they foundno difference between the two rooms when subjects’ eyes were closed. We canhypothesize that when subjects are deprived from both visual and auditory in-formation, their postural situation is too challenging, and their sensory informa-tion needs are reported on the other available modalities, probably consideredas more ”reliable” (proprioception and vestibular system).
This first static sound study confirms that the spatial cues provided by staticsound sources can be integrated by subjects to decrease their postural sway.However, subjects reached a decrease of sway of 10% with 3 static sources,which is far less than the 30% of our first rotating sound study. The auditoryenvironment built in this static sound study was quite simple. It only consistedof 3 sound sources spatially limited, that we could label ”isolated”: indeed, thesources were 3 recorded sounds played independently by 3 different loudspeakers.We can hypothesize that if we enrich the auditory environment, we will bringmore information to subjects and thus allow them to better stabilize.
Proc. of the 12th International Symposium on CMMR, Sao Paolo, Brazil, July 5-8, 2016
77

Sound and Posture 13
Toward a more immersive environment
For that purpose, in a last experiment, we decided to create richer auditoryenvironments by means of two different approaches: firstly, adding other isolatedsources, using more samples played by other loudspeakers. Secondly, by recordinga real sound environment and then by re-synthesizing it in our auditory CAVEusing ambisonics spatialization techniques. These techniques aim to recreate anauditory stimulation closer to natural listening. Thus, the auditory environmentrecreated in the spatialization apparatus was much more realistic and immersivethan what we could create adding isolated sources on separate loudspeakers.
Thus, in this study, we used four different auditory conditions:
– a reference condition without sound– 3 isolated ecological sources (same condition as the previous static sound
experiment)– 10 isolated ecological sources– an immersive environment consisted of the same kind of ecological sources
(fountain, motor sound and cicadas) recorded and re-synthesized in ambison-ics.
Moreover, in this study, we decided to compare two surfaces conditions: sub-jects standing either on a firm surface (as in the other static sound experiment),or on foam. The foam is classically used in postural studies to reduce propriocep-tive feedback from the plantar touch [38]. We were interested here in determiningif less proprioceptive feedback resulted in sound having more influence on pos-ture, or on the contrary in sound being ignored.
Not surprisingly, the amplitude of sway has been found to be far greater onthe foam surface than on the normal firm surface. Then, the results showed adecrease of sway in all the sound conditions when compared to the no sound ref-erence condition. More interestingly, the decrease of sway was significantly moreimportant in presence of the immersive environment than with 3 or 10 isolatedsources (Figure 4.b). In the immersive environment condition, the decrease ofsway reached 15%. This results shows that the richer the auditory environment,the more subjects can integrate sound information to decrease their posturalsway, which is in accordance with our hypothesis. Finally, these results weresimilar on both firm and foam surfaces.
Thus, with these two studies and several static sound studies in literature,we showed that the spatial cues coming from the sound environment canbe integrated by subjects, and help them to better stabilize. In a studyadressing the potential role of auditory information in spatial memory, conductedby Viaud Delmond et al [39], authors built a realistic auditory soundscape ren-dered in headphones. The soundscape was updated in real time according tosubjects movements and displacements in 3D space, thanks to subjects trackingand advanced binaural technologies. Subjects were blindfolded and their taskwas to explore a delimitated area in order to find a hidden auditory target. Inthis study, authors showed that subjects were able to build a representation of
Proc. of the 12th International Symposium on CMMR, Sao Paolo, Brazil, July 5-8, 2016
78

14 Gandemer et al.
space thanks to sensorimotor and auditory cues only, and then navigate and findtheir way in this environment in an allocentric manner. In our studies, subjectsdid not navigate in the space, but we can advance that they also built a spatialrepresentation of auditory environment and used it as an auditory landmarkthat provided them cues to stabilize. Moreover, the richer the environment, thebetter the stabilization. We assume that the rotating sound source around sub-ject provides numerous spatial cues to subjects, and thus could be seen as a richsound environment too. This could explain the greater decrease of sway reachedby subjects in these studies (around 30%).
7 Conclusion and perspectives
In this paper, we presented an overview of the recent studies conducted on theemerging topic of the influence of sound on posture.
The exploration of the sparse literature about sound and posture (section2) showed that sound can play a role in the postural regulation. The resultsof some studies are somehow contradictory, which proves that there is a needto further investigate the field. First, numerous studies showed that the lackof auditory information (partial or total loss of hearing) results in a poorerpostural regulation. Then, a couple of studies investigated the specific role ofauditory stimulation on human posture. Some studies highlighted a stabilizationeffect thanks to sound: the main hypothesis which emerged from these studies isthat sound can provide an auditory landmark helping people to stabilize. Otherstudies demonstrated that sound can also induce destabilization, which suggeststhat the nature of the auditory stimuli plays a role in the sound and postureinteraction.
Through the five postural studies we conducted, we could confirm that sub-jects are able to use auditory information to better stabilize, when there aredeprived of visual information. We explored the various attributes of sound thatcould possibly contribute to subjects’ stabilization. We showed that forcing sub-jects to allocate attention to the auditory stimulation favors the effectsof sound on posture (section 4). Then, we brought evidence to support the viewthat the spatial cues provided by auditory stimulation are the mainattribute of sound responsible of subject’s stabilization, either with amoving sound source around subjects (sections 3 and 5) or with a static soundenvironment (section 6). The richer the sound environment, the better the sub-jects stabilize.
Our studies continue to raise numerous questions. Firstly, the perception of3D sound spatialization techniques (such as ambisonics we used in our studies)lacks research. We are convinced that a better understanding of how humansperceive 3D sound would help to understand how sound interacts with posture.That is why we are currently investigating the perception of sound trajectoriesin space. Then, now that we better understood how subjects lean on auditoryinformation, it would be interesting to invert the approach and try to inducepostural perturbations using perturbation of spatial sound environment. Then,
Proc. of the 12th International Symposium on CMMR, Sao Paolo, Brazil, July 5-8, 2016
79
Sound and Posture 15
we did not address the question of the nature of the sound source. The couple ofstudies in the literature which exhibited a destabilizing effect of non-informativestimuli (pure tones, background noise or conversation, or pure tones) suggestthat subjects can use auditory information only if it provides spatial cues. In ourstudies, we used either static ecological sound sources, which provided spatialreference cues, or a moving abstract sound (pink noise) which provided spatialinformation thanks to its movement (variation of the spatial cues). Moreover,we forced subjects to pay attention to these auditory stimuli and thus probablyto extract spatial information from the sound stimulation. Finally, our theoryleaning on spatial attributes of sound does not explain how subjects can stabilizewith an auditory stimulation played by headphones. As suggested in the section2, they are probably more complex multisensory phenomenon which could beinvolved in sound and posture interactions.
All the results we presented here and all the raising questions associated showthat the interaction between sound and posture is a promising area of research.Following the present overview, we are now convinced that auditory cues are asignificant source of information for the postural control. Thus, auditory percep-tion may be helpful for readaptation purposes, and for improvement of posturalcontrol in various fields, including sport, rehabilitation or sensory substitutionfor instance.
References
1. Maurer, C., Mergner, T. & Peterka, R. Multisensory control of human uprightstance. Experimental Brain Research 171, 231–250 (2006).
2. Asslander, L., Hettich, G. & Mergner, T. Visual contribution to human standingbalance during support surface tilts. Human movement science 41, 147–164 (2015).
3. Juntunen, J. et al. Postural body sway and exposure to high-energy impulse noise.The Lancet 330, 261–264 (1987).
4. Era, P. & Heikkinen, E. Postural sway during standing and unexpected disturbanceof balance in random samples of men of different ages. Journal of Gerontology 40,287–295 (1985).
5. Gandemer, L., Parseihian, G., Kronland-Martinet, R. & Bourdin, C. The influenceof horizontally rotating sound on standing balance. Experimental Brain Research1–8 (2014). URL http://dx.doi.org/10.1007/s00221-014-4066-y.
6. Ross, J. M. & Balasubramaniam, R. Auditory white noise reduces postural fluctu-ations even in the absence of vision. Experimental brain research 233, 2357–2363(2015).
7. Rumalla, K., Karim, A. M. & Hullar, T. E. The effect of hearing aids on posturalstability. The Laryngoscope 125, 720–723 (2015).
8. Zhong, X. & Yost, W. A. Relationship between postural stability and spatialhearing. Journal of the American Academy of Audiology 24, 782–788 (2013).
9. Gago, M. F. et al. Role of the visual and auditory systems in postural stability inalzheimers disease. Journal of Alzheimer’s Disease 46, 441–449 (2015).
10. Mangiore, R. J. The effect of an external auditory stimulus on postural stabilityof participants with cochlear implants (2012).
Proc. of the 12th International Symposium on CMMR, Sao Paolo, Brazil, July 5-8, 2016
80

16 Gandemer et al.
11. Mainenti, M. R. M., De Oliveira, L. F., De, M. A. D. M. T., Nadal, J. et al. Sta-bilometric signal analysis in tests with sound stimuli. Experimental brain research181, 229–236 (2007).
12. Alessandrini, M., Lanciani, R., Bruno, E., Napolitano, B. & Di Girolamo, S. Pos-turography frequency analysis of sound-evoked body sway in normal subjects. Eu-ropean Archives of Oto-Rhino-Laryngology and Head & Neck 263, 248–252 (2006).
13. Forti, S., Filipponi, E., Di Berardino, F., Barozzi, S. & Cesarani, A. The influenceof music on static posturography. Journal of Vestibular Research 20, 351–356(2010).
14. Ross, J. M., Warlaumont, A. S., Abney, D. H., Rigoli, L. M. & Balasubrama-niam, R. Influence of musical groove on postural sway. Journal of experimentalpsychology. Human perception and performance (2016).
15. Kilburn, K. H., Warshaw, R. H. & Hanscom, B. Are hearing loss and balance dys-function linked in construction iron workers? British journal of industrial medicine49, 138–141 (1992).
16. Suarez, H. et al. Balance sensory organization in children with profound hearingloss and cochlear implants. International journal of pediatric otorhinolaryngology71, 629–637 (2007).
17. Viljanen, A. et al. Hearing as a predictor of falls and postural balance in older fe-male twins. The Journals of Gerontology Series A: Biological Sciences and MedicalSciences 64, 312–317 (2009).
18. Lin, F. R. & Ferrucci, L. Hearing loss and falls among older adults in the unitedstates. Archives of internal medicine 172, 369–371 (2012).
19. Kanegaonkar, R., Amin, K. & Clarke, M. The contribution of hearing to normalbalance. Journal of Laryngology and Otology 126, 984 (2012).
20. Easton, R., Greene, A. J., DiZio, P. & Lackner, J. R. Auditory cues for orientationand postural control in sighted and congenitally blind people. Experimental BrainResearch 118, 541–550 (1998).
21. Deviterne, D., Gauchard, G. C., Jamet, M., Vancon, G. & Perrin, P. P. Added cog-nitive load through rotary auditory stimulation can improve the quality of posturalcontrol in the elderly. Brain research bulletin 64, 487–492 (2005).
22. Agaeva, M. Y. & Altman, Y. A. Effect of a sound stimulus on postural reactions.Human Physiology 31, 511–514 (2005).
23. Palm, H.-G., Strobel, J., Achatz, G., von Luebken, F. & Friemert, B. The role andinteraction of visual and auditory afferents in postural stability. Gait and Posture30, 328–333 (2009).
24. Priplata, A. et al. Noise-enhanced human balance control. Physical Review Letters89, 238101 (2002).
25. Tanaka, T., Kojima, S., Takeda, H., Ino, S. & Ifukube, T. The influence of mov-ing auditory stimuli on standing balance in healthy young adults and the elderly.Ergonomics 44, 1403–1412 (2001).
26. Park, S. H., Lee, K., Lockhart, T., Kim, S. et al. Effects of sound on posturalstability during quiet standing. Journal of neuroengineering and rehabilitation 8,1–5 (2011).
27. Raper, S. & Soames, R. The influence of stationary auditory fields on posturalsway behaviour in man. European journal of applied physiology and occupationalphysiology 63, 363–367 (1991).
28. Soames, R. & Raper, S. The influence of moving auditory fields on postural swaybehaviour in man. European journal of applied physiology and occupational physi-ology 65, 241–245 (1992).
Proc. of the 12th International Symposium on CMMR, Sao Paolo, Brazil, July 5-8, 2016
81

Sound and Posture 17
29. Parseihian, G., Gandemer, L., Bourdin, C. & Kronland-Martinet, R. Design andperceptual evaluation of a fully immersive three-dimensional sound spatializationsystem. In International Conference on Spatial Audio (ICSA) : 3rd InternationalConference (2015).
30. Laurens, J. et al. Visual contribution to postural stability: Interaction betweentarget fixation or tracking and static or dynamic large-field stimulus. Gait &posture 31, 37–41 (2010).
31. Lackner, J. R. Induction of illusory self-rotation and nystagmus by a rotatingsound-field. Aviation, Space, and Environmental Medicine (1977).
32. Guerraz, M. & Bronstein, A. M. Mechanisms underlying visually induced bodysway. Neuroscience letters 443, 12–16 (2008).
33. Mitra, S. & Fraizer, E. Effects of explicit sway-minimization on postural–suprapostural dual-task performance. Human movement science 23, 1–20 (2004).
34. Stins, J. F., Roerdink, M. & Beek, P. J. To freeze or not to freeze? affective andcognitive perturbations have markedly different effects on postural control. Humanmovement science 30, 190–202 (2011).
35. Blauert, J. Spatial hearing: the psychophysics of human sound localization (TheMIT press, 1997).
36. Merer, A., Ystad, S., Kronland-Martinet, R. & Aramaki, M. Semiotics of soundsevoking motions: Categorization and acoustic features. In Computer Music Mod-eling and Retrieval. Sense of Sounds, 139–158 (Springer, 2008).
37. Kronland-Martinet, R. & Voinier, T. Real-time perceptual simulation of movingsources: application to the leslie cabinet and 3d sound immersion. EURASIPJournal on Audio, Speech, and Music Processing 2008, 7 (2008).
38. Patel, M., Fransson, P., Lush, D. & Gomez, S. The effect of foam surface propertieson postural stability assessment while standing. Gait & posture 28, 649–656 (2008).
39. Viaud-Delmon, I. & Warusfel, O. From ear to body: the auditory-motor loop inspatial cognition. Frontiers in neuroscience 8, 283 (2014).
Proc. of the 12th International Symposium on CMMR, Sao Paolo, Brazil, July 5-8, 2016
82

Investigating the effects of a postural constrainton the cellists’ bowing movement and timbral
quality
Jocelyn Roze1, Richard Kronland-Martinet1, Mitsuko Aramaki1, ChristopheBourdin2 and Sølvi Ystad1
1 LMA (Laboratoire de Mecanique et d’Acoustique), CNRS, UPR 7051,Aix-Marseille Universite, Ecole Centrale, 13009, Marseille, France
2 ISM (Institut des Sciences du Mouvement), CNRS, UMR 7287, Aix-MarseilleUniversite, 13288, Marseille, France
Abstract. While playing expressively, cellists tend to produce posturalmovements, which seem to be part of their musical discourse. This articledescribes how their instrumental bowing gestures and timbral features ofthe produced sounds may be affected when constraining these postural(or ancillary) movements. We focus here on a specific acoustic timbrealteration qualified as harshness in the constrained condition. A methodbased on Canonical Correlation Analysis (CCA) is used to extract thecorrelations between the bowing displacement and the sound renditionwith and without postural constraint among several cellists. Then a de-tailed investigation of the covariation between gestural and sound datafor the duration of the note is carried out, using Functional Data Anal-ysis (FDA) techniques. Results reveal interesting effects of the posturalconstraint on the coupling patterns between the bowing movement andthe spectro-temporal acoustical features.
Keywords: Cellist, ancillary/postural gestures, gesture-sound relation-ship, acoustical features, musical expressivity, functional data analysis
1 Introduction
Musical expressiveness of instrumentalists is the result of interactions withina multimodal context, in which the perceived acoustic features turn out to beembedded into continuous gesture processes [10]. By gestures, we refer to thosedirectly responsible of the sound production, but also to so-called ancillary ges-tures, in particular the performers’ postural movements, which may form anintegral part of their subtle expressive variations [18]. In the present study, weinvestigate expressivity related to cello playing and focus on the influence ofthe musicians’ bowing gesture on the timbre quality in normal playing, and inposturally constrained situations.
This study falls within a more global experimental context of sound-gesturerelationship for the cello players in musical performance situations [14]. Related
Proc. of the 12th International Symposium on CMMR, Sao Paolo, Brazil, July 5-8, 2016
83
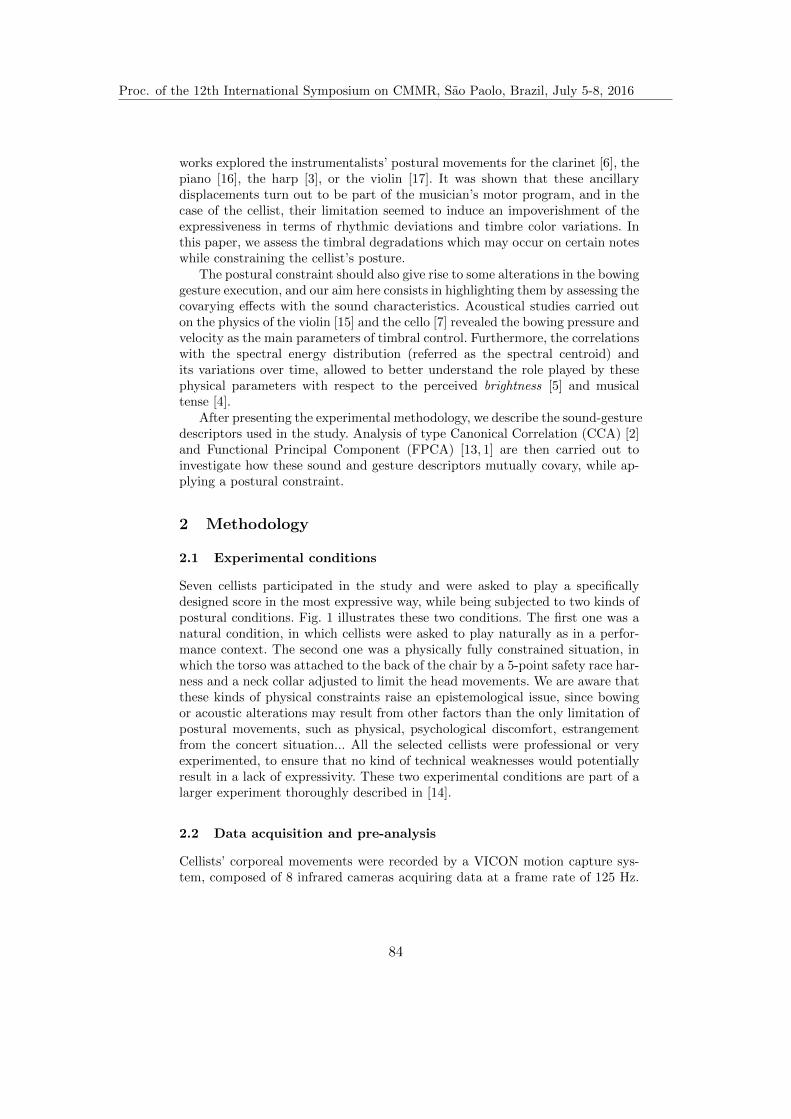
2 Jocelyn Roze et al.
works explored the instrumentalists’ postural movements for the clarinet [6], thepiano [16], the harp [3], or the violin [17]. It was shown that these ancillarydisplacements turn out to be part of the musician’s motor program, and in thecase of the cellist, their limitation seemed to induce an impoverishment of theexpressiveness in terms of rhythmic deviations and timbre color variations. Inthis paper, we assess the timbral degradations which may occur on certain noteswhile constraining the cellist’s posture.
The postural constraint should also give rise to some alterations in the bowinggesture execution, and our aim here consists in highlighting them by assessing thecovarying effects with the sound characteristics. Acoustical studies carried outon the physics of the violin [15] and the cello [7] revealed the bowing pressure andvelocity as the main parameters of timbral control. Furthermore, the correlationswith the spectral energy distribution (referred as the spectral centroid) andits variations over time, allowed to better understand the role played by thesephysical parameters with respect to the perceived brightness [5] and musicaltense [4].
After presenting the experimental methodology, we describe the sound-gesturedescriptors used in the study. Analysis of type Canonical Correlation (CCA) [2]and Functional Principal Component (FPCA) [13, 1] are then carried out toinvestigate how these sound and gesture descriptors mutually covary, while ap-plying a postural constraint.
2 Methodology
2.1 Experimental conditions
Seven cellists participated in the study and were asked to play a specificallydesigned score in the most expressive way, while being subjected to two kinds ofpostural conditions. Fig. 1 illustrates these two conditions. The first one was anatural condition, in which cellists were asked to play naturally as in a perfor-mance context. The second one was a physically fully constrained situation, inwhich the torso was attached to the back of the chair by a 5-point safety race har-ness and a neck collar adjusted to limit the head movements. We are aware thatthese kinds of physical constraints raise an epistemological issue, since bowingor acoustic alterations may result from other factors than the only limitation ofpostural movements, such as physical, psychological discomfort, estrangementfrom the concert situation... All the selected cellists were professional or veryexperimented, to ensure that no kind of technical weaknesses would potentiallyresult in a lack of expressivity. These two experimental conditions are part of alarger experiment thoroughly described in [14].
2.2 Data acquisition and pre-analysis
Cellists’ corporeal movements were recorded by a VICON motion capture sys-tem, composed of 8 infrared cameras acquiring data at a frame rate of 125 Hz.
Proc. of the 12th International Symposium on CMMR, Sao Paolo, Brazil, July 5-8, 2016
84

Impact of the cellists’ posture on their bowing gesture and timbral quality 3
!"#$%&'()*+,-.)+%#/,--)%/0)/,*1)*"&&%#
2"/-.#%3/,0
Fig. 1. The 2 types of experimental postural condition Normal and Constrained
The system tracked the 3D kinematical displacements of a set of sensors placedon the performer body, the cello and the bow. In this paper, we are interested inthe bow displacements, and therefore focus on a bow marker located at the bowfrog (close to the musician’s right hand). Audio data were recorded at a 44.1kHz sampling rate by a DPA 4096 microphone placed under the cello bridge andconnected to a MOTU interface. The gestural and audio streams were manuallysynchronized by a clap at the beginning of each recording.
When analyzing acoustic data collected from the constrained condition, aspecific note of the score which sounded poor, shrill and quaver as a beginnerssound frequently emerged for all the cellists. Following the terminology used byone of the performers, we qualified this as a harshness phenomenon produced byacoustic timbre alterations. When this harsh feature was perceived, we extractedthe note, as well as its nice (or round) counterpart produced in the normalcondition for the same cellist. This extraction process was carefully carried outby a pitch-tracking algorithm adapted from the MIR toolbox[9]. A corpus of 8pairs of round/harsh notes were hereby extracted among all the participatingcellists. The corresponding sequences of bowing displacements were segmentedfrom the motion capture stream, by using the temporal landmarks of the notein the audio stream.
To further investigate potential functional correlations between sound andbowing gesture (in particular for analysis presented in section 5), the computa-tion of acoustic descriptors were adapted to the bowing gesture data. In prac-tice, the frame rate of acquisition within the audio device (44.1 KHz) was muchhigher than that of the motion capture system (125 Hz). To synchronize the com-
Proc. of the 12th International Symposium on CMMR, Sao Paolo, Brazil, July 5-8, 2016
85

4 Jocelyn Roze et al.
putation of audio descriptors on the motion capture stream, an efficient meanconsisted in splitting the audio stream in frames overlapped by a motion capturetime step, i.e 8 ms (1/125Hz). The frame duration was chosen ten times higherthan the hop size, i.e 80 ms, to allow a sufficient frequency resolution (12 Hz).We applied this technique for all the acoustic descriptors.
3 Observing the effects of the postural constraint
The bowing gesture and the perceived sound were explored through suitable sig-nal descriptors. Simple statistic tests were then performed to assess the influenceof the cellists’ posture on these descriptors.
3.1 Bowing gesture descriptor
We focus here on a compact gestural feature which could be related to the bowdisplacements. In the reference frame of the motion capture system, each markeris associated to a triplet of coordinates (x, y, z) providing its position at eachframe. By derivation, we can get the spatial coordinates of the velocity vector(vx, vy, vz). More generally, we worked with the absolute velocity of the bowinferred from the coordinates of the bow frog marker:
V ELbow =√(
v2x + v2y + v2z)
(1)
This information could have been captured by simple accelerometers, butgiven that the experimental context primarily focused on the musician’s posturalaspects, we used the data collected by the motion capture system.
3.2 Acoustic descriptors
In this paper, we tried to find acoustic descriptors, which at best could revealthe relation between the signal and the quality alteration perceived betweennotes played in normal and constrained conditions. This acoustic harshness phe-nomenon might correspond to a degradation of the perceived timbre, i.e a changein the spectro-temporal features of the sound signal, for equal pitches and dura-tions. Several timbre descriptors are potential candidates to suitably characterizesuch time-frequency transformations.
Temporal domain From a temporal viewpoint, a harsh note may differ from itsround counterpart, by the way the energy rises during the onset of the sound.The kind of features that are likely to reflect this observation imply a priorextraction of the sounds temporal envelope, that for example can be obtainedfrom the Root Mean Square (RMS) value [8] of each audio frame l composingthe signal s :
Rms(l) =
√√√√ 1
Nw
Nw−1∑
n=0
s2(lNhop + n) (0 ≤ l ≤ L− 1) (2)
Proc. of the 12th International Symposium on CMMR, Sao Paolo, Brazil, July 5-8, 2016
86

Impact of the cellists’ posture on their bowing gesture and timbral quality 5
where Nw is the frame length, and Nhop the hop size in samples.
Attack slope The classical descriptor Attack Time could have been adopted asa temporal descriptor, but the Attack Slope (ATS) was preferred in the presentcase to overcome energy differences between signals. ATS represents the temporalincrease or average slope of the energy during the attack phase [11]:
ATS =PeakV alue
AT(3)
where AT is the Attack Time, i.e. the time that the RMS envelope takes todeploy from 10% to 90% of its maximal value PeakV alue.
Spectral domain From a spectral viewpoint, the shrill nature of the soundproduced in the constrained situation would suggest energy reinforcement inhigh frequencies. Given the harmonic nature of cello sounds, harmonic spectraldescriptors are believed to characterize this spectral transformation. We chose atotal number of 25 harmonics to compute them.
Harmonic spectral centroid We decided to focus on the Harmonic spectral cen-troid instead of the standard spectral centroid (SC), since the stochastic partof the signal seemed to be negligible with regards to the deterministic part.Hence, from the harmonic instantaneous features provided by subband decom-position, we computed the Harmonic spectral centroid (HSC(l)) to characterizethe barycenter of the spectral energy distribution at each frame l. This descrip-tor is related to the perception of brightness in various acoustic studies on theviolin [5]. HSC represents the mean value of HSC(l) [8] :
HSC =1
L
L−1∑
l=1
HSC(l) =1
L
L−1∑
l=1
∑Hh=1 fh(l)Ah(l)∑H
h=1Ah(l)(0 ≤ l ≤ L− 1) (4)
where fh(l) and Ah(l) are respectively the frequency and the amplitude of thehth harmonic in frame l.
Harmonic tristimulus ratio To characterize more finely the spectral energy trans-fer, which may occur from a round sound to its harsh equivalent, we computedthe harmonic tristimulus [12] at each frame. This descriptor considers the energydistribution of harmonics in three frequency bands and measures the amount ofspectral energy inside each band relatively to the total energy of harmonics.The first band contains the fundamental frequency, the second one the mediumpartials (2, 3, 4) and the last one higher order partials (5 and more). Three spec-tral coordinates are hereby obtained for each frame l, corresponding to spectralbarycenter distribution within each band:
TR1 =1
L
L−1∑
l=1
TR1(l) =1
L
L−1∑
l=1
A1(l)∑H
h=1Ah(l)(0 ≤ l ≤ L− 1) (5)
Proc. of the 12th International Symposium on CMMR, Sao Paolo, Brazil, July 5-8, 2016
87

6 Jocelyn Roze et al.
TR2 =1
L
L−1∑
l=1
TR2(l) =1
L
L−1∑
l=1
∑4h=2Ah(l)
∑Hh=1Ah(l)
(0 ≤ l ≤ L− 1) (6)
TR3 =1
L
L−1∑
l=1
TR3(l) =1
L
L−1∑
l=1
∑Hh=5Ah(l)
∑Hh=1Ah(l)
(0 ≤ l ≤ L− 1) (7)
where Ah(l) is the amplitude of the hth harmonic in frame l. From here, wedesigned a more compact ratio focusing on the spectral transfer feature, whichshould increase for energy transfers towards higher partials:
TRIratio =1
L
L−1∑
l=1
TRIratio(l) =L−1∑
l=1
TR3(l)
TR1(l) + TR2(l)(8)
3.3 Validation of the descriptors
To assess if these four descriptors, i.e. the bowing gesture descriptor and thethree acoustic descriptors, are affected by the postural constraint, we performedstatistical tests for each one, on the basis of the 8 round/harsh data pairs. Fig. 2presents the quartiles of the four descriptors between the two postural conditions.It was observed that in average, the postural constraint tended to reduce thebow velocity, while giving rise to a dual effect in the spectro-temporal acousticfeatures resulting in a decrease of the temporal attack slope coupled with anenergy increase for high-frequency partials.
The relevance of each signal descriptor was evaluated by performing a sim-ple paired two-tailed t-test, based on the null hypothesis that the means arethe same between the normal and constrained conditions. Table 1 reports theresults of these t-tests, which actually reveal that the null hypothesis can be sig-nificantly rejected and thus that the postural conditions can be discriminated forall signal descriptors. This signifies that the sound-bowing gesture relationship issignificantly affected when the cellists are limited in their postural movements.
Table 1. Results of paired t-tests on the defined gestural descriptor and the threeacoustic descriptors. The discrimination capacity between the normal and constrainedgroups of 8 data for each descriptor is given by the p-value : ∗p < 0.05, ∗∗p <0.01, ∗∗∗p < 0.001
Descs BOW VELOCITY ATS HSC TRIRATIO
t(7) 2.77∗ 4.15∗∗ −4.21∗∗ −3.48∗
4 Correlating bow gesture to sound features
In this part, we focus on the global relation that exists between cellists bowinggesture and the resulting sound features. This connection is explored by meansof raw linear and canonical correlations techniques.
Proc. of the 12th International Symposium on CMMR, Sao Paolo, Brazil, July 5-8, 2016
88

Impact of the cellists’ posture on their bowing gesture and timbral quality 7
1000
1100
1200
1300
1400
1500
900
(hz)
0.4
0.6
0.8
1
0.2
Normal Constraint
0.1
0.15
0.2
0.25
0.3
0.35
0.4
0.45
Normal Constraint
800
Normal Constraint
0.3
0.5
0.7
0.9
5
6
7
8
9
10
11
Normal Constraint
BOW VELOCITY
!"#$%&" #'%()**$+,-&"
ATS HSCTRIratio
(cm/s)
Fig. 2. Comparison of the mean gestural and acoustic features between the 2 types ofpostural conditions Normal and Constraint. The central marks are the medians, theedges of the boxes are the 25th and 75th percentiles
4.1 Raw linear correlations
Analysis. Assuming a linear relationship between the gestural and acousticparameters, we computed the Pearson’s linear correlation coefficient of the bow-ing velocity vector with each acoustic vector. Each feature vector was composedof 16 mean data, corresponding to the 8 pairs of {normal/constrained} meandescriptor data.
Results. Raw linear correlations revealed that the bowing velocity was stronglycorrelated to the attack slope (ATS) of the temporal envelope (r2 = 0.6∗). Bycontrast, spectral descriptors such as harmonic centroid (HSC) and tristimulusratio (TRIratio) surprisingly turned out to be weakly correlated to the bowingvelocity (r2 = −0.11 and r2 = −0.21 respectively).
Discussion. Fig. 3 depicts the three graphs of linear correlation between thegestural variable and each acoustic variable. The interpretation of these graphsbecomes interesting if we consider pairs of variables {normal/constraint}. Thefirst graph (a) highlights the influence of the postural constraint on the bowingvelocity and temporal attack slope. It reveals that once the cellists were deprivedof their postural adjustments, they showed a global tendency to combine a de-crease in bow velocity with a less sharp way of attacking the string, reflected bya decrease of attack slope. The second and third graph, (b) and (c) highlightthe influence of the postural constraint on the bowing velocity and spectral de-scriptors. They present similar interesting tendencies, in spite of the weak rawcorrelations obtained in the results: The reduced velocity induced by the posturalconstraint causes an energy shift towards high frequency components. A closerexamination of the canonical correlations might allow confirming this effect onthe spectral variables.
Proc. of the 12th International Symposium on CMMR, Sao Paolo, Brazil, July 5-8, 2016
89

8 Jocelyn Roze et al.
0.5
2
5 6 7 8 9 10 11 12VELbow
0.45
0.4
0.35
0.3
0.25
0.20
0.15
0.1
0.05
21
24
23
25
26 7
28
700
800
900
1000
1100
1200
1300
1400
1500
1600
22
1
242536 7
8
NormalConstraint
0.1
0.2
0.3
0.4
0.5
0.6
0.7
0.8
0.9
1
1.1
2
1
333
2425
67
8
(a)
5 6 7 8 9 10 11 12VELbow
5 6 7 8 9 10 11 12VELbow
(b) (c)NormalConstraint
NormalConstraint
ATS
HSC
TRIratio
Fig. 3. Polar diagrams of the raw linear correlations obtained between the mean ges-tural bowing feature and the three mean acoustic ones over the 16 observations. Each{normal(N)/constraint(C)} pair is connected by a dotted line. The raw linear correla-tions are presented: (a) Between VELbow and ATS, (b) Between VELbow and HSC,(c) Between VELbow and TRIratio
4.2 Canonical correlations
Analysis. We performed a Canonical Correlation Analysis (CCA) to assess andquantify the nature of the interaction between the bowing gesture and all theidentified acoustic features. It consisted in finding two sets of basis vectors, onefor the gesture and the other for the acoustic descriptors, such that the corre-lations between the projections of the initial variables onto these basis vectorsare mutually maximized. Compared with the previous ordinary correlations, thistechnique offers the advantage of being independent of the coordinate system inwhich the variables are described. It actually finds the coordinate system op-timizing their representation. We provided the CCA with the previously usedfeature vectors of 16 mean data, but organized differently : the 16 mean bowingvelocities were contained in a vector X, and the 3 variables (ATS,HSC,TRIratio)of 16 mean acoustic data in a matrix Y.
Results. The Canonical Correlation Analysis between mean gestural and meanacoustic data (X and Y) appeared to be highly significant (r2 = 0.74∗). Theanalysis computed the canonical scores by projecting the initial variables Xand Y on two matrices A and B, which maximize the canonical correlationcorr(XA,YB). We used the canonical loadings A and B to express each variateU = XA and V = YB as a linear combination of the initial gestural andacoustic variables respectively. It thus leaded to the 2 following equations:
{U = −0.5×VELbow
V = −10×ATS− 0.01×HSC + 5×TRIratio
Proc. of the 12th International Symposium on CMMR, Sao Paolo, Brazil, July 5-8, 2016
90

Impact of the cellists’ posture on their bowing gesture and timbral quality 9
Fig. 4 presents the canonical scores (or variates U and V) resulting from themethod.
U = -0.5 x VELbow
V =
-10
x AT
S - 0
.01
x H
SC +
5 x
TRI
ratio
0.5 1 1.50-0.5-1-1.5-2-2.5-3
0.5
1
1.5
0
-0.5
-1
-1.5
-2
2
2.5
23
18
7
4
5
6
NormalConstraint
Fig. 4. Canonical variates of the CCA applied on the mean gestural and acousticfeatures. The variates U and V correspond to linear combinations of bowing gesturesand acoustic features respectively. The canonical correlation between these two variatesis r2 = 0.74∗. Each {normal/constrained} pair has been represented by a dotted line.
Discussion. The canonical weights (or projection eigenvectors) A and B standfor the relative importance of each of the initial variables in the canonical re-lationships. We can hereby deduce from the first correlation equation that thegestural variable VELbow is negatively correlated to its variate U (A = −0.5).In the same manner, the second correlation equation indicates that the variateV is negatively correlated with ATS (B(1) = −10), positively correlated withTRIratio (B(3) = 5), and not correlated with HSC (B(2) = −0.01). By con-trast with the raw linear correlation method, the CCA reveals a correlation withat least one spectral variable (TRIratio).
If we now consider data pairs of postural conditions, as it’s represented onFig. 4, we can get an interesting interpretation of the role played by each variatein the modification of the sound-gesture relationship. Along the gestural variateU, the constrained condition is rated higher as a whole compared to its normalcounterpart, which indicates a global decrease of the gestural variable VELbow.Along the acoustic variate V, the constrained condition is also rated higher as awhole than its normal counterpart, which suggests a global dual effect of the twomain acoustic correlated variables : A decrease of ATS coupled to an increaseof TRIratio. This interpretation of the space built from the CCA variates,
Proc. of the 12th International Symposium on CMMR, Sao Paolo, Brazil, July 5-8, 2016
91

10 Jocelyn Roze et al.
reinforces the results already obtained in section 3. Furthermore, it is coherentwith the results of Guettler [7], who demonstrated that the lowest bow speedsgive the highest relative amplitudes for the upper partials.
5 Extracting functional covariates of the sound-gesturerelationship
The previous statistic tools revealed interesting results for descriptors averagedover the whole duration of each note. However, the examined data are functionalby nature and in this part, we assess if the previous findings might be confirmedin the functional domain. The modifications induced by the postural constraintshould allow extracting functional covariates of the sound-gesture relationship.
5.1 Preliminary processing
By means of a canonical correlation analysis, we showed in section 4 that a ges-tural descriptor of bowing velocity (VELbow) and two dual acoustic descriptors- attack slope (ATS) and spectral energy transfer (TRIratio) - were suitable tomodel the effect of the postural constraint on the sound-bowing gesture rela-tionship within the data corpus. Instead of focusing on their mean values aspreviously, we here consider the functional nature of these descriptors, in orderto compare their evolution in time. Hereby, since ATS descriptor corresponds toa discrete value, we rather consider the RMS envelope in the functional temporaldomain.
Even though the musicians were asked to play the score at a fixed tempo, allthe notes composing the corpus presented slightly different durations, becauseof deviations induced from the constraint or expressive intentions of the play-ers. These temporal variations prevent the sequences of descriptors from beingdirectly compared. A preliminary step thus consisted in synchronizing the tempo-ral sequences of the corpus by time-warping process. The 8 {normal/constraint}pairs of descriptor curves were fitted to the duration of the longest one, whichmeasured 56 data points (i.e. 45 ms in the mocap frame rate). This led to 16time-warped temporal sequences for each one of the three functional descriptors:VELbow(t), RMS(t), TRIratio(t).
5.2 Analysis
The 3 groups of 16 time-warped curves were processed by Functional Data Analy-sis (FDA) techniques [13], which consisted in modeling each time-serie as a linearcombination of equally spaced 6-order B-spline basis functions. We chose a semi-sampled basis with respect to the total number of data points in each curve, i.e.a basis of 28 (56/2) B-spline functions, to keep a fine-grained definition of eachcurve and limit the inner smoothing FDA mechanism.
This functional spline-based representation of time-point data turned out tobe particularly suited to analyze the sources of variability encompassed within
Proc. of the 12th International Symposium on CMMR, Sao Paolo, Brazil, July 5-8, 2016
92

Impact of the cellists’ posture on their bowing gesture and timbral quality 11
the sound-bowing gesture interaction. It was achieved by combining the FDAmodelling to classical multivariate Principal Component Analysis (PCA), a tech-nique known as Functional PCA (FPCA). We thus extracted the major modesof variability of this interaction by carrying out two bivariate FPCAs : The firstone between the functional bow velocities VELbow(t) and the temporal soundenvelopes RMS(t); The second one between the same bow velocities VELbow(t)and the functional descriptor of high-frequency spectral distribution called theTRIratio(t).
5.3 Results
The results of the two bivariate FPCAs are respectively presented Fig. 5 andFig. 6. In each case, we focused on the first two principal components returnedby the method, since they accounted for more than 90% of the overall variabilityamong the bivariate set of 16 curves. A bivariate functional principal componentwas defined by a double vector of weight functions:
{ξm = (ξV ELbow
m , ξRMSm ) for the first FPCA
ηm = (ηV ELbowm , ηTRIratio
m ) for the second FPCA
ξV ELbowm denotes the principal m-variations of the bow velocity curves, relatively
to ξRMSm , the m-variations of temporal sound envelopes. ηV ELbow
m denotes theprincipal m-variations of the bow velocity curves, relatively to ηTRIratio
m , the m-variations of high-frequency spectral distributions. The index m equals 1 or 2,since only two components are necessary to account for the principal variations.
For the first FPCA, we obtained two orthornormal bivariate eigenfunctionsξ1 and ξ2, respectively accounting for 72% and 21% of the variations. The effectsof these bivariate eigenfunctions ξ1 and ξ2 are represented in Fig. 5, by specificperturbations of the mean functional variables V ELbow(t) and RMS(t). Theseperturbations reflect the fact of adding or subtracting each eigenfunction tothe two mean curves, i.e. V ELbow(t) ± ξV ELbow
m (t) and RMS(t) ± ξRMSm (t).
Interestingly, we notice that the first eigenfunction reflects a positive correlation,visible as an overall amplitude shift of the two functional means. The secondeigenfunction correlates a distortion in the timing of the mean velocity profilewith an amplitude shift of the mean sound envelope. The bivariate effect ofthese eigenfunctions is synthesized in polar diagrams (Fig. 5.c1 and Fig. 5.c2),which report the position of the mean function values (V ELbow(t), RMS(t))by a dot in the (x, y) plane. Each point of the polar mean curve is linked toa line indicating the direction of the perturbation (V ELbow(t) + ξV ELbow
m (t),RMS(t) + ξRMS
m (t)).For the second FPCA, we obtained two orthornormal bivariate eigenfunc-
tions η1 and η2, respectively accounting for 71% and 20% of the variations.The effects of these bivariate eigenfunctions η1 and η2 have been representedFig. 6 by specific perturbations of the mean functional variables V ELbow(t)and TRIratio(t), as previously. Interestingly, we notice that the first eigenfunc-tion reflects a negative correlation, visible as an opposed amplitude shift of the
Proc. of the 12th International Symposium on CMMR, Sao Paolo, Brazil, July 5-8, 2016
93

12 Jocelyn Roze et al.
two functional means. The second eigenfunction correlates a distortion in thetiming of the mean velocity profile with an amplitude distortion of the meanhigh-frequency spectral distribution. Polar diagrams of these two mean vari-ables have also been reported with their eigenfunction perturbations (Fig. 6.c1and Fig. 6.c2).
5.4 Discussion
Results revealed that across the two FPCAs, the behavior of the bow velocityeigenfunctions ξV ELbow
m and ηV ELbowm remained consistent. Indeed, their ma-
jor contribution, denoted ξV ELbow1 and ηV ELbow
1 , reflected an overall amplitudeincrease of the mean bow velocity curve, according to an explained variancearound 70% in both cases. Similarly, their minor contribution, denoted ξV ELbow
2
and ηV ELbow2 , reflected an amplitude distortion with respect to the middle of
the mean velocity profile, according to an explained variance around 20% inboth cases. This minor contribution might be interpreted in terms of acceler-ations/decelerations of the mean bowing gesture. The common perturbationsinduced by these bow velocity eigenfunctions, may be viewed as a leveragingtool to interpret the joint effects on acoustic variables RMS(t) and TRIratio(t).
First, the major mode of variations (ξ1, η1) transversal to the variables, re-veals that increasing the overall mean bow velocity, results in a slope rise of themean sound temporal envelope (Fig. 5.b1), combined with a drop of the meanhigh-frequency spectral distribution (Fig. 6.b1). More specifically, the polar di-agram (V ELbow(t), RMS(t)) shows a strong linear increase of the interactionbetween these variables until the velocity peak. The direction being taken by themajor eigenfunction perturbations (ξV ELbow
1 ,ξRMS1 ) reflects a positive covaria-
tion of these parameters over the whole duration of the note (Fig. 5.c1). Similarly,the polar diagram (V ELbow(t), TRIratio(t)) shows a weakest linear decrease ofthe interaction between these variables until the velocity peak. The directionbeing taken by the major eigenfunction perturbations (ηV ELbow
1 ,ηTRIratio1 ) re-
flects a negative covariation of these parameters over the whole duration of thenote (Fig. 6.c1). This coupled effect is coherent with the findings of section 4 andhence turns out to be a major trend of the sound-bowing gesture relationship.
Then, the minor mode of variations (ξ2, η2) transversal to the variables, re-veals that accelerating the mean bowing gesture results in an overall increase ofthe mean sound temporal envelope (Fig. 5.b2), combined with a progressive riseof the mean high-frequency spectral distribution (Fig. 6.b2). The polar diagramsof minor eigenfunctions (ξV ELbow
2 ,ξRMS2 ) in Fig. 5.c2, and (ηV ELbow
2 ,ηTRIratio2 )
in Fig. 6.c2, reflect this tendency by an inversion of the direction being takenby the perturbations towards the middle of the mean sequences. The first onehighlights the combined effect of bow acceleration with a gain of global soundenergy, while the second one suggests that decelerating the bow speed mightinduce a quicker extinction of the high-frequency sound partials.
This last result seems to be coherent with the physics of the instrument,since within a pulling bow movement, the cellists can choose to independently
Proc. of the 12th International Symposium on CMMR, Sao Paolo, Brazil, July 5-8, 2016
94

Impact of the cellists’ posture on their bowing gesture and timbral quality 13
5 10 15 20 25 30 35 40 45 50 55
2
4
6
8
10
0.02
0.03
0.04
0.05
Effects of Eigenfunction I ( variability : 72%)
Time (samples)
5 10 15 20 25 30 35 40 45 50 55
0.02
0.03
0.04
0.05
0.06
0.012 4 6 8 10
VELbow (cm/s)3 5 7 9 11 12
(a1)
(b1)
(c1)
0.02
0.03
0.04
0.05
0.06
0.012 4 6 8 103 5 7 9 11 12
(c2)
VELbow
(cm
/s)
RM
SR
MS
RM
S
VELbow (cm/s)
Effects of Eigenfunction II ( variability : 21%)
2
4
6
8
10
VELbow
(cm
/s)
(a2)
0.02
0.03
0.04
0.05
RM
S
Time (samples)
5 10 15 20 25 30 35 40 45 50 55
(b2)
++++++++++++++++++++++++++++++++++++++++++++++++++++++++
+++++++
++
+++++++++
++
+++++++++++++++++++++++++
++
++
++
++
+++
++++++++++++++++++++++++++++++++++++++++++++++++++++++++
++++++++++++++++++++++++++++++++++++++++++++++
++
++
++
++++
Mean
+VELbow
1Mean
-VELbow
1Mean
1
Mean
+RMS
2Mean
-RMS
2Mean
Mean
+RMS
1Mean
-RMS
1Mean
Mean
+VELbow
2Mean
-VELbow
2Mean
2
Mean
+RMS
1Mean
VELbow
1 ,Mean
+RMS
2Mean
VELbow
2 ,
Fig. 5. Left : Effects of adding or subtracting the 1st bivariate eigenfunction ξ1 to orfrom the mean curve of Bow velocity (a1) and RMS (b1). Right : Effects of addingor subtracting the 2nd bivariate eigenfunction ξ2 to or from the mean curve of Bowvelocity (a2) and RMS (b2). The covariate effect of each eigenfunction on both variablesis presented in polar diagrams: (c1) for eigenfunction I and (c2) for eigenfunction II
Proc. of the 12th International Symposium on CMMR, Sao Paolo, Brazil, July 5-8, 2016
95

14 Jocelyn Roze et al.
5 10 15 20 25 30 35 40 45 50 55
2
4
6
8
10
0.2
0.3
0.4
0.5
Effects of Eigenfunction I ( variability : 71%)
Time (samples)
5 10 15 20 25 30 35 40 45 50 55
2 4 6 8 10
VELbow (cm/s)3 5 7 9 11 12
(a1)
(b1)
(c1)
2 4 6 8 103 5 7 9 11 12
(c2)
VELbow
(cm
/s)
TR
Iratio
VELbow (cm/s)
Effects of Eigenfunction II ( variability : 20%)
2
4
6
8
10
VELbow
(cm
/s)
(a2)
Time (samples)
5 10 15 20 25 30 35 40 45 50 55
(b2)
++++++++++++++++++++++++++++++++++++++++++++++++++++++++Mean
+VELbow
Mean
-VELbow
Mean
1
Mean
+Mean
-Mean
Mean
+Mean
-Mean
Mean
+Mean
-Mean
Mean
+Mean ,Mean
+Mean
+++++
++
++++++++
++++++
++++++++++++
++
+++++++++++++++++++++
++++++++++++++++++++++++++++++++++++++++++++++++++++++++
0.2
0.3
0.4
0.5
0.6
++++++++++++++++++++
++
++++++++++++++++++++++++++++++++++
0
0.1
0.2
0.3
0.4
0.5
0.6
0.7
TR
Iratio
TR
Iratio
0
0.1
0.2
0.3
0.4
0.5
0.6
0.7
TR
Iratio
2
1
1
VELbow
VELbow 2
2
TRIratio
TRIratio 1
1
TRIratio
TRIratio 2
2
VELbow
1 ,VELbow
2
TRIratio
1TRIratio
2
Fig. 6. Left : Effects of adding or subtracting the 1st bivariate eigenfunction η1 toor from the mean curve of Bow velocity (a1) and TRIratio (b1). Right : Effects ofadding or subtracting the 2nd bivariate eigenfunction η2 to or from the mean curveof Bow velocity (a2) and TRIratio (b2). The covariate effect of each eigenfunction onboth variables is presented in polar diagrams: (c1) for eigenfunction I and (c2) foreigenfunction II
Proc. of the 12th International Symposium on CMMR, Sao Paolo, Brazil, July 5-8, 2016
96

Impact of the cellists’ posture on their bowing gesture and timbral quality 15
accelerate the speed or reinforce the pressure, to ensure an optimal timbre qual-ity and high-frequency content, along the bow movement. An additional FPCAcarried out on bow velocities VELbow(t) and spectral barycenter evolutionsHSC(t), strengthened this link between a bow acceleration and a better stabi-lization of the spectral barycenter. Nevertheless, further investigations shouldbe conducted with other essential physical parameters like the bow pressure, tocompletely validate these assumptions.
6 Conclusion
This paper presented a contribution to a better understanding of the musi-cian/instrument interaction in the case of the cello playing. It aimed to betteridentify the connections between the cellists’ motor control principles and therelated expressive timbral features. More specifically, the role played by ancil-lary movements was investigated through a full postural constraint, whose effectswere assessed both on the cellist’s bowing gesture velocity and spectro-temporalacoustic features of the produced sounds.
The results turned out to be coherent with the bowed-string physics [7] andsynthesis models [5]. Indeed, a canonical correlation analysis (CCA) performedon the mean values of sound-gesture parameters, revealed that the discomfortcaused by the postural constraint, was mainly linked to an overall decrease of bowvelocity. This gestural variation was coupled to an harsh spectro-temporal acous-tic transformation, combining a slope attack fall of the sound temporal envelope,with an energy rise in the high-frequency partials. Furthermore, a functionalanalysis of the descriptor data allowed to extract principal components (FPCs)characterizing the sound-bowing gesture covariations in time. These eigenfunc-tions first confirmed the major trend already identified by CCA. On the otherhand, they also highlighted a minor influence of the postural constraint on a bowdeceleration, coupled with a reinforcement in brightness (i.e. the upper partialsin the spectrum) at the beginning of the sound.
Further investigations might consist in identifying more finely the type ofcellists’ postural movements, ensuring an optimal coupling between their bowvelocity and the preservation of spectro-temporal acoustic features.
Acknowledgments. This work was partly supported by the French NationalResearch Agency and is part of the “Sonimove” project (ANR-14-CE24-0018).
References
1. Bianco, T., Freour, V., Rasamimanana, N., Bevilaqua, F., Causse, R.: On gesturalvariation and coarticulation effects in sound control. In: Gesture in EmbodiedCommunication and Human-Computer Interaction, pp. 134–145. Springer (2009)
2. Caramiaux, B., Bevilacqua, F., Schnell, N.: Towards a gesture-sound cross-modalanalysis. In: Gesture in embodied communication and human-computer interac-tion, pp. 158–170. Springer (2009)
Proc. of the 12th International Symposium on CMMR, Sao Paolo, Brazil, July 5-8, 2016
97

16 Jocelyn Roze et al.
3. Chadefaux, D., Le Carrou, J.L., Wanderley, M.M., Fabre, B., Daudet, L.: Gesturalstrategies in the harp performance. Acta Acustica united with Acustica 99(6),986–996 (2013)
4. Chudy, M., Carrillo, A.P., Dixon, S.: On the relation between gesture, tone pro-duction and perception in classical cello performance. In: Proceedings of Meetingson Acoustics. vol. 19, p. 035017. Acoustical Society of America (2013)
5. Demoucron, M.: On the control of virtual violins-Physical modelling and controlof bowed string instruments. Ph.D. thesis, Universite Pierre et Marie Curie-ParisVI; Royal Institute of Technology, Stockholm (2008)
6. Desmet, F., Nijs, L., Demey, M., Lesaffre, M., Martens, J.P., Leman, M.: Assessinga clarinet player’s performer gestures in relation to locally intended musical targets.Journal of New Music Research 41(1), 31–48 (2012)
7. Guettler, K., Schoonderwaldt, E., Askenfelt, A.: Bow speed or bowing position- which one influence spectrum the most ? Proceedings of the Stockholm MusicAcoustic Conference (SMAC 03) (August 6-9 2003)
8. Kim, H.G., Moreau, N., Sikora, T.: MPEG-7 audio and beyond: Audio contentindexing and retrieval. John Wiley & Sons (2006)
9. Lartillot, O., Toiviainen, P.: A matlab toolbox for musical feature extraction fromaudio. In: In Proceedings of the International Conference on Digital Audio Effects.pp. 237–244 (2007)
10. Leman, M.: Embodied music cognition and mediation technology. Mit Press (2008)11. Peeters, G.: A large set of audio features for sound description (similarity and
classification) in the cuidado project. Tech. rep., IRCAM (2004)12. Pollard, H.F., Jansson, E.V.: A tristimulus method for the specification of musical
timbre. Acta Acustica united with Acustica 51(3), 162–171 (1982)13. Ramsay, J.O.: Functional data analysis. Wiley Online Library (2006)14. Roze, J., Ystad, S., Aramaki, M., Kronland-Martinet, R., Voinier, T., Bourdin,
C., Chadefaux, D., Dufrenne, M.: Exploring the effects of constraints on the cel-list’s postural displacements and their musical expressivity. To appear in post-proceedings of CMMR 2015 - Music, Mind and Embodiment, Plymouth (2015)
15. Schelleng, J.C.: The bowed string and the player. The Journal of the AcousticalSociety of America 53(1), 26–41 (1973)
16. Thompson, M.R., Luck, G.: Exploring relationships between pianists’ body move-ments, their expressive intentions, and structural elements of the music. MusicaeScientiae 16(1), 19–40 (2012)
17. Visi, F., Coorevits, E., Miranda, E., Leman, M.: Effects of different bow strokestyles on body movements of a viola player: an exploratory study. Ann Arbor, MI:Michigan Publishing, University of Michigan Library (2014)
18. Wanderley, M.M., Vines, B.W., Middleton, N., McKay, C., Hatch, W.: The musicalsignificance of clarinetists’ ancillary gestures: An exploration of the field. Journalof New Music Research 34(1), 97–113 (2005)
Proc. of the 12th International Symposium on CMMR, Sao Paolo, Brazil, July 5-8, 2016
98

Eclipse: A Wearable Instrument for Performance Based Storytelling
Ezgi Ucar,
New York, [email protected]
Abstract. Eclipse is a dance performance telling the Altai Shaman story of a solar eclipse. Through movement of a dancer, a unique soundscape is created, to which the dancer moves. This feedback mechanism tries to achieve a multisensory interaction where the sounds created by movements are supplementary to the visual perception of the movements.
Keywords: New musical instruments, wearable technology, interactive storytelling, multisensory perception, Altai Shamanism
1 Introduction
Eclipse is a project dedicated to exploring ways for technology to aid performative multi-sensory storytelling. The project revolves around four domains: new musical instruments, wearable technology, interactive storytelling and Altai Shamanism. The project contains a dance costume with embedded electronics, which act as a musical instrument.
Eclipse consists of two consecutive parts: ideation and design of the wearable instrument, and the improvised performance of dancers with the instrument. I decided to discuss each part separately since they address different users. The first part is meant to be used by the dancer as a creative tool, while the latter is meant to be experienced by the audience. Information regarding every step of the creation process can be found in corresponding sections of the paper.
2 Ideation
The purpose of this project is to explore how technology can be used to create audio-visual interactions and how technological advancements affect our perception of sound and music. The exploration not only works towards finding the connection
Proc. of the 12th International Symposium on CMMR, Sao Paolo, Brazil, July 5-8, 2016
99
between technology and performance arts, but also seeks to find the effects of the visual aspect of the performance in the audience’s perception of the sound generated.
An inspiration that lead to the ideation of this project was the facial expressions or body movements that musicians make during a performance. As with every staged performance, musical performances have a visual aspect, and the musicians’ expressions and movements are the most stimulating parts of the visuals. Durkin [4] touches upon this subject in Decomposition: A Music Manifesto.
“We pay attention (with whatever degree of consciousness) to a musician’s body movements, and through them we detect — or assume— certain “expressive intentions.” Experimental subjects pick up on what Levity calls “an emergent quality”— something “that goes beyond what was available in the sound or the visual image alone.” This “emergent quality” seems to be the result of a synergy between visual and audio stimuli, and consequently informs listeners’ understanding of the music.”
The “emergent quality” of musicians’ body movements is an intended quality in this case. While a musician’s body movement has no direct effect on the sound that is created by the traditional instrument, the dancer’s movements are the driving force of creating the sound in Eclipse.
In Eclipse, I explore the paths between dynamic storytelling and multisensory perception. We perceive the world through different modalities. The information provided from multiple modalities are processed interdependently in our brains. The environment around us is dynamic; the visual, sonic, olfactory, tactile, and gustatory elements are constantly changing. So why should a story be limited to a static environment? It should be as dynamic as life is. Eclipse explores a dynamic storytelling environment where the sonic and visual elements change during a performance as well as in different performances.
2.1 Storytelling: The Altai Shaman Story
Altai Shamans worshipped the mother sun and the father moon as their gods. Sun and Moon gods would fight with evil spirits and protect their people from danger. Yet sometimes, evil spirits would capture the gods, causing solar and lunar eclipses. To save their gods, Altai people would shout, drum, and make incredible noises during the eclipse.Eclipse introduces a new way of storytelling, through an interactive dance costume inspired by Altai Shamanism. The costume creates its own visual and sonic environment in response to the dancer’s movements and tells the story of a Shaman Eclipse through its light play and dynamic soundscape. It goes beyond a dance costume, by becoming a performer itself, rather than merely existing as a prop during the performance. It has a personality involving a dynamic, yet unpredictable range of movements, over which the user has limited control.
Proc. of the 12th International Symposium on CMMR, Sao Paolo, Brazil, July 5-8, 2016
100

Running Title ��� 3
The Shaman perceives a world of total aliveness, “in all parts personal, in all parts sentient, in all parts capable of being known and being used”[6]. They believe that everything that exists has life, including non-sentient objects. Drawing from this idea, the Eclipse dress was imagined as a non-sentient object that comes alive with the dancer’s movements.
3 Technical Details
3.1 Sensory Data Processing
The audio interaction starts with sensor based data collection. Two proximity sensors located on the top hoop of the skirt provide relative location information of the dancer, with respect to the center of the dress. The purpose of having the dress as the starting point rather than a geographical location is to keep the interaction solely between the user and the dress.
Collected data are sampled into more manageable chunks of information, which is then translated into a MIDI control panel. To be more clear, each chunk of location information corresponds to a specific area within the 2D space inside the hoop. This 2D space acts as a MIDI control surface, with specific areas randomly assigned to specific controls such as pitch, panning, resonance, etc. The randomness only refers to the initial assignment; the control areas are fixed during the performances.
3.2 Wireless Communication
For the performer to have freedom in her movement, wireless communication between the wearable device and the sound source is essential. Computers with audio processing software and the loud speakers necessary for this project are neither compact, nor light enough to be integrated into a garment. Thus, the garment has to communicate with them remotely to provide data. In earlier prototypes, communication via bluetooth and wifi were eliminated for several reasons including delays in receiving the data and breaking communications. The final version of the dress uses Xbee [13] radios for wireless communication, which provide simultaneous gathering and processing of the data and creation of sound. Simultaneity between the visual and the audio is critical in a live performance; each movement that creates (and represents) a certain sound should occur simultaneously with the corresponding sound. As Newell argues, in order for us to interact with an object, the information we gather from it through different senses should come together as a coherent percept[10]. This will also help inform the audience that the sound is actually created by the movements and it will provide coherent feedback for multisensory perception.
Proc. of the 12th International Symposium on CMMR, Sao Paolo, Brazil, July 5-8, 2016
101

3.3 The Feedback Loop
As the dancer moves, sensory data from the proximity sensors are collected with a Teensy[11] board embedded in the upper loop of the skirt and sent to another Teensy board connected to a laptop through an Xbee radio on each end. The first Teensy board is programmed to sample the data collected into manageable chunks that are then sent to the second Teensy board. In the computer, received data chunks are translated into MIDI commands for Ableton Live, where the sound is created. The sound outputted through external speakers is heard by the dancer who responds to it with reactionary movement.
3.4 Visual Enhancement
The visual aspect of the project consists of two parts. First is the actual dance performance with the aesthetic values added by the dress and the dancer’s movements. Second is the projection of the top view of the performance, which creates the illusion of a solar eclipse. See appendix for the video link.
Image 1: Two hoops of the skirt moving with the dancer
Visual design of the dress is fed by two main domains of this project. The first is Altai Shamanism and the second is storytelling, which come together in the Altai Shaman eclipse story. A Shaman’s costume is believed to be created with the directions of spirits. It is uniquely decorated with characteristic traditional items such as beadwork, metals or feathers. Siberian Shaman costumes have symbols representing their travels to the Upper and Lower worlds. The guide spirits in their travels are represented by
Proc. of the 12th International Symposium on CMMR, Sao Paolo, Brazil, July 5-8, 2016
102

Running Title ��� 5
circular elements. Altai Shamanism, a relative of Siberian Shamanism, uses circular rings on their garments to represent the Sun and Moon gods [9]. The skirt consists of two hoops attached to a bodice, which carries the weight of the dress. Two hoops made of metal wires symbolize the moon and the sun, as a reference to the Altai Shaman rings. Yellow LED strips embedded underneath the lower hoop create the illusion of a solar eclipse when viewed from above.
Image 2: A view of the dancer testing the dress from above
4 Testing with Dancers
For the purpose of uniqueness, the dancers involved in the testing of the Eclipse dress were chosen to have expertise in different dance styles. They were all asked to improvise with the dress in whichever style they would please, keeping the Altai Shaman theme in mind. Visual and aural results of these improvised performances, as well as feedback from the dancers, guided me towards some critical decisions about the performance.
The first dancer, Qui Yi Wu, who considered her dance as “street style”, found the dress to be limiting for the way she dances. Wu stated[12]:
“It is definitely a great design, I think it will fit more experimental and futuristic movement style. I do street dance so it's all about organic movements and freedom, and most of the time grooving to music. I feel like the design doesn't go with the momentum of spinning because of the way it attaches to the body and I don’t know how to move without considering it will bump into my body frequently.
Proc. of the 12th International Symposium on CMMR, Sao Paolo, Brazil, July 5-8, 2016
103

I really like the concept of having lighting around you and making music is always fun. Although sometimes it depends on what kind of music / sound you make. If it's complicated to conduct it might overwhelm the dancer.”
This feedback was helpful in seeing the limitations that the dress creates for the user. In addition to the dancer’s feedback, the performance showed the street dance style to be unfit for the story trying to be told, and the visual and aural elements did not match.
The second dancer, Betty Quinn, described her performance as “contemporary lyrical”[7]. In her feedback about the dress, Quinn observed:
“Feel was swaying, it made me feel like I was dancing with a partner, for sure. I had to navigate the natural movements and weight of the hoop with my body. Sound was otherworldly, mystical, it made the dress seem alive, which goes along with the partner aspect.”
Image 3: Quinn performing Eclipse at Parsons School of Design
In the second user test, the dancer was more comfortable with the dress and its movements. The weight and shape of the skirt was not a limitation in this case, but a unique characteristic of the dress that the dancer can navigate. In her feedback, Quinn refers to the dress as a “partner” rather than a costume, which was the intention while creating the dress. With its weight, unique movements, and musical aspect, Eclipse dress has proven to be an active personality in the performance.
The third dancer, Kiki Sabater could not provide feedback but defined her style as Limón inspired modern dance. This dance style also visually fit the sound created.
Proc. of the 12th International Symposium on CMMR, Sao Paolo, Brazil, July 5-8, 2016
104

Running Title ��� 7
Image 3: Kiki Sabater performing Eclipse at Circuit Bridges Concert No. 35: UK Loop
The takeaway from this study is that, as versatile as the dress was intended to be made to fit all styles of dance, it is more suitable to modern and experimental dance styles. Harsh movements or high jumps makes the dress hard to control for the dancer. Furthermore, modern and experimental styles created better cohesion between the visuals and the sound created during the performance. Since the sound created by the dress does not necessarily supply a consistent rhythmic base for the dancer, a flexible style will help the dancer improvise more comfortably.
5 Background and Related Work
Wearable technology can be classified under three main fields; fashion, data & communication, and performing arts. Wearable devices under the data & communication category have a higher practical and commercial use, while the other two usually have aesthetic and artistic concerns. Expanding DIY culture makes wearable technology accessible to a wider audience of makers and allows for cheaper resources and less costly experimentation. This resulted in the creation of several pieces of musical wearable technology in the past decade. The majority of these pieces involve micro-controllers, sensors, processing of the sensory data collected, and audio editing software to translate the processed data into sound/music. The Crying Dress[3] by Kobakant is a mourning garment that creates a weeping soundscape with a unique trigger; water dripping on embroidered sensors. The speakers embroidered out of conductive thread outputs the sound. This art piece is similar to Eclipse in terms of telling a story through a wearable technology piece creating a custom soundscape. The major distinction between the two projects is that Eclipse is meant for a large audience to observe is as a staged performance, while The Crying Dress is basically an expressive dress for a specified occasion; a funeral. The Crying dress is putting the wearer in a more passive role, by doing the job for the
Proc. of the 12th International Symposium on CMMR, Sao Paolo, Brazil, July 5-8, 2016
105

user, while on the other hand Eclipse needs the user to be active in order to function. Mainstone’s body-centric devices such as Human Harp [1] and the collaborative work of Mainstone and Murray-Brown, The Serendiptichord[5], are examples of sensor based sonification of movement. Human Harp is not considered a self-contained wearable instrument, but rather a sound installation since it acts as an extension to a suspension bridge. However, the implementation of technology consists of sensors providing movement data, which is processed and translated into sound through audio editing software. The Serendiptichord, on the other hand, described by Murray-Brown as a “choreophonic prosthetic” [8], consists of fully mobile wearable components, including a headpiece and a pod for each hand. Sound is again created as an output of sensory data (movement and touch) processing.
Another precedent is Malloch and Hattwick’s Les Geste [2], a performance with prosthetic digital instruments. The instruments are controlled by the performer through touch, movement, and location sensors.
All of these examples are similar to Eclipse in terms of their use of sensory data in creating sound. However, they do not have the storytelling aspect that is a critical part of Eclipse.
6 Future Work
This experimental project provided useful information for future prototypes or continuation of the project with multiple wearable devices. First of all, the user of the dress is narrowed down to modern, lyrical, and experimental dancers. With this information, other dresses fitting the same dance style can be created with the dancer’s feedback during the process. Secondly, feedback from the dancers proved that this is an enjoyable experience for the creator, which can be enhanced by having multiple dresses - and therefore multiple dancers - interact with each other to create a soundscape.
The processes used in this project can be repeated to tell a different story. I would like this project to be a starting point for further multisensory storytelling explorations based on visual and aural interactions.
7 Conclusion
This paper outlines all steps of the experimentation towards creating a wearable instrument for interactive and performative storytelling. The ideation, purpose of the project, design process and implementations were covered in different sections of the paper. User test results, including feedback from dancers and observations of the author were provided.
Proc. of the 12th International Symposium on CMMR, Sao Paolo, Brazil, July 5-8, 2016
106

Running Title ��� 9
This experimentation showed that it is possible to create a feedback loop of movement and sound, where the sounds created by the movements are coherent with the movements. The sonic environment created by the dress was a unique contribution of each dancer performing with it. The conception of a performer dress was successfully created on a wearable device with unique movements that needed navigation and unpredictable sound creation. This wearable “partner”, as it was referred to by Quinn [7], turned out to be a dynamic character in the performance, telling the story of an Altai Shaman solar eclipse with its unique visual and sonic environment.
8 Acknowledgements
This project was executed as my thesis submitted to the faculty of Parsons The New School for Design, in partial fulfillment of the requirements for the degree of Master of Fine Arts in Design and Technology. Special thanks to Anezka Cecile Sebek, Barbara B. Morris, Katherine Moriwaki , Andrew Zornoza, Melissa Grey, Betty Quinn, Kiki Sabater, Qiu Yi Wu, Juno Liu, Kieun Kim, Daniel Mastretta Jimenez, Riley Kalbus, Marc Fiaux, Anna Meriano and Ryan Tunnell.
References
1. “About - Human Harp.” Human Harp. Accessed Spring 2015. http://humanharp.org/.2. ”Cross- Modal Object Recognition." In The Handbook of Multisensory Processes, edited by
Gemma Calvert, Charles Spence, and Barry E. Stein, by Fiona N. Newell, 123. Cambridge, Mass.: MIT Press, 2004.
3. "The Crying Dress." KOBAKANT. Accessed May 11, 2016. http://www.kobakant.at/?p=222.
4. Durkin, Andrew. “Do You Hear What I Hear?” In Decomposition: A Music Manifesto, 159. New York, NY: Pantheon Books, 2014.
5. Murray-Browne, Tim, Di Mainstone, Nick Bryan-Kinns, and Mark D. Plumbley. The Serendiptichord: A Wearable Instrument For Contemporary Dance Performance. Publication no. 8139. London: Audio Engineering Society, 2010.
6. Nicholson, Shirley J. Shamanism: An Expanded View of Reality. Wheaton, Ill., U.S.A.: Theosophical Pub. House, 1987. Foreword.
7. Quinn, Betty. "User Testing Feedback." Online interview by author. June 2, 2015.8. “The Serendiptichord.” Tim Murray Browne Interactive Sound Creative Code. Accessed
Spring 2015. http://timmb.com/serendiptichord/.9. Shamanskiĭ Kosti
um: Iz Kollektsii Irkutskogo Oblastnogo Kraevedcheskogo Muzei
a =
Shaman's Costumes. Irkutsk: Artizdat, 2004.17.10.Solon, Olivia. "Prosthetic Instruments Create Music through Body Movements (Wired
UK)." Wired UK. August 8, 2013. http://www.wired.co.uk/news/archive/2013-08/08/digital-instruments-gestes.
Proc. of the 12th International Symposium on CMMR, Sao Paolo, Brazil, July 5-8, 2016
107

11.”Teensy USB Development Board." Teensy USB Development Board. https://www.pjrc.com/teensy/.
12.Wu, Qui Yi. "User Testing Feedback." Online interview by author. April 10, 2015.13.”XBee® ZigBee." XBee ZigBee. http://www.digi.com/products/xbee-rf-solutions/modules/
xbee-zigbee.
Appendix
The video of the Eclipse performance viewed from above is available at https://vimeo.com/133083095.
Proc. of the 12th International Symposium on CMMR, Sao Paolo, Brazil, July 5-8, 2016
108

Sound interaction design and creation in the context of urban space
Arango, Julián Jaramillo
Programa de Diseño y Creación
Universidad de Caldas Grupo DICOVI
Abstract. This paper reports recent theoretical and creative results of an ongoing postdoctoral study entitled Sound Design for Urban Spaces. The study focuses on the design process of novel audio devices and studies listening strategies for people in transit through the city. Firstly, we will review some conceptual contributions concerning listening and acoustic analysis from the perspective of urban studies. We will argue that urban studies interpretation of musical composition concepts stresses some aspects of sound and listening that are relevant for the sound designer. Secondly, specific methodologies and procedures for sound interaction design and creation in the context of urban spaces will be discussed. In the last section, we will recount the design process of the Smartphone Ensemble, a project that has been got under way along with MA students from the Design and Creation program at the Caldas University in Manizales, Colombia.
Keywords: Mobile Music, Urban Sound Design, Sound Interaction Design
1 Introduction
Wi-Fi, 4G and GPS smartphone capabilities have inspired a new set of locative tools for the contemporary pedestrian. The distribution of computer software and hardware in the public space allows the passerby to interact with computer music applications everywhere. The more urban technologies increase their scope, the more sound takes part in everyday human-computer interaction. This paper will discuss sound and everyday listening from the perspective of design studies, examining the conditions of the urban space as the premises in the design of mobile computer music applications, products and services.
The projects reported in this paper are being created under a two-years postdoctoral research study entitled Sound Design for Urban Spaces, it focuses on the design process of novel audio devices and studies listening strategies for people in transit through the city. The study is funded by the Colombian science and technology research agency (Colciencias) and the University of Caldas design and creation program in Manizales hosts it. In the laboratorio de sonologia we have conformed a group of designers, musicians and engineers that have been developing design projects around a set of questions raised in the study, such as: ¿What is the role of
Proc. of the 12th International Symposium on CMMR, Sao Paolo, Brazil, July 5-8, 2016
109
2 Arango, Julián Jaramillo
sound in the human occupation of urban spaces?, ¿How does sound act in the two-way link between the city passer and his/her mobile computer?
In the first section we will look through some conceptual contributions concerning listening and acoustic analysis from the perspective of urban studies. Augoyard’s notion of sonic effect will allow us to examine Pierre Schaeffer’s sound object and Murray Schafer’s soundscape. We will argue that urban studies interpretation of musical composition concepts stresses aspects of sound and listening relevant in the field of sound design, such as user experience and sustainability. Next section is dedicated to discuss some methodologies for interaction design and creation in the context of public spaces. We will review British theorist Frauke Behrendt’s framework of mobile sound, which has been helpful to identify defined procedures for designers and creators interested in the pedestrian-computer sonic interaction. The last section will describe the design process and aims of the Smartphone Ensemble, a group of musicians and designers from Manizales that adopts mobile phones both as musical instruments and as social mediators.
2 Sound analysis in the urban context
Some studies [1] [2] coming from the Centre de Recherche sur l’espace sonore et l’environnement urbain (CRESSON) in Grenoble, have been discussing sound and listening from the perspective of urban analysis. Notably the theoretic work by Jean François Augoyard [1] proposes a set of analysis tools adapted to the contingencies of contemporary cities, the sound effects. The study embraces concepts and notions from XX century music composition theory, such as Pierre Schaffer’s sound object and Murray Schafer’s soundscape, in a way that some aspects, rarely discussed in music contexts, are highlighted. Under the Augoyard interpretation, the sound object and the soundscape become complementary tools in the analysis of the urban environment.
In the one hand, Augoyard defines the sound object as “… the interaction of the physical signal and the perceptive intentionality” [1]. The author connects listening to the problem of the user experience, that gathers different concerns in contemporary design thinking. User experience based design research has developed diverse methodologies to extract user needs and habits [3]. In the case of sound, the approach to aural perception introduced by Pierre Schaffer provides answers and directions to the “problems” placed by the user, in this case the passerby. Furthermore, Augoyard extracts from Pierre Schaeffer the matter of sound subjective perception, discussing selective listening, memory and hallucination as current issues on auditory urban activity. Nonetheless, under the Augoyard’s view the sound object is too narrow to analyze architectural and urban space acoustic phenomena. The out-of-context method of sound-by-sound examination provided by Pierre Schaeffer is compared with a linguistic analysis focused at the level of the words and syntagmas.
In the other hand, CRESSON researchers critically adopt the soundscape theory. While recognizing its expansive evolution, the soundscape theory is assumed as the main model to understand environmental acoustics. For designers the soundscape concept becomes a fruitful analysis tool since it faces sonic urban activity as a sustainable design problem [2]. We would suggest that, unlike Pierre Schaeffer or John Cage approach to sound, listening and audio recording technology, the
Proc. of the 12th International Symposium on CMMR, Sao Paolo, Brazil, July 5-8, 2016
110

Running Title 3
soundscape theory is the only one that openly deals with sustainability from the perspective of design and creation [4], [5]. In the Murray Schafer conception of sound design, the musician is re-inserted into the society, playing the aesthetic role in a multidisciplinary ecological project. Augoyard, for his part, argues that the soundscape theory blurs the analysis of the urban acoustic environment, leaving out a series of everyday urban situations that would belong to the Murray Schafer’s “low-fi” category. Therefore, Augoyard places soundscape theory near the linguistic analysis tools that covers the whole structure of the text.
In his catalogue Augoyard integrates Pierre Schaeffer and Murray Schafer theories in the inclusive concept of sound effect. To continue the linguistic analogy, sound effects would correspond to an analysis at the level of the sentence. Augoyard goes around acoustic and listening phenomena from different domains of reference that describe them: physical and applied acoustics, architecture and urbanism, psychology and physiology of perception, sociology and everyday culture, musical and electroacoustic aesthetics and textual and media expressions. Augoyard identifies the fields in which his study can be helpful, extracting a set of new directions for the urban sound designer.
3 Methodologies for urban sound design and creation
The theoretical contributions coming from CRESSON contemporary urban design
have feed our aim to envisage new venues for computer music experiments and to find ways to engage new computer music practitioners. The complexity of sound and listening activity in the urban context examined by Augoyard have been one of the conceptual resources of the two-years postdoctoral study “Sound Design for Urban Spaces” [6]. Listening topics involving subjective sound perception, such as anamnesis, phonomnesis or perdition [1], have been explored in our analysis of the local acoustic environment faced by the pedestrian in Manizales.
Along the first phase of the postdoctoral study we have created the laboratorio de sonologia in the School of Design. We are identifying and evaluating alternative technologies available to designers and useful in the field of Sonic Interaction Design, that can be defined as the “… practice and inquiry into any of various roles that sound may play in the interaction loop between users and artifacts, services, or environments” [7]. The projects developed in the laboratorio de sonologia are oriented to the urban context; furthermore the study identifies the pedestrian as the main recipient and the end user of the design projects. The study aims to feed what Brazilian media theorist André Lemos calls “informative territories” [8], inserting sound into the equation of mobile technology, locative media, the internet of things, and the recent concept of Smart Cities.
Frauke Behrendt classification of locative media sound projects has been helpful to identify defined procedures for designers and creators interested in the pedestrian-computer sonic interaction. The study proposes a framework with four different directions in the field of sound mobility: musical instruments, sonified mobility, sound platforms and placed sound [9]. This study In the laboratorio de sonologia we have created portable systems that would belong to the Behrendt musical instruments
Proc. of the 12th International Symposium on CMMR, Sao Paolo, Brazil, July 5-8, 2016
111
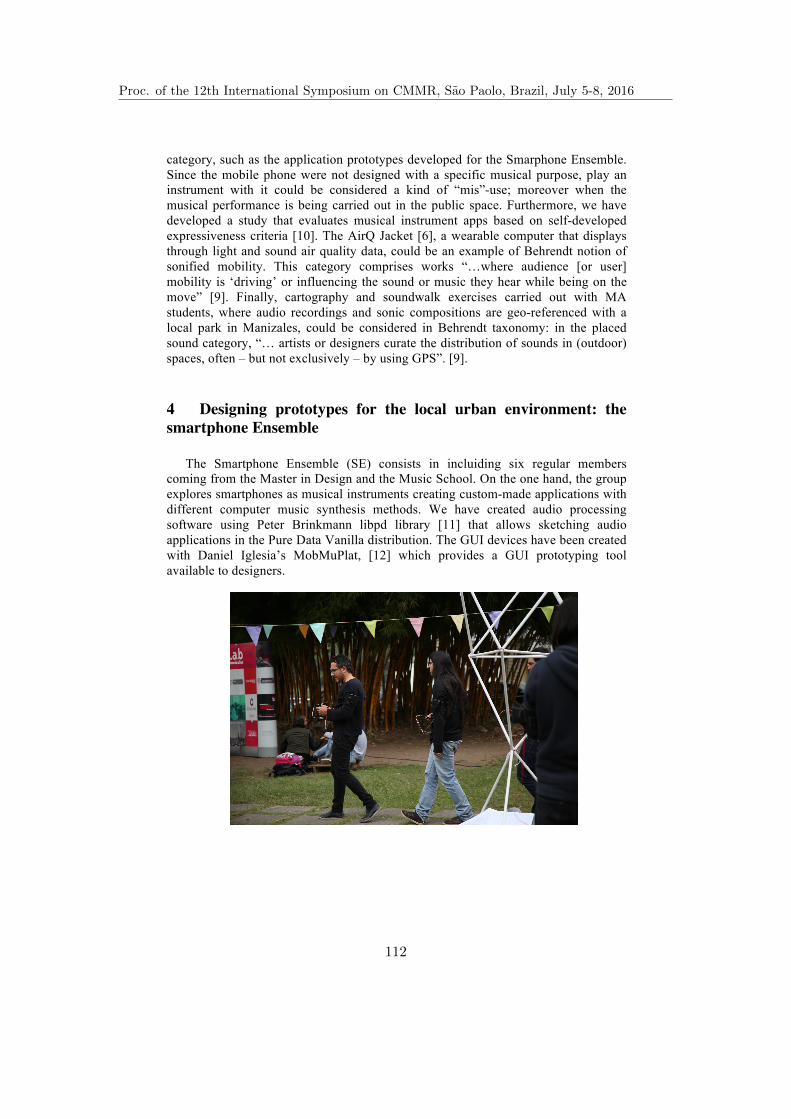
4 Arango, Julián Jaramillo
category, such as the application prototypes developed for the Smarphone Ensemble. Since the mobile phone were not designed with a specific musical purpose, play an instrument with it could be considered a kind of “mis”-use; moreover when the musical performance is being carried out in the public space. Furthermore, we have developed a study that evaluates musical instrument apps based on self-developed expressiveness criteria [10]. The AirQ Jacket [6], a wearable computer that displays through light and sound air quality data, could be an example of Behrendt notion of sonified mobility. This category comprises works “…where audience [or user] mobility is ‘driving’ or influencing the sound or music they hear while being on the move” [9]. Finally, cartography and soundwalk exercises carried out with MA students, where audio recordings and sonic compositions are geo-referenced with a local park in Manizales, could be considered in Behrendt taxonomy: in the placed sound category, “… artists or designers curate the distribution of sounds in (outdoor) spaces, often – but not exclusively – by using GPS”. [9].
4 Designing prototypes for the local urban environment: the smartphone Ensemble
The Smartphone Ensemble (SE) consists in incluiding six regular members coming from the Master in Design and the Music School. On the one hand, the group explores smartphones as musical instruments creating custom-made applications with different computer music synthesis methods. We have created audio processing software using Peter Brinkmann libpd library [11] that allows sketching audio applications in the Pure Data Vanilla distribution. The GUI devices have been created with Daniel Iglesia’s MobMuPlat, [12] which provides a GUI prototyping tool available to designers.
Proc. of the 12th International Symposium on CMMR, Sao Paolo, Brazil, July 5-8, 2016
112
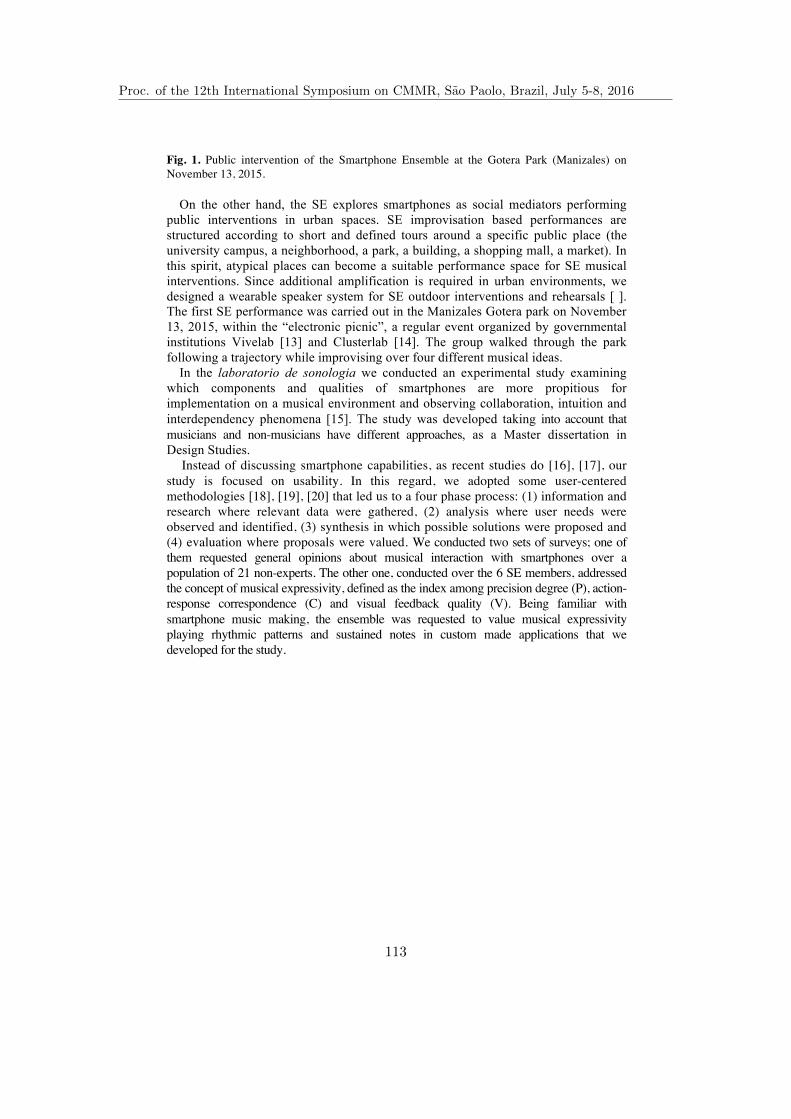
Running Title 5
Fig. 1. Public intervention of the Smartphone Ensemble at the Gotera Park (Manizales) on November 13, 2015.
On the other hand, the SE explores smartphones as social mediators performing public interventions in urban spaces. SE improvisation based performances are structured according to short and defined tours around a specific public place (the university campus, a neighborhood, a park, a building, a shopping mall, a market). In this spirit, atypical places can become a suitable performance space for SE musical interventions. Since additional amplification is required in urban environments, we designed a wearable speaker system for SE outdoor interventions and rehearsals [ ]. The first SE performance was carried out in the Manizales Gotera park on November 13, 2015, within the “electronic picnic”, a regular event organized by governmental institutions Vivelab [13] and Clusterlab [14]. The group walked through the park following a trajectory while improvising over four different musical ideas.
In the laboratorio de sonologia we conducted an experimental study examining which components and qualities of smartphones are more propitious for implementation on a musical environment and observing collaboration, intuition and interdependency phenomena [15]. The study was developed taking into account that musicians and non-musicians have different approaches, as a Master dissertation in Design Studies.
Instead of discussing smartphone capabilities, as recent studies do [16], [17], our study is focused on usability. In this regard, we adopted some user-centered methodologies [18], [19], [20] that led us to a four phase process: (1) information and research where relevant data were gathered, (2) analysis where user needs were observed and identified, (3) synthesis in which possible solutions were proposed and (4) evaluation where proposals were valued. We conducted two sets of surveys; one of them requested general opinions about musical interaction with smartphones over a population of 21 non-experts. The other one, conducted over the 6 SE members, addressed the concept of musical expressivity, defined as the index among precision degree (P), action-response correspondence (C) and visual feedback quality (V). Being familiar with smartphone music making, the ensemble was requested to value musical expressivity playing rhythmic patterns and sustained notes in custom made applications that we developed for the study.
Proc. of the 12th International Symposium on CMMR, Sao Paolo, Brazil, July 5-8, 2016
113

6 Arango, Julián Jaramillo
Fig. 2. Musical Expressivity valued in different smartphone input methods by the six members of the Smartphone Ensemble.
There are different conclusions that we have drawn from the study results. In this paper we would remark that although touch screen and microphone seems to be more precise than the tilt sensor, they were comparatively less valued in the action-response correspondence appreciation. When visual feedback was rated, the tilt sensor was significantly better valued than the other tested input methods. It suggests that the freedom of the body movement, allowed by the tilt sensor and hindered by the touch screen and the microphone, is an important consideration in the design of mobile music applications. Moreover, the results support our intuition that mobility, in this case through the city, is an essential consideration in smartphone music making.
5 Conclusions and further Work
In the city the sound designer faces a challenging context, not only because an arsenal of technological resources is now available, but also because new conceptual directions are being discussed. On the shoulders of Pierre Schaeffer and Murray Schafer, Augoyard extracts concrete urban listening situations for close examination. His interpretation raises relevant topics in the design thinking, such as user experience and sustainability. For her part, Berhendt proposes concrete design procedures gathering projects in defined categories. Her classification of mobile music helps to recognize other projects goals and to identify truly original ideas from apparently spontaneous insights. However, the creation process in the field of sound design still requires methods of evaluation that allows the designers to go further in their projects. The Smartphone Ensemble proposes a research-creation-observation-evaluation iterative cycle. Since the process is still in the second round, we are still drawing usefull conclusions in order to improve the design prototypes.
Proc. of the 12th International Symposium on CMMR, Sao Paolo, Brazil, July 5-8, 2016
114

Running Title 7
On May, 2016, The University of Caldas will host the Festival Internacional de la Imagen [21]. SE will perform a new intervention in the hall of the event main building. Other projects developed under the Sound Design for Urban Spaces study will be presented in the Festival such as, the running prototype of the AirQ Jacket, a project of visualization and sonification called Esmog Data and a one-day seminar called Encuentro de Sonologia [6], where researcher from different academic institutions will present works and reports of sound related projects [6].
6 Acknowledgements
This work is a result of a research funded by Departamento Administrativo de Ciencia, Tecnología e Innovación (COLCIENCIAS), Grant 656.
References
1. Augoyard, Jean François, Torge, Henry (2005). Sonic Experience, a guide to everyday sounds. Montreal, McGill-Queen’s University Press
2. Hellstrom, Bjorn. ¨Towards sound Design¨. (2003) In. Noise Design. Architectural Modelling and the Aesthetics of Urban Space. Bo Ebay Forlag. Sweeden. (pp 31-40)
3. Norman, D., The Design of Future Things (2005). Paperback. New York 4. Gallopin, Gilberto. (2003). Sostenibilidad y desarrollo sostenible: un enfoque sistémico.
Santiago de Chile: Cepal 5. Manzini, Ezio. (2006). Design ethics and sustainability. Milano: Dis-Indaco-Politécnico di Milano. 6. J. J. Arango. Diseño de Sonido para el Espacio Urbano. (2015) https://sonologiacolombia.wordpress.com/ 7. Rocchesso, D., Serafin, S., Behrendt, F., Bernardini, N., Bresin, R., Eckel, G., et al. (2008). Sonic interaction design: sound, information and experience. CHI ’08 extended abstracts on Human factors in computing systems, Florence 8. Lemos. A. City and mobility. Cell phones, post-mass functions and informational territories. (2007) Matrizes, SãoPaulo, n1, p121-138, 9. Behrendt, Frauke,. (2010) Mobile sound: media art in hybrid spaces. PHD Thesis, University of Sussex. 10. D. Melan (MA Dissertation). (2015) Interactive design for collaborative sound creations via mobile devices: Towards a perspective of music creation through design practices. 2015. Design department. University of Caldas. 11. P. Brinkmann, P. Kirn, R. Lawler, C. McCormick, M. Roth, & H.-C. Steinser. LibPD. (2011) Embedding pure data with libpd. In Proc Pure Data Convention. 12. D. Iglesia. Mobmuplat, (2013), mobile music platform http://mobmuplat.com 13. Vivelab Manizales. http://www.vivelabmanizales.com/\ 14. Clusterlab. http://clusterlab.co/networking/eventos/ii-picnic-electrnico-20 15. G. Weinberg, Interconnected Musical Networks: Toward a Theoretical Framework. (2005) Computer Music Journal 29(2):23–39.
Proc. of the 12th International Symposium on CMMR, Sao Paolo, Brazil, July 5-8, 2016
115

8 Arango, Julián Jaramillo
16. G. Essl,, M. Rohs. “Interactivity for Mobile Music Making”, (2009) Organised Sound 14:2 197-207 17. A. Misra, G., Essl, M., Rohs. "Microphone as Sensor in Mobile Phone Performance" (2008) In Proceedings of the 8th International Conference on New Interfaces for Musical Expression (NIME 2008), Genova, Italy, June 5-7 18. A.B. Findeli. Research Through Design and Transdisciplinarity: A Tentative Contribution to the Methodology of Design Research. (2009) http://www.swissdesignnetwork.org/daten_swissdesignnetwork/docs/04_Findeli.pdf. 19. S. Moroni. Apuntes Introducción Diseño - apunte_01-taller-de-diseno-y-creacion. (2008) https://disenoaiep.files.wordpress.com/2008/03/apunte_02-taller-de-diseno-y creacion.pdf. 20. J. C. Jones. Design methods. (1992) John Wiley & Sons. 21. Festival Internacional de la Imagen. www.festivaldelaimagen.com/
Proc. of the 12th International Symposium on CMMR, Sao Paolo, Brazil, July 5-8, 2016
116
Towards a new approach to design sounds inpublic transport
Gaetan Parseihian1, Emmanuelle Delgrange2, Christophe Bourdin3, VincentBrejard4, Damien Arpaja2, Francois Agier2, and Richard Kronland-Martinet1 ?
1 LMA, CNRS, UPR 7051, Aix-Marseille Univ, Centrale Marseille, F-13453 MarseilleCedex 13, France
2 Regie des Transport de Marseille (R.T.M.), Marseille, France3 Aix Marseille Univ, CNRS, ISM UMR 7287, Marseille, France
4 Aix Marseille Univ, LPCLS, E.A. 3278, Aix-en-Provence, [email protected]
Abstract. This paper presents a collaborative project between the Mar-seille transit operator and several laboratories from Aix-Marseille Uni-versity to improve the bus trip with auditory information. A high qualitymulti channel sound spatialization system was integrated in the bus and asonification software based on geolocation was designed in order to studythree fundamental actions of the sound on bus passengers: designingsound announcement to inform passengers of the next stop in a playfuland intuitive way, brightening up the route with spatialized soundscapesto increase the trips pleasantness, and using sound to alert passengersof emergency braking. First, the overall concepts of this project are pre-sented, then the integration of the sound spatialization system and theimplementation of the sonification software are described. Finally, eval-uation method of passengers satisfaction is discussed.
Keywords: Sound design, sonification, mobility
1 Introduction
“Imagine yourself in a bus in an unfamiliar city. You leave the central station toreach the football stadium. Aggressive city soundscapes fade out as the doors areclosing, uncovering an astonishing sound environment. At some stops, the soundof breaking waves comes brushing your ears then return to the front of the bus.Between the bus stops you imagine you can hear seagulls flying in the bus, asoft breeze brushing past your shoulder, and some boat masts knocking togetherfar from you. A passenger informs you of the beaches’ proximity and tells youthat these are regularly heard in the bus. You continue your travel toward thestadium. While approaching, you hear a growing murmur, this doesn’t seem to bedue to the good atmosphere in the bus. Some sounds of soccer balls, of whistles,of roaring crowds, etc. The closer you are to the stadium, the more you have the
? This work was funded by the RTM and by Carnot Star.
Proc. of the 12th International Symposium on CMMR, Sao Paolo, Brazil, July 5-8, 2016
117

2 Parseihian et al.
impression of already being in the stadium. A “ola” wave is heard, coming fromthe front of the bus, reaching the back then returning back to the front of the bus,some passengers participate. It is followed by the stop announcement “VelodromStadium”. This time you are sure that you have reached your destination.”
This scenario fully illustrates Marseille transit operator (Regie des TransportsMaseillais, RTM) vision of next generation of Marseille’s buses. More than a wayof transport, the bus can become a social and cultural meeting place. Soundambiances and announcements can suggest places, open the bus onto the city,diminish the stress and transform a simple trip into a tourist and historic stroll,whereas sound alerts can increase passengers’ security and prevent numerousaccidents; all this in order to offer to the passengers a more pleasant trip. Indeed,nowadays, despite an increasing development of public transport in big cities,the use of personal cars is still dominant inducing many traffic-jams and is animportant factor of air pollution. If the first reason is the lack of appropriateline and the difficulty of developing an homogeneous transport network, anotherfrequent reproach to public transport is the lack of pleasantness of the trip.In the bus case, for example, the traffic-jams, the number of passengers or thetemperature can transform a simple trip into a real ordeal.
The aim of this article is to present a collaborative project between theMarseille transit operator and several laboratories from Aix-Marseille Universityto further improve the bus trip using auditory information.
Sound could acts on humans in different ways: it informs [11,4], guides [12],but also influences the behaviour [7]. Considering these interactions, many po-tential applications might be developed in public transport sector. The soundcan inform on the location of particular places, on points of interest along theroute, or on the engine dynamic in the electric or hybrid vehicle cases. It canalso be used to carry out a specific task (guide the passengers to the rear ofthe bus) and even influence passengers’ behaviour, in term of mood (relaxation)and of posture (anticipatory postural adjustments), especially with the use ofimmersive sound methods.
The presented project consists in the study of three fundamental actions ofthe sound on the bus’ passengers:
– Alert the passengers of the next stop in a playful and intuitive way: the goalhere is to reconsider the sound alerts informing about the bus stops whileillustrating those with typical auditory icons inspired from the places andthe city history and geography.
– Brighten up the route with spatialized soundscapes to increase the trip’sagreeableness: the goal here is to virtually open the bus on surroundingspace by generating spatialized and progressive natural soundscapes (soundsof cresting wave, distant boats, seagulls, etc.) in order to positively impactpassengers’ behaviour and mood while informing them of potential points ofinterest along the route.
– Using sound to alert passengers of possibly destabilizing emergency braking:the goal here is to use spatialized and dynamic sounds in order to alert, in
Proc. of the 12th International Symposium on CMMR, Sao Paolo, Brazil, July 5-8, 2016
118

Towards a new approach to design sounds in public transport 3
advance, the passengers (particularly those who stand up) of destabilizingemergency braking to avoid falls.
For this purpose, a high quality multi-channel sound spatialization systemcomposed of ten loudspeakers was integrated in the bus and a sonification soft-ware based on geolocation was designed.
This article describes the different aspects of this project. First, the threefundamental actions of the sound on the passengers are succinctly described.Then, the integration of the sound spatialization system in the bus and theimplementation of the sonification software are detailed. Finally, first works onthe evaluation of the device by passengers are discussed.
2 Project overview
2.1 Playful and intuitive stop announcement
Auditory warnings in public transports Clear and consistent on-boardstop announcements are vital to ensure that buses are accessible to and usableby people with disabilities, as well as by visitors or others who may not befamiliar with the service area. Without adequate on-board stop announcementssome riders may have difficulty knowing when to get off the vehicle.
Traditionally, stop announcements are made manually by vehicle operatorsusing a public address system or provided as part of an automated voice an-nouncement system [2]. For automated voice announcement, vehicle operatorcan choose between using a text to speech software or pre-recorded voice. Inboth cases, the message must be clear and not misunderstood.
During the last few years, in addition to the vocal announcement, some ve-hicle operators have added different types of sounds to the stop announcementin order to increase its attractiveness and to distinguish their company from theothers. For example, Paris’ and Strasbourg’ tramway stop announcements weredesigned by the sound artist Rodolphe Burger. They are made of musical jinglesand voices. For each stop, a particular musical jingle and a pair of voices wererecorded to design two different stop announcements for each stop (an inter-rogative announcement and an affirmative announcement). Evocative, playingwith our musical memory, the musical jingles are inspired by the names of thestops and allow to introduce the voice announcement. For another example, thecomposer Michel Redolfi has introduced the concept of “sonal” for the tramwaysof Nice, Brest, and Besancon. Unlike the jingles (which suggest unchanging andmonotonous stop announcement that sounds like a warning), the sonals are de-signed as musical sounds that can change over time. According to their designer,they discretely accompanies the riders on their journey and contains musical,vocal and historic elements linked to the specific features of the places and tothe unconscious collective sounds shared by the local population. In Nice, thesonals vary randomly at each stop with a different night and day version. Someof the announcements are dubbed in the Nice dialect (Nissarte). In Brest, thedesigners wanted to evoke, without exaggerating, the marine context. The sonals
Proc. of the 12th International Symposium on CMMR, Sao Paolo, Brazil, July 5-8, 2016
119

4 Parseihian et al.
are pronounced by a women when the tide is coming in and a man as the tide isgoing out. Of course, the time of the day when it shifts is different everyday, butthis design allows passengers to know where the sea is. As for Nice’s tramway,the announcements are randomly dubbed in the local Breton dialect.
Our approach For this project, our intention is to design spatialized intu-itive and playful auditory announcements (coupled with the traditional vocalannouncement) having a semantic link with the bus stop. Hence, we want to re-think the sounds related to the bus stops by illustrating its with typical auditoryicons of the places and of the city. For example, before arriving to the soccerstadium bus stop, a wave will be joined to the traditional announcement voicein order to notify to the passenger the stadium proximity. While the definitionof typical sounds which can be easily identifiable and recognized by all the pas-sengers is simple for few bus stops, the process of finding evocative sounds forall the stop is difficult or impossible. Thus, rather than looking for immediatecorrespondences between stops’ names and sounds, our approach is to draw in-spiration from the identity, the specificity and the history of the places crossedby the bus. In this way, a bike sound at Michelet Ganay stop can inform us thatGustave Ganay was one of the most famous cyclists from the 1920s and thathe was native from Marseille. The sound of stream waters at Luminy Vaufregesstop informs about the presence of an underground river. An extract of IannisXenakis music at Corbusier stop allows the passengers to discover the close linksbetween music and architecture, etc. Linked to a dedicated website or applica-tion (detailing and adding supplementary informations about the sounds usedfor each stop), these auditory icons tend to transform an ordinary trip from oneplace to another in a historic, tourist, and heritage visit.
With the spatialization of sound, auditory icons travel in the bus followingthe wave metaphor, giving the sensation of a sound that informs the passengersone by one, starting from the front of the bus and propagating to the back of thebus. In addition to the playful aspect, the use of the sound spatialization allowsto attract the passengers attention by opposition to the usual announcementimmobility. Different types of waves will be studied as a function of the auditoryicon types. Indeed, the simple propagation from the front to back is of interestfor some auditory icons while other will be easily perceived with a round triptrajectory or with a circular trajectory (e.g. starting from the right side of thebus and returning by the left side).
For a correct identification of the stop name by all the passengers, auditoryicons are coupled with traditional voice clearly announcing the stop name. Thisvocal announcement is uniformly played on all the ten loudspeakers to ensure themost homogeneous diffusion in the bus and to guarantee the best hearing comfortand optimized intelligibility for all the passengers and in all the situations.
By convention, in the bus, a stop is announced twice: the first occur around100 meters after the previous bus stop, the second takes place around 30 metersbefore reaching the stop. Depending on the transport company’s or sound de-signer’s choice, these two types of announcement are differentiated by the voice
Proc. of the 12th International Symposium on CMMR, Sao Paolo, Brazil, July 5-8, 2016
120
Towards a new approach to design sounds in public transport 5
prosody or by the way they are introduced (using ”next stop is...” or ”stop:...”for example). This differentiation with auditory icons is based on the sound du-ration. First type of announces are associated to a long auditory icons (a soundbetween 5 and 10 seconds) while second type are associated to short auditoryicons (between 1 and 2 seconds).
Finally, in order not to disturb and bother regular users, only a selection offew stops will be sonified to punctuate the trip. Selected stop and correspondingauditory icons can change according to the time (morning, afternoon, week-end),and to the traffic (peak or off-peak periods).
2.2 Designing soundscapes for trip’s enhancement
Closed environment, high temperature during summer, direct contact with otherpassengers during peak periods, traffic jams, etc. In certain situations, a bus tripcan become highly stressful for the passengers who are forced to undergo theiruncontrollable environment and the foreign discomfort [8]. To reduce these prob-lems, the idea here consists in enhancing the trip with spatialized soundscapesin order to virtually open the bus toward the surrounding space and to increasetrip’s agreeableness.
Effect of environmental sounds on stress Several studies have demon-strated restorative effects of natural compared with urban environments; theseeffects include increased well-being, decreased negative affects and decreasedphysiological stress responses [16,17,9]. In [17], Ulrich suggested that naturalenvironments have restorative effects by inducing positive emotional states, de-creased physiological activity and sustained attention. Considering the influenceof natural sounds, a study by Alvarsson et al. [1] suggests that, after psycho-logical stress, physiological recovery of sympathetic activation is faster duringexposure to pleasant nature sounds than to less pleasant noise of lower, similar,or higher sound pressure level. Benfield et al. [3] highlight a better relaxationwith natural sounds compared to no sound or to natural sounds mixed with hu-man sounds (voice or motor). Watts et al. [18] describe the beneficial effects onanxiety and agitation of introducing natural sounds and large images of naturallandscapes into a waiting room in a student health center. Other studies high-light the positive impact of music on stress reduction. In [6], the authors suggestthat listening to certain types of music (such as classical) may serve to improvecardiovascular recovery from stress.
Our approach of soundscapes design for the bus In order to reduce pas-sengers anxiety and to virtually open the bus, the project aims at enlivening thebus trip with:
– Spatialized contextualized natural soundscapes (composed with typical soundsfrom Marseille and its surrounding) and musical ambiances;
– Point Of Interest (POI) sound announcements (museum, monuments, parks,beaches, etc.)
Proc. of the 12th International Symposium on CMMR, Sao Paolo, Brazil, July 5-8, 2016
121
6 Parseihian et al.
Soundscapes and POI are geolocalized and triggered when the bus passesclose to their position on the route. For the POI, as in augmented reality, thesounds are virtually placed on the object they are representing, that is the POIsound appears to come from the POI position. Hence, when passing by a church,the passengers will feel that the tinkling of the bells come from the church (thesound spatialization is based on the POI position with respect to the bus). Thesoundscapes are constructed to reflect a particular atmosphere or universe incoherence with the route or the neighbourhood, to give an overview of typi-cal sounds surrounding the city, or to offer a trip based on musical ambiances.For example, in a city close to the sea, soundscapes might be composed of seasounds (waves, boats, wind, seagull, etc.), and in highly urbanised area forests’sounds can be recommended. In addition to stress reduction, designed sound-scapes will allow to divide the bus itinerary in several parts according to crossedneighbourhood and places.
Soundscapes design is based on a random reading of the preselected soundsamples in order to avoid redundancy that could annoy and tire regular passen-gers. With this process, on one part of the route, soundscape ambiance is alwaysthe same but the sound events doesn’t appear twice at the same time and atthe same position. Sounds trajectory and frequency of appearance may vary asa function of the time of the day but also as a function of the traffic, the tem-perature, or the passengers number. It is also possible to design several similarsoundscapes and to associate them to different periods of the week (morning orafternoon, week or week-end, for example).
2.3 Using sounds to secure the passengers
The third part of the project aims at studying brief spatialized warning soundsdesigned to prevent bus passengers from emergency braking. The idea is to usedynamic and spatialized sounds in order to alert, in advance, the passengers(particularly those who stand up) of destabilizing emergency braking. In thebus, some of the passengers do not stand up in the same direction as the buscirculation and do not necessarily see the road. This results in an impossibility ofpredicting sudden vehicle movements and in an important postural destabilisa-tion. Our objective is to analyse driver’s foot behaviour to predict braking phasesand produce an auditory warning allowing the subject to produce anticipatorypostural adjustment.
High postural perturbations, such as those induced by emergency braking,endanger the body’s stability. In order to preserve the equilibrium, as a functionof the perturbation’s predictability, humans can produce compensatory posturaladjustment (CPA) and/or anticipatory postural adjustment (APA). In [13,14],the authors highlight the importance of APAs in control of posture and pointsout the existence of a relationship between the anticipatory and the compen-satory components of postural control. It also suggests a possibility to enhancebalance control by improving the APAs responses during external perturbations.In a study by [10] et al., the authors show that auditory precuing can play a role
Proc. of the 12th International Symposium on CMMR, Sao Paolo, Brazil, July 5-8, 2016
122
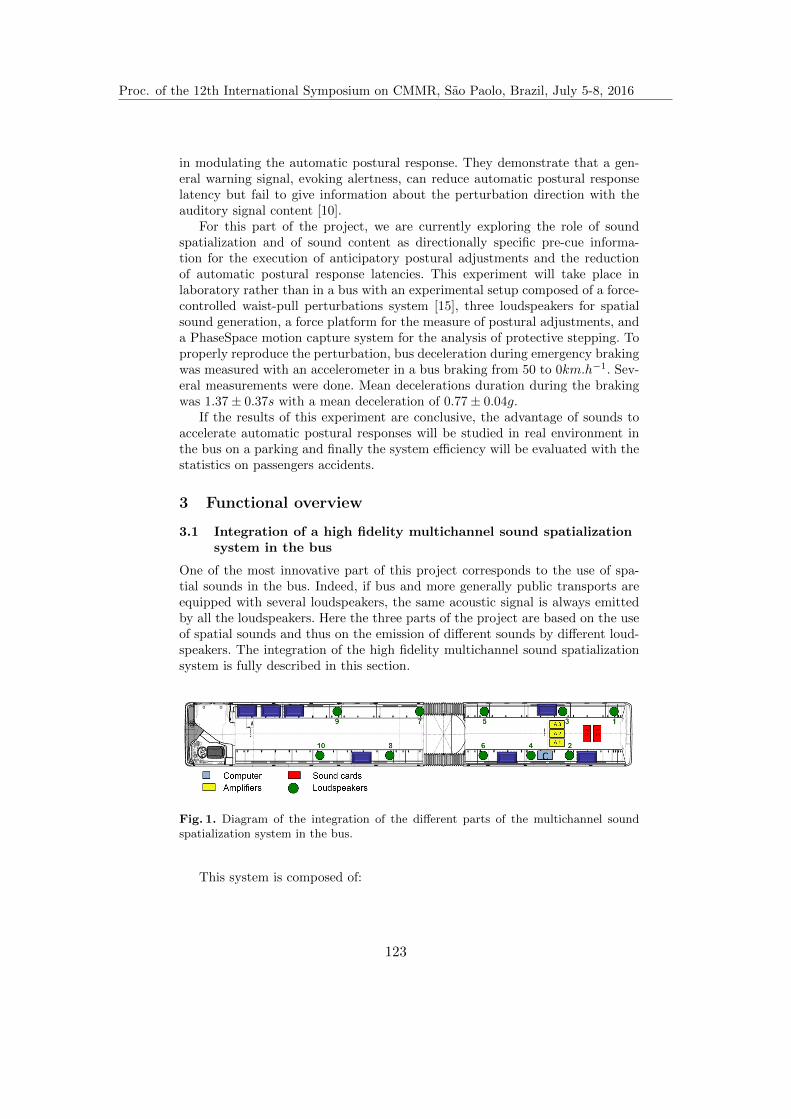
Towards a new approach to design sounds in public transport 7
in modulating the automatic postural response. They demonstrate that a gen-eral warning signal, evoking alertness, can reduce automatic postural responselatency but fail to give information about the perturbation direction with theauditory signal content [10].
For this part of the project, we are currently exploring the role of soundspatialization and of sound content as directionally specific pre-cue informa-tion for the execution of anticipatory postural adjustments and the reductionof automatic postural response latencies. This experiment will take place inlaboratory rather than in a bus with an experimental setup composed of a force-controlled waist-pull perturbations system [15], three loudspeakers for spatialsound generation, a force platform for the measure of postural adjustments, anda PhaseSpace motion capture system for the analysis of protective stepping. Toproperly reproduce the perturbation, bus deceleration during emergency brakingwas measured with an accelerometer in a bus braking from 50 to 0km.h−1. Sev-eral measurements were done. Mean decelerations duration during the brakingwas 1.37 ± 0.37s with a mean deceleration of 0.77 ± 0.04g.
If the results of this experiment are conclusive, the advantage of sounds toaccelerate automatic postural responses will be studied in real environment inthe bus on a parking and finally the system efficiency will be evaluated with thestatistics on passengers accidents.
3 Functional overview
3.1 Integration of a high fidelity multichannel sound spatializationsystem in the bus
One of the most innovative part of this project corresponds to the use of spa-tial sounds in the bus. Indeed, if bus and more generally public transports areequipped with several loudspeakers, the same acoustic signal is always emittedby all the loudspeakers. Here the three parts of the project are based on the useof spatial sounds and thus on the emission of different sounds by different loud-speakers. The integration of the high fidelity multichannel sound spatializationsystem is fully described in this section.
Fig. 1. Diagram of the integration of the different parts of the multichannel soundspatialization system in the bus.
This system is composed of:
Proc. of the 12th International Symposium on CMMR, Sao Paolo, Brazil, July 5-8, 2016
123
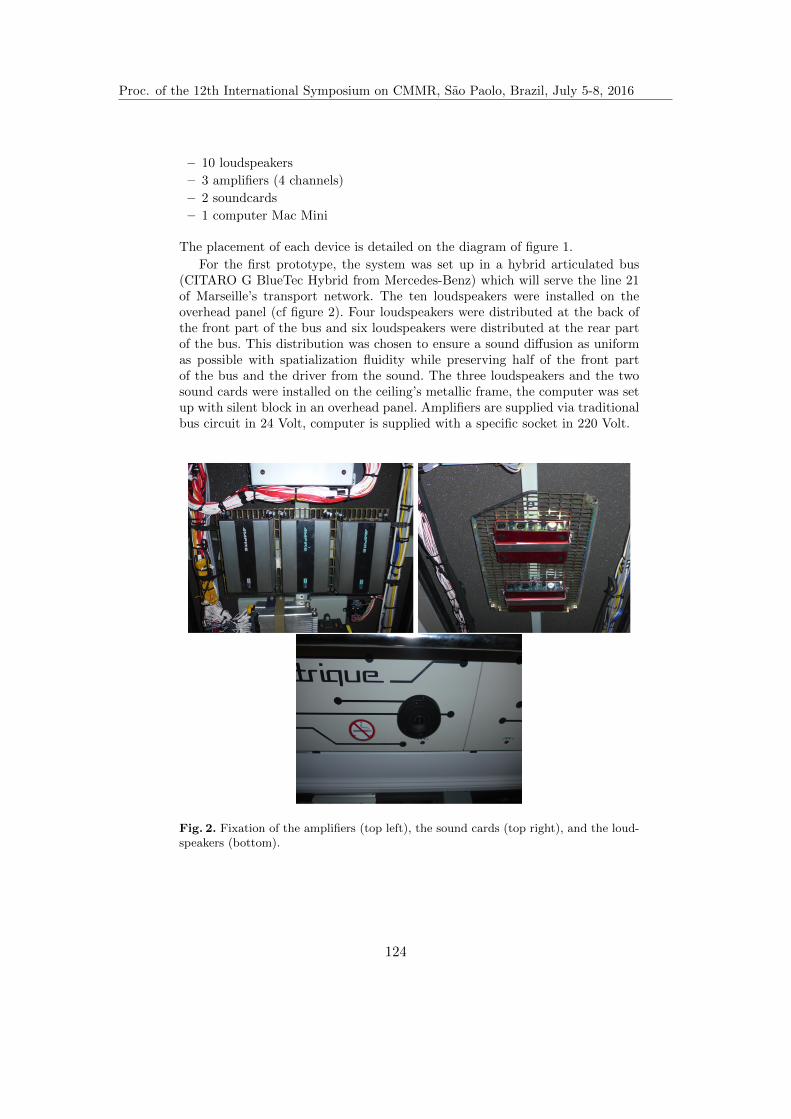
8 Parseihian et al.
– 10 loudspeakers
– 3 amplifiers (4 channels)
– 2 soundcards
– 1 computer Mac Mini
The placement of each device is detailed on the diagram of figure 1.
For the first prototype, the system was set up in a hybrid articulated bus(CITARO G BlueTec Hybrid from Mercedes-Benz) which will serve the line 21of Marseille’s transport network. The ten loudspeakers were installed on theoverhead panel (cf figure 2). Four loudspeakers were distributed at the back ofthe front part of the bus and six loudspeakers were distributed at the rear partof the bus. This distribution was chosen to ensure a sound diffusion as uniformas possible with spatialization fluidity while preserving half of the front partof the bus and the driver from the sound. The three loudspeakers and the twosound cards were installed on the ceiling’s metallic frame, the computer was setup with silent block in an overhead panel. Amplifiers are supplied via traditionalbus circuit in 24 Volt, computer is supplied with a specific socket in 220 Volt.
Fig. 2. Fixation of the amplifiers (top left), the sound cards (top right), and the loud-speakers (bottom).
Proc. of the 12th International Symposium on CMMR, Sao Paolo, Brazil, July 5-8, 2016
124

Towards a new approach to design sounds in public transport 9
3.2 Software overview
The different objectives of the project will be attained by combining input datafurnished by the bus system and geo-referenced data extracted from a geographicinformation system (GIS). Bus sonification will be provided using spatializedaudio rendering with pre-recorded voice, auditory icons and soundscape. Webuilt an innovative system prototype with an architecture divided into severalfunctional elements. The general architecture of the system is shown in figure 3.Each part of the system is described below.
Fig. 3. General architecture of the system.
Geographic Information System Geographic Information System (GIS)stocks, manages and returns the geographic data useful for the sonification.In actual prototype, three types of geographic informations are necessary (seesection 2): bus stop positions, points of interest and soundscapes positions.
The positions of the bus stops that characterize the path are extracted fromthe RTM database. For each bus line, two separates paths (outward and return)are created and exported to GoogleEarth via kml files. For each bus stop thestop name is associated to the stop position (illustrated by yellow drawing pinson figure 4).
POI and Soundscapes data are created and positioned with GoogleEarth. Foreach position, tags are set for the object type (POI or Soundscape), the objectname, and the range (in meter). With these informations, the General Controllerdecides, as a function of the bus position in the path which information is tobe sonified and how. POI and Soundscapes are represented with red and greendrawing pins on figure 4, their ranges are represented with plain circles.
Proc. of the 12th International Symposium on CMMR, Sao Paolo, Brazil, July 5-8, 2016
125

10 Parseihian et al.
Fig. 4. Screen capture of GoogleEarth representing a part of line 21 bus path. Drawingpins represents GIS informations with bus stops in yellow, POI in red, and Soundscapein green. Red and green plain circles represent the ranges of each POI and Soundscape.
Proc. of the 12th International Symposium on CMMR, Sao Paolo, Brazil, July 5-8, 2016
126
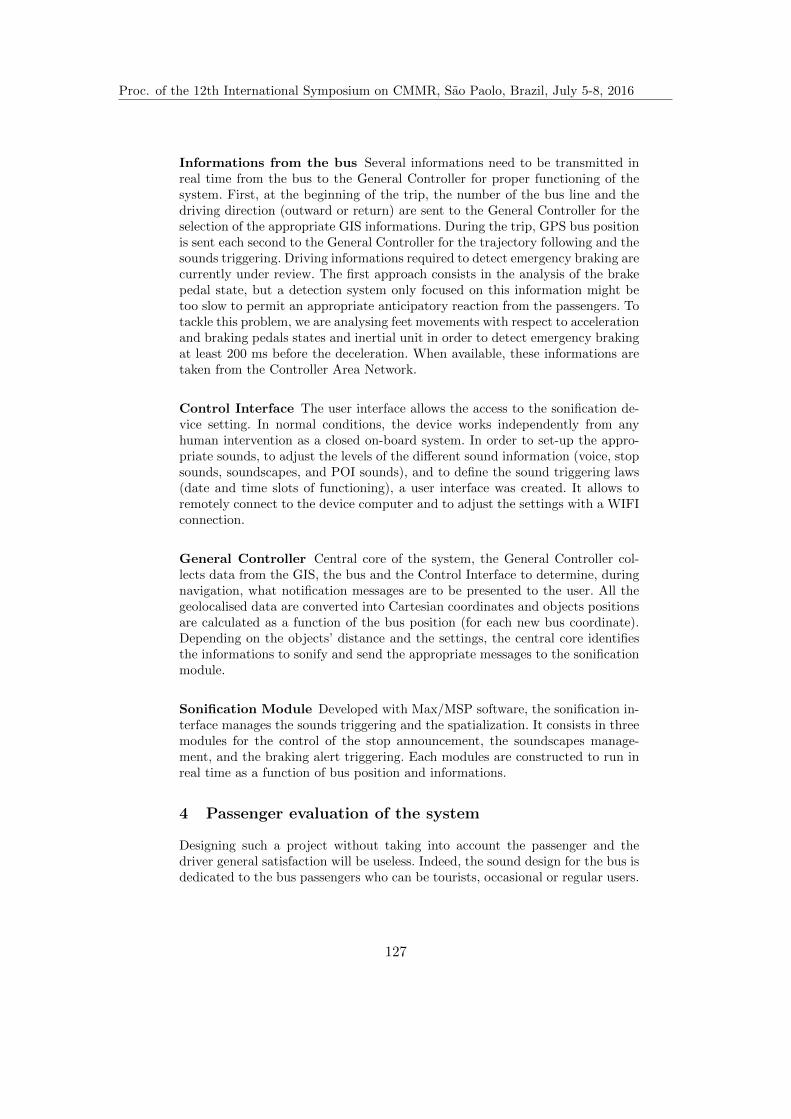
Towards a new approach to design sounds in public transport 11
Informations from the bus Several informations need to be transmitted inreal time from the bus to the General Controller for proper functioning of thesystem. First, at the beginning of the trip, the number of the bus line and thedriving direction (outward or return) are sent to the General Controller for theselection of the appropriate GIS informations. During the trip, GPS bus positionis sent each second to the General Controller for the trajectory following and thesounds triggering. Driving informations required to detect emergency braking arecurrently under review. The first approach consists in the analysis of the brakepedal state, but a detection system only focused on this information might betoo slow to permit an appropriate anticipatory reaction from the passengers. Totackle this problem, we are analysing feet movements with respect to accelerationand braking pedals states and inertial unit in order to detect emergency brakingat least 200 ms before the deceleration. When available, these informations aretaken from the Controller Area Network.
Control Interface The user interface allows the access to the sonification de-vice setting. In normal conditions, the device works independently from anyhuman intervention as a closed on-board system. In order to set-up the appro-priate sounds, to adjust the levels of the different sound information (voice, stopsounds, soundscapes, and POI sounds), and to define the sound triggering laws(date and time slots of functioning), a user interface was created. It allows toremotely connect to the device computer and to adjust the settings with a WIFIconnection.
General Controller Central core of the system, the General Controller col-lects data from the GIS, the bus and the Control Interface to determine, duringnavigation, what notification messages are to be presented to the user. All thegeolocalised data are converted into Cartesian coordinates and objects positionsare calculated as a function of the bus position (for each new bus coordinate).Depending on the objects’ distance and the settings, the central core identifiesthe informations to sonify and send the appropriate messages to the sonificationmodule.
Sonification Module Developed with Max/MSP software, the sonification in-terface manages the sounds triggering and the spatialization. It consists in threemodules for the control of the stop announcement, the soundscapes manage-ment, and the braking alert triggering. Each modules are constructed to run inreal time as a function of bus position and informations.
4 Passenger evaluation of the system
Designing such a project without taking into account the passenger and thedriver general satisfaction will be useless. Indeed, the sound design for the bus isdedicated to the bus passengers who can be tourists, occasional or regular users.
Proc. of the 12th International Symposium on CMMR, Sao Paolo, Brazil, July 5-8, 2016
127
12 Parseihian et al.
Evaluation campaigns are planned in order to evaluate the user satisfaction, tomeasure the stress reduction due to the use of natural soundscapes, the properunderstanding of the auditory icons, and the intelligibility of the sounds. Asbus passengers may not be available for a long time (the mean trip duration inthe bus is around fifteen minutes), it is important to design a short evaluationprocedure. A survey of five questions has been designed and is under evaluationin laboratory to evaluate its efficiency with a correlation to traditional stressmeasurement methods (physiological measures such as skin conductance leveland heart rate variability). This survey is based on visual analogue scale forstress and anxiety, and items assessing valence and intensity of emotional state(Self Assessment Manikin [5]) on the other hand. After the laboratory validationof this survey, the bus sounds will be evaluated during the trip by measuring theevolution of passengers’ emotional state between the beginning and the end ofthe trip.
5 Conclusion
This paper introduces a collaborative project that aims at improving bus tripwith auditory information. Thanks to the design of a high quality multi-channelsound spatialization system and the implementation of a sonification softwarebased on geolocation, three fundamental actions of the sound on the bus passen-gers will be studied. We believe that the use of playful stop sounds announcementpaired with spatialized natural soundscapes can de-stress the bus passengers andtransforms a simple trip into a tourist and historic stroll. Furthermore, the useof sound to alert passengers of possibly destabilizing emergency braking can pre-vent of passengers accidents. Taken together, the three aspects of this projectconstitute a new approach for the design of sounds for public transport thatmay increase people’s interest for the use of public transport. With such sys-tems, it is also simple to transform a bus trip into a musical composition basedon geolocation that could bring sound art to a new public.
References
1. J. J. Alvarsson, S. Wiens, and M. E. Nilsson. Stress recovery during exposureto nature sound and environmental noise. International journal of environmentalresearch and public health, 7(3):1036–1046, 2010.
2. P. Barthe. Announcing method and apparatus, June 3 1958. US Patent 2,837,606.
3. J. A. Benfield, B. D. Taff, P. Newman, and J. Smyth. Natural sound facilitatesmood recovery. Ecopsychology, 6(3):183–188, 2014.
4. M. Bezat, R. Kronland-Martinet, V. Roussarie, and S. Ystad. From acoustic de-scriptors to evoked quality of car-door sounds. Journal of the Acoustical Societyof America, 136(1):226–241, 2014.
5. M. M. Bradley and P. J. Lang. Measuring emotion: the self-assessment manikin andthe semantic differential. Journal of behavior therapy and experimental psychiatry,25(1):49–59, 1994.
Proc. of the 12th International Symposium on CMMR, Sao Paolo, Brazil, July 5-8, 2016
128

Towards a new approach to design sounds in public transport 13
6. S. Chafin, M. Roy, W. Gerin, and N. Christenfeld. Music can facilitate bloodpressure recovery from stress. British journal of health psychology, 9(3):393–403,2004.
7. L. Gandemer, G. Parseihian, R. Kronland-Martinet, and C. Bourdin. The influenceof horizontally rotating sound on standing balance. Experimental brain research,232(12):3813–3820, 2014.
8. B. Gatersleben and D. Uzzell. Affective appraisals of the daily commute comparingperceptions of drivers, cyclists, walkers, and users of public transport. Environmentand behavior, 39(3):416–431, 2007.
9. B. Grinde and G. G. Patil. Biophilia: does visual contact with nature impact onhealth and well-being? International journal of environmental research and publichealth, 6(9):2332–2343, 2009.
10. J. McChesney, H. Sveistrup, and M. Woollacott. Influence of auditory precuing onautomatic postural responses. Experimental brain research, 108(2):315–320, 1996.
11. A. Merer, M. Aramaki, S. Ystad, and R. Kronland-Martinet. Perceptual charac-terization of motion evoked by sounds for synthesis control purposes. Transactionson Applied Perception, 10(1):1–24, 2013.
12. G. Parseihian, C. Gondre, M. Aramaki, S. Ystad, and R. Kronland-Martinet. Com-parison and evaluation of sonification strategies for guidance tasks. IEEE Trans-action on Multimedia, 18(4):674–686, 2016.
13. M. J. Santos, N. Kanekar, and A. S. Aruin. The role of anticipatory posturaladjustments in compensatory control of posture: 1. electromyographic analysis.Journal of Electromyography and Kinesiology, 20(3):388–397, 2010.
14. M. J. Santos, N. Kanekar, and A. S. Aruin. The role of anticipatory posturaladjustments in compensatory control of posture: 2. biomechanical analysis. Journalof Electromyography and Kinesiology, 20(3):398–405, 2010.
15. D. L. Sturnieks, J. Menant, K. Delbaere, J. Vanrenterghem, M. W. Rogers, R. C.Fitzpatrick, and S. R. Lord. Force-controlled balance perturbations associated withfalls in older people: a prospective cohort study. PloS one, 8(8):e70981, 2013.
16. R. Ulrich. View through a window may influence recovery. Science, 224(4647):224–225, 1984.
17. R. S. Ulrich, R. F. Simons, B. D. Losito, E. Fiorito, M. A. Miles, and M. Zelson.Stress recovery during exposure to natural and urban environments. Journal ofenvironmental psychology, 11(3):201–230, 1991.
18. G. Watts, A. Khan, and R. Pheasant. Influence of soundscape and interior designon anxiety and perceived tranquillity of patients in a healthcare setting. AppliedAcoustics, 104:135–141, 2016.
Proc. of the 12th International Symposium on CMMR, Sao Paolo, Brazil, July 5-8, 2016
129

Social filters on the use of public spaces: the electroacoustic music studio of Sweden1
Tiago de Mello
PPGMUS, ECA-USP [email protected]
demellotiago.com
Abstract. This work presents the Electroacoustic Music Studio of Sweden (EMS), and, through an ethnographic study including semi-structured interviews and complementary practices, it draws, in general lines, the topicality in which it belongs. It relies on studies on the possibility of social filters being added to the use of a public studio. A brief history of EMS is also presented.
Keywords: electroacoustic music production, electroacoustic music studio, EMS, formative courses for electroacoustic music, electroacoustic music gear.
1 Introduction
The production of electroacoustic music has always been attached to the electroacoustic music studio. Since its emergence, linked to the studios of big radio corporations, to our days, in which lower prices of equipment makes it possible for it to be created in home studios, electroacoustic music, more than other forms of music making, has always needed a dedicated room, with specific equipment installed and constantly upgraded.
A dedicated room, simply because of the necessity of an adequate soundproof treated environment for sound monitoring, which many times is in multiple channels;
Specific equipment for sound synthesis and sound treatment, like diverse effects racks, controllers, computers and softwares, or even instruments built under commission or some that are not produced in commercial scale;
1 The present work is part of the final term paper named “The electroacoustic music studio of
Sweden: an ethnographic study on the use of public space”[1], developed during the studies on the MBA in Cultural Goods: culture, economy and management at the FGV Management Programme (2014-2015).
Proc. of the 12th International Symposium on CMMR, Sao Paolo, Brazil, July 5-8, 2016
130

2 Tiago de Mello Its constant upgrades are due to the evolution of technological media, since its
beginning, in vinyl records, going through magnetic tapes and coming to fruition in diverse digital formats2;
This work concerns itself specifically with the current social-political-aesthetical affairs of EMS, the Electroacoustic Music Studio of Sweden, established in Stockholm. Through an ethnographic research, I set myself to understand its current configurations, the uses it lends itself, and which demands keep it active.
Methodology and Research. The present work is the result of a field research conducted in January 2014, but which first base dates back to the artistic residency I took there in 2012. In that first occasion, I spent a period of ten days working in the studio with a single purpose: soundscapes that were recorded in walks through the city would be used as sound material on daily in the EMS studios, superposed on sounds that were synthesized there, and assembled in a new track each day. This work resulted in ten music pieces, parts of Cadernos Lagom3.
Thus, once coming into contact with the reality of the studio in a deeper way, routinely, it was in my interest to develop a research to understand some of the dynamics present in that space: after all, who were the people that used that studio?; what sort of use did they make of it?; what took them there?
These are the forming questions of this research. Taking them as a starting point, and also reflecting the reality I saw in Brazil after coming back from an artistic residence in Scandinavia, I pursued the answers to those questions. It was naturally beyond my intentions that clear solutions would emerge from that, though.
From the knowledge acquired through the Quantitative Methods of Research and Qualitative Methods of Research classes I was attending at an MBA course, I was able to surround the goals in a more precise manner, and then design a questionnaire that would better represent the wishes that emerged during my artistic residence.
In January 2014 I went back to Sweden, this time as guest researcher. I spent ten days there, interviewing users of the studio. My goal at that time was to understand not only the actual studio’s configuration and its uses, but also to outline possible correspondences between Swedish and Brazilian scenes for experimental music. I was, at that time, keen on the idea of having a public studio for electroacoustic music in São Paulo. Later I came to participate in debates on the new cultural policies for the music in the city. These considerations will not be a part of this paper, focusing on EMS’s concerns.
On this matter, it is important to remark that, as MORGAN [4] observes, EMS dos not have a “coffee table book” for itself: few works have gone in-depth specifically in its questions. Recently, after my residency there, Kehrer Publisher released the book Politics and aesthetics in electronic music - A study of EMS - Elektronmusikstudion Stockholm, 1964 - 1979, by Danish researcher Sanne Krogh Groth. The author is also responsible for a series of other documents on the studio, such as the article The Stockholm Studio EMS during early years [5] and her Doctor's thesis [6].
2 For a discussion on the matter of the evolution of technology in music, see IAZZETTA [2].
3 Some of these tracks were published by NME’s label Lança, in the album "cadernos, tdm" [3].
Proc. of the 12th International Symposium on CMMR, Sao Paolo, Brazil, July 5-8, 2016
131
Social filters on the use of the public space 3
Questionnaire and language barrier. An early obstacle that imposed itself on this research was language. I do not speak Swedish, and the interviewees would certainly not speak Portuguese. A natural solution to that was to elect English as a lingua franca between researcher and interviewees. The questionnaire was thus completely developed in English.
The language barrier reduced the possible research methods. It would be too hard to achieve consistency in a documentary study research, for instance. As such, I decided to conduct an ethnographic study that entails one main action and a few secondary actions.
The main ethnographic technique that I chose to use at the research, thus, was the interview, starting from a semi-structured questionnaire. It would have been difficult to put focal groups into practice, since even if we elected English as a common language in a focal group, maybe the interviewees would not have felt comfortable speaking to each other in a foreign language.
The questionnaire was divided in four parts: the first part posed questions about the composer themselves, serving as an introductory moment, asking for their nationality and age, for example; these personal questions were followed by a query about their own musical work, posing aesthetical and technical points such as the gear used, venues where they performed and theirs education.
The following parts were designed to understand the composer’s relations towards EMS and the scene for experimental music in Stockholm, posing questions about how often and how they would use that space, what they would find best in the studios, and then, how they would come to EMS, what they thought of EMS’s location and how they felt about the experimental music scene in Stockholm as a whole.
2 The EMS
The EMS is a public studio for electroacoustic music. A simple acronym for Electronic Music Studio (or, in Swedish, Elektronmusikstudion), it emerged inside of and tied to the National Swedish Radio in 1964. In a way, it is possible to point its development to a series of social-political fortuities that aligned in the 1960's in the Scandinavian country:
Sweden in the mid-60s was characterized by a feeling of cultural freedom and experimentation: an expansion of possibilities. It now appears as a rare moment of synchronicity and shared ideals, where the politics ran in parallel with culture. [7]
Situated inside the München Brewery complex since 1985, the EMS became an
autonomous institution, parting both with the state radio, as well as with the Royal Conservatory of Music, to which it was associated in its early years. EMS's 6 studios are configured in different manners, in an effort to contemplate a lot of what is done (or that can be done) in electroacoustic music today. This aesthetical currency is tied, in a way, to the very appropriation that is being done of the space in recent years, and
Proc. of the 12th International Symposium on CMMR, Sao Paolo, Brazil, July 5-8, 2016
132

4 Tiago de Mello
to the change in the profile of composers, both foreigners and Swedish, who have been using the studios [4].
As Francis MORGAN points out in his article about the 50th anniversary of the studio, the EMS is not a museum: even though part of the efforts done by studio personnel is the restoration of the only two analogue synthesizers available from the 1970's, a Buchla and a Serge, this effort also goes in the direction of creating protocols for the communication between these analogue devices and the digital composition environment.
EMS was established, thus, with a plethora of traits that, actually, reflect a bigger trait: the support and incentive to the freedom of sound creation. This same freedom, expressed in Swedish society during the decade of the establishment of the studio, is routinely reinforced, be it in the structure of the use of a public space, or be it in the aesthetical-poetic diversity one can find there.
The Formation Course. Beyond the utilization by professionals, EMS intends to be a teaching facility, in the sense that EMS establishes itself as an important tool of cultural education in society, leading them to mediate the knowledge of electroacoustic music and interested yet lay people.
Regularly, three courses are offered, complementary to each other and sequential: 1. Introduktionskurs, the introductory course: it emphasizes the presentation of the
repertoire and history of electroacoustic music, its technical development and its aesthetics;
2. Grundkurs, the basic course: basic application of the techniques of electroacoustic music, focusing on independent work inside the studio. Tutoring of Pro Tools software, introduction to Buchla (analogue synthesis), live-electronics, sound capture and recording.
3. Fortsättningskurs, the enhancement course: It is the continuation of the basic course, with further focus on musical composition and analysis.
All the courses are taught in Swedish. Even though the courses are sequential, if both first ones are offered in the same period of the year, it is possible to enroll in both at the same time. For the third course, it is necessary to present a small excerpt of the music composed during the second course.
At the end of the last course, a concert is organized at Fylkingen, as an exhibit of the works developed throughout the course, under the teacher's guidance.
The courses are not for free, and an enrolment fee applies:
Table 1. Formation course’s load and fee. [1]
Course load Fee in Swedish Kronor Fee in US Dollar Introductory Course 12 hours 1300 SEK 155 USD Basic Course 60 hours
(30 theoretical and 30 practical)
3300 SEK 385 USD
Enhancement Course 30 hours of theory 3500 SEK 420 USD
Proc. of the 12th International Symposium on CMMR, Sao Paolo, Brazil, July 5-8, 2016
133

Social filters on the use of the public space 5 Part of this research was designed to try to understand how the formative courses
have influenced in the formation of the interviewed composers, as well as how do they have a double function of advertising EMS and as an access filter to it.
3 Discussions on the social filter to the use of the studios
As an objective of this paper, I would like to bring discuss the existence of social filters in the use of EMS, in terms of how open the studios are to society in general, both in and out of Sweden. With this in mind, the semi-structured questionnaire was designed with a few questions, focusing on the use people were giving to that space. I also used complementary studies, such as the study of other articles on the matter of EMS and a brief study of EMS’s advertisement.
The question present in the questionnaire were the following:
Table 2. Selected questions on the social filter matter. [1]
Question number Question formulation 3.3 Have you been to the courses at EMS?
If affirmative on 3.3: 3.3.1.1 How was that? For how long? Do you think the course was worth it? 3.3.1.2 Would you recommend it to a friend? 3.3.1.3 Do you remember any situation when things that you learned in the
course helped you in the studio?
If negative on 3.3 3.3.2.1 Where have you learned? 3.3.2.2 Do you know people who have been to the course? 3.3.2.3 Would you recommend it to a friend? 3.3.2.4 Do you remember any situation when you missed some information
you think you would have learned in the course?
3.8 In your opinion, is EMS open to the whole community, or is there some filter? What kind of filter?
Aesthetical questions. Since its onset, EMS has the vocation, the interest, and the devotion to electroacoustic music, above all the acousmatic form. Knut Wiggen, one of its masterminds and its first director (from 1954 to 1976) was recognized as a visionary of a more orthodox current in contemporary music. But he was also a supporter of new practices and of innovation.
From the beginning Knut Wiggen realized that the studio must be digitally founded. [...] At that time, for example, the four channels recorder was a marvellous sensation! We followed
Proc. of the 12th International Symposium on CMMR, Sao Paolo, Brazil, July 5-8, 2016
134

6 Tiago de Mello
every technological advancement with great excitement and the new machines created a lot of ideas. (JAN MORTHESON apud MORGAN [4])
Some conflicts, though, were generated then. It is important to note that the 1960's
watched the escalation of the ideological battle between the French musique concrète and the German elektronische Musik. Composers and research centres often positioned themselves for one or another of these currents, constituting the two greater forces in the international contemporary music scene.
In this sense, comparing the newly-established EMS to other research centres such as the GRM was inevitable.
[Wiggen] said that he didn't have any composers in Sweden that had researchers' goals or ambitions, like they have for instance at GRM. [...] He was obsessed with research and science and he thought that the whole thing was more like a science project than an artistic project. And these people came into being ten years later, these people from Stanford and IRCAM, and Birmingham and so forth, where composers did have research ambitions. (LARS-GUNNAR BODIN apud MORGAN [4])
Counting on an instrumentalization to conduct certain musical functions, one could
imagine that this ideological bias was decisive for the studio's configuration, not only in its early years under Wiggen's custody, but throughout its development.
I saw the studio as a tool for artistic work, and Knut [Wiggen] saw it as a studio for artistic work, but he would favor composers who could combine science with artistic activities. So that was one of the obstacles from the beginning (LARS-GUNNAR BODIN apud MORGAN [4])
Bodin was, afterwards, the director of EMS (from 1979 to 1985). His interest in artistic work can be pointed to as decisive for the understanding I have of the studio's current configuration.
"People did their own thing... the technology was overwhelming, so there was not so much time to think in aesthetic terms" (LARS-GUNNAR BODIN apud MORGAN [4])
According to the current director, Mats Lindström, ever since the beginning of the
2000's, one can notice a change in how the studio is used, that came along with a change in the manner that electroacoustic music is being made nowadays, as well as the changes in its audience [4]. In this sense, the studio had to be slowly rethought, trying to comprehend these new manifestations, and providing their users with conditions to enjoy it in a more adequate and intense manner.
From a general point of view, the studio offers two greater possibilities of work: the work on digital platforms, relying on their modern acoustically treated studios with amazing loudspeakers, and, at least in two of those, with a multichannel setup (octaphonic and hexaphonic); the work on unique and rare analogue synthesizers.
Proc. of the 12th International Symposium on CMMR, Sao Paolo, Brazil, July 5-8, 2016
135

Social filters on the use of the public space 7 However, the studio has developed tools that facilitate the interaction between
analogue platforms and digital ones. MORTEN, in his research during the studio's 50th anniversary, contemplated that fact, to which he paid close attention.
The studio is not a museum. Rather, it attracts musicians within whose own work old and new technologies intersect, or collide. [4]
In this research, I was interested in capturing the current aesthetic debate that could
be taking place there. I was able to come to a few points that I consider important, which lead me, in this paper specifically, to focus on the social filter side of these aesthetic considerations.
3.1 Introductory course as access filter
Among the answers received through question 3.8, I could verify that the introductory course works as an access filter to the studios. As I have said before, the introductory courses on electroacoustic music production are paid courses offered regularly by the EMS, in which the history, aesthetics, and technical applications of electroacoustic music are discussed. Going through these courses is the direct way into having access to the studios. Other possible forms are the presentation of a portfolio (above all for professional international musicians); being attached to other research centres in Sweden (for example the Royal Conservatory in Stockholm, or the University of Stockholm); or even having a degree in the area, that attests one's expertise in the handling of audio equipment.
Thus, even though it is not of interest to this research to make quantitative deductions in this qualitative research, I found it would be interesting to cross the data synthesis acquired through questions 3.3 and 3.8.
Proc. of the 12th International Symposium on CMMR, Sao Paolo, Brazil, July 5-8, 2016
136

8 Tiago de Mello Table 3. Answers to the questions 3.3 and 3.8 [1]
Interviewee Did you attend the Introductory course?
Summary to the answer of question 3.8
A No It is not for anyone, but there is no artistic-aesthetic filter.
B Yes There are filters and the Introductory course is one of them.
C Yes There are filters such as the lack of knowledge of the people about that music and having to pay for the access to the introductory course, even though it is very cheap.
D Yes There is no artistic-aesthetic filter, but the introductory course works as a filter.
E No It is not for anyone, but that's what the introductory course is for.
F Yes There are filters, but it is good to keep away the people who are strangers to the environment.
G Yes There are filters and the Introductory course is one of them. Maybe attempting to make pop music there would be a problem.
H Yes There are no filters. I No There are filters, but they are much more open
nowadays than they used to be. J Yes It is not for anyone, but there is no artistic-
aesthetic filter.
3.2 Equipment as an access filter
Among the testimonials taken, in what concerns the aesthetic filters that could exist at the EMS, one in particular called my attention: that of Interviewee G. A 19-year-old young man, with no previous experience in electroacoustic music, Interviewee G enrolled in the course without really knowing what it was about. Throughout three semesters of courses, he became more and more interested in electroacoustic production, even though his work is related to electronic dance music. Because he could transit so freely through these two worlds (that of techno dance music and that of the electroacoustic concert), he was able to furnish the research with an important clue to understand another possibility of an access filter to EMS:
Maybe if you like pop music, with vocals, maybe this is not the right studio, with the right equipment. But no one would complain about you being here doing that. People are always happy of having other people here. (Interviewee G, in collected testimonial) [1]
Proc. of the 12th International Symposium on CMMR, Sao Paolo, Brazil, July 5-8, 2016
137

Social filters on the use of the public space 9
4 Conclusion
During this research, I dealt with a myriad of interests in music and in the use of the space of EMS. Nevertheless, bringing forth the discussion of possible uses for that space seemed to be a novelty to the composers interviewed. Once one is inserted in a given condition, it is difficult to see the situation from the other side, from the eyes of an outsider.
The observations I heard from the interviewees reveal that, naturally, aesthetic factors add up to a series of filters, but that takes place more like a technical aspect than as a preference from the studio's directive corps: EMS is an electroacoustic music studio, and as I discussed on this paper, the specificity of this music ends up creating conditions which are more proper to its development, in spite of other music styles.
On the matter of formative courses, one could notice that in general there is an understanding that these courses are focused on electroacoustic music production, tied to the necessity of taking them in order to be granted access to the studio, really does work as an access filters. It is interesting to notice how this understanding is spread equally among those who attended the courses and those who did not. One can also infer that, even though they cost money, the price of the courses does not work as an ultimate barrier to their access.
References
1. De Mello, T.: O estúdio de música eletroacústica da Suécia: um estudo etnográfico sobre a utilização do espaço público. Trabalho de conclusão de curso. São Paulo: Programa FGV Management, 2015.
2. Iazzetta, F.: Música e mediação tecnológica. São Paulo: Ed. Perspectiva, 1ª ed., 2009. 3. De Mello, T.: tdm, cadernos. São Paulo: NMElança, 2013. 1 CD. 4. Morgan, F.: EMS: Utopian workshop. The wire, London, v. 365, p. 32-39, July. 2014. 5. Groth, S. K.: The Stockholm Studio EMS during its Early Years. In: Electroacoacoustic
Music Studies Network International Conference. 2008, Paris. 6. Groth, S. K.: GROTH, S. K. To musikkulturer - én institution: Forskningsstrategier og text-
ljudkompositioner ved det svenske elektronmusikstudie EMS i 1960'erne og1970'erne. Copenhagem: Københavns Universitet, 2010.
7. Haglund, M. The ecstatic society. The wire, London, v. 210, p. 26-31, August 2001.
Proc. of the 12th International Symposium on CMMR, Sao Paolo, Brazil, July 5-8, 2016
138
Using Pure Data for real-time granular synthesis control through Leap Motion
Damián Anache,
CONICET, Consejo Nacional de InvestigacionesCientíficas y Técnicas (Argentina)
UNQ, Universidad Nacional de Quilmes (Argentina)[email protected]
Abstract. This paper documents the development of a granular synthesis instrument programmed on PD (Pure Data, Miller Puckette et al1 ) for being controlled by Leap Motion2, a computer hardware sensor that converts hands and fingers motion into simple data, ready for end-user software inputs. The instrument named mGIL (my_Grainer's Instrument for Leap) uses the my_grainer3 PD's external object as its GS (granular synthesis) engine and leapmotion4 external object as its local interface. This connection between software and hardware intends to reach expressive computer music sounds, with the performer's body imprints. The present status of that interplay (software + hardware) is a work-in-progress advance of the author doctoral thesis.
Keywords: real-time synthesis, Pure Data, Leap Motion, granular synthesis, performance.
1 Introduction
After Isaac Beekman [1], Dennis Gabor [2], Iannis Xenakis [3], Barry Truax [4] and Curtis Roads [1] himself, GS (granular synthesis) is fully documented by Roads on his book Microsound [1]. Nevertheless computer technologies are constantly improving and so are new approaches to this synthesis technique as mGIL (my_Grainer's Instrument for Leap) is an example of this nowadays. This instrument,
1 puredata.info .2 leapmotion.com .3 Developed by Pablo Di Liscia, is available at: puredata.info/Members/pdiliscia/grainer.4 leapmotion external developed by Chikashi Miyama for Linux available at:
http://musa.poperbu.net/index.php/tecnologia-seccions-30/-puredata-seccions-45/129-installing-leapmotion-puredata-external-on-linuxfor Windows at: http://jakubvaltar.blogspot.com.ar/2013/10/leap-motion-pure-data-external-for.html.
Proc. of the 12th International Symposium on CMMR, Sao Paolo, Brazil, July 5-8, 2016
139

mGIL, was developed on Pure Data1 to handle real time GS controlled by LeapMotion2 . In this development, GS focuses the timbral organization level in order to generate individual sound objects, instead of granular clouds. The aim is to create a group of grains as a sonic entity where the individual grains are integrated in a unique sound unit. Each grain has a meaning only inside that object. This can be described as a short time granular sound generated between a packed and a covered fill factor as Roads describe it5.
In the context of the author's doctoral thesis, the main motivation of using granular synthesis on this development was its capacity to allow a huge amount of parameters modifications in a short time scale, with a manifest spectral consequence. This aspect is of special interest in order to reach expressive sounds generated by synthesis.
The author's research is centered on the incidence of the interpreter/performer in computer music generated by synthesis means only. A first approach to the problem [5] suggests that granular synthesis could be an appropriate technique in order to imprint the performer bodily trace actions on every sound generated by a digital instrument. The reason of this is the huge amount of control data that it involves, which could exceed the thousand parameters in just one second6.
According to the author's standpoint, if this feature is properly combined with the right device control, highly expressive synthesis sounds may be produced. Therefore, the lack of physical imprint7 in computer music may be overcome. At this stage of research, the chosen device was Leap Motion . This device was considered an appropriate choice for the aim of this work, because it can acquire the position values for each finger of each hand (at least 36 outputs) with great accuracy at a user defined rate (among other useful data from movements and gesture analysis).
2 Framework
Many of the most important developments for GS can be found on Roads [1], from where the highlights are CG – Cloud Generator (by C. Roads), and the early real time developments by Barry Truax. On the other hand, if we focus on developments for the free and open source platform Pure Data, we find five synthesis units available as external objects. Some of the features of the mentioned externals is discussed in the next summary (Table 1) as well as in the following descriptions.
5 See [1], pag 1056 See [1], page 87.7 This lack is marked by Anache himself [5] and is present on several authors of [6].
Proc. of the 12th International Symposium on CMMR, Sao Paolo, Brazil, July 5-8, 2016
140

Table 1. Pure Data's externals for GS.
Name Developer Release Output G.Wf8 G.Env9
syncgrain~10 Barknecht, F. n.d. Mono Table fix mill~11 Keskinen, O. n.d. Stereo Table Hanndisis_munger1~12 Ji-Sun K., et al 2007 Multichannel Audio fix granule~13 Lyon, E. 2012 Stereo Table Tablemy_grainer~14 Di Liscia, O. P. 2012 Ambisonics Tables Tables
All of these objects implement the GS technique in a different way, offering advantages and disadvantages, different control parameters, possibilities and limitations. syncgrain~ works only with synchronous GS and is a direct port of the SndObject SyncGrain by Victor Lazzarini. The grain waveform is obtained by reading a function table, meanwhile the grain envelope cannot be defined by the user. For mill~ the grain waveform is also defined by user through a function table but the grain envelope is based on a hanning window with expanded sides possibilities. disis_munger1~ is based on Dan Trueman's munger~ (Computer Music Center, Columbia University). It doesn't generate grains by its own and needs an external audio input for working. Its grains envelope function is fix and the user can only change its duration. The output offers up to 64 intensity panning channels. granule~ was developed at Department of Music and Sonic Arts Queen's University Belfast and it's included on the LyonPotpourri collection of externals together with other GS external object: granulesf~. Both, the grain waveform and envelope are defined by function tables but it only offers stereo output. Finally, my_grainer~'s latest version was released on 03/2016 and it can work with up to 24 different function tables at the same time for both the grain waveform and the grain envelope. Moreover it outputs an Ambisonics B-format signal (making 3D sound with full control feasible) and offers very detailed parameters in order to control the GS technique as its main reference literature explains: grain duration; gap between grains; pitch; amplitude level; spatial position; and auxiliary output level for external processing of each grain (like reverberation send.) The external also offers controls for a random deviation of each one of its parameters, different looping capacities for the audio tables read and may receive lists for specific random values choices.
8 G.Wf = Grain Waveform9 G.Env = Grain Envelope10 https://puredata.info/Members/fbar (Last access: 02/2016)11 http://rickygraham.net/?p=130474333 (Last access: 02/2016)12 http://l2ork.music.vt.edu/main/make-your-own-l2ork/software/ (Last access: 02/2016)13 http://www.somasa.qub.ac.uk/~elyon/LyonSoftware/Pd/ (Last access: 02/2016)14 https://puredata.info/author/pdiliscia (Last access: 03/2016)
Proc. of the 12th International Symposium on CMMR, Sao Paolo, Brazil, July 5-8, 2016
141

3 Instrument Description
The instrument started as an improved version of Esteban Calcagno's patch called Grainer_Dinamics15 but during the improvement process the patch achieved its own identity giving birth to mGIL. This new instrument keeps the original idea of being a programmable function-based controller for my_grainer~ with the addition of being triggered and further controlled through an external device. Nowadays the instrument is specially designed to operate with LeapMotion but it could be easily adapted to be used with other devices as well. Figure 1 below shows the instrument's main interface.
Fig. 1. mGIL's GUI.
As explained before in 1.Introduction, mGIL generates short time scale granular sounds, so its control function values are arbitrary limited in order to achieve this special kind of GS. For example, grains duration values are limited to 1-100 msec. and gap (elapsed time between consecutive grains) values are limited to 1-500 msec. Also, as the synthesis engine allows it, mGIL's parameter names are strongly related to Roads terminology [1], so it is designed for users who know the theory in advance. The user must handle carefully this interface, because some especial configurations may lead to undesired results. For example, a gap time smaller than the grain duration may produce overlapped grains, and therefore the audio output may be overloaded.
Each control function takes a starting value and an ending value, and a choice for the interpolation method to perform between these values. The interpolation methods must be chosen from the following options: linear, logarithmic, exponential and S-shaped sigmoid function.
The grain waveform is chosen from seven presets, divided in two groups: functions and noises; functions: sine, triangle, square and saw; noises: white, pink and brown. When using the functions waveforms, mGIL receives pitch values for transposing the original waveform, meanwhile noises ignores that input value (pitch control is explained on 3.1 Pitch and Dynamics). The grain envelope is defined by a Bezier-
15 Available at the following link, and soon to be published on [8] http://www.mediafire.com/download/852o9e2kf7bdc7u/GRAINER_DINAMICS.zip
Proc. of the 12th International Symposium on CMMR, Sao Paolo, Brazil, July 5-8, 2016
142

based GUI, consisting of a sequence of two variable curves with an adjustable joint point. This offers many options for regular and custom envelopes, among them: bell-shaped, triangular, expodec16, rexpodec17, or any other two segment type shape.
Finally, the audio generated by the GS engine is controlled by the main ADSR 18
audio envelope, also defined by keyboard input values for a more precise control. This is different than the main envelope of most digital instruments, because in this case there must be two ADSR defined envelopes. One is for the higher intensity level and the other for the lower (normalized from 0 to 1, where 0 is pp and 1 is ff ). So, the intermediate intensity values are generated by interpolation of the ones of the defined envelopes, according to four interpolation types: lineal, logarithmic, exponential and S-shaped sigmoid function. The main ADSR envelope also defines the total sound´s duration. Because of this, the lengths of the transitions of all the mGIL's control functions are defined proportionally to the length of the ADSR envelope (by Internal Development parameter on GUI ).
As shown in Figure 2, in order to generate two outputs, mGIL needs two input values: pitch and intensity. The outputs are: one control-rate data package to control the GS of my_grainer~ and an audio-rate output to control the main amplitude envelope of my_grainer~ (the main ADSR envelope).
The remaining feature of mGIL is the modulation control. At this stage it just receives a value from 0 to 1 for scaling both the gap time and the bandwidth of the pitch variation (the later will only be taking in account if the defined GS configuration uses a random deviation of the main pitch). This will be the first feature to be improved in future mGIL's versions, by adding more modulation inputs in order to achieve a more significant spectral influence.
Fig. 2. mGIL's connections scheme.
16 Exponentially decaying envelope, see [1], page 88.17 Reverse expodec, see [1], page 88.18 Acronym for Attack, Decay, Sustain, Release.
Proc. of the 12th International Symposium on CMMR, Sao Paolo, Brazil, July 5-8, 2016
143

3.1 Pitch and Dynamics
The design of mGIL offers two ways of pitch control: A) specific frequency input (in hertz) with the option of normalized mode (from 0 to 1 for 20hz to 20khz); and B) Bark Scale index input. For this last feature, barkScale was developed as a PD's abstraction. It just allocates a table that receives a Bark Scale index as input and offers central frequency, bandwidth, low and high limits as outputs values. The input can also be normalized from 0 to 1 float values. On both cases, the received frequency values define the amount of transposition of the chosen grain waveform. In case that the chosen waveform is any kind of noise, the whole frequency input become meaningless and has no influence on the grain waveform.
In order to offer a balanced level audio output based on psychoacoustic data, an abstraction (iso2262003) was created based on the ISO 226:2003 international standard which documents the normal equal-loudness-level contours. The abstraction receives a frequency value (in hertz) and a loudness level contour (from 20 to 80 phon or normalize from 0 to 1) to compute the corresponding sound pressure level (from 0 to 120 dB SPL, or normalized from 0 to 1). It is important to notice that, as the digital domain cannot be related to specific psychoacoustic values, mGIL's design assigned its internal values just to keep a relative balance of intensity across the spectrum, regardless of a strict implementation of the standard.
3.2 External Control
LeapMotion's operation is detailed documented by its developers team at its official website19 and as anticipated on Abstract, it runs on Pure Data platform thanks to an external object developed by Chikashi Miyama4 . The first analysis stage of this project detects active hands on each half of the interaction zone, left and right. Then, the following analysis stage is the detection of the closing/opening hands gesture inside each of these zones, done by comparison of the sphereRadius'20 method output data. This gesture detection sends data for mGIL, where pitch and dynamics are determined by hands' elevation positions and open gesture's velocity, respectively. The whole analysis scheme offers data outputs from each one of the two hands and is connected to two mGIL instances. Thanks to this design, two independent streams sound synthesis can be performed simultaneously.
19 https://developer.leapmotion.com/documentation/ 20 See Leap Motion documentation.
Proc. of the 12th International Symposium on CMMR, Sao Paolo, Brazil, July 5-8, 2016
144

3.3 Package Description
mGIL consists of a set of PD's patches and abstractions, some of them are flexible enough for being used in other instruments or even in general purpose projects. They all are listed below.
Table 2. mGIL's patches and abstractions .
Name Descriptionautopack2; autopack3 Packs two or three floats numbers in one list
regardless of the order of receiving values.barkScale Offers Bark Scale's values on demand, explained
on 3.1 Pitch and dynamics. iso2262003 Offers ISO 226:2003 data on demand, explained
on 3.1 Pitch and dynamics. leapmotion-ctrl Custom Leap Motion analysis for mGIL, needs
leapmotion4 external object, explained on 3.2 External control.
mGILabstraction mGIL's core, GUI shown on Fig. 1.mGILmainPatch Main patch.mGILmy_grainerParameters GUI for my_grainer~'s parameters.onebangTime Bangs redundancy filter.
4 Conclusions, Final Observations and Future Development
This first version of mGIL only works with audio functions and noisy grain waveforms, leaving behind any other kind of audio signals like acoustic sources recordings. It was designed this way in order to completely avoid the generation of sounds that may resemble the ones produced by acoustic sources. However, conscientiously explorations with acoustic sources recordings will be tested on next instrument's versions. The control of the my_grainer external 3D spatialisation capacities by performing gestures is also one of the areas to be further explored.
This work also involved several suggestions of new features to Pablo Di Liscia (my_grainer's developer). Some of them (for example, different looping capacities for grain waveform tables reading) are available in its last release (March, 2016) and some others maybe available on next versions.
One of the most important subject which was researched through this development is the influence of corporal gestures into the morphology of the generated sound in live performance. The actual state of this project allows the author to start his first studio compositions, performances and analysis in order to developed his doctoral thesis. At the same time, the source code, documentation and examples are freely shared on-line, so as other artists and programmers can be able to explore this research area.
Proc. of the 12th International Symposium on CMMR, Sao Paolo, Brazil, July 5-8, 2016
145

References
1. Roads, C., Microsound, The MIT Press, England (2004)2. Gabor, D., Acoustical Quanta and the Theory of Hearing, Nature 159 (4044): 591-594 (1947)3. Xenakis, I., Formalized Music, United States (1992)4. Truax, B., Real-Time Granular Synthesis with the DMX-1000, in P. Berg (ed.), Proceedings
of the International Computer Music Conference, The Hague, Computer Music Association (1986)
5. Anache, D., El Rol del Intérprete en la Música Electrónica - Estado de la Cuestión, In Actas de la Décima Semana de la Música y la Musicología, UCA, Argentina (2013)
6. Peters, D., Eckel, G., Dorschel, A., Bodily Expression in Electronic Music – Perspectives on Reclaiming Performativity, Routledge, United States (2012)
7.Paine, G., Gesture and Morphology in Laptop Music. In: Dean, R.T., (ed) The Oxford Handbook of Computer Music, Oxford University Press, United states of America (2009)
8. Di Liscia, O.P. (ed), Síntesis Espacial de Sonido, CMMAS Centro Mexicano para la Música y las Artes Sonoras, Mexico, ebook with aditional files (2016)
Proc. of the 12th International Symposium on CMMR, Sao Paolo, Brazil, July 5-8, 2016
146

Angkasa:A Software Tool for
Spatiotemporal Granulation
Muhammad Hafiz Wan Rosli1 and Andres Cabrera2
Media Arts & Technology Program,University of California, Santa Barbara
Abstract. We introduce a software tool for performing spatiotemporalgranulation called Angkasa, which allows a user to independently gran-ulate space, and time, through the use of spatially encoded signals. Thesoftware is designed to be used as a creative tool for composition, or as areal-time musical instrument. The current iteration of Angkasa providesan interface for analysis, and synthesis of both spatial, and temporal do-mains. Additionally, we present a brief theoretical overview of spatiotem-poral granulation, and outline the possible, and potential manipulationsthat could be realized through this technique.
Keywords: Microsound, Spatial Sound, Analysis-Synthesis
1 Introduction
The process of segmenting a sound signal into small grains (less than 100 ms),and reassembling them into a new time order is known as granulation. Althoughthere are various techniques for manipulating these grains, almost all imple-mentations have some fundamental processes in common. Broadly speaking, thestages of analysis (selection and sorting of input) and synthesis (constructingtemporal patterns for output) are always present in some form.
Articulation of the grains’ spatial characteristics may be achieved by manyexisting techniques, allowing one to choreograph the position and movement ofindividual grains as well as groups (clouds). This spatial information, however,is generally synthesized (i.e. artificially generated), unlike temporal informationwhich can be extracted from the sound sample itself, and then used to driveresynthesis parameters.
Ambisonics is a technology that captures full-sphere spatial sound (peri-phonic) information through the use of Spherical Harmonics. This research aimsto use the spatial information extracted from the Ambisonics signal as anotherdimension for granulation.
By extracting this spatial information, the proposed method would createnovel possibilities for manipulating sound. It would allow the decoupling of tem-poral and spatial information of a grain, making it possible to independently
Proc. of the 12th International Symposium on CMMR, Sao Paolo, Brazil, July 5-8, 2016
147

2 Muhammad Hafiz Wan Rosli and Andres Cabrera
assign a specific time and position for analysis and synthesis. Furthermore, tem-poral domain processes such as windowing, selection order, density, structure(pattern), higher dimensional mapping, as well as spatial trajectory and posi-tion, could be applied to the spatial dimension.
1.1 Related Work
The analysis, and extraction of grains from different positions in space is aresearch area that has yet to be explored. However, there has been a number oftechniques used to disperse sound particles in space.
Roads outlines the techniques used for spatialization of microsound into twomain approaches [1]:
1. Scattering of sound particles in different spatial locations and depths2. Using sound particles as spatializers for other sounds via granulation, con-
volution, and intermodulation
Truax, on the other hand, uses granular synthesis as a means to diffuse decorre-lated sound sources over multiple loudspeakers, giving a sense of aural volume[2]. Kim-Boyle explored choreographing of grains in space according to flockingalgorithms [4]. Barrett explored the process of encoding spatial information viahigher-order Ambisonics, creating a virtual space of precisely positioned grains[3].
The techniques outlined above aims to position grains in a particular loca-tion in space– spatialization. On the other hand, Deleflie & Schiemer proposeda technique to encode grains with spatial information extracted from an Am-bisonics signal [5]. However, this technique implements temporal segmentation,i.e. classical granulation, and imbues each grain with the component signals ofthe captured sound field.
In contrast, our method of spatiotemporal granulation segments the spaceitself, in addition to time, to produce an array of grains, localized in azimuth &elevation, for each temporal window.
2 Theory
The granulation of sampled sounds is a powerful means of sound transforma-tion. To granulate means to segment (or window) a sound signal into grains, topossibly modify them in some way, and then to reassemble the grains in a newtime order and microrhythm. This might take the form of a continuous streamor of a statistical cloud of sampled grains.- Roads (2001, p. 98)
The classical method of granulation captures two perceptual dimensions:time- domain information (starting time, duration, envelope shape) and frequency-domain information (the pitch of the waveform within the grain and the spectrumof the grain) [1].
Proc. of the 12th International Symposium on CMMR, Sao Paolo, Brazil, July 5-8, 2016
148

Angkasa: A Software Tool for Spatiotemporal Granulation 3
The proposed method granulates space, and adds another dimension to thisrepresentation: Spatial-domain information. The fundamental premise of thismethod lies in the extraction of spatial sound information, and the segmenta-tion of this space into grains which are localized in time, frequency, and space.These grains will henceforth be individually referred to as a Spatiotemporal grain(Figure 1).
Fig. 1: Block diagram of a basic spatiotemporal grain generator
2.1 Encoding of Spatial Sound
There are several microphone technologies that allow the capturing of spatialinformation, such as X-Y/ Blumlein Pair, Decca Tree, and Optimum CardioidTriangle. However, these technologies do not capture the complete full-sphereinformation of spatial sound.
On the other hand, Ambisonics is a technique that captures periphonic spa-tial information via microphone arrays, such as the “SoundField Microphone”[6]. It is important to note that using this technique, sounds from any directionare treated equally, as opposed to other techniques that assumes the frontal in-formation to be the main source, and other directional information as ambientsources.
Proc. of the 12th International Symposium on CMMR, Sao Paolo, Brazil, July 5-8, 2016
149

4 Muhammad Hafiz Wan Rosli and Andres Cabrera
The spatial sound field representation of Ambisonics is captured via “Spher-ical Harmonics” [6]. Spatial resolution is primarily dependent on the order ofthe Ambisonics signal, i.e. order of Spherical Harmonics. A first-order encodedsignal is composed of the sound pressure W, and the three components of thepressure gradients X, Y, Z (Figure 1). Together, these approximate the soundfield on a sphere around the microphone array.
2.2 Decoding of Spatial Sound
One of the strengths of Ambisonics is the decoupling of encoding (via microphone& virtual), and decoding processes. This allows the captured sound field to berepresented using any type of speaker configuration.
In practice, a decoder projects the Spherical Harmonics onto a specific vector,denoted by the position of each loudspeaker θj . The reproduction of a sound fieldwithout height (surround sound), can be achieved via Equation(1).
Pj = W (1√2
) +X(cos(θj)) + Y (sin(θj)) (1)
(a) Start time (sample): 39424 (b) Start time (sample): 50688
Fig. 2: X-Axis= Azimuth (0◦- 360◦), Y-Axis= Frequency bin, Intensity= Mag-nitude of bin, Window size= 512
2.3 Spherical Harmonics Projection
Consider the case where we have N number of loudspeakers arranged in a circle(without height). In the case where N is 360, we are essentially playing back the
Proc. of the 12th International Symposium on CMMR, Sao Paolo, Brazil, July 5-8, 2016
150

Angkasa: A Software Tool for Spatiotemporal Granulation 5
sounds to reconstruct the captured sound field at 1 degree difference. Instead ofplaying back the sounds from 360 loudspeakers, we can use the information asa means to specify different sounds from different locations.
This forms the basis for extracting sound sources in space for the spatiotem-poral grains. If we were to look at the frequency content of these extractedgrains in the same temporal window (Figure 2), we can deduce that each lo-calized grain contains a unique spectrum. Additionally, the directionality of theparticular sound object could also be estimated.
Periphonic Projection Equation 1 can be extended to include height infor-mation, i.e. extracting every spatiotemporal grain (Figure 1) in the capturedsound field (Equation 2).
Pj = W (1√2
) +X(cos(θj) cos(φj))
+ Y (sin(θj) cos(φj)) + Z(sin(θj))
(2)
The result of this decomposed sound field can be represented as a 2 dimensionalarray (azimuth & elevation) of individual spatiotemporal grains, in the sametemporal window (Figure 3).
(a) Start time (sample): 39424 (b) Start time (sample): 50688
Fig. 3: X-Axis= Azimuth (0◦- 360◦), Y-Axis= Elevation (0◦- 360◦), Intensity=Energy of localized spatiotemporal grain, Window size= 512
Proc. of the 12th International Symposium on CMMR, Sao Paolo, Brazil, July 5-8, 2016
151
6 Muhammad Hafiz Wan Rosli and Andres Cabrera
3 Implementation: Angkasa
The word Angkasa originates from the Malay language, derived from the Sanskritterm Akasa. Although the root word bears various levels of meaning, one of themost common translation refers to “space”.
In the context of our research, Angkasa is a software tool which allows auser to analyze, visualize, transform, and perform Spatiotemporal Granulation.The software is designed to be used as a creative tool for composition, real- timemusical instrument, or as an analytical tool. Angkasa was built using openFrame-works (C++ toolkit) on a 2015 Mac Pro (OSX 10.10.5). Video documentationof the software can be accessed at http://vimeo.com/157253180.
3.1 Analysis/ Synthesis
Potentially every parameter [1] used for classical granulation can be adapted tospatiotemporal granulation. One of the parameters [10] that acquire a differentcontext is Selection Order– It is expanded to include not only the selection orderin time, but also the spatially encoded layout of the captured sound field.
Selective Granulation Specifying only a certain region to be granulated allowsus to selectively granulate the sound field. For example, one could granulate onlya single quadrant (of space), and temporally stretch the grains that fall withinthat area, while allowing the other quadrants to progress at a different timespeed. In effect, a moving sound object would retain its spatial trajectory, butassume a different temporal structure as it moves through these selected areasof space.
These areas could be selected via different techniques, including (but notlimited to):1. Regions of the frame, such as quadrants, sections2. User defined selection of grains [9]3. Statistical algorithms for quasi-random selection4. Audio features, as in Concatenative Synthesis [13]
Spatial Read Pointer Because navigating space as a compositional parametercan be complex, an automatic way of moving through the space was designed.In addition to the ability to select a single grain in space, we implementeda technique to select a sequence of grains called the “Spatial Read Pointer”.Analogous to the read pointer in classical (temporal) granulation, the spatialread pointer orbits around a specified trajectory, and extracts grains that fallwithin the path.
To ensure that the spatial read pointer is able to extract grains at the correctposition in space, the orbit needs to be updated at a rate that is at least as highas the trigger rate. This is achieved by calculating the orbit trajectory in theaudio callback, at audio rate. As such, not only are the grains extracted fromthe correct position in space and time, but the movement of the orbit could beincreased to audio rate.
Proc. of the 12th International Symposium on CMMR, Sao Paolo, Brazil, July 5-8, 2016
152

Angkasa: A Software Tool for Spatiotemporal Granulation 7
Algorithmic/ Generative As discussed, the spatial read pointer is one tech-nique for specifying a selection pattern. This functions as a starting point for fur-ther investigations in extracting, and triggering spatiotemporal grains. Other al-gorithms that would be explored in the near future include fractal based, physicsbased (swarm & flocking), statistical, stochastic, and cellular automaton.
Space-time Representation The representations shown in Figure 3 can bethought of as individual slices, or frames of a specific moment in time. If all theframes are successively lined up, we would gain a representation of the full space-time decomposition. This would open up to the possibility of traversing throughboth dimensions, allowing us to simultaneously extract and synthesize grainsfrom different points in space, and time. For example, the Spatial Read Pointercan be used not only to extract grains based on each frame (frozen time), butcould also be used to navigate seamlessly to extract any spatiotemporal grain inspace and time. One could also create a dynamic manipulable cloud containingonly spatiotemporal grains extracted from a section of space, in a specific timeperiod.
Spatial Windowing A temporal grain is generated by multiplying a 1 di-mensional audio signal (less than 100 ms) with a specified window (hanning,hamming, blackman, etc). In other words, the algorithm takes a snapshot ofa number of samples in time, and removes certain parts of the signal. Throughspatiotemporal granulation, we can apply a 2 Dimensional window to select onlya portion of grains to be triggered (or 3 Dimensional in the full space-time rep-resentation). Properties of the window such as window type can be customized,akin to the temporal domain counterpart [11].
Spatial Trajectory The location and motion of sound objects in a spatialscene could now be extracted from a soundfield recording. For example, we couldextract the motion of a moving object, and impose a different path, or changethe course of its original trajectory. Alternatively, we could retain the originalmotion, but change the content of the sound object. An example of this would beto analyze the motion of a flying insect (such as a bee), and use the extracted pathas a trajectory for the sound of a moving train. Additionally, we can spatiallydisintegrate a sound object based on real-world models, such as smoke or fluidsimulation.
As we now have independent control over both the temporal, and the spatialsegmentation, we are able to customize and manipulate one domain, withoutaffecting the other. For example, imagine a scene with an exploding sound object,followed by grains traveling outwards in 360 degrees from the initial burst. Wecan reverse time, causing the sound to be played backwards, and the grainsto spatially coalesce, instead of the radial outwards dispersion. Additionally,we can allow only the spatial dimension to travel backwards, but allow thetemporal dimension to progress normally (or vice versa). The perceived effect
Proc. of the 12th International Symposium on CMMR, Sao Paolo, Brazil, July 5-8, 2016
153

8 Muhammad Hafiz Wan Rosli and Andres Cabrera
would resemble the space collapsing into a single point at the origin, but thesound to move through time at normal speed.
Extracting the trajectory of motion not only allows us to transform, andcustomize the motion of a sound object, but it also allows us to map the in-formation to other granulation parameters. For example, we can map the speedof movement to the pitch of the grain, or a grain’s temporal length (or spatialsize)– the faster the motion, the smaller the size, or vice versa.
Spatial Cross-Synthesis As discussed in Section 2.1, spatial resolution isprimarily dependent on the order of the Ambisonics signal. Additionally, thetype of captured signal, and the space where the sound was captured determineshow correlated the spatiotemporal grains are. For example, transient soundssuch as fireworks tend to produce unique spatiotemporal grains, compared tolong, sustained sounds. Similarly, the sounds captured in an acoustically dryspace tends to produce grains that are more distinct, compared to a reverberantspace.
By performing cross-synthesis, one can “compose” the space-time palette,in order to create a desired space. For example, we can impose the spectralenvelope of a spatiotemporal grain to another grain from a different spatialposition, temporal position, or a grain from a different sample. The resultingpalette can be directly encoded into B-Format as frames for the spatial scene,or used as a platform to extract individual spatiotemporal grains. Examplesof algorithms for performing cross-synthesis include convolution and DictionaryBased Methods [7].
3.2 Spatialization
Individual decomposed spatiotemporal grains could now be assigned to differentlocations in space through the use of various spatialization algorithms. At thetime of writing, we have explored the positioning of grains by re-encoding theminto Ambisonics. Further explorations in spatialization of spatiotemporal grainswill be carried out in the near future. Space now becomes an additional expressiveparameter through maintaining, breaking or contrasting the original space withthe space after the granulation.
Example of techniques that could be used include clustering algorithms tostatistically position the grains around a specified point in space. Additionally, arandom deviation may be applied to the original position of selected spatiotem-poral grains, in order to displace their presence in space.
Exploring Space In classical granulation, when we freeze the time (wherethe grain is extracted from), we hear the grains from that moment in time.Through spatiotemporal granulation, we now have the ability to explore thespatial dimension of sounds. The extreme case would be to freeze time, and“scan” the captured space, which would result in spatially exploring a momentfrozen in time. Examples of algorithms that could be used to trigger these grainsinclude those that are mentioned in Section 3.1.
Proc. of the 12th International Symposium on CMMR, Sao Paolo, Brazil, July 5-8, 2016
154
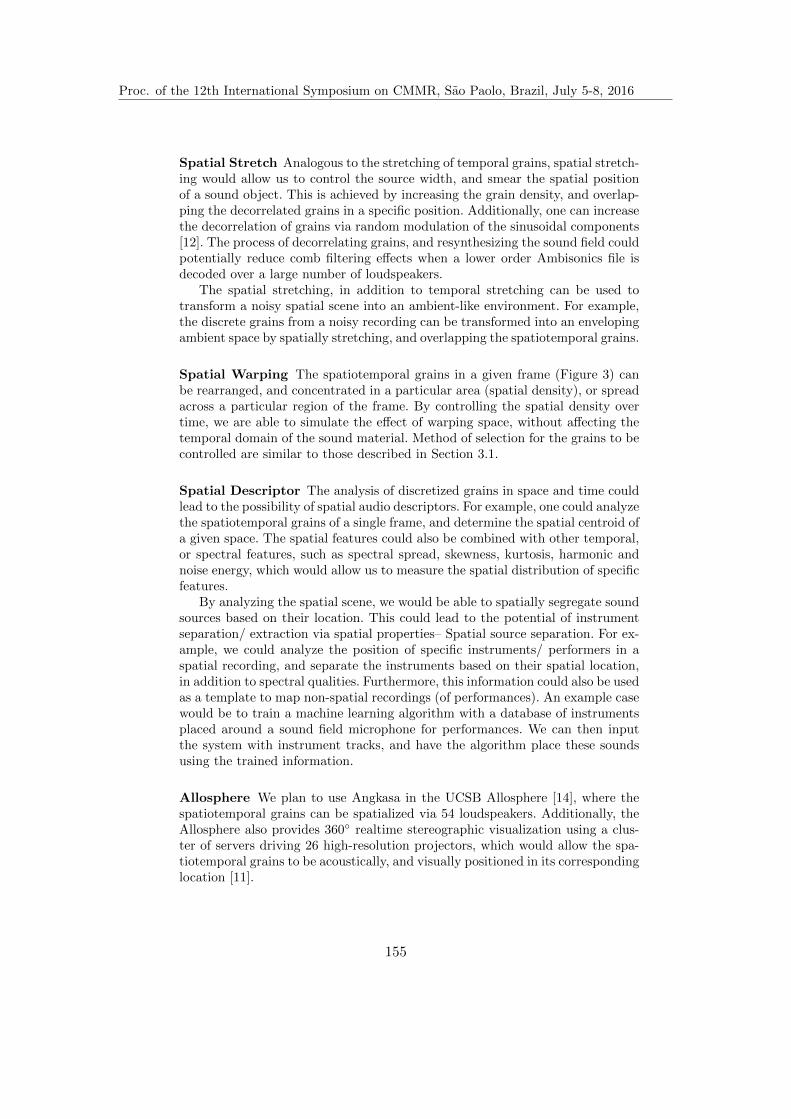
Angkasa: A Software Tool for Spatiotemporal Granulation 9
Spatial Stretch Analogous to the stretching of temporal grains, spatial stretch-ing would allow us to control the source width, and smear the spatial positionof a sound object. This is achieved by increasing the grain density, and overlap-ping the decorrelated grains in a specific position. Additionally, one can increasethe decorrelation of grains via random modulation of the sinusoidal components[12]. The process of decorrelating grains, and resynthesizing the sound field couldpotentially reduce comb filtering effects when a lower order Ambisonics file isdecoded over a large number of loudspeakers.
The spatial stretching, in addition to temporal stretching can be used totransform a noisy spatial scene into an ambient-like environment. For example,the discrete grains from a noisy recording can be transformed into an envelopingambient space by spatially stretching, and overlapping the spatiotemporal grains.
Spatial Warping The spatiotemporal grains in a given frame (Figure 3) canbe rearranged, and concentrated in a particular area (spatial density), or spreadacross a particular region of the frame. By controlling the spatial density overtime, we are able to simulate the effect of warping space, without affecting thetemporal domain of the sound material. Method of selection for the grains to becontrolled are similar to those described in Section 3.1.
Spatial Descriptor The analysis of discretized grains in space and time couldlead to the possibility of spatial audio descriptors. For example, one could analyzethe spatiotemporal grains of a single frame, and determine the spatial centroid ofa given space. The spatial features could also be combined with other temporal,or spectral features, such as spectral spread, skewness, kurtosis, harmonic andnoise energy, which would allow us to measure the spatial distribution of specificfeatures.
By analyzing the spatial scene, we would be able to spatially segregate soundsources based on their location. This could lead to the potential of instrumentseparation/ extraction via spatial properties– Spatial source separation. For ex-ample, we could analyze the position of specific instruments/ performers in aspatial recording, and separate the instruments based on their spatial location,in addition to spectral qualities. Furthermore, this information could also be usedas a template to map non-spatial recordings (of performances). An example casewould be to train a machine learning algorithm with a database of instrumentsplaced around a sound field microphone for performances. We can then inputthe system with instrument tracks, and have the algorithm place these soundsusing the trained information.
Allosphere We plan to use Angkasa in the UCSB Allosphere [14], where thespatiotemporal grains can be spatialized via 54 loudspeakers. Additionally, theAllosphere also provides 360◦ realtime stereographic visualization using a clus-ter of servers driving 26 high-resolution projectors, which would allow the spa-tiotemporal grains to be acoustically, and visually positioned in its correspondinglocation [11].
Proc. of the 12th International Symposium on CMMR, Sao Paolo, Brazil, July 5-8, 2016
155
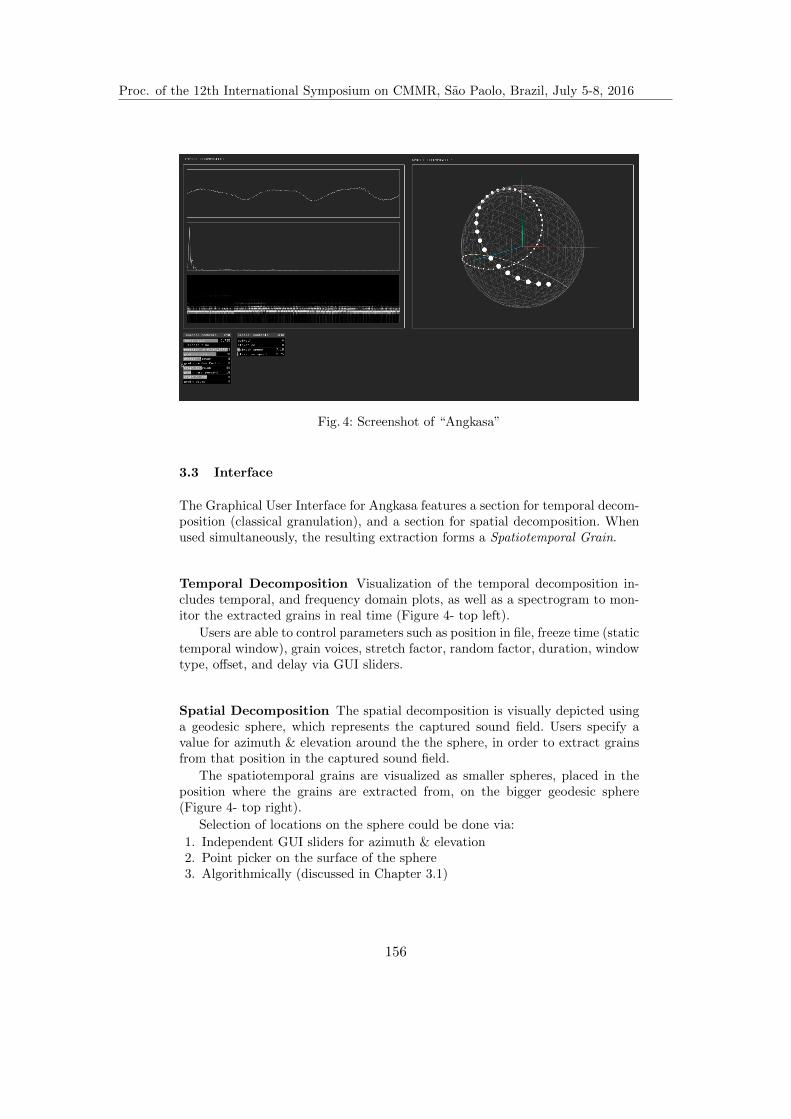
10 Muhammad Hafiz Wan Rosli and Andres Cabrera
Fig. 4: Screenshot of “Angkasa”
3.3 Interface
The Graphical User Interface for Angkasa features a section for temporal decom-position (classical granulation), and a section for spatial decomposition. Whenused simultaneously, the resulting extraction forms a Spatiotemporal Grain.
Temporal Decomposition Visualization of the temporal decomposition in-cludes temporal, and frequency domain plots, as well as a spectrogram to mon-itor the extracted grains in real time (Figure 4- top left).
Users are able to control parameters such as position in file, freeze time (statictemporal window), grain voices, stretch factor, random factor, duration, windowtype, offset, and delay via GUI sliders.
Spatial Decomposition The spatial decomposition is visually depicted usinga geodesic sphere, which represents the captured sound field. Users specify avalue for azimuth & elevation around the the sphere, in order to extract grainsfrom that position in the captured sound field.
The spatiotemporal grains are visualized as smaller spheres, placed in theposition where the grains are extracted from, on the bigger geodesic sphere(Figure 4- top right).
Selection of locations on the sphere could be done via:
1. Independent GUI sliders for azimuth & elevation2. Point picker on the surface of the sphere3. Algorithmically (discussed in Chapter 3.1)
Proc. of the 12th International Symposium on CMMR, Sao Paolo, Brazil, July 5-8, 2016
156

Angkasa: A Software Tool for Spatiotemporal Granulation 11
3.4 Future Work
We plan to improve the visualization so that each grain’s energy is mapped tothe size, or opacity of the smaller spheres, representing the energy content ofeach grain (from that location in space).
Furthermore, we plan to map the representation shown in Figures 2 & 3 ontothe geodesic sphere shown in Figure 4. This would allow a user to analyze thepalette in real-time, before extracting, and triggering the spatiotemporal grains.
The ability to select grains for analysis and synthesis allows a user to usethe software tool for real-time performance. However, a limitation that presentsitself is the ability to control the overall meso or macro structure of the per-formed/ composed piece. One of the future directions in interface design is toimplement an editable automated timeline, which would allow a user to composethe sequence of change over time.
The spatiotemporal “slice” (Figure 3) allows a user to navigate within thefrozen temporal window. In order to change the temporal location of the window,a user would have to change the position in file from the Temporal DecompositionGUI (Section 3.3). As an extension to this representation, we plan to developan interface where each spatiotemporal frame is lined up in the Z-dimension,allowing a user to select, and navigate around the full space- time representation.An external OSC [15] controller will be designed as a means to navigate the fullydecomposed representation.
4 Conclusion
We presented a brief theoretical overview of spatiotemporal granulation, andoutlined the possible, and potential manipulations that could be realized throughthis technique. We introduced a new software tool for performing spatiotemporalgranulation called Angkasa. Development of the tool will proceed in differentdirections, including (but not limited to) analysis, extraction, transformation,synthesis, spatialization, and visualization of spatiotemporal grains.
Acknowledgments. The first author would like to thank his advisors, Cur-tis Roads, Clarence Barlow, Andres Cabrera, and Matthew Wright for theirguidance, and assistance in this research project. His gratitude is also extendedtowards Staatliche Hochschule fur Gestaltung, and Zentrum fur Kunst und Me-dientechnologie, Karlsruhe, Germany, for hosting him during the “Space-Media-Sound” research exchange program. Their encouragement, and assistance hasproven to have had an extensive impact on the research implementation. Thiswork was partly sponsored by Universiti Sains Malaysia, Ministry of EducationMalaysia, and the Baden-Wurttemberg Foundation.
Proc. of the 12th International Symposium on CMMR, Sao Paolo, Brazil, July 5-8, 2016
157

12 Muhammad Hafiz Wan Rosli and Andres Cabrera
References
1. Roads, C.: Microsound. MIT Press, Massachusetts (2001)2. Truax, B.: Composition and Diffusion: Space in Sound in Space. J. Org. Sound. vol.
3, 141–146 (1998)3. Barrett, N.: Spatio-Musical Composition Strategies. J. Org. Sound. vol. 7, 313–323
(2002)4. Kim-Boyle, D.:Spectral and granular spatialization with boids. In: ICMC, Interna-
tional Computer Music Conference (2006)5. Deleflie, E., Schiemer, G.: Spatial-grains: Imbuing granular particles with spatial-
domain information. In: ACMC09, The Australasian Computer Music Conference(2009)
6. Gerzon, M.A.: Periphony: With-height Sound Reproduction. J. Audio Eng. Soc, vol.21, 2–10 (1973)
7. Sturm, B. L., Roads, C., McLeran, A., Shynk, J. J.: Analysis, visualization, andtransformation of audio signals using dictionary-based methods. In: ICMC, Inter-national Computer Music Conference (2008)
8. Roads, C.: The Computer Music Tutorial. MIT Press, Massachusetts (1996)9. W. Rosli, M. H., Cabrera A.: Gestalt principles in multimodal data representation.
Computer Graphics and Applications, IEEE, vol. 35, 80–87 (2015)10. W. Rosli, M. H., Roads, C.: Spatiotemporal Granulation. In: ICMC, International
Computer Music Conference (2016)11. W. Rosli, M. H., Cabrera, A., Wright, M., and Roads, C.: Granular model of
multidimensional spatial sonification. In: SMC, Sound and Music Computing (2015)12. Cabrera, A.: Control of Source Width in Multichannel Reproduction Through Si-
nusoidal Modeling. Ph.D. dissertation, Queens University Belfast (2012)13. Schwarz, D.: A system for data-driven concatenative sound synthesis. In: Digital
Audio Effects (2000).14. Kuchera-Morin, J., Wright, M.: Immersive full- surround multi-user system design.
Computers & Graphics. vol. 40, 10–21, (2014)15. Wright, M., Freed, A.: Open sound control: A new protocol for communicating
with sound synthesizers. J. Org. Sound. vol. 10, 193–200 (2005)
Proc. of the 12th International Symposium on CMMR, Sao Paolo, Brazil, July 5-8, 2016
158
Subjective experience in an interactive musicvirtual environment: an exploratory study
Thomas Deacon1, Mathieu Barthet1, and Tony Stockman1 ?
Centre for Digital Music, Queen Mary, University of [email protected]
Abstract. The Objects VR interface and study explores interaction de-sign at the crossover of interactive music and virtual environments, whereit looks to understand users’ experience, conceptual models of musicalfunctionality, and associated interaction strategies. The system presentedin testing, offers spatio-temporal music interaction using 3D geometricshapes and their spatial relationships. Interaction within the virtual en-vironment is provided through the use of a Leap Motion sensor and theexperience is rendered across an Oculus Rift DK2 with binaural soundpresented over headphones. This paper assesses results for a subset of thewhole study, looking specifically at interview self-report, where thematicanalysis was employed to develop understanding around initial experi-ences. We offer a nuanced understanding of experience across groupsresulting in key themes of Comprehension, Confusion, Engagement, andFrustration, using participants prior knowledge of music technology asthe grouping factor. Future work includes evaluation of the whole study,looking at the effectiveness of questionnaires and interaction frameworksin assessment of novel interactive music virtual environments.
Keywords: 3D user interfaces, virtual environment interaction, inter-active music systems, interaction design, thematic analysis, creativity
1 Introduction
The Objects VR interface marks the beginning of our work into understandingspatial interaction in virtual environment(VE) based music experiences. Our ap-proach is exploratory and by using mixed evaluation methods (semi-structuredinterviews, video analysis and questionnaires) we aim to assess behaviour, expe-rience, and sonic interaction in an interactive music VE. The section of the studypresented in this paper aims to test whether there are differences in understand-ing and interface appropriation according to expertise with music technology,and has the following research questions:
– How do users’ explore and make sense of interactive music virtual environ-ments, and how is this represented in self-report?
? Special thanks to Stuart Cupit from Inition
Proc. of the 12th International Symposium on CMMR, Sao Paolo, Brazil, July 5-8, 2016
159
2 Deacon, Barthet, Stockman
– What level of creative engagement can be achieved when users are not ex-plicitly informed of the sonic or environment functionality?
Directly understanding user strategy is troublesome, but the mixed-methodsapproach presented builds toward this goal of understanding interaction andknowledge formulated “in-situ”. Furthermore, use of mixed methods allows com-parison of how effective different elements of the evaluation are performing,allowing proposed metrics to be critiqued, and adapted to include emergentvariables. Future research and analysis will investigate: (i) Frameworks for inter-action analysis, (ii) Spatial interaction related to music interfaces, (iii) Developunderstanding of problem areas in music interfaces that effect flow, (iv) Ex-pand the design of questionnaires around the subject, to quickly and effectivelyevaluate prototype interfaces.
2 Related Works
Of the research conducted in VE music and interaction, topics fall into some de-finable categories: (i) Controlling musical characteristics of pre-existing composi-tion [15], (ii) Mixer style control of spatial audio characteristics for pre-recordedsound sources, with optional control of effects [22], (iii) Virtual instruments, vir-tual representations of instruments and synthesis control [12,6], (iv) Virtual au-dio environment, multi-process 3D instruments [20,1], (v) Virtual object manip-ulation with parametrised sound output [13,14]. Many of these implementationsoffer novel interaction methods coupled with creative feedback and visualisation.
To better facilitate users’ engagement and learning of interfaces, the conceptof flow must be actively understood in the design space. Flow is described as astate of optimal experience, “the state in which individuals are so involved in anactivity that nothing else seems to matter” [4]. Flow in terms of a user can bethought of as process of comparison a user makes about their perceptions, just aswith ecological affordances[7]. Balancing of challenge, learning, and function ofinteraction elements is at the core of designing experiences for user engagementin music.
An often cited factor in the effectiveness of a VE is the concept of presence.The cognitive model of Wirth et al. [21] presents an operational definition ofpresence: “Spatial Presence is a binary experience, during which perceived self-location and, in most cases, perceived action possibilities are connected to amediated spatial environment, and mental capacities are bound by the mediatedenvironment instead of reality.” Schubert et al. [16] present further analysis ofthe spatial presence theory and highlight that if affordances of virtual objectsactivate actions then a feeling presence is fed back. This disambiguation demon-strates that within an experience it is not only the whole environment in whicha user feels present but also within a virtual object framework, this is pertinentin domain specific applications such as music interaction.
As of the exploratory nature of this work, qualitative methods are consid-ered suitable for developing understanding within the design space. The work ofStowell et al [19] present a method of rigorous qualitative discourse analysis in
Proc. of the 12th International Symposium on CMMR, Sao Paolo, Brazil, July 5-8, 2016
160

Objects, VR Music Interaction and Experience 3
the investigation of musical interfaces. A key concept discussed is that of not cre-ating a test based purely on precision of reproduction tasks, adding a section freeexploration. Discourse analysis was used to determine a user’s appropriation ofan interface into their own conceptual understanding with respect to individualknowledge and interaction experience, though the authors do explain that themethod can be quite verbose. Johnston [10] looks to Grounded Theory Method-ology to understand user experiences with new musical interfaces emphasizingthat evaluation should be comprised of more than task usability. Studies shouldacknowledge the ambiguity of various interactions that users exhibit in musicalinteraction. This moves beyond pure communication of conceptual metaphorsin design, advocating an understanding of multiple interpretations. Johnstonalso highlights that qualitative methods can be used as a foundation to furtherstudies evaluating virtual instruments.
3 Design Space for Objects VR Interface
(a) Green Synth GridUnit Menu with PrismExplosion Feedback
(b) Red Drum PrismGrab Attempt with Raycasting Beam
(c) Blue Bass Loop Cubebeing manipulated byuser
Fig. 1: Comparison of interface sections
Designing the relationship between geometry, motion and sound is essentialto the creation of the Objects VR interface. The system presented looks to craftsonic interactions with embodied associations between motion and sound usinga VE as the interaction space. General design goals were that the experienceshould: (i) Be accessible and fun for novices, (ii) Allow ‘physical’ experimenta-tion and interaction with musical content, (iii) Obtain high levels of presence.A combination of musical composition, spatial audio, and timbral control waschosen for this project; utilising gestural interaction and direct interface manip-ulation, that looks to provide novice users the ability to learn purely within theexperience.
Proc. of the 12th International Symposium on CMMR, Sao Paolo, Brazil, July 5-8, 2016
161
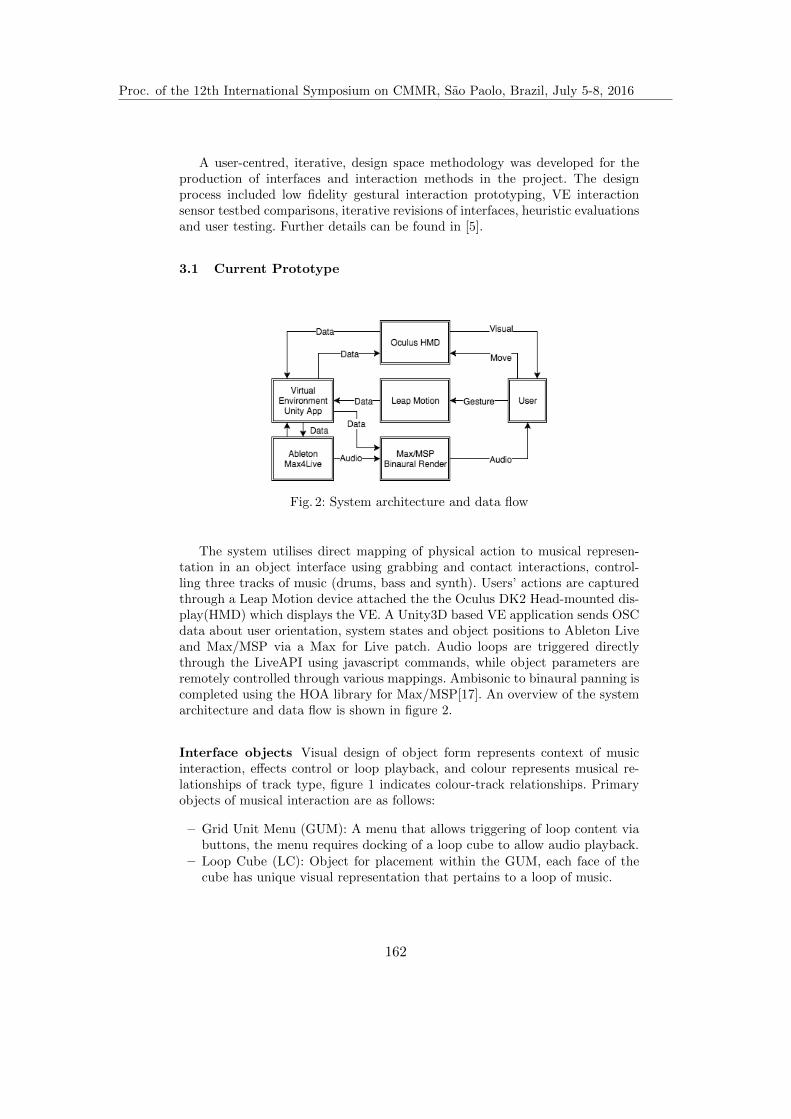
4 Deacon, Barthet, Stockman
A user-centred, iterative, design space methodology was developed for theproduction of interfaces and interaction methods in the project. The designprocess included low fidelity gestural interaction prototyping, VE interactionsensor testbed comparisons, iterative revisions of interfaces, heuristic evaluationsand user testing. Further details can be found in [5].
3.1 Current Prototype
Fig. 2: System architecture and data flow
The system utilises direct mapping of physical action to musical represen-tation in an object interface using grabbing and contact interactions, control-ling three tracks of music (drums, bass and synth). Users’ actions are capturedthrough a Leap Motion device attached the the Oculus DK2 Head-mounted dis-play(HMD) which displays the VE. A Unity3D based VE application sends OSCdata about user orientation, system states and object positions to Ableton Liveand Max/MSP via a Max for Live patch. Audio loops are triggered directlythrough the LiveAPI using javascript commands, while object parameters areremotely controlled through various mappings. Ambisonic to binaural panning iscompleted using the HOA library for Max/MSP[17]. An overview of the systemarchitecture and data flow is shown in figure 2.
Interface objects Visual design of object form represents context of musicinteraction, effects control or loop playback, and colour represents musical re-lationships of track type, figure 1 indicates colour-track relationships. Primaryobjects of musical interaction are as follows:
– Grid Unit Menu (GUM): A menu that allows triggering of loop content viabuttons, the menu requires docking of a loop cube to allow audio playback.
– Loop Cube (LC): Object for placement within the GUM, each face of thecube has unique visual representation that pertains to a loop of music.
Proc. of the 12th International Symposium on CMMR, Sao Paolo, Brazil, July 5-8, 2016
162

Objects, VR Music Interaction and Experience 5
(a) Magnetic grabbing gestures andbounding rules
(b) Synth Prism GridSpace
Fig. 3: Interaction Dynamics and Interface Elements
– Sphere: Object controls binaural panning and distance based volume atten-uation of track given position in 2D (XZ) space.
– Prism: Unique object forms with 3D parameter spaces for controlling trackeffects. Mapping is unique to each object therefore each object has idiosyn-cratic appearance. For each track effects are as follows:• Drum - Interpolated convolution reverb amount and type, 3D (XYZ)
space to 2D (XZ) effect mapping, further away the more wet the signal,depending on which corner of the ‘room’ indicates size of reverb, goingclockwise cavernous, large hall, room, small tight space.
• Bass - Filter cut-off, 3D (XYZ) space to 1D effect mapping, where objectdistance from user sets value.
• Synth - Duration and timbre of notes, uses 3D (XYZ) space to manydimensional mapping with idiosyncratic relationship of spatial param-eter to sonic output. Approximately, distance changes length of notesand height alters timbre. Mapping strategies are in two forms, directparameter mapping of object position to Ableton mapping macros anduse of interpolated spatial parameter spaces, utilising Manifold-InterfaceAmplitude Panning[18].
Interaction metaphors As can be seen from Interface objects functional-ity, two distinct interaction metaphors are present in the prototype. One, anabstract metaphor where users must dock objects within other structures toyield further functionality. And two, a direct metaphor by which objects releasefeedback based on free movement in the space given their respective mappings toaudio functions, unrelated to position of other objects of the given group. Thiscombination of abstract and direct interaction metaphors could prove confusingto users.
Interface features Various elements of interaction dynamics were added to im-prove usability of the interface. Primarily, Magnetic Object Grabbing gestures
Proc. of the 12th International Symposium on CMMR, Sao Paolo, Brazil, July 5-8, 2016
163

6 Deacon, Barthet, Stockman
and logic were implemented to allow an expanded interaction space on top of di-rect object interaction using physics. Objects are selected and hyper-realisticallygrabbed using iconic pinch or grab gestures, see figure 3a. An expanded in-teraction space is gained at the cost of users having to learn the behavioursand their idiosyncrasies. Some further features were implemented to improvethe enjoyment and depth of the experience by enhancing interface dynamics.A light-stream is used to indicate which object is currently closest and avail-able for grabbing. Audio and visual explosion feedback occurs when a Sphere orPrism makes contact with the centre of the GUM, to indicate that the shapedoes not belong there. A shrinking sphere surround indicates time left in theenvironment, starting very large and ending obfuscating all interaction objects.Gaze-based movement of GUMs was implemented to have them move back andforward only when looked at. Object-based gravity was implemented to amelio-rate interaction errors, where if an object is flung beyond the range of directcontrol a force is applied to the object to always bring it back to within yourgrasp. A grab-based visual grid space appears on prism interaction, this 3D ma-trix of points intends to indicate that there is a spatial parameter space, see figure3b. Colour of matrix is context dependant on which prism is grabbed. Thoughchallenging in music interfaces, audio feedback was implemented for LC grabsusing single note of chord with note being dependant on object group, prism andsphere explosion feedback, and completion of docking a LC in a GUM.
Learning Staggered introduction of objects within the environment was utilisedso functionality is explored and discovered one piece at a time. At the start ofthe experience only one LC is presented to user while other objects are hidden,once this object has been grasped another object will appear, this process con-tinues one by one till all objects are available. By embedding the learning in theenvironment, the coupling between sound, space, and action allows mediatedexploration of both the model of interaction and the creative possibilities of thesystem.
4 User Evaluation
4.1 Participants
Participants were recruited from University email lists and special interest groups(music, technology, VR) from meetup.com, there were 23 respondents (9 female,average age 28). Demographic data (age, gender and first language) was collectedalongside Likert based self assessments. Separation of participants into groupsis based on response to the following self assessment item: I am experiencedat using music software and sound synthesis. The response scale had 5 pointspertaining to experience level (Not at all - Very much), as such items 1 & 2are aggregated as Novice and items 4 & 5 were grouped as Experienced; withthe middle category being assigned to moderate. This resulted in the followinggroups: 8 Novice, 9 Experienced. The remaining 6 Moderates are not includedin this papers analysis.
Proc. of the 12th International Symposium on CMMR, Sao Paolo, Brazil, July 5-8, 2016
164

Objects, VR Music Interaction and Experience 7
4.2 Sessions and Tasks
Tasks asked of participants were purposely ambiguous, more of an experientialsetting to allow the user to discover and engage with objects that yield inter-esting feedback. This allows participants to freely form meaning and conceptualmodels of functionality. The interviews conducted look to understand how thisinformation is then represented in their own words. Participants engage in two6 minute uses of the VE, an Explore session and a Task session, order of testingand tasks is adapted from [19]. In the Explore session no explicit training orindication of function was provided before session, and the concept of a musicalloop and effects controllers was not introduced. Participants are told to just playwith the interface and see what things they can learn from it or just how theyfeel trying to use or understand it. The Task session was subsequent to a func-tional overview of environment and interaction gestures is given, but no detailsof sonic or musical function were divulged. The task in this session is to use theinterface again and try to accomplish more musical ideas if they feel they could.
Fig. 4: Flow chart of experimental procedure, data collected; shaded area indi-cates analysis objective of current paper
4.3 Study Method
The study used exploratory mixed methods utilising semi-structured interviews,questionnaires, and video analysis; a breakdown of sections can be seen in figure4. Ordering of data collection was purposeful, to get the most subjective rep-resentations of experience before questionnaires are issued that may introducebias in the self report. Qualitative data was obtained through video data of VEinteractions, bodily actions in space, verbal utterances, and interviews. Quan-titative data relating to user experience was obtained through a series of postexperience questionnaires, of which the results are not presented in this paper,as their responses relate to the whole experimental procedure. This paper dealswith the first phase of self-report for Novice and Experienced users data gatheredfrom interviews prior to functionality briefing and questionnaires.
Proc. of the 12th International Symposium on CMMR, Sao Paolo, Brazil, July 5-8, 2016
165

8 Deacon, Barthet, Stockman
4.4 Analysis Methodology
For locating meaning in qualitative data, thematic analysis was utilised based on[2,8]. Exploratory thematic analysis puts emphasis on what emerges; interactionsbetween researcher and respondent, researcher and the data, and also respondentand technology. In order to analyse multimodal data, content must be arrangedfor combined analysis of: HMD screen-grab, body in physical space video, voicemic and rendered audio. An example of a synced and coded file can be seen infigure 5. This allows multiple perspectives to partially reconstruct events basedon audio and visual stimuli, with the benefit of being able to understand theirsituated physical behaviours. Once familiarised with the data, open coding wasused to annotate points of interest, along with memoing. Then iterative revisionand organisation of codes, categories and themes was undertaken to refine theemergent data. In this way the process was inductive rather than theoretical,whereby codes and themes emerged from the data. Throughout this process it isimportant not to over-simplify the data and subsequent themes, where possibleas much detail on context should be preserved. As such top level themes aremarkers of further inquiry, with component themes being closer to operationalcoding and their clustering around certain topics.
Fig. 5: Example of analysis procedure using MaxQDA 12
5 Explore Session Interview Themes
Analysis of the Explore session highlighted key themes within self-report acrossboth groups. Primary themes include Comprehension, Confusion, Engage-ment, Frustration. Supporting themes, what is referred to when talking aboutprimary themes, include Interface, Interaction, Altered states of percep-tion, Goals and models. Within each of the themes different elements ofthe system and user experience are represented and described using componentthemes. Given the attribution of the themes across both groups, an important
Proc. of the 12th International Symposium on CMMR, Sao Paolo, Brazil, July 5-8, 2016
166

Objects, VR Music Interaction and Experience 9
analysis factor is assessing the way the theme manifests in each groups self report,and what this means for understanding their respective differences of appropria-tion and subjective sense making. As such themes should be seen like dimensions,where individuals will reside at different levels depending on subjective context.
Within theme descriptions the following notation is used to indicate wherein the data a summary of occurrences or where a quote came from. (Px): par-ticipant number e.g. (P7) participant seven said something; (N=x): number ofparticipants that exhibited relationship e.g. (N=3) three participants exhibitedsaid relationship. Where required aberrant cases will be indicated in descriptionsof themes.
5.1 Primary Themes
Comprehension A key dimension that disambiguated novice from experiencedusers was the level of self-report around concepts relating to comprehension. Thelevel and specificity of self report could be considered more detailed for the expe-rienced group, inferring greater structuring of the environment and experience.It may be the case that many novices did understand just as many relationshipsto functionality but they did not talk about them in the process of the interview.For the novice group Colours and groups, Awareness of elements, and Interfaceand feedback were the component themes. Colours and groups describes howcolour and group relationship made sense (N=4), but this did not extend totrack relationship and respective functionality. Awareness of elements indicatesthat most objects were mentioned in their reports, in some capacity. Interfaceand Feedback highlights that objects fed back subjectively useful informationabout what was possible through audio or visual stimuli (N=5).
For the experienced group the component themes were; Functional under-standing, Metaphors, and Form and space. Functional understanding indicatestendency to describe functional items and objects in the interface (N=9), withlinks to the audio functionality that relate to their actual function. The Formand space component describes that most group members (N=8) reported un-derstanding of colour and shape relationships to tracks, along with some idea ofhow the environment was laid out, when speaking and gesturing reflectively. TheMetaphors component shows an awareness of docking and/or parameter spacemetaphors in self report. Aberrant cases included two experienced participants(P11,P19) who understood most of the audio system architecture from just theExplore session, and then focused on interaction strategies to optimise their time.One experienced participant had very little understanding of function due to anunfortunate sequence of events in early interactions (P14). Novice P3 exhibitedall the themes and self-report of an experienced user. Also novice P1 reportedlittle to no comprehension of the interface due to extensive confusion.
Confusion Theme describes how levels of uncertainty manifested within par-ticipants descriptions. A strong theme with high levels of uncertainty in inter-face and interaction in general, but the content of what was confusing varied
Proc. of the 12th International Symposium on CMMR, Sao Paolo, Brazil, July 5-8, 2016
167

10 Deacon, Barthet, Stockman
across groups. Again, novice P3 was an aberrant case, indicating report like anexperienced participant. Novice components included Purpose, Objects, Prismand Spheres, System models and importantly Hearing differences. Purpose high-lights tendency to feeling “lost” (P2) or uncertain in general of what to do(N=3). Objects indicates uncertainty of what objects do and the relationshipof them together and in the space(N=4). Related to this, Prism and Spheresshows misunderstanding was common with these specific objects, see support-ing code supporting code Interface for details. System models outlines reportof highly varied conceptual models of system function, that caused confusionthrough misunderstanding, examples can be found in supporting codes Inter-face and Goals and models. Hearing differences refers to the reporting ofconfusion related to sound and music stimulus within their experience. Specifi-cally, the difficulty in hearing differences across content contributed to confusion(N=3), P22 describes it as follows: “I guess the ‘ahh’ point was the fact that youcould switch off, which is really good, cause then you can actually know whichones playing what, it was quite difficult to hear the differences in each of thebuttons though, so, within the same colour”.The experienced group confusioncomponents include Specific Confusion and Prisms and Spheres. Specific Con-fusion includes detailed descriptions of ones own confusion (N=6), participantsreported what problems occurred, where they occurred, and occasionally offereddescriptions of why something was confusing. Misunderstanding of Prisms andSpheres was common (N=7), see Interface supporting code for details.
Engagement Theme draws attention to highly varied representations of whatwas engaging for individuals in the experience, with many shared componentsacross groups. The only aberrant case was novice P1 who had no componentsin self report, only Confusion and Frustration. Novel was the only uniquegroup component, which related to the experienced group descriptions of nov-elty around various elements in experience and how it was enjoyable despite frus-tration and uncertainty (N=4). Shared components included Playing, Enjoyable,Strange but I like it, Self learning, and Immersed in sonic interaction. Looking atboth groups, Playing indicates use of “play”, “playful” or “playing” as a phraseto describe interaction; Novice (N=3), Experienced (N=3). Enjoyable describesuse of positive vocabulary in reporting aspects of experience, across all but oneparticipant (P1). Strange but I like it notes use of “Strange”, “weird” or “odd”to describe experience but the clarifying the term as enjoyable Novice:(N=4),Experienced:(N=6). Self learning highlights report of self learning through in-terface affordances and feedback; Novice (N=4), Experienced (N=5). Examplesinclude encouragement to learn (P2,P20), moments of discovery (P2,P22), andcomments about “intuitive” interface dynamics. A slight disambiguation aroundimmersion was noted in the groups, novices reported sonic concepts whereas ex-perienced is related to musical information specifically. For the Novice group, theImmersed in sonic interaction component marked levels of immersion linked tosonic interaction across the group (N=3). Experiential descriptions include de-scribing a sense of grounding oneself in the environment, through how they talked
Proc. of the 12th International Symposium on CMMR, Sao Paolo, Brazil, July 5-8, 2016
168

Objects, VR Music Interaction and Experience 11
about the interface, its relationships, and their place in it (P4,P20). Whereas forthe Experienced group, Immersed in sonic interaction highlights how the partic-ipants enjoyed the sonic world (P17,P23) using vivid description of sound timbre(P23), and statement of immersion in musical interaction (P17).
Frustration All users struggled with gestural interaction, interaction dynamicsand the way objects worked, hence this theme is coupled with the Interactiontheme. Again, how and to what level this was reported indicates slight differ-ence in emphasis based on group. Novice components related to Not getting itand Learning Issues. Not getting it indicated how novices had a feeling of miss-ing some level of understanding which was annoying (N=4). While LearningIssues drew attention to it taking a long time to learn gestures and how to in-teract (P2,P10). For the experienced group, the Interaction supporting thememarked varied descriptions of frustration and difficulty in interacting with sys-tem elements (N=7); see the Interaction supporting theme for details. Again,P3 is more like an experienced user than other novices.
5.2 Supporting Themes
Interface Theme catalogs codes and components relating to functionality ofthe environment objects. The following component themes were collected aroundthe loop playback objects (GUMs, LCs and Buttons): Novices had issues aroundComprehension and Confusion of function. Novices would pick out some nu-ances of the interface design and report levels of creative engagement, but noconsistent patterns of understanding were present. Contrasting this, the expe-rienced group had a good Comprehension of functionality. Most participants(N=8) were able to specify functionality clearly, both as a track description(drums, bass, synth) and related system attributes (loops, triggering).
Prism and Sphere objects where reported as follows: Novices indicated thatprisms and spheres served no musical purpose and were often confused by theirfunction (N=4), but intrigued by visual appearance (P4) and explosion feed-back (N=3). From interviews, no mention can be found linking their motion tosubsequent audio effect, despite evidence of this use and effect in the session1.Similarly, understanding in the experienced group about the function of Prismsand Spheres was not extensively reported, barring previous aberrant cases of highComprehension (P11,P19). The associated feedback stimulus when collidingwith a GUM was reported of interest, sometimes enjoyable sometimes alarming,but it was described to help learn what was possible (N=3). In summary, theprism was said to be confusing (N=5), but also fun or interesting (N=3). Whilethe sphere objects, when even mentioned, were reported as playful (N=4) butoften misunderstood (N=3) or confusing (N=5).
1 In some cases the objects were interacted with before their associated track wasplaying, in this case it is impossible to determine their function as no audio feedbackwould occur.
Proc. of the 12th International Symposium on CMMR, Sao Paolo, Brazil, July 5-8, 2016
169
12 Deacon, Barthet, Stockman
Interaction Codes and themes relating to control, gestural interaction, andinterface dynamics such as physics. This theme highlights some important dif-ferences in novices and experienced participants. Primarily that more novicestalked positively about their feeling of interaction and control than the experi-enced group, though still citing similar errors such as “sticky” objects2. Partici-pants of the novice group described their experiences in the following ways: con-trol and interaction felt “physical”“immersive”“powerful”“magical” and “fun”despite errors (P3), tangible interaction with virtual objects (P4), “Cool” hands(P9), enjoyed the sensation of touching virtual objects and interface (P20), hold-ing objects was satisfying (P20). Whereas the experienced group highlightedtheir interaction with elements mostly with frustration at the lack of adequatecontrol to exercise their goals, such as: frustration with interaction (N=3), LeapMotion sensor made it difficult to interact (P6,P8), interaction dynamics got inthe way(P6,P8), interaction was difficult (P11),
Altered states of perception As stated previously, this theme relates stronglyto the Engagement theme. Self report around this area relates to flow and spa-tial presence components. Some descriptions of states are as follows: Novice P10described the entire experience as “dream-like”, as of the odd relationship totheir own body and the lack of body representation, this was reported to createa strange awareness of self. Another novice (P22) described the odd feeling of nothaving a body. Similarly, another novice (P20) described a “floating”, “weird”,perception of self in the VE, highlighting slight discomfort with perceptual in-congruence. As described in Engagement - Immersed in sonic interaction, con-ceptualisations of self in the environment were reported in relation to interfaceelements, and ones position within this object framework. When combined withother descriptions, this frames the environment as a evocative, stimulating worldthat alters feelings of self in relationship to your perception. Furthermore, per-ception of time was reported as augmented in some novice accounts (P20,P22),having a faster passage. In contrast, of the experienced group that describedaltered states of perception there was less of an emphasis on the relationship toself; but equally evocative terms for experience were utilised. P8 indicated anenjoyable feeling of child-like intrigue in the environment and its nature. P17described a wide range of experience including a feeling immersion in the en-vironment and task of making music, and described the sensation of touchingsound via spatialised input mediating experience. Finally, levels of technologicalimmersion were directly reported by P16 and P19, in relation to having onesown hands in the VE via the Leap Motion sensor image pass-through.
Goals and models Theme highlights how participants conceptualised the sys-tem and their purpose in using it, rather than discrete levels of system function
2 Malfunctioning magnetic grabs, when interacting in the environment objects sud-denly attach to your hand without intention of grabbing them, issue with methodof implementation.
Proc. of the 12th International Symposium on CMMR, Sao Paolo, Brazil, July 5-8, 2016
170

Objects, VR Music Interaction and Experience 13
models, which are described in Interface and Interaction themes. Novice ex-perience had two key components in this theme Playful exploration and Variedconceptual models. Playful exploration marks a tendency of self report towards acreative sense of playful discovery and exploration (N=3). Examples include howP4 and P22 described the environment presented as a new experience which wasnavigated by trial and error. Furthermore, certain participants indicated thatthe interface encourages interaction through sound and music engagement andreward (P2,P20), which made them feel creative and prompted them to learnmore (P20). Varied conceptual models highlights where novices offer highly var-ied interpretations of system image as their conceptual model e.g. Game-likepuzzle (P9,P22), creating or making the music yourself (P2,P20), constructingnew objects through actions (P4), being able to create things (P22), music player(P3,P10), and none (P1). In particular the Game-like puzzle metaphor describeshow a model of understanding changes interpretation of feedback, for instanceby docking LCs in GUMs and attempting to turn on multiple buttons, theirthinking was that there is a best combination within a group to progress. Thispuzzle interaction meant they were unsure of function but executed actions andthinking to decipher meaning. Again in contrast to the novices, the experiencedgroup described their understanding of purpose and the interface differently. Pri-marily this group reported levels of Intention, where they saw the goal or taskwas to make music (N=6). As mentioned previously in Engagement - Novel,in certain cases the novelty of the experience was highlighted as an importantdistinction from their other musical work (P8,P17). This emergent concept de-scribes how a experience made them feel different about something they do alot, or know a lot about, giving some freshness and excitement.
6 Discussion
For novices, feeling was a strong indicator of how participants phrased theirunderstanding, putting emphasis in their understanding of system purpose be-ing purely for enjoyment. Whereas, the experienced group’s Goals and modelscomponent of Intention highlighted how, for many, function and purpose were re-lated in their conceptual models. This factor highlights that certain experiencedusers quickly integrate musical functionality of the interface into their under-standing and proceed as they would with other such tools; they understood theenvironment was a music performance system. Commonly though, frustratedreport was witnessed around an inability to interact with the environment toactually make music.
Speculating on this analysis and its relation to flow components of experi-ences; assuming there is a clear expectation in an experienced user, clear and im-mediate feedback is given upon actions in the system, but the user severely lacksa feeling of control over their situation. As such there was a breakdown betweenaction and intention, which meant self report focused on the feeling of frustration.This is qualitatively different from the self report of novices, which could meanlevels of intention and transferred skills expectation are responsible for fram-
Proc. of the 12th International Symposium on CMMR, Sao Paolo, Brazil, July 5-8, 2016
171

14 Deacon, Barthet, Stockman
ing experience. Furthermore, perhaps flow is not achieved for experienced usersbecause their ability to interact (with music) does not match the requirementsfor action in the environment (gestures with objects), while their motivation iswell articulated (to make music). Relating back to human-computer interaction(HCI) literature around direct manipulation [9], the gulfs of execution and eval-uation account for the mismatch of goals, actions, feedback and system state;which manifests in the participants self report under flow characterisations. Apoint of note is that while these concepts are extensively understood in designand evaluation of 2D screen-based interfaces, having a purely visual apprecia-tion of their implementation needs to be extended for spatial music interactionspaces, looking towards integrating product and industrial design understandinginto the design space of VE musical interfaces.
Contrasting the tension between intention and frustration was the experi-enced groups emergent Engagement theme components of Novel & Playful.They highlight that while functionality and purpose are linked in musical tools,new ways of experiencing and controlling music are of value or can at least beinferred to be enjoyable. While certain participants enjoyed engaging with musicand control in new ways, perhaps for others the interface was too similar to pre-vious interaction metaphors within musical applications. This then prompts areformulation of the design space, focusing on an interface that challenges priormodels of understanding. This could yield increased novelty of interaction result-ing in self report more like a novice group member? To assess the effectivenessof such a change in design space, literature around aesthetic [11] and playful[3] interaction will be integrated; to actively challenge skeuomorphic models ofmusical interaction with the intention of fostering creativity in both novice andexperienced groups.
Given highly subjective descriptions in both groups it is important to relatethemes to look deeper at how we represent our understanding through whatwe talk about, rather than over generalising the importance of a single themeor component to describe the system. For instance, take the relationship of thenovice groups Engagement theme to Interface, Interaction, and Alteredstates of perception. Choice of words and description puts an emphasis on howthey felt in the environment, rather than function. Furthermore, the descriptionsof self in the environment, look towards mediation, control and interaction beingreported as internal worlds of feeling. Contrasting this emphasis on feeling, isthe experienced group’s relationship of experience to functional descriptions andunderstanding. Throughout the experienced groups interviews, questions andprobes about felt experience were often replied to with functional responses.Musicians, mixers and sound designers use tools for their craft, so it makessense to describe experience of music in functional ways. Expanding towardsmethodological issues of interviews, perhaps the perception of the interview wasdifferent in the experienced group? This reasoning would posit that they maynot have a fundamentally different experience, but rather, their perception ofthe interviews purpose is geared towards discussing functionality. It is therefore
Proc. of the 12th International Symposium on CMMR, Sao Paolo, Brazil, July 5-8, 2016
172
Objects, VR Music Interaction and Experience 15
important to develop interview technique to break down functionality basedassessment to probe deeper at experiential concerns.
Continuing with methodological concerns, the Engagement theme high-lights descriptions of enjoyment and engagement differ in subtle ways acrossgroups. This informs questionnaire and interview design for future evaluation,by understanding that in direct questioning around engagement it will be diffi-cult to separate variables and look for distinctions between groups. Furthermore,the disambiguation around sonic immersion component requires further devel-opment to look for differences between groups.
7 Conclusion
Designing user interfaces for novel creative applications provides significant chal-lenges for HCI, which can be compounded by immersive VEs technology. Aswithin a VE users are presented with complex new stimuli and must deciphermeaning for possible actions. Furthermore, the inherently abstracted nature ofmusical interaction poses many problems to direct manipulation in this context.Novel musical devices require a different approach to traditional task based de-sign of systems. By engaging the design and evaluation process from a subjectivepoint of view, it is hoped more intuitive and enjoyable experiences can be crafted.
From our early stage analysis of different groups, report around levels ofengagement were not significantly related to experience with music technologybut the reported understanding about the interface was qualitatively different.This highlights higher levels of appropriation of the interface into an experi-enced user’s conceptual framework allowing appraisal of the device as a musicaltool, whereas novice users tended to report the whole experience in emotivefelt terminology. The experienced groups understanding also related to their ex-tended frustration with interaction, as using the environment functionally waswhat inhibited their intentions and goals. This prompted reformulation of thedesign space for the experienced group, where new interfaces should focus oncreative ideation, and viewing a common process in new ways promoting re-interpretation.
While expressed in themes and component themes the differences betweengroups are not complete or orthogonal. They represent our decomposing of ex-perience into what is subjectively important. The extended critical faculty ofexperienced group is no better or worse, but allows a different form of engage-ment than that which was reported in the novice group. Reporting our experi-ences allow self relation to extended concepts that maybe override more visceralunderstanding. It is the goal of further study analysis to challenge and extendthe themes presented, and develop understanding around interaction with VEmusical interfaces.
Acknowledgements. We would like to thank the supervision and developmentteam at Inition for guiding the initial technical development of the interface.Project was conducted as part of Media and Arts Technology research internship,
Proc. of the 12th International Symposium on CMMR, Sao Paolo, Brazil, July 5-8, 2016
173

16 Deacon, Barthet, Stockman
made possible by doctoral training funding from the EPSRC and AHRC GrantEP/L01632X/1.
References
1. Berthaut, F. et al.: DRILE: an immersive environment for hierarchical live-looping.In: Proc. Int. Conf. NIME. pp. 192-197 (2010).
2. Braun, V., Clarke, V.: Using thematic analysis in psychology. Qual. Res. Psychol.3, 2, 77-101 (2006).
3. Costello, B., Edmonds, E.: A study in play, pleasure and interaction design. Proc.Conf. DPPI 07. August, 76 (2007).
4. Csikszentmihalyi, M.: Flow: the psychology of optimal experience. (1990).5. Deacon, T.E.: Virtual Objects and Music Mediation: Virtual Reality Music Inter-
action. Queen Mary, University of London (2015). Available from: http://goo.gl/d1V7zE.
6. Gelineck, S.: Virtual Reality Instruments capable of changing Dimensions in Real-time. Enactive 2005. (2005).
7. Gibson, J.J.: The Ecological Approach To Visual Perception. Psychology Press(1977).
8. Guest, G. et al.: Applied thematic analysis. Sage (2011).9. Hutchins, E. et al.: Direct Manipulation Interfaces. Human-Computer Interact. 1,
4, 311-338 (1985).10. Johnston, A.: Beyond Evaluation : Linking Practice and Theory in New Musical
Interface Design. In: Proc. Int. Conf. NIME. (2011).11. Lenz, E. et al.: Aesthetics of interaction A Literature Synthesis. In: Proc. NordiCHI
’14. pp. 628-637 (2014).12. Mulder, A. et al.: Design of Virtual 3D Instruments for Musical Interaction. Graph.
Interface. 76-83 (1999).13. Mulder, A.: Getting a Grip on Alternate Controllers: Addressing the Variability
of Gestural Expression in Musical Instrument Design. Leonardo Music J. 6, 1996,33-40 (1996).
14. Mulder, A. et al.: Mapping virtual object manipulation to sound variation. IPSJSig Notes. 97, 122, 63-68 (1997).
15. Rodet, X. et al.: Study of haptic and visual interaction for sound and music controlin the Phase project. In: Proc. Int. Conf. NIME. pp. 109-114 (2005).
16. Schubert, T.W.: A new conception of spatial presence: Once again, with feeling.Commun. Theory. 19, 161-187 (2009).
17. Sdes, A. et al.: The HOA library, review and prospects. ICMC Proc. 2014, Septem-ber, 855-860 (2014).
18. Seldess, Z.: MIAP: Manifold-Interface Amplitude Panning in Max/MSP and PureData. Proc. 136th AES Conv. 1-10 (2011).
19. Stowell, D. et al.: Discourse analysis evaluation method for expressive musicalinterfaces. In: Proc. Int. Conf. NIME. (2008).
20. Valbom, L., Marcos, A.: Wave: Sound and music in an immersive environment.Comput. Graph. 29, 6, 871-881 (2005).
21. Wirth, W. et al.: A Process Model of the Formation of Spatial Presence Experi-ences. Media Psychol. 9, 493-525 (2007).
22. Wozniewski, Mike et al.: A spatial interface for audio and music production. DAFX18-21 (2006).
Proc. of the 12th International Symposium on CMMR, Sao Paolo, Brazil, July 5-8, 2016
174

An Extensible and Flexible Middleware forReal-Time Soundtracks in Digital Games
Wilson Kazuo Mizutani and Fabio Kon
Department of Computer ScienceUniversity of São Paulo{kazuo,kon}@ime.usp.br
http://compmus.ime.usp.br/en/opendynamicaudio
Abstract. Real-time soundtracks in games have long since faced designrestrictions due to technological limitations. The predominant solutionsof hoarding prerecorded audio assets and then assigning a tweak or twoeach time their playback is triggered from the game’s code leaves awaythe potential of real-time symbolic representation manipulation and DSPaudio synthesis. In this paper, we take a first step towards a more robust,generic, and flexible approach to game audio and musical composition inthe form of a generic middleware based on the Pure Data programminglanguage. We describe here the middleware architecture and implemen-tation and its initial validation via two game experiments.
Keywords: game audio, game music, real-time soundtrack, computermusic, middleware
1 Introduction
Digital games, as a form of audiovisual entertainment, have specific challengesregarding soundtrack composition and design. Since the player’s experience is thegame designer’s main concern, as defended by Schell (2014), a game’s soundtrackmay compromise the final product’s quality as much as its graphical performance.In that regard, there is one game soundtrack aspect that is indeed commonlyneglected or oversimplified: its potential as a real-time, procedurally manipulatedmedia, as pointed out by Farnell (2007).
1.1 Motivation
Even though there is a lot in common between game soundtracks and othermore “traditional” audiovisual entertainment media soundtracks (such as The-ater and Cinema), Collins (2008) argues that there are also unquestionable dif-ferences among them, of either technological, historical, or cultural origins. Theone Collins points as the most important difference is the deeply nonlinear andinteractive structure of games, which make them “ largely unpredictable in termsof the directions the player may take, and the timings involved ”. Because of this,many game sounds and music tracks cannot be merely exposed through common
Proc. of the 12th International Symposium on CMMR, Sao Paolo, Brazil, July 5-8, 2016
175

playback (as happens with prerecorded media): they also need some form of pro-cedural control to be tightly knit together with the game’s ongoing narrative.However, this is seldom fully explored. Except in a few remarkable cases, mostgame musical soundtracks tend to have little real-time connections between whatis happening in the game and what is going on with the music, for instance.
The ways with which real-time soundtracks are typically dealt with are poorand do not scale well. Basically, the development team needs to find a commonground for musicians, sound designers, and programmers where they can reachan agreement on how to introduce real-time behaviour into the game source codemodules related to audio reproduction and sound assets management. Farnell(2007) explains that the common approach is to produce as many assets asneeded and then list all event hooks that must go into the game code to timelyplay the corresponding sounds and music (perhaps with one or two filters appliedto the output). This is not only a waste of memory and a disproportional amountof effort, but also a very limited way of designing a game soundtrack. Farnellgoes as far as to say that even advanced and automated proprietary middlewaresystems fail to provide a satisfactory solution, since they “are presently audiodelivery frameworks for prerecorded data rather than real ‘sound engines’ capableof computing sources from coherent models”.
1.2 Objective
In our research, we intend to provide an alternative to such excessively asset-driven solutions by empowering the musicians and sound designers with a tool toexpress procedurally how a game soundtrack is to be executed, and by embed-ding it into a cross-platform programming library that can be easily integratedinto the development workflow of digital games. As such, we present, in thispaper, Open Dynamic Audio (OpenDA), an open-source, extensible, and flexi-ble middleware system for the development of real-time soundtracks in digitalgames as a first result of our ongoing research. The middleware implementationis available at https://github.com/open-dynamic-audio/liboda under the MPL2.0 open source license.
2 Soundtrack Implementations in Digital Games
Matos (2014) states that soundtracks are essentially the union of all sound ef-fects, voices, and music that are played along with a visual presentation. Inthe traditional asset-driven approach, each audio element from these soundtrackparts is implemented in the game code by specifying a playback trigger consistingmainly of (Farnell, 2007):
1. Which sample assets are to be played.2. How they are to be played (that is, what filters should be applied).3. When they are to be played.
Proc. of the 12th International Symposium on CMMR, Sao Paolo, Brazil, July 5-8, 2016
176

As an example of this pattern, consider a gunshot sound effect. Using aprerecorded gunpowder explosion sound, one could produce different firearmssounds by applying multiple filters to it and then mapping the correspondingconfiguration whenever a weapon is shot. This way, when the player’s characterwields a specific type of pistol, its respective sound effect is triggered.
Being able to synchronize an audio element playback achieves an initial levelof real-time behaviour on its own. It is often further expanded by allowing theother two parameters (the which and the how) to change according to the gamestate. In the game Faster Than Light1, every musical piece in the soundtrack hastwo versions - one for exploration and one for combat - and they are cross-fadedbetween each other whenever the game situation changes from exploration tocombat and vice-versa. This consists of both a modification in the sample used(the which) and a real-time control over the filters, responsible for fading outthe previous version of the music while fading in the next one (the how).
However, since this method specifies only whole samples to be played, it ex-cludes from the sound design space other forms of audio construction, notablysymbolic representation (e.g., MIDI) and Digital Signal Processing (DSP) au-dio synthesis. The IMuse system (LucasArts 1994) was an example of how touse symbolic representation to allow music changes in real-time. Essentially, itprovided if-then-jump commands among the other typical music score basedmessages, bringing symbolic representation closer to a programming language ofits own. Regarding DSP audio synthesis, there are quite a few works on phys-ically based real-time audio synthesis (James et al. 2006, Bonneel et al. 2008,Farnell 2010), which could contribute to many unexplored ways of dealing withsound effects in games using no sample files, but at a greater computational cost.
3 Real-Time Restrictions in Game Implementation
To be considered a real-time application, digital games rely on the Game Looparchitectural pattern (Nystrom 2014). It guarantees that the time differencebetween the continuous input processing and output generation is so short thatthe user experiences it as being instantaneous. This is accomplished by dividingthe program execution into very short steps between each input handling andoutput rendering and then finely controlling the process rate of these cyclesinside an endless loop.
Nystrom (2014) shows how the Game Loop frequency is related to the gameFrames Per Second ratio (FPS), i.e., the ratio of how many graphical framebuffers are fully rendered per second. Ideally a game’s FPS is greater than orequal to the Game Loop frequency, which means that its visual output maychange and adapt at least as often as changes are made to the game state.On the other hand, conventional asset-driven audio implementations in gamesprovide a slower feedback mechanism, since they load as many audio samples aspossible from the assets to the computer sound card (where they can no longer
1 Subset Games, 2012
Proc. of the 12th International Symposium on CMMR, Sao Paolo, Brazil, July 5-8, 2016
177

be promptly accessed) in each game cycle. The samples are transferred in chunksthat are typically too big, causing effects applied to the game soundtrack to comewith a perceptible delay, thus not satisfying the desirable real-time requirements.Essentially, it incurs in too much latency.
For instance, in the LÖVE game framework2, the default audio stream buffersize contains 4096 samples, which, with an audio sample rate of 44100 Hz, leadsto soundtrack changes being able to occur only every 93 milliseconds, approx-imately. The simple solution to this is to reduce the size of the audio bufferssent to the sound card, which actually means processing less audio in each gamecycle. If a game is to be executed at 60 FPS and its audio is sampled at 44100Hz, then each game cycle must provide only 44100/60 = 735 audio samples. Inthe more general case, one cycle may actually have a variable time length. If welet faudio be the audio sample rate (in Hertz) and ∆t be the time difference (inseconds) between the current game cycle and the last, then the number N ofmaximum audio samples allowed for the current cycle would be:
N = faudio ·∆t (1)
As a matter of fact, the DSP graphical programming language Pure Data3 hasa standard cycle buffer size of merely 64 samples. That would be precise enoughfor a game running at approximately 689 FPS. The drawback of reducing theaudio buffer size is that if the computations needed to fill it actually last longenough to make a perceptible time gap between each buffer update, then thesound might come out chopped by the sudden lack of samples to play. There isalso an increased overhead in having a larger number of smaller data copies sentto the sound card. Thus, even though reducing the buffer size is important todecrease latency, a point of equilibrium must be found or the audio quality maybe compromised. This depends on how much computation time the Game Loophas available for handling audio processing and on the technical capabilities ofthe sound hardware at our disposal.
4 Proposed Architecture
The main purpose of the OpenDA middleware is to bridge soundtracks andgame engines. As such, we understand that its main user is the sound designer,although the programmers that bind the game code to the middleware must alsobe taken into consideration. This is commonplace for game audio middleware,requiring the division of the tool into two separate but complementary inter-faces4. The first is a “soundtrack editor” - a visual application through whichsound designers author audio content that can be later exported to the game.
2 See http://love2d.org3 See https://puredata.info4 See Firelight’s FMOD Studio (http://www.fmod.org) and Audiokinetic’s Wwise(https://www.audiokinetic.com/products/wwise)
Proc. of the 12th International Symposium on CMMR, Sao Paolo, Brazil, July 5-8, 2016
178

The second is a programming library exposed through an Application Program-ming Interface (API) that is capable of loading the media exported by the editorand playing it during the game execution (see Figure 1).
GameApplication
Sound Designer
SoundtrackEditor
Player
Programmer
AudioEngine
AudioData & Metadata
Game Audio Middleware
Fig. 1. Standard overview architecture for game audio middleware.
OpenDA follows this general architecture. However, instead of focusing thesoundtrack editor in audio assets management, we chose to develop a procedure-oriented tool. We designed a collection of high-level abstractions in the PureData programming language that sound designers can use to produce Pure Datapatches as part of a game soundtrack specification. The game engine can thenlink to OpenDA’s audio engine (a programming library) to load and executethe soundtrack patches authored this way. Our intention is to focus on givingsound designers full control over the sonic behaviour instead of just rigid sonicscheduling, since they can program the soundtrack themselves with an accessible,community-approved language such as Pure Data.
4.1 Pure Data Integration
Pure Data originally comes as a stand-alone application capable of creating, edit-ing, and executing patches by itself, promptly serving as our soundtrack editor.However, even though it is capable of communicating with other applicationsthrough sockets or MIDI channels, ideally one would not want to have multipleapplications launched when playing a digital game. The solution would be torun Pure Data’s DSP from inside the game. There is a community developedprogramming library called libpd5 that provides access to Pure Data’s core im-plementation, allowing its host program to load and execute Pure Data patcheswithout the Pure Data application.
However, when using libpd, there is no audio output handling. The hostapplication is only given the processed signal and is responsible for sending it tothe sound card or doing whatever it wants with it. Additionally, the processed5 See http://libpd.cc
Proc. of the 12th International Symposium on CMMR, Sao Paolo, Brazil, July 5-8, 2016
179

signal is provided in blocks of 64 stereo samples, as mentioned before. Our audioengine must synchronize the retrieval of these blocks with the game run timeflow as in Equation (1). For that, the engine API routines demand precise timinginformation from the game execution and properly timed evocation, since timemanagement is controlled by the game code.
The communication between the sound designer patches and our audio engineconsists of two main types of data transfer. The first, which we just described,results from libpd’s audio signal computation happening every frame. The othertransfer occurs when our middleware must inform the designer’s patch of a rel-evant change within the game state. Based on this communication, the patchmay do whatever it deems necessary for the soundtrack to follow up the gamenarrative. The overall architecture of our engine can be seen in Figure 2.
GameApplication
Sound Card
API
SynchronizationMechanism
OpenDA Engine
Invokes
Transfers Audio
Provides Game Time
Data
libpdSends Pd Messages
Transfers Audio
Executes
Pure DataPatches
Fig. 2. OpenDA Engine’s architecture.
5 Implementation
For the sake of game engine compatibility and performance (Nystrom 2014), wechose to develop our middleware in C++, except for the parts that must be madein Pure Data. The audio engine uses OpenAL6 for cross-platform open-source-friendly access to the sound card, enabling us to produce proper playback of thedesired audio.
5.1 Audio Engine
To satisfy the real-time restrictions described in Section 3, our middleware audioengine strongly relies on OpenAL’s buffer queueing mechanism. It enables the6 See https://www.openal.org and http://kcat.strangesoft.net/openal.html
Proc. of the 12th International Symposium on CMMR, Sao Paolo, Brazil, July 5-8, 2016
180

allocation of multiple buffers whose purpose is to send audio data to the soundcard in FIFO order. Each buffer can have arbitrary sizes, but we fit them to PureData’s cycle block size (64 samples). Then, OpenAL automatically switches thecurrent buffer to the next one when it has finished playing. That way, even whenthe game cycles do not match Pure Data’s cycles, we can schedule the nextblock. Doing so increases latency, but since the block is very small the differenceis minimal and allows us to reduce the previously discussed overhead.
5.2 Low-Level Messages
Having completed a minimal framework that can integrate libpd with the GameLoop pattern, the current stage of the project also supports low level patch-engine communication. The audio transfer from the patch to the engine usesthe Pure Data array API instead of its standard output since this simplifiesthe use of multiple simultaneous audio buses. The engine recognizes the audiobuses thanks to a naming convention, but a convenient Pure Data abstractionis provided to wrap and hide this and other implementation details needed toproperly synchronize the filling of the arrays with the engine cycles.
On the engine side, we implemented a very simple API for the game code tonotify its state changes. It relies on Pure Data’s messaging mechanism, accessedvia libpd. With a single routine call, a message is sent to the sound designer’ssoundtrack patch containing as much information as desired, so long as it canbe represented by a list of numbers and character strings (Pure Data symbols).
5.3 Game Audio Experiments and Prototypes
To validate our proposal, we are using our middleware to create soundtracksfor two very different games. First, we forked the open-source game Mari07 andreplaced its default soundtrack for one entirely produced by our middleware. Thegame is a parody of two other famous games: Super Mario Bros. (Nintendo 1985)and Portal (Valve 2007). The focus was the music track, and we experimentedonly with Koji Kondo’s “Overworld Main Theme”, the music track for the firststage of the game. By dividing the music in its three voices – melody, bass andpercussion – and the score bars into a few sections, we were able to add thefollowing real-time behaviours to the game soundtrack:
1. The music advances through the bars as the player progresses through thestage, so that each of its parts has a particular music segment associated.
2. Mario’s size directly influences the bass voice. The stronger he gets, thelouder the bass line becomes.
3. The quantity of enemies nearby also increases the percussion intensity, in anattempt to suggest that the situation became more action-intensive.
The second validation is a completely new soundtrack being composed inpartnership with a professional sound designer. It follows the bullet hell genre,7 See http://stabyourself.net/mari0
Proc. of the 12th International Symposium on CMMR, Sao Paolo, Brazil, July 5-8, 2016
181

where the player moves an avatar that must dodge dozens of falling bullets ina vertical shooter format. The idea is to find a way to synchronize the bul-lets’ choreography to the soundtrack music, making the gameplay itself a formof composition. To achieve that, we are working in partnership with volun-teer sound designers, while also evaluating the tool’s usage by potential users.The source code of both games is available under an open source license athttp://compmus.ime.usp.br/en/opendynamicaudio/games.
6 Conclusion and Ongoing Work
The current priority of our ongoing research is to shape a higher level abstractionmodel for how a game real-time soundtrack should be authored. Finishing thebullet hell prototype will help validate this model. There are interesting chal-lenges waiting ahead in the project roadmap. First, as widespread as Pure Datais, it lacks a simple user interface that would be appealing to sound designersand composers with no programming experience. Second, with a new sound-track composition workflow comes a whole new skill set for sound designers andcomposers to reach out to – an unavoidable cost of breaking well establishedparadigms (Scott 2014). Our expectations are that, with this work, we will atleast open the way for new methods of producing soundtracks for digital gamesthat actually try to exploit the medium dynamic and interactive nature, avoidingfurther waste of this game design space.
References
Bonneel, N., Drettakis, G., Tsingos, N., Viaud-Delmon, I., James, D.: Fast ModalSounds with Scalable Frequency-Domain Synthesis. ACM Trans. Graph. volume27, number 3 (2008)
Collins, K.: Game Sound: An Introduction to the History, Theory, and Practice ofVideo Game Music and Sound Design. The MIT Press (2008)
Farnell, A.: An introduction to procedural audio and its application in computer games.http://cs.au.dk/ dsound/DigitalAudio.dir/Papers/proceduralAudio.pdf (2007)
Farnell, A.: Designing Sound. The MIT Press (2010)James, D. L., Barbic J., Pai, D. K.: Precomputed Acoustic Transfer: Output-Sensitive,
Accurate Sound Generation for Geometrically Complex Vibration Sources. Pro-ceedings of ACM Special Interest Group on Graphics and Interactive Techniques,Volume 25 Issue 3, Pages 987-995 (2006)
LucasArts: Method and Apparatus for Dynamically Composing Music and SoundEffects Using a Computer Entertainment System. United States Patent 5315057(1994)
Matos, E.: A Arte de Compor Música para o Cinema. Senac (2014)Nystrom, R.: Game Programming Patterns. Genever Benning (2014)Schell, J.: The Art of Game Design: a Book of Lenses, Second Edition. A. K. Peters,
CRC Press (2014)Scott, N.: Music to Middleware: The Growing Challenges of the Game Music Composer
Proceedings of the Conference on Interactive Entertainment, Pages 1-3 (2014)
Proc. of the 12th International Symposium on CMMR, Sao Paolo, Brazil, July 5-8, 2016
182

New Atlantis: A Shared Online World Dedicated to Audio Experimentation.
Pete Sinclair 1, Roland Cahen2, Jonathan Tanant3 and Peter Gena4
1 Ecole Superieur d’Art d’Aix. Locus Sonus Research Unity. Aix-En-Provence, France 2 Ecole Nationale Superiere de Creation Industrielle. (ENSCI les ateliers), Paris France.
3 Independant Software Engineer, Jon Lab. Tilly, France. 4 School of the Arts Institute Chicago. (SAIC) Chicago, USA.
[email protected] [email protected]
[email protected] [email protected]
Abstract. Computer games and virtual worlds are "traditionally" visually orientated, and their audio dimension often secondary. In this paper we will describe New Atlantis a virtual world that aims to put sound first. We will describe the motivation, the history and the development of this Franco-American project and the serendipitous use made of the distance between partner structures. We explain the overall architecture of the world and discuss the reasons for certain key structural choices. New Atlantis' first aim is to provide a platform for audio-graphic design and practice, for students as well as artists and researchers, engaged in higher education art or media curricula. We describe the integration of student’s productions through workshops and exchanges and discuss and the first public presentations of NA that took place from January 2016. Finally we will unfold perspectives for future research and the further uses of New Atlantis.
Keywords: audiographic creation, audio for virtual environments, sound spatialisation, networked music.
1 Introduction
New Atlantis is a shared (multi-user) online virtual world dedicated to audio experimentation and practice. Unlike most online worlds where image is the primary concern, in NA sound comes first. NA provides a context for new-media students to showcase research projects that explore the relationship between sound, virtual 3D image and interactivity. It offers a pedagogical platform for audiographic animation, real-time sound synthesis, object sonification and acoustic simulation. It is a place to organize virtual sound installations, online concerts, Soundwalks and other audiovisual art experiences.
Proc. of the 12th International Symposium on CMMR, Sao Paolo, Brazil, July 5-8, 2016
183

2 Pete Sinclair, Roland Cahen, Jonathan Tanant and Peter Gena The name New Atlantis comes from the title of an unfinished 1628 utopian novel by philosopher Francis Bacon [1], which describes a legendary island somewhere in the ocean, doted with extraordinary audio phenomena that might be considered as premonitory of today’s electronic and digital audio techniques. We have adopted some of Bacon’s ideas and nomenclature to create classes for the virtual world such as “Sound Houses”, “Sound Pipes”, “Trunks” and “Helps”. In NA all elements are intended to have audio qualities: spaces resonate, surfaces reflect and collisions activate the multiple sounds of the objects involved. A collection of purpose built scripts implement low level sound synthesis and multiple parameter interactivity, enabling the creation of complex sound sources and environments linked to animation or navigation in the visual scene. NA can be accessed via a web viewer or as a standalone application. It is organized as “spaces” that can be accessed independently but that share the same basic principles of navigation and specific scripts. Multi-user, it can be shared by several players at the same time making it suitable for group playing in both the gaming and the musical sense of the word. Every registered user can create and host individual or shared spaces which he or she can decide to make persistent or not. At the time of writing, we are working on a limited number of public “spaces” that contain multiple “Sound Houses” (architectural elements with specific acoustics) and other sound objects. These can be visited by navigating through the scene or created within the scene. The audio “mix” of these different sources varies with distance, so placing and navigating between sound objects can become a musical experience. In public spaces, players can interact with one another and with shared objects potentially playing together. New Atlantis project is not only about creating a multi user virtual universe, but also about making it together while learning. It is experimental, creative and educational. New opportunities to further development in NA occur through the organization of workshops, courses or events that group art students in different locations, working together at a distance. It is a way to encourage ubiquitous working groups of students to share immaterial and non-local (international) art projects. Most sound and music education schemes tend to be oriented towards established disciplines. NA on the other hand encourages experimental design projects and the exploration of new or emerging creative fields. Francis Bacon’s New Atlantis proposed a model for the role of science and art in society that placed education at the heart of culture. Our project emphasizes discovery, cultural exchange, experimentation, learning and furthering of knowledge in an educational and creative environment.
Proc. of the 12th International Symposium on CMMR, Sao Paolo, Brazil, July 5-8, 2016
184

New Atlantis 3
Fig 1. Students showcasing their projects in New Atlantis. ENSCI les ateliers, September 2015.
2 Context and History
“We have also sound-houses, where we practise and demonstrate all sounds and their generation. We have harmony which you have not, of quarter-sounds and lesser slides of sounds. Divers instruments of music likewise to you unknown, some sweeter than any you have; with bells and rings that are dainty and sweet. We represent small sounds as great and deep, likewise great sounds extenuate and sharp; we make divers tremblings and warblings of sounds, which in their original are entire. We represent and imitate all articulate sounds and letters, and the voices and notes of beasts and birds. We have certain helps which, set to the ear, do further the hearing greatly; we have also divers strange and artificial echoes, reflecting the voice many times, and, as it were, tossing it; and some that give back the voice louder than it came, some shriller and some deeper; yea, some rendering the voice, differing in the letters or articulate sound from that they receive. We have all means to convey sounds in trunks and pipes, in strange lines and distances.” [1]
The origins of the NA project go back to 2005 when the Locus Sonus, ESA-Aix (Ecole Superieur d’Art d’Aix-En-Provence) and SAIC (School of the Art Institute of Chicago) were awarded FACE[2] funding for an academic and research exchange program. The original impulse occurred through collaboration between the of the 3d and sound departments of the partner establishments which led to the observation that there was scope for research into the area of audio in games and other virtual environments. That NA refers to a Utopian model can be interpreted in several different ways. Firstly as the above citation demonstrates, the original text by Francis Bacon describes an island territory that was home to numerous extraordinary audio
Proc. of the 12th International Symposium on CMMR, Sao Paolo, Brazil, July 5-8, 2016
185

4 Pete Sinclair, Roland Cahen, Jonathan Tanant and Peter Gena phenomena. Beyond this the novel predicts the principles of the contemporary research university “Salomon's House” which was both focused on international exchange: “For the several employments and offices of our fellows, we have twelve that sail into foreign countries ... who bring us the books and abstracts, and patterns of experiments of all other parts” [1]. And trans-disciplinary research: “We have three that collect the experiments of all mechanical arts, and also of liberal sciences, and also of practices which are not brought into arts”[1]. These ideas, combined with the fact that we are indeed engaged in creating a utopian world that might be considered as situated (albeit in our imagination) somewhere in the ocean – between Europe and America – combine to make NA a suitable reference.
Since the ESA-Aix/SAIC partnership was separated by the Atlantic Ocean, we rapidly adopted networked solutions for our collaborations: video conferencing and remote desktop were used for exchange conferences and an interconnected 3d cave was set up with an interface in both Aix and Chicago. The first experiments in 3d audio-graphy took place in Second Life[3], using Pure Data[4] as an audio engine. The process involved sending html commands from second life to an external server that did the audio synthesis and streamed the result back to second life, the project was presented in 2009 at the “Second Nature” festival in Aix-En-Provence[5]. This system worked well enough to convince us that it was worthwhile pursuing the development of sophisticated audio features for virtual environments, however, it was difficult to implement and the delay due to streaming was problematic.
The decision was made to build our own multi user world using Panda 3d[6] with Pure Data[4] bundled as an audio engine. Ecole Nationale Superieure de Creation Industrielle (ENSCI, les ateliers) became associated with the project at this point. This first version of NA was developed during multiple workshops that took place in Chicago and Aix en Provence between 2007 and 2011. The project involved a relatively complex path finding system used to calculate acoustics and custom-built client server software [7]. A working version was tested successfully during a workshop at ENSAB in 2011[8] but it was decided to abandon the system in favor of Unity3d[9], a more recent and efficient platform offering greater scope for audio programming and possessing built in networking capabilities.
3 New Atlantis Project Aims
There are multiple aims associated with the NA project: as mentioned above the project issues from an international exchange program and one of the first ambitions is to provide a platform for international academic, artistic, cultural and scientific exchange. The more specific aim is to further research into audio for virtual environments with the precise goals of providing an educational tool for students and a synchronized platform for remote music and sound art practices.
Proc. of the 12th International Symposium on CMMR, Sao Paolo, Brazil, July 5-8, 2016
186

New Atlantis 5
3.1 Research Into Audio for Virtual and networked Environments, background.
The history of audio development in game environments is relatively short and, at least when this project was initiated, somewhat lacking in substance. Arguably, this might be put down to competition between audio and visual requirements in terms of processing power on personal computers or game boxes. If in recent years companies such as AudioGaming[10] that are specialized in audio for game environments have started to appear, for the essential they provide sound design services for the commercial game market, rather than considering the virtual world as a possible audio interface. Therefore the historical origins of this project might be considered from several other angles. One approach is that of visual interfaces for musical compositions such as UPIC[11] originally developed by Iannis Xenakis or navigable scores such as Fontana Mix 1958 by John Cage[12]. Distant listening, remote performance and other streamed and networked art forms are another thread that has been largely investigated by Locus Sonus[13]. Experiments with remote musical presence started as early as 1992 when during an event organized by Michel Redolfi; Jean Claude Risset and Terry Riley in Nice played with David Rosenboom and Morton Subotnick in Los Angeles using Disklaviers and a satellite connection[14]. In 1967, the late Maryanne Amacher conceived of and produced “City Links,” in Buffalo, NY. The 28-hour performance took live microphone feeds from five different locations in the city. Victor Grauer and Max Neuhaus were involved in the Buffalo production and Neuhaus subsequently did similar work that came to be known as “telematic performance”. The rapidly developing discipline of sonification[15] is equally useful when reflecting on the sound of virtual objects. In effect the different members of the research team have pursued these different lines of investigation over the past decades.
We should not however ignore early forays into audio-graphic creation an example being Ivan Chabanaud1 and co-author Roland Cahen’s Icarus [16]. When this virtual reality project was started in 1995, sound synchronization techniques where cumbersome: a Silicon graphics machine rendering visual objects was connected to Opcode Max 3 (MIDI only) using an external MIDI expander and the IRCAM’s spatialisation system. More recent audio-graphic projects that R. Cahen has been involved in include BANDONEON[17], PHASE[18], ENIGMES[19], and TOPOPHONIE[20]. Other recent research initiatives focusing on shared virtual environments such as UDKOSC[21] use the OSC protocol to associate external audio engines such as Pd or Supercollider with a virtual environment. Although the original version of NA followed this line of investigation we have switched to the using the audio engine incorporated in Unity for the sake of simplicity and versatility on the user side (see section 6.). The Avatar Orchestra Metaverse, formed in 2007, is another Interesting experimental project led by American Sound Artist, Pauline Oliveros: “The Avatar
1 Ivan Chabanaud, was a fascinating french digital artist who gave wings to his
Proc. of the 12th International Symposium on CMMR, Sao Paolo, Brazil, July 5-8, 2016
187

6 Pete Sinclair, Roland Cahen, Jonathan Tanant and Peter Gena Orchestra Metaverse is a global collaboration of composers, artists and musicians that approaches the virtual reality platform Second Life as an instrument itself”[22]. However this approach is very different to that adopted for New Atlantis in the sense that it is dependent on the resources of the existing virtual world Second Life.
3.2 Fields of Investigation
Interactive sound and music with virtual objects Audiographic design is a multimodal approach that consists of coordinating graphical form and behavior with auditory events in the design of virtual objects. These objects, although they are visual images, can incorporate physical simulation so they can interact with us and between themselves. Artists and designers often have a limited culture of multimodality, creating audiographic objects or compositions requires interconnections between various domains of expertise such as sound design, graphic design, 3D animation, real time interaction and coding. Designing multimodal interactions and implementing them in a virtual world is more complex than creating simple visual representations or video. It obliges the author to resolve more design issues and to give objects deeper consistency, bringing them close to a physical reality, even if they remain immaterial. At a certain point, the simulated object becomes the object in its own right and the notion of “virtual” is modified. Arguably, virtual objects are somehow non-material objects that incarnate their own reality. This has long been the case in music as well as with other abstract artistic activities, when an initial manipulation of representation ceases to be the finality. Since the audiographic relationship is constructed, it can also be fictitious. An object’s sound can be modified to become quite different from the “real life” original, while paradoxically appearing very real or possibly more than real (hyperreal). An early example of this phenomenon can be found in Jacques Tati’s film “Mon Oncle” where “retouched” audio recordings focus attention unnaturally on specific banal visual objects [23]. We consider that this bending, schematizing or detournement of the relation between the visual object and its associated sound is a fruitful terrain for investigation. Virtual composition also allows us to interact with sound objects using a variety of expressive devices such as physical modeling, avatar form and behavior, fictional scenarios and gameplay, opening a multitude of new forms of narration.
Spatialization, Sound Navigation and Virtual Acoustics Sound navigation consists of browsing through different sound sources placed in a spatialized sound scene, thereby composing a musical form from the mix produced by movements relative to these sources. It is an artistic transposition of our sound experience in the physical world [24]. In virtual worlds, sounds are mainly spatialized through orientation and distance. The simple act of navigation allows us to create spatial mixes or canons as well as subject and object motion sequences. Spatial acoustics are another important part of our audio perception and indeed they participate in our natural audio interactions as we activate reverberant spaces through our own actions such as footsteps or vocalizations [25]. This praxeology[26] of sound
Proc. of the 12th International Symposium on CMMR, Sao Paolo, Brazil, July 5-8, 2016
188

New Atlantis 7
space can also be developed in virtual environments and the juxtaposition of different acoustic responses as we navigate while generating sounds or listening to sounds generated by other players, provides an original approach real-time audio signal processing. Short simple sound sources such as clicks or collision sounds can be used to activate and compare virtual acoustics and continuous sound sources can be multiplied to create complex harmonics. Such indeterminate forms of navigation, inspired by SoundWalking or other Soundscape related activities (see The Tuning of the World by R.Murray Schafer [27]), are alternatives to more permanently authored audiographic forms.
3.3 A Synchronized Platform for Remote Music and Sound Art Practices
Networked Playing and Performance. In the case of NA “playing” may mean “gameplay” in the sense that it is used in video games in general, or it can equally be used to designate musical playing. In the preceding section, we approached NA as a compositional tool but it can also be considered as an audio “sandpit”, as a shared instrument, or as a stage for public performances. The fact that these activities are synchronized online means that NA also opens a line of investigation into remotely shared musical and sound art practices. This in turn invites speculation as to the possibility of a creating a new paradigm in musical practice and distribution. Network music performances have existed since the beginning of the Internet. Until now however, such activities have, for the most part, focused on mixing networked (streamed or midi controlled sounds) with locally sounding instruments one such example is French musician Eric M’s use of Locus Sonus’ “open microphone” live audio streams [28] to introduce indeterminate sounds into his DJ sets. With NA however, the virtual sound world is non-localized, and co-users share events, functions, triggers, controllers and audio recordings (made on the fly) through a dedicated server. The fact that all connected users share the “current state” of a space (see technical explications in section 3) means that as long as an instance of a space is active, they experience the same evolving situation (within the limits of the network’s capabilities). This allows for inventive approaches to shared performance (for example, if one player introduces a sound source object or makes a recording, other players can hear it, move it or modify its parameters). New Atlantis looks to promote group activity, during the processes of design, production and playing. Playing can be individual or collective, it can be a public performance or it can be an online guided tour. In a demo situation, instead of taking a visiting group into the exhibition, performers bring the exhibition to the visitors and play their best to enhance the artistic experience. Doing guided tours of New Atlantis spaces, in itself, implies practicing an art of interpretation. The guide controls the camera, the microphone movements and the interactions. He or she is both the cameraman and the instrumentalist creating a rich performance situation.
Proc. of the 12th International Symposium on CMMR, Sao Paolo, Brazil, July 5-8, 2016
189
8 Pete Sinclair, Roland Cahen, Jonathan Tanant and Peter Gena 3.4 An Educational Tool
Locus Sonus[29] is a research unit based at ESA - Aix and funded by the French ministry for culture. Its main concern is practice-based research into sound art. Locus Sonus’ research investigates virtual and acoustic sound space in a permanent exploration of “new auditoriums”[13]. ENSCI les Ateliers, have worked on numerous sound design projects including sounding objects, industrial sound design, audiography, sound spatialization, auditory interfaces but also sound art, electronic music, radio broadcasts, soundtracks for films, and various research projects [30]. The School of the Art Institute of Chicago’s Art and Technology department teach virtual and augmented reality, gaming, 3d modeling, computer imaging, live performance audio and immersive audio[31]. Between them, these three structures provide the multidisciplinary expertise, creative and educational context that the NA project is founded on.
Teaching Sound in Art and Design Schools Over the last 20 years sound education in France has progressively shifted from the conservatoires (music academies) to schools of art and design. The main reason for this is that, apart some rare exceptions, conservatoires were designed to teach solely classical music theory and instrumental practice and have therefore experienced difficulty in adapting to the challenges of XXth and XXIst century music and sound art production. As a consequence sound arts, sound design, some performing arts and sound for multimedia are now taught in many art and design schools including ENSCI and ESA-Aix. Most of the students concerned are consequently visual artists and rarely trained musicians. On the one hand this is a drawback, because they have a limited sonic culture, and on the other it is an advantage because they don’t have preconceived models or cultural bias. Similarly, artists tend to use sound as material, unlike traditional composers who view music as a result of relationships between pitch, rhythm, etc. Since their culture is primarily visual, these students have a tendency to create sounds in relation to images and to be concerned with multimedia and interaction.
Working and Creating Online in Virtual Workshops, Complementary Skills & Delocalized Working Groups Creating and playing music together and by extension audiographic composition and performance are a great way to link people; this holds for artists, designers and students as well as the game audience. In effect NA “bridges people with and through sound”. NA is a group project within which participants with different expertise and different degrees of expertise can cooperate. Thus although the permanent team of NA is constituted of experienced developers, researchers, artists and teachers, this team has been completed from the outset of the project by successive generations of post graduate students. Different skills and knowledge sets are required in this development process and furthermore different centers of artistic interest and methodology combine or occasionally confront, gradually enlarging and enriching the scope of the world through a process of experimentation and feedback. On another level, as described above, creating content for the world is also be a challenging
Proc. of the 12th International Symposium on CMMR, Sao Paolo, Brazil, July 5-8, 2016
190
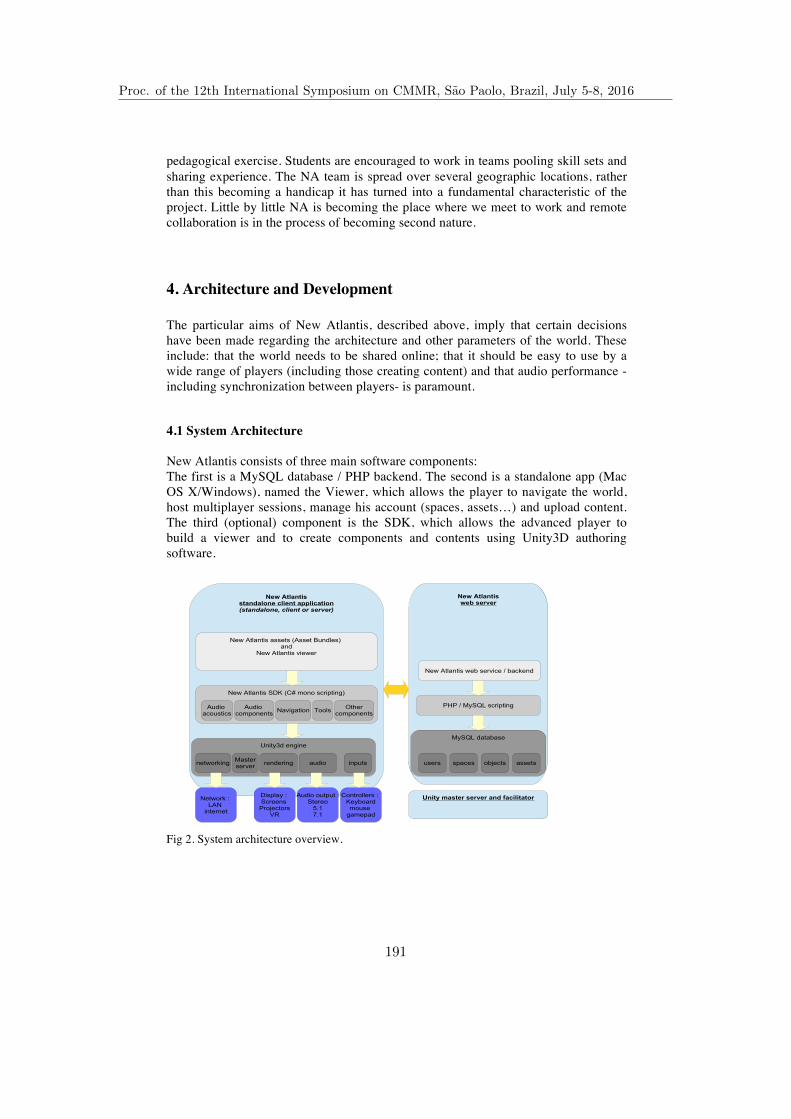
New Atlantis 9
pedagogical exercise. Students are encouraged to work in teams pooling skill sets and sharing experience. The NA team is spread over several geographic locations, rather than this becoming a handicap it has turned into a fundamental characteristic of the project. Little by little NA is becoming the place where we meet to work and remote collaboration is in the process of becoming second nature.
4. Architecture and Development
The particular aims of New Atlantis, described above, imply that certain decisions have been made regarding the architecture and other parameters of the world. These include: that the world needs to be shared online; that it should be easy to use by a wide range of players (including those creating content) and that audio performance -including synchronization between players- is paramount.
4.1 System Architecture
New Atlantis consists of three main software components: The first is a MySQL database / PHP backend. The second is a standalone app (Mac OS X/Windows), named the Viewer, which allows the player to navigate the world, host multiplayer sessions, manage his account (spaces, assets…) and upload content. The third (optional) component is the SDK, which allows the advanced player to build a viewer and to create components and contents using Unity3D authoring software.
Fig 2. System architecture overview.
New Atlantisstandalone client application(standalone, client or server)
New Atlantisweb server
Unity3d engine
New Atlantis SDK (C# mono scripting)
PHP / MySQL scripting
MySQL database
New Atlantis web service / backend
networking rendering audio inputs
Unity master server and facilitator
objectsusers spaces assets
Network : LAN
internet
Display : Screens
ProjectorsVR
Audio output :Stereo
5.17.1
Controllers : Keyboardmouse
gamepad
Audio acoustics
Audio components
New Atlantis assets (Asset Bundles) and
New Atlantis viewer
Masterserver
NavigationOther
componentsTools
Proc. of the 12th International Symposium on CMMR, Sao Paolo, Brazil, July 5-8, 2016
191
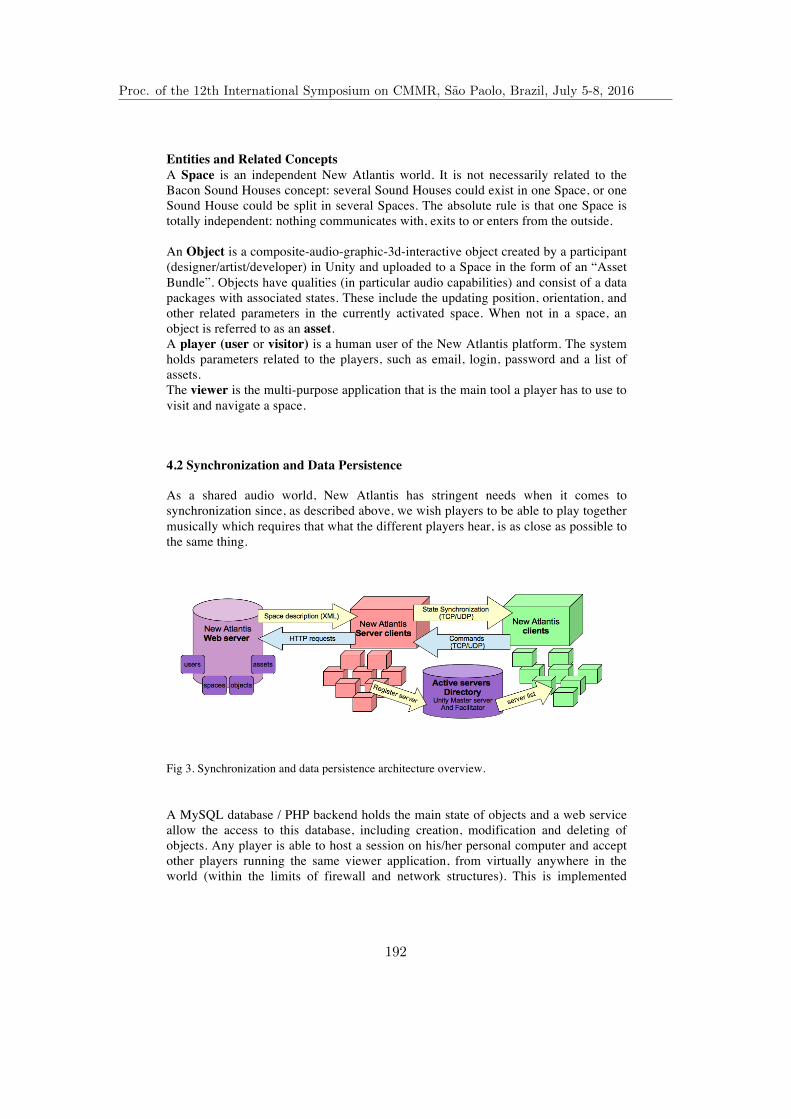
10 Pete Sinclair, Roland Cahen, Jonathan Tanant and Peter Gena Entities and Related Concepts A Space is an independent New Atlantis world. It is not necessarily related to the Bacon Sound Houses concept: several Sound Houses could exist in one Space, or one Sound House could be split in several Spaces. The absolute rule is that one Space is totally independent: nothing communicates with, exits to or enters from the outside. An Object is a composite-audio-graphic-3d-interactive object created by a participant (designer/artist/developer) in Unity and uploaded to a Space in the form of an “Asset Bundle”. Objects have qualities (in particular audio capabilities) and consist of a data packages with associated states. These include the updating position, orientation, and other related parameters in the currently activated space. When not in a space, an object is referred to as an asset. A player (user or visitor) is a human user of the New Atlantis platform. The system holds parameters related to the players, such as email, login, password and a list of assets. The viewer is the multi-purpose application that is the main tool a player has to use to visit and navigate a space.
4.2 Synchronization and Data Persistence
As a shared audio world, New Atlantis has stringent needs when it comes to synchronization since, as described above, we wish players to be able to play together musically which requires that what the different players hear, is as close as possible to the same thing.
Fig 3. Synchronization and data persistence architecture overview.
A MySQL database / PHP backend holds the main state of objects and a web service allow the access to this database, including creation, modification and deleting of objects. Any player is able to host a session on his/her personal computer and accept other players running the same viewer application, from virtually anywhere in the world (within the limits of firewall and network structures). This is implemented
Proc. of the 12th International Symposium on CMMR, Sao Paolo, Brazil, July 5-8, 2016
192

New Atlantis 11
using Unity’s built-in advanced network features (NAT punchthrough, Master server, Facilitator server) – so instead of running a dedicated server, we decided to take this simpler and more flexible approach where any user is able to host a New Atlantis session with a chosen Space (this method is used by most multiplayer video games). We have had to define and implement the way Unity’s network system manages synchronization, once several players are connected together in a session. We decided to use an authoritative server scheme, meaning that the server runs the entire simulation and sends objects states to the clients that are running the scene without the logic (solely the rendering). The only exception to this is the avatar position, which is not sent by the server but generated by each client to guarantee good local fluidity (to avoid lag in the avatar’s own position). The number of objects that need to be synchronized has a direct effect on performance and we tried several variations on “depths” of synchronization, from every single object to only a few main ones. There is a tradeoff to be found between performance and accuracy between clients (largely dependent on bandwidth). We should insist here on the special needs of working with sound: principally good temporal synchronization. To sum up, in the viewer application, two types of synchronization occur:
1. A synchronization of the objects contained in a given space: the viewer app connects to the web service and downloads an XML manifest (list) of all objects in the space with their initial state (position, orientation, name). Each object is an Asset Bundle that is then downloaded by the viewer and held in cache for future retrieval.
2. A client/server synchronization with Unity Network engine: synchronization of avatars positions, created objects, audio recorded during playing... The Unity Network engine implementation works with TCP/IP and UDP/IP messages sending with a proprietary format including synchronized parameters serialization. We have had to implement RPCs (Remote Procedure Calls) functions to handle special cases and audio-graphic synchronization.
4.3 Content Creation: Tradeoff Between Simplicity and Features
As described in section 2, NA has several levels of usage. Technically, the system needs to be used by a wide range of players with skills that range between basic gaming and professional design and programming. Advanced players, such as students in workshops, can use the NA SDK package in Unity, while a player without such skills is still be able to run the viewer app and access the spaces without doing any programming. It should be mentioned that some of the students during the workshops and throughout the duration of project development have even programmed substantial improvements and add-ons to the platform.
We have identified the following users:
1. Simple player/visitor – visits and navigates a space. 2. Advanced player/visitor – creates spaces with existing assets.
Proc. of the 12th International Symposium on CMMR, Sao Paolo, Brazil, July 5-8, 2016
193

12 Pete Sinclair, Roland Cahen, Jonathan Tanant and Peter Gena
3. Builder – builds new assets to be used and shared. 4. Core developer – creates new standard NA components.
Unity is used both as a content creation platform and as the game engine. This means that while it is tempting to allow the builder to use Unity’s authoring tool with as few restrictions as possible, it is necessary to forbid practices that could lead to issues, such as bad synchronization or malfunctioning components.
The need to standardize allowed scripts For security and design reasons, builder created scripts cannot be included in Asset Bundles. User-created Objects can reference existing scripts, but a new script (at the time of writing), needs to be included in the viewer to be available in the system. A workaround would be to build a .NET assembly using Mono Develop or Microsoft Visual Studio and use .NET reflection to make it available at runtime. However this is still in development and is not a perfect solution since it would also enable potentially unlimited access to scripting with the implied security problems.
Performance considerations Resources are a major concern when it comes to user-generated content: a player could potentially build a highly complex object that is too “greedy” with the resources of visiting computers (including video rendering performance, download time, CPU processing and memory). We have decided to manage this in two ways. Firstly, by defining “good practice” guidelines, these include: limiting the number of simultaneously playing sound sources; reducing the number of physical collisions and rigid bodies; reducing the size of audio clips; avoiding triggering too many audio sources too frequently; being careful with the use of custom DSP processing. In addition to these guidelines, we have limited the Asset Bundle upload size to a maximum of 7MB. The second approach is via the implementation of active optimization schemes, such as dynamic audio sources management as well as dynamic components (distant audio sources and objects in general are deactivated).
4.4 The Viewer App and the Standard Tools and Navigation
As we aim for high coherency between spaces and the player’s experience, we decided to introduce some standard concepts.
1. Navigation: after a few early discussions and tests concerning a user-definable avatar and navigation system, we finally decided to provide a standard navigation system, that includes a few cameras and standard controls (with keyboard and mouse or with a dedicated gamepad).
2. Interactions and tools: we designed all interactions as “tools”, that are selectable in the viewer by the player. A large number of these tools have been suggested many of which concern variations on modes of audio interaction (rubbing or dragging as well as simply colliding). At the time of writing roughly half of these ideas are implemented including sound-playing
Proc. of the 12th International Symposium on CMMR, Sao Paolo, Brazil, July 5-8, 2016
194

New Atlantis 13
tools, an object thrower, physical interactions, flashlight/sunlight, trunk creation...
Audio Components We have built a library of audio components to be used on audiographic objects in New Atlantis, these include:
1. Audio synthesis: noise generation, oscillators, FM synthesis, loopers, wave terrain synthesis...
2. Audio triggering: play/stop an audio source based on specific events, such as a collision, a volume intersection (named a trigger), a threshold distance with the listener…
3. Audio parameter modulation: pitch, volume, panning... 4. Experimental audio filtering: implementation of Bacon’s audio helps. 5. Audio recording: with content synchronization over the network (the
“trunk”).
This list of audio components continues to augment with the ultimate intention of providing a comprehensive toolbox for DSP interaction and sound generation.
Other standard components Because in New Atlantis designers can only use built-in scripts, it has also been necessary to provide a wide range of other standard components, including animations, visuals, move and rotate, teleport, GUI, particles triggering, physics…
4.5 Audio Spatialisation and Virtual Acoustics
A standard approach to audio spatialisation divides perception into three classes: the direct path, the early reflections and the late reverberation. As most 3D game engines today, Unity has a simple 3D audio sources management, which we used to spatialize an audio source’s direct path. Unity also has a concept of Reverb zones with dedicated parameters (such as presets, level, reverb time....), but the Reverb effect is applied to the final mix and is triggered by the listener position – this means that, by default, it is not possible to have sources in different spaces and have each source make its space resonate in a complex manner, since all sources are reverberated simultaneously. To compensate for this we have introduced the possibility for an Audio source to make its immediately surrounding space resonate (NAReverbEffector / Resonator) by using volume triggering, that allows us to have more complex shapes than standard Unity reverb zones (simple spherical volumes). This is a workaround since instead of the listener it is the audio source that is reverberated (we found this to be a better compromise).
Proc. of the 12th International Symposium on CMMR, Sao Paolo, Brazil, July 5-8, 2016
195

14 Pete Sinclair, Roland Cahen, Jonathan Tanant and Peter Gena First Reflections We have conducted some experiments concerning first reflections, that consisted of sending rays in all directions around the audio source, determining which rays hit a colliders (corresponding to an audio reflecting surface in our approximation), and then calculating the distance source-to-collider and collider-to-listener to define the audio delay for this path. The audio delay for each ray is then introduced in a multitap delay System (a FIR (Finite Impulse Response) filter) and applied to the audio source (using C# OnAudioFilterRead() custom DSP code). Although still an approximation, this gave interesting results – a sense of scale, small spaces (with a short slap back echo) and big spaces (cliffs, canyons etc.). However at the time of writing we have not yet included this as a standard feature in NA.
Audio Sources Directivity and Roll-off
By default, the Unity audio engine does not provide management of audio sources directivity. We have introduced the possibility to set a curve defining the source volume depending on the angle (similar to a polar diagram). Sound attenuation is implemented either by manual adjustment of roll off curves, where the builder defines how the sound attenuates over distance, or by using a physically accurate model for sound attenuation, (the well known inverse square distance law) where the builder simply defines the Sound Pressure Level at 1m in dB (dB SPL).
5. First Results - Student Workshops Public Presentations
5.1 Period September 2014 - January 2016 Description & Method
New Atlantis design and development took place between September 2014 and September 2015, during workshops in Chicago and Aix-En-Provence and through regular online (skype) meetings. Subsequently a workshop was organized in ENSCI les Ateliers Paris that included a group of 15 students and the whole team of researchers, artists from Aix, Chicago, Troy and Paris. Within a week, students who had never worked with either sound or 3D environments were able to create a set of audiographic objects. At this point we programmed the 2016 performance (see below). From October 2015 to January 2016 the team worked separately but connectedly to prepare this performance: in Paris, another group of 10 students created their own objects, helped to design graphic interface elements such as the avatar and prepared for the upcoming performance. At the same time a Masters student from ESA-Aix (Alex Amiel) was in residence in SAIC Chicago, helping to build the Chicago space; a group of Masters students were working in Aix to create the Aix space; Ben Chang worked in Troy to create his own space. From January 10 to 15 another workshop with a fresh group of students from design art and gaming schools took place at Le Cube. This time, the framework was more advanced and the group was able to work and produce results much faster.
Proc. of the 12th International Symposium on CMMR, Sao Paolo, Brazil, July 5-8, 2016
196
New Atlantis 15
5.2 Presentation January 16th 2016
For the performance on January 16th 2016 participants and audience were gathered in four different venues. Le Cube (Issy les Moulineaux, Paris France), the Vasarely Foundation (Aix en Provence), SAIC (Chicago) and Rensselaer Polytechnic Institute (Troy - New York state). The sound was played over 7.1 or in 5.1 surround systems. Participants were connected via Skype during the performance and the audience was able listen to their commentaries and exchanges live. Five NA spaces were visited during the 80-minute performance that started at 9pm in Paris and 2pm in Chicago. The audience reaction was enthusiastic and there was a positive reaction towards the prospect of continuing development.
6. Conclusions and Further Research
One of the aims of NA is to provide a platform for international academic, artistic, cultural and scientific exchange. In this sense the project has indeed succeeded in creating a robust bridge between the American and French research teams and students. The remaining challenge is for New Atlantis to become a real-time tool or platform for international artistic and musical collaboration. Hopes are high however since music and sound are after all an international language. Possibly the most important step, that of making the app publicly available has yet to be made.
6.1 Game architecture and Development
With the ultimate goal of making all things audio in NA (i.e. that all visual elements have an audio counterpart) the concept of acoustic materials, could allow us to define the way a 3D surface interact with incoming sound, with parameters such as absorption at several audio frequencies, audio diffusion and reflection. We intend to implement audio path-finding using Unity’s ray casting capabilities – precisely calculating the contribution of each source to each space and applying a chain of audio effects based on the traversed space’s characteristics. This was implemented in the previous Panda3D/Pd version of NA it now has to be ported to Unity. Other advanced topics will be addressed in the future, such as accurate sound occlusion (possibly using ray casting between the source and the listener), and more advanced audio spatialization algorithms with the Unity Spatialization SDK. It is our intention to incorporate audio streaming capabilities into NA permitting the real time inclusion “real world” captured sounds. This would enable a voice object for example whereby a visitor could detach his or her voice (from navigation) and use it to make a distant space resound.
Proc. of the 12th International Symposium on CMMR, Sao Paolo, Brazil, July 5-8, 2016
197

16 Pete Sinclair, Roland Cahen, Jonathan Tanant and Peter Gena 6.2 Integration of and Intuitive synthesizer.
Locus Sonus will soon be joining the audio group of the CNRS Laboratory LMA through a joint MCC and CNRS funding program (accord cadre). In this context it is planned to integrate the LMA’s research into intuitive synthesizer interaction. In effect this synthesizer that is controlled by “semantic descriptions of sound events”[32][33], including non-existent ones, would appear to be an ideal solution for audio graphic experimentation in NA.
6.3 Interface and Graphic Design
Before releasing a public version of the New Atlantis app in is necessary to improve the ergonomics of the user interface. The design process is programmed and we hope to achieve this goal within the coming months.
Fig 4. New Atlantis performance synchronized between: Le Cube, Vasarely Foundation, SAIC and RPI. January 2015. Photo: Le Cube.
Proc. of the 12th International Symposium on CMMR, Sao Paolo, Brazil, July 5-8, 2016
198

New Atlantis 17
7. New Atlantis Team 2016
Coordination: Peter Sinclair (Locus Sonus - ESAAix), Peter Gena (SAIC), Roland Cahen (ENSCI) Development Jonathan Tanant (JonLab) : lead developer and software architect , Components developement : Alexandre Amiel (ESAAix) Faculty/Research: Mark Anderson (3d Graphics SAIC), Robb Drinkwater (Audio programming SAIC), Michael Fox (3d GraphicsSAIC), Jerome Joy (Audio Locus Sonus) Ben Chang (Programming , 3d Graphics) Students: Daan De Lange, Théo Paolo, Alexandre Amiel, Antoine Langlois (ESAAix) Adrien Giordana, Luca Notafrancesco, Marion Talou, Dorian Roussel, Valentin Moebs, Anaïs Maurette de Castro, Thomas Signollet, Oscar Gillet, Juliette Gueganton, Mathilde Miossec, Gamzar Lee, David Guinot, Paul Barret, Gaëtan Marchand, Aristide Hersant, Louis Fabre, Blanche Garnier, Lucas Dubosque, Alexandra Radulescu. Organization: Anne Roquigny (Locus Sonus), Julie Karsenty (ESAAix) Partners: Locus Sonus ESAAix Ecole supérieure d’art d’Aix-en-Provence ENSCI Les Ateliers, Rensaler Polytechnic Institute, Troy, School of the art Institute of Chicago, Chicago USA Previous Participants: Ricardo Garcia, Gonzague Defos de Rau, Margarita Benitez, Anne Laforet, Jerome Abel, Eddie Breitweiser, Sébastien Vacherand. References 1. Bacon, F.: The New Atlantis. no publisher given, United Kingdom (1628) 2. French-Americain Cultural Exchange, http://face-foundation.org/index.html 3. Second Life official site, http://secondlife.com/ 4. Pure Data – Pd community site, https://puredata.info/ 5. LS-SL Seconde Nature, http://www.secondenature.org/LS-SL-LOCUS-SONUS-IN-
SECOND-LIFE.html 6. Panda3D – Free 3D game Engine, https://www.panda3d.org/ 7. NA version1, http://locusonus.org/w/?page=New+Atlantis 8. LaForet, A.: New Atlantis, un monde virtuel sonore. In Locus Sonus 10 ans
d’expérimentation en art sonore. pp. – Le Mot et Le Reste, Marseille (2015) 9. Unity Game Engine, https://unity3d.com/ 10. AudioGaming, http://www.audiogaming.net/game-sound-design 11. UPIC https://en.wikipedia.org/wiki/UPICÒ 12. Cage, J. : Fontana Mix. Peters, New York, nº EP 6712, (1960) 13. Sinclair, P., Joy, J.: Locus Sonus 10 ans d’expérimentation en art sonore. pp. – Le Mot et
Le Reste, Marseille (2015) 14. Polymeneas-Liontiris. T, Loveday-Edwards A. (2013) The Disklavier in Networked Music
Performances In: ATINER, 4th Annual International Conference on Visual and Performing Arts 3-6 June 2013, Athens: Greece.
15. Sinclair, P.: ed. Sonification - What Where How Why. AI & Society (Springer) 27, no. 2 (05 2012).
Proc. of the 12th International Symposium on CMMR, Sao Paolo, Brazil, July 5-8, 2016
199

18 Pete Sinclair, Roland Cahen, Jonathan Tanant and Peter Gena 16. Installation Icare de Ivan Chabanaud, http://www.musicvideoart.heure-
exquise.org/video.php?id=2151 17. BANDONEON, http://roland.cahen.pagesperso-orange.fr/bandoneon/Bandoneon.htm http://www.edit-revue.com/?Article=200 18. Cahen, R.: Sound Navigation in the PHASE installation: producing music as performing a game using haptic feedback. Subsol, Gérard, ed. 19. ENIGMES, http://projetenigmes.free.fr/wiki/index.php?title=Accueil 20. TOPOPHONIE, http://www.topophonie.com 21. UDKOSC, https://ccrma.stanford.edu/wiki/UDKOSC 22. Avatar Orchestra Metaverse, http://avatarorchestra.blogspot.fr/ 23. Jacques Tati: Composing in Sound and Image,
https://www.criterion.com/current/posts/3337-jacques-tati-composing-in-sound-and-image 24. Cahen, R. Rodet, X. Lambert, JP.:Virtual Storytelling: Using Virtual Reality Technologies
for Storytelling: Third International Conference, ICVS 2005, Strasbourg, France, November 30-December 2, 2005: Proceedings.
25. Sinclair, P.: Inside Zeno’s Arrow: Mobile Captation and Sonification Audio Mobility Vol. 9 No. 2. 2015, http://wi.mobilities.ca/
26. Thibaud, JP.: Towards a praxiology of sound environment. Sensory Studies - Sensorial Investigations, 2010, pp.1-7.
27. Schafer, RM.: The Tuning Of The World. Alfred Knopf, New York, (1977) 28. Locus Sonus Sound Map, http://locusonus.org/soundmap/051/ 29. Locus Sonus, http://locusonus.org 30. Cahen, R.: Teaching Sound-Design @ENSCI les Ateliers, Sound-Design and innovation: a virtuous circle. Cumulus 2015 Proceedings 31. SAIC, http://www.saic.edu/academics/departments/ats/ 32. Conan S., Thoret E., Aramaki M., Derrien O., Gondre C., Kronland-Martinet R., Ystad S. (2014). An intuitive synthesizer of continuous interaction sounds: Rubbing, Scratching and Rolling. Computer Music Journal, 38(4) 24-37, doi:10.1162/COMJ_a_00266 33. Pruvost L., Scherrer B., Aramaki M., Ystad S., Kronland-Martinet R. Perception-Based Interactive Sound Synthesis of Morphing Solids’ Interactions. Proceedings of the Siggraph Asia 2015, Kobe, Japon, 2-5 Novembre 2015.
Proc. of the 12th International Symposium on CMMR, Sao Paolo, Brazil, July 5-8, 2016
200

Estilhaço 1 & 2: Conversations between Sound and Image in the Context of a Solo Percussion Concert
Fernando Rocha1 and Eli Stine2
1 UFMG (BRAZIL) / UVA (USA)
2 UVA (USA) [email protected]
Abstract. This paper discusses the pieces Estilhaço 1 and 2, for percussion, live electronics, and interactive video. The conception of the pieces (including artistic goal and metaphor used), the context in which they were created, their formal structures and their relationship, the technologies used to create both their audio and visual components, and the relationships between the sound and corresponding images are discussed.
Keywords: Interactive Music, Interactive Video, Percussion Music, Visual Music, Hyper-instruments, Hyper-kalimba.
1 Introduction
Estilhaço 1 and 2 were created as part of a project undertaken by percussionist and composer Fernando Rocha called: ‘The concert as a work of art: A holistic approach to the creation and performance of a full length solo percussion concert’1. The goal of this project was to create a full-length concert for solo percussion and electronics which includes video and other interactive technologies. The concert was conceived as an integrated performance, one which includes individual pieces but which is presented as a connected whole. The project will contribute to an auto-ethnographic study considering how we program contemporary music and how we can consider the trajectory of a concert as a whole, rather than simply putting a series of pieces together. Estilhaço 1 and 2 were written by Rocha to open and close this concert.
Estilhaço 1 and 2 are two related works that can be presented as individual pieces or as a set (preferably with one or more pieces in between them). Despite their very different sound palettes, the two pieces are conceptually quite similar. They both explore the idea of creating long resonances from short notes and extracting short notes from long resonances. The forms of the two pieces are generated by exploring and combining these two layers of sounds (short and long). The electronic part provides a structure over which the performer is free to improvise. Estilhaço 1 also exploits the
1 Project undertaken with the support of the Brazilian federal agency CAPES (Coordenação de
Aperfeiçoamento de Pessoal de Nível Superior).
Proc. of the 12th International Symposium on CMMR, Sao Paolo, Brazil, July 5-8, 2016
201

2 Fernando ROCHA and Eli STINE
melodic potential of the kalimba. The two works dialogue with videos created by Eli Stine. In the first, the video is created in real time, following the performer’s sounds and gestures. In the second, the same video is projected and used as a guide for the performer’s improvisation. Thus the two works play with the relationships between image and sound. (program note written by Fernando Rocha for the premiere of the pieces on Feb 5th, 2016)
The name ‘estilhaço’ (originally in Portuguese) means fragment, splinter, or shard. It relates to the process of breaking the long metal resonances into sharp fragments in Estilhaço 2. Similar processes also occur in Estilhaço 1. Both pieces use custom made patches in Max. The video component of the pieces utilizes Jitter and Processing. In this paper we will present how the pieces were conceived and explain some details of their audio and video components. We will also discuss how the relationship between sound and video was explored.
2 The Audio Element and Formal Structure of Estilhaço 1 and 2
The main compositional idea in both pieces was to explore the dichotomy between long and short sounds; we extended the instruments’ capabilities to create, in real time, extremely long resonances as well as short attacks and complex, dense rhythmic structures. Estilhaço 2 was composed first, and its instrumentation asks for triangles, crotales, bells and gongs (or other metals of long resonances). The objective here was to shift the attention of the audience from the natural, long resonances of the instrument to dense structures, created by a series of short attacks. Formally, the idea was to create a kind of ABA’ structure, beginning with a sparse, soft and relaxed texture, moving gradually to a section of greater density, volume, and tension, and then going back to another relaxed structure, somewhat modified from the beginning as a reflex of the natural trajectory of the piece.
In terms of technology, all the processes used in the piece were created by recording samples (from 90ms to 450ms, depending on the effect to be achieved) after every instrumental attack detected by the system. This made it possible to create a system with no need to touch the computer during the performance. As stated by violinist and electronic music performer Mari Kimura, “in order to convey to the audience that using a computer is just one of many means to create music, I wanted to appear to use the computer as seamlessly as possible on stage.” [1]. The ‘bonk~’ object [2] was used to detect attacks. After an attack is detected, a gate closes for 300ms and no new attack can be detected during this time. A sequence of effects is built into the patch, and each attack sends a sample to a corresponding effect according to this sequence.
There are six types of effects (each one with 6 to 8 variations), all based on different ways of playing back the recorded samples. The first effect is created by looping three versions of the sample with cross fades, thus creating smooth resonances. Effects 2 to 4 create resonances that are less and less smooth, until they are heard as a series of attacks. This is accomplished first by using imperfect cross fades, and then by using amplitude modulation. Effects 5 and 6 are created with shorter samples (90 to 150ms) that are not looped, with envelopes that make the
Proc. of the 12th International Symposium on CMMR, Sao Paolo, Brazil, July 5-8, 2016
202

Estilhaço 1 & 2: Conversations between Sound and Image 3
attacks very clear. Each sample is played using different random rhythmic lines at different tempi, and some of the samples are played at different speeds, resulting in variations of length and pitch.
The sequence of these events in the patch guarantees the formal structure of the piece. They correspond to three sections: (A) a long and gradual crescendo in volume, density and complexity beginning with natural sounds and then adding artificial resonances that are increasingly modified as the piece moves on; (B) a climactic section in which all the different effects occur at the same time. A complex texture is created by using many short samples with sharp attacks; (A’) a gradual decrescendo, moving back to the original state, while keeping some elements of the climax (specifically, two layers with short and articulated sounds from effect 6).
The performer is free to improvise during the piece without necessarily altering the larger structure. This illustrates another layer of dichotomy in the piece: the action of the performer versus the result of the system. For example, the performer can continue playing only long notes throughout the piece, but even in this case the climax section (between 1/2 and 3/4 of the length of the piece) will create a busy, complex texture that is full of short attacks. However, there are ways to interfere with the opening and closing crescendo and decrescendo. In the first sections of the piece, the system creates only long resonances without generating any rhythmic structure. But if two attacks are played with an interval of less than 300ms, the second one will be recorded into the buffer created by the first one. Thus the loop of this sample will create a texture full of short attacks instead of one stable resonance.
Estilhaço 2 also uses a surround system in order to better engage the audience and to highlight each of its multiple rhythmical lines. While most of the samples recorded are sent only to one or two speakers, the samples that are played at different speeds from the original move around the audience. This is particularly effective when two very long resonances are played midway through the piece. At this moment, one of the resonances is slowly pitch shifted to a major third below, while the other goes to a tritone below. Each of these two processes takes about 20 seconds, during which the sounds circle around the audience. This is a very noticeable effect that helps to mark the beginning of the climax section of the piece.
Estilhaço 1 was composed for hyper-kalimba, a thumb piano extended by the use of sensors2. While the piece similarly explores the dichotomy of long vs. short sounds, it also highlights another contrast: noise vs. melody. The kalimba is traditionally a melodic and harmonic instrument. In this piece its sound palette was expanded in order to create a dialogue between the melodic aspect and noisier, less harmonic sounds (in both the acoustic and the electronic domains).
For the performance of Estilhaço 1, a new mapping for the hyper-kalimba was created. This mapping kept some features explored in earlier pieces for the
2 The hyper-kalimba was created by Fernando Rocha with the technical assistance of Joseph
Malloch and the support of the IDMIL (“Input Devices and Music Interaction Laboratory”), directed by Prof. Marcelo Wanderley at McGill University. It consists of a kalimba (a traditional African thumb piano) augmented by the use of sensors (two pressures sensors, three-axis accelerometer and 2 digital buttons) which control various parameters of the sound processing. An Arduino Mini microcontroller board 2 was used for sensor data acquisition and data were communicated to the computer over USB. The instrument has been used in concerts since October 2007, both in improvisational contexts and in written pieces. [3]
Proc. of the 12th International Symposium on CMMR, Sao Paolo, Brazil, July 5-8, 2016
203

4 Fernando ROCHA and Eli STINE
instrument, such as pitch shift (controlled by a combination of tilt and applying pressure to the right pressure sensor), while adding new possibilities. Two of the new features are essential for the piece, since they help to explore the two dichotomies (long vs. short notes and melodic vs. noisy sounds); (1) the possibility of creating artificial resonances of the acoustic sounds; (2) the transformation of the traditional ‘melodic’ sounds of the instrument into ‘noisy’ and unpredictable sounds.
In order to prolong the sounds of the kalimba a modified version of an object called ‘voz1’ (created by Sérgio Freire and used in his piece, Anamorfoses) was used [4]. As in Estilhaço 2, this object creates artificial resonances by recording a fragment of the natural resonance and playing it back in three loops, mixed with crossfades. In this mapping, pressing the right button attached to the instrument opens or closes a gate which allows for the recording of the excerpts. When this gate is open, each attack detected by the ‘bonk~’ object is recorded into a buffer, and the new resonance is played. To avoid recording and reproducing part of the attack of the sound, the recording begins 100ms after the attack is detected. As in Estilhaço 2, the perfomer can also create ‘dirty’ buffers (by playing two consecutive attacks with a short interval between them: the second attack will be recorded into the buffer created for the resonance of the first one). By using the left pressure sensor, the performer is able to cut the artificial resonances into shorter fragments that are played randomly in different speakers of the system at different tempi.
To be able to change the characteristic, melodic sound of the kalimba, the granular synthesis object ‘munger1~’ was used [5]. There are two ways of turning on or off the munger effect: turning the instrument upside down or shaking it vigorously for a few seconds. Shaking stimulates a more dramatic change, since it also adds some distortion to the sound.
Compared to Estilhaco 2, the form of this piece was expanded in order to leave room for melodic exploration and transformations with pitch shift. However, one could still consider the form of the piece to be ABA’, where A correspond to sections 1 and 2, B to 3 and 4; and A’ (or C) to 5 and 6 (fig. 1). 1. exploration of natural noisy sounds of the instrument (scratching and hitting) and
artificial ‘noisy’ sounds created by the munger1~ object (high pitched overtones); 2. exploration of melodies played in the original range of the instrument. At the same
time a layer of long resonances of the noise from the first section are chopped into shorter and shorter envelopes until they disappear, and a new layer of long resonances of notes is created, generating a harmonic background texture.
3. Dramatic change in texture using the munger1~ object with a preset that allows for great variation of grains and pitch.
4. The munger effect is turned off, but the performer explores the pitch shift feature of the mapping, generating a wide variation of pitch around the sounds produced.
5. The munger effect comes back with a preset that showcases high overtones, similar to the first section of the piece.
6. A dramatic gesture of shaking followed by a punching gesture, then placing the kalimba upside down, triggers the last part of the piece. This consists of two layers made by long and short sounds, similar to the last part of Estilhaço 2. One layer is created with the munger1~ object, which continues to process the last sound produced and generates different fragments that contrast in terms of length, separation, and pitch. Long, artificial resonances of high-pitched notes which are
Proc. of the 12th International Symposium on CMMR, Sao Paolo, Brazil, July 5-8, 2016
204
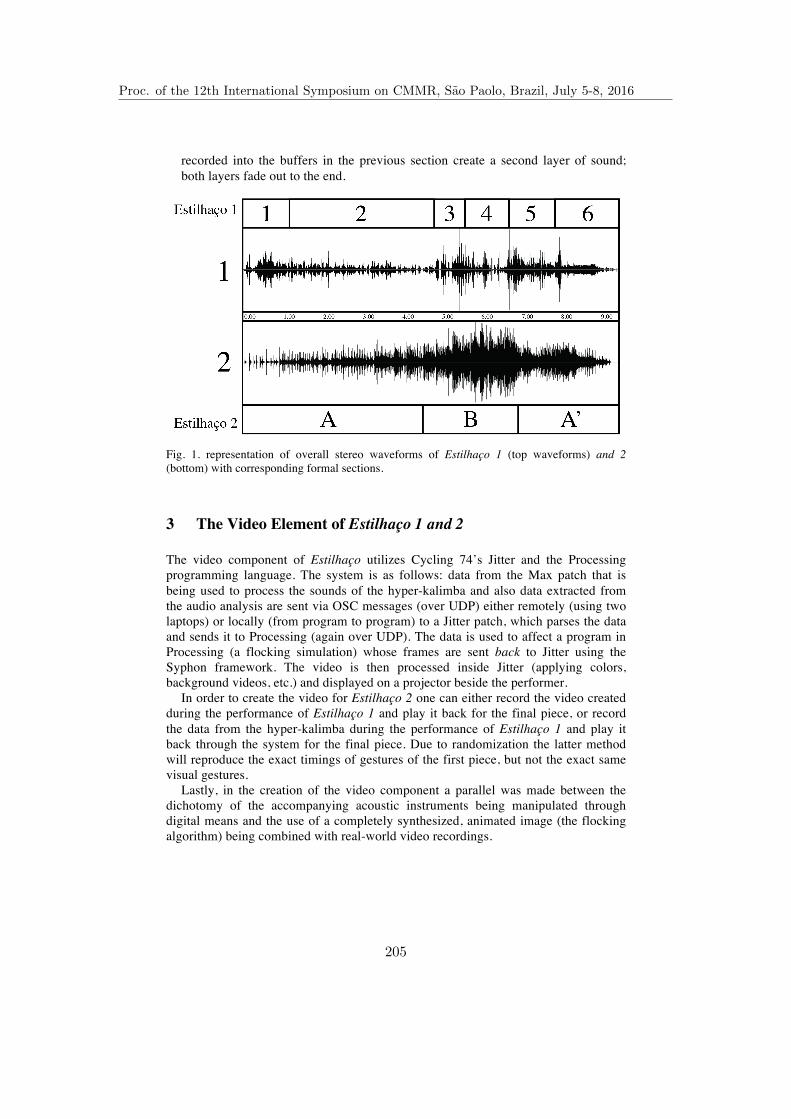
Estilhaço 1 & 2: Conversations between Sound and Image 5 recorded into the buffers in the previous section create a second layer of sound; both layers fade out to the end.
Fig. 1. representation of overall stereo waveforms of Estilhaço 1 (top waveforms) and 2 (bottom) with corresponding formal sections.
3 The Video Element of Estilhaço 1 and 2
The video component of Estilhaço utilizes Cycling 74’s Jitter and the Processing programming language. The system is as follows: data from the Max patch that is being used to process the sounds of the hyper-kalimba and also data extracted from the audio analysis are sent via OSC messages (over UDP) either remotely (using two laptops) or locally (from program to program) to a Jitter patch, which parses the data and sends it to Processing (again over UDP). The data is used to affect a program in Processing (a flocking simulation) whose frames are sent back to Jitter using the Syphon framework. The video is then processed inside Jitter (applying colors, background videos, etc.) and displayed on a projector beside the performer.
In order to create the video for Estilhaço 2 one can either record the video created during the performance of Estilhaço 1 and play it back for the final piece, or record the data from the hyper-kalimba during the performance of Estilhaço 1 and play it back through the system for the final piece. Due to randomization the latter method will reproduce the exact timings of gestures of the first piece, but not the exact same visual gestures.
Lastly, in the creation of the video component a parallel was made between the dichotomy of the accompanying acoustic instruments being manipulated through digital means and the use of a completely synthesized, animated image (the flocking algorithm) being combined with real-world video recordings.
Proc. of the 12th International Symposium on CMMR, Sao Paolo, Brazil, July 5-8, 2016
205
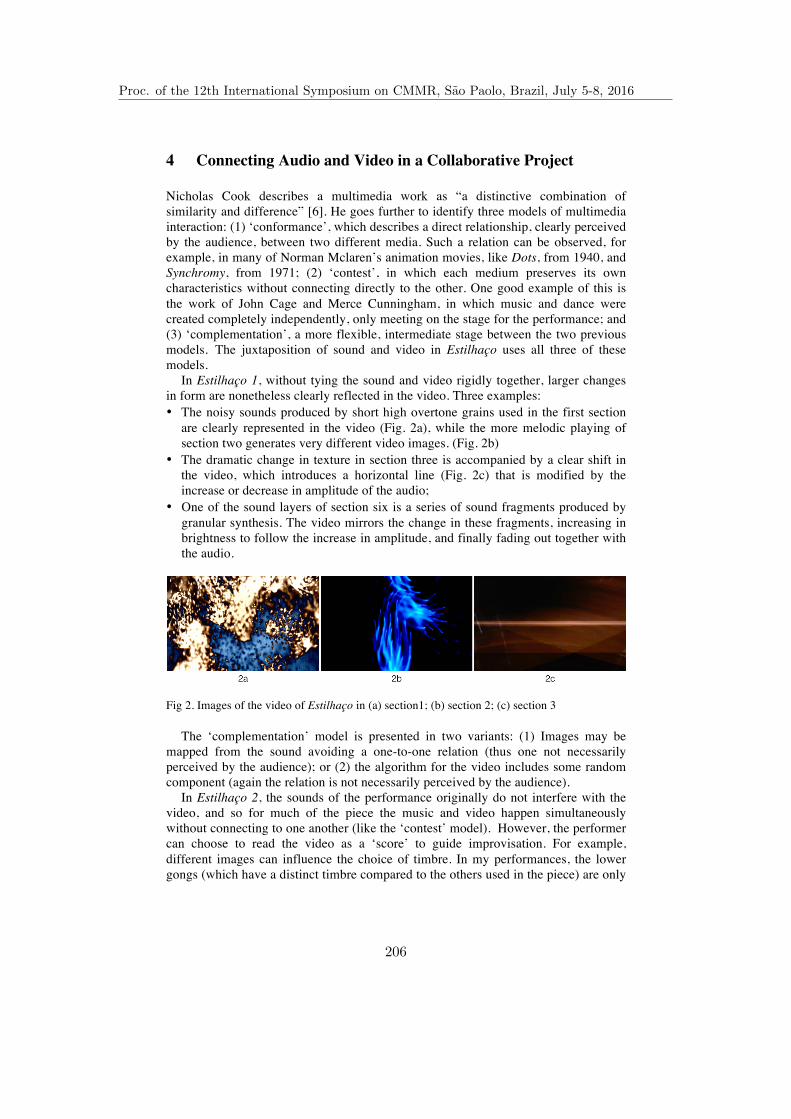
6 Fernando ROCHA and Eli STINE
4 Connecting Audio and Video in a Collaborative Project
Nicholas Cook describes a multimedia work as “a distinctive combination of similarity and difference” [6]. He goes further to identify three models of multimedia interaction: (1) ‘conformance’, which describes a direct relationship, clearly perceived by the audience, between two different media. Such a relation can be observed, for example, in many of Norman Mclaren’s animation movies, like Dots, from 1940, and Synchromy, from 1971; (2) ‘contest’, in which each medium preserves its own characteristics without connecting directly to the other. One good example of this is the work of John Cage and Merce Cunningham, in which music and dance were created completely independently, only meeting on the stage for the performance; and (3) ‘complementation’, a more flexible, intermediate stage between the two previous models. The juxtaposition of sound and video in Estilhaço uses all three of these models.
In Estilhaço 1, without tying the sound and video rigidly together, larger changes in form are nonetheless clearly reflected in the video. Three examples: • The noisy sounds produced by short high overtone grains used in the first section
are clearly represented in the video (Fig. 2a), while the more melodic playing of section two generates very different video images. (Fig. 2b)
• The dramatic change in texture in section three is accompanied by a clear shift in the video, which introduces a horizontal line (Fig. 2c) that is modified by the increase or decrease in amplitude of the audio;
• One of the sound layers of section six is a series of sound fragments produced by granular synthesis. The video mirrors the change in these fragments, increasing in brightness to follow the increase in amplitude, and finally fading out together with the audio.
Fig 2. Images of the video of Estilhaço in (a) section1; (b) section 2; (c) section 3
The ‘complementation’ model is presented in two variants: (1) Images may be mapped from the sound avoiding a one-to-one relation (thus one not necessarily perceived by the audience); or (2) the algorithm for the video includes some random component (again the relation is not necessarily perceived by the audience).
In Estilhaço 2, the sounds of the performance originally do not interfere with the video, and so for much of the piece the music and video happen simultaneously without connecting to one another (like the ‘contest’ model). However, the performer can choose to read the video as a ‘score’ to guide improvisation. For example, different images can influence the choice of timbre. In my performances, the lower gongs (which have a distinct timbre compared to the others used in the piece) are only
Proc. of the 12th International Symposium on CMMR, Sao Paolo, Brazil, July 5-8, 2016
206

Estilhaço 1 & 2: Conversations between Sound and Image 7
used when the image of a horizontal line appears in the video, creating a noticeable shift in the sound world of the piece. The performer may also choose to mimic the sudden appearance of new images in the video with musical attacks.
Since there are similarities in the musical form of the two pieces (as described earlier) it is not surprising that an examination of their waveforms shows parallels between them (fig. 1). In both pieces there is a climax section between 4min45sec and 6min50sec and a clear fade-out after 7min40sec. However, the opening sections are more distinct. In Estilhaço 2, we hear a very gradual crescendo from the beginning to the climax (section A), while Estilhaço 1 includes more variations. Since the video used for Estilhaço 2 is created by the performance of Estilhaço 1, there is a disconnect between the music and the video in the opening of the second piece that did not exist in the opening of the first (at this moment Estilhaço 2 asks for sparse, soft attacks, whereas the video created by Estilhaço 1 reflects its more active texture). After the premiere, we re-discussed this issue and decided to find a way to better connect the music and the video of the section. Our solution was to map the first 18 attacks of Estilhaço 2 to the video, so that each attack would change the contrast of the video and generate a flash effect, as if the video had been turned on and off again. These flashes become progressively longer, so that by the last of the 18 attacks the contrast is back to normal and the video is fully “on”.
The presentation of the same video in a different sonic context (in Estilhaço 2) asks the audience to directly engage with their memory and to re-contextualize both the video and the sonic gestures that are being presented alongside it. A work of visual art that was generated by the sounds of the hyper-kalimba is torn away from that setting and placed in the context of very resonant metal instruments. This provokes the audience to make connections between the video and the hyper-kalimba gestures, the video and its relationship to the gestures of Estilhaço 2, and then between the structures of Estilhaço 1 and Estilhaço 2.
It is also interesting to note that the use of the same video helps to give a form to the concert as a whole, one which follows the main structure of each Estilhaço: A B A’, where A is Estilhaço 1 with the video, B are the other pieces included in the program and A’ is Estilhaço 2 with the same video created by the first piece.
5 Final Considerations and Future Work
Estilhaço is the result of a collaboration between performer/composer Fernando Rocha and video artist/composer Eli Stine. The piece was conceived for a specific concert, one which included both electronic and acoustic elements, and which was designed to hold together as an artistic whole. It was important to us that the system we created served an aesthetic, musical purpose, supporting the overall performance. The fact that the system created for the pieces does not require the performer to touch the computer during the performance aids to make the computer more invisible to the audience, becoming ‘just one of many means to create music’ [1].
The piece’s relation to the context of the concert influenced some ideas used in its composition; for example, the overall structure of the concert mirrored the form of the two versions of Estilhaço (ABA’). The compositional process was guided by a very clear idea about musical materials and the trajectory of the piece’s form—one which
Proc. of the 12th International Symposium on CMMR, Sao Paolo, Brazil, July 5-8, 2016
207

8 Fernando ROCHA and Eli STINE
is indicated by its name, which means “fragment” or “shard.” “Estilhaço” is a metaphor for the process of breaking the long, metallic resonances of the opening into small, sharp fragments3. Estilhaço 2, conceived first, uses this process to explore a dichotomy between short and long notes. Following a quiet, calm opening section, there is an increase in density, dynamic, and complexity, building tension and leading to a climax; then the piece gradually returns to a more ‘relaxed’ texture.
The video element of the piece not only helps to engage the audience but also adds another layer of interest and drama to the works. It opens up an exploration of the possible relationships between music and video (another dichotomy), since, while the two pieces use the same video, they have very distinct sonic palettes.
Estilhaço was premiered on Feb. 5th, 2016, and it has been performed in three other concerts since then (updated in March 15). After the premiere, a few details related to the audio/video connection were edited (like the addition of an interactive aspect at the beginning of the video of Estilhaco 2, as described in section 4 of this paper). As a future goal, the authors intend to make the video even more intimately tied with what’s going on in the hyper-kalimba patch. The work has also inspired us to consider other ways in which video (and repeated viewings of the same/similar videos) can be used in the concert format, and to research other possible hyper-instruments for the control of video systems.
References
1. Kimura, M.: Creative Process and Performance Practice of Interactive Computer Music: a Performer's Tale. In: Organised Sound, Cambridge University Press, Vol. 8, Issue 03, pp. 289--296. (2003)
2. Puckette, M., Apel, T., and Zicarelli, D.: Real-time Audio Analysis Tools for Pd and MSP. In: Proceedings, International Computer Music Conference. San Francisco: International Computer Music Association, pp. 109--112. (1998)
3. Rocha, F., and Malloch, J.: The Hyper-Kalimba: Developing an Augmented Instrument from a Performer’s Perspective. In: Proceedings of 6th Sound and Music Computing Conference, Porto - Portugal, pp. 25--29. (2009)
4. Freire, S.: Anamorfoses (2007) para Percussão e Eletrônica ao Vivo. In: Revista do III Seminário Música Ciência e Tecnologia, pp. 98--108. São Paulo. (2008)
5. Bukvic, I.I., Kim, J-S., Trueman, D., and Grill, T.: munger1 : Towards a Cross-platform Swiss-army Knife of Real-time Granular Synthesis. In Proceedings, International Computer Music Conference. Copenhagen: International Computer Music Association. (2007)
6. Cook, N.: Analysing Musical Multimedia. Oxford University Press. (1998) 7. Wessel, D. and Wright, M.: Problems and Prospects for Intimate Musical Control of
Computers. In: Computer Music Journal, vol. 26, no. 3, pp. 11--22. (2002)
3 As stated by Wessel and Wright, in the creation of interactive works, “metaphors for control
are central to our research agenda” [7].
Proc. of the 12th International Symposium on CMMR, Sao Paolo, Brazil, July 5-8, 2016
208

Interaction, Convergence and Instrumental Synthesis in Live Electronic Music
Danilo Rossetti1
1 Institute of Arts University of Campinas/CICM Université Paris 8
Abstract. In this article we present and discuss the interaction and convergence between the instrumental and electroacoustic parts in live electronic music. Our approach is related to the idea of sound morphology, based on the undulatory and granular paradigms of sound. We also analyze the process of instrumental synthesis based on frequency modulation (FM), in order to generate pitches and enable timbre interpolation. For these purposes, we address some examples in our works Oceanos (for sax alto), Poussières cosmiques (for piano) and Diatomées (for instrumental ensemble), all of them with live electronics. We conclude comparing the analyzed operations with the emerging form of these works considering both the micro and macro temporal aspects.
Keywords: Live electronic music, interaction and convergence, undulatory and granular paradigms, frequency modulation, timbre interpolation.
1 Introduction
When we think about live electronic music, one of the first problems that arise is the interaction between the instrumental acoustic and electroacoustic parts of a work. It means to imagine how to make these two sound sources merge together and sound as a unity of form, as one single timbre. This interaction can be analyzed considering several aspects related to electronic treatments.
In live electronics works, instrumental sounds are captured, treated and the electroacoustic resultant sound is diffused during the performance. They can also be recorded in a support during the performance for subsequent electroacoustic diffusion. In deferred time compositions, the electronic part is fixed in a support, which means the performer(s) must follow the tempo of the electronic part. There is also the question about multichannel spatialization of the generated sounds. One possibility is to conceive them as punctual sources that perform trajectories in the acoustic field; another possibility is the use of an ambisonics spatialization tool which decodes the produced acoustic field in spatial harmonics, similarly to sound decomposition in frequency partials.
We will approach the interaction aspects from the sound morphology standpoint. In this sense, the acoustic sound generated by different instrumental techniques can be combined with the chosen electronic treatments. This means that, in compositional processes, it is possible to converge acoustic sounds and electronic treatments in relation to similar sound models. We expect, as a result, that this idea of convergence
Proc. of the 12th International Symposium on CMMR, Sao Paolo, Brazil, July 5-8, 2016
209

2 Rossetti
will amplify the instrumental possibilities, thus generating new sonorities to be diffused.
Our sound morphology view is based on composition and sound analysis considering both the undulatory (continuous) and granular (discontinuous) paradigms of sound. This approach is slightly different from the notions proposed by Schaeffer [1] and Smalley [2], which are based on a sound object solfège or on a listening typology (auditory description). Our approach is mainly focused on the compositional process, which can be a live electronics process, seeking to converge the instrumental and electronic parts.
We do not think of the undulatory and granular models as the only possibilities to build instrumental and electronic timbres, nor as dialectally opposed. Rather, we think about these two models as complementary, i.e. as a tool that can guide us in processes of timbre fusion. Concerning these paradigms of sounds, we will analyze some examples (scores and sonograms) from our live electronics works Oceanos (2014), for alto sax, and Poussières cosmiques (2014 – 15), for piano.
We will also analyze Gérard Grisey’s concept of instrumental synthesis [3], which is strictly connected with the works of spectral composers from the 1970s. Generally, in acoustic or live electronic music, instrumental synthesis would be the simulation of electronic compositional procedures in instrumental composition. In the examples we will present, frequency modulation synthesis [4] will be addressed in the instrumental context.
Our analysis also includes the use of irrational numbers as indexes of modulation, to generate new inharmonic spectra and timbres. Our examples concern compositional procedures of our work Diatomées (2015), for instrumental ensemble and live electronics. Our final considerations will address the interaction and convergence in live electronic music, including the interaction produced between micro and macro events in order to generate musical form.
The electronic part of the analyzed works is conceived in Max, working with objects of HOA (High Order Ambisonics) Library, developed by the CICM (Centre de recherche Informatique et Création Musicale) of Université Paris 8. Using the process~ object of this library, and choosing a mono source file as input (pre-recorded or captured live with a microphone), we can address treatments such as reverb, delay, granulation, ring modulation, microtemporal decorrelation and convolution, combining them with an ambisonics multichannel spatialization. More specifically, this paper will discuss ring modulation, granulation and microtemporal decorrelation examples.
2 Undulatory and granular paradigms of sound
The undulatory paradigm is related to continuous structures, considering that the sound pitch is defined relatively to the sustained part of the sound envelope. In the 19th century, modern psychoacoustic was structured having, on the one hand, the research of Helmholtz [5] and Ohm and, on the other hand, the research of Seebeck [6]. Helmholtz and Ohm presented an undulatory model based on the Fourier series. When the human ear perceives a sound, it performs a real time spectral analysis where the lowest partial defines the pitch. In 1841, based on his experiments with a siren
Proc. of the 12th International Symposium on CMMR, Sao Paolo, Brazil, July 5-8, 2016
210

Concepts of Interaction, Convergence and Instrumental Synthesis in Live Electronic Music 3
sound, Seebeck observed the presence of a “periodicity pitch”, which means that even when the fundamental frequency of a given sound is missing, we can still perceive it as having the same pitch. Seebeck concluded that not only the fundamental frequency but also the upper partials determine the sound pitch [7]. According to this view, pitch perception is the result of harmonic fusion into a single sound.
In the 1950s, Meyer-Eppler [8], among others, conducted research, observing the triple pitch quality and the presence of an effect called “formant pitch”. Considering the triple pitch quality, the first is its absolute pitch, running parallel to the frequency; the second is the chroma, a quality which recurs cyclically within each octave (for frequencies of up to 4.500Hz); the third is Seebeck’s periodicity pitch. If, in a periodicity pitch experiment, the continuous “mutilated” note (without the fundamental) is interrupted for approximately one second, the sensation is completely altered. Instead of the “residual tone”, we hear a new pitch which lies in the region of the strongest remaining partials. This new perceived structure is the formant pitch. In the 1970s, Terhardt [9] conducted research, defining the terms “virtual pitch” (which corresponds to Seebeck’s periodicity pitch and the synthetic mode) and “spectral pitch” (which corresponds to Helmholtz and Ohm’s analytical mode).
The granular paradigm is associated with discontinuity having Gabor’s acoustic quanta theory [10] as basis, whose heritage is the wave-corpuscle duality of quantum physics. Gabor conceived a sound description method that combines two other methods normally employed for this purpose: time-function description of sound and Fourier frequency analysis. Gabor presented the hypothesis that a sound is composed of innumerous quanta of information, which are described from time and frequency variables (p. 435). His hypothesis is defined in analogy to the corpuscular theory of light, which states that a stream of light is formed by a continuous, granular texture. Under this approach, according to the information theory, the acoustic signal can be divided into cells, with each cell transmitting one datum of information. Any acoustic signal can be divided into cells, and the whole of this representation corresponds to the totality of the audible area, in terms of time and frequency.
Iannis Xenakis, inspired by Gabor's theory, developed a granular theory in the music domain [11] as a part of his Markovian stochastic music. According to his theory, every sound is conceived as an integration of grains (elementary particles, sound quanta). These grains have a threefold nature: duration, frequency and intensity. It is important to highlight that, according to Xenakis’s stochastic music theory, traditional musical notions such as harmony and counterpoint are not applied. They were replaced by notions such as frequency densities (considering a given period of time), grain durations, and sound clouds.
In a compositional process, the most important variables related to the granular paradigm are mainly based on temporal structures (e.g. grain size, grain delay and feedback, cloud density) and linked to ideas of time and rhythm, which can be synchronous or asynchronous. The undulatory paradigm, on the other hand, is mainly connected with the frequency universe, since its most important variables control frequency values, for example, the organization of partials in a certain sound. However, this does not mean that there are no frequency variables related to the granular paradigm (we can define, for instance, the frequency band of a sound cloud) or that there are no temporal definitions concerning the undulatory paradigm (for instance, we can define the duration of each partial of a sound).
Proc. of the 12th International Symposium on CMMR, Sao Paolo, Brazil, July 5-8, 2016
211
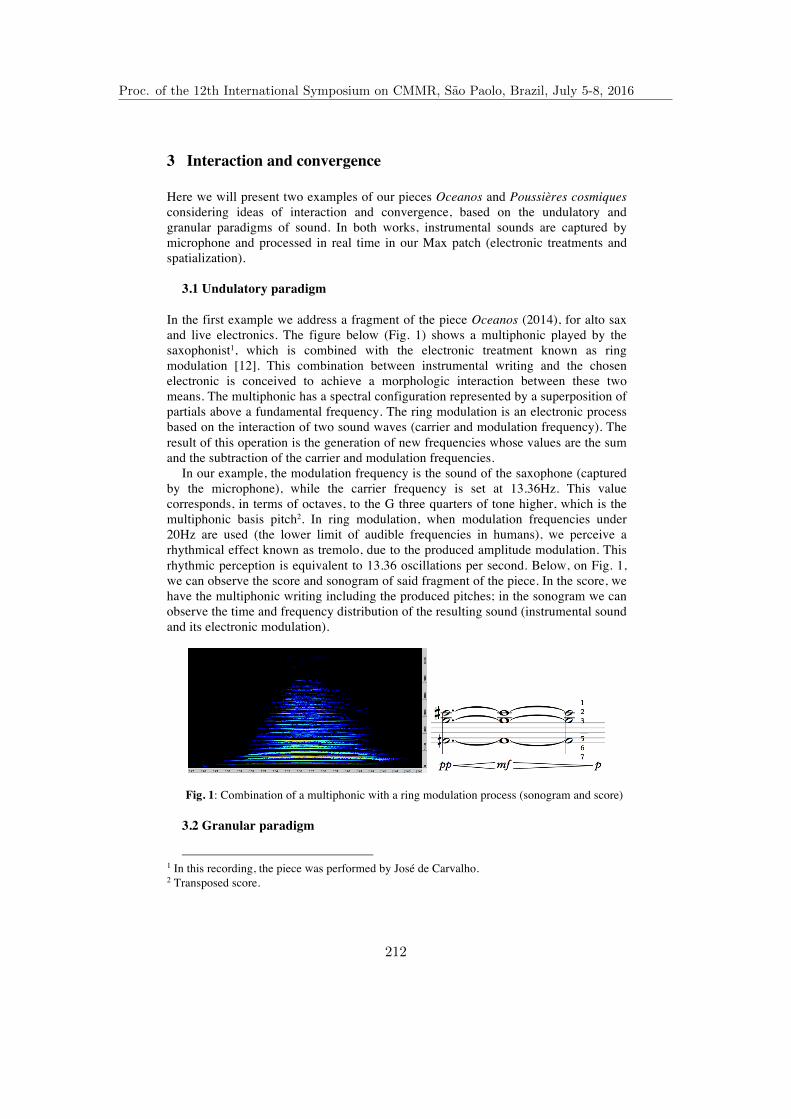
4 Rossetti
3 Interaction and convergence
Here we will present two examples of our pieces Oceanos and Poussières cosmiques considering ideas of interaction and convergence, based on the undulatory and granular paradigms of sound. In both works, instrumental sounds are captured by microphone and processed in real time in our Max patch (electronic treatments and spatialization).
3.1 Undulatory paradigm
In the first example we address a fragment of the piece Oceanos (2014), for alto sax and live electronics. The figure below (Fig. 1) shows a multiphonic played by the saxophonist1, which is combined with the electronic treatment known as ring modulation [12]. This combination between instrumental writing and the chosen electronic is conceived to achieve a morphologic interaction between these two means. The multiphonic has a spectral configuration represented by a superposition of partials above a fundamental frequency. The ring modulation is an electronic process based on the interaction of two sound waves (carrier and modulation frequency). The result of this operation is the generation of new frequencies whose values are the sum and the subtraction of the carrier and modulation frequencies.
In our example, the modulation frequency is the sound of the saxophone (captured by the microphone), while the carrier frequency is set at 13.36Hz. This value corresponds, in terms of octaves, to the G three quarters of tone higher, which is the multiphonic basis pitch2. In ring modulation, when modulation frequencies under 20Hz are used (the lower limit of audible frequencies in humans), we perceive a rhythmical effect known as tremolo, due to the produced amplitude modulation. This rhythmic perception is equivalent to 13.36 oscillations per second. Below, on Fig. 1, we can observe the score and sonogram of said fragment of the piece. In the score, we have the multiphonic writing including the produced pitches; in the sonogram we can observe the time and frequency distribution of the resulting sound (instrumental sound and its electronic modulation).
Fig. 1: Combination of a multiphonic with a ring modulation process (sonogram and score)
3.2 Granular paradigm
1 In this recording, the piece was performed by José de Carvalho. 2 Transposed score.
Proc. of the 12th International Symposium on CMMR, Sao Paolo, Brazil, July 5-8, 2016
212
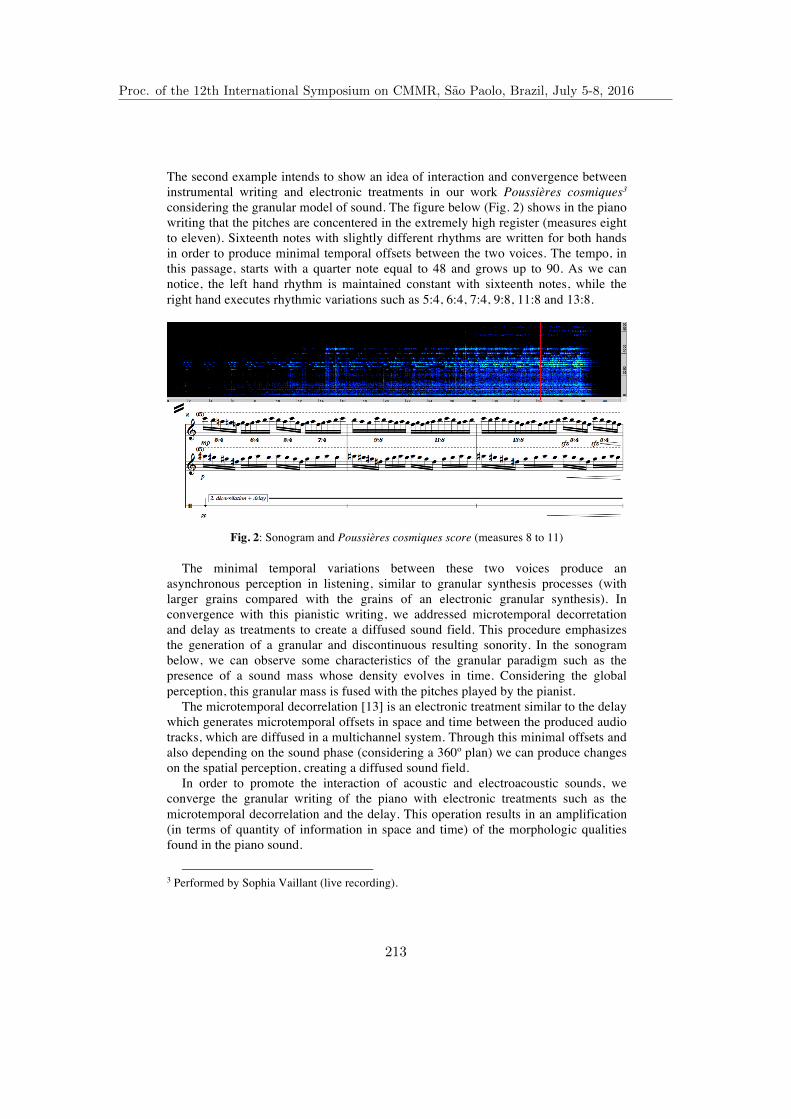
Concepts of Interaction, Convergence and Instrumental Synthesis in Live Electronic Music 5
The second example intends to show an idea of interaction and convergence between instrumental writing and electronic treatments in our work Poussières cosmiques3 considering the granular model of sound. The figure below (Fig. 2) shows in the piano writing that the pitches are concentered in the extremely high register (measures eight to eleven). Sixteenth notes with slightly different rhythms are written for both hands in order to produce minimal temporal offsets between the two voices. The tempo, in this passage, starts with a quarter note equal to 48 and grows up to 90. As we can notice, the left hand rhythm is maintained constant with sixteenth notes, while the right hand executes rhythmic variations such as 5:4, 6:4, 7:4, 9:8, 11:8 and 13:8.
Fig. 2: Sonogram and Poussières cosmiques score (measures 8 to 11)
The minimal temporal variations between these two voices produce an asynchronous perception in listening, similar to granular synthesis processes (with larger grains compared with the grains of an electronic granular synthesis). In convergence with this pianistic writing, we addressed microtemporal decorretation and delay as treatments to create a diffused sound field. This procedure emphasizes the generation of a granular and discontinuous resulting sonority. In the sonogram below, we can observe some characteristics of the granular paradigm such as the presence of a sound mass whose density evolves in time. Considering the global perception, this granular mass is fused with the pitches played by the pianist.
The microtemporal decorrelation [13] is an electronic treatment similar to the delay which generates microtemporal offsets in space and time between the produced audio tracks, which are diffused in a multichannel system. Through this minimal offsets and also depending on the sound phase (considering a 360º plan) we can produce changes on the spatial perception, creating a diffused sound field.
In order to promote the interaction of acoustic and electroacoustic sounds, we converge the granular writing of the piano with electronic treatments such as the microtemporal decorrelation and the delay. This operation results in an amplification (in terms of quantity of information in space and time) of the morphologic qualities found in the piano sound.
3 Performed by Sophia Vaillant (live recording).
Proc. of the 12th International Symposium on CMMR, Sao Paolo, Brazil, July 5-8, 2016
213

6 Rossetti
4 Instrumental synthesis
The definition of instrumental synthesis (synthèse instrumentale) can be found on the well-know text of Grisey [3] (“A propos the la synthèse instrumentale”, 1979, 35 -- 37). In relation to this concept, Grisey states that the advent of electroacoustic music enabled composers to explore and manipulate the morphology of sound in its interior, and then to manipulate the sound in different time scales (from microphonic to macrophonic).
According to Grisey, access to the microphonic universe is only possible through electronic or instrumental synthesis. The electronic synthesis is a microsynthesis because from its different technics (additive synthesis, amplitude, ring or frequency modulation, etc.) we can generate the internal components (partials) of a resulting sound. Instrumental synthesis involves a modelization process where the instrument is used to play each internal component of an analyzed synthetic timbre. In this process, each partial of the analyzed sound is played as a pitch by a determined instrument. Consequently, a new series of partials is produced for each acoustically performed pitch.
In order to describe the instrumental synthesis process employed in our work Diatomées4 (2015) for violin, bass clarinet, harp, percussion and live electronics, we address some considerations of frequency modulation synthesis, according to John Chowning [4]. Frequency modulation is a kind of modulation between two signals (a carrier and a modulating frequency) that produces spectral modifications in the generated timbre along its duration. As Chowning explains, “In FM, the instantaneous frequency of a carrier wave is varied accordingly to a modulating wave, such that the rate at which the carrier varies is the frequency of the modulating wave. The amount of the carrier varies around its average, or peak frequency deviation, is proportional to the amplitude of the modulating wave” (p. 527).
Another quality of FM synthesis is related to the carrier and modulating frequencies and values of index of modulation which fall into the negative frequency domain of the spectrum. These negative values are mixed with components of the positive domain. According to the FM synthesis formula, if the index of modulation corresponds to rational numbers, harmonic spectra are generated, if it corresponds to irrational numbers, inharmonic spectra are generated. In our view, irrational values of indexes of modulation can generate very interesting timbres and constitute a huge universe to be explored. In Diatomées, we employed FM instrumental synthesis procedures from both rational and irrational values of indexes of modulation, which are described below.
In order to generate the main scale of the piece (used in A to C parts), we performed a FM instrumental synthesis from the interval between Bb4 (464Hz) and A2 (110Hz), considering the Bb4 as the carrier and the A2 as the modulating wave. The figure below (Fig. 3) shows the obtained frequencies (and the corresponding pitches) from the first seven modulating indexes (1 to 7). The quarter of tone division of the octave is employed. The arrows indicate slightly deviations in the corresponding pitches (around one eighth of tone).
4 Performed, in this recording, by the Ensemble L’Itinéraire.
Proc. of the 12th International Symposium on CMMR, Sao Paolo, Brazil, July 5-8, 2016
214

Concepts of Interaction, Convergence and Instrumental Synthesis in Live Electronic Music 7
Fig. 3: Main Diatomées scale, generated by FM instrumental synthesis
In the D part (last part of the work), the idea was to apply degree of changing (degré de changement) as proposed by Grisey [3] in his article “Structuration des timbres dans la musique instrumentale” (1991). This is a method to gradually interpolate different timbres in time. The pitches obtained in the first instrumental FM procedure are considered as having an index of modulation value of 1. We gradually distorted the original spectrum from the multiplication of its frequencies by irrational numbers such as 21/5 (1.15), 21/4 (1.25), 21/2 (1.41) and 24/5 (1.74).
In the figure below, we address the new obtained spectra, which are vertically organized and separated in semitones and quarters of tone to provide better visualization. The moment of timbres transition in the piece is highlighted by the presence of Thai gongs notes. This transition also involves pitches from some precedent and posterior measures in order to achieve a gradual interpolation between timbres.
Fig. 4: New timbres obtained from gradual inharmonic distortions of the original spectrum
5 Operations in micro and macro time
Based on the interaction and convergence between instrumental and electroacoustic universes, live electronic music provides innumerous possibilities of new sound generation with aesthetic qualities. These new sound morphologies are the result of timbre fusion between different structures that are perceived as a single unity.
According to our view, concerning the undulatory paradigm in microtime domain (formed by events whose duration is inferior to the note limit), the interaction between acoustic and electroacoustic means is focused in frequency operations. These operations intend to reinforce some partials that are common to both means and also
Proc. of the 12th International Symposium on CMMR, Sao Paolo, Brazil, July 5-8, 2016
215
8 Rossetti
to aggregate new ones in the resultant sound. These operations always consider a continuous timbre.
In relation to the granular paradigm, the interaction is based on discontinuous events, which are mainly modulated by time values. For instance, we can combine a granular electroacoustic texture (with grains up to 100ms of duration) with instrumental grains whose duration is longer. For this purpose, we must imagine instrumental techniques that produce discontinuous sonorities such as the staccato and trills, jeté col legno on strings, or frullato and slap tongue sounds, on aerophonic instruments.
Considering macrotime events (notes and their combination in time), it is possible to apply instrumental synthesis procedures aiming to generate pitches and scales that will be used in the composition process. In terms of form generation, we can apply the idea of timbre interpolation as we approached in Diatomées’s compositional process. Aesthetically interesting timbres can be produced from irrational values of frequency modulation indexes. These spectra can be distributed in different ways in the score, so as to allow timbre interpolation.
In this article, we intended to present different possibilities of interaction and convergence in live electronic music. Based on the operations presented and discussed herein, micro and macrotime issues were approached, in order to produce a formal coherence in the analyzed works. Micro events interfere on each other by means of close contacts between sound particles (grains or partials). At the same time, the macro form is being constituted by means of a continuous modulation, which constitutes the perceived musical form in listening.
References
1. Schaeffer, P.: Traité des Objets Musicaux. Seuil, Paris (1966) 2. Smalley, D.: Spectromorphology: Explaining Sound Shapes. Organized Sound 2, 107--126
(1997) 3. Grisey, G.: Écrits ou l’Invention de la Musique Spectrale. Éditions MF, Paris (2008) 4. Chowning. J.: The Synthesis of Complex Audio Spectra by Means of Frequency
Modulation. J. Audio Eng. Soc. 21, 7, 526--534 (1973) 5. Helmholtz, H.: On the Sensations of the Tone. Dover, New York (1954) 6. Turner, R.S.: The Ohm-Seebeck Dispute, Hermann von Helmholtz, and the Origins of the
Physiological Acoustics. The British Journal for the History of Science 10, 1--24 (1977) 7. Jones. R.K.: Seebeck vs. Ohm, http://wtt.pauken.org/?page_id=1630 8. Meyer-Eppler, W.: Statistic and Psychologic Problems of Sound. Die Reihe 1, 55--61 (1958) 9. Terhardt, E.: Pitch, Consonance, and Harmony. J. Acoust. Soc. Am. 55, 5,1061--1069 (1974) 10. Gabor, D.: Theory of Communication. The Journal of Institution of Electrical Engineers
93, 3, 429--457 (1945) 11. Xenakis, I.: Musiques Formelles. La Revue Musicale Richard Masse, Paris (1962) 12. Bode, H.: The Multiplier-Type Ring Modulator. Electronic Music Review 1, 9--15 (1967) 13. Kendall, G.S.: The Decorrelation of Audio Signals and its Impact on Spatial Imagery.
Computer Music Journal 19, 4, 71--87 (1995)
Proc. of the 12th International Symposium on CMMR, Sao Paolo, Brazil, July 5-8, 2016
216

Musical Communication Modeling Methodology(MCMM):
A theoretical framework for event-basedUbiquitous Music Interaction
Flavio Luiz Schiavoni1 ?
Federal University of Sao Joao Del ReiComputer Science DepartmentSao Joao Del Rei - MG - Brazil
Abstract. This paper introduces Musical Communication Modeling Method-ology (MCMM): a theoretical framework to develop context-aware inter-action in music applications with ubiquitous devices. Music is changingits context everyday and many applications are being developed withoutan easy way to define the interaction and the semantics. The frameworkuses the event-driven model to drive user-to-user interaction based onthe device-to-device communication. The framework itself is a set of ac-tivities and can orient developers to create collaborative and cooperativemusic applications.
Keywords: Ubiquitous Music. Theoretical framework. Context-awaremusic application.
1 Introduction
Computer Science is changing its paradigm from the 1980’s. In the past we hadthe idea of one machine to one person but nowadays it is a common situationthat many people have many devices embedded in a rich environment[3]. Onecan say that Mobile devices are everywhere and the idea of being “always on” isnow part of our daily routine. This situation is explored by ubiquitous music[9],a research field where everyday devices is used to make music.
Music making is a human activity that involves social collaboration and itcan be used as a good metaphor for interaction. Ubiquitous music intends toexplore this natural features of music and the ubiquitous feature of devices ina integrated way, putting together multiple users, devices, sound sources, musicresources and activities[9]. The ubiquitous devices can provide several types
? Author want to thank Alexandre Torres Porres for english proofreading and AntonioD. de Carvalho J. for the assistance on the idea and figures. This work has beensupported by the funding agencies FAPEMIG - Minas Gerais Research Foundationand UFSJ/PROPE.
Proc. of the 12th International Symposium on CMMR, Sao Paolo, Brazil, July 5-8, 2016
217
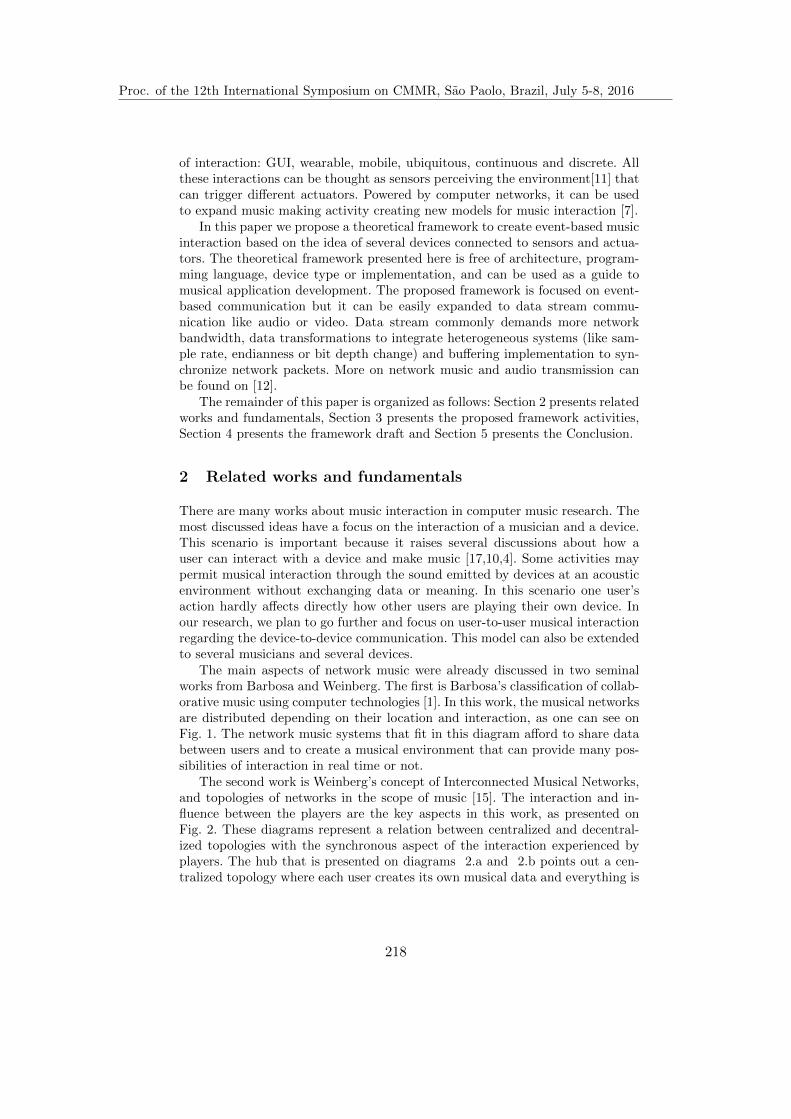
2 Flavio Luiz Schiavoni
of interaction: GUI, wearable, mobile, ubiquitous, continuous and discrete. Allthese interactions can be thought as sensors perceiving the environment[11] thatcan trigger different actuators. Powered by computer networks, it can be usedto expand music making activity creating new models for music interaction [7].
In this paper we propose a theoretical framework to create event-based musicinteraction based on the idea of several devices connected to sensors and actua-tors. The theoretical framework presented here is free of architecture, program-ming language, device type or implementation, and can be used as a guide tomusical application development. The proposed framework is focused on event-based communication but it can be easily expanded to data stream commu-nication like audio or video. Data stream commonly demands more networkbandwidth, data transformations to integrate heterogeneous systems (like sam-ple rate, endianness or bit depth change) and buffering implementation to syn-chronize network packets. More on network music and audio transmission canbe found on [12].
The remainder of this paper is organized as follows: Section 2 presents relatedworks and fundamentals, Section 3 presents the proposed framework activities,Section 4 presents the framework draft and Section 5 presents the Conclusion.
2 Related works and fundamentals
There are many works about music interaction in computer music research. Themost discussed ideas have a focus on the interaction of a musician and a device.This scenario is important because it raises several discussions about how auser can interact with a device and make music [17,10,4]. Some activities maypermit musical interaction through the sound emitted by devices at an acousticenvironment without exchanging data or meaning. In this scenario one user’saction hardly affects directly how other users are playing their own device. Inour research, we plan to go further and focus on user-to-user musical interactionregarding the device-to-device communication. This model can also be extendedto several musicians and several devices.
The main aspects of network music were already discussed in two seminalworks from Barbosa and Weinberg. The first is Barbosa’s classification of collab-orative music using computer technologies [1]. In this work, the musical networksare distributed depending on their location and interaction, as one can see onFig. 1. The network music systems that fit in this diagram afford to share databetween users and to create a musical environment that can provide many pos-sibilities of interaction in real time or not.
The second work is Weinberg’s concept of Interconnected Musical Networks,and topologies of networks in the scope of music [15]. The interaction and in-fluence between the players are the key aspects in this work, as presented onFig. 2. These diagrams represent a relation between centralized and decentral-ized topologies with the synchronous aspect of the interaction experienced byplayers. The hub that is presented on diagrams 2.a and 2.b points out a cen-tralized topology where each user creates its own musical data and everything is
Proc. of the 12th International Symposium on CMMR, Sao Paolo, Brazil, July 5-8, 2016
218

Musical Communication Modeling Methodology (MCMM) 3
Fig. 1: Barbosa’s classification space for collaborative music supported by com-puter systems [1]
grouped on the hub. On the other hand, the decentralized topologies presentedon diagrams 2.c and 2.d indicate a possibility of interaction between users. Inthis way, each user can cooperate directly with the musical material created byanother user, and a defined order may be considered.
(a) (b)
(c) (d)
Fig. 2: Weinberg’s description of network topologies regarding the social organi-zation of players [15]
These works clarify the many spatial organizations of musical interactionsystems over the network structure, but their approaches are focused on high-level classification. Although Weinberg takes care describing the social aspectof players interaction, the musical meaning of the events shared by users is setaside as much as the communication models.
In contrast to application or implementation, in which case the developmentcan reflect a single and closed model, our approach emphasizes an open model tointegrate different applications in a distributed music environment. It does notconsist of a single unified model but a way to map cognitive actions to music in acollaborative way. This approach implies that the mapping outreaches the simple
Proc. of the 12th International Symposium on CMMR, Sao Paolo, Brazil, July 5-8, 2016
219
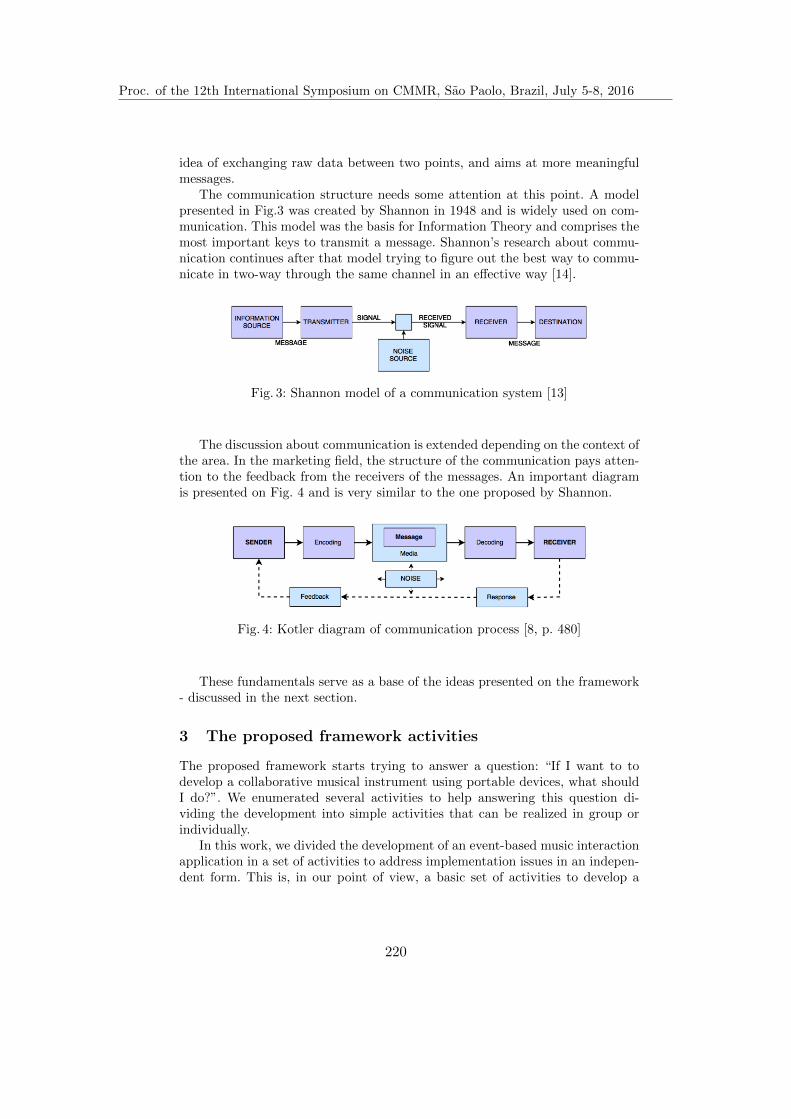
4 Flavio Luiz Schiavoni
idea of exchanging raw data between two points, and aims at more meaningfulmessages.
The communication structure needs some attention at this point. A modelpresented in Fig.3 was created by Shannon in 1948 and is widely used on com-munication. This model was the basis for Information Theory and comprises themost important keys to transmit a message. Shannon’s research about commu-nication continues after that model trying to figure out the best way to commu-nicate in two-way through the same channel in an effective way [14].
Fig. 3: Shannon model of a communication system [13]
The discussion about communication is extended depending on the context ofthe area. In the marketing field, the structure of the communication pays atten-tion to the feedback from the receivers of the messages. An important diagramis presented on Fig. 4 and is very similar to the one proposed by Shannon.
Fig. 4: Kotler diagram of communication process [8, p. 480]
These fundamentals serve as a base of the ideas presented on the framework- discussed in the next section.
3 The proposed framework activities
The proposed framework starts trying to answer a question: “If I want to todevelop a collaborative musical instrument using portable devices, what shouldI do?”. We enumerated several activities to help answering this question di-viding the development into simple activities that can be realized in group orindividually.
In this work, we divided the development of an event-based music interactionapplication in a set of activities to address implementation issues in an indepen-dent form. This is, in our point of view, a basic set of activities to develop a
Proc. of the 12th International Symposium on CMMR, Sao Paolo, Brazil, July 5-8, 2016
220

Musical Communication Modeling Methodology (MCMM) 5
context-awareness application for devices and sensors. Our framework work flowis based on 6 different basic parts, as presented on Fig.5.
Fig. 5: The framework workflow
Like the TCP/IP stack, we arranged different parts of the framework intolayers that are responsible for different activities and abstractions. So, it is pos-sible to describe each activity and each layer as a small problem to be solvedlocally. Furthermore, like the TPC/IP stack, every device would have the samelayered architecture to grant a communication stack and facilitate the messageexchange.
As depicted on Fig.5, we enumerated 6 activities: Input, Output, Time Syn-chronization, Processing, Semantic Meaning and Network Communication. Inthis representation we have only one Input and Output to make it clean andeasy to understand although some devices can have diverse sensors and alsooutputs. Time Synchronization are an optional task and some application de-velopment will not need to use all these activities. The idea of this workflow isto describe the full path to dispatch an event from one device to every deviceconnected to a environment every time a new event occurs on the Input.
3.1 Input (Sensors)
Since we intend to have human interaction, the basic Input in our frameworkis a sensor listener. Sensors are used to map users’ gestures and environmentactivities. It would be possible to have a software input created by an algorithm,another software, or a file, indeed. Since we intend to have users, a sensor is acomputational way to capture or listen to states or changes in user’s activities inthe environment in analog or digital sampling. Sensors can be found embeddedon mobile phones, notebooks, notepads, tablets and also can be attached todifferent devices like Arduino, Galileo or Raspberry Pi [6].
Proc. of the 12th International Symposium on CMMR, Sao Paolo, Brazil, July 5-8, 2016
221
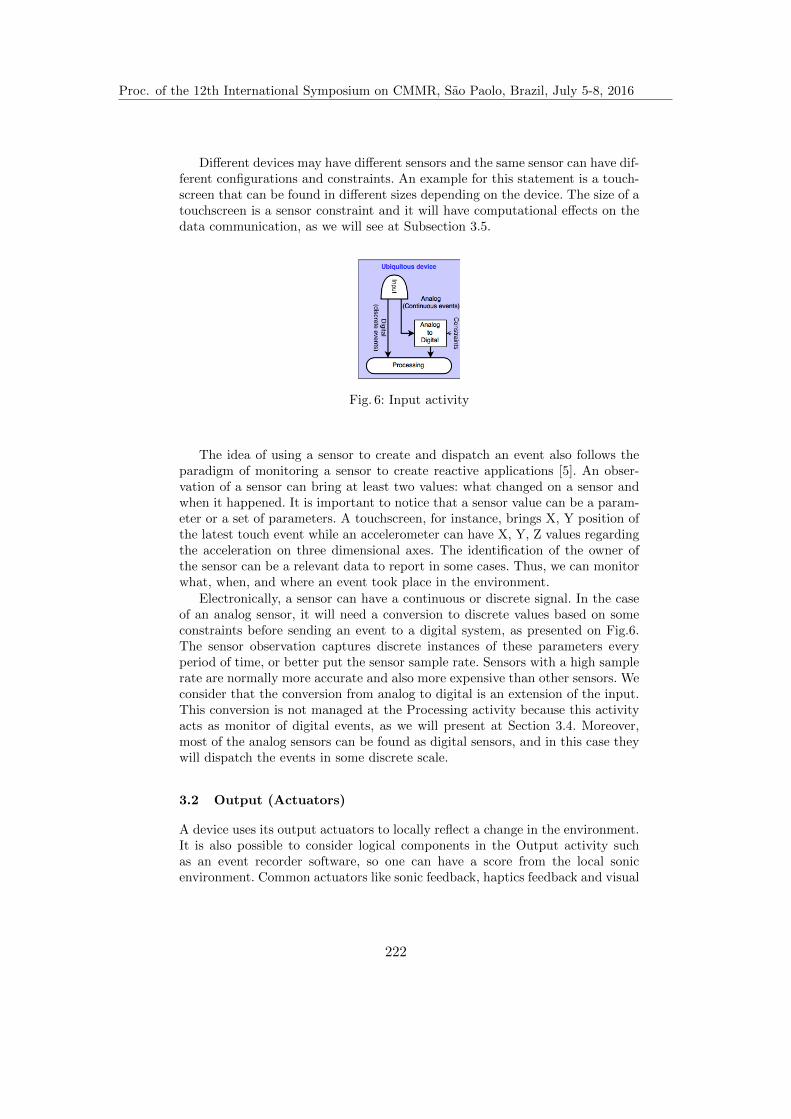
6 Flavio Luiz Schiavoni
Different devices may have different sensors and the same sensor can have dif-ferent configurations and constraints. An example for this statement is a touch-screen that can be found in different sizes depending on the device. The size of atouchscreen is a sensor constraint and it will have computational effects on thedata communication, as we will see at Subsection 3.5.
Fig. 6: Input activity
The idea of using a sensor to create and dispatch an event also follows theparadigm of monitoring a sensor to create reactive applications [5]. An obser-vation of a sensor can bring at least two values: what changed on a sensor andwhen it happened. It is important to notice that a sensor value can be a param-eter or a set of parameters. A touchscreen, for instance, brings X, Y position ofthe latest touch event while an accelerometer can have X, Y, Z values regardingthe acceleration on three dimensional axes. The identification of the owner ofthe sensor can be a relevant data to report in some cases. Thus, we can monitorwhat, when, and where an event took place in the environment.
Electronically, a sensor can have a continuous or discrete signal. In the caseof an analog sensor, it will need a conversion to discrete values based on someconstraints before sending an event to a digital system, as presented on Fig.6.The sensor observation captures discrete instances of these parameters everyperiod of time, or better put the sensor sample rate. Sensors with a high samplerate are normally more accurate and also more expensive than other sensors. Weconsider that the conversion from analog to digital is an extension of the input.This conversion is not managed at the Processing activity because this activityacts as monitor of digital events, as we will present at Section 3.4. Moreover,most of the analog sensors can be found as digital sensors, and in this case theywill dispatch the events in some discrete scale.
3.2 Output (Actuators)
A device uses its output actuators to locally reflect a change in the environment.It is also possible to consider logical components in the Output activity suchas an event recorder software, so one can have a score from the local sonicenvironment. Common actuators like sonic feedback, haptics feedback and visual
Proc. of the 12th International Symposium on CMMR, Sao Paolo, Brazil, July 5-8, 2016
222
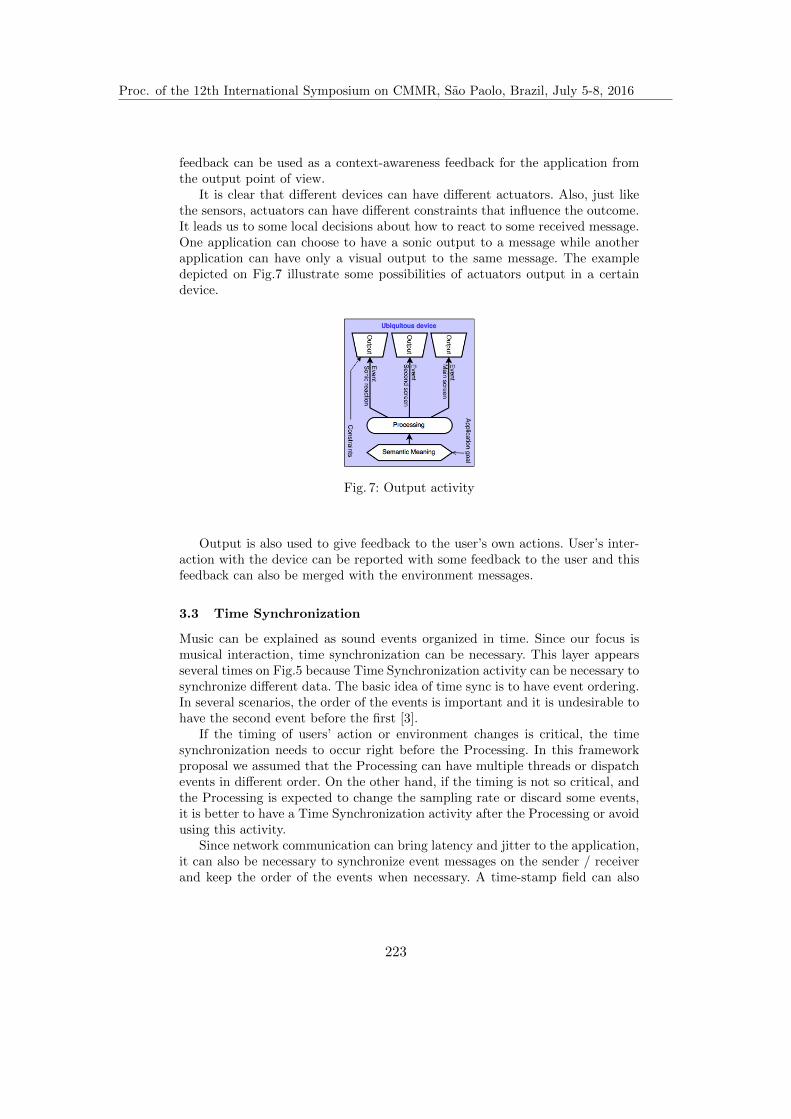
Musical Communication Modeling Methodology (MCMM) 7
feedback can be used as a context-awareness feedback for the application fromthe output point of view.
It is clear that different devices can have different actuators. Also, just likethe sensors, actuators can have different constraints that influence the outcome.It leads us to some local decisions about how to react to some received message.One application can choose to have a sonic output to a message while anotherapplication can have only a visual output to the same message. The exampledepicted on Fig.7 illustrate some possibilities of actuators output in a certaindevice.
Fig. 7: Output activity
Output is also used to give feedback to the user’s own actions. User’s inter-action with the device can be reported with some feedback to the user and thisfeedback can also be merged with the environment messages.
3.3 Time Synchronization
Music can be explained as sound events organized in time. Since our focus ismusical interaction, time synchronization can be necessary. This layer appearsseveral times on Fig.5 because Time Synchronization activity can be necessary tosynchronize different data. The basic idea of time sync is to have event ordering.In several scenarios, the order of the events is important and it is undesirable tohave the second event before the first [3].
If the timing of users’ action or environment changes is critical, the timesynchronization needs to occur right before the Processing. In this frameworkproposal we assumed that the Processing can have multiple threads or dispatchevents in different order. On the other hand, if the timing is not so critical, andthe Processing is expected to change the sampling rate or discard some events,it is better to have a Time Synchronization activity after the Processing or avoidusing this activity.
Since network communication can bring latency and jitter to the application,it can also be necessary to synchronize event messages on the sender / receiverand keep the order of the events when necessary. A time-stamp field can also
Proc. of the 12th International Symposium on CMMR, Sao Paolo, Brazil, July 5-8, 2016
223

8 Flavio Luiz Schiavoni
be used with a local ring buffer to synchronize received events with differentlatency (jitter). In musical interaction through the network, the packet loss is acommon drawback of unreliable connections and the medium can be the sourceof most noise and interference at the communication process. One can imaginea message to start a sound and another message to stop a sound as a commonUse Case to play a musical note, but if the second message is lost, the notewill be played forever. We can also illustrate the same result if the NetworkCommunication delivers the second packet before the first one. On the otherhand, some applications may not have this problem if the events are independent,like play A4 for 1s, and the sonic result is not time aligned.
Another important point is the necessity of defining a clock for the synchro-nization process. Synchronization can be done based on a local clock, a globalclock, a relative time clock, and also a virtual clock adjusted on periodically. Asingle representation of Time Synchronization activity is presented at Fig.8
Fig. 8: Time Synchronization activity
Furthermore, message ordering can be done using an auto-increment for everynew event or attaching a time-stamp field on the event. This activity can holdevents on a buffer before sending in order to assure the synchronization.
3.4 Processing
Sometimes, an Input sensor will keep the same value for a long period of time. Inthis situation, it can be necessary to avoid the generation of several messages tothe environment with the same value. For this reason, a processing of the inputvalue can help to guarantee a new event to update the environment only if thechange in the value is really significant, for example.
Also, it is possible to a) convert a continuous value to a discrete value, b)convert a discrete value into a constrained value based on some rules, c) generatean event only if a change is really significant, d) apply the input constraint to avalue to decide if it is possible to react to an environment change. From digitalsignal processing research we can grab plenty of filters that may be used here incase the data from an event differs from the type of data required to be sent.
A threshold can be applied to a sensor value to estimate a minimum changethat will be reported. A Low Pass Filter can be used to avoid reporting drastic
Proc. of the 12th International Symposium on CMMR, Sao Paolo, Brazil, July 5-8, 2016
224

Musical Communication Modeling Methodology (MCMM) 9
changes of a value and to create a smooth event output. In this way, the Process-ing is responsible to map every user interaction to an event or a group of events,independently of the interaction model[6]. A representation of the Processingactivity in two different situations is presented on Fig.9
Fig. 9: Processing activity
This activity can fit better after an Input or Semantic meaning, dependingon the application context in each device. The events dispatched from SemanticMeaning activity can also be filtered by Processing activity since a message mayneed an adjustment before being sent to the Output. The Processing may be usedto redefine the range of values that an Output will receive after some point. Adrastic pitch change, for instance, can create a glitch effect on the sound, and forthis reason, even when every message changes the pitch value, it can be necessaryto have an interpolation ramp between the previous value and a new one.
3.5 Semantic meaning
The Semantic Meaning activity will map the received message to the specific endfor each actuator to assure a local reflection of this environment change, and inthe end we will have only final meaningful events. This final event must havea semantic meaning instead of a raw value because an isolated event discardsits original context and lacks a semantic meaning. For this reason, a semanticmodel is necessary to associate a particular user interaction and a desired sonicresult. This association is required to: map one or more event to an acousticresult; create a message with semantic meaning, and; normalize or standardizethe data representation [7]. In addiction, semantic models are more abstractthan notations and can decouple the gesture from the acoustic result creating acommon agreement to the environment[3].
Another reason to use a semantic meaning layer considers the device con-straints. If a drum set is played in a touchscreen, for instance, the touch positionmust be mapped to the desired drum pad and this message must be sent to thenetwork and not a single two-dimensional parameter because the drum positionon the screen can vary depending on the device size settings. So far, it is neces-sary to give locally a semantic meaning because only the user’s device knows itsown settings.
Proc. of the 12th International Symposium on CMMR, Sao Paolo, Brazil, July 5-8, 2016
225

10 Flavio Luiz Schiavoni
Fig. 10: Semantic Meaning activity
Since a device can have several sensors, a semantic model can also groupseveral events from one or more sensors into one single message in order togenerate a new unique event. Using this fusion paradigm it is possible to havea more accurate vision of the environment and reflect a more accurate sonicresult. It means that one can acquire user’s position, gesture, localization andother events from available sensors and merge in one single message in the end.This single message can be used to change the audio volume of an instrumentin another point and therefore change the environment with a sonic result.
Another reason to use a semantic meaning layer is related to the applicationconstraint. A touch position from one device can be used to play the piano, thedrums, the xylophone or to control a sequencer, an audio effect or any othermusical instance in other devices. These messages can eventually be interpretedby the second device without any additional mapping since the network messagehas semantic meaning and not X,Y positioning.
From the communication point of view, the event needs to be interpretedby the Semantic Meaning activity considering the application context at thereceiver environment. Although all participants need to talk in the same languageto ensure the communication, the semantic meaning can be used to adapt themessage to another context at a specific environment. In this case, the SemanticMeaning activity at the receiver may or may not share the same semantic modelfrom the sender, but will act in the same way, receiving and mapping severalevents
It can also use different techniques to respond softly to an environment event.Imagining a common instrument played by several musicians, the note pitch canbe defined as an average of the actual value and a received value or it can changeits value on every received message. Altogether, the Semantic Meaning activitywill define a group of messages and send different events through the networkin order to notify the whole distributed environment. Fig.10 presents an overviewof this activity in some possible situations.
Once the group of messages is defined, it is also necessary to define a networkformat to exchange these messages. A network message should be encoded incommon formats, like text-plain, JSON, XML and OSC, before being sent. The
Proc. of the 12th International Symposium on CMMR, Sao Paolo, Brazil, July 5-8, 2016
226

Musical Communication Modeling Methodology (MCMM) 11
latter is considered the most used network data format in music context [16]since it is supported by different music programming languages like Pure Data,CSound or Supercollider and several music applications. Other formats may beapplied, like the byte chunks used by MIDI or any serialization method.
At this point, the codification of the message can also include any cryptogra-phy depending on the medium used. The receiver should be aware of the messageformat, decode the event, interpret the message based on its own semantic model,and create another event to be dispatched by the Semantic Meaning activity.
3.6 Network communication
We need to exchange messages to other users to notify the environment aboutsome new event. In the presented framework, the network communication layeris responsible to exchange messages on the environment. As our aim is to ensurecommunication between many users, a group communication paradigm shouldbe used to fulfill our proposal with specific solutions depending on the commu-nication medium.
Fig. 11: Network Communication activity
In Local Area Networks (LAN), a Broadcast or Multicast addressing method-ology can be used, and for World Area Networks (WAN) communication, a cen-tral relay server is a common solution. Hybrid solutions can mix different networkaddressing methodologies depending on the desired performance structure. Thebuzzword Cloud Computing can be another specific solution that extends thefunctionality of WAN with the addition of distributed servers and cloud services.The Network Communication activity can also be used with technologies thatinterconnect devices in a more direct way. One can cite the wired connections,or the wireless options like Infrared, Bluetooth, and the Wi-Fi Direct.
Network communication turns out to be a critical part of any frameworkwhen a performance using a musical instrument controlled through the networkrequires very precise timing. Thus, network latency and jitter can interfere ad-versely on the application usage. Normally, LAN has lower latency and jitter
Proc. of the 12th International Symposium on CMMR, Sao Paolo, Brazil, July 5-8, 2016
227

12 Flavio Luiz Schiavoni
than WAN but it varies depending on the network infrastructure, number ofdevices, protocol choice and others implementation choices.
All of these alternatives have their own constraints. The selection of the tech-nology depends on the interfaces supported by devices at the sonic environment,and some devices may have more than one interface that can be used at thesame time. Fig. 11 shows the main characteristics of Network Communicationactivity.
4 The framework draft
In this section we present a draft of the MCMM activities. Here we will presenta guideline to start a new application based on this framework. It is necessaryto describe each activity details prior to start developing. In this way you canhave an open view of the constraints of the musical environment, evaluate theapplication goal, come up with solutions for the issues, and have a general rep-resentation of the application developed beforehand.
This theoretical framework comprises a group of ideas that can support thestudy and development of applications for music interaction based on events.We can have some graphical representation like the ones on Figure 12 in orderto better presenting the applications, and we need to use textual descriptionsbased on the draft below if we need to specify the details regarding each activityincluded in the framework We may need to describe other applications that canbe connected or interact with the musical application during a performance incase we want to suggest possible ubiquitous interaction.
Fig. 12: Examples of graphical representation using the framework
1. Input: Read and dispatch values from a sensor or a set of sensors that canmonitor user’s gesture and the environment.– To Define: Sensors and Devices.– Input: Continuous or discrete sensor value.– Output: Discrete sensor value.
2. Output: Use actuators to reflect an environment change or a user’s action.– To Define: Actuators.– Input: Discrete value.– Output: Discrete or continuous value.
Proc. of the 12th International Symposium on CMMR, Sao Paolo, Brazil, July 5-8, 2016
228

Musical Communication Modeling Methodology (MCMM) 13
3. Time Synchronization: Synchronize events based on a clock. Incomingevents can be buffered in order to wait for a specific time.
– To Define: Time sync clock. Buffer type. Localization of the syncs.– Input: Event with or without timing information.– Output: Event with or without timing information. Event on time.
4. Processing: Filter and monitor values.
– To Define: Threshold, ramps and filters.– Input: Raw data in discrete format.– Output: Raw data in discrete format.
5. Semantic Meaning: Transform a raw data into a musical message associ-ating a semantic meaning to an event, or decode a musical message into rawdata before sending to an output. This activity is also called mapping anddepends on the application goal.
– To Define: Application goal. Message format. Message mapping. Con-text.
– Input: Raw data, Message with meaning– Output: Message with meaning, Raw data
6. Network Communication: Send and receive messages from and to theenvironment.
– To Define: Network addressing methodology. Network transport proto-col.
– Input: Message event– Output: Message event
Additionally, some skills may be required by the developers and users of thisframework. For input reading, some skills on sensors and microelectronic mayhelp to deal with the technical aspects of the electronics components. Experi-ence with message packing syntax may help at the mapping activity, and a goodknowledge on network implementation will be necessary to assure a good com-munication between devices. Depending on the application goal, the developersmay need some skills in synthesizer implementation. In addition, the output ma-nipulation depends on the expertise regarding the actuators, while the processingwill be mostly based on DSP fundamentals.
4.1 Case study I: Sensors2OSC
Some applications from music interaction field can be described using this the-oretical framework. In order present our theoretical framework applied in a realcase, we are going to describe an application named Sensors2OSC [2] alreadydeveloped by the authors.
Sensors2OSC is a mobile application that sends all sensors events using OSCthrough the network. A user just needs to select the sensors and set an IP andPort in order to start sending the new events. At another point, we can receivethe OSC messages using any program and use the values to control whatever wewant.
Proc. of the 12th International Symposium on CMMR, Sao Paolo, Brazil, July 5-8, 2016
229

14 Flavio Luiz Schiavoni
Figure 13 presents the application structure with two instances of Sensors2OSCon each side, and a computer music program in the middle. The final contextof an interactive application using Sensors2OSC is described on Table 1. Webelieve that both representations are sufficient in any case.
Fig. 13: Sensors2OSC presented with this framework
Table 1: Sensors2OSC description using MCMM
InputTo define The sensorInput Continuous valuesOutput Digital events
Semantic MeaningTo define OSC address correlated to the sensorInput The sensor ID and valueOutput Message with OSC address
Network CommunicationTo define Unicast or MulticastInput TCP or UDP packetsOutput TCP or UDP packets
Semantic MeaningTo define Interpret OSC addressesInput Message with OSC addressOutput Raw value of the sensor event
ProcessingTo define Optionally the user can filter the valueInput Value of the sensor eventOutput Value of the sensor event
OutputTo define Any synthesizer or programInput OSC messagesOutput Continuous audio signal or program update
4.2 Case study II: Orchidea
The Orchidea is a project focused in the development of an Orchestra of Mobile(Android) Devices, presented in Fig. 14. This project is using MCMM as a baseto the development.
Orchidea Input, initially, is a cellphone touchscreen. Other sensors can beused but our initial development used only the touchscreen. The output is thesound and uses libpd and Puredata patches as the synthesizer. Thus, it was
Proc. of the 12th International Symposium on CMMR, Sao Paolo, Brazil, July 5-8, 2016
230

Musical Communication Modeling Methodology (MCMM) 15
(a) (b)
Fig. 14: Orchidea GUI
possible to detach the sound design from the programming. There are a mes-sage mapping by semantic meaning by instrument development and the networkcommunication uses OSC and multicast.
The development of a new instrument in Orchidea depends on a) the creationof a touchscreen, b) the message definition, c) the synthesizer creation on PureData.
MCMM activities helped this project definition and development and workedas a guide to the application development.
5 Conclusion
In principle, mobile phones were developed for people communication purpose.Once they became pocket computers, they have being used to music makingactivities. Several music making applications were developed focused on a singleuser activity and progressively taking advantage of the communication capabilityof devices.
This paper presented MCMM, a theoretical framework to develop Event-based music applications with a communication layer to allow user-to-user in-teraction based on device-to-device communication. This framework enumerateda group of activities, defined a development workflow and presented some tech-nical issues in every activity.
Since our goal was not focused on implementation details, this frameworkcan be used with any programming language, device type or music applicationtype. Moreover, it can put together in the same musical environment differ-ent applications and devices, from desktop application to notebooks, mobiles orother devices. It is also important to notice that we can also use this frameworkto describe most of the applications already developed for musical interaction.Authors encourage the idea that this framework will serve as an starting pointfor instructing developers and musicians on modeling and sharing the structureof their applications with lay audience and users in a near future.
Proc. of the 12th International Symposium on CMMR, Sao Paolo, Brazil, July 5-8, 2016
231
16 Flavio Luiz Schiavoni
References
1. Barbosa, A.: Displaced soundscapes: A survey of network systems for music andsonic art creation. In: Leonardo Music Journal 13, pp: 53–59 (2003)
2. De Carvalho Junior, A. D. and T. Mayer.: Sensors2OSC. In: Sound and MusicComputing Conference, pp. 209-213. Maynooth (2015)
3. Dix, A. J.: Towards a Ubiquitous Semantics of Interaction: Phenomenology, Scenar-ios, and Traces. In: Proceedings of the 9th International Workshop on InteractiveSystems, Design, Specification, and Verification, DSV-IS 02, pp. 238–252. London,UK, UK, Springer-Verlag (2002)
4. Luciano V. Flores, Marcelo S. Pimenta, Damian Keller. Patterns of Musical Interac-tion with Computing Devices. In: Proceedings of the III Ubiquitous Music Workshop(III UbiMus). Sao Paulo, SP, Brazil: Ubiquitous Music Group (2012)
5. Hinze, A., K. Sachs, and A. Buchmann.: Event-based Applications and EnablingTechnologies. In: Proceedings of the Third ACM International Conference on Dis-tributed Event-Based Systems, DEBS ’09, pp. 1:1–1:15. New York, NY, USA, ACM(2009)
6. Kernchen, R., M. Presser, K. Mossner, and R. Tafazolli.: Multimodal user interfacesin ubiquitous sensorised environments. In: Intelligent Sensors, Sensor Networks andInformation Processing Conference, pp. 397–401 (2004)
7. Malloch, J., S. Sinclair, and M. M. Wanderley.: Libmapper: (a Library for Con-necting Things). In: CHI ’13 Extended Abstracts on Human Factors in ComputingSystems, CHI EA ’13, pp. 3087–3090. New York, NY, USA: ACM (2013)
8. Kotler, P.: Marketing Management, 14th Edition. Prentice Hall (2014)9. Pimenta, Marcelo S., Flores, Luciano V., Capasso, Ariadna, Tinajero, Patricia, and
Keller, Damian.: Ubiquitous Music: Concepts and Metaphors. In: In Proceedings ofthe 12th Brazilian Symp. on Computer Music, pp. 139–150. Recife, Brazil (2009)
10. Radanovitsck, E. A. A.: mixDroid: Compondo atraves de dispositivos moveis.Ph.D. thesis, Universidade Federal do Rio Grande do Sul (2011)
11. Realinho, V., T. Romao, and A. E. Dias.: An Event-driven Workflow Frameworkto Develop Context-aware Mobile Applications. In: Proceedings of the 11th Interna-tional Conference on Mobile and Ubiquitous Multimedia, MUM ’12, pp. 22:1–22:10.New York, NY, USA, ACM (2012)
12. Schiavoni, F. L., and M. Queiroz.: Network distribution in music applications withMedusa. In: Proceedings of the Linux Audio Conference, pp. 9–14. Stanford, USA(2012)
13. Shannon, C. 1948.: A mathematical theory of communication. In: Bell SystemTechnical Journal, The, 27(3):379–423 (1948)
14. Shannon, C. E., et al.: Two-way communication channels. In: Proceedings of 4thBerkeley Symp. Math. Stat. Prob, Volume 1., pp. 611–644 (1961)
15. Weinberg, G.: Interconnected Musical Networks: Toward a Theoretical Framework.In: Computer Music Journal, pp. 29:23–39 (2005)
16. Wright, M.: Open Sound Control: an enabling technology for musical networking.In: Organised Sound, pp. 10:193–200 (2005)
17. Young, J. P.: Using the Web for live interactive music. In: Proceedings of Interna-tional Computer Music Conference, pp. 302–305. Habana, Cuba (2001)
Proc. of the 12th International Symposium on CMMR, Sao Paolo, Brazil, July 5-8, 2016
232

adfa, p. 1, 2016. © Springer-Verlag Berlin Heidelberg 2016
A virtual musical instrument for 3D performance with short gestures
André Montes Rodrigues1, Marcelo Knorich Zuffo1, Olavo da Rosa Belloc1, Regis Rossi Alves Faria1,2
1 Electronic Systems Engineering Department, Polytechnic School, University of São Paulo, São Paulo, Brazil
2 Musical Acoustics and Technology Laboratory, Music Department/FFCLRP, University of São Paulo, Ribeirão Preto, Brazil
{andre.montes.rodrigues,mkzuffo,regis}@usp.br, [email protected]
Abstract. This work presents a new digital virtual instrument, designed and built with 3D interactive technologies aiming to reduce both learning time and difficulty to play musical phrases and chords across the scale. The proposed vir-tual keyboard is built stacking note keys in multiple lines, and the note mapping allows performing musical intervals and patterns with short gestures. This im-plementation employed an Oculus Rift head-mounted display and a Razer Hy-dra for gesture input. The combination of 3D visualization, natural interaction and the proposed mapping can contribute to ease musical performance by al-lowing fast execution of specific note sequences. Our concept encapsulates complexity by creating a fluid way for musicians to perform gesture patterns that would otherwise require non-trivial motor skills.
Keywords: 3D virtual musical instrument, short gesture performance, alterna-tive keyboards
1 Introduction
The main goal of this work is to create a musical instrument that enables easier and faster learning by connecting musical theory to note mapping in an intuitive manner and allowing anyone to play regardless of musical proficiency or physical characteris-tics. Among the factors associated to difficulty of learning of new instruments are physical limitations and the logical, spatial and mechanical complexity in mapping sound to musical patterns. It is assumed that the more clear and intuitive is the map-ping, the less time it takes to learn the instrument. Piano, for instance, is known for its clear and simple layout, but it is one of the most difficult instruments to master due to its particular mapping [1]. A cost-effective and fast approach to design, build and test new concepts towards optimization of note mappings is three-dimensional interactive virtual interfaces.
Virtual reality is having a revival in recent years due to the development of Oculus Rift head-mounted display. In the near future we should expect the rise of new musi-cal instruments using immersive technologies and new generations will likely prefer
Proc. of the 12th International Symposium on CMMR, Sao Paolo, Brazil, July 5-8, 2016
233

to use contemporary technologies which they are familiarized with. Such technologies can definitely contribute to modernization of music creation and performance and further integration with other forms of arts, however, their capabilities and potentials are still not adequately assessed.
Literature suggests that is rather simple to pack several features in virtual instru-ments, although they are quite often unstable and difficult to learn - new interfaces should be harmonized to human minds and bodies [1]. Means to greatly improve mapping transparency are well-designed interfaces, visual and tactile feedbacks and it is also recommended to have a physical piece to handle, which should be portable and aesthetically designed [2]. Interactive instruments may also allow for anyone to par-ticipate in musical processes, from the most talented to the most unskilled of the large public [3]. However, as some players exhibit "spare bandwidth", new instruments should have a "low entry fee" with no limits on virtuosity [4]. Still, according to Cook, full freedom is not a virtue and customization should be controlled [5].
Gesture based instruments stands out as a promising approach to tackle the major issues and to conform to the best practices identified above. A review of NIME pro-ceedings reveals several projects that explore gestures to control sound [6]. Airstick [7] and Termenova [8] are Theremin-style instruments, but the latter introduced laser guides as an improvement, offering the user a perceivable spatial structure. Future Grab [9] employs a data glove and Poepel et al. [10] relies on mouth expressions and arms gestures to control a vocal synthesizer. Leap Motion is adopted on AirKeys [6] and Digito [11] uses depth cameras to capture tap gestures, so the user can choose discrete notes in 3D space in a chromatic keyboard. As we can see, such projects are focused in developing and testing specific interaction methods, not comprehensive solutions for the aforementioned issues. Whenever visual feedback is provided it is accomplished in two dimensions with conventional monitors. It should also be no-ticed that mapping is not a relevant concern. However, research suggests that map-ping is accountable for most of the difficulty to learn and play an instrument [12].
Hunt et al. recommends that mapping should preserve flow and fun [12]. Indeed, creating a good mapping is hard because it is a multidimensional problem. Many note mappings, keyboards and interface layouts have been proposed throughout the history of musical instruments, so to overcome limitations such as difficulty to stretch beyond octaves (due to the large distance of the keys) and to transpose without changing the fingering (resulting in each chord having the same shape and same fingering regard-less of key). The harmonic table note layout, for instance, known since the 18th centu-ry [13], is a tonal array of notes disposed in a symmetrical hexagonal pattern, where the musician can play a sequence of minor thirds ascending along the diagonal axis at left, a sequence of major thirds along the diagonal axis at right, a sequence of fifths along the vertical axis, and a semitone sequence moving on the horizontal. Another example is the Wicki-Hayden layout [13], also a hexagonal lattice with stacks of ma-jor scales arranged in a manner that octave intervals are played along the vertical axis, the left-diagonals cross sequences of fourths, the right diagonals cross fifths intervals, and the notes on the horizontal are separated by a whole-tone. A famous hexagonal isomorphic keyboard is the Jankó's layout, patented in 1885 [13]. With a different combination of the CDE and FGAB groups of notes, this layout may have 4-row up to 6-row implementations, and there is no change in the use of white keys for natural tones and black for sharps and flats. Its neighboring keys on the horizontal row are
Proc. of the 12th International Symposium on CMMR, Sao Paolo, Brazil, July 5-8, 2016
234

distant a whole tonal step, and on the vertical row they are distant a half step (semi-tone).
The mentioned layouts bring advantages in facilitating learning, composing and playing specific music styles, however, they also present some disadvantages, such as costly mechanical implementations and paradoxically vicious playing behavior, as reported in the literature and that are beyond the scope of this paper. However, count-ing with the inherent configurability and cheap implementation allowed by digital virtual instrumentation, one should reconsider nowadays this balance. When design-ing new musical instruments one should pursue improvements and expansion in play-ability and expression. As already noted, none of the aforementioned gestural instru-ments proposed proper solutions for visual feedback or simpler mapping schemes. In this context, we believe that virtual reality methods can tackle feedback issues, which could facilitate mastering some incredible instruments that did not succeed in the past due to, among other things, the required amount of time and effort to master them.
The unique contribution of this work to improvement of gestural instruments is the explicit and designed combination of 3D visual feedback and a mapping optimized for continuous movements. Our approach was to adopt a reconfigurable virtual in-strument to test alternative keyboard layouts that could make easier to traverse inter-vals across the scale, minimizing the path or gestural trajectories in playing phrases and chords, to achieve a particular note mapping that can leverage low-level music knowledge by providing a high-level interface.
In the next section the main concepts of the proposed system are presented in de-tail, followed by a complete description of the current implementation.
2 Design and Operational Concepts
Assuming that reducing the complexity of learning and performance depends on a good correspondence between execution patterns and musical patterns, the main di-rective for our proposal is that an instrument should be more musical than mechani-cal, strengthening the concept of pattern as a solid musical foundation. An essential assumption is that there are finite musical patterns, obvious in the chords and arpeg-gios, but not so obvious in the sequences of single notes. The patterns are finite, but their combination provides varied musical results. Thus, our proposal approaches an 'interpreted' virtual musical instrument, which incorporates low-level musical knowledge, accessed by a high-level interface.
Our strategy adopted agile development concepts, considering rapid user feedback and incremental improvements. The design was based on three pillars, detailed below.
Bi-manual interaction. Despite the possibility of using arm movements, legs, torso and head, we did not come across coherent proposals that would use such movements at this stage and the development team suggested that it could easily incur into unde-sired complexities and cognitive loads, due to several degrees of movement to deal with. Traditional instruments typically embed physical references to avoid the musi-cian getting lost. The adoption of two 3D cursors, each controlled by one hand, sought to reduce the cognitive load to position in space, reducing the need for physical refer-ence elements.
Proc. of the 12th International Symposium on CMMR, Sao Paolo, Brazil, July 5-8, 2016
235

Note mapping to simplify the execution of musical patterns. Considering single notes, in practice, musical expressiveness is directly dependent on the execution fluid-ity of several patterns, from fast scale sequences to intervals and arpeggios. One need to be able to execute jumps with consistency, speed and precision. Considering that transitions between individual notes (e.g. in intervals, octaves and arpeggios) may be difficult to perform with successive gestures, the choice was to locate notes in space so as to maximize movement continuity in the execution of patterns, i.e. avoiding large jumps and abrupt gestural transitions.
The first decision to achieve this in our system is the usage of stacked and shifted redundant keyboards, a recurrent idea in the design of isomorphic keyboards. Differ-ent from usual isomorphic keyboards, our implementation deals with a square lattice where a note has other 8 as neighbors.
The second decision is based on the assumption that traditional western music gen-erally adopts a single heptatonic scale. In fact, despite variations in the number of notes in a scale, most songs adopt specific scales, and their execution benefits from a specific layout. This assumption allows simplification of keyboard layouts. Being able to remove unused notes reduces jumping frequency during execution, but on the other side, demands the choice of a specific scale.
In the current configuration the scale and tonal distance between notes follow the pattern of a diatonic major scale. We opted for five stacked keyboards, two above and two below the base octave. A two note shift was chosen (fig. 1) in order to maximize the amplitude of intervals that can be played in continuous movements, as shown in figure 2 and 3. One can see that the choice for the number of shifts can minimize the path to play distant notes (fig. 2).
Fig. 1. Stacking note keys in multiple lines. The central line is the base octave. The octave above is shifted forward by two displacements and the one below shifted backwards.
Fig. 2. The impact on playability of different interval distances considering the number of shifts. The kernel is a diatonic major scale (natural tones, the white notes on a traditional key-board) and the distances are shown in diatonic tone shifts for this scale.
Proc. of the 12th International Symposium on CMMR, Sao Paolo, Brazil, July 5-8, 2016
236

This phased replication of the kernel scale allows executing various intervals and sequences of notes only by crossing a spatial cursor throughout neighboring notes, reducing therefore the need for jumps (fig. 3).
Fig. 3. Comparing gestural tracks of phrases played on the piano keyboard and on this work. Notice the shorter path to play some intervals due to the arrangement of keys.
Gesture-mapped chords. There are often numerous variations for each type of chord in traditional instruments. This leads to greater execution complexity because the player must know not only the chord type, but how to play it. Considering that the logic of isolated chords and notes, although related, are distinct, it was decided to create two modes (e.g. solo and chord) but only in conceptual terms, avoiding discon-tinuities in the instrument. The user choose the type of chord (minor, major, seventh, etc.) and the note to play in one direct movement. It was possible to encode the main types of chords in few positions. From these basic chords, using both hands, one can create variations by adding isolated notes. It is also assumed that transition between chords are slower than between individual notes and that chords, in several situations, serve only as "base" for the music. Thus, it would still be possible to play the basic chords with one hand while soloing with the other or playing more complex chords with both hands. Although there are ways to increase the combinatorial possibilities (e.g. using buttons) it was decided to map chords with gestures so to maintain sim-plicity and consistency within the interface.
3 System Implementation Description
The virtual instrument (fig. 4) was implemented in the Unity 3D cross-platform en-gine and development environment (unity3d.com) using the Razer Hydra motion-sensor controller as user interface (sixense.com/razerhydra) and the Oculus Rift DK2 for display, a well-known head-mounted virtual reality system to immerse the user inside a 3D virtual environment (www.oculus.com). The sound was synthesized using a MIDI-controlled synthesizer invoked by Pure Data (Pd) and played through 2 loud-speakers. A Kalimba timbre was used as a reference to this interesting instrument but this can be easily changed. It should be stressed that the design of the instrument sought to be generic enough to allow the use of other interfaces that capture gestures, such as infrared or magnetic trackers as the Leap Motion (www.leapmotion.com) and the Kinect motion-sensor. The Razer Hydra magnetic tracked joysticks proved to be one of the best choices when it comes to precision and range. If compared to Leap
Proc. of the 12th International Symposium on CMMR, Sao Paolo, Brazil, July 5-8, 2016
237

Motion, the magnetic sensor is robust and seldom suffers from interference (especial-ly from infrared sources), capturing position, tilt and yaw of the hand, offering also several buttons to ease system debugging. The work of Han & Gold [6] discusses other limitations of the Leap Motion device for gesture-based virtual instruments.
Fig. 4. System diagram (left). a) computer; b) Razer Hydra tracked joysticks; c) Oculus Rift DK2 head-mounted display; d) speakers. View portraying the system in use (right).
The prototype interface (fig. 4) demonstrates the basic features of the proposed in-strument showing a virtual scene on the monitor. The user interacts using Razer Hy-dra’s joysticks, which capture the position and rotation of both hands. The virtual world is displayed on the Oculus Rift. The choice of such devices implies a limited action range, defined by the range of the magnetic tracker and also the range of wires.
In the virtual world a keyboard with a pre-defined scale arrangement is available. The layout follows a planar principle in its main part, but uses the third dimension to provide additional octaves in layers. It is important to recall that the keyboard is re-dundant to allow flexibility in playing gesture patterns (matching musical patterns). Ideally, the user should gravitate near the reference octave (highlighted in the visual) and use redundant lines of octaves to facilitate playing. However, as with string in-struments that have redundancy in the notes, one can freely choose the approach to play and thus gestural trajectory. By capturing the keyboard operational rationale and acquiring proficiency in the instrument, one can get liberated of the reference octave.
Interaction is implemented with two three-dimensional cursors that follow the us-er's hands. To play a single note one must place the cursor on a specific note (observ-ing the right depth) and press the joystick trigger with the index finger (see fig. 4), which allows for sustaining. When the trigger is released the note stops playing. Se-quences of notes can be played by holding the trigger and dragging the joystick in the direction of the other notes. Although this instrument can be played like a xylophone, this keyboard concept allows for agile jumps across notes without unbalancing the motion path.
For chords the user must first hover over the desired note and then choose the chord type by wrist angle. The chosen chord is indicated by a sign. In the neutral hand position, as exemplified in figure 4 (left hand), one can only play single notes.
Proc. of the 12th International Symposium on CMMR, Sao Paolo, Brazil, July 5-8, 2016
238

4 Preliminary Results and Usability Discussions
The first prototype was presented and tested by several expert users in the 3DUI Con-test of the 2015 IEEE symposium on 3D user interfaces [14]. Since this is an ongoing work and there is much room for investigation, preliminary discussions at this stage addressed mainly usability and user behaviour.
Inexperienced subjects on music reported fast learning and enjoyment while exper-imenting with the interface, although hitting the right depth in three dimensions was sometimes challenging. Subjects already familiarized with music were able to per-form fast complex note sequences and enjoyed the 3D trace of the cursor arguing that this visual feedback induces better fluency and gracious gestures. Most users attribut-ed faster learning to the proposed keyboard, after a habituation period. It was also noticed that interaction simplicity allows seamless porting to other devices (Leap Motion, trackers, Kinect or cameras).
As pointed out by some users most songs call for intermittent or persistent acci-dents on scale (reducing or augmenting one or more notes in a half tone), a feature not already supported on the system. This can be easily solved with incremental gestures for sharp/flat tones or by exploring depth during the execution.
5 Concluding Remarks and Future Work
The proposed instrument intended to tackle essential issues on virtual instrumentation design for music, focusing on learning speed, accessibility, playability and also exe-cution joyfulness. To achieve this, the resulting solution sought to improve the match-ing between musical and gestural patterns by restricting the access to a specific user defined scale, coupled with note redundancy and customizable tuning. As discussed in this article, this concept is supported by the fact that most conventional songs adopt compositional patterns. If an instrument is able to capture such patterns, execution is extremely simplified and the essence of music is grasped easier. Feedback from inter-action experts indicate that this strategy can speed learning and ease execution of chords and patterns such as intervals, but more testing and rigorous experiments are necessary to assess our claims, in particular, whether an interpreted instrument can effectively reduce the cognitive load imposed on the player.
Furthermore, there is plenty of room for improvements. One advantage of virtual instruments over traditional ones is their flexibility and possibility for customization. Ideally, the instrument can implement different scale modes, and shifts can be pro-grammed for as many different lines and displacements as wanted, which should be chosen before the execution of a song. The player may also save the playing path in a preparation stage, traditionally carried out when learning a new song.
Currently the main concern is to improve the 3D interface to ensure gestural flow simplicity and effectiveness in note execution. Actual keyboard is still fixed and the scale is pre-defined. Future improvements are the implementation of an agile method for changing scales, for songs that change tonal keys or just to speed up the transition map from one song to another. Other improvements include implementing n-tone
Proc. of the 12th International Symposium on CMMR, Sao Paolo, Brazil, July 5-8, 2016
239

scales to investigate isomorphic keyboard layouts and to explore and take advantage of the virtual space around the instrument.
Acknowledgments. This research has been partially supported by CNPq Brazilian National Research Council, DT Productivity Grant process 311681/2012-3. The au-thors would like to thank Gabriel Roque, Mario Nagamura, Luiz Paulucci, Marcio Cabral and Tainá Saboia for the substantial contribution to this work.
References
1. Fels, S.: Designing for intimacy: creating new interfaces for musical expression. Proceed-ings of the IEEE, 92(4):672–685, Apr (2004).
2. Fels, S. , Lyons, M.: Creating new interfaces for musical expression: Introduction to NIME. In: ACM SIGGRAPH 2009 Courses, SIGGRAPH ’09, ACM, New York, NY (2009).
3. Chadabe, J.: The limitations of mapping as a structural descriptive in electronic instru-ments. In: Proc. of the 2002 Conf. on New Int. for Mus. Express (NIME 2002), Dublin, Ireland (2002).
4. Wessel, D., Wright, M.: Problems and prospects for intimate musical control of computers. Computer Music J., 26(3), Sept. (2002).
5. Cook, P.R.: Laptop orchestras, robotic drummers, singing machines, and musical kitchen-ware: Learning programming, algorithms, user interface design, and science through the arts. J. Comput. Sciences in Colleges, vol. 28 Issue 1, Oct. (2012).
6. Han J, Gold N.: Lessons learned in exploring the Leap Motion TM sensor for gesture-based instrument design. In: Proc. of the 2014 Conf. on New Int. for Mus. Express. (NIME 2014) , London, United Kingdom (2014).
7. Franco, I.: The AirStick: a free-gesture controller using infrared sensing. In Proc. of the 2005 Conf. on New Int. for Mus. Express. (NIME 2005), Vancouver, BC, Canada (2005).
8. Hasan, L et al.: The Termenova: a hybrid free-gesture interface. In: Proc. of the 2002 Conf. on New Int. for Mus. Express (NIME 2002), Dublin, Ireland (2002).
9. Han, Y., Na, J., Lee, K.: Futuregrab: A wearable synthesizer using vowel formants. In: Proc. of the 2012 Conf. on New Int. for Mus. Express. (NIME 2012), Ann Arbor, Michi-gan (2012).
10. C. Poepel, J. Feitsch, M. Strobel, and C. Geiger.: Design and evaluation of a gesture con-trolled singing voice installation. In: Proc. of the 2014 Conf. on New Int. for Mus. Express. (NIME 2014), London, United Kingdom (2014).
11. Gillian, N., Paradiso, J. A.: Digito: A fine-grain gesturally controlled virtual musical in-strument. In: Proc. of the 2012 Conf. on New Int. for Mus. Express. (NIME 2012), Ann Arbor, Michigan (2012).
12. Hunt, A., Wanderley, M.M., Paradis, M.: The importance of parameter mapping in elec-tronic instrument design. In: Proc. of the 2002 Conf. on New Int. for Mus. Express (NIME 2002), Dublin, Ireland (2002).
13. Steven, M., Gerhard, D., Park, B.: Isomorphic tessellations for musical keyboards. In: Proc. of Sound and Music Comp. Conf. (2011)
14. Cabral, M., et al. Crosscale: A 3D virtual musical instrument interface. In: R. Lindeman, F. Steinicke and B. H. Thomas (eds.). In: 3DUI (pp. 199-200), IEEE (2015).
Proc. of the 12th International Symposium on CMMR, Sao Paolo, Brazil, July 5-8, 2016
240
Using sound to enhance taste experiences: An overview
Felipe Reinoso Carvalho1,2, Prof. Abdellah Touhafi1,
Prof. Kris Steenhaut1, Prof. Raymond van Ee2,3,4, & Dr. Carlos Velasco5
1. Department of Electronics and Informatics (ETRO), Vrije Universiteit Brussel, Belgium
2. Department of Experimental Psychology, KU Leuven, Belgium. 3. Donders Institute, Radboud University, Nijmegen, Netherlands
4. Philips Research Labs, Eindhoven, Netherlands 5. Crossmodal Research Laboratory, Oxford University
* Correspondence:
Felipe Reinoso Carvalho ([email protected]) Vrije Universiteit Brussel, ETRO
Pleinlaan 2, 1050 , Brussels, Belgium Abstract We present an overview of the recent research conducted by the first author of this article, in which the influence of sound on the perception of taste/flavor in beer is evaluated. Three studies in total are presented and discussed. These studies assessed how people match different beers with music and the influence that the latter can have on the perception and enjoyment of the beers. In general, the results revealed that in certain contexts sound can modulate the perceived strength and taste attributes of the beer as well as its associated hedonic experience. We conclude by discussing the potential mechanisms behind these taste-flavor/sound interactions, and the implications of these studies in the context of multisensory food and drink experience design. We suggest that future work may also build on cognitive neuroscience. In particular, such an approach may complement our understanding of the underlying brain mechanisms of auditory/gustatory interactions. Keywords: sound, music, taste, beer, perception, multisensory experiences
Proc. of the 12th International Symposium on CMMR, Sao Paolo, Brazil, July 5-8, 2016
241

1. Introduction Chefs, molecular mixologists, food designers, and artists, among other professionals working in the food industry, are increasingly looking at the latest scientific advances in multisensory flavor perception research as a source of inspiration for the design of dining experiences [26,29,30] (see [42], for a review). A number of recent studies have highlighted the idea that the sounds that derive from our interaction with the food (e.g., mastication; see [55]), can be modulated in order to enhance the sensory and hedonic aspects associated with the experience of eating and drinking, (e.g. [10,44,46]; see [41] for a review). What is more, there is also a growing consensus that the sounds and/or noise that occurs in the places where we eat and drink - such as restaurants and airplanes - can dramatically affect our perception of taste and flavor of foods and drinks ([27,28,43]; see [39,41,42] for reviews). Indeed, it has been demonstrated that several acoustic parameters that define the quality of an auditory space, such as the reverberation time of a room and the level of background noise [1,15], can affect the perception of foods; for example, in terms of how sweet or bitter they taste (e.g.,[11,48,54]; see [40], for a review of the influence of noise on the perception of food and drink). Here, we present an overview of studies recently developed by the lead author of the present research, which assesses the influence of sound on taste1/flavor perception of alcoholic beverages. Three studies using beer as taste stimulus are introduced. The first assessed how the participants matched different beer flavors with frequency tones. The second studied how different customized auditory cues would modulate the perception of the beer’s taste. Finally, the third study evaluated how the beer’s hedonic experience can be influenced by a song that was presented as part of the multisensory beer experience. Moreover, we conclude this review by discussing the potential mechanisms behind these taste/sound interactions, and the implications of these assessments in the context of multisensory food and drink experience design. We suggest that future work may rely on cognitive neuroscience approaches in order to better understand the underlying brain mechanisms associated with the crossmodal correspondence between taste/flavor and sound. 2. Looking for beer-pitch matches Recently, we have conducted a study designed to assess how people associate the taste of beers with auditory pitch [30]. Here, the participants were asked to choose the frequency that, in their opinion, best matched the taste of each of three Belgian bitter-dry beer types. Chemically, Jambe de Bois (Beer 1) is almost as bitter as Taras Boulba (Beer 2), but its full body and malt dominance may result in it being perceived as sweeter. Therefore, Jambe de Bois can be considered to be the sweetest of the three beers, while Zinnebir (Beer 3) comes out second due to its alcohol-plus-malt formula. The auditory stimuli consisted of a digital version of an adjustable frequency tone generator. Using an online tone generator (Retrieved from http://plasticity.szynalski.com/tone-generator.htm, February, 2015), the participants were asked to choose the tone frequencies that in their opinion were most suitable for the taste of the beers. Figure 1 shows an image of the graphic interface. This study included three experiments. In Experiment 1, the participant’s ratings were based on a wide range of choices (50-1500Hz). Here, their results suggested that the three beers were ‘tuned’ around the same pitch (see Figure 1). However, in Experiment 2, the addition of a soft drink beverage alongside two of the beers, verified the fact that the participants matched the beers toward the lower end of the available range of frequencies, and the soft drink toward a higher tone (see Figure 1). Note that, in Experiments 1 and 2, the majority of the results fell within a much narrower range than what was available to choose from. Consequently, in Experiment 3, the range of frequencies was reduced to 50-500Hz. Under the new frequency range, the obtained means - and medians - were matched to tones in the same frequency range, as those medians that derived from Experiments 1 and 2 (see Figure 1).
1 By taste we refer to the basic components that are mostly captured by the tongue (sweetness, saltiness, bitterness, sourness and umami). Flavor, on the other hand, is a more complex experience that also involves, at least, retro nasal olfaction.
Proc. of the 12th International Symposium on CMMR, Sao Paolo, Brazil, July 5-8, 2016
242
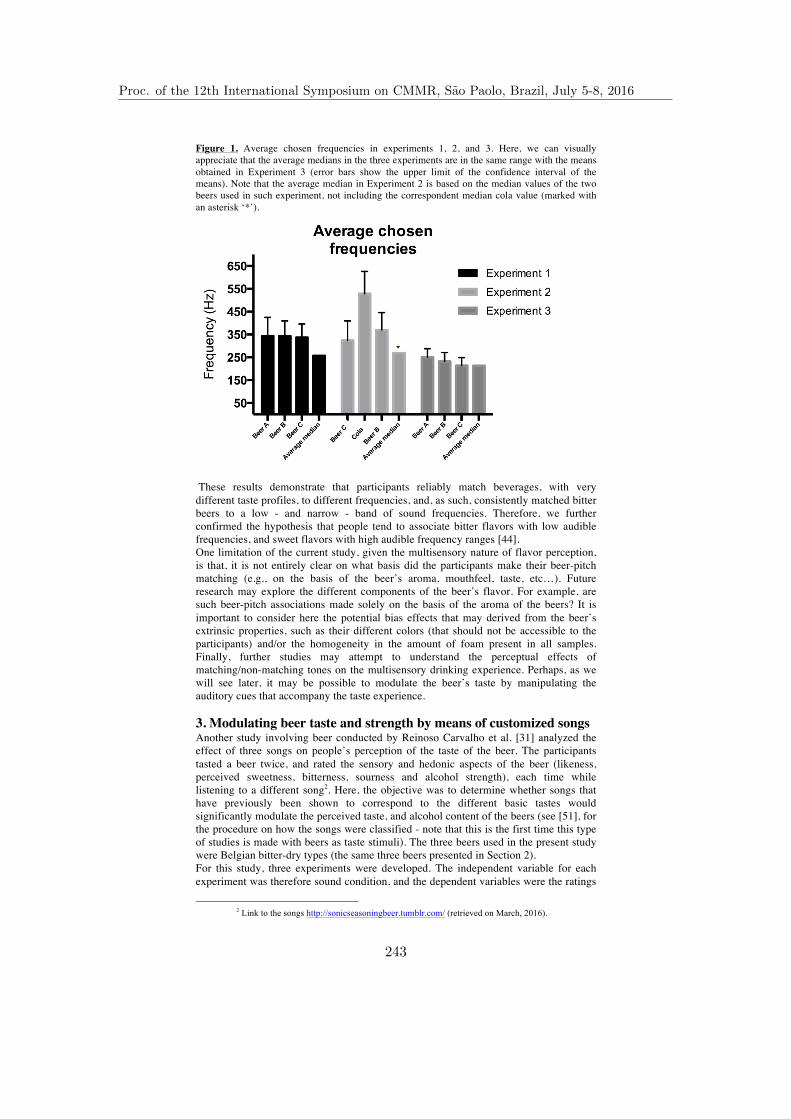
Figure 1. Average chosen frequencies in experiments 1, 2, and 3. Here, we can visually appreciate that the average medians in the three experiments are in the same range with the means obtained in Experiment 3 (error bars show the upper limit of the confidence interval of the means). Note that the average median in Experiment 2 is based on the median values of the two beers used in such experiment, not including the correspondent median cola value (marked with an asterisk ‘*’).
These results demonstrate that participants reliably match beverages, with very different taste profiles, to different frequencies, and, as such, consistently matched bitter beers to a low - and narrow - band of sound frequencies. Therefore, we further confirmed the hypothesis that people tend to associate bitter flavors with low audible frequencies, and sweet flavors with high audible frequency ranges [44]. One limitation of the current study, given the multisensory nature of flavor perception, is that, it is not entirely clear on what basis did the participants make their beer-pitch matching (e.g., on the basis of the beer’s aroma, mouthfeel, taste, etc…). Future research may explore the different components of the beer’s flavor. For example, are such beer-pitch associations made solely on the basis of the aroma of the beers? It is important to consider here the potential bias effects that may derived from the beer’s extrinsic properties, such as their different colors (that should not be accessible to the participants) and/or the homogeneity in the amount of foam present in all samples. Finally, further studies may attempt to understand the perceptual effects of matching/non-matching tones on the multisensory drinking experience. Perhaps, as we will see later, it may be possible to modulate the beer’s taste by manipulating the auditory cues that accompany the taste experience. 3. Modulating beer taste and strength by means of customized songs Another study involving beer conducted by Reinoso Carvalho et al. [31] analyzed the effect of three songs on people’s perception of the taste of the beer. The participants tasted a beer twice, and rated the sensory and hedonic aspects of the beer (likeness, perceived sweetness, bitterness, sourness and alcohol strength), each time while listening to a different song2. Here, the objective was to determine whether songs that have previously been shown to correspond to the different basic tastes would significantly modulate the perceived taste, and alcohol content of the beers (see [51], for the procedure on how the songs were classified - note that this is the first time this type of studies is made with beers as taste stimuli). The three beers used in the present study were Belgian bitter-dry types (the same three beers presented in Section 2). For this study, three experiments were developed. The independent variable for each experiment was therefore sound condition, and the dependent variables were the ratings
2 Link to the songs http://sonicseasoningbeer.tumblr.com/ (retrieved on March, 2016).
Proc. of the 12th International Symposium on CMMR, Sao Paolo, Brazil, July 5-8, 2016
243

that the participants made for each beer. In Experiment 1, the participants tasted Taras Boulba while listening to the sweet and bitter songs. In Experiment 2, they tasted the Jambe de Bois beer while listening to the sweet and sour songs. In Experiment 3, the participants tasted Zinnebir while listening to the sour and bitter songs. Each beer was assigned to the experiment with the songs that expressed the most prominent taste in the beer. Therefore, Taras Boulba, which was ranked as the most bitter, was used in Experiment 1, where the bitter and sweet songs were played. Jambe de Bois, which was ranked as the sweetest, was used in Experiment 2, where the sweet and sour songs were played. Zinnebir, which was ranked in-between the two other ones, in both scales, was used in Experiment 3, where the bitter and sour songs were played. The songs were presented in a counterbalanced order. The songs were found to influence the participants’ rating of the taste and strength of the beer (see Figure 2).
In Experiment 1, the participants rated the beer as significantly sweeter when listening to the sweet song than when listening to the bitter song. In Experiment 2, the participants rated the beer as tasting significantly sweeter while listening to the sweet song than while listening to the sour song. No significant differences were found when comparing taste ratings in Experiment 3. However, only in Experiment 3, the participants rated the difference in alcohol strength as significant (the beer was perceived as more alcoholic while listening to the bitter song than when listening to the sour song). The results also revealed that most participants liked the sweet song when compared to the bitter and sour ones. In general, they did not like the bitter song and really did not like the sour song, when compared to the sweet one. Furthermore, a
Figure 2. Comparison of beer ratings (means and standard error bars) made while listening to songs versus silence. All ratings were made on a 7-point scale, with “1”=not at all and “7”=very much. The asterisk ‘*’indicates a significant difference (p<.05). Source of Figure [26]
Proc. of the 12th International Symposium on CMMR, Sao Paolo, Brazil, July 5-8, 2016
244

control experiment (Experiment 3) without sonic stimuli confirmed that these results could not simply be explained in terms of order (or adaptation) effects. These results may be explained in terms of the notion of sensation transference [5]. That is, while listening to the pleasant sweet song, the participant transfers his/her experience/feelings about the music to the beer that they happen to be tasting. This, in turn, results in higher pleasantness and also higher sweetness ratings (when compared to, in this case, the relatively less pleasant sour and bitter songs), given the hedonic characteristics of such a taste. Finally, here, for the first time, we demonstrate that it is possible to systematic modulate the perceived taste and strength of beers, by means of matching or mismatching sonic cues. These results open further possibilities when it comes to analyzing how the emotional aspects involved in sound-beer experiences can affect such crossmodal correspondences. 4. Analyzing the effect of customized background music in multisensory beer-tasting experiences This study [32] focused on the potential influence of background music on the hedonic and perceptual beer-tasting experience. Here, different groups of customers tasted a beer under three different conditions. The control group was presented with an unlabeled beer, the second group with a labeled beer, and the third group with a labeled beer together with a customized sonic cue (a short clip from an existing song). The beer used in this experiment, namely ‘Salvation’, was a one-time-batch limited edition, and a co-creation between The Brussels Beer Project (TBP), and an UK music band called ‘The Editors3’. The complete description of the creative process involving the development - and characterization - of the experimental taste and sonic stimuli can be accessed in the following link: http://tbpeditors-experience.tumblr.com/ (Retrieved on March 2016). A fragment of the song ‘Oceans of Light’, from the previously-mentioned band was chosen as the sonic stimulus for this experiment. The fragment contained around one minute of the original song (from minute 2:25 to minute 3:25, approximately4. By relating the musical and psychoacoustic analysis with the summary of the cross-modal correspondence between basic tastes and sonic elements presented by [18], we predicted that the song may modulate the perceived sourness of the beer5. The full study was divided into three main steps. In the first step, the participants inserted their personal information, read, and then accept the terms of the informed consent. The second and third steps were different for each of the three experimental conditions. In Condition A, the participants evaluated the beer presentation without any label in the bottle, tasted the beer afterwards and answered some questions regarding their beer experience. In this condition, the participants did not have any information regarding the origin of the beer. In Condition B, the participants evaluated the beer presented with its label on the bottle, tasted the beer afterwards, and answered some questions regarding their beer-tasting experience. Here, they were informed that the beer that they were tasting was the product of a collaboration between TBP and The Editors (band). Finally, in Condition C, the participants evaluated the beer’s presentation with its corresponding label, tasted the beer while listening to the chosen song, and answered some questions regarding their beer-tasting experience. The participants in conditions B and C were told that the beer being tasted was the product of a collaboration between TBP and The Editors (band), and that the song that they listened to was the source of inspiration for the formulation of this beer. The questionnaires of steps two and three were fully randomized.
3 See http://www.editorsofficial.com/ (retrieved November 2015).
4 Link to the song -https://play.spotify.com/track/4yVv19QPf9WmaAmYWOrdfr?play=true&utm_source=open.spotify.com&utm_medium=open (retrieved January 2016) 5 For example, in [17]’s Table 1 - which summarizes the results of a number of studies carried out by different research groups - high spectral balance, staccato articulation, syncopated rhythm, high pitch, among others, are musical/psychoacoustic elements that correspond to sourness. Furthermore, due to the predominant piano in the second verse, the song might also be expected to have an effect on the perceived levels of sweetness.
Proc. of the 12th International Symposium on CMMR, Sao Paolo, Brazil, July 5-8, 2016
245

The results suggested that music may as well be effectively used to add value to multisensory tasting experiences when there is a previous connection between the participants and the music (see Figure 3). Concerning taste ratings, the song seemed to have a modulatory effect on the perceived sourness of the beer. However, the ratings of Conditions A and C are mostly indistinguishable, and significantly higher when compared to the ratings in Condition B. Similarly, the participants reported that the beer tasted significantly stronger when it was presented without labeling (Condition A), and in Condition C, when the beer’s presentation was accompanied by the song, than in Condition B. In the two cases mentioned above, it would seem that drawing attention to the visual aspects of the label, in Condition B, had a negative effect. In particular, we suggest that in Condition B, the semantic contents of the label may have counterbalanced the perceived sourness, and, in Condition C, the song may have enhanced it. Another potential relevant factor present in the label was the visual impact of the diagonal white line. Such line goes from top left down to bottom right. Another study recently reported [55] that consumers potentially have a preference for an oblique line ascending to the right, when evaluating plating arrangements. Something similar is likely to be found with product packaging. In summary, the white line was in the opposite direction as the probable preferred choice of the customers that experienced the label. Figure 3. Mean ratings of the evaluation of the subjective aspects of the tasting experience, with ‘X’ being the ratings of how much they liked the beer (X), and ‘Y’ the likeness ratings of the sound-tasting experience (Y) [ratings based on 7-point scales, being 1 ‘not at all’, and 7 ‘Very much’]. Visualizing these evaluations, it seems that the participants valued the customized soundscape component of the multisensory beer-tasting experience. The error bars represent the standard error (SE) of the means here and in all the other graphs of the present study. Significant differences between the specific interactions are indicated with an asterisk ‘*’ (p-value for the comparison before-tasting and after-tasting ratings ‘Y’ (p = .001); p-value for the comparison after-tasting ratings ‘X’ and ‘Y’ (p < .001) – this figure was taken from open access publication, published in Frontiers in Psychology [27].
One potential limitation of the present study is that it was implemented in a brewery with its own customers and, hence, all of the participants were constantly influenced by the brand, which potentially provided brand-specific cues that may also have contributed to the findings. Future research could develop a similar experience in a more typical drinking environment, such as a common bar, including neutral glassware and a more balanced audience6. Here, it was also not possible to discriminate the influence of the given messages in Conditions B and C (cf. [28]). A future implementation may consider delivering such message only to the participants being stimulated by a song (i.e., in this experiment, only to the participants in Condition C).
6 83% of the participants reported knowing TBP (N=191). When asked how often the participants consumed products from TBP - on a 7 point scale, with 1 corresponding to ‘never’ and 7 to ‘very often’ - the mean of their answers was 3.30 (SD 1.80). Note that, since the vast majority of the participants reported knowing TBP, in this study it was not possible to include in our data analysis control for familiarity of the beer’s brand.
Proc. of the 12th International Symposium on CMMR, Sao Paolo, Brazil, July 5-8, 2016
246

5. Discussion and future work 5.1 General Discussion With the studies reviewed in this article, we have showed that soundscapes/music can influence taste (and potentially flavor) attributes of drinks. With that in mind, we suggest that sound can be used to “liven up” the overall eating and drinking experience. For example, a bitter chocolate (or a bitter beer) accompanied by high-pitched sounds may be perceived as less bitter, making its consumption more pleasant - and potentially with less added sugar - for those who prefer sweeter tastes. So, why auditory cues would influence taste perception? As suggested by [47], when thinking about the modulation of taste perception via sonic cues, it is perhaps difficult to point to a single mechanism that explains the range of effects reported in the literature. Relevant to the studies presented here, [47] suggests that crossmodal correspondences, emotion, and/or sensation transfer may potentially explain the different effects reported in the literature. For instance, crossmodal correspondences may influence taste perception via psychoacoustic features that match or mismatch attributes or features such as sweetness, bitterness, and/or sourness; such features may draw people’s attention towards specific taste attributes (see section 2; see [18] for an overview). Whether or not features match another feature may depend on multiple mechanisms as suggested by [38]. Note, however, that in more everyday life people are rarely exposed to a single psychoacoustic feature while eating. Moreover, whilst it may be possible that a song and/or soundscape have a dominant or a series of dominant psychoacoustic features, music in itself is a more complex construction, and is usually under condition of our own personal preferences. For that reason, the emotional connotation of specific auditory stimuli (either a feature or a more complex sonic stimulus) could transfer to the experience of the food/beverage and thus influence their specific sensory and hedonic characteristics. A pleasant song may therefore lead to higher pleasantness and eventually sweetness ratings (as sweetness tends to be pleasant and thus it matches the pleasantness of the song) - when compared to a relatively less pleasant song (see section 5; see [5], for a review on sensation transference). Importantly, it has also been shown that a person’s mood can influence their ability to detect olfactory (e.g. [25]) and gustatory stimuli [13,14]. In that sense, emotions induced by music can have an attentional effect on the way people perceive taste. Recently, [17] showed that sweetness can be perceived more dominant when the music that is played is liked by the participants, when tasting a chocolate gelati (Italian ice cream). On the other hand, bitterness seems to be enhanced when people dislike the music. This seems to be consistent with the idea that certain crossmodal correspondences may be explained by a common affective connotation of the component unisensory cues that people match [47]. Importantly, more than one study have concluded that liking or disliking the music that people hear while tasting can have a significant effect in the levels of enjoyment of food/beverages [12,16]. As a next step for future research, it will be critical to test the different mechanisms behind sound-taste interactions (i.e. crossmodal correspondences, sensation transference, attentional redirection, among others). Important to say here that the assessment on how sounds – that not necessarily derive from our interaction with food (e.g., mastication, such as in [20]) - influence taste/flavor perception is relatively new, with most of its conclusive results coming from the last ten years. Therefore, we could presume that the existent methods that are here being applied – and revised – are not so well-established yet, when referring to this specific sensorial combination. As such, we believe that future behavioral studies may well be combined with neuroscientific methods. Such combination may help to provide a better understanding on the brain mechanisms that underlie sound/taste correspondences. Take, for instance, the ‘Sensation Transference’ account described by [5], which we suggest as a possible explanation for the modified hedonic value of food/drink experiences that involve sonic cues [31,32]. For example, in [31], it seems that the participant transfers his/her feelings about the music to the beer that they happen to be tasting. Potentially, one possible approach for understanding the relationship between sound and taste, at a neurological level, would be to focus on the way in which the affective value of gustatory and auditory information is encoded by the brain [34].
Proc. of the 12th International Symposium on CMMR, Sao Paolo, Brazil, July 5-8, 2016
247
In the paragraphs below, we will present a short overview about multisensory perception from the perspective of cognitive neuroscience. Afterwards, we will introduce a few studies that have approached how the brain processes music and taste/flavor, separately, hypothesizing on the potential associations between music-food at the brain (mostly related to pleasantness). Finally, we will introduce a few approaches for potential future work, following the quite recent – but already existent – blend of psychophysics and neuroscience towards chemosensory/auditory interactions. 5.2 Sound and taste from a multisensory integration perspective? Most studies on multisensory integration have been focusing on vision and its interaction with audition. So, one question that still remains open is, when thinking about the interaction of sound and taste/flavors in the brain, should we focus on multisensory integration? Or, perhaps, on the way in which sonic cues may prime specific mechanisms that end up having a significant influence on taste/flavor perception, without the necessary need for integration? Multisensory integration – i.e. the interaction between sound and taste – seem to be the product of supra-additive neural responses, at least when it comes to the temporal and spatial characteristics of multisensory cues [37]. This means that, for instance, the response that a neuron produces to sight and sound that co-occur at more or less the same time and from the same spatial location, may be greater than the summed responses to either the sight or sound alone (e.g. [52]). [7] also argues that a multisensory interaction may be a dialogue between sensory modalities rather than the convergence of all sensory information onto a supra-modal area. For instance, [7] suggests that the Bayesian framework may provide an efficient solution for dealing with the combination of sensory cues that are not equally reliable [7], and this may fit into a sound-taste/flavor model. [49] also suggests that the identification and quantification of the effects of multisensory response may demand a comparison between the multisensory versus the single modality response, with the latter evoked by a single specific stimulus. In other words, in some cases, it is also practical to compare the multisensory response to, for example, models in which the unisensory responses are summed, or comparing models that are potentially ideal representations of a predicted response, obtained by the best combination of the unisensory inputs. However, space and time are not be the only factors potentially underlying multisensory integration. Research also suggests that semantic congruency and crossmodal correspondences may also facilitate multisensory integration [38] In particular, semantic congruency can be understood by those situations where, for example, auditory and vision cues are integrated because the different sensory cues belong to the same identity or meaning, as it happens with the picture of a dog and the barking sound of a dog, where both belong to the object ‘dog’ [4,9,38]. Crossmodal correspondences, on the other hand, can be thought of as the associations that seem to exist between basic stimulus attributes across different sensory modalities (i.e. correlations between different basic taste attributes within different frequency ranges, and so on) [23,38]. Now, when thinking about how taste and sound interact, we know that what we hear can help us to identify the gustatory properties of what we eat. For instance, research has shown that modifying food-related auditory cues, regardless the fact that those sounds may come from the food itself or from a person’s interaction with it (think of carbonated beverages, or a bite into an apple), can have an impact on the perception of both food and drink ([48]; see [41] for an overview; see [3] for more general principles). Still, in order to improve our understanding on taste/flavour-audition interactions (especially referring to those sounds that not necessarily derive from our interaction with food, but that nevertheless can still have a significant influence on the final tasting experience), it seems to be critical that future studies focus on the spationtemporal and semantic aspects of those senses, as well as the crossmodal correspondences that have been shown to exist between tastes/flavours and sonic features [36,45]. 5.3 Using neuroscience to assess the mechanisms behind sound-taste correspondences If one intend to build up a case for assessing the interaction of sound and taste/flavor at a cognitive level, which factors should one consider to start with? Listening to
Proc. of the 12th International Symposium on CMMR, Sao Paolo, Brazil, July 5-8, 2016
248

music seems to be mostly about pleasure and, still, we give as much inherent value to it than to eating and/or drinking. On the other hand, feeding ourselves comes as a need, regardless the fact that we will always be able to eat food (and drink beverages) that we find ‘pleasant enough’. However, it seems that a potential successful baseline to build a solid cognitive relation between music and taste/flavor may be the fact that both stimulus, under the correct circumstances, can provide us with pleasure (note that this has been suggested as a possible mechanism for crossmodal correspondences; see [21,38,50]). As such, we could consider, as starting point to work, for example, with the hypothesis that the valence associated with a song or sonic parameter would have perceptual and/or hedonic effect on one’s eating/drinking experience. Assuming that we are pursuing this path, which involves emotions, one way may be to refer to the affective account of crossmodal associations that are based on a common affective connotation. Here, we refer to the extent to which two features may be associated as a function of their common hedonic value ([6,8,22,46,21,50]. In any case, it would seem that when assessing how the brain perceives music, emotions come as a logical path to explore. Researchers have recently shown [53] that the interconnections of the key circuit for internally-focused thoughts, known as the default mode network, were more active when people listened to their preferred music. They also showed that listening to a favorite song alters the connectivity between auditory brain areas and the hippocampus, a region responsible for memory and social emotion consolidation. As suggested by [53], such results were unexpectedly consistent, given the fact that musical preferences are uniquely individualized phenomena and that music can vary in acoustic complexity and message. Furthermore, their assessment went further to previous ones, that focused simply on how different characteristics of music (i.e., classical versus country) affected the brain. Here, they considered that most people when listening to their preferred music (regardless of the type), often report experiencing personal thoughts and memories. Other researchers have also used brain imaging to show, among other things, that the music that people described as highly emotional engaged the reward system in their brains - activating subcortical nuclei known to be important in reward, motivation, and emotion [2]. They also found that listening to what might be called “peak emotional moments” in music causes the release of dopamine, that is an essential signaling molecule in the brain [33]. That is, when we listen to music that we find pleasant, dopamine is released in the striatum. Dopamine is known to respond to the naturally rewarding stimuli – just like when we consume food. As hypothesized above, it seems that emotional assessments could provide us with interesting outcomes. For example, what would happen if we eat chocolate while listening to our favorite songs, versus eating the same chocolate while listening to background noise at unpleasant/uncomfortable levels? Even before eating, when simply thinking about eating chocolate while being hungry, our bodies start to create expectations about the future eating experience7. Therefore, what would happen with our expectations (and their corresponding neural processes) while listening to different sonic cues, considering that they might be emotionally related to the subject being sampled? Or could, perhaps, our favorite songs help us reducing the negative emotional impact that eating low-sugared chocolate may bring into our daily lives? With a better understanding of the cognitive mechanisms behind such multisensory interaction, Music could not only be used to modulate the multisensory tasting experience, but it could, perhaps, also be used to modulate its previous expectations, in order to potentially prime the mind before eating/drinking. Summarizing, as a future objective in this research path, we propose to continue extending the recent research that have started to raise these same questions, by blending psychophysics and neuroscience to chemosensory/auditory interactions (see [35] for a review on the influence of auditory cues on chemosensory perception). Since behavioral tests have been proven to be effective methods for assessing, for instance, emotional response (or its correspondent valence), it seems that a combination with 7 A few quick notes on how chocolate works in the brain were reviewed from both of the following links. http://science.howstuffworks.com/life/inside-the-mind/emotions/chocolate-high2.htm and http://healthyeating.sfgate.com/chocolate-dopamine-3660.html (retrieved on February, 2016); see [24] for a review on mood state effects of chocolate.
Proc. of the 12th International Symposium on CMMR, Sao Paolo, Brazil, July 5-8, 2016
249
cognitive neuroscientific approaches would help in a better understanding of the physiological state (arousal) while reacting to multisensory stimuli8. However, at some point, it would be prudent to consider that the relation between valence and arousal seem to vary with personality and culture, especially when dealing with subjective experiences [19]. Finally, from a design perspective, it is possible to customize the external sonic cues that may be involved in the eating/drinking process, with specific perceptual objectives, and without the need of altering a food/beverage product’s physical appearance. 6. References 1. Astolfi, A., Filippi, M.: Good acoustical quality in restaurants: A compromise
between speech intelligibility and privacy. In: Proceedings 18th International Congress on Acoustics ICA 2004, pp. 1201--1204, Kyoto, Japan (2004)
2. Blood, A. J., Zatorre, R. J.: Intensely pleasurable responses to music correlate with activity in brain regions implicated in reward and emotion. Proceedings of the National Academy of Sciences. 98(20), 11818--11823 (2001)
3. Calvert, G. A., Thesen, T.: Multisensory integration: methodological approaches and emerging principles in the human brain. Journal of Physiology-Paris. 98(1), 191--205 (2004)
4. Chen, Y. C., Spence, C.: When hearing the bark helps to identify the dog: Semantically-congruent sounds modulate the identification of masked pictures. Cognition. 114(3), 389--404 (2010)
5. Cheskin, L.: Marketing success: How to achieve it. Boston, MA: Cahners Books. (1972)
6. Collier, G. L.: Affective synesthesia: Extracting emotion space from simple perceptual stimuli. Motivation and emotion. 20(1), 1--32 (1996)
7. Deneve, S., Pouget, A.: Bayesian multisensory integration and cross-modal spatial links. Journal of Physiology-Paris. 98(1), 249--258 (2004)
8. Deroy, O., Crisinel, A. S., Spence, C.: Crossmodal correspondences between odors and contingent features: odors, musical notes, and geometrical shapes. Psychonomic bulletin & review. 20(5), 878--896 (2013)
9. Doehrmann, O., Naumer, M. J.: Semantics and the multisensory brain: How meaning modulates processes of audio-visual integration. Brain Research. 1242, 136--150 (2008)
10. Elder, R. S., Mohr, G. S.: The Crunch Effect: Food Sound Salience as a Consumption Monitoring Cue. Food Quality and Preference. 51, 39--46 (2016)
11. Ferber, C., Cabanac, M.: Influence of noise on gustatory affective ratings and preference for sweet or salt. Appetite. 8(3), 229--235 (1987)
12. Fiegel, A., Meullenet, J. F., Harrington, R. J., Humble, R., Seo, H. S.: Background music genre can modulate flavor pleasantness and overall impression of food stimuli. Appetite. 76, 144--152 (2014)
13. Frandsen, L. W., Dijksterhuis, G. B., Brockhoff, P. B., Nielsen, J. H., Martens, M.: Feelings as a basis for discrimination: Comparison of a modified authenticity test with the same–different test for slightly different types of milk. Food Quality and Preference. 18(1), 97--105 (2007)
14. Heath, T. P., Melichar, J. K., Nutt, D. J., Donaldson, L. F.: Human taste thresholds are modulated by serotonin and noradrenaline. The Journal of neuroscience. 26(49), 12664--12671 (2006)
15. Heylighen, A., Rychtáriková, M., Vermeir, G.: Designing spaces for every listener. Universal Access in the Information Society. 9(3), 283--292 (2009)
16. Kantono, K., Hamid, N., Shepherd, D., Yoo, M. J., Carr, B. T., Grazioli, G.: The effect of background music on food pleasantness ratings. Psychology of Music (2015)
8 Important to note here that arousal and valence are the most common ways to characterize changes in emotions. In other words, the relation between high/low arousal and positive/negative valence are used to define an emotional state.
Proc. of the 12th International Symposium on CMMR, Sao Paolo, Brazil, July 5-8, 2016
250

17. Kantono, K., Hamid, N., Shepherd, D., Yoo, (JY) M., Grazioli, G., Carr, T. B: Listening to music can influence hedonic and sensory perceptions of gelati. Appetite. 100, 244--255 (2016)
18. Knoeferle, K., Spence, C.. Crossmodal correspondences between sounds and tastes. Psychonomic Bulletin Review. 19, 992—1006 (2012)
19. Kuppens, P., Tuerlinckx, F., Yik, M., Koval, P., Coosemans, J., Zeng, K. J., Russell, J. A.: The relation between valence and arousal in subjective experience varies with personality and culture. Journal of Personality (2016)
20. Luckett, C. R., Meullenet, J. F., Seo, H. S. Crispness level of potato chips affects temporal dynamics of flavor perception and mastication patterns in adults of different age groups. Food Quality and Preference. 51, 8—19 (2016)
21. Marks, L. E.: The unity of the senses: Interrelations among the modalities. Academic Press (1978)
22. Marks, L. E.: On perceptual metaphors. Metaphor and Symbol. 11(1), 39-66 (1996) 23. Parise, C. V., Spence, C.: ‘When birds of a feather flock together’: Synesthetic
correspondences modulate audiovisual integration in non-synesthetes. PLoS One, 4(5), e5664 (2009)
24. Parker, G., Parker, I., Brotchie, H.: Mood state effects of chocolate. Journal of affective disorders. 92(2), 149--159 (2006)
25. Pollatos, O., Kopietz, R., Linn, J., Albrecht, J., Sakar, V., Anzinger, A., ... & Wiesmann, M.: Emotional stimulation alters olfactory sensitivity and odor judgment. Chemical senses. 32(6), 583-589 (2007)
26. Reinoso Carvalho, F., Van Ee, R., Touhafi, A.: T.A.S.T.E. Testing Auditory Solutions Towards the improvement of the Tasting Experience. In Proceedings of 10th International Symposium on Computer Music Multidisciplinary Research. Pp. 795--805. Publications of L.M.A., Marseille (2013)
27. Reinoso Carvalho, F., Van Ee, R., Rychtarikova, M., Touhafi A., Steenhaut, K., Persoone, D., Spence, C. Leman, M.: Does music influence de Multisensory tasting experience? Journal of Sensory Studies. 30(5), 404--412 (2015a)
28. Reinoso Carvalho, F., Van Ee, R., Rychtarikova, M., Touhafi, A., Steenhaut, K., Persoone, D., Spence, C.: Using sound-taste correspondences to enhance the subjective value of tasting experiences. Frontiers in Psychology. 6:1309 (2015b)
29. Reinoso Carvalho, F., Van Ee, R., Touhafi, A., Steenhaut, K., Leman, M. Rychtarikova, M.: Assessing multisensory tasting experiences by means of customized sonic cues. In Proceedings of Euronoise 2015, 352, pp. 1--6. Maastricht (2015c)
30. Reinoso Carvalho, F., Wang, Q. (J.), Steenhaut, K., Van Ee, R., Spence, C. (submitted A). Tune that beer! Finding the pitch corresponding to the Taste of Belgian Bitter Beers.
31. Reinoso Carvalho, F., Wang, Q. J., Van Ee, R., Spence, C.: The influence of soundscapes on the perception and evaluation of beers. Food Quality and Preference. 52, 32--41 (2016a)
32. Reinoso Carvalho, F., Velasco, C., Van Ee, R., Leboeuf, Y., Spence C.: Music influences hedonic and taste ratings in beer. Frontiers in Psychology. 7 (2016b)
33. Salimpor, V. N., Benovoy, M., Larcher, K., Dagher, A., Zatorre, R. J.: Anatomically distinct dopamine release during anticipation and experience of peak emotion to music. Nature Neuroscience. 14(2), 257--262 (2011)
34. Satpute, A., Kang, J., Bickart, K., Yardley, H., Wager, T., Barrett, L. F.: Involvement of sensory regions in affective experience: A meta-analysis. Frontiers in Psychology. 6 (2015)
35. Seo, H. S. Hummel, T.: Influence of auditory cues on chemosensory perception. In The Chemical Sensory Informatics of Food: Measurement, Analysis, Integration. Chapter: 4. Influence of Auditory Cues on Chemosensory Perception, Publisher: ACS Symposium Series, Editors: Brian Guthrie, Jonathan D. Beauchamp, Andrea Buettner, Barry K. Lavine, pp.41--56 (2015)
36. Shepherd, G. M.: Smell images and the flavour system in the human brain. Nature. 444(7117), 316--321 (2006)
37. Small, D. M.: Flavor is in the brain. Physiology & behavior. 107(4), 540--552 (2012)
Proc. of the 12th International Symposium on CMMR, Sao Paolo, Brazil, July 5-8, 2016
251

38. Spence, C.: Crossmodal correspondences: A tutorial review. Attention, Perception, & Psychophysics. 73(4), 971—995 (2011)
39. Spence, C.: Auditory contributions to flavour perception and feeding behaviour. Physiology & Behavior. 107(4), 505—515 (2012)
40. Spence, C.: Noise and its impact on the perception of food and drink. Flavor. 3:9 (2014)
41. Spence, C.: Eating with our ears: Assessing the importance of the sounds of consumption to our perception and enjoyment of multisensory flavour experiences. Flavor. 4:3 (2015a)
42. Spence, C.: Multisensory flavor perception. Cell. 161(1), 24--35 (2015b) 43. Spence, C., Michel, C., Smith, B.: Airplane noise and the taste of umami. Flavor.
3:2 (2014) 44. Spence, C., Shankar, M. U.: The influence of auditory cues on the perception of, and
responses to, food and drink. Journal of Sensory Studies. 25, 406--430 (2010) 45. Spence, C., Piqueras-Fiszman, B.: The perfect meal: the multisensory science of
food and dining. Oxford: John Wiley & Sons (2014) 46. Spence, C., Richards, L., Kjellin, E., Huhnt, A.-M., Daskal, V., Scheybeler, A.,
Velasco, C., Deroy, O.: Looking for crossmodal correspondences between classical music & fine wine. Flavor. 2:29 (2013)
47. Spence, C., Wang, Q. J.: Wine and music (II): can you taste the music? Modulating the experience of wine through music and sound. Flavor. 4(1), 1—14 (2015)
48. Stafford, L. D., Fernandes, M., Agobiani, E.: Effects of noise and distraction on alcohol perception. Food Quality and Preference. 24(1), 218—224 (2012)
49. Stein, B. E., Stanford, T. R., Ramachandran, R., Perrault Jr, T. J., Rowland, B. A.: Challenges in quantifying multisensory integration: alternative criteria, models, and inverse effectiveness. Experimental Brain Research. 198(2-3), 113—126 (2009)
50. Velasco, C., Woods, A. T., Petit, O., Cheok, A. D., Spence, C.: Crossmodal correspondences between taste and shape, and their implications for product packaging: A review. Food Quality and Preference. 52, 17—26 (2016)
51. Wang, Q. (J.), Woods, A., Spence, C.: “What’s your taste in music?” A comparison of the effectiveness of various soundscapes in evoking specific tastes. i-Perception. 6:6 (2015)
52. Wesson, D. W., Wilson, D. A.: Smelling sounds: olfactory–auditory sensory convergence in the olfactory tubercle. The Journal of Neuroscience. 30(8), 3013—3021 (2010)
53. Wilkins, R. W., Hodges, D. A., Laurienti, P. J., Steen, M., Burdette, J. H.: Network science and the effects of music preference on functional brain connectivity: from Beethoven to Eminem. Scientific reports. 4 (2014)
54. Woods, A. T., Poliakoff, E., Lloyd, D. M., Kuenzel, J., Hodson, R., Gonda, H., Batchelor, J., Dijksterhuis, A., Thomas, A.: Effect of background noise on food perception. Food Quality and Preference. 22(1), 42—47 (2011)
55. Zampini, M., Spence, C.: The role of auditory cues in modulating the perceived crispness and staleness of potato chips. Journal of Sensory Studies. 19(5), 347—363 (2004)
Proc. of the 12th International Symposium on CMMR, Sao Paolo, Brazil, July 5-8, 2016
252

Revolt and Ambivalence: Music, Torture and Absurdity in the Digital Oratorio The Refrigerator
Paulo C. Chagas
University of California, Riverside
Abstract. The digital oratorio The Refrigerator (2014) is a composition that reflects on my own experience of torture as a 17-year-old political prisoner during the Brazilian military dictatorship. This paper examines the existential and artistic contexts underlying the conception of the piece including the connection to my previous work. The investigation focuses on intermedia composition—electroacoustic music, live-electronics, audiovisual composition—and its relation to the subject of the torture. The paper aims, from a philosophical point of view, to build bridges between a phenomenological experience, the music, and the technology of sound synthesis. The Refrigerator expresses the conscious revolt struggling with the ambivalence of the torture and its acceptance as a path of illumination and transcendence. The experience of torture is approached from the perspective of Albert Camu's philosophy of absurdity and the mythical character of Sisyphus, who embraces absurdity through his passion as much as through his suffering.
Keywords: digital oratorio, intermedia, electroacoustic music, live-electronics, audiovisual composition, torture, absurdity, Camus, Sisyphus.
1 Introduction
My own experience of torture as a 17-year-old political prisoner during the Brazilian military dictatorship in 1971 is the subject of the digital oratorio The Refrigerator [A Geladeira] (2014) for two singers (mezzo-soprano and baritone), instrumental ensemble (violin, viola, cello, piano and percussion), electronic sounds, live-electronics and interactive visual projection. Commissioned by the Centro Cultural São Paulo and the ensemble “Núcleo Hespérides”, the work was premiered on April 8, 2014 as part of an event for the 50th anniversary of the Brazilian military coup of 1964.1 The “refrigerator” referenced in the work was a cubicle especially designed and equipped for torturing with sound. It was an environment designed for acoustic experience meant to be physically and mentally destructive. Many years later, I described this experience as follows:
I was arrested for collaboration with opposition groups. Arriving
in the military prison, I was put in the ‘refrigerator’, a small room, acoustically isolated, and completely dark and cold. Various noises and sounds (hauling oscillators, rumbling generators, distorted radio
1 The video of the first performance is available at: https://vimeo.com/97100136; and also at:
https://www.youtube.com/watch?v=8hk5Oc6oA14. Accessed May 15, 2016.
Proc. of the 12th International Symposium on CMMR, Sao Paolo, Brazil, July 5-8, 2016
253

2 Paulo C. Chagas
signals, motorcycles, etc.) shot from loudspeakers, hidden behind the walls. Incessantly, the electronic sounds filled the dark space and overwhelmed my body for three long days. After a [certain] time, I lost consciousness. This auditory and acoustic torture was then a recent development, partially replacing traditional methods of physical coercion that killed thousands in Latin American prisons between the 1960s and 1990s. Such sounds injure the body without leaving any visible trace of damage. The immersive space of the torture cell, soundproofed and deprived of light, resonates in my memory as the perfect environment for experiencing the power of sound embodiment. [1]
Being tortured as a political prisoner was an absurd experience. It occurred at a
time when I became interested in music and, soon after, I began to study music composition formally. After graduating from the University of São Paulo (1979), I travelled to Europe to pursue a Ph.D. in Musicology with the composer Henry Pousseur in Liège, Belgium and to study electroacoustic music composition at the Music Academy in Cologne, Germany. It seems a paradox that I devoted myself to electronic music, which draws its artistic potential from noise: electroacoustic music has extended the awareness of noise to the whole musical experience. The feeling of absurdity emerges from the ambivalent role of noise as both instrument of political pressure as well as subversive creation. As Attali claims [2], “noise is the source of purpose and power”. Noise represents disorder and music is a tool used to rationalize noise and exert political pressure in order to consolidate a society. Attali describes musical evolution in terms of the relationship between music and noise. Music controls noise, but at the same time gives birth to other forms of noise that are incorporated in the political economy of music to become music themselves, which, when established, reveal other forms of noise, and so on. Noise is absurd violence and music is absurd revolt, “a constant confrontation between man and his own obscurity” [3]. Listening to music is accepting the presence of noise in our lives: it “is listening to all noise, realizing that its appropriation and control is a reflection of power, that it is essentially political” [2].
Suffering and violence—and the ambivalent feelings we experience towards these things—have been a constant thematic of my work, especially my audiovisual and multimedia compositions. For example, in Francis Bacon (1993), work inspired by the life and work of the British painter Francis Bacon (1909-92), I composed music that acknowledges the feelings of desperation and unhappiness and the role of affliction in his creative expression. The piece is written for three singers (soprano, countertenor and baritone), string quartet, percussion and electronic music and was commissioned by the Theaterhaus Stuttgart for the choreographic theater by Johannes Kresnik and Ismael Ivo Another example that addresses the ambivalence toward and fascination with war, power and violence is the techno-opera RAW (1999). RAW has no plot in the traditional sense. The libretto combines excerpts from Ernst Jünger’s autobiographic books describing his experiences as a soldier fighting in World War I, with quotations form the theoretical work "On War" by the Prussian General and philosopher Carl von Clausewitz, and poetic texts on the Yoruba deity Ogun, the African and Afro-American god of iron worshiped as warrior, builder and destructor. The Yoruba is one of the ethnic groups in today’s Nigeria, whose ancestors were
Proc. of the 12th International Symposium on CMMR, Sao Paolo, Brazil, July 5-8, 2016
254

Revolt and Ambivalence 3
deported in large number as slaves to the American continent. Their religious and philosophical traditions are kept alive today in West Africa and Latin America. The opera is written for five singers and a reduced orchestra of three percussions and three keyboards playing live-electronic music inspired by techno and Afro-Brazilian religious music. The work was commissioned by the Opera Bonn.
These two projects and many others devoted to similar subjects laid the groundwork for me to be able to back and make sense of my own experience of torture. It seems that the requisite level of maturity needed to deal with such a sensitive theme had to be gradually acquired. The transition period between the last years living in Germany and the first years relocating to California (2003-05) provided the opportunity to grasp the absurdity of torture from an artistic perspective. The first experiments were made in the international workshop Interaktionslabor (www.interaktionslabor.de), conceived and organized by the German choreographer and director Johannes Birringer. It was held in the site of the abandoned coalmine of Göttelborg (Saarland) and attracted artists, musicians, dancers and engineers. The works produced in the workshop explored interdisciplinary connections between art, digital technology and the deprived environment of the mine. The site, with its imposing buildings, machines and equipment remaining virtually intact, was a silent witness of the fading industrial landscape and emerging post-industrial society. We felt as strangers living in a sort of exile, “deprived of the memory of a lost home or the hope of a promise land. This divorce between man and his life, the actor and his setting, is properly the feeling of absurdity” [3].
In 2004, the second year I attended the Interaktionslabor, I begun a collaboration project with Birringer inspired by the novel Blindness by the Portuguese author and Nobel Prize winner José Saramago [4]. The book tells the story of a city hit by an unexplained epidemic of blindness afflicting all of its inhabitants with the exception of one woman, who was left with sight in order to help the others to deal with their despair and suffering. The government tried to take control of the epidemic by incarcerating the blind individuals in an asylum that became like a concentration camp. But as the blindness epidemic spread in the outside world and affected the whole population, social life turned into disorder, violence, and chaos. In the deprived landscape of the mine, we found a suitable setting for interpreting Saramago’s novel. The interactive installation Blind City (2004) explores the relationship between sound, gesture and movement through the use of sensors for actors and singers representing characters affected by the mysterious blindness. In the following year, the dancer Veronica Endo joined us for the creation of Canções dos Olhos/Augenlieder (2005), a work that combines electronic music with a digital video-choreography exploring the sensory deprivation of a woman who suddenly finds herself in an imaginary city where people have become blind and disappeared. The dancer in the silent landscape of the mine reveals the absurd confrontation of this irrational world with the “wild longing for clarity whose call echoes in the human heart” [3].
2 Blindness, Technology and Interactivity
Saramago’s Blindness is an allegory for not being able to see. The novel is the metaphor of the feeling of absurdity that springs from recognizing the irrational
Proc. of the 12th International Symposium on CMMR, Sao Paolo, Brazil, July 5-8, 2016
255

4 Paulo C. Chagas
fragility and vulnerability of society. As much as we try to control ourselves—and the imperialistic powers try to take hold of world—we become aware that society provides no unlimited guarantee of stability. We live on the verge of collapsing and chaos, under the threat of collective blindness that can quickly lead to barbarity. Having lived through dictatorship and revolution, Saramago fears the obscure forces that free the beast within us, reinforcing selfishness and ignorance, unleashing violence and cruelty.
Reading Blindness allowed me to relate it to my personal experience of torture. For 21 years, Brazilians have lived in a state of collective blindness of a brutal military dictatorship and learned to survive the mechanisms of oppression, fear and violence. Yet the Brazilian dictatorship is not an isolated incident in human history, and the blind absurdity is not restricted to the spheres of power and politics. Currently, we experience a dramatic change of our existential feelings driven by technology. The digital machines of information and communication take hold of our body and deterritorialize our cognitive functions, affecting our sensory experience—auditory, visual, spatial, and tactile—and transforming the way we live and relate. Yet we also experience the ambivalent dimension of technology: on the one side, it reveals a new kind freedom based on networking dialog (e.g. social media); on the other side, it presents the potential to reinforce authoritarian tendencies of individual and collective control. This paradox unveils techno-absurdity.
Ambivalence lies at the core of the relation between man and machine, which is framed by the notion of interactivity. The so-called “interactive art” tries to achieve a more “organic” relationship between bodies and digital media in the artistic performance through the use of computers, interfaces and sensors, and even involving the spectator in the work (e.g. interactive installations). However, the interactive forms do not necessarily accomplish the dialog in the creation process. In opposition to the dominant discourse of interactivity, focused on the physicality and materiality of the relationship between body and technology, I have defined interactivity as the “embodiment of the collaborative experience that materializes the creation process in the form of the work itself” [1]. This view of interactivity embraces both the set of heterogeneous media and the dynamics of personal relationships involved in the artistic process. Beyond dealing with systems of devices, interactive art has to find a meaning and depth in it, a being-in-the-world that goes beyond technological stunning and illusion. The interactive model of communication should bring about the ethical understanding of the relation of man/machine that critically reflects on the formal structures of power in society.
The digital oratory Corpo, Carne e Espírito [Body, Flesh and Spirit] (2008), another collaboration with Johannes Birringer, is an example of the dialogical approach to interactivity in digital art. The work was commissioned by and premiered in the International Festival of Theater FIT in Belo Horizonte, Brazil.2 Based on the music I composed in 1993 for the choreographic theater Francis Bacon, the vision of the piece is an intermedia translation of Francis Bacon’s paintings. According to Deleuze [5], they constitute “a zone of indiscernibility or undecidability between man and animal”, where the body appears as mediation between the flesh and the spirit [5]. Birringer develops the concept of “choreographic scenarios”: sequences of digital
2 The video of the performance is available at: https://www.youtube.com/watch?v=-
EWfu5W2XO8. Accessed May 15, 2016.
Proc. of the 12th International Symposium on CMMR, Sao Paolo, Brazil, July 5-8, 2016
256
Revolt and Ambivalence 5
images projected onto three screens hung beside each other on the back of the stage above and behind the performers. The main motive of the visual composition is “soundless” bodies that interact with the music, not as visualization of the music, but as independent and asynchronous objects and events. Birringer explores the spatiality of the image projection by treating the digital triptych as a cinematographic video sculpture, “a kind of orchestral spatialization of images” controlled in real time [6]. The music develops an “aesthetic of distortion” that explores extended techniques for the string quartet such as strongly pressing the bow against the string in order to produce noise, or phonetic distortions with the voices by articulating vowels and consonants in an unusual way. The composition operates with figures and their deformations that give birth to abstract forms that turn into complex zones of indiscernibility. The deformations contract and extend the figures, activate rhythms, gestures, resonances, and create contrasts as well as contrasts within contrasts [7]. Music and visual projection are treated as two separated yet integrated levels. Corpo, Carne e Espírito constitutes an emblematic example of intermedia polyphony, an aesthetic orientation driving my audiovisual composition (see below).
3 The Refrigerator: Libretto
The composition of The Refrigerator (39 minutes) was accomplished in a very short time—less than two months—in the beginning of 2014. The first step was to write a libretto that was thought to be both a poem to be interpreted by the mezzo-soprano and the baritone, as well as a script for the whole composition. The libretto elaborates a multi-layered narrative offering multiple perspectives for observing my personal experience of torture and the reality of torture more generally. Torture is associated with the darkness of ignorance, with pain and suffering; the “refrigerator” is presented as a torture machine that stands for the logistics of violence and cruelty in society. The piece takes explicit distance from a political interpretation of torture, such as denouncing the torture as a form of oppression and abuse of power, or drawing attention to the torture in the context of the Brazilian military dictatorship. Beyond acknowledging the inhuman and degrading reality of torture, The Refrigerator reflects on my evolution as human being and my own path of commitment with human values. More than a political action, the journey emerges as a movement of transcendence, an aspiration of elevation aiming to illuminate darkness and overcome ignorance.
The Refrigerator brings back memories of the torture I suffered—impressions, situations, emotions and feelings—but at the same time invites us to look into the reality of torture that exists in the world outside the refrigerator. Torture is not a privilege of dictatorships or oppressing regimes, it is not practiced exclusively by abject individuals. The cruelty of torture does not occur only in extreme situations, it is widespread in normal prisons— for example in Brazil—and is also a tool of imperialism, such as the torture practiced by the US military forces and intelligence services against international “terrorists”. Physical torture, psychological torture and other forms of torture were incorporated into “the banality of evil” to use an expression introduced by Hannah Arendt in the context of the Holocaust. Torture is not an isolated act; it is something that exists within us, a universal feature of the
Proc. of the 12th International Symposium on CMMR, Sao Paolo, Brazil, July 5-8, 2016
257
6 Paulo C. Chagas
human race, which reinforces the limitation of our selfish life. We need a large-scale movement, a transcendent aspiration to transform our consciousness and nature, free ourselves from the darkness of ignorance, inertia, obscurity, confusion and disorder. The barbarity of torture is not the darkness of our origin as vital being, but an intermediate stage of human evolution. The path I propose in The Refrigerator is a journey of sacrifice ascending to the transcendence of the ineffable. The eight scenes represent the steps of this journey. Here is an overview of the large formal structure:3
Prolog: Personal Statement Scene 1: Introduction: The Darkness of Ignorance Scene 2: Electricity: The Machine of Fear Scene 3: Noises: Immersion into Chaotic Vibrations Scene 4: Cold: The Breath of Death Scene 5: Guilt: Witnessing the Torture of a Loved One Scene 6: Pain: The Feeling of Finitude Scene 7: Forms of Torture: The Invisible Torture Scene 8: Peace: Music that Lives Un-Sung
4 Prolog: Personal Statement and Soundscape
In June 1971, I was seventeen and would turn eighteen in August. They got me at my house while I was sleeping and I was taken to the Military Police headquarter at the “Barão de Mesquita” street in the neighborhood of “Tijuca”. I was brought there, and put in the refrigerator, which was a new thing. I know it was new because I could smell the fresh paint. It was a very small cubicle, must have been about two meters by two meters or so, dark and soundproofed, with air conditioning, quite cold. I stayed there a long time, which I believe was about three days. The main particularity of this refrigerator is that it had speakers built behind the walls, and there was communication between the captive and the torturers. Then the torturers were outside and they were talking to you and threatening you, they kept making jokes and being grotesque. Then, at a certain moment they began to play sounds, noises. This was in 1971, when the recording technology was something still very much incipient, and we didn’t have the kind of noises that we have today. But there was, for example, one thing I remember well, which was a then common noise of an AM radio receiver when the station was changed —few people today know that, right? In the past you had that kind of noise [hissing phonemes] when you were searching for a station, tuning—so this was one of the main noise, trying to tune in a radio station and not
3 For a detailed analysis of the scenes see my essay “Observar o inobservável: Música e tortura
no oratório digital A Geladeira” [Observing the Unobservable: Music and Torture in the Digital Oratorio The Refrigerator] in Valente [8].
Proc. of the 12th International Symposium on CMMR, Sao Paolo, Brazil, July 5-8, 2016
258

Revolt and Ambivalence 7
being able to do so and it made this mess. It was a very big noise, which is the noise of the ether, the radio waves that live in the ether. The radio receivers decode these modulations: AM, which is amplitude modulation and FM, which is frequency modulation. So AM makes [imitating amplitude modulation], and FM makes [imitating frequency modulation]. And this was very loud. Imagine yourself in space that is totally acoustically isolated and being subjected to such radio noises that are extremely loud. In addition there were other noises: motorcycle noise, engine noise, saw noise, and other things that they had there and they were having fun [laughing], they were laughing and making these noises. But it was too loud, too loud, loud to the point that you got really hurt. Because being subjected to sounds, to sound vibrations, your whole body might collapse. Not only do you become deaf, but it turns you into a state that affects and transforms your consciousness. So this sound torture was something that was quite sophisticated and few people knew about it. The peculiar thing is that it does not leave the slightest mark. It means, sound is unique in that it invades your body, it gets hold of your body and puts the body in motion, and if you apply noise the movements will be chaotic. You start feeling destroyed physically and psychically.
The prolog was not originally conceived for the composition but added afterwards.
A couple of days before the premiere, I gave an interview to the web radio of the Cultural Center São Paulo (CCSP). In a very informal conversation with Angela Voicov Rimoli, I talked, among others, about how I was tortured in the refrigerator. The concert curator, Dante Pignarati, decided to play an excerpt of interview as a personal statement before the piece, in order to introduce the subject to the audience. When I heard it for the first time in the dress rehearsal I was very surprised with the result: it was not just a statement, but a kind of soundscape made of my voice and other sounds. The author of this radio composition, Marta de Oliveira Fonterrada, designed a playful narrative evoking the sounds I heard in the cabin of torture, especially the radio tuning sounds that kept resonating in my memory. Radio is the sound of electromagnetic energy transformed into acoustic energy, which, as Kahn [9] says, “was heard before it was invented”. The turbulence of electromagnetic waves, captured by the analog radio receptors and heard as disturbance noise, was part of the radio listening culture. Digital technology has almost eliminated the radio noise as it has also suppressed the noise of vinyl records. The scratching and other noises of old records reappeared as material for loops and rhythms in the DJ-culture of sampling and remix. But radio noise has virtually disappeared from the contemporary soundscape. In the torture sessions inside the refrigerator, the analog radio receiver turned into an instrument of torture; by manipulating the tuning button, the torturer produced noise not just to be heard but also to inflict pain and suffering. The concept of soundscape introduced by Murray Shafer [10] accounts for the ethical implication of the relationship between man and the acoustic environment. From the point of view of soundscape studies, the refrigerator can be viewed as an absurd soundscape
Proc. of the 12th International Symposium on CMMR, Sao Paolo, Brazil, July 5-8, 2016
259
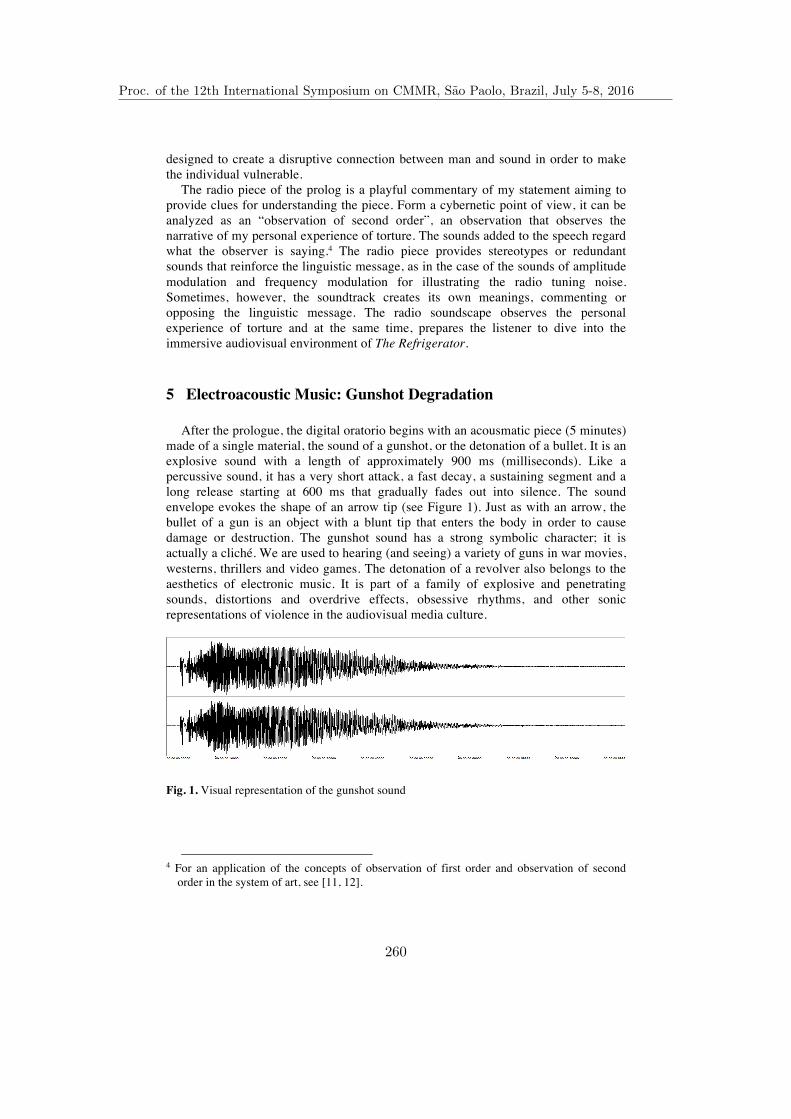
8 Paulo C. Chagas
designed to create a disruptive connection between man and sound in order to make the individual vulnerable.
The radio piece of the prolog is a playful commentary of my statement aiming to provide clues for understanding the piece. Form a cybernetic point of view, it can be analyzed as an “observation of second order”, an observation that observes the narrative of my personal experience of torture. The sounds added to the speech regard what the observer is saying.4 The radio piece provides stereotypes or redundant sounds that reinforce the linguistic message, as in the case of the sounds of amplitude modulation and frequency modulation for illustrating the radio tuning noise. Sometimes, however, the soundtrack creates its own meanings, commenting or opposing the linguistic message. The radio soundscape observes the personal experience of torture and at the same time, prepares the listener to dive into the immersive audiovisual environment of The Refrigerator.
5 Electroacoustic Music: Gunshot Degradation
After the prologue, the digital oratorio begins with an acousmatic piece (5 minutes) made of a single material, the sound of a gunshot, or the detonation of a bullet. It is an explosive sound with a length of approximately 900 ms (milliseconds). Like a percussive sound, it has a very short attack, a fast decay, a sustaining segment and a long release starting at 600 ms that gradually fades out into silence. The sound envelope evokes the shape of an arrow tip (see Figure 1). Just as with an arrow, the bullet of a gun is an object with a blunt tip that enters the body in order to cause damage or destruction. The gunshot sound has a strong symbolic character; it is actually a cliché. We are used to hearing (and seeing) a variety of guns in war movies, westerns, thrillers and video games. The detonation of a revolver also belongs to the aesthetics of electronic music. It is part of a family of explosive and penetrating sounds, distortions and overdrive effects, obsessive rhythms, and other sonic representations of violence in the audiovisual media culture.
Fig. 1. Visual representation of the gunshot sound
4 For an application of the concepts of observation of first order and observation of second
order in the system of art, see [11, 12].
Proc. of the 12th International Symposium on CMMR, Sao Paolo, Brazil, July 5-8, 2016
260

Revolt and Ambivalence 9 The electroacoustic composition develops temporal expansions— time
stretching—of the gunshot sound. This technique is an application of the Fast Fourier Transformation (FFT), an algorithm that describes any sound as a system of periodic vibrations defined as multiples of a fundamental frequency. The Discrete Fourier Transformation (DFT) is a digital implementation of the FFT algorithm. Digital sounds may be transformed by means of DFT in either the time domain or frequency domain. It is a process of analysis and synthesis, in which the sound is broken down into a sequence of sinusoidal periodic signals and later reassembled. It allows changing the duration of the sound while maintaining the relations of frequency and amplitude of its partials that determine the spectrum. The quality of the time stretching depends on the parameters of analysis and synthesis such as the FFT window size that determines the fundamental frequency of the spectrum. A typical window size consists on 4096 samples, which in a sampling rate of 44.1 kHz allows a fundamental frequency of 53 Hz.
In this specific case, the FFT algorithm was used in an unconventional, ‘subversive’ manner: I sought to obtain a sound of low quality. The goal was to degrade the gunshot sound. For this purpose, I use very small FFT windows for the time stretching algorithm—such as 128 and 64 samples allowing fundamental frequencies of 1772 Hz and 3445 Hz respectively—so that the analysis eliminated the low frequencies and the synthesis processed the higher register of the spectrum, producing a variety of digital artifacts that significantly changed the gunshot timbre. The result was a distorted and degraded sound, which is thought of as a metaphor for the torture, a sonic representation of humiliation and dishonor of human dignity driven by the practice of torture. The gunshot remains a symbol of violence and destruction of the human being, which is accomplished by a single movement, the gesture of pulling the trigger. However, from a spectral point of view, the sound of the gunshot has the quality of the noise, which is a “rich” sound consisting of all virtual frequencies of the audible spectrum. But the time stretching accomplished with small window sizes changed the quality of the timbre and destroyed the virtual richness of the noise. The sound of the bullet coming out of the barrel of the revolver lost its imposing quality of firearm; it was depraved, perverted and corrupted. The gunshot noise was stripped of its “dignity”; the explosive and percussive quality of its attack and the richness of its noisy spectrum were lost; it remained a residue of sinusoidal waves, a monotone and amorphous vibration sounding like a banal background noise.
The temporal expansions of the gunshot sound also evoke the noise of the analog radio receiver tuning a station. As mentioned above, the radio disturbance became the symbol of the sound torture I suffered inside the refrigerator. The electronic music thus anticipates a leitmotif of the digital oratory: the "station that is never tuned" (see libretto). Moreover, the electronic monotony provokes a psychoacoustic irritation due to preponderance of high frequencies and repetition. Torture, as a gradual corruption of the physical and moral integrity of the human being, is a repetitive process.
Figure 2 shows the different segments of the acousmatic composition: the first temporal expansion of the gunshot has a low amplitude and a short duration, 1'28 "(0 '- 1'28'); the second time-expansion, is much more louder and longer, 2'50 "(1'28" - 4'18 "); finally, the third expansion is shorter and softer, 47” (4'18 "- 5'05"); we hear it as a moaning sound, evoking a fading voice. The predominance of high frequencies
Proc. of the 12th International Symposium on CMMR, Sao Paolo, Brazil, July 5-8, 2016
261

10 Paulo C. Chagas
hurts the ears and causes monotony; the repetition of the same type of sound is irritating and painful, especially because the second expansion has a long decay and doesn’t introduce any novelty. The sense of boredom and discomfort are intentional. The electroacoustic music immerses the listener in an unpleasant acoustic environment evoking the noise of the torture chamber; one should feel annoyed and injured listening to it.
Fig. 2. Visual representation of the electronic music
6 Intermedia Composition: Live-electronics and Visual Projection
The oratory is a hybrid genre combining vocal and instrumental music. Though it is not a genuine theatrical genre like opera, it has a scenic dimension resulting from the live performance of singers and instrumentalists. Bach’s oratorios and passions, for example, are stage interpretations of the stories of the Bible; the performance of soloists, choir and orchestra evokes visual representations of Christianity strongly influenced by Baroque painting. The digital oratory is a contemporary genre that extends the hybrid principle of oratory to the digital media. It is thus an intermedia form. The concept of intermedia arises from the extension of polyphony to other domains of perception and experience. While polyphony articulates plurality and identity within the acoustic media—vocal and instrumental, “intermedia composition explores artistic connections between different media such as sound, image, speech, movement, gesture, and space while interacting with technical and media apparatuses” [7]. Intermedia art is also linked with the concepts of plurality and heterogeneity. Guattari proposes a polyphonic analysis of subjectivity on the basis of the “ethic-aesthetic paradigm”, which emphasizes the relations of alterity between individual and collective units and offers an alternative to scientific and philosophical models. Guattari’s polyphonic subjectivity embraces the idea that subjectivity is not restricted to human consciousness, but is at the crossroads of “heterogeneous machinic universes” framing the interaction between human beings and technology. In Guattari’s terms, subjectivity shifts from the human consciousness to the “machinic assemblages” of contemporary society.5
5 For an account of “machinic heterogenesis” and “machinic assemblage” see Guattari [13,
14]; see also my article “Polyphony and Technology in Interdisciplinary Composition” [15].
Proc. of the 12th International Symposium on CMMR, Sao Paolo, Brazil, July 5-8, 2016
262
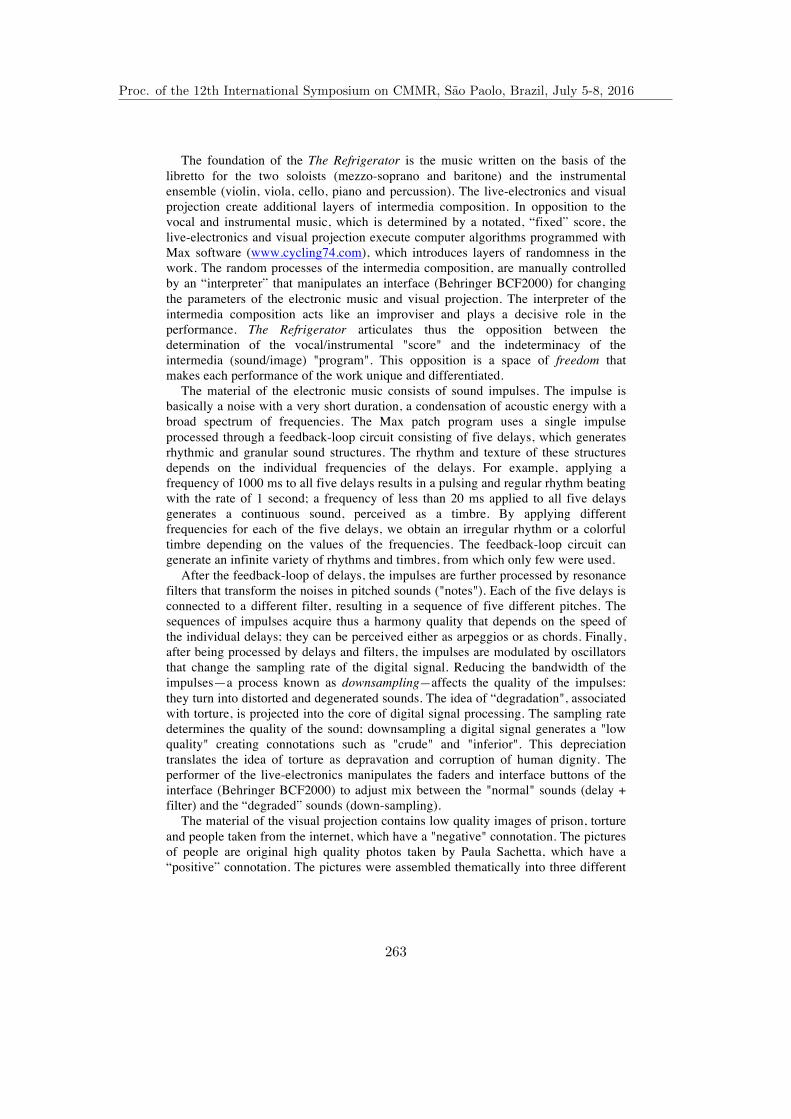
Revolt and Ambivalence 11 The foundation of the The Refrigerator is the music written on the basis of the
libretto for the two soloists (mezzo-soprano and baritone) and the instrumental ensemble (violin, viola, cello, piano and percussion). The live-electronics and visual projection create additional layers of intermedia composition. In opposition to the vocal and instrumental music, which is determined by a notated, “fixed” score, the live-electronics and visual projection execute computer algorithms programmed with Max software (www.cycling74.com), which introduces layers of randomness in the work. The random processes of the intermedia composition, are manually controlled by an “interpreter” that manipulates an interface (Behringer BCF2000) for changing the parameters of the electronic music and visual projection. The interpreter of the intermedia composition acts like an improviser and plays a decisive role in the performance. The Refrigerator articulates thus the opposition between the determination of the vocal/instrumental "score" and the indeterminacy of the intermedia (sound/image) "program". This opposition is a space of freedom that makes each performance of the work unique and differentiated.
The material of the electronic music consists of sound impulses. The impulse is basically a noise with a very short duration, a condensation of acoustic energy with a broad spectrum of frequencies. The Max patch program uses a single impulse processed through a feedback-loop circuit consisting of five delays, which generates rhythmic and granular sound structures. The rhythm and texture of these structures depends on the individual frequencies of the delays. For example, applying a frequency of 1000 ms to all five delays results in a pulsing and regular rhythm beating with the rate of 1 second; a frequency of less than 20 ms applied to all five delays generates a continuous sound, perceived as a timbre. By applying different frequencies for each of the five delays, we obtain an irregular rhythm or a colorful timbre depending on the values of the frequencies. The feedback-loop circuit can generate an infinite variety of rhythms and timbres, from which only few were used.
After the feedback-loop of delays, the impulses are further processed by resonance filters that transform the noises in pitched sounds ("notes"). Each of the five delays is connected to a different filter, resulting in a sequence of five different pitches. The sequences of impulses acquire thus a harmony quality that depends on the speed of the individual delays; they can be perceived either as arpeggios or as chords. Finally, after being processed by delays and filters, the impulses are modulated by oscillators that change the sampling rate of the digital signal. Reducing the bandwidth of the impulses—a process known as downsampling—affects the quality of the impulses: they turn into distorted and degenerated sounds. The idea of “degradation", associated with torture, is projected into the core of digital signal processing. The sampling rate determines the quality of the sound; downsampling a digital signal generates a "low quality" creating connotations such as "crude" and "inferior". This depreciation translates the idea of torture as depravation and corruption of human dignity. The performer of the live-electronics manipulates the faders and interface buttons of the interface (Behringer BCF2000) to adjust mix between the "normal" sounds (delay + filter) and the “degraded” sounds (down-sampling).
The material of the visual projection contains low quality images of prison, torture and people taken from the internet, which have a "negative" connotation. The pictures of people are original high quality photos taken by Paula Sachetta, which have a “positive” connotation. The pictures were assembled thematically into three different
Proc. of the 12th International Symposium on CMMR, Sao Paolo, Brazil, July 5-8, 2016
263
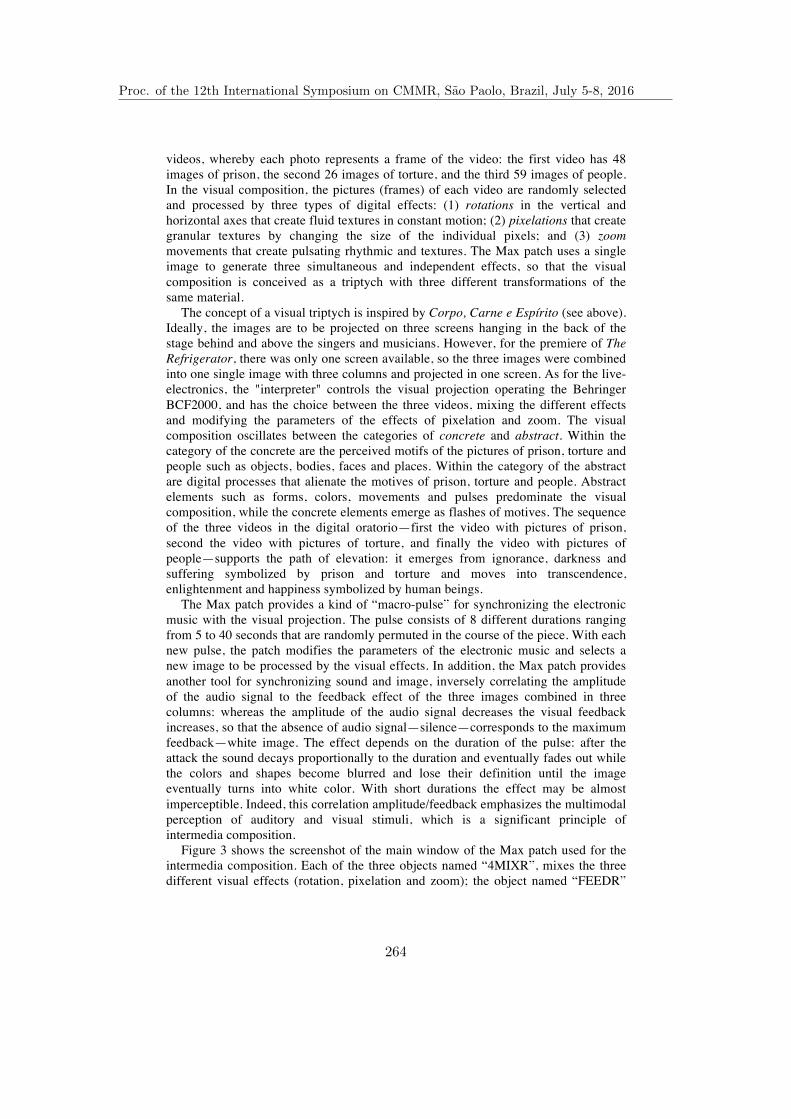
12 Paulo C. Chagas
videos, whereby each photo represents a frame of the video: the first video has 48 images of prison, the second 26 images of torture, and the third 59 images of people. In the visual composition, the pictures (frames) of each video are randomly selected and processed by three types of digital effects: (1) rotations in the vertical and horizontal axes that create fluid textures in constant motion; (2) pixelations that create granular textures by changing the size of the individual pixels; and (3) zoom movements that create pulsating rhythmic and textures. The Max patch uses a single image to generate three simultaneous and independent effects, so that the visual composition is conceived as a triptych with three different transformations of the same material.
The concept of a visual triptych is inspired by Corpo, Carne e Espírito (see above). Ideally, the images are to be projected on three screens hanging in the back of the stage behind and above the singers and musicians. However, for the premiere of The Refrigerator, there was only one screen available, so the three images were combined into one single image with three columns and projected in one screen. As for the live-electronics, the "interpreter" controls the visual projection operating the Behringer BCF2000, and has the choice between the three videos, mixing the different effects and modifying the parameters of the effects of pixelation and zoom. The visual composition oscillates between the categories of concrete and abstract. Within the category of the concrete are the perceived motifs of the pictures of prison, torture and people such as objects, bodies, faces and places. Within the category of the abstract are digital processes that alienate the motives of prison, torture and people. Abstract elements such as forms, colors, movements and pulses predominate the visual composition, while the concrete elements emerge as flashes of motives. The sequence of the three videos in the digital oratorio—first the video with pictures of prison, second the video with pictures of torture, and finally the video with pictures of people—supports the path of elevation: it emerges from ignorance, darkness and suffering symbolized by prison and torture and moves into transcendence, enlightenment and happiness symbolized by human beings.
The Max patch provides a kind of “macro-pulse” for synchronizing the electronic music with the visual projection. The pulse consists of 8 different durations ranging from 5 to 40 seconds that are randomly permuted in the course of the piece. With each new pulse, the patch modifies the parameters of the electronic music and selects a new image to be processed by the visual effects. In addition, the Max patch provides another tool for synchronizing sound and image, inversely correlating the amplitude of the audio signal to the feedback effect of the three images combined in three columns: whereas the amplitude of the audio signal decreases the visual feedback increases, so that the absence of audio signal—silence—corresponds to the maximum feedback—white image. The effect depends on the duration of the pulse: after the attack the sound decays proportionally to the duration and eventually fades out while the colors and shapes become blurred and lose their definition until the image eventually turns into white color. With short durations the effect may be almost imperceptible. Indeed, this correlation amplitude/feedback emphasizes the multimodal perception of auditory and visual stimuli, which is a significant principle of intermedia composition.
Figure 3 shows the screenshot of the main window of the Max patch used for the intermedia composition. Each of the three objects named “4MIXR”, mixes the three different visual effects (rotation, pixelation and zoom); the object named “FEEDR”
Proc. of the 12th International Symposium on CMMR, Sao Paolo, Brazil, July 5-8, 2016
264

Revolt and Ambivalence 13
processes the feedback of the three images combined. The electronic music is programmed inside the sub-patch “music” (left bottom), which is not displayed. In truth, the main window provides a very limited insight on the programing features of the patch.
Fig. 3. Main window of the Max patch of The Refrigerator.
7 The Myth of Sisyphus
Albert Camus’ classic definition of the absurd in the Myth of Sisyphus is that which is born of the “confrontation between the human need and the unreasonable silence of the world” [3]. In Camus’ philosophy, absurdity is a conflict that emerges from the relationship between humanity and the world, from the “impossibility of constituting the world as a unity” [3]. The nostalgia for unity and the absolute, he claims, is “the essential impulse of the human drama” (1955, 17). The absurd is “that divorce between the mind that desires and the world that disappoints, my nostalgia for unity, this fragmented universe and the contradiction that binds them together” [3]. Camus criticizes the existential attitude of philosophers such as Chestov, Jasper Kiekergaard and Husserl who, recognizing the world’s lack of meaning, tries to find a meaning and depth in it. It is impossible to know if the world has a meaning that transcends it, and it is impossible to reduce the world to a rational and reasonable principle: “Living is keeping the absurd alive” [3].
From the consciousness of the absurd, Camus draws three lessons for life: revolt, freedom, and passion. The revolt is a “perpetual confrontation between man and his own obscurity” [3], the insistence of an impossible transparency that questions the world at every instant. Camus frames the question of freedom in the realm of the individual experience. He criticizes the link between freedom and God as he denies the idea of eternal freedom and the belief of any life after death. In opposition, the absurd celebrates the freedom of action and increases man’s availability to live fully in the present. The absurd freedom is an inner freedom, resulting from the attitude of
Proc. of the 12th International Symposium on CMMR, Sao Paolo, Brazil, July 5-8, 2016
265

14 Paulo C. Chagas
acceptance that means to see and feel what is happening in the present moment and accept things just as they are. One has to give up certainty and be indifferent to everything except the “pure flame of life”—no illusion, no hope, no future and no consolation:
The absurd man thus catches sight of a burning and frigid,
transparent and limited universe in which nothing is possible but everything is given, and beyond which all is collapse and nothingness. He can then decide to accept such a universe and draw from it his strength, his refuse to hope, and the unyielding evidence of a life without consolation. [3]
Accepting the absurd means that one lives in a perpetual opposition between the
conscious revolt and the darkness in which it struggles. Man’s individual freedom is what life has given to him, it is life’s destiny: ”what counts is not the best living but the most living” (1955, 61). Man has to plunge into the dark, impenetrable night while remaining lucid and perhaps it will arise “that white and virginal brightness which outlines every object in the light of the intelligence” [3]. The absurd world requires not a logical, but an emotional understanding of the world driven by passion.
For Camus, Sisyphus is the absurd hero, the mythical character who embraces absurdity through his passion as much as through his suffering. The gods condemned Sisyphus “to ceaselessly rolling a rock to the top of a mountain, whence the stone would fall back of its own weight” [3]. He was punished for daring to scorn the gods, challenging death and for his passion for life. According to Camus, Sisyphus’ fate, his futile and hopeless labor, is not different from today’s workers who work every day of their lives doing the same tasks. Sisyphus, the “proletarian of the gods, powerless and rebellious” [3], symbolizes the attitude of conscious revolt: “he knows the whole extent of his wretched condition” but, instead of despair, he accomplishes his job with joy. Camus concludes: “One must imagine Sisyphus happy” [3]. Happiness and the absurd are inseparable: the absurd man’s life, when he contemplates his affliction, is fulfilled by a silent joy.
Thinking of Sisyphus as a happy man, according to the philosopher Sagi [16], reiterates the notion that happiness is a matter of self-realization. The person who embraces the absurd attains self-acceptance as it resolves the paradox of the convergence between the sense of alienation and the aspiration of unity: “The individual who lives the absurd realizes human existence to the full, and is therefore happy” [16]. Camus’ absurd rebellion, for Bowker [17], should not the understood as a rational concept but as practical, psychological and emotional disposition to resist against loss and violence. Yet, the absurd has an ambivalent potential in its refusal to affront violence and its desire for innocence, which, Bowen critically argues, undermines the ability to make loss meaningful. Declaring that the world is absurd perpetuates “a condition in which meaningful assimilation of loss is sacrificed for the sake of an innocence that the absurdist fears losing even more” [17].
Proc. of the 12th International Symposium on CMMR, Sao Paolo, Brazil, July 5-8, 2016
266

Revolt and Ambivalence 15
8 Conclusion
The digital oratorio The Refrigerator recalls a series of tensions and dilemmas of my own life. My experience in adolescence was marked by the political activism fighting the authoritarian and oppressive regime of the Brazilian military dictatorship. In my high school days in Rio de Janeiro, I developed an intense political activity, participating in protests, demonstrations and actions organized by Marxist movements advocating ideas of socialist revolution and supporting the armed struggle against the dictatorial regime. Repression and torture reached their heights in Brazil in the beginning of the 1970s, when a growing number of activists were arrested. Hundreds of people were killed or disappeared by actions of the military repressive apparatus. Torture was a common practice and many political prisoners died or were badly injured because of the brutal practices of torture. Facing international pressure, the regime introduced “clean” torture methods that leave no marks, such as the ‘refrigerator’. Being tortured inside the refrigerator in 1971 was a frightening and terrifying experience, though not so destructive of human life as other torture techniques. The torture has impacted my life in the sense that it brought me into a whole new sphere of existence. The refrigerator didn’t destroy me, though it may have claimed from me the nostalgia for innocence from the adolescent feelings of revolt.
An amazing excitement and energy propelling these feelings came from the cultural changes of the 1960s and its demands for greater individual freedom. The revolt provided unique perspectives for exploring new horizons in society and the passion for visual arts, cinema, and literature. It sparked a creative potential that seemed inexhaustible. Aside from political activism, I was particularly interested in drawing, painting and sculpture. I considered studying design or architecture initially, but wound up on a different path. At the time when I was put inside the refrigerator and absurdly tortured with noise, I had already been listening to Brazilian and international pop music—Beatles, Rolling Stones, Pink Floyd, and others—and was learning to play guitar. Very soon, music became a focus of my existential revolt. In 1972, I moved with my family from Rio de Janeiro to Londrina—my father found a new job in the industry of pesticides and fertilizers—and I found myself learning basic music skills and practicing with piano books for beginners. Despite being 19-years-old, I went to the local conservatory daily to take piano lessons together with the much younger children. In the following year, I moved to São Paulo to study music composition at the University of São Paulo. The rest of the story is contained in my résumé.
Looking back on the journey, it seems that music composition has become increasingly a channel to express the existential feelings of revolt, giving it a voice—a sound—that could convey the full acceptance of the inner struggle. The revolt, as Camus says, is a coherent attitude with which to accept the absurd. No matter what one chooses for his life, one has to confront himself with his own obscurity while seeking an impossible transparency. One has to find balance in the opposition between the “conscious revolt and the darkness in which it struggles” [3]. The revolt “challenges the world anew every second” and “extends awareness to the whole of experience.” But revolt “is not an aspiration, for it is devoid of hope” [3]. In other words, we do what we have to do but we cannot expect to be rewarded for our efforts.
Proc. of the 12th International Symposium on CMMR, Sao Paolo, Brazil, July 5-8, 2016
267

16 Paulo C. Chagas
The revolt is a constant solitary effort charged with extreme tension of conflicting desires. It is a mature and creative response to embrace the absurd, resist the desire of unity, and accept the tragic ambivalence, for which “Sisyphus straining, fully alive, and happy” [18] is the suitable image. At this point of my life, after living in many different countries and cultures, it has become clear that absurdity is both an existential attitude for accepting loss, and a way to avoid melancholy.
The Refrigerator expresses the conscious revolt struggling within the darkness of torture: it is both the conscious revolt of what this particular fate represents in my life and the acceptance of torture as a path to illumination and transcendence. The digital oratorio makes the sound of torture reverberate through the polyphony of voices, instruments, electroacoustic music and live-electronics and the audiovisual forms of intermedia. It offers a multilayered, heterogenic perspective to enlighten the experience of torture against a background of darkness and silence. It introduces turbulent noise—disturbance from both sound and image—for channeling the qualities of oppression, violence and suffering attached to the reality of torture. The piece traces the contours of the invisible torture inside and outside the refrigerator. It makes torture meaningful while rendering it meaningless. It exposes the tensions emerging from my particular experience of torture and the ambivalent character of torture as a whole: the tortured and torturers are “neither victims nor executioners”6 The composition of The Refrigerator occurred in a time of losses caused by illness and death of close family members. Living with loss means giving loss a meaning in reality. But we should not let loss turn into melancholy or take refuge in the narcissistic self. The absurd revolt accepts the tensions of the self and allows us to give up one’s attachments to self-boundaries. It urges us to give up nostalgia for unity and narcissistic identification with the self. We must acknowledge that the experience is beyond one’s comprehension and surrender the desire to understand the world and ourselves.
References
1. Chagas, P.C.: The Blindness Paradigm: The Visibility and Invisibility of the Body. Contemporary Music Review. 25, 1/2, 119-30 (2006)
2. Attali, J.: Noise: The Political Economy of Music. University of Minnesota Press, Minneapolis (1985)
3. Camus, A.: The Myth of Sisyphus and Other Essays. Vintage, New York (1955) 4. Saramago, J.: Blindness. Harcourt, San Diego (1997) 5. Deleuze, G.: Francis Bacon: The Logic of Sensation. University of Minnesota Press,
Minneapolis (2004) 6. Birringer, J.: Corpo, Carne e Espírito: Musical Visuality of the Body. In: Freeman, J. (ed.)
Blood, Sweat & Theory: Research through Practice in Performance, pp. 240--61. Libri Publishing, Faringdon (2009)
7. Chagas, P.C.: Unsayable Music: Six Reflections on Musical Semiotics, Electroacoustic and Digital Music. University of Leuven Press, Leuven (2014)
6 Neither Victims nor Executioners [Ni victimes, ni bourreaux), was a series of essays by
Camus published in Combat, the newspaper of the French Resistance, in 1946. As an intellectual and journalist, Camus fought for justice and the defense of human dignity.
Proc. of the 12th International Symposium on CMMR, Sao Paolo, Brazil, July 5-8, 2016
268

Revolt and Ambivalence 17
8. Valente, H.: Observar o inobservável: Música e tortura no oratorio digital A Geladeira. In: Valente, H. (ed.) Com som. Sem som: Liberdades políticas, liberdades poéticas. Letra e Voz, São Paulo (2016) [forthcoming]
9. Kahn, D.: Earth Sound Earth Signal: Energies and Earth Magnitude in the Arts. University of California Press, Berkeley (2013)
10. Schafer, M.: The Soundscape: Our Sonic Environment and the Tuning of the World. International Distribution Corp, Rochester (1994)
11. Luhmann, N.: Die Kunst der Gesellschaft. Suhrkamp, Frankfurt am Main (1997) 12. Luhmann, N.: Art as Social System. Stanford University Press, Stanford (2000) 13. Guattari, F.: Chaosmose. Paris: Galilée, Paris (1992) 14. Guattari, F.: Machinic Heterogenesis. In: Conley, V.A. (ed.) Rethinking Technologies, pp.
13-17. University of Minnesota Press, Minneapolis (1993) 15. Chagas, P. C.: Polyphony and Technology in Interdisciplinary Composition. Proceedings
of the 11th Brazilian Symposium on Computer Music, pp. 47-58. IME/ECA, São Paulo (2007)
16. Sagi, A.: Albert Camus and the Philosophy of the Absurd. Rodopi, Amsterdam (2002) 17. Bowker, M. H.: Rethinking the Politics of Absurdity : Albert Camus, Postmodernity, and
the Survival of Innocence. Routledge, New York (2014) 18. Aronson, R.: Albert Camus. The Stanford Encyclopedia of Philosophy,
http://plato.stanford.edu/archives/spr2012/entries/camus/ (2012)
Proc. of the 12th International Symposium on CMMR, Sao Paolo, Brazil, July 5-8, 2016
269

Dynamic Mapping Strategies using Content-based Classification: a Proposed Method for an Augmented
Instrument
Gabriel Rimoldi1, Jônatas Manzolli1
1 Interdisciplinary Nucleus of Sound Comunication – NICS –UNICAMP Rua da Reitoria, 163 – Cidade Universitária “Zeferino Vaz” – 13083-872
Campinas, São Paulo, Brazil
{gabriel.rimoldi, jonatas}@nics.unicamp.br
Abstract. We discuss in this paper strategies of dynamic mapping applied to the design of augmented instruments. The proposed method is based on a feedback architecture that allows adjustment of mapping functions through pattern detection from the sonic response of an instrument. We applied this method to design Metaflute, an augmented instrument based on a hybrid system of gestural capture. We used a set of eight phase vocoder modules to process flute samples in real-time with performer movements detected by coupled sensors. A set of audio features was extracted from the sonic response of each synthesis module within a certain period and sent to a K-nearest neighbor algorithm (k-NN). Each synthesis module has its mapping functions modified based on patterns found by k-NN algorithm. This procedure was repeated iteratively so that the system adjusts itself in relation to its previous states. Preliminary results show a gradual differentiation of mapping functions for each synthesis module, allowing them to perform a different response in relation to data arising from the gestural interface.
Keywords: dynamic mapping; augmented instruments; Digital Music Instruments (DMI); machine learning;
1 Introduction In the Digital Music Interface (DMI) domain, mapping is understood as the act of taking real-time data from any input device and using it to control parameters of a sound generation engine [1] [2]. The task of creating a convincing relationship between these elements, both for performers and audience, may be not trivial and the criteria that qualifies the efficacy of this may depend on the context of musical practice. While a fixed mapping between gesture and sound may be more suitable to more deterministic contexts (the interpretation of a written piece, for example), a dynamic adjustment of mapping may be
Proc. of the 12th International Symposium on CMMR, Sao Paolo, Brazil, July 5-8, 2016
270

more interesting in improvisational contexts where there are no previously established sound and gesture materials.
We observed that many of the approaches in DMI design have prescribed the acoustic paradigm, in which the performer must adjust his sensorimotor contingencies to the affordances and constraints of the instrument. According to Dubberly, Haque and Pangaro [3], these approaches are more reactive than properly interactive. For them, reactive systems comprise a fixed transfer function and the relationship between activation and response elements that are linear and unilateral. While an interactive system, the transfer function is dynamic; i.e. the way that “input affects output” can be changed over the time.
We investigated strategies that allowed the machine to adjust its responses in relation to detected performer behaviors. Our goal was to develop a cooperative model of interaction that allows mutual adjustment between performer and instrument. We employed machine learning techniques to recognize patterns in DMI sonic response and to adjust its mapping functions through an affine transformation. Considering that unexpected machine responses may sometimes trigger unique creative moments for the performer, we consider that approach may be more interesting for improvisational contexts. The mapping function becomes an emergent property of the interaction and the system convergence is demonstrated through the machine assimilation of interpretative demands brought by the performer and vice-versa.
We firstly present the development of the Metaflute and describe the proposed method of dynamic mapping. Finally, we demonstrate the system performance through simulations. The applied adjustment allowed a gradual differentiation of mapping for each synthesis modules which perform a different response in relation to the data arising from gestural interface.
2 Metaflute: an Augmented Instrument
Metaflute is an augmented instrument based on a hybrid system that associates direct and indirect gestural acquisition from the flute. A set of buttons and sensors coupled with the instrument allows exploring ancillary gestures (movements of the flute body, for example) as controllers as well as increases the amount of commands that may be deliberately triggered by the performer. We also applied audio
Proc. of the 12th International Symposium on CMMR, Sao Paolo, Brazil, July 5-8, 2016
271

processing techniques to capture movement related to the sound (known as effective gestures). The audio features were calculated using the PDescriptors library, implemented in Pure Data by Monteiro and Manzolli [4]. A detailed description of the sensors and feature extraction implemented in Metaflute is discussed in [5].
For this experiment, we used a set of eight phase vocoder modules that allow real-time processing of flute samples through performer movements. Control parameters are based on roll and yaw orientations of the flute extracted by Magnetic, Angular Rate, and Gravity (MARG) sensors. The audio of the flute is recorded in real-time through a button controlled by the performer. Each module has two control parameters - pitch shifting and time dilation - that process the sound stored by the performer. We adopt individual mapping functions for pitch shifting and time dilation in each synthesis module, respectively associated with yaw and roll inputs. The input variables are associated with the control parameters through a transformation whose scalars 𝛼 and 𝛽 are dependents of the state of the mapping adjustment algorithm, as described in function (1).
𝑓(𝑥)!,! = 𝛼!,!!!𝑥 + 𝛽!,!!! (1)
where 𝑥 is the normalized input values arising from gestural interface, 𝑚 is the defined number of synthesizers with m={1, 2… 8} and 𝑛 is the state of the mapping adjustment algorithm. The domain of this function, which we named Parametrical Space, is pre-defined by the performer. Mapping functions of each synthesizer depend only on its previously state 𝑛.
3 Adaptive Mapping Strategies
The proposed method is based on a feedback DMI architecture that comprises dynamic adjustments of mapping functions through detected patterns in the sonic response of the machine, as shown in Fig. 1. Through the extraction of low-level features from the audio signal, and the clustering of these features over time, the system iteratively adjusts the mapping functions between gestural data and control parameters. The clustering map, which we named Analytical Space, points to resulting patterns of mapping between interface data and synthesis parameters. Therefore, our proposal is to associate the patterns of sonic
Proc. of the 12th International Symposium on CMMR, Sao Paolo, Brazil, July 5-8, 2016
272
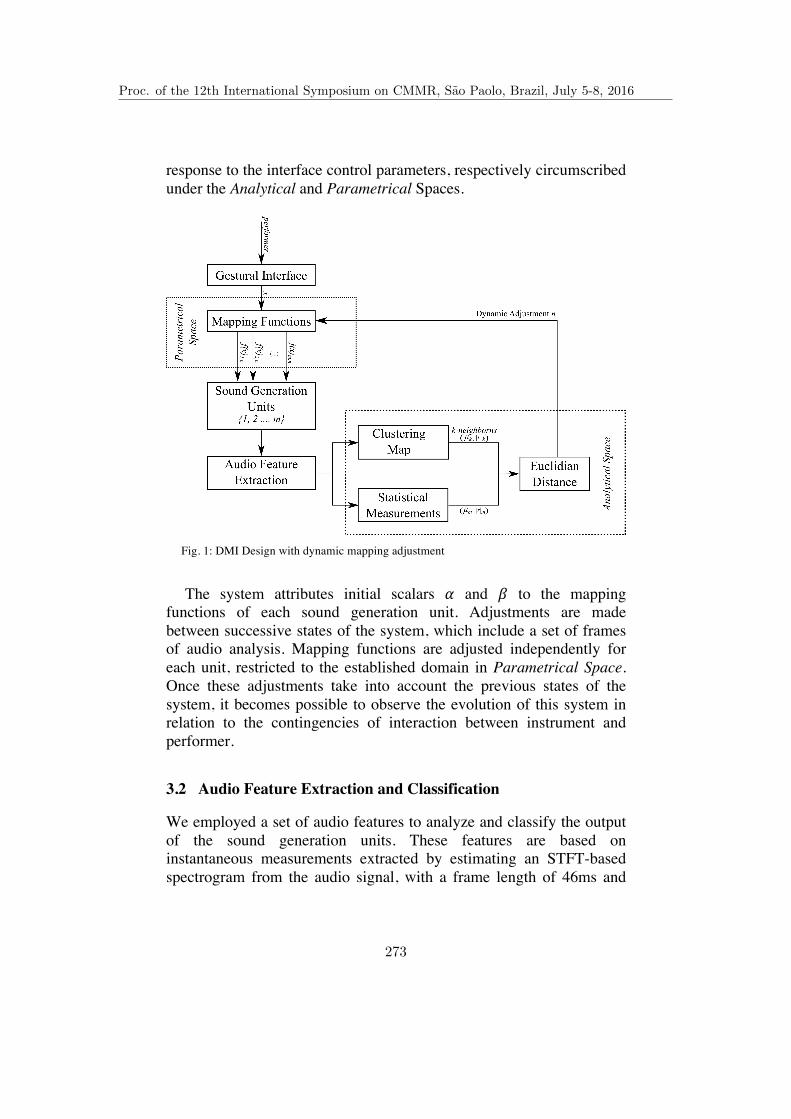
response to the interface control parameters, respectively circumscribed under the Analytical and Parametrical Spaces.
Fig. 1: DMI Design with dynamic mapping adjustment
The system attributes initial scalars 𝛼 and 𝛽 to the mapping
functions of each sound generation unit. Adjustments are made between successive states of the system, which include a set of frames of audio analysis. Mapping functions are adjusted independently for each unit, restricted to the established domain in Parametrical Space. Once these adjustments take into account the previous states of the system, it becomes possible to observe the evolution of this system in relation to the contingencies of interaction between instrument and performer.
3.2 Audio Feature Extraction and Classification
We employed a set of audio features to analyze and classify the output of the sound generation units. These features are based on instantaneous measurements extracted by estimating an STFT-based spectrogram from the audio signal, with a frame length of 46ms and
Proc. of the 12th International Symposium on CMMR, Sao Paolo, Brazil, July 5-8, 2016
273

50% overlap between two subsequent frames. For this experiment, we used two features to classify the resulting sound of the synthesis modules, namely spectral centroid and spectral flux. The first consists of a weighted mean of the frequencies present in an audio signal, while the second is calculated by the difference between the power spectrum of one frame and that of the previous frame. Our hypothesis is that these features can characterize parametric modifications of sound generation units, respectively associated with pitch shifting and time dilation.
The feature vector was extracted within a certain period and sent to a K-nearest neighbor algorithm, which classifies patterns found in audio response. The well-known K-nearest neighbor (k-NN) is an algorithm that clusters multidimensional data on subsets [6]. The algorithm finds K neighbors for each point and constructs a neighborhood graph. Each point and its neighbors form a neighborhood around a distance. In our implementation, the feature vector is iteratively segmented by the algorithm until satisfies a prescribed neighborhood distance.
3.4 Dynamic parameters adjustment
Our goal was to develop a system able to adjust the mapping functions in Parametrical Space based on patterns found in Analytical Space. For this, we applied an affine transformation that adjusts mapping functions based on statistical data of Analytical and Parametric Spaces. As described by functions (2a) and (2b), the scalars 𝛼 and 𝛽 from mapping functions are adjusted in relation to the average (𝜇) and magnitude (|𝑟|) of the feature vector of each module response and the closest k-neighborhood in Analytical Space. For each sound the synthesis module is attributed a neighborhood k based on the smaller distance between the normalized values of 𝜇! and 𝜇!.
𝛼!,! = 𝛼!,!!!|!|!|!|!
𝛽!,! = 𝛽!,!!! + |𝜇!−𝜇!| (2a/2b)
4 Experiment and Preliminary Results
We accomplished a series of experiments with audio and gestural data captured from Metaflute to demonstrate the performance system. We used one sample of 10 seconds with recorded audio flute and
Proc. of the 12th International Symposium on CMMR, Sao Paolo, Brazil, July 5-8, 2016
274
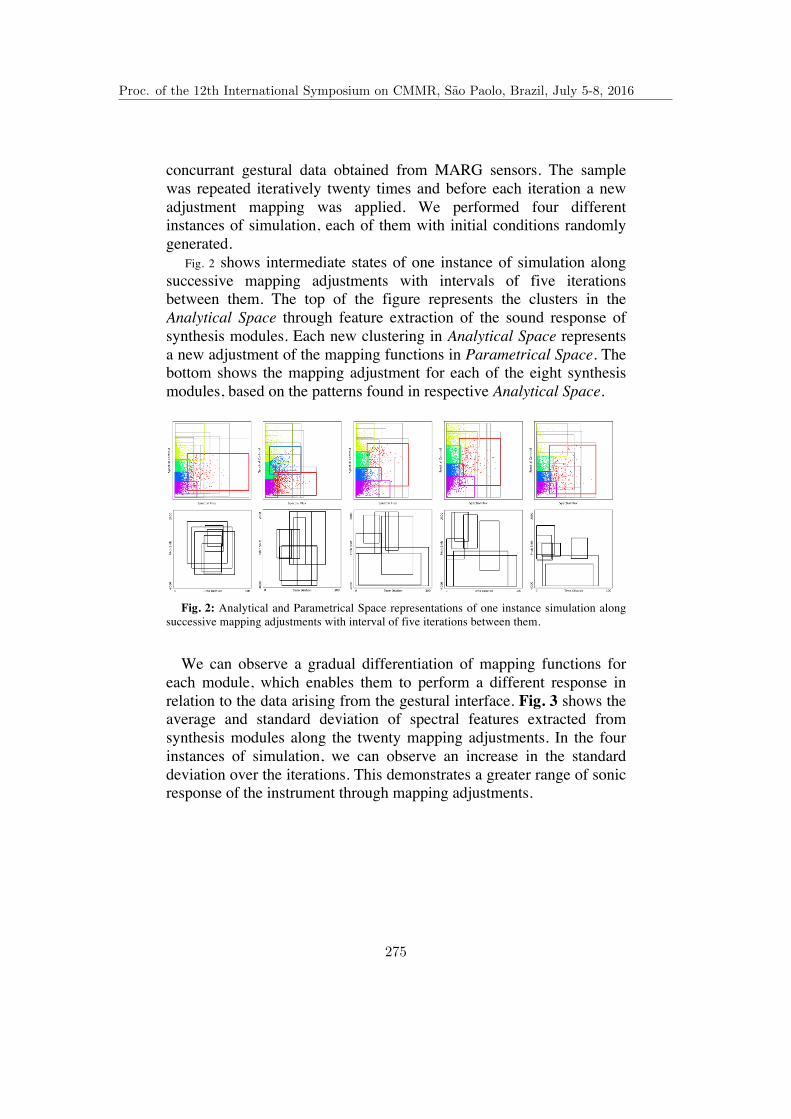
concurrant gestural data obtained from MARG sensors. The sample was repeated iteratively twenty times and before each iteration a new adjustment mapping was applied. We performed four different instances of simulation, each of them with initial conditions randomly generated.
Fig. 2 shows intermediate states of one instance of simulation along successive mapping adjustments with intervals of five iterations between them. The top of the figure represents the clusters in the Analytical Space through feature extraction of the sound response of synthesis modules. Each new clustering in Analytical Space represents a new adjustment of the mapping functions in Parametrical Space. The bottom shows the mapping adjustment for each of the eight synthesis modules, based on the patterns found in respective Analytical Space.
Fig. 2: Analytical and Parametrical Space representations of one instance simulation along
successive mapping adjustments with interval of five iterations between them.
We can observe a gradual differentiation of mapping functions for
each module, which enables them to perform a different response in relation to the data arising from the gestural interface. Fig. 3 shows the average and standard deviation of spectral features extracted from synthesis modules along the twenty mapping adjustments. In the four instances of simulation, we can observe an increase in the standard deviation over the iterations. This demonstrates a greater range of sonic response of the instrument through mapping adjustments.
Proc. of the 12th International Symposium on CMMR, Sao Paolo, Brazil, July 5-8, 2016
275

Fig. 3: Spectral features of synthesis modules along iterative mapping adjustments in the
four instances of simulation.
5 Conclusion and Future Work
We discussed strategies for dynamic mapping of Metaflute based on an automatic classification of audio features. Our hypothesis was that transformations in Parametrical Space may be related to specific dimensions of the Analytical Space and vice-versa. We tested the system performance through simulations that demonstrate a greater variety of sound response at each new iteration. We observed that iterative adjustment of mapping functions enabled a gradual approach between the Analytical and Parametrical domains, such that changes in one may imply correlated transformations in the other.
Proc. of the 12th International Symposium on CMMR, Sao Paolo, Brazil, July 5-8, 2016
276

This work brings a contribution through the use of machine learning in pattern recognition of sonic response interface as strategy of dynamic adjustment of parametric mapping functions. We consider this approach to have potential applications in improvisational contexts and also to comprise a cooperative model that allows mutual adjustments between performer and machine along the experimental creative process. In future work, we intend to apply the developed system to real situations of performance and improvisation, so that it will be possible to observe the mutual adjustment between performer and interface. We also intend to employ other machine learning methods that enable the association between patterns detected in the analysis and control parameters without a previously established correlation between them. Acknowledgments. The authors thank to the FAPESP, Proc. n.14/13166-7 and the CNPq, Proc. n.305065/2014-9 and 470358/2014-9.
References
1. Miranda, E.R., Wanderley, M.M.: New digital musical instruments: control and interaction beyond the keyboard. AR Editions, Inc. (2006).
2. Hunt, A., Wanderley, M.M., Paradis, M.: The importance of parameter mapping in electronic instrument design. J. New Music Res. 32, 429–440 (2003).
3. Dubberly, H., Pangaro, P., Haque, U.: What is interaction? Are there different types? Interactions. 16, 69 (2009).
4. Monteiro, A., Manzolli, J.: A Framework for Real-time Instrumental Sound Segmentation and Labeling. In: Proceedings of IV International Conference of Pure data--Weimar (2011).
5. Rimoldi, G., Manzolli, J.: Metaflauta : design e performance de instrumento aumentado via suporte computacional. In: Proceedings of the 15th Brazilian Symposium on Computer Music. pp. 181–192. , Campinas (2015).
6. Cover, T.M., Hart, P.E.: Nearest neighbor pattern classification. Inf. Theory, IEEE Trans. 13, 21–27 (1967).
Proc. of the 12th International Symposium on CMMR, Sao Paolo, Brazil, July 5-8, 2016
277

The Mitt: Case Study in the Design of aSelf-contained Digital Music Instrument
Ivan Franco? and Marcelo M. Wanderley
CIRMMT, McGill University, Montreal, [email protected]
Abstract. Many Digital Music Instruments (DMI) are composed of aninput controller connected to a general-purpose computer. But as com-puters evolve we witness a proliferation of new form/factors, bringingus closer to the possibility of embedding computing in everyday tangibleobjects. This fact may have a considerable impact on future DMI design,through the convergence between gestural interface and processing unit,materialized into Self-contained DMIs.By bypassing general-purpose computers and their imposed interaction
modalities, these instruments could be designed to better promote embod-ied knowledge through enactive interfaces, while still maintaining manyof the capabilities of computer-based systems. This context suggests theresearch of novel interaction models and design frameworks.“The Mitt” is a Self-contained Digital Music Instrument which exploresthe capture of high-resolution finger gestures through its tangible inter-face. It is a first implementation using an ARM embedded system, cus-tomized for sensor data acquisition and sound synthesis, and capable ofdynamic re-configuration.
Keywords: Digital Music Instrument, Embedded Systems, GranularSynthesis, BeagleBone Black, SuperCollider.
1 Introduction
In this paper we start by discussing the motivation behind the study of Self-contained Digital Music Instruments, after which we describe a supporting tech-nical system and the particular implementation of The Mitt. Lastly we drawconclusions from the development of this first proof-of-concept and discuss fu-ture research directions.
Many Digital Music Instruments (DMI) have traditionally followed a mor-phology that relies on several distinct technical apparatuses, grouped togetherto form what is considered to be the instrument. The most common case is theuse of input controllers connected to general-purpose computers. The controlleracquires information about the performance gesture and sends this data to thecomputer using a standard protocol. The computer is then responsible for sound
? Gratefully acknowledges the financial support from the Portuguese Foundation forScience and Technology.
Proc. of the 12th International Symposium on CMMR, Sao Paolo, Brazil, July 5-8, 2016
278
2 Ivan Franco and Marcelo M. Wanderley
synthesis and mapping, functions that often require a considerable amount ofprocessing power and that are intricately related to the musical properties of theinstrument[1].
Undoubtedly this is a convenient architecture, since it allows the musicianto flexibly reconfigure the functionality of the instrument, by programming newstates into the machine and radically changing its behavior. Yet, instruments thatdepend on general-purpose computers often fail to provide the sense of intimacy,appropriation and determinacy that traditional instruments offer, since theyenforce non-musical activities and rely on fragile technological systems. Theseproblems are less prominent in a category that we will define as dedicated devices- electronic music instruments that use digital processing but are focused onthe musical activity, like traditional hardware keyboard synthesizers or drum-machines.
By observing market trends at music trade shows, like NAMM or Musikmesse,we conclude that the public continues to show a large preference for dedicatedhardware devices when it comes to musical instruments. While many musicianshave promptly embraced the use of computers as virtual substitutes for produc-tion studios, they have largely unexplored their potential as expressive perfor-mance instruments. This could be due to many different factors, so it is relevantto analyze the strengths and weaknesses of both DMIs and dedicated devices tobetter inform new design proposals.
2 Dedicated Devices versus General-purpose Computers
It is difficult to compare dedicated devices to DMIs, considering the diversityof existing instruments, ranging from traditional keyboard synthesizers to theidiosyncratic practices of skillful makers and artists, that create their own in-struments and practices. Still it is useful to try to analyze some of the differencesat both theoretical ends of the spectrum.
Dedicated electronic music devices are readily available to be played anddo not require complex connections, operating systems or the launch of specificcomputing processes to reach a ready-state. The bypass of several non-musicalinteraction layers brings dedicated devices closer to the immediacy of acousticinstruments, which “just work”. One could use the expression “pick & play”for the definition of this quality, which is not present in most computer-basedsystems.
Another important distinction is that dedicated devices have relatively staticfunctionality, while the computer can virtually recreate any type of instrumentthrough software. It can also radically shift its behavior by dynamically changingsynthesis and mapping on-the-fly. This capability for reconfiguration is possiblyone of the clearest distinctions of DMIs. Additionally some DMIs can also incor-porate other parallel interaction tasks, like co-play through algorithmic processesor networking with other devices to share musical data.
A common complaint from computer musicians is related to the effort in deal-ing with non-musical technicalities. Although system complexity can be easily
Proc. of the 12th International Symposium on CMMR, Sao Paolo, Brazil, July 5-8, 2016
279

The Mitt 3
accommodated by tech-savvy individuals or years of practice with specific tools,it is undeniable that having to involve a computer is discouraging for many users.Due to their fixed architectures, dedicated devices have a significantly increasedresilience and reliability, making them less sensitive to problems of longevity.Contrarily, today’s DMIs will most certainly not work in future computer archi-tectures and operating systems. Manufacturers are currently moving to yearlyoperating system updates, often breaking functionality of relatively recent soft-ware and hardware. Personal computers also tend to be dedicated to multipleother activities, which often results degraded performance or compatibility.
Computers are also associated to particular musical sub-genres and practices,such as live coding, which deliberately embraces computer aesthetics and pro-gramming as part of an artistic manifesto. While this is certainly a valid musicalapproach, it relies more on the construction and steering of rules/models and lesson direct motor skill[2], impacting the nature of the musical performance. Manymusicians value instruments that are oriented to the maximization of dexterityand embodied knowledge, possibly easier to achieve through dedicated devicesand their music-focused interfaces.
Finally, another important characteristic of the computer is that it incitescontinuous tweaking, which could be detrimental to the progress of skill-basedknowledge. This problem was often referred by Michel Waisvisz[3], who wascapable of delivering intricate and highly expressive performances with his in-strument, “The Hands”. Waisvisz often referred that his acquired skill was dueto a voluntary decision to stop development and spend another ten years learn-ing to play. The achievement of competence could be strongly molded by staticaffordances and constraints[4], often clearer in dedicated devices than computersystems.
Each of these aspects requires in-depth study. To support our experimentswe have decided to first concentrate on surpassing the model of the controller-computer combo, by developing an embedded computing platform useful in thefast prototyping of Self-contained DMIs.
3 Previous Work
The use of embedded computing in digital music instruments is not new. Mostdigital synthesizers since the 80’s use some sort of dedicated DSP chip, withcompact form/factors, high-performance and low cost[5]. Field ProgrammableGate Arrays (FPGA) are also gaining market in audio applications, due to theirextreme efficiency in hard realtime DSP processing[6].
The recent push in low-powered computing for smartphones and the internet-of-things has also greatly contributed for the advance of ARM processors, whichare being integrated into circuits called System-On-Chip (SOC), coupling pro-cessor, clocks, memory, interfaces and mixed signals into a single package. Closerto computer architectures, SOCs run simple operating systems and take advan-tage of mature software libraries, with a ease-of-use and flexibility more difficultto achieve with DSP or FPGA solutions.
Proc. of the 12th International Symposium on CMMR, Sao Paolo, Brazil, July 5-8, 2016
280
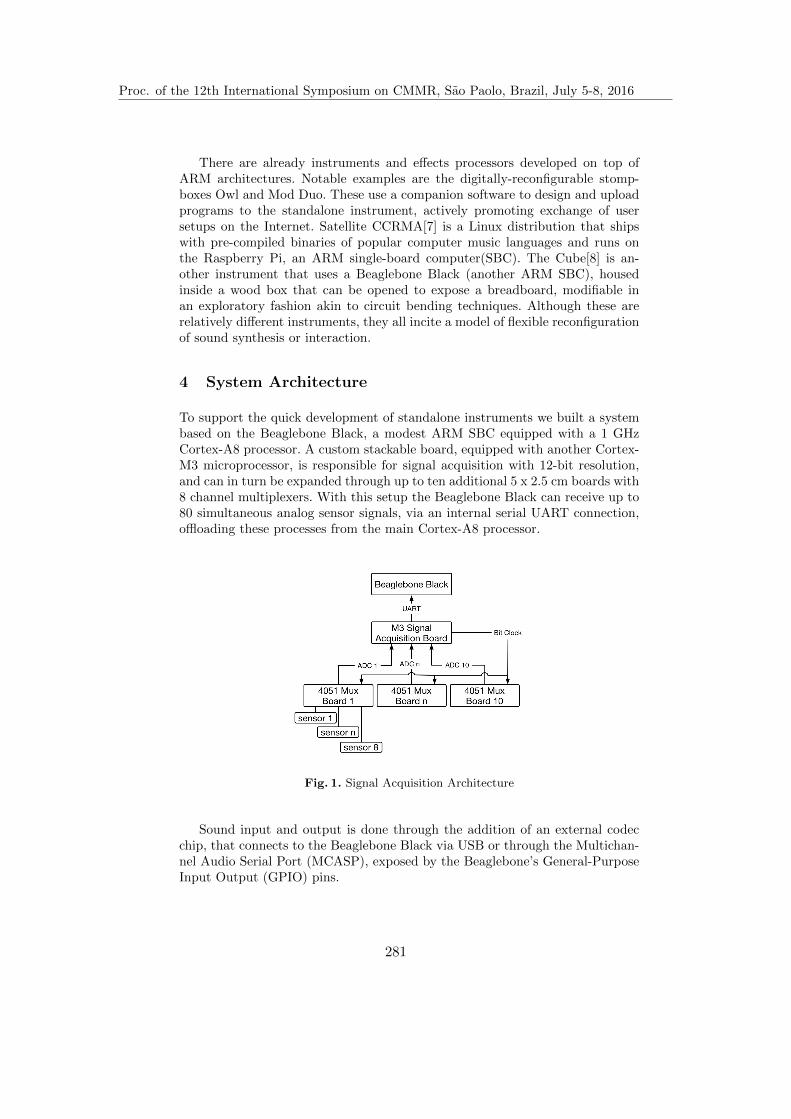
4 Ivan Franco and Marcelo M. Wanderley
There are already instruments and effects processors developed on top ofARM architectures. Notable examples are the digitally-reconfigurable stomp-boxes Owl and Mod Duo. These use a companion software to design and uploadprograms to the standalone instrument, actively promoting exchange of usersetups on the Internet. Satellite CCRMA[7] is a Linux distribution that shipswith pre-compiled binaries of popular computer music languages and runs onthe Raspberry Pi, an ARM single-board computer(SBC). The Cube[8] is an-other instrument that uses a Beaglebone Black (another ARM SBC), housedinside a wood box that can be opened to expose a breadboard, modifiable inan exploratory fashion akin to circuit bending techniques. Although these arerelatively different instruments, they all incite a model of flexible reconfigurationof sound synthesis or interaction.
4 System Architecture
To support the quick development of standalone instruments we built a systembased on the Beaglebone Black, a modest ARM SBC equipped with a 1 GHzCortex-A8 processor. A custom stackable board, equipped with another Cortex-M3 microprocessor, is responsible for signal acquisition with 12-bit resolution,and can in turn be expanded through up to ten additional 5 x 2.5 cm boards with8 channel multiplexers. With this setup the Beaglebone Black can receive up to80 simultaneous analog sensor signals, via an internal serial UART connection,offloading these processes from the main Cortex-A8 processor.
Fig. 1. Signal Acquisition Architecture
Sound input and output is done through the addition of an external codecchip, that connects to the Beaglebone Black via USB or through the Multichan-nel Audio Serial Port (MCASP), exposed by the Beaglebone’s General-PurposeInput Output (GPIO) pins.
Proc. of the 12th International Symposium on CMMR, Sao Paolo, Brazil, July 5-8, 2016
281

The Mitt 5
Audio processing is done using SuperCollider on top of Linux, running at asampling rate of 48 KHz and 16 bit depth. SuperCollider programs can be eitheredited directly on the device (via network connection) or uploaded in a micro SDCard. We chose SuperCollider due to the convenient features of an interpretedlanguage, like on-the-fly reconfiguration without compilation stages or audiointerruption. Although this choice implies a performance trade-off, our previoustests have revealed the ability to run relatively complex audio synthesis[9].
5 “The Mitt”
“The Mitt” is a first instrument built using the previously described systemarchitecture. It aims to explore the fine motor skills of the human hand and theperformative aspects of micro gestures. In the next section we describe some ofthe instrument’s features.
5.1 Tangible Interface Morphology
The Mitt’s tangible interface is constituted by an array of five vertically disposedchannels, each composed of a highly sensitive thumb joystick, three potentiome-ters and a button.
Fig. 2. The Mitt
Instead of using a perfect alignment, the five joysticks are distributed tonaturally accommodate the morphology of the first author’s dominant hand, so
Proc. of the 12th International Symposium on CMMR, Sao Paolo, Brazil, July 5-8, 2016
282

6 Ivan Franco and Marcelo M. Wanderley
that each finger can easily rest on top of its respective joystick. They are equippedwith inner spring, facilitating the unguided return to a neutral central position,and their vertical shaft measures 25 mm, with a 45-degree bend end-to-end. Thisimplies a travel projection on the horizontal plane of about 2.5 cm, resulting ina rough estimation of 1 mm accuracy, considering a single byte reserved for therepresentation of each axis (256 possible values).
The case is made of two aluminum sheets sustained by vertical rivets and thefront panel also accommodates a power connector and a 1/4” stereo audio outputjack. Three additional general-purpose buttons are used for system interactions.
5.2 Sound Synthesis
In this particular implementation we arbitrarily decided to explore granular syn-thesis. Each of the 5 channels produces grains with maximum duration of 1second, driven at a frequency of up to 15 KHz and with a maximum of 20 over-lapping grains. Each channel has an independent sound buffer, to which newsounds can be freely loaded during performance. By continuously changing thesample read position it is possible to induce a sense timbre morphing. Harmonicrelations are possible by using pitched samples and converting notes to the equiv-alent playback rates. Finally each channel is chained to a master effects bus withpanning delays and long-tailed reverberation.
5.3 Mapping
The main instrumental articulation is performed through the joysticks, while thepotentiometers are used for parameter fine-tuning. The bi-dimensional positionof the joystick is converted to polar coordinates and the resulting vector size isapplied to the granular voice amplitude, while angle affects playback rate (pitch).A switch allows for pitch quantization, defined by a scale and distributed acrossan interval of octaves. In turn the three potentiometers control trigger rate, grainsize and position in the buffer.
Although this a case of explicit one-to-one mapping[10], with each controlmapped to a single synthesis parameter, interesting behaviors emerge from themechanical and physiological constraints implicit by the design. Since it is diffi-cult for a human to move fingers independently, any hand gesture will potentiallyinfluence the five points of control simultaneously. It is possible to use gesturessuch as opening, closing, translating or rotating, adding dynamism to the fivevoices simultaneously. Future mappings could further explore this implicit cor-relation by applying gestural classification and interpretation.
By mapping the joystick’s vector size directly to amplitude, the Mitt requirescontinuous energy input from the user[10], due to joystick’s natural return to acentral position. The result is an instrument that has little interruption tolerancebut that in return highly promotes skill and nuanced playing[2]. An alternativemapping that also encourages energy input is the association between sampleposition and angle, controlling timbre morphing with rotational movements.
Proc. of the 12th International Symposium on CMMR, Sao Paolo, Brazil, July 5-8, 2016
283
The Mitt 7
6 Discussion
6.1 Musical Expressiveness with The Mitt
The fast response and fine accuracy of the joysticks result in a control with ahigh range of expressiveness. The extreme gestural amplification derived fromthe chosen mappings causes small movements to have a significant impact in theresulting sound, facilitating dramatic variations from loud, frantic and noisy toquiet, contemplative and delicate. This quality may be deterrent to the audi-ence’s understanding of cause-effect, due to the imperceptibility of such smallmovements, even if the performer is actually involved in an exceptional phys-ical effort required in the sustaining of a musical event. On the other hand itempowers the user with a very direct connection between motor function andsonic result, exploring human sensitivity and skill with detailed finger gestures.Although initially idealized for slow-evolving sounds, the Mitt is also very ap-propriate for playing short events that can be swiftly released, due to the strongpull-to-center exerted by the joysticks.
6.2 Connectivity and Integration into Existing Setups
The distribution of tasks across devices offers the possibility for the musician’scockpit[11] to be composed of several independent instruments and sound pro-cessors, connected to each other to achieve complexity. This notion also extendsto control data since the instruments can be networked. Considering modularityand a shift to more task-focused devices, the limited processing of the ARMprocessor seems less significant. In turn the capability for quick re-routing ofaudio and control functions could promote an increased quality of immediacy,further stimulating quick experimentation and tacit knowledge.
6.3 Reconfigurability
Although we have described a specific synthesis application, the capability forDMIs to change their behavior is one of their defining traits. The Mitt cansmoothly cycle between stored patches, that will gracefully fade out to be sub-stituted by new DSP chains without audio interruptions or the need to compileand relaunch applications. By separating main data handling programs frominstrument definitions, new behaviors can be created with succinct computercode.
6.4 Towards Better Metaphors
The Mitt’s goal is to explore human motor functions through an abstract in-terface, but we admit that there might be advantages in designing interactionmodels that are more tightly coupled with particular sonic creation metaphors.This is the case with the Pebblebox[12], where granular synthesis is representedby a box full of pebbles that can be freely manipulated. These types of interfacescould prove to be beneficial to self-contained instruments, by imposing a strongidentity in detriment of adaptability.
Proc. of the 12th International Symposium on CMMR, Sao Paolo, Brazil, July 5-8, 2016
284
8 Ivan Franco and Marcelo M. Wanderley
7 Conclusions
In this paper we have presented the motivation for the development of digital mu-sic instruments that promote immediacy and ease-of-use through self-containeddesigns, while maintaining attributes that are singular to computer music. Wehave also presented a first test with the Mitt, an instrument that explores aparticular control method, but that can be easily reconfigurable to perform anytype of synthesis and mapping functions.
Future steps will concentrate on further understanding the influence of af-fordances and constraints imposed by tangible interfaces and how they mightinfluence usage patterns and levels of customization.
References
1. Miranda, E. R., Wanderley M. M.: New Digital Musical Instruments: Control andInteraction Beyond the Keyboard. A-R Editions, Inc. (2006)
2. Malloch, J., Birnbaum, D., Sinyor, E., Wanderley, M. M.: Towards a new conceptualframework for digital musical instruments. In: Proceedings of the 9th InternationalConference on Digital Audio Effects, pp. 49-52. Montreal, Quebec, Canada (2006)
3. Krefeld, V., Waisvisz, M.: The Hand in the Web: An Interview with Michel Waisvisz.Computer Music Journal. 14 (2), 28-33 (1990)
4. Norman, D.: The Design of Everyday Things Revised and Expanded Edition. BasicBooks, New York (2013)
5. Wawrzynek, J., Mead, C., Tzu-Mu, L., Hsui-Lin, L., Dyer, L.: VLSI Approach toSound Synthesis. In: Proceedings of the 1984 International Computer Music Con-ference. San Francisco, USA, (1984)
6. Saito, T., Maruyama, T., Hoshino, T., Hirano, S.: A Music Synthesizer on FPGA.In: Field-Programmable Logic and Applications: 11th International Conference, pp.377–387. Springer, Belfast, Northern Ireland, UK (2001)
7. Berdahl, E., Wendy J.: Satellite CCRMA: A Musical Interaction and Sound Synthe-sis Platform. In: Proceedings of the 2011 International Conference on New Interfacesfor Musical Expression, pp. 173-178. Oslo, Norway (2011)
8. Zappi, V., McPherson, A.:Design And Use Of A Hackable Digital Instrument. In:Proceedings of the International Conference on Live Interfaces, pp. 208-219. Lisbon,Portugal (2014)
9. Franco, I., Wanderley, M. M.: Practical Evaluation of Synthesis Performance on theBeagleBone Black. In: Proceedings of the 2015 International Conference on NewInterfaces for Musical Expression, pp. 223-226. Baton Rouge, USA (2015)
10. Hunt, A., Wanderley, M. M.: Mapping Performer Parameters to Synthesis Engines.Organised Sound. 7 (02), 97-108 (2002)
11. Vertegaal, R, Ungvary, T., Kieslinger, M.: Towards a musicians cockpit: Transduc-ers, feedback and musical function. In: Proceedings of the International ComputerMusic Conference, pp. 308-311. Hong Kong, China (1996)
12. O’Modhrain, S., Essl, G.: PebbleBox and CrumbleBag: Tactile Interfaces for Gran-ular Synthesis. In: Proceedings of the 2004 Conference on New Interfaces for MusicalExpression, pp. 74-79. Hamamatsu, Japan (2004)
Proc. of the 12th International Symposium on CMMR, Sao Paolo, Brazil, July 5-8, 2016
285

Music Generation with Relation Join
Xiuyan Ni, Ligon Liu, and Robert Haralick
The Graduate Center, City University of New YorkComputer Science DepartmentNew York, NY, 10016, U.S.A
{xni2,lliu1}@gradcenter.cuny.edu
{rharalick}@gc.cuny.edu
http://gc.cuny.edu/Home
Abstract. Given a data set taken over a population, the question of how can weconstruct possible causal explanatory models for the interactions and dependen-cies in the population is a causal discovery question. Projection and Relation Joinis a way of addressing this question in a non-deterministic context with math-ematical relations. In this paper, we apply projection and relation join to musicharmonic sequences to generate new sequences in given composers styles. In-stead of first learning the patterns, and then making replications as early musicgeneration work did, we introduce a completely new data driven methodology togenerate music.
Keywords: music generation, projection, relation join
1 Introduction
Could a computer compose music sequences that are indistinguishable from the workof human composers to average human listeners? Di↵erent models have been appliedby researchers trying to answer this question.
Early work in music generation use pattern matching process to identify di↵erentstyles of music. The pattern matching process first designs a pattern matcher to locatethe patterns inherited in input works, stores the patterns in a dictionary, then makesreplications according to the patterns[1]. Cope’s Experiments in Musical Intelligenceincorporates the idea of recombinancy, he breaks music pieces into small segmentsand then recombines them under certain music constraints to generate new music ina given style. The music constraints are learned using augmented transition network(ATN). ATN is a type of graph theoretic structure widely used in Natural LanguageProcessing to parse complex natural language and generate new sentences[2, 3]. Thepattern matching algorithm used by Cope matches intervals instead of pitch, that is,(C, E,G) can be matched to (D, F#, A), or any major triads[2]. Manaris et al. (2007)[4]employ genetic programming to music generation, which uses artificial music critics asfitness functions[5, 6]. Walter and Merwe (2010) use Markov Chains (MCs) and HiddenMarkov Models (HMM)[7] to generate music. They use a certain style of music astraining data, then apply the LearnPSA algorithm[8] to produce a prediction su�x treeto find all strings with a statistical significance. The relation between a hidden and an
Proc. of the 12th International Symposium on CMMR, Sao Paolo, Brazil, July 5-8, 2016
286

2 Xiuyan Ni, Ligon Liu and Robert Haralick
observed sequence is then modeled by an HMM. After the whole learning process, theysample from the distributions learned to generate new music sequences in the samestyle as the training data[7]. An HMM is also used to classify folk music from di↵erentcountries[9]. These sampling methods, however, have drawbacks that they may be stuckin local optimal.
Some other music generation methods do not use music pieces as input. They gen-erate music based on certain rules either from music theory, or principles from artificialintelligence algorithms. Ebcioglu (1986)[10] codes music rules in certain styles in for-mal grammar to generate a specific style of music, which means musical knowledgerelated to specific style is needed to make new music. Al-Rifaie (2015)[11] appliesStochastic Di↵usion Search (SDS), a swarm intelligence algorithm, to new music gen-eration. This method generates music based on input plain text and the interaction be-tween the algorithm and its agents. It maps each letter or pair of letters in a sentenceto the MIDI number of a music note, and then calculates the pitch, the note durationand the volume of music notes based on parameters of SDS. The output music does nothave any specific style.
In general, the previous music generation methods either depend on music knowl-edge, or use machine learning techniques that have to estimate the probability of a musicsequence. In the second case, they have to learn the probability of one element givenprevious elements in a sequence. In this paper, we use a completely di↵erent methodol-ogy to generate music specific to a certain composer. We break each piece in our musiccorpus into overlapping small segments and use relation join to generate synthetic mu-sical sequences. The relation join replaces the probabilities in methods like MCs, andHMMs.
Take the MCs method as an example to compare a probability based method to ourmethod. A first order MC assumes that P(xt |xt�1, . . . , x1) = P(xt |xt�1), where< x1, x2, . . . xt > is a sequence of states (a state can be a chord or a note). It esti-mates those probabilities given a music corpus and then generates music sequencesbased on the probabilities. While in our method, we first break the music sequencesinto small segments according to specific length and number of overlapping notes(chords). Then we reconstruct music sequences using the set of segments. We call eachsequence or segment a tuple (See definition 6). For example, we have a tuple sequence< x1, x2, . . . xt >, and we set tuple length of each segment to 4, and overlapping num-ber to 2. We first break the tuple sequence into a set of tuples {< x1, x2, x3, x4 >, <x3, x4, x5, x6 >, < x5, x6, x7, x8 >, . . .}. If we repeat the first step for all sequences, wewill get a dataset that contain all possible 4-tuples with overlap of 2 (4 consecutivechords) for a given music corpus which contain sequences of chords. Then we gener-ate a chord sequence by randomly selecting one 4-tuple from the set that contains all4-tuples from the music corpus, then look at the last two chords of the selected tuple,and select another 4-tuple from the subset that contains all 4-tuples starting with thelast two chords from previous 4-tuple until we reach a certain length. If the process getsstuck because there is no possible consistent selection, the process backtracks in a treesearch manner.
Thus, in our method, there is no need to estimate probabilities. For any 4-tuple (notthe first or the last) in a generated sequence, the 4-tuple in the generated sequence is
Proc. of the 12th International Symposium on CMMR, Sao Paolo, Brazil, July 5-8, 2016
287

Music Generation with Relation Join 3
consistent with the 4-tuple that precedes it and that follows it in the generated musicsequence. Our music generation method is like a solution to a constraint satisfactionproblem. It can therefore be posed in a rule-based mode as well.
Our method can be used without musical knowledge of di↵erent styles, and we donot need to learn patterns or parameters from input music pieces either. We use the ideaof recombination (first breaking the input music into small segments, and then recom-bine them to generate new music sequences), but we don’t have to estimate the prob-abilities. The idea of this method is that the progressions inherent in music sequencescarry the patterns of music of di↵erent composers themselves.
We will describe this method in detail in Section 2. Section 3 will demonstratehow this method is applied to music generation. Several experiments are introduced inSection 4. Section 5 concludes current work and looks into future work.
2 Definition
In order to introduce the procedure of applying relation join to music sequences, weformally define the concepts used in this section[12].
Definition 1. Let X1, ..., XN be the N variables associated with a relation. Let Ln be theset of possible values variable Xn can take. Let R be a data set or knowledge constraintrelation. Then
R ✓N⌘
i=1
Li (1)
We will be working with many relations associated with di↵erent and overlappingvariable sets and therefore over di↵erent domains. For this purpose we will carry anindex set along with each relation. The index set indexes the variables associated withthe relation. An index set is a totally ordered set.
Definition 2. I = {i1, ..., iK} is an index set if and only if i1 < i2 < · · · < iK.
Next we need to define Cartesian product sets with respect to an index set.
Definition 3. If I = {i1, ..., iK} is an index set, we define Cartesian product:
⌘
i2ILi =
K⌘
k=1
Lik = Li1 ⇥ Li2 ⇥ ... ⇥ LiK (2)
The definition tells us that the order in which we take the Cartesian product⇣
i2I Li
is precisely the order of the indexes in I.For a natural number N, we use the convention that [N] = {1, ...,N} and |A| desig-
nates the number of elements in the set A.Now we can define the indexed relation as a pair consisting of an index set of a
relation and a relation.
Proc. of the 12th International Symposium on CMMR, Sao Paolo, Brazil, July 5-8, 2016
288
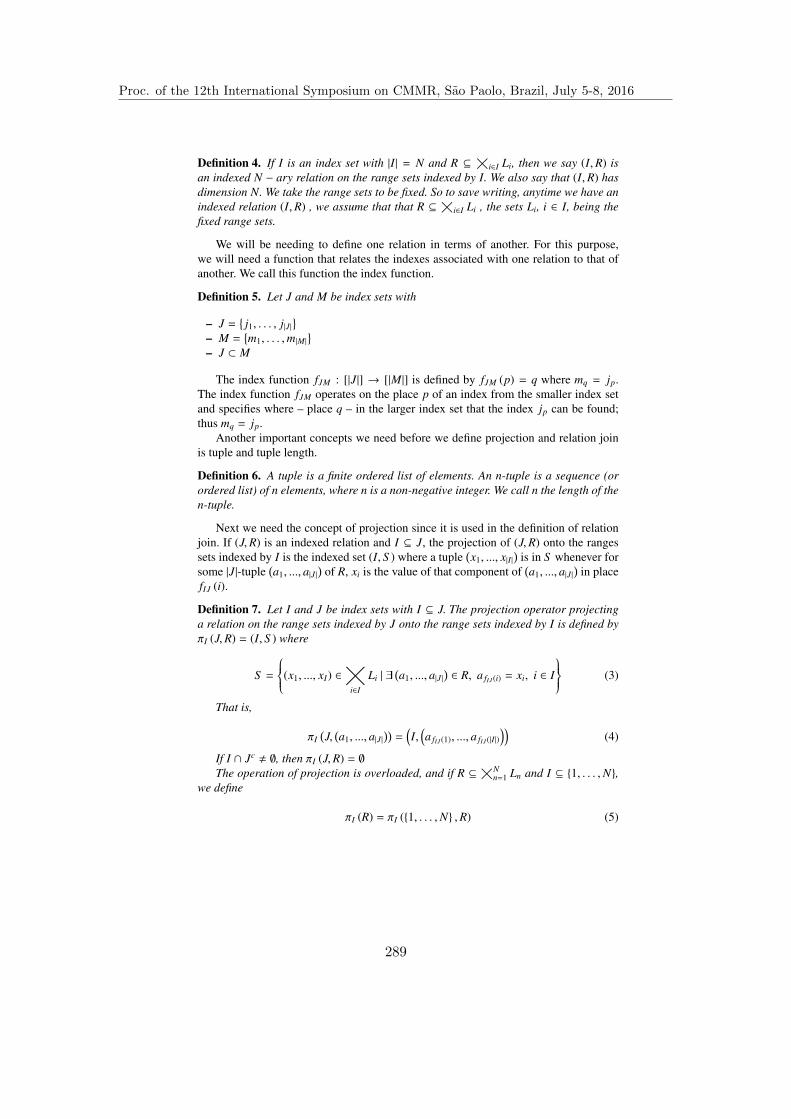
4 Xiuyan Ni, Ligon Liu and Robert Haralick
Definition 4. If I is an index set with |I| = N and R ✓ ⇣i2I Li, then we say (I,R) isan indexed N � ary relation on the range sets indexed by I. We also say that (I,R) hasdimension N. We take the range sets to be fixed. So to save writing, anytime we have anindexed relation (I,R) , we assume that that R ✓ ⇣i2I Li , the sets Li, i 2 I, being thefixed range sets.
We will be needing to define one relation in terms of another. For this purpose,we will need a function that relates the indexes associated with one relation to that ofanother. We call this function the index function.
Definition 5. Let J and M be index sets with
– J =�j1, . . . , j|J|
– M =�m1, . . . ,m|M|
– J ⇢ M
The index function fJM : [|J|] ! [|M|] is defined by fJM (p) = q where mq = jp.The index function fJM operates on the place p of an index from the smaller index setand specifies where – place q – in the larger index set that the index jp can be found;thus mq = jp.
Another important concepts we need before we define projection and relation joinis tuple and tuple length.
Definition 6. A tuple is a finite ordered list of elements. An n-tuple is a sequence (orordered list) of n elements, where n is a non-negative integer. We call n the length of then-tuple.
Next we need the concept of projection since it is used in the definition of relationjoin. If (J,R) is an indexed relation and I ✓ J, the projection of (J,R) onto the rangessets indexed by I is the indexed set (I, S ) where a tuple
�x1, ..., x|I|
�is in S whenever for
some |J|-tuple�a1, ..., a|J|
�of R, xi is the value of that component of
�a1, ..., a|J|
�in place
fIJ (i).
Definition 7. Let I and J be index sets with I ✓ J. The projection operator projectinga relation on the range sets indexed by J onto the range sets indexed by I is defined by⇡I (J,R) = (I, S ) where
S =
8>><>>:(x1, ..., xI) 2⌘
i2ILi | 9 �
a1, ..., a|J|� 2 R, a fIJ (i) = xi, i 2 I
9>>=>>; (3)
That is,
⇡I�J,
�a1, ..., a|J|
��=
⇣I,
⇣a fIJ (1), ..., a fIJ (|I|)
⌘⌘(4)
If I \ Jc , ;, then ⇡I (J,R) = ;The operation of projection is overloaded, and if R ✓ ⇣N
n=1 Ln and I ✓ {1, . . . ,N},we define
⇡I (R) = ⇡I ({1, . . . ,N} ,R) (5)
Proc. of the 12th International Symposium on CMMR, Sao Paolo, Brazil, July 5-8, 2016
289

Music Generation with Relation Join 5
A relation join can be thought of as the equijoin or natural join operation in the database world.
Definition 8. Let (I,R) and (J, S ) be indexed relations, let K = I [ J and Lk be therange set for variable k 2 K. Then the relation join of (I,R) and (J, S ) is denoted by(I,R) ⌦ (J, S ), and is defined by
(I,R) ⌦ (J, S ) =
8>><>>:t 2⌘
k2KLk | ⇡I (K, t) 2 (I,R) and ⇡J (K, t) 2 (J,R)
9>>=>>; (6)
Example 1. Following is an example for relation join. If we have two indexed relations,(I,R) and (J, S ) as in Table 1, the relation join for the two relations will be as in Table2.
Table 1. Values for (I,R) and (J, S )
(I,R) (J, S )I 1,4,7,9 J 2,4,6,71 (a, b, e, d) 1 (e, e, a, d)2 (b, d, e, a) 2 (d, c, b, a)3 (e, c, a, b) 3 (a, d, b, e)4 (c, e, d, a) 4 (b, b, c, e)
Table 2. Values for (I,R) and (J, S )
(K,T ) = (I,R) ⌦ (J, S )K 1,2,4,6,7,9
(1, 4) (a, b, b, c, e, d)(2, 3) (b, a, d, b, e, a)(3, 2) (e, d, c, b, a, b)(4, 1) (c, e, e, a, d, a)
3 Music Generation through Projection and Relation Join
Section 2 introduced the definition of projection and relation join which are the coretechniques we will use in the music generation. In this section, we will introduce howthe techniques can be applied to music sequences (chord sequences). Before that, weneed to introduce the mathematical definition we use for music terms.
Definition 9. A note is a small bit of sound with a dominant fundamental to introducethe frequency and harmonics sound. For the sake of simplicity, this domain includes allthe notes on a piano keyboard,
we define a set of notes N as:
Proc. of the 12th International Symposium on CMMR, Sao Paolo, Brazil, July 5-8, 2016
290

6 Xiuyan Ni, Ligon Liu and Robert Haralick
N = {A0, B0,C1,C#1,D1, . . . , B7,C8} (7)
In music, a chord is a set of notes that is heard sounding simultaneously.
Definition 10. A chord is a set of notes, that is, for any chord c, c ✓ N.
Now we can define a music sequence such as an harmonic sequence.
Definition 11. Let C be a collection of all chords, the harmonic sequence of a musicalpiece of length L is then a tuple h 2 CL.
A music corpus can be represented as a set H of Z Harmonic Sequences. H =nhz 2 CLz
oZ
z=1, where Lz is the length of the tuple hz.
An example of an harmonic sequence with 8 chords is as following:
Example 2. {’B4’, ’E4’, ’D4’, ’G3’}, {’A4’, ’E4’, ’C#4’, ’E3’, ’A3’}, {’G4’, ’E4’, ’C#4’,’E3’, ’A3’}, {’A5’, ’F#4’, ’E4’, ’C#4’, ’A3’, ’A2’}, {’G5’, ’E4’, ’C#4’, ’A3’, ’A2’},{’F#5’, ’F#4’, ’D4’, ’A3’, ’D3’}, {’E5’, ’F#4’, ’D4’, ’A3’, ’D3’}, {’D5’, ’F#4’, ’D4’,’A3’, ’D3’, ’F#3’}
We know that there exist certain rules in chords progressions to make a harmonicsequences sound consistent. To take advantages of those rules, we need to design indexsets for the sequences to project on.
Definition 12. A collectionI (m, n) of K length m sets with uniform overlap of n (n < m)is represented as:
I (m, n) = {Ik | Ik = {(m � n) · k + 1, (m � n) · k + 2, . . . , (m � n) · k + m}}K�1k=0 (8)
I (m, n) is a collection of tuple sets.For example, if m = 4 and n = 2, the tuple sets are:
Example 3.I0 = {1, 2, 3, 4}I1 = {3, 4, 5, 6}I2 = {5, 6, 7, 8}
...
IK�1 = 2 · (K � 1) + 1, 2 · (K � 1) + 2, 2 · (K � 1) + 3, 2 · (K � 1) + 4
I (4, 2) = {I0, I1, . . . , IK�1} .We can now collect data sets from music sequences based on the tuple sets.
Theorem 1. Let I = I (m, n) be a collection of K length m sets with uniform overlapof n, let h be a harmonic sequence, the set Rh of all m-tuples with overlap n from h isdefined by
([(m � n) · (K � 1) + m],Rh) = [I2I⇡I (h) (9)
If H is set of harmonic sequences, then
Proc. of the 12th International Symposium on CMMR, Sao Paolo, Brazil, July 5-8, 2016
291
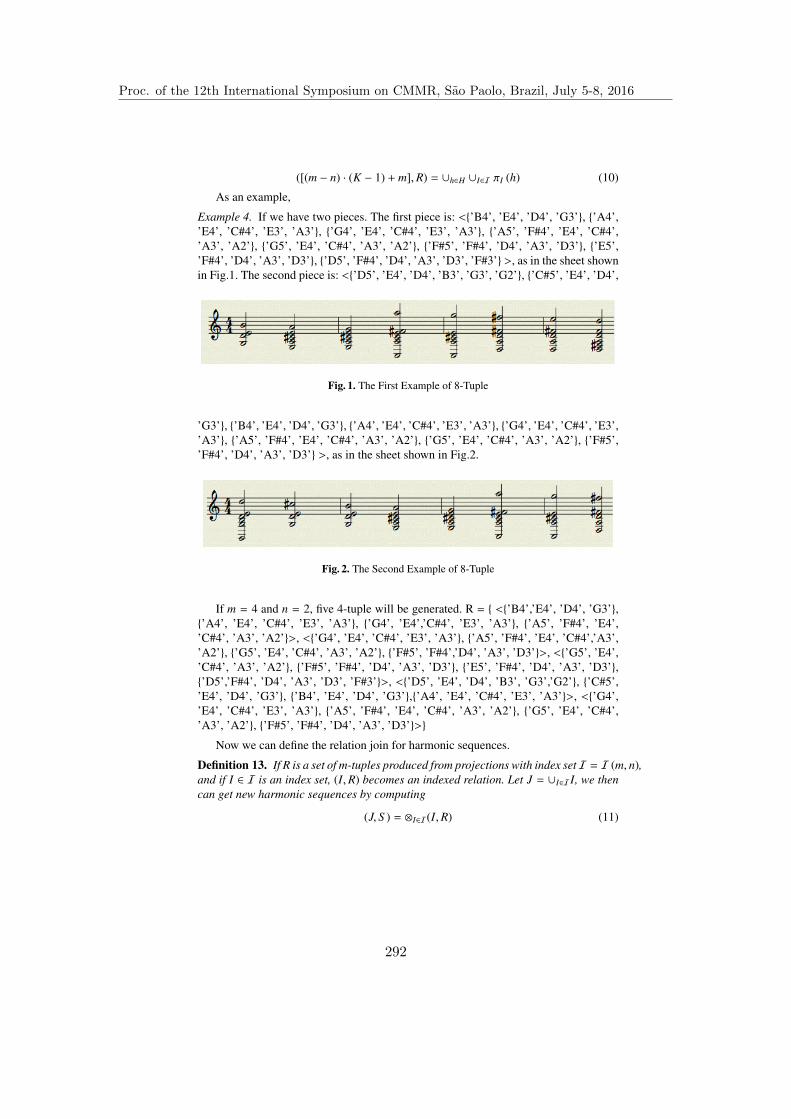
Music Generation with Relation Join 7
([(m � n) · (K � 1) + m],R) = [h2H [I2I ⇡I (h) (10)
As an example,
Example 4. If we have two pieces. The first piece is: <{’B4’, ’E4’, ’D4’, ’G3’}, {’A4’,’E4’, ’C#4’, ’E3’, ’A3’}, {’G4’, ’E4’, ’C#4’, ’E3’, ’A3’}, {’A5’, ’F#4’, ’E4’, ’C#4’,’A3’, ’A2’}, {’G5’, ’E4’, ’C#4’, ’A3’, ’A2’}, {’F#5’, ’F#4’, ’D4’, ’A3’, ’D3’}, {’E5’,’F#4’, ’D4’, ’A3’, ’D3’}, {’D5’, ’F#4’, ’D4’, ’A3’, ’D3’, ’F#3’} >, as in the sheet shownin Fig.1. The second piece is: <{’D5’, ’E4’, ’D4’, ’B3’, ’G3’, ’G2’}, {’C#5’, ’E4’, ’D4’,
Fig. 1. The First Example of 8-Tuple
’G3’}, {’B4’, ’E4’, ’D4’, ’G3’}, {’A4’, ’E4’, ’C#4’, ’E3’, ’A3’}, {’G4’, ’E4’, ’C#4’, ’E3’,’A3’}, {’A5’, ’F#4’, ’E4’, ’C#4’, ’A3’, ’A2’}, {’G5’, ’E4’, ’C#4’, ’A3’, ’A2’}, {’F#5’,’F#4’, ’D4’, ’A3’, ’D3’} >, as in the sheet shown in Fig.2.
Fig. 2. The Second Example of 8-Tuple
If m = 4 and n = 2, five 4-tuple will be generated. R = { <{’B4’,’E4’, ’D4’, ’G3’},{’A4’, ’E4’, ’C#4’, ’E3’, ’A3’}, {’G4’, ’E4’,’C#4’, ’E3’, ’A3’}, {’A5’, ’F#4’, ’E4’,’C#4’, ’A3’, ’A2’}>, <{’G4’, ’E4’, ’C#4’, ’E3’, ’A3’}, {’A5’, ’F#4’, ’E4’, ’C#4’,’A3’,’A2’}, {’G5’, ’E4’, ’C#4’, ’A3’, ’A2’}, {’F#5’, ’F#4’,’D4’, ’A3’, ’D3’}>, <{’G5’, ’E4’,’C#4’, ’A3’, ’A2’}, {’F#5’, ’F#4’, ’D4’, ’A3’, ’D3’}, {’E5’, ’F#4’, ’D4’, ’A3’, ’D3’},{’D5’,’F#4’, ’D4’, ’A3’, ’D3’, ’F#3’}>, <{’D5’, ’E4’, ’D4’, ’B3’, ’G3’,’G2’}, {’C#5’,’E4’, ’D4’, ’G3’}, {’B4’, ’E4’, ’D4’, ’G3’},{’A4’, ’E4’, ’C#4’, ’E3’, ’A3’}>, <{’G4’,’E4’, ’C#4’, ’E3’, ’A3’}, {’A5’, ’F#4’, ’E4’, ’C#4’, ’A3’, ’A2’}, {’G5’, ’E4’, ’C#4’,’A3’, ’A2’}, {’F#5’, ’F#4’, ’D4’, ’A3’, ’D3’}>}
Now we can define the relation join for harmonic sequences.
Definition 13. If R is a set of m-tuples produced from projections with index setI = I (m, n),and if I 2 I is an index set, (I,R) becomes an indexed relation. Let J = [I2II, we thencan get new harmonic sequences by computing
(J, S ) = ⌦I2I(I,R) (11)
Proc. of the 12th International Symposium on CMMR, Sao Paolo, Brazil, July 5-8, 2016
292

8 Xiuyan Ni, Ligon Liu and Robert Haralick
The above procedure can be applied to harmonic sequences with and without corre-sponding time duration. But there is no intentional control of key of harmonic sequencesin this procedure.
Definition 14. Let K be the set of all possible keys in music, then
K = {C,Db; D; Eb; E; F; Gb; G; Ab; A; Bb, B} (12)
Enharmonic keys are counted as one key, that is, C# = Db; D# = Eb; F# =Gb; G# = Ab; A# = Bb; Cb = B
When we say a piece is in a certain ‘key’, it means the piece is formed around thenotes in a certain scale which, in music, is a set of notes ordered by certain frequencyor pitch. For example, the C Major Scale contains C, D, E, F, G, A, B, and C. A piecebased on the key of C will (generally) use C, D, E, F, G, A, B, and C.
Now we could do key constraint relation join.
Definition 15. LetRb
k = {(c1, c2, . . . , cm) | c1 2 Ck} (13)
Rek = {(c1, c2, . . . , cm) | cm 2 Ck} (14)
where Ck is a set of chords who are in the key of k, Rbk ✓ R contains all m-tuples
of chords in which the first chord is in the key of k, 0b0 means begin. Similarly, Rek ✓ R
contains all m-tuples of chords in which the last chord is in the key of k, 0e0 means end.Then compute
(J, S ) =⇣I0,Rb
k
⌘⌦K�2
i=1 (Ii,R) ⌦⇣IK�1,Re
k
⌘(15)
Which is relation join constrained by using chords in the key of k that begin and end thepiece.
We could also do scale constraint relation join.
Definition 16. A scale, in music, is a set of notes ordered by certain frequency or pitch.For example, the C Major Scale contains C, D, E, F, G, A, B, and C.
Let RS ✓ R be a set of tuples of chords in which all chords are in scale S. Then wecan get new harmonic sequences in which all chords are in scale S by computing
(J, S ) = ⌦I2I(I,RS ) (16)
4 Experiments
In this section, we apply the techniques introduced in Section 2 and 3 to a music corpusfrom Music211.
1 Music 21 is a toolkit for computer-aided musicology. See http://web.mit.edu/music21/.
Proc. of the 12th International Symposium on CMMR, Sao Paolo, Brazil, July 5-8, 2016
293
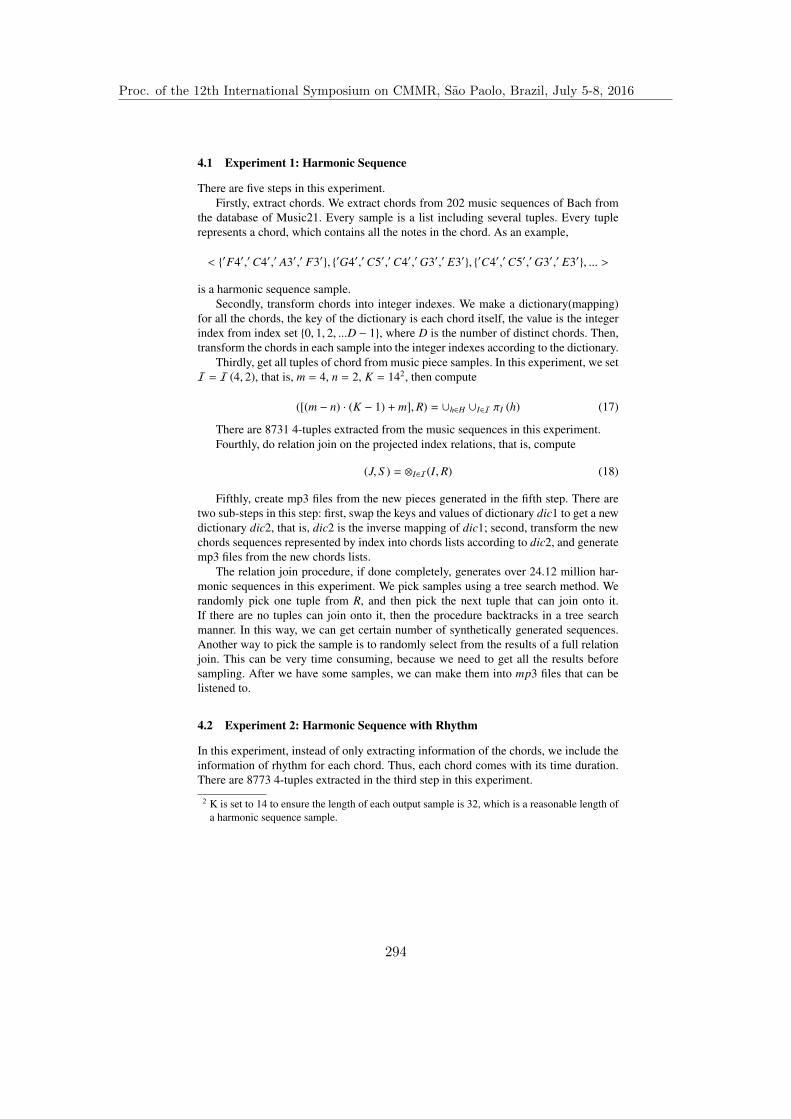
Music Generation with Relation Join 9
4.1 Experiment 1: Harmonic Sequence
There are five steps in this experiment.Firstly, extract chords. We extract chords from 202 music sequences of Bach from
the database of Music21. Every sample is a list including several tuples. Every tuplerepresents a chord, which contains all the notes in the chord. As an example,
< {0F40,0C40,0 A30,0 F30}, {0G40,0C50,0C40,0G30,0 E30}, {0C40,0C50,0G30,0 E30}, ... >
is a harmonic sequence sample.Secondly, transform chords into integer indexes. We make a dictionary(mapping)
for all the chords, the key of the dictionary is each chord itself, the value is the integerindex from index set {0, 1, 2, ...D � 1}, where D is the number of distinct chords. Then,transform the chords in each sample into the integer indexes according to the dictionary.
Thirdly, get all tuples of chord from music piece samples. In this experiment, we setI = I (4, 2), that is, m = 4, n = 2, K = 142, then compute
([(m � n) · (K � 1) + m],R) = [h2H [I2I ⇡I (h) (17)
There are 8731 4-tuples extracted from the music sequences in this experiment.Fourthly, do relation join on the projected index relations, that is, compute
(J, S ) = ⌦I2I(I,R) (18)
Fifthly, create mp3 files from the new pieces generated in the fifth step. There aretwo sub-steps in this step: first, swap the keys and values of dictionary dic1 to get a newdictionary dic2, that is, dic2 is the inverse mapping of dic1; second, transform the newchords sequences represented by index into chords lists according to dic2, and generatemp3 files from the new chords lists.
The relation join procedure, if done completely, generates over 24.12 million har-monic sequences in this experiment. We pick samples using a tree search method. Werandomly pick one tuple from R, and then pick the next tuple that can join onto it.If there are no tuples can join onto it, then the procedure backtracks in a tree searchmanner. In this way, we can get certain number of synthetically generated sequences.Another way to pick the sample is to randomly select from the results of a full relationjoin. This can be very time consuming, because we need to get all the results beforesampling. After we have some samples, we can make them into mp3 files that can belistened to.
4.2 Experiment 2: Harmonic Sequence with Rhythm
In this experiment, instead of only extracting information of the chords, we include theinformation of rhythm for each chord. Thus, each chord comes with its time duration.There are 8773 4-tuples extracted in the third step in this experiment.
2 K is set to 14 to ensure the length of each output sample is 32, which is a reasonable length ofa harmonic sequence sample.
Proc. of the 12th International Symposium on CMMR, Sao Paolo, Brazil, July 5-8, 2016
294

10 Xiuyan Ni, Ligon Liu and Robert Haralick
In the first step, we extract a harmonic sequence sample as following, the numberat the end of each chord is the time duration in quarter length, 1.0 represents a quarter,0.5 represents a eighth, and so on:
< {0F40,0C40,0 A30,0 F30, 0.5}, {0G40,0C50,0C40,0G30,0 E30, 0.5}, {0C40,0C50,0G30,0 E30, 1.0}, ... >The other four steps are the same as in experiment 1. Relation join generates above
1.67 million sequences in this experiment.
4.3 Experiment 3: Harmonic Sequence in Specific Key and Scale
In the above experiments, there is no intentional control of the key of harmonic se-quences and the scale the chords in. We want to see if the harmonic sequences soundbetter when we specify the key and scale. So we do two constraint relation join exper-iments based on each of the above two experiments, which will generate four combi-nations of experiments. The number of harmonic sequences each experiment generatedare summarized in table 3.
Table 3. The number of sequences generated with key and scale constraint
type with key constraint with scale constraintchord 65648 577602
chord with rhythm 4958 867977
Since relation join generates new sequences using existing harmonic sequences, itrelies on the transitions of chords of existing sequences. In addition, machine generatedsequences will have the same length, while the human generated sequences have moresequential features of longer length.
4.4 Experiment 4: Redo the Experiments with m = 5, n = 3
We also do another set of experiments with m = 5, n = 3. We extract 8797 and 88135-tuples from the 202 Music21 sequences respectively for tuples with only chord andtuples including both chord and rhythm. The results are summarized in Table 4.
Table 4. The number of sequences generated with key and scale constraint
type no constraints with key constraint with scale constraintchord 63262 266 365
chord with rhythm 571 1193 1
Some samples from these experiments are also posted to the website: http://haralick.org/music/music.html.
3 Except this experiment, the time duration of all chords with rhythms are restricted to be halfchord
Proc. of the 12th International Symposium on CMMR, Sao Paolo, Brazil, July 5-8, 2016
295
Music Generation with Relation Join 11
5 Conclusion and Future Work
Previous music generation methods try to find music sequences set:
{x1, x2, . . . , xN |P (x1, x2, . . . , xN) > 0} (19)
they use machine learning techniques to estimate:
P (x1, x2, . . . , xN) =KY
k=1
fk (xi : i 2 Ak) (20)
for all x1, . . . xN 2 ⇣Ni=1 Li, where Li are the space of music elements (such as
chords), N is the length of each sequence, Ak is a set of index tuples.Only those music sequences with P (x1, x2, . . . , xN) > 0 will be generated. So they
have to estimate fk (xi : i 2 Ak) and make sure that for 8k, fk (xi : i 2 Ak) > 0.In this paper, we use a completely di↵erent methodology to generate music spe-
cific to certain composers called projection and relation join. Instead of estimating theprobabilities, we calculate the relation join of (Ak,Rk) for all k, in which
(Ak,Rk) = (Ak, {(xi, i 2 Ak) | fk (xi, i 2 Ak) > 0}) (21)
Thus, in our method, fk (xi : i 2 Ak) > 0 is ensured for any k.This method requires neither expert level domain knowledge nor learning patterns
and parameters from input music pieces. The method is based on the idea of recom-bination, but without estimating any probabilities. The idea of this method is that theprogressions inherent in music sequences themselves carry the patterns of music ofdi↵erent composers.
References
1. Papadopoulos,G.,Wiggins,G.: AI Methods for Algorithmic Composition: A survey, a CriticalView and Future Prospects. In: AISB Symposium on Musical Creativity, Edinburgh, UK, 110-117 (1999)
2. Cope, D.: Computer Modeling of Musical Intelligence in EMI. Computer Music Journal, 69-83 (1992)
3. Winograd, T.: Language As a Cognitive Process: Volume 1: Syntax. (1983)4. Manaris, B., Roos, P., Machado, P., Krehbiel, D., Pellicoro, L. and Romero, J.: A Corpus-
based Hybrid Approach to Music Analysis and Composition. In Proceedings of the NationalConference on Artificial Intelligence (Vol. 22, No. 1, p. 839). Menlo Park, CA; Cambridge,MA; London; AAAI Press; MIT Press; 1999 (2007)
5. Romero, J., Machado, P., Santos, A., Cardoso, A.: On the Development of Critics in Evolu-tionary Computation Artists. In: Applications of Evolutionary Computing, 559-569, Springer(2003)
6. Machado, P., Romero, J., Manaris, B.: Experiments in Computational Aesthetics. In: The Artof Artificial Evolution, 381-415, Springer (2008)
7. Schulze, W., Van der Merwe, B.: Music Generation with Markov Models. IEEE MultiMedia(3) 78-85 (2010)
Proc. of the 12th International Symposium on CMMR, Sao Paolo, Brazil, July 5-8, 2016
296

12 Xiuyan Ni, Ligon Liu and Robert Haralick
8. Ron,D.,Singer,Y.,Tishby,N.: The Power of Amnesia: Learning Probabilistic Automata withVariable Memory Length. Machine learning 25(2-3), 117-149 (1996)
9. Chai,W.,Vercoe,B.: Folk Music Classification Using Hidden Markov Models.In:Proceedingsof International Conference on Artificial Intelligence. Volume 6., Citeseer (2001)
10. Ebcioglu, K.: An Expert System for Harmonization of Chorales in the Style of JS Bach.(1986)
11. Al-Rifaie, A.M., Al-Rifaie, M.M.: Generative Music with Stochastic Di↵usion Search. In:Evolutionary and Biologically Inspired Music, Sound, Art and Design, 1-14, Springer (2015)
12. Haralick, R.M., Liu, L., Misshula, E.: Relation Decomposition: the Theory. In: MachineLearning and Data Mining in Pattern Recognition, 311-324, Springer (2013)
Proc. of the 12th International Symposium on CMMR, Sao Paolo, Brazil, July 5-8, 2016
297

Retrograde of Melody and Flip Operation forTime-Span Tree
Keiji Hirata1 and Satoshi Tojo2
1 Future University [email protected]
2 Japan Advanced Institute of Science and [email protected]
Abstract. In this paper, we develop an algebraic framework for ma-nipulating time-span trees based on Generative Theory of Tonal Music,to enrich the logical system with the notion of complement. We intro-duce a flipping operation on time-span trees, which changes the left-branching/right-branching to produce a mirror image of the tree. Firstly,we claim that the flipping operation corresponds to the retrograde of amelody that is a reverse progression of the original melody. Secondly, weshow that the flipped tree lies furthest from the original tree in the latticeof trees, in terms of distance metrics and show that the flipping operationproduces a well-suited tree subsumed by the relative pseudo-complementin an algebraic system.
Keywords: time-span tree, GTTM, flip, retrograde, relative pseudo-complement
1 Introduction
We have been developing an algebraic framework for manipulating time-spantrees [4, 3] that have been retrieved from music pieces based on Generative The-ory of Tonal Music (GTTM) [5]. A time-span tree is a binary tree that representsthe structural importance of each note in a melody. The reduction operation inthe theory removes a less important branch in a time-span tree and eventuallyextracts the fundamental structure, like Schenkerian analysis [1]. The reduc-tion corresponds to the is a relation which is one of the substantial primitivesin knowledge representation. Thus far, we have formalized a time-span tree andthe reduction operation so that the original time-span tree subsumes the reducedone. Accordingly, since the set of time-span trees makes a partially ordered setlattice with this subsumption relation, two operations on time-span trees, joinand meet, become available. These two operations work on two input time-spantrees like union and intersection of the set operations, respectively.
In this paper, we develop such algebraic methods further, and present anattempt to introduce a notion of complement in the system. Firstly, we focus onthe relationships between the retrograde of a melody and the flip operation ofa time-span tree. Secondly, we propose that the flipping operation realizes theapproximation of the relative pseudo-complement.
Proc. of the 12th International Symposium on CMMR, Sao Paolo, Brazil, July 5-8, 2016
298

2 Hirata and Tojo
1 2 3
4 5
1234
5
Fig. 1. Example of retrograde in Beethoven’s Piano Sonata. The circled number 20means the 20th bar from the beginning of the fourth movement; the circled number150 means the 150th bar. In the upper part of the figure, the theme begins in the 16thbar; in the lower part, the retrograde begins in the 152nd bar. Numbers 1 through 5show the correspondences between the original and its retrograde.
2 Retrograde of Melody
The retrograde of a melody is a sequence of notes reversed in time relative to theoriginal melody that preserves the pitch and duration of each note, although theoriginal rhythm might be abandoned. In the medieval period or the Renaissance,the retrograde was developed as an esoteric technique for extending the originalmelody, cantus firmus. For example, we can find the retrograde of the themein the fugue in the fourth movement of Beethoven’s Piano Sonata No. 29 inB-flat major, op.106, (Fig. 1)3. While the theme is played in B-flat major, theretrograde is transposed into B-flat minor with retaining the rhythm. In the 20thcentury, Schoenberg stated that the retrograde was one of the basic operationsin dodecaphony (twelve-tone music), together with the inversion.
3 Flip Operation
The flip operation in this paper means the exchange of the left-branching andthe right-branching in the tree. If we apply this operation to the whole tree, itresults in a mirror image of the original time-span tree. To define the operation,
3 Excerpted from http://imslp.org/. Edited by Heinrich Schenker and published byUniversal Edition (ca.1920).
Proc. of the 12th International Symposium on CMMR, Sao Paolo, Brazil, July 5-8, 2016
299

Retrograde of Melody and Flip Operation for Time-Span Tree 3
flip
flip
Center Line Center Line
Center Line Center Line
Fig. 2. Example of Flip of Time-Span Tree
flip
qe
q e
TP
0 TS
TP
0 TP- T
S
Center Line
Primary BranchSecondary Branch
Fig. 3. Base Case of Flip Operation ofSimple Time-Span Tree
TP
0 TS
Shift by TP- T
S
S P
P
S’’
S’
P’
flip flip
Center Line P
(1)
(2) (3)
(a)
(b)
Primary BranchSecondary Branch
Center Line S
Fig. 4. Inductive Case of Flip Operation
we used the notion of maximum time-span for each pitch event [2]4, which is thelongest time interval within which the pitch event becomes most salient. Thus,the maximum time-span at the top level dominates the entire time-span tree(Fig. 2).
We show the inductive algorithm of the flip for a time-span tree. The basecase is the simplest time-span tree and is made of only two notes (Fig. 3).Themaximum time-span of the primary branch is [0, TP ], whose center line is placedat TP /2, and the maximum time-span of the secondary branch is [0, TS ]. Here,the flip operation means a turn-over at the center line TP /2. Thus, while the flip
4 Originally we called this notion maximal time-span but rename it maximum time-span as it represents a global, not local, maximal time interval.
Proc. of the 12th International Symposium on CMMR, Sao Paolo, Brazil, July 5-8, 2016
300
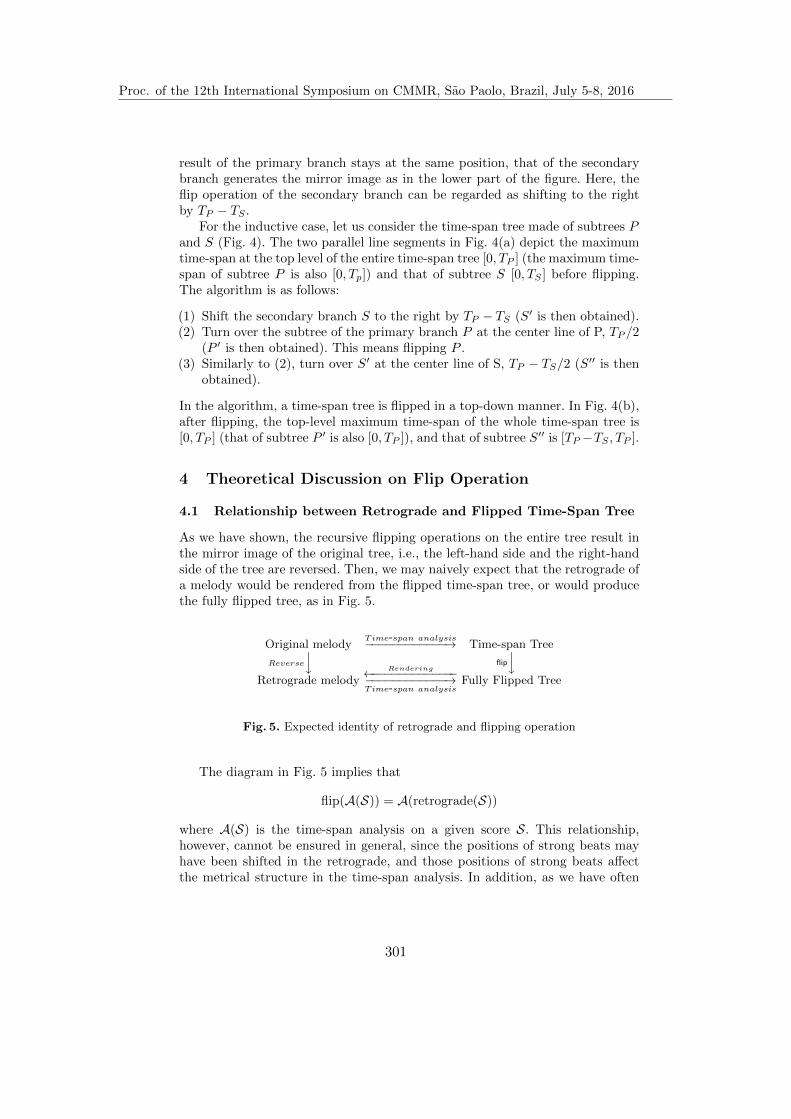
4 Hirata and Tojo
result of the primary branch stays at the same position, that of the secondarybranch generates the mirror image as in the lower part of the figure. Here, theflip operation of the secondary branch can be regarded as shifting to the rightby TP − TS .
For the inductive case, let us consider the time-span tree made of subtrees Pand S (Fig. 4). The two parallel line segments in Fig. 4(a) depict the maximumtime-span at the top level of the entire time-span tree [0, TP ] (the maximum time-span of subtree P is also [0, Tp]) and that of subtree S [0, TS ] before flipping.The algorithm is as follows:
(1) Shift the secondary branch S to the right by TP − TS (S′ is then obtained).(2) Turn over the subtree of the primary branch P at the center line of P, TP /2
(P ′ is then obtained). This means flipping P .(3) Similarly to (2), turn over S′ at the center line of S, TP − TS/2 (S′′ is then
obtained).
In the algorithm, a time-span tree is flipped in a top-down manner. In Fig. 4(b),after flipping, the top-level maximum time-span of the whole time-span tree is[0, TP ] (that of subtree P ′ is also [0, TP ]), and that of subtree S′′ is [TP −TS , TP ].
4 Theoretical Discussion on Flip Operation
4.1 Relationship between Retrograde and Flipped Time-Span Tree
As we have shown, the recursive flipping operations on the entire tree result inthe mirror image of the original tree, i.e., the left-hand side and the right-handside of the tree are reversed. Then, we may naively expect that the retrograde ofa melody would be rendered from the flipped time-span tree, or would producethe fully flipped tree, as in Fig. 5.
Original melodyTime-span analysis−−−−−−−−−−−−→ Time-span TreeyReverse
yflip
Retrograde melodyRendering←−−−−−−−−−−−−−−−−−−−−−−−−−→
Time-span analysisFully Flipped Tree
Fig. 5. Expected identity of retrograde and flipping operation
The diagram in Fig. 5 implies that
flip(A(S)) = A(retrograde(S))
where A(S) is the time-span analysis on a given score S. This relationship,however, cannot be ensured in general, since the positions of strong beats mayhave been shifted in the retrograde, and those positions of strong beats affectthe metrical structure in the time-span analysis. In addition, as we have often
Proc. of the 12th International Symposium on CMMR, Sao Paolo, Brazil, July 5-8, 2016
301

Retrograde of Melody and Flip Operation for Time-Span Tree 5
discussed, an algebraic operation such as flip is held in the domain of the time-span tree, not in that of the music scores; thus, a flipped tree will inevitablyproduce diversity in music in the rendering process.
4.2 Distance and Complement in Lattice of Trees
In the previous section, we used the notion of maximum time-span, and we canactually define the distance between the two trees with the sum of the length ofdifferent maximum time-spans [2]. First, suppose there are two time-span treesσA and σB based on two given melodies A and B. For the two operations of joinand meet, if we obtain σA ⊔ σB = ⊤ and σA ⊓ σB = ⊥, then σA and σB areeach other’s complement in the partially ordered set lattice of the subsumptionrelation. By the definition of the distance, σA is the most distant from σB . Next,we consider the flipped time-span tree of σA, σC . Then, σA ⊓ σC is equal to thetopmost maximum time-span, since σA and σC share only the topmost maximumtime-span and all the others are different. Although we have σA ⊓ σC = ⊥, ifσA ⊓ σC is sufficiently small (σA is sufficiently distant from σC), we come tothe idea that σC is regarded as an approximation of the complement of σA; thissuggests that the most distant melody from a given melody is generated by aretrograde.
The algebraic system that has neither identity nor complement satisfiesonly associativity is called semigroup; the semigroup with the identity is calledmonoid, and the monoid with the complement becomes group. Let us think ofthe framework by examining the analogy of the four arithmetic operations. Sincethe complement in the addition is a negative number, the framework withoutthe complement would look like that in which the subtraction is disabled orthe addition cannot handle a negative number. Similarly with multiplication, wecan imagine how weak (limited) the framework is without the division or 1/n.Therefore, we would expect that the expressivity could be greatly improved byintroducing the complement into semigroup. While the current framework wehave developed [4] contains two operations satisfying associativity, meet andjoin, and provides the identity of join (⊥), it does not provide the identityof meet nor the complements for the two operations. Therefore, the expressivepower of the framework is not strong enough to realize practical applications.
4.3 Relative Pseudo-Complement
The complement of element A, denoted as AC , is defined by A ∩ AC = ϕ andA ∪ AC = ⊤ (⊤ means the whole world). However, given a melody M , melodyMC cannot always be calculated such that M ∩MC = ϕ and M ∪MC = ⊤. Thebasic idea of the relative pseudo-complement is relaxing these two conditions asfollows: M ∩ ξ ⊑ δ (relative) and argmax
ξM ∪ ξ (pseudo), where ξ denotes an
approximation of the complement.The relative pseudo-complement is defined as follows [6]. Suppose that in
an algebraic system, distributive operations ⊓ (meet), ⊔ (join) are defined, and
Proc. of the 12th International Symposium on CMMR, Sao Paolo, Brazil, July 5-8, 2016
302

6 Hirata and Tojo
there is ordering between elements ⊑. Then, for any two elements σA, σB , x iscalled the relative pseudo-complement of σA with respect to σB if the greatestelement uniquely exists among x such that σA ⊓ x ⊑ σB; this relative pseudo-complement is denoted as σA ⊃ σB . That is, we write
σA ⊃ σB = max{x | σA ⊓ x ⊑ σB}.
The lattice in which the relative pseudo-complement exists is called a relativepseudo-complement lattice.
When we calculate the value of the relative pseudo-complement, we needto collect all the elements in the target domain by definition. Since there canbe infinitely many time-span trees in a domain, the collecting step would needsome heuristics for efficient calculation. Even if a domain is built of instances oftime-span trees, it may be inefficient to exhaustively search for all the elementsin the domain.
4.4 Properties of Flipped Time-Span Tree
We present an efficient method of creating (a good approximation of) the relativepseudo-complement by the flip operation. First, we show some properties of theflip operation as follows:
The Law of Excluded Middle: flip(flip(σ)) = σ
Additivity: flip(σA ⊔ σB) = flip(σA) ⊔ flip(σB)
flip(σA ⊓ σB) = flip(σA) ⊓ flip(σB)
Due to space limitation, the proofs of the above properties are omitted. Wederive the following from these properties:
flip(σ ⊔ flip(σ)) = flip(σ) ⊔ σ = σ ⊔ flip(σ)
flip(σ ⊓ flip(σ)) = flip(σ) ⊓ σ = σ ⊓ flip(σ)
Although some readers familiar with order theory may think that σ⊔flip(σ) =⊤, which corresponds to the greatest element in a lattice, please note that theflip operation does not exactly correspond to the complement. After the flipalgorithm (Figs. 3 and 4), for the top-level primary branches of σ and flip(σ),their maximum time-spans are equal to each other, and the orientations of thesecondary branches at the top-level are opposite to each other. Hence, the inter-nal representation of σ ⊔ flip(σ) is always a ternary tree [3]. On the other hand,the value of σ ⊓ flip(σ) is obviously a tree made of only a single leaf, which isthe top-level maximum time-span of σ (or flip(σ)).
Proposition 1. (Approximation of Relative Pseudo-Complement by FlippingOperation): For two time-span trees σA, σB, if the relative pseudo-complementσA ⊃ σB exists, we have flip(σA) ⊔ σB ⊑ σA ⊃ σB, where σA ⊓ σB = ⊥.
Proc. of the 12th International Symposium on CMMR, Sao Paolo, Brazil, July 5-8, 2016
303

Retrograde of Melody and Flip Operation for Time-Span Tree 7
σA
flip(σA)
σB
σA ⊓ σB
σA⊓ flip(σA)
flip(σA) ⊔ σ
B
σA⊃σBTotal maximum time-span
Fig. 6. Element Approximating Relative Pseudo-Complement
Outline of Proof: Let MA be the top-level maximum time-span of σA. σA ⊓(flip(σA)⊔σB) =5 (σA⊓flip(σA))⊔(σA⊓σB) = MA⊔(σA⊓σB) = σA⊓σB (becauseif σA ⊓σB = ⊥, then MA ⊑ (σA ⊓σB)). Thus, we have σA ⊓(flip(σA)⊔σB) ⊑ σB.From the definition of the relative pseudo-complement, flip(σA)⊔σB ⊑ σA ⊃ σB
(Fig. 6). Q.E.D.
The vertical axis of Fig. 6 represents the value of the total maximum time-span, which is denoted as |σ| [4]. On the other hand, the positions on the hori-zontal axis do not have any meaning. Without loss of generality, we can assume|σA| ≤ |σB|. Obviously, we have |σA| ≤ |flip(σA)⊔σB| and |σB | ≤ |flip(σA)⊔σB|.Therefore, the above proposition suggests that flip(σA) ⊔ σB can be used as anapproximation of the relative pseudo-complement.
5 Concluding Remarks
In this research, we have discussed the relationship between a retrograde anda flipped time-span tree and discussed the latter and the role of the relativepseudo-complement. We have shown that
flip(σA) ∪ σB ⊑ σA ⊃ σB
where flip(σA) is the flipped time-span tree of σA and σA ⊃ σB is the pseudo-complement of σA relative to σB .
Now we are interested in the relation between A(retrograde(S)) and flip(A(S)),or which class of music µ satisfies
flip(A(µ)) = A(retrograde(µ)).
In this discussion, we need to pay attention to the diversity of the renderingprocess. When we introduce a rendering process R(·) as a reverse process of
5 The relative pseudo-complement lattice is known to be a distributive lattice.
Proc. of the 12th International Symposium on CMMR, Sao Paolo, Brazil, July 5-8, 2016
304
8 Hirata and Tojo
time-span analysis, our question is restated as: which class of music µ, in relationto R, satisfies µ = R(flip(A(retrograde(µ)))).
In addition, we may use another metrics (similarity) among time-span trees,which is constructed based on the flip operation. According to the algorithm ofthe relative pseudo-complement, given a time-span tree σA, we can create σC
such that the top-level maximum time-span of σC is identical to that of σA andthe branching of the top-level of σC is opposite to that of σA. In reality, therecould be many σC ’s; for example, by flipping only the top level of a given time-span tree, one can obtain the time-span tree satisfying the above two conditions,which is denoted as σC1 . This is because the top-level branchings of σA and σC1
are opposite to each other, and the tree configurations below the second leveldo not affect the value of σA ⊓ σC1 . However, it does not seem to follow ourintuition that the time-span with every node flipped is treated as the same asthe one with only the top-level node flipped. Since the algorithm shown in Figs. 3and 4 fully flips the tree configuration, it is supposed to create the most distanttime-span tree from the original one, which is denoted as σC2 . We believe thatthe similarity between σA and σC1 should be differentiated from that betweenσA and σC2 ; thus, we need to discuss the similarity further in relation to thedifference according to our cognitive intuition.
We expect that the relative pseudo-complement created by the flip operationcould greatly enhance the expressivity of our framework. Future work will includeconstructing useful musical applications using the relative pseudo-complementand verifying that the algorithms of the musical applications satisfy their formalspecifications.
Acknowledgement
The authors thank the anonymous reviewers for their valuable and essentialcomments and suggestions. This work was supported by JSPS KAKENHI GrantNumbers 26280089, 25330434, and 16H01744.
References
1. Cadwallader, A., Gagne, D.: Analysis of Tonal Music: A Schenkerian Approach,Third Edition. Oxford University Press (2010)
2. Tojo, S. and Hirata, K. Structural Similarity Based on Time-span Tree, in Proc.of CMMR2012, 2012.
3. Hirata, K., Tojo, S., Hamanaka, M.: Algebraic Mozart by Tree Synthesis, Proc. ofJoint Conference of ICMC and SMC 2014, pp.991-997.
4. Hirata, K., Tojo, S., Hamanaka, M.: An Algebraic Approach to Time-Span Reduc-tion. Computational Music Analysis, David Meredith (Ed), Chapter 10, pp.251-270,Springer (2016)
5. Lerdahl, F., Jackendoff. R.: A Generative Theory of Tonal Music. The MIT Press(1983)
6. Pagliani, P., Chakraborty, M.: A Geometry of Approximation. Springer (2008).
Proc. of the 12th International Symposium on CMMR, Sao Paolo, Brazil, July 5-8, 2016
305
DataSounds: Sonification tool for scientific dataanalysis
Arnaldo D’Amaral Pereira Granja Russo1,2 and Luiz Carlos Irber Junior3
1 Instituto de Oceanografia, Universidade Federal do Rio Grande (FURG), Av.Italia, km 8, Rio Grande RS 96201-900, Brazil,
2 Instituto Ambiental Boto Flipper, Brazil, Av. Costa Carneiro, 151, Laguna SC88790-000, Brazil,
[email protected],3 Department of Population Health and Reproduction
University of California, DavisDavis, CA 95616, USA,[email protected]
Abstract. Sonification methods are an alternative for graphical dataanalysis, communicating information by turning numerical data intosounds. Observation data as sounds can complement graphical interpre-tation and even becomes an opportunity for sight-impaired people. Thereare some specific programs to process audio signal dealing with sonifi-cation but most of them are written in languages not commonly usedin earth and ocean sciences, biology and ecology. DataSounds is imple-mented in Python and aims to make it easy and flexible to transformdatasets into sounds. Its engine is mainly based on the numerical libraryNumpy and some others, dealing with musical tones, scales and trans-position, and conversion to MIDI (Musical Instrument Digital Interface)files. The DataSounds package focus on transcribe and parameterizingnumerical values to classes of notes based in a musical scale. This al-lows the user to identify variations or similarities of their datasets whilelistening to modification in pitch.
Keywords: Sonification, OceanColor, Remote Sensing, Data Analysis,Python
1 Introduction
Sonification is a subfield of sound display science, specialized in how data canbe communicated through non-speech audio [12]. It is the transformation ofdata into perceived relations in an acoustic signal to facilitate communicationor interpretation [21], [14].
Sonification results allow great improvement on the process of interpretingand analyzing data using other human skills rather than visual ones. This isoften called perceptualization of scientific data, where sound can be used toreinforce the visual presentation. Science uses colors, shapes and lines as thedefault method of information presentation, but sounds can also play a role
Proc. of the 12th International Symposium on CMMR, Sao Paolo, Brazil, July 5-8, 2016
306

2 Russo and Irber
on identifying patterns and describing similarities or dissimilarities in differentspatial and time scales. Sonification algorithms can be a complement to visualanalysis and also an option to communicate data for the blind or sight-impairedpeople [9].
Different initiatives to share datasets with visual deficient exist. For example,the multisensory approach [11] uses sound and touch feedback to communicategeographical data. In other areas, sonification methods were recently used to ex-press the patterns of solar explosion [28] (see [19], [10] ) and solar activities datawere transposed to music [4]. Related to geophysical and cartographic analysis,a geographic information system (GIS) plugin was written to translate topog-raphy as sounds [2]. In biology, sonification has been used for gene expressionobservation [1], cyanobacteria distribution on the sea [22], while others use envi-ronmental data in music composition [3]. Despite being applied to many scientificfields [14], sonification as a methodology is still not used extensively in sciencefield. In oceanography, the first sonification approach was done using marinebuoys dataset [32] [31] and generating a composition of multivariate parameterswith auditory characteristics; however it was not used as a scientific method(i.e. it was not designed to communicate data parameters or even differences ofmeasured parameters).
Why Sonification? is a recurrent question, since visual-based methods usuallyrepresent information better. Sonification encompasses techniques that allowssome types of data to be transposed in different timbers, pitches and other mu-sical combinations, in accordance to given specific purposes. It can also displaylarge and multidimensional datasets that may help find new correlations amongparameters and environmental patterns, otherwise hidden [7]. Music composi-tion was used by [22] in a similar way proposed by this project while significantvalues were transcribed to relative weights and after related to specific musicalnotes.
Despite sonification being used for exploratory data analysis, according toour knowledge, there is no software available that integrates sonification intothe Python ecosystem as a simple package. Python [26] is increasingly becomingthe lingua franca in science and data analysis, with many available libraries thatcan be easily installed and used to explore datasets. Python is concise, powerfuland it is maintained as an open source project. Inside the Python environmentis possible to work with big datasets using libraries as NumPy [25] and Scipy[20] to process data and Matplotlib [16] to visualize plots.
The main objective of this manuscript is to present the DataSounds softwareto facilitate sonification analysis of datasets with an easy integration to thePython scientific ecosystem.
1.1 DataSounds Engine and Implementation
The operational engine of DataSounds is based on the same logical proceduresadopted by colorbar intensities schemes, where different colors represents a rangeof values in a dataset (warm colors for higher values and cold colors for lowervalues, for example). An input array of data values are normalized by scale and
Proc. of the 12th International Symposium on CMMR, Sao Paolo, Brazil, July 5-8, 2016
307

DataSounds 3
key, with each data value assigned a pitch respecting these properties wherelower values correspond to lower musical notes and higher values higher musicalnotes inside the .
Pitch, and timber are musical parameters used at DataSounds to modulatetime series values, where pitch is perceived as the specific frequency of each noteand timber is the feature that instruments have to differentiate themselves whileplaying the same note. Pitch was described by [24] as one of the most used acous-tic dimension in auditory display. Since the lower training effort of listeners withdifferent musical skills to recognize pitch shifts turns it an significant parameterfor DataSounds and for oceanography applications.
The results are encoded using MIDI (Musical Instrument Digital Interface),a protocol designed for recording and playing music on digital synthesizers thatis supported by many computer music cards. It is possible to manipulate valuesof pitch, length and volume and even the attack and delay of sound notes [23].
The DataSounds library uses default parameters to generate sounds fromdata, but each one can be modified. The default settings are C major musicalscale, played by Acoustic Grand Piano and adjusted notes to a single octave (e.g.based on repetition of scale notes - (C major scale) C, D, E, F, G, A, B, C). Inthis version, three classes of musical scale can be chosen to better represent dataas music: major, minor and pentatonic (Figure 2). After parameters are set, thefunction get music converts data into sounds based on:
1. scale key note,2. musical instrument (based on MIDI instrument list) and3. number of octaves used to differentiate the lower and higher data values
(Figure 1).
get music results can be translated to a MIDI file using the w2midi function,and the play function can be used to listen them (Figure 3).
The sounds module inside DataSounds (Figure 3) transforms data into classesof sound intensities (i.e. notes of a music scale) in a manner analogous to howa color palette represents classes of intensities/concentration in a graphical plot[33].
Sonification of more than one time series can be processed by mixing them,with different instruments playing distinct lines of the composition. For example,when you listen to an opera, each instrument is playing their particular line ofthe composition, while you can listen both instruments at the same time by theirspecific timber, since every instrument or even voice have their own (Figure 3).
After a musical scale has been chosen, the extent and intensity of variationsinside time series can be heard by differences in pitch. Therefore, one time seriesof high internal variability can be displayed modifying the number of octaves.
2 DataSounds Usage
2.1 Application Case - Chlorophyll-a Ocean Color Analysis
Usually, satellite ocean color products are images where variable concentra-tions are displayed as color intensities. Ocean color images can be derived from
Proc. of the 12th International Symposium on CMMR, Sao Paolo, Brazil, July 5-8, 2016
308

4 Russo and Irber
hyperspectral images, and biological and chemical parameters can be derivedfrom the ocean’s absorbance and their reflection. This approach can also becomplemented with sounds as another synesthesic method of displaying satel-lite data. Chlorophyll-a is part of these products, and it can better representgreat ocean areas where in situ sampling could not be done. Chlorophyll-a isthe main photosynthetic pigment inside phytoplankton, serving as a proxy tothe amount of primary producers biomass in the ocean. Ten years of mappedmonthly mean chlorophyll-a satellite images (120 images) were acquired fromhttp://oceancolor.gsfc.nasa.gov, and data for a specific pixel was auto-matically extracted generating time series (Figure 4). A demonstration of themethod can be perceptualized [9] online at http://ocean.datasounds.org [18].In the demo, the web interface uses the DataSounds package internally to gen-erate sound of the ocean color images extracted data. the user can select anypoint in the world and listen to the ten years chlorophyll-a concentration timeseries and visualize the graphical plot. Some points in the map may representseries with absent data denoted by silence notes (rests), or even the entirely se-ries represented as silence music as a reference of John Cage silence composition4’33” [6]. This might happen because Chlorophyll-a measurements from spacerequire clear sky to achieve valid data [8], and unfortunately some regions in theworld are predominantly covered by clouds.
2.2 Overview and Future Developments
DataSounds is a ready to use sonification toolbox for exploratory data analysis.Simple installation and availability inside the larger Python ecosystem makes iteasier to interact with a dataset and explore it using sounds. This method cancomplement images or even substitute them, since musical representations of in-tensities can better relate to human cognition [27]. Using simple scales can helpnon-music literate users, with to familiar sounds, especially for where changes be-tween notes are better related to different data value [5]. Musical major scales canbe better related with ordinal scales (see [30]), where determination of greater orless than adjacent values are maintained inside the musical harmonic intervals[15].
Sonification methods are still implemented in many fields of science. Recentlyhealth scientists applied sonification methods to interpret eletroencephalogram(EEG) of numerous diseases [13] and this method is open for many other applica-tions. Through non-controlled evaluation of this toolbox [29] we have noted theinterest of people to listen their dataset and experience newer ways to observeand perceive patterns modification. Especially in oceanography data analysis,data sonification can be useful as an accessory tool or a substitution of some ap-proaches as identifying spikes signal inside a time series and identifying results ofstatistical frequency analysis (e.g. wavelets, empirical orthogonal function, etc).
Proc. of the 12th International Symposium on CMMR, Sao Paolo, Brazil, July 5-8, 2016
309

DataSounds 5
3 Conclusion
Sonification is a method that can be mixed with graphical methods to al-low better exploration and analysis of data, and also provide a viable alter-native for blind or sight-impaired people to approach data exploring and per-ception of changes in their datasets with sounds. The DataSounds packagemakes it possible to easily sonify datasets without leaving the Python ecosys-tem. It is actively developed and hosted at GitHub (https://github.com/DataSounds/DataSounds), and also available for download on the Python Pack-age Index (https://pypi.python.org/pypi/DataSounds/). It is distributedunder the BSD-new license [17], and all functions listed here as well as theinstallation procedure can be found in the DataSounds user manual, availableat http://datasounds.readthedocs.org/.
Proc. of the 12th International Symposium on CMMR, Sao Paolo, Brazil, July 5-8, 2016
310

Bibliography
[1] Alexjander, S., Deamer, D.: The infrared frequencies of DNA bases: science andart. Engineering in Medicine and Biology Magazine, IEEE 18(2), 74–79 (1999),http://ieeexplore.ieee.org/xpls/abs_all.jsp?arnumber=752981
[2] Bearman, N., Fisher, P.F.: Using sound to represent spatial data in ArcGIS.Computers & Geosciences 46, 157–163 (2012), http://www.sciencedirect.com/science/article/pii/S0098300411004250
[3] Ben-Tal, O., Berger, J.: Creative aspects of sonification. Leonardo37(3), 229–233 (2004), http://www.mitpressjournals.org/doi/abs/10.1162/
0024094041139427
[4] Ben-Tal, O., Daniels, M., Berger, J.: De natura sonoris: Sonification of complexdata. Mathematics and Simulation with Biological, Economical, and Musicoa-coustical Applications p. 330 (2001), https://ccrma.stanford.edu/~danielsm/DeNaturaSonoris.pdf
[5] Bovermann, T., Rohrhuber, J., de Campo, A.: Laboratory Methods for Ex-perimental Sonification. Berlin: Logos Verlag (2011), http://iterati.net/
~rohrhuber/articles/Laboratory_Methods_for_Experimental_Sonification.
[6] Cage, J.: Silence. Middletown. Wesleyan University Press (1961)
[7] Edwards, A.D.: Auditory display in assistive technology. The Sonification Hand-book pp. 431–453 (2011)
[8] Fargion, G.S., Mueller, J.L.: Ocean optics protocols for satellite ocean color sensorvalidation, Revision 2. National Aeronautics and Space Administration, GoddardSpace Flight Center (2000), ftp://ftp.nist.gov/pub/physics/lunarproject/
References/SIMBIOS/SimbiosTMSeries/SIMBIOS_ProtocolsRev2.pdf
[9] Grinstein, G.G., Smith, S.: Perceptualization of scientific data. In: ElectronicImaging’90, Santa Clara, 11-16 Feb’102. pp. 190–199. International Society forOptics and Photonics (1990), http://proceedings.spiedigitallibrary.org/
proceeding.aspx?articleid=940311
[10] Grond, F., Halbig, F., Munk Jensen, J., Lausten, T.: SOL (????), http://www.sol-sol.de/htm/English_Frames/English_Frameset.htm
[11] Harding, C., Kakadiaris, I.A., Casey, J.F., Loftin, R.B.: A multi-sensory sys-tem for the investigation of geoscientific data. Computers & Graphics26(2), 259–269 (2002), http://www.sciencedirect.com/science/article/pii/S0097849302000572
[12] Hermann, T., Hunt, A., Neuhoff, J.G.: The sonification handbook. Lo-gos Verlag Berlin (2011), http://sonification.de/handbook/download/
TheSonificationHandbook-chapter18.pdf
[13] Hermann, T., Meinicke, P., Bekel, H., Ritter, H., Muller, H.M., Weiss, S.: Soni-fications for EEG data analysis (2002), https://smartech.gatech.edu/handle/1853/51378
[14] Hermann, T., Williamson, J., Murray-Smith, R., Visell, Y., Brazil, E.: Sonifica-tion for sonic interaction design. In: Proc. of the CHI 2008 Workshop on SonicInteraction Design (SID), Florence. CHI (2008), https://www.researchgate.
net/profile/Roderick_Murray-Smith/publication/228948649_Sonification_
for_sonic_interaction_design/links/5571c35508ae75215866fc9b.pdf
Proc. of the 12th International Symposium on CMMR, Sao Paolo, Brazil, July 5-8, 2016
311

DataSounds 7
[15] Horner, A.: Evolution in digital audio technology. In: Evolutionary Computer Mu-sic, pp. 52–78. Springer (2007), http://link.springer.com/chapter/10.1007/
978-1-84628-600-1_3
[16] Hunter, J.D., others: Matplotlib: A 2d graphics environment. Computing in scienceand engineering 9(3), 90–95 (2007), http://scitation.aip.org/content/aip/
journal/cise/9/3/10.1109/MCSE.2007.55?crawler=true
[17] Initiative, O.S., others: The BSD 3-clause license (2012)[18] Irber, L.C., Russo, A.D.P.G.: Oceansound demonstration (2014), 10.6084/m9.
figshare.1022780.v1
[19] Jarman, R., Gerhardt, J.: Brilliant Noise | semiconductor (2006), http://
semiconductorfilms.com/art/brilliant-noise/
[20] Jones, E., Oliphant, T., Peterson, P., others: SciPy: Open source scientific toolsfor Python, 2001–. URL http://www. scipy. org 73, 86 (2001)
[21] Kramer, G., Walker, B., Bonebright, T., Cook, P., Flowers, J.H., Miner, N.,Neuhoff, J.: Sonification report: Status of the field and research agenda (2010),http://digitalcommons.unl.edu/psychfacpub/444/
[22] Larsen, P., Gilbert, J.: Microbial bebop: creating music from complex dynamicsin microbial ecology. PloS one 8(3), e58119 (2013), http://journals.plos.org/plosone/article?id=10.1371/journal.pone.0058119
[23] MIDI: The History Of MIDI (????), https://www.midi.org/articles/
the-history-of-midi
[24] Neuhoff, J.G., Knight, R., Wayand, J.: Pitch change, sonification, and musical ex-pertise: Which way is up? (2002), https://smartech.gatech.edu/handle/1853/51370
[25] Oliphant, T.E.: A guide to NumPy, vol. 1. Trelgol Publishing USA (2006), http://ftp1.tw.freebsd.org/distfiles/numpybook.pdf
[26] Oliphant, T.E.: Python for scientific computing. Computing in Science & Engi-neering 9(3), 10–20 (2007), http://scitation.aip.org/content/aip/journal/cise/9/3/10.1109/MCSE.2007.58
[27] Perrachione, T.K., Fedorenko, E.G., Vinke, L., Gibson, E., Dilley, L.C.: Evi-dence for shared cognitive processing of pitch in music and language. PloS one8(8), e73372 (2013), http://journals.plos.org/plosone/article?id=10.1371/journal.pone.0073372
[28] Quinn, M.: “WALK ON THE SUN” INTERACTIVE IMAGE ANDMOVEMENT SONIFICATION EXHIBIT/TECHNOLOGY (2008),http://interactive-sonification.org/ISon2010/proceedings/papers/
Quinn_ISon2010.pdf
[29] Russo, A.D.P.G., Irber, L.C.: The soundscape of oceancolor images (MODIS-Aqua). In: V Congresso Brasileiro de Oceanografia (2012)
[30] Stevens, S.S.: On the theory of scales of measurement. Bobbs-Merrill, CollegeDivision (1946)
[31] Sturm, B.L.: Surf music: Sonification of ocean buoy spectral data (2002), https://smartech.gatech.edu/handle/1853/51384
[32] Sturm, B.L.: “Music From the Ocean”: A Multimedia Cross-Discipline CD(2003), https://www.researchgate.net/profile/Bob_Sturm/publication/
228449209_MUSIC_FROM_THE_OCEAN_A_MULTIMEDIA_CROSS-DISCIPLINE_CD/
links/00b7d52c9875fa4834000000.pdf
[33] Yeo, W.S., Berger, J.: Application of image sonification methods to music. Onlinedocument (2005), http://www.music.mcgill.ca/~ich/research/misc/papers/
cr1064.pdf
Proc. of the 12th International Symposium on CMMR, Sao Paolo, Brazil, July 5-8, 2016
312

8 Russo and Irber
Fig. 1. Conceptual design of DataSounds, based on user data and default settings,which can be modified accordingly to specific needs.
Fig. 2. Musical scales implemented inside DataSounds engine. Scales based on C keytone (Major, Minor, Pentatonic and Blues scale).
Proc. of the 12th International Symposium on CMMR, Sao Paolo, Brazil, July 5-8, 2016
313

DataSounds 9
Fig. 3. Python script execution of DataSounds engine. A) Single time series sonifica-tion. B) Two time series sonification, with MIDI instruments selection (e.g. 0 corre-sponds to Acoustic Grand Piano for the first time series and 32 corresponds to AcousticBass for the second time series).
Fig. 4. Time series construction from ocean color images formed by extraction of thesame latitude and longitude of each image. Values of each pixel are generally presentedas colors representing the intensity of each pixel, while DataSounds transposes themto sounds inside a musical scale, turning a time series into a melody.
Proc. of the 12th International Symposium on CMMR, Sao Paolo, Brazil, July 5-8, 2016
314

Life-like Behaviour in a Gestural Interface for Interacting with Sound
Peter Beyls
Centre for Research in Science and Technology for the Arts
Universidade Católica Portuguesa Rua Diogo Botelho, 1327
4169-005 Porto [email protected]
Abstract. The present paper introduces a music improvisation system exploring user supplied physical gestures and independent generative behaviour. We avoid the notion of explicit instrumental control in favour of implicit influence. In addition, global system behaviour results from blending physical and algo-rithmic activity at multiple levels. An evolving population of gestures interact, mutate and evolve according to a virtual physics. Data extracted from gestures feed a dynamic mapping scheme influencing a population of granular synthe-sizers. The system affords intimate human-machine musical improvisation by merging direct speculative action and unpredictable yet coherent algorithmic behaviour in an integrated structure.
1 Introduction
The notion of gesture is ubiquitous in music; from expressive microtonal articula-tion in acoustic instruments to sensor-based instruments with sophisticated software informed mapping to electronic sound (Wanderley, 2004). Recently, the Motion and Computing conference has recognized the diversity of interdisciplinary research in the field (MOCO, 2015). From the perspective of both micro and macrostructure, musical meaning materializes from the perception of a particular temporal dynamics. For ex-ample, the significance of a sound is defined by the way its spectral qualities change over time (Smalley, 1986). Within the social communicative paradigm of networked music, musical gesture is understood as emergent clustering of data in the network. In free improvisation, global musical gesture emerges spontaneously from local interac-tions between performers engaged in a given musical agency (Borgo, 2006).
Thus, gesture might (1) be addressed as explicit instruction towards conveying a particular conception of scored music or (2) be viewed as implicit emergent function-ality in a distributed musical system. An orchestral conductor could be a viewed as a social mediator facilitating both the coordination and communication of a given cul-tural aesthetic. The system documented here suggests an operational blend of precise
Proc. of the 12th International Symposium on CMMR, Sao Paolo, Brazil, July 5-8, 2016
315

human-provided abstract gestures and their relatively intricate life-like behaviour once they are accommodated in a virtual society of interacting system gestures. Need-less to say, we take inspiration from the field of biology, like to theory of autopoiesis (Maturana and Varela, 1992) – it is understood that true interaction (in contrast to merely predictive responsive behaviour) only subsists in a system supporting dynamic morphology, an organism/system evolves over time, conditioned by the relationship between internal forces and a random external environment.
Within the scope of this paper, a ‘gesture’ is defined as a user-supplied list (of arbi-trary length) of XY-coordinates in 2D space, for example, by sketching in a GUI us-ing a mouse. However, our system explores the gesture’s behavioural qualities as explained in section 3. The generic notion of “behavioural objects” was suggested to capture the unique interaction paradigm afforded by software based performance; behavioural objects act as components of social exchange between system compo-nents and provide system-performer interchange, suggesting a new form of creative human-computer interaction (Bown et al. 2009). We might question the executive roles of human agents and artificial software agents mutually engaging in a hybrid performance universe. Part of the universe is indeed virtual and embedded in the ab-stract specification of software-defined objects. However, all cognitive functionality in a grounded human performer is embedded in a strictly embodied workspace. Then, physical energy (e.g. a directed gesture) is acquired by an artificial system, and once accommodated according to some protocol, the energy becomes a behavioural object expressing life-like qualities.
Let us briefly address the fundamental disparities between natural and cultural arte-facts; as we shall see, this will suggest biology-informed methods for designing musi-cal organisms.
Expressing faith in explicit knowledge, cultural artefacts are typically designed fol-lowing a top-down methodology. One creates symbolic representations while engag-ing reasoning processes towards the application of explicit knowledge guiding the construction of deterministic artefacts. In contrast, natural artefacts grow and evolve bottom-up, for example, on the microscopic level; morphology follows from the in-teraction of DNA, while on the macroscopic level; dynamic behaviour such as coor-dinated locomotion follows from the interaction of a myriad of low-level components. Behaviour is said to be implicit – complexity unfolds spontaneously without relying on any coordinating higher-level agency. In addition, natural systems adapt gracefully facing pressure from an unpredictable environment. Subsumption robot architecture (Brooks, 1992) suggests reflexive intelligent behaviour to exist without the prerequi-site for designing complex memory representations and corresponding reasoning processes. For example, a Brooksian approach in musical human-computer interac-tion is core to Odessa, a small collection of competing behaviours typically organised as a hierarchy of layers (Linson et al. 2015).
Proc. of the 12th International Symposium on CMMR, Sao Paolo, Brazil, July 5-8, 2016
316

2 Design principles
One of the core values in the present approach to human-machine interaction is the principle of influence; we imagine gestures to express influence over partially pre-dictable algorithmic behaviour. We abandon the notion of explicit and detailed in-strumental control and develop an exploratory methodology. Interaction with audio is viewed as a process of discovery and exploration of temporary rewarding behavioural niches afforded by particular systems configurations.
In addition, we approach interaction as negotiation with a complex dynamical sys-tem. Since system components interact (for example, individual gestures, elements in the patching matrix and control parameters in a synth) global systems behaviour is perceived as complex and somehow unpredictable; the system displays coherent yet often unanticipated behaviour. A performer develops helpful insight in systems be-haviour within the process of interaction itself; one navigates and evaluates the sys-tem state space by way of audio-visual feedback.
Our system also blurs explicit gestural instruction and implicit algorithmic activity aiming for a fluid control structure supporting smooth continuous specification of influence steering system behaviour in a particular direction. Sailing a boat to a par-ticular remote harbour while facing a rough ocean is a wonderful metaphor aptly framing this particular approach to interaction (Chadabe, 1984). Gestures define an initial control mechanism that, once accommodated in the system, starts to evolve, interact and possibly disintegrates. Multiplicity, parallelism and database orientation are all implied system features as N gestures connect to M mappings controlling S synthesizers in a flexible network of variable density. In addition, we provide a con-trol continuum; from sample-level audio processing to macroscopic control over mu-sical gestures lasting several seconds.
Improvisation is vital to the system; a virtually infinite parametric search space is explored through interactive engagement – one learns about the behavioural potential of parametric niches, promising ones may be stored to disk and retrieved at a later stage. One may even interpolate between any two points in control space. Therefore, initial exploratory interaction may gradually evolve to fruitful exploitation i.e. making smart use of learned system responses. In other words, human-machine interaction becomes a channel to reveal the emergent system identity as reflected in audio.
3 Implementation
We provide a brief description of the various classes defining the system’s soft-ware architecture (figure 1). Our system views rewarding instrumental human-machine interaction as facilitated by audio sample manipulation in real-time. Meta-phorically speaking, we adopted the notion of a Field to denote the playground where individual gestures – 2D gestures via mouse input, or 3D gestures acquired via 3D acceleration sensors – are assimilated, interact and evolve in time. FieldBase, the main class, holds the GUI for sketching and includes dynamic visualisation of the
Proc. of the 12th International Symposium on CMMR, Sao Paolo, Brazil, July 5-8, 2016
317
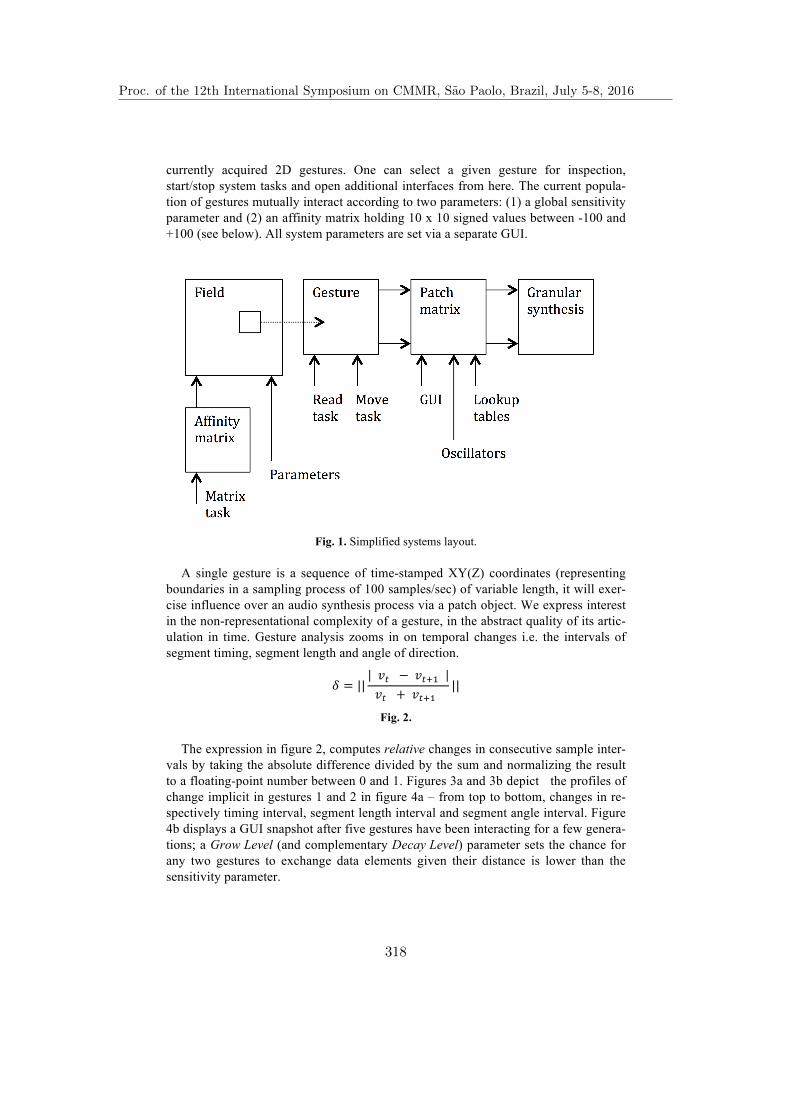
currently acquired 2D gestures. One can select a given gesture for inspection, start/stop system tasks and open additional interfaces from here. The current popula-tion of gestures mutually interact according to two parameters: (1) a global sensitivity parameter and (2) an affinity matrix holding 10 x 10 signed values between -100 and +100 (see below). All system parameters are set via a separate GUI.
Fig. 1. Simplified systems layout.
A single gesture is a sequence of time-stamped XY(Z) coordinates (representing boundaries in a sampling process of 100 samples/sec) of variable length, it will exer-cise influence over an audio synthesis process via a patch object. We express interest in the non-representational complexity of a gesture, in the abstract quality of its artic-ulation in time. Gesture analysis zooms in on temporal changes i.e. the intervals of segment timing, segment length and angle of direction.
𝛿 = || 𝑣! − 𝑣!!! 𝑣! + 𝑣!!!
||
Fig. 2.
The expression in figure 2, computes relative changes in consecutive sample inter-vals by taking the absolute difference divided by the sum and normalizing the result to a floating-point number between 0 and 1. Figures 3a and 3b depict the profiles of change implicit in gestures 1 and 2 in figure 4a – from top to bottom, changes in re-spectively timing interval, segment length interval and segment angle interval. Figure 4b displays a GUI snapshot after five gestures have been interacting for a few genera-tions; a Grow Level (and complementary Decay Level) parameter sets the chance for any two gestures to exchange data elements given their distance is lower than the sensitivity parameter.
Proc. of the 12th International Symposium on CMMR, Sao Paolo, Brazil, July 5-8, 2016
318
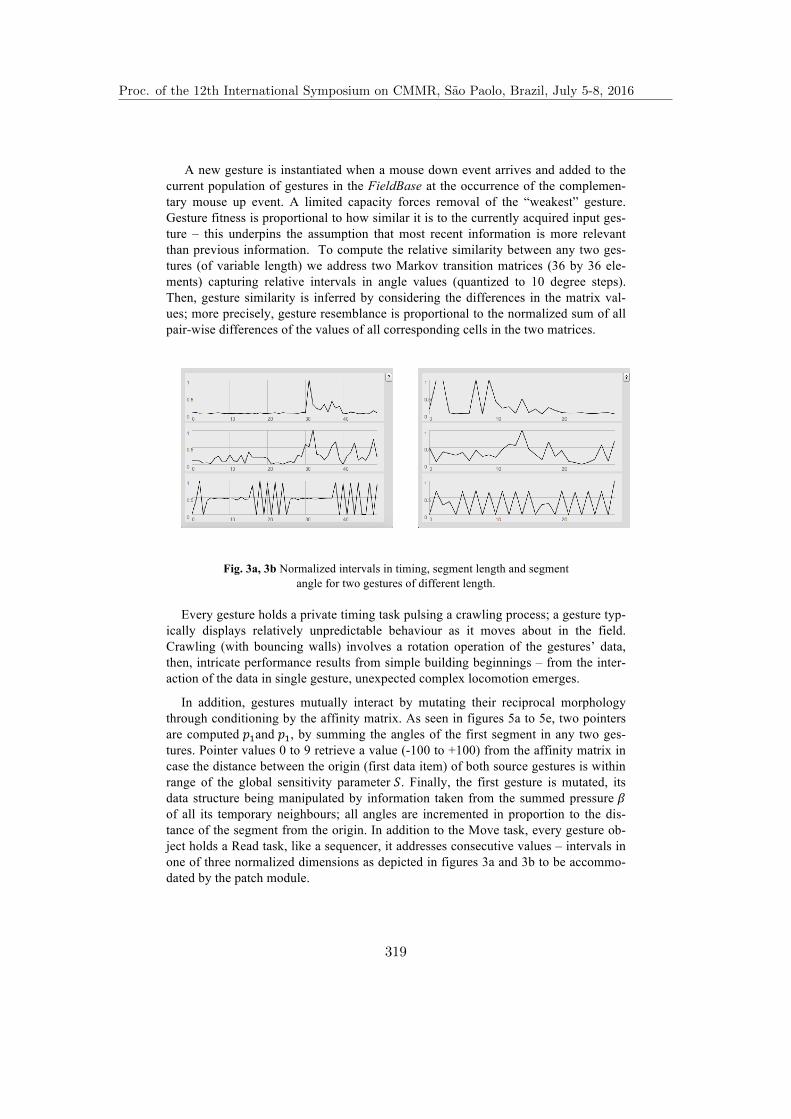
A new gesture is instantiated when a mouse down event arrives and added to the current population of gestures in the FieldBase at the occurrence of the complemen-tary mouse up event. A limited capacity forces removal of the “weakest” gesture. Gesture fitness is proportional to how similar it is to the currently acquired input ges-ture – this underpins the assumption that most recent information is more relevant than previous information. To compute the relative similarity between any two ges-tures (of variable length) we address two Markov transition matrices (36 by 36 ele-ments) capturing relative intervals in angle values (quantized to 10 degree steps). Then, gesture similarity is inferred by considering the differences in the matrix val-ues; more precisely, gesture resemblance is proportional to the normalized sum of all pair-wise differences of the values of all corresponding cells in the two matrices.
Fig. 3a, 3b Normalized intervals in timing, segment length and segment angle for two gestures of different length.
Every gesture holds a private timing task pulsing a crawling process; a gesture typ-ically displays relatively unpredictable behaviour as it moves about in the field. Crawling (with bouncing walls) involves a rotation operation of the gestures’ data, then, intricate performance results from simple building beginnings – from the inter-action of the data in single gesture, unexpected complex locomotion emerges.
In addition, gestures mutually interact by mutating their reciprocal morphology through conditioning by the affinity matrix. As seen in figures 5a to 5e, two pointers are computed 𝑝!and 𝑝!, by summing the angles of the first segment in any two ges-tures. Pointer values 0 to 9 retrieve a value (-100 to +100) from the affinity matrix in case the distance between the origin (first data item) of both source gestures is within range of the global sensitivity parameter 𝑆. Finally, the first gesture is mutated, its data structure being manipulated by information taken from the summed pressure 𝛽 of all its temporary neighbours; all angles are incremented in proportion to the dis-tance of the segment from the origin. In addition to the Move task, every gesture ob-ject holds a Read task, like a sequencer, it addresses consecutive values – intervals in one of three normalized dimensions as depicted in figures 3a and 3b to be accommo-dated by the patch module.
Proc. of the 12th International Symposium on CMMR, Sao Paolo, Brazil, July 5-8, 2016
319
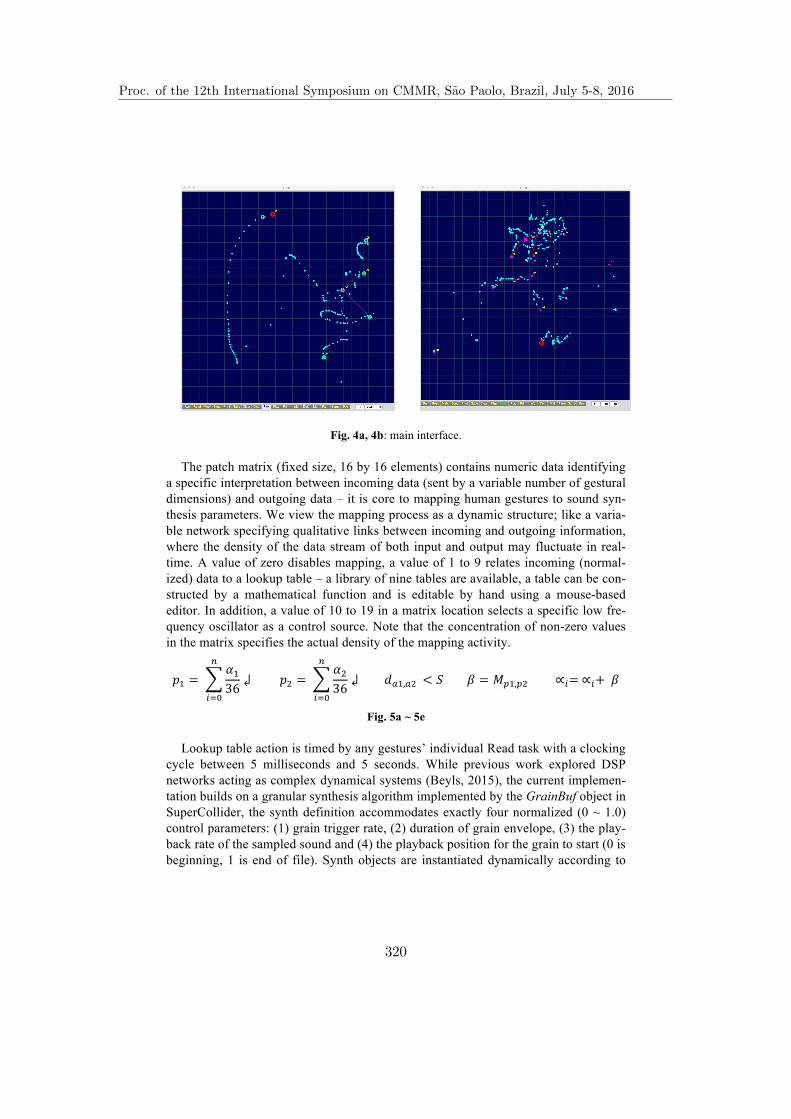
Fig. 4a, 4b: main interface.
The patch matrix (fixed size, 16 by 16 elements) contains numeric data identifying a specific interpretation between incoming data (sent by a variable number of gestural dimensions) and outgoing data – it is core to mapping human gestures to sound syn-thesis parameters. We view the mapping process as a dynamic structure; like a varia-ble network specifying qualitative links between incoming and outgoing information, where the density of the data stream of both input and output may fluctuate in real-time. A value of zero disables mapping, a value of 1 to 9 relates incoming (normal-ized) data to a lookup table – a library of nine tables are available, a table can be con-structed by a mathematical function and is editable by hand using a mouse-based editor. In addition, a value of 10 to 19 in a matrix location selects a specific low fre-quency oscillator as a control source. Note that the concentration of non-zero values in the matrix specifies the actual density of the mapping activity.
𝑝! = 𝛼!36
↲ !
!!!
𝑝! = 𝛼!36
↲ !
!!!
𝑑!!,!! < 𝑆 𝛽 = 𝑀!!,!! ∝!= ∝!+ 𝛽
Fig. 5a ~ 5e
Lookup table action is timed by any gestures’ individual Read task with a clocking cycle between 5 milliseconds and 5 seconds. While previous work explored DSP networks acting as complex dynamical systems (Beyls, 2015), the current implemen-tation builds on a granular synthesis algorithm implemented by the GrainBuf object in SuperCollider, the synth definition accommodates exactly four normalized (0 ~ 1.0) control parameters: (1) grain trigger rate, (2) duration of grain envelope, (3) the play-back rate of the sampled sound and (4) the playback position for the grain to start (0 is beginning, 1 is end of file). Synth objects are instantiated dynamically according to
Proc. of the 12th International Symposium on CMMR, Sao Paolo, Brazil, July 5-8, 2016
320

the number of signals sent by the mapping module. Also, synth objects manipulate audio samples taken from an unconstrained number of online audio buffers.
4 Discussion
While we express system design in terms of an adaptable control structure, the no-tion of ‘control’ might be misleading terminology; we designed a particular quite specific architecture yet we can only exercise influence over a relatively autonomous behaviour. The notion of ’autonomy’ here refers to the apparent perception of signifi-cant system complexity, intricate behaviour implied in the system’s architecture. In addition, our system affords the gradual and continuous steering of musical processes from (1) initially acquiring gestures in a dynamic pool of online gestures, (2) selecting particular gestures as temporary control structure, (3) addressing global system pa-rameters like sensitivity, gesture mutation en clocking tempi of the three processes (Run task, Read task and Matrix task), and (4) interfering with the density of non-zero values in the mapping matrix. A multi-modal performance mode results where overall complexity emerges from the mutual impact of many parallel considerations.
Within the process of tactile gestural interaction, the user develops gradual under-standing of the behavioural scope of the system: a typical performance mode evolves from initial speculative gesture input, to tentative selection of existing gestures to global parameter tuning. This process blurs the distinction between audio-level mi-croscopic deliberations and macroscopic structural development into a single iterative control continuum. Incidentally, a significant pioneering precedent (and source of inspiration) in this respect was the SalMar Construction (Franco, 1974), as it made (1) no clear distinction between sound synthesis and sound manipulation and (2) a sup-ported a timing continuum from microseconds to minutes in a singe integrated framework.
5 Conclusion
This paper provides an introduction to the design principles and working modali-ties of a generative audio system merging explicit gestural instruction and implicit behaviour. A user supplies physical gestures to a gestural playground in which ges-tures interact and evolve. In addition, the user supplies parametric conditioning to the system. Global parameters include gesture sensitivity and probabilities for gesture growth, decay and merging partial gestures into new macroscopic gestures. Three independent processing tasks coordinate gesture propagation, reading data from ges-tures and gesture interaction by way of a matrix – the matrix represents the artificial physics implied in a virtual universe.
The collective effect of crawling, affinity-based interaction and gesture mutation over time leads us refer to the global system as “a living interface” for sound. A patching array channels selected, specific incoming data, modifies the data according to the currently selected lookup tables and send the data to a granular synthesizer. At
Proc. of the 12th International Symposium on CMMR, Sao Paolo, Brazil, July 5-8, 2016
321

all operational levels, complex overall system behaviour results from simple interac-tions between lower level components. A strong improvisation oriented music making modality underpins the design, implementation and management of the current sys-tem.
Our work addresses the complex relationships between gesture and sound through the implementation of an experimental performance framework. Embodied gestures are viewed as dynamic media; they become alive and evolve in a lively population of interacting objects. Typical in open improvisation-oriented systems, temporary mo-ments of understanding materialize spontaneously – sudden understanding surfacing from the appreciation of complex system behaviour. Then, performance becomes a continuous process driven by exploration and discovery oscillating between bodily engagement and musical interpretation.
Finally, I would like to thank the anonymous reviewers whose comments and sug-gestions contributed substantially to the clarity of the present paper.
References
1. Wanderley, M.: Gestural Control of Sound Synthesis, Proceedings of the IEEE, vol. 92, nr. 4 (2004)
2. MOCO Proceedings 2015, http://dl.acm.org/citation.cfm?id=2790994
3. Smalley, D.: Spectromorphology and Structuring Processes, In: The Lan-guage of Electroacoustic Music, Emmerson, S (ed.) Basingstoke, UK (1986)
4. Borgo, D.: Sync or Swarm: Improvising Music in a Complex Age, Blooms-bury Academic (2006)
5. Maturana, H. and Varela, F.: The Tree of Knowledge: The Biological Roots of Human Understanding, Shambhala Publications, Inc. Boston, MA (1992)
6. Bown, O. Eldridge, A. and McCormack, J.: Understanding Interaction in Contemporary Digital Music: from instruments to behavioural objects. Or-ganised Sound 14:20, Cambridge University Press (2009)
7. Brooks, R.: Intelligence without representation, Artificial Intelligence Jour-nal 47, pp. 139-159 (1991)
8. Beyls, P.: Towards Emergent Gestural Interaction, Proceedings of the Gen-erative Arts Conference 2015, Venice, Italy (2015)
9. Linson, A. Dobbyn, C. Lewis, G. and Laney, R.: A Subsumption Agent for Collaborative Free Improvisation, Computer Music Journal, 39:4 (2015)
10. Chadabe, J.: Interactive Composing, An Overview, Computer Music Journal, 8:1 (1984)
11. Franco, S.: Hardware Design of a Real-time Musical System, PhD Thesis, University of Illinois, Champaign-Urbana (1974)
Proc. of the 12th International Symposium on CMMR, Sao Paolo, Brazil, July 5-8, 2016
322

Lowering dissonance by relating spectra on equal
tempered scales
Micael Antunes da Silva1 and Regis Rossi A. Faria1,2
1 Research Centre on Sonology, School of Arts and Comunications, University of São Paulo,
São Paulo, Brazil 2 Musical Acoustics and Technology Laboratory, Music Department, Faculty of Philosophy,
Sciences and Letters, University of São Paulo, Ribeirão Preto, Brazil
[email protected], [email protected]
Abstract. This paper presents an ongoing investigation on the technique of relating equal tempered scales and notes spectra in order to reduce or to model the sensory dissonance. For this, we have created some synthesis patches using
Pure Data to evaluate the perception of dissonance with artificial complex tones used in simple musical examples. The experiment illustrates some first steps towards testing concepts on "super-consonant" orchestration possibilities.
Keywords: Equal temperament scales; Musical Scales Spectra; Dissonance
modeling; Psychoacoustics;
1 Introduction
The twentieth-century music had on sound and noise a strong path for its expansion. Composers like Claude Debussy and Edgard Varèse are examples of founders of the “aesthetics of sound” idea [12]. In this context, the pitch lost its protagonism to many experimental schools, like the Spectral and Noise Music. However, the musical pitch has many unexploited ways that can still contribute to the construction of new sonorities. Having that in mind, our paper aims to contribute with new discussions on
pitch, relating the equal temperament with the construction of consonant timbres spectra in sound synthesis.
The equal temperament as a tuning system has been present in the practice of western music since long ago. The first known mention to it was in the Franchinus Gafirus’s theoretical work Pratica Musica from 1496, and its first rule is found in the Giovanni Maria Lanfrancos’s work Scintille de Musica, published in 1553. Since
then, its development is linked with the expansion of tonality on classical music and the construction of musical instruments. With the development of computer music, the equal temperament has expanded its possibilities, using other divisions of the octave, or even working with sub-divisions of other intervals.
Within this context it is important to approach the concept of sensorial dissonance. Some authors, such as Pierce [1] and Sethares [2], have been speculating the
possibility of relating spectrum and scale, so to minimize the sensory dissonance across scale steps. In our paper we will disclose these elements in the following
Proc. of the 12th International Symposium on CMMR, Sao Paolo, Brazil, July 5-8, 2016
323

2 Micael Antunes and Regis Rossi A. Faria
topics: the equal temperament on various divisions of octave, the sensorial dissonance and related scale and spectrum, and musical examples synthesized for perceptual evaluation.
2 A revision about equal temperament
Articles within the’ framework of this research explore the temperament divisions taking approaches with just intervals as reference, such as fifths and thirds. These ideas are founded in the very early works on tuning. Dirk de Klerk [3] cites proposals
such as Nicolas Mercator’s (1620-87) who found in a 53-part division of octave 31 good fifths and 17 good major thirds. He also cites Christian Huygens (1629-95) who proposed one system with 31 equal divisions for the octave, getting 10 pure thirds and 18 fifths.
On the literature we can find various experiments carried out in this manner by contemporary authors. Klerk [3] has tested all tunings between 1 and 120 divisions of
octave using a spectrum with 7 harmonic partials, testing fifths and major and minor thirds. One of his results shows that on the 12th, 19th, 31st and 41st divisions the fifths and major third exhibit deviations lesser than five cents.
Fuller [4] describes in his article some parameters for his choice of equal temperament divisions that privilege just intonation. The first parameter is to keep octave exactly tuned. The fifth is the second most important interval for the tuning.
He also stipulates that deviations can be tolerated in fifth and third intervals, starting by just intonation. He however makes it clear that these criteria are arbitrary and that experiments can follow other criteria.
Krantz and Douthett [5] establish criteria for the equal temperament: 1- it must be based logarithmically; 2- it has to generate symmetrically invertible intervals; 3- it should be applicable to multiple intervals. They also stipulate mathematical criteria
for the operation of these temperaments possibilities. Blackwood [6] shows various divisions of temperament with the objective of
accommodating diatonic scales and obtaining harmonic tonal functions. On the paper Six American Composers on Nonstardard Tunings [7], he discusses divisions that are closer to those of diatonic scales, like the 12th, 17th, 19th , 22nd and 24th divisions, and others that are farther, such as the ones of the 11-division scale, in which there are no
consonance between any pair of notes.
2.1 The math of equal temperament
An equal tempered scale leads to a group of frequencies that divides a frequency interval in equal length steps and, consequently, the same ratio is shared between all the scale steps. Using Sethares' terminology, a 12-tet scale is obtained by dividing the
octave in 12 parts. Therefore, the scale step ratio is obtained by √212
, where 12 is the
number of parts and 2 is the interval of an octave. This ratio is 1.059463. The scale is constructed by the multiplication of this ratio starting by an arbitrary frequency.
Starting in such a way, one can explore the equal temperament in n divisions of
Proc. of the 12th International Symposium on CMMR, Sao Paolo, Brazil, July 5-8, 2016
324
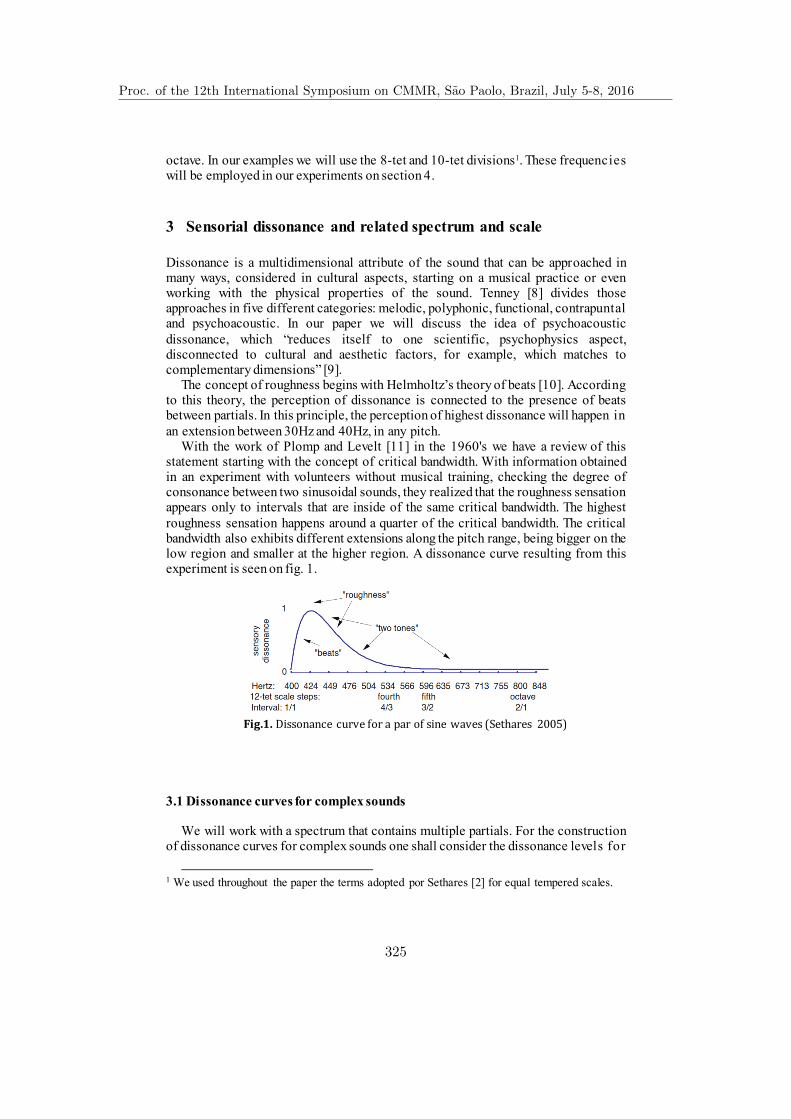
Lowering dissonance relating spectrum on tempered scales 3
octave. In our examples we will use the 8-tet and 10-tet divisions1. These frequencies will be employed in our experiments on section 4.
3 Sensorial dissonance and related spectrum and scale
Dissonance is a multidimensional attribute of the sound that can be approached in many ways, considered in cultural aspects, starting on a musical practice or even working with the physical properties of the sound. Tenney [8] divides those approaches in five different categories: melodic, polyphonic, functional, contrapuntal and psychoacoustic. In our paper we will discuss the idea of psychoacoustic
dissonance, which “reduces itself to one scientific, psychophysics aspect, disconnected to cultural and aesthetic factors, for example, which matches to complementary dimensions” [9].
The concept of roughness begins with Helmholtz’s theory of beats [10]. According to this theory, the perception of dissonance is connected to the presence of beats between partials. In this principle, the perception of highest dissonance will happen in
an extension between 30Hz and 40Hz, in any pitch. With the work of Plomp and Levelt [11] in the 1960's we have a review of this
statement starting with the concept of critical bandwidth. With information obtained in an experiment with volunteers without musical training, checking the degree of consonance between two sinusoidal sounds, they realized that the roughness sensation appears only to intervals that are inside of the same critical bandwidth. The highest
roughness sensation happens around a quarter of the critical bandwidth. The critical bandwidth also exhibits different extensions along the pitch range, being bigger on the low region and smaller at the higher region. A dissonance curve resulting from this experiment is seen on fig. 1.
Fig.1. Dissonance curve for a par of sine waves (Sethares 2005)
3.1 Dissonance curves for complex sounds
We will work with a spectrum that contains multiple partials. For the construction of dissonance curves for complex sounds one shall consider the dissonance levels for
1 We used throughout the paper the terms adopted por Sethares [2] for equal tempered scales.
Proc. of the 12th International Symposium on CMMR, Sao Paolo, Brazil, July 5-8, 2016
325
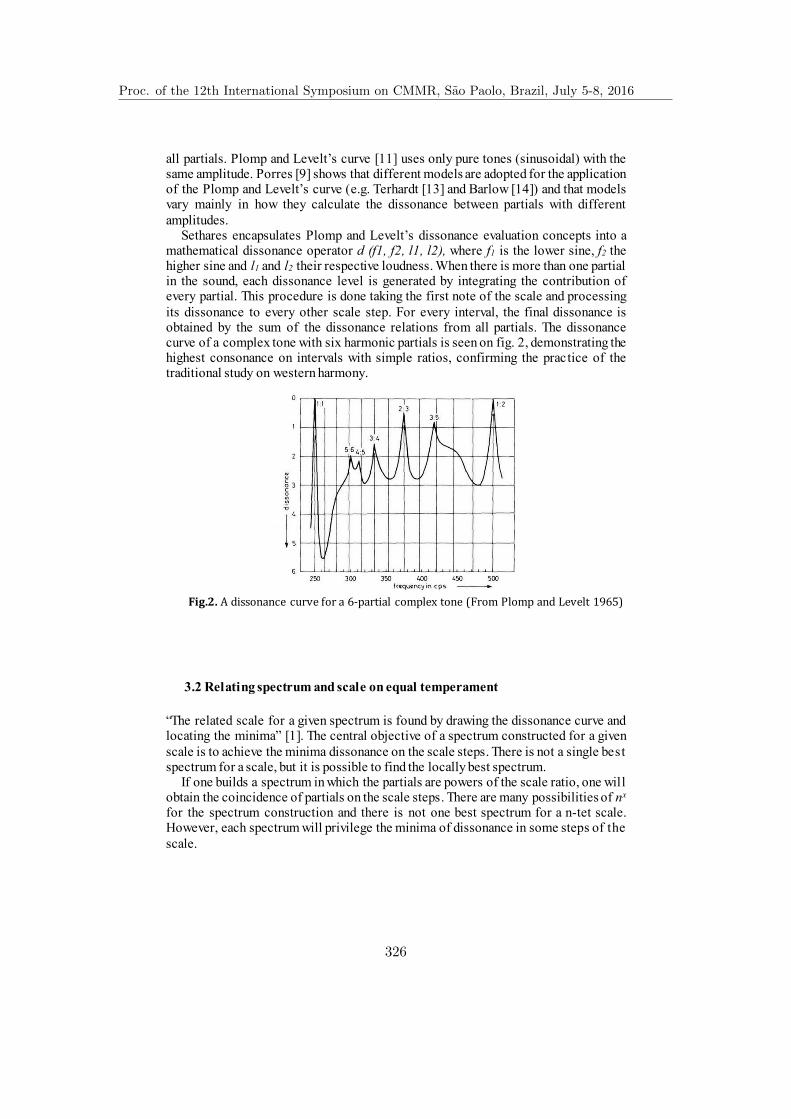
4 Micael Antunes and Regis Rossi A. Faria
all partials. Plomp and Levelt’s curve [11] uses only pure tones (sinusoidal) with the same amplitude. Porres [9] shows that different models are adopted for the application of the Plomp and Levelt’s curve (e.g. Terhardt [13] and Barlow [14]) and that models vary mainly in how they calculate the dissonance between partials with different
amplitudes. Sethares encapsulates Plomp and Levelt’s dissonance evaluation concepts into a
mathematical dissonance operator d (f1, f2, l1, l2), where f1 is the lower sine, f2 the higher sine and l1 and l2 their respective loudness. When there is more than one partial in the sound, each dissonance level is generated by integrating the contribution of every partial. This procedure is done taking the first note of the scale and processing
its dissonance to every other scale step. For every interval, the final dissonance is obtained by the sum of the dissonance relations from all partials. The dissonance curve of a complex tone with six harmonic partials is seen on fig. 2, demonstrating the highest consonance on intervals with simple ratios, confirming the practice of the traditional study on western harmony.
Fig.2. A dissonance curve for a 6-partial complex tone (From Plomp and Levelt 1965)
3.2 Relating spectrum and scale on equal temperament
“The related scale for a given spectrum is found by drawing the dissonance curve and locating the minima” [1]. The central objective of a spectrum constructed for a given
scale is to achieve the minima dissonance on the scale steps. There is not a single best spectrum for a scale, but it is possible to find the locally best spectrum.
If one builds a spectrum in which the partials are powers of the scale ratio, one will obtain the coincidence of partials on the scale steps. There are many possibilities of nx for the spectrum construction and there is not one best spectrum for a n-tet scale. However, each spectrum will privilege the minima of dissonance in some steps of the
scale.
Proc. of the 12th International Symposium on CMMR, Sao Paolo, Brazil, July 5-8, 2016
326

Lowering dissonance relating spectrum on tempered scales 5
3.3 The 8-tet and 10-tet scales and their respective spectra
Based on Plomp and Levelt’s work [11], Pierce [1] speculated the possibility of
synthesizing tones with inharmonic spectrum to obtain consonance on arbitrary scales. Using an 8-tet scale, Pierce forged a spectrum with six partials. Taking 𝑟 = √2
8= 1.09051, the partials are:
1, r10, r16 r20 r22 r24 (1)
Similarly, using a 10-tet scale, Sethares forged a spectrum with seven partials [2].
The ratio of the 10-tet scale is √210
= 1.071773. Based on this ratio, his spectrum
partials are:
1, r10, r17, r20, r25, r28, r30 (2)
Considering that a 12-tet scale can be divided into six equal tones, an 8-tet scale can similarly be divided into four equal parts. With this division in mind, Sethares [2] has drawn a dissonance curve to make a comparison between the twelve-tone scale and the eight-tone scale generated according to the spectrum at (1). Similarly, he has drawn a dissonance curve to compare the 12-tet scale and the 10-tet scale generated with the spectrum at (2). These curves are shown in fig. 3.
Fig.3. 8-tet and 10-tet spectrum dissonance curves (From Sethares 2005)
We can see that there is a coincidence of maximum consonance between the 3rd, 6th, 9th and 12th divisions of the twelve-tone scale, and between the 2nd, 4th, 6th and 8th of the eight-tone scale. This illustrates a scale with very consonant diminished triads and dissonant perfects triads. Thereby, the traditional concept of consonance and dissonance can be changed due to the structure of the inharmonic spectrum.
On fig. 3 one can also see a maximum consonance on the steps 3, 5 and 8 of the
10-tet scale. This information will be used to construct chord examples based on this scale in the next section. On our example, however, we won’t use the last partial of the Sethares’ spectrum because we want to compare only spectra with 6 partials.
Proc. of the 12th International Symposium on CMMR, Sao Paolo, Brazil, July 5-8, 2016
327
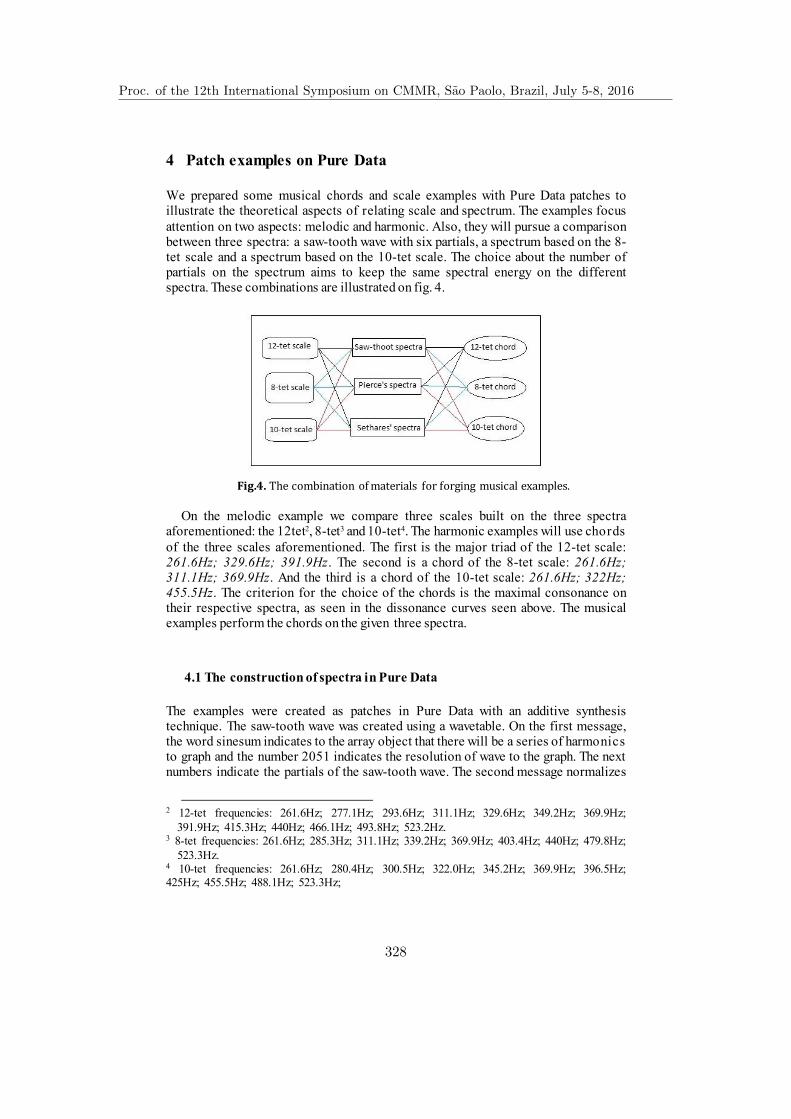
6 Micael Antunes and Regis Rossi A. Faria
4 Patch examples on Pure Data
We prepared some musical chords and scale examples with Pure Data patches to illustrate the theoretical aspects of relating scale and spectrum. The examples focus
attention on two aspects: melodic and harmonic. Also, they will pursue a comparison between three spectra: a saw-tooth wave with six partials, a spectrum based on the 8-tet scale and a spectrum based on the 10-tet scale. The choice about the number of partials on the spectrum aims to keep the same spectral energy on the different spectra. These combinations are illustrated on fig. 4.
Fig.4. The combination of materials for forging musical examples. On the melodic example we compare three scales built on the three spectra
aforementioned: the 12tet2, 8-tet3 and 10-tet4. The harmonic examples will use chords
of the three scales aforementioned. The first is the major triad of the 12-tet scale: 261.6Hz; 329.6Hz; 391.9Hz. The second is a chord of the 8-tet scale: 261.6Hz; 311.1Hz; 369.9Hz. And the third is a chord of the 10-tet scale: 261.6Hz; 322Hz; 455.5Hz. The criterion for the choice of the chords is the maximal consonance on their respective spectra, as seen in the dissonance curves seen above. The musical examples perform the chords on the given three spectra.
4.1 The construction of spectra in Pure Data
The examples were created as patches in Pure Data with an additive synthesis technique. The saw-tooth wave was created using a wavetable. On the first message, the word sinesum indicates to the array object that there will be a series of harmonics to graph and the number 2051 indicates the resolution of wave to the graph. The next numbers indicate the partials of the saw-tooth wave. The second message normalizes
2 12-tet frequencies: 261.6Hz; 277.1Hz; 293.6Hz; 311.1Hz; 329.6Hz; 349.2Hz; 369.9Hz;
391.9Hz; 415.3Hz; 440Hz; 466.1Hz; 493.8Hz; 523.2Hz. 3 8-tet frequencies: 261.6Hz; 285.3Hz; 311.1Hz; 339.2Hz; 369.9Hz; 403.4Hz; 440Hz; 479.8Hz;
523.3Hz. 4 10-tet frequencies: 261.6Hz; 280.4Hz; 300.5Hz; 322.0Hz; 345.2Hz; 369.9Hz; 396.5Hz; 425Hz; 455.5Hz; 488.1Hz; 523.3Hz;
Proc. of the 12th International Symposium on CMMR, Sao Paolo, Brazil, July 5-8, 2016
328

Lowering dissonance relating spectrum on tempered scales 7
the amplitude of the wave. The partial’s amplitude is 1/partial. These messages are seen on fig. 5.
Fig.5. The saw-tooth synthesizer messages in Pure data The 8-tet and 10-tet synthesizer were created with an additive synthesis technique
using the sum of sine waves with the osc~ object. The first information is the frequency of the fundamental. Then the frequency will be multiplied by the partials of the spectrum. And lastly we have the amplitude of the partials, decaying at a rate of 10% in each partial.
Fig.6. The 8-tet and 10-tet synthesizer in Pure data
On fig. 7 one can see the waveforms of the three spectra. The periods of 8-tet and 10-tet waves are more complex, because of their inharmonic spectrum.
Fig.7. The saw-tooth, 8-tet and 10-tet spectra waveforms, created with Pure data
Proc. of the 12th International Symposium on CMMR, Sao Paolo, Brazil, July 5-8, 2016
329

8 Micael Antunes and Regis Rossi A. Faria
5 Conclusions and future work
These very first steps towards the conception of experimental techniques to lower dissonance in synthetic timbers are likely to highlight the efficacy of the applied
proposed theory. By listening the synthesized examples, for instance, we can assume that triad chords are more recognizable played with spectra optimized for their n-tet scale, and that a distorted perception results if played with spectra optimized for other n-tet scales. We can also perceive a distortion on the perception of major triads if played with Pierce’s and with Sethares’ spectra recipes. These preliminary cues, however, are to be confirmed properly in a future psychoacoustic auditory
investigation, taking also curves previously generated by Sethares' models for comparison. We will also add the models from Terhardt [13] and Barlow [14] in our discussions, which are the basis of a Pure Data’s external developed by Porres [9] to generate dissonances curves.
Considering the feasibility in modeling tone spectra to match arbitrary n-tet tempered scales, these experiments are the basis for a next research phase towards
what we could name "super-consonant synthesis", pursuing the implementation of optimized timbre spectra for digital instruments based on this theory.
References
1. Pierce, J. R.: Attaining consonance in arbitrary scales. Journal of acoustical society (1966) 2. Sethares, W. A.: Tuning, timbre, spectrum, scale. Springer-Verlag (2005)
3. De Klerk, D. Equal temperament. Acta Musicologica, 51 (Fasc. 1), 140-150 (1979). 4. Fuller, R. A study of microtonal equal temperaments. Journal of Music Theory, 35(1/2),
211-237 (1991). 5. Krantz, R. J., & Douthett, J. Construction and interpretation of equal-tempered scales using
frequency ratios, maximally even sets, and P-cycles. The Journal of the Acoustical Society of America, 107(5), 2725-2734 (2000).
6. Blackwood, E. Modes and Chord Progressions in Equal Tunings. Perspectives of New
Music, 166-200 (1991). 7. Keislar, D., Blackwood, E., Eaton, J., Harrison, L., Johnston, B., Mandelbaum, J., &
Schottstaedt, W. Six American composers on nonstandard tunings. Perspectives of New
Music, 176-211 (1991). 8. Tenney, J.: A history of consonance and dissonance. Excelsior (1988). 9. Porres, A. T.: Modelos psicoacústicos de dissonância para eletrônica ao vivo. Doctorate
Thesis. Universidade de São Paulo - Escola de Comunicação e Artes (2012).
10. Helmholtz, H. L. F.: On the sensation of tone as a psychological basis for the theory of harmony. Dover publications (1954).
11. Plomp, R., Levelt, W. J. M.: Tonal consonance and critical bandwidth. Journal of the Acoustical Society of America, n. 38, pp. 548-568 (1965).
12.Guigue, D. Estética da sonoridade: premissas para uma teoria. Seminário Música Ciência Tecnologia, 1(3) (2008).
13.Terhardt, E. Pitch, consonance, and harmony. The Journal of the Acoustical Society of America, 55(5), 1061-1069 (1974).
14.Barlow, C. Bus journey to Parametron. Feedback Papers vol. 21-23, Feedback, Studio Verlag, Köln (1980).
Proc. of the 12th International Symposium on CMMR, Sao Paolo, Brazil, July 5-8, 2016
330

Development of a sound reproduction four-channel
system with 360º horizontal sound image applied to
music, sound arts, and bioacoustics
José Augusto Mannis1 2, Tato Taborda1 and Djalma de Campos Gonçalves Júnior 2
1 Instituto de Arte e Comunicação Social - PPGCA – UFF
2 Departamento de Música – UNICAMP
Abstract. This article refers to ongoing research related to the Postdoctoral
project “multichannel audio devices applied to music, sound art and
bioacoustics” developed by the author for UFF (2016-2018) with support from
CAPES and in collaboration with the Laboratory of Acoustics and Sound Arts –
LASom/DM/IA/UNICAMP. This work aims to (1) consolidate a spatial sound
projection device involving signal processing; and (2) its application in the arts
(music) and science (biology and ecology) domains.
Keywords: Immersive environment; Electroacoustic Music; Bioacoustics
1 Introduction
This investigation is part of the postdoctoral project developed by Prof. José
Augusto Mannis, with the support of CAPES, having Prof. Tato Taborda as his
advisor at UFF (2016-18), involving the Laboratory of Acoustics and Sound Arts -
LASom/DM/IA/Unicamp (University of Campinas), and Laboratory of Sound
Production/UFF (Fluminense Federal University).
Our goal is to consolidate a spatial sound projection device involving sound capture
techniques and signal processing; and its applications in the domains of music and
sound arts (performances, sound installations) and ecology (environment monitoring,
bioacoustics, museology applied to natural sciences). Therefore, we must develop and
improve knowledge, techniques and methods in multichannel audio systems,
especially in sound reproduction in a four-channel audio immersion environment.
2 Main Problem
We have been working, since 2013, in a research project aiming at the
development of a four-channel sound recording and playback device
Proc. of the 12th International Symposium on CMMR, Sao Paolo, Brazil, July 5-8, 2016
331

2 MANNIS et al.
(conception and implementation), for application in the fields of Arts
and Biology, expecting to achieve the following: to rebuild in the
laboratory a 360º horizontal sound image, a multichannel system to
capture sound, to analyze delays between the incidences of the
wavefront in each microphone, and through the same microphone
recording point, to determine the spatial position of the sound source.
Part of the problem to be solved is reproducing the sound recorded in
four channels, four microphones arranged in a square with edge A (3 to
10 m) allowing studio reconstitution in deferred time of the sound image
perceived at the central point of the square at the moment of sound
capture.
Fig. 1. Left: Recording and playback devices superimposed. The transducers in both cases must
occupy the same relative spatial position. Right: illustration of different sound plans in depth
can be perceived in the sound recording relief when reproduced on a proper device.
Since the signal must also serve to locate the position of each sound source by
recording analysis, the recording must be performed only with omnidirectional
microphones. However, during the capture with omnidirectional microphones, each
microphone receives delays of the signals already registered by other microphones
(recidivism), requiring its cancellation by phase inversion. However, the simple
cancellation of this hypothesis may not be enough, it is probably necessary to dose the
mixture and the signal intensities so that the resulting sound image is homogeneous
and balanced, which is why we included the coefficient. We propose an algorithm
to obtain cancellation of phase opposition [Eq. 1] (Algorithm owner).
The signal processing will start from the following algorithm:
Proc. of the 12th International Symposium on CMMR, Sao Paolo, Brazil, July 5-8, 2016
332

Development of a sound reproduction system in four channels 3
EFQ DFQ
LF RF
LB RB
EBQ DBQ
Microphones: LNO, LSO, RNE, RSE
Quadraphonic signal recurrence of phase cancellation processing: LF, LB, RF, RB
Quadraphonic signal processing Quadradisc CD-4: EFQ, EBQ, RFQ, RBQ
A = 10,00 m (also 5,00 m and 3,00 m)
D = 10 . 2^0,5 = 14,14 m
c (21º C) = 343,48 m/s 10,0m= 29,09 ms 14,14m= 41,14 ms
c (25º C) = 345,81 m/s 10,0m= 28,89 ms 14,14m= 40,86 ms
c (30º C) = 348,70 m/s 10,0m= 28,65 ms 14,14m= 40,52 ms
c (35º C) = 51,56 m/s 10,0m= 28,42 ms 14,14m= 40,19 ms
Recidivism phase cancellation processing - Eq. 1
LF = LNO – LSO ( 10,0 m) – RNE (10,0 m) – RSE (14,14,0 m)
LB = LSO – LNO ( 10,0 m) – RSE (10,0 m) – RNE (14,14,0 m)
RF = RNE – RSE ( 10,0 m) – LNO (10,0 m) – LSO (14,14,0 m)
RB = RSE – RNE ( 10,0 m) – LSO(10,0 m) – LNO (14,14,0 m)
Proc. of the 12th International Symposium on CMMR, Sao Paolo, Brazil, July 5-8, 2016
333

4 MANNIS et al.
The coefficient in Eq. 1 will be used in order to find the exact mixture
point for the cancellation stage so that the sound image and a feeling of relief
(Condamines, 1978) may remain continuous, stable and balanced.
The device set up for this investigation reconstructs the sound image caused
only by sources located outside the square delineated by the four microphones.
Moreover, with phase cancellations we also experience the result of further
processing proposed by Peter Scheiber (SCHEIBER, 1971) [Eq. 2] known as
Compatible Discrete 4 (CD-4) or Quadradisc.
Compatible Discrete 4 Processing (CD-4) ou Quadradisc - [Eq. 2]
(LF+LB)+(LF-LB) = 2LF [EFQ]
(LF+LB)-(LF-LB) = 2LB [EBQ]
(RF+RB)+(RF-RB) = 2RF [DFQ]
(RF+RB)-(RF-RB) = 2RB [DBQ]
Another part of the experiment allows a complementary sound capture to
record sound events occurring in the area created by the square formed by the four
original microphones. This additional recording would occur in a single point located
in the center of the square. This technique can also be made with omnidirectional
microphones, with its superior quality of response in relation to the cardioid
microphones (DICKREITER, 1989), to obtain a sound quality similar to the sound
image from outside the square.
The original design capture scheme idealized by the author consists in a
design from a model known as Jecklin Disc (Jecklin, 1981) (Johnsson; Nykanen,
2011), with two omnidirectional separated by an absorbent material Disc 280mm in
diameter, overlapping two orthogonally Jecklin Discs with omnidirectional capsules
facing up or with 90 adapter reaching the configuration shown in the following figure:
Proc. of the 12th International Symposium on CMMR, Sao Paolo, Brazil, July 5-8, 2016
334
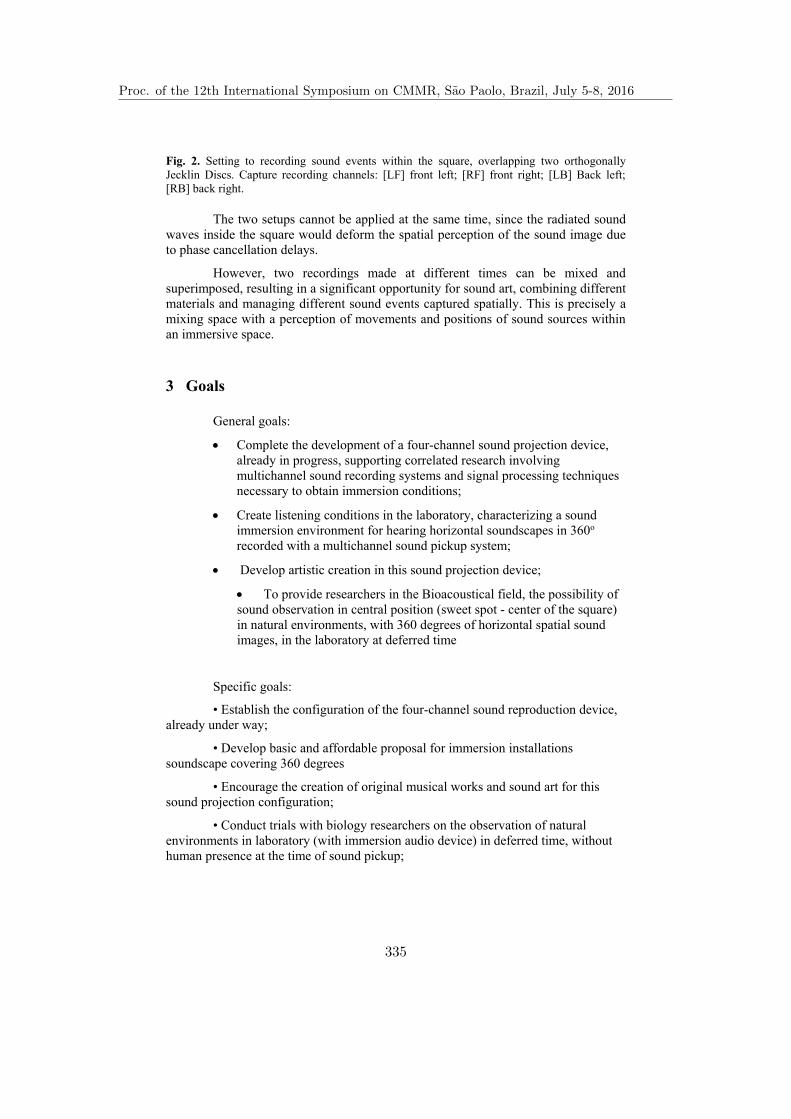
Development of a sound reproduction system in four channels 5
Fig. 2. Setting to recording sound events within the square, overlapping two orthogonally
Jecklin Discs. Capture recording channels: [LF] front left; [RF] front right; [LB] Back left;
[RB] back right.
The two setups cannot be applied at the same time, since the radiated sound
waves inside the square would deform the spatial perception of the sound image due
to phase cancellation delays.
However, two recordings made at different times can be mixed and
superimposed, resulting in a significant opportunity for sound art, combining different
materials and managing different sound events captured spatially. This is precisely a
mixing space with a perception of movements and positions of sound sources within
an immersive space.
3 Goals
General goals:
Complete the development of a four-channel sound projection device,
already in progress, supporting correlated research involving
multichannel sound recording systems and signal processing techniques
necessary to obtain immersion conditions;
Create listening conditions in the laboratory, characterizing a sound
immersion environment for hearing horizontal soundscapes in 360o
recorded with a multichannel sound pickup system;
Develop artistic creation in this sound projection device;
To provide researchers in the Bioacoustical field, the possibility of
sound observation in central position (sweet spot - center of the square)
in natural environments, with 360 degrees of horizontal spatial sound
images, in the laboratory at deferred time
Specific goals:
• Establish the configuration of the four-channel sound reproduction device,
already under way;
• Develop basic and affordable proposal for immersion installations
soundscape covering 360 degrees
• Encourage the creation of original musical works and sound art for this
sound projection configuration;
• Conduct trials with biology researchers on the observation of natural
environments in laboratory (with immersion audio device) in deferred time, without
human presence at the time of sound pickup;
Proc. of the 12th International Symposium on CMMR, Sao Paolo, Brazil, July 5-8, 2016
335
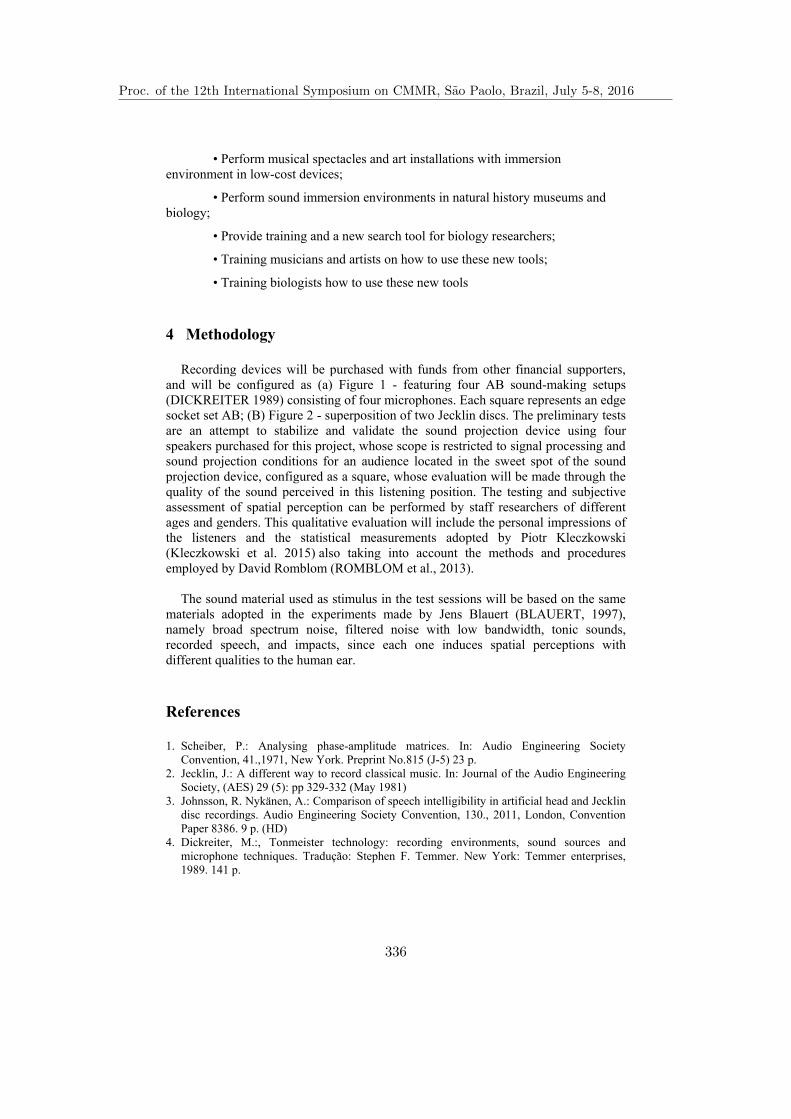
6 MANNIS et al.
• Perform musical spectacles and art installations with immersion
environment in low-cost devices;
• Perform sound immersion environments in natural history museums and
biology;
• Provide training and a new search tool for biology researchers;
• Training musicians and artists on how to use these new tools;
• Training biologists how to use these new tools
4 Methodology
Recording devices will be purchased with funds from other financial supporters,
and will be configured as (a) Figure 1 - featuring four AB sound-making setups
(DICKREITER 1989) consisting of four microphones. Each square represents an edge
socket set AB; (B) Figure 2 - superposition of two Jecklin discs. The preliminary tests
are an attempt to stabilize and validate the sound projection device using four
speakers purchased for this project, whose scope is restricted to signal processing and
sound projection conditions for an audience located in the sweet spot of the sound
projection device, configured as a square, whose evaluation will be made through the
quality of the sound perceived in this listening position. The testing and subjective
assessment of spatial perception can be performed by staff researchers of different
ages and genders. This qualitative evaluation will include the personal impressions of
the listeners and the statistical measurements adopted by Piotr Kleczkowski
(Kleczkowski et al. 2015) also taking into account the methods and procedures
employed by David Romblom (ROMBLOM et al., 2013).
The sound material used as stimulus in the test sessions will be based on the same
materials adopted in the experiments made by Jens Blauert (BLAUERT, 1997),
namely broad spectrum noise, filtered noise with low bandwidth, tonic sounds,
recorded speech, and impacts, since each one induces spatial perceptions with
different qualities to the human ear.
References
1. Scheiber, P.: Analysing phase-amplitude matrices. In: Audio Engineering Society
Convention, 41.,1971, New York. Preprint No.815 (J-5) 23 p.
2. Jecklin, J.: A different way to record classical music. In: Journal of the Audio Engineering
Society, (AES) 29 (5): pp 329-332 (May 1981)
3. Johnsson, R. Nykänen, A.: Comparison of speech intelligibility in artificial head and Jecklin
disc recordings. Audio Engineering Society Convention, 130., 2011, London, Convention
Paper 8386. 9 p. (HD)
4. Dickreiter, M.:, Tonmeister technology: recording environments, sound sources and
microphone techniques. Tradução: Stephen F. Temmer. New York: Temmer enterprises,
1989. 141 p.
Proc. of the 12th International Symposium on CMMR, Sao Paolo, Brazil, July 5-8, 2016
336

Development of a sound reproduction system in four channels 7
5. Kleczkowski, P. et al.: Multichannel sound reproduction quality improves with algular
separation of direct and reflected sounds. In: Journal of the Audio Engineering Society
(AES) 63 (6): 427-442. (June 2015)
6. Romblom, D.: A Perceptual evaluation of recording, rendering, and reproduction techniques
for multichannel spatial audio. Audio Engineering Society Convention, 135., 2013, New
York. Convention Paper 9004. 10 p. (HD)
7. Blauert, J.: Spatial hearing: the psychoacoustic of human sound localization. Ed. Rev.
Cambridge (EUA): MIT Press, 1997. 494 p. (PL)
Proc. of the 12th International Symposium on CMMR, Sao Paolo, Brazil, July 5-8, 2016
337

Graphic Interfaces for Computer Music: Two Models
Ariane de Souza Stolfi
Universidade de São Paulo
Escola de Comunicação e Artes – Departamento de Música [email protected]
Abstract. In this paper, we will analyze design aspects of two different paradigms of interface for computer music, the Digital audio workstation, represented by Pro Tools software and patch guided software, represented by Pure Data and Max software, emphasizing on aesthetical aspects, and trying to find speeches and ideologies underlying in their design, tying to approximate design and computer music research fields.
Keywords: User interface, design, design ideology, computer music, music production, music software.
1 Introduction
Interface has been considered by the human-computer interaction field, as said Magnussom [1], as a border that allows communication between two systems, human and software, or the visible part of a complex system, method or class, as define software engineering, an intelligible base that allows people to control high level underlying structures. It can be considered as a communication system, as it connects two agents and objects in a common signic space as said Iazzetta [2] (p. 105). At the same time, it allows the user to communicate things to the software and things from the software to the user. Our goal in these article, however is to deal with aspects of interface design of some music software, trying to find possible underlying discourse and ideologies, as interface can itself be seen as a musical ideology, as argue Magnussom:
“The interface is an instrument. It is a graphical manifestation of musical ideas and work processes. An interface is at the same time the aesthetic platform defining musical structures and the practical control-base for the underlying sound-engine. In a way it can be seen as a musical ideology. It defines possibilities but also the limitations of what can be composed or played. Here we are mainly thinking of the graphical user interfaces of audio software, but this argument could be extended to audio programming languages as well: the objects or classes ready at hand in a given language define what can be expressed.” [1]
On physical electronic instruments, interface is literally the shell: buttons, knobs, keys, wires, leds, and other control and feedback elements, everything that is intelligible to the user, as the sound generating system itself keeps hidden and protected, while on digital instruments, generating sound systems are usually
Proc. of the 12th International Symposium on CMMR, Sao Paolo, Brazil, July 5-8, 2016
338

2 Ariane Stolfi
inaccessible, as most programs are compiled, and thus their code are closed. The digitalization of instruments for producing electronic music guides the design work from industrial design and ergonomics to the interdisciplinary field of interface design. [3]
In this paper, we will analyze aesthetic aspects of two different paradigms of interface for computer music, the Digital audio workstation, represented by Pro Tools software and patch guided software, represented by Pure Data and Max software.
2 The Digital Audio Workstation
By 1990, a partnership between Digidesign and Opcode, which was the largest manufacturer of MIDI interfaces in the 80’s, generated Studio Vision (Figure 1), the first to integrate recording, audio editing and MIDI, considered the first digital audio workstation (DAW) software. Its GUI mixed concepts developed in the first audio editors, such as the representation of sound by using the amplitude-time graphs and a piano roll for marking notes in function of time, witch helped to bring musicians who already used digital score writers [4]. The multi-track editing interface allowed to record multiple tracks and superimpose them in parallel on the screen's graphic space, which gives the music producer the possibility of visual organization of the sound flow over time, allowing for more precise adjustments of synchronization and mixing.
Fig 1. Studio Vision, the first multi-track audio editor, released in 1990. [4]
On the next year Digidesign released the first version of Pro Tools, with integrated hardware and software systems. To an easier approach with musical business workers, familiar to traditional analog studios, the system relied on a graphical user interface based on mimesis of elements of the classic studio, that was copied in a literal way: sliders, control buttons like play, stop and pause, displays and rotary controllers were added to multi-track editing interface developed before on Studio Vision. In an announcement by the time of release (figure 2), company defines the system as a reinvention of the studio:
“Pro Tools take the three most important recording technologies of today – digital audio, MIDI and mix automation – and combines them into a single revolutionary system. (...) Time to reinvent your studio is now. And the complete systems starting at less than $6000, Pro Tools makes it easy.” [5]
Proc. of the 12th International Symposium on CMMR, Sao Paolo, Brazil, July 5-8, 2016
339

Graphic Interfaces for Computer Music 3
Fig 2. Protools release advertisement [14]
Although the discourse is about revolution, the interface is in practice shaped to
become more like the traditional studio (figure 3). Each version released of the software has a small redesign in the interface to accommodate more features and also to look more "realistic", or more like an imitation of the analog recording studio, including shadows, reflections and gradients. In the picture below, which shows a newer version of the software, we can see that the knobs have more details, and we can also see a screen similar to an oscilloscope’s one, which has a light reflection in the upper corner. These don’t add any extra functionality to the software, in fact, is possible that they prejudice, as they demand heavier graphic processing. They serve only to feed an idea of materiality, giving the software a fanciful feature physical object.
Fig 3. Interface from a recent version of Pro Tools
Proc. of the 12th International Symposium on CMMR, Sao Paolo, Brazil, July 5-8, 2016
340
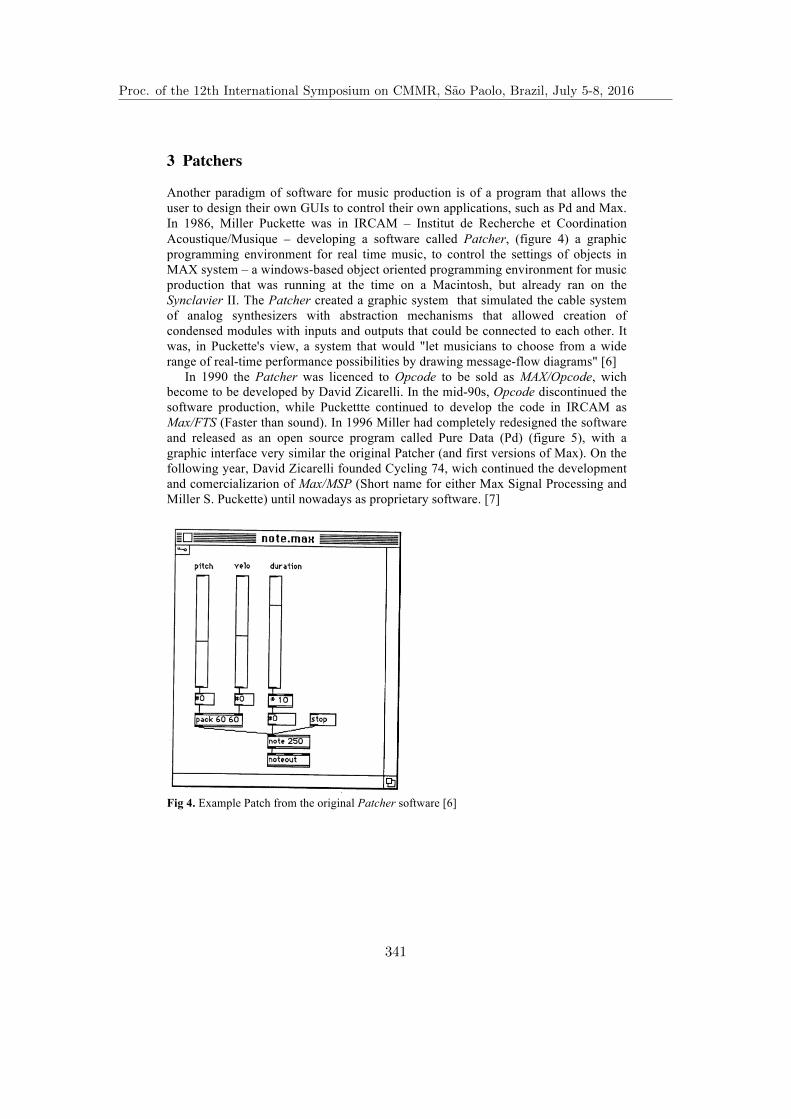
4 Ariane Stolfi
3 Patchers
Another paradigm of software for music production is of a program that allows the user to design their own GUIs to control their own applications, such as Pd and Max. In 1986, Miller Puckette was in IRCAM – Institut de Recherche et Coordination Acoustique/Musique – developing a software called Patcher, (figure 4) a graphic programming environment for real time music, to control the settings of objects in MAX system – a windows-based object oriented programming environment for music production that was running at the time on a Macintosh, but already ran on the Synclavier II. The Patcher created a graphic system that simulated the cable system of analog synthesizers with abstraction mechanisms that allowed creation of condensed modules with inputs and outputs that could be connected to each other. It was, in Puckette's view, a system that would "let musicians to choose from a wide range of real-time performance possibilities by drawing message-flow diagrams" [6]
In 1990 the Patcher was licenced to Opcode to be sold as MAX/Opcode, wich become to be developed by David Zicarelli. In the mid-90s, Opcode discontinued the software production, while Puckettte continued to develop the code in IRCAM as Max/FTS (Faster than sound). In 1996 Miller had completely redesigned the software and released as an open source program called Pure Data (Pd) (figure 5), with a graphic interface very similar the original Patcher (and first versions of Max). On the following year, David Zicarelli founded Cycling 74, wich continued the development and comercializarion of Max/MSP (Short name for either Max Signal Processing and Miller S. Puckette) until nowadays as proprietary software. [7]
Fig 4. Example Patch from the original Patcher software [6]
Proc. of the 12th International Symposium on CMMR, Sao Paolo, Brazil, July 5-8, 2016
341

Graphic Interfaces for Computer Music 5
Fig 5. Blank screen from a new file on Pd-extended. (autor’s screenshot)
Fig 6. New file screen on Max. In bottom right corner, autocomplete feature on a new object (Author’s screenshot) As says the collective written documentation of Pd published on Foss Manuals site, it's interface is very different of other commercial software that usually presents buttons, icons menus and timelines; it have only a blank screen where the user can build several applications to serve diverse artistic pursues as: synthesizers, video mixers, translate inputs from different kinds of sensors or even make video streaming:
“The difference between Pd and software like Live is that it doesn't start with any preconceived ideas about how to make your artwork. Where Live provides you with a set of tools suited primarily for the production of loop-driven dance music, Pd acts
Proc. of the 12th International Symposium on CMMR, Sao Paolo, Brazil, July 5-8, 2016
342

6 Ariane Stolfi
more like a text editor where anything is possible, so long as you know how to write it. It is this kind of possibility and freedom that attracts many artists to using Pd.” [8]
This reveals a certain ideological stance in defense of creative freedom, which is relative also, since as the software does not impose anything at first, it does not communicate too much neither, and to accomplish something significant, the user must have an accumulated knowledge and know about the functionalities of built-in objects and how they work.
The software is available as free and open source software and is maintained by an international community of artists and programmers, it is a tool but it's not sold and so it's not a product. Their libraries and extra features are available for free thanks to a philosophy of sharing and mutual aid. Max, in turn, is commercial software and so is sold as a product, and therefore should provide technical support independent of a community of users. It’s interesting to notice that although both programs have similar capabilities, the major difference between the two relies on theirs GUIs. While Pd interface is a blank screen and has no icon, Max's initial screen (figure 6) already provides a number of possible choices for the new user, with icons, menus and facilities like autocomplete on object's names, and in addition, objects and paths have rounded corners, that convey an idea of softness in association with organic forms. While rounding corners doesn't bring any functional advantage to its interface, it is used as a graphic resource to differentiate the program from its free competitor.
These graphic resources, however, doesn't guarantee a more efficient or even more appealing design on user's patches. The OMAX (figure 7), developed in Max by a group from IRCAM since 2004 to make automated tracking of free improvisation performances [16], although very sophisticated in terms of audio processing technology has a somewhat confusing interface design, with misaligned modules, texts, numeric fields and edges, inconsistent margins between objects and excessive use of colors. In the other hand, interface developed in Pd-extended by CHDH group for the Egregore software [17] (figure 8), and audiovisual synthesizer, is quite consistent with aligned text and sliders, uneven edges and precise use of color to highlight most important buttons, which shows a certain care to the application's design as a whole, and not only to the functional practical part.
Fig 7. OMAX interface, developed on Max by an IRCAM team. (Author’s screenshot)
Proc. of the 12th International Symposium on CMMR, Sao Paolo, Brazil, July 5-8, 2016
343

Graphic Interfaces for Computer Music 7
Fig 8. CHDH’s Egreggore software interface, developed on Pd-extended [8]
4 Final Considerations
As well pointed by Miller Puckette in a 2014 article [9], we can't do too much in music today without software, and each generation of programs help to shape the music of its time. The possibility of graphic representation of the sound brought by audio processing software, latter facilitated by the popularization of personal computers, aided on the whole development of electronic pop music.
There is a significant amount of books and academic papers dealing with technical capacities, possibilities and technical aspects of computer music and also a good volume of research published on the development of physical or digital experimental interfaces for music production, like most of the papers presented on NIME (New Interfaces for Musical Expression) conferences, but we could find no papers or books addressing the issue of appearance of musical graphic interfaces.
It is possible that this gap occurs only for a casual departure from design and musical research areas, but is also possible that this lack of interest happens because of a certain common sense that the aesthetic function is something to be additional, as criticizes the philosopher Slavoj Zizek in his text the Design an Ideological State-apparatus”:
“It is thus not enough to make the rather common point that the dimension of non-functional 'aesthetic' display always supplements the basic functional utility of an instrument; it is, rather, the other way around: the non-functional 'aesthetic' display of the produced object is primordial, and its eventual utility comes second, i.e., it has the status of a by-product, of something that parasitizes on the basic function. In other words, today's definition of man should no longer be 'man is a tool-making animal': MAN IS THE ANIMAL WHICH DESIGNS HIS TOOLS.” [11]
Proc. of the 12th International Symposium on CMMR, Sao Paolo, Brazil, July 5-8, 2016
344

8 Ariane Stolfi For him "designers articulate the meaning above and beyond the mere
functionality of a product", sometimes even at expense of its own functionality, "the design of a product can stage the unconscious FANTASY that seduces us into buying". Musical instruments, being physical or digital as software, are also design products, and as such, their appearance also should evoke certain fantasies and desires in users and consumers. The aesthetic of many commercial software is based on the idea of mimesis of physical objects; the more "advanced" is the software, the more realistic is the imitation, but this realism is not reflected in practice on better control of musical processes. There is a broad research field on interface design to explore potential interaction resources fleeing from mere imitation game.
References
1. Magnusson, T. IXI Software: The Interface as Instrument. Proceedings of the 2005 International Conference on NIME, Vancouver, BC, Canada (2005)
2. Iazzetta. F. Sons de silício: Corpos e Máquinas Fazendo Musica. 1997. São Paulo: Pontifícia Universidade Católica (1997)
3. Paradiso, Joseph. Electronic Music Interfaces. MIT Media Laboratory (1998), https://web.archive.org/web/20150302082747/http://web.media.mit.edu/~joep/SpectrumWeb/SpectrumX.html
4. Halaby, Chris. "It was 21 years ago today..." - How The First Software DAW Came About, http://www.kvraudio.com/focus/it_was_21_years_ago_today_how_the_first_software_daw_came_about_15898
5. Digidesign. Digidesign Reinvents the Studio. (1991) in Keyboard Magazine, October (1991), https://www.gearslutz.com/board/electronic-music-instruments-electronic-music-production/353517-old-gear-ads-magazines-9.html
6. Puckette, M. The Patcher. IRCAM, (1988) 7. The OMax Project Page. (2015) http://www.omax.ircam.fr/ 8. CHDH. Egreggore (2015), http://www.chdh.net/egregore_source_manual.htm 9. Puckette, M. The Deadly Embrace Between Music Software and Its Users. Online
Proceedings, Electroacoustic Music Studies Conference, Berlin (2014) 10. Overholt, D. The Musical Interface Technology Design Space. Organised Sound / Volume
14 / Issue 02 / August, pp 217 - 226. (2009) 11. Zizek, S. Design as an Ideological State-Apparattus. Montreal: International Council of
Design (2006) http://www.ico-d.org/connect/features/post/236.php
Proc. of the 12th International Symposium on CMMR, Sao Paolo, Brazil, July 5-8, 2016
345

On the Symbolic Transmission of Meaning Through Music
Bernardo Penha1 and José Fornari2,
1
Arts Institute, UNICAMP
2
NICS, UNICAMP [email protected], [email protected]
Abstract. Music conveys meanings beyond its perceptual and cognitive nature. This article presents an initial research on this subject, specifically studying the basis of the transmission of symbolic meanings through music. We aim to study how symbolic musical communication intervenes changes in the behavioral and affective framework of the listeners, based on the theories of analytical psychology (Jung, 2008) and cognition (Schneck & Berger, 2006). Excerpts of musical compositions will be further analyzed, whose pieces will be composed of both traditional musical elements and soundscapes. This article proposes the foundations for a future experimental study intending to verify the consistency and veracity of the hypotheses raised by this theoretical research.
Keywords: Symbolism, Analytic Psychology, Cognitive Psychology, Musical Meaning, Music Composition.
1 Introduction
Music, as performance, is an art constituent of the intangible sociocultural heritage [1]. As a notational composition, music promotes the creation of a structure that can be understood as a form of procedural algorithm which registers the necessary steps, arranged along time, for the subsequent creation of a musical performance. From this perspective, music has a dual nature: one that is intangible, the performing arts; and other that is concrete, similar to plastic arts (where sound is treated as an object), a fact further exacerbated with the advent of sound recording. It is common for music compositions to be inspired by acoustical aspects of soundscapes; the singing of birds, the percussive and melodic regularities of nature sounds (e.g. wind, rain), and so many other aspects that have been collected over the centuries and are now part of the Collective Unconscious (term coined by Carl Jung, referring to the unconscious mind of the structures that are shared by individuals of the same species). This paper presents an initial theoretical research, which will investigate the possible manipulation of sound materials and their resulting effects on listeners, in order to suggest ideas and even support the process of musical composition. The aim here is to relate the approach of analytical psychology, on symbols and the unconscious, with the study of the effects of music in the body and mind of the listener. As from this introductory theoretical scope, the study will operate with sound elements, retrieved from soundscapes, as well as with instrumental musical elements. Once this initial step is carried out and the musical excerpts are created, we intend to conduct an
Proc. of the 12th International Symposium on CMMR, Sao Paolo, Brazil, July 5-8, 2016
346

! Bernardo Penha and José Fornari 2
experimental study to verify and validate the hypotheses of this research. The general hypothesis is: "one can construct a musical object that effectively transmits (communicates) specific symbolic meanings through the manipulation of sound materials." The specific hypothesis is "the use of soundscape elements together with instrumental music can make the transmission of symbolic meanings more efficient.”
The following sections present the theoretical framework and the methodology proposed for this research. It will treat about subjects such as: the relationship between sound and symbolism, the activated brain areas during the process of music listening (and the possible implications of these neural activity), the influences that music has in the mind and body of listeners, and the description of a methodological process to be further adopted in this investigation.
2 Sound, Symbol and Neuroscience
Sounds can embody meanings beyond those essential to survival (usually manifest and obvious) and assume connotations and indirect nuances. Sounds can represent ideas, concepts, emotions and feelings, assuming a symbolic function, which is often communicated from and to the unconscious. Jung [2] defines Symbol as a name or a familiar image that has special meanings beyond its ordinary one, implying something vague, unknown or even hidden. It has a wider unconscious aspect, which cannot be precisely defined or explained. When the mind explores a symbol, it is usually led to concepts that may dwell beyond the reach of reasoning. According to Freud [3], this happens because the conscious covers the representation of the object (person, object, or idea) added to its semantic representation (word), while the unconscious representation refers only to the symbolic representation (mental image) of this object, and has no fundamental association with language. Thus, the symbolic level is the mediator of reality and, at the same time, what defines the individual as a human being [3]. Levi-Strauss says that culture is a set of symbolic systems and that such symbolic systems are not made from the moment we translate given external data in symbols, instead it is the symbolic thought which constitutes the cultural or social fact. These symbolic systems (with symbolic functions) are the structural laws of the unconscious [3].
As music is part of the human culture, it is also made up of symbols and obeys its symbolic functions. One of the musical areas that relies upon this concept, as a determinant role of the compositional process, is Film Music. One can say that it is made for the purpose of transferring messages to the psyche of the viewers, with which it actually aims to persuade them to experience the emotional framework determined by the movie script. In film music, music conveys an implicit symbolic meaning to visual images [4]. Another interesting field of musical art is Instrumental Music, which does not follow the semantic meaning contained in song lyrics. However, instrumental music also holds the ability to induce, in a symbolic manner, the listener's unconscious mind to respond emotionally, within the context of their own memory and life experiences, since the medium itself imposes largely the general direction in which the listener's emotions will be directed [5].
Regarding the brain activation of listeners and performers, the processing of listening and thinking of tonal sounds occurs in specialized groups of neural pathways, in the superior temporal and frontal cortex regions, particularly in the right hemisphere. However, recent studies show that it also activates bilateral occipital
Proc. of the 12th International Symposium on CMMR, Sao Paolo, Brazil, July 5-8, 2016
347

Running Title ! 3
areas, which are normally involved in visual processing, despite the eventual absence of visual input signals during music listening [6]. Moreover, parts of the motor cortex and the limbic area (activated in emotional processing) are shown to be involved in the evaluation aspects of the musical experience. This suggests the possibility that the auditory processing of music is integrated with space-visual images, in addition to what we could name as an imaginary movement (or gesture) corresponding to an imaginary emotion. As shown in these studies, despite the stimulus being exclusively acoustical, it triggers in the listener's brain a multimodal imaginary activity, often composed of scenarios and fanciful situations, landscapes or architectural structures, possibly with people who move, gesticulate and behave emotionally, as if these were scenes of a virtual opera or an interactive motion picture intersubjectively personified.
This imaginary aspect of music listening prepares the brain to the semantics of human interaction, in the sense that our imaginary gestures and imaginary emotional states are like virtual feelings; a content that we can adopt or just consider possible or appropriate, not directly "lived" but “felt". These are instances of meaning that have imaginary (semiotic) reality [6]. Another interesting example regarding brain activation, as reported by [7], is the simple fact of imagining music, which can activate the auditory cortex with almost the same intensity of activation caused by the act of listening factual music, thus preparing musicians with great efficiency for their actual performance.
3 Mind and Body Musical Influences
Music influences the mind and the body in different ways and at different levels, from changes in emotional and affective subjective states (which are difficult to quantify) to several measurable neurochemical, endocrine and structural changes. It is known that the human species is the only one that presents spontaneous synchronization of gestures and actions through music, in particular for regular rhythmic aspects. This phenomenon is called Music Entrainment [8]. Musical rhythms can trigger certain behaviors, simultaneously instigating emotions and altering the functioning of involuntary physiological aspects, such as: heart rate, muscle tone, blood pressure and breathing. In addition, under the influence of music, the human parasympathetic system prevails over the sympathetic, resulting in a relaxation response characterized by the presence of alpha brain frequencies , 1
physiologically manifesting through a state of greater muscular relaxation, with regular deep and slow breathing, and reducing the heart beating rate [9].
The influence of music on the listener is undoubtedly an interesting subject. This is a current topic of research that has been widely explored, including the use of music as a therapeutic element; which has been studied and developed in the area of science known as Music Therapy [10]. However, there is a certain shortage of theoretical material regarding the relationship of music with analytical theories of the functioning of the mind, especially in relation to the production and structuring of musical material, in the process of music composition. One of the main objectives of this research is to study the transmission of symbolic meanings through music in the relationship between soundscape sounds and instrumental music. The specific
Frequencies that range from 8 to 13Hz, which characterize the normal activity of the human brain in conscious 1and relaxed state. [9]
Proc. of the 12th International Symposium on CMMR, Sao Paolo, Brazil, July 5-8, 2016
348

! Bernardo Penha and José Fornari 4
objectives are: 1) To develop a theoretical study based on the notion of symbol in view of its relationship with music, from the perspective of psychoanalysis and analytical psychology, and grounded in the study of cognitive psychology on the behavioral effects generated by music; 2) To apply the acquired theoretical knowledge in the practice of musical composition; 3) To carry out an experimental study using the composed musical materials in order to verify the validity and reliability of the hypotheses.
4 Proposed Methodology
This article deals with the theoretical proposition of a study on the transmission of symbolic meaning through musical aspects. So initially this work aims to lay the foundations for the future development of this project. The methodology will initially construct a solid theoretical framework through an extensive literature review of related and similar studies. Initial references focus on the study of the symbolism, according to analytical psychology of Jung [2], and the philosophical approach on symbolic forms developed by Cassirer [22]; and on the study of physiological effects caused by music according to Schneck & Berger [11] .
For the composition of the sound material, the writings of [12] and [13] on soundscape will be used. Regarding musical composition, [14] and [15] shall be studied. About film music, the studies of Neumeyer [16] and Harper [17] will be used. From the theoretical scope and practical consolidation of this knowledge (which will result in the development of musical material) experiments will be conducted in order to verify the assumptions initially described.
The experimental method proposed here is based on experiments described in the literature on musical psychology as [18]. This method consists of observation and data retrieval of two psychological instances: 1) Behavioral: focused on involuntary reactions of the organism, 2) Subjective: involving reflection and introspection of the listeners. The option to perform experiments with this type of orientation is due to the fact, that the phenomena, observed through only one of the instances, could be too complex or furnish insufficient data, which would hamper or even preclude the development of music cognition models. Thus, it is intended to confront subjective and behavioral data to give more correlated bases of understanding the process of symbolic music perception. We aim to achieve a more robust method by comparing the listener's behavior changes and their verbal reports, which cannot rescue the musical meanings completely by itself, since some auditory perception processes occur in more basal mental levels (below consciousness), unlike what usually happens with language [19].
4.1 Variables
Initially, the independent variable in this study is determined as being the "efficient transmission of a particular symbolic significance." Then we seek to assess quantitative and qualitative measurements (dependent variables), so that the subsequent analysis of the data can lead to possibly more significant conclusions, which will be afforded by comparing these two types of data. In the study of Statistics, an independent variable can be defined as the type of variable that is
Proc. of the 12th International Symposium on CMMR, Sao Paolo, Brazil, July 5-8, 2016
349

Running Title ! 5
studied and manipulated by the researcher, whose effects can be observed by measuring the dependent variables.
In the group of quantitative variables it will be used: a) Heart Rate Variability (HRV), and b) Respiratory Rate (RR). These measures were chosen because they are factors that can be understood as behavioral changes, that is, indicators of psychological states. In the group of qualitative variables it will be used: c) Body Expressions [1], d) Facial Expressions [2] (as related to involuntary behavioral changes), e) Verbal Reports about feelings, f) Verbal Reports about Thoughts (as subjective descriptive data). The variables c) and d) were chosen for the reason that they provide information about the effects of music on human behavior in a richer way than just physiological factors, and still more objective than e) and f). For the interpretation of facial and body expressions, it will be used the studies of [20] and [21].
4.2 Experiment Features
In the experiments of this research it will be used a Within-Subject Design [21], in which the same subjects are used in all levels of the independent variable, i.e., for each specific symbolic meaning all subjects will be studied. In other words, it can be said that, for all survey participants, the same Sound Stimuli (SS) will be applied.
The study population of this research will be composed of individuals with a similar educational level, which is an incomplete university education (from 2nd year) or higher, not including professional musicians, or people with intermediate/advanced musical training. This choice was taken because, in theory, these individuals have greater familiarity with some musical conventions, which therefore may have different representations for symbolic meanings common to most listeners. This population was chosen because, with all individuals in a similar level of formal education, it is assumed that they present a similar level of familiarity with the music content to be studied.
As in many statistical surveys, this will also be carried out with a small sample of the total population, which will be consisted of students, teachers or employees of the respective educational entity, with incomplete higher education (from second year) or above. The control group will consist of a set of music students at the same university, being at least undergraduate students of the second year. This will be adopted by the same reason given above, that is, the fact that they may have, theoretically, greater familiarity with some musical conventions that represent specific symbolic meanings.
5 Conclusions
This theoretical work intend to lay the foundations of this introductory research whose main objective is to study the symbolic transmission of meaning mediated by music. This research aims to contribute to the increase of theoretical material and data body on the interdisciplinary relationship between musical cognition and analytical psychology theory, in regard to musical meaning and possible handling of musical structures. In this way, this research does not aim to be exhaustive, in all the myriad of aspects involved in this interdisciplinary field, but it could encourage the development of future research in this subject, for instance: creating musical analysis
Proc. of the 12th International Symposium on CMMR, Sao Paolo, Brazil, July 5-8, 2016
350

! Bernardo Penha and José Fornari 6
methods based on the emerging symbolic meanings, developing studies on the differentiation of styles or genres (based on their symbolic meanings), or any other future developments that may derivate from this work.
References
1. Smith L., Akagawa N. (2008). Intangible Heritage. Routledge Ed.
2. Jung, C. G. (2008). O Homem e seus Símbolos. 6 Edição. Rio de Janeiro. Editora Nova Fronteira S.A.
3. Garcia-Roza, L. A. (2009). Freud e o inconsciente. 24a. Edição, Rio de Janeiro. Jorge Zahar Editor.
4. Green, J. (2010). Understanding the Score: Film music communicating to and influencing the audience. University of Illinois Press. Journal of Aesthetic Education, Vol. 44, No. 4, pp. 81-94.
5. Nebenzahl, B. F. (2000). The Narative Power of Sound: Symbolism, emotion & meaning conveyed through the Interplay of sight and sound in Terrence Malick´s Days of Heaven. Los Angeles, University of California.
6. Brandt, A. (2009). Music and the abstract Mind. The Journal of Music and Meaning, vol. 7.
7. Sacks, O. (2007). Musicophilia: Tales of Music and the Brain. Knopf Ed.
8. Clayton, M., Sager, R., Will, U. (2005). In time with the music: the concept of entrainment and its significance for ethnomusicology. European meetings in ethnomusicology. Vol. 11. Romanian Society for Ethnomusicology.
9. Solanki, M. S., Zafar, M., Rastogi, R. (2013). Music as a Therapy: Role in psychiatry. Asian Journal of Psychiatry, pp.193-199.
10. Eschen, J. Th. (2002). Analytical Music Therapy. Jessica Kingsley Publishers.
11. Schneck, D. J., Berger, D. S. (2006). The Music Effect: Music physiology and clinical applications. Jessica Kingsley Publishers.
12. Schafer, R. M. (2001). A Afinação do Mundo. São Paulo. Editora UNESP.
13. Truax, B. (2008). Soundscape Composition as Global Music: Electroacoustic music as soundscape. Organized Sound, 13(2), 103-109.
14. Schoenberg, A. (1970). Fundamentals of Musical Composition. London. Faber and Faber Limited.
15. Cope, D. (1997). Techniques of the Contemporary Composer. Schirmer.
16. Neumeyer, D. (2014). The Oxford Handbook of Film Music Studies. Oxford University Press.
Proc. of the 12th International Symposium on CMMR, Sao Paolo, Brazil, July 5-8, 2016
351
Running Title ! 7
17. Harper, G. (2009). Sound and Music in Film and Visual Media: A critical overview. Continuum International Publishing Group Ltd
18. Huron, D. (2006). Sweet Anticipation: Music and the Psychology of Expectation. Bradford Books.
19. Reznikoff, I. (2004/2005). On Primitive Elements of Musical Meaning. The Journal of Music and Meaning, vol. 3, Fall, Section 2.
20. Ekman, P., Friesen, W. V., Ellsworth, P. (1972). Emotion in the Human Face: Guidelines for research and an integration of findings. Pergamon Press Inc.
21. Sampaio, A. A. S., Azevedo, F. H. B., Cardoso, L. R. D., Lima, C., Pereira, M. B. R., Andery, M. A. P. A. (2008). Uma introdução aos delineamentos experimentais de sujeito único. Interação em Psicologia 12.1 páginas: 151-164.
22. Cassirer, E. (1980). The Philosophy of Symbolic Forms. Yale University Press.
Proc. of the 12th International Symposium on CMMR, Sao Paolo, Brazil, July 5-8, 2016
352

Proc. of the 12th International Symposium on CMMR, Sao Paolo, Brazil, July 5-8, 2016
353

Author Index
Agier, Francois, 117Anache, Damian, 139Aramaki, Mitsuko, 83Arango, Julian Jaramillo, 109Arpaja, Damien, 117
Barthet, Mathieu, 159Belloc, Olavo da Rosa, 233Beyls, Peter, 315Blot, Guillaume, 21Bourdin, Christophe, 66, 83, 117Brejard, Vincent, 117
Cabrera, Andres, 147Cahen, Roland, 183Carvalho, Darlinton, 51Carvalho, Felipe Reinoso, 241Chagas, Paulo C., 253Chen, Xiaoou, 37Cheng, Yao, 37
da Silva, Micael Antunes, 323de Mello, Tiago, 130de Paulo, Avner, 51Deacon, Thomas, 159Delgrange, Emmanuelle, 117
Faria, Regis Rossi Alves, 233, 323Ferreira, Rodrigo, 51Fornari, Jose, 346Franco, Ivan, 278
Gandemer, Lennie, 66Gena, Peter, 183Goncalves Junior, Djalma de Campos, 331
Hamanaka, Masatoshi, 8Haralick, Robert, 286Hirata, Keiji, 8, 298
Irber Junior, Luiz Carlos, 306
Kon, Fabio, 175Kronland-Martinet, Richard, 66, 83, 117
Laia, Marcos, 51Liu, Ligon, 286
Madeira, Daniel, 51Mannis, Jose Augusto, 331Manzolli, Jonatas, 270Mizutani, Wilson Kazuo, 175Moreira, Joao Pedro, 51
Ni, Xiuyan, 286
Parseihian, Gaetan, 66, 117Penha, Bernardo, 346
Rimoldi, Gabriel, 270Rocha, Fernando, 201Rodrigues, Andre Montes, 233Rossetti, Danilo, 209Rousseaux, Francis, 21Roze, Jocelyn, 83Russo, Arnaldo D’Amaral Pereira Granja,306
Saurel, Pierre, 21Schiavoni, Flavio Luiz, 217Schiavoni, Flavio, 51Sinclair, Peter, 183Steenhaut, Kris, 241Stine, Eli, 201Stockman, Tony, 159Stolfi, Ariane de Souza, 338
Taborda, Tato, 331Tanant, Jonathan, 183Tojo, Satoshi, 8, 298Touhafi, Abdellah, 241
Ucar, Ezgi, 99
van Ee, Raymond, 241Velasco, Carlos, 241
Wan Rosli, Muhammad Hafiz, 147Wanderley, Marcelo M., 278
Yang, Deshun, 37Ystad, Sølvi, 83
Zu↵o, Marcelo Knorich, 233
Proc. of the 12th International Symposium on CMMR, Sao Paolo, Brazil, July 5-8, 2016
354