1-Yankee Candle 03AR 13256 CV - Media Corporate IR Net
50
I NNOVATION . P ERFORMANCE . Q UALITY . F RAGRANCE . 2003 ANNUAL REPORT
-
Upload
khangminh22 -
Category
Documents
-
view
0 -
download
0
Transcript of 1-Yankee Candle 03AR 13256 CV - Media Corporate IR Net

I N N O V A T I O N . P E R F O R M A N C E . Q U A L I T Y . F R A G R A N C E .
2 0 0 3 A N N U A L R E P O R T
T H E Y A N K E E C A N D L E C O M P A N Y , I N C .
16 Yankee Candle Way South Deerfield, Massachusetts 01373

CO R P O R AT E IN F O R M AT I O N
Chairman EmeritusMICHAEL J. KITTREDGEFounderThe Yankee Candle Company, Inc.
DirectorsDALE F. FREYRetired Chairman and PresidentGeneral Electric Investment Corp.
MICHAEL F. HINESExecutive Vice President andChief Financial OfficerDick’s Sporting Goods, Inc.
SANDRA J. HORBACHGeneral PartnerForstmann Little & Co.
JAMIE C. NICHOLLSGeneral PartnerForstmann Little & Co.
MICHAEL B. POLKSenior Vice President, Marketing and Chief Operating OfficerUnilever BestfoodsNorth America
CRAIG W. RYDINChairman, President andChief Executive OfficerThe Yankee Candle Company, Inc.
RONALD L. SARGENTPresident andChief Executive OfficerStaples, Inc.
ROBERT R. SPELLMANSenior Vice President, Financeand Chief Financial OfficerThe Yankee Candle Company, Inc.
DOREEN A. WRIGHTSenior Vice President,Chief Information OfficerCambell Soup Company
Executive OfficersCRAIG W. RYDINPresident and Chief Executive Officer
ROBERT R. SPELLMANSenior Vice President, Financeand Chief Financial Officer
GAIL M. FLOODSenior Vice President,Retail
PAUL J. HILLSenior Vice President,Supply Chain
HARLAN M. KENTSenior Vice President,Wholesale
MARTHA S. LACROIXSenior Vice President,Human Resources
JAMES A. PERLEYVice President,General Counsel
Operating OfficersSTEPHEN K. ATWATERVice President,Process Improvement
RONALD J. BOHONOWICZVice President,Quality and Engineering
DOUGLAS G. HIGGINBOTHAMVice President,Distribution and Transportation
G. PAT HOWARDVice President,Wholesale Finance and Planning
DEBORAH H. LYNCHVice President,Retail Finance and Planning
GERALD F. LYNCHVice President,Controller
THOMAS J. REGANVice President,Retail
ARTHUR F. RUBECKVice President,Manufacturing
DENNIS M. SHOCKROVice President,Information Systems
JOHN M. STAIBVice President, Wholesale Sales
ANTHONY P. VILLANIVice President,Real Estate
THOMAS J. WOODSIDEVice President,Chief Retail Marketing Officer
Shareholder InformationCorporate OfficesThe Yankee Candle Company, Inc. 16 Yankee Candle WaySouth Deerfield, Massachusetts 01373Telephone: (413) 665-8306Internet address: www.yankeecandle.com
Transfer Agent and RegistrarEquiServe Trust Company, N.A. is the Transfer Agentand Registrar for the Company’s Common Stock andmaintains shareholder accounting records. The TransferAgent should be contacted directly concerning changesin address, name or ownership, lost certificates and toconsolidate multiple accounts. When correspondingwith the Transfer Agent, shareholders should referencethe exact name(s) in which Yankee Candle stock is registered as well as the certificate number.EquiServe Trust Company, N.A.P.O. Box 43023Providence, Rhode Island 02940-3023Telephone: (877) 282-1168Internet address: www.equiserve.comEmail address: [email protected]
Financial InformationA copy of Yankee Candle’s annual report on Form 10-K for the fiscal year ended January 3, 2004 as filed with the Securities and Exchange Commission is available on the Company’s web site, www.yankeecandle.com, or by written request to theOffice of Investor Relations at our corporate address.
Annual MeetingThe Annual Meeting of Stockholders of The YankeeCandle Company, Inc. will be held on June 16, 2004at 10:00 a.m. at The Yankee Candle Employee Healthand Fitness Center, 25 Greenfield Road, SouthDeerfield, Massachusetts 01373.
Designed by Curran & Connors, Inc. / www.curran-connors.com

Yankee Candle’s success is driven by our diverse, time-tested and growing capabilities: Our core
competency in developing and delivering FRAGRANCE, which bolsters our leadership position in the
premium scented candle market and accelerates our progress in other home fragrance categories. Our
talent for INNOVATION, which spurs our product development activities and encourages superior
execution throughout our business. Our commitment to developing the highest QUALITY products,
which reinforces our brand’s image for excellence. And our tradition of delivering outstanding financial
and operational PERFORMANCE, which generates increasing value for our employees, customers,
partners and shareholders.
FragranceInnovation
QualityPerformance

2 The Yankee Candle Company, Inc.
The Yankee Candle Company, Inc. is the nation’s leading designer, manufacturer, wholesaler and retailer of premium scented candles, with
the largest share of the premium scented candle market and the most highly recognized brand of any premium scented candle manufacturer.
The Company is also a major designer and marketer of candle accessories, and a growing factor in other segments of the home fragrance
and scented personal care product markets.
Yankee Candle’s success is driven by its vertically integrated structure, which gives the Company control over all of the operations required
to develop, manufacture, distribute and sell its products. This exceptional degree of control enables Yankee Candle to create innovative,
high-quality products that it markets through a broad range of image-appropriate channels. As a result, the Company has built Yankee Candle�
into a powerful brand that projects premium quality and resonates with consumers.
At year-end 2003, Yankee Candle marketed its products through approximately 15,000 wholesale doors in North America; 286 Company-
owned and operated retail stores in the United States; a proprietary website at yankeecandle.com; a catalog program; approximately 1,900
European wholesale doors, primarily in the United Kingdom; 23 European distributors that serve 26 countries; and a European distribution
center in Bristol, England. Founded in 1969, Yankee Candle is headquartered in South Deerfield, Massachusetts. The Company’s common
stock is traded on the New York Stock Exchange under the symbol YCC.

The Yankee Candle Company, Inc. 3
(Dollar Amounts In Thousands) 1999 2000 2001 2002 2003
Operating Results:
Net sales $262,075 $338,805 $379,831 $444,842 $508,637Operating income 76,386 89,098 89,861(2) 109,831 126,983Net income 34,295(1) 43,559 48,165(3) 63,979 74,786
(1) Before extraordinary item.(2) Excludes $8,000 restructuring charge.(3) Pro forma to exclude $8,000 restructuring charge from pre-tax income and apply 39% tax rate to pre-tax income.
F I N A N C I A L HI G H L I G H TS
NET SALES
(dollars in millions)
18% CAGR* 14% CAGR* 22% CAGR*
’99 ’00 ’01 ’02 ’03
$262.1
$89.1 $89.9
$127.0
$74.8
$34.3
$43.6
$48.2
$64.0
$76.4$338.8
$379.8
$444.8
$508.6
OPERATING INCOME
(dollars in millions)
’99 ’00 ’01 ’02 ’03
NETINCOME
(dollars in millions)
’99 ’00 ’01 ’02 ’03
$109.8
*CAGR = Compound Annual Growth Rate

4 The Yankee Candle Company, Inc.
Exceptional performance is never the result of random activities.
Instead, it’s the product of careful planning, steady focus and hard
work—characteristics that are especially vital during challenging
times. In 2003, The Yankee Candle Company, Inc. team once again
proved that we have these characteristics and we know how to chan-
nel them, delivering another year of record financial results, despite
continued economic uncertainty and soft consumer spending.
We achieved record total sales of $508.6 million for the
year, an increase of 14 percent compared with 2002. In our whole-
sale business, which includes our international wholesale operations,
we posted an 18 percent increase in sales to $242.0 million. In our
retail business, we generated sales of $266.6 million, an increase
of 11 percent, despite a small decline in our same-store sales, which
was primarily due to a decline in mall traffic. In our direct retail
channels of catalog and Internet, we delivered a 2 percent increase
compared with 2002.
This performance, combined with our ongoing efforts to
control expenses and realize process improvements, enabled us to
generate record operating profit, net income and earnings per share.
We posted operating profit of $127.0 million, an increase of 16 per-
cent compared with $109.8 million in fiscal 2002. Our net income
grew 17 percent to $74.8 million from $64.0 million in 2002; and
earnings per share grew 20 percent to $1.40 per diluted common
share from $1.17 per diluted common share a year ago. We also
generated $91.4 million of free cash flow, an increase of 35 percent
over 2002.
In summary, we made outstanding progress in 2003,
sharply underscoring the growing power of the Yankee Candle�
brand; the strength, flexibility and efficiency of our vertically inte-
grated business model; and the skill of our management team in
leveraging these unique assets. In addition, our Board of Directors
authorized a $100 million share repurchase program, which we
completed during the year. This initiative improved our Company’s
capitalization structure, while providing a tangible benefit to our
shareholders in return for their loyalty and support.
Accelerating Product Innovation
Will Rogers once noted that, “Even if you are on the right track,
you’ll get run over if you just sit there.” At Yankee Candle, we
wholeheartedly agree with this message. In fact, our deep-seated
belief in driving continuous innovation has been a primary factor
behind many of our Company’s accomplishments—from
developing the most recognized brand in the premium scented
candle industry, to becoming the industry leader in a number
of gift categories.
While we regularly innovate throughout our Company,
we are best known for our product innovation initiatives, which
include developing, packaging and marketing new Yankee Candle�
branded merchandise. In 2003, we took these activities to new
heights. We added many new fragrances to our traditional
Housewarmer� candle collection; launched two new candle lines,
each with a unique design and exclusive fragrances; expanded our
assortment of accessories; increased our penetration of the home
fragrance market; and test marketed a wide array of new products.
One of our most exciting initiatives was our entry into
the electric home fragrancer market. Electric home fragrancers are
a large segment in the home fragrance category, and one that is
growing as consumers seek around-the-clock fragrance solutions.
We capitalized on this demand in 2003 by introducing our
Housewarmer� electric home fragrancer. Our fragrancer offers
characteristics that consumers want—it is small and attractive, can
be adjusted to use horizontally or vertically, allows one outlet to
remain available, and uses a scented oil insert to diffuse any one of
eight of our most popular candle fragrances 24 hours a day for up
to eight weeks. This exciting product was a resounding success with
consumers, complementing our other home fragrance merchandise
TO OU R SH A R E H O L D E R S

The Yankee Candle Company, Inc. 5
and strengthening our position as a key player in
the high-demand home fragrance market. We
believe that significant opportunity exists for our
Company to capture additional square footage with our existing
wholesale customers and to generate greater sales volume in our
retail stores by increasing our penetration of non-candle home
fragrance categories. We are actively working to identify promising
opportunities that leverage our core fragrance competency, align
with our brand image and respond to the needs of consumers.
We built demand for our new products, promoted greater
brand awareness and paved our way to further develop key regional
markets by executing an integrated marketing campaign. This cam-
paign encompassed advertising in major national magazines around
the country, as well as executing a range of public relations activities
and continuing our successful catalog program. We complemented
these initiatives by drawing on our extensive customer database
to send direct mailings that highlighted new products and store
openings to millions of consumers.
Driving Profitability
Our 2003 product innovation activities were a strong catalyst for
increased sales performance across all of our distribution channels.
During the year, we launched our electric home fragrancer into
our wholesale channel, building on the success of the other home
fragrance products we introduced to this channel in 2002. Our
expanded product assortment enabled us to secure significant addi-
tional shelf space with many existing customers and to attract new
customers. In total, we added approximately 1,100 new wholesale
doors in 2003, ending the year with approximately 15,000 wholesale
locations across North America.
Our new products were also powerful performance drivers
for our retail channel, generating news within our stores, and creating
a level of freshness and excitement that enhanced our customers’
shopping experience. We laid the groundwork to gain greater leverage
from our growing product portfolio by introducing a new retail
sales training program. Developed exclusively
for Yankee Candle, this program has prompted
us to intensify our focus on building relation-
ships with our customers so that we can better understand their
product preferences. We also continued to extend the reach of the
Yankee Candle� brand, opening 49 retail stores, adding a test satellite
Yankee Candle� Home store in Nashua, N.H., and revamping our
e-commerce site, making it more functional and easier to use. We
supported our growth by continuing to enhance our supply chain
operations, taking a number of steps that yielded greater productivity
and efficiency, while positioning us for ongoing expansion.
Earning Recognition
Our 2003 financial and operational accomplishments were highly
rewarding, but some of the year’s most exciting achievements came
in the form of industry accolades. Our Company was singled out by
a wide range of organizations who applauded some of our most
gratifying accomplishments—from our continued progress in a
tough economy, to our ability to contribute to economic stability
in our home state of Massachusetts, to our exceptional success in
the e-commerce arena. For example:
• BusinessWeek ranked us 23rd on their annual list of
100 Hot Growth Companies, citing our steady sales and earnings
growth, as well as our strong return on capital over the past
three years.
• The Boston Globe ranked us number five overall in its
annual list of the best performing public companies in Massachusetts.
We were also the top-rated company in the consumer goods category
and 14th on the Growth 50 list.
• The Boston Herald ranked us number seven overall on
The Herald Hundred, its annual list of the top performing compa-
nies in Massachusetts. This high ranking also earned us a place on
the publication’s Superstar 10 list, a subset of the Herald Hundred
that highlights the State’s leading ten companies based on 12-month
revenue and earnings growth.

6 The Yankee Candle Company, Inc.
• Internet trade magazine, Internet Retailer, named us one
of the top 50 Internet Retailers. According to the magazine’s Web site,
the companies selected for this commendation “represent retailers who
know their customers, understand how the Web fits into a retail
strategy and continually improve online shopping.”
In addition to these distinctions, Massachusetts Governor
Mitt Romney and The Massachusetts Alliance for Economic
Development both honored Yankee Candle for our signif icant
positive impact on the Massachusetts economy. The Boston Club,
an organization that provides a forum for women as business, profes-
sional and community leaders, also recognized us, applauding
the number of women on our Board of Directors and in our
Executive ranks.
Generating Shareholder Value
We continued to evolve our Board in 2003, adding several talented
leaders who will provide our Company with hands-on guidance
and valuable perspective as we pursue continued growth. Our new
members include Michael F. Hines, Executive Vice President and
Chief Financial Officer of Dick’s Sporting Goods; Michael B. Polk,
Senior Vice President of Marketing and Chief Operating Officer
of Unilever Bestfoods North America; and Doreen A. Wright,
Senior Vice President and Chief Information Off icer of
Campbell Soup Company.
Each of these individuals is a talented, experienced pro-
fessional. Collectively, our Board members offer a powerful
combination of financial acumen, successful retailing experience,
proven brand-building skills and valuable insight into managing
a growing business. As we move into 2004, we are confident that
Yankee Candle’s involved and exceptionally competent Board of
Directors will help us to achieve continued progress.
Moving Forward
As I reflect on our Company’s success in 2003, I am once again
impressed by the talent and dedication of my fellow employees. Year
after year, the members of the Yankee Candle team prove that we
can function as a warm, “family” business, while delivering the
outstanding growth and financial results required of a nationally
recognized public company. Every day, our employees demonstrate
the spirit and work ethic that make this possible, and I thank each
of them for their many contributions to our success.
Our team enters 2004 with confidence and enthusiasm.
We are highly energized about our prospects for growth. Moreover,
we are sharply focused on optimizing those prospects by continuing
to develop the assets that have yielded our success to date—from
our core competency in fragrance development, to our high-quality
products, our vertically integrated business model, our consistently
strong financial performance and our tradition of innovation. As we
move forward, we’re intent on using these strengths to continue to
build the Yankee Candle� name into a powerful, national brand
that consumers recognize and value.
Sincerely,
Craig W. Rydin
Chairman and Chief Executive Officer

The Yankee Candle Company, Inc. 7
“We made outstanding progress in 2003, generating record financial results in the areas of operating profit,
net income and earnings per share. Our ability to deliver this performance in a challenging economic
environment sharply underscores the growing power of the Yankee Candle� brand; the strength, flexibility
and efficiency of our vertically integrated business model; and the skill of our management team in
leveraging these unique assets.”
FragranceInnovation
QualityPerformance

8 The Yankee Candle Company, Inc.
Innov

The Yankee Candle Company, Inc. 9
With more than three decades of success in creating innovative, high-quality products, Yankee Candle has become the undisputed leader in
the premium scented candle market. As awareness and interest in our brand have grown over the years, we have worked to capitalize on
these strengths, drawing on our fragrance competency and vertically integrated business model to expand our offering of premium scented
candles and to apply the Yankee Candle� brand to other merchandise, including high-quality candle accessories and home fragrance items.
These efforts have enabled us to capture a growing share of our traditional market of premium scented candles, while penetrating other
high-volume home fragrance market segments.
In 2003, we executed several strategic marketing programs that highlighted our fragrance competency and showcased our new
products. One of our most significant initiatives was the continued execution of our national print campaign. Through full-page, color ads
in such publications as People, Family Circle, Good Housekeeping and Redbook, this campaign heightened product awareness across all of our
distribution channels, stimulating consumer demand for our new merchandise. We complemented our advertising efforts by drawing on our
extensive customer database to launch a variety of direct marketing initiatives and invitation-only promotions, as well as to execute regional
marketing plans through which we tested our products in different markets.
Our marketing and brand-building efforts were rewarded. We continued to gain market share and achieve greater brand recogni-
tion during 2003, as evidenced by the results of the annual market research survey that we conduct. Perhaps more telling, Giftbeat maga-
zine’s annual survey of leading gift products cited Yankee Candle� as the leading candle brand in the country for the 11th consecutive year,
as well as the most profitable gift shop product line for the third year in a row. Giftbeat also found that our Housewarmer� candles were the
nation’s number-one selling item in the category of gifts costing more than $10, and our Yankee Car Jars� air fresheners, Tarts� wax potpourri
and Samplers� votive candles were top-selling items in the category of gifts costing $5 or less. In fact, according to Giftbeat, Yankee Candle�
was the top giftware reorder product line of 2003, marking the ninth time we have earned this distinction in the 11 years that it has been given.
B R A N D
ovationYear after year, consumer surveys affirm that Yankee Candle� is the most highly recognized brand in the premium scented candle market with best-selling gift items ina growing variety of merchandise categories.

10 The Yankee Candle Company, Inc.
Innov

The Yankee Candle Company, Inc. 11
At Yankee Candle, product innovation has always been central to our business philosophy and vital to our success. In fact, our emphasis
on product innovation sharply distinguishes our development activities from other companies that compete in our markets. In 2003, we
continued this tradition, introducing many new Housewarmer� candle fragrances, and innovating a wide range of exciting new products that
showcased our ability to leverage our fragrance competency to stimulate growth.
Perhaps our greatest “hit” of the year was our introduction of the Housewarmer� electric home fragrancer. Designed to resemble
a small nightlight with an attractive shade, the refillable unit diffuses scented oil versions from a selection of eight of our most popular
candle scents—including MacIntosh, Clean Cotton� and Sage & Citrus. A high-demand product in all of our distribution channels, the
Housewarmer� electric home fragrancer has helped to fortify our position in the growing home fragrance market.
We also expanded Yankee� Home Classics�, the sophisticated premium scented candle line we first launched in 2002. Characterized
by fluid candle shapes and unique, blended fragrances, the Yankee� Home Classics� collection features graceful, curved jar candles with peel-off
labels, as well as Samplers� votive candles, scented tea lights, Tarts� wax potpourri, and oval pillar candles. This collection is available in
14 distinctive scents that are exclusive to this line, including Apple & Rose and Basil & Nectarine. We also launched Deck Delights�,
an innovative new line of insect-repellent candles and accessories for outdoor use. Available in f ive fragrances, including Marigold &
Geranium and Citron Eucalyptus, Deck Delights�candles can be purchased in jars, flower-shaped scented tea light packs, and wrapped
Samplers� votive candles. Our Deck Delights�accessory line encompasses an attractive selection of rustic metal accessories for outdoor use.
At year end, we also started testing two new candle lines. Our new Stripes� candles feature three of our popular scented candles
layered in a clear glass tumbler. Stripes� are available in six different combinations, including Farmstand Fresh�, which layers MacIntosh,
Raspberry Sorbet and Vineyard�; and Flower Garden�, which combines Fresh Cut Roses, Lilac Blossoms and Hydrangea. Our YC� premium
natural wax blend scented candles combine distinctive scents with a clean, decorator look. Packaged in sleek, rectangular glass holders that
come in four different sizes, YC� candles come in seven fashion-forward fragrances, including Bamboo Musk� and Chai Tea�.
I N N O V A T I O N
ovationWe continually work to expand our product portfolio, adding premium scented candles,candle accessories, scented personal care products and home fragrancing items that bearthe quality assurance of the Yankee Candle� name.

12 The Yankee Candle Company, Inc.
Innov

The Yankee Candle Company, Inc. 13
Having a highly recognized brand in a fragmented industry translates into strong demand for our products. We meet this demand by
employing a unique, multi-channel distribution strategy, which ensures that Yankee Candle� merchandise is broadly available to consumers
in the United States and many international markets. At year end 2003, our channels included approximately 15,000 wholesale locations
in North America, our own network of 286 retail stores, a catalog program, an Internet website, approximately 1,900 European wholesale
doors, international distributors, and a European distribution center.
Wholesale. In 2003, we expanded the selection of products that we offer to our wholesale customers, increasing our offering of potpourri,
room sprays and linen sprays, and launching our new electric home fragrance diffuser into our wholesale channel. These activities helped us
to attract local and national retailers to our wholesale customer base, as well as to secure additional shelf space with many existing customers.
Yankee Candle’s wholesale business success is predicated on developing mutually beneficial partnerships with our core specialty
retailers, most of whom are owners or managers of independent card and gift shops. In 2003, we accelerated this effort. We offered several
special products and “gift with a purchase” promotions that were exclusive to our wholesale channel. We refined and enhanced Yankee Candle
University, the proprietary sales training program that we conduct for wholesale customers. We also expanded our Wholesale Advisory Council
(WAC). WAC is a powerful forum through which we bring together representatives from our core specialty retail accounts with professionals
from Yankee Candle’s supply chain and marketing divisions. Our WAC members give us valuable perspective on their needs, which we act
on and share with their peers. Input from WAC members in 2003 prompted us to develop new product ideas, merchandising plans and
selling program concepts.
We also continued to focus on enhancing our programs with national accounts. Our national partners have different requirements
than our core specialty retailers, which we meet by providing them with category management programs that boost their sales, as well as by
delivering unparalleled service and efficiency. As a result, we help large-scale retail customers maintain a consistently high in-stock position,
making us one of their most valuable vendors and positioning us to enter new product channels.
P E R F O R M A N C E
ovationWe employ a unique, multi-channel distribution strategy, which ensures that Yankee Candle� merchandise is broadly available to consumers in the United States and many international markets.

14 The Yankee Candle Company, Inc.
International. Yankee Candle’s products have universal appeal. As a result, we believe our Company can pursue the success that we have
enjoyed in the United States in a number of global markets. We’ve worked diligently toward this goal over the past several years, developing
the Yankee Candle� brand in several international markets. Our international operations are still only a small part of our overall business,
but they are posting strong performance and solid growth statistics.
We continued to execute our growth plan in Europe during 2003, partnering with a new, broad-based retail account in the
United Kingdom and developing additional retailer partners who can distribute our products in other European countries. We also forged
new distribution agreements in Canada and Asia that position us to market our candles, accessories, home fragrance merchandise and
personal care items in these regions.
Retail. For our retail organization, 2003 was a year of continued growth and market penetration. Our extensive selection of new products
helped to drive sales, attract new customers and communicate Yankee Candle’s exceptional fragrance expertise to the marketplace. We accel-
erated these efforts by creating a formal sales training program specifically for our needs. Called “Selling Scents,” this proprietary program
focuses the attention of our associates on getting closer to our customers so that we can understand their preferences and help them select
the products that best meet their needs.
We enhanced our ability to reach customers in their homes by revamping our Internet site, executing our successful catalog program
and expanding our direct mail activities. Direct mail is a powerful tool for us to use in building our brand and encouraging existing customers
to try our new products. We utilized our extensive database of consumer names more than ever before in 2003, sending targeted promotional
materials that combined with our national advertising campaign to highlight our new product introductions.
We continued to expand our retail reach in 2003, opening 49 new locations and laying the groundwork to open 45 more in 2004.
In addition, we opened our f irst test Yankee Candle� Home satellite store adjacent to our candle store at the Pheasant Lane Mall in
Nashua, N.H. Similar to the Yankee Candle� Home area in our flagship location, this 1,500 square-foot facility offers a range of home
accessories for kitchen, bath and garden needs, as well as gourmet foods, specialty teas and personal care products. The store also features
an Inspiration Center where customers can get home decorating and fragrancing tips.
P E R F O R M A N C E( C O N T I N U E D )
$138.9
$163.5 $168.1
$123.2
$175.3
$211.7
$239.9
$266.6
$204.9
$242.0
WHOLESALESALES
(dollars in millions)
15% CAGR
’99 ’00 ’01 ’02 ’03
RETAILSALES
(dollars in millions)
21% CAGR
’99 ’00 ’01 ’02 ’03

The Yankee Candle Company, Inc. 15

16 The Yankee Candle Company, Inc.
Innov

The Yankee Candle Company, Inc. 17
Yankee Candle’s supply chain operations are vitally important to our success. Encompassing product development, purchasing, logistics,
manufacturing, packaging and distribution capabilities, our supply chain is the central force that enables us to realize our product innovation
goals, fortify our position as a leader in quality, and continually strengthen our relationships with our customers. We are sharply focused
on driving continuous improvement in these areas as a means of spurring our growth, satisfying our customers, and generating greater
productivity and profitability.
We made outstanding progress on all of these fronts in 2003. We continued to implement our Supply Chain Strategy, executing
a range of new initiatives that enhanced the quality of our operations, eliminated unnecessary costs, expedited our delivery processes and
improved our safety standing. Since we introduced this program in 2001, we have improved our product quality and safety metrics, and we
have realized a significant increase in productivity. We have a strong pipeline of new initiatives that we plan to implement in 2004.
With an eye on increasing our efficiency, we introduced two innovative training programs for our supply chain employees. These
programs focus on teamwork and the fundamentals of effective project management. Perhaps more vital, they encourage our employees to
engage in analytical troubleshooting so that we can quickly identify problems and resolve them with smart, thoughtful solutions. We also
emphasized our commitment to teamwork by designating senior members of our operations business team to liaison with members of our
retail operations, as well as with some of our external wholesale customers. By directly interacting with each of these groups, we gained a
greater understanding of their particular requirements. These interactions prompted us to make process improvements that resulted in better
and faster shipments, new packaging and heightened product quality.
As Yankee Candle continues to develop new candle products and enter new merchandise categories, our supply chain is increasingly
challenged to manage the initiatives required to bring these new products to market, manufacture products with consistently high quality,
and deliver them to customers around the world. We are meeting these challenges by increasing our use of automation, as well as by
introducing more quantitative and analytical techniques that enable us to work harder and smarter than ever before.
Q U A L I T Y
ovationOur discipline of driving continuous improvement in our supply chain areas enablesYankee Candle to produce consistently high-quality products, while simultaneously realizing valuable operational efficiencies.

18 The Yankee Candle Company, Inc.
FragrF R A G R A N C E F O R Y O U R L I F E

TOTAL YANKEE CANDLE SALES(dollars in millions)
31% CAGR OVER 20 YEARS
’03’02’01’00’99’98’97’96’95’94’93’92’91’90’89’88’87’86’85’84
$3 $4 $6 $8 $11 $14 $20 $30 $41$59 $70
$95$115
$147
$189
$262
$445
$380
$339
$509
The Yankee Candle Company, Inc. 19
Yankee Candle’s remarkable fragrance competency distinguishes our Company from competitors and helps fuel
the growth of our brand. We capitalize on this expertise by innovating an ever-growing collection of premium
scented candles, as well as by applying our proprietary fragrances to categories outside of the candle market,
including scented personal care products and a wide array of home fragrance items.
grance

20 The Yankee Candle Company, Inc.
At Yankee Candle, we truly believe that our people are our greatest asset. This conviction prompts us to maintain a keen focus on developing,
supporting and rewarding our employees, despite the tough economic trends of recent years. In 2003, we continued to demonstrate this
commitment, implementing, enhancing and even adding programs to build morale, encourage teamwork and foster the professional
development of our employees. All of our initiatives were developed with the recognition that we must balance the proud heritage and
unique culture that come from Yankee Candle’s roots as a “family business” with our current position as a swiftly growing public company
with a national brand name and a global reach.
Our initiatives included maintaining our competitive pay scale and benefits packages, adding a profit sharing program, and
advancing our extensive learning and development program. We also continued to offer a “total rewards” environment. Our “total rewards”
programs include service awards for employees who reach tenure benchmarks; our Founder’s Award, which recognizes employees for an
exceptional work ethic and the delivery of extraordinary results that link to our business plan; and our Piece of the Pie program, which
enables each division to identify a goal within their area, and then allocates funds to spend as they wish when they achieve that goal.
Inspired by these awards, our employees have introduced improvements across a wide range of areas, including team-building, job safety,
productivity and sales growth.
We also maintained a steady focus on the characteristics that have long made Yankee Candle a great place to work: We cross-train
our employees to create efficiencies, meet seasonal demand and prepare them for promotions. We emphasize accountability for individual
results while cultivating a team-oriented culture. We strongly encourage the flow of communication throughout our organization. And we
regularly demonstrate our commitment to the community, teaming with our employees to donate money, time and effort to numerous
philanthropic organizations, including the United Way, Make-a-Wish Foundation, Toys For Tots, The Food Pantry, Coats for Kids, Junior
Achievement and Relay for Life.
O U R E M P L O Y E E S
We are deeply committed to providing a work environment that promotes teamworkand camaraderie, encourages meaningful professional development, and drives ourCompany’s success.

The Yankee Candle Company, Inc. and Subsidiaries 21
FI N A N C I A L TA B L E O F CO N T E N T S
Selected Financial Data 22
Management’s Discussion and Analysis of Financial Condition and Results of Operations 24
Consolidated Statements of Operations 32
Consolidated Balance Sheets 33
Consolidated Statements of Stockholders’ Equity 34
Consolidated Statements of Cash Flows 36
Notes to Consolidated Financial Statements 37
Independent Auditors’ Report 45
Market for the Company’s Common Equity and Related Stockholder Matters 46
Corporate Information IBC

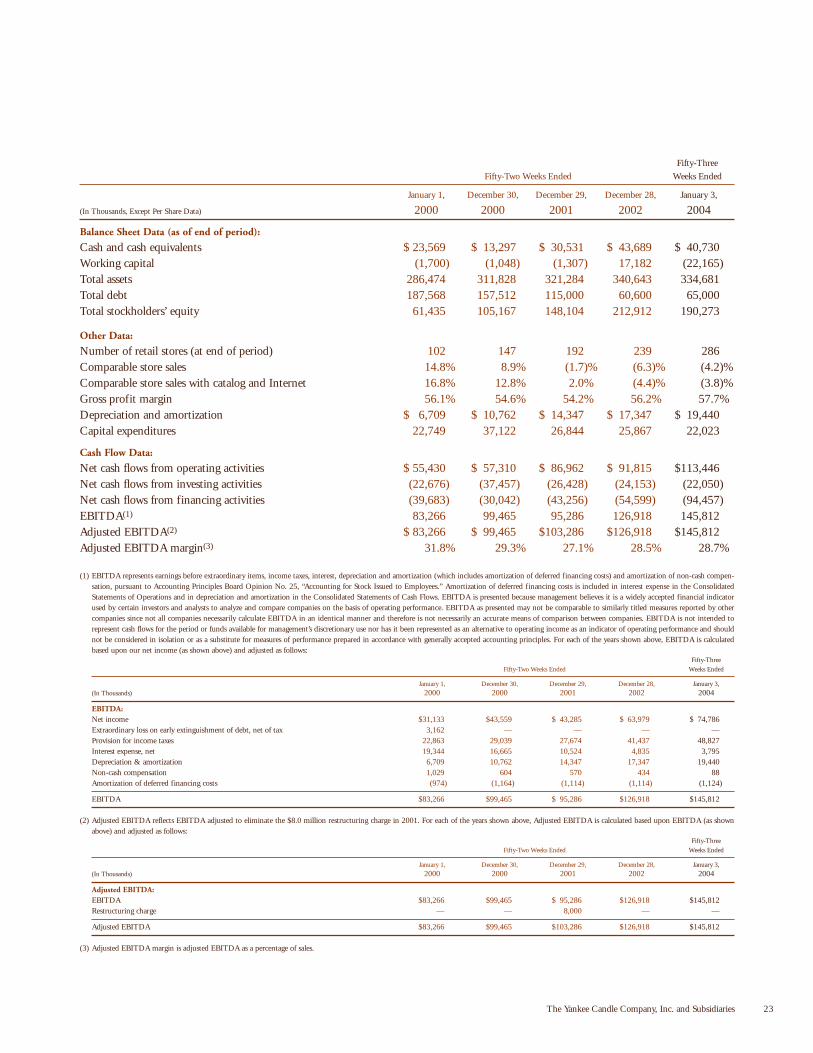
The selected historical consolidated financial and other data that follows should be read in conjunction with the “Consolidated FinancialStatements,” the accompanying notes thereto and “Management’s Discussion and Analysis of Financial Condition and Results of Operations”included in this Annual Report. The historical financial data as of December 28, 2002 and January 3, 2004 and for the fifty-two weeks endedDecember 29, 2001 and December 28, 2002 and fifty-three weeks ended January 3, 2004 has been derived from the audited consolidatedfinancial statements and the accompanying notes included in this document.
The historical financial data as of January 1, 2000, December 30, 2000, and December 29, 2001 and for the fifty-two weeks endedJanuary 1, 2000 and December 30, 2000 has been derived from audited financial statements for the corresponding period, which are not contained in this document.
The selected historical financial data may not be indicative of our future performance.
Fifty-Three
Fifty-Two Weeks Ended Weeks Ended
January 1, December 30, December 29, December 28, January 3,
(In Thousands, Except Per Share Data) 2000 2000 2001 2002 2004
Statement of Operations Data:
Sales $262,075 $338,805 $379,831 $444,842 $508,637Cost of sales 115,119 153,667 174,107 194,748 215,316
Gross profit 146,956 185,138 205,724 250,094 293,321Selling expenses 44,547 64,464 77,348 96,714 115,777General and administrative expenses 26,023 31,576 38,515 43,549 50,561Restructuring charge — — 8,000 — —
Income from operations 76,386 89,098 81,861 109,831 126,983Interest income (627) (235) (72) (23) (31)Interest expense 19,971 16,900 10,596 4,858 3,826Other (income) expense (116) (165) 378 (420) (425)
Income before provision for income taxes 57,158 72,598 70,959 105,416 123,613Provision for income taxes 22,863 29,039 27,674 41,437 48,827
Income before extraordinary loss on early extinguishment of debt 34,295 43,559 43,285 63,979 74,786Extraordinary loss on early extinguishment of debt, net of tax 3,162 — — — —
Net income $ 31,133 $ 43,559 $ 43,285 $ 63,979 $ 74,786
Basic earnings per share:Income before extraordinary item $ 0.69 $ 0.82 $ 0.81 $ 1.19 $ 1.41Net income $ 0.62 $ 0.82 $ 0.81 $ 1.19 $ 1.41
Diluted earnings per share:Income before extraordinary item $ 0.66 $ 0.80 $ 0.79 $ 1.17 $ 1.40Net income $ 0.60 $ 0.80 $ 0.79 $ 1.17 $ 1.40
Weighted-average basic shares outstanding 49,857 52,900 53,537 53,896 53,024Weighted-average diluted shares outstanding 51,789 54,663 54,643 54,686 53,419
Selected Financial Data
22 The Yankee Candle Company, Inc. and Subsidiaries
Fifty-Three
Fifty-Two Weeks Ended Weeks Ended
January 1, December 30, December 29, December 28, January 3,
(In Thousands, Except Per Share Data) 2000 2000 2001 2002 2004
Balance Sheet Data (as of end of period):
Cash and cash equivalents $ 23,569 $ 13,297 $ 30,531 $ 43,689 $ 40,730Working capital (1,700) (1,048) (1,307) 17,182 (22,165)Total assets 286,474 311,828 321,284 340,643 334,681Total debt 187,568 157,512 115,000 60,600 65,000Total stockholders’ equity 61,435 105,167 148,104 212,912 190,273
Other Data:
Number of retail stores (at end of period) 102 147 192 239 286Comparable store sales 14.8% 8.9% (1.7)% (6.3)% (4.2)%Comparable store sales with catalog and Internet 16.8% 12.8% 2.0% (4.4)% (3.8)%Gross profit margin 56.1% 54.6% 54.2% 56.2% 57.7%Depreciation and amortization $ 6,709 $ 10,762 $ 14,347 $ 17,347 $ 19,440Capital expenditures 22,749 37,122 26,844 25,867 22,023
Cash Flow Data:
Net cash flows from operating activities $ 55,430 $ 57,310 $ 86,962 $ 91,815 $113,446Net cash flows from investing activities (22,676) (37,457) (26,428) (24,153) (22,050)Net cash flows from financing activities (39,683) (30,042) (43,256) (54,599) (94,457)EBITDA(1) 83,266 99,465 95,286 126,918 145,812Adjusted EBITDA(2) $ 83,266 $ 99,465 $103,286 $126,918 $145,812Adjusted EBITDA margin(3) 31.8% 29.3% 27.1% 28.5% 28.7%
(1) EBITDA represents earnings before extraordinary items, income taxes, interest, depreciation and amortization (which includes amortization of deferred financing costs) and amortization of non-cash compen-sation, pursuant to Accounting Principles Board Opinion No. 25, “Accounting for Stock Issued to Employees.” Amortization of deferred financing costs is included in interest expense in the ConsolidatedStatements of Operations and in depreciation and amortization in the Consolidated Statements of Cash Flows. EBITDA is presented because management believes it is a widely accepted financial indicatorused by certain investors and analysts to analyze and compare companies on the basis of operating performance. EBITDA as presented may not be comparable to similarly titled measures reported by othercompanies since not all companies necessarily calculate EBITDA in an identical manner and therefore is not necessarily an accurate means of comparison between companies. EBITDA is not intended torepresent cash flows for the period or funds available for management’s discretionary use nor has it been represented as an alternative to operating income as an indicator of operating performance and shouldnot be considered in isolation or as a substitute for measures of performance prepared in accordance with generally accepted accounting principles. For each of the years shown above, EBITDA is calculatedbased upon our net income (as shown above) and adjusted as follows:
Fifty-ThreeFifty-Two Weeks Ended Weeks Ended
January 1, December 30, December 29, December 28, January 3,(In Thousands) 2000 2000 2001 2002 2004
EBITDA:Net income $31,133 $43,559 $ 43,285 $ 63,979 $ 74,786Extraordinary loss on early extinguishment of debt, net of tax 3,162 — — — —Provision for income taxes 22,863 29,039 27,674 41,437 48,827Interest expense, net 19,344 16,665 10,524 4,835 3,795Depreciation & amortization 6,709 10,762 14,347 17,347 19,440Non-cash compensation 1,029 604 570 434 88Amortization of deferred financing costs (974) (1,164) (1,114) (1,114) (1,124)
EBITDA $83,266 $99,465 $ 95,286 $126,918 $145,812
(2) Adjusted EBITDA reflects EBITDA adjusted to eliminate the $8.0 million restructuring charge in 2001. For each of the years shown above, Adjusted EBITDA is calculated based upon EBITDA (as shownabove) and adjusted as follows:
Fifty-ThreeFifty-Two Weeks Ended Weeks Ended
January 1, December 30, December 29, December 28, January 3,(In Thousands) 2000 2000 2001 2002 2004
Adjusted EBITDA:EBITDA $83,266 $99,465 $ 95,286 $126,918 $145,812Restructuring charge — — 8,000 — —
Adjusted EBITDA $83,266 $99,465 $103,286 $126,918 $145,812
(3) Adjusted EBITDA margin is adjusted EBITDA as a percentage of sales.
The Yankee Candle Company, Inc. and Subsidiaries 23
Critical Accounting Policies and Estimates
“Management’s Discussion and Analysis of Financial Condition andResults of Operations” discusses our consolidated financial state-ments, which have been prepared in accordance with accountingprinciples generally accepted in the United States of America. Thepreparation of these financial statements requires management tomake estimates and judgments that affect the reported amounts ofassets and liabilities and the disclosure of contingent assets and lia-bilities at the date of the f inancial statements and the reportedamounts of revenues and expenses during the reporting period. Onan ongoing basis, management evaluates its estimates and judgments,including those related to inventories, restructuring costs, bad debts,intangible assets, income taxes, debt service and contingencies andlitigation. Management bases its estimates and judgments on histor-ical experience and on various other factors that are believed to bereasonable under the circumstances, the results of which form thebasis for making judgments about operating results and the carryingvalues of assets and liabilities that are not readily apparent fromother sources. Actual results may differ from these estimates underdifferent assumptions or conditions. Management believes the fol-lowing critical accounting policies, among others, involve its moresignificant estimates and judgments and are therefore particularlyimportant to an understanding of our results of operations andfinancial position.
REVENUE / RECEIVABLES
We sell our products both directly to retail customers and throughwholesale channels. Revenue from the sale of merchandise to retailcustomers is recognized at the time of sale, while revenue fromwholesale customers is recognized when risk of loss has passed to thecustomers. We believe that this is the time that persuasive evidenceof an agreement exists, delivery has occurred, the price is fixed anddeterminable and collectability is reasonably assured. Revenue is rec-ognized net of any applicable discounts and allowances. Customers,be they retail or wholesale, do have the right to return product to usin certain limited situations. Such rights of return have not precludedrevenue recognition because we have a long history with suchreturns, which we use in constructing a reserve. This reserve, however, is subject to change. In addition to returns, we bear creditrisk relative to our wholesale customers. We have provided a reservefor bad debts in our financial statements based on our estimates of the creditworthiness of our customers. However, this reserve isalso subject to change. Changes in these reserves could affect ouroperating results.
INVENTORY
We write down our inventory for estimated obsolescence or unmar-ketable inventory in an amount equal to the difference between thecost of inventory and the estimated market value, based uponassumptions about future demand and market conditions. If actualfuture demand or market conditions are less favorable than those
projected by management, additional inventory write-downs may be required. In addition, our inventory is stated at the lower of costor market on a last-in f irst-out (“LIFO”) basis. Fluctuations ininventory levels along with the cost of raw materials could impactthe carrying value of our inventory. Changes in the carrying value ofinventory could affect our operating results.
TAXES
We have a significant deferred tax asset recorded on our financialstatements. This asset arose at the time of our recapitalization in1998 and is a future tax deduction for us. The recoverability of thisfuture tax deduction is dependent upon our future profitability. Wehave made an assessment that this asset is likely to be recovered andis appropriately reflected on the balance sheet. Should we find thatwe are not able to utilize this deduction in the future we would haveto record a reserve for all or a part of this asset, which wouldadversely affect our operating results and cash flows.
RESTRUCTURING RESERVE
In fiscal 2001 we closed our distribution facility in Utah, recorded arestructuring charge and established a reserve for future expensesrelated to the restructuring. Part of the restructuring charge relatedto the lease commitment that we have through 2005. In connectionwith the restructuring we did not record the entire lease commitmentas a liability because we believed we would be able to sublet thefacility. During the second quarter of fiscal 2002, we were successfulin subletting the facility for the remaining lease term. If the facilitywere to be vacated by the current tenant in breach of its sublease,this would negatively affect our results of operations and cash flows.
VALUE OF LONG-LIVED ASSETS, INCLUDING INTANGIBLES
Long-lived assets on our balance sheet consist primarily of property,plant and equipment and trademarks. We periodically review thecarrying value of all of these assets based, in part, upon our projec-tions of anticipated undiscounted future cash flows. We undertakethis review when facts and circumstances suggest that cash flowsemanating from those assets may be diminished. Any impairmentcharge that we record reduces our earnings. While we believe thatour future estimates are reasonable, different assumptions regardingitems such as future cash flows and the volatility inherent in marketswhich we serve could affect our evaluations and result in impairmentcharges against the carrying value of those assets.
STOCK-BASED COMPENSATION
Effective in 2003, we adopted the fair value recognition provisionsof SFAS No. 123, “Accounting for Stock-Based Compensation.”Under the prospective transition method selected by us, as describedin SFAS No. 148, “Accounting for Stock-Based Compensation—Transition and Disclosure, an Amendment of SFAS No. 123,” allstock option grants beginning with grants made in fiscal 2003 arebeing expensed over the vesting period, based on the fair value at the
Management’s Discussion and Analysis of Financial Condition and Results of Operations
24 The Yankee Candle Company, Inc. and Subsidiaries

date of the grant. Fair value is determined based on a variety of factors, all of which are estimates subject to judgment. Changes inestimated lives of options, risk-free interest rates or exercise patternscould impact our results of operations. We recorded a charge of approximately $0.6 million for the f ifty-three weeks endedJanuary 3, 2004.
Performance Measures
We measure the performance of our retail and wholesale segmentsthrough a segment margin calculation, which specifically identifiesnot only gross profit on the sales of products through the two chan-nels but also costs and expenses specifically related to each segment.
Fluctuations in Quarterly Operating Results
We have experienced, and may experience in the future, fluctuationsin our quarterly operating results. There are numerous factors thatcan contribute to these fluctuations; however, the principal factorsare seasonality and new store openings.
Seasonality. We have historically realized higher revenues and operat-ing income in our fourth quarter, particularly in our retail business.We believe that this has been due primarily to the increase in thenumber of our retail stores and to increased sales in the giftwareindustry during the holiday season of the fourth quarter.
New Store Openings. The timing of our new store openings may alsohave an impact on our quarterly results. First, we incur certain one-time expenses related to opening each new store. These expenses,which consist primarily of salaries, supplies and marketing costs, areexpensed as incurred. Second, most store expenses vary proportion-ately with sales, but there is a fixed cost component. This typicallyresults in lower store profitability when a new store opens becausenew stores generally have lower sales than mature stores. Due toboth of these factors, during periods when new store openings as apercentage of the base are higher, operating profit may decline indollars and/or as a percentage of sales. As the overall store basematures, the fixed cost component of selling expenses is spread overan increased level of sales, assuming sales increase as stores age,resulting in a decrease in selling and other expenses as a percentageof sales.
Fifty-Three Weeks Ended January 3, 2004 (“2003”) Comparedto Fifty-Two Weeks Ended December 28, 2002 (“2002”)
GENERAL
The fiscal year ended January 3, 2004 consisted of 53 weeks, whilethe fiscal years ended December 28, 2002 and December 29, 2001consisted of 52 weeks.
SALES
Sales increased 14.3% to $508.6 million in 2003 from $444.8 million in 2002. The additional 53rd week in 2003 contributed
$5.2 million and $1.1 million in retail and wholesale sales, respec-tively. Wholesale sales, including European operations, increased18.1% to $242.0 million in 2003 from $204.9 million for 2002.This growth was achieved primarily by increasing sales to existingcustomers and to a lesser extent by increasing the number of whole-sale locations.
Retail sales increased 11.1% to $266.6 million in 2003from $239.9 million for 2002. There were 286 retail stores open asof January 3, 2004 compared to 239 stores open at December 28,2002. The increase in retail sales was achieved primarily through theaddition of 49 new stores in 2003 and to a lesser extent increasedsales in the 47 stores opened in 2002 (which in 2002 were open forless than a full year), partially offset by a decrease in comparablestore sales. Comparable store and catalog and Internet sales in 2003decreased 4.0% compared to 2002. Retail comparable store sales in2003 decreased 4.0% compared to 2002. We believe the primaryfactor contributing to the decrease in comparable store sales was adecline in store traffic, and mall traffic generally. Comparable storesales were also negatively impacted in 2003 due to the President’sDay (February 16–17) snowstorm which affected most of our storebase in the Eastern half of the United States and successive weekendsnowstorms in early December. Comparable store sales represent acomparison of the sales, during the corresponding fiscal periods ofthe two fiscal years compared, of the stores included in our compa-rable store sales base. A store first enters our comparable store salesbase after completing 13 fiscal months of operation. There were 237stores included in the comparable store base at the end of 2003, and47 of these stores were included for less than a full year.
GROSS PROFIT
Gross prof it increased 17.3% to $293.3 million in 2003 from$250.1 million in 2002. As a percentage of sales, gross prof itincreased to 57.7% in 2003 from 56.2% in 2002. The increase in gross profit dollars in 2003 compared to 2002 was primarilyattributable to the increase in sales and more efficient supply chainoperations. The improvement in gross profit rate in 2003 comparedto 2002 was primarily due to continued productivity improvementsin supply chain operations and more eff icient sourcing of non-manufactured product.
SELLING EXPENSES
Selling expenses increased 19.8% to $115.8 million in 2003 from$96.7 million in 2002. These expenses are related to both wholesaleand retail operations and consist of payroll, occupancy, advertisingand other operating costs, as well as preopening costs, which areexpensed as incurred. As a percentage of sales, selling expenses were22.8% in 2003 and 21.7% in 2002. The increase in selling expensesin dollars and as a percentage of sales was primarily related to thecontinued growth in the number of retail stores, from 239 as ofDecember 28, 2002 to 286 as of January 3, 2004, the effect ofwhich is an increase in the weighting of immature stores. Immature
The Yankee Candle Company, Inc. and Subsidiaries 25

stores are generally stores that are less than four years old. Immaturestores typically generate higher selling expenses as a percentage ofsales than stores that have been open for more than four years sincefixed costs, as a percent of sales, are higher during the early salesmaturation period. The increase in selling expense as a percentage ofsales for 2003 is also explained by the decrease in retail comparablestore sales since the fixed components of labor and occupancy donot decrease with negative comparable store sales. Selling expenseswere also unfavorably impacted by the $1.0 million bad debt provi-sion the Company recognized in the fourth quarter of 2003 relatedto the failure of our former Canadian distributor to pay to usamounts due and payable for product shipped.
SEGMENT PROFITABILITY
Segment profitability is sales less cost of sales and selling expenses.Segment prof itability for our wholesale operations, includingEurope, was $101.6 million or 42.0% of wholesale sales in 2003compared to $87.2 million or 42.6% of wholesale sales in 2002.Segment profitability for our retail operations was $76.0 million or28.5% of retail sales in 2003 compared to $66.2 million or 27.6%of retail sales in 2002. The increase in wholesale segment profitabil-ity in dollars was primarily attributable to increased wholesale sales.The decrease in wholesale segment profitability as a percentage ofwholesale sales was primarily due to a $1.0 million bad debt provi-sion the Company recognized in the fourth quarter of 2003 relatedto the failure of our former Canadian distributor to pay to usamounts due and payable for product shipped. The increase in retailsegment profitability in dollars and as a percentage of retail sales wasprimarily attributable to increased retail sales and improved supplychain operations, offset in part by a decrease in retail comparablestore sales and the impact of our most immature stores, the 2003and 2002 store classes.
GENERAL AND ADMINISTRATIVE EXPENSES
General and administrative expenses, which consist primarily of personnel-related costs, increased 16.3% to $50.6 million in 2003from $43.5 million in 2002. As a percentage of sales, general andadministrative expenses increased to 9.9% from 9.8%. The increasein general and administrative expenses was primarily attributable toheadcount additions in the latter part of 2002 and in 2003, consult-ing costs related to a strategic planning project that began in lateFebruary 2003, stock option expense, profit sharing expense and to alesser extent increased insurance costs associated with the Company’sDirectors and Officers insurance policy.
In 2003, we adopted the fair value recognition provisions of SFASNo. 123. Under the prospective transition method selected by us asdescribed in SFAS No. 148, all stock option grants beginning withgrants made in f iscal 2003 are being expensed over the vestingperiod, based on the fair value at the date of the grant. This resultedin $0.6 million of incremental stock compensation expense in 2003.
NET OTHER EXPENSE
Net other expense was $3.4 million in 2003 compared to $4.4 mil-lion in 2002. The primary component of this expense was interestexpense, which was $3.8 million in 2003 compared to $4.9 millionin 2002. The decrease in interest expense in 2003 compared to 2002was primarily the result of the reduction in the average daily debtoutstanding.
INCOME TAXES
The income tax provision for 2003 was $48.8 million compared to$41.4 million for 2002. The 2003 tax provision was based on aneffective tax rate of 39.5%. The 2002 tax provision was based on aneffective tax rate of 39.3%. We have provided and expect to providein 2004 a valuation allowance against the deferred tax asset for ourinternational operations. As a result, it is anticipated that our effec-tive tax rate for 2004 will be approximately 39.5%. We re-evaluateour effective tax rate on a quarterly basis.
NET INCOME
Net income increased 16.9% to $74.8 million in 2003 from $64.0million in 2002.
Fifty-Two Weeks Ended December 28, 2002 (“2002”) Comparedto Fifty-Two Weeks Ended December 29, 2001 (“2001”)
SALES
Sales increased 17.1% to $444.8 million in 2002 from $379.8 mil-lion in 2001. Wholesale sales, including European operations,increased 21.9% to $204.9 million in 2002 from $168.1 millionfor 2001. This growth was achieved primarily by increasing thenumber of wholesale locations and also by increasing sales to exist-ing customers.
Retail sales increased 13.3% to $239.9 million in 2002from $211.7 million for 2001. There were 239 retail stores open asof December 28, 2002 compared to 192 stores open at December29, 2001. The increase in retail sales was achieved primarily throughtwo factors, the addition of 47 new stores in 2002 and increasedsales in the 45 stores opened in 2001 (which in 2001 were open forless than a full year), and, to a lesser extent, through increased salesin catalog and Internet operations, partially offset by a decrease incomparable store sales. Comparable store and catalog and Internetsales in 2002 decreased 4.4% compared to 2001. Retail comparablestore sales in 2002 decreased 6.3% compared to 2001. The primaryfactors which drove the decrease in comparable store sales were adecline in store traffic, and mall traffic generally, and our decisionnot to repeat certain promotional activities undertaken in 2001.There were 192 stores included in the comparable store base at theend of 2002, and 45 of these stores were included for less than a full year.
Management’s Discussion and Analysis of Financial Condition and Results of Operations (continued)
26 The Yankee Candle Company, Inc. and Subsidiaries

GROSS PROFIT
Gross prof it increased 21.6% to $250.1 million in 2002 from$205.7 million in 2001. As a percentage of sales, gross prof itincreased to 56.2% in 2002 from 54.2% in 2001. The increase ingross profit dollars in 2002 compared to 2001 was primarily attrib-utable to the increase in sales and more efficient supply chain oper-ations. The improvement in gross profit rate in 2002 compared to2001 was primarily the result of improved productivity in supplychain operations, supply chain ineff iciencies in early 2001 that were not experienced in 2002 and our decision not to engage indeep discounting activities.
SELLING EXPENSES
Selling expenses increased 25.1% to $96.7 million in 2002 from$77.3 million in 2001. These expenses are related to both wholesaleand retail operations and consist of payroll, occupancy, advertisingand other operating costs, as well as preopening costs, which areexpensed as incurred. As a percentage of sales, selling expenses were21.7% in 2002 and 20.4% in 2001. The increase in selling expensesin dollars and as a percentage of sales was primarily related to thecontinued growth in the number of retail stores, from 192 as ofDecember 29, 2001 to 239 as of December 28, 2002, the effect of which is an increase in the weighting of immature stores. Immaturestores are generally stores that are less than four years old. Immaturestores typically generate higher selling expenses as a percentage ofsales than stores that have been open for more than four years sincefixed costs, as a percent of sales, are higher during the early salesmaturation period. The increase in selling expense as a percentage ofsales for 2002 is also explained by the decrease in retail comparablestore sales since the fixed components of labor and occupancy donot decrease with negative comparable store sales.
SEGMENT PROFITABILITY
Segment profitability is sales less cost of sales and selling expenses.Segment prof itability for our wholesale operations, includingEurope, was $87.2 million or 42.6% of wholesale sales in 2002 com-pared to $65.5 million or 39.0% of wholesale sales in 2001. Segmentprofitability for our retail operations was $66.2 million or 27.6% ofretail sales in 2002 compared to $62.9 million or 29.7% of retailsales in 2001. The increase in wholesale segment profitability wasprimarily attributable to increased wholesale sales and improved pro-ductivity in supply chain operations. The increase in retail segmentprofitability in dollars was primarily attributable to increased retailsales and improved supply chain operations. The decrease in retailsegment profitability as a percentage of retail sales was primarilyattributable to a decline in retail comparable store sales and a declinein operating profit in catalog and Internet operations, partially offsetby improved productivity in supply chain operations.
GENERAL AND ADMINISTRATIVE EXPENSES
General and administrative expenses, which consist primarily of personnel-related costs, increased 13.0% to $43.5 million in 2002from $38.5 million in 2001. As a percentage of sales, general andadministrative expenses decreased to 9.8% from 10.1%. Theincrease in general and administrative expenses in dollars was prima-rily attributable to headcount additions in the latter part of 2001and in 2002, higher bonus program accruals for fiscal 2002 as com-pared to 2001 and occupancy expenses associated with our newheadquarters opened in May 2001 (i.e., we incurred 12 months of such expenses in 2002 compared to approximately eight monthsin 2001). The decrease in general and administrative expenses as apercentage of sales for fiscal 2002 was primarily attributable to ourability to leverage these expenses over a larger sales base and our continued focus on expense control.
NET OTHER EXPENSE
Net other expense was $4.4 million in 2002 compared to $10.9 mil-lion in 2001. The primary component of this expense was interestexpense, which was $4.9 million in 2002 compared to $10.6 millionin 2001. The decrease in interest expense was the result of thereduction in total debt outstanding from $115.0 million atDecember 29, 2001 to $60.6 million at December 28, 2002, and areduction in borrowing rates resulting from decreases in the federalfunds and eurodollar rates.
INCOME TAXES
The income tax provision for 2002 was $41.4 million compared to$27.7 million for 2001. The 2002 tax provision reflects an effectivetax rate of 39.3%. The 2001 tax provision reflects an effective taxrate of 39.0%.
NET INCOME
Net income increased 47.8% to $64.0 million in 2002 from$43.3 million in 2001.
RESTRUCTURING CHARGE
A restructuring charge for $8.0 million was recorded in fiscal 2001to record costs associated with our decision to consolidate andrestructure our distribution and manufacturing operations. Weclosed our Utah distribution facility and restructured our distribu-tion and manufacturing work force during 2001. Included in therestructuring charge are severance and other employee related costs,$2,124 of a non-cash write-down of non-recoverable leaseholdimprovements, f ixture and equipment investments and estimated
The Yankee Candle Company, Inc. and Subsidiaries 27

continuing occupancy expenses for abandoned facilities, net ofanticipated sub-lease income. As a result of this consolidation andrestructuring, the Company terminated approximately 450 manu-facturing and logistics employees. An analysis of the activity withinthe restructuring reserve since its inception is as follows:
Costs Paid During the Fifty-Two Weeks Ended Accrued as of
December 29, December 29,(In Thousands) Expense 2001 2001
Occupancy $2,635 $ 781 $1,854Employee related 2,635 2,304 331Other 606 606 —
Total $5,876 $3,691 $2,185
Costs Paid During the Accrued as of Fifty-Two Weeks Ended Accrued as ofDecember 29, December 28, December 28,
(In Thousands) 2001 2002 2002
Occupancy $1,854 $ 747 $1,107Employee related 331 284 47
Total $2,185 $1,031 $1,154
Costs Paid During the Accrued as of Fifty-Three Weeks Ended Accrued as ofDecember 28, January 3, January 3,
(In Thousands) 2002 2004 2004
Occupancy $1,107 $ 311 $ 796Employee related 47 47 —
Total $1,154 $ 358 $ 796
During the second quarter of fiscal 2002, the Companywas successful in subletting the facility covered under the “Occu-pancy” heading for the remaining lease term. Management believesthat the remaining reserve at January 3, 2004 appropriately reflectsthe Company’s remaining lease commitment exposure.
Liquidity and Capital Resources
We have consistently generated positive cash flow from operations.Specifically, over the last three fiscal years we have generated totalcash flow from operations of approximately $292 million, includingapproximately $113 million in 2003. These amounts have exceedednet income in all the fiscal years presented due to two factors. First,we have incurred non-cash charges for depreciation and amortiza-tion. Second, income tax expense has significantly exceeded taxesactually paid owing to the tax deduction that we continue to utilizethat arose from the 1998 recapitalization. This tax deduction isexpected to continue to provide an annual cash benefit for the nextten years. On an annual basis, this results in tax savings of approxi-mately $11.7 million per year through 2013 assuming sufficientincome to realize the full benefit of this deduction.
These internally generated cash flows have been sufficientto fund necessary capital expenditures for our expansion plans.Capital expenditures in 2003 were $22.0 million and were primarily
related to the capital requirements to open 49 new stores and investments in manufacturing and logistics operations. Capitalexpenditures were approximately $25.9 million in 2002 and prima-rily related to similar expenditures. We anticipate that capital expenditures in 2004 will total approximately $24.0 million andwill be spent in a similar manner as in 2003. We plan to openapproximately 45 new stores in 2004.
Despite significant capital expenditures, and our repur-chase of $100 million of our common stock pursuant to our stockrepurchase program discussed below, operating cash flows have alsoprovided sufficient cash to fund both repayments of our term loanand borrowings under our credit facility. We currently have a creditagreement with a consortium of banks that was established at thetime of our initial public offering. This credit agreement providesfor an initial maximum borrowing of $300 million and consists of arevolving credit facility for $150 million and a term loan for $150million. We can elect to set the interest rates on all or a portion ofthe borrowings outstanding under the credit agreement at a rate perannum equal to (a) the greatest of (1) the prime rate, (2) the baseCD rate plus 1.00% or (3) the federal funds effective rate plus 1⁄2%,plus a margin ranging from 0.00% to 0.75%, or (b) the eurodollarrate plus a margin ranging from 1.00% to 1.75%. The weighted-average interest rate on outstanding borrowings at January 3, 2004was 2.9%.
Our credit agreement requires that we comply with several financial and other covenants, including requirements thatwe maintain at the end of each fiscal quarter the following financialratios as set forth in our credit agreement:
• a consolidated total debt to consolidated EBITDA ratio of nomore than 2.50 to 1.00 at January 3, 2004 and for subsequentfiscal quarters (at January 3, 2004 this ratio was 0.44 to 1.00).
• a fixed charge coverage ratio (the ratio of the sum of consolidatedEBITDA plus lease expense to the sum of consolidated cash interest expense plus lease expense) of no less than 4.00 to 1.00 atJanuary 3, 2004 and for subsequent fiscal quarters (at January 3,2004 this ratio was 7.12 to 1.00).
Our credit agreement defines EBITDA as our consoli-dated net income (excluding extraordinary gains, and gains andlosses from material dispositions), plus the amount of net interestexpense, depreciation and amortization, income taxes, certain non-cash compensation expenses, and certain rental expenses. EBITDAas defined in our credit agreement differs from the definition ofEBITDA used elsewhere herein, in that it excludes gains and lossesfrom dispositions of material assets and non-cash compensationexpense. We have included the amount of these expenses in ourmore conservative calculation of EBITDA used elsewhere, whichcalculation is therefore lower than EBITDA as used in our creditagreement.
Management’s Discussion and Analysis of Financial Condition and Results of Operations (continued)
28 The Yankee Candle Company, Inc. and Subsidiaries
This credit arrangement matures in July 2004 and wehave accordingly classified all our debt as current on our balancesheet. No payments of principal are due on the revolving creditfacility until this maturity date. The term loan is payable in quar-terly installments. In 2004, the remaining two term loan paymentsof $9.5 million each will be made in March and June. As of January 3,2004, $46.0 million was outstanding under the revolving credit
facility, leaving $104.0 million in availability. As of January 3, 2004,we were in compliance with all covenants under our credit facility.
We are currently engaged in negotiations with variouscommercial banks to replace our existing Credit Agreement with anew credit facility. We are optimistic that a new credit facility will befinalized and in place prior to the expiration of our existing CreditAgreement in July 2004.
The Yankee Candle Company, Inc. and Subsidiaries 29
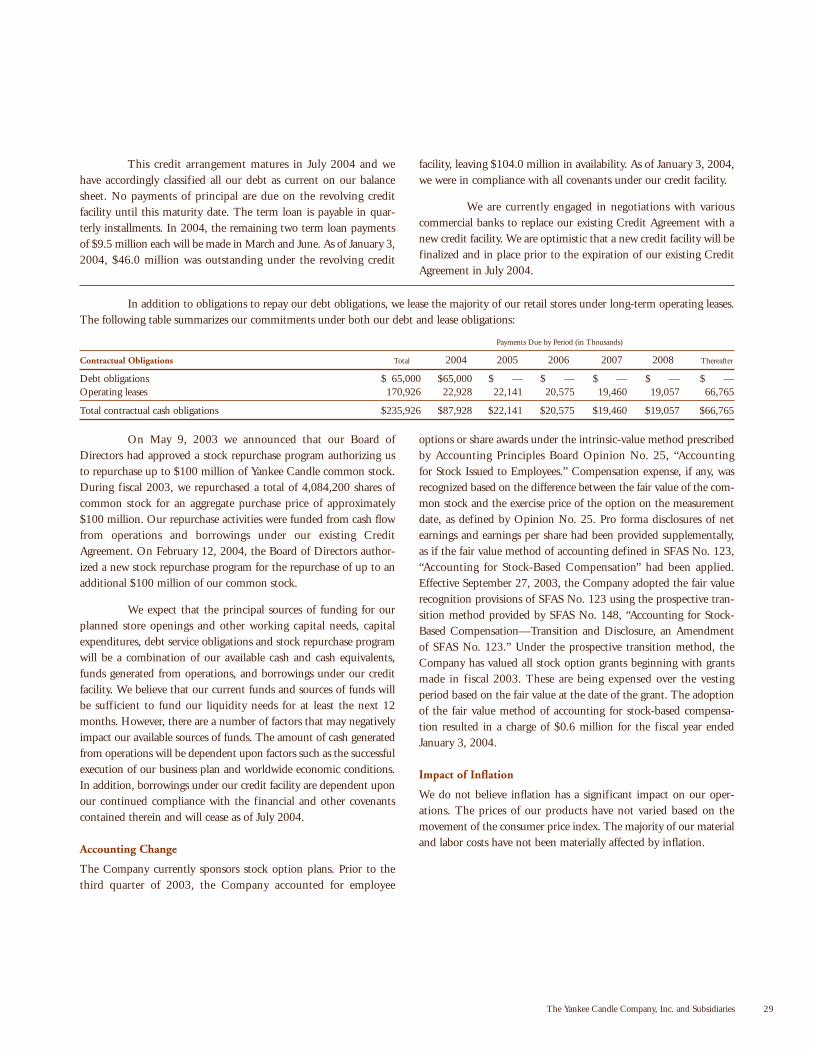
In addition to obligations to repay our debt obligations, we lease the majority of our retail stores under long-term operating leases.The following table summarizes our commitments under both our debt and lease obligations:
Payments Due by Period (in Thousands)
Contractual Obligations Total 2004 2005 2006 2007 2008 Thereafter
Debt obligations $ 65,000 $65,000 $ — $ — $ — $ — $ —Operating leases 170,926 22,928 22,141 20,575 19,460 19,057 66,765
Total contractual cash obligations $235,926 $87,928 $22,141 $20,575 $19,460 $19,057 $66,765
On May 9, 2003 we announced that our Board ofDirectors had approved a stock repurchase program authorizing usto repurchase up to $100 million of Yankee Candle common stock.During fiscal 2003, we repurchased a total of 4,084,200 shares ofcommon stock for an aggregate purchase price of approximately$100 million. Our repurchase activities were funded from cash flowfrom operations and borrowings under our existing CreditAgreement. On February 12, 2004, the Board of Directors author-ized a new stock repurchase program for the repurchase of up to anadditional $100 million of our common stock.
We expect that the principal sources of funding for ourplanned store openings and other working capital needs, capitalexpenditures, debt service obligations and stock repurchase programwill be a combination of our available cash and cash equivalents,funds generated from operations, and borrowings under our creditfacility. We believe that our current funds and sources of funds willbe sufficient to fund our liquidity needs for at least the next 12months. However, there are a number of factors that may negativelyimpact our available sources of funds. The amount of cash generatedfrom operations will be dependent upon factors such as the successfulexecution of our business plan and worldwide economic conditions.In addition, borrowings under our credit facility are dependent uponour continued compliance with the financial and other covenantscontained therein and will cease as of July 2004.
Accounting Change
The Company currently sponsors stock option plans. Prior to thethird quarter of 2003, the Company accounted for employee
options or share awards under the intrinsic-value method prescribedby Accounting Principles Board Opinion No. 25, “Accounting for Stock Issued to Employees.” Compensation expense, if any, wasrecognized based on the difference between the fair value of the com-mon stock and the exercise price of the option on the measurementdate, as defined by Opinion No. 25. Pro forma disclosures of netearnings and earnings per share had been provided supplementally,as if the fair value method of accounting defined in SFAS No. 123,“Accounting for Stock-Based Compensation” had been applied.Effective September 27, 2003, the Company adopted the fair valuerecognition provisions of SFAS No. 123 using the prospective tran-sition method provided by SFAS No. 148, “Accounting for Stock-Based Compensation—Transition and Disclosure, an Amendmentof SFAS No. 123.” Under the prospective transition method, theCompany has valued all stock option grants beginning with grantsmade in f iscal 2003. These are being expensed over the vestingperiod based on the fair value at the date of the grant. The adoptionof the fair value method of accounting for stock-based compensa-tion resulted in a charge of $0.6 million for the fiscal year endedJanuary 3, 2004.
Impact of Inflation
We do not believe inflation has a significant impact on our oper-ations. The prices of our products have not varied based on themovement of the consumer price index. The majority of our materialand labor costs have not been materially affected by inflation.

Future Operating Results
As referenced above, there are a number of factors that might causeour actual results to differ significantly from the results reflected by the forward-looking statements contained herein. In addition tofactors generally affecting the political, economic and competitiveconditions in the United States and abroad, such factors includethe following:
If we fail to grow our business as planned, our business could suffer and
financial results could decline. As we grow it will be difficult to maintain
our historical growth rates.
We intend to continue to pursue a business strategy of increasingsales and earnings by expanding our retail and wholesale operationsboth in the United States and internationally. Our current plans areto grow internally and not by acquisition, although from time totime we do consider possible acquisition candidates. In particular,our retail growth strategy depends in large part on our ability toopen new stores in both existing and new geographic markets. Sinceour ability to implement our growth strategy successfully will bedependent in part on factors beyond our control, including con-sumer preferences and the competitive environment, we may not be able to achieve our planned growth or sustain our f inancial performance. Our ability to anticipate changes in the candle andgiftware industries, and identify industry trends, will be critical factors in our ability to remain competitive.
We expect that, as we grow, it will become more difficultto maintain our historical growth rate, which could negativelyimpact our operating margins and results of operations. New storestypically generate lower operating margin contributions than maturestores because fixed costs, as a percentage of sales, are higher andbecause preopening costs are fully expensed in the year of opening.In addition, our retail sales generate lower margins than our whole-sale sales. Our wholesale business has grown by increasing sales toexisting customers and by adding new customers. If we are not ableto continue this, our sales growth and prof itability could beadversely affected. We cannot assure you that we will continue togrow at a rate comparable to our historic growth rate or that our historic financial performance will continue as we grow.
We face significant competition in the giftware industry. This competi-
tion could cause our revenues or margins to fall short of expectations
which could adversely affect our future operating results, financial
condition and liquidity and our ability to continue to grow our business.
We compete generally for the disposable income of consumers withother producers in the giftware industry. The giftware industry ishighly competitive with a large number of both large and small par-ticipants. Our products compete with other scented and unscented
candle and personal care products and with other gifts within acomparable price range, like boxes of candy, flowers, wine, fine soapand related merchandise. Our retail stores compete with franchisedcandle store chains, specialty candle stores and gift and housewareretailers. Some of our competitors are part of large, diversified com-panies which have greater financial resources and a wider range ofproduct offerings than we do. This competitive environment couldadversely affect our future revenues and profits, financial conditionand liquidity and our ability to continue to grow our business.
A material decline in consumers’ discretionary income could cause our
sales and income to decline.
Our results depend on consumer spending, which is influenced bygeneral economic conditions and the availability of discretionaryincome. Accordingly, we may experience declines in sales duringeconomic downturns or during periods of uncertainty like thatwhich followed the September 11, 2001 terrorist attacks on theUnited States, the outbreak of the war in Iraq or the possibilityof further terrorist attacks. Any material decline in the amount ofdiscretionary spending could have a material adverse effect on oursales and income.
Because we are not a diversified company and are effectively dependent
upon one industry, we have less flexibility in reacting to unfavorable
consumer trends, adverse economic conditions or business cycles.
We rely primarily on the sale of premium scented candles andrelated products in the giftware industry. In the event that sales ofthese products decline or do not meet our expectations, we cannotrely on the sales of other products to offset such a shortfall. As a sig-nificant portion of our expenses is comprised of fixed costs, such aslease payments, our ability to decrease expenses in response toadverse business conditions is limited in the short term. As a result,unfavorable consumer trends, adverse economic conditions orchanges in the business cycle could have a material and adverseimpact on our earnings.
If we lose our senior executive officers, our business could be disrupted
and our financial performance could suffer.
Our success is substantially dependent upon the retention of oursenior executive off icers. If our senior executive off icers becomeunable or unwilling to participate in our business, our future busi-ness and financial performance could be materially affected.
Many aspects of our manufacturing and distribution facilities are cus-
tomized for our business; as a result, the loss of one of these facilities
would disrupt our operations.
Approximately 74% of our sales in 2003 were generated by productswe manufacture at our manufacturing facility in Whately,
Management’s Discussion and Analysis of Financial Condition and Results of Operations (continued)
30 The Yankee Candle Company, Inc. and Subsidiaries

Massachusetts and we rely primarily on our distribution facilities inSouth Deerfield, Massachusetts to distribute our products. Becausemost of our machinery is designed or customized by us to manufac-ture our products, and because we have strict quality control stand-ards for our products, the loss of our manufacturing facility, due tonatural disaster or otherwise, would materially affect our operations.Similarly, our distribution facilities rely upon customized machinery,systems and operations, the loss of which would materially affect ouroperations. Although our manufacturing and distribution facilitiesare adequately insured, we believe it would take up to twelve monthsto resume operations at a level equivalent to current operations.
Seasonal, quarterly and other fluctuations in our business, and
general industry and market conditions, could affect the market for
our common stock.
Our sales and operating results vary from quarter to quarter. Wehave historically realized higher sales and operating income in ourfourth quarter, particularly in our retail business, which accounts fora larger portion of our sales. We believe that this has been due pri-marily to an increase in giftware industry sales during the holidayseason of the fourth quarter. As a result of this seasonality, we believethat quarter to quarter comparisons of our operating results are notnecessarily meaningful and that these comparisons cannot be reliedupon as indicators of future performance. In addition, we may alsoexperience quarterly fluctuations in our sales and income dependingon various factors, including, among other things, the number ofnew retail stores we open in a particular quarter, changes in theordering patterns of our wholesale customers during a particularquarter, and the mix of products sold. Most of our operatingexpenses, such as rent expense, advertising and promotional expenseand employee wages and salaries, do not vary directly with sales andare difficult to adjust in the short term. As a result, if sales for a par-ticular quarter are below our expectations, we might not be able toproportionately reduce operating expenses for that quarter, andtherefore a sales shortfall could have a disproportionate effect on ouroperating results for that quarter. Further, our comparable store salesfrom our retail business in a particular quarter could be adverselyaffected by competition, economic or other general conditions orour inability to execute a particular business strategy. As a result ofthese factors, we may report in the future sales, operating results orcomparable store sales that do not match the expectations of marketanalysts and investors. This could cause the trading price of ourcommon stock to decline. In addition, broad market and industryfluctuations may adversely affect the price of our common stock,regardless of our operating performance.
Public health epidemics such as Severe Acute Respiratory Syndrome may
affect our operating results.
Approximately 11% of our sales in 2003 were generated by prod-ucts, primarily accessories, that we purchased overseas. Substantiallyall of these products were purchased from East Asia. A sustainedinterruption of the operations of our suppliers, as a result of theimpact of Severe Acute Respiratory Syndrome or other similarhealth epidemics, could have an adverse effect on our ability toreceive timely shipments of certain of our products and could resultin scrutiny or embargoing of goods produced in infected areas.
Provisions in our corporate documents and Massachusetts law could
delay or prevent a change in control of Yankee Candle.
Our Articles of Organization and By-Laws may discourage, delay orprevent a merger or acquisition involving Yankee Candle that ourstockholders may consider favorable by:
• authorizing the issuance of preferred stock, the terms of whichmay be determined at the sole discretion of the board of directors,
• providing for a classified board of directors, with staggered three-year terms, and
• establishing advance notice requirements for nominations forelection to the board of directors or for proposing matters thatcan be acted on by stockholders at meetings.
Massachusetts law may also discourage, delay or preventsomeone from acquiring or merging with us.
We do not currently intend to pay dividends on our capital stock.
We have never paid a cash dividend on our common stock as a pub-lic company. Instead, we have retained earnings for the future oper-ation of our business. While we have no current plan to pay anycash dividends, we intend to periodically evaluate the advisability ofa dividend program. Any determination to pay dividends in thefuture will be at the discretion of our board of directors and will bedependent upon our results of operations, our financial condition,contractual and legal restrictions, and other factors deemed relevantby our board of directors. Under the terms of our existing creditagreement (which is scheduled to expire on July 7, 2004), we maynot declare or pay dividends on our common stock unless our ratioof consolidated total debt to consolidated EBITDA (as defined inour credit agreement) is less than or equal to 2:1 or our aggregateprincipal amount of loans and letters of credit outstanding is lessthan $100 million. Although we currently meet this requirement,we have no current plan to pay dividends.
The Yankee Candle Company, Inc. and Subsidiaries 31

Fifty-Three
Fifty-Two Weeks Ended Weeks Ended
December 29, December 28, January 3,
(In Thousands, Except Per Share Data) 2001 2002 2004
Sales $379,831 $444,842 $508,637Cost of Sales 174,107 194,748 215,316
Gross Profit 205,724 250,094 293,321
Operating Expenses:
Selling expenses 77,348 96,714 115,777General and administrative expenses 38,515 43,549 50,561Restructuring charge 8,000 — —
Total operating expenses 123,863 140,263 166,338
Income from Operations 81,861 109,831 126,983
Other Income (Expense):
Interest income (72) (23) (31)Interest expense 10,596 4,858 3,826Other expense (income) 378 (420) (425)
Total other expense 10,902 4,415 3,370
Income Before Provision for Income Taxes 70,959 105,416 123,613Provision for Income Taxes 27,674 41,437 48,827
Net Income $ 43,285 $ 63,979 $ 74,786
Basic Earnings Per Share $ 0.81 $ 1.19 $ 1.41
Diluted Earnings Per Share $ 0.79 $ 1.17 $ 1.40
Weighted-Average Basic Shares Outstanding 53,537 53,896 53,024
Weighted-Average Diluted Shares Outstanding 54,643 54,686 53,419
See notes to consolidated financial statements.
Consolidated Statements of Operations
32 The Yankee Candle Company, Inc. and Subsidiaries
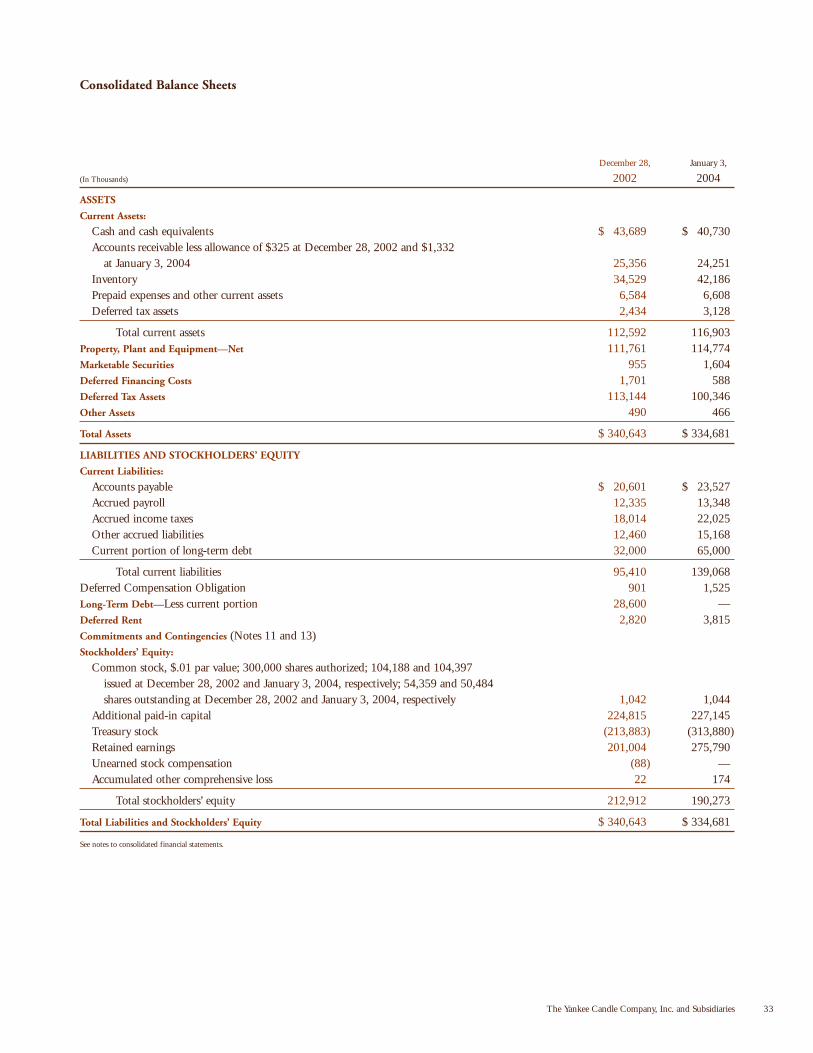
December 28, January 3,
(In Thousands) 2002 2004
ASSETS
Current Assets:
Cash and cash equivalents $ 43,689 $ 40,730Accounts receivable less allowance of $325 at December 28, 2002 and $1,332
at January 3, 2004 25,356 24,251Inventory 34,529 42,186Prepaid expenses and other current assets 6,584 6,608Deferred tax assets 2,434 3,128
Total current assets 112,592 116,903Property, Plant and Equipment—Net 111,761 114,774Marketable Securities 955 1,604Deferred Financing Costs 1,701 588Deferred Tax Assets 113,144 100,346Other Assets 490 466
Total Assets $ 340,643 $ 334,681
LIABILITIES AND STOCKHOLDERS’ EQUITY
Current Liabilities:
Accounts payable $ 20,601 $ 23,527Accrued payroll 12,335 13,348Accrued income taxes 18,014 22,025Other accrued liabilities 12,460 15,168Current portion of long-term debt 32,000 65,000
Total current liabilities 95,410 139,068Deferred Compensation Obligation 901 1,525Long-Term Debt—Less current portion 28,600 —Deferred Rent 2,820 3,815Commitments and Contingencies (Notes 11 and 13)Stockholders’ Equity:
Common stock, $.01 par value; 300,000 shares authorized; 104,188 and 104,397 issued at December 28, 2002 and January 3, 2004, respectively; 54,359 and 50,484 shares outstanding at December 28, 2002 and January 3, 2004, respectively 1,042 1,044
Additional paid-in capital 224,815 227,145Treasury stock (213,883) (313,880)Retained earnings 201,004 275,790Unearned stock compensation (88) —Accumulated other comprehensive loss 22 174
Total stockholders’ equity 212,912 190,273
Total Liabilities and Stockholders’ Equity $ 340,643 $ 334,681
See notes to consolidated financial statements.
Consolidated Balance Sheets
The Yankee Candle Company, Inc. and Subsidiaries 33

AdditionalCommon Stock Paid-in
Shares Amount Capital
Balance, December 30, 2000 104,059 $1,041 $224,381Redemption of common stock — — —Issuance of common stock on option exercises 2 — 8Unearned stock compensation — — 461Amortization of unearned stock compensation — — —Comprehensive income (loss):
Net income — — —Foreign currency translation loss — — —
Comprehensive income — — —
Balance, December 29, 2001 104,061 1,041 224,850Issuance of common stock and option exercises 127 1 1,307Costs of 2002 issuance of common stock — — (1,342)Amortization of unearned stock compensation — — —Comprehensive income:
Net income — — —Foreign currency translation — — —
Comprehensive income — — —
Balance, December 28, 2002 104,188 1,042 224,815Issuance of common stock and option exercises 209 2 2,673Costs of 2003 issuance of common stock — — (976)Stock compensation expense — — 633Payments for the redemption of common stock — — —Comprehensive income:
Net income — — —Foreign currency translation — — —
Comprehensive income — — —
Balance, January 3, 2004 104,397 $1,044 $227,145See notes to consolidated financial statements.
Consolidated Statements of Stockholders’ EquityFifty-Two Weeks Ended December 29, 2001, December 28, 2002 and Fifty-Three Weeks Ended January 3, 2004(In Thousands)
34 The Yankee Candle Company, Inc. and Subsidiaries

AccumulatedUnearned Other
Treasury Retained Stock Comprehensive ComprehensiveStock Earnings Compensation Loss Income Total
$(212,988) $ 93,740 $(631) $(376) $ — $105,167(764) — — — — (764)
— — — — — 8— — (461) — — —— — 570 — — 570
— 43,285 — — 43,285 43,285— — — (162) (162) (162)
— — — — $ 43,123 —
(213,752) 137,025 (522) (538) 148,104(131) — — — — 1,177
— — — — — (1,342)— — 434 — — 434
— 63,979 — — 63,979 63,979— — — 560 560 560
— — — — $ 64,539 —
(213,883) 201,004 (88) 22 212,912— — — — — 2,675— — — — — (976)— — 88 — — 721
(99,997) — — — — (99,997)
— 74,786 — — 74,786 74,786— — — 152 152 152
— — — — $ 74,938 —
$(313,880) $275,790 $ — $ 174 $190,273
The Yankee Candle Company, Inc. and Subsidiaries 35

Consolidated Statements of Cash Flows
36 The Yankee Candle Company, Inc. and Subsidiaries
Fifty-Three
Fifty-Two Weeks Ended Weeks Ended
December 29, December 28, January 3,
(In Thousands) 2001 2002 2004
Cash Flows Provided by (Used in) Operating Activities:
Net income $ 43,285 $ 63,979 $ 74,786Adjustments to reconcile net income to net cash provided by (used in) operating activities:
Depreciation and amortization 14,347 17,347 19,440Impairment 2,324 — —Unrealized loss (gain) on marketable securities 47 135 (365)Stock-based compensation expense 570 434 721Deferred taxes 10,515 14,995 12,105Loss on disposal of fixed assets and classic vehicles 519 567 692
Changes in assets and liabilitiesAccounts receivable, net (5,240) (2,029) 1,380Inventory 11,276 (10,564) (7,359)Prepaid expenses and other assets 275 (1,956) (178)Accounts payable 2,917 1,540 2,899Accrued expenses and other liabilities 6,127 7,367 9,325
Net Cash Provided by Operating Activities 86,962 91,815 113,446
Cash Flows (Used in) Provided by Investing Activities:
Purchase of property and equipment (26,844) (25,867) (22,023)Proceeds from sale of property and equipment 352 1,842 259Investments in marketable securities (191) (391) (286)Proceeds from sale of marketable securities 255 263 —
Net Cash Used in Investing Activities (26,428) (24,153) (22,050)
Cash Flows (Used in) Provided by Financing Activities:
Payments for redemption of common stock (764) — (99,997)Net proceeds (costs) from issuance of common stock 8 (165) 1,699Net (repayments) borrowings under bank credit agreements & other (42,500) (54,434) 3,841
Net Cash Used in Financing Activities (43,256) (54,599) (94,457)
Effect of Exchange Rate Changes on Cash (44) 95 102Net Increase (Decrease) in Cash and Cash Equivalents 17,234 13,158 (2,959)Cash and Cash Equivalents, Beginning of Year 13,297 30,531 43,689
Cash and Cash Equivalents, End of Year $ 30,531 $ 43,689 $ 40,730
Supplemental Disclosures of Cash Flow Information:
Cash paid during the year for:Interest $ 12,029 $ 3,444 $ 2,111
Income taxes $ 14,703 $ 22,181 $ 31,532
Purchase of equipment by assumption of capital lease and lease incentives $ — $ 172 $ —
See notes to consolidated financial statements.

The Yankee Candle Company, Inc. and Subsidiaries 37
1. Nature of Business
The Yankee Candle Company, Inc. and subsidiaries (“YankeeCandle” or “the Company”) is the leading designer, manufacturerand branded marketer of premium scented candles in the giftwareindustry. The Company has a 34-year history of offering its distinc-tive products and marketing them as affordable luxuries and consum-able gifts. Yankee Candle products are available in approximately180 fragrances and include a wide variety of jar candles, Samplers�votive candles, Tarts� wax potpourri, pillars and other candle prod-ucts, all marketed under the Yankee Candle� brand. The Companyalso sells a wide range of coordinated candle and home décor acces-sories and branded fragranced non-candle products including,Yankee Candle Car Jars� air fresheners and Yankee Candle™ Bathpersonal care products. The Company has also extended its brandinto the growing premium home fragrance market segment withproducts such as Housewarmer� electric home fragrancers andYankee Candle� branded potpourri, sachets, room sprays and linensprays. The Company sells its products through several channelsincluding wholesale customers who operate approximately 15,000stores in North America, 286 Company-owned and operated retailstores in 42 states as of January 3, 2004, direct mail catalogs, itsInternet web site (www.yankeecandle.com), international distribu-tors and its distribution center located in the United Kingdom.
2. Summary of Significant Accounting Policies
Basis of Presentation—The fiscal year is the 52 or 53 weeks endingthe Saturday closest to December 31. In some instances, the fifty-two weeks ended December 29, 2001 and December 28, 2002 andfifty-three weeks ended January 3, 2004 are referred to as f iscal2001, fiscal 2002, and fiscal 2003, respectively.
Principles of Consolidation—The accompanying consolidated finan-cial statements include the accounts of the Company and its whollyowned subsidiaries. All intercompany accounts and transactionshave been eliminated.
Accounting Estimates—The preparation of f inancial statements inconformity with accounting principles generally accepted in theUnited States of America requires management to make estimatesand assumptions that affect the reported amounts of assets and lia-bilities and disclosure of contingent assets and liabilities at the dateof the financial statements and the reported amounts of revenuesand expenses during the reporting period. Actual results could differfrom those estimates.
Revenue Recognition—The Company sells its products directly toretail customers and through wholesale channels. Revenue from thesale of merchandise to retail customers is recognized at the time ofsale while revenue from wholesale customers is recognized when riskof loss has passed to the customers. The Company believes thatthese are the times when persuasive evidence of an arrangementexists, delivery has occurred, the Company’s price is f ixed and
collectability is reasonably assured. Revenue is recognized net of anyapplicable discounts and allowances. Customers, be they retail orwholesale, do have the right to return product in certain limited situations. Such right of returns have not precluded revenue recogni-tion because the Company has a long history with such returns onwhich it constructs a reserve.
The Company has sold gift certificates in prior years andcurrently sells gift cards. At the point of sale of a gift certificate orgift card, the Company records a deferred liability. Revenue isrecorded upon the redemption of the gift certificate or gift card.
Cash and Cash Equivalents—The Company considers all short-terminterest-bearing investments with original maturities of threemonths or less to be cash equivalents. Such investments are clas-sif ied by the Company as “held to maturity” securities under the provisions of Statement of Accounting Standards (“SFAS”) No. 115, “Accounting for Certain Investments in Debt and EquitySecurities.” These securities are stated at cost, adjusted for amorti-zation of discounts and premiums to maturity.
Marketable Securities—The Company classifies the marketable secu-rities held in its deferred compensation plan as “trading” securitiesunder SFAS No. 115. In accordance with the provisions of thisstatement, the investment balance is stated at fair market value,based on quoted market prices. Unrealized gains and losses arereflected in earnings; realized gains and losses are also reflected inearnings and are computed using the specif ic-identif icationmethod. As the assets held in the deferred compensation plan reflectamounts due to employees, but available for general creditors of the Company in the event the Company becomes insolvent, theCompany has recorded the investment balance as a noncurrent assetand has established a corresponding other long-term liability entitled “deferred compensation obligation” on the balance sheet.
The marketable securities held in this plan consist ofinvestments in mutual funds at December 28, 2002 and January 3,2004. Unrealized gains (losses) included in earnings during the fifty-two weeks ended December 29, 2001 and December 28, 2002 andfifty-three weeks ended January 3, 2004 were $(58), $(171) and$364, respectively. Gains of $11 and $36 were realized during thefifty-two weeks ended December 29, 2001 and December 28, 2002,respectively. There were no realized gains for the fifty-three weeksended January 3, 2004.
Inventories—Inventories are stated at the lower of cost or market ona last-in, first-out (“LIFO”) basis. In fiscal 2001, the liquidation ofcertain LIFO layers decreased cost of sales by $171. There were nosuch liquidations in either f iscal years 2002 or 2003. Inventoryquantities on hand are regularly reviewed, and where necessary pro-visions for excess and obsolete inventory are recorded based prima-rily on the Company’s forecast of product demand and productionrequirements.
Notes to Consolidated Financial StatementsFor the Fifty-Two Weeks Ended December 29, 2001 and December 28, 2002 and Fifty-Three Weeks Ended January 3, 2004(In Thousands, Except Share and Per Share Amounts)

Notes to Consolidated Financial Statements (continued)
For the Fifty-Two Weeks Ended December 29, 2001 and December 28, 2002 and Fifty-Three Weeks Ended January 3, 2004(In Thousands, Except Share and Per Share Amounts)
38 The Yankee Candle Company, Inc. and Subsidiaries
Property, Plant and Equipment—Property, plant and equipment arestated at cost and are depreciated on the straight-line method basedon the estimated useful lives of the various assets. The estimated useful lives are as follows:
Buildings and improvements 5 to 40 yearsComputer equipment 2 to 5 yearsFurniture and fixtures 5 to 10 yearsEquipment 10 yearsVehicles 5 years
Leasehold improvements are amortized using the straight-line method over the lesser of the estimated life of the improvementor the remaining life of the lease. Expenditures for normal maintenance and repairs are charged to expense as incurred.
Deferred Financing Costs—The Company amortizes deferred financ-ing costs using the effective-interest method over the life of therelated debt. Accumulated amortization was $4,367 and $5,480 atDecember 28, 2002 and January 3, 2004, respectively.
Trademarks—Trademarks are recorded at cost and amortized over 15years. Cost of trademarks, included in other assets at December 28,2002 and January 3, 2004, was $231. Accumulated amortizationwas $132 and $147 at December 28, 2002 and January 3, 2004,respectively.
Advertising—The Company expenses the costs of advertising,including cooperative funds provided to customers, as they areincurred. Advertising expense was $4,869, $7,745 and $8,712 forthe fifty-two weeks ended December 29, 2001 and December 28,2002 and fifty-three weeks ended January 3, 2004, respectively.
Impairment of Long-Lived Assets—The Company reviews the recover-ability of its long-lived assets (property, plant and equipment andtrademarks) when events or changes in circumstances occur thatindicate that the carrying value of the assets may not be recoverable.This review is based on the Company’s ability to recover the carry-ing value of the assets from expected undiscounted future cashflows. If an impairment is indicated, the Company measures the lossbased on the fair value of the asset using various valuation tech-niques. If an impairment loss exists, the amount of the loss will berecorded in the consolidated statements of operations. It is possiblethat future events or circumstances could cause these estimates to change.
Income Taxes—The Company accounts for income taxes under theprovisions of SFAS No. 109, “Accounting for Income Taxes.” SFASNo. 109 requires the recognition of deferred tax liabilities and assetsfor the expected future tax consequences of temporary differencesbetween the carrying amounts and the tax basis of assets and liabili-ties using expected tax rates in effect in the years in which the differ-ences are expected to reverse. Valuation allowances are establishedwhen necessary to reduce deferred tax assets to the amount that is
more likely than not to be realized. The provision for income taxesin the consolidated statements of operations is the actual computedtax obligation or receivable for the period, plus or minus the changeduring the period in deferred income tax assets and liabilities.
Fair Value of Financial Instruments—At January 3, 2004, the estimatedfair values of all f inancial instruments approximate their carryingamounts in the consolidated balance sheets due to (i) the short-termmaturity of certain instruments or (ii) the variable interest rate asso-ciated with certain instruments which have the effect of repricingsuch instruments regularly.
Earnings Per Share—SFAS No. 128, “Earnings Per Share,” requirestwo presentations of earnings per share, “basic” and “diluted.” Basicearnings per share is computed by dividing income available to common stockholders (the numerator) by the weighted-averagenumber of common shares (the denominator) for the period. Thecomputation of diluted earnings per share is similar to basic earn-ings per share, except that the denominator is increased to includethe number of additional common shares that would have been out-standing if the potentially dilutive common shares had been issued.The denominator in the calculation is based on the followingweighted-average number of common shares:
December 29, December 28, January 3,
2001 2002 2004
Basic 53,537,000 53,896,000 53,024,000Add:
Contingently returnable shares 795,000 420,000 —
Shares issuable pursuant to option grants 311,000 370,000 395,000
Diluted 54,643,000 54,686,000 53,419,000
At December 29, 2001, December 28, 2002 and January3, 2004, approximately 79,000, 554,000 and 13,000 shares issuablepursuant to option grants were excluded from the computation ofdiluted earnings per share due to the anti-dilutive effect, respectively.
Foreign Operations—Assets and liabilities of foreign operations aretranslated into U.S. dollars at the exchange rate on the balance sheetdate. The results of foreign subsidiary operations are translated usingaverage rates of exchange during each reporting period. Gains andlosses upon translation are deferred and reported as a component ofother comprehensive income. Foreign currency transaction gains orlosses, whether realized or unrealized, are recorded directly in thestatements of operations.
Comprehensive Income—Comprehensive income includes all changesin equity during the period except those resulting from transactionswith owners of the Company. It has two components: net incomeand other comprehensive income. Accumulated other comprehen-sive income reported on the Company’s consolidated balance sheets consists of foreign currency translation adjustments. Comprehensive

The Yankee Candle Company, Inc. and Subsidiaries 39
income, net of related tax effects (where applicable), is detailed inthe consolidated statements of stockholders’ equity.
Accounting Change—The Company currently sponsors stock optionplans. Prior to the third quarter of 2003, the Company accountedfor employee options or share awards under the intrinsic-valuemethod prescribed by Accounting Principles Board Opinion No. 25,“Accounting for Stock Issued to Employees.” Compensation expense,if any, was recognized based on the difference between the fair valueof the common stock and the exercise price of the option on themeasurement date, as defined by Opinion No. 25. Pro forma disclo-sures of net earnings and earnings per share had been provided sup-plementally, as if the fair value method of accounting defined inSFAS No. 123, “Accounting for Stock-Based Compensation” hadbeen applied. Effective September 27, 2003, the Company adoptedthe fair value recognition provisions of SFAS No. 123 using the prospective transition method provided by SFAS No. 148,“Accounting for Stock-Based Compensation—Transition andDisclosure, an Amendment of SFAS No. 123.” Under the prospec-tive transition method, the Company has valued all stock optiongrants beginning with grants made in fiscal 2003. These are beingexpensed over the vesting period based on the fair value at the dateof the grant. The adoption of the fair value method of accountingfor stock-based compensation resulted in a charge of $633 for thefiscal year ended January 3, 2004.
Awards under the Company’s option plan vest, in general,over a four year period. Therefore, the cost related to stock-basedemployee compensation included in the determination of netincome for all periods presented in the Company’s historical consol-idated statements of operations is less than that which would havebeen recognized if the fair value based method had been applied toall awards since the original effective date of SFAS No. 123.
The following table illustrates the effect on net incomeand earnings per share if the fair value based method had beenapplied to all outstanding and unvested awards in each period.
December 29, December 28, January 3,
2001 2002 2004
Net income, as reported $43,285 $63,979 $74,786Add: Stock compensation recorded
under Opinion No. 25 570 434 88Deduct: Total stock-based employee compen-
sation expense determined under fair valuebased method for awards granted prior to 2003, net of related tax effects (1,993) (1,900) (1,483)
Pro forma net income $41,862 $62,513 $73,391
Earnings per share:Basic—as reported $ 0.81 $ 1.19 $ 1.41Basic—pro forma $ 0.78 $ 1.16 $ 1.38
Weighted-average basic shares outstanding 53,537 53,896 53,024Diluted—as reported $ 0.79 $ 1.17 $ 1.40Diluted—pro forma $ 0.77 $ 1.14 $ 1.37
Weighted-average diluted shares outstanding 54,643 54,686 53,419
The following weighted-average assumptions were used tocompute the pro forma results of operations for f iscal 2001 and2002 and the stock option expense that was recorded in theStatement of Operations in fiscal 2003:
2001 2002 2003
Volatility 50% 44% 44%Dividend yield 0% 0% 0%Risk free interest rate 1.69% 2.79% 2.85%Expected lives 5 years 5 years 4 years
Prior-Year Reclassifications—Certain prior year amounts have beenreclassified to conform to the current year presentation.
3. Inventories
The components of inventory were as follows:
December 28, January 3,
2002 2004
Finished goods $ 30,273 $ 37,537Work-in-process 641 975Raw materials and packaging 4,287 4,487
35,201 42,999Less LIFO adjustment (672) (813)
$ 34,529 $ 42,186
4. Property, Plant and Equipment
The components of property, plant and equipment were as follows:
December 28, January 3,
2002 2004
Land and improvements $ 5,039 $ 5,039Buildings and improvements 69,502 77,402Computer equipment 28,182 33,623Furniture and fixtures 29,430 34,443Equipment 28,993 30,706Vehicles 849 549Construction in progress 4,689 3,868
Total 166,684 185,630Less: accumulated depreciation
and amortization (54,923) (70,856)
$111,761 $114,774
Depreciation and amortization expense related to prop-erty, plant and equipment was $13,061, $16,045 and $18,118 forthe fifty-two weeks ended December 29, 2001 and December 28,2002 and f ifty-three weeks ended January 3, 2004, respectively.$464, $119 and $68 of interest was capitalized in the f ifty-twoweeks ended December 29, 2001 and December 28, 2002 and fifty-three weeks ended January 3, 2004, respectively.
5. Concentration of Credit Risk
The Company maintains cash balances at several financial institu-tions. Accounts at each institution are insured by the FederalDeposit Insurance Corporation up to $100. Uninsured balances

Notes to Consolidated Financial Statements (continued)
For the Fifty-Two Weeks Ended December 29, 2001 and December 28, 2002 and Fifty-Three Weeks Ended January 3, 2004(In Thousands, Except Share and Per Share Amounts)
40 The Yankee Candle Company, Inc. and Subsidiaries
aggregated $38,117 and $38,670 at December 28, 2002 andJanuary 3, 2004, respectively. The Company extends credit to itswholesale customers. For the fifty-two weeks ended December 29,2001 and December 28, 2002 and fifty-three weeks ended January 3,2004, no single customer accounted for more than 2.0%, 4.0% and6.0% of total sales, respectively.
6. Long-Term Debt
Long-term debt is summarized as follows:
December 28, January 3,
2002 2004
Term loan $51,000 $19,000Revolving line of credit 9,500 46,000Capital lease obligations 100 —
60,600 65,000Less current portion 32,000 65,000
Non-current portion $28,600 $ —
The Company has a credit agreement with a consortiumof banks (the “Credit Agreement”). The Credit Agreement providesfor a maximum borrowing of $300,000 and consists of a revolvingcredit facility for $150,000 and a term loan for $150,000. The termloan is payable in quarterly installments ranging from $7,500 to$9,500 in March, June, September and December. As of December28, 2002 and January 3, 2004, the unused portion of the revolvingcredit facility was $140,500 and $104,000, respectively. The CreditAgreement matures on July 7, 2004, with any outstanding amountsdue on that date; no payments of principal are due on the revolvingcredit facility until this maturity date. The Company is currentlyengaged in negotiations with various commercial banks to replacethe existing Credit Agreement with a new credit facility. TheCompany is optimistic that a new credit facility will be finalized andin place prior to the expiration of our existing Credit Agreement inJuly 2004.
The Company is required to pay a commitment fee onthe average daily unutilized portion of the revolving credit facility ata rate ranging from 1⁄4% to 3⁄8% per annum. The Company may electto set the interest rate on all or a portion of the borrowings out-standing under the Credit Agreement at a rate per annum equal to(a) the greatest of (1) the prime rate, (2) the base CD rate plus1.00% or (3) the federal funds effective rate plus 1⁄2% plus a marginranging from 0.00% to 0.75%, or (b) the eurodollar rate plus amargin ranging from 1.00% to 1.75%. The weighted-average inter-est rate on outstanding borrowings at January 3, 2004 was 2.90%.
The Credit Agreement includes restrictions as to, amongother things, the amount of additional indebtedness, contingentobligations, liens, investments, asset sales and capital expendituresand requires the maintenance of minimum levels of interest cover-age. It also includes a restriction for the payment of dividends. Noneof the restrictions contained in the Credit Agreement are expectedto have a significant effect on the ability of the Company to operate.
7. Restructuring Charge
A restructuring charge for $8.0 million was recorded in fiscal 2001to record costs associated with our decision to consolidate andrestructure our distribution and manufacturing operations. Weclosed our Utah distribution facility and restructured our distribu-tion and manufacturing work force during 2001. Included in therestructuring charge are severance and other employee related costs,$2,124 of a non-cash write-down of non-recoverable leaseholdimprovements, f ixture and equipment investments and estimatedcontinuing occupancy expenses for abandoned facilities, net ofanticipated sub-lease income. As a result of this consolidation andrestructuring, the Company terminated approximately 450 manu-facturing and logistics employees. An analysis of the activity withinthe restructuring reserve since its inception is as follows:
Costs Paid During the Fifty-Two Weeks Ended Accrued as of
December 29, December 29,Expense 2001 2001
Occupancy $2,635 $ 781 $1,854Employee related 2,635 2,304 331Other 606 606 —
Total $5,876 $3,691 $2,185
Costs Paid During the Accrued as of Fifty-Two Weeks Ended Accrued as ofDecember 29, December 28, December 28,
2001 2002 2002
Occupancy $1,854 $ 747 $1,107Employee related 331 284 47
Total $2,185 $1,031 $1,154
Costs Paid During the Accrued as of Fifty-Three Weeks Ended Accrued as ofDecember 28, January 3, January 3,
2002 2004 2004
Occupancy $1,107 $ 311 $ 796Employee related 47 47 —
Total $1,154 $ 358 $ 796
During the second quarter of fiscal 2002, the Companywas successful in subletting the facility covered under the“Occupancy” heading for the remaining lease term.

The Yankee Candle Company, Inc. and Subsidiaries 41
8. Provision for Income Taxes
Income tax expense, exclusive of that relating to extraordinary items,consists of the following:
Fifty-ThreeFifty-Two Weeks Ended Weeks Ended
December 29, December 28, January 3,
2001 2002 2004
Federal:Current $15,552 $23,694 $32,956Deferred 9,530 13,437 10,863
Total federal 25,082 37,131 43,819
State:Current 1,607 2,748 3,766Deferred 985 1,558 1,242
Total state 2,592 4,306 5,008
Total income tax provision $27,674 $41,437 $48,827
In connection with the recapitalization of the Companyin 1998, an election was made for federal and state income tax pur-poses to value the assets and liabilities of the Company at fair value.As a result of such election, there is a difference between the finan-cial reporting and tax bases of the Company’s assets and liabilities.This difference was accounted for by recording a deferred tax assetof approximately $175,700 with a corresponding credit to additionalpaid-in capital. The deferred tax asset is being realized as these differ-ences, including tax goodwill, are deducted, principally over a periodof 15 years. In the opinion of management, the Company will havesufficient profits in the future to realize the deferred tax asset.
The tax effect of signif icant items comprising theCompany’s net deferred tax assets (liabilities) are as follows:
December 28, January 3,
2002 2004
Current Non-current Current Non-current
Deferred tax assets:Basis differential as a result
of a basis step-up for tax $ — $120,516 $ — $108,824Foreign net operating loss
carryforwards — 2,453 — 2,549Deferred compensation
arrangements, including stock-based compensation 351 — 595 247
Employee benefits 1,047 — 1,101 —Restructuring accrual 450 — 310 —Other 586 450 1,122 417Valuation allowance — (2,453) — (2,549)
Deferred tax liabilities—fixed assets — (7,822) — (9,142)
$2,434 $113,144 $3,128 $100,346
A reconciliation of the statutory federal income tax rateand the effective rate of the provision for income taxes consists ofthe following:
Fifty-ThreeFifty-Two Weeks Ended Weeks Ended
December 29, December 28, January 3,
2001 2002 2004
Statutory federal income tax rate 35.0% 35.0% 35.0%State income taxes net of federal benefit 4.0 4.0 4.0Other, including increase in valuation
allowance — 0.3 0.5
39.0% 39.3% 39.5%
At January 3, 2004, the Company has foreign net operat-ing loss carryforwards totaling approximately $8,500. A valuationallowance has been established for these net operating losses whichhave been fully reserved.
9. Profit Sharing Plan
The Company maintains a profit sharing plan (the “Plan”) undersection 401(k) of the Internal Revenue Code. Under the terms ofthe Plan the Company may make discretionary matching contribu-tions in an amount, if any, to be determined annually based on apercentage of the employee’s pretax contributions. Matching contri-butions, if made, are subject to a maximum of 4% of the employee’seligible compensation contributed to the Plan during the applicableplan year. Employer matching contributions amounted to $632,$731 and $815 for the fifty-two weeks ended December 29, 2001and December 28, 2002 and f ifty-three weeks ended January 3,2004, respectively. The Company, at its discretion, may also makeannual profit sharing contributions to the Plan. For the fifty-threeweeks ended January 3, 2004, the Company incurred $500 forprofit sharing contributions. There were no profit sharing contribu-tions in fiscal 2001 and 2002.
10. Deferred Compensation
The Company has a deferred compensation agreement with certainkey employees. Under this agreement, the Company at its electionmay match certain elective salary deferrals of eligible employees’compensation up to a maximum of $20 per employee per year.Employer contributions amounted to $89, $94 and $135 for fiscal2001, 2002 and 2003, respectively. Benefits under the plan will bepaid in a lump sum upon termination of the plan or termination ofemployment. Benefits paid to retired employees during fiscal 2001and 2002 were $255 and $263, respectively. There were no benefitspaid in 2003.

Notes to Consolidated Financial Statements (continued)
For the Fifty-Two Weeks Ended December 29, 2001 and December 28, 2002 and Fifty-Three Weeks Ended January 3, 2004(In Thousands, Except Share and Per Share Amounts)
42 The Yankee Candle Company, Inc. and Subsidiaries
11. Contingencies
The Company is engaged in various lawsuits, either as plaintiff ordefendant. In the opinion of management, the ultimate outcome ofthese lawsuits will not have a material adverse effect on theCompany’s financial condition, results of operations or cash flows.
12. Stockholders’ Equity
Capital Stock—As of December 28, 2002 and January 3, 2004, theCompany had 104,188,000 and 104,397,000 shares of commonstock (par value $.01) issued, respectively. In connection with therecapitalization of the Company in 1998, the Company repurchasedfor treasury approximately 49,560,000 shares of common stock.Subsequently, pursuant to a stock repurchase program adopted May 9, 2003, the Company repurchased a total of 4,084,200 sharesfor an aggregate purchase price of approximately $100,000. Theseshares are also held in treasury. On February 12, 2004, the Board ofDirectors authorized a new stock repurchase program for the repur-chase of up to $100,000 of currently outstanding shares.
Options to purchase common stock were granted to keyemployees and directors of the Company in 1998 (the “1998 Plan”).
The options granted under the 1998 Plan were “nonqualified” fortax purposes. For f inancial reporting purposes, the award of theright to purchase stock and the grant of options, in certain cases,were considered to be below the fair value of the stock at the time ofgrant. The fair value was determined based on an appraisal con-ducted by an independent appraisal firm as of the relevant dates.The differences between fair value and the purchase price or theexercise price was being charged to compensation expense over therelevant vesting period—generally between three and five years. Inthe fifty-two weeks ended December 29, 2001 and December 28,2002 and fifty-three weeks ended January 3, 2004, such expenseaggregated $570, $434 and $88, respectively.
In addition to the options granted above, the Companyadopted the 1999 Employee Stock Option and Award Plan in June1999 (the “1999 Plan”). The 1999 Plan provides for the grant ofboth incentive stock options intended to qualify under Section 422of the Internal Revenue Code and nonqualified options. Options,granted to date under the 1999 Plan generally have an exercise priceequal to the fair market value of the stock on the date of grant, arenon-qualified and expire after 10 years. Options granted under the1999 Plan vest ratably over four years.
A summary of the status of option grants and changes during the period ending on that date are presented below:
Weighted-Average Weighted-AverageRange of Exercise Price Grant Date
Options Exercise Prices Per Share Fair Value
Outstanding at December 30, 2000 718,111 $ 4.25 –$21.125 $ 8.76 —Granted 691,500 13.17 – 17.92 14.41 6.34Exercised (1,953) 4.25 4.25 —Forfeited (11,130) 4.25 – 21.125 11.44 —
Outstanding at December 29, 2001 1,396,528 4.25 – 21.125 11.51 —Granted 236,500 16.80 – 21.30 21.16 8.95Exercised (126,679) 4.25 – 21.125 5.43 —Forfeited (5,000) 16.88 16.88 —
Outstanding at December 28, 2002 1,501,349 4.25 – 21.30 13.89 —Granted 555,000 16.05 – 28.53 21.45 8.01Exercised (209,108) 4.25 – 21.125 7.09 —Forfeited (10,750) 21.125– 21.30 18.18 —
Outstanding at January 3, 2004 1,836,491 $ 4.25 –$28.53 $16.93 —
Under the existing stock option plans, there are 858,626shares available for future grants at January 3, 2004. At January 3,2004, options were exercisable for 716,118 shares of common stockat a weighted-average exercise price of $13.88 per share.
The following table summarizes information about theCompany’s stock options outstanding at January 3, 2004:
Range of Options Average Options RemainingExercise Prices Outstanding Exercisable Life (Years)
$ $ 4.25 120,684 111,645 4.4611.875 – 16.25 655,000 341,041 7.2516.80 – 18.00 255,107 178,732 6.6821.125 – 28.53 805,700 84,700 9.00
$ 4.25 – 28.53 1,836,491 716,118 7.76

The Yankee Candle Company, Inc. and Subsidiaries 43
13. Commitments
The Company leases most store locations, its corporate office build-ing, a distribution facility and a number of vehicles. The operatingleases, which expire in various years through 2016, contain renewaloptions ranging from six months to five years and provide for baserentals plus contingent rentals thereafter, which are a function ofsales volume. In addition, the Company is required to pay real estatetaxes, maintenance and other operating expenses applicable to theleased premises. Furthermore, several facility leases contain rentescalation clauses.
The aggregate annual future minimum lease commitmentsunder operating leases as of January 3, 2004 are as follows:
Operating Leases
2004 $ 22,9282005 22,1412006 20,5752007 19,4602008 19,057Thereafter 66,765
Total minimum lease payments $170,926
Rent expense, including contingent rentals, for the fifty-two weeks ended December 29, 2001 and December 28, 2002 andfifty-three weeks ended January 3, 2004 was approximately $13,583,$17,975 and $20,851, respectively. Included in rent expense were
contingent rental payments of approximately $1,368, $996 and$802, for the f ifty-two weeks ended December 29, 2001 andDecember 28, 2002 and fifty-three weeks ended January 3, 2004,respectively.
14. Segments of Enterprise and Related Information
The Company has segmented its operations in a manner that reflectshow its chief operating decision-maker (the “CEO”) currentlyreviews the results of the Company and its subsidiaries’ businesses.The Company has two reportable segments—retail and wholesale.The identif ication of these segments results from management’srecognition that while the product produced is similar, the type ofcustomer for the product and services and the methods used to dis-tribute the product are different.
The CEO evaluates both its retail and wholesale opera-tions based on an “operating earnings” measure. Such measure givesrecognition to specifically identifiable operating costs such as cost ofsales and selling expenses. Administrative charges are generally notallocated to specif ic operating segments and are accordinglyreflected in the unallocated/corporate/other category. Other compo-nents of the statement of operations, which are classif ied belowoperating income, are also not allocated by segments. The Companydoes not account for or report assets, capital expenditures or depre-ciation and amortization by segment to the CEO.
The following are the relevant data for the fifty-two weeks ended December 29, 2001 and December 28, 2002 and fifty-threeweeks ended January 3, 2004:
Balance perConsolidated
Unallocated/ Statements ofRetail Wholesale Corporate/Other Operations
Fifty-Two Weeks Ended December 29, 2001
Sales $211,707 $168,124 $ — $379,831Gross Profit 131,816 73,908 — 205,724Operating Margin 62,852 65,524 (46,515) 81,861Other income (expense) — — (10,902) (10,902)Income before provision for income taxes — — — 70,959
Fifty-Two Weeks Ended December 28, 2002
Sales $239,920 $204,922 $ — $444,842Gross Profit 153,520 96,574 — 250,094Operating Margin 66,168 87,212 (43,549) 109,831Other income (expense) — — (4,415) (4,415)Income before provision for income taxes — — — 105,416
Fifty-Three Weeks Ended January 3, 2004
Sales $266,649 $241,988 $ — $508,637Gross Profit 179,826 113,495 — 293,321Operating Margin 75,968 101,576 (50,561) 126,983Other income (expense) — — (3,370) (3,370)Income before provision for income taxes — — — 123,613
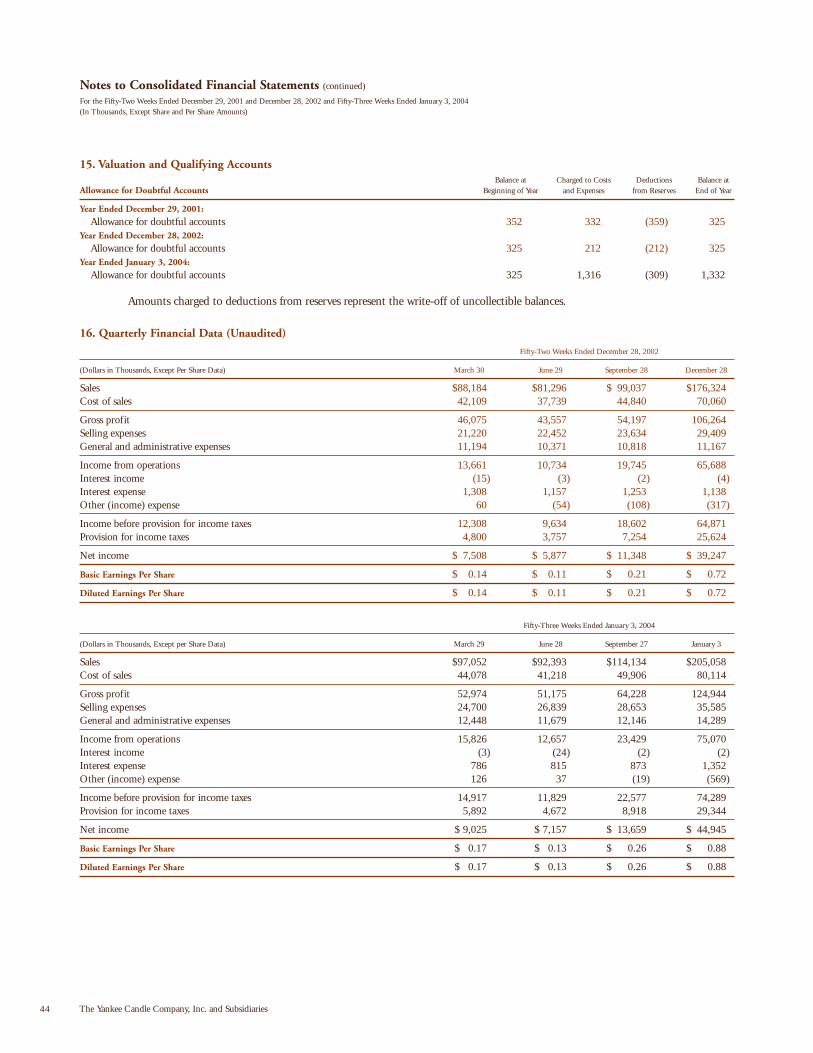
Notes to Consolidated Financial Statements (continued)
For the Fifty-Two Weeks Ended December 29, 2001 and December 28, 2002 and Fifty-Three Weeks Ended January 3, 2004(In Thousands, Except Share and Per Share Amounts)
44 The Yankee Candle Company, Inc. and Subsidiaries
15. Valuation and Qualifying AccountsBalance at Charged to Costs Deductions Balance at
Allowance for Doubtful Accounts Beginning of Year and Expenses from Reserves End of Year
Year Ended December 29, 2001:
Allowance for doubtful accounts 352 332 (359) 325 Year Ended December 28, 2002:
Allowance for doubtful accounts 325 212 (212) 325Year Ended January 3, 2004:
Allowance for doubtful accounts 325 1,316 (309) 1,332
Amounts charged to deductions from reserves represent the write-off of uncollectible balances.
16. Quarterly Financial Data (Unaudited)
Fifty-Two Weeks Ended December 28, 2002
(Dollars in Thousands, Except Per Share Data) March 30 June 29 September 28 December 28
Sales $88,184 $81,296 $ 99,037 $176,324Cost of sales 42,109 37,739 44,840 70,060
Gross profit 46,075 43,557 54,197 106,264Selling expenses 21,220 22,452 23,634 29,409General and administrative expenses 11,194 10,371 10,818 11,167
Income from operations 13,661 10,734 19,745 65,688Interest income (15) (3) (2) (4)Interest expense 1,308 1,157 1,253 1,138Other (income) expense 60 (54) (108) (317)
Income before provision for income taxes 12,308 9,634 18,602 64,871Provision for income taxes 4,800 3,757 7,254 25,624
Net income $ 7,508 $ 5,877 $ 11,348 $ 39,247
Basic Earnings Per Share $ 0.14 $ 0.11 $ 0.21 $ 0.72
Diluted Earnings Per Share $ 0.14 $ 0.11 $ 0.21 $ 0.72
Fifty-Three Weeks Ended January 3, 2004
(Dollars in Thousands, Except per Share Data) March 29 June 28 September 27 January 3
Sales $97,052 $92,393 $114,134 $205,058Cost of sales 44,078 41,218 49,906 80,114
Gross profit 52,974 51,175 64,228 124,944Selling expenses 24,700 26,839 28,653 35,585General and administrative expenses 12,448 11,679 12,146 14,289
Income from operations 15,826 12,657 23,429 75,070Interest income (3) (24) (2) (2)Interest expense 786 815 873 1,352Other (income) expense 126 37 (19) (569)
Income before provision for income taxes 14,917 11,829 22,577 74,289Provision for income taxes 5,892 4,672 8,918 29,344
Net income $ 9,025 $ 7,157 $ 13,659 $ 44,945
Basic Earnings Per Share $ 0.17 $ 0.13 $ 0.26 $ 0.88
Diluted Earnings Per Share $ 0.17 $ 0.13 $ 0.26 $ 0.88

Independent Auditors’ Report
The Yankee Candle Company, Inc. and Subsidiaries 45
Board of DirectorsThe Yankee Candle Company, Inc.South Deerfield, Massachusetts 01373
We have audited the accompanying consolidated balance sheets of The Yankee Candle Company, Inc. and subsidiaries (the“Company”) as of December 28, 2002 and January 3, 2004, and therelated consolidated statements of operations, stockholders’ equityand cash flows for the fifty-two weeks ended December 29, 2001and December 28, 2002 and the fifty-three weeks ended January 3,2004. The f inancial statements are the responsibility of theCompany’s management. Our responsibility is to express an opinionon the financial statements based on our audits.
We conducted our audits in accordance with auditingstandards generally accepted in the United States of America. Thosestandards require that we plan and perform the audit to obtain rea-sonable assurance about whether the financial statements are free ofmaterial misstatement. An audit includes examining, on a test basis,evidence supporting the amounts and disclosures in the financialstatements. An audit also includes assessing the accounting princi-ples used and significant estimates made by management, as well asevaluating the overall financial statement presentation. We believethat our audits provide a reasonable basis for our opinion.
In our opinion, such consolidated f inancial statementspresent fairly, in all material respects, the financial position of TheYankee Candle Company, Inc. and subsidiaries as of December 28,2002 and January 3, 2004 and the results of their operations andtheir cash flows for the fifty-two weeks ended December 29, 2001and December 28, 2002 and the fifty-three weeks ended January 3,2004 in conformity with accounting principles generally accepted inthe United States of America.
As described in Note 2 to the financial statements, theCompany changed its method of accounting for stock-based com-pensation to conform to the provisions of Statement of FinancialAccounting Standard No. 123, “Accounting for Stock-BasedCompensation and No. 148, “Accounting for Stock-BasedCompensation—Transition and Disclosure” during the year endedJanuary 3, 2004.
Boston, MassachusettsFebruary 25, 2004

46 The Yankee Candle Company, Inc. and Subsidiaries
Market Information
Our common stock has been traded on the New York Stock Exchangesince July 1, 1999 under the symbol “YCC.” For the fiscal periodsindicated, the high and low sales prices per share of the common stockas reported on the New York Stock Exchange—Composite TransactionReporting System were as follows:
High Low
Fifty-Three Weeks Ended January 3, 2004
First Quarter $18.19 $15.25Second Quarter 24.20 16.64Third Quarter 26.42 22.26Fourth Quarter 30.00 25.35
Fifty-Two Weeks Ended December 28, 2002
First Quarter $23.65 $18.29Second Quarter 27.68 20.00Third Quarter 26.71 16.50Fourth Quarter 20.00 13.80
On March 12, 2004, the closing sale price as reported onthe New York Stock Exchange—Composite Transaction ReportingSystem for our common stock was $27.97 per share. As of March 12,2004, there were 593 holders of record of our common stock. Thisdoes not include the number of persons whose stock is in nomineeor “street name” accounts through brokers.
Dividends
We have never paid a cash dividend on our common stock as a publiccompany. Instead, we have retained earnings for the future operationof our business. While we have no current plan to pay any cashdividends, we intend to periodically evaluate the advisability of a div-idend program. Any determination to pay dividends in the futurewill be at the discretion of the board of directors and will be dependentupon results of operations, financial condition, contractual and legalrestrictions and other factors deemed relevant by our board of direc-tors. Under the terms of our existing credit agreement (which isscheduled to expire on July 7, 2004), we may not declare or pay div-idends on our common stock unless our ratio of consolidated totaldebt to consolidated EBITDA (as defined in our credit agreement)is less than or equal to 2:1 or our aggregate principal amount ofloans and letters of credit outstanding is less than $100 million.Although we currently meet this requirement, we have no currentplan to pay dividends.
Market for the Registrant’s Common Equity, Related Stockholder Matters and Issuer Purchases of Equity Securities

CO R P O R AT E IN F O R M AT I O N
Chairman EmeritusMICHAEL J. KITTREDGEFounderThe Yankee Candle Company, Inc.
DirectorsDALE F. FREYRetired Chairman and PresidentGeneral Electric Investment Corp.
MICHAEL F. HINESExecutive Vice President andChief Financial OfficerDick’s Sporting Goods, Inc.
SANDRA J. HORBACHGeneral PartnerForstmann Little & Co.
JAMIE C. NICHOLLSGeneral PartnerForstmann Little & Co.
MICHAEL B. POLKSenior Vice President, Marketing and Chief Operating OfficerUnilever BestfoodsNorth America
CRAIG W. RYDINChairman, President andChief Executive OfficerThe Yankee Candle Company, Inc.
RONALD L. SARGENTPresident andChief Executive OfficerStaples, Inc.
ROBERT R. SPELLMANSenior Vice President, Financeand Chief Financial OfficerThe Yankee Candle Company, Inc.
DOREEN A. WRIGHTSenior Vice President,Chief Information OfficerCambell Soup Company
Executive OfficersCRAIG W. RYDINPresident and Chief Executive Officer
ROBERT R. SPELLMANSenior Vice President, Financeand Chief Financial Officer
GAIL M. FLOODSenior Vice President,Retail
PAUL J. HILLSenior Vice President,Supply Chain
HARLAN M. KENTSenior Vice President,Wholesale
MARTHA S. LACROIXSenior Vice President,Human Resources
JAMES A. PERLEYVice President,General Counsel
Operating OfficersSTEPHEN K. ATWATERVice President,Process Improvement
RONALD J. BOHONOWICZVice President,Quality and Engineering
DOUGLAS G. HIGGINBOTHAMVice President,Distribution and Transportation
G. PAT HOWARDVice President,Wholesale Finance and Planning
DEBORAH H. LYNCHVice President,Retail Finance and Planning
GERALD F. LYNCHVice President,Controller
THOMAS J. REGANVice President,Retail
ARTHUR F. RUBECKVice President,Manufacturing
DENNIS M. SHOCKROVice President,Information Systems
JOHN M. STAIBVice President, Wholesale Sales
ANTHONY P. VILLANIVice President,Real Estate
THOMAS J. WOODSIDEVice President,Chief Retail Marketing Officer
Shareholder InformationCorporate OfficesThe Yankee Candle Company, Inc. 16 Yankee Candle WaySouth Deerfield, Massachusetts 01373Telephone: (413) 665-8306Internet address: www.yankeecandle.com
Transfer Agent and RegistrarEquiServe Trust Company, N.A. is the Transfer Agentand Registrar for the Company’s Common Stock andmaintains shareholder accounting records. The TransferAgent should be contacted directly concerning changesin address, name or ownership, lost certificates and toconsolidate multiple accounts. When correspondingwith the Transfer Agent, shareholders should referencethe exact name(s) in which Yankee Candle stock is registered as well as the certificate number.EquiServe Trust Company, N.A.P.O. Box 43023Providence, Rhode Island 02940-3023Telephone: (877) 282-1168Internet address: www.equiserve.comEmail address: [email protected]
Financial InformationA copy of Yankee Candle’s annual report on Form 10-K for the fiscal year ended January 3, 2004 as filed with the Securities and Exchange Commission is available on the Company’s web site, www.yankeecandle.com, or by written request to theOffice of Investor Relations at our corporate address.
Annual MeetingThe Annual Meeting of Stockholders of The YankeeCandle Company, Inc. will be held on June 16, 2004at 10:00 a.m. at The Yankee Candle Employee Healthand Fitness Center, 25 Greenfield Road, SouthDeerfield, Massachusetts 01373.
Designed by Curran & Connors, Inc. / www.curran-connors.com

I N N O V A T I O N . P E R F O R M A N C E . Q U A L I T Y . F R A G R A N C E .
2 0 0 3 A N N U A L R E P O R T
T H E Y A N K E E C A N D L E C O M P A N Y , I N C .
16 Yankee Candle Way South Deerfield, Massachusetts 01373