1. THE PROBLEM - IOPscience
25
THE ASTROPHYSICAL JOURNAL, 499 : 41È65, 1998 May 20 1998. The American Astronomical Society. All rights reserved. Printed in U.S.A. ( TESTING THE DARK MATTER HYPOTHESIS WITH LOW SURFACE BRIGHTNESS GALAXIES AND OTHER EVIDENCE STACY S. MCGAUGH1 Department of Terrestrial Magnetism, Carnegie Institution of Washington, 5241 Broad Branch Road NW, Washington, DC 20015 AND W. J. G. DE BLOK2 Kapteyn Astronomical Institute, Postbus 800, 9700 AV Groningen, The Netherlands Received 1997 July 29 ; accepted 1997 December 30 ABSTRACT The severity of the mass discrepancy in spiral galaxies is strongly correlated with the central surface brightness of their disks. Progressively lower surface brightness galaxies have ever larger mass discrep- ancies. No other parameter (luminosity, size, velocity, morphology) is so well correlated with the magni- tude of the mass deÐcit. The rotation curves of low surface brightness disks thus provide a unique data set with which to probe the dark matter distribution in galaxies. The mass discrepancy is apparent from R \ 0, giving a nearly direct map of the halo mass distribution. The luminous mass is insigniÐcant. Interpreting the data in terms of dark matter leads to troublesome Ðne-tuning problems. Di†erent observations require contradictory amounts of dark matter. Structure formation theories are as yet far from able to explain the observations. Subject headings : dark matter È galaxies : formation È galaxies : halos È galaxies : kinematics and dynamics È galaxies : structure È gravitation W hat gets us into trouble is not what we donÏt know. ItÏs what we know for sure that just ainÏt so. Yogi Berra 1. THE PROBLEM The evidence for the existence of dark matter is clear in a great variety of data These include the Oort (Trimble 1987). discrepancy in the disk of the Milky Way & (Kuijken Gilmore Flynn, & Gould the velocity 1989 ; Bahcall, 1992), dispersions of dwarf spheroidal galaxies (see, e.g., et al. Vogt the Ñat rotation curves of spiral galaxies 1995), (Rubin, Ford, & Thonnard the statistics of 1980 ; Bosma 1981), satellite galaxy orbits & White the timing (Zaritsky 1994), argument in the Local Group & Woltjer the (Kahn 1959), velocity dispersions of clusters of galaxies & (Zwicky Humason bulk Ñows on large scales et 1964), (Lynden-Bell al. et al. the excess of mass density in the 1988 ; Mould 1993), universe over that visible in galaxies () dyn ? ) gal ; Ostriker & Steinhardt and gravitational lensing 1995), (Tyson, Wenk, & Valdes 1990). What these data really demonstrate is that the observed distribution of luminous matter together with the usual dynamical equations can not reproduce the observations. This can be interpreted either to require dark matter or as a need to modify the equations we use (e.g., the law of gravity). In this series of papers, we examine and compare the pros and cons of both alternatives. Here we shall examine the dark matter hypothesis. In companion papers & de Blok hereafter Blok & (McGaugh 1998, Paper II); de McGaugh hereafter we examine alterna- 1998, Paper III), tive dynamical theories. The H I rotation curves of disk galaxies provide powerful 1 Present address : Physics and Astronomy, Rutgers University, 136 Frelinghuysen Road, Piscataway, NJ 08854-8019. 2 Present address : Astrophysics Groups, School of Physics, University of Melbourne, Parkville, Victoria 3052, Australia. tests of the various hypotheses (see, e.g., Kent 1987 ; Broeils, & Sanders These share the general Begeman, 1991). characteristic of becoming asymptotically Ñat at large radii. One would expect V (R) P R~1@2 without dark matter. The major advantage of using H I rotation curves is that the geometry of the orbits is obvious. Dissipation in the gas enforces circular orbits. Thus it is possible to directly equate the centripetal acceleration a c \ V 2 R (1) with the gravitational acceleration g N \[ Lr LR (2) determined from the Poisson equation +2r \ 4nGo (3) in order to predict the expected form of the rotation curve V (R) from any given mass distribution o(R). In no other type of system are tests so direct and free of assumptions. An important aspect of any test is probing a large dynamic range in the relevant parameters. It turns out that the luminous surface density of disks is a critical parameter (see so the important thing is to have a large dynamic ° 4), range in surface brightness. This is exempliÐed by the fact that the few good rotation curves of low surface brightness dwarf galaxies that exist are constantly being reanalyzed (see, e.g., & Primack precisely Flores 1994 ; Moore 1994) because they provide leverage for testing ideas principally motivated by data for high surface brightness (HSB) spirals. Here, we augment existing data with our own data for low 41
-
Upload
khangminh22 -
Category
Documents
-
view
0 -
download
0
Transcript of 1. THE PROBLEM - IOPscience

THE ASTROPHYSICAL JOURNAL, 499 :41È65, 1998 May 201998. The American Astronomical Society. All rights reserved. Printed in U.S.A.(
TESTING THE DARK MATTER HYPOTHESIS WITH LOW SURFACE BRIGHTNESS GALAXIES ANDOTHER EVIDENCE
STACY S. MCGAUGH1Department of Terrestrial Magnetism, Carnegie Institution of Washington, 5241 Broad Branch Road NW, Washington, DC 20015
AND
W. J. G. DE BLOK2Kapteyn Astronomical Institute, Postbus 800, 9700 AV Groningen, The Netherlands
Received 1997 July 29 ; accepted 1997 December 30
ABSTRACTThe severity of the mass discrepancy in spiral galaxies is strongly correlated with the central surface
brightness of their disks. Progressively lower surface brightness galaxies have ever larger mass discrep-ancies. No other parameter (luminosity, size, velocity, morphology) is so well correlated with the magni-tude of the mass deÐcit.
The rotation curves of low surface brightness disks thus provide a unique data set with which toprobe the dark matter distribution in galaxies. The mass discrepancy is apparent from R\ 0, giving anearly direct map of the halo mass distribution. The luminous mass is insigniÐcant.
Interpreting the data in terms of dark matter leads to troublesome Ðne-tuning problems. Di†erentobservations require contradictory amounts of dark matter. Structure formation theories are as yet farfrom able to explain the observations.Subject headings : dark matter È galaxies : formation È galaxies : halos È
galaxies : kinematics and dynamics È galaxies : structure È gravitation
W hat gets us into trouble is not what we donÏt know. ItÏs what we know for sure that justainÏt so. Yogi Berra
1. THE PROBLEM
The evidence for the existence of dark matter is clear in agreat variety of data These include the Oort(Trimble 1987).discrepancy in the disk of the Milky Way &(KuijkenGilmore Flynn, & Gould the velocity1989 ; Bahcall, 1992),dispersions of dwarf spheroidal galaxies (see, e.g., et al.Vogt
the Ñat rotation curves of spiral galaxies1995), (Rubin,Ford, & Thonnard the statistics of1980 ; Bosma 1981),satellite galaxy orbits & White the timing(Zaritsky 1994),argument in the Local Group & Woltjer the(Kahn 1959),velocity dispersions of clusters of galaxies &(ZwickyHumason bulk Ñows on large scales et1964), (Lynden-Bellal. et al. the excess of mass density in the1988 ; Mould 1993),universe over that visible in galaxies ()dyn? )gal ; Ostriker& Steinhardt and gravitational lensing1995), (Tyson,Wenk, & Valdes 1990).
What these data really demonstrate is that the observeddistribution of luminous matter together with the usualdynamical equations can not reproduce the observations.This can be interpreted either to require dark matter or as aneed to modify the equations we use (e.g., the law ofgravity). In this series of papers, we examine and comparethe pros and cons of both alternatives. Here we shallexamine the dark matter hypothesis. In companion papers
& de Blok hereafter Blok &(McGaugh 1998, Paper II) ; deMcGaugh hereafter we examine alterna-1998, Paper III),tive dynamical theories.
The H I rotation curves of disk galaxies provide powerful
1 Present address : Physics and Astronomy, Rutgers University, 136Frelinghuysen Road, Piscataway, NJ 08854-8019.
2 Present address : Astrophysics Groups, School of Physics, Universityof Melbourne, Parkville, Victoria 3052, Australia.
tests of the various hypotheses (see, e.g., Kent 1987 ;Broeils, & Sanders These share the generalBegeman, 1991).
characteristic of becoming asymptotically Ñat at large radii.One would expect V (R) P R~1@2 without dark matter.
The major advantage of using H I rotation curves is thatthe geometry of the orbits is obvious. Dissipation in the gasenforces circular orbits. Thus it is possible to directly equatethe centripetal acceleration
ac\ V 2
R(1)
with the gravitational acceleration
gN
\ [ LrLR
(2)
determined from the Poisson equation
+2r\ 4nGo (3)
in order to predict the expected form of the rotation curveV (R) from any given mass distribution o(R). In no othertype of system are tests so direct and free of assumptions.
An important aspect of any test is probing a largedynamic range in the relevant parameters. It turns out thatthe luminous surface density of disks is a critical parameter(see so the important thing is to have a large dynamic° 4),range in surface brightness. This is exempliÐed by the factthat the few good rotation curves of low surface brightnessdwarf galaxies that exist are constantly being reanalyzed(see, e.g., & Primack preciselyFlores 1994 ; Moore 1994)because they provide leverage for testing ideas principallymotivated by data for high surface brightness (HSB) spirals.Here, we augment existing data with our own data for low
41

42 MCGAUGH & DE BLOK Vol. 499
surface brightness (LSB) disk galaxies der Hulst et al.(vanBlok, McGaugh, & van der Hulst to probe1993 ; de 1996)
the lower extremes of surface brightness with many moregalaxies than previously available, thus extending thedynamic range in the critical parameter of luminous surfacedensity.
One important result is the universality of the Tully-Fisher relation across this increased dynamic range insurface brightness et al. et al.(Zwaan 1995 ; Sprayberry
This requires a surprising Ðne tuning between the1995).optical properties (central surface brightness) of a galaxyand its halo (mass-to-light ratio). et al. sug-Zwaan (1995)gested that galaxies must become progressively more darkmatter dominated toward lower surface brightnesses. Thisconclusion was conÐrmed by H I rotation curves Blok et(deal. that require a greater ratio of dark to luminous1996)mass at any given radius in LSB relative to HSB galaxies
Blok & McGaugh Another essential result is the(de 1997).way in which the shape of rotation curves changes system-atically with surface brightness from steeply rising curves inHSB galaxies to slowly rising curves in LSB galaxies.
The challenge is to Ðt these and other observations into aconsistent and coherent picture of the formation and evolu-tion of dark matter halos and their associated spiral disks.In this paper we examine the difficulties encountered inundertaking this task. As yet, it is impossible to developsuch a picture without resorting to a large number of Ðne-tuned relations between supposedly independent galaxyproperties.
In we describe the data. In we deÐne symbols and° 2, ° 3,clarify terms. gives a summary of the most rele-Section 4vant empirical facts. The physical interpretation of theTully-Fisher relation is discussed in In we introduce° 5. ° 6and test a variety of galaxy formation models. Section 7tests various dark matter candidates and discusses the° 8implications of baryon fractions determined from a varietyof data.
We adopt a Hubble constant of km s~1 Mpc~1H0\ 75throughout.
2. DATA
We employ data we have obtained for low surface bright-ness disk galaxies in the 21 cm line as described in dervanHulst et al. and Blok et al. combined with(1993) de (1996),optical surface photometry presented in those papers and in
& Bothun and Blok, van der Hulst, &McGaugh (1994) deBothun We augment our own data with published(1995).data for dwarfs and high surface brightness spirals for whichboth 21 cm rotation curves and adequate surface photo-metry are available, as compiled by andBroeils (1992) deBlok et al. (1996).
The data are listed in The columns give (1) theTable 1.name of the galaxy, (2) its B-band absolute magnitude M
B,
(3) the inclination-corrected central surface brightness ofk0the disk in B-mag arcsec~2, (4) the scale length of the disk hin kpc, (5) the circular velocity in the Ñat part of theV
crotation curve, (6) the inclination i in degrees, and (7) thedynamical mass-to-light ratio measured at R\ 4h in!
o(seeM_/L
_° 3).
A requirement for inclusion in is that both an H ITable 1rotation curve and surface photometry exist. Most data ofthe latter sort are in B, so we use that as standard. ThoughR or even K might seem preferable, this severely reduces theamount of available data. The choice of bandpass makes nodi†erence to the interpretation. In collecting data from the
TABLE 1
DATA
Galaxy MB
k0 h Vc
i !o(1) (2) (3) (4) (5) (6) (7)
F563-1 . . . . . . . . . . [17.3 23.5 4.3 111 25 36.6F563-V2 . . . . . . . . [18.2 22.1 2.1 111 29 8.2F568-1 . . . . . . . . . . [18.1 23.8 5.3 116 26 24.3F568-3 . . . . . . . . . . [18.3 23.1 4.0 119 40 16.2F568-V1 . . . . . . . . [17.9 23.3 3.2 124 40 20.8F571-V1 . . . . . . . . [17.0 24.0 3.2 73 35 15.6F574-1 . . . . . . . . . . [18.4 23.3 4.7 100 65 11.8F583-1 . . . . . . . . . . [16.5 24.0 1.6 88 63 18.6F583-4 . . . . . . . . . . [16.9 23.8 2.7 67 55 12.0UGC 128 . . . . . . . [18.8 24.2 9.2 130 55 28.8UGC 6614 . . . . . . [20.3 24.5 15.8 204 36 30.2
Data from the Literature
DDO 154 . . . . . . . [13.8 23.2 0.5 48 70 20.8DDO 168 . . . . . . . [15.2 23.4 0.9 55 58 13.5NGC 55 . . . . . . . . [18.6 21.5 1.6 87 65 2.6NGC 247 . . . . . . . [18.0 23.4 2.9 108 72 12.8NGC 300 . . . . . . . [17.8 22.2 2.1 97 79 8.9NGC 801 . . . . . . . [21.7 21.9 12.0 222 81 7.4NGC 1560 . . . . . . [15.9 23.2 1.3 79 75 21.2NGC 2403 . . . . . . [19.3 21.4 2.1 136 67 4.4NGC 2841 . . . . . . [21.7 21.1 4.6 323 69 6.0NGC 2903 . . . . . . [20.0 20.5 2.0 201 78 4.8NGC 2998 . . . . . . [21.9 20.3 5.4 214 63 2.7NGC 3109 . . . . . . [16.8 23.1 1.6 67 62 8.2NGC 3198 . . . . . . [19.4 21.6 2.6 157 64 6.7NGC 5033 . . . . . . [20.2 23.0 5.8 222 30 14.3NGC 5533 . . . . . . [21.4 23.0 11.4 273 75 14.1NGC 5585 . . . . . . [17.5 21.9 1.4 92 76 7.1NGC 6503 . . . . . . [18.7 21.9 1.7 121 66 4.9NGC 6674 . . . . . . [21.6 22.5 8.3 266 78 8.1NGC 7331 . . . . . . [21.4 21.5 4.5 241 65 4.3UGC 2259 . . . . . . [17.0 22.3 1.3 90 63 10.0UGC 2885 . . . . . . [22.8 21.9 13.0 298 68 5.3
literature, we have attempted to be as inclusive as possible,in some cases transforming photographic surface photo-metry from di†erent bands to B when a color is available.
We correct optical surface brightnesses to face-on valuesassuming that the disk is optically thin. This is supported bystatistical studies that show that, except for the innermostregions, spiral galaxies are semitransparent throughouttheir disks (see, e.g., & van AlbadaHuizinga 1992 ;
et al. In general, the outer parts of galaxiesGiovanelli 1994).are optically thin. Measurements of extinction in fore-ground spirals obscuring background galaxies suggestextinction values of D0.3 mag in B in the interarm regionsof the outer parts of a spiral & van der Kruit(Andredakis
& Keel As is not a measure of the1992 ; White 1992). k0actual surface brightness in the center of a galaxy but theintercept of a Ðt to the disk proÐle that depends more on theouter than the inner points, extinction is not a seriousconcern. This is especially true in LSB galaxies where themetallicity and dust content are low The(McGaugh 1994).assumption of optically thin disks is likely to be invalid onlyin edge-on galaxies.
Bulges have little e†ect on the derived of LSB galaxiesk0& Bothun Blok et al. see also(McGaugh 1994 ; de 1995 ; deJong A bigger problem is the great1996a ; Courteau 1996).inhomogeneity of sources of the surface photometryamongst the literature data. However, the range is surfacebrightness in our sample (D5 mag arcsec~2) is much largerthan the most pessimistic error estimates on the surfacebrightnesses.

No. 1, 1998 TESTING THE DARK MATTER HYPOTHESIS 43
TABLE 2
OTHER LSB GALAXIES
Galaxy Limitation
F561-1 . . . . . . . . . . i \ 25¡F563-V1 . . . . . . . . Gross asymmetryF564-V3 . . . . . . . . Gross asymmetryF565-V2 . . . . . . . . V (R) still risingF567-2 . . . . . . . . . . i \ 25¡F571-8 . . . . . . . . . . i \ 90¡F571-V2 . . . . . . . . No B-band dataF574-2 . . . . . . . . . . V (R) still risingF577-V1 . . . . . . . . Gross asymmetryF579-V1 . . . . . . . . Gross asymmetryUGC 1230 . . . . . . i \ 25¡UGC 5005 . . . . . . No B-band dataUGC 5209 . . . . . . UnresolvedUGC 5750 . . . . . . No B-band dataUGC 5999 . . . . . . No B-band data
Sometimes, the rotation curves themselves are lacking.For completeness, we published all our synthesis data in deBlok et al. but not all galaxies are useful for dynami-(1996),cal analyses We observed galaxies with a variety(Table 2).of inclinations, and some are too face-on to be of use here.We nonetheless prefer to accept large errors than to arbi-trarily limit the data and so impose a very liberal inclinationlimit : i[ 25¡.
As well as very face-on galaxies, there are LSB galaxieswith such slowly rising rotation curves that even the synthe-sis observations do not reach the Ñat portion of the rotationcurve. In others, substantial asymmetries are present. This isnot an uncommon feature of galaxies generally &(RichterSancisi and calls into question the assumption of cir-1994)cular orbits on which dynamical analyses are based. Hencethese galaxies are also excluded.
The list of excluded galaxies in is not preciselyTable 2identical to that for our rotation curve Ðts Blok &(deMcGaugh because that is a di†erent sort of1997 ; Paper III)analysis. The Ðts depend to a large extent on the shape ofthe rotation curve that can be sensitive to the resolution ofthe observations. In this analysis, we are concerned onlywith the amplitude of the rotation curve, so we canV
cproceed if is reasonably well deÐned.VcSome tests are less sensitive to these limitations than
others, so it will sometimes be possible to make use of thegalaxies in However, unless so noted, the sample isTable 2.restricted to those galaxies listed in This sample isTable 1.not complete in any volume-limited sense, but that is notthe goal of this work. Our aim here is to represent as broadas possible a range of the relevant physical parameters. Thecollected data span factors of 4000 in luminosity, 30 in size,and nearly 100 in surface brightness. This large dynamicrange in surface brightness with good sampling of the LSBregime is the essence of the new contribution of this work.
3. DEFINITIONS
Here we explicitly deÐne the symbols and notation wewill use. The optical luminosity of a galaxy will be denotedin the usual way by and the corresponding absoluteL
Omagnitude by where O denotes the relevant bandpass.MO,
Unless otherwise speciÐed, all optical quantities are B-bandmeasurements. To symbolically distinguish between abso-lute magnitude and mass, the latter will be denoted by M.
The light distribution of an exponential disk is character-
ized by the central surface brightness and the scale lengthk0h. As the intercept and slope of a Ðt to the light proÐle, thesedescribe the global luminous surface density and size ofdisks. It is sometimes convenient to discuss surface bright-ness in mag arcsec~2, and sometimes in linear units L
_pc~2. In general, we will use k to specify a surface bright-ness, & to specify a luminous surface density, and p tospecify a mass surface density. The total luminosity of thedisk component is of course simply related to the diskparameters by L \ 2n&0 h2.
An important quantity is the mass-to-light ratio, whichwe will denote as !. We need to distinguish several di†erentmass-to-light ratios :
is the total mass-to-light ratio.1. !Tis the observable dynamical mass-to-light ratio.2. !o is the mass-to-light ratio of the stars.3. !*
The latter relates stellar mass to observable luminosity ; itincludes any remnants that occur in the natural course ofstellar evolution (e.g., white dwarfs) but not baryons in thegas phase. The total mass-to-light ratio includes all mass!
Tand encompasses the entirety of any halo. Since MP R fora Ñat rotation curve, and there exists no clear evidence of anedge to any halo mass distribution, is a purely theoreti-!
Tcal construct. It is nonetheless useful to keep in mind whendiscussing the observable mass-to-light ratio This!
o.
includes all mass (including dark matter) within some Ðniteobservable radius For the usual assumption of spher-R
o.
icity, the mass within isRo
M(Ro) \ R
oV 2(R
o)/G . (4)
Deviations from sphericity can complicate this equation,but only by geometrical factors. They do not alter the basicfunctional dependence that is the issue of relevance here.
The value of G is known, and L , R and V are directlymeasured. The quantities and are thus uniquelyM(R
o) !
odetermined by If exceeds what is reasonableequation (4). !ofor we infer the presence of dark matter.!
*,
The absolute mass inferred depends on the distance scalethat enters through R (V is distance independent for theredshifts that concern us). The choice of is not importantH0to the shape derived for trends of with optical properties.!
oThe absolute value of will of course shift with changes to!othe distance scale.
The choice of is important. It is tempting simply toRotake this as the largest radius measured. However, this
depends more on the details of the observations than any-thing intrinsic to a galaxy. It is therefore necessary to makea sensible choice for that can systematically be applied toR
oall disk galaxies. Since as R becomes large, oneV (R) ] Vcobvious stipulation is that be sufficiently large that theR
orotation curves have become essentially Ñat. The rotationcurves of LSB galaxies are observed to rise slowly Blok(deet al. and in some cases the Ñat portion has not yet1996),been reached at the last measured point. These galaxiesmust be excluded from analysis. In most cases, the rotationcurves are still rising slightly but becoming asymptoticallyÑat. We proceed if the gradient in the outer slope is small(following see Fig. 11 of Blok et al.Broeils 1992 ; de 1996).The actual observed value is used, not the apparent asymp-totic value. Another stipulation in deÐning is that itR
ocontain essentially all of the luminosity of the galaxy, sothat has the obvious meaning. A further requirement is!
o

44 MCGAUGH & DE BLOK Vol. 499
that not be so large as to exceed the last measured pointRoof the observations.
Ideally, we would like to relate to the extent of theRomass distribution. Presumably dark halos have some sort of
edge, which we will denote by Since we can not see theRH.
dark matter, it is impossible to relate to withoutRo
RHsomehow assuming the answer. Observations are incapable
of uniquely deconvolving the contribution of luminous anddark mass into any useful scale radius (see, e.g., Albadavan& Sancisi & Feinswog Blok &1986 ; Lake 1989 ; deMcGaugh 1997).
The only observationally available, fair measure of adiskÏs size is the scale length h. Isophotal radii like areR25meaningless for LSB galaxies : the dimmest objects studiedhere have so by deÐnition. The e†ectivek0B 25, R25B 0(half-light) radius is proportional to the scale length for puredisk systems, but depends on the bulge component ingeneral. We are concerned here with deÐning a radius forthe rotating disk, so the scale length is preferable to thee†ective radius.
It might seem preferable to deÐne a half-mass radius ofthe observable matter by combining stars and gas.However, this requires that molecular gas be mapped aswell as the H I and optical light. Even if such data wereavailable, some assumption about and the con-!
*CO/H2version factor would still have to be made.
We therefore choose to deÐne in units of h, in particu-Rolar Most rotation curves have reached theirR
o\ 4h.
asymptotic velocities by 3 scale lengths, while the last mea-sured point for the bulk of the data is around 5h. Four scalelengths contains 91% of the luminosity of a pure exponen-tial disk extrapolated to inÐnity, and disks are generallythought to truncate around 4 or 5 scale lengths der(van
Kruit A choice of 5h, or any other deÐnition based on1987).the disk light distribution, simply inserts a multiplicativefactor.
As a matter of nomenclature, we will refer to the observ-able gas and stars as ““ baryonic ÏÏ matter and treat the darkmatter as a distinct component of unknown composition.
4. OBSERVATIONAL FACTS
Empirical results about the rotation curves and whatthey imply for the dependence of the mass discrepancy onthe optical properties of galaxies can be summarized inde-pendently of any theoretical framework by the followingfour facts :
1. All disk galaxies obey the same Tully-Fisher relation,irrespective of surface brightness or bandpass (Fig. 1 ;
et al. et al. et al.Sprayberry 1995 ; Zwaan 1995 ; Ho†man& Verheijen1996 ; Tully 1997).
2. At a given luminosity, the shapes of rotation curvesV (R) vary systematically with surface brightness (Fig. 2).When R is measured in physical units (kpc), lower surfacebrightness galaxies have rotation curves that rise moregradually. When R is measured in terms of disk scalelengths, the shape of V (R/h) is more similar, though notnecessarily identical (see Fig. 8 of Blok et al.de 1996).
3. The mass discrepancy manifests itself at progressivelysmaller radii in dimmer galaxies de Blok &(Fig. 3 ;McGaugh see also & van Gorkom1996, 1997 ; Casertano
Zee et al.1991 ; Broeils 1992 ; van 1997).4. The severity of the mass discrepancy is strongly corre-
lated with the central surface brightness of the disk (Fig. 4 ;Blok et al. This is the !-& relation et al.de 1996). (Zwaan
1995).
FIG. 1.ÈTully-Fisher relation for spiral galaxies over a large range in surface brightness. The B-band relation is shown; the same result is obtained in allbands. In the left-hand panel, the ““ authentic ÏÏ Tully-Fisher relation is shown with the abscissa being the velocity width of the 21 cm line observed by singledish radio telescopes. Corrections have been applied as per & Fouque� as discussed by et al. In the right-hand panel, theTully (1985) Zwaan (1995).““ intrinsic ÏÏ Tully-Fisher relation is plotted with measured from full rotation curves plotted along the abscissa. The velocity measurements in each panelV
care completely independent, and there is little overlap between the samples. The lines are Ðts to the data ; though there is a perceptibly di†erent slope, to agood approximation measures Open symbols in the left-hand panel are an independent sample taken to deÐne the Tully-FisherW 20c D2V
c. (Broeils 1992)
relation (solid line). Solid symbols are galaxies binned by surface brightness : ( Ðlled stars) ; ( Ðlled squares) ; ( Ðlledk0\ 22 22\k0\ 23 23 \k0\ 24triangles) ; and ( Ðlled circles). Clearly, galaxies fall on the same Tully-Fisher relation irrespective of surface brightness.k0[ 24

No. 1, 1998 TESTING THE DARK MATTER HYPOTHESIS 45
FIG. 2.ÈLog-log plots showing the shapes of the rotation curves of twogalaxies, one of high surface brightness (NGC 2403 ; open circles) and oneof low surface brightness (UGC 128 ; Ðlled circles). The two galaxies havevery nearly the same asymptotic velocity and luminosity, as required byV
cthe Tully-Fisher relation. However, they have central surface brightnessesthat di†er by a factor of 13. Even though the asymptotic velocities aresimilar, occurs at a very small radius in the high surface brightnessV
cgalaxy but not until a very large radius in the LSB galaxy. Indeed, therotation curve of UGC 128 is still rising at the last measured point of NGC2403, which occurs at RB 9h.
FIG. 3a
FIG. 3b
FIG. 3.ÈRadius of dark matter domination in disk galaxies ofR2>1di†erent (a) absolute magnitude and (b) central surface brightness. Darkmatter domination is deÐned to occur when the mass discrepancy reachesa factor of 2, even attributing as much mass to the disk as possible(maximum disk). That is, is the radius whereR2>1 M
T(R2>1)/Mdisk(R2>1) º2. Bright galaxies do not require much dark matter until quite large radii,
whereas dim galaxies are dark matter dominated down to nearly R\ 0.The mass discrepancy does not set in at any particular length scale.
4.1. Fact 1The relationship between luminosity and linewidth has
long been known & Fisher That the same(Tully 1977).relation holds for all surface brightnesses has been obtainedindependently by et al. et al.Sprayberry (1995), Zwaan
et al. and & Verheijen(1995), Ho†man 1996, Tully 1997.These di†erent works all obtain the same observationalresult but o†er varying interpretations of it.
The interpretation depends entirely on the basic assump-tions one must make. One obvious assumption is that lighttraces mass, in which case LSB galaxies should rotateslowly for their luminosity and not obey the Tully-Fisherrelation. This occurs because R is larger for the same L ,reducing V in et al. That LSBequation (4) (Zwaan 1995).galaxies are not expected to fall on the Tully-Fisher relationwas Ðrst discussed by Huchra, & MouldAaronson, (1979)and et al. using this assumption. OtherRomanishin (1982)assumptions can also be made (discussed in detail but° 5)generally result in some sort of shift of LSB galaxies o† theTully-Fisher relation (see, e.g., et al. TheDalcanton 1995).only scenario in which no shift is expected is one in whichhalos of a given mass are identical. This assumption is itselfmotivated by the Tully-Fisher relation, so it o†ers no inde-pendent expectation value. In cases where there is a clearexpectation of a shift, that expectation is not realized.
Indeed, it is already difficult to understand a luminosity-linewidth relation with little scatter. One expects a greatdeal more scatter for plausible initial conditions (see, e.g.,
& Loeb The lack of surface brightnessEisenstein 1995).segregation in the luminosity-linewidth plane complicatesthings much further (as discussed in For now, note that° 5).in a Tully-Fisher relation is obtained for bothFigure 1, W 20cand the velocity width is, as expected, an indicator of theV
c:
rotation velocity. The scatter is greater when the linewidthis used (0.9 vs. 0.6 mag). We cannot say much about theintrinsic scatter of the Tully-Fisher relation since we includelow-inclination galaxies. This naturally increases thescatter, so the intrinsic scatter is presumably smaller thanwhat we measure. The slopes obtained from Fig 1a and 1bare marginally di†erent, being [7 ^ 2 in (a) and [9.4^ 1in (b). This may indicate that is not a perfect indicatorW 20cof the real quantity of interest, V
c.
The most important fact is that there is a strongluminosityÈrotation velocity relation with little intrinsicscatter and a slope indistinguishable from the theoreticalvalue. The details of the bandpass dependence of the slopeare not critical (see Appendix) as we are not trying to estab-lish a calibration of the Tully-Fisher relation, but rathertrying to understand why LSB galaxies follow it at all. Inthis context, we are concerned with the relation of stellarmass to the Ñat rotation velocity The near-infrared isV
c.
thought to be the best indicator of stellar mass, and both Het al. and K & Verheijen band(Aaronson 1979) (Tully 1997)
Tully-Fisher relations have slopes indistinguishable fromthe theoretical expectation, [10.
4.2. Fact 2It is well known that the shape of galaxy rotation curves
is luminosity dependent et al.(Burstein 1982 ; Persic,Salucci, & Stel At a given luminosity, the shape varies1996).systematically with surface brightness in that the rotationcurves of LSB galaxies rise more gradually than do those ofhigh surface brightness galaxies. This behavior is expected iflight traces mass and surface mass density follows from

46 MCGAUGH & DE BLOK Vol. 499
FIG. 4a FIG. 4b
FIG. 4c
FIG. 4.ÈObserved dynamical mass-to-light ratio (in plotted against (a) luminosity, (b) central surface brightness, and (c) scale length. Error!o
M_
/L_
)bars are plotted for a nominal inclination uncertainty of The very strong correlation in (b) is related to the Tully-Fisher relation et al.p
i\ 3¡. (Zwaan 1995)
and cannot be a selection e†ect.
surface brightness in the obvious way. This is indeed thecase at small radii, both for the speciÐc example illustratedin Blok & McGaugh and in general.Figure 2 (de 1996)Moreover, the relative similarity of V (R/h) suggests that thedark halo is strongly coupled to the properties of the disk(see also Paper II).
If surface brightness is a good indicator of mass density,LSB galaxies should not lie on the Tully-Fisher relation, yet
they do. Reconciling facts (1) and (2) proves to be verydifficult and leads to fact (3).
4.3. Fact 3In high surface brightness spiral galaxies, it is generally
possible to attribute essentially all of the observed rotationto the luminous disk out to 3 scale lengths or so by scalingthe disk contribution up to the maximum value allowed by

No. 1, 1998 TESTING THE DARK MATTER HYPOTHESIS 47
the amplitude of the inner part of the rotation curve (Bosma& van Albada1981 ; Kent 1987 ; Sancisi 1987 ; Sanders
This ““ maximum disk ÏÏ solution has led to a general1990).picture in which the luminous material dominates the innerpart of spiral galaxies, and dark matter becomes dominantonly in the outer fringes near the edge of the luminous disk.An important aspect of this picture is that the peak in therotation curve of the exponential disk at R\ 2.2h is compa-rable in amplitude to the circular velocity due to the halo
giving a smooth transition between the[V diskpeak(2.2h) B VH],
two components (the disk-halo ““ conspiracy ÏÏ).The disks of LSB spirals can not be maximal in this sense.
Because they are very di†use, the Newtonian rotationcurves of LSB disks peak at very low amplitudes for(>V
c)
plausible values of the mass-to-light ratio of the stellarpopulation. From a purely dynamical standpoint, there issome room to consider values of that are unreasonably!
*large for the blue stellar populations of LSB galaxies.However, even for (as opposed to reasonable!
*D 10
values of D1 or 2), it is still not possible to attribute avelocity comparable to to the disk. Even larger are notV
c!*allowed by the slow rate of rise of the rotation curves. The
disk simply can not dominate in these galaxies except atvery small radii : the mass discrepancy sets in at essentiallyR\ 0 Only the highest surface brightness disks(Figure 3).can be maximal in the sense that luminous disks dominatesthe inner dynamics, with dark matter becoming importantonly at large radii. There is no reason to believe that asegregation between inner dominance by a disk and outerdominance by a dark matter halo is a general property ofgalaxies.
4.4. Fact 4The severity of the global mass discrepancy, as measured
by the observed mass-to-light ratio is correlated with!o,
both luminosity and surface brightness It is not(Figure 4).correlated with the optical size of the galaxy. The corre-lation with surface brightness is much stronger (R\ 0.88)than with absolute magnitude (R\ 0.46). The scatter in theformer case can plausibly be attributed entirely to obser-vational error, especially considering the very inhomoge-neous sources of the surface photometry. In the case of M
B,
there is substantial real scatter. Absolute magnitude andsurface brightness are themselves weakly correlated(R\ 0.50 in this sample), so it seems likely that the relationbetween luminosity and is caused by the convolution of!
othe strong relation with the lack of a size relation!o-&0through Surface brightness, not luminosity orL P&0 h2.
morphological type, is the variable of greatest interest.
5. THE TULLY-FISHER AND RELATIONS!o-&
The relation between and can be derived from the!o
k0Tully-Fisher relation et al. assuming that the(Zwaan 1995)observed velocity width W is proportional to the asymp-totic rotation velocity and taking RP (L /&)1@2. TheV
c,
latter is true by deÐnition ; the former is empirically con-Ðrmed by the full rotation curve data. Various authors (see,e.g., et al. & Ho†man giveSprayberry 1995 ; Salpeter 1996)apparently conÑicting results, but these stem entirely fromdi†ering deÐnitions of The data are all consistent.R
o.
To discuss possible interpretations of the Tully-Fisherrelation, we make the usual assumptions that the H I gas isin circular orbit and that halos are spher-[a
c\ V 2(R)/R]
ical and dominant where so thatV (R) ] Vc, g
N\
Setting givesGM(R)/R2. ac\ g
N
V 2(R) \GM(R)R
. (5)
These are very basic assumptions, which are widelyemployed ; plausible deviations (e.g., triaxial halos) will notalter the gist of the results. Observationally, the Tully-Fisher relation is
LjP V
cxj , (6)
where is the slope in bandpass j. To relate toxj
equation (5)let us deÐne a mass surface densityequation (6),
p(R) 4M(R)R2 (7)
and make a substitution of variables so that
V 4\G2M2(R)R2 \ G2pM(p) . (8)
By deÐnition, and Here,M(R) \ !j(R)L
jp(R) \ !
j(R)&
j(R).
is the average surface brightness within R (which will&j(R)
decrease as R grows) and is the dynamical mass-to-!j(R)
light ratio within radius R. Both and are strong func-&j
!jtions of R. However, we are concerned only with the relative
functional dependencies, so the actual value of R drops outwhere V (R) \V
c.
In theory,
Vc4P !
j2&
jLj, (9)
while in actuality
Vcxj P L
j. (10)
As discussed by et al. one needs to arrange toZwaan (1995),keep the term constant in order to recover the!
j2&
jobserved Tully-Fisher relation from basic physics. This isoften attributed to a universal constancy of the mass-to-light ratio and FreemanÏs law which states(Freeman 1970),that all spirals have essentially the same surface brightness,
mag arcsec~2. By deÐnition LSB galaxiesk0B 21.65deviate from this value, and should not fall on the sameTully-Fisher relation as Freeman disks if the mass-to-lightratio is constant as generally assumed. shows theFigure 5relation expected from if is constant ; theequation (9) !
orange of surface brightnesses examined is large enough thatthis e†ect would be very readily apparent. Instead of follow-ing this relation, LSB galaxies rigorously adhere to theTully-Fisher relation. The mass-to-light ratio mustsomehow be Ðne tuned to compensate.
Consider the error budget required. In magnitude units,the Tully-Fisher relation is M
j\ [10 log V
c] C,
assuming Hencexj\ 4.
dM \ 4.34dV
cVc
, (11)
so an intrinsic scatter of \0.6 mag stems from a modest\14% intrinsic variation in Disk and halo mustV
c.
combine to specify very precisely. More generally, theVcvariation is
o dM o2\ o dk0 o2] 18.86K dV
cVc
K2] 1.18K d!!
K2. (12)

48 MCGAUGH & DE BLOK Vol. 499
FIG. 5.ÈResiduals about the Tully-Fisher relation as a function ofsurface brightness. The residual in luminosity is shown in the upper panel,while that in velocity is shown in the lower panel. The triangles are datawhere only the linewidth has been measured, while the circles areW 20cgalaxies with measured from a full rotation curve. Also shown as solidV
clines are the prior expectations for the relation between rotation lumi-nosity or velocity and surface brightness for a Ðxed mass-to-light ratio.More di†use, lower surface brightness galaxies require a higher mass andluminosity to achieve the same rotation velocity, or they should peak atmuch lower velocities at the same mass. Though these statements followdirectly from V 2\ GM/R and the assumption of constant neither are!
o,
trueÈgalaxies rigorously adhere to the Tully-Fisher relation (dashed lines)rather than following the expected trend (solid lines).
A 1 mag shift in should translate directly into 1 mag ink0M. Even for disks that obey the Law, theFreeman (1970)scatter in (0.35 mag) should propagate directly into thek0Tully-Fisher relation. Here we have disks spanning nearly 5mag in The mass-to-light ratio must be Ðne tuned tok0.compensate, with essentially zero scatter.
5.1. ImplicationsThe observed mass-to-light ratio as we have deÐned it!
oincludes all mass within some arbitrary radius The exactRo.
deÐnition of is not essential, as long as we choose a ÐxedRonumber of scale lengths that encompass the luminous
matter and reach the Ñat part of the rotation curve. Then,using equation (9),
!o\ j!
*fb
f*
P &~1@2 , (13)
where is the mass-to-light ratio of the stellar population,!* is the baryonic mass fraction, isf
b\M
b/M
Tf*
\M*/M
bthe fraction of baryonic disk mass in the form of stars, and
is the fraction of the total mass encom-j \M(Ro)/M
Tpassed by the edge of the disk. Note that since MP R,where is the halo radius (edge). We thusj BR
o/R
HR
Hdecompose into four fundamental parameters : two!oinvolve galaxy evolution and two involve galaxy(!
*, f
*)
formation j). The requirement now implies( fb, !
oP&~1@2
that a combination of four parameters must be Ðne tunedwith surface brightness. Let us examine each of them inturn.
5.2. Evolutionet al. attributed the observed adherence toZwaan (1995)
the Tully-Fisher relation to evolutionary regulation. Froma theoretical perspective, not taking the surface brightnesse†ects into account, & Loeb came to theEisenstein (1995)same conclusion in more general terms. They showed that itwas very difficult to obtain a Tully-Fisher relation with thesmall observed scatter from plausible initial conditions.There should always be some scatter in the density structureof halos so that velocity is not so precisely speciÐed by totalmass and luminosity. Some evolutionary regularizing e†ectsmust thus reduce the scatter. The physical mechanism bywhich this occurs is unknown. Feedback from star forma-tion activity is often invoked, but it is hard to see how thestochastic energy input of massive stars will have a strongregularizing e†ect. Since the nature of the evolutionaryregulation is unclear, let us simply examine the conse-quences for and!
*f*.
5.2.1. Stellar Mass-to-L ight Ratios
The mass-to-light ratio of a stellar population is mea-sured directly in our own Milky Way, where in B!
*B 1.7
& Gilmore This appears to be typical of(Kuijken 1989).high surface brightness disks, with substantial variation anduncertainty. Ðnds fromBottema (1997) !
*\ 1.8 ^ 0.5
velocity dispersions. For LSB galaxies, one infers slightlysmaller from their colors, D1 with great uncertainty!
* & Bothun Blok et al. There is a(McGaugh 1994 ; de 1995).lot of real scatter in color at any given surface brightness,implying substantial scatter in !
*.
The inferred trend of with is much smaller in mag-!*
&0nitude than the relation and has the opposite sign. In!o-&0addition to what the colors imply for the slow rate of!
*,
rise of the rotation curves (de Blok & McGaugh 1996 1997)dynamically rules out the large values that are needed in!
*LSB galaxies to explain the relation. The peak ampli-!o-&0tudes of the rotation curves of the stellar disk are much
smaller than so the stellar disks alone cannot cause theVcTF relation, let alone the Ðne tuning. The only way to!
o-&0alter this conclusion is to drop the usual assumption that
light traces stellar mass and make a strong function of!*radius [the unlikely form would be!
*PR~1 exp (R/h)
required]. It is therefore unlikely that the relation can!o-&0be caused by a relation.!
*-&05.2.2. Stellar Mass Fractions
The fraction of the baryonic disk mass that is in the formof stars is well correlated with surface brightnessf
*(Fig. 6 ;
& de Blok The correlation goes in theMcGaugh 1997).correct sense, with LSB galaxies having relatively fewerstars. The slope is approximately correct, though the corre-lation is not as tight as that with !
o.
It is therefore tempting to attribute the fact that !oP
to This would mean a regulatory mecha-&0~1@2 f*
P &[email protected] that somehow maintains a mass fraction of stars

No. 1, 1998 TESTING THE DARK MATTER HYPOTHESIS 49
FIG. 6.ÈFraction of baryonic mass in the form of stars f*
\M*/M
bplotted against (see & de Blok There is a relation&0 McGaugh 1997).but this is not sufficient to explain the relation.f
*P&00.17, !
o-&0
appropriate to both the Tully-Fisher and relations. It!o-&0is possible to check this since the gas mass is directly mea-
surable from the 21 cm Ñux. That is, whereMgas \ gMH I,g \ 1.4 is appropriate for solar metallicity atomic gas.Molecular gas does not seem to be common in LSB galaxies
et al. and is presumably distributed like(Schombert 1990)the stars. If this is the case, it is subject to the same dynami-cal constraints as Moreover, the approach to evolution-!
*.
ary regulation taken here is motivated by the similarity ofthe and M(H I)/L - relations. This motivation!
o-&0 &0would vanish if molecular gas were more important than
the H I.We can correct for the atomic gas simply by subtrac-!
oting its mass from the total. This removes the term fromf*equation (13) :
!oc \M(R
o) [MgasL
\ j!*
fb
. (14)
Though this accounts for the M(H I)/L - relation, it makes&0no real di†erence to the problem The bary-!o-&0 (Fig. 7).
onic mass is too small a part of the total mass to mattermuch to the problem, even within the optical edge of LSBdisks. Evolutionary regulation simply cannot solve theproblem.
5.3. FormationThe evolutionary parameters just discussed fail to have
an impact on the problem because LSB galaxies are darkmatter dominated throughout. The evolution of the bary-
relation, with and without gas. The solid trianglesFIG. 7.È!o-k0include all mass within (identical to while the openR
o\ 4h Fig. 4b),
squares are the same quantity with the gas mass subtracted (Moc\
the factor 1.4 is the standard correction for heliumRoV
c2G~1 [ 1.4MH I ;and metals.) The downward apex of each triangle points at the correspond-
ing square for the same galaxy. Correcting for has no impact on thef*relation other than a very small downward shift.!
o-k0
onic disk is almost irrelevant. This leaves the conditions offormation.
5.3.1. Variations in the Baryon Fraction
To explain the relation using the baryon fraction!o-&0 f
b,
one can simply assume that halos contain di†erent amountsof baryons. This is of course just an ad hoc assumption.Nominally, one would expect a universal baryon fractionwith some modest amount of cosmic scatter.
This approach requires that the baryon fraction beuniquely related to the disk central surface brightness :
fbP &01@2 . (15)
Since the Tully-Fisher relation must be maintained withimplies Halos ofMP L P&0 h2, equation (15) MP h2f 2
b.
a given M may have di†erent baryon fractions butsomehow form larger or smaller disks to counterbalancethis. Halos with low must make up the deÐciency in lumi-f
bnosity they su†er from low surface brightness by forminglarger disks : Why this should be the case isf
bP h~1.
unclear. Beyond stating these requirements, little can besaid because the hypothesized solution is so arbitrary.
5.3.2. Enclosed Mass and Spin
The situation is only a little better with j. In this case, therequirement is
j P &0~1@2 . (16)

50 MCGAUGH & DE BLOK Vol. 499
Since the di†erence in this case isj \M(Ro)/M
TB R
o/R
H,
that the disks of lower surface brightness galaxies stretchfurther out into their halos. This has the built-in virtue ofexplaining the increasing dark matter domination of lowersurface brightness disks while keeping the global baryonfraction Ðxed. In e†ect, this asserts that the mass densityp(R) is unrelated to the surface brightness &(R). Then, if p isa constant in the lack of a shift in the Tully-equation (8),Fisher relation follows and the relation just reÑects the!
o-&
di†erence in p(R) and &(R). We measure increasing mass-to-light ratios with decreasing surface brightness because
just measures a systematically greater portion of the!o(R
o)
global !T
: !o/!
TD R
o/R
HD j D &0~1@2.
A consequence of this approach is that measuring oneparameter of the optical light distribution, the centralsurface brightness, immediately tells one the extent of thedark matter relative to the light. Specifying the distributionof either j or & immediately determines the distribution ofthe other. By the variational principle,
d&&
\ [2djj
. (17)
Our parameter j can be related to the theoretical conceptof the spin parameter
js\J oE o1@2
GM5@2 (18)
This parameterizes the angular momentum(Peebles 1971).acquired by protogalaxies from tidal torques. The details ofthis process are uncertain, but all that matters here is thatwithin this framework dissipative baryonic collapse is haltedby angular momentum. Collapse from the initial of thej
shalo and protogalaxy stops when This gives thejsdisk] 1.
condition Objects with high primordialj B Ro/R
HBj
s.
spin will collapse less than low spin objects.jsPresuming that spin is the underlying reason for j pro-
vides a test. Equations and give the mapping from(18) (19)spin to surface brightness :
k0\ 5 logAj
sjs*B
] k0* . (19)
This can be used to compare the observed distribution /(k0)Jong with the spin distribution(McGaugh 1996a ; de 1996b)predicted by numerical models. We are free to Ðt the param-eters and in order to obtain a Ðt, but the shapes of thej
s* k0*distributions are speciÐed by and henceequation (19)
provide a test.There have been various theoretical attempts to predict
the distribution of the spin parameter (see, e.g., &EfstathiouJones & Efstathiou & Loeb1979 ; Barnes 1987 ; Eisenstein
& Bartelmann These are all rather1995 ; Steinmetz 1995).uncertain. Nevertheless, there seems to be general con-sensus that the distribution of spins is broad and approx-imately symmetric about some typical value, j
sB 0.07
^ 0.03. Two typical examples are plotted together with thesurface brightness data in for andFigure 8 j
s* \ 0.03 k0* \
21.5. These values are chosen to put the theoretical distribu-tions in the same vicinity as the data, but we do not attempta formal Ðt because of the great uncertainty in the predictedspin distribution. A tolerable match is found given the largeerror bars.
At the moment, there is no test in the shape of the surfacebrightness distribution at the low surface brightnesses.
FIG. 8.ÈSurface brightness distribution (data points from varioussources) together with the distribution expected from the variation of spinparameters. Solid line : & Jones Dashed line :Efstathiou (1979). Eisenstein& Loeb Theory predicts a very broad distribution with curvature(1995).inconsistent with observations. Worse, a cuto† must be inserted by hand toreconcile the high surface brightness end of /(k0).
Because of the stretching imposed by theequation (19),theoretical prediction of the spin distribution needs to bemade at quite high resolution in to provide a useful test.j
sSimilarly, the observed surface brightness distributionneeds to be determined to much greater accuracy.
A sharp feature in the surface brightness distributionoccurs at high surface brightness that is not reÑected in thespin distributions. The picture predicts a largej
s] k0number of high surface brightness disks that are not found
observationally. In order to match the high surface bright-ness cuto†, one must invoke some critical phenomenon at
For example, one might suppose that protoga-js* B 0.03.
laxies with fail to form disks, perhaps becomingjs\ 0.03
ellipticals instead. This might plausibly come about ifdestructive disk instabilities set in when a critical surfacedensity is exceeded.
The environmental dependence of and provides ak0 jsconstraint that is independent of The numerical simu-/(k0).lations generally agree that is only weakly correlated withj
senvironment & Bartelmann if at all(Steinmetz 1995)& Efstathiou In contrast, putatively high-(Barnes 1987).
spin LSB galaxies very clearly reside in low-density environ-ments et al. et al.(Schombert 1992 ; Bothun 1993 ; Mo,McGaugh, & Bothun It is thus difficult to under-1994).stand the observed environments of LSB galaxies if spin isthe principal parameter determining the surface brightness.
6. ROTATION CURVE SHAPES
So far, we have discussed possible interpretations of onlyobservational fact (1), the universality of the Tully-Fisherrelation. That is, we have attempted only to understandwhy is correlated with L . This proves difficult since L PV
cdoes not follow from V 2\ GM/R. The full shapes of theVc4
rotation curves complicate matters even further.
6.1. Expectation ValuesIn order to interpret the shapes of rotation curves, it is
necessary to establish some prior expectation. This requiresa deeper investigation of the subject of galaxy formationthan we have made so far. Galaxy formation is a difficultsubject, and even very sophisticated modeling e†orts haveyet to reach the point where the formation and evolution of
No. 1, 1998 TESTING THE DARK MATTER HYPOTHESIS 51
an individual galaxy can be studied in detail. Buildingsophisticated models requires specifying a cosmology anddeciding what the dark matter is. Our interest here is inplacing constraints free of such assumptions, so we take adi†erent tack. We construct two models that illustrate themost obvious possibilities. We intentionally keep thesemodels simple to illustrate the important physical ideas.More complex models are usually special cases of one or theother.
Disk galaxies are thought to be composed of two basiccomponents, a dynamically cold disk and a dynamically hotdark matter halo. To construct our models, we will assumethat the disk is purely exponential. This is not precisely true,of course, but it is an adequate approximation for our pur-poses. We will also make the usual assumption that darkmatter halos are isothermal spheres.
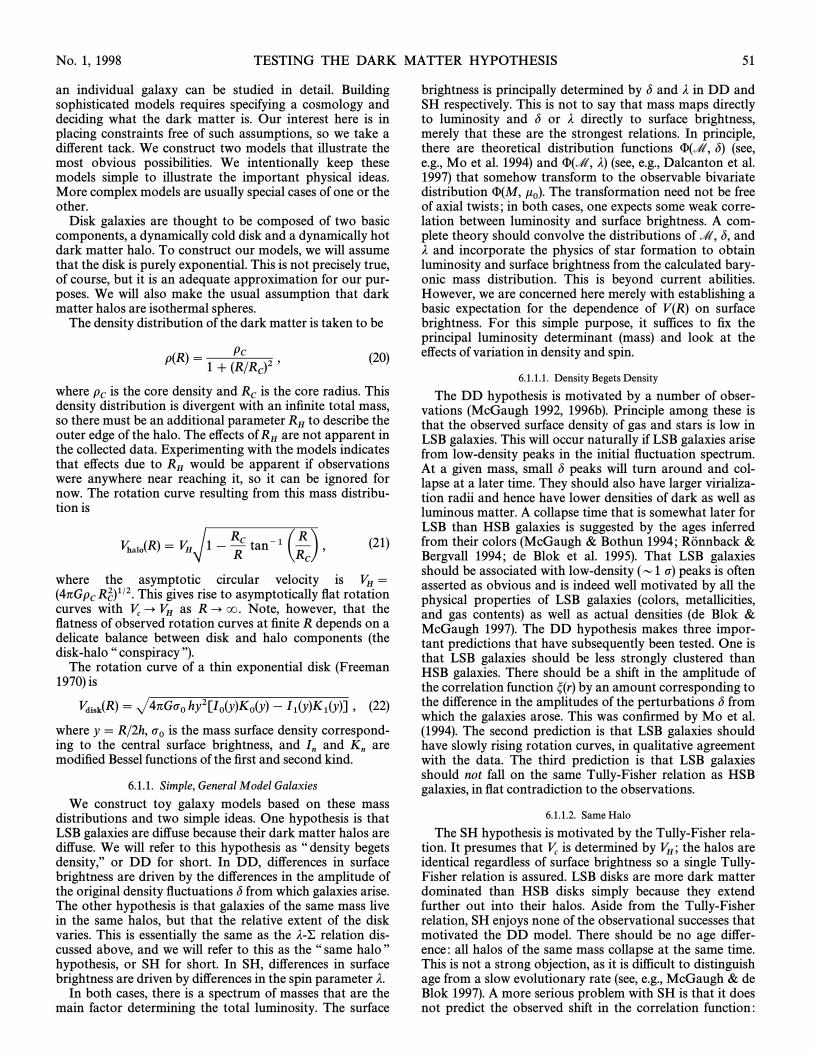
The density distribution of the dark matter is taken to be
o(R) \ oC
1 ] (R/RC)2 , (20)
where is the core density and is the core radius. ThisoC
RCdensity distribution is divergent with an inÐnite total mass,
so there must be an additional parameter to describe theRHouter edge of the halo. The e†ects of are not apparent inR
Hthe collected data. Experimenting with the models indicatesthat e†ects due to would be apparent if observationsR
Hwere anywhere near reaching it, so it can be ignored fornow. The rotation curve resulting from this mass distribu-tion is
Vhalo(R)\ VH
S1 [ R
CR
tan~1A RR
C
B, (21)
where the asymptotic circular velocity is VH
\This gives rise to asymptotically Ñat rotation(4nGo
CR
C2)1@2.
curves with as R] O. Note, however, that theVc] V
HÑatness of observed rotation curves at Ðnite R depends on adelicate balance between disk and halo components (thedisk-halo ““ conspiracy ÏÏ).
The rotation curve of a thin exponential disk (Freemanis1970)
Vdisk(R) \ J4nGp0 hy2[I0(y)K0(y) [ I1(y)K1(y)] , (22)
where y \ R/2h, is the mass surface density correspond-p0ing to the central surface brightness, and and areIn
KnmodiÐed Bessel functions of the Ðrst and second kind.
6.1.1. Simple, General Model Galaxies
We construct toy galaxy models based on these massdistributions and two simple ideas. One hypothesis is thatLSB galaxies are di†use because their dark matter halos aredi†use. We will refer to this hypothesis as ““ density begetsdensity,ÏÏ or DD for short. In DD, di†erences in surfacebrightness are driven by the di†erences in the amplitude ofthe original density Ñuctuations d from which galaxies arise.The other hypothesis is that galaxies of the same mass livein the same halos, but that the relative extent of the diskvaries. This is essentially the same as the j-& relation dis-cussed above, and we will refer to this as the ““ same halo ÏÏhypothesis, or SH for short. In SH, di†erences in surfacebrightness are driven by di†erences in the spin parameter j.
In both cases, there is a spectrum of masses that are themain factor determining the total luminosity. The surface
brightness is principally determined by d and j in DD andSH respectively. This is not to say that mass maps directlyto luminosity and d or j directly to surface brightness,merely that these are the strongest relations. In principle,there are theoretical distribution functions '(M, d) (see,e.g., et al. and '(M, j) (see, e.g., et al.Mo 1994) Dalcanton
that somehow transform to the observable bivariate1997)distribution '(M, The transformation need not be freek0).of axial twists ; in both cases, one expects some weak corre-lation between luminosity and surface brightness. A com-plete theory should convolve the distributions of M, d, andj and incorporate the physics of star formation to obtainluminosity and surface brightness from the calculated bary-onic mass distribution. This is beyond current abilities.However, we are concerned here merely with establishing abasic expectation for the dependence of V (R) on surfacebrightness. For this simple purpose, it suffices to Ðx theprincipal luminosity determinant (mass) and look at thee†ects of variation in density and spin.
6.1.1.1. Density Begets Density
The DD hypothesis is motivated by a number of obser-vations (McGaugh Principle among these is1992, 1996b).that the observed surface density of gas and stars is low inLSB galaxies. This will occur naturally if LSB galaxies arisefrom low-density peaks in the initial Ñuctuation spectrum.At a given mass, small d peaks will turn around and col-lapse at a later time. They should also have larger virializa-tion radii and hence have lower densities of dark as well asluminous matter. A collapse time that is somewhat later forLSB than HSB galaxies is suggested by the ages inferredfrom their colors & Bothun &(McGaugh 1994 ; Ro� nnbackBergvall Blok et al. That LSB galaxies1994 ; de 1995).should be associated with low-density (D1 p) peaks is oftenasserted as obvious and is indeed well motivated by all thephysical properties of LSB galaxies (colors, metallicities,and gas contents) as well as actual densities Blok &(deMcGaugh The DD hypothesis makes three impor-1997).tant predictions that have subsequently been tested. One isthat LSB galaxies should be less strongly clustered thanHSB galaxies. There should be a shift in the amplitude ofthe correlation function m(r) by an amount corresponding tothe di†erence in the amplitudes of the perturbations d fromwhich the galaxies arose. This was conÐrmed by et al.Mo
The second prediction is that LSB galaxies should(1994).have slowly rising rotation curves, in qualitative agreementwith the data. The third prediction is that LSB galaxiesshould not fall on the same Tully-Fisher relation as HSBgalaxies, in Ñat contradiction to the observations.
6.1.1.2. Same Halo
The SH hypothesis is motivated by the Tully-Fisher rela-tion. It presumes that is determined by the halos areV
cVH;
identical regardless of surface brightness so a single Tully-Fisher relation is assured. LSB disks are more dark matterdominated than HSB disks simply because they extendfurther out into their halos. Aside from the Tully-Fisherrelation, SH enjoys none of the observational successes thatmotivated the DD model. There should be no age di†er-ence : all halos of the same mass collapse at the same time.This is not a strong objection, as it is difficult to distinguishage from a slow evolutionary rate (see, e.g., & deMcGaughBlok A more serious problem with SH is that it does1997).not predict the observed shift in the correlation function :

52 MCGAUGH & DE BLOK Vol. 499
spin and environment are not correlated & Bar-(Steinmetztelmann & Efstathiou An additional1995 ; Barnes 1987).environmental e†ect must be invoked to produce this.Whatever mechanism causes LSB galaxies to be isolatedmust be quite strong, as their isolation is clear out to [1Mpc et al. This is much too large a range for(Bothun 1993).tidal forces to be e†ective, especially as the dark matterdomination of LSB galaxies makes them quite robustagainst even strong tidal encounters McGaugh, &(Mihos,de Blok Yet so compelling is the constraint imposed1997).by the Tully-Fisher relation that a number of models for theformation of LSB galaxies have already appeared that areprimarily motivated by this observation (see, e.g.,
et al. Though more com-Dalcanton 1997 ; Navarro 1996a).plicated than our illustrative SH model, these modelsreduce to the same basic scenario and enjoy the samevirtues and su†er the same vices as SH.
The level of the Ñat part of the rotation curve is onlyVcone piece of the information contained in V (R). The full
shape of the rotation curves provide the most complete testof both DD and SH hypotheses. To see what these predict,let us construct a nominal HSB model with h \ R
C\ 1
In general, this is approximately true in HSB gal-(Fig. 9).axies (see, e.g., Bosma, & PapaioannouAthanassoula, 1987 ;
Blok & McGaugh thatBroeils 1992 ; Rhee 1996 ; de 1997)are frequently modeled in this way (see, e.g., Hernquist
We assume the disks are maximal with as1993). V diskpeak B VH,
suggested by the disk-halo conspiracy. This is a conserva-tive assumption for testing the shapes of rotation curves,since the di†erences between HSB and LSB halos are mini-mized in this case Blok & McGaugh In practice,(de 1997).
this means This results inVH
\ (nGp0 h)1@2\ 1. V diskpeak Bas found empirically in HSB galaxies Blok0.8Vtotal(2.2h), (de
& McGaugh 1997).The resulting null HSB model is plotted in the top panels
of The expected shape of the rotation curve of anFigure 9.LSB galaxy (bottom panels of follows from the nullFig. 9)HSB model and each hypothesis by simple scaling. Weassume that the mass of the HSB and LSB galaxy are thesame, both disk and halo, so that the baryon fraction is thesame. The same disk mass imposes the requirement that
be the same. This gives the scaling required to calcu-p0 h2late the rotation curves under each hypothesis. For illustra-tion, we choose h(LSB)\ 3 (the di†erence between NGC2403 and UGC 128), which gives top0(HSB)/p0(LSB)\ 9conserve mass.
Under the DD hypothesis, the halo should be di†use likethe disk. We assume This is not the onlyR
C\ h(LSB)\ 3.
possibility, but all that matters for this test is that there issome stretching of the halo. The resulting rotation curve isplotted in the lower left-hand panel of This isFigure 9.essentially just a stretched version of the HSB model,sharing the same disk-halo conspiracy but not the same V
c,
since R is larger in V 2\ GM/R.Under the SH hypothesis, the halo is the same so R
C\ 1
even though h(LSB)\ 3. For the baryon fractions to be thesame, the LSB galaxy must reach to much nearer the edgeof the halo than the HSB, though this is presumably still along way o†. The resulting V (R) is dominated by the halo atall radii and by construction reaches the same V
c.
We can now test the models against the data. The HSBmodel has been constructed to typify a disk with the
FIG. 9.ÈToy galaxy model rotation curves with V and R in normalized physical units. Each panel represents the expectations of the simple modelsdescribed in the text. The dashed line is the contribution of the halo and the dotted line the contribution of the disk to the total rotation curve (solid line). Insetin each panel is a schematic representation of the model. Top panels are a Ðducial HSB galaxy of high surface density residing in a high-density halo. Lowerpanels are the expectations for LSB galaxies in two scenarios. In the left-hand panel is the ““ density begets density ÏÏ (DD) hypothesis with a di†use LSB galaxyresiding in a di†use halo. In the right-hand panel is the ““ same halo ÏÏ (SH) case with a di†use LSB galaxy extending out to near the edge of a dense halo. Theexpected shapes of the rotation curves are strikingly di†erent : V (R) rises slowly and does not reach the same as an HSB of the same mass in the DD case,V
cwhile in the SH case, this happens after a rapid rise.

No. 1, 1998 TESTING THE DARK MATTER HYPOTHESIS 53
Freeman central surface brightness The LSBk0\ 21.65.model is a factor of 9 lower in surface density, correspond-ing to assuming is similar. There are fourk0 \ 24.04, !
*galaxies with reasonable data within 0.2 mag of this surfacebrightness. These are plotted in by scaling R byFigure 10the observed scale length h and V so that V
c\ 1.
The data are not well predicted by either model. The DDmodel predicts a gradual rise of V (R), which is indeed seenat small R. However, V (R) continues to rise to a level wellV
cin excess of that anticipated by DD, which does not predicta universal Tully-Fisher relation. The SH model has thecorrect (indeed, it was constructed to do just this), butV
cpredicts that V (R) should rise much more rapidly than itactually does. To be consistent with observations, the halosof LSB galaxies must indeed by more di†use (the basis ofthe DD model). Yet somehow they must also attain the V
cdictated by the Tully-Fisher relation (the basis of SH).Neither DD nor SH alone adequately explain the observ-
ations. It seems that some hybrid is required. Perhaps aconvolution of the d and j distributions is needed, withboth initial density and spin contributing to determine thesurface brightness. Indeed, a proper theory should accountfor both e†ects ; these simple models assume that one or theother dominates.
The hybrid approach has its own problems. To match theenvironments of LSB galaxies and the slow rate of rise oftheir rotation curves, DD must make a substantial contri-bution to the hybrid. However, any mixing of DD with SHdegrades the latterÏs ability to explain the Tully-Fisher rela-tion. A perceptible shift in the normalization with surfacebrightness would be introduced, and the scatter wouldincrease.
Having argued that neither model nor a hybrid is ade-quate, we note that the DD model was able to explain manyof the observations of LSB galaxy densities and ages, anddid successfully predict the slow rate of rise of LSB galaxyrotation curves and the shift in the correlation function
Yet it is made very implausible by LSB galaxies(Table 3).obeying the Tully-Fisher relation. Why a model should besuccessful in many respects and yet fail on one importantpoint is a puzzle. But fail it does, so in the following sectionwe examine more elaborate models to see if they fare anybetter.
FIG. 10.ÈModel LSB galaxy rotation curves from confrontedFig. 9with data for galaxies of the appropriate surface brightness. Both modelsfail to predict the shapes of the actual rotation curves. These rise graduallyas expected in the DD model, but reach a dictated by the Tully-FisherV
crelation as expected in the SH model.
TABLE 3
HYPOTHESES
HYPOTHESIS
TEST DD SH
Age . . . . . . . Y ?/(k0) . . . . . . ? ?m(r) . . . . . . . . Y NTF . . . . . . . . N YV (R) . . . . . . Y N
6.1.2. Complex, SpeciÐc Model Galaxies
Until now, we have intentionally kept our models simpleso that genuine predictions can be identiÐed and tested.More complex models necessarily have more parametersand generally assume a speciÐc cosmogony. Many make nospeciÐc predictions that are actually testable. However,some do, and we examine these here.
A more elaborate version of the SH model is given byet al. They give a detailed model thatDalcanton (1997).
speciÐcally incorporates LSB galaxies and makes testablepredictions about them. In essence this is an elaboration ofSH and shares the same virtues and vices. As such, it doeshave the correct Tully-Fisher relation, with LSB disksreaching further out into the halo than HSB disks. Consis-tency with the Tully-Fisher relation is not a predictionÈitis a construction motivated by the data. The initial predic-tion of the same physical scenario does predict a shift in theTully-Fisher relation for LSB galaxies et al.(Dalcanton1995).
Nevertheless, the model of et al. doesDalcanton (1997)have the virtue of making a number of speciÐc, bona Ðdepredictions about the bivariate distribution (their'(k0, h)Fig. 2), the di†erential luminosity density as a function ofsurface brightness (their Fig. 7), and the shapes of theJ(k0)rotation curves (their Figs. 1 and 8). At this time, thebivariate distribution is too poorly determined obser-vationally to provide a good test. The best available esti-mate of is provided by Jong'(k0, h) de (1996b).
It has sharp features that are not obviously consistentwith the smooth prediction of but the error bars'(k0, h),are sufficiently large that it is not obviously inconsistentexcept for very high surface brightnesses. Here, many moregalaxies are predicted than observed. This is the sameproblem already discussed for j-& in and° 5.2 Figure 8.
The di†erential luminosity distribution though stillJ(k0),rather uncertain observationally, currently provides a testthat is less sensitive to assumptions about the size distribu-tion. The predictions of et al. are repro-Dalcanton (1997)duced together with the available data (as per McGaugh
in The model overpredicts the luminosity1996a) Figure 11.density in HSB galaxies just as it overpredicts their number.It also overpredicts the luminosity density due to LSB gal-axies. The predicted distribution is broad and continuous,unlike the sharp featured that is observed. However,J(k0)the disagreement at the faint end is not terribly severe, sothe model might be salvaged by imposing a cuto† at thebright end. Disk stability might provide such a mechanism,since at some high surface density, disk self gravity willbecome so dominant that the usual instabilities set in.
A stronger test is provided by the shape of the rotationcurves. The model makes speciÐc choices for the baryonfraction and mass-to-light ratio that need not be precisely

54 MCGAUGH & DE BLOK Vol. 499
FIG. 11.ÈRelative luminosity density of disk galaxies as a func-J(k0)tion of surface brightness, as predicted by et al. line) andDalcanton (1997 ;as observed (data as per see McGaughFig. 8 ; 1996a).
correct. To circumvent this and obtain a test that is inde-pendent of these assumptions, we use the information pro-vided by Figure 1 of et al. to constructDalcanton (1997)directly observable quantities. For each model of a givenmass and spin (M, we extract the disk scale length h andj
s),
the radius where These can be combinedR34 V (R34) \ 34Vc.
to give a dimensionless ratio that measures the rate ofR34/hrise of the rotation curve independent of most modelassumptions and directly relatable to observations.
The choice of is motivated by whichR34/h Figure 9,shows that the rate of rise of the inner portion of V (R)provides the most sensitive test of SH models. We choose 34of rather than because resolution can a†ect the estimateV
c12of V at small R. For this test, we use only galaxies resolved
with at least 8 beams across the diameter corresponding toNote that this test is independent of inclination, so weR34.can use galaxies from that are adequately resolvedTable 2
and for which is well deÐned.VcThe data and model predictions are plotted in Figure 12.
The rate of rise of V (R/h) is clearly correlated with bothluminosity and surface brightness in the sense that brightergalaxies have more rapidly rising rotation curves. Thecorrelation with absolute magnitude is particularly clear,consistent with other work et al. This is not to(Persic 1996).say that we conÐrm the precise functional form that Persicet al. suggest for the ““ universal rotation curve,ÏÏ but it(1996)is true that, to Ðrst order, luminosity is a good predictor ofthe shape of V (R/h). As with the Tully-Fisher relation, thesame result applies to both HSB and LSB galaxies and isnot a selection e†ect stemming from samples limited to onlyone or the other.
Also shown in are curves constructed from theFigure 12models of et al. These can be shifted orDalcanton (1997).
FIG. 12a FIG. 12b
FIG. 12.ÈRate of rise of disk galaxy rotation curves as measured by the radius where (a) vs. absolute magnitude and (b) vs.R34 V (R34) \ 34Vc. R34/h R34/hdisk central surface brightness. Only well-resolved galaxies (at least 8 beams diameter~1) are plotted. Bright galaxies have rapidly rising rotation curves, with
V (R) frequently reaching before 1 scale length. Dimmer galaxies have rotation curves that rise more gradually, sometimes not reaching for 3 scale34Vc34Vclengths. Also plotted are the predictions of the model of et al. for no luminosityÈsurface brightness correlation (solid line) and forDalcanton (1997) L P &01@3as they predict (dashed line). These predictions are obtained from their Fig. 1 and depend on two parameters, the halo mass and the spin parameterM
Hjs.
Points along the lines are labeled (in solar masses) in (a) and by in (b).by log (MH) j
s

No. 1, 1998 TESTING THE DARK MATTER HYPOTHESIS 55
stretched in the abscissa by changing the assumed or!*inserting an correlation. Curves are shown for MM-j
sindependent of and for a relation that on average givesjsL P &1@3, as et al. predict. The modelDalcanton (1997)
parameters have been well chosen to reproduce theobserved range of and However, they are far too lowM
Bk0.in V (R) is predicted to rise much more rapidly thanR34/h :
observed, just as in the simple SH model.Though it is possible to shift the models along the abscis-
sa, the same is not true for the ordinate. The nearly 1 orderof magnitude o†set in is a serious problem. Worse,R34/hthe predicted run of with is orthogonal to theR34/h M
Bobservations in This can not be cured by aFigure 12a.simple o†set. The shape of the model curve is also wrong in
with decreasing slightly over most of theFigure 12b, R34/hrange of where in fact it should continue to increase.js,
Hence, the inner shape of the observed rotation curves is aserious problem for the et al. model.Dalcanton (1997)
The severe normalization problem encountered by thismodel could be helped by using isothermal halosj
s-driven
rather than Hernquist or Navarro proÐles as has been done.However, this provides an additional parameter, the coreradius. It is that controls the shape of rotation curvesR
Cso it will always be possible to obtain an adequate(eq. [21]),solution by making an appropriate function of TheR
CM
B.
challenge then is to understand why halos have Ðnite coreradii, contrary to the expectations of many numerical simu-lations & Carlberg Frenk, &(Dubinski 1991 ; Navarro,White & Lacey and additionally why1996b ; Cole 1996),
assumes the particular value required at eachRC
MB& van Gorkom(Casertano 1991).
et al. describe a model that employs iso-Flores (1993) jsthermal halos. They predict how the outer slope of rotation
curves should depend on (their Figs. 5 and 6c), whichjsshould lead to a segregation of the data by surface bright-
ness in these plots. This is not apparent in our data, but thepredicted amplitude of the e†ect is too small relative to theuncertainties for this to provide a useful test. We can notethat, by their own stipulation, the model of et al.Flores
is only viable for a fairly narrow range of parameters,(1993)and The truncation radiusf
bB Sj
sT B 0.05 R
c/Rtr[ 0.2. Rtris the radius beyond which no baryonic infall occurs. The
low required baryon fraction is not consistent with thatdetermined from clusters of galaxies (see, e.g., Evrard,Metzler, & Navarro they can not both be correct. In1996) ;the context of LSB galaxies the required truncation radius
seems to be too small. et al. state that theRtr Flores (1993)cooling time places an upper limit on the truncation radiusso that
Rtr\ 100A f
b0.1B1@2A V
c300 km s~1
B1@2
]A H0100 km s~1 Mpc~1
B~1@2kpc . (23)
For a galaxy like Malin 1, this gives kpc, which isRtr B 58only 1 disk scale length et al. The disk(Bothun 1987).extends much further than this, and the baryons shouldhave originated at even larger radii in this sort of collapsemodel. Though Malin 1 is an extreme example and
is subject to modiÐcation, the problem isequation (23)generic to LSB galaxies. Upper limits on their baryon frac-tions Blok & McGaugh are comparable to(° 7.2 ; de 1997)the value preferred by et al. Thisf
bB 0.05 Flores (1993).
means either that the true is much lower than tolerable, orfbthat LSB galaxies have collapsed so little that they sample
the initial baryon fraction : This implies very highRoBRtr.spin, The highest spin considered in any model isj
sD 1.
around jsD 0.2.
Since sophisticated models are unable to explain anymore than the simple DD and SH models, one wonders ifperhaps the answer lies in the complex interplay betweendark matter, gas hydrodynamics, and star formation duringgalaxy formation. A fundamental assumption of modelsj
sis that angular momentum is conserved and not transferredbetween dark and luminous components. Numericalmodels indicate that angular momentum transfer doesindeed occur & Gunn(Katz 1991).
There has been a great deal of progress on numericalmodels that incorporate hydrodynamics. One promisingexample that makes testable predictions for galaxies is thatof & Ostriker Their Figure 3 predicts the trendCen (1993).of total mass and cold gas mass with stellar mass and isreproduced here in together with the data.Figure 13
The data are plotted in assuming andFigure 13a !*
\ 2for a dynamical mass within a radius of R\ 5h. The precisevalue assumed for makes no di†erence on this logarith-!
*mic plot that spans many decades. A di†erent choice for Rsimply translates the dynamical mass vertically. The trendpredicted by & Ostriker qualitatively mimicsCen (1993)that of However, they predict a much strongerFigure 4a.change of with than is actually observed. The dif-M
TM
*ference between the slope of the data and that of the line ofconstant is barely perceptible.f
bPresumably, halos extend further than R\ 5h. Some ofthe data could be shifted into agreement with the models byan appropriate choice of R, but not all of it at once. Thiscould be done only by forcing to be an appropriateR
Hfunction of i.e., by inserting the answer. Unfortunately,M*,
there is no test here. The simulations predict but notMT
M(R), while observations can probe only the latter.There is a test in the other panel of Figure 3 of &Cen
Ostriker This is a prediction of the cold gas mass as(1993).a function of stellar mass and is reproduced in Figure 13b.This is an important test of any hydrodynamical model thatattempts to model the gasdynamics of galaxy formation.Data for spiral galaxies are taken from & deMcGaughBlok and that for elliptical galaxies from(1997), Wiklind,Combes, & Henkel with computed following the(1995) !
*relation of der Marel The model prediction isvan (1991).orthogonal to the data and o† by 5 orders of magnitude atthe bright end.
It would appear that numerical models are as yet a longway from producing realistic galaxies (see also &NavarroSteinmetz 1997).
6.2. More Fine T uning ConspiraciesThe fundamental problem is this : one needs pieces of
both the DD and SH models, yet grafting them togetheralways results in a serious Ðne-tuning conspiracy. Recallthat To satisfy the Tully-Fisher relationV
HP (o
C)1@2R
C.
(Fact 1), and hence the product must be the sameVc, o
CR
C2,
for all galaxies of the same luminosity. Lower surfacebrightness galaxies have rotation curves that rise moregradually than those of higher surface brightness galaxies ofthe same luminosity (Fact 2). To decrease the rate of rise ofthe rotation curves as surface brightness decreases, mustR
Cincrease Together, these two require a Ðne-tuning(eq. [21]).

56 MCGAUGH & DE BLOK Vol. 499
FIG. 13a FIG. 13b
FIG. 13.ÈPredictions of & Ostriker confronted with the data. (a) The halo mass and (b) the cold gas mass are shown as functions of stellarCen (1993)mass. The solid line represents the mean prediction while the dashed line shows the expected 1 p dispersion. The squares in (a) are the data discussed here.The circles in (b) are data for spiral galaxies from & de Blok while the triangles are data for elliptical galaxies from et al.McGaugh (1997), Wiklind (1995). Cen& Ostriker predict far too strong a deviation from constant in (a) (the dotted line is drawn for For the cold gas mass in (b), the(1993) M
T/M
*fb\ 0.05).
prediction fares even worse. Too little cold gas is retained in galaxies at the present epoch, the slope of the predicted trend is orthogonal to the data, and thegas content of bright galaxies is o† by 5 orders of magnitude.
conspiracy to keep the product constant at Ðxed lumi-oCR
C2
nosity while must vary with the surface brightness. ThatRCis, stays Ðxed while and oscillateV
HP (o
C)1@2R
CR
C(o
C)1@2
up and down as dictated by The conspiracy hask0. &0-!ogrown into one tying the optical and halo parameters inti-mately together.
Though both DD and SH and their variants do not work,there is a very clear need to keep Ðxed (as in SH) and anV
Hequally clear need to vary (as in DD). The exact amountRCof variation depends on how the disk-halo decomposition is
treated Blok & McGaugh For example, in the(de 1997).maximum disk case, much of the variation in is trans-R
Cferred to resulting in a systematic increase of as!*, !
*&0decreases, opposite the sense indicated by the colors. The
problem simply shifts from one parameter to another. Ingeneral, introducing more parameters just increases thenumber of things that must be Ðne tuned.
To be successful, structure formation models must repro-duce this peculiar behavior.
7. FLAVORS OF DARK MATTER
In this section, we examine constraints that our data canplace on the various hypothesized forms of dark matter.Ideally, this requires testable predictions for each. There aresome, but not many. The issue of dark matter has alwaysbeen data driven. As a result, the process is often more amatter of examining the sensibility of previous data-based
inferences with the expanded dynamic range of the presentdata.
7.1. Cold Dark MatterPerhaps the leading candidate for the dark matter is
CDM. This DM candidate is composed of dynamically coldmassive particles. Usually imagined to be some hypotheti-cal fundamental particle (e.g., weakly interacting, massiveparticles [WIMPs] or axions), CDM could also be massiveblack holes or some other entity that interacts only gravita-tionally. Here we are concerned with only the dynamicale†ects, since this is all that deÐnes CDM. By stipulation,there is very little else about it that can be tested. This isboth a virtue and a vice, since DM candidates that arerelatively easy to detect (e.g., faint stars) are more easilyfalsiÐed.
Nevertheless, CDM has many genuine virtues. A non-baryonic form of dark matter is required to reconciledynamical measures of the cosmic density see, e.g.,()Z 0.2 ;
Nusser, & Willick with the low density ofDavis, 1996)baryons indicated by primordial nucleosynthesis ()
b[
0.03 ; et al. Schramm, & Turner AnFields 1996 ; Copi, 1995).important aspect of CDM is that it does not respond toradiation pressure. It can therefore begin to clump and formstructure early without leaving too much of an imprint onthe microwave background. Indeed, this was another moti-vation for inventing CDM, since it is not otherwise possible

No. 1, 1998 TESTING THE DARK MATTER HYPOTHESIS 57
to get from the very smooth universe that existed at the timeof recombination to the very clumpy one we see today.
These two facts, and the lack of structural imprint)?)bon the microwave background, demand CDM. Indeed, the
ability of CDM models to hide anisotropies in the micro-wave background far below the upper limits of variousexperiments was considered a great success until Ñuctua-tions were actually measured by COBE et al.(Bennett 1994).These are at a level much higher than expected in standard)\ 1 CDM.
The shape of the power spectrum P(k) predicted by stan-dard CDM has been clearly falsiÐed (see, e.g., et al.Fisher
The expectation P(k) P kn with n \ 1 is not so much1993).a bona Ðde prediction as the physically most plausible case,so it is possible to repair CDM after the fact. Ideas for doingthis include ““ tilting ÏÏ the spectrum (twiddling n), lowering
adding an admixture of hot dark matter to boost P(k))CDM,on large scales, and invoking the cosmological constant.Indeed, it appears necessary to do several of these things
& Steinhardt(Ostriker 1995).Even so, there are no dark matter candidates more viable
than CDM, which does at least make some testable predic-tions. For example, the mass function of galaxies is directlycalculable and can be used to predict the observed lumi-nosity function. It is very difficult to reconcile the two (Heylet al. One expects a much higher ([300 km s~1)1995).pairwise velocity dispersion than is observed (\100 kms~1 ; & Ostriker et al. ThoughCen 1993 ; Governato 1997).structure forms rapidly in CDM, CDM scenarios have con-siderable difficulty in explaining the presence of large disks
& Wolfe and hot clusters et al.(Prochaska 1997) (Donahueat high redshift. It also anticipates rapid1997) (Kaiser 1986)
evolution in the cluster X-ray luminosity function, which isnot observed et al. et al. et(Scharf 1997 ; Burke 1997 ; Rosatial. 1997).
Another important test is whether LSB galaxies arebiased relative to HSB galaxies. This clearly is not as strongan e†ect as would be required if )\ 1 Schombert,(Pildis,& Eder but it does occur in the expected sense et1997), (Moal. This is a deÐnite success, but not one speciÐc to1994).CDM. The tendency for low-density galaxies to reside inlow-density regions is a generic consequence of bottom-upstructure formation.
A very important, testable, bona Ðde prediction of CDMhas recently been made by Navarro et al. and(1996b) Cole& Lacey see also & Carlberg They(1996) ; Dubinski (1991).show that individual CDM halos have a universal structureproÐle. These take the form
oCDM(R)\ oi
(R/Rs)(1] R/R
s)2 , (24)
where is the characteristic radius of the halo and isRs
oirelated to the density of the universe at the time of collapse.
These parameters are not independent and are set by thecosmology. The concentration of the resultant halo isencapsulated in the concentration parameter c\ R200/Rs
.is the radius where the density contrast exceeds 200,R200roughly the virial radius. This establishes a clear expecta-
tion value for the mass distribution and resultant rotationcurves of CDM halos, which are
V (R) \ V200Cln (1] cx) [ cx/(1 ] cx)
x[ln (1 ] c) [ c/(1 ] c)]D1@2
, (25)
where (Navarro et al. The velocityx \ R/R200 1996b). V200is characteristic of the halo, and is deÐned in the same wayas The halo rotation curve is thus speciÐed by twoR200.parameters, and c, which give the total halo mass andV200the degree of concentration of that mass.
Low surface brightness galaxies are a good place to testthis prediction as their disks are dynamically insigniÐcant :the rotation curves provide a direct map of the dark massdistribution. The strongest test is a†orded by the lowestsurface brightness galaxy with the best resolved rotationcurve. Surface brightness is important because it is relatedto the rate of rise of the rotation curve that constrains theconcentration parameter. Resolution is important becausewe wish to test the shape of the rotation curve speciÐed by
The galaxy that best suits these requirementsequation (25).is F583-1.
In order to compare observations with theory, we need todo several things. Observationally, we wish to remove theinÑuence of the known baryonic component and isolate thedark matter. This is done by assuming the maximum diskmass from Blok & McGaugh Both full and cor-de (1997).rected rotation curves are shown in where it canFigure 14,be seen that the assumption about the optical disk mass isirrelevant. This is the virtue of using LSB galaxies for thissort of test.
Theoretically, we need to specify an appropriate c andThe concentration parameter depends on the cosmol-V200.ogy, for which we consider several possibilities using the
halo characterization code provided by J. F. Navarro (1997,private communication). We will refer to three basic cases :standard CDM with )\ 1 (SCDM), open CDM with)\ 0.3 (OCDM), and a Ñat "-dominated cosmology with
("CDM). Lower ) generally results in lower c, as)" \ 0.7does lower The latter is not a strong e†ect, so we retainH0.a Ðxed km s~1 Mpc~2. Other parameters matterH0\ 75fairly little, except the normalization of the power spectrumthat we Ðx to the COBE observations. Adopting anothernormalization, like that for rich clusters, has the fairlyminor e†ect of interchanging the relative concentrations ofthe OCDM and "CDM cases : OCDM is the least concen-trated model with a COBE normalization, but "CDM isthe least concentrated for a lower normalization. This dis-tinction is unimportant.
We shall see that the observations require extremely lowSuch low concentrations are readily obtained only byc[ 5.
lowering the power spectrum normalization to p8\ 0.2.This is completely inconsistent with either the COBE or therich cluster normalization.
The last item we need is an estimate or the mass ofV200the halo, which is also a minor factor in determining c. Thiscan be done in a variety of ways. Perhaps the most obviousis to use the observed baryonic disk mass as an indicator ofthe halo mass. The mass of the disk is reasonably well con-strained by the maximum disk solution (M
*¹ 4.5] 108
and the fact that most of the baryons are in directlyM_)
observable atomic gas It is unlikely(Mg\ 2.4] 109 M
_).
that any signiÐcant additional baryonic mass is in unde-tected forms (either molecular or ionized gas), and evenfactors of 2 here will not much a†ect the arguments thatfollow. The total baryonic mass of F583-1 is thus MbarB2.9] 109 This can be combined with a baryon frac-M
_.
tion to give a halo mass. The universal baryon fraction isthought to be well measured by rich clusters of galaxies,giving (for km s~1 Mpc~2 ; see, e.g.,f
bB 0.09 H0\ 75

58 MCGAUGH & DE BLOK Vol. 499
FIG. 14a
FIG. 14b
FIG. 14c
FIG. 14.ÈRotation curve of F583-1 compared with the form predictedfor appropriate CDM halos (Navarro et al. The solid points are the1996b).observed rotation curve, while the open points are the rotation curve of thedark matter with the baryonic component subtracted from the total. Theopen points have been o†set slightly in R for clarity, as the baryons con-tribute very little at any radii. Lines show the predictions of various cos-mologies assuming (a) the value indicated by clusters,(Table 4) f
b\ 0.09,
and (b) km s~1 (i.e., a Tully-Fisher normalization that ignoresV200\ 80the consequences for the baryon fraction). None of the predictions aresatisfactory, so in (c) we test whether any Navarro et al. proÐle can(1996b)Ðt the observations, regardless of cosmology. Even treating both c and V200as completely free parameters, no Ðt can be obtained. CDM predicts thewrong shape for galaxy halo density proÐles.
& Fabian This then implies a halo mass ofWhite 1995).Note that the maximum diskM
HB 2.9] 1010 M
_.
decomposition already implies MH
º 2.2] 1010 M_
(deBlok & McGaugh so either this disk is observed to1997),very near the edge of its halo, or the baryon fraction deter-mined in clusters is not universal (° 8).
The concentration indices derived for these cases arelisted in and the results plotted in TheTable 4 Figure 14a.results are disastrous. The SCDM model grossly over-predicts the rate of rise of the rotation curve. The less con-centrated OCDM and "CDM models do the same. Worse,all predict very much the wrong asymptotic velocity, as thehalo mass appropriate for the observed baryon mass gives
km s~1 when km s~1.V200 \ 43 Vc\ 84
Part of the problem here is the well-known failure ofCDM models to simultaneously match the observed lumi-nosity density and the normalization of the Tully-Fisherrelation (see, e.g., et al. Baugh, & ColeHeyl 1995 ; Frenk,
Let us therefore try another approach.1996). Navarrosuggests that the Tully-Fisher relation arises(1996a)
because (though note that foundVcBV200 Navarro 1996b
that halo mass should not be well correlated with opticalluminosity). By adopting km s~1, we should atV200 \ 80least come close to matching the outer portion of the rota-tion curve. This implies a much more massive halo, M
HB
1.2] 1011 and a correspondingly lower baryon frac-M_
,tion, f
b\ 0.015.
This exercise again fails Only the lowest c(Fig. 14b).model comes close to the observations, and even that pre-dicts velocities that are too high for the dark matter. This isespecially true in the inner parts but remains true even inthe outer parts where the normalization was set. Appar-ently, the Tully-Fisher relation does not arise from a simpleequation of with However, if it does not, why does aV
cV200.Tully-Fisher relation with small scatter arise at all ?
Note that the shapes of the observed rotation curves arenot similar to the predicted shapes. Is it possible to Ðt thedata with at all ? The answer would appear toequation (25)be no. gives several examples that come reason-Figure 14cably close by choosing c and without regard to theirV200cosmological origins. The model with c\ 12 gives a nicelyÑat rotation curve for the outer points, but grossly overpredicts the inner rotation. Lower concentration modelscan be made to Ðt the interior points, but then they get theexterior ones wrong. gives the wrong shapeEquation (25)and the clear prediction of CDM is simply not realized :
oCDM(R) D oobs(R) . (26)
Moreover, we do not have the freedom to Ðt c and V200freely. The virtue of the model is that these are predictedonce the cosmological parameters (especially ), P(k), and f
b)
are stipulated. No plausible cosmology predicts (c, V200)that approximate the lowest surface brightness galaxies.It has already been noted &(Moore 1994 ; Flores
Primack that the steep interior density distribution1994)
TABLE 4
CONCENTRATION
Model fb\ 0.09 V200 \ 80
SCDM . . . . . . 59 52OCDM . . . . . . 9 8"CDM . . . . . . 12 11

No. 1, 1998 TESTING THE DARK MATTER HYPOTHESIS 59
at small R] predicted by CDM is com-[oCDM(R)PR~1pletely inconsistent with the few (four) analyzed obser-vations of dwarf galaxies. These are all low surfacebrightness systems, which is the reason they are relevant.This problem of the shape of the rotation curves is generaland clear in all of our data. We therefore conÐrm andextend the results of and & PrimackMoore (1994) Flores(1994).
This situation admits three possibilities :
1. CDM is not the solution to the mass discrepancyproblem.
2. CDM is correct but has not been correctlyoCDM(R)predicted.
3. Both are correct but further physics intervenes totransform intooCDM(R) oobs(R).
The second possibility seems unlikely. There is widespreadagreement between independent modeling e†orts (Dubinski
Navarro et al. & Lacey1994 ; 1996a, 1996b ; Cole 1996).There is good physical reason for this agreement. Non-baryonic CDM interacts only gravitationally, with no wayto set a preferred scale such as a core radius. This predictionof CDM seems very robust.
Within the framework of CDM, we are thus forced toconsider the third possibility. This requires large-scale massredistribution that presumably results from the behavior ofthe baryonic component. The behavior of the baryonsdepends on such things as the hydrodynamics of gas Ñowsand energy input from star formation and is much moredifficult to model than the CDM. Various possibilities forthe e†ect of the baryons are generally referred to as““ feedback ÏÏ or sometimes as ““ gastrophysics.ÏÏ
That feedback takes place at some level will modify theprediction that arises from CDM-only models. However,there is no guarantee that it will Ðx the problem underconsideration. If we simply add feedback parameters to themodel and tune them to match the observations, the modelloses its predictive value.
There are three basic possibilities for mass redistribution :
1. Contraction of the CDM following dissipation of thebaryons.
2. Orbital family redistribution at small radii.3. Expansion of the CDM following expulsion of
baryons in galactic winds.
These might come about in a myriad of ways ; we discussthe generic aspects of each in turn below. There is, however,a serious objection to any of them being important to large-scale redistribution of the dark matter. In dark matterdominated LSB galaxies, baryons are a very small fractionof the total mass. To alter o(R) in the required fashion is acase of the tail wagging the dog.
The Ðrst possibility is that the dissipation of baryonsduring disk formation draws the dark matter distributionfurther in. This is sometimes called the adiabatic response ofthe halo to the disk and should happen at some level
It is relatively straightforward to model(Dubinski 1994).but makes the problem worse. Halos that are initially tooconcentrated become even more so.
In order to model adiabatic contraction, one generallyassumes that the baryons conserve angular momentum.This need not be the case, as numerical models indicate thata great deal of angular momentum can be transported tothe dark matter & Gunn Such a process might(Katz 1991).
result in the redistribution of orbital families, especially atsmall radii where the importance of the baryons is maxi-mized. Such a redistribution might alter the cuspy nature ofthe initial CDM mass distribution. This process must trans-fer enough angular momentum to the dark matter to estab-lish a large core radius, but not so much that it fails to forma rotationally supported baryonic disk. Simulations suggestthat while some orbital redistribution does occur, it doesnot signiÐcantly impact o(R) (Merritt 1997).
The third possibility is the opposite of the Ðrst. Massiveamounts of baryons are expelled. The dark matter followsgravitationally, thus establishing a more di†use mass dis-tribution. A frequently invoked mechanism for expelling thebaryons is feedback due to violent star formation (see, e.g.,
Eke, & Frenk There is one clear predictionNavarro, 1996a).of this scenario : galaxies explode and gas is lost. Yet the dimgalaxies for which the need for mass redistribution is mostsevere are in fact very gas rich & de Blok(McGaugh 1997).In addition, a direct search for the residue of baryonicblowout resulted in nondetection Eriksen, &(Bothun,Schombert It therefore seems unlikely that baryonic1994).outÑows can play a signiÐcant role in redistributing thedark matter.
Regardless of what mechanism is invoked, two drasticevents are required to reconcile CDM with the obser-vations. First, the baryon fraction must change by an orderof magnitude from the universal value found in clusters.Second, the dark matter distribution must be radicallychanged from a et al. proÐle toNavarro (1996b) (eq. [24])something close to an isothermal sphere This is(eq. [20]).indeed a major transformation : o(R)P R~1] R0 at smallR and o P R~3] R~2 at large R.
In many ways, CDM is superior to other hypothesizedforms of dark matter. Most importantly, it does make sometestable predictions. Unfortunately, these predictions per-sistently fail.
7.2. Hot Dark MatterAnother possible dark matter candidate is massive neu-
trinos. Though often invoked in the context of the solarneutrino problem, massive neutrinos do not help with themass discrepancy problem in LSB galaxies. It has long beenknown that hot dark matter is good at forming structure onlarge scales (top-down), but not at making galaxies. In orderfor neutrinos to remain in dwarf galaxy halos, they wouldhave to be much more massive than allowed by experiment
& Faber It seems unlikely that mixing hot and(Lin 1983).cold dark matter would address the problems encounteredby CDM alone, simply because the HDM component playsno role on the small scale of galaxies.
7.3. Baryonic Dark MatterBaryonic dark matter (BDM) is any form of hypothesized
DM composed of ordinary matter. There are a great varietyof hypothesized forms including brown dwarfs, very faintstars, Jupiters, and very cold molecular gas. The advantageof BDM is that baryons are known to exist. The problem isthat BDM candidates are detectable, so most have beenruled out (Carr 1994).
The case in favor of BDM has been strengthened by therecent detection of microlensing events (see, e.g., etAlcockal. However, the detection of microlensing, a physical1996).process that should at least occasionally occur, is not thesame as the detection of BDM MACHOs. The clearestresult of these experiments is to rule out MACHOs as dark

60 MCGAUGH & DE BLOK Vol. 499
FIG. 15.ÈBest Ðt we could attain for the rotation curve of a well-resolved LSB galaxy, F583-1, by scaling the contribution of the H I com-ponent. The stars are assumed to contribute maximally, but this matterslittle to the Ðt. Clearly, there is no scaling that reproduces the shape of theobserved rotation curve. Though the H I distribution may be a goodindicator of the shape of the rotation curves in some HSB galaxies, itgenerally is not in LSB galaxies. This nulliÐes one of the arguments in favorof baryonic dark matter.
matter over many decades of mass, up to and including themost reasonable possibility of brown dwarfs et al.(Ansari
et al. Only if the lensing objects are1996 ; Renault 1997).surprisingly massive can MACHOs make up a(Z0.5 M
_)
signiÐcant fraction of the halo, and only then because thismass delimits the sensitivity range of the experiments. Suffi-cient statistics have yet to accrue to demand a signiÐcanthalo mass fraction and there is no guar-(Paczynski 1996),antee that the events observed to date are connected withthe missing mass problem. Since particle physics analogiesare often made for these experiments, we o†er one of ourown. The Ðrst thing one is likely to learn about is the back-ground contaminants one did not expect (see, e.g., Zaritsky& Lin 1997).
A substantial amount of BDM su†ers the two seriousdrawbacks that motivate CDM: the small amplitude ofÑuctuations in the microwave background and )?)
bfrom primordial nucleosynthesis. Although is often)b?)
*invoked as an argument for baryonic dark matter, this cannot explain the dynamical mass discrepancy or add up tothe total ) et al. To contemplate a con-(Dalcanton 1994).ventional universe composed entirely of baryons, one mustsomehow dismiss both of these pillars of modern cosmol-ogy.
We are not aware of viable BDM scenarios that makespeciÐc predictions. Those that did have been ruled out.Nevertheless, there are several lines of argument favoringBDM. One is that light and dark matter are intimatelycoupled. This is certainly true The potential for(Paper II).information transfer between the distinct dynamical com-ponents is maximized if they are cut from the same cloth.Another connection is that the ratio of atomic gas mass todynamical mass seems to be roughly constantMH I/Mo
This holds approximately true for LSB gal-(Bosma 1981).axies (see Fig. 13 of Blok et al. as and arede 1996) MH I/L !
oboth related to with similar slopes.k0A serious problem with this picture is the total failure ofto redress the relation This occurs becausef
*!o-&0 (Fig. 7).
a constant gives a constant shift not aMH I/Moin log !
o,
systematic trend as required. The only way to salvage thispicture would be to arbitrarily make the conversion factor gbetween and total gas mass an appropriate function ofMH IThat is, since g \ 1.4 strictly applies only to atomic gas,k0.one might suppose that molecular gas becomes systemati-cally more important with decreasing surface brightness.This would have to be an enormous e†ect to account for thelarge change in and of course must be very systematic!
o,
with surface brightness. This seems quite unreasonable, andin fact the opposite is observed : lower surface brightnessgalaxies appear to have substantially less molecular gasthan higher surface brightness spirals et al.(Schombert
An additional conspiracy must now be invoked : the1990).conversion factor also varies systematically withCO/H2surface brightness. This would have to be a big e†ect, but
the size if not the systematic surface brightness dependenceis already required if much of the dark matter is to behidden in molecular form Combes, & Martinet(Pfenniger,1994).
Another motivation for BDM is that the outer shape ofthe rotation curve of HSB galaxies can sometimes be Ðt byscaling up the contribution of the H I. This suggests anadditional undetected gaseous component with the samedistribution as the H I but with substantially more mass.Implicit in this is that the dark matter be conÐned to a disk,which has the usual problems with disk instability (Ostriker& Peebles If instead the BDM is distributed in a halo,1973).there is no reason to draw a connection between the shapeof the H I disk and that of the total rotation curve.
We can test the notion of gas scaling against the rotationcurves of LSB galaxies. This sometimes works tolerablywell, as long as one is free to adjust the scaling factor fromgalaxy to galaxy. However, it frequently fails to reproducethe shape of the rotation curves at all well. In weFigure 15,show the best Ðt that can be obtained by this method to thebest resolved LSB galaxy. The shape of the actual rotationcurve is completely di†erent from that predicted by the H I
distribution. This is often true of the LSB data, so eventhough there may be some cases of HSB galaxies for whichthe rotation curves are reasonably well predicted by the H I
distribution, this simply is not the case in LSB galaxies. Thisremoves a major argument in favor of BDM.
The various arguments in favor of BDM make no sensein the context of the LSB galaxy observations. This does notcompletely rule out the existence of BDM or mean that wehave discovered and cataloged every baryon in the universe,but it does make it very difficult to construct a sensiblemodel with BDMa dynamically important component.
In general, the arguments that favor BDM are based onthe inferred coupling between dark and luminous matter.With this much we certainly concur : the two componentsmust be intimately related (e.g., Indeed, there does° 6.2).exist a unique analytic formalism relating the dynamics tothe observed luminous mass distribution (Papers II and III).
8. GENERAL CONSTRAINTS ON BARYON FRACTIONS
There are a few interesting constraints that can be placedon the presence of dark matter completely irrespective of its

No. 1, 1998 TESTING THE DARK MATTER HYPOTHESIS 61
composition. There is a wealth of data besides rotationcurves that bear on the issue. These place both upper andlower limits on the extent and mass of dark matter halosand sometimes provide measures of the actual baryon frac-tion.
Observations that place lower limits include themaximum radii to which rotation curves remain Ñat
& van Albada et al. the timing(Sancisi 1987 ; Meurer 1996),argument in the local group & Woltjer(Kahn 1959 ; Peebleset al. the statistical motions of satellite galaxies at1989),large separations from L* galaxies & White(Zaritsky 1994),and QSO absorption lines that imply large halos withroughly Ñat rotation curves extending to very large radii
Lanzetta, & Webb Evidence that places(Barcons, 1995).upper limits on the extent of dark halos is more difficult toestablish, but there is the very important result that overlymassive halos suppress the formation of observed tidal tails
Mihos, & Hernquist In addition, it might(Dubinski, 1996).be possible to constrain the amount of dark matter allowedwithin the optical radius by disk stability constraints. Somedark matter is needed to stabilize disks & Peebles(Ostriker
but too much inhibits features like spiral arms that1973),stem from self-gravity in the disk. This criterion has beenused by et al. to place minimum massesAthanassoula (1987)on disks in disk-halo decompositions. Finally, it now seemsreasonably well established that actual baryon fractions canbe measured in X-ray galaxy clusters so that the ratio ofdark to luminous mass is known et al.(White 1993 ; White& Fabian et al.1995 ; Evrard 1996).
The most interesting (i.e., extreme) of these limits areshown in and given in Listed are theFigure 16 Table 5.object, the type of data and analysis, the linear extentrequired of the dark matter halo (in both kpc and disk scalelengths where applicable), the observed mass-to-light ratio
the ratio of dark to luminous mass, the corresponding!o,
baryon fraction, and the source of the data. We have beenas conservative as possible in assessing these limits ; most ofthem are quite hard.
Listed Ðrst are those observations that place lower limitson the amount of dark matter required. The hardest of theselimits come from the extended H I rotation curves of diskgalaxies. These are observed to remain Ñat as far asobserved, sometimes to very large radii. To calculate thelimits, we have used the maximum disk case, attributing asmuch mass as possible to the luminous matter. Theminimum required dark mass is then just V
c2R/G [Mbar.NGC 3198 is a classic example of an HSB spiral with a
rotation curve that remains Ñat to 11 scale lengths, nearly 3times the extent of the bulk of the luminous mass. The darkhalo must extend at least this far, and presumably muchfurther since there is no hint of a turn down in V (R).However, the required amount of dark mass is fairlymodest : exceeds the observed luminous mass byMdark Mbaronly a factor of a few. Recently, et al. haveMeurer (1996)been able to trace V (R) out to 22 scale lengths in the HSBdwarf NGC 2915. This extraordinary radius places inter-esting constraints, with the dark mass exceeding the lumi-nous baryonic mass by at least a factor of 19. There are 4LSB galaxies listed in we have chosen the mostTable 5 ;extreme examples with There are manyMdark/Mbar [ 10.more that are nearly as extreme Blok & McGaugh(de
Even though V (R) is not measured to large R/h in1997).LSB galaxies as in the above two examples, it should beobvious from that LSB galaxies provide interestingFigure 4limits in this way. The lowest surface brightness galaxieshave so for This is a!
o[ 30, Mdark/Mbar[ 10 Mbar/L \ 3.
fairly conservative number in the B-band ; is more!*
B 2realistic. We do not need to make any assumption about !
*TABLE 5
LIMITS ON THE EXTENT OF DARK HALOS
Object Type R (kpc) R (h) !o
Mdark/Mbar fb
References
Lower Limits
NGC 3198 . . . . . . . . . H I V (R) [30 [11 [18 [2.7 \0.27 1NGC 2915 . . . . . . . . . H I V (R) [15 [22 [76 [19 \0.05 2F568-V1 . . . . . . . . . . . . H I V (R) [19 [6 [41 [11 \0.08 3, 4F571-8 . . . . . . . . . . . . . . H I V (R) [15 [4 [49 [20 \0.05 3, 4UGC 5750 . . . . . . . . . H I V (R) [21 [6 [10a [11 \0.08 3, 5UGC 5999 . . . . . . . . . H I V (R) [15 [3 [35a [11 \0.08 3, 51704]6068 . . . . . . . . QSO abs. [82 [35 [75 [25b \0.04 62135[1446 . . . . . . . . QSO abs. [64 [16 [123 [41b \0.03 6Local Group . . . . . . Timing D700 . . . [100 [33b \0.03b 7Satellites . . . . . . . . . . . Statistical [200 . . . [100 [33b \0.03b 8, 9
Upper Limits
Tidal tails . . . . . . . . . . Model D100 . . . \30b \10c [0.09 10, 11Disk stability . . . . . . Theory . . . \4 \12b \4d . . . 12, 13
Measurement
X-ray clusters . . . . . . b-model [700 . . . [100e 11 ^ 4f 0.09^ 0.03f 14, 15
a R-band : !o\M/L
R.
b Assumes Mbar/L \ 3.c Constrains total mass.d Constrains mass within disk.e Includes optical luminosity only.f Scaled to km s~1 Mpc~1 ; errors represent full range of data.H0\ 75REFERENCES.È(1) & van Albada (2) et al. (3) Blok & McGaugh (4) Blok etSancisi 1987 ; Meurer 1996 ; de 1997 ; de
al. (5) der Hulst et al. (6) et al. (7) et al. (8) & White (9)1996 ; van 1993 ; Barcons 1995 ; Peebles 1989 ; Zaritsky 1994 ;et al. (10) et al. (11) et al. (12) et al. (13) et al.Zaritsky 1997 ; Dubinski 1996 ; Mihos 1998 ; Athanassoula 1987 ; Mihos
(14) & Fabian (15) et al.1997 ; White 1995 ; Pildis 1995.

62 MCGAUGH & DE BLOK Vol. 499
FIG. 16.ÈGraphical representation of the limits from OneTable 5.would expect a universal baryon fraction, but no such value emerges unlessonly a small subset of the data are considered (e.g., clusters of galaxies).When all data are considered, one Ðnds many contradictory measurementsand nonoverlapping limits. Note that even within the same type of object,contradictory limits occur. In disk galaxies, Ñat rotation curves require alot of dark matter, while disk stability prefers a more moderate amount.For groups of galaxies, the Local Group requires much more dark matterthan is measured in external groups. A broad distribution of baryon frac-tions seems to be required, but this contradicts the small scatter in theTully-Fisher relation.
though ; the dynamical mass of the baryonic disk is con-strained by the rotation curve.
We stress that the limits obtained from the maximumdisk decompositions of the rotation curves provide veryhard lower limits on and Maximum diskMdark/Mbar R
H.
does not generally return realistic values for especially!*,
in LSB galaxies Blok & McGaugh A more rea-(de 1997).sonable estimator based on disk velocity dispersions(Bottema gives nearly a factor of 2 less in HSB1993, 1997)galaxies and even less in LSB galaxies. Also, we have ofcourse not observed to the edge of the halo. It is difficult toconstruct a model in which the e†ects of an outer edge tothe halo do not lead to observable consequences unless
The point is that the limits in are bothRH
[ 2Ro. Table 5
hard and conservative. A more realistic estimate gives aresult 3 or 4 times more extreme.
Aside from H I rotation curves, there are a number ofother observations that place lower limits on the extent ofdark matter halos. et al. present obser-Barcons (1995)vations of two systems with QSO absorption lines inionized gas many tens of kpc from the centers of disk gal-axies, very nearly along the major axes. The gas is appar-ently associated with the galaxies, though the geometriesand orbital orientations are unknown. Nevertheless, nearlyÑat rotation seems to persist out to very large radii. If inter-
preted in the most obvious way, this implies limits evenmore extreme than those derived from bona Ðde rotationcurves.
On larger scales, the timing argument in the local group(see, e.g., et al. implies yet more dark matter.Peebles 1989)The same sort of result follows from the motions of satellitegalaxies around L* galaxies, which show no evidence of anedge to the halos to the largest scales probed, kpcZ200
& White et al. Though sta-(Zaritsky 1994 ; Zaritsky 1997).tistical in nature, both of these approaches robustly require
For this means!o[ 100. Mbar/L \ 3, Mdark/Mbar [ 33.
This is generally consistent with the impression given by therotation curves : dark matter halos are large and massive.
The lower limits just discussed are challenging to obtain.Perhaps even more difficult to acquire are upper limits onthe extent of dark matter halos. Nevertheless, a few con-straints can be placed. Recently, et al. haveDubinski (1996)pointed out that massive halos suppress the formation oftidal tails observed around merger remnants. This con-strains the dark to luminous mass ratio rather severely ;tidal features do not form unless ThisMdark/Mbar[ 10.upper limit is smaller than the hard lower limits imposedabove, Mdark/Mbar[ 20.
The results of et al. are based on N-bodyDubinski (1996)simulations that one might simply choose to dismiss asmodel dependent. However, further modeling (Mihos,Dubinski, & Hernquist shows that there is no plaus-1998)ible variation of parameters that changes the essentialresult. There is a very good, simple reason for this. If darkmatter halos are large and massive, the baryonic matter isburied at the bottom of a deep potential well. Even in aviolent merger, the largest velocities imparted to some ofthe stars are insufficient to climb out of this potential well.This very e†ectively su†ocates the formation of the large,linear features observed in merger remnants to extend overtens and sometimes even hundreds of kpc. Systems with
suppress such features before they getMdark/MbarZ 10started.
Strictly speaking, it is the gradient of the potential thatthis modeling exercise constrains, not just the darkÈtoÈluminous mass ratio et al. It is possible to(Mihos 1998).contrive very tenuous halo distributions that might weakenthis limit, essentially by placing a lot of mass at large radiiwhere it does not participate in the merger dynamics. Thetidal tails argument therefore provides the weakest of thelimits discussed so far, and the only upper limit, so onemight be tempted to equivocate. However, it does notappear that the argument can simply be dismissed. Thelimit it imposes is separated from the others by a factor of 2and points in the opposite direction. Models contrived spe-ciÐcally to evade the tidal tails limit seem unlikely to satisfyother constraints.
Another way to constrain the ratio of halo to disk mass,at least within the radius of the disk, comes from disk stabil-ity. Purely Newtonian disks su†er from unchecked insta-bilities ; perturbations like bars grow exponentially anddestroy the disk in a few dynamical times. The survival ofspiral disks over a Hubble time requires some stabilizinginÑuence. One possibility is to embed the disks in dynami-cally hot, spherical dark matter halos & Peebles(Ostriker
though it should be noted that altering the e†ective1973),force law can also have a stabilizing e†ect (Christodoulou
The problem with dark matter halos is that they can1991).provide too much stability. Observed features like bars and

No. 1, 1998 TESTING THE DARK MATTER HYPOTHESIS 63
spiral arms occur because of self-gravity in the disk. If thehalo is too dominant, this is negligible and one must invokenondynamical origins for the observed features. Athanas-soula et al. used this fact to constrain in their(1987) !
*rotation curve decompositions. In HSB galaxies, this givesreasonable results, the relevant e†ects being relatively small
di†erence between the maximum disk and the mini-([50%mum disk required to sustain spiral structure). Translatingthis into a limit on the dark halo mass within the radiusof the optical disk gives or 4.Mdark(R\ 4h)/Mbar[ 3
LSB galaxies are so dark matter dominated, even withinthe optical extent of the disk, that features due to disk selfgravity should simply not be evident et al.(Mihos 1998).The minimum disk required to form spiral features by thecriteria of et al. exceeds the maximumAthanassoula (1987)disk allowed by the rotation curve (see, e.g., & Pick-Quillenering Though rarely pretty grand design spirals, LSB1997).galaxies do have spiral features Blok et al.(de 1995 ;
Schombert, & Bothun This is not an iso-McGaugh, 1995).lated problem of a few strange morphologies ; [80% of the198 LSB galaxies in the primary list of et al.Schombert
are spirals.(1992)Again, one might be inclined to equivocate. Spiral struc-
ture is not well understood and might not have an origininternal to disk dynamics at all. It is not likely that thespiral features can be attributed to interactions with com-panions, as LSB galaxies are usually very isolated (Bothunet al. et al. The more extreme LSB galaxies1993 ; Mo 1994).have whereas dynamical spiralMdark(R\ 4h)/Mbar[ 10,features seem to require Consider-Mdark(R\ 4h)/Mbar\ 4.able work remains to be done to better quantify thesee†ects, but the discrepancy is already large. There is aserious problem with invoking dark matter halos to stabil-ize disks if spiral structure is driven by disk self-gravity as isoften supposed.
So far we have discussed only limits that can be placed onthe amount of dark matter required by various observ-ations. Recently, it has become possible to estimate actualbaryon fractions in X-ray clusters and groups of galaxies
et al. & Fabian Bregman,(White 1993 ; White 1995 ; Pildis,& Evrard This procedure has a number of uncer-1995).tainties, but the essential result seems to be quite robust
et al. This gives a surprisingly large amount(Evrard 1996).of baryonic mass, for the value of the Hubble con-f
bB 0.09
stant adopted here. This resides between the limits dis-
cussed above. The clusters give whileMdark/MbarB 10,rotation curves, satellites and the local group all require
and tidal tails implyMdark/Mbar[ 20 Mdark/Mbar[ 10.At this juncture, it is unclear how to proceed. One option
is to selectively disbelieve some combination of the resultsimposing these contradictory limits. Note that it is not pos-sible to arrive at a single universal baryon fraction by dis-missing a single limit ; at least several observations must bealtered. Another option is to conclude that varies arbi-f
btrarily from halo to halo. We could perhaps salvage a uni-versal by making some or all of the dark matter baryonicf
band simply varying the fraction that becomes luminous. Thedistinction between these two latter possibilities is small. Inboth cases, we must randomly vary the amount of luminousmatter in a way stipulated only by observation. Things thatform tidal tails happen to have small halos. Galaxies withsatellites happen to have large halos. The Tully-Fisher rela-tion somehow manages to ignore these random, large Ñuc-tuations in the luminousÈtoÈdark mass ratio and remainuniversal with little scatter. Structure formation theorieslose all potential predictive power since becomes a freef
bparameter for each and every halo.It is not clear whether the contradictory limits imposed
by the various observations can be reconciled. Furtherwork needs to concentrate on this point and on the Ðne-tuning problems that arise from the systematics of rotationcurves. The current situation also poses a philosophicaldilemma: what would be required to falsify the dark matterhypothesis ?
We thank all of the many, many people who have dis-cussed and debated these issues with us with varyingdegrees of patience and credulity. We are particularly grate-ful to Renzo Sancisi and Vera Rubin for many enlighteningconversations. Most of all, we would like to thank Thijs vander Hulst for his contributions to our work. We also thankPeter van Dokkum for the lively debate that clariÐed thevirtues and vices of DD and SH and brought out theimplicit assumptions we all were making. We are also grate-ful to Chris Mihos, Roelof Bottema, Eric Schulman, MotiMilgrom, and the referee for their comments. We wouldboth like to thank the Kapteyn Institute and the Depart-ment of Terrestrial Magnetism of the Carnegie Institutionof Washington for their strong support and warm hospital-ity.
APPENDIX
COLOR TERMS AND THE SLOPE OF THE TULLY-FISHER RELATION
In the discussion of the physical interpretation of the Tully Fisher relation we adopted the near-infrared luminosity as(° 5),an indicator of stellar mass. This results in a slope sometimes attributed to the viral theorem,
L P Vc4 . (A1)
This particular slope is not speciÐc to dark matter in general, as it depends on the assumptions that are necessarily made (° 5).Here we show that bandpass dependent deviations of the slope from the adopted value have no signiÐcant impact on our
discussion of the physical interpretation of the Tully Fisher relation. The full requirement on the relation between mass-to-light ratio, surface brightness, and luminosity imposed by the Tully-Fisher relation in any bandpass j is
!jP &
j~1@2L
jyj@2 , (A2)
where measures the bandpass-dependent deviation of the slope of the Tully-Fisher relation from the adoptedyj\ (4[ x
j)/x
jvalue of 4. This is a small e†ect compared to the Ðne balancing act that must be performed by ! and &.

64 MCGAUGH & DE BLOK Vol. 499
Consider the residual color term between two bands j and k. The residual e†ect on the mass-to-light ratio is
* logA!
k!j
B\ 4
5xj
C(m
j[ m
k) ]A1 [ x
jxk
BM
k
D, (A3)
where is the color. For example, if and this becomes(mj[ m
k) x
V\ 3 x
H\ 4,
* logA!
H!V
B\ 0.27[(V [H)] 0.25M
H] , (A4)
so a 1 mag color change corresponds to a 0.27 dex shift in the ratio of !, and 1 mag in luminosity to a shift of only 0.07 dex.Systematic changes in the slope of the Tully-Fisher relation with bandpass can plausibly be attributed to modest systematic
variation of the stellar population or extinction with luminosity. The observed trends operate in the sense expected for stellarpopulations (brighter galaxies tend to be redder) and the luminosity-metallicity relation (brighter galaxies should containrelatively more dust). These are small e†ects that have no real impact on the !-& relation. The increment for increment shiftexpected in the Tully-Fisher relation with surface brightness does not happen. This requires Ðne-tuning over nearly 5 mag in
irrespective of the precise slope of the Tully-Fisher relation.k0REFERENCES
M., Huchra, J., & Mould, J. 1979, ApJ, 229,Aaronson, 1C., et al. 1996, ApJ, 463,Alcock, 67
Y. C., & van der Kruit, P. C. 1992, A&A, 265,Andredakis, 396R., et al. 1996, A&A, 314,Ansari, 94
E., Bosma, A., & Papaioannou, S. 1987, A&A, 179,Athanassoula, 23J. N., Flynn, C., & Gould, A. 1992, ApJ, 389,Bahcall, 234X., Lanzetta, K. M., & Webb, J. K. 1995, Nature, 376,Barcons, 321
J., & Efstathiou, G. 1987, ApJ, 319,Barnes, 575K. G., Broeils, A. H., & Sanders, R. H. 1991, MNRAS, 249,Begeman, 523
C. L., et al. 1994, ApJ, 436,Bennett, 423A. 1981, AJ, 86,Bosma, 1825G. D., Eriksen, J., & Schombert, J. M. 1994, AJ, 108,Bothun, 913G. D., Impey, C. D., Malin, D. F., & Mould, J. R. 1987, AJ, 94,Bothun, 23G. D., Schombert, J. M., Impey, C. D., Sprayberry, D., &Bothun,
McGaugh, S. S. 1993, AJ, 106, 530R. 1993, A&A, 275,Bottema, 16
1997, A&A, 328,ÈÈÈ. 517A. H. 1992, Ph.D. thesis, Univ.Broeils, Groningen
D. J., Collins, C. A., Sharples, R. M., Romer, A. K., Holden, B. P., &Burke,Nichol, R. C. 1997, ApJ, 488, 83
D., Rubin, V. C., Thonnard, N., & Ford, W. K. 1982, ApJ, 253,Burstein, 70B. 1994, ARA&A, 32,Carr, 531
S., & van Gorkom, J. H. 1991, AJ, 101,Casertano, 1231R., & Ostriker, J. P. 1993, ApJ, 417,Cen, 415
D. M. 1991, 372,Christodoulou, 471S., & Lacey, C. 1996, MNRAS, 281,Cole, 716
S. 1996, ApJS, 103,Courteau, 363C., Schramm, D. N., & Turner, M. S. 1995, Science, 267,Copi, 192
J. J., Canizares, C. R., Granados, A., Steidel, C. C., & Stocke,Dalcanton,J. T. 1994, ApJ, 424, 550
J. J., Spergel, D. N., & Summers, F. J. 1995, preprint (astro-phDalcanton,9503093)
1997, ApJ, 482,ÈÈÈ. 659M., Nusser, A., & Willick, J. A. 1996, ApJ, 473,Davis, 22
Blok, W. J. G., & McGaugh, S. S. 1996, ApJ, 469,de L891997, MNRAS, 290,ÈÈÈ. 5331998, in preparation (PaperÈÈÈ. III)
Blok, W. J. G., McGaugh, S. S., & van der Hulst, J. M. 1996, MNRAS,de283, 18Blok, W. J. G., van der Hulst, J. M., & Bothun, G. D. 1995, MNRAS,de274, 235Jong, R. S. 1996a, A&AS, 118,de 557
1996b, A&A, 313,ÈÈÈ. 45M., Gioia, I., Luppino, G., Hughes, J. P., & Stocke, J. T. 1997,Donahue,
preprintJ. 1994, ApJ, 431,Dubinski, 617J., & Carlberg, R. G. 1991, ApJ, 378,Dubinski, 496J., Mihos, J. C., & Hernquist, L. 1996, ApJ, 462,Dubinski, 576G., & Jones, B. J. T. 1979, MNRAS, 186,Efstathiou, 133D. J., & Loeb, A. 1995, ApJ, 439,Eisenstein, 520
A. E., Metzler, C. A., & Navarro, J. F. 1996, ApJ, 469,Evrard, 494B. D., Kainulainen, K., Olive, K. A., & Thomas, D. 1996, NewFields,
Astron., 1, 57K. B., Davis, M., Strauss, M. A., Yahil, A., & Huchra, J. P. 1993,Fisher,
ApJ, 402, 42R. A., & Primack, J. R. 1994, ApJ, 427,Flores, L1R. A., Primack, J. R., Blumenthal, G. R., & Faber, S. M. 1993, ApJ,Flores,
412, 443K. C. 1970, ApJ, 160,Freeman, 811
C. S., Baugh, C. M., Cole, S. 1996, in IAU Symp. 171, New Light onFrenk,Galaxy Evolution, ed. R. Bender & R. L. Davies (Dordrecht : Kluwer),247
R., Haynes, M. P., Salzer, J. J., Wegner, G., Da Costa, L. N., &Giovanelli,Freudling, W. 1994, AJ, 107, 2036
F., Moore, B., Cen, R., Stadel, J., Lake, G., Quinn, T. 1997,Governato,New Astron., 2, 91
L. 1993, ApJS, 86,Hernquist, 389J. S., Cole, S., Frenk, C. S., & Navarro, J. F. 1995, MNRAS, 274,Heyl, 755
G. L., Salpeter, E. E., Farhat, B., Roos, T., Williams, H. & Helou,Ho†man,G. 1996, ApJS, 105, 269
J. E., & van Albada, T. S. 1992, MNRAS, 254,Huizinga, 677F. D., & Woljter, L. 1959, ApJ, 130,Kahn, 705N. 1986, MNRAS, 222,Kaiser, 323
N., & Gunn, J. E. 1991, ApJ, 377,Katz, 365S. M. 1987, AJ, 93,Kent, 816
K., & Gilmore, G. 1989, MNRAS, 239,Kuijken, 605G., & Feinswog, L. 1989, AJ, 98,Lake, 166
D. N. C., & Faber, S. M. 1983, ApJ, 266,Lin, L21D., Faber, S. M., Burstein, D., Davies, R. L., Dressler, A.,Lynden-Bell,
Terlevich, R. J., & Wegner, G. 1988, ApJ, 326, 19S. S. 1992, Ph.D. thesis, Univ.McGaugh, Michigan
1994, ApJ, 426,ÈÈÈ. 1351996a, MNRAS, 280,ÈÈÈ. 3371996b, in IAU Symp. 171, New Light on Galaxy Evolution, ed.ÈÈÈ.
R. Bender & R. L. Davies (Dordrecht : Kluwer), 97S. S., & Bothun, G. D. 1994, AJ, 107,McGaugh, 530S. S., & de Blok, W. J. G. 1997, ApJ, 481,McGaugh, 689
1998, ApJ, 499, 66 (PaperÈÈÈ. II)S. S., Schombert, J. M., & Bothun, G. D. 1995, AJ, 109,McGaugh, 2019
D. 1997, ApJ, 486,Merritt, 102G. R., Carignan, C., Beaulieu, S. F., & Freeman, K. C. 1996, AJ,Meurer,
111, 1551J. C., Dubinski, J., & Hernquist, L. 1998, ApJ, 494,Mihos, 183J. C., McGaugh, S. S., & de Blok, W. J. G. 1997, ApJ, 477,Mihos, L79
H. J., McGaugh, S. S., & Bothun, G. D. 1994, MNRAS, 267,Mo, 129B. 1994, Nature, 370,Moore, 629J. R., Akeson, R. L., Bothun, G. D., Han, M., Huchra, J. P., Roth,Mould,
J., & Schommer, R. A. 1993, ApJ, 409, 14J. F. 1996a,Navarro, preprint
1996b, in IAU Symp. 171, New Light on Galaxy Evolution, ed.ÈÈÈ.R. Bender & R. L. Davies (Dordrecht : Kluwer), 255
J. F., Eke, V. R., & Frenk, C. S. 1996a, MNRAS, 283,Navarro, L72J. F., Frenk, C. S., & White, S. D. M. 1996b, ApJ, 462,Navarro, 563J. F., & Steinmetz, M. 1997, ApJ, 478,Navarro, 13J. P., & Peebles, P. J. E. 1973, ApJ, 186,Ostriker, 467J. P., & Steinhardt, P. J. 1995, Nature, 377,Ostriker, 600
B. 1996, ARA&A, 34,Paczynski, 419P. J. E. 1971, A&A, 11,Peebles, 377P. J. E., Melott, A. L., Holmes, M. R., & Jiang, L. R. 1989, ApJ,Peebles,
345, 108R. A., Bregman, J. N., & Evrard, A. E. 1995, ApJ, 443,Pildis, 514R. A., Schombert, J. M., & Eder, J. 1997, ApJ, 481,Pildis, 157M., Salucci, P., & Stel, F. 1996, MNRAS, 281,Persic, 27
D., Combes, F., & Martinet, L. 1994, A&A, 285,Pfenniger, 79J. X., & Wolfe, A. M. 1997, ApJ, 487,Prochaska, 73
A. C., & Pickering, T. E. 1997, AJ, 113,Quillen, 2075C., et al. 1997, A&A, 342,Renault, L69
M.-H. 1996, Ph.D. thesis, Univ.Rhee, GroningenO.-G., & Sancisi, R. 1994, A&A, 290,Richter, 9
W., Krumm, N., Salpeter, E. E., Knapp, G. R., Strom, K. M.,Romanishin,& Strom, S. E. 1982, ApJ, 263, 94
J., & Bergvall, N. 1994, A&A, 108,Ro� nnback, 193P., Della Ceca, R., Norman, C., & Giacconi, R. 1997, ApJ, 492,Rosati, L21V. C., Ford, W. K., & Thonnard, N. 1980, ApJ, 238,Rubin, 471
E. E., & Ho†man, G. L. 1996, ApJ, 465,Salpeter, 595R., & van Albada, T. S. 1987, in IAU Symp. 117, Dark Matter inSancisi,
the Universe, ed. G. Knapp & J. Kormendy (Dordrecht : Reidel), 67R. H. 1990, A&A Rev., 2,Sanders, 1

No. 1, 1998 TESTING THE DARK MATTER HYPOTHESIS 65
C., Jones, L. R., Ebeling, H., Perlman, E., Malkan, M., Wegner, G.Scharf,1997, ApJ, ApJ, 477, 79
J. M., Bothun, G. D., Impey, C. D., & Mundy, L. G. 1990, AJ,Schombert,100, 1523
J. M., Bothun, G. D., Schneider, S. E., & McGaugh, S. S. 1992,Schombert,AJ, 103, 1107
D., Bernstein, G. M., Impey, C. D., & Bothun, G. D. 1995, ApJ,Sprayberry,438, 72
M., & Bartelmann, M. 1995, MNRAS, 272,Steinmetz, 570V. T. 1987, ARA&A, 25,Trimble, 425
R. B., & Fisher, J. R. 1977, A&A, 54,Tully, 661R. B., & Fouque� , P. 1985, ApJS, 58,Tully, 67R. B., & Verheijen, M. A. W. 1997, ApJ, 484,Tully, 145J. A., Wenk, R. A., & Valdes, F. 1990, ApJ, 349,Tyson, L1
Albada, T. S., & Sancisi, R. 1986, Philos. Trans. R. Soc. London A, 320,van447
der Hulst, J. M., Skillman, E. D., Smith, T. R., Bothun, G. D.,vanMcGaugh, S. S., & de Blok, W. J. G. 1993, AJ, 106, 548
der Kruit, P. C. 1987, A&A, 173,van 59der Marel, R. P. 1991, MNRAS, 253,van 710Zee, L., Haynes, M. P., Salzer, J. J., & Broeils, A. H. 1997, AJ, 113,van 1618
S. S., Mateo, M., Olszewski, E. W., & Keane, M. J. 1995, AJ, 109,Vogt, 151D. A., & Fabian, A. C. 1995, MNRAS, 273,White, 72R. E., & Keel, W. C. 1992, Nature, 359,White, 129S. D. M., Navarro, J. F., Evrard, A. E., & Frenk, C. S. 1993, Nature,White,
366, 429T., Combes, F., & Henkel, C. 1995, A&A, 297,Wiklind, 643D., & Lin, D. N. C. 1997, AJ, 114,Zaritsky, 2545D., Smith, R., Frenk, C., & White, S. D. M. 1997, ApJ, 478,Zaritsky, 39D., & White, S. D. M. 1994, ApJ, 435,Zaritsky, 599
M. A., van der Hulst, J. M., de Blok, W. J. G., & McGaugh, S. S.Zwaan,1995, MNRAS, 273, L35
F., & Humason, M. L. 1964, ApJ, 139,Zwicky, 269