Study of sorptivity of self‐compacting concrete with mineral additives
Upload
khangminh22Category
view
6download
0
HAL Id: hal-03063715https://hal.archives-ouvertes.fr/hal-03063715
Submitted on 14 Dec 2020
HAL is a multi-disciplinary open accessarchive for the deposit and dissemination of sci-entific research documents, whether they are pub-lished or not. The documents may come fromteaching and research institutions in France orabroad, or from public or private research centers.
L’archive ouverte pluridisciplinaire HAL, estdestinée au dépôt et à la diffusion de documentsscientifiques de niveau recherche, publiés ou non,émanant des établissements d’enseignement et derecherche français ou étrangers, des laboratoirespublics ou privés.
Structural study of the effect of mineral additives on thetransparency, stability, and aging of silicate gels
N. El Felss, A. Gharzouni, Maggy Colas, J. Cornette, I. Sobrados, S. Rossignol
To cite this version:N. El Felss, A. Gharzouni, Maggy Colas, J. Cornette, I. Sobrados, et al.. Structural study of theeffect of mineral additives on the transparency, stability, and aging of silicate gels. Journal of Sol-Gel Science and Technology, Springer Verlag, 2020, 96 (2), pp.265-275. �10.1007/s10971-020-05385-x�.�hal-03063715�
1
Structural study of the effect of mineral additives on the transparency, stability and
ageing of silicate gels
N. El Felss1, A. Gharzouni1, M. Colas1, J. Cornette1, I. Sobrados2 and S. Rossignol1
1 Institut de Recherche sur les Céramiques (IRCER), 12 rue Atlantis, 87068 Limoges Cedex, France.
2 Instituto de Ciencia de Materiales de Madrid, Consejo Superior de Investigaciones Científicas (CSIC),
C/Sor Juana Inés de la Cruz, 3, 28049 Madrid, Spain
Corresponding author: [email protected], tel.: 33 5 87 50 25 64
Abstract
The objective of this work is to evaluate to structural evolution of silicate gel in function of time and mineral
additives. A comparison between fresh and aged silicate gel synthesized by silica and potassium hydroxide was
carried out using FTIR, Raman and 29Si MAS-NMR spectroscopies. Then, different additives such as NaOH,
AlOOH, Li2B4O7 and HCl were incorporated in the silica solution. Their effect on the aspect, transparency, Qn
polymerization and stability of silicate gels was studied. The structural study has shown that the quantification of
Qn species is difficult using FTIR and Raman spectroscopy because of the existence of several contributions in the
same spectral region of silicate species. More precise informations were given by 29Si NMR spectroscopy which
has demonstrated the increase of Q3 species in the detriment of Q4 revealing the depolymerization of the structure
over time. The study of effect of additives reveals that HCl, AlOOH and Li2B4O7 do not permit to improve the
stability of the gel due to the formation of several networks. However, promising results of stability and
transparency were obtained using NaOH with a molar ratio of former to modifier of 2.52.
Keywords: silicate, 29 Si MAS-NMR, Qn, mineral additive, ageing, pH value
I. INTRODUCTION
Silicate gel has attractive properties such as transparency, high adsorption capacity [1] acid/base properties,
insolubility in different solvents and thermal stability. Due to these properties, they can be used in several
applications fields such as optical sensors and biosensors [2], for the removal of heavy metals from low content
effluents [3], or high concentrations of toluene vapor from gas [4], in pharmaceutical industry [5].
Among the processes used to synthesize silica gels, there is sol-gel process [6], acidification or precipitation of
silica [7, 8] and ion exchange in an alkaline solution [9,10].Whatever the used process, it is important to elucidate the

2
structure and the stability of the gel over time. The focus on the use of mineral precursors (silica and alkaline
solution) due to their lower environmental impact [11] is important as well as the interaction of the silica with
alkaline cations which was extensively studied. Different spectroscopic techniques such as nuclear magnetic
resonance 29Si NMR, infrared Fourier transform spectroscopy (FTIR), and Raman spectroscopy were used. The
network connectivity is generally denoted by the structural unit Q n, defined by Engelhard [12], with Q representing
the silicon atom connected with n bridging oxygen atoms and (4-n) non-bridging oxygen atoms in a tetrahedral
environment. The characterization of silicate solutions by 29Si NMR allows the distinction and the quantification
of the silicate species. The variation of the Qn species depends on the Si/M ratio (with M = Na or/and K) and the
pH value [13, 14]. It has been shown that the alkali silicate solution depolymerizes in the presence of cyclic species
Q2c and Q3c thus indicating the formation of rings within the solution [15]. FTIR spectroscopic measurements
indicate information on OH bonds [16,17] and SiO2 framework characteristic of the asymmetric stretching vibration
of Si–O–Si bond which are located between 1200 and 1000 cm-1 [18]. The silicate species Q4, Q3 and Q2 are located
respectively around 1150-1200, 1100 and 1000-1030 cm-1, while the position of the species Q1, Q0 is respectively
around 900-920 and 820-876 cm-1 [19]. Raman spectroscopy allows highlighting the depolymerization of the
different species as a function of the content of alkaline ions [20,21]. Raman spectroscopy was also combined to
chemometric techniques to easily determine the alkaline silicate solution depolymerization degree and therefore
reactivity through the chains to rings ratio [22]. It was also used to study the Qn speciation in binary potassium
silicate melts [23]. The ageing of silicate gel is an important parameter to control because it influences the properties
and thus the desired application. In fact, it was demonstrated that with time the condensation continues after
gelation due to the high amount of labile hydroxyl groups. In addition to that, the polymerization reaction
strengthens the network [24]. Wijnen et al [25], have studied silica gel after 1 year of ageing using 29 Si MAS-NMR.
They have found a decrease of Q3 species at the expense of Q4.
Different additives can be added to silicate gel such as organic additives, gelatin, poly- vinyl alcohol and
glycerol [26]. Furthermore, formamide and oxalic acid were proven to improve the strength of the gel, in order to
resist to capillary stresses. However, few studies have investigated the addition of mineral additives. For example,
inorganic salts were proven to affect the particle growth and the gel structure. Their influence was intimately
related to the valency of the cation of the salt [27]. The additives added to silica can act as modifiers and /or formers
[28] (polyhedra, connected by bridging oxygen atoms and located at the vertices). The network modifier cations are
alkaline or alkaline earth, which lead to breaking the bridges between the different forming cations inducing
negatively charged non-bridging oxygens. The use of modifier cations leads mainly to the increase of the NBO
3
(number of non-bridging oxygen atoms) and therefore to the depolymerization of the network. The effect of
network-modifying cations on Qn distributions depends on the alkali size. For example, in borosilicate glasses, it
was demonstrated using Raman spectroscopy that the silica polymerization rate, defined as (4Q4+3Q3+2Q2+Q1)/4,
increased with the increase of the ionic radius increase (Li< Na< K <Cs) [29]. Moreover, the increase of the amount
of BIV compared to BIII leads to the increase of the non-bridging oxygen (NBO) [30]. NMR spectroscopy study of
B2O3 doped bioactive glasses synthesized with a sol-gel process reveals that the majority of the borate is present
as anionic BO4/2− species and the need for charge compensation leads to an increase of the polymerization degree
of phosphate species [31]. Furthermore, FTIR spectroscopy on Al3+ doped silica gel adsorbents evidences the
formation of Si-O-Al band situated at 960 cm−1 [32]. Otherwise, it has been shown that the addition of Al2O3 to the
SiO2 gel allows avoiding the dependence of glass transition temperature (Tg) on hydroxyl concentration. This
effect is due to the highly cross-linked structure in alumina-silica gels [33].Indeed, previous studies confirm by
NMR spectroscopy the formation of the chemical bond Si-O-Al in alumina-silica gels rather than Al-O-Al linking
with Al2O3 content lower than 14 mol% [34]. Lithium silicate gels were also studied. The NMR results indicate
that depending on the lithium source, the lithium ions can be part of the silica network or in the form of hydrated
ions situated in the pores of the gel [35]. It was also demonstrated that the large size of hydration sphere of Li
reduces its depolymerizing effect [36]. The structure of silicate gel is also modified by the presence of sodium. Low
SiO2/Na2O molar ratio increases the NBO and favors the formation of Q2 and Q1 species in the form of chains,
dimers, and monomers. However, high SiO2/Na2O molar ratio decreases the NBO and leads to structures consisting
of Q3 and Q4 species. Furthermore, the hydrolytic stability and the compressive strength of sodium silicate gels
were improved with the increase of SiO2/Na2O molar ratio [37]. Despite the numerous studies on the structure of
silicate gel, there is a lack of informations on the relation between the structure evolution and the stability of the
gel over the time and the role of mineral additives.
The aim of this work is to improve the stability of silicate gels. For this, the structural evolution of fresh and
aged silicate gels was determined using several spectroscopic techniques (FTIR, Raman and 29 Si MAS-NMR).
Then, the effect of different additives as NaOH, AlOOH, Li2B4O7 and HCl on the transparency and the stability of
the silicate gels was investigated.
II. EXPERIMENTAL PART
Synthesis of silicate gels
The synthesis of silicate gels was carried out using a rotary evaporator. A colloidal silica SiO2 is placed in a
flask and then mixed with potassium hydroxide. Then the whole mixture was matured for 30 min at 60 °C. In order

4
to avoid the formation of bubbles, the mixture was degassed for 1h at room temperature. The solution is then
transferred into a vial and dried at 90 °C for 48 h. The recipient should be kept closed during the curing of the gel.
In order to improve the silicate gel stability, different additives such as sodium hydroxide (NaOH), boehmite
(AlOOH), lithium tetraborate (Li2B4O7) and HCl were added to silica solution. The purity of the different
precursors is presented in Table 1.
The initial synthesized silicate gel was denoted as G and the modified gels were denoted as Gx with x is NaOH
or AlOOH or Li2B4O7 or HCl.
Characterization techniques
FTIR spectra of the gels after curing were obtained on a Thermo Fisher Scientific 380 infrared spectrometer
(Nicolet) using transparent potassium bromide (KBr). The IR spectra were collected between 4000 and 400 cm-1
with a resolution of 4 cm-1 and 64 scans. The atmospheric CO2 contribution was removed via a straight-line fit
between 2400 and 2280 cm- 1. All data was normalized by the most intense band Q3.
29Si MAS-NMR spectra of silicate gels were recorded with an AVANCE-400 Bruker spectrometer (9.4T
magnetic field) working at 79.5 MHz. Spectra were recorded, after 5.0 μs irradiation with the MAS technique (5
kHz rotation around an axis inclined 54°44′ with respect the external magnetic field). The number of scans was
400. The time between acquisitions was set to 10 s to minimize saturation effects. The position of NMR
components was referred to TMS. The fitting of NMR spectra was performed with the dmfit software (D. Massiot,
CNRS), that allowed position, linewidth and intensity of components to be deduced with a nonlinear least-square
iterative method. The errors for chemical shifts and relative area are estimated at 0.2 ppm and 2% respectively.
The Raman spectra were acquired using an inVia Reflex Renishaw confocal Raman spectrometer. Raman data
were collected with 532 nm laser operating on the gel at a power of 40 mW. The objective used was x100 with a
holographic grating of 2400 lines/mm. The spectral rage was 700 to 1200 cm-1, and the acquisition time was 2
accumulations of 60 s.
UV spectroscopy was performed on the gel using a CARY 5000 spectrophotometer. The spectra were
obtained between 400 and 750 nm with a baseline set to 0 and a step of 1 nm.
The pH values were measured after the synthesis of the gels using a Schott Instrument Lab860 pH-
meter at 25°C.
The stability of gels depends on their irreversible state. In order to verify this, the vials containing the gels are
placed upside down in an oven at around 50 °C. A graduation is pasted on the vials in order to follow the
deformation of the meniscus of the gel as a function of time.
5
III. RESULTS AND DISCUSSION
1. Structure evolution of gels
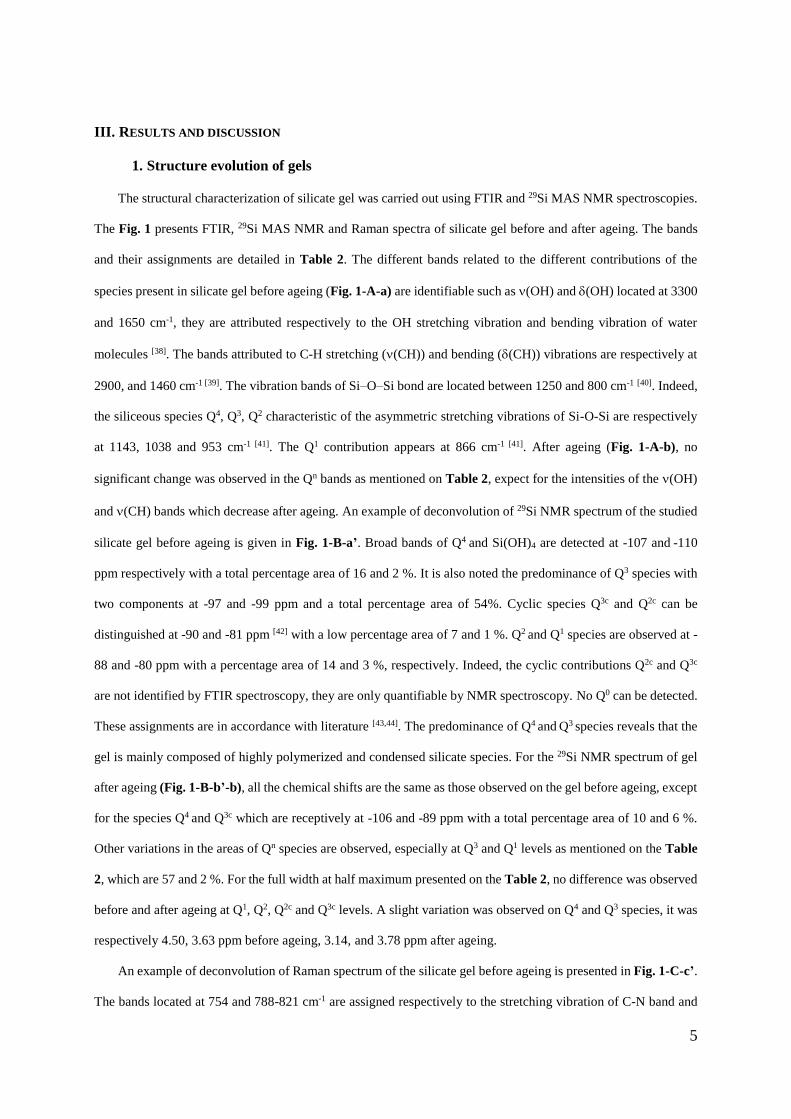
The structural characterization of silicate gel was carried out using FTIR and 29Si MAS NMR spectroscopies.
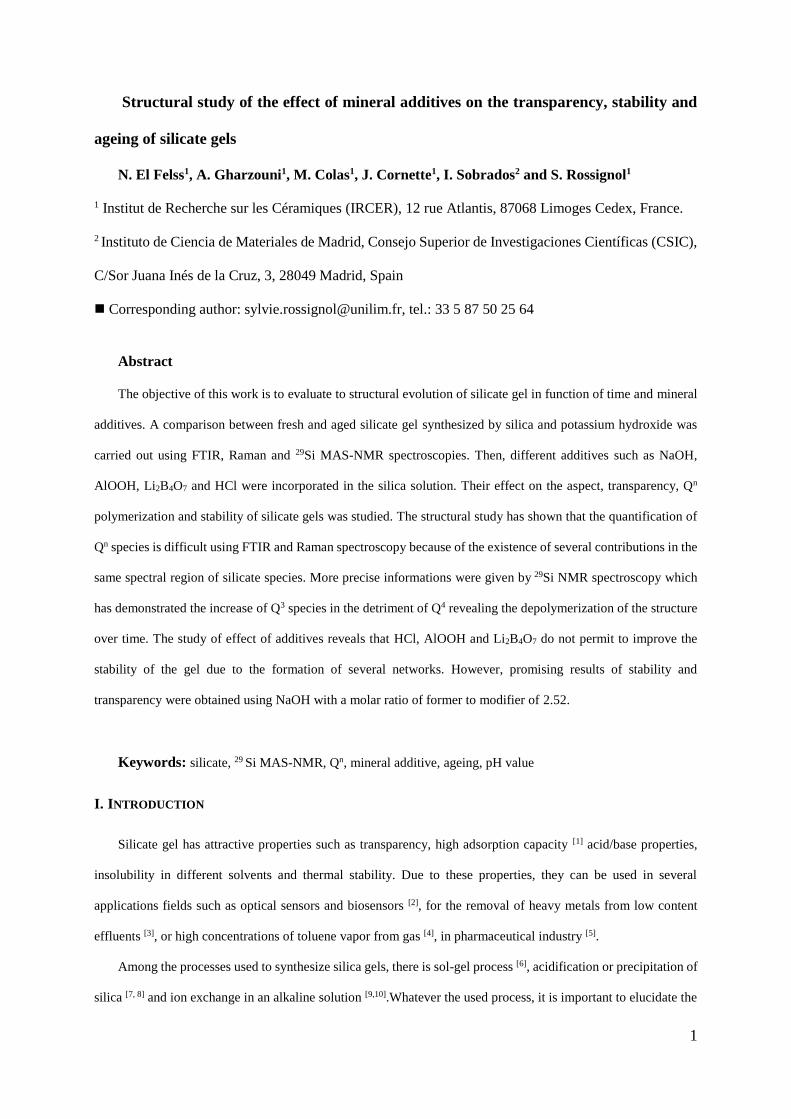
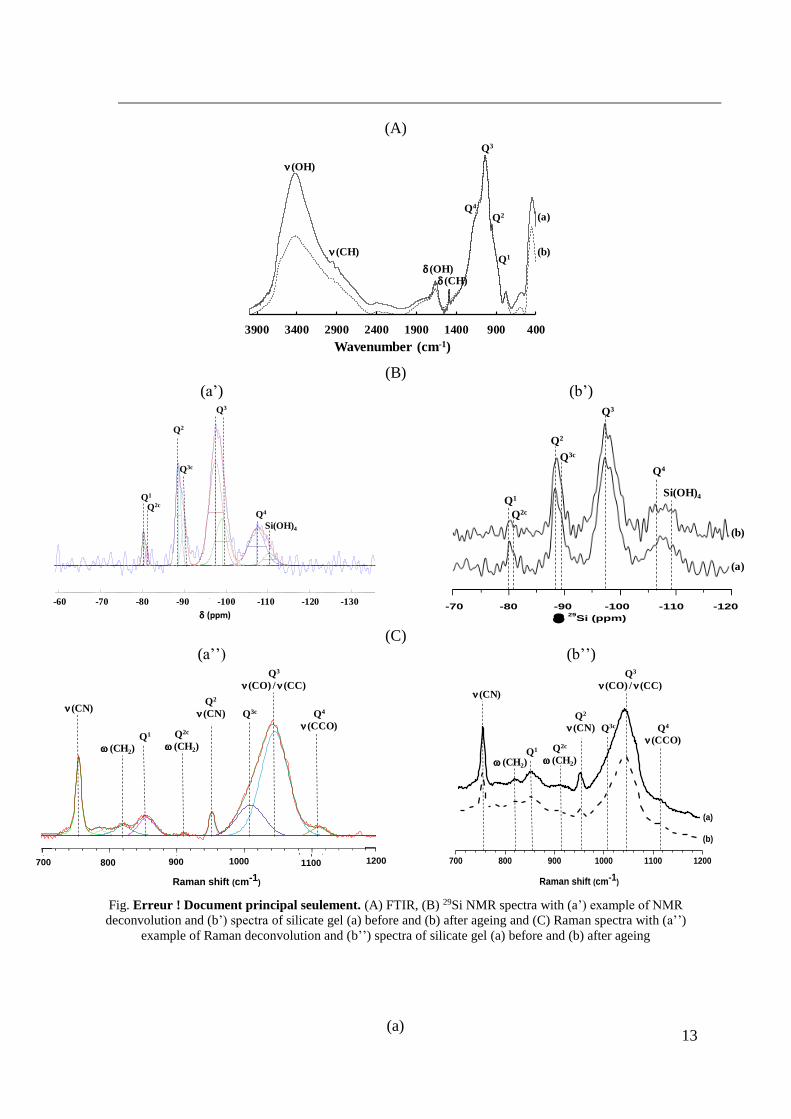
The Fig. 1 presents FTIR, 29Si MAS NMR and Raman spectra of silicate gel before and after ageing. The bands
and their assignments are detailed in Table 2. The different bands related to the different contributions of the
species present in silicate gel before ageing (Fig. 1-A-a) are identifiable such as (OH) and (OH) located at 3300
and 1650 cm-1, they are attributed respectively to the OH stretching vibration and bending vibration of water
molecules [38]. The bands attributed to C-H stretching ((CH)) and bending ((CH)) vibrations are respectively at
2900, and 1460 cm-1 [39]. The vibration bands of Si–O–Si bond are located between 1250 and 800 cm-1 [40]. Indeed,
the siliceous species Q4, Q3, Q2 characteristic of the asymmetric stretching vibrations of Si-O-Si are respectively
at 1143, 1038 and 953 cm-1 [41]. The Q1 contribution appears at 866 cm-1 [41]. After ageing (Fig. 1-A-b), no
significant change was observed in the Qn bands as mentioned on Table 2, expect for the intensities of the (OH)
and (CH) bands which decrease after ageing. An example of deconvolution of 29Si NMR spectrum of the studied
silicate gel before ageing is given in Fig. 1-B-a’. Broad bands of Q4 and Si(OH)4 are detected at -107 and -110
ppm respectively with a total percentage area of 16 and 2 %. It is also noted the predominance of Q3 species with
two components at -97 and -99 ppm and a total percentage area of 54%. Cyclic species Q3c and Q2c can be
distinguished at -90 and -81 ppm [42] with a low percentage area of 7 and 1 %. Q2 and Q1 species are observed at -
88 and -80 ppm with a percentage area of 14 and 3 %, respectively. Indeed, the cyclic contributions Q2c and Q3c
are not identified by FTIR spectroscopy, they are only quantifiable by NMR spectroscopy. No Q0 can be detected.
These assignments are in accordance with literature [43,44]. The predominance of Q4 and Q3 species reveals that the
gel is mainly composed of highly polymerized and condensed silicate species. For the 29Si NMR spectrum of gel
after ageing (Fig. 1-B-b’-b), all the chemical shifts are the same as those observed on the gel before ageing, except
for the species Q4 and Q3c which are receptively at -106 and -89 ppm with a total percentage area of 10 and 6 %.
Other variations in the areas of Qn species are observed, especially at Q3 and Q1 levels as mentioned on the Table
2, which are 57 and 2 %. For the full width at half maximum presented on the Table 2, no difference was observed
before and after ageing at Q1, Q2, Q2c and Q3c levels. A slight variation was observed on Q4 and Q3 species, it was
respectively 4.50, 3.63 ppm before ageing, 3.14, and 3.78 ppm after ageing.
An example of deconvolution of Raman spectrum of the silicate gel before ageing is presented in Fig. 1-C-c’.
The bands located at 754 and 788-821 cm-1 are assigned respectively to the stretching vibration of C-N band and
6
CH2 rocking mode [45][46]. The assignment of Raman bands is complicated to attribute in the frequency range 900-
1200 cm-1 due to the overlap of different vibrations. Indeed, many vibrations are coupled. The different bands are
attributed to the COH deformation (1342 cm−1), CCO vibration modes (1054 and 1115 cm−1) and CH2 rocks (976
and 925 cm−1) [47]. These vibrations are due to the other organic components of the silicate gel. The bands Q4 and
Q1 species are located respectively at 1110 and 855 cm-1 with percentage area of 1 and 3 % [48] [49]. The
contributions of species Q3 and Q3c are observed respectively at 1045 and 1010 cm-1 with 28 and 8 % as an area
percentage [50]. Low area percentages are observed for the species Q2 and Q2c located at 952 and 910 cm-1, they are
respectively 1 and 0 % [51]. No Q0 was detected. These assignments are in accordance with literature. However,
the overlap of these different contributions may false the decomposition of the spectra and therefore the area
percentages of the Qn species, especially for species Q2, Q3 and Q3c. After ageing (Fig. 1-C-d’-b), the area
percentage of Q4 species located at 1097 cm-1 increased to 4 %. The same variations observed for species Q3c, Q2c
located respectively at 1015 and 905 cm-1 with area percentages of 13 and 1 %. A decrease in the area percentages
is observed for the species Q3, Q2 and Q1 located respectively at 1047, 952 and 853 cm-1 as mentioned on the Table
2, which are 1, 1 and 2%.
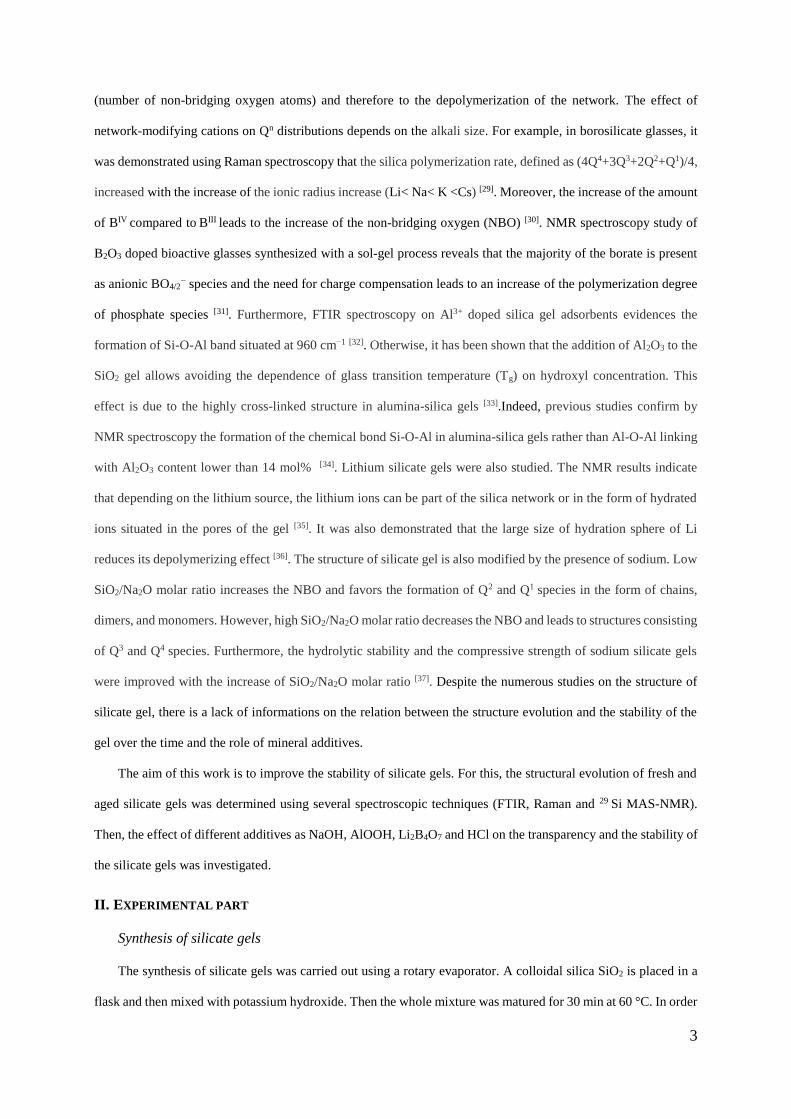
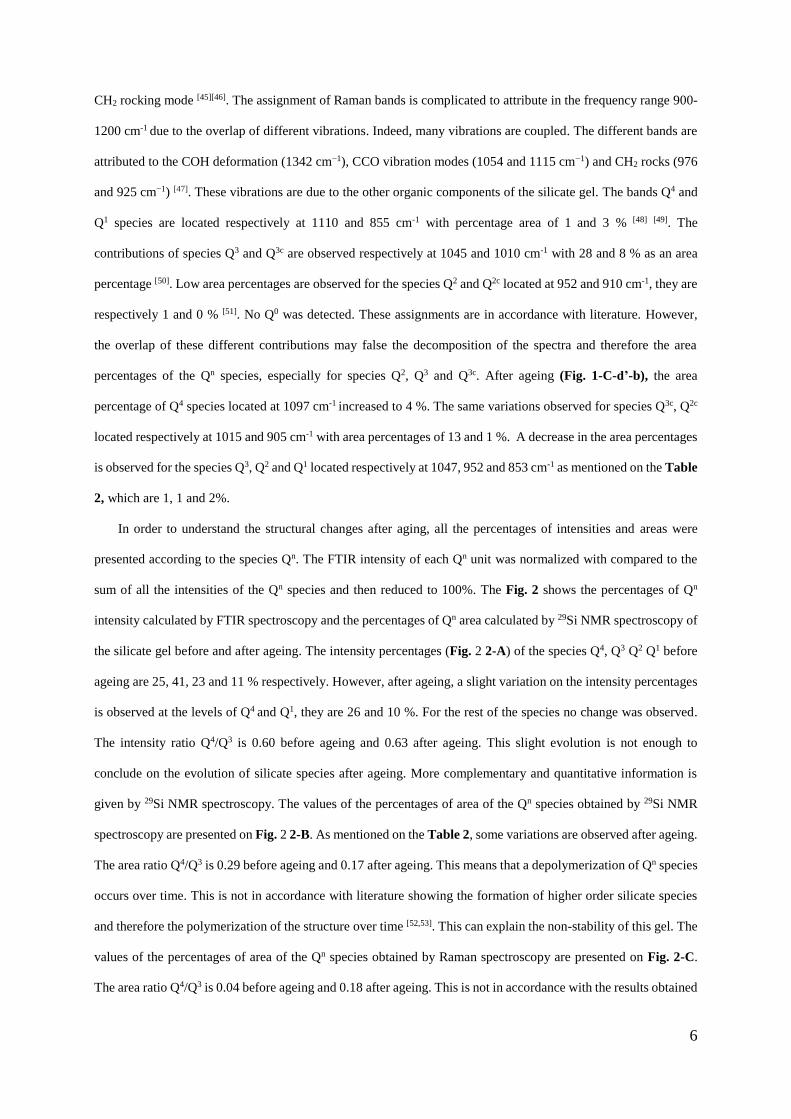
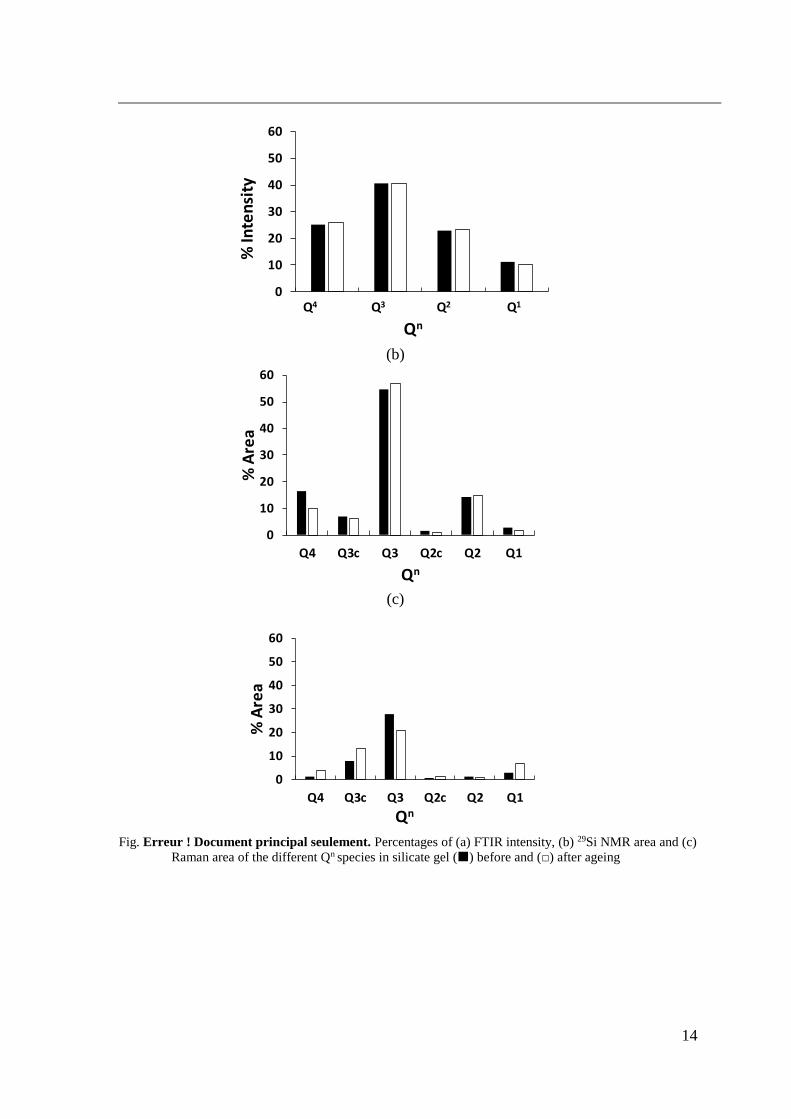
In order to understand the structural changes after aging, all the percentages of intensities and areas were
presented according to the species Qn. The FTIR intensity of each Qn unit was normalized with compared to the
sum of all the intensities of the Qn species and then reduced to 100%. The Fig. 2 shows the percentages of Qn
intensity calculated by FTIR spectroscopy and the percentages of Qn area calculated by 29Si NMR spectroscopy of
the silicate gel before and after ageing. The intensity percentages (Fig. 2 2-A) of the species Q4, Q3 Q2 Q1 before
ageing are 25, 41, 23 and 11 % respectively. However, after ageing, a slight variation on the intensity percentages
is observed at the levels of Q4 and Q1, they are 26 and 10 %. For the rest of the species no change was observed.
The intensity ratio Q4/Q3 is 0.60 before ageing and 0.63 after ageing. This slight evolution is not enough to
conclude on the evolution of silicate species after ageing. More complementary and quantitative information is
given by 29Si NMR spectroscopy. The values of the percentages of area of the Qn species obtained by 29Si NMR
spectroscopy are presented on Fig. 2 2-B. As mentioned on the Table 2, some variations are observed after ageing.
The area ratio Q4/Q3 is 0.29 before ageing and 0.17 after ageing. This means that a depolymerization of Qn species
occurs over time. This is not in accordance with literature showing the formation of higher order silicate species
and therefore the polymerization of the structure over time [52,53]. This can explain the non-stability of this gel. The
values of the percentages of area of the Qn species obtained by Raman spectroscopy are presented on Fig. 2-C.
The area ratio Q4/Q3 is 0.04 before ageing and 0.18 after ageing. This is not in accordance with the results obtained

7
by 29Si NMR spectroscopy. Indeed, the measurements by silicon NMR are specific only to the siliceous species
Qn, while by Raman spectroscopy, other contributions associated with the C-N, C-C and CH2 bonds are also
observed in the same frequency range as that of the Qn species, namely between 800 and 1200 cm-1. The area
percentages obtained by Raman spectroscopy are not specific to Qn species. Although Raman spectroscopy is a
powerful technique, it can not be used in this case to quantify the Qn species because of the contributions of the
other components of silicate gel. Only 29Si NMR spectroscopy is selective for the Qn species present in the gel.
In order to improve the stability of the gel, different additives were added and their impact on Qn species
distribution was studied.
2. Influence of additives on Qn polymerization
The influence of the chemical composition of the additives on the silica was evaluated by carrying out various
reaction mixtures. The amount of moles of alkaline was varied compared to that of the initial gel which is 0.23
mol. The additives added to silica can act as modifiers and /or formers as explained in the introduction.
Feature and pH value
Table 3 presents the photographs of the gels obtained after curing. All the gels obtained have a solid texture.
The appearance of the gels differs depending on the additive added. The gels produced with Li2B4O7 and HCl have
a white appearance. The use of AlOOH modifes slightly the gels with a cloudy and less white appearance. The
initial gel as well as the gel modified with NaOH have a transparent appearance. The pH values were measured
directly after the synthesis of the gels. The pH values of all the modified gels are presented in Table 4. For the
initial gel noted G, the pH value is 12.14. After adding NaOH, AlOOH, Li2B4O7 and HCl, the pH values decrease
to 11.5, 11.89, 11.80 and 11.70 respectively. This decrease in pH value compared to the reference means a variation
in the level of Qn species able of polycondensation reactions. Goto demonstrated that polymerization is favored
and larger particles are formed at higher pH [54]. However, the formation and polymerization of silicate gels with
a basic pH value higher than 10 is not much studied in literature.
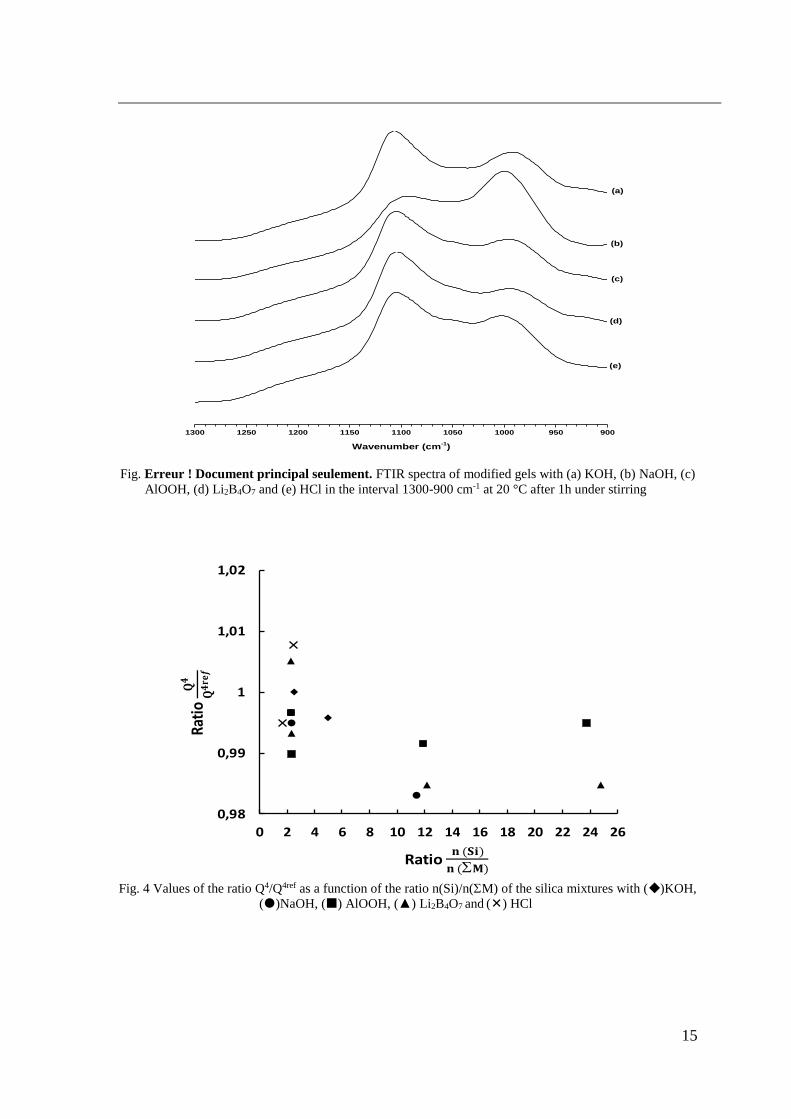
FTIR results
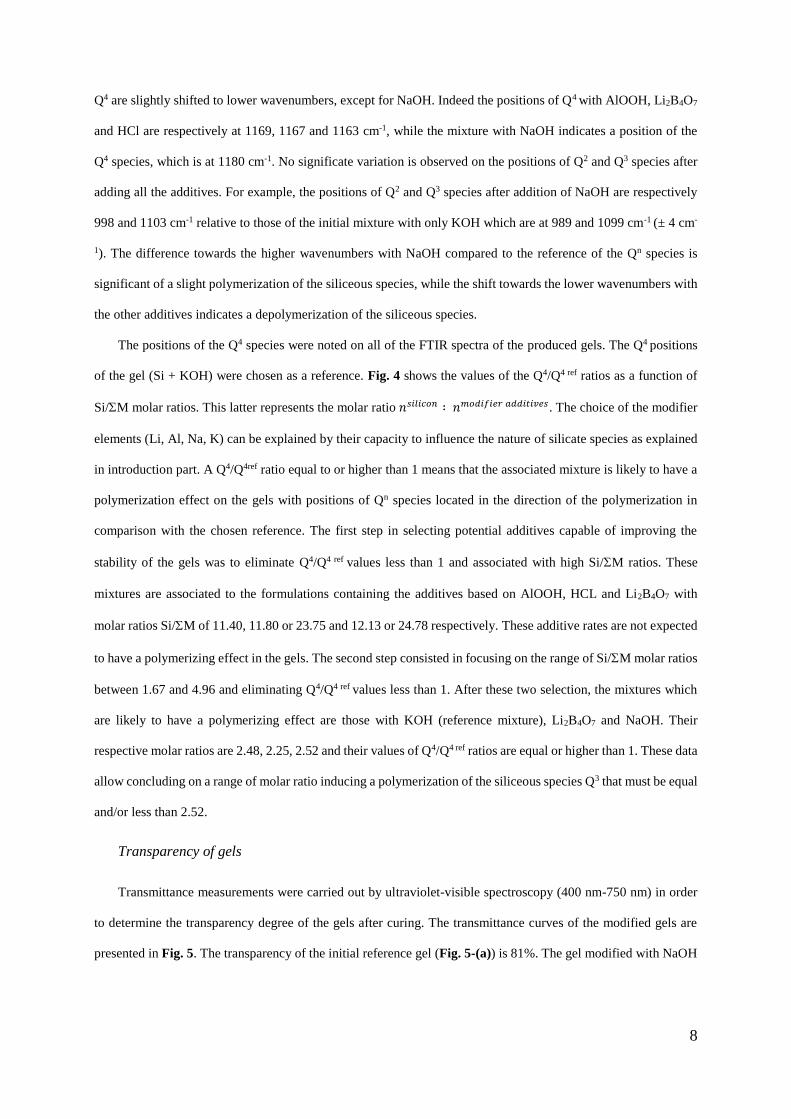
The FTIR spectra are recorded at 20 °C and after 1 hour of reactive mixture stirring. Fig. 3 shows the FTIR
spectra of the silica mixed with KOH, NaOH, AlOOH, Li2B4O7 and HCl. In Fig. 3 the spectrum of the reference
mixture with KOH (a) indicates that the Q4 species is located at 1175 cm-1. When adding the additives NaOH
(spectrum (b)), AlOOH (spectrum (c)), Li2B4O7 (spectrum (d)) and HCl (spectrum (e)) the positions of the species
8
Q4 are slightly shifted to lower wavenumbers, except for NaOH. Indeed the positions of Q4 with AlOOH, Li2B4O7
and HCl are respectively at 1169, 1167 and 1163 cm-1, while the mixture with NaOH indicates a position of the
Q4 species, which is at 1180 cm-1. No significate variation is observed on the positions of Q2 and Q3 species after
adding all the additives. For example, the positions of Q2 and Q3 species after addition of NaOH are respectively
998 and 1103 cm-1 relative to those of the initial mixture with only KOH which are at 989 and 1099 cm-1 (± 4 cm-
1). The difference towards the higher wavenumbers with NaOH compared to the reference of the Qn species is
significant of a slight polymerization of the siliceous species, while the shift towards the lower wavenumbers with
the other additives indicates a depolymerization of the siliceous species.
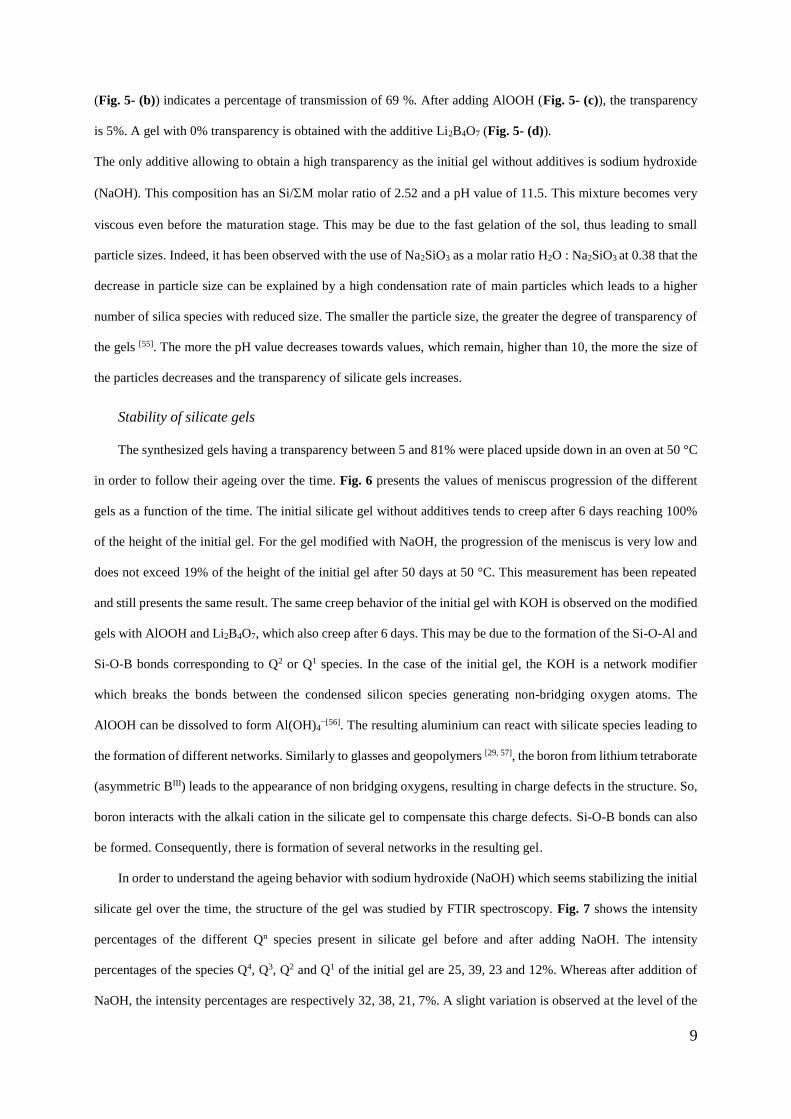
The positions of the Q4 species were noted on all of the FTIR spectra of the produced gels. The Q4 positions
of the gel (Si + KOH) were chosen as a reference. Fig. 4 shows the values of the Q4/Q4 ref ratios as a function of
Si/M molar ratios. This latter represents the molar ratio 𝑛𝑠𝑖𝑙𝑖𝑐𝑜𝑛 ∶ 𝑛𝑚𝑜𝑑𝑖𝑓𝑖𝑒𝑟 𝑎𝑑𝑑𝑖𝑡𝑖𝑣𝑒𝑠. The choice of the modifier
elements (Li, Al, Na, K) can be explained by their capacity to influence the nature of silicate species as explained
in introduction part. A Q4/Q4ref ratio equal to or higher than 1 means that the associated mixture is likely to have a
polymerization effect on the gels with positions of Qn species located in the direction of the polymerization in
comparison with the chosen reference. The first step in selecting potential additives capable of improving the
stability of the gels was to eliminate Q4/Q4 ref values less than 1 and associated with high Si/M ratios. These
mixtures are associated to the formulations containing the additives based on AlOOH, HCL and Li2B4O7 with
molar ratios Si/M of 11.40, 11.80 or 23.75 and 12.13 or 24.78 respectively. These additive rates are not expected
to have a polymerizing effect in the gels. The second step consisted in focusing on the range of Si/M molar ratios
between 1.67 and 4.96 and eliminating Q4/Q4 ref values less than 1. After these two selection, the mixtures which
are likely to have a polymerizing effect are those with KOH (reference mixture), Li2B4O7 and NaOH. Their
respective molar ratios are 2.48, 2.25, 2.52 and their values of Q4/Q4 ref ratios are equal or higher than 1. These data
allow concluding on a range of molar ratio inducing a polymerization of the siliceous species Q3 that must be equal
and/or less than 2.52.
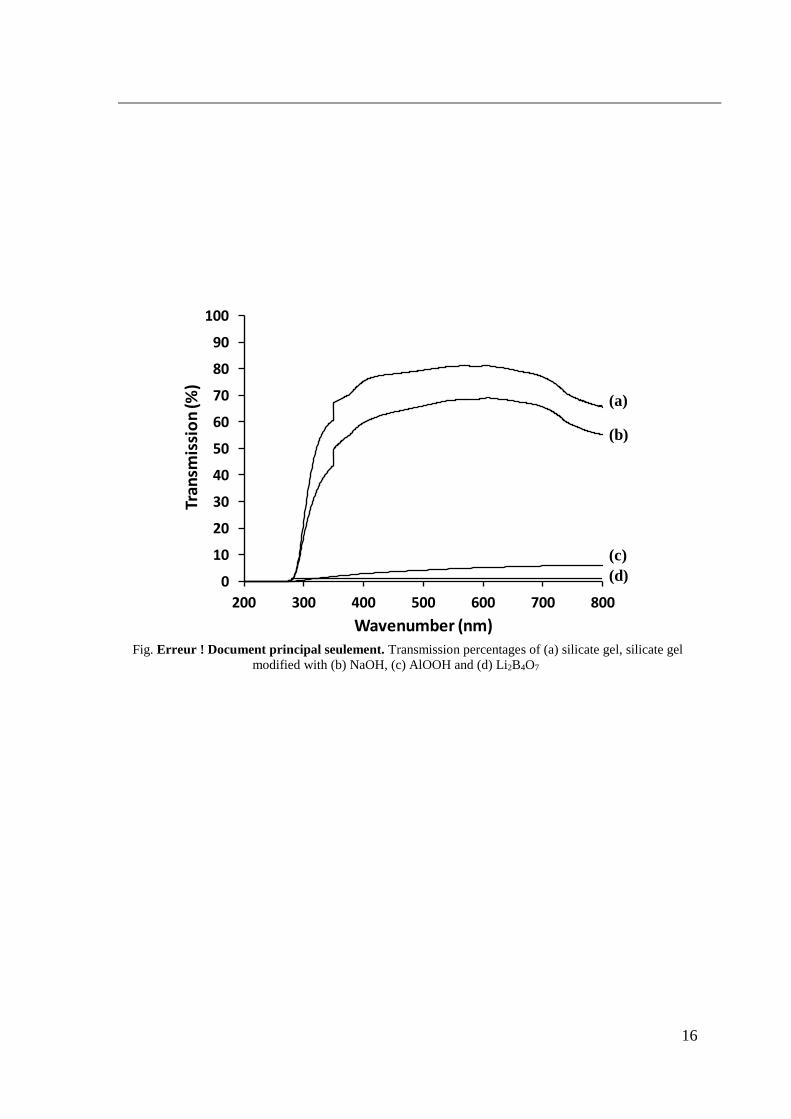
Transparency of gels
Transmittance measurements were carried out by ultraviolet-visible spectroscopy (400 nm-750 nm) in order
to determine the transparency degree of the gels after curing. The transmittance curves of the modified gels are
presented in Fig. 5. The transparency of the initial reference gel (Fig. 5-(a)) is 81%. The gel modified with NaOH
9
(Fig. 5- (b)) indicates a percentage of transmission of 69 %. After adding AlOOH (Fig. 5- (c)), the transparency
is 5%. A gel with 0% transparency is obtained with the additive Li2B4O7 (Fig. 5- (d)).
The only additive allowing to obtain a high transparency as the initial gel without additives is sodium hydroxide
(NaOH). This composition has an Si/M molar ratio of 2.52 and a pH value of 11.5. This mixture becomes very
viscous even before the maturation stage. This may be due to the fast gelation of the sol, thus leading to small
particle sizes. Indeed, it has been observed with the use of Na2SiO3 as a molar ratio H2O : Na2SiO3 at 0.38 that the
decrease in particle size can be explained by a high condensation rate of main particles which leads to a higher
number of silica species with reduced size. The smaller the particle size, the greater the degree of transparency of
the gels [55]. The more the pH value decreases towards values, which remain, higher than 10, the more the size of
the particles decreases and the transparency of silicate gels increases.
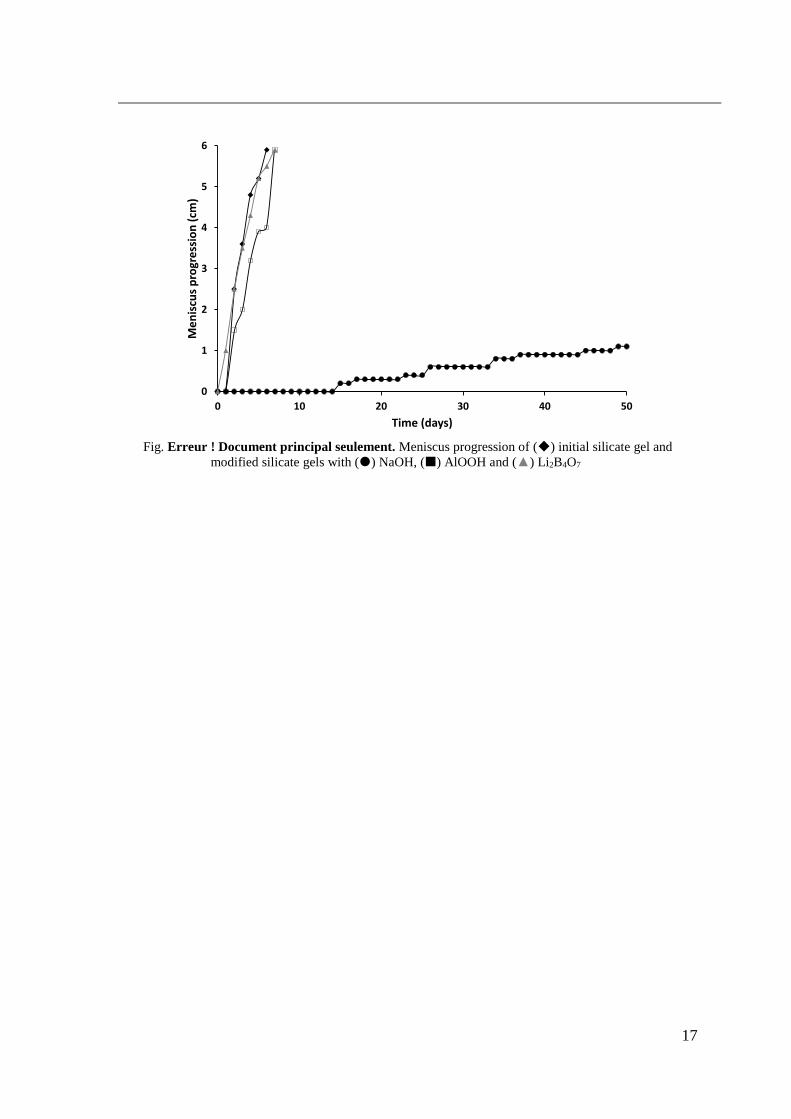
Stability of silicate gels
The synthesized gels having a transparency between 5 and 81% were placed upside down in an oven at 50 °C
in order to follow their ageing over the time. Fig. 6 presents the values of meniscus progression of the different
gels as a function of the time. The initial silicate gel without additives tends to creep after 6 days reaching 100%
of the height of the initial gel. For the gel modified with NaOH, the progression of the meniscus is very low and
does not exceed 19% of the height of the initial gel after 50 days at 50 °C. This measurement has been repeated
and still presents the same result. The same creep behavior of the initial gel with KOH is observed on the modified
gels with AlOOH and Li2B4O7, which also creep after 6 days. This may be due to the formation of the Si-O-Al and
Si-O-B bonds corresponding to Q2 or Q1 species. In the case of the initial gel, the KOH is a network modifier
which breaks the bonds between the condensed silicon species generating non-bridging oxygen atoms. The
AlOOH can be dissolved to form Al(OH)4−[56]. The resulting aluminium can react with silicate species leading to
the formation of different networks. Similarly to glasses and geopolymers [29, 57], the boron from lithium tetraborate
(asymmetric BIII) leads to the appearance of non bridging oxygens, resulting in charge defects in the structure. So,
boron interacts with the alkali cation in the silicate gel to compensate this charge defects. Si-O-B bonds can also
be formed. Consequently, there is formation of several networks in the resulting gel.
In order to understand the ageing behavior with sodium hydroxide (NaOH) which seems stabilizing the initial
silicate gel over the time, the structure of the gel was studied by FTIR spectroscopy. Fig. 7 shows the intensity
percentages of the different Qn species present in silicate gel before and after adding NaOH. The intensity
percentages of the species Q4, Q3, Q2 and Q1 of the initial gel are 25, 39, 23 and 12%. Whereas after addition of
NaOH, the intensity percentages are respectively 32, 38, 21, 7%. A slight variation is observed at the level of the
10
species Q3 and Q2. However, it is observed the increase in Q4 species and the decrease in Q1 species for the gel
modified with NaOH. The intensity ratio Q4/Q3 is 0.64 in the initial gel and 0.84 after adding NaOH. This evolution
after adding NaOH suggest the formation of higher order silicate species and therefore the polymerization of the
structure [53, 52].
It would seem relevant to focus on controlling the minimum pH values, to control the transparency (around
69 %) and to have molar ratios between 2.48 and 2.52 in order to stabilize alkali-based silicate gels.
IV. CONCLUSION
This work aims to improve the stability of silicate gels. For this, a silicate gel based on based silica and
potassium hydroxide with various additives were investigated and characterized after synthesis and after ageing
using different spectroscopic techniques (FTIR, Raman and 29Si MAS-NMR spectroscopies).
The structural study of the initial gel by FTIR and 29Si MAS-NMR spectroscopies demonstrated the decrease
of Q4/Q3 area ratio after ageing revealing the depolymerization of the structure over time. In order to improve the
stability of the gel, different additives (NaOH, AlOOH, Li2B4O7 and HCl) were added and their impact on the
transparency, the stability and Qn species distribution was studied. The transparency was very reduced by HCl,
AlOOH and Li2B4O7. However, NaOH preserves the transparency of gel. The ageing was accelerated by placing
the silicate gels at 50 °C. The silicate gel without additives tends to creep after 6 days. The gels with AlOOH and
Li2B4O7 exhibit the same behavior due to the formation of the Si-O-Al and Si-O-B bonds inducing the formation
of several networks. However, it is possible to stabilize the gel ageing by adding NaOH (nSi/(nNa+nK) = 2.52) due
to the polymerization of siliceous species.
V. REFERENCES
1 Nasri Z, Shams E (2009) Application of silica gel as an effective modifier for the voltammetric determination
of dopamine in the presence of ascorbic acid and uric acid. Electrochimica Acta 54:7416-7421 2 Estella J, Echeverría J, Laguna M, Garrido J (2007) Effects of aging and drying conditions on the structural
and textural properties of silica gels. Microporous Mesoporous Mater 102:274-282 3 Guibal E, Lorenzelli R, Vincent T, Cloirec P (2010) Application of Silica Gel to Metal Ion Sorption: Static
and Dynamic Removal of Uranyl Ions. Environ Technol 16:101-114 4 Sui H, Liu H, An P, He L, Li X, Cong S (2017) Application of silica gel in removing high concentrations
toluene vapor by adsorption and desorption process. J Taiwan Inst Chem E 74:218-224 5 Hentzschel M, Alnaief M, Smirnova I, Sakmann A, Leopold CS (2012) Tableting properties of silica aerogel
and other silicates. Drug Dev Ind Pharm 38:462–467 6 Livage J, Henry M, Sanchez C (1988) Sol-gel chemistry of transition metal oxides. Prog Solid St Chem 18:
259-341
11
7 Vail JG (1952) Soluble silicates: Their properties and uses. Reinhold, New York, 1:357 8 McGavack J, Patrick WA (1920) The adsorption of sulfur dioxide by the gel of silicic acid. J Am Chem Soc
42:946-978 9 Gerber T, Himmel B, Hübert C (1994) WAXS and SAXS investigation of structure formation of gels from
sodium water glass. J Non Cryst Solids 175:160-168 10 Lee CJ, Kim GS, Hyun S.H (2002) Synthesis of silica aerogels from waterglass via new modified ambient
drying. J Mater Sci 37:2237-2241 11 Dokkum V, Hulskotte HP, Kramer JHJ, KJM Wilmot (2004) Emission, fate and effects of soluble silicates
(waterglass) in the aquatic environment. Environ Sci Technol 38:515–521 12 Engelhard G, Zeigan D, Jancke H, Hoebbel D, Weiker Z (1975) High resolution 29Si NMR of silicates and
Zeolites. Anorg Allg Chem 418:17–28 13 Brykov AS, Danilov VV, Yu Aleshunina E (2008) State of silicon in silicate and silica-containing solutions
and their binding properties. Russ J Appl Chem 81:1717–1721 14 Tognonvi MT, Soro J, Rossignol S (2012) Physical-chemistry of silica/alkaline silicate interactions during
consolidation. Part 2: effect of pH. J Non Cryst Solids 358:492-501 15 Svensson L, Sjöberg S, Öhman LO (1986) Polysilicate equilibria in concentrated sodium silicate solutions.
J Chem Soc Faraday Trans. 1 82:3635–3646 16 Cannas C, Casu M, Musinu A, Piccaluga G (2005) 29Si CP MAS NMR and Near-IR study of sol-gel
microporous silica with tunable surface area. J Non Cryst Solids 351:34-76 17 Estella J, Echeverria JC, Laguna M, Garrido J (2007) Effect of supercritical drying conditions in ethanol on
the structural and textural properties of silica aerogels. Microporous Mesoporous Mater 102-274 18 Lutz W, Täschner D, Kurzhals R, Heidemann D, Hübert C (2009) Characterization of Silica Gels by 29Si
MAS NMR and IR Spectroscopic Measurements. Z. Anorg Allg Chem 2191-2196 19 MacDonald SA, Schardt CR, Masiello DJ, Simmons JH (2000) Dispersion analysis of FTIR reflection
measurements in silicate glasses. J Non Cryst Solids 275:72-82 20 Mysen BO, Cody GD (2005) Solution mechanisms of H2O in depolymerized peralkaline melts. Geochim.
Cosmochim 69:5557-5566 21 Vidal L, Gharzouni A, Joussein E, Colas M, Cornette J, Absi J, Rossignol S (2017) Determination of the
polymerization degree of various alkaline solutions: Raman investigation. J Sol-Gel Sci Technol 83:1-11 22 Arnoult M, Dupuy C, Colas M, Cornette J, Duponchel L, Rossignol S (2019) Determination of the
Reactivity Degree of Various Alkaline Solutions: A Chemometric Investigation. Applied Spectroscopy, 73:12 23 Malfait WJ, Zakaznova-Herzog VP, Halter WE (2007) Quantitative Raman spectroscopy: High-temperature
speciation of potassium silicate melts. J Non Cryst Solids 353:4029-4042 24 Kalapathy U, Proctor A, Shultz J (2000) Production and properties of flexible sodium silicate films from
rice hull ash silica. Bioresour Technol 72:99-106 25 Wijnen PWJG, Beelen TPM, Rummens KPJ, Saeijs HCPL, De Haan JW, Van De Ven LJM, Van Santen
RA (1991) The molecular basis of aging of aqueous silica gel. J Colloid Interf Sci 145:17-32 26 Nassif N, Roux C, Coradin T, MN Rager, OMM Bouvet, Livage JA (2003) Sol-gel matrix to preserve the
viability of encapsulated bacteria. J Mater Chem. 13 203–208 27 Murakata T, Sato S, Ohgawara T (1992) Control of pore size distribution of silica gel through sol-gel process
using inorganic salts and surfactants as additives. J Mater Sci 27:1567-1574 28 Jiang ZH, Zhang QY (2014) The structure of glass: a phase equilibrium approach. Prog Mater Sci 61:144-
215 29 Neyret M, Lenoir M, Granhean A, Massoni N, Penelon B, Malki M (2015) Ionic transport of alkali in
borosilicate glass. Role of alkali nature on glass structure and on ionic conductivity at the glassy state, J Non Cryst
Solids 410:74-81 30 Xie J, Tang H, Wang J, Wu M, Han J, Liu C (2018) Network connectivity and properties of non-alkali
aluminoborosilicate glasses. J Non Cryst Solids 481 :403-408 31 Deilmann L, Winter O, Cerrutti B, Bradtmüller H, Herzig C, Limbeck A, Lahayne O, Hellmich C, Eckert
H, Eder D (2020) Effect of boron incorporation on the bioactivity, structure, and mechanical properties of ordered
mesoporous bioactive glasses. Mater Chem B 8:1456 32 Fang YT, Liu T, Zhang ZC, Gao XN (2014) Silica gel adsorbents doped with Al, Ti, and Co ions improved
adsorption capacity, thermal stability and aging resistance. Renew Energy 63:755-761
33 Liu S, Boffa V, Yang D, Fan Z, Meng F, Yue Y (2018) Clarifying the gel-to-glass transformation in Al2O3-
SiO2 systems. J Non Cryst Solids 492:77‑ 83 34 Ren JJ, Zhang L, Eckert H (2014) Medium-range order in sol–gel prepared Al2O3–SiO2glasses: new results
from solid-state NMR. J Phys Chem C 118:4906–4917 35 Szu SP, Klein LC, Greenblatt M (1990) Effect of precursors on lithium containing silicate gels studied by
7Li nuclear magnetic resonance. J Non Cryst Solids 121:1-3
12
36 Schwartz I, Anderson P, de Lambilly H, Klein LC (1986) Stability of lithium silicate gels. J Non Cryst
Solids 83:391-399 37 D Dimas, I Giannopoulou, D Panias (2009) Polymerization in sodium silicate solutions: a fundamental
process in geopolymerization technology. J Mater Sci 44:3719-3730 38 M. Muroya (1999) Correlation between the formation of silica skeleton and Fourier transform reflection
infrared absorption spectroscopy spectra. Colloid Surf A 157:147-55 39 Chiang CH, Ishida H, Koenig JL (1980) The Structure of y-Aminopropyltriethoxysilane on Glass Surfaces.
J Colloid Interf Sci 74:396-404 40 Lutz W, Taschner D, Kurzhals R, Heidemann D, Hubert C (2009) Characterization of Silica Gels by 29Si
MAS NMR and IR Spectroscopic Measurements. Z Anorg Allg Chem 635:2191-2196 41 Tan J, Zhao S, Wang W, Davies G, Mo X (2004) The effect of cooling rate on the structure of sodium
silicate glass. Mater Sci Eng B 106:295-9 42 Knight CTG (1988) A two-dimensional silicon-29 nuclear magnetic resonance spectroscopic study of the
structure of the silicate anions present in an aqueous potassium silicate solution. J Chem Soc Dalton Trans. 1457-
1460 43 Kawazoe H, Application of NMR Spectroscopy to the Science and Technology of Glasses and Ceramics
(1994) Editor(s): I. Ando, G.A. Webb, Annual Reports on NMR Spectroscopy, Academic Press, 28:1-27 44 Sjöberg S (1996) Silica in aqueous environments. J. Non-Cryst. Solids 196:51-57 45 Michaud PT, Babic D (1998) A Raman Study of Etching Silicon in Aqueous Tetramethylammonium
Hydroxide. J Electrochem Soc 145:11 46 Gryniewicz-Ruzicka C, Arzhantsev S, Pelster LN, Westenberger B, Buhse, J Kauffman (2011) Multivariate
Calibration and Instrument Standardization for the Rapid Detection of Diethylene Glycol in Glycerien by Raman
Spectroscopy. Appl Spectrosc 65:334-341 47 Mendelovici E, Frost RL, Kloprogge T (2000) Cryogenic Raman spectroscopy of glycerol. J Raman
Spectrosc 31:1121-1126 48 Zotov N, Keppler H (1998) The influence of water on the structure of hydrous sodium tetrasilicate glasses.
Am Mineral 83:823-834 49 Matos MC, Ilharco LM, Almeida RM (1992) The evolution of TEOS to silica gel and glass by vibrational
spectroscopy. J Non Cryst Solids 147-148:232-237 50 Brykov AS, Danilov VV, Aleshunina EY (2008) State of silicon in silicate and silica-containing solutions
and their binding properties. Russ J Appl Chem 81:1717-1721 51 Melkior T, Yahiaoui S, Thoby D, Motellier S, Barthès V (2007) Diffusion coefficients of alkaline cations
in Bure mudrock. Phys Chem Earth 32:453-462 52 Goudarzi N (2013) Silicon-29 NMR spectroscopy study of the effect of tetraphenylammonium (TPA) as a
template on distribution of silicate species on alkaline aqueous and alcoholic silicate solutions. Appl Magn Reson
44:469-78 53 Vega AJ, Scherer GW (1989) Study of structural evolution of silica gel using 1H and 29Si NMR. J Non Cryst
Solids 111:153-166 54 Goto K (1956) Effect of pH on polymerization of silicic acid. J Phys Chem 60: 1007-1008 55 Bangi UKH, Jung IK, Park CS, Baek S, Park HH (2013) Optically transparent silica aerogels based on
sodium silicate by a two step sol–gel process and ambient pressure drying. Solid State Sci 18:50-57 56 Panias D, Asimidis P, Paspaliaris I (2001) Solubility of boehmite in concentrated sodium hydroxide
solutions: model development and assessment. Hydrometallurgy 59:15-29 57 Dupuy C, Gharzouni A, Sobrados I, Texier-Mandoki N, Bourbon X, Rossignol S (2019) 29Si, 27Al, 31P and
11B magic angle spinning nuclear magnetic resonance study of the structural evolutions induced by the use of
phosphor- and boron–based additives in geopolymer mixtures. J Non Cryst Solids 521:119-541
13
(A)
(B)
(a’)
(b’)
(C)
(a’’) (b’’)
Fig. Erreur ! Document principal seulement. (A) FTIR, (B) 29Si NMR spectra with (a’) example of NMR
deconvolution and (b’) spectra of silicate gel (a) before and (b) after ageing and (C) Raman spectra with (a’’)
example of Raman deconvolution and (b’’) spectra of silicate gel (a) before and (b) after ageing
(a)
400900140019002400290034003900
Wavenumber (cm-1)
(a)
(b)
(OH)
(OH)(CH)
Q3
Q2
Q1
Q4
(CH)
(ppm)-130-120-110-100-90-80-70-60
File : D:\GHARZP01\DESKTOP\RMN NADIA\SIHMBCO\007003.1R
Solicitud: ; Muestra: HmBCO; Nucleo: 29Si
(ppm)
Q1
Q2c
Q2
Q3c
Q3
Q4
Si(OH)4
-60 -70 -80 -90 -100 -110 -120 -130
Q1
Q2c
Si(OH)4
Q4
Q3
Q3c
Q2
(a)
(b)
-70 -80 -90 -100 -110 -120
-70 -80 -90 -100 -110 -120
29
Si (ppm)
400 500 600 700 800 900 1000 1100
Raman shift / cm-1
-1000
0
1000
2000
3000
4000
5000
6000
7000
8000
9000
10000
11000
12000
Counts
700 800 900 1000 1100 1200
(b)
Raman shift (cm-1)
(a)
700 800 900 1000 1100 1200
(b)
Raman shift (cm-1)
(a)
700 800 900 1000 1100 1200
(b)
Raman shift (cm-1)
(a)
700 800 900 1000 1100 1200
(b)
Raman shift (cm-1)
(a)
700 800 900 1000 1100 1200
(b)
Raman shift (cm-1)
(a)
700 800 900 1000 1100 1200
(b)
Raman shift (cm-1)
(a)
700 800 900 1000 1100 1200
(b)
Raman shift (cm-1)
(a)
700 800 900 1000 1100 1200
(b)
Raman shift (cm-1)
(a)
Q1 Q2c
(CH2)
Q4
(CCO)
Q3
(CO) / (CC)
Q3c
Q2
(CN) (CN)
(CH2)
700 800 900 1000 1100 1200
(b)
Raman shift (cm-1)
(a)
700 800 900 1000 1100 1200
(b)
Raman shift (cm-1)
(a)
Q1 Q2c
(CH2)
Q4
(CCO)
Q3
(CO) / (CC)
Q3c
Q2
(CN)
(CN)
(CH2)
14
(b)
(c)
Fig. Erreur ! Document principal seulement. Percentages of (a) FTIR intensity, (b) 29Si NMR area and (c)
Raman area of the different Qn species in silicate gel () before and (□) after ageing
0
10
20
30
40
50
60
1 2 3 4
% In
ten
sity
Qn
Q4 Q3 Q1Q2
0
10
20
30
40
50
60
Q4 Q3c Q3 Q2c Q2 Q1
% A
rea
Qn
0
10
20
30
40
50
60
Q4 Q3c Q3 Q2c Q2 Q1
% A
rea
Qn
15
Fig. Erreur ! Document principal seulement. FTIR spectra of modified gels with (a) KOH, (b) NaOH, (c)
AlOOH, (d) Li2B4O7 and (e) HCl in the interval 1300-900 cm-1 at 20 °C after 1h under stirring
Fig. 4 Values of the ratio Q4/Q4ref as a function of the ratio n(Si)/n(M) of the silica mixtures with (◆ )KOH,
()NaOH, () AlOOH, (▲) Li2B4O7 and () HCl
1300 1250 1200 1150 1100 1050 1000 950 900
(e)
(d)
(c)
(b)
Wavenumber (cm-1)
(a)
0,98
0,99
1
1,01
1,02
0 2 4 6 8 10 12 14 16 18 20 22 24 26
Rati
o
Ratio
16
Fig. Erreur ! Document principal seulement. Transmission percentages of (a) silicate gel, silicate gel
modified with (b) NaOH, (c) AlOOH and (d) Li2B4O7
0
10
20
30
40
50
60
70
80
90
100
200 300 400 500 600 700 800
Tran
smis
sio
n (%
)
Wavenumber (nm)
(a)
(b)
(c)
(d)
17
Fig. Erreur ! Document principal seulement. Meniscus progression of () initial silicate gel and
modified silicate gels with () NaOH, () AlOOH and (▲) Li2B4O7
0
1
2
3
4
5
6
0 10 20 30 40 50
Me
nis
cus
pro
gre
ssio
n (
cm)
Time (days)

18
Fig. Erreur ! Document principal seulement. Percentages of FTIR intensity of the different Qn species
present in silicate gel () before and (□) after adding NaOH. The intensities were normalized to the total sum of
Qn intensities and reduced to 100%
0
10
20
30
40
50
60
1 2 3 4
% In
ten
sity
QnQ4 Q3 Q1Q2

19
Table Erreur ! Document principal seulement. : Purity percentages of the different precursors used
Precursors SiO2 KOH NaOH AlOOH Li2B4O7 HCl
Purity (%) 49.8 50.5 97 80 99.50 37
supplier Merck
Germany
Sigma-
Aldrich
USA
Sigma-
Aldrich
USA
Sasol
USA
Sigma-
Aldrich
USA
VWR
USA
Copyright © 2022 FDOKUMEN