1 Introduction This volume of the 1999 Community Needs ...
225
1 Introduction This volume of the 1999 Community Needs Assessment provides an inventory of a variety of studies which have assessed the social, health and economic needs of Delawareans. A number of reports representing small community studies and statewide needs assessments of special populations, as well as data collected form focus groups and two telephone helplines (Delaware Helpline, Contact Delaware), have been examined to determine what is known about the health and social service needs of Delawareans. The assessments, reports, and data reviewed here include: The ABC Evaluation: The Early Economic Impact’s of Delaware’s A Better Chance Welfare Reform Program, by DHSS-DSS Access to Jobs / Reverse Commute Application, of Delaware Department of Transportation and Delaware Transit Corporation Adolescent Substance Abuse in Delaware, by CUAPP Affordable Housing Finance Needs Assessment, by The First State Community Loan Fund (Terry Kreer) Alcohol, Tobacco and Other Drug Abuse Among Delaware Students, by UD - CCD - The Center for Drug and Alcohol Studies Annual Report and Strategic Plan Annual, by Delaware Health Care Commission; includes: 1. Consumer Assessment of Health Plans in Delaware: Preliminary Report 2. Delaware Health Care Commission Committee on Managing Managed Care: Recommendations for Regulating Managed Health Care 3. Delaware Without Health Insurance: A Demographic Overview 4. Options for Medicaid Managed Long Term Care in Delaware: Executive Summary Assessment of the Capacity-Building Needs of Nonprofit Housing Development Organizations in Delaware: Overview Report, by O M G, Inc. Barriers to Food Security in Wilmington: Problems in Access to Affordable, Nutritious Food, by CUAPP - CCDFP Care & Services for Adults with Disabilities in Delaware, By Cari DeSantis - for The Longwood Foundation - Easter Seals of DE and MD Eastern Shore CAREVan Data, by Ingleside Homes Client Satisfaction Survey Results for Wilmington, New Castle County, Kent County and Sussex County, by DHSS - Delaware State Service Centers A ‘Competitive Advantages’ Analysis of Wilmington, Delaware Economy: 1990-1995, by UD - CHEP - SUAPP CONTACT Delaware Helpline Statistics, by CONTACT Delaware
-
Upload
khangminh22 -
Category
Documents
-
view
0 -
download
0
Transcript of 1 Introduction This volume of the 1999 Community Needs ...

1
Introduction
This volume of the 1999 Community Needs Assessment provides an inventory of avariety of studies which have assessed the social, health and economic needs of Delawareans. Anumber of reports representing small community studies and statewide needs assessments ofspecial populations, as well as data collected form focus groups and two telephone helplines(Delaware Helpline, Contact Delaware), have been examined to determine what is known aboutthe health and social service needs of Delawareans. The assessments, reports, and data reviewedhere include:
The ABC Evaluation: The Early Economic Impact’s of Delaware’s A Better Chance WelfareReform Program, by DHSS-DSS
Access to Jobs / Reverse Commute Application, of Delaware Department of Transportationand Delaware Transit Corporation
Adolescent Substance Abuse in Delaware, by CUAPP
Affordable Housing Finance Needs Assessment, by The First State Community Loan Fund(Terry Kreer)
Alcohol, Tobacco and Other Drug Abuse Among Delaware Students, by UD - CCD - TheCenter for Drug and Alcohol Studies
Annual Report and Strategic Plan Annual, by Delaware Health Care Commission; includes:
1. Consumer Assessment of Health Plans in Delaware: Preliminary Report 2. Delaware Health Care Commission Committee on Managing Managed Care:
Recommendations for Regulating Managed Health Care3. Delaware Without Health Insurance: A Demographic Overview4. Options for Medicaid Managed Long Term Care in Delaware: Executive
Summary
Assessment of the Capacity-Building Needs of Nonprofit Housing DevelopmentOrganizations in Delaware: Overview Report, by O M G, Inc.
Barriers to Food Security in Wilmington: Problems in Access to Affordable, NutritiousFood, by CUAPP - CCDFP
Care & Services for Adults with Disabilities in Delaware, By Cari DeSantis - for TheLongwood Foundation - Easter Seals of DE and MD Eastern Shore
CAREVan Data, by Ingleside Homes
Client Satisfaction Survey Results for Wilmington, New Castle County, Kent County andSussex County, by DHSS - Delaware State Service Centers
A ‘Competitive Advantages’ Analysis of Wilmington, Delaware Economy: 1990-1995, byUD - CHEP - SUAPP
CONTACT Delaware Helpline Statistics, by CONTACT Delaware

2
Crime & Justice in the Enterprise Community: The Public’s View, by CHEP - SUAPP andCCDFP
Crime in Delaware 1993: An Analysis of Delaware Crime, by Executive Department -Statistical Analysis Center - State of Delaware
Crime in Delaware 1995: An Analysis of Delaware Crime, by Executive Department -Statistical Analysis Center - State of Delaware
Crime, Public safety & Police Service: Attitudes of Wilmington Residents, by CHEP -CCDFP
Delaware Career Compass: Charting Your Course, by Delaware Dept. of Labor
Delaware: Child Care Challenges, by Children’s Defense Fund
Delaware Dropouts, 1996-1997: Summary Statistics, by State of Delaware - Departmentof Education
Delaware Helpline Data, by Delaware Helpline
Delaware Jobs: What Do They Offer?, by Delaware Department of Labor, Office ofOccupational and Labor Market Information
Delaware Monthly Labor Review: November 1998, by Delaware Dept. of Labor
Delaware Perinatal Board Progress Report, by Delaware Perinatal Board
Delaware Regional Job Access Transportation Business Plan (draft), by Delaware TransitCorporation and KFH
Delaware Tomorrow 1997, by Delaware Dept. of Labor
Delaware Wages 1995, by Delaware Dept. of Labor
Delaware Women: Where Are They Working - by the Delaware Department of Labor: Office of Occupational and Labor Information and the Delaware OccupationalInformation Coordinating Committee
Delaware’s Continuum of Care Narrative: Gaps and Priorities, by Homeless PlanningCouncil
Demographic Packet, by DHSS - Division of Services for Aging and Adults with PhysicalDisabilities
Domestic Violence: An Inventory of Programs and Policies - Report I: Community-BasedService Organizations, by CUAPP - CCD
Domestic Violence: An Inventory of Programs and Policies - Report II: EducationalInstitutions, by CUAPP - CCD

3
Domestic Violence: An Inventory of Programs and Policies - Report III: EmergencyShelters and Transitional Housing Programs, by CUAPP - CCD
Domestic Violence: An Inventory of Programs and Policies - Report IV: AdvocacyOrganizations, by CUAPP - CCD
Domestic Violence: An Inventory of Programs and Policies - Report V: Health CareTreatment Services, by CUAPP - CCD
Domestic Violence: An Inventory of Programs and Policies - Report VI: EnforcementServices, by CUAPP - CCD
Domestic Violence: An Inventory of Programs an Policies // Report VII: Survivors’Perspective on Emergency and Support Services, By CUAPP - CCD
Empowerment Zone/Enterprise Community Strategic Plan for Wilmington, Delaware: Capturing the Potential of Wilmington’s Future - prepared by Kise, Straw & Kolodnerwith Urban Partners for the City of Wilmington
Enterprise (Wilmington) Community Evaluation Design: An Assessment of the Program’sImplementation and a Framework for Future Evaluation, by SUAPP - CCDFP
Enterprise Community Progress Report: January 1, 1995 - June 30, 1996, by EnterpriseCommunity
Evaluation of the Wilmington Weed & Seed Program January to December 1995, byState of Delaware - Executive Department - Statistical Analysis Center
Family Survey Report, by Center for Disabilities Studies (CDS), University of Delaware,Interagency Resource Management Committee
Final Report: Delaware Alcohol and Drug Prevalence Survey, by CUAPP - DHHS - CSAT
Findings and Recommendations to the Complaint of the Coalition for Equal Justice inPublic Education, by State of Delaware - Human Relations Commission
Focusing on Information Sources for Delaware’s Developmental Disabilities Community,by UD - CUAPP - Delaware Public Administration Institute
History Report: Services Integration in the State of Delaware - Robert B. Denhardt andJoseph W. Grubbs, CCDFP
Homebound Seniors by Zip Code, by Meals on Wheels
Homelessness in Delaware, CUAPP/Urban Agent Division, in cooperation with TheSalvation Army
Homelessness in Delaware Revisited, by CUAPP - CCDFP
Hunger: The Faces and Facts 1993 - prepared by the VanAmburg Group, Inc. for theFood Bank of Delaware

4
Hunger: The Faces and Facts 1997 - prepared by the VanAmburg Group, Inc. for theFood Bank of Delaware
The Impact of a Boys and Girls Club Facility / Component A: Baseline Analysis, byCUAPP
Juvenile Victims and Their Perpetrators, by State of Delaware - Executive Department -Statistical Analysis Center, in conjunction with the Attorney General’s Task Force on ChildVictims
Lenders’ Profile of Southern Delaware, by Community and Consumer Affairs Dept -Federal Reserve Bank of Philadelphia
The Location of Critical Businesses and Services in Wilmington, Delaware, by CHEP -CCDFP
1995 Vital Statistics Annual Report, by Delaware Health and Social Services
1997 Delaware Behavioral Risk Factor Survey, by DHSS - DPH - CDC
1997 Delaware Medical Assistance Program Annual Report - DHSS, DSS
1996 Surveillance Report: Division of Public Health, Office of Lead Poisoning Prevention(OLPP) - Russell Dynes, OLPP
1996 Vital Statistics Annual Report, by Delaware Health and Social Services
No Home, Poor Health: Final Report of the Wilmington Homeless Health Care Study,by CUAPP - Urban Agent Division
The “Persistent Emergency” of Hunger: Food Pantry Usage in Delaware - by Karen Curtisand Brian Green of CUAPP
Prevalence and Need for Treatment of Alcohol/Drug Abuse Among Women in Delaware,by Roberta Murphy, Christine Saum, Dorothy Lockwood, Karen Cerra and Steven Martin
The Prevalence and Treatment of Alcohol and Other Drug Abuse and Dependence amongthe Sheltered Homeless in Delaware, by CCDFP - CHEP
Protection From Abuse Act Statistics for Calender Year 1997, by The Family Court ofDelaware
(Public Perceptions) 1997 Statewide Poll on the Condition of Education in Delaware -Summary of Results, by UD - College of Education - Delaware Education Research andDevelopment Center
Public Perceptions of the Condition of Education in Delaware - Summaries of Results ofComparisons of African-American Households to Caucasian-American Households, byUD - College of Education - Delaware Education Research and Development Center

5
The Realities of Poverty in Delaware (1989 - 1999 Updates), by Public Assistance TaskForce
Secondary Conditions and Community Integration Among Delawareans with TraumaticBrain Injuries: A First Look, by Ed Ratledge, CADSR
Service Provider Survey, prepared for Division of Child Mental Health Services -Department of Services for Children, Youth and Their Families - State of Delaware, byUniversity of Delaware - College of Human Resources, Education and Public Policy -Center for Community Development and Family Policy
State of Delaware Consolidated Plan, Fiscal Year 1998 Annual Action Plan for period7/1/98 to 6/30/99 (Document number 10-03-98-05-01), by Delaware State HousingAuthority
Statewide Housing Needs Assessment: Executive Summary and Technical Summary, byPrepared by Legg Mason Realty Group, Inc. for Delaware State Housing Authority
Substance Abuse and Need for Treatment Among Criminal Justice Detainees in Delaware1995 -- Steven S. Martin, Center for Drug and Alcohol Studies, CUAPP
Substance Use and Abuse Patterns of Delaware Youth: Implications for Treatment ServicesPlanning Summary Report (and Interim Draft Report), by Delaware Department ofHealth and Social Services - Division of Alcoholism, Drug Abuse and Mental Health
The Need for Supported Housing in Delaware: A Survey of Existing Data, byIndependent Living
The Needs of Delawareans with Disabilities: A Five Year Plan for Strengthening Person’sand Families’ Community Supports, by Community Systems and Services Inc.
A Turning Point: A Series of News Journal Special Sections, by The Wilmington NewsJournal, CADSR
Urban Neighborhoods: Opportunity for Community Reinvestment Act Investment - Dr.John E. Stapleford and Dr. Francis X. Tannian, Bureau of Economic Research, College ofBusiness and Economics, UD
Wilmington Area Community-Based Development Project: First Year Report - byRaheemah M. Jabbar-Bey, CUAPP
Year 1 -1997: A Report on the Focus Groups (Study Circles on Racism and Race Relations;New Castel County, Delaware, by Study Circle Resource Center and the YWCA of NewCastle County, Delaware
While each report differs in its scope and methodology, each has been assessed for itscontribution to the understanding of problems and needs in thirteen categories corresponding tothe National taxonomy of exempt entities (NTEE) Classification Codes. These are:children/youth problems/needs; civil rights problems/needs; crime and legal servicesproblems/needs; problems/needs of the disabled; problems/needs of the disabled; emergencyassistance problems/needs; employment problems/needs; health/health care problems/needs;
6
housing problems/needs; parenting problems/needs; public infrastructure problems/needs; andvictim assistance problems/needs. In addition, any data pertaining to the supply of services andor problems Delawareans encounter when trying to obtain services is also documented. We alsodocument the source of the report or data, the geographic area of the state addressed, and thekinds of information/data used. A summary table listing each report and its area(s) of study isprovided in Appendix A for easy reference.
Problems/needs relating to the above areas, as well as barriers to service, were also exploredthrough a telephone survey of 1,200 Delawareans, four focus groups in the City of Wilmington,suburban New Castle County, Kent County, and Sussex County, and a mailed survey of 141nonprofit and government service providers. The results of these surveys and focus groups canbe found in Volume 4: Responses from Surveys of Households and Service Providers and FocusGroup Report. A synthesis of the data collected through the surveys, focus groups, and thisinventory of needs assessments is provided in Volume 2: Synthesis of Survey and Focus GroupFindings and Existing Needs Assessment Reports. Together with Volume 1: Executive Summary,these reports comprise the entire 1999 Community Needs Assessment prepared by the Center forCommunity Development and Family Policy for the Budget Office, State of Delaware.

7
TITLETITLE: The ABC Evaluation: The Early Economic Impacts of Delaware’s A Better ChanceWelfare Reform Program
AUTHOR: AUTHOR: David J. Fein and Jennifer A. Karweit, Abt Associates Inc.
DATE:DATE: December 1997
SOURCE:SOURCE: Delaware Health and Social Services: Division of Social Services
GEOGRAPHICAL AREA: GEOGRAPHICAL AREA: Statewide
KINDS OF INFORMATION/DATA USED IN THE STUDY:KINDS OF INFORMATION/DATA USED IN THE STUDY:
Primary data - Survey of ABC and control group participants regarding the relative successof AFDC vs. ABC clients, including earnings, employment rates, sanction rates,education/training; demographics of recipients; understanding of welfare reformprovisions
IS THE DATA/STUDY REPRESENTATIVE OF COMMUNITY INPUT?IS THE DATA/STUDY REPRESENTATIVE OF COMMUNITY INPUT?
Yes. Survey of clients receiving AFDC and those who had started ABC
PROBLEMS/NEEDS ADDRESSED IN THE STUDY:PROBLEMS/NEEDS ADDRESSED IN THE STUDY:
“GENERAL” and “EMPLOYMENT”
Delaware’s A Better Chance Program was one of the first state welfare reform programs. Since welfare reform is such a major issue nationwide, it is important to evaluate theimpacts of the ABC program. This evaluation measured and compare outcomes of thosewho had randomly been chosen to participate in ABC and those who remained under theAFDC program.
Results:
• After one year of follow-up, ABC participants had higher employmentrates (56% vs. 45%) and higher average earnings ($167 or 16% more inthe fourth quarter) than control group (AFDC) members.
• Average welfare payments were lower ($76 less in the fourth quarter) forABC than AFDC participants
• The program did not have a statistically significant impact on overall ratesof welfare receipt, likely because working ABC recipients retain theireligibility longer than under AFDC.
• Participants had knowledge of many of the ABC rules but did notunderstand the details
• Compliance problems led to high sanction rates in the ABC group• ABC recipients were somewhat less likely (50% vs. 63%) than AFDC
recipients to attribute leaving the program to increased earnings• ABC had little impact on employment and welfare receipt for the least
and most disadvantaged recipients• ABC did not affect utilization of other public and private assistance or
total household income

8
TITLE:TITLE: Access to Jobs/Reverse Commute Grant Application
AUTHOR:AUTHOR: Delaware Department of Transportation (DelDOT) and Delaware TransitCorporation (DTC)
DATE:DATE: 1998
SOURCE:SOURCE: DelDOT
GEOGRAPHICAL AREA: GEOGRAPHICAL AREA: Entire state, with sections emphasizing needs in each of the threecounties individually.
KINDS OF INFORMATION/DATA USED: KINDS OF INFORMATION/DATA USED: Secondary data on individuals in Delaware’s ABetter Chance Program (ABC) obtained from the following agencies: U.S. Department of theCensus, Wilmington Area Planning Council. Delaware Department of Health and Social Services,and the Delaware Economic Development Office. Primary data on the state’s publictransportation routes and the relationship of where individuals live to these routes obtained byDelDOT and DTC.
IS THE DATA/STUDY REPRESENTATIVE OF COMMUNITY INPUT? IS THE DATA/STUDY REPRESENTATIVE OF COMMUNITY INPUT? No.
PROBLEMS/NEEDS ADDRESSED IN THE STUDY: PROBLEMS/NEEDS ADDRESSED IN THE STUDY: “INFRASTRUCTURE” /“EMPLOYMENT”
A section of this grant application details the unmet public transportation needs of individuals inDelaware’s ABC program. These are divided into four primary sections: The overall need andservice needs for each of the three by counties.
THE OVERALL PUBLIC TRANSPORTATION NEED• The fixed bus routes do not serve where some ABC clients live, where the jobs
are, or where child and adult day care facilities are located.• The fixed bus routes do not operate at the hours or days when ABC clients
need to get to work - especially if they are involved or can be involved in shiftwork.
• The fixed bus route fares are prohibitive, especially during the first few monthsABC clients are working.
• There are almost no fixed bus routes in rural areas of the state.• Information about bus routes and times is difficult to obtain, making it
difficult for ABC clients and caseworkers to use existing transportation services. There is a general lack of understanding concerning public transportationoptions by ABC clients.
NEW CASTLE COUNTY SERVICE NEEDS• No Sunday service - affecting workers who need to work then, especially in
the retail sector.• Many people live beyond a reasonable walking distance to fixed route bus
stops.• Lack of late night service - persons working third shifts are unable to utilize
fixed route bus service.• Lack of service in Southern New Castle County - the only fixed bus route
operating below the canal is the 301 Intercounty service, creating problems of

9
employment access for these residents.
KENT COUNTY SERVICE NEEDS• No fixed route bus service on evenings or weekends in the Dover area, when
many ABC clients would need to get to work.• Many people live beyond a reasonable walking distance to fixed route bus
stops.• No service to rural areas of Kent County. About 1,500 client families in Kent
County live outside the fixed route service area and do not own a car.
SUSSEX COUNTY SERVICE NEEDS• Overall lack of service. Currently, only three fixed bus routes run in the entire
county, and these offer only two or three runs each way per day. In addition,service to the shore, where resort and outlet jobs are, ends in mid-afternoon.
• There are no fixed route bus services in Sussex County on Saturday or Sunday,when many people need to get to work.
• More inter-urban connector routes within Sussex County are needed. The onlyconnections currently available in Sussex County are from Laurel to Millsboroand Georgetown, and from Georgetown to the shore communities.
• Most of Sussex County has no service at all. About 1,000 client families inSussex County live outside the fixed route service area and do not own a car.

10
TITLE:TITLE: Adolescent Substance Abuse in Delaware
AUTHOR:AUTHOR: Debra Brucker
DATE:DATE: 1995
SOURCE:SOURCE: Analytic Paper, College of Urban Affairs and Public Policy
GEOGRAPHICAL AREA:GEOGRAPHICAL AREA: New Castle County, Kent County, Sussex County and the City ofWilmington.
TYPE OF DATA USED:TYPE OF DATA USED: The 1993 Public School Survey, the Perspectives, Activities, and UseSurvey (PAUS) (Database, 1990), 1990 Delaware Census data, American Drug and Alcohol Survey(ADAS) of 1990, and in-class surveys with fifth, eighth, and eleventh grade students in Delawarestate public schools.
REPRESENTATIVE OF COMMUNITY INPUT:REPRESENTATIVE OF COMMUNITY INPUT: Yes, the original sample included between13 and 14% of public school students enrolled in each grade.
NEEDS/PROBLEMS IDENTIFIED:NEEDS/PROBLEMS IDENTIFIED:
“Child/Youth”; cross-listed with “Health and Health Care”
Number of Children Who Have Reported Ever Using a Particular Substance:• Alcohol; Fifth Graders - 33%, Eighth graders - 75%, Eleventh Graders - 86%• Cocaine; Fifth Graders - .3%, Eighth Graders - 1.65, Eleventh Graders - 3.6%• Marijuana; Fifth Graders - .1%, Eighth Graders - 15%, Eleventh Graders - 34%
Comparing Delaware to the Nation• There are quite similar lifetime use rates between Delaware and national figures
of all substances at the eleventh grade level and in alcohol use at all three gradelevels.
• There is minimal difference between Delaware and national levels on substanceuse at the lower grades.
• There is a large increase in usage rates for all substances from the eighth to the eleventh grade both in Delaware and nationally.
Need Estimates• It is estimated that 7-10% of those persons who ever use a substance will develop
an addiction.• Approximately 35% of students “in need of treatment” were male.• Nearly 38% of these substance abusing students met the criteria for both alcohol
and marijuana abuse.• 33% met the criteria for solely alcohol abuse, 29% for solely marijuana abuse.• A higher amount of students were found to abuse substances in Sussex County,
however, findings suggest the greatest absolute need for treatment is found in New Castle County.

11
• The rate of substance abuse may in fact be higher in private than public schools.• In Delaware’s eleventh grade population, including public and private schools,
there is an estimated 1,103 students who met DSM-III-R criteria for substance abuse.
Demand Estimate• The total demand for treatment for eleventh grade students falls somewhere
between 140 and 180 slots.• Adding in private school students the total rises 166 to 221 slots per year.
Comparing Supply to Demand• In 1991, Delaware treatment facilities were servicing 101 youth of all ages.• A service gap exists between the number of youths clinically diagnosed as
abusing substances and the number actually obtaining treatment.• There is a need for substantially more treatment of youthful substance abusers in
all three Delaware counties.
Conclusions• The analysis performed here does not enable us to determine the extent of services
necessary for each student.• A wide array of services is available to substance abusing adolescents. These
services vary considerably in their intensity and duration. Often students will avail themselves of several forms of treatment before leaving the system.
• Current efforts at drug prevention are misguided to the extent they focus on symptoms, rather than the psychological syndrome underlying the drug abuse.
• Education programs such as the “Just Say No” program seem to trivialize the factors involved in drug use, implicitly denying their depth and pervasiveness.
• The perception of drug abuse as a result of a “lack of education” diverts attention from the real physiological, and sociological causes of drug abuse.

12
TITLETITLE: Affordable Housing Needs Assessment
AUTHORAUTHOR: Terry L. Kreer
DATEDATE: 1998
SOURCESOURCE: First State Community Loan Fund
GEOGRAPHICAL AREAGEOGRAPHICAL AREA: statewide
KINDS OF INFORMATION/DATA USED IN THIS STUDYKINDS OF INFORMATION/DATA USED IN THIS STUDY: survey of 20 nonprofithousing developers and 1 for profit housing developer as well as information obtained from theStatewide Housing Needs Assessment.
IS THIS DATA/STUDY REPRESENTATIVE OF COMMUNITY INPUT?: IS THIS DATA/STUDY REPRESENTATIVE OF COMMUNITY INPUT?: Yes, but only inresponse to survey questions.
PROBLEMS/NEEDS ADDRESSED IN THIS STUDY:PROBLEMS/NEEDS ADDRESSED IN THIS STUDY: “Housing”
AFFORDABLE HOUSING NEEDS
# The Statewide Housing Needs Assessment (SHNA) suggests that the supply of rental unitsstatewide should increase by a total of 3,000 units by the year 2000 or 600 units peryear. It is recommended that 1,000 of these units be market rate and the affordable newunits be targeted as follows:
• Very Low Income - Defined as households earning less than $15,000 peryear. It is estimated that 1,000 units will be needed during the period of1995-2000 to meet the demand
• Low Income - Defined as households earning between $15,000 - $25,000per year. Five hundred units will be needed during 1995-2000 to meetthe demand of this group.
• Senior Renters - The number of senior citizen households aged 75+ isexpected to increased by 2,815 during the period of 1995-2000. It isestimated that an additional 500 units in senior rental housing will beneeded.
At-Risk Renter Households
• The Statewide Housing Needs Assessment estimates that there are 9,615 at-risk renterhouseholds that are earning less than 50% of area median income and are paying morethan 50% of those incomes for housing expenses. It is also estimated that up to 15,995renter households would have to be assisted in order to have all very low-incomehouseholds paying 30% or less for of their incomes for housing. Therefore, the currentneed for affordable rental units is estimated at between 9,615 and 15,995.
Demand for Home ownership
• The SHNA estimates the demand for affordable Home ownership in the State at 31,500

13
units over the five-year period of 1995-2000. This demand was forecasted by estimatingthe number of home buyer households within the $25,000 - $50,000 income range. The following estimates are for Home ownership demand by location.
First-Time BuyerFirst-Time Buyer Other AffordableOther AffordableWilmington 1,000 1,500New Castle County 3,500 11,000Kent County 1,000 4,500Sussex County 2,500 6,500
• The demand for manufactured housing is strongest in Sussex County at 400 units peryear. This demand declines to 300 units in Kent and 200 in New Castle County.
At-Risk Home ownership Units
• The SHNA has estimated that there are at least 4,869 at-risk homeowners. Thesubmarkets with the highest concentrations of at-risk homeowners in 1995 were inWilmington, New Castle, Brandywine, Lower Christiana, Dover, Selbyville-Frankford andLaurel-Delmar.
AFFORDABLE HOUSING FINANCE NEEDS
Past Experiences
• All 21 organizations surveyed are currently involved or are planning to become involvedin the development of affordable housing in Delaware. The majority of theorganizations surveyed (62 percent) have been developing affordable housing for 15years or less. The remaining 38 percent have been developing affordable housing for 16to 30 years. These organizations have developed a combined total of 2,500 units oraffordable housing throughout the state. Over the past two years, 900 units ofaffordable housing have been developed by these organizations.
Funding Sources
• The resources used by more than 50 percent of the organizations surveyed are the StateHousing Development Fund, HOME Program, financial institutions and foundations. The most commonly utilized resources are financial institutions and foundations.
Projected Financing Needs
• Of the 21 organizations surveyed, 16 have plans to develop between 810 and 830 unitsover the three- year period of 1998-2001. Each organization was asked to providedetails on the estimated financing needs for the projects in development. The followingis a summary of the housing finance needs for each category of funding.
Type of Financing Total Amount Total Units
Pre-development $ 365,000 153

14
Acquisition 5,620,000 287Acquisition/Renovation 1,620,000 33Renovation 1,670,000 83
Renovation/Construction 4,625,000 185Construction 14,069,000 246Construction/Permanent 11,300,000 142Permanent 10,610,000 256Bridge 2,650,000 65Gap 2,000,000 103
Totals* $54,529,000 1,553**
*These totals do not include additional units that may need funding.**There are a total of 810-830 units that are planned for development over thenext three years. This number is higher because some units will require more thanone type of financing.
General Comments on Training and Financing Tools Needed
• Each organization was asked to provide an opinion about the need for additionaltraining in completing applications for funding and about the need for additionalfinancing tools that would encourage more affordable housing development in Delaware.
• Concerning training, 57 percent of the organizations surveyed stated that they thoughtthere was a need for additional training. Ten percent of the survey respondents statedthat there may be a need, and 33 percent stated that there was no need for additionaltraining. Specific types of training were noted by some organizations:
• Information on the format for applications and what should be included.• Information on resources available• Understanding of underwriting principles• Low-Income Housing Tax Credit training• Board training regarding contractual agreements
• There were many ideas expressed concerning financing tools that would stimulateincreased housing development in Delaware. Some of these ideas include:
• Offer more below-market financing.• Provide funding for rental subsidies• Streamline the application process so that it takes less time; this may involve pre-
qualifying organizations• Provide affordable pre-development financing• Increase funding available for low-and very-low income housing• Provide a revolving line of credit statewide or some type of working capital
product that does not have excessive terms and is readily accessible• Provide lower-interest rates on short-term loans to help with acquisition and
renovation of Home ownership projects.• Provide operating funds for nonprofit organizations.• Provide grants for site acquisition
• Increase marketing by funders of resources available

15
TITLE:TITLE: Alcohol, Tobacco and Other Drug Abuse Among Delaware Students 1998
AUTHORS:AUTHORS: Steven S. Martin, Tihomir N. Enev, Robert L. Peralta, Roberta E. Gealt andChristina L. Purcell
DATE: DATE: January 1999
SOURCE: SOURCE: University of Delaware - The Center for Community Development and FamilyPolicy - The Center for Drug and Alcohol Studies
GEOGRAPHICAL AREA: GEOGRAPHICAL AREA: statewide
KINDS OF INFORMATION/DATA USED IN THE STUDY:KINDS OF INFORMATION/DATA USED IN THE STUDY: Survey administered toeleventh-, eighth- and fifth-graders.
IS THE DATA/STUDY REPRESENTATIVE OF COMMUNITY INPUT? IS THE DATA/STUDY REPRESENTATIVE OF COMMUNITY INPUT? Yes (studentresponses)
PROBLEMS/NEEDS ADDRESSED IN THE STUDY: PROBLEMS/NEEDS ADDRESSED IN THE STUDY: “CHILD/YOUTH” and “HEALTH ANDHEALTH CARE”
SOME KEY FINDINGS:
Monthly Use Trends:• Between 1989-1998, reports of monthly drug use by 5th graders have remained low and
stable within margin of statistical error. There is no evidence of any trend up or down,and the estimates remain small. Very few 5th graders are current drug users.
• Monthly cigarette use by 11th graders, which had gone up significantly between 1995 and1997, did not change in 1998; however, monthly cigarette use by 8th graders went upslightly in 1998 after two previous years of decline. One-third of 11th graders and one-fourth of 8th graders have smoked in the past month.
• Monthly alcohol use for 11th graders has remained at a very high level for the last decade,with an estimate for 1998 of 47%, the same as in 1997. Past month alcohol use for 8thgraders has also been quite high but stable for the last decade, with 29% reportingdrinking in the past month.
• Monthly marijuana use increased markedly from 1992 to 1995 f or both 11th and 8thgraders. Since 1995, 11th grade marijuana use has been stable with 25% past month usersin 1998. However, 8th grade marijuana use rose 4% in 1998 to 19%, the highest everrecorded.
• Reports of monthly use of other drugs remain rare. The other drug most often used by8th graders is inhalants (8%), and for 11th graders - hallucinogens and stimulants (3%). For 8th and 11th graders, heroin use is 1%.
Other Findings:• In the 5th grade, most students have not yet experimented with drugs. Even the most

16
common drug tried, alcohol, has only been tried by one out of four; cigarettes - by lessthan one out of five; and inhalants - by less than one out of seven.
• In general, use of any of the drugs illegal for youth (that includes cigarettes and alcohol)does not differ significantly among the three counties in Delaware. Nor, in general, arethere significant differences in male and female use.
• About the only drug that males use consistently more than females is smokeless tobacco;smokeless tobacco use declined in 1998 for 8th and particularly 11th graders.
•
Binge drinking (defined here as 3 or more drinks at a time in the past two weeks) isquite high among 8th and 11th graders. Most students who report having at least onedrink in the past month also report binge drinking in the past two weeks. Twenty-eightpercent of all 11th graders report binge drinking.
• Cigarettes are a gateway drug. For 5th, 8th, and 11th grade students, those who reportpast month cigarette use, as compared to those who do not, are significantly more likelyto be past month users of alcohol, marijuana, and other illegal drugs. In fact, if an 8th or11th grader is a current cigarette smoker, chances are better than 50/50 that she or he isalso a current drinker and user of marijuana.
• Cigarettes, alcohol, marijuana, and even cocaine are available to 5th graders -- one out ofsix 5th graders says it is easy to get cigarettes and one out of eight says it is easy to getcocaine. On the encouraging side, easy availability of all drugs to 5th graders hasdeclined slightly since 1997.
• When it comes to 8th and 11th graders, the majority of students know where to getcigarettes, alcohol, and marijuana. There are small decreases in getting cigarettes for 8thgraders but no change for 11th graders.
• Fifth graders report they were most likely to get cigarettes from friends or a vendingmachine; 8th graders - from friends; and 11th graders - from friends or from a store clerk. Getting cigarettes from vending machines declined for the second year in a row for eachof 5th, 8th, and 11th graders. Getting cigarettes from store clerks went down for 5thgraders.
• Ninety-seven percent of 5th graders, 91% of 8th graders, and 85% of 11th graders reporthaving had some drug education in school (DARE is part of the 5th grade curriculumstatewide). Eleventh graders have improved significantly; it was only 50% in 1995,58% in 1996 and 69% in 1997. This reflects the increasing coverage of DARE statewidesince 1990.
• Whereas 97% of 5th graders report receiving drug education in the past year, only 56%of 8th and 29% of 11th graders report any drug education in the 1997-1998 year.
• Fewer 5th, 8th and 11th graders thought there is a "great risk" from smoking a pack ofcigarettes a day in 1998 as compared to 1997.
• Most Delaware students do not think there is a "great risk" in using alcohol -- only 27%

17
of 5th graders, 20% of 8th graders and 28% of 11th graders think there is a great riskfrom drinking everyday. All percentages are declines from 1997.
• Most Delaware students do not think there is a "great risk" in trying marijuana -- only28% of 5th graders, 18% of 8th graders, and 15% of 11th graders think there is a greatrisk in trying marijuana. The 5th and 8th graders' perceived risk decreased from 1997,significantly for 8th graders.
• Even among those students who have never tried marijuana, 40% of 5th graders, 46%of 8th graders and 54% of 11th graders think there is little risk from trying marijuana. Allpercentages are up from 1997.
• Only 27% of 5th graders think there is great risk from trying cocaine. The percentagefinding great risk from trying cocaine rises to 35% for 8th graders and 52% for 11thgraders. However, for all 3 grades, fewer students see a great risk from trying cocaine in1998 as compared to 1997.
• Half of 5th, 8th, and 11th graders think that fighting or violence is a problem at theirschool. However, taking a weapon to school declined slightly in 1998 to 4% of 8thgraders and 5% of 11th graders.
• The vast majority of students feel safe in school. However, only about 64% of 5thgraders think kids at school obey their teachers, and only 19% of 8th graders and 22% of11th graders think students treat teachers with respect most of the time. Less than half of5th graders think kids at school are well-behaved in class, and this percentage declines to28% of 8th graders and 33% of 11th graders who think students are well-behaved inpublic. For 5th and 8th graders, these are significant declines from 1997.
• About 8% of 11th graders report driving after smoking marijuana in the past month, and11% report driving after drinking in the past month. One in seven 11th graders has riddenwith a drinking driver and one in five has ridden with a marijuana-using driver in the pastmonth.
• Among both 8th and 11th graders, past month substance use -- whether cigarettes,alcohol, or marijuana -- is highly correlated with other delinquent behaviors such as gangfights, stealing, illegal entry, and trouble with police.
• Four percent of 8th graders meet criteria approximating a clinical definition of each ofcigarette and alcohol dependence, and an additional 14% of 8th graders are alcoholabusers. Among 11th graders, 12% meet dependence criteria for each of cigarettes andalcohol, and an additional 30% are alcohol abusers. Levels of dependence have beensteady for the last four years.
• For all grades and for 8th graders in particular, students who report they communicatewell with their parents and that their parents are involved with their school are less likelyto use drugs.
• Students, particularly 8th graders, whose parents or siblings smoke cigarettes are morelikely to smoke cigarettes and use other drugs.

18
• How do the data for Delaware compare with what is happening regionally andnationally? We have little data yet from other states for 1998. National data reportsmall declines in drug use for 8th and 12th graders in 1998. In the past four years,Delaware trends have tended to precede national trends by about a year. The rates ofdrug use among Delaware students are comparable to those reported regionally andnationally in the past couple of years, though 8th grade marijuana use has been slightlyhigher in Delaware.
19
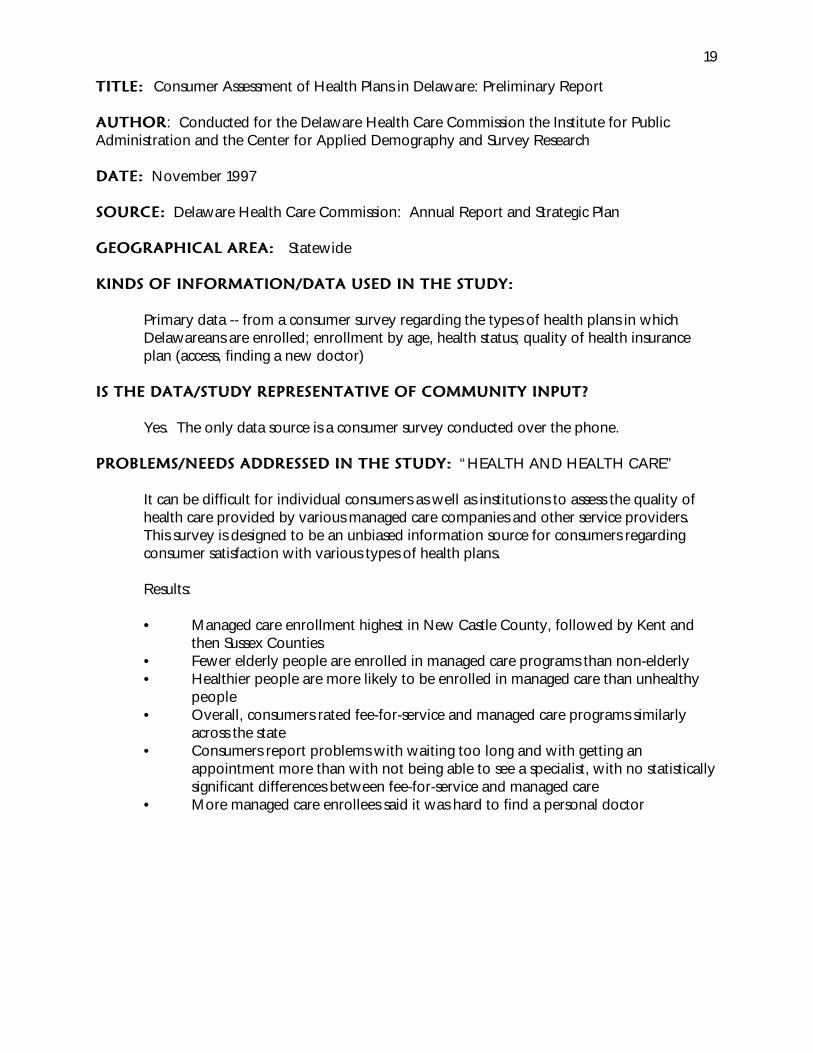
TITLE: TITLE: Consumer Assessment of Health Plans in Delaware: Preliminary Report
AUTHORAUTHOR: Conducted for the Delaware Health Care Commission the Institute for PublicAdministration and the Center for Applied Demography and Survey Research
DATE:DATE: November 1997
SOURCE:SOURCE: Delaware Health Care Commission: Annual Report and Strategic Plan
GEOGRAPHICAL AREA: GEOGRAPHICAL AREA: Statewide
KINDS OF INFORMATION/DATA USED IN THE STUDY: KINDS OF INFORMATION/DATA USED IN THE STUDY:
Primary data -- from a consumer survey regarding the types of health plans in whichDelawareans are enrolled; enrollment by age, health status; quality of health insuranceplan (access, finding a new doctor)
IS THE DATA/STUDY REPRESENTATIVE OF COMMUNITY INPUT?IS THE DATA/STUDY REPRESENTATIVE OF COMMUNITY INPUT?
Yes. The only data source is a consumer survey conducted over the phone.
PROBLEMS/NEEDS ADDRESSED IN THE STUDY:PROBLEMS/NEEDS ADDRESSED IN THE STUDY: “HEALTH AND HEALTH CARE”
It can be difficult for individual consumers as well as institutions to assess the quality ofhealth care provided by various managed care companies and other service providers. This survey is designed to be an unbiased information source for consumers regardingconsumer satisfaction with various types of health plans.
Results:
• Managed care enrollment highest in New Castle County, followed by Kent andthen Sussex Counties
• Fewer elderly people are enrolled in managed care programs than non-elderly• Healthier people are more likely to be enrolled in managed care than unhealthy
people• Overall, consumers rated fee-for-service and managed care programs similarly
across the state• Consumers report problems with waiting too long and with getting an
appointment more than with not being able to see a specialist, with no statisticallysignificant differences between fee-for-service and managed care
• More managed care enrollees said it was hard to find a personal doctor

20
TITLE: TITLE: Delaware Health Care Commission Committee on Managing Managed Care:Recommendations for Regulating Managed Health Care
AUTHORAUTHOR: Delaware Health Care Commission
DATE:DATE: June 1997
SOURCE:SOURCE: Delaware Health Care Commission: Annual Report and Strategic Plan
GEOGRAPHICAL AREA: GEOGRAPHICAL AREA: Statewide
KINDS OF INFORMATION/DATA USED IN THE STUDY:KINDS OF INFORMATION/DATA USED IN THE STUDY:
Analysis of secondary data - data resulting in the Commission’s recommendations as tohow to regulate managed care in Delaware
IS THE DATA/STUDY REPRESENTATIVE OF COMMUNITY INPUT?IS THE DATA/STUDY REPRESENTATIVE OF COMMUNITY INPUT?
Yes. Only to the degree that Commissioners represent consumers and providers who aremembers of the community
PROBLEMS/NEEDS ADDRESSED IN THE STUDY:PROBLEMS/NEEDS ADDRESSED IN THE STUDY: “HEALTH AND HEALTH CARE”
The shift toward managed care has created the need for new regulatory approaches tohealth care. The Delaware Health Care Commission’s Committee on Managing ManagedCare developed guiding principles and the following key recommendations:
• Adopt National Association of Insurance Commissioners Model as a basis forregulation, in particular:
• Adopt “prudent layperson” standard to all health plans in emergencyroom/urgent care center use.
• Strengthen regulations regarding utilization review• Financial payment incentives and disclosure of arrangements, including
bans on incentives to provide less than medically necessary services• Network adequacy• Set standards for quality assessment among health plans• Require plans to establish procedures to verify credentials• Assure adequate consumer complaint procedures
• Adopt Delaware Health Information Network Enabling Legislation• Continue internal health plan and independent statewide patient satisfaction surveys• Avoid piecemeal regulatory/legislative approaches

21
TITLE: TITLE: Delaware Without Health Insurance: A Demographic Overview
AUTHORAUTHOR: Prepared for the Delaware Health Care Commission by Edward C. Ratledge andRebecca C. Bedford
DATE:DATE: November 1997
SOURCE:SOURCE: Delaware Health Care Commission: Annual Report and Strategic Plan
GEOGRAPHICAL AREA: GEOGRAPHICAL AREA: Statewide
KINDS OF INFORMATION/DATA USED IN THE STUDY:KINDS OF INFORMATION/DATA USED IN THE STUDY:
Secondary data -- regarding the numbers and characteristics of Delawareans withouthealth insurance and demographics of Delaware including the labor market
IS THE DATA/STUDY REPRESENTATIVE OF COMMUNITY INPUT?IS THE DATA/STUDY REPRESENTATIVE OF COMMUNITY INPUT?
Yes. One of the data sources was the March Current Population Survey, which is a surveyof households conducted by the U.S. Census Bureau
PROBLEMS/NEEDS ADDRESSED IN THE STUDY: PROBLEMS/NEEDS ADDRESSED IN THE STUDY: “HEALTH AND HEALTH CARE”
• The lack of access to health care of those Delawareans who are uninsured, and thesubsequent impact on costs for the insured and employers.
• Overall the percentage of Delawareans who are uninsured has declinedsignificantly since 1982 (as a result of population growth), while the overallnumber of uninsured Delawareans has remained nearly constant
• Changing structures in the state’s economy and in employment in particular affectwho has/does not have health insurance
• Current trends of population growth would increase the number of uninsuredDelawareans by 15,000-20,000, but such trends may not continue
• Single person households are by far the most likely to be uninsured, while twoand four person households are the least likely
• As would be expected, a lack of health insurance is also correlated with poverty• African-Americans, Hispanics, and other minorities in Delaware are much more
likely to lack health insurance than whites.

22
TITLE: TITLE: Options for Medicaid Managed Long Term Care in Delaware: Executive Summary
AUTHOR: AUTHOR: The MEDSTAT Group
DATE:DATE: April 1997
SOURCE:SOURCE: Delaware Health Care Commission: Annual Report and Strategic Plan
GEOGRAPHICAL AREA: GEOGRAPHICAL AREA: Statewide
KINDS OF INFORMATION/DATA USED IN THE STUDY:KINDS OF INFORMATION/DATA USED IN THE STUDY:
Secondary data -- policy options for how Delaware can approach Medicaid managedlong-term care services
IS THE DATA/STUDY REPRESENTATIVE OF COMMUNITY INPUT?IS THE DATA/STUDY REPRESENTATIVE OF COMMUNITY INPUT?
No. Report and recommendations written by an out-of-state consulting firm
PROBLEMS/NEEDS ADDRESSED IN THE STUDY: PROBLEMS/NEEDS ADDRESSED IN THE STUDY: “HEALTH AND HEALTH CARE”
Delaware has started a major initiative to enroll Medicaid recipients in fully capitulatedmanaged health care plans. About 70 percent of Medicaid spending pays for services forindividuals who are excluded from enrollment in the state’s plan, the Diamond StateHealth Plan. These individuals are primarily elderly (also receiving Medicare) and/orreceiving long-term care services. In 1996, $154 million or 38% of total Medicaidspending in Delaware went to long-term care services. In this study, 14 different policyoptions for addressing Medicaid managed long-term care are reviewed

23
TITLE:TITLE: Assessment of the Capacity-Building Needs of Non-profit Housing DevelopmentOrganizations in Delaware.
AUTHOR: AUTHOR: O G M, Inc.
DATE:DATE: April 1992
TYPE OF DATA USED:TYPE OF DATA USED: Individual organizational assessments were conducted throughinteractive meetings and review and follow-up of self-assessment forms and other supportinginformation supplied by the organization.
GEOGRAPHICAL AREA:GEOGRAPHICAL AREA: statewide
REPRESENTATIVE OF COMMUNITY INPUT:REPRESENTATIVE OF COMMUNITY INPUT: Yes, the views of non-profit housingorganizations were solicited through meetings and self-assessment forms.
NEEDS/PROBLEMS IDENTIFIED:NEEDS/PROBLEMS IDENTIFIED: HOUSING
Technical Assistance
• Strategic Planning and Board Development. Redefinition and/or clarification of mission,focus, housing, related development and/or service goals and policies; clarification of the roleof the board and the staff in decision-making, board-staff relations, board composition,including community representation and levels of expertise; understanding the strategicplanning process and development of multi-year strategic plans that balance production goalswith organizational goals and client needs. ($40-75,000 needed)
• Organizational and Management Development. Review of leadership roles andmanagement styles, organizational governance, project planning and development process,identification or staffing needs, staff expansion options, re-definition of staff structure andstaff working relationships; staff training to acquire new management skills. ($40-65,000needed)
• Fund-raising. Assistance in assessing current Fund-raising efforts, developing Fund-raisingstrategies and planning Fund-raising programs, establishing board and staff roles in Fund-raising, training and coaching in Fund-raising approaches and specific techniques. ($30-55,000 needed)
• Housing-Related Technical Assistance. For housing producers, specific training and coachingin housing finance, project identification and feasibility assessment, project development andpackaging, and ongoing project management. For organizations providing housing-relatedservices, assistance in reviewing program goals and current operations, coaching in programmanagement and performance assessment. ($25-30,000 needed)
Financial Assistance
• Pre-Development Funding. Early funding for project planning, feasibility analysis and siteacquisition. ($70-90,000)
• Core Operating Support. All forms of non-project specific support that contributes to thecore administrative and operating budgets of an organization. Support for additional staffsalaries, additional equipment and/or facilities, and working capital are all included in thiscategory. ($275-360,000)

24
As the above estimates suggest, the level of funding required to meet the near-term capacitybuilding needs of the nine organizations assessed is in the order of $135-225,000 for directtechnical assistance and $345-459,000 for other financial assistance. These six categories describethe full array of needs identified in the individual assessments. These needs are believed to reflectthose of the broader system.

25
TITLE:TITLE: Barriers to Food Security in Wilmington: Problems in Access to Affordable, NutritiousFood
AUTHOR:AUTHOR: Karen A. Curtis and Stephanie A. McClellan
DATE: DATE: December 1996
SOURCE: SOURCE: CUAPP - CCDFP
GEOGRAPHICAL AREA: GEOGRAPHICAL AREA: Wilmington
KINDS OF INFORMATION/DATA USED IN THE STUDY: KINDS OF INFORMATION/DATA USED IN THE STUDY: Income / poverty levels / demographics / employment by geographic areasRequests for assistance from the emergency food assistance systemAccessibility to supermarkets (opening and closing of supermarkets, at which locations)Individual ResourcesCommunity ResourcesQuality, contents and amenities of supermarkets
IS THE DATA/STUDY REPRESENTATIVE OF COMMUNITY INPUT? IS THE DATA/STUDY REPRESENTATIVE OF COMMUNITY INPUT? No. Interviewswith food recipients are reported in other products of this project.
PROBLEMS/NEEDS ADDRESSED IN THE STUDY: PROBLEMS/NEEDS ADDRESSED IN THE STUDY: Emergency Assistance
Emergency Assistance - Food and Sufficient NutritionEmergency Assistance - Food and Sufficient Nutrition
STATEWIDE
• Indicator of demand for service: substantial growth in the emergency food assistancenetwork in DE since 1981
• Barrier to service: restrictions on use of emergency food programs• Barrier to service: accessibility to supermarkets (also noted in “Public Infrastructure”
below), with affordable and culturally-acceptable food• Decreased purchasing power among poor people• Changes in AFDC and the Food Stamp Program - eligibility restrictions and declines in
funding levels
WILMINGTON• Areas with high poverty rates and minority concentration also lack full-service
supermarkets
• Many low-income households do not own automobiles
II.II. Public Infrastructure/ServicesPublic Infrastructure/Services• Access to conventional sources of food declined substantially in Wilmington

26
TITLE: TITLE: Care & Services For Adults with Disabilities in Delaware
AUTHOR: AUTHOR: Cari DeSantis
DATE: DATE: June 1999
SOURCE: SOURCE: Easter Seal Society of Del-Mar/ Longwood Foundation
GEOGRAPHICAL AREA: GEOGRAPHICAL AREA: statewide
KINDS OF INFORMATION/DATA USED IN THE STUDY: KINDS OF INFORMATION/DATA USED IN THE STUDY: Qualitative- Responses toquestionnaires from service providers
IS THE DATA/STUDY REPRESENTATIVE OF COMMUNITY INPUT? IS THE DATA/STUDY REPRESENTATIVE OF COMMUNITY INPUT? Yes
PROBLEMS/NEEDS ADDRESSED IN THE STUDY: PROBLEMS/NEEDS ADDRESSED IN THE STUDY: Disabled/ Elderly
Target PopulationTarget Population1. Adults Ages 19 though 642. Mental Retardation3. Physical Impairment4. Chronic and Long Term
Demographic ProfileDemographic ProfileI Definition of DisabilitySome Disability:Some Disability:A limitation in a social defined role or task
Severe Disability:Severe Disability:An inability to perform one or more functional or socially defined roles or tasks; having one ormore specific impairments; or using a mobility device, such as a cane or wheelchair. II HistoryIt was not until the 1990 U.S. Census that there was a concerted effort to collect disabilities datafrom the general population; prior to the 1990Census, data gathered referred only to personswith a work-related disability.
III Delaware Population with Disabilities• At least 19.4% of Delawareans (129,237 people) have some type of disability.
• Of the disabled Delawareans over age 20, 70.8% (67,815 people) have a mild ormoderate disability.
• Of the disabled Delawareans over the age of 20, 29.2% (27,969 people) have a severe disability.
IV Developmental DisabilitiesDevelopmental Disabilities include a variety of physical and mental disorders, either geneticallycaused or acquired during fetal or early childhood development. Developmental disability is

27
usually a lifelong condition, requiring specialized medical, educational, rehabilitation, andtransportation resources. It usually results in an inability to work and premature death. A list ofmental retardation and physical disabling conditions can be found in the report.
Service ProvidersService ProvidersMost of the organizations serving people with disabilities are non-profit agencies (57%);government agencies comprised less than 20% of the organizations (17) and the remainder arefor-profit companies (15%) or those who IRS status was unreported in the study (11%).
I Population ServedInconsistencies in reporting and the fact that so few agencies reported in detail make theaggregate information unreliable. Therefore, the aggregate number of total clients served asreported by agencies on the Provider Survey is not reported in this study summary at this time.
II Annual ExpendituresWith just 25 of the 100 organizations reporting a 1998 annual budget, the total annualexpenditures exceed $138.2 million. Human resource expenditures consume over 50% of theannual budget. In terms of number of employees, the 27 agencies that responded reportedemploying over 2,300 people in Delaware.
III Funding Sources Except for the government agencies or organizations fully contracted by them, most of the non-profit organizations rely on some form of private philanthropy: foundation or corporate grants,donor solicitations and fund-raising events.
IV The Network of CareInformation about the network of care and services for people with disabilities in Delaware isfragmented and not easily accessible in any comprehensive format.
Service Gaps Service Gaps In the provider survey, respondents were asked to identify and rank services that they believedwere not available or were not adequately available. Further information is available in thereport.
Service ThreatsService ThreatsOne of the highest concerns among providers responding to the survey was the threat to care byreduced Medicaid and Medicare reimbursements. Non-profit organizations identified the impactof managed care as the biggest threat to care for people with disabilities
I Threats to Care and Services in the FutureIn the provider survey, providers were asked to rank perceived threats to care and services forpeople with disabilities in the future. Thirty-nine organizations participated in the ranking.
II Insurance: Perhaps the Greatest ThreatAccording to the provider survey conducted as part of this study, five of the top nine Threats toCare and Services for the future involve the changes in the nation’s insurance industry and medicalreimbursements. They are (in order):
• Reduced Medicaid & Medicare Reimbursements
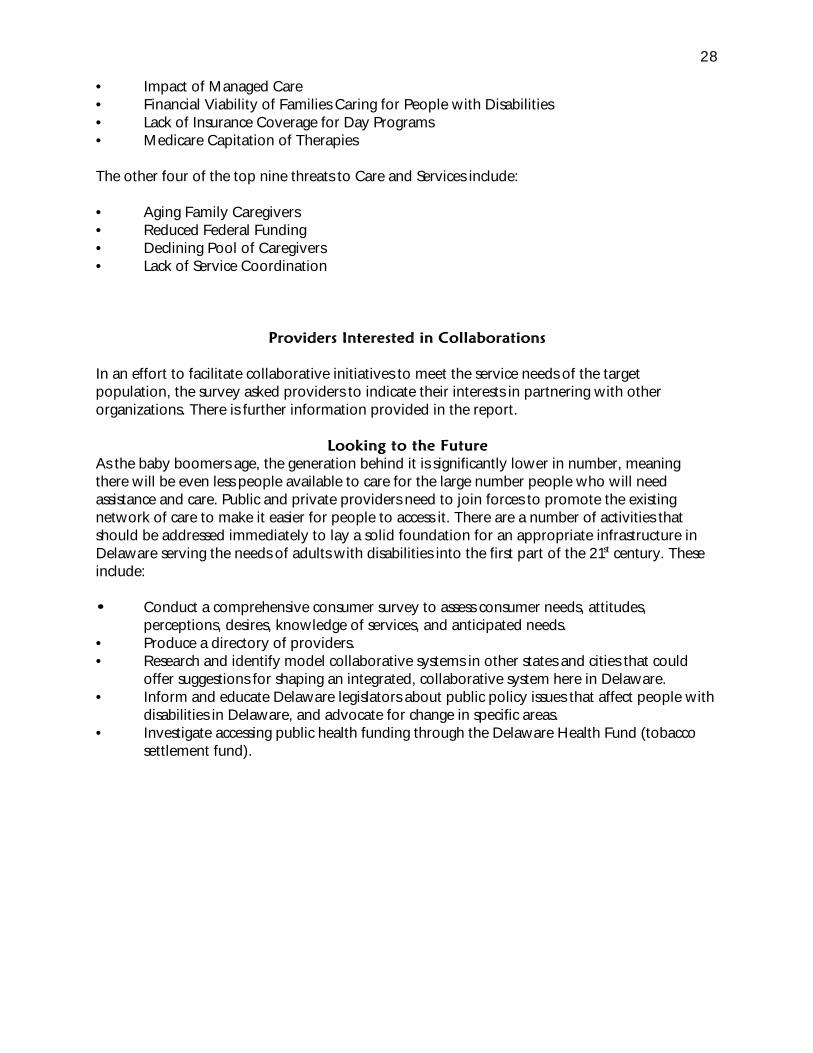
28
• Impact of Managed Care• Financial Viability of Families Caring for People with Disabilities • Lack of Insurance Coverage for Day Programs • Medicare Capitation of Therapies
The other four of the top nine threats to Care and Services include:
• Aging Family Caregivers• Reduced Federal Funding• Declining Pool of Caregivers• Lack of Service Coordination
Providers Interested in CollaborationsProviders Interested in Collaborations
In an effort to facilitate collaborative initiatives to meet the service needs of the targetpopulation, the survey asked providers to indicate their interests in partnering with otherorganizations. There is further information provided in the report.
Looking to the FutureLooking to the FutureAs the baby boomers age, the generation behind it is significantly lower in number, meaningthere will be even less people available to care for the large number people who will needassistance and care. Public and private providers need to join forces to promote the existingnetwork of care to make it easier for people to access it. There are a number of activities thatshould be addressed immediately to lay a solid foundation for an appropriate infrastructure inDelaware serving the needs of adults with disabilities into the first part of the 21st century. Theseinclude:
•• Conduct a comprehensive consumer survey to assess consumer needs, attitudes,perceptions, desires, knowledge of services, and anticipated needs.
• Produce a directory of providers.• Research and identify model collaborative systems in other states and cities that could
offer suggestions for shaping an integrated, collaborative system here in Delaware.• Inform and educate Delaware legislators about public policy issues that affect people with
disabilities in Delaware, and advocate for change in specific areas.• Investigate accessing public health funding through the Delaware Health Fund (tobacco
settlement fund).

29
TITLE: TITLE: CAREVan Data
AUTHOR: AUTHOR: Ingleside Homes
DATE: DATE: Calendar Year 1998
SOURCE: SOURCE: Ingleside Homes
GEOGRAPHICAL AREA: GEOGRAPHICAL AREA: Wilmington and parts of New Castle County
KINDS OF INFORMATION/DATA USED IN THE STUDY: KINDS OF INFORMATION/DATA USED IN THE STUDY: Statistics of service provisionby mobile informational and referral unit.
IS THE DATA/STUDY REPRESENTATIVE OF COMMUNITY INPUT?IS THE DATA/STUDY REPRESENTATIVE OF COMMUNITY INPUT? Yes
PROBLEMS/NEEDS ADDRESSED IN THE STUDY: PROBLEMS/NEEDS ADDRESSED IN THE STUDY: “ELDERLY”
Total Number reported: 788
Top Ten Problems/needs reported by CAREVan in 1998
1. Transportation (271)2. Home Maintenance (95)3. Health/Medical (89)4. Home Health (73)5. Information (73)6. Housing (49)7. Financial Assistance (30)8. Insurance (29)9. Food (15)10. Shopping Assistance (11)

30
TITLE: TITLE: Client Satisfaction Survey
AUTHORAUTHOR: Division of State Service Centers and Division of Management Services
DATE:DATE: May 29, 1996
SOURCE:SOURCE: Division of State Service Centers
GEOGRAPHICAL AREA: GEOGRAPHICAL AREA: Statewide
KINDS OF INFORMATION/DATA USED IN THE STUDY:KINDS OF INFORMATION/DATA USED IN THE STUDY:
Primary data -- results of client satisfaction survey
IS THE DATA/STUDY REPRESENTATIVE OF COMMUNITY INPUT?IS THE DATA/STUDY REPRESENTATIVE OF COMMUNITY INPUT?
Yes. The data reflects responses provided by Division of State Service Center clients.
PROBLEMS/NEEDS ADDRESSED IN THE STUDY:PROBLEMS/NEEDS ADDRESSED IN THE STUDY: “GENERAL”
• Level of satisfaction with state services and service centers, including specifically:• Services not available that clients would like to see in the building• How satisfied clients are with how early/late the center is open• Appearance of the waiting room/office• D. Availability of free parking• Helpfulness of receptionist• Extent to which the services provided meet client needs• Average length of waiting time for clients to receive services• Open comments - results included generally positive comments about
courtesy, attitude, helpfulness of staff, level of client satisfaction withservices, and some negative comments regarding clients having difficultyscheduling appointments and having to wait too long for services.
• Recommendations Offered:• Access Issues
• Division of State Service Centers should evaluate outreachmechanisms for enhancing awareness of services
• DSSC should evaluate changes in the mix of services and changesrelated to welfare reform with the goal of identifying andproviding support services to assist clients through transitions
• Further evaluate responses regarding additional services desired byclients
• Further analyze transportation issues for those clients traveling along way to service centers.
• Alleviate the problem at several centers of inadequate parking• Post adequate signs clarifying the location of offices within centers
• Client Satisfaction

31
• Determine acceptable level of client satisfaction and evaluateperformance using that standard
• Conduct evaluation and training for front desk staff• Recognize staff commended by clients• Share results with other agencies and work together to improve
satisfaction and access• At centers with notable levels of dissatisfaction for appearance of
waiting rooms/offices, evaluate facilities and make improvementswhere feasible
• Overall• Present each center with these results, comparing statewide average
to that particular center• Examine all operating policies and procedures and make necessary
revisions to enhance quality and productivity of service deliveryOngoing evaluation of client satisfaction is recommended in order to chart
progress• For 1994 Analysis, see 1994 Community Needs Assessment, Vol. III, pp. 56-62.

32
TITLE:TITLE: A Competitive Advantages Analysis of the Wilmington, Delaware Economy:1990-1995.
AUTHOR:AUTHOR: Brian Bailey
DATE:DATE: 1999
SOURCE:SOURCE: Center for Community Development and Family Policy, College of HumanResources, Education, and Public Policy, University of Delaware.
GEOGRAPHICAL AREA: GEOGRAPHICAL AREA: Primarily Wilmington, with more minor implications for theremainder of Northern New Castle County.
KINDS OF INFORMATION/DATA USED: KINDS OF INFORMATION/DATA USED: Data on employment trends by one-digit SICeconomic classification by year for the years 1990-1995. This data was analyzed using theeconomic base modeling method, which is explained in detail on pages 5-11. The economic basemodeling method was used as a methodological surrogate for Professor Michael Porter=stheoretical A Competitive Advantage@ model, explained briefly on pages 1-4.
IS THE DATA/STUDY REPRESENTATIVE OF COMMUNITY INPUT?IS THE DATA/STUDY REPRESENTATIVE OF COMMUNITY INPUT?No.
PROBLEMS/NEEDS ADDRESSED IN THE STUDY: PROBLEMS/NEEDS ADDRESSED IN THE STUDY: “EMPLOYMENT”Overall, this report presents a very positive view of the growth and overall strength ofWilmington’s economy during the early and mid-1990's. The notable economic problemsaddressed in this study are the growth of low-paying, comparatively non-secure service and retailjobs, as well as the question of equity between workers who are Wilmington residents vs.workers who commute from suburban New Castle County.
Highlights of this study:
• While total employment in Wilmington grew by nearly 7% (5,527 jobs) between 1990and 1995, much of that growth came from personal services, educational services, retailtrade, and other unclassified services. These jobs tend to be among the lowest paying,with few benefits and poor job security.
• The primary economic activity comprising Wilmington’s economic base is financialservices. While these tend to be higher-paying, higher-skill jobs, the trend inWilmington’s economy has been toward increased reliance upon this activity, thusmaking the city’s economy more narrow,@ i.e. less diversified.

33
• Several sectoral components of Wilmington’s economic base are Abase@ activities inname only. Such economic activities as personal services provision actually flow fromother activities upon which the local economy is actually based, such as financial services,transportation, and utilities. This shows that these lower-paying, low-skill activities aregrowing at a rate faster than the national rate of growth, and this is a potential futureweak point in the city’s economy.
• The city’s highest-paying, largest-employment, and highest-skill Abase@ economicactivities, such as financial services and professional services, are thought to employ a highpercentage of workers from outside the city limits of Wilmington. This leads to amismatch between residents’ skills and available jobs. The growth rate of these economicsectors leads to an increasing gap between Wilmington residents’ skills and available jobsin the city.
• In terms of governmental needs, a data system which more accurately reflects actualemployment figures and which accurately reflects wages paid to employees is needed toadequately perform research using annual data. This is needed in the future to adequatelyassess the employment, income, and training needs of Wilmington residents, as well asthose of residents of Northern New Castle County who depend on Wilmington’seconomic health for employment.

34
TITLE: TITLE: CONTACT Delaware Helpline Statistics
AUTHOR: AUTHOR: N/A
DATE: DATE: 1996-1998
SOURCE: SOURCE: CONTACT Delaware
GEOGRAPHICAL AREA: StatewideGEOGRAPHICAL AREA: Statewide
KINDS OF INFORMATION/DATA USED IN THE STUDY: KINDS OF INFORMATION/DATA USED IN THE STUDY: Primary Data. . Calls receivedare categorized monthly by: age of caller, gender of caller, number of new callers and byclassification of type of call.
IS THE DATA/STUDY REPRESENTATIVE OF COMMUNITY INPUT? YesIS THE DATA/STUDY REPRESENTATIVE OF COMMUNITY INPUT? Yes
PROBLEMS/NEEDS ADDRESSED IN THE STUDY: PROBLEMS/NEEDS ADDRESSED IN THE STUDY: Mental Health/ Legal/ Victim’sAssistanceListed under “GENERAL”, “VICTIM ASSISTANCE”, “HEALTH AND HEALTH CARE” and“CRIME AND LEGAL SERVICES”
Top 10 Types of calls
19961996 1997 1997 1998 19981 Mental/Emotional (4972) 1. Mental/Emotional (6156) 1. Mental/Emotional (4149)2. Loneliness (2728) 2. CONTACT Related*(2750) 2. CONTACT
Related*(2556)3. CONTACT Related* (2054) 3. Loneliness (2034) 3. Loneliness (2076)4. Depression (1382) 4. Family/interpersonal (1152) 4. Family (1248)5. Family (1228) 5. Misc. (1010) 5.Depression(1050)7. Nonfamily/Interpersonal (957) 6. Rape/Sexual (856) 6. Misc (931)8. Misc (857) 7. Health problems (787) 7. Rape/Sexual (831)9. Health Problems (822) 8. Depression (780) 8. Mental (726)10. Rape/Sexual (654) 9. Nonfamily/interpersonal (761) 9. Health problems (672)11. Addictions (not D&A) (538) 10. Marital (455) 10. Interpersonal (479)
Total Calls: 19942 19978 21521
Percent Female: 69% 73% 70%
Age Percent 36-60 yrs. 71% 70% 70%
New Callers 47% 43% n/a
* CONTACT Related calls are informational requests about the program.

35
TITLE: TITLE: Crime and Justice in the Enterprise Community: The Public’s View (An Examination anda Comparison of the Public’s Perception of Crime and Justice Inside and Outside of the EnterpriseCommunity)
AUTHOR: AUTHOR: Danilo Yanich
DATE: DATE: March 1998
SOURCE: SOURCE: UD-CHEP-SUAPP-CCDFP
GEOGRAPHICAL AREA: GEOGRAPHICAL AREA: Enterprise Community
KINDS OF INFORMATION/DATA USED IN THE STUDY: (KINDS OF INFORMATION/DATA USED IN THE STUDY: (Qualitative) Responses tosurvey questions
IS THE DATA/STUDY REPRESENTATIVE OF COMMUNITY INPUT? IS THE DATA/STUDY REPRESENTATIVE OF COMMUNITY INPUT? Yes - surveyconducted between April and September 1997 of 734 Wilmington residents.
PROBLEMS/NEEDS ADDRESSED IN THE STUDY: PROBLEMS/NEEDS ADDRESSED IN THE STUDY:
•• GENERAL
• Some neighborhoods in center city have undergone a dramatic decline in investment andhave suffered extensive out migration from their residential population
• Deteriorated housing stock, limited employment and economic opportunity, andwidespread poverty
• Considerable obstacles in achieving its goal for community and economic revitalization,especially that the EC’s 14 census tracts constitutes one of the regions most economicallydistressed areas
CRIMINAL JUSTICE SYSTEMCRIMINAL JUSTICE SYSTEM
• Residents within the EC rated the performance if the Wilmington Police Dept., the adultcourts in the state and the state’s adult corrections system much lower than residents outsideof the EC
SAFETYSAFETY
• Residents outside of EC felt more safe during the day, but all residents felt much less safe afterdark; significantly lower evaluations about neighborhood generally as compared to previousyear for EC residents (about 44% felt about the same, but 38% rated their neighborhoodworse than the previous year)
DRUGS AND DRUG USEDRUGS AND DRUG USEAlmost 2/3 (65%) of the EC residents saw drugs as a major problem within their neighborhood
(in terms of both perceived number of people using and drug-dealing taking place)

36
TITLE: TITLE: Crime in Delaware 1993: An Analysis of Delaware Crime
AUTHORS: AUTHORS: Eric Zoeckler, Charles Huenke and John P. O’Connell
DATE: DATE: May 1995
SOURCE: SOURCE: State of Delaware, Executive Department, Statistical Analysis Center; and State Bureauof Identification
GEOGRAPHICAL AREA: GEOGRAPHICAL AREA: statewide
KINDS OF INFORMATION/DATA USED IN THE STUDY: KINDS OF INFORMATION/DATA USED IN THE STUDY: Prevalence of categories ofcrime statewide – (number of incidents and comparisons to other years, etc.)
IS THE DATA/STUDY REPRESENTATIVE OF COMMUNITY INPUT? IS THE DATA/STUDY REPRESENTATIVE OF COMMUNITY INPUT? No.
PROBLEMS/NEEDS ADDRESSED IN THE STUDY: PROBLEMS/NEEDS ADDRESSED IN THE STUDY:
Crime/YouthCrime/Youth
This report is an annual tabulation of the incidence of crime in the state. “Needs” are nota focus of this report.
Outline of Crime
I. Part I CrimeA. Violent Crime
1. Homicide2. Forcible rape3. Robbery4. Aggravated assault
B. Property Crime1. Larceny2. Burglary3. Motor vehicle theft4. Arson
Trends of Part I Crimes (as compared to 1992 level unless otherwise specified)
I. Part I Crime overall· Statewide: decrease (58.2 per 1000 population to 53.7) ê· New Castle: decrease (26,823 to 25,041) ê· Kent: decrease (6,417 to 5,649) ê· Sussex: increase (6,321 to 6,500) é
A. Violent crime· Statewide: rising steadily since 1987; increase of 2.6% from 1992 level é
· New Castle: increase (3,151 to 3,455) é

37
· Kent: decrease (905 to 773) ê· Sussex: decrease (948 to 910) ê
1. Homicide· Statewide: decrease (36 to 26) ê
· No comparisons given for the counties
2. Forcible Rape· Statewide: decrease (605 to 581) ê
· New Castle: decrease (342 to 312) ê· Kent: increase (112 to 129) é· Sussex: decrease (151 to 140) ê
3. Robbery· Statewide: increase (1,313 to 1,426) é
· New Castle: increase (1,039 to 1,181) é· Kent: decrease (158 to 140) ê· Sussex: decrease (116 to 105) ê
4. Aggravated Assault· Statewide: increase (3,050 to 3,105); steady increase since 1986 é
· New Castle: increase (1,752 to 1,945) é· Kent: decrease (624 to 501) ê· Sussex: decrease (674 to 659) ê
B. Property crime· Statewide: decrease (34,557 to 32,052); declining since 1982, reaching a
low in 1986 and gradually rising to a peak in 1991; since 1992, declined toroughly 1990 level and decreased further in 1993 ê· New Castle: decrease (23,672 to 21,586) ê· Kent: decrease (5,512 to 4,876) ê· Sussex: increase (5,373 to 5,590) é
1. Larceny· Statewide: decrease (24,470 to 22,307) ê
· New Castle: decrease (16,625 to 14,972) ê· Kent: decrease (4,162 to 3,601) ê· Sussex: increase (3,683 to 3,734) é
2. Burglary· Statewide: decrease (7,249 to 6,733) ê
· New Castle: decrease (4,673 to 4,059) ê· Kent: decrease (1,070 to 1,044) ê· Sussex: increase (1,506 to 1,630) é
3. Motor vehicle theft· Statewide: increase (2,537 to 2,740) é
· New Castle: increase (2,172 to 2,380) é· Kent: decrease (229 to 193) é

38
· Sussex: increase (136 to 167) é
4. Arson· Statewide: decrease (301 to 272) ê
· New Castle: decrease (202 to 175) ê· Kent: decrease (51 to 38) ê· Sussex: increase (48 to 59) é
39
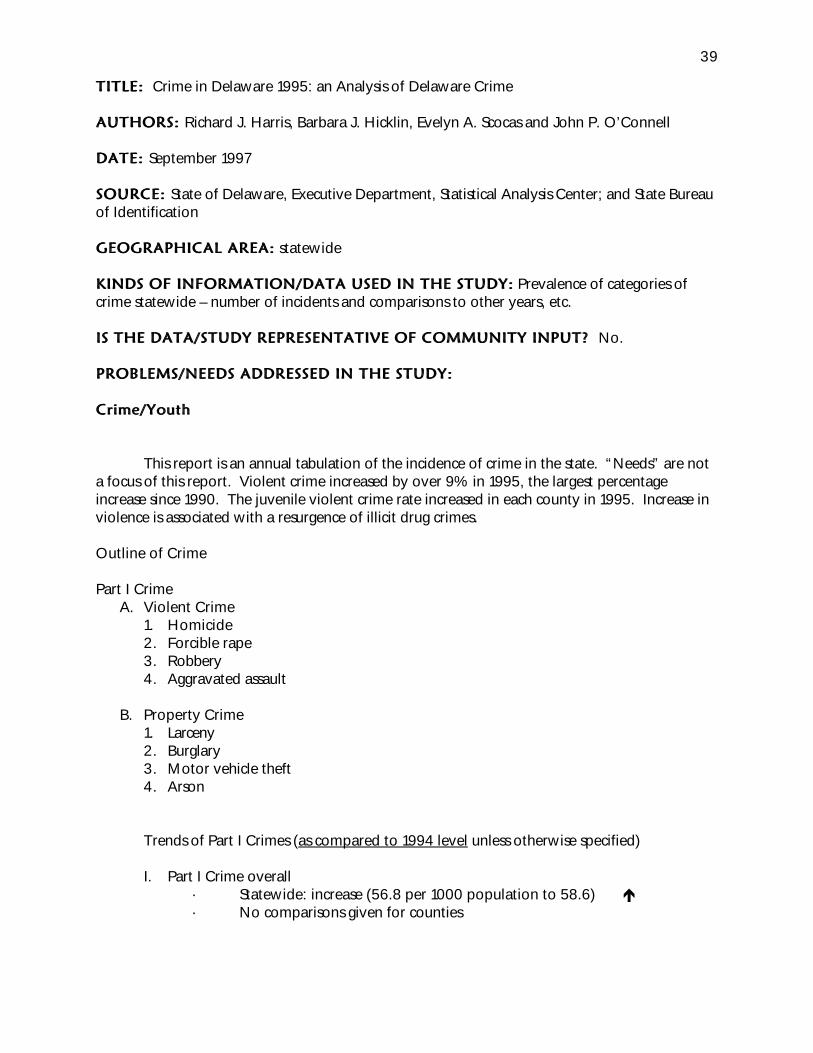
TITLE: TITLE: Crime in Delaware 1995: an Analysis of Delaware Crime
AUTHORS: AUTHORS: Richard J. Harris, Barbara J. Hicklin, Evelyn A. Scocas and John P. O’Connell
DATE: DATE: September 1997
SOURCE: SOURCE: State of Delaware, Executive Department, Statistical Analysis Center; and State Bureauof Identification
GEOGRAPHICAL AREA: GEOGRAPHICAL AREA: statewide
KINDS OF INFORMATION/DATA USED IN THE STUDY: KINDS OF INFORMATION/DATA USED IN THE STUDY: Prevalence of categories ofcrime statewide – number of incidents and comparisons to other years, etc.
IS THE DATA/STUDY REPRESENTATIVE OF COMMUNITY INPUT? IS THE DATA/STUDY REPRESENTATIVE OF COMMUNITY INPUT? No.
PROBLEMS/NEEDS ADDRESSED IN THE STUDY: PROBLEMS/NEEDS ADDRESSED IN THE STUDY:
Crime/YouthCrime/Youth
This report is an annual tabulation of the incidence of crime in the state. “Needs” are nota focus of this report. Violent crime increased by over 9% in 1995, the largest percentageincrease since 1990. The juvenile violent crime rate increased in each county in 1995. Increase inviolence is associated with a resurgence of illicit drug crimes.
Outline of Crime
Part I CrimeA. Violent Crime
1. Homicide2. Forcible rape3. Robbery4. Aggravated assault
B. Property Crime1. Larceny2. Burglary3. Motor vehicle theft4. Arson
Trends of Part I Crimes (as compared to 1994 level unless otherwise specified)
I. Part I Crime overall· Statewide: increase (56.8 per 1000 population to 58.6) é· No comparisons given for counties

40
A. Violent crime· Statewide: increase (5,132 to 5,598) é
· New Castle: increase (3,396 to 3,683) é· Kent: increase (812 to 862) é· Sussex: increase (924 to 1,053) é
1. Homicide· Statewide: increase (30 to 36) é
· New Castle: decrease (21 to 20) ê· Kent: same (5 each year) ---· Sussex: increase (4 to 11) é
2. Forcible Rape· Statewide: increase (540 to 601) é
· New Castle: increase (306 to 339) é· Kent: increase (116 to 127) é· Sussex: increase (118 to 135) é
3. Robbery· Statewide: increase (1,383 to 1,685) é
· New Castle: increase (1,138 to 1,385) é· Kent: increase (142 to 176) é· Sussex: increase (103 to 124) é
4. Aggravated Assault· Statewide: increase (3,179 to 3,276) é
· New Castle: increase (1,931 to 1,939) é· Kent: increase (549 to 554) é· Sussex: increase (699 to 783) é
B. Property crime· Statewide: increase (35,026 to 36,420) é
· New Castle: increase (24,278 to 25,572) é· Kent: decrease (5,293 to 5,289) ê· Sussex: increase (5,455 to 5,559) é
1. Larceny· Statewide: increase (23,337 to 25,264) é
· New Castle: increase (15,887 to 17,600) é· Kent: decrease (3,854 to 3,783) ê· Sussex: increase (3,596 to 3,881) é
2. Burglary· Statewide: increase (6,831 to 7,486) é
· New Castle: increase (4,123 to 4,890) é· Kent: increase (1,087 to 1,152) é· Sussex: decrease (1,621 to 1,444) ê

41
3. Motor vehicle theft· Statewide: decrease (4,415 to 3,099) ê
· New Castle: decrease (3,952 to 2,666) ê· Kent: decrease (279 to 256) ê· Sussex: decrease (184 to 177) ê
4. Arson· Statewide: increase (443 to 571) é
· New Castle: increase (316 to 416) é· Kent: increase (73 to 98) é· Sussex: increase (54 to 57) é
JUVENILE CRIMEJUVENILE CRIME
I. Arrests· Statewide: increase (6,636 to 7,236) é
· New Castle – 52.7% of the arrests· Kent: no information given
· Sussex: increase and highest rate of three counties é
II. Part I Crime overall· Statewide: increase (2,725 to 2,744) é· No comparisons given for counties
A. Violent crime· Statewide: increase (514 to 588) é
· New Castle: increase (321 to 382) é· Kent: increase (90 to 93) é· Sussex: increase (103 to 113) é
B. Property crime· Statewide: decrease (2,211 to 2,156) ê
· New Castle: decrease (1,363 to 1,305) ê· Kent: decrease (470 to 415) ê· Sussex: increase (378 to 436) é

42
III. Part II Crimes· Statewide: increase (3,911 to 4,492) é
· New Castle: increase (2,173 to 2,456) é· Kent: increase (756 to 852) é· Sussex: increase (982 to 1,184) é
ILLICIT DRUGSILLICIT DRUGS
Complaints· Statewide: increase of 11.9% (1995 rate: 9.4 per 1,000 population) é
· New Castle: increase of 22.8% to 9.7 per 1,000 é· Kent: increase of 4.4% to 9.4 per 1,000 é· Sussex: decrease of 8.5% to 8.5 per 1,000 ê
Arrests· Statewide: increase by 20% to 4.2 per 1,000 (3,036 arrests) é
· New Castle: increase of 33.3% é· Kent: increase of 8.3% to 3.9 per 1,000 é· Sussex: no change – 3.9 per 1,000 ---
Type· Marijuana use appears to be on the rise, as does that of heroin. Use of powder cocaine seems
to have decreased.
Juvenile Drug Arrests· Statewide: increase by 45% (413 to 597 arrests) é
· Statewide: increase of 442% between 1986 and 1995 é· New Castle: increase of 62% (265 to 428 arrests) é· Kent: increase of 14% é· Sussex: increase of 15% é

43
TITLE: TITLE: Crime, Public Safety & Police Service: Attitudes of Wilmington Residents
AUTHOR: AUTHOR: Timothy Barnekov, with the assistance of Danilo Yanich
DATE: DATE: October 1998
SOURCE: SOURCE: University of Delaware – College of Human Resources, Education and PublicPolicy – Center for Community Development and Family Policy
GEOGRAPHICAL AREA: GEOGRAPHICAL AREA: Wilmington
KINDS OF INFORMATION/DATA USED IN THE STUDY: KINDS OF INFORMATION/DATA USED IN THE STUDY: primary data: survey ofWilmington residents about issues of crime, public safety and police service
IS THE DATA/STUDY REPRESENTATIVE OF COMMUNITY INPUT? IS THE DATA/STUDY REPRESENTATIVE OF COMMUNITY INPUT? Yes.
PROBLEMS/NEEDS ADDRESSED IN THE STUDY: PROBLEMS/NEEDS ADDRESSED IN THE STUDY:
“CRIME AND LEGAL SERVICES”
Over 1,000 residents of Wilmington were surveyed between April and June of 1998 bothcitywide and within six police service areas (PSAs).
Respondent Demographics
· Just under a third of the respondents citywide have a college degree or more andonly 14 percent have less than a fall high school education.
· Thirty-four percent are married, 18 percent are divorced or separated, 33 percenthave never married, and 13 percent are widowed.
· Twenty- six percent live in households where there are children under 10 and 18percent say that there are children between 10 and 17 in their household.
· Four percent of the respondents are of Hispanic, Latino or Spanish origin. Forty-five percent describe themselves as African-Americans, 50 percent as White and 5percent as Other.
· Almost two in five have lived in their present housing unit for 11 or more years. Nearly 60 percent say that they own the housing unit they presently occupy. Forty-four percent have lived in their neighborhood for 11 or more years.
· Twenty-eight percent live in households with incomes of $20,000 or less last yearwhile 30 percent live in households with incomes of $50,000 and above.
· Thirty-four percent of the respondents are 35 years of age or younger, 34 percentare between 36 and 55, and 32 percent are age 56 or older.
· Sixty percent of the respondents are female.
Crime, Safety, and Neighborhood
· Fully 55 percent of the respondents citywide feel that conditions in the staterelated to crime are getting worse and 60 percent say that conditions in the city

44
related to crime are getting worse. · During the day, Wilmington residents (84%) feel safe in their neighborhood but
at night more than half (56%) do not. · While nearly three-quarters of the respondents say that safety conditions in their
neighborhood are about the same, a little more, or much more safe than a yearago, a significant minority (28%) feels that these conditions are a little less ormuch less safe than a year ago.
· Almost three-quarters of the respondents feel that, as a place to live, theirneighborhood is about the same, a little better or much better than a year ago anda majority say that their neighborhood is one where people work together andhelp each other.
· Most (71%) believe that residents and the police together are responsible for thequality of life in their neighborhood and generally respondents (over 60%) saythat they contribute personally to the quality of life in their neighborhood.
The Police and the Criminal Justice System
· Nearly 60 percent of the respondents feel that their neighborhood is patrolledsatisfactorily, but only 13 percent know any of the officers who are assigned totheir neighborhood and, of those, about half could name one or more of them.
· Citywide, just under half of the respondents rate the service provided by theofficers in their neighborhood as good or excellent and 45 percent believe thatthe service being provided in the rest of the city is good or excellent.
· Fifty-one percent of the respondents rate the performance of the WilmingtonPolice as A or B but 63 percent give this grade to the performance of the NewCastle Country Police and 70 percent rate the performance of the Delaware StatePolice as A or B.
· With respect to other institutions of the criminal justice system inDelaware, 33 percent rate the performance of the adult court system as A or B, 29percent rate the performance of the family/juvenile court system as A or B, and 25percent rate the performance of the adult corrections system as A or B.
Experiences with the Criminal Justice System
· Five percent of city residents acknowledge having been a defendant in a criminalcase and 10 percent have been a witness.
· Just over four out of ten Wilmington residents have been a victim of a crime anda third indicate that a member of their household has been a victim of a crime.
· Twenty-three percent of the respondents (or a member of their household) havebeen a victim of one or more crimes in the past year. Of this group, 81 percentsay that they reported at least one of the crimes to the police and an additional 7percent say that they reported some of the crimes.
· Auto break-ins, physical assaults, robbery from the person, stolen cars, homebreak-ins, and theft are most frequently mentioned as the crimes experienced inthe last year.
· Almost half of the respondents have (at some time) reported a crime to thepolice.
· Of those who say that someone in their household had been avictim of a crime in the past year and that they had reported one or more of the

45
incidents to the police, 31 percent were very dissatisfied or somewhat dissatisfiedwith the service they received.
Neighborhood Problems
· According to respondents across the city, the most serious neighborhoodproblems are the lack of recreational programs for juveniles, groups of personshanging around on the streets, and drugs being sold on the streets.
· Property crime, dirty streets, violent crime and abandoned houses and buildingsare also regarded as very serious issues by at least 20 percent of the respondents.
· The degree of concern about these issues varies considerably acrossthe police service areas with residents of the eastern section of the NorthernDivision (N2) and both the western (E1) and eastern (E2) sections of the EasternDivision expressing the greatest concern about drugs, the lack of recreationalprograms for juveniles, and groups of persons hanging around on the streets.

46
TITLETITLE: Delaware Career Compass: Charting Your Course
AUTHORAUTHOR: Delaware Department of Labor: Office of Occupational and Labor MarketInformation
DATEDATE: 1997
SOURCESOURCE: Delaware Department of Labor: Office of Occupational and Labor MarketInformation
GEOGRAPHICAL AREAGEOGRAPHICAL AREA: Statewide
KINDS OF INFORMATION/DATA USED IN THE STUDYKINDS OF INFORMATION/DATA USED IN THE STUDY:
Secondary data - statistics regarding statewide employment trends
IS THE DATA/STUDY REPRESENTATIVE OF COMMUNITY INPUT?IS THE DATA/STUDY REPRESENTATIVE OF COMMUNITY INPUT?
No. The data are a compilation of statistics based on information collected by a variety of state and federal government agencies.
PROBLEMS/NEEDS ADDRESSED IN THE STUDY: “EMPLOYMENT”PROBLEMS/NEEDS ADDRESSED IN THE STUDY: “EMPLOYMENT”
This report includes statewide employment trend data also included in Delaware TomorrowReport, which has also been summarized. But in order to be user friendly for job seekers, thisreport breaks the statewide employment data down by job title/description, offering theprojected number of annual openings, percentage growth in jobs, and average wages per hour, aswell as general qualifications and job characteristics.

47
TITLETITLE: Delaware: Child Care Challenges
AUTHORAUTHOR: Gina Adams and Karen Shulman
DATEDATE: May 1998
SOURCESOURCE: Children’s Defense Fund
GEOGRAPHICAL AREAGEOGRAPHICAL AREA: statewide
KINDS OF INFORMATION/DATA USED IN THE STUDYKINDS OF INFORMATION/DATA USED IN THE STUDY: National studies, census data,child care statistics and Children Defense Fund reports
IS THE DATA/STUDY REPRESENTATIVE OF COMMUNITY INPUT?IS THE DATA/STUDY REPRESENTATIVE OF COMMUNITY INPUT? No, nothingbeyond information provided by The Family and Workplace Connection.
PROBLEMS/NEEDS ADDRESSED IN THE STUDY: “CHILD/YOUTH”PROBLEMS/NEEDS ADDRESSED IN THE STUDY: “CHILD/YOUTH”
• Child Care ABCs: The need for child care and early education has become a fact of life formany Delaware parents.
• A recent Delaware report estimates that about 40,000 Delaware preschool andschool-age children (ages 0-12) currently need but do not have child care. Thereare approximately 37,000 children in licensed or legally operating child careprograms, with an additional 12,000 cared for by relatives or caregivers in thechildren’s home. Based on 1990 census data projections, it is estimated thatapproximately 90,000 preschool and school-age children currently need sometype of child care during all or part of the year.
• An estimated 66 percent of Delaware mothers with children younger than six, and81 percent of women with children between the ages of six and 17, are in thelabor force.
• Child Care Costs: Quality child care is unaffordable for many working families inDelaware.
• The average annual cost of public college tuition in Delaware in 1997 was $4,180- less than the average cost of care for a four-year old in a center and three-quarters the average cost for an infant in a center.
• Families in Delaware with both parents working full-time at the federal minimumwage earn only $21,400 per year. There are about 47,610 children younger than13 who live in low-income families (with incomes below about $27,000 for afamily of three or 200 percent of poverty).
• In Delaware, child care for a four-year old in a child care center cost an averages of$4,531 in 1997; in Wilmington - $4,871, with fees as high as $9,360; in SussexCounty - $3,636, with fees as high as $4,836. Parents with more than one childin care spend significantly more.

48
• To buy child care for an infant and a four-year old in a child care center at theaverage price in Delaware, a two-parent family with both parents working full-time at the minimum wage would have to spend 47 percent of their income onchild care.
• Delaware ranked in the bottom third of all states as far as making low-incomefamilies eligible for child care assistance. In January 1998, the state only allowedlow-income working families earning less than $20,664 (for a family of three) tobe eligible for any child care help, although federal law allows the state to servefamilies with incomes up to $38,927.
• The situation is likely to get worse in the coming years, as more families arerequired to move from welfare to work under A Better Chance. In a recentsurvey, Delaware reported that, without additional funds, it is not confident thatit will be able to meet the demand the child care assistance generated by theincrease in welfare work requirements.
• The state estimates that an additional 1,300 children will enter state-subsidizedcare annually through the end of the decade. While state officials believe thatsufficient slots are available for the total of 8,375 children who will needassistance this year, it is not clear that their families can find the kind of care thatthey want for their children.
• The state spent $0.38 out of every $100 in state tax revenues on child care andearly education in 1994.
• The state requires one of the highest family copayment levels in the country.•• Families in Delaware who receive child care assistance still face enormous
difficulties finding providers who will take care of their children, as the amountthat the state will pay for care is significantly below market prices. In contrast, anumber of other states pay at levels based in current market prices.
C Child Care Quality: Although child care shapes children’s futures, too many children inDelaware are in care that may be harmful to their development, health and safety.
C Delaware is one of the many states that do not adequately protect their children. In 1997, the state met recommended levels for the number of children a singlecaregiver could care for in a child care center for only two of the six age groupsexamined.
C Delaware does not have enough licensing inspectors to visit each licensed careprovider annually. For example, family child care homes may be visited onlyevery five years, even though small homes are responsible for two-thirds of thehealth, safety and administrative violations recorded by the state.
C Each licensing worker in the state is responsible for 235 facilities, although expertsrecommend no more than one worker for 100 to 150.
C three-month investigation in Delaware by The News Journal, which examined35,000 records, found that inspectors rarely conduct surprise visits.
C High turnover rates, low wages and inadequate training for child care providersthreaten the quality of care.
C Delaware requires that child care providers have only 15 hours of training withinthe first year of receiving a license.
C In 1996, the annual average wage of child care workers in Delaware was only$13,640 (as compared to bus drivers - $20,150, garbage collectors - $18,100, orbartenders - $14,450). In addition, national studies of child care providers find

49
that they tend to receive no benefits or paid leave.C Low wages are closely linked to rapid turnover rates among child care providers,
which breaks the stable relationship that children need to have with theircaregivers to feel safe and secure. Turnover rates are high in Delaware. Onaverage, one out of every five family child care homes goes out of business eachyear, with rates as high as one out of four in Wilmington, and one out of three inSussex County.
C As of December 1997, the Family and Workplace Connection reported that only11 percent of the operating licensed child care centers in the state were accredited. There is only one accredited program in Wilmington out of 37 licensed operatingchild care centers, and only one accredited child care center in Sussex County outof 50 licensed operating child care centers.
C Child Care Availability: Families across Delaware face difficulties finding quality,affordable care. The lack of such care is even greater for some groups of families,including families with school-age children and families with children younger than three.
C In Delaware, agencies that help families find child care report that there is a seriousshortage of various kinds of needs, including infant care, school-age care, care forchildren with special needs, care for children who are mildly ill, and care forfamilies who work during nontraditional hours.
C Certain regions in Delaware have general shortages of child care. For instance, inthe Bear area of New Castle County, there are only six child care centers; in KentCounty there is a need for family child care homes; and in rural Sussex County,there is a limited supply of child care overall.
C In Delaware, only one out of five public schools offer extended-day programs in1993-1994.
C There are only 8,900 before- and after-school care slots in legally operating daycare facilities in Delaware, although there are an estimated 74,600 school-agechildren with working parents.
C There are limited infant care options of any type in Bear. Local experts reportshortages on infant care in other communities as well, including NorthWilmington.
C Families have limited options in Middletown, and particularly limited options iftheir jobs don’t end until 5:30 or later. There are no child care centers in town,and there are only 45 family child care homes. Only 12 of these homes are openpast 5:30 PM and only three are open past 6 PM.
C Many Delaware communities report shortages of care during nontraditional hours. Evening and weekend care can be especially hard to find. For example, eveningcare is scarce in North Wilmington, Hockessin, Stanton and Ogletown. In KentCounty, only three centers are open till 9PM or later, and none are open onweekends. In Sussex County, only two child care centers are open until at least 9PM, and only two offer some kind of weekend care.
C North Wilmington and Middletown/Bear both report shortages of care for mildlyill children.
See attached “Child Care Facts at a Glance”See attached “Child Care Facts at a Glance”

50
TITLE:TITLE: Delaware Dropouts, 1996-1997 Summary Statistics
AUTHORAUTHOR: Department of Education, State of Delaware.
DATEDATE: December 1997
GEOGRAPHICAL AREAGEOGRAPHICAL AREA: State of Delaware, New Castle, Kent and Sussex Counties.
TYPE OF DATA USEDTYPE OF DATA USED: Tables and charts aggregated by state, county, district, school, race andgender on Delaware dropouts from master student data base and administrative records fromboth the school and district levels.
REPRESENTATIVE OF COMMUNITY INPUTREPRESENTATIVE OF COMMUNITY INPUT: No
NEEDS/PROBLEMS IDENTIFIEDNEEDS/PROBLEMS IDENTIFIED: CHILD/YOUTH
• During the 1996-1997 school year, 1,464 out of 32,568 students enrolled in grades 9through 12 left school.
• The statewide annual dropout rate of 4.5% for the school year 1996-97 remains thesame as last year’s dropout rate.
• Of the 1,464 dropouts:• 58.2% were male and 41.8% were female.• 55.1% were White/Other, 39.1% were African American/Black; 5.9% were
Hispanic• African American/Black students dropped out at the rate of 6.1%• Hispanic students dropped out at the rate of 7.3%• White/Other students dropped out at the rate of 3.7%.• Most dropouts left school in either the 9 th or 10th grade (63.3%).C Most dropouts left school when they were 16 or 17 years of age (61.2%), a
reflection of the compulsory school attendance law requiring attendance at schoolbetween 5 and 16 years of age.

51
TITLETITLE: Delaware Helpline Problems/Needs
AUTHORAUTHOR: Delaware Helpline
DATEDATE: Calendar Year 1998
SOURCESOURCE: Delaware Helpline
GEOGRAPHICAL AREAGEOGRAPHICAL AREA: Statewide
KINDS OF INFORMATION/DATA USED IN THE STUDYKINDS OF INFORMATION/DATA USED IN THE STUDY: Tracks the number and types ofcalls individuals made to the Delaware Helpline, a Statewide information and referral service, forassistance.
IS THE DATA/STUDY REPRESENTATIVE OF COMMUNITY INPUT?IS THE DATA/STUDY REPRESENTATIVE OF COMMUNITY INPUT? Yes
PROBLEMS/NEEDS ADDRESSED IN THE STUDYPROBLEMS/NEEDS ADDRESSED IN THE STUDY: Calls received are recorded in fourcategories, Basic Needs Financial Assistance, Health/Medical and Govt./Taxes/Licenses.“GENERAL”
The top ten problem/needs areas wereThe top ten problem/needs areas were:
AREAAREA Calls per yearCalls per year
1. Utilities (4757)2. Rent (2200)3. Gov’t Agencies/Employment (1881)4. Medical Insurance (1383)5. Medical Care (1251)6. Shelter (Basic) (1170)7. Security Deposits (1151)8. Emergency Food (879)9. Medical Information (796)10. Other Financial Assistance (794)
NOTESNOTES:The overall number of calls per month were highest in December (4406) and lowest in February(2549). There is no geographical breakdown of calls received.
• For 1993 analysis, see 1994 Community Needs Assessment, Vol. III, pp. 29-38.

52
TITLETITLE: Delaware Jobs: What Do They Offer?
AUTHORAUTHOR: Edward Simon, Delaware Labor Market Information Supervisor.
DATEDATE: 1997
SOURCESOURCE: Delaware Department of Labor, Office of Occupational and Labor MarketInformation (OOLMI).
GEOGRAPHICAL AREAGEOGRAPHICAL AREA: Statewide.
KINDS OF INFORMATION/DATA USEDKINDS OF INFORMATION/DATA USED: Original survey data obtained by OOLMI. Thissurvey, a two-page survey sent out in February 1997, was sent to 1,488 employers in Delaware.These employers were randomly selected from a stratified sample, working from the assumptionthat an employer=s size is the single most important characteristic in determining whether or notthe employer provides benefits to its employees. For this study, employers were divided intothe following four class sizes:
1-19 employees20-49 employees50-249 employees250+ employees.
All 208 of Delaware=s employers falling into the largest class size were surveyed, with a samplerepresenting an accurate cross section by industrial classification@ surveyed from each of theother three size classes.
IS THE DATA/STUDY REPRESENTATIVE OF COMMUNITY INPUT?IS THE DATA/STUDY REPRESENTATIVE OF COMMUNITY INPUT? No.
PROBLEMS/NEEDS ADDRESSED IN THE STUDYPROBLEMS/NEEDS ADDRESSED IN THE STUDY: “EMPLOYMENT”
Overall, this report presents a very positive view of conditions for employees of Delawarecompanies. The notable need addressed in this study is the need for benefits, such as healthinsurance, day care, and retirement benefits for a portion of Delaware=s work force.
Highlights of this study, showing unmet needs of Delaware workers:
• Just over 21% (@ 78,000 jobs) of all employment in Delaware is part-time, with overhalf of all jobs in the retail trade and personal services sectors (both rapidly growingeconomic sectors in Delaware) being part-time. Most part-time employment in Delawareis in firms with under 250 employees. Almost none of these employees receive extensiveor even adequate@ benefits. However, it should be noted that the composition of theApart-time labor force@ is not addressed in this study.
• About 4% (@15,000 jobs) of jobs in Delaware pay minimum wage. Well over half ofthese jobs are in retail trade and services, with less than 1% of all workers in othereconomic sectors earning only the federally mandated minimum wage.
• About 35% (@ 160 firms) of firms who responded to this survey stated that they

53
planned to do no new hiring in 1997. Manufacturing, construction, and service firmswere most likely to be hiring.
• Only 6% of the firms responding to this survey provide on-site day care or day caresubsidies to their workers.
• Over 90% of Delaware workers are employed in firms that provide health insurance. However, nearly 35% of all firms with fewer than 20 workers do not offer healthinsurance benefits of any sort to their employees. Strangely, perhaps, workers at largefirms (100+ employees) in the state are less likely to have their employer pay the entirecost of their medical insurance coverage than workers in small firms.
• Nearly 35% of workers employed in Delaware are not provided dental insurance bytheir employer.
• Nearly 70% of all employers in Delaware, cutting across firm size classes, do not offervision insurance or benefits to their employees.
• Only 46% of all Delaware firms with under 100 employees offer some form of aretirement plan. 16% of all Delaware firms with over 100 employees do not offer someform of a retirement plan.

54
TITLETITLE: Delaware Monthly Labor Review: November 1998
AUTHORAUTHOR: Delaware Department of Labor: Office of Occupational and Labor MarketInformation
DATEDATE: November 1998
SOURCESOURCE: Delaware Department of Labor: Office of Occupational and Labor MarketInformation
GEOGRAPHICAL AREAGEOGRAPHICAL AREA: Statewide
KINDS OF INFORMATION/DATA USED IN THE STUDYKINDS OF INFORMATION/DATA USED IN THE STUDY:
Secondary data - statistics regarding statewide employment trends
IS THE DATA/STUDY REPRESENTATIVE OF COMMUNITY INPUT?IS THE DATA/STUDY REPRESENTATIVE OF COMMUNITY INPUT?
No. The data are a compilation of statistics based on information collected by a varietyof state and federal government agencies.
PROBLEMS/NEEDS ADDRESSED IN THE STUDYPROBLEMS/NEEDS ADDRESSED IN THE STUDY: “EMPLOYMENT”
This report is a monthly update of employment growth by occupational sector. The highlightsof the data are:• Between October 1998 and November 1998 total non-farm employment increased by
2,900 in Delaware to 409,300
• 900 of these new jobs were in government
• 800 of these new jobs were in services, mainly business services
• 800 of these new jobs were in wholesale and retail trade
• Since November 1997 total non-farm jobs have increased by 12,500
• 5,000 of these new jobs were in “services,” including business services
• 2,300 were in wholesale and retail trade
• 1,700 were in finance, insurance, and real estate
• 1,200 were in construction
• 1,000 were in manufacturing
• 800 were in government
• 500 were in transportation and public utilities

55
TITLETITLE: Delaware Perinatal Board Progress Report AUTHORAUTHOR: Delaware Perinatal Board
DATEDATE: 1996
GEOGRAPHICAL AREAGEOGRAPHICAL AREA: Delaware
TYPE OF DATA USEDTYPE OF DATA USED: Findings from executive and working committees of DelawarePerinatal Board.
REPRESENTATIVE OF COMMUNITY INPUTREPRESENTATIVE OF COMMUNITY INPUT: Board co-sponsored three town meetings inall three Delaware counties and requested input from participants. The Board initiated a plan forcontacting and interviewing the grassroots community with special interest on teenagers andminorities. Focus groups were used in each county to obtain direct involvement of the needsassessments.
NEEDS/PROBLEMS IDENTIFIEDNEEDS/PROBLEMS IDENTIFIED: This is a progress report that identifies the PerinatalBoard’s responsibilities in reducing Delaware’s high infant mortality rate and discusses their effortin this areas. “CHILD/YOUTH”, “HEALTH AND HEALTH CARE” and “PARENTING”
The Board’s Vision:• Delaware will have the healthiest infants in the nation.• The strategic framework identifies four key areas that are to be addressed by the committees.
• Reduction of the proportion of high risk pregnancies;• Reduction of the incidence of low birth weight (LOBW) and pre-term births by the
improvement of health care the behavior of women;• Improvement of birth weight specific survival by strengthening obstetric and neonatal
health systems;• Reduction of death from specific causes in the post neonatal period.
Short-Term Agenda:• Develop standards of educational programs for the child bearing family during the perinatal
period.• Promote efforts for eligible parents to participate in the Home Visiting Program.• Continue communication and collaboration with agencies involved in education programs,
which are beneficial to childbearing families to avoid duplication.• Develop a plan for the delivery of client based education to the community (i.e., Public
Service Announcements).• Establish guidelines for the education of perinatal health care providers.• Investigate individual risk factors that negatively impact Delaware’s infant mortality rates.
Systematically evaluate these risks factors related to the three stages of perinatal health: preconception, pregnancy by trimester, and neonatal infant.
• Promote healthy lifestyles of adolescents, childbearing adults, and their families bydeveloping an educational plan for client based education in the community.
• Coordinate an annual perinatal symposium sponsored by the Delaware Perinatal Board.
Long -Term Issues:• Increasing the public’s awareness of behaviors which affect the health of pregnant women and
56
infants;• Continued funding for the ongoing function of the Board.• Identification of funding sources for long-term initiatives to prevent infant mortality and
reduce low birth weights.• The concept of regionalization as it relates to community resources;
Goals:• Facilitate the identification of appropriate services to pregnant women and infants which
meet identified community needs.• Advocate for appropriate resources for critical maternal/infant health initiatives (e.g., home
visiting, developmental assessments for at risk infants; expanded coverage for adolescentmothers; drug rehabilitation coverage, uniform and universal coverage for genetic counselingetc.)
• Collect and collate information on agencies and individual providers impacting the issuessurrounding infant mortality and underweight births. Disseminate this information onavailable services and initiatives related to reducing infant mortality in Delaware.
• Foster coordination of efforts between agencies providing related services to women andchildren.
• Identify system deficiencies, which result in unmet client needs, which may increase infantmortality.
• Promote cultural sensitivity education so that the childbearing population is well informedabout the need for health lifestyle (mental and physical).
• Establish guidelines for ongoing education for physicians, nurses, and other care providers inmaternal and infant care.
• Describe factors associated with infant mortality, which most effects Delaware’s high rate.• Identify priority areas for infant mortality reduction efforts.• Assure standards for care during the prenatal, delivery of infants, and postnatal periods are
met by all providers.

57
TITLETITLE: Delaware Regional Job Access Transportation Business Plan
AUTHORAUTHOR: Delaware Transit Corporation (DTC), also KFH, a consulting firm.
DATEDATE: 1998
SOURCESOURCE: DTC, with assistance from Wilmington Area Planning Council.
GEOGRAPHICAL AREAGEOGRAPHICAL AREA: Entire state, with sections emphasizing needs in each of the threecounties individually. Also a section detailing needs of DTC in terms of providing better, moreappropriate services.
KINDS OF INFORMATION/DATA USEDKINDS OF INFORMATION/DATA USED: Secondary data on individuals in Delaware’s ABetter Chance Program (ABC) obtained from the following agencies: U.S. Department of theCensus, Wilmington Area Planning Council. Delaware Department of Health and Social Services,and the Delaware Economic Development Office. Primary data on the state’s publictransportation routes and the relationship of where individuals live to these routes obtained byDelDOT and DTC. Much of the information used in this study is also used in the FTA Access toJobs/Reverse Commute Grant Application.
IS THE DATA/STUDY REPRESENTATIVE OF COMMUNITY INPUT?IS THE DATA/STUDY REPRESENTATIVE OF COMMUNITY INPUT? No.
PROBLEMS/NEEDS ADDRESSED IN THE STUDYPROBLEMS/NEEDS ADDRESSED IN THE STUDY: “INFRASTRUCTURE”
A section of this grant application details the unmet public transportation needs of individuals inDelaware’s ABC program. These are divided into five primary sections: general transportationservice gaps, the overall state public transportation need, and service needs for each of the threeby counties.
GENERAL TRANSPORTATION SERVICE GAPS• There is a lack of common access to the various databases, which are useful for
finding employment for ABC clients. These databases, such as those dealing withemployment opportunities, fixed transportation routes, etc., are maintained byvarious state agencies that do not coordinate their use in finding employment forABC clients. This creates a barrier to more effective use of transportation services(in addition to fixed route bus services) which are available.
• Lack of coordination among public transportation service providers includingpublic, agency, and private transportation.
• Lack of funding to better serve the transportation needs of ABC clients.
• THE OVERALL PUBLIC TRANSPORTATION NEED• The fixed bus routes do not serve where some ABC clients live, where the jobs are,
or where child and adult day care facilities are located.• The fixed bus routes do not operate at the hours or days when ABC clients need
to get to work - especially if they are involved or can be involved in shift work.• The fixed bus route fares are prohibitive, especially during the first few months
ABC clients are working.• There are almost no fixed bus routes in rural areas of the state.
58
• Information about bus routes and times is difficult to obtain, making it difficultfor ABC clients and caseworkers to use existing transportation services. There is ageneral lack of understanding concerning public transportation options by ABCclients.
• NEW CASTLE COUNTY SERVICE NEEDS• No Sunday service - affecting workers who need to work then, especially in the
retail sector.• Many people live beyond a reasonable walking distance to fixed route bus stops.• Lack of late night service - persons working third shifts are unable to utilize fixed
route bus service.• Lack of service in Southern New Castle County - the only fixed bus route
operating below the canal is the 301 Intercounty service, creating problems ofemployment access for these residents.
• KENT COUNTY SERVICE NEEDS• No fixed route bus service on evenings or weekends in the Dover area, when
many ABC clients would need to get to work.• Many people live beyond a reasonable walking distance to fixed route bus stops.• No service to rural areas of Kent County. About 1,500 client families in Kent
County live outside the fixed route service area and do not own a car.
• SUSSEX COUNTY SERVICE NEEDS• Overall lack of service. Currently, only three fixed bus routes run in the entire
county, and these offer only two or three runs each way per day. In addition,service to the shore, where resort and outlet jobs are, ends in mid-afternoon.
• There are no fixed route bus services in Sussex County on Saturday or Sunday,when many people need to get to work.
• More inter-urban connector routes within Sussex County are needed. The onlyconnections currently available in Sussex County are from Laurel to Millsboro andGeorgetown, and from Georgetown to the shore communities.
• Most of Sussex County has no service at all. About 1,000 client families in SussexCounty live outside the fixed route service area and do not own a car.

59
TITLETITLE: Delaware Tomorrow 1997
AUTHORAUTHOR: Delaware Department of Labor: Office of Occupational and Labor MarketInformation
DATEDATE: 1997
SOURCESOURCE: Delaware Department of Labor: Office of Occupational and Labor MarketInformation
GEOGRAPHICAL AREAGEOGRAPHICAL AREA: Statewide
KINDS OF INFORMATION/DATA USED IN THE STUDYKINDS OF INFORMATION/DATA USED IN THE STUDY:
Secondary data - statistics regarding statewide employment trends, population trends,and education levels
IS THE DATA/STUDY REPRESENTATIVE OF COMMUNITY INPUT?IS THE DATA/STUDY REPRESENTATIVE OF COMMUNITY INPUT?
No. The data are a compilation of statistics based on information collected by a varietyof state and federal government agencies.
PROBLEMS/NEEDS ADDRESSED IN THE STUDYPROBLEMS/NEEDS ADDRESSED IN THE STUDY: “EMPLOYMENT”
This report looks at statewide trends in employment, demographics, and education, and atemployment and demographic growth projections from 1995 to 2005. The following arehighlights of the reported data:
• The statewide unemployment rate has generally been below the national average, andstood at 4.3% in the first part of 1997
• Over the last several decades most job growth in Delaware has been in the serviceindustries: including wholesale/retail trade; finance, insurance, and real estate;government; and transportation, communication, and utilities.
• By the year 2005, service industries will provide 80% of all jobs in the state, comparedto 48% in 1950
• Delaware’s labor force participation rate of 69.7% in 1995 was higher than the nationalaverage (66.65) and increased from a rate of 62.6% in 1976
• While the labor force participation rate of men in Delaware has remained relativelyconstant, that of women has increased from under 50% in 1976 to nearly 65% in 1995
• From 1995 to 2005 Delaware’s population is expected to increase from 717,400 to795,300, with much of the growth occurring in the 45-64 age group.
• The sector that is expected to experience the most growth in employment between 1995and 2005 in Delaware is professionals, paraprofessionals, and technical workers (both inpercentage and sheer numbers)
60
• The industries in Delaware projected to have the most new jobs created between 1995and 2005 are commercial banks (7,097), eating and drinking places (3,629), personnelsupply services (2,581), elementary schools (2,337), and self-employed (2,137)
• The industries with the most rapid rates of growth in Delaware in the period 1995-2005are projected to be commercial sports (114.4%), computer and data processing services(60.4%), child and day care services (58.2%), amusement and recreational services(52.8%), and drugs (50.1%)
• It is estimated that 60% of all new jobs in Delaware in the period 1995-2005 will requiretraining beyond high school, and wages are generally tied to education level.
• Wages are distributed unevenly across the state, as New Castle County has a much higherpercentage of workers in the upper income brackets than either Kent or Sussex Counties.

61
TITLETITLE: Delaware Wages 1995
AUTHORAUTHOR: Delaware Department of Labor: Office of Occupational and Labor MarketInformation
DATEDATE: February 1998
SOURCESOURCE: Delaware Department of Labor: Office of Occupational and Labor MarketInformation
GEOGRAPHICAL AREAGEOGRAPHICAL AREA: Statewide
KINDS OF INFORMATION/DATA USED IN THE STUDYKINDS OF INFORMATION/DATA USED IN THE STUDY:
Secondary data - statistics regarding statewide employment and wages
IS THE DATA/STUDY REPRESENTATIVE OF COMMUNITY INPUT?IS THE DATA/STUDY REPRESENTATIVE OF COMMUNITY INPUT?
No. The data are a compilation of statistics based on information collected by a varietyof state and federal government agencies.
PROBLEMS/NEEDS ADDRESSED IN THE STUDYPROBLEMS/NEEDS ADDRESSED IN THE STUDY: “EMPLOYMENT”
The report summarizes average hourly wages in Delaware broken down by occupational group,specific occupation, and county. The following are highlights of the findings:
a.Statewide, the average hourly wage in 1995 was $13.86, with an average wage of $15.01 inNew Castle County, $11.50 in Kent County, and $10.40 in Sussex County
• The median hourly wage statewide was $10.76, with the 25th percentile at $7.04 and the75th percentile at $16.71
• Managerial and Administration was the occupational group that had the higheststatewide average hourly wage at $28.94, while the “Service” group had the lowestaverage hourly wage of $7.46

62
TITLETITLE: Delaware Women: Where Are They Working?
AUTHORAUTHOR: Delaware Department of Labor: Office of Occupational and Labor MarketInformation/Delaware Occupational Information Coordinating Committee
DATEDATE: 1997
SOURCESOURCE: Delaware Department of Labor
GEOGRAPHICAL AREAGEOGRAPHICAL AREA: Statewide
KINDS OF INFORMATION/DATA USED IN THE STUDYKINDS OF INFORMATION/DATA USED IN THE STUDY:
Secondary data -- statistics regarding statewide employment trends by gender
IS THE DATA/STUDY REPRESENTATIVE OF COMMUNITY INPUT?IS THE DATA/STUDY REPRESENTATIVE OF COMMUNITY INPUT?
No. The data is purely government statistics
PROBLEMS/TRENDS ADDRESSED IN THE STUDYPROBLEMS/TRENDS ADDRESSED IN THE STUDY: “EMPLOYMENT”
• In 1995 Delaware women had a 62.9% labor force participation rate compared to thenational average of 58.9%, and up from 49.1% in 1976
• As the economy expands, Delaware must attract more women into the workforce or facelabor shortages, particularly for skilled workers
• More than 90% of all new jobs created since 1990 have been in service industries
• Since 1980, 58% of Delawareans entering the workforce have been women
• The number of Delaware women working full-time has increased 79% since 1980
• In 1995, only 2.3% of Delaware women worked part-time because they couldn’t findfull-time work (down from 7.4% in 1980)
C In 1995, 24% of the jobs held by women in Delaware were part-time (down from 32%in 1980)
C The population of Delaware women is aging: over the next 10 years the number ofDelaware women aged 25-34 is expected to drop 11%, while the number of womenaged 55-64 will increase 45%
C Women held 47.4% of all Delaware jobs in 1995, up from 43.4% in 1980
C Only 12% of employed Delaware women worked in goods-producing industries in 1995
C Women in Delaware have increased their share of executive, administrative, andmanagerial jobs from 28.2% in 1980 to 41.6% in 1995.

63
• 56.9% of Delaware’s professional jobs are now held by women
• Nearly 80% of all clerical jobs are still held by women
• The proportion of farming, forestry, and fishing workers who are women dropped from21.0% in 1980 to 11.4% in 1995
• In descending order, the number of jobs held by Delaware women experienced thegreatest increase in sheer numbers in the following sectors: Executive, Administrative,Managerial (14,583 jobs); Administrative Support and Clerical (14, 565 jobs); Sales(13,343 jobs); and Professional Specialties (9,781 jobs)
• The statewide unemployment rate was somewhat lower for women (4.1%) than for men(4.5%) in 1995
• Nationally, women earn only 75% as much as men and the same trend exists in Delaware

64
TITLE: TITLE: Delaware’s Continuum of Care Narrative: Gaps and Priorities
AUTHOR: AUTHOR: Homeless Planning Council
DATE: DATE: 1998
SOURCE: SOURCE: Homeless Planning Council
GEOGRAPHICAL AREA: GEOGRAPHICAL AREA: Statewide
KINDS OF INFORMATION/DATA USED IN THE STUDY:KINDS OF INFORMATION/DATA USED IN THE STUDY: Qualitative:survey/questionnaire responses by homeless shelter providers and homeless individuals,Quantitative: inventory of service units
IS THE DATA/STUDY REPRESENTATIVE OF COMMUNITY INPUT?IS THE DATA/STUDY REPRESENTATIVE OF COMMUNITY INPUT? Yes
PROBLEMS/NEEDS ADDRESSED IN THE STUDY: PROBLEMS/NEEDS ADDRESSED IN THE STUDY: Housing/Homelessness
Over 500 copies of the 1998 Homeless Planning Council Survey were distributed throughout thestate. The survey solicited participants’ opinions as to the relative need for housing andsupportive service elements for the homeless, ranking perceived needs both for individuals andfor families with children. Of the 145 surveys completed, two thirds of the respondents werefrom Wilmington/New Castle County, an appropriate representation as these are the mostdensely populated subsections. The Homeless Shelter Providers Associations was particularlyinstrumental in obtaining survey participation by homeless individuals. Over half of the surveysstatewide were completed by current and previous homeless respondents. Survey results were asignificant factor, coupled with actual inventories of service units available, in determiningranking and relative priority of needs.
Unit count of needs:Unit count of needs:
Both individuals and persons in families with children:Both individuals and persons in families with children:Permanent Housing
Support Services for individuals:Support Services for individuals:• Substance Abuse• Mental Health Care• Housing PlacementSupport Services for Families:Support Services for Families:• Job Training• Child Care• Mental Health CareThe sub-population for both individuals and families:The sub-population for both individuals and families:• Chronic Substance Abusers• Seriously Mentally Ill• Dually-diagnosedGaps in Service: Individuals Gaps in Service: Individuals

65
Beds/Beds/UnitsUnits
EstimatedNeeds
CurrentInventory
UnmetNeed/ Gap
RelativePriority
EmergencyShelter
600600 197197 403403 MediumMedium
TransitionalHousing
450450 318318 132132 LowLow
PermanentSupportiveHousing
51135113 415415 988988 HighHigh
TotalTotal 61636163 46404640 15231523
SupportSupportServicesServicesSlotsSlots
EstimatedNeeds
CurrentInventory
UnmetNeed/ Gap
RelativePriority
Job Training 24992499 528528 19711971 MediumMedium
CaseManagement
25502550 453453 20972097 MediumMedium
SubstanceAbuseTreatment
19381938 195195 17431743 HighHigh
MentalHealth Care
237237 162162 7676 HighHigh
HousingPlacement
25502550 443443 21072107 HighHigh
Life SkillsTraining
25502550 351351 21992199 LowLow
Other -Dental
25502550 255255 22952295 MediumMedium
Other -Medical
25502550 308308 22422242 LowLow
Sub-Sub-PopulationsPopulations
EstimatedNeeds
CurrentInventory
UnmetNeed/ Gap
RelativePriority
ChronicSubstanceAbuse
150150 2525 125125 HighHigh
SeriouslyMentally Ill
150150 99 141141 HighHigh

66
Sub-Sub-PopulationsPopulations
EstimatedNeeds
CurrentInventory
UnmetNeed/ Gap
RelativePriority
Dually-Diagnosed
150150 55 145145 HighHigh
Veterans 225225 3030 195195 LowLow
Persons withHIV/ AIDS
177177 1818 149149 MediumMedium
Victims ofDomesticViolence
4545 1515 3030 MediumMedium
Youth 160160 2424 136136 MediumMedium
Other-Developmental
150150 125125 2525 LowLow
Gaps in Service: Persons In Families with ChildrenGaps in Service: Persons In Families with Children
Beds/Beds/UnitsUnits
EstimatedNeeds
CurrentInventory
UnmetNeed/ Gap
RelativePriority
EmergencyShelter
394394 274274 103103 MediumMedium
TransitionalHousing
266266 122122 144144 LowLow
PermanentSupportiveHousing
1535015350 1243512435 2915 2915 HighHigh
TotalTotal 1601016010 1283112831 31793179
SupportSupportServicesServicesSlotsSlots
EstimatedNeeds
CurrentInventory
UnmetNeed/ Gap
RelativePriority
Job Training 10801080 346346 734 734 High High
CaseManagement
21602160 322322 18381838 MediumMedium
Child Care 12831283 128128 11551155 HighHigh
SubstanceAbuseTreatment
832 832 89 89 743 743 MediumMedium

67
SupportSupportServicesServicesSlotsSlots
EstimatedNeeds
CurrentInventory
UnmetNeed/ Gap
RelativePriority
MentalHealth Care
802802 401401 401401 MediumMedium
HousingPlacement
21602160 322322 18381838 MediumMedium
Life SkillsTraining
19441944 322322 16221622 LowLow
Other -Dental
21602160 300300 18601860 Low Low
Other -Medical
21602160 299299 18611861 LowLow
Sub-Sub-PopulationsPopulations
EstimatedNeeds
CurrentInventory
UnmetNeed/ Gap
RelativePriority
ChronicSubstanceAbuse
150150 2525 125125 HighHigh
SeriouslyMentally Ill
150150 2525 125 125 HighHigh
Dually-Diagnosed
150150 55 145145 HighHigh
Veterans 60 60 1515 45 45 LowLow
Persons withHIV/ AIDS
100100 1414 86 86 MediumMedium
Victims ofDomesticViolence
9090 4545 4848 MediumMedium
Other-Developmental
50 50 0 0 5050 HighHigh

68
TITLETITLE: Delaware Health and Social Services’ Division of Services for Aging and Adults withPhysical Disabilities: Demographic Packet
AUTHORAUTHOR: Delaware Health and Social Services’ Division of Services for Aging and Adults withPhysical Disabilities
DATEDATE: March 1998
SOURCESOURCE: Delaware Health and Social Services
GEOGRAPHICAL AREAGEOGRAPHICAL AREA: Statewide
KINDS OF INFORMATION/DATA USED IN THE STUDYKINDS OF INFORMATION/DATA USED IN THE STUDY:
Quantitative data - statistical analysis of household survey
IS THE DATA/STUDY REPRESENTATIVE OF COMMUNITY INPUT?IS THE DATA/STUDY REPRESENTATIVE OF COMMUNITY INPUT?
No. Just a compilation of statistical information derived from Delaware PopulationConsortium projections.
PROBLEMS/TRENDS ADDRESSED IN THE STUDY: “ELDERLY”PROBLEMS/TRENDS ADDRESSED IN THE STUDY: “ELDERLY”
Projected growth in the elderly population of the state, particularly in Sussex County.
Highlights:
• Between 1990 and 2020 Delaware’s population over age 60 will increase 68%,while population under 60 will increase only 28%.
• While those 85 and older will no longer be the fastest growing segment of theolder population, between 1990 and 2015 this group will increase 80%.
• While between 1990 and 2000 the number of persons aged 60-70 is expected tohave declined due to the Depression years, by 2010 “baby boomers” will startbecoming “elder boomers.”
• Between 1990 and 2020 New Castle, Kent, and Sussex Counties’ 60 and olderpopulations will grow by 46%, 99%, and 115% respectively.
• Of the three counties, Sussex has the largest percentage of its total population overage 60 at 23.5%, followed by Kent at 15.5% and New Castle at 14.6%.

69
TITLETITLE: Domestic Violence: An Inventory of Programs and Policies // Report I: Community-Based Service Organizations
AUTHORAUTHOR: Robin Beads and Andrea Luckring
DATEDATE: May 1995
SOURCESOURCE: UD - CUAPP - CCD
GEOGRAPHICAL AREAGEOGRAPHICAL AREA: statewide
KINDS OF INFORMATION/DATA USED IN THE STUDYKINDS OF INFORMATION/DATA USED IN THE STUDY: Qualitative - responses toquestionnaire
IS THE DATA/STUDY REPRESENTATIVE OF COMMUNITY INPUT?IS THE DATA/STUDY REPRESENTATIVE OF COMMUNITY INPUT? Yes - writtenquestionnaires and some telephone surveys of organizations.
PROBLEMS/NEEDS ADDRESSED IN THE STUDY:PROBLEMS/NEEDS ADDRESSED IN THE STUDY: DOMESTIC VIOLENCE
Service Needs and Access (pp. 16-18)
Wilmington
• Emergency shelter• Financial assistance• Law enforcement• Individual counseling/therapy and family counseling/therapy• Substance abuse treatment
Suburban New Castle County• Affordable, accessible individual counseling/therapy• Financial assistance• Law enforcement services• Legal assistance• Family counseling/therapy
Kent County• Emergency shelter• Financial assistance• Transportation• Substance abuse treatment• Also mentioned: day care, Individual counseling/therapy and family counseling/therapy,
and food

70
Sussex County• Individual counseling/therapy and family counseling/therapy• Emergency shelter• Law enforcement (both quicker response time and before situation becomes a crisis)• Day care• Medical care
Obstacles to Service (pp. 19-21)
Wilmington
Obstacles That Impede Victims
• Fear of reprisal, fear of exposure and dislike of going outside for help• Lack of awareness of services, lack of a telephone, lack of transportation, belief that the
service will be ineffective and illiteracy• Belief that service provider will be unsympathetic, language barrier, problems due to
developmental and physical disabilities, lack of child care, lack of money, organization’shours, and the goals and mission of the agency
Obstacles That Impede Perpetrators
• Fear of reprisal, fear of exposure and dislike of going outside for help• Lack of awareness of services, belief that service provider will be unsympathetic, language
barrier, problems due to developmental disabilities, lack of child care, lack of money,organization’s hours, and the goals and mission of the agency
Suburban New Castle County
Obstacles That Impede Victims
• Lack of awareness of services, fear of exposure, dislike of going outside for help, lack oftransportation and problems due a physical disability
• “Older people seem to just ‘put up’ with abuse (often long-term).”
Kent County
Obstacles That Impede Victims
• Lack of awareness and knowledge of services • Fear of reprisal, dislike of going outside for help and lack of transportation• Fear of exposure, belief that the service will be ineffective, belief that service provider will
be unsympathetic, lack of a telephone, a developmental disability and language barriers

71
Obstacles That Impede Perpetrators
• Lack of awareness and knowledge of services, fear of exposure, lack of transportation,illiteracy, service organization hours, lack of a telephone, and a developmental disability
Sussex County
Obstacles That Impede Victims
• Dislike of going outside for help• Fear of reprisal, fear of exposure, lack of a telephone, lack of transportation, and illiteracy• Lack of awareness and knowledge of services, and service organization’s hours
Obstacles That Impede Perpetrators
• Lack of awareness and knowledge of services• Illiteracy, failure to see the need for services, belief that the services will be ineffective and
that the service provider will be unsympathetic• Dislike of going outside for help and service organization hours

72
TITLETITLE: Domestic Violence: An Inventory of Programs and Policies // Report II: EducationalInstitutions
AUTHORAUTHOR: Stephanie Moller
DATEDATE: May 1995
SOURCESOURCE: UD - CUAPP - CCD
GEOGRAPHICAL AREAGEOGRAPHICAL AREA: statewide
KINDS OF INFORMATION/DATA USED IN THE STUDYKINDS OF INFORMATION/DATA USED IN THE STUDY: Qualitative - responses toquestionnaire
IS THE DATA/STUDY REPRESENTATIVE OF COMMUNITY INPUT?IS THE DATA/STUDY REPRESENTATIVE OF COMMUNITY INPUT? Yes - writtenquestionnaires from public and private schools.
PROBLEMS/NEEDS ADDRESSED IN THE STUDY:PROBLEMS/NEEDS ADDRESSED IN THE STUDY: DOMESTIC VIOLENCE
PART I - ELEMENTARY AND SECONDARY SCHOOLS
Service Needs and Access (p. 22)
Obstacles to Addressing Domestic Violence
Public school districts (19 respondents) listed their three most challenging obstacles
• Lack of resources in the school (11 districts)• Lack of assistance for victims and families (9 districts)• Lack of training and expertise among school staff (9 districts)• Amount of time agencies take to respond to reports of abuse (7 districts)• Victim’s fear (4 districts)• Maintaining confidentiality, family and victim denial, and lack of knowledge and
support in the community (3 districts)• Others: fear of making situation worse, child socialization that justifies abuse, lack of
functional networks with other agencies and difficulty in confirming abuse
Private schools (9 respondents) listed their three most challenging obstacles• Time (4 schools)• Denial in the family, pressure on the parents (esp. single parents) who are overworked
and stressed, and difficulty in verifying the violence (2 schools)• Others: fear both for children and retaliation, finding trained professionals to teach the
information, determining the amount of information appropriate to share withelementary school children, family ignorance, informing parents of the investigation,confidentiality, convincing faculty that violence is important enough to warrant time inclass, and ambivalence of the natural parent to sometimes ask for assistance or support

73
Needed State InitiativesPublic school districts (17 respondents) listed the three most important initiatives that need to betaken by the State
• Increase in support services, including counseling and social services for students, parentsand “criminals” (8 districts)
• Increased funding for services, programs and staff (7 districts)• Raise awareness (6 districts)• More training opportunities for school staff (5 districts)• Improved cooperation and communication between districts and social service agencies
(3 districts)• More thorough investigations of reports and stronger penalties for perpetrators (2
districts)
Private schools (8 respondents) listed the three most important initiatives that need to be takenby the State
• Educational programs for victims, perpetrators, the public and women in general (4schools)
• Increased services and support for victims, including “drop-in resource areas” for a parentor child (3 schools)
• Reference service for victims to find assistance (2 schools)• Addressing “the issue of the integrity of the family - fathers must be in the home and
taking lead in the family in a loving way”• Challenging parts of society that promote violence (e.g., television)• Finding causes of abuse• Giving churches the opportunity to expand programs and services
PART II - INSTITUTIONS OF HIGHER EDUCATION University of DelawareChallenging Obstacles
• Finding out about the violence• Preventing victims from returning to abusive relationships• Dealing with denial and lack of education• Providing services for perpetrators
Initiatives That Should be Taken by the University• Providing more programs and services for employees• Educating people who are not involved in abusive relationships• Clarifying the appropriate role for the University in domestic violence situations• Mobilizing the community• Incorporating domestic violence issues into the curriculum• Making employees aware of services both within the institution and in the surrounding
community• Educating supervisors about the indicators of domestic violence and how to
appropriately address the issue

74
Initiatives That Should be Taken by the State• Educating the public on the magnitude of the problem• Making systems, such as the courts, hospitals and police, more user-friendly• Committing to this issue - put more money behind programs• Providing more shelters for battered women and children• Increasing protection for spouses and the counselors who work in the field• Encouraging primary prevention to help people express feelings in a positive manner• Holding batterers accountable and supporting the needs of battered women• Providing alternatives to treatment• Conferring continually with mental health practitioners• Addressing perpetrators

75
TITLETITLE: Domestic Violence: An Inventory of Programs and Policies // Report III: EmergencyShelters and Transitional Housing Programs
AUTHORAUTHOR: Emily Knearl
DATEDATE: May 1995
SOURCESOURCE: UD - CUAPP - CCD
GEOGRAPHICAL AREAGEOGRAPHICAL AREA: statewide
KINDS OF INFORMATION/DATA USED IN THE STUDYKINDS OF INFORMATION/DATA USED IN THE STUDY: Qualitative - responses toquestionnaire
IS THE DATA/STUDY REPRESENTATIVE OF COMMUNITY INPUT?IS THE DATA/STUDY REPRESENTATIVE OF COMMUNITY INPUT? Yes - writtenquestionnaires from shelters
PROBLEMS/NEEDS ADDRESSED IN THE STUDYPROBLEMS/NEEDS ADDRESSED IN THE STUDY: DOMESTIC VIOLENCE
The vast majority of emergency shelters and/or transitional housing programs have noprogramming to address domestic violence. There are only two shelters in Delaware specificallydesigned to deal with domestic violence and only three others that offer limited services tovictims of domestic violence. 18 of the 23 shelters that responded to the survey do not addressthe problem in any substantial way.
Services that shelters would like to offer
Aid in Dover, Inc. (Dover) 1Medical care and substance abuse treatment• Formal, accredited education
The Salvation Army Booth Social Service Center (Wilmington)• Individual counseling/therapy• Substance abuse treatment
House of Joseph (Wilmington)• Individual counseling/therapy• Family counseling/therapy• Legal assistance
The Sussex Community Crisis Housing Services, Inc. (Georgetown)• Individual and family counseling/therapy• Support groups• Safe shelter
The Sunday Breakfast Mission (Wilmington)• Individual counseling• Medical care

76
• Substance abuse treatment• Support groups• Legal assistance• Day care
Emmaus House (Newark)• Individual and family counseling and therapy
Impediments to Accessing Services (shelter providers’ responses as to why a victim or perpetratormay not seek help)
• Fear of reprisal• Fear of exposure• Dislike of going for outside help• Lack of knowledge of services
Also noted:• Access problems due to lack of telephone• Lack of transportation• Language barriers
Most Significant Needs
• Individual counseling• Substance abuse treatment• Law enforcement (noted: consequences of violent behavior must be administered
quickly (i.e., punishment))• Emergency shelter• Legal Assistance (particularly with child custody cases)
Also noted: • Family counseling• Support groups• Transitional housing• Transportation• Day care• Awareness of the problem itself• Support and education for the victims• Visitation centers• Out-of-state women who cannot be taken by the local shelter
Safety is a special concern when dealing with domestic violence.

77
TITLETITLE: Domestic Violence: An Inventory of Programs and Policies // Report IV: AdvocacyOrganizations
AUTHORAUTHOR: Robin Beads and Andrea Luckring
DATEDATE: May 1995
SOURCESOURCE: UD - CUAPP - CCD
GEOGRAPHICAL AREAGEOGRAPHICAL AREA: statewide
KINDS OF INFORMATION/DATA USED IN THE STUDYKINDS OF INFORMATION/DATA USED IN THE STUDY: Qualitative - responses toquestionnaire
IS THE DATA/STUDY REPRESENTATIVE OF COMMUNITY INPUT?IS THE DATA/STUDY REPRESENTATIVE OF COMMUNITY INPUT? Yes - writtenquestionnaires and some telephone surveys of victim advocacy organizations / programs.
PROBLEMS/NEEDS ADDRESSED IN THE STUDY:PROBLEMS/NEEDS ADDRESSED IN THE STUDY: DOMESTIC VIOLENCE
Hotlines• Three of thirteen organizations have hotlines
Populations and Issues for Which the Organizations Advocate• The organizations list what they do and for which populations
Direct Client Services• Organizations responded whether/which of the seventeen services they provided and if so,
whether they charged a fee
Victim Characteristics• The organizations describe general characteristics of the clients with whom the organizations
have had contact
Perpetrator Characteristics• The organizations describe general characteristics of the perpetrators with whom the
organizations have had contact
SERVICE AND NEEDS (p. 10)
Unmet Needs• Legal assistance was indicated by six of the nine organizations.• Housing was identified as a significant need by six organizations.• Transitional housing was noted by three organizations, two of which also noted
that long-term housing is needed as well.• Two organizations indicated that emergency shelter is needed - more funding for
it, too.

78
• One organization noted that housing following shelter is a need that is notadequately met.
• Financial assistance was indicated by four of the nine responding organizations.• Medical care was indicated by three organizations, one of which said that
expanded medical care is needed.• Substance abuse treatment, transportation, support groups and family
counseling/therapy were each identified as significant needs by two organizations.• Expanded individual counseling/therapy, law enforcement services, day care, self
defense law, a toll-free statewide hotline, and economic independence throughskills-building/job training/education were each identified by one organization
Services That Organizations Would Like to Offer to Persons Affected by Domestic Violence• Four organizations identified support groups.• Three organizations identified transportation services (two of which would like to
expand their current provision).• Individual counseling/therapy and family counseling/therapy were indicated by
two organizations.• Legal assistance was noted by two organizations, one of which already provides
some, but would like to provide more.• Emergency shelter, day care and law enforcement services were each indicated by
two organizations.• Financial assistance, medical care and substance abuse treatment were each
identified by one organization.
Obstacles to ServiceObstacles That Impede Victims
• Lack of awareness of services, fear of reprisal, fear of exposure, and accessproblems due to lack of transportation were each identified by threeorganizations.
• The belief that service will be ineffective, the scarcity of treatmentresources, financial barriers, and access problems due to lack of atelephone, mobility of the victims and organizations hours were eachidentified by one organization
Obstacles That Impede Perpetrators• Lack of awareness of services, fear of exposure, and access problems due to
lack of transportation, and the belief that the service provider will beunsympathetic were each identified by two organizations.
• The scarcity of treatment resources, financial barriers, a dislike of going foroutside help, and access problems due to lack of a telephone were eachidentified by one organization.

79
TITLETITLE: Domestic Violence: An Inventory of Programs and Policies // Report V: Health CareTreatment Services
AUTHORAUTHOR: Stephanie Moller and Andrea Luckring
DATEDATE: January 1996
SOURCESOURCE: UD - CUAPP - CCD
GEOGRAPHICAL AREAGEOGRAPHICAL AREA: statewide
KINDS OF INFORMATION/DATA USED IN THE STUDYKINDS OF INFORMATION/DATA USED IN THE STUDY: Primary data, quantitative -responses to questionnaire
IS THE DATA/STUDY REPRESENTATIVE OF COMMUNITY INPUT? IS THE DATA/STUDY REPRESENTATIVE OF COMMUNITY INPUT? Yes - writtenquestionnaires of the 73 health care providers who responded.
PROBLEMS/NEEDS ADDRESSED IN THE STUDYPROBLEMS/NEEDS ADDRESSED IN THE STUDY: DOMESTIC VIOLENCE
The responses to each item in the outline below are broken down by the followingprovider types:
• Physical Health Care only (25 providers)• Mental Health Care only (14 providers)• Substance Abuse Counseling only (3 providers)• Physical and Mental Health Care (3 providers)• Mental Health and Substance Abuse Counseling (21 providers)• Physical Health, Mental Health and Substance Abuse Counseling (7 providers)
• Contact with Victims (asked to indicate if they come into contact with victims of domestic violence as patients or clients and if they maintain statistics on their contact)• Victim characteristics
• Gender/age• adult - male/female• elderly - male/female• child victims/witnesses
• special populations • physically challenged• functionally illiterate• developmentally disabled•• immigrants or refugees, and/or spoke little or no English where the
majority of the victims came from (county or state)• Asked whether they employ particular strategies for identifying victims of
domestic violence
• Contact with Perpetrators (asked to indicate if they come into contact with perpetratorsof domestic violence as patients or clients and if they maintain statistics on their contact)

80
• Perpetrator characteristics• male, female or both• special populations: physically challenged, functionally illiterate and/or
developmentally disabled• immigrants or refugees, and/or spoke little or no English• where the majority of the perpetrators came from (county or state)
• Asked to indicate whether they come in contact with individuals that they wouldcharacterize as both victims and perpetrators of domestic violence
• Hotlines, Referrals and Treatment Modality• Hotline characteristics: staffed by paid operator, staffed 24 hours/day, shared
with others, recording after business hours, offers information and referral, offerscrisis intervention counseling
• Referrals given to victims and perpetrators • Treatment Modality (e.g., group treatment, psycho-educational treatment, family
therapy for couples, etc.)
• Service Needs and Access• Needs• Obstacles to Service - Victims • Obstacles to Service - Perpetrators
Characteristics of All 6 Provider Types Combined
• Contact With Victims
• 66 of the 73 health care providers that they come in contact with victims ofdomestic violence as patients or clients• Victim Characteristics
• Gender/age• 60 of the 66 had contact with adult female victims • 47 of the 66 had contact with child victims/witnesses• 38 of the 66 had contact with adult male victims• 30 of the 66 had contact with elderly female victims• 16 of the 66 had contact with elderly male victims
• Special populations• 33 of the 66 had contact with victims who were physically
challenged• 30 of the 66 had contact with victims who were functionally
illiterate• 30 of the 66 had contact with victims who were developmentally
disabled• 24 of the 66 had contact with victims who spoke little or no English and
20 of the 66 had contact with victims who were immigrants or refugees tothe United States
• Geographical region of origin• 54% of responding providers indicated that the majority of their
victims were from NCC• 16% of responding providers indicated that the majority of their

81
victims were from Kent County• 13% of responding providers indicated that the majority of their
victims were from Sussex County• 5% of responding providers indicated that the majority of their
victims were from either Kent or Sussex County• Strategies - 33 of the 66 indicated that they have strategies for identifying
victims of domestic violence
• Contact With Perpetrators• 52 of the 73 respondent health care providers reported that they definitely come
into contact with perpetrators of domestic violence as patients or clients; 4providers were not sure; 1 indicated “probably”; 1 wrote “not aware”; and 15reported that they do not
• Perpetrator Characteristics• Male, female or both
• 49 of the 52 reported definite contact with male perpetrators; 3indicated that they may have
• 35 of the 52 reported contact with female perpetrators; 2 wereuncertain if they had
• Special populations• 23 of the 52 had contact with perpetrators who were functionally
illiterate; 3 providers were not sure • 18 of the 52 had contact with perpetrators who were
developmentally disabled; 2 providers were not sure• 13 of the 52 had contact with perpetrators who were physically
challenged; 2 providers were not sure• 13 of the 52 had contact with perpetrators who spoke little or no English
and 2 providers were not sure; 11 of the 52 had contact with perpetratorswho were immigrants or refugees to the United States and 2 providerswere not sure
• Geographical region of origin• 29 of the responding providers indicated that the majority of
their perpetrators were from NCC• 8 of the responding providers indicated that the majority of their
perpetrators were from Kent County• 9 of the responding providers indicated that the majority of their
perpetrators were from Sussex County• 2 of the responding providers indicated that the majority of their
victims were from either Kent or Sussex County
• Hotlines and Referrals • Hotlines
• 18 of the 73 providers (25%) reported operating a hotline• 13 of the 18 (72%) are staffed by paid operators• 13 of the 18 (72%) are staffed 24 hours a day• 5 of the 18 are shared with other organizations• 5 of the 18 rely on a recording after business hours

82
• 16 of the 18 provide information and referral• 13 of the 18 provide crisis intervention counseling• None are staffed by volunteers
C Referrals - Victims
• 66 of the 73 providers specified types of referrals that they offer tovictims of domestic violence
• 50 providers offer victims referrals to emergency shelters• 49 providers offer victims referrals to mental health care• 48 providers offer victims referrals to law enforcement services• 43 providers offer victims referrals to medical care • 43 providers offer victims referrals to legal assistance• 39 providers offer victims referrals to substance abuse counseling• 2 providers offer victims referrals to Child Protective Services • 2 providers offer victims referrals to the Victim Assistance Program• 2 providers offer victims referrals to support groups• Each of the following were indicated once as other types of referrals
offered to victims: Battered Women’s Hotline, career/vocationalcounseling and planning, other housing assistance, educational groups,psychiatric inpatient hospitalization, and Adult Protective Services
C Referrals - Perpetrators• 54 of the 73 providers specified types of referrals that they offer to
perpetrators of domestic violence• 75% of the responding providers offer perpetrators referrals to mental
health care• 72% of the responding providers offer perpetrators referrals to substance
abuse counseling• 20 of the responding providers offer perpetrators referrals to medical care• 17 of the responding providers offer perpetrators referrals to legal
assistance• 16 of the responding providers offer perpetrators referrals to law
enforcement services• Over 1/5 of the responding providers offer perpetrators referrals to
emergency shelters
• Service Needs and Access (Providers identified what they believed to be the three mostsignificant needs.)• Various Needs
• 43% (28 of 65 respondents) identified financial assistance and individualcounseling/therapy
• 37% (24 respondents) - legal assistance• 34% (22 respondents) - family counseling/therapy• 32% (21 respondents) - affordable housing• almost 25% (16 respondents) - emergency shelter• 22% - transportation• 18% - law enforcement services• 15% - substance abuse counseling services

83
• 14% - support groups• 11% - day care• 5% - medical care• one provider listed psychopharmacology and psycho educational skills-
building programs for victims, perpetrators and couples• Each of the following was listed once by responding providers: job
training, prevention, affordable treatment services, individualized supportservices, alternative housing and protection following the report
• Obstacles to Victims• 75% of the 60 responding providers indicated lack of awareness or
knowledge of services• 73% - fear of reprisal• 22 respondents - indicated fear of exposure• 21 - the victim’s belief that the service will be ineffective• 16 - lack of transportation• 12 - fear of legal repercussions• 4 - lack of a telephone and financial difficulties• 3 - physical disability• 2 - developmental disability• 2 - problems due to illiteracy
• Obstacles to Perpetrators• 35 of the 48 responding providers indicated fear of exposure• 32 - fear of legal repercussions • 24 - lack of awareness or knowledge of services• 35% - fear of reprisal• 31% - the perpetrator’s belief that the service will be ineffective• 4 respondents - lack of transportation• 2 - financial difficulties• 2 - problems due to illiteracy

84
TITLETITLE: Domestic Violence: An Inventory of Programs and Policies // Report VI: LawEnforcement Services
AUTHORAUTHOR: Andrea Luckring
DATEDATE: June 1996
SOURCESOURCE: UD – CUAPP - CCD
GEOGRAPHICAL AREAGEOGRAPHICAL AREA: statewide
KINDS OF INFORMATION/DATA USED IN THE STUDYKINDS OF INFORMATION/DATA USED IN THE STUDY: Primary data – responses toquestionnaire, police department/call data
IS THE DATA/STUDY REPRESENTATIVE OF COMMUNITY INPUT? IS THE DATA/STUDY REPRESENTATIVE OF COMMUNITY INPUT? Yes - writtenquestionnaires returned by 24 police departments.
PROBLEMS/NEEDS ADDRESSED IN THE STUDYPROBLEMS/NEEDS ADDRESSED IN THE STUDY: “DOMESTIC VIOLENCE”
Although the full report covers law enforcement services, domestic violence calls and arrests,including statistics on the number and type of domestic violence calls to which departmentsrespond, frequency of arrests for categories of perpetrators, arrests of perpetrators for violatingthe Protection From Abuse Act and/or restraining order, policies and procedures, services,training, service needs and access, police dispatcher services, domestic violence calls and clientserved, and procedures; only services provided and service needs and access are summarizedhere.

85
Services
Types of Assistance Officers Can Offer to Victims of Domestic Violence
Respondents were asked to indicate from a list of eleven services, including an"other" category, the types of assistance that the officers of the department are able tooffer victims of domestic violence. The number of departments that indicated theirofficers can offer a particular type of assistance is provided in the table below. Asummary by area of the state served follows the table.
Number of Departments Whose Officers Offer Specific Types of Assistance toVictims of Domestic Violence
Type of Assistance Offered by Officers Number of Departments WhoseOfficers Can Offer the Assistance
Referrals to emergency shelter 24
Referrals to social services 23
Escort to an emergency shelter 21
Escort to medical care 21
Referrals to counseling 21
Referrals to medical care 19
Referrals to legal assistance 16
On-site intervention counseling 9
Bilingual services 9
Referrals to the department’s victim assistanceprogram
5
Statewide
· Both departments with statewide jurisdiction offer victims an escort to emergencyshelter and to medical care and referrals to: emergency shelter, medical care, andsocial services.
· In addition, the officers of one of the departments with statewide jurisdiction alsooffer victims on site crisis intervention counseling, bilingual services and referralsto: counseling, legal assistance, and the department's victims assistance program.

86
New Castle County
· All six departments located in New Castle County offer victims an escort tomedical care and referrals to: emergency shelter, counseling, and social services.
· Five of the six respondent departments located in New Castle County can offervictims of domestic violence an escort to emergency shelter and referrals to legalassistance.
· Four respondents indicated that their departments' officers can offer victimsreferrals to medical care.
· Three departments offer victims on site crisis intervention counseling, bilingualservices, and referrals to the Delaware Victim Center that is employed by theDelaware State Police.
· Two respondents indicated that their departments' officers can offer victims ofdomestic violence referrals to their departments' victims assistance program.
Kent County
· All four departments that responded to the survey can offer victims of domesticviolence an escort to emergency shelter, and referrals to: emergency shelter,counseling, legal assistance, and social services.
· Three of the four respondent departments indicated referrals to medical care andan escort to medical care.
· Two of the four respondent departments that serve Kent County offer victims ofdomestic violence on site intervention counseling.
· One respondent indicated that officers on the department's force can offer victimsof domestic violence referrals to their department's victims assistance program.
· One respondent noted that the department's officers can offer victims “referrals tothe Delaware State Police victims services personnel."
· The officers on one department's force can also offer victims "assistance with [the]filing of violent crimes claims and Protection Orders or various other relatedcriminal paperwork as well as transportation and court accompaniment.”
Sussex County
· All ten departments that serve Sussex County can offer victims of domesticviolence referrals to emergency shelter.
· Nine of the ten respondents indicated that their departments' officers can offervictims referrals to medical care and referrals to social services.
· The officers of eight departments' forces can offer victims an escort to emergency

87
shelter, an escort to medical care and referrals to counseling.
· Five departments' officers can offer victims referrals to legal assistance.
· Four can offer victims of domestic violence bilingual services.
· Two of the ten responding departments indicated that they can offer victims onsite intervention counseling and referrals to the Delaware State Police VictimsAssistance Program.
Other
· Both departments in this category can offer victims of domestic violence an escortto emergency shelter and to medical care, and referrals to: emergency shelter,counseling, and social services.
· One respondent also indicated that the department's officers can offer victims ofdomestic violence on site intervention counseling, referrals to medical care, andreferrals to the department's victims assistance program.
· The second department can also offer victims bilingual services and referrals tolegal assistance.
Departments with Victims Assistance Programs
Respondents were asked to indicate whether or not their department has a victims assistance program. If the respondent indicated yes, he/she was then asked: how many persons work in the program, the type ofprofessions on the program's staff, and the types of services offered by the program.
Five of the twenty-four responding departments indicated that they have a victims assistance program. One of the five has statewide jurisdiction, two serve all or part of New Castle County, one is located in KentCounty and the last department with a victims assistance program serves the University of Delaware campuses. None of the respondent departments with jurisdiction in Sussex County indicated that they have a victimsassistance program.
The five departments that have victims assistance programs are listed in the table below detail theprograms' staff and available services. Following the table is summary information on the services offered bythe programs.
Departments With Victims Assistance Programs
Department Number of Staff Types of Professionson Program's Staff
Types of ServicesOffered by the
ProgramsStatewide

88
Department Number of Staff Types of Professionson Program's Staff
Types of ServicesOffered by the
ProgramsDelaware State Police 5 full time, 10 part
time, 4 volunteersSocial worker, policeofficer, investigator,and volunteers
arrangement ofProtection FromAbuse (PFA) orders,referrals to emergencyshelters, referrals tosocial services,referrals to legalassistance, referrals tocounseling, bi-lingualservices,accompaniment ofvictim to courtproceedings, 24 hourcrisis intervention,assistance with VCCB[violent crimescompensation board]forms, hospitalaccompaniment, andtransportation
New Castle CountyNew Castle County
Police Department2 counselor counseling,
arrangement of PFAorders, referrals toemergency shelters,referrals to socialservices, bilingualservices, andaccompaniment ofvictim to courtproceedings
Wilmington PoliceDepartment
full-time, periodicstudent internvolunteers
social worker, studentvolunteers
legal assistance,counseling,arrangement of PFAorders, referrals toemergency shelters,referrals to socialservices,accompaniment ofvictim to courtproceedings
Kent County

89
Department Number of Staff Types of Professionson Program's Staff
Types of ServicesOffered by the
ProgramsCity of Dover PoliceDepartment
1 full-time1 part-time
police officer, VictimServices Coordinator
arrangement of PFAorders, referrals toemergency shelters,referrals to socialservices,accompaniment ofvictim to courtproceedings,transportation, caseinformation updates,assistance with filingfor violent crimescompensation, crisisintervention
OtherUD Department of
Public Safety
2 Police officer
As seen in the above table the victims assistance programs run by the police departmentsoffer an array of services. A tally of the services offered is provided below.
· All five departments with victims assistance programs offer victims of domestic violencereferrals to emergency shelters and referrals to social services.
· Four of the five departments offer arrangement of Protection From Abuse (PFA) ordersand four offer victims accompaniment to court proceedings.
· Two of the five programs offer: bilingual services, counseling services, transportation,crisis intervention (one program offers 24-hour crisis intervention), and assistance in filingfor violent crimes compensation.
· One program offers victims of domestic violence legal assistance, one program offers caseinformation updates, and one other program offers victims of domestic violenceaccompaniment to the hospital, referrals to legal assistance, and referrals to counseling.

90
Service Needs and Access
In the final section of the survey, respondents were asked to indicate the obstacles/barriersthat victims of domestic violence face that may prevent them from calling the police. Respondents were also asked to identify the services that they think victims need most frompolice departments. The responses of the departments are summarized below.
Obstacles/Barriers
Respondents were asked to indicate from a list of ten obstacles the top threeobstacles/barriers that they think victims of domestic violence face that may prevent them fromcalling the police. The list includes the following obstacles:
· lack of knowledge of 911 dispatcher service; · lack of telephone;· desire to keep problems private/do not want outside help; · belief that the service will be ineffective;· belief that the police, prosecutor or court system will be unsympathetic;· access problems due to a physical disability;· access problems due to a language barrier;· the victim is among the homeless population; · fear of reprisal from attacker; and · an "other" category.
One respondent department located in Sussex County did not answer this question andtwo respondents identified only two obstacles. An overall summary of the obstacles/barriersindicated by the respondents is provided below followed by a breakdown of the responses bythe area of the state in which each department has jurisdiction.
· Twenty-two of the twenty-three respondents that identified obstacles indicated that thedesire to keep problems private/do not want outside help and fear of reprisal fromattacker are among the top three obstacles that prevent victims from calling the police.
· Eleven respondents indicated the belief that police, prosecutor, or court system will beunsympathetic is among the top three obstacles/barriers.
· The belief that the service will be ineffective was identified by six respondents.
· Two respondents indicated that a lack of a telephone is one of the top three barriers thatprevent victims of domestic violence from calling the police.
· Access problems due to a language barrier, "fear that the spouse will be arrested," a beliefthat the "court system will not punish violator," and a belief by the victim that she/he"will not be able to reconcile if the police become involved, i e., loss of lover,companion, funds, home, child custody, etc." were each identified by one respondent asamong the top three obstacles that victims face that may prevent them from calling thepolice.
Statewide

91
Both respondent departments with statewide jurisdiction identified the same three,obstacles that they think may prevent victims of domestic violence from calling the police. Theyare listed below.
· the desire to keep problems private/do not want outside help· the belief that the service will be ineffective
· fear of reprisal from the attacker
New Castle County
· All six respondent departments in New Castle County indicated that fear ofreprisal from attacker is among the top three obstacles that prevent victims ofdomestic violence from calling the police.
· Five of the six respondents indicated that they believe the desire to keepproblems private do not want outside help is among the top three obstaclesvictims face that may prevent them from calling the police.
· The belief that the police, prosecutor or court system will be unsympathetic wasidentified by three respondents as among the top three barriers that preventvictims from calling the police.
· Two respondents indicated the belief that the service will be ineffective.
· Lack of telephone and a "fear that the spouse will be arrested” were eachindicated by one respondent.
Kent County
· All four respondents identified the desire to keep problems private/do not wantoutside help and fear of reprisal from the attacker as major obstacles that preventvictims of domestic violence from calling the police.
· Three of the four respondents indicated the belief that the police, prosecutor, orcourt system will be unsympathetic.
· Lack of a telephone was indicated by one respondent as one of the three mostsignificant obstacles that prevent victims of domestic violence from calling thepolice.
Sussex County
One of the ten respondent departments located in Sussex County did not identify anyobstacles/barriers that may prevent victims of domestic violence from seeking assistance from thepolice. Two of the ten identified only two obstacles.
· Nine respondents indicated that they believe the desire to keep problems private/do notwant outside help is among the top three obstacles that prevent victims from calling thepolice.
· Fear of reprisal from the attacker was identified by eight respondents as among the top

92
three obstacles that victims face that may prevent them from seeking help from thepolice.
· The belief that the police, prosecutor, or court system will be unsympathetic wasindicated by three respondents.
· Two respondents indicated the belief the service will be ineffective.
· One respondent indicated that access problems due to a language barrier is among thetop three obstacles facing victims that may prevent them from calling the police.
· One respondent wrote, "Court system will not punish violator.”
· One respondent noted that, in their opinion, one of the top three obstacles that mayprevent victims from calling the police is that the victim fears she/he "will not be able toreconcile if the police become involved, i e., loss of lover, companion, funds, home, childcustody, etc. "
Other
Both departments in this category identified the same three obstacles/barriers that theybelieve may prevent victims of domestic violence from calling the police. The obstaclesidentified follow.
· the desire to keep problems private/do not want outside help · the belief that the police, prosecutor or court system will be unsympathetic · fear of reprisal from the attacker
Service Needs
Respondents were also asked to indicate on a list of eleven services the services that, intheir opinion, victims of domestic violence need most from police departments. The list includesthe following services:
· escort to an emergency shelter; · referrals to emergency shelter;· escort to medical care;· referrals to medical care; · family counseling; · counseling of perpetrator; · counseling of victim; · referrals to counseling; · referrals to legal assistance; · referrals to social services; · and an "other" category. · The service needs identified by the respondents are summarized below. An
overall tally of the services identified by all twenty-four respondents is providedfirst followed by a summary of responses by the area of the state in which eachdepartment has jurisdiction.

93
Overall
· Fourteen respondents indicated that among the services victims of domestic violenceneed most from police departments are referrals to social services and referrals tocounseling.
· Twelve indicated referrals to legal assistance.
· Counseling of the victim and referrals to emergency shelter were identified by tenrespondents as among the services victims need most from police departments.
· Referrals to medical care, an escort to an emergency shelter, and counseling of theperpetrator were each specified by eight respondents as among the services victims needmost from police departments.
· Seven respondents identified an escort to medical care.
· Family counseling was indicated by six respondent departments as among the servicesvictims need most from police departments.
· Individual respondents specified: "immediate intervention - usually arrest action,""protection," "preparation of criminal case against perpetrator," "information on domesticviolence and its effects," "removal [of] threat by arrest," and "protection from abuse."
Statewide
· Both respondents with statewide jurisdiction indicated that they think victims ofdomestic violence need an escort to an emergency shelter, referrals to emergencyshelter, an escort to medical care, referrals to medical care, and counseling mostfrom police departments.
· One of the two respondents checked all other services listed as well, includingfamily counseling, counseling of the perpetrator, referrals to counseling, referralsto legal assistance, and referrals to social services.
New Castle County
· Three of the six respondent departments indicated that they think what victimsneed most from police departments are counseling for victims, counseling ofperpetrators, referrals to counseling, and referrals to legal assistance.
· Referrals to medical care, referrals to social services, family counseling,"protection," and "immediate intervention - usually arrest action," were eachspecified by one respondent as among the services that victims need most frompolice departments.
Kent County
· Referrals to emergency shelter, referrals to counseling, and referrals to legalassistance were each indicated by three of the four respondent departments with

94
jurisdiction in Kent County.
· Two respondents indicated that what victims need most from police departmentsare an escort to an emergency shelter and referrals to social services.
· An escort to medical care, referrals to medical care, "preparation of criminal caseagainst the perpetrator, "information on domestic violence and its effects," and"removal of the threat by arrest" were each specified by one respondent.
Sussex County
· Eight of the ten respondents in Sussex County indicated that victims need referralsto social services most from police departments.
· Six respondents indicated referrals to counseling.
· Referrals to emergency shelter and referrals to legal assistance were each identifiedby four respondents as among the services that victims need most from policedepartments.
· Three respondents indicated an escort to medical care, referrals to medical care,family counseling, and counseling of the victim.
· Escort to an emergency shelter and counseling of the perpetrator were eachindicated by two respondents.
· One respondent specified that what victims need most from police departments is"protection from abuse."
Other
· Both departments in this category indicated that in their opinions the services thatvictims of domestic violence need most from police departments are an escort toan emergency shelter, counseling of the perpetrator, counseling of the victim, andreferrals to social services.
· In addition, one department indicated all other services on the list includingreferrals to an emergency shelter, an escort to medical care, referrals to medicalcare, family counseling, referrals to counseling, and referrals to legal assistance.

95
TITLETITLE: Domestic Violence: An Inventory of Programs an Policies // Report VII: Survivors’Perspective on Emergency and Support Services
AUTHORAUTHOR: Robin Beads
DATEDATE: July 1996
SOURCESOURCE: UD - CUAPP - CCD
GEOGRAPHICAL AREAGEOGRAPHICAL AREA: statewide
KINDS OF INFORMATION/DATA USED IN THE STUDYKINDS OF INFORMATION/DATA USED IN THE STUDY: Qualitative-responses toquestionnaire
IS THE DATA/STUDY REPRESENTATIVE OF COMMUNITY INPUT?IS THE DATA/STUDY REPRESENTATIVE OF COMMUNITY INPUT? Yes - interviewsconducted with twenty domestically abused women
PROBLEMS/NEEDS ADDRESSED IN THE STUDYPROBLEMS/NEEDS ADDRESSED IN THE STUDY: DOMESTIC VIOLENCE
IntroductionDuring the fall of 1995, twenty female survivors of domestic abuse were interviewed about theabuse they had suffered and about their satisfaction with assistance they sought from varioussources in Delaware.
Section I: Participant Backgrounds and Demographics
Survivor CharacteristicsCharacteristic BreakdownTwenty survivors were interviewed. They ranged in age from 23 years old to 69 years old at thetime of the interviews. Fifty percent of the survivors identified themselves as African American orBlack, forty percent identified themselves as White, and the remaining ten percent said that theyare Hispanic. At the time of the interview, seventy-five percent of the women surveyed were notemployed.
Survivor ResidencyThe report gives the survivor’s residency by counties in Delaware, or the if the interviewee saidthat she was a resident of a state other than Delaware when interviewed. The report gives abreakdown of the survivor’s residency.
Educational Level Two of the survivors hold college degrees and four others indicated that they have completedsome college. Seven women completed high school and the remaining five women completedgrade school or the sixth grade.
Illness or DisabilityThe women were asked if they suffered from illnesses or disabilities that did not have to berelated to the abuses they suffered. Further information is provided in the report.
Children

96
The women were asked if they have children who live with them, whether that be at home or atone of the shelters. The average number of children was slightly higher than two, and the childrenranged in age from one week to thirteen years at the time of their mother’s interview. Not allwomen had children.
Abuse InformationThe participants were asked about the person who abused them and about the abuse theysuffered.• 50% of the women were abused by their husbands.• 35% were abused by a current boyfriend.• 10% were abused by a former boyfriend.• One participant indicated that her female partner had abused her.
Race/EthnicityThe racial characteristic of women interviewed:• 50% were African American• 35% were White• 10% were Hispanic• 5% were other (described as biracial)
Section II: Experience with Services
Experiences with PoliceIn response to questions about interaction with police, eighteen of the twenty Survivorsresponded that the police had called at least once because of an abusive episode. Furtherinformation about experiences with police are available in the report.
Experience with Protection From Abuse OrdersNine of the twenty Survivors had filed Protection From Abuse Orders (PFAs) at the time of theinterview. They were asked to describe briefly what they could remember about the filingprocess. In the report the Survivors list their experiences. Experiences with Advocates and LawyersOnly five Survivors were in a position to obtain legal counsel, or involved in legal proceedingsthat either required them to retain a lawyer or have an advocate assigned to them.
Experiences with CourtsOnly a few Survivors have had court room experiences related to the abuse they suffered. Theirexperiences fall into three categories including divorce proceedings, child custody hearings, andcriminal proceedings in which either the woman or their abusers were the defendants. Most ofthe experiences with court proceedings and judges described by the Survivors were not positives.The responses given by the Survivors are given in the report.
Experiences with Family Violence SheltersOnly two of the twenty Survivors never had sought refuge in a family violence shelter.Overwhelmingly, the Survivors were extremely satisfied with and appreciative of the shelters,shelter staff and the services they could access while residents. The most common complaint bywomen was that the length of stay in shelter should be longer. No information is available forthe Survivor who did not complete the interview. Further comments are available in the report

97
from the Survivors that completed the interview.
Experiences with Medical Care ProvidersHalf of the Survivors interviewed have sought medical treatment for the injuries suffered as aresult of abuse. Comments describing their experiences are provided in the report. All commentsrefer to experiences at the hospital emergency rooms or private physician’s offices.
Experiences with CounselingOut of the nineteen Survivors who responded to this section, seventeen had participated in someform of counseling at the time of their interview. Only two of the Survivors had participated inindividual or private counseling. The other Survivors had attended support groups sponsored bythe family violence programs and shelters in New Castle and Kent Counties. The majority ofwomen were pleased with the counseling that they and their children had received. Furtherresponses by the Survivors are provided in the report.
Opinions, Obstacles, and SuggestionsAt the end of the interview, Survivors were asked a series of questions that attempted to identifytheir most immediate needs when they first sought assistance as well as the obstacles theyencountered. The women were also asked to identify the services that ere most helpful to themand make suggestions for the improvement of service access. The Survivors’ responses are givenin the article.
Section III: Interviews
Section III provides a small sample of the interviews transcribed from audiotape. Included in thissection are interviews with four of the African American Survivors, four of the White Survivors,and one Hispanic Survivor. All women are identified by pseudonyms. These nine women werechosen because of the varied number of services they used as a group, the experiences theyshared, and the variety of unique circumstances they experienced.

98
TITLETITLE: Empowerment Zone/Enterprise Community Strategic Plan for Wilmington, Delaware:Capturing the Potential of Wilmington’s Future
AUTHORAUTHOR: Prepared by Kise, Straw & Kolodner with Urban Partners for the City of Wilmington
DATEDATE: October 9, 1998
SOURCESOURCE: Wilmington Enterprise Community, Inc.
GEOGRAPHICAL AREAGEOGRAPHICAL AREA: Wilmington Census Tracts 1, 7, 8, 9, 16, 17, 18, 19, 20, 21, 22, 27
KINDS OF INFORMATION/DATA USED IN THE STUDYKINDS OF INFORMATION/DATA USED IN THE STUDY:
Secondary data -- regarding statewide health and social services statistics including infantmortality, teen pregnancy, household characteristics, welfare caseload, waiting list forsubsidized child care, new job creation, and HIV/AIDS rates.
Primary data -- results of surveys of residents of each neighborhood that is part of theenterprise community, including information regarding “neighborhood issues,”“opportunities and concerns,” “neighborhood priorities and goals,” and “developmentinitiatives.”
IS THE DATA/STUDY REPRESENTATIVE OF COMMUNITY INPUT?IS THE DATA/STUDY REPRESENTATIVE OF COMMUNITY INPUT?
Yes. The data includes surveys of residents in neighborhoods included in the EnterpriseCommunity.
PROBLEMS/TRENDS ADDRESSED IN THE STUDYPROBLEMS/TRENDS ADDRESSED IN THE STUDY: “GENERAL” and “HEALTH ANDHEALTH CARE”
C The Need to Strengthen Delaware’s Families:C Trends/Problems:
C In 1992, 1,400 babies in Delaware born to teen mothersC Nearly 100,000 people in the state lacked health insurance
C More than 25% of children were living in single-parent householdsC 70% of all parents were working outside the home
C Some efforts to date:• A Better Chance welfare reform initiative cut state’s welfare case-
load by 23% since 1989• Waiting list for subsidized child-care has been reduced from 1,750
children to zero• Health care coverage has been extended to 38,000 working poor
since 1993
• Minority Health Issues:
As minority population increases, health issues effecting minorities increase, and thus areaswith large minority populations must receive specialized care. Four target areas of health

99
concern for Delaware’s minority population outlined by Governor’s Advisory Council onMinority Health:
• Infant Mortality• Problems
• Infant mortality rates are much higher for African-Americans inDelaware (18.2%) than for whites (6.6%)
• While low birth weight infants comprise 7% of all infants, the costs oftheir care comprise 57% of all newborn costs
• Recommendations• Use community-based resources, particularly in the African-American
community• Improve access to services, including transportation or increasing the
number of providers.• Continue emphasis on teenage pregnancy prevention
C Cancer• Problems
• Five cancers (lung, colo-rectal, breast, prostate, bladder) account for 60%of all of the state’s reported cases
• For all cancers, survival rates are lower for African-Americans than forwhites
• Smoking contributes to 74% of all Delaware’s lung cancer cases• Age-adjusted mortality from prostate cancer for African-American males
in Delaware is 20% higher than for African-American males across theU.S.
C RecommendationsC Early detection and treatment services should be developed to target minority
populationsC Emphasis should be placed on smoking cessation
• Organizations that are not minority focused should developprograms that are known to be successful in minority communities
• HIV/AIDS• Problems
• Delaware ranks 6th in the nation in AIDS rate with 37.7 cases per 100,000 population
• Between 1987 and 1991 the number of HIV cases increased sharply,making HIV/AIDS the 5 th leading cause of death in the 22-44 agegroup
• Rates of HIV infection are increasing most rapidly among minoritiesand women
• 75% of AIDS cases reported among African-American males since • 1993 were drug-related infections, as well as 84% of cases among
African-American females.
• Recommendations• Education about HIV should be improved through a variety of media• Minority providers must be identified and approached to assist in
providing treatment

100
• More money needs to be invested into the long-term treatment of • Substance abuse
• Enterprise Community• Characteristics
C 1990 unemployment rate in the EC (13%) was more than twice that of the city as a whole
C 44% of EC residents did not graduate from high school, compared to32% in the entire city
C Household income in the EC was substantially lower, and the percentage of poor residents much greater than the city as a whole
C More people in the EC rent their homes (50%) than own them (33%)• The EC’s housing vacancy rate was 14% compared to the city’s 9%• The median house value was also much lower in the EC ($57,387) than
the entire city ($77,756)C EC population is 71% African-American, 16% Hispanic and 13%
whiteC Between 1990-1998 the white population of the EC decreased 26%
while the Hispanic population increased 99%C Problems/Opportunities
C The city’s recent economic development has benefitted the region but not the EC
C The city could support construction of 400-650 new residences, and theEC is a prime location
C While having locational advantages to the reap the benefits of the EC, ECresidents are not prepared to take advantage of coming development
C Residents identify top needs as education, crime reduction, anti-drug programs, and health care.
C A majority of surveyed residents believed that the EC has brought positivechanges to their neighborhood
• Neighborhood by neighborhood analysis of population, labor force, housing, income,land-use/zoning/open space, transportation/circulation, historic resources and“neighborhood issues”/ “opportunities and concerns”/ “neighborhood priorities andgoals”/ “development initiatives” as determined through surveys of neighborhoodresidents.
Neighborhoods analyzed:
• West Center City - bounded by I-95 to the west, Delaware Ave. to thenorth, MLK Boulevard to the south, and Tatnall Street/Center City to theeast
• Eastside - bounded by Brandywine Creek to the north, the Cristina Riverto the south, Walnut Street to the west and Church Street to the east
• Northeast - bounded by Market St. to the west, Amtrak/Penn Central RR tracks to the east, Brandywine Creek to the south, and city boundary tothe north.
• Southbridge - census tract 19, bounded by the Cristina River to the east, north, and west, and by the city boundary to the south

101
• Browntown - census tract 27, bounded by MLK Boulevard to the north, the Cristina River to the east, the city boundary/B&O RR to the southeast,city boundary to the southwest, and Maryland Avenue to the west
• Westside/Hilltop - census tract 22, bounded by 6 th Street to the north, Jackson Street to the east, Lancaster Avenue to the south, and Broom Streetto the west

102
TITLETITLE: Enterprise Community Evaluation Design: An Assessment of the Program’sImplementation and a Framework for Future Evaluation
AUTHORAUTHOR: J. Grubbs, T. Barnekov and R. Denhardt
DATEDATE: November 1997
SOURCESOURCE: CCDFP
GEOGRAPHICAL AREAGEOGRAPHICAL AREA: Wilmington - Enterprise Community
KINDS OF INFORMATION/DATA USED IN THE STUDYKINDS OF INFORMATION/DATA USED IN THE STUDY: • Process-oriented assessment of the implementation phase• Program analysis, which outlines the numerous programs under the EC umbrella
within each EC strategic theme• Stakeholder interviews, which examines stakeholder perceptions of EC programs and
their impact on neighborhoods within the designated area• Citizen survey conducted by telephone on a random sample of households within the
EC
IS THE DATA/STUDY REPRESENTATIVE OF COMMUNITY INPUT?IS THE DATA/STUDY REPRESENTATIVE OF COMMUNITY INPUT? Yes, stakeholderinterviews and citizen surveys.
PROBLEMS/NEEDS ADDRESSED IN THE STUDYPROBLEMS/NEEDS ADDRESSED IN THE STUDY: General
Stakeholder InterviewsC EC could explore ways to enhance its capacity to communicate with citizens and others
involved in the programC Suggestions that the partnership build upon its effort to support emerging citizen
organizations; work on strategies to make neighborhoods more self-sufficient and help thembecome equal partners
C Expand EC governance structure to make it more engaging
Citizen Survey• Services most needed in their neighborhoods included education (78%), crime and anti-drug
programs (each 73%) and youth activities (73%)• Belief that the City of Wilmington had not become more concerned with / responsive to
their neighborhoods• Only 24% of the EC residents said that the City of Wilmington and the Wilmington EC
administration had been “effective” or “very effective” in representing the interests of theresidents’ communities
• 27% of the respondents said that the partnership had been “ineffective” in representing theirneighborhood’s needs
RecommendationStrategy Development
Strategic planning: The Wilmington EC should redevelop its strategic plan, based on the

103
changing needs and accomplishments of the partnership
Financial strategy: The Wilmington EC should identify means of enhancing the financialbase of the existing partnership by creating a sustainability plan, geared toward replacinglimited federal EC funding.
External Environment
Governance structure: The Wilmington EC should explore ways of broadening itsgovernance structure, including the development of steps to enhance and sustaininvolvement in the planning, implementation and evaluation processes.
Communication: The Wilmington EC should build upon its existing capacity tocommunicate with stakeholders and citizens.
Internal Environment
Goal-setting and benchmarking: The Wilmington EC should undertake a goal-setting andbenchmarking process, drawing from the redevelopment of the strategic plan andnational standards established by other EC sites.
Administration: The Wilmington EC should update its administrative functions andexplore ways of re-engineering the management arm of the partnership.
Evaluation
Accountability: The Wilmington EC should enhance its accountability strategy to reach agreater portion of the population than current means.
Reporting: The Wilmington EC should build from the framework provided by thisevaluation design and create a system of reporting for the EC and EC-related programs.
Tables (starting on page 11):
Table 1 - Enterprise Community Needs Assessment(most needs were ranked “very important” by at least 60% of the residents)Table 2 - Changes in the Neighborhood by Service Area During the Past Two YearsTable 3 - Perceptions of CommunityTable 4 - Participation in Enterprise Community ProgramsTable 5 - Length of Participation in Enterprise Community ProgramsTable 6 - Importance of Enterprise Community ProgramsTable 7 - Effectiveness of City of Wilmington/Enterprise Community inRepresenting Community InterestsTable 8 - Level of Participation in Community OrganizationsTable 9 - Neighborhood/Planning Council of ResidenceTable 10 - Education AttainmentTable 11 - Household Income
104
Table 12 - Resident status: Rent v. OwnTable 13 - Gender
Table 14 - Eastside-Southbridge Needs Assessment(most needs were ranked “very important” by at least 70% of the residents)Table 15 - Eastside-Southbridge Changes in the Neighborhood by Service AreaDuring the Past Two YearsTable 16 - Eastside-Southbridge Perceptions of CommunityTable 17 - Northeast Needs Assessment(most needs were ranked “very important” by at least 60% of the residents)Table 18 - Northeast Changes in the Neighborhood by Service Area During thePast Two YearsTable 19 - Northeast Perceptions of CommunityTable 20 - Southwest-Browntown Needs Assessment(most needs were ranked “very important” by at least 60% of the residents)Table 21 - Southwest-Browntown Changes in the Neighborhood by Service AreaDuring the Past Two YearsTable 22 - Southwest-Browntown Perceptions of CommunityTable 23 - West Center City Needs Assessment(most needs were ranked “very important” by 40-58% of the residents)Table 24 - West Center City Changes in the Neighborhood by Service AreaDuring the Past Two Years
Table 25 - West Center City Perceptions of Community
Table 26 - Westside Needs Assessment(most needs were ranked “very important” by at least 60% of the residents)Table 27 - Westside Changes in the Neighborhood by Service Area During the PastTwo YearsTable 28 - Westside Perceptions of CommunityTable 29 - Analysis of Variance / Community Perceptions by EC Location StatusTable 30 - Correlation Matrix for Community Perceptions

105
TITLETITLE: Enterprise Community Progress Report
AUTHORAUTHOR: The Enterprise Community, Inc.
DATEDATE: January 1, 1995 - June 30, 1996
SOURCESOURCE: The Enterprise Community, Inc.
GEOGRAPHICAL AREAGEOGRAPHICAL AREA: The portion of Wilmington included in the Enterprise CommunityDesignation (Census Tracts 1, 6.01, 6.02, 7, 8, 9, 16, 17, 18, 19, 20, 21, 22, 27)
KINDS OF INFORMATION/DATA USED IN THE STUDYKINDS OF INFORMATION/DATA USED IN THE STUDY:
Qualitative data -- regarding the goals, strategies, and programs of the EnterpriseCommunity
IS THE DATA/STUDY REPRESENTATIVE OF COMMUNITY INPUT?IS THE DATA/STUDY REPRESENTATIVE OF COMMUNITY INPUT?
Yes. Community members participate in the Enterprise Community through theNeighborhood Planning Councils and general meetings.
PROBLEMS/NEEDS ADDRESSED IN THE STUDYPROBLEMS/NEEDS ADDRESSED IN THE STUDY: “EMPLOYMENT” and “GENERAL”
• Job Preparation and Education
Programs which address this need:• Wilmington Employment Corps• Tutoring• New Head Start and early childhood education classrooms• Wellness Center• Mentoring• School-based Intervention Programs• Americorps• Community School Prevention Partnership
Economic Development
Programs which address this need:• Pre-Jobs Fairs• People’s Produce Market• North Market Street Initiative• College of Art and Design• Small Business Investment
C Strong Families
Programs which address this need:• “A Better Chance” - Welfare Reform• “Strengthening Young Parent Families” -Welfare Reform

106
• Home Visiting Program• Family Allies/Family Services Partnership• WHA Youth Opportunity Program
C Supportive Communities
Programs which address this need:• Crime Control Program• Substance Abuse Prevention • Fire Safe Campaign• Housing Development• “Connect Wilmington” Bulletin Board• Technical Assistance Grants

107
TITLETITLE: Evaluation of the Wilmington Weed & Seed Program January to December 1995
AUTHORSAUTHORS: Richard J. Harris and John P. O’Connell
DATEDATE: April 1997
SOURCESOURCE: State of Delaware - Executive Department - Statistical Analysis Center
GEOGRAPHICAL AREAGEOGRAPHICAL AREA: Wilmington
KINDS OF INFORMATION/DATA USED IN THE STUDYKINDS OF INFORMATION/DATA USED IN THE STUDY: reported crime statistics; keyfindings from a report by MJM Consulting Services (in-depth interviews); also includes summaryof 1992-1995 activity
IS THE DATA/STUDY REPRESENTATIVE OF COMMUNITY INPUT?IS THE DATA/STUDY REPRESENTATIVE OF COMMUNITY INPUT? Not in and ofitself, but references to MJM Consulting Services does provide information on community input.
PROBLEMS/NEEDS ADDRESSED IN THE STUDYPROBLEMS/NEEDS ADDRESSED IN THE STUDY:
“CRIME AND LEGAL SERVICES”
Wilmington Delaware's Operation Weed & Seed - 1992 to 1995
Definition of the Department of Justice's “Operation Weed & Seed”:
Weeding programs consisted of five community policing officers targeted to walkingpatrols, increased funding for traditional narcotics enforcement and state prosecutor andstate probation officers dedicated to Weed & Seed cases. New under Operation Weed &Seed, an active investigative consortium of federal (ATF, DEA, FBI) and local lawenforcement agencies chaired by the Delaware Federal Prosecutor was established.
The seeding programs focused on victim services, substance abuse education andtreatment, recreation, tutoring, and parent training. Most of the seeding programs areoffered in conjunction with the area's four safe havens (community centers): West EndNeighborhood House, William "Hicks" Anderson Community Center, Hilltop LutheranNeighborhood Center, and the Latin American Community Center.
Key to Operation Weed & Seed is the evolution from traditional policing "responding toa problem” to community policing "having a ready knowledge of a community and itsissues". Making the transformation from traditional to community policing involvesincreasing communication between the community and police such that a partnership ofcommon goals is obtained. The goal of Operation Weed & Seed is to weed out theproblems so that seeding programs have a better chance of succeeding thus changing theatmosphere, quality of life, and safety in tough neighborhoods.
The West Center City and Hilltop neighborhood are parts of the city that have recentlyexperienced the most significant increase in illicit drug activity.
108
Successes: 1992 - 1993
Crime statistics and perceptions of the community and law enforcement showed thatOperation Weed & Seed had clearly made measurable improvements in quality of lifeand safety in 1992 and 1993. Drug-related calls for service decreased significantly and thenumber of arrests began to drop as reported crime decreased.
Walking patrols received high marks and were recognized as the symbol of theenvisioned partnership being sought by the community.
People reported less fear and exhibited a greater willingness to walk, shop, and visit intheir neighborhood.
Lost Ground: 1994 - 1995
Though drug related calls for service from the Weed & Seed area rose by 43 percent,arrests for drug related crimes decreased. This decrease in drug arrests while reportedillicit drug related events increased was troublesome.
Probably the best known reason for the negative turnaround in the Weed & Seed area wasthe city's "financial squeeze" that was associated with a significant reduction inWilmington Police Department (WPD) manpower from an authorized staffing level of289 to a low of 235.
Community members observed a decrease in police presence, particularly the absence ofcommunity policing officers "walking their beat".
The release of many drug offenders who were arrested and incarcerated during the earlyphases of Weed & Seed and an influx of outside drug traffickers may have led to anincrease in the number of criminally prone persons in the Weed & Seed area.
Fighting Back: 1995-present
Late in 1995, drug-related arrests in the Weed & Seed area rose by 42 percent, mostly as aresult of increased enforcement in the Westside/Hilltop area and three special policeinitiatives-the Reactionary Drug Enforcement Team (RDET), the Warrant Execution Team(WET), and the Strategic Community Action Team (SCAT).
109
The impact of these efforts are related to increased arrests in the area, but have not fullytranslated into a decrease in reported drug related events. The results sector by sector aremixed; some are up and some are down. It does not appear, however, that the type ofincrease that the area experienced in 1994 has continued. The special police emphasis in1995 appears to have contained the situation.
Finally, the news breaking event in 1996 is the increase in the number of firearm relatedassaults, which are occurring at a rate far higher than at any time in Wilmington's history. Since 1993, calls for service from the Weed & Seed area for shooting incidents haveincreased by 167 percent, from 21 calls in 1993 to 56 calls in 1996.
Summary of Intensive Interviews with Key Weed & Seed Program ParticipantsSummary of Intensive Interviews with Key Weed & Seed Program Participants
A series of in-depth interviews with Weed & Seed area residents and community leaders,community policing officers, the Chief of the Wilmington Police Department, and key Weed &Seed program participants were held in Spring 1996. The interviews are part of an ongoingpanel study by Mary I Mande, Ph.D. of MJM Consulting Services of community policing inWilmington and its impact on the city's drug trade. The spring 1996 interviews focused onevents that occurred in 1995. The resulting report, entitled "The War on Drugs in Wilmington,Delaware - February 1989 to June 1996" details the responses of those who participated in thepanel interviews. Following is a summary of some of the report's key findings.
Residents in the Weed & Seed area have been very receptive to community policing. Both police and residents felt that assigning foot patrols to an area on a long-term basiswas the most effective community policing strategy; however reductions in policestaffing levels made it necessary to use "park and walk" officers in lieu of permanentwalking patrols. Residents felt that the “park and walk” community policing strategywas not as effective as permanent patrols because they tend to interact less with park andwalk officers, which makes it more difficult to build a rapport with them.
Residents felt that permanently assigned walking patrols are more likely to be aware ofneighborhood issues like who the troublemakers are, which house is frequented by drugusers, which families allow their children roam the streets unsupervised at night, etc.
Reduced funding for Weed & Seed community policing officers, combined with overallpolice staffing reductions resulting from the city's financial problems has beendetrimental to efforts at reducing the area's drug trade. Those interviewed said thatpolice visibility in the area is noticeably less since the number of dedicated Weed & Seedofficers was reduced from five to three.
Residents of the area and community activists generally felt that the drug problem in theneighborhood had worsened in the past year. Police, on the other hand, felt that thearea's drug problem is about the same or slightly better than it was a year ago. The

110
police's perception that the area was stabilizing was possibly influenced by the fact thatthey had made more drug related arrests in the area.
Some of those interviewed said that they did not feel that their neighborhood was safeat night. One individual said that he wouldn't drive down certain streets at night, forfear of being robbed or wounded by a stray bullet. Community activists have said thatthey have been threatened and their car windows have been shot out. Some said thatthey were less willing to participate in drug vigils, marches, or other high-profile anti-drug activities because they fear harassment or other forms of retaliation by drug dealers.
Both the police and area residents felt that much of the area's drug problem stems fromout-of-state drug dealers, mostly from New York and Philadelphia. However, some ofthose interviewed stated that a lack of parental guidance in some families who reside inthe area is also a problem. Out-of-state drug dealers often recruit local youths to selldrugs for them. Some parents may look the other way when their children come homewith large amounts of cash, especially when the family is struggling financially. In somecases, the parents themselves may be addicted to drugs or alcohol.
Absentee landlords who fail to adequately screen prospective tenants before leasing theirproperties was also identified as a big problem. One landlord in particular is known tohave rented several properties to Dominican drug dealers. This landlord has beenwarned several times, but so far nothing has been done about it.
Some felt that Weed & Seed should place more emphasis on drug and alcoholrehabilitation. A substance abuse treatment counselor who participated in the panelinterviews said that there was dearth of treatment facilities in Wilmington, given themagnitude of the city's drug problem. The high prevalence of substance abuse amongarea residents creates a problem for the entire neighborhood since drug addictedresidents usually don't care that drugs are being sold nearby. Some of those interviewedsuggested that referral to substance abuse treatment should be more integrated withWeed & Seed's law enforcement component.
• For 1992 & 1994 analysis, see 1994 Community Needs Assessment, Vol. III, pp. 14-17

111
TITLETITLE: Family Survey Report
AUTHORAUTHOR: M. Gamel-McCormick, Ph.D. & C. deCsipkes, M.S.
DATEDATE: November 1997
SOURCESOURCE: Center for Disabilities Studies (CDS), University of Delaware, Interagency ResourceManagement Committee
GEOGRAPHICAL AREAGEOGRAPHICAL AREA: statewide/with some over-representation of Sussex and Kentcounties.
KINDS OF INFORMATION/DATA USED IN THE STUDYKINDS OF INFORMATION/DATA USED IN THE STUDY: Survey of parents with childrenin one of four Delaware Early Intervention Programs: Child Development Watch Program, HeadStart Program, Early Childhood Assistance Program, and Preschool Special Education.
IS THE DATA/STUDY REPRESENTATIVE OF COMMUNITY INPUT?IS THE DATA/STUDY REPRESENTATIVE OF COMMUNITY INPUT? Yes
PROBLEMS/NEEDS ADDRESSED IN THE STUDYPROBLEMS/NEEDS ADDRESSED IN THE STUDY: “DISABLED” and “CHILD/YOUTH”
Services and Programs available to children and families in four Delaware EarlyServices and Programs available to children and families in four Delaware EarlyIntervention ProgramsIntervention Programs
Transportation Health & Medical servicesPhysical therapy Occupational TherapyEmployment Services Child development servicesParent education Program Vocational/Rehabilitation ServicesSocial work Services Service coordinationHome visits Special educationNutrition Counseling servicesPsychological services Child CareSpeech-Language therapy Parent support ProgramVision Therapy Substance Abuse Services
Delaware Early Intervention Programs (General)Delaware Early Intervention Programs (General)
• Over 91% of the parents with children returning the survey indicated that they felt theirfamilies were better able to care for their children because of their involvement in theprograms: specifically, 93.9% of the parents stated that they were more confident as parentssince enrolling in the program.
• Over 93% of the parents the survey felt that their children were more advanced sinceenrolling in the programs; parents reported positive changes in their children in the areas ofphysical development, speech skills, social skills, cognitive skills, and self-help skills sinceenrolling in the programs.
• Over 93% of the parents reported they were satisfied with the interactions they had with the

112
programs:
• Over 87% of the parents stated that they felt their families were respected and were includedin decision-making about their children;
• Over 85% of parents were satisfied with the accessibility and responsiveness of theprograms; and
C Over 92% of the families returning the surveys were satisfied with the programs in whichtheir children were enrolled.
C Overall the parents felt that the programs made an effort to link their children and families toservices such as counseling, parent support groups and services for all four-program types.
Child Development Watch Program (CDWP)Child Development Watch Program (CDWP)
The most frequently used services by the families in the CDWP were home visits, the leastfrequently used services were vocational rehabilitation, substance abuse, and employment services(0.9%).
C 92.8% were satisfied. 2.2% of the families were dissatisfied and 5.0% of the families statedthey were less satisfied than they would like to be with the overall services of the programs.
• Families receiving CDWP services reported lower levels of use of service coordination, healthand medical, and child development services. Each family identified themselves as havingused an average of 4.38 services.
C Families receiving CDWP services had an overall positive response to the services theyreceived. Aggregating the six clusters and weighing the individual cluster totals according tototal responses within the cluster results in an overall positive response rate of 90.1% with9.9% of the families’ responding negatively.
Head Start Program ResultsHead Start Program Results
• The most frequently used services by the families receiving Head Start services were homevisit services with a total of 76.9% reporting receiving these services.
• The least frequently used services were vocational rehabilitation, psychological, andoccupational services with only 1.6% families reporting the use of these services.
• The families receiving Head Start services had an overall positive response to the services theyreceived. Aggregating the six cluster results in an overall positive response rate of 90.5%with 9.5% of the families responding negatively.
Early Childhood Assistance Program (ECAP)Early Childhood Assistance Program (ECAP)

113
• Families identified a total of 631 services as being used during the program year. This is anaverage of 5.01 services per family.
• The most frequently used services used by the families receiving ECAP services were homevisit services with a total of 74.6% families reporting receiving these services.
• The least frequently used services were vocational rehabilitation, psychological, substanceabuse, and service coordination services with less than 4% of the families reporting the use ofthese services.
• 98.7% of the families indicated that they were satisfied. Only 0.8% of the families statedthey were less satisfied than they would like to be with the overall services of the programs.
Preschool Special Education Program Results (PSE)Preschool Special Education Program Results (PSE)
• The services most frequently reported by families as being used by the children in the PSEprograms or the children’s family members were speech-language therapy services (75.1%).
• The least frequently services provided were employment, vocational rehabilitation, andsubstance abuse services.
• 92.6% of the families reporting were satisfied with the services provided. Only 2.1% of thefamilies indicated they were dissatisfied and 5.5% stated they were less satisfied than theywould like to be with the overall services of the programs.

114
TITLETITLE: Final Report: Delaware Alcohol and Drug Prevalence Surveys
AUTHORAUTHOR: Robert Wilson, Walter Mateja, Jill Shreiner, CUAPP, University of Delaware
DATEDATE: February 1996
GEOGRAPHICAL AREAGEOGRAPHICAL AREA: State of Delaware
TYPE OF DATA USEDTYPE OF DATA USED: Questionnaire, interviews household telephone surveys, analysis ofdrug and alcohol mortality rates and 11 demographic variables from the United Status Census
REPRESENTATIVE OF COMMUNITY INPUTREPRESENTATIVE OF COMMUNITY INPUT: Yes, the Delaware Alcohol and DrugTelephone Survey sampled 907 persons: 229 from New Castle County (excluding Wilmington),225 from Kent county, 226 from Sussex County, and 227 from Wilmington. The DelawareSmall Area Prevalence Survey sampled 1,604 persons: 835 from New Castle County, 363 fromKent County, and 404 from Sussex County.
NEEDS/PROBLEMS IDENTIFIEDNEEDS/PROBLEMS IDENTIFIED: “HEALTH and HEALTH CARE”This study is part of a three year program, the Delaware Treatment Needs Assessment Project,which is to assess the current alcohol and drug treatment needs in the state. The small area studywas conducted to estimated DSM-III-R prevalence rates as defined by the American PsychiatricAssociation and determine the age, gender, race and treatment history profiles of persons in highrisk areas for alcohol and drug problems. The total population projection for persons over 18for the statewide survey was 520,110 for 1993 and 505,600 for 1994. The total populationprojection for persons over 18 for the small areas is estimated at 114,902 persons for 1995.
Delaware Alcohol and Drug Telephone SurveyDelaware Alcohol and Drug Telephone SurveySubstance Use
• Marijuana is the most frequently used illicit drug, followed by cocaine, hallucinogens, andopiates. Gender (being male) is a statistically significant predictor of use for all drugs, andhousehold income (higher levels) is a statistically significant predictor for all drugs exceptopiates.
Lifetime and One-Year Alcohol Diagnoses
• Males 18-29 have the highest rates of lifetime and one-year alcohol dependence and abuse(33.3%). Rates from this survey are consistent with national studies.
• White males have the highest rates of lifetime and one-year alcohol dependence and abuse(24.1%). Rates from this survey are nearly two times the national average (13.6%).
• Lifetime and one-year alcohol dependence and abuse is most prevalent in New Castle County(6.6%), followed by Sussex County (5.8%), the City of Wilmington (4.9%), and KentCounty (4.4%).
Drug Dependence and Abuse Diagnoses
• The number of respondents reporting lifetime drug dependence and abuse was too small toprovide a statistically significant demographic profile of an abuser.

115
Alcohol Treatment: Need and Demand
• This survey estimates that in 1995 approximately 43,000 persons over 18 in Delaware are inactive need of alcohol and drug treatment. National studies have estimate that 20% ofactive abusers that would seek treatment if there were no barriers to receiving treatment (e.g.waiting lists, transportation). Therefore, estimated treatment demand in Delaware is 8,600persons. In 1995, over 4,000 persons are estimated to have received treatment. Thedifference between 8,600 and the number who received some form of treatmentapproximates the unmet demand for treatment in Delaware.
Delaware Small Area Prevalence SurveyDelaware Small Area Prevalence SurveySubstance Use
• Alcohol was the most prevalent substance followed by illicit substances, marijuana, cocaine,hallucinogens, and opiates.
Lifetime and One-Year Alcohol DiagnosesSmall area population projections for substance abuse from self-reported substance use:• Lifetime; Alcohol - 105,250, Marijuana - 34,241, Cocaine - 8,733, Hallucinogens -
5,056, Opiates - 1,494.• Last 18 Months; Alcohol - 73,997, Marijuana - 72,239, Cocaine - 1,034, Hallucinogens -
345, Opiate - 115.
Use in state Planning AreasNew Castle County Kent County Sussex County
Alcohol 71.4% 61.1% 54.5%Marijuana 8.0% 3.85 5.3%Cocaine 1.0% 0.5% 0.8%Hallucinogens 0.95%Opiates 0.2%
• Lifetime alcohol prevalence rates for persons over 18 are: alcohol abuse 2.9%, alcoholdependence 1.4%, alcohol dependence with abuse 6.0%, and dependence and abuse9.65%. Prevalence rates are the highest for white males in the 18-29 and 30-44 agecategories.
• One-year alcohol prevalence rate for persons over 18 are: 1.0% for abuse, 0.5% fordependence, 1.6% for dependence with abuse, and 3.1% dependence and abuse. Prevalence rates are highest for white males between 18-29.
Frequency of DSM-III-R Symptoms of Alcohol Dependence• 6.8% experience drinking larger amounts or more than intended.• 2.8% experience a persistent desire or one or more unsuccessful efforts to cut down.• 1.7 spent a great deal of time drinking or getting over effects from drinking.• 7.7% experienced frequent intoxication when expected to fulfill major roles obligations
or when physically dangerous.• 7.7% gave up more social, occupation, or recreational activities because of drinking.• 4.1% continued to drink despite a social, physical, or emotional problem caused or
exacerbated by drinking.• 2.6% experienced tolerance to alcohol.

116
• 0.4% experienced withdrawal symptoms.• 0.9% drank to relieve withdrawal symptoms.
Lifetime and One-Year Drug Diagnoses• Lifetime prevalence rates for drug diagnoses for those over 18 are: 0.8% for abuse, 1.7%
dependence, and 2.4% dependence and abuse. Prevalence rates are highest amongAfrican-American males in the 30-44 age group.
• One-year prevalence rates for those over 18 are: 0.2% for abuse, 0.9% dependence,1.1% dependence and abuse. Drug diagnoses are most prevalent for African-Americanmales in the 30-44 age group.
• Lifetime and One-Year Alcohol and Drug Dependence and Abuse• Lifetime prevalence is highest in New Castle County, 11.6%, followed by Sussex County,
10.8%, and Kent County, 9.7%.• One-year prevalence rates are highest for Sussex County, 6.2%, followed by New Castle
County at 3.50% and Kent County at 2.90%.
Treatment Histories• Approximately 5,200 persons or 4.5% of survey respondents ever received treatment
for alcohol or drug problems.• During the last year, 1.9%, or nearly 2,200 persons received treatment and 4.1%, or
about 4,711 persons were in need of treatment.• The most utilized lifetime treatment modalities include: outpatient services, Alcoholics
Anonymous, informal therapy, detox services, and short-term residential treatment.• During the last year, the most frequent modalities were: Alcoholics Anonymous,
informal treatment-therapy, informal treatment—clergy, and less than intensiveoutpatient treatment.
• Respondents in Sussex County were more likely to ever receive treatment in theirlifetimes and in the last year, followed by New Castle and Kent Counties.
• Sussex and Kent Counties utilized more informal treatment modalities such as AlcoholicsAnonymous, informal treatment-clergy, and informal treatment-therapy.
• Treatment modalities were more evenly dispersed in New Castle County betweeninformation and formal types.
• The most utilized modalities were: Alcoholics Anonymous, informal treatment-therapy,inpatient hospital rehabilitation, and less than intensive outpatient treatment.
Comparisons and Contrasts between the SurveysComparisons and Contrasts between the Surveys• Both surveys indicate that alcohol dependence and abuse is most prevalent among 18-29 year
olds, males, and white-males.
• Alcohol disorders seem to be widely dispersed throughout the state’s population; however,drug disorders seem to be concentrated in clusters in certain areas among certain populations.
• The statewide survey indicates that only 10% of those in need of treatment actually receivedtreatment in 1995. The small area survey indicated that roughly 40% of those in need oftreatment received treatment in 1995.
Alcohol Prevalence Implications

117
• It appears that more aggressive treatment planning efforts need to target young white maleadults (18-29 years old).
Drug Prevalence Implications
• More prevention and intervention can be targeted at 30-44 year old non-white males, thedemographic group with the highest rate of drug dependence and abuse.

118
TITLE: TITLE: Findings and Recommendations to the Complaint of the Coalition for Equal Justice inPublic Education
AUTHOR: AUTHOR: State of Delaware: Human Relations Commission
DATE: DATE: March 1999
SOURCE: SOURCE: Human Relations Commission
GEOGRAPHICAL AREA: GEOGRAPHICAL AREA: statewide
KINDS OF INFORMATION/DATA USED IN THE STUDY: EEO-4 employmentKINDS OF INFORMATION/DATA USED IN THE STUDY: EEO-4 employmentinformation from 14 Delaware school districtsinformation from 14 Delaware school districts
IS THE DATA/STUDY REPRESENTATIVE OF COMMUNITY INPUT? No IS THE DATA/STUDY REPRESENTATIVE OF COMMUNITY INPUT? No
PROBLEMS/NEEDS ADDRESSED IN THE STUDY: Civil Rights/ Child Youth/PROBLEMS/NEEDS ADDRESSED IN THE STUDY: Civil Rights/ Child Youth/EmploymentEmployment
IntroductionIntroductionThe Commission’s review included five employment areas:
•The district’s total work force•Recruitment / retention policies
•Hiring practices•Applicant flow data•Affirmative Action
Statistical data provided to the Commission included: work force by race, gender and EEO-4categories, hires, promotions, terminations, applicant flow, etc. Employment information
was provided through written policies on recruitment, training, and retention plans, outlinesof district’s hiring process, records of the composition of applicant flow data and affirmativeaction plans. Once all the information was submitted, a subsequent interview was completed,
and the results were tabled to provide a format for comparison on the reported districts.
Fourteen school districts responded with the requested information:1.Caesar Rodney2.Cape Henlopen
3.Capital4.Delmar
5.Indian River6.Lake Forest
7.Laurel8.Milford
9.New Castle County Vo-T10.Polytech11.Seaford12.Smyrna
13.Sussex County Vo-Tech14.Woodbridge

119
State Human Relations Commission Summary, Conclusions and RecommendationsState Human Relations Commission Summary, Conclusions and Recommendations
In this report, the State Human Relations Commission reviewed fourteen Delaware schools.The examination of the content of this indicates that minority group members are underrepresented in most Delaware Public Schools throughout their work force. The Commissionrecognizes that minority administrators and professionals are in great demand nationwide, andthat availability is more than likely less than the labor market availability percentage of 20% foradministrators and 15% for teachers in Delaware. In an ideal situation, the administrative andprofessional staff should reflect the racial composition of the student population.
It is the recommendation of the Commission, and indeed the philosophy of the Department ofEducation, that school districts should adopt a goal of working toward similar staff to studentrepresentation. The urges school districts to work toward equalizing this balance. Thecommission recommends development of an Affirmative Action Plan for each school district. Aneffort to develop plans with consistent core elements among districts would strengthen a climateof employment desirability for the State of Delaware.The State Human Relations Commission implores Delaware’s Colleges and Universities to stepup efforts in educating minority teachers. In turn, the Districts could increase their efforts to raisethe awareness of minority students to the opportunities of a teaching career. The Commissionplans to annually monitor the progress of the District’s implementation of the recommendationscontained in the report over the next five years.

120
TITLETITLE: Focusing on Information Sources for Delaware’s Developmental Disabilities Community
AUTHORAUTHOR: Audrey Helfman, Robert Wilson, Donna Bacon - Delaware Public AdministrationInstitute, Graduate College of Urban Affairs and Public Policy; University of Delaware
DATEDATE: 5\96
SOURCESOURCE: Delaware Developmental Disabilities Planning Council, 302-739-3333
GEOGRAPHICAL AREAGEOGRAPHICAL AREA: New Castle, Kent and Sussex counties.
KINDSKINDS OF INFORMATION/DATA USED IN THE STUDY OF INFORMATION/DATA USED IN THE STUDY: Four service-provider focusgroups, six consumer-focus groups (two of which were Spanish-speaking).
ISIS THE DATA/STUDY REPRESENTATIVE OF COMMUNITY INPUT? THE DATA/STUDY REPRESENTATIVE OF COMMUNITY INPUT? Yes, 10 focus groupsof five to ten participants were recruited through community press releases, agency publications,flyers sent to local schools and service provision organizations, and mailing lists from disabilityrelated agencies.
PROBLEMS/NEEDS ADDRESSED IN THE STUDYPROBLEMS/NEEDS ADDRESSED IN THE STUDY: Disabled
Information needs of the developmentally disabled population from both consumer and serviceprovider viewpoints. Focus group participants confirmed the fragmentation of information andservices among private, non-profit, and public agencies throughout the state.
What did consumers say
C Parent and consumer questions ranged from general and broad based to specific, personalinquiries about services available in Delaware.
• Other parents had looked for specific information about symptoms, treatment, medicalspecialists for recently diagnosed disabilities or conditions.
• Questions about funding and support contacts were prevalent among all ages and disabilities.• Parents of pre-schoolers were interested in were most interested in finding the most talented
diagnosticians and therapist, funding sources for special services and equipment, and seekingsome source of respite care.
• Parents of school -age children were mostly concerned with placement in special schools,inclusion in regular classroom, understanding the IEP process and how to get involved with it,accessing assistive technology and funding for it, and finding and accessing respite or regular daycare.
• Consumers who were past secondary-school age had concerns about accessing technology,assistance in pursuing college or job training courses.
• Housing, independent living, and transportation questions were prevalent among adultconsumers and their parents.

121
Consumers first source for information
• There was a strong consensus within each consumer group, that the most reliable andcomfortable source of information was to call someone from their personal network of serviceproviders or acquaintances.
• For those traumatically acquiring a disability or just moving to the state there were several firstsources noted. The phone book was found to have inconsistencies of department or agencynames. Others contacted agencies by agency name recognition, still others went to a local schoolor hospital as a first step in seeking information.
• There was general agreement the phone book’s blue or yellow pages were difficult to navigateand quickly locate information in.
• The efforts of the Child Development Watch Program were noted for providing support andinformation to parents of newborns or babies diagnosed early with potential disabilities.
• Most consumers were receptive to computers as a resource but agreed they would not be theirfirst priority.
• A central 800# was often suggested as a viable means of information retrieval, but that it wouldonly be as good as the personnel trained to provide information and explain the resourcesavailable.
• The ideal system cited was a “mixed bag” of multiple resources, including a published directory,an 800#, and an on-line system which they could both look up specific information and chat toothers in the disability community.
What did Spanish speaking consumers say?
• Spanish-speaking consumers cited language barriers as their greatest difficulty in accessing servicesor information.
• Participants noted that most state agencies do not have bilingual workers to help them. As aresult most use a third party, such as La Oficina de la Familia y los Ninos, St Michael’s Church orChild Watch Development in their information searches. Bilingual friends were also cited as animportant resource for finding information.
• No Spanish-speaking consumers had computer experience, but were open to training.• One-on-one contact was preferred by all, with Spanish speaking operators available was
recommended as the most effective and accessible format for information retrieval.
What did service providers say?
• Questions asked of providers ran the gamut from general statewide availability of services tovery specific questions of personal eligibility for equipment and services
• Many were also faced with questions about specific topics that are not within their expertise, suchas housing, independent living or respite care.
• Each provider group verified that its own network of service providers and associates were theirgreatest source of information. Some have put together their own notebook, directory orRolodex of names, addresses, and phone numbers should a question or situation come up.
• Several of the state directories, such as the DHSS Directory of Services, DPI Handbook, DATIResource Guide, and the handbook for the elderly were mentioned as first sources.
• A few have used the phone book’s blue and yellow pages, but indicated they were not the mostefficient or effective tool.
• Some have called the Delaware HelpLine for help, others have been called by the helpline foranswers.

122
• Most service providers are limited to e-mail capabilities and have very little computer access toother agencies in the state or the Internet. All service providers seemed receptive to using acomputerized Database, especially if they could correspond directly with other providers inother agencies. Service providers thought a central 800# would be a good central point for boththemselves and their clients to first look for information, if staffed with properly trainedpersonnel. Providers thought that an ideal system for information would include a wide rangeof multimedia mechanisms. They would like an 800# or an enhanced Helpline, a computerDatabase and chat line, a published directory of agencies, addresses, numbers, contacts, andrevised cross-referenced blue pages in the phone book.

123
TITLETITLE: History Report: Services Integration in the State of Delaware
AUTHORAUTHOR: Robert B. Denhardt and Joseph W. Grubbs, Center for Community Development andFamily Policy, College of Human Resources, Education, and Public Policy, University ofDelaware
DATEDATE: May 1998
SOURCESOURCE: Center for Community Development, College of Human Resources, Education, andPublic Policy, University of Delaware
GEOGRAPHICAL AREAGEOGRAPHICAL AREA: Statewide
KINDS OF INFORMATION/DATA USED IN THE STUDYKINDS OF INFORMATION/DATA USED IN THE STUDY:
Secondary data - narrative regarding the history of the Family Services Cabinet Council (FSCC)and service integration in Delaware
IS THE DATA/STUDY REPRESENTATIVE OF COMMUNITY INPUT?IS THE DATA/STUDY REPRESENTATIVE OF COMMUNITY INPUT?
No. The data are a compilation of information presented in government documentsdescribing the relevant events and processes
PROBLEMS/NEEDS ADDRESSED IN THE STUDYPROBLEMS/NEEDS ADDRESSED IN THE STUDY: “GENERAL” and “HEALTH AND HEALTHCARE”
Supply of Services/Barriers to Service
• Governor Carper’s Executive Order of May 17, 1993 that created the Family Services CabinetCouncil was necessary because of changes in family structure/social environment in the state,and the gap between schools and State service agencies
• The Services Integration Working Group, created in 1996 to oversee the practicalimplementation of services integration, began to work on integration of services in schoolsand communities
• The task of evaluating the emerging services was given to the Benchmarking and EvaluationSubgroup, and the task of linking the technological infrastructures of State Agencies was givento the Technology Subgroup
• The school-based component of the initiative, known as the School Friendly component,grew out of a Wellness Center program begun by DPI and DOE, which put an array of healthcare, counseling, and other support personnel in high schools to ensure that children hadmore immediate access to services
• The community-based component of the initiative, known as Community Links, built uponexisting, successful community-based health and social service delivery and neighborhood

124
redevelopment programs, including Family Services Partnerships, K-3 Early InterventionPrograms, Strong Communities, HB 247 Pilot Programs, First Time Home Visiting Program,“A Better Chance” Welfare Reform, Community Policing, and School Resource Officers
• More recently, the Working Group has made strides toward developing a comprehensivemodel for services integration

125
TITLE: TITLE: Homebound Seniors by Zip Code
AUTHOR: AUTHOR: Meals on Wheels
DATE: DATE: 1998
SOURCE: SOURCE: Meals on Wheels-Delaware
GEOGRAPHICAL AREA: GEOGRAPHICAL AREA: statewide
KINDS OF INFORMATION/DATA USED IN THE STUDY: KINDS OF INFORMATION/DATA USED IN THE STUDY: statistics regarding seniors, whoreceived home meal delivery in the state of Delaware in 1998
IS THE DATA/STUDY REPRESENTATIVE OF COMMUNITY INPUT? IS THE DATA/STUDY REPRESENTATIVE OF COMMUNITY INPUT? Yes
PROBLEMS/NEEDS ADDRESSED IN THE STUDY: PROBLEMS/NEEDS ADDRESSED IN THE STUDY: “ELDERLY”
According to the data recorded:According to the data recorded:
• There are 60,421 seniors 65 years of age or older in the state of Delaware.
• There are 3,545 (6%) of seniors in Delaware that are being served by Meals on Wheels.
The Top Ten Zip Codes with Seniors Being Served:The Top Ten Zip Codes with Seniors Being Served:
CC 19805 Wilmington19805 Wilmington 342 seniors (10%)342 seniors (10%)CC 19802 Wilmington19802 Wilmington 285 seniors ( 8%)285 seniors ( 8%)CC 19901 Dover19901 Dover 233 seniors ( 7%)233 seniors ( 7%)CC 19801 Wilmington19801 Wilmington 208 seniors ( 6%)208 seniors ( 6%)CC 19947 Georgetown19947 Georgetown 201 seniors ( 6%)201 seniors ( 6%)CC 19711 Newark19711 Newark 200 seniors ( 6%)200 seniors ( 6%)CC 19713 Newark19713 Newark 167 seniors ( 5%)167 seniors ( 5%)CC 19808 Wilmington19808 Wilmington 166 seniors ( 5%)166 seniors ( 5%)CC 19804 Wilmington19804 Wilmington 140 seniors ( 4%)140 seniors ( 4%)CC 19720 New Castle19720 New Castle 139 seniors ( 4%)139 seniors ( 4%)
126
TITLETITLE: Homelessness in Delaware
AUTHORAUTHOR: Steven W. Peuquet and Pamela J. Leland
DATEDATE: 1988
SOURCESOURCE: The Urban Agent Division, College of Urban Affairs and Public Policy, University ofDelaware, in cooperation with the Salvation Army
GEOGRAPHICAL AREAGEOGRAPHICAL AREA: statewide
KINDSKINDS OF INFORMATION/DATA USED IN THIS STUDY OF INFORMATION/DATA USED IN THIS STUDY: four types of surveys wereutilized: inventory of service providers, client survey, expert survey, and supplemental enumeration.
ISIS THIS DATA/STUDY REPRESENTATIVE OF COMMUNITY INPUT? THIS DATA/STUDY REPRESENTATIVE OF COMMUNITY INPUT?: Yes, but only inresponse to survey questions.
PROBLEMS/NEEDS ADDRESSED IN THIS STUDYPROBLEMS/NEEDS ADDRESSED IN THIS STUDY: “Housing”
Age, Gender, Race
• In a survey of 262 households and a total of 472 individuals the surveyed shelter populationwas young. The median age of all shelter residents was 21. Looking at the heads ofhouseholds, this group’s median age was also relatively young, standing at 28.5 years.
• Of those who were residing at emergency shelters, 36 percent were female adults. A greaterproportion, 39 percent, were children 18 years old or younger. Of the children, 23.0percent were under the age of five. Only a quarter (25.4 percent) were adult males.
• Out of the total number of household heads answering questions about their race, 16.3percent were black men and 25.9 percent were black females, for a total of 42.2 percent.Only 4.4 percent of the remaining population was Hispanic and other minorities, whilewhites comprised the remaining 53.4 percent.
Household Types
• More than half (54.7 percent) of surveyed households were headed by women. Familieswith children accounted for a total of 32.9 percent of the surveyed households, and mostof these (73 out of 85) were headed by a female. One person male households were seen37.2 percent of the time, and one person female households were observed at a frequencyof 26.4 percent. Male/female couples with or without children were seen 8.2 percent of thetime.
• Households consisting of a male/female couple without children had the lowest median ageat 25 years. This was closely followed by a median of 26 years for females who are headsof households with children. In order of increasing median age, single femalehouseholds came next (27 years), followed by male/female couples with children (29 years),with the highest median age being for single male households (39 years).
Education, Marital Status and Place of Origin
• Slightly more than half (51 percent) of the surveyed homeless had not graduated from high

127
school. About a quarter (26 percent) had obtained a high school diploma but went nofurther, almost one-fifth (18.5 percent) had some college, and only one out of twenty (4.6percent) had a college diploma.
• The vast majority (77.1 percent) of all surveyed homeless heads of households had eithernever been married or were separated or divorced.
• When asked where they were from, almost half (44.6 percent) of the surveyed homelessstated they had been in the area where they were currently sheltered for three years or more,and almost a fifth (19 percent) had been there his or her entire life. Of the 55.5 percent ofhousehold heads who reported they had been in that location two years or less, almost halfcame from some other place in Delaware.
Employment and Income
• The majority of all responding heads of households were unemployed at the time of thesurvey, 73.2 percent that did not have work, more than a third (35.4 percent) could beviewed as long-term unemployed in that they had been unemployed a year or more. Abouta quarter (27.5 percent) had been without a job for less than a year but more than twomonths, and the remainder (23.4 percent) had stopped working within the last threemonths.
• While only 26.8 percent of the household heads surveyed were employed, 56.5 percentclaimed to have a steady source of income. Half said they got part or all of their moneyfrom their job. The other most common sources were: Aid to Families with DependentChildren (26.7 percent), Supplemental Security Income (11.6 percent), and General Assistance(5.5 percent).
• A total of 80.9 percent of all the surveyed heads had incomes of less than $450 monthly,or $5,400 per year.
Homeless Episodes
• Among the 262 heads of households interviewed, 62.2 percent were homeless for the firsttime, and on average, they tended to be younger than those who had previouslyexperienced one or more homeless episodes. Almost 56 percent of those homeless for thefirst time were under 30 years old compared to 46.9 percent for those who had beenhomeless one or more times previously.
Mental Health Problems and Substance Abuse
• Six out of every 10 responding heads of households stated that they had never previouslybeen treated for an emotional or mental health problem or for substance abuse. Those witha history of substance abuse or emotional or mental health problems were more likely toreport that they had been homeless at least once before.
• Of those stating that this was not their first homeless episode, 52.2 percent indicated theyhad previously been treated or were hospitalized for substance abuse or an emotional ormental health problem. This compares to only 34.2 percent for first-time homeless persons.By disaggregating the 52.2 percent of those who had previously been homeless and had ahistory of problems, it can be seen that as the number of episodes of previous homelessnessincreases, so does the proportion of respondents with a history of substance abuse oremotional or mental health problems. For those previously homeless one to three time in

128
the past two years, 47.5 percent had a history of these health problems. For those with fourto seven previous homeless episodes, the proportion reporting a history of such problemsrose to 62.5 percent.
• There also appears to be a correlation between the duration of the current homeless episodeand a history of substance abuse or mental health problems. For those homeless for three orless weeks at the time of the interview, only about 28 percent reported any history ofsubstance abuse or emotional or mental health problems. For those homeless one to twelvemonths, 57.5 percent claimed a history of such problems. And for the chronically homeless,i.e., those homeless for more than a year, the reported incidence of these types of heathproblems was 64.4 percent.

129
TITLETITLE: Homelessness in Delaware Revisited
AUTHORAUTHOR: Steven W. Peuquet, Ph.D. and Abigael Miller-Sowers
DATEDATE: 1996
SOURCESOURCE: Center for Community Development, College of Urban Affairs and Public Policy University of Delaware
GEOGRAPHICAL AREAGEOGRAPHICAL AREA: statewide
KINDS OFKINDS OF INFORMATION/DATA USED IN THIS STUDY INFORMATION/DATA USED IN THIS STUDY: residents of both emergency andtransitional shelters participated in telephone interviews. Managers of emergency and transitionalshelters completed inventories and surveys. Also, managers provided data on the number of familiesand individuals sheltered on the night of January 25, 1995 generating a point-in-time estimate ofsheltered homeless in the state for that time.
IS THIS DATA/STUDY REPRESENTATIVE OF COMMUNITY INPUT?IS THIS DATA/STUDY REPRESENTATIVE OF COMMUNITY INPUT?: Yes, but only inresponse to survey questions.
PROBLEMS/NEEDS ADDRESSED IN THIS STUDYPROBLEMS/NEEDS ADDRESSED IN THIS STUDY: “Housing”
Number of Sheltered Homeless in 1995
• On January 25, 1995, a total of 1,031 persons were estimated to be residing in emergencyand transitional housing in the state.
• Of this homeless population 299 (29 percent) were children under the age of 18; and 732(71 percent) were adults.
• Adult men living by themselves represented 39.1 percent of all sheltered homeless persons.Adults and children living in households headed by a female represented 37.4 percent of allsheltered homeless persons. Adult females living alone were 12.7 percent. Male/femalecouples with children represented 4.5 percent of this population. Male headed householdswith children when there was no female present were 2.7 percent. Male/female couples withno children and children living by themselves were 1.6 percent. Households with multipleadults of the same sex with no children was only 0.4 percent of the homeless population.
Counts by Type of Shelter
• Of the 1,031 persons residing in emergency and transitional shelters on Jan. 25, 1995, 49percent (504 persons) were living in site-based emergency shelter facilities. Fourteen percent(148 persons) were living in motel rooms provided through an emergency shelter program.Thirty-seven percent (379 persons) were occupying a transitional shelter facility. In addition,136 persons entered a day shelter program on that day.
Counts by Location
• Approximately two-thirds (66.1 percent) of the individuals residing in emergency andtransitional shelters in the state on Jan. 25, 1995 were staying in Wilmington. The portionof

130
New Castle County outside of Wilmington housed only 6 percent. Kent County housed 16.1percent of the homeless population on that day and Sussex County played host to 11.7percent.
Size of Selected Subpopulations
• Based on their response to interview questions, nineteen percent (76 adults) residing inemergency shelters in the state on Jan. 25, 1995 can be categorized as having mental healthproblems. 184 adults (46.3 percent) can be categorized as abusers of alcohol and/or otherdrugs. 10.3 percent (41 adults) can be categorized as having mental health problems andalcohol or drug abuse problems. 7.6 percent (30 persons) suffered from domestic violenceor the threat of domestic violence.
Changes in Point-in-Time Estimates
• For February 25th, 1986 it was found that 178 adults and 88 children for a total of 266persons were housed by the state’s emergency shelter programs (Note: data obtained froma 1986 study conducted by Steve Peuquet and Pamela Leland entitled Homelessness inDelaware). On the night of Jan. 25th, 1995 the number grew to 652 persons (254 childrenand 398 adults) an increase of 14.5 percent. (Note: The number of homeless housed intransitional housing programs was not recorded in the 1986 study).
Statewide Overview of the Shelter Network
• Of the 53 shelter programs located throughout the state, 38 facilities were located inWilmington/New Castle County; 8 were located in Kent County, and 7 were located inSussex County.
• A total of 870 shelter beds were provided by 44 site based emergency and transitionalshelter programs throughout the state. Of these beds, 450 were strictly for singles, 328 werestrictly for families, and 92 were for a combination of singles and families.
• Of the 450 single beds, 85 were designated for females, 310 were for men and 55 were foreither men or women depending on the need.
• Of the 53 shelter programs in Delaware, 13 provided general medical care; 5 providedwomen’s health care; 7 provided HIV/AIDS testing or counseling; 3 provided tuberculosis(TB) testing; 5 provided monies for dental services; and 16 provided funds for eyeglassassistance.
• Ten shelters provided psychological counseling; none offered alcohol or detoxificationservices; 17 provided some type of alcohol counseling; 18 programs offered drug counseling;18 programs offered family counseling; and 15 shelters offered domestic abuse counseling.
• Twenty-one shelters offered parenting classes; 6 shelters provided child care services; 29shelters provided life skills training; 10 shelters provided literacy training; 12 sheltersprovided GED classes; 10 shelters provided job training; 25 shelters provided job searchassistance.
• 17 provided legal assistance; 32 provided financial counseling; 30 provided housingcounseling; 23 assisted residents in finding permanent housing; 26 assisted residents inobtaining welfare assistance; 30 assisted residents in obtaining proper identification; and 31helped transport their residents to appointments.
Household Structure and Gender

131
• A total of 69 percent of the 147 homeless individuals interviewed lived by themselves inwhat is termed single persons households. Women with children comprised 19 percent ofsurveyed participants. Adults living in traditional family units consisting of male/femalecouples with or without children comprised 12 percent.
• There were more female adults found in emergency shelters than males; 56 percentcompared to 44 percent respectively.
Age, Race and Spanish Ancestry
• The median age of all the 147 persons interviewed was 31 years. Women with children hadthe lowest median age of 26 years. In order of increasing median age, single females camenext (29.5 years), followed by other adults(30.5 years), with the highest median age beingfor single male households (35.5 years).
• The proportion of homeless blacks in the survey was 60 percent, more than 3.5 times thatfound in the general state population. Whites comprised 33 percent of the surveyedpopulation. A total of 4 percent of the surveyed homeless adults reported that they wereHispanic, Latino, or of Spanish decent.
Education
• Of the surveyed population, 21.2 percent had not graduated from high school; while 43percent had obtained a high school diploma but went no further; 33.1 percent had attendedsome college but had not earned a bachelor’s degree; and 2.3 percent had a four-year collegeor higher degree.
Duration of Residency in the Community
• Of the surveyed population, 46 percent said they had been in the area where they werecurrently sheltered for three years or more. Of the remainder who said they had been in thelocation less than three years, almost half came from some other place in Delaware.
Income and Its Sources
• A total of 59 percent of all those interviewed had an annual household income of less than$10,000, and 35 percent existed on less than $5,000 per year. Women living by themselveswere the poorest households, with 67 percent having annual incomes under $10,000. Sixty-five percent of “other households” consisting mostly of male/female couples with or withoutchildren brought in less than $10,000 per year. Sixty-two percent of women with childrenhouseholds brought in under $10,000 per annum. Fifty percent of single male householdsbrought in less than $10,000 per year.
• A total of 58 percent of those interviewed claimed to have a steady source of income fromemployment or from a government sponsored program. Of the homeless adults surveyed,6.7 percent receive income from the General Assistance program; 12.7 percent participatedin the AFDC program; 2.2 percent were receiving income from SSI; and 0.7 percent receivedincome from the VA Disability program.

132
Employment
• More than half (56 percent) of those interviewed were unemployed at the time of thesurvey. About one-quarter of these individuals (23 percent) could be viewed as chronicallyunemployed in that they were without a job for a year or more. However, the majority, 63percent were only recently unemployed.

133
TITLETITLE: Hunger: The Faces and Facts of 1993
AUTHORAUTHOR: Prepared by the VanAmburg Group, Inc.
DATEDATE: January 15, 1994
SOURCESOURCE: Food Bank of Delaware
GEOGRAPHICAL AREAGEOGRAPHICAL AREA: Statewide
KINDS OF INFORMATION/DATA USED IN THE STUDYKINDS OF INFORMATION/DATA USED IN THE STUDY:
Primary data -- results of an agency survey and client personal interviews undertaken atemergency shelters, emergency kitchens, food pantries, and other emergency food assistanceprograms.
IS THE DATA/STUDY REPRESENTATIVE OF COMMUNITY INPUT?IS THE DATA/STUDY REPRESENTATIVE OF COMMUNITY INPUT?
Yes. The data includes surveys of both agencies and clients.
PROBLEMS/TRENDS ADDRESSED IN THE STUDYPROBLEMS/TRENDS ADDRESSED IN THE STUDY: “EMERGENCY ASSISTANCE”
The following statistics are highlights derived from the client survey, with figures in parenthesesindicating national data acquired from similar surveys across the country
· 12.4% of Delawareans relied on emergency food programs in 1993 (10.4% nationally).· 64.8% of respondents did not expect to need emergency food help 3 months ago (45.5%).· 58.3% of respondents were female (60.9%).· 58.3% of respondents were living with children 17 or under. · 64.4% of respondents lived in households with annual incomes of $10,000 or less (73.0%).· 82.2% of respondents did not have private medical insurance (84.0%).· 42.8% were covered under Medicaid (43.0%).· 50.6% were receiving Food Stamps (48.3%).· 61.1% reported that Food Stamps last 3 weeks or less (82.1%).· 41.7% were part of single-parent households (26.8%).· 23.9% were homeless (18.1%).· 43.7% were unemployed (39.0%).· 8.2% were seniors (8.1%).· 38.5% were white (50.7%).· 53.4% were African-American (32.8%).· 6.0% were Hispanic (11.4%).· 95.9% lived in the same county as the food program they were utilizing (94.9%).· 17.0% were disabled (17.2%).· 46.8% were high school graduates (36.6%).· 30.2% of adults missed meals in the past month (32.4%).· 7.2% of children missed meals in the past month (10.7%).· 30.7% had wages as their primary source of income (26.1%).· 17.0% had AFDC as their primary source of income (12.0%).· 10.6% had Social Security as their primary source of income (16.5%).

134
TITLETITLE: Hunger: The Faces and Facts 1997
AUTHORAUTHOR: Prepared for the Food Bank of Delaware by the VanAmburg Group, Inc.
DATEDATE: 1997
SOURCESOURCE: Food Bank of Delaware
GEOGRAPHICAL AREAGEOGRAPHICAL AREA: Statewide
KINDS OF INFORMATION/DATA USED IN THE STUDYKINDS OF INFORMATION/DATA USED IN THE STUDY:
Primary data -- results of an agency survey and client personal interviews undertaken atemergency shelters, emergency kitchens, food pantries, and other emergency food assistanceprograms.
IS THE DATA/STUDY REPRESENTATIVE OF COMMUNITY INPUT?IS THE DATA/STUDY REPRESENTATIVE OF COMMUNITY INPUT?
Yes. The data includes surveys of clients.
PROBLEMS/TRENDS ADDRESSED IN THE STUDYPROBLEMS/TRENDS ADDRESSED IN THE STUDY: “EMERGENCY”
The following statistics are highlights derived from the client survey, with figures in parenthesesindicating national data acquired from similar surveys across the country
• 10.3% of Delawareans relied on emergency food programs in 1993 • 66.7% of respondents did not expect to need emergency food help 3 months ago (45.8%)• 62.6% of respondents were female (62.4%) • 59.4% of respondents lived in households with annual incomes of $10,000 or less (67.0%)• 84.4% of respondents did not have private medical insurance (80.8%)• 37.8% were covered under Medicaid (40.3%)• 41.2% were receiving Food Stamps (40.7%)• 67.8% reported that Food Stamps last 3 weeks or less (78.7%)• 50.6% were part of single parent households (33.4%)• 23.1% were homeless (15.8%)• 48.4% were unemployed (37.0%)• 19.0% were working (20.7%)• 54.4% were adults (46.4%)• 8.7% were seniors (16.0%)• 40.5% were white (47.1%)• 51.7% were African-American (32.1%)• 5.3% were Hispanic (14.6%)• 95.3% lived in the same county as the food program they were utilizing (95.0%)• 20.2% were disabled (21.0%)• 44.1% were high school graduates (36.2%)• 31.8% of adults missed meals in the past month (27.5%)• 7.3% of children missed meals in the past month (9.1%)• 33.0% had wages as their primary source of income (28.1%)

135
• 6.9% had TANF as their primary source of income • 13.2% had Social Security as their primary source of income (18.2%)• 7.1% had SSI as their primary source of income (10.9%)
136
TITLETITLE: The Impact of a Boys and Girls Club Facility; Component A: Baseline Analysis
AUTHORAUTHOR: Timothy Barnekov, Marjorie Eldridge, and Steven Peuquet
DATEDATE: August 1992
GEOGRAPHICAL AREAGEOGRAPHICAL AREA: New Castle county, Delaware-specifically the neighborhoods ofBrookmont Farms, Greenfield Manor, Glasgow Pines Trailer Court, Glasgow Pines Townhouses,Glasgow Pine Homes, and Glasgow Court Trailer Park.
TYPE OF DATA USEDTYPE OF DATA USED: The overall study includes three components:
Component AComponent A: A baseline analysis to be completed prior to the opening of the facility consistingof the following items:• adult perceptions about the nature and extent of juvenile problems from a household survey;• key informant interviews with local community leaders, police officers, school administrators,
and public officials;• incidence data on crime, substance abuse, truancy, school dropout, academic failure, and teenage
pregnancy; and• demographic information from the 1990 census.
Component BComponent B : A third year follow-up consisting of the following items:• During the third year of operation, the household survey, key-informant interviews, and
collection of incidence data will be carried out again in the same way as in Component A.• Additionally, the household survey will be administered to a representative sample of parents
or guardians of the boys and girls who use the new boys and girls Clubs.• Problem incidence information will also be collected from member/users of the facility.• Comparisons will be made between the community-related data collected in Components A and
B, additional comparisons will be made between the community-related data and the user-related data in Component B.
Component CComponent C : Fifth year follow-up consisting of the following items:Component C will be structured in the same way as component B. Again, cross comparisons willbe made. Here, community-related data from Component C will be compared with community-related data from Components A and B. Additionally, user related data from Component C willbe compared to community-related data from Component C, and to user-related data fromComponent B.
REPRESENTATIVEREPRESENTATIVE OF COMMUNITY INPUT OF COMMUNITY INPUT: Yes, there were community key informantinterviews and household surveys conducted as well as surveys of member/users of the facilitiesdone. Additionally, the following neighborhoods were studied: Brookmont Farms, GreenfieldManor, Glasgow Pines Trailer Court, Glasgow Pines townhouses, Glasgow Pines Homes (singlefamily), and Glasgow Court Trailer park.NEEDS/PROBLEMS IDENTIFIEDNEEDS/PROBLEMS IDENTIFIED: General
Neighborhood Problems• Respondents were presented with a list of 15 problems and were asked whether each was a
problem in their neighborhood. Most frequently indicated were:• lack of supervision after school (62%)

137
• vandalism/disorderly conducted (62%)• crimes involving property such as burglary and theft (58%)
• The following are the results for the remaining problems:* Use or sale of illicit drugs (45%)* Staying out of school without permission (39.4%)* Teenage pregnancy (37.6%)* Violet criminal behavior (29.7%)* Physical or other abuse in the family (20%)
* Alcohol abuse (41%)* Unemployment among teenagers* Dropping out of school (35.8%)* Poor performance in school (31.8%)* Suspension or expulsion from school
(23.4%)* Lack of sufficient food or nutrition
(18%).
• Brookmont Farms respondents indicated a higher portion of concern across all 15 problem areas.44% said the most serious neighborhood problems was the use or sale of illegal drugs ascompared to 12% of all respondents.
• 41% of Glasgow Pines Homes respondents say it was lack of supervision as more seriouscompared to 16% of all respondents.
• Female heads of households tended to be more concerned than male heads of households about:* children dropping out of school (41%
vs. 31%)* alcohol abuse (49% vs. 35%)
* teenage pregnancy (45% vs. 32%)
* sale of illegal drugs (56% vs. 39%)
• Males were more likely than females to say the biggest neighborhood problem was lack ofsupervision after school 26% vs. 14%).
• Females were more likely than males to say the biggest neighborhood problem wasvandalism/disorderly conduct (18% vs. 12%)
C Hispanic heads of households consistently expressed more concern about neighborhoodproblems than did blacks or whites. Responses to the problem of poor performance in schoolillustrates the typical pattern. Nearly 88% of the Hispanics said they were concerned about thisproblem as compared to 41% of the black respondents and 29% of the white respondents.
C 23% of the white respondents said the biggest problem facing their neighborhood was the lackof supervision after school, as compared to 13% of black and Hispanic respondents. A greaterproportion of white respondents also identified crimes involving property (17%), andvandalism/disorderly conduct (15%) as the biggest problems.
C The three areas in which the responses did vary significantly among ethnic group lines were:gang activity, crimes involving property, and vandalism/disorderly conduct.
C Marital status was not related to the perception of neighborhood problems with the exceptionthat those who were separated (42%) were much more likely to indicated that physical or otherabuse in the family was a neighborhood problem as compared to the entire population ofrespondents (20%).
C Those who were married said that lack of supervision was the biggest problem (29% vs. 15%unmarried).
C Those who were not married (divorced, widowed, separated, and never married) said thebiggest neighborhood problem was crimes involving property (19% vs. 12% married).
C Middle-aged respondents expressed more concern than younger and older respondents didabout three problem areas: alcohol abuse, the use or sale of illegal drugs, and unemploymentamong teenagers. For example 57% of those between 35 and 44 years of age said they wereconcerned about the sale and use of illegal drugs as compared to 44% of those who were under
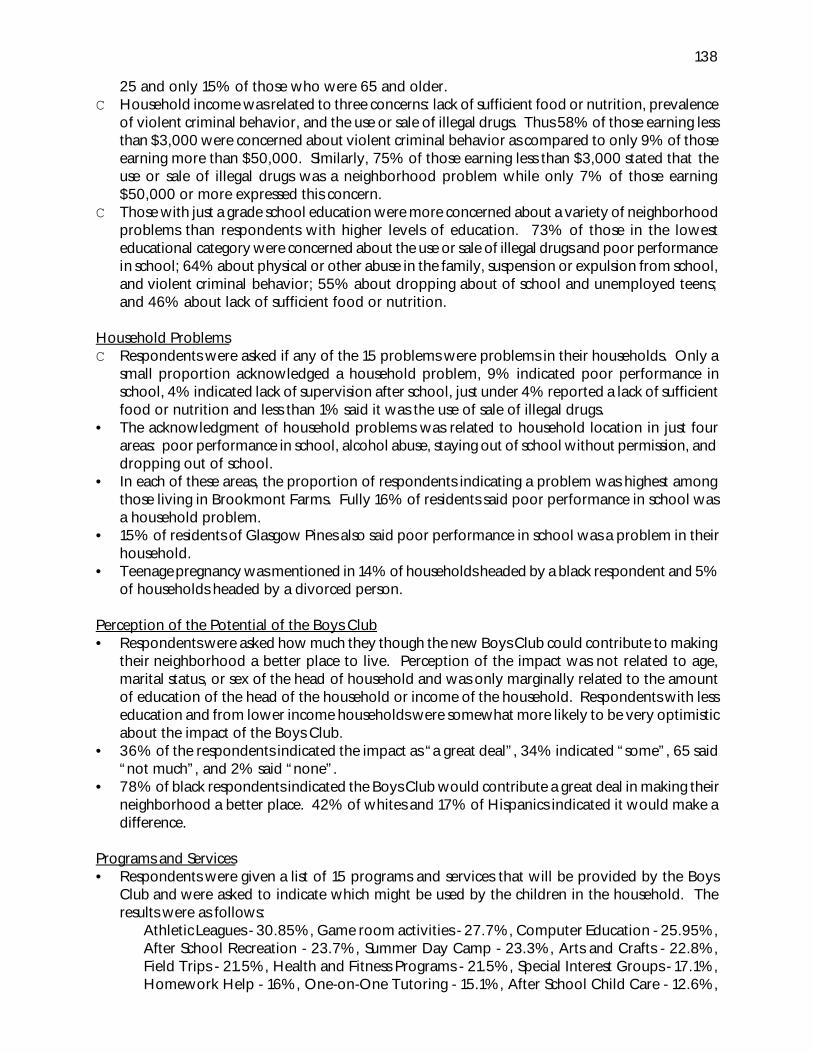
138
25 and only 15% of those who were 65 and older.C Household income was related to three concerns: lack of sufficient food or nutrition, prevalence
of violent criminal behavior, and the use or sale of illegal drugs. Thus 58% of those earning lessthan $3,000 were concerned about violent criminal behavior as compared to only 9% of thoseearning more than $50,000. Similarly, 75% of those earning less than $3,000 stated that theuse or sale of illegal drugs was a neighborhood problem while only 7% of those earning$50,000 or more expressed this concern.
C Those with just a grade school education were more concerned about a variety of neighborhoodproblems than respondents with higher levels of education. 73% of those in the lowesteducational category were concerned about the use or sale of illegal drugs and poor performancein school; 64% about physical or other abuse in the family, suspension or expulsion from school,and violent criminal behavior; 55% about dropping about of school and unemployed teens;and 46% about lack of sufficient food or nutrition.
Household ProblemsC Respondents were asked if any of the 15 problems were problems in their households. Only a
small proportion acknowledged a household problem, 9% indicated poor performance inschool, 4% indicated lack of supervision after school, just under 4% reported a lack of sufficientfood or nutrition and less than 1% said it was the use of sale of illegal drugs.
• The acknowledgment of household problems was related to household location in just fourareas: poor performance in school, alcohol abuse, staying out of school without permission, anddropping out of school.
• In each of these areas, the proportion of respondents indicating a problem was highest amongthose living in Brookmont Farms. Fully 16% of residents said poor performance in school wasa household problem.
• 15% of residents of Glasgow Pines also said poor performance in school was a problem in theirhousehold.
• Teenage pregnancy was mentioned in 14% of households headed by a black respondent and 5%of households headed by a divorced person.
Perception of the Potential of the Boys Club• Respondents were asked how much they though the new Boys Club could contribute to making
their neighborhood a better place to live. Perception of the impact was not related to age,marital status, or sex of the head of household and was only marginally related to the amountof education of the head of the household or income of the household. Respondents with lesseducation and from lower income households were somewhat more likely to be very optimisticabout the impact of the Boys Club.
• 36% of the respondents indicated the impact as “a great deal”, 34% indicated “some”, 65 said“not much”, and 2% said “none”.
• 78% of black respondents indicated the Boys Club would contribute a great deal in making theirneighborhood a better place. 42% of whites and 17% of Hispanics indicated it would make adifference.
Programs and Services• Respondents were given a list of 15 programs and services that will be provided by the Boys
Club and were asked to indicate which might be used by the children in the household. Theresults were as follows:
Athletic Leagues - 30.85%, Game room activities - 27.7%, Computer Education - 25.95%,After School Recreation - 23.7%, Summer Day Camp - 23.3%, Arts and Crafts - 22.8%,Field Trips - 21.5%, Health and Fitness Programs - 21.5%, Special Interest Groups - 17.1%,Homework Help - 16%, One-on-One Tutoring - 15.1%, After School Child Care - 12.6%,
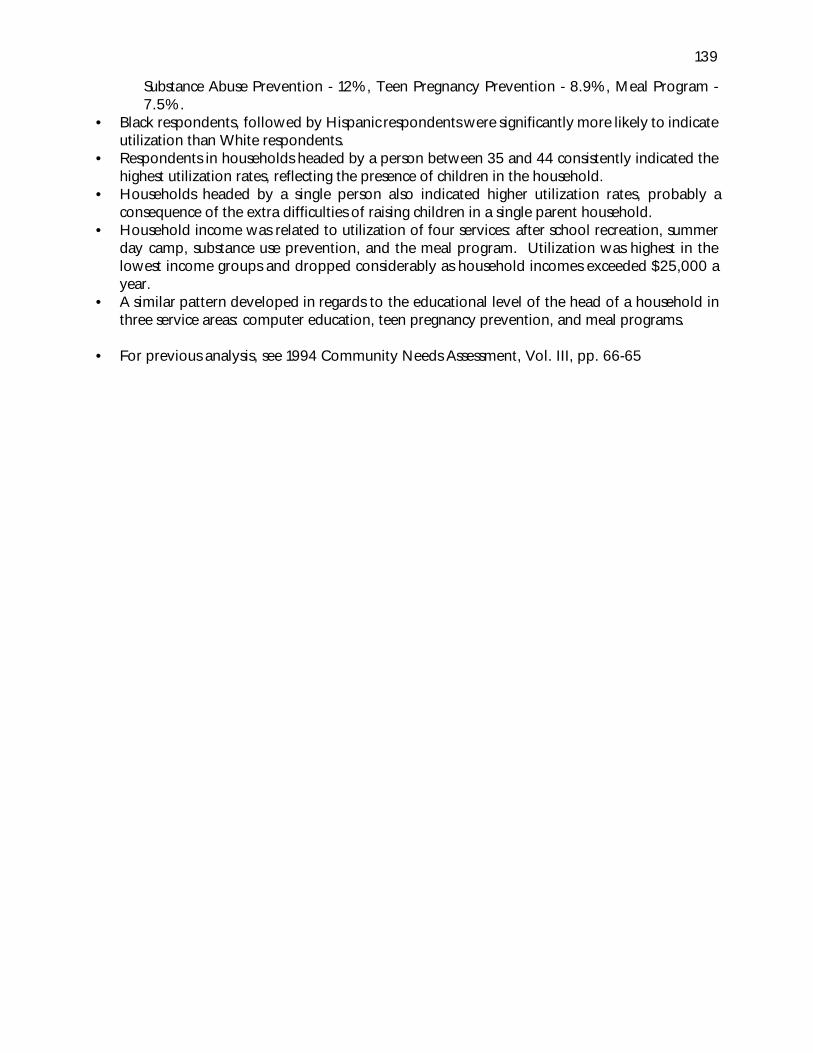
139
Substance Abuse Prevention - 12%, Teen Pregnancy Prevention - 8.9%, Meal Program -7.5%.
• Black respondents, followed by Hispanic respondents were significantly more likely to indicateutilization than White respondents.
• Respondents in households headed by a person between 35 and 44 consistently indicated thehighest utilization rates, reflecting the presence of children in the household.
• Households headed by a single person also indicated higher utilization rates, probably aconsequence of the extra difficulties of raising children in a single parent household.
• Household income was related to utilization of four services: after school recreation, summerday camp, substance use prevention, and the meal program. Utilization was highest in thelowest income groups and dropped considerably as household incomes exceeded $25,000 ayear.
• A similar pattern developed in regards to the educational level of the head of a household inthree service areas: computer education, teen pregnancy prevention, and meal programs.
• For previous analysis, see 1994 Community Needs Assessment, Vol. III, pp. 66-65

140
TITLETITLE: Juvenile Victims and Their Perpetrators
AUTHORAUTHOR: Evelyn Scocas, Charles J. Huenke, Jr., and John P. O’Connell, Jr.
DATEDATE: October 1997
SOURCESOURCE: State of Delaware - Executive Department - Statistical Analysis Center, inconjunction with the Attorney General’s Task Force on Child Victims
GEOGRAPHICAL AREAGEOGRAPHICAL AREA: statewide
KINDS OF INFORMATION/DATA USED IN THE STUDYKINDS OF INFORMATION/DATA USED IN THE STUDY: (reported) 1995 crime statistics
IS THE DATA/STUDY REPRESENTATIVE OF COMMUNITY INPUT?IS THE DATA/STUDY REPRESENTATIVE OF COMMUNITY INPUT? No.
PROBLEMS/NEEDSPROBLEMS/NEEDS ADDRESSED IN THE STUDY ADDRESSED IN THE STUDY: “CHILD/ YOUTH” and “CRIME ANDLEGAL SERVICES”
Ten General Categories of Crime:
1. Felony Assault2. Misdemeanor Assault3. Harassment4. Homicide5. Kidnaping6. Robbery7. Felony Sexual Assault8. Misdemeanor Sexual Assault9. Theft10. Welfare
• Overall
• There were a total of 3,444 crime incidents for selected crimes involving juvenilevictims in 1995.
• The 15-17 age group is the most victimized age group overall, victimized in 41percent of incidents.
• Victims tend to be the youngest when the perpetrator is female and the victim ismale.
• Males make up over three-quarters of the perpetrators, while making up just half ofthe juvenile victims.
• 41.3 percent of the perpetrators are juveniles.• The most common scenario for total selected crime is that males victimize other
males.• Perpetrators are more likely to be juveniles when both the victim and the offender
are of the same sex.• Males are more likely to victimize males; females are more likely to victimize
females.• Child victims ages 0-2 are nearly always victimized by adults.

141
• Child victims ages 9-11 are victimized by peers and older juveniles in about half ofthe cases.
• Older juvenile victims are more likely to be victimized by peers than youngervictims.
Felony Assault (includes reckless endangering 1st; assault 1st and 2nd; vehicular assault 1st; andaggravated act of intimidation)
• There were 301 felony assaults with juvenile victims in 1995.• The 15-17 age group was the most victimized among the juvenile victims of
felony assault, victimized in nearly half (49 percent) of the incidents. Thenumber of juvenile cases of felony assault increases at age 12.
• Males are the victims in 71.3 percent of the juvenile cases of felony assault• The age group with the most perpetrators against juveniles is the 15-17
group, arrested in 29 percent of the incidents.• Males are the perpetrators in 80.7 percent of arrests.• 42.8 percent of the perpetrators are juveniles.• For felony assault, the most common scenario is that males victimize other
males (63 percent).
Misdemeanor Assault (includes offensive touching, menacing, reckless endangering 2nd,assault 3rd, terroristic threatening, and vehicular assault 2nd)
• There were a total of 1,661 misdemeanor assaults in 1995.• Males make up 53.8 percent of the juvenile victims, but 75.0 percent of the
perpetrators.• The 15-17 age group is the most victimized among the juvenile victims of
felony assault, victimized in 49 percent of the incidents.• The age group with the most perpetrators against juveniles is the 15-17
group, arrested in 30 percent of the incidents.• 48.6 percent of the perpetrators are juveniles.• For misdemeanor assault, the most common scenario is that males victimize other
males.
Harassment (includes harassment, aggravated harassment and stalking)
• There were a total of 74 harassment crime incidents in 1995.• Juvenile females are victims of harassment more frequently than juvenile males (73.0
percent vs. 27.0 percent). • The 15-17 age group is the most victimized among the juvenile victims of
harassment, victimized in 61 percent of the incidents.• Males are more frequently the arrestees (63.5 percent vs. 36.5 percent).• The age group with the most perpetrators against juveniles is the 15-17 group,
arrested in 34 percent of the incidents.• 47.3 percent of the perpetrators are juveniles.• For harassment, the most common scenario is that males victimize females

142
Homicide (includes criminally negligent homicide; manslaughter; and murder 1st and 2nd)
• There were a total of 13 homicides involving juvenile victims in 1995.• The 15-17 age group is the most victimized among the juvenile victims of homicide,
victimized in 38 percent of the incidents.• Juvenile males are more likely to be victims than juvenile females (84.6 percent vs.
15.4 percent).
• The age group with the most perpetrators against juveniles is the 15-17 group,arrested in 38 percent of the incidents.
• 38.5 percent of the perpetrators are juveniles.• For homicide, the most common scenario is that males victimize other males.• Males tend to victimize other males; females tend to victimize males.
• Males are the perpetrators in 84.6 percent of arrests.
Kidnaping (includes unlawful imprisonment 1st and 2nd; kidnaping 1st and 2nd; andinterference with custody)
• There were a total of 60 kidnaping crime incidents involving juvenile victims in1995.
• The 15-17 age group is the most victimized among the juvenile victims of kidnaping,victimized in half of the incidents.
• Juvenile females are victims of kidnaping more frequently than juvenile males (66.7percent vs. 33.3 percent).
• The age group with the most perpetrators against juveniles is the 15-17 group,arrested in 38 percent of the incidents.
• 16.7 percent of the perpetrators are juveniles.• Males are more frequently the arrestees (83.3 percent vs. 16.7 percent).• For kidnaping, the most common scenario is that males victimize females.• Both males and females tend to victimize juvenile females.
Robbery (includes robbery 1st and 2nd)
• There were a total of 156 robberies involving juvenile victims in 1995.• The 15-17 age group is the most victimized among the juvenile victims of robbery,
victimized in 63 percent of the incidents.• Most juvenile victims are male (82.7 percent vs. 17.3 percent).• The age group with the most perpetrators against juveniles is the 15-17 group,
arrested in 40 percent of the incidents.• 60.9 percent of the perpetrators are juveniles.• The vast majority of perpetrators are male (94.9 percent vs. 5.1 percent).• For robbery, the most common scenario is that males victimize other males (over 80
percent of the cases).

143
Felony Sexual Assault (unlawful sexual contact 1st and 2nd; unlawful sexual penetration 1st, 2nd
and 3rd; unlawful sexual intercourse 1st, 2nd and 3rd; continuous sexual abuse of a child; andsexual exploitation of a child)
• There were a total of 385 felony sexual assaults involving juvenile victims in 1995.• The victims are younger than most crime categories in this study; 32 percent are in
the 12-14 age group.• Most juvenile victims are female (84.7 percent vs. 15.3 percent).• 25.2 percent of the perpetrators are juveniles.
• The vast majority of perpetrators are male (97.4 percent vs. 2.6 percent).• The age group with the most perpetrators against juveniles is the 30-34 age group,
arrested in 17 percent of the cases. Felony sexual assault perpetrators were older thanthe perpetrators from any other crime category in this study.
• For felony sexual assault, the most common scenario is that males victimize females.
Misdemeanor Sexual Assault (includes sexual harassment, indecent exposure, incest, unlawfulsexual contact 3rd, and obscenity)
• There were a total of 125 misdemeanor sexual assaults involving juvenile victims in1995.
• The 12-14 age group is the most victimized among the juvenile victims ofmisdemeanor sexual assault, victimized in 46 percent of the incidents.
• Most juvenile victims are female (86.4 percent vs. 13.6 percent).• The vast majority of perpetrators are male (94.4 percent vs. 5.6 percent).• 44.8 percent of the perpetrators are juveniles.• The age group with the most perpetrators against juveniles is the 12-14 group,
arrested in 25 percent of the incidents.• For misdemeanor sexual assault, the most common scenario is that males victimize
females (85 percent of the cases).
Theft (includes theft and extortion)
• There were a total of 175 thefts involving juvenile victims in 1995.• The 15-17 age group is the most victimized among the juvenile victims of homicide,
victimized in 44 percent of the incidents.• Most juvenile victims of theft are male (76.6 percent vs. 23.4 percent).• 85.1 percent of the perpetrators are juveniles.• The age group with the most perpetrators against juveniles is the 12-14 group,
arrested in 39 percent of the incidents; the 15-17 age group made up 37 percent ofthe arrests.
• Males make up 88.0 percent of the arrestees in theft involving juvenile victims, whilefemales make up 12.0 percent.
• For theft, the most common scenario is that males victimize other males (71 percentof the cases).
Welfare (includes abandonment of children, endangering the welfare of a child, unlawfuldealing with a child, and endangering children)

144
• There were a total of 494 welfare crime incidents involving juvenile victims in 1995.• The 0-2 age group is the most victimized among the juvenile victims of homicide,
the youngest most victimized age group among all the crime categories. Victims 5and under make up 32 percent of the incidents.
• Males make up a slight majority of juvenile victims (52.8 percent vs. 47.2 percent).• 8.1 percent of the perpetrators are juveniles.• The age group with the most perpetrators against juveniles is the 25-29 group,
arrested in 21 percent of the incidents; this is the oldest age group of the mostarrested of all crime groups in this study.
• Females make up a slight majority of arrestees in welfare incidents involving juvenilevictims (51.0 percent vs. 49.0 percent).
• Welfare is a less gender-oriented crime for victims and perpetrators than the othercrime types.

145
TITLETITLE: Lenders’ Profile of Southern Delaware: Community Affairs Consulting Report
AUTHORAUTHOR: Federal Reserve Bank of Philadelphia - Keith Rolland
DATEDATE: February 1990
SOURCESOURCE: Federal Reserve Bank of Philadelphia: Consumer Affairs
GEOGRAPHICALGEOGRAPHICAL AREA AREA: Kent and Sussex Counties and New Castle County below the Chesapeakeand Delaware Canal.
KINDS OF INFORMATION/DATA USED IN THE STUDYKINDS OF INFORMATION/DATA USED IN THE STUDY:
Qualitative data -- regarding the banking needs of the communityQuantitative data -- regarding loan/deposit ratios of banks, types of loans awarded,
demographics, and employment..
IS THE DATA/STUDY REPRESENTATIVE OF COMMUNITY INPUT?IS THE DATA/STUDY REPRESENTATIVE OF COMMUNITY INPUT?
Yes. Community leaders from banks, community-based organizations, etc. were interviewedfor the “community perceptions” section.
PROBLEMS/NEEDS ADDRESSED IN THE STUDYPROBLEMS/NEEDS ADDRESSED IN THE STUDY: “GENERAL” and “HOUSING”
• Affordable Housing• Community Perceptions
• Cost of housing rising faster than incomes• Need for more affordable housing• Difficulty with 20% down payment required• Limitations of the Farmers Home Administration (FMHA)
program• Those in the 50-80% range of median family income are
above FMHA’s target and below that of banks• Banks should partner with other players to assist low and
moderate income home buyers.• Minorities and others feel banks put too much emphasis on
long-past as opposed to recent credit history• Minorities go directly to mortgage and finance companies in
anticipation of rejection by banks• Minorities would use bank services more if more minorities
were loan officers and managers• Banks can serve on the boards of nonprofits, provide funding
and favorable financing for projects
• Bankers’ Perceptions• Agree that there is a serious housing affordability problem• Larger Wilmington banks disagree that 20% down payment
is the standard; Smaller banks in Southern Delaware agree.

146
• Agree with statement about FMHA problem• Disagree strongly that bank policies exclude low and
moderate income borrowers• Agree with need for more partnerships• Mixed response to credit history issue• Agree that minorities anticipate rejection but deny that this is
based in reality• Mixed response to issue of working with nonprofits
• Opportunities for Bank Responses• Offer low down payment mortgage loans, possibly through
a “soft second” program in cooperation with a public agency• Eliminate minimum loan amount policiesC Work with CDCsC Establish a CDCC Participate in a consortium loan pool for low-income rental housing
developersC Work with a nonprofit on a lease-purchase programC Work with Fannie Mae’s secondary market programs
C Small Business and Rural Economic DevelopmentC Community PerceptionsC Banks not interested in working with start-up small businesses and
businesses with less than 100% of collateralC Banks not willing to use Small Business Administration alternative in
order to accommodate credit needs of small businessesC No specialized commercial loan offices in Southern DelawareC Banks reluctant to consider micro-loans for businessC Minorities in particular feel financing needs not met by banksC Others feel banks simply averse to most small business, not just
minority businessesC Banks should become part of support system for small business start-
ups and expansionsC Banks should participate more in partnerships with public agencies,
nonprofitsC Development officials and business leaders want banks to purchase
bonds for developing industrial parks, provide credit to expandingbusinesses, invest in venture capital funds.
C Bankers PerceptionsC Not a lack of interest but averse to the risk involvedC Major disincentives to using SBAC Large Wilmington banks denied there was a location problem, small
downstate banks agreedC Willing to make micro-loans but collateral necessaryC Range of reactions to rapport with minorities questionC Disagree that banks are averse to small businessC Agree that support systems for small business would be usefulC Agree that partnerships are good businessC Mixed reactions to supporting regional economic development
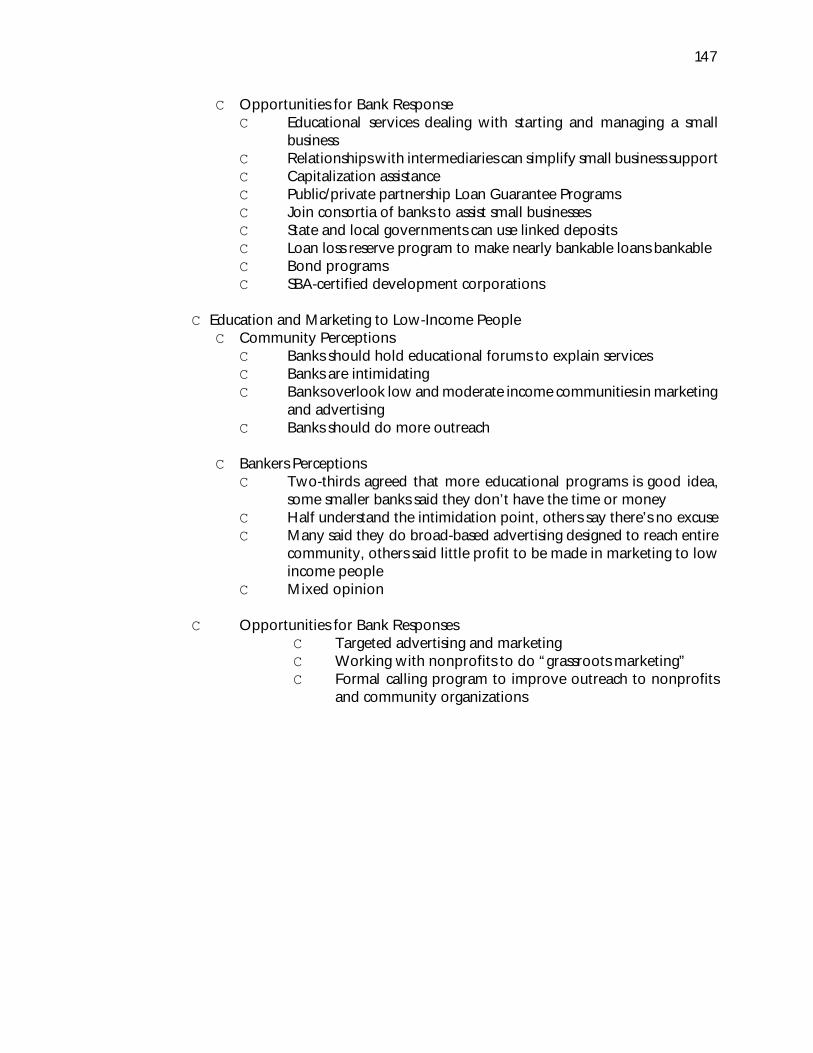
147
C Opportunities for Bank ResponseC Educational services dealing with starting and managing a small
businessC Relationships with intermediaries can simplify small business supportC Capitalization assistanceC Public/private partnership Loan Guarantee ProgramsC Join consortia of banks to assist small businessesC State and local governments can use linked depositsC Loan loss reserve program to make nearly bankable loans bankableC Bond programsC SBA-certified development corporations
C Education and Marketing to Low-Income PeopleC Community Perceptions
C Banks should hold educational forums to explain servicesC Banks are intimidatingC Banks overlook low and moderate income communities in marketing
and advertisingC Banks should do more outreach
C Bankers PerceptionsC Two-thirds agreed that more educational programs is good idea,
some smaller banks said they don’t have the time or moneyC Half understand the intimidation point, others say there’s no excuseC Many said they do broad-based advertising designed to reach entire
community, others said little profit to be made in marketing to lowincome people
C Mixed opinion
C Opportunities for Bank ResponsesC Targeted advertising and marketingC Working with nonprofits to do “grassroots marketing”C Formal calling program to improve outreach to nonprofits
and community organizations

148
TITLETITLE: The Location of Critical Businesses and Services in Wilmington, Delaware.
AUTHORAUTHOR: Brian Bailey, Center for Community Development and Family Policy, University ofDelaware.
DATEDATE: December 1997
GEOGRAPHICAL AREAGEOGRAPHICAL AREA: Wilmington, Delaware
TYTYPE OF DATA USEDPE OF DATA USED: The methodology used in this study taken from the “McHarg Approach”used in geography to locate one group of entities in relation to the location of another group. Inthis report, retail service facilities were identified through the use of city record, the Bell AtlanticYellow Pages and field survey. These facilities were mapped using a geographic information systemcalled ArcView. Each sector’s ArcView output was overlaid on a map of Wilmington’s analysis areas,as well as a map of city bus routes. In addition, a residents-per-business ratio was calculated for bothWilmington and suburban New Castle County to determine how well Wilmington is served in eachsector relative to its surrounding communities.
WASWAS THE COMMUNITY REPRESENTED THE COMMUNITY REPRESENTED: No; however, this report details the spatialdistribution of retail and service establishments with the needs of the poorest residents in Wilmingtonin mind. The purpose to assist city government and city residents in visioning creative solutions tothe city’s long-standing problem of inadequate access to basic goods and services, notably in poorerareas.
PROBLEM/ISSUES IDENTIFIEDPROBLEM/ISSUES IDENTIFIED: PUBLIC INFRASTRUCTURE
• Wilmington lags significantly behind the suburban communities in access to lower-costquality in food provided in supermarkets. The southern and southeastern areas of the citycontinue to have the poorest access.
• Wilmington enjoys excellent access to small neighborhood markets and convenience stores.• Wilmington’s poorest neighborhoods have very limited access to full-service banking. Such
facilities are basically non-existent.• Several low-income areas of Wilmington lack convenient access to self-service laundromats.• Access to physicians in Wilmington is spatially segregated, with the higher-incomes areas
enjoying easy access to individual family and general practice physicians and poorer areashaving walk-in medical clinics.
• Wilmington has a proportionally much smaller number of pharmacies than suburban NewCastle County but only Southbridge has a serious access problem to the existing pharmaciesin the city.

149
TITLETITLE: 1995 Vital Statistics Annual Report
AUTHORAUTHOR: Delaware Health and Social Services
DATEDATE: 1997
SOURCESOURCE: Delaware Health and Social Services
GEOGRAPHICAL AREAGEOGRAPHICAL AREA: statewide
KINDSKINDS OF INFORMATION/DATA USED IN THE STUDY OF INFORMATION/DATA USED IN THE STUDY: secondary data (birth, death,marriage and divorce records for 1995)
IS THE DATA/STUDY REPRESENTATIVE OF COMMUNITY INPUT?IS THE DATA/STUDY REPRESENTATIVE OF COMMUNITY INPUT? No.
PROBLEMS/NEEDS ADDRESSED IN THE STUDYPROBLEMS/NEEDS ADDRESSED IN THE STUDY: HEALTH AND HEALTH CARE
• There was a 4.3% decrease in the Delaware infant mortality rate for the five-yearperiod 1991-1995, dropping to a five-year rate of 8.9 deaths per 1,000 live births.
• More Delawareans were married in 1995.• For the fourth consecutive year, there were fewer births to Delaware residents.
Other highlights from the report:
• The breast cancer mortality rate for black females, which has historically been higherthan the U.S. rate, in 1991-1995 dropped below the U.S. rate for the first time.
• After decreasing for two consecutive years, the percentage of women receivingadequate prenatal care in Kent County increased from 53.1% in 1994 to 61.6% in1995. The percentage of mothers receiving adequate prenatal care in Wilmingtonincreased from 70.7% in 1994 to 73.5% in 1995. Increases were also seen in NewCastle County (80.5% in 1994; 82.5% in 1995) and Sussex County (66% in 1994;67.8% in 1995).
• More than 33% of births in Delaware during the 1991-1995 period were to singlemothers, up slightly from the previous five-year period. Only 65.5% of singlemothers received adequate prenatal care during 1995, compared to 82.2% ofmarried mothers.
• The percentage of mothers who reported smoking during pregnancy dropped from14.1% in 1994 to 13.1% in 1995. The percentage has dropped every year since1989, when 19.7% of mothers reported smoking.
• Heart disease, cancer and stroke continued to be the three leading causes of death inDelaware and the nation.
• Among persons in the 25-44 age group in Delaware, HIV infection/AIDS was thesecond leading cause of death during the 1991-1995 period.

150
TITLETITLE: 1997 Delaware Behavioral Risk Factor Surveillance Survey
AUTHORAUTHOR: Delaware Health and Social Services
DATEDATE: 1998
SOURCESOURCE: Delaware Health and Social Services
GEOGRAPHICAL AREAGEOGRAPHICAL AREA: statewide
KINDSKINDS OF INFORMATION/DATA USED IN THE STUDY OF INFORMATION/DATA USED IN THE STUDY: primary data (random sample,telephone interview survey, interviewing 2,539 adult Delawareans)
ISIS THE DATA/STUDY REPRESENTATIVE OF COMMUNITY INPUT? THE DATA/STUDY REPRESENTATIVE OF COMMUNITY INPUT? No, exceptrespondents to survey behavioral risks
PROBLEMS/NEEDS ADDRESSED IN THE STUDYPROBLEMS/NEEDS ADDRESSED IN THE STUDY: HEALTH AND HEALTH CARE
Sexual health
• Approximately 4% of Delaware’s adult population are engaging in behaviors that placethem at high risk of being infected with HIV, the virus that causes AIDS.
• Delawareans, between the ages of 18 and 50, were surveyed regarding their behaviors thatcould directly affect the risk of contracting AIDS. 78% reported only one sexual partnerduring the past 12 months. However, 7% said that they had 2-3 sexual partners, whileanother 3% reported four or more partners. 11% reported that they had no sexual partners.
• As expected, the number of sexual partners in the past year was significantly higher amongyoung adults in the 18-24 age group. Approximately 16% of this group reported 2 or 3partners during the past year, while 7% of the young adult group reported four or moresexual partners in the past year.
• 9% of adults in the 18-49 age group reported a new partner, while an additional 6%reported 2 or more new partners. Again, the young adults were more likely to report newsexual partners, with 15% reporting one new partner in the past year, and an additional 15%reporting two or more new partners.
• About ¼ of the adult population in the 18-49 group reported using condoms during theirlast intercourse. The majority (79%) of those who use condoms say they use them for bothdisease prevention and birth control. Only 3% said that they use condoms exclusively toprevent sexually transmitted diseases, while 18% reported using condoms only to preventpregnancy.
• Respondents were asked about their own perception of HIV risk. The majority - about 61%of adults age 18-64 - believe that they have no risk of HIV infection. 31% think that havea low risk, while 7% believe that they are at a medium or high risk.

151
• To better determine actual risk, the study gave respondents a list of four high-risk situationsand asked “if any of these situations apply to you.” The situations were:
• use of intravenous drugs during the past year;• a positive test for HIV;• treatment for a sexually transmitted disease in the past year; and • anal sex without condoms in the past year.
About 4% of the 18-49 year-old age group reported one or more of these situations.
• Adult between the ages of 18 and 64 were asked, “Considering what you know about HIV,have you changed your sexual behavior in the past 12 months?” 13% replied yes. Amongthose who answered positively:
• 82% reported a decrease in the number of partners or became abstinent;• 74% said they now have sex with “only the same partner”; and• 46% said they now always use condoms for protection.
These responses add up to more than 100% because respondents may have reported morethan one of these behavior changes.
• Public perception about the effectiveness of condoms continues to change in a positivedirection. The percentage of adults who think a “properly used condom is very effective forprotection against HIV infection through sexual activity” has risen from a low of 28% in1992 to almost 47% in 1997. Another 43% of Delaware adults believe condoms are“somewhat effective”.
• ¾ of Delaware adults believe that AIDS education should begin by at least the sixth grade.Another 15% say that AIDS education should start in the middle school years, 7th to 9th
grades.• Almost half of Delaware’s adults believe that they have been tested for HIV infection. The
most common reason - given by 25% of those who have been tested - was to see if theywere infected. Nearly 72% of those tested said that they received results, and 26% of thosereceived results also received counseling. Many people who submitted blood as part ofroutine physicals, pregnancy tests or physical exams believe that they had an HIV test.However, in reality, at least in part, for the high percentage of people who say they did, didnot receive test results.
• Approximately 3% of adults in the 18-49 age group said that they had been treated for asexually transmitted or “venereal” disease in the past year. The percentage was 9% amongyoung adults (18-24).
Cigarette Smoking
• 27% of Delaware adults smokes; this smoking prevalence has not changed significantly forthe past eight years.
• Prevalence among young adults aged 18-24 has increased from 22% in 1990 to 35% in1997.
• Among Delaware adults, there was no statistically significant difference between white andminority smoking prevalence in 1997 (whites = 27%, Af-Am = 26%, Hispanic = 25%).

152
Weight and Nutrition
• 1/3 of all Delaware adults are significantly overweight, using the Body Mass Index (BMI) asthe standard. The prevalence of overweight adults is increasing in Delaware (from 25% in1992 to 33% in 1997), while the percentage of adults who even get moderate physicalactivity is decreasing.
• There is no statistically significant difference between men and women.• Nonwhites are more likely to be overweight (37%) than whites (31%), using the BMI
standard.• The U.S. Centers for Disease Control indicate that lack of exercise combined with poor diet
is the second leading cause of premature death and illness in the United States.
Awareness of Health Problems (diabetes, high blood pressure and “in poor health”)
• In 1997, 6.4% of Delaware adults were told by a doctor that they had diabetes. Thispercentage has been about the same since 1992.
• The prevalence of high blood pressure appears to have increased slightly. In 1997, 25.5%of Delaware adults were told that they had high blood pressure, which is up from 21% in1995. Nonwhites report a slightly higher prevalence (28%) than whites (25%).
• About 14% of Delaware adults report that they are in “poor health”. Other studies indicatethat self-assessment of quality of health is a good indicator of risk.
Health Insurance Coverage
• In 1997, about 11% of Delawareans report having no health insurance. The prevalence ofuninsured adults has remained the same for the past four years.
• Nonwhites are significantly more likely to report not having health insurance than whites(21% uninsured among nonwhites vs. 8% among whites).
• Younger adults and those with less than a high school education are also less likely to havehealth insurance coverage.
• Nearly 10% of Delaware adults say that they could not see a doctor at least once during thepast year because of cost (8% of whites, 16% of nonwhites).
Alcohol Abuse (binge drinkers, chronic drinkers, and drinking and driving)
• About 12% of Delaware adults are “binge drinkers”, defined by the Behavioral Risk FactorSurveillance Survey as having five or more drinks at one occasion, one or more times duringthe past month.
• There is no difference between whites and nonwhites.• There are major gender and age differences: 21% of men report binge drinking compared
to only 4% of women. Young males are the largest group at risk. In the 18-24 year-old agegroup, 44% of men report binge drinking versus 9% of the women.
• Based on their reported alcohol consumption, 3.4% of adults are classified as “chronicdrinkers”, which is defined as having an average of more than 60 alcoholic drinks per month.
• Nonwhites are more likely to report chronic drinking (6%) than whites (3%).• Gender again is the biggest factor: 6% of men vs. 1% of women.

153
• About 13% of young males in the 18-24 age group report chronic drinking, vs. only 2% ofyoung women.
• 2% of adults responded yes, that they had driven “when perhaps they had too much todrink”.
• Almost 13% of men in the 18-24 age group say that they had driven after drinking.
Preventive Care
Screening tests results
• Sigmoidoscopic examination• 48% of Delaware adults aged 50 and older reported having a
Sigmoidoscopic examination• 52% of males, 44% of females• 37% of nonwhites, 49% of whites
• Mammogram and clinical breast exam• 72% of women aged 50 and older reported having a mammogram and
clinical breast exam during the past two years• No significant difference between nonwhites and whites
• Pap smear• 89% of adult women reported having a Pap smear during the past three
years• No significant difference between nonwhites and whites
• Blood pressure • 94% of Delaware adults reported having their blood pressure checked in the
past two years• 91% of males, 97% of females• No significant difference between nonwhites and whites
• Cholesterol • 69% of Delaware adults reported having their cholesterol level checked in
the past five years• No significant difference between men and women • 60% of nonwhites, 72% of whites
Immunizations
• Flu shot• About 69% of Delawareans age 65 and older had a flu shot within the past
year• No significant difference between men and women • 62% of nonwhites, 70% of whites
• Pneumonia vaccination• About 53% of Delawareans age 65 and older had a pneumonia vaccinationC 39% of nonwhites, 55% of whites

154
TITLETITLE: 1997 Delaware Medical Assistance Program Annual Report
AUTHORAUTHOR: Delaware Health and Social Services, Division of Social Services
DATEDATE: September 1998
SOURCESOURCE: Delaware Health and Social Services
GEOGRAPHICAL AREAGEOGRAPHICAL AREA: Statewide
KINDS OF INFORMATION/DATA USED IN THE STUDYKINDS OF INFORMATION/DATA USED IN THE STUDY:
Primary data -- regarding eligibility trends, expenditures, and program trends
IS THE DATA/STUDY REPRESENTATIVE OF COMMUNITY INPUT?IS THE DATA/STUDY REPRESENTATIVE OF COMMUNITY INPUT?
No.
PROBLEMS/NEEDS ADDRESSED IN THE STUDYPROBLEMS/NEEDS ADDRESSED IN THE STUDY: “HEALTH AND HEALTH CARE”
Health Needs:
• Eligibility Trends• The Delaware Medical Assistance Program (DMAP) covered 11% of the state’s
population in 1997, up from 10% the previous year• 80% of the DMAP population now have “medical homes” through manage care,
while the other 20% receive health care through a fee for service system• 56% of the eligible DMAP population live in New Castle County, Kent County had
the highest growth rate (16%)• Females outnumber males by a 3:2 ratio in DMAP
• Expenditure Trends• 12% of the State’s General Fund appropriation was spent on DMAP services• The average cost per recipient declined by 4.1% from $4,106 to $3,939• Individuals served increased by 12.5% from 90,835 to 102,220• Cost savings attributable to managed care are estimated to be 5% of annual
expenditures
• Program Trends• 80% of DMAP eligibles are enrolled in the Diamond State Health Plan• Cost savings from managed care have been used to expand coverage to 12,000+
poor adults• Public/private partnerships with Nemours and Robert Wood Johnson Foundations
continue• Changes in public assistance programs have an impact on DMAP eligibility and
expenditures

155
TITLETITLE: 1996 Surveillance Report: Division of Public Health, Office of Lead Poisoning Prevention(OLPP)
AUTHORAUTHOR: Russell Dynes, Management Analyst III, Delaware Health and Social Services, Divisionof Public Health, Office of Lead Poisoning Prevention
DATEDATE: June 30, 1997
SOURCESOURCE: Delaware Health and Social Services, Division of Public Health, Office of Lead PoisoningPrevention
GEOGRAPHICAL AREAGEOGRAPHICAL AREA: Statewide
KINDS OF INFORMATION/DATA USED IN THE STUDYKINDS OF INFORMATION/DATA USED IN THE STUDY:
Primary data - statistics regarding cases of childhood lead poisoning by zip code; dwellingsidentified with lead-based paint hazards in Wilmington by census tract; high-risk census tractsfor lead exposure based on household density and number of children under five years ofage; prioritized list of geographical areas targeted by the Office Of Lead PoisoningPrevention; the number of child care facilities in the state by county; the location ofHeadstart and daycare programs that have blood lead screenings; the results of blood leadscreenings at these facilities between July, 1994 and May, 1995.
IS THE DATA/STUDY REPRESENTATIVE OF COMMUNITY INPUT?IS THE DATA/STUDY REPRESENTATIVE OF COMMUNITY INPUT?
No. The data are a compilation of statistics based on information collected by a variety ofstate and local government agencies.
PROBLEMS/NEEDSPROBLEMS/NEEDS ADDRESSED IN THE STUDY ADDRESSED IN THE STUDY: “HEALTH AND HEALTH CARE”,“HOUSING” and “CHILD/YOUTH”
As in most of the country, a good deal of the older housing in Delaware contains lead-based paints,which poses the greatest risk of exposure to lead. This is particularly true of housing that hasstructural damage or is in poor condition due to deferred maintenance. Such housing tends to beconcentrated in urban poor and minority communities. Less common sources of lead exposureinclude drinking water, imported ceramic tableware with glazed lead, old toys and furniture paintedwith lead-based paint, parents unknowingly bringing home lead dust on their clothes from theirworkplaces, folk remedies, and vinyl mini-blinds.
• An estimated 5,000 children in Delaware are exposed to hazardous levels of lead in theirhomes.
• According to FY 96 Delaware screening statistics, 8.8% of tested children had blood-leadlevels exceeding 10 mcg/dl, indicating environmental exposure to lead.
• These children are distributed very unevenly throughout the state, and are concentrated inpoorer, older neighborhoods.
• At 8.8%, the percentage of Delaware children exposed to hazardous levels of lead is abouttwice the national average of 4.4%.

156
• Just 3 out of 22 zip codes in the state (all in Wilmington—19801, 19802, 19805) containmore than 60% of the identified children.
• 13 of 18 high-risk census tracts (identified by household density and number of childrenunder five years of age) in the state are within the 3 zip codes mentioned above in the cityof Wilmington.
• Most lead-poisoned children in the state are in areas with 76% or more pre-1960 housingin, while in Kent and Sussex Counties pre-1940 housing is strongly associated with childhoodlead poisoning.
• The target areas of the Office of Lead Poisoning Prevention include Census Tracts 1, 3, 4, 5,6.01, 6.02, 7, 9, 15, 17, 22, and 23 in Wilmington, 154, 155, 158 in Westside New Castle,504 in Seaford, 408 and 417 in Dover, and 503 in Bridgeville.
• In screenings conducted at child-care centers across the state in 1994 and 1995, about 2,000children were screened at over 40 sites and only four were found to have elevated blood-lead levels. These results suggest that screenings at child-care centers is not a good use ofOLPP resources. Targeted screenings are now focused on door-to-door and communitycenter screenings in at-risk neighborhoods.

157
TITLETITLE: 1996 Vital Statistics Report
AUTHORAUTHOR: Delaware Health and Social Services
DATEDATE: 1998
SOURCESOURCE: Delaware Health and Social Services
GEOGRAPHICAL AREAGEOGRAPHICAL AREA: statewide
KINDS OF INFORMATION/DATA USED IN THE STUDYKINDS OF INFORMATION/DATA USED IN THE STUDY: secondary data / records for fiveevents: fetal deaths, births, deaths, marriages and divorces; also includes population figures
IS THE DATA/STUDY REPRESENTATIVE OF COMMUNITY INPUT?IS THE DATA/STUDY REPRESENTATIVE OF COMMUNITY INPUT? No.
PROPRO BLEMS/NEEDS ADDRESSED IN THE STUDYBLEMS/NEEDS ADDRESSED IN THE STUDY: “CHILD/YOUTH”, “HEALTH ANDHEALTH CARE” and “GENERAL”
Fetal deaths (death occurring during the first year of life)
• The Delaware infant mortality rate for the 1992-1996 period (7.9) dropped belowthe national rate (8.0) for the first time since the mid-1970s.
• The Delaware rate was down 11.2% from the 1991-1995 rate of 8.9• Between 1979 and 1995, Delaware’s infant mortality rates were consistently higher
than the U.S. rates• High infant mortality rates are due to high neonatal (less than 28 days after birth)
mortality rates and high black infant mortality rates• Two significant factors influencing infant mortality rate are low birth weight and
inadequate prenatal care
Neonatal mortality (less than 28 days after birth)
• About 68 percent of Delaware infant deaths between 1992-1996 took place duringthe neonatal period
C Both white and black neonatal mortality rates have tended to run above national levels, with black rates running more than twice as high as white rates
Postnatal mortality (28 to 364 days after birth)
• About 32 percent of Delaware infant deaths between 1992-1996 took place duringthe postnatal period
• The 1992-1996 rate of 2.5 decreased from 1991-1995; this rate is lower than the U.S.rate of 2.9 deaths per 1,000 live births
• Historically, Delaware’s postnatal rates have tended to be lower than those of thenation
Births
• The number of births of Delaware residents declined during 1996 to

158
10,152, a decrease of 108 births from 1995. This was the fifth consecutive year thatbirths declined.
• Sussex County’s general fertility rate was the highest among Delaware’sthree counties (1992-1996 rate was 68.6 births per 1,000 females)
• Prenatal care (based on the Kessner Index, which assigns mother to either“adequate”, “intermediate” or “inadequate” based on 1.) number of prenatal visits,2.) the trimester during which prenatal care began and 3.) the gestational age of thenewborn)
Geographic breakdown• In 1996, 74.0 percent of all Delaware mothers received adequate prenatal care
compared to 76.4 percent during the previous year• New Castle County: decrease in “adequate” from 82.5 percent to 81.2 percent• New Castle County excluding Wilmington: 83.1 percent had adequate care• Wilmington: 72.6 percent had adequate care• Sussex County: 67.3 percent had adequate care• Kent County: 55.0 percent had adequate care
Breakdown by race, level of education, marital status, age of mother and birth weight of theinfant
• 77.4 percent of white mothers received adequate prenatal care, 63.4 percent of blackmothers
• white mothers from New Castle County (outside of Wilmington) had highest rate(85.1 percent); black mothers from Kent County had lowest rate (46.9 percent)
• 85.1 percent of mothers with more than three years of college received adequateprenatal care vs. 42.0 percent of mothers who had less than nine years of education
• 80.4 percent of all married mothers received adequate prenatal care vs. 62.5 percentof all single mothers
• 78.6 percent of mothers 25 years old or older received adequate prenatal care vs.69.4 percent of mothers between 20-24 years old and 60.2 percent of teenage mothers
• For 1992-1996 five-year average data, 64.4 percent of mothers delivering low birthweight babies received adequate prenatal care vs. 75.2 percent of mothers deliveringbabies weighing more than 2,500 grams
The teenage fertility rate• Statewide: increased from 57.4 per 1,000 females age 15-19 in 1991-1995 to 57.7
during 1992-1996 (in the U.S.: declined from 59.6 to 58.0 for same periods)• Statewide: has increased 18.7 percent since 1982-1986• Kent County: decreased slightly from 65.6 births in 1991-1995 to 65.3 in 1992-1996• Sussex County: A somewhat larger decrease was observed over the same period
(76.9 in 1991-1995; 73.0 in 1992-1996). • New Castle County: the rate in increased from 50.3 to 51.5• Over 34% of births during the 1992-1996 period were to single mothers,
up slightly from the previous five-year period. Only 62.5% of singlemothers received adequate prenatal care during 1995 compared to 80.4% ofmarried mothers.

159
Variance by race• Delaware’s 1992-1996 rate for blacks was 76.3 births per 1,000 females compared
to 58.8 for whites• The 1992-1996 rates for both blacks and whites decreased relative to the preceding
five-year period• The number of births to persons of Hispanic origin increased over 12% from 676 in
1995 to 758 in 1996.• The percentage of babies delivered by cesarean section has slowly declined from a
peak of 25.2% in 1990 to 21.0% in 1996. The likelihood of a C-section deliveryvaried by source of payment (23.0% for private insurance, 17.9% for Medicaid and12.7% for self-pay).
Deaths
• Delaware’s total age-race-sex-adjusted mortality rate was significantly higherthan the U.S. rate during 1991-1995.
• The number of HIV infection/AIDS deaths decreased from 163 in 1995 to 132in 1996. This is the first decrease in the number of HIV infection/AIDS deathssince the first deaths were reported in 1984.
• Heart disease, malignant neoplasms (cancer) and cerebrovascular diseases(stroke) continued to be the three leading causes of death in Delaware and thenation. Among persons in the 25-44 age group in Delaware, HIVinfection/AIDS became the leading cause of death during 1992-1996,surpassing unintentional injuries for the first time.
• After steadily increasing for a number of years, the state’s cancer mortalityrate dropped for the second consecutive five-year period.
• Mortality rates in Delaware for respiratory cancer were significantly higherthan the U.S. rates for all race-sex groups during the 1992-1996 period.Diabetes mortality rates were higher for all groups except white males,whereas kidney disease mortality rates were higher for all groups except blackfemales. For all race-sex groups except white females, the mortality rates forhomicide and legal intervention in Delaware were significantly lower than theU.S.
Marriages
• In 1996, the number of marriages (5,209) decreased by 3.1 percent (5,378) from theprevious year.
• New Castle County continues to have a much lower marriage rate than Kent or SussexCounty.
Divorces
• In 1996, the number of divorces and annulments (3,405) decreased by 3.0 percent(3,509) from the previous year.
• Of all couples divorced in 1996, a total of 1,831 (53.8 percent) reported that theyhad children under 18 years of age.

160
TITLETITLE: No Home, Poor Health: Final Report of the Wilmington Homeless Health Care Study
AUTHORAUTHOR: No Home, Poor Health by Anne Mooney, Steve Peuquet, Shin-Ho Kim, Anne Axcel,College of Urban Affairs and Public Policy, University of Delaware
DATEDATE: 2/92
SOURCESOURCE: CUAPP
GEOGRAPHICAL AREAGEOGRAPHICAL AREA: Wilmington
KINDS OF INFORMATION/DATA USED IN THE STUDYKINDS OF INFORMATION/DATA USED IN THE STUDY:
• Review of cross-sectional and longitudinal data, and case studies done elsewhere.• Analysis of existing (secondary) data pertaining to demographic, health, and socioeconomic
characteristics of local and national populations.• Collection/analysis of primary data on health status and needs, and characteristics of health
care delivery systems pertaining to homeless persons in Wilmington.
ISIS THE DATA/STUDY REPRESENTATIVE OF COMMUNITY INPUT? THE DATA/STUDY REPRESENTATIVE OF COMMUNITY INPUT? Yes, 135 homelesspersons responded to the study survey. They were predominately male, between 25-44 years old,never married, African American, non-veterans, with no college education. Of the 46 children, halfwere 4 years and under and slightly less than half were between 5 and 10 years of age: there weremore boys than girls.
PROBLEMS/NEEDS ADDRESSED IN THE STUDYPROBLEMS/NEEDS ADDRESSED IN THE STUDY:
Indicators of overall health.
• The homeless in Wilmington are subject to greater exposure to the elements, contagiousdiseases, inadequate nutrition, and higher levels of stress.
• Homeless people in the city are more likely to lack ready access to primary health careservices, facilities and resources useful for self-care such as a place to rest and recuperate,appropriate storage for medications, and availability of simple home remedies.
• 37% of respondents rated their overall health to be only fair or poor. • Seven chronic diseases were more prevalent in Wilmington’s Homeless than nationally. These were
Hay fever and allergies High blood pressure (especially males)Anemia (especially females) HemorrhoidsAsthma Chronic bronchitis and emphysemaCataracts
• A large proportion of the respondents has one or more limitations on physical activity,including trouble walking, climbing, bending, lifting and stooping.
• Generally parents or guardians rated their children’s health as good or excellent. Mostprevalent conditions experienced in the past 30 days were: feeling sad or depressed, feelingangry most of the time, skin rash, itching skin, colds, and accidents.
Behavioral Risk Factors

161
• Smoking is more prevalent in the Wilmington homeless population, than in the Delawarepopulation as a whole.
• Drinking was found to be only slightly more prevalent among the homeless as compared toDelaware as a whole. However, chronic and binge drinkers were found to be more prevalentin the Wilmington male homeless population than in the overall state population.
• Nearly half of the homeless adults reported past treatments for alcohol problems. About39% said they could benefit from more treatment now.
• About 35% of homeless adults reported past treatment for drug abuse. Fully 80% of thosewho reported past drug abuse stated that they could benefit from more treatment now.
Evidence of High Prevalence of Chronic and Acute Conditions
• Of all adults interviewed, 90% reported having one or more acute symptoms or conditionsrecently, nearly as many said they have one or more chronic conditions.
• There was a high prevalence of acute and chronic respiratory conditions for the adultpopulation. While the incidence of pneumonia and tuberculosis were low, the risk of moreserious respiratory illness is potentially high due to the general prevalence of smoking andrespiratory conditions.
• A total of 43 adults reported having at least one sexually transmitted disease sometime intheir life, while 16 reported having at least two STDs in their lifetime. Gonorrhea was themost reported STD.
• No attempt was made to assess the mental health of the respondent however, nearly 70%reported either being “nervous or anxious or depressed, sad or angry most of the time.
Utilization and Access to Health Care
• 78% of respondents said they had seen a doctor in the last year. The last visit for 11% of therespondents was between 13 and 24 months prior to the interview, and the remaining 11%said they had not seen a doctor in more than two years.
• For adults the last visit to a doctor was more likely to have occurred in a hospital emergencyroom. Children were most commonly seen in an outpatient clinic.
• All conditions and symptoms were categorized as to whether they should have prompteda doctor visit. 90% of adults reported at least one condition or symptom that warranted adoctor visit. A determination was made as to whether a doctor visit actually occurred in anappropriate time period. The results are:
25% failed to go when they should have 27% failed to go on some but not all occasions48% never failed to go when they should have
• Three quarters of adults said they had a skin test for tuberculosis, but only half reported achest x-ray for TB or a blood test for HIV/AIDS or syphilis.
• Most of the women in the survey reported having had a Pap test within the last year. 22%had never had a Pap test.
• Most of the women studied never had a mammogram, but most are also under the age of45. More information would be needed to ascertain the risk status of these women in orderto know whether regular mammograms would be recommended.
• Eye care and eyeglasses were reported to be relatively difficult for homeless adults to obtain.33% need eyeglasses but do not have them25% need eyeglasses and have them

162
42% do not need eyeglasses• For homeless adults the average number of months since the last dental visit was 44, which
is nearly four years. Dental care is among the services homeless people report having thegreatest difficulty obtaining. When asked about medical services for which they could notfind help, 33% of respondents mentioned dental problems. Furthermore, 44% personsreported they needed dentures, and of these, 73% did not have dentures.
• Most of the children have had appropriate immunizations for DPT and measles, althoughit can not be determined whether immunization was delayed. Those interviewed were askedabout problems that are sometimes encountered in seeking health care. The following threewere deemed most serious: cost too high, no transportation, long waits.
• Generally speaking the homeless population surveyed is not covered by any kind of healthinsurance, public or private. Medicaid and Medicare benefits were being received by only20% and 2% of respondents respectively, and only 9% reported any other type of healthinsurance coverage.

163
TITLETITLE: The “Persistent Emergency” of Hunger: Food Pantry Usage in Delaware
AUTHORAUTHOR: Karen Curtis and Brian Green, College of Urban Affairs and Public Policy of theUniversity of Delaware.
DATEDATE: 1996
SOURCESOURCE: College of Urban Affairs and Public Policy, University of Delaware
GEOGRAPHICAL AREAGEOGRAPHICAL AREA: Statewide
KINDS OF INFORMATION/DATA USED IN THE STUDYKINDS OF INFORMATION/DATA USED IN THE STUDY:
Secondary data -- U.S. Conference of Mayors (1993) data regarding emergency foodassistance facilities and clients; Food Research and Action Center data regarding children andhunger; Food Bank of Delaware data regarding the demographics of emergency foodassistance clients, levels of use, etc.
IS THE DATA/STUDY REPRESENTATIVE OF COMMUNITY INPUT?IS THE DATA/STUDY REPRESENTATIVE OF COMMUNITY INPUT?
No. It is secondary data gathered from government agencies and nonprofits.
PROBLEMS/TRENDS ADDRESSED IN THE STUDYPROBLEMS/TRENDS ADDRESSED IN THE STUDY: “EMERGENCY ASSISTANCE”
• A substantial increase in Food Pantry usage in Delaware between 1981 and 1993 occurred inthe context of increased unemployment, increased rental housing costs, and a state-levelsafety net that lags behind much of the nation.
• There has been substantial growth in the number of emergency food assistance facilities inDelaware since 1981.
• Peaks in emergency food assistance service seem to coincide with national and statewideeconomic downturns.
• Since 1989, 54% of those served by reporting Delaware food pantries have been children.
• Requests for food assistance were highest in the colder months in New Castle and SussexCounties, but highest in the warmer months in Kent County (possibly due to the presence ofseasonal farm workers).
• The percentage of emergency food assistance clients reporting AFDC income decreased overthe 1980’s from 45% to 28%, while the percentage reporting wages as their primary sourceof income increased from 8% to 12%.
• The percentage of client households reporting no regular source of income increased duringthe 80’s from 21% in 1981 to 30% in 1989.
• From 1989 to 1993 there was a 51% increase in emergency food assistance service statewide,with the largest increase occurring in Sussex County (179%).

164
TITLETITLE: Prevalence and Need for Treatment of Alcohol and Other Drugs Abuse Among Women InDelaware
AUTHORAUTHOR: Roberta Murphy, Christine Saum, Dorothy Lockwood, Karen Cerra, Steven Martin,Center for Drug and Alcohol Studies, University of Delaware.
DATEDATE: February 1997.
GEOGRAPHICALGEOGRAPHICAL AREA AREA: Delaware counties; where possible ,by State Planning Area (the City ofWilmington, New Castle County excluding Wilmington, Kent County and Sussex County).
TYPES OF DATA USEDTYPES OF DATA USED:
• Interpolations from national and regional survey data.• Survey responses, which identify regular alcohol or drug use and classify by DSM-III-R criteria.• Social indicators, such as Drug and Alcohol involved emergency room visits and mortality rates.• Information concerning special populations such as prison inmates or birthing mothers.
WAS THE COMMUNITY REPRESENTEDWAS THE COMMUNITY REPRESENTED: Yes, 1993 Delaware Alcohol and Drug HouseholdTelephone Survey was used, besides the telephone survey estimates, (data on women in Delawareexisted in state data base of national information.)
PROBLEMS/ISSUES IDENTIFIEDPROBLEMS/ISSUES IDENTIFIED: HEALTH AND HEALTH CARE
• Although lifetime and past alcohol use was reported at rates somewhat higher than nationalnorms, alcohol “abuse and dependence” was estimated to be within the range of national norms.
• There appears to be more alcohol dependence and abuse among older women (aged 45-64)than among older men in Delaware, a direction different from national norms.
• White females also appear to have comparable or higher levels of abuse and abuse withdependence than non-white women.
• Female alcohol involvement did not vary appreciably by race, but alcohol involved motherswere more likely to smoke cigarettes, be unmarried, and have less than a high school education.
• Alcohol-involved birthing mothers were significantly more likely to reside in Kent County thanin either New Castle or Sussex Counties.
• Alcohol-involved mothers were almost twice as likely to have a low birth weight baby as non-alcohol involved mothers, but this is confounded with the colinearity with cigarette smoking aswell.
• The highest concentrations of women meeting DSM-III-R criteria are in the level V incarceratedpopulation.
• Non-Whites (overwhelmingly Blacks) make up over 75% of the incarcerated women inDelaware.
• Non-White women are more cocaine involved, while White women use more heroin andinjection drugs.
• Cocaine is the most problematic drug for both Whites and Non-Whites.• White women are more likely to state that alcohol is their biggest problem than are Non-Whites.• Blacks are disproportionately represented in the publicly funded treatment slots in Delaware.• Women in treatment are, on average, less than high school graduates and about 32 years old,
20% are married.• Alcohol and cocaine are the primary drugs of abuse with over 40% of women reporting each

165
as their primary problem drug, with heroin about 10%. This is different than the estimates formen where alcohol is by far the primary drug of abuse reported.
• Women remained in treatment a median of under 10 days; however, a smaller group remain inlong-term treatment, so that the average for women is 29 days.
• 19% of female detox clients and 12% of females in other modalities are needle users at high riskfor HIV transmission.
• 2% of the detox cases and 15% of the other treatment women were reported as pregnant at thetime of admission.
• The hidden treatment needs of women in Delaware were not being adequately represented inthe phone survey nor are they adequately measured in the current state databases.

166
TITLETITLE: The Prevalence and Treatment of Alcohol and Other Drug Abuse and Dependence Amongthe Sheltered Homeless in Delaware
AUTHORAUTHOR: Steven W. Peuquet, Ph.D., Abigael Miller-Sowers, and Susan Pfeifer, Ph.D.
DATEDATE: n.d.
SOURCESOURCE:
GEOGRAPHICAL AREAGEOGRAPHICAL AREA: statewide
KINDS OF INFORMATION/DATA USED IN THIS STUDYKINDS OF INFORMATION/DATA USED IN THIS STUDY: the study was based on a surveyof 147 adults residing in site-based shelters who were interviewed by telephone between November1994 and August 1995.
ISIS THIS DATA/STUDY REPRESENTATIVE OF COMMUNITY INPUT? THIS DATA/STUDY REPRESENTATIVE OF COMMUNITY INPUT?: Yes, but only inresponse to survey questions.
PROBLEMS/NEEDS ADDRESSED IN THIS STUDYPROBLEMS/NEEDS ADDRESSED IN THIS STUDY: “Health and Health Care” and“Housing”
General Prevalence
• Statewide, 38.2 percent of those participating in the study were currently abusing ordependent on alcohol. The rate was highest in Wilmington/New Castle County, standingat 49.2 percent, compared to 19.2 percent in Kent County and 17.1 percent in Sussex County.
• After alcohol, cocaine, especially in the form of crack, was the drug of choice. The surveydata revealed that 22.6 percent of the sheltered homeless statewide had been diagnosed withcocaine abuse or dependence. The rate was 26.9 percent in Wilmington/New Castle County,while the prevalence rates in Sussex and Kent County were 19.2 percent and 13.5 percentrespectively.
• On January 25, 1995, there were an estimated 184 adults who were receiving emergencyshelter services who had any drug or alcohol diagnosis. Of this number, 141 were located inWilmington/New Castle County, 26 were sheltered in Kent County, and 17 were shelteredin Sussex County.
Prevalence Rates by Sex
• While 23.5 percent of women were diagnosed as abusers of alcohol or other drugs, thepercent was three times greater, 74.2 percent for men.
Prevalence Rates by Age Group
• For alcohol, the rates of abuse increases consistently with age. The rate starts at 7.7 percentfor those under 21, this abuse rate grows to 32.7 percent for those 21-30, increases furtherto 47.1 percent for those in the two age groups of 31-40 and 41-50 and peaks at 80 percentfor those age 51-60.
• For those abusing drugs other than alcohol, the rate grows, peaks, and the subsidies. The rate

167
is 0 percent for those under 21, and the rates are 30.9 percent and 34.6 percent respectivelyfor those in the 21-30 and 31-40 age groups. The rate then drops to 29.4 percent and 0percent respectively for those between the ages of 41-50 years and 51-60 years.
Prevalence Rates by Race
• For alcohol, the rate of abuse was higher for Whites (50 percent) than it was for AfricanAmericans (34.1 percent).
• For drugs other than alcohol, the rates of abuse for these two racial groups were very similar,Whites (50 percent) as compared to African Americans (47.4 percent).
Prevalence Rates by Household Types
• Seventy-seven percent of men living alone were diagnosed with drug or alcohol abuse. Thenext highest rates of drug and alcohol abuse were females with children (30.0 percent), male-female couples without children (25.0 percent), and females living by themselves (20.5percent).
Treatment History
• Of the surveyed adults diagnosed with current drug or alcohol abuse, 17.5 percent reportedthat they had not received treatment in the past 12 months for their abuse problem. Thismeans that on January 25, 1995, there were approximately 32 adults in the emergencyshelter system in the state that had a diagnosable substance abuse problem and had notreceived any treatment for that problem over the preceding 12 months.
• Of those interviewed adults with a substance abuse diagnosis who were treated within theprevious 12 months, overall, 42.6 percent of these individuals said they would have availedthemselves of more treatment if such treatment had been available to them.

168
TITLE: TITLE: Protection From Abuse Act Statistics for Calender Year 1997
AUTHOR: AUTHOR: Michael W. Arrington
DATE: DATE: January 1998
SOURCE: SOURCE: The Family Court of Delaware
GEOGRAPHICAL AREA: GEOGRAPHICAL AREA: statewide
KINDSKINDS OF INFORMATION/DATA USED IN THE STUDY: OF INFORMATION/DATA USED IN THE STUDY: Statistical analysis from theProtection From Abuse Act for calendar year 1997
IS THE DATA/STUDY REPRESENTATIVE OF COMMUNITY INPUT? IS THE DATA/STUDY REPRESENTATIVE OF COMMUNITY INPUT? No
PROBLEMS/NEEDS ADDRESSED IN THE STUDY: Domestic ViolencePROBLEMS/NEEDS ADDRESSED IN THE STUDY: Domestic Violence
Statistics from Protection From Abuse Act proceedings for calendar year 1997 were collected fromcatalogued petitions and orders maintained in each county.
Summary AnalysisSummary Analysis
Filings:Filings:• There were 2549 petitions for Protection From Abuse tracked through disposition.
The county percentages for filing were:
66% New Castle County 19% Kent County15% Sussex County
•• Female petitioners in 85% of the cases. Males were petitioners in 15% of the cases.
Ex parte Orders:Ex parte Orders:• Ex Parte orders were given in 20% of the cases. County percentages for ex parte
orders were:
20% New Castle County29% Kent County32% Sussex County
• 22% of all female petitioners are granted ex parte orders. 2% of all male petitionersare granted ex parte orders.
PFA Orders Issued:PFA Orders Issued:•• PFA Orders consist of three categories: Consent orders, Default orders, and “Full”
orders. Consent orders may have been agreed to in a pretrial conference with courtstaff or in the courtroom before a judicial officer. Default orders are issued when arespondent fails to appear after receiving proper notice. “Full” orders are issued after

169
a finding of abuse at trial.
• Orders were issued in 58% of the cases. 58% of all female petitioners receive PFAorders. 55% of all male petitioners receive PFA orders.
• Consent orders represent 61% of the PFA orders issued. Females given orders receivethem by consent 62% of the time. Males given orders receive them by consent 57%of the time.
• Default orders represent 16% of all PFA orders issued. Females given orders receivethem by default 16% of the time. Males given orders receive them 16% of the time.
•• Orders after a hearing represent 23% of all PFA orders issued. Females given ordersreceive them after a hearing 22% of the time. Males given orders receive them aftera hearing 27% of the time.
Dismissals:Dismissals:•• 42% of all petitioners are dismissed either voluntarily before a hearing , for
petitioner’s failure to appear for the hearing, or because abuse was not found by apreponderance of the evidence after a hearing.
• Voluntary dismissals account for 38% of the dismissals. Female petitioners dismiss15% of their petitions. Male petitioners dismiss 22% of their petitions.
• Failure of the petitioner to appear for the hearing accounts for 26% of all dismissals.Female petitioners fail to show for the hearing 12% of the time. Male petitioners failto appear 7% of the time.
• Dismissals for failure to prove abuse by a preponderance of the evidence at trialaccount for 23% of all dismissals.
• Dismissals for other reasons, e.g., failure to effect services of process, account for 13%of all dismissals.
Hearing Statistics:Hearing Statistics:•• 23% of all petitions result in a hearing. 21% of female petitioners have a hearing.
30% of all male petitioners have a hearing.
• Abuse is found in 58% of all trials. Abuse is found in 60% of the hearings in whichpetitioner is female. Abuse is found in 48% of the hearings in which petitioner ismale.
Modifications and Contempts:Modifications and Contempts:•• There were 173 civil motions for contempt heard in 1997. Females filed 87% of the
motions for contempt. Males filed 13% of the motions for contempt.
• Contempt is found for 65% of all motions for civil contempt. Contempt is foundfor 66% of motions filed by female petitioners. Contempt is found for 64% ofmotions by male petitioners.

170
• Motions for modification are granted 62% of the time. Motions for modificationby female petitioners are granted 67% of the time. Motions for modification bymale petitioners are granted 40% of the time.
The report subsequently gives statistical changes from 1996 to 1997 in the aforementioned, as wellas other topics. These statewide and county statistics include: 1996 and 1997 numbers andpercentages, percent of change, and the amount of percent change.

171
TITLETITLE: (Public Perceptions) 1997 Statewide Poll on the Condition of Education in Delaware:Summary of Results
AUTHORAUTHOR: Pamela Brown and Paul LeMahieu; contributions from Kim Harries, Michele Kreismanand Julie Mueller
DATEDATE: January 1998
SOURCESOURCE: University of Delaware - College of Human Resources, Education and Public Policy -Delaware Education Research and Development Center
GEOGRAPHICAL AREAGEOGRAPHICAL AREA: statewide
KINDS OF INFORMATION/DATA USED IN THE STUDYKINDS OF INFORMATION/DATA USED IN THE STUDY: Survey information.
IS THE DATA/STUDY REPRESENTATIVE OF COMMUNITY INPUT?IS THE DATA/STUDY REPRESENTATIVE OF COMMUNITY INPUT? Yes.
PROBLEMS/NEEDS ADDRESSED IN THE STUDYPROBLEMS/NEEDS ADDRESSED IN THE STUDY: “CHILD/YOUTH”
HIGHLIGHTS OF FINDINGSHIGHLIGHTS OF FINDINGS
Quality of Education in Delaware
While only 3% of Delaware citizens would give the public schools a grade of “A”, 32% agrade of "B" or better, and 67% a grade of "C” or better, the remainder (22%) grade theschools at "D" or “F" (12% responded "don't know"). Many view the public schools in theirown community in a more favorable light. Some citizens (9%) would give the schools intheir community a grade of "A", 39% a "B" or better, and 68% a grade of "C" or better.
Many citizens (43%) believe children today are getting a poorer quality ("worse") educationthan they did themselves. Some (27%) believe children today are receiving a bettereducation than they themselves received.
Ways to Improve Delaware’s Schools
To bring about the greatest improvement in the schools, the top two areas in which citizensfeel funds should be spent if additional money became available to spend on public schoolswould be to improve the curriculum (37%) and to buy/upgrade technology (27%).
Most citizens (85%) believe that providing professional development for teachers will leadto improvement in all of Delaware's schools.
School Climate and Organization
Most citizens (85 %) believe that discipline problems in school are strongly related to thelack of discipline in the home.

172
Many citizens (62%) believe that a teacher is limited in what he/she can do because astudent's home environment is a large influence on a student's achievement.
Many parents (66%) believe that, in class, students frequently or always concentrate on theirwork with very little disruption.
Assessment/Accountability/Standards
Most citizens (63%) state that they are not familiar at all with the Delaware ContentStandards.
Most citizens believe that students (82%) and parents (89%) should be held very muchaccountable for the academic achievement of students. In addition, most (more than orequal to 86%) feel that teachers, principals, local school board members, districtadministrators, the State Board of Education, the State Secretary of Education, and theGovernor should be held at least somewhat accountable for the academic achievement ofstudents.
While many citizens believe that the state accountability system should serve multiplepurposes, there are several purposes that are supported by most citizens:
· to identify areas in which teachers need to improve their teaching skills(88%);
· to identify areas in which students need extra help (88%);· to indicate an individual student's progress (83%), a school's progress (84%)
and a district's progress (85%) in relation to the state content standards;· to determine if a student graduates from high school (82%); and · to determine if a student advances to the next grade level of schooling
(76%).
Finance Reform and Financial Issues
Few citizens support allowing school boards to raise or lower taxes without submitting thechange to a public referendum vote, even if the increase will only account for changes ininflation (17%), changes in student enrollment (21%), or changes in property values (11%).
Most citizens (81%) would favor having all of the lottery and casino proceeds in the staterevenue fund earmarked specifically for education.
Some citizens would be willing to pay more state income taxes (66%) or pay a 1% sales tax(64%) if it were earmarked specifically for education.
Instructional Focus
About half of the citizens state that schools do not give enough attention to teaching students

173
how to think (53%), preparing students who do not go to college for a job or career aftergraduation (54%), and developing students' moral and ethical character (53%).
Community Involvement
About one-third (36%) have attended any public school district function (i.e., PTA meeting,teacher conference, school board meeting, etc.) in the last year. Half (52%) of the citizenshave attended other functions held in a public school building (i.e., lecture, sports event,meeting, or social occasion) during the last year. Less than half (42%) voted in the lastschool referendum in their community.
Communication
While some citizens (43%) believe they get enough information about public schools in theircommunity, many (53%) feel they do not. Furthermore, the top three sources ofinformation about public schools cited by the public were the newspaper (47%); school ordistrict newsletter (30%); and friends, relatives, or neighbors (25%).
Most citizens (80%) anticipate that the "School Profiles" that will be available to parents andcommunity members will be useful or very useful.

174
TITLETITLE: Public Perceptions of the Condition of Education in Delaware: Summary of Results -Comparisons of African-American Households to Caucasian-American Households
AUTHORAUTHOR: James A. Riedel and Paul G. LeMahieu
DATEDATE: January 1996
SOURCESOURCE: University of Delaware - Delaware Education Research and Development Center
GEOGRAPHICAL AREAGEOGRAPHICAL AREA: statewide
KINDS OF INFORMATION/DATA USED IN THE STUDYKINDS OF INFORMATION/DATA USED IN THE STUDY: Survey information.
IS THE DATA/STUDY REPRESENTATIVE OF COMMUNITY INPUT?IS THE DATA/STUDY REPRESENTATIVE OF COMMUNITY INPUT? Yes.
PROBLEMS/NEEDS ADDRESSED IN THE STUDYPROBLEMS/NEEDS ADDRESSED IN THE STUDY: “CHILD/YOUTH”
Highlights of Findings
Many of the results of analyses comparing African-American households to Caucasian-Americanhouseholds reveal similar responses for both groups. The following highlights enumerate just thosepoints at which substantial differences (defined as twelve percentage points difference - the marginof statistical significance) between the two groups occur. (On numerous other issues the differencereached ten or eleven percentage points.) Significant differences between the two groups included:
African-American respondents gave the public schools in Delaware higher grades: 56%gave them a grade of "B" or better as compared to 34% of the Caucasian-Americanrespondents.
In order to help the schools earn an "A", the only differences in recommendations are thatmore African-American respondents than Caucasian-American respondents felt that“raising teachers' salaries” (86% to 71%) and "building new schools" (62% to 43%) are"Important" or "Very Important."
Thirty-eight percent (38%) of African-Americans compared to twenty-three percent(23%) of Caucasian-Americans "think that children today get a 'Better' quality ofeducation" than they did.
More African-Americans are "willing to pay more taxes to improve the schools in poorercommunities" than Caucasian-Americans (73% versus 59%).
More African-American respondents "feel that parents and community members shouldhave 'More Say' with regard to policies about" the following four areas in the publicschools: "books and instructional materials" (50% to 32%), "books placed in the schoollibraries" (50% to 32%), "amount of homework assigned" (43% to 31%), "disciplinepolicies" (75% to 63%). Thirty percent (30%) of African-Americans felt parents andcommunity members have about the right amount of say regarding the "selection andhiring of teachers" compared to forty-two percent (42%) of Caucasian-Americans.
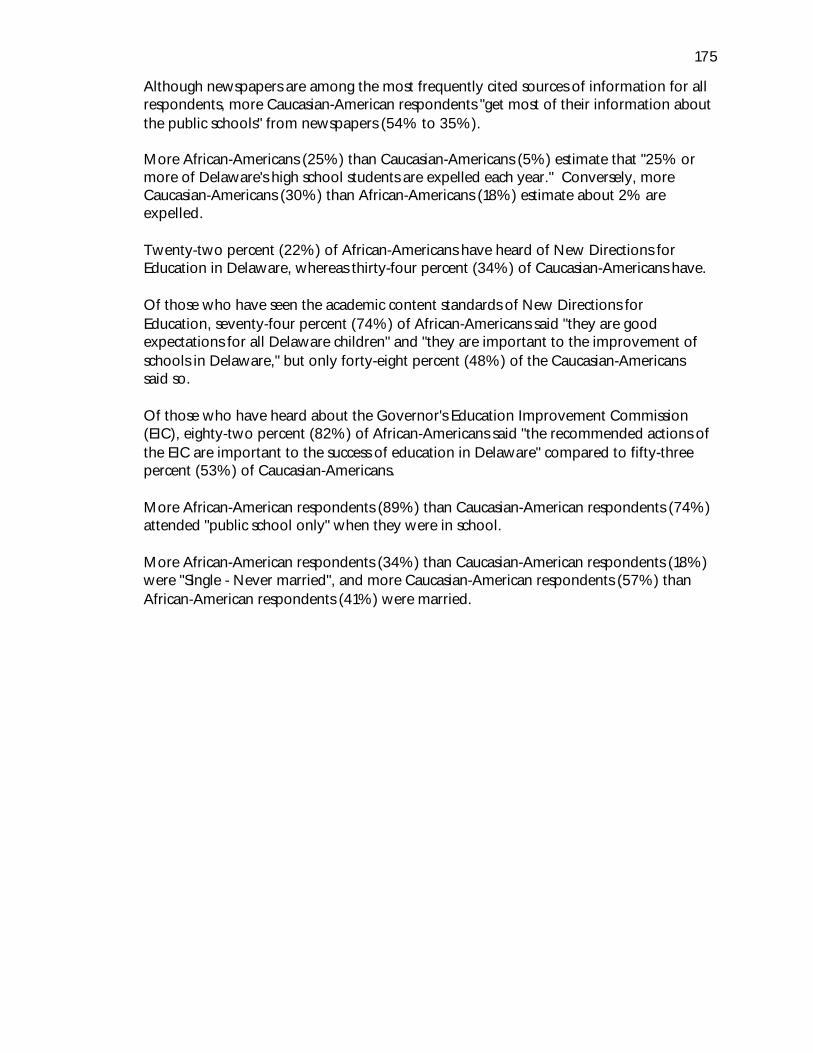
175
Although newspapers are among the most frequently cited sources of information for allrespondents, more Caucasian-American respondents "get most of their information aboutthe public schools" from newspapers (54% to 35%).
More African-Americans (25%) than Caucasian-Americans (5%) estimate that "25% ormore of Delaware's high school students are expelled each year." Conversely, moreCaucasian-Americans (30%) than African-Americans (18%) estimate about 2% areexpelled.
Twenty-two percent (22%) of African-Americans have heard of New Directions forEducation in Delaware, whereas thirty-four percent (34%) of Caucasian-Americans have.
Of those who have seen the academic content standards of New Directions forEducation, seventy-four percent (74%) of African-Americans said "they are goodexpectations for all Delaware children" and "they are important to the improvement ofschools in Delaware," but only forty-eight percent (48%) of the Caucasian-Americanssaid so.
Of those who have heard about the Governor's Education Improvement Commission(EIC), eighty-two percent (82%) of African-Americans said "the recommended actions ofthe EIC are important to the success of education in Delaware" compared to fifty-threepercent (53%) of Caucasian-Americans.
More African-American respondents (89%) than Caucasian-American respondents (74%)attended "public school only" when they were in school.
More African-American respondents (34%) than Caucasian-American respondents (18%)were "Single - Never married", and more Caucasian-American respondents (57%) thanAfrican-American respondents (41%) were married.

176
TITLETITLE: The Realities of Poverty in Delaware, 1989 Update
AUTHORAUTHOR: Alice Brandreth, Editor
DATEDATE: 1989
SOURCESOURCE: Public Assistance Task Force; Wilmington, DE
GEOGRAPHICAL AREAGEOGRAPHICAL AREA: Statewide
KINDS OF INFORMATION/DATA USED IN THE STUDYKINDS OF INFORMATION/DATA USED IN THE STUDY: (Secondary date: The NewsJournal, Children’s Defense Fund, DHSS - Office of Community Services, National Health CareCampaign, food closet / Food Bank reports, DelDoT, The United Way of Delaware and others)
IS THE DATA/STUDY REPRESENTATIVE OF COMMUNITY INPUT?IS THE DATA/STUDY REPRESENTATIVE OF COMMUNITY INPUT? No.
PROBLEMS/NEEDS ADDRESSED IN THE STUDYPROBLEMS/NEEDS ADDRESSED IN THE STUDY: General
General discussion of increasing poverty in America; poverty in Delaware; who the poor are;Delaware’s poor: welfare recipients and the working poor.
Unmet Needs of the Poor
Lack of Affordable HousingLack of Health Care CoverageFood/HungerFuel/Energy CostsTransportationCrisis Alleviation
Lack of Affordable Housing· Since 1983, the group among whom homelessness has increased the most is
families; members of families with children represent 28% of the homelesspopulation
· More families are joining the ranks of the homeless because of increasing housingcosts and decreased or stagnant wages
· In Delaware, the number of very low income renter households exceeded thenumber of very low rent units by 123.7% in 1985 (= a shortage of 10,086 units)
· Except for a brief period in September 1988, the Wilmington Housing Authorityhas not taken housing applications for public housing since 1986 because of the264 families on the waiting list; approximately 10,000 households in Delawareare on waiting lists for public and other subsidized housing
· All three counties experienced substantial growth in the number of persons housedby emergency shelters between January 1984 and October 1987
· During 1988, 4,065 individuals were not sheltered (2,849 were sheltered), asreported by 12 agencies statewide (unserved number may include duplicatedpeople)
Lack of Health Care Coverage

177
· According to a 1987 study, 86,000 Delawareans are uninsured and another35,000 are under insured
· The working poor and their families comprise the largest category of theuninsured and under insured
Food/Hunger· Approximately one out of every ten citizens in Delaware is chronically hungry· Emmanuel Dining Hall reports increasing numbers of women and children, as well
as a continual and gradual increase annually in the number of persons served· Food Conservers also estimated an increase in the number of persons served from
1982-1988 through their Food Warehouse program
Energy Costs· Household energy costs rose 201% for the poor, resulting in crisis for low and
fixed-income households, forcing them to choose between energy and otherhousehold needs
· Funding from LIHEAP (Low Income Housing Energy Assistance Program)decreased in 1987-1988, with average household benefits decreasing from about$346.00 per year to $330.00 per year (1988-1989)
· Even after LIHEAP benefits are distributed, a sizable inequity occurs· The decrease in households eligible for LIHEAP benefits is a consequence of the
decrease of affordable housing units available for poor families
Transportation· Lack of evening and weekend bus service, as well as circumscribed routes
provided, creates a barrier for low-income persons in accessing jobs
Crisis Alleviation· FEMA (Federal Emergency Management Agency) allocated $250,000 to 42
agencies throughout the state from October 1, 1988 to September 30, 1989· The amount of crisis alleviation funds is inadequate to meet the needs· In June 1988, when 17 agencies were contacted, 7 had already used up FEMA
funds and the remaining agencies had a very small amount left; by September1988, only 2 of the 21 agencies in New Castle County had any FEMA fundsremaining

178
TITLETITLE: The Realities of Poverty in Delaware, 1991 Update
AUTHORAUTHOR: Alice Brandreth, Editor
DATEDATE: 1991
SOURCESOURCE: Public Assistance Task Force; Wilmington, DE
GEOGRAPHICAL AREAGEOGRAPHICAL AREA: Statewide
KINDS OF INFORMATION/DATA USED IN THE STUDYKINDS OF INFORMATION/DATA USED IN THE STUDY: (Secondary date: The NewsJournal, Children’s Defense Fund, DHSS - Office of Community Services, National Health CareCampaign, food closet / Food Bank reports, DelDoT, The United Way of Delaware and others)
IS THE DATA/STUDY REPRESENTATIVE OF COMMUNITY INPUT?IS THE DATA/STUDY REPRESENTATIVE OF COMMUNITY INPUT? No.
PROBLEMS/NEEDS ADDRESSED IN THE STUDYPROBLEMS/NEEDS ADDRESSED IN THE STUDY: General
General discussion of poverty and inequality - declining opportunity in the U.S.; who the poorare; poverty and inequality in Delaware; children in poverty; Delaware’s poor: welfare recipientsand the working poor.
The AFDC caseload increasing after decrease in the 1980s
Unmet Needs of the Poor
Lack of Affordable HousingLack of Health Care CoverageFoodFuelTransportationCrisis Alleviation
Lack of Affordable Housing· Since 1983, the group among whom homelessness has increased the most is
families; members of families with children represent 28% of the homelesspopulation
· In Delaware, there is a significant shortage of affordable rental housing; few rentalunits are being constructed that are affordable at income levels of people workingin major job growth areas; prices of homes are out of reach of incomes earned
· In contrast to federal government funding, state government funding hasincreased for the development of affordable housing
· Although a state Housing Trust Fund has been established, there is no permanentfunding mechanism upon which it can depend; the current funding level is grosslyinadequate to meet the demand of 35,000 renter households statewide
· Those who are homeless are increasing in number; in 1990, only 33% of thoseseeking emergency or transitional housing received shelter
Lack of Health Care Coverage

179
· Approximately 72,000 Delawareans (about 12% of the non-elderly population)are likely to be without any form of health care coverage at any point in time
· The uninsured population is predominantly younger, with 51% of all uninsuredpersons being under the age of 21
· The working poor and their families comprise the largest category of theuninsured and under insured
Food· Hunger continues to escalate in Delaware· Approximately one out of every ten citizens in Delaware is chronically hungry· Emmanuel Dining Hall reports increasing numbers of women and children, as well
as employed workers who are being fed
Fuel· Costs for low-income families in Delaware for heating and energy are the highest
in the nation· A typical three-person family receiving welfare in Delaware spends 42% of its
income on energy· Household energy costs rose 201% for the poor, resulting in crisis for low and
fixed-income households, forcing them to choose between energy and otherhousehold needs
· Funding from LIHEAP (Low Income Housing Energy Assistance Program)decreased in 1987-1988, with average household benefits decreasing from about$346.00 per year to $330.00 per year (1988-1989); as of January 1991, thecurrent average household benefit was $315.00
· Even after LIHEAP benefits are distributed, a sizable inequity occurs
Transportation· In a 1990 study in New Castle County, 21% of unemployed persons interviewed
reported that they were not working because of lack of transportation and 33%of the low-income persons attributed their un(der)employment to lack oftransportation
· Lack of evening and weekend bus service, and routes and schedules not availablefor the reverse commute to the suburbs or to travel between suburbs preventedlow-income persons from accessing jobs in the suburbs
· In rural Sussex and Kent counties, there is little access to public transportation
Crisis Alleviation· FEMA (Federal Emergency Management Agency) allocated $324,282 to 44
agencies throughout the state from October 1, 1990 to September 30, 1991· The amount of crisis alleviation funds is inadequate to meet the needs

180
TITLETITLE: The Realities of Poverty in Delaware, 1993 Update
AUTHORAUTHOR: Alice Brandreth, Editor
DATEDATE: 1993
SOURCESOURCE: Public Assistance Task Force; Wilmington, DE
GEOGRAPHICAL AREAGEOGRAPHICAL AREA: Statewide
KINDS OF INFORMATION/DATA USED IN THE STUDYKINDS OF INFORMATION/DATA USED IN THE STUDY: (Secondary Data: The NewsJournal, Children’s Defense Fund, DHSS - Office of Community Services, National Health CareCampaign, food closet / Food Bank reports, DelDoT, The United Way of Delaware and others)
IS THE DATA/STUDY REPRESENTATIVE OF COMMUNITY INPUT?IS THE DATA/STUDY REPRESENTATIVE OF COMMUNITY INPUT? No.
PROBLEMS/NEEDS ADDRESSED IN THE STUDYPROBLEMS/NEEDS ADDRESSED IN THE STUDY: General
General discussion of income redistribution; who the poor are; myths about AFDC; poverty andinequality in Delaware; Delaware’s poor; the working poor.
· The AFDC caseload increased from 8,025 (1990) to 8,866 (1991) to 10,350 (1992) (12th
highest caseload increase in the nation)
Unmet Needs of the Poor
Lack of Affordable HousingLack of Health Care CoverageChild CareFood/HungerEnergy CostsTransportation GapsCrisis Alleviation
Lack of Affordable Housing· Home ownership is increasingly out of reach for young families in America;
family housing crisis is the result of rising housing costs, falling incomes and adecade of inadequate government housing and income assistance for the poor
· There is a significant shortage of affordable housing in Delaware; income is notkeeping pace with housing rates
· Although a state Housing Trust Fund has been established, there is no permanentfunding mechanism upon which it can depend; the current funding level is grosslyinadequate to meet the demand of 35,000 renter households statewide
· Those who are homeless are increasing in number (see p. 10 for numbers of thosenot able to be sheltered due to lack of space or funds)
· The number of those seeking emergency or transitional housing has more thandoubled since 1988
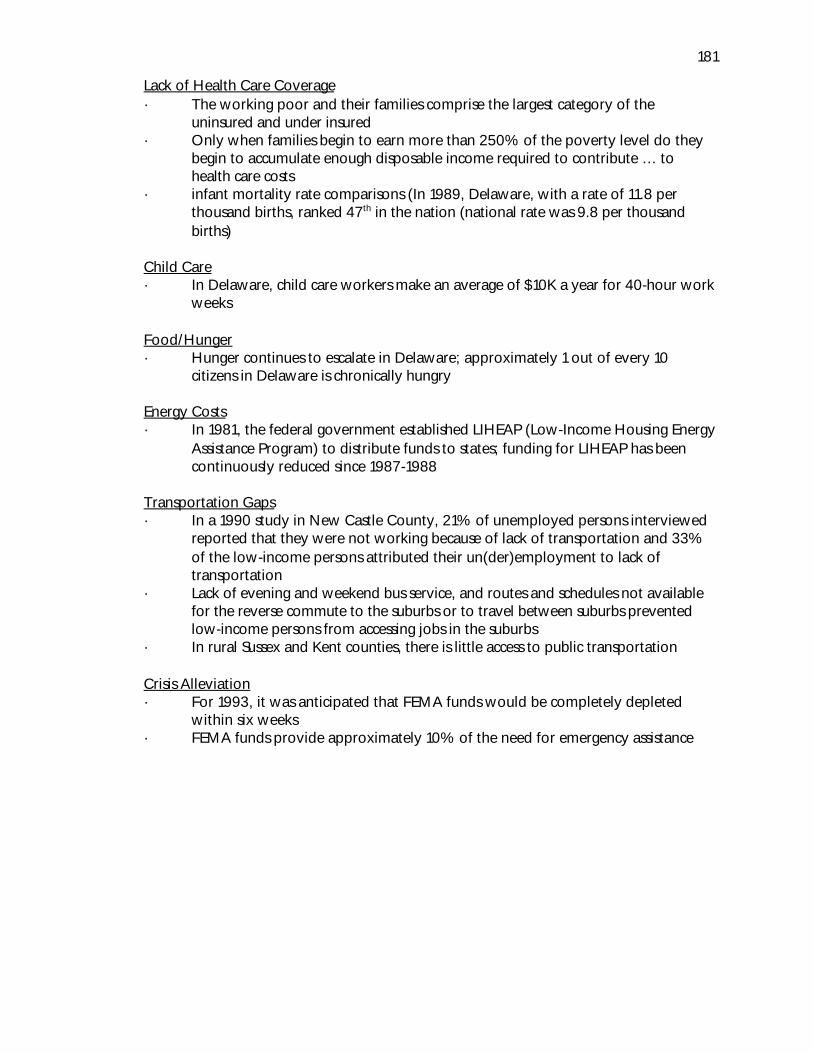
181
Lack of Health Care Coverage· The working poor and their families comprise the largest category of the
uninsured and under insured· Only when families begin to earn more than 250% of the poverty level do they
begin to accumulate enough disposable income required to contribute … tohealth care costs
· infant mortality rate comparisons (In 1989, Delaware, with a rate of 11.8 perthousand births, ranked 47th in the nation (national rate was 9.8 per thousandbirths)
Child Care· In Delaware, child care workers make an average of $10K a year for 40-hour work
weeks
Food/Hunger· Hunger continues to escalate in Delaware; approximately 1 out of every 10
citizens in Delaware is chronically hungry
Energy Costs· In 1981, the federal government established LIHEAP (Low-Income Housing Energy
Assistance Program) to distribute funds to states; funding for LIHEAP has beencontinuously reduced since 1987-1988
Transportation Gaps· In a 1990 study in New Castle County, 21% of unemployed persons interviewed
reported that they were not working because of lack of transportation and 33%of the low-income persons attributed their un(der)employment to lack oftransportation
· Lack of evening and weekend bus service, and routes and schedules not availablefor the reverse commute to the suburbs or to travel between suburbs preventedlow-income persons from accessing jobs in the suburbs
· In rural Sussex and Kent counties, there is little access to public transportation
Crisis Alleviation· For 1993, it was anticipated that FEMA funds would be completely depleted
within six weeks· FEMA funds provide approximately 10% of the need for emergency assistance

182
TITLETITLE: The Realities of Poverty in Delaware, 1995 Update
AUTHORAUTHOR: Alice Brandreth, Editor
DATEDATE: 1995
SOURCESOURCE: Public Assistance Task Force; Wilmington, DE
GEOGRAPHICAL AREAGEOGRAPHICAL AREA: Statewide
KINDS OF INFORMATION/DATA USED IN THE STUDYKINDS OF INFORMATION/DATA USED IN THE STUDY: (Secondary data: The NewsJournal, Children’s Defense Fund, DHSS - Office of Community Services, National Health CareCampaign, food closet / Food Bank reports, DelDoT, The United Way of Delaware and others)
IS THE DATA/STUDY REPRESENTATIVE OF COMMUNITY INPUT?IS THE DATA/STUDY REPRESENTATIVE OF COMMUNITY INPUT? No.
PROBLEMS/NEEDS ADDRESSED IN THE STUDYPROBLEMS/NEEDS ADDRESSED IN THE STUDY: General
General discussion of economic insecurity in America (structural changes in the economy; policychanges that have increased poverty); who the poor are; myths vs. facts of welfare reform;poverty rate amongst children; Delaware’s poor: welfare recipients and the working poor.
Unmet Needs of the Poor
Lack of Affordable HousingLack of Health Care CoverageChild CareFood/HungerEnergy CostsTransportation GapsCrisis Alleviation
Lack of Affordable Housing· For the past two decades, homelessness has increased faster among families with
children than among any other group of Americans; families with childrenaccounted for, on average, 39% of the homeless population
· In Delaware, there is a significant shortage of affordable rental housing; the needfor subsidized housing is estimated to be at least 11,000 additional units to closethe gap between what the market provides and what very low incomehouseholds can afford
· Large reductions in rental housing assistance have contributed to homelessness· In January 1995, the Wilmington Housing Authority reported that there were
1,148 households on their waiting list for public housing; because of this, newapplicants have not been accepted for four years
· In December 1995, there were 1,546 households in Kent and Sussex that were onthe waiting list for public housing, with 1,508 of these households also on theSection 8 waiting list
· Although a state Housing Trust Fund has been established, there is no permanentfunding mechanism upon which it can depend; the current funding level is grossly

183
inadequate to meet the demand· prices of homes are out of reach of incomes earned
Lack of Health Care Coverage· Estimates of the number of Delawareans lacking health insurance range from
89,000 to 95,000· The working poor and their families comprise the largest category of the
uninsured and under insured· Delaware ranks as the 28th worst state in the nation for the percent of its total
population that is medically undeserved· Delaware’s improvements in health care access (establishment of pediatric clinics
and health care for adults below 100% of poverty under Delaware’s MedicaidManaged Care program) are severely threatened by the federal government’sproposed Medicaid cuts
Child Care· Child care is a major concern due to increasing number of two-wage earners and
the increase of single-parent, largely female-, headed households· Although many children of the working poor qualify for subsidized day care, the
State Division of Social Services reported in June 1994 that approximately 1,376children who were then qualified were on the waiting list for an available slot
· The State Division of Social Services also reported that 42% of the families wereforced to return to welfare because the family could not afford child care
Food/Hunger· Approximately one out of every ten citizens in Delaware is chronically hungry;
the Food Research and Action Center estimates that 21.8% of Delaware’s childrenunder age 12 are hungry or at-risk for hunger
· Emmanuel Dining Hall feeds women and children, as well as employed andunemployed workers; low wages and expensive rental housing costs create theneed for food subsidy
· The number served at Emmanuel Dining Hall peaked in 1991, but 1992-1994numbers are all greater that those years previous to 1991
Energy Costs· A typical three-person family receiving welfare in Delaware spends 42% of its
income on energy· Household energy costs rose 201% for the poor, resulting in crisis for low and
fixed-income households, forcing them to choose between energy and otherhousehold needs
· Funding from LIHEAP (Low Income Housing Energy Assistance Program) has beencontinually reduced since 1987-1988; expected cut in funding to Delaware is from$3.5 million (1994-1995) to $2.6 million (1995-1996)
· Average household benefits have decreased: $346.00 (1987-1988) , $330.00(1988-1989) , $315.00 (1990-1991) , $300.00 (1991-1992) , $230.00 (1992-1993) , $250.00 (1993-1994) , $193.00 (1994-1995) a 44% decline between1987 and 1997
· Even after LIHEAP benefits are distributed, a sizable inequity occurs

184
Transportation· In a 1990 study in New Castle County, 21% of unemployed persons interviewed
reported that they were not working because of lack of transportation and 33%of the low-income persons attributed their un(der)employment to lack oftransportation
· Lack of evening and weekend bus service, and routes and schedules not availablefor the reverse commute to the suburbs or to travel between suburbs preventedlow-income persons from accessing jobs in the suburbs
· In rural Sussex and Kent counties, there is little access to public transportation · In 1995, these transportation gaps still exist
Crisis Alleviation· The amount of crisis alleviation funds is inadequate to meet the needs· Based on the experience that FEMA funds are completely depleted in six weeks, it
can be extrapolated that FEMA provides approximately 10% of the need ofemergency assistance

185
TITLETITLE: The Realities of Poverty in Delaware, 1997 Update
AUTHORAUTHOR: Alice Brandreth, Editor
DATEDATE: 1997
SOURCESOURCE: Public Assistance Task Force; Wilmington, DE
GEOGRAPHICAL AREAGEOGRAPHICAL AREA: Statewide
KINDS OF INFORMATION/DATA USED IN THE STUDYKINDS OF INFORMATION/DATA USED IN THE STUDY: (Secondary data: The NewsJournal, Children’s Defense Fund, DHSS - Office of Community Services, National Health CareCampaign, food closet / Food Bank reports, DelDoT, The United Way of Delaware and others)
IS THE DATA/STUDY REPRESENTATIVE OF COMMUNITY INPUT?IS THE DATA/STUDY REPRESENTATIVE OF COMMUNITY INPUT? No.
PROBLEMS/NEEDS ADDRESSED IN THE STUDYPROBLEMS/NEEDS ADDRESSED IN THE STUDY: General
General discussion of Welfare Reform; Employment - “invisible” job displacement; poverty andchildren: Delaware had lowest percentage of those living in poverty in comparison to otherstates (tied with New Hampshire); and Working Poor.
Lack of Affordable HousingInadequate Health Care CoverageChild CareFood/HungerEnergy CostsTransportation GapsCrisis Alleviation
Lack of Affordable Housing· Sanctions and work requirements from Delaware’s welfare reform’s Contract of
Mutual Responsibility have increased the risk of homelessness and the subsequentplacement of children in foster care
· Peuquet and Leland, and Peuquet and Miller-Sowers studies have shown a sizableincrease in homelessness in Delaware between 1984-1987 and 1986-1996,respectively
· The changing face of who are the primary clients in shelters - today’s homelessinclude young as well as older single individuals, and a significant number offamilies, a large portion of which are headed by a single parent
· Homelessness rose in Delaware even during periods of economic prosperity andlow unemployment
· “No arrangements known” is the largest category for those leaving emergency ortransitional housing, which reflects the need for more comprehensive services toaddress the need of chronic homelessness, and demonstrates the difficulty andfrustration on the part of shelters in attempting to assist households become self-sufficient in a short period of time and with limited resources
· The Wilmington Housing Authority has 672 eligible families on their waiting listand has not accepted new application for families since February 1996

186
Inadequate Health Care Coverage· The estimated of the number of Delawareans lacking health insurance in 1995 was
96,000, about the same as in 1994 - 94,000· The majority of Delaware’s uninsured have remained uninsured for over a year· 64% are working; 73% are above the poverty line· As of December 1996, a total of 60,603 clients were enrolled in Medicaid
Managed Care Organization (MCO)
Child Care· TANF/ABC time limits put increased pressure on low-income families who will
struggle to survive with wages too low to pay for subsistence needs and also topay for day care
· The Congressional Budget Office estimates that TANF provides $1.4 billion lessthan what is needed over the next six years for the child care necessary to meet therequirements, even if the states put up all of the state matching funds needed toobtain the new federal dollars
· The State Division of Social Services is reporting that no one is on the waiting listfor subsidized day care
Food/Hunger· The welfare reform law targets food assistance programs for the deepest
reductions in their history, which means an average loss of $355 in food stampbenefits, and cuts in meals for children in summer programs and WIC
· Emmanuel Dining Hall feeds employed and unemployed workers, as well as anincreasing number of children; low wages and expensive rental housing costscreate the need for food subsidy
· The number served at Emmanuel Dining Hall peaked in 1991, but 1992-1994numbers are all greater that those years previous to 1991; hit lower dip in 1994,with increases in 1995 and again in 1996
Energy Costs· A typical three-person family receiving welfare in Delaware spends 42% of its
income on energy· Household energy costs rose 201% for the poor, resulting in crisis for low and
fixed-income households, forcing them to choose between energy and otherhousehold needs
· Funding from LIHEAP (Low Income Housing Energy Assistance Program) has beencontinually reduced since 1987-1988; cuts are reflected in the reduction of bothnumber of households receiving benefits and the average benefits received
· Average household benefits have decreased: $346.00 (1987-1988) , $330.00(1988-1989) , $315.00 (1990-1991) , $300.00 (1991-1992) , $230.00 (1992-1993) , $250.00 (1993-1994) , $193.00 (1994-1995) , $185.00 (1995-1996) ,$186.00 (1996-1997), a 46% decline between 1987 and 1997
· Even after LIHEAP benefits are distributed, a sizable inequity occurs
Transportation· Little has changed since 1990 study:· In New Castle County, 21% of unemployed persons interviewed reported that

187
they were not working because of lack of transportation and 33% of the low-income persons attributed their un(der)employment to lack of transportation
· Lack of evening and weekend bus service, and routes and schedules not availablefor the reverse commute to the suburbs or to travel between suburbs preventedlow-income persons from accessing jobs in the suburbs
· In rural Sussex and Kent counties, there is little access to public transportation
Crisis Alleviation· The amount of crisis alleviation funds is inadequate to meet the needs· Based on the experience that FEMA funds are completely depleted in six weeks, it
can be extrapolated that FEMA provides approximately 10% of the need ofemergency assistance

188
TITLE: TITLE: The Realities of Poverty in Delaware,1999 Update
AUTHOR: AUTHOR: Alice Brandreth
DATE: DATE: Summer 1999
SOURCE: SOURCE: The Housing Journal
GEOGRAPHICAL AREA: GEOGRAPHICAL AREA: statewide
KINDS OF INFORMATION/DATA USED IN THE STUDY: KINDS OF INFORMATION/DATA USED IN THE STUDY: Secondary data from UD’s Center for Applied Demography and Survey Research, Center on Budget and Policy Priorities,U.S. Bureau of the Census, Department of Health and Human Services, U.S. Department of HUD,Delaware Health Statistics Center, Allan Zaback, DHSS/DSSC/Office of Community Services. IS THE DATA/STUDY REPRESENTATIVE OF COMMUNITY INPUT? IS THE DATA/STUDY REPRESENTATIVE OF COMMUNITY INPUT? No
PROBLEMS/NEEDS ADDRESSED IN THE STUDY: General, Emergency Assistance,PROBLEMS/NEEDS ADDRESSED IN THE STUDY: General, Emergency Assistance,Housing, EmploymentHousing, Employment
Profile of the poorProfile of the poor• Despite rising prosperity in the nation, child poverty increased from 14.4% in 1973 to more
than 20% in 1996.• In 1993, Delaware shared first place in having the lowest percentage of children living in
poverty in the United States. Now Delaware ranks 16th in the U.S..• Married couples with children typically had income 12% lower in 1994 than in 1973. • In Delaware, welfare benefits have not been increased since 1990.
Outcomes of welfare reformOutcomes of welfare reform• Since the 1996 welfare reform law was enacted, welfare caseloads have dropped 31%
nationwide.• Since 1996, Delaware’s welfare caseloads have dropped by 35%.• In Delaware, most clients, who leave the welfare program, enter the workforce finding jobs
that pay an average of $6.17 an hour.• In Februay1999, a statewide survey was done to show the effects of welfare reform in
Delaware. It reported:
C Nearly two-thirds of responding households reported at least one personworking, while a quarter of respondents reported two or more workers
C The average number of hours worked a week was 32.7C The average wage reported was $7.42 per hourC High levels of Medicaid and Food Stamps were reported, while child care
assistance remained low.C Minimal support for education or job training was reported.
Unmet needs of the poorUnmet needs of the poor• Homelessness:
The rate of homelessness in Delaware is similar to rates found elsewhere in the U.S. and forthe nation overall.There are approximately 20 homeless per 10,000 persons. With a statewide population of

189
700,000, this equates to about 1,400 homeless persons in Delaware.The rise of homelessness in Delaware can be attributed to the overall growth of one-personand single-parent households, combined with a lack of real growth in earnings for a numberof years.
• Health care coverage:From the early 1980's until the mid-1990's, Delaware residents without health insurance hasdecreased for 15.6% to 13.6%. According to a study conducted for the Delaware Health Care Commission, the majority ofDelaware’s uninsured have remained uninsured for more than a year.In 1999, the Delaware Healthy Children Program was initiated to provide children under theage of 19 with family incomes at or below 200 percent of the federal poverty level withhealth insurance.
• Child care:In 1998, the state only allowed low-income working families earning less than $20,644(for a family of three) to be eligible for any child care help although federal law allows thestate to serve families with incomes up to $38,927. A family of three earning $19,995 a year receiving child care help could be required to pay asmuch as 15% of their income in family copayment, which is 50% more than expertsrecommend.
• Food security:It is estimated that $15 million in food stamps will be cut between 1997 and 2002, which isequivalent of three meals per day for one year for 33,970 people.
• Energy:By 1989, according to the National Consumer Law Center Report, a typical person receivingwelfare in Delaware spent 42% of its income on energy.Since 1995, the Low Income Housing Energy Assistance Program (LIHEAP), which distributesfunds to states for the purpose of assisting, low-income households with their energy costshas experienced funding cuts that are reflected both in the number of households receivingbenefits and average benefits received.
• Transportation:A study in 1990 by New Castle County for the Delaware Transportation Authority reportedthat 21% of the unemployed were not working because of lack of transportation.There is also a lack of evening and weekend bus service, as well as limited routes andschedules available for the reverse commuter trip to the suburbs.
• Emergency assistance:The Federal Emergency Management Agency (FEMA) allocates money to the states foremergency food and shelter programs.Information about the total amount of emergency assistance funds dispersed in Delaware byall private and state agencies from all sources has not been collected.
Escalating income disparityEscalating income disparity• Corporate CEO’s who earned 41 times what their workers made in 1960, made 185 times as
much as their workers in 1995•• In 1995, CEO’s earned more every two days than the average worker earned in a whole year.• In Delaware 38% of jobs pay less than $15,330 a year ($7.37 an hour).• Between the 1970's and the 1990's the average income of the poorest fifth of families fell by
$810, from $12,850 to $12,040, while the average income of the richest fifth of familiesincreased by $27,250, from $89,720 to $116,940.

190
• Welfare reform at both the federal and state levels has accelerated the growth of poverty aseconomic realities are ignored and the notion of “personal responsibility” for economicinsecurity is embraced by those eager to reduce government benefits from the poor.
ConclusionConclusion• Lack of awareness of the realities of poverty by the average American contributed to a
political environment in which the needs of the poor can be readily ignored.• Welfare reform has succeeded in reducing welfare rolls but failed in reducing poverty.• Social services and casework treatments of the problems of the poor can neither keep pace
with the rate of impoverishment nor address the root cause. • The escalation of redistribution of income from the poor to the wealthy and the increasing
disparity of economic opportunity in the U.S. raises questions about the values of Americans.

191
TITLETITLE: Secondary Conditions and Community Integration Among Delawareans with TraumaticBrain Injuries: A First Look
AUTHORAUTHOR: Prepared by Edward C. Ratledge, Center for Applied Demography and SurveyResearch, University of Delaware, for Delaware Disabilities Prevention Program Division of PublicHealth, Delaware Department of Health and Social Services
DATEDATE: June 1997
SOURCESOURCE: Center for Applied Demography and Survey Research, University of Delaware
GEOGRAPHICAL AREAGEOGRAPHICAL AREA: Statewide
KINDS OF INFORMATION/DATA USED IN THE STUDYKINDS OF INFORMATION/DATA USED IN THE STUDY:
Primary data - results of a survey of 16 adults in Delaware with brain injuries
IS THE DATA/STUDY REPRESENTATIVE OF COMMUNITY INPUT?IS THE DATA/STUDY REPRESENTATIVE OF COMMUNITY INPUT?
Yes, to the degree that the respondents represent the community of Delawareans withbrain injuries.
PROBLEMS/NEEDS ADDRESSED IN THE STUDYPROBLEMS/NEEDS ADDRESSED IN THE STUDY: “HEALTH AND HEALTH CARE” and‘DISABLED”
The report is the end product of a study conducted to gather information about secondaryconditions suffered by and the degree of community integration of Delawareans with braininjuries. The highlights of the results are:
· The degree of community integration among those surveyed varied greatly.
· The frequency and treatment of secondary conditions also varied widely, though onlyabout one-third of respondents reported being treated for secondary conditions.
· Those that were treated for secondary conditions were generally satisfied.
· The frequency of secondary conditions appears to be negatively related to the degree ofcommunity integration.

192
TITLETITLE: Service Provider Survey
AUTHORAUTHOR: Leslie Cooksy and Janice Sturgis; prepared for Division of Child Mental HealthServices - Department of Services for Children, Youth and Their Families - State of Delaware
DATEDATE: July 1998
SOURCESOURCE: University of Delaware - College of Human Resources, Education and PublicPolicy - Center for Community Development and Family Policy
GEOGRAPHICAL AREAGEOGRAPHICAL AREA: statewide
KINDS OF INFORMATION/DATA USED IN THE STUDYKINDS OF INFORMATION/DATA USED IN THE STUDY: Primary data (survey results)
IS THE DATA/STUDY REPRESENTATIVE OF COMMUNITY INPUT?IS THE DATA/STUDY REPRESENTATIVE OF COMMUNITY INPUT? Yes (surveyresponses)
PROBLEMS/NEEDS ADDRESSED IN THE STUDYPROBLEMS/NEEDS ADDRESSED IN THE STUDY: “CHILD/YOUTH” and “HEALTH ANDHEALTH CARE”
The Division of Child Mental Health Services (DCMHS) Mission and Values
Areas for Improvement:
· Supporting the implementation of innovative programs and services· Providing a structure for effective collaboration· Increasing the scope of services· Demonstrating sensitivity to cultural and ethnic differences· Strengthening accountability
DCMHS System Performance
Conclusions:
Respondents were generally satisfied with the performance of the DCMHS system. Specific strengths included improvements in communication and the concern for clientsdemonstrated by DCMHS personnel.
Despite the positive evidence for DCMHS’s communication with service providers,communication is also an area identified as needing improvement. In particular,improvements were suggested in:
• the provider appeals process; • the consistency and amount of information provided to the providers;
and • the amount and complexity of the paperwork.
Better coordination across Divisions within the Department of Services for Children,Youth and Their Families was also recommended, as well as additional training andclarification of the roles of DCMHS personnel.

193
Role of the Provider in the DCMHS Managed Behavioral Health System
Findings:
Overall, providers were very aware of expectations and requirements of the role of theprovider. When asked about strengths of the provider role, the respondents tended tocomment in the strengths of their agency, including the quality of services that theyprovided, the quality of their staff, and their communication with DCMHS. Similarly,some of the areas for improvement identified were specific to the individual agencies. The areas in which DCMHS needs to improve focused on communication andpaperwork.
Areas for Improvement:
The respondents indicated that communication between DCMHS and the providers could beimproved by:
· Clarifying the providers’ accountability responsibilities to different DCMHScomponents;
· Continuing the process of identifying systems concerns;· Improving coordination and communication between wraparound service and
primary clinical providers; and· Improving the timeliness of paperwork.
Provider Network Administration
Findings:
Respondents’ experience with the DCMHS Program Administrators was generallypositive. A majority of the respondents having direct experience with the contracting ormonitoring processes gave favorable responses about the clarity or appropriateness of theprocesses. Strengths that were noted were the monitoring process, accessibility, the RFPprocess, and one specific staff member.
Despite the strengths, communication was again identified as a concern.
Areas for Improvement:
The responses of the service providers indicate that communication could be improved by:· Clarifying the awards process and making it more objective;· Reducing the time that elapses between monitoring visits and provision of
feedback based on the visit;· Making feedback from incident reporting more informative (Note: Those
providing intensive outpatient services were much more satisfied with feedbackthan the other service providers.);
· Revising forms to ensure consistency with service providers’ other paperworkprocesses;
· Respecting service providers in deliberations by treatment teams; and· Reducing inconsistencies between the central and local offices.

194
Clinical Services Management
Findings for Coordinators/Supervisors:
Clinical Services Coordinators received generally high approval from the surveyrespondents. Over 22 (79%) of the service providers who responded to the surveyagreed with statements about the coordinators' accessibility, responsiveness, involvement,ability to explain decisions, and knowledge. The items receiving the highest proportionof favorable responses (89%) were those addressing the accessibility and responsivenessof the Coordinators/Supervisors. The items receiving the lowest proportion of favorableresponses were those addressing the usefulness of the service plan and the clarity of therole of the Clinical Services Management Team, with 19 (or 68%) of the service providersagreeing.
Areas for Improvement for Clinical Services Coordinators and Supervisors:
The overall picture of the management by the Coordinators and Supervisors is positive,but clinical services management could be further strengthened by:
· Making the service plan more useful to the provider agencies; and· Clarifying the coordinators'/supervisors' role.
Findings for Clinical Services Team Leaders:
The pattern of responses to the questions about Team Leaders was similar to, althoughrated slightly lower than, that for the Coordinators/Supervisors. The proportion ofservice providers agreeing to positive statements about the Team Leaders ranged from ahigh of 86% (agreeing with the item about the accessibility of Team Leaders) to a low of61% (for the item about Team Leaders' resolution of disagreements).
Areas for Improvement for Clinical Services Team Leaders:
While the responses were generally favorable, management by the Team Leaders could befurther improved by:
· Increasing skills and practice in resolving disagreements and explainingdecisions; and
· Increasing the clinical sophistication of team leaders.

195
General Findings:
Looking at clinical services management in general, more than half the service providerswho returned the survey responded positively to items about the coordinators' role intreatment; the response rates to emergencies; the clarity and reasonableness of theauthorization procedures; and the planning and facilitation of transitions (except thetransition to adult services, which was not applicable to many of the service providers). The favorable responses ranged from 68% agreement that the agency therapist's inputwas considered, to 54% agreement that discharge planning and facilitation waseffectively planned. (The item about planning and facilitating transitions to adult serviceswas agreed to by only 21%, but 57% indicated that they either did not know or the itemwas not applicable.)
Looking at the data from the other direction, the items receiving the most negativeresponses were:
• clarity of the authorization procedures (36% disagreement); • importance of the coordinators' role in treatment (29% disagreement); • reasonableness of the information required for continued authorization
(29% disagreement); and • effectiveness of DCMHS discharge planning and facilitation (29%
disagreement).
Compared to other parts of the survey, the responses to items in this section of thesurvey were more likely to vary by the type of services provided by the respondents. For example, crisis service providers were generally more satisfied with clinical servicesmanagement than all providers. In responses to open-ended questions, strengths ofclinical services management included the quality of the people involved, the focus onclients, the accessibility of the teams, and the coordination of services. However, someof these same areas appeared in the suggestions for improvements.
General Areas for Improvement:
Three themes emerged from the service providers' responses to both closed- and open-ended questions in this section:
• inconsistencies across different clinical management teams and betweenDCMHS central office and local staff;
• complexity and appropriateness of management procedures; and • communication.
The responses suggest the following improvements:
Inconsistencies in clinical services management could be addressed by:· Using similar decision making procedures across the different management teams
(e.g., for determining length of stay); and· Improving skills in local teams (e.g., in making referrals).

196
Management procedures could be improved by:· Simplifying and clarifying paperwork requirements, especially for initial
authorizations and reauthorizations;· Seeking more feedback on appropriateness of clinical information required for
continued authorization (some find it unreasonable) and making appropriatechanges; and
· Seeking more feedback on discharge planning and facilitation, and makingappropriate changes.
Communication could be improved by:· Increasing coordination between DCMHS and other divisions within the
Department of Services for Children, Youth and Their Families;· Increasing face to face contact with clients and other participants; and · Using service providers' expertise and documentation of case in making decisions.
The DCMHS Provider Survey: Responsiveness and Improvements
Findings:
A majority of respondents to this section of the survey (53%) indicated satisfaction withDCMHS' response to issues raised in last year's survey. In particular, efforts to improvecommunication between DCMHS and its providers were appreciated, with the clarification of theauthorization procedures in the Provider Manual and the annual meeting receiving the largestproportions of agreement (76% for the Provider Manual and 70% for the annual meeting). Indescribing the value of the survey, respondents emphasized the value of knowing that DCMHS iscommitted to obtaining feedback. In addition, internal uses of the provider survey process wereidentified.
Areas for Improvement:
The respondents also provided recommendations for improving the survey by:· Expanding the scale to 5 points;· Asking for frequency or extent instead of agreement;· Including questions about the quality of services for clients or survey clients
directly;· Including questions about coordination of services within the Department of
Children, Youth and Their Families; and· Asking more questions about the functioning of local teams.
CONCLUSIONS
In many ways the news from the service providers who responded to the FY 1998 survey isgood. For example, the value of collaboration stated in the new mission statement was sharedby the service providers; service providers recognized DCMHS's improvements incommunication and concern for clients; and accessibility, responsiveness, and knowledgecharacterized clinical services management.
Despite the many positive responses about DCMHS system performance in FY 1998, many areaswhere improvements are still needed were also identified. In particular, communication

197
continued to be a major concern for the service providers. Looking across the comments made indifferent sections, the major communications needs appear to be:
• Providing more or clearer information about • the DCMHS managed care system;• the provider appeals process; • providers' accountability responsibilities to different DCMHS components;
• the awards process; and • the coordinators role;
• Reducing and simplifying paperwork required of service providers;• Providing quick feedback based on visits and reports and quickly completing
paperwork required of DCMHS;• Increasing consistency across different sources of information (individual
personnel, local offices, provider manual, central office);• Coordinating (1) with other divisions of the Department of Services for Children,
Youth and Their Families, and (2) across different kinds of services; and• Respecting and using service providers' expertise and documentation of case in
making decisions.
Continued progress on these fronts could bring even more positive feedback in response to nextyear's survey than was received this year.
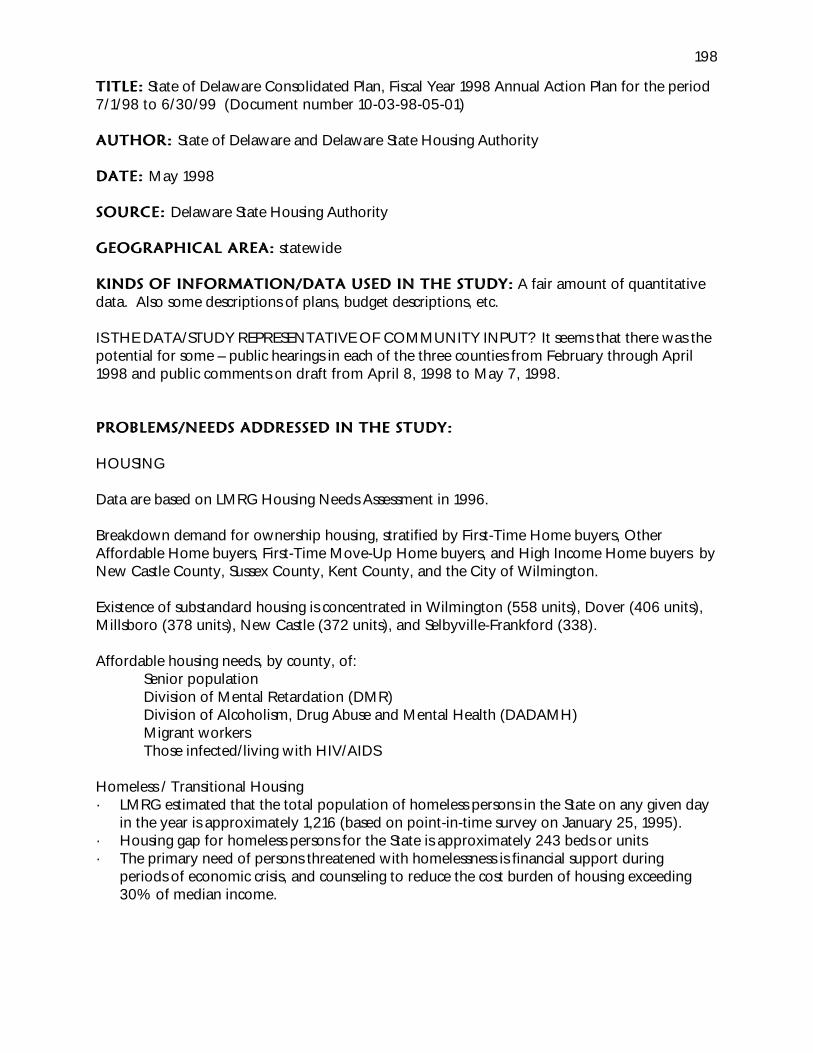
198
TITLE:TITLE: State of Delaware Consolidated Plan, Fiscal Year 1998 Annual Action Plan for the period7/1/98 to 6/30/99 (Document number 10-03-98-05-01)
AUTHOR: AUTHOR: State of Delaware and Delaware State Housing Authority
DATE: DATE: May 1998
SOURCE: SOURCE: Delaware State Housing Authority
GEOGRAPHICAL AREA: GEOGRAPHICAL AREA: statewide
KINDS OF INFORMATION/DATA USED IN THE STUDY: KINDS OF INFORMATION/DATA USED IN THE STUDY: A fair amount of quantitativedata. Also some descriptions of plans, budget descriptions, etc.
IS THE DATA/STUDY REPRESENTATIVE OF COMMUNITY INPUT? It seems that there was thepotential for some – public hearings in each of the three counties from February through April1998 and public comments on draft from April 8, 1998 to May 7, 1998.
PROBLEMS/NEEDS ADDRESSED IN THE STUDY: PROBLEMS/NEEDS ADDRESSED IN THE STUDY:
HOUSING
Data are based on LMRG Housing Needs Assessment in 1996.
Breakdown demand for ownership housing, stratified by First-Time Home buyers, OtherAffordable Home buyers, First-Time Move-Up Home buyers, and High Income Home buyers byNew Castle County, Sussex County, Kent County, and the City of Wilmington.
Existence of substandard housing is concentrated in Wilmington (558 units), Dover (406 units),Millsboro (378 units), New Castle (372 units), and Selbyville-Frankford (338).
Affordable housing needs, by county, of:Senior populationDivision of Mental Retardation (DMR)Division of Alcoholism, Drug Abuse and Mental Health (DADAMH)Migrant workersThose infected/living with HIV/AIDS
Homeless / Transitional Housing· LMRG estimated that the total population of homeless persons in the State on any given day
in the year is approximately 1,216 (based on point-in-time survey on January 25, 1995).· Housing gap for homeless persons for the State is approximately 243 beds or units· The primary need of persons threatened with homelessness is financial support during
periods of economic crisis, and counseling to reduce the cost burden of housing exceeding30% of median income.

199
NON-HOUSING COMMUNITY DEVELOPMENTNON-HOUSING COMMUNITY DEVELOPMENTCommunity Revitalization strategy includes:· Neighborhood revitalization (housing rehabilitation)· Water and wastewater infrastructure improvements· Community redevelopment (economic development and job creation)
(p. 25a – Continuum of Care: Gaps Analysis numbers – Individuals)(p. 25b – Continuum of Care: Gaps Analysis numbers – Persons in Families with Children)
Page 27 – Gaps in the Housing Delivery System· Lack of sufficient resources· Limited resources available for essential related social service programs
Lead-based paint hazard (p. 27)

200
TITLETITLE: Statewide Housing Needs Assessment
AUTHORAUTHOR: Prepared by Legg Mason Realty Group, Inc.
DATEDATE: 1996
SOURCESOURCE: Delaware State Housing Authority
GEOGRAPHICAL AREAGEOGRAPHICAL AREA: statewide
KINDS OF INFORMATION/DATA USED IN THE STUDYCurrent and projected housing conditions based on analysis of demographic, economic and realestate development data, as well as qualitative information gathered through extensiveinterviews with experts.
IS THE DATA/STUDY REPRESENTATIVE OF COMMUNITY INPUT?IS THE DATA/STUDY REPRESENTATIVE OF COMMUNITY INPUT? No
PROBLEMS/NEEDS ADDRESSED IN THE STUDY:PROBLEMS/NEEDS ADDRESSED IN THE STUDY: “HOUSING”
POPULATIONS THAT NEED HOUSING
Households Living in Substandard Housing - This report estimates that the total number ofsubstandard housing units in the State in 1995 to be 12,053, or 4.34 percent of the housingsupply of the State. 45.8 percent of the State=s substandard units are home ownership units;54.2 percent are rental.
City of Wilmington - has an estimated 2,434 substandard unitsNew Castle County - has approximately 3,804 substandard unitsKent County - this county has an estimated 2,311 substandard unitsSussex County - has an estimated 3,504 substandard units
At-Risk Households - Defined as 1) living in overcrowded conditions, and 2) having very lowincome (less than 50 percent of Area Median Income) and paying more than 50 percent of theirincome for housing expenses. There are an estimated 14,486 at-risk households in the State. 33.6 percent of at-risk households occupy home ownership units. Renters are an estimated9,615 out of the total of at-risk households. Almost 12.5 percent of renters are at-risk comparedwith only 2.4 percent of homeowners.
City of Wilmington - estimated 3,223 at-risk householdsNew Castle County - there are an estimated 6,907 at-risk householdsKent County - estimated 2, 235 at-risk householdsSussex County - estimated 2,121 at-risk households
Special Needs Populations - This population includes primarily: senior citizens, the mentallyretarded, mentally ill, homeless, migrant workers, and persons with AIDS.
Senior Citizen Population (65+)- The senior population of DE was at 92,796 in 1995constituting 13 percent of the total population. Growth of the senior population during

201
the next five years is forecast to be 6,706 persons: an increase of 7.2 percent. LeggMason concentrated on longer-term trends in order to highlight the accelerating increaseof the senior population and in the housing needs of the low-income segment of saidpopulation. The total population of the State will grow only 28.6 percent during the1995-2020 period. The senior population will grow 60.7 percent. The fastest growingsegment of the senior population and of the State=s population as a whole is the 85+age groups. This segment will increase by 7,532 (107.5 percent) statewide between 1995and 2020. Senior households account for 25.7 percent of all households experiencinghousing problems, predominately excess housing cost burden. Almost 27 percent ofsenior households in the State have these problems, 19.3 percent of all seniorhomeowners and 54.3 percent of all senior renters.
City of Wilmington - Wilmington is estimated to have 2,654 senior householdspaying more than 30 percent of their incomes for housing expenses in 1995.New Castle County - This county has an estimated 6,400 senior householdsaffected by excessive housing costs, 57.7 percent of them homeowners.Kent County - In 1995 the county has an estimated 2,035 senior householdspaying excessive housing costs, 62.0 percent homeowners.Sussex County - The county is estimated to have 3,300 senior households payingmore than 30 percent of their incomes for housing expenses in 1995; 80.0percent of them are homeowners.
Mentally Retarded Persons - It is currently estimated that of a total Division of MentalRetardation (DMR) caseload of 1,253 persons, 414 mentally retarded persons may needhousing in the next five years. Effective demand for housing this population is up to 30beds (6-10 group homes) annually.
Mentally Ill Persons - The total number of mentally ill persons within the Division ofAlcoholism, Drug Abuse and Mental Health (DADAMH) caseload management system is2,349. Housing units for mentally ill persons in supportive environments total 570statewide. Legg Mason estimates the need for supportive housing statewide in 1995 tobe up to 1,779 units for those with mental illness. Effective demand is limited to anestimated 30 beds (6-10 homes) per year.
Homeless Persons - From the information obtained for the University of Delaware=sCenter for Community Development, it is estimated that homeless persons in the state onany given day total 1,217. 973 persons were observed as housed in all shelters,reception/day centers and transitional housing throughout the state. The housing gap forhomeless persons for the State is approximately 244 beds.
Migrant Workers - It is estimated that the total number of households in the peakseasonal migrant farm labor force is at 2,186. Housing units available to migranthouseholds in licensed labor camps and Elizabeth=s Landing total 904. The potentialhousing gap at peak season (July-September) can be considered as high as 1,282 units.
Persons with AIDS - As of July 1995, the Division of Health estimates that there are 519persons living with AIDS in the state. This number does not include HIV infected persons. As of 1995, there were 16 beds dedicated to Persons with AIDS. A potential housing gap

202
can be estimated as high as 575.
Housing Problems by Income - This analysis focused on households earning 0-60 percent ofmedian income.
City of Wilmington - There are an estimated 8,331 households in the 0-60 percent ofmedian income range experiencing housing needs. More than 3/4 of these households isrenter. Substandard units account for one-quarter (2,083 households) of housingproblems. Housing cost burden (and to a lesser extent overcrowding) is the predominantproblem: 6,248 households are paying more than 30 percent of their incomes forhousing.New Castle County- 18,440 households in the 0-60 percent of median income rangeexperience housing needs. Two-thirds of these households are renters.Kent County - Estimated 5,761 households experiencing housing needs in the 0-60percent of median income range. Seventy percent of these households are renters.Sussex County - Estimated 7,206 households in the 0-60 percent of median income rangeexperiencing housing needs. Substandard units account for 39.8 percent of housingproblems, due in large part to the high level of failing septic systems.
NEED FOR AFFORDABLE RENTAL HOUSING
Need for New Rental Construction - The supply of rental units statewide should increase by atotal of 3,000 by the Year 2000 (an average of 600 units per year) to accommodate net newrental demand. The principal components of the State=s demand for new construction,affordable rental units between 1995 and 2020 are:
Very Low Income - The largest single block (1,000 units) of demand for affordable rentalunits in the 1995-2000 periods comes for those households earning less than $15,000 peryear.Low Income - This $15,000 - $25,000 annual income segment will account for another500 units of demand during the 1995-2000 period.Senior Renters (Aged 75+) - The need for additional senior rental units is 500 for the1995-2000 period.
Needs Within Existing Rental Supply
Substandard Rental Units - Legg Mason estimates that there are 6,533 occupiedsubstandard rental housing units in the State, representing 54.2 percent of all substandardunits. Each substandard rental unit will need at least $30,000 in rehabilitation expenses: atotal expenditure of $196 million. In addition to substandard units needing substantialrehabilitation, Legg Mason has estimated that 12,000 occupied rental units statewide arein need of moderate rehabilitation averaging about $10,000 - $30,000 in repairs: a totalexpenditure of $210 million.
At-Risk Renter Households - An estimated 9,615 at-risk renter households in the state areearning less than 50 percent of area median income and are paying more than 50 percentof their incomes toward housing expenses. An estimated 15,995 households are payingmore than 30 percent of their incomes toward housing expenses. Therefore, the currentneed for affordable rental units, can therefore, be defined as between 9,615 and 15,995

203
units.
Rental Demand by Location
City of Wilmington - Will need essentially no new net rental units over the next fiveyears.New Castle County - Will need approximately 500 new rental units for very low incomehouseholds earning less than $15,000 per year. The need for low income senior rentalsshould increase by 250 units.Kent County - Is projected to need about 150 new affordable rental units for low incomeseniors.Sussex County - Needs 1,100 affordable rental units over the 1995-2000 period. Targetrenter populations are very low (500 units) and low (500 units) income households, withan additional 100 units for low income seniors.
Low Income Housing Tax Credits - The core need for rental housing units assisted by Low IncomeHousing Tax Credits can be estimated by determining the number of renter households in the 51-60 percent income group living in substandard housing or at-risk conditions or paying more than30 percent of their incomes toward housing expenses. Legg Mason estimates the total number ofrenter households falling within the 51-60 percent guideline in 1995 as 7,126: 1,160 inWilmington; 4,071 in New Castle County; 1,112 in Kent County, and 783 in Sussex. The numberof those households with housing needs totals 2,082 in the State in 1995: 268 in Wilmington;891 in New Castle; 419 in Kent; and 504 in Sussex.
NEED FOR AFFORDABLE OWNERSHIP HOUSING
Demand for Home ownership Opportunities - The demand for affordable ownership housingtotals 31,500 units over the next five years (47.0 percent of the total ownership demand).
Needs of Existing Home ownership Inventory
Substandard Home ownership Inventory - Legg Mason estimates that 5,523 occupiedsubstandard home ownership units in the State need at least $30,000 in rehabilitationexpenses: a total of $166 million. Legg Mason also estimates that 12,000 occupiedhousing units statewide are in need of moderate rehabilitation averaging about $10,000 -$30,000 in repairs: a total of $210 million.
At Risk Home ownership Units - Legg Mason estimates that there are at least 4,869 at riskhomeowners in the State in 1995 earning less than 50 percent of area median income andpaying more than 50 percent of their incomes toward total housing expenses.
Home ownership Demand by Location
City of Wilmington- Affordable home ownership demand constitutes 2,500 units andmore than half of the total home ownership demand.New Castle County - Affordable home ownership demand constitutes 14,500 units.Kent County - Projected to experience 5,500 affordable home ownership salesSussex County - Affordable home ownership demand constitutes 9,000 units.

204
OTHER ASSISTANCE NEEDED
Senior Citizen Needs - There are an estimated 10,891 senior households in the State that haveincomes of less than $15,000 annually and are paying more than 30 percent of their incomestoward housing expenses. Homeowners comprise 6,285 (57.7 percent) of those householdsand renters constitute the remaining 4,606 households. Though these households are sheltered,their quality of life could be substantially improved by reducing their housing expenses throughthe provision of some sort of direct or indirect rental subsidy from the public sector.
The needs for senior homeowners are rehabilitation financing, and social services supports gearedtoward assisting them in aging in place through increased specialization, home health care, andminor adaptive repairs. Reverse annuity mortgages or similar financial strategies are otheroptions.
Resource Gaps
Infrastructure for Construction of Affordable Housing - One of the most critical impedimentsfacing affordable housing providers is the supply and location of land appropriately zoned forthe construction of new multifamily housing. Zoning policies and the zoning process in manylocalities effectively exclude many new affordable rental communities.
Financing for Housing Rehabilitation - There is a need for $361 million in rehabilitation financingin order the make the State=s 12,053 substandard housing units fully habitable. In addition tosubstandard housing units needing substantial rehabilitation, there are an estimated 24,000housing units statewide in need of moderate rehabilitation requiring an additional $420 million.
Rehabilitation permits in the State have averaged only 3,000 per year in recent years at anaverage pocket size of $11,241, for a total of approximately $33.7 million annually. Projectingthose numbers out over the 1995-2000 period, the gap between moderate rehabilitation need($420 million) and available financing ($168.6 million) is approximately $251 million and atleast 9,000 unrehabbed units.
Financing for New Construction
Home ownership Financing - That State=s 8,000 first-time home buyers during the 1995-2000 period need a continued source of moderate-cost financing, mortgage underwritingat reasonable terms, and assistance with down payment and settlement expenses.Rental Financing - The State=s need for 2,000 affordable rental units over the 1995-2000 period reveals a significant gap in available financing. Quantifying the dollaramount of the financing gap is impossible. The size of the gap is ultimately totallydependent on the ability of the targeted renter population to pay some real contributiontoward its housing expenses.
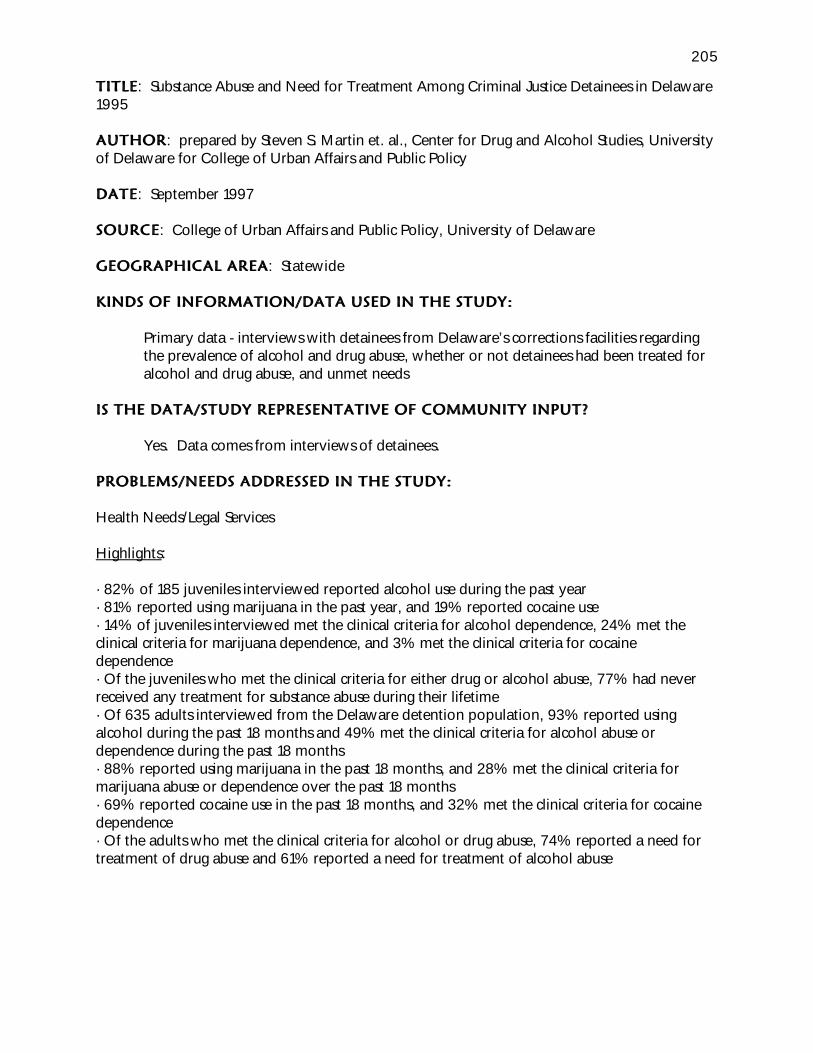
205
TITLETITLE: Substance Abuse and Need for Treatment Among Criminal Justice Detainees in Delaware1995
AUTHORAUTHOR: prepared by Steven S. Martin et. al., Center for Drug and Alcohol Studies, Universityof Delaware for College of Urban Affairs and Public Policy
DATEDATE: September 1997
SOURCESOURCE: College of Urban Affairs and Public Policy, University of Delaware
GEOGRAPHICAL AREAGEOGRAPHICAL AREA: Statewide
KINDS OF INFORMATION/DATA USED IN THE STUDY:KINDS OF INFORMATION/DATA USED IN THE STUDY:
Primary data - interviews with detainees from Delaware’s corrections facilities regardingthe prevalence of alcohol and drug abuse, whether or not detainees had been treated foralcohol and drug abuse, and unmet needs
IS THE DATA/STUDY REPRESENTATIVE OF COMMUNITY INPUT?IS THE DATA/STUDY REPRESENTATIVE OF COMMUNITY INPUT?
Yes. Data comes from interviews of detainees.
PROBLEMS/NEEDS ADDRESSED IN THE STUDY:PROBLEMS/NEEDS ADDRESSED IN THE STUDY:
Health Needs/Legal Services
Highlights:
· 82% of 185 juveniles interviewed reported alcohol use during the past year· 81% reported using marijuana in the past year, and 19% reported cocaine use· 14% of juveniles interviewed met the clinical criteria for alcohol dependence, 24% met theclinical criteria for marijuana dependence, and 3% met the clinical criteria for cocainedependence· Of the juveniles who met the clinical criteria for either drug or alcohol abuse, 77% had neverreceived any treatment for substance abuse during their lifetime· Of 635 adults interviewed from the Delaware detention population, 93% reported usingalcohol during the past 18 months and 49% met the clinical criteria for alcohol abuse ordependence during the past 18 months· 88% reported using marijuana in the past 18 months, and 28% met the clinical criteria formarijuana abuse or dependence over the past 18 months· 69% reported cocaine use in the past 18 months, and 32% met the clinical criteria for cocainedependence· Of the adults who met the clinical criteria for alcohol or drug abuse, 74% reported a need fortreatment of drug abuse and 61% reported a need for treatment of alcohol abuse

206
TITLETITLE: Substance Use and Abuse Patterns of Delaware Youth: Implications for TreatmentServices Planning Interim Draft Report and Summary Report
AUTHORAUTHOR: Jeffrey A. Raffel and Debra L. Brucker
DATEDATE: October 1994 and July 1995
SOURCESOURCE: University of Delaware - College of Urban Affairs and Public Policy
GEOGRAPHICAL AREAGEOGRAPHICAL AREA: statewide (three counties, and to some extent, the city ofWilmington)
KINDS OF INFORMATION/DATA USED IN THE STUDYKINDS OF INFORMATION/DATA USED IN THE STUDY: primary data - in-class surveyof fifth-, eighth-, and eleventh-graders; secondary data - reports, research models (i.e., DSM-III-Rcriteria), etc.
IS THE DATA/STUDY REPRESENTATIVE OF COMMUNITY INPUT?IS THE DATA/STUDY REPRESENTATIVE OF COMMUNITY INPUT? yes; surveyresponses of students and informal telephone survey of treatment providers
PROBLEMS/NEEDS ADDRESSED IN THE STUDYPROBLEMS/NEEDS ADDRESSED IN THE STUDY: “CHILD/YOUTH” and “HEALTH ANDHEALTH CARE”
Any Lifetime Use· A comparison of the fifth grade and eighth grade data indicates a large increase in usage
rates, both within Delaware and the nation, for all substances from the fifth to eighthgrades.
· A significant increase in usage rates is evident between the eighth and eleventh grades aswell.
Treatment Need Estimate· From the Perspectives, Activities and Use Survey (PAUS, a public school survey) eleventh
grade driver sample, 103 eleventh graders were found to meet the criteria for substanceabuse; approximately 67 percent of these students were male.
· Nearly 38 percent of these substance abusers met the criteria for both alcohol andmarijuana abuse.
· 33 percent met the Diagnostic and Statistical Manual of Mental Disorders, Third Edition,Revised (DSM-III-R) criteria solely for alcohol abuse and 29 percent met the criteria solelyfor marijuana abuse.
· The sample findings suggest that the greatest absolute need for treatment is found in NewCastle County (56/103 - New Castle County; 21/103 - Kent County; 26/103 - SussexCounty). However, a higher percentage of students (18.3%) were estimated to abusesubstances in Sussex County than in New Castle County (16.4%) and Kent County(13.5%). The overall statewide rate was 16.1 percent.
· To extrapolate from sample to general population, an estimated 1103 Delaware eleventhgrade students met DSM-III-R criteria for substance abuse.
· The number of public and non-public high school students meeting DSM-III-R criteria forsubstance abuse is estimated to be 3551.

207
Treatment Demand Estimate· According to the research, an estimated 15-20 percent of substance abusers should be
targeted for treatment in a given year. Given this, the demand would be 27-36 eleventhgraders in Kent County, 107-142 in New Castle County and 32-43 in Sussex County(=1107 total).
· The total demand for treatment of eleventh graders (public and private schools) wouldbe 166-221 at any given time.
· The total demand for treatment of all high school students (9-12 grades, public andprivate schools) would be 533-710 at any given time.
Treatment Supply Estimate· The U.S. Department of Health and Human Services’ 1991 National Drug and Alcoholism
Treatment Unit Survey (NDATUS) findings indicate that on September 30, 1991, 101Delaware youth were receiving substance abuse treatment, either outpatient or residentialservices (since this is all youth, the number of adolescents would be fewer).
· None of the agencies that were contacted during the telephone survey had a waiting listfor services, although some had waiting lists in the past.
· Many stated that they could expand their services if the need arose.· At any point in time, the seven residential services that were contacted stated they have a
total of 216 slots available for Delaware and non-Delaware substance-abusing adolescents.· The seven counseling agencies that were contacted stated they have a total of 121 to 145
outpatient slots available.· The number of slots available for Delaware youth may be fewer since a significant portion
of the agencies contacted are located outside of the state.
Implications· The estimate of the number of substance abuse treatment slots needed for all high school-
aged youth reveals a need for services that clearly surpasses the supply.· With 533 to 710 slots required, and an estimated 337-361 slots available, the provision
of at least an additional 200-350 slots is necessary. The provision of even more seriousservices could be required given the fact that all need and demand estimates made in thisreport err on the conservative side.
· Few adolescent substance abuse treatment services are easily accessible to populationsliving in Kent or Sussex Counties.
· The telephone survey reveals a lack of adequate adolescent-focused treatment servicesstatewide.
· Further research is needed for an analysis of reasons for the gap between need and supply.
Recommendations· Prevention efforts must focus on the underlying issues that often precede substance abuse,
rather than focusing solely on drug education.· Efforts should be made to assist students in making a smooth transition to new schools
(to decrease anxiety and therefore, the desire to experiment with drugs to gain peeracceptance).

208
· Offer youth-structured activities, such as sports or clubs, which provide an instant peergroup.
· Identify interests of those youth who do not join standardized types of activitiesprovided by schools and agencies.
· There is a need for a more effective and efficient statewide system for identifying thesupply of substance abuse treatment. This would greatly assist any future treatmentservices planning efforts.

209
TITLE: TITLE: The Need for Supported Housing in Delaware: A Survey of Existing Data
AUTHOR:AUTHOR: Independent Living, Inc and OMG Center DATE:DATE: September 1995
SOURCE:SOURCE: Independent Living, Inc. 1800 N. Broom Street, Wilmington Delaware.
GEOGRAPHICAL AREA:GEOGRAPHICAL AREA: State of Delaware
KINDS OF INFORMATION USED IN THE STUDY:KINDS OF INFORMATION USED IN THE STUDY: Previously existing statistics obtainedfrom the U.S. Census of Population and Housing and the Social Security Administration.Telephone interviews with service providers.
IS THE DATA/STUDY REPRESENTATIVE OF COMMUNITY INPUT: IS THE DATA/STUDY REPRESENTATIVE OF COMMUNITY INPUT: Yes, but for serviceproviders not service recipients.
PROBLEMS/NEEDS ADDRESSED IN THE STUDY:PROBLEMS/NEEDS ADDRESSED IN THE STUDY: Disabled/ HousingDisabled/ HousingThis report surveys the existing data on people with disabilities in Delaware in order todetermine how many adults between the ages of 21 and 54 are likely to need supported housingservices.
Summary of Data on Target Population
· According to the census definition of disability (i.e., mobility or self-care limitation), there arenearly 33,000 adults in Delaware aged 16 and over with disabilities - or roughly 38,000 ifresidents of institutions are counted.
· The rate of disability varies considerably with age. As expected, elderly persons aged 65 andolder have the highest prevalence, with rates approaching 20%. Working age adults have arelatively low rate of disability.
· Delaware’s rate of disability (6.5%) is slightly lower than the national rate (7.1%).· Within the state, the highest rate of disability (7.5%) is in Sussex County, in the vicinity of
Georgetown and Millsboro. Wilmington and Dover also have a relatively high prevalence ofdisability(5%-7.5%).
· In terms of raw numbers, disabled people are most numerous where the state’s population isconcentrated north of the Chesapeake and Delaware Canal.
· Census data indicate that, within the targeted age group, 21 to 54, the number of disabledpeople is over 13,000
· Although there is no reliable information on the prevalence of various disabling conditions inthe state, developmental disabilities (especially mental retardation) and other mentaldisorders account for the majority of disabled people within this group.
· Based on national prevalence rates, the number of people aged 21 to 54 with developmentaldisabilities (primarily mental retardation) can be roughly estimated at 8,300. Of that group,an estimated 4,900 are considered unable to perform a major life activity, such as working ata job.
· An inexact estimate of the number of adults in the targeted age group with moderate orsevere mental illness is 3,000, based on national prevalence.
· An analysis of the census data suggests that there are over 3,000 adults aged 21 to 54 whoare still living with their parents or as dependents of other household members.

210
· A reasonable, but very rough estimate of the number of people who need supported housingservices is 3,300. This includes an estimated 2,600 who are currently living in households(i.e., not in an institution, group home or other group quarters).
Summary of Data on Existing Programs
· Existing residential facilities for adults with mental retardation accommodate about 700clients. This figure includes about 315 individuals who are currently residing at StockleyCenter, but that number will drop over the next few years as that institution is downsized.
· Non-institutional residential programs for people with mental retardation (includingICF/MRs, neighborhood homes, apartment programs, and foster care) now accommodatenearly 390 persons. (If ILI’s programs for people with unspecified disabilities are included,this figure rises to about 410 persons.)
· Nearly 270 people are the waiting list for placement in residential programs. When childrenare included, the number rises to 400. In addition, some 150 people at the Stockley Centershould be moved to less restrictive settings over the next few years. Thus, there is animmediate need for 450 to 550 additional community-based residential programs.
· Non-institutional residential facilities for people with mental illness (including group homesand scattered site housing) presently accommodate about 290 persons.
· About 490 mentally ill persons in Delaware receive case management services throughContinuous Treatment Team Programs (CTTPs), which include some housing-related services.
· Due to the absence of a centralized waiting list, the immediate need for residential programsserving the mentally ill is unclear.
Summary and Conclusions
· According to the 1990 census, 13,000 people are in the targeted age with disabilities severeenough to be reported as “mobility or self-care limited.” This includes some 4,000 peoplewho are unable to perform major life activities due to mental retardation (or some otherdevelopmental disability. Another 3,000 in this age group are likely to suffer from moderateor severe mental illness.
· Of the roughly 8,000 adults in the age group who are mentally retarded or chronicallymentally ill, some 2,000 are either living in residential facilities or have immediate access tosupport services through CTTPs or other programs. It is likely that a sizable portion of the6,000 does need supported housing.
· 3,000 disabled adults aged 21 to 54 continue to live as dependents with their parents orother household members. It is proposed 2,600 of these people could benefit fromsupported housing programs.
· 270 adults (or 400 persons in total, including school age children) are on waiting lists forresidential programs for the mentally retarded.

211
TITLE: TITLE: The Needs of Delawareans with Disabilities: A Five Year Plan for Strengthening Person’and Families’ Community Supports
AUTHOR: AUTHOR: Community Systems and Services Inc. prepared for the Developmental DisabilitiesPlanning Council, State of Delaware
DATEDATE: December 1996
SOURCE: SOURCE: Community Systems and Services Inc., Suite 440, 8301 Greensboro Drive, McLean,Virginia, 22102
GEOGRAPHICAL AREA: GEOGRAPHICAL AREA: Delaware
KINDS OF INFORMATION/DATA USED IN THE STUDY: KINDS OF INFORMATION/DATA USED IN THE STUDY: Interviews with governmentadministrators and managers, state agency social workers/case managers, private agencymanagers, consumer and their families, and other people with special roles and expertise.
IS THE DATA/STUDY REPRESENTATIVE OF COMMUNITY INPUT? IS THE DATA/STUDY REPRESENTATIVE OF COMMUNITY INPUT? Yes
PROBLEMS/NEEDS ADDRESSED IN THE STUDY: PROBLEMS/NEEDS ADDRESSED IN THE STUDY: DISABILITY
Services available to persons with disabilities include: intake for community services, casemanagement, family support, respite services, residential services, services for special populations- The Department of Health and Social Services (DHSS), The Division of Mental Retardation(DMR)
Case management, adult foster care/Homemaker/home health care/Home deliveredmeals/Assistive technology, home modification/Attendant services/Emergency responsesystem/Medicaid home and community-based Waiver/Other - DHSS, The Division of Services forAging and Adults with Physical Disabilities (DSAAPD)
Outreach/intake/Independent living/ Orientation, Mobility, and low Vision Program/Education,/Training/Equipment services/Vocational Services/Material and Volunteer Center - DHSS, Division for the Visually Impaired (DVI)
DHSS, Bureau of Alcohol and Drug Abuse Mental Health Services - Division of Alcohol, DrugAbuse, and Mental Health Services
Vocational rehabilitation services (except for those with vision loss) - Department of Labor,Division of Vocational Rehabilitation
Administrative base for special purpose organizations - Department of Administrative Services
Low and moderate income housing- Delaware State Housing Authority
Transportation assistance- Delaware Department of Transportation
Prevalence estimates and service needs

212
· With respect to persons with mental retardation 1,883 persons were identified by Delawareservice agencies as receiving community or institutional services. Depending upon theresearch data source utilized, there are an estimated 2,495 to 8,194 persons with mentalretardation living in Delaware, the lower number including persons with moderate tosevere levels of disability and the higher number including persons with a functionallimitation.
· With respect to persons with chronic physical disabilities, 11,087 persons have been identifiedby Delaware service agencies as receiving community or institutional services. There are17, 000 to 105, 000 Delawareans with chronic physical disabilities. There would beappear to be 6, 000 or more Delawareans with moderate to severe levels of disabilitywho are neither institutionalized nor known to DSAAPD. The majority of the 6, 495persons receiving DSAAPD services receive only food services, and it is questionable, giventhe prevalence estimates of moderate to severe disability, whether that service alonemeets their need.
· With respect to persons with serious and persistent mental illness and/or chronic substanceabuse, there were 7,644 service recipients identified by Delaware service agencies, almostall of whom were currently receiving services and few wait-listed for service. There are anestimated 12,167 to 72,612 persons with mental illness or abusing drugs/alcohol, thelower number including only persons with moderate to severe levels of disability. Theremay be an additional 2,076 persons with disability caused by mental disorder in need ofservices.
· Service need, even among persons with moderate to severe disabilities, does not necessarilyequate with service demand. Delawareans with physical disabilities are likely to be thosehaving the greatest unmet service needs, which, if there were enhanced public informationprograms about service availability, would result in some additional, expressed demand. There would appear to be smaller number of persons with serious and persistent mentalillness, chronic substance abuse, and moderate to profound mental retardation also inneed of services.
· There is a nationwide movement toward granting persons with all disabilities theopportunity for community inclusion and community integration. Delaware shouldcontinue to advance current efforts to incorporate persons with disabilities in thecommunities. In so doing, it might look to the experience of Oregon and Rhode Island,for example, as states having strong community-based programming.
· Improving accessibility to public, commercial, and private buildings: persons with chronicdisabilities have continuing concern that their activities of daily living - grocery shopping,seeing their physician, eating at a restaurant, attending the movies - are still hindered bythe lingering noncompliance. Specific compliance include the placement of accessibleparking spaces and curb cuts, the failure to provide accessibility through the front door,and the failure to have functioning checkout lines which accommodate adapted shoppingcarts.
· Persons with disabilities oftentimes report being isolated or "trapped" in their homes by theirdisability, because they lack a vehicle, are unable to drive a vehicle independently, or

213
cannot access public transportation. There is a need to strengthen transportation optionsfor persons with disabilities throughout the state.
· It is recommended that DART First State Paratransit strengthen the role of consumers withdisabilities in its operations/governance.
· Among the consumers and families who have participated in this study, there is greatvariability in the degree to which they have knowledge of publicly sponsored programsserving persons with disabilities, their participation criteria, and their specific serviceofferings.
· There is need for a minimum, uniform DHSS policy on public/consumer information sharingthat utilizes common approaches and common media.
· Some persons interviewed (having chronic disabilities or the parents of persons with suchdisabilities) participated in the Diamond State Health Plan and were assigned one of itsfour managed care organizations. They report reductions in services or the threatenedloss of services, most typically in the number of home health aide hours assigned/week,the number of physical therapy sessions/week, or the threatened loss altogether of thoseservices.
· There are two significant public/private organization partnerships (Arc/DMR andAMID/DADAMH, which have lead to the creation of supportive housing beyond thatsponsored directly by the DHSS. It is reported that United Cerebral Palsy (UCP) and theMary Campbell Center (MCC) are contemplating the creation of supportive, communityhousing as well. Consumers with physical disabilities (other than those associated withUCP and MCC) and substance abuse histories lack parallel opportunities. There is a needfor additional public/private and public/family partnerships.
· The community-based service delivery strategies of both DSAAPD and DMR rely increasinglyon families to provide the primary supports to persons with physical disabilities andmental retardation. Primary consumers and informal caregivers both indicate thecaregivers’ need for training and technical assistance to fulfill their role.
· There is insufficient supportive housing currently to meet the needs of Delawareans withchronic disability and there are additional persona with significant chronic disabilitiesabout whom the state has no knowledge.
· 30 persons statewide receive financial support from DHSS to engage Utilization of PersonalCare Attendants (PCAs). The PCA services should be doubled.
· Examining the Interface Between the Youth and Adult Human Services Delivery systems Theresources of this needs assessment have not permitted a detailed examination of the issuesfacing youth with chronic disabilities (and their families) upon turning 18 or, in specialcircumstances, turning 22.
· Persons with traumatic head injuries have no DHSS recognized service division. Only somepersons are admitted to DSAAPD services, because of their special services and behavioral

214
support needs.
· The 1994 reorganization of the DHSS, which permitted the creation of DSAAPD, is welcomeamong persons with physical disabilities. Important service models to promote andsustain community living for younger persons with disabilities have been established,including the Medicaid Waiver program and the Emergency Response Pendant Program. Delaware should consider a publicly supported service animal program.
· There is need to continue piloting new approaches to supporting persons’ independence,because consumers, especially young consumers who could live an integrated life formany more years if they could overcome their lack of human resource support, remain atrisk of nursing home placement. DSAAPD should create one supportive housing pilot percounty.
· Consumers with physical disabilities, developmental disabilities, and mental retardationinterviewed in this study speak to the isolation that can come from living alone withdisabilities, particularly when mobility impairments complicate travel. Many also speakto their individual efforts to remain physically fit, as means of better managing theirchronic disabilities.
· There is an inadequate supply of respite services, particularly for in-home services, which arepreferred by consumers. There is a need for physical health facilities, which are adapted tothe needs of persons with disabilities and around which socialization activities can beorganized.
· DSAAPD caseworkers were periodically confronted with circumstances in which a consumer’ssupport systems “crumbled” or his/her health declined precipitously. Thereforeinstitutional placement decisions may be made on an emergency basis. There is a need forinstitutional placement pre-screening in which a person’s qualifications for such placementare determined.
· Companion services are fundable within Medicaid Waiver plans, but are not funded in theDelaware Medicaid Waiver Services Plan for persons with physical disabilities. Companion services should be a Medicaid Waiver option.
· The informal administrative policy, which restricts Medicaid Waiver Funding to $3696Maximum for a month, should be eliminated.
· The state should open 100 new Medicaid Waiver slots to eliminate the wait-list, and 50 slotsper year in the following five years.

215
TITLE: TITLE: A Turning Point: A Series of News Journal Special Sectionss
AUTHOR: AUTHOR: Wilmington News Journal
DATE:DATE: September 1998
SOURCE: SOURCE: Wilmington News Journal, CADSR
GEOGRAPHICAL AREA: GEOGRAPHICAL AREA: Statewide
KINDS OF INFORMATION/DATA USED IN THE STUDY: KINDS OF INFORMATION/DATA USED IN THE STUDY: Primary data from a Center forApplied Demography and Survey Research (CADSR) telephone survey.
IS THE DATA/STUDY REPRESENTATIVE OF COMMUNITY INPUT? IS THE DATA/STUDY REPRESENTATIVE OF COMMUNITY INPUT? Yes, surveyresponses, “people on the street” interviews, and breakout sessions of forums ondiversity.
PROBLEMS/NEEDS ADDRESSED IN THE STUDY:PROBLEMS/NEEDS ADDRESSED IN THE STUDY: Civil Rights
A State of ToleranceA State of Tolerance
This study seeks to evaluate the state of race relations in Delaware 30 years after the rioting thatled to the National Guard’s occupation of Wilmington. According to the article, at atime when the state is more integrated than it has previously been, people of differentraces more tolerate than accept the differences between races. There is still a “mistrust”between the races. The following statistics are taken from a 1998 News Journal survey,conducted by CADSR, of 394 Delawareans.
• How would you describe the racial make up of your neighborhood?Mostly white: 51%Evenly split: 24%Mostly non-white: 14%All white: 8.7%All non-white: 2.3%Other: 0.5%
Whites Minorities
Question: Agree Disagree Agree Disagree
Most of the problems racial minorities havetoday are due to discrimination.
42% 58% 66% 34%
Minority businesses should be givenpreference when bidding ongovernment contracts.
13% 87% 28% 72%
Many racial minorities miss out on goodhousing because white owners won’trent or sell to them.
33% 67% 49% 51%

216
Whites Minorities
Question: Agree Disagree Agree Disagree
Relations between the races are much bettertoday than they were in the 1960s.
85% 15% 86% 14%
Many racial minorities in Delaware miss outon jobs and promotions because ofdiscrimination.
25% 75% 58% 42%
The amount of prejudice against racialminorities today is highlyexaggerated.
64% 36% 37% 63%
In the U.S., people of all races are treated thesame.
18% 82% 12% 88%
People like to live in an integratedneighborhood.
32% 68% 54% 46%
The media places too much emphasis onrace.
84% 16% 69% 31%
Over the past years the government andpoliticians have paid too muchattention to racial minorities.
50% 50% 23% 77%
By 2050, people in the majority race todaywill be in the minority. When theyare in the minority, they will be at adisadvantage.
54% 46% 47% 53%
Affirmative action programs have eliminatedmost of the employmentdiscrimination experienced by racialminorities in the past.
54% 46% 53% 47%
Relations between the races in Delawaretoday are better than they are in therest of the U.S.
55% 45% 37% 63%
Most racial prejudice is still here; peoplehave just learned to hide it.
76% 24% 88% 12%
Compared to your own experience with racerelations, do you expect the youngestgeneration’s experience to be better?
75% 25% 73% 27%
Uniting To Find SolutionsUniting To Find Solutions
The following are results from breakout sessions from a statewide forum of Delawareansdiscussing the frustrations, hopes, and dreams of a diverse society.

217
• Workplace & Affirmative Action• Hiring and diversity practices are needed, but negative attitudes about
racism must be changed.• Senior management and public officials must be role models.• Accountability for minority hiring practices must be required, along with
consequences for negative actions.
• Education• Schools must close the achievement gap between white students and
students of color. Test scores soon to be released by Department ofEducation will show that the gap remains wide.
• Every student should be expected to achieve at a high level. Teachers andschools must be held accountable for those who don’t.
• Public schools need greater racial diversity among faculty andadministrators. More blacks must be recruited into teaching.
• Tolerance & Acceptance• Educate parents to the problems of racism. Because parents are the first
teachers of their children, they are able to head off the development ofracist attitudes.
• Inform the media of positive stories. This will help the media cover abroader spectrum of events in minority communities.
• Define expected behavior and results from the criminal justice system -including adequate resources for legal assistance to poor people. Establishconsequences for unacceptable results.

218
TITLETITLE: Urban Neighborhoods: Opportunity for Community Reinvestment Act
AUTHORAUTHOR: prepared by Dr. John E. Stapleford and Dr. Francis X. Tannian, Bureau of EconomicResearch, College of Business and Economics, University of Delaware
DATEDATE: May 1993
SOURCESOURCE: College of Business and Economics, University of Delaware
GEOGRAPHICAL AREAGEOGRAPHICAL AREA: Community Reinvestment Act Target Area, including census tracts6.01, 6.02, 7, 8, 9, 15, 16, 17, 19, 21, 22 in Wilmington and 155 south of Wilmington,which includes: East Side Areas; Northeast; Price’s Run Area; South Wilmington; and WestWilmington
KINDS OF INFORMATION/DATA USED IN THE STUDY:KINDS OF INFORMATION/DATA USED IN THE STUDY:
Primary data -- results of a survey of small businesses in the target area, a customer survey in theAdams Four Shopping Center, and a survey of target are residents’ shopping patterns.
IS THE DATA/STUDY REPRESENTATIVE OF COMMUNITY INPUT?IS THE DATA/STUDY REPRESENTATIVE OF COMMUNITY INPUT?
Yes. Community input is the primary source of information.
PROBLEMS/NEEDS ADDRESSED IN THE STUDY:PROBLEMS/NEEDS ADDRESSED IN THE STUDY:
This study looks at local business conditions in the Wilmington census tracts targeted under theCommunity Reinvestment Act (CRA). Authors point out that all attention has been given tocentral business districts and that the conditions in these targeted neighborhoods are poorlyunderstood.
Conclusions:
• Despite the low incomes of many households and residents, the neighborhoods targetedunder CRA are densely populated making commercial access quite easy. There is anactive retail/service base in each neighborhood, and there is sufficient purchasing powerfor expansion of the base.
• Much of the residents’ spending on retail and services “leaks” out of the neighborhoods,and some of it could be captured by new small businesses.
• Neighborhood residents have clearly defined preferences for certain retail and servicebusinesses that they believe are important to have in their neighborhoods: drug stores,supermarkets, full-service banks, medical clinics, and doctor/dentist offices. Leastimportant were liquor stores, pawn shops, movie theaters, flower shops, accountant/legalservices, and family counseling.
• Most residents are positive about the business climate in their neighborhoods, and theybelieve the quality of merchandise and service are good, and that stores are not rundown. Residents believe their neighborhoods are safe places to shop and food locations

219
for businesses to move. They find local prices too high, an inadequate number andvariety of stores, and too many gangs of youths congregating outside neighborhoodbusinesses. They also report that neighborhood businesses are not generally creating jobsfor neighborhood residents.
• While generally satisfied with City services, business owners and residents alike couldbenefit from neighborhood-based training programs targeted at the labor needs ofneighborhood businesses and the establishment of small business insurance pools. Mostsmall business owners are not aware of the array of small business support servicesavailable to them at no cost from various government agencies and non-profits.
• About half of the existing small business base is “nonlegal”, and must be encouraged toenter the legal business structure so that lending institutions can be of assistance.

220
TITLETITLE: Wilmington Area Community-Based Development Project: First Year Report
AUTHORAUTHOR: College of Urban Affairs and Public Policy: University of Delaware - Raheemah M. Jabbar-Bey
DATEDATE: May 1991
SOURCESOURCE: College of Urban Affairs and Public Policy of the University of Delaware
GEOGRAPHICAL AREAGEOGRAPHICAL AREA: Wilmington’s Census Tracts 6.01, 6.02, 7, 8, 9, 15, 16, 17, 19, 21,22
KINDS OF INFORMATION/DATA USED IN THE STUDY:KINDS OF INFORMATION/DATA USED IN THE STUDY:
Primary data - statistical results of a survey conducted at community-based developmentneighborhood forums; specific problems cited by respondents at the community-baseddevelopment neighborhood forums; statistical results of a survey of community-basedorganizations and government agencies understanding of community needs and the fieldof community-based development
Secondary data -- census data (1980) regarding housing vacancy rates, median householdincome, types of households, household size, owner vs. renter occupancy, and race;statewide labor and unemployment statistics
IS THE DATA/STUDY REPRESENTATIVE OF COMMUNITY INPUT?IS THE DATA/STUDY REPRESENTATIVE OF COMMUNITY INPUT?
Yes. The data received at the community-based development neighborhood forumscame from direct surveying of community members. The survey of community-basedorganizations and government agencies can likewise be considered community input.
PROBLEMS/TRENDS ADDRESSED IN THE STUDY:PROBLEMS/TRENDS ADDRESSED IN THE STUDY: “GENERAL”
The responses of the participants at the community-based development neighborhoodforums were grouped into the following categories and ranked in the following orderaccording to the most common overall responses:
• Need for community organizing and outreach;• Need for human capital development;• Need for political education;• Need for improved relations between the community and institutions;• Need for economic development and job creation; and• Need for improved community health and well-being.
The 47 agencies responding to the community-based development survey included 17social service agencies, 28 human and community development organizations, 9substance abuse agencies, 6 ethnic issue-oriented organizations, 5 organizations for thementally ill, 9 affordable housing groups, and 4 advocacy organizations. Theorganizations’ responses to the survey revealed the following ranking of needs/problemsin their target areas:
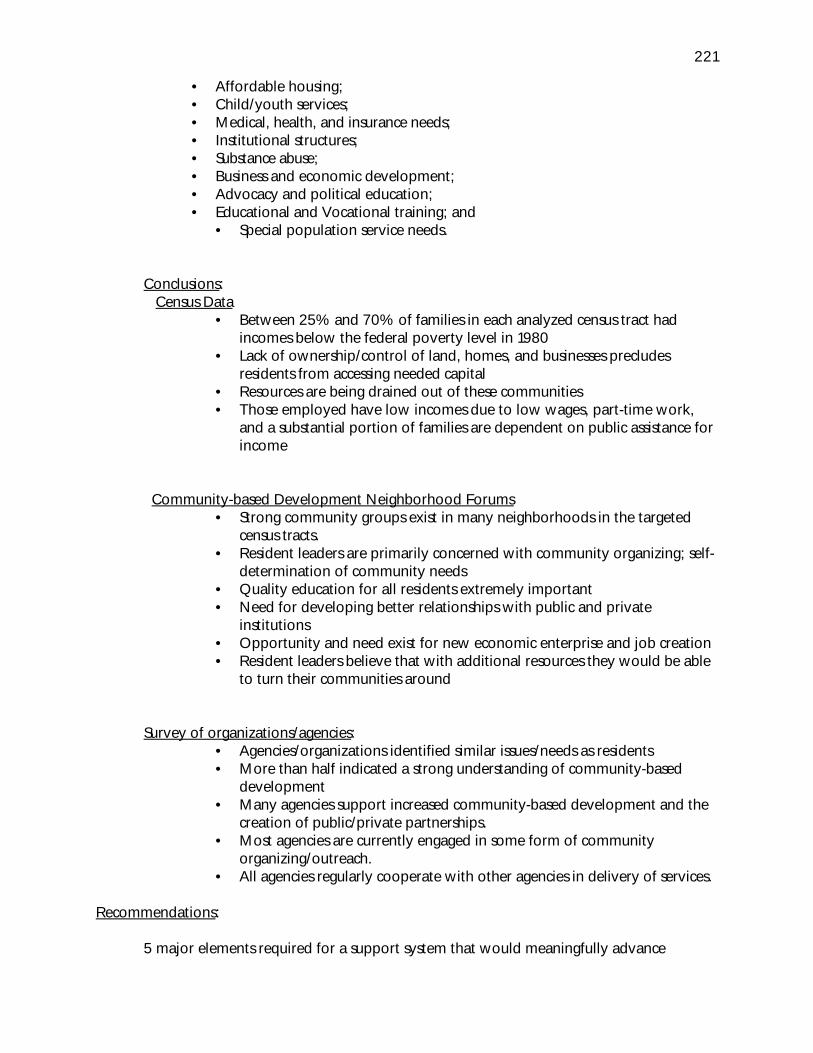
221
• Affordable housing;• Child/youth services;• Medical, health, and insurance needs;• Institutional structures;• Substance abuse;• Business and economic development;• Advocacy and political education;• Educational and Vocational training; and
• Special population service needs.
Conclusions: Census Data
• Between 25% and 70% of families in each analyzed census tract hadincomes below the federal poverty level in 1980
• Lack of ownership/control of land, homes, and businesses precludesresidents from accessing needed capital
• Resources are being drained out of these communities• Those employed have low incomes due to low wages, part-time work,
and a substantial portion of families are dependent on public assistance forincome
Community-based Development Neighborhood Forums• Strong community groups exist in many neighborhoods in the targeted
census tracts.• Resident leaders are primarily concerned with community organizing; self-
determination of community needs• Quality education for all residents extremely important• Need for developing better relationships with public and private
institutions• Opportunity and need exist for new economic enterprise and job creation• Resident leaders believe that with additional resources they would be able
to turn their communities around
Survey of organizations/agencies:• Agencies/organizations identified similar issues/needs as residents• More than half indicated a strong understanding of community-based
development• Many agencies support increased community-based development and the
creation of public/private partnerships.• Most agencies are currently engaged in some form of community
organizing/outreach.• All agencies regularly cooperate with other agencies in delivery of services.
Recommendations:
5 major elements required for a support system that would meaningfully advance

222
community-based development in the Wilmington area:
C Financial support for newly-formed organizations;C Affordable training opportunities for practitioners;C Educational opportunities to inform the public about CBD;C Adequate access to capital; andC Affordable technical assistance.

223
TITLE: TITLE: Year 1 – 1997: A Report on the Focus Groups (Study Circles on Racism and RaceRelations; New Castle County, Delaware)
AUTHORS: AUTHORS: Catherine Flavin-McDonald, with the assistance of Damon Higgins,Jennifer Necci-Dineen, Martha McCoy and Ruth Sokolowski
DATE: DATE: 1998
SOURCE: SOURCE: Study Circles Resource Center and the YWCA of New Castle County, Delaware
GEOGRAPHICAL AREA: GEOGRAPHICAL AREA: New Castle County
KINDS OF INFORMATION/DATA USED IN THE STUDY: KINDS OF INFORMATION/DATA USED IN THE STUDY: results from focus groups
IS THE DATA/STUDY REPRESENTATIVE OF COMMUNITY INPUT?IS THE DATA/STUDY REPRESENTATIVE OF COMMUNITY INPUT? Yes.
PROBLEMS/NEEDS ADDRESSED IN THE STUDY: PROBLEMS/NEEDS ADDRESSED IN THE STUDY:
“CIVIL RIGHTS”
Need for the Program
Focus Group respondents felt: C saw a need in the community for interracial dialogue and for open
conversations about racism and race relations;C were disturbed, and at times angry, that this need for dialogue about
racism and race relations persists;C saw the importance of action steps and the importance of dialogue
leading to action, (though their ideas of meaningful action differed);C were frustrated by wide variations in knowledge about race - between
people of different races and sometimes within racial groups (forexample, between people of different generations). Many felt thisvariation made it difficult to move beyond elementary conversations;
C acknowledged that their communities have deep-seated race problems andthat reluctance to acknowledge racial issues is common;
C saw that face-to-face dialogue in the Study Circles as a sign of progress, asan acknowledgment of problems, and as a productive first step;
C saw that candor and a willingness to be uncomfortable contributed toproductive interracial dialogue;
C saw that diversity was central to creating the conditions for productiveconversations;
C saw that the initial participation of about 600 people was a beginning,and that more should be done to address racism and that it wasimportant to find ways to involve more people (particularly youngpeople);
C saw that it was important to move beyond "black and white" whendiscussing racism and race relations, as well as the importance ofaddressing racial tensions within communities of color;
C felt that limited time was the strongest constraint on productive dialogue;

224
C felt that newspaper coverage would continue to be a deciding factor in thesuccess of the program; and
C saw that sponsors' and public officials' endorsements of the program as animportant way to draw attention and support to the program; actualparticipation would be even more meaningful.
Individual and Community-level Effects of the Study Circles
Many white respondents felt the Study Circles had helped them to build meaningful relationshipswith African American individuals. These respondents also felt they were able to effect positivechange through those relationships. On the other hand, many black respondents indicated thatthey were not able to build meaningful relationships with whites in their Study Circles, largelybecause of the limited time period.
Most white respondents were generally satisfied with the program thus far. Many AfricanAmerican respondents felt that the jury was still out, and were withholding judgment until theylearned what happened as a result of the program.
Respondents in all three groups said Study Circles had contributed to their understanding ofracism and race relations.
Many white respondents reported that they had a higher resolve to protest when they heardracist comments after participating in Study Circles.
Other follow-up actions were also reported, including neighbor-to-neighbor efforts to resolve azoning problem and to combat racism in a local school.
Challenges
The respondents in these focus groups saw racism as an ominous problem, and were eager to seeit end. In light of their assessment of the race problems facing their community and the country,and given the limited time and reach of the Study Circles to date, they expressed doubts andconcerns about the program's ability to reach the essence of the problem and effect sustainablechange. That acute concern underlies all of the findings. It sometimes provokes hope andsometimes provokes despair.
In many cases, the respondents' sense of the Study Circle program's possibilities was dependentupon the visibility of outcomes, and this was especially true for African American respondents. To overcome this knowledge gap, one of the major challenges that this program faces is toimprove communications.
Another challenge involves connecting participants with opportunities for action. Again andagain, respondents indicated that they wanted more; people were looking to make connectionsin different ways. Participants needed an opportunity to find out how and where to getinvolved.

225
The YWCA Addressing the Need in New Castle County
Program organizers at the YWCA are also continuing their efforts to adapt and expand theirStudy Circle program. In light of this report, organizers are working to connect Study Circleparticipants with volunteer opportunities, supporting and publicizing the work of Study Circleaction groups, looking for ways to connect and collaborate with local media, exploring the useof Study Circles in area workplaces, and seeking to involve more members of the community inthe future rounds of Study Circles.


![Quest [Spring 1999] - CORE](https://static.fdokumen.com/doc/165x107/6332b87eb0ddec4616073edb/quest-spring-1999-core.jpg)