1 Bold Park Drive Floreat WA 6014 T: 08 9347 6000 - Town of ...
240
-
Upload
khangminh22 -
Category
Documents
-
view
3 -
download
0
Transcript of 1 Bold Park Drive Floreat WA 6014 T: 08 9347 6000 - Town of ...

CONTENTS
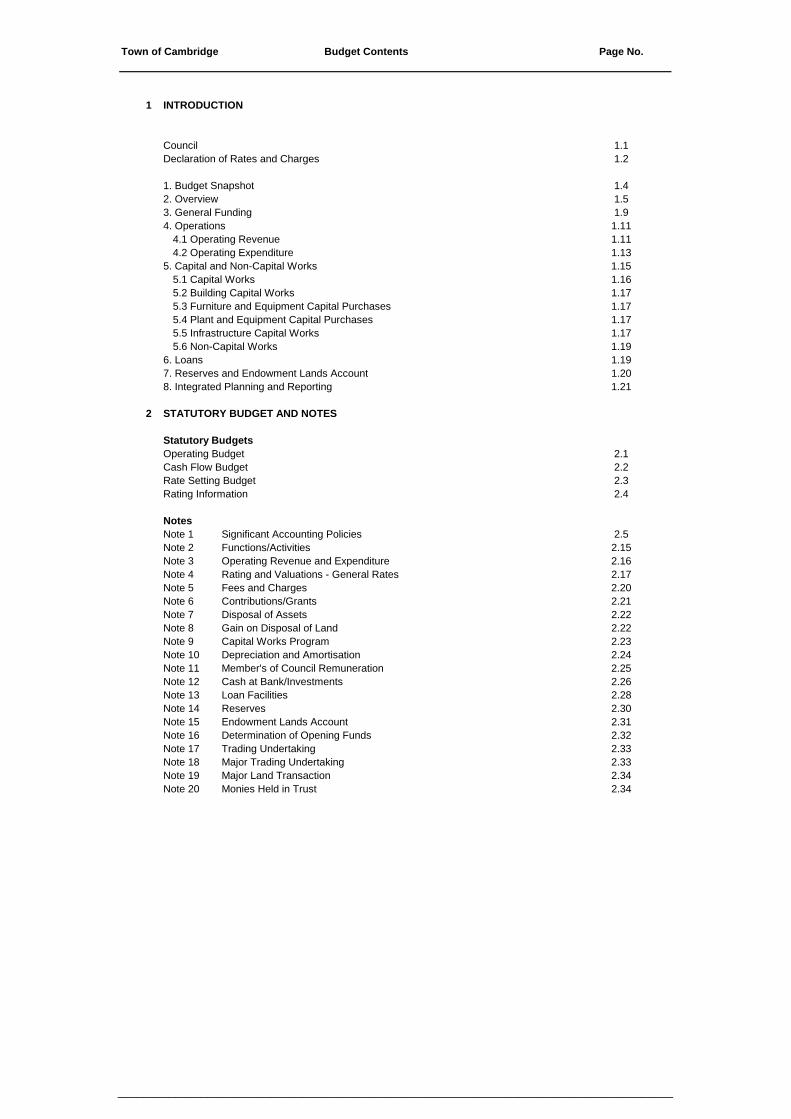
Town of Cambridge Page No.
1 INTRODUCTION
Council 1.1Declaration of Rates and Charges 1.2
1. Budget Snapshot 1.42. Overview 1.53. General Funding 1.94. Operations 1.11
4.1 Operating Revenue 1.114.2 Operating Expenditure 1.13
5. Capital and Non-Capital Works 1.155.1 Capital Works 1.165.2 Building Capital Works 1.175.3 Furniture and Equipment Capital Purchases 1.175.4 Plant and Equipment Capital Purchases 1.175.5 Infrastructure Capital Works 1.175.6 Non-Capital Works 1.19
6. Loans 1.197. Reserves and Endowment Lands Account 1.208. Integrated Planning and Reporting 1.21
2 STATUTORY BUDGET AND NOTES
Statutory BudgetsOperating Budget 2.1Cash Flow Budget 2.2Rate Setting Budget 2.3Rating Information 2.4
NotesNote 1 Significant Accounting Policies 2.5Note 2 Functions/Activities 2.15Note 3 Operating Revenue and Expenditure 2.16Note 4 Rating and Valuations - General Rates 2.17Note 5 Fees and Charges 2.20Note 6 Contributions/Grants 2.21Note 7 Disposal of Assets 2.22Note 8 Gain on Disposal of Land 2.22Note 9 Capital Works Program 2.23Note 10 Depreciation and Amortisation 2.24Note 11 Member's of Council Remuneration 2.25Note 12 Cash at Bank/Investments 2.26Note 13 Loan Facilities 2.28Note 14 Reserves 2.30Note 15 Endowment Lands Account 2.31Note 16 Determination of Opening Funds 2.32Note 17 Trading Undertaking 2.33Note 18 Major Trading Undertaking 2.33Note 19 Major Land Transaction 2.34Note 20 Monies Held in Trust 2.34
Budget Contents
_______________________________________________________________________________________
Town of Cambridge Page No.Budget Contents
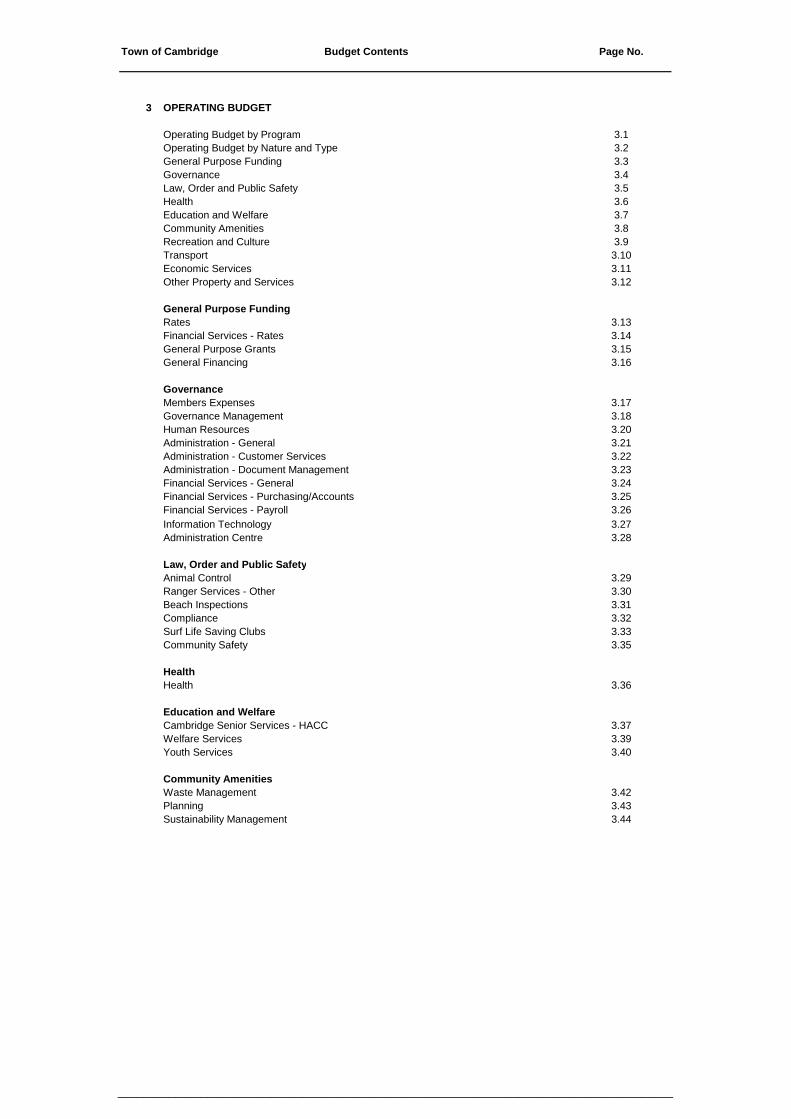
3 OPERATING BUDGET
Operating Budget by Program 3.1Operating Budget by Nature and Type 3.2General Purpose Funding 3.3Governance 3.4Law, Order and Public Safety 3.5Health 3.6Education and Welfare 3.7Community Amenities 3.8Recreation and Culture 3.9Transport 3.10Economic Services 3.11Other Property and Services 3.12
General Purpose FundingRates 3.13Financial Services - Rates 3.14General Purpose Grants 3.15General Financing 3.16
GovernanceMembers Expenses 3.17Governance Management 3.18Human Resources 3.20Administration - General 3.21Administration - Customer Services 3.22Administration - Document Management 3.23Financial Services - General 3.24Financial Services - Purchasing/Accounts 3.25Financial Services - Payroll 3.26Information Technology 3.27Administration Centre 3.28
Law, Order and Public SafetyAnimal Control 3.29Ranger Services - Other 3.30Beach Inspections 3.31Compliance 3.32Surf Life Saving Clubs 3.33Community Safety 3.35
HealthHealth 3.36
Education and WelfareCambridge Senior Services - HACC 3.37Welfare Services 3.39Youth Services 3.40
Community AmenitiesWaste Management 3.42Planning 3.43Sustainability Management 3.44
_______________________________________________________________________________________
Town of Cambridge Page No.Budget Contents
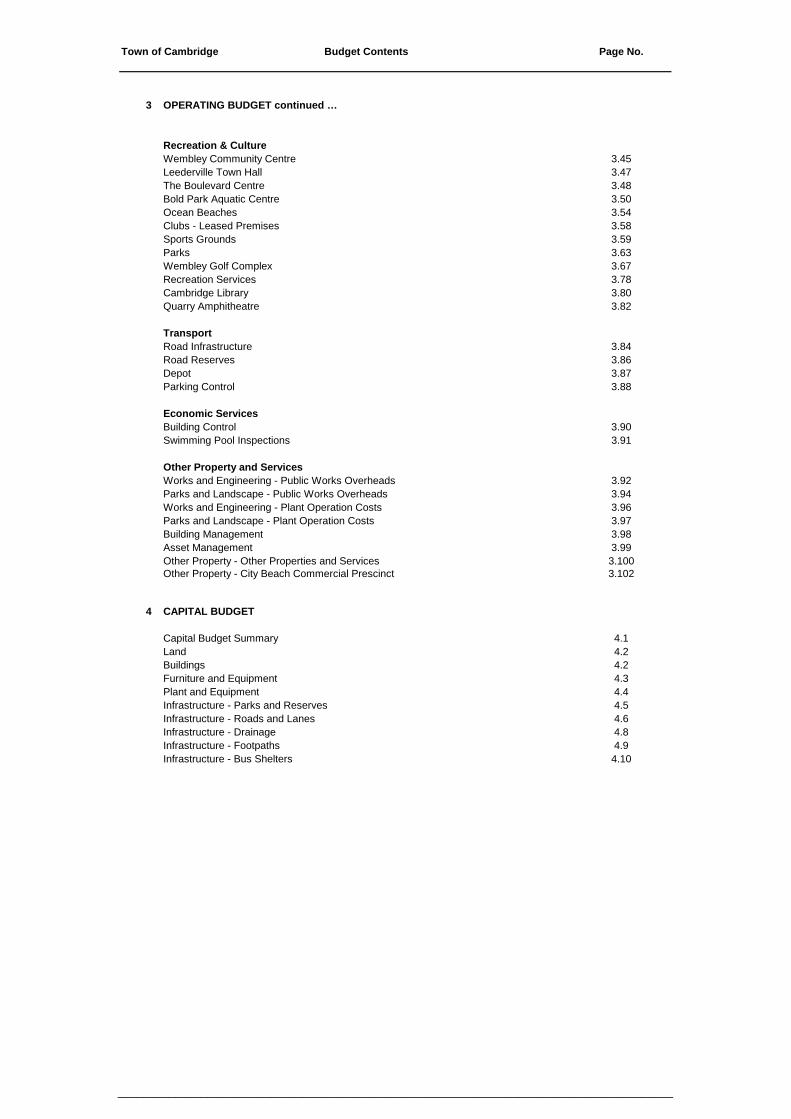
3 OPERATING BUDGET continued …
Recreation & CultureWembley Community Centre 3.45Leederville Town Hall 3.47The Boulevard Centre 3.48Bold Park Aquatic Centre 3.50Ocean Beaches 3.54Clubs - Leased Premises 3.58Sports Grounds 3.59Parks 3.63Wembley Golf Complex 3.67Recreation Services 3.78Cambridge Library 3.80Quarry Amphitheatre 3.82
TransportRoad Infrastructure 3.84Road Reserves 3.86Depot 3.87Parking Control 3.88
Economic ServicesBuilding Control 3.90Swimming Pool Inspections 3.91
Other Property and ServicesWorks and Engineering - Public Works Overheads 3.92Parks and Landscape - Public Works Overheads 3.94Works and Engineering - Plant Operation Costs 3.96Parks and Landscape - Plant Operation Costs 3.97Building Management 3.98Asset Management 3.99Other Property - Other Properties and Services 3.100Other Property - City Beach Commercial Prescinct 3.102
4 CAPITAL BUDGET
Capital Budget Summary 4.1Land 4.2Buildings 4.2Furniture and Equipment 4.3Plant and Equipment 4.4Infrastructure - Parks and Reserves 4.5Infrastructure - Roads and Lanes 4.6Infrastructure - Drainage 4.8Infrastructure - Footpaths 4.9Infrastructure - Bus Shelters 4.10
_______________________________________________________________________________________

Town of Cambridge Page No.Budget Contents
5 RESERVE/ENDOWMENT LANDS ACCOUNT BUDGET
RESERVE BUDGET 5.1
Area ImprovementWembley/West Leederville Area 5.2Aged Care Services and Facilities 5.2
Community FacilitiesGeneral 5.3Wembley Community Centre 5.3Cambridge Senior Services 5.3Wembley Golf Complex 5.3The Boulevard Centre 5.3
Asset ManagementPlant 5.4Light Fleet 5.4Equipment 5.4
Waste Management 5.5
Clubs and Associations - Buildings 5.6Clubs and Associations - Synthetic Courts and Lighting Funds 5.6Clubs and Associations - Car Parks and Surroundings 5.6
Development Contributions - ParkingMedical Zone (SJOG) 5.7Floreat ForumDistrict Centre Zoning 5.7Southport Street Node 5.7Cambridge High Street Node 5.7Wembley Town Centre 5.7Other/Traditional Strip Commercial Centres 5.7
Development Contributions - Public ArtsMedical Zone (SJOG) 5.8Floreat ForumDistrict Centre Zoning 5.8Southport Street Node 5.8Cambridge High Street Node 5.8Wembley Town Centre 5.8Other/Traditional Strip Commercial Centres 5.8
ENDOWMENT LANDS ACCOUNT BUDGET 5.9
Endowment Lands Account 5.10
_______________________________________________________________________________________

Town of Cambridge Page No.Budget Contents
6 MISCELLANEOUS SCHEDULES
Budget Summary 6.1General Purpose Funding 6.2Major Projects 6.3Carried Forward 6.4Disposal of Assets 6.7
Operating Revenue SchedulesContributions/Grants for the Development of Assets 6.8
Operating Expenditure SchedulesEmployee Expenses 6.9Information Systems 6.10Building Maintenance 6.12Job Costing 6.13Non-Capital Works 6.14Depreciation 6.16Activity Based Costing 6.18Clubs Lease Schedule 6.21
_______________________________________________________________________________________

Town of Cambridge Page No.Budget Contents
7 FEES AND CHARGES
General Fees and ChargesAdministration 7.1Rates 7.1Underground Power 7.1
Community Development Fees and ChargesLibrary 7.2Youth Services 7.2Street Party Road Closure 7.2Fitting and Checking of Vehicle Child Restraints 7.2Cambridge Senior Services 7.3
RangerServices Fees and ChargesDog Registrations 7.4Dog Pound 7.4Cat Registrations 7.4Cat Impound and Cat Management Facility Fees 7.4Cat Sterilisation Fees 7.4Administration Fees - Animal Local Laws 7.4Administration Fees - Parking Local Law 7.4Infringement Agency Costs 7.4Tow Away of Vehicles 7.5Bush Fires Act Charges 7.5Impounding Fees 7.5Helicopter Landing Fees 7.5Parking Fees 7.5
Halls and Community CentresThe Boulevard Centre 7.6Wembley Community Centre 7.7Leederville Town Hall 7.8
Sportsgrounds and ReservesLiquor Permits 7.9Wedding Licences 7.9Commercial Rates 7.9Commercial Group Fitness Licence 7.9Functions on Reserve 7.9Driver Training 7.9Promotion and Public Sampling 7.9Charges for Reserves 7.10Special Events 7.10Reserve Bond 7.10Floreat Beach Volleyball Courts 7.10Cancellation Fees 7.10Storage Alderbury Reserve 7.10Holyrood Park Facility 7.10
Wembley Golf Course 7.11
Bold Park Aquatic Centre 7.13
Quarry Amphitheatre 7.14
Planning, Health and Building FeesPlanning Services 7.16Development Application Fees 7.16Administration Fees - Town Planning Services 7.16Development Assesment Panel Application Fees 7.16Other Information 7.16
Building Service Fees and ChargesBuilding Applications 7.17Building Service Levies 7.17Other Licences/Applications 7.18Administration Fees - Building Services 7.18Local Law - General Applications for Approval 7.18Archive Search - Building Plans or Historical Building Information 7.18
_______________________________________________________________________________________

Town of Cambridge Page No.Budget Contents
7 FEES AND CHARGES Cont'd…
Environmentl Health Services Fees and ChargesGeneral Applications for permits 7.19Health Local Law - Local Law Applications 7.19Food Act 2008 Fees 7.19Offensive Trades 7.19Application to construct/Alter/Extend a public building 7.19Septic Tank & Application Fees 7.19Noise Regulation Fees 7.19Administration Fees - Environmental Health Services 7.20
Works Fees and ChargesSecure Sums (Works Bonds) 7.21Depot 7.22Parks and Reserves Access Fees and Bonds 7.22Sanitation Charges 7.23
_______________________________________________________________________________________

INTRODUCTION
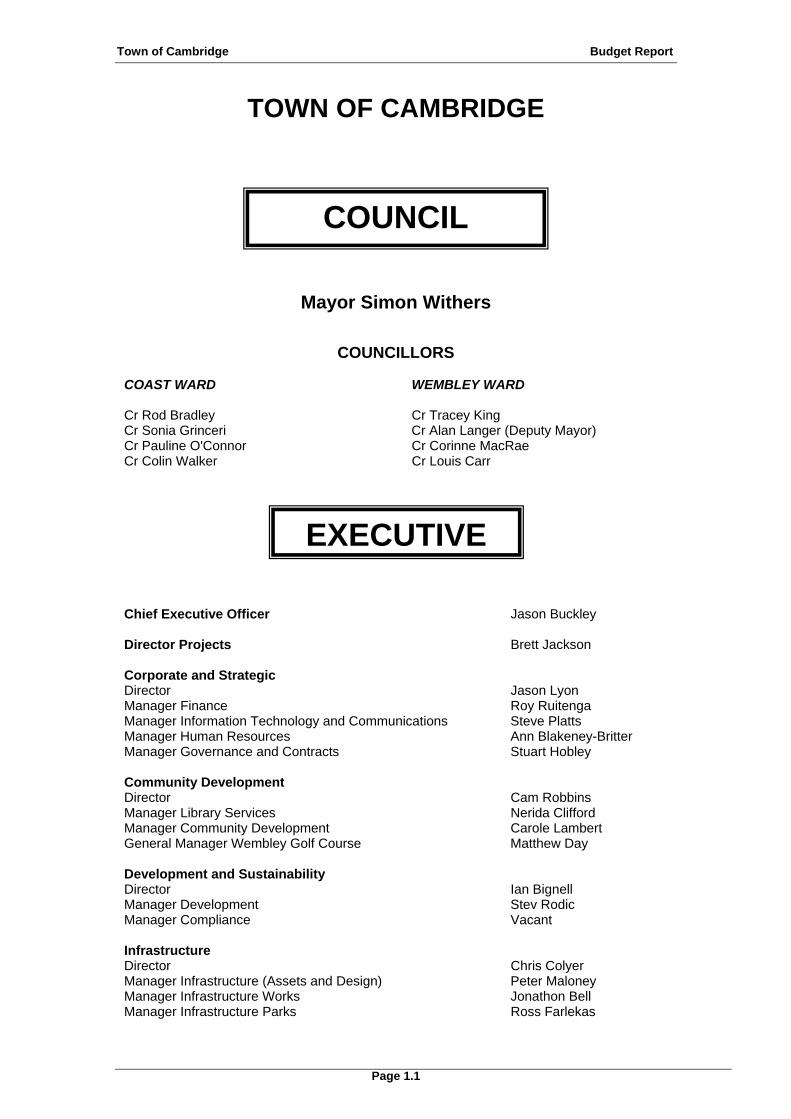
Town of Cambridge Budget Report
Page 1.1
TOWN OF CAMBRIDGE
Mayor Simon Withers
COUNCILLORS
COAST WARD
WEMBLEY WARD
Cr Rod Bradley Cr Tracey King Cr Sonia Grinceri Cr Alan Langer (Deputy Mayor) Cr Pauline O'Connor Cr Corinne MacRae Cr Colin Walker Cr Louis Carr
Chief Executive Officer Jason Buckley Director Projects Brett Jackson Corporate and Strategic Director Jason Lyon Manager Finance Roy Ruitenga Manager Information Technology and Communications Steve Platts Manager Human Resources Ann Blakeney-Britter Manager Governance and Contracts Stuart Hobley Community Development Director Cam Robbins Manager Library Services Nerida Clifford Manager Community Development Carole Lambert General Manager Wembley Golf Course Matthew Day Development and Sustainability Director Ian Bignell Manager Development Stev Rodic Manager Compliance Vacant Infrastructure Director Chris Colyer Manager Infrastructure (Assets and Design) Peter Maloney Manager Infrastructure Works Jonathon Bell Manager Infrastructure Parks Ross Farlekas
COUNCIL
EXECUTIVE
Town of Cambridge Budget Report
Page 1.2
DECLARATION OF RATES AND CHARGES
In accordance with Section 6.2(1) of the Local Government Act 1995, the Town of Cambridge proposes to adopt the Budget for the period ending 30 June 2016 by an Absolute Majority at a special Council meeting to be held on Monday 20 July 2015. The following rates and charges are imposed in respect of the Budget. (i) General Rate
(a) A rate of 5.8607 cents in the dollar on all rateable property within the Town of Cambridge assessed on the Gross Rental Valuation (GRV) method (ie. excluding the lands specified in the Cambridge Endowment Lands Act).
(b) A rate 0.2093 cents in the dollar on all rateable property within the Town of
Cambridge as specified in the Cambridge Endowment Lands Act assessed on the Unimproved Valuation (UV) method.
(ii) Minimum Rate
A minimum rate of $937 on all rateable property. (iii) Waste Disposal Fee and Collection Charges In accordance with Section 68 of the Waste Avoidance and Resource Recovery Act
2007 and the Town of Cambridge Health Local Law, the Town has imposed a Waste Charge levied on all rateable properties in the district that have, or are entitled to have a domestic general waste bin.
Waste Service Collection Charge:
120 lt general waste bin service (side lift or rear lift service ) $100 per annum 240 lt general waste bin service (side lift or rear lift service) $500 per annum 660 lt general waste bin service (weekly collection) $980 per annum 660 lt general waste bin service (single collection) $19 per collection 240 lt recycling bin service (side lift or rear lift service) $nil per annum 360 lt recycling bin service (side lift or rear lift service) $nil per annum 660 lt recycling bin service (weekly service) $710 per annum 660 lt recycling bin service (single collection) $14 per collection
240 lt green waste bin service (with 120lt general waste) $70 per annum 240 lt green waste bin service (with 240lt general waste) $70 per annum
(iv) Waste Service Charge for Non-Rateable Properties and Ratable Properties with
Additional Services: The following charges are levied on Non-Rateable Properties that receive a rubbish service, or Rateable Properties with a service in addition to the standard entitlement. Charges are levied on a per annum or pro rata amount per service. 120 lt general waste bin service (side lift service) $200 per annum 120 lt general waste bin service (rear lift service) $210 per annum 240 lt general waste bin service (side lift or rear lift service) $500 per annum 240 lt recycling bin service (side lift or rear lift service) $48 per annum 360 lt recycling bin service (side lift or rear lift service) $57 per annum 240 lt green waste bin service $70 per annum

Town of Cambridge Budget Report
Page 1.3
Supply of an additional 240 lt general waste bin $70 Supply of an additional 240 lt recycling bin in excess of policy $70 Supply of an additional 360 lt recycling bin in excess of policy $115 Supply of an additional 240 lt green waste bin $70 Supply and deliver 660 lt waste bin $610 Exchange 120 lt for a 240 lt general waste bin $87 Exchange 240 lt for a 120 lt general waste bin $nil
(vi) Instalment Administration Fee and Interest
An Administration Fee of $8.00 per instalment and instalment interest of 5.5% be charged on rates and service charges for those ratepayers selecting the instalment option in accordance with Section 6.45(3) and 6.13 of the Local Government Act 1995. The administration fee or instalment interest will not apply to entitled pensioners or eligible seniors.
(vii) Late Payment Interest Late payment interest of 11% per annum, calculated on a daily basis, to be charged on rates and service charges which are outstanding from the due date (35 days after issue of the assessment notice) until the date prior to the outstanding amounts being paid, in accordance with Section 6.51(1) of the Local Government Act 1995. Late payment interest shall not apply to entitled pensioners or eligible seniors.
(viii) Fees and Charges
The fees and charges to be imposed have been adopted in accordance with the supporting schedule of fees and charges included in the Budget.
SIMON WITHERS JASON BUCKLEY MAYOR CHIEF EXECUTIVE OFFICER
20 July 2015

Town of Cambridge Budget Report
Page 1.4
2015/2016 - BUDGET REPORT
1. BUDGET SNAPSHOT
The following table provides a quick overview of the main features of the 2015/2016 budget.
Rate Revenue $23,396,500
Increase in the GRV Rate in the Dollar 3.00%
Operating Revenue (excluding Rates) $27,213,000
Operating Expenditure $43,505,000
Proceeds from sale of assets $5,182,000
Contributions and Grants for Capital Works $4,801,000
Capital Works $38,647,500
Transfers to the Endowment Lands Account $917,000
Transfers to Reserves $3,518,000
Loan proceeds $2,000,000
Transfers from Reserves $5,561,500
Transfers from the Endowment Lands Account $19,166,000
Town of Cambridge Budget Report
Page 1.5
2. OVERVIEW Impact of Major Projects on the 2015/2016 Budget The Town has undertaken a number of major projects to date with some about to be completed and others still in progress. This year sees the completion of the Bold Park Aquatic Centre Upgrade, ongoing construction works associated with the Wembley Golf Course Hospitality and Miniature Golf project and the completion of the City Beach Precinct Commercial Facilities and City Beach Surf Club. The impact of these major projects upon the 2015/2016 budget are as follows: Bold Park Aquatic Centre The operations of the Bold Park Aquatic Centre will resume back to normal for a nine month period commencing from October 2015. The new facility generates additional revenue of $300k to $400k over previous norms. Coupled with this is additional operating and staffing costs in maintaining the expanded facility, which sees expenditure increase by a similar amount. For this financial year it is not anticipated that any real change to the rate subsidy of $330k will be required. Wembley Golf Course This year will see the construction of a new hospitality and function centre and the decommissioning of the old tavern with a temporary food and beverage facility being put in place. As a result revenue is predicted to fall for this year, however operations will resume back to normal for the 2016/2017 financial year. With the completion of the new facilities in place, an increase in operating results above the historical norms will be generated for the 2016/2017 financial year onwards. The net surplus from operations for this construction year subsequently drops from $2 million to $1.5 million which will have no impact on rates as this is being financed by reserve funds to accommodate the projected associated downturn this year. City Beach Commercial Operations The City Beach Precinct major works project, including the City Beach Surf Club and commercial operations, is scheduled for completion with three new commercial restaurants due to open in November 2015. These are estimated to contribute an additional $340k to the overall net operating result for the financial year, after operating expenditure and loan financing costs have been taken into account.

Town of Cambridge Budget Report
Page 1.6
2. OVERVIEW (continued)
General Overview
The 2015/2016 budget for the Town of Cambridge has been developed by applying a 3.0% increase in the rate in the dollar applied to the gross rental value (GRV) of rateable properties. This increase reflects the underlying increase in costs and allows the rate funds allocated to infrastructure renewal to be increased.
Rate revenue represents 28% of the Town’s main sources of funds. Other funding sources include:
$5 million proceeds from the sale of land assets. The Endowment Lands Account, funding $19.2 million of capital works, primarily for
the Town's major projects program. Reserve funding of $5.6 million, of which $3.5 million is for capital works.
These funds are shown in the chart below:

Town of Cambridge Budget Report
Page 1.7
2. OVERVIEW (continued) Budgeted cash operating expenses total $36.5 million. In addition, an amount of $0.9 million is transferred to the Endowment Lands Account from internal loans and similarly, $3.5 million is transferred to Reserves with $1.8 million from land sales, (Catalina Estate, Tamala Park), plant proceeds, club contributions, interest, and rates.
Capital works total $38.6 million and features $7.6 million for the Wembley Golf Course Hospitality project, $5.4 million for the Bold Park Aquatic Centre Upgrade, $3 million for the Wembley Sports Park Pavilion and $1.9 million for the Wembley Golf Course Miniature Golf project with the balance being made up primarily of parks and roads infrastructure works. The main items in the capital works program for this year are listed on the following page.

Town of Cambridge Budget Report
Page 1.8
2. OVERVIEW (continued)
Capital Budget Major Works $100,000 plus Budget Funding Funding2015/2016 Source Amount
$
BUILDINGSWembley Golf Course Hospitality 7,190,500 Endow/Loan (7,190,500)City Beach Amenities 6,315,000 Endow/Grant (6,315,000)Bold Park Aquatic Centre Upgrade 5,365,000 Endow (5,365,000)Wembley Sports Park - Pavilion 3,007,500 Grant/Area Res (3,007,500)Floreat Surf Life Saving Club - Replace Roof 450,000 Club Res (450,000)Wembley Golf Course Hospitality Fitout 400,000 Endow (400,000)Cambridge Bowling Club - Replacement of Green A 200,000 Contribution/Grant (132,000)Floreat Beach Storage Shed for Coastcare and FSLSC 147,000 Contribution/CF (147,000)Quarry Amphitheatre - Fire Management Assets 130,000 Endow (130,000)Cambridge Scouts & Guides Hall Additions 105,000 Contribution (50,000)
INFRASTRUCTURE - PARKS AND RESERVESWembley Golf Course Miniature Golf 1,909,500 Endow (1,909,500)Perry Lakes Skate Park - Stage 2 450,000 Contribution (300,000)Wembley Sports Park - Infrastructure Works 412,500 Area Res (412,500)City Beach Groyne Maintenance Stage 3 of 3 335,000 Dep Tran/Endow (335,000)Rutter Park Improvements 320,000 Lake Monger Reserve - Lighting (Stage 5) 100,000 CF (40,000)
INFRASTRUCTURE - ROADS AND LANESGrantham/Harborne - Intersection Safety 700,000 Blackspot (700,000)Railway Pde (Loftus - Kerr) 446,500 MRWA Rehab (297,500)Salvado Rd - Roundabout at SJOG Hospital Entrance 304,000 Contribution/CF (304,000)The Boulevard (Durston - Templetonia) 293,000 MRWA Rehab (195,500)Donegal Road 234,000 R2R (221,000)Crofts Lane 210,000 R2R/CF (210,000)Jacobson Laneway 203,500 Area/CF (203,500)Waddington Lane 200,000 Loveridge Lane 200,000 Atterton Lane 200,000 Kerb replacement for road resurfacing program 197,000 CF (47,000)Nanson Street (Cambridge - Grantham) 186,000 Empire Avenue - (Weaponess - Erskine) W 183,000 Contribution/CF (183,000)Launceston Ave (Helston - Challenger) 149,000 R2R (137,000)Piper Lane (Grantham/Herdsman/Alexander/Simper) 145,000 CF (145,000)Pedestrian Crossing - Grantham between Harborne & Jersey 137,000 CF (137,000)Kinross Crescent 116,500 Kintyre Road 116,500 Cambridge St - Pedestrian Crossing to Oxford from PTA 116,000 CF (116,000)Kilpa Court (Town Car Park) 113,500 CF (113,500)Maloney Way 111,500 Grantham St - Pedestrian Crossinf at Essex St 110,000
INFRASTRUCTURE - DRAINAGEDrainage Pipe and Pit Rehabilitation 124,000 CF (24,000)Ruislip/Marlow St - Drainage Improvement 112,000 CF (112,000)14 Chipping Road - Desing and Construct 100,000
FURNITURE AND EQUIPMENTPurchase and Supply Waste Bins 326,000 Grant/Waste Res (326,000)Replace NetApp Controller x 2 (Admin & Library) 200,000 TechOne Annual Upgrade + New Module 140,000 Desktop Workstations (replace workstations) 120,000 CF (20,000)VMWare Enterprise Agreement Bundle 100,000
PLANT AND EQUIPMENTWorks - Front End Loader 150,000 PLT Res/ Trade In (150,000)Works - Hino Ranger PRO9 Tipper Truck 174,000 PLT Res/ Trade In/CF (174,000)
Town of Cambridge Budget Report
Page 1.9
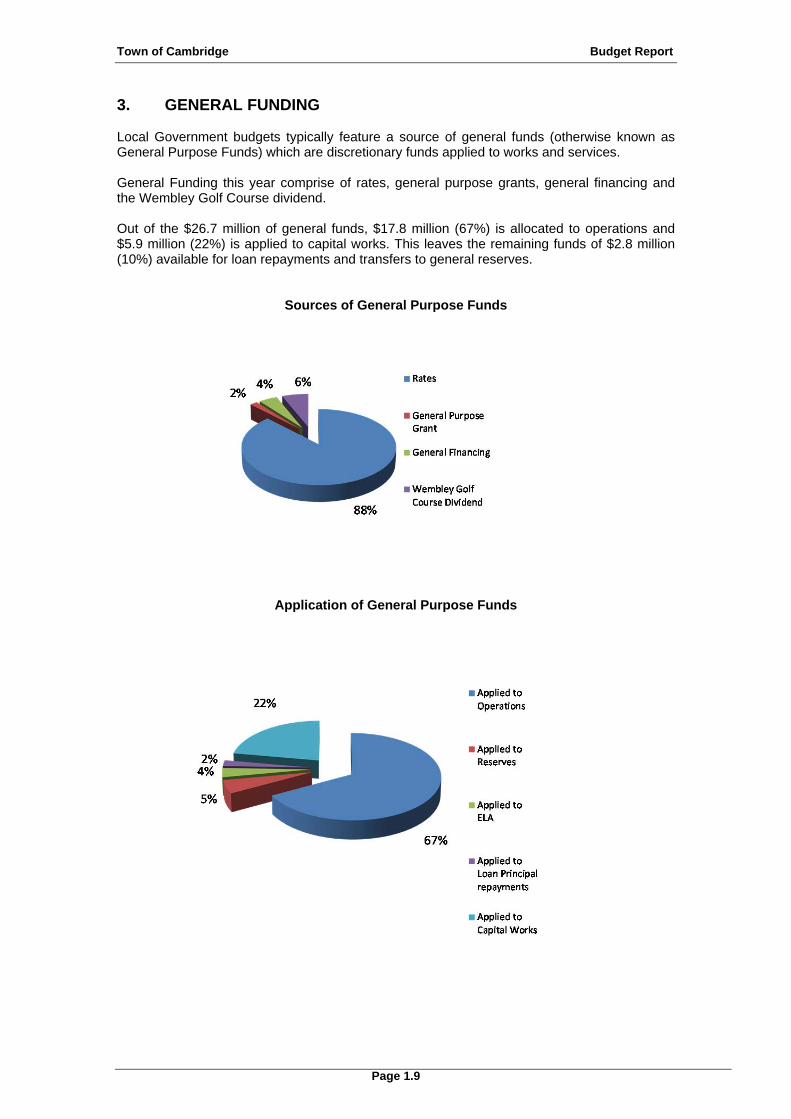
3. GENERAL FUNDING Local Government budgets typically feature a source of general funds (otherwise known as General Purpose Funds) which are discretionary funds applied to works and services. General Funding this year comprise of rates, general purpose grants, general financing and the Wembley Golf Course dividend. Out of the $26.7 million of general funds, $17.8 million (67%) is allocated to operations and $5.9 million (22%) is applied to capital works. This leaves the remaining funds of $2.8 million (10%) available for loan repayments and transfers to general reserves.
Sources of General Purpose Funds
Application of General Purpose Funds

Town of Cambridge Budget Report
Page 1.10
3. GENERAL FUNDING (continued)
In terms of the application of these discretionary funds, the Town has increased the amount allocated to the capital and non-capital works program over a number of years, and is now in a position where it can fully fund its depreciation from rates.
Application of General Purpose Funds Budget Budget Budget Budget
2014/2015 2015/2016 % Change $ Change
$ $ +/(-) +/(-)
General Purpose Funding
Rates 22,136,000 23,396,500 5.7% 1,260,500
General Purpose Grant 954,000 467,500 (51.0%) (486,500)
General Financing* 1,341,500 1,162,500 (13.3%) (179,000)
Wembley Golf Course Dividend 1,627,000 1,627,000 0.0% 0
Total General Purpose Funds 26,058,500 26,653,500 2.3% 595,000
Application of General Purpose Funds
Applied to Operations 16,860,100 17,881,000 6.1% 1,020,900
Applied to Reserves 2,011,900 1,339,000 (33.4%) (672,900)
Applied to ELA 720,000 917,000 27.4% 197,000
Applied to Loan Principal repayments 554,100 588,500 6.2% 34,400
18,625,800 20,725,500 11.3% 2,099,700
Applied to Capital Works:
Land & Buildings 209,500 265,000 26.5% 55,500
Furniture and Equipment 632,500 922,500 45.8% 290,000
Plant and Equipment (100) 15,000 (15100.0%) 15,100
Infrastructure - Parks and Reserves 1,111,000 996,000 (10.4%) (115,000)
Infrastructure - Roads and Lanes 2,909,500 2,636,500 (9.4%) (273,000)
Infrastructure - Drainage 305,000 345,000 13.1% 40,000
Infrastructure - Footpaths 715,000 718,000 0.4% 3,000
Infrastructure - Bus Shelters 30,000 30,000 0.0% 0
5,912,400 5,928,000 0.3% 15,600
Total Application of Funds 26,058,500 26,653,500 2.3% 595,000
Town of Cambridge Budget Report
Page 1.11
3. GENERAL FUNDING (continued)
Of note, the Town achieved its target of covering depreciation with rates allocated to asset renewal and the strategy is to now maintain this funding commitment. The Town will be moving towards recording its entire infrastructure asset base at the current value as from 30 June 2015 and as a result, it will reset its asset-renewal-from-rates target. 4. OPERATIONS 4.1 Operating Revenues
Budget Budget Budget
2013/2014 2014/2015 2015/2016
Depreciation (A) $5,955,500 $6,698,000 $6,994,000
Capital Asset Works $5,538,100 $5,701,400 $5,928,000
Non-Capital Asset Works $1,015,500 $921,200 $1,104,000
Reserve Transfers: future renew a $567,000 $766,000 $774,000
Total Works & Provisions (B) $7,120,600 $7,388,600 $7,806,000
Difference (A) - (B) -$1,165,100 -$690,600 -$812,000
Percentage of Rates 33.4% 34.8% 35.1%
Budget BudgetBudget Budget $ Change % Change
2014/2015 2015/2016 +/(-) +/(-)
$22,136,000 $23,396,500 $1,260,500 5.69%
$2,269,000 $1,825,500 ($443,500) (19.55%)
$4,159,800 $4,801,000 $641,200 15.41%
$8,553,500 $2,627,000 ($5,926,500) (69.29%)
$14,439,300 $15,744,500 $1,305,200 9.04%
$1,509,000 $1,332,500 ($176,500) (11.70%)
$511,000 $882,500 $371,500 72.70%
53,577,600 50,609,500 ($2,968,100) (5.54%)
OPERATING REVENUE
Operating Grants,Subsidies and Contributions
Contributions
Profit on asset disposals
Rates
Interest earnings
Other revenue/income
Fees and charges
Town of Cambridge Budget Report
Page 1.12
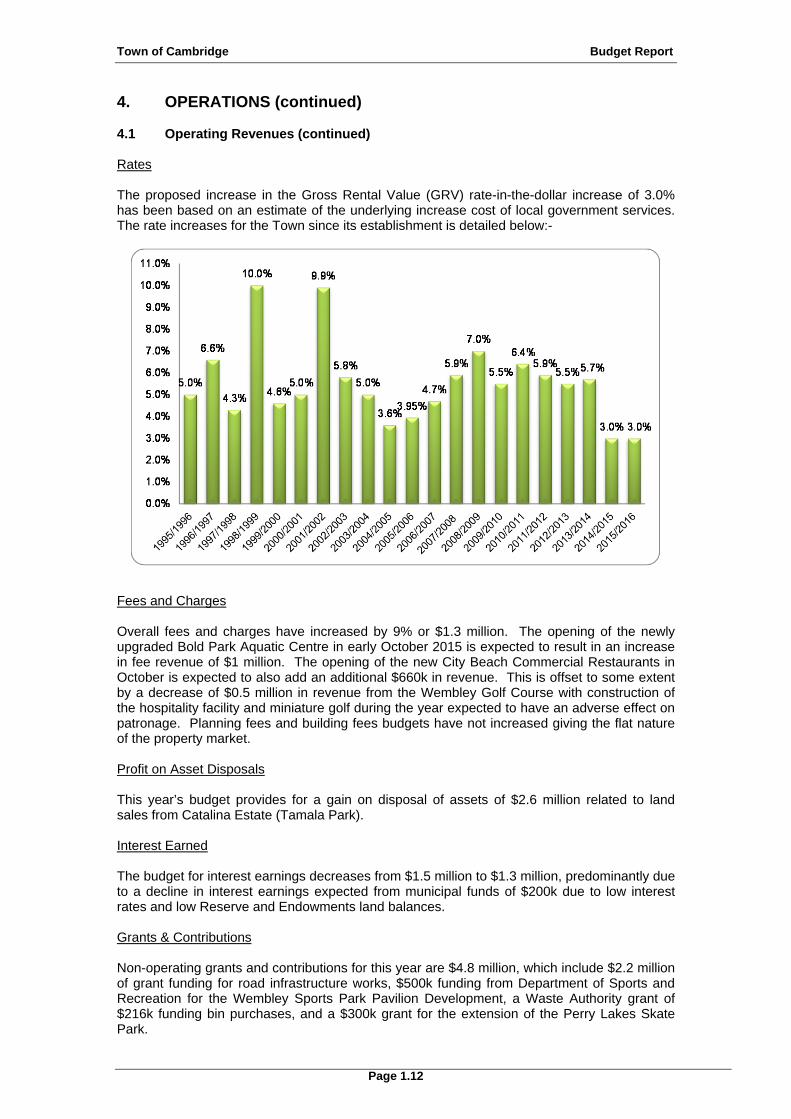
4. OPERATIONS (continued) 4.1 Operating Revenues (continued) Rates The proposed increase in the Gross Rental Value (GRV) rate-in-the-dollar increase of 3.0% has been based on an estimate of the underlying increase cost of local government services. The rate increases for the Town since its establishment is detailed below:-
Fees and Charges Overall fees and charges have increased by 9% or $1.3 million. The opening of the newly upgraded Bold Park Aquatic Centre in early October 2015 is expected to result in an increase in fee revenue of $1 million. The opening of the new City Beach Commercial Restaurants in October is expected to also add an additional $660k in revenue. This is offset to some extent by a decrease of $0.5 million in revenue from the Wembley Golf Course with construction of the hospitality facility and miniature golf during the year expected to have an adverse effect on patronage. Planning fees and building fees budgets have not increased giving the flat nature of the property market. Profit on Asset Disposals This year’s budget provides for a gain on disposal of assets of $2.6 million related to land sales from Catalina Estate (Tamala Park). Interest Earned The budget for interest earnings decreases from $1.5 million to $1.3 million, predominantly due to a decline in interest earnings expected from municipal funds of $200k due to low interest rates and low Reserve and Endowments land balances. Grants & Contributions Non-operating grants and contributions for this year are $4.8 million, which include $2.2 million of grant funding for road infrastructure works, $500k funding from Department of Sports and Recreation for the Wembley Sports Park Pavilion Development, a Waste Authority grant of $216k funding bin purchases, and a $300k grant for the extension of the Perry Lakes Skate Park.

Town of Cambridge Budget Report
Page 1.13
4. OPERATIONS (continued) 4.2 Operating Expenditures
Employee Costs The overall increase in employee costs of 5% includes a 3% increase in employee costs provisioned and additional positions at the newly upgraded and expanded Bold Park Aquatic Centre. The chart below shows employee expenses which enable the Town to deliver its services and capital works, and includes all costs for salaries, long service leave, superannuation, workers compensation, training, fringe benefits tax, uniform/clothing and car allowance.
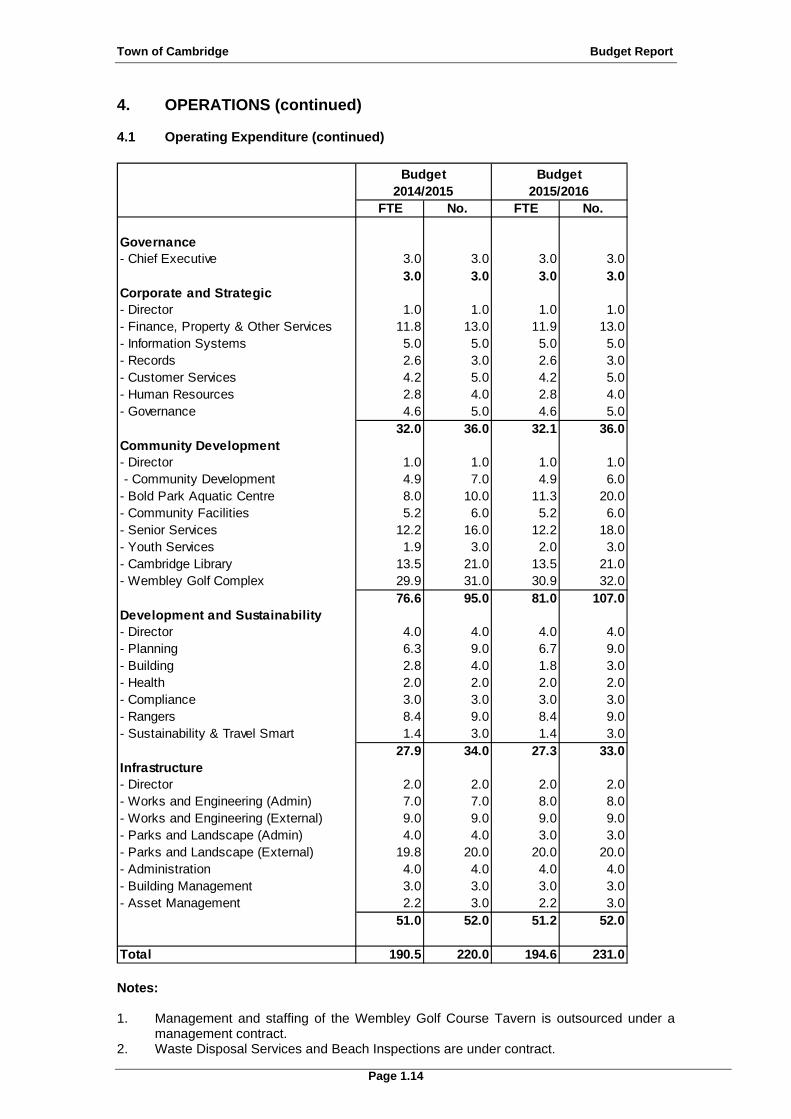
Employee Establishment Numbers The Town's operations are divided into a number of service areas. A summary of the established employee numbers divided into each of these areas is provided below. The FTE Column represents Full Time Equivalent staff numbers as the Town employs part time staff in various areas. The No. column represents actual numbers of employees.
Budget Budget Budget Budget2014/2015 2015/2016 $ Change % Change
$ $ +/(-) +/(-)
$16,799,700 $17,643,900 $844,200 5.03%
$13,604,400 $14,131,400 $527,000 3.87%
$2,385,600 $2,489,300 $103,700 4.35%
$6,698,000 $6,994,000 $296,000 4.42%
$469,800 $779,500 $309,700 65.92%
$380,600 $384,400 $3,800 1.00%
$811,000 $944,000 $133,000 16.40%
88,000 138,500 $50,500 57.39%
$41,237,100 $43,505,000 $2,267,900 5.50%
Interest expenses
Insurance expenses
Other Expenditure
Employee costs
OPERATING EXPENDITURE
Materials and contracts
Utilities (gas, electricity, w ater etc.)
Depreciation on non-current assets
Loss on disposal of assets
Town of Cambridge Budget Report
Page 1.14
4. OPERATIONS (continued) 4.1 Operating Expenditure (continued)
Notes: 1. Management and staffing of the Wembley Golf Course Tavern is outsourced under a
management contract. 2. Waste Disposal Services and Beach Inspections are under contract.
FTE No. FTE No.
Governance- Chief Executive 3.0 3.0 3.0 3.0
3.0 3.0 3.0 3.0Corporate and Strategic- Director 1.0 1.0 1.0 1.0- Finance, Property & Other Services 11.8 13.0 11.9 13.0- Information Systems 5.0 5.0 5.0 5.0- Records 2.6 3.0 2.6 3.0- Customer Services 4.2 5.0 4.2 5.0- Human Resources 2.8 4.0 2.8 4.0- Governance 4.6 5.0 4.6 5.0
32.0 36.0 32.1 36.0Community Development- Director 1.0 1.0 1.0 1.0 - Community Development 4.9 7.0 4.9 6.0- Bold Park Aquatic Centre 8.0 10.0 11.3 20.0- Community Facilities 5.2 6.0 5.2 6.0- Senior Services 12.2 16.0 12.2 18.0- Youth Services 1.9 3.0 2.0 3.0- Cambridge Library 13.5 21.0 13.5 21.0- Wembley Golf Complex 29.9 31.0 30.9 32.0
76.6 95.0 81.0 107.0Development and Sustainability- Director 4.0 4.0 4.0 4.0- Planning 6.3 9.0 6.7 9.0- Building 2.8 4.0 1.8 3.0- Health 2.0 2.0 2.0 2.0- Compliance 3.0 3.0 3.0 3.0- Rangers 8.4 9.0 8.4 9.0- Sustainability & Travel Smart 1.4 3.0 1.4 3.0
27.9 34.0 27.3 33.0Infrastructure- Director 2.0 2.0 2.0 2.0- Works and Engineering (Admin) 7.0 7.0 8.0 8.0- Works and Engineering (External) 9.0 9.0 9.0 9.0- Parks and Landscape (Admin) 4.0 4.0 3.0 3.0- Parks and Landscape (External) 19.8 20.0 20.0 20.0- Administration 4.0 4.0 4.0 4.0- Building Management 3.0 3.0 3.0 3.0- Asset Management 2.2 3.0 2.2 3.0
51.0 52.0 51.2 52.0
Total 190.5 220.0 194.6 231.0
Budget2014/2015
Budget2015/2016
Town of Cambridge Budget Report
Page 1.15
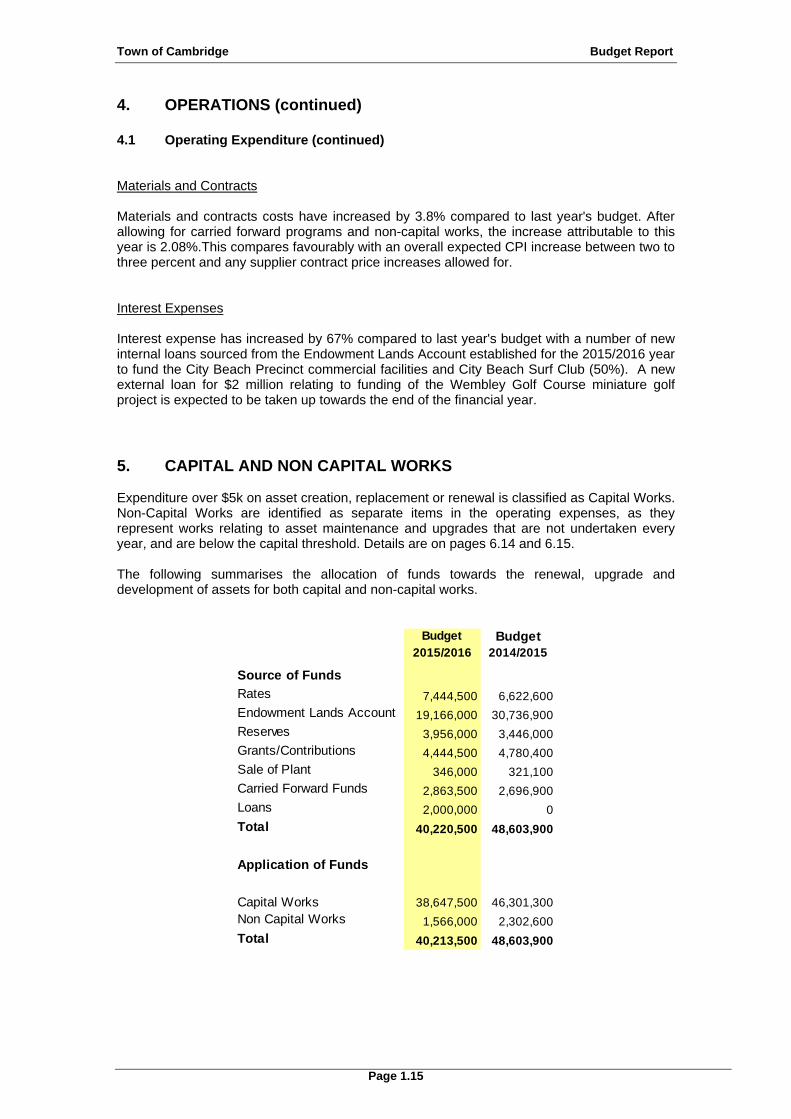
4. OPERATIONS (continued) 4.1 Operating Expenditure (continued) Materials and Contracts Materials and contracts costs have increased by 3.8% compared to last year's budget. After allowing for carried forward programs and non-capital works, the increase attributable to this year is 2.08%.This compares favourably with an overall expected CPI increase between two to three percent and any supplier contract price increases allowed for. Interest Expenses Interest expense has increased by 67% compared to last year's budget with a number of new internal loans sourced from the Endowment Lands Account established for the 2015/2016 year to fund the City Beach Precinct commercial facilities and City Beach Surf Club (50%). A new external loan for $2 million relating to funding of the Wembley Golf Course miniature golf project is expected to be taken up towards the end of the financial year. 5. CAPITAL AND NON CAPITAL WORKS Expenditure over $5k on asset creation, replacement or renewal is classified as Capital Works. Non-Capital Works are identified as separate items in the operating expenses, as they represent works relating to asset maintenance and upgrades that are not undertaken every year, and are below the capital threshold. Details are on pages 6.14 and 6.15. The following summarises the allocation of funds towards the renewal, upgrade and development of assets for both capital and non-capital works.
Budget Budget2015/2016 2014/2015
Source of Funds
Rates 7,444,500 6,622,600
Endowment Lands Account 19,166,000 30,736,900
Reserves 3,956,000 3,446,000Grants/Contributions 4,444,500 4,780,400
Sale of Plant 346,000 321,100
Carried Forward Funds 2,863,500 2,696,900
Loans 2,000,000 0
Total 40,220,500 48,603,900
Application of Funds
Capital Works 38,647,500 46,301,300
Non Capital Works 1,566,000 2,302,600
Total 40,213,500 48,603,900

Town of Cambridge Budget Report
Page 1.16
5. CAPITAL AND NON CAPITAL WORKS (continued) This year, the increase in rate funding allocated to the capital and non-capital programs has primarily been allocated to ongoing development of the Town's parks, roads and laneways improvements and replacing footpaths.
5.1 Capital Works The capital works sources and application of funds are shown below:
Budget Budget2014/2015 2015/2016
5,554,400 6,340,500
30,696,900 19,094,000
3,147,000 3,772,000
4,079,800 4,418,500
321,100 346,000
2,502,100 2,676,500
2,000,000
46,301,300 38,647,500
Land nil nil
Buildings 28,036,500 23,751,000
1,489,500 1,612,000
937,000 1,013,500
7,621,000 4,351,500
5,385,900 6,027,000
1,160,100 928,500
1,613,600 904,000
57,700 60,000
46,301,300 38,647,500
Application of Funds
Total
Source of Funds
Drainage
Furniture and Equipment
Roads and Lanes
Parks and Reserves
Plant and Equipment
Total
Bus Shelters
Footpaths
Loans
Grants/Contributions
Sale of plant
Carried Forward
Rates
Endowment Lands
Reserves
Town of Cambridge Budget Report
Page 1.17
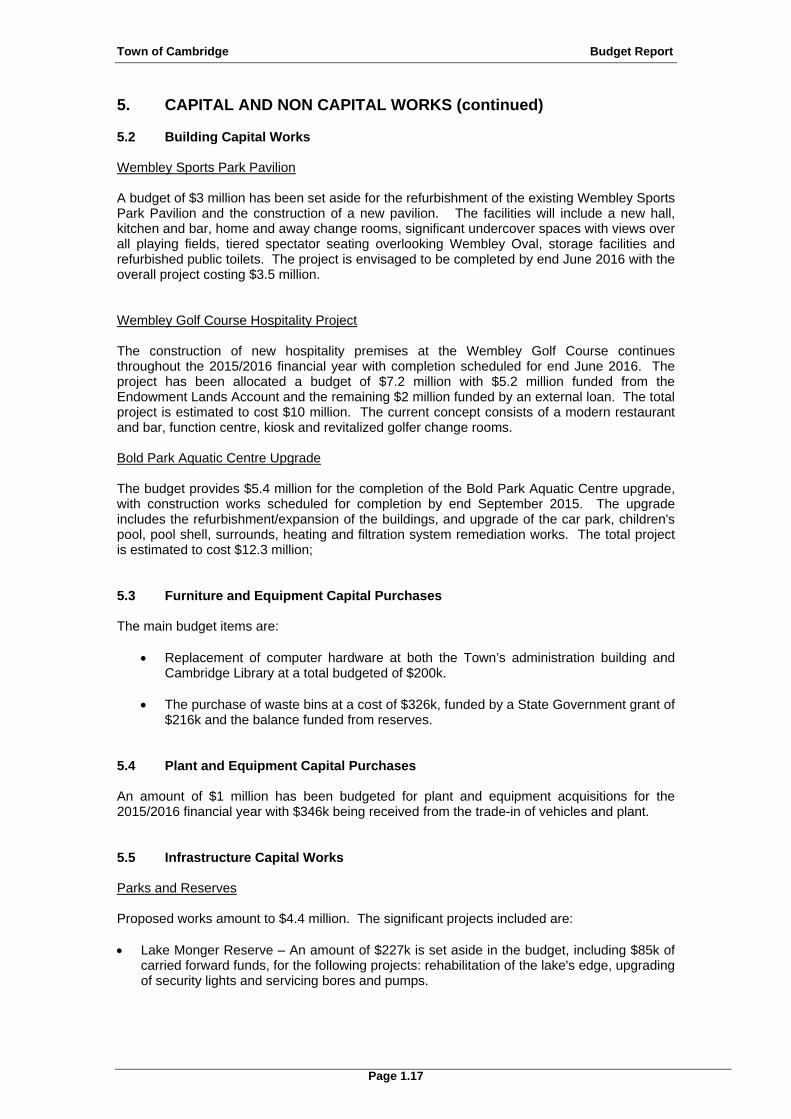
5. CAPITAL AND NON CAPITAL WORKS (continued) 5.2 Building Capital Works Wembley Sports Park Pavilion A budget of $3 million has been set aside for the refurbishment of the existing Wembley Sports Park Pavilion and the construction of a new pavilion. The facilities will include a new hall, kitchen and bar, home and away change rooms, significant undercover spaces with views over all playing fields, tiered spectator seating overlooking Wembley Oval, storage facilities and refurbished public toilets. The project is envisaged to be completed by end June 2016 with the overall project costing $3.5 million. Wembley Golf Course Hospitality Project The construction of new hospitality premises at the Wembley Golf Course continues throughout the 2015/2016 financial year with completion scheduled for end June 2016. The project has been allocated a budget of $7.2 million with $5.2 million funded from the Endowment Lands Account and the remaining $2 million funded by an external loan. The total project is estimated to cost $10 million. The current concept consists of a modern restaurant and bar, function centre, kiosk and revitalized golfer change rooms. Bold Park Aquatic Centre Upgrade The budget provides $5.4 million for the completion of the Bold Park Aquatic Centre upgrade, with construction works scheduled for completion by end September 2015. The upgrade includes the refurbishment/expansion of the buildings, and upgrade of the car park, children's pool, pool shell, surrounds, heating and filtration system remediation works. The total project is estimated to cost $12.3 million; 5.3 Furniture and Equipment Capital Purchases The main budget items are:
Replacement of computer hardware at both the Town’s administration building and Cambridge Library at a total budgeted of $200k.
The purchase of waste bins at a cost of $326k, funded by a State Government grant of
$216k and the balance funded from reserves. 5.4 Plant and Equipment Capital Purchases An amount of $1 million has been budgeted for plant and equipment acquisitions for the 2015/2016 financial year with $346k being received from the trade-in of vehicles and plant. 5.5 Infrastructure Capital Works Parks and Reserves Proposed works amount to $4.4 million. The significant projects included are: Lake Monger Reserve – An amount of $227k is set aside in the budget, including $85k of
carried forward funds, for the following projects: rehabilitation of the lake's edge, upgrading of security lights and servicing bores and pumps.

Town of Cambridge Budget Report
Page 1.18
5. CAPITAL AND NON CAPITAL WORKS (continued)
5.5 Infrastructure Capital Works (continued)
Perry Lakes Reserve - Skate Park Extension (Stage 2). An amount of $450k has been set aside for Stage 2 of the skate park extension which includes a peanut bowl skate park, installation of lights, paths, shade shelter, landscaping and spectator seating, with $300k funded by a grant from the Lotteries Commission.
Rutter Park Improvements - An amount of $320k has been set aside for the improvements of the park which include picnic and barbeque facilities, a flying fox playground, an interactive nature playground and a shared path network.
Wembley Golf Course Miniature Golf Project – An amount of $1.9 million has been allocated for the construction of a landscaped miniature golf course, which will provide an opportunity to open up the course to more of the community and promote the game of golf to the next generation of potential golfers. The total cost of the project has been budgeted at $2 million and is scheduled for completion by the end of the 2015/2016 financial year.
City Beach Groyne Maintenance - An amount of $335k has been set aside for the final stage of maintenance works for the City Beach Groyne with $168k funded by a grant from the Department of Transport and the balance funded by the Endowment Lands Account.
Wembley Sports Park - An amount of $413k has been set aside for the infrastructure works associated with the Wembley Sports Park development with the Matthew Netball Centre having been completed during the 2013/2014 financial year.
Roads and Lanes The total roads and lanes spend is $6 million for the budget year, of which $2 million is funded by government grants and contributions with $1.3 million of funding carried forward from the 2014/2015 financial year. Major new road works projects include $700k for upgrade of the Grantham Street/Harborne Street fully funded by a Federal Blackspot grant.
The road surfacing budget totals $3.1 million enabling roads to be resurfaced in accordance with the Town's road resurfacing program. The major resealing works occur at Railway Parade (Loftus Street to Kerr Street) with a budget of $447k, The Boulevard (Durston to Templetonia) with a budget of $293k, and roads to recovery project Donegal Road with a budget of $234k. The budget also provides for the upgrade of three laneways including Waddington Lane, Loveridge Lane and Atterton Lane each with a budget of $200k. $204k has been set aside for Jacobson Laneway. Drainage The 2015/2016 budget sets aside $929k for drainage works, in accordance with the Town's five year drainage program, which includes $112k for drainage improvement in Ruislip and Marlow Street and $100k for the design and construction of drainage works at 14 Chipping Road to address flooding issues. Footpaths An amount of $904k has been budgeted for with respect to the Town’s footpath infrastructure. Replacement of slab paths with insitu concrete costs $751k and a further $50k is set aside for a new shared path at Perry Lakes (Meagher Drive).
Town of Cambridge Budget Report
Page 1.19
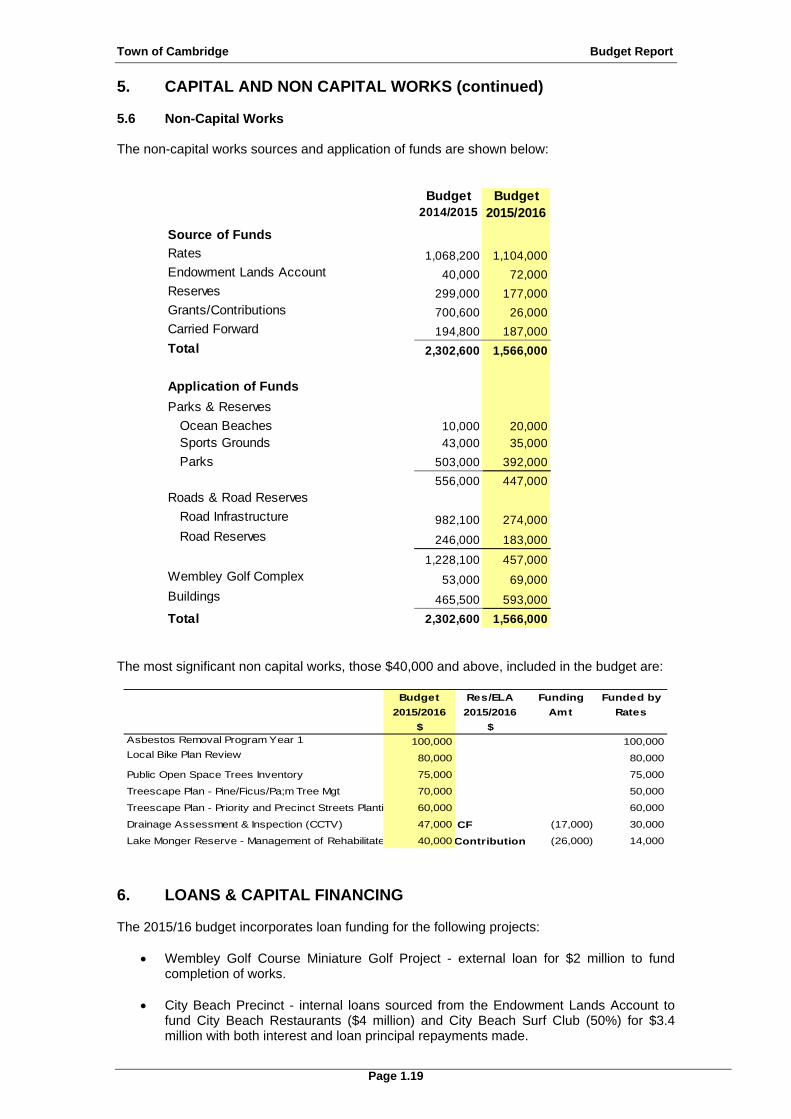
5. CAPITAL AND NON CAPITAL WORKS (continued) 5.6 Non-Capital Works The non-capital works sources and application of funds are shown below:
The most significant non capital works, those $40,000 and above, included in the budget are:
6. LOANS & CAPITAL FINANCING The 2015/16 budget incorporates loan funding for the following projects:
Wembley Golf Course Miniature Golf Project - external loan for $2 million to fund completion of works.
City Beach Precinct - internal loans sourced from the Endowment Lands Account to fund City Beach Restaurants ($4 million) and City Beach Surf Club (50%) for $3.4 million with both interest and loan principal repayments made.
Budget Budget2014/2015 2015/2016
Source of Funds
Rates 1,068,200 1,104,000
Endowment Lands Account 40,000 72,000
Reserves 299,000 177,000
Grants/Contributions 700,600 26,000
Carried Forward 194,800 187,000
Total 2,302,600 1,566,000
Application of Funds
Parks & Reserves
Ocean Beaches 10,000 20,000
Sports Grounds 43,000 35,000
Parks 503,000 392,000
556,000 447,000
Roads & Road Reserves
Road Infrastructure 982,100 274,000
Road Reserves 246,000 183,000
1,228,100 457,000
Wembley Golf Complex 53,000 69,000
Buildings 465,500 593,000
Total 2,302,600 1,566,000
Budget Res/ELA Funding Funded by
2015/2016 2015/2016 Amt Rates
$ $Asbestos Removal Program Year 1 100,000 100,000Local Bike Plan Review 80,000 80,000
Public Open Space Trees Inventory 75,000 75,000
Treescape Plan - Pine/Ficus/Pa;m Tree Mgt 70,000 50,000
Treescape Plan - Priority and Precinct Streets Planti 60,000 60,000
Drainage Assessment & Inspection (CCTV) 47,000 CF (17,000) 30,000
Lake Monger Reserve - Management of Rehabilitate 40,000 Contribution (26,000) 14,000

Town of Cambridge Budget Report
Page 1.20
7. RESERVES AND THE ENDOWMENT LANDS ACCOUNT Reserves The table below lists the funds transferred to the Town's main Reserve funds, in addition to interest earnings of $51,000.
Significantly, the Area Improvement Reserve receives $1.8 million resulting from the sale of land at the Catalina Estate (Tamala Park) in Wanneroo, for which the Town has a one twelfth share. It is expected this amount will increase and continue over the next 10 to 15 years as the land subdivision is completed and lots sold. The Asset Management Reserve receives $721,500 of funding with $346,000 from trade in proceeds and a further transfer of $360,000 to cover change-over prices for plant and vehicles. The Waste Management Reserve receives an amount of $220,000 for the amortisation of waste bins, which are charged through the waste fee. The Clubs and Associations - Buildings Reserve receives $397,500 of funding attributable to contributions from the Town and Community Associations under the community leasing policy. The Clubs and Associations - Synthetic Court and Lightings Reserve receives $178,500 of funding attributable to contributions from the Town and Community Associations under the community leasing policy. The Clubs and Associations - Car Parks and Surroundings Reserve receives $45,000 of funding attributable to contributions from the Town and Community Associations under the community leasing policy. Below, transfers from reserves for works and services are summarised.
Budget2015/2016
$
Transfers to ReservesArea Improvement 1,833,000Community Facilities 11,500Asset Management 721,500Waste Management 220,000Clubs and Associations 621,000Development Contributions - Parking 60,000Development Contributions - Public Arts 0
3,467,000
Budget2015/2016
$
Transfers from ReservesArea Improvement 2,909,500Community Facilities 768,500Asset Management 969,000Waste Management 110,000Clubs and Associations 804,500Development Contributions - Parking 0Development Contributions - Public Arts 0
5,561,500
Town of Cambridge Budget Report
Page 1.21
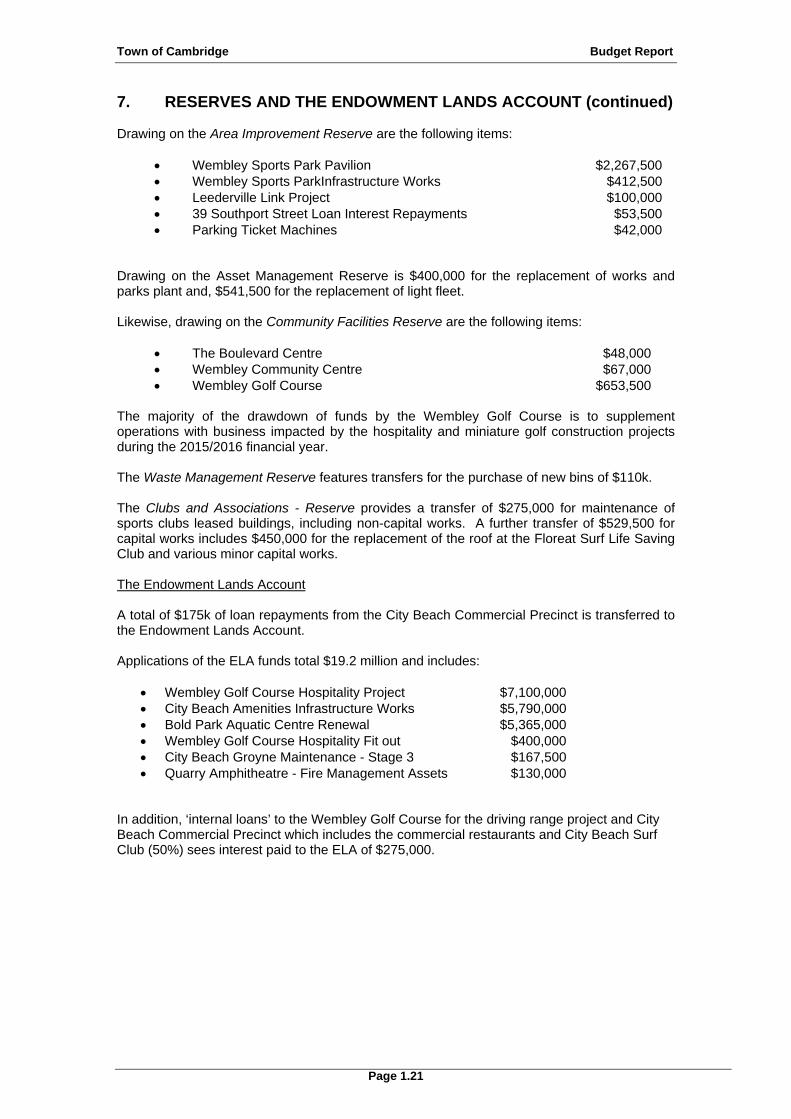
7. RESERVES AND THE ENDOWMENT LANDS ACCOUNT (continued) Drawing on the Area Improvement Reserve are the following items:
Wembley Sports Park Pavilion $2,267,500 Wembley Sports ParkInfrastructure Works $412,500 Leederville Link Project $100,000 39 Southport Street Loan Interest Repayments $53,500 Parking Ticket Machines $42,000
Drawing on the Asset Management Reserve is $400,000 for the replacement of works and parks plant and, $541,500 for the replacement of light fleet. Likewise, drawing on the Community Facilities Reserve are the following items:
The Boulevard Centre $48,000 Wembley Community Centre $67,000 Wembley Golf Course $653,500
The majority of the drawdown of funds by the Wembley Golf Course is to supplement operations with business impacted by the hospitality and miniature golf construction projects during the 2015/2016 financial year.
The Waste Management Reserve features transfers for the purchase of new bins of $110k. The Clubs and Associations - Reserve provides a transfer of $275,000 for maintenance of sports clubs leased buildings, including non-capital works. A further transfer of $529,500 for capital works includes $450,000 for the replacement of the roof at the Floreat Surf Life Saving Club and various minor capital works. The Endowment Lands Account A total of $175k of loan repayments from the City Beach Commercial Precinct is transferred to the Endowment Lands Account. Applications of the ELA funds total $19.2 million and includes:
Wembley Golf Course Hospitality Project $7,100,000 City Beach Amenities Infrastructure Works $5,790,000 Bold Park Aquatic Centre Renewal $5,365,000 Wembley Golf Course Hospitality Fit out $400,000 City Beach Groyne Maintenance - Stage 3 $167,500 Quarry Amphitheatre - Fire Management Assets $130,000
In addition, ‘internal loans’ to the Wembley Golf Course for the driving range project and City Beach Commercial Precinct which includes the commercial restaurants and City Beach Surf Club (50%) sees interest paid to the ELA of $275,000.

Town of Cambridge Budget Report
Page 1.22
8. INTEGRATED PLANNING AND REPORTING
This budget has been prepared as an integrated component of the Town’s Strategic Community Plan which was adopted by Council in May 2013.
The Plan, which was developed over a nine month period was adopted by Council in May 2013. It responds to the priorities of the Community revolving around Community Life, Neighbourhood Planning, the Natural Environment and Council Governance.
Specific projects and actions are included in the Town’s Corporate Business Plan, which was informed by the Financial, Workforce and Strategic Asset Plans, and by the draft Land Use Planning Strategy.
Some of the major projects and actions include:
Our Community Life City Beach Surf Club & Commercial Precinct development Improved paths and lighting at Lake Monger Redevelopment of the Bold Park Aquatic Centre
Our Planned Neighbourhoods Provision to and commence the commercial centres strategy A specific budget for the Leederville Link project Implementation of the West Leederville Centre (Cambridge High Street) project
Our Natural Environment Implementation of the Biodiversity Plan Implementation of initiatives to improve energy efficiency including PV Panels Further reductions in the household waste sent to Landfill
Our Council Improved website and communications; Improved asset management systems, planning and asset renewal Design and construction of the Wembley Golf Course Hospitality.
The Financial Plan was updated throughout 2014/2015 and endorsed by Council in June 2015. It provided the basis for the development of this year's budget, and is available on the Town's website.
JASON LYON JASON BUCKLEY DIRECTOR CORPORATE & STRATEGIC CHIEF EXECUTIVE OFFICER
20 July 2015

STATUTORY BUDGET
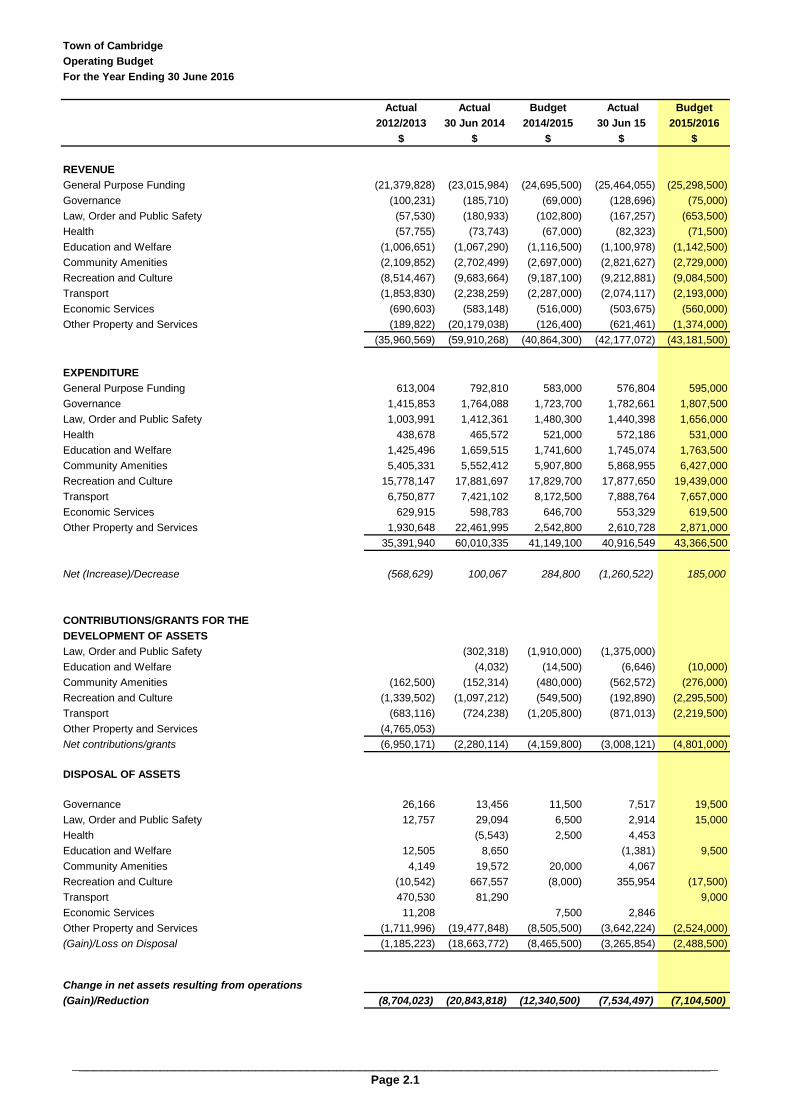
Town of Cambridge
Operating Budget
For the Year Ending 30 June 2016
Actual Actual Budget Actual Budget
2012/2013 30 Jun 2014 2014/2015 30 Jun 15 2015/2016
$ $ $ $ $
REVENUE
General Purpose Funding (21,379,828) (23,015,984) (24,695,500) (25,464,055) (25,298,500)
Governance (100,231) (185,710) (69,000) (128,696) (75,000)
Law, Order and Public Safety (57,530) (180,933) (102,800) (167,257) (653,500)
Health (57,755) (73,743) (67,000) (82,323) (71,500)
Education and Welfare (1,006,651) (1,067,290) (1,116,500) (1,100,978) (1,142,500)
Community Amenities (2,109,852) (2,702,499) (2,697,000) (2,821,627) (2,729,000)
Recreation and Culture (8,514,467) (9,683,664) (9,187,100) (9,212,881) (9,084,500)
Transport (1,853,830) (2,238,259) (2,287,000) (2,074,117) (2,193,000)
Economic Services (690,603) (583,148) (516,000) (503,675) (560,000)
Other Property and Services (189,822) (20,179,038) (126,400) (621,461) (1,374,000)
(35,960,569) (59,910,268) (40,864,300) (42,177,072) (43,181,500)
EXPENDITURE
General Purpose Funding 613,004 792,810 583,000 576,804 595,000
Governance 1,415,853 1,764,088 1,723,700 1,782,661 1,807,500
Law, Order and Public Safety 1,003,991 1,412,361 1,480,300 1,440,398 1,656,000
Health 438,678 465,572 521,000 572,186 531,000
Education and Welfare 1,425,496 1,659,515 1,741,600 1,745,074 1,763,500
Community Amenities 5,405,331 5,552,412 5,907,800 5,868,955 6,427,000
Recreation and Culture 15,778,147 17,881,697 17,829,700 17,877,650 19,439,000
Transport 6,750,877 7,421,102 8,172,500 7,888,764 7,657,000
Economic Services 629,915 598,783 646,700 553,329 619,500
Other Property and Services 1,930,648 22,461,995 2,542,800 2,610,728 2,871,000
35,391,940 60,010,335 41,149,100 40,916,549 43,366,500
Net (Increase)/Decrease (568,629) 100,067 284,800 (1,260,522) 185,000
CONTRIBUTIONS/GRANTS FOR THE
DEVELOPMENT OF ASSETS
Law, Order and Public Safety (302,318) (1,910,000) (1,375,000)
Education and Welfare (4,032) (14,500) (6,646) (10,000)
Community Amenities (162,500) (152,314) (480,000) (562,572) (276,000)
Recreation and Culture (1,339,502) (1,097,212) (549,500) (192,890) (2,295,500)
Transport (683,116) (724,238) (1,205,800) (871,013) (2,219,500)
Other Property and Services (4,765,053)
Net contributions/grants (6,950,171) (2,280,114) (4,159,800) (3,008,121) (4,801,000)
DISPOSAL OF ASSETS
Governance 26,166 13,456 11,500 7,517 19,500
Law, Order and Public Safety 12,757 29,094 6,500 2,914 15,000
Health (5,543) 2,500 4,453
Education and Welfare 12,505 8,650 (1,381) 9,500
Community Amenities 4,149 19,572 20,000 4,067
Recreation and Culture (10,542) 667,557 (8,000) 355,954 (17,500)
Transport 470,530 81,290 9,000
Economic Services 11,208 7,500 2,846
Other Property and Services (1,711,996) (19,477,848) (8,505,500) (3,642,224) (2,524,000)
(Gain)/Loss on Disposal (1,185,223) (18,663,772) (8,465,500) (3,265,854) (2,488,500)
Change in net assets resulting from operations
(Gain)/Reduction (8,704,023) (20,843,818) (12,340,500) (7,534,497) (7,104,500)
________________________________________________________________________________________Page 2.1
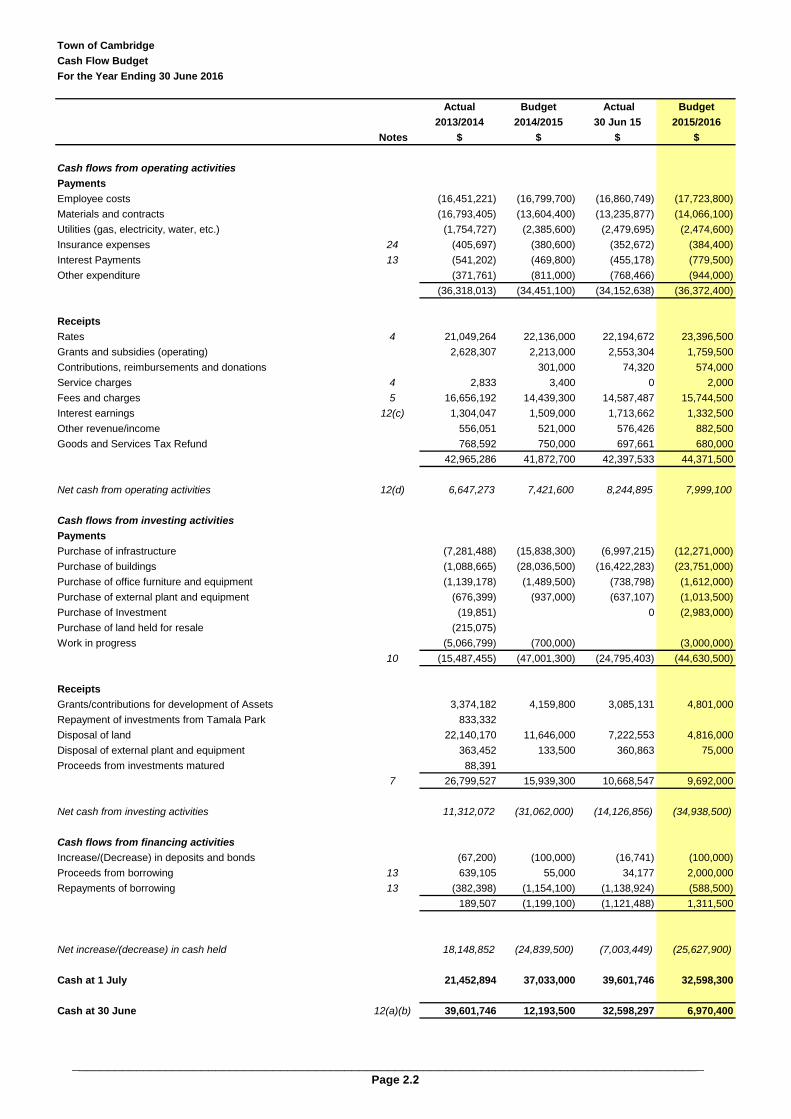
Town of Cambridge
Cash Flow Budget
For the Year Ending 30 June 2016
Actual Budget Actual Budget
2013/2014 2014/2015 30 Jun 15 2015/2016
Notes $ $ $ $
Cash flows from operating activities
Payments
Employee costs (16,451,221) (16,799,700) (16,860,749) (17,723,800)
Materials and contracts (16,793,405) (13,604,400) (13,235,877) (14,066,100)
Utilities (gas, electricity, water, etc.) (1,754,727) (2,385,600) (2,479,695) (2,474,600)
Insurance expenses 24 (405,697) (380,600) (352,672) (384,400)
Interest Payments 13 (541,202) (469,800) (455,178) (779,500)
Other expenditure (371,761) (811,000) (768,466) (944,000)
(36,318,013) (34,451,100) (34,152,638) (36,372,400)
Receipts
Rates 4 21,049,264 22,136,000 22,194,672 23,396,500
Grants and subsidies (operating) 2,628,307 2,213,000 2,553,304 1,759,500
Contributions, reimbursements and donations 301,000 74,320 574,000
Service charges 4 2,833 3,400 0 2,000
Fees and charges 5 16,656,192 14,439,300 14,587,487 15,744,500
Interest earnings 12(c) 1,304,047 1,509,000 1,713,662 1,332,500
Other revenue/income 556,051 521,000 576,426 882,500
Goods and Services Tax Refund 768,592 750,000 697,661 680,000
42,965,286 41,872,700 42,397,533 44,371,500
Net cash from operating activities 12(d) 6,647,273 7,421,600 8,244,895 7,999,100
Cash flows from investing activities
Payments
Purchase of infrastructure (7,281,488) (15,838,300) (6,997,215) (12,271,000)
Purchase of buildings (1,088,665) (28,036,500) (16,422,283) (23,751,000)
Purchase of office furniture and equipment (1,139,178) (1,489,500) (738,798) (1,612,000)
Purchase of external plant and equipment (676,399) (937,000) (637,107) (1,013,500)
Purchase of Investment (19,851) 0 (2,983,000)
Purchase of land held for resale (215,075)
Work in progress (5,066,799) (700,000) (3,000,000)
10 (15,487,455) (47,001,300) (24,795,403) (44,630,500)
Receipts
Grants/contributions for development of Assets 3,374,182 4,159,800 3,085,131 4,801,000
Repayment of investments from Tamala Park 833,332
Disposal of land 22,140,170 11,646,000 7,222,553 4,816,000
Disposal of external plant and equipment 363,452 133,500 360,863 75,000
Proceeds from investments matured 88,391
7 26,799,527 15,939,300 10,668,547 9,692,000
Net cash from investing activities 11,312,072 (31,062,000) (14,126,856) (34,938,500)
Cash flows from financing activities
Increase/(Decrease) in deposits and bonds (67,200) (100,000) (16,741) (100,000)
Proceeds from borrowing 13 639,105 55,000 34,177 2,000,000
Repayments of borrowing 13 (382,398) (1,154,100) (1,138,924) (588,500)
189,507 (1,199,100) (1,121,488) 1,311,500
Net increase/(decrease) in cash held 18,148,852 (24,839,500) (7,003,449) (25,627,900)
Cash at 1 July 21,452,894 37,033,000 39,601,746 32,598,300
Cash at 30 June 12(a)(b) 39,601,746 12,193,500 32,598,297 6,970,400
________________________________________________________________________________________Page 2.2

Town of Cambridge
Rate Setting Budget
For the Year Ending 30 June 2016
Actual Actual Budget Actual Budget
2012/2013 30 Jun 2014 2014/2015 30 Jun 15 2015/2016
$ $ $ $ $
REVENUE
General Purpose Funding (Excluding Rates) (3,130,930) (2,013,669) (2,559,500) (3,269,383) (1,902,000)
Governance (100,231) (185,710) (69,000) (128,696) (75,000)
Law, Order and Public Safety (57,530) (180,933) (102,800) (167,257) (653,500)
Health (57,755) (68,200) (67,000) (82,323) (71,500)
Education and Welfare (1,006,651) (1,067,290) (1,116,500) (1,100,978) (1,142,500)
Community Amenities (2,109,852) (2,702,498) (2,697,000) (2,821,627) (2,729,000)
Recreation and Culture (8,514,467) (9,683,663) (9,187,100) (9,212,881) (9,084,500)
Transport (1,853,830) (2,238,260) (2,287,000) (2,074,117) (2,193,000)
Economic Services (690,603) (583,148) (516,000) (503,675) (560,000)
Other Property and Services (189,822) (269,251) (126,400) (621,461) (1,374,000)
(17,711,671) (18,992,622) (18,728,300) (19,982,399) (19,785,000)
LESS: EXPENDITURE
General Purpose Funding 613,004 608,279 583,000 576,804 595,000
Governance 1,415,853 1,764,089 1,723,700 1,782,661 1,807,500
Law, Order and Public Safety 1,003,991 1,412,362 1,480,300 1,440,398 1,656,000
Health 438,678 460,029 521,000 572,186 531,000
Education and Welfare 1,425,496 1,659,515 1,741,600 1,745,074 1,763,500
Community Amenities 5,405,331 5,552,412 5,907,800 5,868,955 6,427,000
Recreation and Culture 15,778,146 17,881,697 17,829,700 17,877,650 19,439,000
Transport 6,750,877 7,421,102 8,172,500 7,888,764 7,657,000
Economic Services 629,915 598,783 646,700 553,329 619,500
Other Property and Services 1,930,651 2,265,174 2,542,800 2,610,728 2,871,000
35,391,942 39,623,442 41,149,100 40,916,549 43,366,500
(Increase)/Decrease 17,680,271 20,630,820 22,420,800 20,934,150 23,581,500
ADD:
Contributions for the development of assets 6,950,171 2,280,114 4,159,800 3,008,121 4,801,000
Proceeds from sale of assets 2,752,577 21,777,992 11,987,500 7,528,953 5,182,000
Depreciation written back 5,800,516 6,500,707 6,698,000 6,363,722 6,994,000
Fair Value Adjustment to Financial Assets 184,531
Interest Capitalised - Southport Street 4,714
Deferred Rates (Non Current) (396,276)
Provision for Employee Long Service Leave (309,386)
14,802,316 30,743,344 22,845,300 16,900,796 16,977,000
(Increase)/Decrease 2,877,955 (10,112,524) (424,500) 4,033,354 6,604,500
LESS: CAPITAL PROGRAM
Land 998,591 215,075
Buildings 486,169 4,013,025 28,036,500 16,422,283 23,751,000
Furniture and equipment 447,101 1,139,178 1,489,500 738,798 1,612,000
Plant and equipment 1,780,880 881,926 937,000 637,107 1,013,500
Infrastructure :
- parks and reserves 4,125,829 4,302,908 7,621,000 1,784,279 4,351,500
- roads and lanes 3,897,218 3,819,629 5,385,900 3,640,624 6,027,000
- drainage 952,356 327,260 1,160,100 450,848 928,500
- footpaths 1,010,812 739,060 1,613,600 1,093,920 904,000
- bus shelters 24,997 23,180 57,700 27,544 60,000
- work in progress 1,623,619
Ocean Mia Development Costs capitalised 40,078
Repayment of Debt Principal 89,044 382,398 1,154,100 1,138,924 588,500
Investment in/(Redemption of) Tamala Park Investment (166,521) (833,332) 2,233,000 2,983,000
Transfers to Reserves 3,253,161 4,496,706 4,316,000 5,323,127 3,518,000
Transfers to Endowment Lands Account 1,381,469 22,091,228 7,500,000 5,512,680 917,000
19,944,803 41,598,241 61,504,400 36,770,134 46,654,000
PLUS: FUNDING SOURCES
Reserves Utilised 3,047,531 5,056,647 4,619,800 3,403,716 5,561,500
Endowment Lands Account Utilised 1,125,438 3,982,150 30,775,400 14,782,525 19,166,000
Loans 990,000 639,105 55,000 34,177 2,000,000
Opening Funds 3,475,923 4,274,054 3,493,700 3,522,897 3,134,500
Less: Closing Funds (4,065,032) (3,432,200) (3,636,000)
4,573,860 10,519,756 38,943,900 18,107,315 29,862,000
TO BE MADE UP FROM RATES (18,248,898) (20,965,962) (22,136,000) (22,696,173) (23,396,500)
RATES RAISED (18,248,898) (20,965,962) (22,136,000) (22,194,672) (23,396,500)
DIFFERENCE 0 0 0 (501,500) 0
________________________________________________________________________________________________________ Page 2.3

Town of Cambridge
Rating Information
For the Year Ending 30 June 2016
No. Rateable Rate in $ Yield No. Rateable Min Rate Yield No. Rateable Yield
Value $ $0.00 $ Value $ $ $ Value $ $
2015/2016 Budget
General Rate - Gross Rental Value
Residential 5.8607 cents in the dollar 5,226 148,725,370 5.86070 8,716,329 940 11,994,846 937 880,780 6,166 160,720,216 9,597,109
Commercial 5.8607 cents in the dollar 503 50,930,611 5.86070 2,984,884 17 205,420 937 15,929 520 51,136,031 3,000,813
Interim Rates 155,000
Written Off
5,729 199,655,981 11,701,213 957 12,200,266 896,709 6,686 211,856,247 12,752,922
General Rate - Unimproved Value
Residential 0.2093 cents in the dollar 4,447 4,992,880,000 0.20932 10,450,996 99 25,790,000 937 92,763 4,546 5,018,670,000 10,543,759
Commercial 0.2093 cents in the dollar 10 34,510,000 0.20932 72,236 1 390,000 937 937 11 34,900,000 73,173
Interim Rates 26,500
Written Off
4,457 5,027,390,000 10,523,232 100 26,180,000 93,700 4,557 5,053,570,000 10,643,432
10,186 22,224,445 1057 990,409 11,243 23,396,354
2014/2015 Budget
General Rate - Gross Rental Value
Residential 5.6900 cents in the dollar 5,082 140,295,873 5.69000 7,983,100 951 12,136,349 910 865,400 6,033 152,432,222 8,848,500
Commercial 5.6900 cents in the dollar 490 46,096,924 5.69000 2,622,900 16 199,440 910 14,600 506 46,296,364 2,637,500
Interim Rates 300,000
Written Off
5,572 186,392,797 10,606,000 967 12,335,789 880,000 6,539 198,728,586 11,786,000
General Rate - Unimproved Value
Residential 0.20849 cents in the dollar 4,434 4,867,380,000 0.20849 10,148,000 110 21,520,000 910 100,100 4,544 4,888,900,000 10,248,100
Commercial 0.20849 cents in the dollar 10 36,560,000 0.20849 76,000 1 395,000 910 900 11 36,955,000 76,900
Interim Rates 25,000
Written Off
4,444 4,903,940,000 10,224,000 111 21,915,000 101,000 4,555 4,925,855,000 10,350,000
Total Rates Levied 10,016 20,830,000 1078 981,000 11,094 22,136,000
Note: Independent Retirement Living Accomodation are now shown as sepearate properties and account (in part) for the increase in th enumber of properties.
General Rates Minimum Rates Total Rates
_________________________________________________________________________________________________________________________________________________Page 2.4
Town of Cambridge Budget Notes
Page 2.5
1. SIGNIFICANT ACCOUNTING POLICIES
The significant accounting policies which have been adopted in the preparation of this budget are:
(a) Basis of Preparation
The budget has been prepared in accordance with applicable Australian Accounting Standards (as they apply to local governments and not for profit entities), Australian Accounting Interpretations, other authorative pronouncements of the Australian Accounting Standards Board, the Local Government Act 1995 and accompanying regulations. Material accounting policies which have been adopted in the preparation of this budget are presented below and have been consistently applied unless stated otherwise. Except for cash flow and rate setting information, the budget has also been prepared on the accrual basis and is based on historical costs, modified, where applicable, by the measurement at fair value of selected non-current assets, financial assets and liabilities.
(b) The Local Government Reporting Entity
All Funds through which the Council controls resources to carry on its functions have been included in the financial statements forming part of this budget. In the process of reporting on the local government as a single unit, all transactions and balances between those Funds (for example, loans and transfers between Funds) have been eliminated. All monies held in the Trust Fund are excluded from the financial statements, but a separate statement of those monies appears at Note 20 of this budget.
(c) Property, Plant and Equipment
Each class of fixed assets within either property, plant and equipment or infrastructure is carried at cost or fair value as indicated, where applicable, any accumulated depreciation and impairment losses.
(i) Capitalisation of Non-Current Assets
Fixed assets other than infrastructure assets are capitalised if the cost exceeds $1,000.
Infrastructure assets are capitalised if the cost or valuation exceeds the following for each type of infrastructure. Parks and Reserves $10,000 Roads and Lanes $10,000 Drainage $10,000 Footpaths $ 2,000 Bus Shelters $ 2,000 Underpasses $10,000 The Chief Executive Officer or nominee has discretion to capitalise assets with a value of $1,000 or less having regard to the nature of the item.
(ii) Property, Plant and Equipment and Infrastructure
All assets are initially recognised at cost. Cost is determined as the fair value of the assets given as consideration plus costs incidental to the acquisition. For assets acquired at no cost or for nominal consideration, cost is determined as fair value at the date of acquisition. The cost of non-current assets constructed by the Council includes the cost of all materials used in construction, direct labour on the project and an appropriate proportion of variable and fixed overhead.

Town of Cambridge Budget Notes
Page 2.6
1. SIGNIFICANT ACCOUNTING POLICIES (continued) (c) Property, Plant and Equipment (continued)
(iii) Depreciation
The depreciable amount of all fixed assets including buildings but excluding freehold land, are depreciated on a straight line basis over the individual asset's useful life from the time the asset is held ready for use. Leasehold improvements are depreciated over the shorter of either the unexpired period of the lease or the estimated useful life of improvements. When an item of property, plant and equipment is revalued, any accumulated depreciation at the date of revaluation is treated in one of the following ways:
(a) Restated proportionately with the change in the gross carrying amount of the asset so that the carrying amount of the asset after revaluation equals its revalued amount; or
(b) Eliminated against the gross carrying amount of the asset and the net amount restated to the revalued amount of the asset:
Major depreciation periods used for each class of depreciation assets are:
CATEGORY USEFUL LIFE DEPRECIATIONRATE
Buildings 25-50 Years 4%-2% Office Furniture and Equipment 3-10 Years 33.3%-10% Plant and Equipment 3-10 Years 33.3%-10% Infrastructure - Parks and Reserves 5-75 Years 20%-1.3% - Roads and Lanes 20-50 Years 5%-2% - Drainage 50-75 Years 2%-1.3% - Footpaths 50 Years 2% - Bus Shelters 20 Years 5% - Underpasses 60 Years 1.6%
The asset residual values and useful lives are reviewed and adjusted if appropriate, at the end of each reporting period.
An Asset's carrying amount is written down immediately to its recoverable amount if the asset's carrying amount is greater than its estimated recoverable amount. Gains and losses on disposals are determined by comparing proceeds with the carrying amount. These gains and losses are included in the statement of comprehensive income in the period in which they arise. When revalued assets are disposed of, amounts included in the revaluation surplus relating to that asset are transferred to retained surplus.
(iv) Mandatory Requirement to Revalue Non-Current Assets
Effective from 1 July 2012, the Local Government (Financial Management) Regulations were amended and the measurement of non-current assets at Fair Value became mandatory.
The amendments allow for a phasing in of fair value in relation to fixed assets over three years as follows:
(a) for the financial year ending on 30 June 2013, the fair value of all of the assets of the local government that are plant and equipment; and

Town of Cambridge Budget Notes
Page 2.7
1. SIGNIFICANT ACCOUNTING POLICIES (continued)
(c) Property, Plant and Equipment (continued)
(iv) Mandatory Requirement to Revalue Non-Current Assets (continued)
(b) for the financial year ending on 30 June 2014, the fair value of all of the assets of the local government that are –
(I) land and buildings; or (II) infrastructure;
and
(c) for a financial year ending on or after 30 June 2015, the fair value of all of the assets of the local government.
Thereafter, in accordance with the regulations, each asset class must be revalued at least every 3 years.
In 2013, Council commenced the process of adopting Fair Value in accordance with the Regulations.
Relevant disclosures, in accordance with the requirements of Australian Accounting Standards, have been made in the financial report as necessary.
(v) Land Under Control
In accordance with Local Government (Financial Management) Regulation 16(a), the Council is required to include as an asset (by 30 June 2013), Crown Land operated by the local government as a golf course, showground, racecourse or other sporting or recreational facility of State or regional significance. Council has no such assets on Crown Land with the Wembley Golf Course owned freehold.
(vi) Revaluation
When performing a revaluation, the Council uses a mix of both independent and management valuations using the following as a guide:
Revalued assets are carried at their fair value being the price that would be received to sell the asset, in an orderly transaction between market participants at the measurement date (Level 1 inputs in the fair value hierarchy).
For Plant and Equipment, fair value is determined to be the current replacement cost of an asset (Level 2 inputs in the fair value hierarchy) less, where applicable, accumulated depreciation calculated on the basis of such cost to reflect the already consumed or expired future economic benefits of the asset (Level 3 inputs in the fair value hierarchy).
Increases in the carrying amount arising on revaluation of assets are credited to a revaluation surplus in equity. Decreases that offset previous increases of the same asset are recognised against revaluation surplus directly in equity. All other decreases are recognised in profit or loss.
Any accumulated depreciation at the date of revaluation is eliminated against the gross carrying amount of the asset and the net amount is restated to the revalued amount of the asset.
Those assets carried at a revalued amount, being their fair value at the date of revaluation less any subsequent accumulated depreciation and accumulated impairment losses, are to be revalued with sufficient regularity to ensure the carrying amount does not differ materially from that determined using fair value at reporting date.
In addition, the amendments to the Financial Management Regulations mandating the use of Fair Value imposes a further minimum of 3 years revaluation requirement. As a minimum, all assets carried at a revalued amount, will be revalued at least every 3 years.
Town of Cambridge Budget Notes
Page 2.8
1. SIGNIFICANT ACCOUNTING POLICIES (continued)
(c) Property, Plant and Equipment (continued)
(vii) Transitional Arrangement
During the time it takes to transition the carrying value of non-current assets from the cost approach to the fair value approach, the Council may still be utilising both methods across differing asset classes.
Those assets carried at cost will be carried in accordance with the policy detailed in the Initial Recognition section as detailed above.
Those assets carried at fair value will be carried in accordance with the Revaluation Methodology section as detailed above.
(d) Land Under Roads Acquired on or before 30 June 2008 – Council has elected not to recognise the value of lands under roads acquired on or before 30 June 2008
in accordance with AASB 1051. Acquired on or before 1 July 2008 – Land under roads acquired after 30 June 2008 is accounted for in accordance with AASB 116 –
Property, Plant and Equipment. However, Local Government (Financial Management) Regulation 16 prohibits the recognition of land under roads as asset that is crown land, but vested under the control or management of the local government.
Local Government (Financial Management) Regulation 4 states that where the Accounting Standard is
inconsistent with the provisions of the regulations, the provisions of the regulations prevail to the extent of that inconsistency.
Consequently, any land under roads acquired on or after 1 July 2008 is not included as an asset of the
Council. (e) Rates, Grants, Donations and Other Contributions
Rates, grants, donations and other contributions are recognised as revenues when the Council obtains control over the assets comprising the contributions.
The rating and reporting periods of the Council coincide. All rates levied for the year are recognised as revenues. All outstanding rates are collectable and therefore, no provision will be made for doubtful debts. Provision for other bad and doubtful debts is made where considered necessary.
Control over assets acquired from rates is obtained at the commencement of the rating period or, where earlier, upon receipt of the rates.
(f) Cash and Cash Equivalents
Items described in the Balance Sheet as “Cash and Cash Equivalents” include short term fixed, at-call deposits of cash that are readily convertible to known amounts of cash and which are subject to an insignificant risk of changes in value and cash managed funds held with banks or other authorised financial institutions. The Council holds no bonds or shares. All investments (excluding cash managed funds) are valued at cost and interest earnings on those investments are recognised as revenue as they accrue.
(g) Inventories
Inventories are valued at the lower of cost and net realisable value. Net realisable value is the estimated selling price in the ordinary course of business less the estimated costs of completion and the estimated costs necessary to make the sale.

Town of Cambridge Budget Notes
Page 2.9
1. SIGNIFICANT ACCOUNTING POLICIES (continued) (h) Land Held for Resale Land held for development and sale is valued at the lower of cost and net realisable value. Cost
includes the cost of acquisition, development, borrowing costs and holding costs until completion of the development. Finance costs and holding charges incurred after development is completed are expensed.
Gains and losses are recognised in profit or loss at the time of signing an unconditional contract of sale if
significant risks and rewards, and effective control over the land, are passed on to the buyer at this point.
Land held for resale is classified as current except where it is held as non-current based on Council’s intentions to release for sale.
(i) Financial Instruments
Initial Recognition and Measurement Financial assets and financial liabilities are recognised when the Council becomes a party to the contractual provisions to the instrument. For financial assets, this is equivalent to the date that the Council commits itself to either the purchase or the sale of the asset (i.e. trade date accounting is adopted). Financial instruments are initially measured at fair value plus transaction costs, except where the instrument is classified ‘at fair value through profit of loss’, in which case transaction costs are expensed to profit or loss immediately. Classification and Subsequent Measurement
Financial instruments are subsequently measured at fair value, amortised cost using the effective interest rate method, or cost. Amortised cost is calculated as: (a) the amount at which the financial asset or financial liability is measured at initial recognition; (b) less principal repayments and any reduction for impairment; and (c) plus or minus the cumulative amortisation of the difference, if any, between the amount initially recognised and the maturity amount calculated using the effective interest rate method. The effective interest method used is to allocate interest income or interest expense over the relevant period and is equivalent to the rate that discounts estimated future cash payments or receipts (including fees, transaction costs and other premiums or discounts) through the expected life (or when this cannot be reliably predicted, the contractual term) of the financial instrument to the net carrying amount of the financial asset or financial liability. Revisions to expected future net cash flows will necessitate an adjustment to the carrying value with a consequential recognition of an income or expense in profit or loss. (i) Financial assets at fair value through profit and loss Financial assets are classified at “fair value through profit or loss” when they are held for trading for the purpose of short-term profit taking. Such assets are subsequently measured at fair value with changes in carrying amount being included in profit or loss. Assets in this category are classified as current assets. (ii) Loans and receivables Loans and receivables are non-derivative financial assets with fixed or determinable payments that are not quoted in an active market and are subsequently measured at amortised cost. Gains or losses are recognised in profit or loss. Loans and receivables are included in current assets where they are expected to mature within 12 months after the end of the reporting period. (iii) Held-to-maturity investments Held-to-maturity investments are non-derivative financial assets with fixed maturities and fixed or determinable payments that the Council has the positive intention and ability to hold to maturity. They are subsequently measured at amortised cost. Gains or losses are recognised in profit or loss. Held-to-maturity investments are included in current assets where they are expected to mature within 12 months after the end of the reporting period. All other investments are classified as non-current.

Town of Cambridge Budget Notes
Page 2.10
1. SIGNIFICANT ACCOUNTING POLICIES (continued) (i) Financial Instruments (continued)
(iv) Available-for-sale financial assets Available-for-sale financial assets are non-derivative financial assets that are either not suitable to be classified into other categories of financial assets due to their nature, or they are designated as such by management. They comprise investments in the equity of other entities where there is neither a fixed maturity nor fixed or determinable payments. They are subsequently measured at fair value with changes in such fair value (i.e. gains or losses) recognised in other comprehensive income (except for impairment losses). When the financial asset is derecognised, the cumulative gain or loss pertaining to that asset previously recognised in other comprehensive income is reclassified into profit or loss. Available-for-sale financial assets are included in current assets, where they are expected to be sold within 12 months after the end of the reporting period. All other available-for-sale financial assets are classified as non-current. (v) Financial liabilities Non-derivative financial liabilities (excluding financial guarantees) are subsequently measured at amortised cost. Gains or losses are recognised in profit or loss. Impairment A financial asset is deemed to be impaired if, and only if, there is objective evidence of impairment as a result of one or more events (a “loss event”) having occurred, which has an impact on the estimated future cash flows of the financial asset(s). In the case of available-for-sale financial assets, a significant or prolonged decline in the market value of the instrument is considered a loss event. Impairment losses are recognised in profit or loss immediately. Also, any cumulative decline in fair value previously recognised in other comprehensive income is reclassified to profit or loss at this point. In the case of financial assets carried at amortised cost, loss events may include: indications that the debtors or a group of debtors are experiencing significant financial difficulty, default or delinquency in interest or principal payments; indications that they will enter bankruptcy or other financial reorganisation; and changes in arrears or economic conditions that correlate with defaults. For financial assets carried at amortised cost (including loans and receivables), a separate allowance account is used to reduce the carrying amount of financial assets impaired by credit losses. After having taken all possible measures of recovery, if management establishes that the carrying amount cannot be recovered by any means, at that point the written-off amounts are charged to the allowance account or the carrying amount of impaired financial assets is reduced directly if no impairment amount was previously recognised in the allowance account. Derecognition Financial assets are derecognised where the contractual rights to receipt of cash flows expire or the asset is transferred to another party whereby the Council no longer has any significant continual involvement in the risks and benefits associated with the asset. Financial liabilities are derecognised where the related obligations are discharged, cancelled or expired. The difference between the carrying amount of the financial liability extinguished or transferred to another party and the fair value of the consideration paid, including the transfer of non-cash assets or liabilities assumed, is recognised in profit or loss.

Town of Cambridge Budget Notes
Page 2.11
1. SIGNIFICANT ACCOUNTING POLICIES (continued)
(j) Fair Value of Assets and Liabilities
When performing a revaluation, the Council uses a mix of both independent and management valuations using the following as a guide:
Fair Value is the price that Council would receive to sell the asset or would have to pay to transfer a liability, in an orderly (i.e. unforced) transaction between independent, knowledgeable and willing market participants at the measurement date. As fair value is a market-based measure, the closest equivalent observable market pricing information is used to determine fair value. Adjustments to market values may be made having regard to the characteristics of the specific asset. The fair values of assets that are not traded in an active market are determined using one or more valuation techniques. These valuation techniques maximise, to the extent possible, the use of observable market data. To the extent possible, market information is extracted from either the principal market for the asset (i.e. the market with the greatest volume and level of activity for the asset or, in the absence of such a market, the most advantageous market available to the entity at the end of the reporting period (ie the market that maximises the receipts from the sale of the asset after taking into account transaction costs and transport costs). For non-financial assets, the fair value measurement also takes into account a market participant’s ability to use the asset in its highest and best use or to sell it to another market participant that would use the asset in its highest and best use. Fair Value Hierarchy AASB 13 requires the disclosure of fair value information by level of the fair value hierarchy, which categorises fair value measurement into one of three possible levels based on the lowest level that an input that is significant to the measurement can be categorised into as follows: Level 1 Measurements based on quoted prices (unadjusted) in active markets for identical assets or liabilities that the entity can access at the measurement date. Level 2 Measurements based on inputs other than quoted prices included in Level 1 that are observable for the asset or liability, either directly or indirectly. Level 3 Measurements based on unobservable inputs for the asset or liability. The fair values of assets and liabilities that are not traded in an active market are determined using one or more valuation techniques. These valuation techniques maximise, to the extent possible, the use of observable market data. If all significant inputs required to measure fair value are observable, the asset or liability is included in Level 2. If one or more significant inputs are not based on observable market data, the asset or liability is included in Level 3. Valuation techniques The Council selects a valuation technique that is appropriate in the circumstances and for which sufficient data is available to measure fair value. The availability of sufficient and relevant data primarily depends on the specific characteristics of the asset or liability being measured. The valuation techniques selected by the Council are consistent with one or more of the following valuation approaches: Market approach Valuation techniques that use prices and other relevant information generated by market transactions for identical or similar assets or liabilities. Income approach Valuation techniques that convert estimated future cash flows or income and expenses into a single discounted present value. Cost approach Valuation techniques that reflect the current replacement cost of an asset at its current service capacity.
Town of Cambridge Budget Notes
Page 2.12
1. SIGNIFICANT ACCOUNTING POLICIES (continued)
(a) Fair Value of Assets and Liabilities (continued)
Each valuation technique requires inputs that reflect the assumptions that buyers and sellers would use when pricing the asset or liability, including assumptions about risks. When selecting a valuation technique, the Council gives priority to those techniques that maximize the use of observable inputs and minimise the use of unobservable inputs. Inputs that are developed using market data (such as publicly available information on actual transactions) and reflect the assumptions that buyers and sellers would generally use when pricing the asset or liability and considered observable, whereas inputs for which market data is not available and therefore are developed using the best information available about such assumptions are considered unobservable. As detailed above, the mandatory measurement framework imposed by the Local Government (Financial Management) Regulations requires, as a minimum, all assets carried at a revalued amount to be revalued at least every 3 years.
(b) Impairment of Assets
In accordance with Australian Accounting Standards the Council’s assets, other than inventories, are assessed at each reporting date to determine whether there is any indication they may be impaired. Where such an indication exists, an impairment test is carried out on the asset by comparing the recoverable amount of the asset, being the higher of the asset’s fair value less costs to sell and value in use, to the asset’s carrying amount. Any excess of the asset’s carrying amount over its recoverable amount is recognised immediately in profit or loss, unless the asset is carried at a revalued amount in accordance with another standard (e.g. AASB 116) whereby any impairment loss of a revalued asset is treated as a revaluation decrease in accordance with that other standard.
For non-cash generating assets such as roads, drains, public buildings and the like, value in use is represented by the depreciated replacement cost of the asset.
(c) Actual Balances
Balances shown in this budget as 2014/15 Actual are as forecast at the time of budget preparation and are subject to final adjustments.
(d) Trade and Other Payables
Trade payables and other payables represent liabilities for goods and services provided to the Council prior to the end of the financial year that are unpaid and arise when the Council becomes obliged to make future payments in respect of the purchase of these goods and services. The amounts are unsecured, are recognised as a current liability and are normally paid within thirty days of recognition.
(n) Trade and other Receivables Trade receivables and other receivables include amounts due from ratepayers for unpaid rates and
service charges and other amounts due from third parties for goods sold and services performed in the ordinary course of business.
Receivables expected to be collected within 12 months of the end of the reporting period are classified
as current assets. All other receivables are classified as non-current assets. Collectability of trade and other receivables is reviewed on an ongoing basis. Debts that are known to be
uncollectable are written off when identified. An allowance for doubtful debts is raised when there is objective evidence that they will not be collectable.
(o) Comparatives
Comparative figures are, where appropriate, reclassified as to be comparable with the figures presented for the current budget year. Unless otherwise stated, the budget comparative figures shown in this budget document relate to the original budget estimates for the relevant item of disclosure.
Town of Cambridge Budget Notes
Page 2.13
1. SIGNIFICANT ACCOUNTING POLICIES (continued)
(p) Employee Benefits
Annual Leave and Long Service Leave (Short Term Benefits) Provision is made for the Council's obligations for short term employee benefits. Short term employee benefits are benefits (other than termination benefits) that are expected to be settled wholly before 12 months after the end of the annual reporting period in which the employees render the related service, including wages, salaries and sick leave. Short term employee benefits are measured at the (undiscounted) amounts expected to be paid when the obligation is settled. The Council's obligations for short term employee benefits such as wages, salaries and sick leave are recognised as a part of current trade and other payables in the statement of financial position. The Council's obligations for employees' annual leave and long service leave entitlements are recognised as provisions in the statement of financial position. Annual Leave and Long Service Leave (Long Term Benefits) Provision is made for employees' long service leave and annual leave entitlements not expected to be settled wholly within 12 months after the end of the annual reporting period in which the employees render the related service. Other long term employee benefits are measured at the present value of the present value of the expected future payments to be made to employees. Expected future payments incorporate anticipated future wage and salary levels, durations or service and employee departures and are discounted at rates determined by reference to market yields at the end of the reporting period on government bonds that have maturity dates that approximate the terms of the obligations. Any remeasurements for changes in assumptions of obligations for other long term employee benefits are recognised in profit or loss in the periods in which the changes occur. The Council's obligations for long term employee benefits are presented as non-current provisions in its statement of financial position, except where the Council does not have an unconditional right to defer settlement for at least 12 months after the end of the reporting period, in which case the obligations are presented as current provisions.
Superannuation The Council meets the statutory requirements of the Superannuation Guarantee Act by contributing the minimum 9.5% to the WA Local Government Superannuation Plan or the City of Perth Superannuation Scheme depending on the employee's membership status. The Council also contributes an additional 4% to the WA Local Government Superannuation Plan and an additional 5% to the City of Perth Superannuation Scheme where voluntary contributions are made by employees. The Council contributions are charged against revenue in the financial years to which the payments relate.
(q) Provisions
Provisions are recognised when the Council has a present legal or constructive obligation as a result of past events; for which it is probable that an outflow of economic benefits will result and that outflow can be reliably measured. Provisions are measured using the best estimate of the amounts required to settle the obligation at the end of the reporting period.
(r) Borrowing Costs
Borrowing costs are recognised as an expense when incurred except where they are directly attributable to the acquisition, construction or production of a qualifying asset. Where this is the case, they are capitalised as part of the cost of the particular asset until such time as the asset is substantially ready for its intended use or sale.
(s) Rounding
All figures shown in the budget, other than a rate in the dollar are rounded to the nearest $100 for budget items and to the nearest ($) for actual results. Some minor variations between Schedules may result.

Town of Cambridge Budget Notes
Page 2.14
1. SIGNIFICANT ACCOUNTING POLICIES (continued)
(t) Interests in Joint Arrangements
Joint arrangements represent the contractual sharing of control between parties in a business venture where unanimous decisions about relevant activities are required. Separate joint venture entities providing joint venturers with an interest to net assets are classified as a joint venture and accounted for using the equity method. Refer to note 1(r) for a description of the equity method of accounting. Joint venture operations represent arrangements whereby joint operators maintain direct interests in each asset and exposure to each liability of the arrangement. The Council’s interests in the assets, liabilities, revenue and expenses of joint operations are included in the respective line items of the financial statements. Information about the joint ventures is set out in notes accompanying the financial report.
(u) Variance from Budget
Variations arising during the 2015/2016 financial year between budget and actual results exceeding $30,000 as a permanent variance or $100,000 as a timing variance from year to date budget will be considered to be material in accordance with AASB 1031 and reported upon to Council on a monthly basis together with explanations for such variations arising.
(v) Goods and Services Tax (GST)
Revenues, expenses and assets are recognised net of the amount of GST, except where the amount of GST incurred is not recoverable from the Australian Taxation Office (ATO). Receivables and payables are stated inclusive of GST receivable or payable. The net amount of GST recoverable from, or payable to, the ATO is included with receivables or payables in the statement of financial position. Cash flows are presented on a Gross basis. The GST components of cash flows arising from investing or financing activities which are recoverable from, or payable to, the ATO are presented as operating cash flows.
(w) Current and Non-Current Classification
In the determination of whether an asset or liability is current or non-current, consideration is given to time when each asset or liability is expected to be settled. The asset or liability is classified as current if it is expected to be settled within the next 12 months, being the Council's operational cycle. In the case of liabilities where the Council does not have unconditional right to defer settlement beyond 12 months, such as vested long service leave, the liability is classified as current even if not expected to be realised in the next 12 months. Inventories held for trading are classified as current even if not expected to be realised in the next 12 months except for land held for sale where it is held as non-current based on the Council's intentions to release for sale.
(x) Leases
Leases of fixed assets where substantially all the risks and benefits incidental to the ownership of the asset, but not legal ownership, are transferred to the Council, are classified as finance leases. Finance leases are capitalised recording an asset and a liability at the lower amounts equal to the fair value of the leased property or the present value of the minimum lease payments, including any guaranteed residual values. Lease payments are allocated between the reduction of the lease liability and the lease interest expense for the period. Leased assets are depreciated on a straight line basis over the shorter of their estimated useful lives or the lease term. Lease payments for operating leases, where substantially all the risks and benefits remain with the lessor, are charged as expenses in the periods in which they are incurred. Lease incentives under operating leases are recognised as a liability and amortised on a straight line basis over the life of the lease term.
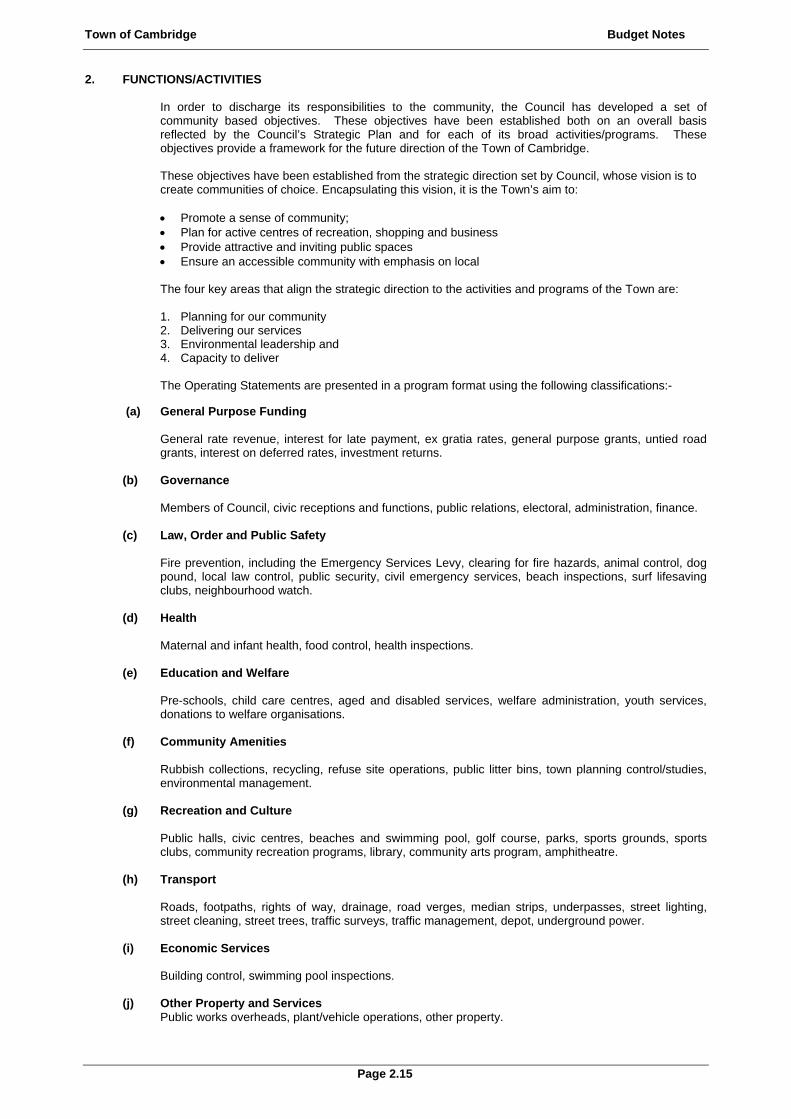
Town of Cambridge Budget Notes
Page 2.15
2. FUNCTIONS/ACTIVITIES In order to discharge its responsibilities to the community, the Council has developed a set of community based objectives. These objectives have been established both on an overall basis reflected by the Council’s Strategic Plan and for each of its broad activities/programs. These objectives provide a framework for the future direction of the Town of Cambridge.
These objectives have been established from the strategic direction set by Council, whose vision is to create communities of choice. Encapsulating this vision, it is the Town’s aim to:
Promote a sense of community; Plan for active centres of recreation, shopping and business Provide attractive and inviting public spaces Ensure an accessible community with emphasis on local
The four key areas that align the strategic direction to the activities and programs of the Town are:
1. Planning for our community 2. Delivering our services 3. Environmental leadership and 4. Capacity to deliver
The Operating Statements are presented in a program format using the following classifications:-
(a) General Purpose Funding
General rate revenue, interest for late payment, ex gratia rates, general purpose grants, untied road grants, interest on deferred rates, investment returns.
(b) Governance Members of Council, civic receptions and functions, public relations, electoral, administration, finance.
(c) Law, Order and Public Safety Fire prevention, including the Emergency Services Levy, clearing for fire hazards, animal control, dog pound, local law control, public security, civil emergency services, beach inspections, surf lifesaving clubs, neighbourhood watch.
(d) Health Maternal and infant health, food control, health inspections.
(e) Education and Welfare Pre-schools, child care centres, aged and disabled services, welfare administration, youth services, donations to welfare organisations.
(f) Community Amenities
Rubbish collections, recycling, refuse site operations, public litter bins, town planning control/studies, environmental management.
(g) Recreation and Culture Public halls, civic centres, beaches and swimming pool, golf course, parks, sports grounds, sports clubs, community recreation programs, library, community arts program, amphitheatre.
(h) Transport
Roads, footpaths, rights of way, drainage, road verges, median strips, underpasses, street lighting, street cleaning, street trees, traffic surveys, traffic management, depot, underground power.
(i) Economic Services Building control, swimming pool inspections.
(j) Other Property and Services Public works overheads, plant/vehicle operations, other property.

Town of Cambridge Budget Notes
Page 2.16
3. OPERATING REVENUE AND EXPENDITURE
Classified by Nature and TypeBudget Budget
2014/2015 2015/2016
Operating Revenue
Rates $22,136,000 $23,396,500
Operating Grants,Subsidies and Contributions $2,269,000 $1,825,500
Non Operating Grants,Subsidies and Contributions $4,159,800 $4,801,000
Profit on asset disposals $8,553,500 $2,627,000
Fees and charges $14,439,300 $15,744,500
Interest earnings $1,509,000 $1,332,500
Other revenue/income $511,000 $882,500
$53,577,600 $50,609,500
EXPENDITURE
Employee costs $16,799,700 $17,727,400
Materials and contracts $13,604,400 $14,061,100
Utilities (gas, electricity, water etc.) $2,385,600 $2,476,100
Depreciation on non-current assets $6,698,000 $6,994,000
Interest expenses $469,800 $779,500
Insurance expenses $380,600 $384,400
Other Expenditure $811,000 $944,000
Loss on disposal of assets $88,000 $138,500
$41,237,100 $43,505,000
Change in net assets resulting from operations $12,340,500 $7,104,500
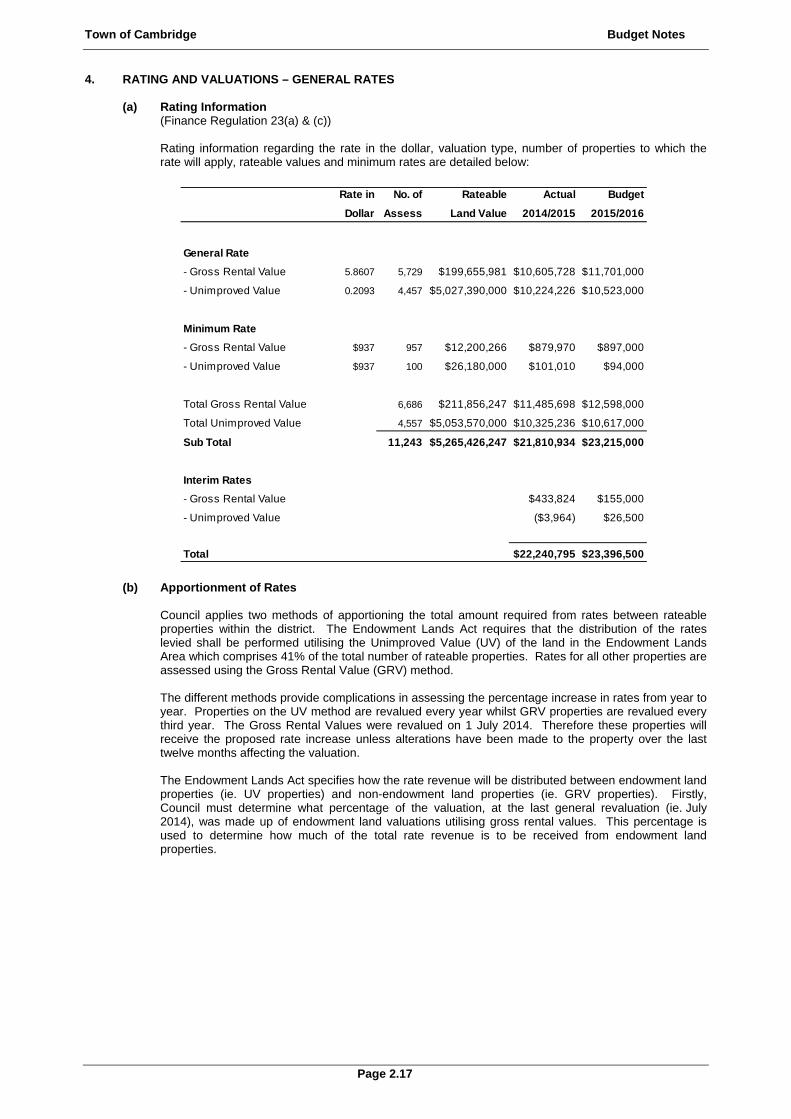
Town of Cambridge Budget Notes
Page 2.17
4. RATING AND VALUATIONS – GENERAL RATES
(a) Rating Information (Finance Regulation 23(a) & (c))
Rating information regarding the rate in the dollar, valuation type, number of properties to which the rate will apply, rateable values and minimum rates are detailed below:
(b) Apportionment of Rates
Council applies two methods of apportioning the total amount required from rates between rateable properties within the district. The Endowment Lands Act requires that the distribution of the rates levied shall be performed utilising the Unimproved Value (UV) of the land in the Endowment Lands Area which comprises 41% of the total number of rateable properties. Rates for all other properties are assessed using the Gross Rental Value (GRV) method. The different methods provide complications in assessing the percentage increase in rates from year to year. Properties on the UV method are revalued every year whilst GRV properties are revalued every third year. The Gross Rental Values were revalued on 1 July 2014. Therefore these properties will receive the proposed rate increase unless alterations have been made to the property over the last twelve months affecting the valuation. The Endowment Lands Act specifies how the rate revenue will be distributed between endowment land properties (ie. UV properties) and non-endowment land properties (ie. GRV properties). Firstly, Council must determine what percentage of the valuation, at the last general revaluation (ie. July 2014), was made up of endowment land valuations utilising gross rental values. This percentage is used to determine how much of the total rate revenue is to be received from endowment land properties.
Rate in No. of Rateable Actual Budget
Dollar Assess Land Value 2014/2015 2015/2016
General Rate
- Gross Rental Value 5.8607 5,729 $199,655,981 $10,605,728 $11,701,000
- Unimproved Value 0.2093 4,457 $5,027,390,000 $10,224,226 $10,523,000
Minimum Rate
- Gross Rental Value $937 957 $12,200,266 $879,970 $897,000
- Unimproved Value $937 100 $26,180,000 $101,010 $94,000
Total Gross Rental Value 6,686 $211,856,247 $11,485,698 $12,598,000
Total Unimproved Value 4,557 $5,053,570,000 $10,325,236 $10,617,000
Sub Total 11,243 $5,265,426,247 $21,810,934 $23,215,000
Interim Rates
- Gross Rental Value $433,824 $155,000
- Unimproved Value ($3,964) $26,500
Total $22,240,795 $23,396,500
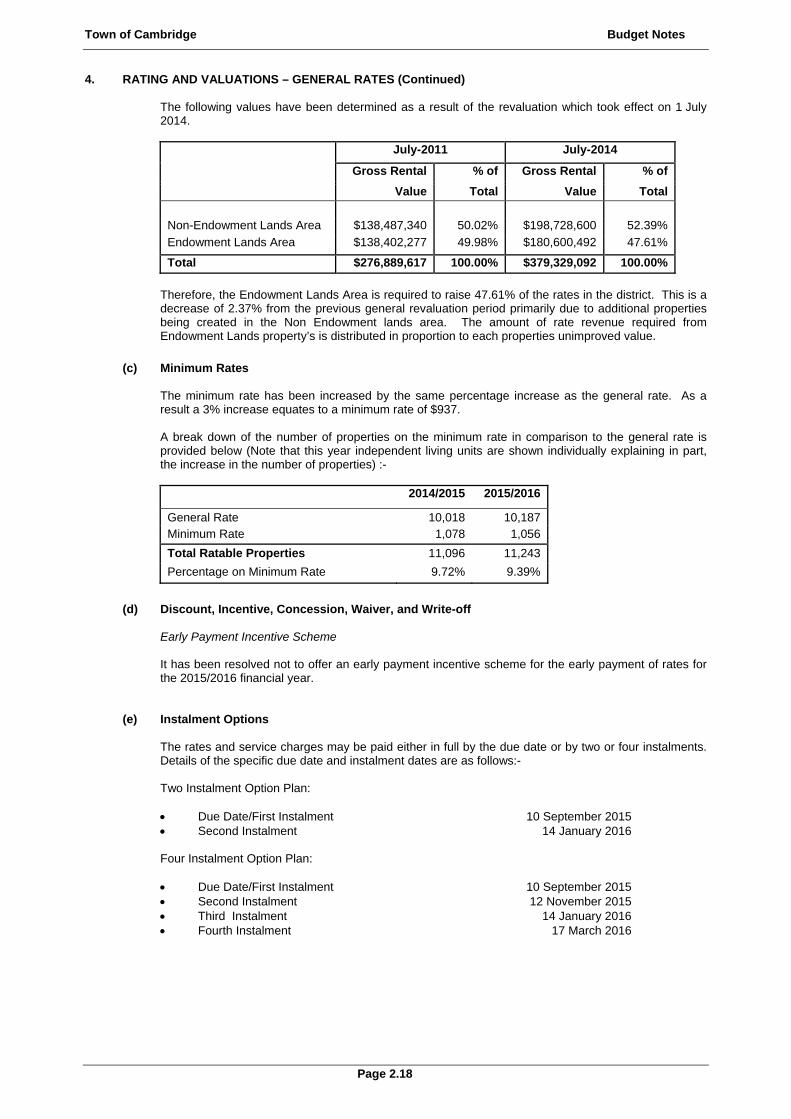
Town of Cambridge Budget Notes
Page 2.18
4. RATING AND VALUATIONS – GENERAL RATES (Continued)
The following values have been determined as a result of the revaluation which took effect on 1 July 2014.
July-2011 July-2014
Gross Rental % of Gross Rental % of
Value Total Value Total
Non-Endowment Lands Area $138,487,340 50.02% $198,728,600 52.39%
Endowment Lands Area $138,402,277 49.98% $180,600,492 47.61%
Total $276,889,617 100.00% $379,329,092 100.00%
Therefore, the Endowment Lands Area is required to raise 47.61% of the rates in the district. This is a decrease of 2.37% from the previous general revaluation period primarily due to additional properties being created in the Non Endowment lands area. The amount of rate revenue required from Endowment Lands property’s is distributed in proportion to each properties unimproved value.
(c) Minimum Rates
The minimum rate has been increased by the same percentage increase as the general rate. As a result a 3% increase equates to a minimum rate of $937. A break down of the number of properties on the minimum rate in comparison to the general rate is provided below (Note that this year independent living units are shown individually explaining in part, the increase in the number of properties) :-
2014/2015 2015/2016
General Rate 10,018 10,187Minimum Rate 1,078 1,056
Total Ratable Properties 11,096 11,243
Percentage on Minimum Rate 9.72% 9.39%
(d) Discount, Incentive, Concession, Waiver, and Write-off
Early Payment Incentive Scheme It has been resolved not to offer an early payment incentive scheme for the early payment of rates for the 2015/2016 financial year.
(e) Instalment Options
The rates and service charges may be paid either in full by the due date or by two or four instalments. Details of the specific due date and instalment dates are as follows:- Two Instalment Option Plan: Due Date/First Instalment 10 September 2015 Second Instalment 14 January 2016
Four Instalment Option Plan:
Due Date/First Instalment 10 September 2015 Second Instalment 12 November 2015 Third Instalment 14 January 2016 Fourth Instalment 17 March 2016

Town of Cambridge Budget Notes
Page 2.19
4. RATING AND VALUATIONS – GENERAL RATES (Continued) An interest rate of 5.5% per annum and an administration fee of $8.00 will apply to the second, third and fourth instalments. An estimate of the additional revenue from these charges is detailed below:-
Amount Instalment Interest 5.5% Administration Fee $8 Total
(f) Penalties
Late payment Interest of 11% is to be applied to outstanding rate payments. It is estimated that an amount of $52,000 will be imposed as detailed on Page 3.14.
(g) Interim Rates
Interim rates are derived when the valuation of a property increases during the year. Interim rates will be levied if any of the following occur:- Completion of new buildings on previously vacant land; Additions or alterations to existing buildings; Reappraisal of the value by the Valuer General at his own instigation; Recent subdivision or amalgamation of property; Demolition of buildings with vacant land resulting (this can sometimes have the effect of increasing
the value of the property). Council will only levy interim rates on properties based on the GRV method of valuation as improvements to buildings add to the rental value. Additions do not add to the unimproved value of the land. Interim rates will only be applied to UV properties if land is subdivided.
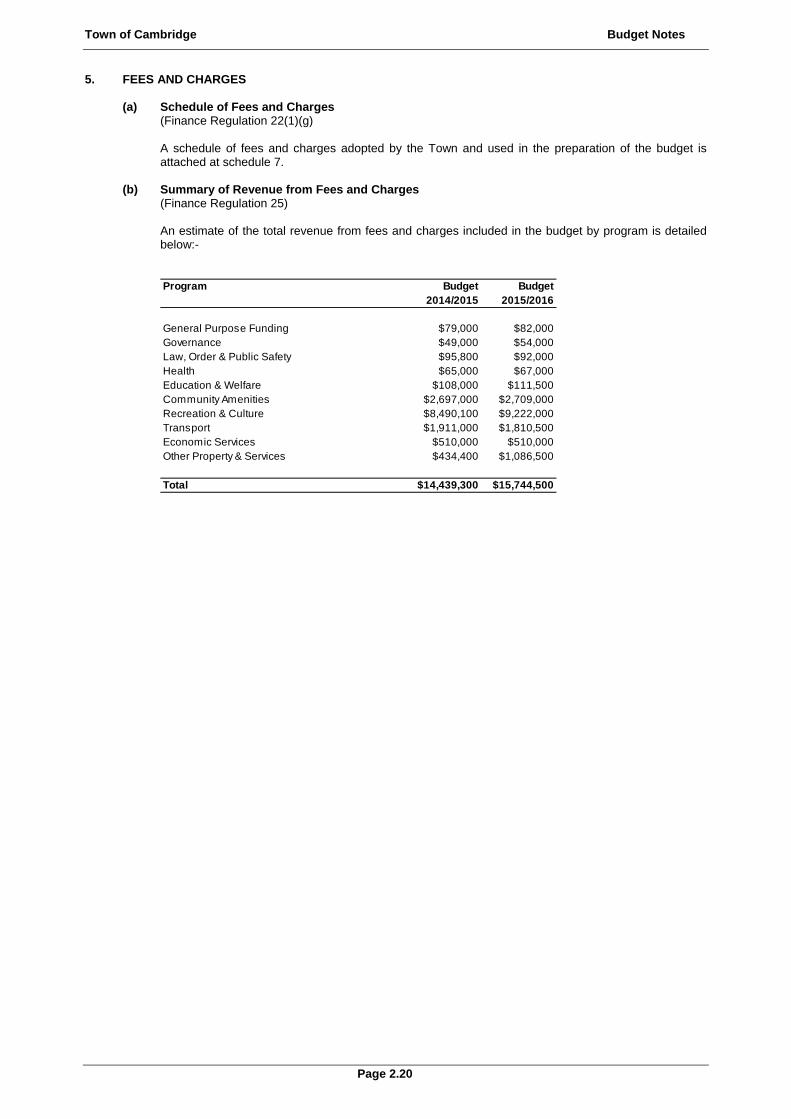
Town of Cambridge Budget Notes
Page 2.20
5. FEES AND CHARGES
(a) Schedule of Fees and Charges (Finance Regulation 22(1)(g) A schedule of fees and charges adopted by the Town and used in the preparation of the budget is attached at schedule 7.
(b) Summary of Revenue from Fees and Charges (Finance Regulation 25) An estimate of the total revenue from fees and charges included in the budget by program is detailed below:-
Program Budget Budget2014/2015 2015/2016
General Purpose Funding $79,000 $82,000Governance $49,000 $54,000Law, Order & Public Safety $95,800 $92,000Health $65,000 $67,000Education & Welfare $108,000 $111,500Community Amenities $2,697,000 $2,709,000Recreation & Culture $8,490,100 $9,222,000Transport $1,911,000 $1,810,500Economic Services $510,000 $510,000Other Property & Services $434,400 $1,086,500
Total $14,439,300 $15,744,500
Town of Cambridge Budget Notes
Page 2.21
6. CONTRIBUTION/GRANTS
(a) Contributions for the Development of Assets
Contributions for the development of assets is recorded as operating revenue and is brought to account in the Operating Budget under the respective program to which the asset relates. Details of the contributions included in the budget are provided below:
Asset Description Source Amount
Education & Welfare
Capital Grant
Cambridge Senior Services - Furniture State 10,000
0 10,000
Community Amenities 0
Capital Grant 0
Waste Authority - Waste Bins State 216,000
0
Capital Contribution 0
Development Contributions 0 60,000
0 276,000
Recreation and Culture 0
Capital Grant 0
Department of Transport 0
Beaches & Dunes - City Beach Groyne Maintenance State 167,500
Lotteries Commission 0
Perry Lakes Skate Park - Stage 2 State 300,000
Department of Sports and Recreation 0
City Beach Amenities State 525,000
Wembley Sports Park Pavilion Development State 500,000
Cambridge Bowling Club State 66,000
City Beach Tennis Club State 23,000
0 1,811,500
Capital Contribution 0
Wembley Sports Park Pavilion Development 0 218,000
Cambridge Bowling Club 0 66,000
City Beach Tennis Club 0 23,000
Cambridge Scouts & Girl Guides Association 0 50,000
0 484,000
Transport 0
Capital Grant 0
Main Roads Western Australia (MRWA) - Rehabilitation 0
Empire Avenue - (Weaponess - Erskine) W MRWA 74,000
Empire Avenue - (The Boulevard - Dumfries) MRWA 42,000
Cambridge St (Harborne - Gregory) MRWA 36,500
Brookdale Street (Alderbury to Underwood) MRWA 25,500
Railway Pde (Loftus St to Kerr St) MRWA 297,500
Selby Street (Hay Street to Daikin) MRWA 16,500
The Boulevard (Templetonia to WCH) MRWA 70,000
The Boulevard (Durston to Templetonia) MRWA 195,500
0 757,500
Main Roads Western Australia (MRWA) - Blackspots 0
Grantham / Harborne - Intersection safety Federal 700,000
0 700,000
Roads to Recovery 0
Donegal Federal 221,000
Launceston Ave (Helston to Challenger) Federal 137,000
Capital Works to be advised Federal 153,000
0 511,000
Capital Contribution 0
City of Subiaco 0
Salvado Road - roundaboout at SJOG Hospital Entrance 0 110,0000
City of StirlingEmpire Avenue - (Weaponess - Erskine) W 0 31,000
0St John of God HospitalSalvado Road - roundaboout at SJOG Hospital Entrance 0 110,000
251,000
Total Contributions to Town Assets 4,801,000
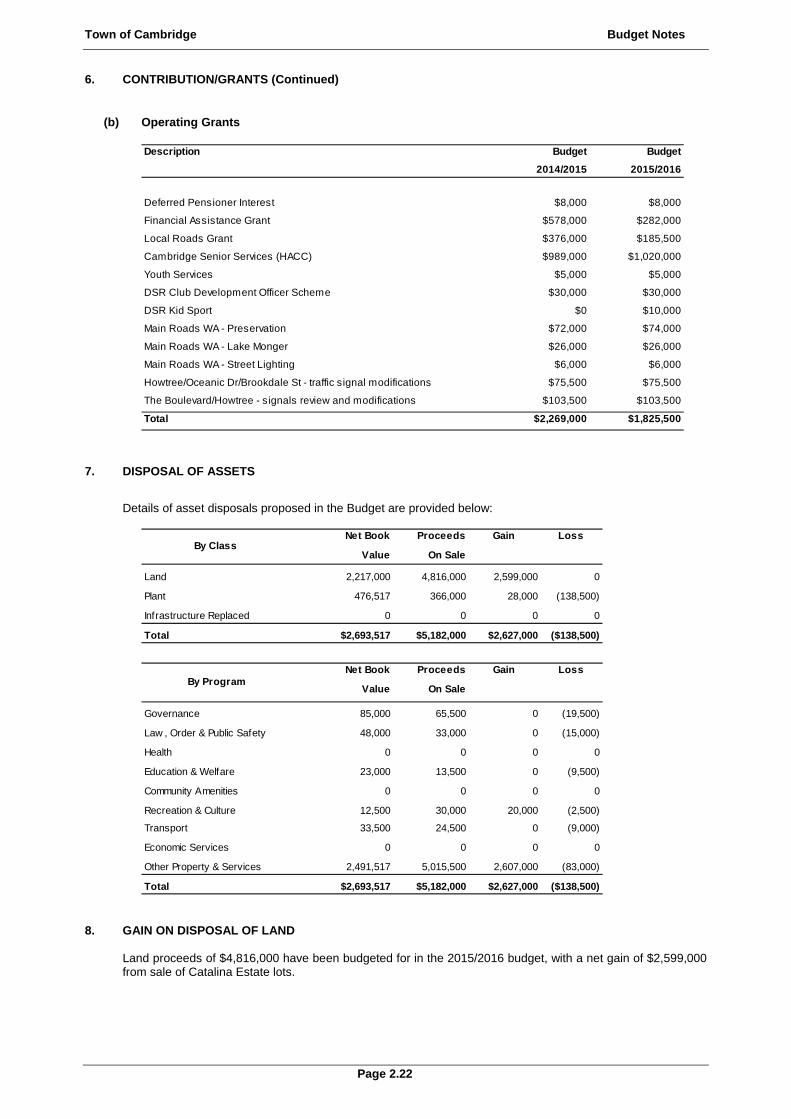
Town of Cambridge Budget Notes
Page 2.22
6. CONTRIBUTION/GRANTS (Continued)
(b) Operating Grants
7. DISPOSAL OF ASSETS
Details of asset disposals proposed in the Budget are provided below:
8. GAIN ON DISPOSAL OF LAND
Land proceeds of $4,816,000 have been budgeted for in the 2015/2016 budget, with a net gain of $2,599,000 from sale of Catalina Estate lots.
Budget Budget
2014/2015 2015/2016
Deferred Pensioner Interest $8,000 $8,000
Financial Assistance Grant $578,000 $282,000
Local Roads Grant $376,000 $185,500
Cambridge Senior Services (HACC) $989,000 $1,020,000
Youth Services $5,000 $5,000
DSR Club Development Officer Scheme $30,000 $30,000
DSR Kid Sport $0 $10,000
Main Roads WA - Preservation $72,000 $74,000
Main Roads WA - Lake Monger $26,000 $26,000
Main Roads WA - Street Lighting $6,000 $6,000
Howtree/Oceanic Dr/Brookdale St - traffic signal modifications $75,500 $75,500
The Boulevard/Howtree - signals review and modifications $103,500 $103,500
Total $2,269,000 $1,825,500
Description
Net Book Proceeds
Value On Sale
Land 2,217,000 4,816,000 2,599,000 0
Plant 476,517 366,000 28,000 (138,500)
Infrastructure Replaced 0 0 0 0
Total $2,693,517 $5,182,000 $2,627,000 ($138,500)
By ClassGain Loss
Net Book Proceeds
Value On Sale
Governance 85,000 65,500 0 (19,500)
Law , Order & Public Safety 48,000 33,000 0 (15,000)
Health 0 0 0 0
Education & Welfare 23,000 13,500 0 (9,500)
Community Amenities 0 0 0 0
Recreation & Culture 12,500 30,000 20,000 (2,500)
Transport 33,500 24,500 0 (9,000)
Economic Services 0 0 0 0
Other Property & Services 2,491,517 5,015,500 2,607,000 (83,000)
Total $2,693,517 $5,182,000 $2,627,000 ($138,500)
By ProgramGain Loss
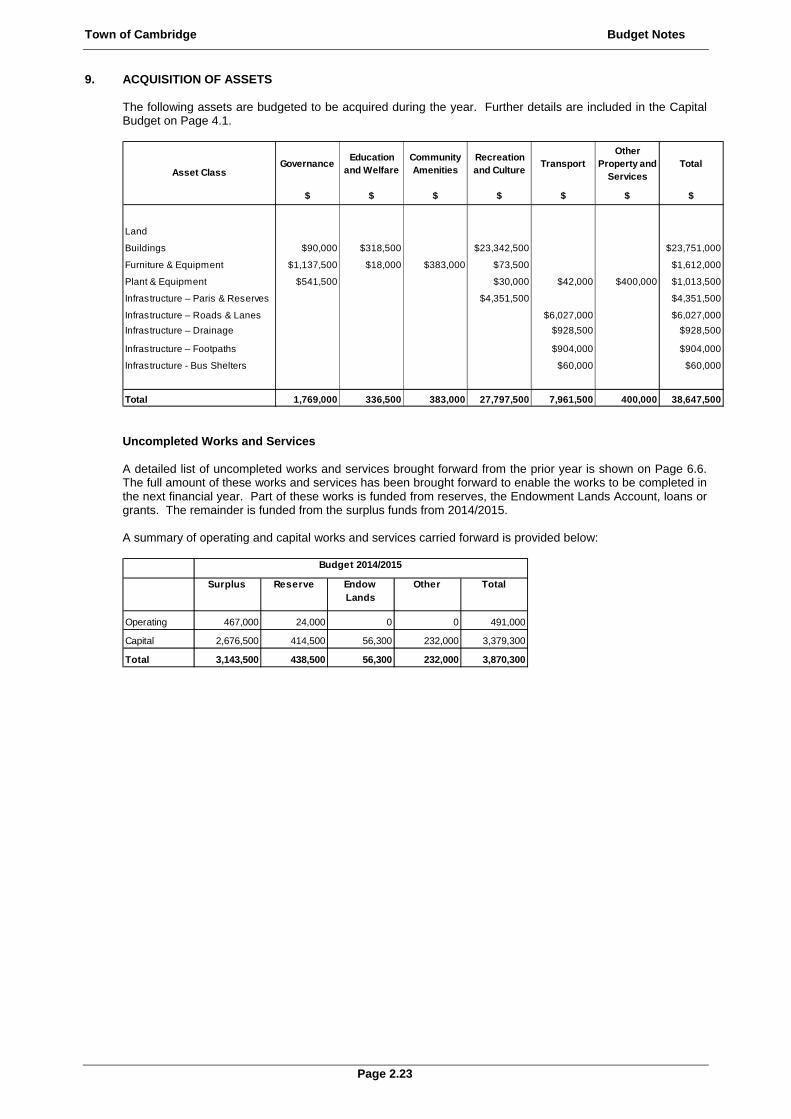
Town of Cambridge Budget Notes
Page 2.23
9. ACQUISITION OF ASSETS
The following assets are budgeted to be acquired during the year. Further details are included in the Capital Budget on Page 4.1.
Uncompleted Works and Services A detailed list of uncompleted works and services brought forward from the prior year is shown on Page 6.6. The full amount of these works and services has been brought forward to enable the works to be completed in the next financial year. Part of these works is funded from reserves, the Endowment Lands Account, loans or grants. The remainder is funded from the surplus funds from 2014/2015. A summary of operating and capital works and services carried forward is provided below:
$ $ $ $ $ $ $
Land
Buildings $90,000 $318,500 $23,342,500 $23,751,000
Furniture & Equipment $1,137,500 $18,000 $383,000 $73,500 $1,612,000
Plant & Equipment $541,500 $30,000 $42,000 $400,000 $1,013,500
Infrastructure – Paris & Reserves $4,351,500 $4,351,500
Infrastructure – Roads & Lanes $6,027,000 $6,027,000
Infrastructure – Drainage $928,500 $928,500
Infrastructure – Footpaths $904,000 $904,000
Infrastructure - Bus Shelters $60,000 $60,000
Total 1,769,000 336,500 383,000 27,797,500 7,961,500 400,000 38,647,500
TransportOther
Property and Services
TotalAsset Class
GovernanceEducation
and WelfareCommunity Amenities
Recreation and Culture
Operating 467,000 24,000 0 0 491,000
Capital 2,676,500 414,500 56,300 232,000 3,379,300
Total 3,143,500 438,500 56,300 232,000 3,870,300
TotalSurplus Reserve EndowLands
Other
Budget 2014/2015
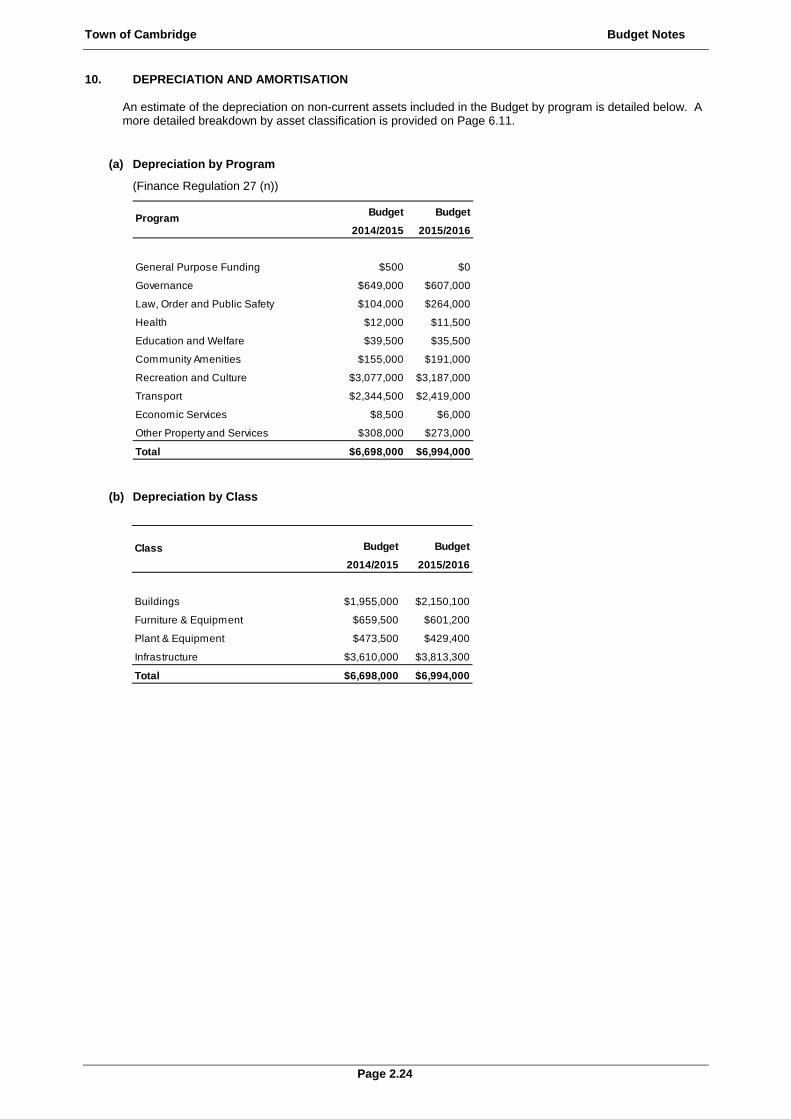
Town of Cambridge Budget Notes
Page 2.24
10. DEPRECIATION AND AMORTISATION
An estimate of the depreciation on non-current assets included in the Budget by program is detailed below. A more detailed breakdown by asset classification is provided on Page 6.11.
(a) Depreciation by Program
(Finance Regulation 27 (n))
(b) Depreciation by Class
Budget Budget
2014/2015 2015/2016
General Purpose Funding $500 $0
Governance $649,000 $607,000
Law, Order and Public Safety $104,000 $264,000
Health $12,000 $11,500
Education and Welfare $39,500 $35,500
Community Amenities $155,000 $191,000
Recreation and Culture $3,077,000 $3,187,000
Transport $2,344,500 $2,419,000
Economic Services $8,500 $6,000
Other Property and Services $308,000 $273,000
Total $6,698,000 $6,994,000
Program
Budget Budget
2014/2015 2015/2016
Buildings $1,955,000 $2,150,100
Furniture & Equipment $659,500 $601,200
Plant & Equipment $473,500 $429,400
Infrastructure $3,610,000 $3,813,300
Total $6,698,000 $6,994,000
Class

Town of Cambridge Budget Notes
Page 2.25
11. MEMBER’S OF COUNCIL REMUNERATION Details of the fees, expenses and allowances to be paid to Members of Council in accordance with Sections
5.98 and 5.99 of the Local Government Act 1995 are outlined below:
Amount Quantity Total (a) Annual Meeting Fee (Section 5.99(b)) - Mayor $30,300 1 $30,300
-Councilors $22,600 8 $181,200 $211,500 (b) Annual Local Government Allowance - Mayor (Section 5.98(5)(b) $62,000 1 $62,000
- Deputy Mayor (Section 5.98A) $15,500 1 $15,500 $77,500
(c) Other Allowances (Section 5.99A) - Telecommunications Technology Allowance $3,700 9 $33,000 $33,000 (d) Reimbursement of Expenses (Section 5.98(2)) - Out of Pocket and Traveling Expenses 9 $500 Total $322,500
Note: The figures provided above are subject to review by the Salaries and Allowances Tribunal.
Some Elected Members may not claim the full amount of their entitlement. The budgeted expenditure is shown on Page 3.17.

Town of Cambridge Budget Notes
Page 2.26
12. CASH AT BANK/INVESTMENTS
(a) Reconciliation of Cash
For the purpose of the cash flow budget, the Town considers cash to include cash on hand and cash equivalents. Cash on hand means notes and coins held, and deposits held at call with a financial institution. Cash equivalents are highly liquid investments with short periods of maturity which are readily convertible to cash on hand, and borrowings integral to the cash management function and not subject to a term facility.
Cash at the end of the reporting periods as shown in the cash flow budget is reconciled to the related items in the current assets shown in Note 12(b) as follows:
(b) Restricted Assets
Restrictions are placed on the cash held and not the full amount recorded in the above note is available for use in operations unless the criteria for their use have been met.
The cash reserves are restricted in accordance with the purpose adopted by Council. The Endowment Lands Account has restrictions placed upon it by the Cambridge Endowment Lands Act 1920. Details of the nature of the restrictions for the reserves and the endowment land account are provided later in these notes. The provision for long service leave is an employee entitlement and is held until the employee takes long service leave or entitlements paid upon termination according to the requirements of the long service leave regulations.
(c) Investment Earnings
Revenue earned from Interest on investments is listed in various areas of the budget and is summarised as follows:
Budget Est. Actual Budget
2014/2015 2014/2015 2015/2016
Cash ComprisesCash on Hand/Cash Advances 500,000 608,391 800,000
Short Term Investments 8,002,100 31,989,906 6,170,400
Total 8,502,100 32,598,297 6,970,400
Budget Est. Actual Budget
2014/2015 2014/2015 2015/2016
Cash Reserves 3,002,100 5,960,572 3,907,000
Endowment Lands Account (0) 18,349,507 100,500
Provision for Long Service Leave 1,300,000 1,460,592 1,400,000
Sub Total 4,302,100 25,770,671 5,407,500
Cash Available for Use 4,200,000 6,827,626 1,562,900
Total Cash 8,502,100 32,598,297 6,970,400
Budget Budget
2014/2015 2015/2016
Interest from money held in reserve $43,500 $48,000
Interest from endowment lands $720,000 $742,000
Interest from other money $600,000 $394,500
Interest from rate instalments $90,000 $93,000
Interest from late payment of rates $50,000 $52,000
Interest from HACC operational subsidy $5,500 $3,000
Total Interest $1,509,000 $1,332,500
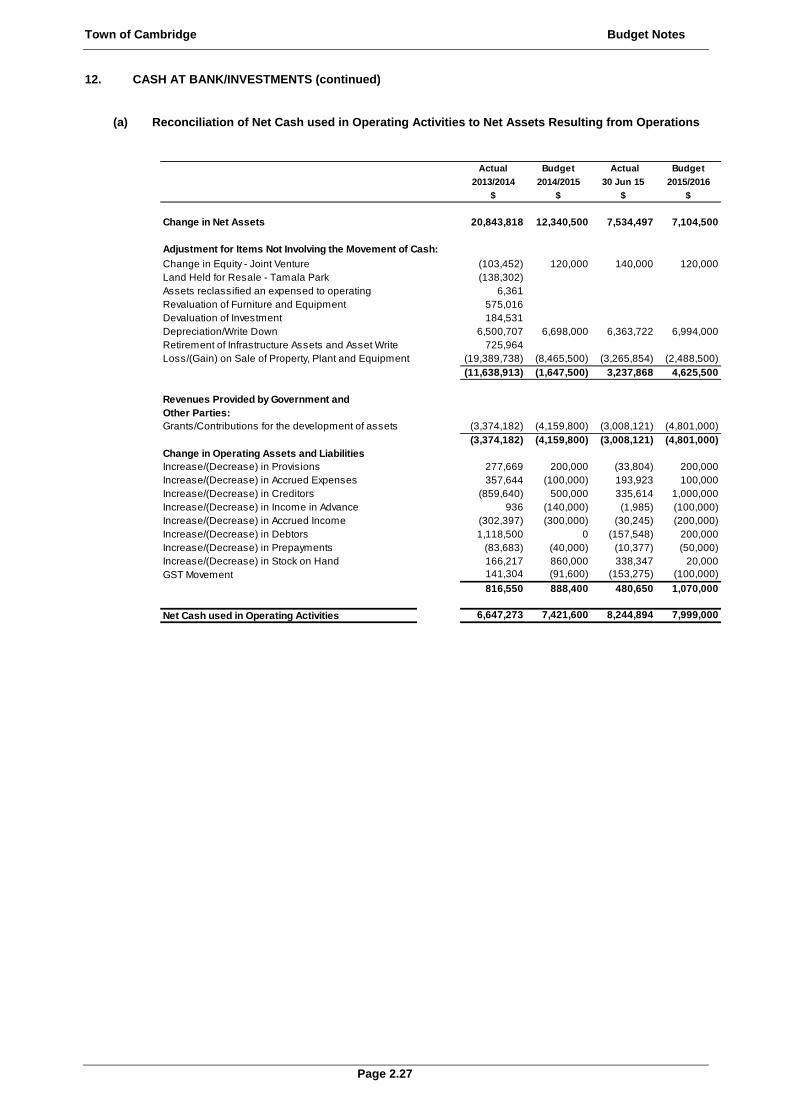
Town of Cambridge Budget Notes
Page 2.27
12. CASH AT BANK/INVESTMENTS (continued)
(a) Reconciliation of Net Cash used in Operating Activities to Net Assets Resulting from Operations
Actual Budget Actual Budget
2013/2014 2014/2015 30 Jun 15 2015/2016
$ $ $ $
Change in Net Assets 20,843,818 12,340,500 7,534,497 7,104,500
Adjustment for Items Not Involving the Movement of Cash:
Change in Equity - Joint Venture (103,452) 120,000 140,000 120,000Land Held for Resale - Tamala Park (138,302)Assets reclassified an expensed to operating 6,361Revaluation of Furniture and Equipment 575,016Devaluation of Investment 184,531Depreciation/Write Down 6,500,707 6,698,000 6,363,722 6,994,000Retirement of Infrastructure Assets and Asset Write 725,964Loss/(Gain) on Sale of Property, Plant and Equipment (19,389,738) (8,465,500) (3,265,854) (2,488,500) (11,638,913) (1,647,500) 3,237,868 4,625,500
Revenues Provided by Government andOther Parties:Grants/Contributions for the development of assets (3,374,182) (4,159,800) (3,008,121) (4,801,000)
(3,374,182) (4,159,800) (3,008,121) (4,801,000)Change in Operating Assets and LiabilitiesIncrease/(Decrease) in Provisions 277,669 200,000 (33,804) 200,000Increase/(Decrease) in Accrued Expenses 357,644 (100,000) 193,923 100,000Increase/(Decrease) in Creditors (859,640) 500,000 335,614 1,000,000Increase/(Decrease) in Income in Advance 936 (140,000) (1,985) (100,000)Increase/(Decrease) in Accrued Income (302,397) (300,000) (30,245) (200,000)Increase/(Decrease) in Debtors 1,118,500 0 (157,548) 200,000Increase/(Decrease) in Prepayments (83,683) (40,000) (10,377) (50,000)Increase/(Decrease) in Stock on Hand 166,217 860,000 338,347 20,000GST Movement 141,304 (91,600) (153,275) (100,000)
816,550 888,400 480,650 1,070,000
Net Cash used in Operating Activities 6,647,273 7,421,600 8,244,894 7,999,000

Town of Cambridge Budget Notes
Page 2.28
13. LOAN & CREDIT FACILITIES
(a) Repayments
Loan #4 Southport street loan was refinanced in May 2015 based on interest payable only.
Loan #3 Wembley Golf Course – Driving Range, Pro Shop based on 20 year loan term with both interest and principal repayments.
New Loan:
Loan #7 Wembley Golf Course - Miniature Golf Project will be partly funded by a $2 million loan and anticipated to be taken out towards end of 2015/2016 financial year. It is expected the loan term will be for 20 years and at an interest rate of around 3% with both interest and principal repayments being made.
(b) Unspent Loans
Nil (c) Overdraft
An overdraft facility of up to $500,000 is to be provided at the Council’s bank if required in accordance with Section 6.2(4)(d) of the Local Government Act.
(d) Internal Loans
2014/2015 2015/2016 2014/2015 2015/2016 30 June 2015 30 June 2016
Actual Budget Actual Budget Actual Budget
$ $ $ $ $ $
Loan 6 HP Agreement 16,930 18,000 3,400 2,500 37,772 19,725
16,930 18,000 3,400 2,500 37,772 19,725
Loan 1 WGC Irrigation Upgrade 152,873 158,000 60,028 64,000 1,639,251 1,481,051
Loan 3a WGC Driving Range, Proshop 335,154 412,500 321,494 372,000 10,464,846 10,052,194
Loan 7 WGC Miniature Golf 0 0 0 12,000 0 2,000,000
488,027 570,500 381,522 448,000 12,104,097 13,533,245
Loan 4 39 Southport Street 0 0 0 53,500 1,107,102 1,107,102
0 0 0 53,500 1,107,102 1,107,102
Total 504,957 588,500 384,922 504,000 13,248,971 14,660,072
Recreation and Culture
Details
Other Property & Services
Principal Payments
Governance
Interest Payments Principal Remaining
2014/2015 2015/2016 2014/2015 2015/2016 30 June 2015 30 June 2016
Actual Budget Actual Budget Actual Budget
$ $ $ $ $ $
Loan 3b WGC Driving Range, Proshop 0 0 109,740 110,500 3,768,395 3,768,395
Loan 8 WGC Hospitality 0 0 0 0 0 10,400,000
0 0 109,740 110,500 3,768,395 14,168,395
City Beach Surf Club & Commercial Development
Loan 9b City Beach Restaurants 0 97,500 0 92,000 0 4,016,874
Loan 10 City Beach Surf Club (50%) 0 77,500 0 73,000 0 3,200,550
0 175,000 0 165,000 0 7,217,424
Total 0 175,000 109,740 275,500 3,768,395 21,385,819
Recreation and Culture
Details
Principal Payments Interest Payments Principal Remaining
Other Property & Services
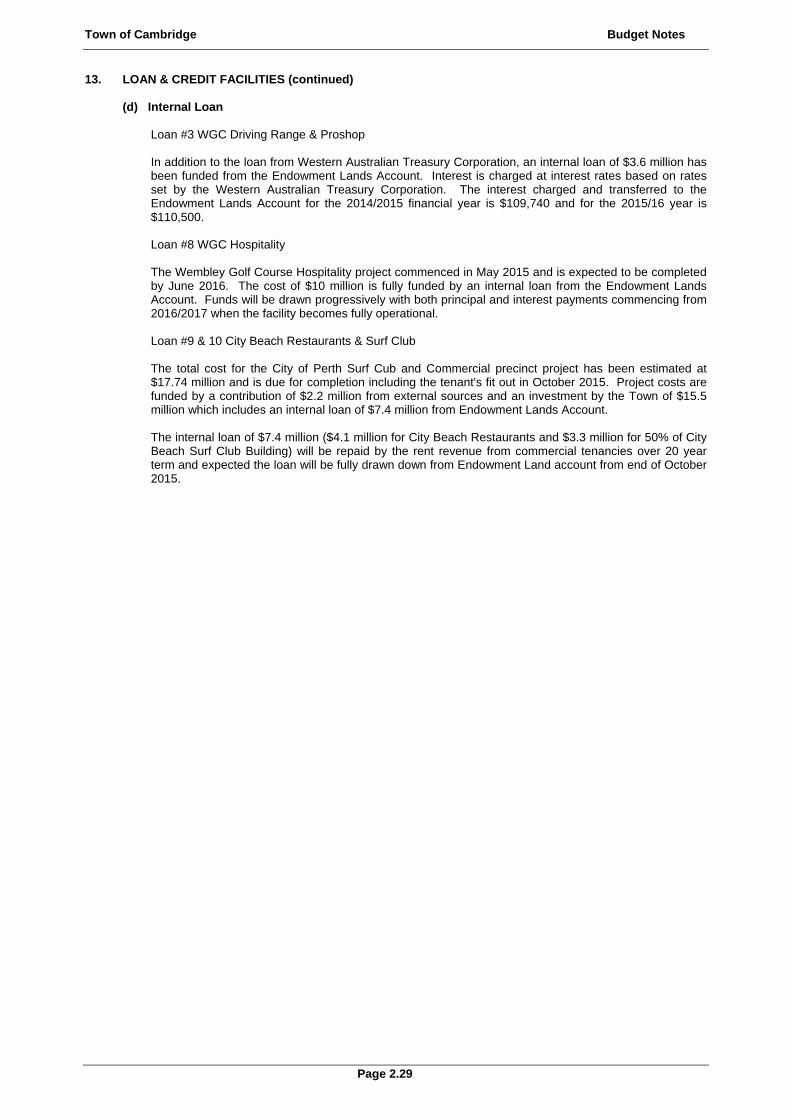
Town of Cambridge Budget Notes
Page 2.29
13. LOAN & CREDIT FACILITIES (continued) (d) Internal Loan
Loan #3 WGC Driving Range & Proshop In addition to the loan from Western Australian Treasury Corporation, an internal loan of $3.6 million has been funded from the Endowment Lands Account. Interest is charged at interest rates based on rates set by the Western Australian Treasury Corporation. The interest charged and transferred to the Endowment Lands Account for the 2014/2015 financial year is $109,740 and for the 2015/16 year is $110,500. Loan #8 WGC Hospitality The Wembley Golf Course Hospitality project commenced in May 2015 and is expected to be completed by June 2016. The cost of $10 million is fully funded by an internal loan from the Endowment Lands Account. Funds will be drawn progressively with both principal and interest payments commencing from 2016/2017 when the facility becomes fully operational. Loan #9 & 10 City Beach Restaurants & Surf Club The total cost for the City of Perth Surf Cub and Commercial precinct project has been estimated at $17.74 million and is due for completion including the tenant's fit out in October 2015. Project costs are funded by a contribution of $2.2 million from external sources and an investment by the Town of $15.5 million which includes an internal loan of $7.4 million from Endowment Lands Account. The internal loan of $7.4 million ($4.1 million for City Beach Restaurants and $3.3 million for 50% of City Beach Surf Club Building) will be repaid by the rent revenue from commercial tenancies over 20 year term and expected the loan will be fully drawn down from Endowment Land account from end of October 2015.

Town of Cambridge Budget Notes
Page 2.30
14. RESERVES
Council maintains various reserves, which provide financial resources for projects and for items requiring urgent attention during the year, which have not been budgeted for. Full details on Reserves are shown on Pages 5.1 to 5.6.
(a) Purpose of Cash Backed Reserves
(i) Area Improvement Reserve To provide funds for the acquisition and development of assets excluding community recreation
facilities or the provision of services that are in the view of the Council beneficial and provides improvements to areas within the district of the Town.
(ii) Community Facilities Reserve
To provide funds for acquisition and development of community facilities in the Town. (iii) Asset Management Reserve
To provide a source of funds for future asset replacement. This reserve recognises the need to make provision for the future replacement of assets having regard to the depreciating nature of non-current assets. The amount in this reserve is to be accumulated over the useful life of the assets and expended on replacement as considered appropriate. The reserve provides for the acquisition and replacement of the Town’s plant, equipment and infrastructure. “Plant, equipment and Infrastructure” shall be defined to mean trucks, loaders, cars, utilities, rollers, tractors, movers, computers, photocopies, buildings, roads, footpaths, drainage, parks, reticulation and similar.
(iv) Waste Management Reserve
To provide funds for the provision of waste management services, including recycling. These services may include acquisition of assets such as land, buildings, plant and equipment, mobile rubbish bins, etc. The reserve also provides for the expenses relating to the Tamala Park land in which the Town has an ownership interest.
(v) Clubs and Associations Reserves
(i) Clubs and Associations - Buildings
This reserve was established in accordance with the Town's new community leasing policy to provide funding for ongoing building maintenance for the various facilities.. Contributions are made by both the Town and the Community Associations and held by the Council for this purpose.
(ii) Clubs and Associations - Synthetic Court and Lightings
This reserve was established in accordance with the Town's new community leasing policy to provide replacement of synthetic courts and lighting infrastructure where applicable. Contributions are made by both the Town and Community Associations and held by the Council for this purpose.
(iii) Clubs and Associations - Car Parks and Surroundings
This reserve was established in accordance with the Town's new community leasing policy to provide for the replacement of car parks and surroundings where applicable. Contributions are made by both the Town and Community Associations and held by the Council for this purpose.
(vi) Development Contributions Reserve
The Town under its "Access and Parking Strategy" endorsed by Council in 2012, has a requirement for developers to make a "cash in lieu of parking" contribution, as part of its planning approval process where it is evident that there are insufficient parking facilities being provided. The "Cash in lieu of parking" contribution will differ depending in which precinct the construction is taking place. To enable contributions to be appropriately monitored and acquitted, a reserve has been created for each precinct.
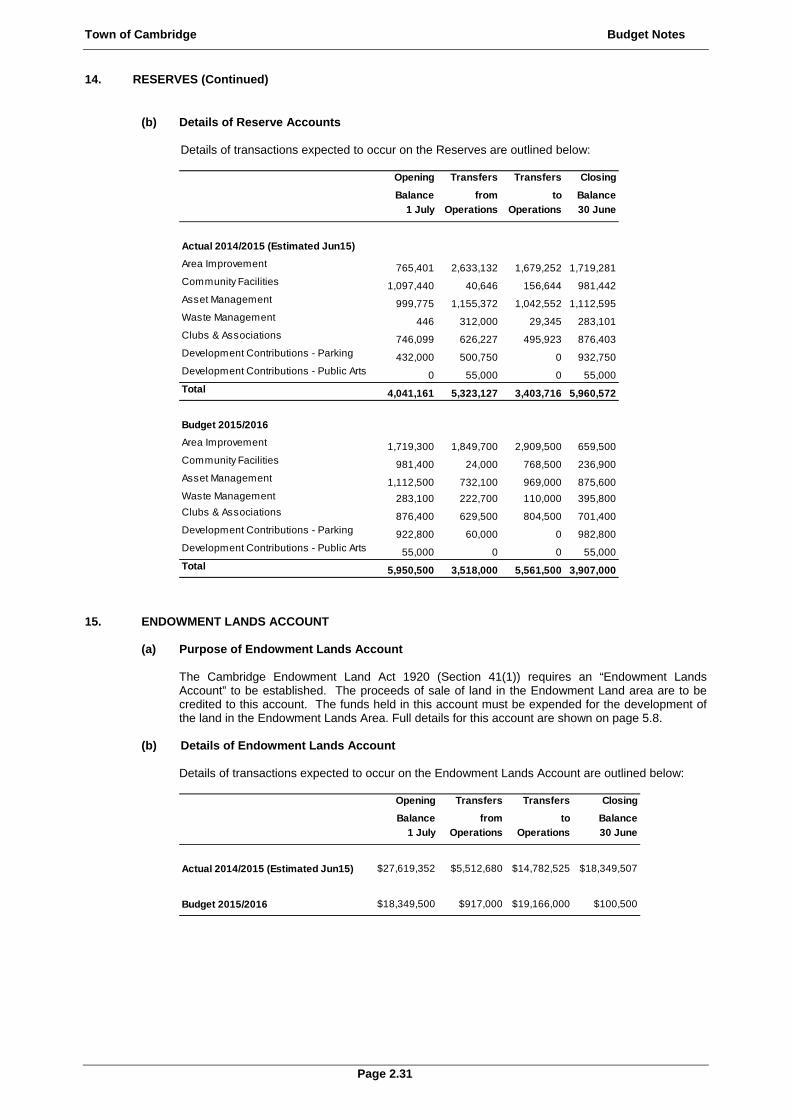
Town of Cambridge Budget Notes
Page 2.31
14. RESERVES (Continued)
(b) Details of Reserve Accounts
Details of transactions expected to occur on the Reserves are outlined below:
15. ENDOWMENT LANDS ACCOUNT
(a) Purpose of Endowment Lands Account The Cambridge Endowment Land Act 1920 (Section 41(1)) requires an “Endowment Lands Account” to be established. The proceeds of sale of land in the Endowment Land area are to be credited to this account. The funds held in this account must be expended for the development of the land in the Endowment Lands Area. Full details for this account are shown on page 5.8.
(b) Details of Endowment Lands Account Details of transactions expected to occur on the Endowment Lands Account are outlined below:
Opening Transfers Transfers Closing
Balance from to Balance
1 July Operations Operations 30 June
Actual 2014/2015 (Estimated Jun15)
Area Improvement 765,401 2,633,132 1,679,252 1,719,281Community Facilities 1,097,440 40,646 156,644 981,442Asset Management 999,775 1,155,372 1,042,552 1,112,595Waste Management 446 312,000 29,345 283,101Clubs & Associations 746,099 626,227 495,923 876,403Development Contributions - Parking 432,000 500,750 0 932,750Development Contributions - Public Arts 0 55,000 0 55,000Total 4,041,161 5,323,127 3,403,716 5,960,572
Budget 2015/2016
Area Improvement 1,719,300 1,849,700 2,909,500 659,500Community Facilities 981,400 24,000 768,500 236,900Asset Management 1,112,500 732,100 969,000 875,600Waste Management 283,100 222,700 110,000 395,800Clubs & Associations 876,400 629,500 804,500 701,400Development Contributions - Parking 922,800 60,000 0 982,800Development Contributions - Public Arts 55,000 0 0 55,000Total 5,950,500 3,518,000 5,561,500 3,907,000
Opening Transfers Transfers Closing
Balance from to Balance
1 July Operations Operations 30 June
Actual 2014/2015 (Estimated Jun15) $27,619,352 $5,512,680 $14,782,525 $18,349,507
Budget 2015/2016 $18,349,500 $917,000 $19,166,000 $100,500
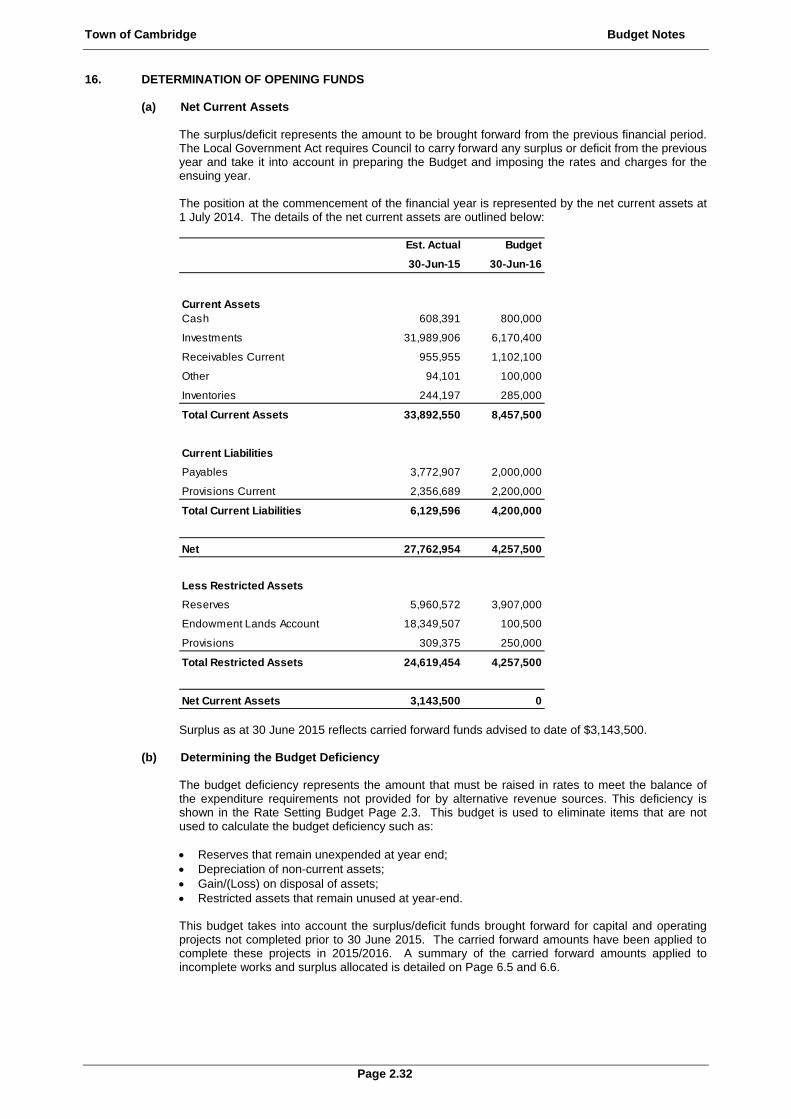
Town of Cambridge Budget Notes
Page 2.32
16. DETERMINATION OF OPENING FUNDS
(a) Net Current Assets The surplus/deficit represents the amount to be brought forward from the previous financial period. The Local Government Act requires Council to carry forward any surplus or deficit from the previous year and take it into account in preparing the Budget and imposing the rates and charges for the ensuing year. The position at the commencement of the financial year is represented by the net current assets at 1 July 2014. The details of the net current assets are outlined below:
Surplus as at 30 June 2015 reflects carried forward funds advised to date of $3,143,500.
(b) Determining the Budget Deficiency
The budget deficiency represents the amount that must be raised in rates to meet the balance of the expenditure requirements not provided for by alternative revenue sources. This deficiency is shown in the Rate Setting Budget Page 2.3. This budget is used to eliminate items that are not used to calculate the budget deficiency such as:
Reserves that remain unexpended at year end; Depreciation of non-current assets; Gain/(Loss) on disposal of assets; Restricted assets that remain unused at year-end.
This budget takes into account the surplus/deficit funds brought forward for capital and operating projects not completed prior to 30 June 2015. The carried forward amounts have been applied to complete these projects in 2015/2016. A summary of the carried forward amounts applied to incomplete works and surplus allocated is detailed on Page 6.5 and 6.6.
Est. Actual Budget
30-Jun-15 30-Jun-16
Current AssetsCash 608,391 800,000
Investments 31,989,906 6,170,400
Receivables Current 955,955 1,102,100
Other 94,101 100,000
Inventories 244,197 285,000
Total Current Assets 33,892,550 8,457,500
Current Liabilities
Payables 3,772,907 2,000,000
Provisions Current 2,356,689 2,200,000
Total Current Liabilities 6,129,596 4,200,000
Net 27,762,954 4,257,500
Less Restricted Assets
Reserves 5,960,572 3,907,000
Endowment Lands Account 18,349,507 100,500
Provisions 309,375 250,000
Total Restricted Assets 24,619,454 4,257,500
Net Current Assets 3,143,500 0

Town of Cambridge Budget Notes
Page 2.33
17. TRADING UNDERTAKING The Town operates only one activity for the purpose of producing a profit in accordance with the definition of a trading undertaking in Section 3.59 of the Local Government Act 1995. (a) Operating Statement
Wembley Golf Course Details concerning the operation of the Golf Course are shown on pages 3.64 to 3.74. A summary of the financial position is detailed below:-
(b) Other Information The Wembley Golf Course operates as a stand-alone activity and is budgeted to pay the Town a dividend of $1.627 million in 2015/2016. Any additional revenue raised is transferred to a Golf Course Reserve to be used specifically for Golf Course improvements. The Golf Course is completely self-funding without the expectation that rate revenue would be required for improvements. Similarly, a guaranteed dividend is paid to the Town each year, which subsidies the amount of rates, levied on ratepayers.
18. MAJOR TRADING UNDERTAKING The Wembley Golf Course qualifies under the minimum requirements of Section 3.59 of the Local Government Act 1995 and Regulation 9 of the Functions and General Regulations for a major trading undertaking. The Town does not operate any other major trading undertakings. The information contained in the above Operating Statement is inclusive of all items of revenue and expenditure which has been used in the pricing structure for goods and services provided by the golf Course trading undertaking. There are no other items outside the above Operating Statement used for this purpose.
Budget Est. Actual Budget
2014/2015 2014/2015 2015/2016
Revenue 7,258,500 7,166,449 6,793,500Less: Profit on Disposal of Asset (20,000) 0 (20,000)Net Revenue 7,238,500 7,166,449 6,773,500
Expenditure 6,144,400 6,034,555 6,218,000
Less: Loss on Disposal of Asset 0 0 0Less: Depreciation and ABC (1,026,400) (878,101) (968,500)Net Expenditure 5,118,000 5,156,454 5,249,500
Cash Surplus 2,120,500 2,009,995 1,524,000Plus Proceeds from sale of plant & equipment 20,000 0 20,000Less Cash Dividend (1,627,000) (1,627,000) (1,627,000)Less Loan Repayments (152,900) (152,873) (158,000)Less Loan Repayments (369,100) (369,121) (412,500)Less WGC Reserve Transfer to Operations for NCW 44,956 69,000Project Financing from ELA 8,500 94,044 0Cash Transfer to Reserve 0 0 (584,500)
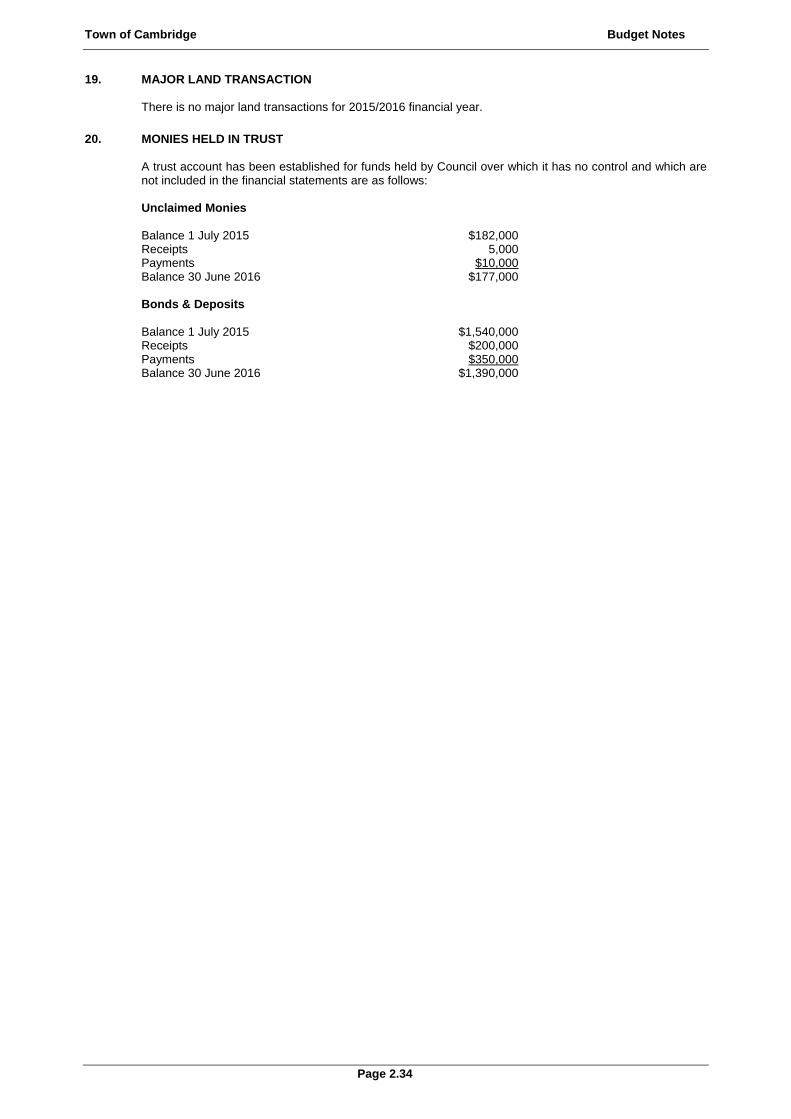
Town of Cambridge Budget Notes
Page 2.34
19. MAJOR LAND TRANSACTION There is no major land transactions for 2015/2016 financial year.
20. MONIES HELD IN TRUST
A trust account has been established for funds held by Council over which it has no control and which are not included in the financial statements are as follows: Unclaimed Monies Balance 1 July 2015 $182,000 Receipts 5,000 Payments $10,000 Balance 30 June 2016 $177,000
Bonds & Deposits Balance 1 July 2015 $1,540,000 Receipts $200,000 Payments $350,000 Balance 30 June 2016 $1,390,000

OPERATING BUDGET
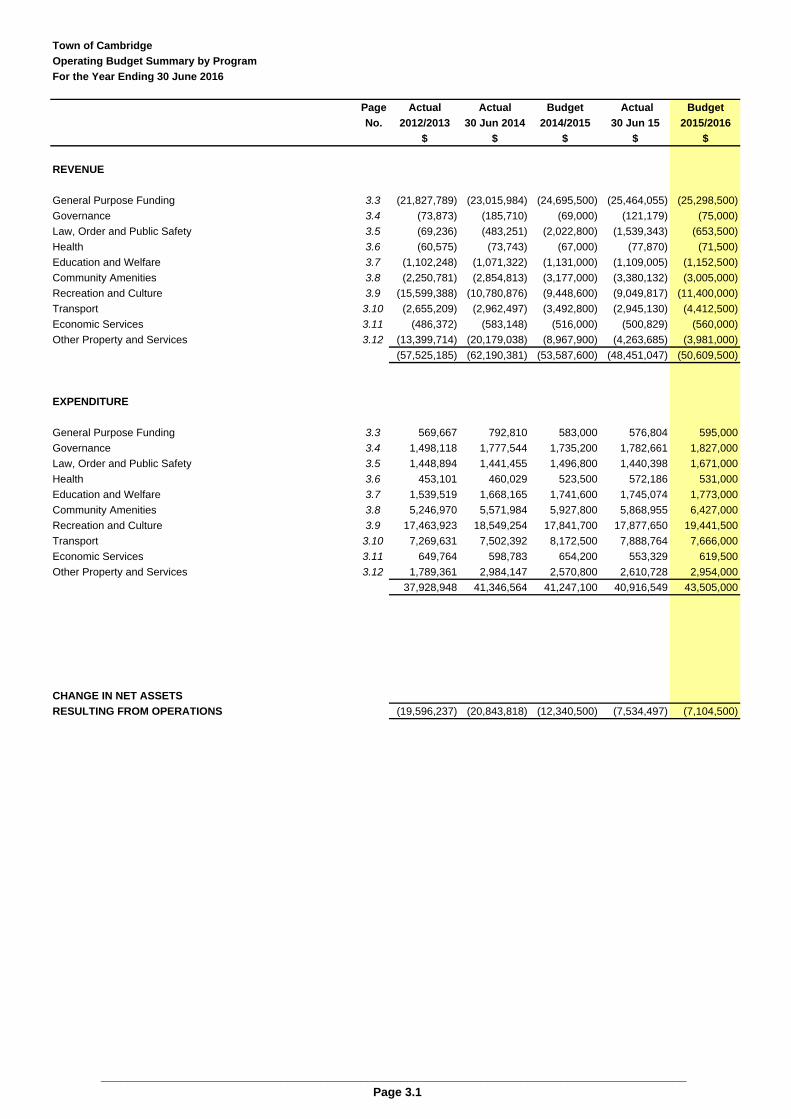
Town of Cambridge
Operating Budget Summary by Program
For the Year Ending 30 June 2016
Page Actual Actual Budget Actual Budget
No. 2012/2013 30 Jun 2014 2014/2015 30 Jun 15 2015/2016
$ $ $ $ $
REVENUE
General Purpose Funding 3.3 (21,827,789) (23,015,984) (24,695,500) (25,464,055) (25,298,500)
Governance 3.4 (73,873) (185,710) (69,000) (121,179) (75,000)
Law, Order and Public Safety 3.5 (69,236) (483,251) (2,022,800) (1,539,343) (653,500)
Health 3.6 (60,575) (73,743) (67,000) (77,870) (71,500)
Education and Welfare 3.7 (1,102,248) (1,071,322) (1,131,000) (1,109,005) (1,152,500)
Community Amenities 3.8 (2,250,781) (2,854,813) (3,177,000) (3,380,132) (3,005,000)
Recreation and Culture 3.9 (15,599,388) (10,780,876) (9,448,600) (9,049,817) (11,400,000)
Transport 3.10 (2,655,209) (2,962,497) (3,492,800) (2,945,130) (4,412,500)
Economic Services 3.11 (486,372) (583,148) (516,000) (500,829) (560,000)
Other Property and Services 3.12 (13,399,714) (20,179,038) (8,967,900) (4,263,685) (3,981,000)
(57,525,185) (62,190,381) (53,587,600) (48,451,047) (50,609,500)
EXPENDITURE
General Purpose Funding 3.3 569,667 792,810 583,000 576,804 595,000
Governance 3.4 1,498,118 1,777,544 1,735,200 1,782,661 1,827,000
Law, Order and Public Safety 3.5 1,448,894 1,441,455 1,496,800 1,440,398 1,671,000
Health 3.6 453,101 460,029 523,500 572,186 531,000
Education and Welfare 3.7 1,539,519 1,668,165 1,741,600 1,745,074 1,773,000
Community Amenities 3.8 5,246,970 5,571,984 5,927,800 5,868,955 6,427,000
Recreation and Culture 3.9 17,463,923 18,549,254 17,841,700 17,877,650 19,441,500
Transport 3.10 7,269,631 7,502,392 8,172,500 7,888,764 7,666,000
Economic Services 3.11 649,764 598,783 654,200 553,329 619,500
Other Property and Services 3.12 1,789,361 2,984,147 2,570,800 2,610,728 2,954,000
37,928,948 41,346,564 41,247,100 40,916,549 43,505,000
CHANGE IN NET ASSETS
RESULTING FROM OPERATIONS (19,596,237) (20,843,818) (12,340,500) (7,534,497) (7,104,500)
________________________________________________________________________________________ Page 3.1

Town of Cambridge
Operating Budget Summary by Nature and Type
For the Year Ending 30 June 2016
Actual Actual Budget Actual Budget
2012/2013 30 Jun 2014 2014/2015 30 Jun 15 2015/2016
Notes $ $ $ $ $
REVENUE
Rates (19,354,871) (21,002,315) (22,136,000) (22,194,672) (23,396,500)
Operating Grants,Subsidies and Contributions (2,609,268) (2,657,299) (2,269,000) (2,627,624) (1,825,500)
Non Operating Grants,Subsidies and Contributions (11,208,112) (2,280,114) (4,159,800) (3,085,131) (4,801,000)
Profit on asset disposals (13,344,578) (19,555,965) (8,553,500) (3,666,044) (2,627,000)
Fees and charges (1,477,344) (14,301,275) (14,439,300) (14,587,487) (15,744,500)
Interest earnings (375,234) (1,477,997) (1,509,000) (1,713,662) (1,332,500)
Other revenue/income (9,155,777) (915,417) (511,000) (576,426) (882,500)
3 (57,525,184) (62,190,381) (53,577,600) (48,451,047) (50,609,500)
EXPENDITURE
Employee costs 15,509,898 16,793,377 16,799,700 16,860,749 17,723,800
Materials and contracts 12,314,989 12,988,345 13,604,400 13,235,877 14,066,100
Utilities (gas, electricity, water etc.) 1,583,553 1,754,727 2,385,600 2,479,695 2,474,600
Depreciation on non-current assets 5,937,912 6,500,707 6,698,000 6,363,722 6,994,000
Interest expenses 624,387 541,202 469,800 455,178 779,500
Insurance expenses 465,264 488,792 380,600 352,672 384,400
Other Expenditure 697,237 627,675 811,000 768,466 944,000
Fair Value Adjustments to Financial Assets 184,531
Impairment Loss on Non-current Assets 575,016
Loss on disposal of assets 795,707 892,191 88,000 400,190 138,500
3 37,928,947 41,346,564 41,237,100 40,916,549 43,504,900
Change in net assets resulting from operations
(Gain)/Reduction 12(d) (19,596,237) (20,843,818) (12,340,500) (7,534,497) (7,104,600)
______________________________________________________________________________Page 3.2
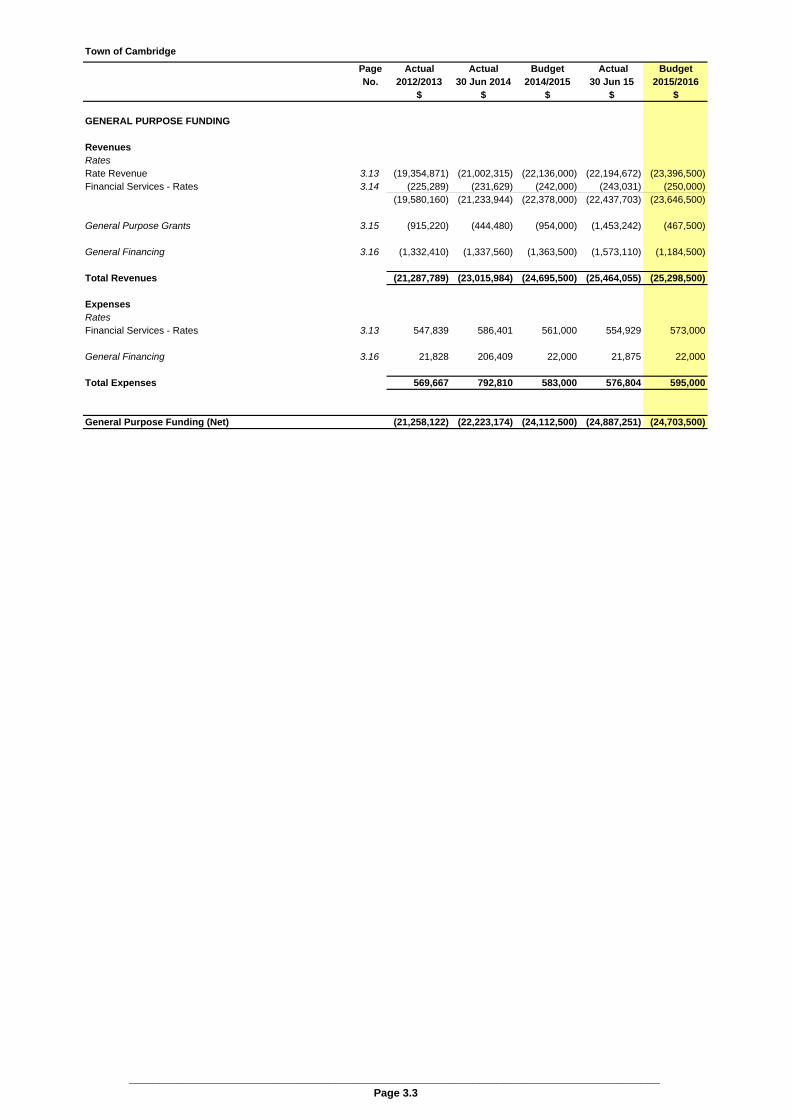
Town of Cambridge
Page Actual Actual Budget Actual BudgetNo. 2012/2013 30 Jun 2014 2014/2015 30 Jun 15 2015/2016
$ $ $ $ $
GENERAL PURPOSE FUNDING
RevenuesRatesRate Revenue 3.13 (19,354,871) (21,002,315) (22,136,000) (22,194,672) (23,396,500)Financial Services - Rates 3.14 (225,289) (231,629) (242,000) (243,031) (250,000)
(19,580,160) (21,233,944) (22,378,000) (22,437,703) (23,646,500)
General Purpose Grants 3.15 (915,220) (444,480) (954,000) (1,453,242) (467,500)
General Financing 3.16 (1,332,410) (1,337,560) (1,363,500) (1,573,110) (1,184,500)
Total Revenues (21,287,789) (23,015,984) (24,695,500) (25,464,055) (25,298,500)
ExpensesRatesFinancial Services - Rates 3.13 547,839 586,401 561,000 554,929 573,000
General Financing 3.16 21,828 206,409 22,000 21,875 22,000
Total Expenses 569,667 792,810 583,000 576,804 595,000
General Purpose Funding (Net) (21,258,122) (22,223,174) (24,112,500) (24,887,251) (24,703,500)
________________________________________________________________________________________Page 3.3

Town of Cambridge
Page Actual Actual Budget Actual BudgetNo. 2012/2013 30 Jun 2014 2014/2015 30 Jun 15 2015/2016
$ $ $ $ $
GOVERNANCE
RevenuesMembers of CouncilMembers Expenses 3.17 (155) (159) 0 0 0
(155) (159) 0 0 0Other GovernanceGovernance Management 3.18 (9,352) (80,366) (20,000) (60,457) (21,000)Administration - General 3.21 (19) 0 0 0 0Administration - Customer Services (Admin Centre) 3.22 (62,822) (66,153) (49,000) (60,723) (54,000)Administration Centre 3.28 (1,526) (39,032) 0 0
(73,719) (185,550) (69,000) (121,179) (75,000)
Total Revenues (73,873) (185,710) (69,000) (121,179) (75,000)
ExpensesMembers of CouncilMembers Expenses 3.17 754,005 912,666 929,200 918,058 972,500
0 0 0 0 0754,005 912,666 929,200 918,058 972,500
Other GovernanceGovernance Management 3.18 1,012,849 1,120,540 1,126,000 1,339,239 1,129,500Human Resources 3.20 430,058 469,133 473,900 458,913 504,000Administration - General 3.21 298,589 217,380 193,800 179,856 210,000Administration - Customer Services (Admin Centre) 3.22 481,211 496,339 577,200 511,776 596,000Administration - Document Management 3.23 325,988 346,657 403,900 383,960 380,500Financial Services - General 3.24 484,018 556,502 542,900 549,917 544,000Financial Services - Purchasing/Accounts 3.25 236,133 239,136 270,900 289,245 280,500Financial Services - Payroll 3.26 170,596 200,694 192,100 208,925 196,000Information Technology 3.27 846,800 924,111 1,233,700 913,289 1,258,500Administration Centre 3.28 614,444 705,283 657,600 681,093 698,000
4,900,686 5,275,775 5,672,000 5,516,214 5,797,000Less ABC Allocated (4,156,574) (4,410,897) (4,866,000) (4,651,611) (4,942,500)
744,112 864,878 806,000 864,603 854,500
Total Expenses 1,498,117 1,777,544 1,735,200 1,782,661 1,827,000
Governance (Net) 1,424,245 1,591,835 1,666,200 1,661,482 1,752,000
________________________________________________________________________________________Page 3.4
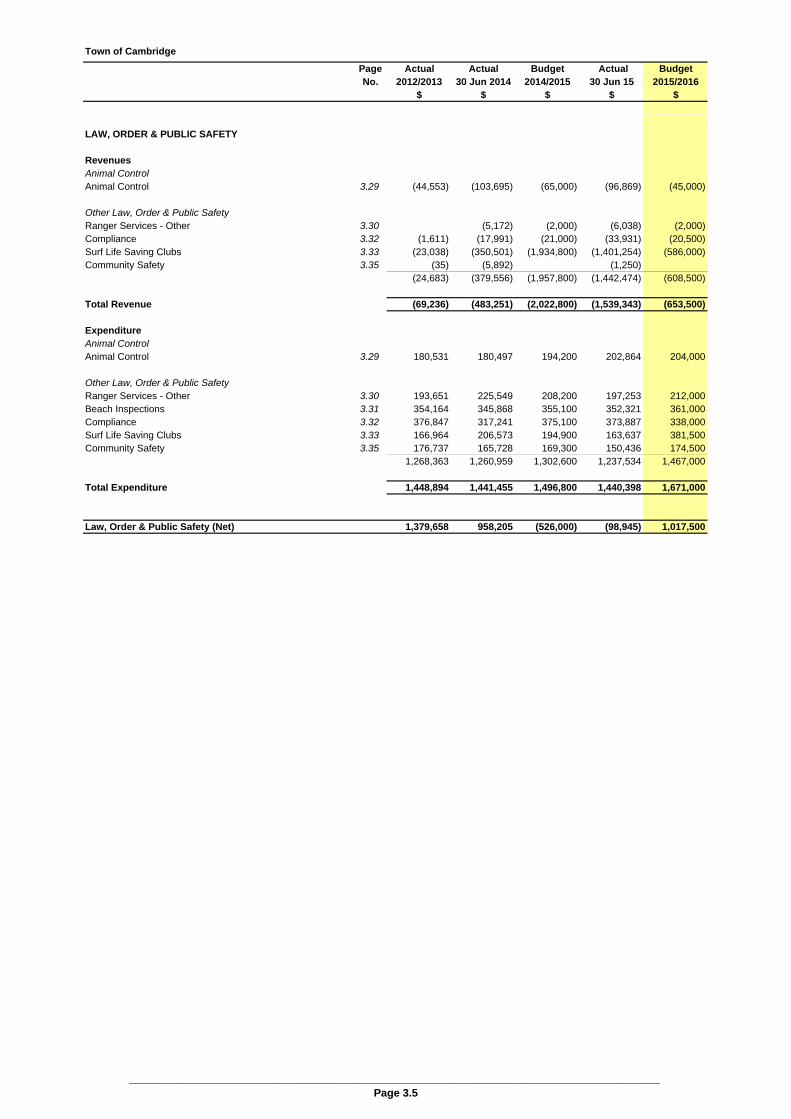
Town of Cambridge
Page Actual Actual Budget Actual BudgetNo. 2012/2013 30 Jun 2014 2014/2015 30 Jun 15 2015/2016
$ $ $ $ $
LAW, ORDER & PUBLIC SAFETY
RevenuesAnimal ControlAnimal Control 3.29 (44,553) (103,695) (65,000) (96,869) (45,000)
Other Law, Order & Public SafetyRanger Services - Other 3.30 (5,172) (2,000) (6,038) (2,000)Compliance 3.32 (1,611) (17,991) (21,000) (33,931) (20,500)Surf Life Saving Clubs 3.33 (23,038) (350,501) (1,934,800) (1,401,254) (586,000)Community Safety 3.35 (35) (5,892) 0 (1,250) 0
(24,683) (379,556) (1,957,800) (1,442,474) (608,500)
Total Revenue (69,236) (483,251) (2,022,800) (1,539,343) (653,500)
ExpenditureAnimal ControlAnimal Control 3.29 180,531 180,497 194,200 202,864 204,000
Other Law, Order & Public SafetyRanger Services - Other 3.30 193,651 225,549 208,200 197,253 212,000Beach Inspections 3.31 354,164 345,868 355,100 352,321 361,000Compliance 3.32 376,847 317,241 375,100 373,887 338,000Surf Life Saving Clubs 3.33 166,964 206,573 194,900 163,637 381,500Community Safety 3.35 176,737 165,728 169,300 150,436 174,500
1,268,363 1,260,959 1,302,600 1,237,534 1,467,000
Total Expenditure 1,448,894 1,441,455 1,496,800 1,440,398 1,671,000
Law, Order & Public Safety (Net) 1,379,658 958,205 (526,000) (98,945) 1,017,500
________________________________________________________________________________________Page 3.5
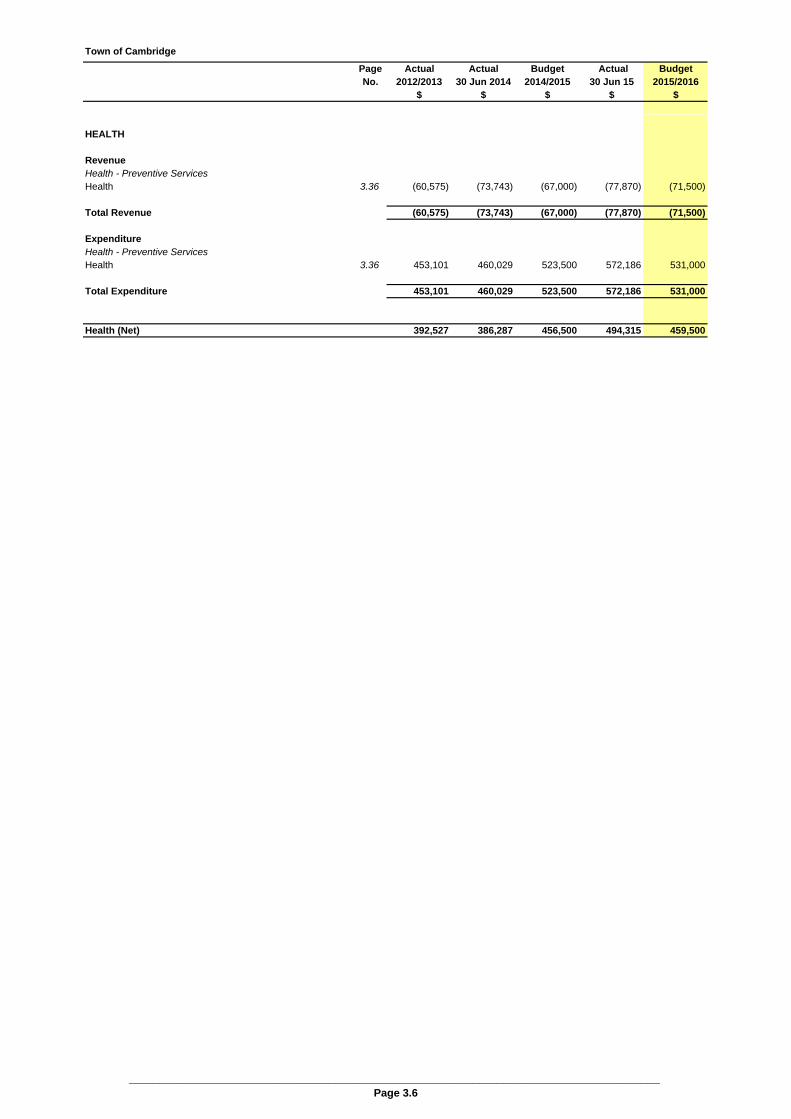
Town of Cambridge
Page Actual Actual Budget Actual BudgetNo. 2012/2013 30 Jun 2014 2014/2015 30 Jun 15 2015/2016
$ $ $ $ $
HEALTH
RevenueHealth - Preventive ServicesHealth 3.36 (60,575) (73,743) (67,000) (77,870) (71,500)
Total Revenue (60,575) (73,743) (67,000) (77,870) (71,500)
ExpenditureHealth - Preventive ServicesHealth 3.36 453,101 460,029 523,500 572,186 531,000
Total Expenditure 453,101 460,029 523,500 572,186 531,000
Health (Net) 392,527 386,287 456,500 494,315 459,500
________________________________________________________________________________________Page 3.6
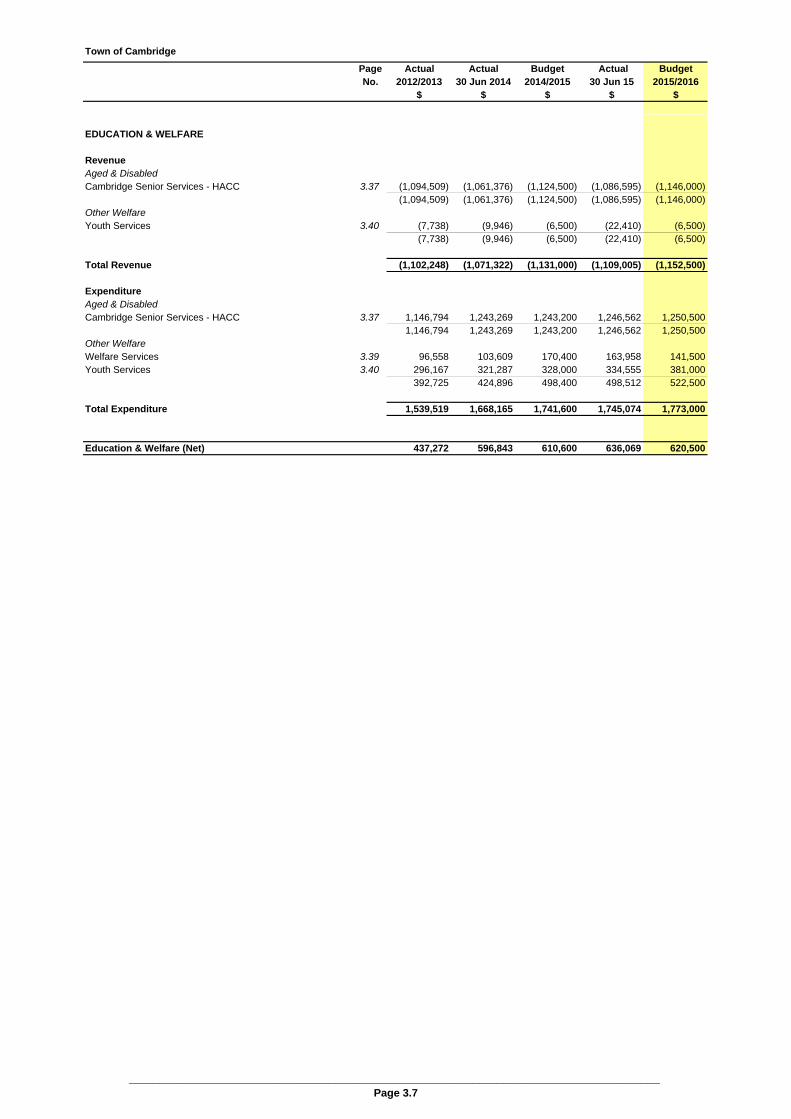
Town of Cambridge
Page Actual Actual Budget Actual BudgetNo. 2012/2013 30 Jun 2014 2014/2015 30 Jun 15 2015/2016
$ $ $ $ $
EDUCATION & WELFARE
RevenueAged & DisabledCambridge Senior Services - HACC 3.37 (1,094,509) (1,061,376) (1,124,500) (1,086,595) (1,146,000)
(1,094,509) (1,061,376) (1,124,500) (1,086,595) (1,146,000)Other WelfareYouth Services 3.40 (7,738) (9,946) (6,500) (22,410) (6,500)
(7,738) (9,946) (6,500) (22,410) (6,500)
Total Revenue (1,102,248) (1,071,322) (1,131,000) (1,109,005) (1,152,500)
ExpenditureAged & DisabledCambridge Senior Services - HACC 3.37 1,146,794 1,243,269 1,243,200 1,246,562 1,250,500
1,146,794 1,243,269 1,243,200 1,246,562 1,250,500Other WelfareWelfare Services 3.39 96,558 103,609 170,400 163,958 141,500Youth Services 3.40 296,167 321,287 328,000 334,555 381,000
392,725 424,896 498,400 498,512 522,500
Total Expenditure 1,539,519 1,668,165 1,741,600 1,745,074 1,773,000
Education & Welfare (Net) 437,272 596,843 610,600 636,069 620,500
________________________________________________________________________________________Page 3.7
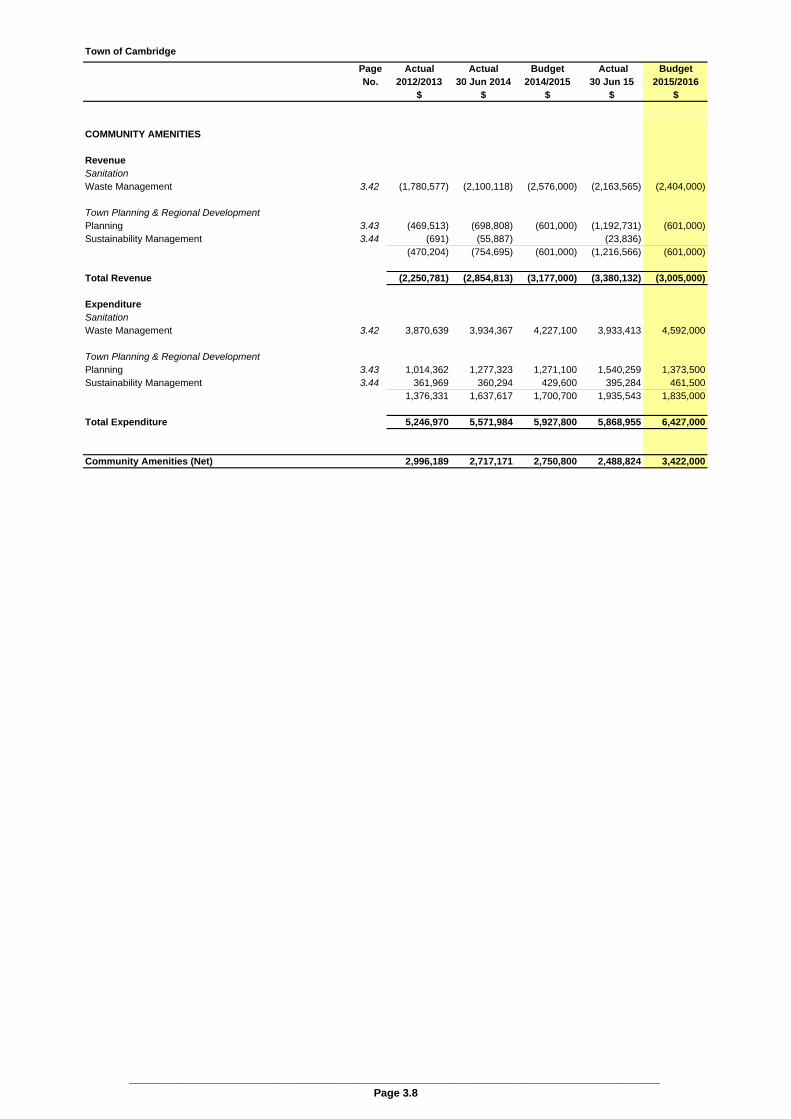
Town of Cambridge
Page Actual Actual Budget Actual BudgetNo. 2012/2013 30 Jun 2014 2014/2015 30 Jun 15 2015/2016
$ $ $ $ $
COMMUNITY AMENITIES
RevenueSanitationWaste Management 3.42 (1,780,577) (2,100,118) (2,576,000) (2,163,565) (2,404,000)
Town Planning & Regional DevelopmentPlanning 3.43 (469,513) (698,808) (601,000) (1,192,731) (601,000)Sustainability Management 3.44 (691) (55,887) 0 (23,836) 0
(470,204) (754,695) (601,000) (1,216,566) (601,000)
Total Revenue (2,250,781) (2,854,813) (3,177,000) (3,380,132) (3,005,000)
ExpenditureSanitationWaste Management 3.42 3,870,639 3,934,367 4,227,100 3,933,413 4,592,000
Town Planning & Regional DevelopmentPlanning 3.43 1,014,362 1,277,323 1,271,100 1,540,259 1,373,500Sustainability Management 3.44 361,969 360,294 429,600 395,284 461,500
1,376,331 1,637,617 1,700,700 1,935,543 1,835,000
Total Expenditure 5,246,970 5,571,984 5,927,800 5,868,955 6,427,000
Community Amenities (Net) 2,996,189 2,717,171 2,750,800 2,488,824 3,422,000
________________________________________________________________________________________Page 3.8

Town of Cambridge
Page Actual Actual Budget Actual BudgetNo. 2012/2013 30 Jun 2014 2014/2015 30 Jun 15 2015/2016
$ $ $ $ $
RECREATION & CULTURE
RevenuePublic Halls & Civic CentresWembley Community Centre 3.45 (146,461) (142,346) (144,500) (148,410) (148,000)Leederville Town Hall 3.47 (43,124) (54,225) (45,000) (57,460) (50,000)The Boulevard Centre 3.48 (549,601) (453,879) (528,000) (435,819) (484,500)
(739,186) (650,451) (717,500) (641,689) (682,500)Swimming Areas & BeachesBold Park Aquatic Centre 3.50 (998,558) (1,034,387) (83,100) (96,120) (1,308,500)Ocean Beaches 3.54 (247,115) (149,365) (143,500) (143,889) (191,500)
(1,297,108) (1,183,752) (226,600) (240,009) (1,500,000)Other Sport & RecreationClubs - Leased Premises 3.58 (273,403) (248,614) (439,500) (361,844) (1,310,500)Sports Grounds 3.60 (6,022,889) (1,020,659) (71,500) (101,581) (97,500)Parks 3.63 (75,201) (66,918) (320,000) (72,162) (568,000)Wembley Golf Course 3.67 (6,811,105) (6,986,611) (7,258,500) (7,166,449) (6,793,500)Recreation Services 3.78 (78,706) (15,832) (75,000) (59,853) (60,000)
(13,261,305) (8,338,633) (8,164,500) (7,761,889) (8,829,500)LibrariesCambridge Library 3.80 (49,052) (53,455) (49,000) (69,360) (49,000)
Other CultureQuarry Amphitheatre 3.82 (252,737) (230,283) (291,000) (336,870) (339,000)
Total Revenue (15,599,388) (10,456,574) (9,448,600) (9,049,817) (11,400,000)
ExpenditurePublic Halls & Civic CentresWembley Community Centre 3.45 325,945 352,230 363,300 363,714 369,500Leederville Town Hall 3.47 108,102 111,689 104,200 133,552 127,000The Boulevard Centre 3.48 592,463 559,605 586,300 571,303 591,500
1,026,510 1,023,524 1,053,800 1,068,568 1,088,000Swimming Areas & BeachesBold Park Aquatic Centre 3.50 1,571,483 1,581,025 945,000 765,553 2,007,000Ocean Beaches - Buildings 3.55 273,644 241,655 257,200 249,028 346,000Ocean Beaches - Grounds 3.56 777,242 739,928 761,500 710,683 852,500Ocean Beaches - Other 3.57 8,975 6,545 7,000 7,000 7,000
2,631,345 2,569,153 1,970,700 1,732,265 3,212,500Other Sport & RecreationClubs - Leased Premises 3.58 559,249 629,210 865,500 852,110 724,500Sports Grounds - Buildings 3.61 553,206 370,889 376,200 693,645 496,000Sports Grounds - Grounds 3.62 751,293 1,548,602 789,300 896,190 835,500Parks - Buildings 3.64 49,974 66,730 68,200 56,113 82,500Parks - Grounds 3.65 2,810,184 3,164,544 3,149,600 3,114,285 3,219,000Wembley Golf Course 3.67 6,056,228 6,019,511 6,144,400 6,034,555 6,218,000Recreation Services 3.78 773,559 730,701 866,500 863,267 855,000
11,553,694 12,530,187 12,259,700 12,510,166 12,430,500LibrariesCambridge Library 3.80 1,915,076 2,083,485 2,200,000 2,125,573 2,250,000
Other CultureQuarry Amphitheatre 3.82 337,298 342,904 357,500 441,078 460,500
Total Expenditure 17,463,923 18,549,254 17,841,700 17,877,650 19,441,500
Recreation & Culture (Net) 1,864,535 8,092,680 8,393,100 8,827,833 8,041,500
________________________________________________________________________________________Page 3.9

Town of Cambridge
Page Actual Actual Budget Actual BudgetNo. 2012/2013 30 Jun 2014 2014/2015 30 Jun 15 2015/2016
$ $ $ $ $
TRANSPORT
RevenueMaintenance Streets, Roads, DepotsRoad Infrastructure 3.84 (1,034,036) (1,364,171) (1,561,800) (1,092,095) (2,577,000)Road Reserves 3.86 (85,326) (87,000) (90,000) (89,400) (93,500)
(1,119,362) (1,451,171) (1,651,800) (1,181,495) (2,670,500)Parking FacilitiesParking Control 3.88 (1,535,847) (1,511,326) (1,841,000) (1,763,635) (1,742,000)
Total Revenue (2,655,209) (2,962,497) (3,492,800) (2,945,130) (4,412,500)
ExpenditureMaintenance Streets, Roads, DepotsRoad Infrastructure 3.84 4,955,440 5,101,190 5,585,500 5,382,696 5,014,500Road Reserves 3.86 1,444,668 1,528,695 1,593,500 1,525,183 1,619,000Depot 3.87 309,218 359,994 326,800 315,477 339,500 - Less Allocated (309,218) (359,994) (326,800) (315,477) (339,500)
6,400,108 6,629,886 7,179,000 6,907,879 6,633,500Parking FacilitiesParking Control 3.88 869,523 872,506 993,500 980,885 1,032,500
Total Expenditure 7,269,631 7,502,392 8,172,500 7,888,764 7,666,000
Transport (Net) 4,614,423 4,539,895 4,679,700 4,943,634 3,253,500
________________________________________________________________________________________Page 3.10

Town of Cambridge
Page Actual Actual Budget Actual BudgetNo. 2012/2013 30 Jun 2014 2014/2015 30 Jun 15 2015/2016
$ $ $ $ $
ECONOMIC SERVICES
RevenueBuilding ControlBuilding Control 3.90 (485,827) (583,148) (512,000) (488,440) (512,000)Swimming Pool Inspections 3.91 (545) 0 (4,000) (12,389) (48,000)
(486,372) (583,148) (516,000) (500,829) (560,000)
Total Revenue (486,372) (583,148) (516,000) (500,829) (560,000)
ExpenditureBuilding ControlBuilding Control 3.90 558,674 597,495 651,200 553,037 571,500Swimming Pool Inspections 3.91 91,090 1,289 3,000 292 48,000
649,764 598,783 654,200 553,329 619,500
Total Expenditure 649,764 598,783 654,200 553,329 619,500
Economic Services (Net) 163,392 15,635 138,200 52,500 59,500
________________________________________________________________________________________Page 3.11

Town of Cambridge
Page Actual Actual Budget Actual BudgetNo. 2012/2013 30 Jun 2014 2014/2015 30 Jun 15 2015/2016
$ $ $ $ $
OTHER PROPERTY & SERVICES
RevenueOverheadsWorks & Engineering 3.92 (1,994) (2,109) 0 (5,631) 0Parks & Landscaping 3.94 (1,239) 0 (3,000) 0 0
(3,233) (2,109) (3,000) (5,631) 0Plant Operation CostsWorks & Engineering 3.96 (80,686) (9,067) (15,500) (23,091) (20,500)Parks & Landscape 3.97 (7,931) (659) (11,000) (17,196) 0
(88,617) (9,726) (26,500) (40,287) (20,500)UnclassifiedAsset Management 3.99 (4,994) 0 0 0Other Property 3.100 (13,307,864) (20,484,356) (8,938,400) (4,217,767) (3,960,500)
(13,307,864) (20,489,350) (8,938,400) (4,217,767) (3,960,500)
Total Revenue (13,399,714) (20,501,185) (8,967,900) (4,263,685) (3,981,000)
ExpenditureOverheadsWorks & Engineering 3.92 1,268,510 1,444,320 1,466,800 1,381,227 1,552,400Less Allocated to Works and Services 3.92 (877,635) (1,057,163) (1,078,500) (972,470) (1,130,900)Parks & Landscape 3.94 1,599,425 1,769,145 1,775,400 1,733,895 1,800,500Less Allocated to Works and Services 3.94 (1,166,854) (1,232,090) (1,255,500) (1,253,807) (1,268,000)Building Management 3.98 266,382 308,840 310,500 262,760 291,500Asset Management 3.99 233,488 276,353 407,500 437,324 539,000
1,319,083 1,509,406 1,626,200 1,588,929 1,784,500Plant Operation CostsWorks & Engineering 3.96 269,163 271,031 315,100 276,598 305,500Less Allocated to Works and Services 3.96 (246,585) (236,420) (283,000) (231,302) (266,500)Parks & Landscape 3.97 253,559 272,792 284,600 262,441 295,500Less Allocated to Works and Services 3.97 (186,228) (242,056) (244,500) (197,725) (265,500)
89,384 65,347 72,200 110,013 69,000UnclassifiedLess Allocated to Works and Services 0 0 0 0Other Property 3.100 376,134 1,409,394 872,400 911,786 1,100,500Less Allocated to Works and Services
376,134 1,409,394 872,400 911,786 1,100,500
Total Expenditure 1,789,358 2,984,147 2,570,800 2,610,728 2,954,000
Other Property & Services (Net) (11,610,356) (17,517,038) (6,397,100) (1,652,957) (1,027,000)
Total Operating (Net) (3,903,249) (20,841,663) (12,340,500) (7,534,497) (7,104,500)
________________________________________________________________________________________Page 3.12

OPERATING BUDGET
SCHEDULE
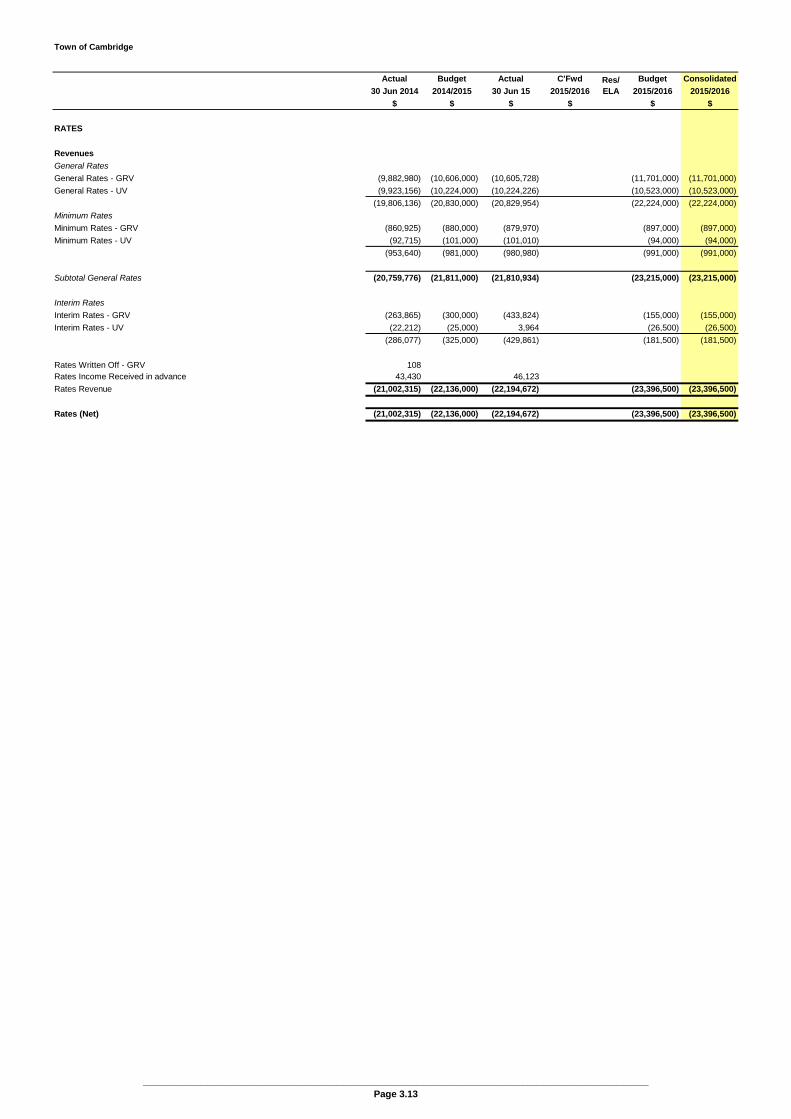
Town of Cambridge
Actual Budget Actual C'Fwd Budget Consolidated
30 Jun 2014 2014/2015 30 Jun 15 2015/2016 2015/2016 2015/2016
$ $ $ $ $ $
RATES
Revenues
General Rates
General Rates - GRV (9,882,980) (10,606,000) (10,605,728) (11,701,000) (11,701,000)
General Rates - UV (9,923,156) (10,224,000) (10,224,226) (10,523,000) (10,523,000)
(19,806,136) (20,830,000) (20,829,954) (22,224,000) (22,224,000)
Minimum Rates
Minimum Rates - GRV (860,925) (880,000) (879,970) (897,000) (897,000)
Minimum Rates - UV (92,715) (101,000) (101,010) (94,000) (94,000)
(953,640) (981,000) (980,980) (991,000) (991,000)
Subtotal General Rates (20,759,776) (21,811,000) (21,810,934) (23,215,000) (23,215,000)
Interim Rates
Interim Rates - GRV (263,865) (300,000) (433,824) (155,000) (155,000)
Interim Rates - UV (22,212) (25,000) 3,964 (26,500) (26,500)
(286,077) (325,000) (429,861) (181,500) (181,500)
Rates Written Off - GRV 108Rates Income Received in advance 43,430 46,123
Rates Revenue (21,002,315) (22,136,000) (22,194,672) (23,396,500) (23,396,500)
Rates (Net) (21,002,315) (22,136,000) (22,194,672) (23,396,500) (23,396,500)
Res/ELA
________________________________________________________________________________________________Page 3.13

Town of Cambridge
Actual Budget Actual C'Fwd Budget Consolidated
30 Jun 2014 2014/2015 30 Jun 15 2015/2016 2015/2016 2015/2016
$ $ $ $ $ $
Res/ELA
FINANCIAL SERVICES - RATES
Revenues
Other Rates Revenue
Rates Instalment Administration Fee (53,863) (54,000) (62,294) (56,000) (56,000)
Rate Interest - Instalments (90,427) (90,000) (93,339) (93,000) (93,000)
Rate Interest - Late Payment Penalty (44,534) (50,000) (41,757) (52,000) (52,000)
(188,824) (194,000) (197,390) (201,000) (201,000)
Operating Grants & Subsidies
Pensioner Deferred Rates Interest (6,909) (8,000) (17,945) (8,000) (8,000)
(6,909) (8,000) (17,945) (8,000) (8,000)
Reimbursements
Reimbursements - Legal Expenses (11,607) (15,000) (1,646) (15,000) (15,000)
(11,607) (15,000) (1,646) (15,000) (15,000)
Other Income
Commission (24,290) (25,000) (25,599) (26,000) (26,000)
Other Income (450)
(24,290) (25,000) (26,049) (26,000) (26,000)
Financial Services - Rates Revenue (231,629) (242,000) (243,031) (250,000) (250,000)
Expenditure
Employee Costs
Salaries 197,654 192,000 201,858 199,100 199,100
Superannuation 21,119 24,500 23,184 21,700 21,700
Workers Compensation 4,700 4,500 4,500 4,800 4,800
Uniforms/Protective Clothing & Equipment 500 87 600 600
Fringe Benefits Tax 1,445 1,500 1,300 1,300 1,300
Training 8,485 2,000 3,250 2,000 2,000
233,403 225,000 234,178 229,500 229,500
Office Expenses 39,306 42,000 34,694 43,500 43,500
IT & Other Equipment 17,370
Operational Expenses
Valuation Fees 63,631 40,000 57,956 41,000 41,000
Bank & Agency Charges 57,287 57,000 57,270 59,000 59,000
120,918 97,000 115,226 100,000 100,000
Other Expenses
Debt Provisions Write-Offs & Refunds 1,748 2,000 1,522 2,000 2,000
Debt Collection 12,307 5,000 1,646 5,000 5,000
Other Expenses 395 1,000 337 1,000 1,000
14,449 8,000 3,506 8,000 8,000
Sub-total 425,446 372,000 387,603 381,000 381,000
Depreciation 265 500 146
Cost Allocation (ABC) 160,691 188,500 167,179 192,000 192,000
Financial Services - Rates Expenditure 586,401 561,000 554,929 573,000 573,000
Financial Services - Rates (Net) 354,772 319,000 311,898 323,000 323,000
________________________________________________________________________________________________Page 3.14

Town of Cambridge
Actual Budget Actual C'Fwd Budget Consolidated
30 Jun 2014 2014/2015 30 Jun 15 2015/2016 2015/2016 2015/2016
$ $ $ $ $ $
Res/ELA
GENERAL PURPOSE GRANTS
Revenues
Operating Grants & Subsidies
Financial Assistance Grant (268,178) (578,000) (872,821) (282,000) (282,000)
Local Roads Grant (176,302) (376,000) (580,421) (185,500) (185,500)
(444,480) (954,000) (1,453,242) (467,500) (467,500)
General Purpose Grants Revenue (444,480) (954,000) (1,453,242) (467,500) (467,500)
________________________________________________________________________________________________Page 3.15

Town of Cambridge
Actual Budget Actual C'Fwd Budget Consolidated
30 Jun 2014 2014/2015 30 Jun 15 2015/2016 2015/2016 2015/2016
$ $ $ $ $ $
Res/ELA
GENERAL FINANCING
Revenues
Interest Earnings
Interest on Investments - Municipal (554,275) (600,000) (504,485) (394,500) (394,500)
Interest on Investments - Reserve (106,598) (43,500) (137,894) Res (48,000) (48,000)
Interest on Investments - Endowment Lands (676,688) (720,000) (930,731) ELA (742,000) (742,000)
General Financing Revenue (1,337,560) (1,363,500) (1,573,110) (1,184,500) (1,184,500)
Expenditure
Operational Expenses
Investment Advisory Fees 21,878 22,000 21,875 22,000 22,000Other Operational Expenses 184,531
General Financing Expenditure 206,409 22,000 21,875 22,000 22,000
General Financing (Net) (1,131,151) (1,341,500) (1,551,235) (1,162,500) (1,162,500)
________________________________________________________________________________________________Page 3.16
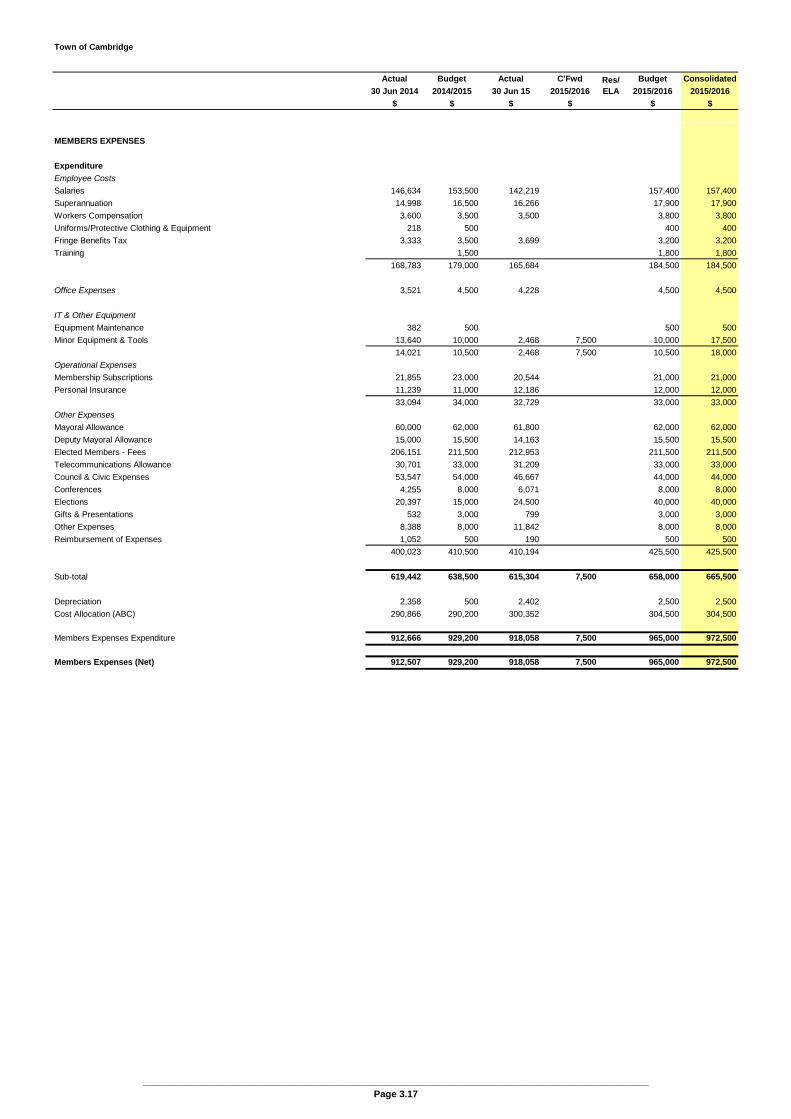
Town of Cambridge
Actual Budget Actual C'Fwd Budget Consolidated
30 Jun 2014 2014/2015 30 Jun 15 2015/2016 2015/2016 2015/2016
$ $ $ $ $ $
Res/ELA
MEMBERS EXPENSES
Expenditure
Employee Costs
Salaries 146,634 153,500 142,219 157,400 157,400
Superannuation 14,998 16,500 16,266 17,900 17,900
Workers Compensation 3,600 3,500 3,500 3,800 3,800
Uniforms/Protective Clothing & Equipment 218 500 400 400
Fringe Benefits Tax 3,333 3,500 3,699 3,200 3,200
Training 1,500 1,800 1,800
168,783 179,000 165,684 184,500 184,500
Office Expenses 3,521 4,500 4,228 4,500 4,500
IT & Other Equipment
Equipment Maintenance 382 500 500 500
Minor Equipment & Tools 13,640 10,000 2,468 7,500 10,000 17,500
14,021 10,500 2,468 7,500 10,500 18,000
Operational Expenses
Membership Subscriptions 21,855 23,000 20,544 21,000 21,000
Personal Insurance 11,239 11,000 12,186 12,000 12,000
33,094 34,000 32,729 33,000 33,000
Other Expenses
Mayoral Allowance 60,000 62,000 61,800 62,000 62,000
Deputy Mayoral Allowance 15,000 15,500 14,163 15,500 15,500
Elected Members - Fees 206,151 211,500 212,953 211,500 211,500
Telecommunications Allowance 30,701 33,000 31,209 33,000 33,000
Council & Civic Expenses 53,547 54,000 46,667 44,000 44,000
Conferences 4,255 8,000 6,071 8,000 8,000
Elections 20,397 15,000 24,500 40,000 40,000
Gifts & Presentations 532 3,000 799 3,000 3,000
Other Expenses 8,388 8,000 11,842 8,000 8,000
Reimbursement of Expenses 1,052 500 190 500 500
400,023 410,500 410,194 425,500 425,500
Sub-total 619,442 638,500 615,304 7,500 658,000 665,500
Depreciation 2,358 500 2,402 2,500 2,500
Cost Allocation (ABC) 290,866 290,200 300,352 304,500 304,500
Members Expenses Expenditure 912,666 929,200 918,058 7,500 965,000 972,500
Members Expenses (Net) 912,507 929,200 918,058 7,500 965,000 972,500
________________________________________________________________________________________________Page 3.17
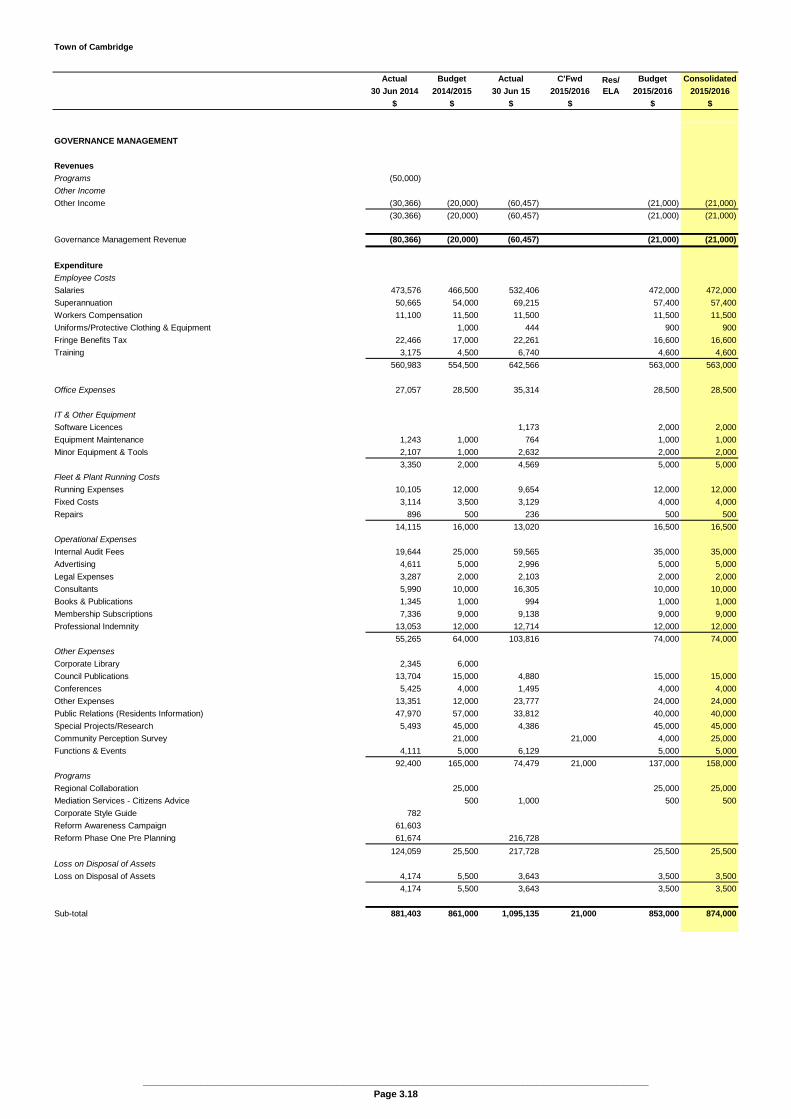
Town of Cambridge
Actual Budget Actual C'Fwd Budget Consolidated
30 Jun 2014 2014/2015 30 Jun 15 2015/2016 2015/2016 2015/2016
$ $ $ $ $ $
Res/ELA
GOVERNANCE MANAGEMENT
Revenues
Programs (50,000)
Other Income
Other Income (30,366) (20,000) (60,457) (21,000) (21,000)
(30,366) (20,000) (60,457) (21,000) (21,000)
Governance Management Revenue (80,366) (20,000) (60,457) (21,000) (21,000)
Expenditure
Employee Costs
Salaries 473,576 466,500 532,406 472,000 472,000
Superannuation 50,665 54,000 69,215 57,400 57,400
Workers Compensation 11,100 11,500 11,500 11,500 11,500
Uniforms/Protective Clothing & Equipment 1,000 444 900 900
Fringe Benefits Tax 22,466 17,000 22,261 16,600 16,600
Training 3,175 4,500 6,740 4,600 4,600
560,983 554,500 642,566 563,000 563,000
Office Expenses 27,057 28,500 35,314 28,500 28,500
IT & Other Equipment
Software Licences 1,173 2,000 2,000
Equipment Maintenance 1,243 1,000 764 1,000 1,000
Minor Equipment & Tools 2,107 1,000 2,632 2,000 2,000
3,350 2,000 4,569 5,000 5,000
Fleet & Plant Running Costs
Running Expenses 10,105 12,000 9,654 12,000 12,000
Fixed Costs 3,114 3,500 3,129 4,000 4,000
Repairs 896 500 236 500 500
14,115 16,000 13,020 16,500 16,500
Operational Expenses
Internal Audit Fees 19,644 25,000 59,565 35,000 35,000
Advertising 4,611 5,000 2,996 5,000 5,000
Legal Expenses 3,287 2,000 2,103 2,000 2,000
Consultants 5,990 10,000 16,305 10,000 10,000
Books & Publications 1,345 1,000 994 1,000 1,000
Membership Subscriptions 7,336 9,000 9,138 9,000 9,000
Professional Indemnity 13,053 12,000 12,714 12,000 12,000
55,265 64,000 103,816 74,000 74,000
Other Expenses
Corporate Library 2,345 6,000
Council Publications 13,704 15,000 4,880 15,000 15,000
Conferences 5,425 4,000 1,495 4,000 4,000
Other Expenses 13,351 12,000 23,777 24,000 24,000
Public Relations (Residents Information) 47,970 57,000 33,812 40,000 40,000
Special Projects/Research 5,493 45,000 4,386 45,000 45,000
Community Perception Survey 21,000 21,000 4,000 25,000
Functions & Events 4,111 5,000 6,129 5,000 5,000
92,400 165,000 74,479 21,000 137,000 158,000
Programs
Regional Collaboration 25,000 25,000 25,000
Mediation Services - Citizens Advice 500 1,000 500 500
Corporate Style Guide 782
Reform Awareness Campaign 61,603
Reform Phase One Pre Planning 61,674 216,728
124,059 25,500 217,728 25,500 25,500
Loss on Disposal of Assets
Loss on Disposal of Assets 4,174 5,500 3,643 3,500 3,500
4,174 5,500 3,643 3,500 3,500
Sub-total 881,403 861,000 1,095,135 21,000 853,000 874,000
________________________________________________________________________________________________Page 3.18
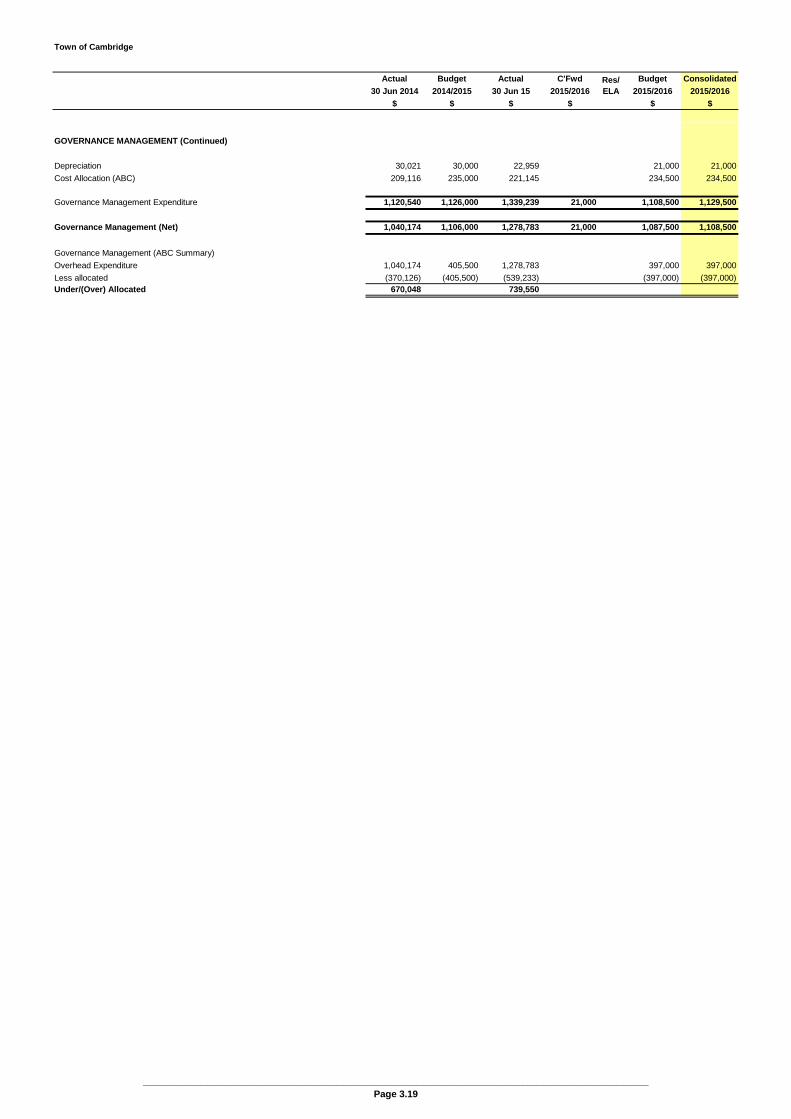
Town of Cambridge
Actual Budget Actual C'Fwd Budget Consolidated
30 Jun 2014 2014/2015 30 Jun 15 2015/2016 2015/2016 2015/2016
$ $ $ $ $ $
Res/ELA
GOVERNANCE MANAGEMENT (Continued)
Depreciation 30,021 30,000 22,959 21,000 21,000
Cost Allocation (ABC) 209,116 235,000 221,145 234,500 234,500
Governance Management Expenditure 1,120,540 1,126,000 1,339,239 21,000 1,108,500 1,129,500
Governance Management (Net) 1,040,174 1,106,000 1,278,783 21,000 1,087,500 1,108,500
Governance Management (ABC Summary)
Overhead Expenditure 1,040,174 405,500 1,278,783 397,000 397,000
Less allocated (370,126) (405,500) (539,233) (397,000) (397,000)Under/(Over) Allocated 670,048 739,550
________________________________________________________________________________________________Page 3.19
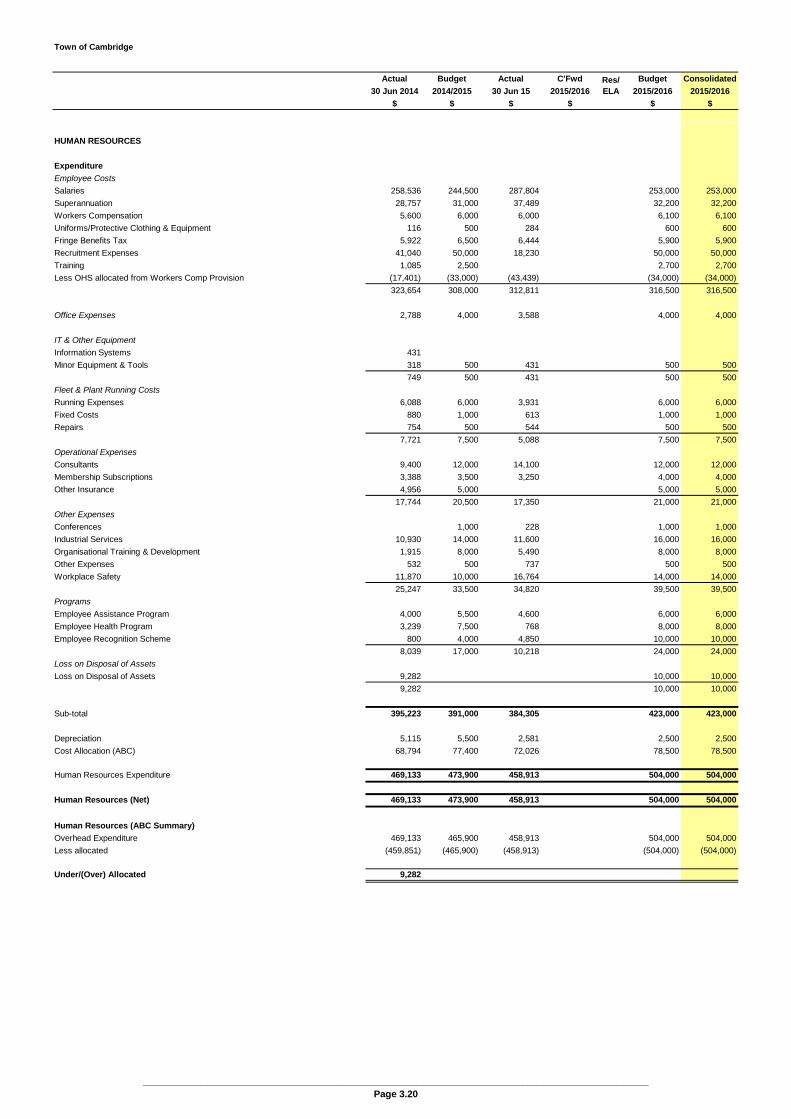
Town of Cambridge
Actual Budget Actual C'Fwd Budget Consolidated
30 Jun 2014 2014/2015 30 Jun 15 2015/2016 2015/2016 2015/2016
$ $ $ $ $ $
Res/ELA
HUMAN RESOURCES
Expenditure
Employee Costs
Salaries 258,536 244,500 287,804 253,000 253,000
Superannuation 28,757 31,000 37,489 32,200 32,200
Workers Compensation 5,600 6,000 6,000 6,100 6,100
Uniforms/Protective Clothing & Equipment 116 500 284 600 600
Fringe Benefits Tax 5,922 6,500 6,444 5,900 5,900
Recruitment Expenses 41,040 50,000 18,230 50,000 50,000
Training 1,085 2,500 2,700 2,700
Less OHS allocated from Workers Comp Provision (17,401) (33,000) (43,439) (34,000) (34,000)
323,654 308,000 312,811 0 316,500 316,500
Office Expenses 2,788 4,000 3,588 4,000 4,000
IT & Other Equipment
Information Systems 431
Minor Equipment & Tools 318 500 431 500 500
749 500 431 500 500
Fleet & Plant Running Costs
Running Expenses 6,088 6,000 3,931 6,000 6,000
Fixed Costs 880 1,000 613 1,000 1,000
Repairs 754 500 544 500 500
7,721 7,500 5,088 7,500 7,500
Operational Expenses
Consultants 9,400 12,000 14,100 12,000 12,000
Membership Subscriptions 3,388 3,500 3,250 4,000 4,000
Other Insurance 4,956 5,000 5,000 5,000
17,744 20,500 17,350 21,000 21,000
Other Expenses
Conferences 1,000 228 1,000 1,000
Industrial Services 10,930 14,000 11,600 16,000 16,000
Organisational Training & Development 1,915 8,000 5,490 8,000 8,000
Other Expenses 532 500 737 500 500
Workplace Safety 11,870 10,000 16,764 14,000 14,000
25,247 33,500 34,820 39,500 39,500
Programs
Employee Assistance Program 4,000 5,500 4,600 6,000 6,000
Employee Health Program 3,239 7,500 768 8,000 8,000
Employee Recognition Scheme 800 4,000 4,850 10,000 10,000
8,039 17,000 10,218 24,000 24,000
Loss on Disposal of Assets
Loss on Disposal of Assets 9,282 10,000 10,000
9,282 10,000 10,000
Sub-total 395,223 391,000 384,305 423,000 423,000
Depreciation 5,115 5,500 2,581 2,500 2,500
Cost Allocation (ABC) 68,794 77,400 72,026 78,500 78,500
Human Resources Expenditure 469,133 473,900 458,913 504,000 504,000
Human Resources (Net) 469,133 473,900 458,913 504,000 504,000
Human Resources (ABC Summary)
Overhead Expenditure 469,133 465,900 458,913 504,000 504,000
Less allocated (459,851) (465,900) (458,913) (504,000) (504,000)
Under/(Over) Allocated 9,282
________________________________________________________________________________________________Page 3.20

Town of Cambridge
Actual Budget Actual C'Fwd Budget Consolidated
30 Jun 2014 2014/2015 30 Jun 15 2015/2016 2015/2016 2015/2016
$ $ $ $ $ $
Res/ELA
ADMINISTRATION - GENERAL
Expenditure
Employee Costs
Salaries 74,309 73,500 74,653 76,700 76,700
Superannuation 10,173 10,500 17,339 10,600 10,600
Workers Compensation 1,700 2,000 2,000 1,800 1,800
Uniforms/Protective Clothing & Equipment 100 100
Fringe Benefits Tax 4,272 3,500 3,523 3,700 3,700
Training 946 2,000 2,100 2,100
91,400 91,500 97,516 95,000 95,000
Office Expenses 30,618 32,500 35,806 33,500 33,500
Fleet & Plant Running Costs
Running Expenses 1,720 2,000 1,773 2,000 2,000
Fixed Costs 622 500 755 500 500
2,341 2,500 2,528 2,500 2,500
Operational Expenses
Books & Publications 629 1,000 828 1,000 1,000
Professional Indemnity 2,316 2,500 2,649 2,500 2,500
2,944 3,500 3,477 3,500 3,500
Other Expenses
Other Expenses 2,034 1,500 1,812 2,000 2,000
Integrated Planning & Risk 49,867 20,000 30,000 30,000
Provisions 4,610 8,000 5,670 8,000 8,000
56,512 29,500 7,481 40,000 40,000
Loss on Disposal of Assets
Loss on Disposal of Assets 6,000 6,000
6,000 6,000
Sub-total 183,816 159,500 146,808 180,500 180,500
Depreciation 12,097 10,500 9,835 5,500 5,500
Cost Allocation (ABC) 21,467 23,800 23,213 24,000 24,000
Administration - General Expenditure 217,380 193,800 179,856 210,000 210,000
Administration - General (Net) 217,380 193,800 179,856 210,000 210,000
Administration - General (ABC Summary)
Overhead Expenditure 217,380 193,800 179,856 210,000 210,000
Less allocated (217,380) (193,800) (179,856) (210,000) (210,000)
Under/(Over) Allocated
________________________________________________________________________________________________Page 3.21
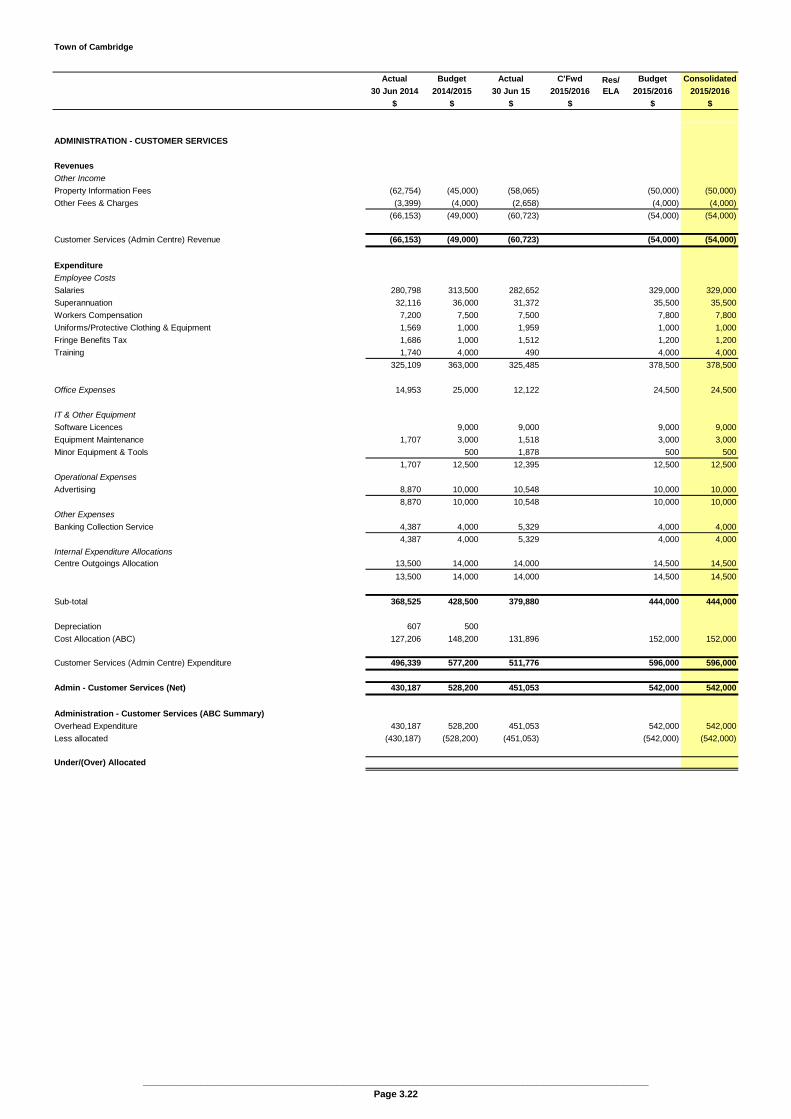
Town of Cambridge
Actual Budget Actual C'Fwd Budget Consolidated
30 Jun 2014 2014/2015 30 Jun 15 2015/2016 2015/2016 2015/2016
$ $ $ $ $ $
Res/ELA
ADMINISTRATION - CUSTOMER SERVICES
Revenues
Other Income
Property Information Fees (62,754) (45,000) (58,065) (50,000) (50,000)
Other Fees & Charges (3,399) (4,000) (2,658) (4,000) (4,000)
(66,153) (49,000) (60,723) (54,000) (54,000)
Customer Services (Admin Centre) Revenue (66,153) (49,000) (60,723) (54,000) (54,000)
Expenditure
Employee Costs
Salaries 280,798 313,500 282,652 329,000 329,000
Superannuation 32,116 36,000 31,372 35,500 35,500
Workers Compensation 7,200 7,500 7,500 7,800 7,800
Uniforms/Protective Clothing & Equipment 1,569 1,000 1,959 1,000 1,000
Fringe Benefits Tax 1,686 1,000 1,512 1,200 1,200
Training 1,740 4,000 490 4,000 4,000
325,109 363,000 325,485 378,500 378,500
Office Expenses 14,953 25,000 12,122 24,500 24,500
IT & Other Equipment
Software Licences 9,000 9,000 9,000 9,000
Equipment Maintenance 1,707 3,000 1,518 3,000 3,000
Minor Equipment & Tools 500 1,878 500 500
1,707 12,500 12,395 12,500 12,500
Operational Expenses
Advertising 8,870 10,000 10,548 10,000 10,000
8,870 10,000 10,548 10,000 10,000
Other Expenses
Banking Collection Service 4,387 4,000 5,329 4,000 4,000
4,387 4,000 5,329 4,000 4,000
Internal Expenditure AllocationsCentre Outgoings Allocation 13,500 14,000 14,000 14,500 14,500
13,500 14,000 14,000 14,500 14,500
Sub-total 368,525 428,500 379,880 444,000 444,000
Depreciation 607 500
Cost Allocation (ABC) 127,206 148,200 131,896 152,000 152,000
Customer Services (Admin Centre) Expenditure 496,339 577,200 511,776 596,000 596,000
Admin - Customer Services (Net) 430,187 528,200 451,053 542,000 542,000
Administration - Customer Services (ABC Summary)
Overhead Expenditure 430,187 528,200 451,053 542,000 542,000
Less allocated (430,187) (528,200) (451,053) (542,000) (542,000)
Under/(Over) Allocated
________________________________________________________________________________________________Page 3.22
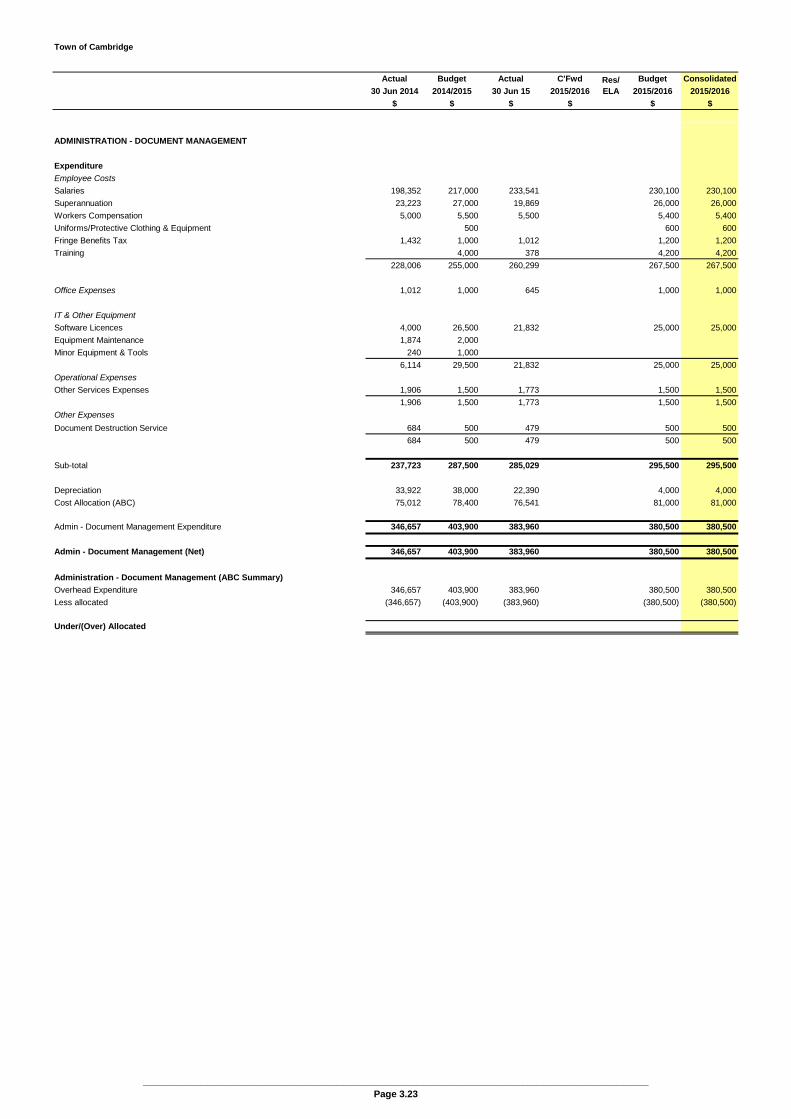
Town of Cambridge
Actual Budget Actual C'Fwd Budget Consolidated
30 Jun 2014 2014/2015 30 Jun 15 2015/2016 2015/2016 2015/2016
$ $ $ $ $ $
Res/ELA
ADMINISTRATION - DOCUMENT MANAGEMENT
Expenditure
Employee Costs
Salaries 198,352 217,000 233,541 230,100 230,100
Superannuation 23,223 27,000 19,869 26,000 26,000
Workers Compensation 5,000 5,500 5,500 5,400 5,400
Uniforms/Protective Clothing & Equipment 500 600 600
Fringe Benefits Tax 1,432 1,000 1,012 1,200 1,200
Training 4,000 378 4,200 4,200
228,006 255,000 260,299 267,500 267,500
Office Expenses 1,012 1,000 645 1,000 1,000
IT & Other Equipment
Software Licences 4,000 26,500 21,832 25,000 25,000
Equipment Maintenance 1,874 2,000
Minor Equipment & Tools 240 1,000
6,114 29,500 21,832 25,000 25,000
Operational Expenses
Other Services Expenses 1,906 1,500 1,773 1,500 1,500
1,906 1,500 1,773 1,500 1,500
Other Expenses
Document Destruction Service 684 500 479 500 500
684 500 479 500 500
Sub-total 237,723 287,500 285,029 295,500 295,500
Depreciation 33,922 38,000 22,390 4,000 4,000
Cost Allocation (ABC) 75,012 78,400 76,541 81,000 81,000
Admin - Document Management Expenditure 346,657 403,900 383,960 380,500 380,500
Admin - Document Management (Net) 346,657 403,900 383,960 380,500 380,500
Administration - Document Management (ABC Summary)
Overhead Expenditure 346,657 403,900 383,960 380,500 380,500
Less allocated (346,657) (403,900) (383,960) (380,500) (380,500)
Under/(Over) Allocated
________________________________________________________________________________________________Page 3.23

Town of Cambridge
Actual Budget Actual C'Fwd Budget Consolidated
30 Jun 2014 2014/2015 30 Jun 15 2015/2016 2015/2016 2015/2016
$ $ $ $ $ $
Res/ELA
FINANCIAL SERVICES - GENERAL
Expenditure
Employee Costs
Salaries 354,621 340,500 352,612 352,200 352,200
Superannuation 34,084 39,500 38,596 40,400 40,400
Workers Compensation 7,900 8,000 8,000 8,400 8,400
Uniforms/Protective Clothing & Equipment 178 1,000 800 800
Fringe Benefits Tax 5,029 4,500 4,808 4,800 4,800
Training 8,386 3,500 4,617 3,400 3,400
410,198 397,000 408,633 410,000 410,000
Office Expenses 2,592 2,500 1,694 2,500 2,500
IT & Other Equipment
Software Maintenance/Support 6,028 4,000 1,915
Minor Equipment & Tools 2,523 1,000 878 1,000 1,000
8,550 5,000 2,793 1,000 1,000
Fleet & Plant Running Costs
Running Expenses 4,341 4,000 3,955 4,000 4,000
Fixed Costs 1,269 1,000 890 1,000 1,000
Repairs 500 965 500 500
5,611 5,500 5,809 5,500 5,500
Operational Expenses
Audit Fees 37,600 26,000 35,050 27,000 27,000
Bank & Agency Charges 6,879 7,000 6,674 7,000 7,000
Books & Publications 838 1,000 641 1,000 1,000
Membership Subscriptions 1,586 1,000 586 1,000 1,000
Professional Indemnity 2,105 2,000 2,119 2,000 2,000
Other Insurance 6,681 7,000 6,681 7,000 7,000
55,689 44,000 51,751 45,000 45,000
Other Expenses
Debt Provisions Write-Offs & Refunds 459 500 (4) 500 500
Debt Collection 500 500 500
WALGA Taxation Service 1,830 2,000 1,900 2,000 2,000
2,289 3,000 1,896 3,000 3,000
Loss on Disposal of Assets
Loss on Disposal of Assets 6,000 3,868
6,000 3,868
Sub-total 484,929 463,000 476,444 467,000 467,000
Depreciation 6,390 6,000 5,165 2,500 2,500
Cost Allocation (ABC) 65,183 73,900 68,307 74,500 74,500
Financial Services - General Expenditure 556,502 542,900 549,917 544,000 544,000
Financial Services - General (Net) 556,502 542,900 549,917 544,000 544,000
Financial Services - General (ABC Summary)
Overhead Expenditure 556,502 542,900 549,917 544,000 544,000
Less allocated (556,504) (542,900) (546,048) (544,000) (544,000)
Under/(Over) Allocated (2) 3,868
________________________________________________________________________________________________Page 3.24
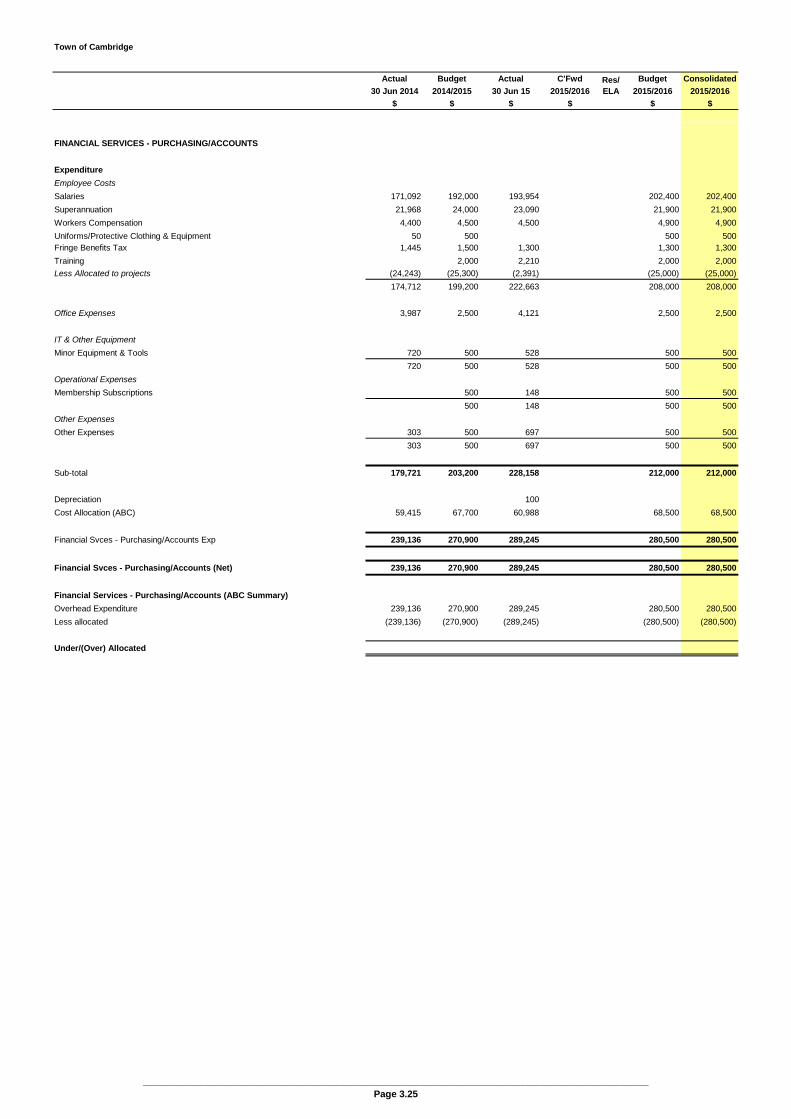
Town of Cambridge
Actual Budget Actual C'Fwd Budget Consolidated
30 Jun 2014 2014/2015 30 Jun 15 2015/2016 2015/2016 2015/2016
$ $ $ $ $ $
Res/ELA
FINANCIAL SERVICES - PURCHASING/ACCOUNTS
Expenditure
Employee Costs
Salaries 171,092 192,000 193,954 202,400 202,400
Superannuation 21,968 24,000 23,090 21,900 21,900
Workers Compensation 4,400 4,500 4,500 4,900 4,900
Uniforms/Protective Clothing & Equipment 50 500 500 500Fringe Benefits Tax 1,445 1,500 1,300 1,300 1,300
Training 2,000 2,210 2,000 2,000
Less Allocated to projects (24,243) (25,300) (2,391) (25,000) (25,000)
174,712 199,200 222,663 208,000 208,000
Office Expenses 3,987 2,500 4,121 2,500 2,500
IT & Other Equipment
Minor Equipment & Tools 720 500 528 500 500
720 500 528 500 500
Operational Expenses
Membership Subscriptions 500 148 500 500
500 148 500 500
Other Expenses
Other Expenses 303 500 697 500 500
303 500 697 500 500
Sub-total 179,721 203,200 228,158 212,000 212,000
Depreciation 100
Cost Allocation (ABC) 59,415 67,700 60,988 68,500 68,500
Financial Svces - Purchasing/Accounts Exp 239,136 270,900 289,245 280,500 280,500
Financial Svces - Purchasing/Accounts (Net) 239,136 270,900 289,245 280,500 280,500
Financial Services - Purchasing/Accounts (ABC Summary)
Overhead Expenditure 239,136 270,900 289,245 280,500 280,500
Less allocated (239,136) (270,900) (289,245) (280,500) (280,500)
Under/(Over) Allocated
________________________________________________________________________________________________Page 3.25

Town of Cambridge
Actual Budget Actual C'Fwd Budget Consolidated
30 Jun 2014 2014/2015 30 Jun 15 2015/2016 2015/2016 2015/2016
$ $ $ $ $ $
Res/ELA
FINANCIAL SERVICES - PAYROLL
Expenditure
Employee Costs
Salaries 145,321 129,000 154,636 132,300 132,300
Superannuation 14,014 15,500 14,027 15,900 15,900
Workers Compensation 3,100 3,000 3,000 3,200 3,200
Uniforms/Protective Clothing & Equipment 77 500 400 400Fringe Benefits Tax 1,445 1,500 1,300 1,300 1,300
Training 1,209 1,500 1,068 1,400 1,400
165,167 151,000 174,030 154,500 154,500
Office Expenses 1,952 1,500 1,315 1,500 1,500
IT & Other Equipment
Equipment Maintenance 500 500 500
399 500 500 500
Other Expenses
Other Expenses 500 98 500 500
500 98 500 500
Sub-total 167,518 153,500 175,443 157,000 157,000
Depreciation 118 33
Cost Allocation (ABC) 33,058 38,600 33,448 39,000 39,000
Financial Services - Payroll Expenditure 200,694 192,100 208,925 196,000 196,000
Financial Services - Payroll (Net) 200,694 192,100 208,925 196,000 196,000
Financial Services - Payroll (ABC Summary)
Overhead Expenditure 200,694 192,100 208,925 196,000 196,000
Less allocated (200,694) (192,100) (208,925) (196,000) (196,000)
Under/(Over) Allocated
________________________________________________________________________________________________Page 3.26

Town of Cambridge
Actual Budget Actual C'Fwd Budget Consolidated
30 Jun 2014 2014/2015 30 Jun 15 2015/2016 2015/2016 2015/2016
$ $ $ $ $ $
Res/ELA
INFORMATION TECHNOLOGY
Expenditure
Employee Costs
Salaries 375,077 381,500 387,423 404,100 404,100
Allowances 1,000 1,000 1,000
Superannuation 39,572 43,500 39,800 45,400 45,400
Workers Compensation 8,700 9,000 9,000 9,600 9,600
Uniforms/Protective Clothing & Equipment 1,000 900 900
Fringe Benefits Tax 4,272 3,500 3,523 3,700 3,700
Training 6,702 17,000 11,907 16,800 16,800
434,323 456,500 451,654 481,500 481,500
Office Expenses 5,357 4,000 5,504 4,000 4,000
IT & Other Equipment
Information Systems (Network Charges) 15,388 20,000 18,208 25,000 25,000
Software Maintenance/Support 19,961 22,000 3,282 40,000 40,000
Software Licences 85,706 162,500 107,284 55,000 170,500 225,500
Equipment Maintenance 42,944 63,500 25,999 11,000 11,000
Minor Equipment & Tools 3,385 6,000 1,754 6,000 6,000
167,384 274,000 156,526 55,000 252,500 307,500
Other Expenses
Other Expenses 165 500 449 500 500
Website Development & Maintenance 15,650
15,815 500 449 500 500
Internal Expenditure Allocations
Centre Outgoings Allocation 7,000 7,000 7,000 7,000 7,000
7,000 7,000 7,000 7,000 7,000
Sub-total 630,148 742,000 621,133 55,000 745,500 800,500
Depreciation 169,462 346,000 164,854 311,000 311,000
Cost Allocation (ABC) 124,500 145,700 127,303 147,000 147,000
Information Technology Expenditure 924,111 1,233,700 913,289 55,000 1,203,500 1,258,500
Information Technology (Net) 924,111 1,233,700 913,289 55,000 1,203,500 1,258,500
Information Technology (ABC Summary)Overhead Expenditure 924,111 1,233,700 913,289 1,203,500 1,203,500Less allocated (924,111) (1,218,200) (913,289) (1,203,500) (1,203,500)
Under/(Over) Allocated
________________________________________________________________________________________________Page 3.27
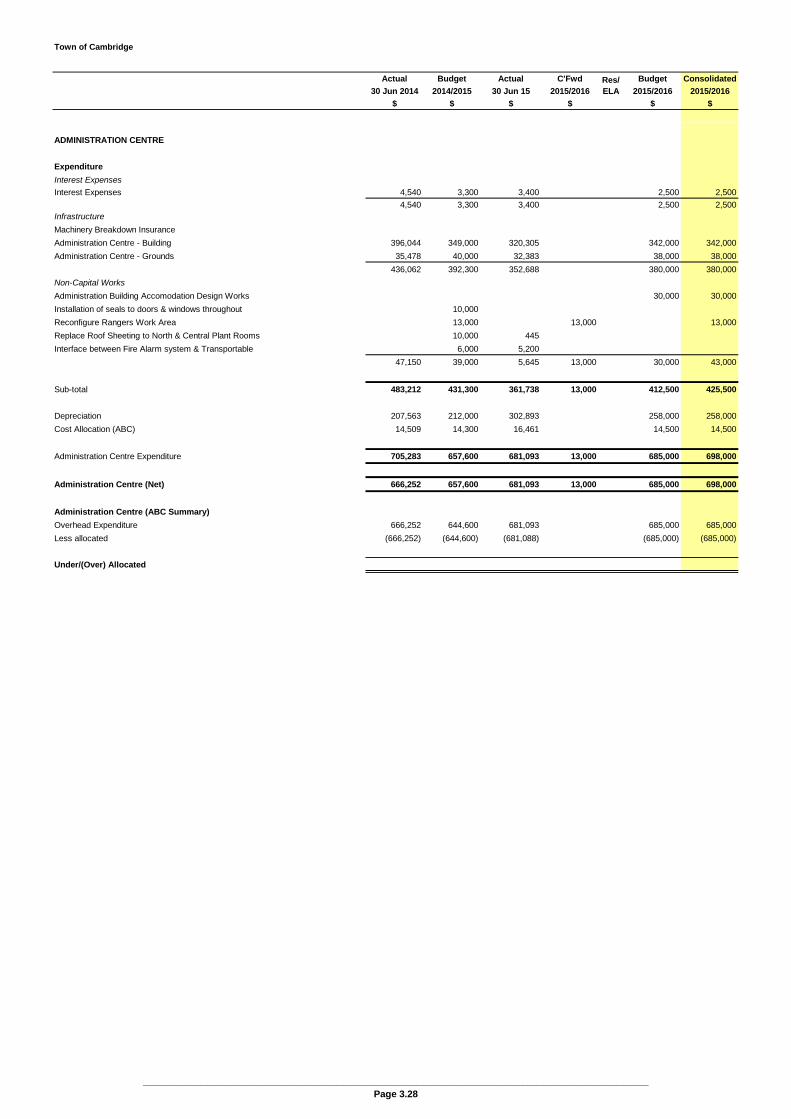
Town of Cambridge
Actual Budget Actual C'Fwd Budget Consolidated
30 Jun 2014 2014/2015 30 Jun 15 2015/2016 2015/2016 2015/2016
$ $ $ $ $ $
Res/ELA
ADMINISTRATION CENTRE
Expenditure
Interest Expenses
Interest Expenses 4,540 3,300 3,400 2,500 2,500
4,540 3,300 3,400 2,500 2,500Infrastructure
Machinery Breakdown Insurance
Administration Centre - Building 396,044 349,000 320,305 342,000 342,000
Administration Centre - Grounds 35,478 40,000 32,383 38,000 38,000
436,062 392,300 352,688 380,000 380,000
Non-Capital Works
Administration Building Accomodation Design Works 30,000 30,000
Installation of seals to doors & windows throughout 10,000
Reconfigure Rangers Work Area 13,000 13,000 13,000
Replace Roof Sheeting to North & Central Plant Rooms 10,000 445
Interface between Fire Alarm system & Transportable 6,000 5,200
47,150 39,000 5,645 13,000 30,000 43,000
Sub-total 483,212 431,300 361,738 13,000 412,500 425,500
Depreciation 207,563 212,000 302,893 258,000 258,000
Cost Allocation (ABC) 14,509 14,300 16,461 14,500 14,500
Administration Centre Expenditure 705,283 657,600 681,093 13,000 685,000 698,000
Administration Centre (Net) 666,252 657,600 681,093 13,000 685,000 698,000
Administration Centre (ABC Summary)
Overhead Expenditure 666,252 644,600 681,093 685,000 685,000
Less allocated (666,252) (644,600) (681,088) (685,000) (685,000)
Under/(Over) Allocated 5
________________________________________________________________________________________________Page 3.28
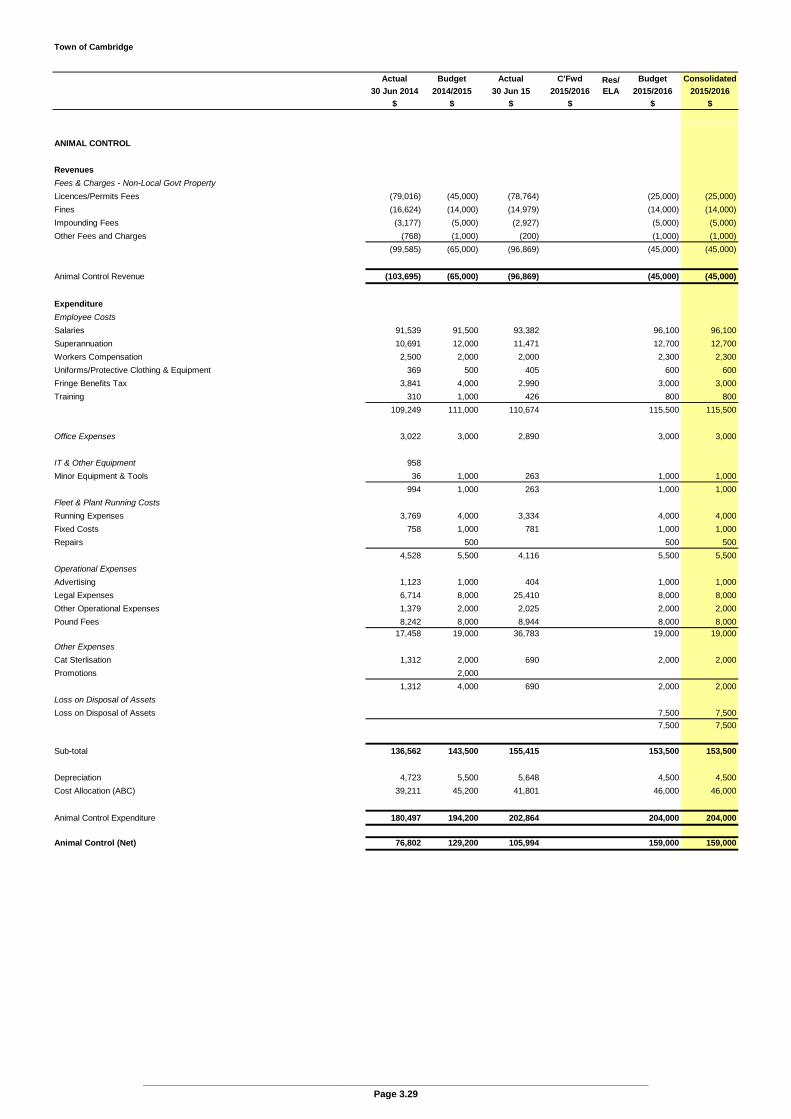
Town of Cambridge
Actual Budget Actual C'Fwd Budget Consolidated
30 Jun 2014 2014/2015 30 Jun 15 2015/2016 2015/2016 2015/2016
$ $ $ $ $ $
Res/ELA
ANIMAL CONTROL
Revenues
Fees & Charges - Non-Local Govt Property
Licences/Permits Fees (79,016) (45,000) (78,764) (25,000) (25,000)
Fines (16,624) (14,000) (14,979) (14,000) (14,000)
Impounding Fees (3,177) (5,000) (2,927) (5,000) (5,000)
Other Fees and Charges (768) (1,000) (200) (1,000) (1,000)
(99,585) (65,000) (96,869) (45,000) (45,000)
Animal Control Revenue (103,695) (65,000) (96,869) (45,000) (45,000)
Expenditure
Employee Costs
Salaries 91,539 91,500 93,382 96,100 96,100
Superannuation 10,691 12,000 11,471 12,700 12,700
Workers Compensation 2,500 2,000 2,000 2,300 2,300
Uniforms/Protective Clothing & Equipment 369 500 405 600 600
Fringe Benefits Tax 3,841 4,000 2,990 3,000 3,000
Training 310 1,000 426 800 800
109,249 111,000 110,674 115,500 115,500
Office Expenses 3,022 3,000 2,890 3,000 3,000
IT & Other Equipment 958
Minor Equipment & Tools 36 1,000 263 1,000 1,000
994 1,000 263 1,000 1,000
Fleet & Plant Running Costs
Running Expenses 3,769 4,000 3,334 4,000 4,000
Fixed Costs 758 1,000 781 1,000 1,000
Repairs 500 500 500
4,528 5,500 4,116 5,500 5,500
Operational Expenses
Advertising 1,123 1,000 404 1,000 1,000
Legal Expenses 6,714 8,000 25,410 8,000 8,000
Other Operational Expenses 1,379 2,000 2,025 2,000 2,000
Pound Fees 8,242 8,000 8,944 8,000 8,00017,458 19,000 36,783 19,000 19,000
Other Expenses
Cat Sterlisation 1,312 2,000 690 2,000 2,000
Promotions 2,000
1,312 4,000 690 2,000 2,000
Loss on Disposal of Assets
Loss on Disposal of Assets 7,500 7,500
7,500 7,500
Sub-total 136,562 143,500 155,415 153,500 153,500
Depreciation 4,723 5,500 5,648 4,500 4,500
Cost Allocation (ABC) 39,211 45,200 41,801 46,000 46,000
Animal Control Expenditure 180,497 194,200 202,864 204,000 204,000
Animal Control (Net) 76,802 129,200 105,994 159,000 159,000
________________________________________________________________________________________________Page 3.29

Town of Cambridge
Actual Budget Actual C'Fwd Budget Consolidated
30 Jun 2014 2014/2015 30 Jun 15 2015/2016 2015/2016 2015/2016
$ $ $ $ $ $
Res/ELA
RANGER SERVICES - OTHER
Revenues
Fees & Charges - Non-Local Govt Property
Fines (5,172) (2,000) (6,038) (2,000) (2,000)
(5,172) (2,000) (6,038) (2,000) (2,000)
Ranger Services - Other Revenue (5,172) (2,000) (6,038) (2,000) (2,000)
Expenditure
Employee Costs
Salaries 102,693 98,500 105,540 103,100 103,100
Superannuation 16,809 12,000 13,935 13,700 13,700
Workers Compensation 2,500 2,500 2,500 2,500 2,500
Uniforms/Protective Clothing & Equipment 1,077 500 252 600 600
Fringe Benefits Tax 4,546 4,500 1,463 3,700 3,700
Training 457 1,000 1,431 900 900
128,083 119,000 125,120 124,500 124,500
Office Expenses 7,493 7,000 6,831 7,000 7,000
IT & Other Equipment
Minor Equipment & Tools 22 1,000 506 1,000 1,000
22 1,000 506 1,000 1,000
Fleet & Plant Running Costs
Running Expenses 11,735 12,000 8,244 12,500 12,500
Fixed Costs 2,745 2,500 2,343 2,500 2,500
Repairs 1,267 1,000 1,996 1,000 1,000
Plant Consumables
15,747 15,500 12,584 16,000 16,000
Operational Expenses
Legal Expenses 11,867 3,000 1,326 3,000 3,000
Professional Indemnity 2,105 2,000 2,119 2,000 2,000
13,973 5,000 3,445 5,000 5,000
Other Expenses
Fire Breaks 532 1,000 1,000 1,000
Other Expenses 882 1,000 451 1,000 1,000
1,414 2,000 451 2,000 2,000
Programs
Emergency Management 1,500 1,181 1,500 1,500
1,500 1,181 1,500 1,500
Loss on Disposal of Assets
Loss on Disposal of Assets 11,957 4,000 2,914 7,500 7,500
11,957 4,000 2,914 7,500 7,500
Sub-total 178,688 155,000 153,031 164,500 164,500
Depreciation 12,355 13,500 7,627 7,000 7,000
Cost Allocation (ABC) 34,506 39,700 36,595 40,500 40,500
Ranger Services - Other Expenditure 225,549 208,200 197,253 212,000 212,000
Ranger Services - Other (Net) 220,378 206,200 191,215 210,000 210,000
________________________________________________________________________________________________Page 3.30

Town of Cambridge
Actual Budget Actual C'Fwd Budget Consolidated
30 Jun 2014 2014/2015 30 Jun 15 2015/2016 2015/2016 2015/2016
$ $ $ $ $ $
Res/ELA
BEACH INSPECTIONS
Expenditure
Other Expenses
Contract Beach Inspections 335,854 344,000 340,638 350,000 350,000
Promotions 1,000 644 1,000 1,000
335,854 345,000 341,282 351,000 351,000
Sub-total 335,854 345,000 341,282 351,000 351,000
Cost Allocation (ABC) 10,014 10,100 11,039 10,000 10,000
Beach Inspections Expenditure 345,868 355,100 352,321 361,000 361,000
Beach Inspections (Net) 345,868 355,100 352,321 361,000 361,000
________________________________________________________________________________________________Page 3.31

Town of Cambridge
Actual Budget Actual C'Fwd Budget Consolidated
30 Jun 2014 2014/2015 30 Jun 15 2015/2016 2015/2016 2015/2016
$ $ $ $ $ $
Res/ELA
COMPLIANCE
Revenues
Fees & Charges - Non-Local Govt Property
Licences/Permits Fees (9,844) (12,000) (12,500) (12,500)
Fines (7,535) (8,000) (33,931) (8,000) (8,000)
(17,991) (21,000) (33,931) (20,500) (20,500)
Compliance Revenue (17,991) (21,000) (33,931) (20,500) (20,500)
Expenditure
Employee Costs
Salaries 204,273 247,000 227,777 218,300 218,300
Superannuation 23,717 28,000 18,879 24,400 24,400
Workers Compensation 5,500 6,000 6,000 5,300 5,300
Uniforms/Protective Clothing & Equipment 1,591 1,000 2,216 1,100 1,100
Fringe Benefits Tax 13,244 6,000 11,859 11,200 11,200
Training 965 2,500 1,251 2,200 2,200
249,289 290,500 267,982 262,500 262,500
Office Expenses 1,072 1,500 6,817 1,500 1,500
IT & Other Equipment
Minor Equipment & Tools 607 1,483 1,000 1,000
607 1,483 1,000 1,000
Fleet & Plant Running Costs
Running Expenses 4,854 6,000 7,353 6,000 6,000
Fixed Costs 2,435 2,000 1,734 2,000 2,000
Repairs 504 500 1,511 500 500
7,793 8,500 10,599 8,500 8,500
Operational Expenses
Consultants 1,000 1,000 1,000
Legal Expenses 4,737 20,000 48,970 16,000 16,000
Advertising 3,346
4,737 21,000 52,316 17,000 17,000
Other Expenses
Enforcement Action Expenses 15,000 1,109 15,000 15,000
Other Expenses 103 1,000 1,305 1,000 1,000
103 16,000 2,413 16,000 16,000
Loss on Disposal of Assets
Loss on Disposal of Assets 17,137 2,500
17,137 2,500
Sub-total 280,737 340,000 341,609 306,500 306,500
Depreciation 11,124 9,500 5,182 5,000 5,000
Cost Allocation (ABC) 25,380 25,600 27,096 26,500 26,500
Compliance Expenditure 317,241 375,100 373,887 338,000 338,000
Compliance (Net) 299,250 354,100 339,955 317,500 317,500
________________________________________________________________________________________________Page 3.32

Town of Cambridge
Actual Budget Actual C'Fwd Budget Consolidated
30 Jun 2014 2014/2015 30 Jun 15 2015/2016 2015/2016 2015/2016
$ $ $ $ $ $
Res/ELA
SURF LIFE SAVING CLUBS
City of Perth Surf Life Saving Club
Revenues
Reimbursements
Reimbursements - Other (10,500) (10,500)
(10,500) (10,500)
Capital Grants
New Surf Club Premises at City Beach - CSRFF (525,000) (525,000)
(525,000) (525,000)
Capital Contributions
City of Perth Surf Life Saving Club (40,000) (1,900,000) (1,375,000)
(40,000) (1,900,000) (1,375,000)
Fees & Charges - Local Govt Property
Contributions (5,000) Res (22,500) (22,500)
Administration Fee
Waste Fee (1,000)
(1,000) (5,000) (22,500) (22,500)
Capital Contributions
City of Perth Surf Life Saving Club (262,318)
Capital Contributions (262,318)
City of Perth Surf Lifesaving Club Revenue (303,318) (1,905,000) (1,375,000) (558,000) (558,000)
Expenditure
Other Expenses
Donations Contributions & Subsidies 12,000 19,000 10,909 28,000 28,000
12,000 19,000 10,909 28,000 28,000
Infrastructure
City of Perth Surf Lifesaving Club 15,181 2,642 10,500 10,500
15,181 2,642 10,500 10,500
Sub-total 27,181 19,000 13,551 38,500 38,500
Depreciation 135 500 170,000 170,000
Cost Allocation (ABC) 7,433 8,000 8,640 8,000 8,000
City of Perth Surf Lifesaving Club Expenditure 34,749 27,500 22,191 216,500 216,500
________________________________________________________________________________________________Page 3.33
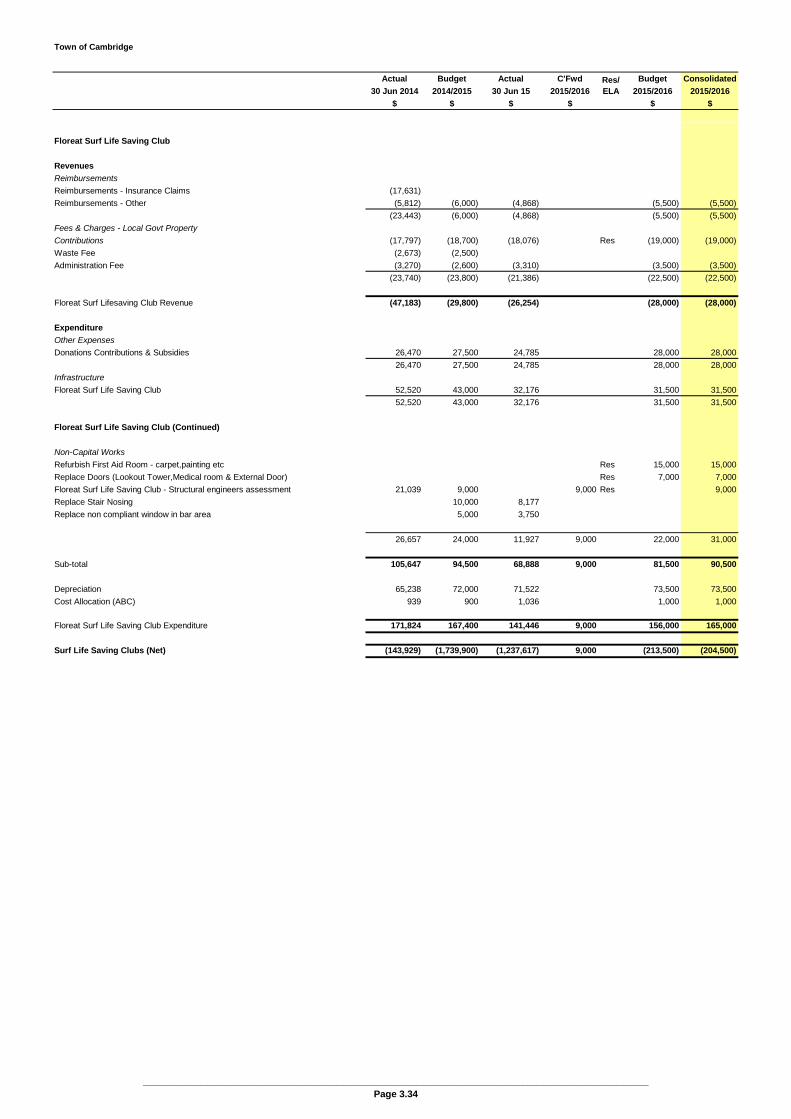
Town of Cambridge
Actual Budget Actual C'Fwd Budget Consolidated
30 Jun 2014 2014/2015 30 Jun 15 2015/2016 2015/2016 2015/2016
$ $ $ $ $ $
Res/ELA
Floreat Surf Life Saving Club
Revenues
Reimbursements
Reimbursements - Insurance Claims (17,631)
Reimbursements - Other (5,812) (6,000) (4,868) (5,500) (5,500)
(23,443) (6,000) (4,868) (5,500) (5,500)
Fees & Charges - Local Govt Property
Contributions (17,797) (18,700) (18,076) Res (19,000) (19,000)
Waste Fee (2,673) (2,500)
Administration Fee (3,270) (2,600) (3,310) (3,500) (3,500)
(23,740) (23,800) (21,386) (22,500) (22,500)
Floreat Surf Lifesaving Club Revenue (47,183) (29,800) (26,254) (28,000) (28,000)
Expenditure
Other Expenses
Donations Contributions & Subsidies 26,470 27,500 24,785 28,000 28,000
26,470 27,500 24,785 28,000 28,000
Infrastructure
Floreat Surf Life Saving Club 52,520 43,000 32,176 31,500 31,500
52,520 43,000 32,176 31,500 31,500
Floreat Surf Life Saving Club (Continued)
Non-Capital Works
Refurbish First Aid Room - carpet,painting etc Res 15,000 15,000
Replace Doors (Lookout Tower,Medical room & External Door) Res 7,000 7,000
Floreat Surf Life Saving Club - Structural engineers assessment 21,039 9,000 9,000 Res 9,000
Replace Stair Nosing 10,000 8,177
Replace non compliant window in bar area 5,000 3,750
26,657 24,000 11,927 9,000 22,000 31,000
Sub-total 105,647 94,500 68,888 9,000 81,500 90,500
Depreciation 65,238 72,000 71,522 73,500 73,500
Cost Allocation (ABC) 939 900 1,036 1,000 1,000
Floreat Surf Life Saving Club Expenditure 171,824 167,400 141,446 9,000 156,000 165,000
Surf Life Saving Clubs (Net) (143,929) (1,739,900) (1,237,617) 9,000 (213,500) (204,500)
________________________________________________________________________________________________Page 3.34

Town of Cambridge
Actual Budget Actual C'Fwd Budget Consolidated
30 Jun 2014 2014/2015 30 Jun 15 2015/2016 2015/2016 2015/2016
$ $ $ $ $ $
Res/ELA
COMMUNITY SAFETY
Revenues
Operating Contributions
Local Road Safety Grant (500)
(500)
Fees & Charges - Non-Local Govt Property
Sale Miscellaneous Items (166)
(166)
Operating Grants & Subsidies
Operating Grants (5,726) (750)
(5,726) (750)
Community Safety Revenue (5,892) (1,250)
Expenditure
Employee Costs
Salaries 43,001 41,500 43,547 42,700 42,700
Allowances 273
Superannuation 4,291 4,000 4,489 4,300 4,300
Workers Compensation 900 1,000 1,000 1,000 1,000
Fringe Benefits Tax 298 500 304 300 300
Uniforms/Protective Clothing & Equipment 200 200
Training 500 366 500 500
48,490 47,500 49,979 49,000 49,000
Programs
Crime Deterrent Programs 65,135 65,000 43,807 67,000 67,000
Youth & Child Safety 15,598 14,000 13,260 14,000 14,000
Community Safety Other 6,459 10,000 10,522 10,000 10,000
Local Road Safety 500
87,193 89,000 68,089 91,000 91,000
Sub-total 135,683 136,500 118,068 140,000 140,000
Depreciation 3,067 3,000 4,141 4,000 4,000
Cost Allocation (ABC) 26,978 29,800 28,227 30,500 30,500
Community Safety Expenditure 165,728 169,300 150,436 174,500 174,500
Community Safety (Net) 159,836 169,300 149,186 174,500 174,500
________________________________________________________________________________________________Page 3.35

Town of Cambridge
Actual Budget Actual C'Fwd Budget Consolidated
30 Jun 2014 2014/2015 30 Jun 15 2015/2016 2015/2016 2015/2016
$ $ $ $ $ $
Res/ELA
HEALTH
Revenues
Fees & Charges - Non-Local Govt Property
Licences/Permits Fees (61,443) (62,000) (62,506) (64,000) (64,000)
Fines (2,500) (2,500)
(61,443) (62,000) (62,506) (66,500) (66,500)
Other Income
Other Fees & Charges (1,380) (3,000) (730) (3,000) (3,000)
Other Income (5,377) (2,000) (14,634) (2,000) (2,000)
(6,757) (5,000) (15,364) (5,000) (5,000)
Health Revenue (73,743) (67,000) (77,870) (71,500) (71,500)
Expenditure
Employee Costs
Salaries 263,813 290,500 344,750 300,600 300,600
Superannuation 29,819 34,500 44,200 36,700 36,700
Workers Compensation 7,000 7,000 7,000 7,300 7,300
Uniforms/Protective Clothing & Equipment 1,638 500 1,749 700 700
Fringe Benefits Tax 10,579 14,000 7,761 7,000 7,000
Training 3,000 2,073 3,200 3,200
312,849 349,500 407,533 355,500 355,500
Office Expenses 3,532 4,500 3,713 4,500 4,500
IT & Other Equipment
Minor Equipment & Tools 656 2,000 1,136 2,000 2,000
656 2,000 1,136 2,000 2,000
Fleet & Plant Running Costs
Running Expenses 4,399 5,000 4,006 5,000 5,000
Fixed Costs 1,389 1,500 1,411 1,500 1,500
Repairs 477 500 887 500 500
6,265 7,000 6,304 7,000 7,000
Operational Expenses
Legal Expenses 2,500 2,500
Books & Publications 547 1,000 387 1,000 1,000
Membership Subscriptions 768 1,000 1,268 1,000 1,000
Professional Indemnity 12,737 12,500 13,244 13,000 13,000
14,052 14,500 14,900 17,500 17,500
Other Expenses
Conferences 2,748 3,000 1,950 3,000 3,000
Food Control 6,150 6,500 6,605 6,500 6,500
Other Expenses 73 1,000 829 1,000 1,000
Pest Control 1,355 2,500 3,984 2,500 2,500
Pollution/Noise Control 2,500 2,110 2,500 2,500
10,326 15,500 15,479 15,500 15,500
Loss on Disposal of Assets
Loss on Disposal of Assets 2,500 4,453
2,500 4,453
Sub-total 347,681 395,500 453,518 402,000 402,000
Depreciation 8,736 12,000 10,195 11,500 11,500
Cost Allocation (ABC) 103,613 116,000 108,473 117,500 117,500
Health Expenditure 460,029 523,500 572,186 531,000 531,000
Health (Net) 391,830 456,500 494,315 459,500 459,500
________________________________________________________________________________________________Page 3.36
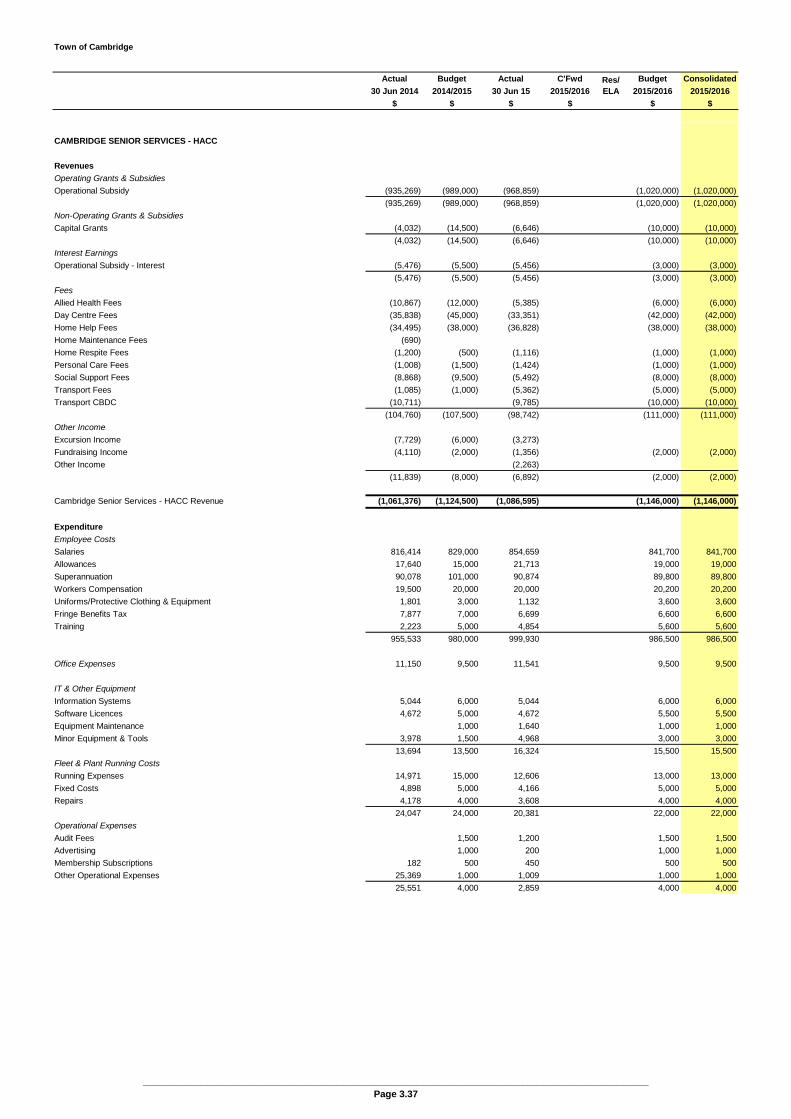
Town of Cambridge
Actual Budget Actual C'Fwd Budget Consolidated
30 Jun 2014 2014/2015 30 Jun 15 2015/2016 2015/2016 2015/2016
$ $ $ $ $ $
Res/ELA
CAMBRIDGE SENIOR SERVICES - HACC
Revenues
Operating Grants & Subsidies
Operational Subsidy (935,269) (989,000) (968,859) (1,020,000) (1,020,000)
(935,269) (989,000) (968,859) (1,020,000) (1,020,000)
Non-Operating Grants & Subsidies
Capital Grants (4,032) (14,500) (6,646) (10,000) (10,000)
(4,032) (14,500) (6,646) (10,000) (10,000)
Interest Earnings
Operational Subsidy - Interest (5,476) (5,500) (5,456) (3,000) (3,000)
(5,476) (5,500) (5,456) (3,000) (3,000)
Fees
Allied Health Fees (10,867) (12,000) (5,385) (6,000) (6,000)
Day Centre Fees (35,838) (45,000) (33,351) (42,000) (42,000)
Home Help Fees (34,495) (38,000) (36,828) (38,000) (38,000)
Home Maintenance Fees (690)
Home Respite Fees (1,200) (500) (1,116) (1,000) (1,000)
Personal Care Fees (1,008) (1,500) (1,424) (1,000) (1,000)
Social Support Fees (8,868) (9,500) (5,492) (8,000) (8,000)
Transport Fees (1,085) (1,000) (5,362) (5,000) (5,000)
Transport CBDC (10,711) (9,785) (10,000) (10,000)
(104,760) (107,500) (98,742) (111,000) (111,000)
Other Income
Excursion Income (7,729) (6,000) (3,273)
Fundraising Income (4,110) (2,000) (1,356) (2,000) (2,000)
Other Income (2,263)
(11,839) (8,000) (6,892) (2,000) (2,000)
Cambridge Senior Services - HACC Revenue (1,061,376) (1,124,500) (1,086,595) (1,146,000) (1,146,000)
Expenditure
Employee Costs
Salaries 816,414 829,000 854,659 841,700 841,700
Allowances 17,640 15,000 21,713 19,000 19,000
Superannuation 90,078 101,000 90,874 89,800 89,800
Workers Compensation 19,500 20,000 20,000 20,200 20,200
Uniforms/Protective Clothing & Equipment 1,801 3,000 1,132 3,600 3,600
Fringe Benefits Tax 7,877 7,000 6,699 6,600 6,600
Training 2,223 5,000 4,854 5,600 5,600
955,533 980,000 999,930 986,500 986,500
Office Expenses 11,150 9,500 11,541 9,500 9,500
IT & Other Equipment
Information Systems 5,044 6,000 5,044 6,000 6,000
Software Licences 4,672 5,000 4,672 5,500 5,500
Equipment Maintenance 1,000 1,640 1,000 1,000
Minor Equipment & Tools 3,978 1,500 4,968 3,000 3,000
13,694 13,500 16,324 15,500 15,500
Fleet & Plant Running Costs
Running Expenses 14,971 15,000 12,606 13,000 13,000
Fixed Costs 4,898 5,000 4,166 5,000 5,000
Repairs 4,178 4,000 3,608 4,000 4,000
24,047 24,000 20,381 22,000 22,000
Operational Expenses
Audit Fees 1,500 1,200 1,500 1,500
Advertising 1,000 200 1,000 1,000
Membership Subscriptions 182 500 450 500 500
Other Operational Expenses 25,369 1,000 1,009 1,000 1,000
25,551 4,000 2,859 4,000 4,000
________________________________________________________________________________________________Page 3.37

Town of Cambridge
Actual Budget Actual C'Fwd Budget Consolidated
30 Jun 2014 2014/2015 30 Jun 15 2015/2016 2015/2016 2015/2016
$ $ $ $ $ $
Res/ELA
CAMBRIDGE SENIOR SERVICES - HACC (Continued)
Other Expenses
Employee Recoverable Expenditure
Client Management Services 986 1,000 234 1,000 1,000
Contract Care Services 7,963 7,000 5,575 7,000 7,000
Conferences 500 500 500
Excursion Expenses 6,900 4,000 3,727
Fundraising Expenses 562 1,000 1,000 1,000
Home Maintenance Expenses 885 500 258
Provisions 27,707 28,000 24,522 26,000 26,000
Special Events 4,673 4,000 2,657 4,000 4,000
Meals (Home Delivered) 1,219 1,500 872 1,500 1,500
Volunteer Expenses 126
51,021 47,500 37,844 41,000 41,000
Infrastructure
Cleaning 345 1,000 668 1,000 1,000
Utilities 7,557 7,000 7,651 7,000 7,000
7,901 8,000 8,319 8,000 8,000
Loss on Disposal of Assets
Loss on Disposal of Assets 8,650 9,500 9,500
8,650 9,500 9,500
Internal Expenditure Allocations
Centre Outgoings Allocation 20,000 20,000 20,000 20,000 20,000
20,000 20,000 20,000 20,000 20,000
Sub-total 1,117,547 1,106,500 1,117,198 1,116,000 1,116,000
Depreciation 19,094 22,500 17,434 17,500 17,500
Cost Allocation (ABC) 106,629 114,200 111,930 117,000 117,000
Cambridge Senior Services - HACC Expenditure 1,243,269 1,243,200 1,246,562 1,250,500 1,250,500
Cambridge Senior Services - HACC (Net) 181,893 118,700 159,967 104,500 104,500
Less Partial Costs Allocated (88,629) (96,200) (93,930) (99,000) (99,000)
Less Loss on Disposal of Assets (8,650) (9,500) (9,500)
Less Depreciation (19,094) (22,500) (17,434) (17,500) (17,500)
Less Capital Grants 10,000 10,000
Transfer to/(from) Reserve 3,618 (2,765) Res 11,500 11,500
Funded by General Purpose Funds (50,289) (45,838)Cambridge Senior Services - HACC (Net) 18,850
________________________________________________________________________________________________Page 3.38

Town of Cambridge
Actual Budget Actual C'Fwd Budget Consolidated
30 Jun 2014 2014/2015 30 Jun 15 2015/2016 2015/2016 2015/2016
$ $ $ $ $ $
Res/ELA
WELFARE SERVICES
Expenditure
Employee Costs
Salaries 47,323 50,000 53,562 50,100 50,100
Superannuation 2,159 6,000 2,182 5,000 5,000
Workers Compensation 1,200 1,000 1,000 1,200 1,200
Uniforms/Protective Clothing & Equipment 100 100
Fringe Benefits Tax 298 500 304 300 300
Training 594 500 300 300
51,574 58,000 57,049 57,000 57,000
Programs
Disability Services 5,459 26,000 23,053 16,000 16,000
5,459 26,000 23,053 16,000 16,000
Contributions
Volunteer Task Force - Donation 3,500 3,500 3,500 3,500 3,500
People Who Care - Donation 1,000 1,000 1,000 1,000 1,000
Whitfords Sea Search and Rescue 5,000 5,000 5,000 5,000 5,000
Churchlands Senior High School 2,000 2,000 2,000 2,000 2,000
Shenton College - Chaplain Contribution 2,000 2,000 2,000 2,000 2,000
Lake Monger Primary School 500 500 500 500 500
West Leederville Primary School 500 500 500 500 500
Floreat Park Primary School 500 500 500 500 500
15,000 15,000 15,000 15,000 15,000
Non-Capital Works
Disability Access Projects 1,979 38,000 37,578 20,000 20,000
1,979 38,000 37,578 20,000 20,000
Sub-total 74,011 137,000 132,680 108,000 108,000
Depreciation 204 500
Cost Allocation (ABC) 29,393 32,900 31,278 33,500 33,500
Welfare Services Expenditure 103,609 170,400 163,958 141,500 141,500
Welfare Services (Net) 103,609 170,400 163,958 141,500 141,500
________________________________________________________________________________________________Page 3.39
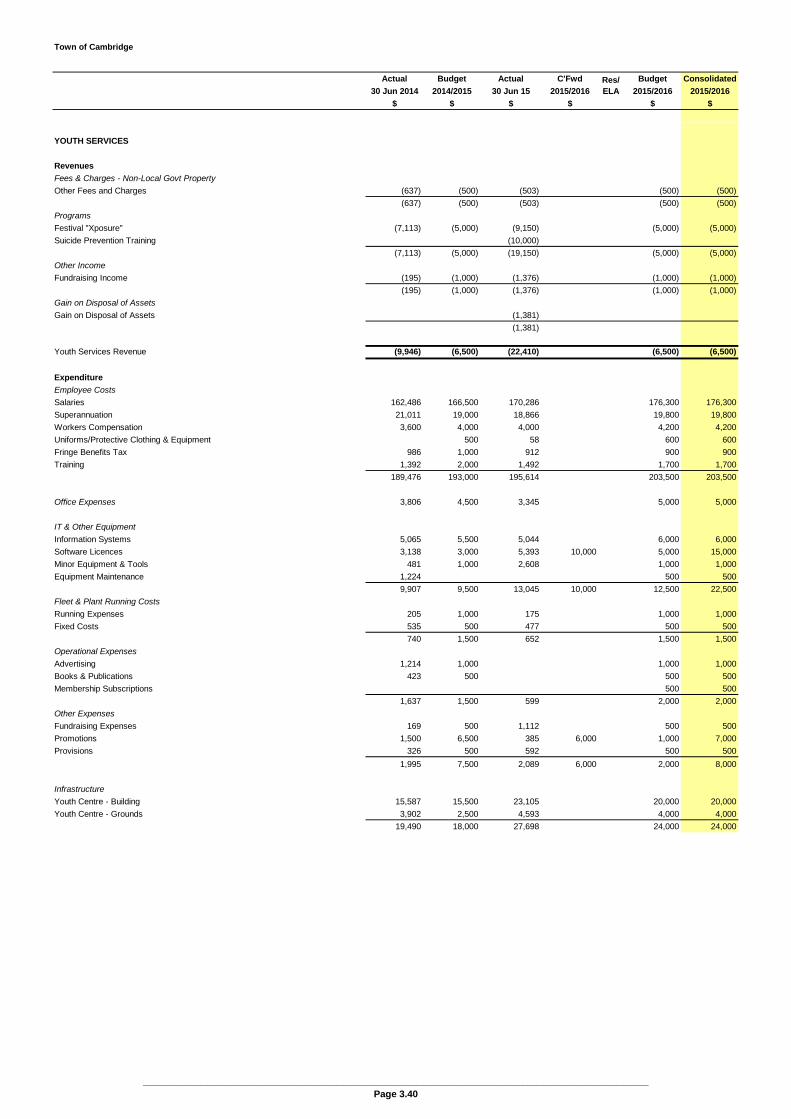
Town of Cambridge
Actual Budget Actual C'Fwd Budget Consolidated
30 Jun 2014 2014/2015 30 Jun 15 2015/2016 2015/2016 2015/2016
$ $ $ $ $ $
Res/ELA
YOUTH SERVICES
Revenues
Fees & Charges - Non-Local Govt Property
Other Fees and Charges (637) (500) (503) (500) (500)
(637) (500) (503) (500) (500)
Programs
Festival "Xposure" (7,113) (5,000) (9,150) (5,000) (5,000)
Suicide Prevention Training (10,000)
(7,113) (5,000) (19,150) (5,000) (5,000)
Other Income
Fundraising Income (195) (1,000) (1,376) (1,000) (1,000)
(195) (1,000) (1,376) (1,000) (1,000)
Gain on Disposal of Assets
Gain on Disposal of Assets (1,381)
(1,381)
Youth Services Revenue (9,946) (6,500) (22,410) (6,500) (6,500)
Expenditure
Employee Costs
Salaries 162,486 166,500 170,286 176,300 176,300
Superannuation 21,011 19,000 18,866 19,800 19,800
Workers Compensation 3,600 4,000 4,000 4,200 4,200
Uniforms/Protective Clothing & Equipment 500 58 600 600
Fringe Benefits Tax 986 1,000 912 900 900
Training 1,392 2,000 1,492 1,700 1,700
189,476 193,000 195,614 203,500 203,500
Office Expenses 3,806 4,500 3,345 5,000 5,000
IT & Other Equipment
Information Systems 5,065 5,500 5,044 6,000 6,000
Software Licences 3,138 3,000 5,393 10,000 5,000 15,000
Minor Equipment & Tools 481 1,000 2,608 1,000 1,000
Equipment Maintenance 1,224 500 500
9,907 9,500 13,045 10,000 12,500 22,500
Fleet & Plant Running Costs
Running Expenses 205 1,000 175 1,000 1,000
Fixed Costs 535 500 477 500 500
740 1,500 652 1,500 1,500
Operational Expenses
Advertising 1,214 1,000 1,000 1,000
Books & Publications 423 500 500 500
Membership Subscriptions 500 500
1,637 1,500 599 2,000 2,000
Other Expenses
Fundraising Expenses 169 500 1,112 500 500
Promotions 1,500 6,500 385 6,000 1,000 7,000
Provisions 326 500 592 500 500
1,995 7,500 2,089 6,000 2,000 8,000
Infrastructure
Youth Centre - Building 15,587 15,500 23,105 20,000 20,000
Youth Centre - Grounds 3,902 2,500 4,593 4,000 4,000
19,490 18,000 27,698 24,000 24,000
________________________________________________________________________________________________Page 3.40
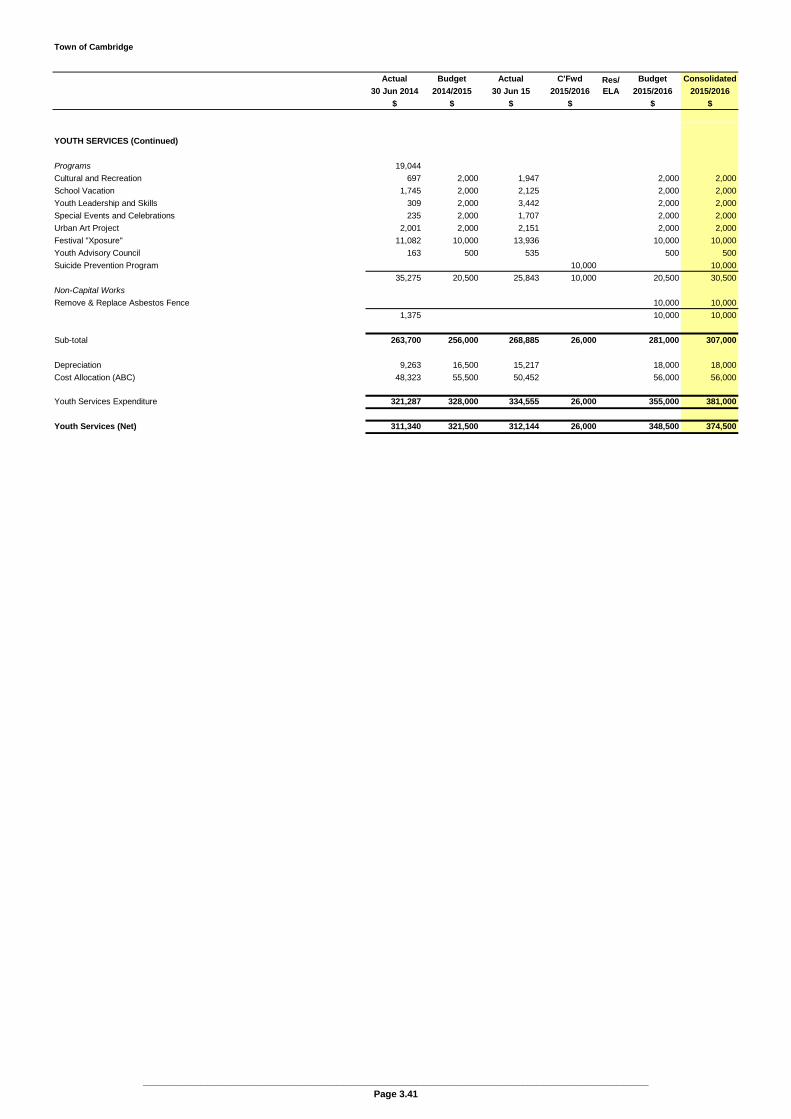
Town of Cambridge
Actual Budget Actual C'Fwd Budget Consolidated
30 Jun 2014 2014/2015 30 Jun 15 2015/2016 2015/2016 2015/2016
$ $ $ $ $ $
Res/ELA
YOUTH SERVICES (Continued)
Programs 19,044
Cultural and Recreation 697 2,000 1,947 2,000 2,000
School Vacation 1,745 2,000 2,125 2,000 2,000
Youth Leadership and Skills 309 2,000 3,442 2,000 2,000
Special Events and Celebrations 235 2,000 1,707 2,000 2,000
Urban Art Project 2,001 2,000 2,151 2,000 2,000
Festival "Xposure" 11,082 10,000 13,936 10,000 10,000
Youth Advisory Council 163 500 535 500 500
Suicide Prevention Program 10,000 10,000
35,275 20,500 25,843 10,000 20,500 30,500
Non-Capital Works
Remove & Replace Asbestos Fence 10,000 10,000
1,375 10,000 10,000
Sub-total 263,700 256,000 268,885 26,000 281,000 307,000
Depreciation 9,263 16,500 15,217 18,000 18,000
Cost Allocation (ABC) 48,323 55,500 50,452 56,000 56,000
Youth Services Expenditure 321,287 328,000 334,555 26,000 355,000 381,000
Youth Services (Net) 311,340 321,500 312,144 26,000 348,500 374,500
________________________________________________________________________________________________Page 3.41

Town of Cambridge
Actual Budget Actual C'Fwd Budget Consolidated
30 Jun 2014 2014/2015 30 Jun 15 2015/2016 2015/2016 2015/2016
$ $ $ $ $ $
Res/ELA
WASTE MANAGEMENT
Revenues
Reimbursements
Reimbursements - Other (1,136) (1,437)
(1,136) (1,437)
Non-Operating Grants & Subsidies
Recycling Bins 360 Litre (Waste Authority) (400,000) (216,000) (216,000)
(400,000) (216,000) (216,000)
Fees & Charges - Non-Local Govt Property
Non-Rated Property Bin Charges/Additional Bins/Upgrades (401,233) (432,000) (375,875) (390,000) (390,000)
Waste Fee (1,348,420) (1,352,000) (1,385,107) (1,368,000) (1,368,000)
Green Waste Fee (349,330) (392,000) (401,147) (430,000) (430,000)
(2,098,982) (2,176,000) (2,162,129) (2,188,000) (2,188,000)
Waste Management Revenue (2,100,118) (2,576,000) (2,163,565) (2,404,000) (2,404,000)
Expenditure
Employee Costs
Salaries 235,635 279,000 260,961 276,800 276,800
Allowances 502
Superannuation 27,663 36,000 27,421 36,100 36,100
Workers Compensation 4,800 7,000 7,000 6,800 6,800
Uniforms/Protective Clothing & Equipment 500 700 700
Fringe Benefits Tax 5,093 3,000 2,197 2,700 2,700Training 1,449 2,500 2,076 2,900 2,900
274,641 328,000 300,157 326,000 326,000
Office Expenses 2,317 5,000 4,013 5,000 5,000
Fleet & Plant Running Costs
Running Expenses 2,938 3,500 2,757 3,500 3,500
Fixed Costs 1,055 1,000 979 1,000 1,000
Repairs 23 500 500 500
4,017 5,000 3,736 5,000 5,000
Other Expenses
Client Management Services 58,321 61,000 58,666 61,000 61,000
Other Expenses 46,739 65,000 34,872 63,000 63,000
General Waste 628,559 665,000 596,361 627,000 627,000
Recycling 410,369 420,000 418,308 475,000 475,000
Verge Collection 449,420 475,000 457,850 483,000 483,000
Refuse Site Operations 1,165,837 1,185,000 1,088,052 1,370,000 1,370,000
Green Waste 268,753 290,000 313,233 310,000 310,000
Bin Repair & Replace Damage Bins 3,845 11,500 6,668 27,000 27,000
Public Litter Bins 167,954 183,000 165,599 190,000 190,000
Depot Waste Collection 8,765 14,000 6,282 10,000 10,000
3,208,562 3,369,500 3,145,891 3,616,000 3,616,000
Programs
E-Waste Collection 32,000 12,912 32,000 32,000
Replace St Be Tidy Bins 20 8,000 7,203 8,000 8,000
Waste Education Program 96,253 150,000 95,347 54,500 162,000 216,500
School Education Program 555 11,000 2,868 18,000 18,000
Exchange Program 61,068
157,897 201,000 118,331 54,500 220,000 274,500
Sub-total 3,657,433 3,908,500 3,572,127 54,500 4,172,000 4,226,500
Depreciation 99,829 129,000 168,375 173,500 173,500
Cost Allocation (ABC) 177,105 189,600 192,911 192,000 192,000
Waste Management Expenditure 3,934,367 4,227,100 3,933,413 54,500 4,537,500 4,592,000
Waste Management (Net) 1,834,250 1,651,100 1,769,847 54,500 2,133,500 2,188,000
________________________________________________________________________________________________Page 3.42
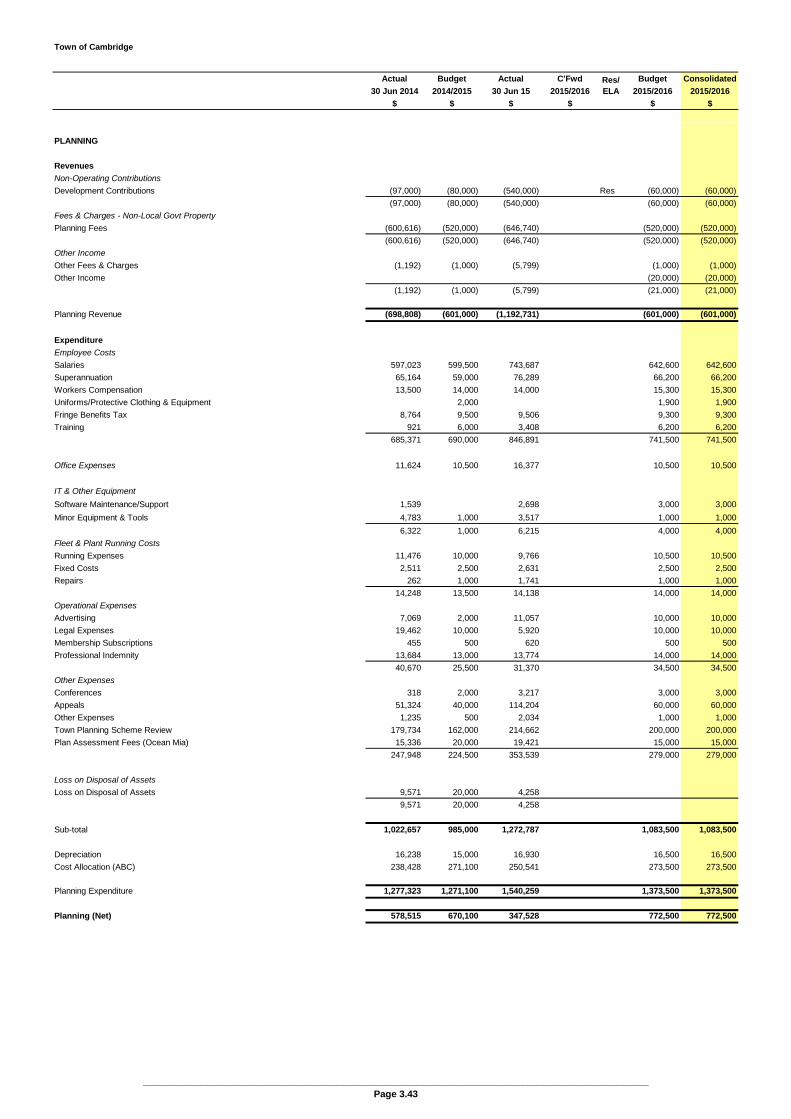
Town of Cambridge
Actual Budget Actual C'Fwd Budget Consolidated
30 Jun 2014 2014/2015 30 Jun 15 2015/2016 2015/2016 2015/2016
$ $ $ $ $ $
Res/ELA
PLANNING
Revenues
Non-Operating Contributions
Development Contributions (97,000) (80,000) (540,000) Res (60,000) (60,000)
(97,000) (80,000) (540,000) (60,000) (60,000)
Fees & Charges - Non-Local Govt Property
Planning Fees (600,616) (520,000) (646,740) (520,000) (520,000)
(600,616) (520,000) (646,740) (520,000) (520,000)
Other Income
Other Fees & Charges (1,192) (1,000) (5,799) (1,000) (1,000)
Other Income (20,000) (20,000)
(1,192) (1,000) (5,799) (21,000) (21,000)
Planning Revenue (698,808) (601,000) (1,192,731) (601,000) (601,000)
Expenditure
Employee Costs
Salaries 597,023 599,500 743,687 642,600 642,600
Superannuation 65,164 59,000 76,289 66,200 66,200
Workers Compensation 13,500 14,000 14,000 15,300 15,300
Uniforms/Protective Clothing & Equipment 2,000 1,900 1,900
Fringe Benefits Tax 8,764 9,500 9,506 9,300 9,300
Training 921 6,000 3,408 6,200 6,200
685,371 690,000 846,891 741,500 741,500
Office Expenses 11,624 10,500 16,377 10,500 10,500
IT & Other Equipment
Software Maintenance/Support 1,539 2,698 3,000 3,000
Minor Equipment & Tools 4,783 1,000 3,517 1,000 1,000
6,322 1,000 6,215 4,000 4,000
Fleet & Plant Running Costs
Running Expenses 11,476 10,000 9,766 10,500 10,500
Fixed Costs 2,511 2,500 2,631 2,500 2,500
Repairs 262 1,000 1,741 1,000 1,000
14,248 13,500 14,138 14,000 14,000
Operational Expenses
Advertising 7,069 2,000 11,057 10,000 10,000
Legal Expenses 19,462 10,000 5,920 10,000 10,000
Membership Subscriptions 455 500 620 500 500
Professional Indemnity 13,684 13,000 13,774 14,000 14,000
40,670 25,500 31,370 34,500 34,500
Other Expenses
Conferences 318 2,000 3,217 3,000 3,000
Appeals 51,324 40,000 114,204 60,000 60,000
Other Expenses 1,235 500 2,034 1,000 1,000
Town Planning Scheme Review 179,734 162,000 214,662 200,000 200,000
Plan Assessment Fees (Ocean Mia) 15,336 20,000 19,421 15,000 15,000
247,948 224,500 353,539 279,000 279,000
Loss on Disposal of Assets
Loss on Disposal of Assets 9,571 20,000 4,258
9,571 20,000 4,258
Sub-total 1,022,657 985,000 1,272,787 1,083,500 1,083,500
Depreciation 16,238 15,000 16,930 16,500 16,500
Cost Allocation (ABC) 238,428 271,100 250,541 273,500 273,500
Planning Expenditure 1,277,323 1,271,100 1,540,259 1,373,500 1,373,500
Planning (Net) 578,515 670,100 347,528 772,500 772,500
________________________________________________________________________________________________Page 3.43
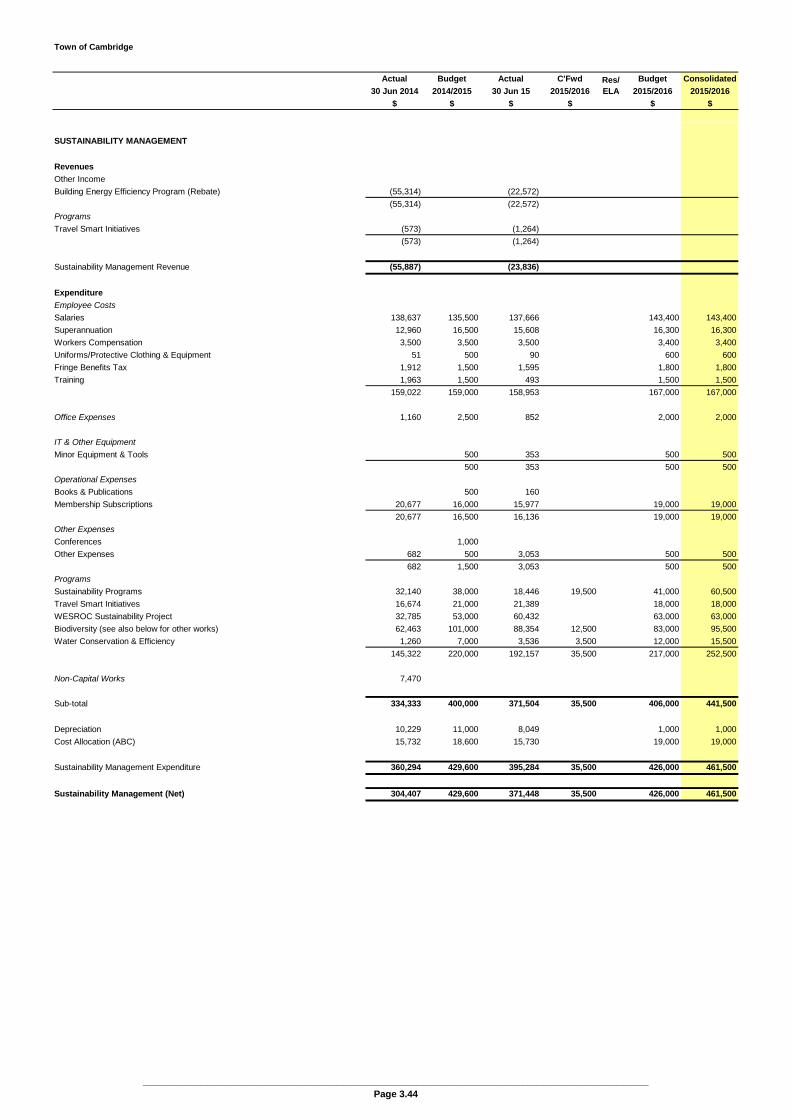
Town of Cambridge
Actual Budget Actual C'Fwd Budget Consolidated
30 Jun 2014 2014/2015 30 Jun 15 2015/2016 2015/2016 2015/2016
$ $ $ $ $ $
Res/ELA
SUSTAINABILITY MANAGEMENT
Revenues
Other Income
Building Energy Efficiency Program (Rebate) (55,314) (22,572)
(55,314) (22,572)
Programs
Travel Smart Initiatives (573) (1,264)
(573) (1,264)
Sustainability Management Revenue (55,887) (23,836)
Expenditure
Employee Costs
Salaries 138,637 135,500 137,666 143,400 143,400
Superannuation 12,960 16,500 15,608 16,300 16,300
Workers Compensation 3,500 3,500 3,500 3,400 3,400
Uniforms/Protective Clothing & Equipment 51 500 90 600 600
Fringe Benefits Tax 1,912 1,500 1,595 1,800 1,800
Training 1,963 1,500 493 1,500 1,500
159,022 159,000 158,953 167,000 167,000
Office Expenses 1,160 2,500 852 2,000 2,000
IT & Other Equipment
Minor Equipment & Tools 500 353 500 500
500 353 500 500
Operational Expenses
Books & Publications 500 160
Membership Subscriptions 20,677 16,000 15,977 19,000 19,000
20,677 16,500 16,136 19,000 19,000
Other Expenses
Conferences 1,000
Other Expenses 682 500 3,053 500 500
682 1,500 3,053 500 500
Programs
Sustainability Programs 32,140 38,000 18,446 19,500 41,000 60,500
Travel Smart Initiatives 16,674 21,000 21,389 18,000 18,000
WESROC Sustainability Project 32,785 53,000 60,432 63,000 63,000
Biodiversity (see also below for other works) 62,463 101,000 88,354 12,500 83,000 95,500
Water Conservation & Efficiency 1,260 7,000 3,536 3,500 12,000 15,500
145,322 220,000 192,157 35,500 217,000 252,500
Non-Capital Works 7,470
Sub-total 334,333 400,000 371,504 35,500 406,000 441,500
Depreciation 10,229 11,000 8,049 1,000 1,000
Cost Allocation (ABC) 15,732 18,600 15,730 19,000 19,000
Sustainability Management Expenditure 360,294 429,600 395,284 35,500 426,000 461,500
Sustainability Management (Net) 304,407 429,600 371,448 35,500 426,000 461,500
________________________________________________________________________________________________Page 3.44

Town of Cambridge
Actual Budget Actual C'Fwd Budget Consolidated
30 Jun 2014 2014/2015 30 Jun 15 2015/2016 2015/2016 2015/2016
$ $ $ $ $ $
Res/ELA
WEMBLEY COMMUNITY CENTRE
Revenues
Fees & Charges - Local Govt Property
Facilities Hire Fees (95,652) (91,000) (94,228) (93,500) (93,500)
Catering Income (24,172) (33,500) (34,182) (34,500) (34,500)
(119,824) (124,500) (128,410) (128,000) (128,000)
Internal Revenue Allocations
Centre Outgoings Recovered (20,000) (20,000) (20,000) (20,000) (20,000)(20,000) (20,000) (20,000) (20,000) (20,000)
Wembley Community Centre Revenue (142,346) (144,500) (148,410) (148,000) (148,000)
Expenditure
Employee Costs
Salaries 75,193 81,500 80,425 83,400 83,400
Allowances 500 27
Superannuation 7,860 8,500 8,225 8,600 8,600
Workers Compensation 1,900 2,000 2,000 2,000 2,000
Uniforms/Protective Clothing & Equipment 359 500 357 300 300
Fringe Benefits Tax 298 500 304 300 300
Training 815 1,000 373 900 900
86,425 94,500 91,710 95,500 95,500
Office Expenses 3,232 3,000 2,472 3,000 3,000
IT & Other Equipment
Software Licences 1,578 2,000 1,578 2,000 2,000
Equipment Maintenance 11 1,000 605 1,000 1,000
Minor Equipment & Tools 5,703 2,000 1,268 2,000 2,000
7,292 5,000 3,451 5,000 5,000
Operational Expenses
Bank & Agency Charges 461 500 685 500 500
Licences 164 500 168 500 500
625 1,000 853 1,000 1,000
Other Expenses
Provisions 2,867 2,000 2,975 3,000 3,000
2,867 2,000 2,975 3,000 3,000
Infrastructure
Wembley Community Centre - Building 124,908 120,500 135,282 135,000 135,000
Wembley Community Centre - Grounds 13,590 8,000 15,808 14,000 14,000
138,497 128,500 151,090 149,000 149,000
________________________________________________________________________________________________Page 3.45
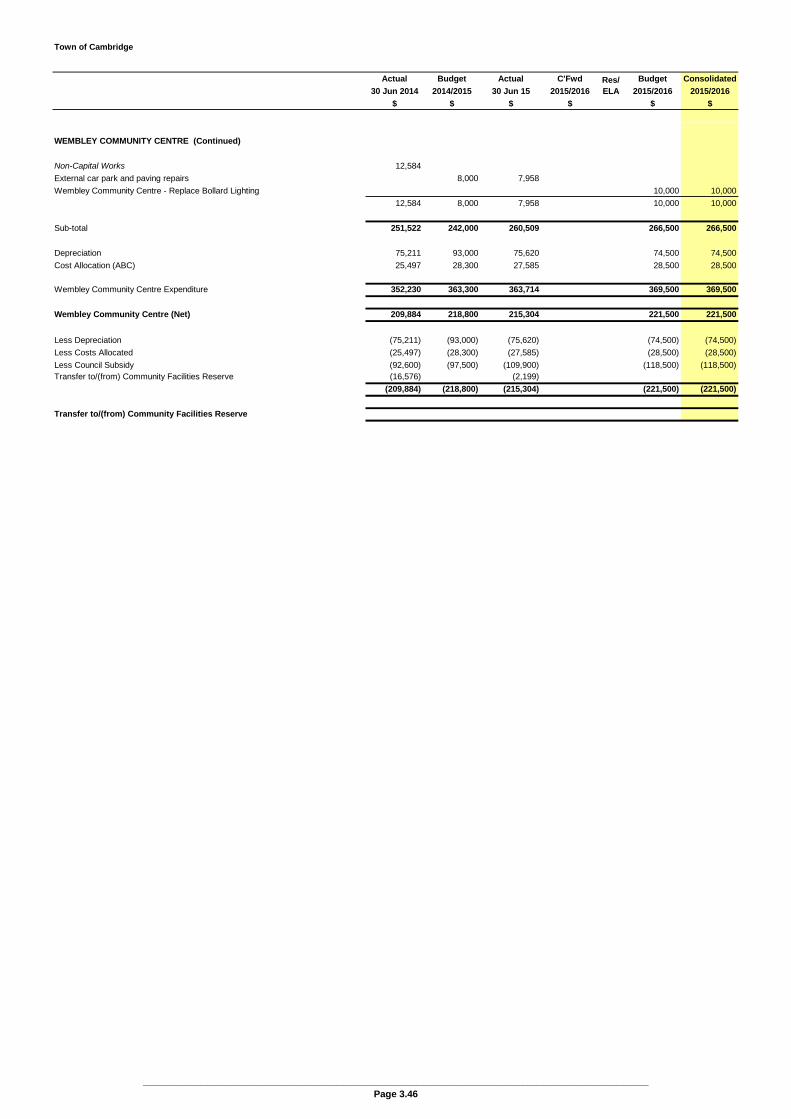
Town of Cambridge
Actual Budget Actual C'Fwd Budget Consolidated
30 Jun 2014 2014/2015 30 Jun 15 2015/2016 2015/2016 2015/2016
$ $ $ $ $ $
Res/ELA
WEMBLEY COMMUNITY CENTRE (Continued)
Non-Capital Works 12,584
External car park and paving repairs 8,000 7,958
Wembley Community Centre - Replace Bollard Lighting 10,000 10,000
12,584 8,000 7,958 10,000 10,000
Sub-total 251,522 242,000 260,509 266,500 266,500
Depreciation 75,211 93,000 75,620 74,500 74,500
Cost Allocation (ABC) 25,497 28,300 27,585 28,500 28,500
Wembley Community Centre Expenditure 352,230 363,300 363,714 369,500 369,500
Wembley Community Centre (Net) 209,884 218,800 215,304 221,500 221,500
Less Depreciation (75,211) (93,000) (75,620) (74,500) (74,500)
Less Costs Allocated (25,497) (28,300) (27,585) (28,500) (28,500)
Less Council Subsidy (92,600) (97,500) (109,900) (118,500) (118,500)Transfer to/(from) Community Facilities Reserve (16,576) (2,199)
(209,884) (218,800) (215,304) (221,500) (221,500)
Transfer to/(from) Community Facilities Reserve
________________________________________________________________________________________________Page 3.46
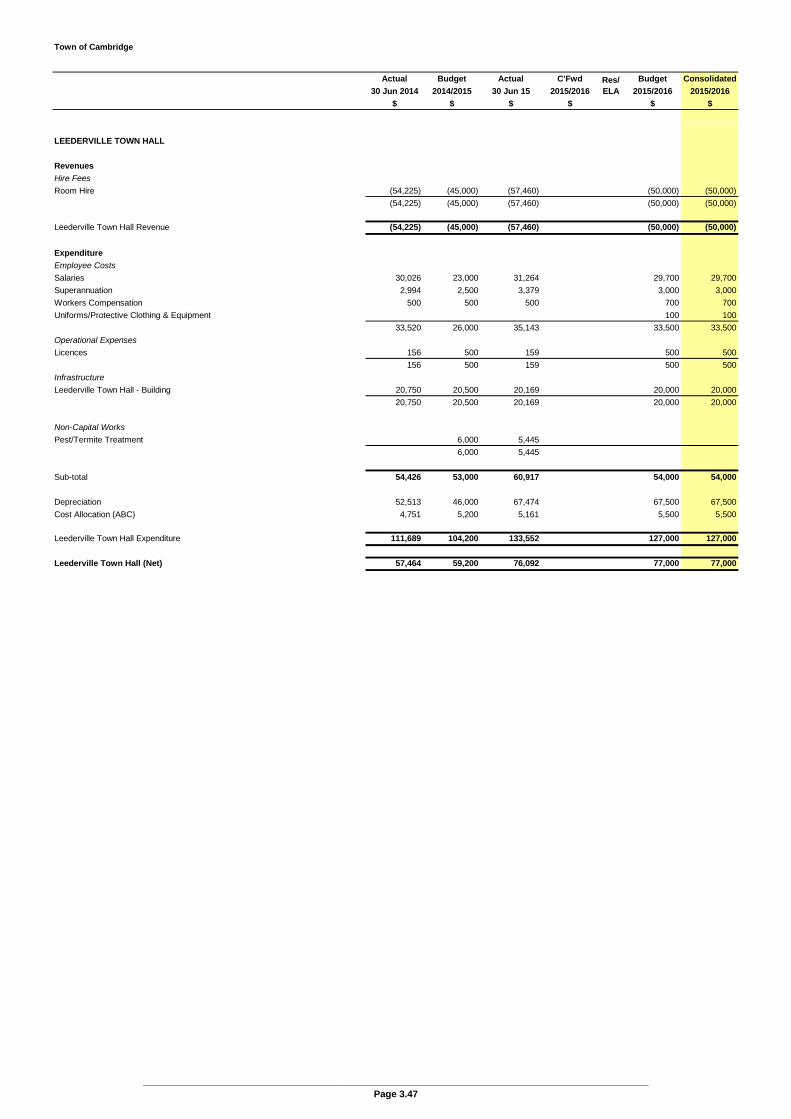
Town of Cambridge
Actual Budget Actual C'Fwd Budget Consolidated
30 Jun 2014 2014/2015 30 Jun 15 2015/2016 2015/2016 2015/2016
$ $ $ $ $ $
Res/ELA
LEEDERVILLE TOWN HALL
Revenues
Hire Fees
Room Hire (54,225) (45,000) (57,460) (50,000) (50,000)
(54,225) (45,000) (57,460) (50,000) (50,000)
Leederville Town Hall Revenue (54,225) (45,000) (57,460) (50,000) (50,000)
Expenditure
Employee Costs
Salaries 30,026 23,000 31,264 29,700 29,700
Superannuation 2,994 2,500 3,379 3,000 3,000
Workers Compensation 500 500 500 700 700
Uniforms/Protective Clothing & Equipment 100 100
33,520 26,000 35,143 33,500 33,500
Operational Expenses
Licences 156 500 159 500 500
156 500 159 500 500
Infrastructure
Leederville Town Hall - Building 20,750 20,500 20,169 20,000 20,000
20,750 20,500 20,169 20,000 20,000
Non-Capital Works
Pest/Termite Treatment 6,000 5,445
6,000 5,445
Sub-total 54,426 53,000 60,917 54,000 54,000
Depreciation 52,513 46,000 67,474 67,500 67,500
Cost Allocation (ABC) 4,751 5,200 5,161 5,500 5,500
Leederville Town Hall Expenditure 111,689 104,200 133,552 127,000 127,000
Leederville Town Hall (Net) 57,464 59,200 76,092 77,000 77,000
________________________________________________________________________________________________Page 3.47
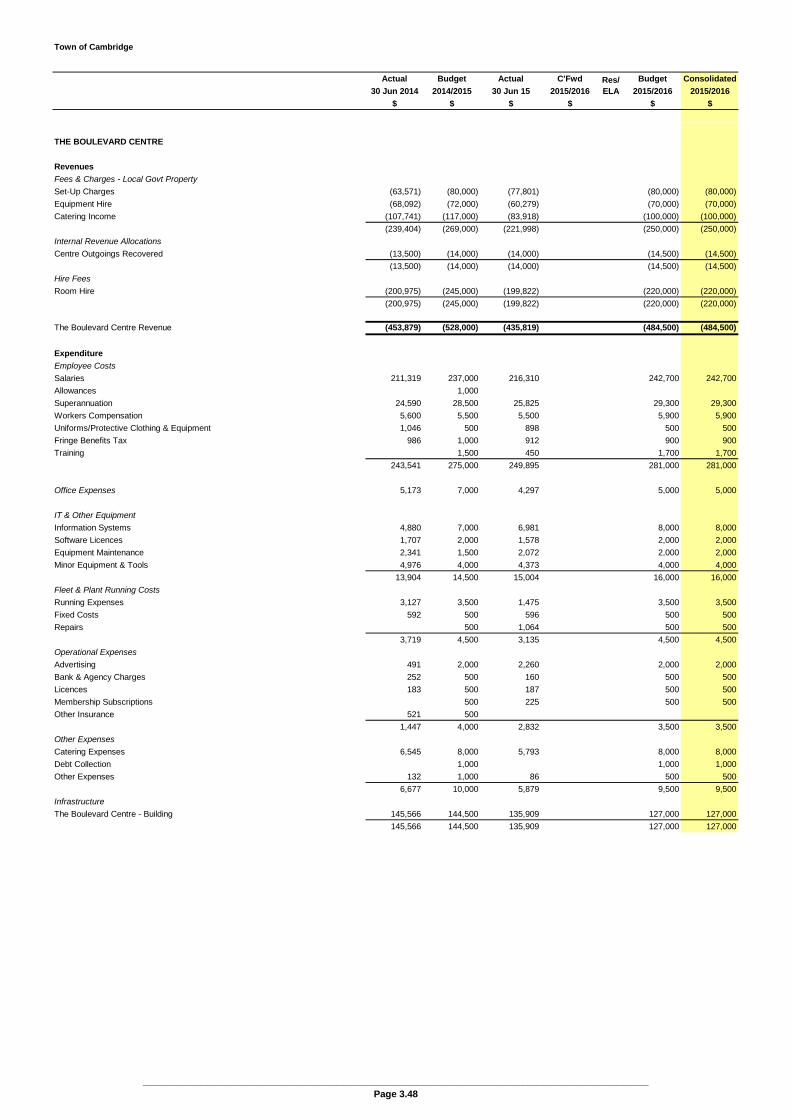
Town of Cambridge
Actual Budget Actual C'Fwd Budget Consolidated
30 Jun 2014 2014/2015 30 Jun 15 2015/2016 2015/2016 2015/2016
$ $ $ $ $ $
Res/ELA
THE BOULEVARD CENTRE
Revenues
Fees & Charges - Local Govt Property
Set-Up Charges (63,571) (80,000) (77,801) (80,000) (80,000)
Equipment Hire (68,092) (72,000) (60,279) (70,000) (70,000)
Catering Income (107,741) (117,000) (83,918) (100,000) (100,000)
(239,404) (269,000) (221,998) (250,000) (250,000)
Internal Revenue Allocations
Centre Outgoings Recovered (13,500) (14,000) (14,000) (14,500) (14,500)
(13,500) (14,000) (14,000) (14,500) (14,500)
Hire Fees
Room Hire (200,975) (245,000) (199,822) (220,000) (220,000)
(200,975) (245,000) (199,822) (220,000) (220,000)
The Boulevard Centre Revenue (453,879) (528,000) (435,819) (484,500) (484,500)
Expenditure
Employee Costs
Salaries 211,319 237,000 216,310 242,700 242,700
Allowances 1,000
Superannuation 24,590 28,500 25,825 29,300 29,300
Workers Compensation 5,600 5,500 5,500 5,900 5,900
Uniforms/Protective Clothing & Equipment 1,046 500 898 500 500
Fringe Benefits Tax 986 1,000 912 900 900
Training 1,500 450 1,700 1,700
243,541 275,000 249,895 281,000 281,000
Office Expenses 5,173 7,000 4,297 5,000 5,000
IT & Other Equipment
Information Systems 4,880 7,000 6,981 8,000 8,000
Software Licences 1,707 2,000 1,578 2,000 2,000
Equipment Maintenance 2,341 1,500 2,072 2,000 2,000
Minor Equipment & Tools 4,976 4,000 4,373 4,000 4,000
13,904 14,500 15,004 16,000 16,000
Fleet & Plant Running Costs
Running Expenses 3,127 3,500 1,475 3,500 3,500
Fixed Costs 592 500 596 500 500
Repairs 500 1,064 500 500
3,719 4,500 3,135 4,500 4,500
Operational Expenses
Advertising 491 2,000 2,260 2,000 2,000
Bank & Agency Charges 252 500 160 500 500
Licences 183 500 187 500 500
Membership Subscriptions 500 225 500 500
Other Insurance 521 500
1,447 4,000 2,832 3,500 3,500
Other Expenses
Catering Expenses 6,545 8,000 5,793 8,000 8,000
Debt Collection 1,000 1,000 1,000
Other Expenses 132 1,000 86 500 500
6,677 10,000 5,879 9,500 9,500
Infrastructure
The Boulevard Centre - Building 145,566 144,500 135,909 127,000 127,000
145,566 144,500 135,909 127,000 127,000
________________________________________________________________________________________________Page 3.48

Town of Cambridge
Actual Budget Actual C'Fwd Budget Consolidated
30 Jun 2014 2014/2015 30 Jun 15 2015/2016 2015/2016 2015/2016
$ $ $ $ $ $
Res/ELA
THE BOULEVARD CENTRE (Continued)
Non-Capital WorksDisabled Toilet Auto Door ResTOC Permanent Car Park ResAirconditioning System Upgrade 5,000 5,054Fluro lights replacement with LED 18,000Oceanic Projector screen & Curtain 3,996Non-Capital Works 21,996 5,000 5,054
Loss on Disposal of Assets
Loss on Disposal of Assets 6,500 6,374
6,500 6,374
Sub-total 442,116 471,000 428,379 446,500 446,500
Depreciation 94,515 91,000 118,485 120,500 120,500
Cost Allocation (ABC) 22,974 24,300 24,439 24,500 24,500
The Boulevard Centre Expenditure 559,605 586,300 571,303 591,500 591,500
The Boulevard Centre (Net) 105,726 58,300 135,484 107,000 107,000
Less Depreciation (94,515) (91,000) (118,485) (120,500) (120,500)
Less Disposal of Plant (6,500) (6,374)
Transfer to/(from) Reserve operations (39,215) (13,800) (46,871) (39,500) (39,500)
Transfer to/(from) Reserve non capital works (21,996) (5,054)
Dividend to Town 50,000 51,500 41,300 53,000 53,000
Subtotal (105,726) (58,300) (135,484) (107,000) (107,000)
Transfer to (from) Reserve
________________________________________________________________________________________________Page 3.49
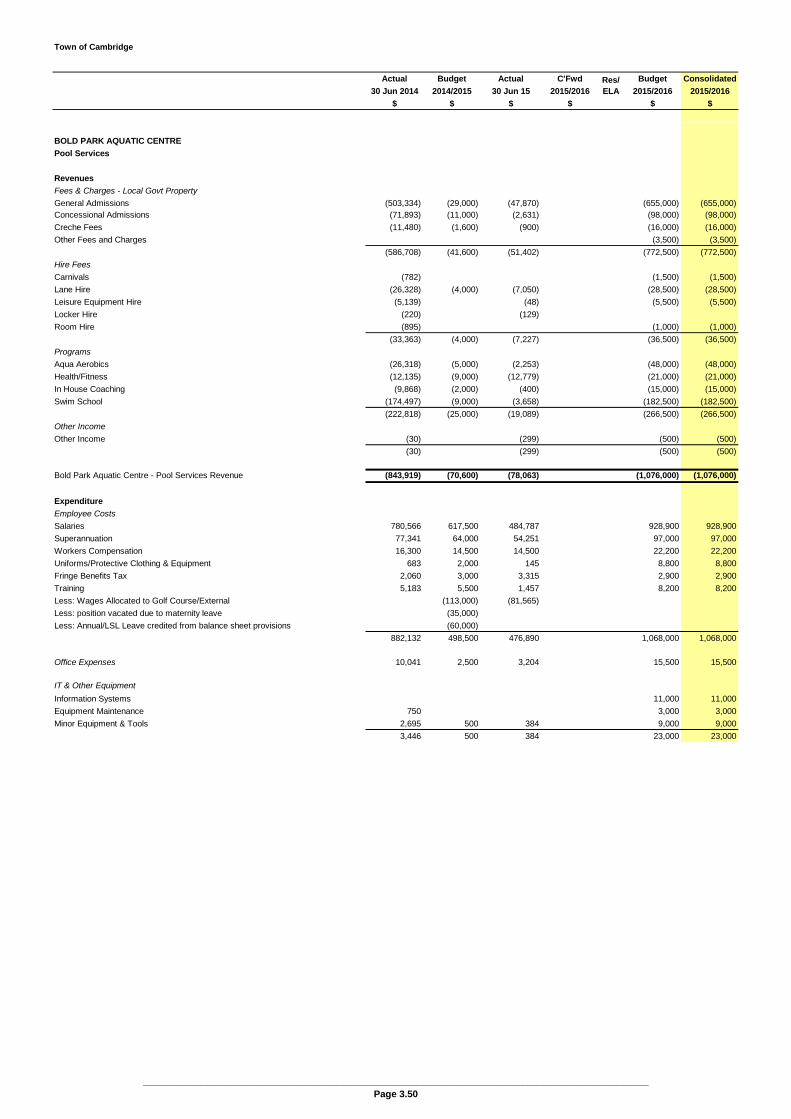
Town of Cambridge
Actual Budget Actual C'Fwd Budget Consolidated
30 Jun 2014 2014/2015 30 Jun 15 2015/2016 2015/2016 2015/2016
$ $ $ $ $ $
Res/ELA
BOLD PARK AQUATIC CENTRE
Pool Services
Revenues
Fees & Charges - Local Govt Property
General Admissions (503,334) (29,000) (47,870) (655,000) (655,000)Concessional Admissions (71,893) (11,000) (2,631) (98,000) (98,000)
Creche Fees (11,480) (1,600) (900) (16,000) (16,000)
Other Fees and Charges (3,500) (3,500)
(586,708) (41,600) (51,402) (772,500) (772,500)
Hire Fees
Carnivals (782) (1,500) (1,500)
Lane Hire (26,328) (4,000) (7,050) (28,500) (28,500)
Leisure Equipment Hire (5,139) (48) (5,500) (5,500)
Locker Hire (220) (129)
Room Hire (895) (1,000) (1,000)
(33,363) (4,000) (7,227) (36,500) (36,500)
Programs
Aqua Aerobics (26,318) (5,000) (2,253) (48,000) (48,000)
Health/Fitness (12,135) (9,000) (12,779) (21,000) (21,000)
In House Coaching (9,868) (2,000) (400) (15,000) (15,000)
Swim School (174,497) (9,000) (3,658) (182,500) (182,500)
(222,818) (25,000) (19,089) (266,500) (266,500)
Other Income
Other Income (30) (299) (500) (500)
(30) (299) (500) (500)
Bold Park Aquatic Centre - Pool Services Revenue (843,919) (70,600) (78,063) (1,076,000) (1,076,000)
Expenditure
Employee Costs
Salaries 780,566 617,500 484,787 928,900 928,900
Superannuation 77,341 64,000 54,251 97,000 97,000
Workers Compensation 16,300 14,500 14,500 22,200 22,200
Uniforms/Protective Clothing & Equipment 683 2,000 145 8,800 8,800
Fringe Benefits Tax 2,060 3,000 3,315 2,900 2,900
Training 5,183 5,500 1,457 8,200 8,200
Less: Wages Allocated to Golf Course/External (113,000) (81,565)
Less: position vacated due to maternity leave (35,000)
Less: Annual/LSL Leave credited from balance sheet provisions (60,000)
882,132 498,500 476,890 1,068,000 1,068,000
Office Expenses 10,041 2,500 3,204 15,500 15,500
IT & Other Equipment
Information Systems 11,000 11,000
Equipment Maintenance 750 3,000 3,000
Minor Equipment & Tools 2,695 500 384 9,000 9,000
3,446 500 384 23,000 23,000
________________________________________________________________________________________________Page 3.50
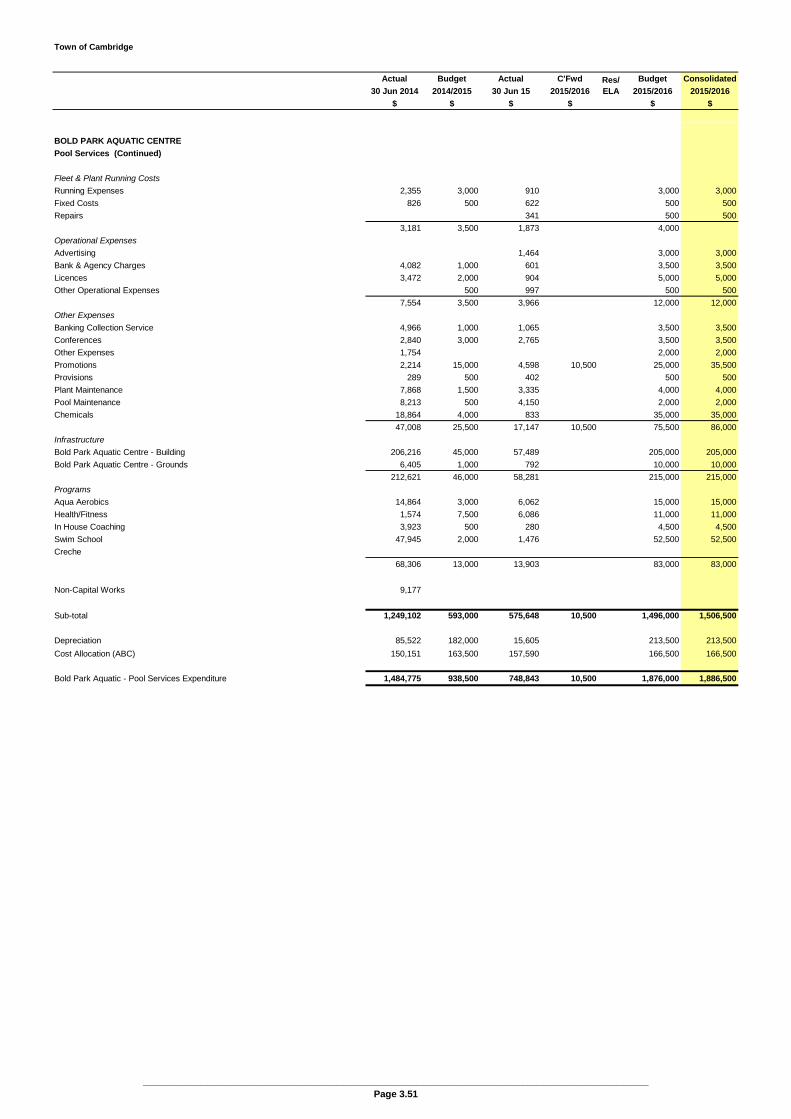
Town of Cambridge
Actual Budget Actual C'Fwd Budget Consolidated
30 Jun 2014 2014/2015 30 Jun 15 2015/2016 2015/2016 2015/2016
$ $ $ $ $ $
Res/ELA
BOLD PARK AQUATIC CENTRE
Pool Services (Continued)
Fleet & Plant Running Costs
Running Expenses 2,355 3,000 910 3,000 3,000
Fixed Costs 826 500 622 500 500
Repairs 341 500 500
3,181 3,500 1,873 4,000
Operational Expenses
Advertising 1,464 3,000 3,000
Bank & Agency Charges 4,082 1,000 601 3,500 3,500
Licences 3,472 2,000 904 5,000 5,000
Other Operational Expenses 500 997 500 500
7,554 3,500 3,966 12,000 12,000
Other Expenses
Banking Collection Service 4,966 1,000 1,065 3,500 3,500
Conferences 2,840 3,000 2,765 3,500 3,500
Other Expenses 1,754 2,000 2,000
Promotions 2,214 15,000 4,598 10,500 25,000 35,500
Provisions 289 500 402 500 500
Plant Maintenance 7,868 1,500 3,335 4,000 4,000
Pool Maintenance 8,213 500 4,150 2,000 2,000
Chemicals 18,864 4,000 833 35,000 35,000
47,008 25,500 17,147 10,500 75,500 86,000
Infrastructure
Bold Park Aquatic Centre - Building 206,216 45,000 57,489 205,000 205,000
Bold Park Aquatic Centre - Grounds 6,405 1,000 792 10,000 10,000
212,621 46,000 58,281 215,000 215,000
Programs
Aqua Aerobics 14,864 3,000 6,062 15,000 15,000
Health/Fitness 1,574 7,500 6,086 11,000 11,000
In House Coaching 3,923 500 280 4,500 4,500
Swim School 47,945 2,000 1,476 52,500 52,500
Creche
68,306 13,000 13,903 83,000 83,000
Non-Capital Works 9,177
Sub-total 1,249,102 593,000 575,648 10,500 1,496,000 1,506,500
Depreciation 85,522 182,000 15,605 213,500 213,500
Cost Allocation (ABC) 150,151 163,500 157,590 166,500 166,500
Bold Park Aquatic - Pool Services Expenditure 1,484,775 938,500 748,843 10,500 1,876,000 1,886,500
________________________________________________________________________________________________Page 3.51
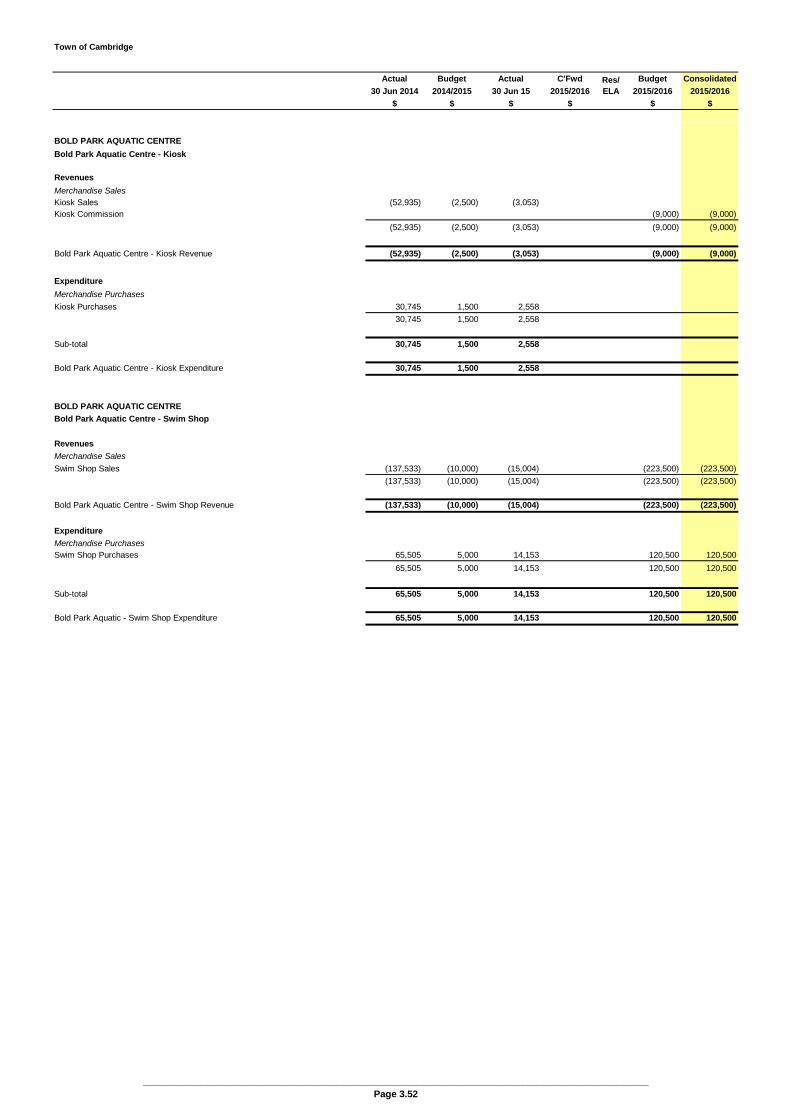
Town of Cambridge
Actual Budget Actual C'Fwd Budget Consolidated
30 Jun 2014 2014/2015 30 Jun 15 2015/2016 2015/2016 2015/2016
$ $ $ $ $ $
Res/ELA
BOLD PARK AQUATIC CENTRE
Bold Park Aquatic Centre - Kiosk
Revenues
Merchandise SalesKiosk Sales (52,935) (2,500) (3,053)Kiosk Commission (9,000) (9,000)
(52,935) (2,500) (3,053) (9,000) (9,000)
Bold Park Aquatic Centre - Kiosk Revenue (52,935) (2,500) (3,053) (9,000) (9,000)
Expenditure
Merchandise Purchases
Kiosk Purchases 30,745 1,500 2,558
30,745 1,500 2,558
Sub-total 30,745 1,500 2,558
Bold Park Aquatic Centre - Kiosk Expenditure 30,745 1,500 2,558
BOLD PARK AQUATIC CENTRE
Bold Park Aquatic Centre - Swim Shop
Revenues
Merchandise Sales
Swim Shop Sales (137,533) (10,000) (15,004) (223,500) (223,500)
(137,533) (10,000) (15,004) (223,500) (223,500)
Bold Park Aquatic Centre - Swim Shop Revenue (137,533) (10,000) (15,004) (223,500) (223,500)
Expenditure
Merchandise PurchasesSwim Shop Purchases 65,505 5,000 14,153 120,500 120,500
65,505 5,000 14,153 120,500 120,500
Sub-total 65,505 5,000 14,153 120,500 120,500
Bold Park Aquatic - Swim Shop Expenditure 65,505 5,000 14,153 120,500 120,500
________________________________________________________________________________________________Page 3.52

Town of Cambridge
Actual Budget Actual C'Fwd Budget Consolidated
30 Jun 2014 2014/2015 30 Jun 15 2015/2016 2015/2016 2015/2016
$ $ $ $ $ $
Res/ELA
BOLD PARK AQUATIC CENTREConsolidated Financial Summary
Pool Services (exluding CSRFF Capital Grant) 640,856 867,900 670,780 10,500 800,000 800,000Kiosk (22,190) (1,000) (495) (9,000) (9,000)Swim Shop (72,028) (5,000) (851) (103,000) (103,000)
546,638 861,900 669,434 10,500 688,000 698,500
0
Less Depreciation (85,522) (182,000) (15,605) (213,500) (213,500)
Less Costs Allocated (150,151) (163,500) (157,590) (166,500) (166,500)
Less Council Subsidy (310,964) (516,400) (496,239) (308,000) (308,000)
(546,638) (861,900) (669,434) (688,000) (688,000)
Bold Park Aquatic Centre (Net)
________________________________________________________________________________________________Page 3.53
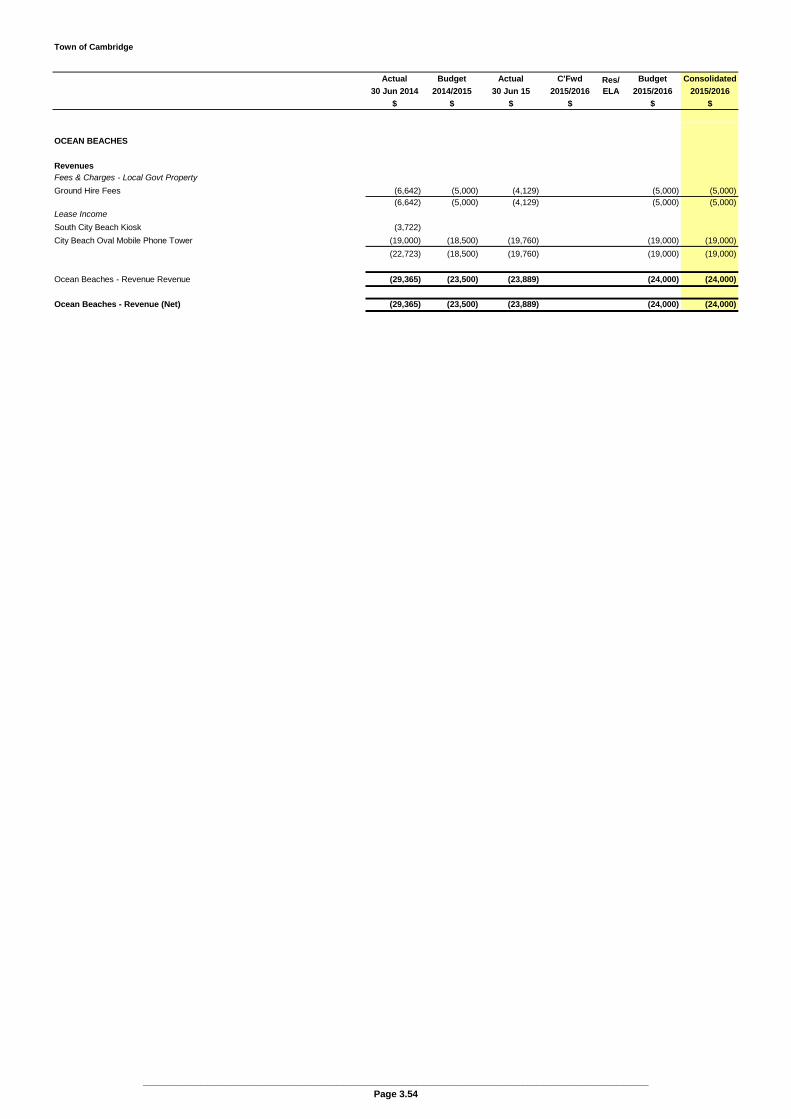
Town of Cambridge
Actual Budget Actual C'Fwd Budget Consolidated
30 Jun 2014 2014/2015 30 Jun 15 2015/2016 2015/2016 2015/2016
$ $ $ $ $ $
Res/ELA
OCEAN BEACHES
RevenuesFees & Charges - Local Govt Property
Ground Hire Fees (6,642) (5,000) (4,129) (5,000) (5,000)(6,642) (5,000) (4,129) (5,000) (5,000)
Lease Income
South City Beach Kiosk (3,722)
City Beach Oval Mobile Phone Tower (19,000) (18,500) (19,760) (19,000) (19,000)
(22,723) (18,500) (19,760) (19,000) (19,000)
Ocean Beaches - Revenue Revenue (29,365) (23,500) (23,889) (24,000) (24,000)
Ocean Beaches - Revenue (Net) (29,365) (23,500) (23,889) (24,000) (24,000)
________________________________________________________________________________________________Page 3.54
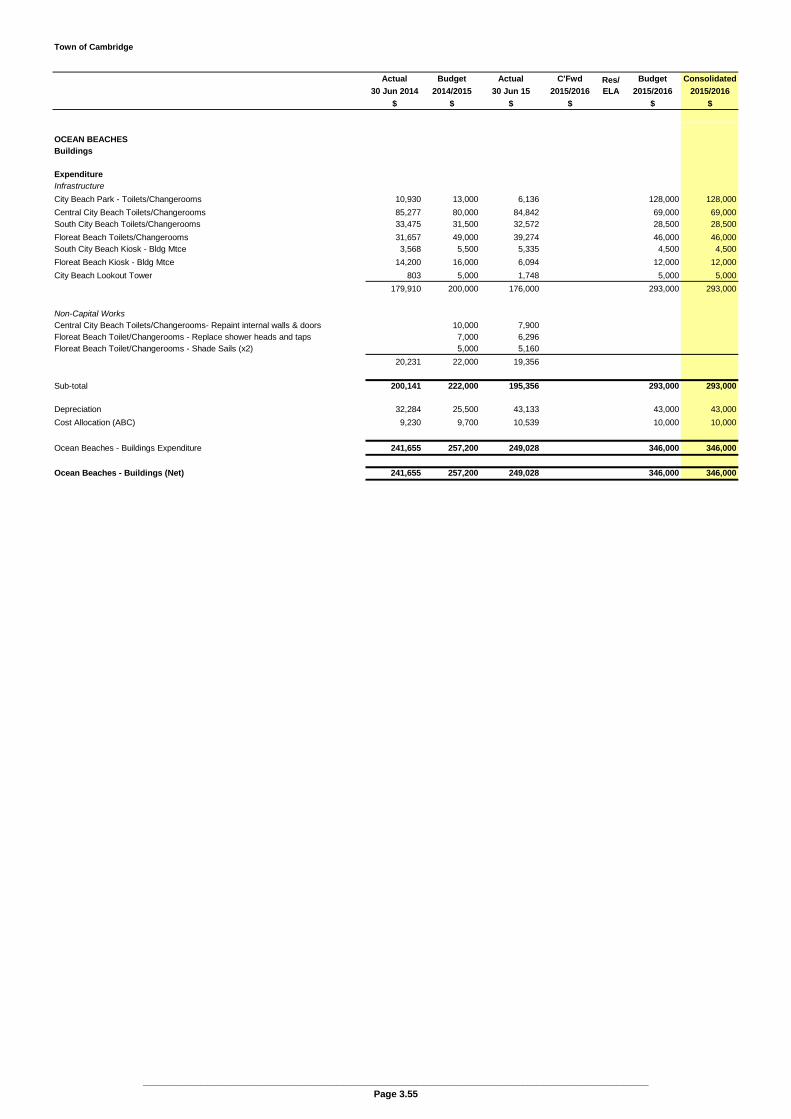
Town of Cambridge
Actual Budget Actual C'Fwd Budget Consolidated
30 Jun 2014 2014/2015 30 Jun 15 2015/2016 2015/2016 2015/2016
$ $ $ $ $ $
Res/ELA
OCEAN BEACHESBuildings
ExpenditureInfrastructure
City Beach Park - Toilets/Changerooms 10,930 13,000 6,136 128,000 128,000
Central City Beach Toilets/Changerooms 85,277 80,000 84,842 69,000 69,000South City Beach Toilets/Changerooms 33,475 31,500 32,572 28,500 28,500
Floreat Beach Toilets/Changerooms 31,657 49,000 39,274 46,000 46,000South City Beach Kiosk - Bldg Mtce 3,568 5,500 5,335 4,500 4,500
Floreat Beach Kiosk - Bldg Mtce 14,200 16,000 6,094 12,000 12,000
City Beach Lookout Tower 803 5,000 1,748 5,000 5,000
179,910 200,000 176,000 293,000 293,000
Non-Capital WorksCentral City Beach Toilets/Changerooms- Repaint internal walls & doors 10,000 7,900Floreat Beach Toilet/Changerooms - Replace shower heads and taps 7,000 6,296Floreat Beach Toilet/Changerooms - Shade Sails (x2) 5,000 5,160
20,231 22,000 19,356
Sub-total 200,141 222,000 195,356 293,000 293,000
Depreciation 32,284 25,500 43,133 43,000 43,000
Cost Allocation (ABC) 9,230 9,700 10,539 10,000 10,000
Ocean Beaches - Buildings Expenditure 241,655 257,200 249,028 346,000 346,000
Ocean Beaches - Buildings (Net) 241,655 257,200 249,028 346,000 346,000
________________________________________________________________________________________________Page 3.55
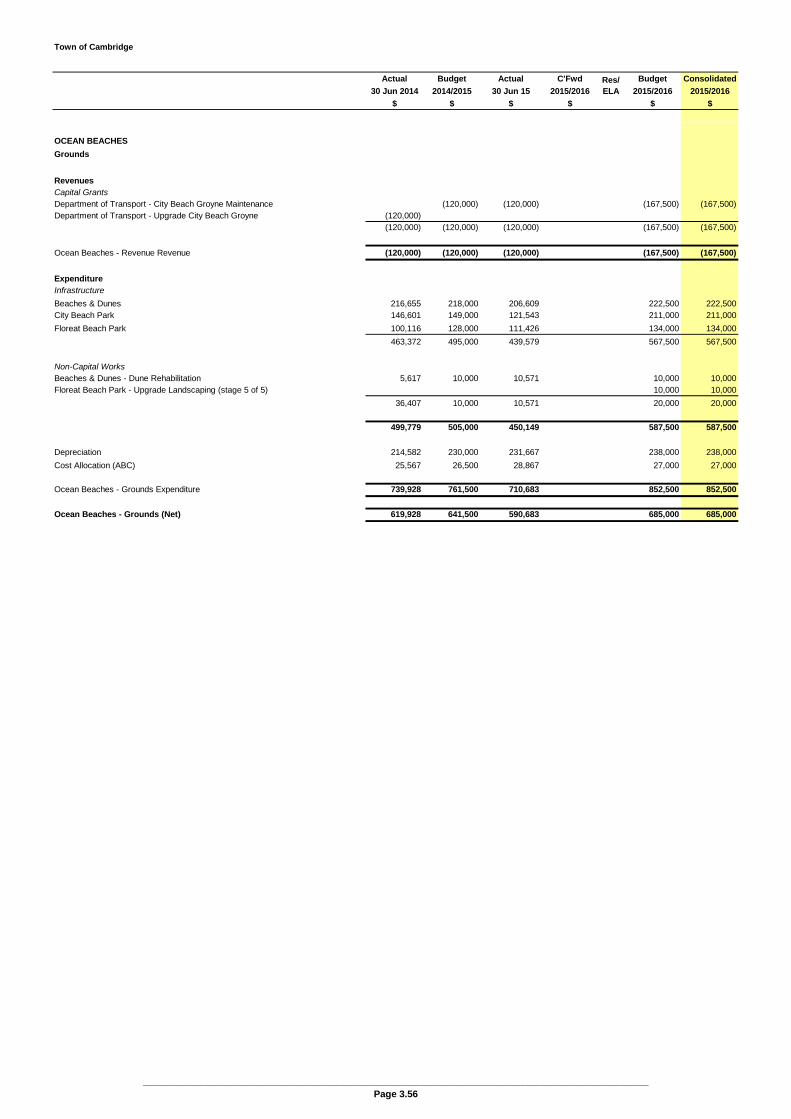
Town of Cambridge
Actual Budget Actual C'Fwd Budget Consolidated
30 Jun 2014 2014/2015 30 Jun 15 2015/2016 2015/2016 2015/2016
$ $ $ $ $ $
Res/ELA
OCEAN BEACHES
Grounds
RevenuesCapital GrantsDepartment of Transport - City Beach Groyne Maintenance (120,000) (120,000) (167,500) (167,500)Department of Transport - Upgrade City Beach Groyne (120,000)
(120,000) (120,000) (120,000) (167,500) (167,500)
Ocean Beaches - Revenue Revenue (120,000) (120,000) (120,000) (167,500) (167,500)
ExpenditureInfrastructure
Beaches & Dunes 216,655 218,000 206,609 222,500 222,500City Beach Park 146,601 149,000 121,543 211,000 211,000
Floreat Beach Park 100,116 128,000 111,426 134,000 134,000
463,372 495,000 439,579 567,500 567,500
Non-Capital WorksBeaches & Dunes - Dune Rehabilitation 5,617 10,000 10,571 10,000 10,000Floreat Beach Park - Upgrade Landscaping (stage 5 of 5) 10,000 10,000
36,407 10,000 10,571 20,000 20,000
499,779 505,000 450,149 587,500 587,500
Depreciation 214,582 230,000 231,667 238,000 238,000
Cost Allocation (ABC) 25,567 26,500 28,867 27,000 27,000
Ocean Beaches - Grounds Expenditure 739,928 761,500 710,683 852,500 852,500
Ocean Beaches - Grounds (Net) 619,928 641,500 590,683 685,000 685,000
________________________________________________________________________________________________Page 3.56
Town of Cambridge
Actual Budget Actual C'Fwd Budget Consolidated
30 Jun 2014 2014/2015 30 Jun 15 2015/2016 2015/2016 2015/2016
$ $ $ $ $ $
Res/ELA
OCEAN BEACHES
Other
ExpenditureContributions
Coastcare Contributions 2,000 2,000 2,000 2,000 2,000Coastal Support Officer - Contributions 4,545 5,000 5,000 5,000 5,000
6,545 7,000 7,000 7,000 7,000
6,545 7,000 7,000 7,000 7,000
Ocean Beaches - Other Expenditure 6,545 7,000 7,000 7,000 7,000
Ocean Beaches - Other (Net) 6,545 7,000 7,000 7,000 7,000
________________________________________________________________________________________________Page 3.57

Town of Cambridge
Actual Budget Actual C'Fwd Budget Consolidated
30 Jun 2014 2014/2015 30 Jun 15 2015/2016 2015/2016 2015/2016
$ $ $ $ $ $
Res/ELA
CLUBS - LEASED PREMISES
RevenuesCapital Grants
Wembley Sports Park -Wembley Sports Park Pavilion CSRFF (500,000) (500,000)
Cambridge Bowling Club - CSRFF (66,000) (66,000)
City Beach Tennis Club - CSRFF (23,000) (23,000)West Coast Sporting Association - CSRFF (49,000) (98,400)Reabold Tennis Club - Shade Sails - CSRFF (4,500)
(53,500) (98,400) (589,000) (589,000)Capital Contributions
Wembley Sports Park -Wembley Sports Park Pavilion (218,000) (218,000)
Cambridge Bowling Club (66,000) (66,000)
City Beach Tennis Club (23,000) (23,000)
Cambridge Scouts & Girl Guides Association (50,000) (50,000)Floreat Beach Storage shed for Coastcare and FSLSC (127,000) (127,000) (127,000)
(24,561) (127,000) (484,000) (484,000)InfrastructureMatthews Netball Facility (25,169) (42,200) (58,639) (46,000) (46,000)
City Beach Oval Pavillion (13,110) (13,900) (22,847) (14,000) (14,000)Perry Lakes Scouts & Guides Hall (5,451) (6,200) (5,668) (5,000) (5,000)
City Beach Civic Centre (15,856) (15,500) (15,229) (16,000) (16,000)B J Giles Hall - Henderson Park (11,640) (10,600) (4,478)
Sydney Cheek Pavilion - Floreat Oval (25,975) (17,700) (19,270) (18,500) (18,500)Leederville Bowling Facility (12,160) (13,000) (12,710) (13,500) (13,500)
Lake Monger Bowling Facility (5,214) (19,800) (19,713) (19,500) (19,500)Floreat Oval Croquet Facility (6,305) (8,300) (6,441) (9,000) (9,000)
City Beach Tennis - Frinton Av Tennis Facility (13,572) (13,900) (16,225) (12,000) (12,000)Floreat Tennis Club - Birkdale St Tennis Facility (21,130) (21,800) (21,171) (21,500) (21,500)
Reabold Tennis Club - Floreat Oval Tennis Facility (21,065) (18,800) (19,651) (20,000) (20,000)Floreat Oval Bowling Facility (31,462) (27,200) (25,213) (29,500) (29,500)
Pat Goodridge Pavilion (6,600) (6,800) (7,718) (5,000) (5,000)Alderbury Sportsground Pavilion (9,344) (9,800) (8,471) (8,000) (8,000)Association Community Facility Administration Fee (13,500)
(224,053) (259,000) (263,444) (237,500) (237,500)
Clubs - Leased Premises Revenue (248,614) (439,500) (361,844) (1,310,500) (1,310,500)
________________________________________________________________________________________________Page 3.58
Town of Cambridge
Actual Budget Actual C'Fwd Budget Consolidated
30 Jun 2014 2014/2015 30 Jun 15 2015/2016 2015/2016 2015/2016
$ $ $ $ $ $
Res/ELA
CLUBS - LEASED PREMISES (Continued)
ExpenditureEmployee Costs
Salaries 44,917 58,000 60,596 62,200 62,200Superannuation 4,247 5,500 5,642 5,900 5,900
Workers Compensation 1,300 1,500 1,500 1,500 1,500
Uniforms/Protective Clothing & Equipment 63 200 200
Training 500 251 700 70050,527 65,500 67,989 70,500 70,500
Fleet & Plant Running Costs
Running Expenses 2,708 2,500 3,433 2,500 2,500
Fixed Costs 618 500 628 500 500Repairs 80 500 78 500 500
3,405 3,500 4,139 3,500 3,500InfrastructureCity Beach Surf Riders Association Shed 344 1,000 358 1,000 1,000Matthews Netball Facility 23,681 19,000 44,846 22,500 22,500
City Beach Oval Pavillion 5,141 14,500 12,890 13,000 13,000Perry Lakes Scouts & Guides Hall 3,498 9,500 6,355 8,000 8,000
City Beach Civic Centre 4,779 16,000 12,922 15,000 15,000B J Giles Hall - Henderson Park 11,521 6,500 3,746
Sydney Cheek Pavilion - Floreat Oval 24,500 17,000 20,340 17,000 17,000Leederville Bowling Facility 14,270 15,000 10,954 14,000 14,000
Lake Monger Bowling Facility 37,398 22,000 32,098 24,500 24,500Floreat Oval Croquet Facility 6,206 8,500 9,412 8,500 8,500
Frinton Avenue Tennis Facility (City Beach Tennis Club) 11,062 9,500 9,691 11,500 11,500Birkdale Street Tennis Facility (Floreat Tennis Club) 4,837 9,500 12,140 9,000 9,000
Floreat Oval Tennis Facility (Reabold Tennis Club) 4,590 7,500 7,498 9,000 9,000Floreat Oval Bowling Facility 15,954 17,500 18,086 19,000 19,000
Pat Goodridge Pavilion 9,577 15,000 17,928 10,500 10,500Alderbury Sportsground Pavilion 13,076 17,500 13,122 11,500 11,500
Clubs Various
190,436 205,500 232,385 194,000 194,000
Non-Capital Works 55,325
Reabold Tennis Club - Internal/external Painting Res 25,000 25,000
Lake Monger Recreation Club - Install electrical Distribution Boards Res 15,000 15,000
Leederville Bowling and Sporting Club - Replace Fence Res 10,000 10,000City Beach Oval Pavilion - Replace Exit Door to playground area Res 8,000 8,000City Beach Oval Pavilion - Install Roof anchor points Res 2,000 2,000City Beach Tennis Club - Paint External Steelwork Res 6,000 6,000Cambridge Croquet Facility - Painting Internally Res 5,000 5,000Cambridge Bowling Club - External Painting of Building Res 6,000 6,000YMCC HOCKEY Club - External Painting 10,000 10,000YMCC HOCKEY Club - Pavilion brickwork repairs & rendering 15,000 10,563BJ Giles Hall - Henderson Park - Demolish Building 40,000 48,792Cambridge Bowling Club - Repairs to pavement where tree root intrusion 4,000 1,904Cambridge Scouts and Guides - (Reseal Timber Floor) 10,000 5,497City Beach Civic Centre - Installation of emergency light to kitchen area 1,000City Beach Civic Centre - Installation of roof anchor points & ladder brackets 3,000 1,817City Beach Oval Pavillion - Bin Store 10,000 10,997City Beach Oval Pavillion - Signage 7,000 7,000 7,000Floreat Tennis Club - Remedial repairs to shower flooring 5,000 4,863Leederville Bowling and Sporting Club - External Painting 10,000 10,750Reabold Tennis Club - Install anchor points to roof 3,000 2,165Sydney Cheek Pavillion - Paint internal walls to function room 5,000 3,150Sydney Cheek pavillion - Repaint External Walls and Steel Structures 7,800 25,000 11,443YMCC Hockey Pavilion - Electrical Rewiring/replace distribution board 35,000 6,934YMCC Hockey Pavilion - Render older section of ext brickwork 15,000 18,953YMCC Hockey Pavilion - Re-paint fascias all around 5,000 6,134YMCC Hockey Pavilion - Re-paint kitchen walls 4,000 2,200Sydney Cheek Pavilion - Upgrade Lease Facilities 12,328
63,125 207,000 168,489 7,000 77,000 84,000Loss on Disposal of Assets
Loss on Disposal of Assets 2,500 2,5002,500 2,500
307,637 481,500 473,003 7,000 347,500 354,500
Depreciation 316,969 379,000 373,770 365,000 365,000
Cost Allocation (ABC) 4,604 5,000 5,337 5,000 5,000
Clubs - Leased Premises Expenditure 629,210 865,500 852,110 7,000 717,500 724,500
Clubs - Leased Premises (Net) 380,597 426,000 490,266 7,000 (593,000) (586,000)
________________________________________________________________________________________________Page 3.59
Town of Cambridge
Actual Budget Actual C'Fwd Budget Consolidated
30 Jun 2014 2014/2015 30 Jun 15 2015/2016 2015/2016 2015/2016
$ $ $ $ $ $
Res/ELA
SPORTS GROUNDS
RevenuesGround Hire
Alderbury Sportsground (16,479) (13,000) (19,108) (19,000) (19,000)City Beach Ovals (13,200) (13,000) (17,746) (18,000) (18,000)
Floreat Oval (6,654) (8,000) (8,600) (8,000) (8,000)
Grantham Park (2,049) (500) (1,274) (1,500) (1,500)Henderson Park (19,699) (15,000) (22,839) (22,000) (22,000)
McLean Park (5,331) (3,000) (5,195) (5,000) (5,000)Pat Goodridge Park (1,265) (3,000) (3,815) (3,500) (3,500)
Alderbury Reserve Storage (709) (1,000) (473) (1,000) (1,000)Wembley Oval (3,844) (4,000) (4,000)
(65,387) (56,500) (82,894) (82,000) (82,000)
(65,387) (56,500) (82,894) (82,000) (82,000)
Sports Grounds - Revenue (Net) (65,387) (56,500) (82,894) (82,000) (82,000)
________________________________________________________________________________________________Page 3.60
Town of Cambridge
Actual Budget Actual C'Fwd Budget Consolidated
30 Jun 2014 2014/2015 30 Jun 15 2015/2016 2015/2016 2015/2016
$ $ $ $ $ $
Res/ELA
SPORTS GROUNDS - BUILDINGS
Buildings
RevenuesCapital GrantsHolyrood Park Pavilion (2,576) (15,000) (18,687) (15,500) (15,500)
Wembley Sports Park - Matthews Netball Centre (601,000)
(603,576) (15,000) (18,687) (15,500) (15,500)
Capital Contributions (351,651)
(955,272) (15,000) (18,687) (15,500) (15,500)
ExpenditureInfrastructure
Holyrood Park Pavilion 2,817
Alderbury Sportsground Toilet & Changeroom 47,256 35,500 34,706 33,500 33,500City Beach Oval Toilet & Changeroom 4,115 18,000 14,706 15,000 15,000
Floreat Oval Toilet & Changeroom 8,352 10,000 5,245 10,500 10,500Grantham Park Toilet & Changeroom 15,155 11,000 10,449 12,500 12,500
Henderson Park Toilet & Changeroom 22,479 18,500 16,143 17,500 17,500McLean Park Toilet & Changeroom 13,396 13,500 8,307 13,500 13,500
Pat Goodridge Park Toilets 21,611 18,500 18,650 17,000 17,000Dodd St Toilets 21,560 21,500 18,320 14,500 14,500
Swanage Avenue Toilets 689Holyrood Park Pavilion 33,392 17,500 8,977 13,500 13,500
City Beach Oval Gardeners Shed 150 1,500 378 1,000 1,000
Floreat Oval Gardeners Shed 293 1,000 144 1,000 1,000
188,446 166,500 138,842 149,500 149,500
Non-Capital Works 12,389
Alderbury SportsGrd Toilet & Changeroom - Electronic Timers & Doors 10,000 10,000
Alderbury SportsGrd Toilet & Changeroom - External Painting / Rendering 30,000 30,000
Alderbury SportsGrd Toilet & Changeroom - Bituminise Garden Bed 6,000 6,000
Dodd St Toilets - Replace electrical distribution board 5,000 5,000
Grantham Park Toilet & Changeroom - Electronic Timers 6,000 6,000
Grantham Park Toilet & Changeroom - Paint Walls & Doors 10,000 10,000
Henderson Park Toilet & Changeroom - Replace Glazing & Window Frames 20,000 20,000
Henderson Park Toilet & Changeroom - Electronic Timers and New Doors 15,000 15,000
Henderson Park Toilet & Changeroom - Paint Internal Walls & Modify distribution board 35,000 35,000
McLean Park Toilets & Changerooms - Install Autodoors & timers 10,000 10,000
McLean Park Toilets & Changerooms - External Painting 5,000 5,000
Alderbury Sportsground Toilet & Changeroom - Replace Toilet Cisterns 4,000 2,553
Alderbury Sportsground Toilet & Changeroom - Repairs to timber eaves 10,000 3,394
Alderbury Sportsground Toilet & Changeroom - Replace verandah roof 5,000 4,688
Alderbury Sportsground Toilet & Changeroom - Replace DHWS Heater 5,000 3,659
Floreat Oval Gardeners Shed - Install backflow valve to Cricket shed 1,000 899
12,389 25,000 15,192 152,000 152,000
Loss on disposal of assets
Loss on disposal of assets 351,385
351,385
200,836 191,500 505,418 301,500 301,500
Depreciation 161,889 176,000 178,864 185,500 185,500
Cost Allocation (ABC) 8,165 8,700 9,363 9,000 9,000
Sports Grounds - Buildings Expenditure 370,889 376,200 693,645 496,000 496,000
Sports Grounds - Buildings (Net) (584,383) 361,200 674,958 480,500 480,500
________________________________________________________________________________________________Page 3.61
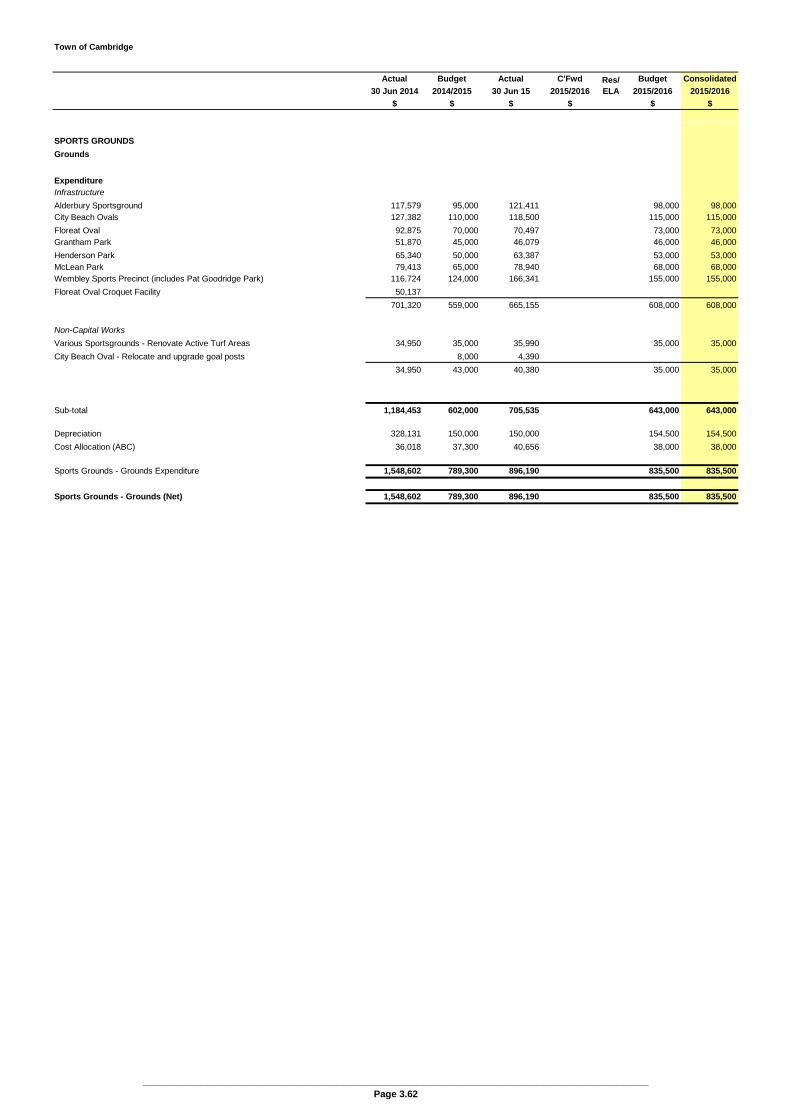
Town of Cambridge
Actual Budget Actual C'Fwd Budget Consolidated
30 Jun 2014 2014/2015 30 Jun 15 2015/2016 2015/2016 2015/2016
$ $ $ $ $ $
Res/ELA
SPORTS GROUNDS
Grounds
ExpenditureInfrastructure
Alderbury Sportsground 117,579 95,000 121,411 98,000 98,000City Beach Ovals 127,382 110,000 118,500 115,000 115,000
Floreat Oval 92,875 70,000 70,497 73,000 73,000Grantham Park 51,870 45,000 46,079 46,000 46,000
Henderson Park 65,340 50,000 63,387 53,000 53,000McLean Park 79,413 65,000 78,940 68,000 68,000Wembley Sports Precinct (includes Pat Goodridge Park) 116,724 124,000 166,341 155,000 155,000
Floreat Oval Croquet Facility 50,137
701,320 559,000 665,155 608,000 608,000
Non-Capital Works
Various Sportsgrounds - Renovate Active Turf Areas 34,950 35,000 35,990 35,000 35,000
City Beach Oval - Relocate and upgrade goal posts 8,000 4,390
34,950 43,000 40,380 35,000 35,000
Sub-total 1,184,453 602,000 705,535 643,000 643,000
Depreciation 328,131 150,000 150,000 154,500 154,500
Cost Allocation (ABC) 36,018 37,300 40,656 38,000 38,000
Sports Grounds - Grounds Expenditure 1,548,602 789,300 896,190 835,500 835,500
Sports Grounds - Grounds (Net) 1,548,602 789,300 896,190 835,500 835,500
________________________________________________________________________________________________Page 3.62

Town of Cambridge
Actual Budget Actual C'Fwd Budget Consolidated
30 Jun 2014 2014/2015 30 Jun 15 2015/2016 2015/2016 2015/2016
$ $ $ $ $ $
Res/ELA
PARKS
RevenuesOperating Contributions Donations/Sponsorship
Lake Monger Rehab (Town of Vincent/Main Roads) (26,600) (26,000) (26,600) (26,000) (26,000)
(26,600) (26,000) (26,600) (26,000) (26,000)Capital Contributions
Perry Lakes - Skate Park Extension Stage 2 Lotterywest Grant (300,000) (300,000)
Perry Lakes - Skate Park Extension Lotterywest Grant (230,000) (230,000) (230,000)
Perry Lakes - Basketball Courts Extension CSRFF Grant (19,000)
W/Leederville Community Garden - Fence/Gate Replace (10,000)
(259,000) (530,000) (530,000)Ground HirePerry Lakes - Garden Show (24,273) (25,000) (25,000)Other Parks Hire (16,045) (10,000) (20,562) (12,000) (12,000)
(40,318) (35,000) (45,562) (12,000) (12,000)
Parks - Revenue Revenue (66,918) (320,000) (72,162) (568,000) (568,000)
Parks - Revenue (Net) (66,918) (320,000) (72,162) (568,000) (568,000)
________________________________________________________________________________________________Page 3.63

Town of Cambridge
Actual Budget Actual C'Fwd Budget Consolidated
30 Jun 2014 2014/2015 30 Jun 15 2015/2016 2015/2016 2015/2016
$ $ $ $ $ $
Res/ELA
PARKS
Buildings
ExpenditureInfrastructure
Perry Lakes Reserve Toilets 14,111 19,500 15,176 15,000 15,000Lake Monger Drive Toilets & Gregory St Depot 20,556 25,000 17,663 22,500 22,500
Cowden Park Toilets 8,693 9,000 4,962 14,000 14,000
Beecroft Park Gardeners Shed 3,188 2,000 556 2,000 2,000
46,547 55,500 38,356 53,500 53,500Non-Capital Works 6,445
Lake Monger Drive Toilets & Gregory St Depot - Install soffit/fascia board 1,000 1,000
Cowden Park Toilets - Install auto doors & timer 10,000 10,000
6,445 11,000 11,000
Sub-total 52,992 55,500 38,356 64,500 64,500
Depreciation 12,006 11,000 15,845 16,000 16,000
Cost Allocation (ABC) 1,731 1,700 1,911 2,000 2,000
Parks - Buildings Expenditure 66,730 68,200 56,113 82,500 82,500
Parks - Buildings (Net) 66,730 68,200 56,113 82,500 82,500
________________________________________________________________________________________________Page 3.64

Town of Cambridge
Actual Budget Actual C'Fwd Budget Consolidated
30 Jun 2014 2014/2015 30 Jun 15 2015/2016 2015/2016 2015/2016
$ $ $ $ $ $
Res/ELA
PARKS
Grounds
ExpenditureInfrastructure
Beecroft Park 43,442 36,000 33,906 36,000 36,000Bent Park 59,708 47,000 64,249 56,500 56,500
Challenger Park 35,187 29,000 40,372 36,000 36,000Maloney Park 47,843 45,000 52,320 53,000 53,000
Helston Park 35,165 29,000 38,641 42,000 42,000Jubilee Park 44,799 29,000 28,143 26,000 26,000
Perry Lakes Reserve 268,153 244,000 286,468 259,000 259,000Rose Gardens 78,241 79,000 78,650 82,000 82,000
Rutter Park 31,533 30,000 33,286 26,000 26,000Alyth Park 16,117 15,000 17,760 15,500 15,500
Berkley Park 11,612 12,000 6,375 7,500 7,500Birkdale Park 21,932 26,000 27,589 24,000 24,000
Chipping Park 58,182 28,000 29,276 26,000 26,000Fred Burton Park 26,706 19,000 29,195 23,500 23,500
City Beach Civic Centre 10,325 12,000 10,058 11,500 11,500Frinton Park 22,825 20,000 15,378 18,000 18,000
Crosby Park 14,147 15,000 12,245 11,000 11,000Donegal Park 8,786 9,000 1,244 7,000 7,000
Drabble Park 12,718 18,000 12,908 12,000 12,000Dumfries Park 6,154 6,000 6,358 6,000 6,000
Fortview Park 12,413 7,000 7,161 7,500 7,500Lothian Park 15,946 18,000 24,176 21,500 21,500
Brookdale Park 8,119 8,000 7,951 7,000 7,000Winmarley Park 12,178 17,000 14,275 14,500 14,500
Taworri Park 5,129 7,000 4,781 4,500 4,500Templetonia Park 8,903 9,000 12,846 12,500 12,500
Tilton Park 15,686 12,000 17,261 12,000 12,000West Coast Park 7,224 9,000 14,836 10,500 10,500
Ruislip Park 12,777 12,000 11,639 13,000 13,000Tara Vista Park 9,471 9,000 11,646 8,500 8,500
Lake Monger Reserve 430,356 430,000 441,907 539,000 539,000Cambridge Gardens 2,868 4,000 3,450 5,000 5,000
Cowden Park 38,349 28,000 30,547 31,000 31,000Holyrood Park 21,801 22,000 24,790 24,000 24,000
Leederville Memorial Gardens 23,729 25,000 29,262 27,500 27,500McCourt Park 11,161 10,000 8,355 8,000 8,000
Woolwich Park 7,897 9,000 6,887 4,000 4,000Ocean Village Park 84,542 74,000 65,769 67,000 67,000
Perry Lakes Garden Show 27,256 15,000 871Civic/Administration Park 7,529 3,000 3,204 5,000 5,000
Amphitheatre Grounds 4,952 5,000 2,605 4,000 4,000Ocean Mia Park 49,243 51,000 60,188 52,000 52,000Perry Lakes Residential Estate 57,241 177,000 123,046 210,500 210,500
Other Parks 89,409 96,000 94,805 94,500 94,500
1,817,749 1,805,000 1,846,682 1,961,500 1,961,500
________________________________________________________________________________________________Page 3.65

Town of Cambridge
Actual Budget Actual C'Fwd Budget Consolidated
30 Jun 2014 2014/2015 30 Jun 15 2015/2016 2015/2016 2015/2016
$ $ $ $ $ $
Res/ELA
PARKS
Grounds (Continued)
Non-Capital WorksPublic Open Space Trees Inventory 75,000 75,000Lake Monger Reserve - Management of Rehabilitated Zones 32,034 30,000 29,392 40,000 40,000Arboricultural Risk Management Tree Works 10,850 15,000 14,140 30,000 30,000Calibrate water meters of irrigation bores 5,000 7,095 25,000 25,000Perry Lakes Reserve - Arboriculture Risk Mgt Tree Works 15,909 16,000 16,380 25,000 25,000Repair damaged shade sails at playgrounds 14,547 15,000 14,111 20,000 20,000Cowden Park - Install Fence around Playground 6,000 395 16,000 16,000Ground Water Monitoring 13,069 15,000 14,591 16,000 16,000Lake Monger Reserve - Decorate Christmas Tree 11,074 16,000 14,340 16,000 16,000Treat Bores for Iron Bacteria 44,453 40,000 41,586 16,000 16,000Install Seats, Bins, Drink Fountains 10,000 10,759 15,000 15,000Perry Lakes Reserve - Remove Lake Tree Weeds 13,780 15,000 14,638 15,000 15,000Replace playground sand/minor play items 15,615 15,000 15,182 15,000 15,000Park Improvement Concept Plans 16,000 24,000 10,054 12,000 12,000Parks - Remark Car-Park Bays 13,894 15,000 16,823 10,000 10,000Upgrade Garden Beds 14,724 16,000 11,902 8,000 8,000Feral Animal Control 8,000 7,541 5,000 5,000Replace Park Signs 5,000 5,000External Lighting Testing and Inspection Stage 2 50,000 30,577External Lighting Maintenance and Repairs Stage 1 and 2 50,000 42,183Lake Monger Reserve – Tree Planting Program in Lawn Stage 4 10,509 5,000 4,802Lake Monger Reserve - Upgrade Interpretive Signs 5,176 62,000 33,742 28,000 28,000Perry Lakes Reserve - Arboriculture Risk Mgt Tree Works 25,566 25,000 24,950Templetonia Park - Remove Wattle Trees 50,000 42,374
311,027 503,000 417,558 44,000 348,000 392,000
Sub-total 2,325,267 2,308,000 2,264,239 44,000 2,309,500 2,353,500
Depreciation 750,737 750,000 750,235 772,500 772,500
Cost Allocation (ABC) 88,540 91,600 99,810 93,000 93,000
Parks - Grounds Expenditure 3,164,544 3,149,600 3,114,285 44,000 3,175,000 3,219,000
Parks - Grounds (Net) 3,164,544 3,149,600 3,114,285 44,000 3,175,000 3,219,000
________________________________________________________________________________________________Page 3.66

Town of Cambridge
Actual Budget Actual C'Fwd Budget Consolidated
30 Jun 2014 2014/2015 30 Jun 15 2015/2016 2015/2016 2015/2016
$ $ $ $ $ $
Res/ELA
WEMBLEY GOLF COURSE
Administration- Golf Course
RevenuesOther IncomeOther Revenue/Income (182) (3,503)
(182) (3,503)
Administration- Golf Course (182) (3,503)
Expenditure
Employee Costs
Salaries 329,046 381,500 388,856 393,000 393,000
Superannuation 31,812 37,000 37,233 40,000 40,000
Workers Compensation 9,000 9,000 9,000 8,000 8,000
Uniforms/Protective Clothing & Equipment 181 1,000 239 1,000 1,000
Fringe Benefits Tax 8,850 9,000 8,319 10,000 10,000
Training 1,024 3,500 168 4,000 4,000
379,913 441,000 443,815 456,000 456,000
Office Expenses 8,899 6,000 6,678 6,000 6,000
IT & Other Equipment
Information Systems 10,210 8,000 6,259 8,000 8,000
Software Licences 2,000 724
Minor Equipment & Tools 3,509 1,000 623 1,000 1,000
13,720 11,000 7,606 9,000 9,000
Fleet & Plant Running Costs
Running Expenses 3,034 10,500 2,123 2,500 2,500
Fixed Costs 609 1,000 790 1,000 1,000
Repairs 1,295 455
Operating Lease 2,025 8,101 8,000 8,000
6,963 11,500 11,469 11,500 11,500
Operational Expenses
Advertising 1,645 500 36 500 500
Other Operational Expenses (booking system) 622 1,000 1,000 1,000
Legal Expenses 146 1,248
2,413 1,500 1,284 1,500 1,500
Other Expenses
Conferences 4,500 5,000 5,000 5,000
Other Expenses 3,451 2,000 5,228 2,000 2,000
System Administration (Clublinks POS & support software) 117,124 120,000 114,179 124,000 124,000
125,075 127,000 119,407 131,000 131,000
Administration- Golf Course Expenditure 536,983 598,000 590,259 615,000 615,000
Administration - Golf Course (Net) 536,801 598,000 586,756 615,000 615,000
________________________________________________________________________________________________Page 3.67

Town of Cambridge
Actual Budget Actual C'Fwd Budget Consolidated
30 Jun 2014 2014/2015 30 Jun 15 2015/2016 2015/2016 2015/2016
$ $ $ $ $ $
Res/ELA
WEMBLEY GOLF COURSE
Wembley Golf Course - Driving Range
Revenues
Merchandise Sales
Sponsorship (20,000) (54,000) (50,000) (50,000)
(20,000) (54,000) (50,000) (50,000)
Fees & Charges - Local Govt Property
Driving Range Fees (1,507,260) (1,540,000) (1,573,569) (1,540,000) (1,540,000)
Booking Fees - Function Centre (27,300) (42,500) (18,080) (30,000) (30,000)
Golf Lesson Fees (441,597) (562,000) (505,839) (475,000) (475,000)
Rent (67,500) (13,000) (12,813) (9,000) (9,000)
(2,043,657) (2,157,500) (2,110,301) (2,054,000) (2,054,000)
Merchandise Sales
Vending Machine Sales (7,741) (12,000) (8,407) (10,000) (10,000)
(7,741) (12,000) (8,407) (10,000) (10,000)
Other Income
Other Revenue/Income (1,597)
(1,597)
Driving Range Revenue (2,071,398) (2,223,500) (2,120,305) (2,114,000) (2,114,000)
Expenditure
Employee Costs
Salaries 197,836 199,500 183,704 205,300 205,300
Superannuation 18,279 19,000 19,230 19,600 19,600
Workers Compensation 4,500 5,000 5,000 5,100 5,100
Uniforms/Protective Clothing & Equipment 1,290 986 1,500 1,500
Training 112 1,000 1,300 1,000 1,000
222,016 224,500 210,220 232,500 232,500
Office Expenses 795 4,000 1,014 1,000 1,000
Fleet & Plant Running Costs
Running Expenses 2,418 2,000 1,722 2,500 2,500
Fixed Costs 1,251 114
Repairs 1,843 755 1,000 1,000
5,511 2,000 2,591 3,500 3,500
Operational Expenses
Golf Lessons - teaching expenses 316,643 370,000 352,717 309,000 309,000
General Op. Expenses (incl. Club Fitting) 35,390 10,000 3,858 12,000 12,000
Other Insurance 1,564 1,500 2,000 2,000
353,597 381,500 356,575 323,000 323,000
Interest Expenses
Interest Expenses 259,287 244,000 244,000 334,000 334,000
259,287 244,000 244,000 334,000 334,000
Infrastructure
Utility Charges 19,585 20,000 16,166 20,000 20,000
Mowing 15,493 19,500 35,939 19,500 19,500
Fertilising 10,806 15,500 11,997 15,500 15,500
Weed/Pest Control 11,601 11,000 12,487 11,000 11,000
Turf 14,341 24,000 18,909 24,000 24,000
Irrigation 11,905 15,000 22,052 15,000 15,000
Infrastructure 18,986 23,000 31,009 24,000 24,000
Wembley Golf Course - Driving Range 74,875 55,000 89,717 56,000 56,000
177,592 183,000 238,276 185,000 185,000
Non-Capital Works
Rust Removal - Driving Range Infrastructure 15,000 15,000 15,000
15,000 15,000 15,000
Other Expenses
Range Equipment (previously Minor Equipment & Tools) 50,751 70,000 57,051 70,000 70,000
Promotions 9,555 10,000 9,286
Other Expenses 2,981 3,000 2,947 3,000 3,000
63,286 83,000 69,285 73,000 73,000
Sub-total 1,082,085 1,137,000 1,121,961 15,000 1,152,000 1,167,000
Depreciation 307,627 392,500 248,815 245,000 245,000
Cost Allocation (ABC)
Driving Range Expenditure 1,389,712 1,529,500 1,370,776 15,000 1,397,000 1,412,000
Wembley Golf Driving Range (Net) (681,686) (694,000) (749,529) 15,000 (717,000) (702,000)
________________________________________________________________________________________________Page 3.68
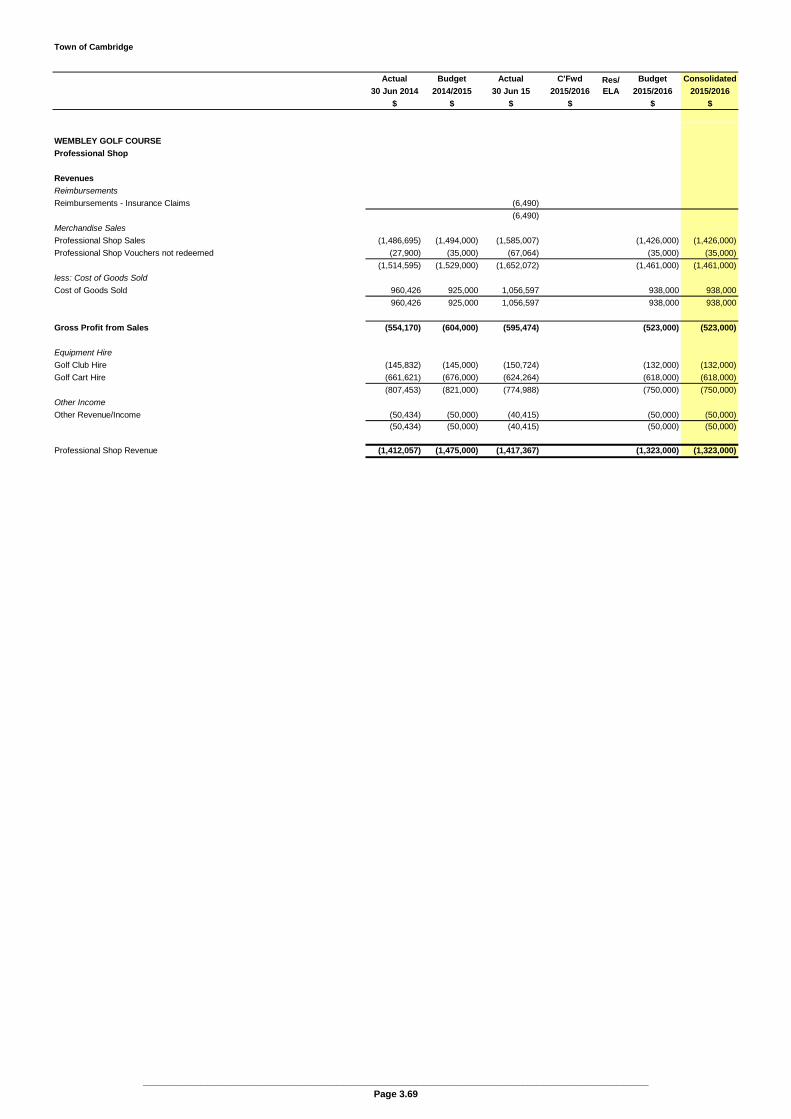
Town of Cambridge
Actual Budget Actual C'Fwd Budget Consolidated
30 Jun 2014 2014/2015 30 Jun 15 2015/2016 2015/2016 2015/2016
$ $ $ $ $ $
Res/ELA
WEMBLEY GOLF COURSE
Professional Shop
Revenues
Reimbursements
Reimbursements - Insurance Claims (6,490)
(6,490)
Merchandise Sales
Professional Shop Sales (1,486,695) (1,494,000) (1,585,007) (1,426,000) (1,426,000)
Professional Shop Vouchers not redeemed (27,900) (35,000) (67,064) (35,000) (35,000)
(1,514,595) (1,529,000) (1,652,072) (1,461,000) (1,461,000)
less: Cost of Goods Sold
Cost of Goods Sold 960,426 925,000 1,056,597 938,000 938,000
960,426 925,000 1,056,597 938,000 938,000
Gross Profit from Sales (554,170) (604,000) (595,474) (523,000) (523,000)
Equipment Hire
Golf Club Hire (145,832) (145,000) (150,724) (132,000) (132,000)
Golf Cart Hire (661,621) (676,000) (624,264) (618,000) (618,000)
(807,453) (821,000) (774,988) (750,000) (750,000)
Other Income
Other Revenue/Income (50,434) (50,000) (40,415) (50,000) (50,000)(50,434) (50,000) (40,415) (50,000) (50,000)
Professional Shop Revenue (1,412,057) (1,475,000) (1,417,367) (1,323,000) (1,323,000)
________________________________________________________________________________________________Page 3.69
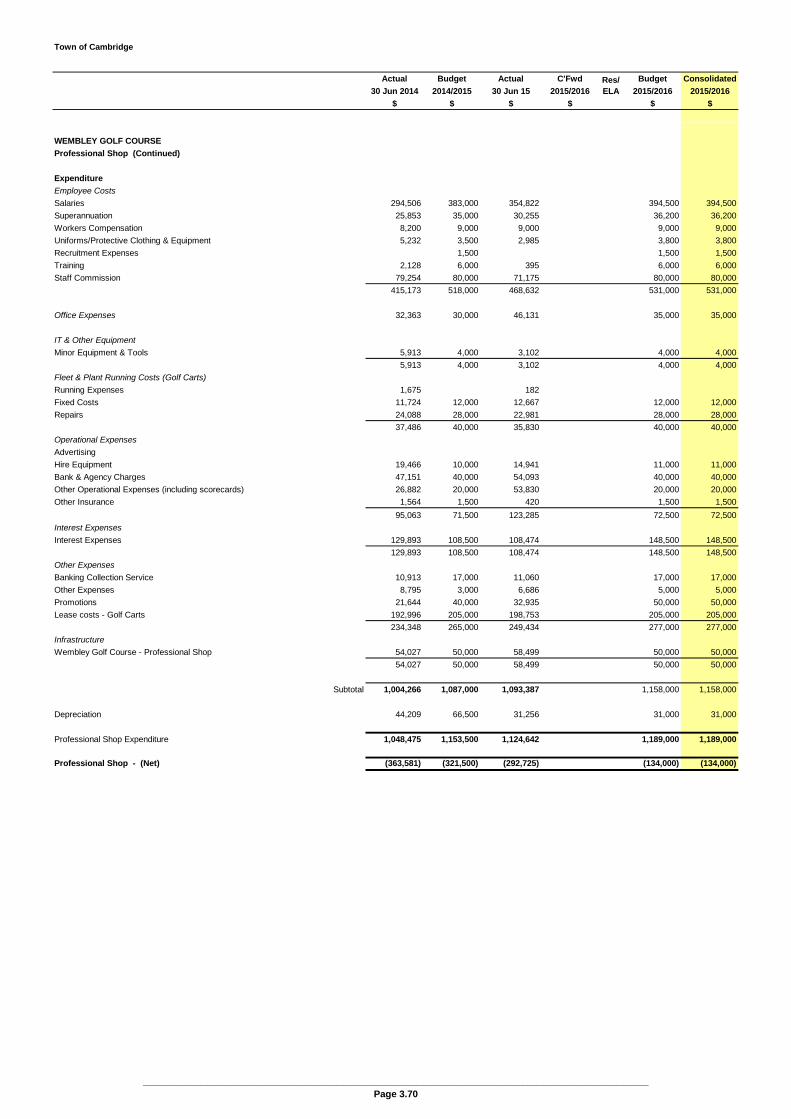
Town of Cambridge
Actual Budget Actual C'Fwd Budget Consolidated
30 Jun 2014 2014/2015 30 Jun 15 2015/2016 2015/2016 2015/2016
$ $ $ $ $ $
Res/ELA
WEMBLEY GOLF COURSE
Professional Shop (Continued)
Expenditure
Employee Costs
Salaries 294,506 383,000 354,822 394,500 394,500
Superannuation 25,853 35,000 30,255 36,200 36,200
Workers Compensation 8,200 9,000 9,000 9,000 9,000
Uniforms/Protective Clothing & Equipment 5,232 3,500 2,985 3,800 3,800
Recruitment Expenses 1,500 1,500 1,500
Training 2,128 6,000 395 6,000 6,000
Staff Commission 79,254 80,000 71,175 80,000 80,000
415,173 518,000 468,632 531,000 531,000
Office Expenses 32,363 30,000 46,131 35,000 35,000
IT & Other Equipment
Minor Equipment & Tools 5,913 4,000 3,102 4,000 4,000
5,913 4,000 3,102 4,000 4,000
Fleet & Plant Running Costs (Golf Carts)
Running Expenses 1,675 182
Fixed Costs 11,724 12,000 12,667 12,000 12,000
Repairs 24,088 28,000 22,981 28,000 28,000
37,486 40,000 35,830 40,000 40,000
Operational Expenses
Advertising
Hire Equipment 19,466 10,000 14,941 11,000 11,000
Bank & Agency Charges 47,151 40,000 54,093 40,000 40,000
Other Operational Expenses (including scorecards) 26,882 20,000 53,830 20,000 20,000
Other Insurance 1,564 1,500 420 1,500 1,500
95,063 71,500 123,285 72,500 72,500
Interest Expenses
Interest Expenses 129,893 108,500 108,474 148,500 148,500
129,893 108,500 108,474 148,500 148,500
Other Expenses
Banking Collection Service 10,913 17,000 11,060 17,000 17,000
Other Expenses 8,795 3,000 6,686 5,000 5,000
Promotions 21,644 40,000 32,935 50,000 50,000
Lease costs - Golf Carts 192,996 205,000 198,753 205,000 205,000
234,348 265,000 249,434 277,000 277,000
Infrastructure
Wembley Golf Course - Professional Shop 54,027 50,000 58,499 50,000 50,000
54,027 50,000 58,499 50,000 50,000
Subtotal 1,004,266 1,087,000 1,093,387 1,158,000 1,158,000
Depreciation 44,209 66,500 31,256 31,000 31,000
Professional Shop Expenditure 1,048,475 1,153,500 1,124,642 1,189,000 1,189,000
Professional Shop - (Net) (363,581) (321,500) (292,725) (134,000) (134,000)
________________________________________________________________________________________________Page 3.70
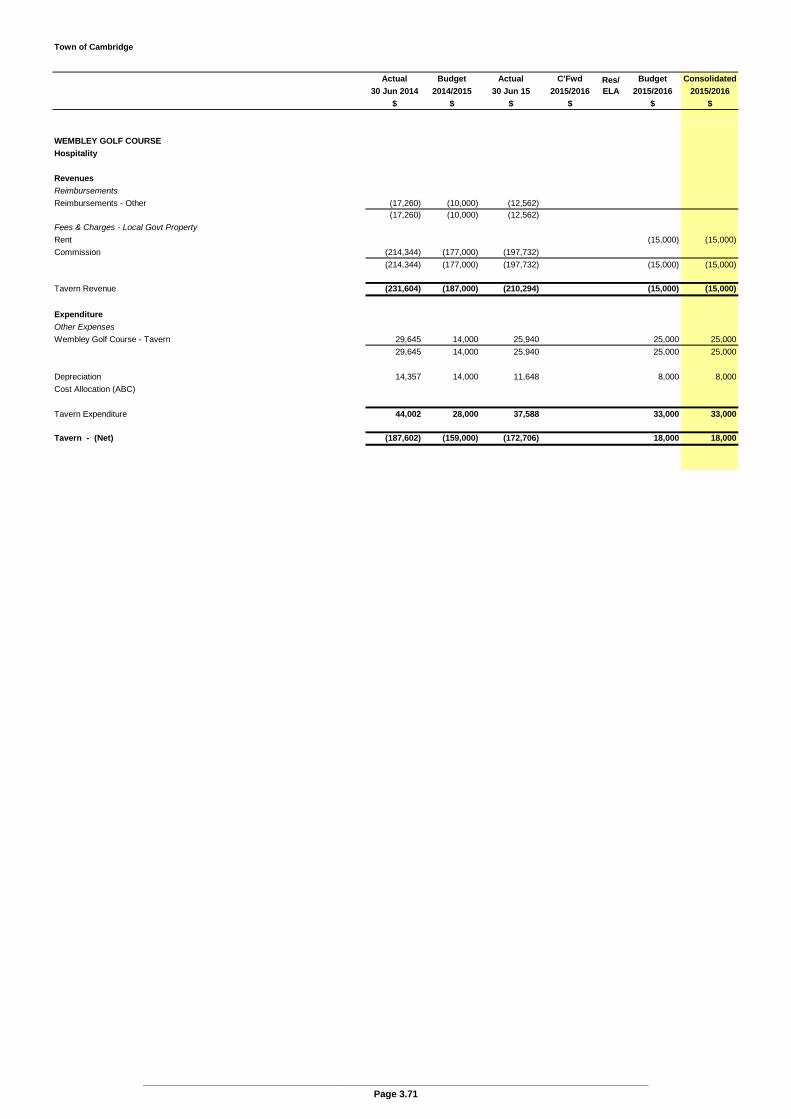
Town of Cambridge
Actual Budget Actual C'Fwd Budget Consolidated
30 Jun 2014 2014/2015 30 Jun 15 2015/2016 2015/2016 2015/2016
$ $ $ $ $ $
Res/ELA
WEMBLEY GOLF COURSE
Hospitality
Revenues
Reimbursements
Reimbursements - Other (17,260) (10,000) (12,562)(17,260) (10,000) (12,562)
Fees & Charges - Local Govt Property
Rent (15,000) (15,000)
Commission (214,344) (177,000) (197,732)
(214,344) (177,000) (197,732) (15,000) (15,000)
Tavern Revenue (231,604) (187,000) (210,294) (15,000) (15,000)
Expenditure
Other Expenses
Wembley Golf Course - Tavern 29,645 14,000 25,940 25,000 25,000
29,645 14,000 25,940 25,000 25,000
Depreciation 14,357 14,000 11,648 8,000 8,000
Cost Allocation (ABC)
Tavern Expenditure 44,002 28,000 37,588 33,000 33,000
Tavern - (Net) (187,602) (159,000) (172,706) 18,000 18,000
________________________________________________________________________________________________Page 3.71
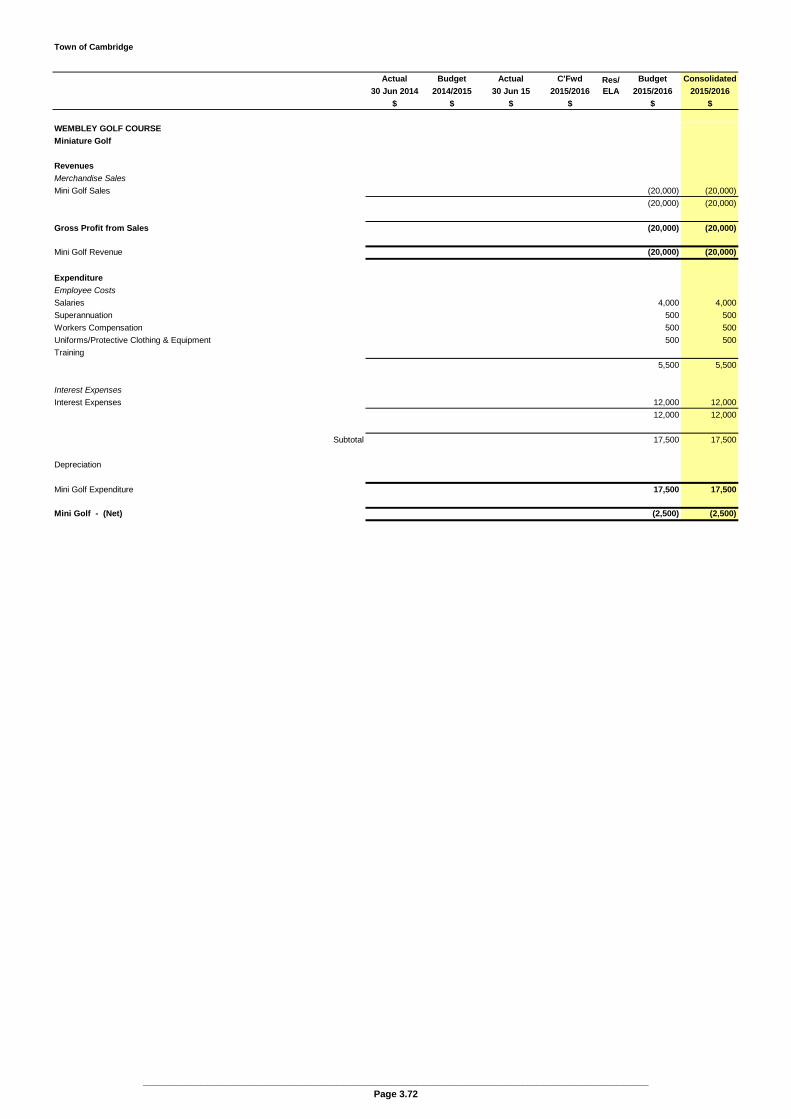
Town of Cambridge
Actual Budget Actual C'Fwd Budget Consolidated
30 Jun 2014 2014/2015 30 Jun 15 2015/2016 2015/2016 2015/2016
$ $ $ $ $ $
Res/ELA
WEMBLEY GOLF COURSE
Miniature Golf
Revenues
Merchandise Sales
Mini Golf Sales (20,000) (20,000)
(20,000) (20,000)
Gross Profit from Sales (20,000) (20,000)
Mini Golf Revenue (20,000) (20,000)
Expenditure
Employee Costs
Salaries 4,000 4,000
Superannuation 500 500
Workers Compensation 500 500
Uniforms/Protective Clothing & Equipment 500 500
Training
5,500 5,500
Interest Expenses
Interest Expenses 12,000 12,000
12,000 12,000
Subtotal 17,500 17,500
Depreciation
Mini Golf Expenditure 17,500 17,500
Mini Golf - (Net) (2,500) (2,500)
________________________________________________________________________________________________Page 3.72

Town of Cambridge
Actual Budget Actual C'Fwd Budget Consolidated
30 Jun 2014 2014/2015 30 Jun 15 2015/2016 2015/2016 2015/2016
$ $ $ $ $ $
Res/ELA
WEMBLEY GOLF COURSE
Course Operations
Revenues
Fees & Charges - Local Govt Property
Green Fees 9 Holes (1,429,179) (1,520,000) (1,578,406) (1,465,500) (1,465,500)
Green Fees 18 Holes (1,736,530) (1,778,000) (1,752,359) (1,714,000) (1,714,000)
Foot Golf (40,000) (40,000)
Mobile Phone Tower Lease (101,965) (55,000) (82,763) (57,000) (57,000)
(3,267,673) (3,353,000) (3,413,528) (3,276,500) (3,276,500)
Other Income
Membership Fees (net) (25,000) (25,000)
Other Income (3,698) (1,452)
(3,698) (1,452) (25,000) (25,000)
(3,271,371) (3,353,000) (3,414,981) (3,301,500) (3,301,500)
Expenditure
Employee Costs
Salaries 492,186 487,500 493,977 502,300 502,300
Superannuation 47,425 44,500 49,296 50,200 50,200
Workers Compensation 11,900 11,500 11,500 11,800 11,800
Uniforms/Protective Clothing & Equipment 734 1,000 77 1,000 1,000
Training 625 7,000 159 7,200 7,200
552,869 551,500 555,008 572,500 572,500
Operational Expenses
Public Liability Insurance 21,053 21,000 22,250 23,000 23,000
Other Insurance 1,000 1,000 1,000
21,053 22,000 22,250 24,000 24,000
Interest Expenses
Interest Expenses 108,377 59,000 60,028 64,000 64,000
108,377 59,000 60,028 64,000 64,000
Infrastructure
Utility Charges 230,795 245,000 192,657 200,000 200,000
Mowing 475,526 448,000 499,800 479,500 479,500
Fertilising 115,560 117,000 119,663 120,500 120,500
Weed/Pest Control 118,775 119,000 122,791 122,500 122,500
Turf 260,653 301,000 314,726 310,000 310,000
Trees/Shrubs 133,687 137,000 145,033 141,000 141,000
Irrigation 135,411 138,000 142,656 142,000 142,000
Infrastructure 203,576 145,000 160,597 149,500 149,500
Wembley Golf Course - Concourse 45,270 46,500 51,129Wembley Golf Course - Depot/Office 9,327 8,000 14,471 10,000 10,000
1,728,579 1,704,500 1,763,522 1,675,000 1,675,000
Non-Capital Works
Bore & Pump Maintenance 26,933 20,000 24,627 30,000 30,000
Lake Maintenance 12,118 6,000 9,177 6,000 6,000
Lightning Guard 18,000 18,000
Depot Shed & Front Gate 12,000 11,153
Concrete paving (defered) 7,682
46,733 38,000 44,956 54,000 54,000
Sub-total 2,466,495 2,375,000 2,445,764 2,389,500 2,389,500
Depreciation 300,112 290,000 315,007 416,500 416,500
Cost Allocation (ABC) 138,620 143,900 152,121 145,500 145,500
WGC - Course Operations Expenditure 2,905,227 2,808,900 2,912,893 2,951,500 2,951,500
Course Operations - (Net) (366,144) (544,100) (502,088) (350,000) (350,000)
________________________________________________________________________________________________Page 3.73
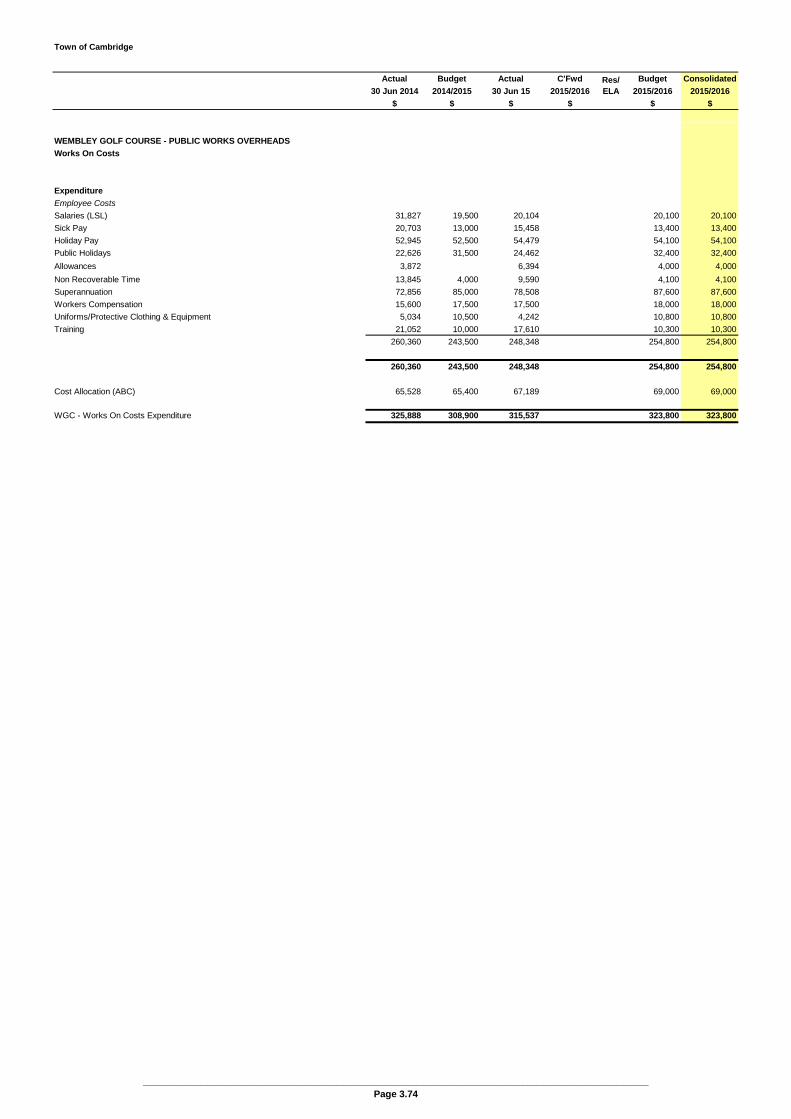
Town of Cambridge
Actual Budget Actual C'Fwd Budget Consolidated
30 Jun 2014 2014/2015 30 Jun 15 2015/2016 2015/2016 2015/2016
$ $ $ $ $ $
Res/ELA
WEMBLEY GOLF COURSE - PUBLIC WORKS OVERHEADS
Works On Costs
Expenditure
Employee Costs
Salaries (LSL) 31,827 19,500 20,104 20,100 20,100
Sick Pay 20,703 13,000 15,458 13,400 13,400
Holiday Pay 52,945 52,500 54,479 54,100 54,100
Public Holidays 22,626 31,500 24,462 32,400 32,400
Allowances 3,872 6,394 4,000 4,000
Non Recoverable Time 13,845 4,000 9,590 4,100 4,100
Superannuation 72,856 85,000 78,508 87,600 87,600
Workers Compensation 15,600 17,500 17,500 18,000 18,000
Uniforms/Protective Clothing & Equipment 5,034 10,500 4,242 10,800 10,800
Training 21,052 10,000 17,610 10,300 10,300
260,360 243,500 248,348 254,800 254,800
260,360 243,500 248,348 254,800 254,800
Cost Allocation (ABC) 65,528 65,400 67,189 69,000 69,000
WGC - Works On Costs Expenditure 325,888 308,900 315,537 323,800 323,800
________________________________________________________________________________________________Page 3.74

Town of Cambridge
Actual Budget Actual C'Fwd Budget Consolidated
30 Jun 2014 2014/2015 30 Jun 15 2015/2016 2015/2016 2015/2016
$ $ $ $ $ $
Res/ELA
WEMBLEY GOLF COURSE - PUBLIC WORKS OVERHEADS
Works Overheads
Expenditure
Employee Costs
Salaries 85,989 105,000 93,627 108,200 108,200
Superannuation 12,824 14,500 13,450 14,900 14,900
Workers Compensation 2,500 2,500 2,500 2,600 2,600
Uniforms/Protective Clothing & Equipment 109 1,000 162 1,000 1,000
Fringe Benefits Tax 7,641 6,000 5,890 6,200 6,200
Training 452 1,000 1,483 1,000 1,000
109,515 130,000 117,112 133,900 133,900
Office Expenses
Telephone 2,137 1,783
Other Office Expenses 6,664 3,000 1,043 3,000 3,0008,801 3,000 2,826 3,000 3,000
IT & Other EquipmentMinor Equipment & Tools 5,424 4,000 2,254 5,000 5,000
5,424 4,000 2,254 5,000 5,000Fleet & Plant Running Costs
Running Expenses (including lease costs) 6,031 13,500 2,265 3,500 3,500
Fixed Costs 494 500 696 1,000 1,000
Repairs
Operating Lease 10,341 10,500 10,500
6,525 14,000 13,302 15,000 15,000
Operational Expenses
Other Operational Expenses 1,741 1,000 1,000 1,000
2,677 1,000 1,000 1,000
Other Expenses
Other Expenses 396 500 305 1,000 1,000
Provisions
396 500 305 1,000 1,000
136,702 152,500 135,799 158,900 158,900
Depreciation 174 500 33
Cost Allocation (ABC) 35,746 39,900 37,721 40,000 40,000
WGC - Works Overheads Expenditure 172,622 192,900 173,553 198,900 198,900
WGC - Public Works Overheads (Net) 498,510 501,800 489,089 522,700 522,700
Wembley Golf Course - Public Works Overheads (ABC Summary)
Overhead Expenditure 81,251 501,800 25,872 522,700 522,700
Less Overhead Recovered (417,259) (473,000) (463,217) (522,200) (522,200)
Under/(Over) Allocated 81,251 28,800 25,872 500 500
________________________________________________________________________________________________Page 3.75
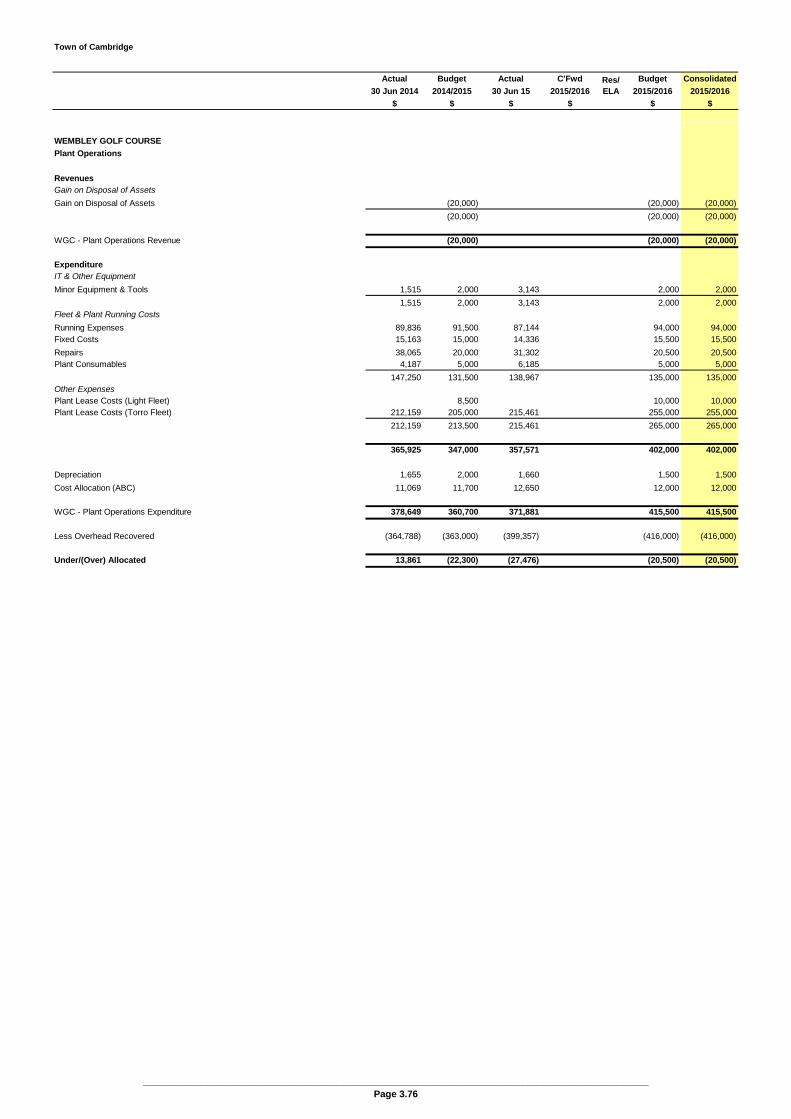
Town of Cambridge
Actual Budget Actual C'Fwd Budget Consolidated
30 Jun 2014 2014/2015 30 Jun 15 2015/2016 2015/2016 2015/2016
$ $ $ $ $ $
Res/ELA
WEMBLEY GOLF COURSE
Plant Operations
RevenuesGain on Disposal of Assets
Gain on Disposal of Assets (20,000) (20,000) (20,000)
(20,000) (20,000) (20,000)
WGC - Plant Operations Revenue (20,000) (20,000) (20,000)
ExpenditureIT & Other Equipment
Minor Equipment & Tools 1,515 2,000 3,143 2,000 2,000
1,515 2,000 3,143 2,000 2,000Fleet & Plant Running Costs
Running Expenses 89,836 91,500 87,144 94,000 94,000Fixed Costs 15,163 15,000 14,336 15,500 15,500
Repairs 38,065 20,000 31,302 20,500 20,500Plant Consumables 4,187 5,000 6,185 5,000 5,000
147,250 131,500 138,967 135,000 135,000Other ExpensesPlant Lease Costs (Light Fleet) 8,500 10,000 10,000Plant Lease Costs (Torro Fleet) 212,159 205,000 215,461 255,000 255,000
212,159 213,500 215,461 265,000 265,000
365,925 347,000 357,571 402,000 402,000
Depreciation 1,655 2,000 1,660 1,500 1,500
Cost Allocation (ABC) 11,069 11,700 12,650 12,000 12,000
WGC - Plant Operations Expenditure 378,649 360,700 371,881 415,500 415,500
Less Overhead Recovered (364,788) (363,000) (399,357) (416,000) (416,000)
Under/(Over) Allocated 13,861 (22,300) (27,476) (20,500) (20,500)
________________________________________________________________________________________________Page 3.76
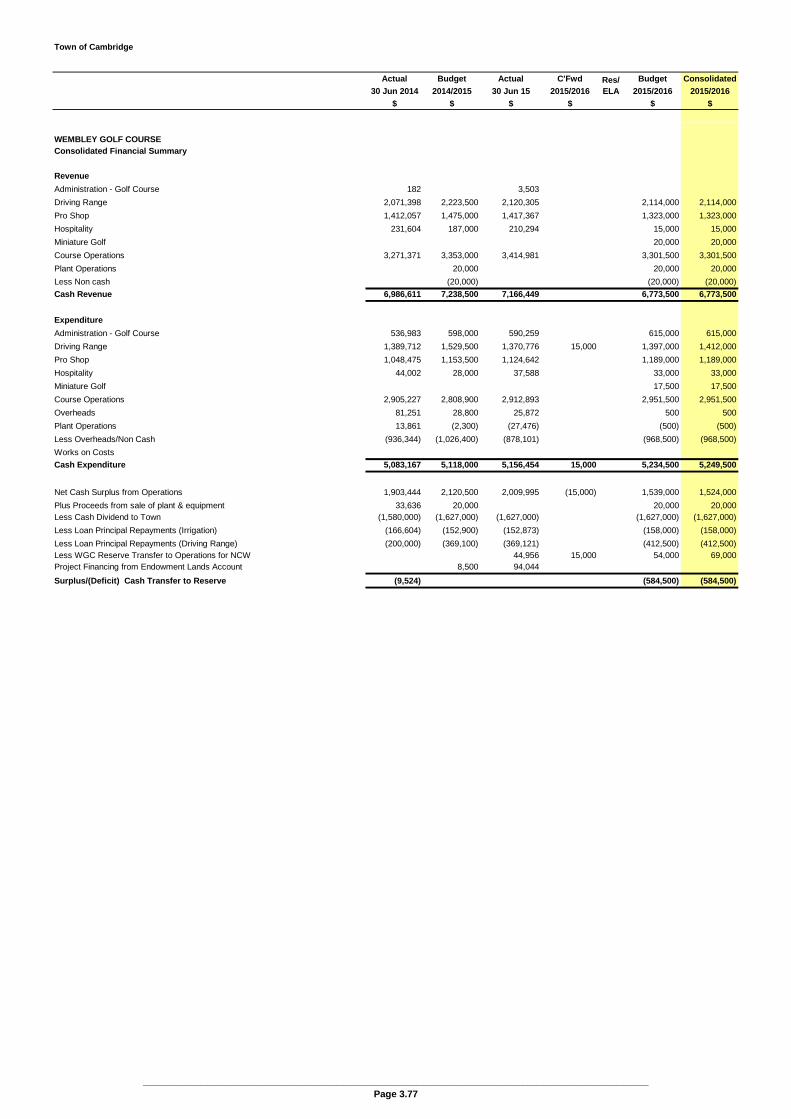
Town of Cambridge
Actual Budget Actual C'Fwd Budget Consolidated
30 Jun 2014 2014/2015 30 Jun 15 2015/2016 2015/2016 2015/2016
$ $ $ $ $ $
Res/ELA
WEMBLEY GOLF COURSEConsolidated Financial Summary
Revenue
Administration - Golf Course 182 3,503
Driving Range 2,071,398 2,223,500 2,120,305 0 2,114,000 2,114,000
Pro Shop 1,412,057 1,475,000 1,417,367 0 1,323,000 1,323,000
Hospitality 231,604 187,000 210,294 0 15,000 15,000
Miniature Golf 0 20,000 20,000
Course Operations 3,271,371 3,353,000 3,414,981 0 3,301,500 3,301,500
Plant Operations 20,000 20,000 20,000
Less Non cash (20,000) (20,000) (20,000)
Cash Revenue 6,986,611 7,238,500 7,166,449 6,773,500 6,773,500
Expenditure
Administration - Golf Course 536,983 598,000 590,259 0 615,000 615,000
Driving Range 1,389,712 1,529,500 1,370,776 15,000 1,397,000 1,412,000
Pro Shop 1,048,475 1,153,500 1,124,642 0 1,189,000 1,189,000
Hospitality 44,002 28,000 37,588 0 33,000 33,000
Miniature Golf 0 17,500 17,500
Course Operations 2,905,227 2,808,900 2,912,893 0 2,951,500 2,951,500
Overheads 81,251 28,800 25,872 0 500 500
Plant Operations 13,861 (2,300) (27,476) 0 (500) (500)
Less Overheads/Non Cash (936,344) (1,026,400) (878,101) 0 (968,500) (968,500)
Works on Costs
Cash Expenditure 5,083,167 5,118,000 5,156,454 15,000 5,234,500 5,249,500
Net Cash Surplus from Operations 1,903,444 2,120,500 2,009,995 (15,000) 1,539,000 1,524,000
Plus Proceeds from sale of plant & equipment 33,636 20,000 20,000 20,000Less Cash Dividend to Town (1,580,000) (1,627,000) (1,627,000) (1,627,000) (1,627,000)
Less Loan Principal Repayments (Irrigation) (166,604) (152,900) (152,873) (158,000) (158,000)
Less Loan Principal Repayments (Driving Range) (200,000) (369,100) (369,121) (412,500) (412,500)Less WGC Reserve Transfer to Operations for NCW 44,956 15,000 54,000 69,000Project Financing from Endowment Lands Account 8,500 94,044
Surplus/(Deficit) Cash Transfer to Reserve (9,524) (584,500) (584,500)
________________________________________________________________________________________________Page 3.77
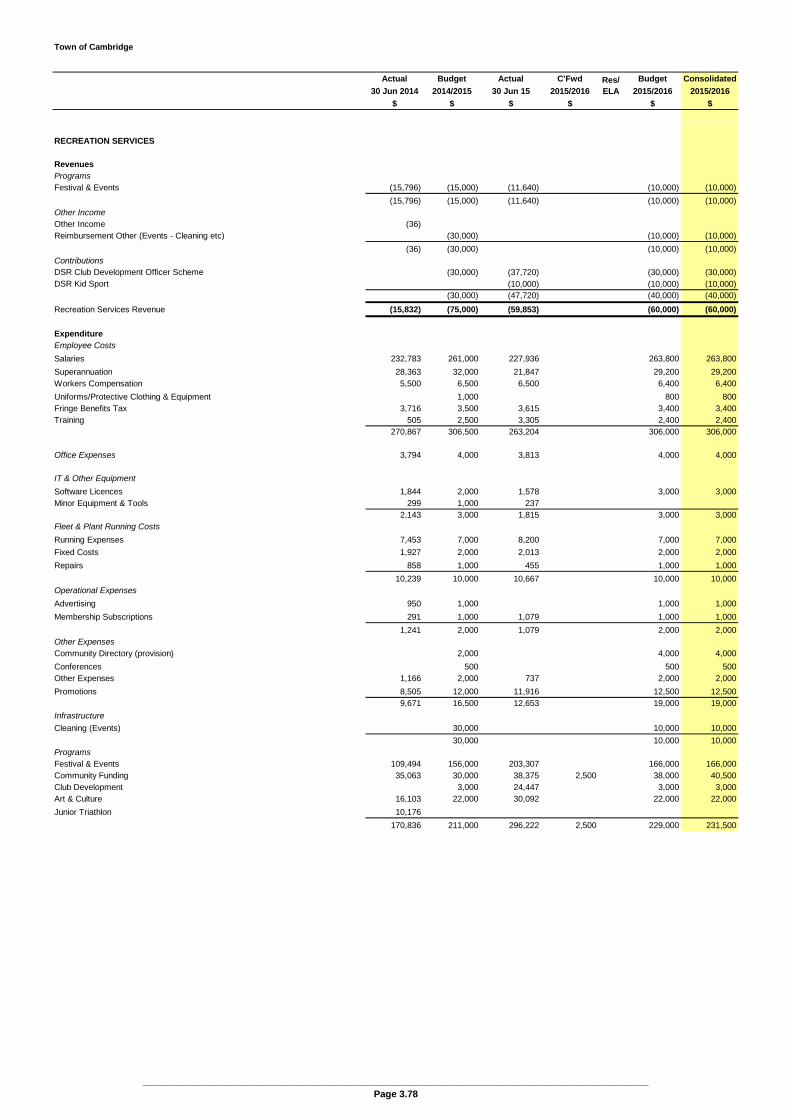
Town of Cambridge
Actual Budget Actual C'Fwd Budget Consolidated
30 Jun 2014 2014/2015 30 Jun 15 2015/2016 2015/2016 2015/2016
$ $ $ $ $ $
Res/ELA
RECREATION SERVICES
RevenuesProgramsFestival & Events (15,796) (15,000) (11,640) (10,000) (10,000)
(15,796) (15,000) (11,640) (10,000) (10,000)Other IncomeOther Income (36)Reimbursement Other (Events - Cleaning etc) (30,000) (10,000) (10,000)
(36) (30,000) (10,000) (10,000)ContributionsDSR Club Development Officer Scheme (30,000) (37,720) (30,000) (30,000)DSR Kid Sport (10,000) (10,000) (10,000)
(30,000) (47,720) (40,000) (40,000)
Recreation Services Revenue (15,832) (75,000) (59,853) (60,000) (60,000)
ExpenditureEmployee Costs
Salaries 232,783 261,000 227,936 263,800 263,800
Superannuation 28,363 32,000 21,847 29,200 29,200Workers Compensation 5,500 6,500 6,500 6,400 6,400
Uniforms/Protective Clothing & Equipment 1,000 800 800Fringe Benefits Tax 3,716 3,500 3,615 3,400 3,400Training 505 2,500 3,305 2,400 2,400
270,867 306,500 263,204 306,000 306,000
Office Expenses 3,794 4,000 3,813 4,000 4,000
IT & Other Equipment
Software Licences 1,844 2,000 1,578 3,000 3,000Minor Equipment & Tools 299 1,000 237
2,143 3,000 1,815 3,000 3,000Fleet & Plant Running Costs
Running Expenses 7,453 7,000 8,200 7,000 7,000
Fixed Costs 1,927 2,000 2,013 2,000 2,000
Repairs 858 1,000 455 1,000 1,000
10,239 10,000 10,667 10,000 10,000Operational Expenses
Advertising 950 1,000 1,000 1,000
Membership Subscriptions 291 1,000 1,079 1,000 1,000
1,241 2,000 1,079 2,000 2,000Other ExpensesCommunity Directory (provision) 2,000 4,000 4,000
Conferences 500 500 500Other Expenses 1,166 2,000 737 2,000 2,000
Promotions 8,505 12,000 11,916 12,500 12,5009,671 16,500 12,653 19,000 19,000
Infrastructure
Cleaning (Events) 30,000 10,000 10,000
30,000 10,000 10,000ProgramsFestival & Events 109,494 156,000 203,307 166,000 166,000Community Funding 35,063 30,000 38,375 2,500 38,000 40,500Club Development 3,000 24,447 3,000 3,000Art & Culture 16,103 22,000 30,092 22,000 22,000
Junior Triathlon 10,176
170,836 211,000 296,222 2,500 229,000 231,500
________________________________________________________________________________________________Page 3.78
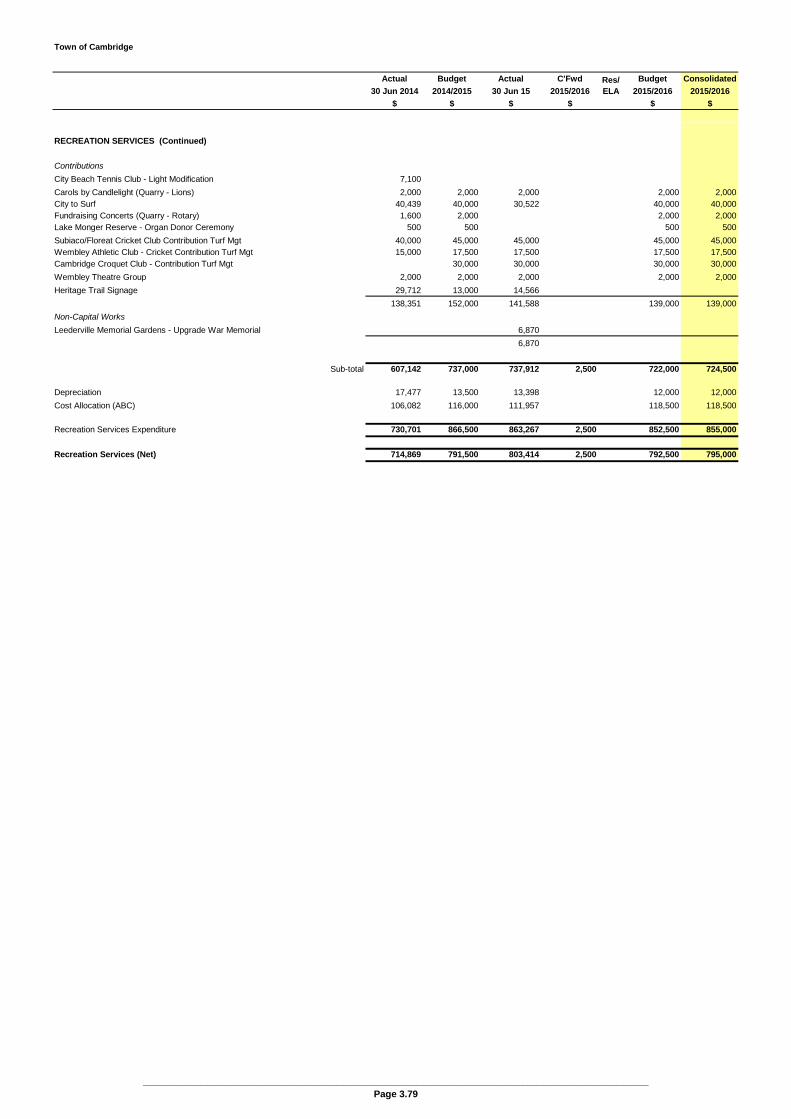
Town of Cambridge
Actual Budget Actual C'Fwd Budget Consolidated
30 Jun 2014 2014/2015 30 Jun 15 2015/2016 2015/2016 2015/2016
$ $ $ $ $ $
Res/ELA
RECREATION SERVICES (Continued)
Contributions
City Beach Tennis Club - Light Modification 7,100
Carols by Candlelight (Quarry - Lions) 2,000 2,000 2,000 2,000 2,000City to Surf 40,439 40,000 30,522 40,000 40,000Fundraising Concerts (Quarry - Rotary) 1,600 2,000 2,000 2,000Lake Monger Reserve - Organ Donor Ceremony 500 500 500 500
Subiaco/Floreat Cricket Club Contribution Turf Mgt 40,000 45,000 45,000 45,000 45,000Wembley Athletic Club - Cricket Contribution Turf Mgt 15,000 17,500 17,500 17,500 17,500Cambridge Croquet Club - Contribution Turf Mgt 30,000 30,000 30,000 30,000
Wembley Theatre Group 2,000 2,000 2,000 2,000 2,000
Heritage Trail Signage 29,712 13,000 14,566
138,351 152,000 141,588 139,000 139,000
Non-Capital Works
Leederville Memorial Gardens - Upgrade War Memorial 6,870
6,870
Sub-total 607,142 737,000 737,912 2,500 722,000 724,500
Depreciation 17,477 13,500 13,398 12,000 12,000
Cost Allocation (ABC) 106,082 116,000 111,957 118,500 118,500
Recreation Services Expenditure 730,701 866,500 863,267 2,500 852,500 855,000
Recreation Services (Net) 714,869 791,500 803,414 2,500 792,500 795,000
________________________________________________________________________________________________Page 3.79
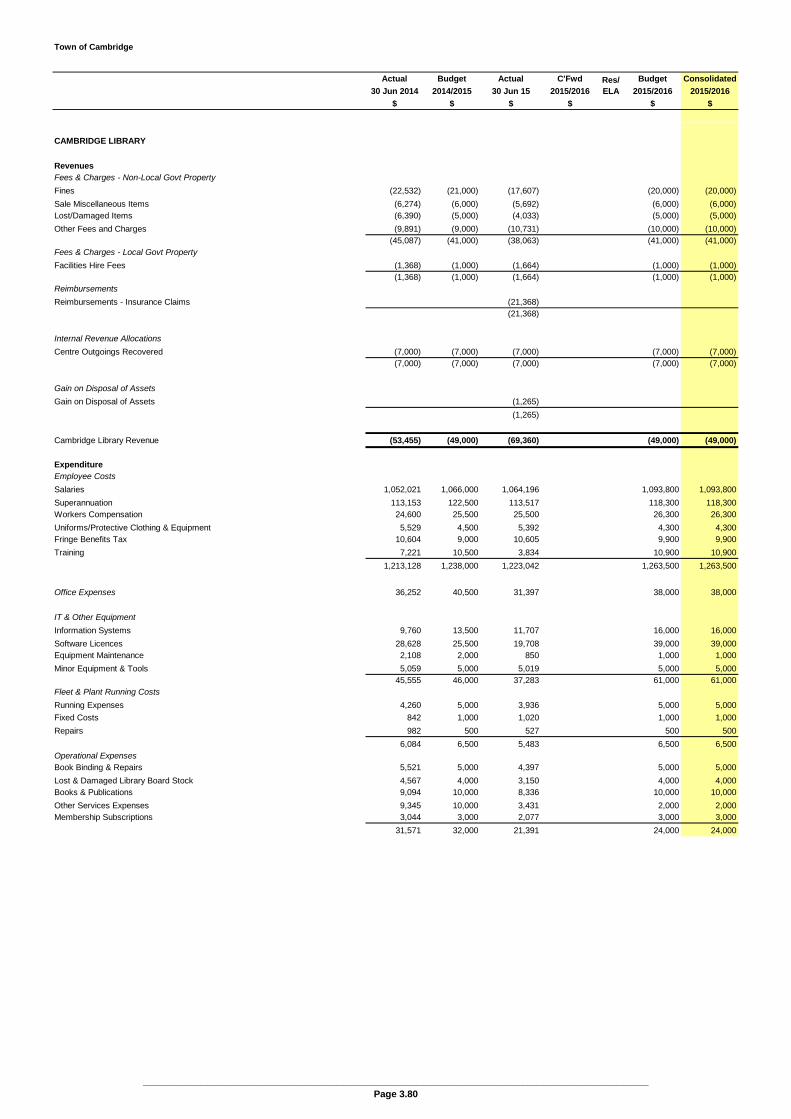
Town of Cambridge
Actual Budget Actual C'Fwd Budget Consolidated
30 Jun 2014 2014/2015 30 Jun 15 2015/2016 2015/2016 2015/2016
$ $ $ $ $ $
Res/ELA
CAMBRIDGE LIBRARY
RevenuesFees & Charges - Non-Local Govt Property
Fines (22,532) (21,000) (17,607) (20,000) (20,000)
Sale Miscellaneous Items (6,274) (6,000) (5,692) (6,000) (6,000)Lost/Damaged Items (6,390) (5,000) (4,033) (5,000) (5,000)
Other Fees and Charges (9,891) (9,000) (10,731) (10,000) (10,000)(45,087) (41,000) (38,063) (41,000) (41,000)
Fees & Charges - Local Govt Property
Facilities Hire Fees (1,368) (1,000) (1,664) (1,000) (1,000)(1,368) (1,000) (1,664) (1,000) (1,000)
Reimbursements
Reimbursements - Insurance Claims (21,368)(21,368)
Internal Revenue Allocations
Centre Outgoings Recovered (7,000) (7,000) (7,000) (7,000) (7,000)(7,000) (7,000) (7,000) (7,000) (7,000)
Gain on Disposal of Assets
Gain on Disposal of Assets (1,265)
(1,265)
Cambridge Library Revenue (53,455) (49,000) (69,360) (49,000) (49,000)
ExpenditureEmployee Costs
Salaries 1,052,021 1,066,000 1,064,196 1,093,800 1,093,800
Superannuation 113,153 122,500 113,517 118,300 118,300Workers Compensation 24,600 25,500 25,500 26,300 26,300
Uniforms/Protective Clothing & Equipment 5,529 4,500 5,392 4,300 4,300Fringe Benefits Tax 10,604 9,000 10,605 9,900 9,900
Training 7,221 10,500 3,834 10,900 10,900
1,213,128 1,238,000 1,223,042 1,263,500 1,263,500
Office Expenses 36,252 40,500 31,397 38,000 38,000
IT & Other Equipment
Information Systems 9,760 13,500 11,707 16,000 16,000
Software Licences 28,628 25,500 19,708 39,000 39,000Equipment Maintenance 2,108 2,000 850 1,000 1,000
Minor Equipment & Tools 5,059 5,000 5,019 5,000 5,00045,555 46,000 37,283 61,000 61,000
Fleet & Plant Running Costs
Running Expenses 4,260 5,000 3,936 5,000 5,000
Fixed Costs 842 1,000 1,020 1,000 1,000
Repairs 982 500 527 500 500
6,084 6,500 5,483 6,500 6,500Operational ExpensesBook Binding & Repairs 5,521 5,000 4,397 5,000 5,000
Lost & Damaged Library Board Stock 4,567 4,000 3,150 4,000 4,000Books & Publications 9,094 10,000 8,336 10,000 10,000
Other Services Expenses 9,345 10,000 3,431 2,000 2,000Membership Subscriptions 3,044 3,000 2,077 3,000 3,000
31,571 32,000 21,391 24,000 24,000
________________________________________________________________________________________________Page 3.80

Town of Cambridge
Actual Budget Actual C'Fwd Budget Consolidated
30 Jun 2014 2014/2015 30 Jun 15 2015/2016 2015/2016 2015/2016
$ $ $ $ $ $
Res/ELA
CAMBRIDGE LIBRARY (Continued)
Other Expenses
Conferences 2,317 2,000 2,245 2,000 2,000Debt Collection 734 1,000 129 1,000 1,000
Library Stock Purchases 40,885 41,000 41,235 42,000 42,000Local Studies 5,125 5,000 6,599 5,000 5,000
Other Expenses 680 1,000 615 1,000 1,000Promotions 4,977 7,000 4,112 7,000 7,000
Provisions 3,485 3,000 4,334 3,500 3,500
58,203 60,000 59,269 61,500 61,500Infrastructure
Cambridge Library - Building 156,174 176,500 161,786 153,000 153,000Cambridge Library - Ground 3,576 4,000 3,669 4,000 4,000
159,751 180,500 165,455 157,000 157,000
Non-Capital WorksDonneybrook stone facing - minor maintenance 5,000 4,200
5,000 4,200
Sub-total 1,550,543 1,612,000 1,547,521 1,611,500 1,611,500
Depreciation 156,117 135,000 194,185 184,500 184,500
Cost Allocation (ABC) 376,825 453,000 383,868 454,000 454,000
Cambridge Library Expenditure 2,083,485 2,200,000 2,125,573 2,250,000 2,250,000
Cambridge Library (Net) 2,030,030 2,151,000 2,056,213 2,201,000 2,201,000
________________________________________________________________________________________________Page 3.81
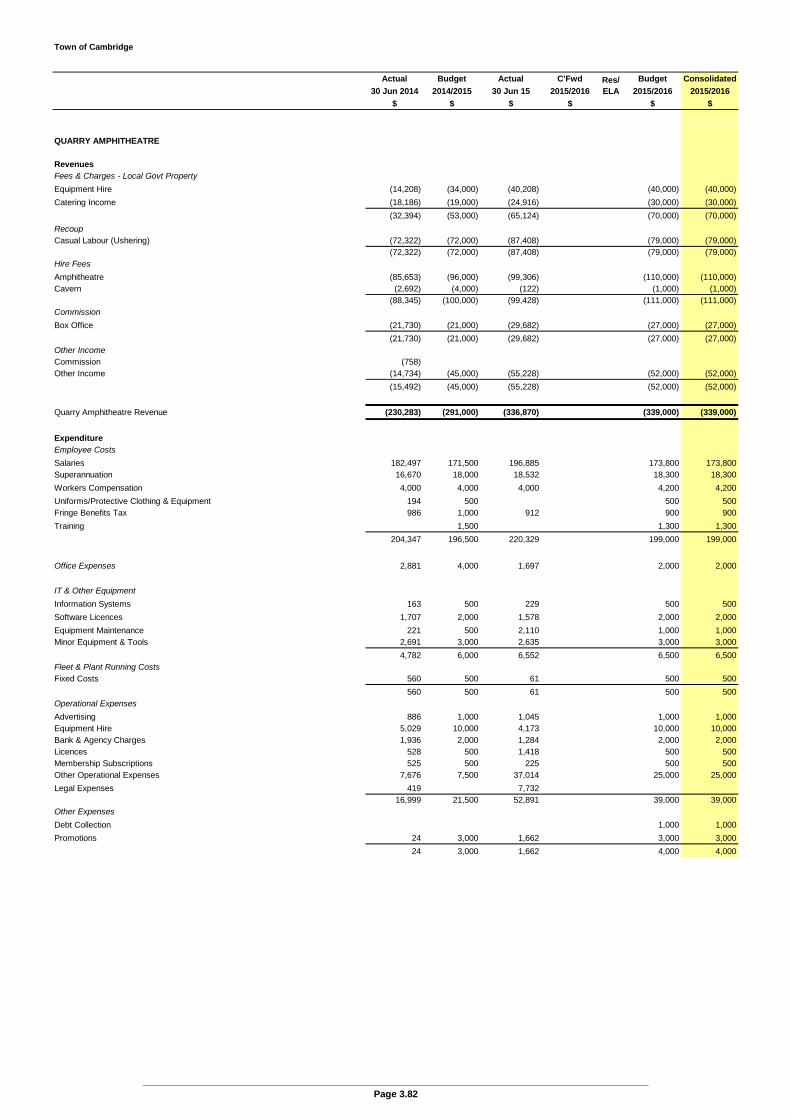
Town of Cambridge
Actual Budget Actual C'Fwd Budget Consolidated
30 Jun 2014 2014/2015 30 Jun 15 2015/2016 2015/2016 2015/2016
$ $ $ $ $ $
Res/ELA
QUARRY AMPHITHEATRE
RevenuesFees & Charges - Local Govt Property
Equipment Hire (14,208) (34,000) (40,208) (40,000) (40,000)
Catering Income (18,186) (19,000) (24,916) (30,000) (30,000)
(32,394) (53,000) (65,124) (70,000) (70,000)
RecoupCasual Labour (Ushering) (72,322) (72,000) (87,408) (79,000) (79,000)
(72,322) (72,000) (87,408) (79,000) (79,000)Hire Fees
Amphitheatre (85,653) (96,000) (99,306) (110,000) (110,000)Cavern (2,692) (4,000) (122) (1,000) (1,000)
(88,345) (100,000) (99,428) (111,000) (111,000)Commission
Box Office (21,730) (21,000) (29,682) (27,000) (27,000)
(21,730) (21,000) (29,682) (27,000) (27,000)Other IncomeCommission (758)Other Income (14,734) (45,000) (55,228) (52,000) (52,000)
(15,492) (45,000) (55,228) (52,000) (52,000)
Quarry Amphitheatre Revenue (230,283) (291,000) (336,870) (339,000) (339,000)
ExpenditureEmployee Costs
Salaries 182,497 171,500 196,885 173,800 173,800Superannuation 16,670 18,000 18,532 18,300 18,300
Workers Compensation 4,000 4,000 4,000 4,200 4,200
Uniforms/Protective Clothing & Equipment 194 500 500 500Fringe Benefits Tax 986 1,000 912 900 900
Training 1,500 1,300 1,300
204,347 196,500 220,329 199,000 199,000
Office Expenses 2,881 4,000 1,697 2,000 2,000
IT & Other Equipment
Information Systems 163 500 229 500 500
Software Licences 1,707 2,000 1,578 2,000 2,000
Equipment Maintenance 221 500 2,110 1,000 1,000Minor Equipment & Tools 2,691 3,000 2,635 3,000 3,000
4,782 6,000 6,552 6,500 6,500Fleet & Plant Running CostsFixed Costs 560 500 61 500 500
560 500 61 500 500Operational Expenses
Advertising 886 1,000 1,045 1,000 1,000Equipment Hire 5,029 10,000 4,173 10,000 10,000Bank & Agency Charges 1,936 2,000 1,284 2,000 2,000Licences 528 500 1,418 500 500Membership Subscriptions 525 500 225 500 500Other Operational Expenses 7,676 7,500 37,014 25,000 25,000
Legal Expenses 419 7,73216,999 21,500 52,891 39,000 39,000
Other Expenses
Debt Collection 1,000 1,000
Promotions 24 3,000 1,662 3,000 3,000
24 3,000 1,662 4,000 4,000
________________________________________________________________________________________________Page 3.82

Town of Cambridge
Actual Budget Actual C'Fwd Budget Consolidated
30 Jun 2014 2014/2015 30 Jun 15 2015/2016 2015/2016 2015/2016
$ $ $ $ $ $
Res/ELA
QUARRY AMPHITHEATRE (Continued)
Infrastructure
Quarry Amphitheatre - Building 45,683 44,500 39,291 49,000 49,000
Quarry Amphitheatre - Ground 11,624 7,500 9,498 10,000 10,000
57,308 52,000 48,789 59,000 59,000Non-Capital Works
Profile Lighting ELA 6,000 6,000Container Electrical & Shelving Fit-out ELA 6,000 6,000Rockface Remedial Works 15,000 15,000Rockface Anchor Points - Install ELA 20,000 20,000Light Modifications ELA 10,000 10,000Protection System from Falling Debris ELA 30,000 30,000
Stair Light Replacement 6,000 5,700Row 'O' leveling 5,500 4,380Zip Wall Boiler (office) 2,000 1,850Marquee roof panels (3) 2,000 2,545Quarry Amphitheatre - Re-coating stage 3,732
6,159 19,500 18,207 87,000 87,000
Sub-total 293,059 303,000 350,186 397,000 397,000
Depreciation 26,454 29,500 64,493 38,000 38,000
Cost Allocation (ABC) 23,391 25,000 26,399 25,500 25,500
Quarry Amphitheatre Expenditure 342,904 357,500 441,078 460,500 460,500
Quarry Amphitheatre (Net) 112,621 66,500 104,208 121,500 121,500
________________________________________________________________________________________________Page 3.83

Town of Cambridge
Actual Budget Actual C'Fwd Budget Consolidated
30 Jun 2014 2014/2015 30 Jun 15 2015/2016 2015/2016 2015/2016
$ $ $ $ $ $
Res/ELA
ROAD INFRASTRUCTURE
RevenuesOperating Grants & SubsidiesOperating Grants (11,567)MRWA Street Lighting Subsidy (8,357) (6,000) (7,427) (6,000) (6,000)
(8,357) (6,000) (18,994) (6,000) (6,000)
Contributions
Operational MRWA Preservation (69,613) (72,000) (72,600) (74,000) (74,000)(69,613) (72,000) (72,600) (74,000) (74,000)
Reimbursements
Recoverable Works (14,690) (14,000) (7,739) (14,500) (14,500)
(14,690) (14,000) (7,739) (14,500) (14,500)Fees & Charges - Non-Local Govt Property
Other Administration Fees (84,302) (70,000) (56,215) (68,500) (68,500)(84,302) (70,000) (56,215) (68,500) (68,500)
MRWA RehabilitationRailway Pde (Loftus St to Kerr St) (297,500) (297,500)The Boulevard (Durston to Templetonia) (195,500) (195,500)Brookdale Street (Alderbury to Underwood) (126,000) (100,532) (25,500) (25,500)Cambridge St (Harborne to Gregory) (61,000) (24,408) (36,500) (36,500)Cambridge St (McCourt - Kimberley) (125,794) (188,200) (145,382)Empire Avenue (The Boulevard to Dumfries) (70,000) (27,794) (42,000) (42,000)Empire Avenue West (Weaponess to Erskine) (123,000) (49,083) (74,000) (74,000)Selby Street (Hay Street to Daikin) (81,000) (64,608) (16,500) (16,500)The Boulevard (Templetonia to WCH) (117,000) (46,800) (70,000) (70,000)Cambridge St (Southport - Kimberley) (22,032)
(444,789) (766,200) (480,639) (757,500) (757,500)
MRWA BlackspotGrantham / Harborne - Intersection safety (700,000) (700,000)Howtree Pl/Brookdale St/Oceanic Dr Traffic signal modification (34,560) (75,500) (75,500) (75,500)The Boulevard/Howtree - signals review and modifications (413,066) (103,500) (103,500) (103,500)
(465,626) (179,000) (879,000) (879,000)
(221,000) (221,000)(137,000) (137,000)(153,000) (153,000)
Roads to RecoveryDonegal Launceston Ave (Helston to Challenger) Crofts LaneElphin St - (The Boulevard - Oceanic) (182,500) (178,980)
(182,856) (182,500) (511,000) (511,000)
Capital GrantsKalinda Dr (Kalari to The Boulevard) (5,393) (174,600) (146,014)Cambridge St - Pedestrian crossing to Oxford from PTA (50,000)Southport St - (Cambridge St - Tower St) (15,380)
(5,393) (174,600) (211,394)Capital ContributionsSalvado Rd - roundabout at SJOG Hospital Entrance (City of Subiaco) (110,000) (110,000)Salvado Rd - roundabout at SJOG Hospital Entrance (St John of God) (110,000) (110,000)Brookdale Street (Alderbury to Underwood) (City of Nedlands) (31,500) (31,500)Selby Street (Hay Street to Daikin) (City of Nedlands) (20,000) (20,000)Empire Avenue West (Weaponess to Erskine) (City of Stirling) (31,000) (31,000) (31,000)
(73,200) (82,500) (51,500) (251,000) (251,000)Other Income
Other Income (Adshell) (15,345) (15,000) (14,033) (15,500) (15,500)
(15,345) (15,000) (14,033) (15,500) (15,500)
Road Infrastructure Revenue (1,364,171) (1,561,800) (1,092,095) (2,577,000) (2,577,000)
________________________________________________________________________________________________Page 3.84
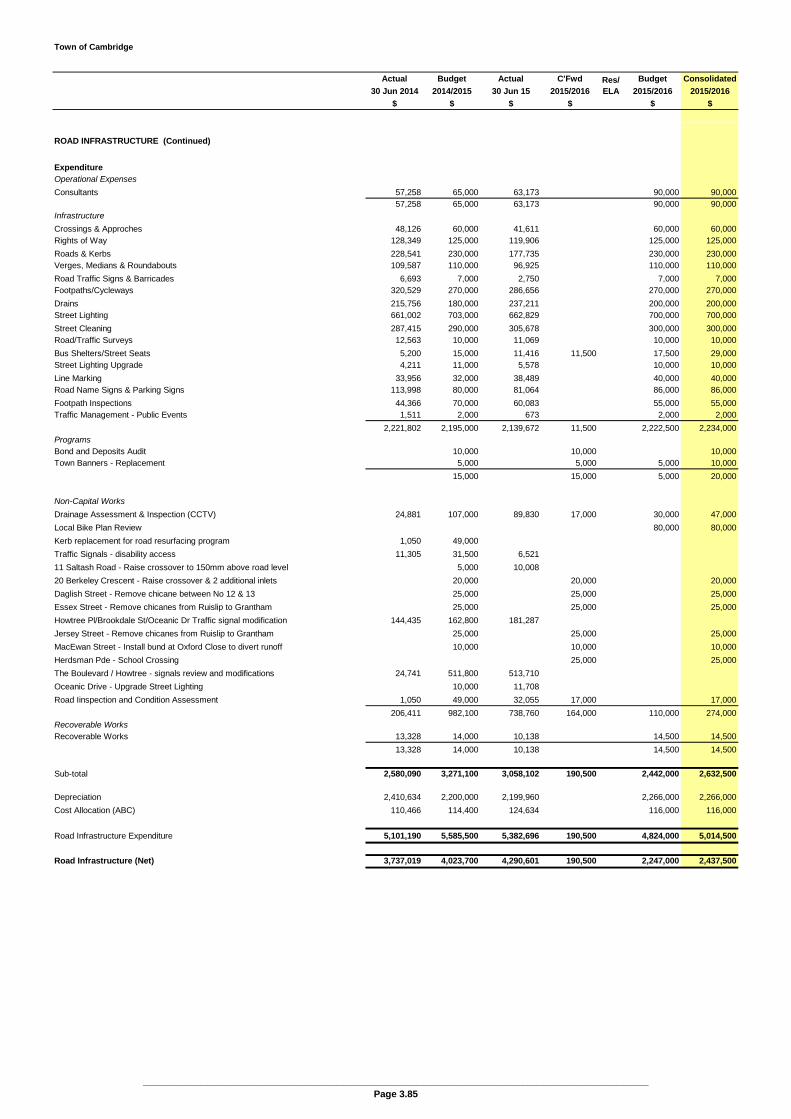
Town of Cambridge
Actual Budget Actual C'Fwd Budget Consolidated
30 Jun 2014 2014/2015 30 Jun 15 2015/2016 2015/2016 2015/2016
$ $ $ $ $ $
Res/ELA
ROAD INFRASTRUCTURE (Continued)
ExpenditureOperational Expenses
Consultants 57,258 65,000 63,173 90,000 90,00057,258 65,000 63,173 90,000 90,000
Infrastructure
Crossings & Approches 48,126 60,000 41,611 60,000 60,000Rights of Way 128,349 125,000 119,906 125,000 125,000
Roads & Kerbs 228,541 230,000 177,735 230,000 230,000Verges, Medians & Roundabouts 109,587 110,000 96,925 110,000 110,000
Road Traffic Signs & Barricades 6,693 7,000 2,750 7,000 7,000Footpaths/Cycleways 320,529 270,000 286,656 270,000 270,000
Drains 215,756 180,000 237,211 200,000 200,000Street Lighting 661,002 703,000 662,829 700,000 700,000
Street Cleaning 287,415 290,000 305,678 300,000 300,000Road/Traffic Surveys 12,563 10,000 11,069 10,000 10,000
Bus Shelters/Street Seats 5,200 15,000 11,416 11,500 17,500 29,000Street Lighting Upgrade 4,211 11,000 5,578 10,000 10,000
Line Marking 33,956 32,000 38,489 40,000 40,000Road Name Signs & Parking Signs 113,998 80,000 81,064 86,000 86,000
Footpath Inspections 44,366 70,000 60,083 55,000 55,000Traffic Management - Public Events 1,511 2,000 673 2,000 2,000
2,221,802 2,195,000 2,139,672 11,500 2,222,500 2,234,000ProgramsBond and Deposits Audit 10,000 10,000 10,000Town Banners - Replacement 5,000 5,000 5,000 10,000
15,000 15,000 5,000 20,000
Non-Capital Works
Drainage Assessment & Inspection (CCTV) 24,881 107,000 89,830 17,000 30,000 47,000
Local Bike Plan Review 80,000 80,000
Kerb replacement for road resurfacing program 1,050 49,000
Traffic Signals - disability access 11,305 31,500 6,521
11 Saltash Road - Raise crossover to 150mm above road level 5,000 10,008
20 Berkeley Crescent - Raise crossover & 2 additional inlets 20,000 20,000 20,000
Daglish Street - Remove chicane between No 12 & 13 25,000 25,000 25,000
Essex Street - Remove chicanes from Ruislip to Grantham 25,000 25,000 25,000
Howtree Pl/Brookdale St/Oceanic Dr Traffic signal modification 144,435 162,800 181,287
Jersey Street - Remove chicanes from Ruislip to Grantham 25,000 25,000 25,000
MacEwan Street - Install bund at Oxford Close to divert runoff 10,000 10,000 10,000
Herdsman Pde - School Crossing 25,000 25,000
The Boulevard / Howtree - signals review and modifications 24,741 511,800 513,710
Oceanic Drive - Upgrade Street Lighting 10,000 11,708
Road Iinspection and Condition Assessment 1,050 49,000 32,055 17,000 17,000
206,411 982,100 738,760 164,000 110,000 274,000Recoverable WorksRecoverable Works 13,328 14,000 10,138 14,500 14,500
13,328 14,000 10,138 14,500 14,500
Sub-total 2,580,090 3,271,100 3,058,102 190,500 2,442,000 2,632,500
Depreciation 2,410,634 2,200,000 2,199,960 2,266,000 2,266,000
Cost Allocation (ABC) 110,466 114,400 124,634 116,000 116,000
Road Infrastructure Expenditure 5,101,190 5,585,500 5,382,696 190,500 4,824,000 5,014,500
Road Infrastructure (Net) 3,737,019 4,023,700 4,290,601 190,500 2,247,000 2,437,500
________________________________________________________________________________________________Page 3.85

Town of Cambridge
Actual Budget Actual C'Fwd Budget Consolidated
30 Jun 2014 2014/2015 30 Jun 15 2015/2016 2015/2016 2015/2016
$ $ $ $ $ $
Res/ELA
ROAD RESERVES
RevenuesInfrastructure
Southport Street Freeway Overpass - MRWA Recoverable (3,500) (4,000) (3,640) (4,000) (4,000)West Coast Highway - MRWA Recoverable (77,000) (79,000) (79,000) (82,000) (82,000)Lake Monger Freeway Reserve - MRWA Recoverable (6,500) (7,000) (6,760) (7,500) (7,500)
(87,000) (90,000) (89,400) (93,500) (93,500)
Road Reserves Revenue (87,000) (90,000) (89,400) (93,500) (93,500)
ExpenditureInfrastructure
Elphin St Median 11,081 12,000 14,283 10,500 10,500Oceanic Drive Median 39,694 47,000 40,239 43,000 43,000
The Boulevard Median 57,261 62,000 66,560 57,000 57,000Underwood Avenue Median 17,279 11,000 11,551 13,000 13,000
Vincent St Median 10,703 11,000 10,385 13,500 13,500Lake Monger Drive Median 27,254 20,000 19,497 21,500 21,500
Launceston Avenue Verge 14,978 7,000 4,985 7,000 7,000Railway Parade Verge 9,332 11,000 5,634 9,000 9,000
Bold Park Verges 7,176 10,000 6,323 9,500 9,500Other Road Reserves 188,255 208,000 181,272 173,000 173,000Cambridge St , West Leederville High Street 35,000 35,000
Street Trees 641,449 661,000 649,696 627,000 627,000Kerb & Path Weeds 48,859 65,000 49,656 60,000 60,000Tree Watering 128,000 128,000
Southport Street Freeway Overpass - MRWA Recoverable 4,687 4,000 4,636 4,000 4,000West Coast Highway - MRWA Recoverable 76,273 79,000 78,357 82,000 82,000
Lake Monger Freeway Reserve - MRWA Recoverable 6,436 7,000 6,920 7,500 7,500
1,160,716 1,215,000 1,149,995 1,300,500 1,300,500Non-Capital WorksHolyrood Street - Ficus Trees Risk Management 68,870 30,000 23,400 30,000 30,000Treescape Plan - Pine/Ficus/Palm Trees Management 70,000 71,557 70,000 70,000Treescape Plan – Priority and Precinct Streets Planting Programs 115,590 138,000 134,209 60,000 60,000Oceanic Drive Median - Arboricultural Tree Works 15,000 15,000Upgrade Garden Beds 8,000 8,485 8,000 8,000
249,301 246,000 237,651 183,000 183,000
Sub-total 1,410,017 1,461,000 1,387,646 1,483,500 1,483,500
Depreciation 67,010 80,000 80,040 82,500 82,500
Cost Allocation (ABC) 51,669 52,500 57,498 53,000 53,000
Road Reserves Expenditure 1,528,695 1,593,500 1,525,183 1,619,000 1,619,000
Road Reserves (Net) 1,441,695 1,503,500 1,435,783 1,525,500 1,525,500
________________________________________________________________________________________________Page 3.86

Town of Cambridge
Actual Budget Actual C'Fwd Budget Consolidated
30 Jun 2014 2014/2015 30 Jun 15 2015/2016 2015/2016 2015/2016
$ $ $ $ $ $
Res/ELA
DEPOT
ExpenditureEmployee Costs
Salaries 119,297 116,500 109,306 122,300 122,300Superannuation 13,334 14,000 14,199 14,400 14,400
Workers Compensation 2,700 3,000 3,000 2,900 2,900
Uniforms/Protective clothing & Equipment 500 300 300
Training 1,000 2,838 1,100 1,100
135,331 135,000 129,343 141,000 141,000
Office Expenses 6,294 6,500 6,515 6,500 6,500
IT & Other Equipment
Information Systems 13,500 11,000 13,500 13,500 13,500
Minor Equipment & Tools 353 500 138 500 500
13,853 11,500 13,638 14,000 14,000Other ExpensesProvisions 3,141 500 3,000 500 500
3,141 500 3,000 500 500InfrastructureRates 408 7,500 7,334 7,500 7,500
Depot - Building 102,883 98,000 76,322 88,000 88,000Depot - Grounds 15,272 8,500 15,067 15,000 15,000
118,564 114,000 98,723 110,500 110,500
Sub-total 303,626 267,500 251,771 272,500 272,500
Depreciation 31,771 31,000 38,091 38,500 38,500
Cost Allocation (ABC) 24,597 28,300 25,616 28,500 28,500
Depot Expenditure 359,994 326,800 315,477 339,500 339,500
Depot (Net) 359,994 326,800 315,477 339,500 339,500
Depot (ABC Summary)
Overhead Expenditure 359,994 326,800 315,477 339,500 339,500
Less allocated (359,994) (326,800) (315,477) (339,500) (339,500)
Under/(Over) Allocated ()
________________________________________________________________________________________________Page 3.87
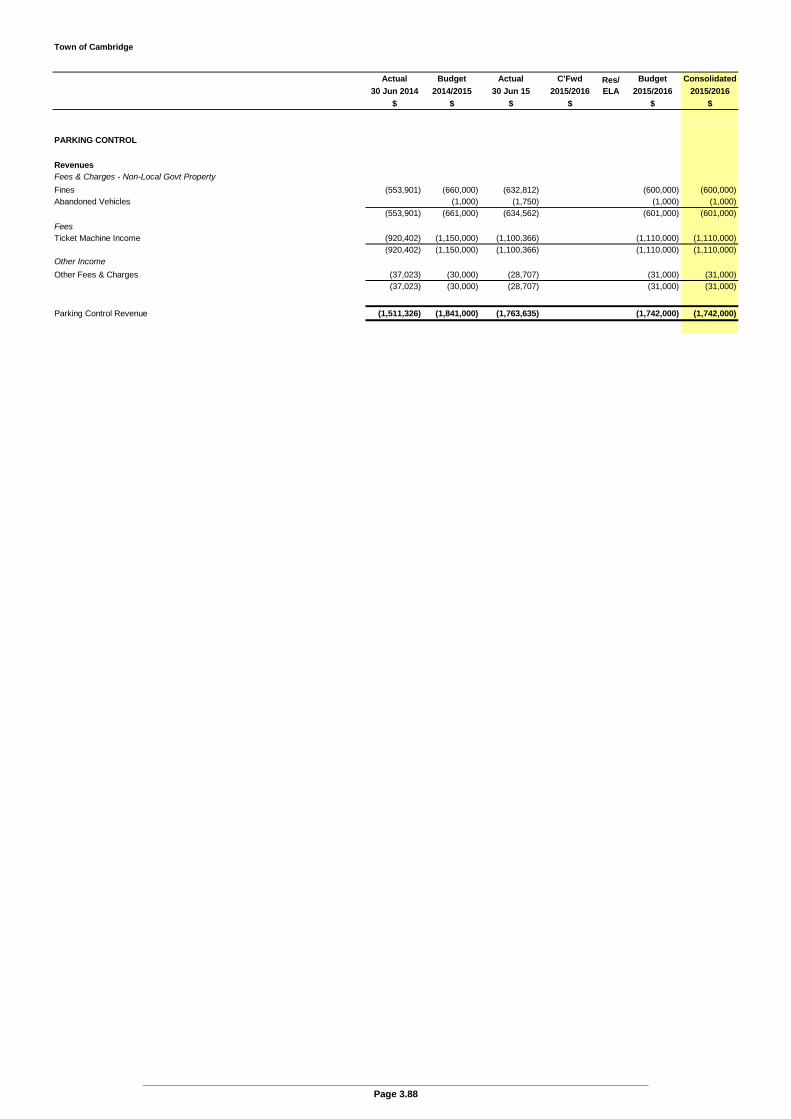
Town of Cambridge
Actual Budget Actual C'Fwd Budget Consolidated
30 Jun 2014 2014/2015 30 Jun 15 2015/2016 2015/2016 2015/2016
$ $ $ $ $ $
Res/ELA
PARKING CONTROL
RevenuesFees & Charges - Non-Local Govt Property
Fines (553,901) (660,000) (632,812) (600,000) (600,000)Abandoned Vehicles (1,000) (1,750) (1,000) (1,000)
(553,901) (661,000) (634,562) (601,000) (601,000)
FeesTicket Machine Income (920,402) (1,150,000) (1,100,366) (1,110,000) (1,110,000)
(920,402) (1,150,000) (1,100,366) (1,110,000) (1,110,000)Other Income
Other Fees & Charges (37,023) (30,000) (28,707) (31,000) (31,000)(37,023) (30,000) (28,707) (31,000) (31,000)
Parking Control Revenue (1,511,326) (1,841,000) (1,763,635) (1,742,000) (1,742,000)
________________________________________________________________________________________________Page 3.88

Town of Cambridge
Actual Budget Actual C'Fwd Budget Consolidated
30 Jun 2014 2014/2015 30 Jun 15 2015/2016 2015/2016 2015/2016
$ $ $ $ $ $
Res/ELA
PARKING CONTROL (Continued)
ExpenditureEmployee Costs
Salaries 400,713 476,500 478,515 497,000 497,000Superannuation 45,115 55,500 58,724 61,200 61,200
Workers Compensation 10,600 11,500 11,500 12,000 12,000Uniforms/Protective Clothing & Equipment 2,578 4,500 2,151 4,300 4,300
Fringe Benefits Tax 18,526 19,000 14,672 14,600 14,600
Training 387 4,500 3,365 4,900 4,900
477,919 571,500 568,927 594,000 594,000
Office Expenses 16,636 22,000 24,869 22,000 22,000
IT & Other EquipmentSoftware Licences 15,620 33,000 35,000 35,000Equipment Maintenance 15,361 16,000 9,656 16,500 16,500
Minor Equipment & Tools 1,758 4,000 1,684 4,000 4,00042,885 53,000 11,341 55,500 55,500
Fleet & Plant Running Costs
Running Expenses 5,971 7,500 6,256 7,500 7,500
Fixed Costs 1,120 1,500 1,322 1,500 1,500
Repairs 190 500 441 500 500
7,282 9,500 8,019 9,500 9,500
Operational Expenses
Advertising 500 500 500
Legal Expenses 7,447 10,000 15,156 10,500 10,500
Bank & Agency Charges 48,374 42,000 59,203 43,500 43,500
Membership Subscriptions 1,000 250 1,000 1,000
Professional Indemnity 2,105 2,000 2,119 2,000 2,000
Other Insurance 521 500 781 500 500
58,448 56,000 77,509 58,000 58,000
Other Expenses
Abandoned Vehicles 965 1,000 800 1,000 1,000
Conferences 2,000 1,410 2,000 2,000
Inspection Services 15,423 24,000 26,392 24,500 24,500
Ticket Machine Operations 102,868 87,000 105,808 89,500 89,500
Licenced Carpark Maintenance 960
119,256 114,000 135,370 117,000 117,000
Loss on Disposal of Assets
Loss on Disposal of Assets 9,000 9,000
9,000 9,000
Sub-total 722,425 826,000 826,035 865,000 865,000
Depreciation 33,171 33,500 31,971 32,000 32,000
Cost Allocation (ABC) 116,910 134,000 122,878 135,500 135,500
Parking Control Expenditure 872,506 993,500 980,885 1,032,500 1,032,500
Parking Control (Net) (638,820) (847,500) (782,750) (709,500) (709,500)
________________________________________________________________________________________________Page 3.89

Town of Cambridge
Actual Budget Actual C'Fwd Budget Consolidated
30 Jun 2014 2014/2015 30 Jun 15 2015/2016 2015/2016 2015/2016
$ $ $ $ $ $
Res/ELA
BUILDING CONTROL
Revenues
Reimbursements
Reimbursements - Other (1,000) (1,000) (1,000)
(1,000) (1,000) (1,000)
Fees & Charges - Non-Local Govt Property
Building Fees (501,522) (450,000) (417,963) (450,000) (450,000)
Fines
(501,522) (450,000) (417,963) (450,000) (450,000)
Other Income
Other Fees & Charges (67,798) (60,000) (63,577) (60,000) (60,000)
Other Income (13,829) (1,000) (6,900) (1,000) (1,000)
(81,626) (61,000) (70,477) (61,000) (61,000)
Building Control Revenue (583,148) (512,000) (488,440) (512,000) (512,000)
Expenditure
Employee Costs
Salaries 311,755 330,000 250,782 249,600 249,600
Superannuation 33,026 36,500 29,067 24,800 24,800
Workers Compensation 7,600 8,000 8,000 5,900 5,900
Uniforms/Protective Clothing & Equipment 1,000 391 800 800
Fringe Benefits Tax 12,619 12,500 10,578 8,000 8,000
Training 3,000 73 2,400 2,400
365,001 391,000 298,892 291,500 291,500
Office Expenses 13,007 8,000 9,876 11,500 11,500
IT & Other Equipment
Minor Equipment & Tools 1,000 15 1,000 1,000
1,000 15 1,000 1,000
Fleet & Plant Running Costs
Running Expenses 6,586 6,000 4,428 6,000 6,000
Fixed Costs 1,159 1,000 1,347 1,000 1,000
Repairs 893 1,000 2,843 1,000 1,000
8,637 8,000 8,618 8,000 8,000
Operational Expenses
Legal Expenses 2,000 2,957 2,000 2,000
Consultants 18,770 20,000 25,644 40,000 40,000
Search Fees 2,930 500 4,781 3,000 3,000
Membership Subscriptions 1,000 2,976 3,000 3,000
Professional Indemnity 10,000 9,000 9,536 9,500 9,500
31,700 32,500 45,894 57,500 57,500
Other Expenses
Conferences 405 2,000 943 2,000 2,000
405 2,000 943 2,000 2,000
Loss on Disposal of Assets
Loss on Disposal of Assets 7,500 2,846
7,500 2,846
Sub-total 418,749 450,000 367,084 371,500 371,500
Depreciation 8,795 8,500 7,332 6,000 6,000
Cost Allocation (ABC) 169,950 192,700 178,620 194,000 194,000
Building Control Expenditure 597,495 651,200 553,037 571,500 571,500
Building Control (Net) 14,347 139,200 64,597 59,500 59,500
________________________________________________________________________________________________Page 3.90
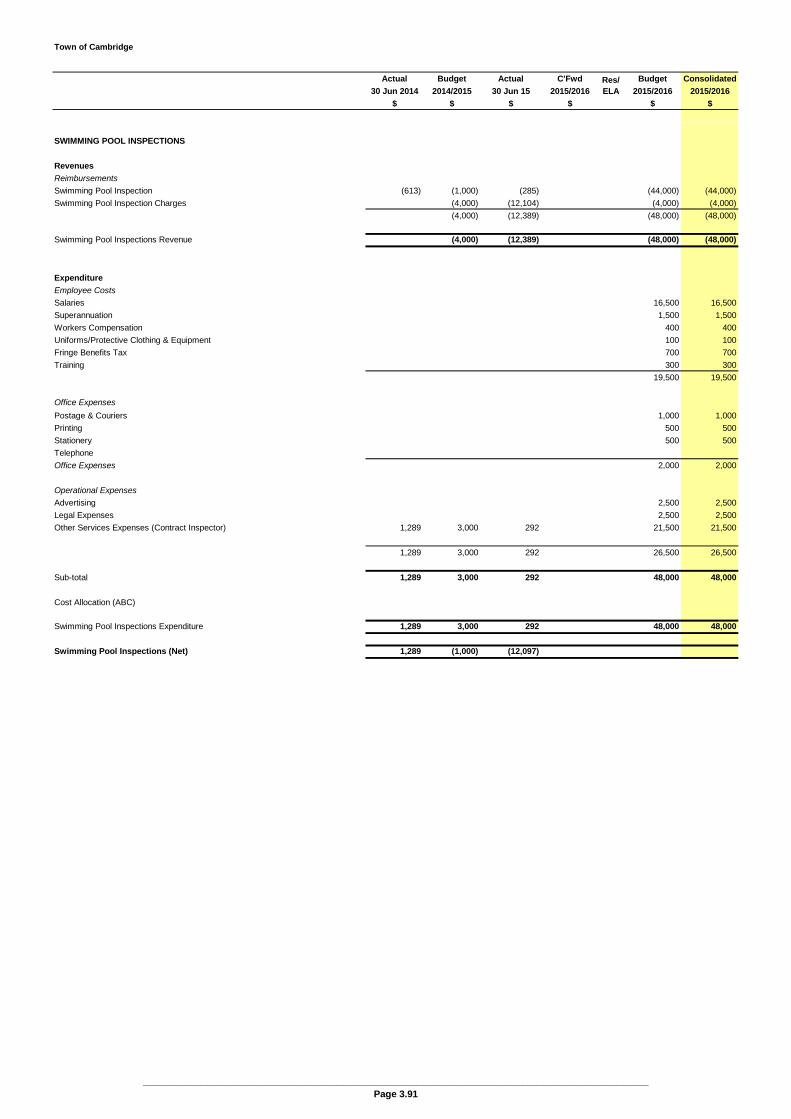
Town of Cambridge
Actual Budget Actual C'Fwd Budget Consolidated
30 Jun 2014 2014/2015 30 Jun 15 2015/2016 2015/2016 2015/2016
$ $ $ $ $ $
Res/ELA
SWIMMING POOL INSPECTIONS
Revenues
Reimbursements
Swimming Pool Inspection (613) (1,000) (285) (44,000) (44,000)
Swimming Pool Inspection Charges (4,000) (12,104) (4,000) (4,000)
(4,000) (12,389) (48,000) (48,000)
Swimming Pool Inspections Revenue (4,000) (12,389) (48,000) (48,000)
Expenditure
Employee Costs
Salaries 16,500 16,500
Superannuation 1,500 1,500
Workers Compensation 400 400
Uniforms/Protective Clothing & Equipment 100 100
Fringe Benefits Tax 700 700
Training 300 300
19,500 19,500
Office Expenses
Postage & Couriers 1,000 1,000
Printing 500 500
Stationery 500 500
Telephone
Office Expenses 2,000 2,000
Operational Expenses
Advertising 2,500 2,500
Legal Expenses 2,500 2,500
Other Services Expenses (Contract Inspector) 1,289 3,000 292 21,500 21,500
1,289 3,000 292 26,500 26,500
Sub-total 1,289 3,000 292 48,000 48,000
Cost Allocation (ABC)
Swimming Pool Inspections Expenditure 1,289 3,000 292 48,000 48,000
Swimming Pool Inspections (Net) 1,289 (1,000) (12,097)
________________________________________________________________________________________________Page 3.91
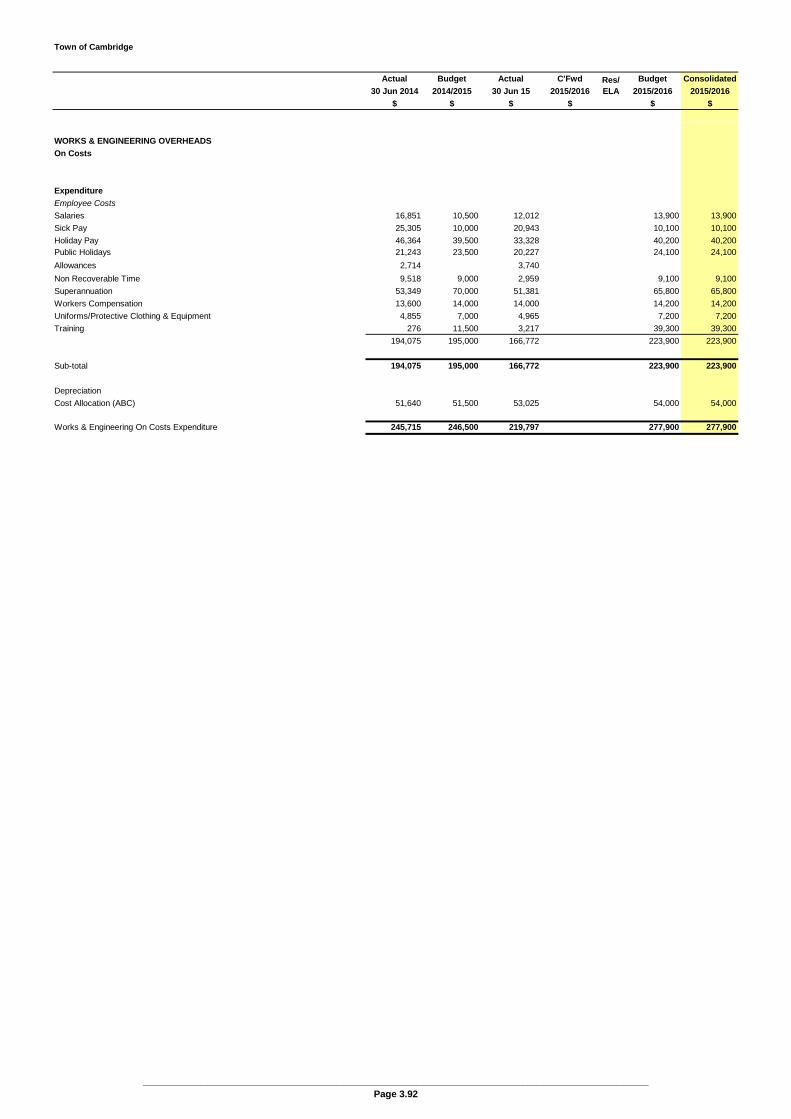
Town of Cambridge
Actual Budget Actual C'Fwd Budget Consolidated
30 Jun 2014 2014/2015 30 Jun 15 2015/2016 2015/2016 2015/2016
$ $ $ $ $ $
Res/ELA
WORKS & ENGINEERING OVERHEADS
On Costs
Expenditure
Employee Costs
Salaries 16,851 10,500 12,012 13,900 13,900
Sick Pay 25,305 10,000 20,943 10,100 10,100
Holiday Pay 46,364 39,500 33,328 40,200 40,200Public Holidays 21,243 23,500 20,227 24,100 24,100
Allowances 2,714 3,740
Non Recoverable Time 9,518 9,000 2,959 9,100 9,100
Superannuation 53,349 70,000 51,381 65,800 65,800
Workers Compensation 13,600 14,000 14,000 14,200 14,200
Uniforms/Protective Clothing & Equipment 4,855 7,000 4,965 7,200 7,200
Training 276 11,500 3,217 39,300 39,300
194,075 195,000 166,772 223,900 223,900
Sub-total 194,075 195,000 166,772 223,900 223,900
Depreciation
Cost Allocation (ABC) 51,640 51,500 53,025 54,000 54,000
Works & Engineering On Costs Expenditure 245,715 246,500 219,797 277,900 277,900
________________________________________________________________________________________________Page 3.92

Town of Cambridge
Actual Budget Actual C'Fwd Budget Consolidated
30 Jun 2014 2014/2015 30 Jun 15 2015/2016 2015/2016 2015/2016
$ $ $ $ $ $
Res/ELA
WORKS & ENGINEERING OVERHEADS
Overheads
Revenues
Reimbursements
Reimbursements - Other (2,109) (2,131)
(2,109) (2,131)
Gain on Disposal of Assets
Gain on Disposal of Assets (3,500)
(3,500)
(2,109) (5,631)
Expenditure
Employee Costs
Salaries 592,759 603,500 554,381 621,300 621,300
Superannuation 70,434 75,500 71,918 77,000 77,000
Workers Compensation 14,500 14,500 14,500 14,900 14,900
Uniforms/Protective Clothing & Equipment 542 1,500 822 1,400 1,400
Fringe Benefits Tax 20,464 13,000 17,402 15,300 15,300
Recruitment Expenses 4,000 4,000 4,000
Training 6,178 6,000 5,319 6,100 6,100
704,877 718,000 664,343 740,000 740,000
Office Expenses 31,836 26,000 35,011 27,000 27,000
IT & Other Equipment
Software Licences 1,416 1,455 3,500 3,500Equipment Maintenance 1,000 469 1,000 1,000
Minor Equipment & Tools 8,258 9,000 10,778 9,500 9,500
9,674 10,000 12,702 14,000 14,000Fleet & Plant Running Costs
Running Expenses 20,811 23,000 17,105 23,500 23,500Fixed Costs 4,130 4,000 4,117 4,000 4,000
Repairs 2,234 500 47 500 500
27,175 27,500 21,269 28,000 28,000Operational Expenses
Advertising 260 3,000 1,517 3,000 3,000Books & Publications 170 500 170 500 500Other Services Expenses 500 500 500
Membership Subscriptions 2,400 1,500 1,386 1,500 1,500Public Liability Insurance 45,263 46,000 48,738 47,500 47,500
48,094 51,500 51,811 53,000 53,000Other Expenses
Conferences 6,690 7,000 4,035 7,000 7,000Other Expenses 3,554 2,000 3,619 2,000 2,000
Workplace Safety 500 500 50010,244 9,500 7,653 9,500 9,500
Programs
Auto Civil CAD Support Group 6,384 6,500 3,951 6,500 6,500
6,384 6,500 3,951 6,500 6,500
Loss on Disposal of Assets
Loss on Disposal of Assets 9,780 5,500 6,744 14,000 14,000
9,780 5,500 6,744 14,000 14,000
Sub-total 848,064 854,500 803,483 892,000 892,000
Depreciation 23,329 29,000 36,003 40,000 40,000
Cost Allocation (ABC) 327,212 336,800 321,944 342,500 342,500
Works & Engineering Overheads Expenditure 1,198,605 1,220,300 1,161,430 1,274,500 1,274,500
Less Overhead Recovered (Operations) (1,057,163) (1,078,500) (972,470) (1,130,900) (1,130,900)
Works & Engineering Overheads (Net) 385,048 388,300 403,125 421,500 421,500
________________________________________________________________________________________________Page 3.93
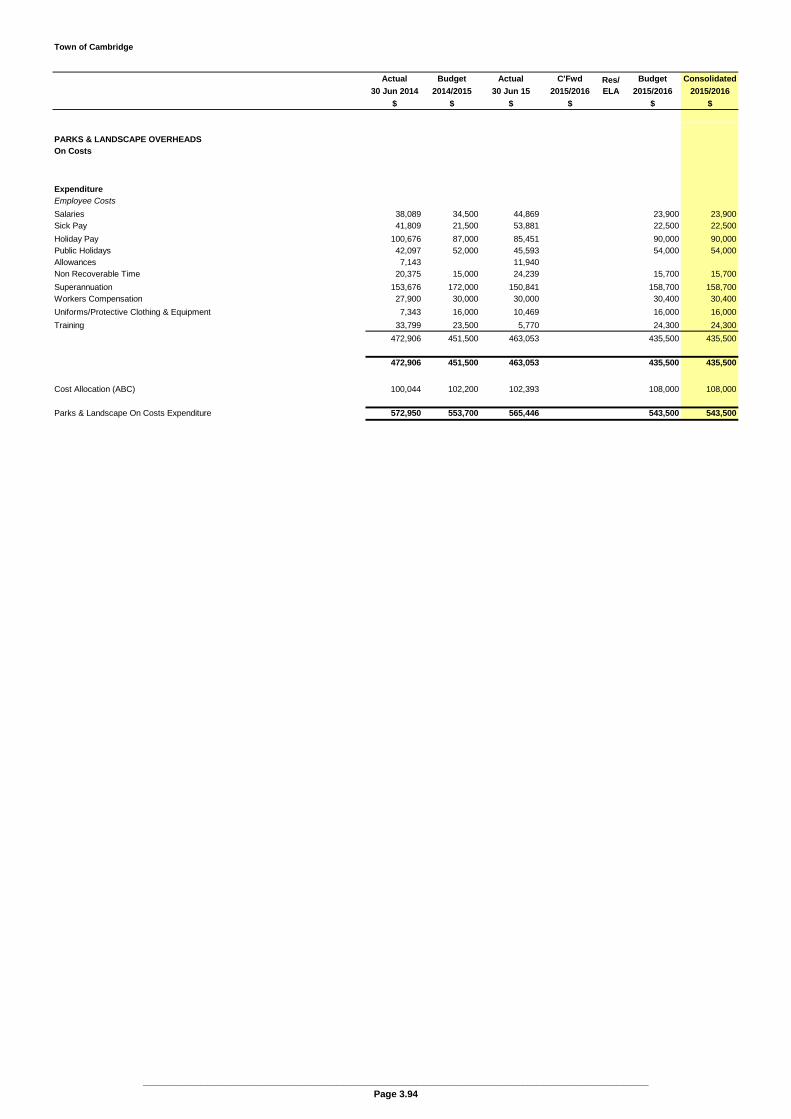
Town of Cambridge
Actual Budget Actual C'Fwd Budget Consolidated
30 Jun 2014 2014/2015 30 Jun 15 2015/2016 2015/2016 2015/2016
$ $ $ $ $ $
Res/ELA
PARKS & LANDSCAPE OVERHEADSOn Costs
ExpenditureEmployee Costs
Salaries 38,089 34,500 44,869 23,900 23,900Sick Pay 41,809 21,500 53,881 22,500 22,500
Holiday Pay 100,676 87,000 85,451 90,000 90,000Public Holidays 42,097 52,000 45,593 54,000 54,000Allowances 7,143 11,940Non Recoverable Time 20,375 15,000 24,239 15,700 15,700
Superannuation 153,676 172,000 150,841 158,700 158,700Workers Compensation 27,900 30,000 30,000 30,400 30,400
Uniforms/Protective Clothing & Equipment 7,343 16,000 10,469 16,000 16,000
Training 33,799 23,500 5,770 24,300 24,300
472,906 451,500 463,053 435,500 435,500
472,906 451,500 463,053 435,500 435,500
Cost Allocation (ABC) 100,044 102,200 102,393 108,000 108,000
Parks & Landscape On Costs Expenditure 572,950 553,700 565,446 543,500 543,500
________________________________________________________________________________________________Page 3.94
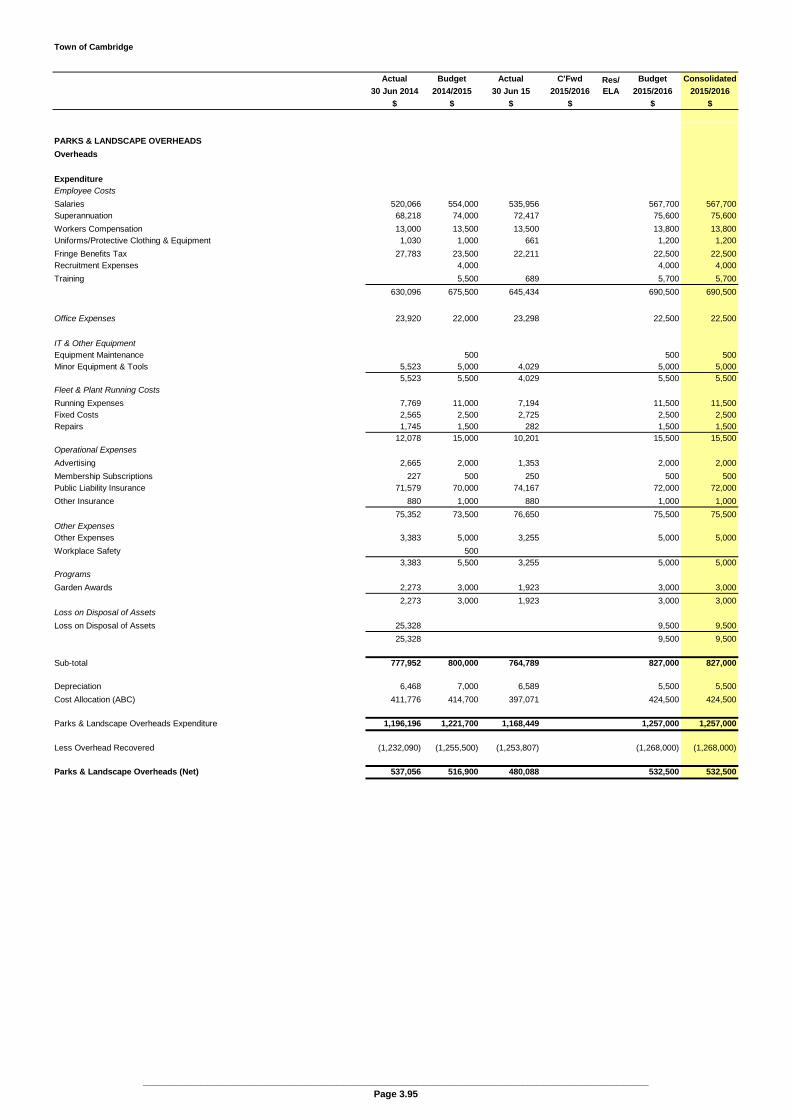
Town of Cambridge
Actual Budget Actual C'Fwd Budget Consolidated
30 Jun 2014 2014/2015 30 Jun 15 2015/2016 2015/2016 2015/2016
$ $ $ $ $ $
Res/ELA
PARKS & LANDSCAPE OVERHEADS
Overheads
ExpenditureEmployee Costs
Salaries 520,066 554,000 535,956 567,700 567,700Superannuation 68,218 74,000 72,417 75,600 75,600
Workers Compensation 13,000 13,500 13,500 13,800 13,800Uniforms/Protective Clothing & Equipment 1,030 1,000 661 1,200 1,200
Fringe Benefits Tax 27,783 23,500 22,211 22,500 22,500Recruitment Expenses 4,000 4,000 4,000
Training 5,500 689 5,700 5,700
630,096 675,500 645,434 690,500 690,500
Office Expenses 23,920 22,000 23,298 22,500 22,500
IT & Other EquipmentEquipment Maintenance 500 500 500Minor Equipment & Tools 5,523 5,000 4,029 5,000 5,000
5,523 5,500 4,029 5,500 5,500Fleet & Plant Running Costs
Running Expenses 7,769 11,000 7,194 11,500 11,500Fixed Costs 2,565 2,500 2,725 2,500 2,500Repairs 1,745 1,500 282 1,500 1,500
12,078 15,000 10,201 15,500 15,500Operational Expenses
Advertising 2,665 2,000 1,353 2,000 2,000
Membership Subscriptions 227 500 250 500 500Public Liability Insurance 71,579 70,000 74,167 72,000 72,000
Other Insurance 880 1,000 880 1,000 1,000
75,352 73,500 76,650 75,500 75,500Other ExpensesOther Expenses 3,383 5,000 3,255 5,000 5,000
Workplace Safety 5003,383 5,500 3,255 5,000 5,000
Programs
Garden Awards 2,273 3,000 1,923 3,000 3,000
2,273 3,000 1,923 3,000 3,000Loss on Disposal of Assets
Loss on Disposal of Assets 25,328 9,500 9,500
25,328 9,500 9,500
Sub-total 777,952 800,000 764,789 827,000 827,000
Depreciation 6,468 7,000 6,589 5,500 5,500
Cost Allocation (ABC) 411,776 414,700 397,071 424,500 424,500
Parks & Landscape Overheads Expenditure 1,196,196 1,221,700 1,168,449 1,257,000 1,257,000
Less Overhead Recovered (1,232,090) (1,255,500) (1,253,807) (1,268,000) (1,268,000)
Parks & Landscape Overheads (Net) 537,056 516,900 480,088 532,500 532,500
________________________________________________________________________________________________Page 3.95

Town of Cambridge
Actual Budget Actual C'Fwd Budget Consolidated
30 Jun 2014 2014/2015 30 Jun 15 2015/2016 2015/2016 2015/2016
$ $ $ $ $ $
Res/ELA
WORKS & ENGINEERING PLANT OPERATION COSTS
RevenuesOther Income
Other Revenue/Income (8,862) (12,000) (22,264) (12,500) (12,500)
(8,862) (12,000) (22,264) (12,500) (12,500)Gain on Disposal of Assets
Gain on Disposal of Assets (205) (3,500) (827) (8,000) (8,000)
(205) (3,500) (827) (8,000) (8,000)
Works/Engineering Plant Operation Costs Revenue (9,067) (15,500) (23,091) (20,500) (20,500)
ExpenditureIT & Other EquipmentMinor Equipment & Tools 1,782
1,782Fleet & Plant Running Costs
Running Expenses 120,535 118,000 119,963 121,500 121,500Fixed Costs 17,305 18,000 15,979 18,500 18,500
Repairs 17,250 10,000 26,872 10,500 10,500
155,090 146,000 162,814 150,500 150,500Loss on Disposal of Assets
Loss on Disposal of Assets 3,537 15,000 15,000
3,537 15,000 15,000
Sub-total 158,627 146,000 164,596 165,500 165,500
Depreciation 94,604 151,000 93,051 121,500 121,500
Cost Allocation (ABC) 17,801 18,100 18,950 18,500 18,500
Works/Engineering Plant Operation Costs Exp 271,031 315,100 276,598 305,500 305,500
Less Plant Operation Recovered (236,420) (283,000) (231,302) (266,500) (266,500)
Works/Engineering Plant Op Costs (Net) 25,544 16,600 22,205 18,500 18,500
________________________________________________________________________________________________Page 3.96

Town of Cambridge
Actual Budget Actual C'Fwd Budget Consolidated
30 Jun 2014 2014/2015 30 Jun 15 2015/2016 2015/2016 2015/2016
$ $ $ $ $ $
Res/ELA
PARKS & LANDSCAPE PLANT OPERATION COSTS
RevenuesGain on Disposal of Assets
Gain on Disposal of Assets (659) (11,000) (17,196)
(659) (11,000) (17,196)
Parks & Landscape Plant Op Costs Revenue (659) (11,000) (17,196)
ExpenditureFleet & Plant Running Costs
Running Expenses 104,466 107,000 108,399 110,000 110,000Fixed Costs 14,098 16,000 15,388 16,500 16,500
Repairs 24,118 16,000 17,146 16,500 16,500
Plant Consumables 2,844
145,526 139,000 140,933 143,000 143,000IT & Other Equipment
Minor Equipment & Tools 3,000 585 1,000 1,000
3,000 585 1,000 1,000Loss on Disposal of Assets
Loss on Disposal of Assets 21,218 22,500 13,699 44,500 44,50021,218 22,500 13,699 44,500 44,500
Sub-total 166,744 164,500 155,218 188,500 188,500
Depreciation 76,877 91,000 77,023 77,000 77,000
Cost Allocation (ABC) 29,171 29,100 30,200 30,000 30,000
Parks/Landscape Plant Operation Costs Exp 272,792 284,600 262,441 295,500 295,500
Less Plant Operation Recovered (242,056) (244,500) (197,725) (265,500) (265,500)
Parks/Landscape Plant Op Costs (Net) 30,077 29,100 47,521 30,000 30,000
________________________________________________________________________________________________Page 3.97

Town of Cambridge
Actual Budget Actual C'Fwd Budget Consolidated
30 Jun 2014 2014/2015 30 Jun 15 2015/2016 2015/2016 2015/2016
$ $ $ $ $ $
Res/ELA
BUILDING MANAGEMENT
ExpenditureEmployee Costs
Salaries 162,778 162,000 136,394 150,000 150,000Superannuation 21,067 22,500 18,110 21,400 21,400
Workers Compensation 3,700 4,000 4,000 3,700 3,700Uniforms/Protective Clothing & Equipment 500 271 400 400
Fringe Benefits Tax 5,714 5,500 5,787 5,200 5,200
Training 1,500 966 1,300 1,300
193,259 196,000 165,528 182,000 182,000
Office Expenses 2,278 2,000 2,590 2,000 2,000
IT & Other Equipment
Minor Equipment & Tools 3,481 5,000 4,431 5,000 5,000
3,481 5,000 4,431 5,000 5,000
Fleet & Plant Running Costs
Running Expenses 5,910 6,500 4,972 6,500 6,500
Fixed Costs 1,394 1,500 1,239 1,500 1,500
Repairs 3,838 1,000 895 1,000 1,000
11,143 9,000 7,105 9,000 9,000
Operational Expenses
Advertising 1,464
Consultants 22,828 25,000 13,424 20,000 20,000
Other Operational Expenses 922
23,750 25,000 14,888 20,000 20,000
Sub-total 239,901 237,000 194,541 218,000 218,000
Depreciation 6,299 6,000 4,826 4,500 4,500
Cost Allocation (ABC) 62,641 67,500 63,393 69,000 69,000
Building Management Expenditure 308,840 310,500 262,760 291,500 291,500
Less allocated
Building Management (Net) 308,840 310,500 262,760 291,500 291,500
________________________________________________________________________________________________Page 3.98

Town of Cambridge
Actual Budget Actual C'Fwd Budget Consolidated
30 Jun 2014 2014/2015 30 Jun 15 2015/2016 2015/2016 2015/2016
$ $ $ $ $ $
Res/ELA
ASSET MANAGEMENT
ExpenditureEmployee Costs
Salaries 137,309 169,000 198,828 172,600 172,600Superannuation 19,405 22,000 24,841 22,200 22,200
Workers Compensation 4,300 4,000 4,000 4,300 4,300Uniforms/Protective Clothing & Equipment 91 500 218 500 500Fringe Benefits Tax 3,000 3,000
Training 1,200 1,500 2,172 1,900 1,900
162,305 197,000 230,058 204,500 204,500
Office Expenses 1,319 500 2,061 500 500
IT & Other Equipment
Software Maintenance/Support 27,077 31,500 9,387 31,000 31,000
Software Licences 53,649 75,000 74,957 83,500 83,500
80,726 106,500 84,344 114,500 114,500
Operational Expenses
Asset valuations (fair value infrastructure assets) 29,500 50,000 64,998
Asset Management - systems and data 50,000 50,893 70,000 70,000
Other Operational Expenses 1,000 2,067 2,000 2,000
Membership Subscriptions
29,500 101,000 117,959 72,000 72,000
Sub-total 273,850 405,000 434,422 391,500 391,500
Non-Capital Works
External Lighting Testing and Inspection Year 3 25,000 25,000
External Lighting Maintenance and Repairs Year 2 20,000 20,000
Asbestos Removal Programme Year 1 100,000 100,000
145,000 145,000
Sub-total 434,422 536,500 536,500
Depreciation
Cost Allocation (ABC) 2,503 2,500 2,902 2,500 2,500
Asset Management Expenditure 276,353 407,500 437,324 539,000 539,000
Less 2% Overhead on Capital Works Recovered: Asset Design
Asset Management (Net) 271,359 407,500 437,324 539,000 539,000
________________________________________________________________________________________________Page 3.99

Town of Cambridge
Actual Budget Actual C'Fwd Budget Consolidated
30 Jun 2014 2014/2015 30 Jun 15 2015/2016 2015/2016 2015/2016
$ $ $ $ $ $
Res/ELA
OTHER PROPERTY
Other Property - Other Properties and Services
Revenues
Other Income
Other Revenue/Income (108,750)
(108,750)
Reimbursement
Tamala Park (Catalina Estate) Rates Reimbursement (1,115) (15,000) (16,005) (15,500) (15,500)
(1,115) (15,000) (16,005) (15,500) (15,500)
Lease Income
Jersey Street Out of School Care (YMCA Mtce Contribution) (27,273) (15,500) (18,818) Res (15,500) (15,500)
Jersey Street Out of School Care (Tiddly Winks) (3,781) (3,000) (4,453) (3,500) (3,500)
Bold Park Community School Car Park (2,176) (2,176)Pre-Primary Centre West Leederville (2,000)
Churchlands Kindergarten (2,000)
(35,230) (20,500) (25,447) (19,000) (19,000)
Programs
Tamala Park (Lease Revenue - MRC) (85,197) (56,500) (129,279) (61,000) (61,000)
Mindarie Regional Council (359,366)
(444,563) (56,500) (129,279) (61,000) (61,000)
Gain on Disposal of Assets
Gain on Disposal of Assets (19,549,558) (8,519,000) (3,641,144) (2,599,000) (2,599,000)
Ocean Mia Holding & Marketing Costs 30,000 37,561
(19,549,558) (8,489,000) (3,603,584) (2,599,000) (2,599,000)
Other Property - Other Commercial Properties Revenue (20,139,216) (8,581,000) (3,774,315) (2,694,500) (2,694,500)
Expenditure
Employee Costs
Salaries 315,189 344,000 335,086 357,100 357,100
Superannuation 39,371 43,500 43,029 44,600 44,600
Workers Compensation 7,600 8,500 8,500 8,500 8,500
Uniforms/Protective Clothing & Equipment 401 500 213 700 700
Fringe Benefits Tax 19,751 17,000 17,544 16,800 16,800
Training 1,960 3,500 89 3,300 3,300
Less Allocated to projects (90,923) (93,000) (53,130) (93,000) (93,000)
293,349 324,000 351,331 338,000 338,000
Office Expenses 947
Telephone 2,569 1,500 3,140 1,500 1,500
Office Expenses 3,516 1,500 3,140 1,500 1,500
Other Expenses
Emergency Services Levy (Council Buildings) 31,731 32,000 31,190 33,000 33,000
Conferences 2,000 2,000 2,000
Other Expenses 182 1,762
31,913 34,000 32,951 35,000 35,000
Fleet & Plant Running Costs
Running Expenses 4,979 5,000 6,029 5,000 5,000
Fixed Costs 1,015 1,500 1,547 1,500 1,500
Repairs 500 801 500 500
5,994 7,000 8,377 7,000 7,000
Operational Expenses
Advertising 1,200 1,000 5,150 1,000 1,000
Legal Expenses 27,308 50,000 33,617 50,000 50,000
Consultants 10,604 50,000 61,945 50,000 50,000
Valuation Fees 22,353 15,000 12,700 15,000 15,000
Other Insurance 18,772 17,500 5,032 17,000 17,000
Other Services Expenses 12,768
80,236 133,500 131,211 133,000 133,000
________________________________________________________________________________________________Page 3.100
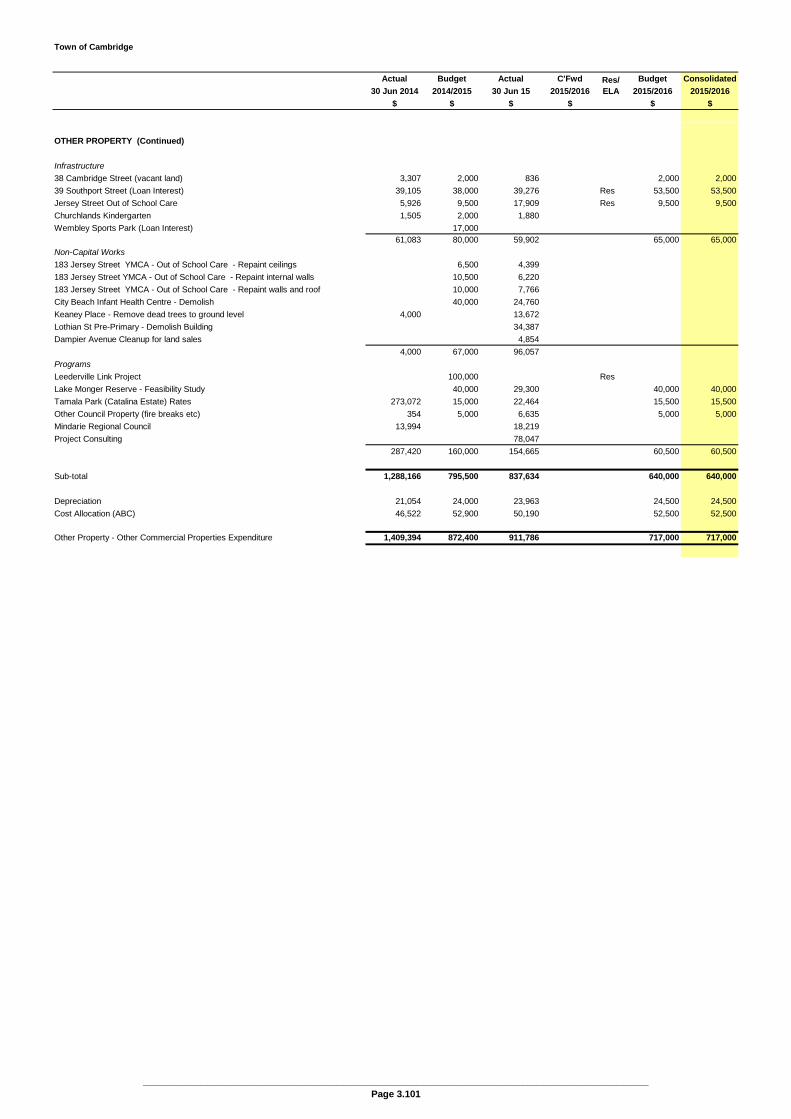
Town of Cambridge
Actual Budget Actual C'Fwd Budget Consolidated
30 Jun 2014 2014/2015 30 Jun 15 2015/2016 2015/2016 2015/2016
$ $ $ $ $ $
Res/ELA
OTHER PROPERTY (Continued)
Infrastructure
38 Cambridge Street (vacant land) 3,307 2,000 836 2,000 2,000
39 Southport Street (Loan Interest) 39,105 38,000 39,276 Res 53,500 53,500
Jersey Street Out of School Care 5,926 9,500 17,909 Res 9,500 9,500
Churchlands Kindergarten 1,505 2,000 1,880
Wembley Sports Park (Loan Interest) 17,00061,083 80,000 59,902 65,000 65,000
Non-Capital Works
183 Jersey Street YMCA - Out of School Care - Repaint ceilings 6,500 4,399
183 Jersey Street YMCA - Out of School Care - Repaint internal walls 10,500 6,220
183 Jersey Street YMCA - Out of School Care - Repaint walls and roof 10,000 7,766
City Beach Infant Health Centre - Demolish 40,000 24,760
Keaney Place - Remove dead trees to ground level 4,000 13,672
Lothian St Pre-Primary - Demolish Building 34,387
Dampier Avenue Cleanup for land sales 4,854
4,000 67,000 96,057
Programs
Leederville Link Project 100,000 Res
Lake Monger Reserve - Feasibility Study 40,000 29,300 40,000 40,000
Tamala Park (Catalina Estate) Rates 273,072 15,000 22,464 15,500 15,500
Other Council Property (fire breaks etc) 354 5,000 6,635 5,000 5,000
Mindarie Regional Council 13,994 18,219
Project Consulting 78,047
287,420 160,000 154,665 60,500 60,500
Sub-total 1,288,166 795,500 837,634 640,000 640,000
Depreciation 21,054 24,000 23,963 24,500 24,500
Cost Allocation (ABC) 46,522 52,900 50,190 52,500 52,500
Other Property - Other Commercial Properties Expenditure 1,409,394 872,400 911,786 717,000 717,000
________________________________________________________________________________________________Page 3.101
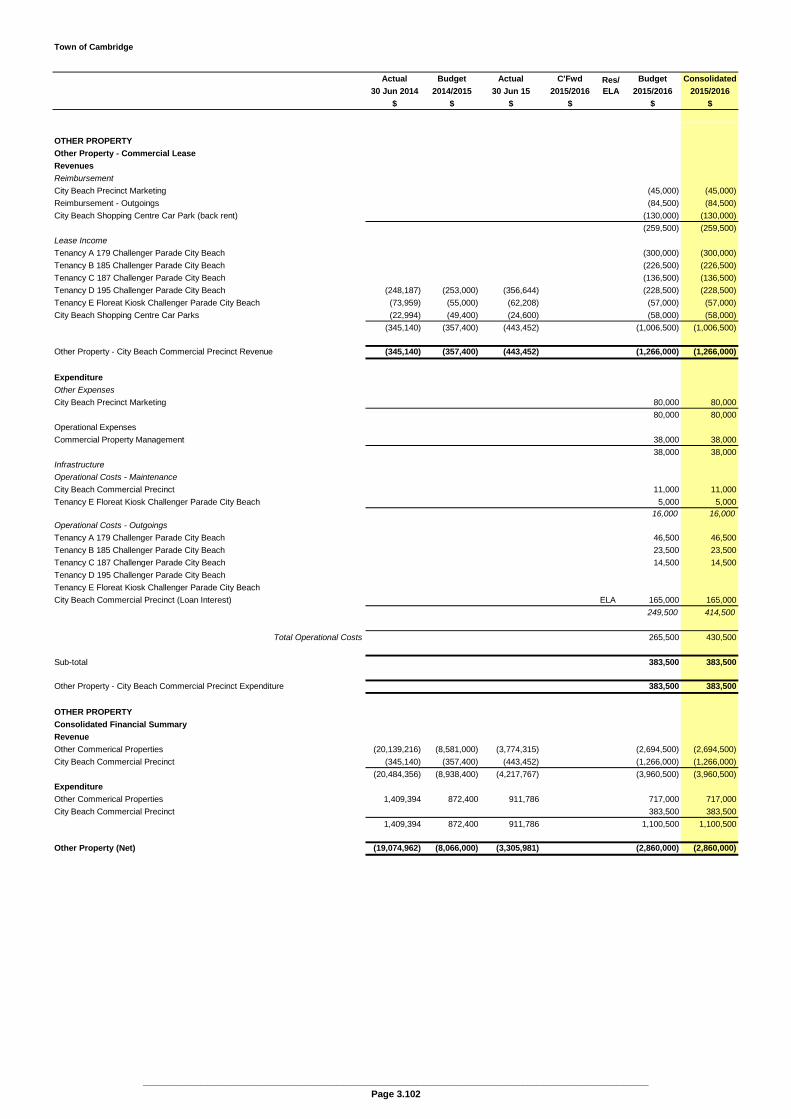
Town of Cambridge
Actual Budget Actual C'Fwd Budget Consolidated
30 Jun 2014 2014/2015 30 Jun 15 2015/2016 2015/2016 2015/2016
$ $ $ $ $ $
Res/ELA
OTHER PROPERTY
Other Property - Commercial Lease
Revenues
Reimbursement
City Beach Precinct Marketing (45,000) (45,000)
Reimbursement - Outgoings (84,500) (84,500)
City Beach Shopping Centre Car Park (back rent) (130,000) (130,000)
(259,500) (259,500)
Lease Income
Tenancy A 179 Challenger Parade City Beach (300,000) (300,000)
Tenancy B 185 Challenger Parade City Beach (226,500) (226,500)
Tenancy C 187 Challenger Parade City Beach (136,500) (136,500)
Tenancy D 195 Challenger Parade City Beach (248,187) (253,000) (356,644) (228,500) (228,500)
Tenancy E Floreat Kiosk Challenger Parade City Beach (73,959) (55,000) (62,208) (57,000) (57,000)
City Beach Shopping Centre Car Parks (22,994) (49,400) (24,600) (58,000) (58,000)
(345,140) (357,400) (443,452) (1,006,500) (1,006,500)
Other Property - City Beach Commercial Precinct Revenue (345,140) (357,400) (443,452) (1,266,000) (1,266,000)
Expenditure
Other Expenses
City Beach Precinct Marketing 80,000 80,000
80,000 80,000
Operational Expenses
Commercial Property Management 38,000 38,000
38,000 38,000
Infrastructure
Operational Costs - Maintenance
City Beach Commercial Precinct 11,000 11,000
Tenancy E Floreat Kiosk Challenger Parade City Beach 5,000 5,00016,000 16,000
Operational Costs - Outgoings
Tenancy A 179 Challenger Parade City Beach 46,500 46,500
Tenancy B 185 Challenger Parade City Beach 23,500 23,500
Tenancy C 187 Challenger Parade City Beach 14,500 14,500
Tenancy D 195 Challenger Parade City Beach
Tenancy E Floreat Kiosk Challenger Parade City Beach
City Beach Commercial Precinct (Loan Interest) ELA 165,000 165,000
249,500 414,500
Total Operational Costs 265,500 430,500
Sub-total 383,500 383,500
Other Property - City Beach Commercial Precinct Expenditure 383,500 383,500
OTHER PROPERTY
Consolidated Financial Summary
Revenue
Other Commerical Properties (20,139,216) (8,581,000) (3,774,315) (2,694,500) (2,694,500)
City Beach Commercial Precinct (345,140) (357,400) (443,452) (1,266,000) (1,266,000)
(20,484,356) (8,938,400) (4,217,767) (3,960,500) (3,960,500)
Expenditure
Other Commerical Properties 1,409,394 872,400 911,786 717,000 717,000
City Beach Commercial Precinct 383,500 383,500
1,409,394 872,400 911,786 1,100,500 1,100,500
Other Property (Net) (19,074,962) (8,066,000) (3,305,981) (2,860,000) (2,860,000)
________________________________________________________________________________________________Page 3.102

CAPITAL BUDGET
Town of Cambridge Capital Budget Summary
Page Funding Budget Funding BudgetNo. 2014/2015 2014/2015 2015/2016 2015/2016
Total$ $ $
CAPITAL FUNDING
Sale of Plant and Equipment 4.1 321,100 346,000Grants 3,870,300 3,541,500Contibutions 209,500 877,000Loan proceeds 0 2,000,000Transfers from reserves 3,147,000 4,184,500Transfers from the ELA 30,696,900 19,094,000
Carried forward funds 2,502,100 2,676,500
Total Funding Excluding Rates 0 40,746,900 0 32,719,500
CAPITAL EXPENDITURE
By ClassLand 4.2 0 0 0 0Buildings 4.2 (27,827,000) 28,036,500 (23,486,000) 23,751,000Furniture and Equipment 4.3 (857,000) 1,489,500 (689,500) 1,612,000Plant and Equipment 4.4 (937,100) 937,000 (998,500) 1,013,500Infrastructure
Parks and Reserves 4.5 (6,510,000) 7,621,000 (3,355,500) 4,351,500Roads and Lanes 4.6 (2,687,400) 5,385,900 (3,390,500) 6,027,000Drainage 4.7 (855,100) 1,160,100 (583,500) 928,500Footpaths 4.7 (898,600) 1,613,600 (186,000) 904,000Bus Shelters 4.8 (27,700) 57,700 (30,000) 60,000
Total Expenditure - by Class (40,599,900) 46,301,300 (32,719,500) 38,647,500
By ProgramGovernance (1,449,100) 1,975,000 (847,000) 1,769,000Education and Welfare (45,000) 45,000 (300,500) 336,500Community Amenities (420,000) 420,000 (326,000) 383,000Recreation and Culture (33,886,000) 35,266,000 (26,614,000) 27,797,500Transport (4,510,800) 8,259,300 (4,232,000) 7,961,500Other Property and Services (289,000) 336,000 (400,000) 400,000
Total Expenditure - by Program (40,599,900) 46,301,300 (32,719,500) 38,647,500
Asset Management SummaryTotal Replacement 24,179,600 20,085,000Total Upgrade 3,920,900 3,770,500Total new 18,200,800 14,792,000
Total Expenditure 48,797,900 38,647,500
Balance (Capital Funding From Rates) 0 5,554,400 0 5,928,000
_______________________________________________________________________________________________Page 4.1

CAPITAL BUDGET
SCHEDULE

Capital Budget - Schedule
Funding Funding Budget Source Amount 2015/2016
$ $
LAND
Catalina Estate Land Sale Proceeds (Tamala Park) 4,816,000
Total Land Revenue 0 4,816,000
BUILDINGS
GovernanceAdministration Building - External Canopy Lighting (Replace) R 15,000Administration Building - Upgrade Security System U 25,000Administration Building - Council Kitchen Refurbishment U 50,000
Recreation and Culture
Community Leased propertiesFloreat Surf life Saving Club - Replace roof R Club Res (450,000) 450,000Cambridge Bowling Club - Replacement of Green A R Contribution/Grant (132,000) 200,000Floreat Beach Storage Shed for Coastcare and FSLSC Contribution N CF/Contribution (147,000) 147,000Cambridge Scouts & Guides Hall Additions N Contribution (50,000) 105,000Reabold Tennis Club - Installation of Kitchen Cupboards and Oven R Club Res (15,000) 15,000City Beach Tennis Club - Replacement of External Fence R Contribution/Grant (46,000) 70,000YMCC HOCKEY Club - Installation of New Ceiling N Club Res (10,000) 10,000Floreat Surf life saving Club - Roof fixing and Roof Design R Club Res (32,500) 32,500
Town FacilitiesMajor Project - Wembley Golf Course Hospitality R Endow/Loan (7,190,500) 7,190,500Major Project - City Beach Amenities N Grant/Endow (6,315,000) 6,315,000Major Project - Bold Park Aquatic Centre Upgrade R Endow (5,365,000) 5,365,000Major Project - Wembley Sports Park - Pavilion N Grant/Area Res (3,007,500) 3,007,500Major Project - Wembley Golf Course Hospitality Fitout (Contribution) N Endow (400,000) 400,000Bold Park Aquatic Centre - Chemical Shed (waterproof brick) N CF (15,000) 15,000Building Energy Efficiency U CF (35,500) 35,500Floreat Beach Kiosk & Public Toilets Upgrade U CF (35,000) 35,000Quarry Amphitheatre - Driveway bollards & entrance lights replace R Endow (10,000) 10,000Quarry Amphitheatre - Fire Management Assets N Endow (130,000) 130,000Quarry Amphitheatre - Kiosk/FOH/Office R Endow (50,000) 50,000Wembley Community Centre - Public & Disabled Toilet refurbishment R Com Res (50,000) 60,000Wembley Community Centre - Under eave closed panelling R 18,000
Total Buildings (23,486,000) 23,751,000
Asset Management SummaryTotal Replacement 13,476,000Total Upgrade 145,500Total New 10,129,500
Total Buildings (23,486,000) 23,751,000
Total Land & Buildings Expenditure (23,486,000) 23,751,000
_______________________________________________________________________________________________Page 4.2
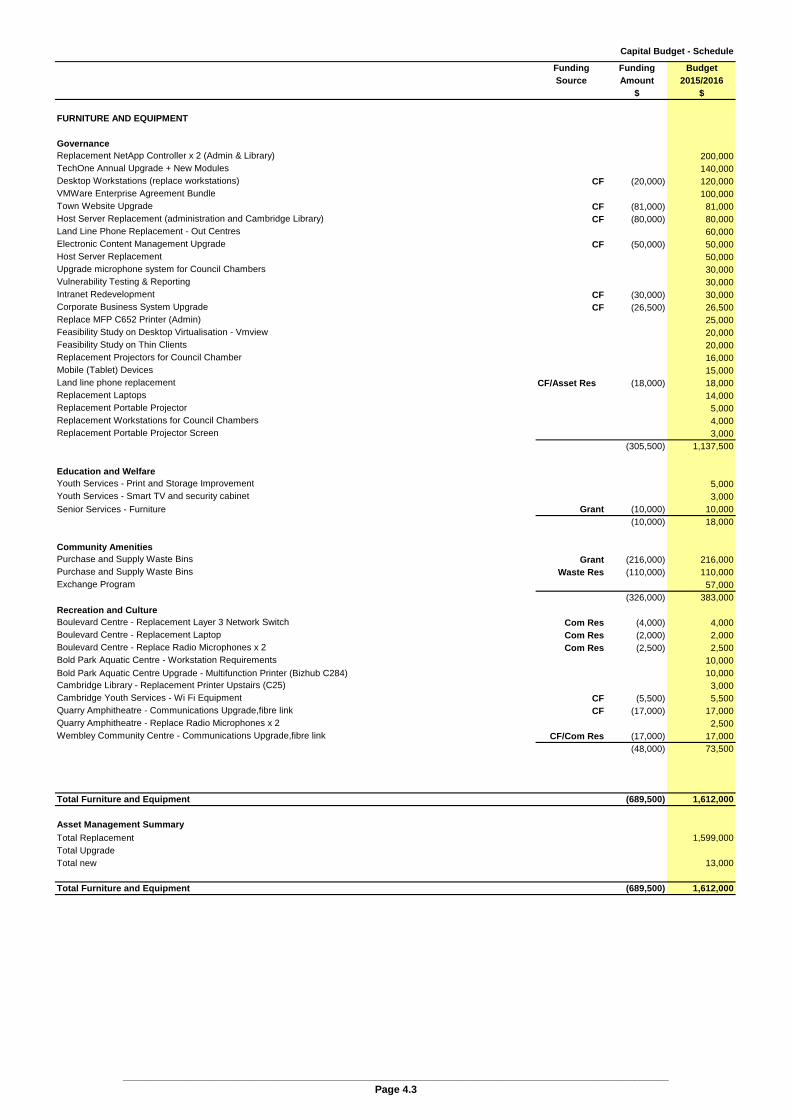
Capital Budget - Schedule
Funding Funding Budget Source Amount 2015/2016
$ $
FURNITURE AND EQUIPMENT
GovernanceReplacement NetApp Controller x 2 (Admin & Library) 200,000TechOne Annual Upgrade + New Modules 140,000Desktop Workstations (replace workstations) CF (20,000) 120,000VMWare Enterprise Agreement Bundle 100,000Town Website Upgrade CF (81,000) 81,000Host Server Replacement (administration and Cambridge Library) CF (80,000) 80,000Land Line Phone Replacement - Out Centres 60,000Electronic Content Management Upgrade CF (50,000) 50,000Host Server Replacement 50,000Upgrade microphone system for Council Chambers 30,000Vulnerability Testing & Reporting 30,000Intranet Redevelopment CF (30,000) 30,000Corporate Business System Upgrade CF (26,500) 26,500Replace MFP C652 Printer (Admin) 25,000Feasibility Study on Desktop Virtualisation - Vmview 20,000Feasibility Study on Thin Clients 20,000Replacement Projectors for Council Chamber 16,000Mobile (Tablet) Devices 15,000Land line phone replacement CF/Asset Res (18,000) 18,000Replacement Laptops 14,000Replacement Portable Projector 5,000Replacement Workstations for Council Chambers 4,000Replacement Portable Projector Screen 3,000
(305,500) 1,137,500
Education and WelfareYouth Services - Print and Storage Improvement 5,000Youth Services - Smart TV and security cabinet 3,000Senior Services - Furniture Grant (10,000) 10,000
(10,000) 18,000
Community AmenitiesPurchase and Supply Waste Bins Grant (216,000) 216,000Purchase and Supply Waste Bins Waste Res (110,000) 110,000Exchange Program 57,000
(326,000) 383,000Recreation and CultureBoulevard Centre - Replacement Layer 3 Network Switch Com Res (4,000) 4,000Boulevard Centre - Replacement Laptop Com Res (2,000) 2,000Boulevard Centre - Replace Radio Microphones x 2 Com Res (2,500) 2,500Bold Park Aquatic Centre - Workstation Requirements 10,000Bold Park Aquatic Centre Upgrade - Multifunction Printer (Bizhub C284) 10,000Cambridge Library - Replacement Printer Upstairs (C25) 3,000Cambridge Youth Services - Wi Fi Equipment CF (5,500) 5,500Quarry Amphitheatre - Communications Upgrade,fibre link CF (17,000) 17,000Quarry Amphitheatre - Replace Radio Microphones x 2 2,500Wembley Community Centre - Communications Upgrade,fibre link CF/Com Res (17,000) 17,000
(48,000) 73,500
Total Furniture and Equipment (689,500) 1,612,000
Asset Management Summary
Total Replacement 1,599,000Total Upgrade Total new 13,000
Total Furniture and Equipment (689,500) 1,612,000
_______________________________________________________________________________________________Page 4.3
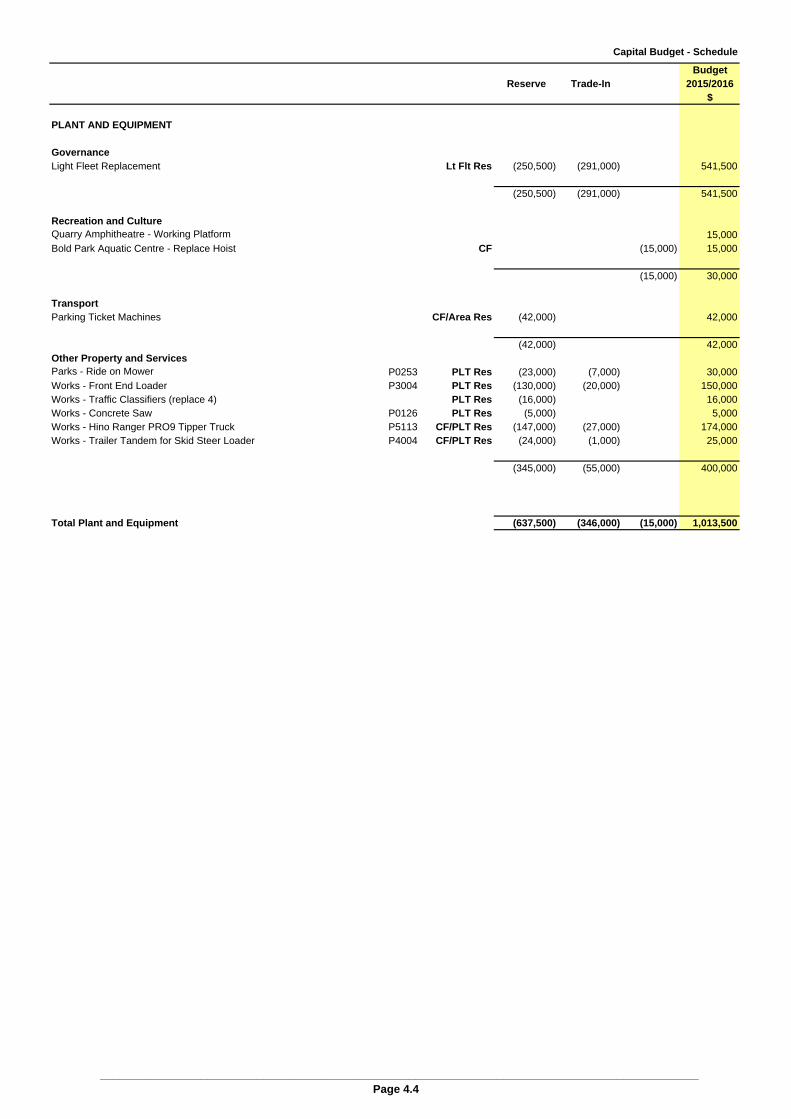
Capital Budget - Schedule
BudgetReserve Trade-In 2015/2016
$
PLANT AND EQUIPMENT
GovernanceLight Fleet Replacement Lt Flt Res (250,500) (291,000) 541,500
(250,500) (291,000) 0 541,500
Recreation and CultureQuarry Amphitheatre - Working Platform 15,000Bold Park Aquatic Centre - Replace Hoist CF (15,000) 15,000
00 0 (15,000) 30,000
TransportParking Ticket Machines CF/Area Res (42,000) 42,000
(42,000) 42,000Other Property and ServicesParks - Ride on Mower P0253 PLT Res (23,000) (7,000) 30,000Works - Front End Loader P3004 PLT Res (130,000) (20,000) 150,000Works - Traffic Classifiers (replace 4) PLT Res (16,000) 0 16,000Works - Concrete Saw P0126 PLT Res (5,000) 0 5,000Works - Hino Ranger PRO9 Tipper Truck P5113 CF/PLT Res (147,000) (27,000) 174,000Works - Trailer Tandem for Skid Steer Loader P4004 CF/PLT Res (24,000) (1,000) 25,000
(345,000) (55,000) 0 400,000
Total Plant and Equipment (637,500) (346,000) (15,000) 1,013,500
_______________________________________________________________________________________________Page 4.4
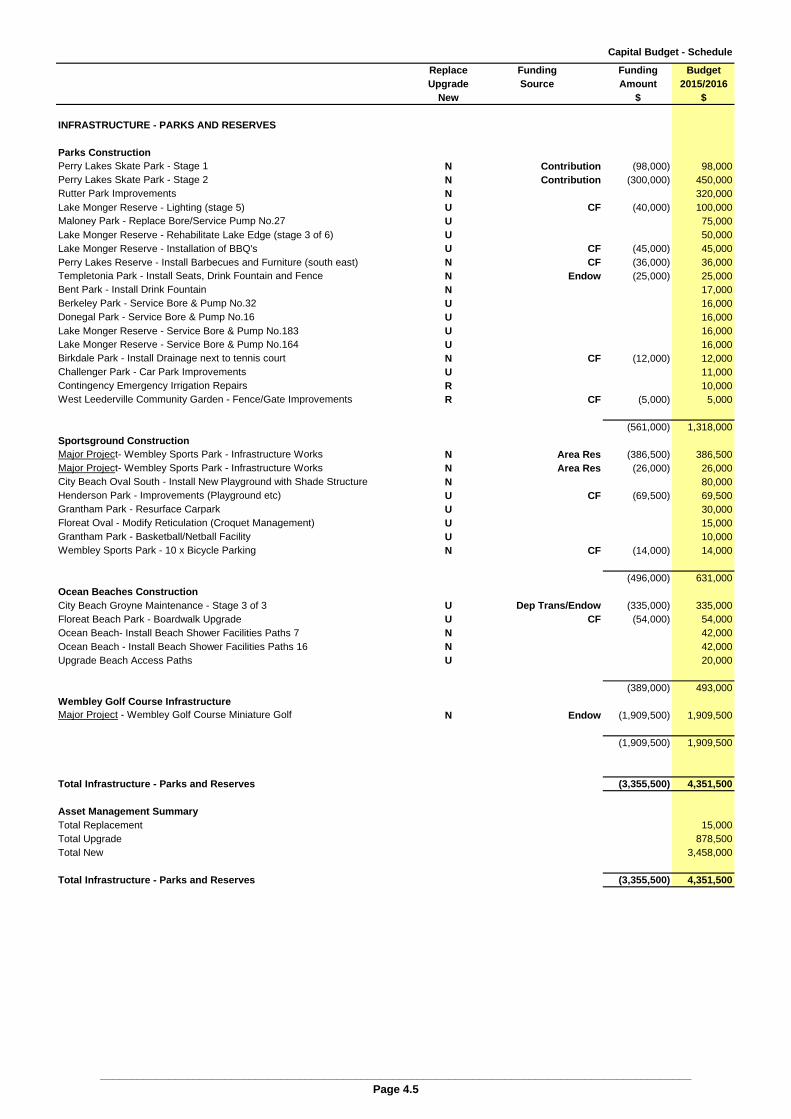
Capital Budget - Schedule
Replace Funding Funding BudgetUpgrade Source Amount 2015/2016
New $ $
INFRASTRUCTURE - PARKS AND RESERVES
Parks ConstructionPerry Lakes Skate Park - Stage 1 N Contribution (98,000) 98,000Perry Lakes Skate Park - Stage 2 N Contribution (300,000) 450,000Rutter Park Improvements N 320,000Lake Monger Reserve - Lighting (stage 5) U CF (40,000) 100,000Maloney Park - Replace Bore/Service Pump No.27 U 75,000Lake Monger Reserve - Rehabilitate Lake Edge (stage 3 of 6) U 50,000Lake Monger Reserve - Installation of BBQ's U CF (45,000) 45,000Perry Lakes Reserve - Install Barbecues and Furniture (south east) N CF (36,000) 36,000Templetonia Park - Install Seats, Drink Fountain and Fence N Endow (25,000) 25,000Bent Park - Install Drink Fountain N 17,000Berkeley Park - Service Bore & Pump No.32 U 16,000Donegal Park - Service Bore & Pump No.16 U 16,000Lake Monger Reserve - Service Bore & Pump No.183 U 16,000Lake Monger Reserve - Service Bore & Pump No.164 U 16,000Birkdale Park - Install Drainage next to tennis court N CF (12,000) 12,000Challenger Park - Car Park Improvements U 11,000Contingency Emergency Irrigation Repairs R 10,000West Leederville Community Garden - Fence/Gate Improvements R CF (5,000) 5,000
(561,000) 1,318,000Sportsground ConstructionMajor Project- Wembley Sports Park - Infrastructure Works N Area Res (386,500) 386,500Major Project- Wembley Sports Park - Infrastructure Works N Area Res (26,000) 26,000City Beach Oval South - Install New Playground with Shade Structure N 80,000Henderson Park - Improvements (Playground etc) U CF (69,500) 69,500Grantham Park - Resurface Carpark U 30,000Floreat Oval - Modify Reticulation (Croquet Management) U 15,000Grantham Park - Basketball/Netball Facility U 10,000Wembley Sports Park - 10 x Bicycle Parking N CF (14,000) 14,000
(496,000) 631,000Ocean Beaches ConstructionCity Beach Groyne Maintenance - Stage 3 of 3 U Dep Trans/Endow (335,000) 335,000Floreat Beach Park - Boardwalk Upgrade U CF (54,000) 54,000Ocean Beach- Install Beach Shower Facilities Paths 7 N 42,000Ocean Beach - Install Beach Shower Facilities Paths 16 N 42,000Upgrade Beach Access Paths U 20,000
(389,000) 493,000Wembley Golf Course InfrastructureMajor Project - Wembley Golf Course Miniature Golf N Endow (1,909,500) 1,909,500
(1,909,500) 1,909,500
Total Infrastructure - Parks and Reserves (3,355,500) 4,351,500
Asset Management SummaryTotal Replacement 15,000Total Upgrade 878,500Total New 3,458,000
Total Infrastructure - Parks and Reserves (3,355,500) 4,351,500
_______________________________________________________________________________________________Page 4.5

Capital Budget - Schedule
Replace Funding Funding BudgetUpgrade Source Amount 2015/2016
New $ $
INFRASTRUCTURE - ROADS AND LANES
Road Works Grantham / Harborne - Intersection safety U Blackspot (700,000) 700,000Salvado Rd - roundabout at SJOG Hospital Entrance U Contribution/CF (304,000) 304,000Kerb replacement for road resurfacing program R CF (47,000) 197,000Pedestrian Crossing - 1 of 5 Grantham BTW Harborne & Jersey U CF (137,000) 137,000Cambridge St - Pedestrian Crossing to Oxford from PTA U CF (116,000) 116,000Grantham St. Pedestrian Crossing at Essex St #2 N 110,000The Boulevard - Durston to Templetonia Final Median Extension. U 60,000Chipping Rd / Bent St intersection - Traffic island channelisation - improve safety a U 50,000Holland St ( 4 ) - 67/68, 45/46, 31/32, 13/14 - Install Plateaux, remove chicane U 50,000Streetscaping Cambridge St - Northwood to Kerr U CF (50,000) 50,000Underwood/Brookdale/Brockway - Nedlands U CF (50,000) 50,000Daglish St (3) - 65/66, 43/44, 35/36 - Install Plateaux, remove chicane U 40,000Salvado/Selby St - Improvements to verge adjacent Wembley Sports Park U 30,000McKenzie St (2) - 31/32 and 47/48 - Install Plateaux, remove chicane U 25,000Pangbourne St ( 1 ) - 23/24 - Install Plateaux, remove chicane U 15,000Crosby/Highbury St Intersection Improvements U CF (14,500) 14,500Railway Parade - Crossing at Kerr St N CF (7,500) 7,500
(1,426,000) 1,956,000
Road Surfacing
Railway Pde (Loftus St to Kerr St) R MRWA Rehab (297,500) 446,500
The Boulevard (Durston to Templetonia) R MRWA Rehab (195,500) 293,000
Nanson Street (Cambridge to Grantham) R 186,000
Empire Avenue - (Weaponess - Erskine) W R Contribution/CF (183,000) 183,000
Kinross Crescent R 116,500
Kintyre Road R 116,500
Kilpa Court (Town Car Park) R CF (113,500) 113,500
Maloney Way R 111,500
Camborne Ave (Helston - Saltash) R CF (49,500) 49,500
Norbury Crescent R 93,000
Alexander (Grantham to Herdsman) R 79,000
Lentara Crescent R CF (74,000) 74,000
Kildare Road R 72,000
Helston Ave R 70,000
Jukes Way R 70,000
Boscombe Avenue (Frinton to Helston) R 53,500
Glenties Road R 53,500
Kilpa Court R CF (50,000) 50,000
Boscastle Avenue R 46,500
Dundalk Road R 44,000
Kavanagh Street R 39,500
Karla Place R CF (33,000) 33,000
D'Arcy Lane (Station to SJOG Hospital) R 30,000
Cork Road R 28,000
Penryn Avenue R CF (28,000) 28,000
Wise St (Harborne St to Gregory St) R 25,500
MacEwan St (Oxford - Loftus) R CF (24,000) 24,000
(1,048,000) 2,529,500
_______________________________________________________________________________________________Page 4.6

Capital Budget - Schedule
Replace Funding Funding BudgetUpgrade Source Amount 2015/2016
New $ $
INFRASTRUCTURE - ROADS AND LANES (Continued)
Roads to Recovery
Donegal Road R R2R (221,000) 234,000
R R2R/CF (210,000) 210,000Crofts Lane Launceston Ave (Helston to Challenger) R R2R (137,000) 149,000
(568,000) 593,000LanewaysJacobson Laneway U CF/Area (203,500) 203,500Waddington Lane U 200,000Loveridge Lane U 200,000Atterton Lane U 200,000Piper Lane (Grantham/Herdsman/Alexander/Simper) U CF (145,000) 145,000
(348,500) 948,500
Total Infrastructure Roads and Lanes (3,390,500) 6,027,000
Asset Management SummaryTotal Replacement 3,319,500Total Upgrade 2,590,000Total New 117,500
Total Infrastructure Roads and Lanes (3,390,500) 6,027,000
_______________________________________________________________________________________________Page 4.7
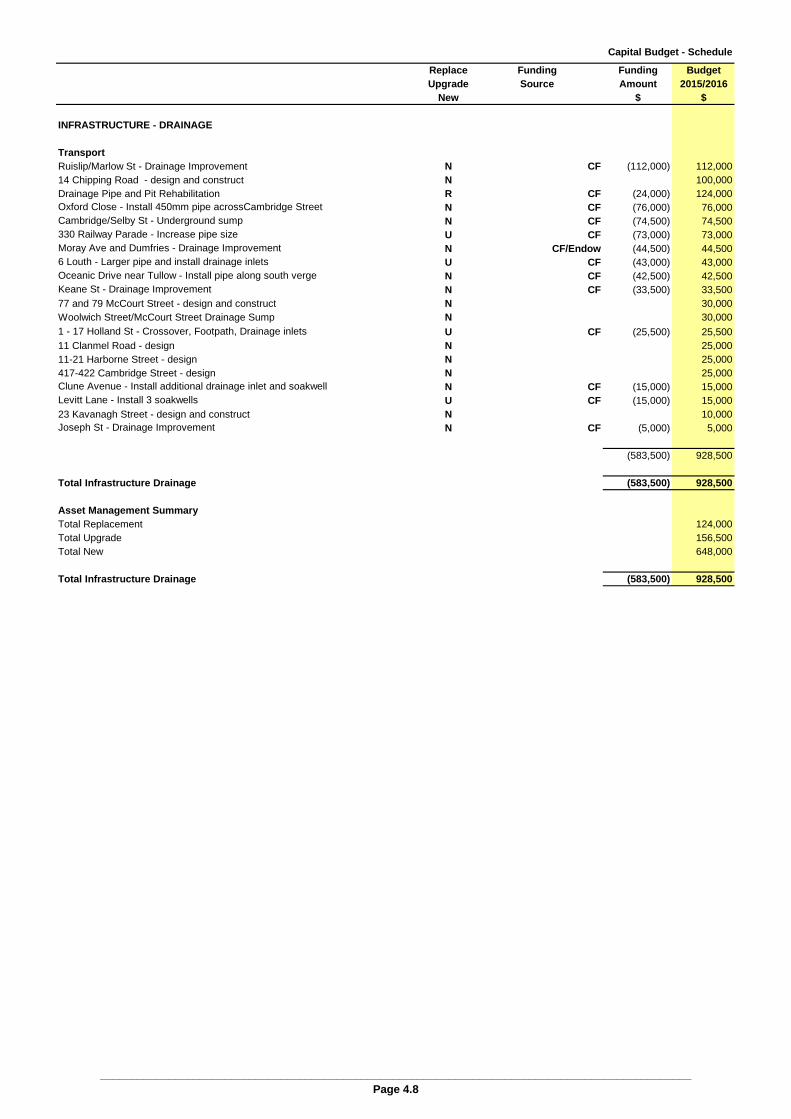
Capital Budget - Schedule
Replace Funding Funding BudgetUpgrade Source Amount 2015/2016
New $ $
INFRASTRUCTURE - DRAINAGE
TransportRuislip/Marlow St - Drainage Improvement N CF (112,000) 112,00014 Chipping Road - design and construct N 100,000Drainage Pipe and Pit Rehabilitation R CF (24,000) 124,000Oxford Close - Install 450mm pipe acrossCambridge Street N CF (76,000) 76,000Cambridge/Selby St - Underground sump N CF (74,500) 74,500330 Railway Parade - Increase pipe size U CF (73,000) 73,000Moray Ave and Dumfries - Drainage Improvement N CF/Endow (44,500) 44,5006 Louth - Larger pipe and install drainage inlets U CF (43,000) 43,000Oceanic Drive near Tullow - Install pipe along south verge N CF (42,500) 42,500Keane St - Drainage Improvement N CF (33,500) 33,50077 and 79 McCourt Street - design and construct N 30,000Woolwich Street/McCourt Street Drainage Sump N 30,000
1 - 17 Holland St - Crossover, Footpath, Drainage inlets U CF (25,500) 25,50011 Clanmel Road - design N 25,00011-21 Harborne Street - design N 25,000417-422 Cambridge Street - design N 25,000Clune Avenue - Install additional drainage inlet and soakwell N CF (15,000) 15,000Levitt Lane - Install 3 soakwells U CF (15,000) 15,00023 Kavanagh Street - design and construct N 10,000Joseph St - Drainage Improvement N CF (5,000) 5,000
(583,500) 928,500
Total Infrastructure Drainage (583,500) 928,500
Asset Management SummaryTotal Replacement 124,000Total Upgrade 156,500Total New 648,000
Total Infrastructure Drainage (583,500) 928,500
_______________________________________________________________________________________________Page 4.8
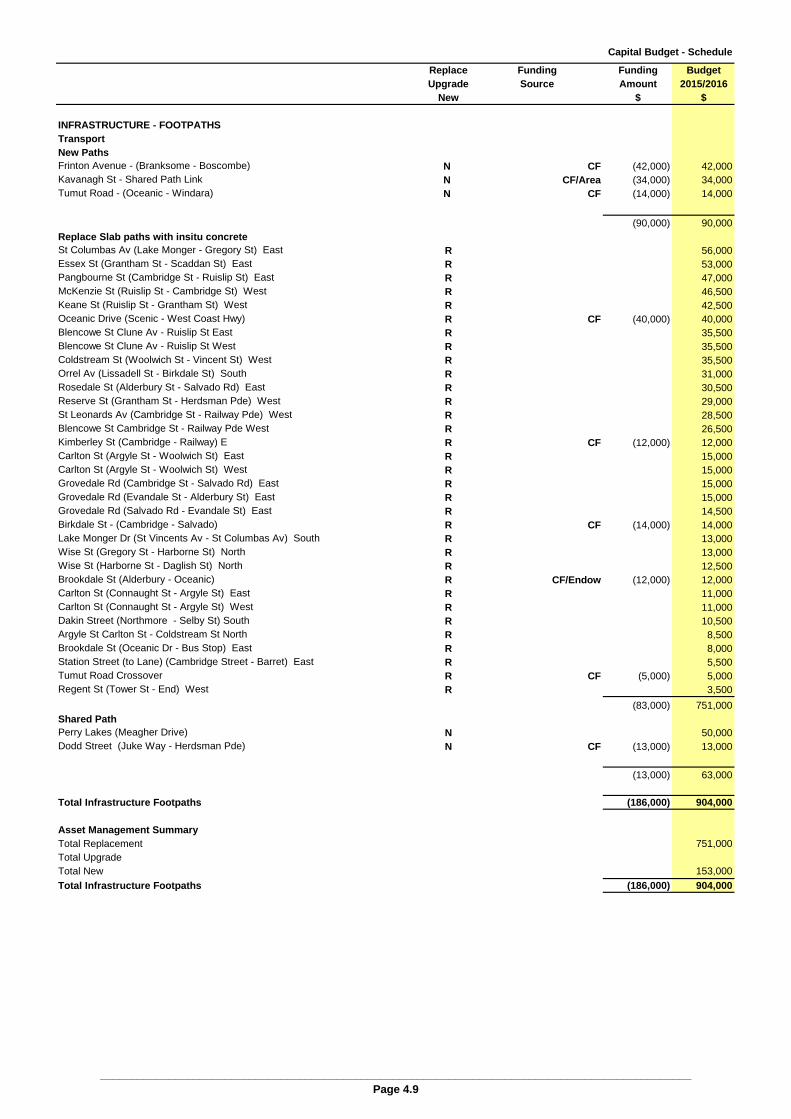
Capital Budget - Schedule
Replace Funding Funding BudgetUpgrade Source Amount 2015/2016
New $ $
INFRASTRUCTURE - FOOTPATHSTransportNew PathsFrinton Avenue - (Branksome - Boscombe) N CF (42,000) 42,000Kavanagh St - Shared Path Link N CF/Area (34,000) 34,000Tumut Road - (Oceanic - Windara) N CF (14,000) 14,000
(90,000) 90,000Replace Slab paths with insitu concreteSt Columbas Av (Lake Monger - Gregory St) East R 56,000Essex St (Grantham St - Scaddan St) East R 53,000Pangbourne St (Cambridge St - Ruislip St) East R 47,000McKenzie St (Ruislip St - Cambridge St) West R 46,500Keane St (Ruislip St - Grantham St) West R 42,500Oceanic Drive (Scenic - West Coast Hwy) R CF (40,000) 40,000Blencowe St Clune Av - Ruislip St East R 35,500Blencowe St Clune Av - Ruislip St West R 35,500Coldstream St (Woolwich St - Vincent St) West R 35,500Orrel Av (Lissadell St - Birkdale St) South R 31,000Rosedale St (Alderbury St - Salvado Rd) East R 30,500Reserve St (Grantham St - Herdsman Pde) West R 29,000St Leonards Av (Cambridge St - Railway Pde) West R 28,500Blencowe St Cambridge St - Railway Pde West R 26,500Kimberley St (Cambridge - Railway) E R CF (12,000) 12,000Carlton St (Argyle St - Woolwich St) East R 15,000Carlton St (Argyle St - Woolwich St) West R 15,000Grovedale Rd (Cambridge St - Salvado Rd) East R 15,000Grovedale Rd (Evandale St - Alderbury St) East R 15,000Grovedale Rd (Salvado Rd - Evandale St) East R 14,500Birkdale St - (Cambridge - Salvado) R CF (14,000) 14,000Lake Monger Dr (St Vincents Av - St Columbas Av) South R 13,000Wise St (Gregory St - Harborne St) North R 13,000Wise St (Harborne St - Daglish St) North R 12,500Brookdale St (Alderbury - Oceanic) R CF/Endow (12,000) 12,000Carlton St (Connaught St - Argyle St) East R 11,000Carlton St (Connaught St - Argyle St) West R 11,000Dakin Street (Northmore - Selby St) South R 10,500Argyle St Carlton St - Coldstream St North R 8,500Brookdale St (Oceanic Dr - Bus Stop) East R 8,000Station Street (to Lane) (Cambridge Street - Barret) East R 5,500Tumut Road Crossover R CF (5,000) 5,000Regent St (Tower St - End) West R 3,500
(83,000) 751,000Shared PathPerry Lakes (Meagher Drive) N 50,000Dodd Street (Juke Way - Herdsman Pde) N CF (13,000) 13,000
(13,000) 63,000
Total Infrastructure Footpaths (186,000) 904,000
Asset Management SummaryTotal Replacement 751,000Total Upgrade 0Total New 153,000
Total Infrastructure Footpaths (186,000) 904,000
_______________________________________________________________________________________________Page 4.9

Capital Budget - Schedule
Replace Funding Funding BudgetUpgrade Source Amount 2015/2016
New $ $
INFRASTRUCTURE - BUS SHELTERSTransportBus Shelter N CF (30,000) 60,000
(30,000) 60,000
Total Infrastructure Bus Shelters (30,000) 60,000
Asset Management SummaryTotal Replacement 0Total Upgrade 0Total New 60,000
Total Infrastructure Bus Shelters (30,000) 60,000
TOTAL INFRASTRUCTURE (7,545,500) 12,271,000
Asset Management SummaryTotal Replacement 4,209,500Total Upgrade 3,625,000Total New 4,436,500
Total Infrastructure (7,545,500) 12,271,000
Total Capital Expenditure (32,704,500) 38,647,500
_______________________________________________________________________________________________Page 4.10
RESERVE/ENDOWMENT
LANDS ACCOUNT BUDGET

Town of Cambridge
Reserve Budget
For the Year Ending 30 June 2016
Page Actual Budget Actual Budget
No. 2013/2014 2014/2015 30 Jun 15 2015/2016
$ $ $ $
Opening Balance
Area Improvement 5.2 3,189,883 1,145,400 765,401 1,719,300
Community Facilities 5.3 0 (108,800) 1,097,440 981,400
Asset Management 5.4 899,075 797,100 999,775 1,112,500
Waste Management 5.5 0 4,600 446 283,100
Clubs and Associations 5.6 379,326 741,000 746,099 876,400
Development Contributions - Parking 5.7 132,820 187,500 432,000 922,800
Development Contributions - Public Art 5.8 0 0 0 55,000
4,601,104 2,766,800 4,041,161 5,950,500
Interest on Investments
Area Improvement 5.2 41,711 6,500 18,889 16,700
Community Facilities 5.3 4,430 13,100 37,985 12,500
Asset Management 5.4 39,447 9,700 30,393 10,600
Waste Management 5.5 446 0 0 2,700
Clubs and Associations 5.6 20,563 9,100 32,800 8,500
Development Contributions - Parking 5.7 0 5,100 15,750 0
Development Contributions - Public Art 5.8 0 0 0 0
106,597 43,500 135,817 51,000
Transfers from Accumulated Surplus
Area Improvement 5.2 833,332 2,583,000 2,614,243 1,833,000
Community Facilities 5.3 1,290,473 7,000 2,661 11,500
Asset Management 5.4 547,627 704,600 1,124,979 721,500
Waste Management 5.5 548,714 312,000 312,000 220,000
Clubs and Associations 5.6 513,182 585,900 593,427 621,000
Development Contributions - Parking 5.7 341,511 80,000 485,000 60,000
Development Contributions - Public Art 5.8 0 0 55,000 0
4,074,839 4,272,500 5,187,310 3,467,000
Transfers to Accumulated Surplus
Area Improvement 5.2 3,299,525 2,491,500 1,679,252 2,909,500
Community Facilities 5.3 197,462 76,300 156,644 768,500
Asset Management 5.4 486,374 1,521,000 1,042,552 969,000
Waste Management 5.5 548,714 20,000 29,345 110,000
Clubs and Associations 5.6 166,972 511,000 495,923 804,500
Development Contributions - Parking 5.7 42,331 0 0 0
Development Contributions - Public Art 5.8 0 0 0 0
4,741,378 4,619,800 3,403,716 5,561,500
Closing Balance
Area Improvement 5.2 765,401 1,243,400 1,719,281 659,500
Community Facilities 5.3 1,097,441 (165,000) 981,442 236,900
Asset Management 5.4 999,775 (9,600) 1,112,595 875,600
Waste Management 5.5 446 296,600 283,101 395,800
Clubs and Associations 5.6 746,099 825,000 876,403 701,400
Development Contributions - Parking 5.7 432,000 272,600 932,750 982,800
Development Contributions - Public Art 5.8 0 0 55,000 55,000
4,041,162 2,463,000 5,960,572 3,907,000
_______________________________________________________________________________________________Page 5.1
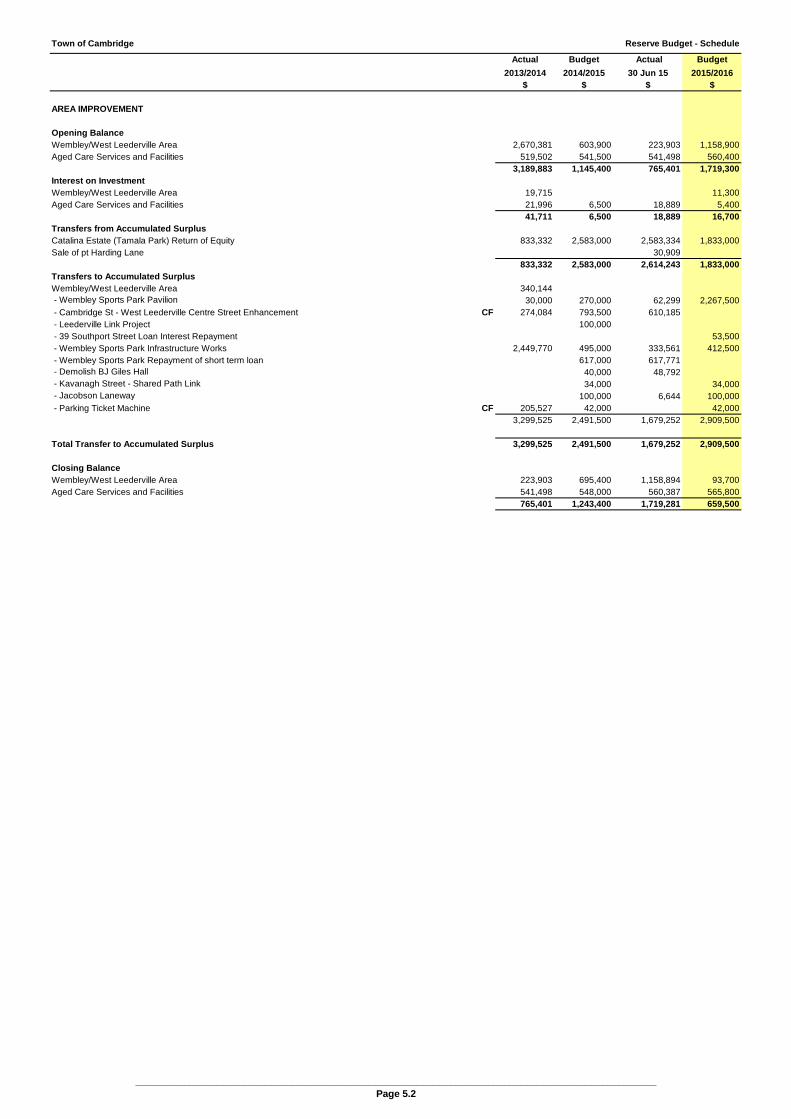
Town of Cambridge Reserve Budget - Schedule
Actual Budget Actual Budget
2013/2014 2014/2015 30 Jun 15 2015/2016$ $ $ $
AREA IMPROVEMENT
Opening BalanceWembley/West Leederville Area 2,670,381 603,900 223,903 1,158,900Aged Care Services and Facilities 519,502 541,500 541,498 560,400
3,189,883 1,145,400 765,401 1,719,300Interest on InvestmentWembley/West Leederville Area 19,715 11,300Aged Care Services and Facilities 21,996 6,500 18,889 5,400
41,711 6,500 18,889 16,700Transfers from Accumulated Surplus 0Catalina Estate (Tamala Park) Return of Equity 833,332 2,583,000 2,583,334 1,833,000Sale of pt Harding Lane 30,909
833,332 2,583,000 2,614,243 1,833,000Transfers to Accumulated SurplusWembley/West Leederville Area 340,144 - Wembley Sports Park Pavilion 30,000 270,000 62,299 2,267,500 - Cambridge St - West Leederville Centre Street Enhancement CF 274,084 793,500 610,185 - Leederville Link Project 100,000 0 - 39 Southport Street Loan Interest Repayment 53,500 - Wembley Sports Park Infrastructure Works 2,449,770 495,000 333,561 412,500 - Wembley Sports Park Repayment of short term loan 617,000 617,771 - Demolish BJ Giles Hall 40,000 48,792 - Kavanagh Street - Shared Path Link 34,000 34,000 - Jacobson Laneway 100,000 6,644 100,000 - Parking Ticket Machine CF 205,527 42,000 42,000
3,299,525 2,491,500 1,679,252 2,909,500
Total Transfer to Accumulated Surplus 3,299,525 2,491,500 1,679,252 2,909,500
Closing BalanceWembley/West Leederville Area 223,903 695,400 1,158,894 93,700Aged Care Services and Facilities 541,498 548,000 560,387 565,800
765,401 1,243,400 1,719,281 659,500
________________________________________________________________________________________________Page 5.2

Town of Cambridge Reserve Budget - Schedule
Actual Budget Actual Budget
2013/2014 2014/2015 30 Jun 15 2015/2016$ $ $ $
COMMUNITY FACILITIES
Opening BalanceGeneral 779,939 838,100 810,851 839,500Wembley Community Centre 92,793 59,600 70,038 66,400Cambridge Senior Services 24,482 0 0 0Wembley Golf Course (1,168,835) (1,182,200) 72,974 28,000The Boulevard Centre 271,621 175,700 143,577 47,500
0 (108,800) 1,097,440 981,400Interest on InvestmentsGeneral 30,912 10,100 28,659 8,100Wembley Community Centre 3,347 700 2,429 600Cambridge Senior Services 4,677 200 2,765 3,000Wembley Golf Course (43,989) 0 300The Boulevard Centre 9,483 2,100 4,132 500
4,430 13,100 37,985 12,500Transfers from Accumulated SurplusCambridge Senior Services (2,765) 11,500
The Boulevard Centre 0 0 - Proceeds from sale of vehicle 7,000 5,426
Wembley Golf Course 1,300,000 - Transfer from Operations (43,163) - Proceed from sale of vehicle 33,636
1,290,473
1,290,473 7,000 2,661 11,500
Transfers to Accumulated SurplusWembley Community Centre 9,526 - To Operations 16,576 2,199 - Public & Disabled Toilet refurbishment 50,000 - Zip Wall Boiler 2,000 1,480 - Fridge Replacement 2,380 - Communications Upgrade, fibre link 17,000 17,000
26,102 19,000 6,059 67,000
The Boulevard Centre 98,312 - To Operations 39,215 13,800 58,299 39,500 - Replace Layer 3 Network Switch 4,000 - Replace Laptop 2,000 - Replace Radio Microphones 2,500 - Airconditioning System Upgrade 5,000 5,054 - Vehicle Replacement 25,000 27,628 - Data Projector AV systems 6,000 6,096 - Digital Signage Foyer/Gallery 7,500 8,552
137,527 57,300 105,629 48,000Wembley Golf Course - Transfer of Funds to Operations 584,500 - Ball Washer Unit conveyor replacement 4,675 - Bore & Pump Maintenance 24,627 30,000 - Lake Maintenance 9,177 6,000 - Lightning Guard 18,000 - Rust Removal Driving Range Infrastructure CF 15,000 - Depot Shed & Front Gate 11,153
4,675 0 44,956 653,500
Total Transfer to Accumulated Surplus 197,462 76,300 156,644 768,500
Closing BalanceGeneral 810,851 848,200 839,510 847,600Wembley Community Centre 70,038 41,300 66,408 0Cambridge Senior Services 0 200 0 14,500Wembley Golf Course 72,974 (1,182,200) 28,018 (625,200)The Boulevard Centre 143,577 127,500 47,506 0
1,097,440 (165,000) 981,442 236,900
________________________________________________________________________________________________Page 5.3

Town of Cambridge Reserve Budget - Schedule
Actual Budget Actual Budget
2013/2014 2014/2015 30 Jun 15 2015/2016$ $ $ $
ASSET MANAGEMENT
Opening BalanceBuildings 526,343 413,600 413,613 531,900Plant 39,984 131,600 306,964 416,900Light Fleet 233,671 148,500 148,495 152,100Equipment 99,077 103,400 103,430 4,800YMCA 27,273 6,800
899,075 797,100 999,775 1,112,500Interest on InvestmentBuildings 22,270 5,000 4,879 5,100Plant 1,162 1,600 14,885 4,000Light Fleet 11,662 1,800 7,021 1,500Equipment 4,353 1,300 3,608 0
39,447 9,700 30,393 10,600Transfers from Accumulated SurplusBuildings 15,000 15,000 464,882
Plant 175,354 160,000 160,000 160,000Park Plant (Trade Proceeds) 10,500 9,999 7,000Works Plant (Trade Proceeds) CF 28,500 827 48,000Funds reallocated from building reserve 150,000
325,354 199,000 170,826 215,000
Light Fleet 180,000 200,000 200,000 200,000Light Fleet (Trade Proceeds) 275,100 270,453 291,000
180,000 475,100 470,453 491,000YMCAJersey Street Out of School Care (YMCA Mtce Contribution) 27,273 15,500 18,818 15,500
27,273 15,500 18,818 15,500
547,627 704,600 1,124,979 721,500Transfers to Accumulated SurplusBuildingsAdministration Bldg - Replacement HVAC System CF 500,000 351,478Reallocate funds to plant reserve 150,000
150,000 500,000 351,478 0
Plant - Parks Plant 52,827 79,000 67,500 30,000 - Works Plant 6,709 179,000 3,150 171,000 - Works Concrete Grinder CF 6,000 5,090 - Works - Hino Ranger PRO9 Tipper Truck CF 174,000 - Works Concrete Trailer Tandem for Skid Steer Loader CF 25,000 25,000
59,536 289,000 75,740 400,000
Light Fleet 276,838 - Light Fleet Vehicle Replacement 521,000 428,605 541,500 - Youth Services Bus Replacement 45,000 45,216 0
276,838 566,000 473,821 541,500
Equipment 0 0Admin - PABX Telephone System (Replace) CF 120,000 102,196 18,000
0 120,000 102,196 18,000
Jersey Street Childcare Centre - Self funding maintenance fund183 Jersey Street YMCA - Out of School Care - General Maintenance 7,000 14,370 9,500183 Jersey Street YMCA - Out of School Care - Repair roof 10,000 7,766 0183 Jersey Street YMCA - Out of School Care - Replace carpet CF 5,000 1,755 0183 Jersey Street YMCA - Out of School Care - Replace existing Evap. AC CF 7,000 4,807 0183 Jersey Street YMCA - Out of School Care - Repaint ceilings CF 6,500 4,399 0183 Jersey Street YMCA - Out of School Care - Repaint internal walls CF 10,500 6,220 0
0 46,000 39,317 9,500
Total Transfer to Accumulated Surplus 486,374 1,521,000 1,042,552 969,000
Closing BalanceBuildings 413,613 (66,400) 531,896 537,000Plant 306,964 43,200 416,935 235,900Light Fleet 148,495 59,400 152,148 103,100Equipment 103,430 (15,300) 4,842 (13,200)YMCA 27,273 (30,500) 6,774 12,800
999,775 (9,600) 1,112,595 875,600
________________________________________________________________________________________________Page 5.4

Town of Cambridge Reserve Budget - Schedule
Actual Budget Actual Budget
2013/2014 2014/2015 30 Jun 15 2015/2016$ $ $ $
WASTE MANAGEMENT
Opening Balance 4,600 446 283,100
Interest on Investment 446 2,700
Transfers from Accumulated SurplusBin Amortisation - General Waste Bins 81,000 85,000 85,000 85,000Bin Amortisation - Green Bins 37,000 50,000 50,000 50,000Bin Amortisation - Recycling Bins 82,000 85,000 85,000 85,000Transfer fund from operations 348,714 92,000 92,000
548,714 312,000 312,000 220,000
Transfers to Accumulated Surplus - Bin Purchases (Waste Bins) 200,000 20,000 29,345 110,000 - fund deficit from waste bins purchases 348,714
548,714 20,000 29,345 110,000
Closing Balance 446 296,600 283,101 395,800
________________________________________________________________________________________________Page 5.5

Town of Cambridge Reserve Budget - Schedule
Actual Budget Actual Budget
2013/2014 2014/2015 30 Jun 15 2015/2016$ $ $ $
CLUBS AND ASSOCIATIONS
Opening BalanceBuildings (35,823) 128,400 128,779 130,600Synthetic Courts and Lighting Funds 357,080 517,100 520,123 600,800Car Parks and Surroundings 58,069 95,500 97,197 145,000
379,326 741,000 746,099 876,400
Interest on InvestmentBuildings 11,094 1,600 6,935 1,300Synthetic Courts and Lighting Funds 7,263 6,300 21,068 5,800Car Parks and Surroundings 2,206 1,200 4,797 1,400
20,563 9,100 32,800 8,500
Transfers from Accumulated SurplusBuildings 319,200 359,700 354,483 397,500Synthetic Courts and Lighting Funds 156,136 181,800 191,138 178,500Car Parks and Surroundings 37,846 44,400 47,806 45,000
513,182 585,900 593,427 621,000
Transfers to Accumulated SurplusBuildings 461,000 359,577Transfer to operations 163,342 275,000Transfer to capital 2,350 529,500
165,692 461,000 359,577 804,500Synthetic Courts and Lighting Funds 356City Beach Oval - Flood Lighting Upgrade 50,000 49,200Reabold Tennis Club - Replace Bore 18,617Leederville Bowling Club - Replace Flood Lights 63,729
356 50,000 131,546 0Car Parks and Surroundings 924
4,800924 0 4,800 0
Total Transfer to Accumulated Surplus 166,972 511,000 495,923 804,500
Closing BalanceBuildings 128,779 28,700 130,620 (275,100)Synthetic Courts and Lighting Funds 520,123 655,200 600,783 785,100Car Parks and Surroundings 97,197 141,100 145,000 191,400
746,099 825,000 876,403 701,400
________________________________________________________________________________________________Page 5.6
Town of Cambridge Reserve Budget - Schedule
Actual Budget Actual Budget
2013/2014 2014/2015 30 Jun 15 2015/2016$ $ $ $
DEVELOPMENT CONTRIBUTIONS RESERVE - PARKING
Opening BalanceMedical Zone (SJOG) 90,000 90,000 90,000 256,700Floreat Forum District Centre Zoning 0 0 0Southport Street Node 245,000 331,400 332,000 656,100Cambridge High Street Node 0 0 0Wembley Town Centre 0 0 0Other/Traditional Strip Commercial Centres (202,180) (233,900) 10,000 10,000
132,820 187,500 432,000 922,800
Interest on InvestmentMedical Zone (SJOG) 1,100 4,169Southport Street Node 4,000 11,581
0 5,100 15,750 0
Transfers from Accumulated SurplusMedical Zone (SJOG) 60,000 162,500Southport Street Node 87,000 312,500Cambridge High Street Node 60,000Other/Traditional Strip Commercial Centres 254,511 20,000 0
341,511 80,000 485,000 60,000
Transfers to Accumulated Surplus - Birkdale St (Cambridge - Newry) Parking improvements 42,331
42,331 0 0 0
Closing BalanceMedical Zone (SJOG) 90,000 151,100 256,669 256,700Floreat Forum District Centre Zoning 0 0 0 0Southport Street Node 332,000 335,400 656,081 656,100Cambridge High Street Node 0 0 0 60,000Wembley Town Centre 0 0 0 0Other/Traditional Strip Commercial Centres 10,000 (213,900) 10,000 10,000
432,000 272,600 922,750 982,800
________________________________________________________________________________________________Page 5.7

Town of Cambridge Reserve Budget - Schedule
Actual Budget Actual Budget
2013/2014 2014/2015 30 Jun 15 2015/2016$ $ $ $
DEVELOPMENT CONTRIBUTIONS RESERVE - PUBLIC ARTS
Opening BalanceMedical Zone (SJOG) 55,000
0 0 0 55,000
Transfers from Accumulated SurplusMedical Zone (SJOG) 55,000
0 0 55,000 0
Closing BalanceMedical Zone (SJOG) 0 0 55,000 55,000
0 0 55,000 55,000
RESERVES - CLOSING BALANCE 4,041,161 2,463,000 5,950,572 3,907,000
________________________________________________________________________________________________Page 5.8
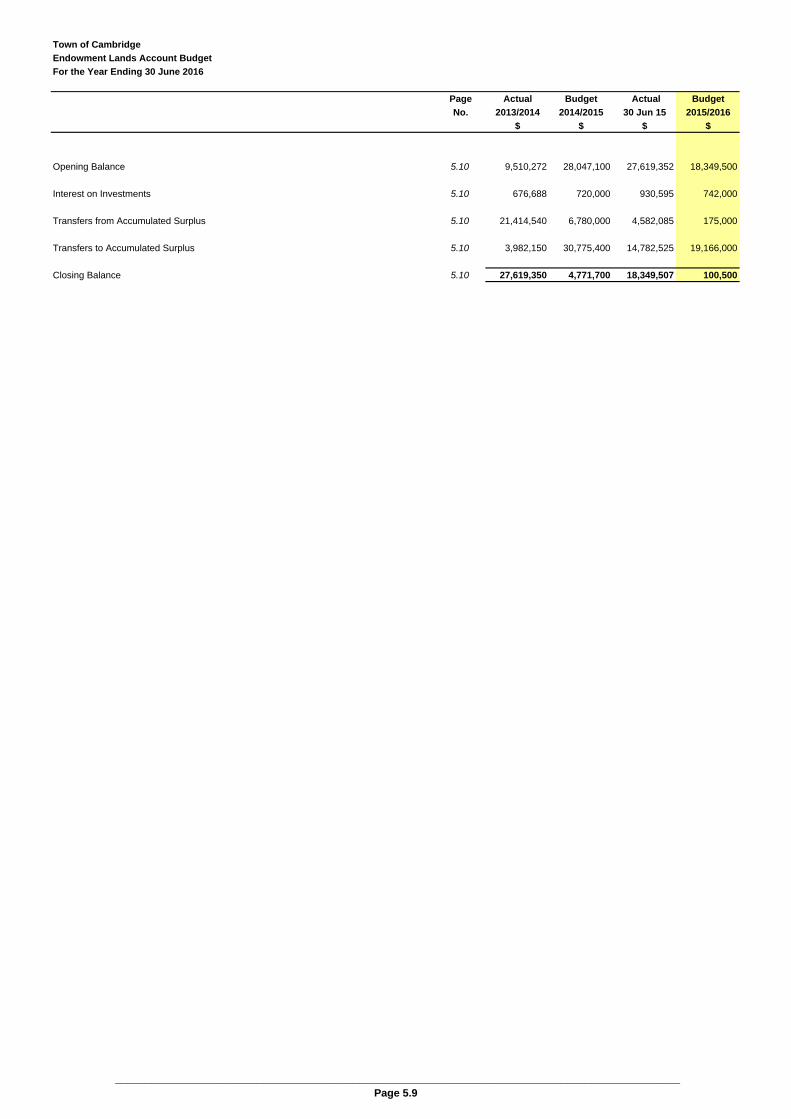
Town of Cambridge
Endowment Lands Account Budget
For the Year Ending 30 June 2016
Page Actual Budget Actual Budget
No. 2013/2014 2014/2015 30 Jun 15 2015/2016
$ $ $ $
Opening Balance 5.10 9,510,272 28,047,100 27,619,352 18,349,500
Interest on Investments 5.10 676,688 720,000 930,595 742,000
Transfers from Accumulated Surplus 5.10 21,414,540 6,780,000 4,582,085 175,000
Transfers to Accumulated Surplus 5.10 3,982,150 30,775,400 14,782,525 19,166,000
Closing Balance 5.10 27,619,350 4,771,700 18,349,507 100,500
_______________________________________________________________________________________________Page 5.9
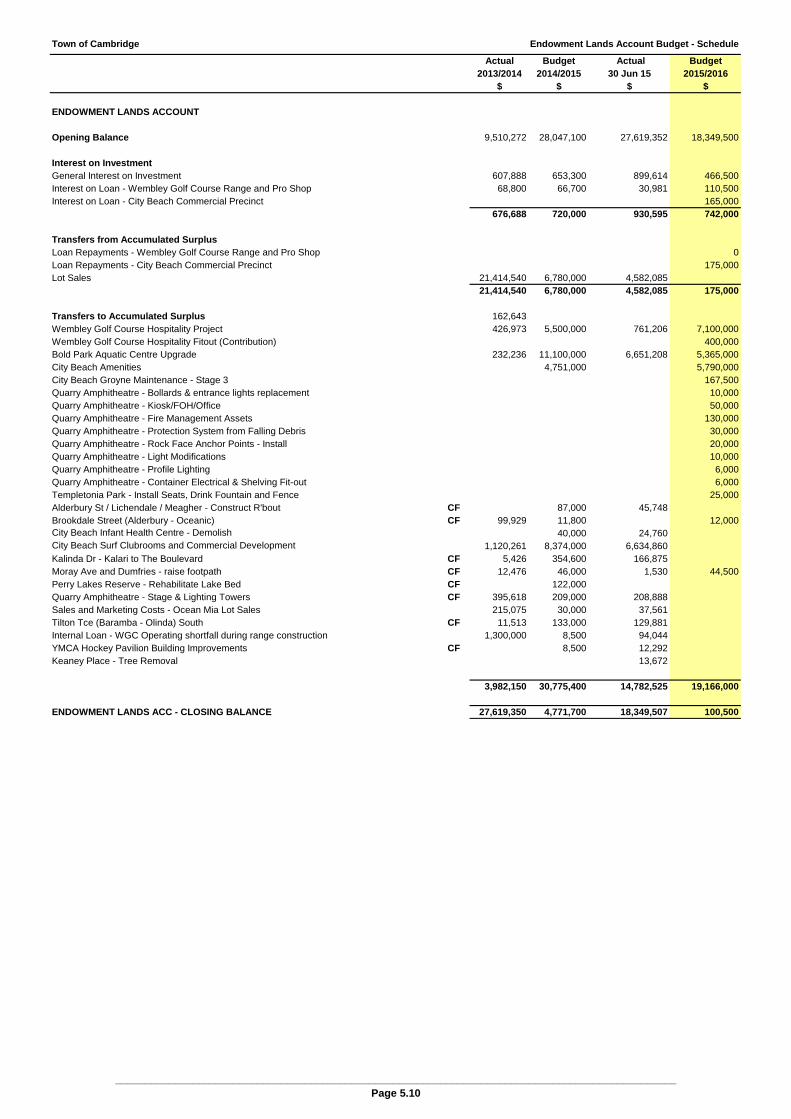
Town of Cambridge Endowment Lands Account Budget - Schedule
Actual Budget Actual Budget2013/2014 2014/2015 30 Jun 15 2015/2016
$ $ $ $
ENDOWMENT LANDS ACCOUNT
Opening Balance 9,510,272 28,047,100 27,619,352 18,349,500
Interest on InvestmentGeneral Interest on Investment 607,888 653,300 899,614 466,500Interest on Loan - Wembley Golf Course Range and Pro Shop 68,800 66,700 30,981 110,500Interest on Loan - City Beach Commercial Precinct 0 0 0 165,000
676,688 720,000 930,595 742,000
Transfers from Accumulated SurplusLoan Repayments - Wembley Golf Course Range and Pro Shop 0Loan Repayments - City Beach Commercial Precinct 0 0 0 175,000Lot Sales 21,414,540 6,780,000 4,582,085
21,414,540 6,780,000 4,582,085 175,000
Transfers to Accumulated Surplus 162,643Wembley Golf Course Hospitality Project 426,973 5,500,000 761,206 7,100,000Wembley Golf Course Hospitality Fitout (Contribution) 400,000Bold Park Aquatic Centre Upgrade 232,236 11,100,000 6,651,208 5,365,000City Beach Amenities 4,751,000 5,790,000City Beach Groyne Maintenance - Stage 3 167,500Quarry Amphitheatre - Bollards & entrance lights replacement 10,000Quarry Amphitheatre - Kiosk/FOH/Office 50,000Quarry Amphitheatre - Fire Management Assets 130,000Quarry Amphitheatre - Protection System from Falling Debris 30,000Quarry Amphitheatre - Rock Face Anchor Points - Install 20,000Quarry Amphitheatre - Light Modifications 10,000Quarry Amphitheatre - Profile Lighting 6,000Quarry Amphitheatre - Container Electrical & Shelving Fit-out 6,000Templetonia Park - Install Seats, Drink Fountain and Fence 25,000Alderbury St / Lichendale / Meagher - Construct R'bout CF 87,000 45,748Brookdale Street (Alderbury - Oceanic) CF 99,929 11,800 12,000City Beach Infant Health Centre - Demolish 40,000 24,760City Beach Surf Clubrooms and Commercial Development 1,120,261 8,374,000 6,634,860Kalinda Dr - Kalari to The Boulevard CF 5,426 354,600 166,875Moray Ave and Dumfries - raise footpath CF 12,476 46,000 1,530 44,500Perry Lakes Reserve - Rehabilitate Lake Bed CF 122,000Quarry Amphitheatre - Stage & Lighting Towers CF 395,618 209,000 208,888Sales and Marketing Costs - Ocean Mia Lot Sales 215,075 30,000 37,561Tilton Tce (Baramba - Olinda) South CF 11,513 133,000 129,881Internal Loan - WGC Operating shortfall during range construction 1,300,000 8,500 94,044YMCA Hockey Pavilion Building Improvements CF 8,500 12,292Keaney Place - Tree Removal 13,672
3,982,150 30,775,400 14,782,525 19,166,000
ENDOWMENT LANDS ACC - CLOSING BALANCE 27,619,350 4,771,700 18,349,507 100,500
_______________________________________________________________________________________________Page 5.10

MISCELLANEOUS SCHEDULES
Budget Summary 6.1
General Purpose Funding 6.2
Major Projects 6.3
Carried Forward 6.4
Disposal of Assets 6.7
Operating Revenue Schedules
Contributions/Grants for the Development of Assets 6.8
Operating Expenditure Schedules
Employee Expenses 6.9
Information Systems 6.10
Building Maintenance 6.12
Job Costing 6.13
Non-Capital Works 6.14
Depreciation 6.16
Activity Based Costing 6.18
Clubs Lease Schedule 6.21

Town of Cambridge
Budget Summary
For the Year Ending 30 June 2016
Page Actual Budget Actual Budget
No. 2013/2014 2014/2015 30 Jun 15 2015/2016
$ $ $ $
FUNDING SOURCE
Rate Revenue 3.13 21,002,315 22,136,000 22,194,672 23,396,500
Operating Revenues (excluding Rates) 3.1 41,188,066 31,192,600 26,256,374 27,213,000
Proceeds from the Sale of Assets 3.1 25,738,133 11,987,500 7,528,953 5,182,000
Less Non Cash Proceeds from sale of Tamala Park (3,960,141)
From Reserves 5.1 5,056,647 4,619,800 3,403,716 5,561,500
From Endowment Lands Account 5.8 3,982,149 30,775,400 14,782,525 19,166,000
Loans 2.3 639,105 55,000 34,177 2,000,000
Opening From Prior Year 2.1 4,274,054 3,493,700 3,522,897 3,134,500
Redemption of Tamala Park Investment 833,332
Less Rates received in advance (36,352) 0 0
98,717,308 104,260,000 77,723,315 85,653,500
Less (Gain)/Loss on Disposal of Assets 2.1 (18,663,773) (8,465,500) (3,265,854) (2,488,500)
Total 80,053,535 95,794,500 74,457,461 83,165,000
FUNDING APPLICATION
Operating Expenses 3.1 41,346,564 41,247,100 40,916,549 43,505,000
Capital Expenses 4.1 15,461,241 46,301,300 24,795,403 38,647,500
Purchase of Investment Tamala Park 359,366 2,233,000 0 2,983,000
Mindarie Principal Capitalised (255,914)
Repayment of Debt Principal 382,398 1,154,100 1,138,924 588,500
To Reserves 5.1 4,496,706 4,316,000 5,323,127 3,518,000
To Endowment Lands Account 5.9 22,091,228 7,500,000 5,512,680 917,000
83,881,589 102,751,500 77,686,683 90,159,000
Less Fair Value Adjustments of Financial Assets (184,531)
Less Devaluation of Assets - Furniture & Equipment (575,016)
Less Depreciation 2.3 (6,500,707) (6,698,000) (6,363,722) (6,994,000)
Total 76,621,335 96,053,500 71,322,961 83,165,000
Surplus/(Deficit) 3,432,200 (259,000) 3,134,500 0
__________________________________________________________________________________________Page 6.1

Town of Cambridge
Application of General Purpose Funds
For the Year Ending 30 June 2016
Application of General Purpose Funds Budget Budget Budget Budget
2014/2015 2015/2016 % Change $ Change
$ $ +/(-) +/(-)
General Purpose Funding
Rates 22,136,000 23,396,500 5.7% 1,260,500
General Purpose Grant 954,000 467,500 (51.0%) (486,500)
General Financing* 1,341,500 1,162,500 (13.3%) (179,000)
Wembley Golf Course Dividend 1,627,000 1,627,000 0.0% 0
Total General Purpose Funds 26,058,500 26,653,500 2.3% 595,000
Application of General Purpose Funds
Applied to Operations 16,860,100 17,881,000 6.1% 1,020,900
Applied to Reserves 2,011,900 1,339,000 (33.4%) (672,900)
Applied to ELA 720,000 917,000 27.4% 197,000
Applied to Loan Principal repayments 554,100 588,500 6.2% 34,400
18,625,800 20,725,500 11.3% 2,099,700
Applied to Capital Works:
Land & Buildings 209,500 265,000 26.5% 55,500
Furniture and Equipment 632,500 922,500 45.8% 290,000
Plant and Equipment (100) 15,000 (15100.0%) 15,100
Infrastructure - Parks and Reserves 1,111,000 996,000 (10.4%) (115,000)
Infrastructure - Roads and Lanes 2,909,500 2,636,500 (9.4%) (273,000)
Infrastructure - Drainage 305,000 345,000 13.1% 40,000
Infrastructure - Footpaths 715,000 718,000 0.4% 3,000
Infrastructure - Bus Shelters 30,000 30,000 0.0% 0
5,912,400 5,928,000 0.3% 15,600
Total Application of Funds 26,058,500 26,653,500 2.3% 595,000
____________________________________________________________________________________Page 6.2

Town of Cambridge
Project Buget Total Project Total Actual to Actual to Actual to Forecast Projected Future Year Future Year
FYE 2015 Revisions Revised FYE 2012 FYE 2013 FYE 2014 FYE 2015 PLTD Projection Projection
Description Project FYE 2015 Project 30 June 2015 FYE 2016 FYE 2017
$ $ $ $ $ $ $ $ $ $ $
WEMBLEY SPORTS PARK INFRASTRUCTURE WORKS
Sources of Funds
Rates Muni $0 $0 $132,974 -$132,974 $0
Contribution from the State (Variation) Grant $450,000 $450,000 $400,000 $50,000 $450,000
Contribution from the State (Western Power) Grant $170,000 $170,000 $170,000 $170,000
Res $495,000 $5,851,500 $246,500 $6,098,000 $0 $2,884,500 $2,449,500 $951,500 $6,285,500 $412,500 $0
Loan Loan $600,000 $600,000 $600,000 -$600,000 $0 0
$495,000 $7,071,500 $246,500 $7,318,000 $132,974 $3,284,500 $3,136,526 $351,500 $6,905,500 $412,500 $0
Project Expenditure
Roads, Intersection, Car Parks & Oval $495,000 $6,447,500 $246,500 $6,694,000 $73,000 $2,720,500 $3,136,500 $351,500 $6,281,500 $412,500 $0
Payment to State for Design $60,000 $60,000 $60,000 $60,000 $0
Payment to State for Infra & Shared roads $564,000 $564,000 $0 $564,000 $564,000 $0
$495,000 $7,071,500 $246,500 $7,318,000 $133,000 $3,284,500 $3,136,500 $351,500 $6,905,500 $412,500 $0
CRxx.xx [Date] Approval of project budget
CRxx.xx [Date] Revision of Project Budget
WEMBLEY SPORTS PARK PAT GOODRIDGE PAVILION REDEVELOPMENT
Sources of Funds
Rates Muni $0 $0
Club Contribution Contribution $218,000 $218,000 $218,000
CRFSS Grant Grant $1,650,000 -$1,150,000 $500,000 $0 $0 $500,000 $0
Building Maintenance Reserve Fund Res $22,000 $22,000 $22,000
Area Improvement Reserve Res $250,000 $850,000 $1,910,000 $2,760,000 $0 $0 $30,000 $62,500 $92,500 $2,267,500 $400,000
$250,000 $2,500,000 $1,000,000 $3,500,000 $0 $0 $30,000 $62,500 $92,500 $3,007,500 $400,000
Project Expenditure
Wembley Sports Park Pavilion Redevelopment - Design & Construction $250,000 $2,500,000 $800,000 $3,300,000 $30,000 $62,500 $92,500 $2,807,500 $400,000
Wembley Sports Park Pavilion Redevelopment - Design & Construction (Town Facilities) $0 $200,000 $200,000 $0 $0 $0 $200,000 $0
$250,000 $2,500,000 $1,000,000 $3,500,000 $0 $0 $30,000 $62,500 $92,500 $3,007,500 $400,000
CRxx.xx [Date] Approval of project budget
CRxx.xx [Date] Revision of Project Budget
CITY BEACH SURF CLUB & COMMERCIAL DEVELOPMENT
Sources of Funds
Grant for the Surf Club redevelopment Grant $1,900,000 $1,940,000 $1,940,000 $40,000 $1,375,000 $1,415,000 $525,000
Contribution from the Surf Club Contribution $250,000 $20,000 $270,000 $262,318 $7,682 $270,000
ELA: $0 $0
ELA $6,472,000 $7,537,000 $7,537,000 $51,728 $262,500 $5,758,772 $6,073,000 $1,464,000
ELA $1,477,000 $2,448,000 $2,448,000 $51,728 $367,500 $1,120,261 $868,364 $2,407,853 $40,000
ELA $5,176,000 $5,565,000 $5,565,000 $189,147 $0 $189,147 $4,286,000 $1,090,000
Subtotal ELA $13,125,000 $15,550,000 $0 $15,550,000 $103,457 $819,147 $1,120,261 $6,627,136 $8,670,000 $5,790,000 $1,090,000
$15,025,000 $17,740,000 $20,000 $17,760,000 $103,457 $819,147 $1,422,579 $8,009,818 $10,355,000 $6,315,000 $1,090,000
Project Expenditure
City Beach Commercial development $4,322,000 $5,287,000 $5,287,000 $51,728 $262,500 $2,983,625 $3,297,853 $1,989,000
City Beach Surf Club $5,952,000 $6,848,000 $20,000 $6,868,000 $51,728 $367,500 $1,422,579 $5,026,193 $6,868,000 $0
City Beach Amenities $4,751,000 $5,605,000 $5,605,000 $189,147 $189,147 $4,326,000 $1,090,000
$15,025,000 $17,740,000 $20,000 $17,760,000 $103,457 $819,147 $1,422,579 $8,009,817 $10,355,000 $6,315,000 $1,090,000
CRxx.xx 22 July 2012 Approval of Project Budget
CR13.8 18 February 2013 Revision to Project Budget
BOLD PARK AQUATIC CENTRE
Sources of Funds
Endowment Lands Account ELA $11,100,000 $12,500,000 -$250,000 $12,250,000 $1,764 $232,236 $6,651,000 $6,885,000 $5,365,000
$11,100,000 $12,500,000 -$250,000 $12,250,000 $0 $1,764 $232,236 $6,651,000 $6,885,000 $5,365,000 $0
Project Expenditure
Bold Park Aquatic Centre $11,100,000 $12,500,000 -$250,000 $12,250,000 $0 $1,764 $232,236 $6,651,000 $6,885,000 $5,365,000
$11,100,000 $12,500,000 -$250,000 $12,250,000 $0 $1,764 $232,236 $6,651,000 $6,885,000 $5,365,000 $0
CRxx.xx [Date] Approval of project budget
CRxx.xx [Date] Revision of Project Budget
WEMBLEY GOLF COURSE FACILITIES
Sources of Funds
Loan Loan $0 $2,000,000 $2,000,000 $0 $2,000,000
Endowment Lands Account (Loan) ELA $5,500,000 $11,000,000 -$1,000,000 $10,000,000 $91,742 $219,991 $426,973 $761,294 $1,500,000 $7,100,000 $1,400,000
Endowment Lands Account (Contribution) ELA $800,000 $800,000 $0 $400,000 $400,000
$5,500,000 $11,000,000 $1,800,000 $12,800,000 $91,742 $219,991 $426,973 $761,294 $1,500,000 $9,500,000 $1,800,000
Project Expenditure
Wembley Golf Course Hospitality Development $5,050,000 $9,500,000 $500,000 $10,000,000 $91,742 $219,991 $401,442 $696,325 $1,409,500 $7,190,500 $1,400,000
Wembley Golf Course Miniature Golf $450,000 $1,500,000 $500,000 $2,000,000 $25,531 $64,969 $90,500 $1,909,500
Wembley Golf Course Hospitality Fitout (Contribution) $800,000 $800,000 $0 $400,000 $400,000
$5,500,000 $11,000,000 $1,800,000 $12,800,000 $91,742 $219,991 $426,973 $761,294 $1,500,000 $9,500,000 $1,800,000
CRxx.xx [Date] Approval of project budget
CRxx.xx [Date] Revision of Project Budget
Funding Summary
Reserves $745,000 $6,701,500 $2,178,500 $8,880,000 $0 $2,884,500 $2,479,500 $1,014,000 $6,378,000 $2,702,000 $400,000
Endowment $29,725,000 $39,050,000 -$450,000 $38,600,000 $195,199 $1,040,902 $1,779,470 $14,039,430 $17,055,000 $18,655,000 $2,890,000
Grants $1,900,000 $4,210,000 -$1,150,000 $3,060,000 $0 $400,000 $260,000 $1,375,000 $2,035,000 $1,025,000 $0
Contributions $0 $250,000 $238,000 $488,000 0 0 262,318 $7,682 $270,000 $218,000 $0
Loans $0 $600,000 $2,000,000 $2,600,000 $0 $0 $600,000 -$600,000 $0 $2,000,000 $0
Rates $0 $0 $0 $0 $132,974 $0 -$132,974 $0 $0 $0 $0
Total Funding $32,370,000 $50,811,500 $2,816,500 $53,628,000 $328,173 $4,325,402 $5,248,314 $15,836,112 $25,738,001 $24,600,000 $3,290,000
Endowment Lands Account (Community Infrastructure)
This Schedule provides a summary of the Town's major projects over $500,000,
spanning more than one financial year.
Area Improvement Re (incorporating $5M nursery site)
Endowment Lands Account (Commercial & 50% Surf Club)
Endowment Lands Account
_____________________________________________________________________________________________
Page 6.3
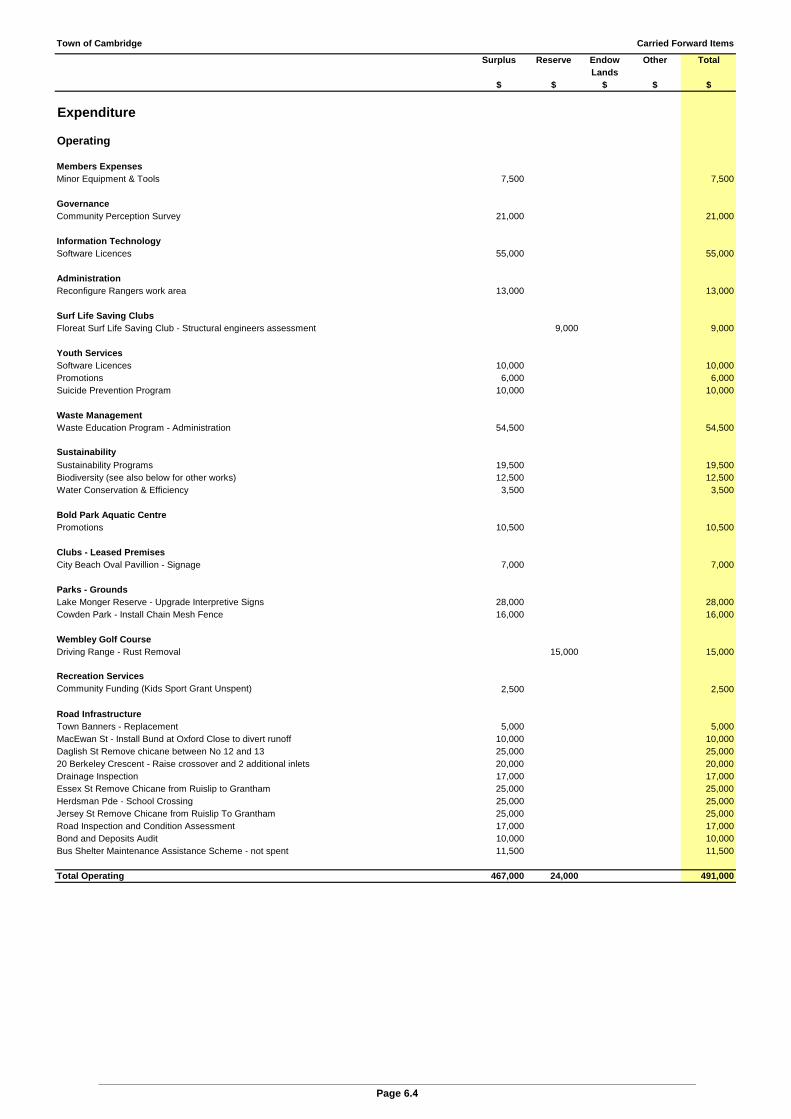
Town of Cambridge Carried Forward Items
Surplus Reserve Endow Other TotalLands
$ $ $ $ $
Expenditure
Operating
Members ExpensesMinor Equipment & Tools 7,500 7,500
0GovernanceCommunity Perception Survey 21,000 21,000
0Information TechnologySoftware Licences 55,000 55,000
0Administration 0Reconfigure Rangers work area 13,000 13,000
0Surf Life Saving Clubs 0Floreat Surf Life Saving Club - Structural engineers assessment 9,000 9,000
0Youth Services 0Software Licences 10,000 10,000Promotions 6,000 6,000Suicide Prevention Program 10,000 10,000
0Waste Management 0Waste Education Program - Administration 54,500 54,500
0Sustainability 0Sustainability Programs 19,500 19,500Biodiversity (see also below for other works) 12,500 12,500Water Conservation & Efficiency 3,500 3,500
0Bold Park Aquatic Centre 0Promotions 10,500 10,500
0Clubs - Leased Premises 0City Beach Oval Pavillion - Signage 7,000 7,000
0Parks - Grounds 0Lake Monger Reserve - Upgrade Interpretive Signs 28,000 28,000Cowden Park - Install Chain Mesh Fence 16,000 16,000
0Wembley Golf Course 0Driving Range - Rust Removal 15,000 15,000
0Recreation Services 0Community Funding (Kids Sport Grant Unspent) 2,500 2,500
0Road Infrastructure 0Town Banners - Replacement 5,000 5,000MacEwan St - Install Bund at Oxford Close to divert runoff 10,000 10,000Daglish St Remove chicane between No 12 and 13 25,000 25,00020 Berkeley Crescent - Raise crossover and 2 additional inlets 20,000 20,000Drainage Inspection 17,000 17,000Essex St Remove Chicane from Ruislip to Grantham 25,000 25,000Herdsman Pde - School Crossing 25,000 25,000Jersey St Remove Chicane from Ruislip To Grantham 25,000 25,000Road Inspection and Condition Assessment 17,000 17,000Bond and Deposits Audit 10,000 10,000Bus Shelter Maintenance Assistance Scheme - not spent 11,500 11,500
Total Operating 467,000 24,000 0 0 491,000
________________________________________________________________________________________________________ Page 6.4
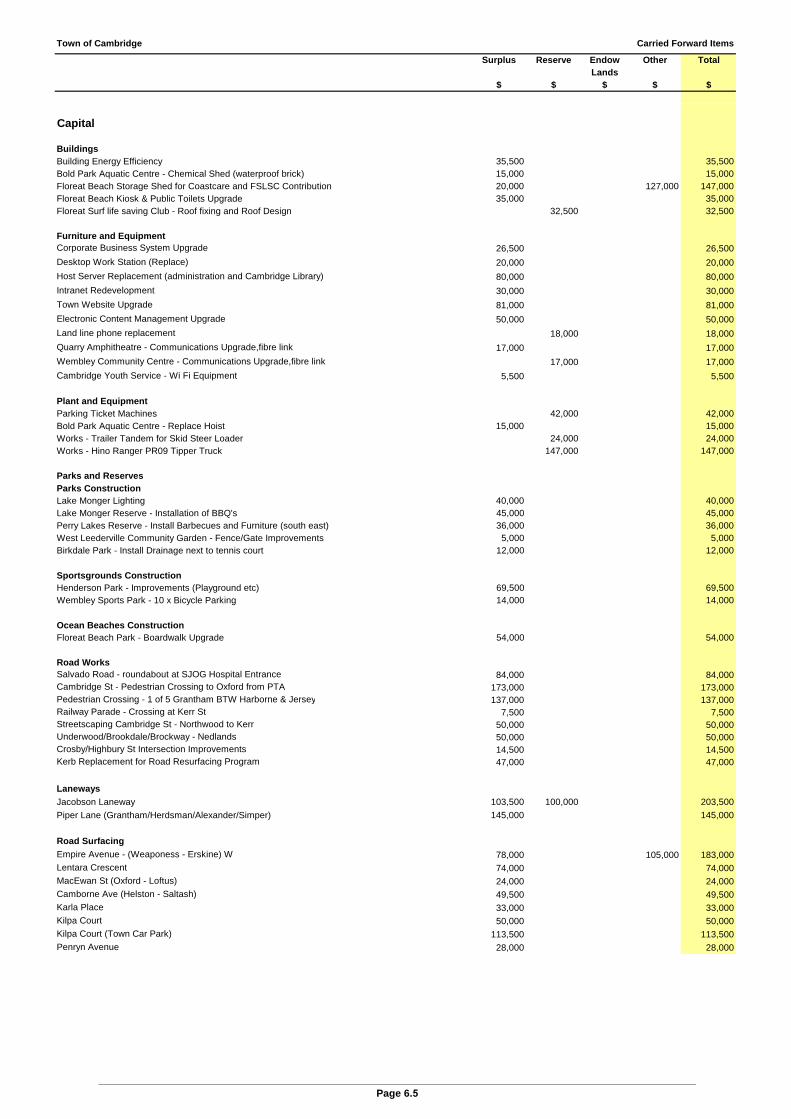
Town of Cambridge Carried Forward Items
Surplus Reserve Endow Other TotalLands
$ $ $ $ $
Capital
Buildings 0Building Energy Efficiency 35,500 35,500Bold Park Aquatic Centre - Chemical Shed (waterproof brick) 15,000 15,000Floreat Beach Storage Shed for Coastcare and FSLSC Contribution 20,000 127,000 147,000Floreat Beach Kiosk & Public Toilets Upgrade 35,000 35,000Floreat Surf life saving Club - Roof fixing and Roof Design 32,500 32,500
0Furniture and Equipment 0Corporate Business System Upgrade 26,500 26,500
Desktop Work Station (Replace) 20,000 20,000
Host Server Replacement (administration and Cambridge Library) 80,000 80,000
Intranet Redevelopment 30,000 30,000
Town Website Upgrade 81,000 81,000
Electronic Content Management Upgrade 50,000 50,000
Land line phone replacement 18,000 18,000
Quarry Amphitheatre - Communications Upgrade,fibre link 17,000 17,000
Wembley Community Centre - Communications Upgrade,fibre link 17,000 17,000
Cambridge Youth Service - Wi Fi Equipment 5,500 5,500
Plant and Equipment 0Parking Ticket Machines 42,000 42,000Bold Park Aquatic Centre - Replace Hoist 15,000 15,000Works - Trailer Tandem for Skid Steer Loader 24,000 24,000Works - Hino Ranger PR09 Tipper Truck 147,000 147,000
0Parks and Reserves 0Parks Construction 0Lake Monger Lighting 40,000 40,000Lake Monger Reserve - Installation of BBQ's 45,000 45,000Perry Lakes Reserve - Install Barbecues and Furniture (south east) 36,000 36,000West Leederville Community Garden - Fence/Gate Improvements 5,000 5,000Birkdale Park - Install Drainage next to tennis court 12,000 12,000
0Sportsgrounds Construction 0Henderson Park - Improvements (Playground etc) 69,500 69,500Wembley Sports Park - 10 x Bicycle Parking 14,000 14,000
0Ocean Beaches Construction 0Floreat Beach Park - Boardwalk Upgrade 54,000 54,000
0Road Works Salvado Road - roundabout at SJOG Hospital Entrance 84,000 84,000Cambridge St - Pedestrian Crossing to Oxford from PTA 173,000 173,000Pedestrian Crossing - 1 of 5 Grantham BTW Harborne & Jersey 137,000 137,000Railway Parade - Crossing at Kerr St 7,500 7,500Streetscaping Cambridge St - Northwood to Kerr 50,000 50,000Underwood/Brookdale/Brockway - Nedlands 50,000 50,000Crosby/Highbury St Intersection Improvements 14,500 14,500Kerb Replacement for Road Resurfacing Program 47,000 47,000
0
Laneways 0
Jacobson Laneway 103,500 100,000 203,500
Piper Lane (Grantham/Herdsman/Alexander/Simper) 145,000 145,000
0Road Surfacing 0Empire Avenue - (Weaponess - Erskine) W 78,000 105,000 183,000Lentara Crescent 74,000 74,000MacEwan St (Oxford - Loftus) 24,000 24,000Camborne Ave (Helston - Saltash) 49,500 49,500Karla Place 33,000 33,000Kilpa Court 50,000 50,000Kilpa Court (Town Car Park) 113,500 113,500Penryn Avenue 28,000 28,000
________________________________________________________________________________________________________ Page 6.5
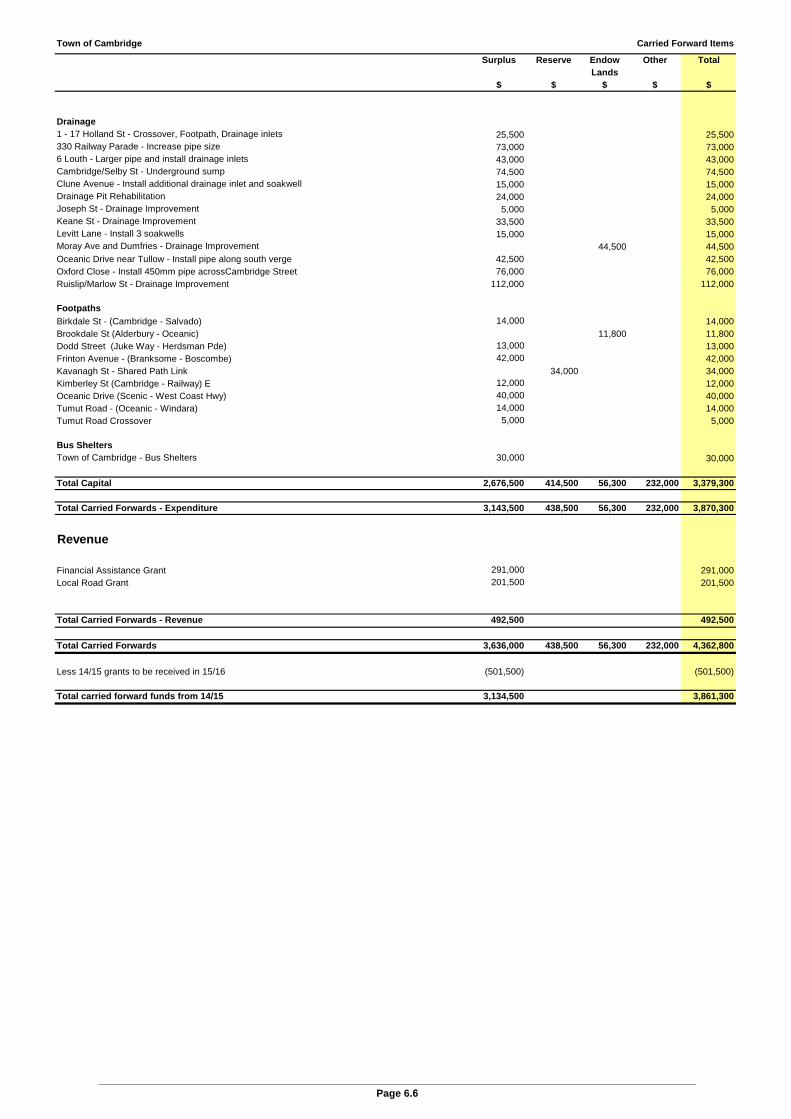
Town of Cambridge Carried Forward Items
Surplus Reserve Endow Other TotalLands
$ $ $ $ $
Drainage1 - 17 Holland St - Crossover, Footpath, Drainage inlets 25,500 25,500330 Railway Parade - Increase pipe size 73,000 73,0006 Louth - Larger pipe and install drainage inlets 43,000 43,000Cambridge/Selby St - Underground sump 74,500 74,500Clune Avenue - Install additional drainage inlet and soakwell 15,000 15,000Drainage Pit Rehabilitation 24,000 24,000Joseph St - Drainage Improvement 5,000 5,000Keane St - Drainage Improvement 33,500 33,500Levitt Lane - Install 3 soakwells 15,000 15,000Moray Ave and Dumfries - Drainage Improvement 44,500 44,500Oceanic Drive near Tullow - Install pipe along south verge 42,500 42,500Oxford Close - Install 450mm pipe acrossCambridge Street 76,000 76,000Ruislip/Marlow St - Drainage Improvement 112,000 112,000
0Footpaths
Birkdale St - (Cambridge - Salvado) 14,000 14,000Brookdale St (Alderbury - Oceanic) 11,800 11,800Dodd Street (Juke Way - Herdsman Pde) 13,000 13,000Frinton Avenue - (Branksome - Boscombe) 42,000 42,000Kavanagh St - Shared Path Link 34,000 34,000Kimberley St (Cambridge - Railway) E 12,000 12,000Oceanic Drive (Scenic - West Coast Hwy) 40,000 40,000Tumut Road - (Oceanic - Windara) 14,000 14,000Tumut Road Crossover 5,000 5,000
0Bus Shelters 0Town of Cambridge - Bus Shelters 30,000 30,000
0Total Capital 2,676,500 414,500 56,300 232,000 3,379,300
Total Carried Forwards - Expenditure 3,143,500 438,500 56,300 232,000 3,870,300
Revenue
Financial Assistance Grant 291,000 291,000Local Road Grant 201,500 201,500
Total Carried Forwards - Revenue 492,500 0 0 0 492,500
Total Carried Forwards 3,636,000 438,500 56,300 232,000 4,362,800
Less 14/15 grants to be received in 15/16 (501,500) (501,500)
Total carried forward funds from 14/15 3,134,500 3,861,300
________________________________________________________________________________________________________ Page 6.6

Town of Cambridge Disposal of Assets
Asset Asset Regn/ Cost Purchase Accum Written Estimated Gain (Loss) Gain/Description Type Plant No. Centre Cost Depn Down Val. Proceeds On Sale (Loss)
$ $ $ $ $
GovernanceGovernance ManagementJeep grand Cherokee CRD PLT P0238 Gov 50,100 (11,609) 38,500 35,000 0 (3,500) (3,500)
50,100 (11,609) 38,500 35,000 0 (3,500) (3,500)Human Resources
Subaru XV CVT 2.0i PLT P0276 HR 27,400 (895) 26,500 16,500 0 (10,000) (10,000)27,400 (895) 26,500 16,500 0 (10,000) (10,000)
Administration General
Honda CRV Vti Navi PLT P0249 Adm 28,175 (8,168) 20,000 14,000 0 (6,000) (6,000)28,175 (8,168) 20,000 14,000 0 (6,000) (6,000)
105,675 (20,672) 85,000 65,500 0 (19,500) (19,500)Law Order and Public SafetyAnimal ControlSubaru Forester 2.5i PLT P0236 Ani 29,800 (5,803) 24,000 16,500 0 (7,500) (7,500)
29,800 (5,803) 24,000 16,500 0 (7,500) (7,500)Ranger Services - OtherSubaru XV CVT 2.0i PLT P0278 Ranger 27,190 (3,201) 24,000 16,500 0 (7,500) (7,500)
27,190 (3,201) 24,000 16,500 0 (7,500) (7,500)
56,990 (9,005) 48,000 33,000 0 (15,000) (15,000)Education and WelfareCambridge Senior ServicesHolden Captiva PLT P0251 CSS 24,756 (1,768) 23,000 13,500 0 (9,500) (9,500)
24,756 (1,768) 23,000 13,500 0 (9,500) (9,500)
24,756 (1,768) 23,000 13,500 0 (9,500) (9,500)Recreation & CultureWGC Plant Operations
P&E WGCplant 0 20,000 20,000 0 20,0000 0 0 20,000 20,000 0 20,000
Clubs - Leased PremisesMitsubishi Triton S/Cab 4x2 PLT P0234 Clubs 16,200 (3,655) 12,500 10,000 0 (2,500) (2,500)
16,200 (3,655) 12,500 10,000 0 (2,500) (2,500)
16,200 (3,655) 12,500 30,000 20,000 (2,500) 17,500TransportParking ControlSubaru Forester 2.5i PLT P0250 Parking 28,983 (6,450) 22,500 16,500 0 (6,000) (6,000)Honda Jazz Vti PLT P0246 Parking 15,850 (4,839) 11,000 8,000 0 (3,000) (3,000)
44,833 (11,289) 33,500 24,500 0 (9,000) (9,000)
44,833 (11,289) 33,500 24,500 0 (9,000) (9,000)Other Property & Services
Parks OverheadSubaru Forester 2.5i PLT P0281 Park OH 27,423 (1,463) 26,000 16,500 0 (9,500) (9,500)
27,423 (1,463) 26,000 16,500 0 (9,500) (9,500)
Works Overhead `
Ford Ranger Dual Cab 4x2 PLT P0216 Work OH 27,905 (7,930) 20,000 15,000 0 (5,000) (5,000)Mitsubishi Triton S/Cab 4x2 PLT P0235 Work OH 25,604 (6,639) 19,000 10,000 0 (9,000) (9,000)
53,509 (14,569) 39,000 25,000 0 (14,000) (14,000)
Parks Plant OperationsToyota Hilux Single Cab 4x4 PLT P0277 Parks 39,288 (5,739) 33,500 17,000 0 (16,500) (16,500)
Ford Ranger crew Cab 4x2 PLT P0215 Parks 30,000 (6,967) 23,000 15,000 0 (8,000) (8,000)
Ford Ranger Single Cab 4x2 PLT P0260 Parks 18,706 (5,230) 13,500 13,000 0 (500) (500)
Holden Calorado S/Cab 4x4 PLT P0242 Parks 29,166 (8,623) 20,500 13,000 0 (7,500) (7,500)
Ford Ranger 4x4 PLT P0245 Parks 29,126 (8,585) 20,500 15,000 0 (5,500) (5,500)
Kubota Ride On Mower P&E P0253 Parks 16,000 (2,515) 13,500 7,000 0 (6,500) (6,500)162,285 (37,660) 124,500 80,000 0 (44,500) (44,500)
Works Plant OperationsFord Ranger PX XL Supercab PLT P0280 Works 26,984 (2,498) 24,500 15,000 0 (9,500) (9,500)
Holden Colorado D/Cab 4x2 PLT P0244 Works 29,404 (8,922) 20,500 15,000 0 (5,500) (5,500)Trailer Tandem for Skid Steer Loader P&E P4004 Works 18,123 (18,123) 1,000 1,000 1,000
Hino Ranger PRO9 Tipper Truck P&E P5113 Works 50,000 (24,983) 25,017 27,000 2,000 0 2,000Works - Front End Loader P&E P3004 Works 19,001 (4,001) 15,000 20,000 5,000 0 5,000
143,512 (58,528) 85,017 78,000 8,000 (15,000) (7,000)
Catalina Estate Land Sales Land 2,217,000 2,217,000 4,816,000 2,599,000 0 2,599,0002,217,000 0 2,217,000 4,816,000 2,599,000 0 2,599,000
2,603,730 (112,219) 2,491,517 5,015,500 2,607,000 (83,000) 2,524,000
Total 2,852,183 (158,608) 2,693,517 5,182,000 2,627,000 (138,500) 2,488,500
___________________________________________________________________________________________________________________Page 6.7
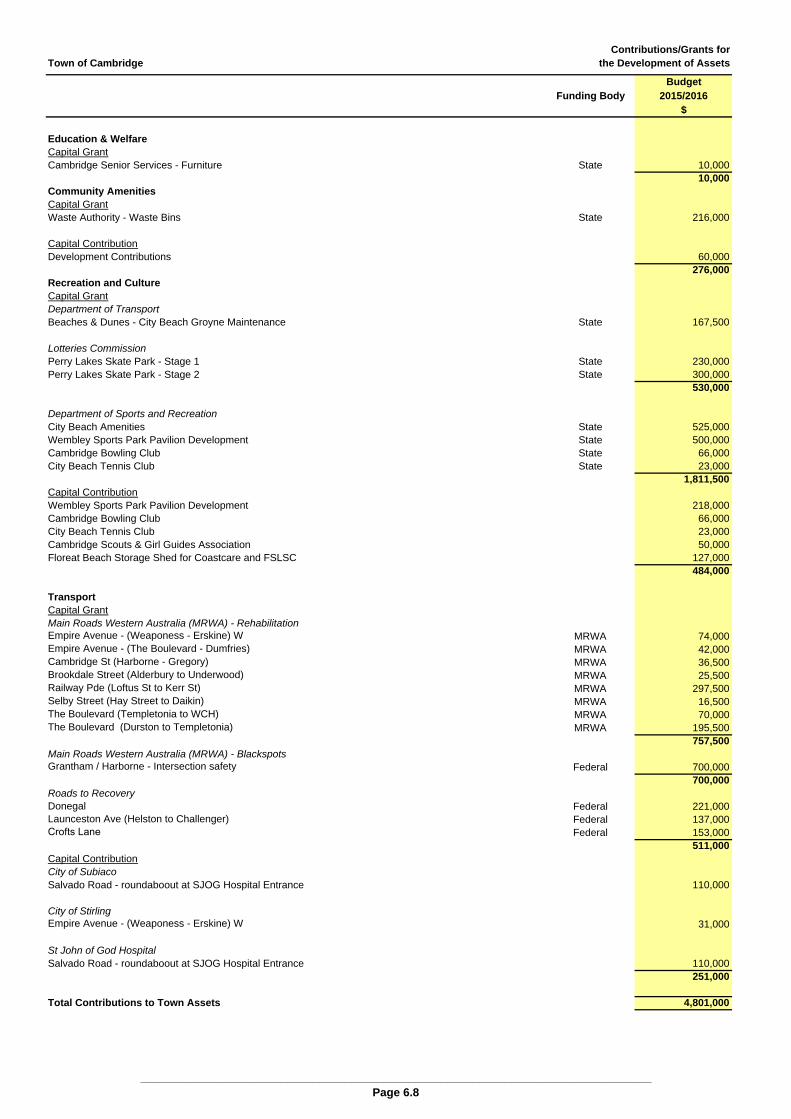
Town of Cambridge
BudgetFunding Body 2015/2016
$
Education & WelfareCapital GrantCambridge Senior Services - Furniture State 10,000
10,000Community AmenitiesCapital GrantWaste Authority - Waste Bins State 216,000
Capital ContributionDevelopment Contributions 60,000
276,000Recreation and CultureCapital GrantDepartment of TransportBeaches & Dunes - City Beach Groyne Maintenance State 167,500
Lotteries CommissionPerry Lakes Skate Park - Stage 1 State 230,000Perry Lakes Skate Park - Stage 2 State 300,000
530,000
Department of Sports and RecreationCity Beach Amenities State 525,000Wembley Sports Park Pavilion Development State 500,000Cambridge Bowling Club State 66,000City Beach Tennis Club State 23,000
1,811,500Capital ContributionWembley Sports Park Pavilion Development 218,000Cambridge Bowling Club 66,000City Beach Tennis Club 23,000Cambridge Scouts & Girl Guides Association 50,000Floreat Beach Storage Shed for Coastcare and FSLSC 127,000
484,000
TransportCapital GrantMain Roads Western Australia (MRWA) - RehabilitationEmpire Avenue - (Weaponess - Erskine) W MRWA 74,000Empire Avenue - (The Boulevard - Dumfries) MRWA 42,000Cambridge St (Harborne - Gregory) MRWA 36,500Brookdale Street (Alderbury to Underwood) MRWA 25,500Railway Pde (Loftus St to Kerr St) MRWA 297,500Selby Street (Hay Street to Daikin) MRWA 16,500The Boulevard (Templetonia to WCH) MRWA 70,000The Boulevard (Durston to Templetonia) MRWA 195,500
757,500Main Roads Western Australia (MRWA) - BlackspotsGrantham / Harborne - Intersection safety Federal 700,000
700,000
Federal 221,000Federal 137,000
Roads to RecoveryDonegal Launceston Ave (Helston to Challenger) Crofts Lane Federal 153,000
511,000Capital ContributionCity of SubiacoSalvado Road - roundaboout at SJOG Hospital Entrance 110,000
City of StirlingEmpire Avenue - (Weaponess - Erskine) W 31,000
St John of God HospitalSalvado Road - roundaboout at SJOG Hospital Entrance 110,000
251,000
Total Contributions to Town Assets 4,801,000
Contributions/Grants forthe Development of Assets
________________________________________________________________________________Page 6.8
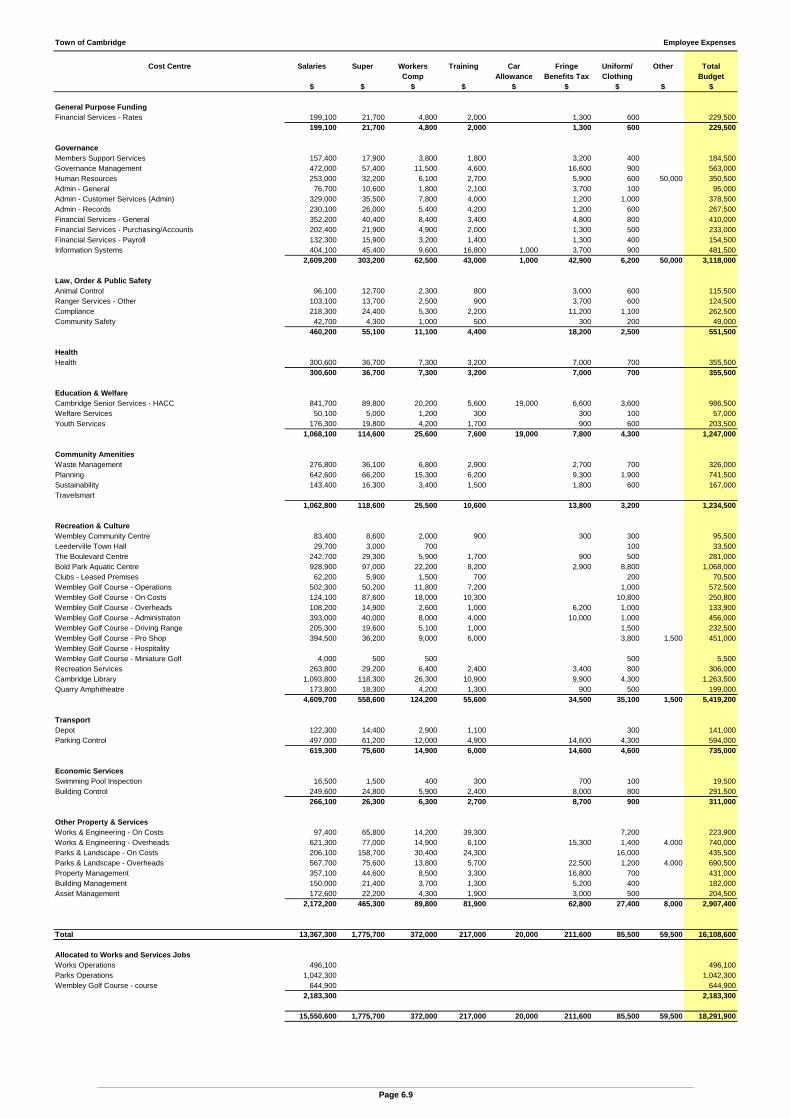
Town of Cambridge Employee Expenses
Cost Centre Salaries Super Workers Training Car Fringe Uniform/ Other TotalComp Allowance Benefits Tax Clothing Budget
$ $ $ $ $ $ $ $ $
General Purpose FundingFinancial Services - Rates 199,100 21,700 4,800 2,000 1,300 600 229,500
199,100 21,700 4,800 2,000 0 1,300 600 0 229,500
GovernanceMembers Support Services 157,400 17,900 3,800 1,800 0 3,200 400 184,500Governance Management 472,000 57,400 11,500 4,600 0 16,600 900 563,000Human Resources 253,000 32,200 6,100 2,700 0 5,900 600 50,000 350,500Admin - General 76,700 10,600 1,800 2,100 0 3,700 100 95,000Admin - Customer Services (Admin) 329,000 35,500 7,800 4,000 0 1,200 1,000 378,500Admin - Records 230,100 26,000 5,400 4,200 0 1,200 600 267,500Financial Services - General 352,200 40,400 8,400 3,400 0 4,800 800 410,000Financial Services - Purchasing/Accounts 202,400 21,900 4,900 2,000 0 1,300 500 233,000Financial Services - Payroll 132,300 15,900 3,200 1,400 0 1,300 400 154,500Information Systems 404,100 45,400 9,600 16,800 1,000 3,700 900 481,500
2,609,200 303,200 62,500 43,000 1,000 42,900 6,200 50,000 3,118,000
Law, Order & Public SafetyAnimal Control 96,100 12,700 2,300 800 3,000 600 115,500Ranger Services - Other 103,100 13,700 2,500 900 0 3,700 600 124,500Compliance 218,300 24,400 5,300 2,200 0 11,200 1,100 262,500Community Safety 42,700 4,300 1,000 500 0 300 200 49,000
460,200 55,100 11,100 4,400 0 18,200 2,500 0 551,500
HealthHealth 300,600 36,700 7,300 3,200 0 7,000 700 355,500
300,600 36,700 7,300 3,200 0 7,000 700 0 355,500
Education & WelfareCambridge Senior Services - HACC 841,700 89,800 20,200 5,600 19,000 6,600 3,600 986,500Welfare Services 50,100 5,000 1,200 300 0 300 100 57,000Youth Services 176,300 19,800 4,200 1,700 0 900 600 203,500
1,068,100 114,600 25,600 7,600 19,000 7,800 4,300 0 1,247,000
Community AmenitiesWaste Management 276,800 36,100 6,800 2,900 0 2,700 700 326,000Planning 642,600 66,200 15,300 6,200 0 9,300 1,900 741,500Sustainability 143,400 16,300 3,400 1,500 0 1,800 600 167,000Travelsmart 0 0 0 0 0 0 0 0
1,062,800 118,600 25,500 10,600 0 13,800 3,200 0 1,234,500
Recreation & CultureWembley Community Centre 83,400 8,600 2,000 900 300 300 95,500Leederville Town Hall 29,700 3,000 700 0 0 100 33,500The Boulevard Centre 242,700 29,300 5,900 1,700 900 500 281,000Bold Park Aquatic Centre 928,900 97,000 22,200 8,200 2,900 8,800 1,068,000Clubs - Leased Premises 62,200 5,900 1,500 700 0 200 70,500Wembley Golf Course - Operations 502,300 50,200 11,800 7,200 0 1,000 572,500Wembley Golf Course - On Costs 124,100 87,600 18,000 10,300 0 10,800 250,800Wembley Golf Course - Overheads 108,200 14,900 2,600 1,000 6,200 1,000 133,900Wembley Golf Course - Administraton 393,000 40,000 8,000 4,000 10,000 1,000 456,000Wembley Golf Course - Driving Range 205,300 19,600 5,100 1,000 0 1,500 232,500Wembley Golf Course - Pro Shop 394,500 36,200 9,000 6,000 0 3,800 1,500 451,000Wembley Golf Course - Hospitality 0Wembley Golf Course - Miniature Golf 4,000 500 500 500 5,500Recreation Services 263,800 29,200 6,400 2,400 3,400 800 306,000Cambridge Library 1,093,800 118,300 26,300 10,900 9,900 4,300 1,263,500Quarry Amphitheatre 173,800 18,300 4,200 1,300 900 500 199,000
4,609,700 558,600 124,200 55,600 0 34,500 35,100 1,500 5,419,200
TransportDepot 122,300 14,400 2,900 1,100 0 300 141,000Parking Control 497,000 61,200 12,000 4,900 14,600 4,300 594,000
619,300 75,600 14,900 6,000 0 14,600 4,600 0 735,000
Economic ServicesSwimming Pool Inspection 16,500 1,500 400 300 700 100 19,500Building Control 249,600 24,800 5,900 2,400 0 8,000 800 291,500
266,100 26,300 6,300 2,700 0 8,700 900 0 311,000
Other Property & ServicesWorks & Engineering - On Costs 97,400 65,800 14,200 39,300 7,200 223,900Works & Engineering - Overheads 621,300 77,000 14,900 6,100 0 15,300 1,400 4,000 740,000Parks & Landscape - On Costs 206,100 158,700 30,400 24,300 16,000 435,500Parks & Landscape - Overheads 567,700 75,600 13,800 5,700 0 22,500 1,200 4,000 690,500Property Management 357,100 44,600 8,500 3,300 0 16,800 700 431,000Building Management 150,000 21,400 3,700 1,300 0 5,200 400 182,000Asset Management 172,600 22,200 4,300 1,900 0 3,000 500 204,500
2,172,200 465,300 89,800 81,900 0 62,800 27,400 8,000 2,907,400
Total 13,367,300 1,775,700 372,000 217,000 20,000 211,600 85,500 59,500 16,108,600
Allocated to Works and Services JobsWorks Operations 496,100 0 0 0 0 496,100Parks Operations 1,042,300 0 0 0 0 1,042,300Wembley Golf Course - course 644,900 0 0 0 0 644,900
2,183,300 0 0 0 0 0 0 0 2,183,300
15,550,600 1,775,700 372,000 217,000 20,000 211,600 85,500 59,500 18,291,900
_________________________________________________________________________________________________________________________________Page 6.9
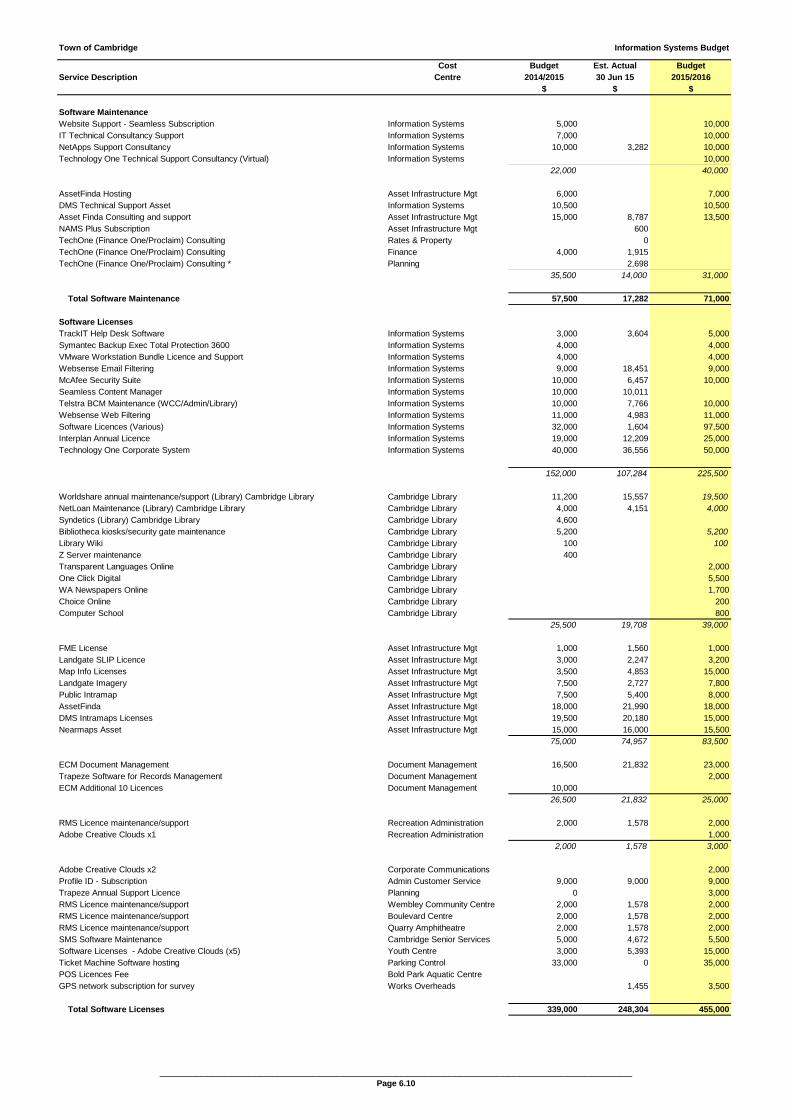
Town of Cambridge Information Systems Budget
Cost Budget Est. Actual BudgetService Description Centre 2014/2015 30 Jun 15 2015/2016
$ $ $
Software Maintenance Website Support - Seamless Subscription Information Systems 5,000 10,000IT Technical Consultancy Support Information Systems 7,000 10,000NetApps Support Consultancy Information Systems 10,000 3,282 10,000Technology One Technical Support Consultancy (Virtual) Information Systems 10,000
22,000 40,000
AssetFinda Hosting Asset Infrastructure Mgt 6,000 7,000DMS Technical Support Asset Information Systems 10,500 10,500Asset Finda Consulting and support Asset Infrastructure Mgt 15,000 8,787 13,500NAMS Plus Subscription Asset Infrastructure Mgt 600TechOne (Finance One/Proclaim) Consulting Rates & Property 0TechOne (Finance One/Proclaim) Consulting Finance 4,000 1,915TechOne (Finance One/Proclaim) Consulting * Planning 2,698
35,500 14,000 31,000
Total Software Maintenance 57,500 17,282 71,000
Software Licenses TrackIT Help Desk Software Information Systems 3,000 3,604 5,000Symantec Backup Exec Total Protection 3600 Information Systems 4,000 4,000VMware Workstation Bundle Licence and Support Information Systems 4,000 4,000Websense Email Filtering Information Systems 9,000 18,451 9,000McAfee Security Suite Information Systems 10,000 6,457 10,000Seamless Content Manager Information Systems 10,000 10,011Telstra BCM Maintenance (WCC/Admin/Library) Information Systems 10,000 7,766 10,000Websense Web Filtering Information Systems 11,000 4,983 11,000Software Licences (Various) Information Systems 32,000 1,604 97,500Interplan Annual Licence Information Systems 19,000 12,209 25,000Technology One Corporate System Information Systems 40,000 36,556 50,000
152,000 107,284 225,500
Worldshare annual maintenance/support (Library) Cambridge Library Cambridge Library 11,200 15,557 19,500NetLoan Maintenance (Library) Cambridge Library Cambridge Library 4,000 4,151 4,000Syndetics (Library) Cambridge Library Cambridge Library 4,600Bibliotheca kiosks/security gate maintenance Cambridge Library 5,200 5,200Library Wiki Cambridge Library 100 100Z Server maintenance Cambridge Library 400Transparent Languages Online Cambridge Library 2,000One Click Digital Cambridge Library 5,500WA Newspapers Online Cambridge Library 1,700Choice Online Cambridge Library 200Computer School Cambridge Library 800
25,500 19,708 39,000
FME License Asset Infrastructure Mgt 1,000 1,560 1,000Landgate SLIP Licence Asset Infrastructure Mgt 3,000 2,247 3,200Map Info Licenses Asset Infrastructure Mgt 3,500 4,853 15,000Landgate Imagery Asset Infrastructure Mgt 7,500 2,727 7,800Public Intramap Asset Infrastructure Mgt 7,500 5,400 8,000AssetFinda Asset Infrastructure Mgt 18,000 21,990 18,000DMS Intramaps Licenses Asset Infrastructure Mgt 19,500 20,180 15,000Nearmaps Asset Asset Infrastructure Mgt 15,000 16,000 15,500
75,000 74,957 83,500
ECM Document Management Document Management 16,500 21,832 23,000Trapeze Software for Records Management Document Management 2,000ECM Additional 10 Licences Document Management 10,000
26,500 21,832 25,000
RMS Licence maintenance/support Recreation Administration 2,000 1,578 2,000Adobe Creative Clouds x1 Recreation Administration 1,000
2,000 1,578 3,000
Adobe Creative Clouds x2 Corporate Communications 2,000Profile ID - Subscription Admin Customer Service 9,000 9,000 9,000Trapeze Annual Support Licence Planning 0 3,000RMS Licence maintenance/support Wembley Community Centre 2,000 1,578 2,000RMS Licence maintenance/support Boulevard Centre 2,000 1,578 2,000RMS Licence maintenance/support Quarry Amphitheatre 2,000 1,578 2,000SMS Software Maintenance Cambridge Senior Services 5,000 4,672 5,500Software Licenses - Adobe Creative Clouds (x5) Youth Centre 3,000 5,393 15,000Ticket Machine Software hosting Parking Control 33,000 0 35,000POS Licences Fee Bold Park Aquatic CentreGPS network subscription for survey Works Overheads 1,455 3,500
Total Software Licenses 339,000 248,304 455,000
________________________________________________________________________________Page 6.10
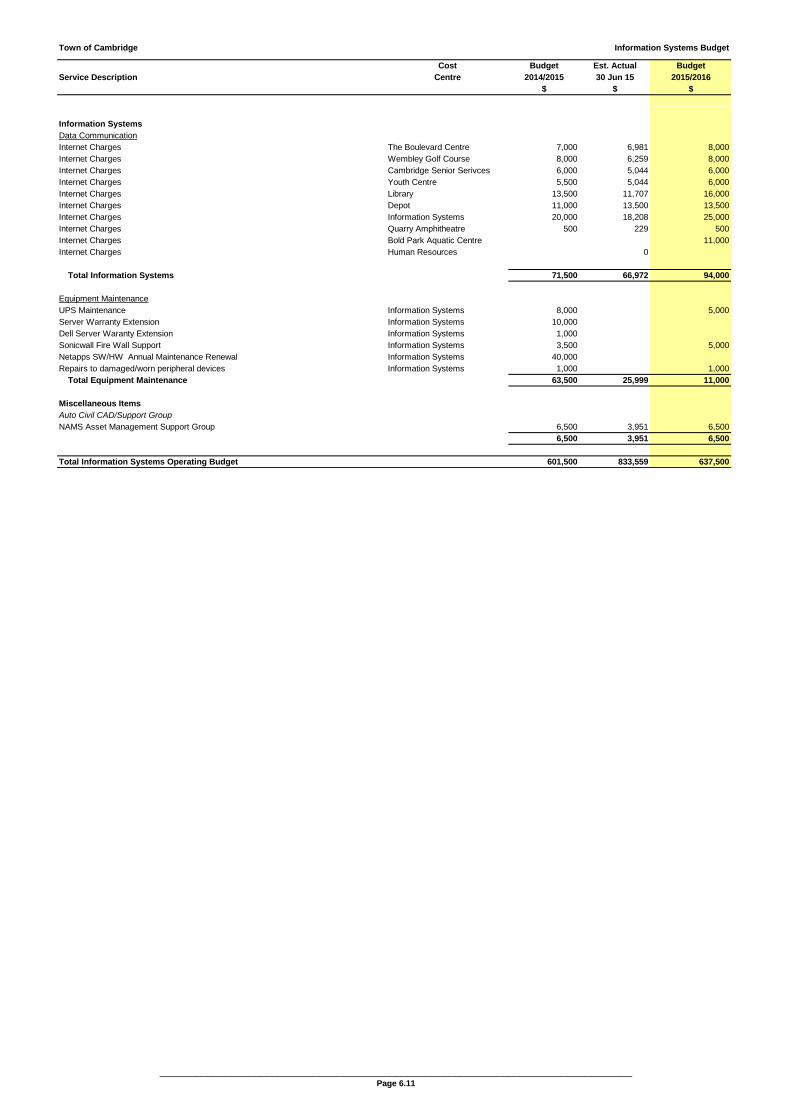
Town of Cambridge Information Systems Budget
Cost Budget Est. Actual BudgetService Description Centre 2014/2015 30 Jun 15 2015/2016
$ $ $
Information Systems Data CommunicationInternet Charges The Boulevard Centre 7,000 6,981 8,000Internet Charges Wembley Golf Course 8,000 6,259 8,000Internet Charges Cambridge Senior Serivces 6,000 5,044 6,000Internet Charges Youth Centre 5,500 5,044 6,000Internet Charges Library 13,500 11,707 16,000Internet Charges Depot 11,000 13,500 13,500Internet Charges Information Systems 20,000 18,208 25,000Internet Charges Quarry Amphitheatre 500 229 500Internet Charges Bold Park Aquatic Centre 11,000Internet Charges Human Resources 0
Total Information Systems 71,500 66,972 94,000
Equipment MaintenanceUPS Maintenance Information Systems 8,000 5,000Server Warranty Extension Information Systems 10,000Dell Server Waranty Extension Information Systems 1,000Sonicwall Fire Wall Support Information Systems 3,500 5,000Netapps SW/HW Annual Maintenance Renewal Information Systems 40,000Repairs to damaged/worn peripheral devices Information Systems 1,000 1,000
Total Equipment Maintenance 63,500 25,999 11,000
Miscellaneous ItemsAuto Civil CAD/Support GroupNAMS Asset Management Support Group 6,500 3,951 6,500
6,500 3,951 6,500
Total Information Systems Operating Budget 601,500 833,559 637,500
________________________________________________________________________________Page 6.11
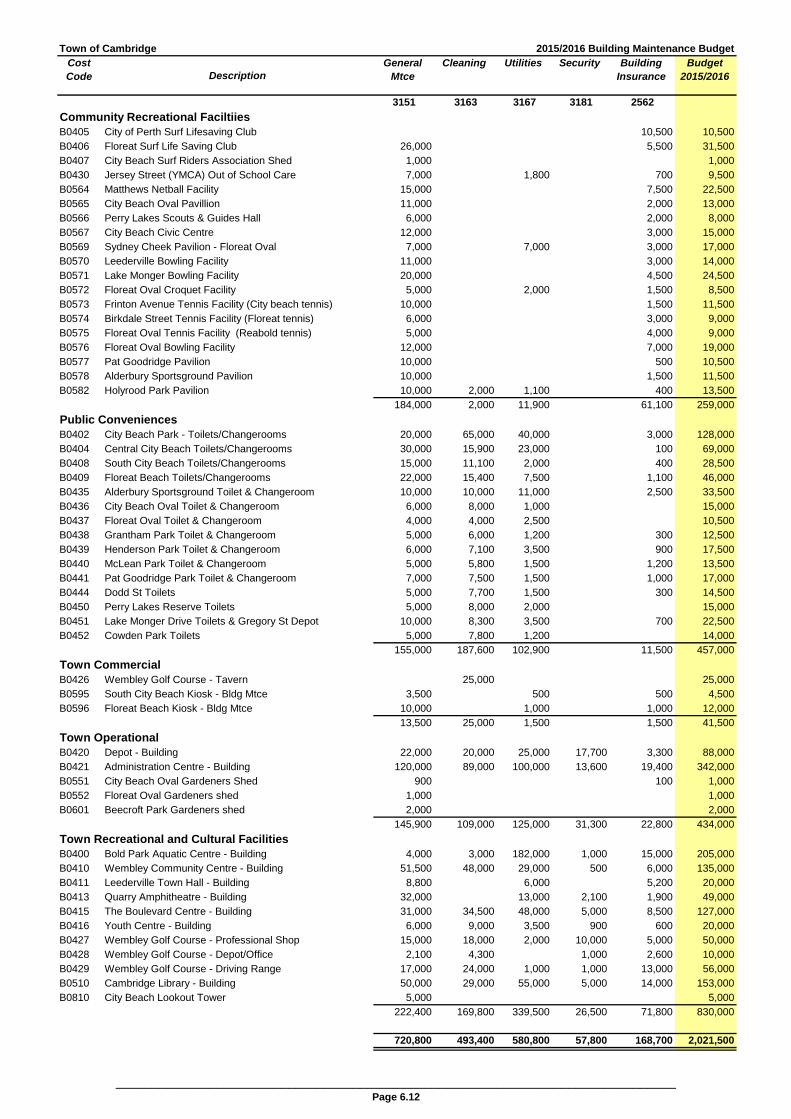
Town of Cambridge 2015/2016 Building Maintenance BudgetCost Code Description
General Mtce
Cleaning Utilities Security Building Insurance
Budget 2015/2016
3151 3163 3167 3181 2562
Community Recreational FaciltiiesB0405 City of Perth Surf Lifesaving Club 0 10,500 10,500B0406 Floreat Surf Life Saving Club 26,000 0 0 0 5,500 31,500B0407 City Beach Surf Riders Association Shed 1,000 0 0 0 0 1,000B0430 Jersey Street (YMCA) Out of School Care 7,000 0 1,800 0 700 9,500B0564 Matthews Netball Facility 15,000 0 0 0 7,500 22,500B0565 City Beach Oval Pavillion 11,000 0 0 0 2,000 13,000B0566 Perry Lakes Scouts & Guides Hall 6,000 0 0 0 2,000 8,000B0567 City Beach Civic Centre 12,000 0 0 0 3,000 15,000B0569 Sydney Cheek Pavilion - Floreat Oval 7,000 0 7,000 0 3,000 17,000B0570 Leederville Bowling Facility 11,000 0 0 0 3,000 14,000B0571 Lake Monger Bowling Facility 20,000 0 0 0 4,500 24,500B0572 Floreat Oval Croquet Facility 5,000 0 2,000 0 1,500 8,500B0573 Frinton Avenue Tennis Facility (City beach tennis) 10,000 0 0 0 1,500 11,500B0574 Birkdale Street Tennis Facility (Floreat tennis) 6,000 0 0 0 3,000 9,000B0575 Floreat Oval Tennis Facility (Reabold tennis) 5,000 0 0 0 4,000 9,000B0576 Floreat Oval Bowling Facility 12,000 0 0 0 7,000 19,000B0577 Pat Goodridge Pavilion 10,000 0 0 0 500 10,500B0578 Alderbury Sportsground Pavilion 10,000 0 0 0 1,500 11,500B0582 Holyrood Park Pavilion 10,000 2,000 1,100 0 400 13,500
184,000 2,000 11,900 0 61,100 259,000
Public ConveniencesB0402 City Beach Park - Toilets/Changerooms 20,000 65,000 40,000 0 3,000 128,000B0404 Central City Beach Toilets/Changerooms 30,000 15,900 23,000 0 100 69,000B0408 South City Beach Toilets/Changerooms 15,000 11,100 2,000 0 400 28,500B0409 Floreat Beach Toilets/Changerooms 22,000 15,400 7,500 0 1,100 46,000B0435 Alderbury Sportsground Toilet & Changeroom 10,000 10,000 11,000 0 2,500 33,500B0436 City Beach Oval Toilet & Changeroom 6,000 8,000 1,000 0 0 15,000B0437 Floreat Oval Toilet & Changeroom 4,000 4,000 2,500 0 0 10,500B0438 Grantham Park Toilet & Changeroom 5,000 6,000 1,200 0 300 12,500B0439 Henderson Park Toilet & Changeroom 6,000 7,100 3,500 0 900 17,500B0440 McLean Park Toilet & Changeroom 5,000 5,800 1,500 0 1,200 13,500B0441 Pat Goodridge Park Toilet & Changeroom 7,000 7,500 1,500 0 1,000 17,000B0444 Dodd St Toilets 5,000 7,700 1,500 0 300 14,500B0450 Perry Lakes Reserve Toilets 5,000 8,000 2,000 0 0 15,000B0451 Lake Monger Drive Toilets & Gregory St Depot 10,000 8,300 3,500 0 700 22,500B0452 Cowden Park Toilets 5,000 7,800 1,200 0 0 14,000
155,000 187,600 102,900 0 11,500 457,000
Town CommercialB0426 Wembley Golf Course - Tavern 0 25,000 0 0 0 25,000B0595 South City Beach Kiosk - Bldg Mtce 3,500 0 500 0 500 4,500B0596 Floreat Beach Kiosk - Bldg Mtce 10,000 0 1,000 0 1,000 12,000
13,500 25,000 1,500 0 1,500 41,500
Town OperationalB0420 Depot - Building 22,000 20,000 25,000 17,700 3,300 88,000B0421 Administration Centre - Building 120,000 89,000 100,000 13,600 19,400 342,000B0551 City Beach Oval Gardeners Shed 900 0 0 0 100 1,000B0552 Floreat Oval Gardeners shed 1,000 0 0 0 0 1,000B0601 Beecroft Park Gardeners shed 2,000 0 0 0 0 2,000
145,900 109,000 125,000 31,300 22,800 434,000
Town Recreational and Cultural FacilitiesB0400 Bold Park Aquatic Centre - Building 4,000 3,000 182,000 1,000 15,000 205,000B0410 Wembley Community Centre - Building 51,500 48,000 29,000 500 6,000 135,000B0411 Leederville Town Hall - Building 8,800 6,000 5,200 20,000B0413 Quarry Amphitheatre - Building 32,000 13,000 2,100 1,900 49,000B0415 The Boulevard Centre - Building 31,000 34,500 48,000 5,000 8,500 127,000B0416 Youth Centre - Building 6,000 9,000 3,500 900 600 20,000B0427 Wembley Golf Course - Professional Shop 15,000 18,000 2,000 10,000 5,000 50,000B0428 Wembley Golf Course - Depot/Office 2,100 4,300 1,000 2,600 10,000B0429 Wembley Golf Course - Driving Range 17,000 24,000 1,000 1,000 13,000 56,000B0510 Cambridge Library - Building 50,000 29,000 55,000 5,000 14,000 153,000B0810 City Beach Lookout Tower 5,000 0 0 0 5,000
222,400 169,800 339,500 26,500 71,800 830,000
720,800 493,400 580,800 57,800 168,700 2,021,500
______________________________________________________________________________Page 6.12
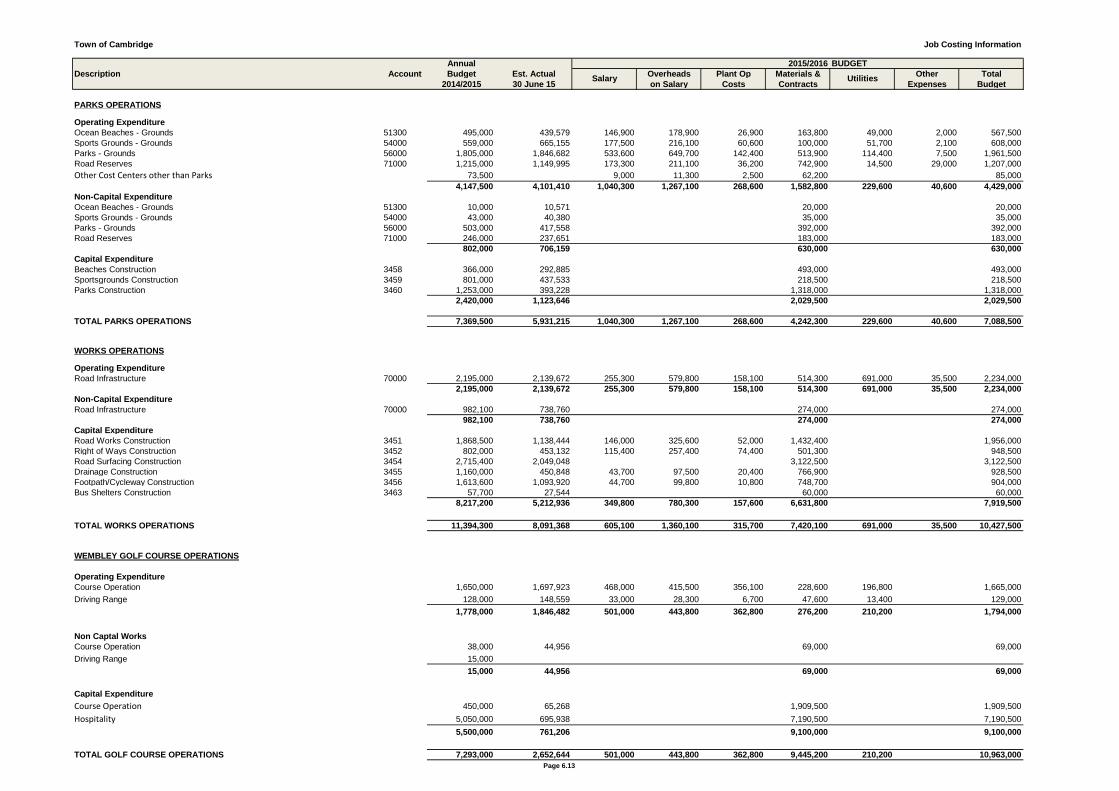
Town of Cambridge Job Costing Information
Annual 2015/2016 BUDGET
Description Account Budget Est. Actual Overheads Plant Op Materials & Other Total
2014/2015 30 June 15 on Salary Costs Contracts Expenses Budget
PARKS OPERATIONS
Operating Expenditure
Ocean Beaches - Grounds 51300 495,000 439,579 146,900 178,900 26,900 163,800 49,000 2,000 567,500
Sports Grounds - Grounds 54000 559,000 665,155 177,500 216,100 60,600 100,000 51,700 2,100 608,000
Parks - Grounds 56000 1,805,000 1,846,682 533,600 649,700 142,400 513,900 114,400 7,500 1,961,500
Road Reserves 71000 1,215,000 1,149,995 173,300 211,100 36,200 742,900 14,500 29,000 1,207,000
Other Cost Centers other than Parks 73,500 9,000 11,300 2,500 62,200 85,000
4,147,500 4,101,410 1,040,300 1,267,100 268,600 1,582,800 229,600 40,600 4,429,000
Non-Capital Expenditure
Ocean Beaches - Grounds 51300 10,000 10,571 20,000 20,000
Sports Grounds - Grounds 54000 43,000 40,380 35,000 35,000
Parks - Grounds 56000 503,000 417,558 392,000 392,000
Road Reserves 71000 246,000 237,651 183,000 183,000
802,000 706,159 0 0 0 630,000 0 0 630,000
Capital Expenditure
Beaches Construction 3458 366,000 292,885 493,000 493,000
Sportsgrounds Construction 3459 801,000 437,533 218,500 218,500
Parks Construction 3460 1,253,000 393,228 1,318,000 1,318,000
2,420,000 1,123,646 0 0 0 2,029,500 0 0 2,029,500
TOTAL PARKS OPERATIONS 7,369,500 5,931,215 1,040,300 1,267,100 268,600 4,242,300 229,600 40,600 7,088,500
WORKS OPERATIONS
Operating Expenditure
Road Infrastructure 70000 2,195,000 2,139,672 255,300 579,800 158,100 514,300 691,000 35,500 2,234,000
2,195,000 2,139,672 255,300 579,800 158,100 514,300 691,000 35,500 2,234,000
Non-Capital Expenditure
Road Infrastructure 70000 982,100 738,760 274,000 274,000
982,100 738,760 0 0 0 274,000 0 0 274,000
Capital Expenditure
Road Works Construction 3451 1,868,500 1,138,444 146,000 325,600 52,000 1,432,400 1,956,000
Right of Ways Construction 3452 802,000 453,132 115,400 257,400 74,400 501,300 948,500
Road Surfacing Construction 3454 2,715,400 2,049,048 0 0 0 3,122,500 3,122,500
Drainage Construction 3455 1,160,000 450,848 43,700 97,500 20,400 766,900 928,500
Footpath/Cycleway Construction 3456 1,613,600 1,093,920 44,700 99,800 10,800 748,700 904,000
Bus Shelters Construction 3463 57,700 27,544 0 0 0 60,000 60,000
8,217,200 5,212,936 349,800 780,300 157,600 6,631,800 0 0 7,919,500
TOTAL WORKS OPERATIONS 11,394,300 8,091,368 605,100 1,360,100 315,700 7,420,100 691,000 35,500 10,427,500
WEMBLEY GOLF COURSE OPERATIONS
Operating Expenditure
Course Operation 1,650,000 1,697,923 468,000 415,500 356,100 228,600 196,800 1,665,000
Driving Range 128,000 148,559 33,000 28,300 6,700 47,600 13,400 129,000
1,778,000 1,846,482 501,000 443,800 362,800 276,200 210,200 0 1,794,000
Non Captal Works
Course Operation 38,000 44,956 69,000 69,000
Driving Range 15,000 0 0
15,000 44,956 0 0 0 69,000 0 0 69,000
Capital Expenditure
Course Operation 450,000 65,268 1,909,500 1,909,500
Hospitality 5,050,000 695,938 7,190,500 7,190,500
5,500,000 761,206 0 0 0 9,100,000 0 0 9,100,000
TOTAL GOLF COURSE OPERATIONS 7,293,000 2,652,644 501,000 443,800 362,800 9,445,200 210,200 0 10,963,000
Salary Utilities
Page 6.13
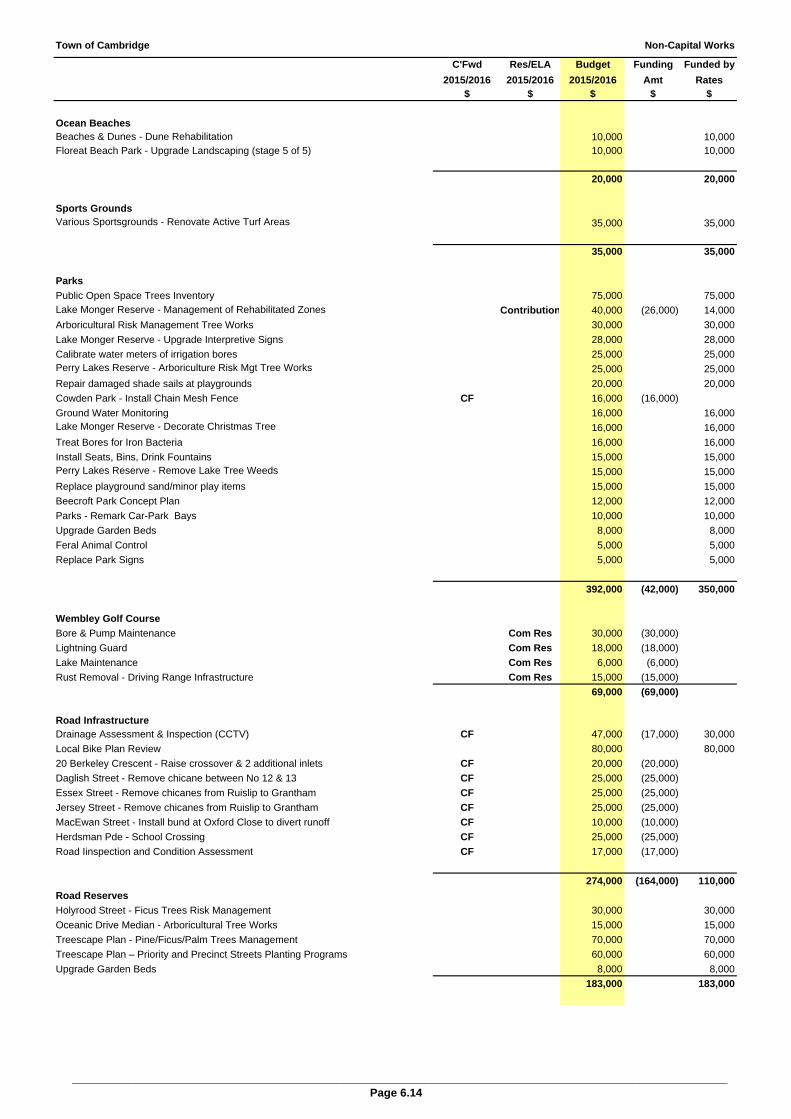
Town of Cambridge Non-Capital Works
C'Fwd Res/ELA Budget Funding Funded by
2015/2016 2015/2016 2015/2016 Amt Rates$ $ $ $ $
Ocean BeachesBeaches & Dunes - Dune Rehabilitation 10,000 10,000Floreat Beach Park - Upgrade Landscaping (stage 5 of 5) 10,000 10,000
0 20,000 0 20,000
Sports GroundsVarious Sportsgrounds - Renovate Active Turf Areas 35,000 35,000
00 35,000 0 35,000
Parks
Public Open Space Trees Inventory 75,000 75,000
Lake Monger Reserve - Management of Rehabilitated Zones Contribution 40,000 (26,000) 14,000
Arboricultural Risk Management Tree Works 30,000 30,000
Lake Monger Reserve - Upgrade Interpretive Signs 28,000 28,000
Calibrate water meters of irrigation bores 25,000 25,000Perry Lakes Reserve - Arboriculture Risk Mgt Tree Works 25,000 25,000
Repair damaged shade sails at playgrounds 20,000 20,000
Cowden Park - Install Chain Mesh Fence CF 16,000 (16,000) 0
Ground Water Monitoring 16,000 16,000Lake Monger Reserve - Decorate Christmas Tree 16,000 16,000
Treat Bores for Iron Bacteria 16,000 16,000
Install Seats, Bins, Drink Fountains 15,000 15,000Perry Lakes Reserve - Remove Lake Tree Weeds 15,000 15,000
Replace playground sand/minor play items 15,000 15,000
Beecroft Park Concept Plan 12,000 12,000
Parks - Remark Car-Park Bays 10,000 10,000
Upgrade Garden Beds 8,000 8,000
Feral Animal Control 5,000 5,000
Replace Park Signs 5,000 5,000
0 392,000 (42,000) 350,000
Wembley Golf Course
Bore & Pump Maintenance Com Res 30,000 (30,000) 0
Lightning Guard Com Res 18,000 (18,000) 0
Lake Maintenance Com Res 6,000 (6,000) 0
Rust Removal - Driving Range Infrastructure Com Res 15,000 (15,000)
0 69,000 (69,000) 0
Road InfrastructureDrainage Assessment & Inspection (CCTV) CF 47,000 (17,000) 30,000
Local Bike Plan Review 80,000 80,000
20 Berkeley Crescent - Raise crossover & 2 additional inlets CF 20,000 (20,000)
Daglish Street - Remove chicane between No 12 & 13 CF 25,000 (25,000)
Essex Street - Remove chicanes from Ruislip to Grantham CF 25,000 (25,000)
Jersey Street - Remove chicanes from Ruislip to Grantham CF 25,000 (25,000)
MacEwan Street - Install bund at Oxford Close to divert runoff CF 10,000 (10,000)
Herdsman Pde - School Crossing CF 25,000 (25,000)
Road Iinspection and Condition Assessment CF 17,000 (17,000)
0 274,000 (164,000) 110,000
Road Reserves
Holyrood Street - Ficus Trees Risk Management 30,000 30,000
Oceanic Drive Median - Arboricultural Tree Works 15,000 15,000
Treescape Plan - Pine/Ficus/Palm Trees Management 70,000 70,000
Treescape Plan – Priority and Precinct Streets Planting Programs 60,000 60,000
Upgrade Garden Beds 8,000 8,000
0 183,000 0 183,000
________________________________________________________________________________________________________Page 6.14
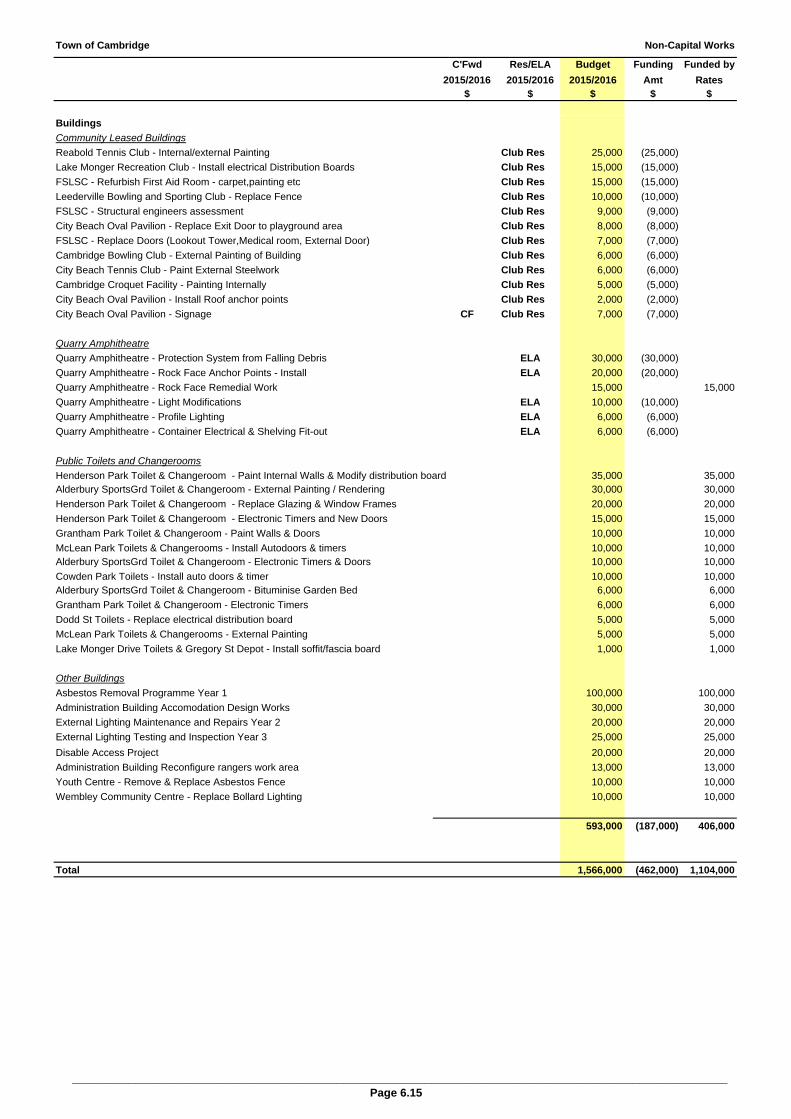
Town of Cambridge Non-Capital Works
C'Fwd Res/ELA Budget Funding Funded by
2015/2016 2015/2016 2015/2016 Amt Rates$ $ $ $ $
Buildings
Community Leased Buildings
Reabold Tennis Club - Internal/external Painting Club Res 25,000 (25,000) 0
Lake Monger Recreation Club - Install electrical Distribution Boards Club Res 15,000 (15,000) 0
FSLSC - Refurbish First Aid Room - carpet,painting etc Club Res 15,000 (15,000) 0
Leederville Bowling and Sporting Club - Replace Fence Club Res 10,000 (10,000) 0
FSLSC - Structural engineers assessment Club Res 9,000 (9,000) 0
City Beach Oval Pavilion - Replace Exit Door to playground area Club Res 8,000 (8,000) 0
FSLSC - Replace Doors (Lookout Tower,Medical room, External Door) Club Res 7,000 (7,000) 0
Cambridge Bowling Club - External Painting of Building Club Res 6,000 (6,000) 0
City Beach Tennis Club - Paint External Steelwork Club Res 6,000 (6,000) 0
Cambridge Croquet Facility - Painting Internally Club Res 5,000 (5,000) 0
City Beach Oval Pavilion - Install Roof anchor points Club Res 2,000 (2,000) 0
City Beach Oval Pavilion - Signage CF Club Res 7,000 (7,000)
Quarry Amphitheatre
Quarry Amphitheatre - Protection System from Falling Debris ELA 30,000 (30,000)
Quarry Amphitheatre - Rock Face Anchor Points - Install ELA 20,000 (20,000)
Quarry Amphitheatre - Rock Face Remedial Work 15,000 15,000
Quarry Amphitheatre - Light Modifications ELA 10,000 (10,000)
Quarry Amphitheatre - Profile Lighting ELA 6,000 (6,000)
Quarry Amphitheatre - Container Electrical & Shelving Fit-out ELA 6,000 (6,000)
Public Toilets and Changerooms
Henderson Park Toilet & Changeroom - Paint Internal Walls & Modify distribution board 35,000 35,000Alderbury SportsGrd Toilet & Changeroom - External Painting / Rendering 30,000 30,000
Henderson Park Toilet & Changeroom - Replace Glazing & Window Frames 20,000 20,000
Henderson Park Toilet & Changeroom - Electronic Timers and New Doors 15,000 15,000
Grantham Park Toilet & Changeroom - Paint Walls & Doors 10,000 10,000
McLean Park Toilets & Changerooms - Install Autodoors & timers 10,000 10,000Alderbury SportsGrd Toilet & Changeroom - Electronic Timers & Doors 10,000 10,000
Cowden Park Toilets - Install auto doors & timer 10,000 10,000Alderbury SportsGrd Toilet & Changeroom - Bituminise Garden Bed 6,000 6,000
Grantham Park Toilet & Changeroom - Electronic Timers 6,000 6,000
Dodd St Toilets - Replace electrical distribution board 5,000 5,000
McLean Park Toilets & Changerooms - External Painting 5,000 5,000
Lake Monger Drive Toilets & Gregory St Depot - Install soffit/fascia board 1,000 1,000
0
Other Buildings
Asbestos Removal Programme Year 1 100,000 100,000
Administration Building Accomodation Design Works 30,000 30,000
External Lighting Maintenance and Repairs Year 2 20,000 20,000
External Lighting Testing and Inspection Year 3 25,000 25,000
Disable Access Project 20,000 20,000
Administration Building Reconfigure rangers work area 13,000 13,000
Youth Centre - Remove & Replace Asbestos Fence 10,000 10,000
Wembley Community Centre - Replace Bollard Lighting 10,000 10,000
0 593,000 (187,000) 406,000
Total 0 1,566,000 (462,000) 1,104,000
________________________________________________________________________________________________________Page 6.15
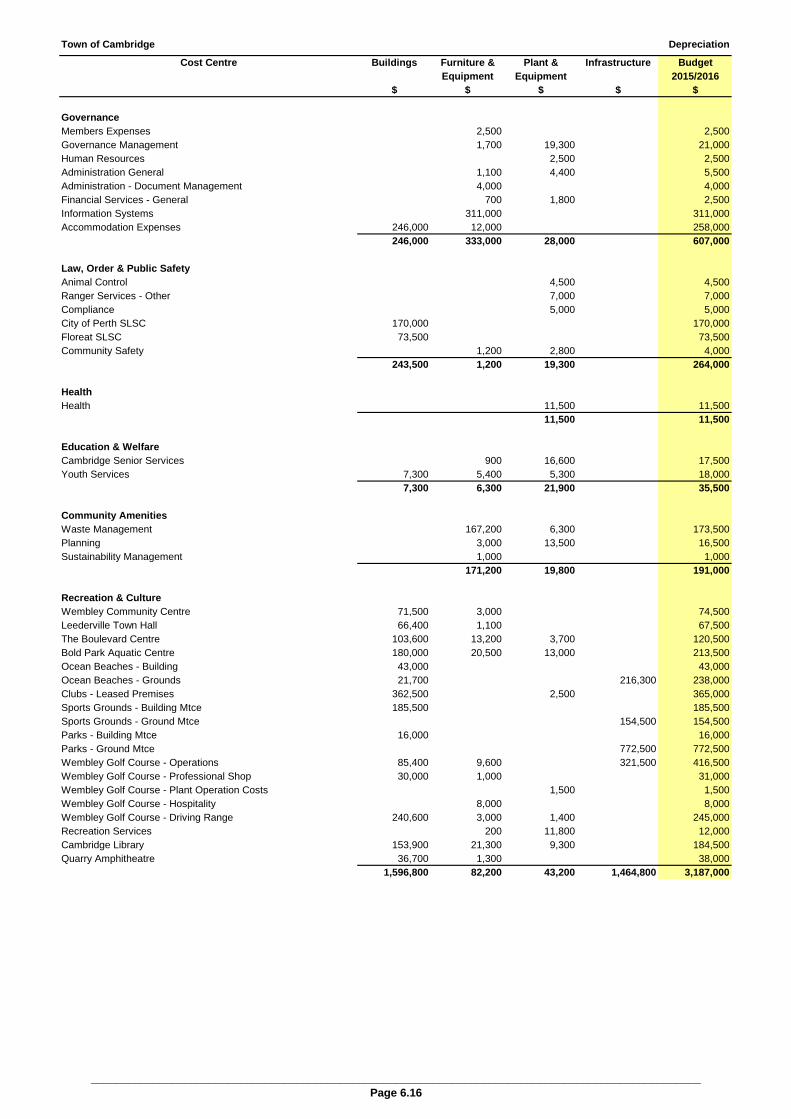
Town of Cambridge Depreciation
Cost Centre Buildings Furniture & Plant & Infrastructure BudgetEquipment Equipment 2015/2016
$ $ $ $ $
GovernanceMembers Expenses 0 2,500 0 0 2,500Governance Management 0 1,700 19,300 0 21,000Human Resources 0 2,500 0 2,500Administration General 0 1,100 4,400 0 5,500Administration - Document Management 0 4,000 0 0 4,000Financial Services - General 0 700 1,800 0 2,500Information Systems 0 311,000 0 0 311,000Accommodation Expenses 246,000 12,000 0 0 258,000
246,000 333,000 28,000 0 607,000
Law, Order & Public SafetyAnimal Control 0 0 4,500 0 4,500Ranger Services - Other 0 0 7,000 0 7,000Compliance 0 0 5,000 0 5,000City of Perth SLSC 170,000 0 0 0 170,000Floreat SLSC 73,500 0 0 0 73,500Community Safety 0 1,200 2,800 0 4,000
243,500 1,200 19,300 0 264,000
HealthHealth 0 0 11,500 0 11,500
0 0 11,500 0 11,500
Education & WelfareCambridge Senior Services 0 900 16,600 0 17,500Youth Services 7,300 5,400 5,300 0 18,000
7,300 6,300 21,900 0 35,500
Community AmenitiesWaste Management 0 167,200 6,300 0 173,500Planning 0 3,000 13,500 0 16,500Sustainability Management 0 1,000 0 0 1,000
0 171,200 19,800 0 191,000
Recreation & CultureWembley Community Centre 71,500 3,000 0 0 74,500Leederville Town Hall 66,400 1,100 0 0 67,500The Boulevard Centre 103,600 13,200 3,700 0 120,500Bold Park Aquatic Centre 180,000 20,500 13,000 0 213,500Ocean Beaches - Building 43,000 0 0 0 43,000Ocean Beaches - Grounds 21,700 0 0 216,300 238,000Clubs - Leased Premises 362,500 0 2,500 0 365,000Sports Grounds - Building Mtce 185,500 0 0 0 185,500Sports Grounds - Ground Mtce 0 0 0 154,500 154,500Parks - Building Mtce 16,000 0 0 0 16,000Parks - Ground Mtce 0 0 772,500 772,500Wembley Golf Course - Operations 85,400 9,600 321,500 416,500Wembley Golf Course - Professional Shop 30,000 1,000 0 0 31,000Wembley Golf Course - Plant Operation Costs 0 0 1,500 0 1,500Wembley Golf Course - Hospitality 0 8,000 0 0 8,000Wembley Golf Course - Driving Range 240,600 3,000 1,400 0 245,000Recreation Services 0 200 11,800 0 12,000Cambridge Library 153,900 21,300 9,300 0 184,500Quarry Amphitheatre 36,700 1,300 0 38,000
1,596,800 82,200 43,200 1,464,800 3,187,000
__________________________________________________________________________________________________Page 6.16
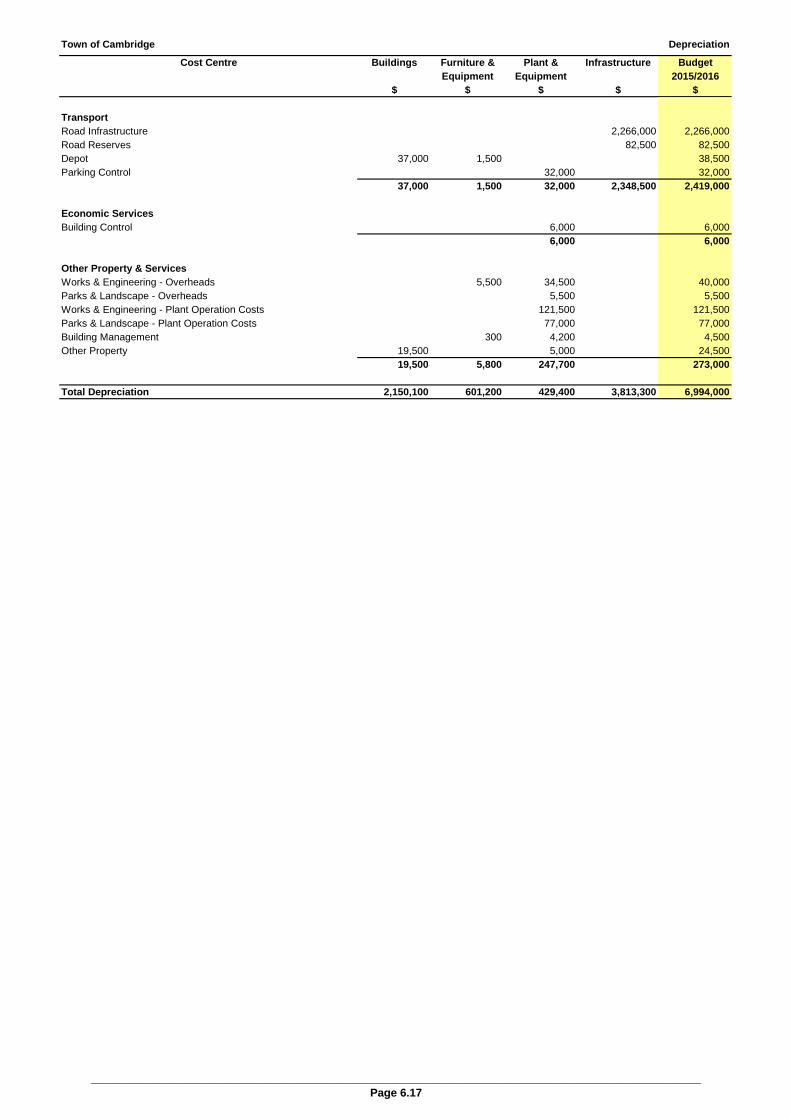
Town of Cambridge Depreciation
Cost Centre Buildings Furniture & Plant & Infrastructure BudgetEquipment Equipment 2015/2016
$ $ $ $ $
TransportRoad Infrastructure 0 0 0 2,266,000 2,266,000Road Reserves 0 0 0 82,500 82,500Depot 37,000 1,500 0 0 38,500Parking Control 0 0 32,000 0 32,000
37,000 1,500 32,000 2,348,500 2,419,000
Economic ServicesBuilding Control 0 6,000 0 6,000
0 0 6,000 0 6,000
Other Property & ServicesWorks & Engineering - Overheads 0 5,500 34,500 0 40,000Parks & Landscape - Overheads 0 0 5,500 0 5,500Works & Engineering - Plant Operation Costs 0 0 121,500 0 121,500Parks & Landscape - Plant Operation Costs 0 0 77,000 0 77,000Building Management 0 300 4,200 0 4,500Other Property 19,500 0 5,000 0 24,500
19,500 5,800 247,700 0 273,000
Total Depreciation 2,150,100 601,200 429,400 3,813,300 6,994,000
__________________________________________________________________________________________________Page 6.17

Town of Cambridge Activity Based Costing
Cost Centre Governance Human Admin Admin Admin Fin Serv Fin Serv Fin Serv Information Accom Depot TotalMangmnt Resources General Cust Admin Records General Purch/Acct Payroll Systems Expenses
$ $ $ $ $ $ $ $ $ $ $ $
General Purpose FundingFinancial Services - Rates 5,657 9,341 2,777 103,475 5,952 7,219 1,270 2,804 37,234 16,478 0 192,000
5,657 9,341 2,777 103,475 5,952 7,219 1,270 2,804 37,234 16,478 0 192,000
GovernanceMembers Expenses 8,844 0 4,342 6,271 5,612 11,287 4,691 542 19,013 243,975 0 304,500Governance Management 5,025 9,063 5,752 13,302 57,292 14,520 4,362 2,575 61,715 60,801 0 234,500Human Resources 2,543 7,305 2,910 12,336 4,915 7,346 2,374 2,010 24,244 12,611 0 78,500Admin - General 775 1,648 887 4,029 4,033 2,240 2,464 448 3,583 3,948 0 24,000Admin - Customer Services 1,904 11,480 2,179 61,189 780 5,501 3,647 3,322 38,619 23,256 0 152,000Admin - Records 1,190 6,042 1,362 195 4,375 3,438 0 1,644 17,985 42,237 2,508 81,000Financial Services - General 1,696 7,965 1,942 2,551 8,385 4,901 4,452 2,144 27,959 12,547 0 74,500Financial Services - Purch/Accts 1,206 7,003 1,380 2,623 4,441 3,483 1,002 2,026 30,349 15,057 0 68,500Financial Services - Payroll 669 3,872 766 820 512 1,932 0 1,244 22,393 6,820 0 39,000Information Systems 3,457 11,398 3,957 2,003 2,403 9,988 3,639 3,162 84,715 22,291 0 147,000Accommodation Expenses 1,987 0 2,274 0 160 5,740 2,735 0 0 1,724 0 14,500
29,295 65,776 27,751 105,321 92,909 70,377 29,366 19,119 330,575 445,267 2,508 1,218,000
Law, Order & Public SafetyAnimal Control 1,619 3,158 795 20,841 4,567 2,067 5,080 861 4,672 2,356 0 46,000Ranger Services - Other 1,568 2,856 770 18,076 4,253 2,001 3,043 802 4,672 2,356 0 40,500Beach Inspections 3,560 0 1,748 340 0 4,543 0 0 0 0 0 10,000Compliance 5,771 8,400 2,833 340 0 7,365 0 1,630 0 0 0 26,500City of Perth SLSC 1,090 0 535 0 0 1,391 5,217 0 0 0 0 8,000Floreat SLSC 343 0 168 0 0 438 0 0 0 0 0 1,000Community Safety 2,593 2,554 1,273 2,860 813 3,310 1,396 867 9,252 5,461 0 30,500
16,544 16,968 8,123 42,458 9,634 21,115 14,735 4,161 18,595 10,173 0 162,500
HealthHealth 5,467 11,021 2,684 17,714 18,290 6,977 3,547 3,199 28,533 20,020 0 117,500Wembley Infant Health Centre 66 0 33 0 0 85 1,018 0 0 0 0 1,000
5,533 11,021 2,717 17,714 18,290 7,062 4,565 3,199 28,533 20,020 0 118,500
Page 6.18

Town of Cambridge Activity Based Costing
Cost Centre Governance Human Admin Admin Admin Fin Serv Fin Serv Fin Serv Information Accom Depot TotalMangmnt Resources General Cust Admin Records General Purch/Acct Payroll Systems Expenses
$ $ $ $ $ $ $ $ $ $ $ $
Education & WelfareCambridge Senior Services - HACC 13,941 33,096 6,845 935 3,233 17,793 4,691 9,550 25,924 901 0 117,000Welfare Services 2,079 3,293 1,021 11,039 1,850 2,653 3,673 856 3,994 3,209 0 33,500Youth Services 4,172 7,224 2,048 536 4,047 5,325 3,673 2,378 25,604 901 0 56,000
20,192 43,613 9,914 12,510 9,130 25,771 12,036 12,784 55,522 5,011 0 206,500
Community AmenitiesWaste Management 39,526 4,200 19,406 44,060 10,047 50,447 11,006 1,202 7,333 4,632 0 192,000Planning 10,706 20,429 5,257 78,358 52,079 13,665 4,428 5,954 49,516 33,312 0 273,500Environmental Management 0 3,360 0 0 0 0 0 962 12,274 2,275 0 19,000
50,232 27,989 24,663 122,418 62,126 64,111 15,434 8,119 69,122 40,219 0 484,500
Recreation & CultureWembley Community Centre 3,027 3,360 1,486 883 1,696 3,863 6,087 977 7,023 299 0 28,500Leederville Town Hall 653 840 321 0 291 833 1,144 210 963 0 0 5,500The Boulevard Centre 4,718 4,402 2,316 0 1,149 6,021 0 1,071 4,464 479 0 24,500Bold Park Aquatic Centre 19,116 33,533 9,386 353 3,262 24,398 7,849 17,401 50,151 901 0 166,500Ocean Beaches - Buildings 2,064 0 1,013 0 0 2,634 4,199 0 0 0 0 10,000Ocean Beaches - Grounds 6,935 0 3,405 0 0 8,851 7,723 0 0 0 0 27,000Clubs - Leased Premises 730 0 359 0 0 932 3,055 0 0 0 0 5,000Sports Grounds - Buildings 1,675 0 822 0 0 2,137 4,199 0 0 0 0 9,000Sports Grounds - Grounds 9,812 0 4,817 0 0 12,523 10,743 0 0 0 0 38,000Parks - Buildings 633 0 311 0 0 807 0 0 0 0 0 2,000Parks - Grounds 24,605 0 12,081 0 0 31,404 24,851 0 0 0 0 93,000Wembley Golf - Operations 39,909 4,032 19,595 0 1,090 50,937 12,013 1,092 14,317 2,370 0 145,500Wembley Golf - On Costs 2,995 40,321 1,471 0 0 3,823 0 20,221 0 0 0 69,000Wembley Golf - Overheads 5,109 3,360 2,508 0 2,252 6,520 1,899 1,923 15,341 1,256 0 40,000Wembley Golf - Plt Op Costs 2,433 0 1,194 0 0 3,105 5,172 0 0 0 0 12,000Recreation Services 8,373 8,434 4,111 19,448 11,406 10,687 6,842 2,473 20,080 26,419 0 118,500Cambridge Library 22,222 46,066 10,911 775 5,592 28,362 10,000 17,989 309,591 2,456 0 454,000Quarry Amphitheatre 4,283 504 2,103 583 2,034 5,466 9,118 129 512 602 0 25,500
159,291 144,851 78,208 22,041 28,772 203,303 114,892 63,486 422,443 34,782 0 1,273,500
Page 6.19
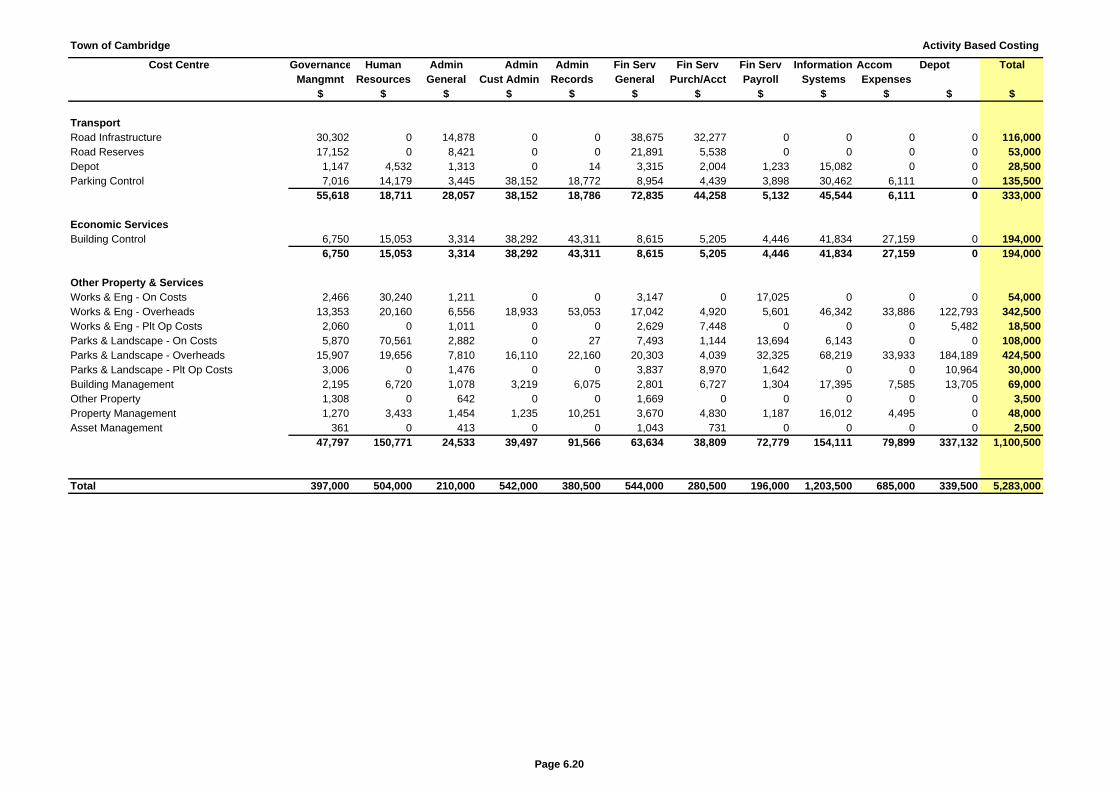
Town of Cambridge Activity Based Costing
Cost Centre Governance Human Admin Admin Admin Fin Serv Fin Serv Fin Serv Information Accom Depot TotalMangmnt Resources General Cust Admin Records General Purch/Acct Payroll Systems Expenses
$ $ $ $ $ $ $ $ $ $ $ $
TransportRoad Infrastructure 30,302 0 14,878 0 0 38,675 32,277 0 0 0 0 116,000Road Reserves 17,152 0 8,421 0 0 21,891 5,538 0 0 0 0 53,000Depot 1,147 4,532 1,313 0 14 3,315 2,004 1,233 15,082 0 0 28,500Parking Control 7,016 14,179 3,445 38,152 18,772 8,954 4,439 3,898 30,462 6,111 0 135,500
55,618 18,711 28,057 38,152 18,786 72,835 44,258 5,132 45,544 6,111 0 333,000
Economic ServicesBuilding Control 6,750 15,053 3,314 38,292 43,311 8,615 5,205 4,446 41,834 27,159 0 194,000
6,750 15,053 3,314 38,292 43,311 8,615 5,205 4,446 41,834 27,159 0 194,000
Other Property & ServicesWorks & Eng - On Costs 2,466 30,240 1,211 0 0 3,147 0 17,025 0 0 0 54,000Works & Eng - Overheads 13,353 20,160 6,556 18,933 53,053 17,042 4,920 5,601 46,342 33,886 122,793 342,500Works & Eng - Plt Op Costs 2,060 0 1,011 0 0 2,629 7,448 0 0 0 5,482 18,500Parks & Landscape - On Costs 5,870 70,561 2,882 0 27 7,493 1,144 13,694 6,143 0 0 108,000Parks & Landscape - Overheads 15,907 19,656 7,810 16,110 22,160 20,303 4,039 32,325 68,219 33,933 184,189 424,500Parks & Landscape - Plt Op Costs 3,006 0 1,476 0 0 3,837 8,970 1,642 0 0 10,964 30,000Building Management 2,195 6,720 1,078 3,219 6,075 2,801 6,727 1,304 17,395 7,585 13,705 69,000Other Property 1,308 0 642 0 0 1,669 0 0 0 0 0 3,500Property Management 1,270 3,433 1,454 1,235 10,251 3,670 4,830 1,187 16,012 4,495 0 48,000Asset Management 361 0 413 0 0 1,043 731 0 0 0 0 2,500
47,797 150,771 24,533 39,497 91,566 63,634 38,809 72,779 154,111 79,899 337,132 1,100,500
Total 397,000 504,000 210,000 542,000 380,500 544,000 280,500 196,000 1,203,500 685,000 339,500 5,283,000
Page 6.20

Property Budget for 2015/2016Leased Properties: Clubs & Asscoiations Reserve Funds
Description CodeCambridge
Bowling Club Cambridge
Croquet Club
Cambridge Scout and Girl Guides
HallCity Beach
Civic CentreCity Beach
Oval Pavilion
City Beach Surf Riders
AssociationCity Beach Tennis Club
City of Perth Surf Life
Saving Club
Floreat Surf Life Saving
Club Floreat
Tennis Club Henderson Park Hall
Pat Goodridge
Pavilion
Lake Monger Recreation
Club
Leederville Bowling and
Sporting Club
Matthews Netball Facility
Reabold Tennis Club
Sydney Cheek
Pavilion
YMCA Hockey Pavilion Total
Total Sports Clubs
Total Surf Clubs
RESERVE FUNDS
CLUBS & ASSOCIATIONS BUILDING FUND
Opening Balance 80,500 16,800 6,700 50,700 ‐147,000 ‐300 21,400 ‐26,000 30,900 24,100 9,500 13,900 ‐7,600 ‐7,600 ‐3,800 21,400 27,300 21,600 132,500 127,600 4,900
Contributions: Building Fund Club 1300 14,000 3,000 2,500 10,500 8,500 0 5,000 21,500 18,500 4,000 3,500 8,000 7,000 11,500 5,000 5,500 4,500 132,500 92,500 40,000
Contributions: Building Fund Town 1300 28,000 6,000 5,000 21,000 17,000 0 10,000 43,000 37,000 8,000 0 7,000 16,000 14,000 23,000 10,000 11,000 9,000 265,000 185,000 80,000
Total Contributions 42,000 9,000 7,500 31,500 25,500 0 15,000 64,500 55,500 12,000 0 10,500 24,000 21,000 34,500 15,000 16,500 13,500 397,500 277,500 120,000
Withdrawals: Maintenance ‐18,000 ‐10,000 ‐6,000 ‐12,000 ‐21,000 ‐1,000 ‐16,000 0 ‐457,000 ‐6,000 0 ‐10,000 ‐35,000 ‐21,000 ‐15,000 ‐45,000 ‐7,000 ‐10,000 ‐690,000 ‐716,000 26,000
Closing balance 104,500 15,800 8,200 70,200 ‐142,500 ‐1,300 20,400 38,500 ‐370,600 30,100 9,500 14,400 ‐18,600 ‐7,600 15,700 ‐8,600 36,800 25,100 ‐160,000 172,100 ‐332,100
CLUBS & ASSOCIATIONS SYNTHETIC SURFACES AND LIGHTING FUND
Opening Balance 51,400 11,600 0 0 4,600 0 63,700 0 0 186,000 14,700 0 56,700 11,900 0 80,000 13,100 4,700 498,400 498,400 0
Contributions: SS&L Fund Club 5,500 1,500 0 0 1,500 0 4,000 0 0 12,500 0 4,000 1,500 19,000 8,500 1,000 500 59,500 59,500 0
Contributions: SS&L Fund Town 11,000 3,000 0 0 3,000 0 8,000 0 0 25,000 0 0 8,000 3,000 38,000 17,000 2,000 1,000 119,000 119,000 0
Total Contributions 16,500 4,500 0 0 4,500 0 12,000 0 0 37,500 0 0 12,000 4,500 57,000 25,500 3,000 1,500 178,500 178,500 0
Withdrawals: Maintenance 0
Closing balance 67,900 16,100 0 0 9,100 0 75,700 0 0 223,500 14,700 0 68,700 16,400 57,000 105,500 16,100 6,200 676,900 676,900 0
CLUBS & ASSOCIATIONS CAR PARKS & SURROUNDS FUND
Opening Balance 5,600 5,600 800 6,300 1,200 0 5,900 0 2,900 10,000 2,500 3,100 12,300 6,200 0 15,000 7,400 3,100 87,900 85,000 2,900
Contributions: CP&S Fund Club 500 500 0 500 500 0 500 1,000 500 1,000 500 1,000 500 5,500 1,500 500 500 15,000 13,500 1,500
Contributions: CP&S Fund Town 1,000 1,000 0 1,000 1,000 0 1,000 2,000 1,000 2,000 0 1,000 2,000 1,000 11,000 3,000 1,000 1,000 30,000 27,000 3,000
Total Contributions 1,500 1,500 0 1,500 1,500 0 1,500 3,000 1,500 3,000 0 1,500 3,000 1,500 16,500 4,500 1,500 1,500 45,000 40,500 4,500
Withdrawals: Maintenance
Closing balance 7,100 7,100 800 7,800 2,700 0 7,400 3,000 4,400 13,000 2,500 4,600 15,300 7,700 16,500 19,500 8,900 4,600 132,900 125,500 7,400
CLUBS & ASSOCIATIONS: TOTAL FUND CONTRIBUTIONS
Opening Balance (All Funds) 137,500 34,000 7,500 57,000 ‐141,200 ‐300 91,000 ‐26,000 33,800 220,100 26,700 17,000 61,400 10,500 ‐3,800 116,400 47,800 29,400 718,800 711,000 7,800
Contributions: All Funds Club 20,000 5,000 2,500 11,000 10,500 0 9,500 22,500 19,000 17,500 0 4,000 13,000 9,000 36,000 15,000 7,000 5,500 207,000 165,500 41,500
Contributions: All Funds Town 40,000 10,000 5,000 22,000 21,000 0 19,000 45,000 38,000 35,000 0 8,000 26,000 18,000 72,000 30,000 14,000 11,000 414,000 331,000 83,000
Total Contributions 60,000 15,000 7,500 33,000 31,500 0 28,500 67,500 57,000 52,500 0 12,000 39,000 27,000 108,000 45,000 21,000 16,500 621,000 496,500 124,500
Withdrawals: Maintenance ‐18,000 ‐10,000 ‐6,000 ‐12,000 ‐21,000 ‐1,000 ‐16,000 0 ‐457,000 ‐6,000 0 ‐10,000 ‐35,000 ‐21,000 ‐15,000 ‐45,000 ‐7,000 ‐10,000 ‐690,000 ‐233,000 ‐457,000
Closing balance 179,500 39,000 9,000 78,000 ‐130,700 ‐1,300 103,500 41,500 ‐366,200 266,600 26,700 19,000 65,400 16,500 89,200 116,400 61,800 35,900 649,800 974,500 ‐324,700
Page 6.21

FEES AND CHARGES
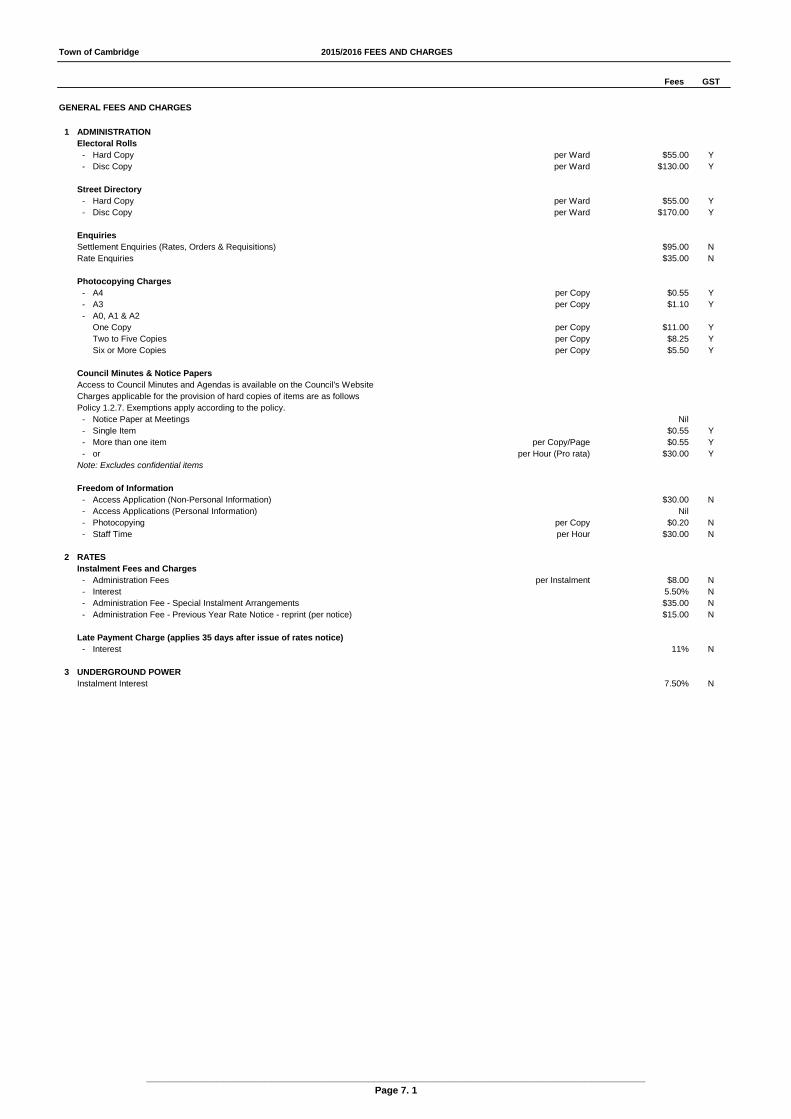
Town of Cambridge 2015/2016 FEES AND CHARGES
Fees GST
GENERAL FEES AND CHARGES
1 ADMINISTRATIONElectoral Rolls
- Hard Copy per Ward $55.00 Y- Disc Copy per Ward $130.00 Y
Street Directory- Hard Copy per Ward $55.00 Y- Disc Copy per Ward $170.00 Y
EnquiriesSettlement Enquiries (Rates, Orders & Requisitions) $95.00 NRate Enquiries $35.00 N
Photocopying Charges- A4 per Copy $0.55 Y- A3 per Copy $1.10 Y- A0, A1 & A2
One Copy per Copy $11.00 YTwo to Five Copies per Copy $8.25 YSix or More Copies per Copy $5.50 Y
Council Minutes & Notice PapersAccess to Council Minutes and Agendas is available on the Council's WebsiteCharges applicable for the provision of hard copies of items are as followsPolicy 1.2.7. Exemptions apply according to the policy.
- Notice Paper at Meetings Nil- Single Item $0.55 Y- More than one item per Copy/Page $0.55 Y- or per Hour (Pro rata) $30.00 Y
Note: Excludes confidential items
Freedom of Information- Access Application (Non-Personal Information) $30.00 N- Access Applications (Personal Information) Nil- Photocopying per Copy $0.20 N- Staff Time per Hour $30.00 N
2 RATESInstalment Fees and Charges
- Administration Fees per Instalment $8.00 N- Interest 5.50% N- Administration Fee - Special Instalment Arrangements $35.00 N- Administration Fee - Previous Year Rate Notice - reprint (per notice) $15.00 N
Late Payment Charge (applies 35 days after issue of rates notice)- Interest 11% N
3 UNDERGROUND POWERInstalment Interest 7.50% N
____________________________________________________________________________________________Page 7. 1

Town of Cambridge 2015/2016 FEES AND CHARGES
Fees GST
COMMUNITY DEVELOPMENT FEES & CHARGES
1 LIBRARYPhotocopying
- A4 Black and White per Copy $0.20 Y- A3 Black and White per Copy $0.40 Y- A4 Colour per Copy $2.00 Y- A3 Colour per Copy $3.00 Y
- Replacement Membership Card per Card $6.50 Y- Flash Drives per Drive $10.00 Y- Audio Ear Buds per Pair $4.00 Y- Library Bags per Bag $1.00 Y- Printing Charges per Page $0.20 Y- Internet Training Minimum $10.00 Y- Public Scanner (Local Studies) per Page $5.00 Y- Children's Reading Door Hangers $0.50 Y- Lost/Damage of Library Items Minimum $7.50 Y- Temporary Membership (Refundable deposit) Single $50.00 N- PC Guest Pass (free first 15mins) per Hour or part thereof $4.00 Y
Room Hire- Group Studies Room per Hour $15.00 Y- Reading Room per Hour $20.00 Y- Interview Room per Hour $10.00 Y- Reservation Cancellation Fee $2.00 N
Event Attendance- Introductory/ Special Events Nil- 1-2 Hours $15.00 Y- Over 2 Hours per Hour $10.00 Y- Non Attendance Fee $5.00 Y
Historical Photographs on Disk (Council Copyright)- 1 Image $5.00 Y- 2 or more Images per Image $2.00 Y
Administration Fee Overdue Loan Fines- Overdue per Day $0.20 N- Maximum Charge per Item $5.00 N- Debt Collection Administration Fee $10.00 N
2 YOUTH SERVICES - Entry Fee - Gigs and Music Events per Event $7.20 Y - Entry Fee* - Activities and Workshop (Dependent upon material costs) per Activity/Workshop $7.20 - $45.00 Y - Photocopying per Page $0.20 Y - Telephone per Call $0.60 Y
* Discretion of staff is required in cases of genuine hardship
3 STREET PARTY ROAD CLOSURE- Administration Fee $22.00 Y- Bond Traffic Management Signage $250.00 N- Bond Damage and Litter $150.00 N
4 FITTING AND CHECKING OF VEHICLE CHILD RESTRAINTS
Non-Residents- Checking previously installed child car seats $15.00 Y- Conversion of restraint from rear to forward facing or vice versa $20.00 Y- Fully fitting a child car seat $25.00 Y- Purchase of Extension Strap $18.00 Y
Residents- Checking previously installed child car seats Nil- Conversion of restraint from rear to forward facing or vice versa Nil- Fully fitting a child car seat Nil- Purchase of Extension Strap $18.00 Y
____________________________________________________________________________________________Page 7. 2

Town of Cambridge 2015/2016 FEES AND CHARGES
Fees GST
COMMUNITY DEVELOPMENT FEES & CHARGES Cont'd….
5 CAMBRIDGE SENIOR SERVICES (HACC)
Senior Services- Centre-Based Program - Activities per occasion $8.00 N- Centre-Based Program - Meal and Refreshments $8.50 N- All Home Based Programs - Personal Care, Shopping, Home Respite etc per Service $8.00 N- Social Support - Group per occasion $8.00 N- Allied Health - Podiatry (Centre) per Session $30.00 Y- Allied Health - Podiatry (Domiciliary) per Session $30.00 Y- Home Maintenance per Hour $8.00 Y- Outings (within parameters of the Day program) Full cost recovery Y- Visiting group per Person $6.00 Y- Extended Excursions (overnight trips, 4 nights 5 days) up to $300.00 Y- Transport up to 10 kms (one way trip) per Person $5.00 Y- Transport 11-30 kms (one way trip) per Person $8.00 Y- Transport 31-60 kms (one way trip) per Person $10.00- Transport - Centre Based Program (one way trip) per Person $2.50 Y
Fee Limit- Level One - Full Pensioner or equivalent pension eligibility income per Week $64.00 Y- Level Two - Part Pensioner or equivalent pension eligibility income per Week $154.00 Y
(Fee Limit - Applicable to clients with multipe needs (with the exception of meals, transport, podiatry, allied health and home maintenance)
Note: Funding for Respite Services is conditional upon Council not
denying access to clients on the grounds of financial hardship.
____________________________________________________________________________________________Page 7. 3
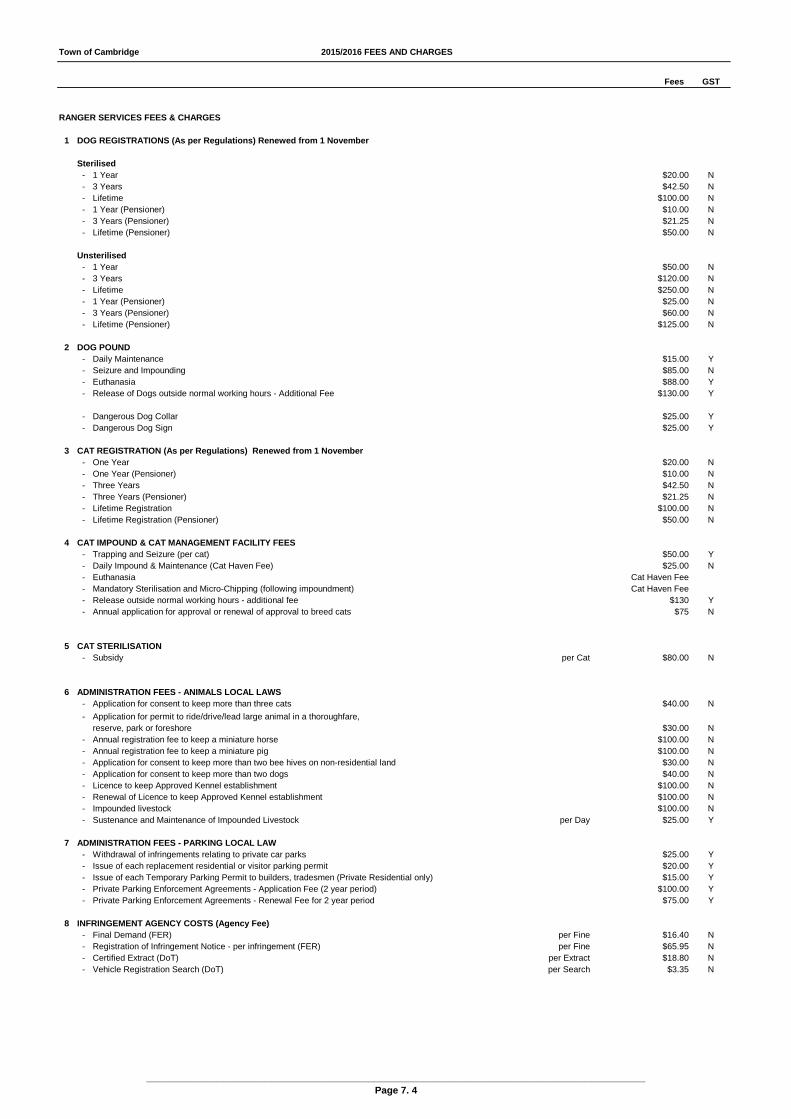
Town of Cambridge 2015/2016 FEES AND CHARGES
Fees GST
RANGER SERVICES FEES & CHARGES
1 DOG REGISTRATIONS (As per Regulations) Renewed from 1 November
Sterilised- 1 Year $20.00 N- 3 Years $42.50 N- Lifetime $100.00 N- 1 Year (Pensioner) $10.00 N- 3 Years (Pensioner) $21.25 N- Lifetime (Pensioner) $50.00 N
Unsterilised- 1 Year $50.00 N- 3 Years $120.00 N- Lifetime $250.00 N- 1 Year (Pensioner) $25.00 N- 3 Years (Pensioner) $60.00 N- Lifetime (Pensioner) $125.00 N
2 DOG POUND- Daily Maintenance $15.00 Y- Seizure and Impounding $85.00 N- Euthanasia $88.00 Y- Release of Dogs outside normal working hours - Additional Fee $130.00 Y
- Dangerous Dog Collar $25.00 Y- Dangerous Dog Sign $25.00 Y
3 CAT REGISTRATION (As per Regulations) Renewed from 1 November- One Year $20.00 N- One Year (Pensioner) $10.00 N- Three Years $42.50 N- Three Years (Pensioner) $21.25 N- Lifetime Registration $100.00 N- Lifetime Registration (Pensioner) $50.00 N
4 CAT IMPOUND & CAT MANAGEMENT FACILITY FEES- Trapping and Seizure (per cat) $50.00 Y- Daily Impound & Maintenance (Cat Haven Fee) $25.00 N- Euthanasia Cat Haven Fee- Mandatory Sterilisation and Micro-Chipping (following impoundment) Cat Haven Fee- Release outside normal working hours - additional fee $130 Y- Annual application for approval or renewal of approval to breed cats $75 N
5 CAT STERILISATION- Subsidy per Cat $80.00 N
6 ADMINISTRATION FEES - ANIMALS LOCAL LAWS- Application for consent to keep more than three cats $40.00 N
- Application for permit to ride/drive/lead large animal in a thoroughfare,reserve, park or foreshore $30.00 N
- Annual registration fee to keep a miniature horse $100.00 N- Annual registration fee to keep a miniature pig $100.00 N- Application for consent to keep more than two bee hives on non-residential land $30.00 N- Application for consent to keep more than two dogs $40.00 N- Licence to keep Approved Kennel establishment $100.00 N- Renewal of Licence to keep Approved Kennel establishment $100.00 N- Impounded livestock $100.00 N- Sustenance and Maintenance of Impounded Livestock per Day $25.00 Y
7 ADMINISTRATION FEES - PARKING LOCAL LAW- Withdrawal of infringements relating to private car parks $25.00 Y- Issue of each replacement residential or visitor parking permit $20.00 Y- Issue of each Temporary Parking Permit to builders, tradesmen (Private Residential only) $15.00 Y- Private Parking Enforcement Agreements - Application Fee (2 year period) $100.00 Y- Private Parking Enforcement Agreements - Renewal Fee for 2 year period $75.00 Y
8 INFRINGEMENT AGENCY COSTS (Agency Fee)- Final Demand (FER) per Fine $16.40 N- Registration of Infringement Notice - per infringement (FER) per Fine $65.95 N- Certified Extract (DoT) per Extract $18.80 N- Vehicle Registration Search (DoT) per Search $3.35 N
____________________________________________________________________________________________Page 7. 4
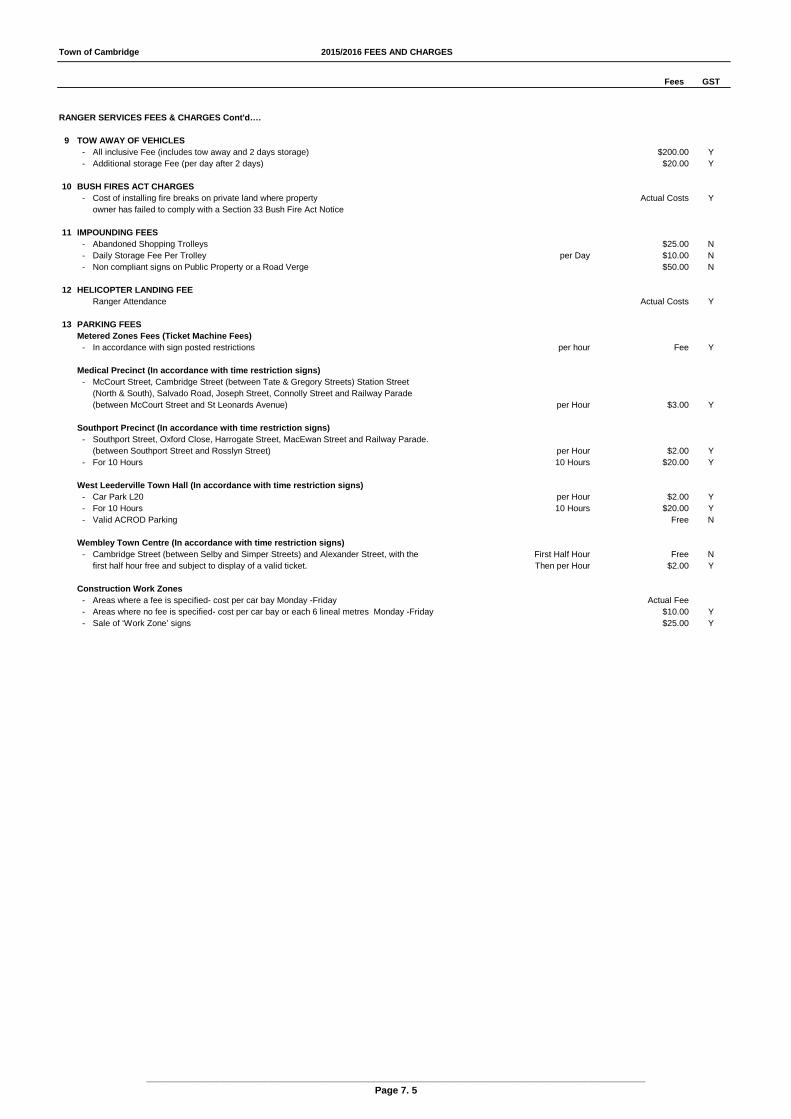
Town of Cambridge 2015/2016 FEES AND CHARGES
Fees GST
RANGER SERVICES FEES & CHARGES Cont'd….
9 TOW AWAY OF VEHICLES- All inclusive Fee (includes tow away and 2 days storage) $200.00 Y- Additional storage Fee (per day after 2 days) $20.00 Y
10 BUSH FIRES ACT CHARGES- Cost of installing fire breaks on private land where property Actual Costs Y
owner has failed to comply with a Section 33 Bush Fire Act Notice
11 IMPOUNDING FEES- Abandoned Shopping Trolleys $25.00 N- Daily Storage Fee Per Trolley per Day $10.00 N- Non compliant signs on Public Property or a Road Verge $50.00 N
12 HELICOPTER LANDING FEERanger Attendance Actual Costs Y
13 PARKING FEESMetered Zones Fees (Ticket Machine Fees)
- In accordance with sign posted restrictions per hour Fee Y
Medical Precinct (In accordance with time restriction signs)- McCourt Street, Cambridge Street (between Tate & Gregory Streets) Station Street
(North & South), Salvado Road, Joseph Street, Connolly Street and Railway Parade(between McCourt Street and St Leonards Avenue) per Hour $3.00 Y
Southport Precinct (In accordance with time restriction signs)- Southport Street, Oxford Close, Harrogate Street, MacEwan Street and Railway Parade.
(between Southport Street and Rosslyn Street) per Hour $2.00 Y- For 10 Hours 10 Hours $20.00 Y
West Leederville Town Hall (In accordance with time restriction signs)- Car Park L20 per Hour $2.00 Y- For 10 Hours 10 Hours $20.00 Y- Valid ACROD Parking Free N
Wembley Town Centre (In accordance with time restriction signs)- Cambridge Street (between Selby and Simper Streets) and Alexander Street, with the First Half Hour Free N
first half hour free and subject to display of a valid ticket. Then per Hour $2.00 Y
Construction Work Zones- Areas where a fee is specified- cost per car bay Monday -Friday Actual Fee- Areas where no fee is specified- cost per car bay or each 6 lineal metres Monday -Friday $10.00 Y- Sale of ‘Work Zone’ signs $25.00 Y
____________________________________________________________________________________________Page 7. 5

Town of Cambridge 2015/2016 FEES AND CHARGES
Fees GST
HALLS AND COMMUNITY CENTRES
THE BOULEVARD CENTRE FEES & CHARGES
1 AGENCY RATE - Not for profit community based organisations and Local Government- The Boulevard North per Hour $51.00 per Day $371.50 Y- The Boulevard South per Hour $51.00 per Day $371.50 Y- The Boulevard Hall (combined halls) per Hour $76.00 per Day $583.50 Y- Lake Monger Room per Hour $32.00 per Day $223.50 Y- Perry Lakes Room per Hour $32.00 per Day $223.50 Y- The Lakes Suite (combined meeting rooms) per Hour $45.50 per Day $327.50 Y- Oceanic Room per Hour $23.00 per Day $152.50 Y
2 GOVERNMENT RATE - All State & Federal Government Departments and Organisations- The Boulevard North per Hour $69.00 per Day $479.50 Y- The Boulevard South per Hour $69.00 per Day $479.50 Y- The Boulevard Hall (Combined Halls) per Hour $106.00 per Day $700.00 Y- Lake Monger Room per Hour $40.00 per Day $308.00 Y- Perry Lakes Room per Hour $40.00 per Day $308.00 Y- The Lakes Suite (Combined Meeting Rooms) per Hour $56.50 per Day $406.00 Y- Oceanic Room per Hour $29.00 per Day $205.00 Y
3 COMMERCIAL RATE - All commercial business and private hirers- The Boulevard North per Hour $100.00 per Day $698.00 Y- The Boulevard South per Hour $100.00 per Day $698.00 Y- The Boulevard Hall (Combined Halls) per Hour $146.00 per Day $980.00 Y- Lake Monger Room per Hour $59.50 per Day $410.00 Y- Perry Lakes Room per Hour $59.50 per Day $410.00 Y- The Lakes Suite (Combined Meeting Rooms) per Hour $87.50 per Day $573.00 Y- Oceanic Room per Hour $40.00 per Day $286.00 Y
4 EQUIPMENT HIRE- Data Projector & P.A - Large per Hour $64.00 per Session $190.00 Y- Data Projector only - Large per Hour $51.50 per Session $150.00 Y- P.A & Lecturn mic - Large per Hour $20.00 per Session $60.00 Y- Data Projector & P.A - Small per Hour $30.00 per Session $90.00 Y- Laptop per Hour $27.00 per Session $75.00 Y- Flipchart excluding Stationery per Session $17.00 Y- Radio Microphone per Session $80.00 Y- Additional Microphones per Session $24.00 Y- Ice 100Kg per Session $62.00 Y- Effects Lighting per Session $206.00 Y- Ceiling Silks per Session $345.00 Y- Table centre pieces Each $29.00 Y- High Cocktail Bars per Session $29.00 Y- High Cocktail Bar with Linen per Session $58.00 Y- Ice Buckets (set of 24) per Session $55.00 Y
5 CATERING- Tea/Coffee (one serve) per Head $2.50 Y- Tea/Coffee (2 serves) per Head $4.00 Y- Tea/Coffee (3 serves) per Head $5.50 Y- Tea/Coffee (4 serves) per Head $7.00 Y- Preferred catering suppliers Gross Sales 10% Y- Crockery (per head) per Setting $1.85 Y- Kitchen Fee (per head) per Head $1.15 Y
6 OTHER FEES- Setting Up/Cleaning per Hour/Staff $40.00 Y- Security Call Out Fees/Crowd Control/Additional Cleaning Cost Recovery Rate Y- Debt Recovery per Month $22.00 Y- Photo Copying A4 (Black & Whtie) each $0.35 Y- Photo Copying A4 (Colour) each $0.50 Y
7 CUSTOMER SERVICE ATTENDANTS- Weekdays per Hour/Staff $40.00 Y- Saturdays per Hour/Staff $48.00 Y- Sundays per Hour/Staff $53.00 Y- Public Holidays per Hour/Staff $75.00 Y
CANCELLATION FEES for Room HireCancellation is made prior to booking
- 46 days or more Room Hire Levied 0% Y- Between 31 and 45 days Room Hire Levied 25% Y- Between 15 and 30 days Room Hire Levied 50% Y- 14 days or less Room Hire Levied 100% Y
The Chief Executive Officer is authorised to waive the fees and charges should special circumstances apply inaccordance with Section 6.12 of the Local Government Act 1995.
____________________________________________________________________________________________Page 7. 6
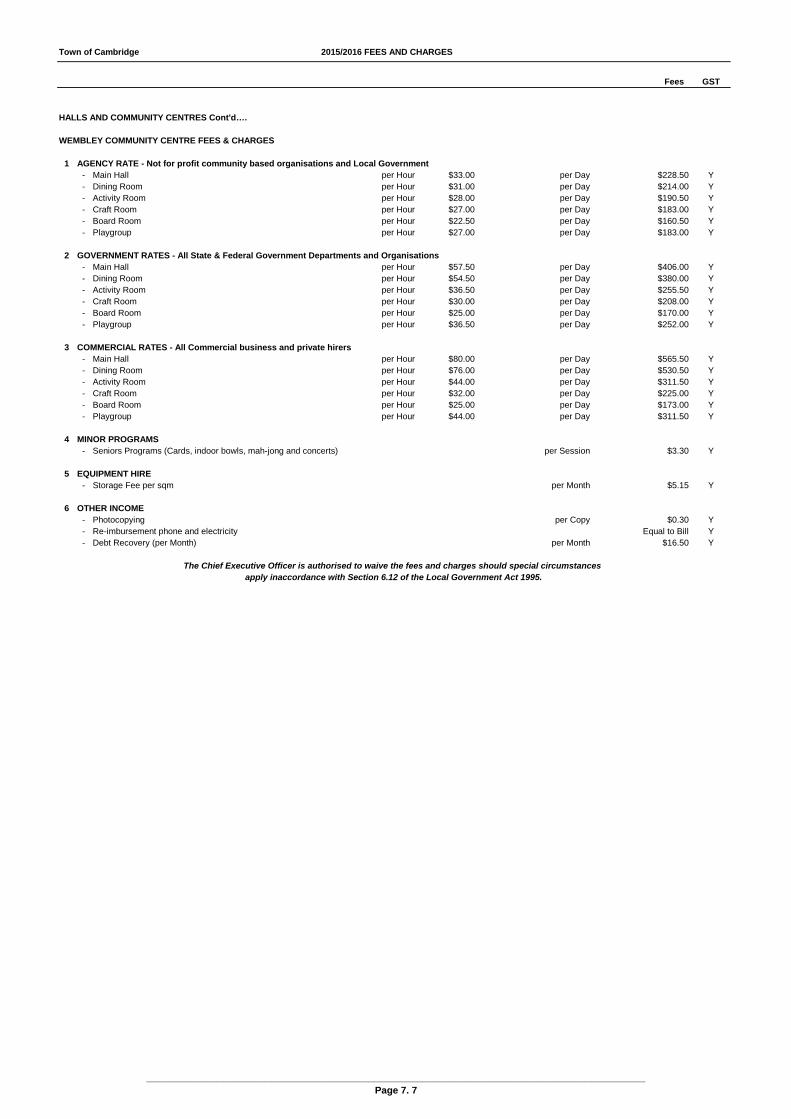
Town of Cambridge 2015/2016 FEES AND CHARGES
Fees GST
HALLS AND COMMUNITY CENTRES Cont'd….
WEMBLEY COMMUNITY CENTRE FEES & CHARGES
1 AGENCY RATE - Not for profit community based organisations and Local Government- Main Hall per Hour $33.00 per Day $228.50 Y- Dining Room per Hour $31.00 per Day $214.00 Y- Activity Room per Hour $28.00 per Day $190.50 Y- Craft Room per Hour $27.00 per Day $183.00 Y- Board Room per Hour $22.50 per Day $160.50 Y- Playgroup per Hour $27.00 per Day $183.00 Y
2 GOVERNMENT RATES - All State & Federal Government Departments and Organisations- Main Hall per Hour $57.50 per Day $406.00 Y- Dining Room per Hour $54.50 per Day $380.00 Y- Activity Room per Hour $36.50 per Day $255.50 Y- Craft Room per Hour $30.00 per Day $208.00 Y- Board Room per Hour $25.00 per Day $170.00 Y- Playgroup per Hour $36.50 per Day $252.00 Y
3 COMMERCIAL RATES - All Commercial business and private hirers- Main Hall per Hour $80.00 per Day $565.50 Y- Dining Room per Hour $76.00 per Day $530.50 Y- Activity Room per Hour $44.00 per Day $311.50 Y- Craft Room per Hour $32.00 per Day $225.00 Y- Board Room per Hour $25.00 per Day $173.00 Y- Playgroup per Hour $44.00 per Day $311.50 Y
4 MINOR PROGRAMS- Seniors Programs (Cards, indoor bowls, mah-jong and concerts) per Session $3.30 Y
5 EQUIPMENT HIRE- Storage Fee per sqm per Month $5.15 Y
6 OTHER INCOME- Photocopying per Copy $0.30 Y- Re-imbursement phone and electricity Equal to Bill Y- Debt Recovery (per Month) per Month $16.50 Y
apply inaccordance with Section 6.12 of the Local Government Act 1995.The Chief Executive Officer is authorised to waive the fees and charges should special circumstances
____________________________________________________________________________________________Page 7. 7

Town of Cambridge 2015/2016 FEES AND CHARGES
Fees GST
HALLS AND COMMUNITY CENTRES Cont'd….
LEEDERVILLE TOWN HALL
1 AGENCY RATE - Not for profit community based organisations and Local Government- Fee per Hour $39.00 per Day $275.00 Y
2 GOVERNMENT RATES - All State & Federal Government Departments and Organisations- Fee per Hour $51.50 per Day $360.50 Y
3 COMMERCIAL RATES - All Commercial business and private hirers- Fee per Hour $62.00 per Day $432.50 Y
MISCELLANEOUS FEES - HALLS AND COMMUNITY CENTRESApplies to The Boulevard Centre, Wembley Community Centre and Leederville Town Hall
1 BONDS- All bonds are held via credit card details on a 100% cost recovery basis. N
2 CANCELLATION FEES (% of room hire retained)Cancellation is made prior to booking
- 46 Days or more Amount Retained 0% Y- 30 to 45 Days Amount Retained 25% Y- 15 to 29 Days Amount Retained 50% Y- 14 Days or less Amount Retained 100% Y
3 SETTING UP FEES- As per the Town's booking policy, all set up and packing down times must be incorporated into the hires total booking time.
Note: Bonds at the discretion of the Chief Executive Officer within the parameters identified.
The Chief Executive Officer is authorised to waive the fees and charges should special circumstances apply inaccordance with Section 6.12 of the Local Government Act 1995.
____________________________________________________________________________________________Page 7. 8

Town of Cambridge 2015/2016 FEES AND CHARGES
Fees GST
SPORTSGROUNDS AND RESERVES
1 LIQUOR PERMITS per Day Nil
2 FILMING LICENCE- Community (Students, Community groups) Nil- Low Budget Community Commercial & Small Independent Films per Day $143.00 Y
per Half Day $71.00 Yper Hour (up to 2) $16.50 Y
- Corporate Commecial per Day $286.00 Yper Half Day $143.00 Y
per Hour (up to 2) $42.00 Y- Feature Film Price on Application Refer to Commercial Rates
3 WEDDING LICENCES- Ceremony (Flat Rate) $143.00 Y
4 COMMERCIAL RESERVE HIRELight Commercial Use
- First Two Hours per Hour $285.00 Y- Second Two Hours per Hour $133.00 Y- Thereafter per Hour $58.00 Y- Minimum Charge $285.00 Y- Maximum Charge per Day $893.00 Y
Heavy Commercial use- First Two Hours per Hour $508.00 Y- Second Two Hours per Hour $300.00 Y- Thereafter per Hour $168.00 Y- Minimum Charge $508.00 Y- Maximum Charge per Day $1,782.00 Y
5 COMMERCIAL GROUP FITNESS LICENCEMaximum of 12 hours per week (3 or more people)
- 6 Months $363.00 Y- 12 Months $724.00 Y
6 FUNCTIONS ON RESERVE- 50+ Participants (Corporate Event) per Hour $39.00 Y
per Half Day (Max 5 Hours) $191.00 YFull Day $380.00 Y
- 100+ Participants (Private Event eg. Family Gathering) per Hour $39.00 Yper Half Day (Max 5 Hours) $191.00 Y
Full Day $380.00 Y
* Bond is also applicable**
7 DRIVER TRAININGPrivate Nil
Commercial
- Less than 30 mins at a time, 5 times per week Nil- Fixed Term (6 Months) $349.00 Y- Fixed Term (12 Months) $697.00 Y
8 PROMOTION AND PUBLIC SAMPLING- Maximum time allocation of 4 hours per day for a maximum of 2 days $128.00 Y
Not applicable to companies who advertise materials or petitions on various political subjects or religious bias
____________________________________________________________________________________________Page 7. 9

Town of Cambridge 2015/2016 FEES AND CHARGES
Fees GST
SPORTSGROUNDS AND RESERVES Cont'd….
9 CHARGES FOR RESERVESSeasonal Hire Charges
- Training & Match Play per Senior Player per Season $63.00 Y- Training & Match Play per Junior Player (under 18) per Season $17.00 Y- Sub Juniors (8 years and under) Nil- Town managed change room facilities per senior player per Season $34.00 Y- Town managed change room facilities per junior player per Season $9.00 Y
Casual Hire- Town Managed Facilities (< 150 people) per Half Day $51.50 per Day $103.00 Y
Hourly Rate (max 2 hours) $15.50 Y- Town Managed Facilities (151 - 500 people) per Half Day $77.00 per Day $155.00 Y
Hourly Rate (max 2 hours) $23.00 Y- Town Managed Facilities (501 - 1000 people) per Half Day $77.00 per Day $232.00 Y
Hourly Rate (max 2 hours) $34.00 Y- Town Managed Facilities (1001 - 1500 people) per Half Day $115.00 per Day $347.00 Y
Hourly Rate (max 2 hours) $52.00 Y- Reserve (< 150 people) per Half Day $71.00 per Day $143.00 Y
Hourly Rate (max 2 hours) $25.00 Y- Reserve (151-500 people) per Half Day $106.00 per Day $212.00 Y
Hourly Rate (max 2 hours) $37.00 Y- Reserve (501-1000 people) per Half Day $159.00 per Day $318.00 Y
Hourly Rate (max 2 hours) $56.00 Y- Reserve (1001-1500 people) per Half Day $239.00 per Day $477.00 Y
Hourly Rate (max 2 hours) $82.00 Y
- Reserve (1501 > people)
CLEANING TOWN MANAGED FACILITIES AND TOILETS ASSOCIATED WITH RESERVE HIRE- Charge for additional clean (Mon - Fri) Cost Recovery- Charge for additional clean (Sat) Cost Recovery- Charge for additional clean (Sun & Public Holidays) Cost Recovery
10 SPECIAL EVENTSSpecial events at any of Council's venues will be at the discretion of Council and charged the approriate commercial rate. Y
11 RESERVE BOND- For social purposes up to 499 people (weddings, parties etc). $200.00 N- Bonds for Special Events and events with over 500 people will be at the discretion of Council.
12 FLOREAT BEACH VOLLEYBALL COURTS- Public Court Hire per Hour $25.00 Y
13 CANCELLATION FEESCancellation is made prior to booking - 30 days or more Amount Retained 0% Y - 14 days to 29 days Amount Retained 25% Y - 7 to 13 days Amount Retained 50% Y - less than 7 days Amount Retained 100% Y
14 STORAGE AT ALDERBURY RESERVE per Month $74.00 Y
15 HENDERSON PARK LIGHTS per Hour $15.00 Y
16 HOLYROOD PARK FACILITY - Per Hour Not For Profit (2 hour minimum charge) $21.00 Y - Per Hour Commercial (2 hour minimum charge) $36.00 Y - Cleaning Fee (all bookings where food and beverage is consumed) $52.00 Y
(Definition: Town managed facilities exclude those leased directly to a Club or Association)
Fee at Discretion of Council
Town managed facilities exclude those leased directly to a club or association.
Juniors 50% off relevant charges - except for change room hire
The Chief Executive Officer is authorised to waive the fees and charges should special circumstances apply inaccordance with Section 6.12 of the Local Government Act 1995.
____________________________________________________________________________________________Page 7. 10
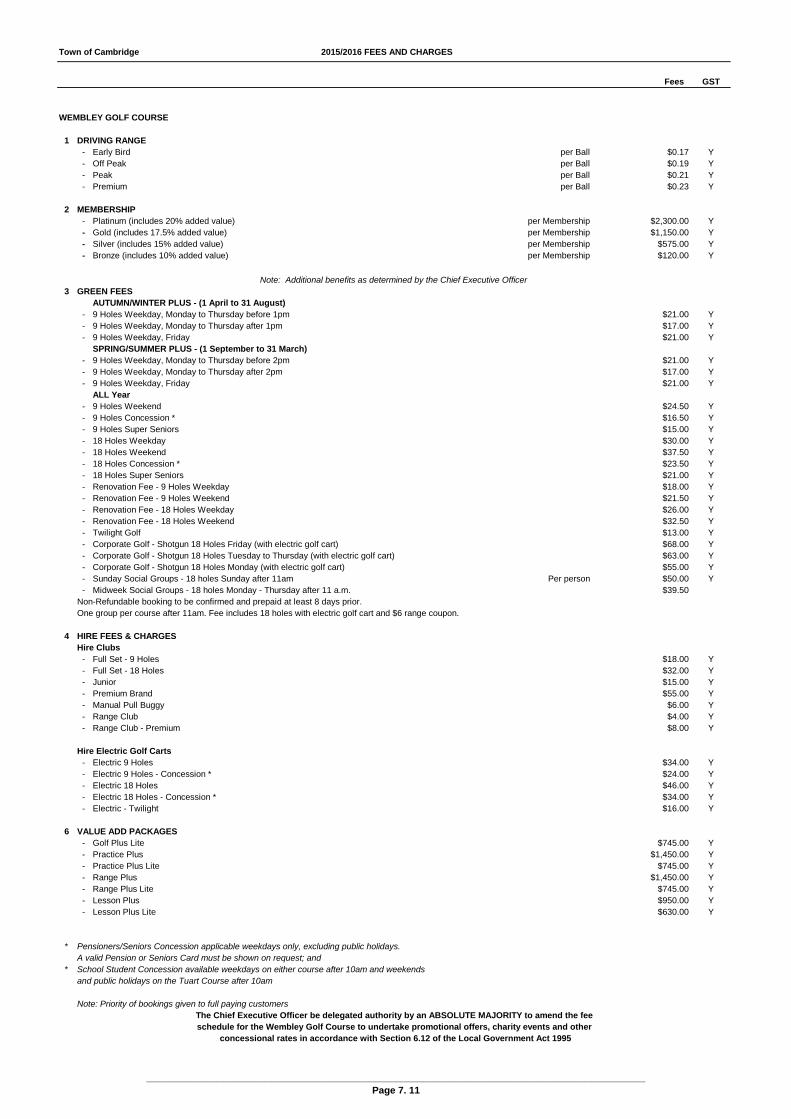
Town of Cambridge 2015/2016 FEES AND CHARGES
Fees GST
WEMBLEY GOLF COURSE
1 DRIVING RANGE- Early Bird per Ball $0.17 Y- Off Peak per Ball $0.19 Y- Peak per Ball $0.21 Y- Premium per Ball $0.23 Y
2 MEMBERSHIP- Platinum (includes 20% added value) per Membership $2,300.00 Y- Gold (includes 17.5% added value) per Membership $1,150.00 Y- Silver (includes 15% added value) per Membership $575.00 Y- Bronze (includes 10% added value) per Membership $120.00 Y
3 GREEN FEESAUTUMN/WINTER PLUS - (1 April to 31 August)
- 9 Holes Weekday, Monday to Thursday before 1pm $21.00 Y- 9 Holes Weekday, Monday to Thursday after 1pm $17.00 Y- 9 Holes Weekday, Friday $21.00 Y
SPRING/SUMMER PLUS - (1 September to 31 March)- 9 Holes Weekday, Monday to Thursday before 2pm $21.00 Y- 9 Holes Weekday, Monday to Thursday after 2pm $17.00 Y- 9 Holes Weekday, Friday $21.00 Y
ALL Year- 9 Holes Weekend $24.50 Y- 9 Holes Concession * $16.50 Y- 9 Holes Super Seniors $15.00 Y- 18 Holes Weekday $30.00 Y- 18 Holes Weekend $37.50 Y- 18 Holes Concession * $23.50 Y- 18 Holes Super Seniors $21.00 Y- Renovation Fee - 9 Holes Weekday $18.00 Y- Renovation Fee - 9 Holes Weekend $21.50 Y- Renovation Fee - 18 Holes Weekday $26.00 Y- Renovation Fee - 18 Holes Weekend $32.50 Y- Twilight Golf $13.00 Y- Corporate Golf - Shotgun 18 Holes Friday (with electric golf cart) $68.00 Y- Corporate Golf - Shotgun 18 Holes Tuesday to Thursday (with electric golf cart) $63.00 Y- Corporate Golf - Shotgun 18 Holes Monday (with electric golf cart) $55.00 Y- Sunday Social Groups - 18 holes Sunday after 11am Per person $50.00 Y- Midweek Social Groups - 18 holes Monday - Thursday after 11 a.m. $39.50
Non-Refundable booking to be confirmed and prepaid at least 8 days prior. One group per course after 11am. Fee includes 18 holes with electric golf cart and $6 range coupon.
4 HIRE FEES & CHARGESHire Clubs
- Full Set - 9 Holes $18.00 Y- Full Set - 18 Holes $32.00 Y- Junior $15.00 Y- Premium Brand $55.00 Y- Manual Pull Buggy $6.00 Y- Range Club $4.00 Y- Range Club - Premium $8.00 Y
Hire Electric Golf Carts- Electric 9 Holes $34.00 Y- Electric 9 Holes - Concession * $24.00 Y- Electric 18 Holes $46.00 Y- Electric 18 Holes - Concession * $34.00 Y- Electric - Twilight $16.00 Y
6 VALUE ADD PACKAGES- Golf Plus Lite $745.00 Y- Practice Plus $1,450.00 Y- Practice Plus Lite $745.00 Y- Range Plus $1,450.00 Y- Range Plus Lite $745.00 Y- Lesson Plus $950.00 Y- Lesson Plus Lite $630.00 Y
* Pensioners/Seniors Concession applicable weekdays only, excluding public holidays. A valid Pension or Seniors Card must be shown on request; and
* School Student Concession available weekdays on either course after 10am and weekendsand public holidays on the Tuart Course after 10am
Note: Priority of bookings given to full paying customersThe Chief Executive Officer be delegated authority by an ABSOLUTE MAJORITY to amend the feeschedule for the Wembley Golf Course to undertake promotional offers, charity events and other
concessional rates in accordance with Section 6.12 of the Local Government Act 1995
Note: Additional benefits as determined by the Chief Executive Officer
____________________________________________________________________________________________Page 7. 11
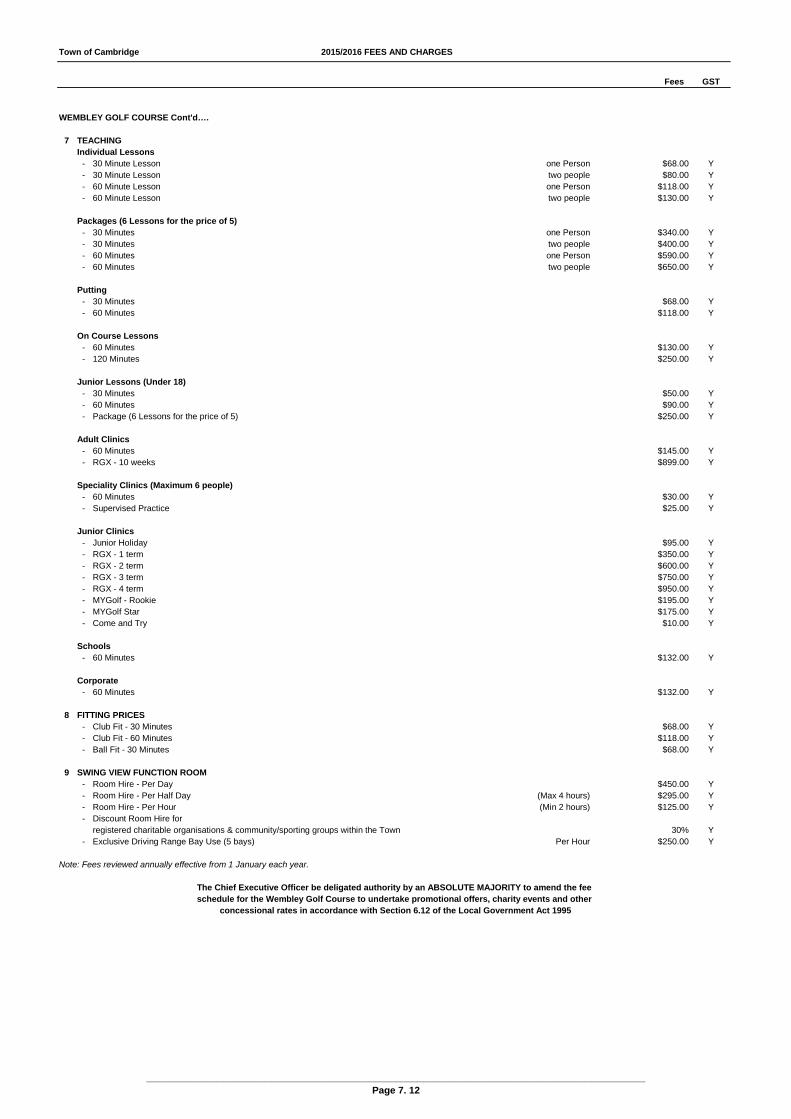
Town of Cambridge 2015/2016 FEES AND CHARGES
Fees GST
WEMBLEY GOLF COURSE Cont'd….
7 TEACHINGIndividual Lessons
- 30 Minute Lesson one Person $68.00 Y- 30 Minute Lesson two people $80.00 Y- 60 Minute Lesson one Person $118.00 Y- 60 Minute Lesson two people $130.00 Y
Packages (6 Lessons for the price of 5)- 30 Minutes one Person $340.00 Y- 30 Minutes two people $400.00 Y- 60 Minutes one Person $590.00 Y- 60 Minutes two people $650.00 Y
Putting- 30 Minutes $68.00 Y- 60 Minutes $118.00 Y
On Course Lessons- 60 Minutes $130.00 Y- 120 Minutes $250.00 Y
Junior Lessons (Under 18)- 30 Minutes $50.00 Y- 60 Minutes $90.00 Y- Package (6 Lessons for the price of 5) $250.00 Y
Adult Clinics- 60 Minutes $145.00 Y- RGX - 10 weeks $899.00 Y
Speciality Clinics (Maximum 6 people)- 60 Minutes $30.00 Y- Supervised Practice $25.00 Y
Junior Clinics- Junior Holiday $95.00 Y- RGX - 1 term $350.00 Y- RGX - 2 term $600.00 Y- RGX - 3 term $750.00 Y- RGX - 4 term $950.00 Y- MYGolf - Rookie $195.00 Y- MYGolf Star $175.00 Y- Come and Try $10.00 Y
Schools- 60 Minutes $132.00 Y
Corporate- 60 Minutes $132.00 Y
8 FITTING PRICES- Club Fit - 30 Minutes $68.00 Y- Club Fit - 60 Minutes $118.00 Y- Ball Fit - 30 Minutes $68.00 Y
9 SWING VIEW FUNCTION ROOM- Room Hire - Per Day $450.00 Y- Room Hire - Per Half Day (Max 4 hours) $295.00 Y- Room Hire - Per Hour (Min 2 hours) $125.00 Y- Discount Room Hire for
registered charitable organisations & community/sporting groups within the Town 30% Y- Exclusive Driving Range Bay Use (5 bays) Per Hour $250.00 Y
Note: Fees reviewed annually effective from 1 January each year.
The Chief Executive Officer be deligated authority by an ABSOLUTE MAJORITY to amend the feeschedule for the Wembley Golf Course to undertake promotional offers, charity events and other
concessional rates in accordance with Section 6.12 of the Local Government Act 1995
____________________________________________________________________________________________Page 7. 12
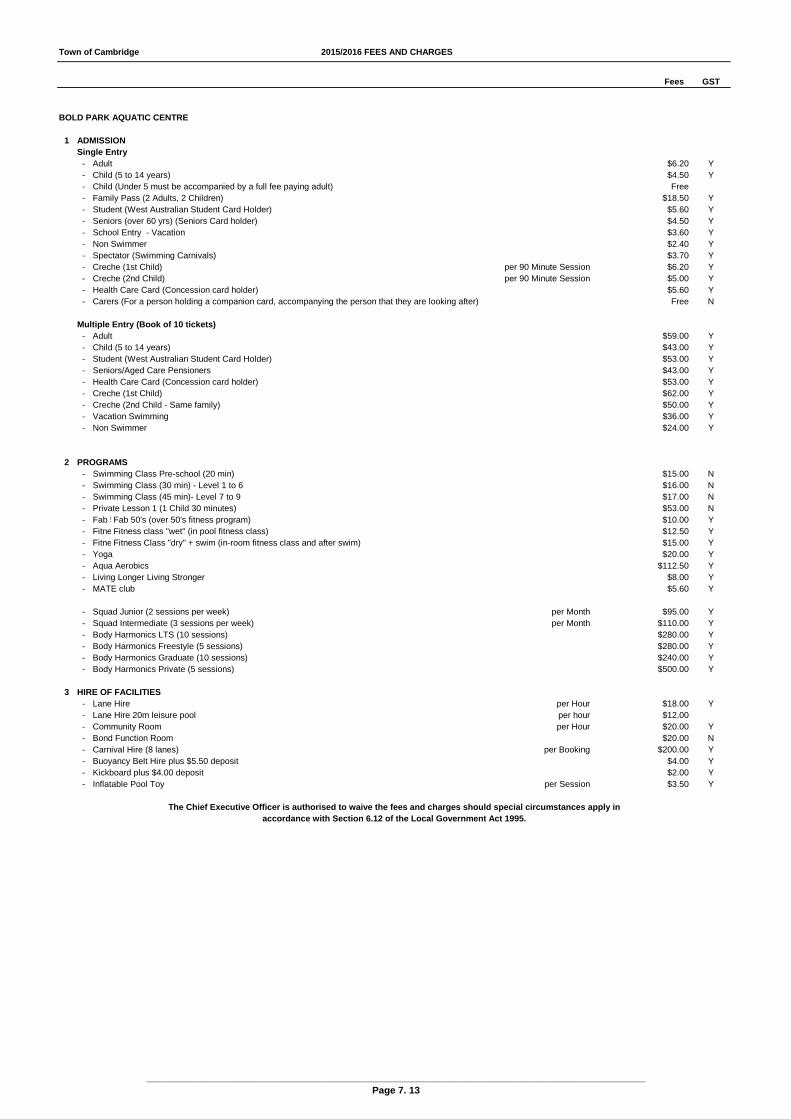
Town of Cambridge 2015/2016 FEES AND CHARGES
Fees GST
BOLD PARK AQUATIC CENTRE
1 ADMISSIONSingle Entry
- Adult $6.20 Y- Child (5 to 14 years) $4.50 Y- Child (Under 5 must be accompanied by a full fee paying adult) Free- Family Pass (2 Adults, 2 Children) $18.50 Y- Student (West Australian Student Card Holder) $5.60 Y- Seniors (over 60 yrs) (Seniors Card holder) $4.50 Y- School Entry - Vacation $3.60 Y- Non Swimmer $2.40 Y- Spectator (Swimming Carnivals) $3.70 Y- Creche (1st Child) per 90 Minute Session $6.20 Y- Creche (2nd Child) per 90 Minute Session $5.00 Y- Health Care Card (Concession card holder) $5.60 Y- Carers (For a person holding a companion card, accompanying the person that they are looking after) Free N
Multiple Entry (Book of 10 tickets)- Adult $59.00 Y- Child (5 to 14 years) $43.00 Y- Student (West Australian Student Card Holder) $53.00 Y- Seniors/Aged Care Pensioners $43.00 Y- Health Care Card (Concession card holder) $53.00 Y- Creche (1st Child) $62.00 Y- Creche (2nd Child - Same family) $50.00 Y- Vacation Swimming $36.00 Y- Non Swimmer $24.00 Y
2 PROGRAMS- Swimming Class Pre-school (20 min) $15.00 N- Swimming Class (30 min) - Level 1 to 6 $16.00 N- Swimming Class (45 min)- Level 7 to 9 $17.00 N- Private Lesson 1 (1 Child 30 minutes) $53.00 N- Fab 5Fab 50's (over 50's fitness program) $10.00 Y- Fitne Fitness class "wet" (in pool fitness class) $12.50 Y- Fitne Fitness Class "dry" + swim (in-room fitness class and after swim) $15.00 Y- Yoga $20.00 Y- Aqua Aerobics $112.50 Y- Living Longer Living Stronger $8.00 Y- MATE club $5.60 Y
- Squad Junior (2 sessions per week) per Month $95.00 Y- Squad Intermediate (3 sessions per week) per Month $110.00 Y- Body Harmonics LTS (10 sessions) $280.00 Y- Body Harmonics Freestyle (5 sessions) $280.00 Y- Body Harmonics Graduate (10 sessions) $240.00 Y- Body Harmonics Private (5 sessions) $500.00 Y
3 HIRE OF FACILITIES- Lane Hire per Hour $18.00 Y- Lane Hire 20m leisure pool per hour $12.00- Community Room per Hour $20.00 Y- Bond Function Room $20.00 N- Carnival Hire (8 lanes) per Booking $200.00 Y- Buoyancy Belt Hire plus $5.50 deposit $4.00 Y- Kickboard plus $4.00 deposit $2.00 Y- Inflatable Pool Toy per Session $3.50 Y
The Chief Executive Officer is authorised to waive the fees and charges should special circumstances apply inaccordance with Section 6.12 of the Local Government Act 1995.
____________________________________________________________________________________________Page 7. 13
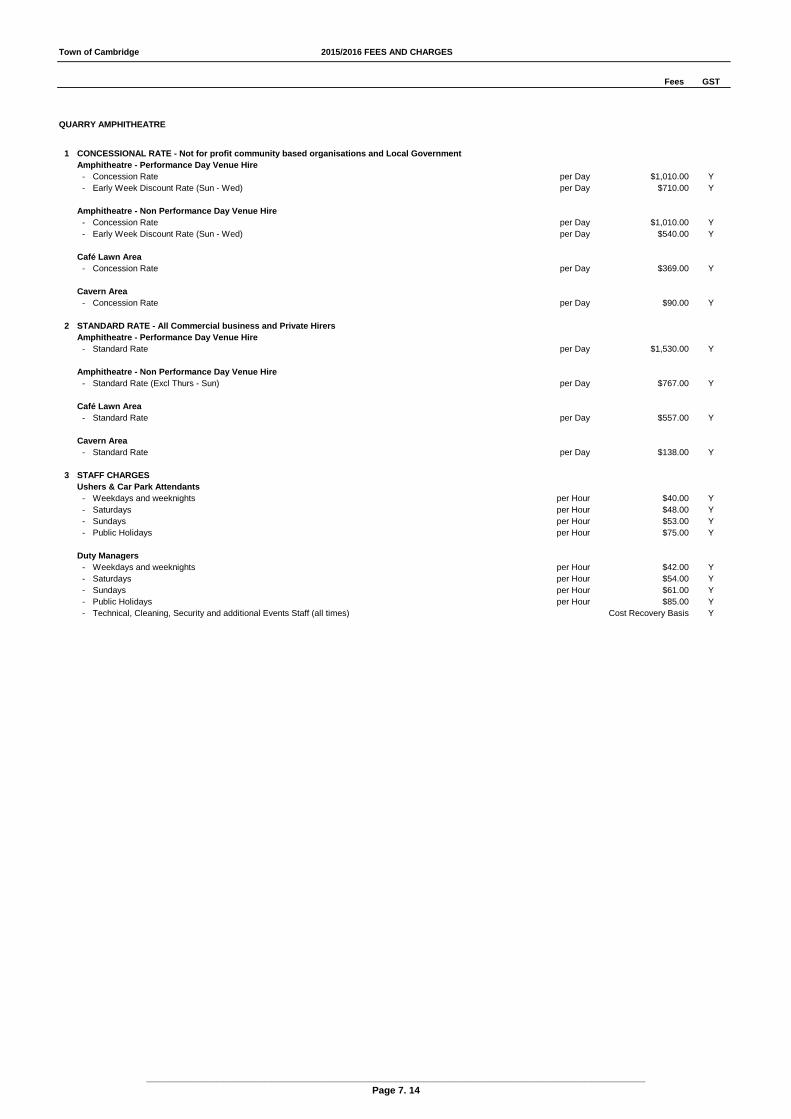
Town of Cambridge 2015/2016 FEES AND CHARGES
Fees GST
QUARRY AMPHITHEATRE
1 CONCESSIONAL RATE - Not for profit community based organisations and Local GovernmentAmphitheatre - Performance Day Venue Hire
- Concession Rate per Day $1,010.00 Y- Early Week Discount Rate (Sun - Wed) per Day $710.00 Y
Amphitheatre - Non Performance Day Venue Hire- Concession Rate per Day $1,010.00 Y- Early Week Discount Rate (Sun - Wed) per Day $540.00 Y
Café Lawn Area- Concession Rate per Day $369.00 Y
Cavern Area- Concession Rate per Day $90.00 Y
2 STANDARD RATE - All Commercial business and Private HirersAmphitheatre - Performance Day Venue Hire
- Standard Rate per Day $1,530.00 Y
Amphitheatre - Non Performance Day Venue Hire- Standard Rate (Excl Thurs - Sun) per Day $767.00 Y
Café Lawn Area- Standard Rate per Day $557.00 Y
Cavern Area- Standard Rate per Day $138.00 Y
3 STAFF CHARGESUshers & Car Park Attendants
- Weekdays and weeknights per Hour $40.00 Y- Saturdays per Hour $48.00 Y- Sundays per Hour $53.00 Y- Public Holidays per Hour $75.00 Y
Duty Managers- Weekdays and weeknights per Hour $42.00 Y- Saturdays per Hour $54.00 Y- Sundays per Hour $61.00 Y- Public Holidays per Hour $85.00 Y- Technical, Cleaning, Security and additional Events Staff (all times) Cost Recovery Basis Y
____________________________________________________________________________________________Page 7. 14
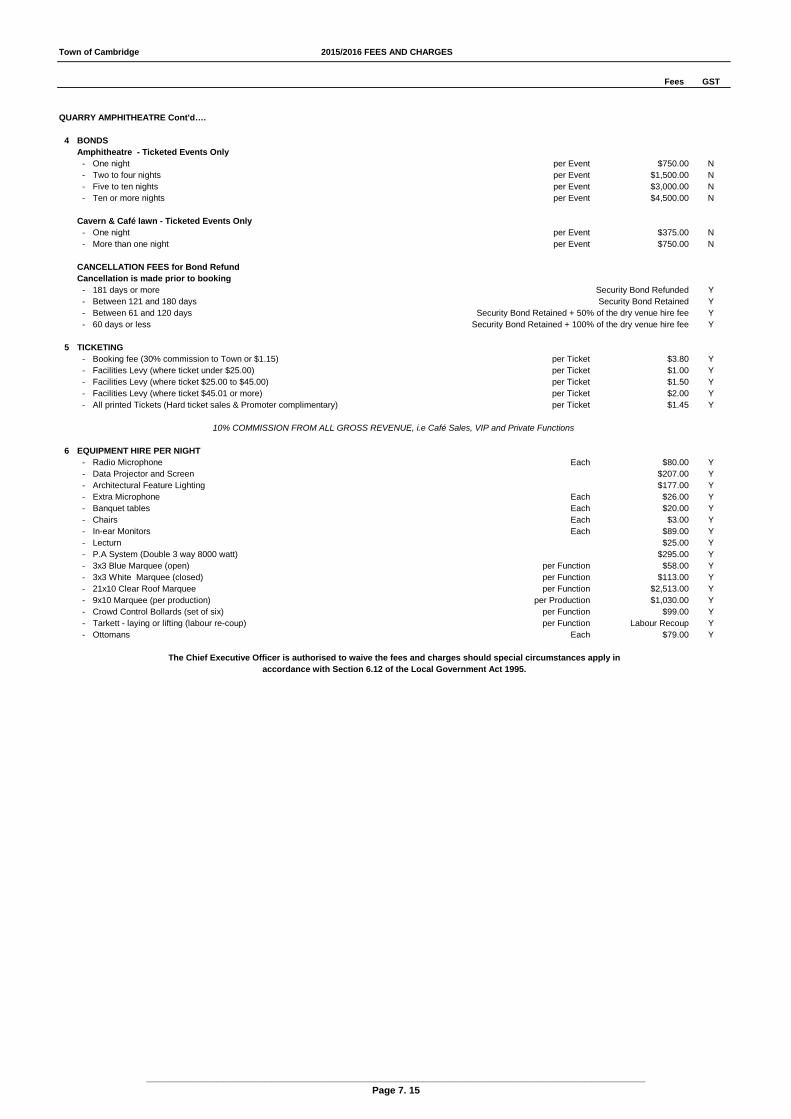
Town of Cambridge 2015/2016 FEES AND CHARGES
Fees GST
QUARRY AMPHITHEATRE Cont'd….
4 BONDSAmphitheatre - Ticketed Events Only
- One night per Event $750.00 N- Two to four nights per Event $1,500.00 N- Five to ten nights per Event $3,000.00 N- Ten or more nights per Event $4,500.00 N
Cavern & Café lawn - Ticketed Events Only- One night per Event $375.00 N- More than one night per Event $750.00 N
CANCELLATION FEES for Bond RefundCancellation is made prior to booking
- 181 days or more Security Bond Refunded Y- Between 121 and 180 days Security Bond Retained Y- Between 61 and 120 days Security Bond Retained + 50% of the dry venue hire fee Y- 60 days or less Security Bond Retained + 100% of the dry venue hire fee Y
5 TICKETING- Booking fee (30% commission to Town or $1.15) per Ticket $3.80 Y- Facilities Levy (where ticket under $25.00) per Ticket $1.00 Y- Facilities Levy (where ticket $25.00 to $45.00) per Ticket $1.50 Y- Facilities Levy (where ticket $45.01 or more) per Ticket $2.00 Y- All printed Tickets (Hard ticket sales & Promoter complimentary) per Ticket $1.45 Y
6 EQUIPMENT HIRE PER NIGHT- Radio Microphone Each $80.00 Y- Data Projector and Screen $207.00 Y- Architectural Feature Lighting $177.00 Y- Extra Microphone Each $26.00 Y- Banquet tables Each $20.00 Y- Chairs Each $3.00 Y- In-ear Monitors Each $89.00 Y- Lecturn $25.00 Y- P.A System (Double 3 way 8000 watt) $295.00 Y- 3x3 Blue Marquee (open) per Function $58.00 Y- 3x3 White Marquee (closed) per Function $113.00 Y- 21x10 Clear Roof Marquee per Function $2,513.00 Y- 9x10 Marquee (per production) per Production $1,030.00 Y- Crowd Control Bollards (set of six) per Function $99.00 Y- Tarkett - laying or lifting (labour re-coup) per Function Labour Recoup Y- Ottomans Each $79.00 Y
10% COMMISSION FROM ALL GROSS REVENUE, i.e Café Sales, VIP and Private Functions
The Chief Executive Officer is authorised to waive the fees and charges should special circumstances apply inaccordance with Section 6.12 of the Local Government Act 1995.
____________________________________________________________________________________________Page 7. 15

Town of Cambridge 2015/2016 FEES AND CHARGES
Fees GST
PLANNING SERVICES FEES & CHARGES
1 GENERAL PLANNING SERVICES (STATUTORY FEES)- Scheme Amendments/Rezoning Applications Refer to Regulations N
(An estimate will be provided in the form of Schedule 3 of the Regulations.The Applicant will be required to pay any advertising costs associated withthe application. Refer to Planning and Development Regulations 2009 (Part 7Local Government Planning Charges)
- Structure Plan Proposals Refer to Regulations N(An estimate will be provided in the form of Schedule 4 of the Regulations.The Applicant will be required to pay any advertising costs associated with the application. Refer to Planning and Development Regulations 2009 (Part 7Local Government Planning Charges)
2 DEVELOPMENT APPLICATION FEES (STATUTORY FEES)PART 1 - MAXIMUM FIXED FEES1 Determining a development application (other than for an extracitve industry) where the
development has not commenced or been carried out and the estimated cost of the development is:(a ) Not more than $50,000 $147.00 N(b ) More than $50,000 but not more than $500,000 0.32% of the Estimated cost of development N(c ) More than $500,000 but not more than $2.5 million $1,700 + 0.257% for every $1 over $500,000 N(d ) More than $2.5 million but not more than $5 million $7,161 + 0.206% for every $1 over $2.5 million N(e ) More than $5 million but not more than $21.5 million $12,633 + 0.123% for every $1 over $5 million N(f ) More than $21.5 million $34,196.00 N
2 Determining a development application (other than for an extractive Fee of item 1 plus, by wayindustry) where the development has commenced or been carried out of penalty, twice that fee
3 Providing a subdivision clearance for:(a ) Not more than 5 lots per Lot $73.00 N(b ) More than 5 lots but not more than 195 lots - $73.00 per lot for the first 5 lots and then per Lot $35.00 N(c ) MMore than 195 lots $7,393.00
4 Determining an initial application for approval of a home occupationwhere the home occupation has not commenced $222.00 N
5 Determing an initial application for approval of a home occupation The fee in item 4 plus, bywhere the home occupation has commenced way of penalty, twice that fee N
6 Determining an application for a change of use or for an alteration or extension or change of a non-conforming use to which item 1 does not apply, where the change or the alterations, extensions or change has not commenced or been carried out $295.00 N
7 Determining an application for change of use or for alteration or extension or change The fee in item 6 plus, byof a non-conforming use to which item 2 does not apply, where the change of the way of penalty, twice that fee Nalteration, extension or change has commenced or been carried out
8 Amended Plans (Requiring further assessment or submitted after planning approval) Minimum $147.00 Nor renewal of previously approved applications. Up to a Maximum 50% of orginal fee N
PART 2 -ADMINISTRATION FEES: SCHEME AMENDMENTS, RE-ZONINGS AND STRUCTURE PLANS- Director Hourly Rate $96.80 N- Manager/Senior Planner Hourly Rate $72.60 N- Planning Officer Hourly Rate $40.55 N- Other Staff e.g environmental Health Officer Hourly Rate $40.55 N- Administration Officer Hourly Rate $33.22 N
3 ADMINISTRATION FEES - TOWN PLANNING SERVICES- Reply to a Property Settlement Enquiry (Statutory Fee) $80.30 Y- Written planning advice $80.30 Y- Zoning Certificate (Statutory fee) Other Statutory Certificates $73.00 N
(ie. second hand dealers, Liquor Control Act Section 40 certificates and the like)
4 DEVELOPMENT ASSESMENT PANEL APPLICATION FEES(Collected on behalf of the Department of Planning and remitted within 30 days)A DAP application where the estimate cost of the development is:
- Not less than $3 million and less than $7 million $3,503.00 N- Not less than $7 million and less than $10 million $5,409.00 N- Not less than $ 10 million and less than $12.5 million $5,885.00 N- Not less than $12.5 million and less than $15 million $6,053.00 N- Not less than $15 million and less than $17.5 million $6,221.00 N- Not less than $17.5 million and less than $20 million $6,390.00 N- $20 Million or more $6,557.00 N- Minor amendment application $150.00 N
5 OTHER INFORMATION - Planning Scheme Text $27.50 Y- Planning Scheme Maps
A3 per Map $11.00 YA1 per Map $88.00 Y
- Town Planning Scheme Policy Manual $27.50 Y
____________________________________________________________________________________________Page 7. 16
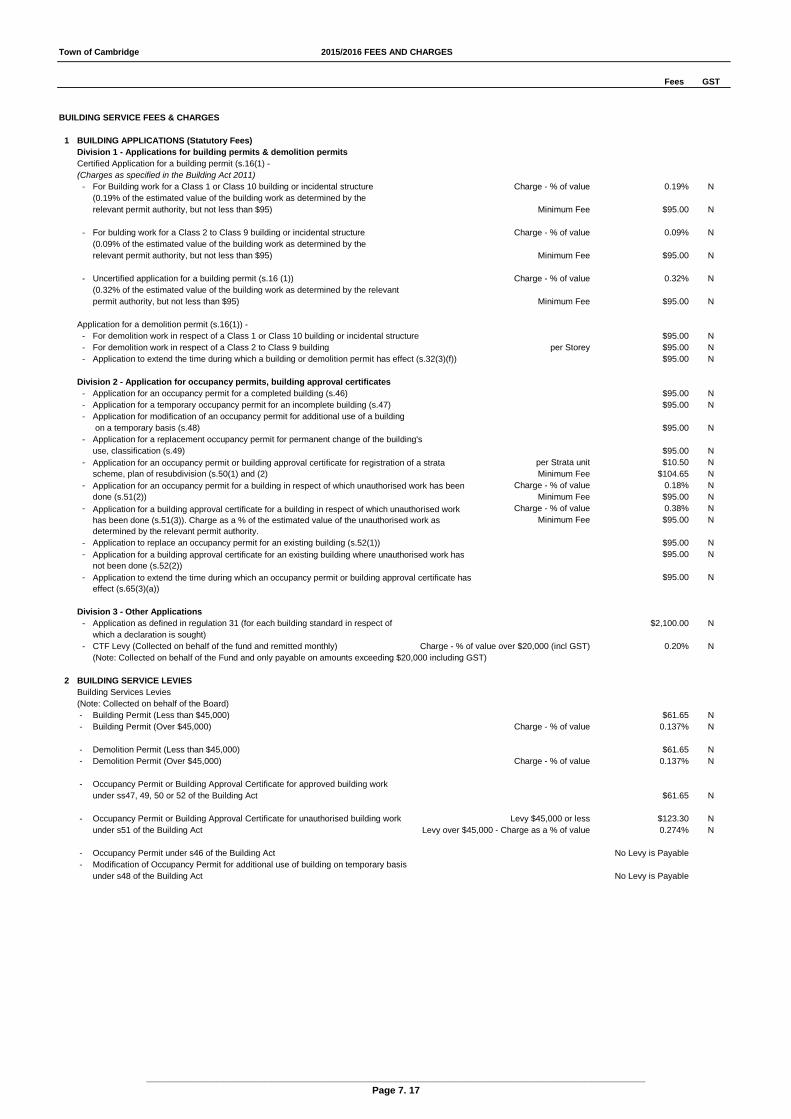
Town of Cambridge 2015/2016 FEES AND CHARGES
Fees GST
BUILDING SERVICE FEES & CHARGES
1 BUILDING APPLICATIONS (Statutory Fees)Division 1 - Applications for building permits & demolition permitsCertified Application for a building permit (s.16(1) - (Charges as specified in the Building Act 2011)
- For Building work for a Class 1 or Class 10 building or incidental structure Charge - % of value 0.19% N(0.19% of the estimated value of the building work as determined by the relevant permit authority, but not less than $95) Minimum Fee $95.00 N
- For bulding work for a Class 2 to Class 9 building or incidental structure Charge - % of value 0.09% N(0.09% of the estimated value of the building work as determined by the relevant permit authority, but not less than $95) Minimum Fee $95.00 N
- Uncertified application for a building permit (s.16 (1)) Charge - % of value 0.32% N(0.32% of the estimated value of the building work as determined by the relevantpermit authority, but not less than $95) Minimum Fee $95.00 N
Application for a demolition permit (s.16(1)) - - For demolition work in respect of a Class 1 or Class 10 building or incidental structure $95.00 N- For demolition work in respect of a Class 2 to Class 9 building per Storey $95.00 N- Application to extend the time during which a building or demolition permit has effect (s.32(3)(f)) $95.00 N
Division 2 - Application for occupancy permits, building approval certificates- Application for an occupancy permit for a completed building (s.46) $95.00 N- Application for a temporary occupancy permit for an incomplete building (s.47) $95.00 N- Application for modification of an occupancy permit for additional use of a building
on a temporary basis (s.48) $95.00 N- Application for a replacement occupancy permit for permanent change of the building's
use, classification (s.49) $95.00 N- per Strata unit $10.50 N
Minimum Fee $104.65 N- Charge - % of value 0.18% N
Minimum Fee $95.00 N- Charge - % of value 0.38% N
Minimum Fee $95.00 N
- $95.00 N- $95.00 N
- $95.00 N
Division 3 - Other Applications- Application as defined in regulation 31 (for each building standard in respect of $2,100.00 N
which a declaration is sought)- CTF Levy (Collected on behalf of the fund and remitted monthly) Charge - % of value over $20,000 (incl GST) 0.20% N
(Note: Collected on behalf of the Fund and only payable on amounts exceeding $20,000 including GST)
2 BUILDING SERVICE LEVIESBuilding Services Levies(Note: Collected on behalf of the Board) - Building Permit (Less than $45,000) $61.65 N - Building Permit (Over $45,000) Charge - % of value 0.137% N
- Demolition Permit (Less than $45,000) $61.65 N - Demolition Permit (Over $45,000) Charge - % of value 0.137% N
- Occupancy Permit or Building Approval Certificate for approved building workunder ss47, 49, 50 or 52 of the Building Act $61.65 N
- Occupancy Permit or Building Approval Certificate for unauthorised building work Levy $45,000 or less $123.30 Nunder s51 of the Building Act Levy over $45,000 - Charge as a % of value 0.274% N
- Occupancy Permit under s46 of the Building Act No Levy is Payable - Modification of Occupancy Permit for additional use of building on temporary basis
under s48 of the Building Act No Levy is Payable
Application for an occupancy permit for a building in respect of which unauthorised work has been done (s.51(2))
Application for a building approval certificate for a building in respect of which unauthorised work has been done (s.51(3)). Charge as a % of the estimated value of the unauthorised work as determined by the relevant permit authority.Application to replace an occupancy permit for an existing building (s.52(1))Application for a building approval certificate for an existing building where unauthorised work has not been done (s.52(2))Application to extend the time during which an occupancy permit or building approval certificate has effect (s.65(3)(a))
Application for an occupancy permit or building approval certificate for registration of a strata scheme, plan of resubdivision (s.50(1) and (2)
____________________________________________________________________________________________Page 7. 17
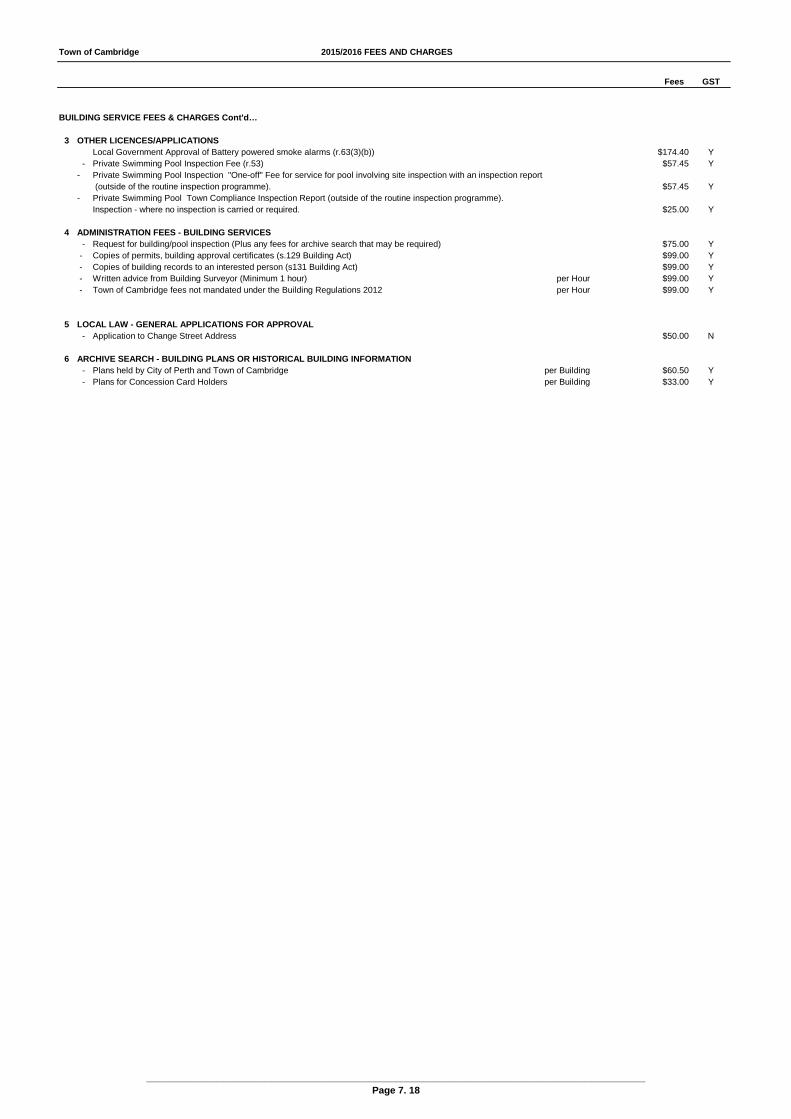
Town of Cambridge 2015/2016 FEES AND CHARGES
Fees GST
BUILDING SERVICE FEES & CHARGES Cont'd…
3 OTHER LICENCES/APPLICATIONS Local Government Approval of Battery powered smoke alarms (r.63(3)(b)) $174.40 Y
- Private Swimming Pool Inspection Fee (r.53) $57.45 Y- Private Swimming Pool Inspection "One-off" Fee for service for pool involving site inspection with an inspection report
(outside of the routine inspection programme). $57.45 Y- Private Swimming Pool Town Compliance Inspection Report (outside of the routine inspection programme).
Inspection - where no inspection is carried or required. $25.00 Y
4 ADMINISTRATION FEES - BUILDING SERVICES- Request for building/pool inspection (Plus any fees for archive search that may be required) $75.00 Y
- Copies of permits, building approval certificates (s.129 Building Act) $99.00 Y - Copies of building records to an interested person (s131 Building Act) $99.00 Y - Written advice from Building Surveyor (Minimum 1 hour) per Hour $99.00 Y - Town of Cambridge fees not mandated under the Building Regulations 2012 per Hour $99.00 Y
5 LOCAL LAW - GENERAL APPLICATIONS FOR APPROVAL- Application to Change Street Address $50.00 N
6 ARCHIVE SEARCH - BUILDING PLANS OR HISTORICAL BUILDING INFORMATION- Plans held by City of Perth and Town of Cambridge per Building $60.50 Y- Plans for Concession Card Holders per Building $33.00 Y
____________________________________________________________________________________________Page 7. 18
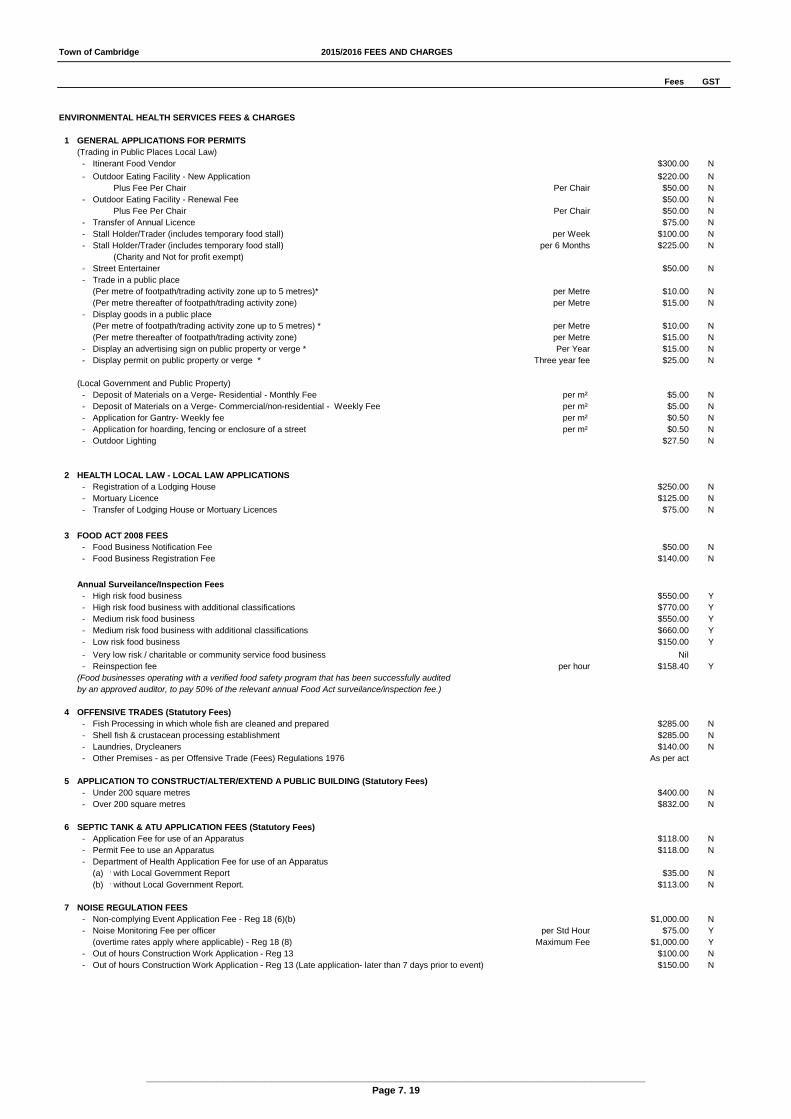
Town of Cambridge 2015/2016 FEES AND CHARGES
Fees GST
ENVIRONMENTAL HEALTH SERVICES FEES & CHARGES
1 GENERAL APPLICATIONS FOR PERMITS(Trading in Public Places Local Law)
- Itinerant Food Vendor $300.00 N
- Outdoor Eating Facility - New Application $220.00 NPlus Fee Per Chair Per Chair $50.00 N
- Outdoor Eating Facility - Renewal Fee $50.00 NPlus Fee Per Chair Per Chair $50.00 N
- Transfer of Annual Licence $75.00 N- Stall Holder/Trader (includes temporary food stall) per Week $100.00 N- Stall Holder/Trader (includes temporary food stall) per 6 Months $225.00 N
(Charity and Not for profit exempt)- Street Entertainer $50.00 N- Trade in a public place
(Per metre of footpath/trading activity zone up to 5 metres)* per Metre $10.00 N(Per metre thereafter of footpath/trading activity zone) per Metre $15.00 N
- Display goods in a public place(Per metre of footpath/trading activity zone up to 5 metres) * per Metre $10.00 N(Per metre thereafter of footpath/trading activity zone) per Metre $15.00 N
- Display an advertising sign on public property or verge * Per Year $15.00 N- Display permit on public property or verge * Three year fee $25.00 N
(Local Government and Public Property)- Deposit of Materials on a Verge- Residential - Monthly Fee per m² $5.00 N- Deposit of Materials on a Verge- Commercial/non-residential - Weekly Fee per m² $5.00 N- Application for Gantry- Weekly fee per m² $0.50 N- Application for hoarding, fencing or enclosure of a street per m² $0.50 N- Outdoor Lighting $27.50 N
2 HEALTH LOCAL LAW - LOCAL LAW APPLICATIONS- Registration of a Lodging House $250.00 N- Mortuary Licence $125.00 N- Transfer of Lodging House or Mortuary Licences $75.00 N
3 FOOD ACT 2008 FEES- Food Business Notification Fee $50.00 N- Food Business Registration Fee $140.00 N
Annual Surveilance/Inspection Fees- High risk food business $550.00 Y- High risk food business with additional classifications $770.00 Y- Medium risk food business $550.00 Y- Medium risk food business with additional classifications $660.00 Y- Low risk food business $150.00 Y
- Very low risk / charitable or community service food business Nil- Reinspection fee per hour $158.40 Y
(Food businesses operating with a verified food safety program that has been successfully auditedby an approved auditor, to pay 50% of the relevant annual Food Act surveilance/inspection fee.)
4 OFFENSIVE TRADES (Statutory Fees)- Fish Processing in which whole fish are cleaned and prepared $285.00 N- Shell fish & crustacean processing establishment $285.00 N- Laundries, Drycleaners $140.00 N- Other Premises - as per Offensive Trade (Fees) Regulations 1976 As per act
5 APPLICATION TO CONSTRUCT/ALTER/EXTEND A PUBLIC BUILDING (Statutory Fees)- Under 200 square metres $400.00 N- Over 200 square metres $832.00 N
6 SEPTIC TANK & ATU APPLICATION FEES (Statutory Fees)- Application Fee for use of an Apparatus $118.00 N- Permit Fee to use an Apparatus $118.00 N- Department of Health Application Fee for use of an Apparatus
(a) wwith Local Government Report $35.00 N(b) wwithout Local Government Report. $113.00 N
7 NOISE REGULATION FEES- Non-complying Event Application Fee - Reg 18 (6)(b) $1,000.00 N- Noise Monitoring Fee per officer per Std Hour $75.00 Y
(overtime rates apply where applicable) - Reg 18 (8) Maximum Fee $1,000.00 Y- Out of hours Construction Work Application - Reg 13 $100.00 N- Out of hours Construction Work Application - Reg 13 (Late application- later than 7 days prior to event) $150.00 N
____________________________________________________________________________________________Page 7. 19

Town of Cambridge 2015/2016 FEES AND CHARGES
Fees GST
ENVIRONMENTAL HEALTH SERVICES FEES & CHARGES Cont'd…
8 ADMINISTRATION FEES - ENVIRONMENTAL HEALTH SERVICES- Food Premises Fit out or Alterations $230.00 N- Food Premises Settlement Enquiry - inspection not required $70.00 Y- Food Premises Settlement Enquiry - inspection required $140.00 Y- Liquor Control Act Section 39 certificates $250.00 N- Liquor Control Act Section 60 & 61 Extended Trading Permit Applications $150.00 N- Liquor and Gaming Licence Application request Fee (One off less than 1 year) $125.00 N- Liquor and Gaming Licence Application request Fee (Ongoing and more than 1 year) $400.00 N
(Charity and Not-for profit organisations are exempt)- Public swimming pool water sampling - Large (3 or more pools, deep, shallow plus spa) Per year $500.00 N- Public swimming pool water sampling - Medium (2 pools, deep, shallow plus spa) Per year $250.00 N- Public swimming pool water sampling - Small (1 pool plus plus spa) Per year $100.00 N- Re-sample fee due to non-complying results per Sample $75.00 N- Copy of Results of Food Analysis per Sample $5.50 Y- Copy of Results of non compliant water analysis per Sample $10.00 Y
(Public Buildings)- Temporary Public Building-High Risk premises (5 Premises) $250.00 N- Temporary Public Building-Medium Risk Premises (25 premises) $150.00 N- Temporary Public Building-Low Risk Premises (42 premises) $75.00 N
____________________________________________________________________________________________Page 7. 20

Town of Cambridge 2015/2016 FEES AND CHARGES
Fees GST
WORKS FEES AND CHARGES
1 SECURE SUMS (WORKS BONDS) See NoteRemediation Works - New Developments - One bond per development or applicant
Value of Development(a) $0 - $20,000 - Works Bond Nil N- Administration Fee Nil Y
(b) $20,001 - $100,000- Works Bond $700.00 N- Administration Fee $110.00 Y
(c) $100,001 - $500,000- Works Bond $1,500.00 N- Administration Fee $220.00 Y
(d) $500,001 - $1,000,000- Works Bond $2,500.00 N- Administration Fee $220.00 Y
(e) $1,000,001 - $5,000,000- Works Bond $5,000.00 N- Administration Fee $220.00 Y
(f) $5,000,001 - $10,000,000- Works Bond $10,000.00 N- Administration Fee $220.00 Y
(g) Greater than $10,000,000- Works Bond $25,000.00 N- Administration Fee $220.00 Y
Residential or Commercial Demolitions
Value of Demolition(a) $0 - $20,000 - Works Bond $700 N- Administration Fee Nil Y
(b) $20,001 - $100,000- Works Bond $1,000.00 N- Administration Fee $110.00 Y
(c) $100,001 - $500,000- Works Bond $1,500.00 N- Administration Fee $220.00 Y
(d) $500,001 - $1,000,000- Works Bond $2,500.00 N- Administration Fee $220.00 Y
(e) $1,000,001 - $5,000,000- Works Bond $5,000.00 N- Administration Fee $220.00 Y
(f) $5,000,001 - $10,000,000- Works Bond $10,000.00 N- Administration Fee $220.00 Y
(g) Greater than $10,000,000- Works Bond $25,000.00 N
- Administration Fee $220 Y
Verge Street Tree Preservation BondCommercial DevelopmentsHeight of street tree(a) Less than 3 Metres in height- Works Bond $1,500.00 N- Administration Fee $25.00 Y
(b) 3 to 5 metres in height- Works Bond $2,500.00 N- Administration Fee $25.00 Y
(a) More than 5 metres in height- Works Bond $5,000.00 N- Administration Fee $25.00 Y
____________________________________________________________________________________________Page 7. 21
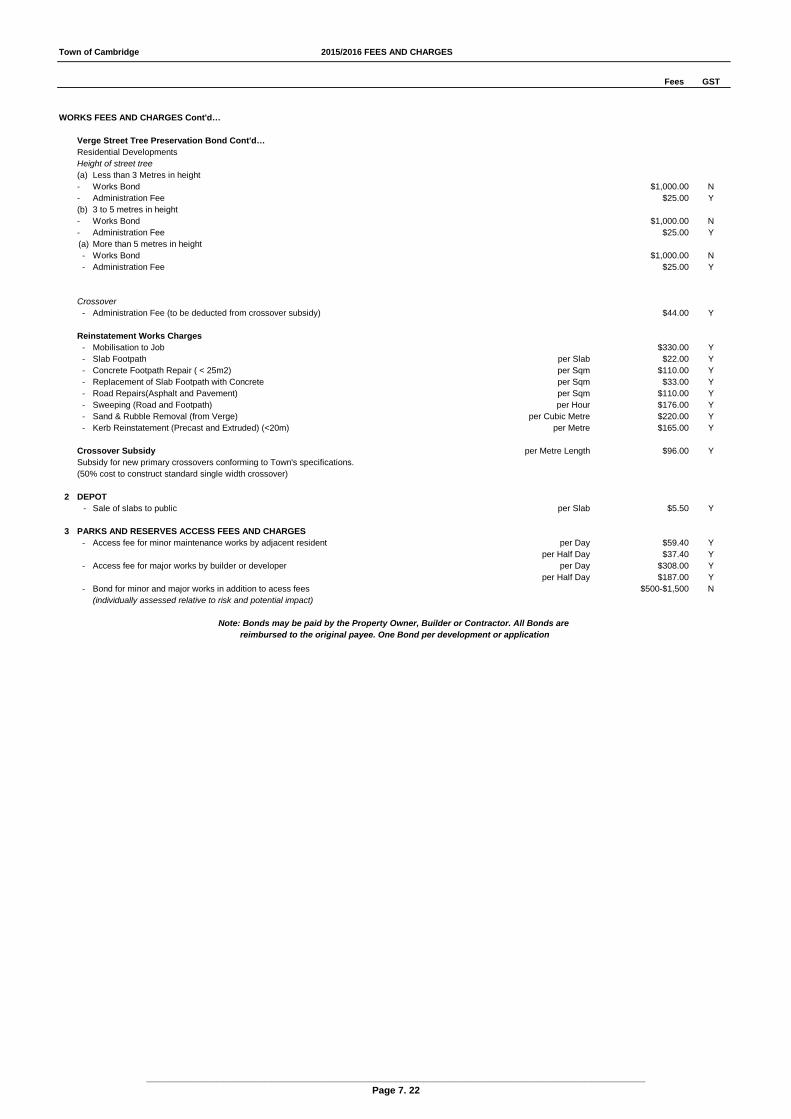
Town of Cambridge 2015/2016 FEES AND CHARGES
Fees GST
WORKS FEES AND CHARGES Cont'd…
Verge Street Tree Preservation Bond Cont'd…Residential DevelopmentsHeight of street tree(a) Less than 3 Metres in height- Works Bond $1,000.00 N- Administration Fee $25.00 Y(b) 3 to 5 metres in height- Works Bond $1,000.00 N- Administration Fee $25.00 Y(a) More than 5 metres in height- Works Bond $1,000.00 N- Administration Fee $25.00 Y
Crossover - Administration Fee (to be deducted from crossover subsidy) $44.00 Y
Reinstatement Works Charges- Mobilisation to Job $330.00 Y- Slab Footpath per Slab $22.00 Y- Concrete Footpath Repair ( < 25m2) per Sqm $110.00 Y- Replacement of Slab Footpath with Concrete per Sqm $33.00 Y- Road Repairs(Asphalt and Pavement) per Sqm $110.00 Y- Sweeping (Road and Footpath) per Hour $176.00 Y- Sand & Rubble Removal (from Verge) per Cubic Metre $220.00 Y- Kerb Reinstatement (Precast and Extruded) (<20m) per Metre $165.00 Y
Crossover Subsidy per Metre Length $96.00 YSubsidy for new primary crossovers conforming to Town's specifications. (50% cost to construct standard single width crossover)
2 DEPOT - Sale of slabs to public per Slab $5.50 Y
3 PARKS AND RESERVES ACCESS FEES AND CHARGES- Access fee for minor maintenance works by adjacent resident per Day $59.40 Y
per Half Day $37.40 Y- Access fee for major works by builder or developer per Day $308.00 Y
per Half Day $187.00 Y- Bond for minor and major works in addition to acess fees $500-$1,500 N
(individually assessed relative to risk and potential impact)
reimbursed to the original payee. One Bond per development or applicationNote: Bonds may be paid by the Property Owner, Builder or Contractor. All Bonds are
____________________________________________________________________________________________Page 7. 22

Town of Cambridge 2015/2016 FEES AND CHARGES
Fees GST
WORKS FEES AND CHARGES Cont'd….
4 SANITATION CHARGES
Waste Service - 120 Litre Bin (General Waste) per Annum $100.00 N - 120 Litre Bin (Ancillary Property) per Annum $250.00 N - 240 Litre Bin (General Waste) per Annum $500.00 N- 240 Litre Bin (General Waste) - Concession per Annum $200.00 N - Exchange 120 Litre for a 240 Litre (General Waste) Each $87.00 N - Exchange 240 Litre for a 120 Litre (General Waste) Each Nil
Recycle Service - 240 Litre Bin (Recycle) (Up to 2 Bins) per Annum Nil - 360 Litre Bin (Recycle) per Annum Nil
Green Waste ServiceGreen Waste Service (Single Residential Properties Only) - 240 litre Green Waste Bin On Application $70.00 N
Additional Bins, Non Rateable and Rate Exempt properties
General Waste Collection - 120 Litre Bin (Side Lift Service) per Annum $200.00 N - 120 Litre Bin (Rear Lift Service) per Annum $210.00 N - 240 Litre Bin (General Waste) per Annum $500.00 N - Supply Additional 240 Litre Bin for General Waste Each $70.00 N - 660 Litre Bin (General Waste) per Annum $980.00 N - 660 Litre Bin (General Waste) per Collection $19.00 N - Supply and Deliver 660 Litre Bin (General Waste) Each $610.00 N
Recyclable Collection - 240 Litre Bin (Recycle) per Annum $48.00 N - 360 Litre Bin (Recycle) per Annum $57.00 N - Supply Additional 240 Litre Bin Each $70.00 N - Supply Additional 360 Litre Bin Each $115.00 N - 660 Litre Bin (Recycle) per Annum $710.00 N - 660 Litre Bin (Recycle) per Collection $14.00 N - Supply and Deliver 660 Litre Bin (Recycle) Each $610.00 N
Green Waste Collection - 240 Litre Bin (Green Waste) per Annum $70.00 N - Supply Additional 240 Litre Bin Each $80.00 N
(Levied under the Local Government Act 1995, Waste Avoidance and Resource Recovery Act 2007 and Health Act 1911, and allocated in accordance with Policies 5.3.1, 5.3.2, 5.3.3 and 5.3.4 on all rateable properties)
____________________________________________________________________________________________Page 7. 23