1 AP42 Section: 10.5 Emission Test Report--Georgia - US ...
590
1 AP42 Section: 10.5 11 Emission Test Report--Georgia- Pacific Springfield Plant, Springfield, Oregon, EM6 Report 81-PLY-4, U. S. Environmental Protection Agency, Research Triangle Park, NC, June 1981. 1997 supplement
-
Upload
khangminh22 -
Category
Documents
-
view
1 -
download
0
Transcript of 1 AP42 Section: 10.5 Emission Test Report--Georgia - US ...

1 AP42 Section: 10.5
11
Emission Test Report--Georgia- Pacific Springfield Plant, Springfield, Oregon, EM6 Report 81-PLY-4, U. S. Environmental Protection Agency, Research Triangle Park, NC, June 1981.
1997 supplement

c I I (I I I I I I I I I I I I I I 1
PLYWDOD/VENEER EMISSION TEST REPORT
GEORGIA-PACIFIC PLYWDOD PLANT SPRINGFIELD, OREGON
JUNE 1 9 8 1
Environmental Consultants, Inc.
P I B Report 81-PLY-4' ESED P r o j e c t 80/02 EPA C o n t r a c t No. 68-02-3543 Work Assignment No. 1 TFC Project No. 1460-E80-51
P repa red for : C.E. Ri ley F,PA/EMB Task Manager
P r e p a r e d by: P e t e r W . K a l i k a , P.E.
Program Manager Eugene A. B r a c k b i l l , P.E.
Work Assignment Manager John H. Powell
P r o j e c t S c i e n t i s t E r i c A. Pearson
P r o j e c t S c i e n t i s t
J a n u a r y 1982
800 Connecticut Blvd. East Hartford, CT 06108 (203) 289-8631
I I ' (1

I I I I I I I I I I I I I I I I I I I
This report has been reviewed by the Emission Standards and Engineering Division, Office of Air Quality Planning and Standards, Office of Air, Noise and Radiation, Environmental Protection Agency, and approved for publication. Mention of company OK product names does not constitute endorsement by EPA. Copies are available free of Charge to Federal employees, current contractors and grantees, and nonprofit organizations - as supplies permit - from the Library Services Office, MD-35, Environ- mental Protection Agency, Research Triangle Park, NC 27711.
Order: FMB Report 81-PLY-4

I I I I I I I I I I I I I I I I I I I
PREFACE
The work described herein was conducted by personnel from TRC - Environ- mental Consultants, Inc., Research Triangle Institute (RTI), Del Green ASSO-
CiateS (DGA) ; CIfpHill, Engineers, Planners, Economists and Scientists;
Pollution Control Science, Inc., (PCS); Georgia-Pacific (G-P) in Springfield,
Oregon; the National Council of the Paper Industry for Air and Stream Improve-
ment, Inc. (NCASI) ; and the United States Environmental Protection Agency
(EPA) Emission Measurement Branch (EMB).
The scope of work was issued under EPA Contract 68-02-3543, Work Assign-
ment 1. The work was performed under the supervision of Eugene A. Brackbill,
P.E., TRC work assignment manager, and John H. Powell, TRC field crew chief.
Robert L. Chessin of RTI monitored process operations and was assisted by
Paul Willhite of DGA. RTI was responsible for preparing Section 3 and Appen-
dix I of this report, both of which deal with process descriptions and opera-
tions. Mark s. Boedigheimer supervised Method 5X analyses performed by
CHpHill. David Robinson supervised Method 25 analysis performed by PCS.
Victor Dallons supervised NCASI sampling and analysis activities as well as
providing helpful suggestions and comments in support of the test program.
Mitch Steffensen and Pete Fetter of Georgia-Pacific, provided invaluable
assistance and guidance to TRC, EPA and RTI in the performance of the test
program. Clyde E. Riley, Office of Air Quality Planning and Standards
(OAQPS), Emission Measurement Branch, EPA, served as task manager and was
responsible for coordinating the test program.
Edwin J. Vincent, OAQPS, Chemical and Petroleum Branch, EPA, served as
project lead engineer. He was also responsible for coordinating and directing
the process operations monitoring.

'I I 1 1 I I I I I I 1 I I 1 I I 1 I
SECTION
1.0 1.1 1.2 1.3
1.3.1 1.3.2 1.3.3
1.4.1 1.4.2 1.4.3 1.4.4 1.4.5 1.4.6
1.4
1.5
2.0 2.1
2.1.1 2.1.2 2.1.3 2.1.4
2.2
2.2.1 2.2.2
2.3.1 2.3.2
2.3
2.4 2.5 2.6 2.7 2.8 2.9
3 . 0 3.1 3.2 3.3 3.4
4 . 0 4.1 4.2 4.3 4.4
TABLE OF CONTENTS
PAGE - PREFACE.. . . . . . . . . . . . . . . . . . . . . . . ii
INTRODUCTION . . . . . . . . . . . . . Background . . . . . . . . . . . . Sumary of Process and Emissions . Applicability of EPA Reference Test EPA Method 5X (Provisional) . . . EPA Method 25 . . . . . . . . . . Comparability of Test Methods . .
Measurement Program Summary . . . . Scrubber Inlet . . . . . . . . . Scrubber Outlet . . . . . . . . . Georgia-Pacific Scrubber System . Fugitive Emissions. . . . . . . . Ambient Air Measurements. . . . . Clean-up Evaluations . . . . . .
Report Sections . . . . . . . . . . SUMMARY AND DISCUSSION OF RESULTS . .
Background and Definitions . . . . Particulate Emissions . . . . . . Condensible Emissions . . . . . . . Noncondensible Emissions . . . . Total Organic Emissions . . . . .
Method 5X - Particulate/Condensible Organics Emission Tests . . . . . Scrubber Inlet. . . . . . . . . . Scrubber Outlet . . . . . . . . .
Method 25 - Total Organic Tests . . Scrubber Inlet. . . . . . . . . . Scrubber Outlet . . . . . . . . .
Visible Emissions . . . . . . . . . Scrubber Operational Summary. . . . Ambient Air Measurements . . . . . Clean-up Evaluation . . . . . . . . Possible Test Interferences . . . .
Summary of Fugitive Emissions . . .
. . . . . . . . . . . . Methods . . . . . . . . . . . . . . . . . . . . . . . . . . . . . .
. . . . . 1-1 . . . . . 1-1 . . . . . 1-2 . . . . . 1-3 . . . . . 1- 3 . . . . . 1-5 . . . . . 1-6 . . . . . 1-7 . . . . . 1-7 . . . . . 1-7 . . . . . 1-8 . . . . . 1-8 . . . . . 1-8 . . . . . 1-9 . . . . . 1-9
. . . . . . . . . 2-1 . . . . . . . . . 2-1 . . . . . . . . . 2-1 . . . . . . . . . 2- 2
. . . . . . . . . 2-2
. . . . . . . . . , 2-2
. . . . . . . . . 2- 3 . . . . . . . . . 2-6 . . . . . . . . . 2-8 . . . . . . . . . 2-13 . . . . . . . . . 2-16 . . . . . . . . . 2-16 . . . . . . . . . 2-21 . . . . . . . . . 2-21 . . . . . . . . . 2-23 . . . . . . . . . 2-23 . . . . . . . . . 2-21 . . . . . . . . . 2-21
PROCESS DESCRIPTION AND OPERATIONS . . . . . . . . . . 3-1 Process Equipment . . . . . . . . . . . . . . . . . . 3-1 Emission Control Equipment . . . . . . . . . . . . . 3-1 Production and Control Equipment Monitoring . . . . . 3-2 Process Operating Conditions During Test Program. . . 3-2
DESCRIPTION OF SAMPLING LOCATIONS . . . . . . . . . . . 4-1 Scrubber Inlet. . . . . . . . . . . . . . . . . . . . 4-1 Scrubber Outlet . . . . . . . . . . . . . . . . . . . 4-1 Scrubber Operational Measurement Locations. . . . . . 4- 5 Fugitive Emissions. . . . . . . . . . . . . . . . . . 4-5

TABLE OF CONTENTS (Continued)
i PAGE - SAMPLING AND ANALYTICAL METHODS . . . . . . . . . . . .
EPA Reference M e t h o d s . . . . . . . . . . . . . . . . p r e l i m i n a r y Measurements . . . . . . . . . . . . . . Measurements f o r P a r t i c u l a t e , Condensible and
Noncondensible Emiss ions . . . . . . . . . . . . . EPA Method 5 x ( P r o v i s i o n a l ) - P a r t i c u l a t e and
Condensible Organic Compounds . . . . . . . . . . EPA Reference Method 2 5 - Condensible and Noncondensible Organic compounds . . . . . . . . .
P r e l i m i n a r y Mois ture Determinat ion. . . . . . . . . . P r e l i m i n a r y velocity Determinat ion . . . . . . . . . vis ib le Emissions . . . . , . . . . . . . . . . . . . p r e s s u r e D K O ~ Measurements . . . . . . . . . . . . . Scrubber S o l u t i o n Samples . . . . . . . . . . . . . . F u g i t i v e Emissions . . . . . . . . . . . . . . . . . Ambient Temperature and R e l a t i v e Humidity . . . . . .
QUALITY ASSURANCE . . . . . . . . . . . . . . . . . . . Method 2 5 . . . . . . . . . . . . . . . . . . . . . . Method 5 x . . . . . . . . . . . . . . . . . . . . . . Method 9 . . . . . . . . . . . . . . . . . . . . . .
5-1 5 - 1 5-2 1
1. 1
5-2
5-2
5-10 5-22 5-22
1 5-23 5-23 5-23 5-24 5-25
6-1
1 6-1 6-3 6-3
SECTION
5 . 0 5 . 1 5 . 2 5 .3
5.3.1
5 . 3 . 2
5.4 5 . 5 5 . 6 5 . 1 5 . 8 5 . 9 5 .10
6.0 6.1 6 . 2 6.3
-iv-
1 1 1 1 1 1 1 1

.I i 'I I 1 I 1 I I I I' I I I 1 I t I I
SECTION
1-1
4-1
4-2
4-3
5-1
5-2
5-5
5-6
5-1
2-la
2-lb
2-2
2-3
2-4
2-5a
2-5b
LIST OF FIGURES
PAGE - Veneer Dryer Exhaust and Scrubber System . . . . . . . 1-4
Veneer Dryer Exhaust and Scrubber System Sampling Locations . . . . . . . . . . . . . . . . . 4-2
Scrubber Inlet Sampling Port Configuration and Traverse Point Locations . . . . . . . . . . . . . . 4-3
Scrubber Outlet Sampling Port Configuration and Traverse Point Locations . . . . . . . . . . . . . . 4-4
Modified EPA Particulate and Condensible Organics Sampling Train . . . . . . . . . . . . . . . . . . . 5-4
Method 25 Sampling Train . . . . . . . . . . . . . . . 5-11
Method 25 Flow Control Assembly Adjustment . . . . . . 5-13
TRC Norunethane Organic Analyzer . . . . . . . . . . . . 5-18
TRC Condensate Recovery and Conditioning Apparatus . . 5-21
LIST OF TABLES
Summary of Method 5X Particulate and Condensible Organic Collection Efficiency for Georgia-Pacific Scrubber System (English Units) . . . . . . . . . . . 2- 4
Summary of Method 5X Particulate and Condensible Organic Collection Efficiency for Georgia-Pacific Scrubber System (Metric Units). . . . . . . . . . . . 2-5
Summary of Method 5X Particulate and Condensible Organic Measurements for Gases Enterin¶ the Georgia-Pacific Scrubber System . . . . . . . . . . . 2- 7
Summary of Method 5X Particulate and Condensible Organic Measurements for Gases Exitinq the Georgia-Pacific Scrubber System . . . . . . . . . . . 2-9
Comparison of Particulate and Condensible Measured Emissions with Calculated Emissions . . . . . . . . . 2-10
Summary of Method 25 Total Organic Collection Efficiency for Georgia-Pacific Scrubber System (English Units) . . . . . . . . . . . . . . . . . . . 2-14
Summary of Method 25 Total Organic Collection Efficiency for Georgia-Pacific Scrubber System (Metric Units). . . . . . . . . . . . . . . . . . . . 2-15
-V-
i

SECTION
2-6
2-7
2-8
2-9
2-10
2-lla
2-llb
2-llc
2-12
LIST OF TABLES (Continued)
Summary Method 25 Individual Total Organic Measurements for Gases Entering the Georgia-Pacific Scrubber System . . . . . . . . . . . . . . . . . . .
Summary Method 25 Individual Total Organic Measurements for Gases Exitinq the Georgia-Pacific Scrubber System . . . . . . . . . . . . . . . . . . .
Summary of Method 25 Individual Total Organic Trap, Tank Measurements for Gases Entering the Georgia-Pacific Scrubber System . . . . . . . . . . .
Summary of Method 25 Individual Total Organic Trap. Tank Measurements for Gases Exitinq the Georgia-Pacific Scrubber System . . . . . . . . . . .
Georgia-Pacific Scrubber System Operational Data Summary . . . . . . . . . . . . . . . . . . . .
Fugitive Emission Summary . . . . . . . . . . . . . . . Fugitive Emission Summary . . . . . . . . . . . . . . . Fugitive Emission Summary . . . . . . . . . . . . . . . Method 5X Clean-up Evaluation Results . . . . . . . . .
PAGE -
2-1 7
2-18
2-19
2-20
2-22
2-24
2-25
2-26
2-28
I 1 I I 1 I t 1 I I I I
-vi-
I I I I I 1 1

1 I I 'I I 1 I I I .I 1 I' I I I I I I I I I
1
APPENDICES
A A . l A.2
B 8.1 B.2
C c.1
c.1.1 c . 1 . 2
c . 2 . 1 c . 2 . 2
C.3 .1 C.3.2
c . 2
c.3
c . 4
D D . l D.2 D.3 D.4 D.5 D.6
D.6.1 D.6.2
D.7
E E . l E.2 E .3 E.4 E.5 E.6
F F . l F .2 F.3 P.4 F.5
G G . l
G . l . l G . 1 . 2
TRBLE OF CONTENTS
SUMMARY OF TEST DATA EPA Method 5 X - R e s u l t s EPA Method 2 5 - R e s u l t s
SAbPLE EQUATIONS AND CALCULATIONS EPA Method 5 X EPA Method 2 5
FIELD DATA SHEETS EPA M e t h o d s 1, 2 and 5 X
Scrubber I n l e t S c r u b b e r O u t l e t
TW: Data NCMI Data
TRC Data NCASI Data
Scrubber Solut ion S a m p l e C o l l e c t i o n
EPA Method 25 - S c r u b b e r I n l e t
EPA Method 2 5 - S c r u b b e r O u t l e t
P r e s s u r e Drop Measurements and
SAMPLING LOGS Dai ly Summary M g Sampling Task Log Method 5x - Sample I.D. Log Chain of C u s t o d y Forms For Method 5 X and Method 2 5 - Samples Crew C h i e f F i e l d O p e r a t i o n s Log F i e l d L a b o r a t o r y Log
EPA Method 5X EPA Method 2 5
Method 5X - Operators F ie ld Mg
CALIBRATION DATA Summary of E q u i p m e n t Used D u r i n g T e s t i n g Orif ices , Dry Gas Meters and DGM T h e r m o c o u p l e s P i t o t Tubes N o z z l e s EPA Method 2 5 - Flow C o n t r o l R e g u l a t o r s C a l i b r a t i o n Gases
SAMPLING AND ANALYTICAL PROCEDURES EPA Methods 1, 2 , 4 , 5 a n d 5X E P A Method 2 5 as used by TFC EPA Method 2 5 as u s e d b y NCASI Scrubber S o l u t i o n A n a l y s i s EPA Method 2 2 - F u g i t i v e Emissions
LABORATORY ANALYSIS DATA EPA Method 5 X - Data
Data Summary L a b o r a t o r y Data a n d No tebook
-vii-

TABLE OF CONTENTS (CONTINUED)
APPENDICES (CONTINUED)
6 . 2 G . 2 . 1 G. 2 . 2 G. 2 . 3 G. 2.4
G. 3
H
I
J
K K.l K. 2 K.3
EPA Method 2 5 - Data Data Summaries TRC Laboratory Data and Notebook NCASI Laboratory Data and Notebook PCS Laboratory Data and Notebook
Scrubber Solution Data
CLEAN-UP EVALUATION RESULTS
PROCESS OPERATIONS
PROJECT PARTICIPANTS
SCOPE OF WORK Work Assignment Site Test Plan Associated Correspondence
-viii-
I I 1 1 1 I' I I I I I I I I I I I --

1 1'1 I I I 1 I 1 1 1 I 1 I 1 1 I I I I
I\
1.0 INTRODUCTION
1.1 Background
Section 111 of the Clean Air Act of 1970 Charges the administrator of the
United States Environmental Protection Agency with the responsibility of
establishing Federal Standards of Performance for New Stationary Sources
(SPNSS) that may significantly contribute to air pollution. When promulgated,
these standards of performance for new stationary sources are to reflect the
degree of emission limitation achievable through application of the best dem-
onstrated emission control technology. mission data collected from con-
trolled sources in the plywood industry will provide a portion of the database
used by EPA to develop SPNSS.
EPA's Office of Air Quality Planning and Standards selected the Georgia-
Pacific (G-P) plywood plant in Springfield, Oregon, as a site for an emission
test program because it is considered to employ process and emission techno-
logy representative of modern plywood manufacturing plants.
The test program was designed to determine the emission rate of particu-
late matter and condensible and noncondensible organic material emitted from
the veneer drying operation. A second objective was to measure the collection
efficiency of the Georgia-Pacific scrubber system for condensible and non-
condensible organic emissions.
TRC - Environmental Consultants, Inc. was retained by the EPA Emissions
Measurement Branch (EMB) to perform emission measurements at the G-P plywood
plant in Springfield, Oregon. Testing was performed during the week of June
8, 1981 on the veneer dryer emissions and their pollution control, a G-P
scrubber system. This report has been prepared in accordance with EPA Con-
tract No. 68-02-3543 under the provisions of Work Assignment No. 1.
I 1-1
I

The Research Triangle Institute (RTI), the New Source Standard (NSS) con-
tractor, was responsible for coordinating the overall test program with G-P
personnel and €or assuring that process and control equipment operating con-
ditions were suitable for testing. A l l process data were monitored and
recorded by RTI. Fugitive emissions from the veneer dryers, ambient air tem-
perature and relative humidity were monitored and recorded by RTI.
Additional testing for total organic compounds was performed by the
National Council of the Paper Industry for Air and Stream Improvement, Inc,
(NCASI) simultaneously with the TRC test program. This testing was performed
at the request of the American Plywood Association (APA) for research purposes
and to provide an additional measure of quality assurance.
1.2 Summary of Process and Emissions
The G-P Springfield plant is a combination veneer and lay-up facility, and
is considered to employ process and emission control technology representative
of modern plywood manufacturing plants. The plywood production rate for the
drying operation is approximately 800 ,000 square feet (3/8-inch basis) per
24-hour day.
The veneer drying operation begins after the veneer has been peeled from
the log at the lathe operation and is transferred to the drying operation.
Here, the veneer is continuously hand-fed onto the dryer feed conveyor and
into the dryer. The purpose of the operation is to thermally drive the mois-
ture out of the veneer in preparation for the lay-up and laminating operations
which follow. During the drying operaion, organic compounds are driven out of
the veneer. These organic compounds are the emissions of interest.
1- 2
1 I I I 1 I 1 I t I I I I I I I I I 1

i l 1 I I 1 I I I 1' I I I I I I I I 1
The G-P Springfield plant has four veneer dryers. Each is a s t e m heated,
multideck unit, with the number of drying zones varying. Each dryer has two
exhausts from the heated zones, except dryer 4, which has three exhausts. The
nine exhausts are ducted to a common manifold which carries the dryer emis-
sions to the G-P scrubber system. A schematic drawing of the veneer dryer
exhaust system is presented in Figure 1-1.
1.3 Applicability of EPA Reference Test Methods
EPA is required to publish a national reference test method for each reg-
ulated source category and pollutant for which a New Source Performance
Standard (NSPS) is established. Reference test methods are usually specified
by a State regulatory agency during the State Implementation Planning process
and may be different from national reference test methods.
The purpose of establishing a national reference test method is to ensure
that emission data collected from a specific source is representative of that
source and Comparable to data collected at other designated sources. The pri-
mary purpose of this test program was to collect emission data using standard-
ized test methods which allow the data to be evaluated to develop a national
SPNSS. Two different test methods were selected by EPA to measure emissions
from plywood veneer drying operations. These methods are briefly described in
the following subsections and are described in detail in Section 5.
1.3.1 EPA Method 5 X (Provisional)
Provisional Method 5 X is similar to the Oregon Department of Environmental
Quality (ODEQ) Method 7 used to measure condensible organic emissions. EPA
Method 5X measures particulate matter and condensible organic matter. 'Par-
ticulate matter" is defined as any finely divided solid OK liquid material,
1-3

Dryer 3 d Dryer 2
F igu re 1-1. Veneer Dryer Exhaust and Scrubber System Georg ia -Pac i f i c Plywood P l a n t S p r i n g f i e l d , Oregon
1-4
I I I I I I I I I I 1 1 I I I I (1 I 1 -

I ' I 1 1 I I 1 I 1 I I I I I 1 I I' I I
other than uncombined water, that condenses at or above the filtration temper-
ature range of 350 +25OF (177 2 1 4 C), and is collected by the probe and
filter (front half of the sampling train). "Condensible organic matter" is
defined as any material remaining after extraction, filtration and ambient
evaporation of the ether-chloroform extract of the impinger portion of the
sampling train. Particulate matter and condensible organic matter are quanti-
fied gravimetrically and results are expressed as the mass of collected mater-
ial.
0
The purpose of the 35OoF filtration temperature is to precondition the
Method 2 5 slipstream sample being withdrawn from the Method 5X sample stream.
This temperature was selected on the basis of average veneer dryer operating
temperatures throughout the industry. This temperature condition excludes
from the Method 2 5 samples only matter than can condense at or above 350 F.
It does not affect Method 5X results because the remaining sample is caught in
the condenser portion of the train.
0
1 . 3 . 2 EPA Method 2 5
EPA Reference Method 2 5 , as promulgated in the October 3, 1 9 8 0 Federal
Register (volume 1 4 5 , no. 1 9 4 , 6 5 9 5 9 ff.), applies to the measurement of
organic compounds as total gaseous nonmethane organics (TGNMO). Emissions are
expressed as equivalent carbon (C1) mass. Method 2 5 sample fractions are
separated by a gas chromatographic column, oxidized to carbon dioxide (a2),
and reduced to methane (CH ) prior to analysis by flame ionization detector
( F I D ) . Since all the sample organic compounds are reduced to CH the pro-
blems associated with the variable FID response characteristic for different
organic compound structures is eliminated. This allows comparison of emission
data on a uniform C basis. Method 2 5 is discussed in greater detail in
Section 5 of this report.
4
4 '
1
1- 5

Major procedural modifications made to Method 25 were required to measure
accurately emissions from plywood veneer drying facilities. These modifica-
tions are discussed in Section 5. An additional condensate trap immersed in
water ice was placed in the sampling train ahead of the standard dry ice im-
mersed condensate trap. The purpose of the additional trap is to condense
moisture that would freeze in the dry ice immersed trap and cause a premature
sample flow stoppage. In this manner gas stream moisture content, which may
range from 30 to 60 percent by volume, may effectively be reduced to 3 percent
or less before entering the dry ice immersed trap.
The use of the Method 5X sampling train as a sample preconditioner also
represents a major modification. In addition to the 350°F sample stream
temperature, isokinetic sample extraction from the source using Method 5X was
also deemed necessary to obtain a representative Method 25 sample. This is
particularly the case when moisture-saturated gas streams, such as those
following wet scrubbing devices, are being sampled. Entrained water droplets
may contain organic materials that would not be collected using the normal
Method 25 constant sampling rate procedure.
1.3.3 Comparability of Test Methods
Methods 5X and 25 are not related and measured results can not be compared
under any circumstances. Condensation temperatures difEer by more than
100°F between the two methods, and consequently different condensible com-
pounds are collected by each method. In addition, it has been demonstrated
that Method 5X has limited collection capabilities for organic compounds with
high-vapor pressures. A loss of organic material is experienced even during
normal Method 5 X sample recovery and analysis operations.
1-6
1 l1 1 I I 1 I I I I I I I I I I 1, (I I 1

P I 1 1 I I I I 1 I t I I I 1 I I I I
1.4 Measurement Program Summary
The measurement program was conducted at the G-P Springfield facility dur-
ing the week of June 8, 1981. The emission tests were designed to measure the
veneer dryer organic emissions and to determine the collection efficiency of
the G-P scrubber system for those emissions. Tests were performed at the
veneer dryer exhaust duct (scrubber inlet) and at the outlet of the scrubber
system.
A l l emission testing was performed by TRC and NCASI personnel. RTI per-
sonnel monitored process operating conditions, while DGA personnel monitored
fugitive emissions, ambient temperature and relative humidity. Scrubber oper-
ational data and solution samples were collected by TRC personnel.
1.4.1 Scrubber Inlet
Preliminary Measurements
Preliminary testing was performed on June 8 to determine volumetric flow rate and stack gas moisture content.
Method 5X - Particulate and Condensible Orqanics Tests Three Method 5 X tests were performed, one each on June 9, 10, and 11. con- currently with tests performed at the Scrubber outlet.
Method 25 - Total Organic Tests Eighteen Method 25 samples were taken at this location concurrently with the Method 5 X tests performed. Six Method 25 samples were taken concur- rently with each Method 5X test.
1.4.2 Scrubber Outlet
Preliminary Measurements
Preliminary tests were performed on June 8 to determine volumetric flow rate and stack gas moisture content.
Method 5X - Particulate and Condensible Organics Tests Three Method 5X tests were performed at this location, one each on June 9, 10, and 11 concurrently with tests performed at the scrubber inlet.
1-7

Method 25 - Total Organic Tests Eighteen Method 2 5 samples were taken at this location concurrently with the Method 5X samples (six per test run), and simultaneously with Method 2 5 samples taken at the scrubber inlet.
Method 9 - Visible Emissions Scrubber outlet visible emissions were not monitored as planned because of overcast sky background conditions. The scrubber outlet plume was bluish- white and was therefore indistinguishable from the overcast sky. Overcast skies were present on June 8, 9 and 10. During the last test day, June 11, the sky began to clear and only scattered clouds were present in the afternoon. However. the final test sequence was nearly completed by this time. Consequently, no visible emission observations were recorded.
Although the scrubber outlet stack had an attached steam plume, the Method 9 observations were not cancelled because of this condition. The method provides for attached steam plumes by requiring that observations be made at the point where the condensed water vapor is no longer visible.
1.4.3 Georqia-Pacific Scrubber System
Static pressure upstream and downstream of the system induced draft €an
was measured with U-tube water manometers and recorded at 30-minute inter-
vals. These measurements were used to calculate pressure drop (AP) across
the scrubber system.
Scrubber solution samples were taken every 30 minutes during the scrubber
Outlet Method 5 X test period. One-hundred-ml samples were collected from the
scrubber recirculation tank every 30 minutes during each test. The individual
samples collected during each test were composited for analysis.
1.4.4 Fugitive Enissions
Fugitive emissions from the veneer dryers were monitored by DGA during
each Method 5X test.
1.4.5 Ambient Air Measurements
Ambient air temperature and relative humidity were monitored and recorded
by DGA at the beginning and end of each Method 5 X test. 1-8
I 1 I I 1 I 1 I I I 1 I t I I 1 (1 I 1 -

I I 1 I I 1 I I 1 t I I I I 1 I I I I
1.4.6 Clean-up Evaluations
Prior to any emission testing, two Method 5X sampling trains were prepared
and charged, ready to perform a test. The unexposed trains were then cleaned
according to the method and samples recovered. The samples were analyzed to
establish background and/or contamination levels from the .sample collection
equipment.
1.5 Report Sections
The remaining sections of this report present the Summary and Discussion
of Results (Section 2), Process Description and Operations (Section 3),
Description Of Sampling Locations (Section 4). Sampling and Analytical Pro-
cedures (Section 5) , and Quality Assurance (Section 6). Descriptions of
methods and procedures, field and laboratory data, and calculations are pre-
sented in various appendices as noted in the Table o€ Contents.
1-9

I 1 1 I I I I I 1 I I B I t 1 I I I I
2 . 0 SUMMARY AND DISCUSSION OF RESULTS
A summary of all emission measurements and collected data is presented in
this section. Section 2.1 provides a brief background discussion and defini-
tions of measured parameters. Section 2.2 presents Method 5X particulate/
condensible organics results with a complete breakdown and discussion of par-
ameters at both sampling sites. Method 25 total organic emission results are
described in detail in Section 2.3, which includes a discussion of emissions
at both sampling sites as well as a breakdown of major analytical data.
Section 2.4 discusses visible emissions ObSeKVatiOnS. A summary of Scrubber
operational data is presented in Section 2.5. Fugitive emissions are dis-
cussed in Section 2.6. A summary of ambient air measurements is presented in
Section 2.7 . A full discussion of the Method 5 X clean-up evaluation and
results may be found in Section 2.8 .
2 . 1 Background and Definitions
The test program was designed t me
and noncondensible organic material emitted
particulate matter, condensible
from veneer dryers, and to deter-
mine the collection efficiency of the G-P Scrubber system as a control for
those emissions.
2.1.1 Particulate missions
Particulate emissions are defined as any finely divided solid OK liquid
matter, other than uncombined water, that condenses at or above 350 +25 F
( 1 7 7 214 C) and is collected in the probe and filter (front half) of the
Method 5X sampling train.
0
0
2 - 1
~

2 . 1 . 2 Condensible Emissions
Condensible emissions are defi
~~ ~~~
differently in Methods 5X and 25.
Although called by the same name, these two sample fractions differ signifi-
cantly in content and composition and may not under any circumstances be com-
pared.
Method 5X condensibles are collected in glass impingers containing deion-
ized distilled water and immersed in a water ice bath, and on a back-up filter
following those impingers. Any material remaining after extraction, filtra-
tion and ambient evaporation of the impinger solution, plus any material
collected on the desiccated back-up filter, is defined as condensible organic
matter. Quantification of this matter is done gravimetrically.
Method 2 5 condensibles are collected in two stainless-steel traps, one
immersed in water ice followed by another packed in dry ice. Material
collected in the traps is oxidized, reduced and analyzed by flame ionization.
Results are expressed as a concentration of carbon (C1).
2.1.3 Noncondensible Emissions
Noncondensible emissions are measured by Method 2 5 only and are those that
pass through both ice traps to the evacuated sample tank at the end of the
Method 2 5 train. These samples are oxidized, reduced and analyzed by PID.
Results are expressed as concentrations of carbon (C1).
2.1.4 Total Organic Emissions
Total organic emissions are those collected by the complete Method 2 5 sam-
pling train drawing a preconditioned sample slipstream from a Method 5X
train. These emissions include condensible and noncondensible emissions as
defined above.
2-2
1 I 1 I 1 I I t I t 1 I 1 1 I 1 I 1 1 -
'1 1 8 1 II I 1 I 1 I I I 1 I I I I I t
2.2 Method 5X - Particulate/Condensible Organics Emission Tests
A summary of Method 5X data collected at the scrubber inlet and outlet is
presented in Tables 2-la (English units) and 2-lb (metric units). These
tables include relevant emission data: stack gas temperature, moisture con-
tent and volumetric €low rate; veneer dryer production rate; and a summary of
the total measured particulate/condensible emissions by concentration, mass
emission rate, and emission rate per unit production.
Emission data are presented for the three test series. Testing was per-
formed concurrently at the scrubber inlet and outlet. missions at the Scrub-
ber inlet averaged 18.3 lbs/hr (8.29 kg/hr) or 0.53 lbs/1000 Et' veneer on a
3/8-inch basis (2.56 kg/1000 inr on 9.5 m basis) for the three tests.
missions from the scrubber outlet averaged 14.9 lbs/hr (6.77 kg/hr) or 0.43
lbs/1000 ft' veneer (2.10 kg/lOOO m') for the three tests. The concentra-
tions of the emissions from the two sources, however, differed markedly. The
average Scrubber inlet concentration was 0.164 gr/DSCF (0.376 g / N ' ) , while
the scrubber outlet averaged only 0.103 gr/DSCF (0.236 g/NM') for the three
tests.
The removal efficiency of the G-P scrubber system for particulate/
condensible organics averaged 16.4 percent for the three tests. Efficiencies
ranged from 29 percent during test 1 to 6 percent during test 3.
Detailed summaries of this test data are presented in Sections 2.2.1 and
2.2.2 and in Appendix A. Sample equations and calculations are presented in
Appendix B. Field data sheets appear in Appendix C. Sampling logs and sum-
maries are shown in Appendix D. Calibration data for the Method 5x sampling
train are found in Appendix F. Laboratory analysis data are presented in
Appendix G.
2- 3

c 0 m
3
u 9
n. 3
2-4
1 I 1 I I I I I I I 1 I I 1 I I I I 1

I 1 II 1 I t I I 1) I I I 1 I I I
c
0 .n
c c yl
,
2-5

0
2.2.1 Scrubber Inlet
R summary of Method 5X data collected at the Scrubber inlet is presented
in Table 2-2. Data presented include sample volume; stack gas flow rate, tem-
perature, and moisture content; isokinesis for each test; veneer prduction
rate; front half (particulate) and total (particulate/condensible) emissions.
Tests 1, 2 and 3 were performed at the Scrubber inlet on June 9, 10, and
11, respectively. Measured particulate emissions ranged from 0.77 to 2.93
lbS/hr (0.02 to 0.08 lbs/lOOO ft’ veneer), averaging 1.83 lbs/hr (0.05
lbs/1000 ft’ veneer). Total particulate/condensible emissions ranged from
13.4 to 23.0 lbs/hr (0.39 to 0.64 lbs/lOOO ft’ veneer) for an average of
18.3 lbS/hr (0.53 lbs/1000 ft’ veneer). Particulate matter accounted for
approximately 10 percent of the total sample weight while the remaining 90
percent of the catch was condensible organics.
Measured particulate grain loadings averaged 0.016 gr/DSCF for tests 1, 2
and 3; ranging from 0.007 to 0.025 gr/DSCF. Total particulate/condensible
grain loadings ranged from 0.124 to 0.198 gr/DSCF, for a threetest average of
0.164 gr/DSCF. The bulk of the total emission concentration was accounted for
by condensible organics (90 percent).
0 The average stack gas temperature was 309 F with an average moisture
content of 32.6 percent. Moisture content varied from 31.8 percent to 34.0
percent over the three tests. The average stack gas flow rate was 12,300
DSCFM and did not vary significantly among the three tests.
Isokinesis averaged 109 percent for the three tests performed. Isokinesis
for test 1 was 116.5 percent due to a nomograph calculation error, while test
2 was high at 111.4 percent due to a higher than expected gas stream moisture
content. Isokinesis was acceptable for test 3 at 99.2 percent. Leak checks
were performed at the conclusion of each test and leak rates were acceptable
at less than 0.02 cfm.
2-6
- 1 I t I I I 1 I I I 1 I I 1 I I t I 1

I I I I 1 I t I 1 1 I 8 I 1l I I 8 1 I
9 c c n
w c
c N - c Ln n
u n n m
N O ? ?
D -
2 o . o l
0
2 - 7

The mass emission rates for tests 1 and 2 were recalculated using the area
ratio method because of the unacceptable anisokinetic conditions. The results
are presented in Table 2-4 and are only slightly higher than those obtained
from the concentration method, which is the normal approach. This result is
' probably due to the small percentage of particulate matter in the gas stream
which would escape collection by the sampling nozzle under superisokinetic
sampling conditions. An explanation of the area ratio method for calculating
mass emission rates is presented in Section 5.3.1.4 of this report. Mass
emission rates presented in Tables 2-1 and 2-2 represent the average of the
two calculation methods for tests 1 and 2.
2.2.2 Scrubber Outlet
A summary of Method 5X data collected at the scrubber outlet is presented
in Table 2-3. Data presented include sample volume; stack gas flow rate, tem-
perature, and moisture content; isokinesis for each test; veneer production
rate: front half (particulate) and total (particulate/condensible) emissions.
Three emission tests were performed at the scrubber outlet. Testing was
performed concurrently with tests at the scrubber inlet on June 9, 10 and 11.
Measured particulate emissions for tests 1, 2 and 3 ranged from 2.59 (0.08
lbs/100 ft') to 3.70 lbs/hr (0.11 lbs/1000 ft'l, averaging 3.20 lbs/hr
(0.09 lbs/1000 ft' veneer). Total measured particulate/condensible
emissions ranged from 12.6 lbs/hr (0.37 lbs/1000 ft') for test 3 to 16.3
lbs/hr (0.46 ~lbs/lOOO ft') for test 1. The average total emission rate was
14.9 lbs/hr (0.43 lbs/lOOO ft* veneer). Particulate material collected
during these three tests accounted for approximately 21 percent of the total
emissions on the average, while the remaining 79 percent was condensible
organics.
2- 8
t I I I I I I 1 1 1 I I I 1 1 I t 1 I

P I I 1 1 I I 1 1 1 I t I 1 I P I t I
o ̂
" 2
V I 0
- m . . c
c n
0 0 *I Io - c -
n
n n VI
n n 0
0
O N
0
n m 0
* d YI n
- - 0 n
Io
c Y) n
m Io m N
n 0 - 0
Y 0 c n
c
c n
0 0
Io - *
'4 - Io
VI n 0
0
m D
0
- Io m 0
0
0 0 VI e "
. - n
m Y)
n
v) c 0
0
c 0 - 0
n m n
0 0 N VI -
I
0 n
n
c VI I*
m Io VI
*I n 0
0
n m
0 9
VI
I
0
-
e
0 0 0 * - a n .
Y Y
0 0 0 I
2 n I
D
ij k D
Y c (Y e &
r " Y 10
2-9

TABLE 2-4
COMPARISON OF PARTICULATE AND CONDENSIBLE MEASURED EMISSIONS WITH CALCULATED EMISSIONS
(Concentration Method VS. Area Ratio Method)
GeOKgia-PaCifiC Plywood Plant, Springfield, Oregon
Emission Rate (lbs/hr) Concentration Area-Ratio
Sample No. Sample Fraction Method Method AveKage
5X-1-Inlet Front half 2.69 3.16 2.93 (%I* = 116.5) Back half 18.4 21.6 20.0
Total 21.1 24.8 23.0
5X-2-Inlet Front half 1.67 1.88 1.78 (%I* = 111.4) Back half 15.7 17.7 16.7
Total 17.4 19.6 18.5
SX-1-Outlet FKont half 2.98 3.59 3.30 (%I* = 120.4) Back half 12.0 14.5 13.3
Total 15.0 18.1 16.3
5X-3-Outlet Front half 3.51 3.89 3.70 (#I* = 111.3) Back half 8.39 9.30 8.85
Tot.al 11.9 13.2 12.6
isokinesis
2-10
I I I I f I I I t I I t I I I 8 I I 1

I I 1 1 1 '1 I I II 1 il t I 1 1 I I 1 I
P a r t i c u l a t e g r a i n l o a d i n g s measured a t t h e scrubber o u t l e t averaged 0.022
gr/DSCF f o r these t e s t s , ranging from 0.017 gr/DSCF to 0.025 gr/DSCF. Tota l
g r a i n loadings (particulate/condensible) ranged from 0.086 to 0.115 gr/DSCF,
averaging 0.103 gr/DSCF f o r t h e t h r e e tests.
The average s t a c k g a s temperature measured dur ing t h e t h r e e tes ts was
167OF. The measured moisture c o n t e n t of t h e g a s s t ream averaged 38.5 per-
cent f o r the t h r e e tests with s l i g h t v a r i a t i o n .
The moisture c o n t e n t of t h e g a s stream as measured dur ing each tes t
exceeded s a t u r a t i o n a t t h e measured temperature . T h i s phenomenon was n o t
s u r p r i s i n g since e n t r a i n e d water d r o p l e t s were observed i n t h e g a s stream by
TFC and EPA personnel . I n accordance w i t h EPA Method 4 , t h e g a s Stream
moisture c o n t e n t was r e c a l c u l a t e d assuming s a t u r a t i o n o f t h e g a s s t ream a t the
average s t a c k g a s temperature f o r each 'test. An e x p l a n a t i o n of t h i s procedure
is presented i n S e c t i o n 5.3.1.4. Recalcu la ted g a s s t ream mois ture c o n t e n t s
ranged from 3 7 . 4 p e r c e n t f o r tes ts 1 and 2 t o 39.3 p e r c e n t for t e s t 3, averag-
ing 38.0 percent . T h e s e s a t u r a t i o n mois ture v a l u e s were c a r r i e d through t h e
remainder o f the emission c a l c u l a t i o n s .
Measured s t a c k g a s flow r a t e s ranged from 15,200 DSCFM ' to 17,500 DSCFM,
averaging 16,300 DSCFM. The average o u t l e t stack gas flow r a t e was measured
to be approximately 25 percent g r e a t e r than t h a t measured e n t e r i n g t h e
scrubber system. One reason f o r t h e d i f f e r e n c e i n the flow r a t e measurements
may be l e a k s w i t h i n the system (around s p r a y nozz les , i n t h e cyclone ductwork,
and before the f a n ) which would draw ambient a i r i n t o the s y s t e m . Another
reason may be the i n h e r e n t inaccuracy of EPA Method 2 a t s t a c k g a s velocities
o f approximately 500 f e e t per minute (fpm). A t h i r d p o s s i b l e reason i s wind
i n t e r f e r e n c e . S i n c e sampling was performed only 9 f e e t from t h e t o p of a 9
f o o t i . d . s t a c k , even a small g u s t of w i n d . c r e a t e d turbulence w i t h i n t h e
2-11

duct. Momentary negative flow rates were indeed observed during the test pro-
gram. These reasons may account for the differences between the measured
inlet and outlet flow rates as well as the wide variation in measured flow
rates from test to test.
Isokinesis was acceptable only for test 2 at 102 percent. Isokinesis was
unacceptable for tests 1 and 3 at 120.4 percent and 111.3 percent, respective-
ly. The average isokinesis for the three tests performed was 111.3 percent.
Varying stack gas moisture content was a major factor affecting the unaccept-
able isokinetic conditions. The preliminary determination indicated 15.8 per-
cent moisture, but measured moistures were more than twice this during the
subsequent tests. It was later discovered that different grades of veneer
with varying moisture contents were dried throughout the test program, as
shown in Table 3-1.
The mass emission rates for tests 1 and 3 were recalculated using the area
ratio method because of unacceptable superisokinetic conditions. The results
are presented in Table 2-4 and are only slightly higher than those obtained
from the concentration method, which is the normal approach. This fact is
probably due to the small percentage of particulate matter in the gas stream
which would escape collection by the sampling nozzle under anisokinetic sampl-
ing conditions. An explanation of the area ratio method for calculating mass
emission rates is presented in Section 5.3.1.4 of this report. Mass emission
rates presented in Tables 2-1 and 2-3 are the average of the two calculation
methods for tests 1 and 3. Leak checks were performed at the conclusion of
each test and leak rates were acceptable at less than 0.02 cfm. Some diffi-
culty was encountered maintaining probe and filter outlet temperatures at 350
- +25 F during these tests. Further discussion is presented in Section
5.3.1.1.
0
2-12
I I t 1 T 1 I 1 I I I t I I I f I 1 It

I I 1 1 t I 8 I 1 I 1 1 I I d I t 1 I
2.3 Method 25 - Total Organic Tests A summary of the Method 25 total organic data (condensible and nonconden-
sible) collected at the scrubber inlet and outlet is presented in Tables 2-5a
(English units), 2-5b (metric units). These tables include TRC, PCS, and
NCASI average emission data: stack gas flow rate, moisture content and tem-
perature; veneer drying production rate, and a summary of the total organic
emissions by concentration, mass emission rate, and emission rate per unit
production. A11 emissions are expressed as carbon (C1). "3.51 calculates
the emission rate as lbs/hr equivalent methane (CH4) instead of carbon
(CL). Their data in the tables have been converted to lbs/hr C1 to
present the data on a consistent basis, conforming with Method 25.
~ - - - ~- - -
Emission data are presented for the three test series. Testing was per-
formed simultaneously at the scrubber inlet and outlet on June 9, 10 and 11.
Total organic emissions entering the Scrubber system ranged from 23.8 lbs/hr
(10.6 kg/hr) or 0.67 lbs/lOOO ft' veneer (3.20 kg/1000 m') to 35.8 lbs/hr
(16.2 kg/hr) or 1.05 lbs/lOOO Et' (5.10 kg/1000 m'), averaging 30.2 lbs/hr
(13.6 kg/hr) or 0.87 lbs/lOOO ft2 veneer (4.22 kg/1000 m'). missions
exiting the scrubber system ranged from 30.9 lbs/hr (13.8 kg/hr) to 43.6
lbs/hr (19.6 kg/hr) or 1.22 lbs/1000 ft' (5.87 kg/lOOO m') for an average
emission rate of 38.8 lbs/hr (17.5 kg/hr) or 1.12 lbs/1000 ft' veneer (5.39
kg/1000 in'). The collection efficiency of the system was measured to be
less than zero for tests 1 and 2 and 13.7 percent for test 3. The average
collection efficiency of the scrubber system was less than zero.
Detailed summaries of these test data are presented in Sections 2.3.1 and
2.3.2, and in Appendix A. Sample equations and calculations are presented in
Appendix B. Field data sheets appear in Appendix C. Sampling logs and sum-
maries are shown in Appendix D. Laboratory analysis data are presented in
Appendix G.
2-13

YI
n
- m o r . m n . n n . n . - 0 1 3 -
0 "
2-14
1 8 1 1 t 1 1 I 1 1 I t
' I 1 t I I I I

1 t I 1 I 1 t I I I I 1 I 1 1 'I I 1 I
E 0 m
0 z
I 0 0
W P e n
. .
m n . n n .
n . e n
- 0 n . - n
n
I . e n m m c n
. .
I c c c e e m
. .
e ? . . - 0 . a - 0
2-15

2.3.1 Scrubber Inlet
A summary of Method 25 condensible and noncondensible organics data
collected at the scrubber inlet is presented in Tables 2-6 and 2-8. Table 2-6
shows relevant emission data and presents total organic emissions calculated
by TRC, PCS, and NCASI as concentration, mass emission rate, and emission rate
per unit production. Table 2-8 presents a breakdown of the total organic
emissions into condensible and noncondensible organics as analyzed by the
three laboratories. In addition, individual sample train analyses results are
shown. The relative standard deviation between the paired sample trains is
also presented.
Emissions of carbon (5) from the scrubber as analyzed by TRC, PCS and
NCASI showed good overall correlation. The precision of the test data between
paired samples (relative
averaging 19.8 percent RSD
2.3.2 Scrubber Outlet
A summary of Method
collected at the scrubber
standard deviation-RSD) was excellent overall,
for the three laboratories involved.
25 condensible and noncondensible organics data
outlet is presented in Tables 2-7 and 2-9. Table
2-7 shows relevant emission data and presents total organic emissions calcula-
ted by TRC, PCS and NCASI as concentration, mass emission rate, and emission
rate per unit production. Table 2-9 presents a breakdown of the total organic
emissions into condensible and noncondensible organics as analyzed by the
three laboratories. In addition, individual sample train analyses results are
shown. The relative standard deviation between paired sample trains is also
presented.
Emissions of carbon (cl) from the scrubber as measured by TRc and NCASI
showed good correlation. The average emissions calculated by TRC were
slightly greater than those calculated by NCASI and PCS. There is no apparent
2-16
I I I I 1 1 : 1 I 8 I II I 1 I I I I I
~

0 0
n 9 -
r % Y 111
r x Y 111
m N
0
n
0
I*
0
m n
0
c *I
0
c c
0
- n
0
0 n
0
n n 0
w n
0
m I
0
n n 0
c7
!7 0 . D
2-17

2-18
1 I I 1 I I 1 1 I I f I I 1 I -1 1 1 1

I
I
0 0 c N d
N n *I
n n n
n m c 4
2-19
n (0 n
m m n
c n VI 3
. n m r(
0 n c
m c P
m n P
0 D
I D
U

0 0 VI
c I
2-20
0 0 0
w "
I 1 I t 1 1 1 1 I 8 I I
, 1 I 1 I I l 1

explanation for this difference. The precision of the test data between
paired samples (relative standard deviation) was excellent overall, averaging
12.8 percent RSD for the three laboratories involved.
2.4 Visible Emissions
Visible emissions observations were not conducted during this sampling
program as planned. Overcast skies prevented an accurate determination of the
scrubber outlet plume opacity. Further details of the decision to abort this
phase of the test program are presented in Sections 1.4 and 5 . 1 .
2.5 Scrubber Operational Summary
A summary of operational parameters of the G-P scrubber system during the
test program is presented in Table 2-10. Pressure drop measurements (AP)
across the scrubber system are presented as well as scrubber solution analysis
data.
Scrubber solution samples were taken from the recirculating tank every 30
minutes and then compsited into one Sample per test. Sample analyses for
total organic carban (TOC) ranged from 3,010 mg/l for test 1 to 2,860 mg/l for
test 3, averaging 2,956 mg/l for the three tests.
Pressure drop (AP) measurements across the scrubber were made at 30
minute intervals during the test program. The AP gradually increased during
tests 1 and 2, and averaged 14.2 and 15.0 inches water, respectively. During
test 3, however, the AP peaked shortly after the start of testing and then
gradually declined for the rest of the test, averaging 13.9 inches water. The
three test average AP was 14.4 inches water.
2-21

TABLE 2-10
GEORGIA-PACIFIC SCRUBBER SYSTEM OPERATIONAL DATA SUMMARY
Georgia-Pacific Plywood Plant, Springfield, Oregon June 1981
Pressure Drop Measurements Scrubber Solution
AP Volume Collected TOC Run Number Date Time (in. H70) (ml) (mg/U
1 June 9 1400 12.5 1430 13.0 1500 14.0 1530 14.8 1600 14.5 1630 14.7 1700 15.1
15.2 1730 Average 14.2
- -
2
3
June 10 1300. 1400 1430 1500 1530 1600 1630
Average -
14.7 14.8 15.0 14.8 15.2 15.4 15.3 15.0
June 11 1145 13.8 1215 14.5 1245 14.0 1315 13.9 1345 13.8 1415 14.2
12.9 Average 13.9
- 1445
800
700
3010
3000
700 2860
(I 1 ! c I f B 1 1 I J I 8 1 t E 8 P I
2.6 Summary of Fugitive Emissions (Provided by RTI)
The temperature and pressure changes that a veneer dryer is subjected to
make it very difficult for a dryer to be completely air tight. Door seals and
skins, green and' dry end baffles, and abort stacks will with time all even-
tually develop leaks. Door seals and dryer skins most readily develop them.
At Springfield all the dryers had fugitive emissions. The three Older dryers
leaked more from around the elephant ears than from individual door seals.
The jet dryer also experienced d w r leaks with quality checks showing varying
amounts from one day to another. It was impossible to estimate volume of fug-
itive gases from any fugitive source.
At the abort stacks there were also fugitive emissions. Very little was
seen from the jet dryer abort stacks, while opacities (unofficially1 up to 30
percent were seen from the other three dryer abort stacks. Cooling section
air volumes are large. No bluish haze was seen coming from cooling section
exhausts from the three longitudinal dryers. However, the jet dryer cooling
stacks showed some bluish opacity.
All of the fugitive emissions evaluations were purely qualitative and
visual. Tables 2-lla, 2-llb and 2-llc contain fugitive emission data.
2.7 Ambient Air Measurements
A summary of ambient temperature and relative humidity measurements by RTI
and DGA is presented along with process information in Table 3-1. Ambient
temperatures ranged from 54O to 75OF, while relative humidity ranged from
36 percent to 76 percent during the test program.
2-23

0' r Y O
2-24
I
1 t I
i

. (Y
2-25

2-26

2.8 Clean-up Evaluation
Results of the clean-up evaluations performed on both Method 5x sampling
trains are presented in Table 2-12. Clean-up evaluation rationale and pro-
cedures are presented in Section 1.4.6 and Section 6.1. Front half total
residue collected was 55.5 mg and 1 2 . 1 mg for the inlet and outlet sampling
trains, respectively. Back half total residue collected was 3 9 . 8 mg and 164.2
mg, respectively. Total residue collected during the clean-up evaluation was
96.3 mg and 176.3 mg for the inlet and outlet trains, respectively.
The high blank value of the inlet probe wash is probably due to the fact
that the probe was not acid washed before the evaluation. The high value
detected as impinger residue was probably due to a large amount of chromium
residue ( 2 . 5 0 mg/l) remaining from the pretest chromic acid wash of the glass-
ware. Further analysis foi chromium was performed on the actual test impinger
solutions with only a trace amount being detected in test 1 samples. There-
fore, it is believed no test sample interference resulted from chromium con-
tamination. Chromium analytical data are presented in Appendix G.
2.9 Possible Test Interferences
A possibility exists that components and reagents used in the Method 5X
sampling train may cause interferences with the Method 25 samples drawn from
the Method 5X train. At the time of this report, a study is being performed
by TRC to quantify the possible interfering effects of acetone, silicone
vacuum grease, and silicone rubber sealant (R'PV) on the Method 25 procedures.
The scrubber outlet Method 5X filtration temperature could not be main-
tained in the planned 350 2 2 5 F range due to insufficient heater capacity.
Temperatures ranged Erom 310° to 34OOF. Although not a factor in the
0
2-27

TABLE 2-12
METHOD 5X CLEAN-UP EVALUATION RESULTS, JUNE 8 , 1981
Georgia-Pacific Plywood Plant, Springfield, Oregon
Train Residue Weiqht (9) Component Sample Fraction Inlet Outlet
Probe Wash (DD H20) 0.0337. 0.0116 Front Half Probe Wash (acetone) 0 . 0 4 4 8 0.0113
Front Filter
Front Half Total 0 .0785 0.0229
N R t - NAt -
Impinger Water Organic Extraction
Acetone Rinse Back-up Filter
Back Ealf Total Total Sample
Back Half Evaporation 0 .0014 0.0019 0 .0230 0.1360.. 0.0151 0 .0260
NAt - NAt - 0 .0395 0 . 1 6 3 9 0.1180 0 . 1 8 6 8
Probe not acid washed prior to test program. ** Upon further analysis, it was discovered that Sample 5X-0-0-4 contained
2 .50 mg/liter chromium, indicating residue remaining from the chromic acid cleaning solution used in the pretest preparation of the glassware.
t Filters not inserted into trains.
2-28

Method 5 X sample collection, this may have resulted in a slight low bias for
the Method 25 samples. Organic materials which would have passed through the
filter at 350 525 F may instead have condensed and been collected on the
lower temperature filter.
0

I I 1 1 c tE I 1 c I 2 P n 1 I I I c 1
3.0 PROCESS DESCRIPTION AND OPERATIONS (Provided by RTI)
This section describes the plywood manufacturing process, specifically the
veneer drying process and its emission control, a G-P scrubber system. Pro-
duction monitoring as well as process operational conditions during the test
program are also discussed.
3.1 Process Equipment
The veneer drying operation begins after the veneer has been peeled from
the log at the lathe operation. The veneer then proceeds to the drying opera-
tion. Here, the veneer is continuously hand-fed onto the dryer feed conveyor
and into the dryer. The purpose of the operation is to thermally drive the
moisture out of the veneer in preparation for the layup and laminating opera-
tions which follow. During the drying operation, organic compounds are also
driven out of the veneer.
The G-P Springfield plant has four veneer dryers. Each is a Steam heated,
multideck unit, with the number of drying zones varying between dryers.
Dryers 1, 2 and 3 are longitudinal dryers, with 22, 18 and 18 zones, respect-
ively. Dryer 4, a new unit, is a 22 zone jet dryer. Each dryer has two
exhausts from the heated zones, except dryer 4 which has three exhausts. Atop
each exhaust is an abort damper for emergency use only. These are a source of
fugitive emissions. T h e w xhausts are ducted to a common manifold which
carries the exhaust to the Georgia-Pacific scrubber system. 4
\ .
rJIJF \
3.2 Emission Control Equipment
The Georgia-Pacific scrubber system shown in Figure 1-1 includes a wet
spray zone, six wet cyclones, a packed tower, and a mesh pad entrainment
separator. AS dryer exhaust gases pass through the 35.25-inch inside diameter
3- 1

duct, six nozzles inject water countercurrently into the gas stream to
saturate and cool the gas stream, thereby condensing the organics. Solids are
separated and agglomerated droplets are collected in the six wet cyclones
which follow. The remaining moisture laden gases are drawn through an induced
draft fan and forced through a packed tower and a mesh pad to rid the effluent
of aerosols. A l l water within the scrubber system is recirculated. The gas
stream, at approximately 165 F and 35 percent moisture by volume, then
discharges to the atmosphere through a 9-foot i.d. stack.
0
3.3 Production and Control Equipment Monitorinq
A l l production monitoring data collected by RTI and DGA is presented in
Table 3-1. Scrubber operational data, collected by TRC, is presented in
Table 2-10.
3.4 Process Operating Conditions During Test Program
The operation of each dryer is set according to the size, thickness, and
kind of wood being dried. The operation of the three longitudinal dryers does
not frequently vary, but it appears that the jet dryer makes more frequent
changes. During the testing hours of the first day (June 9) there was a
change of production, despite efforts on Georgia-Pacific's part to keep the
dryer operation steady state. Dryer 4 changed from drying 1/6-inch sapwood to
1/6-inch heartwood. This was not considered to be a major change worthy of
cancelling the test run.
It is normal for small plugups in the feeding and outloading mechanisms to
Occur and this did happen during the tests. On the third test day (June 11)
there was more of this type upset than usual on Dryer 4, but these were con-
sidered minor and insufficient cause for cancelling a test.
3-2

TABLE 3-1
SUMMARY OF OPERRTING CONDITIONS (Provided by RTI)
Georgia-Pacific Plywood Plant, Springfield, Oregon
June 8 June 9 June 10 June 11
I Production (ft*. per hour on 3/8-in. basis)
Sapwood Hear t m 0 d
Total
I1 Redry Rate ( $ 1
I11 Steam Use (lbs per hour)
IV Temperatures
V Fugitives
1. abort stacks
2. door leaks
3. above dryers
4. cooling stacks
VI Weather
19,935 12,090
31,424
9.7
No Evaluation
NO Evaluation
NO Evaluation
No Evaluation
21,604 14,143
35,747
9.0
51,430
steady 3 2 5- 3 7 5OF
150-300 CFM'
nos. 164
nos. 1 6 3 had blue haze
4
cloudy, showers, mid 60s
53-748 rel. humidity
21,509 19,847 12,863 14,221
34,372 34,068
9.6 11.4
50,467 51,450
steady steady 325-375OF 325-375OF
150-300 CFM* 150-300 CFM'
nos. 1,2 6 4 less small leaks than on June 9
noticeable above all dryers
4 4
cloudy, small morning fog, showers, sunny, 6Oo-75O 5 4O- 6 bo
36-70% 51-76% rel. rel. humidity humidity
*Per dryer, except no. 4
3-3

Steam usage, d r y e r temperatures, and d r y i n g times were maintained evenly
throughout t h e t h r e e days of tests. P r o c e s s o p e r a t i n g c o n d i t i o n s are
summarized i n Table 3-1.
Product ion f i g u r e s provided are not t h e a c t u a l square f o o t a g e of g r e e n
veneer d r i e d i n t h e steam-heated d r y e r s b u t r a t h e r a f i g u r e t h a t accounts f o r
t r im and shr inkage . A f u l l g reen veneer s h e e t is approximately 54 inches by
1 0 1 i n c h e s and w i l l e v e n t u a l l y be trimmed to 48 i n c h e s by 96 inches fol lowing
shr inkage i n t h e d r y e r . The amount of shr inkage depends on t h e o r i g i n a l
moisture l e v e l . A s is t h e c a s e wi th a l l western softwoods, Douglas f i r
sapwood w i l l s h r i n k more t h a n heartwood. An expected shr inkage loss is 5
p e r c e n t to 7 p e r c e n t . The product ion f i g u r e s repor ted are, t h e r e f o r e , approx-
imate ly 85 p e r c e n t of t h e a c t u a l throughput of t h e d r y e r s . A l l veneer has
been conver ted to a 3/8-inch b a s i s .
3-4
I 1 1 I I I I I I I *I I I 1 t I I 1 I

I I I I I I I I c I E I I I I I I P I
4.0 DESCRIPTION OF T W SAMPLING LOCATIONS
This section presents a description of each sampling location and a sum-
mary of the work performed at each site. Figure 4-1 presents a schematic
layout of the veneer dryer exhaust system and identifies all sampling loca-
tions.
4.1 Scrubber Inlet
The inlet to the scrubber system was sampled employing EPA Methods 1, 2,
4, 5X and 25 in the 35.25-inch inside diameter insulated duct at sampling
ports 45 above the horizontal duct axis. These ports were located 30 feet
downstream (>8 diameters) and 24 feet upstream (>2 diameters) from the
nearest respective flow disturbances. In accordance with EPA Method 1, sam-
pling was performed at 1 2 traverse points. Sampling port and traverse point
locations are presented in Figure 4-2. Duct static pressure was also
measured at this location.
0
Method 5X tests performed at this location were 60 minutes in duration as
were the Method 25 tests performed simultaneously. A total of three Method
5X and 18 Method 25 tests was performed at this location.
4 .2 Scrubber Outlet
Sampling ports were located 9 feet upstream (1 diameter) from the top of
the 9-foot i.d. stack and approximately 6 Eeet (2 /3 diameter) downstream from
the mesh pad entrainment separator. In accordance with EPA Method 1,
sampling was performed at 48 traverse points. Sampling port and traverse
point locations are presented in Figure 4-3.
4-1

Dryer 2
V
e e e
Spray--: Nozzles
crubber Inlet Sampling Location
Dryer 1
F i g u r e 4-1. Veneer Dry
Iryer 3
ExhaL
E Dryer 4
t and Scrubber System Sampling Locat ions G e o r g i a - G c i f i c Plywood P l a n t S p r i n g f i e l d , Oregon
4-2
I I I I I I I I I I I I I I I I I I I

I I I I I I I I I I I I I I I I I I I
+ Flow - To Scrubber
.~ Traverse Po in t Number
West
m / 4 " 12 I . D .
Traverse P o i n t Loca t ion From I n s i d e Duct Wall
( Inches) ~ ~~
1.6 5.1
10.4
24.8 30.1 33.7
F igu re 4-2. Scrubber I n l e t Sampling P o r t Con f igu ra t i on and Traverse P o i n t Locat ions , Georg ia -Pac i f i c Plywood P l a n t S p r i n g f i e l d , Oregon
4-3
~

T 108"
i 72" -L
From Scrubber
N - 24 108"I.D. @I ~~
T raverse P o i n t Number
1 2 3 4 5 6 7 8 9
13 14
19
24
Traverse P o i n t Loca t ion From I n s i d e Duct Wall
1.2 3.5 5.9 8.5 11.3 14.3 17.4 21 .o 24.8 29.4 34.9 43.0 65.0 73.1 78.6 83.2 87.0 90.6 93.7 96.7 99.5 102.1 104.5 106.8
F i g u r e 4-3. Scrubber O u t l e t Sarnpl i n g P o r t C o n f i g u r a t i o n and Traverse P o i n t Locat ions Georg ia -Pac i f i c Plywood P l a n t , S p r i n g f i e l d Oregon
4-4
I I I I I I I I I I I I I I I I I I I -

I I I
I I I I I I I I I I I I I I I
Method SX tests performed at this location were 96 minutes in duration.
Method 2 5 sampling began 18 minutes into each Method 5X test and ran for 60
minutes, leaving 18 minutes of Method 5 X testing after the completion of the
Method 2 5 tests. A total of three Method 5X and 18 Method 2 5 tests were per-
I formed at this location.
4.3 Scrubber Operational Measurement Locations
Scrubber solution samples were taken from the scrubber recirculation tank
during each test. Pressure drop across the scrubber system was calculated
from static pressures in the duct measured at the scrubber inlet and at two
pressure taps each located 2 feet from the scrubber fan inlet and outlet.
These sampling locations are shown in Figure 4-1.
4.4 Fugitive Emissions
Fugitive emissions were observed by RTI and DGA around the veneer dryers
and their abort dampers.
4-5
I I I I I I I .I I I I I I I I I I I I
5-0 SAMPLING AND ANALYTICAL METHODS
This section presents descriptions of sampling and analysis procedures
employed during the emission testing conducted at the Georgia-Pacific plywood
facility in Springfield, Oregon during the week of June 8, 1981. EPA Methods
1. 2, 4, 5X*, 9, 22 and 25 were used to measure emissions at the veneer dryer
exhaust and from the scrubber outlet. These methods are presented in greater
detail in Appendix G.
5.1 EPA Reference Methods Used in This Program
The following EPA Reference Methods were used for the testing at the G P
plywood plant. These methods** were taken from C s 40, July 1, 1980, part
60, "Standards of Performance for New Stationary Sources," Appendix A, pp.
183 ff.; and Federal Register, volume 45, no. 194, Friday, October 3, 1980.
pp. 65959 ff.
Method 1 - Sample and Velocity Traverses for Stationary Sources This method specifies the number and location of sampling points within a duct, taking into account duct size and shape and local flow disturbances.
Method 2 - Determination of Stack Gas Velocity and Volumetric Flow Rate This method specifies the measurement of gas velocity and flow rate using an S-type pitot tube, manometer, and temperature sensor. The physical dimensions of the pitot tube and its spatial relationship to the temper- ature sensor and a sampling probe are also specified.
Method 4 - Determination of Moisture Content in Stack Gases This method specifies the procedures by which the water vapor content of a gas stream be can determined.
Method 5X will be assigned a reference letter designation when the NSS regulation is proposed in the Federal Register. This method was derived from EPA Method 5 and ODEQ Method 7.
* * With the exception of the Provisional Method 5X, which has yet to be proposed.
5-1

5 . 2
Method 5 X - Determinat ion of P a r t i c u l a t e and Condensible Organic ( P r o v i s i o n a l ) Emissions from S t a t l o n a r y Sources i n t h e Plywood I n d u s t r y
T h i s method, based u p o n EPA Method 5 and ODEQ Method 7 . d e s c r i b e s pro- c e d u r e s for measuring emissions i n t h e c o n t e x t of t h e fol lowing d e f i n i - t i o n s . P a r t i c u l a t e mat te r is m a t e r i a l which condenses a t OK above fil- t r a t i o n temperature and i s c o l l e c t e d by t h e f r o n t h a l f o f the sampling t r a i n . Condensible o r g a n i c matter is t h a t m a t e r i a l which remains a f t e r extract ion, f i l t r a t i o n , and evapora t ion o f t h e impinger p o r t i o n of t h e t r a i n .
Method 9 - V i s u a l Determinat ion of t h e Opaci ty of Emissions From Sta- t i o n a r y Sources
T h i s method s p e c i f i e s t h e procedures by w h i c h o p a c i t y of emissions a r e measured.
Method 2 2 - V i s u a l Determination o f F u g i t i v e Emissions from M a t e r i a l Process ing Sources
T h i s method s p e c i f i e s t h e procedures f o r v i s u a l de te rmina t ion of t h e pre- sence and to ta l t ime of Occurence of f u g i t i v e process emissions.
Method 2 5 - Determinat ion of T o t a l Gaseous Nonmethane Organic Emissions a s Carbon
T h i s method d e s c r i b e s procedures f o r t h e sampling and a n a l y s i s of gaseous nonmethane o r g a n i c emissions. An emiss ion sample is drawn through a con- d e n s a t e t r a p and i n t o a n evacuated tank. T r a p and tank contents a r e o x i - d i z e d t o carbon d i o x i d e , reduced t o methane, and analyzed by a flame ion- i z a t i o n d e t e c t o r .
P r e l i m i n a r y Measurements
Before t h e s t a r t of emission sampling, each l o c a t i o n w a s t e s t e d according
t o EPA Methods 1, 2 and 4 t o determine t h e p r e l i m i n a r y s t a c k g a s v e l o c i t y and
moisture conten t w i t h i n t h e d u c t s .
5 . 3 Measurements f o r P a r t i c u l a t e , Condensible and Noncondensible Emissions
5.3.1 E P A Method SX ( P r o v i s i o n a l ) - P a r t i c u l a t e and Condensible Organic Compounds
T h i s s e c t i o n p r e s e n t s a summary o f procedures followed by TFC during par-
t i c u l a t e and condens ib le o r g a n i c sample c o l l e c t i o n , recovery and p r e p a r a t i o n ,
a n a l y s i s , and d a t a reduct ion . Devia t ions from the s p e c i f i e d method a r e
5-2
I I I I I I I I I I I I I I I I I I I -

I I I 1 I I I I I I I I I I 1 I I I I
explained in this section. Further details of this method are presented in
Appendix G.
5.3.1.1 Method 5 X - Sample Collection The sampling train was a modified EPA Method 5X train as shown in
Figure 5-1. This train was designed and built by TRC. A slipstream was
drawn from behind the heated Method 5X filter to quadruplicate TRC and dupli-
cate NCASI Method 25 sampling trains. Vacuum grease was used in the assembly
of the Method 5X train ahead of the Teflon sample line-impinger train connec-
tion for test 1. This may have caused contamination of the total organic
compound samples for test 1. No vacuum grease was used at those locations
during tests 2 and 3 . A minimum amount of grease was used in the impinger
train. Leak checks were performed on the complete sampling train (modified
5X train attached to the six Method 25 trains) before and after each test.
Field data were recorded on standard EPA Method 5 data sheets which are pre-
sented in Appendix C.
The Method 5X sampling train is essentially the same as that described by
EPA Method 5 with the following modifications. A flexible Teflon sample line
was used to connect the outlet of the 4-1/2 inch glass-fiber Gelman Spectro-
grade no. 64948 filter to the impinger train. Since the filter was at a
higher elevation than the impinger train, condensation in the sample line ran
into the first impinger and not back into the filter. The Method 5X impinger
train consisted of four impingers and a 2-1/2 inch glass-fiber filter. The
first impinger was a modified Greenburg-Smith (impingement plate removed)
charged with 100 ml of deionized distilled (D.D.) water. The second impinger
was a regular Greenburg-Smith unit also charged with 100 ml D.D. water. The
third was another modified Greenburg-Smith and was empty. The fourth was
5-3

I- t- L
c = Y V 4
1 Mol3 5
5-4
S
L c,
m E
.r m
.r - n E, VI
VI U E .r
a m L 0
w - n .r v) c
3 . .
In 01 L a m .r U
1 I I I I I I I I I I I I I I I I I I

I I I I 1 1 I I I I I I I I I I I I I
also a modified Greenburg-Smith type and was charged with 200 grams of silica
gel. A 2-1/2 inch glass-fiber filter (similar to the 4-1/2 inch filter) was
inserted between the third and fourth impinger to collect any organic
material condensed but not collected in the impingers.
Prior to initial field use, all glassware was washed with a chromic acid
solution and rinsed with D.D. water and acetone according to Method 5X.
Sampling train operations were identical to those of EPA Method 5, with
several exceptions. In order to prevent condensation of organic materials in
the probe and on the 4-1/2 inch glass-fiber filter, the stainless steel probe
and the filter were heated to 350° +25OF. Thermocouples were inserted
into the probe and the filter outlet gas stream to ensure that proper tem-
peratures were maintained. These temperatures were noted on the field data
sheet during routine data recording intervals.
During sampling at the scrubber outlet it was sometimes impossible to
maintain probe and filter outlet temperatures in the range of 350° +25OF
because of insufficient heater capacity. Probe and filter outlet tempera-
tures ranged between 310 to 340 F at the scrubber outlet throughout the
test program and averaged about 320°F. Filter box temperatures were main-
tained at 350° +25OF with no problems.
0 0
0 Impinger outlet temperatures were monitored and maintained below 68 F
throughout the test program. These temperatures were not, however, recorded
on the scrubber outlet field data sheets.
Velocity pressure at the scrubber outlet was extremely low as measured by
the S-type pitot tube, hovering near the lower detection limit of EPA Method
2. In addition, wind gusting across the top of the stack sometimes caused
turbulence within the 9-foot i.d. duct, creating the illusion of negative
flows. If this phenomenon was more than momentary, sampling was halted until
flows again appeared positive, and then restarted.
5-5

A 2 1 / 2 - i n c h f i l t e r was used i n t h e f r o n t ha l f of t h e i n l e t sampling
t r a i n f o r tests 1 and 2 , and t h e o u t l e t sampling t r a i n for t es t 2. Th i s w a s
done because t h e 4 1/2-inch f i l t e r assembly would n o t p a s s t h e leak c h e c k .
During ou t le t test 3, t h e f i l t e r assembly was broken i n t h e process of
changing sampling ports. The f i l t e r was recovered and rep laced wi th ano the r
f i l t e r assembly to complete t h e t es t .
5.3.1.2 Method 5X - Sample ReCOVeKV and P r e p a r a t i o n
Sample recovery was performed i n an improvised l a b o r a t o r y on site.
Because t h i s a r e a had a c l e a n , wind-free environment and was well l i g h t e d , i t
w a s s u i t e d f o r sample recovery and p r e p a r a t i o n f o r shipment.
Sample recovery was performed i n accordance wi th EPA Methods 5 and 5X a s
p r e s e n t e d i n Appendix G. A t t he conc lus ion o f each t es t run , s e p a r a t e sample
f r a c t i o n s were c o l l e c t e d from each Method 5X sampling t r a i n by a three-person
clean-up crew. The l i q u i d samples were p laced i n g l a s s sample j a r s w i t h
Tef lon- l ined l i d s , and t h e f i l t e r s were p laced i n i n e r t pe t r i d i s h e s and
s e a l e d . The sample f r a c t i o n s c o l l e c t e d were as fo l lows :
Conta iner 1 - 4-1/2 i nch g l a s s - f i b e r f i l t e r (2-1/2 inch f i l t e r s were used du r ing test 1-1, 1-2, and 0 - 2 ) .
C o n t a i n e r 2 - D.D. tl$ wash of nozz le , p robe and f r o n t h a l f of t h e 4-1/2 inch f i l t e r ho lde r .
Con ta ine r 3 - Acetone wash o f nozz le , probe and f r o n t h a l f o f t h e 4-1/2 inch f i l t e r ho lder .
Con ta ine r 4 - Exposed impinger s o l u t i o n from impingers 1, 2 and 3 and D.D. HP wash of impingers , c o n n e c t o r s , Tef lon sample l i n e , back h a l f of 4-1/2 inch f i l t e r holder and f r o n t h a l f of 2-1/2 i nch f i l t e r ho lder .
Con ta ine r 5 - Acetone w a s h o f f i r s t three impingers , connec tors . Tef lon sam- p l e l i n e , back ha l f o f 4-1/2 i n c h f i l t e r ho lde r , and f r o n t h a l f of 2-1/2 inch f i l t e r ho lder .
Con ta ine r 6 - 2-1/2 inch g l a s s - f i b e r f i l t e r .
5-6
I I I I I I I 1 I I I I I I I I I 1 I

~
I I I I I 1 I I I 1 I I I I I I I I 'I
The probe and nozzle were brushed and rinsed three times with D.D. H20,
which was deposited in container 2. The front half of the 4-1/2 inch filter
holder was also rinsed with D.D. H 2 0 , which was deposited in container 2 .
The probe, nozzle and front half of the 4-1/2 inch filter holder were brushed
and rinsed with acetone in the same manner and deposited in container 3.
The Teflon sample line was drained into the impinge? train. The Teflon
sample line was not brushed because the particulate catch in the sample line
is generally considered to be insignificant. Impinge? contents were weighed
to determine moisture catch and deposited in container 4 . The Teflon sample
line, impingers, connectors and the back half of the 4-1/2 inch filter holder
were rinsed three times with D.D. H 0 into container 4 , and then rinsed 2
three times with acetone into container 5.
Prior to tests 2 and 3 both the probe and Teflon sample line were washed
with D.D. H 0 after the acetone wash to remove any acetone residue which
might have contaminated the EPA Method 2 5 samples. These washes were dis-
carded and the components allowed to dry at ambient conditions before being
reassembled. A possibility of Method 25 acetone contamination exists for
test 1.
2
Both filters were removed from their holders and deposited into their
respective petri dishes, containers 1 and 6. Filter residue on the filter
holders was scraped and deposited into the same acetone rinse containers as
the front halves of their respective filter holders. The stainless steel and
glass filter frits used in the filter holders were not rinsed during sample
recovery, because any organic material collected on the frits is generally
considered to be insignificant. Glass and/or metal particles could become
detached and contaminate sample fractions.
Silica gel samples were weighed immediately at the conclusion of each
test and the weights recorded by the clean-up crew. All Method 5X samples
5-7

I I I I I I I
were packed in shock-proof containers and driven to the CH Hill laboratory
in Corvalis, Oregon for analysis at the conclusion of the test program. ZM
5.3.1.3 Method 5 X - Sample Analysis With the exception of the silica gel samples, all sample fractions were
analyzed by CHpHill. CHpHill was chosen to perform the analytical
phase of the Method 5X sampling program because of their extensive experience
with Oregon DEQ Method 7, from which E P A Method 5X was derived. A l l analyses
were performed in accordance with EPA Method 5 X and as approved by EPA/EMB.
The sample fractions were analyzed as follows:
Container 1 -
Container 2 -
Container 3 -
Container 4 -
Container 5 - Container 6 -
(4-1/2 inch glass-fiber filter) - desiccate and weigh after 24 I hours.
I I I I
( D . D . H20 probe rinse) - evaporate, desiccate and weigh after 24 hours.
(acetone probe rinse) - evaporate, desiccate and weigh after 24 hours.
(impinger water solution and D . D . H20 rinse) - extract, desiccate and weigh.
(impinger acetone wash) - evaporate, desiccate and weigh. (2-1/2 inch glass-fiber filter) - desiccate and weigh after 24 hours.
Silica gel samples were weighed on site with a triple-beam balance at the I I I I
conclusion of each test by the Method 5X sample recovery crew. The weight
gain of the silica gel was determined to the nearest 0.5 gram and recorded.
A l l analytical data were recorded on the data sheets as presented in
Appendix H. Sample residue remaining after analysis was retained for 90 days
after the end of the field program after which they were discarded according
to EPA instructions. 1
I

I I I I I I I I I I I I I I 1 1 I 1 I
5.3.1.4 Method 5X Data Reduction
All Method 5X data reduction was performed in a manner identical to pro-
cedures described by EPA Method 5. (See Appendices B and G.) The only
variation from these calculations was as follows. Because of the
unacceptable super- isokinetic sampling conditions during tests 1 and 2 at
the scrubber inlet and tests 1 and 3 at the scrubber outlet, the particulate
mass emission rate (MER) for these runs were calculated by two methods: the
Concentration method (by which calculations are normally done) and the area
ratio method.’ With the former method, the concentration of particulate
matter entering the nozzle is calculated and then multiplied by the
volumetric flow rate to obtain the mass emission rate:
where m = v = Q =
If the nozzle
amount of particulate sampled (lbs) volume of sampled gas (DSCF) volumetric flow rate (DSCF/hr)
(Eq. 5-1)
sampling velocity is greater than the stack gas velocity
(superisokinetic sampling conditions), then the calculated mass flow rate
will be less than the true MER. This is because the heavier particles will
leave their streamlines (gas streamlines diverted into the nozzle) and will
not enter the nozzle, as they would under isokinetic conditions. Since the
volume of gas sampled is greater than what would be sampled under isokinetic
conditions, the concentration (m/V) will be less than that under isokinetic
conditions.
With the area ratio method, the mass of particulate matter collected is
divided by the sampling time and then multiplied by the ratio of the stack
area to the nozzle area to obtain the mass emission rate:
Brenchley, D.F., C.D. Turley and R.F. Yarmac. Industrial Source Sampling. Ann Arbor Science Publishers, Inc., 1973, p. 173 ff.
5-9
where
(m/t) x (AS/An) = MER (lbs/hr)
m = amount of particulate sample (lbs) t = sampling time (hrs)
AS = area of stack (ft';) An = area of nozzle (ft':)
(Eq. 5-2)
Again, if the nozzle sampling velocity is greater than the ,stack gas
velocity, then the MER calculated by this method will be somewhat greater
than the true MER. The lighter particles follow the diverted streamlines
into the nozzle; the amount of particulate matter sampled in time (t) is
therefore assumed to be greater than what should be sampled. The volume of
sampled gas is not a factor in this calculation. The average of the two
calculated MERs was used as an estimate of the true MER.
Gas stream moisture content measured at the scrubber outlet exceeded the
saturation values for the duct temperatures measured. Therefore moisture
values were recalculated using the following psychometric equation:
pv x 100
PB $ H O = 2
(Eq. 5-3)
where pV = vapor pressure o€ air at a given temperature PB = barometric pressure
5.3.2 EPA Reference Method 25 - Condensible and Noncondensible Organic Compounds
This section presents a summary of procedures followed by TRC during con-
densible and noncondensible organic sampling equipment preparation, sample
collection, field sample recovery, and sample analysis. The TRC Method 25
sampling train is shown in Figure 5-2. Deviations from the method are also
5-10
I I I I I I I I I 1 I 1 1 1 I I 1 I

I 1 1 I I I 1 I I 1 I I I 1 I 1 I I I
I
I
z W L3 z 0 V \
I o w N U r -
5-11

explained in this section. Further details of Method 25 are presented in
Appendix G. NCASI Method 25 procedures are also presented in Appendix G.
5 . 3 . 2 . 1 Method 25 - Sampling Equipment Preparation This procedure is based on and supplements EPA Method 25, "Determination
of Total Gaseous Nomethane Organic Emissions as Carbon."'
Condensate Trap
After being checked for any sign of physical damage, each trap was inter-
connected to a hydrocarbon flowmeters and C02 moni-
tor (nondispersive infrared detector ( N D I R ) ) and inserted in the furnace as
shown in Figure 5-3. The trap was then purged with the HC-free air at a 100
ml/min flow rate with the furnace operating at a temperature of 60OOC. A
propane torch was used to heat those portions of the trap and probe assembly
(HC)-free air cylinder,
that extend outside the furnace.
monitor indicated a concentration oE
Sample Tank
Each sample tank was connected
2 The purge was performed until the CO
10 ppm or less.
to a cylinder of HC-free air, a vacuum
pump, and a mercury manometer as shown in Figure 5-4. The tank was evacuated
to 29 inches Hg vacuum after which the three-way valve was switched and the
tank pressurized to 10 inches Hg with HC-free air. This cycle was repeated
three times. After the third pressurization, the tank was connected to the
TGNMO analyzer and a sample analysis was performed. If a nonmethane organic
concentration greater than 10 ppm was measured, the tank was again subjected
Federal Register, volume 45, no. 194, October 3, 1980, pp. 65959-73.
5-12
I 1 I I I I I I I I I 1 I I I I 1 I I

I I 1 1 1 I I 1 1 I I I I I 1 1 I 1 I
-
& FLOW I
F / - I I
VALVE I / PRESSURE GAUGE ON/OFF I I FLOWMETER -
T METER
TRAP TANK
-
Ll \ I METER
F i g u r e 5-3. Method 25 Trap P r e p a r a t i o n 1 -
1 ANALYZER
3- WAY VALVE
I,
Q!iiE:T 1 MERCURY MANOMETER
F i g u r e 5-4. Method 25 Tank Purg ing and Evacua t ion
F i g u r e 5-5. Method 25 Flow C o n t r o l Assembly Adjus tment
5-13

to the evacuation-pressurization analysis procedure until accepted. Each
tank was then evacuated and pressurized with dry nitrogen for shipment to the
field.
Flow Control Assembly
The sampling train was assembled as shown in Figure 5-5 and leak
checked. The probe end cap was removed and the probe connected to a flow
meter as shown. The sample flow shut-off valve was opened and the flow con-
trol valve adjusted to achieve a flow rate of 50 5 5 ml/minute. The flow con-
trol adjustment screw was sealed after the flow rate was achieved. The flow
control valve number and calibration data were recorded on forms presented in
Appendix E.
5.3.2.2 Method 25 - Sample Collection The sampling train was a modified EPA Method 25 apparatus. The modifi-
cation consists of placing an additional condensibles trap, immersed in a
water ice bath, ahead of the trap immersed in dry (C02) ice. (See
Figure 5-2.) The additional trap is intended to remove the high moisture
content associated with the process emission streams and prevent freezeup in
the dry ice trap which leads to premature sample flow stoppage.*
The sample tanks were shipped to the site slightly pressurized with dry
nitrogen. Immediately prior to each test, tanks were evacuated. The tank
vacuum, ambient temperature and barometric pressure were recorded on the
field sampling data sheet. (See Appendix C.)
"Method Development for the Plywood/Plywood Veneer Industry," EPA Contract 68-02-3543, Work Assignment 1. TRC - Environmental Consultants, Inc., August 1981.
5-14
I I I I I I I I I 1 I I I I I I 1 1 1

-
I I 1 I 1 1 I I 1 I I 1 I I I t I I I
With t h e flow shut-off va lve i n t h e c l o s e d p o s i t i o n , t h e t r a i n was
checked a g a i n a f t e r a minimum p e r i o d o f 1 0 minutes. I f t h e i n d i c a t e d vacuum
had n o t changed, t h e p o r t i o n of t h e sampling t r a i n behind t h e shut-off va lve
d i d n o t l e a k and was cons idered a c c e p t a b l e . Assuring t h a t t h e probe t i p was
t i g h t l y capped, t h e f r o n t p a r t of t h e sampling t r a i n was l e a k checked by
opening t h e f low shut-off valve. A f t e r a s h o r t per iod to a l low p r e s s u r e
s t a b i l i z a t i o n ( n o t more than 2 m i n u t e s ) , t h e i n d i c a t e d gauge vacuum was
formed. The t a n k vacuum a s i n d i c a t e d by t h e vacuum gauge was recorded and
assembled as shown i n F igure 5-2. The pretest leak c h e c k was t h e n per-
formed. Af te r a minimum per iod of 1 0 minutes , t h e i n d i c a t e d vacuum was a g a i n
noted. The l e a k c h e c k was cons idered a c c e p t a b l e i f no v i s i b l e change i n
vacuum occurred. The p r e t e s t leak r a t e ( i n c h e s Hg/lO m i n u t e s ) was recorded
i f observed. A t t h e complet ion o f t h e l e a k c h e c k s , t h e sample f low shut-off
valve was c losed .
A f t e r t h e leak c h e c k had been performed, t h e sample tank number and t r a p
numbers f o r each sampling t r a i n were recorded on t h e f i e l d d a t a s h e e t w i t h
t h e r e s p e c t i v e t es t run number and sampling s i te . Four TRC and two NCASI
sampling t r a i n s were connected t o each Method 5X sampling t r a i n a t t h e
i n s u l a t e d o u t l e t of t h e i r r e s p e c t i v e hotbox f i l t e r s . Immediately p r i o r to
sampling, t h e gauge vacuum and c l o c k time were noted. The f low shut-off
va lve was opened and sampling begun. TRC gauge vacuum r e a d i n g s were recorded
every 5 minutes d u r i n g t h e sampling p e r i o d . A t t h e end of t h e sampling
per iod , t h e f low shut-off va lve was c l o s e d , t h e time and f i n a l gauge vacuum
recorded. Af te r t h e Method 5X sampling was completed, t h e Method 25 probe
l i n e s were d isconnec ted from t h e Method 5X i n t e r f a c e and t i g h t l y capped.
A post-test leak c h e c k was performed p r i o r t o disassembly of t h e sampling
Af ter a s s u r i n g t h a t t h e probe had been t i g h t l y capped, t h e f low s h u t - t r a i n .
5-15

off valve was opened and the gauge vacuum monitored for a minimum of 10
minutes. The leak check was acceptable if no visible change in tank vacuum
OCCuIred. The post-test leak rate (inches Hg/lO minutes) was recorded if
observed. At the completion of the leak check, the flow shut-off valve was
closed.
5.3.2.3
After the post-test leak check was completed, the TRC sampling train com-
ponents were disconnected. Both ends of each condensibles trap were tightly
sealed. The traps were then packed in dry ice for sample preservation and
shipment to the laboratory.
Method 25 - Field Sample Recovery
5.3.2.4 Method 25 - Sample Rnalysis Two inlet sampling trains and two outlet sampling trains from each test
were analyzed by TRC. The Other two inlet sampling trains and two outlet
sampling trains from each test were analyzed by Pollution Control Science,
Inc., (PCS). NCASI analyzed the samples collected with their equipment.
Additional analyses of the PCS analyzed samples were performed at the TRC
laboratory. The purpose of this approach was to identify the cause of the
poor paired sample data precision obtained during the method development pro-
gram.
The analyses were performed in general accordance with the method as pub-
lished (Appendix F). Prior to the nonmethane organic analysis of the tank
Samples, a preliminary analysis was performed with an FID to determine the
relative sample concentrations. The purpose of this analysis was to provide
additional information for the resolution of any poor precision. If the pre-
5-16
I I 1 I I I I I I 1 I I I I I I 1 I 1 -

1 1 1 1 I I 1 I
I I I 1 I I 1 I I I
i
liminary tank sample analyses indicated relatively equal tank concentrations
for paired samples, the nonmethane organic analyses should also produce
relatively equal values. These data are presented in Appendix F.
Preliminary Sample Tank Analysis
The preliminary sample tank analysis was performed using the nonmethane
organic analyzer. However, the separation column, oxidation catalyst, and
reduction catalyst were bypassed. The sample tank was pressurized to approx-
imately 100 mmHg gauge and then connected to the analyzer. The sample loop
was purged and charged with sample gas. The sample was then injected from
the loop into the analyzer, bypassing the separation column and catalysts,
and introduced directly to the flame ionization detector. The detector
response was plotted and scaled by the integrator. The responses for paired
sample tanks were compared for relative magnitude on a ppm CH4 (methane)
basis and recorded for reference during the nonmethane organic analysis pro-
cedure.
TRC Analysis Equipment
The analyzer was fabricated by TRC using the following base components:
Varian Model 2800 gas chromatograph with flame ionization detector; and Hewlett-Packard Model 3390A Reporting Integrator.
These components were interconnected to provide an analyzer scheme very sim-
ilar to that described in the method. However, TRC has made some changes
which improved the ease of operation without affecting analyzer performance.
Figure 5-6 is a schematic rendering of the analyzer as assembled. A high-
grade, HC-free carrier gas is used which eliminates the necessity for the
purification furnace.
5-17

PI W =& 4
5-18

A six-port valve (Carle Model 5521) was substituted for the two four-port
valves in the oxidation catalyst flow scheme. One four-port valve was used
instead of two four-port valves in the reduction catalyst flow scheme. In
effect the latter valving modification precluded hydrogen venting within the
laboratory.
The exit line from the oxidation furnace to the six-port valve was heat
traced to avoid condensation. Additionally, all four switching valves incor-
porated in the analyzer were enclosed in a heated, insulated compartment
thermostatically controlled to maintain a constant ~ O O O C temperature.
The separation column used was prepared by Supelco, Inc. It was a 4-1/2
foot long, 1/8-inch diameter stainless steel tube with two packed sections.
The injection side section was 3 feet long and contains 10 percent OV-101
(liquid methyl silicone) on 8 O / l O O mesh Supelcoport. The following section
was 1-1/2 feet long packed with 60/80 mesh POKOpak Q.
The reduction catalyst was a Byron Instruments unit with integral
heater. This was mounted within the Varian gas chromatograph oven to ensure
constant temperature operation.
Although not clearly shown in Figure 5-6, a single combustion air source
services both the oxidation catalyst and the flame ionization detector.
Individual metering valves are used after the flow splitter to regulate the
supply to each device.
The condensate recovery and conditioning apparatus equipment was assem-
bled by TRC as shown in Figure 5-7 and was essentially the same as the con-
figuration detailed by the method. The NDIR incorporated was an Anarad AR
400, with a range of 0 to 10,000 ppm COz.
The TRC arrangement did not incorporate the vacuum pump in a direct link
with Other equipment. Instead it was located remotely. This was done to
avoid contamination by the oil mist vented from the vacuum pump.
5-19
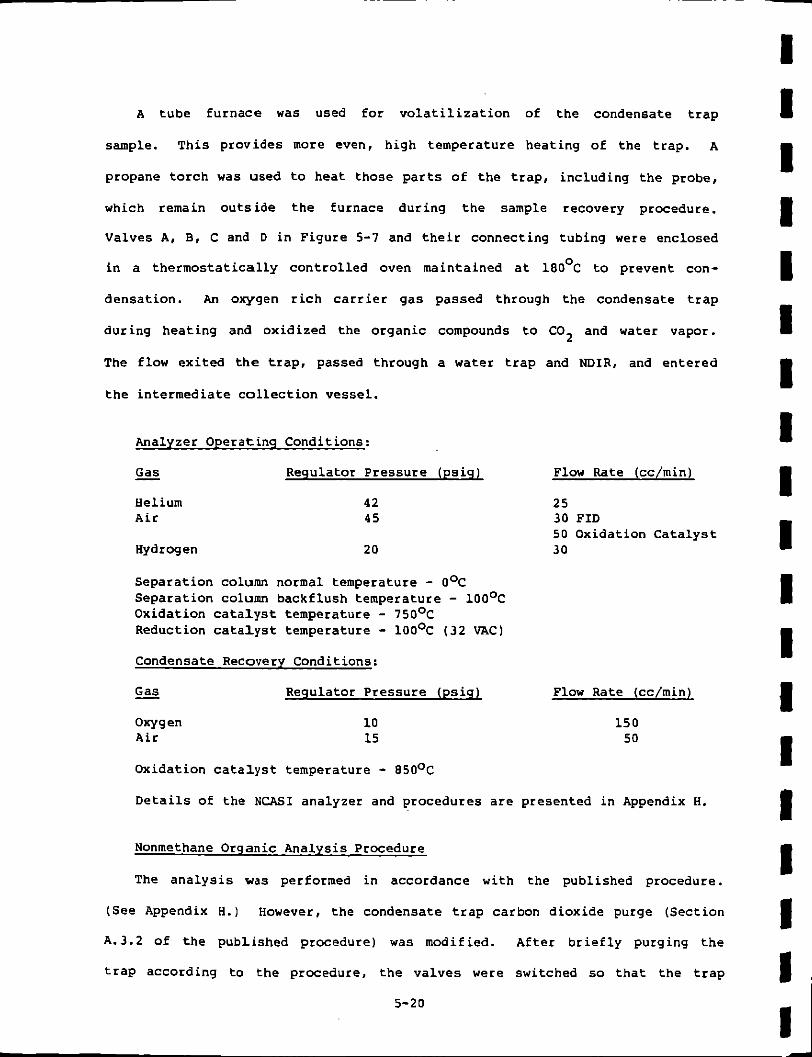
A tube furnace was used for volatilization of the condensate trap
sample. This provides more even, high temperature heating of the trap. A
propane torch was used to heat those parts of the trap, including the probe,
which remain outside the furnace during the sample recovery procedure.
Valves A, 8 , C and 0 in Figure 5-7 and their connecting tubing were enclosed
in a thermostatically controlled oven maintained at 180 C to prevent con-
densation. An oxygen rich carrier gas passed through the condensate trap
during heating and oxidized the organic compounds to C02 and water vapor.
The flow exited the trap, passed through a water trap and NDIR, and entered
the intermediate collection vessel.
0
Analyzer Operating Conditions:
- Gas RegUlatOK Pressure (psig)
Helium Air
42 45
Hydrogen 20
Separation column normal temperature - OOC Separation column backflush temperature - 100°C Oxidation catalyst temperature - 75OoC Reduction catalyst temperature - 100°C (32 VAC)
Condensate Recovery Conditions :
- Gas Regulator Pressure (psig)
Oxygen Air
10 15
Flow Rate (cc/min)
25 30 FID 50 Oxidation Catalyst 30
Flow Rate (cc/min)
150 50
Oxidation catalyst temperature - 85OoC Details of the NCASI analyzer and procedures are presented in Appendix H.
Nonmethane Organic Analysis Procedure
The analysis was performed in accordance with the published procedure.
(See Appendix H.1 However, the condensate trap carbon dioxide purge (Section
A.3.2 of the published procedure) was modified. After briefly purging the
trap according to the procedure, the valves were switched so that the trap
5-20
I I I I I I I I I I I I 1 I I I I 1 1

-
I I I I I I I I 3 I I 1 I 1 <I I I t I
CATALYST BY PASS 1
- - N D I R
ANALYZER
-- REGULATING
VALVE
Q U I C K CONNECT
MERCURY INTERMEDIATE MANOMETER COLLECTION
VESSEL
F i g u r e 5-7. TRC Condensate Recovery and C o n d i t i o n i n g Apparatus
5-21

was bypassed. A f t e r t h e t r a p had been bypassed, the car r ie r g a s flow con-
t i n u e d through the system and i n t o t h e tank f o r approximately 5 m i n u t e s . I t
was then vented t o t h e a m s p h e r e through t h e v a l v e l o c a t e d downstream of t h e
NDIR. This time p e r i o d was s u f f i c i e n t t o purge t h e i n t e r -
connec t ing tubing and NDIR c e l l volume. P r i o r t o resuming flow through t h e
condensa te t r a p , the va lve was switched t o i n t r o d u c e a g a i n t h e flow i n t o t h e
sample t a n k . The t rap was removed from t h e d r y ice b a t h and allowed to warm
t o ram temperature (determined by t o u c h ) . The t r a p was p laced back i n t o t h e
d r y ice ba th and t h e v a l v e s switched t o resume car r ie r g a s flow through t h e
trap a f t e r f r o s t i n g appeared on e x t e r n a l t r a p s u r f a c e s . The procedure was
t h e n completed a s d e s c r i b e d . T h i s m o d i f i c a t i o n t o t h e procedure was intended
to a s s u r e t h e removal of any CO which may be t rapped w i t h i n t h e ice
c r y s t a l s p r e s e n t i n t h e t r a p . *
(See Figure 5-7.)
2
5 . 4 Pre l iminary Moisture Determinat ion
Pre l iminary moisture t e s t s were performed a t t h e scrubber i n l e t and
o u t l e t p r i o r t o emission t e s t i n g . T e s t i n g was performed i n accordance with
EPA Method 4. Data were recorded o n
p r e s e n t e d i n Appendix C.
5.5 Pre l iminary V e l o c i t y Determinat ion
Pre l iminary v e l o c i t y measurements
I I I I I I 1 I i I I I f i e l d moisture d e t e r m i n a t i o n forms as
I were made a t t h e scrubber i n l e t and I
I 1 I
out le t p r i o r t o emission t e s t i n g . EPA Methods 1 and 2 were followed i n
measuring t h e v e l o c i t y o f the g a s stream. Data were recorded on t h e f i e l d
d a t a sheets (Traverse P o i n t w a t i o n f o r C i r c u l a r D u c t s and Pre l iminary
V e l o c i t y Traverse , Appendix c) .
" I n v e s t i q a t i o n o f Carbon Dioxide I n t e r f e r e n c e w i t h Method 25." EPA C o n t r a c t
1 68-02-2814, Work Assignment 41. Midwest Research I n s t i t u t e , A p r i l 15. 1981, p. 7.
5-22
I

I I I I I I I I I 1 I I I I I I I I I
5.6 Visible Emissions
Scrubber outlet visible emissions were not monitored as planned because
of overcast sky background conditions. The controlled emissions were bluish-
white which made it impossible to distinguish the emissions from the overcast
sky. Overcast skies were present on June 8, 9 and 10. During the last test
day, June 11, the sky began to clear and only scattered clouds were present
in the afternoon. However, the final test sequence was nearly completed by
this time. Consequently, no visible emission observations were recorded.
Although the scrubber outlet stack had an attached steam plume, the
Method 9 observations were not cancelled because of this condition. The
method provides for attached steam plumes by requiring that observations be
made at the point where the condensed water vapor is no longer visible.
5 . 1 Pressure Drop Measurements
The pressure drop across the scrubber system was measured in order to
determine if the unit was operating at design conditions and to provide a
means of correlating a scrubber operating parameter with collection effi-
ciency. U-tube water manometers were used to measure static pressure at
three points at 30-minute intervals during the test period. Measurements
were made at the inlet sampling location, just before, and just after the
induced draft fan. Pressure drop across the scrubber system was then cal-
culated from the static pressures.
5.8 Scrubber Solution Samples
Scrubber solution samples were taken from the holding tank of the recir-
culating system concurrently with the particulate/condensible organics test-
ing performed at the scrubber outlet. These samples were taken to determine
5-23

the relationship between the total organic carbon content of the scrubber
solution and the actual measured emissions.
A 100-ml sample was taken approximately every 30 minutes while Method 5X
was being performed at the outlet. These samples were taken by dipping a 100
ml graduated cylinder into the holding tank. Sample numbers and collection
times were recorded on the Scrubber Solution Sample Collection form. The
100-ml aliquots collected during a test were composited into one sample jar
for that test.
The composite samples were placed in shock-proof containers and trans-
ported to C H P i l l at the conclusion of the test program. The scrubber
solution samples were analyzed for total organic carbon (TOC) following Stan-
dard Method 415.1. All analyses were performed within two weeks of sample
collection.
5.9 Fugitive Emissions
The purpose of these measurements was to visually determine the frequency
of occurrence of emissions that are not emitted directly from the process
stack or duct. These are generally referred to as fugitive emissions and
include such emissions as those: (1) escaping capture by process equipment
exhaust hoods: (2) emitted during material transfer: (3) emitted from build-
ings housing material processing or handling equipment: (4) emitted directly
from process equipment.
EPA Method 22 modified guidelines, as presented in Appendix F, were used
to determine fugitive emissions from the veneer dryer doors and abort
stacks. The method does not require that the opacity of emissions be deter-
mined. Instead, the amount of time that any visible emissions occur during
the observation period is measured.
I I I I I 1 I I I I I I I I I I 1 1 I
5-24

I I I I I I I 1 I 1 I 1 1 1 I I I I I
Fugitive emissions from the veneer dryers were monitored by RTI and DGA.
Observations were recorded periodically throughout the test program.
5.10 Rmbient Temperature and Relative Humidity
Outdoor ambient air temperature and relative humidity were measured with
a psychrometer at the beginning and end of each test period. Measurements
were made by RTI and theit subcontractor to determine if a relationship
exists between ambient temperature and relative humidity, and the emissions
from the veneer dryers. Data was recorded on a form presented in Appendix I.
5-25

I I I I I I I I I I I I I I I I I I 'I
6.0 QUALITY A S S W C E
The TRC quality assurance program is designed to ensure that emission
measurement work is performed by qualified people using proper equipment
Eollowing written procedures in order to provide accurate, defensible data.
This program is based upon the EPA Quality Assurance Handbook for Air Pollu-
tion Measurement Systems, Volume I11 (EPA-600/4-7-027b).
At the beginning of each day, a meeting was held to orient personnel to
the activities scheduled for that day and to discuss results from the pre-
vious day, and to determine if any special considerations were appropriate
for the day's work.
6.1 Method 5 X
TRC's measurement devices, pitot tubes, dry gas meters, thermocouples,
probes and nozzles are uniquely identified and calibrated with documented
procedures and acceptance criteria before and after each field ef€ort.
Records of all calibration data are maintained in TRC files. Samples of
these calibration forms are presented in Appendix F.
All Method 5X sampling shall be 100 210 percent isokinetic. Probe and
hotbox temperatures were maintained at 350° +25OF. Deviations €rom these
criteria were reported to the EPA/EMB task manager to decide whether a test
run should be repeated or continued.
A single clean-up evaluation test was performed on each initial set
(collector train) of glassware prior to collecting €ield samples. The eval-
uation tests (Method 5 X ) were performed in the field clean-up laboratory and
were observed by the EPA task manager. Necessary changes or modifications to
the clean-up procedures were specified by the EPA task manager prior to
collecting field samples. The sets of glassware, including the probes,
6-1

were prepared and precleaned before conducting the clean-up evaluation
tests. The impingers were precharged as specified in the actual test pro-
gram. Afterward, the Sample COlleCtOrs, including probes, were cleaned and
the blank samples recovered and analyzed as specified in the actual test pro-
gram. Results are presented in Section 2 of this report.
In summary, the evaluation tests were designed to precondition the sample
collectors, to establish blank background values, and to educate the clean-up
personnel in specific sample recovery procedures.
Acetone was provided by CHpHi11 in glass-lined containers. Both the
acetone and D.D. water were analyzed by CH MHill prior to field use. Resi-
due data from this preliminary analysis was evaluated by the EPA/EM.B task
manager with respect to the suitability for use during the test program.
These data are presented in Appendix H. In addition, three blank samples of
D.D. water, acetone, and both 2-1/2 inch and 4-1/2 inch filters were
collected for background analysis. All clean-up evaluation and blank samples
were analyzed in conjunction with the actual test samples.
2
All sample recovery was performed by a three-person clean-up crew.
Appropriate sample recovery data were recorded on the sample identification
log, sample handling log, chain-of-custody form, and analytical data forms as
presented in Appendix D.
Recovered samples were secured in padlocked, shock-proof, steel con-
tainers for storage and shipment for analysis.
All preparation and analysis of Method 5X samples were performed by
CHPHi11, which has extensive experience with Oregon DEQ Method 7, from
which Method 5 X derives. CH MHill adhered to the standards of quality
assurance set forth in the pality Assurance Handbook for Air Pollution
2
6- 2
I I I I I I I I I I I I I I I I I I I
~

I I I ,I !I 'I I I I I I I I I I I I I I
Measurement Systems, Volume I11 (EPA-600/4-7-027b) and the Handbook for
Analytical Quality Control in Water and Wastewater Laboratories (EPA-600/4-
79-019, March 1979).
6.2 Method 25
Method 25 traps were burned out according to the method prior to testing
and spot-checked for contamination. All Method 25 tanks were flushed with
nitrogen and checked for contamination prior to field use.
Six sampling trains were used to provide a check on data precision. Two
trains were analyzed by TRC; two by PCS, and NCASI analyzed the remaining two
trains. All tanks and traps have permanently engraved identification numbers.
Analyzers were calibrated over the specified ranges using certified cali-
bration gases. Certification forms are provided in Appendix F.
6.3 Method 9
The TRC observer had been certified within the past 6 months to perform
visible emission evaluations.
6-3

I I I I I I I I I I1 I I I 1 I I I( I I
APPENDIX A
SUMMARY OF TEST DATA
A . l EPA Method 5 X - R e s u l t s A . 2 EPA Method 2 5 - Results

#I I I 1 I I! 1 I I I 1
I I 1 I I 1 'I' I I
APPENDIX A.l EPA METBOD 5X - RESULTS

I I I 1 I I I I I I I I I 1 1 1 IN I I
e m W V I
4 - . .
.. b b - - .I r . m " - n n . .
A - I
.. . . .

I 1 I I I
1 1 I
i . v.7 27. i.5 r: =. I a:., . . -1 n
1
(0.78 'I
\ . . Bammtric Pressure - in. Hg
Stack Area - Ft2 Nozzle Diameter - in. Total Faupling Time - min. Calibration Factor 0.99 Pitot Coefficient Average Square Root of Velocity Head (in. HzO) Average Orifice Pressure Dmp - in. H20
2% 7 5
0 # 2.75 40
111 I '3 1;i 1::'
0, a5 ' 7 . f .I.,
0. FIY -.I ...,
.:, -..a;.. : -, 9,
2.00 Average Meter Temperature 'F 7+ Average Stack F'ressure - in., HzO
Avenge Stack Tenperame 'F 305 -
r - ._; !J . '3 .... L 1.1. Meter V o l a at Meter Conditions - Ft3
Toral Water Vapor Collected - ml
% wz in Srack Gas (Dry) % 02 in Stack Gas (Dry)
(Dry)
450.9
20.9 . .
, I!. . . 0
% 0) in Stack Gas n 11
H l J . 2 5Oal
. . -,4. 2 ?arx Land . .
Total Particulate Catch - Mg 4 5 ~ 2 3 !j e, 4 :3 i,
~ , . % Hydrogen in Fuel
% Carton in Fuel i._. a % : - . li. % Sulfur in Fuel \ Nitrogen in Fuel
I . ' .I
i
.:a c; 1 0 (-! :-, - :> :; 1 f , :3 '' I?. 5; 6: ::: 2: 5
::; 8 . 1 :2 Cl 2 i:! F.; c*\ ! % Oxygen in Fuel i Gross Califoric V o l a of Fuel - BTU/lb
. !I! !:!{:I Cl I:I :; g, : ii '- '
bkter V o l a a t Standard Conditions (Dry)-Ft' % HzO Vapor in Stack Gas 7i .9 i >blecular Weight of Stack Gas (Vet) Average Velocity of Stack Gas - FRI kNal Stack Gas Flowrate - ACM S t d Gas Flowate (0.011 H2O; STP) - K F b l
% Isokinetic (Avg. Nozzle Vel/Avg. Stk Vel) Particulate Concentration-lb/DSCF 7 . b Z W h -b 2 .,,8,/o-"
F Factor - ECFiWi BTU Particulate Emissions - IbsDM BTJ
'.I ._I ~ .- c; 'I; 111 4 2 -3 ~
: .. - I ~i I .- a
2e%w Zbbao r z + o
I j L.4
Particulate Emission Rate-lb/hour z.bt & + T H I e.+
I Rev. 2 6/17/01
4-2

P bar As En Time Y
CP (be)
AH Tn Pstk Tstk Vm vl
---zc02
02 -a
m
% H
% C % S
% N
% O
rn Calculated
Vm (std) % H20 &ti%
VS 9s QS ( S W
% I cs ET
F E
I I 1 I
__?__~ ---,-. .-- Bamtric Pressure - in. Hg 29.7/ r S t a c k Area - FtZ 6.'78 l N o A e Diameter - in. 0.255- Toral S a p l i n g Time - m i n . (0 0 !
Calibration Factor 0.99;
1 s 74
P i t o t Coefficient fl sq Average ?quare bat of Velocity Head (in. H20) 0 909 Average Orifice Ressure h o p - in. H20 Average Meter Temperature 'F 7 8 Avenge StXk Pressure - in. H20
Average Stack Tenperamre OF 5 [LI
Total later Vapor Collected - m l +in, 3 I 0J.L in Stack Gas (Dry) 0 I 02 in Stack Gas (Dry) 20.9 I i l l in Stack G a s @ry) 0
I
- - L Meter Volune at Meter Conditions - Ft3
- .- Pw s LQ-d - -
% Wdmgen in Fuel 1 Carbon in Fuel % Sulfur in Fuel 8 Nitrogen in Fuel % Oxygen in Fuel Gross Cnliforic Volune of Fuel - 5lU/lb
*ter Volume at Standard Conditions @ry)-Ft3 '$?./ I H2O Vapor in Stack Gas W l d a r Weight of Stack Gas Over) Average Velocity of Stack Gas - FI?I Actual Stack Gas Flowrace - KR.4 2, , oo . . :.......,..._I.i..-d
Stack Gas Flowate (0.0% H2O; 5E') - DSCFFI
JWJ 25-. I
. el 111 111 111 111 2 ::: 1 :: 2 1 . t. ! '~ .I, ,.. J La 1.: i .I
1 f I . q I 1
. -..-.,2C i - .
Vi)n/r
a /2-ceo % Isokineric (Avg. Nozzle Vel/Ave. Stk Vel) Particulate Concencration-lb/DSCF e.z iwswn- ' - iB,/O'S Paniculate Emission Rate-lb/hour l .L,7 + t5:7 F Factor - DSCF/EM B N Particulate Emissions - 1bsfi.FI BN
Rev. 2 6/17/81
A-3

1 I I I
PARTICLUTE EST DATA
e P bar &
Lhl Time Y
cp :
(bP) 112 A H
Tn Pstk Tsrk Vm
-3 m2 02
--W
bh
E % H \ C % S t t i
80 Gcy
Calculated
\h (srd) \ H20
hhgs
Vs QS
Qs (srd) \ I cs ET
F E
Bammcric Ressure - in. Hg Stack Area - F t 2 Nozzle Diameter - in. Tom1 *ling T i m - min. Cilibrarion Factor P i to t Coefficient
Average Square Root of Velocity Head [in. Average Orifice Pressure Drop - &. HzO Average Wrer Temperaeure OF Average Stack Ressure - in. HzO Average Stack Tenperanue *F Meter Volurne a t Merer Conditions - F t 3 Toral Water Vapor Collecred - ml \ CO2 in Stack Gas (m) I 02 in Stack Gas (Dv) 4 0) in Stack Gas ( try)
Total Parciculare Catch - hlg
k Hydrogen i n ' F u e l t Cartan in Fuel \ Sulfur in Fue l t Nirmgen in Fuel t Oxygen in Fuel Gross Califoric V o l m of Fuel - ETJ/lb
- * ,
Average Velocity of Stack Gas - F P I Actual Stack Gas Flowate - ACRl Srack Cas Floware (0.0% HzO; 5Tp)
k Isokinetic (Avg. Nozzle Vel/Ave. 5rk Vel) Parciculare Concentration-lb/DS~ 0. I a 3 X t d
q O L U
37ao 0. 1 2 . b C b
54 .L - DSCFhl
Particulate Emission Rare-lb/horp F Factor - DSCFfiBI BW
Panicula te Emissions - lbs/\PI BIU

Inout A
P bar As En Time Y
-
cp (Ap)
m P s t k Tstk VlU
n za CO?
O? --4 cw
b h
Inout C - , b H
I C % S % N % O CCY
Calculated
Vm (srd) \ H20 M W S
vs
Qs Qs (std) % I cs Er F E
Barometric Pressure - in. Hs Stack Area - F t 2 Nozzle Diameter - in. Total S q l i n g Time - m i n . Calibration Factor Pitot Coefficient
~
Average q u a r e b o t of Velocity Head (in. HZO)
Average Orifice Ressure Drop - in. H20 0 70 Average Xeter Temperature O F
Average Stack Pressure - in. H20
0 . 1 1 5
81 0 .
Average Stack Temperame 'F t.leter V o l m a r Meter Conditions - F t 3 Total IVater Vapor Collecred - ml b cO2 in Stack Cas (W) 1 02 i n Stack Gas (Dry) 'L a3 i n Stack Gas (Dry)
Total Parriculate Catch - bfg
166 3 9 . Y 3 501. L
D 20.9
I Hydrogen in Fuel 8 Carbon in Fuel \ Sulfur in Fuel \ Nitrogen in Fuel % Oxygen in Fuel Gmss Califoric Volume of Fuel - Blu/lb
Meter'Volume a t Standard Conditiom m. 1 H20 Vapor in Stack Gas b h l d a r IVeiqhr of Stack Gas (lifer) Average Velwciry of Stack Gas - F F I Acwl Stack Gas Flowrare - A131 Stack Gas Flowrate (0.0% H20; STP) - DSCFhl % Isokineric (Avg. Nozzle Vel/AvE. Stk Vel)
3g.3 7 r . 3 3 r . 7 qs7
2.9100 1 5 / 0 0 1 a i . g
a ,411 / 1a.o P a r r i d a r e C.oncenrrarion-lb/DSCF 0.327 X I O ~ ~ / I . ~ Z X ~ O ' ~
F Facror - DSCF/FM BW Panicula te Enissions - IbsbN 9m
Parriculare Emission Rate-lb/hour
C37.Y) I
a-5- Rev. 2 6/17/81 I

1 1 I 1 I I
I I I 1 I I I I I 1 I 1
i.
Barometric Ressure - in. Hg 2qcT. 7 / S t a d Area - Fr2 63.62 Nozzle Diameter - in. 0. coy Total Sanpling T i n e - m i n . 9 6 Calibration Factor / . 0 Picor Coefficient 0. BY Average sure bot of Velocicy Head (in. H20) Average Orifice Ressure Drop - &. H20 Average Meter Temperature 'F 7 9 Average Stack Pressure - in. H20 Average Stack Temperame 'F k t e r V o l m ac Meter CondiKions - Fr3 3 6. 2 . 1 Total Water Vapor Collecred - ml L/ IJ- % CO2 in Stack Gas (Lhy) /I % 02 i n Stack Cas (Dry) 30. 9 % CO in Stack Gas (Dry) 0
P d / C A - L
0 . / 3 r 0.58
0 /6 6
Total Pan icu la t e Catch - Mg q1.4 / 1t-K 7
% Hydrogen in Fuel % Carbon in Fuel k Sulfur i n Fuel % Nitrogen in Fuel % Orygen in Fuel tmss Califoric Volwc of Fuel - BN/lb
Meter V o l m a t Standard Conditions @ry)-Ft3 37.3 % H20 Vapor in Stack Gas 3 7.5- hblecular Might of Srack Gas DfeKer) 2q. 8 Average Velociry of Stack Gas - FPI 52 .r AcNal Stack Gas Flowrare - ACRI J3Y Ob Stack Gas Flowrare (0.0% HzO; Srp) - E F ? I I l T O O 5 Isokineric (Avg. Nozzle Vel/AvE. Srk Vel) Par r imla te Concentracion-lb/OSCF Panicula te Emission Rare-lb/hour a.59 / 13.9 ( d .19/ 1 3 , 3 ) F Facror - DSCF/EN BN Parriculace Emissions - lbs/?@I BTJ
l 0 L . L . L Y E K h J - 5 / 8.1 g K I 0 - i
4 - b Rev. 2 6/17/81
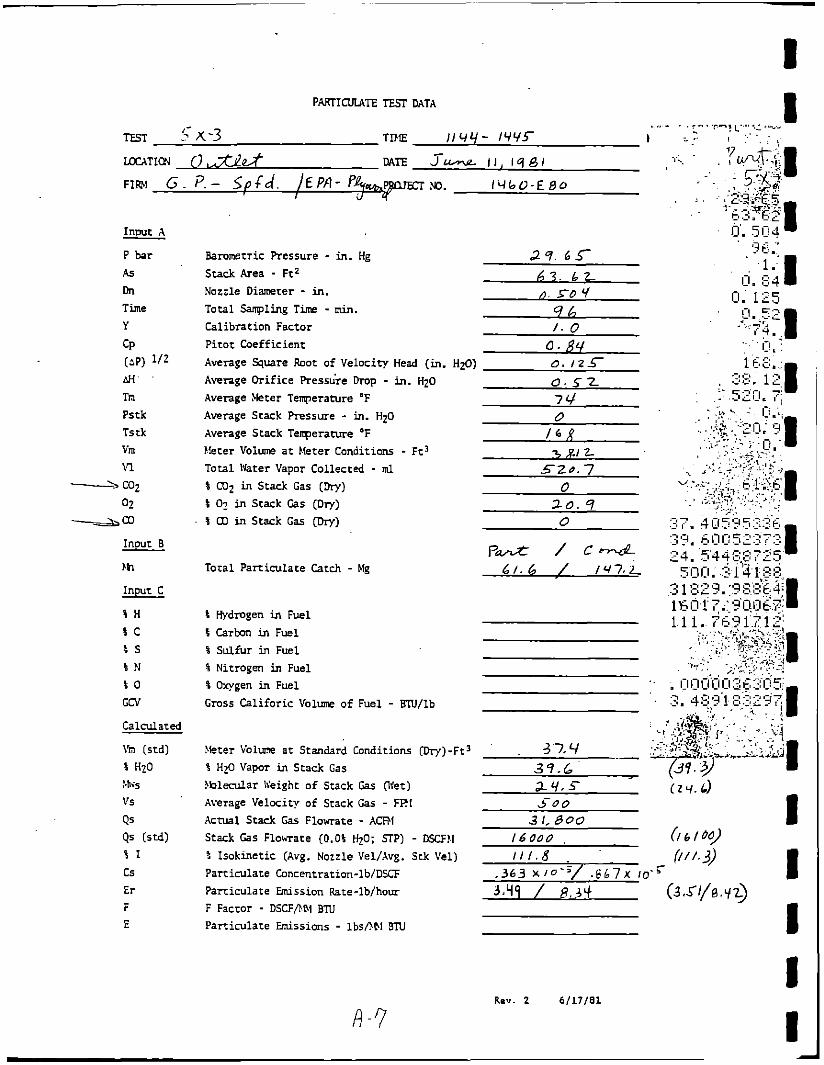
Barometric Pressure - in. Hg Stack Area - F t 2
Nozzle Diameter - in. Total Sampling Time - &. Calibration Factor Pitot Cnef f i c ienr Average N u r e b o t of Velociry Head (in. HzO) Average Orifice Pressire h p - in. H20
Average Meter Temperamre O F 7q Average Stack Pressure - in. H2O
Avenge Stack Temperame O F 1 6 f ? h e r Volum? a t Meter Conditions - F t 3 Total IVater Vapor Collected - ml
% CU2 in Stack Gas (m) 0
0. i23-
0 - 5 2
0
-5 I./ 2 5 2 0 . 7
8 01 in Stack Cas (on) % a3 in Srack G a s (Dry)
20. 9
P d / c 4 Total Panicu la te Catch - hlg 6 1 . 6 / I Y 7 . L
8 Hydmgen in Fuel 5 Carbon in Fuel 8 Sulfur in Fuel % Nitrogen in Fuel % Wgen in Fuel Gross Califoric V o l m of Fuel - B"ilJ/lb
Yeter V o l m ar Standard Conditions (Dry)-Ft' % H20 Vapor in Stack Gas Sblecular Weight of Stack Gas O W ) Average Velccity of Stack Gas - FFtl Actual Stack Gas Flowrare - ACFM Stack Gas Flowrate (0.0% HzO; STP) S Isokinetic (Avg. Nozzle Vel/Avg. Particulate Concentration-lb/DSCF Particulate Emission Rate-lb/hour F Factor - DSCFb.III BTd Particulate Emissions - lbsfibl STU
- DscFhI Srk Vel)
4.7.4 39.6 . a Y . 5-
Rev. 2 6/17/81
A -?
I I I I I

1 1 I I 1 I I I I I I 1 I I 11 (I I I 1
APPENDIX A . 2 EPA METHOD 2 5 - RESULTS

I 1 I I 1
I I 11 11 I I I A-€3

m n m n
n 9
m 10
0 - 9

1 I 1 I 1 t I I I I 1 I I I 1 1 3 I I A - 1 0

A - / I

1 I I I
t t 1 1. I I I 'I 1 I I I 1 I
i
APPENDIX B
SAMPLE EQUATIONS AND CALCULATIONS
8.1 E P A Method 5x 8 . 2 EPR Method 25

I I I 1 I. 1 I 1 t
1 I I I 1 1 I
I
i
i
APPENDIX 8.1 EPA METBOD 5X

.t I 1 I
mct-Lcp s-x EMISSION CALCULATION SYMBOLS
La - Allowable l e a k ra te , cfm
Vm - T o t a l meter sample volume, f t
- T o t a l sampling time, min T t o t a l
L - F i n a l l e a k ra te of sampling t r a i n , cfm P
Vmc
y - Dry gas meter c a l i b r a t i o n f a c t o r , d imens ion le s s
Tstd - Standard tempera ture , F
Tm
‘bar
AH
‘std
VI - Volume o€ l i q u i d c o l l e c t e d i n impingers , m l
VSG - Volume of l i q u i d c o l l e c t e d i n s i l i c a gel, grams
M - Molecular weight of s t a c k g a s , lb / lb-mole
% C 0 2 - Percen t C 0 2 by volume (d ry b a s i s ) ,
%CO - Percent CO by volume (dry b a s i s ) , %
ZN2 - Percent M2 by volume (dry b a s i s ) , %
%O - Percen t O2 by volume (dry b a s i s ) , %
Dst - Average d u c t g a s d e n s i t y , l b s / f t
P s
T s - Average d u c t tempera ture , F
FA - Excess a i r , %
Vs - Average d u c t v e l o c i t y , f t / m i n
C - P i t o t t ube c o e f f i c i e n t , d imens ion le s s
(KP)avg - Average squa re r o o t of v e l o c i t y head , J””
3 t o t a l
3 - T o t a l volume sampled c o r r e c t e d f o r e x c e s s i v e leakage , f t t o t a l
0
0 - Pverage d r y g a s meter t empera tu re , F 629.
- Barometric p r e s s u r e , “llg
- Average o r i f i c e p r e s s u r e d rop , “H20 avg . - Standard p r e s s u r e , “Hg
S
%
2 3
- Average d u c t s t a t i c p r e s s u r e , “H20 avg
avg 0
P
2 - Cross - sec t iona l area of d u c t , f t A s

merho ,L 3-x FNISSION CALCULATION SYMBOLS (cont ‘d)
Q - Duct vo lumet r i c f low r a t e , acfm
Q s t d
Dn - Nozzle diameter,’ i n c h e s
F - F f a c t o r , DSCF/MM BTU
XH - Percen t by weight of hydrogen i n f u e l
XC - Percen t by weight of carbon in f u e l
XS - Percen t by weight of s u l f u r i n f u e l
%N - Percen t by weight of n i t r o g e n i n f u e l
%O - Percen t by weight of oxygen i n f u e l
GCV - Gross c a l o r i f i c v a l u e of f u e l , BTU/lb.
C - Actua l p a r t i c u l a t e c o n c e n t r a t i o n , g r a i n s / a c f
C, - P a r t i c u l a t e c o n c e n t r a t i o n , g r a i n s / d s c f
ER - P a r t i c u l a t e emis s ion r a t e , lbs/hr
E - P a r t i c u l a t e e m i s s i o n s , l b s />M BTU
C, @ 1 2 % C02 - P a r t i c u l a t e c o n c e n t r a t i o n , g r a i n s l d s c f @ 12% C 0 2
C, @ 50% EA - P a r t i c u l a t e c o n c e n t r a t i o n , g r a i n s / d s c f @ 50% EA
CLb - P a r t i c u l a t e c o n c e n t r a t i o n , l b s /1000 duc t gas
CLb @ 1 2 % C 0 2 - P a r t i c u l a t e c o n c e n t r a t i o n , lbs/1000 l b s @ 1 2 % C 0 2
CLb @ 50% FA - P a r t i c u l a t e c o n c e n t r a t i o n , lbs/1000 lbs @ 50% EA
Mn - T o t a l p a r t i c u l a t e c o l l e c t e d , mg
- Duct v o l u m e t r i c f low r a t e , c o r r e c t e d t o dry s t anda rd c o n d i t i o n s , dscfm
6-3,
I I I 1 L 8 II 8 I I I t 1 I I I I I 1
\
1

r ) I \Ud 5-x- I - 'I
1. Allowable Leak Rate
La = 0.02 cfm or 0 .04 vm t o t a l
t o t a l
which e v e r i s l e s s ,
0 . 0 4 'm t o t a l - - 0 . 0 4 x qL. 2b T t o t a l COO
La = 0.0731 cfm
2.' Cor rec t ion for Excess ive Leak R a t e
Lp = 0. o i o cfm
i f Lp > La u s e 'mc t o t a l in p l a c e of 'm t o t a l in a l l subsequent e q u a t i o n s .
! 'mc t o t a l = 'm t o t a l - (LP - La) Ttotal
-( - ) - - f t 3 = 'mc t o t a l
. . . . .
~
. .. . ~~~ ~~ ~ ~ . I . .
, . 3 . - Volume of Sample Measured .by Dry Gas Meter. Correc ted t o Standard Cond i t ions AH a v g
"m t o t a l ( s t d ) - - 'm t o t a l '( T s t d + 460 ) [ 'bar Pstd + .13.6 1 'L'3"T+ 13.6 = q;,sc ( o . q , , , ) [ o , q q 9 i ] V . m t o t a l ( s t d ) =L(b-U xt.W ( ,,$ + 460 ) [ 2 9 . 9 2 " 1 Tm avg + 4 6 0
68 + 460
'm t o t a l ( s t d ) = q5.I d s c f
4 . Mois tu re Content of Duct Gas
x 100 X H20 = 0~ .04707 ('1 + 'SG)
'm t o t a l ( s t d ) + 0 .04707 (VI + VsG)
% H20 = 0 .04707 ( q % + < ) ) X 100 6. j + 0 .04707 (L('(L+;
% H20 = 3 1 . 9 %

5. Molecular Weight o f Stack Gas -
6 . Average Duct Gas Density
= 0.0458 x 12s
Ts avg + 460
Vk
Dst
Dst yizo ) = 0.0458 x ( +
- l b s / f t3 Dst -
7 . Excess Air
v 4 1 % '2 - 0 . 5 % CO 0 .264 % N2 - (% O2 - 0.5% CO) E A -
, ,
1 - 0.5 x .- 0.5 x ) EA = loo [0 .264 x - (
EA= %
8 . Average Duct V e l o c i t y I
1 3 . 6
V = 5129.4 C ( 6 ' ) a v g P 9
l3 -4

9. Duct Volumetric Flow Rate
Q - V s x A s
Q - 3 9 L O x b.78
(2 = 2 L b O O acfm
10. Duct Volumetric Flow Rate, Corrected to Drv Standard Conditions
Ts avg + 460 'std Qs td
r'A 12. F - Factor F - 1 0 6 ( 3 . 6 4 % H + 1.53% C + 0.57% S + 0 . 1 4 % N - 0 . 4 6 % 0 )
GCV
-0 .46 x ) . +0.57 x +0.14 x 6 F = 10 ( 3 . 6 4 x +1.53 x
F = DSCF/MM BTU
11. Isokinetic Factor
5.67 (Ts avg + 4 6 0 ) ('rn std) I = (h)' x 0.7854

13. Actual Particulate Concentration - & %H20 0.01543 x Mn (Tstd + 460)(%ar+ 13.6 )( -loo) C =
Vmstd Tsavg + 460 ’std
14. Particulate Concentration, Corrected to Dry Standard Conditions
C, = 0.01543 x Mn - std
L
~ 8 2 . 3 Cs = 0.01543 x
Y i, 3 C = u . 1 4 g grains/dscf = Z . t ; y X \ O - ’ - s
15. Particulate Emission Rate
ER = 0.008571 x C
ER = 0.008571 x u . i’r 6 x
ER = .2I. I lbs/hr.
x Qstd S
~ 4 0 0
& A - 16. Particulate Emission 1
20.9 -. %02 E = 0.0001429 Cs x F
E = 0.0001429 x X ( 2 o Y ) E = lbs/MM BTU
17. Particulate Concentration Corrected to Dry Standard Conditions and 12% C02
NA-- c, @ 12x co2 =
cs e 12% co2 =
12 7: co2
X 1 2
cs @ 12% co2 = grains/dscf @ 12% C02
Q-L
I I 1 c I 8 B ID I e !I I I 1 I I I I t -

1 B I I 1 1 1
t s I I I 1
E 0 1 f
a
-
i
Modified EPA Method 5X C a l c u l a t i o n s
A l l c a l c u l a t i o n s and nomenclature are t h e same as i n Method 5,
wi th t h e fo l lowing a d d i t i o n s .
Nomenclature
Ce = Ether-chloroform-water b l ank r e s i d u e c o n c e n t r a t i o n , mg/ml.
mb = Residue mass from ace tone r i n s e of impingers a f t e r ether- chloroform e x t r a c t i o n and e v a p o r a t i o n , mg.
m = Residue mass from EC e x t r a c t i o n of h p i n g e r water a f t e r C
e v a p o r a t i o n s , mg.
m = E x t r a c t r e s idue mass of water b l ank , mg e
mf = Residue mass c o l l e c t e d on 47 m f i l t e r , mg.
m = T o t a l amount of condensed o r g a n i c matter c o l l e c t e d , mg. 0
V = Volume of water b lank used i n t h e EC e x t r a c t i o n , m l . e
Vww = Volume of l i q u i d c o l l e c t e d i n t h e impingers , ml.
We = Mass of e ther-chloroform-water b lank e x t r a c t , mg.
Ether-Chloroform-Water Blank Concen t r a t ion
m
e V c = P
e
W = ce vww e
m = m + m + m - W 0 c b f e
T o t a l P a r t i c u l a t e and Condensed Organic Matter Concent ra t ion
C t = (0 .001 g/mg)(mn + mo)/Vm(std)
B - l

APPENDIX 8 . 2 EPA METKID 25

I I .
I 1 I c I I' B I 1 I I I 1 1 I t I I
EPA NETROD. 25 (MODIFIED)
GP
LABORATORY DATA AND CALCULATIONS
Fie ld Sample R u n No. - &5---/-1-4 Laboratory Sample Run No. Analyst: r+L
Date Analyzed: 1x7 /Y /
SAMPLING TRAIN DATA
R20 I c e Trap No. SI>- C02 Ice Trap No. \ I I Sample Tank No. L-
- Intermediate Tank Data - H,O Ice Trap
5- 3- Tank No.
vvl ( l i t e r s ) q- $7 7 Pfl (mm Hg) 1 q 7 3 - G Tf 1 (d 2 5 5 i<
L
Intermediate Tank Data - CO, Ice Trap i
Tank No. 1 1 I
vv2 ( l i t e r s ) Lf- 6 b Pf2 (UID Hg) ( 0 7 0 . 9 S?C/ I(
ANALYSIS DATA
I / q * co PPn c1 l 3 L P P c1 1 1 3 1 P P c1
- Average Sample Tank Concentration, Ctm
Average R20 Ice Trap Concentration, Ccml
Average C02 Ice Trap Concentration, Ccm2
- -

!ETHOD 25 CALCULATIONS
m 3 1. Sample Volume, Vs (y)
- V - 0.386 V 9
I - r -4
I I

1 d I
I b
. . .
b. C02 Ice Trap
&( 22-- I - 2 - 4 METHOD 25 CALCULATIONS (Cone.)
4. Total Gaseous Nonmethane Organics, C (ppm C,)
c = Ct + CCl + cc2
C m I l8b g*
' 5. Total Gaseous Nonmethane OrRanic Mass Concentration, Mc (lbCl/scf)
Mc - 3.11 x 10⁻⁸C
-7 - 7 . L Y y i u

I I I I I I I I I I I I I I I I I I I
APPENDIX C
FIELD DATA SHEETS
C . l EPA Methods 1, 2 and 5X C . l . l Scrubber I n l e t C.1 .2 Scrubber O u t l e t
C.2 EPA Method 25 - Scrubber I n l e t C . 2 . 1 TRC Data c . 2 . 2 . NCASI Data
C.3 EPA Method 25 - Scrubber O u t l e t c . 3 . 1 TRC D a t a , C .3 .2 K A S I Data
C.4 Pressure Drop Measurements and Scrubber S o l u t i o n Sample C o l l e c t i o n

I I I I I I I I 1 I I I I I c I I I I
APPENDIX C.l EPA METHODS 1, 2 and 5X

I
I I I 1 1 I
I
APPENDIX C.1.1 SCRUBBER INLET
I
1 1 I
I I

I ! I I I I I I I I I I I I I I I I I
I I I I I I I I I I I I I I I I I I I I 1 I i I I
I ' 1 I I I
I I I I I
I I I I I i I ! ! i
- 4 li 1
I
I
1- I c- I

. .
I FRELlb:I:;ARY V E L O C I T Y T R A V E R S E
. ?LANT T w t . \4r \ I. ('. U
L c c a T T \TE
BAROiXTRIC PRESSURE, in. Hg STACK1.D. ' ' &s 35.25"
STACK GAUGE PRESSURE. in. HzO OPEilATORS S D P I u3 E
2q.6 L sE7ssg - 2 2
. .
€?A (Our) 2 3 0.791 . 3 0 6 4/12 c-2
~~ . ----- ~~ ~.- ~c
J

I: . - ' - .' I
1, c .
I .

NOMOGRAPH DATA
PLANT
DATE
SAMPLING LOCATION
I I
STATIC PRESSURE IN STACK, in. Hg
RATIO OF STATIC PRESSURE TO METER PRESSURE
ACTUAL NOZZLE DIAMETER, in.
€PA (Dur) 234

1 I 1 I I 1 I I I I I 1 I I 1 I' 1 1 I -5

NOMOGRAPH DATA
CALIBRATED PRESSURE DIFFERENTIAL ACROSS ORIFICE, in. HP 4H@
AVERAGE METER TEMPERATURE ( A M B I E H T + ~ o O , o F T,,VI.
PERCEKT MOISTURE IN GAS STREAM BY VOLUME %O
BAROMETRIC PRESSURE AT METER, in. Hg Pm
1.83
65
m\ 3-L
STATIC PRESSURE IN STACK, in. HE
(P,+0.073 I STACK GAUGE PRESSURE in in. HzO)
RATIO OF STATIC PRESSURE TO METER PRESSURE
-a . / .
p s
I ps/Pm /
I I
I f
EPA (Our) 234


NOMOGRAPH DATA
SAMPLING LOCATION
CALIBRATED PRESSURE OIFFERENTIAL ACROSS ORIFICE, in. H20
AVERAGE METER TEMPERANRE (AMBIENT+2OoI?,'F
PERCENT MOISTURE IN GAS STREAM BY VOLUME b a 33 BAROMETRIC PRESSURE AT MmER, in. Hg
STATIC PRESSURE IN STACK, in. Hg
(P&O.U73 I STACK GAUGE PREaURE in in. HzO)
pm ?S.bS
ps 1.4
PS - /P, RATIO OF STATIC PRESSURE TO METER PRESSURE
TS avg. 31 0 AVERAGE STACK TEMPERATURE, OF
AVERAGE VELOCITY HEAD, in. H$ %VK. 0.9 MAXIMUM VELOClTI HEAD, in. H20 *pmx. 1.1
C FACTOR 5 s 0,SY C A L C U I A T m NOZZLE DIAhlmR, in. 6.25
ACTUAL NOZZLE DIAMETER, in. b'2S5 REFERENCE 4 p , in. H20 I 1.05
€PA (Our) 234 4/12
I I I I i

I 1 I I 1 1 k
i*
1
1 1 I
I

1 1 1 I I I I I 1 I I 1 I 1 I I I I I
APPENDIX c.1.2 SCRUBBER OUTLET

1 TRAVERSE POINT LOCATION FOR CIRCULAR DUCTS
- PLANT OATE
INSIDE OF FAR WALL TO OUTSIDE OF NIPPLE, (DISTANCE A) 1 INSIDE OF NEAR WALL TO OUTSIDE OF NIPPLE,(OISTANCE E)
STACK I.D., (DISTANCE A . DISTANCE E) y' = 108 0 1 NEAREST UPSTREAM DISTURBANCE q ' , NEAREST DOWNSTREAM DISTURBANCE b
SCHEMATIC OF SAMPLING LOCATION
TRAVERSE POINT LOCATION FROM OUTSIOE OF NIPPLE COLUMNS 2 AND 3

Pi?ELI;.;Ii;ARY VELOCITY Ti!AVERSEd,
f-r4..l,rL- r\, -1
cy k c t . Air+!*+ 9 c e u = b L r
?LANT . ?& ‘ .TE 8.1PblU
d 2 LOCATION STACK 1.0. BAR0i;ETRIC PRESSURE. In. HE STACK GAUGE PRESSURE. in. H20
Z?.L.& - 0. o 25
. _ OPEZATORS b F I
TRAVERSE VELOCITY POINT TUGPERATIRE
NUIABER hps) , in.Hz0 CfsL ‘F
I \ 1 -0.005 1 16 1
ETA (Our) 2 3 4/12
1 I I I 1
STACK TRAVERSE VELOClrY POINT HEAO TELIPERATURE~
- NUtBER CfJ, ‘F

-~
1 1 I I I 1 I I 1 I I 1 I 1 I I I 1 I .-.
By Absorption:
Barometric pressure 2.9.61
. . . . 4 .. . . . . . . . .
- . -.--.- cq.-- ..-- - . , - - ._-_.__ . .
. . . . . . . . . . . . . . . . . . . . . . . . . . . . . . . . . . . . . . . . . . .
/ 1. . I . .
: ..
. . .
. .
......

I
'mavg.
BwLl
AVERAGE METER TEMPERATURE (AMBlENT+2O0F),OF
PERCENT MOISTURE IN GAS STREAM BY VOLUME
NOMOGRAPH DATA
0
(5. ?
DATE T U & 9 1 7 8 1 SAMPLING LOCATION S d L ob-
pm BAROMETRIC PRESSURE AT METER, in. Hg
STATIC PRESSURE IN STACK, in. Hg
(Pmf0.073 x STACK GAUGE PRESSURE in in. H20) PS
CALIBRATED PRESSURE OIFFERENTIAL ACROSS ORIFICE. in. H 2 0 I A H @ 1 \ * 7 b I
zt.7i
0
AVERAGE VELOCITY HEAD, in. H20
MAXIMUM VELOCITY HEAD, in. H ~ O
C FACTOR
CALCULATED NOZZLE DIAMETER, in.
Apavg. 0 . c\ q>j-
APmax. o I 0 2 D 7 7 (p
o ' c l g . I
I TSa"@. I (G: 4, I AVERAGE STACK TEMPERATURE, "F
ACTUAL NOZZLE DIAMETER, in.
REFERENCE ~ p , in. H20 0.0CI7-
EPA (Our) 234 4 n 2
C 213
I I I I I I I I I I I I I I I 1 I I I -

1 1 I 1 I
I i
1
I'
I I I 1

f '.. L'
I I
I I
I

1 1 I 1 I P 1 t I I 1 I 1 I I I
I I

:-
I

1 1 I 1 I i I' I ~~ ~ ~~~
CALIBRATED PRESSURE DIFFERENTIAL ACROSS ORIFICE, in. HZO
AVERAGE METER TEMPERATURE (AMBIENT+2O0F),'F 1 'I
AH@ 1 %
Tmavg. 1 3
I 6 I I 1
STATIC PRESSURE IN STACK, in. Hg
(Pm?0.073 x STACK GAUGE PRESSURE in in. H20)
P & ~ O < W E - ~ ~ R R J W S ~ ~ ~
AVERAGE STACK TEMPERATURE, "F
NOMOGRAPH DATA
PLANT G3-W (2- v I,
7
DATE .-Le t c 1 4 a / SAhlPLING LOCATION SC,wbLk a&
27.7 / ps
% 0 . q J v Tsave. iG3-
AVERAGE VELOCITY HEAD, in. H20
MAXIMUM V E L O C I ~ HEAD, in. H ~ O
I PERCENT MOISTURE IN GAS STREAM BY VOLUME I Bwo I 3: I
- Apavg. I Q7->
APmaa. c . d $ > ,
I BAROMETRIC PRESSURE AT METER, in. Hg
I .-- 0.3 I C FACTOR I
I CALCULATED NOZZLE DIAMETER, in. I 0 . Y 8 I I d.D-6 I ACTUAL NOZZLE DIAMETER, in. I I Q.r lLb i 1 REFERENCE Ap. in. H ~ O
EPA (Dur) 234 4/72

f' L
1 I
I ' I

1 lr- 1 I I I I I t t I 1 1 I 1 I I I I
I
- I l l I

I
4 3 t

L I
2 I
i
I I I I- I

I .
c -23 I

I 1 I P I II I 1 I I 1 1 I 1 I I I 1 I

.I I
I I

&::.'
1 1 I I I 1 I I I

1 I I I 1 I I 1 I 1 1 It I I I I 1 I I
APPENDIX C.2 EPA METHOD 25 - SCRUBBER INLET

I 1 I 1 I I I I I I I 1 1 I I I 1 I I
APPENDIX C.Z.1 TRC DATA

I I ' 4,. ,
I I I I I I I I 'I I I I I I I , I I

4
_. . ,
I I I I I I I I I I I I I I I I I I I -

I '
I I I I I I I 3 . I I I I I I .I I I
'\

4
I - I
\
\
I I I I I I I I I I I I I I I I I I I -

I I I I 1 I I L *I I I I I I I 'I I I C - 3 1

I I I I I I ' I
I I I I I I I I I I

I ' -I I I I 1 I I I (I'
I
5.
\ ",
!
1 i ! I I

- ,/ ’
I
I I I I I I I I I I I .I I I -

I 4 J I I I I 1 I 3, I 1 I I I I 'I1 I I

. I I I I I I I I I I I I I I I I (I I I c -3L

I ' I I I I 1 I I I :3 I I I I I I I1 1 I

I I I I I I I I I I I I 1 I I \I I I
_1 1 c -3%

I 1 I 1 1 I I I I I I I I I I I 11 I 1
APPENDIX C.2.2 NCASI DATA

:omm enf2
3.3 5 dM3
. . .
Vessel -sp
-\
I
- c-3 1

.. I , ..: . . . .. . . .
. .
.
Vessel 3:'
@ c-4a
I
1 1 I 1 I 1 1 1 1 I I I I
i
-

I I I 1 1 I I I I
I 1 I I I I
I I
6-
t-
1 i I
. . .
.. . . .
2 .TL c

i
c.
i
.
Y zz .o
V e s s e l C
I I 1 I I I I I I I I- I I I -

I 1 I I I I I . P 1 I I I I I
1 . I


1 I 1 I I I I 1 1 I 1 I I I I 1 I I
APPENDIX C . 3 EPA METHOD 2 5 - SCRUBBER OUTLET

I I' I 1 I I I I I I I I 1 I I 1 1 1 I
APPENDIX C . 3 . 1 TRC DATA

t I 1 1 I 1 I I 1 3 I 1 I I I I 1 I I
~
j~ . !
I - -
. .
z
I 4
,-
. ,
_- .r I
. .
@-G .

1 I I I I 1 I 1 I 1 1 I 1 I I I I I I

__
I I 1' I I I I I I 3 I I I I I 'I 1 1 I __
f \
I I / Y I I

4
, \.
c -4%
I .I 1 I 1 I I t I 1 I 1 I
- 1 I t
I
I '1


. !'
- I ! 1
I ' I
i !
I i i !
I I I
,.-.
L
i I I I !
C -50
- 1 1 I I I I I t I I I I 1 I 1 I 3 I 1

~
f 1 t I 1 I I I I 3 I 1 I I ;I I 1 I I

I I / I I .
M
I
1 I . I I
! I 1 i i
I i i I
I . I
I !
i i ! ! ! !
I
c -52
I 1 I I i I I 1 I I I 1: I f I I I I I

I 1 I
/
1 I I 4 :
I I i. I I 11 $1 1 1

.
,.. .
\
I ’ I I .e I
I I I / f I
I
I I t I I I 1 I I 1 I
1 I I I I I I
t

I I' 1 I 1. 1 1 I I 1. I 1 11 I 1 f 1 8 I


I f 1 f 1. 1 I I I I t U 1 1 I I s t I
APPENDIX C.3.2 NCASI DATA

:AMPLE SOURCE O E h r E € R PLAN7
Vessel s

.. 1 .? .
' /
. . . . . .
. . .
I
V e s s e l IO
1 .I 3 I 1 I I 1 I 1 1 1 I c

1
.I I 1. I 1 I I F 1 1' I t I f
43
43 V e s s e l Y

~ N M V O C
I I I I i I I I I 1 1 I 8
D A T A -
S H E E T
1 . Y . . . , . .
. .

.~ . .,.: . .
~. .
Vessel -3-

1 . -
' i
. . .
V e s s e l i
J 1 I I I 1 I I I E I t fi I f I I

TANK VOLUME TRAP
V e s s e l 7

1 t I I 1- 1 I E I 1 c e 8 ! 9 1 I C I
APPENDIX C . 4 PRESSURE DROP MEASUREMENTS AND
SCRUBBER SOLUTION SAMPLE COLLECTION

I f I ( I 1 1 I I I
I F 0 I d SI
e ,
c I
PESSLTRE DROP F.EASURBNTS
c -G4

i
1’ I I 3 I I t I t 1 s 0
‘ 1 z I I 1


r.
c
I I
Scrubber Solution Smple Collection
I
r , i
~
I I I I
A i n

I R I I I 1 I I 1 c I E l I n I I
L c -a
L ~~
I / I
Scrubber Solution Smple Collection
I I I I I I I I
' I . I I I I I
~~ ~
mm:
7- I I I
I I I I I I
I I I I

Scrubber Solution Sample Collection
I I I
I . I I I I
I I I I
I I I I I ! I I
I I I I
L I I I I 1
4 I I I I
I I I I I I I I

I I I I I I I I I
I I I I I I I I I
APPENDIX D
SAMPLING LOGS
D.l Dai ly SurrWry Log
D . 2 Sampling Task Log
D.3 Method 5 X - Sample I . D . Log
D . 4 Chain oE Custody Forms FOK Method 5X and Method 25 - Samples
D . 5 Crew Chief F i e l d Operations Log
D . 6 F i e l d tdboKatOKy M g D.6.1 EPA Method 5X D.6.2 EPA Method 25
D.7 Method 5X - Operators F i e l d Log

1 I I I I I I I I I
I I I I I I I I I
APPENDIX D . l DRILY SUMMARY LOG

I I I I I I I I
11 I I I I 1 I I I
c c 3 yl
0 0 3 0 0 0 N 0 N 0 o I * 3 3 0 3 c O 3 " c . . c y l o . a . a c c c 3 3 3 4 3 3 3 3 3 3
0 c
yl .a
0 3
ID e
3 ID
e 5 m 4
I m u 4
Y
r Y " Y " * Y 111
:& :
a a a 0 Y 111

I I I i I I I I I I I fii \ 1 I I I I I I I I
APPENDIX D.2 SAMPLING TASK LOG

. ..

i
,I 1 I I I I I I I I I I I I I I I -

(I I 'I 1 I 1 I I I '1 1 I I I I I I I I
'.

c r
r d
c,
I 1. I 1 I I I 1 I I I I I I 1 I I I I
-
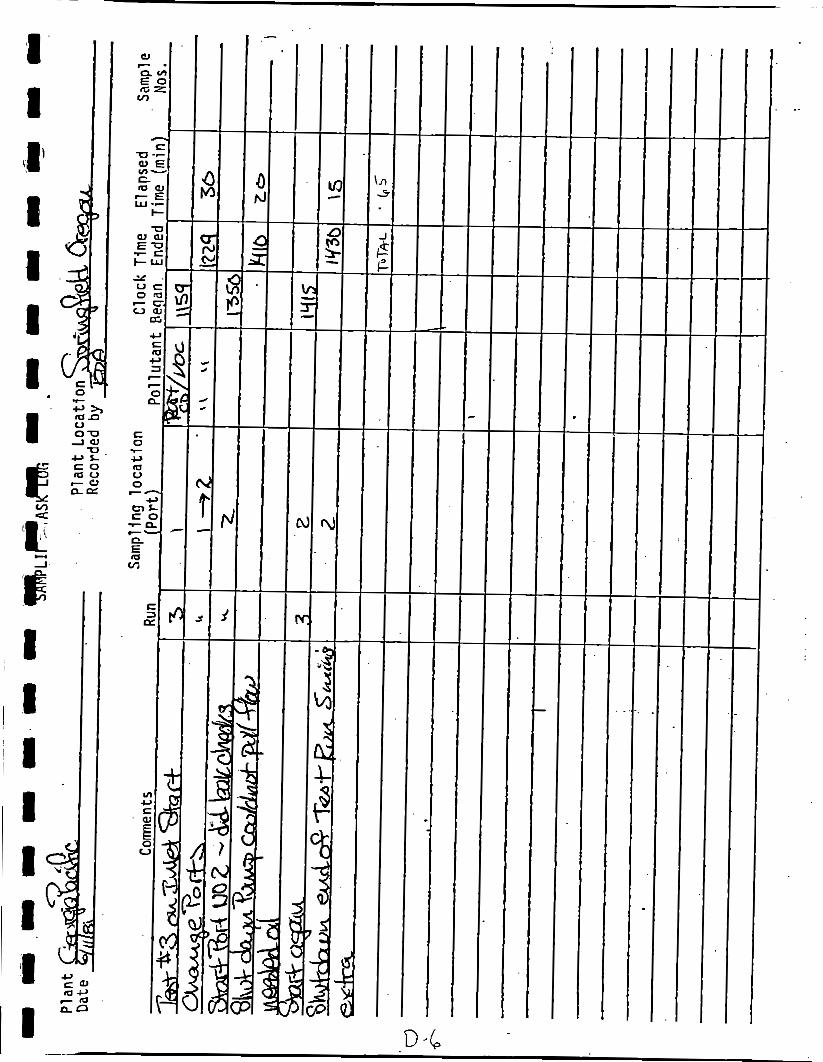
I I
D -6
. ..

. - m na
i
I I 'I I I I 1 I I I I I I I 1 1 I I 1 -

I 1'
I I 1
I
I 1
I
I
I
RPPENDIX D.3 MElWOD 5 X - SAMPLE I . D . LOG
... .


I
I 4 1 1 I I I I I I I I I 1 I 1 I I

:1. I .. -
.

I 1 li I 1 I I I I I! 1 I I 1 I 1 I I1 1,
APPENDIX D . 4 CHAIN OF CUSTODY FORMS FOR METHOD 5 X AND METHOD 25 - SAMPLES

[ SrnLES R E C O ~ Y
:oncainer Code
z\s I l l
5
2\9 220
I
a 9 a53 68
a35 9 rent
Dace of Lecoverg
Time of I e c o v e q
RECLPIFNTS OF S L - F L E S . o t h e r than recove- person(s): ' I
ocacion of R e c o v e n Si-cure T i t l e
~ . . . .
T i t l e Dace & Time
I

CBAIN OF CUSTODY
)ate of Time of .ecovcn Recoveq
,cation of Xecoverp
t

1 I -
8 S M L E S RECOVERY
:on ta iner Code
31 (mi) IO&
Lf
a10 am ai
aad aaa a 3
2x3 109 6 0
Time of Recovery
.ocacion of Recoverg S i w t u r e I Title

- CHAIN OF CUSTODY -.
LOrQ 3
i - , C r . , I C P l a n t Location - Plant -
I -1
Tested - .k rilhh TBC Rojeet No. ..
I J
1 SAnPLES RECOVEUI
Date dIUdd
6 b
6 / 1 0
6/10
6/10
>ace of : e c w w
T h e of lecoveq
I a c a c i o a of Recoverp
r I

Dace 5am~led
6/1\
611 \
61 I \
6/11
Date o f Recoveq s i v t u r e T i t l e
I 11 signature T i t l e Date 6 Time
I S i p a m r e T i t l e D=;e 5 :he
X E C I P I ~ S OF S L Z L Z S , OCSS than recoverjr uerson(s) :
t i B O X A i O i l Y l F S O N (S) E C I V T Y G S E E S :
I

Date of Lecwery
ocacioo of Recovery S i w t u r e
' I
-i.
t
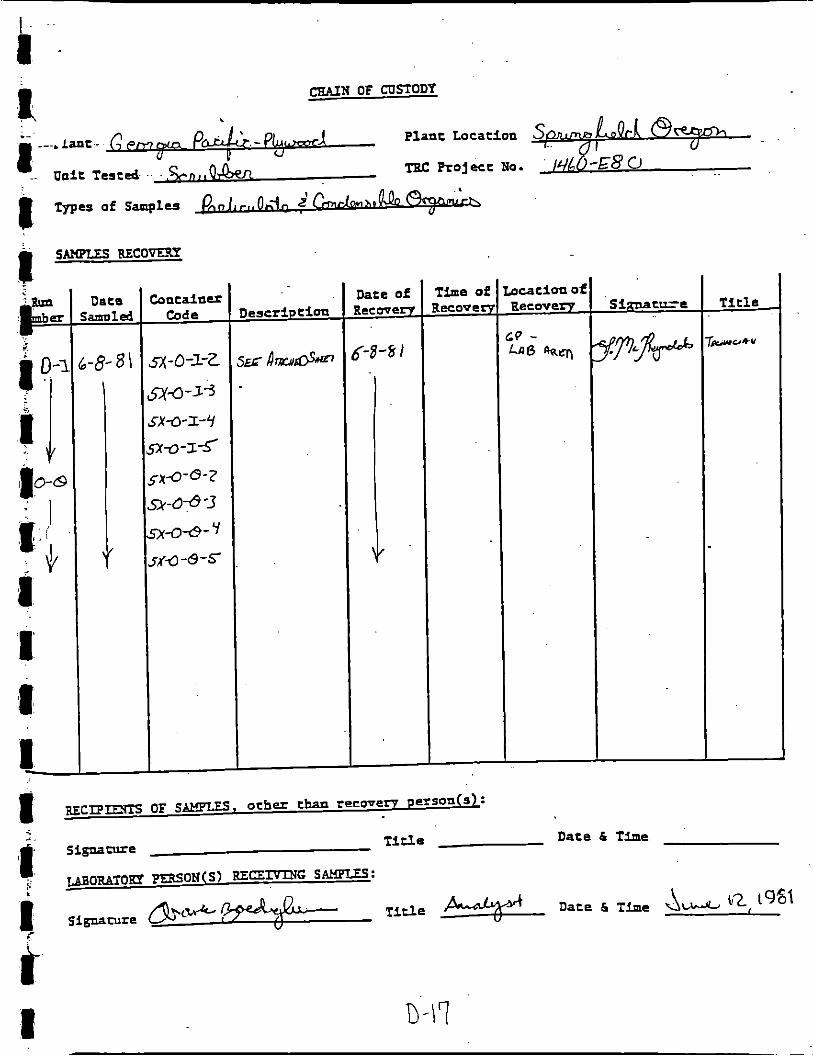
1, I 'I F
i, r
i
-
I
I
Date Of
: - a 4 I
T i t l e
X y U * U
D-I?

RECIPIENTS OF SAHFLES, ocher than recover? person(s): ~
ocacion of Becove7
0 ~ A ~ B K E ~
1
I I I I I 1 I I I
- ~ 1 1irle Date h Time >
Signature.
LABORATORY pFRsON(S) E Q m G S B W Z T S :
i. I I
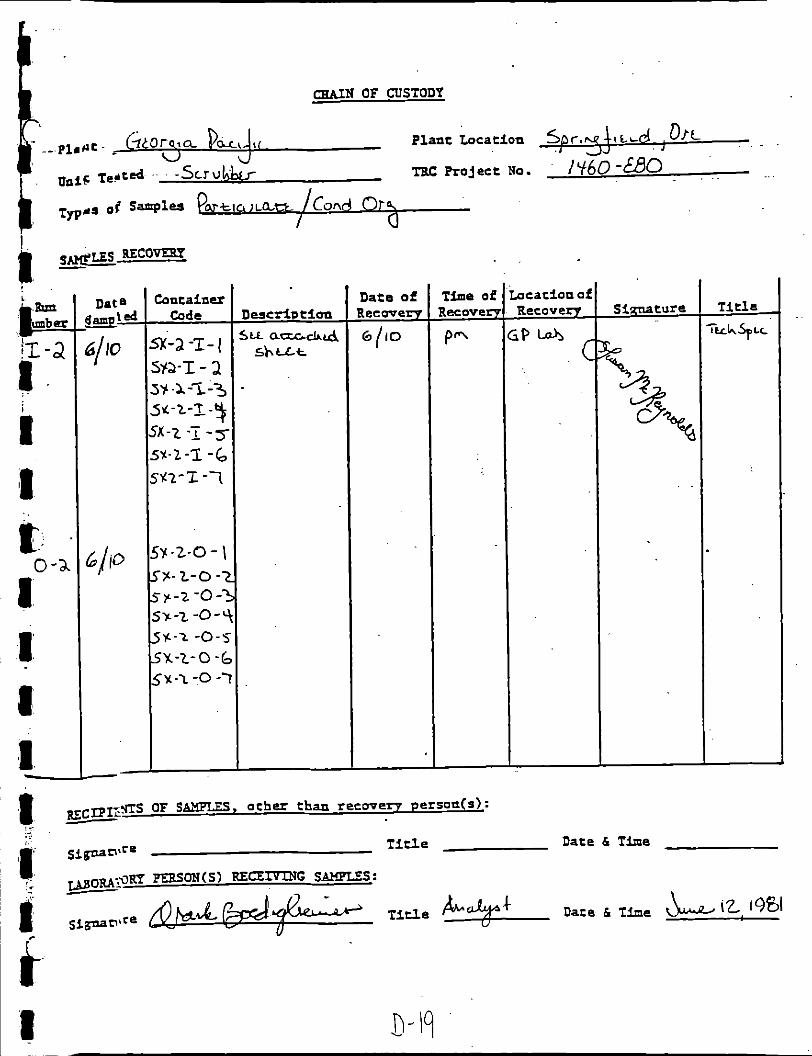
c
5x7-5 -7
b,/io y - 2 -0-
'c-2 -0-5
Date of 3ecweq
6/10
Time of Recoveq
P-

CHAlN OF CUSTODY
1 - lant- Plant Location
. Unit Tested &n TBC Project No. J4L O-t-sO
Types of Samplm
I I I 1 I I C -I
SAEIPLES R T c o m
v 1
Date of leco-veq b-h-k\
E C l P I E K I s OF SAKFLES, other than recovery person(s):
Simtura
a h
3 a
I
Title Date 6 Time a 7 1 4 r. LABORATOKP maSOtl(S) REEEIVING SAKWXS:
Signature
I
D-2b

CHAIN OF CUSTODY
L Descri c ion
53
SY
5s-
56
5 7
6- E,
Date of Recove-
Time of Recooeq
ocation of Recovery
C
R E C I P m OF SAMTES, ocher t h a n recovery person(.).:

1 (1 t 1 I 1 I 4 1 a 1 1 t 1 t '1 I 1 I
APPENDIX D . 5 CREW CHIEF
F I E L D OPERATIONS LOG

I t t tB t I 8
~~ ~ ~ . . _ . _ _ . . . ~~ . . ~..
.~ . .. . . . ... . . ~ . . . . .... - . To Page N
Witnessed & Understood by me, Dale Invented by Dale
Recorded by

I Project No. Book No. TITLE

I l l Project No.
TITLE Book No. 3

' Witnessed 8 Understood by me, [Date D-s
I ' I ~
Invented by Date I '-

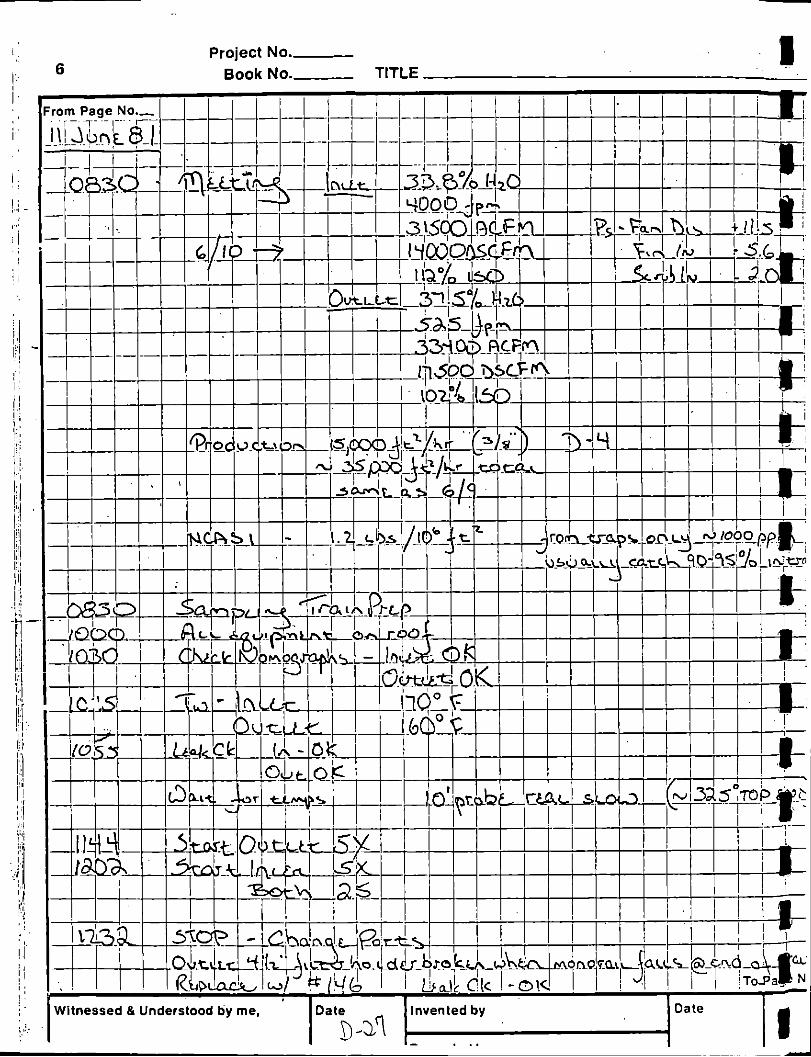
Project NO. 6 Book No. TITLE
Witnessed B Understood hy me,

I .
c
Witnessed B Understood by me,
. I
!
Dale lnvenled by Dale I Recorded by

APPENDIX D.6 FIELD LABORATORY LOG

'I'
:i A P P E N D I X D . 6 . 1 EPA METEDD 5 X
e

. . .
4 - . .
To Paae N, - Nitnessed B Understood by me, Date Invented by Date


~
I
1 I' I I El I t 1 I I B 6 t I I
1' I c P

. , , ,
, .
. . ~. ~ ... - ~
To Page No.
sessed 8 Understood by me, Date Invented by Dale qo
- ' I' d. kecorded by
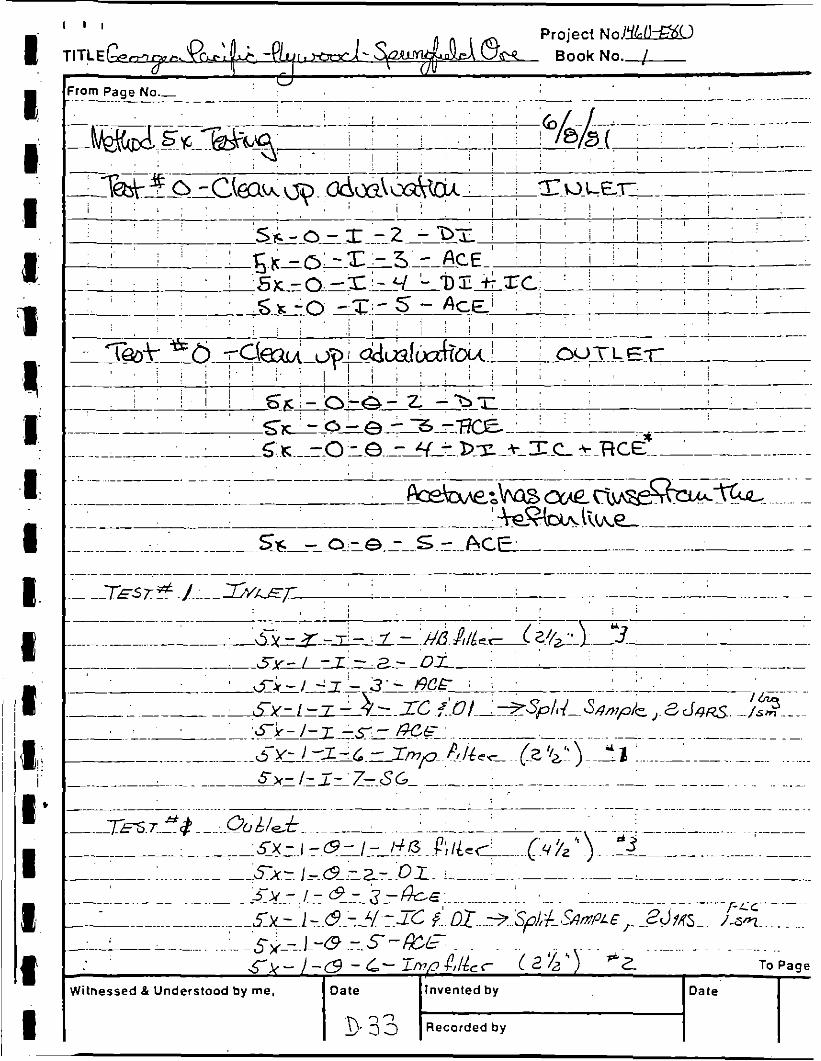
I Witnessed 8 Understood by me, Date Invented by

Project NO.-
Book No.

APPENDIX D . 6 . 2 EPA METKID 25

I 4 I I I 1 I c I 1 1 c 1 I I 1
'I


I I I I I I I I' I'
1 I '1 i
'I. 1
I
i


5

I I I I
I' I I' I, I I I I I I I I

0- P f l i LL Yilnessed 8 Understood by me. Date lnvenled by . 9 Reccrdcd by
Dale
(/ u-'J rl 8/

id 8 Underslood by me, Date
I I
Dale Invented by o- p c ( ~ - ~ L 11 s w t 8 1
n---.,lc.A hv
1. I I' I I: I I

1 I
I I I I I I I
I I I I
I
APPENDIX D.7 METHOD 5 X - OPERATORS FIELD LOG
I

~
I 1 I I I I, I I I I I I 1
I .L. -~ . ~ . . . . . . ~. ..~ ...~ .. ...
To Page ,
Witnessed 8 Understood by me. Date Invented by
/q3 R-?co;dedSv Fgf i


!
c%?-c+- 6- Project NO.- CYu Book No. TITLE ,
I 1 I I 1 I I
I , . _~ ........ ......... .. .........
...... - . . . . . . . . . . . . . . . .. .- ... - I .... . .........
......... ........ . I : . / .
I ,
! : , , ' . . , ! ,
, , L - . . ! ' , . .
, , ----- .... .................. . , --.- : , . . 1 , , , ! : , .
--.- ... . . . . . . . . . . . . . . . . . . . . ...... , . , , To Page No.
Dale lnvenled by Dale ;sed 6 Understood by me,
- r I\ Recorded by Lgrf ' I

1 1 1 Project No. I 'r6 0 1 TITLE cru hh.-r c C I ' , s r \ - . t GP Book No. I
I I
I I

-. ~
. ....
Witnessed 8 Understood by me.
.
. ~. ~.
Dale Invented by Date
D-94 R:,cord?d bv

D A T E :
SUBJECT:
. . . . ... . F R O M : . . . . . . . . .
T O :
UNITED STATES ENVIRONMENTAL PROTECTION AGENCY I Office of Air Quality Planning and Standards
Research Triangle Park, North Carolina 27711 , 1/25/82
Source Test Report
J. E. McCarley, Chief, Field Testing Section, . .
Emission bteasurement Branch, ESED (MD-13) ...- : L- .:.. . . . . . . . . . .~
See Below . . '! / . .
'I . .
The enclosed final source test report is submitted for your I
-. informtion. Any questions regarding the test should be directed . to the Project Officer (telephone: 8/629-5543). Additional . copies of this report are available from the ERC Library, Research Triangle Park, North Carolina 27711.
, ,
Industry: PlywoodlVeneer
Process:
- ._ Company: Ge0.rgi.a-Pacific
* . Location: Springfield Plant, Springfield, Oregon
. . Project Report Number: 81-PLY-4
Project Officer: George bl . Walsh
Enclosure
Addressees: Ken Knapp, ESRL (KO-46) -
A r c h IhcQueen, I4DAD (MD' -14) Rodney Midgett, EMSL (MD-77) Rark . 5. Siegler, DSSE (I4D-EN-341) Director, Air & Hazardous Materials Division, Region
Eob Kilgore, EPA Library Services (MD-35)
X .(copy enclosed for State agency)
. . .
. ,
..-.,.
.i-;. ,I.<.
' ., ...
:. ... . . . . . . . . . . .- , ,.. ~ . , -.: "., , . ... . . . ... ..... . - . - . . . ...... ., .
- . .. , - ...... , . , :..,. , .., . , . 'I
I
d 1
. .
I

.~ ~. . ~ . . . . . .
.. . . - .
To Page F. Qpprd> l f lGL . . 1
Witnessed 8 Understood by me. Date Invented by Date
3 -\ty Recorded by ~-
I ~~

9 ; I I I Project N o . L Y b r G 6b TITLE Book No.
I
.. . .. . . . . ~ . - ..
. . . .- . - .. , . .. .- ..... ~ ~. . . ~ . ... . . . ~
. .. ..
.~ -.
Dale Invented by I -
- Milnessed 8 Underslood by me.
~- ~~

~
I I I’ I I I 0 I I I I 1 I I I! It I 1 I
APPENDIX E
CALIBRATION DATA
E . l Surmnary of Equipment used During T e s t i n g E.2 O r i f i c e s , Dry Gas Meters and DGM Thermocouples E.3 P i t o t Tubes E . 4 Nozzles
E.6 C a l i b r a t i o n Gases E . 5 EPA Method 2 5 - F 1 W Contro l Regulators

I 1 I) 1 I I t I I I I t I I I1 I 1 I I
RPPENDIX E.l SUMMARY OF EQUIPMENT USED DURING TESTING

I 1 t 1 I I I I 1 I I I I I 11 # I I I
TABLE E-1
TRC Equipment Used Dur ing Georg ia -Pac i f i c T e s t i n g
M25 RUn Regula tor
Orifice A B C D _ _ _ _ Date - NO. Loca t ion P r o b e / P i t o t Nozzle - 6-9-81 1 Inlet 501/A 4-2 T-2 3 4 1 2
6-10-81 2 I n l e t 501/A 4 -2 T-2 3 4 7 0
6-11-81 3 In le t 501/A 4 -2 T-2 7 8 4 3
O u t l e t 1001/D 2 -4 T-1 5 6 7 8
Outlet 1001/D 2-4 T-1 5 6 2 1
Outlet 1001/D 2 -4 T-1 6 5 1 2
E -I

I 1
I
I
I I I 1 I
I
APPENDIX E . 2 O R I F I C E S , DRY GAS METERS AND DCM TBERMOCOUPLES
:I
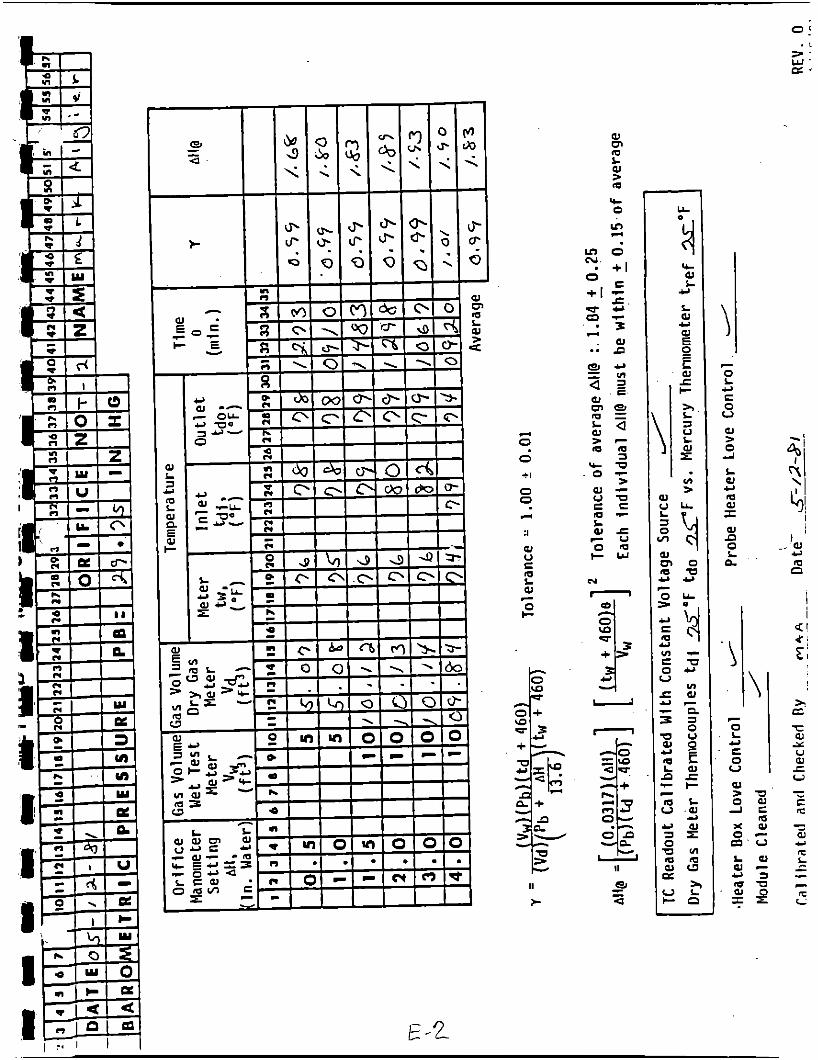
E -2
- 0 L Y E 0 V
W ~ n 0 L 0. m n
.. '0) Y

4 0 0 +I
0 0 r(
:I
aJ V E
L aJ 0 I-
a -
I1
r
7
0 L Y c 0 u aJ > 0 2
L aJ Y
al I aJ 0 L
m
n
I I

1 I I 1 E I I I 1 I I I 1 I 8 I I I t
APPENDIX E . 3 PITOT TUBES

S-TYPE P I T O T GEOMETRIC CALIBRATION PART 2 - P I T O T ALIGNMENT
TRC Probe I d e n t i f i c a t i o n 50\ P i t o t I d e n t i f i c a t i o n
Technical S p e c i a i i s t &ti e Date' %18, .
A.
Transverse Tube Axis
a * + bz - c2 = cos e
a 2 + d2 - e2 = G O S 8 l
2a b
2ad
E.
NOTE: values i n parentheses a r e EPA Method 2 spec i f i ca t i ons .
PROBE THERMOCOUPLE CALIBRATION To1 erances
Expected Stack Temperature (TS) OR
Thermocouple Readout OR (Tref 1.5%)
Mercury Thermometer (Tref ) OR (Ts 2 10%)
Probe I d e n t i f i c a t i o n Technic ian Date
€3

. I
1
Probe
5-TYPE P I T O T GEOMETRIC,CAL
1 Nozzle
, I 7
BR
A ~,...~. ~~ ...~ . . ... ...... . . j
P i t o t I d e n t i f i c a t i o n . . .~~ .
TRC Probe I d e n t i f i c a t i o n S O \ ...~.
A.
8.
Technical S p e c i a l i s t rJ &(p
Date .
Center
r--d--l '2 I Probe -
I
'2
I Probe -
1 OR - I
I
Spec i f i ca t i ons (EPA Method 2 ) D t = 3/16" t o 318" Dn = 1/2"
a L 314" b 2 0'
c 1. 3" d 2 3" e 2 3/4" f 2 2"
I 1' Dt 4.393
Pa0.55G 1 b O.bSO
c 4.756 d 4,700 1 e I.@
OR - C
I I I
f
P = P a b 1.05 D t I P L l . 5 0 Dt I
~~
I f these s p e c i f i c a t i o n s a r e met. proceed w i t h Par t 2 P i t o t alignment.
FORM 811-1 ~~ E -5
I

1.'
1 'I II ,t t' I 1 I I
.I 1. d 1' .I 1 :I ,I
.,
. ........ :.:.:;::;;) .....~
'I; ......, ....
....... ........ ....... : .... 1 ........ .......
Procedure No. T/S-811
Date Oecember 9, 1080 I Revis ion No. 7
Page o f S-TYPE PITOT GEOMETRIC CALIBRATION
PART 2 - P I T O T ALIGNMENT
TRC Probe I d e n t i f i c a t i o n IbO I P i t o t I d e n t i f i c a t i o n
Technical S p e c i a l i s t E& h\%Q Date
A.
Transverse Tube Axis
' (80' c e c lOOoJ
(80' < e ' < 100')
'lo RM-811- 2
B. a m a2 + b2 - c 2
= cos e b o 540 Za b
2ad
Long i tud ina l Tu be -
a2 + d2 - e 2 = e ,
L b A e?:; (85' c e c 95')
(85' c e ' c 95') e ' a!
7 g 5 . 3 0.
( f l / 8 " ) ( g c 1/32")
. NOTE: values in parentheses a r e EPA Method 2 s p e c i f i c a t i o n s .
PROBE' THERMOCOUPLE CALIBRATION To1 erances
Expected Stack Temperature (TS) OR
Mercury Themmete r (Tref) OR (T, 2 10:) Thermocouple Readout OR (Tref 2 1.5:)
Probe I d e n t i f i c a t i o n Technician Date

Procedure No. T/S-811 Revision No. Oate O e c e m b e e g Page
S-TYPE PITOT GEOMETRIC CALIBRATION PART 1 - PROBE CONFIGURATION -
.- .,.. ...... . .. . . . . , Pitot Identification b
:..;;;: 3 ....~. ~ - . TRC Probe Identification \Ob\
Technical Specialist b Date q/ir,leI
Center-
-A. Probe Nozzle c
I I
....... ....... ~~.. . . . . ........ . ......I , . . . . , , ~-
. ...
Specifications (EPA Method 2)
: Pa 0,566 1
I' c 4 , 3 5 0 d 4,200 1 e 0.545
1 C I
I
OR -
.. f
'a a 'b Ot 3/16" t o 3/8" c 2 3" d 1. 3"
a 3/4" e 2 3/4" 1.05 Ot 1. PL1.50 Ot b,O f 2 2"
on = 1/2"
.. .
I f these specifications are met, proceed with Part 2 Pitot alignment.
I S I I I .-
'FORM 811-1 2 -7

I I 'I
1
RPPENOIX E . 4 NO2 ZLES

I 1 '8 1 I I I I 1 0
[ I I 1 I
Tech. Nozzle Set NO. 2
Diameter' - a b C . average.' Nozzle No.
72- \
7.2 2 - 3
'measwe to nearest .001" "three measurements must be within .004" of each other

...... ~ . . ........ ....... ) ....... . . . ..... .-
..... .-
Y Nozzle Set ,No.
Nozzle No. Diameter. - a b C average *
'measure t o nearest .001" **three measurements must be w i t h i r . 0 0 4 " of each other
.. ...... ....... ...... ....... ...... 3 ....
I I b
I I I I I I

a
I I
APPENDIX E . 5 EPA ME2'tlDD 25 - FIDW CONTROL REGULATORS
2-40

1 I ENMO - METHOD 25
FLOW CONTROL REGULATUR CALIBRATION
Leak Check G k Regulator I Date 6 ' - f - A ( Leak Fate d PB (m) 758 Temperature (OC) ?f Technician 0. p E [ @ G e
Vacuum ( " Hg)
- 3- 2 0 - 7 - w -. b
70- I
Flowrate
5-@ - -5-7 3-0-4.+
J-0.49
56. 3 7
5 F o . 36 -5-G . f 6

E N M O - METHOD 25 FMW CONTROL FEGlJLAmR CALIBWLTION
-7 Regulator # - Date L- ( -01 Pg (MM) 7Y8
Technician I ) . I P f € ( & L c E
0 Temperature ( C)
Vacuum ( " Hg)
2 2 > 9 -. 7
- ' 6
-. 7 17.8
17- I
Leak Check 0 k Leak Rate 6
L-
seconds/50 cc
,5'8. 3 3
5-8. 48
Flowrate
57.43
s/. 3 7
3 3-0. 9
_. I 1" I t A
c (3 J \L
! I I I s J I 1 I I i a I 1 0 i c I I -

TGNMO - METHOD 25 FLOW CONTROL REGULATOR CALIBRATION
Regulator # 3 Date & / - S f pg (NM) 75-9
Technician 0. Pi!\C.ZcG
0 Temperature ( C) zr
Vacuum ( " Hg)
29.8 - -7
2 9 - 1
28.4
2 7 . 8
27.1
- - 7
-.G - 17
2 k-5-
Leak Check 6 k Leak Rate 0
Approv - 5-0
\

- TGNMO -.METHOD 25
FLOW CONTROL REGULATOR CALIBRATION
Leak Check ok Leak Fate 0
Approva G L
Vacuum ( ” Hq)
2q. 3 - * b
28. 7
--7 2 e - 0
- -7 2 b - I
Seconds/50 cc
5-23> 78
E -14

TGNMO - METHOD 25 FLOW CONTROL REGULATOR CALIBRATION
Regulator # d s - Leak C h e c k @(T
D a t e %7-$ L - I - B f Leak Rate 0 PB (m) 772
0 T e m p e r a t u r e ( C)
Technician c) . PE(lzCF, A p p r o v
Time ( M i n u t e s )
0 I4...S--2!.,
A v e r a g e

TGNMO - METHOD 25 FLOW CONTROL REGULAlUR CALIBRATION
L e a k Check 0 1% Leak Fate 0
Seconds/SO cc
3-4- 3 4
5 7 - fa . y y . J - 2
-F?. 7 0
s 4 - 66
5-9.70

E N M O - METTIOD 25 F m W CONTROL REGULATOR CALIBRATION
Regulator # 7 Leak Check e & - ( - P I Leak Rate 0 Date
Vacuum ( " H g l
2 7 -8, I- 7
Approv
Flowrate
so- 5y.38
3 4
Specia l sampling Condit ions:

TGNMO - METHOD 25 FLOW CONTROL REGULATJR CALIBRATION
Regulator # 8 Date fo-[- B/ p g 7,Tj
Leak Check 81-< Leak Rate 0
Vacuum ( " Hg)
- > 7 PJ-. 1? -. b
2 s. 0
L Seconds/SO cc
3-8 . a,
5 - 7 - 8 '7
3-8. OG
1-8. 03 5-7.57
5-7. 77
S p e c i a l Sampling Condit ions:

APPENDIX E . 6 CALIBRATION GASES

C a r b o n D i o x i d e 5 OPPM 5 lPPM A i r / Z - 1 B a1 an ce B a l a n c e
C a r b o n D i o x i d e SOOPPM 492PPM A i r / Z - 1 B a l a n c e B a l a n c e
1A-9 86 0 C a r b o n D i o x i d e 1% 1 . 0 0 % ' #L+"..%\ Y-4 A i r / Z - 1 B a l a n c e B a l a n c e
I All d u e s reporred in Mole percenr unless orhe .
I 5 orhenvise rrored.
/ ANALYST Michae l :M. H o l l a n d e r

I I, I t I I I 1 t b I I 1 !I I I I I I
APPENDIX F
SAMPLING AND ANALYTICAL PROCEDURES
F . 1 EPA M e t h o d s 1 , 2 , 4 , 5 a n d 5 X F . 2 EPA M e t h o d 25 a s u s e d by TRC F . 3 EPA M e t h o d 2 5 a s u s e d by NCASI F . 4 S c r u b b e r S o l u t i o n A n a l y s i s F . 5 EPA M e t h o d 2 2 - F u g i t i v e E m i e s i o n s

I c. I I I I I I I I I I I I I I I 1 I
APPENDIX F . l EPA METRODS 1, 2 , 4 , 5 and 5X

~~
I I I I I I I I I I I I I I I I I I I
EPA HETROD 1 SANPLE AND VELOCITY TRAVERSES
FOR STATIONARY SOURCES
* DUCT DIAMETERS UPSTfiEAM FROM FLOW DISTURBANCE (DISTANCE A)
0.5 1 .o 1.5 2.0 2.5
I I I 3 4 5 6 7 8 9 10
-x
0 2
DUCT DIAMETERS DOWNSTREAM FROM FLOW DISTUOBANCE (DISTANCE B)
Figure 1.1. Minimum number of traverse points for particulate traverses.
FEDERAL REGISTER, September 9, 1979.

TRAVERSE POlNT
1 2 3 4 5 6
ameter I8
1.4 4.4
7.5 10.9
18.8 14.6
23.6 29.6 38.2 61.8
70.4 76.4 81.2
85.4 89.1
92.5 95.6 98.6
DISTANCE. x 01 diammler
1.4 1a.7 29.5 70.5 85.3 95.6
20
1.3 3.9 6 . 7 9.7
1 2 . 9 16.5 20.4 25.0 10.6 38.8 61.2 6 9 . 4 75 .0 79.6. 83.5
87.1 90.3
. 9 3 . 3 96. i 98.7
EPA METHOD #?.
Figure 1.3. Example rhowing circular rfaFk'crois section divided inlo 12 q u a l areas, With localion Of lmem poinu indicated
Table 1-2 LOCATION OF TRAVERSE POINTS IN CIRCULAR STACKS (Percent of stack diameter From inside wall to traverse point)
I Traverse winL
I - 6
4.1
14.1
!9.1 10.t l5.t 15.t
- ,cr - 8
3.: IO.'
19.1
12.: ;7.:
y1.I
19.! %.I
- t ra I O
2.6 8.2
4.6 2.6
4 . 2 5.8 7 . 4 5.4 I .a 7 .4
- -
're mints 1 1 - 16
I .6 4 . 9
8.5 12.5 16.9 22.0 18.3 17.5 52.5 I I .I 18.0 13.1 17.5 t1.5 E.1
-
3a.4
- 22
1.1
3.5 6.0 8.7
11.6 14.6 18.0 !I .8 !6.2 1 1 . 5 19.1 io, 7
f 3 . 8 '8.2
12.0 15.4 18.4 11.3
14.0
16.5 18.9
-
ia.5
-
- 23
1 . I
5.5 7.9
10.5 13.2
16.1 19.4
21.0
27.2 12.3 19.8 50.2 57.7
- 3.2
12.8 1 7 . 0 30.6
33.9 16.8 19.5 12.1.
t 4 . 5 36.8 18.9
I I I I I I I I I I I I I I 1 1 I I I

~
I I I (I I I I I I I I I I I I I I I
I I
EPA METHOD # 2 DETERMINATION OF STACK G A S VELOCITY AND VOLUHETRIC FLOW RATE (TYPE S PITOT TITBE)
Determinations of stack gas ve loc i ty and volumetric flow rate w i l l be made according to EPA Method 8 2 as descr ibed in the Federal Register of September 7 , 1979. An S-type p i t o t tube connected to an inclined manometer vi11 b e u t i l i zed . A l l cal ibrations w i l l b e in accordance wi th the Method.
7.62 cm (3 in.)' T E M P E R A T U R E SENSOR
'SUGGESTED ( IN .TERFERENCE F R E E ) P I T O T T U B E . T H E R M O C O U P L E SPACING
I
Figure 2-1. Type S pitot tube manometer assembly.
F - 3

I EPA NETHOD # 4
D!3TERMINATION OF MOISTURE CONTENT IN STACK GASES
D e t e d n a t i o n s of s tack gas moisture content w i l l b e made according EPA Method # 4 a s recorded i n the Federal Regis te r , September 7, 1979. A schematic of t h e required sampling t r a i n i s presented below. Moisture determinations v i11 be made using ca l cu la t ions presented i n the Method u t i l i z i n g the corrected dry gas meter volume, t h e mount of l iqu id col lected in t h e condenser, and t h e veight gain of t h e s i l i c a gel.
to I I I
Figurc 4 -1 . Moisture sampling Iraiii-referelice n:elllod.
F -q
1 I 'I I I

I I; I I I I I 1 I, I I I I I I I 'I' I I
. --
1213577 -63 STATIONARY SOURCES
97-79
Eqwltion c 5
4-0
IAppndl. A. Mmhnd 51
h b l i s h e d by THE BUREAU OF NATIONAL AFFAIRS. MC.. WASHl?iGTON. D.C. 20037 104

121:1578 F E C i i l A L KEGULATIONS
IMPINGER T Z A I i i JPTIONAL. M A Y BE REPLACED BY AN EOUIVALENT CONDENSER
PITOT MANOMETER.
ORY GASMETER AIR.;TIGHT PUhlP
Fjgure 5 1. Particulatesampling Irain.
"1 I I I I 1 I
I I
. ._

I I ' I I I I I I I I' I I I I I I
I
5-163 STATIONARY SOURCES 121 :1579
47-79
[ A p w d h A. MnhDd 51
Published by THE BUREAU OF N A T l O N A L A F F A I R S , MC.. WASHlNGTON. D.C. 20037 111
I F -7

121:1580 FEDERAL REGULATIONS
? L I N T
LOCATION
OPERAIOR,
DATE
RUN NO.
SPIMPLE BOX no. METER BOXNO. METER AH6 E FACTOR
AMBlEllT TEMPERATURE
QAROMEIRIC PRESURC
ASSUME0 MOISTURE.%
PnoaE LENGIH..~~~I
NOZZLE IOENTIFICATION NO.
AVERAGE CALIBRATED NOZZLE 0lAMETER.did- PROeE l l f A T E R S E l l I N C LEAK RATE. nllmin.ldm)
PnoaE LINER MATERIAL
~ A T l C ? R E ~ U R E , m m H ~ I i h H ~
FILTER NO.
SPIINAIIC G+ SIACI c n m S E C I ~ ~ PITOT TUQE COEFFICl€NT,Cp-
1 . I I I I I I I I I I
t I I I I I I I I I I I
I I 1 I I I I I I I TOTU Arg. A"9.
.Yr- I I I I I A"#. I I
Figure 5-2. Particvlale field d a l b
[Apmandix A. Mahod 51 112
I -I I I I I I . I I ' I I I I I 1 I
' -(I I I
I - t
\.

I
'I I I I I I I 1 I I I I I I
I i "
CONTAINER NUMBER
.-
1
2
5 4 6 3 STATIONARY SOURCES 121:1581
WEIGHT OF PARTICULATE COLLECTED, mg
FINAL ViEIGHT TAZE YI'EIGHT WEIGHT GAIN --
I - - 97-79
I
..
Plant
Date
Filler Co.
FINAL
INITIAL
I VOLUME OF L i m o WATER COLLECTED
~~~
IMPINGER I SILICA GEL I VOLUME, WEIGHT,
ml. I 9 I
8' I ml
' CONVERT WEIGHT OF WATER TO VOLUME BY DIVIDING TOTAL WEIGHT INCREASE BY DENSITY OF WATER (lg/rnll:
INCREASE' ' : VOLUME KATER. d 1 Yrnl
Figure 5-3. Analy l ica l dala.
Published by T H E BUREAU OF NATIONAL AFFAIRS. INC.. WASHINGTON. D.C. 20037
F - 7 f I3

121:1582 FEDERAL REGULATIONS
VACUUM
BLOW INTO TUBING UNTIL MANOMETER
READS 5 TO 1 INCHES WATER COLUMN RY TEST METE
h1 A. E ,
C. L
I L.
I.;
I I I I I I I I 4 ( I I
Figure 5 4 . Leak check of meter box. I
En.i.onm.nr Rep0.1..
F-\@
I I I I
!J
IAppndu A. Mnhnd 51
-
I 1
I14

I I, I
'I I I I 1 1 I I{ I I I I I I
STATIONARY SA63
SOURCES 121:1593
I Published by THE BUREAU OF NATIONAL AFFAIRS. INC.. WASHINGTON. D.C. 20037
F - \ \
115

1. A p D l i c a b i l i t v and P r i n c i p l e
1.1 A p p l i c a b i l i t y . T h i s method a p p l i e s t o t h e d e t e r m i n a t i o n of - p a r t i c u l a t e and c o n d e n s i b l e o r g a n i c matter w i t h i n t h e c o n t e x t o f t h e f o l l o v -
i n g d e f i n i t i o n :
l i q u i d m a t e r i a l , o t h e r t h a n uncombined w a t e r , t h a t condenses a t or above
t h e f i l t r a t i o n t e m p e r a t u r e , and is c o l l e c t e d b y t h e f r o n t h a l f of t h e sampl ing
t r a i n . "Condens ib l e o r g a n i c matter" means any material which i s c o l l e c t e d
i n t h e impinger p o r t i o n of t h e t r a i n , i n c l u s i v e of t h e back-up f i l t e r .
" P a r t i c u l a t e matcer" means any f i n e l y d i v i d e d s o l i d or
1 . 2 P r i n c i p l e . p a r t i c u l a t e and c o n d e n s i b l e o r g a n i c matter is w i t h d r a m
i s o k i n e t i c a l l y from t h e s o u r c e , a c c o r d i n g t o EPA Method 5. P a r t i c u l a t e matter
I s c o l l e c t e d on a g l a s s f i b e r f i l t e r m a i n t a i n e d a t t e m p e r a t u r e s of 350 t 25OF.
The p a r t i c u l a t e mass is determined g r a v i m e t r i c a l l y a f t e r removal of uncombined
water.
impingers a t t e m p e r a t u r e s less t h a n 70°F. The condensed o r g a n i c s a r e ana lyzed
g r a v i m e t r i c a l l y a f t e r e v a p o r a t i o n and from t h e water by e t h e r and chloroform.*
Condensed o r g a n i c s a r e c o l l e c t e d i n t h e w a t e r - f i l l e d Greenburg-Smith
*Warning: Chloroform is a s u s p e c t e d c a r c i n o g e n . The v a p o r s of e t h y l e t h e r are an e x p l o s i o n h a z a r d . All work s h o u l d be done under an e x p l o s i o n proof hood w i t h t h e a n a l y s t p r o t e c t e d from e x p o s u r e t o these c h e m i c a l s . E t h e r s h o u l d n o t be r e t a i n e d beyond t h e c o n t a i n e r d a t e ; opened c o n t a i n e r s shou ld n o t b e s t o r e d f o r more t h a n s i x months.
F .I2 Revi sed 10 /26 /81
I I I' I I I I I I I I I I I I I I I I

~~
I 1 'I 1 I I I I I I I I I I I I I' I 1 I
2 . Aoparatus
2 . 1 Samoline T r a i n . Sane as EPA Method 5 , S e c t i o n 2 . 1 ( F e d e r a l R e g i s t e r ,
40 CFR 601, e x c e p t t h a t t h e Greenburg-Smith s y s t e m s h a l l b e u s e d co d e t e r m i n e s t a c k
g a s m o i s t u r e c o n t e n t and c o n d e n s i b l e o r g a n i c m a t t e r and an unhea ted 2-1 /2" g l a s s
f i b e r f i l t e r s h a l l b e i n s e r t e d between t h e t h i r d and f o u r t h Fmpingers.
matic of t h i s c r a i n i s p r e s e n t e d i n Figure 2.1.
t h e imp inge r s and f i l t e r a s s e m b l i e s w i l l b e washed w i t h a ch romic a c i d c l e a n i n g
solution f o l l o w e d by
and a . . e tone r inses .
A s che -
I n a d d i t i o n , b e f o r e i n i t i a l use,
a tho rough t a p water r i n s e and s i x d e i o n i z e d d i s t i l l e d water
2 . 2 samole Recovery . Same as Method 5 , S e c t i o n 2 . 2 . I n a d d i t i o n .
a l l g l a s s w a r e used t o h a n d l e t h e sample w i l l t e c l e a n e d w i t h chromic a c i d c l e z n i n g
s o l u t i o n as d e s c r i b e d i n S e c t i o n 2 . 1 (sample j a rs , g r a d u a t e s , e t c . ) .
2 . 3 h a l v s i s . Same as Method 5 , S e c t i o n 2 . 3 , w i t h t h e f o l l o w i n g
a d d i t i o n a l i t ems:
2 . 3 . 1 S e p a r a t o r y F u n n e l s . Two, 100 m l c a p a c i t y w i t h T e f l o n s t o p c o c k .
1 . 3 . 2 Buchner F u n n e l . 47 mm d i a m e t e r .
2 . 3 . 3 Erlenmeyer F l a s k . 500 m l .
3. Reagen t s
3 .1 Samoling and S a m p l e Recovery. Same a s Method 5 , S e c t i o n s 3 . 1 and
3 . 1 , r e s p e c t i v e l y , w i t h t h e following a d d i t i o n s :
3 . 1 . 1 Water. D e i o n i z e d d i s t i l l e d t o conform t o ASTI-! s p e c i f i c a t i o n
D1193-74, Type 3 .
blank on tes t s a m p l e s .
Blanks w i l l b e a n a l y z e d p r i o r t o f i e l d u s e t o e l i m i n a t e a h i g h
3 . 1 . 2 Chromic Acid C l e a n i n g S o l u t i o n . ? r e p a r e by s l o w l y 2dd ing 1 l i t e r
c o n c e n t r a t e d s u l f u r i c a c i d , K i t h s t i r r i n g , t o 35 m l s a t u r a t e d so6ium
d i c h r o m a t e s o l u t i o n . FXVDLE YITH C A U T I O N .

MODIFIED EPA 5X SAMPLING TRAIN
I I I I I I I I I I I I I I
2-112" 4-112"
n
the-;oome ter VZCCIP
FIGURE 2.1

I I I I 1 I I I I I I I I I I 1 I I I
3 . 2 A n a l v s i s . Same a s Method 5 , S e c t i o n 3 . 3 , e x c e p t t h e f o l l o w i n g
a d d i t i o n a l r e a g e n t s a r e r e q u i r e d f o r t h e a n a l y s i s .
3 . 2 . 1 E t h y l E t h e r . Reagent g r a d e , 5 0.001 p e r c e n t r e s i d u e i n s u i t a b l e
c o n t a i n e r s t o r e t a i n low r e s i d u e b l a n k
3 . 2 . 2 Chloroform. Reagent g r a d e , 5 0.001 p e r c e n t r e s i d u e , i n g l a s s
b o t t l e s .
3 . 2 . 3 Water. Deionized d i s t i l l e d as d e s c r i b e d i n S e c t i o n 3.1.
3 . 2 . 4 F i l t e r s . 4 - 1 / 2 " and 2 - 1 / 2 " d i a m e t e r g l a s s f i b e r f i l t e r s a s
d e s c r i b e d i n Method 5 . S e c t i o n 3.1.1.
3 . 2 . 5 H y d r o c h l o r i c Acid, C o n c e n t r a t e d . HANDLE WITH CAUTION.
3 . 2 . 6 Sodium Hydroxide, 10 N . D i s s o l v e 4 0 g N a O H i n d e i o n i z e d d i s -
t i l l e d water and d i l u c e co 100 ml. HANDLE WITH CAUTION.
4 . Procedure
4 . 1 Sampling. Same as Method 5 , S e c t i o n 4 . 1 , e x c e p t cse d e i o n i z e d
d i s t i l l e d water w i l l be used i n t h e i m p i n g e r s .
4 . 2 Sample Recovery. Same as Method 5 , S e c t i o n 4 . 2 , w i t h t h e f o l l o w i n g
e x c e p t i o n s a n d / o r a d d i t i o n s .
4.2.1 C o n t a i n e r No. 1 ( 4 - 1 / 2 " g l a s s f i b e r f i l t e r ) C a r e f u l l y remove
f i l t e r from h o l d e r and p l a c e i n i d e n t i f i e d i n e r t p e t r i d i s h , and sea l .
2 4.2.2 C o n t a i n e r No. 2 (DI d i s t i l l e d H 0 p robe r i n s e ) R i n s e and b r u s h
p robe , n o z z l e , and f r o n t h a l f of 4-112' ' f i l t e r h o l d e r t h r e e t imes w i t h D I
d i s t i l l e d H 0 Fnto i d e n t i f i e d g l a s s sample c o n t a i n e r . 2
4.2.3 C o n t a i n e r No. 3 (Acetone p r o b e r i n s e ) R i n s e and b r u s h as i n
S e c t i o n 4.2.2 u s i n g a c e t o n e i n s t e a d of H 2 0 .
4.2.4 C o n t a i n e r # 4 ( I n p i n g e r K a t e r ) . Trea t the f i r s t t h r e e h p L n g e r s
as f o l l o w s : Leav ing each impinge r i n t a c t t o t r a n s f e r t h e l i q u i d , cap o f f
t h e i n l e t , and p o u r t h e l i q u i d t h r o u g h t h e o u t l e t d i r e c t l y i n t o a t a r e d sarnple
c o n t a i n e r . Determine t h e l i q u i d w e i g h t t o w i t h i n 2 0.3 g.
r; - 1.5

I
I 'I I I I I I I 1 I I
I I I I I
A f t e r t r a n s f e r r i n g t h e water and c o n d e n s i b l e o r g a n i c m a t t e r t o t h e sample
con ta ine r , t i g h t e n t h e l i d on t h e sample c o n t a i n e r and seal so t h a t water w i l l no
l e a k o u t when i t i s s h i p p e d t o t h e l a b o r a t o r y .
l e v e l t o d e t e r m i n e l a t e r whether l e a k a g e o c c u r r e d d u r i n g t r a n s p o r t . Label
t h e c o n t a i n e r t o c l e a r l y i d e n t i f y i t s c o n t e n t s .
Mark t h e h e i g h t of t h e f l u i d
4 . 2 . 5 C o n t a i n e r No. 5 (Acetone Wash). A f t e r i n s u r i n g t h a t a l l j o i n t s
o f t h e impinger s e c t i o n g l a s s w a r e are wiped c l e a n of s i l i c o n e g r e a s e , r i n s e
t h e i n s i d e s u r f a c e s of t h e f i r s t t h r e e i m p i n g e r s and t h e g l a s s c o n n e c t i n g
j o i n t s w i t h a c e t o n e . R i n s e a l l s u r f a c e s t h r e e times or more i f n e c e s s a r y
t o remove v i s i b l e p a r t i c u l a t e . A n y l o n b r i s t l e b r u s h may be used t o f a c i l i t a t e
removal of any a d h e r i n g material . I n a d d i t i o n , r i n s e t h e g r a d u a t e d c y l i n d e r
used t o measure t h e i m p i n g e r catch w i t h a c e t o n e .
A f t e r a l l a c e t o n e wash ings and p a r t i c u l a t e matter are c o l l e c t e d i n t h e
sample c o n t a i n e r , t i g h t e n t h e l i d on the sample c o n t a i n e r and s e a l so t h a t ace ton
w i l l n o t l e a k o u t when i t is sh ipped t o the l a b o r a t o r y . Mark t h e h e i g h t o f
the f l u i d l e v e l t o d e t e r m i n e l a t e r whe the r l e a k a g e o c c u r r e d d u r i n g t r a n s p o r t .
Labe l c o n t a i n e r t o c l e a r l y i d e n t i f y i t s c o n t e n t s .
4.2.6 C o n t a i n e r No. 6 ( 2 - 1 / 2 " F i l t e r ) . Recover same as C o n t a i n e r No. 1,
Method 5 , S e c t i o n 4 .2 .
4 . 2 2 C o - t ~ i c e r !)? ( S i l i c a Gel) I.Ieigh t3 n e a r e s t 0.5g.
4.2.6 Water Blank. Save a p o r t i o n o f t h e d e i o n i z e d d i s t i l l e d w a t e r used
i n t h e imp inge r s .
c o n t a i n e r l a b e l e d "Iiater b l a n k . "
Take 200 m l of t h i s water and p l a c e i t i n a g l a s s sample
4 . 3 A n a l y s i s . Samples shou ld b e a n a l y z e d w i t h i n one week of s ampl ing i n
o r d e r t o p r e v e n t any p o s s i b i l i t y of d e g r a d a t i o n .
4.3.
d a t a s h e e t is shown i n F i g u r e 5;;-1):
Same a s Method 5 , S e c t i o n
In a d d i t i o n , h a n d l e C o n t a i n e r s No. 1, 4 , 5 and 6 a s f o l l o w s (an example
v - Ib
I I

I
1 1 I I .t I J i l
1 I I I I I I I I I
TOTAL VOLUME COLLECTED 1 vlC = g'
WEIGHT OF PARTICULATE COLLECTED, mg
NUMBER IFIKAL WEIGHTITARE WEIGHT I WEIGHT GAIN CONTAINER
rnl
TOTAL 1 x 1 Less acetons blank
Weight of parriculare matter
WEIGHT OF CONDENSABLE ! ORGANIC M A T E R COLLECTED. mg
1111, - .-. -. . . - . , .._ .
1 - L o s s E.C waror blank
WoiuIir of conduairabln oruanic minior mo - I 'Durn corrucrud (or ucuiunn Llunk luqii. 2761
WA'I 1.11 (:Ol.l.l.~:~l 111) . - . - - -. ,_.-
IMPINGER 1 SILICA GEL
F I N A L I I INITbAL I I
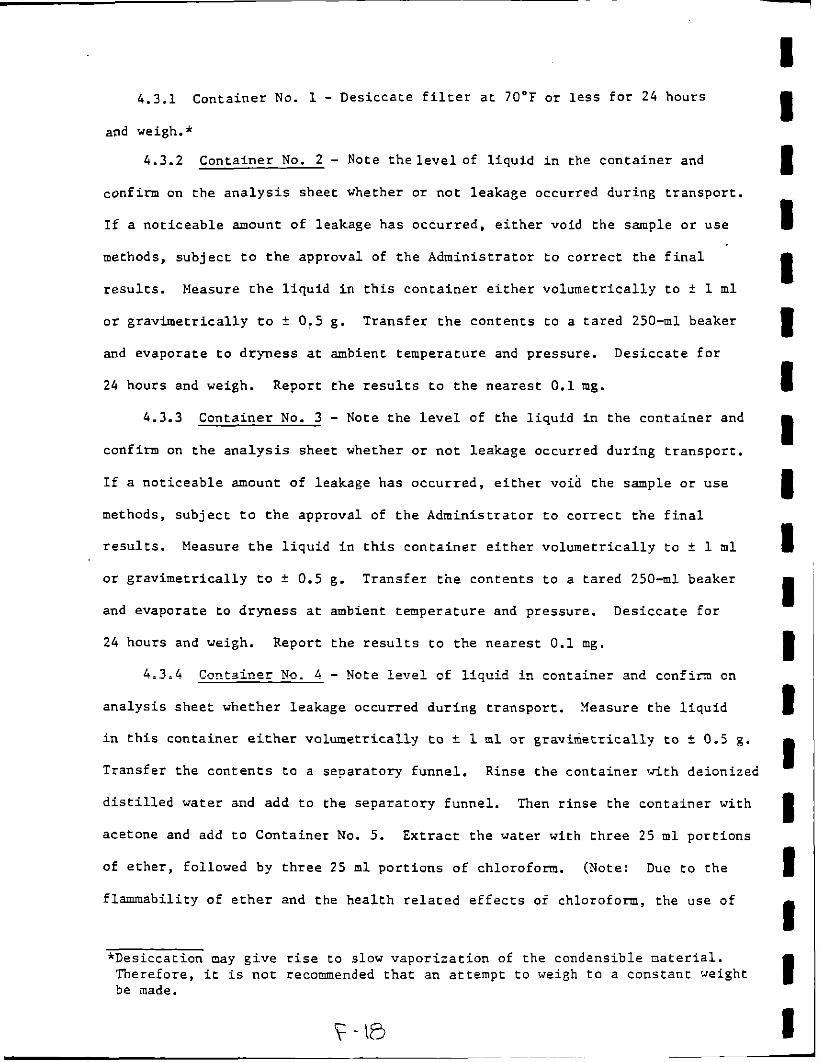
4.3.1 Conta iner No. 1 - Desicca te f i l t e r a t 70°F or l e s s f o r 2 4 hours
and weigh.*
4.3.2 Conta iner No. 2 - Note t h e l e v e l of l i q u i d i n the con ta ine r and
confirm on t h e a n a l y s i s shee t whether or n o t leakage occurred dur ing t r anspor t .
If a no t i ceab le m o u n t of leakage has occurred . e i t h e r void the sample or use
methods, s u b j e c t t o t h e approval of t h e Adminis t ra tor t o c o r r e c t t h e f i n a l
results. Measure t h e l i q u i d i n t h i s c o n t a i n e r e i t h e r vo lumet r i ca l ly t o t 1 ml
o r g rav ime t r i ca l ly t o f 0.5 g. Trans fe r t h e con ten t s t o a t a r ed 250-ml beaker
and evaporate t o d ryness at ambient tempera ture and pressure . Des icca te f o r
24 hours and weigh. Report t h e r e s u l t s t o t h e nea res t 0 .1 mg.
4.3.3 Conta iner No. 3 - Note t h e l e v e l of t h e l i q u i d i n t h e con ta ine r and
confirm on t h e a n a l y s i s shee t whether o r n o t leakage occurred dur ing t r a n s p o r t .
I f a no t i ceab le amount of leakage h a s occur red , e i t h e r void the sample o r use
methods, sub jec t t o t h e approval of t h e Adminis t ra tor t o c o r r e c t t h e f i n a l
r e s u l t s . Measure t h e l i q u i d in t h i s con ta ine r e i t h e r vo lumet r i ca l ly t o 2 1 ml
or grav ime t r i ca l ly t o f 0.5 g. Transfer t h e conten ts t o a ta red 250-ml beaker
and evaporate to d ryness a t ambient tempera ture and pressure. Des i cca t e f o r
24 hours and weigh. Report t h e r e s u l t s t o t h e nea res t 0 .1 mg.
L ; 3 ; b Cny?tzi=er Ye. L - PJcte k v d cf l i q u i d i n conta iner and c o n f i m cn
a n a l y s i s shee t whether leakage occurred dur ing t r anspor t . Yeasure t h e l i q u i d
i n t h i s conta iner e i t h e r vo lumet r i ca l ly t o +_ 1 m l o r g rav ime t r i ca l ly t o f 0.5 g.
Transfer t h e c o n t e n t s t o a separa tory funnel . Rinse t h e con ta ine r with deionized
d i s t i l l e d water and add t o the sepa ra to ry funnel . Then r i n s e the con ta ine r w i t h
acetone and add t o Container No. 5. E x t r a c t t h e water w i t h three 2 5 m l po r t ions
of e t h e r , followed by t h r e e 2 5 m l p o r t i o n s of chloroforn. (Note: Due t o t h e
f lammabil i ty of e t h e r and the h e a l t h r e l a t e d e f f e c t s of chloroform, the use of
*Desiccation n a y g i v e r ise t o slow v a p o r i z a t i o n of t h e condensible m a t e r i a l . Therefore , i t i s n o t recommended t h a t an a t tempt t o we igh t o a cons tan t weight be made.
F - \8
I I I I 1 1 I I I I I I I I 1 I I I I

I I I I I I I I I I I 1 I I ‘I 1 a 1
il
t h e s e r e a g e n t s s h o u l d be c a r e f u l l y s u p e r v i s e d . )
t a r e d beake r and e v a p o r a t e a t 220°F.
0.1 mg.
T r a n s r e r t h e aqeous phase t o a
D e s i c c a t e f o r 24 h o u r s and weigh t o n e a r e s t
F i l t e r t h e o r g a n i c phase through Buchner f u n n e l a p p a r a t u s and a 47 rmu g l a s s
f i b e r f i l t e r t o remove any p a r t i c u l a t e s e n t r a i n e d i n t h e s o l v e n t .
t h e f i l t r a t e a t 70°F and l a b o r a t o r y p r e s s u r e u n t i l t h e s o l v e n t h a s e v a p o r a t e d .
This is t y p i c a l l y i n d i c a t e d by the a b s e n c e of a mob i l e l i q u i d phase . D e s i c c a t e
f o r 24 h o u r s and weigh. Repor t t h e r e s u l t s t o the n e a r e s t 0 .1 mg.
Then, e v a p o r a t e
4 . 3 . 5 Conca ine r No. 5 - Note t h e l eve l of t h e l i q u i d i n c o n t a i n e r and
conf i rm on t h e a n a l y s i s s h e e t whe the r l e a k a g e o c c u r r e d d u r i n g t r a n s p o r t . Measure
t h e l i q u i d i n t h i s c o n t a i n e r e i t h e r v o l u m e t r i c a l l y t o f 1 ml 01 g r a v i m e t r i c a l l y
t o t 0 . 5 g. T r a n s f e r t h e c o n t e n t s t o a t a r e d 250-ml b e a k e r , and e v a p o r a t e
at ambient t e m p e r a t u r e and p r e s s u r e .
t h e r e s u l t s t o the n e a r e s t 0 .1 mg.
Desiccate f o r 24 h o u r s and weigh. Report
4.3.6 C o n t a i n e r No. 6 - A n a l y s i s same as C o n t a i n e r No. 1, S e c t i o n 4 . 3 . 1 .
4 . 3 . 7 C o n t a i n e r No. 7 - 1-7eigh and r e c o r d t o n e a r e s t 0.5 g.
4 . 3 . 8 Water-Ether-Chloroform Blank - Transfer 100 m l of water t aken i n
t h e f i e l d a s a v a t e r b l a n k i n t o a s e p a r a t o r y f u n n e l . Extract t h e v a t e r v i t h
three 25 m l p o r t i o n s of e t h e r fo l lowed by three 25 m l p o r t i o n s of chloroform.
Combine t h e o r g a n i c extract i n a t a r e d c o n t a i n e r and e v a p o r a t e t h e c o n t e n t s
a t ambient t e m p e r a t u r e and p r e s s u r e . D e s i c c a t e f o r 24 h o u r s and weigh. Report
t h e resu l t s t o t h e n e a r e s t 0 .1 mg.
5 .
6.
C a l i b r a t i o n
The c a l i b r a t i o n p r o c e d u r e s a r e t h e same as Nethod 5 , S e c t i o n 5 .
C a l c u l a t i o n s
All c a l c u l a t i o n and n o m e n c l a t u r e are t h e sane as i n Nethod 5 , S e c t i o n 6 ,
w i t h t h e f o l l o w i n g a d d i t i o n s .
v -17

6.1
"b
m C
m e
m
V
0
e
vww
M W
6.2
6.3
Nomenclature . Add t h e f o l l o w i n g :
R e s i d u e mass from a c e t o n e r i n s e of imp inge r s a f t e r e t h e r - c h l o r o f o r m e x t r a c t i o n and e v a p o r a t i o n , mg.
R e s i d u e mass from e t h e r - c h l o r o f o r m e x t r a c t i o n o f impinger water a f t e r e v a p o r a t i o n s , mg.
E x t r a c t r e s i d u e mass o f water b l a n k , mg. .
Res idue mass c o l l e c t e d on 2-112" f i l t e r .
T o t a l amount of condensed o r g a n i c m a t t e r c o l l e c t e d , mg
Volume o f water bl.ank u s e d i n t h e e t h e r - c h l o r o f o r m e x t r a c t i o n , m l .
Volume o f r e c o v e r e d impinge r c o n t e n t s i n c l u d i n g impinge r s de ion ized d i s t i l l e d water rinse.
Mass of e the r -ch lo ro fo rm-wa te r blank extract , me.
I I
I I
Ether-Chloroform-Water Blank C o n c e n t r a t i o n .
M = m
V e
e - W Eq. 5X-1
Eq. 5X-2 Mo - - mc i- % , + mf = Mv
T o t a l P a r t i c u l a t e and Condensed O r g a n i c Matter C o n c e n t r a t i o n .
Cr = (0.001 g/mg)(mn + ) 1 VD(s td ) Eq. 5X-3 - 0
I I I I I I I I I I

I I I I I I I I ‘I I I 1 I I
I 1 I I
7. B ib l iog raphy
7 . 1 Addendum t o S p e c i f i c a t i o n s f o r I n c i n e r a t o r T e s t i n g a t Federal
F a c i l i t i e s , PHS, NCXPA, Dec. 6 , 1967.
7.2 M a r t i n , R o b e r t M. C o n s t r u c t i o n Details of I s o k i n e t i c Source-
Sampling Equipment. Env i ronmen ta l P r o t e c t i o n Agency, Research T r i a n g l e
Pa rk , N.C. APTD-0581. A p r i l 1971.
7.3 Rom, Jerome J. Main tenance , C a l i b r a t i o n and O p e r a t i o n of I s o k i n e t i c
Source Sampling Equipment. - E n v i r o n m e n t a l P r o t e c t i o n Agency. Resea rch T r i a n g l e
Pa rk , N . C . APTD-0576. Marchm 1972.
7 . 4 Smith, W.S., R.T. S h i g e h a r a , and Id. F. Todd. A method of I n t e r p r e t i n g
S t a c k Sampling Data. Pape r p r e s e n t e d a t t h e 63rd Annual Mee t ing of t h e A i r
P o l l u c i o n C o n t r o l A s s o c i a t i o n . S t . L o u i s , MO. J u n e 14-19, 1970.
7.5 Smith, W.S., e t a l . S t a c k Gas Sampling Improved and S i m p l i f i e d w i t h
New Equipment. A K A Paper No. 67-119. 1967.
7.6 S p e c i f i c a t i o n s f o r I n c i n e r a t o r T e s t i n g a t F e d e r a l F a c i l t i e s , PHS, N C A P C ,
1967.
7.7 S h i g e h a r a , R. T. Ad jus tmen t s i n t h e EPA Nomograph f o r D i f f e r e n t P i t o t
Tube C o e f f i c i e n t s and Dry M o l e c u l a r Weights . S t a c k Sampling News 2:4-11, October
19 74.
7.8 V o l l a r o , R. F. A. Su rvey of Commercially A v a i l a b l e I n s t r u m e n c a t i o n f o r
t h e Measurement o f Low-Range Gas V e l c o t i e s . U.S. Env i ronmen ta l P r o t e c t i o n Agency,
Emission Measurement Branch, R e s e a r c h T r i a n g l e P a r k , N.C . November, 1976 (unpub-
l i s h e d p a p e r ) .
7.9 Annual Book of ASTM S t a n d a r d s . P a r k 26. Gaseous F u e l s : Coal and Coke:
Atmospheric A n a l y s i s . American S o c i e t y f o r T e s t i n g and M a t e r i a l s . P h i l a d e l p h i a ,
PA. 1974. pp. 617-622.
7.10 McGaughley, J .F. , and D.E. Wagoner. S p e c i a l Ana lyses of Samples
from S i n t e r P l a n t s i n t h e Iron and S t e e l I n d u s t r y . Research T r i a n g l e I n s t i t u t e .
Xesearch T r i a n g l e P a r k , NC. J u l y 1978.
F-2.1

7 . 1 1 E v a l u a t i m of Sampling Techn iques for S i n t e r i n g i n t h e Iron and
S t e e l I n d u s t r y . A D r a f t Repor t by PEDCo E n v i r o n m e n t a l , I n c . . 11499 C h e s t e r
Road, C i n c i n n a t i , Ohio 4 5 2 4 6 .
7 . 1 2 S t a t e of Oregon Department of Env i ronmen ta l Q u a l i t y , Source Sampling
Method 7.
7.13 S t a n d a r d Methods for t h e Examina t ion of Water and Wastewater , 1 4 t h
E d i t i o n , Method 502A.
I I I I I I I I I I I I I I (I I I 1 I

APPENDIX F . 2 EPA METHOD 25 AS USED BY TRC
EPA Method 25 a s used by TRC during t h e Georg ia -Pac i f i c t e s t i n g program d i f f e r s s l i g h t l y from the method a s it is presented i n t h i s appendix. The TRC m o d i f i c a t i o n s to Method 25 a r e d i s c u s s e d i n deta i l i n S e c t i o n 5 . 3 . 2 of t h e main text r e p o r t .

I I 1 I I I 1 1 'I : ,I I I I 11 1 I I I
.. MaLhod ZCDelerrnimtiou of TOM Garsolu ' Nonmalhaw Og& EmissIom ea Cubon 1. AppIicnbiIity andFrhciple
the meanvement of volstlla o g a d c wmpoundr IVW as total galeom nometbarre organin (TCNMO] as carbon La waca emiaalom. Gqanlc p d c u l a l e matter wiU iuk-rerr with the d p i s M d therefom in ylme cases. an h-rrack p d c u l a l e Mter la requLed Tkd m e t h d in no1 h a only method the1 appliem to the meaaumen l of.KNM0. Cask logisticr and 0th- pncticalltic# of - 80- leiling may make other t es t method, more desirmblc ror mcaivring voc of cef ia in effluent m l r r m r m . Pmper judpeni i s required in determining the moil appUcablc VOC teat method For example. depending upon the moledar waight or the oganiicl ln the aflluml stre- a lolally eulomalcd s e d - cnnhuous nomethane oganlc [NMO) nnslyra lnterficed dlrrclly 10 the sou1sa
the advaatege of providing emlaaim dele mcmiiconhuoualy over M exlrnded h e
.
1l Applicability. Thla method applle? IO
I
-may yield armrsm r e a u l k This approach ham
be spproprials mth prior chmdari2etlon 61 the gas stream and knowledge thst the detector m p o n d . predinably to the oganlc wmpound. ih thn u l r r m ~ II p r e w n ~ methene ~ l l l or CDWE. & o b m e a a m d LU p m c b - c ~ t h e m CAU be applied Io the determination or the ma^ m-mtimor tho 101ai moladar mmchm of the organic emkaloni
-under the IoUowiq l i d l ed wndltlonr: (I) When, only one wmpound Is known lo e d s t (2) when the organic m m p m d r conslal of only hydrogen and d o % (3) when, the rrlative p e m m g e or the compound. la . known or can be dele-ed and tho FID response Io the compoundr im h o m u 14) when, a comislenl mixhvF of compounds Udrb before and d le r emirsion conml M d
'only the relative concenmtions are lo be assessed: 01 (5) wbere the €TD can be . '
calibrated a g a k t mass alandarda of the mmpounda edr l ed (solvent c d i r s i o a 4 for example).
.

65960 Federal Regisler / Val. 45, No. 194 / Friday. October 3. 1980 / Rules and Regulations
CO. reduced to CH. and measwed by m FD. In thin mlyyler. tho veiable reapanse of Lbc FlD a s s d a t e d with dinerent rypes of O r g S ~ U 1s e l i d n a t e d
. ZAppamhu Tha sampliq mystem comisoa of a
condenrate pap. now
wnmista ot two major submy- an oddation system fm the r r c ~ v u g and condltlo+ of tho condamate Uap c~nlcnl l and a NMO analyzer. The NMO analyzer IS a GC with bacLLIwh capeblllly for "0 alp la and L. equipped with an oddstion - - catalyaL redudon catdysL and Fm. IFlgurr, z an$ s M schamntio of n rypical NMO MdyZer.) Tbe aysrem-for tha m v - r y and conditio^ 01 tha orgsnlca caphmd to the condamam hap consLIU 011 heat 8oIvcc. oddation c a t a l y s ~ wndlepenive Infrared [NDIR) ~ a l p r and a Intermedlab
mid system) TGNMO aamplin~ equlpmmt can ba mDltnuted h m commvdally a v d a b l e wmponertu end ampncnta fabrlcnted Lo a m a h a shop NMO ~alyrpn M available commudally or cnn be mnormcted hm.nveUeble compnnenta by I qvallIied IrumIllult laborutorp.
21 s a m p b 'Tbe foilowlng epulpment u mjulrrd-
ZLI Fmba. 32.- OD (%-in.) e t a a s s steel hbing.
212 Condensate Trap. Conshcted of 3 l B
nU0l nyatem and sample tank ( F i I). % e analylicd syolem
-
couemon V & ~ I IF^ 4 IS a ~hemetls of i
sraldess 8teel: conshction deraih ofa nuitable trap are shown to Figure 5
mml valva for stuflng and s t o p p b r€mpla~Pov.
211 flow Conml System Any w t e m capabb of maintddq Lbc s a m p b a rate (0
wilhin *IO percent of the selected now raw (50 la.im a/& m g e b
m o n i m Lha sscyum of the sample lank d u i q leak &a& and aampl@
alvmlnum kllk with a volums of 4 tn 8 ulem equlppcd vdth a stainles s t n l lemala qulch corned for auernbly tn the a m p l a hain and ~alytlral system .
m e w manometer capable of mennuring p r e r e w la w i U 1 mmHg Lo the m m r n 'pnss.
cvacuntlng tn an absolute p r e ~ a m of 10 mm H& -U Anal* ~ h s [ah- equipment IS w. zz1 condewdl0 R C ~ M d ~
CondlUdag A p p m t u r An apparnhu for recoveriu.g and catalgt ldy oxididq the oDnder+ata hap contmta b fequLed fl- 4 L a Khamatlc of mch a system Tha analpt muit damoeArata prior m ldtial we that .the analytical system Is capable of proper oddation and m v e r y . as spcdfied Lo sedon hL The mnderuate recovety and. condltiodua apparahlr conriato of tho loUowing major componentr ..
221.1 Heat Source. A heat s m s d d e n t to heat the condenwta . Cidudlne probe) to I tempemhve where the
hap tumo n 'dull red" color. A system us+
219 flow Shul-oUValVh S L a i d n S alee!
. .
2- Vncuum Gauge. Gauge for
21d Sample Ted. Slalnless eteel m
-
ZL7 ME- Manometer. U-lube
210 Vacvvm Pump Capable of
-
.-
both a propano t o d and an electric m d b mypa fumacs lo r a w m e n d e d
2213 Oddatloll CntalysL A catalyst . systam capable of meetlng h a catalyst affidancy pileria of Lbis method [sectlon h u b Aclduldum I of thh method Uata n catalyst system found lo b acceptabla.
moL.nud hap capable of -ovlng m o u r n kam the gns stream.
u 1 . 4 NDIR Deleam. A detector capable of lDdlca!dlt# co. crmunrmtion to the mro la 1 p m m t ranah Thla detector la requiradfor monltorlng the pmgeas of ambimlion of h a q h c compound. hnn ths condemnla hap.
2116 Resawn R d s t o r . S ta idc ia ileal n e d a valva reqvLed Lo malntaln the hap condltionhg syilem a1 a ~ E U I c o n a ~ l
uu Water Trap Any le&-pm<
pE¶UlRW. u1.n k t e r m d a m ~ o ~ e c t i o d VesurL
Slalnlaas steel or alvmlnum wlleciion verurl equlppad with a femdn quick canned. T& with n o d d volumes Ln the 1 la 4-Ulu w e am mmmedded rrl9 Mercury Manometer. U-tube
mercury rnunwelu capable of measuring p m s w In wilhin 1 mm H# to the m mm rang6 -
u 1 . e cas mur caa p u d b m n s y e m iuiiicient 10 mahlaln Con and organic bpurltiea in the carrier gar and a d a y o x y s n 81 a Iwel of leas than 10 ppm (may not be requlred depending an qudty of cyllnder gasea wed). 2u NMO Analyrer. Seml-contlnuous
GC/W analyzer capabla o€ (1) separating CO. CO. and CH. ham nomethme organlc mmpolmdr. (2) reducing &a CO.tlo (3H. and q m a r u l n a am CH. m d (31 orididug the nonmalhaus orwnic m m p o u d to CO. reducing the CD. b QL and quantifying as ai. 'lb analyal mwt demomuale prlor to Lallial we that tha andyrn la Enpable d proper MPMUOU oxidation reduction a d
m L t a of h e followlog rnsior component%
mystam capable of mea- the ~ ~ a l y s t eEfldmcg aiteria of lhln method (section UI~. Addendum I of this method l i s ~ a catalyst ayatem found 0 be aaeptabla. Lzu Rrductlon CatalysL A catalyat
myelem capable of men- the calalya eEdency citerla of &h mehod I d o n a U b Addendum I of this method h U a
mQNRmmt [ O d O n u). Tbbs MdyrSr
-1 Wdatlon Catalysl. A ca ta lp t .
calalylt syalem found to be s a e p t a b l c UU Spuatlan C o l w s j GM
chmmetomphle rnlWm1 capable of nqanrtlng CO. CO. and a h r n NMO mmpmmda LI dcmrmshllted aosordQ to the p d m r n t a b l i s k d In tbir method [eecticm S 2 5 ) . Addendum I d lbis method hta a wlamn found la be aaeprable.
w 4 Sample Iniemon System A G C sample bjectim valve fitted with a sampla loop pmpedy shed IO interfaca with the NMO analper (1 sc loop recommended). rzU F7D. A Fm meehng the loud-
-
BoedceuOM R O & d
2 1 l 8 Dam Rccordiq Symtam Analog s ~ n p c b h recorder or diptal lntergratian system wmpahble mth tho Fill for pcnnanenrly recow the ~ a l y t l d resulu. tw Barnmeter. Mercury. M e d d or
other barnmeter capable of messuriw
Thermomater. b p a b l s of measuring the laboratoy t e m p e r e m mrhln I'C Lu Vacuum F'ump. Capable of
evacuating to an absolute pressura of 10 mm
ruI Syrlnsa (2). 10 pl and lm pl Uquld injectioo syringe& Lu' Uquid Sample Injectloo U d L 318 SS
U-tube Btted wilb I Teflon LoIecUon septum
s ~ o s p ~ t r ( s pressw to *rlrtuo I ng
. w -
sreF@un& - 3 Rqwu
d u q sampllq. 3.1 &PI@ h h e d dry ice Is raguiced
32 A n d y a k I 3 2 1 NU0 Aoalyre.~. Tbn foUowlng gases
M needed: U L I mer Gas. Zero gzda gas
wnluining less than 1 ppm C Addendum 1 of U u method lbta a d e r gas l o u d lo be aaep tab la 3 2 1 2 P d C a a Pure bydmecn
conrain& lesa lban I p p i c azu Combustion Gnu Zem m d a sir or
o w e n 81 reqvLEd by the detector. 3 - U Condemate Recovery and
Conditioning Apparanu. 3 L T 1 Carrier Gar. Five percent 0. In N..
containing less thm I ppm C 3- Audliarg Oxygen Zero grade
oxygm mnlaining less than I ppm C 32tl Hulana. ACS grad.% for Uquid
Injection 3 Y 4 Tolocne. ACS v d e . for liquid
injestion $3 cdllbrntlon lor aU calibration gsies. -
the mandacnuer mu1 recommend a m d &elf Me for each cylhder (1.e. the l e d of time the gaa conemuation IS nol expected lo chaage mora thnn * 5 p e w n l fmm ita d e d value]. n e date of gas c y h d n preparation certlIied o g d c concenmtion and recommended maximum ahelf life mwt be qfiued to each cylinder b e f m shipment €-om the gas manufaclurer la
. ,
~~
z t u . 1 Line&. A h e a r responaa 6%) over the operating m g e as demommted by &a procedures established to section 5 2 1 Lzru Range. Sipa l anenualom shall
be arsUable to produce a minlmm airplel r e s p m e of 10 percent of full scab for a tun surle mugo of 10 10 5uxyI ppm a
to Ib. u2 Flnme Ionization nateclar heanly
and Nonmethnne O g m c Callbrution Games (3). caa mhtw standards with normnal pmpam concmhaUoP( of p ppm ZM ppm. and 3oooppu~ to nir. 331 Carima Dlodde Cdmmllon Gases
13). Carmlxhm stendards with nomlnal CO. concrnhatioru d 50 ppm. yx) ppm and 1 perccnL In air. Note: total NMO lees than 1 ppm reqalnrd for 1 percent &hm.
33.4 NU0 Analyzer System Check Calibrntlon G a e n (4).
3.141 h p a n e Mlxhuc. Gas mixme stnndard mnlalning [nominal) 50 ppm CO, 50 ppm M. Z p m n t CO. and m ppm cst. prepemd iu alr.
33.42 Hexane. Gas mix& standard conteh lq [nominal] 50 ppm hsxnne ln air.
I I I I
4 -I i i 1 I 1- I I 1 0- 'I 1 1 1 -

Federal Register / VoL 45. No. I& / Friday, Ociober 3. 1980 / Rules and Regulatioae 65961
4. Pluudwd
mk vn- on the lebanlov dam form ham that thm NDIR nnalyzer Indlcstes zrm outpnt krsl and thm swilch the SarriU now lhmd thn condaosat0 bap. +&tdy mild tho d a Onw-hm v m l lo coUesr Tbe sondemato h p r e w v ~ and & t i o w epparahu should now be mal up a~ Indicated In Rguro B Modtor tho NDR when u3. La M lauser beW parsed lhmush tho ,y~tem. milch the carrier now M thnt il o o ~ s qain bypnm.ss the c a n h e l a bap. ~ontlmur b thl, manner una tho gaa sampla tank !J preseuriud Lon n o m i d gauge p r a m of BOO rm Hg. AI &ia m e . iadala tha lan~. "mi the d e r flow, and rewd the sample tanL pressvrr IPJ. bammehls p r e r a m pd. and ambient temperalum ITJ. Remove the ample lmk from the rnystem.
4w Recmery of Condenrats Trap S a m p l ~ Olddatim and mUecrian of h e . sample In the condeDsals hap ia now randy to b- From Lhe.atep l l y t completed In medon U.U a b % the myatem should be net up so thal the d e r Daw bypaarea the condensam hap, bypamaes the dd.aUon csialynt. and b vented to the ahnosphere. Attach an evacuated Intumedlsla wlleclhe v-1 ID tho system and then s m l c h the d e r no that It now8 lhmugh the oddation catalyst. Swltch the d e r from vent la
~. conen andapen the valve to the coUscdon vesiel; remove the dry Ice bom the mp and t h ~ n mwilch tha sarrier now thmugh the mp. Ths system ahould now bo ret up to operala ne Indicated In F@m 8. hriq olddsUM o l the w d e u n t e hap n a ~ ~ l + modlor tho NDIR IO determius when all the sarnple hns been m v a d and oldxldlrrd [indicnkd by . return ID h e l l n a of NDR a n a l p r outpul). Be@ hesung the sondemate kap and pmbe wlth a-propane 10rCb n e bap should be heated ID a kmpentum at which tha bap glows a %dl d" ( q p a ~ e l e l y m'q. h r i q the d y p a r t o f t h e hap "bw out.". adlust the d e r and aadllary orygen now rales so the1 an e x ~ s s n o l oxygen I s belug fed Io h a catalyst symlem Gradually Inaesae Iha Bow of d e r gas lhmugh ths Imp Mer the M)IRindiCstea.thslmoslof the o r g d c matter ham been pursed plsca h a hap In n mrgle fumance (SOO'C). Continue to best the pmbe with n lor& or wme other p m c e d w .(4.g. e l e d c a l resinlsncc heeler]. Continoe h pmced- lor nl lea81 5 minulas after tha NDR has returned to basehe. Remove the heat fmm h a a s p but sonhue the d e r flow vnu the intcrmedlste mRectian vessel ia pFssuri2ed lo a gauge pressure of Boo mm
..
-
.

I
-
I 65962 Federal Register / Vol. 45. No. 194 / Friday, October 3. 1980 / Rules and-Rewlalions
(nominal]. When the vessel Im presalvlred vent h a carrier meaaw and nmrd the Tmal intermtdiale c o U d o n v e x d p n m l w WJ M well 81 the bammebic preaaurc lP4. ambient t e m p e r a m F.1. d colleFtlon vesaol volume pJ.1.
a n d p r into roudnm operaUon an Initial perlormanoc test mm.1 be conducted S U Iha analper and perlorm all tha necessary
proper order. then conduct the performnncs test acsodhg m the p m c e d m s u t a b l l a h d in s e d o n 5 2 Once lho . performance test haabern euccesshrlly complotd and the CO. and NMO callbration reaporwe focton dotermlncd proceed with
4.4.1 Daily O ~ C ~ ~ U O M and callbrution checks M o r IO and Lmmedlalely following the analyils of each .et ol s ~ p l e s or on o daily baala (wblchever o o ~ n b a t ) conduct a calibration test acw- to the procedures establlsbad in secllon 53. U Lha mteria of the daily calibration test m o l bo met. repeat thc NMO analper perlormeam tent ( i d o n MI before pmuedlng.
4.42 Analyola of Recovered Condcmalc Sample. m - e the ample I w p with sample and then bjed o prelbiaary vlmple in order lo delemahe the appropriate FUl snenustion Inject IripUcate samples h m lhs intermadlate collection vessel and record the value. obtained for the c o n d d b l e o q d o
4.43 AnalpLI of Sample Tank. RusF lhe .ample Imp wilh sample and Inject a
sample in order tn%etcrmina thc appropriate mfattenuation for monitoring the badflushed m - m e h e o r g d a b j e a Wpllsate samples fmm the a m p l e tad and record.lhe values obtalned for the nanmelhane organlo (GI. 5 Cblibmtion and Operational Checks
Iten
Condensate Recovery and Coditionkg AppamlvL
Carrler Cam and Avxillary O w e n Blanlr Set equal now rates for both Lha h e r 8- and auxiliary oxygen Wllh the. trap rwirching v a l v e in the bypass psltion and lhe catalyst In-line. U an evacuated intermediate collection vessel with carrier PI A n a l p the collection vessel far c1x: the carriar b l e d Is acceptable U the CO. mncenh t ion ia less than loppm.
- 5.12 Calplyat Efficiency Check Set np the c o n d w t o h p recovery system so that the carrier flow bypasses the bop Met and b vcnled lo the obnosphero at Iha iystcm oulleL &wuo that the valves &oh- Ihe solledan syalim from the aknoapberic vent &d vucuum pump are closed and thm attsch an svacualed intermediate collection vessel to the system CQMEC~ the mathane m m d d gas cychde r [ l edon 311) to the syatem's condensate hap wmector (pmbe e n d Fl- 41. Adjust the system valviq 10 that the i t andud gaa cylinder acts as tha carrier gas and a d j u t the Pow rstd to the rate normally used during trap sample recovery. Switch on the avlillary oxygen now and then switch horn vent to collect in order 10 begin callectlng n sample. Conlinua col lecbg a m p l c In a normal m m e r mril the
4.4 h a l y s i h Priw to punLng tho NMO
h v l c t i O M O d o r I O QUI the m1Wr
'
-sample malysb M lollowe
0s M. ICA
Mainlain a recod of perlo-ca of each
11 Inltial Performanco Check of ..
- .5.1.1
btermcdlalc venial I; Wed Io a nominal gnyso presswe of 3m mm I-@ Remove the intermediate vessel bum tho system and vent Iho uvrier Pow to the ahnospbera.9witch the valvlng I0 return lho stem to Ib normal carrier gam and n o d o p e r a - sondlUonh Analyze tha colldon.veaael for COi the catalyst cBdcncy b a-ptable U tho C R cnnconhUon la wllbln -5 percent of the axpeaad value. .
5.13 System Performance Check C~MUUCI a Uqlrld lample Lnjestlon dl slmllar in dedgn I0 lhs d t shown in F l p a n ~ n a d w vnlt hlo tho condrmate -wry and wndltionlng syatem In place 01 a condensste tnp and set the cam- goo and a d s r g oxygen now rates to normal oparatlng Ieveh Ana& an evmcuatd lntmedlata mllactian veanol to the syatem and'swltch h m system vant tn collesr Wllh Iha d e r goo routed h w g h the inledon d t and Ihc oxldatton satalps injacf a liquid sample (Ens 1121 I0 5.13.4) vi. tho hiedon seplum Heat Iho b j e d o n d t with o torch w U e modtoring Iho oddation reoction on the NDR ConUnue tho pvga QUI the nactim b mmplct l Meesw Lha hal collectian v e s 4 pressw and then analyze tho Yoise l to dstermina tho to. concentation For each injection. cnlorlate Iho percnnt recovery M ~ E the qualion in sectlon nn
The pe r lomnce test is aacptable if the averago percent recovery la 100 & 10 p e w 1 with a relative i t a D d d deviation lw3ion a71 of lw than 5 percent lor each set of hipka le h j d m ! d 81 fOuoVS: ' 6,111 100plhexme a . u f ioplhexane. LUJ loo pl IOIUCE &la4 10 pl toluene. S 2 Initial NhjO .+Iyler Rrlormansc
MI . ~ x i d a t i o i ~ a t d y s t a d e n c y chick. TosL
T m 0601 bypass tho NMO pnalyn?r r edudon calelysL Mako WpUcate i n j d o l u of tho hi& level m e h a s e d d (section 33.1). The oxldation catdyat operation u aaeptable U M FID response u noted u Analyzer Linedty Check and NMO
CalibraUon Opera- both the d a t i o n and radudon catalpu conduct a linearity check
spedaed in i d o n 23 mako Wplicatc lnjectlons of each calibration gsr and hen
ipm C) for each gas. M well as tho o v d .
mkaq of the mponw factor valvllr Tbe . ~
b t r k e n t linearity u a c ~ p t a b l e U the a v e r a p reaponme f a h r of each callbration gas b wi& e5 percent of tho ovomll mean value and if ths relative standard deviation [sectlon for+ach ret of Wpllcate h j e c t i o ~ b less than e 5 percenr Rewrd tho o v m d mean of the propane reapoms factor values astho NMO calibration reSpOMC factor[Rp,). -
of lha analyzer usha Ihe propane atandarda
d d e l e the average reSpoMe faClOr ( m a /
- -5w. Reduction Catalyst EEcimcy Caeck
and CO, Calibration An exact determination of the reduction catalyst efficiency la not reqvLed h t e s d proper catalyst operatian is indkec~Iy checked and m n h m u s l y modmred by cstebliahing e CO. response factor and compm'iq It to the NMO reaponae factor. Operating both the oddation and reduction calalysu make triplicate injectiolu of esch of the COS calibration gsscs (sedan 333). Calculate Ihe average response fsmr
6 - 7 I
[ma lppm) for each callbraUon g a r am well as the overall mean of h IWPOMO factor valuea 'Ibc reduction catalyst operation b acceptable U Ihe average W ~ O M O factor of each d b r a t i o n gas la wirbln f 0 percent of the overall mean value and U the rOlatlve s h d d deviation (saction for each set of LripUcote h i s C u O M La less than * S pemnL Add l t iody . the to. overall mean naponis factor must be wilhln f 10 percent of the NMO callbretlon reeporuc factor IRp-1 calculated h sadon S L Z Remd lho overall mean of lhc response kchr values M tha CO. callbration r e s p o m factor [RF,).
6 2 4 NMO System BlanL. For the high level CO. callbration gam (mectioa 353) I record h e NMO d o e meomred d w i q the CO. callbrption conducted in sectlon 5 U This valw 11 tho NMO blank valva for the analyrer (eJ and shodd be Icu than 10 ppm 5 1 5 System Rrlormanur Check Check
Iha mlvmn noparation and o v o d perlommcn of rho analyzer by mnklna *pUcatc b l e c t i o ~ of the calibrallon gssea bled in .ectlon 5 1 4 . rho d y r u pdormanco is aaeptabla U the m e a i d NMO value for each gas (average of biplicata hjectionm] b wilbln * 12 percent of the
.
33 NMO Analper Daily Callbration S3.1 NMO Blnnk and CO, Inlact
kiplicate samples of the hi& level CO. calibnnon gem (rectlon 33.3) and calculate the averago mponso factor. The system Dperatlon b adequate if the d d a l e d
W, cslcvlated d u r i q tho inltlal perform- teat (OCCUOU -1. UK the daily
callbration and the dculation of m e a i d CO. amconhatiom In the c o l l d o n vessel samplea b addition rewrd the NMO blank value [SJ: lhb value &odd bo lesi than 10 PPE
s 1 u NMO crllbration Inled wpucate iampler of the mlrcd propane callbraUon cylinda (redon 33.4.1) and calcdelo tho average NMO r e s e e factor. The syatem operation b odequato U the calculated respom factor La wilhin 210 percent of the RFmD calcvletd d u i q the initial perlormanso teal ( ~ t l o n 521). Use the daily
&libration and calculation of NMO
EapoMO faClOr !d & l o perCen1 Of Ihe
mpom Lector (DWJ for analyrsr
ESpDMe factor (DW-) f01 m d p r
C O U - h u O M h the lampk
- , - -
5.4 Sample Tank. 3%- volume of the g n i sampllq tnalu ~d must be dstsrmlnsd Prior to pu- aach rank ln servisa d e t e r m h Ihe rank mlume b j wci- Ihe ranks empty and then U e d with doionired dlslillod water we@ to the nearest 5 p and record the resuita AltamaUvely. mensum b e volume ofwoter uxd to U the La& to the nenrest s ml 55 biermediate tollectlonVesseL Tho ' .
v o l m o of the btarmadlate collection vesreh used to collect CO. durlng the analysis of Ihs condenseto m p s must be determined Prior to put- each vessel Lnto sery1sD. determine Ihe volume by weighkg the vessel empry and then filled wilh delonLad distilled water weigh to Ihe nearest 5 am and record the r e d & Alternatively. rncmsum the volume ol water used IO RU the t a d c s lo the nearest 5 ml / - OIWYG moe w i - u
I 1 1, I ' I I I 8 I
s l
- I 1 91 I I 1 1

1 11 t I I 1 4 I I I 1 1- 1 P 1; P
I -
, ,
.. . . - , F d m d Regisler / Vol. 45. No. 194 /-Friday. October 3. lee0 / Rules and Replatiom 65963
.. . “ C a o . e ’ . r - u .u
+ U
c ‘c.’.. . i f . . - (u
. % E . ’ I
. . . . u - -
. ,
. X i # . . , .
’ . ‘ . . .
. .
c I
i
. .
I .: -


I Federal Register / Vol. 45. No. 144 / Friday, October 3. 1980 / Rules and Regulations 659G .
0 I
. - . . -,
Figure 1. Sampling apparatus. . . . . -
- . . . ,
. . . . . . .
. .. . .
. . . . '. .
. .
. .
. .
, - . p; ' . \ '
I 1. :I
- . . . . . . -.
- .
. . . .

65966 Federal Regisler / Vol. 45, No. 184 / Friday. October 3. 1980 / Rules and Regulalions
CARRIER GAS
1 ''
: . . . . CALIBRATION STANDARDS . .
-. - .
~~
SAMPLE SAMPLE TANK INJECTION
LOOP - --
, . . . . ~ .~ . . . . .
.. . ' . - INTERMEDIATE
\
COLLECTION VESSEL
~CONDlTlONED TRAP SAMPLE) . .
. . . . - . .
, . .
-. -. .-
- MON-METHANE . .
. . . .
1 '1 I I 1'. I- t
Figure
.
OXIDATION CATALYSI
..
REDUCTION HYDROGEN CATALYST
. . \. ~ . . .
. . -
,.
2 Simplified schematic of non-methane organic (NMO) analyzer. * .I . . ~ . , .~ . . . . . . -
- - I .
'. .~
. . . .
. .. : I .
~. . . - .
. . .
. .
. .
. . . . . .~
. , - . . . .
. . -- . . .
. - . . , . . . . .
. - . ,
, . .
. , . . - . . . ' - . . . -
.~ . . . -
- - -. ~. \
. ~.

. .
Federal Register / Vol. 45. No. 194 / Friday, Oclober 3. 19CU / Rules and Regulations ' 65967
, . '
. . . . 35
2 z
: \
F-3 \
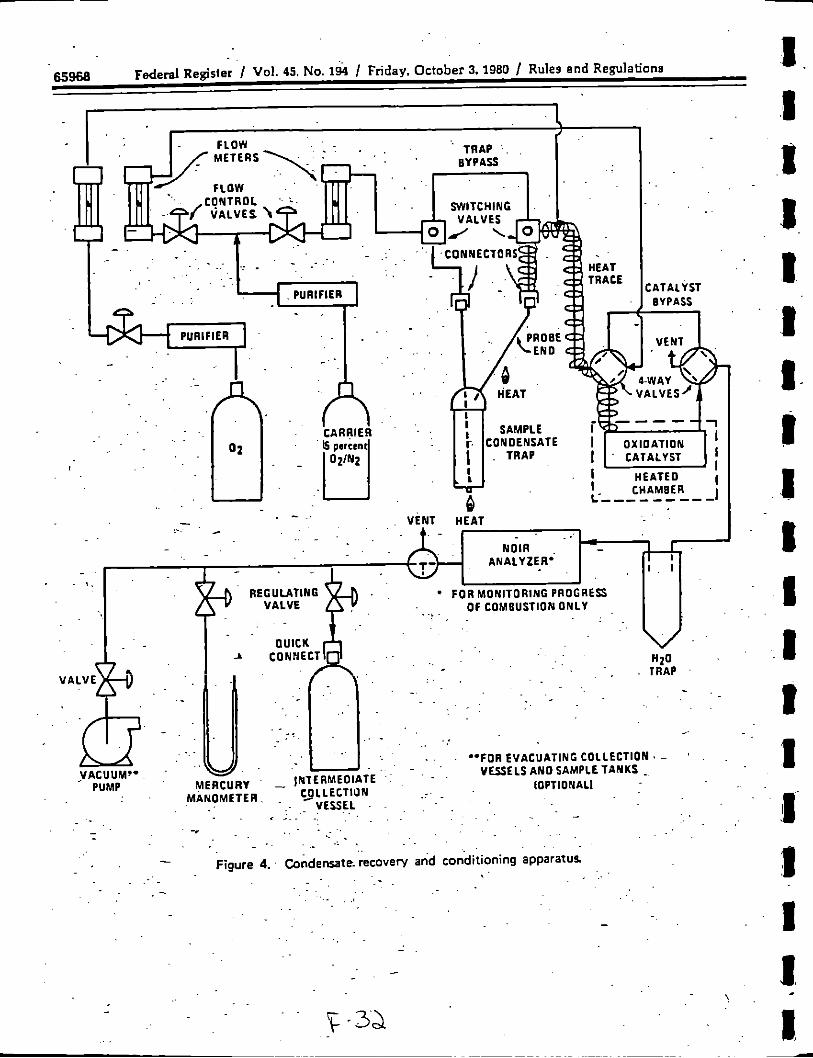
6.5468 Federal Register / Vol. 45. No. lw / Friday, October 3,1980 / Rules and Regulations
t 1 I I 1 B 3 I

'I "
..
Federal Register / Vol. 45, No. 194 / Friday, October 3.19W / Rcles and Regulations 65969
PROBE. 3mm l l m in1 0.0. . -.
. .
. . ~.
~. . MATERIAL: TYPE 316SlTAINLESJSTEEL .. .
Figure 5. Condinsate irapz. . -
. . . . ..
-_ . . F - 3 . 3
. .
. .

1 65970 Federal Re-gisIe~ / Vol. 45. No. 194 / Fndey. October 3. 1980 / Rules end Regulations

, Federal Register / Vol. 45. No. 141 / Friday, October 3. 1980 / Rules and Regulations 6597Y
. " ' VOLATILE ORGANIC CARBON . . I
- F A C I L I l V SAMPLE LOCATION - ' LOCATION OPERATOR
R U N NUMBER - DATE
TANK NUMBER TRAP NUMBER SAMPLE I D NUMBE- , .
-- ' . . BAROMEThIC - AMBIENT TEMPERATURE. . PRESSURE.
- oc
- . T A N K VACUUM, - .
rnm Hg -em H i .~ mm,Hg
. - . . - - . PRETEST(MANOMETERI IGAUGEI
-, PO= T E S l (MANOMETER1 IGAUGE)
.
-. . . . . . M Ha 1-10 min < . . LEAK RATE
. PRETF23
. - .
.~ ~. - . . . . P O S T T E n
/ - ~
. .TIME - GAUGE VACUUM.. . - CLDCKKAMPLE . -- M no . FLOWMETER SElTlNG COMMENTS
. . . . .
. I - ~. . .
- - . . .
~~
, . . . .
I . , .
. . . - . ./
.. I . . . . . ..... Figure 7. .Example Field Dam Form.
. _ - - . -. . .
. , . -. - . . . - . . .
. . -. . . . .
, ~- - . . ... -
. -
-

65972 Federal Regisler / Vol. 45, No. 194 / Friday. October 3.1980 / Rules and Regulations
I . . i
V E N T I 1 - NOtR
.. -
I I ANALYZER'
FOR MDNITORING PROGRESS VALVE OF COMBUSTION ONLY
. . IOPEN)
- (OPEN) , . auictc
H20 CONNECT . .
TRAP . .
- . . ' . . -
. . - ' ' . -FOR ~ V A C U A T I N G COLLECTION VESSELS A N 0 SAMPLE TANKS
~. IOPllONALI.
VACUUM'. PUMP
. COLLECT ION . , . ., , - MERCURY
MANOMETER
.~
. . .VESSEL
. . I >
Figure 8. Condensate recovery and conditioning apparatus, carbon dioxide purge. ~ . .
.~
, , . , . . , , .
. . . . . , .
.. .

.Federal Register / Vol. 45. No. 194 / Friday, October 3.1980 / Rules and Regulations 65973
- MANOMETER . COLLECTIJN
. I .~ - VESSEL . ~ '
. . . . . .
. .
\
. - .~
. Figure 9. Candensate recover/ .and conditioning apparatw collection Of trap organics.
p. : . . I . . . . - , -
f , I '.

APPENDIX F.3 METHOD 25 AS USED BY NCRSI

NATIONAL COUNCIL OF THE PAPER INDUSTRY FOR AIR AND STREAM IMPROVEMENT, INC. (NCASI)
TOTAL GASEOUS PHOTOCHEMICALLY REACTIVE ORGANICS (TGPRO)
SAMPLING AND ANALYSIS PROCEDURES
c-38

ANALYSIS CF TOTAL GASEOUS ORGANICS FRO? PULP A N D PAPER MILL I COElBUSTION SOUPCES
Victor J . D a l l o n s , NCASI
The N a t i o n a l C o u n c i l is c u r r e n t l y s u r v e y i n g t o t a l g a s e o u s o r g a n i c e m i s s i o n f rom p u l p and paper i n d u s t r y combus t ion and o t h e r p r o c e s s s o u r c e s . The o h j c c t i v e of t h e p ro j ec t is t o d e v e l o p a d a t a b a s e on g a s e o u s o r a a n i c which c o u l d en te r i n t o a p h o t o c h e m i c a l r e a c t i o n i n t h e a m b i e n t an2 form o z o n e . I t is t h e aim t o p r o d u c e d a t a c o n s i s t e n t w i t h what t h e N a t i o n a l C o u n c i l e x p e c t s w i l l be t h e EPA r e f e r e n c e method f o r the measurement of t o t a l g a s e o u s non- methane o r g a n i c compounds. The s a m p l i n g and a n a l y s i s p r o c e d u r e s used i n t h i s s t u d y a re i n a c c o r d a n c e w i t h t h e l a t e s t EPA d r a f t document c i r c u l a t e d f o r comment o n t h e p r o p o s e d method.
t .I 1 II I
The t o t a l g a s e o u s nonmethane o r g a n i c a n a l y s i s method g i v e s r e s u l t s f o r carbon monoxide, c a r b o n d i o x i d e , me thane , and t c t a l g a s e o u s o r p a r i c s . The N a t i o n a l C o u n c i l a l s o a d j u s t e d t h e a n a l y t - i c a l method t o m e a s u r e e t h a n e and e t h e n e . F t h a n e and me thane a r e nonphoto r eac t ive compounds and a re n o t i n c l u d e d ir. t h e g a s e o u s compound r e s u l t s . The t o t a l g a s e o u s photZochemical ly r e a c t i v e o r g a n i c s ( T G P R O ) are r e p o r t e d a s me thane .
SAMPLING AND AN?.LYSIS PROCECURES
The p r o c e d u r e u s e d on t h i s p ro jec t w a s s i m i l i a r t o t h e one d e v e l o p e d by t h e S o u t h e r n C a l i f o r n i a A i r P o l l u t i o n C o n t r o l D i s t r i c t and t h e A p r i l 5 , 1979 EPA " D r a f t d o n o t q u o t e " p r o c e d u r e s . The p r i n c i p l e of t h e p r o c e d u r e w a s t o s e p a r a t e t h e l i a h t compounds ( t h o s e w i t h vzpor p r e s s u r e s a t 78OC) from t h e h e a v i e r o r g a n i c s w i t h a c o l d t r a p i n t h e f i e l d . The l i a h t c o m p o n e n t s were c a p t u r e d _., e v a c - z t e d t a n k . The t r a p c n r ! t z i n i n g condensed o r g a n i c s w a s burned to c o n v e r t o r g a n i c s t o C O ? . f o r a n a l y s i s i n t h e l a b o r a t o r y . The l i g h t o r g a n i c s c a p t u r e d i n t h e e v a c u a t e d t a n k were s e p a r a t e d on a c h r o m a t o g r a p h i c column y i e l d i n g c o n c e n t r a t i o n s f o r CO, CH , CO C H , cZ2E4, and all other o r g a n i c s . ana ' t a h 6 0 r g a n i c r e s u l t s g a v e TGNPO s t a c k c o n c e n t r a t i o n s . r e s u l t s were r e p o r t e d as me thane .
A . Sampl ina
i" 2..
Summation of t h e t r ad A l l
3 2
F i e l d st-nples were t a k e n i n d u p l i c a t e t h r o u g h a s i n g l e % i n . s t a i n l e s s s teel p r o b e f i t t e d w i t h a tee t o s p l i t t h e f low t o two s a m p l i n g t r a i n s . The s t a c k end of t h e p r o b e w a s f i l l e d w i t h q u a r t z g l a s s wool b e f o r e e a c h sample w a s drawn t o p r e v e n t collec- t i o n of p a r t i c l e s ir: t h e t r aps . S i x f e e t o f 1 / R i n . s t a i n l e s s s t ee l t u b i n g r a n from t h e tee ' t o each t r a p which were submerged i n g r a n u l a r E r y ice. S c h e m a t i c s of t h e t r a p c o n s t r u c t i o n and s a m p l i n g a s s e m b l y a r e p r e s e n t e d i n F i g u r e 1 and 2 , r e s p e c t i v e l y . C o n d e n s i b l e o r g a n i c s and w a t e r v a p o r were c a p t u r e d i n t h e t r a p s .
-.
F -39 I

c .-
WELDED ON - SWAGELOK NUTS
5/16 INCH EXIT TUBE
STAINLESS STEEL- TURNINGS
5/16 INCH SAMPLE I N L E T
FILLED WITH STAINLESS STEEL TURNINGS I- . QUARTZ WOOL PLUGS
-NO. 40 DRILLED HOLES
WELDED PLUG
F I G U R E 1
CONDENSATE T R A P

-I -I a 3
a Y V !- v)
3
E w I- w 2 3
I 0 -I LL
I I
v) KI
W I
IL W
KIN
J Z w w
z>
T--ct\
W L

From t h e t r a p s t h e ?as f lowed t h r o u g h a r o t o n e t e r , a flow c o n t r o l v a l v e , a n d i n t o a 1 7 l i t e r e v a c u a t e d s t a i n l e s s steel t a n k .
A l l screw c o n n e c t i o n s i n t h e s a m p l i n g s y s t e m were checked for l e a k s i n t h e f i e l d before s a m p l i n q by p r e s s u r i z i n g w i t h a i r a t 3 0 p s i and s o a k i n ? t h e j o i n t s i n d i v i d u a l l y w i t h s o a p y w a t e r . Leaks detected were e l i m i n a t e d p r i o r t o s a m p l i n g .
Sampling f l o w r a t e s were s e t a t a b o u t le0 ml/min so t h a t abou t 1 0 l i t e r s of sample w a s col lected i n 3/4 h r . When a t r a p f r o z e n due t o c o n d e n s a t i o n of s t a c k m o i s t u r e t h e t r a p i n l e t was h e a t e d momenta r i ly w i t h a p r o p a n e t o r c h t o m e l t t h e ice. The sampling sys t em w a s wa tched c lose ly t o m a i n t a i n t h e proper f low r a t e . A t t h e e n d of t h e s a m p l i n g period t h e tee and probe to t h e s t a c k were h e a t e d g e n t l y w i t h a p r o p a n e t o r c h t o v o l a t i l i z e any o r g a n i c s c o n d e r s e d . A f t e r s a m p l i n g , t h e t r ap and 6 f o o t s e c t i o n of l i n e t o t h e tee was capped and t r a n s p o r t e d t o t h e l a b o r a t o r y packed i n d r y ice . Tank p r e s s u r e s were measured b e f o r e a n d aEter sampling t o d e t e r m i n e sample s i z e . O r s a t a n a l y s e s w e r e made for C 0 2 and O2 before and a f t e r s a m p l i n g .
B . Sample P r e p a r a t i o n
When t h e samples were r e t u r n e d t o t h e l a b o r a t o r y , e a c h t r a p and samFle t a n k c o m b i n a t i o n used i n t h e f i e l d w a s c o n n e c t e d t o t h e t r a p b u r n i n g system i n t he s e q u e n c e of t r a p , o x i d a t i o n tube fur- nace , U-tube w a t e r t r a p packed in d r y ice and IF a n a l y z e r and sampling v e s s e l as shown i n F i g u r e 3 . The s t a c k gases r e m a i n i n ? i n t h e t r ap was f l u s h e d i n t o t h e tank w i t h carbon compound f r e e a i r ( h e r e a f t e r referred t o a s z e r o a i r ) . When a l l of t h e CO was f l u s h e d and i n t o t h e t a n k as i n d i c a t e d by t h e IR detec tor rezponse, t h e t a n k was p r e s s u r i z e ? w i t h zero a i r v i a a t r a p h y p a s s .
Fol lowing s a m p l i n g t a n k p r e s s u r i z a t i o n , a f o u r l i t e r s t a i n l e s s s tee l v e s s e l e v a c u a t e d t o a minimum of 28 i n . Hg was t h e n a t t a c h e d i n t h e t a n k ' s place. Zero a i r was passed t h r o u g h t h e s a m p l i n o l i n e and t r a p w h i l e t h e y were h e a t e d t o a d u l l red co lor w i t h an a c e t y l e n e torch. A m e t e r i n g valve in t h e zero a i r s u p p l y l i n e c o n t r o l l e d t h e p r e s s u r e i n t h e t r a p t o 15 t o 25 i n Hg w h i l e f l o w was c o n t r o l l e d b y a valve on the e v a c u a t e d vessel. P r e s s u r e i n t h e t r a p can increase r a p i d l y d u e t o b o i l i n q of condensed w a t e r . The t r a p was m o n i t o r e d t o a v o i d excess p r e s s u r e s t ha t may r e s u l t i n leaks. F j a u r e 4 shows t h e b u r n - o u t a s sembly .
Care was t a k e n t h a t the s a m p l i n g l i n e , t r a p , and l i n e s t o t h e o x i d i z e r were h e a t e d s e q u e n t i a l l y so t h a t i n c o m p l e t e l y o x i d i z e d o r g a n i c s t h a t n i g h t r e c o n d e n s e in t h e sys tem would be r e v o l a t i l i z e d . Each t r a p was b u r n e d u n t i l t h e C 0 2 i n t h e c a r r i e r g a s as shown by t h e IR a n a l y z e r had r e t u r n e d t o b a s e l i n e . The v e s s e l w a s t h e n p r e s s u r i z e d t o less t h a n 5 i n . H a .
from c y l i n d e r s . A i r from t h e c y l i n d e r was p a s s e d over a n oxida- t i o n c a t a l y s t t o o x i d i z e o r g a n i c c o n t e n t s and t h e n p a s s e d t h r o u g h
--.-
Zero a i r w a s p r e p a r e d by f u r t h e r p u r i f y i n g z e r o arade a i r

t-
U > rf-’
3 0
\ I W
I I I 3 1. I I t 1 1 I 1 t J1 1. 3 1 3 I

-- .-
2- I

1 I
a s c a r i t e f o r c a r b o n d iox ide removal. The n i t r o g e n c a r r i e r g a s used f o r t h e c h r o m a t o g r a p h i c column w a s c l e a n e d by p a s s i n g t h r o u g h a m o l e c u l a r s ieve a n d t h r o u o h a c a t a l y t i c o x i d a t i o n column.
C . Sample A n a l y s i s
The a n a l v s i s s y s t e m components c o n s i s t e d of a n i n j e c t i o n port 5 w i t h an i n e r t - s e p t u m , a s i l i ccn SF-96 o n Chromosorb W/Porapak p column o p e r a t e d a t -78OC, - 3 O o C , 25OC, and 100°C w i t h back f l u s h c a p a b i l i t y , a MnO o x i d a t i o n f u r n a c e for o x i d a t i o n of t h e C€I4 , c0, and V O C ' s ro $0 , a n d h y d r o g e n a d d i t i o n t o t h e n i t r o g e n c a r r i e r a t a rhodium c a t a l y g t m e t h a n a t o r t o c o n v e r t CO was ana lyzed by a flame i o n i z a t i o n d e t e c t o r ( F j D ) . was i n t e g r a t e ? w i t h a n i n t e g r a t o r . A s e c o n d i n e r t i n j e c t i o n p o r t was p l a c e d j u s t p r ior t o t h e o x i d a t i o n f u r n a c e f o r s y s t e m c h e c k s . F i g u r e 5 d e p i c t s t h e s y s t e m .
b a t h 'a t - 7 8 " C , a 5 m l s a m p l e w a s d rawn from the p r e s s u r i z e d e v a c u - a t e d sampl ing t a n k an2 i n j e c t e d i n t o t h e car r ie r g a s t o t h e column. 8, Carbon monoxide a n d methane were separated. The column was t h e n o p e r a t e d a t room temperature f o r carbon d i o x i d e e l u t i o n . After t h e e l u t i o n , t h e column was p l a c e d i n a b o i l i n g water b a t h and t h e ca r r i e r g a s flow t h r o u g h t h e column reversed. The V O C ' s were r e l e a s e d from t h e co lumn. Each e v a c u a t e d s a m p l i n q t a n k was a n a l y z e d in t r i p l i c a t e . Cn t h e f i r s t i n j e c t i o n of e a c h d . u p l i c a t e p a i r , t h e column was p l a c e d i n a C a C 1 2 - i c e h a t h a t - 3 0 ° C t o s e p a r a t e e t h y l e n e , '
e t h a n e , and p r o p a n e . I f no e t h y l e n e w a s d e t e c t e s t h e s a m p l e s ' e r e a n a l y z e d a s a b o v e . I f e t h y l e n e w a s p r e s e n t , t h e samples were a n a l y z e d w i t h t he -30°C column t e m p e r a t u r e s t e p .
.-. t o CH The CRd
Tf!; FIE o u t p u t
S t a r t i n g w i t h t h e column submerged i n a d r y i c e - i s o p r o p a n o l
1 , I 1
A n a l y s i s of t h e s a m p l i n a t a n k f o r c a r b o n d i o x i d e r e q u i r e d s e p a r a t e i n j e c t i o n s from t h a t u s e d for t h e o r g a n i c a n a l y s e s . The amount of c a r b o n d i o x i d e in a 5 r n l i n j e c t i o n w a s shown t o o v e r l o a d L , ~ C L C ~ ~ ~ ~ ~ ~ ~ ~ c;aLalyst c a u s i n g a ?=r c a r b o n d i o x i d e v a l u e t o h e reported. C a r b o n d i o x i d e c o n c e n t r a t i o n s i n t h e t a n k s a r e deter- mine2 i n t r i p l i c a t e u s i n q 3 m l i n j e c t i o n s d i r e c t l y t o t h e o x i d i z e r . Carbon monoxide a n d TGNMO c o n c e n t r a t i o n s were s u b t r a c t e d from t h e C 0 2 v a l u e t h u s a t t a i n e d .
5 m l drawn from t h e v e s s e l i n t o t h e ca r r i e r g a s b y p a s s i n g t h e c h r o m a t o g r a p h i c co lumn and e n t e r e d t h e o x i d a t i o n f u r n a c e . The r e s u l t s were reported as pprn C H 4 .
& L _ _ ^ > _ _ _ L -. -- _ _ & -
S 3
The t r a p b u r n - o f f v e s s e l c o n t e n t s were a n a l y z e d by i n j e c t i n g
1.
D . C a l c u l a t i o n s
L a b o r a t o r y r e s u l t s are i n terms of ppm VOC as methane as -: - found i n t h e s a m p l i n q t a n k or v e s s e l . T h e s e were corrected t o
s t a n d a r d c o n d i t i o n s i n t h e s t a c k . Summation of t a n k a n d v e s s e l c o n c e n t r a t i o n s a re p r e s e n t e d as s t a c k TGPRO c o n c e n t r a t i o n a t s t a n d a r d c o n d i t i o n s .

T R A P A N A L Y S I S TANK A N A L Y S I S
SILICONE SF-96 PORAPAK Q
COLUMN H E A T E D
T R A P -
W I g M n 0 2 $IF
OX1 DI Z E R 5 1:
ICOLLECTION I
Mn02 OXIDIZER
I V E S S E L I
I I I
FREEZE OUT WATER T R A P
INTEGRATOR
I I I I I
RHODIUM METHAN ATOR
FIGURE 5
TGPRO ANALYTICAL SCHEME
I
DETECTOR I F I D N D I R C 0 2 I *AIR

For wood r g s i d u e b o i l e r s s t a c k TGPRO c o n c e n t r a t i o n s were con- v e r t e d t o l b / 1 0 B t u e m i s s i o n s t h r o u g h u s e of c o n v e r s i o n f o r m u l a s p u b l i s h e d i n 4 0 CFR 121:1516, 6 0 . 4 5 , s e c t i o n s E and F. The con- v e r s i o n e q u a t i o n u s e d w a s :
1 0 0 Fc % co2 E =
6 where E = p o l l u t a n t e m i s s i o n s , l b / 1 0 B tu where C= p o l l u t a n t c o n c g n t r a t i o n , l b / d s c f and Fc= 1 8 4 0 scf C02/10
For k r a f t r e c o v e r y f u r n a c e s , s t a c k TGPRO w e r e c o n v e r t e d t o l b / m i l l i o n B tu e m i s s i o n s by m u l t i p l y i n g s t a c k c o n c e n t r a t i o n s b y t h e s t a c k g a s f l o w r a t e and a n appropriate u n i t s c o n v e r s i o n f a c t o r . S t a c k flow rates were measured by S - t y p e p i t o t t u b e t r a v e r s e s a t t h e p o i n t of s a m p l i n g e a c h day s a m p l e s were t a k e n . Gas m o l e c u l a r w e i g h t s were c a l c u l a t e d from O r s a t a n a l y s i s r e s u l t s and m o i s t u r e c o n t e n t s founE b y measurement of t h e w a t e r found i n t h e c o n s e n s a t e t r a p s .
Dtu for wood r e s i d u e
QUALITY CONTROL
T h e TGPRO a n a l y s i s s y s t e m w a s checked for proper o p e r a t i o n a t f r e q u e n t i n t e r v a l s . D a i l y c h e c k s were made f o r t h e FID s e n s i - t i v i t y , zero a i r p u r i t y , column carr ier g a s p u r i t y and s y s t e m l e a k s . Weekly c h e c k s w e r e made on a l l c a t a l y s t s e f f i c i e n c i e s . Bi-weekly checks were made for evacuated s a m p l i n g t a n k l e a k s and t a n k con- t a m i n a t i o n .
A . C a t a l y s t E f f i c i e n c y Checks 1. All c a t a l y s t e f f ic ienc ies were checked a t t h e b e g i n n i n g of
The O x i d a t i o n C a t a l y s t E f f i c i e n c y was c h e c k e d weekly b y i n j e c t i n g m e t h a n e gas s t a n d a r d t o t h e o x i d a t i o n c a t a l y s t w h i l e t h e r e d u c t i o n c a t a l y s t was b y p a s s e d . I f t h e o x i d a t i o n c a t a l y s t was o p e r a t i n g proper ly , t h e o n l y gas r e a c h i n g the FID w a s c a r b o n d i o x i d e a n d n o r e s p o n s e was i n d i c a t e d . When t h e c a t a l y s t e f f i - c i e n c y was f o u n d t o be less t h a n 9 5 % , it was r e p l a c e d .
The R e d u c t i o n C a t a l y s t E f f i c i e n c y was c h e c k e d w h i l e o p e r a t i n g t h e TGPRO a n a l y s i s system i n i t s normal o p e r a t i n y mode and i n f e c t - i ng s t a n d a r d CO g a s d i r e c t l y t o t h e r e d u c t i o n c a t a l y s t . Low FID r e s p o n s e s i n d i c a t e d a f a u l t y r e d u c t i o n c a t a l y s t . e f f i c i e n c y w a s less t h a n 95% it w a s r e p l a c e d .
each week.
1 When t h e c a t a l y s t
- - . - The c r y o g e n i c t r a p o x i d a t i o n c a t a l y s t w a s c h e c k e d by c o n n e c t - i ng t h e me thane c a l i b r a t i o n gas c y l i n d e r t o t h e t r a p o x i d a t i o n c a t a l y s t and v e n t i n g t o a t m o s p h e r e a f l o w of 1 6 0 ml /min . Samples of t h e f low t a k e n from a n i n j e c t i o n / w i t h d r a w a l por t f o l l o w i n g t h e
3 1

c a t a l y s t were in j ec t e s i n t o t h e TGPMO a n a l y s i s s y s t e m w h i l e t h e c a r r i e r g a s b y p a s s e d b o t h t h e o x i d i z e r and t h e m e t h a n a t o r . A r e s p o n s e from t h e F I D de t ec to r i n d i c a t e d a f a u l t y o x i d i z e r c a t a l y s t i n t h e c r y o g e n i c t rap b u r n - o u t s y s t e m . A t a c a t a l y s t e f f i c i e n c y of less t h a n 95% it was replaced.
B. C a r r i e r G a s C o n t a m i n a t e Check
T h e p u r i t y of t h e c h r o m a t o g r a p h i c column n i t r o g e n car r ie r g a s and t h e zero a i r used f o r c r y o g e n i c t r a p b u r n i n u a s w e l l as f o r t ank and v e s s e l p r e s s u r i z a t i o n w e r e c h e c k e d d a i l y . I m p u r i t i e s in e i t h e r ? a s r e s u l t i n a pos i t i ve b ias i n t h e r e s u l t s . Zero a i r w a s checked for its t o t a l c a r b o n c o n t e n t b y w i t h d r a w i n g a sample from a p o r t i n t h e z e r o a i r s u p p l y l i n e when t h e t r a p b u r n o u t system was r e c e i v i n a a flow of 160 m l / m i n , and i n j e c t i n g it i n t o t h e TGNMO a n a l y s i s system p r io r t o t h e o x i d i z e r . A z e r o a i r t o t a l carbon c o n t e n t qreater t h a n 5 ppm i n d i c a t e d t h a t r e p l a c e m e n t o f t h e a s c a r i t e CO f i l t e r , molecular s e i v e , or z e r o a i r o x i d a t i o n c a t a l y s t w a s r e d u i r e d .
The n i t r o g e n carrier g a s w a s c h e c k e d fo r c o n t a m i n a n t s d a i l y by measurement of material c a u g h t on t h e column d u r i n g a b l a n k run . I f t h e o r g a n i c s peak c a l c u l a t e d was more t h a n 5 ppm, t h e c a r r i e r gas c l e a n u p s y s t e m is r e g e n e r a t e d w i t h a new m o l e c u l a r s i e v e a n d ox ida t ion c a t a l y s t . O r g a n i c s peaks of less t h a n 5 ppm a r e s u b t r a c t e d from t h a t d a y ' s t a n k a n a l y s e s .
f. Leak C h e c k s
L e a k s i n t h e TGPRO a n a l y s i s a n d s a m p l i n g system are n Q t r e a d i l y a p p a r e n t and t h e s y s t e m must. be d i l i g e n t l y checked t o a s s u r e i n t e g r i t y of t h e samples. Each s e c t i o n of t h e s a m p l i n g a n d z n n l y s i s s y s t e m w a s checked f o r l e a k s d a i l y p r io r t o use .
( 1 ) Tank L e a k s The e v a c u a t e d sampling t a n k s were checked f o r 12aks once e v e r y t w o weeks by e v a c u a t i n g them t o more t h a n 25 i n . Xg. m e a s u r i n g t h e vacuum w i t h a m e r c u r y n a n o m e t e r , and r e m e a s u r i n g t h e vacuum 24 h o u r s or more la ter . I f t h e vacuum decreased t h e t ank was a s sumed t o have leaked, a n d was r e p a i r e d .
( 2 ) S a m p l i n g Assembly L e a k s The gauge a s s e m b l y , c o n n e c t i o n s '??tween t h e qauqe assembly, rotometer, t r a p s , and s a m D l i n a l i n e s --?re c h e c k e d - d a i l y a t t h e - s a m p l i n g s i t e fo; ieaks. The s a m p l i n g l i n e w a s capped and a t a n k p r e s s u r i z e d t o 30 i n . hg . w a s a t t a c h e d TJ t h e gauge assembly. A l l c o n n e c t i o n s in the system were s q u i r t e d v i t h soapy w a t e r and i n s p e c t e d for b u b b l e s . I f a l e a k was found :t was c o r r e c t e d before s a m p l i n g .
I ! 3 ) Trap B u r n o f f Assembly Leaks T h i s a s sembly w a s checked f o r ::aks d a i l y b y p l u g g i n ? the t rap b u r n o f f s y s t e m where the t r a p w a s
--- -:Jnnected and a vacuum of 20 i n . Hg d r a w n o n the system. Both t h e f l o w meter a n d t h e I R a n a l v z e r w e r e m o n i t o r e d . A f low t h r o u g h t h e
t h e I R a n a l y z e r i n d i c a t e d a leak' of t h e s y s t e m . A l l t r a p c o n n e c t i o n s
.. :?ow meter or a CO response o n i k i c h w a s r e p a i r e d p r i o r t o use 2
F -

t o t h e b u r n - o u t s y s t e m were c h e c k e d f o r l e a k s by s q u i r t i n o t h e j o i n t s w i t h s o a p y w a t e r w h i l e t ,he s y s t e m w a s unde r p r e s s u r e , p r i o r t o b u r n o u t of e a c h t r a p .
( 4 ) A n a l y t i c a l - F i e l d CO, C r o s s Check An u n r e a s o n a b l y low a n a l y t - i c a l CO v a l u e as compared t o t h e orsat CO value i n d i c a t e d a possiblz l e a k i n t h e s a m p l i n g s y s t e m d u r i n d t h e s a m p l e co l l ec t and
I I
t h e r e s u l t s w e r e l i s c a r d e d . k.
D. FID C a l i b r a t i o n
D a i l y c a l i b r a t i o n c h e c k s of t h e flame i o n i z a t i o n d e t e c t o r ( F I D ) were r e q u i r e d t o d e t e c t c h a n q e s i n gas flows and l e a k s which cause d e c r e a s e s i n s e n s i t i v i t y . Two c a l i b r a t i o n s were needed , one t h r o u g h t h e c z t a l y s t and FID, and one t h r o u g h t h e c o l u m n , c a t a l y s t and FID. 3.
1 The F I D d e t e c t o r w a s c a l i b r a t e d d a i l y b y f o u r i n j e c t i o n s cf a @
51.
The d e t e c t o r l i n e a r i t y w a s c h e c k e d once a week. T h r e e s i m u l a t e d c o n c e n t r a t i o n s of m e t h a n e w5re i n j e c t e d b o t h t h r o u q h t h e column and h y p a s s l n g t h e co lumn. A r was c a l c u l a t e d t o s h o w t h a t l i n e a r i t y was m a i n t a i n e d .
s t a n d a r d m e t h a n e c a l i b r a t i o n g a s . The c a l i b r a t i o n l i n e was r e a u i r e d t o s t a y w i t h i n bounds d e t e r m i n e d by s t a t i s t i c a l a n a l y s i s of p r e v i o u c a l i b r a t i o n d a t a so as t o a v o i d c a l i b r a t i o n l i n e d r i f t . When t h e c a l i b r a t i o n l i n e f e l l o u t of t h e b o u n d s t h e s y s t e m w a s checked for l e a k s , g a s f l o w s , d e t e c t o r c l e a n l i n e s s , e tc . I n a d d i t i o n t h e f o u r c a l i b r a t i o n p o i n t s were r e q u i r e d t o have a i r a c c u r a c y of 2 3 % a t t h e 9 5 % c o n f i d e n c e l e v e l .
E. Data R e j e c t i o n a n d P r e c i s i o n 1 1-
N o n d u p l i c a t e d r e s u l t s from p a i r e d samples w e r e a n i n d i c a t i o n
4 1
An estimate of t h e precis ion of the a v e r a g e of t h e d a t a pa i r s J 1 i
of errors e i t h e r d u r i n g t h e s a m p l i n g o r sample p r e p a r a t i o n p o r t i o n s of t h e p r o c e d u r e . Data w a s r e j e c t e d when t h e a n a l y t i c a l r e s u l t s from t h e d u p l i c a t e samples d i d n o t a g r e e w i t h e a c h o t h e r . A p a i r e d r e s u l t w a s a c c e p t e d when t h e a b s o l u t e d i f f e r e n c e between t h e p a i r w a s no t q r e a t e r t h a n three times t h e s t a n d a r d d e v i a t i o n of a l l t h e t e s t d a t a t a k e n f r o m a sou rce . Data w a s a l so r e j e c t e d when s a m p l i n g or a n a l y s i s errors s u c h as l e a k s were n o t e d .
c a n be found f r o m t h e s t a n d a r d d e v i a t i o n of t h e s i g n e d d i f f e r e n c e of t h e d a t a pairs. The c o n f i d e n c e i n t e r v a l a round t h e s i g n e d a v e r - a g e d i f f e r e n c e w a s found by t h e e q u a t i o n :
t a / 2 : v s 2 n
where s is t h e s t a n d a r d d e v i a t i o n of t h e s i g n e d d i f f e r e n c e between
s t u d e n t s t v a l u e from tables a t t h e a p p r o p r i a t e c o n f i d e n c e l e v e l .
C o n f i d e n c e i n t e r v a l = f
-- - . t h e d a t a - p a i r s , n i s t h e number o f d a t a p a i r s , t a / 2 : v is t h e
.

-- .-
Accuracv
The a c c u r a c y of t h e o v e r a l l TGPRO a n a l y s i s t e c h n i q u e w a s demons t r a t ed by i n j e c t i o n of known q u a n t i t i e s of o r g a n i c s i n t o t r a p s b o t h i n t h e l a b o r a t o r y and i n t h e f i e l d . L a b o r a t o r y me thano l i n j e c t i o n s in to the t r a p s e q u i v a l e n t t o 4 1 0 t o 4 9 0 ppm methane showed an a v e r a g e recovery o f 1 0 4 % . F i e l d r e c o v e r i e s were deter- mined by i n j e c t i n g t h e e q u i v a l e n t of 250 t o 4 1 0 ppm methanol i n to one o f t h e d u p l i c a t e p a i r s w h i l e s ampl ing a wood r e s i d u e bo i le r . The TGPRO d e t e r m i n e d from t h e sample w i t h o u t methanol i n j e c t i o n was subtracted from t h e sample r e s u l t s into which me thano l w a s i n j e c t e d t o give t h e r e c o v e r y . The a v e r a g e of t h e f i e l d recoveries was 9 6 % .
F. -
F. C o n c l u s i o n
Sampl ing and a n a l y s i s o f TGPRO emissions is cumbersome and e x a c t i n g work r e q u i r i n g a h i g h l y t r a i n e d a n d dedica ted team for worthy r e s u l t s . A c a r e f u l l y p l a n n e d q u a l i t y c o n t r o l program is r e q u i r e d t o perform m e a n i n g f u l l TGPRO s a m p l i n g and a n a l y s i s . Assembly of t h e equ ipmen t and p e r s o n n e h a t i n d i v i d u a l m i l l s for TGPRO s a m p l i n g is n o t a d v i s a b l e .

APPENDIX P.4 SCRUBBER SOLUTION ANALYSIS

ORGANIC CARBON, TOTAL
Method 415.1 (Combustion or Oxidation)
STORET NO. Total 00680 Dissolved 00681
1. Scope and Application 1.1 This method includes the measurmmt of organic carbon in drinking, surface and saline
waters. domaric'and industrial wasts. Exclusions are noted under Definitions and Inta-fcrmees. The method is most applicable to measurement of o r m i c carbon above I m d l .
Organic carbon in a sample is convened to carbon dioxide (CO,) by d y t i c combustion or wet chemical oxidation. The C02 formed can be measured directly by an infrared detector or converted to methane (CH,) and measured by a flame ionization detector. The amount of CO, or CH. is directly propomonal to the concentration of carbonaceous marcrialin thesample.
The carbonaceous malyrcr m a ~ u r s all of the carbon in a sample. B e c a m of various pmpenics of carbonxontaining compounds in Liquid samples. preliminary trealment of the sample prior to analysis dicfats the definition of the carbon as it is measured F o m ofcarbon that are measured by the method are: A) solubls nonvolatile organic carbon; for instance, natural sugars. E) soluble, volatile organic carbon; for instance mercaptans C) insoluble, pamally volatile carbon; for instancs oils. D) insoluble, particdace carbonaceous materials, for instancc; cellulose fibers. E) soluble or insoluble carbonamus materials adsorbed or entrapped on insoluble
inorgaaic suspended maner, for instance, oily matter adsorbed on silt particles The f d uscfulnbs of the carbon measurement is in assessing the potential oxygen- demanding load of organic material on a receiving st-. This sratemrnt applies whether the carbon measurement is made on a sewage plant efflumf industrial waste, or on water taken directly from the st-. In this light, carbonate and bicarbonate carbon are not a p m ' of the oxygen demand in the s t r m and therefore should be discounted in the final calculation or removed prior to analysis. The manner of preliminary treatment of the sample and instrument sutings defines the types of carbon which are measured. Instrument manufacturer's instructions should be followed.
1.2
Z 1 2 SummaryofMethcd
3. Dellnitions 3.1
3.2
Approved for NPDES Issued 1971 Editorial revision 1974
415.1-1

4.
f
5.
6.
' ( .
7.
Sample Handling and Preservation 4.1 Sampling and storage of samples in nlass bottles is preferable. Sampling and stonge in
plastic bottle such as conventional polyethylene and cubitainen is permissible if it is srablished that the conrainen do nor contribute contaminating organics to the sampkS. NOTE 1: A brief study performed in the EPA Laboratory indicated that distilled water stored in new. one quart cubitainers did not show any increase in organic carbon after
Because of the possibility of oxidation or bacterid decomposition of some components of aqumus samples, the lapse of time between collection of samples and SIM of analysis should be kmt to a minimum. Also, sample should be kept cool (4.0 and p r o t s t d
two weeks exposure. 4.2
from sunliqht and atmospheric oxygen. In insranca where analysis cannot be performed within two hours (2 hours) from tirue of samwl in~ , the sample is acidified (pH c 2) wirh HCI or H,SOI
4.3
Interferences 5. I
5.2
Carbonate and bicarbonate carbon rcprsenr M interference under the terms of this test and must be removed or accounted for in the final calculation 'This pmcedurc is applicable only to homoReneous sampls which can be injected into the agpamtus reproducibly by means of a microliter type syrinqe crr pipette. The openines of
or wipette limit the maximum size of particle which may be included in the
+
sample. APP-m 6.1
6.2
Apparatus for blending or homogenizing samples: Generally. a Waring-type blender is satisfactoy. -
Apparatus for total and dissolved organic carbon: 6.21 A number of companies manufacture system for mearuring carbonaccoru
marcrial in liquid sample% Considerations should be made as to the types of sampla to be analyzed, the expected concentration m g e and forms of carbon to b e m a u r d
6.22 No specific analyzer is recommended as superor.
Distilled water wd in preparation of standards and for dilution of samples should bc ultra pure to reduce the carbon concentration of the b l d Carbon dioxide-frrr double distilled water is recommended Ion exchanged waters are not recommended because o i the possibilities of contamination with organic materials from the rsins. Porapsium hydrogen phthalate, stock solution. loo0 mg carbodliter: Dissolve 0.2128 g of potassium hydrogen phthalate (primary Standard Grade) in distilled water and dilute to 1 W . O d NOTE 2: Sodium oxalare and acetic acid are not recommended as stock solutions. Potassium hydrogen phlhalatz staudard solutions: Prepare standard solutions from the stocksolution by dilution with disrilled water. Carbomte-bicarbonatc, stock solution. loo0 mg carbon/liter: Weigh 0.3503 g of sodium bicarbonate and 0.4418 g of sodium carbonate and transfer both to the same 100 ml volumetric flask Dissolve with distilled water.
Reagents 7.1
7.2
7.3
7.4
415.1-2 .
F -32

8.
9.
7.5 Carbonate-bicarbonntc. standard solution: Prepare a series of standards similar to step I.J.
NOTE 3: This sundard is not required by some instmments. Blank solution: Use the same distilled water (or similar quality water) used for the preparation of the standard soluuons.
7.6
Procedure 8.1 Follow instrument manufacturer’s instructions for calibration, procedure. and
calculations. 8.2 For calibration of the instrument, it is mommended that a Sen5 of standards
encompassing the expected concentration range of the sampla be uxd Precision and Accuracy 9.1 Twency-cight analysts in twenty4nc laboratories analyzed distilled water Solutions
containing exact increments of oxidirable organic compounds. with the fqllowing rsults:
*-a9 B~ Increment BI Prazkion BI TOC Standard Denallon Biac.
r n o t c r TOC m g n i t u 70 m o t a
4.9 107
3.93 8.32
+ 15.27 + 1.01
+0.75 + 1.08
(FWPCA Method Study 3, Demand Analyses)
Bibliography
Annual Book of ASTM Standards, Pan 3 1. “ W a t d , Standard D 2574-79, p 469 (1976). Standard Methods for the Examination of Water and Wastewarcr, 14th Edition. p 5 3 2 Method 505, (1975).
1. 2
415.1-3
F. - 5 3

APPENDIX F . 5 EPA METHOD 2 2 - FUGITIVE EMISSIONS

METHOD 22 VISUAL DETERMINATION OF FUGITIVE
EHISSIONS FROM NATERZAL PROCESSING SOURCES
Preamble
This method invo lves t h e visual de te rmina t ion of f u g i t i v e emission;
i .e.. emissions nor emi t t ed d i r e c t l y from a p rocess s t a c k o r duc t . F u g i t i v e
emissions i n c l u d e such emissions as those :
equipment exhaust hoods; 2 ) e m i t t e d d u r i n g m a t e r i a l t r a n s f e r ; 3) emi t t ed
from b u i l d i n g s housing material p rocess ing o r handl ing equipment; 4) e m i t t e d
d i r e c t l y from p rocess equipment.
1) escaping c a p t u r e by p rocess
This method does n o t r e q u i r e t h a t t h e o p a c i t y of emissions be determined.
I n s t e a d , t h i s method determines the amounc of t ime that any v i s i b l e
emissions occur during t h e o b s e r v a t i o n pe r iod ; i . e . . t h e accumulated emission
time.
no t a v i s i b l e emission exists and does no t r e q u i r e che de t e rmina t ion of
o p a c i t y levels, no s p e c i a l i n s p e c t o r t r a i n i n g is r equ i r ed .
S ince t h i s procedure r e q u i r e s on ly t h e de t e rmina t ion of whether or
1. P r i n c i p l e . F u g i t i v e emissions produced during material p rocess ing ,
handl ing, and t r a n s f e r o p e r a t i o n s a r e v i s i b l y determined by an obse rve r
without t h e a i d of instruments .
2 . A p p l i c a b i l i t y . This method is a p p l i c a b l e f o r t h e de t e rmina t ion of
t h e frequency of f u g i t i v e emissions from s t a t i o n a r y sources only when
s p e c i f i e d a s t h e test method f o r determining compliance w i t h new source
performance s t anda rds . This method is a p p l i c a b l e t o emission sources
l o c a t e d indoor s or outdoors .
3. D e f i n i t i o n s .
3.1 Emission Frequency. The percent of t ime emissions
a r e v i s i b l e during t h e obse rva t ion pe r iod .
3 .2 Emission Time. The accumulated amount of t ime t h a t
emissions a r e v i s i b l e d u r i n g t h e obse rva t ion per iod.

4 .
5 .
3.3 F u g i t i v e Emission. The p o l l u t a n t gene ra t ed by an
a f f e c t e d f a c i l i c y v h i c h is no t c o l l e c t e d by a c a p t u r e
system and is r e l e a s e d t o t h e atmosphere.
3.4 Observat ion Pe r iod . The accumulated t ime pe r iod
d u r i n g v h i c h o b s e r v a t i o n s a r e conducted, n o t t o be less
than 6 minutes.
Equipment.
4.1 Stopwatch. Accumulative t y p e stopwatch v i t h a sveep
second hand and un i t d i v i s i o n s of a t least one-half second.
4.2 Ligh t Meter. Light meter c a p a b l e of measuring
i l l uminance in t h e 50 t o 200 lux (lx.) range; r e q u i r e d f o r
indoor o b s e r v a t i o n s only.
Procedure.
5.1 General . The i n s p e c t o r su rveys t h e a f f e c t e d f a c i l i t y
or b u i l d i n g or s t n c t u r e housing t h e p rocess uni t . t o be
observed and determines t h e l o c a t i o n s of p o t e n t i a l emissions.
The obse rve r then chooses a s u i t a b l e obse rva t ion p o s i t i o n .
If t h e a f f e c t e d f a c i l i t y is l o c a t e d i n s i d e a b u i l d i n g t h e
o b s e r v e r chooses an obse rva t ion l o c a t i o n which permits
o b s e r v a t i o n of t h e emissions in a m e r c o n s i s t e n t w i t h
the requirements of t h e a p p l i c a b l e r e g u l a t i o n ( i . e . , o u t s i d e
o b s e r v a t i o n of emission escaping t h e b u i l d i n g l s t r u c t u r e
or i n s i d e obse rva t ions of emissions d i r e c t l y emi t t ed from
t h e a f f e c t e d f a c i l i t y p rocess u n i t ) .
r- -55

5 . 2 P o s i t i o n . The obsenre r s t a n d s in a p o s i t i o n which
enab le s a c l e a r view of t h e p o t e n t i a l emission p o i n t c s ) .
of t h e a f f e c t e d f a c i l i t y or of t h e b u i l d i n g o r s t r u c t u r e
housing t h e a f f e c t e d f a c i l i t y , as a p p r o p r i a t e f o r t h e
a p p l i c a b l e s u b p a r t . A p o s i t i o n of a t l e a s t 15 f e e t b u t
no t more than one-quarter mile from t h e emission s o u r c e
is recommended. For outdoor l o c a t i o n s t h e obse rve r
should be p o s i t i o n e d so that t h e sun is no t d i r e c t l y in
t h e o b s e r v e r ' s eyes.
5.3 F i e l d Records.
5.3.1 Outdoor Location. The obse rve r shall r e c o r d t h e
fol lowing information on t h e f i e l d d a t a shee t (F igu re 1):
company name, i n d u s t r y , p r o c e s s u n i t , o b s e r v e r ' s name,
o b s e r v e r ' s a f f i l i a t i o n , and d a t e . Weather c o n d i t i o n s ,
i nc lud ing e s t ima ted wind speed, v ind d i r e c t i o n , and sky
c o n d i t i o n w i l l be recorded. The observer s h a l l s k e t c h
t h e p rocess u n i t being o b s e m e d and shall n o t e his
l o c a t i o n relative t o t h e sou rce and t h e sun. The p o t e n t i a l
and a c t u a l f u g i t i v e emission p o i n t s should be i n d i c a t e d
on t h e ske tch .
5 . 3 . 2 Indoor Locat ion. The observer s h a l l r eco rd t h e
fol lowing in fo rma t ion on t h e f i e l d d a t a s h e e t (F igu re 2 ) :
company name, i n d u s t r y , p rocess u n i t , o b s e r v e r ' s name,
o b s e r v e r ' s a f f i l i a t i o n , and d a t e . The type, l o c a t i o n , and
i n t e n s i t y of l i g h t i n g w i l l be recorded as a p p r o p r i a t e on

, t h e daca s h e e t .
being observed and shall noce h i s l o c a t i o n r e l a t i v e t o t h e
source. The p o t e n t i a l and ac tua l f u g i t i v e emission p o i n t s
should be i n d i c a t e d on t h e s k e t c h .
5.4 Indoor L igh t ing Requlremeuts. For indoor l o c a t i o n s ,
a l i g h t meter s h a l l be used t o measure t h e l e v e l of
i l l u m i n a t i o n . The obse rve r shall measure t h e i l l u m i n a t i o n
a t a l o c a t i o n as c l o s e t o t h e emission source ( s ) as is
f e a s i b l e . An i l lumination of g r e a t e r than 100 l u x (10 f . c .1
is cons ide red necessa ry f o r p rope r a p p l i c a t i o n of t h i s method.
5.5 Observat ions. The o b s e r v e r r e c o r d s t h e c l o c k t ime
o b s e r v a t i o n s begin. One scopva tch is used t o monitor t h e
d u r a t i o n of t h e obse rva t ion p e r i o d ; t h i s stopwatch is
s t a r t e d when t h e obse rva t ion p e r i o d beg ins . If t h e observa-
c ion pe r iod is d iv ided i n t o two o r more segments by process
s h u t d o m s or inspector rest b reaks , t h e stopwatch is stopped
when a break beg ins and r e s t a r t e d without resetting when
the b reak ends. The stopwacch is stopped a t t h e end of
t h e o b s e r v a t i o n per iod. The accumulated t ime i n d i c a t e d by
c h i s stopwatch is t h e d u r a t i o n of t h e o b s e r v a t i o n pe r iod .
Wheu t h e obse rva t ion per iod i s completed t h e obse rve r r e c o r d s
t h e c l o c k t ime.
During t h e obse rva t ion pe r iod , the obse rve r con t inuous ly
watches t h e p o t e n t i a l emission source . Upon observing an
emission (condensed water vapor is n o t considered an emis s ion ) ,
t h e second accumulative s topwatch is s t a r r e d ; t h e watch is
The obse rve r shall s k e t c h t h e p rocess u n i t

I
1
E E t i B
\ 1 i
stopped when t h e emission s t o p s .
t h i s procedure f o r t h e ent i re o b s e r v a t i o n per iod.
accumulated e l apsed t ime on t h i s stopwatch i n d i c a t e s t h e
t o t a l t ime emissions were v i s i b l e d u r i n g t h e obse rva t ion
pe r iod , i .e., t h e emission t ime.
5.5.1 Observation Period. The obse rve r s h a l l choose sn
obse rva t ion pe r iod of s u f f i c i e n t l e n g t h t o meet t h e r equ i r e -
ments f o r determining compliance w i t h t h e emission r e g u l a t i o n
in t h e a p p l i c a b l e subpa r t .
per iod is s p e c i f i c a l l y s t a t e d i n t h e a p p l i c a b l e s u b p a r t , i t
may n o t be necessa ry t o obse rve t h e source € o r t h i s e n t h e
period if t h e emission t ime r e q u i r e d t o a d i c a t e non-
compliance (based on t h e s p e c i f i e d obse rva t ion pe r iod ) is
observed in a s h o r t e r t ime pe r iod . In o t h e r words i f t h e
r e g u l a t i o n p r o h i b i t s emis s ions f o r more than 6 minutes in
any hour, then o b s e r v a t i o n s may ( o p t i o n a l ) be stopped a f t e r
an emission t ime of 6 minutes is exceeded. S i m i l a r l y ,
when t h e r e g u l a t i o n is expressed as an emission frequency,
if t h e r e g u l a t i o n p r o h i b i t s emis s ions f o r g r e a i e r than 10
percent of t h e t ime in any hour , then o b s e r v a t i o n s may
( o p t i o n a l ) be terminated a f t e r 6 minutes of emissions are
observed s i n c e 6 minutes is 10 percent of an hour. I n any
case, t h e obse rva t ion pe r iod s h a l l not be less than 6 minutes
in d u r a t i o n . I n some c a s e s , t h e p rocess o p e r a t i o n may be
intennittmt o r c y c l i c . I n such cases, it may be convenieut
f o r t h e obse rva t ion period t o c o i n c i d e with t h e l e n g t h of t h e
process c y c l e .
The observer c o n t i n u e s
The
When t h e l e n g t h of t h e o b s e r v a t i o n
F -58

5.5.2 I n s p e c t o r Rest Breaks. The i n s p e c t o r s h a l l n o t
observe emissions con t inuous ly for a per iod of more than
15 to 20 minutes without t a k i n g a rest break. For sou rces
r e q u i r i n g obse rva t ion pe r iods of g r e a t e r than 20 m i n u t e s ,
t h e obse rve r s h a l l t a k e a b reak of n o t less than 5 minutes
and not more than 10 minutes a f t e r every 15 t o 20 minutes
of obse rva t ion . Lf cont inuous o b s e r v a t i o n s a r e d e s i r e d for
extended t ime pe r iods , t h i s can b e accomplished by tvo
i n s p e c t o r s a l t e r n a t i n g between making o b s e r v a t i o n s and t ak ing
breaks.
5 . 5 Recording Observat ions. The accumulated t ime of the
o b s e r v a t i o n pe r iod i s recorded on t h e d a t a s h e e t as t h e
obse rva t ion per iod d u r a t i o n .
were observed is recorded on t h e d a t a sheet a s t h e emission
time. Record t h e c l o c k t ime t h e obse rva t ion per iod began
and ended, a s w e l l a s t h e c l o c k t ime any i n s p e c t o r b reaks
began and ended.
The accumulated t ime emissions
6 . C a l c u l a t i o n s . If t h e a p p l i c a b l e subpa r t r e q u i r e s t h a t t h e
Pmissinr? r i l ~ e he expressed as an emission f requency, determine t h i s v a l u e
a s follows: Divide t h e accumulated emission t ime (seconds) by t h e
d u r a t i o n of t h e o b s e r v a t i o n per iod (seconds) or by any minimum
obse rva t ion per iod r e q u i r e d i n t h e a p p l i c a b l e subpa r t if t h e a c t u a l
obee rva t ion pe r iod is less than t h e r e q u i r e d per iod; m u l t i p l y t h i s
q u o t i e n t by one hundred to determine t h e emission frequency (percent).
I I I I I I I I I I I I I I I I I I II
APPENDIX G
LABORATORY ANALYSIS DATA
G.l EPA Method 5 X - Data G . l . l Data Summary G . 1 . 2 Laboratory Data and Notebook
G . 2 EPA Method 25 - Data G . 2 . 1 Data Summaries G . 2 . 2 TRC Laboratory Data and Notebook 6 . 2 . 3 NCASI Laboratory Data and Notebook G . 2 . 4 PCS Laboratory Data and Notebook
G . 3 Scrubber S o l u t i o n Data

I I I II
I I
I I I I I I
I I I I 1 I ' I 'I I I I I
APPENDIX G . l EPA METHOD 5X - DATA
The Method 5X ana ly t i ca l procedures used during the Georgia-Pacific tes t ing program are discussed i n derai l i n Section 5 .3 .1 o f the main report .

I ‘I I I I I I I I I
( , I I I I I I ‘I < I I I I
APPENDIX G.l.l DATA SUMMARY

I 'I ,I, I 1 I I I 'I 0 1 1 I I I I il
I I
< J 1

APPENDIX G . 1 . Z mmrnRr DATA AND NOTEBOOK

I .
I ' I( I 1 1 I I I I I I 1 I I "I
I' I
, J I'
ENVIRONMENTAL LABORATORY 1600 S.W. Western Blvd. Corvallis. Oregon 97330
METHOD 5x SAMPLE ANALYSIS Client Name: T R C FF.~ /J&M IM1EkJl-A I To&%d~LThrf5 Dale Received: I J ~ /a. IqPI
Location: GFOeh IA- PHCIFI~ (niz 0. Dale Analyzed o%u- 15.1991 . .
F I 1 ~ t 7 c n.5 8 . m M - Project No.: Source:
Sample Identity l- Blank - - ru - - FRONT HALF ANALYSIS
Probe Wash (D.l./Disl. H20 Rinse) Volume. mls - 370 A Tare + Residue 6$!0547 6 3. %3LFi Tare WI. ld 0/4/ b 3 . 3 6 h l L.6.7IL-7
Blk. Corr. 0. nm? b . oq'q- Residue Wt. - 0. a/& Volume, mls A 370 I O 0
- \ -0-a - - Tare No.
Residue Wl. 0. 0/03 n. om1
Probe Wash (Acelone Rinse)
- - - - Tare No. Tare + Residue Io 59/67 bd.4131 Tare Wt.
Residue Wl. D -moa a 1~4.4135 '4%
Blk. Corr. A+!.- .-,e- Residue Wt. B . 0 9 6- 0.0 3%-
Filler No. #3 d.3 #9 * 10 Tare + ParI. 0. /9BO n. 7747 n. t9qo Tare Wl. n.aooi 0.7b65 , - n- 1937 Par(. WI. - 0. Doai D .ooaz; o .oora A . 0003
Paticulale WI. - 0 . / 7 & Z Y 0 , oam- -
Filler Colleclion (Fronl Filler)
0003 ( q %" ) -( a'L" ) - Blk. Corr.
Front Half (wl. grns) 0.07yz- 0.0262
G -2

~~ ~ ~~~ ~ ~~ ~~~~
. . ENVIRONMENTAL LABORATORY
I f M P I ! I
EL.4F-U ' I I
GhloRd7+ER.1
I I
0. /a9 d.07Aq I
1600 S.W. Western Blvd. Corvallis. Oregon 97330
METHOD 5x SAMPLE ANALYSIS
Client Name: =& N V i ROblMEmki f OChcll-TFNTT Oate Received: f i 8r Location: G-~wP. - P A c i Fic Coan. IM-e I S . f i 4 8 Source: E- Daec; DtJ Project No.:
Sample Identity 5 x - I - r h l 5r - I - o m Blank
BACK HALF ANALYSIS
lmpinger Waler (+ H20 Rinse) Total Volume, ml (T) I350 1310
Organic Extracllon Volume Extracted. mt (Ex) 1350 1310 I 5 0 Tare No. 1 - 7 - 0%. I - n-or6. Tere + Extract 6%. a i 17. 67. (€363 b6. a4se Tare wt. /ob. 1416 ~ 7 . 1/31. 66.
(3. oooa Blk. Corr. 0.06Oa Extract Wt. x (T/Ex) a Extract Wt. d L, ,073 I -
1 (06. 936 &.lfbl I
I &.9/7 I
I I I
Back Hall (wt. gms) 0. .;ow D-23rn ;I I I
Resldue on Evaporatlon
100 I? - 0 - Res.
Volume Evap.. ml (Ev) . I r?n rOO. Tare No. 1-r-Re3 - -
66 - 86063 a .74n Tare +Residue L Q L d l b B Tare Wt. 63 6 2.7445 Residue Wt. e .ma3 R . ooa7 O.'
? U P . e % u l t . 0 .ma6 D . a o. oaw 0.034/ I Residue WI. x (TIEv)
Back Hall Rinse (Acetone)
Volume, mls L/a I 4/b 100
Tare + Residue bq. a303 65.oa47 /A. 41 3 7 Tare WI. b/: 037d I h 4 J/ 3 5
0 . O M Residue Wt. D . a o r r 0.1076 Btk. Con.
Residue W i .aom 0./06E.
Tar9 No. - - I -0-5
Flller Collectlon (Back-up Filter) 4 * I O
n . ISYO -- Part Wt. 0. /492 --- *A Filter No.
Tare + Parr.
Tare Wt.
Blk. Corr. n .ml n .ax+ Parlicutate Wt. 0. 1489 fi .ma
.. , .. Total Sample (wt. gms) D. 5 s 3- O.aR69
The inlormation shown on this sheet is test data only and no analysis or interpretation is intended or implied. Samples will be retained 30 days unless otherwise requested.
6 -3 ~~~ ~ ~~~ -

. .
~
I I I 1 I I 1
ENVIRONMENTAL LABORATORY 1600 S.W. Western Blvd. Corvallis, Oregon 97330
METHOD 5x SAMPLE ANALYSIS
Client Name: n c F h i R o N OnsuiTAUr5 Date
Location:
Source: GI ) A -L G Project ..
0hsIA I FI 6 3 U - D . Date - -
Blank Sample ldenllty - - -~ FRONT HALF ANALYSIS
Probe Wash (D.l./Disl. H20 Rinse) I
, 353
Io 5 . M44
w3
65.58Wn
a. a25 o - m o
a -0-a, Volume, mls 370 Tare + Residue &3.&339 Tare Wt. (b3.6796 Residue Wl. n nasB 4 . 0 0 9 3 Blk. Corr. ef- Residue WI. 7-
- - Tare No.
I. ’
I - -
Probe Wash (Acetone Rinse) Volume. mls a 9 b %A
Tare + Residue A6 .ai5 66.7393.
Residue Wt -- m 6 - D . OdOB-
- - Tare No a-I- 3
Tare Wt - 66. 7611 I - # Blk. Corr I Residue WI f l . 047- fl.0373-
I I 1 “I 1:
Filler Collecllon (Front Filler) Filler NO.
Tare + Part. Tare Wt.
Part. WI. Blk. Corr.
Paliculale WI.
Front Half (wl. gms)
I

ENVIRONMENTAL LABORATORY 1600 S.W. Western Blvd. Cowallis. Oregon 97330
METHOD 5x SAMPLE ANALYSIS Client Name: FNutebuw - q m C, Vl4KLt+&l-5 f
Localion: C9.=?!m&rA c BRClf i c rhm. I - - Source: 6-r ( 3 Q t ~ m d
Sample Identity - Blank - - BACK HALF ANALYSIS
lmpinger Waler (+ H20 Rinse) Total Volume, ml (T)
_ I
Organlc Exlracllon Volume Extracled. rnl (Ex) Tare No.
Tare + Extract Tare Wt. Extracl WL
elk. Corr. Exlracl WL x (T/Ex)
Residue on Evaporallon
Volume Evap.. ml (Ev) Tare No. Tare + Residue Tare wt.
Residue Wt. -, m*m Residue WL x (T/Ev)
Back Hall Rlnse (Acetone) Volume, mls
Tare NO.
Tare + Residue Tare Wt. Residue W. elk. Corr.
Residue WL
*.Filler Collecllon (Back-up Filler)
Filler No. Tare + Pan Tare WI. . Part. WL elk. Corr.
- /7.&90 3 Particulale Wl. 0 0 & 5 @ . O w 6
7
-
Back Hall (wt. gms)
. Total Sample (wt. gms)
The information shown on lhis sheel is test data only and no analysis or inlerprelalion is intended or implied. Samples will be retained 30 days unless olherwise requested.
G 4
I I 1 I 1 I I I I 1 I I I I I I I1 1 I

I I 1 I t t t I li I
I I 1 'I I' I I
ENVIRONMENTAL LABORATORY 1600 S.W. Western Blvd. Cowallis, Oregon 97330
METHOD 5x SAMPLE ANALYSIS Cllenl Name. C Et,idi~fiifi-+,,j Cfi u+ C T M 6
Localion. 3 C& Q6 ;fl - n a .
Source g ~ 4 - e e ~ a = 7 - ~ a 4
- - - Blank Sample Identity - - FRONT HALF ANALYSIS
Probe Wash (D I /DisI H20 Rinsel Volume, mls
Tare NO.
Tare + Residue
Tare WI.
Residue WI.
Blk. Corr.
Residue Wt.
Probe Wash (Acelone Rinse)
Volume, rnls Tare No.
Tare +Residue Tare wt.
Residue WI.
Elk. Corr.
Residue Wt.
Filler Collecllon (Fronl Filler)
Filler No.
Tare + Part.
Tare WI.
Part. WI.
Elk. Corr.
Paliculate WI.
Front Half (wl. gms)

ENVIRONMENTAL LABORATORY 1600 S.W. Western Blvd. Cowallis, Oregon 97330
h.ETt.OD 5 x SAMPLE ANALYSIS Client Name: crkcm&.a5
GeBUf.4 -a - Location: 1 Gic
Source: F,.adi, Sample Idenlily - - - K Blank
BACK HALF ANALYSIS
lmplnger Water (+ H20 Rinse)
Total Volume, ml m -a - 8
Organls Exlracllon Volume Extracted. ml (Ex) Tare No. Tare + Extract
Tare Wl.
Extract WL Blk. Corr.
Extract Wt. x (T/Ex)
Resldue on Evaporallon Volume Evap.. ml (Ev) Tare No. Tare + Residue Tare Wt.
Residue WL Blk. Corr. Ke3. W t .
Residue Wt. x (TIEv)
Back Hall Rtnse (Acelone) Volume, mls
Tare No. Tare + Residue Tare Wt.
Residue Wl.
Blk. Corr. Residue Wl.
a 4 0. 05
=&3 Filler Collectlon (Back-Up Filler)
Filter NO.
Tare + Part Tare Wt.
Pati. Wt. Blk. Corr.
.=- dk - c
Partlculale WI. 0 . oabi o-&m7 Back Hall (wt. gms) R . 3 m R. 14%
Total Sample (wt. gms)
The informalion shown on this sheet IS test data only and no analysos or interprelalion is Samples will be relamed 30 days unless olhemise requested.
I I 1 I I I I I I 1 I I I I I I 11 1 I


. . . . i FILTER W E I M . i ' ~ ' ' :'.: , , , . , ' .,:. ~- . . , ,'
. . . ' , . . . .
. . , . .. . . . - . , ~. . . . . . .
. .
.. ,
. .
!
I
. .
,'6 -9 . . . ,
- ~

I t I 1 I I 1 I I 11 I I I 1 1 I B I 1
APPENDIX G.2 EPA MEXWD 25 - DATA
The Method 25 a n a l y t i c a l procedures used during the Georgia-Pacif ic t e s t i n g program a r e discussed i n d e t a i l i n S e c t i o n 5 . 3 . 2 of the main t e x t report .

I I I
I
I I
I
1
I
APPENDIX G.2.1 DATA SUMMRRIES

I I 1 I t 1 I I b I I I d 1 1 1 I 1
?- . . - - . . a - . . Cln o m 0 0
a n 4 3

I 1 I t 1 I I 1 1 E 1 I I I 1 P
I 1
i
APPENDIX G.Z.2 TI(C LABORAZORY DATA AND NOTEBOOK

1
6
2
4 Y
E
K U
* - ;E -la
. . _. b b 0 4 d 4
I .. n 4 4 - 4
b d
0 YI m d
s"

9 c
6 - Y : e
i d
E d
'4 0
I-
O
* d
8"
I I I I 1 I I I I d I 1 (1 I I 1 I 1 I_

1 I I I I I I I I c 1 1 1) d 1 I I I a
c 10
3 0 c d
n 10 n
G -13
m - 3
m n 3
m e n
m d

I I 1 I 1 I I s I 8 I t (1 1 I I I I 11
m c 3 In n
- Q 4 0
0 4 0 4
E m n
m n d
m 0 3

G f
I. 1 . i-
LABORATORY DATA AND CALCULATIONS
Field Sample Run N O . w- 1- 51- d Date Analyzed: $/. ?/-
Laboratory S a m p l e Run No. Analyst: P R L c . ~ ~ ~
SAMPLING TRAIN DATA
H ~ O I ce Trap NO. aI9- C02 I c e Trap No. I / / Sample Tank No.
Intermediate Tank Data - H,O I c e Trap i
Tank No. 52,
vv l ( l i t e r s ) Y r77 pf l Hg) I Y ? 3. G Tf 1 ("C) 2?9 ' 4
Intermediate Tank Data - CO, I c e TraE L
Tank No. ( I t
vv2 ( l i t e r s ) 4. VG P f 2 (mm Hg) f0 ?a. 9 T f 2 ("C) X?vdk
ANALYSIS DATA
l/+l., 6 PPn c1 -
Average Sample Tank Concentration, C
Average H20 Ice Trap Concentration.
t m
I3 19 ppm C1 - Ccml
Average C02 I c e Trap Concentration, c cm2 t I f Ppm c1

,-. i 1. Sample Volume, V ( s
V s - 0.386 V [f pt - 4 t i
3 .
c = e
Condensible Organics,
a . .H20 Ice Trap
Y77. /3pm - -
Q - \b

4. Total Gaseous Nomethane Organics. C (ppm C1) P 1
S I
c = c + c e c l + cc2
5 . Total Gaseous Nonmethane Organic Mass Concentration, Mc (lbCl/scf)
Mc = 3.11 x lO-'C
d
..
.
6-\7 . . ~ . .

EP.? ).!ETHOD 2 5 - (MODIFIED)
OP
LABORATORY DATA AND CALCULATIONS
I Laboratory Sample Run NO. Analyst: Pl+*-t- 1
-- 1 - r f - r4 Date Analyzed: 6-30-&=7 Field Sample Run No. 2 5
SAMPLING TRAIN DATA
H ~ O Ice Trap NO. 2 I7 co2 Ice Trap NO. S a d Sample Tank NO. /
Sample Tank Data
V (liters) 7 .83
ANALYSIS DATA
Ppn c1 - tm Average Sample Tank Concentration, C
Average H20 Ice Trap Concentration. Ccml
Average C02 Ice Trap Concentration. Ccm2
90- PPm c1 2/3. Ppm c1
- -
6 - \$ . ._ __ - , . . . .- .
I 8
. I
I

V = 0.386 V S
V = 0.386 (JG ) S
2. Non-condensible Organics. Ct (PPm c,)
c = C
3. Condensible Organics, cc (PPm c,)

\:.. 3 (a31
4 . Total Gaseous Nonmethane Organics. C (ppm C1)
c - ct + CCl + cc2
C = 8%.
5 . Total Gaseous Nonmethane Organic Mass Concentration, M ( lbCl/scf) C
Mc = 3.11 x lO-'C
6 -20

EPA METHOD 15 (MODIFIED)
Gf
LABORATORY DATA AND CALCULATIONS
Field Sample Run No. 2 q- 2 - s I- 4 Date Analyzed: L-A'-'/ Laboratory Sample Run No. Analyst: L'4i eq-m
SAMPLING TRAIN DATA
3f C02 Ice Trap No. 1 0 2 Sample Tank No. 7 - H20 Ice Trap No.
Intermediate Tank Data - H,O Ice Trap L
Tank No. 2 A Vvl (liters) 4 w Pfl (m Hg) I1SG.Y Tf 1 (oc) 274 ' k
Intermediate Tank Data - CO, Ice Trap &
Tank No. IO
Vv2 (liters) 4, m-r Pf2 (nrm Hg) /a5577
ANALYSIS DATA ! Average Sample Tank Concentration, Ftm 229 PPn c1
Average H 2 0 Ice Trap Concentration. ccml 53- a 9 ppm c1 Average C02 Ice Trap Concentration, CCd 158 - Y Ppm c1 -

Vs = 0.386 V - - [:. ::j V = 0.386 ( P W W
8
vs =
2. Non-condensible Or
c = t
!
t . b 4 J.
1 I 1 I I 1 1 1
3. Condensible Organics, C (ppm C,) C
a. .H20 Ice Trap Ccl = 0.386
= 0.386 [ Tya ] @)
= - P P 4 83
1 I 1 I 1 1
G -21

.. .
-
4. Total Gaseous Nonmethane Organics, C (ppm C,)
c = c + c t c l + cc2
5 . Total Gaseous Nonmethane Organic Mass Concentration, M c ( lbCl/scf)
Mc = 3 . 1 1 x lO-'C
-5 Mc = 4.551

EPA YIETI!OD 25 (MODIFIED)
LABORATORY DATA AND CALCULATIONS
Field Sample Run NO. 2% - S I - B Date Analyzed: G - 2 7-&I
Laboratory Sample Run NO. Analyst: PA L * S W ~
SAMPLING TRAIN DATA
H ~ O Ice Trap NO. atk CO Ice Trap No. 210 . Sample Tank No. 2 f
Intermediate Tank Data - H,O Ice Trap L
Tank No. IG vVl (liters) 4. 8GO Pfl (mm Hg) i aaw Tfl ("0 a7 q'k
Intermediate Tank Data - CO, Ice Trap L
Tank No. II Vv2 (liters) 4, Pro Pf2 (mm Hg) IS r L Y Tf2 ("'3
ANALYSIS DATA - a 267.3 ppn c1 tm Average Sample Tank Concentration,
Average H 0 Ice Trap Concentration, Ccml 170.8 Ppm c1 4 Z P b7.\ P P c1
- 2
Average C02 Ice Trap Concentration, c C d
I 11 1 1 I I 1 t 1 s I I i I I 1 1 J

,I -..
V = 0.386 V [T Pt - 4 t i 9
V = 0.386 (,&TI 9
2. Non-condensible Organics, Ct (ppm C1)
tm C ct
3. Condensible Organics, Cc (ppm C,)
a. .H20 Ice Trap Ccl = 0.386
G -15

, I , ; , . . . , . . . ~ . . .
r
. . . . , '>
- m2
C
cc2 - 212 pp"'
4. Total Gaseous Nonmethane Organics, C (ppm C,)
c = ct + CCl + cc2 - 1515 5. Total Gaseous Nonmethane Organic Mass Concentration, M (lbCl/scf) C
ME = 3.11 x lO-'C -5
Mc = W X
2 1 II 1 I 8 I

E?.? METHOD 25 (MODIFIED)
LABORATORY DATA AND CALCULATIONS
Field Sample Run No. 2 r - 7 - 5 J - A Date Analyzed: b-33-gl
Laboratory Sample Run No. Analyst: PA L *-or\
H20 Ice Trap No.
Sample Tank Data
V (liters) "t, k.r Pti (m Hg) I 0 , f
Tti ("0 2 k g ' h
SAMPLING TRAIN DATA
C02 Ice Trap No. t 2 r Sample Tank No. /+
Intermediate Tank Data - H,O Ice Trap
Tank No. b &
("C) 3 d l * k Vvl (liters) *.ay Pfl (mn Hg) ILtd. Y Tf 1
Intermediate Tank Data - CO, Ice Trap Tank No. 7 q
L
(liters) 432 Pf2 (m Hg) /zqL.? Tf2 ("0 ? O A * k vv2
ANALYSIS DATA
2 b n . PPD c1
Average H20 Ice Trap Concentration, - Ccml Ib5- rJPmcl
J3Y- Ppm c1
- tm Average Sample Tank Concentration, C
- Average CO Ice Trap Concentration, Ccm2 2

XETHOD 25 CALCULATIONS
= 0.386 V [q Pt - 4 ti vs
2. Non-condensible Organics, Ct (ppm C1)
Ct = I c = t
3. Condensible Organics,
a. .H20 Ice Trap
i.28 g
G *253

4. Total Gaseous Nomethane Organics, C (ppm C1)
c = c + c t c l + cc2
c = a&, /+J&
5 . Total Gaseous Nonmethane Organic Mass Concentration, M ( lbCl/scf) C
Mc = 3.11 x lO-*C
-5 M = 6.58 x I O
C

EPA METHOD 25 (MODIFIED) Gf
LABORATORY DATA AND CALCULATIONS
Field Sample Run No. 2rd? -53-8 Date Analyzed: 6-36- VI
Laboratory Sample Run No. Analyst: el& L e w m c H
SAMPLING TRAIN DATA
H20 Ice Trap No. j r C02 Ice Trap No. d a r Sample Tank No. / f
Intermediate Tank Data - H,O Ice Trap L
Tank No. /2 Vvl (liters) 4.095' Pfl (mm Hg) /Y 3de 9 T~~ (ec) 302"k
Intermediate Tank Data - CO, Ice Trap L
Tank No. 13 Vv2 (liters) W S >- Pf2 Hg) 0 L G . Y Tf2 ("C) 301 ' k
ANALYSIS DATA
Average Sample Tank Concentration, if 2- PPD c1 tm - Average H20 Ice Trap Concentration, Ccml 3a9. Ppm c1 Average C02 Ice Trap Concentration, C Cm2 Ppm c1
- / 95:
G -3b

1.
2 .
3 .
v8
V = 0.386 (,& ) 8
= Ct
c = t
Condensible Organics, Cc (ppm C1)
a . .R20 Ice Trap = 0.386 I$::] = 0.386 [ .3qD] p?)
6-31

t 4. Total Gaseous Nonmechane Organics. C (ppm C,)
c = ct + CCl + cc2
62/57 c =
5 . Total Gaseous Nonmethane Organic Mass Concentration, Mc (lbCl/scf)
Mc = 3.11 x 10⁻⁸C
6-32
I D 1 5 T 1 s I 1 I I 9 I

,, - E?:. !!FTHOO 2 5 (?IODIFIED)
c - P
... .
LABORATORY DATA AND CALCULATIONS
Field Sample Run No. p r - 1 - 5 3 - 8 Date Analyzed: G- 2 K - g l
Laboratory Sample Run No. Analyst: - SAMPLING TRAIN DATA
H 2 0 Ice Trap No. %?-? C02 Ice Trap No. 2 3 3 Sample Tank No. -fa%
Intermediate Tank Data - H,O Ice Trap L
Tank No. 9 \-
Intermediate Tank Data - CO, Ice Trap Tank No. 5 G
& -
ANALYSIS DATA
203 PPn c1 - Average Sample Tank Concentration, Ctm
- Average H20 Ice Trap Concentration, Ccml . 319 PPm c1
- Average CO Ice Trap Concentration, Ccm2 /OY P P C1 2
G -33

?IETHOD 25 CALCULATIONS
3 1?1 1. Sample Volume. v
9 i
3. Condensible Organics. Cc (ppm c l ) 1
G-3Y
R 1 1, II I i

8 ' . . ' . . , . . .. , . _ . ., . . . , I .. . . . .
4. Total Gaseous Nonmethane Organics, C (ppm C1) .e c = c + c t cl + cc2
5 . Total Gaseous Nonmethane Organic Mass Concentration, Mc (lbCl/scf)
Mc = 3.11 x 10⁻⁸C

Gf LABORATORY DATA AND CALCULATIONS
F ie ld Sample Run No. 2S-- 1- rQ - 4 Date Analyzed: 4 - L Y
Laboratory Sample Run No. Analyst: I ! ! . P f L . ,
SAMPLING TRAIN DATA
H20 Ice Trap No. 2 2 I C02 I c e Trap No. xT%e Sample Tank No. 9
In te rmedia te Tank Data - H,O I c e Trap L
Tank No. 7 0 (
Vvl ( l i t e r s ) 4, Pfl (mm Hg) / I ;kt. T f l ( " 0 A19 ' k ,
In te rmedia te Tank Data - CO, Ice T r a p - Tank No. 9
ANALYSIS DATA -
t m Average Sample Tank Concentrat ion,
Average H 0 I c e Trap Concentration. Ccml 3 4 b PPm c1
Average CO 2 I c e Trap Concentrat ion, ccm2 307 Ppm c1
- 2

?iiTtlOD 2 5 CALCULATIONS
)MJ 1. Sample Volume, V C y )
S
vs = 0.386 V [$ - 4 V = 0.386 w) 0.048 7
9
c t = [ 2.45 }(/5B)
3 . Condensible Organics, Cc (ppm C1) - - = 0.386 [ vvlpf 1 1 Fml
ys Tfl
= 0.386 [567 3 (H) a . .H20 I c e Trap
G-37

(:-
f,. Total Gaseous Nonmethane Organics. C (PPm c,)
cl + cc2 c = c + c t
l884 p v C =
5 . Total Gaseous Nonmethane Organic Mass Concentration, Mc (lbCl/scf)
Mc = 3.11 x lO-'C
-5 M~ = 5 8 b x / O
1 1 1 I I
G -38

EP:. !!ETI?CID 25 (NODIFIED)
LABORATORY DATA AND CALCULATIONS
Field Sample Run No. 2s - 2 -so - A Date Analyzed: G-ay-8/ Laboratory Sample Run No. Analyst: PA Lewwl*
SAMPLING TRAIN DATA
H20 I ce Trap No. %Ab C02 I c e Trap No. 2aX Sample Tank No. 2 3
Intermediate Tank Data - H,O I c e Trap &
Tank No. b<
Intermediate Tank Data - CO, I c e Trap L
Tank No. IS
ANALYSIS DATA
Average Sample Tank Concentrat ion, ?! t m 2 Ob. PPD c1
Average H20 I c e Trap Concentration, Ccml /4a * PPm c1 /O 7 PPm c1
- c C d
Average C02 Ice Trap Concentration,
.. . 6 -37

(-- 1.
2.
!
!iiTdOD 2 5 CALCULATIONS
4
Sample Volume, Vs (+a
V S = 0.386 V [$ -4 Non-condensible Organics. Ct (PPm c,)
3 . Condensible Organics. cc (PPm c,)
1 c
E E s
J SI
i
G -40 i --

i ', ... , . i , . . _ . . . , , . . . . . . .
4 . Total Gaseous Nonmethane Organics. C (ppm C,)
c = Ct + CCl + cc2
5 . Total Gaseous Nonmethane Organic Mass Concentration. Mc ( lbCl/scf)
Mc = 3.11 x lO-'C
-5 nc = #&a x /Q

I LABORATORY DATA AND CALCULATIONS
1 1 4 8
Pti (m Hg) /OIL Pt He) u 14.L Ptf (om Hg)- /f/2. s 1
Tti ("0 aqo'k Tt ("C) a74 * JC Ttf ("C) 30 z"k
1' @ 8 E
Field Sample Run No. 2q-A-5dm & Date Analyzed: 6 - 3 0 - Laboratory Sample Run NO. Analyst: PA Le-*-
SAMPLING TRAIN DATA
H20 Ice Trap No. 3 3 0 C02 Ice Trap No. 137 Sample Tank No. Go
Sample Tank Data
v (liters) +,&?
L Intermediate Tank Data - H,O Ice Trap
Tank No. 6 7 r m . Y Tfl ("0 3 d f k vVl (liters) 't.8Cg Pfl (mn Hg)
L Intermediate Tank Data - CO, Ice Trap Tank No. 3 vV2 (liters) Y.k.3 P f 2 (= Hg) Tf2 ("C) Jb2'k 1% i i a q
ANALYSIS DATA
2%. ppm c1 Average H20 Ice Trap Concentration, 'cml ' 7 ' PPm c1 Average C02 Ice Trap Concentration. CCd /go .- Ppm c1
- Average Sample Tank Concentration, Ctm
.-.. - -

X T i i O D 25 CALCULATIONS
2 . Non-condensible Organics. C (ppm C,) t

'r. Cn., Tce Trap -
4. Total Gaseous Nonmethane Oreanics, C (ppm C,)
c = c + c t c l + cc2
y c =
I 9 O * F 5. Total Gaseous Nonmethane Organic Mass Concentration, Mc ( lbCl/scf)
Mc = 3.11 x lO-'C
M = c - ss3ei+ 0 c
6 - 4 ' f

1.
c
1 I I k n
EPA YETHOD 25 (NOD IF I D )
LABORATORY DATA AND CALCULATIONS 6p
Field Sample Run No. 2 q- 3- To - c- Date Analyzed: 7-/-,f'i
Laboratory Sample Run No. Analyst: I /? Lc**m
SAMPLING TRAIN DATA
H20 Ice Trap No. L? C02 Ice Trap No. 3 Sample Tank No. 5 q
Intermediate Tank Data - H,O Ice Trap
Tank No. "L "
Intermediate Tank Data - CO, Ice Trap L
Tank No. La
ANALYSIS DATA
tm '"7
cCml
PPn c1
/Ob PPm c1 Average CO Ice Trap Concentration, c -77.2 PPm c1
Average Sample Tank Concentration,
Average H20 Ice Trap Concentration, -
2 cm2

V 6 0.386 V [T Pt - 4 ti
V = 0.386 6 . .
2 . Non-condensible Organics. Ct (PPm c,)
tm
-= [ 2pti 1 - C Ct [$- q]
3 . Condensible Organics, C (ppm C1) C
G - 4 b
a. .H20 Ice Trap Ccl = 0.386
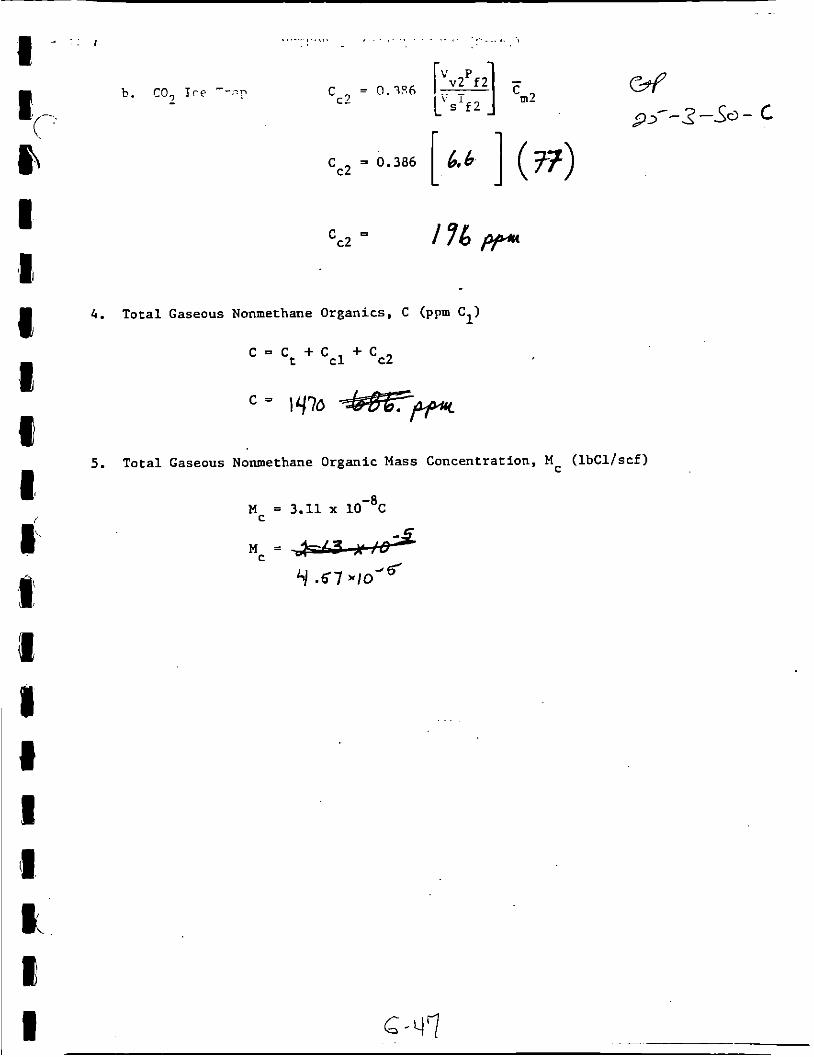
1
4 .
5.
b. CO, I r e ---!) c = 0.706 p f 2 ] c E 4 - m2 C 2 s f 2 a.---Z -53 - c
cc2 = 0.386 [ 6,6 ] (77) cc2 f 9 6 p a
c = c + c t c l + cc2
11/70 w p p t
Total Gaseous Nonmethane Organic Mass Concentration, M C ( lbCl/scf)
= 3.11 x lO-'C MC
M = C # -.B Y .67 *lo

,-- -3 -. .. I ?!rTHOD 2 5
(XODIFIED) G-f
Q I
LABORATORY DATA AND CALCULATIONS
F ie ld Sample Run No. 2 T -3-10- D Date Analyzed: c- 3 0
Laboratory Sample Run No. Analyst: 6 2 - L 4 u r -
SAMPLING TRAIN DATA
I H20 Ice Trap No. 2 2 3 C02 I c e Trap No. a" 2 Sample Tank No. se3
Sample Tank Data
v ( l i t e r s ) 4. fi
In te rmedia te Tank Data - H,O I c e Trap L
Tank No. ao
In te rmedia te Tank Data - CO, I c e TraE L
Tank No. 64
ANALYSIS DATA
Average Sample Tank Concentrat ion, - C t r n (192) P P ~ C1
Average H 0 I c e Trap concent ra t ion , Tcml
Ccm2
/ 6 q . P P c1
7 9, Ppm c1 2 -
Average CO Ice Trap Concentrat ion, 2

1.
2.
3 .
Vs = 0.386 V
V = 0.386 ( , 0 0 8 ) S
v = S , O O 3 / Y m 3 = 3 I 1 Lf .(
Non-condensible Organics. Ct (ppm C,)
tm
2.33
Condensible Organics,
a. .H20 Ice Trap
w
G 4 q
3--3 -50-D

b. Cn., IC. T r a p -
4. Total Gaseous Nonmethane Organics, C (ppm C,)
c = Ct + CCl t cc2
5. Total Gaseous Nonmethane Organic Mass Concentration, M (lbCl/scf) C
Mc = 3.11 x 10⁻⁸C
=
3.29 x l o - g
G-50
I I 8


I I t I 1 - s3 I Recorded by

Project No. ‘I 4 Book No. TITLE

~
TITLE Book No. f
itnessed 8 Understood by me,
I I I


I I I L C UOOK NO.
itnessed 8 Understood by me, F I Date Invented by Date
G sl I Recorded by 1 I

Project No. Book No. TITLE


Projec; ;..u.
Book No. TITLE
!rsed & Understood by me, Dafe Invented by Date
.. _ _ _ . . 2 . > L .
6 -60

TITLE C, Y ' J / / I , - " - - I v\ Book No.
itnessed B Understood by me, 1. Dale Invented by Date
Recorded by


YTLE Book No.

Project No.

& i T i E Book No.

Project No. 16 Book No. TITLE
I ' Wltnessed 8 Understood by me, Invented by Dale
~ -~ --

~~
TL E Book No. 17

Project No. I#


-
Project No. Book NO. TITLE


Project No. 22 Book No. TITLE,
I I
! I
! I i -/ I I I I ' I I I I , -
Wltnessed 8 Understood by me,


tnessed & Underslood by me, Invented by Date I '-


Project No. i 1 'I Book No. TITLE

- - - Book No.

Project No. Book No. TITLE


Project No.

I I l L t UOOK N O .
Invented by
Recorded by
Witnessed 8 Understood by me, Date


Witnessed 8 Understood by me. 7
Book No. --fP u, 3
Dale Invented by

I i l l Project No.
6 Book No. TITLE
'ilnessed 8 Underslood by me,
~~

i / . !
Witnessed & Understood by me, Date lnvenled by I Date
. .

Project NO. I 11,


Prqject No. Book No. TITLE
:sed & Understood by me, lDate (, q b
I: I '
I 1 Invented by Date 1

Book No. I I I I I'
E
U 1 I 1 I 1 1 I I 1 I
I
i

Project No. I i I I 1

Book No.
Date
, . Recorded by I I ' 6 -93 '

I\ I
I I
I
'I
B Y I
.r a
APPENDIX G.2.3 NCASI LABORA?DRY DATA AND NOTEBOOK
J
I

If BQ- I
I Au3.
PPm .
i 9- I
I I I

I I 1 I I I
I

I - .
A03 .
Pr"
4 335345 I3?€3,3
-' i :. . , ,, .." :-m .. .- .:.


Sample * aloboQ-\ I VOC CAC C U L A T I O N S S-lpL d

Sam& tt FJ- 1 VOC CPC C U L A T I ONS s-!DI+ d G-C-nr
I
I I


G-\b3
I I I I

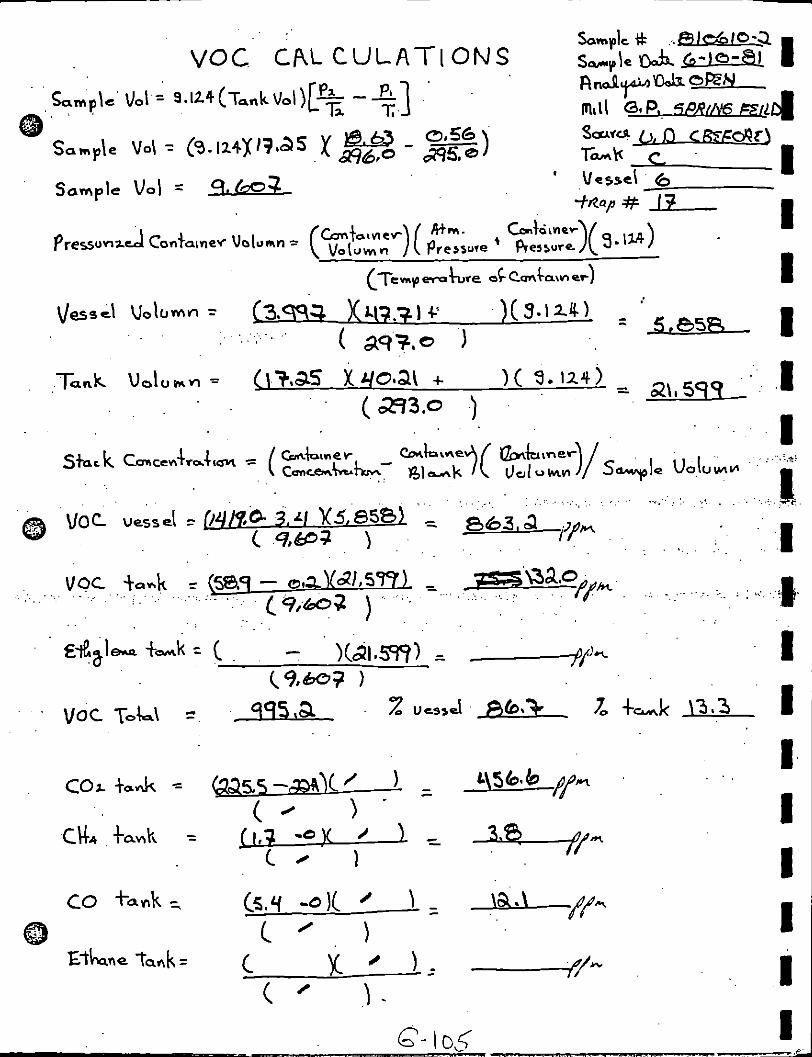
I Q- I h / I

I
1 I 1 I I I I P I 1 I I I I
I I

u I W I A
1 1 I I 1 I

I b I I 1 I I I I
I I 1 I 1 1
I
Es

I I I

I I I I I I p
1 I 1 I
, 1
I
I I”
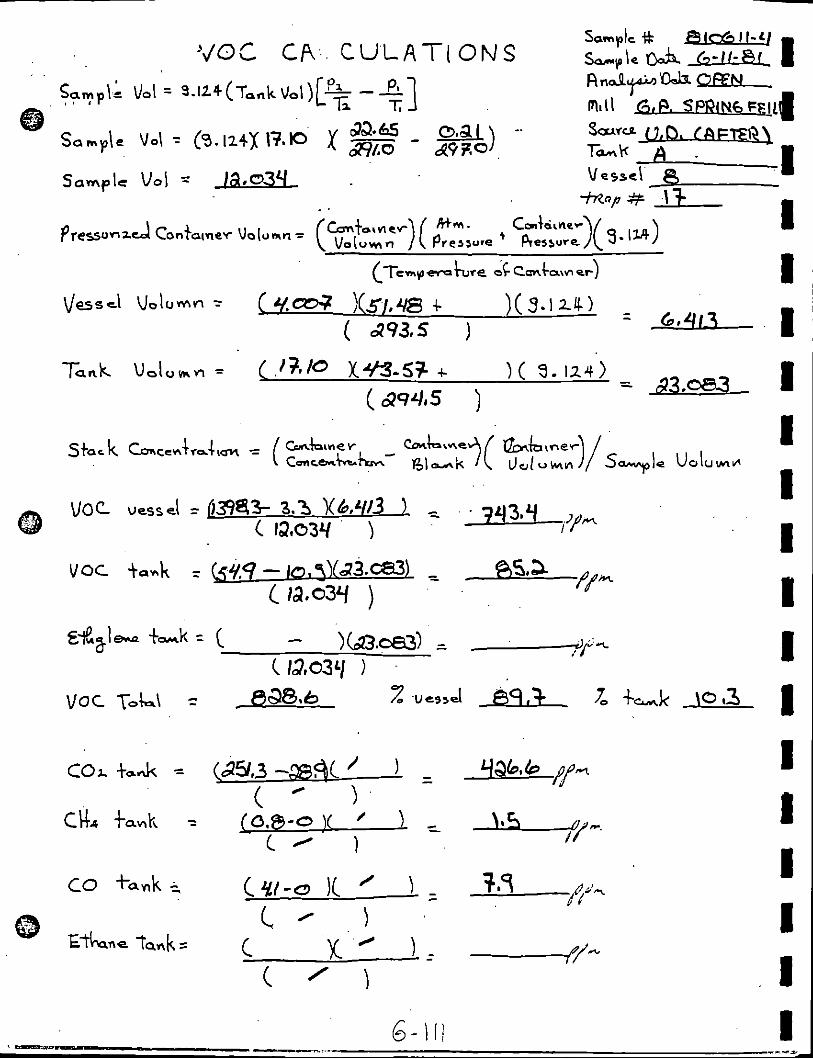
U,l,,n = d3 .as3
I

I

C P t l , l B R A T I O N FORM
THROUGH c-+J I
I
DIRECT A
I I
4
’. I cor voc CH4
I I I 1
co L 2awL
as, a
1 I I . I I
,
Cs -l\3
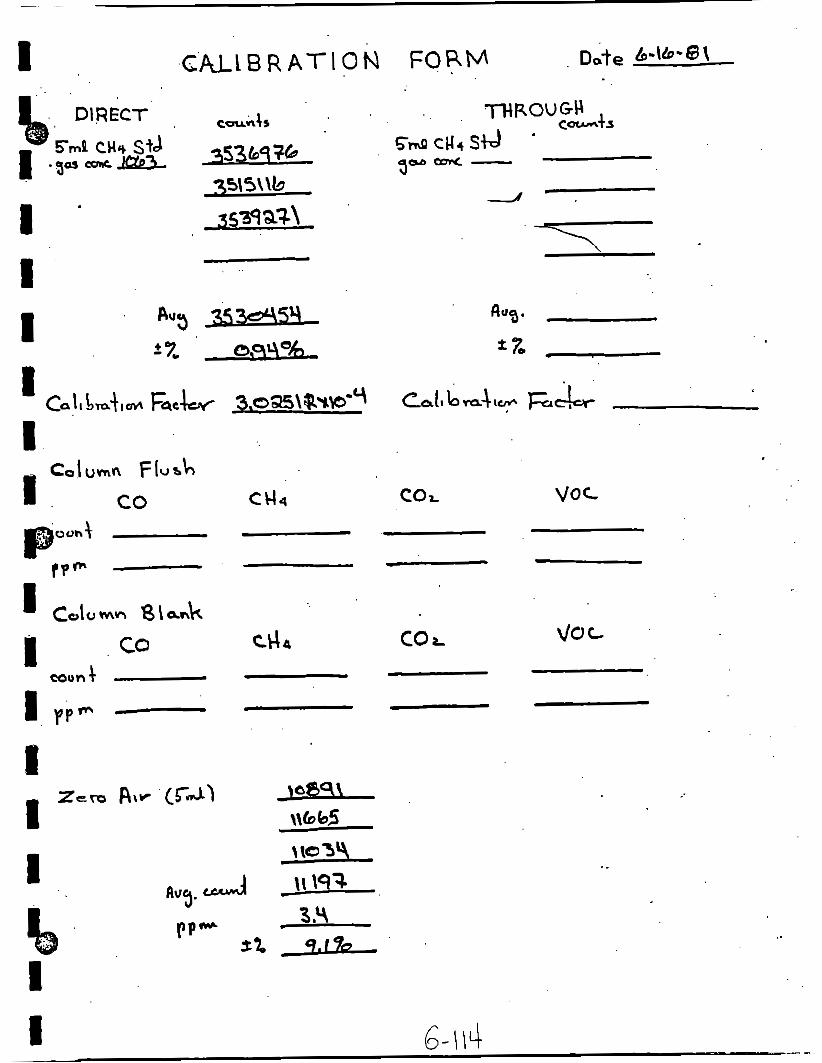
I G U L B R A T I O N FORM
I pP- -
I
I I
U
no- ” s%-.

G A L L B R A T I O N FORM
THROUGH C-+3
cmp cut stpl 9 0aasl.Cw
I I I
CPIumn Flush co Ccls co L
PP- -
’ 1 I I
VU t I I I I I 1 I
VOC
,
G - 115

I . , Dote
-I co c I44 cor VOC . . . ..
I

G M L B R A T I O N FORM
pP- - . -
cor voc
.
I I I I I I 1 I t

I
count
.

I I I 1 I 'I 1 1 1 I 1 I 1 I ,I 1 ,I I I
APPENDIX 6.2.4 PCS LRBORAlORY DATA AND NOTEBOOK

I I I I I I I I I I I I I 1 I I I 1 I
\
.

I
I I I I I I I I I I I I I I I I I 0 I -

I I I I I I I I I C I I I I I I I
c H 0'
c
I I: -

- 6
z o 3 F
6-122
I I I I I I I I I I I I I I I I I I 1 -

i l 1 I I I I I I I I I I I I I I I I I
, I , , t I , I
6 -\23

- !
-- i
.A
.-
I .-
EPA METHOD 25 ANALYSIS
TRC ENVIRONMENTAL CONSULTANTS, INC.
August 5, 1981
for
TRC Environmental Consultants, Inc. 125 Silas Deane Highway
Wethersfield, Connecticut 06109
TRC P.0.B 8196/Project # 1460-E80-32
by
POLLUTION CONTROL SCIENCE, INC. 6015 Manning Road
Miamisburg, Ohio 45342 (513) 866-5908 TLX 288348
T Z 7 s David T. RO inson
~
Group Leader, Instrumental
I I I I I I I I I I I I I I I I I I
-- X S PN 172-001 A -G -124 POLLUTION CONTROL SCIENCE, IN

I I
,- a
Date
6-19-81
6-22-81
6-23-81
6-24-81
6-25-81
6-26-81
DAILY NMO ANALYZER CALIBRATIONS
Std. Conc. (PPm C 1 )
199 pprn C02 298 pprn C1 NMO
199 ppm C02 298 ppm C1
1 9 9 ppm CO 298 ppm CI2NMO
199 ppm C02 298 ppm C1 NMO
199 pprn C02 298 pprn C2 NMO
199 ppm C 0 2 298 ppm C1 NMO
54.58 (1 .82%) + 2.27 49.42 (4 .45%) + 2.04
50.10 ( 1 . 2 0 % ) - 5.96 50.19 (1 .17%) + 3.63
52.93 ( 1 . 2 6 % ) - 0.82 48.26 (0 .07%) - 0.35
50.88 ( 1 . 4 0 % ) - 4.67 47.89 ( 0 . 9 8 % ) - 1.12
51.54 (0 .80%) - 3.43 44.78 ( 0 . 7 4 % ) - 7.54
52.49 (2 .81%) - 1.65 48.93 ( 1 . 7 8 % ) + 1.03
NMO Blank NMO o x . (ppm). Eff ( % )
3.8 99.1
(2 99.4
(2 99.4
(2 99.4
<2 99.5
5.7 99.0
\
(1) Area units in u-volt-seconds; the number in parentheses is the relative standard deviation of the individual injections.
( 2 ) deviation from the system performance check response factors. For the six days of calibration, the average deviation of the CO response factors was - 2.38%, and the average deviation of Id0 response factors was - 0.38%.
I G -125 POLLUTION CONTROL SCIENCE, INC.

Fcs# SAMPLE^
13764 25-1-SO-C 13765 25 -1 -SO-D
13766 25-1-SI-C 13761 25-1-SI-D
13768 25-2-SO-C 13769 25 -2 -SO-D
13770 25-2-SI-C 13771 25-2-SI-D
13772 25-3-SO-A 13773 2 5 - 3- SO-B
13774 25-3-SI-C 13775 25-3-SI-D
N o t e : T h e B 0 des igna ted co2 h e
.
EPA METEOD 25 DATA SUMMARY
TRAP* I
115 104 72 2.471 1180 406 323 1901 1 1 4 108 2 2.947 905 117 146 1168 1 207 227 8 232 107 67
1 0 6 112 6 1 231 103 13
1 0 1 209 58 27 201 51
2.652 510 268 25 ; O 80 3 2.773 720 164
2.704 598 118 317 1033 3.698 571 102 178
2.112 539 352 433 1324 2.677 550 368 542 1460
2 2 - o 906 I 851 I
105 204 24 3.135 535 177 0 712 I 212 234 57 3.028 414 641 39.0 1094
213 214 7 1 3.145 496 551 159 1206 I 217 203 7 3.459 517 316 103 996
c o l u m n d e s i g n a t e s t h e ice-water traps and t h e column dry - i ce t r a p s . I
I I I
G -1Z.L POLLUTION CONTROL SCIENCE, IN

PCS #
1 3 7 6 4 1 3 7 6 5 1 3 7 6 6 1 3 7 6 7 1 3 7 6 8 1 3 7 6 9 1 3 7 7 0 1 3 7 7 1 1 3 7 7 2 1 3 7 7 3 1 3 7 7 4 1 3 7 7 5
- 1
STRAIGHT PID ANALYSES OF METHOD 2 5 TANKS
TEST #
25-1-SO-C 25-1-SO-D 25-1-SI-C 25-1-SI-D 2 5 - 2 -SO- C 25-2-SO-D 25-2-SI-C 25-2-SI-D 2 5 - 3 -SO- A 25-3-SO-8 25-3-SI-C 25-3-SI-D
STRAIGtIT FID RELATIVE APPROXIMATE
TANK # CONCENTRATION PPm c1
7 2 2 8
6 7 6 1 1 3 58 51 2 4 57 7 1
7
46 18
0 0
2 3 40 48 64
0 0 0 0
2 3 9 , - -
1 1 . 5 20 24 32 -
1 6 - 12’7 POLLUTION CONTROL SCIENCE, INC. ~

July 10, 1981
Mr. Eugene A. Brackbill
125 Silas Deane Highway Wethersfield CP 06109
Dear Skip:
TRC ENVIRONMENTAL CONSULTANTS
SUBJECT: PCS PN 172-001: INTERMEDIATE COLLECTION VESSELS
Enclosed are the 24 intermediate collection vessels you requested for analysis from the recent Method 25 testing performed in Oregon. I have also enclosed a list of the sample ID'S and the corresponding collection vessel numbers. I will send you a list of the measured C02 concentrations with the final report.
Sincerely,
POLLUTION CONTROL SCIENCE, INC.
David T. Robinson Group Leadei, Instrumental
DVbg Enclosures Inv. 115353 PCS Sample #13764-13775
Pollution Control Science, Inc. 8016 Manning Road. Mlamisburg, Ohm45342
15131 BbWWTUtBBJ4B
G -12g
I ' I I I I I I I I I I I I I I I I I I

-
I I I I I I I I I I I I I 1 I I I I
- . ”
- pes#
11 164 11764
13765 13765
13 166 13766
13767 J 3767
13768 !3768
13769 13769
17’772 . ’ 770
‘ 771 13771
. 1172 13772
13773 1 j773
13774 11774
11775 13775
I N E B M D m CARRIER VESSEL IDENTIFICATION
Sample ID
25-1-S0-c 25-1-S3-C
25-1-SO-D 25-1-50-0
25-1-SI< 25-1-SIX
25-1-SI< 25-1-SI<
25-2-S0-c 25-2-S0-C
2 5- 2-SUD 25-2-S0-D
?--.?-ST< 25-2-SIX
25 -2-SI-D 25-2-SI-D
2 5- 3-%-A 25-3-SO-A
25-3-50-B 25-3-9243
25- 3-SI< 25-3-SI<
25-3-SI-D 25-3-SI-!J
V o l m Tank
4.82 L 4.82 L
4.82 L 4.82 L
4.82 L 4.82 L
4.82 L 4.82 L
4.82 L 4.82 L
4.82 L 4.82 L
4.?2 L 4.82 L
4.82 L 4.82 L
4.82 L 4.82 L
4.82 L 4.82 L
4.82 L 4.82 L
4.82 L 4.82 L
I n t e m d i a t e Collection Vessel #
ICV 62 Icv 54
Icv 34 ICV 63
ICV 41, ICV 85 ICV 43
Icv 8 ICV 30
ICY 16 Icv 37
ICV 50 Icv 1
IC.’ 77 Icv 7
ICV 66 Icv 2
Icv 12 ICV 40
Icv 45 ICV 35
Icv 39 ICV 26
ICY 55 ICV 60
Tank # #
115 72 104 72
114 2 108 2
207 a 227 8
232 67 107 67
106 61 112 61
231 13 103 13
1c1 2”
209 58
27 51 201 51
105 24 204 24
7 3
212 57 234 57
213 71 214 71
217 7 203 7
I 6 - 12-3 POLLUTlnN CONTRO! W F N r F INC.

I
. J
.-
. .A --
I !
! I
I 1
I I
! I
I ! i
1 !
1 I -I I I I .I I I I I I I I I I I I I -

.........................................................
POST-TEST bAROMETRIC '. 1°K VH1:IJlJr.I ' TEMPERHTIJRE
6-- I31

.
I I I I I I I I I I I I I I I I I I I

1 1 I I I I I
- - -" 5 5
& p l

E " J E E
m I E 2
m m x x
; I E E
. c
m z E ..u
- - E B m a

1

......................................................... POLLl.!TIOti I-LINTROL S.CIEPiCEr ItiC.
EFH FlETHOD 25 - TGNPIO ZHMPLE DHlA
CLIENT: TPC L O I ~ I T ION: METHERSFIELD PES :;AMPLE :: 1:3765. PI:^ PROJECT :: 172. 0l:il r m x s z I . D . CODE: 25- TRHP :: 114 rANK :: 2
C T
-SO-D
LRh PHPOMETPIC LAP TENFEPHTCIPE
F I tiHL 1 AtiP PREYSURE THtik 'XILIJPIE
LRP E:RPONETFIT, TEMPFPATI IPF
7 5 5 . 6 mm HG 745 mm HI: 11 DEG C:
747 NN HS 22 DEG. C 4.82 L I T E R S b i u mm HIS
6 -136
.I I -1 I I 1 I I I I I I I I I I 1 I
-
II

DRTE : 6 ./22 /.I981 TIME: 13 :4 :13
C L I E N T : TRC LOCATIO~~: WETHERSFIELD CT
TOTHL TGrimO C0rIC:ENTRAT I Uti .............. 116.6 PPM Cl . 058 MG..'L C 1 - - T H W C:OPiC.ENTF'AT ION ..................... . O PPM TRAP CONCENTRHTION ....... .'. ............. 116.6 PPM
PRE-TEST BHROMETRIC T A W 'VACIJUM TEMPERATLWE
I i
J ,'
755. iz mri HS 743 PIN HI? 11 LIE6 c
LHE! BARONETRIC LAB TEMPEFfiTURE 1 Hrilr 'si OLCl ME F I N H L TRPik, PRESSURE
L A E BHFOFIETRIC TEMPEPHTUPE

I
m D l x x
4 E E
E E E E 2
E E ' 4 E
,1 1
7
.i
I .I
g I.
n
;j
I.J
il
11 f\
I I I 1 I t I 1 I 1 I
2" E P
- - W E - m a

I I E
4 E
I -
'I 1.

G- I+O
1- 1 I I 1l I I I I 1 1 I 1 I I I 1 I I,

......................................................... POLLI.ITIOP~ i c o t i T m L 51: IEriCE. INI::.
E F ~ I YETHL~D ~3 - T i m w :;HMFLE KiHlH
TANK :: 61 ......................................................... TOTHL TSNmO C0PIC:ENTEATION .............. 9 1 4 . 6 FPM C:1 - - . 457 mi:.,L [:I
THPiK C:OPIC:EPITk:HT IOPI ..................... :zi 6 . :3 w r i TRHP COPICEriTPHTIOPI ..................... 537.'3 PPM
:SHMFLE 'VOLUME .......................... 2.7[14 LITEF'Z.
0~~...~**~~.~*~**......0.*............0.~*..~0.*..*.0...*
. .
LHB 1EPlFEP~TUEE T H t i l VOL LIME F I F l i I L TAW PPEZ.SIJPE
H'v'I3. rlEH5. THNC C G I i C . 1 U 1 PFM C 1
"#,I:. r.1EHZ. IC'.., I,OtlC. 1'32 PPM C : l .........................................................

EPH METHOD c'5 - TGPIPIO SHMFLE 116113 .-
i:LIENT: TRC: LOI-ATIO~~: WETHERSFIELD CT PI-.-? SHWFLE :: 1 3 7 6 3 PCS PROJECT :: 172 .001 PROCESS I . D. CODE: zs-z-:so-r ~
TRAP :: 112 ...
...... . ._ TANK :: 61
TOTAL TGriMO C0riC:EPiTRAT I O N 117.5 FPM 1111 .............. . 059 MG/~L c1 - - . ,
THrW COPICENT15ATIOfi ..................... . 0 PPM TEHP COtiCENTFAT I O N ...................... 117.5 PPM
SHMPLE VOLIJME .......................... 2. 704 L I T E R S
I ;! !..i
. -1 LHE: PHROr lETFIC . . I L H B TEMPEFHTUPE
! -1 T A W ',:'OLUWE F I PIAL THrib:. PRES5UF:E
754.6 MM HI; :51b MPl HC 21 LIES. c. 746 mri HI; 24 DEI;. C 4. : 3 5 L I TEES 6 I J O rim HG
I I I I I1 1 1' 1 I 1 I 1 I
1 I

i? 8~ 4 E E '
s i$$
I I
0 1 >
d z a m !4
r
3 3 3 3

m r 2 " J E E


T H r w Carii;EriTRnT I mi ..................... 177.5 w r i ..................... Szl. 0 PPM T R A P COr lCEPlTRAT I O N . --
P F E - T E S T B A P O M E T F I C , , T A W a.:'~~: I-IIJPI , I TEMP E R A T LIFE
L A B E:AF OWE T P I C LHB T E M P E F A T U F E T I 4 M VOLCIPlE . . . . ~
F I PIAL T H r i k P R E S S U R E
I I I I I 1 1 I
/ I I t I I I I I 1 I I

I I 1l I I I I 1 I I I
I 1 I 1 I 1
i
LOCHTIOH: METHERSFIELD CT PC'; SHPIPLE :: 1376'4
PPE-TETT EHF'OPIETRIC THW VHC IJIJM TEMPEPHTIJPE
I ,
~I
LHE: BHRUNE TR IC L FIB T E rlF EF' H T 1-1 RE T HNK. 'VOL IJ WE F I r i m THNk PRESSIJF:E
+DHTH FOR F I R S T IC'.+* LHB BHKIMETR I C TEMPEPHTIJPE IL'V 'mLImE FINHL I C Y PRESSIJRE
742 rim HI; ~ . . 24 DEG. C 4.W LITERS i u u mi HG
F

m a
1 I I I I 1 I I , I t
i

.I I 1) 1 I 'I' I
m m 2 : x
E E 2
"I m H &
an4
m m T T .
E E L
m z
L I E
- - m z.. a
m 2:
E 2
I

i
,... I ; li
.-
r.
E i
I I I I I 1 I 1 I 1 1 I I I I I I I 1

FflS 1 c:
POLLUTION COI ITFOL .>I: IENCEI I I JC .
EPA METHOD 25 - TGIWlO ':.APlPLE D A T H
.............. 524.6. ppri C I *, .. - TOTHL TI31PlO CONCENTRHT I ON . ct.: MG/L C1 - -
THIIk:. C:ONC:ENTF:ATION ..................... . n w m TEHF C:Ol-ICEtlTRAT I OPI ..................... 5:34.6 ppm
SHPlPLE VOLIJME .......................... :3. 1-35 L I T E R S
40~*.*.~*~**~**~***.0****~**~*~*~4~4*0*~~*04*0*0*0***~~00
r - LHE EHF:OPtETF:IC . . qt.. :? r i M HI: LHE: *TEMPEPATURE 2;' DEG. C.
621) NM HI5 4.W L I T E P S THNI' G'OLIJNE
, F I I-IHL THNK. PRESSUF'E
H':?I:. MEH:;. TANK CONI:. rPm ci
G -151

..................... .0 P F M THNK C:OI-iCENTF:HTION TRHP CONCENTRATION ..................... 176.8 PPM
WE-TEST BHPOMETRIC TANK ?H~:.I-ll-lPl
I ,~ TEPIPEBHTIJRE , ,.
POST-TEST BHROMETPIC ' THNC. ~?HCl-il-IF1 ' TEPIPERRT ILIRE
753. 1 MPI HI;
L k : BREOPIETRIC 746. 1 FIN HI; L k R ;TEPIPEPHlUPE z3 DEI?. 1:
THNK 'VOL CINE 4.83' L I T E R S F I N H L TANg PPESSIJEE ' . 620 MM HS . .
*DFITA FOP F I P S T ICV* LHB BHPOMETPIC ._ TEMPEFIATU~E I C : V VOLCIME F INHL 11:;' PRESSCIRE
74k.. 1 mri HS Z3 LIES. C
I I I I I I I 1 1 I 1 I I t I I I I 1

I a rJ N E
-7 /.i o s *

- i ! .;
r. L
i

.. . . . . . . . --... -._. . . . -. .. _ i . l : _ _ _ - .Q--[.cJ~ . . . ... . . . . . . . . . . . . . . . . . . . . . . . . . . . . . . . . . . . ...... . . . ....... . . . . ..... . . . .

CLIENT: TPC LOCHT ION: IdETHEF$.F.IELL! CT
TRHP .:: 212 THNF. :: S i ......................................................... ......................................... 43:::.2 PFM C 1 - - . 226 IIG.,'L I Z 1
............................................. , 39.0 PPM
.......................................... 4 1 4 . : 3 w m ;'HPIPL . VoLi-iriE .......................... 3. 028 LITER.:,
*.0~000**0**00000*00~0~*00*00.0**..00**0.*.0***..00.*000.
G - r5h
1 1 1 I 1 1 1 1 I I 1 I 1 I 1 I I I 1 I

......................................................... HILLLIT Ion CONTROL s c IENCE. Ire.
EF'A NETHOD 25 - TGriMO WIMPLE 11Hln
PROCESS 1. D. CODE: 25-3-SO-E TPHP :: 234 TANK :: 557
PEE-TEST E:HROMETRIC T"k~ VACUUM TEMPERHTURE
,' , , ,
P05T-TEST EHF:OMETFIC 753.1 I I M HS I ' TANK YHC:UUM zijg r i m HG
" TEMPERATURE zz DES. c:
LAB BHROMETPIC 745.6 mi HI: LHB TEUPERHTURE 2s UEC.. I:
-1. :35 L I T E R I ~ bZ2 MM HI:
4DHTA FOF: FIRST IC'-/* LHB BHROMETRIC TEMPERHTURE I c v ',J 0 L IJ r1 E F I tiHL 1 CV PRESSIWE

. . . . . . . . . . . . . . . . . . .
- - O b m a

m m 5 : z
E E 2
m 5:
d E
m m x z
4 E E
N N m . H B ~ a a 8 si > a n
m m 5 : z
E E ? ! g:.+I 0 .
z L I a
m . - - -?E - m a
- - - E - m a
3 3 3 a q c
. . .-


................................ PGLLl lT IOPi ILlPiTROL :Z.C.IEIiCE, INC.
EPA METHOD 25 - TGNMO :SHMPLE D A l H
C L I E N T : TPC LOT-HTION: VETHERSFIELD CT PCS SHPIPLE :: 1:37156.
~~ ~~ ~~. FCS PROJEFT :: 172. 0101 PFOCESS I . D . CODE: 25-1-SI-13 TPHP :: 207
TOTHL TSNPlO COPlCEtfTRATIOfl .............. 533.8 FPM C 1 E .z67 Mlj,'L 1:1
THM. CONCEPiTP,AT IOrl ..................... 2 5 . 0 TPHP CONCENTRHT I OPI .............. i ...... 5111. 7 PPM
PEE-TEST PHROMETPIC
TEMPERATURE I i ~ n r i ~ VHI:IJI-IFI . . . .
7.:3 PPM Cl
747 mri HI:
6 1.1 IJ m r i HI:
2:3 DEG. 1:
4.82 LITER'.;

.~ C L I E N T : TRC L n c a T I o N : WETHERSFIELD CT FCS S a r i P L E :: 13766.
TRAP :: 227
F C S PROJECT :: 172.001 PROCESS I . D . CODE: 25-1-SI-C.
TOTAL TSNMO CONCENTRATION .............. 2 6 i . i PPM C 1 .134 MG/L c1 - -
TANK: CONC:EtlTRHT I O H ...................... ' .0 FPM
SAMPLE VOLIJHE .......................... 2.652 L I T E R S
TRAP CONCENTRATION ..................... 267.7 PPM . .
PEE-TEST w m r i E T F IC I i TANK. 'i~HI;IJlJI'l i , TEMPERATURE
POZ T-TEST EAROPlETR I C '' TAIik. r)AClJlJM
I '. TEMFERATUFE
LAB BHROMETRIC LHE TEMPERATURE T A N t , 'VOLUFIE F I N A L TAPW PFEXIJPE
. . ~ -. . ...
I 1 i 1 t I 1 1 I 1 1 1 I Il P 1 I l 1


1
P 1 E
It m t X J
A E I
- - e ? 8 5 ti a
m X
E 2
I I
- - - E . - m a
i[ 0 V


......................................................... POLLIJT 1 O N CONTROL 51: IEtiCE? I tic.
EPA METHUP 25 - TC.IIFI0 SRMPLE D A l H
DHTE : 6 4 2 ~ 1 4 8 1 T IME: 13 : 7 :16
TOTHL TGHMO CONCENTRATION .............. 742.6 PPM C 1 .371 MS,'L C 1 - -
TANK COIiCEriTF'fI T ION ..................... 22.5 PPPl TRHP CONCEWTRATION ..................... 720.1 PPM
.sHriPLE G'OLCIME .......... .,. .............. 0000*000000*00000000000**~00000*000000*0000*000000000000'0
2.773 L I T E R S
PPE-TEST LHPOMETWIC
TEMPERATURE T W i Y VACIJCIM > I
,. :
POST-TEST BHROMETRIC 1 Hrw. WCIJUM
'. TEMPEPHTURE
75.5.6 MM HI?
11 UEG C
755.6 MM HI?
22 L E G . C
737 Mri HG
30IJ Mm HI3
1 f t I I I II 1
> 1 I I I I I 3 I 1 J

PBLLIJT I ori 1;ormoL :.I:. I E r u , I NI:: . €PA METHOD Z3 - TGNMO SHMPLE DHTH
CLIENT: TRC LOCHT ION: IJETHERSF IELD PCS SAMPLE :: ,13767 F I X PROJECT :: 172:001 PPOcESS I . D . CODE: 25- TCHP :: 1 0 7 TANK :: 67
CT
TANK c o r i c E r m H i I uti ..................... . o Ppri TRAP CONCENTRHTION ..................... 164.1 PPM
PFE-TEST BAPOMETPIC T HN k. VHCUIJPI TEmPERRTURE
I ,'
... ,
POST-TEST FHPOMETRIC ' TW". VACUUPl I
I '- TEMPERHTURE
LHB HHROPlETPIC: LAB TEMPERHTIJRE THNk. VOLLlllE F INHL TRNk PRESSURE
755.6 MM HG -_- I' a ,' MM HG 11 DEG C
755 .6 MM HI5
52 UEG. C ~ O I J mi HG
747 mi HI: 23 L E G . c: 4.865 L I T E R S 6 0 0 MM HC.
AVG. MEAS. TANK CONC. U PPM C 1
*DHTA FOR FIRST ICV- LHB EHPOMETPIC
2 4 LIES. I: 4.83 L I T E R S 9uI.1 MM HG

. - Zb Q
n4

I m u e .z
E E
- - T" 5'7; 7;
&
- - A N
m e E:
e, E:
m m r e
' E E .u
s - ' m w F
& &
3

1 1 I 1 1 I 1 3 9 I 1 I I I a E P

TOTAL TChiMO C0riC:ENTF:AT I O N .............. 3 5 Z . 2 PPM C1 - - - . i ~ i r i w L c i
.., TAPW C0EiC:EriTFATI OPi ...................... TRAP CONCENTEATION ..................... SHMPLE VOLIJPIE .......................... 2 L F e L I T E R S
xi -..
POST-TEST BHE:ONETPIC ' TANK. '.,wi::IJlJfi ' TEMPERATURE
L A B E:HFONETRIC LHF TEMPEEHTIJRE T H M VOLUME
i !
F I r i H L m i C : PPESSIJRE
745 Mfi HI: 25 IIEl5. r, 4.855 L I T E R S 6.28 MM HI:
A ' W . MEAS. TANK .COPiC. 0 FPM C1 ~
ODHTH FOP F I R S T IC'$* LHP B W O M E T R I C TENPEPliTUPE

c r P Fu -
..


.. - I.
i
7
i
r7 L!
i 'l
I_ ,' 1 '
n- I ) I-
F / I u
:- 1 , . j !i
.-
. ?
. L'
.- . . ' I
! I -
&S&: i377f 4 : I
1 1 I I1
f t I
I 1 I I I t 1)
1 1
a
m

TEHF :: 27 THIiF :: 51
***o*oo**oo***o~*******o************~****oo********~*+*+*
TOTAL TGririo CoriCEriTwiT tori .............. 1041 .4 PPM C:1 - - .545 NG,'L c 1
.T A t-iY COPt CE Pi TFMT I ON ..................... 5 4 1 . 8 PPII TRHP CONCENTRATION ..................... 549.7 FPM
.--+. . . . .-a?--
SHMPLE 'YOLIJPIE .......................... 2 h T T L I T E R S
*oo*oooo********o******,+**~*******oooo*****o**~~*****~oo*
PI?€-TEST BHFOME TR I C: i .-m4. 6 . M M HI5 -c . . . . , I
THMK ?HC:lJI?Pl . . 744 MM'HI? TEMPERATURE 17 DEG C
-r r LAB BHFOMETRIC: d?. :3 r i M HI? 24 I lE6 . I;
4.84 L I T E E S F I r i w Tnrilr PREXUPE 66s rim HI:
LHB TEMPEPHTUF:E TWtk VOLUME
HVS. PIERS. THtiK 130PiC. 164 PPN C1
*DHTH FOP F I P S T ICV* LAB BHPOPlETPIC TEMFEPHTUPE

.........................................................
DHTE : 6 1 2 2 ./1?81 TINE: 17 :33 :41>
CLIENT: TRC LOCHT Iori: METHERSF F'CS SHMPLE :: 13771 PCS PROJECT :: 172. PROCESS I . D . CODE: TPHP :: 2 0 1
I E L D CT
0 I! 1 25-2-5 I -D
~~
TANK :: 51
***~*~**~**o*~*~**~o~****~****~**.~****..*~**.o.*o~*~~~..
TOTHL TSPlmO C0PiC:EPiTPAT I ON .............. :3i-7. 3 PPM 1:1
THPIK i : : o r m r i T w n I ori ..................... . o PPM ..................... 3.5.p.9 PPM TPHP C:OPICENlRHT I OPi
. .~. ,. - . 184 MG..'L C 1 .- -
-.. . . .*a*
SAMFLE VOLIJME ........................... ~.-'S,i5i7 . -. . LITER::
PRE-TEST BAROMETPIC THHE ?,HC:UI.IM
, I TEMPERATURE
~. I ,
POST- TEST EHPO~lETP I C
" TEMPERHTURE J ' T W i K '.iHCIJI?PI
L l iB E:tiF:OIIETPIC L HE: T E PIPE P H TIME THhlr '~:'OLIJME F IPiHL TAPlk: PFESSIJRE
H?S. MEAS. TANK CONC.
754.6 MM HG 744 NM .HS 17 DES C
0 PPM C1
EAZ I C 6-17L

. ...
.l

-
m X
E 2
- , . I ! I> 1 .
si

6-11?

C L I E N T : TRC LOCHTIOPi: h!ETHERSFJELD CT PC.5 SRMPLE :: 13774 PCS PPOJECT :: 172.001 PROCESS I . D. CODE: 25-3-S TRHP :: 213
rt TFNT: T R r . LOCHTIOPi: h!ETHERSFJELD CT P C S CRMPLE :: 13774 ... . . . . . . _ _ . . . . . PCS PROJECT :: 172.001 PROCESS I . D. CODE: 25-3-S TRHP :: 213
1-1:
TANk. :: 71
.............. TOTAL TGriMO C O H C E ~ i T R H T I O N 6.55.1 PPM C1 - - .3;17 MS,'L 121
T F I W CONCEPiTRAT I OPi ....................... 159.2 PPM 'TRHP IXlPiCENTPAT ION ..................... 496.0 PPM
:znriPLE VOLCIME .......................... :3 . lJ l j L I T E P Z :
******)******************.?*********~**+**********,*~-****
. . . ...
PRE-TEST BHEOMETPIC. THIW VHCUUM TEMPERHTURE
I ,. ,' .
FOST - TEST BHPOMETF 11:: ~. T HPlk '.iA~:.l-lI_lM '. TEMPERATURE
LHB BHFOMETYIC L HB T EPIP ERFIT IlRE THIiC; ?OLIJriE F I PIAL TANK PRESZIJRE
HVS. MEHS. TANK COPiC.
*DATH FOR F I R S T IC'?* L H B BHROMETRIC TEMPERHTURE IC? VOLLlME F I N A L ,IC'? FPESSCIPE
75.3. 1 M M HI5
15 UEG C
753.1 UM HG
743 rim HG
246 rim HS 22 UEG. C
4.843 L I T E R S 608 M W H S
39 PPM C1
i
I s
I I 1 1 I I I 1 B 1 1 I E c I I 1 I -

P O L L U T I O t l C.ONTROL ZCIEPICE. I N C .
EPH METHOD 25 - TSNMO SAPlPLE DHTH
DHTE : 6 / 2 6 /'lgSl T I N E : 8 :25 :37
CLIEPIT: TRC LOCATION: WETHERSFfELD CT PCS SAMPLE :: 13774 PCS PROJECT :: 172.OUl PROCESS I . D. CODE: 25-3-S I - C TRAP :: 214
' . TANK :: 7 1
. . . . . . . . . . . . . . . . . . . . . . . . . . . . . . . . . . . . . . . . . . . . . . . . . . . . . . . . . TOTAL TGNMO CONCENTRATION .............. 559.8 PPM 131
- - . i v 5 r iwL ci -
T w i K c:nriC.EriTwiT I ori ..................... ~~ . .O PPM TRAP CONCENTRATION ...................... 551y.s PPm
. . . .
PEE-TEST BHROMETRIC J I TANt.. VACUIUN J ,' TEI lPERHTl~ lkE
FOZT-TEST E:HEOMETFIC. .'. THtW 'v'ACUIUI1 ' TEPIPERATUFE
L R B HAROMETR IC L A B TEMPERATURE TANK VOLUME F I N H L TAM. PRESSIUPE
-53 (~,.-.. 1 riri HI: 743 M t l HI? 15 DEG C
7 % . I rim HI: 24h t l t l HI? 24 UEG. C
745.7 MM HI5 25 DEG. C 4. S45 L I TERS 608 MM HI?
*IIHTH FOR F I R S T IC'+ L A B BAFOMETRIC TEMPEFATURE IC'? '?'OLIJtlE
*IIHTH FOR F I R S T IC'+ L A B BAFOMETRIC TEMPEEHTIWE .. - IC'? '?'OLIJtlE
I ....

0 z a Ll w m
t F m z z
E E ?
. -
- - e 2 8 8 8 a
- w zw m a
I I I I I I I I I I 1 I I I II z 5 z s c I
I-
I

1 . - . . I - - . .. .. -

I I I I I I I I I I I I I I I I I I I

TOTAL TGNPIO COtlCEIlTRHT IOPI .............. 679.2 PPM C l .3:39 MG/L c'1 - -
102.6 PPM THI-ik; ~I .ONC.E~iTF:HTI0~1 ..................... TFHF CO1.iCEfiTRfiTION ..................... 576 .7 PPM
SHMFLE 'VOLUME .......................... 3 . 4 5 3 LIT.ER5:
L G B , BHF:OPlETEIC LI4L: TEMPERHTURE TRIW voLi-iriE F I PiHL THPih PEESSIJFE
HVG. P l E K . TANK COtlC.
*I iHTH FOF F I R S T IC.'\;*
TE.MFEFHTlWE L I4 P E: HFOFiE T P I 1:
745.5 Piri HS 25 DEG. C

POLL U T I O n
EPH METHOII 25 - TGNMO' 5:HPlPLE I l A l A
C: Dri T F'OL 15: C I E Nl:'E . I NC .
TOTHL TGNPiO CONCEHTRHT IOPI ............... 315.9 PFM C:1 - - . 158 rlC./'L c:1
THNK CONC EHTPHT I ON ..................... .rJ PPM TRHP CONCENTRATION ....................... 315.Q PPW
:IHPlFLE VOLIJME ........................... 3.45'3 L I T E R I :
~ ~ * * ~ * - - * - * ~ ~ ~ ~ ~ ~ ~ ~ * ~ * ~ ~ ~ * * ~ ~ o ~ * o ~ ~ o * o o * ~ ~ ~ o ~ ~ ~ ~ ~ ~ ~ o ~ ~ ~ ~ ~
" TENPERATUPE
L fh BHF:OWETRIC LHB TEMPERHTURE T A M VOLIJME F INHL THHK PRESSCIRE
- r . 5 3 . 1 MM HI? 74.1 riM HG
(-.-#3.1 riri HI;
22 DEG. C
15 UEG C ..=. 19% MI.1 HI3
747.6 MM HG 24 DES. C 4.85 L I T E R S 604 MM -HG
AVG. MEHS. THNK CONC. 0 PWI C1
747.6 MM HI? 24 DEI;. C:
6-12 1
-I I I I I I I I I I I I
. I I I I I I I

.
’3 Ln ?:
4 E d
E E
5
- - NC! m E c
l a l a
i4 E
Ln e
E:
U u
c f c c
? ? m E E? B o l a
- . zk m
la
u z w’
Y V z 0 II)
-I 0
c z 0 V
a
,- 3

. .. .~ ~ . -. . . .. ... . - .
I I I I I I I I I I I I I I
ii -1
i 2
E 0
4.
i
I

I I 'I I .I 'I I I I I I 1 I I I I I I I
R P P E N D I X G . 3 SCRUBBER SOLUTION DATA

I I I I I I I I I I I 1 I 1 1 I I I I
TABLE G-10
Veneer Dryer Scrubber Operation Data Summary Georgia-Pacific Plywood Plant - Springfield, Oregon
Scrubber Solution
Sample Volume' Tc€* Run NO. Date (ml ) (mg/l) -
1 6-9-81
2 6-10-81
3 6-11-81
800
700
700
3010
3000
2860
Total of 7 or 8 1 0 0 4 samples collected during each t e s t run. **Total Organic Carbon.
6 -189
Average Pressure Drop
(inches H20L
14.2
15 .O
13.9

-1 ENVl RONMENTAL LABORATORIES
CH2M .. HILL 7201 N.W. Eleventh Place P.O. Drawer 1647 Gainesville, Florida 32602 9041377-2442
15715-15717 Sample No.
Lab ID No. 82112
1
I REPORTOF ANALYSIS
C15079 .M6 Project No.
6/15/81 Received
Reported 6/18/81
CH2M HILL ( C o r v a l l i s ) TRC Enviro
Mark Boedigheimer
Client
Attention
Address
Description of Sample: Water Samples- -Col lected by c l i e n t Scrubber l i q u i d
- # D e s c r i p t i o n TOC (mg/l)
15715 T e s t 1 - -6 /09/81 L a b #3978
15716 Test 2 - -6 /10 /81 L a b #3979
15717 Test 3--6/11/81 L a b #3977
3,010
3 ,000
2,860
Respectfully submitted,
PO"& a ~~ )Pa Roger A . Yorton Chemist
The information shown O n rh i i sheer is rerr data only and no inrsrprerauon O f the dara is intended or implied.
FL 101 G- Iqo

I I I I I I I I I I 1 I 1 1 1 I I I I
APPENDIX H
CLEAN-UP EVALUATION RESULTS
c
. . ~.
I i

1 I I: I 1
ENVIRONMENTAL LABORATORY 1600 S.W. Western Blvd. Corvallis, Oregon 97330
METHOD 5x SAMPLE ANALYSIS ct. Dale Receiv Client Name: -fRC EUULRONF-.\~N~AI - C O W
Location: G c a u w H - - P&cl.l=,? CARD.
Source: 6w b-hlE orr- t-r-bl Sample Identity -~ GX-D-DJr Blank
FRONT HALF ANALYSIS
Probe Wash (D.l./Dist. H20 Rinse)
Volume, mls A - z a z - 65.5-
fe3.5D23 &.O&
nm3 I 3
Tare No. a-r-a - - Tare + Residue 61.53e Tare Wt. c?5.5746 Residue WI. e3 O ? d O 9
Residue Wt. 0 I 0537 - - - Elk. Corr.
Probe Wash (Acelone Rinse)
Volume, rnls Tare No.
Tare t Residue
Tare Wt.
Residue Wl.
Blk. Corr.
Residue Wl.
( q %" ) (4'1: ) /49 *q t d L P " L L
Filler Collection (Fronl Filler) TRC
Filler No. /3.7haD 0.- 0. &Bra
Tare + Part. 0. €5521 Tare Wt. 0.0503 Part. Wl. R . ona4 Blk. Corr.
Paticulate Wl.
Fronl Hall (wl. gms)
I \ . ~.
I

, ENVIRONMENTAL LABORATORY 1600 S W Western Blvd Corvallis, Oregon 97330
METHOD 5x SAMPLE ANALYSIS
Client Name TRc EN- orhur- Dale Received
Location b R b r d - Qac;F=ic Chec 3 I
Source Euk4 E Qv-%-Xl t
Sample Identity - - 4 5 -0-rn Blank
BACK HALF ANALYSIS
lmplnger Water (+ H20 Rinse)
8% A ~
~.. Total Volume. m l (T) ..
Organlc Erlracllon
Volume Exlracled, m l (Ex) Tare No. Tare + Exlract Tare Wt.
Exlracl WI.
Blk. Corr. Exlracl Wl. x (T/Ex)
Residue on Evaporalion Volume Evap.. rnl (Ev) Tare No. Tare + Residue
Tare Wl.
Residue Wt.
Blk. Corr.
Residue Wl. x (T/Ev)
Back Hall Rlnse (Acetone)
Volume, mls Tare N a ~ Tare + Residue Tare Wt.
Residue Wt.
Blk. Corr.
Residue W t ~
9 Filler Collecllon (Back Filler No.
Tare + Part. Tare Wt. Part. Wl.
Blk. Corr. Particulale Wt.
Back Hall (wt. gms)
I I I I I I 1
Tolal Sample (wt. gms) o. iiet /J . /Ab7 / I i I ( ;L7
The information shown on lhis sheet is lest dala only and no analysis or inlerprelalion is intended or implied. Samples will be retained 30 days unless olherwise requesled.
H-a
I I 1 I I I I I
-

~
I I I 1 I I I I I I t
I I I I 1 I I I 1
CH2M “HILL ..
engineers planners economists scientists
Environmental Laboratory
Date: July 10, 1981
Project No.: C15079.M6
Subject: Analysis of impinger water from EPA Method 5X samples. Samples collected by TRC Environmental Consultants at Georgia Pacific Corporation, Springfield, Oregon.
Sample Identity
5X-0-0-4 5X- 0- I- 4 5X-1-0-4 5X-1-1- 4 5X-2-0-4 5X-2-1-4 5X- 3-0- 4 5X-3-1- 4
Impinger Water Chromium
E milligrams/liter
2.80 3.05 3.30 3.64 3.77 3.56 3.42 3.49
2.50 0.29 0.12 0.06 0.04
C O . 0 2 c 0 . 0 2 c0.02
Note:’ < Indicates “less than”.
All tests are performed in accordance with current Environ- mental Protection Agency guidelines as published in the Federal Reqister.
The information shown on this sheet is test data only and no analysis or interpretation is intended or implied.
Reported by: MarR Boedimeirner
jd/LABlR
t-l-3 Corvdlia Oflice 1600 S.W. Western Elvd.. PO. Box 428. Cowallis, Oregon 97330 503/752-4271 Cable: CH2M CVO

I
APPENDIX I
PROCESS OPERATIONS (Provided by RTI)
I t I I

I I I 1 I 1 I i I I I 1 1 I I I 4 1 I
I Production (ft2 per hour on 3/8" bas i s)
sapwood heartwood
Total
I 1 Redry Rate
I 1 1 Steam Use ( l b s
:V Temperatures
per hour)
V Fugi t ives
1. abor t s t a c k s 2. door l e a k s
3. above d r y e r s
4. cool ing s t a c k s
V I Weather
SUM4ARY OF OPERATING CONDITIONS ~
June 8
19.935 12,090
31.424
9.7%
No Evaluat ion
No Evaluat ion
No Eva1 ua t i on
No Evaluat ion
per dryer , except 44
June 9
21,604 14,143
35,747
9.0%
51,430
s t eady 325-375OF
.50-300 CFM !1&4'
81 8 3 had b l u e haze
#4
cloudy, showers, mid 6 0 ' s
53-74% re1 .
hum i d i t y
June 10
21,509 12,863
34.372
9.6%
50,467
s teady 325-375OF
50-300 CFM' .2 & #4 less
.han on June I
#4
:1 oudy. smal 1 ihowers, io"-75'
36-7OZ rel.
humidity
June 11
19.847 14,221
34,068
11.4%
51.450
s teady 325-3750F
150-300 CFM* mall l eaks
no t i ceab le above a l l
d rye r s
iorning fog, iunny, i4'-66"
54
51-76% rel.
humidity

Summary o f Product ion f o r G e o r g i a - P a c i f i c ' s S p r i n g f i e l d , Oregon plywood p l a n t
June 8-11 , I q 8 I
JUNE 8
sap - 19,935 f t 2 / h r heartwood - 12.090 f t Z / h r
t o t a l product ion - 31,424 ft2 (3 /8" b a s i s ) per hour
Redry 24,382/251,397 = 9.7 percent d r y e r P 1 - 24% d r y e r P2 - 23% d r v e r f 3 - 0%
\
I I 1
I 1
. d r i e r 64 - 13%
Notes - The d r y e r s were a l l o p e r a t i n g Monday af ternoon w i t h no breakdown's o r 1 I
upsets. not monitored.
Weather condi t ions , f u g i t i v e s , and d r y e r temperatures were
1 1
I . I I I I f 1
i

TEST OF JUNE 9
Production: Doug1 as Fir
I 1 I 1 I I 1 I I I 1
'1 I
A. Total Production: f t 2 / h r (3/8" b a s i s )
1. u p u n t i l 3:52 p-m-
redry dryer 91 dryer 82 dryer 93 dryer ,Y4
not es t imated 9.0% 8.2% not es t imated 4.9% (adjusted) not es t imated 8.9% n o t es t imated
14.6% not es t imated
2. a f t e r 3:52 p.m. when #4 d r y e r switched from sapwood t o heartwood 1/6" veneer
GP production fiqure RTI (3:53 p .m. information not requested p.m.
sapwood heartwood Total
redry -
10,575 31,499 42,074
7-9.5: (dryer #4 only)
* Error i n reported production from d r y e r number 2. adjusted according t o p lan t records.
I- 3

JUNE 9 (Continued)
B. Operat ing Parameters
1. Temperature (F')
G 315 350 360
D 345 G 315 348 360
D 340
- N
t i m e 2:15 pm G* 325 350 360
D* 340
315 355 360 325 315 352 360 325
3:30 G 325 3 50 360
D 345- - 3:59 G 325 . 350
360 D 350- - 4:52 G 325
350
-
D 335
348 4:OO G 323 -
360 D 345 - 5:24 G 325
3 50 360
D 345
~~~
350
- - 4:23 -
- 5 325 345 335 335 325 345 360 335 325 345 -365 335 323 342 360 335 323 343 360 335
360 D 340 G 310
Dryer Number
366 325 315
D 330 - -
- 4:51 G 323 350 362
360 I 360
323 350 360
350 360
0 340 G 315 350 360
D,340
360 I I D - 335
352 360 325 315 353 360 325
5:20 G 325 350 360
D 330
- D 335 1 350
320 5.:18 350 360 350
-
G i s green end temperature, 0 i s d r y end temperature N i s nor ths ide. 5 i s southside.
- 2. Dry ing t imes Dryer #I - 15.5 rnin
(1/8" sap f u l l ) #2 - 16.0 min
(l/8" sap s t r i p s ) #3 - 6.2 min
(1/8" heartwood) #4 - 11-12 rnin (1/6" sapwood)
6.1 min (1/6" heartwood)
3 N 1 . 5
G 310 I 315 348 350
I I 1
4 I I 2:12 G . 347
355 -
0 375 2:23 G 345
350 1 - 0 ' 375
3:55 G 345
D 375 - 4:11 G 350
350 1 -
D 385 360 I - 4:28 G 350 -
D $: I - 4:45 G 350
355 D 375 1 - 5:17 G 350
354
1. I I I I I I 1 -

__
11 I 1 I 1 1 I 1 'I I I 1 1 I I I ,I I [I.
I L N
M 30% N H 20% . N H 30% N H 30% N
JUNE 9 (Continued)
C. Fuqitives
L 100 cfm 2:lO M 200 cfm 3:25 M 200 cfm 4:15
' H 250 cfm 5:05 H 300 cfm 5:40
I / ABORT STACKS
I I I
2M 2L.2T SM
,f2 1:50 I M 2:45 . H
1M M 1M 1L M 1M 2H H
2:45 3:40 4:50 5:30
H 25% H 30%
M H
INSIDE
1L 3L
Door Elephant Above Seals Ears Dryers
I I
4M 1 H H 2M M
1L
L L M
M 10% M 10%
H 20% M 30% M 30%
H 30% L
I
N M 150 cfm 2:05 N M 200 cfm 3:25 N M 200 cfm 4:15 N M 150 cfm 5:05 N M 150 cfm 5:40
N H 250 cfm 2:05 N H 250 cfm 3:15 N H 250 cfm 4:13 N M 150 cfm 5:OO
H 300 cfrn 5:40 N I 1
N N I H
I M 2M- I NA
d4 1:45 N N 2:45 N N 3:40 N N 4:40 N N 5:27 N N
KEY 1CFM Estimates -
N 5% L - 2:oo N 10% L - 3:18 N 10% L - 4:12 N 10% VL 5:OO N 15% L 5:40
1 2 3
I'-5
4 5
' I - Building Fans N = None
lM,IL 1L lH, lL 1H.lL
NA L NA L NA L NA L
- (Opaii t y )
2:oo 5; 5; 5% - not
2:45 54, 10% - 5% - 3:45 5% 10% - 5% - 4:45 5% 5% - 5% - 5:30 5% 5% - 10% 54,
observed
T = Trace are gross VL = Very l igh t est imates
% = opacity L = L i g h t M = Moderate H = Heavy on blue V H = Very Heavy plumes
I

D.
E.
JUNE 9 (Continued)
Stearn Usage ( f o r veneer d ryers o n l y )
t ime 10:17 a.m. 11:23 a.m. 1:33 p.m. 2:30 p.m. 3:30 p.m. 4:32 p.m. 5:44 p.m.
- steam r a t e ( i n l b s / h r l 52.500 51 IO00 54.000
. 52,000 51,500 49.000 50,000
avg. 51,430 l b s / h r
J 'I I I I I 1
Weather Cond i t i ons
T wet bu lb T dry b u l b I - time (OF) ( O F ) % Rel. Humidi ty Comments
11:oo 58 1:40 57 2:30 59 3:40 58 4:40 60 5:25 58
64 69 Showers, heavv 67 53 C1 ouds 67 62 C1 ouds 64 69 C1 ouds, showers 65 74 L i a h t showers 65
7-43 1
65
I I I I I I I I 1'

I' 1 I I I I I 'I ' I I
'I 1 I 1 1 1 I 1 ,I
1 'I
TEST OF JUNE 10
A. Production ( f t 2 / h r on 3/8" b a s i s ) .
RTI (during GP product ion figure tes t ing hrs)
1. S t a r t u p u n t i l 3:47 (switch from sapwood . t o heartwood on d rye r 4 ) Total 29.440
sap 18,447 heartwood 10,869
Redry # I #2 8 3 84
2. Af t e r 3:47 Total -
sapwood heartwood
d r y e r #3 dryer f 4
11.5% 10.9%
34.372 21,509 12,863
not estimated not es t imated not es t imated not es t imated n o t es t imated
40,495 10,339 30,156 12,863 17,293
6. Operating Parameters
1. Dryer Temperatures (see a t t a c h e d )
2. drying t imes B 1 - 16.3 m i n . ( l / 8 " sapwood f u l l ) #2 - 15.8 m i n . (1/8" sapwood s t r i p s )
94 12.0 min. (1/6" sap, f u l l ) 6.0 min. (1/6" heartwood, -
#3 - 5.8 m i n . (1/8" heartwood, f u l l ) f u l l )
C. Fugi t ives
(see a t t ached)
D. Steam Usage, d r y e r s only
1:29 2:23 3:30 4:19 4:46
steam r a t e ( l b s / h r ) 50,800 51,500 52.500 52,000 48,000 48,000

JUNE 10 (Continued)
- N
t i m e 12:12 pm G 325 350 360
l:oo
2:lO
2:47
4:08
4:38 -
-D 340 G 325
350 360
D 340 G 324
360 D 340 G 325
350 360
D - 340 G 325
350 360
D 350 G 325
350 360 350
348
Dryer temperatures
2 - S N I s 320 340 360 335 321 345 360 335 320 340 360 335 320 340 360 335 320 34 5 360 335 320 345 360 335
D 335 12:59 G 325
350 360
D 337 2:07 G 325
350 362
D 335
-
2:45 G 325 350 360
D 335
-
4:16 G 325 350
- 360
D 335 - 4:36 G 325
350 360 335
- N . 310 350 360
353 D 340 313 12:33 G 310
360 360 350 D 335
350 - 348
15 12:56 G 50 - .~
60 50 D 315 2:04 G 310
360 360 350 D 340 315 2:43 G 315 350 350
- 350 348
- 360 360 350 0 340 312 - 3:33 G 350 360 350 D
4:04 G 323 352 364 340
4:33 320 350 360 340
-
-
- S
315 355 360 325 315 350 360 325 315 352
355 360 325 315 350 360 325 318 352 360 325 325 360 352
362 325
June lo 1 6
12:OO G
D - 12:33 G
D 12:55 G
D 2:03 G
D 2:42 G
D 3:32 G
D 4:03 G
-
-
-
-
-
-
4:32 G
D
-
3451 350
350
34 375
35 375
37 354
37 355
I I
I I I I I -

i l 'I 'I 'I 'I I I 'I 'I I I I :I :I :I 'I <I 1 I .I
ABORT STACKS
time Green End Dry End Cooling Overall1
JUNE 10 (Continued)
C. Fuqitives
INSIDE APPEARANCE
Door Elephant time Seals Ears Top C o m n t s
Date 6-10-81 Test St-0 p.m. Stop 4:45 G. P. Sprlngfleld
Observer P. Willhite
12:ZO 5 1:lj 5 2:15 5 2:45 5 3:45 5 4:15 5 4:4D 5
5 5 - 5 5
5
N - None T = Trace VL - Very light L - Light M = Moderate H = Heavy VH - V e r y Heavy
CFM Estimates are gross estimates
I - opacity on blue plumes

J U N E 10 (Continued) 1 E . Weather Conditions
1
I I
- . T wet bulb T dry bulb
time 0 (OF) % Rel. Humidity Comments
11:50 53 . 60.5 61 80% cloud cover 1 1:15 56.5 62 70 80% cloud, showers 2:12 56.5 66 54 50% cloud, sun 3:OO 58.5 75 36 30% clouds 3:45 55.5 68 44 20% clouds 4:30 59 71 48 20% clouds
I I I I I I- I I I I I I I i~

TEST OF JUNE 11
A. Product ion ( f t z / h r on 3/8" bas is )
8.
C.
E.
To ta l sapwood heartwood
Redry r a t e 6 1 #2 83 64
Operat ing Parameters
RTI GP p roduc t ion f i q u r e - 33,708 34,068 19,811 19,847 13.897 14,221
1. Dryer Temperatures - a t t 2. . d r y i n g t imes
#I 16.3 min. -~ +2 #3 #4
F u g i t i v e Observat ions
see at tached
S t e a m Usage, dryers
t ime 10:23 11:21 11:58 12:31
1:39 2:36
-
Weather Cond i t ions
t ime T wet bu lb - 10:27 50 11:30 52 12:oo 55.5 12:33 55 1:41 54 2:40 56.5
11.4% not est imated 10.3% no t est imated 11.3% not est imated 13.5% no t est imated
not est imated 9.8%
:hed
(1/8" sapwood, f u l l ) 15.4 min. ( l /8" sapwood, s t r i p s ) 6.0 min. ( l / 8 " heartwood, f u l l ) 8.6 min. (1/8" sapwood; f u l l )
on l y
steam r a t e ( l bs /h r ) 50.500
T d ry bu lb % Rel. Humidi ty
54 58 64 62 64 66.5
1-1 I
76 67 58 63 51 52
Comments
morning f o g sunny sunny, h igh clouds sunny, h igh clouds sunny, 704, c loud cover sunny, h igh overcast
/ /
/ I
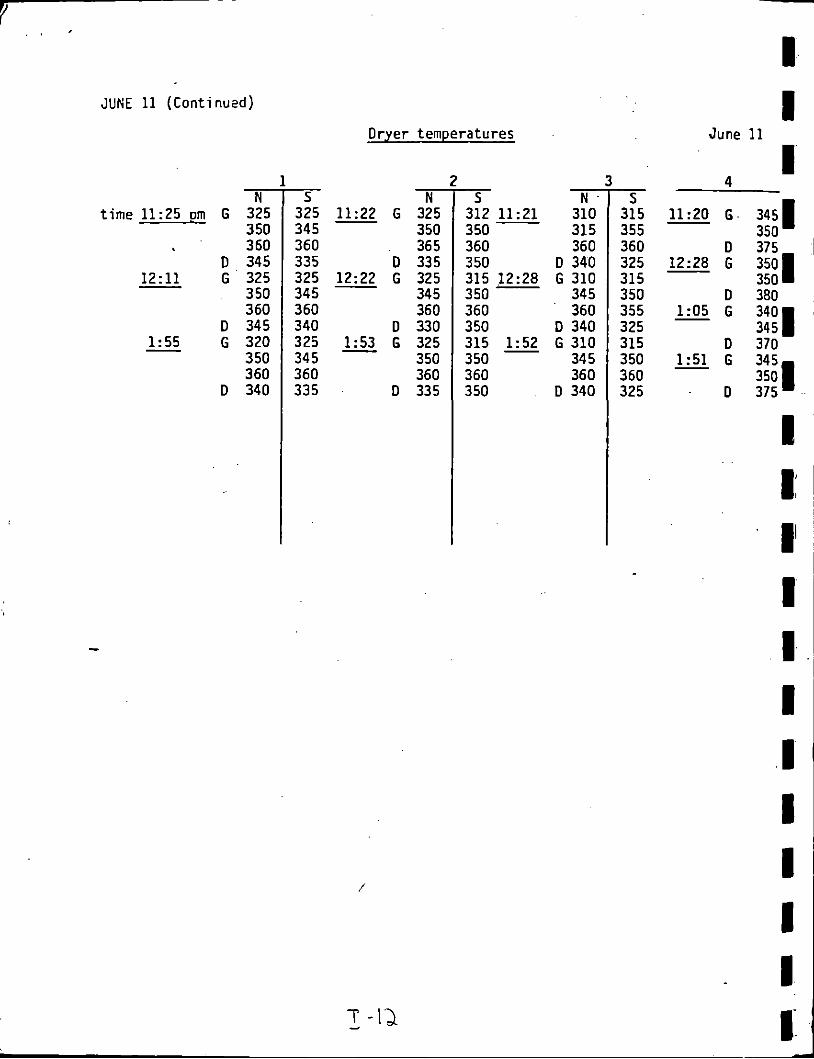
JUNE 11 (Continusd)
- N
time 11:25 om G 325 350 3 60
0 345 12:11 G 325
3 50 360
D 345 1:55 G 320
350 360
D 340
-
-
Oryer temperatures
325 11:22 G 325 345 350 360 36 5
- 335 D 335 325 12:22 G 325 345 - 34 5 360 360 340 D 330 325 - 1:53 G 325 345 350 _.. ~~
360 360 335 0 335
360 360 350 0 340
350 D 340 315 1:52 G 310 350 34 5 _ - - - .-
360 360 350 D 340
- S
315 355 360 325 315 350 355 325 315 350 360 325
June 11
I 4
- 11:20 G - 3451 350
12:28 G 350
D 380 1:o5 G 340
34 5 D 370
1:51 G 345 350 1
- 3 7 5 ~ 350
I -
- D 375
1 I: I'

JUNE 11 (Continued)
- S e a l s
S a t e 6-11-81 Test S t a r t 11:30 p.m. Stop 3:OO p.m.
E a r s TOP Comnents
ABORT STACKS
P I 10:50 11:46 12:20 12:55
t i m e Green Eni v H H
M 5 M 5
300 H 300 H 250 H 250 H 300 H 250 H
350- 300 H 250 H 150 n 300 H 200 n 350 H 350 H 350 H 350 H 300 H 250 H
1:06 M 5 2:281 M 10
10:42 11:32 12:OB 12:45
1:26 2:17 2:47 r
11:30 l2:07 12:45
1:26 2:16 2:47
10:3B 11:30 12:06 12:43
1:27 2:15
10:37 l l : 2 8 12:06 12:43
1:27 2:14 2:47
2:4a
11:45 H I 12:ZO H
12:55 H 10
1 M 1 L 1 L 1 L 1 L 1 L 1 L I L 1 L 1 L 1 L N N N N
N N ' NA NA NA NA NA
N 1:48 H 10 2:271 n 20
L M H M L M a t c e n t e r L f a n s on t o p M L L n H H s t ack leaks H & middle fan : H hlgh H emissions
H H L L YL YL VL
m
1:48
5 5 - - - 5
5 - - 5 - - -
H H 20 H 10 H 10 H 30 H 20
M n 10 M 10
L n 10
-
n i o -
H 20 H 20 H 20 H 20 H 20 H Z Q
N - None CFM Est imates
VL - Very 1 i ght T - Trace a r e gross
L - Light M - Moderate 2 = opaci ty
e s t ima tes
Paof I A Vents
1l:lO 5 - - 11:45 - 5 - 12::9 5 - 5 12:55 10 5 -
1:48 5 10 - 2.27 10 5 -
Cooling
- N N N N N N
N N N N c N
102 5-10 0-5 5-10
5 5-10
-
-
-
1 .
G. P. S p r i n g f i e l d Observer P. Willhite
3 L 3 L 2 L 2 VL 2 VL Z L 1 L
N N N N N N N N N N N N N N
ZVL N N N N N
-
-
mi
- KEY
1 L
1 M center f ans

I I I I I 1 1 I I I I I I I I I 1 I I
APPENDIX J
PRQJXT PARTICIPANTS

I I I 1 I 1 1 I 1 I I 1 1 I I 1 1 I I
PR0;IECT PARTICIPANTS AT GEORGIA-PACIFIC PLYWOOD PLANT SPRINGFIELD, OREGON, JUNE 6-11, 1961
TRC - Manaqement :
Peter W. Kalika, P.E. Eugene A. Brackbill, P.E. John H. Powell
Field Crew:
S. Dexter Peirce Edward D. Astle 'David D. Ethier Susan M. Reynolds Mark A. Algier
Laboratory:
Sam S. Cha Stefan Wawzyniecki Patricia Lennon Dudley W. Alleman
Report Preparation:
Eric A. Pearson David E. Ringquist Anne Cretella
Gary D. McAlistee Clyde E. Riley Edwin J. Vincent
L. Hitch Steffensen Pete Fetter
Victor Dallons Ron Mesmec Dean Boy
Program Manager Work Assignment Manager Project Scientist, Field Crew Chief
Environmental Engineer Environmental Engineer Assiatant Environmental Engineer Technical Specialist Technical Specialist
Chemistry Laboratory Manager Environmental Chemist Environmental Chemist Assistant Environmental Scientist
Project Scientist Environmental Engineer Word Processing Supervisor
EPA - Task Manager Task Manager Project Lead Engineer
GEORGIA-PACIFIC
Product Development Manager EnViKOIImental Technician
NCASI - Research Engineer Research Assistant Research Assistant
RTI - Robert Chessin Paul Willhite (Del Green Associates)
CHWii11
Mark Boedigheimer Environmental Analyst
PCS - David T. Robinson Group Leader, Instrumental

I
I 1 P I I 1 1 1 1 I I I 1 I I I 1 I I
APPENDIX K
SCOPE OF WORK
~ . 1 Work Assignment R.Z Site Test P l a n K.3 Associated Correspondence
I

I I I I I I t 1 1 I1 I I 1 I 1 I I I I
APPENDIX R.l WORK ASSIGNMENT

I 1 1 I 1 I 1 1 I I 1
'1 I I I 1 I
Research 1rk.l~ Park: H.C. 27711
- m E O I l E Method Development and Testing for Plywood/Veneer Industry 14 AUG
EsCOl=nM
The Contractor shall perform the following work- areas-for the plywoodlveneer industry i n accordance with the basic contract scope of work. I
, . ~i Method Fi~eld E;aluation.-- - - Testing Documentation
Standard Development Field Tests Non-Reference Methods
. .
The Task Manager is Gary McAlister Triangle Park, North Carolifid 27711.
, Mail Drop 13, E M , ESED, OAQPS, Research
All reports shall be submitted directly to the Tzsk Manager. . . . .
- ~ . .. D A T E
1
I I
.

1 1 I I 1 I t I I I I I 1 1 I I I I I
APPENDIX K.2 SITE TEST PLAN

1 I 1 I 1 I 1 i 1 I 1 I I I I I I i I
__ -
SECTION 1
INTRODUCTION
TRC - Environmental Consultants, Inc. will be performing emissions test-
ing on the veneer dryer exhaust system and its poliution control, a Georgia-
Pacific scrubber system, at the Georgia-Pacific Plywood Plan-t in Springfield,
Oregon. Testing will be performed during the week of June 8, 1981 to deter-
mine the removal efficiency of the Georgia-Pacific scrubber system for par-
ticulates and volatile organic compounds ( V C C s ) . Data acquired during this
test program will be used to reflect the degree of limitation on control' of
veneer dryers, and if needed, establish an NSPS for that control.
The purpose of-this report is to establish a plan of action for this
source test program and provide complete details of the proposed sampling
program. This report has been prepared in accordance with and under the pro-
visions of EPA Contract No. 68-02-3543. Further information relating to this
field test program can be found in "Pretest Survey Report for Standard
Development Testing at GeOKgia-PaCifiC Plywood Plpnt, Springfield, Oregon",
dated March, 1981; and revised June, 1981.
Research Triangle Institute (RTI) , the NSS contractor, will be responsi-
ble for coordinating the overall test program with Georgia-Pacific .plant
officials. RTI will be responsible for assuring that process and control
equipment operating conditions are suitable for testing; as well as, monitor-
ing and recording all process operating data. Fugitive emissions from the
1
K-a

veneer dryers and ambient temperature and relative humidity will also be mon-
itored by RTI and their subcontractor, Del Green Associates. I I I 1 I
TRC will be-responsible for performing the emissions test program. EPA-
EMB will be responsible for any coordination with the local regulatory agency
deemed necessary.
The line of communication during the test program will be between
Georgia-Pacific, RTI, EPA-Em's Task Manager, and TRC'S project manager.
Communication to any other TRC personnel will therefore be through the TRC
project manager and/or the appropriate TRC crew chief. -
NCASI personnel will be drawing samples from TRC's sampling train for
their research purposes and to afford a measure of quality assurance. HOW-
ever, if the sampling locations become too congested with equipment and per-
sonnel, TRC's project manager will decide whether or not concurrent TRC-NCASI
samling is still practical and should continue.
1 l I I
TRC will designate a Crew Chief-Project Scientist to fully coordinate and
carry out the test program. A l l other technical personnel will be responsi-
ble to the Crew Chief.
Following the performance of the emission test program TRC will submit a I
I I - I 1 I
draft of the proposed emission report to the EMB. The draft will be pro-
cessed as being confidential information. EMB personnel wil.1 incorporate the
process description and operations data obtained Erom the EPA Lead Engineer
into the draft report. The EMB Task Manager will transmit the proposed
technical and confiden-
t h l review. AfteK receiving comments from the plant official, the EMB Task
.Manager will submit revision comments to TFC. Final report c0pies:will be
distributed by the EMB Task Manager to project team members, applicable plant
officials, and interested parties.
i
emission report' to the designated plant official for
2
I < - 3
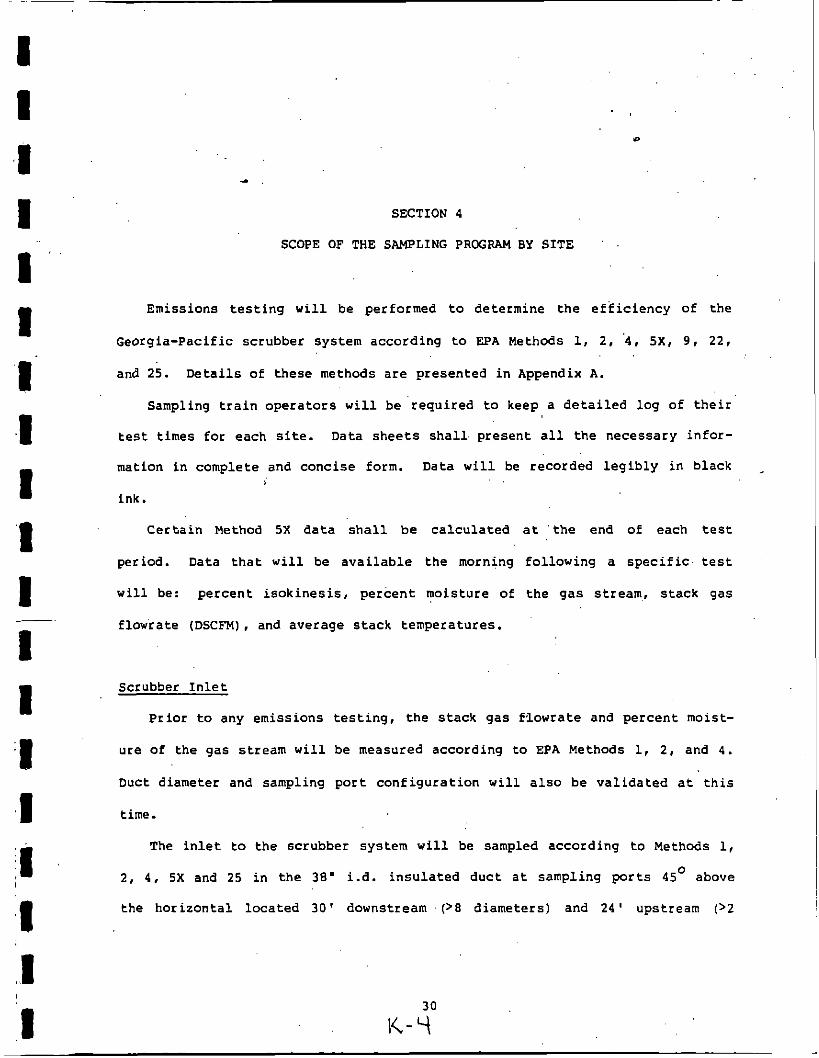
~
I 1 I I 1 I I I I I 1 I 1 I 1
I .I I
-
I I
D
SECTION 4
SCOPE OF THE SAMPLING P R E P A M BY SITE
Emissions testing will be performed to determine the efficiency of the
Georgia-Pacific scrubber system according to EPA Methods 1, 2, '4, 5 X , 9 , 22,
and 25. Details of these methods are presented in Appendix A.
Sampling train operators will be required to keep a detailed log of their
test times for each site. Data sheets shall present all the necessary infor-
mation in complete and concise form. Data will be recorded legibly in black
ink.
Certain Method 5X data shall be calculated at the end of each test
period. Data that will be available the morning following a specific test
will be: percent isokinesis, percent moisture of the gas stream, stack gas
flowrate (DSCE'M), and average stack temperatures.
Scrubber Inlet
Prior to any emissions testing, the stack gas Plowrate and percent moist-
ure of the gas stream will be measured according to EPA Methods 1, 2, and 4.
Duct diameter and sampling port configuration will also be validated at this
time.
The inlet to the scrubber system will be sampled according to Methods I,
2 , 4, 5 X and 25 in the 38" i.d. insulated duct at sampling ports 45 above
the horizontal located 30' downstream (>E diameters) and 24' upstream (>2
0
30
IC- q
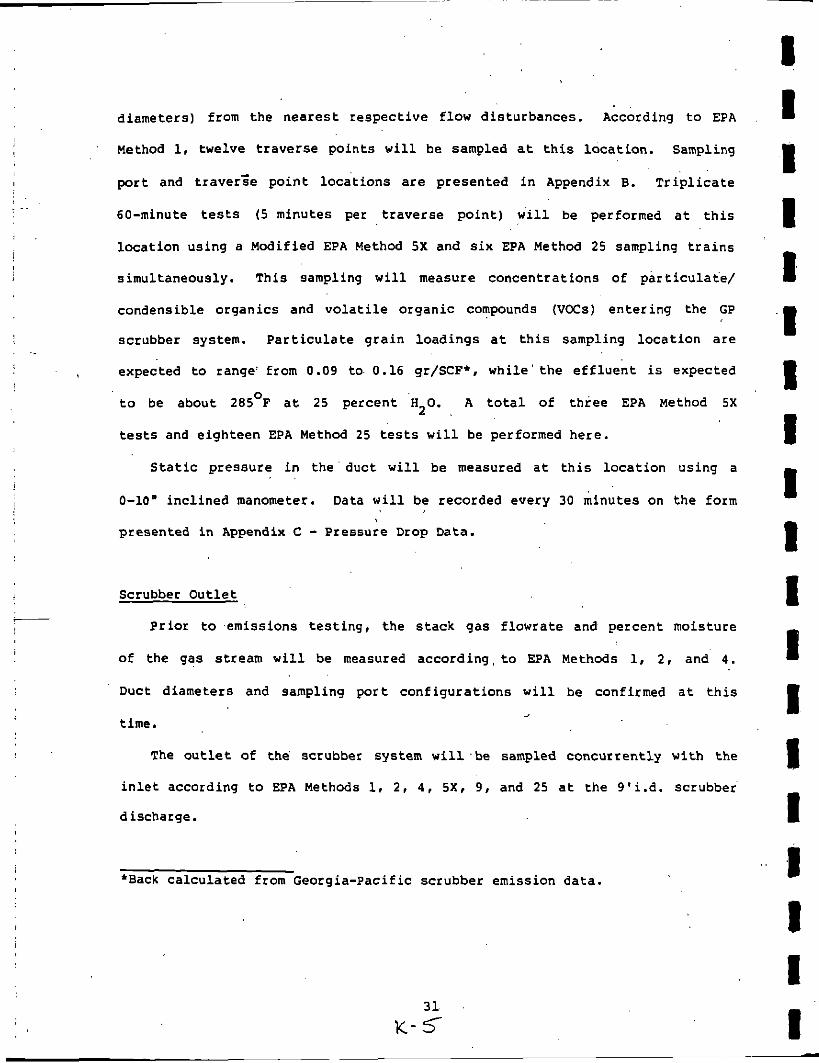
I diameters) from t h e n e a r e s t r e s p e c t i v e f low d i s t u r b a n c e s . According t o EPA I
I 1 I I
Method 1. twelve t r a v e r s e p o i n t s w i l l be sampled a t t h i s l o c a t i o n . Sampling
port and t r a v e r z e p o i n t l o c a t i o n s are p r e s e n t e d i n Appendix B. T r i p l i c a t e
60-minute tests ( 5 m i n u t e s per t r a v e r s e po in t ) w i l l be performed a t t h i s
l o c a t i o n u s i n g a Modified EPA Method 5X and s i x EPA Method 2 5 sampling t r a i n s
s imul taneous ly . T h i s sampling w i l l measure c o n c e n t r a t i o n s of p a r t i c u l a t e /
condens ib le o r g a n i c s and v o l a t i l e o r g a n i c compounds (VCCs) e n t e r i n g t h e GP
scrubber system. P a r t i c u l a t e g r a i n l o a d i n g s a t t h i s sampling l o c a t i o n are
expected to range: from 0.09 to. 0 .16 gr/SCF*, w h i l e ' t h e e f f l u e n t is expected
t o be about 285OF a t 25 p e r c e n t 'HZO. A t o t a l o f th ree EPA Method 5 X
tests and e i g h t e e n EPA Method 25 tes ts w i l l be performed h e r e .
S t a t i c pressure i n t h e ' d u c t w i l l be measured a t t h i s location us ing a
Data w i l l be recorded every 30 m i n u t e s on t h e form
. .
0-10" i n c l i n e d manometer.
p r e s e n t e d i n Appendix C - P r e s s u r e Drop Data.
Scrubber O u t l e t
P r i o r to emiss ions t e s t i n g , t h e s t a c k g a s f l o w r a t e and p e r c e n t mois ture
of t h e g a s stream w i l l be measured a c c o r d i n g , t o EPA Methods 1, 2 , and 4 .
D u c t d i a m e t e r s and sampling p o r t c o n f i g u r a t i o n s w i l l be confirmed a t t h i s
time. 2
The o u t l e t of t h e scrubber system w i l l be sampled c o n c u r r e n t l y wi th t h e
i n l e t according to EPA Methods 1, 2 , 4 , 5 X . 9 , and 25 a t t h e 9 ' i . d . sc rubber
d ischarge .
'Back c a l c u l a t e d from Georgia-Pac i f ic s c r u b b e r emiss ion d a t a .
31
K- 5
I I I I I I I I I I I I I

1 1 I I 1 I I 1 I I I 1
I il I 1 I
emissions will be monitored concurrently with the Method 5 X sampling at the
scrubber outlet for 96 minutes. It may be that moisture entrained in the
plume is too d e y e to make an accurate opacity determination. This will be
determined on site by the certified observer.
Scrubber solution samples will be taken every 30 minutes during the
scrubber outlet Method 5X test period. Three 100 ml samples will be taken
from the scrubber solution holding tank or from the scrubber water outlet
during each test. The samples will be composited for analysis.
Static pressure prior to and directly after the 1.0. fan.will be measured
with U-tube manometers and recorded .at 30 minute intervals. These measure-
ments will be used to calculate pressure drop (AP) across the scrubber
system.
Miscellaneous Measurements
Fugitive emissions from the veneer dryers (through doors, cracks, and
abort stacks) will be monitored by RTI or their subcontractor, Del Green
Associates, according to guidelines from EPA Method 22 as presented in
Appendix A. Fugitive emissions will be monitored during each entire 96
minute test period.
Ambient temperatures and relative humidity outdoors will be measured and .I
recorded at the beginning and end of each 96 minute test period.
All data will be recorded on forms provided by TRC and presented in
Appendix C.
Upon conclusion of the test program, Modified EPA Method 5 X samples,
along with the scrubber liquor samples, will be driven to CH2MHill - Engineers, Planners, Economists, and Scientists, in Corvalis, Oregon for
33
K-6 ' ,

a n a l y s i s . EPA Method 25 condensate t r a p s w i l l be packed i n d r y ice a t t h e
conclusion of each test. One t h i r d of t h e traps and one t h i r d of Method 25
sampling t a n k s w l l l be ,packed and sh ipped v i a a i r f r e i g h t t o TRC's l a b o r a t o r y
i n Wethers f ie ld , Connect icu t f o r a n a l y s i s . Another t h i r d of t h e t a n k s and
t r a p s w i l l be packed i n a s i m i l a r f a s h i o n and sent a i r f r e i g h t t o PCS i n
Miamisburg, Ohio f o r a n a l y s i s . The remaining t h i r d of t h e Method 25 samples
w i l l be analyzed by NCASI by methpas p r e s e n t e d i n Appendix H.
A l l f i e l d d a t a s h e e t s to be used d u r i n g t h e t e s t program a r e presented i n
Appondix C. Sample recovery and a n a l y s i s d a t a s h e e t s a r e p r e s e n t e d i n
Appendix D. Sample c a l c u l a t i o n s a r e p r e s e n t e d i n Appendix E, whi le Appendix
F c o n t a i n s a l l c a l i b r a t i o n fotms t h a t w i l l be used.

Sampling p r t s w i l l be l o c a t e d 9 ' upstream (1 d i a m e t e r ) from t h e t o p of
t h e stack and approximately 6 ' (2/3 d i a m e t e r ) downstream from t h e mesh pad.
T h i s sampling l o c a t i o n is c o n s i d e r a b l y less than i d e a l . According t o
Method 1, f o r t y - e i g h t t r a v e r s e p o i n t s w i l l be sampled a t t h i s l o c a t i o n .
Sampling p o r t and t r a v e r s e p o i n t locations are p r e s e n t e d i n Appendix B.
T r i p l i c a t e tests w i l l be performed us ing a Modified EPA Method 5 x and s i x EPA
Method 25 yampling t r a i n s . The Method 5X tests require f o r t y - e i g h t t w o -
minute t r a v e r s e p o i n t s f o r a t o t a l test time of 9 6 minutes . Method 25 sampl-
ing w i l l begin 1 E minutes i n t o t h e Method 5X test, and run f o r 60 m i n u t e s .
Eighteen m i n u t e s of particulate/condensibles t e s t i n g w i l l s t i l l be performed
a f t e r t h e Method 25 run is completed. The sampling t r a v e r s e s w i l l a l t e r n a t e
so a s to a l low f u l l coverage of t h e sampling a r e a wi th Method 25 f o r t h e
three tests to be performed, even though f u l l coverage w i l l n o t occur dur ing
a s i n g l e g iven tes t . B o t h 60-minute i n l e t tests w i l l run s imul taneous ly wi th
t h e Method 25 t e s t a t t h e o u t l e t .
\
Emissions t e s t i n g performed a t t h e sc rubber o u t l e t w i l l de te rmine concen-
t r a t i o n s of p a r t i c u l a t e / c o n d e n s i b l e o r g a n i c s and VWs. Gra in l o a d i n g s are
expected to range between 0.05 and 0.09 gr/SCF wi th t h e e f f l u e n t temperature
being 150°F a t 18 p e r c e n t H20: The average s tack v e l o c i t y was l a s t
measured t o be 11 f p s , which t r a n s l a t e s to a A P o f 0.03 which w i l l be
measured w i t h an S-type p i t o t and a 0-0.25" low range manometer. A t o t a l of
t h r e e EPA Method 5X tests and e i g h t e e n EPA Method 25 tests w i l l be performed
a t t h i s location.
V i s i b l e emiss ions from t h e sc rubber o u t l e t w i l l be monitored accord ing t o
EPA Method 9. Readings w i l l be taken by a c e r t i f i e d observer a t 15 second
i n t e r v a l s t o be averaged for a 6 consecut ive minute p e r i o d . V i s i b l e
3 2

I 1 I I I I I I I 1 1 I I t I 1 I I I
APPENDIX K.3 ASSOCIATED CORRESPONDENCE

reply Io: WEST W A S I mtCI IuIYML LCIY u Cn Engineering Experiment Slalion
Oregon State University. Corvallis. Oregon 97331 Phone: 503 754-2015
NATIONaL COUNCIL OF THE PAPER INDUSTRY FOR AIR AND STREAM IMPROVEMENT, INC.
October 2 , 1 9 8 1
Mr. Clyde E. R i l e y F i e l d Tesc ing S e c t i o n Emission Measurement Branch Environmental P r o t e c t i o n Agency Research T r i a n g l e P a r k , NC 27711
Dear Gene:
H i t c h S t e f f e n s o n of t h e G e o r g i a - P a c i f i c C o r p o r a t i o n was good enough t o forward a copy of t h e d r a f t r e p o r t b y your c o n t r a c t o r , TRC, c o v e r i n g t h e sampling e f f o r t a t t h e G e o r g i a - P a c i f i c , S p r i n g f i e l d , Oregon v e n e e r d r y e r d u r i n g t h e week o f J u n e 9 . 1981. The f o l l o w i n g are my comments o n t h i s r e p o r t , a s you r e q u e s t e d .
.” 1. The d u c t diameter used by TRC i n c a l c u h t i n g the i n l e t gas f low t o t h e s c r u b b e r is i n c o r r e c t . TRC used a ducc d i a m e t e r of 38 i n . , whereas I measured it to be 35 1 J 4 in. Mitch S t e f f e n s o n h a s t o l d m e t h a t t h e nominal d u c t d i a m e t e r is 36 in. The mass emiss ion r a t e s c a l c u l a t e d i n t h e r e p o r t should b e a d j u s t e d a c c o r d i n g l y .
The s t a c k f low r a c e s r e p o r t e d f o r t h e s c r u b b e r o u t l e t a r e q u e s t i o n a b l e . Durinp: t h e t e s t s . t h e EPA-5 t r a i n o p e r a t o r s a i d c h a t n e g a t i v e f l o w s were
2 . -
b e i n g e x p e r i e n c e d . s h e e t s , n o r were they accounted f o r i n t h e c a l c u l a t i o n . I n f u r c h e r sampling a t t h i s s o u r c e w e have found t h a t t h e s t a c k v e l o c i t i e s measured
These n e R a t l v e f lows were not e n t e r e d o n t o t h e d a t a
a r e a f f e c t e d b y wind blowing a c r o s s t h e l a r g e diameter s t a c k . of t h e s e measurement problems, t h e s c r u b b e r o u t l e t f low rates should n o t be c o n s i d e r e d v a l i d . T h i s c o n t r o l sys tem is r e l a c i v e l y f r e e of l e a k s and t h e o u t l e t f l o w s a r e e s s e n c i a l l y t h e same a s t h e i n l e t f l o w s . The i n l e t f l o w s should be used t o c a l c u l a t e mass e m i s s i o n r a t e s . Scrubber e f f i c i e n c i e s should b e e s t i m a t e d from changes i n c o n c e n t r a t i o n of t h e c o n s t i t u e n t s measured.
A thorough d i s c u s s i o n of t h e p o t e n t i a l i n t e r f e r e n c e s t o t h e EPA-25 samples e x p e r i e n c e d d u r i n g c h i s sampl ing e f f o r t s h o u l d b e i n c l u d e d in t h e r e p o r t . h i g h e r t h a n t h e i n l e t c o n c e n t r a t i o n s needs e x p l a n a t i o n . p o i n t is t h a t o n l y f o r t h e t h i r d tes t was che c o n n e c t i o n between t h e EPA-25 and t h e 5-X t r a i n s a l lowed t o thoroughly d r y a f t e r b e i n g r i n s e d w i t h
o r g a n i c compounds a c r o s s t h e s c r u b b e r , and is l i k e l y t h e only v a l i d tes t .
Because
3 .
The f a c t t h a t o u t l e t t o t a l o r g a n i c compound c o n c e n t r a t i o n s were A s i g n i f i c a n t
-. The t h i r d t e s t v a s the o n l y t es t t o show a r e x o v a l o f t o t a l
IC- IO

,C. E. Ri ley I October 2 , 1981
Page 2 , '
4 . The TRC EPA-25 d a t a should not be used i n c a l c u l a t i n g t o t a l o rganic compound average emissions unc i1 i t can be determined why t h e TRC da ta was s i g n i f i c a n t l y d i f f e r e n t than t h a t obtained by PSC and NCASI.
For your r e f e r e n c e , my previous comments concerning t h i s sampling e f f o r t a r e enclosed.
- I f you should have any ques t ions concerning my c o m e n t s , p l ease do not
h e s i t a t e t o c a l l .
S ince re ly ,
/- Vic to r Dal lons Research Engineer
VJD:rg cc: R. 0. B losse r
A. L. Caron H. F. Berger C. G . SFmon M. S t e f f enson V. T r e t t e r
i
I 1 t 1 B I 1 I I 1 I I I f t # I 1 I

L "
Georgia.Pacific Corporation P. 0. B~~ id l e En n e . e e p n 97440 Te&phone (503) 689-1221
I I I t 1 1 I
8 1 1 I 1 I I I
September 2 1 , 1981
Clyde E. R i l e y F i e l d T e s t i n g S e c t i o n Emission Measurement Branch Env i ronmen t a l P r o t e c t i o n Agency Research T r i a n g l e Park, NC 2 7 7 1 1
Dear M r . R i l e y :
Our o f f i c e has conducted a p r e l i m i n a r y assessment o f t he T . R . C . . veneer -d rye r em iss ion r e p o r t , conducted a t the G e o r g i a - P a c i f i c S p r i n g f i e l d Plywood p l a n t . I t i s o u r p resen t o p i n i o n t h a t the r e p o r t shou ld _. n o t be quoted o r c i t e d i n i t s p r e s e n t c o n d i t i o n . The genera l c o n c l u s i o n o f t he Method 25 t e s t r e p o r t i n d i c a t e s t h a t
.~ ths system a t S p r i n g f i e l d i s o p e r a t i n g w i t h a n e g a t i v e e f f i c i e n c y . ' T h i s concept , o f cou rse , i s n o t s u b s t a n t i a t e d by d a i l y o p e r a t i n g '
r e s u l t c . The f i r s t p h y s i c a l example i s t h a t 400 to 1,000 g a l l o n s o f p i t c h i s c o l l e c t e d and burned i n the b o i l e r each month f rom the d r y e r s . The second p h y s i c a l example i s t h a t t he exhaust f l o w ( r e p r e s e n t a t i v e f u g i t i v e s from the a b o r t s tacks were read a t 30% o p a c i t y d u r i n g t h e t e s t ) passes th rough the scrubber system, and when d i s c h z r g e d i s w i t h i n the S t a t e s tandard (average 10% o p a c i t y ) . Thernfore, we f e e l t h a t t h i s r e p o r t as now w r i t t e n would r e s u l t i n s u b s t a n t i a l ha rmfu l i n t e r p r e t a t i o n o f t h e s i n c e r e e f f o r t o u r c o r p o r a t i o n has e x e r t e d t o meet and comply w i t h Oregon's emiss ion r e g u l a t i o n s . Secondly, t h e genera l r e s u l t s o b t a i n e d w i t h the Method 25 o b v i o u s l y i n d i c a t e t h a t t h i s method i s n o t y e t p s r f e c t e d f o r use i n e v a l u a t i n g t h i s emiss ion source. A t t h i s w r i t i n g M r . V i c t o r D a l l o n s has been unab le t o f o r w a r d h i s v iew- p o i n t on t h i s r e p o r t t o o u r group. Therefore, i t i s ou r judgment t h z t these t e s t s m u s t n o t be used f o r development o f new source s tandzrds as they do n o t r e l a t e t o a c t u a l performance.
F o l l o w i n g a r e p o r t i o n s of m a t e r i a l which should be r s - e v a l u a t e d :
1 . Page 4. V i s i b l e emiss ion must be mon i to red a f t e r the d i z i p z - - t i o n o f t he steam, a s t he d i s c h a r g e plume i s always s a t u r z t e d . - .
The equipment must meet an O p a c i t y L tandard i n Origon.

September 2 1 , 1981 h ..J r/& r.'
2 . -
3.
4 .
/1' 6 .
& 3%' 3f Y D .
7.
a.
Paqe 6 , 7 . d e s c r i b e d by u s i n g the " i n l e t g r a i n loading ' ' and " o u t l e t g r a ~ n 1oad.ing" a s parameters t o c a l c u l a t e e f f i c i e n c y . The exhaus t f l o w r a t e s canno t be a c c u r a t e l y measured under the c o n d i t i o n s t h a t e x i s t a t t h e top of thepacked tower. The e f f i c i e n c i e s a r e s i g n i f i c a n t l y d i f f e r e n t i f viewed a s shown on t h e copy of page 7 .
Paqe 9. i s a g a i n i n c o n s i s t e n t w i t h expe r i ence and a l l previous t e s t s .
Page 9 . To s t a t e t h a t t o t a l o r g a n i c compound e f f i c i ency i s
and the f a c t t h a t condensed o r g a n i c m a t e r i a l i s p h y s i c a l l y removed from the sc rubbe r . The informat ion b e t t e r s t a t e s t h a t Method 25 i s no t s u i t e d f o r t e s t i n g t h e s e c o n d i t i o n s .
Page 1 4 , IS. A l l in format ion given t o the t e s t group i n d i c a t e d t h a t t he gas m o i s t u r e c o n t e n t w o u l d be g r e a t e r than 20%. , Therefore , t h e i ndi v i dual t e s t measurement general 1 y show t h a t t h e gas m o i s t u r e c o n t e n t was c o n s i - s t e n t , r a t h e r than i n - c o n s i s t e n t . T h e gas moi s tu re content i s c o n s i s t e n t l y ind ica t ed by t h e s a t u r a t e d gas tempera ture of the exhaus t w h i c h r e f l e c t s the wet bu lb measurement. d u r i n g t h e t e s t ( t e s t i n g f i e l d d a t a s h e e t s o u t l e t ) .
Page 1 5 .
( n o z z l e c l e a n i n g p o r t s ) would be l e s s than four sque re i n c h e s . ) ] The ba l ance o f t h e duc t i s i n good r e p a i r . Having no two s imul taneous t e s t s t h a t a're bo th i s o k i n e t i c , would d i s a l l o w any i n d u s t r y t e s t s submit ted f o r compl iance .
Page 3 0 , 3 3 , 34. The i n l e t d u c t d e s i g n d i ame te r i s 3 6 r a t h e r than 38 i n c h e s , and the a c t u a l two insid-e d iameters a r e 3 5 i nches . This was reconfirmed o n September 18.
Ne feel t h a t t h e system e f f i c i e n c y i s b e t t e r /
1
I To s u g g e s t t h a t the p a r t i c u l a t e e f f i c i e n c y i s nega t ive
-5 .4% i s , a s i t a t e d e a r l i e r , c o n t r a r y t o o p a c i t y
E 1,
This v a r i e d f r o n 1 6 I o F to 170°F
The d u c t system has n o l eaks t h a t could i n c r e a s e ' / L E f l o w 3 , 0 0 0 SCFM. The combined openings i n t h e spray ' d u c t ) b t
P. A b 1'3@ \
I Page 39 . I b e l i e v e t h a t t he f l e x i b l e t e f l o n sample l i n e should b e checked t o see i f i t i s e f f z c c e d by t h e condens ib l e o r - g a n i c s . A l l g a s k e t s made f ro7 n a t u r a l s y n t h e t i c rubbers a r e d e s t r o y e d b y t he o r g a n i c r e s i n a r i d s ( a l l p l a s t i c i z e r s a r e d i s o l v e d ) , and a l l gaske ts made from s y n t h e t i c polymers a r e

,
Clyde E. Riley
September 21, I981 . Page 3 I
P swollen. Due to this one fact, all our test trains have, been a combination of only stainless and glass. Our testing and the ODE@ testings have indicated grain loading on the inlet and outlet generally half o f that obtained in these tests. The WSU report f o r the A P A , on Table 14 , indicated a total Lazeous and Non-Gaseous Fraction equal to 301.5 mg/rn3 which is approximately equal to the particulate and condensible Fraction TRC obtained with the ODEQ Method 7..
e
We will continue t o edit and comment on this report as time allows. B u t again in conclusion, this report as i t stands could lead in our opinion to erroneous conclusions for new source standards and harmful interpretation o f our corporate effort.
Very truly yours,
L. M. Steffensen Product Development Manager
.i
L MS/c r r
cc: Vince Trettcr, Atlanta Phi 1 Wi 1 1 iams, Springfield George Ri tchie, Portland Victor Dallons, NCASI, Corvallis .
. .

WEST COAST 6kcB REGIONAL *'"'?# CENTE Engineering Experiment Station
Oregon Slate Universit Cowallis. OR 9733
(503) 754-201
NATIONAL COUNCIL OF THE PAPER INDUSTRY FOR AIR AND STREAM IMPROVEMENT, INC.
August 1 4 , 1981
M r . C. E. R i l e y Emissions Standards and
Engineering Div is ion ESED (MD-13) Research Tra ingle Park, NC 2 7 7 1 1
Dear Gene:
Here a r e t h e a n a l y t i c a l r e s u l t s of t h e EPA-25 samples taken i n conjunct ion w i t h TRC a t Georgia-Pacific Corp. i n Eugene dur ing the week of 6/9/81 through 6/11/81. p a i r s .
Samples designated A and B are dup l i ca t e
Date Location R e s u l t s (ppm) - Ave . - - B - A - -
6/8 Scrubber i n l e t 1292 1128 1210 Scrubber o u t l e t 1292 1321 1306
6/10 Scrubber inlet 1594 995 1295 Scrubber o u t l e t 1294 1148 1221
6 / 1 1 Scrubber i n l e t 1304 1365 1334 Scrubber o u t l e t 1018 829 924
Although we have confidence i n t h e a n a l y t i c a l r e s u l t s f o r t h e samples analyzed; we f e e l t h e r e s u l t s may not be r e p r e s e n t a t i v e of the source sampled due t o concerns discussed i n my June 1 9 , 1981, le t ter t o you.
S ince re ly ,
d# QKe, Victor J. Dallons Research Engineer
VJD:rg c c : A. L. Caron
R. 0. Blosser H. F. Berger C. G . Simon
K - (5- ~
E I 1 1 1 I I I I 1 I I I I 1 t I

I I I I I I 2 I I I I I
s I
i
Mr. Gene R i l e y Environmental P r o t e c t i o n Agency Office of A i r Q u a l i t y P lann ing and S t a n d a r d s Emission S t a n d a r d s and Eng inee r ing D i v i s i o n ESED. (ND-13) Research T r i a n g l e Pa rk , NC 2 7 7 1 1
Dear Gene:
The f o r e s t p r o d u c t s i n d u s t r y and the NCASI a p p r e c i a t e your e f f o r t s t o i n c l u d e t h e Counc i l i n t h e sampling program by your c o n t r a c t o r TRC a t t h e Georg ia -Pac i f i c venee r d r y e r i n S p r i n g f i e l d , Oregon, d u r i n g t h e week of March 6. 1981. Our coop- e r a t i v e e f f o r t s should produce v a l u a b l e d a t a on veneer d r y e r e m i s s i o n s , t h e i r c o n t r o l . as w e l l as i n f o r m a t i o n on the p r e c i s i o n and a c c u r a c y of EPA method 25 i n t h i s a p p l i c a t i o n . I vas p l e a s e d t h a t our sampling crews were a b l e t o work w e l l t o g e t h e r .
I b e l i e v e t h a t imp lemen ta t ion of t h e f o l l o w i n g recommendations i n t h e p rocedure would improve t h e p r e c i s i o n and a c c u r a c y of t h e sampling e f f o r t and produce r e s u l t s c o n s i s t e n t w i t h t h e i n t e n t t o measure o r g a n i c compounds i n v e n e e r d r y e r emis s ions t h a t are v o l a t i l e a t a t e m p e r a t u r e of 177°C (350'F) and lower.
(1) A l l p o r t i o n s of t h e sampling t r a i n between t h e EPA-5 n o z z l e and t h e EPA-25 t r a i n s shou ld be ma in ta ined a t o r above t h e f i l t e r t e m p e r a t u r e of 1 7 7 O C (350OF). Cold s p o t s between t h e s e two p o i n t s c o u l d resul t i n t h e c o n d e n s a t i o n of o r g a n i c s and t h e i r l o s s p r i o r t o t h e EPA-25 t r a i n s .
(2) A l l p a r t s of t h e sampling t r a i n s h o u l d be c l eaned and h e a t e d p r i o r t o use . During t h e s t u d y a t G e o r g i a - P a c i f i c , S p r i n g f i e l d , t h e manifold t o t h e EPA-25 t r a i n s w a s n o t c l eaned b e f o r e each u s e .
(3) materials a r e being measured. V o l a t i l i z a t i o n of t h e vacuum g r e a s e may con tamina te t h e EPA-25 samples .
( 4 ) Care must be t a k e n t o a s s u r e t h a t a l l a c e t o n e used i n the c l eanup of t h e EPA-5 t r a i n is removed b e f o r e use . The a c e t o n e w i l l c o n s t i t u t e a p o s i t i v e inter- f e r e n c e i n t h e EPA-25 a n a l y s i s . The q u i c k connec t a t t a c h i n g i n t h e EPA-25 mani- f o l d t o t h e EPA-5 t r a i n is a n especial ly d i f f i c u l t place t o remove a c e t o n e from. The spaces i n i t s i n t e r n a l mechanisms canno t be e a s i l y washed. This qu ick connect should be e l i m i n a t e d from t h e sampling system.
(5) The t e f l o n tube connec t ing t h e h o t f i l t e r t o t h e impingers should p robab ly be brushed vhen washing w i t h a c e t o n e . A s i m p l e a c e t o n e r i n s e may n o t be s u f f i - c i e n t t o tho rough ly c l e a n condensed o r g a n i c s from t h e t u b e .
Vacuum g r e a s e shou ld - n o t be u s e d on any sampling t r a i n where o r g a n i c
K - l b

, I
(6) accozd ing t o t h e p r o c e d u r e s d e t a i l e d in t h e Oc tobe r 3 , 1980 F e d e r a l R e g i s t e r . The t r a p bu rnou t system shows s e v e r a l v a l v e s and h e a t t r a c e d l i n e s b e t v e e n the c r y o g e n i c t r a p and t h e o x i d i z e r . These l i n e s were i n d i c a t e d t o be h e a t e d to only-125'C i n t h e TRC system. c o n d e n s a t i o n of o r g a n i c s such a s res in and f a t t y a c i d s commonly found i n v e n e e r d r y e r e m i s s i o n s . During t r a p burnout t h e l i n e s b e t v e e n t h e t r a p t o t h e o x i d i z e r s h o u l d b e hea ted t o 600'C t o i n s u r e complete r ecove ry of t h e sample. is a s i m p l e v a l v i n g d i ag ram t h a t will a l l o w a c w p l e t e bu rnou t of t h e t r a p . s ampl ing l i n e s , and p i p i n g t o t he o x i d i z e r .
Both TRC and P o l l u t i o n C o n t r o l S c i e n c e w i l l be a n a l y z i n g t h e i r samples
T h i s t e m p e r a t u r e is much t o o low t o p r e v e n t
Attached
Implemen ta t ion of t h e above p rocedures s h o u l d enhance t h e i n t e g r i t y of t h e samples i n f u t u r e v e n e e r d r y e r emis s ion sampl ing e f f o r t s . Should you have any q u e s t i o n s c o n c e r n i n g t h e s e s u g g e s t i o n s o r o t h e r conce rns , p l e a s e f ee l f r e e t o c o n t a c t me.
S i n c e r e l y ,
r d- Victor Da l lons Chemical Eng inee r
VD: r c
Enc.
cc: R. B l o s s e r A . Caron 8. Berge r C . Simon E. B r a c k b i l l J. Emery M. S t e f f e n s e n
I I I t 1 I I I 1 I S I I I I I I 2

fn L.7 4 o >. .a E
e 4 0
W

c :'-*r Environmental ' Y b Consultants, Inc.
June 1 7 , 1981
M r . C. E. Ri ley U.S. Environmental P ro tec t ion Agency Room 730 North Carol ina Mutual Bui lding 4 1 1 West Chapel H i l l S t r e e t Durham, NC 27701
Dear Gene:
I 125 Silas Deane Highway Wetherslield CT 06109 (XI31 563-1431
I I I I t a
Subject : Method Developmenr and Tes t ing f o r t h e Plywood/Plpood Veneer Indus t ry EPA Contract 68-02-3543, Work Assignment 1 ESED Pro jec t 80/02 TRC P ro jec t 1460-E80 Revisions t o Georgia-Pacif ic , Sp r ing f i e ld . Oregon, S i t e Test Plan
This l e t t e r p re sen t s f o r rhe record t h e r ev i s ions t o t h e Method 5X and Method 25 a n a l y t i c a l procedures presented i n t h e body of t h e sub jec t t e s t p lan dated June 3, ,1981, and which were discussed during the tests. A l l f u t u r e t e s t p l a n s w i l l incorpora te these r ev i s ions . - I Method 5X I
page 14: Container No. 2 - (D.I. d i s t i l l e d H20 Probe Rinse) - evaporate, des i cca t e , and weigh
Container No. 2a - DELETE
Container No. 4a - DELETE
Method 25
page 25: Prel iminary Sample Tank Analysis
The prel iminary tank a n a l y s i s w i l l be performed a f t e r both of I I I
i t s r e l a t e d condensate t r a p s have been CO purged i n t o t h e tank. This procedure i s being s u b s t i t u t e d f o r &e s t a t e d p res su r i za t ion t o approximately 100 mm Hg w i t h hydrocarbon f r e e a i r i n order to a s su re t h a t both craps can be purged i n t o t h e i r corresponding sample tank. I f t h e rank were t o be prepressur ized t o 100 mm Hg, the p o s s i b i l i t y e x i s t s t h a t p r i o r t o t h e completion of both purges t h e sample tank pressure would reach s y s t e m pressure (= 760 mm Hg gauge) and r e s u l t in an incomplete purge.
Principal Offices: VCethersliele. CT . Englewood. CO
IC- 14

r .-
June 17, 1981 -2- TRC P ro jec t 1460-E80
1 I l a
page 25: Nonmethane Organic Analysis Procedure
The s t a t e d condensate t r a p C02 purge procedure w i l l be f u r t h e r modified a l s o t o assu re t h a t the sample tank pressure does not reach system pressure. Af t e r t h e t r a p has been bypassed, t h e c a r r i e r gas flow w i l l cont inue through t h e system and i n t o t h e tank f o r approximately f i v e minutes. It wil l then be vented t o atmosphere through t h e va lve loca ted downstream of t h e NDIR (Figure 3-7, page 23). This time period will be s u f f i c i e n t t o purge the in te rconnec t ing tub ing and NDIR c e l l volume. P r i o r t o resuming flow through t h e condensate t r a p , the va lve will be switched t o aga in in t roduce t h e flow i n t o t h e sample tank.
I f you have any ques t ions o r require f u r t h e r c l a r i f i c a t i o n , don’t h e s i t a t e to contact me. b
1 . I 1 I
.I I 1 C 1 r
EABIjjs cc: David Robinson, PCS
Stefan Wawzyniecki, TRC
Very t r u l y yours,
TRC-Environmental Consul tants , Inc.
51~3 - - \
Eugene A. Brackbi l l , P.E. P r o j e c t Manager
14 -20

. . . . .
. . . . : . . M r . Pau'l W i l l h i t e : ,
D e l Green A s s o c i a t e s . InC. 1535 N. P a c i f i c Highway Woodburn, OR 97071
Dear P a u l :
RE: Upcoming Source T e s t s a t ' t - P S p r i n g f i e l d
The e n c l o s e d D r a f t T e s t P lan was r e l e a s e d by EPA o n F r i d a y . It i s s t i l l a d r a f t , b u t o n l y m i n o r changes w i l l be made.
E e r t C h e s s i n i s g o i n g ' t o c o n t a c t you from Nontana r e g a r d i n g t h e t i m e t o meet a t t h e p l a n t on June 7 , b u t I am s u r e i t w i l l be i n t h e a f t e r n o o n s i n c e T R C w o n ' t a r r i v e u n t i l then. By copy o f t h i s l e t t e r , I am r e v i e w i n g R T I ' s r e s p o n s i b i l i t i e s f o r B e r t a l s o .
d u r i n g t h e t e s t s . T h i s means:
r.
. .
You and B e r t w i l l . be r e s p o n s i b l e f o r m o n i t o r i n g p r o d u c t i o n v a r i a b l e s _ _
1. Measur ing a c t u a l d r y e r p r o d u c t i o n d u r i n g each t e s t . p r o d u c t i o n f i g u r e s reduced t o t h e t i m e f rame of t h e t e s t w i l l n o t be
The use o f d a i l y -
c l o s e enough. found t h a t measur ing t h e h e i g h t and w i d t h o f each p a l l e t o f wet veneer as i t came up t o t h e d r y e r was 2 good method. I f Y O U s t a r t
You and B e r t can d i s c u s s methods on Sunday, b u t we
measur ing and u t i n g p a l l e t s - : l 5 - 3 0 m i n i t e s b e f o r e t h e t e s t s t a r t s , thni we w i l l know what i s i n t h e d r y e r a t t n e s t a r t nf t p Z t i ng. be TCFE L O measure t h e s t a c k s o t veneer b e i n g f e d t o t h e d r y e r s a t t h e inornent t s t i n g s t a r t s . You and T R C s h o u l d E i t h e r agree i n advance on
&me f o r t h e s e w U Q T a T k i e - t a l k i e . tror t h e r o o f . No te t h a t each t e s t i s T I I ~ t o f a s t Yb m i n u t e s , but t M l i t e l l s me t h a t 3 h o u r s i s more r e a l i s t i c g i v e n a l l t h e equipment t h e y ' l l be u s i n g . I 'recommend t h a t y o u c o n t i n u a l l y count p r o d u c t i o n u n t i l t h e t e s t i s over , even i f T i l C s t o p s t e m p o r a r i l y i n m i d - t e s t . s y n c h r o n i z e s watches eve ry day ! be forehand. f o r each ;est :
P l e a s e be s u r e t h a t ~ e v e r y o n e You and B e r t can c r e a t e d a t a forms
I n a d d i t i o n t o veneer p r o d u c t i o n , y g u s h o y l d a l s o r e c o r d
Vood t y p e , t h i c k n e s s and w i d t h tem:erature o f each zone s:eai;! r a t e t o d r y e r s ( i f a v t i l a b l e ) r e d r y c o n t r o l l e r s e t t i n g s ( % , r e d r y ) m o i s t u r e l e v e l s e t t i n g cf r e d r y c o n t r o l l e r dry i n g t i ne
. ..
F i n a l l y , io h e l p i n i r i t e r p r e i i n g t h e d a t a ; ~ i t . w w l d be aoo6 :o k~ic:.. !!le histcmry o f each d r y e r : me;:? m d e l , t y > e , ma in tenance h i s t o r y , r?bc:lds, e:c.
IC -a\
I 1 I .I I I ' I I! I I I I t I I 1 I 1 I

1 I I I I I E l 1 I I I I I 1 1 c
2.
3.
4.
F l o n i t o r i n g f u g i t i v e emiss ions . The T e s t P l a n i n c o r r e c t l y s t a t e s t ha t F!TI/Del Green w i l l use EPA I'lethod 22. Ra the r , YOU s h o u l d wa lk around each d r y e r a t some i n t e r v a l (e.g., t w i c e p e r da;) and make no tes on f u g i t i v e s f r o m doors , s k i n s , ends, e t c . Your e x p e r i e n c e , ,Pau l , w i l l b e h e l p f u l i n a s s e s s i n g t h e r e l a t i v e e x t e n t o f f u g i t i v e s . know t h e number o f doors h a v i n g s i g n i f i c a n t l e a k s and t h e t o t a l number o f doo rs and s k i n l e a k s f o r e a c h . . d r y e r . f o r l e a k s a t t h e a b o r t s tacks .
We need t o
You s h o u l d a l s o check
. .
N o t i f y i n g TRC t o s t o p t e s t i n g i n even o f s e r i o u s process d is tu rbance. ' T h i s r e s p o n s i b i l i t y i s u l t i m a t e l y B e r t ' s " . Such a d i s t u r b a n c e would i n c l u d e a d r y e r f i k . enough t o s t o p t e s t s wou ld be when one d r y e r was a l r e a d y down and a second one came down d u r i n g t h e t e s t . I n g e n e r a l , a v o i d s t o p p i n g a t e s t i f a t a l l p o s s i b l e . d r y e r and G-P opens t h e doors and c u t s steam t o c o o l i t dow'n, I b e l i e v e t h e t e s t c o u l d go on; M i t c h S t e f f e n s o n says t h e sc rubber i n l e t f l o w r a t e and te inge ra tu re wou ld n o t change s i g n i f i c a n t l y i n such a case. You and B e r t shou ld use y o u r judgement i n such a c a s e - - i f t h e t e s t were n e a r c o m p l e t i o n and wou ld a1,ready y i e l d usab le da ta , i t m i s h t pay t o s t o p ; if s e v e r a l hou rs or a day wou ld be l o s t by s t o p p i n g i t wou ld p r o b a b l y be O.K. t o c o n t i n u e t e s t i n g .
Ano the r s j t u a t i o n wh ich m i g h t be serious
Even i f a s e r i o u s p lug -up occu rs i n one
F ieesur ing ambien t t empera tu re and r e l a t i v e h u m i d i t y . You and B e r t w i l l be r e s p o n s i b l e f o r measur ing o u t s i d e t e m p e r a t u r e and r e l a t i v e h u m i d i t y . These measurements can b e s t b e made b e f o r e and a f t e r each t e s t t o a v o i d i n t e r f e r i n g w i th y o u r o t h e r d u t i e s .
TRC w i l l p r o v i d e a thermometer and a s l i n g p s y c h r o i w t e r .
I t i s i m p o r t a n t t h a t y o u and B e r t r u n t h r o u g h a p r a c t i c e t e s t on I4onday t o viork o u t any problems b e f o r e t h e a c t u a l t e s t s on Tuesday. . A l s o , p l e a s e make sure y o u unders tand t h e l i n e o f c o m u n i c a t i o n . I f a s e r i o u s p r o b l e n occurs or you heve a q u e s t i o n , p l e a s e d i s c u s s i t w i th Gene R i l e y o f EMS ahd /o r S k i p 3 r a c k b i l l o f TKC (See paces 1 -2 o f t h e D r a f t T e s t Plan. ' ) F e e l f r e e t o c a l l me a t i ,mrk ( 9 1 9 ) 541-6796 or home (919) 929-2748 i f y o u - w i s h t o di 'scuss a n y t h i n g b e f o r e o r d u r i n g t h e t e s t i n g .
Thank you f o r y o u r h e l p on t h i s t e s t and on t h e o t h e r m a t t e r s we have d i scussed .
S i n c e r e l y ,
#aAe J . 1.1. I i c t a r r h y P r o j e c t Leader
. ,.

Environmental Consultants, Inc.
Hay 22, 1 9 8 1
125 Silas Deane Highway Wethersfield CT 06109 (203) 553.1431
Mr. Gary HcdiSteK U.S. Envi romen ta l P r o t e c t i o n Agency OAQPS /ES ED/ -19 Research Tr iangle Park , NC 2 7 7 1 1
Dear Gary:
Subject : Method Development and Tes t ing f o r t h e Plyuood/Plywood Veneer Indus t ry EPA Con t rac t 68-02-3543, Work Assignment 1 ESED P r o j e c t 80102 TRC P r o j e c t 1460-E80 Laboratory S e l e c t i o n f o r Comparative Method 25 Analyses
This l e t t e r reviews a n d supplements OUT te lephone d i scuss ion of Tuesday, May 1 9 , regarding t h e s e l e c t i o n of a l a b o r a t o r y t o p a r t i c i p a t e i n t h e a n a l y s i s of t h e Method 25 samples which will b e c o l l e c t e d during t h e f i r s t method development cest program a t Georgia-Pac i f ic , S p r i n g f i e l d , Oregon. The d iscuss ion w a s p red icaced by my te lephone conversa t ion w i t h Gene Riley on Friday, May 15. during which he informed m e that had decided t o s e l e c t M i d w e s t Research I n s t i t u t e (MRI). you had recommended P o l l u t i o n Control Sc ience , Inc. (PCS). Our conversa t ion Tuesday seemed t o i n d i c a t e that a f i n a l d e c i s i o n has n o t been made. I s t i l l be l i eve t h a t PCS r e p r e s e n c s t h e b e t t e r s e l e c t i o n and would l i k e t g take t h e oppor tuni ty t o f u r t h e r e x p l a h why.
My understanding i s t h a t PIB f avor s s e l e c t i n g MRI p r imar i ly because they
modified Dohrmann DC-50 water t o t a l o r g a n i c carbon (TOC) ana lyzer . F igures 1 and 2. while TRC. and PCS. u s e an ana lyze r assembled t o e s s e n t i a l l y resemble t h e scheme depic ted in t h e published method, F igure 3. The i n t e n t is t o compare a g a i n s t MRI's Method 25 "equivalent" scheme a s a means f o r determining whether t h e publ ished method i s a p p l i c a b l e . I do n o t b e l i e v e t h a t such an a n a l y s i s comparison vi11 n e c e s s a r i l y be conclus ive when i n a c t u a l i t y a t h i r d v a r i a b l e i s be ing introduced; t h a t is, one sampling procedure and two d i f f e r e n t a n a l y s i s procedures . I f a comparison is performed wi th PCS, there a r e only two v a r i a b l e s - the sampling procedure a n d e s s e n t i a l l y t h e same a n a l y s i s procedure. This would be f a r more conclus ive a s t o t h e published method's a p p l i c a b i l i t y . determine?
1
My lecter of May 8 addressed t o
u s e a somewhat d i f f e r e n t a n a l y s i s approach. S p e c i f i c a l l y , t hey u s e a .
I s n ' t t h a t in f a c t what w e a r e t r y i n g t o
Principal Offices: Vlelherslield.CT . Englewood.CO
I<- a3

i- I I I I I I I I I I I I I I I 11 I 1
1
Mr. Gary UcAl is te r -2- May 22, 1981
In a comparison wi th PCS, d e f i n i t i v e conc lus ions r ega rd ing t h e publ i shed method could be d r a m . If both show a c c e p t a b l e p r e c i s i o n , t h e method 's a p p l i c a b i l i t y is s u b s t a n t i a t e d . Conversely, if n e i t h e r show a c c e p t a b l e p rec i s ion , t h e r e i s a h i g h p r o b a b i l i t y t h a t t h e publ i shed method is unsui tab le . It would then seem more a p p r o p r i a t e t o i n v e s t i g a t e t h e MRI
o r t h e PCS r e s u l t s i n d i c a t e d a c c e p t a b l e p r e c i s i o n , one could s t i l l conclude that t h e publ ished method is a p p l i c a b l e and a t t r i b u t e t h e unacceptab le r e s u l t s t o a s y s t e m a t i c ana lyze r o r p rocedura l f a u l t . Th i s in i t s e l f could be b e n e f i c i a l in t h a t i t would f u r t h e r add t o working knowledge of t h e method by i d e n t i f y i n g t h e f a u l t s .
A comparison w i t h t h e NRI "equivalent" procedure would be f a r less con- c l u s i v e except f o r t h e case where bo th show a c c e p t a b l e p r e c i s i o n . o b t a i n s a c c e p t a b l e p r e c i s i o n but w e d o n ' t , a l l that can be concluded is t h a t t h e i r a n a l y s i s scheme i s a p p l i c a b l e . The fundamental ques t ion regard- ing t h e publ i shed method ' s a p p l i c a b i l i t y cannot be d e f i n i t i v e l y answered because t h e p o s s i b i l i t y of a TRC s y s t e m a t i c e r r o r could s t i l l exist. Likewise, if TRC showed p r e c i s i o n and MRI d i d n ' t , one could conclude that t h e publ ished method is a p p l i c a b l e b u t , in v i e w of an MRI sys t ema t i c e r r o r , i t would be u n f a i r t o conclude that t h e i r "equiva len t" method is unacceptab le . A g r e a t e r dilemma exists if both sets of r e s u l t s showed unaccep tab le r e s u l t s because I don ' t b e l i e v e any conc lus ions cou ld be s u b s t a n t i a t e d .
I have c o n t i n u a l l y r e f e r r e d t o t h e "publ ished" method and have t h e r e f o r e a f forded i t c o n s i d e r a b l e s i g n i f i c a n c e . Although t h e HRI a n a l y z e r has been termed a s "equivalent ." I t h i n k i t r e p r e s e n t s a r a d i c a l enough d e p a r t u r e t o be termed a d i f f e r e n t method. obvious. If a comparison v i t h MRI i n d i c a t e s t h a t the publ i shed method is unsu i t ab le , e i t h e r Method 25 has t o b e t o t a l l y rewritten t o make t h e modified Dohrnam a n a l y t i c a l scheme the primary approach f o r a l l VOC s o u r c e s o r t h e plyvood i n d u s t r y is s o l e l y sub jec t ed t o t h e scheme. The la t te r i s n ' t c o s t - e f f e c t i v e since i t would r e q u i r e companies involved in VOC sampling t o have tw d i f f e r e n t a n a l y z e r s (three if one c o n s i d e r s t h e Method 25A t o t a l
equivalent" procedure should t h i s occur . Add i t iona l ly , if on ly t h e TRC 11
I f MRI
The p o t e n t i a l r a m i f i c a t i o n s should be
hydrocarbon ana lyze r approach) . . The foregoing has not been in tended t o s l i g h t t h e c a p a b i l i t i e s of MRI o r t h e i r a n a l y t i c a l p rocedure in any way. As w e are a l l aware, t h e i r a u d i t r e s u l t s and o t h e r pub l i shed comparat ive t e s t d a t a a r e env iab le . b e l i e v e that the a t t e n t i o n should f i r s t b e focused on t h e publ i shed method t o more c o n c l u s i v e l y de t e rmine i t s a p p l i c a b i l i t y .
Obviously, I am w i l l i n g t o f u r t h e r d i s c u s s t h i s matter. I look forward t o r ece iv ing EMB's d e c i s i o n a s it is of c r i t i ca l importance t o the r a p i d l y approaching s t anda rd development test program.
I simply
V e r g t r u l y yours ,
C-Environhental Consu l t an t s , Inc .
L Q I L M E u i 9 e A. 'Brackbi l l , P.E. Pro ect Manager
EAB:ces cc: Mr. C. E. R i l ey , USEPA
.