0._vaw_study_main_report_0.pdf - UNFPA Asia-Pacific ...
502
MINISTRY OF PLANNING AND INVESTMENT GENERAL STATISTICS OFFICE MINISTRY OF LABOUR, INVALIDS AND SOCIAL AFFAIRS
-
Upload
khangminh22 -
Category
Documents
-
view
1 -
download
0
Transcript of 0._vaw_study_main_report_0.pdf - UNFPA Asia-Pacific ...

MINISTRY OF PLANNING AND INVESTMENTGENERAL STATISTICS OFFICE
MINISTRY OF LABOUR, INVALIDS AND SOCIAL AFFAIRS

2
I say this to other women, “If you feel like you can endure then endure,
otherwise find a way to live for yourself. We should not be so afraid of
the stigma of leaving husbands that we bury ourselves in a prison.”
―IDI 27 Woman, aged43, responding to qualitative survey
as part of the National Study on Violence against Women in Viet Nam 2019
MINISTRY OF LABOR, INVALIDS AND SOCIAL AFFAIRS
12 Ngo Quyen, Hoan Kiem, Ha Noi
GENERAL STATISTICS OFFICE OF VIET NAM
54 Nguyen Chi Thanh, Dong Da, Ha Noi
UNITED NATIONS POPULATION FUND IN VIET NAM
304 Kim Ma, Ba Dinh, Ha Noi
MOLISA, GSO and UNFPA (2020), Results of the National Study on Violence against Women in Viet Nam 2019 - Journey for Change.

iv
TABLE OF CONTENT
Foreword xi
Acknowledgements xiii
Acronyms and abbreviations xiv
Executive summary xv
1. Introduction 1
1.1. Violence against women 1
1.2. Geographic and demographic context 5
1.3. What is known on violence against women in Viet Nam? 6
2. Research objectives and methodology 8
2.1. Quantitative component 10
2.1.1. Questionnaire 10
2.1.2. Operational definitions of different types of violence 11
2.1.3. Reference periods for the experience of violence 14
2.1.4. Definition of a husband/partner 15
2.1.5. Interviewer selection and training 15
2.1.6. Fieldwork 16
2.1.7. Ethical and safety considerations 17
2.1.8. Quality control mechanisms 18
2.1.9. Data processing and analysis 18
2.2. Qualitative component 19
2.2.1. Qualitative research approaches 19
2.2.2. Sample 20
2.2.3. Fieldwork 21
2.2.4. Qualitative data analysis 22
3. Response rates and description of the survey sample 23
3.1. Response rates 23
3.2. Description of the respondents in the sample 23

ii
3.3. Representativeness of the sample 26
3.4. Effect of selection probability on findings 27
3.5. Participation bias 27
3.6. Respondents’ satisfaction with interview 27
4. Violence against women by a husband/partner 29
4.1. Physical violence 31
4.2. Sexual violence 38
4.3. Physical and/or sexual violence as a main indicator for violence by a husband/partner 41
4.4. Emotional violence 42
4.5. Overlap of physical, sexual and emotional violence by a husband/partner 46
4.6. Controlling behaviours 47
4.7. Economic violence 49
4.8. Violence by a husband/partner by ethnicity 51
5. Violence against women by others (non-partners) 59
5.1. Physical violence by non-partners since age 15 60
5.2. Sexual violence by non-partners since age 15 63
5.3. Other forms of sexual harassment and abuse 66
5.4. Sexual abuse in childhood before age 15 67
5.5. Forced first sex 68
5.6. Comparison of violence by a husband/partner and violence by a non-partner since age 15 70
6. Women with a disability and their experiences of violence 71
7. Attitudes and perceptions about gender and husband/partner violence 76
7.1. Women’s attitudes towards gender roles and violence 76
7.2. Perceived triggers for physical violence 82
8. Impact of husband/partner violence on women’s health 84
8.1. Injuries due to violence by a husband/partner 84
8.2. Impact of violence by a husband/partner on general health 86
8.3. Husband/partner violence and mental health 87
8.4. Impact of violence by a husband/partner on reproductive health 88

iii
9. Impact of violence by a husband/partner against women on their children, and the
intergenerational aspects of violence 90
9.1. Husband/Partner violence and the health of children 90
9.2. Children witnessing violence as mentioned by women 91
9.3. Intergenerational violence 93
10. Women’s responses to violence by a husband/partner and their coping strategies 95
10.1. Who women tell about violence and who helps 95
10.2. Agencies or authorities to which women turn for support 98
10.3. Leaving home due to the violence 101
10.4. Fighting back 102
10.5. Women’s own descriptions of their coping strategies 102
10.6. Women’s opinions on factors that protect against violence by a husband/partner 106
11. Economic costs of violence against women in Viet Nam 109
11.1. Methodology 110
11.2. Economic activity and earnings 111
11.3. Prevalence of violence among working women 114
11.4. Costs incurred due to husband/partner violence 115
11.4.1. Out-of-pocket expenditures 115
11.4.2. Indirect/opportunity cost: missed work and care work 116
11.4.3. Productivity loss for the economy 117
11.5. National estimates of costs for Viet Nam economy 119
11.6. Comparison of results to other studies and with the 2012 costing study in Viet Nam 120
12. Risk factors associated with violence against women by a husband/partner 122
12.1. Method used for risk-factor analysis 122
12.2. Risk factors for currently experiencing violence by a husband/partner against women 126
12.3. Risk-factor analysis: discussion and conclusions 134
13. Comparison of violence against women between 2010 and 2019 144
13.1. Husband/partner violence 147
13.2. Non-husband/partner violence 152

iv
13.3. Attitudes to gender roles 153
13.4. Risk-factor analysis: discussion and conclusions 156
14. Conclusions and recommendations 157
14.1. General conclusions 157
14.2. Partner violence in Viet Nam and other countries in Asia and the Pacific 158
14.3. Recommendations and policy implications 160
References 171
ANNEXES 175
Annex I: Research team, field staff and task force members 175
Annex II: Glossary of terms 180
Annex III: Sample design and weighting 184
Annex IV: Economic costs of physical and/or sexual violence 189
Annex IVa : Estimation notes 208
Annex V: Definition of disability 212
Annex VI: Method to Develop a Household Assets Index for the Viet Nam Violence against Women
Study 214
Annex VIIa: Questionnaire 227
Annex VIIb: Differences between Viet Nam's questionnaire version 2010 and 2019 316
Annex VIII: Data tables 318

v
List of figures
Figure 1: Overlap among violence against women, gender-based violence, domestic violence and intimate partner
violence against women 2
Figure 2: Illustration of the type of intimate partner and non-partner violence measured in the survey 10
Figure 3: Illustration of the pictures used for anonymous disclosure of sexual abuse before the age of 15. 15
Figure 4: Frequency distribution of respondents by region, all women (unweighted), Viet Nam 2019 (N=5,976) 25
Figure 5: Age distribution of respondents by husband/partner status, Viet Nam 2019 (all women N=5,976, ever-
married/partnered N=5,553) 26
Figure 6: Proportion of women earning money by herself and the way they are earning money, among all women,
Viet Nam 2019 (N=5,976) 27
Figure 7: Age distribution of respondents in the sample and the population aged 15 to 64 years (2009 Census), Viet
Nam 2019 28
Figure 8: Women’s satisfaction upon completion of the interview, according to experience of violence by a
husband/partner, Viet Nam 2019 (N=5,976) 29
Figure 9: Prevalence of physical, sexual, emotional, and economic violence, and controlling behaviours by
husband/partner during lifetime and the last 12 months among ever-married/partnered women, Viet Nam 2019
(N=5,553) 31
Figure 10: Prevalence of physical violence by a husband/partner during lifetime and in the last 12 months among
ever-married/partnered women by location, Viet Nam 2019 (N=5,553) 33
Figure 11: Prevalence of physical violence by a husband/partner during lifetime and in the last 12 months among
ever-married/partnered women by age group, Viet Nam 2019 (N=5,553) 34
Figure 12: Prevalence of physical violence by a husband/partner during lifetime and in the last 12 months among
ever-married/partnered women by education level, Viet Nam 2019 (N=5,553) 34
Figure 13: Prevalence of specific acts of physical violence by a husbands/partner, as occurred during lifetime and in
the last 12 months, among ever-married/partnered women, Viet Nam 2019 (N=5,553) 35
Figure 14: Frequency distribution of number of times specific acts of physical violence by husband/partner happened
during lifetime, among ever-married/partnered women who experienced such acts, Viet Nam 2019 36
Figure 15: Lifetime prevalence of physical violence by a husband/partner among ever-married/partnered women by
severity, total and by age group, Viet Nam 2019 (N=5,553) 37
Figure 16: Proportion of women who reported physical violence in pregnancy among ever-pregnant women, Viet Nam
2019 (N=5,236) 38
Figure 17: Prevalence of sexual violence by a husband/partner during lifetime and in the last 12 months among ever-
married/partnered women by location, Viet Nam 2019 (N=5,553) 39
Figure 18: Prevalence of sexual violence by a husband/partner during lifetime and in the last 12 months among ever-
married/partnered women by age group, Viet Nam 2019 (N=5,553) 40
Figure 19: Prevalence of sexual violence by a husband/partner during lifetime and in the last 12 months among ever-
married/partnered women by education level, Viet Nam 2019 (N=5,553) 40
Figure 20: Prevalence of specific acts of sexual violence by husband/partner, during lifetime and the last 12 months
among ever-married/partnered women, Viet Nam 2019 (N=5,553) 41
Figure 21: Frequency distribution of number of times of specific acts of sexual violence by a husband/partner
happened during lifetime, among ever-married/partnered women who have experienced such acts, Viet Nam 2019
41
Figure 22: Prevalence of physical and/or sexual violence by a husband/partner during lifetime and in the last 12
months among ever-married/partnered women by location, Viet Nam 2019 (N=5,553) 42
Figure 23: Prevalence of physical and/or sexual violence by a husband/partner during lifetime and in the last 12
months among ever-married/partnered women by age group, Viet Nam 2019 (N=5,553) 42
Figure 24: Prevalence of emotional violence by a husband/partner during lifetime and in the last 12 months among
ever-married/partnered women by location, Viet Nam 2019 (N=5,553) 43
Figure 25: Prevalence of emotional violence by a husband/partner during lifetime and in the last 12 months among
ever-married/partnered women by age group, Viet Nam 2019 (N=5,553) 44

vi
Figure 26: Prevalence of emotional violence by a husband/partner during lifetime and in the last 12 months among
ever-married/partnered women by education level, Viet Nam 2019 (N=5,553) 44
Figure 27: Prevalence of specific acts of emotional violence by a husband/partner, as occurred during lifetime and in
the last 12 months, among ever-married/partnered women, Viet Nam 2019 (N=5,553) 45
Figure 28: Frequency distribution of number of times specific acts of emotional abuse by a husbands/partner during
lifetime happened, among ever-married/partnered women who have experienced such acts, Viet Nam 2019 46
Figure 29: Overlap of the prevalence of physical, sexual and/or emotional violence by a husband/partner among ever-
married/partnered women, Viet Nam 2019 (N=5,553) 47
Figure 30: Prevalence of controlling behaviours by a husband/partner during lifetime and in the last 12 months among
ever-married/partnered women by location, Viet Nam 2019 (N=5,553) 48
Figure 31: Prevalence of specific acts of controlling behaviour by a husband/partner, as occurred during lifetime and
in the last 12 months, among ever-married/partnered women, Viet Nam 2019 (N=5,553) 48
Figure 32: Prevalence of economic abuse by a husband/partner during lifetime among ever-married/partnered
women, by age, Viet Nam 2019 (N=5,553) 49
Figure 33: Prevalence of economic abuse by a husband/partner during lifetime among ever-married/partnered
women, by education level, Viet Nam 2019 (N=5,553) 50
Figure 34: Prevalence of specific acts of economic abuse by a husband/partner, as occurred during lifetime, among
ever-married/partnered women, Viet Nam 2019 (N=5,553) 50
Figure 35: Prevalence of physical violence by a husband/partner during lifetime among ever-married/partnered
women by ethnicity, with upper and lower 95 per cent confidence intervals, Viet Nam 2019 (N=5,553) 52
Figure 36: Prevalence of physical violence by a husband/partner in the last 12 months among ever-married/partnered
women by ethnicity, with upper and lower 95 per cent confidence intervals, Viet Nam 2019 (N=5,553) 53
Figure 37: Prevalence of sexual violence by a husband/partner during lifetime among ever-married/partnered women
by ethnicity, with upper and lower 95 per cent confidence intervals, Viet Nam 2019 (N=5,553) 53
Figure 38: Prevalence of sexual violence by a husband/partner in the last 12 months among ever-married/partnered
women by ethnicity, with upper and lower 95 per cent confidence intervals, Viet Nam 2019 (N=5,553) 54
Figure 39: Prevalence of physical and/or sexual violence by a husband/partner during lifetime among ever-
married/partnered women by ethnicity, with upper and lower 95 per cent confidence intervals, Viet Nam 2019
(N=5,553) 54
Figure 40: Prevalence of physical and/or sexual violence by a husband/partner in the last 12 months among ever-
married/partnered women by ethnicity, with upper and lower 95 per cent confidence intervals, Viet Nam 2019
(N=5,553) 55
Figure 41: Prevalence of emotional violence by a husband/partner during lifetime among ever-married/partnered
women by ethnicity, with upper and lower 95 per cent confidence intervals, Viet Nam 2019 (N=5,553) 55
Figure 42: Prevalence of emotional violence by a husband/partner in the last 12 months among ever-
married/partnered women by ethnicity, with upper and lower 95 per cent confidence intervals, Viet Nam 2019
(N=5,553) 56
Figure 43: Prevalence of controlling behaviours during lifetime among ever-married/partnered women by ethnicity,
with upper and lower 95 per cent confidence intervals, Viet Nam 2019 (N=5,553) 56
Figure 44: Prevalence of controlling behaviours in the last 12 months among ever-married/partnered women by
ethnicity, with upper and lower 95 per cent confidence intervals, Viet Nam 2019 (N=5,553) 57
Figure 45: Prevalence of economic violence by a husband/partner during lifetime among ever-married/partnered
women by ethnicity, with upper and lower 95 per cent confidence intervals, Viet Nam 2019 (N=5,553) 57
Figure 46: Prevalence of economic violence by a husband/partner in the last 12 months among ever-
married/partnered women by ethnicity, Viet Nam 2019 (N=5,553) 58
Figure 47: Prevalence of physical violence by non-partner, since age 15 and in the last 12 months, among all women,
by location, Viet Nam 2019 (N=5,976) 60
Figure 48: Prevalence of physical violence by a non-partner. since age 15 and in the last 12 months, among all
women, by age, Viet Nam 2019 (N=5,976) 61
Figure 49: Distribution of frequency of physical violence by a non-partner among all women who experienced such
violence, Viet Nam 2019 (N=630) 61

vii
Figure 50: Prevalence of sexual violence by a non-partner, since age 15 and in the last 12 months, among all women,
by location, Viet Nam 2019 (N=5,976) 63
Figure 51: Prevalence of sexual violence by a non-partner, since age 15 and in the last 12 months, among all women,
by age, Viet Nam 2019 (N=5,976) 64
Figure 52: Distribution of frequency of sexual violence by a non-partner, since age 15, among all women who
experienced such violence, Viet Nam 2019 66
Figure 53: Prevalence of sexual harassment, among all women, Viet Nam 2019 (N=5,976) 67
Figure 54: Prevalence of child sexual abuse experienced before the age of 15 among all women, by age (at time of
interview), Viet Nam 2019 (N=5,976) 67
Figure 55: Age of first sexual intercourse among all women, Viet Nam 2019 (N=5,976) 68
Figure 56: Nature of first sexual experience among all women who ever had sex, Viet Nam 2019 (N=5,390) 69
Figure 57: Comparison of violence by a non-partner and violence by a husband/partner since age 15, among all
women, Viet Nam 2019 (N=5,976) 70
Figure 58: Prevalence of violence by a husband/partner during lifetime among ever-married/partnered women, by
disability status, Viet Nam 2019 (N=5,553) 73
Figure 59: Prevalence of violence by a husband/partner during last 12 months among ever-married/partnered
women, by disability status, Viet Nam 2019 (N=5,553) 73
Figure 60: Proportion of all women who said they agree with specific statements on gender roles, by location, Viet
Nam 2019 (N=5,976) 77
Figure 61: Proportion of all women who said they agree with the statement “a good wife/partner obeys her husband
even if she disagrees”, by education level, Viet Nam 2019 (N=5,976) 77
Figure 62: Proportion of all women who said they agree with the statement “a good wife/partner obeys her husband
even if she disagrees”, by age group, Viet Nam 2019 (N=5,976) 78
Figure 63: Proportion of all women who said they agree with specific “good reasons” for a man to hit his wife/partner
among all women, Viet Nam 2019 (N=5,976) 79
Figure 64: Proportion of all women agreeing with at least one ‘”good reasons” for a man to hit his wife/partner among
all women by education level, Viet Nam 2019 (N=5,976) 81
Figure 65: Proportion of all women who said they agree with specific ”good reasons” for a man to hit his wife/partner
among all ever-married/partnered women, Viet Nam 2019 (N=5,553) 81
Figure 66: Perceived triggers of physical violence by a husband/partner among ever-married/partnered women who
experienced such violence, Viet Nam 2019 (N=1,471) 82
Figure 67: Type of injury among women who were ever injured, Viet Nam 2019 (N=438) 85
Figure 68: Distribution of frequency of injuries among ever-married/partnered women injured by physical and/or
sexual violence by a husband/partner, Viet Nam 2019 (N=438) 86
Figure 69: Self-reported impact of violence on women’s health, among women who experienced physical and/or
sexual violence by a husband/partner ever in their lifetime (N=1,791) 86
Figure 70: Mental health problems based on Kessler score, according to women’s experience of physical and/or
sexual violence by a husband/partner, Viet Nam 2019 (N=5,553) 88
Figure 71: Reproductive health outcomes experienced by women, according to their experience of physical and/or
sexual violence by a husband/partner among those ever-pregnant, Viet Nam 2019 (N=5,239) 89
Figure 72: Well-being of children aged 5-12 years, as reported by women with children in this age group, according to
their experience of physical and/or sexual violence by a husband/partner, Viet Nam 2019 (N=2,338) 91
Figure 73: Children witnessing the violence, according to women who ever experienced physical violence by a
husband/partner, Viet Nam 2019 (N=1,437) 91
Figure 74: Proportion of women reporting on their children’s specific behavioural problems, among women with
children 5-12 years old and who have experienced physical violence by a husband/partner, according to how
frequently they witnessed the violence, Viet Nam 2019 (N=647) 92
Figure 75: Ever-married/partnered women disclosing violence against her mother, against her partner’s mother,
against herself when she was a child and against her husband/partner when he was a child, according to experience
of physical and/or sexual violence by a husband/partner, Viet Nam 2019 (N=5,553) 93
Figure 76: Percentage of women who were physically and/or sexually abused by a husband/partner in their lifetime
who told no one, someone and/or a service about their experience of violence, Viet Nam 2019 (N=1,791) 96

viii
Figure 77: Percentage of women who told no one about the violence, among women who experienced physical
and/or sexual violence by a husband/partner, Viet Nam 2019 (N=1,791) 98
Figure 78: Distribution of type of employment among all working women, Viet Nam 2019 (N=5,234) 112
Figure 79: Distribution of all working women aged 15-64, by occupation, Viet Nam 2019 113
Figure 80: Distribution of monthly earnings (’000 VNDs) of working women aged 15-64, Viet Nam 2019* 113
Figure 81: Prevalence of physical and/or sexual violenceby a husband/partner during lifetime and in the last 12
months, among ever-married/partnered women by employment category Viet Nam 2019 114
Figure 82: Average annual out of pocket expenditure by women experiencing physical and/or sexual violence by a
husband/partner in the last 12 months, Viet Nam, 2019 115
Figure 83: Proportion of ever-married/partnered women experiencing physical and/or sexual violence by a
husband/partner in the last 12 months and missing work (including care work) due to physical and/or sexual violence,
and mean number of days missed, Viet Nam 2019 116
Figure 84: Proportion of ever-married/partnered women experiencing physical and/or sexual violence by a
husband/partner in their lifetime, and impact on their work (N= 1,791), Viet Nam, 2019* 117
Figure 85: National estimate of loss of income for ever-married/partnered working women due to experience of
physical and/or sexual violence in the last 12 months, Viet Nam 2019 (billion VNDs) 120
Figure 86: Numbers of women in the survey according to their partnership status and their experience of physical
and/or sexual violence by a husband/partner, Viet Nam 2019 123
Figure 87: Prevalence of physical, sexual, physical and/or sexual, emotional violence by a husband/partner and
controlling behaviour during lifetime and the last 12 months among ever-married/partnered women, with upper and
lower 95 per cent confidence intervals, Viet Nam 2010 (N=4,561, aged 18-60) and 2019 (N=5,553, aged 15-64)148
Figure 88: Prevalence of physical violence by a husband/partner during lifetime among ever-married/partnered
women by age group, Viet Nam 2010 (N=4,561) and 2019 (N=5,553) 149
Figure 89: Prevalence of physical violence by a husband/partner during last 12 months among ever-
married/partnered women by age group, Viet Nam 2010 (N=4,561) and 2019 (N=5,553) 149
Figure 90: Prevalence of sexual violence by a husband/partner during lifetime among ever-married/partnered women
by age group, Viet Nam 2010 (N=4,561) and 2019 (N=5,553) 150
Figure 91: Prevalence of sexual violence by a husband/partner during last 12 months among ever-married/partnered
women by age group, Viet Nam 2010 (N=4,561) and 2019 (N=5,553) 150
Figure 92: Perceived triggers of physical violence by a husband/partner among ever-married/partnered women who
experienced such violence, Viet Nam 2010 (N=1,393) and 2019 (N=1,471) 151
Figure 93: Prevalence of non-partner physical and sexual violence since age 15 and child sexual abuse (before age
15) among all women, Viet Nam 2010 (N=4,838) and 2019 (N=5,976) 153
Figure 94: Proportion of all women who said they agree with the statement that “a good wife obeys her husband even
if she disagrees”, by location, Viet Nam 2010 (N=4,838) and 2019 (N=5,976) 154
Figure 95: Proportion of all women who said they agree with the statement “a good wife obeys her husband even if
she disagrees”, by age group, Viet Nam 2010 (N=4,838) and 2019 (N=5,976) 155
Figure 96: Proportion of all women who said they agree with the statement “a good wife obeys her husband even if
she disagrees”, among all women by education level, Viet Nam 2010 (N=4,838) and 2019 (N=5,976) 155
Figure 97: Prevalence of physical and/or sexual violence by a husband/partner during lifetime and last 12 months for
countries of Asia and the Pacific (latest year available between 2000 and June 2019) 156
Figure 98: Distribution of all women in the survey by work status, Viet Nam 2019 191
Figure 99: Average hours of care work done daily by activity, among all women, Viet Nam 2019 (N=5,976) 192
Figure 100: Disability status of respondents based on responses to Washington Group questions among all women
(N=5,976), Viet Nam 2019 213
Figure 101: Distribution of household SES score in Viet Nam (urban & rural combined), Viet Nam 2019 223

ix
List of tables
Table 1: Operational definitions of violence used in the 2010 and 2019 studies on violence against women in Viet
Nam 12
Table 2: Distribution of qualitative interviews, Viet Nam 2019 22
Table 3: Severity classification for acts of physical violence 37
Table 4: Type of perpetrator of physical violence by a non-partner since age 15, among all respondents, Viet Nam
2019 (N=5,976) 63
Table 5: Type of perpetrator of sexual violence by a non-partner since age 15, among all women who experienced
such violence, Viet Nam 2019 67
Table 6: Nature of first sexual experience among all women who ever had sex, by age of first sexual intercourse, Viet
Nam 2019 70
Table 7: Prevalence of violence by a husband/partner during lifetime and the last 12 months among ever-
married/partnered women, by disability status, Viet Nam 2019 (N=5,553) 73
Table 8: Prevalence of non-partner violence since age 15 and the last 12 months among all women, by disability
status, Viet Nam 2019 (N=5,553) 75
Table 9: Self-reported general health status among ever-married/partnered women who experienced no violence and
those who experienced physical and/or sexual violence by a husband/partner ever in their lifetime, Viet Nam 2019
(N=5,553) 89
Table 10: Elements of husband/partner violence cost estimation applied in Viet Nam survey 115
Table 11: Average earnings of ever-married/partnered working women by their experience of violence by a
husband/partner, Viet Nam 2019 122
Table 12: Overall estimate of productivity loss of working women due to lifetime experience of physical and/or sexual
violence by a husband/partner, Viet Nam 2019 123
Table 13: National estimate out-of-pocket expenditures in the past 12 months, Viet Nam 2019 124
Table 14: National estimate of costs for the Viet Nam economy in the past 12 months, Viet Nam 2019, by cost
category 125
Table 15: Independent variables used for risk factor analysis for current violence by a husband/partner (categories
that are underlined are used as the baseline or reference category), Viet Nam 2019 129
Table 16: Univariate and multivariate logistic regression for risk-factor analysis to identify risk factors for physical
and/or sexual partner violence in the last 12 months, Viet Nam 2019 141
Table 17: Summary of key indicators on violence against women, Viet Nam 2010 and 2019. 151
Table 18: Possible sample sizes for a range of margins of error 192
Table 19: Margin of error using an average probability P of 0.5 193
Table 20: Enumeration areas in the sample 194
Table 21: Elements of husband/partner violence cost estimation 198
Table 22: Distribution of type of employment among all working women, Viet Nam 2019 (N=5,234) 200
Table 23: Distribution of all working women aged 15-64, by occupation, Viet Nam 2019 200
Table 24: Distribution of all working women’s monthly income among working women aged 15-64, Viet Nam 2019
201
Table 25: Distribution of husband’s monthly income among all married/partnered women, Viet Nam 2019 202
Table 26: Categories of employment among working women, Viet Nam 2019 202
Table 27: Prevalence of different types of violence among ever-married/partnered working women 15 to 64 years old,
Viet Nam 2019 203
Table 28: Average health care-related costs incurred (per woman/household) in the last 12 months among women
injured in the last 12 months (N=14) for outpatient care (‘000 VNDs), Viet Nam 2019 204
Table 29: Average cost to replace damaged property ('000 VNDs), among women who experienced physical/sexual
violence in the last 12 month and incurred expenditure, Viet Nam 2019 205
Table 30: Average cost per woman incurred when left home in the last time ('000 VNDs), among ever-
married/partnered women who experienced physical/sexual violence by a husband/partner in the last 12 month, Viet
Nam 2019 206

x
Table 31: Proportion of out-of-pocket expenditure incurred by ever-married/partnered survivors of physical and/or
sexual violence by a husband/partner as proportion women survivors’ annual income, Viet Nam 2019 206
Table 32: Missed days of work/care work by women experiencing physical and sexual violence in the past 12 months,
Viet Nam 2019 207
Table 33: Missed days of work by type of employment among working women due to experience of physical and
sexual violence in the past 12 months, Viet Nam 2019 207
Table 34: National estimate out-of-pocket expenditures in the past 12 months, Viet Nam 2019 208
Table 35: National estimate of number of women experiencing physical and sexual violence in past 12 months, Viet
Nam 2019 208
Table 36: National estimate of lost workdays per annum among women experiencing violence by a husband/partner
(physical and/or sexual) in the 12 months preceding the survey, Viet Nam 2019 209
Table 37: National estimate loss of women’s income per annum due to physical and/or sexual violence in the
preceding 12 months, Viet Nam 2019 210
Table 38: Various annual costs to government budget due to physical or/and sexual violence in the past 12 months,
Viet Nam 2019 210
Table 39: Proportion of women who self-reported impact of violence on work, Viet Nam 2019 211
Table 40: Average earnings of working women by experience of physical and/or sexual violence, Viet Nam 2019212
Table 41: Estimation of productivity loss (Propensity Score Matching and Two Stage Least Squares Instrumental
Variable Regression), Viet Nam 2019 214
Table 42: Overall estimate of productivity loss of working women 215
Table 43: Profile and corresponding variables in the survey data set, Viet Nam 2019 217
Table 44: Questions and response categories used to identify women with one of more forms of disability, Viet Nam
2019 221
Table 45: Description and frequency of SES variables, Viet Nam 2019 225
Table 46: Description of SES variables used in PCA analysis, Viet Nam 2019 228
Table 47: Results from principal components analysis – total sample, Viet Nam 2019 230
Table 48: Results from principal components analysis – urban and rural separated, Viet Nam 2019 231
Table 49: Mean socioeconomic scores by SES group (N=5,997), Viet Nam 2019 233
Table 50: Mean ownership of SES variables by SES group (N=5,977), Viet Nam 2019 234
Table 51: Distribution of household SES by urban and rural location (total sample analysis; urban sample analysis
and rural sample analysis), Viet Nam 2019 235
List of explanatory boxes
Box 1: Violence against women: Global data at a glance 4
Box 2: Six socioeconomic and geographic regions in Viet Nam 6
Box 3: Seeking help from shelters 101
Box 4: Considerations when interpreting change between the 2010 and 2019 survey 152
Box 5: Considerations Strengths and limitations of the study 164
Box 6: Selection of households and eligible women in the enumeration areas 195
xi
Foreword
In 2010, the National Study on Domestic Violence against Women was the first to provide nationally
representative data on this issue in Viet Nam. Its results caught the attention of the Government and the
public regarding the high prevalence of violence in the most intimate part of a woman’s life – the family –
which is supposed to be her safe haven. Domestic violence in many forms was found to be a daily
occurrence, regardless of the victim’s ethnicity, socioeconomic status or place of residence. It transcended
generations, and its economic cost to the family, the community and the country have proven to be
immense. Deeply rooted in gender inequality, violence against women in Viet Nam, like in many other
countries, is one of the most pervasive human rights violations and among the hardest to eliminate, though
not impossible.
The Government of Viet Nam has taken the issue seriously. Since the 2010 study, it has put in place
legislation, reinforced implementation of the Law on Domestic Violence Prevention and Control (2007) and
the Law on Gender Equality (2006), carried out national-scale campaigns to raise public awareness, and
introduced essential services for domestic violence survivors. In both prevention and response, the public
and the civil society at large have joined such government initiatives.
In 2019, Viet Nam conducted its second National Study using the adapted WHO Multi-country Study on
Women’s Health and Domestic Violence against Women, which was also used in the 2010 study. The
results allow Viet Nam to understand what has changed and what has not changed, and what needs to be
in place for further change and progress. This time the scope of the study was broadened with extension
to ages of 15 to 64. Violence was explored beyond the family sphere to include workplace and other public
spaces. Particular attention was paid to violence against vulnerable segments of Viet Nam’s population,
especially ethnic minorities and women and girls with disabilities. The economic cost of violence was
calculated, clearly showing how much money violence against women and girls is costing the country.
The findings of the second study show the pervasive complexity of violence against women and girls. In
the nine years since the initial study, the prevalence of most forms of violence by intimate partners, as
reported in interviews with women, has decreased slightly in Viet Nam. Sexual violence seems to have
increased, however, although this may be attributed to more women being comfortable disclosing sexual
violence to interviewers in this round. Most women in Viet Nam remain at great risk of one or other forms
of intimate partner violence. Variation in violence prevalence rates was noted between different
geographical regions and different ethnic groups. Violence has had serious consequences for women’s
health, dignity, security, upward social mobility and economic productivity. Yet despite its high prevalence,
violence against women continues to be very much hidden and silenced in Vietnamese society. Just like
the study nine years ago, most women did not speak out or seek help, largely due to a culture of victim-
blaming and impunity for perpetrators. It was also confirmed that violence was a learned behaviour:
childhood experience was an important risk factor with respect to a woman being a victim as an adult or to
a man being a perpetrator later in life. Thus, it is important to identify the potential consequences of the
impact on children as victims when living in violent households.
Yet, there was good news too. Younger women are experiencing less physical violence by intimate partners
than older women, and are less likely to agree that wives should obey husbands. This offers hope for
change, and younger women can be great game changers if concerted efforts and investments are made
in them. But to eliminate violence against women and girls effectively and holistically, a structured and multi-
sectoral approach involving all relevant agencies and organizations is critically needed. This is the only
way to bring about change in social norms and promote gender equality.
This report presents key findings of the second study, “Results of the National Study on Violence against
Women in Viet Nam 2019”. It does so in an integrated fashion, based on quantitative and qualitative studies
of violence as well as an economic costing of violence. Bearing in mind that the root cause of violence is

xii
gender inequality, it analyses direct causes of violence as well as risk factors. The study contributes to
evidence-based advocacy to facilitate the country’s policymaking and decision-making at both national and
subnational levels. If violence against women and girls is not addressed now, it will be a serious impediment
for Viet Nam to achieve the Sustainable Development Goals by 2030. We must all act now for a Viet Nam
which is free of violence, for the future we want in Viet Nam. We must not leave women, particularly women
victims of violence, behind in the country’s sustainable development process.
We would like to extend our special appreciation to the Government of Australia for putting gender-based
violence high on its development assistance programme priorities and for jointly supporting the study with
the Government of Viet Nam and UNFPA. We also recognize and applaud the thousands of women and
girls who shared their courage and their life stories with us. Without their stories, this research could not
happen, and violence against women and girls would have remained in the shadow of their private lives.
Mr Pham Quang Vinh
Deputy Director General
General Statistics Office
Mr. Pham Ngoc Tien
Director of Gender Equality Department
Ministry of Labor, Invalids and Social
Affairs
Ms. Naomi Kitahara
Representative
UNFPA in Viet Nam

xiii
Acknowledgements The National Study on Violence against Women 2019 was conducted by the General Statistics Office at
the request of the Ministry of Labour, Invalids and Social Affairs (MOLISA). The Study was supported by
UNFPA under the framework of the project titled “Support the development and implementation of evidence
and human rights-based policies and programmes on prevention and response to gender-based
violence/domestic violence and addressing sex work-related issues”. The study was technically and
financially supported by the Government of Australia through its Department of Foreign Affairs and Trade
(DFAT) and UNFPA.
A core research team was established to give technical support throughout the study or to specific
components, consisting of Dr. Kristin Diemer (team leader), Dr. Henrica (Henriette) Jansen, Dr. Nata
Duvvury, Ms. Jessica Gardner, Dr. Seema Vyas, Ms. Phan Thi Minh Hien and Ms. Hoang Tu Anh. This
core team was also responsible for the data analysis and the writing of this report. Support by Henrica
Jansen and Jessica Gardner was given through the kNOwVAWdata Initiative (UNFPA Asia and the Pacific
Regional Office – DFAT).
This important study would not have been possible without the invaluable support provided by other
organizations, collaborators and experts, whose dedication, commitment and hard work have significantly
contributed to making the study and this report possible. There are too many people to mention, but at the
risk of forgetting some, we would like to especially thank the following:
First and foremost, we want to acknowledge the 5,976 women and girls who generously agreed to be
interviewed for the survey and who shared their often painful personal experiences. We also want to thank
the 269 participants in the qualitative study, who gave their time to answer questions and shared their life
experiences.
We gratefully acknowledge the excellent work of the 100 field enumerators and field staff, as well as the
five interviewers from the qualitative research team. Collectively, they carried out thousands of interviews
with an incredible sense of professionalism and responsibility to assure that the women interviewed were
treated according to the highest safety and ethical standards.
We would also like to acknowledge the positive support of the local authorities in the 500 communes of 63
provinces where the quantitative survey was conducted as well as the local leaders in the six communes
of the three provinces where the qualitative component was undertaken, especially the active support from
local members of the Women's Union, and officers representing the Department of Labour, Invalids and
Social Affairs at provincial, district and commune levels where the study took place.
Likewise, we gratefully acknowledge the district and provincial level staff in the 63 Provincial Statistics
Offices for their smooth collaboration with the 14 survey teams during the quantitative fieldwork.
We extend sincere thanks also to Mr. Pham Ngoc Tien, Director of Gender Equality Department, and Ms.
Tran Thi Bich Loan, Deputy Director of Gender Equality Department (MOLISA); Mr. Do Anh Kiem, Director
of Social and Environmental Statistics Department, and Ms. Nguyen Thi Viet Nga, Senior Officer of Social
and Environmental Statistics Department (GSO); Ms. Mia Urbano, Senior Gender Equality & Social
Development Advisor in Viet Nam and Myanmar, and Mr. Justin Baguley, Counsellor, Economic and
Development Section, and Ms. Than Thi Thien Huong, Gender Specialist (DFAT Office in Viet Nam).
The study was supported as a priority by dedicated staff of the UNFPA Regional Office in Bangkok and the
UNFPA Country Office in Viet Nam. Commitments and passion by all UNFPA staff involved in this study
are duly acknowledged, united to end violence against women in the world.

xiv
Acronyms and abbreviations CAPI Computer Assisted Personal Interview
CCIHP Centre for Creative Initiatives in Health and Population
CEDAW Convention on the Elimination of All Forms of Discrimination against Women
DFAT Australian Government Department of Foreign Affairs and Trade
DV Domestic violence
EA Enumeration Area
FGD Focus group discussions
GBV Gender-based Violence
GDP Gross Domestic Product
GE Gender equality
GSO General Statistics Office
HH Households
HIV Human immunodeficiency virus
HMIS Health Management Information System
IDI In-depth interview
IPV Intimate partner violence
K6+ Kessler Psychological Distress Scale
KI Key informant interviews
MOLISA Ministry of Labour, Invalids and Social Affairs
OPE Out-of-pocket expenditures
PCA Principle components analysis
PSM Propensity score matching
PSU Primary sampling unit
SDG Sustainable Development Goals
SES Socioeconomic Status
SSU Second sampling unit
UN United Nations
UNCRPD United Nations Convention on the Rights of Persons with Disabilities
UNFPA United Nations Population Fund
VAW Violence against women
VHLSS Viet Nam Household Living Standards Survey
VNDs Vietnamese Dong (national currency)
WG Washington Group short set of disability questions
WHO World Health Organization

xv
Executive summary Data on violence against women forms an essential evidence base for proposed actions to
prevent and respond to violence in Viet Nam. The first national survey to measure the prevalence
of violence against women in Viet Nam was conducted during 2009 and 2010. The second
national survey was conducted during 2018 and 2019 and forms the basis of this report. The
studies provide comparable data, including quantitative data at national level. This report presents
the results of the 2019 study, explores differences between the two studies and provides
recommendations for future action.
Violence against women
Gender based violence, especially violence against women is a global problem. Eliminating it is
a priority for all countries as they work towards gender equality. Research shows that most
violence against women is perpetrated by a husband or other intimate partner, or someone known
to them. Most of this violence is not reported to formal authorities. Gender inequality is both the
underlying cause and a consequence of violence against women – it is more prevalent in areas
where women are less valued than men, and where VAW exists, it serves to prevent the
empowerment of women and girls.
The term (intimate) partner includes current or former husbands as well as other male intimate
partners with whom a woman has a couple relationship without being married. Nearly all (97%
per cent) women in this survey who had a current for former partner had been married.
The term non-partner in this report is used for anybody who is not a husband/ partner. It
includes male and female family members, friends, acquaintances and strangers. A person
whom a woman has just met, for example a first date, would be considered a non-partner.
The United Nations defines violence against women as “any act of gender-based violence that
results in, or is likely to result in, physical, sexual or psychological harm or suffering to women,
including threats of such acts, coercion or arbitrary deprivations of liberty, whether occurring in
public or in private life”. This includes, but is not limited to, physical, sexual, psychological and
economic violence by husbands or other intimate partners (in this report, referred to as
“husband/partner”), and physical and sexual violence perpetrated by someone other than a
husband/partner (in this report referred to as “non-partners”). Most, though not all, VAW is also
gender-based violence (GBV). These forms of violence are the focus of this study.
Objectives
The objectives of the 2019 study were to measure and assess:
● The prevalence and frequencies of different forms of violence against women aged 15
to 64 caused by a current or former husband/partner, including violence against women
with disabilities;
● The prevalence, frequency and place of occurrence of physical and sexual violence by
non-partners against women since the age of 15 years, and the prevalence of physical
and sexual violence caused by any perpetrators to women during their childhood (aged
under 15 years);
● Women’s attitudes towards gender roles and violence;

xvi
● The extent to which violence affects women’s general, mental and reproductive health;
● The impact of violence by a husband/partner on children and the intergenerational
aspects of violence;
● Women’s responses to violence by a husband/partner (including their coping
strategies);
● The direct economic cost of violence by a husband/partner and the impact on work,
productivity, and the country’s economy;
● Factors which put women at risk of more violence; and
● Changes between 2010 and 2019 regarding violence against women and girls.
The study aimed to obtain these results at national level as well as for rural and urban areas, and
analysis has been done by the characteristics of women, such as age, location, ethnicity and
disability status. The overarching aim was to assess impact of existing policies and programmes
and to serve as evidence for strengthening policies and programmes going forward.
Organization of the study
The 2019 study consists of three parts: the quantitative study; the qualitative study; and economic
costing of violence against women.
The quantitative component of the study (the “survey”) was conducted by the General Statistics
Office at the request of the Ministry of Labour, Invalids and Social Affairs (MOLISA). This included
reviewing and testing questionnaires, interviewer training, fieldwork and data processing. The
quantitative study is a household survey covering all six regions of Viet Nam and is nationally
representative. A multistage sample design was used to select a sample of 6,000 households. A
total of 5,976 women aged between 15 and 64 completed a face-to-face interview with a trained
female interviewer.
The qualitative component of the study was conducted by the Centre for Creative Initiatives in
Health and Population (CCIHP). The qualitative study aimed to: provide a context for violence
against women by intimate partners; triangulate the quantitative results; gain insights and
explanations for quantitative data that are unexplained; and explore related issues that by their
nature could not be studied through a quantitative survey. Data was gathered through in-depth
interviews, key informant interviews and focus-group discussions. A total of 269 participants,
including women with disabilities and from ethnic minorities, as well as 11 key informants,
provided information and shared their experiences for the qualitative research.
Lastly, the study component on economic costing of violence against women was carried out
by UNFPA Viet Nam in cooperation with several local and international consultants.
UNFPA Viet Nam managed the overall process with technical assistance from the kNOwVAWdata
Initiative (a partnership between the UNFPA Asia and the Pacific Regional Office and the
Australian Government). The entire study was technically and financially supported by the
Government of Australia through the Department of Foreign Affairs and Trade (DFAT) and
UNFPA.

xvii
Violence against women perpetrated by husbands/partners
The survey measured women’s experience of violence using a series of behaviour-specific
questions about whether any current or former husband or other intimate partner1 had ever
perpetrated specific physically, sexually or emotionally abusive acts towards her, exhibited
economic abuse or controlling behaviour. The word violence was not used in these questions.
Such questions were asked about violent acts that had happened at any time in her life (to
measure her “lifetime” experience of violence), as well as in the last 12 months (referred to as
“current violence”).
Physical and/or sexual violence by a husband/partner
One in four women (26.1 per cent) in Viet Nam who had ever been married or married/partnered
mentioned that she had experienced physical violence from a husband/partner during her lifetime
(lifetime violence), and one in (4.6 per cent) experienced physical violence from a
husband/partner in the last 12 months (current violence).
Sexual violence by a husband/partner was experienced by 13.3 of women in Viet Nam in their
lifetime, and for 5.7 per cent of women this occurred within the last 12 months.
The proportion of women who experienced the combination of physical and/or sexual violence by
a husband/partner is the most-used measure for national prevalence studies; violence by a
husband/partner is utilized especially for international comparison and for monitoring over time.
This is because the methods to measure these two types of violence are better developed as
compared with other types of violence. In Viet Nam, one in three women aged between 15 and
64 (32.0 per cent) experienced physical and/or sexual violence in their lifetime. In real numbers
this equates to 9,251,740 ever-married/partnered women in this age group.2 Nearly one in ten
(8.9 per cent) or 2,648,234 women, experienced that violence in the last 12 months. Rates are
higher in rural than in urban areas.
Emotional violence, controlling behaviours, economic violence by husband/partner
More women mentioned they experienced emotional violence by a husband/partner compared
with any other form of violence: Nearly half (47.0 per cent) have experienced it at least once in
their lifetime and close to one fifth (19.3 per cent) within the last 12 months.
More than a quarter (27.3 per cent) of women experienced one or more acts of controlling
behaviour (a form of psychological abuse) by a husband/partner during their lifetime and 12.9
during the last 12 months. When controlling behaviour is combined with physical, sexual and
emotional abuse, the violence rate becomes 60.2 per cent (nearing two thirds) during lifetime and
27.8 per cent in the last 12 months.
One in five (20.6 per cent) women in Viet Nam experienced economic abuse by a husband/partner
during their lifetime and one in ten (11.5 per cent) in the last 12 months.
1 In Viet Nam, 97 per cent of women in this survey who had ever had a partner (current or former) had been
married to that partner. 2 The population figures have been calculated based on the 2019 Viet Nam census which recorded a total
population of women aged 15 to 64 as 32,698,283. Nearly all of the survey respondents (91 per cent - weighted)
were ever-married/partnered, which equates to an estimated total population of 29,755,437 women aged 15 to 64
and ever-married/partnered in Viet Nam.

xviii
Combining all five forms of violence by a husband/partner (physical, sexual, emotional, controlling
behaviours, and/or economic), more than half (62.9 per cent) of ever-married/partnered3 women
have experienced at least one of these forms of violence in their lifetime and one in three (31.6
per cent) in the last 12 months.
Violence against women by non-partners
The survey also asked about a woman’s experience of physical and sexual violence by
perpetrators other than a husband/partner, here referred to as ‘non-partners’ (including both
male and female perpetrators). These questions were asked of all 5,976 women interviewed
regardless of whether they had ever been partnered.
Physical violence by non-partners since age 15
More than one in ten (11.4 per cent) women have experienced non-partner physical violence
since the age of 15. The proportion of women who experienced non-partner physical violence in
the last twelve months was 1.4 per cent. Perpetrators were most commonly family members (more
often male than female) and friends (more female than male).
Sexual violence by non-partners since age 15
Nearly one in ten (9.0 per cent) women have experienced sexual violence by a non-partner since
age 15 and 1.2 per cent in the last 12 months. Perpetrators were predominantly male friends or
acquaintances or male strangers. Young women aged between 20 and 24 were most at risk of
non-partner sexual violence since age 15 (18.0 per cent).
Other forms of violence against women
One in ten women (11.4 per cent) experienced one or more kinds of sexual harassment. Women
were most likely to receive unwanted personal electronic messages with sexual content (7.6 per
cent) followed by being groped or touched sexually in a public place such as on a bus (4.9 per
cent).
Sexual abuse when the woman was a child
Women were asked about experiences of sexual abuse as a child (before the age of 15). This
includes whether anyone had ever touched them sexually or made them do something sexual
that they did not want to do. As this is a particularly sensitive topic, child sexual abuse was asked
two times: using a set of questions during the interview, and in a concealed (anonymous) way, at
the end of the interview by having her mark a picture of a smiling or sad face (the latter indicating
she had experienced such abuse).
Overall, 4.4 per cent of women indicated that they experienced child sexual abuse – 4.0 per cent
using the face card at the end of the interview and 1.6 per cent when asked the question during
the interview. Women from younger age groups experienced the highest rates of child sexual
abuse, peaking for women aged 30 to 34 of which 6.5 per cent have experienced such abuse.
Rates were at or below the national average for women aged 35 and above.
3 ‘Ever-married’ or ‘ever-partnered’ terminology refers to women who have ever been married or
married/partnered in their lifetime.

xix
Comparing husband/partner and non-partner violence
A common misconception worldwide is that women are most at risk of violence from people they
hardly know rather than from people they know well. To explore this, a measure of prevalence of
physical and/or sexual violence, regardless of perpetrator, was compiled for all respondents in
the study, whether they had ever been married/partnered or not.
Overall, two fifths of women in Viet Nam (40.3 per cent) have experienced physical and/or sexual
violence since age 15 by either a husband/partner or non-partner. For both physical and sexual
violence, husbands or partners are the most likely perpetrator. When comparing the two, women
in Viet Nam are more than twice as likely to have experienced physical violence by a
husband/partner than from others. Sexual violence by a husband/partner is also more prevalent
than sexual violence by a non-partner (12.0 per cent compared with 9.0 per cent).
Attitudes and perceptions of violence
Over one third of women in Viet Nam hold attitudes supporting men as decision makers and the
head of the household. Women in rural areas as compared with urban areas more strongly held
these views. Harmful gender attitudes are less common in younger women and women with
higher levels of education, as they are less likely to hold these views.
More than half of the women interviewed (51.8 per cent) believe that a man is justified in beating
his wife if she were unfaithful (45.2 per cent) or did not take “care of children” (27.0 per cent).
These myths were also more strongly supported by people living in rural areas as compared with
urban areas and among women with lower levels of education.
Women who were victims of violence were also more likely to justify and excuse perpetration of
violence by a husband/partner compared with women who have not experienced violence.
Women who experienced physical violence by a husband/partner were asked if there were
situations that led to or triggered their husband/partner’s violent behaviour. Multiple triggers could
be mentioned. The most commonly mentioned triggers were “family problem” (50.8 per cent) and
“drunkenness” (40.9 per cent), followed by “money problems” (18.8 per cent).
Consequences of violence against women
Injuries due to violence
Nearly one quarter (23.3 per cent) of women who experienced physical and/or sexual violence by
a husband/partner mentioned they were injured because of that violence. Most of these women
were injured more than once, with one in five women (21.8 per cent) injured many times in her
life.
Associations between physical and/or sexual violence and health outcomes
Women who had experienced violence by a husband/partner were more likely to mention they
had overall "poor" or "very poor" health compared with women who had not experienced this
violence.
Women who have experienced physical and/or sexual violence by a husband/partner were more
than three times as likely as women who have not experienced violence from a husband/partner
to score high on questions that measure likelihood of mental distress.

xx
Women who experienced violence from a husband/partner also consistently had higher risks of
miscarriage, stillbirths and abortions compared with women who had not experienced violence
from a husband/partner.
Violence against children, intergenerational aspects of violence
Women who experienced physical and/or sexual violence by a husband/partner were more likely
to mention behavioural issues among their children such as having frequent nightmares and being
unusually quiet or withdrawn.
Of the women who experienced physical violence by a husband/partner, a majority stated that
their children had witnessed or overheard the violence (60 per cent).
Vietnamese women who experienced violence by a husband/partner were more likely to have
been brought up in a violent home or have a husband/partner who witnessed violence and/or
experienced violence as a child from his father. This shows that violence is often learned when
children grow up in violent families.
Economic and social disadvantage
In general, women have less access to resources, credit, markets and extension services; their
access reduces further if they are living with violence. Violence against women often disturbs
women’s ability to work resulting in a risk of loss of employment, a decrease in income, and
increased isolation.
Women who do not work and rely on their husband/partner to support them financially may also
face complex disadvantage due to economic abuse and controlling behaviour. These
circumstances seriously disadvantage all women living with violence, and particularly those most
vulnerable such as poor women, women with disability, elderly and of ethnic minority.
When women are not empowered to mobilize the resources needed to take pre-emptive action to
enhance their resilience they find themselves increasingly socially disadvantaged and
disproportionately vulnerable to events outside their control such as natural disasters and climate
change.
Women’s coping strategies and response to violence by a husband/partner
Half (49.6 per cent) the women who experienced physical and/or sexual violence by a
husband/partner had never told anyone about it (before being interviewed) and most women (90.4
per cent) did not seek help from formal services or authorities.
The main reason women gave for not seeking help was they believed the “violence was normal
or not serious” (among 48.4 per cent of women who did not seek help). Women generally sought
help when they could not endure the violence anymore (69.7 per cent of women who did seek
help gave this as a reason).
Just under one in five (19.3 per cent) women left home at least once due to violence by a
husband/partner. Women who left home stayed away on average 20 days. In most cases they
stayed with their own relatives.
Women who returned home after leaving did so because they did not want to leave their children
(50.4 per cent), he asked her to go back (26.0 per cent), and/or she forgave him (25.5 per cent).

xxi
Most women (80.8 per cent) who experienced physical violence by a husband/partner never
fought back.
Experiences of violence among women with disabilities
Nine per cent of women in the sample have a functional disability as defined by the Washington
Group short set of disability questions4 (women have a disability if they score themselves as
having ‘a lot of difficulty or cannot do at all’ in one or more of the areas – seeing, hearing, walking,
remembering, self-care or communicating).
Women with a disability mentioned higher rates of husband/partner violence than women without
disability. This was consistent across all forms of violence (physical, sexual, economic, emotional
abuse and controlling behaviours). Prevalence rates of non-partner physical and/or sexual
violence were similar between women with a disability and without.
The experience of childhood sexual abuse was higher among women with a disability (6.4 per
cent) compared with women without a disability (4.2 per cent).
Costs of violence by a husband/partner
The 2019 survey included, for the first time, new questions on costs associated with
husband/partner violence. Three types of costs that can be estimated based on survey data:
● Out-of-pocket expenses such as those associated with hospital stays or
damaged/destroyed assets in the home;
● Opportunity costs from not doing paid or unpaid work because of violence by a
husband/partner, and for the husband/partner missing work; and
● Productivity loss for the Vietnamese economy.
Women experiencing physical and/or sexual violence in the past 12 months spent, on average,
9,426.5 ('000 VNDs) on out-of-pocket expenses (health care, accessing services, leaving home,
and replacing damaged household items) as a direct result of all violence experienced over 12
months. This is equivalent to a quarter of women’s annual income.
Women experiencing physical and/or sexual violence are likely to have 30.8 per cent reduction
in their annual income compared with women not experiencing violence.
Viet Nam experiences a productivity loss5 equivalent to 100,507 billion VNDs, which is about
1.81 per cent of 2018 GDP, due to lifetime experience of physical and/or sexual violence among
ever-partnered working women aged 15 to 64.
4 The Washington Group (WG) Short Set of Disability Questions. This well-tested set of six questions is often
used to monitor adherence to the United Nations Convention on the Rights of Persons with Disability (UNCRPD) and the Sustainable Development Goals (SDGs). http://www.washingtongroup-disability.com/washington-group-question-sets/short-set-of-disability-questions/ 5 Measured as the income differential between women experiencing violence and those not experiencing
violence

xxii
The productivity loss is at the same level as estimated in 2012 study of costs of domestic
violence in Viet Nam – about 1.91 per cent of 2010 GDP.6
Women and households also had indirect income loss via missed days of work by the woman
and her husband/partner, as well as missed household care work in the past 12 months. This
foregone income is nationally estimated to be 974 billion VNDs.
The costs of physical and/or sexual violence by a husband/partner is a drain on the productivity
of women and has significant consequences to the broad national economy.
Risk factors associated with violence by a husband/partner
Risk factors – characteristics related to the woman and her husband/partner associated with
experiencing violence by a husband/partner in the last 12 months – were explored. A
multivariate logistic regression analysis was done to identify the risk characteristics using data
from a subsample of women whose current or most recent partner was violent, plus all women
who had not experienced violence by a husband/partner. This was because data on
husband/partner characteristics were collected for the current or most recent husband/partner
only.
At the individual level, women’s higher age and engagement in employment were associated
with lower risk of violence. Significant higher risk associations were, however, found with a
primary school level of education, compared with no schooling, women’s other experiences with
violence (non-partner physical violence, non-partner sexual violence, unwanted, forced or
coerced first sex and witnessing mother being beaten), and with attitudes tolerant towards wife
beating.
Among the husband/partner sociodemographic characteristics, only educational attainment was
found to be significantly associated with violence by a husband/partner – the higher the
educational attainment of the husband/partner the lower the risk of violence.
The strongest associations with violence by a husband/partner were found with their behavioural
characteristics and their own experiences of violence. Husband/partner alcohol use, fighting with
other men and extramarital relationships – all expressions of masculinity – were significantly
associated with higher violence. In addition, intergenerational exposure to violence,
husband/partner mother abused and/or husband/partner abused as child, were also significantly
associated with higher violence. These results are similar to the findings in the 2010 study.
Comparison between 2010 and 2019 studies
The economic cost of violence by a husband/partner and the risk factors for experiencing partner
violence have changed very little in the past decade. But the prevalence of violence has changed.
Comparing the results of the two studies, the prevalence of all forms of husband/partner violence,
except sexual violence, are lower in 2019 as compared with 2010. The prevalence of
husband/partner sexual violence is higher in 2019 as compared with 2010 (13 per cent compared
with 10 per cent respectively across the lifetime).
6 Duvvury N, Minh N & Carney P. 2012. Estimating the cost of domestic violence against women in Viet Nam. 1st
edition. Hanoi, Viet Nam: UN Women.

xxiii
There are important differences when looking beyond the national averages. Younger women in
2019 are experiencing relatively less physical violence by a husband/partner than older women,
suggesting that change is happening for the better, starting with the younger women. A future
third data point will be important to establish whether there is a real trend in reduction of violence.
A different pattern is seen for sexual violence, with younger women experiencing sexual violence
at a relatively higher rate. This is unexpected because all other forms of violence seem to be
reduced. Rather than being a reason for concern, this could be the result of a social change where
women are more open to talking about sex and sexual violence compared with 10 years ago.
Contrary to what was found for violence by a husband/partner, all forms of non-partner violence
since age 15 were mentioned more often in 2019 compared with 2010. Non-partner physical
violence was slightly higher (11.4 per cent of all women) than in 2010 (9.9 per cent). Non-partner
sexual violence was considerably higher at 9.0 per cent in 2019 compared with 2.3 per cent in
2010. (In 2019 the question was asked differently, which could have contributed to a higher
mention of non-partner sexual violence.) Rates of child sexual abuse before age 15 were
mentioned almost twice as often in 2019 (4.4 per cent) than indicated in 2010 (2.8 per cent).
Attitudes are slow to change. This is evident in the percentage of women who agree with the
statement that “a good wife obeys her husband even if she disagrees”, which is the same in 2019
as it was in 2010 (27 per cent of women agree). When looking by age group however, the
difference between young and old women is larger in 2019 and younger women were less likely
to hold these views, for example, among women aged 18 to 24, 11 per cent agreed with the
statement in 2019 compared with 14 per cent in 2010.
Conclusion
Violence by a husband/partner or non-partner affects 9,251,740 ever-married/partnered women
aged 15 to 64 in Viet Nam with grave consequences for them and their families. The proportion
of women experiencing different types of violence remains high in Viet Nam.
The prevalence of all types of violence, except sexual violence, were lower in 2019 compared
with 2010, which may be evidence that policies and programmes are having affect. However,
sexual violence was higher in 2019 than in 2010, and almost two thirds of women still experienced
one or more forms of violence in their lifetime. Therefore, it should be recognised that the rate of
change has been slow, showing that much more concerted efforts are needed to eliminate
violence against women in Viet Nam.
At the same time, it is important to recognise the positive changes which have taken place over
the past nine years since the first survey was conducted. Younger women seem to be
experiencing less violence and may have more equitable attitudes towards gender norms and
husband/partner violence. The gap between the experiences of older women versus younger
women seems to be widening.
Key findings from the 2019 study on violence against women are summarized as follows:
a) Nearly two in three (62.9 per cent) ever-married/partnered women have experienced
physical, sexual, psychological (emotional and controlling behaviours) and/or economic
violence by a husband/partner at some point in their life, and 31.6 per cent in the last 12
months.
xxiv
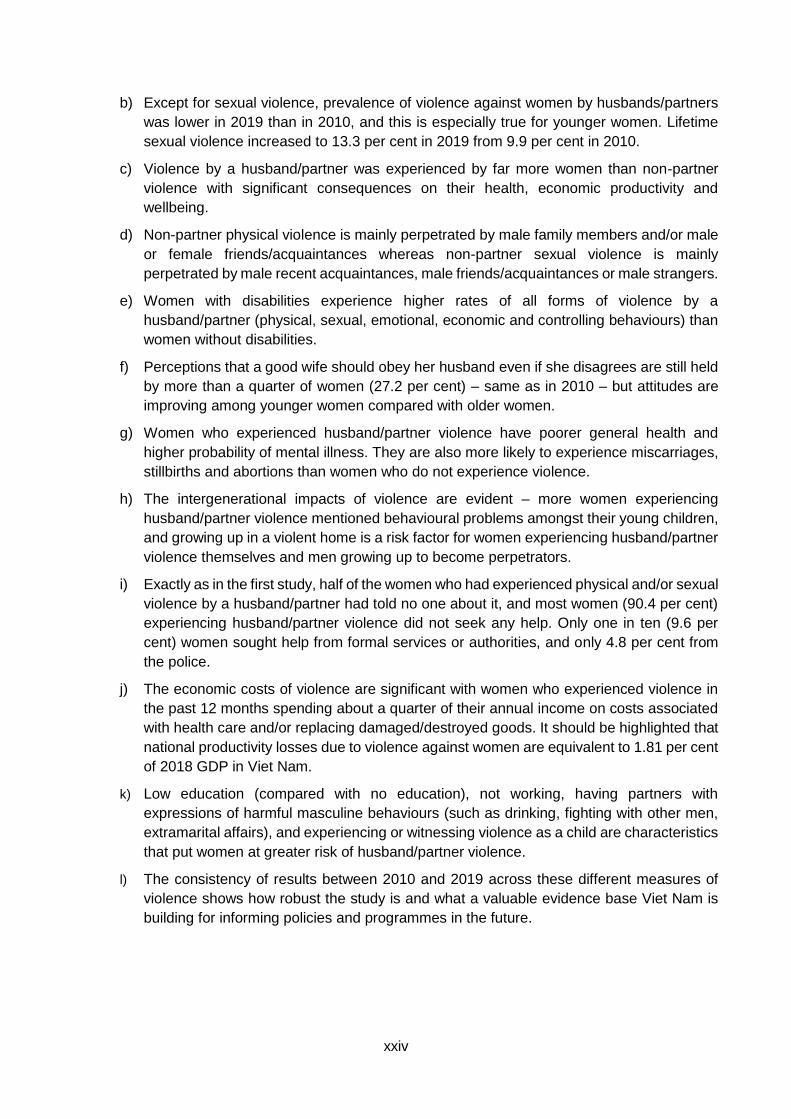
b) Except for sexual violence, prevalence of violence against women by husbands/partners
was lower in 2019 than in 2010, and this is especially true for younger women. Lifetime
sexual violence increased to 13.3 per cent in 2019 from 9.9 per cent in 2010.
c) Violence by a husband/partner was experienced by far more women than non-partner
violence with significant consequences on their health, economic productivity and
wellbeing.
d) Non-partner physical violence is mainly perpetrated by male family members and/or male
or female friends/acquaintances whereas non-partner sexual violence is mainly
perpetrated by male recent acquaintances, male friends/acquaintances or male strangers.
e) Women with disabilities experience higher rates of all forms of violence by a
husband/partner (physical, sexual, emotional, economic and controlling behaviours) than
women without disabilities.
f) Perceptions that a good wife should obey her husband even if she disagrees are still held
by more than a quarter of women (27.2 per cent) – same as in 2010 – but attitudes are
improving among younger women compared with older women.
g) Women who experienced husband/partner violence have poorer general health and
higher probability of mental illness. They are also more likely to experience miscarriages,
stillbirths and abortions than women who do not experience violence.
h) The intergenerational impacts of violence are evident – more women experiencing
husband/partner violence mentioned behavioural problems amongst their young children,
and growing up in a violent home is a risk factor for women experiencing husband/partner
violence themselves and men growing up to become perpetrators.
i) Exactly as in the first study, half of the women who had experienced physical and/or sexual
violence by a husband/partner had told no one about it, and most women (90.4 per cent)
experiencing husband/partner violence did not seek any help. Only one in ten (9.6 per
cent) women sought help from formal services or authorities, and only 4.8 per cent from
the police.
j) The economic costs of violence are significant with women who experienced violence in
the past 12 months spending about a quarter of their annual income on costs associated
with health care and/or replacing damaged/destroyed goods. It should be highlighted that
national productivity losses due to violence against women are equivalent to 1.81 per cent
of 2018 GDP in Viet Nam.
k) Low education (compared with no education), not working, having partners with
expressions of harmful masculine behaviours (such as drinking, fighting with other men,
extramarital affairs), and experiencing or witnessing violence as a child are characteristics
that put women at greater risk of husband/partner violence.
l) The consistency of results between 2010 and 2019 across these different measures of
violence shows how robust the study is and what a valuable evidence base Viet Nam is
building for informing policies and programmes in the future.

xxv
Recommendations The National Study on Violence against Women in Viet Nam 2019
To address violence against women effectively, a structured, multi-sectoral approach involving all
relevant agencies and organizations is needed. The recommendations and policy implications
below have been developed in collaboration with stakeholders in Viet Nam. Experts from MOLISA
and the relevant sectors have guided the research team in documenting a comprehensive set of
recommended actions. They are based on the evidence provided by the 2019 study findings,
building on what was recommended in 2010 and responding to the national priorities and context
of violence against women in Viet Nam today.
Recommendations are presented under four main strategic pillars: (1) strengthening national
commitment and action; (2) promoting violence prevention; (3) developing appropriate
responses and (4) supporting research, data collection and collaboration.
1. Strengthening national commitment and action (policy)
1.1. Increase monitoring and tracking effective implementation of national policies and laws
on gender equality, prevention and response to GBV, and alignment with international
commitments.
1.2. Review, evaluate, amend and revise existing national policies and laws aligning with
international commitments.
1.3. Review, revise and supplement current policies and laws to ensure full coverage and
accessibility to support services for the most vulnerable groups and groups that
experience specific patterns of violence (e.g. child marriage and dating violence).
Allocate additional resources (such as service supports, awareness-raising and
qualitative research with service users) to understand barriers to help-seeking among all
women, especially vulnerable groups such as migrants, ethnic minorities, youth and
women with disabilities.
1.4. Introduce policies to promote prevention of gender-based violence by educating both
women and men, and especially young people, about women’s rights, respectful
relationships and social norms for achieving gender equality.
1.5. Ensure adequate and sustained resource allocations are incorporated in government
budgets for effective implementation of interventions to prevent gender-based violence,
mitigate its impacts on women and promote robust prosecution to signal no impunity for
perpetrators of GBV.
1.6. Convene a state management agency on gender equality to lead coordination of work on
prevention and response to gender-based violence, and violence against women and girls.
2. Promoting violence prevention (early prevention before violence happens as well as stopping violence)
2.1. Recognize the links between GBV and gender equality, develop, implement and monitor
programmes aimed at the prevention of gender-based violence by promoting gender
equality, in particular through public awareness and by involving local communities.
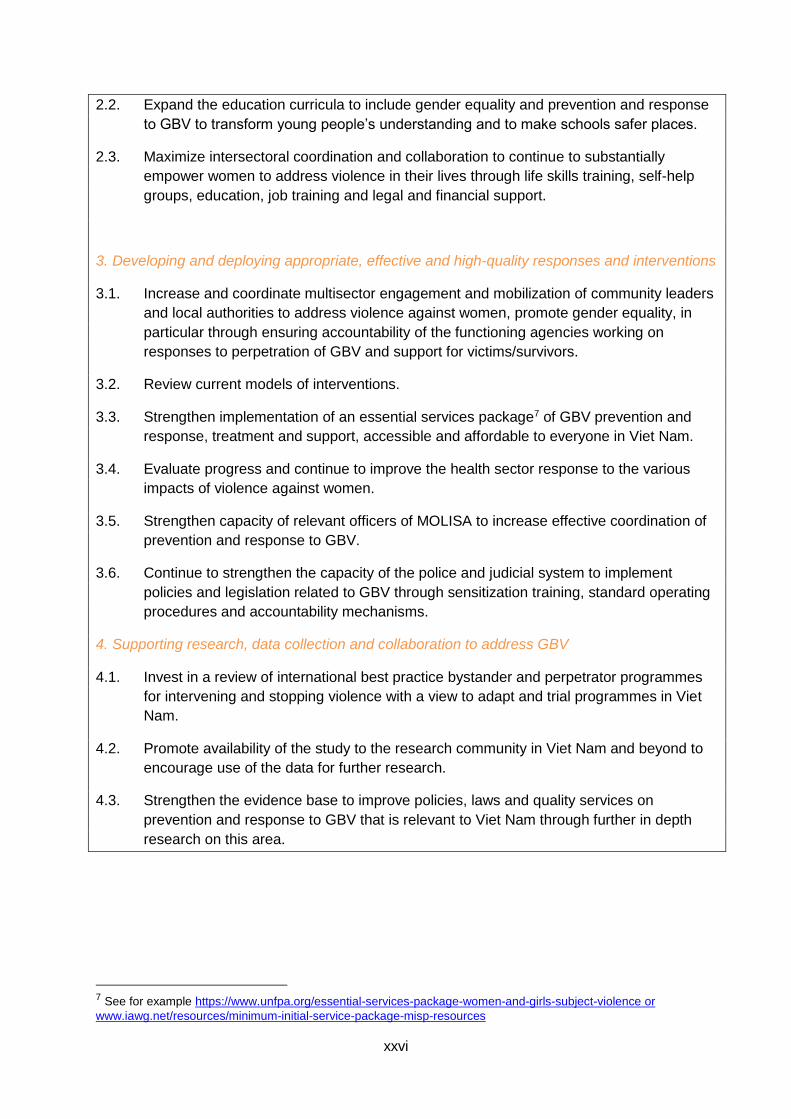
xxvi
2.2. Expand the education curricula to include gender equality and prevention and response
to GBV to transform young people’s understanding and to make schools safer places.
2.3. Maximize intersectoral coordination and collaboration to continue to substantially
empower women to address violence in their lives through life skills training, self-help
groups, education, job training and legal and financial support.
3. Developing and deploying appropriate, effective and high-quality responses and interventions
3.1. Increase and coordinate multisector engagement and mobilization of community leaders
and local authorities to address violence against women, promote gender equality, in
particular through ensuring accountability of the functioning agencies working on
responses to perpetration of GBV and support for victims/survivors.
3.2. Review current models of interventions.
3.3. Strengthen implementation of an essential services package7 of GBV prevention and
response, treatment and support, accessible and affordable to everyone in Viet Nam.
3.4. Evaluate progress and continue to improve the health sector response to the various
impacts of violence against women.
3.5. Strengthen capacity of relevant officers of MOLISA to increase effective coordination of
prevention and response to GBV.
3.6. Continue to strengthen the capacity of the police and judicial system to implement
policies and legislation related to GBV through sensitization training, standard operating
procedures and accountability mechanisms.
4. Supporting research, data collection and collaboration to address GBV
4.1. Invest in a review of international best practice bystander and perpetrator programmes
for intervening and stopping violence with a view to adapt and trial programmes in Viet
Nam.
4.2. Promote availability of the study to the research community in Viet Nam and beyond to
encourage use of the data for further research.
4.3. Strengthen the evidence base to improve policies, laws and quality services on
prevention and response to GBV that is relevant to Viet Nam through further in depth
research on this area.
7 See for example https://www.unfpa.org/essential-services-package-women-and-girls-subject-violence or
www.iawg.net/resources/minimum-initial-service-package-misp-resources

331
1. Introduction
1.1. Violence against women
Violence against women (VAW) is recognized by UN bodies as a human rights violation and a
public health problem.8 It is defined by the UN as “any act of gender-based violence that results
in, or is likely to result in, physical, sexual or psychological harm or suffering to women, including
threats of such acts, coercion or arbitrary deprivations of liberty, whether occurring in public or in
private life”.9 According to this definition, VAW encompasses, but is not limited to:
● physical, sexual and psychological violence occurring in the family, including battering,
sexual abuse of female children in the household, dowry-related violence, marital rape,
female genital mutilation and other traditional practices harmful to women;
● non-spousal violence and violence related to exploitation;
● physical, sexual and psychological violence occurring within the general community,
including rape, sexual abuse, sexual harassment and intimidation at work, in educational
institutions and elsewhere;
● trafficking in women and forced prostitution; and
● physical, sexual and psychological violence perpetrated or condoned by the state,
wherever it occurs.
Most, though not all, VAW is also gender-based violence (GBV). GBV is “violence that is directed
against a person on the basis of gender. It constitutes a breach of the fundamental right to life,
liberty, security, dignity, equality between women and men, non-discrimination and physical and
mental integrity” (Council of Europe, 2012). In the case of VAW, GBV is “violence that is directed
against a woman because she is a woman, or violence that affects women disproportionately”. It
includes acts that inflict physical, mental or sexual harm or suffering, threats of such acts, coercion
and other deprivations of liberty.10
Many cases of VAW are committed by their husband or long-term partner. Violence in these cases
is also called intimate partner violence (IPV). According to the WHO (2013), IPV “refers to
behaviour by an intimate partner or ex-partner that causes physical, sexual or psychological harm,
including physical aggression, sexual coercion, psychological abuse and controlling behaviours.”
Article 2 of CEDAW emphasizes that VAW can occur at the family, community and state levels.
When it occurs in the family, this composes a form of domestic violence. In Viet Nam, there is no
specific law on VAW and GBV but the Law on Domestic Violence was passed in 2007. In this law
domestic violence (DV) is defined as:
8 United Nations. 1993. Declaration on the Elimination of Violence against Women. United Nations General
Assembly Resolution, document A/RES/48/104. New York, NY; and Krug EG et al., eds. 2002. World report on violence and health. Geneva, World Health Organization. 9 United Nations. 1993. Declaration on the Elimination of Violence against Women. United Nations General
Assembly Resolution, document A/RES/48/104. New York, NY. https://www.ohchr.org/EN/ProfessionalInterest/Pages/ViolenceAgainstWomen.aspx 10 Article 1. Elimination of Discrimination against Women, 1992.

2
purposeful acts of certain family members that cause or may possibly cause physical,
mental or economic injuries to other family members. )11
The various terms and concepts mentioned before are not the same, but they are to a large extent
overlapping as follows:12
Figure 1: Overlap among violence against women, gender-based violence, domestic violence and intimate partner violence against women
● Violence against women (VAW): Focuses on the fact that the interest is in women as victim;
the term is limited in the sense that it does not mention perpetrators or context.
● Gender-based violence (GBV): Brings in the nature of the perpetrators, because "gender"
refers to roles of persons and relationship, the power relationship between men and women
– rights of power to privilege to use power by the perpetrators. Not all VAW is GBV but a much
of VAW is GBV. It should be realized that GBV is now also used to include certain types of
11 The acts of domestic violence consist of a) Corporal beating, ill-treating, torturing or other purposeful acts
causing injuries to one’s health and life; b) Insulting or other intended acts meant to offend one’s human pride, honour and dignity; c) Isolating, shunning or creating constant psychological pressure on other family members, causing serious consequences; d) Preventing the exercise of the legal rights and obligations in the relationship between grandparents and grandchildren, between parents and children, between husbands and wives as well as among brothers and sisters; e) Forced sex; f) Forced child marriage, forced marriage or divorce and obstruction of freewill and progressive marriage; g) Appropriating, demolishing, destroying or other purposeful acts to damage the private properties of other family members, or the shared properties of family members; h) Forcing other family members to overwork or to contribute more earning than they can afford; controlling other family members’ incomes to make them financially dependent; i) Conducting unlawful acts to turn other family members out of their domicile. https://www.ilo.org/dyn/natlex/natlex4.detail?p_lang=en&p_isn=80835) 12 UNFPA Asia and the Pacific Regional Office. August 2016. Measuring Prevalence of Violence against Women:
Key terminology. kNOwVAWdata. Bangkok. https://asiapacific.unfpa.org/en/publications/violence-against-women-key-terminology-knowvawdata

3
violence against boys or LGBTQI+. Note that GBV term is shifting that that often it is not used
consistently.13
● Domestic violence (DV): This term overlaps with much of GBV. Where it differs is that it does
not focus on the victim or the perpetrator, but on the context. The domestic context refers to
marriage or blood relationships.
● Intimate partner violence (IPV) is the area where much of VAW, GBV and DV overlaps.
Victims are mostly women, perpetrators are intimate partners (and thus it is gender-based),
and (in most definitions) it will be considered domestic violence.
VAW is prevalent throughout the world. Around 30 per cent of married women have experienced
some form of violence by their husband or long-term current or ex-partner, however this
prevalence varies between countries and region14. In Asia and the Pacific, studies show that the
prevalence of physical and/or sexual IPV during women’s lifetime is as high as 68 per cent in
Papua New Guinea and as low 15 per cent in Bhutan and Laos.15 Box 1 provides a summary of
VAW prevalence, causes and consequences at the global level.
Box 1: Violence against women: Global data at a glance16
● One in three (35 per cent) of women worldwide have experienced either physical and/or sexual intimate partner violence or non-partner sexual violence in their lifetime.
● Almost one third (30 per cent) of women who have been in a relationship mentioned that they have experienced some form of physical and/or sexual violence by their intimate partner in their lifetime.
● 38 per cent of murders of women are committed by a male intimate partner.
● Seven per cent of women mentioned having been sexually assaulted by someone other than an intimate partner.
● Violence can negatively affect women’s physical, mental, sexual, and reproductive health and may increase the risk of acquiring HIV in some settings.
● Men are more likely to perpetrate violence if they have low education, a history of child maltreatment, exposure to domestic violence against their mothers, harmful use of alcohol, unequal gender norms including attitudes accepting of violence, and a sense of entitlement over women.
● Women are more likely to experience intimate partner violence if they have low education, exposure to mothers being abused by a partner, abuse during childhood and attitudes accepting violence, male privilege and women’s subordinate status.
● There is evidence that advocacy and empowerment counselling interventions, as well as home visitation are promising in preventing or reducing intimate partner violence against women.
Gender inequality is a root cause of VAW but there are many associated factors (also called risk
factor) that contribute to VAW happening. Heise’s ecological framework conceptualizes VAW
through the intersection of culture, social, economic and political factors at individual, family,
13 UNFPA Asia and the Pacific Regional Office. August 2016. Measuring Prevalence of Violence against Women:
Key terminology. kNOwVAWdata. Bangkok. https://asiapacific.unfpa.org/en/publications/violence-against-women-key-terminology-knowvawdata 14 Heise L and Kotsadam A. 2015. Cross- National and Multilevel Correlates of Partner Violence: An Analysis of
Data from Population- Based Surveys. The Lancet Global Health 3, no. 6. 15 UNFPA Asia and the Pacific Regional Office. 2019. Regional Snapshot. kNOwVAWdata. Bangkok. 16 World Health Organisation 2017. Fact sheet on violence against women
(www.who.int/mediacentre/factsheets/fs239/en/)

4
community and society levels17. Individual risk factors for VAW, especially IPV, are; lower levels
of education, a history of exposure to child maltreatment or witnessing family violence; harmful
use of alcohol; having multiple partners or suspected by their husband/partner of infidelity; low
levels of women’s access to paid employment. Attitudes that condone violence and community
norms that privilege or ascribe a higher status to men and lower status to women are also
associated with a higher prevalence of VAW. Research shows that VAW contributes to a higher
incidence of sexual and reproductive health problems and mental health issues, such as
depression and suicide, etc. IPV, especially during pregnancy, is associated with a low birth
weight, premature birth and malnutrition of children18, 19, 20, 21, 22. Children born into families with
violence and who are exposed to IPV are influenced by it and are at a higher risk of becoming a
victim or perpetrator of violence as adults.23, 24 VAW also creates social and economic burden25,
and leads to higher social and economic costs for women, their families and societies.
Building on past studies
The WHO Multi-country Study on Women's Health and Domestic Violence against Women
was initiated in 1999 and published in 2005. This was a groundbreaking effort to document the
prevalence of intimate partner violence and other forms of violence against women using
population-based sampling. The study was initially carried out in 15 sites in 10 countries by WHO
in collaboration with the London School of Hygiene and Tropical Medicine; PATH, an international
NGO based in the United States26; together with other research institutions and women's
organizations in the participating countries.27 As of 2019, more than 35 countries (26 in Asia and
the Pacific28) have applied the study’s methodology to measure VAW in their country, including
Viet Nam.
The first national survey on domestic violence against women was conducted in Viet Nam during
2009 and 2010 by the General Statistics Office with funding and technical support from WHO and
UNFPA. It was titled “Keeping silent is dying”: National Study on Domestic Violence against
Women in Viet Nam 2010. More than 5,000 women representing different socioeconomic
17 Heise L, Ellsberg M and Gottemoeller M. 1999. Ending Violence Against Women, Population Reports 27, no.
4. 18 WHO, London School of Hygiene and Tropical Medicine. 2013. Global and regional estimates of violence
against women: prevalence and health effects of intimate partner violence and non-partner sexual violence. Geneva: World Health Organization. 19 Humphreys J, Epel ES, Cooper BA, Lin J, Blackburn EH, Lee KA. 2012. Telomere shortening in formerly
abused and never abused women. Bio Res Nurs 2012; 14: 115-23. 20 Bonomi AE. Anderson ML, Rivara FP, Thompson RS. 2009. Health care utilization and cost associated with
physical and nonphysical-only intimate partner violence. Health Serv Res: 44: 1052-67. 21 Ansara DL, Hindin MJ. 2010. Formal and informal help seeking associated with women’s men’s experiences of
intimate partner violence in Canada. Soc Sci Med 2010; 70: 1011-18. 22 Black CM. 2001. Intimate partner violence and adverse health consequences: implications for clinicians. Am J
Lifestyle Med: 5: 428-39. 23 WHO, London School of Hygiene and Tropical Medicine. 2010. Preventing intimate partner and sexual
violence against women: taking action and generating evidence. Geneva: World Health Organization. 24 Garcia-Moreno C et al. 2015. Addressing Violence Against Women: A Call to Action, The Lancet 385, no.
9978. 25 World Bank. 2014. Voice and agency: empowering women and girls for shared prosperity. Washington, DC:
World Bank. 26 www.path.org 27 Garcia-Moreno C, Jansen HAFM, Ellsberg M, Heise L and Watts C. 2005. WHO multi-country study on
women’s health and domestic violence against women. Initial results on prevalence, health outcomes and
women’s responses. WHO, Geneva. 28 UNFPA. 2019. Violence against Women - Regional Snapshot. kNOwVAWdata. Bangkok.

5
backgrounds and geographic regions in Viet Nam were included in the survey. The WHO
questionnaire was adapted to suit the Vietnamese context and Viet Nam also included a
qualitative component in the study (as advised by the original WHO protocol).
This report describes the second national study, “Journey for change”: “Results of the
National Study on Violence against Women in Viet Nam 2019. This fieldwork for this survey
component of the study was conducted from November 2018 through January 2019 applying the
WHO methodology, which was similar to the first national study, including a survey of nearly 6,000
women. The studies each included both a quantitative survey and qualitative component to gain
deeper insight into core concepts. The 2019 study included adaptations to the questionnaire
based on lessons learned from the 2010 study and to take into account changes in the
Vietnamese context. Details on the adaptations will be given below.
1.2. Geographic and demographic context
Viet Nam is a country in Southeast Asia bordered by Cambodia, China and Lao People’s
Democratic Republic. It has a total inland and island area of 330.221 km2. The country is divided
into six socioeconomic and geographic regions (Box 2)29.
Box 2: Six socioeconomic and geographic regions in Viet Nam
Northern Midlands and Mountains: Contains 14 provinces in northern Viet Nam and ethnic minorities account for 56.2 per cent of the population (2019 census). Some of them border with the Lao People’s Democratic Republic or China. This mountainous region is the second largest in Viet Nam and is relatively poor.
Red River Delta: Contains 11 provinces that are small but populous. They are based around the Red River, including the national capital, Ha Noi. It is the smallest and most densely populated region in the country.
North and South Central Coast: Contains 14 coastal provinces in the northern and southern part of central Viet Nam. This is the largest and second most populous region. It often suffers from natural disasters, causing difficult living conditions.
Central Highlands: Contains five provinces that are mostly mountainous. The local inhabitants include ethnic minorities as well as Kinh people.
South East: There are six cities and provinces, including the biggest city in Viet Nam, Ho Chi Minh City.
Mekong Delta: Viet Nam's southernmost region, containing 13 mostly small but populous provinces. This region is considered the rice granary of Viet Nam, providing millions of tons of rice for export every year.
The most recent census in April 2019 recorded a population of 96,208,984 in Viet Nam,
48,327,923 (50.2 per cent) female and 47,881,061 (49.8 per cent) male. In comparison to the last
census in 2009, the population has increased by 10.4 million people30. Viet Nam has one of the
29 Note: Since 2019, the Ministry of Planning and Investment has been proposing a socio-economic development
plan (2021–2030) moving to seven socioeconomic and geographic regions as the current division of six regions showed some limitations. For example, there are significant differences in terms of social and economic context of the northeast and northwest of the northern midland mountain. https://Viet Namnet.vn/vn/kinh-doanh/dau-tu/thay-doi-quan-trong-ca-nuoc-co-7-vung-kinh-te-xa-hoi-499714.html 30 Viet Nam General Statistics Office. 2019. Preliminary results of Population and Household Census. GSO.
Hanoi, Viet Nam.

6
fastest ageing populations in Asia. By 2050 the number of people over 60 will triple from 8.9 per
cent to over 30 per cent.31
Since the economic reform in 1986, Viet Nam has achieved significant economic growth. A
government report in 2019 showed local gross domestic product (GDP) of about 7 per cent – the
highest level for the last nine years.32 However, there are large discrepancies in economic status
between different socioeconomic groups in Viet Nam. Ethnic minority peoples make up 15 per
cent of the population but account for 73 per cent of poor households. Income of the Kinh and
Hoa people is more than double that of people from ethnic minority groups. Only 13.7 per cent of
ethnic minority children attended lower secondary schools, whereas the percentage among
majority Kinh and Hoa populations is 65 per cent.
1.3. What is known on violence against women in Viet Nam?
Viet Nam adopted (CEDAW) in 1980. In Viet Nam, VAW was brought to public attention as early
as 199733. As stated in the Constitution, everyone in Viet Nam including women of all ages should
be able to enjoy equal rights and be protected from all forms of violence and discrimination.34 The
Law on Gender Equality passed in 2006 confirmed the equal rights of women.35 In 2007, the Law
on Domestic Violence Prevention and Control was passed.36 The Law on Marriage and Family
regulates that marriage is based on equal and non-violent relationships. Women can ask for a
divorce and a woman’s rights are protected, e.g. regarding to property and custody of children,
during and after the divorce.37
Despite these progressive laws, prevailing gender norms reinforce inequality and place women
at high risk of IPV. Confucian and patriarchal norms put men in a privileged position and women
in a subordinate position. Taoist perceptions about men as "hot" (nóng) and women as "coolness"
(mát) help to legitimize violence by men and pressure women to endure it.38 Myths about men’s
sexuality, such as men have high sexual demands which should be satisfied to promote good
health lead to a tolerance of forced and unwanted sex within long-term relationships.39 The
Women’s Union in its efforts to promoting women’s positions within the family, community and
society has sometimes inadvertently reinforced these norms, thus unfortunately normalizing
VAW.40
31 HelpAge International. 2018. Global AgeWatch Insight Viet Nam Report Card. HelpAge: Viet Nam. 32 Viet Nam News. 2019. GDP in first three quarters climbs to 9-year high. https://Viet
Namnews.vn/economy/536134/gdp-in-first-three-quarters-climbs-to-9-year-high.html#cWHEMmiH5ZukyxLw.97. 33 Rydstrom H. 2003. Encountering "Hot" Anger: Domestic Violence in Contemporary Viet Nam. (Special Issue:
Responses and Challenges to Violence Against Women in East and Southeast Asia), Violence Against Women
9, no. 6. 34 Viet Nam National Assembly. 2013. Constitution of the Socialist Republic of Viet Nam. Hanoi, Viet Nam. 35 Viet Nam National Assembly. 2006. Law on Gender Equality. Hanoi, Viet Nam. 36 Viet Nam National Assembly. 2007. Law on Domestic Violence Prevention and Control, Vol. 02/2007/QH12
Hanoi, Viet Nam. 37 Viet Nam National Assembly. 2014. Marriage and Family Law. Hanoi, Viet Nam. 38 Horton P et al. 2001. Heterosexual Masculinity in Contemporary Viet Nam. Men and Masculinities 14, no. 5,
542-564. 39 Viet Nam General Statistics Office. 2010. 'Keeping Silent is Dying': Results from the National Study on
Domestic Violence Against Women in Viet Nam. Hanoi, Viet Nam: GSO. 40 Schuler SR et al. 2006. Constructions of Gender in Viet Nam: In Pursuit of the 'Three Criteriaư," Culture,
Health & Sexuality 8, no. 5, 383-394.

7
Data from the first national VAW survey in 2010 in Viet Nam revealed that 58 per cent of ever-
married Vietnamese women had suffered from physical, sexual or emotional violence by their
husband/partner in their lifetime and 27 per cent experienced any of these three types of violence
in the 12 months prior to the survey.41 This first national survey also showed that only half of the
violence survivors revealed this violence to anyone and only 10 per cent sought formal help from
Women’s Union or local authorities.42
The study also revealed that women living in poor economic conditions are at higher risk of
violence from their intimate partners, and that women who finished secondary school or a higher
level of education are less risk at risk from violence than women with a lower educational level.
The research also revealed marked regional variances in the prevalence of VAW in Viet Nam.
For example, women in the Red River Delta, Central Highland and South East regions of Viet
Nam are at higher risk of IPV. The factors most strongly associated with violence were male
behaviour that could be considered harmful forms of expressing manhood, and both the woman’s
and husband/partner’s early victimization.43, 44 The increased risk in the before-mentioned regions
is assumed to be related to the stricter practice of patriarchal and traditional family norms, such
as son preference, in these regions.45, 46 Qualitative research indicates that older women and
women with disability may have a higher risk of GBV and IPV.47 However, these groups were at
the time not specifically included the national VAW survey.
Research in Viet Nam also shows a high level of acceptance of VAW perpetrated by the husband.
Although domestic violence was outlawed in 2007, the level of acceptance does not seem to be
diminishing. In the first national survey, 41.3 per cent of women interviewed claimed that a
husband was justified in hitting his wife in at least one situation.48 In another survey conducted in
2014, this rate was as high as 50 per cent.49 In a smaller survey, using a set of 10 scenarios, 95.1
per cent of women interviewed claimed that a husband would be justified in hitting his wife in at
least one of the presented scenarios.50
The Vietnamese national management related agencies have been actively partnering with the
United Nations, research institutes and non-government organizations to develop and seek
approval for national programmes, action plans and proposals on gender equity, responses to
GBV and the prevention and control of domestic violence against women. Every year Viet Nam
joins the global movement to launch a national campaign to eliminate violence against women
41 Viet Nam General Statistics Office. 2010. 'Keeping Silent is Dying': Results from the National Study on
Domestic Violence Against Women in Viet Nam. Hanoi, Viet Nam: GSO. 42 Ibid. 43 Jansen HAFM, Ng Nguyen TV and Hoang TA. 2013. Why do some Women Experience Violence More than
the Others? Viet Nam: UNFPA. 44 Jansen HAFM, Ng Nguyen TV and Hoang TA. 2016. Exploring risk factors associated with intimate partner
violence in Viet Nam: results from a cross-sectional national survey. Int J Public Health; 61:923–34. https://doi.org/10.1007/s00038-016-0879-8. 45 Barbieri M and Bélanger D. 2009. Reconfiguring Families in Contemporary Viet Nam. Stanford University
Press. 46 Guilmoto C.Z. 2012. "Son Preference, Sex Selection, and Kinship in Viet Nam," Population and Development
Review 38, no. 1 47 Center for Creative Initiatives in Health and Population (CCIHP). 2019. ICPD+25 monitoring report. 48 Viet Nam General Statistics Office. 2012. Multiple Indicator Cluster Survey Viet Nam 2011: Key Findings
Hanoi, Viet Nam: GSO 49 Viet Nam General Statistics Office. 2014. Viet Nam 2013–2014 Multiple Indicator Cluster Survey (MICS).
Hanoi: GSO. 50 Yount KM et al. 2014. Measuring Attitudes about Intimate Partner Violence Against Women: The ATT-IPV
Scale. Demography 51, no. 4, 1551-1572.

8
and girls. Viet Nam undertakes a national month on prevention and control of domestic violence
(June) and an action month for gender equality, prevention and response to GBV (15 Nov-15
Dec). Programmes working with men to prevent VAW prevention are being piloted. Government
and non-government organizations are also developing and strengthening services to support
violence survivors including legal aid, health care and shelters.
In this context, the second national study on VAW was conducted. This study helps quantify the
prevalence of VAW in Viet Nam and to monitor any change in levels and types of violence since
the previous survey. Further, it aimed to assess the availability and accessibility of information
and services related to preventing and responding to VAW, within a context of increasing social
and economic inequity. This report also aims to cover VAW among groups that were not well
presented in the first national study such as older women, women with disability and ethnic
minority women. Finally, the study aims to provide further understanding of the persistence of
attitudes that condone VAW, help-seeking behaviours and coping mechanisms of violence
survivors, and the cost of violence to women, households and society. More details on the
objectives are given in the next chapter.
2. Research objectives and methodology
The current 2019 study on violence against women in Viet Nam had a quantitative and a
qualitative component. In this chapter we will first describe the quantitative component (the
survey), followed by the qualitative component.
The quantitative research (the survey) has been carried out using an adaptation of the
methodology of WHO Multi-Country Study on Women’s Health and Domestic Violence against
Women. The qualitative component was conducted following analysis of the survey to further
explore some of the findings.
The objectives of the study were to:
● estimate the prevalence and frequencies of different forms of violence against women
aged 15 to 64 caused by husbands/partners (including violence against women with
disabilities);
● measure the prevalence, frequency and place of occurrence of physical and sexual
violence caused by non-partners against women since the age of 15, and the
prevalence of physical and sexual violence caused by any perpetrators to women
during their childhood (aged under 15 years);
● measure women’s attitudes towards gender roles and violence;
● assess the extent to which violence affects women’s general, mental and reproductive
health;
● assess the impact of violence by a husband/partner on children and the
intergenerational aspects of violence;
● assess women’s responses to violence by a husband/partner (including coping
strategies);
● estimate the direct cost of violence by a husband/partner and the impact on work and
productivity;
● assess which factors put women at risk of more violence; and
● identify any changes in the situation regarding violence against women and girls in Viet
Nam during the period 2010-2019.

9
To meet these objectives, violence against women by both partners and non-partners needs to
be measured, as well as violence experienced as a child (before the age of 15) and after the age
of 15. Figure 2 provides a graphical illustration of the types of violence measured in the Viet Nam
prevalence survey (based on the methodology of WHO Multi-Country Study on Women’s Health
and Domestic Violence against Women).
Figure 2: Illustration of the type of intimate partner and non-partner violence measured in the survey
In the original WHO Multi-country Study on Women's Health and Domestic Violence Against
Women (2005),51 most participating countries selected women aged 15 to 49 as the study
respondents. The WHO study particularly aimed to understand the consequences of violence on
women’s health (including reproductive health), and this age range was selected to compare the
results among the participating countries and the results of other studies that measured domestic
violence such as the Demographic Health Survey.
In Viet Nam, the first National Study on Domestic Violence against Women in Viet Nam (2010)
focused on women aged 18 to 60. The current 2019 study expanded the age group of interest
and focused on; women aged 15 to 64 were selected as the respondents. The minimum age of
15 years intended to better capture the experience of adolescent girls as many in the age group
15 to 17 are already at risk of different types of violence, including violence by a husband/partner.
For international comparison and Sustainable Development Goals (SDGs) monitoring, violence
rates are measured for women aged 15 and older.
51 Available at: www.who.int/reproductivehealth/topics/violence/mc_study/en/
Violence against women
Intimate partner violence
Physical
Sexual Psychological
Controlling
behaviour
Emotional abuse
Economic
Non-partner violence
Physical
after age 15
Sexual
after age 15
Forced sexual
intercourse
Attempted rape and
other sexual abuse
Child abuse before age 15
Physical
Sexual
“… any act of gender-based violence that results in, or is likely to result in,
physical, sexual, or psychological harm or suffering to women…” (United
Nations, 1993)
‘Intimate partners’ are current and former
husbands, cohabiting partners, fiancés, and
regular dating partners
Anyone not a current or former intimate
partner, e.g. parent, teacher, friend, sibling,
other family member, stranger
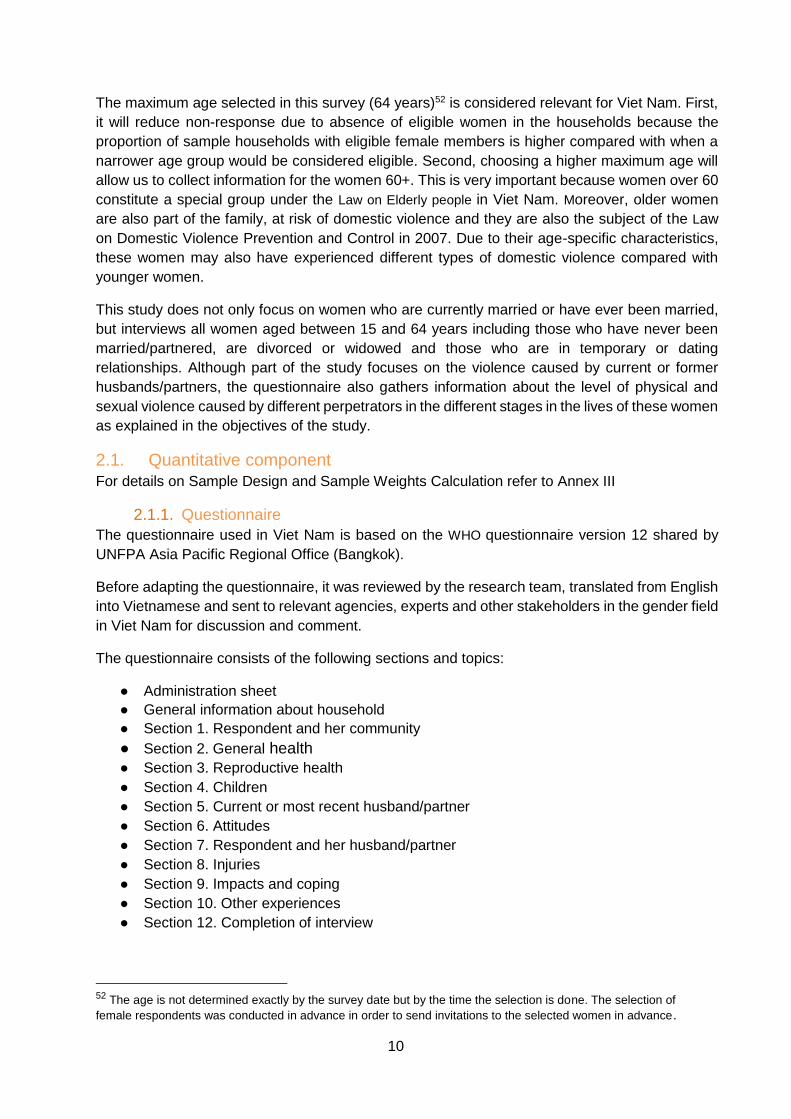
10
The maximum age selected in this survey (64 years)52 is considered relevant for Viet Nam. First,
it will reduce non-response due to absence of eligible women in the households because the
proportion of sample households with eligible female members is higher compared with when a
narrower age group would be considered eligible. Second, choosing a higher maximum age will
allow us to collect information for the women 60+. This is very important because women over 60
constitute a special group under the Law on Elderly people in Viet Nam. Moreover, older women
are also part of the family, at risk of domestic violence and they are also the subject of the Law
on Domestic Violence Prevention and Control in 2007. Due to their age-specific characteristics,
these women may also have experienced different types of domestic violence compared with
younger women.
This study does not only focus on women who are currently married or have ever been married,
but interviews all women aged between 15 and 64 years including those who have never been
married/partnered, are divorced or widowed and those who are in temporary or dating
relationships. Although part of the study focuses on the violence caused by current or former
husbands/partners, the questionnaire also gathers information about the level of physical and
sexual violence caused by different perpetrators in the different stages in the lives of these women
as explained in the objectives of the study.
2.1. Quantitative component
For details on Sample Design and Sample Weights Calculation refer to Annex III
2.1.1. Questionnaire
The questionnaire used in Viet Nam is based on the WHO questionnaire version 12 shared by
UNFPA Asia Pacific Regional Office (Bangkok).
Before adapting the questionnaire, it was reviewed by the research team, translated from English
into Vietnamese and sent to relevant agencies, experts and other stakeholders in the gender field
in Viet Nam for discussion and comment.
The questionnaire consists of the following sections and topics:
● Administration sheet
● General information about household
● Section 1. Respondent and her community
● Section 2. General health
● Section 3. Reproductive health
● Section 4. Children
● Section 5. Current or most recent husband/partner
● Section 6. Attitudes
● Section 7. Respondent and her husband/partner
● Section 8. Injuries
● Section 9. Impacts and coping
● Section 10. Other experiences
● Section 12. Completion of interview
52 The age is not determined exactly by the survey date but by the time the selection is done. The selection of
female respondents was conducted in advance in order to send invitations to the selected women in advance.

11
The full questionnaire is in Annex VIIa.
The main differences between the questionnaire used in the 2019 survey and the questionnaire
used for the first survey in 2010 include:
● Addition of nine questions about women's employment to support analysis for economic
empowerment.
● Replacement of some of the old general health questions with questions to measure
disability (Washington group, short set).
● Addition of economic violence behaviours common in Viet Nam to section 7. These were
determined based on types of economic violence identified in the previous survey and
qualitative research.
● Addition of questions to estimate the cost of violence, especially to sections 7 and 8,
● More detailed questions on non-partner violence and new types of violence in section 10.
● Removing section 11 and incorporating the questions in that section into section 1 to avoid
duplication in the information-gathering process.
For the full list of adaptations/modifications, see Annex VIIb
The questionnaire was applicable to all female respondents whether they were married/cohabiting
or not. However, questions about violence caused by husband/partner were only asked to women
who said that they ever had a husband or intimate partner.
Data collection was carried out by using tablets (CAPI), whereas in 2010, data was collected with
paper questionnaires. The data entry application was pre-tested in Hoa Binh and Da Nang before
it was finalized. During the pre-test phase, the respondents not only answered the questions, but
were also asked to comment on the clarity and acceptability of the questions.
2.1.2. Operational definitions of different types of violence
In the survey each form of violence was measured by asking about specific behavioural acts, as
listed in Table 1. Differences with the 2010 questionnaire are indicated in red.
Table 1: Operational definitions of violence used in the 2010 and 2019 studies on violence against women in Viet Nam
Type of violence 2010 Study 2019 Study
Physical violence by a husband/partner
a) Slapped her or thrown something
at her that could hurt her
b) Pushed her or shoved her or
pulled her hair
c) Hit her with his fist or with
something else that could hurt her
d) Kicked her, dragged her or beaten
her up
e) Choked or burned her on purpose
f) Threatened with or actually used
a gun, knife or other weapon
against her

12
Sexual violence by a husband/partner
a) Physically forced her to have
sexual intercourse when she did
not want to
b) She had sexual intercourse when
she did not want to because she
was afraid of what her partner
might do
c) He forced her to do something
sexual that she found degrading
or humiliating
d) He forced her to have sex with
another person
a) Forced her to have sexual
intercourse when she did not want
to
b) She had sexual intercourse when
she did not want to because she
was afraid of what her partner
might do
c) He forced her to do something
sexual that she found degrading
or humiliating
Emotional violence (part of psychological violence)
a) Insulted her or made her feel bad
about herself
b) Belittled or humiliated her in front
of other people
c) Done things to scare or intimidate
her on purpose, e.g. by the way
he looked at her, by yelling or
smashing things.
d) Threatened to hurt her or
someone she cared about
e) Threatened to throw her out of the
house or actually threw her out
a) Insulted her or made her feel bad
about herself
b) Belittled or humiliated her in front
of other people
c) Done things to scare or intimidate
her on purpose, e.g. by the way
he looked at her, by yelling or
smashing things
d) Threatened to hurt her or
someone she cared about.
Controlling behaviours (part of psychological violence)
a) Tried to keep her from seeing
friends
b) Tried to restrict contact with her
family of birth
c) Insisted on knowing where she
was at all times
d) Ignored her and treated her
indifferently
e) Got angry if she spoke with
another man
f) Was often suspicious that she
was unfaithful
g) Expected her to ask permission
before seeking health care for
herself
a) Tried to keep her from seeing
friends
b) Tried to restrict contact with her
family of birth
c) Insisted on knowing where she
was at all times
d) Got angry if she spoke with
another man
e) Was often suspicious that she
was unfaithful
e) Expected her to ask permission
before seeking health care for
herself
Economic violence53 a) Took away what she earned or
saved
b) Refused to give money
a) Prohibited her from getting a job,
going to work, trading, earning
money or participating in income-
generation projects
b) Took her earnings from her
against her will
c) Refused to give her money
needed for household expenses
53 This is also referred to as economic abuse because there are no perfect methods to make sure that the acts
included always measure economic violence in every context.

13
even when he has money for
other things (such as alcohol and
cigarettes)
d) Expected her to be financially
responsible for his family and
himself54
e) Expected her to ask his
permission before buying
anything for herself55
Non-partner physical violence
Since she was 15 years old, someone other than her partner beat or physically mistreated her
a) Slapped, hit, beaten, kicked or
done anything else to hurt her
b) Thrown something at her, pushed
her or pulled her hair
c) Choked or burned her on purpose
d) Threatened with or actually used
a gun, knife or other weapon
against her
Non-partner sexual violence
Since the age of 15 years, has anyone (FOR WOMEN WITH CURRENT OR PAST PARTNER: other than her husband/partner) ever forced her to have sex or to perform a sexual act when she did not want to
a) Forced her to have sexual
intercourse when she did not want
to
b) Forced to have sexual intercourse
when she was too drunk or
drugged to refuse
c) Forced or persuaded to have sex
against her will with more than
one man at the same time
d) Attempted to force her into sexual
intercourse when she did not want
to, for example by holding her
down or putting her in a situation
where she could not say no
e) Touched her sexually against her
will
f) Made her touch their private parts
against her will
Child physical abuse Not asked:
When she was a child (before age 15), did anyone in her family ever:
a) Slapped or spanked her (with
hand)
b) Beaten or kicked her or hit her
with fist
c) Hit her with a belt, stick, broom or
something else
d) Tied her with a rope
54 This act was initially not included in the WHO questionnaire but was added into the Vietnamese questionnaire 55 This act was initially not included in the WHO questionnaire but was added into the Vietnamese questionnaire

14
e) Insulted or humiliated her
regularly
f) Scolded and cursed her regularly
Child sexual abuse* Before she was 15 years old, someone had touched her sexually or made her do something sexual that she did not want to.
Before she was 15 years old, someone had touched her sexually or made her do something sexual that she did not want to.
Notes: Items in red indicate changes between the two questionnaires. * At the end of the interview, the respondent was shown a tablet screen by the interviewer and was asked to choose between a smiling face and a sad face. Using the same question on child sexual abuse before age 15 as in the interview the respondent was asked to click on the smiling face if it had not happened to her, and on the sad face if it had happened. She was also told that the interviewer would not know which face she had selected (see Figure 3).
Figure 3: Illustration of the pictures used for anonymous disclosure of sexual abuse before the age of 15.
2.1.3. Reference periods for the experience of violence
For each act of violence that the respondent said had happened to her, she was asked whether
it had happened ever in her lifetime (lifetime violence), and, if so, if it happened in the past 12
months. Violence that has occurred in the past 12 months is also referred to as current violence
by a husband/partner. Both reference periods are important because they tell us about different
aspects of the issue.
Violence that has ‘ever happened’ is considered part of the lifetime experience of violence
whether it has happened once or many times; whether it happened this morning or 20 years ago.
From this perspective, once it has happened, it will always be counted, no matter how long time
ago, so by definition ‘lifetime violence’ increases with age. Lifetime prevalence tells us the
The happy/smiling face means ’no, it had not happened’; the sad face means ’yes, it had happened’.

15
proportion of women who experienced violence at some point in their lives. This is especially
important for policy advocacy and raising awareness of violence against women.
Violence mentioned as happening within the last 12 months preceding the survey is considered
current violence. While it is part of the lifetime experience, and because only recent experiences
are counted, by definition the rate of this violence is lower (or maximum the same) than the rate
of violence in lifetime because it only identifies the most recent acts. The percentage of women
suffering from violence in the past 12 months is an important indicator to reflect the actual
situation. This indicator is therefore important for intervention planning (e.g. how many women
currently need support services). The 12-month period is much better suitable to monitor change
and thus to measure the impacts of intervention programmes.56
2.1.4. Definition of a husband/partner
According to the Law on Domestic Violence Prevention and Control in Viet Nam, a woman only
suffers from domestic violence caused by her current or former husband, or by her intimate
partner if she lives together with him (cohabiting). In this study, women are considered to have
intimate partners if they have ever been married, have ever cohabited with someone like spouses
of each other, or have ever dated a male partner (boyfriend). In fact, the quantitative survey shows
that 97 per cent of women who have ever had a partner are married women (see Section 3),
therefore when in the report we speak of violence by a husband/partner it mainly refers to spousal
violence. This also shows that if women experience violence caused by their husband/partner, in
almost all cases it corresponds to the definition of domestic violence in the Law on Domestic
Violence Prevention and Control.
2.1.5. Interviewer selection and training
One of the steps to ensure that women disclose violence and thus to collect quality data (which
also improves comparability with countries using the same method) is the careful selection of and
specialized training at the national level of interviewers.57 The General Statistics Office (GSO) in
cooperation with the Project Management Unit of MOLISA carefully recruited and trained 100
interviewers (113 people were trained and 100 of them were selected).
The following criteria were used for selecting interviewers: First, they must be women between
the ages of 25 and 55. Second, they needed to have experience in conducting surveys and be
able to use tablets (CAPI) for interviews, hence they were selected from the staff of the Statistics
Departments of provinces and centrally-run cities (101 people) and GSO’s collaborators (12
people). Skills required included: ability to interact with all kinds of people; no prejudice; being
mature and having life experience; good communication skills to build trust with respondents; and
experience in dealing with sensitive issues. It was important for them to know how to use CAPI
fluently because the survey was conducted using CAPI.
56 It should be noted when interpreting/explaining the changes in the prevalence of violence:
sometimes, when awareness is raised, more women will reveal about their violence experience, which will result in an increasing number of violence victims. However, this does not necessarily mean that violence has increased. 57 Jansen HAFM et al. 2004. Interviewer Training in the WHO Multi-Country Study on Women’s
Health and Domestic Violence. Domestic violence, 10(7):831-849.

16
As the interviewers already had experience in quantitative surveys, training was adjusted and
shortened to two weeks (shorter than the specialized training for the WHO methodology, which is
usually three weeks). Training took place from 29 October to 9 November 2018. Two days of
training were spent on sensitization in gender and violence issues, followed by training on
interview techniques and questionnaire discussion (explanation of each question), one day for
interviewers to familiarize themselves with CAPI and then practice interview skills through role-
play and entering information into CAPI; and one day for field practice (pilot survey) in week 2
after the trainees basically grasped the contents of the questionnaire, knew how to interview and
record information into CAPI.
During the training, trainees had to pay close attention to lectures, complete all tests and practice
interviewing. The selected interviewers were those who had a high score in the tests and good
interviewing skills, and thus they met all requirements on technical qualifications and interviewing
skills.
2.1.6. Fieldwork
To avoid exhaustion and burn-out in the survey on violence against women, it was recommended
that each interviewer interview no more than 100 people during the survey. Moreover, experience
from other studies shows that for safety and confidentiality reasons it is recommended to complete
one entire survey site in a day. These recommendations were applied to the study in Viet Nam.
It was planned that each interviewer would interview three women every day; each survey site
had 12 households, which was achieved with field teams of four interviewers and one team leader.
To complete the survey within 2 months, 20 survey teams were formed with each team consisting
of five people. The team leaders were responsible for supervising all activities of each group in
each surveyed site, assigning/allocating women to be interviewed by interviewers and
interviewers conducted direct interviews with tablets.
The respondents were not interviewed at home, but they received an invitation letter in advance
and the interview was conducted at a public location, usually a commune centre or a
communal/culture house. The idea of holding interviews in a public location is to ensure more
safety and privacy for respondents and in this way the respondents would not be
affected/distracted by their family members, including their husband/partner, who might be
around, eavesdrop/ overhear the interview. This setting was expected to save more time spent
on identifying households and determining the right time to meet the respondents (because the
interviewers may have to travel many times).
The field survey took place from November 21, 2018 to mid-January 2019 over a two-month
period. We refer to this study as the “2019 study”. Research safety and ethical principles were
adhered to throughout implementation of the survey as explained in details below.
17
2.1.7. Ethical and safety considerations
Due to the sensitive nature of the study topic, ethical and safety recommendations developed for
research on violence against women by WHO58 were strictly applied in all stages of the survey.
● Safe name: the survey was always referred to as the Women's Health and Life
Experiences Study 2019 and there was no mention of violence in fieldwork planning and
implementation. This allowed the interviewers and the respondents to explain the survey
to others without referring to violence. Similarly, word use was carefully considered in the
documents related to the survey (including the internal documents of the GSO, supporting
documents, questionnaires, and guide/handbook). This safe name was also used by
researchers/ interviewers to describe the survey from within the GSO to external partners
and local authorities at different levels.
● Information confidentiality agreement: all interviewers signed an information confidentiality
agreement, which was considered as part of the employment contract.
● Consent to participate in the survey: information confidentiality, voluntary participation, the
right to refuse to answer any questions or to stop the interview at any time, were clearly
explained to selected women before the interview and their consent was sought before
proceeding.
● Confidentiality: only team leaders knew the respondents’ names. Data were transmitted
to a central secure location daily and deleted from the handheld devices.
● Support for interviewers: supervision and support protocols were in place to keep
interviewers physically safe and protect their mental wellbeing. In addition, information on
the hotline and supporting materials for the survey team were also provided to the team
members. Interviewers were equipped with “dummy” questionnaires, which consisted of
only questions up to section 4 and had no questions about violence to deal with the
situation where a respondent's husband/ partner or someone wanted to see the
questionnaires or information in tablets.
● Support for respondents: a leaflet containing general information on domestic violence
and existing services for female victims of violence in Viet Nam was developed, printed
and handed out to each respondent after ending each interview. In order to minimize the
risk for women who were possibly experiencing violence and who could be in danger if a
violent husband/partner would find the leaflet with violence-related information, the leaflet
was part of a set of many other leaflets with appropriate health information for women that
were handed out at the same time. The potential risk to the respondents when they
brought the materials home was also mentioned when this material was given to them
because in some cases the respondents themselves may not be aware of that risk.
● Selecting only one woman from each household: for households with more than one
eligible woman to participate in the survey, only one woman was randomly selected, so
no other household members could know about the content of the interviews.
● Interview location: the interviews were conducted in a private and safe location. All women
selected to participate in the study received an invitation to a commune office such as a
Health Station or a Culture/ Communal House for interview at specific times to avoid that
women needed to wait or would run into other respondents.
58 WHO. 2001. Putting women first: Ethical and safety recommendations for research on
domestic violence against women. Geneva, World Health Organization.
http://whqlibdoc.who.int/hq/2001/WHO_FCH_GWH_01.1.pdf

18
● Training of interviewers: interviewers were trained to create a safe, peaceful and reliable
environment for the respondents to feel comfortable.
● Changing interview locations after each day: survey groups were not allowed to stay
overnight in the commune where interviews had been conducted, especially in rural areas
because local people could ask them many things about the scope of the study and that
could create stressful situations.
2.1.8. Quality control mechanisms The quality control was guaranteed right from the selection of interviewers. Interviewers had to
have relevant experience and were assessed as to whether or not she met the standards/
requirements at the end of the training to become an interviewer.
During the information collection interview, four levels of quality control were set out to ensure
high quality of data. First of all, even during the interview with a tablet, warnings about errors and
inconsistencies between response information were displayed to help interviewers manage the
errors/problems immediately during the interview process. The second level of control were the
online supervisors. There were 20 survey groups conducting the survey at the same time. The
GSO mobilized 20 online supervisors from the Department of Social and Environmental Statistics
to supervise the progress of each group; each supervisor was responsible for checking all
questionnaires and technically assisting one survey group in terms of technical issues and support
related to the field survey process. Because the interview was done with CAPI, when completing
a questionnaire, each interviewer was required to immediately send data to the server. Online
supervisors were always on hand to receive and check data. If the information was inaccurate or
questionable, the online supervisors would immediately contact the interviewer to request
immediate information verification and correction (if any) before leaving the area. All data in the
questionnaires must be approved by the online supervisor (online supervisors had to complete
the “data approval” step) before being accepted on the server. The next control level was the
survey site report prepared by the team leader right after completing each day’s survey. This
report helped online supervisors and team leaders have an overview of the entire survey area
and the quality of answers to the questionnaires related to each interviewer. Based on that, online
supervisors and team leaders could make timely adjustments to any issues which arose during
the survey. In addition, some survey teams were directly supervised by field supervisors,
especially in the first weeks of the survey, so that the field supervisors could directly provide on-
site technical assistance and ensure compliance with research safety and ethical requirements.
Any problems arising during the survey were reported directly and received feedback from
supervisors under the direction and supervision of international consultants.
After finishing the information collection process, the supervisors reviewed all data received and
cleaned the data before handing over the data to the Project Management Board.
2.1.9. Data processing and analysis
The questionnaire was programmed into electronic format using CSPro software V7.1, which
allowed interviewers to enter responses to questions directly into the tablet. The software directly
checked internal consistency, range and error checking and skip patterns of the responses at the
point of entering the answers during the interview. The uploaded files aggregated at GSO were
immediately available for data analysis, after checking, editing and recoding using standard and
adapted recode syntax files.

19
The data were analysed using SPSS® 24. Descriptive analysis was guided by template tables as
provided by kNOwVAWdata. The analysis methods for the calculation of the Household assets
index is given in Annex VI, and for the estimation of the cost of violence in Annex IVa.
All analysis was done using “women weights” (the product of the household weight and the weight
for selecting a woman in each household, normalized for the total sample size). In this report and
the tables all results (usually percentages) are weighted whereas the numbers of respondents
providing the data (usually the last columns in the tables giving the total numbers, also called
sample counts or denominators) are presented unweighted, unless indicated otherwise. Selected
mean values, frequencies and proportions are presented with 95 per cent confidence intervals.
The analysis for cost of violence and for risk factors is very specific and only applies to these
topics. Therefore, the details of these particular analysis methods are given in the relevant
chapters together with the related findings.
The quantitative findings are supplemented by qualitative findings for triangulation, to enhance
interpretation and to add human stories to the data.
2.2. Qualitative component
2.2.1. Qualitative research approaches
The qualitative research component of the study was conducted following the quantitative survey. It aimed to provide the context of violence against women by intimate partners; to triangulate the quantitative results; to gain insight and explanations of quantitative data that are unexplained; and to explore related issues that by their nature could not be studied through a quantitative technique.
Themes explored in the qualitative research were identified during stakeholder consultations on
the survey results. The main concepts that the qualitative research focused on included:
● attitudes towards violence;
● the ways in which women cope with violence;
● barriers and facilitators for seeking support;
● further understanding of the triggers of violence; and
● sexual violence among younger women.
Qualitative results and discussion are presented in this report in blue text.59
The three main techniques were employed including in-depth interview, key informant
interview and focus group discussion.
- In-depth interview (IDI): used among women who have experienced violence, were from
ethnic minorities and/or women with disabilities. Among ethnic minority women and
women with disabilities interviews included both women who have experienced violence
and those without violence experience or where it was unknown. Questions explored
knowledge, perception, and attitudes about violence by a husband/partner. Among
women who had experienced violence, the qualitative research sought to gain a greater
understanding of help-seeking behaviours and coping with the violence.
- Key informant interviews (KI): commune officers, village leaders and service providers at
59 Blue has been chosen as a colour that is less affected by visual impairments and colour blindness both on paper and on screen.

20
commune, district and provincial level were interviewed to provide insight on service
provision, service provider perception and attitudes towards violence by a
husband/partner in the local area.
- Focus group discussions (FGD): used to gather collective views on gender-based
violence from women in the general public. FGDs in three provinces included four with
women of younger groups and older groups, two with women with disabilities, four with
ethnic minority women, and two with members of commune reconciliation.
2.2.2. Sample
The qualitative research was conducted in six communes in three provinces across northern,
central and southern Viet Nam. All qualitative research was conducted in rural areas. As the
research questions included some concepts best answered by victims/survivors of violence (e.g.
ways of coping with violence and seeking help or support) sites with higher prevalence rates of
violence in the last 12 months were nominated for the study. This helped increase the likelihood
that recruitment into the qualitative research would include women who had experienced
violence by a husband/partner in their lifetime.
The provinces were also purposively selected to ensure ethnic minority groups were included in
the quantitative analysis. The main ethnicities in selected provinces were Cham60 (Bani and
Islam), Khmer, Nung and Tay. The societies of the Cham Islam, Nung and Tay groups are
modelled on patriarchy while Cham Bani is modelled on matriarchy.
Due to the limit of time and resources, provinces with other ethnic minorities could not be
included in the qualitative component.
Forty-six in-depth interviews were conducted including 35 with community women and 11 with
key informants. Among the interviewees, 22 were known violence survivors, there were ten
women with disabilities, and 13 of ethnic minority (Table 2).
In addition, there were 36 focus group discussions involving 223 women from the general
public. Women selected for the FGDs were not screened for their experience of violence and
included a mix of women who were survivors of violence and those who had not experienced
violence.
In total, 269 people took part in the qualitative component (both interviews and focus groups).
The women interviewed were purposely selected to serve the objectives of the study by
including violence status known women, violence status unknown women, women with
disabilities, ethnic minorities women, younger and older women. Victim/survivors were
identified by key informants through a purposive sampling method, asking them to identify
known victims/survivors. These cases were often known by people in the community and local
officers had intervened in the situation. Thus, the local officer could identify them for the study.
60 The Cham ethnic group in Viet Nam live near the Khmer people. Cham in coastal central Viet Nam speak
Eastern Cham.

21
Table 2: Distribution of qualitative interviews, Viet Nam 2019
Violence survivors Violence unknown Total
In-depth interviews 21 14 35
Women not identifying
as having a disability
nor being in an ethnic
minority
10 2 12
Women with a disability* 6 4 10
Ethnic minority women* 5 8 13
Key informants** 1 10 11
Total interviews 46
*There are some women included who were both of ethnic minority and living with disability.
** Three key informants were at provincial level, all others were in rural areas
2.2.3. Fieldwork
Fieldwork in three provinces was conducted at almost the same time by three teams. Each
team included: a lead senior researcher with a minimum of 20 years of experiences in
conducting qualitative research on gender and gender-based violence; two researchers who
have five to ten years’ experience of qualitative research; and one support person who could
serve as an assistant researcher in group discussions and handle the administrative and
logistic work for the team during the field trip. In one province, where fieldwork was started
two days later than the other provinces, one additional researcher was assigned so the team
could finish on the same schedule as the other teams. Each research team also included a
counsellor for violence survivors.
To implement the fieldwork, the Gender Equity Department in MOLISA sent a request to the
Provincial Department of the selected province asking support for the research team to select
areas and respondents. The Provincial Department then held discussion with their colleagues
at district and commune level to select communes and participants to take part in the
research. For ethical reasons, the study was introduced to local officers using the same name
as the quantitative component. The request for selection of women with violence experience
was explained as necessary because violence is an important aspect of women’s life and
women’s health. Local officers were reminded not to mention this in the invitation to the
woman and to give special attention to them during and after the interview in order to detect
and respond effectively to potential risks and vulnerabilities related to their violence situation.
Researchers also carried with them brochures and leaflets of other health promotion
programmes to ensure further protection of women in the cases of violence.
Local officers were encouraged to include violence survivors both who had used and had not
used supporting services. Due to the short time for the fieldwork, participants identified for
interviews were mostly women who had experienced severe physical violence. The cases
were often known by the community and local officers. Thus, the local officers could identify
them for the study. In most cases, local officers could identify only women who used services
at the communes. Excepting one case of refusal, all others gave consent to take part in the
study. All interviews and FGDs were recorded with consent of the participants.

22
2.2.4. Qualitative data analysis
Transcribing: all interviews and focus group discussion were recorded (with consent) and
transcribed verbatim. Ten per cent of the transcripts were randomly verified to ensure quality of
transcribing.
Initial coding: each researcher received two transcripts for open coding. The team then met to
consolidate the results and agree on a common code frame that was used for analysis. The
qualitative coding frame follows the main content of quantitative study and objectives of the study.
It includes awareness of violence by husband or long-term partner, attitude towards this form of
violence, experiences of violence including triggers of violence, help-seeking behaviours,
responses and coping strategies. A one-day analysis workshop was organized for field trip
debriefing and discussion of initial coding.
Coding: researchers used the code frame to code all transcripts using NVivo10. This software for
qualitative analysis can work with Vietnamese text.
Analysis: analysis was conducted by senior researchers. Due to limited time and resource, the
analysis was primarily conducted using Vietnamese transcripts by the Vietnamese research team.
A complete analysis of qualitative findings will be written up in a separate report by the research
team.

23
3. Response rates and description of the survey sample This section describes the response rate and the sample of the quantitative survey. It describes
how well the survey sample reflects the general population of women and the satisfaction of
respondents with the interview. This chapter does not deal with the sample for the qualitative
component.
3.1. Response rates
Out of the 6,000 official households that were initially selected, 4,200 interviews were achieved
providing an estimated 70 per cent response rate for the official households. To achieve the
desired sample of 6,000 interviews, an additional 1,776 interviews were achieved from 3,000
reserve households (replacing missing or vacant households).61 A total of 5,976 interviews were
achieved from the combined official and reserve households.
The fieldwork and questionnaire design were such that the reasons for replacement and
incomplete surveys were not captured. Unfortunately, this makes it impossible to analyse why
and where refusals occurred and expand on understanding the response rate.
3.2. Description of the respondents in the sample
There were 5,976 women aged between 15 and 64 years included in the sample who completed
an interview. Table 3.2 (see Annex VIII) describes the sample in terms of geographic distribution,
education level, age, and partnership status (weighted62 and unweighted). The unweighted
distributions are given for all respondents (N=5,976) and ever-married/partnered respondents
(N=5,553).
Around 42 per cent of the respondents were from urban areas and the remaining 58 per cent from
rural areas. As shown in Figure 4, around 21 per cent of respondents were from the Red River
Delta (N=1,248) and a similar proportion from North and South Central Coast (N=1,147). Central
Highlands had the fewest respondents at 10 per cent of the sample (N=597).
61 Information was not recorded on how many of the reserve list were approached to achieve the additional
interviews so we cannot make an exact calculation of the final response rate. 62 Data weighting is used to correct for differences in sampling probability which is different for each sampling
stratum. These are applied to the study findings so that they correctly reflect the rates in the actual population. Please see Annex III for further discussion of the sample weights.

24
Figure 4: Frequency distribution of respondents by region, all women (unweighted), Viet Nam 2019 (N=5,976)
Using weighted data, four of every five respondents (82 per cent) were currently married. Overall,
93 per cent of the respondents had been in an intimate relationship (ever-married/partnered). Of
the ever-married/partnered women, 89 per cent were currently married, 5 per cent were divorced
or separated, 4 per cent widowed, 2 per cent were in a regular dating relationship and a small
proportion (0.2 per cent) were living with a man but not married.
In terms of education levels, around 16 per cent of the respondents had no education, 21 per cent
had primary level education, 30 per cent had lower secondary school, at 18 per cent upper
secondary. A total of 11 per cent had a university education and 4 per cent had been to college.
Most of the respondents (83 per cent) were of Kinh ethnicity. The next largest ethnic group was
Thai (2.8 per cent) followed by Tay (2.4 per cent). Around 2 per cent of respondents were Khmer.
Women of all ages were represented in the sample (Figure 5). Among all respondents, 6 per cent
were aged 15 to 19 (N=357) and almost 6 per cent aged 20 to 24 (N=332). As can be expected,
among ever-married/partnered women there were fewer women aged 15 to 19 (2 per cent of
respondents).
14.2
20.9
19.2
10.0
17.8
17.9
0 10 20 30 40 50 60 70 80 90 100
Northern Midlands and Mountains
Red River Delta
North and South Central Coast
Central Highlands
Southeast
Mekong River Delta
Percentage of all women

25
Figure 5: Age distribution of respondents by husband/partner status, Viet Nam 2019 (all women N=5,976, ever-married/partnered N=5,553)
The wealth of respondents varied by urban and rural areas. Based on the household assets
index63 applied, one third of the urban respondents were in the higher wealth category (36 per
cent) with 41 per cent of medium wealth and 23 per cent lower. In rural areas, less than one
quarter were higher wealth (23 per cent), 45 per cent medium and 32 per cent lower.
Table 3.6 (Annex VIII) shows the proportion of women owning certain assets, either by herself or
with someone else. Half of the respondents (50.3 per cent) own their house together with others
and 38.6 per cent are joint owners of land. Only 14 per cent of the respondents own a house or
land independently (14.4 per cent and 14.7 per cent respectively). Two thirds (66.2 per cent)
jointly own large household items (TV, bed, cooker) and 42.5 per cent jointly own a motor car.
Independent ownership of assets was most common for jewellery, gold or other valuables (44.6
per cent) or a motor car (35.5 per cent).
As shown in Figure 6, around 39.7 per cent of respondents are self-employed in primary industries
(agriculture, fishing and aquaculture) and a similar proportion (38.9 per cent) are in wage/salaried
employment. Around 14.7 per cent of respondents are not earning money by themselves.
63 See Annex VI for the calculation of the assets index
6.0 5.6
10.513.7 14.5 13.0 13.4 12.3 11.1
1.75.0
10.914.6
15.513.8 14.0 13.0
11.6
0
10
20
30
40
50
15-19 20-24 25-29 30-34 35-39 40-44 45-49 50-54 55-64
Percentage of all women
Age (years)
All women Ever-married/partnered

26
Figure 6: Proportion of women earning money by herself and the way they are earning money, among all women, Viet Nam 2019 (N=5,976)
Note: More than one answer could be given, therefore the total percentage of women earning money by
herself is greater than 100 per cent.
3.3. Representativeness of the sample
The unweighted and weighted age distribution of respondents is plotted in Figure 7, together with
the distribution according to the 2009 census for the total population of women aged 15 to 64 to
assess representativeness and sampling bias. The 2009 population census was used as the
frame to design the sample for the 2019 survey but, since then, the 2019 population census has
been conducted and results are available (also shown in Figure 7).64 The age distribution of the
respondents in the sample (the blue line; unweighted), shows that due to the selection strategy
used, the youngest women are underrepresented and the middle and older age groups (age 30
to 64) are overrepresented. This is a result of the sample strategy used in the study, where for
safety reasons only one woman per household was interviewed; women coming from households
with fewer eligible women were likely to be overrepresented because of their higher probability of
being selected. This difference in selection probability is in turn affecting the age distribution of
respondents, as households with women in the middle age group are likely to have on average
fewer eligible women in the same household (daughters still too young and mother too old), while
in households with an adolescent woman it is more likely that there are also others who are in the
eligible age group (her siblings, her mother).
We can see from the graph that this effect happened in Viet Nam (the weighted data brings the
distribution closer to the distribution in the population); however, the data also show that even
with this correction the group 15 to 29 remains somewhat underrepresented.
64 The age profile of women 15 to 64 years is slightly different in 2018 to that in 2010 with fewer younger women
and more in the oldest age group. The spike in the percentage of older women aged 55 to 64 may be evidence of
the rapidity of the ageing population currently occurring in Viet Nam but it is exaggerated because the oldest age
group is a ten-year group and the rest of the data are shown in five-year age groups.
38.9 39.7
25.7
14.7
0
20
40
60
80
100
Waged/salaried Self employed(Agriculture, Forestry,
Aquaculture)
Self employed (Nonagriculture)
Not earning money byherself
Percentage of all women

27
Figure 7: Age distribution of respondents in the sample and the population aged 15 to 64 years (2009 Census), Viet Nam 2019
3.4. Effect of selection probability on findings
Table 18 (Annex III) shows the effect of the sample design (selecting only one woman per
household) on the estimates of violence by a husband/partner by presenting prevalence data on
lifetime and current physical, sexual and physical and/or sexual violence by a husband/partner
for weighed and unweighted data. The results show that when applying weights for both the
selection probability of households and of women in a household, the prevalence rates remain
practically unchanged. This suggests that women in Viet Nam experience similar levels of
violence, independent of whether they live in small or large households.
3.5. Participation bias
As well as a possible bias created by the sampling strategy in terms of who is selected and who
not (as discussed above), bias can also be created by the refusal of a proportion of the selected
women to participate. This is of particular importance in a study of VAW since women who are
living in a situation of violence might be more reluctant to participate in a study. It may also be
possible that a woman who has a violent husband/partner is less easily found, for example if she
temporarily left the house. For this reason, the study invited the women selected to be interviewed
to a common venue outside the home. All interviews in an EA were conducted in one day.
Response rates did not include information on individual refusals and therefore it is difficult to
comment on the full effect of participation bias.
3.6. Respondents’ satisfaction with interview
It is commonly perceived that women do not want to be asked about their experiences of violence.
To explore this issue, towards the end of the interview all women were asked how they felt:
good/better, the same, or worse, compared with before the interview. The response to this
question was very meaningful.
Overall most respondents found participating in the study a positive experience. Among all women
who completed the interview, 63.1 per cent felt better after it, whether she had experienced
violence or not (Figure 8). About one third felt the same as before the interview and less than one
per cent of women said they felt worse. Respondents on average felt that participating in the
survey was beneficial and were happy that someone listened to their problems. It is very
0
5
10
15
20
25
30
35
15-19 20-24 25-29 30-34 35-39 40-44 45-49 50-54 55-64
Percentage of total
Respondents
Respondents (weighted)
Population (Census 2009)
Population (Census 2019)

28
encouraging to find that women who did experience violence were even more likely to feel better
after the interview than those without violence, with the highest level of satisfaction among women
who suffered more severe/multiple forms of violence. Almost all (96 per cent) agreed to be
contacted again if needed.
Figure 8: Women’s satisfaction upon completion of the interview, according to experience of violence by a husband/partner, Viet Nam 2019 (N=5,976)
Note: In less than one per cent of interviews the answer was unstated. These are not included in the graph for ease
of reading.
63.159.6
68.4 68.4
78.4
36.3 40.2 31.5 30.4 20.1
0.5 0.2 0.1 1.1 1.6
0
20
40
60
80
100
All ever-married/partnered
respondents
No violence Only physical violence Only sexual violence Both physical andsexual violence
Good/better Same/no difference WorsePercentage of all
women

29
RESULTS
4. Violence against women by a husband/partner
Key findings from this chapter
● Nearly two in three women (62.9 per cent) experienced one or more forms of
physical, sexual, emotional and economic violence, and controlling behaviours by
their husband in their lifetime, and 31.6 per cent in the last 12 months.
● One in four ever-married/partnered women (26.1 per cent) in Viet Nam experienced
physical violence from a husband/partner during their lifetime (lifetime violence), and
one in twenty (4.6 per cent) experienced husband/partner physical violence in the
last 12 months (current violence).
● Sexual violence by a husband/partner was experienced by more than one in ten
(13.3 per cent) women in Viet Nam, and one in twenty (5.7 per cent) stated this
occurred in the last 12 months.
● One in three women (32.0 per cent) experienced physical and/or sexual violence in
their lifetime and 8.9 per cent in the last 12 months. Prevalence rates are higher in
rural than in urban areas.
● Emotional violence from a husband/partner was the form of violence with the highest
prevalence rate – nearly half (47.0 per cent) of women surveyed had experienced it
in their lifetime.
● One in five (20.6 per cent) women in Viet Nam mentioned economic abuse from a
husband/partner during their lifetime and one in ten (11.5 per cent) in the last 12
months.
● Women aged between 20 and 34 are more likely than older women to experience
both physical and/or sexual violence in the last 12 months.
● Highest prevalence rates of physical violence by a husband/partner, in a lifetime,
were in the Central Highlands (40.0 per cent) and the Red River Delta (32.8 per
cent).
● Both current and lifetime rates of physical violence were comparatively lower among
women with higher levels of education than those with lower education.
This chapter presents data on the prevalence and patterns of different forms of violence against
women perpetrated by a male partner or husband, which is usually the most common form of
violence that women experience. This includes physical violence, sexual violence, emotional
violence, economic violence and controlling behaviours. Violence by other people (non-partners)
is discussed in Chapter 5.

30
Violence by a husband/partner is presented for ‘ever-married/partnered’ women because only
those women were asked about violence by a husband/partner. This group of women are referred
to as ‘ever-married/partnered women’ – of which there were 5,553 in the survey sample.65
The survey questionnaire measured women’s experience of violence using a series of behaviour-
specific questions (See Table 1 for definitions). For each act of abuse, the survey participant was
asked whether she had ever experienced that act in her lifetime. If yes, she was asked whether it
had occurred in the last 12 months.
Proportion of women who experienced violence by a husband/partner
Figure 9 illustrates the proportion of women who have experienced violence by a husband/partner
in their lifetime, and in the last 12 months, for each form of violence measured. Of all forms of
violence measured, emotional violence is the most prevalent, experienced by nearly half of ever-
married/partnered women (47.0 per cent) in their lifetime and close to one fifth (19.3 per cent) in
the last 12 months.
One in three women (32.0 per cent) experienced physical and/or sexual violence in their lifetime
and 8.9 per cent in the last 12 months. Other forms of violence measured were emotional,
economic and controlling behaviours. These can have severe impact emotionally and
psychologically, but they are more difficult to consistently define cross-culturally.
65 The current survey included women in a wider age band than the 2010 survey. Comparative analysis by different age groups is included in Chapter 13.

31
Considering all five forms of violence measured, nearly two in three women (62.9 per cent)
experienced one or more forms of violence and/or controlling behaviours by their husband in their
lifetime, and 31.6 per cent in the last 12 months. Each form of violence is discussed in more detail
below.
Figure 9: Prevalence of physical, sexual, emotional, and economic violence, and controlling behaviours by husband/partner during lifetime and the last 12 months among ever-married/partnered women, Viet Nam 2019 (N=5,553)
4.1. Physical violence
Physical violence includes being slapped or having something thrown at her, being pushed,
shoved or her hair pulled, being hit with a fist or something else that could hurt, being kicked,
dragged or beaten up, choked or burned on purpose, or being threatened with, or actually having
used, a weapon used against her.
The lifetime prevalence of physical violence by a husband/partner in Viet Nam is 26.1 per cent,
or more than one quarter of women. This means that one in every four women in Viet Nam have
experienced it at least once in their lifetime. For 4.6 per cent of ever-married/partnered women,
such violence happened recently, within the last 12 months. While the lifetime prevalence rates
in rural areas are a little higher than the urban areas, the variation of prevalence rates vary
between the geographical regions is much greater (Figure 10).
26.1
13.3
32.0
47.052.9
27.3
60.2
20.6
62.9
4.6 5.78.9
19.3 21.8
12.9
27.8
11.5
31.6
0
20
40
60
80
100
Physicalviolence
Sexualviolence
Physicaland/orsexual
violence
Emotionalviolence
Physical,sexualand/or
emotionalviolence
Controllingbehaviours
Physical,sexual,
emotionaland/or
controllingbehaviours
Economicviolence
Any form ofviolence*
Lifetime Last 12 months
* 'Any violence' includes at least one of the following: physical, sexual, emotional, economic violence or controlling behaviours
Percentage of ever-
married/partnered women
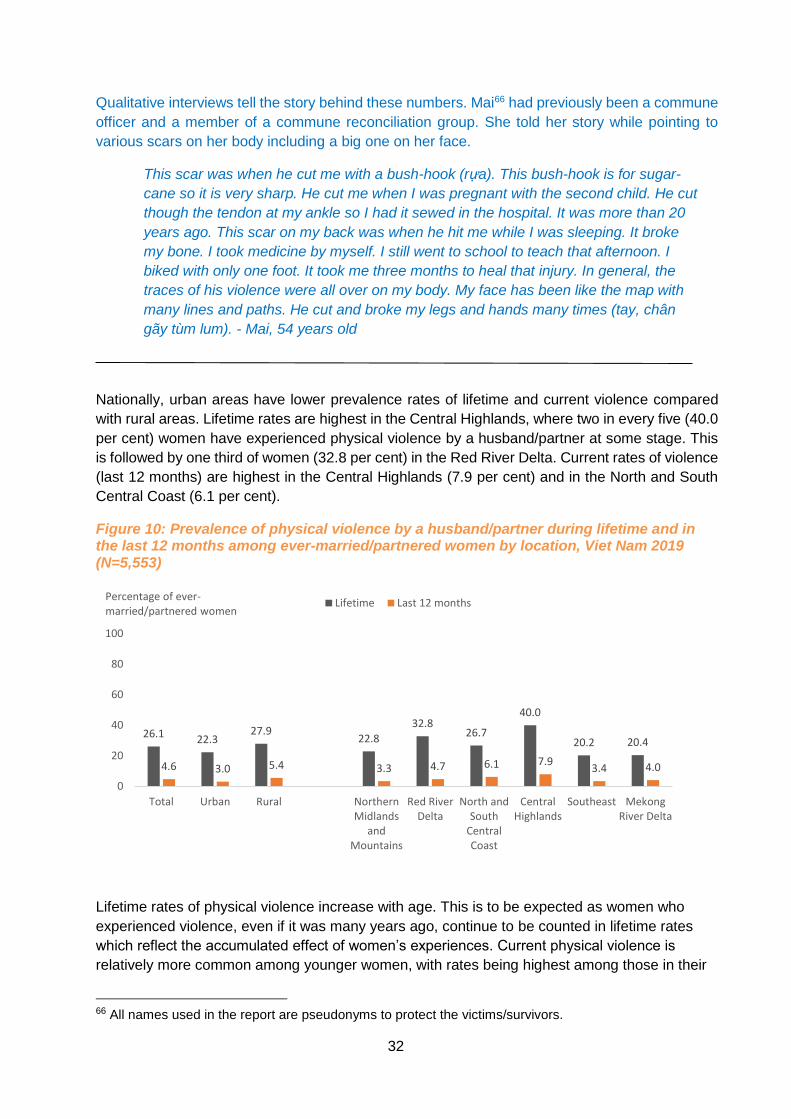
32
Qualitative interviews tell the story behind these numbers. Mai66 had previously been a commune
officer and a member of a commune reconciliation group. She told her story while pointing to
various scars on her body including a big one on her face.
This scar was when he cut me with a bush-hook (rựa). This bush-hook is for sugar-
cane so it is very sharp. He cut me when I was pregnant with the second child. He cut
though the tendon at my ankle so I had it sewed in the hospital. It was more than 20
years ago. This scar on my back was when he hit me while I was sleeping. It broke
my bone. I took medicine by myself. I still went to school to teach that afternoon. I
biked with only one foot. It took me three months to heal that injury. In general, the
traces of his violence were all over on my body. My face has been like the map with
many lines and paths. He cut and broke my legs and hands many times (tay, chân
gãy tùm lum). - Mai, 54 years old
Nationally, urban areas have lower prevalence rates of lifetime and current violence compared
with rural areas. Lifetime rates are highest in the Central Highlands, where two in every five (40.0
per cent) women have experienced physical violence by a husband/partner at some stage. This
is followed by one third of women (32.8 per cent) in the Red River Delta. Current rates of violence
(last 12 months) are highest in the Central Highlands (7.9 per cent) and in the North and South
Central Coast (6.1 per cent).
Figure 10: Prevalence of physical violence by a husband/partner during lifetime and in the last 12 months among ever-married/partnered women by location, Viet Nam 2019 (N=5,553)
Lifetime rates of physical violence increase with age. This is to be expected as women who
experienced violence, even if it was many years ago, continue to be counted in lifetime rates
which reflect the accumulated effect of women’s experiences. Current physical violence is
relatively more common among younger women, with rates being highest among those in their
66 All names used in the report are pseudonyms to protect the victims/survivors.
26.1 22.327.9
22.8
32.826.7
40.0
20.2 20.4
4.6 3.0 5.4 3.3 4.7 6.1 7.93.4 4.0
0
20
40
60
80
100
Total Urban Rural NorthernMidlands
andMountains
Red RiverDelta
North andSouth
CentralCoast
CentralHighlands
Southeast MekongRiver Delta
Lifetime Last 12 monthsPercentage of ever-married/partnered women
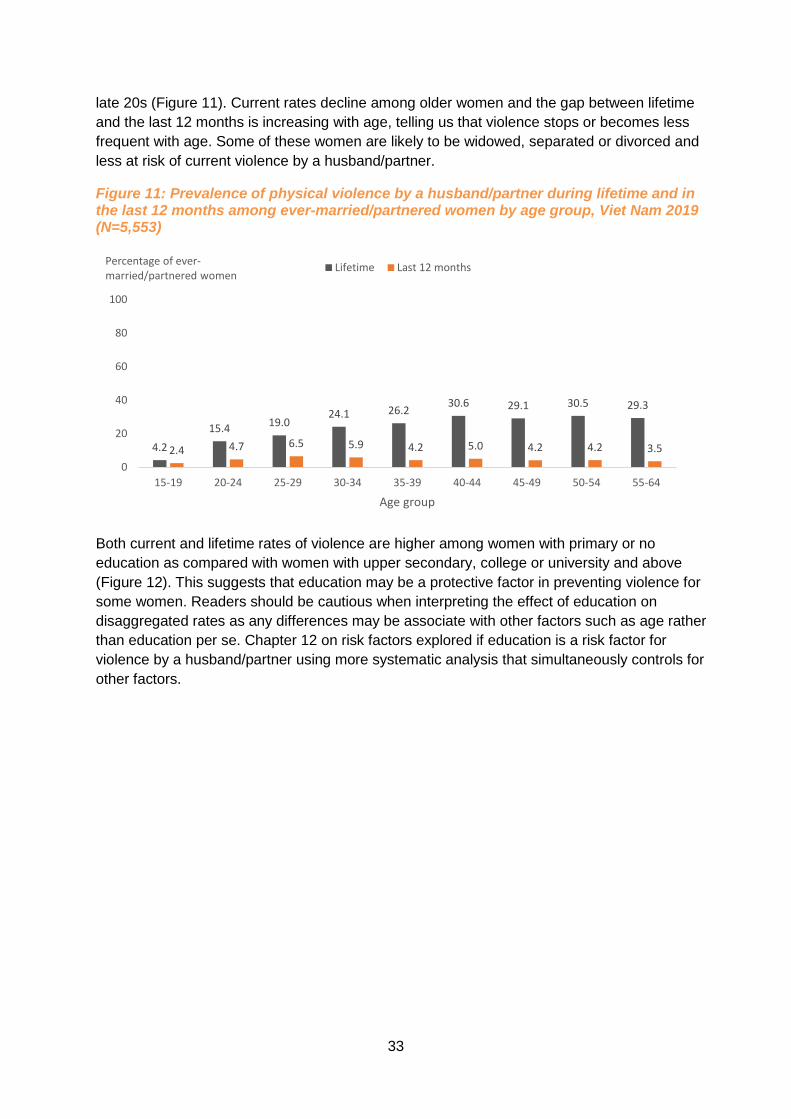
33
late 20s (Figure 11). Current rates decline among older women and the gap between lifetime
and the last 12 months is increasing with age, telling us that violence stops or becomes less
frequent with age. Some of these women are likely to be widowed, separated or divorced and
less at risk of current violence by a husband/partner.
Figure 11: Prevalence of physical violence by a husband/partner during lifetime and in the last 12 months among ever-married/partnered women by age group, Viet Nam 2019 (N=5,553)
Both current and lifetime rates of violence are higher among women with primary or no
education as compared with women with upper secondary, college or university and above
(Figure 12). This suggests that education may be a protective factor in preventing violence for
some women. Readers should be cautious when interpreting the effect of education on
disaggregated rates as any differences may be associate with other factors such as age rather
than education per se. Chapter 12 on risk factors explored if education is a risk factor for
violence by a husband/partner using more systematic analysis that simultaneously controls for
other factors.
4.2
15.4 19.024.1 26.2
30.6 29.1 30.5 29.3
2.4 4.7 6.5 5.9 4.2 5.0 4.2 4.2 3.5
0
20
40
60
80
100
15-19 20-24 25-29 30-34 35-39 40-44 45-49 50-54 55-64
Age group
Lifetime Last 12 monthsPercentage of ever-married/partnered women

34
Figure 12: Prevalence of physical violence by a husband/partner during lifetime and in the last 12 months among ever-married/partnered women by education level, Viet Nam 2019 (N=5,553)
Being slapped or having something thrown at her that could hurt her is the form of violence by a
husband/partner that women mentioned the most (23.4 per cent during lifetime and 3.6 per cent
in the last 12 months). This is followed by being pushed or shoved (Figure 13).
Although slapping is the most common form of violence, the qualitative results reveal that slapping
is not often recognized by women as significant violence. They are often aware of other cases of
violence in the commune and they make comparison between cases and conclude that slapping
is a lighter form of violence.
‘My husband is not as serious as other people. When he was hot tempered, he gave
me one slap. That’s all. Sometimes I also got angry, I could not stand and talked back
one or two words he would beat me with what he was having in his hands. He did
only that not like other people using rod or stick to beat their wife heavily. He only
slapped me or kicked me – IDI 15, woman aged 37
According to some women, ‘violence’ includes acts that are stronger than a slap and may cause
severe consequences such as bleeding or other injuries. This perception of violence is important
as it shows the level of community tolerance towards less severe forms of violence. Tolerating
some forms of violence is an attitude that may cause resistance to report violence and less
responsive action on cases of violence. Regarding a slap as acceptable violence may result in
ignoring signs of escalating of violence to more severe forms.
30.1 31.327.8
21.317.7
12.36.3 6.5 3.8 3.7 3.9 1.3
0
20
40
60
80
100
No education Primary Lower Secondary Upper Secondary College University andabove
Education level
Lifetime Last 12 monthsPercentage of ever-married/partnered women

35
Figure 13: Prevalence of specific acts of physical violence by a husbands/partner, as occurred during lifetime and in the last 12 months, among ever-married/partnered women, Viet Nam 2019 (N=5,553)
Most women experienced each type of physical act of violence a few times (Figure 14). Being
choked is often regarded as one of the more severe forms of physical violence indicating a woman
is at high risk of being seriously harmed or killed. Worryingly, more than one quarter (26 per cent)
of women who experienced being burned or choked said that it happened many times. A further
quarter of women (25.2 per cent) who had been hit also said that it happened many times. All
other forms of violence occurred many times by around one fifth of Vietnamese ever-
married/partnered women.
23.4
8.1 6.9 4.4 2.3 2.13.6 2.3 1.7 0.9 0.6 0.50
20
40
60
80
100
Slapped, threwsomething
Pushed or shoved Hit with a fist orsomething else
Kicked, dragged,beaten
Choked or burnton purpose
Threatened withor used a gun,
knife or weaponSpecific acts of physical violence
Lifetime Last 12 monthsPercentage of ever-married/partnered women

36
Figure 14: Frequency distribution of number of times specific acts of physical violence by husband/partner happened during lifetime, among ever-married/partnered women who experienced such acts, Viet Nam 2019
Note: Percentages are based on weighted analysis and all numbers are unweighted. Percentages in parentheses (xx)
are based on fewer than 25 unweighted cases.
The specific acts of violence are typically classified into groupings of moderate (slapped, pushed,
shoved, hair pulled) and severe (hit, kicked, dragged, choked, burned, use of weapons) as
illustrated in Table 3. The severity categories are not classified based on women's perception of
severity or emotional impact, but because of the likely association with injuries.67 A woman is
considered to have experienced severe violence if she has experienced at least one of the severe
acts. A woman is considered to have experienced moderate violence if she has experienced any
act of physical violence but none of the acts that are considered severe.
Table 3: Severity classification for acts of physical violence
Physical violence
Severe acts of violence
Hit with a fist Kicked, dragged or beaten up Choked or burned Threatened with or used a weapon
Moderate acts of violence
Slapped her or threw something at her Pushed, shoved her Pulled her hair
The survey found that of the ever-married/partnered women who experienced physical violence
by a husband/partner in their lifetime, for almost half it had been severe (11.2 per cent
experienced severe acts and 14.8 per cent experienced moderate acts) (Figure 15). Severe acts
67 Classifications used in Viet Nam are consistent with international comparisons used in the WHO Multi-Country
Study on Women’s Health and Domestic Violence.
34.2
13.823.9 26.0
33.9 (35.6)
48.5
69.3 50.953.9 40.1
(46.9)
17.3 17.025.2 20.0 26.0
(17.5)
0%
20%
40%
60%
80%
100%
Slapped, threwsomething
Pushed orshoved
Hit with a fist orsomething else
Kicked, dragged,beaten
Choked or burnton purpose
Threatened withor used a gun,
knife or weapon
Specific acts of physical violence
Many times
Few times
One time
Percentage of ever-married/partneredwomen experiencing these acts

37
of violence are likely to be perpetrated alongside moderate acts, and with increasing age,
relatively more women seem to accumulate experiences of severe violent acts.
Figure 15: Lifetime prevalence of physical violence by a husband/partner among ever-married/partnered women by severity, total and by age group, Viet Nam 2019 (N=5,553)
Among the ever-married/partnered women who have been pregnant (5,236 women in this
survey), 3.4 per cent of them experienced physical violence during a pregnancy (Figure 16).
Women in the Central Highlands were most likely to mention physical violence during pregnancy
(6.9 per cent – twice the national prevalence for violence in pregnancy).
Figure 16: Proportion of women who reported physical violence in pregnancy among ever-pregnant women, Viet Nam 2019 (N=5,236)
Nearly all the women who experienced physical violence by a husband/partner during a
pregnancy were beaten by the father of the child (97.9 per cent) in the last pregnancy in which
they were beaten, and the person who beat them also did so before the pregnancy (81.7 per
cent). Most women experienced less violence during their pregnancy (65.3 per cent) compared
14.8
1.19.7 13.4 13.5 16.1 17.9 17.8 15.3 14.0
11.2
3.1 5.75.6
10.6 10.112.7 11.4 15.3 15.3
0
20
40
60
80
100
Total 15-19 20-24 25-29 30-34 35-39 40-44 45-49 50-54 55-64
Age group (years)
Severe ModeratePercentage of ever-married/partnered women
3.4 2.5 3.8 2.4 4.4 3.86.9
2.4 2.1
0
10
20
30
40
50
Total Urban Rural NorthernMidlands
andMountains
Red RiverDelta
North andSouth
CentralCoast
CentralHighlands
Southeast MekongRiver Delta
Percentage of ever-pregnant women

38
with before, but for a substantial portion of women the violence stayed the same (21.4 per cent)
or got worse (11.8 per cent). The impact that violence by a husband/partner has on women’s
reproductive health is explored further in section 8.4.
The qualitative component of this study explored violence during pregnancy (see Section 8.4).
Commonly identified triggers related to pregnancy and birth included women refusing sex,
preferring a male offspring and economic challenges (e.g. reduction of the woman’s involvement
in earning money, the health care costs and preparation for the baby).
I had the first baby when I was 22 or 23. When I was pregnant for two months, and still
suffered from morning sickness, my husband beat me a lot… Then my marriage ended.
When the child was one year old, he returned and promised that he would give up all bad
behaviours. I thought that we were classmates and then husband and wife, we already
had a child together, so I forgave him. We remarried and had the second child. During
those years when I was pregnant and with young children, I was beaten almost every day.
I suffered from physical, emotional and sexual violence. People in the community thought
that I would suffer from health problem after giving birth as I was very weak. I felt hopeless
and wanted to end my life many times. However, whenever I was going to take the pills I
thought of my parents then I stood up. I carried my child with one hand, the other hand I
worked in the field, sold things in the shop and did my teaching - IDI 24, woman aged 54.
4.2. Sexual violence
Sexual violence by a husband/partner includes being forced to have sexual intercourse with her
husband/partner when she did not want to; having sexual intercourse when she did not want to
because she was afraid what her husband/partner might do, or if she was forced to perform
degrading or humiliating sexual acts.
More than one in every eight women (13.3 per cent) have experienced sexual violence by a
husband/partner in their lifetime and 5.7 per cent in the last 12 months. Prevalence rates are
higher in rural than in urban areas (Figure 17). Proportions of women experiencing lifetime and
current sexual violence are highest in the Red River Delta, followed by the Northern Midlands and
Mountains.

39
Figure 17: Prevalence of sexual violence by a husband/partner during lifetime and in the last 12 months among ever-married/partnered women by location, Viet Nam 2019 (N=5,553)
Younger women are more likely to have experienced sexual violence by a husband/partner in
the last 12 months (Figure 18) compared with older women. It is most prevalent among women
aged 30 to 34 (8.3 per cent) and among in their 20s. The current rates decline among older
women. An outlier is the high rate of lifetime prevalence of sexual violence by a husband/partner
among the 20 to 24 year old age group (15.2 per cent). This may be a data artefact but could
also be related to an unprecedented climate of openness around sexual violence that is
particularly apparent among young women.
The qualitative study further explored this phenomenon, but was unable to identify a clear
understanding of what might be happening with younger women. From the overall analysis of
women’s narrations of violence, it seems that violence often starts early after marriage and
includes both physical and sexual violence. The high rate of sexual violence towards women in
the 20 to 24 year old age group could be explained as a result of unexpected sexual demands
from husband after marriage. Men may have higher sexual demand after marriage and feel it to
be his right in doing so. Normalization of forced sex after marriage is metaphoric in the folklore:
‘I paid for the tray so I should be able to stab a hole in the tray’
In addition, young women may not be in the mood of having sex after marriage due to new roles
and responsibilities that might make them more tired or feeling of lack of privacy due to sleeping
arrangements when living together with parents-in-law, a common practice in Viet Nam. Being
pregnant shortly after marriage can also be reason that makes young women reluctant to have
sex with their husband. A woman’s reluctance for sex may trigger a new husband to force sex in
marriage.
13.3 10.614.6 13.9
18.411.8 12.7 11.7 9.9
5.7 4.6 6.2 6.2 7.2 5.6 3.3 5.7 4.3
0
20
40
60
80
100
Total Urban Rural NorthernMidlands
andMountains
Red RiverDelta
North andSouth
CentralCoast
CentralHighlands
Southeast MekongRiver Delta
Percentage of ever-married/partnered women
Lifetime Last 12 months

40
Figure 18: Prevalence of sexual violence by a husband/partner during lifetime and in the last 12 months among ever-married/partnered women by age group, Viet Nam 2019 (N=5,553)
Women with a university education and above experienced the lowest rates of both lifetime (10.4
per cent) and current (4.3 per cent) sexual violence by a husband/partner (Figure 19). As with
physical violence, higher levels of education may reduce the risk of experiencing sexual violence
by a husband/partner.
Figure 19: Prevalence of sexual violence by a husband/partner during lifetime and in the last 12 months among ever-married/partnered women by education level, Viet Nam 2019 (N=5,553)
The act of sexual violence that was mentioned most by women was being forced to have sex
when she did not want to – a form of marital rape – (9.6 per cent during lifetime and 4.0 per cent
in the last 12 months). This is followed by women reporting they have had intercourse when they
did not want to as a result of being afraid of what the husband/partner might do to them if they
refused (Figure 20). The impact of violence is often compounded by the frequency by which is
occurs. Around three-quarters of women who experienced both forms of sexual violence in their
lifetime said that it happened a few times. Over one in ten said it occurred many times (Figure
21).
5.915.2
10.4 13.5 11.4 12.6 15.9 13.8 14.75.9 7.4 7.1 8.3 5.7 6.1 4.6 4.7 3.0
0
20
40
60
80
100
15-19 20-24 25-29 30-34 35-39 40-44 45-49 50-54 55-64
Percentage of ever-married/partnered women
Age group
Lifetime Last 12 months
12.4 13.0 15.3 13.0 12.4 10.45.3 5.8 5.5 6.9 7.0 4.3
0
20
40
60
80
100
No education Primary Lower Secondary Upper Secondary College University andabove
Percentage of ever-married/partnered women
Education level
Lifetime Last 12 months

41
Figure 20: Prevalence of specific acts of sexual violence by husband/partner, during lifetime and the last 12 months among ever-married/partnered women, Viet Nam 2019 (N=5,553)
Figure 21: Frequency distribution of number of times of specific acts of sexual violence by a husband/partner happened during lifetime, among ever-married/partnered women who have experienced such acts, Viet Nam 2019
4.3. Physical and/or sexual violence as a main indicator for violence by a
husband/partner
In this section women’s experiences of physical and/or sexual violence by a husband/partner are
combined. This measure is most often used for comparison regionally and internationally and for
monitoring prevalence over time. It makes sense to consider these forms of violence together as
they often co-occur. They also tend to be measured using consistent and robust definitions.
Emotional (psychological violence) and economic violence are not included in the combined
9.6 7.81.24.0 3.4 0.4
0
20
40
60
80
100
Forced to have sexual intercoursewhen she did not want to
Had sexual intercourse she did notwant to because she was afraid of
what your partner might do
Forced to perform degrading orhumiliating sexual act
Percentage of ever-married/partnered women
Lifetime Last 12 months
12.4 12.1
71.3 76.5
16.3 11.4
0
20
40
60
80
100
Forced to have sexual intercourse whenshe did not want to
Had sexual intercourse she did not wantto because she was afraid of what your
partner might do
Many times
Few times
One time
Percentage of womenexperiencing these acts

42
measures used to make comparisons between countries and over time because it is
methodologically more difficult to measure and there are no internationally consistent definitions.
As shown in Figure 22, one in three women (32.0 per cent) experienced physical and/or sexual
violence in their lifetime and 8.9 per cent in the last 12 months. Rates are higher in rural than in
urban areas.
Figure 22: Prevalence of physical and/or sexual violence by a husband/partner during lifetime and in the last 12 months among ever-married/partnered women by location, Viet Nam 2019 (N=5,553)
The overall experience of physical and/or sexual abuse across the life course can be seen among
the different age groupings in Figure 23. This shows that younger women, aged between 20 and
44 years, are more likely to experience current violence (last 12 months) which cumulates into
higher rates of lifetime experience above the age of 44. More than one third of Vietnamese women
in all age groups from 40 years onwards report physical and/or sexual violence from a
husband/partner during their lifetime.
Figure 23: Prevalence of physical and/or sexual violence by a husband/partner during lifetime and in the last 12 months among ever-married/partnered women by age group, Viet Nam 2019 (N=5,553)
4.4. Emotional violence
Women often report that emotional violence (a form of psychological violence) affects them more
than physical or sexual violence. However, emotional violence is more difficult to measure in a
32.027.8
34.1
8.9 6.8 10.0
0
20
40
60
80
100
Total Urban Rural
Lifetime Last 12 monthsPercentage of ever-married/partnered women
7.9
23.2 24.930.4 31.6 35.7 36.0 37.2 34.3
7.0 9.5 12.0 12.1 8.5 9.8 7.6 7.6 6.2
0
20
40
60
80
100
15-19 20-24 25-29 30-34 35-39 40-44 45-49 50-54 55-64
Age group
Lifetime Last 12 monthsPercentage of ever-married/partnered women

43
survey as there are a lack of behavioural questions that fully measure the same thing across
cultures. Moreover, most forms of emotional abuse are not included in national laws also because
they are difficult measure. In this study, emotional violence includes being insulted or made to
feel bad about herself, being belittled or humiliated in front of other people, being scared or
intimidated on purpose, and/or being verbally threatened (either her or someone she cares about).
Almost half (47.0 per cent) of Vietnamese women have been emotionally abused by their
husband/partner. Almost one in five (19.3 per cent) have experienced such violence in the last 12
months (Figure 24). As with other forms of violence, prevalence rates are slightly higher in rural
than in urban areas.
Figure 24: Prevalence of emotional violence by a husband/partner during lifetime and in the last 12 months among ever-married/partnered women by location, Viet Nam 2019 (N=5,553)
As with physical and sexual violence, current emotional violence from a husband/partner is more
often experienced by younger women (occurring in the last 12 months) and cumulative lifetime
experience increases with age. Women over the age of 44 experienced the highest lifetime
prevalence of emotional violence (Figure 25).
47.041.4
49.7
19.3 16.020.9
0
20
40
60
80
100
Total Urban Rural
Lifetime Last 12 monthsPercentage of ever-married/partnered women

44
Figure 25: Prevalence of emotional violence by a husband/partner during lifetime and in the last 12 months among ever-married/partnered women by age group, Viet Nam 2019 (N=5,553)
Vietnamese women with university education experience slightly lower rates of emotional violence
over their lifetime. However, the experience of emotional abuse within the last 12 months does
not vary much according to education levels (Figure 26).
Figure 26: Prevalence of emotional violence by a husband/partner during lifetime and in the last 12 months among ever-married/partnered women by education level, Viet Nam 2019 (N=5,553)
The most common forms of emotional abuse mentioned involve feeling scared or intimidated by
their husband/partner, both over a lifetime (mentioned by 38.7 per cent of women) and in the last
12 months (15.0 per cent) (Figure 27). This is followed by being insulted so that she feels bad
(25.0 per cent lifetime and 9.9 per cent last 12 months).
22.5
35.144.0 47.2 47.3 47.2 51.5 50.6 49.5
12.922.3 26.2 23.9 19.5 21.8
16.9 14.5 14.4
0
20
40
60
80
100
15-19 20-24 25-29 30-34 35-39 40-44 45-49 50-54 55-64
Age group
Lifetime Last 12 monthsPercentage of ever-married/partnered women
43.5 46.554.2
43.7 42.7 39.8
18.6 20.1 20.0 18.8 17.8 18.0
0
20
40
60
80
100
No education Primary Lower Secondary Upper Secondary College University andabove
Percentage of ever-married/partnered women
Education level
Lifetime Last 12 months

45
Figure 27: Prevalence of specific acts of emotional violence by a husband/partner, as occurred during lifetime and in the last 12 months, among ever-married/partnered women, Viet Nam 2019 (N=5,553)
Women who experienced any of the acts of emotional violence were asked how often these
emotionally abusive acts occurred in the past 12 months. They mostly occurred more than once,
usually between two and five times thereby indicating they are a part of a pattern of abusive
behaviour rather than rare or one-off incidents. For most acts, around two thirds of women who
experienced different types of emotional abuse from a husband/partner said that it occurred a few
times in their lifetime (Figure 28). A further quarter said the experience occurred many times.
‘Being scared or intimidated’ was the form of emotional violence that was less likely to occur many
times (13.6 per cent) but most likely to occur more than once (67.4 per cent). ‘Being humiliated
or belittled’ (experienced by the smallest proportion of women), when it occurred, it occurred many
times for a quarter of women (25.9 per cent).
38.7
25.015.3
10.915.0
9.94.6 4.5
0
20
40
60
80
100
Scared or intimidated you Insulted you or made youfeel bad
Threatened to hurt you orsomeone you care about
Belittled or humiliated
Percentage of ever-married/partnered women
Specific acts of emotional abuse
Lifetime Last 12 months

46
Figure 28: Frequency distribution of number of times specific acts of emotional abuse by a husbands/partner during lifetime happened, among ever-married/partnered women who have experienced such acts, Viet Nam 2019
4.5. Overlap of physical, sexual and emotional violence by a husband/partner
Plotting the overlap between different forms of violence by a husband/partner shows which kinds
of abuse are typically occurring at the same time. The results confirm that physical, sexual and
emotional violence by a husband/partner do overlap in Viet Nam.
Overall, more than half of ever-married/partnered women (52.9 per cent) have experienced at
least one form of violence (physical, sexual or emotional abuse) by a current or former
husband/partner. As shown in Figure 29, there is a large overlap between physical and emotional
violence, with almost a quarter of women (22.1 per cent) experiencing both forms. More women
experience sexual violence with emotional abuse (10.9 per cent of women experienced both) than
sexual violence with physical violence (7.3 per cent of women).
18.9 14.3 17.4 15.1
67.463.7 60.4 58.9
13.622.0 22.2 25.9
0
20
40
60
80
100
Scared or intimidatedyou
Insulted you or madeyou feel bad
Threatened to hurt youor someone you care
about
Belittled or humiliated
Specific acts of emotional abuse
Many times
Few times
One time
Percentage of womenexperiencing these acts

47
Figure 29: Overlap of the prevalence of physical, sexual and/or emotional violence by a husband/partner among ever-married/partnered women, Viet Nam 2019 (N=5,553)
4.6. Controlling behaviours
Controlling behaviours include behaviours such as a woman being prevented from seeing family
and friends, a husband/partner insisting on knowing where she is at all times, getting angry if she
speaks with another man, being suspicious that she is unfaithful, and/or expecting her to seek
permission before seeking health care.
More than a quarter (27.3 per cent) of women experienced one or more acts of controlling
behaviour from an intimate husband/partner during their lifetime and 12.9 per cent during the last
12 months (Figure 30). At the subnational level, rates are above average in the Central Highlands
(36.3 per cent).

48
Figure 30: Prevalence of controlling behaviours by a husband/partner during lifetime and in the last 12 months among ever-married/partnered women by location, Viet Nam 2019 (N=5,553)
The form of controlling behaviour mentioned more than any other type (17.0 per cent of women
mentioned it had happened in their lifetime) was that her husband/partner gets angry if she speaks
with another man. Having a husband/partner insist on knowing where a woman is at all times was
experienced by one in ten women (11.2 per cent) as the second most commonly mentioned form
of controlling behaviour (Figure 31). These two controlling behaviours were also the most
commonly mentioned as occurring in the past 12 months.
Figure 31: Prevalence of specific acts of controlling behaviour by a husband/partner, as occurred during lifetime and in the last 12 months, among ever-married/partnered women, Viet Nam 2019 (N=5,553)
27.3 25.6 28.1 25.8 23.832.6 36.3
28.123.7
12.9 11.6 13.5 10.9 9.316.0 19.2
12.9 13.4
0
20
40
60
80
100
Total Urban Rural NorthernMidlands
andMountains
Red RiverDelta
North andSouth
CentralCoast
CentralHighlands
Southeast MekongRiver Delta
Percentage of ever-married/partnered women
Lifetime Last 12 months
8.62.1
11.217.0
6.7 3.7
27.3
3.8 0.86.8 6.4 2.9 1.6
12.9
0
20
40
60
80
100
Keeps her fromseeing her
friends
Tries to restrictcontact with
family of birth
Insists onknowing where
she is at alltimes
Gets angry ifspeak with
another man
Oftensuspicious thatshe is unfaithful
Needs to ask hispermission
before seekinghealth care
At least onetype of
controllingbehavior
Percentage of ever-married/partnered women
Specific acts of controlling behaviour
Lifetime Last 12 months

49
4.7. Economic violence
The survey also collected information about whether a husband/partner ever used economic
control as a form of abuse. Economic violence, also referred to as economic abuse, includes
acts such as taking her earnings against her will, refusing to give her money for household
expenses even when he has money for things like alcohol and cigarettes, or prohibiting her from
getting a job or earning money.
One in five (20.6 per cent) women in Viet Nam have experienced at least one type of economic
violence during their lifetime and 11.5 per cent during the last 12 months. Rates of lifetime
experience are similar among women of all ages ranging from 18.6 per cent and 23.7 per cent
(Figure 32). Current rates of economic abuse are lowest among older women aged 50 and
above. These women are more likely to be widowed, separated or divorced than younger
women, which may explain some of lower prevalence in older women.
Figure 32: Prevalence of economic violence by a husband/partner during lifetime among ever-married/partnered women, by age, Viet Nam 2019 (N=5,553)
There are some differences in the rates of economic abuse by education level. Women with a
higher education (upper secondary, college, university and above) have lower rates of economic
abuse than women who had a lower level of education (Figure 33). Again, readers should be
cautious when interpreting the effect of education on disaggregated rates and refer to Chapter
12 for more systematic analysis that simultaneously controls for other factors.
20.6 19.7 22.2 21.1 22.8 19.6 19.5 19.0 23.718.6
11.5 14.5 15.1 13.8 15.1 12.4 9.8 10.7 8.8 8.3
0
20
40
60
80
100
Total 15-19 20-24 25-29 30-34 35-39 40-44 45-49 50-54 55-64
Percentage of ever-married/partnered women
Age group
Lifetime Last 12 months

50
Figure 33: Prevalence of economic violence by a husband/partner during lifetime among ever-married/partnered women, by education level, Viet Nam 2019 (N=5,553)
The most commonly mentioned type of economic abuse women in Viet Nam experience is
being prohibited from getting a job or generating an income (mentioned by 11.5 per cent in
lifetime and 6.4 per cent in the last 12 months). One in sixteen women experienced being
refused money (6.3 per cent) or having her income taken away from her (6.0 per cent) (Figure
34).
Figure 34: Prevalence of specific acts of economic violence by a husband/partner, as occurred during lifetime, among ever-married/partnered women, Viet Nam 2019 (N=5,553)
21.4 20.425.3
18.813.2 10.611.6 12.0 14.1
9.8 6.5 5.6
0
20
40
60
80
100
No education Primary Lower Secondary Upper Secondary College University andabove
Percentage of ever-married/partnered women
Education level
Lifetime Last 12 months
11.56.0 6.3
2.0 3.7
20.6
6.42.5 3.0 1.0 1.9
11.5
0
20
40
60
80
100
Prohibits fromgetting a job or
generating income
Taken away whatshe earned or
saved
Refused to givemoney
Financialresponsibility
Financialpermission
At least one of theacts
Percentage of ever-married/partnered women
Specific acts of economic violence
Lifetime Last 12 months

51
4.8. Violence by a husband/partner by ethnicity
Partner violence disaggregated by ethnic group shows some variation. Caution is urged when
interpreting the results as some ethnic groups are represented by very small sample sizes such
as: Hoa (28 respondents), H’Mong (36 respondents), Dao (54 respondents) and Nung (71
respondents). This makes the findings for these groups not very precise. A description of the
findings that may be meaningful are listed immediately below, followed by all of the figures for
illustrative purposes. Interpretation of each figure is not provided due to the cautionary note on
small samples. All of the figures include 95 per cent confidence intervals to assist with
interpreting the precision of the estimates.68
Most respondents in the sample were of Kinh ethnicity (83 per cent) and therefore results for
this group will be most reliable. Figures 35 through 46 present the results for each of the five
types of violence, both in terms of lifetime and last 12 months, and for the combined physical
and/or sexual violence by ethnic group.
Some descriptive findings of analysis by ethnicity
● Rates for physical and/or sexual violence were much lower among the Mong,
Khmer, Thai and Muong groups compared with the national average.
● Physical and/or sexual violence was highest among Nung women in lifetime (42.8
per cent) and last 12 months (25.8 per cent). Nearly one quarter of Nung women
(24.1 per cent) experienced physical violence and another quarter (23.8 per cent)
experienced sexual violence in their lifetime. This result, particularly for sexual
violence, was higher than the national average.
● Prevalence rates of sexual violence were highest among Nung (23.8 per cent in
lifetime and 17.3 per cent in last 12 months) and Dao (15.8 per cent in lifetime and
12.0 per cent in last 12 months).
● H’Mong women experienced the lowest rates of emotional abuse for both lifetime
(21.9 per cent) and last 12 months (5.8 per cent). Rates are highest among the
Nung ethnic group with more than one third (34.9 per cent) experiencing it in the
last 12 months compared with 19.3 per cent of the total population.
● Controlling behaviour is especially high among H’Mong (54.7 per cent in lifetime and 25.6 in last 12 months) and Dao (51.3 per cent in lifetime and 32.0 per cent in last 12 months) women even though they have lower than average rates of physical and/or sexual violence by a husband/partner.
● Economic abuse is also high among Dao women (45.8 per cent) - more than twice
the national average (20.6 per cent).
The qualitative analysis shows that violence in ethnic cultures may be influenced by whether
the group follows a patrilineal or matrilineal line. In patrilineal societies the practice of gender
roles and values are similar to those of the Kinh people. For example, women from the Nung
68 The 95 per cent confidence interval is a range of values around that statistic that are believed to contain, with a 95 per cent probability the true value of that statistic.

52
ethnic group (a patrilineal society) said that their parents were under pressure if they did not
bear male children.
Women belonging to ethnic minorities following a matrilineal line, such as Cham, seem to
have more power and control in the family.
We, the women here, are like the men in Kinh ethnicity. We pay money to
marry the man and bring him to our home. – FGD24, Cham women, aged
more than 30
These ethnic women are not under pressure to have sons, but instead daughters. Among
these ethnic groups, daughters receive the inheritance from her parents and are responsible
for taking care of the parents in older age.
One interesting observation was that community members and leaders in ethnic minority
communes often spoke about GBV comparatively between their ethnicity and the Kinh
people (majority ethnic group in Viet Nam). Ethnic minority women believed they do not
suffer from violence as much as Kinh women.
Figure 35: Prevalence of physical violence by a husband/partner during lifetime among ever-married/partnered women by ethnicity, with upper and lower 95 per cent confidence intervals, Viet Nam 2019 (N=5,553)
26.1 26.6
16.0 15.4 17.912.5
30.424.1
10.215.7
38.6
0
20
40
60
80
100
Total(N=5553)
Kinh(N=4596)
Tay(N=135)
Thai(N=160)
Muong(N=66)
Khmer(N=108)
Hoa(N=28)
Nung(N=71)
Mong(N=36)
Dao(N=54)
Other(N=298)
Percentage of ever-married/partnered women

53
Figure 36: Prevalence of physical violence by a husband/partner in the last 12 months among ever-married/partnered women by ethnicity, with upper and lower 95 per cent confidence intervals, Viet Nam 2019 (N=5,553)
Figure 37: Prevalence of sexual violence by a husband/partner during lifetime among ever-married/partnered women by ethnicity, with upper and lower 95 per cent confidence intervals, Viet Nam 2019 (N=5,553)
4.6 4.1 6.3 2.2 3.0 4.1 8.1 9.64.8 3.9
13.7
0
20
40
60
80
100
Total(N=5553)
Kinh(N=4596)
Tay(N=135)
Thai(N=160)
Muong(N=66)
Khmer(N=108)
Hoa(N=28)
Nung(N=71)
Mong(N=36)
Dao(N=54)
Other(N=298)
Percentage of ever-married/partnered women
13.3 13.4 11.74.0 7.1 4.3
12.6
23.8
5.1
15.819.9
0
20
40
60
80
100
Total(N=5553)
Kinh(N=4596)
Tay(N=135)
Thai(N=160)
Muong(N=66)
Khmer(N=108)
Hoa(N=28)
Nung(N=71)
Mong(N=36)
Dao(N=54)
Other(N=298)
Percentage of ever-married/partnered women

54
Figure 38: Prevalence of sexual violence by a husband/partner in the last 12 months among ever-married/partnered women by ethnicity, with upper and lower 95 per cent confidence intervals, Viet Nam 2019 (N=5,553)
Figure 39: Prevalence of physical and/or sexual violence by a husband/partner during lifetime among ever-married/partnered women by ethnicity, with upper and lower 95 per cent confidence intervals, Viet Nam 2019 (N=5,553)
5.7 5.5 5.7 2.7 3.9 3.18.1
17.3
0.0
12.0 8.7
0
20
40
60
80
100
Total(N=5553)
Kinh(N=4596)
Tay(N=135)
Thai(N=160)
Muong(N=66)
Khmer(N=108)
Hoa(N=28)
Nung(N=71)
Mong(N=36)
Dao(N=54)
Other(N=298)
Percentage of ever-married/partnered women
32.0 32.724.6
17.4 20.314.6
30.4
42.8
12.1
24.6
45.0
0
20
40
60
80
100
Total(N=5553)
Kinh(N=4596)
Tay(N=135)
Thai(N=160)
Muong(N=66)
Khmer(N=108)
Hoa(N=28)
Nung(N=71)
Mong(N=36)
Dao(N=54)
Other(N=298)
Percentage of ever-married/partnered women

55
Figure 40: Prevalence of physical and/or sexual violence by a husband/partner in the last 12 months among ever-married/partnered women by ethnicity, with upper and lower 95 per cent confidence intervals, Viet Nam 2019 (N=5,553)
Figure 41: Prevalence of emotional violence by a husband/partner during lifetime among ever-married/partnered women by ethnicity, with upper and lower 95 per cent confidence intervals, Viet Nam 2019 (N=5,553)
8.9 8.3 10.74.9 4.9 5.9 8.1
25.8
4.813.9
19.6
0
20
40
60
80
100
Total(N=5553)
Kinh(N=4596)
Tay(N=135)
Thai(N=160)
Muong(N=66)
Khmer(N=108)
Hoa(N=28)
Nung(N=71)
Mong(N=36)
Dao(N=54)
Other(N=298)
Percentage of ever-married/partnered women
47.0 47.7
38.542.0
35.240.3
35.0
56.3
21.9
30.5
53.0
0
20
40
60
80
100
Total(N=5553)
Kinh(N=4596)
Tay(N=135)
Thai(N=160)
Muong(N=66)
Khmer(N=108)
Hoa(N=28)
Nung(N=71)
Mong(N=36)
Dao(N=54)
Other(N=298)
Percentage of ever-married/partnered women

56
Figure 42: Prevalence of emotional violence by a husband/partner in the last 12 months among ever-married/partnered women by ethnicity, with upper and lower 95 per cent confidence intervals, Viet Nam 2019 (N=5,553)
Figure 43: Prevalence of controlling behaviours during lifetime among ever-married/partnered women by ethnicity, with upper and lower 95 per cent confidence intervals, Viet Nam 2019 (N=5,553)
19.3 19.2
7.5
17.2 18.8
10.0 9.4
34.9
5.8
26.430.5
0
20
40
60
80
100
Total(N=5553)
Kinh(N=4596)
Tay(N=135)
Thai(N=160)
Muong(N=66)
Khmer(N=108)
Hoa(N=28)
Nung(N=71)
Mong(N=36)
Dao(N=54)
Other(N=298)
Percentage of ever-married/partnered women
27.3 26.0
35.4
18.223.5 21.9
28.3
18.6
54.751.3
47.5
0
20
40
60
80
100
Total(N=5553)
Kinh(N=4596)
Tay(N=135)
Thai(N=160)
Muong(N=66)
Khmer(N=108)
Hoa(N=28)
Nung(N=71)
Mong(N=36)
Dao(N=54)
Other(N=298)
Percentage of ever-married/partnered women

57
Figure 44: Prevalence of controlling behaviours in the last 12 months among ever-married/partnered women by ethnicity, with upper and lower 95 per cent confidence intervals, Viet Nam 2019 (N=5,553)
Figure 45: Prevalence of economic violence by a husband/partner during lifetime among ever-married/partnered women by ethnicity, with upper and lower 95 per cent confidence intervals, Viet Nam 2019 (N=5,553)
12.9 12.0 9.6 10.7 7.4 9.815.0 12.4
25.632.0
27.5
0
20
40
60
80
100
Total(N=5553)
Kinh(N=4596)
Tay(N=135)
Thai(N=160)
Muong(N=66)
Khmer(N=108)
Hoa(N=28)
Nung(N=71)
Mong(N=36)
Dao(N=54)
Other(N=298)
Percentage of ever-married/partnered women
20.6 19.9
28.1
10.513.5
17.312.3
23.929.3
45.8
33.5
0
20
40
60
80
100
Total(N=5553)
Kinh(N=4596)
Tay(N=135)
Thai(N=160)
Muong(N=66)
Khmer(N=108)
Hoa(N=28)
Nung(N=71)
Mong(N=36)
Dao(N=54)
Other(N=298)
Percentage of ever-married/partnered women

58
Figure 46: Prevalence of economic violence by a husband/partner in the last 12 months among ever-married/partnered women by ethnicity, Viet Nam 2019 (N=5,553)
11.5 10.513.9
6.49.7 11.4
5.911.6
17.3
28.6 26.4
0
20
40
60
80
100
Total(N=5553)
Kinh(N=4596)
Tay(N=135)
Thai(N=160)
Muong(N=66)
Khmer(N=108)
Hoa(N=28)
Nung(N=71)
Mong(N=36)
Dao(N=54)
Other(N=298)
Percentage of ever-married/partnered women

59
5. Violence against women by others (non-partners)
Key findings from this chapter
● One in ten (11.4 per cent) women in Viet Nam experienced physical violence since
the age of 15 by someone other than a current or former husband/partner (further
referred to as “non-partner”). Regional variation showed notable differences with
higher rates in the Central Highlands (15.4 per cent) and Red River Delta (14.8 per
cent) and lower rates in the Mekong Delta (6.8 per cent).
● The rate of non-partner physical violence women currently experience (in the last 12
months) was very low (1.4 per cent). Current non-partner physical violence was
highest among young women aged 15 to 19 years (10.4 per cent in this age group
mentioned it).
● Non-partner physical violence differs from husband/partner physical violence in
many ways for example it is not commonly a repeated event. Most abused women
(78 per cent) said it only occurred to them once since they were 15 years old.
● The majority of violence by a non-partner was perpetrated by a male (60.6 per cent)
and more than one third of women (35.4 per cent) who experienced it identified a
male family member as the perpetrator.
● Overall, nearly one in ten (9 per cent) women have experienced non-partner sexual
violence since age 15 and 1.2 per cent in the last 12 months. Almost all of it was
perpetrated by males who were not family members (e.g. male stranger, friend or
acquaintance, recent acquaintance or someone at work). Younger women aged
between 20 and 24 years were most at risk of non-partner sexual violence since age
15 (18.0 per cent).
● One in ten women (11.4 per cent) experienced one or more kinds of sexual
harassment. Women were most likely to receive unwanted personal electronic
messages with sexual content (7.6 per cent of women) followed by being groped or
touched sexually in a public place such as on a bus (4.9 per cent).
● Just under one in twenty women (4.4 per cent) said that they experienced sexual
abuse before they were 15 years old. Women from younger age groups experienced
the highest rates of child sexual abuse peaking for women aged 30 to 34 years of
which 6.5 per cent have experienced such abuse. Among these women more than
one third (36.6 per cent) of cases identified the perpetrator as a male friend or
acquaintance, and a further quarter (27.7 per cent) identified it as a stranger.
● Overall, two in five women in Viet Nam (40.3 per cent) have experienced physical
and/or sexual violence in their lives/since age 15 by either a husband/partner or non-
partner. When comparing between the two, women in Viet Nam are more than twice
as likely to have experienced physical violence by a husband/partner rather than
non-partners. More women have experienced sexual violence perpetrated by their
husband/partner than a non-partner.

60
Besides violence against women perpetrated by a former or current husband/partner (see
Chapter 4), the survey also asked about a woman’s experience of physical and sexual violence
by perpetrators other than a husband/partner, here referred to as “non-partners” (including both
male and female perpetrators). These questions were asked of all 5,976 women interviewed
regardless of whether they had ever been married/partnered.
While violence by a husband/partner is the most common type of violence against women
internationally, many women experience violence from other people (non-partners). Gathering
information on these experiences enables comparison of the prevalence of violence by a
husband/partner with violence from other people. It also enables identification of forms of
violence against women by other family members.
This chapter presents data on the prevalence and patterns of different forms of violence against
women by a non-partner. Non-partners are any person who is not a current or former intimate
partner of the woman. Non-partners may be a parent, sibling, friend or acquaintance, co-worker,
teacher or a stranger.
5.1. Physical violence by non-partners since age 15
Around 11 per cent of women have experienced non-partner physical violence since the age of
15 (Figure 47). Rates do not vary between urban and rural areas but are higher in the Central
Highlands (15.4 per cent) and Red River Delta (14.8 per cent) and below the national average in
the Mekong River Delta (6.8 per cent). The prevalence of non-partner violence in the last twelve
months is very low and experienced by 1.4 per cent and 1.3 per cent of women in urban and rural
areas respectively.
Figure 47: Prevalence of physical violence by non-partner, since age 15 and in the last 12 months, among all women, by location, Viet Nam 2019 (N=5,976)
Young women aged 15 to 19 years, experienced the highest levels of non-partner physical
violence. Nearly one quarter (23.8 per cent) identified this happened to them since age 15 and
one in ten said it occurred within the last 12 months (10.4 per cent). Very few women older than
24 years experienced non-partner physical violence in the last 12 months (Figure 48). This
appears to be a form of violence that particularly affects younger women. The cumulative
reporting of experience since age 15 is lower among older women than younger women. This
11.4 11.7 11.2 11.914.8
12.515.4
8.96.8
1.4 1.4 1.3 1.1 1.9 0.9 2.6 1.7 0.8
0
10
20
30
40
50
Total Urban Rural NorthernMidlands
andMountains
Red RiverDelta
North andSouth
CentralCoast
CentralHighlands
Southeast MekongRiver Delta
Percentage of all women
Since age 15 Last 12 months

61
could be due to two reasons. First, older women may not always recall early experiences of non-
partner physical violence. Second, it may be that non-partner physical violence has become more
common in recent years.
Figure 48: Prevalence of physical violence by a non-partner. since age 15 and in the last 12 months, among all women, by age, Viet Nam 2019 (N=5,976)
For most women (78 per cent) who experienced physical non-partner violence since age 15 it
happened one time only (Figure 49). For 15 per cent of women it happened a few times (2 to 5),
and for 7 per cent it happened many times (more than 5).
Figure 49: Distribution of frequency of physical violence by a non-partner among all women who experienced such violence, Viet Nam 2019 (N=630)
In most cases, physical non-partner violence involved one perpetrator only (89.4 per cent of
women who experienced such violence). For 10.6 per cent of women there was more than one
perpetrator. Males were the most common perpetrators (n= 382, 60.6 per cent) and over half of
the men (n=223, 58.4 per cent) were family members. Nearly one in five Vietnamese women
experienced non-partner violence from female friends or acquaintances (19.7 per cent) (Table 4).
11.4
23.8
16.611.5 10.2
7.0 9.5 10.6 8.8 11.0
1.4
10.4
2.7 0.9 0.5 0.4 0.2 0.1 0.3 0.40
10
20
30
40
50
Total 15-19 20-24 25-29 30-34 35-39 40-44 45-49 50-54 55-64
Percentage of all women
Age group
Since age 15 Last 12 months
Physical violence by any person 1 time
78%
Physical violence by any person a few (2-5) times
15%
Physical violence by any person many (> 5)
times7%
Since age 15
Physical violence by any person 1 time
90%
Physical violence by any person a few (2-5) times
6%
Physical violence by any person many (> 5)
times4%
Last 12 months

62
Table 4: Type of perpetrator of physical violence by a non-partner since age 15, among all respondents, Viet Nam 2019 (N=5,976)
Physical violence since age 15
Number of women
who mentioned
certain perpetrator
s % of all women
% of women who experienced such
violence
Total 630 11.4 100.0
Number of perpetrators
One perpetrator 563 10.1 89.4
More than one perpetrator 67 1.2 10.6
Type of perpetrator (grouped)
Male family member(s) 223 3.6 35.4
Female family member(s) 122 2.1 19.4
Male other(s) 159 3.3 25.2
Female others(s) 178 3.3 28.3
Type of perpetrator (detail)
Father/stepfather 115 1.8 18.3
Mother/stepmother 75 1.3 11.9
Father in law 10 0.1 1.6
Mother in law 16 0.3 2.5
Brother 60 1.2 9.5
Sister 17 0.3 2.7
Other male family member 44 0.6 7.0
Other female family member 17 0.2 2.7
Someone at work - male 7 0.1 1.1
Someone at work - female 7 0.1 1.1
Friend/acquaintance - male 99 2.3 15.7
Friend/acquaintance - female 124 2.3 19.7
Recent acquaintance - male 0 0.1 0.0
Recent acquaintance - female 5 0.1 0.8
Complete stranger - male 30 0.5 4.8
Complete stranger - female 11 0.2 1.7
Teacher - male 1 0.0 0.2
Teacher - female 4 0.1 0.6
Other – male 28 0.4 4.4
Other - female 33 0.6 5.2
* The percentages are based on weighted analysis and all numbers are unweighted.

63
5.2. Sexual violence by non-partners since age 15
Sexual violence includes being forced by any non-partner to have sexual intercourse when a
woman did not want to, being forced to have sex when she was too drunk or drugged to refuse,
and/or being forced or persuaded to have sex with more than one man at a time. Sexual violence
also includes attempts at forced sex, being touched sexually against her will, and/or being made
to touch his private parts against her will.
Overall, 9.0 per cent of women have experienced sexual violence by a non-partner in since age
15 and 1.2 per cent in the last 12 months. Proportions of women who experienced this since age
15 are highest in the Red River Delta (11.4 per cent) and lowest in the Mekong River Delta (5.4
per cent). Current rates, are highest in the North and South Central Coast (1.6 per cent), Central
Highlands (1.6 per cent) and the Southeast region (1.4 per cent) (Figure 50).
Figure 50: Prevalence of sexual violence by a non-partner, since age 15 and in the last 12 months, among all women, by location, Viet Nam 2019 (N=5,976)
Women aged between 20 and 24 years experienced the highest rates for sexual violence since
age 15 (18.0 per cent) and those even younger (aged 15 to 19) have the highest rates in the last
9.0 9.7 8.6 7.711.4 10.7 10.5
8.25.4
1.2 1.4 1.1 0.7 1.2 1.6 1.6 1.4 0.8
0
10
20
30
40
50
Total Urban Rural NorthernMidlands
andMountains
Red RiverDelta
North andSouth
CentralCoast
CentralHighlands
Southeast MekongRiver Delta
Percentage of all women
Since age 15 Last 12 months

64
12 months (5.4 per cent) (Figure 51). The trend in current rates of non-partner sexual violence
suggest youngest women are most at risk.
Figure 51: Prevalence of sexual violence by a non-partner, since age 15 and in the last 12 months, among all women, by age, Viet Nam 2019 (N=5,976)
The acts of sexual violence that women experienced were mainly attempted forced intercourse
or other unwanted sexual acts (8.4 per cent of women experienced this since age 15 and 1.1 per
cent in the last 12 months – Table 5.3 in Annex VIII). Fewer than 1 per cent (0.6 per cent) of
women experienced forced intercourse since age 15 and 0.1 per cent in the last 12 months.
For almost all (91 per cent) of the women who have experienced forced sexual intercourse it
happened once by one perpetrator (Figure 52). For 3 per cent it happened a few times by any
perpetrator and for the remaining 6 per cent it happened many times (more than five times).
Similarly, for women who experienced attempted intercourse or other acts of sexual violence it
happened once by one perpetrator in almost all cases (92 per cent). For 7 per cent of the women
it happened a few times by one or more different perpetrators and for 1 per cent it was many
times.
9.0 9.1
18.013.9 12.2
8.1 6.1 6.2 7.3 5.81.2
5.4 3.6 2.0 0.8 0.8 0.2 0.3 0.2 0.20
10
20
30
40
50
Total 15-19 20-24 25-29 30-34 35-39 40-44 45-49 50-54 55-64
Percentage of all women
Age group
Since age 15 Last 12 months

65
Figure 52: Distribution of frequency of sexual violence by a non-partner, since age 15, among all women who experienced such violence, Viet Nam 2019
Most forced sex by a non-partner occurred in the perpetrator’s or someone else’s home or yard
(31.5 per cent of women who experienced it since age 15) or in her own home or yard (22.9 per
cent). The next most common location was a rural area, woods, park or campground (12.4 per
cent), or in a street, alley, parking lot or car (11.9 per cent). A point of difference is that other acts
of sexual violence (attempted intercourse, unwanted touching, or being forced to touch the
perpetrator sexually) mainly occurred in public places; most commonly the street, alley, parking
lot or car (43.5 per cent of cases) and then in the woman’s own home or yard (13.7 per cent).
Office buildings, shop or public building (8.8 per cent), public transport (7.2 per cent), rural areas,
woods, parks, campgrounds (6.1 per cent) and on school or college campuses (5.6 per cent) were
also mentioned in the survey (See Table 5.4b in Annex VIII).
Almost all non-partner sexual violence is perpetrated by males who are not family members
(Table 5). It is usually a stranger, male friend or acquaintance, a recent acquaintance or someone
at work.
Once by any one perpetrator 91%
Few times by any
perpetrator 3%
Many times by any
perpetrator 6%
Forced intercourse (N=33)
Once by any one perpetrator 92%
Few times by any perpetrator 7%
Many times by any perpetrator
1%
Attempted intercourse or other unwanted sexual acts (N=479)

66
Table 5: Type of perpetrator of sexual violence by a non-partner since age 15, among all women who experienced such violence, Viet Nam 2019
Since age 15
Forced intercourse
Attempted intercourse or other unwanted
sexual acts
Number % Number %
Total 33 100.0 479 100.0
Type of perpetrator (grouped)
Male family member(s) 3 9.1 13 2.7
Female family member(s) 0 0.0 0 0.0
Male other(s) 30 90.9 463 96.7
Female others(s) 0 0.0 5 1.0
Type of perpetrator (detailed)
Father/stepfather 1 3.0 0 0.0
Other male family member 2 6.1 13 2.7
Someone at work - male 0 0.0 27 5.6
Someone at work - female 0 0.0 1 0.2 Friend/acquaintance -
male 17 51.5 164 34.2 Friend/acquaintance -
female 0 0.0 3 0.6 Recent acquaintance -
male 6 18.2 23 4.8
Stranger - male 7 21.2 253 52.8
Teacher - male 0 0.0 3 0.6
Doctor/Health staff - male 0 0.0 5 1.0
Other - male 2 6.1 20 4.2
5.3. Other forms of sexual harassment and abuse
The survey asked women if they have experienced forms of sexual harassment and abuse in
their workplace, schools or public places. More than one in ten women (11.4 per cent)
experienced one or more kinds of harassment and abuse (Figure 53). The most mentioned form
was receiving unwanted personal electronic messages with sexual content (mentioned by 7.6
per cent of women), followed by being groped or touched sexually on a bus or other public place
(4.9 per cent).

67
Figure 53: Prevalence of sexual harassment, among all women, Viet Nam 2019 (N=5,976)
5.4. Sexual abuse in childhood before age 15
Women are asked to recall any experiences of sexual abuse as a child (before the age of 15).
This includes whether anyone had ever touched them sexually or made them do something
sexual that they did not want to do. As this is a particularly sensitive topic, child sexual abuse was
asked two times: using a set of questions during the interview, and in a concealed (anonymous)
way, at the end of the interview by having her mark a picture of a smiling or sad face (the latter
indicating she had experienced such abuse).
Overall, 4.4 per cent of women mentioned that they experienced child sexual abuse based on the
results of both methods combined – 4.0 per cent using the face card at the end of the interview
and 1.6 per cent when asked the question during the interview (Table 5.5 in Annex VIII). When
child sexual abuse rates are compared by age group (Figure 54), women in younger age groups
had the highest rates of child sexual abuse peaking for women aged 30 to 34 years of which 6.5
per cent have experienced such abuse (higher than the national average of 4.4 per cent). Rates
were at or below the national average for women aged 35 years and above.
Figure 54: Prevalence of child sexual abuse experienced before the age of 15 among all women, by age (at time of interview), Viet Nam 2019 (N=5,976)
0.4 0.24.9
7.611.4
0
10
20
30
40
50
Asked to performsexual acts to get a
job, keep a job or bepromoted
Asked to performsexual acts to pass an
exam or get goodgrades at school
Groped or touchedsexually on a bus orother public place
Received unwantedpersonal electronic
messages with sexualcontent
Any form of sexualharassment
Percentage of all women
Specific acts of sexual harassment
4.4 5.6 5.6 6.1 6.5 4.4 3.3 2.3 3.7 4.0
0
10
20
30
40
50
Total 15-19 20-24 25-29 30-34 35-39 40-44 45-49 50-54 55-64
Percentage of all women
Age group

68
Among the women who revealed child sexual abuse during the interview, most mentioned that
the abuse happened between the ages of 10 and 14 years (76.6 per cent). For more than one
third (36.6 per cent) of women the perpetrator was a male friend or acquaintance and for a quarter
(27.7 per cent) of women it was a stranger (Table 5.6 in Annex VIII).69
5.5. Forced first sex
A majority of women identified that their first sexual experience occurred as an adult, that is from
the age of 18 and older (80.5 per cent). For half of these women the experience was in early
adulthood, between the ages of 18 and 21 years. A very small portion had their first experience
during adolescence (6.2 per cent) or below the age of 15 (0.4 per cent) Figure 55.
Figure 55: Age of first sexual intercourse among all women, Viet Nam 2019 (N=5,976)
Most Vietnamese women have said that their first sexual experience was something they wanted
(95.1 per cent). A small portion (4.1 per cent) said they were pressured into having sex when they
did not want to or were forced to have sex (0.8 per cent) (Figure 56).
69 Note: For women who reported child sexual abuse at the end of the interview by marking one of the two faces (sad or happy), no further information was recorded about the perpetrator or the event, as the interviewers would not know which face was marked.
12.8
0.46.2
40.4 40.1
0
10
20
30
40
50
Not had sex Age <15 Age 15-17 Age 18-21 Age 22+
Percentage of all women

69
Figure 56: Nature of first sexual experience among all women who ever had sex, Viet Nam 2019 (N=5,390)
When looking at first sexual experience by age of first sexual experience (17 years and younger
compared with 18 years and older), women who had their first sex before age 18, while still largely
positive towards wanting their first sexual experience, were less likely to report they wanted that
experience (88.0 per cent) as compared with women whose first experience was at an older age
(95.7 per cent) (Table 6).
The other side of the coin is that women who had their first sex at a younger age were more likely
to report they did not want to have sex but had sex anyway (7.6 per cent) and being forced to
have sex (4.4 per cent) as compared with women whose first sex was above the age of 18 (3.8
per cent and 0.5 per cent respectively).
Table 6: Nature of first sexual experience among all women who ever had sex, by age of first sexual intercourse, Viet Nam 2019
Wanted to have
sex
Did not want to have
sex, but had sex
Forced to have
sex
Number of women
interviewed
% % %
Total 95.1 4.1 0.8 5 390
Age of first sexual intercourse
17 years and younger 88.0 7.6 4.4 395
18 years and older 95.7 3.8 0.5 4 995
.
Wanted to have sex, 95.1
Did not want but had sex,
4.1
Forced to have sex, 0.8
Percentage of women who had ever had sex

70
5.6. Comparison of violence by a husband/partner and violence by a non-partner
since age 15
A common misconception worldwide is that women are most at risk of violence from people they
hardly know rather than from people they know well. To explore this, a measure of prevalence of
physical and/or sexual violence, regardless of perpetrator, was compiled for all respondents in
the study, whether they ever had been married/partnered or not (Annex VIII Table 5.7).
For both physical and sexual violence against women, the husband/partner is the most likely
perpetrator. Overall, 40.3 per cent of women in Viet Nam have experienced physical and/or sexual
violence since age 15 by a partner or non-partner. When comparing between the two, women in
Viet Nam are twice as likely to have experienced physical violence by partners rather than non-
partners (Figure 57). Partner sexual violence is also more prevalent than non-partner sexual
violence although the gap is not as large as for physical violence.
Figure 57: Comparison of violence by a non-partner and violence by a husband/partner since age 15, among all women, Viet Nam 2019 (N=5,976)
* The prevalence rates for violence by a husband/partner are slightly lower here compared with the tables in Chapter
4 because the denominator in this figure includes all women, not just those who have ever had a partner or been
married.
11.4 9.018.0
23.6
12.0
29.031.9
18.8
40.3
0
20
40
60
80
100
Physical violence Sexual violence Physical and/or sexual violence
Non-partner Husband/Partner* Husband/Partner and/or Non-partnerPercentage of all women
331
6. Women with a disability and their experiences of violence
Key findings from this chapter
● Nine per cent of women in the sample reported having some forms of functional
disability.70
● Women with a disability experienced much higher rates of violence by a
husband/partner than women without disability. This was consistent across all forms
of violence (physical, sexual, economic, emotional abuse and controlling
behaviours).
● Rates of partner violence are also much higher among women who have some
difficulty in one or more of the six domains compared with women with no difficulty.
Prevalence rates of non-partner physical and/or sexual violence were similar
between women with a disability and without.
● The experience of childhood sexual abuse was higher among women with a
disability (6.4 per cent) compared with women without a disability (4.2 per cent).
Disability is a complex concept and there is no single measure able to capture all forms of
disability or the ways that people’s lives are limited by living in an able-bodied oriented society.
A recommended and commonly used measurement approach deemed appropriate for a survey
such as this one is the Washington Group (WG) Short Set of Disability Questions.71 This well-
tested set of questions is often used to monitor adherence to the United Nations Convention on
the Rights of Persons with Disability (UNCRPD) and the Sustainable Development Goals (SDGs).
Rather than a dichotomous (Yes/No) measuring a static state of disability, the WG questions
attempt to measure disability on a spectrum. The questions are based on functioning in six
domains: seeing, hearing, walking or climbing stairs, remembering or concentrating, self-care
(washing or dressing), communicating (understanding or being understood by others).
Responses are a 4-point scale of difficulty with each functional domain ranging from ‘no difficulty’
through to ‘a lot of difficulty’ or ‘cannot do this at all’ (see Annex V).
Women giving responses as having ‘a lot of difficulty’ or ‘cannot do at all’ in any of the six domains
are considered to have a disability. Among the 5,976 women interviewed, 9.0 per cent have a
disability using this definition. Among ever-married/partnered women (N=5,553) the prevalence
is slightly higher at 9.2 per cent with a disability (see Table 3.2 in Annex VIII).
Women’s experience of violence often leads them to be isolated and excluded from different parts
of their community. Functional disabilities can compound this isolation and place women at
greater risk of harm. This chapter explores the experience that women have with
and non-partner violence and how this differs by disability status. As with other measures
70 As defined by the Washington Group Short Set of Disability Questions. 71 Washington Group on Disability Statistics: Short Set of Disability Questions. http://www.washingtongroup-
disability.com/washington-group-question-sets/short-set-of-disability-questions/
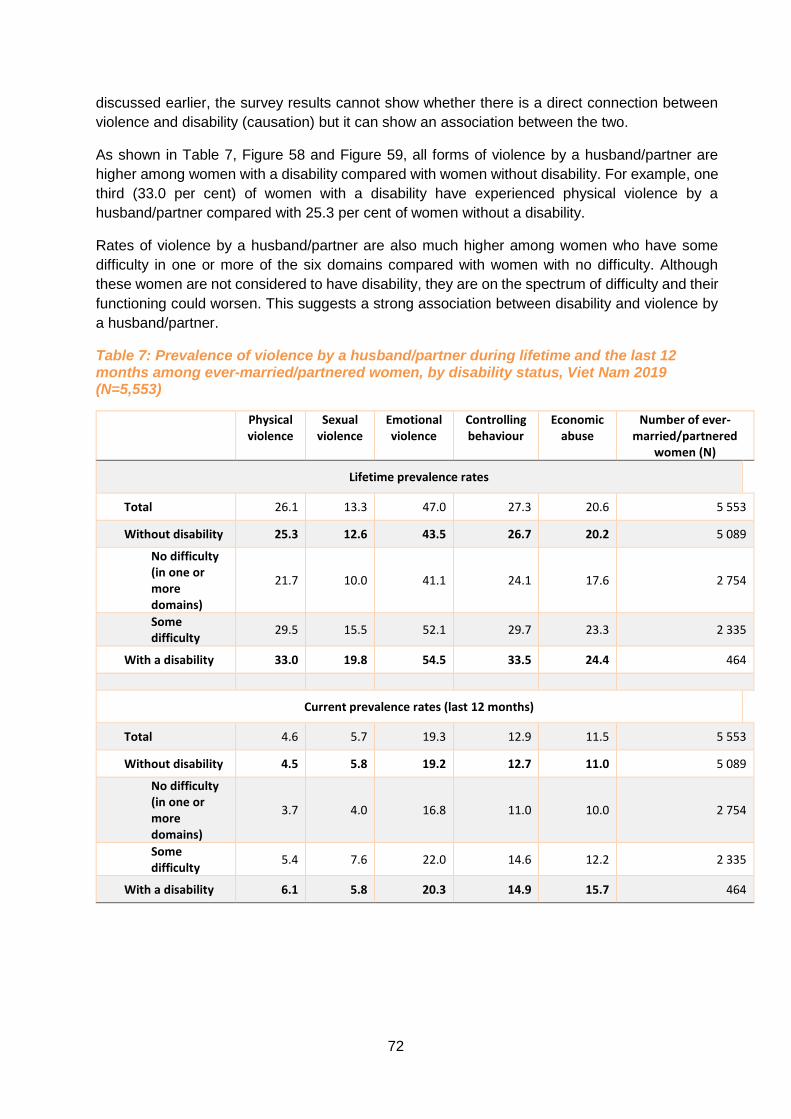
72
discussed earlier, the survey results cannot show whether there is a direct connection between
violence and disability (causation) but it can show an association between the two.
As shown in Table 7, Figure 58 and Figure 59, all forms of violence by a husband/partner are
higher among women with a disability compared with women without disability. For example, one
third (33.0 per cent) of women with a disability have experienced physical violence by a
husband/partner compared with 25.3 per cent of women without a disability.
Rates of violence by a husband/partner are also much higher among women who have some
difficulty in one or more of the six domains compared with women with no difficulty. Although
these women are not considered to have disability, they are on the spectrum of difficulty and their
functioning could worsen. This suggests a strong association between disability and violence by
a husband/partner.
Table 7: Prevalence of violence by a husband/partner during lifetime and the last 12 months among ever-married/partnered women, by disability status, Viet Nam 2019 (N=5,553)
Physical violence
Sexual violence
Emotional violence
Controlling behaviour
Economic abuse
Number of ever-married/partnered
women (N)
Lifetime prevalence rates
Total 26.1 13.3 47.0 27.3 20.6 5 553
Without disability 25.3 12.6 43.5 26.7 20.2 5 089
No difficulty (in one or more domains)
21.7 10.0 41.1 24.1 17.6 2 754
Some difficulty
29.5 15.5 52.1 29.7 23.3 2 335
With a disability 33.0 19.8 54.5 33.5 24.4 464
Current prevalence rates (last 12 months)
Total 4.6 5.7 19.3 12.9 11.5 5 553
Without disability 4.5 5.8 19.2 12.7 11.0 5 089
No difficulty (in one or more domains)
3.7 4.0 16.8 11.0 10.0 2 754
Some difficulty
5.4 7.6 22.0 14.6 12.2 2 335
With a disability 6.1 5.8 20.3 14.9 15.7 464

73
Figure 58: Prevalence of violence by a husband/partner during lifetime among ever-married/partnered women, by disability status, Viet Nam 2019 (N=5,553)
Figure 59: Prevalence of violence by a husband/partner during last 12 months among ever-married/partnered women, by disability status, Viet Nam 2019 (N=5,553)
When it comes to non-partner physical and sexual violence (Table 8), women’s experiences,
regardless of level of disability, are similar: The prevalence of physical violence since age 15 is
slightly higher among women with a disability (12.3 per cent) than for women without (11.3 per
cent), however, current rates within the last 12 months are lower for women with a disability (0.8
per cent compared with 1.4 per cent).
There is an evident difference in the rates of child sexual abuse. There were 6.4 per cent of
women with a disability who experienced sexual abuse before the age of 15 compared with 4.2
per cent of women without a disability (see Table 5.5 in Annex VIII).
25.3
12.6
43.5
26.720.2
33.0
19.8
54.5
33.5
24.4
0
20
40
60
80
100
Physical violence Sexual violence Emotional violence Controllingbehaviour
Economic abuse
Women without disability Women with disability
Percentage of ever-married/partnered women
4.5 5.8
19.212.7 11.0
6.1 5.8
20.314.9 15.7
0
20
40
60
80
100
Physical violence Sexual violence Emotional violence Controllingbehaviour
Economic abuse
Women without disability Women with disability
Percentage of ever-married/partnered women

74
Table 8: Prevalence of non-partner violence since age 15 and the last 12 months among all women, by disability status, Viet Nam 2019 (N=5,553)
Physical violence
Sexual violence
Child sexual abuse
Number of women (N)
Lifetime prevalence rates
Total 11.4 9.0 4.4 5 976
Without disability 11.3 9.0 4.2 5 436
No difficulty (in one or more domains)
10.1 8.8 4.3 3 012
Some difficulty 12.7 9.3 4.1 2 464
With a disability 12.3 8.4 6.4 500
Current prevalence rates (last 12 months)
Total 1.4 1.2 5 976
Without disability 1.4 1.1 5 436
No difficulty (in one or more domains)
1.2 1.2 3 012
Some difficulty 1.6 1.1 2 464
With a disability 0.8 1.6 500
Qualitative interviews and group discussions with women with disabilities showed that it is more
difficult for them to get married or form long-term relationships than it is for men with disabilities.
Women with disabilities often married men with disabilities while men more often married
persons without disability. Women with disabilities may be disadvantaged compared with men
regardless of form and level of disability. For example, in the case of Hoa – a Nung woman with
mobility difficulty:
Hoa runs a small shop. Her husband is blind and from Tay ethnicity. Although Hoa is
the one who earns the income in her family, her husband controls the money and beats
her. Hoa could not report as no one believes her. Other people did not believe that Hoa
– a woman in wheelchair – could be beaten by a blind man.
Hoa also suffers from sexual violence from her husband. She could not move very well
and she feels inferior in sex. Thus, this increases her embarrassment when talking
about sex. As result, Hoa has never talked about her suffering with anyone. – IDI1,
woman aged 37, Nung ethnicity
Women with disabilities may have a higher tolerance towards violence by a husband/partner.
Finding a partner is difficult, thus the women may accept violence in order to sustain their
relationship.
It was not just women with disabilities who stigmatized themselves. In a group discussion with
commune officers, people told us a story of a deaf woman, who had a child without knowing the
75
child’s father name. Her brother took her to the commune health station for regular
contraception injections. People seemed very curious to know who the father of the child was
and they discussed her sexual capacity a lot.

76
7. Attitudes and perceptions about gender and husband/partner
violence
Key findings from this chapter
● Around one third of women in Viet Nam hold attitudes supporting that men rather
than women should be decision makers and the head of the household. Women in
rural held these views more strongly than urban women.
● More than half of the women interviewed (51.8 per cent) agreed with at least one
reason or situation in which it was acceptable for violence by a husband/partner such
as if she were ‘unfaithful’ (45.2 per cent) or did not take ‘care of children’ (27.0 per
cent). These attitudes were also supported by more women living in rural areas as
compared with urban areas and among more women with lower levels of education.
● Women who were victims of violence were also more likely to accept or justify
violence by a husband/partner as compared with women who have not experienced
violence.
● Women who experienced physical violence by a husband/partner were asked if
there were situations that led to or triggered the violent behaviour. Multiple triggers
could be mentioned with the most frequently mentioned being ‘family problem’ (50.8
per cent), ‘drunkenness’ (40.9 per cent), or ‘money problems’ (18.8 per cent).
7.1. Women’s attitudes towards gender roles and violence
The 2019 survey measures attitudes and beliefs about gender roles, power in the household and
relationship, and the circumstances in which women consider it acceptable for a husband to
abuse his wife. Measuring attitudes and beliefs towards gender roles and husband/partner
violence reveals how acceptable violence against women is in society.
Just over one third (35.9 per cent) of women believe that “a man should show he is the boss”
(Figure 60). This attitude is notably stronger among women living in rural areas (40.1 per cent)
compared with urban areas (27.3 per cent). More than one quarter (27 per cent) of all women
supported the notion that “a good wife obeys her husband even if she disagrees”. Women in rural
areas were more likely to hold this belief (32 per cent).
Focus group discussions reinforced the quantitative findings. There was greater support for the
statement “a man should show he is the boss” than the statement “a good wife obeys her husband
even if she disagrees”. The women in the FGDs explained that since the man is “the boss of
family” (chủ gia đình) thus a man should show he is the boss. This implies that the man holds
enough knowledge and experience for being the head of the family and can lead the family.
With the statement “a good wife obeys her husband even if she disagrees”, women questioned
the knowledge and experience of the husband. They explained that if the husband is a good
husband, a husband that the wife can count on, then it is good for the wife to obey the husband.

77
However, if the husband is not a good husband, then a good wife should be able to question the
husband and give him good advice.
However, there was overall consensus that women should obey their husbands. They used the
term ‘đón ý’ (respond to the opinion) of the husband. This means that though the women do not
have to follow the husband all of the time, they are not free. Women said they would consult with
their husband and listen to his preferences to ensure that they make their husband happy, or at
least do not upset them. Even in matrilineal ethnicities women said they would not upset their
husbands by disobeying them – unless he was a ‘bad’ husband.
Figure 60: Proportion of all women who said they agree with specific statements on gender roles, by location, Viet Nam 2019 (N=5,976)
Agreement with harmful gender norms is more likely among women with no formal education or
a low level of education (Figure 96). This connection between attitudes and education suggests
that harmful attitudes may be mitigated by increased education levels.
Figure 61: Proportion of all women who said they agree with the statement “a good wife/partner obeys her husband even if she disagrees”, by education level, Viet Nam 2019 (N=5,976)
27.235.9
16.727.3
32.440.1
0
20
40
60
80
100
2019 2019
"A good wife obeys her husband even if she disagrees" "A men should show he is the boss"
Total Urban RuralPercentage of all
women
49.2
34.027.6
15.0
5.0 3.0
0
20
40
60
80
100
No education Primary LowerSecondary
UpperSecondary
College University andabove
Percentage of all women

78
Disaggregating the findings by age group shows only 11.4 per cent of women aged 18 to 24 agree
with the statement “A good wife should obey her husband”. As age increases, so too does the
likelihood that women will agree with the statement (Figure 62). The gap between older women
and younger women is large. Two fifths (41.8 per cent) of women in their late 50s agree with the
statement versus 12.8 per cent of women in their late 20s).
Figure 62: Proportion of all women who said they agree with the statement “a good wife/partner obeys her husband even if she disagrees”, by age group, Viet Nam 2019 (N=5,976)
The study also explored women’s attitudes about whether a man would be justified in hitting his
wife under a number of specified circumstances. Overall, the survey shows more than half of the
women (51.8 per cent) agreed that a man would be justified in hitting his wife for one or more of
the reasons mentioned (Figure 63).
The most commonly mentioned reason to justify physical violence was if the wife was unfaithful
(45.2 per cent), followed by ‘not taking care of children’ (27.0 per cent). However, respondents
were far less inclined to agree that asking about girlfriends, refusing sex or suspecting the wife
was unfaithful were good reasons to hit a wife. Overall, women living in rural areas were more
likely to justify physical violence for all situations described in the survey. For five of the seven
situations measured, rural women were more than twice as likely to agree as compared with urban
women.
11.4 12.819.9 21.6
31.234.7
41.3 41.8
0
20
40
60
80
100
18-24 25-29 30-34 35-39 40-44 45-49 50-54 55-60
Percentage of all women

79
Figure 63: Proportion of all women who said they agree with specific “good reasons” for a man to hit his wife/partner among all women, Viet Nam 2019 (N=5,976)
These reasons used as justifications for violence were explored in the qualitative FGDs. Almost
all participants agreed that violence is justified if the wife is unfaithful. They even use the language
of ‘she should be beaten’ (phải đánh). According to them being unfaithful is the most serious
transgression a woman can make and therefore justifies physical violence. Descriptions of an
unfaithful woman included being a ‘spoiled woman’ (hư), ‘rubbish’ (đồ bỏ đi), ‘no one can tolerate’
(không thể tha thứ). They expressed that they thought unfaithful women should be ‘punished’’
(trừng phạt). Some participants showed very strong reaction towards an unfaithful woman and
insisted that ‘if the husband did not beat her, I would tell him to beat her or even beat her myself’.
This strong reaction could be due to the rural context of the qualitative study where people may
rarely see cases of unfaithful women.
Only a few participants did not agree that unfaithful women should be beaten. According to them,
beating the woman would not solve the problem and they suggested that the woman and the man
should talk to each other to find out why the woman was looking for another relationship. They
suggested that the discussion should convince the woman to return to her family.
Even in the cases of serious violence, if the woman was thought to have been unfaithful, she
would not get any support or intervention from others, even people in the family. Mai, the woman
quoted earlier, shared that her two daughters had never been at her side. Her husband suspected
that she had another relationship. He called her ‘prostitute’ (con đĩ). She had three children: two
elder daughters and one son. Her two daughters had not talked to her for a long time. They
blamed her for problems in the family using the same words as their father.
Meanwhile, when discussing a similar case, but with the man being unfaithful, research
participants held different attitudes. While not supporting men in having affairs, almost no
participants said that they would beat the man or that the man deserved to be beaten. They said
that ‘It is normal that man has other relationships’ and then quoted the folklore ‘It is normal that
man has three or five concubines’ (Đàn ông năm thê bảy thiếp là thường).
Further discussion revealed that participants believed an unfaithful woman would lead to the
collapse of the family. However, when a man is unfaithful, he is still able to keep his family, thereby
51.845.2
27.0
12.2 9.3 7.7 7.2 4.1
40.634.7
20.9
7.2 5.4 4.6 4.7 1.9
57.450.4
30.0
14.7 11.3 9.3 8.4 5.3
0
20
40
60
80
100
One or more ofthe reasonsmentioned
"Reason to hit:husband finds
out wifeunfaithful"
"Reason to hit:wife does nottake care of
children"
"Reason to hit:wife disobeys
him"
"Reason to hit:not completehousework"
"Reason to hit:wife refuses
sex"
"Reason to hit:husband
suspects wifeunfaithful"
"Reason to hit:wife asks about
girl firends"
Percentage of all women
Total Urban Rural

80
suggesting that tolerance for a man’s unfaithfulness is widely accepted, even within his own
family, whereas unfaithfulness by the woman provides a valid reason for the man to leave the
relationship or fracture the family. Family is very important in Viet Nam society. Battered women
are often advised to stay in order to keep the family together. Thus, anyone who breaks-up the
family is blamed.
Even in matriarch ethnicities, people are more tolerant towards men having out-of-wedlock
relationships than women. A woman in the study, who is Cham ethnic, shared the following:
If a man has other relationship he does not need to hide, he tells other men, for
example when they drink together. No one will accuse him. They even congratulate
him and praise him. According to them, he is so powerful and attractive that he can
get attention of other women. – IDI17, woman aged 47, Cham ethnicity
After this interview the research team discovered that her husband had an affair and
had a child from that relationship. However, the woman hid this in the interview. She
only said positive things about him. She was also proud of herself that she paid for
his education.
Further in the qualitative research, when the situation of a woman having an affair was given the
context that the husband was a violent person, heavily drinking or gambling, most people changed
their opinion. In these circumstances it was acceptable for woman to find another relationship if
her husband was not a good husband. This further reinforces the earlier discussion where women
qualified that women should obey their husbands if they are a ‘good husband’.
The final excuse explored was the justification of violence in the case where women did not take
a good care of the children. This was less acceptable as a reason as they believed that taking
care of the children was the responsibility of both husband and wife. Thus, if the wife could not
take care of the children well, the husband should be involved and support her to do the work.
Attitudes differ considerably according to the education level of the respondent. As education
increases, women are less likely to agree that men have a right to hit their wives/partners in some
circumstances. Only one in five (20.5 per cent) of university educated women agree with one of
more of the statements compared with two thirds (66.2 per cent) of women with no education
(Figure 64). This points to the important role that education plays in changing attitudes and moving
towards a society where violence by a husband/partner is unacceptable.

81
Figure 64: Proportion of all women agreeing with at least one ‘”good reasons” for a man to hit his wife/partner among all women by education level, Viet Nam 2019 (N=5,976)
Women who experienced violence by a husband/partner are notably more inclined to agree that
a man can hit his wife/partner under certain circumstances (63.7 per cent) compared with women
who have not experienced violence (48.7 per cent) (Figure 65). This pattern is consistent across
all the questions of attitudes towards a man having the right to hit his wife/partner. These results
illustrate how some women normalize and justify the violence they experience or feel powerless
to change. We call these “violence supportive attitudes” which in themselves do not cause
violence but can create a climate of acceptance preventing women from seeking help. When
pervasive in a community they shape responses by leaders and support service providers, also
making it more difficult for women to obtain the help they need when they do seek it.
Figure 65: Proportion of all women who said they agree with specific ”good reasons” for a man to hit his wife/partner among all ever-married/partnered women, Viet Nam 2019 (N=5,553)
51.8
66.2 64.353.0
42.1
28.620.5
0
20
40
60
80
100
Total No education Primary LowerSecondary
UpperSecondary
College University andabove
Percentage of all women
48.742.3
24.5
11.2 8.7 6.9 7.1 4.0
63.756.5
35.5
15.911.8 11.0 8.3
4.9
0
20
40
60
80
100
One or moreof the
reasonsmentioned
"Reason tohit: husband
finds out wifeunfaithful"
"Reason tohit: wife doesnot take careof children"
"Reason tohit: wife
disobeys him"
"Reason tohit: not
completehousework"
"Reason tohit: wife
refuses sex"
"Reason tohit: husbandsuspects wife
unfaithful"
"Reason tohit: wife asks
about girlfirends"
Percentage of ever-married/partnered women
No violence Sexual and/ or physical

82
7.2. Perceived triggers for physical violence
Women who experienced physical violence by a husband/partner were asked if there were
situations that led to or triggered the violent behaviour (Figure 66).72 Multiple triggers could be
mentioned. The most mentioned triggers were ‘family problem’ (50.8 per cent) and ‘drunkenness’
(40.9 per cent), as well as ‘money problems’ (18.8 per cent).
Figure 66: Perceived triggers of physical violence by a husband/partner among ever-married/partnered women who experienced such violence, Viet Nam 2019 (N=1,471)
The triggers for violence were explored in the qualitative study. When the item of drunkenness
was discussed among the participants it was revealed that the trigger of alcohol leading to
violence is more complex than simply drunkenness. Drinking alcohol was presented in almost all
cases of in-depth interviews with violence survivors. Though some women mentioned the
changes in their husband after drinking as being “a totally different person” (một con người khác),
others relayed problems other than the chemical effect.
Forcing a woman to buy alcohol can be the first step her partner takes towards power and control
over his wife and children. In addition, drinking alcohol gives men a widely acceptable excuse for
anger and violent behaviours. An excuse accepted by the community, including the women. The
qualitative data reveals that if a woman is beaten after her husband/partner has been drinking
72 The translation of this question into Vietnamese asked about situations leading to violence and perceived
reasons. These expressions are not used in reporting in order to reflect international recognition that the actual reasons for, and situations leading to, intimate partner violence are deepely embedded in gender inequality. However, there may be may things in daily life which trigger the perpetrator to use power and control to
perpetrate violence. This is the internationally preferred language for reporting on this topic.
0.2
1.5
3.0
4.2
4.3
4.5
4.5
5.0
7.3
7.3
16.6
18.8
40.9
50.8
0 20 40 60 80 100
She is pregnant
Refuses sex
Unemployed
Disobedient
Wants to teach her a lesson
No food at home
No particular reason
Show he is boss
Jealous
Problem with work
Other problem
Money problem
Drunkeness
Family problem
Percentage of ever-married/partnered women who experienced physical violence by a husband/partner

83
alcohol people in the community, and even the woman herself believe that it is her fault. She is
beaten because she does not know how to behave when her husband drinks or does not find
place to hide away from his temper and violence. For families with economic challenges,
expenses on alcohol can increase tension in the family and trigger the violence.
Drinking alcohol and economic challenges were listed as the most common triggers of violence
in qualitative study. Jealousy and having an out-of-marriage relationship were other common
triggers.
Economic hardship can be a direct or indirect trigger according to participants. Fights are triggered
by economic hardship such as having less choice available to them, and concern about ‘making
ends meet’ can add intensity to other issues.
When people are wealthy, the feeling is better, the mind is more relaxed, and people
can be nicer to each other. They do not have to think much if they want to buy
somethings or invest in somethings. However, if the family is poor, people are always
in stress. Thus, a small conflict can lead to big quarrel and violence. – FGD with
women
The concept of ‘family problem’ as a trigger for violence by a husband/partner was identified by
the largest portion of respondents in the quantitative interviews. As this is a non-specific trigger it
was further explored in the qualitative research. Participants in IDIs and FGDs explained their
understanding of ‘family problem’ as an overall term that refers to small and non-specific issues
that happen between a couple in daily life. This term can include many issues such as economic
tension, drinking alcohol, communication problem, tension between extended family, economic
investment, out-of-wedlock relationships, giving birth to a girl rather than a boy, conflict over land
and house, problem regarding raising children, etc. It seems that when there is one specific and
dominant issue that triggers violence, then people will identify it. When there is not only one
conflict or issue, but several combined issues either temporary or long-term, people would use
the term ‘family problem’. Qualitative study participants noted that ‘family problem’ exist in every
family.
Every family has a problem - (FGD25 women aged < 30 years, rural)
Among women who experienced violence this statement was sometimes used to normalize the
violence; among non-violence women they would sometimes qualify it by saying problems exist
in all families but do not always trigger violence.

84
8. Impact of husband/partner violence on women’s health
Key findings from this chapter
● Nearly one quarter (23.3 per cent) of women who experienced physical and/or
sexual violence by a husband/partner incurred injuries as a result of that violence.
Most injured women experienced this more than once, with one in five women (21.8
per cent) injured many times in her life.
● Women who had experienced physical and/or sexual violence by a husband/partner
were more likely to self-report overall ‘poor’ or ‘very poor’ health compared with
women who had not experienced such violence.
● Women who experienced physical and/or sexual violence by a husband/partner
were three times more likely than women who had not experienced such violence to
score 13 and above on the Kessler Psychological Distress Scale (K6+) indicating
higher likelihood of mental illness.
● Women who experienced physical and/or sexual violence by a husband/partner
consistently had higher risks of miscarriage, stillbirths and abortions as compared
with women who had not experienced violence by a husband/partner.
The effects of violence on women can manifest in many ways; it can impact her health, her
children and other aspects of daily life. Women can experience direct physical injuries, but also
negative effects on mental health and income earning potential. In this chapter we report on
how physical and/or sexual partner violence affects women’s health and daily life.
8.1. Injuries due to violence by a husband/partner
Women who experienced physical and/or sexual violence by a husband/partner were asked
whether these acts had resulted in injuries. Follow-up questions asked when it occurred, the types
of injury, the frequency and whether health care services were needed and used.
Nearly a quarter (23.3 per cent), Table 7.1 in Annex VIII) of women who experienced physical
and/or sexual violence by a husband/partner incurred injuries as a result of that violence during
their lifetime, and 3.7 per cent experienced injuries in the last 12 months. The most common
injuries included scratches, abrasions and bruises (83.2 per cent). Severe injuries were relatively
common with more than one in ten suffering internal injuries (12.4 per cent) or broken
eardrum/injured eye (12.2 per cent) (Figure 67).
Fewer than one in ten (8.0 per cent) women who experienced physical and/or sexual violence by
a husband/partner said that the violence resulted in being hurt enough to require health care. Of
those women who needed health care, more than one in ten (13.2 per cent) needed health care
in the last 12 months. Two thirds (66.3 per cent) of those women who needed health care actually
received health care for the injuries. Among those who did receive health care nearly one in ten
(9.2 per cent) required hospitalization due to the injury (see Table 7.2 in Annex VIII).

85
Figure 67: Type of injury among women who were ever injured, Viet Nam 2019 (N=438)
Most women who were injured from violence by a husband/partner were injured more than once:
almost half (44.2 per cent) were injured between two and five times, and a further one fifth (21.8
per cent) were injured more than five times in their life. One third (34.0 per cent) of women injured
from violence by a husband/partner were injured only once (Figure 68).
0.6
1.3
2.1
2.7
6.0
9.7
12.2
12.4
14.1
83.2
0 20 40 60 80 100
Broken teeth
Burns
Cuts, puncture, bites
Fractures, broken bones
Sprains, dislocations
Penetrating injuries, deep cuts
Broken ear drum, eye injuries
Internal injuries
Other
Scratch, abrasion and bruises
Percentage of women who were injured

86
Figure 68: Distribution of frequency of injuries among ever-married/partnered women injured by physical and/or sexual violence by a husband/partner, Viet Nam 2019 (N=438)
Less than half (44.6 per cent) of the Vietnamese women who sought health care for their injuries
told their health care worker that the reason for their injury was due to violence (Table 7.2 in
Annex VIII).
8.2. Impact of violence by a husband/partner on general health
Women who experienced physical and/or sexual violence by a husband/partner were asked
whether the violence had affected their physical or mental health. The majority of women who
experienced violence by a husband/partner said it had affected their health: More than one third
(37.3 per cent) of women said that the violence had ‘a little’ effect on their health, and a quarter
(25.3%) said it had ‘a lot’ of effect (Figure 69). The remaining one third (37.3 per cent) said the
violence had ‘no effect’.
Figure 69: Self-reported impact of violence on women’s health, among women who experienced physical and/or sexual violence by a husband/partner ever in their lifetime (N=1,791)
Injured once34.0%
Injured 2-5 times44.2%
Injured more than five times
21.8%
Percentage of women who were injured
No effect; 38%
A little; 37%
A lot; 25%
Percentage of women who experiencedphysical and/or sexual violence

87
There was no difference in the self-reported impact of violence by a husband/partner between
women in urban versus rural areas. Women who reside in the Central Highlands were more likely
to say that violence by a husband/partner had a lot of effect on their health and well-being (35.3
per cent) compared with women in Northern Midlands and Mountainous region (11.9 per cent).
There was minimal difference based on age, education level or disability status. Women in the
lower wealth group (based on household assets) were more likely to say that the violence had ‘a
lot’ of effect (30.4 per cent) (Annex VIII Table 7.3).
Early in the survey, before a woman was asked about her experience of violence, every woman
was asked about her health status. To analyse associations between the experience of violence
by a husband/partner and health status, responses were compared between women who
experienced physical and/or sexual violence and those women who did not mention violence.
More than two thirds of women who had experienced violence by a husband/partner said they
had ‘fair’ or ‘poor/very poor’ health (69.3 per cent), compared with 58 per cent of women who had
not experienced husband/partner violence (Table 9).
Table 9: Self-reported general health status among ever-married/partnered women who experienced no violence and those who experienced physical and/or sexual violence by a husband/partner ever in their lifetime, Viet Nam 2019 (N=5,553)
General health status
No
Violence (N=3,757)
%
Physical/ sexual
Violence (N=1,796)
% P-value*
All married/partnere
d women (N=5,553)
%
Good or Excellent
42.1 30.8 0.000 38.4
Fair
47.9 56.1 0.000 50.5
Poor or very poor
10.1 13.2 0.001 11.1
The cross-sectional nature of a survey (measuring everything in one point in time), we often
cannot be sure what was earlier: the experience of violence or the health problem (in other words,
we cannot determine “directionality”). A statistically significant difference in (self-reported) health
status between women who experienced violence and those who did not, does not imply that
there is a causal link with violence, or the direction of the link.
8.3. Husband/partner violence and mental health
In the 2019 survey the Kessler Psychological Distress Scale (K6+)73 was introduced to measure
the association between violence by a husband/partner and psychological distress. The K6+ is a
five-item self-report measure of psychological distress intended to be used as a quick tool to
assess risk for serious mental illness in the general population.
Respondents answering questions on the scale receive a score between 0 and 24. Respondents
with scores of 13 to 24 are classified as having a probable serious mental illness and those with
73 Kessler RC, Green JG, Gruber MJ, Sampson NA, Bromet E, Cuitan M, Furukawa TA, Gureje O, Hinkov H, Hu CY, Lara C,
Lee S, Mneimneh Z, Myer L, Oakley-Browne M, Posada-Villa J, Sagar R, Viana MC & Zaslavsky AM. 2010. Screening for Serious Mental Illness in the General Population with the K6 screening scale: results from the WHO World Mental Health (WMH) survey initiative, International Journal of Methods in Psychiatric Research, Vol 19: 4-22.

88
scores of 0 to 12 as probably not having a serious mental illness. The results here are only
indicative and a medical practitioner should be involved in all official diagnoses.
Comparing scores on the K6+ (Figure 70) shows that a greater proportion of women who have
experienced physical and/or sexual violence by a husband/partner scored 13 and above on the
K6+ (7 per cent) compared with only 2 per cent of women who have not experienced such
violence. These results show that women who have experienced physical and/or sexual violence
by a husband/partner are more than three times as likely to score as probable to have a mental
illness as compared with women who have not experienced husband/partner violence.
Figure 70: Mental health problems based on Kessler score, according to women’s experience of physical and/or sexual violence by a husband/partner, Viet Nam 2019 (N=5,553)
Note: scores of 13 to 24 are classified as having a probable serious mental illness and those with scores of 0 to 12 as
probably not having a serious mental illness.
8.4. Impact of violence by a husband/partner on reproductive health
All women were asked questions about reproductive health, such as whether they had ever lost
a pregnancy. Women who had ever been pregnant were asked if they had experienced violence
during pregnancy.
Three per cent (3.4 per cent) of the women who had been pregnant at some time, had been
beaten during a pregnancy (Table 4.6 in Annex VIII).74 In the last pregnancy in which these
women were beaten, nearly all were beaten by the father of the child (97.9 per cent). One in five
of the women who had been beaten in pregnancy (18.2 per cent) were kicked or punched in the
stomach thereby posing a risk to the unborn child.
The survey results show that rates of miscarriage were significantly higher among women who
had experienced violence by a husband/partner (23.9 per cent) compared with those who had not
(17.1 per cent), and highest among those who had previously experienced violence during
pregnancy (29.4 per cent) (Figure 71). Patterns for rates of abortion were similar to those of
74 While the number of women who disclosed violence during pregnancy was small, all of these women faced
increased risk of injury to both herself and the unborn child.
0-1298%
13-242%
No violence
0-1293%
13-247%
Physical and/or sexual violence

89
miscarriage. While the variation in rates of stillbirth were small between the groups of women,
stillbirths occurred more frequently among women who experienced violence by a
husband/partner and violence during pregnancy.
During the qualitative research, an example of the impact of violence on reproductive health was
given was by a woman who had her ovary broken after being kicked in the stomach by her
husband. She had serious vaginal bleeding and was admitted to the hospital for emergency
surgery.
Figure 71: Reproductive health outcomes experienced by women, according to their experience of physical and/or sexual violence by a husband/partner among those ever-pregnant, Viet Nam 2019 (N=5,239)
17.1
5.2
16.7
23.9
6.0
25.829.4
6.5
27.1
0
10
20
30
40
50
Ever had miscarriage Ever had stillbirth Ever had abortion
Percentage of ever-pregnant women
No violence Physical/sexual violence Violence in pregnancy

90
9. Impact of violence by a husband/partner against women on
their children, and the intergenerational aspects of violence
Key findings from this chapter
● Women who experienced physical and/or sexual violence by a husband/partner
were more likely to mention behavioural issues among their children such as having
frequent nightmares and being unusually quiet or withdrawn.
● Of the women who experienced physical violence by a husband/partner, a majority
reported that their children witnessed or overheard the violence (60 per cent).
● Vietnamese women who experienced violence by a husband/partner were more
likely to have been brought up in a violent home or have a partner who witnessed
violence and/or experienced violence as a child from his father.
There is evidence from other studies that children who live in families where violence by a
husband/partner exists are affected regardless of whether or not they are directly harmed or
witness the violence. Children and young people are likely to have poorer mental and physical
health as well as exhibit disruptive behaviour patterns as compared with children who do not live
in violent households. There is also a greater likelihood that children who grow up in a
household where their father is physically/and or sexually abusive to their mother, will normalize
this behaviour. Boys are at risk of becoming violent and abusive partners themselves while girls
are at risk of partnering with someone who exhibits abusive behaviours like their fathers.
While the intergenerational transmission of violent behaviours is common, it is not pre-
determined. Many violent men grow up in non-violent families and not all boys in violent families
become violent themselves.
In the survey, all women with children between 5 and 12 years old, were asked questions about
the health and well-being of their children. These questions were asked before any questions
were asked about the experience of violence.
9.1. Husband/Partner violence and the health of children
More than two fifths of women (44.6 per cent) in this sample were living with children aged
between 5 and 12 years old. These mothers were asked a series of questions about behaviour
problems among their children in this age group.
Mothers who experienced physical and/or sexual violence by a husband/partner were more likely
to mention behavioural issues among their children, such as nightmares, bedwetting, being
withdrawn, or aggressive compared with women who did not experience violence by a
husband/partner (Figure 72).

91
Figure 72: Well-being of children aged 5-12 years, as reported by women with children in this age group, according to their experience of physical and/or sexual violence by a husband/partner, Viet Nam 2019 (N=2,338)
9.2. Children witnessing violence as mentioned by women
Women who experienced physical violence were asked whether their child(ren) had ever
witnessed the violence. Most (61.4 per cent) said that their children witnessed or overheard the
violence. One quarter (23.8 per cent) thought they had witnessed it several times and nearly one
fifth (17.6 per cent) said children witnessed it many times (Figure 73). The real proportions of
children witnessing violence are likely to be higher because mothers are not always aware of what
their child(ren) see (although not even 1 per cent replied “don’t know”).
Figure 73: Children witnessing the violence, according to women who ever experienced physical violence by a husband/partner, Viet Nam 2019 (N=1,437)
In the qualitative study with victims/survivors of violence, women did recognize that their children
had witnessed the violence. Though the qualitative study did not focus on measuring impact of
violence on the health of the children, comments made suggest that participants suspect that
witnessing the violence had a negative impact on the children.
12.6 14.722.8
9.4
21.7 18.4
29.9
16.6
0
20
40
60
80
100
Nightmares Bedwetting Child quiet / withdrawn Child aggressive
Percentage of women with children aged 5-12 years
Behavioural problems observed in children
No Violence With physical or sexual partner violence
37.9
20.0 23.817.6
0.70
20
40
60
80
100
Never Once or twice Several times Many times Don't know,refuse
Percentage of women who experiencedphysical and/or sexual violence and have children

92
Returning to the case study of Mai mentioned throughout this report, she shared that her youngest
son was with her when her husband beat her and stabbed her. The child had to run several times
to avoid being injured himself by the knife of his father.
Figure 74 includes different types of children’s behavioural problems. The analysis includes
information on whether a woman has experienced physical violence by a husband/partner, and if
she has, the frequency she estimates her children have witnessed violence. In the case of
bedwetting and nightmares we can see an association between the frequency of witnessing
violence and an increased proportion mentioning the unfavourable behaviours. In the cases of
children being withdrawn or aggressive there is a clear distinction between witnessing violence
once or twice and many times.
The high proportion of abused mothers indicating unfavourable behaviour while their children
have ‘never’ witnessed violence is difficult to interpret. Other research shows that mothers
sometimes believe that their children have not witnessed the violence when in fact they have, and
others are reluctant to admit that their children have been exposed. While it is likely that ‘never
witnessing’ violence is an overestimation, if we assume that the women are correct, it shows that
living in a violent household whether children witness the violence or not is harmful for children.
Figure 74 shows the proportions of women who have experienced violence by a husband/partner
and who mention unfavourable behaviours among their children, this time according to how many
times they said the children have witnessed or overheard the violence. It suggests a relationship
between witnessing violence frequently and increased behavioural problems among children.
Figure 74: Proportion of women reporting on their children’s specific behavioural problems, among women with children 5-12 years old and who have experienced physical violence by a husband/partner, according to how frequently they witnessed the violence, Viet Nam 2019 (N=647)
22.720.7
27.5
18.417.4
10.6
23.2
14.1
23.2
16.9
36.2
8.5
29.5
20.0
32.6
25.8
0
10
20
30
40
50
Nightmares Bedwetting Child quiet / withdrawn Child aggressive
Never(N=270)
Once or twice(N=127)
Several times(N=123)
Many times(N=122)
'Percentage of women with children aged 5-12

93
9.3. Intergenerational violence
To further explore the intergenerational patterns of violent husband/partner relationships, women
were asked whether their father had beaten their mother, or whether their husband/partner’s
father had beaten his mother or himself when he was young.
Ever-married/partnered women who experienced physical and/or sexual violence by a
husband/partner mentioned intergenerational violence in their family at higher rates as compared
with women who had not experienced violence by a husband/partner (Figure 75). One third (32.9
per cent) mentioned that her mother also experienced physical violence by a husband/partner,
and that her husband/partner was hit when he was a child (34.1 per cent). For women who had
not experienced violence by a husband/partner, this was 19.6 per cent and 22.0 per cent
respectively. One in six women (16.4 per cent) who experienced physical and/or sexual violence
mentioned that their husband/partner’s mother was hit by his father – more than twice as likely as
those who had not experienced violence. This is likely to be an under-report since women may
not have this information from their husband/partner. Each of these comparisons were statistically
significant (P<.000).75
Figure 75: Ever-married/partnered women disclosing violence against her mother, against her partner’s mother, and against her husband/partner when he was a child, according to experience of physical and/or sexual violence by a husband/partner, Viet Nam 2019 (N=5,553)
Intergenerational violence was further compared across the types of violence experienced
(sexual only, physical only or both), and severity (moderate and severe). A consistent trend is
visible identifying slightly more women mentioning violence against her mother, her
husband/partner’s mother or her husband/partner, when she had experienced combinations or
more severe types of violence. For example, a higher proportion of women experiencing both
sexual and physical abuse mentioned that her husband/partner was beaten as a child (40.7 per
cent) compared with women with only one type of violence (physical only: 29.5 per cent, sexual
75 t-test for equality of means P-value for the difference between women who experienced violence and who did not experience physical and/or sexual partner violence
19.6
6.5
22.0
32.9
16.4
34.1
0
10
20
30
40
50
Her mother was hit by mother'shusband
Partner's mother was hit bymother's husband
Partner was hit as a child
Percentage of ever-marrried/partnered women
No violence With physical and/or sexual partner violence

94
only: 33.0 per cent) or no experience of violence by a husband/partner (22.1 per cent mentioned
that her husband/partner was hit as a child) (see Table 8.3 in Annex VIII).

95
10. Women’s responses to violence by a husband/partner and
their coping strategies
Key findings from this chapter
● Half (49.6 per cent) of the women who experienced physical and/or sexual violence
by a husband/partner had not told anyone about it.
● Most women (90.4 per cent) who experienced physical and/or sexual violence by a
husband/partner had not sought help from formal services or authorities.
● The main reason women gave for not seeking help was they believed the “violence
was normal or not serious”; half of the women who did not seek help (48.4 per cent)
gave this as the reason.
● Women generally sought help when they could not endure the violence anymore
(69.7 per cent of women who sought help gave this as a reason).
● Just under one in five (19.3 per cent) women left home at least once due to violence
by a husband/partner.
● Women who left home stayed away on average 20 days. In most cases they stayed
with their own relatives.
● Women who returned home after leaving did so because they did not want to leave
their children (50.4 per cent), he asked her to go back (26.0 per cent), and/or she
forgave him (25.5 per cent).
● Most women (80.8 per cent) who experienced physical violence by a
husband/partner never fought back.
Women living with violence by a husband/partner find ways to cope, protect themselves and
protect their children from harm, usually for many years before asking others for help. It is
particularly the case that women will explore ways of helping themselves or reaching out to family
and friends before turning to formal services such as the police and specialist violence services.
Most women experience shame and fear inhibiting them from reaching out for help.
This study asked women about help-seeking across both informal and formal networks.
10.1. Who women tell about violence and who helps
Who women tell about the violence
Women were asked whether they had told anyone about their partner’s violent behaviour and if
so, who that was. Women could give multiple answers.
Half (49.6 per cent) of the women who experienced physical and/or sexual violence by a
husband/partner told no one else about it; for them, participating in this interview was the first time
they told someone about the violence (Figure 76).

96
If women did speak to someone about their husband/partner’s violence, it was most often to family
members. Two in five (42.9 per cent) of women told a family member – mainly their siblings
(brother or sister) (21.9 per cent), their parents (20.8 per cent), or the husband/partner’s family
(20.6 per cent).
Figure 76: Percentage of women who were physically and/or sexually abused by a husband/partner in their lifetime who told no one, someone and/or a service about their experience of violence, Viet Nam 2019 (N=1,791)
Note: Respondents who did talk about the violence could have told more than one person and so the total value may
exceed 100 per cent.
The qualitative study also explored women’s help-seeking. It was frequently mentioned that when
victims/survivors of violence did speak to someone about the violence, they most often spoke to
people in their husband’s family such as his parents, his brother or sister rather than her own
family members. According to these women, she will talk to her husband’s family with hope that
they could intervene in the violence. However, if she believed his family would side with her
husband and blame her, then she would not talk with the husband’s family.
Women did not want to inform people in her own family, especially her own parents, because they
often live too far away to intervene. They also reinforced the perception that married women
belong to the husband’s family. Women would tell their parents only when the problem was very
serious and she would like to leave her husband and stay with her parents, or to divorce.
Another barrier to involving her own family was that they wanted to ‘save face’ for her husband.
Women in both IDI and FGDs shared that they were afraid that if they told their parents or other
members in her family about the violence, people in her family would ‘hate’ or ‘dislike’ her
husband. This notion may derive from the traditional perception that the wife should make her
0.0
0.1
0.1
1.0
1.1
1.6
2.2
4.4
6.3
10.7
15.0
42.9
49.6
0 20 40 60 80 100
Counsellor
Priest/Religious leader
Other
Doctor/health worker
Ngo/women’s organization
Local leader
Police
Uncle or aunt
Children
Neighbours
Friends
Family members
No one
Percentage of women who experienced physical and/or sexual violence

97
husband proud as in Vietnamese folklore: “A man gets rich by his friend and gets pride by his
wife” (Giàu vì bạn, Sang vì vợ).
You know what, my family is far away. Everyone here already knew my case so I am fed
up of hiding and continuing to endure. However, I covered up from my brothers and sisters.
– IDI22, women aged 47
When the woman’s family members and relatives lived nearby such as in the same commune,
the women would talk to these members to ask for support. In this case, they often talked to a
brother rather than a sister. With brothers it was possible for them to talk to their husband or
intervene in the situations of violence. However, revealing the violence to the women’s family
members, especially parents, was only considered by women when the violence was known by
other people, when it had lasted for long time, got worse or could lead to ending of the marriage.
In ethnicities that follow matrilineal inheritance such as Cham and Khmer, help-seeking responses
were different. These women would first tell their own parents because the couple often lived with
or near the woman’s family. Their house, if they live in their own house was often given by the
woman’s parents or was bought/built with financial support of the women’s parents. In these
cases, the woman’s parents then talked to the man and if necessary, they would bring the couple
to the man’s family to talk to his parents. In cases of serious violence, or if the couple wanted to
get divorce, the woman’s parents would talk to the religious leader in their commune to ask for
advice and also bring the couple to the religion leader for advice. In almost all cases, family
members and religious leaders would talk to both the man and woman to educate them in
behaviour change. It was expected that counselling would include convincing the couple to
continue their relationship/marriage.
Forms of violence also influenced women’s reporting. Women would feel more comfortable asking
other people for help if they suffered from physical and emotional violence. Women would not feel
comfortable asking for help for sexual violence, they believed it was a private matter and was not
proper to speak with others about it.
In addition, the women in the qualitative research also believed that other people would not be
able to help her and she was the only one could deal with the situation. This is not just the women’s
opinion. In-depth interviews and group discussions showed that this perception was shared by
others. People who took part in the study said that they did not expect any woman to tell them
about sexual violence such as forcing the woman to have sex, even if the woman is their family
member, friend or neighbour. These research participants did not know what to do to help a sexual
violence survivor and therefore they would be very hesitant to hear about these experiences.
Many people saw sexual violence as a couple’s problem rather than violence towards the woman.
They felt sorry for the man and assumed his sexual demand could not be satisfied by his wife.
Thus, common advice if they were asked to help the woman was that the woman should try to
satisfy sexual demand of her husband. They also advised the woman to have medical check-up
to see if they have any health problem or to take better care of herself including eating well and
increased sleep. They suspected that health or physical problems may be the reason that
prevented the woman from meeting her husband’s sexual demand. They would consider the issue
as ‘violence’ only when the husband’s sexual demand seemed abnormal or when there was other
serious physical violence during the sexual violence or when it caused other serious physical

98
injuries to the women, or negative consequences to the children. In these cases, they would
support the women to report the violence and even to leave the relationship.
Men in commune, even if they are neighbours or in official position to support women were very
much hesitated to help in the case of sexual violence. They were afraid that the husband would
accuse them as having special relationship with the woman.
There was little difference nationally in women’s willingness to talk about their experiences (Figure
77). Across Viet Nam, in all regions, around half of the women who experienced violence had not
told anyone. Women in rural areas were slightly less likely to have told no one (48.5 per cent) as
compared with women in urban areas (52.5 per cent).
Figure 77: Percentage of women who told no one about the violence, among women who experienced physical and/or sexual violence by a husband/partner, Viet Nam 2019 (N=1,791)
10.2. Agencies or authorities to which women turn for support
Women who had experienced physical and/or sexual violence by a husband/partner were asked
whether they had ever gone to a formal service or people in authority for help. The options were
asked one by one and included police, hospital, religious leaders, women’s organizations or social
services.
Most women (90.4 per cent) who experienced physical and/or sexual violence by a
husband/partner did not seek help from a formal service. Those who did seek help most often
went to the police (4.8 per cent among all women who experience physical and/or sexual violence
by a husband/partner), local leaders (3.6 per cent), hospital or health professional (2.3 per cent),
court or legal centre (2.3 per cent), or a women’s organization (2.3 per cent). Less than 1 per cent
mentioned seeking help from a shelter.
Even if the numbers seeking help were small (185 women out of 1,791 who experienced physical
and/or sexual violence by a husband/partner, most women were satisfied with the help they
received from these formal services. Almost all women seeking help from a health care
professional were satisfied (95.7 per cent), three quarters satisfied with help from women’s
49.6 52.5 48.5 51.843.9
55.046.7
55.847.6
0
20
40
60
80
100
Total Urban Rural NorthernMidlands
andMountains
Red RiverDelta
North andSouth
CentralCoast
CentralHighlands
Southeast MekongRiver Delta
Percentage of women who experienced physical and/or sexual violence by a husband/partner

99
organizations (78.2 per cent) and local leaders (75.2 per cent), and two thirds satisfied with the
help provided by the police (67.2 per cent).
As we identified earlier in this report, a majority of women do not tell anyone about their
husband/partner’s violence towards them, and if they do, it will most likely be a family member.
To better understand what motivates women to seek help we asked those who did report to formal
services to explain why they called on that service. The main reasons were related to the severity
and impact of the violence. Two thirds (69.7 per cent) mentioned they could not endure the
violence anymore, and one quarter were afraid of further violence (26.5 per cent).
Box 3: Seeking help from shelters
Formal domestic violence services and shelters are relatively new in Viet Nam. The first shelter was established in 2007. Information about the shelters has not been widely communicated and access is limited. Additional barriers to using shelters include the inability of some women to take their children from their home with them or sometime the cases that shelters are under capacity to receive them with children. However, a number of shelters provided support women with their children; and women would face shame and stigma when they returned home if it became known that they had been staying in a shelter
The questions on help-seeking were asked of all 1,791 women who ever experienced physical and/or sexual violence by a husband/partner, no matter how long ago the violence occurred. It can be expected that many of these women experienced violence before there were shelters and specific services for women survivors of violence.
To put it in perspective, a small portion of women (8.9 per cent or 381 women) experienced physical and/or sexual violence in the last 12 months preceding the survey, and only 75 women said they were injured as a result of the violence in the last 12 months, of which 21 needed health care. As discussed in the results, women were more likely to seek help when they were injured or felt they could no longer endure the violence.
With these small numbers, it is not surprising that only a small proportion of women sought assistance from a shelter in the 2019 survey results.
Women who experienced physical and/or sexual violence by a husband/partner but had not gone
for help were asked for the reasons why they did not seek help. Multiple answers were possible.
Most commonly women who did not seek help perceived the violence as normal or not serious
(48.4 per cent, Table 9.5 in Annex VIII) and therefore did not think it was appropriate to seek help.
The stigma associated with violence was the next most common reason why women did not seek
help. Women believed it would bring a bad name to the family (35.8 per cent) or they were
embarrassed/ashamed/afraid she would not be believed (20.2 per cent).
The qualitative research supported the quantitative results and provided examples to explain why
women did not seek help. Women who were violence survivors were not in favour of reporting
violence to formal agencies at the local area. Women, who took part in the study, both those with
known and unknown violence status, criticized women survivors who reported violence. They
believe that reporting violence is possible but under certain conditions. For example, they believe
a woman should report only in serious violence situations or when she cannot endure the violence
any longer. A woman who reported every time she suffered from violence would not be considered
a good woman. This point of view was explained in relation to the notion that women should “give
in” and endure (nhịn) violence by her husband or long-term partner. Women, including violence

100
survivors, saw “enduring” (nhịn) an important quality of women. They believed a good woman
should endure for the sake of the family and the reputation of her husband.
When women decide to report violence and ask for support, they would be more likely to turn to
police. One reason for reporting to police was if she knew that violence by a husband/partner
violated the law and therefore reporting to police would help claim justice for her.
Some women sought help from the police when they could not stop the violence and also saw
that there was no one in his family that she could rely on for support. They would report to local
authority if they decided to get divorced or if the violence was very serious.
It seemed that women were likely to report if this was supported by other people in the family. For
example, one woman reported to police and even asked the police to detain her husband when
her son insisted, she do so.
Several violence survivors in the study shared that they stopped reporting to the police when they
saw that the police failed to intervene with their husband, or they intervened but did not have
success. Women expected police to have solutions for their husband and intervention to change
his behaviour. Moreover, the women complained about paying a fine for reporting violence.
According to the law, people committed violence have to pay an administrative fine. However, in
practice, it was the women, rather than the men, who paid the fine. Thus, after several times of
reporting, the women would not report except in very serious or emergency cases.
Some women also shared that they did not report to the police because they were afraid that their
husband may have to pay fine or would be punished.
I thought that we were already living together as husband and wife. If I report and he might
be arrested and beaten. The police may beat my husband. He may get sick and then I
must take care of him. I have to take care of myself, and if it is the case, I would have to
take care of him. Therefore, I keep silent. – IDI18, woman aged 38
Women also thought that it would be difficult for women from the Women’s Union to intervene
with her husband.
I know my husband. He is very stubborn, even like crazy. Sometimes he would say bad
words. I’m afraid that if people from the Women’s Union came he would talk badly to
them and make them offended. I don’t want that. Thus, I would rather call the police
directly. – IDI15, woman aged 37
Moreover, it seemed that Women’s Unions at the research sites did not have strong relationships
with local women and were not active in GBV prevention or response. Several women, especially
younger women, who took part in the study were not sure if they were member of Women’s Union.
These women did not know much about the local Women’s Union leader and meetings. Women
with disabilities, especially, said that they were not member of Women’s Union because they were
not ‘allowed’ to join. Women with disabilities only joined associations of people with disabilities
that may not be available at commune level.
Some women continued their life and suffered the violence without reporting because they
believed that having that violent husband was their fate. They may believe their fate is related to

101
something they did in a previous life. Thus, living with the current suffering is a way for them to
pay back their karma.
The qualitative study also asked specific questions about seeking help through a shelter. Most
interviewed women did not know about shelters. In one of the interview communes, there was a
commune crisis shelter. However, the shelter was new and there was almost no communication
about the shelter in the local area. Except for some local officers, no one in that locality knows
about the commune shelter. People also did not have information about shelter at the province or
at national level.
Understanding women’s help-seeking for violence
As discussed in this section, women who live with violence tend to wait many years before seeking external help. There are multiple reasons for this such as, women believing that it is her duty to endure the violence and keep the family together, fear for the name of the family, fearing the violence will get worse if they seek help, experiencing low self-esteem because of the violence, self-blame and shame believing that the violence is their fault, they also fear that no one will believe them.
It is often the case that the first time women seek help the person they speak to may (unintentionally) blame her by asking questions about ‘why’ her husband/partner is violent. Support people may also excuse him, minimize the experience and may try to convince her that the violence is normal. This type of response is common from family and friends. It is also common from formal services such as health practitioners and police who are not trained to support victims of violence.
When a victim/survivor receives a response, which minimizes her experience or further blames her, she is unlikely to ask for assistance again, or not until the violence becomes much worse or when her children are suffering too much.
10.3. Leaving home due to the violence
Just under one in five (19.3 per cent) women who experienced violence by a husband/partner left
home at least once, due to that violence. Rates are almost the same in urban and rural areas (see
Table 9.6 in Annex VIII). Almost half (45.7 per cent) of those women left home once, over one
third (38.9 per cent) left home two to five times and the remaining 15.3 per cent left more than
five times.
The qualitative research revealed that although the violence is often severe, including serious and
life-threatening physical injuries, many women stayed in abusive relationship. The cycle of
violence76 (an episode of violence, then an apology and promise not to do it again, followed by a
period of calm in the relationship before building up to another violent episode) is typically
presented in women’s narrative as reason for them to stay – ‘he promised not to do it again’.
Some women in the qualitative component of the study were separated at the time of interview,
but they had separated after many years of serious violence.
Women who left home stayed away an average of 20 days. The number of days was higher in
urban areas (25 days) compared with rural areas (18 days). Most women who left went to stay
with her own relatives (61.4 per cent of women who left) while one in ten went to their friends or
neighbours (11.4 per cent) and a similar proportion went to their partner’s relatives (10.1 per cent).
No woman had mentioned that she had stayed overnight in a shelter.
76 http://www.center4research.org/cycle-domestic-violence/

102
The main reason given for leaving home was that they could not endure the violence any longer
(mentioned by 65.2 per cent of women who left). The second most common reason, mentioned
by nearly two fifths of women (19.2 per cent), was being thrown out of the home.
Of those who did not leave home, reasons for staying included not wanting to leave their children
(38.0 per cent), they considered the violence normal or not serious (36.8 per cent), and/or did not
want to bring shame onto their family (25.8 per cent).
Women often returned home after leaving and common reasons given for returning home
included: not wanting to leave their children (50.4 per cent), the partner asking her to return (26.0
per cent), and/or she forgave him (25.5 per cent).
10.4. Fighting back
Women who had experienced physical violence by a husband/partner were asked if they had ever
fought back. Most women (80.8 per cent) who experienced physical violence by a
husband/partner mentioned that they had never fought back. Women who did fight back mostly
did so once (8.9 per cent of women experiencing physical violence), or only a few times (7.4 per
cent). Few women fought back many times (2.7 per cent). Of those women who did fight back,
one third (30.5 per cent) indicated that the violence became less as a result of fighting back, and
one quarter of the women (26.3 per cent) said the violence stopped. Nearly one fifth of the women
who fought back (17.6 per cent) said the violence became worse.
Qualitative interviews and FGDs also found that fighting back was not common and not supported
by community members, including the women. When victim survivors were asked about fighting
back, they would say that they did not fight back because the perpetrators were ‘men’ and they
were women – implying they were weaker than the men. However, even in cases where women
were physical stronger than their husbands, the women would not fight back thereby indicating
that social norms also prevent women from fighting back.
There was some variation about perceptions of fighting back expressed among ethnic minority
women. They sometimes claimed they were different in comparison with Kinh people and this
flowed through to a willingness to fight back.
Yes, some people fought back but not me. We are not the same with Kinh people. We did not dare to fight back. The ethnic minority people did not dare to fight back. – IDI5, woman aged 54, Nung ethnicity
10.5. Women’s own descriptions of their coping strategies
The results of both the quantitative and qualitative research shows that Vietnamese women are
reluctant to seek any form of help for violence by a husband/partner. To understand this further,
the qualitative study explored ways women cope with the violence in the absence of any external
support.
All interviewed violence survivors in the qualitative study had a long experience of suffering. Most
of them had been in an abusive relationship for many years. Women who divorced did so after
many years of suffering. Depending on the form and severity of violence, women used different
strategies to cope. Their strategies within the relationship may range from enduring (nhịn),
avoiding, convincing and challenging. When the violence was not able to be endured any longer,
reporting and asking for help from others and getting divorced were the strategies implemented.
The use of these strategies was not only to reduce the risk of violence and ensure physical safety

103
for the women and children but many times, the women also used these strategies to ensure
social and financial security for herself and the children or for the family in general.
Each of these methods of coping are further explored below.
Enduring (nhịn, nhịn nhục)
‘Enduring’ (nhịn) when the man was in hot temper. The women employed this strategy as they
learned from their experiences that “the more we talk the more the husband gets angry” (Càng
nói thì chồng càng nóng tính hơn thôi). Many women used this as a first-hand strategy before
they resourced other approaches, other women used it as the last strategy when they saw other
strategies did not work, or it was their only way of coping. An endurance strategy was also popular
among women who identified this as a key to happiness in the family, but did not mention violence.
Sometimes the word ‘nhịn’ (endure) was mentioned as ‘nhịn nhục’ to imply the sense of being
subordinated, suppressed and humiliated. The woman accepted to endure and to stay in
suppression to keep her and the children safe from violence or at least reduce violence.
My family is far away. As I married a husband from far location, I have to
endure him. How can I get angry? – (IDI14, woman aged 56, rural
I say this to other women, “If you feel like you still can endure then endure, otherwise find a way to live for yourself. We should not be so afraid of the stigma of leaving husbands that we bury ourselves in a prison.” IDI 27, woman aged 43
Many women accepted to endure their situation and stay in the abusive marriage for the sake of
their children.
Even if I got angry, I could not do anything. I should think of my children. If I
tried to show my attitude, the children would suffer. So, I should take
everything easy. I have been living in this situation for many years. I had
four children already. If I tried to make changes or assert myself the children
would live either with only mother or father, then they may become naughty.
I am a woman; I should endure to live. – IDI 33, woman aged 49, rural.
Enduring could be used by the women as either a long-term or temporary strategy. For example,
in a fishing commune, where the men went fishing for several week and were only back near the
end of each month. The returning of the husband could trigger violence, but this was also the time
that he brought money home. Women in this commune shared that they would think and act
carefully, enduring situations of violence to ensure that they could hold the money.
Avoiding risky moments or actively reducing the risk
Women living with violence for a long time could identify moments that they could be at higher
risk of violence by a husband/partner, including his demands for sex. In most of these cases
women described this occurring after the husband/partner drank and became drunk. Anticipating
these situations, women would go out and stay with neighbours until he sleeps, or they may do
an activity where they are out of his eyesight.

104
I would pretend to do something to pass that time. I would not come near him
and wait till he falls asleep, deeply snoring then I would come into the room.
– IDI 22, 47 years old, rural
My son told me that I should not talk because if I spoke, I would be beaten.
If he scolds me, I would go to other houses, houses of brothers, sisters or
relatives in the village. My neighbours said that my husband is still angry so
I should stay there and come home only when he is sober. My son said that
when my husband talks, I should keep silent. He said dad is in a hot temper
and would hurt me. – IDI5, woman age 54, Nung ethnicity
Many violence survivors in the study said that their husband often committed violence after
drinking. Another self-protection strategy includes women reducing access to alcohol or their
husbands’ alcohol consumption. For example, a woman intended to give her husband less
alcohol.
I cook alcohol. Before I did not aware of it so I gave him a full bottle of wine. However, my son told me that I should give him only little. Thus, now I provided him much less, so he did not get drunk much. – IDI5, woman age 54, Nung ethnicity
Talking sweet, supporting husband and finding opportunities to convince husband not to
use violence
Women often expressed frustration and sadness during the interviews when talking about their
husbands and the violence that they suffered. However, in most of the cases, the research team
also heard that the women often tried to maintain good care for their husband such as cooking
for him, taking care of him when he was sick or had an accident, became drunk, needed to spend
money for his business, or paying for his financial losses and gambling debts. This could be a
combined strategy to keep herself sweet with the husband, and to ensure a positive image and
position in the family and in the commune. This could give her credibility when she wanted to
report the violence or ask for help. One woman said:
No matter what, we as women should always give our husband proper food
and care…I often gave in. I kept silence and left for a while. I came back home
then, if he is quiet, I would cook proper meals for him and initiate conversation
with him in sweet voice so he would not be able to blame me. – IDI15, woman
aged 37, rural
In other situations, women would try to find opportunities to talk with her husband and convince
him not to use violence. These women avoided critical moments when they might be at risk of
violence (as described above) and waited till the husband was calmer to have the conversation.
When he beats me or we have quarrels, I would not say anything. I just went
into another chamber. My husband said that when he was drunk, I should not
say any word and wait until he got sober. He said, “I have hot temper, if so
do you, it might lead to quarrel or fighting.” If we continued talking, we would
end in quarrels and fight. – IDI19, woman, aged 33, rural

105
Being in ‘standby mode’ to avoid violence
In some situations, where violence was regular and the woman could not find support, she would
set herself in ‘standby mode’ so she could be ready to respond to the violence any time.
I’m very quick. My mind and my reaction are always fast and ready. He could
hit me only twice when I was 25 or 26 years old. It was when I dared to stand
in front of him to challenge him and to see if he would dare to do anything to
me. Then he hit me. One time it was a slap and the other time was several
punches. That’s all. He would never be able to hit me up front. If he hit me, I
would push it away and he would fall …He is not weak. He is small but tight.
He is also very fast but I’m faster. I’m fast and strong. – IDI22, woman aged
46, rural
Talking back/challenging the husband
Though keeping silent and enduring were common, some women also said that they would
‘endure’ only in certain situations. If the intention to violence developed, the women may talk back
to show her disapproval and challenge her husband. For example, the same woman quoted in
‘taking sweet’ above would challenge her husband if she saw that the ‘talking sweet’ strategy did
not work, and her husband continued being aggressive.
If he refrained from talking or from being aggressive then I gave in [not
challenge him, accept the situation]. However, if he continued talking or using
bad words to insult me and my family then I felt obligated to talk back. – IDI15,
woman aged 37, rural
Normalizing violence
In some situations, the women would normalize the violence suffered as acceptable in marriage
and as something that happens to every married woman. Normalization helped women to live
with violence without feeling shame of her situation but also prevented her from reporting and
asking for help.
I have never reported to the police or local authority. Everyone suffers from
this so I would not report my situation. I know that every woman in this
meeting is beaten by their husband, but no one talks about it. No one would
feel embarrassed because everyone is the same. – IDI5, woman aged 54,
rural
Accepting violence as fate or bad luck
When a woman found that she could not do anything to deal with the violence by her husband
and could not turn to anyone for help, sometimes she would look at it as her fate. Though this
thought did not help eliminate violence, it helped the woman to live with the situation.
After I built the house, I went to the fortune teller and was told that I should
worship Guan Yin in order to stop violence from my husband. I should pray
Guan Yin a lot to reduce the violence. I followed the advice and worshipped
Guan Yin. – IDI22, woman aged 46, rural

106
I think that it is someone’s bad luck to marry to a husband who is violent. Who
else wants to get marriage twice? Thus, I would give in to keep calm in the
family. – IDI15, woman aged 37, rural
Divorce
Though not popular, some women in the research used divorce to escape violence. These cases
were few among the group of women who suffered violence thus it is difficult to make any
conclusions about how and when women make this decision. What we can say about this small
group is that all of them were economically independent, and their divorce was supported by their
children and/or their parents. One woman in the research shared that it was her eldest son who
initiated the idea of divorce and very much encouraged her to make that decision. The divorced
cases in the research included severe violence. However, it was not only cases of physical but
also emotional violence and controlling behaviours. None of these women regretted their decision.
They experienced happier lives after divorce.
10.6. Women’s opinions on factors that protect against violence by a
husband/partner
Qualitative in-depth interviews and group discussions identified several protective factors that
could be explored further in future studies.
Children grow up, protect their mothers and do not support violence
Adult children of violence survivors can help protect the women against violence by a
husband/partner. Adult sons can directly intervene to stop their fathers from beating their
mothers. In addition, as mentioned in a previous section, adult children can be allies of mothers
to give her physical and mental support in making important decisions to cope with violence,
including options for separation and divorce.
Adult daughters have some power to request fathers not to be violence as it may reflect badly
on the family and make it difficult for the daughters to find husbands. Marriage is very important
in Viet Nam and rumours of violence in the family may reduce the marriage opportunities for
young women.
His violence reduced when the children grew up. – IDI14, woman aged 56,
rural
Our daughter got married to a man in Binh Dinh. However, she came back
to stay with us for almost a year now. Since the day she came back here,
the violence reduced. – IDI32, woman aged 47, disabled, rural
The man getting older
In several cases women spoke about violence by a husband/partner reducing as he aged. This
is also one reason women stayed in their marriage. By the time their children were grown, and
she might consider leaving, her husband will be older and may be reducing his use of violence.

107
Ageing as a protective factor is difficult to interpret. It could be an independent influential factor
of violence in that men may be weaker or less aggressive due to mental and physical changes.
Ageing could also be a confounding factor coinciding with the time children become adults and
more independent.
The woman fought back
Women fighting back was not common and not supported by most of the community women
including violence survivors. However, interviews and group discussions did reveal several
cases where fighting prevented further violence.
When seeing the husband brought alcohol home, the wife took the rod. Thus,
the husband stood still and did not dare to do anything.
– FGD23, women under 30 years old, Cham ethnicity
This woman is living next to me. Her husband beats her a lot. However, later,
I don’t know why but she seemed less afraid of him. When her husband beat
her, she got the rod and beat him back. Then I could see that the violence is
less now. – FGD14, women older than 30 years old, rural
Women reported and received appropriate responses from local authorities
Discussions with people from local authorities showed that they could help the women in both the
long-term and/or intervene timely and effectively if the women reported the case. Interviews with
violence survivors showed that proper responses from local authority such as the police could be
very effective in changing behaviours of the men.
In 2013, he did something wrong and was fined by the police. Since then, he did not dare to repeat this act anymore. Just being ignored, he threw mobile phone to the wall, or damaged chairs. After I asked the police to come and arrest him, he changed a lot. Drinking also reduced. [Before this,] he got into two motor bike accidents when driving after drinking. - IDI25, woman aged 54, rural
The couple has good communication with each other
Interviews and group discussions with women who considered themselves having a happy family
remarked that equal, respectful relationship and good communication are important in preventing
violence.
It is because I know how to behave and to communicate. For example, if the
husband is wrong, I could give in a bit. It does not matter. We may be also
wrong sometimes. Just give in and the most important thing is to understand
each other. If we do not understand each other, we would quarrel all the
times. – IDI9, woman aged 38, Cham ethnicity
We would discuss together. If we agree or not agree we should say so. –
IDI9, woman aged 38, Cham ethnicity
Support of family

108
Some women acknowledged support of their family in responding to violence. The women’s family
did not often intervene in the violence. However, they could provide physical, emotional, financial
and other support for the women and their children at a distance from the violence. This is often
a family response to help a woman when they believe they can not intervene in the violence.
For example, when I do not have money, I can borrow it from my parents. I
could sometimes leave my children with them for caring so I could get out and
walk for a short time. And as my husband does not have any reaction (say
nothing) with my parents, I keep living as it is for a while. – IDI15, woman
aged 37, rural

109
11. Economic costs of violence against women in Viet Nam
Key findings from this chapter
● Physical and/or sexual violence imposes a range of costs on Vietnamese
households and the overall economy, undermining the economic security and well-
being of women and their families.
● Women experiencing physical and/or sexual violence in the past 12 months spent, on average, 9426.5 ('000 VNDs) as a direct result of the violence, which is equivalent to a quarter of their annual income.
● Women experiencing physical and/or sexual violence are likely to have 30.8 per cent reduction in their annual income compared with women not experiencing violence.
● Viet Nam experiences a productivity loss equivalent to 100,507 billion VNDs, which is about to 1.81 per cent of 2018 GDP due to lifetime experience of physical and/or sexual violence among ever-married/partnered women aged 15 to 64 years.
● The productivity loss is at the same level as estimated in 2012 study of costs of violence in Viet Nam – about 1.91 per cent of 2010 GDP.
● Women and households also had indirect income loss via missed days of work by the woman and her husband, as well as missed household care work in the past 12 months– equivalent to national estimate of 974 billion VNDs.
● The costs of physical and/or sexual violence by an intimate partner is a drain on the
productivity of women and has significant consequences to the broad national
economy.
Across countries there is a growing recognition that violence by a husband/partner is not only a
fundamental human rights violation but also has significant health and economic impacts. These
impacts result in significant costs that are often not visible to stakeholders. Estimates of the
costs of violence by husbands/partners are critical to advocate the need to eliminate violence
and also to highlight the economic gains that can be realized by government with a decline in
prevalence rates. A growing number of research studies on the economic costs of violence by
husbands/partners have been undertaken across the world in the last 10 years, and more
recently in Viet Nam (2012), Egypt (2015), Ghana (2019), Pakistan (2019), and South Sudan
(2019). Many of these studies were based on focused surveys on the economic costs of
husband/partner violence and had detailed questions on costs incurred.
A new aspect of the second National Study on Violence against Women in in Viet Nam 2019 is
the addition of questions to explore the economic costs borne by women as a consequence of
experiencing violence by a husband/partner.77 It is the first time that cost questions have been
incorporated into a national survey such as this, representing innovation to advance cost
research. There is an inherent challenge - balancing between asking too many questions (and
increasing duration of the interview) and asking too few questions (and thus gathering
insufficient information). Another challenge is that follow-up questions on costs are relevant only
for a smaller subsample.
77 See Annex IV for the detailed explanation and discussion on the calculation of the costs of partner violence.

110
The economic impacts of husband/partner violence are multiple and range from short term to
medium and long-term impacts. Immediate impacts include physical or mental harm, inability to
do work, paid or unpaid (absenteeism). Medium term to long-term impacts include loss of quality
of life due to chronic pain and suffering, loss of productivity, reduced labour force participation of
women or intergenerational loss such as lower educational achievement for the children of
victims, affecting their future income potential.
This chapter presents the approach and findings from this costing study. The analysis focuses
on the immediate impacts to establish the annual cost incurred by ever- married/partnered
women due to the experience of physical and/or sexual violence in the last 12 months. See
Annex IV for the detailed explanation and discussion on the calculation of the costs of violence
by a husband/partner.
11.1. Methodology
The costing of various impacts of intimate violence by a husband/partner is fairly complex. Data
availability is problematic given women themselves often lack awareness of the economic
impacts of violence. There are also methodological complexities given the lack of methods to
monetize some of the medium and long-term impacts such as deterioration in quality of life due
to violence. It also difficult to distinguish the interaction between the different impacts to produce
a total estimate of the economic costs associated with violence against women and girls. Most
costing studies produce, at best, partial estimates than capture the myriad of impacts.
Given these complexities, the current study has focused on establishing the costs of impacts
that can be monetized, i.e. the focus is on estimating direct and indirect monetary costs
experienced by women and their households, and the national estimates of these costs. The
estimates presented in this report however do not include the cost of provision of services,
which are difficult to establish through a survey of women’s health and their experiences in
accessing services. The estimation of costs of husband/partner violence derived in this report
are based on a validated costing model applied in other country studies on the costs of
husband/partner violence in Egypt, Ghana, Pakistan and South Sudan among others.78
The costs of violence can be broadly divided into two types of costs – direct and indirect.
o Direct costs are simply expenditures that are incurred as direct result of the husband/partner violence experienced. For example, expenditure on health care treatment of injuries is classified as a direct cost of husband/partner violence. Similarly, expenses incurred for legal/court expenses, or replacing and repairing of damaged property, or seeking shelter are classified as direct costs. Indirect costs are secondary costs due to husband/partner violence and do not include a monetary expenditure by the women. For example, women who experience violence miss their paid and unpaid economic work for such reasons as injuries, stress or anxiety. These missed days result in lost income or what is called opportunity cost. Similarly, women who experience violence are often unable to do their unpaid household production and reproduction work79 (together referred to as care work). The missed care work impacts on the welfare of the household, another opportunity cost of the woman and her family. Another indirect cost is
78 See Annex IV for fuller discussion of the formal costing model and its equations. 79 Unpaid household production activities are economic activities that have economic value but are unpaid and
includes tasks such as taking care of livestock, gathering forest produce for consumption, gathering firewood, fetching water and so on. Reproductive labour includes tasks such cooking, cleaning, taking care of children and elders, washing dishes/clothes, and so on.

111
that husbands (who perpetrated the violence) may also miss work leading to further income loss for the household. The key point is that these opportunity costs are invisible to both women and their households and assumed as part of daily life in a social context where husband/partner violence is normalized.
o There is also an overall indirect/opportunity cost for the economy, which captures the reality that women experiencing violence not only miss paid and unpaid work but are also less productive while at work. The overall output of the economy is affected by this productivity loss due to absenteeism as well as lower productivity among women who experience husband/partner violence. This productivity loss due to violence manifests in wage differential between women experiencing and not experiencing violence. The size of the wage differential then represents the opportunity cost for the economy in terms of reduced output.
Table 10: Elements of husband/partner violence cost estimation applied in Viet Nam survey
Costs Elements
Out-of-pocket cost Health care expenses, police fees (formal and informal, including for arrest), shelter, filing cases, costs incurred in courts, replacement costs for property damaged, transport costs
Indirect cost Days lost from paid work by the women and their husbands; days lost in unpaid household production and reproduction (commonly referred to as care work)
Productivity loss for the economy Measured as the income differential between women experiencing violence and those not experiencing violence
In simple terms, the estimation of the costs incurred involved the following steps:
• All women surveyed were asked more detailed questions about their employment and earnings to understand the impacts of costs in relation to their income.
• Women who experienced physical and/or sexual violence and were injured were asked questions about any costs incurred associated with those injuries.
• Women who experienced violence in the last 12 months were asked about their help-seeking from various agencies such as police, courts, health services, women’s organizations, community leaders and the associated expenses incurred.
• Women who experienced violence in the last 12 months were asked if there was any property damage or damage to goods that needed to be replaced and the amount they incurred.
• Women who experienced physical and/ or sexual violence in the last 12 months were asked if they had left their home and sought refuge with parents, siblings, friends, etc. and the expenses incurred as result
• All working women who experienced physical and/or sexual violence in the last 12 months were asked if they missed work as a result, all women experiencing physical and/or sexual violence in the last 12 months were asked if their husbands missed work, and all women experiencing physical and/or sexual violence in the last 12 months were asked if they missed household work, including care work.
11.2. Economic activity and earnings
To understand the economic costs of husband/partner violence for women in Viet Nam, it is
important to have a clear picture of women’s involvement in economic activity. Women were

112
asked if they were working in the preceding 12 months of the survey and if so, in which type of
employment.80 The survey results verify the very high-level participation of women in economic
activity in Viet Nam, a key feature of the Vietnamese economy. More than 85 per cent of women
said they work across urban and rural areas. With respect to type of employment, about 40 per
cent of women are in wage/salaried employment, and which is considerably higher in urban
areas (Figure 78). There is also a distinct difference in the type of self-employment between
rural and urban areas, with self-employment (agriculture) dominant in rural areas.
Figure 78: Distribution of type of employment among all working women, Viet Nam 2019 (N=5,234)
Another important dimension to consider that influences the earnings of women is distribution of
working women by occupation. Despite the high level of participation of women in economic
activity, most women are involved in largely unskilled work (Figure 79).
80 The question on work status (Q 112.1) probed women’s work in recognised categories in the employment law
of the Socialist Republic of Viet Nam. It was a direct question and did not have an opening probing question of do you work.
32.2
56.9
4046.9
8.4
34.7
20.9
34.7
25.3
0
20
40
60
80
100
Rural Urban Total
Waged/salaried Self-employed (Agriculture) Self-employed (Non-agriculture)
Percentage of all working women

113
Figure 79: Distribution of all working women aged 15-64, by occupation, Viet Nam 2019
Based on earnings data from the Labour Force Survey (LFS) and the Viet Nam Household
Livings Standard Survey (VHLSS 2016) we derived monthly and yearly income for each working
woman in the survey.81 One third of women were estimated to earn between 2501-5000 VND,
and one quarter each 1000-2500 VND or 5000-10,000 VND. (Figure 80).
Figure 80: Distribution of monthly earnings (’000 VNDs) of working women aged 15-64, Viet Nam 2019*
81 See the Annex IV for detailed discussion of estimation of monthly earning of working women.
11.316.4
3.5
11.4
57.2
0.20
20
40
60
80
100
Professionals,semi and
skilled
Clerical andSales
Skilled agr,fisheries,mining
Crafts andmachineoperators
Simple labour Others
Percentage of all working women
2.0
12.2
26.034.1
24.8
1.00
20
40
60
80
100
No income Less than 1000 1000 - 2500 2501 - 5000 5001 - 10000 > 10000
Weighted Percentage

114
*A small proportion of women were unpaid family contributing workers and thus had no earning per se.
While only a small proportion have no income (2 per cent), majority of working women (60 per
cent) reported in the survey to earn between 1,000,000 and 5,000,000 VNDs. Nearly 52.1 per
cent of the women are below the average monthly earning of about 3,582,000 VND as per
VHLSS survey (See Annex IV and IVa). Using the same method, husband’s earnings were
estimated. Nearly 58.8 per cent of husbands earned less than the average monthly earning
5,975,000 VND as per the VHLLS survey.82
11.3. Prevalence of violence among working women
To establish the opportunity cost of violence for women experiencing physical and/or sexual
violence, the prevalence of physical and/or sexual violence in the lifetime for working women is
a key variable. Ever-married/partnered working women experienced a lifetime prevalence of 32
per cent and current prevalence of 8.9 per cent for physical and/or sexual violence, compared
with a lifetime prevalence of 27.8 per cent and current prevalence of 8.8 per cent among ever-
married/partnered non-working women.
Working women, whether ever-married/partnered or not, reported lifetime prevalence of 31.1
per cent and current prevalence of 8.1 per cent married/partnered.
Among working women, those self-employed women in agriculture have the highest prevalence
rates of physical and/or sexual violence during both lifetime and in the past 12 months (Figure
81).
Figure 81: Prevalence of physical and/or sexual violence by a husband/partner during lifetime and in the last 12 months, among ever-married/partnered women by employment category Viet Nam 2019
82 Detailed distribution of husband’s earnings is given in Annex IV.
32 31.1 27.436.3
29.9
8.9 8.1 7.7 11 6.7
0
20
40
60
80
100
Ever-partneredwomen
(N=5,555)
Among all workingwomen
(N= 5,234)
Among allwaged/salaried
women(N= 2,177)
Among self-epmployed
(Agriculture)(N= 1,707)
Among self-epmployed (Non-
Agriculture)(N= 1,350)
Lifetime Last 12 monthsPercentage ever-maried/partnered women

115
11.4. Costs incurred due to husband/partner violence
11.4.1. Out-of-pocket expenditures
Out-of-pocket expenditures (OPE) are direct costs incurred by women due to the experience of
violence. OPE reflect the extent to which women pay to access services to mitigate the negative
impacts of husband/partner violence experienced by women. For the estimation of costs, the
analysis is limited to the last 12 months given the difficulty women would have recalling
expenditures over their lifetime. The OPE estimate includes:
● associated costs for health sector, police and judicial services
● cost of replacing or repairing broken durable consumption goods such as furniture, electronics, vehicles and utensils
● costs of leaving home for those women survivors who sought refuge with a shelter, family and/or friends.
Help-seeking from formal services such as health, police, courts, leaders, women’s
organizations was quite low as reported in Chapter 9. Additionally, among those few who sought
assistance, smaller proportions incurred expenditure for health care, legal services or
assistance from local leaders or women’s organizations. In contrast, higher proportions of
women had expenditures associated with repairing/replacing damaged goods and leaving home
in the last 12 months due to physical and/or sexual violence. Overall, the weighted annual
average out-of-pocket expenditure across all women who had expenditures came to 9426.5
(’000 VNDs) or about 25.5 per cent of the annual income of the women who incurred expenses
due to experiences of physical and/or sexual violence (Figure 82).83
Figure 82: Average annual out of pocket expenditure by women experiencing physical and/or sexual violence by a husband/partner in the last 12 months, Viet Nam, 2019
Note: See Annex IV for further information about calculation of these figures.
83 See Annex IV for more detailed information on the calculation of income of IPV survivors is provided.
2705.5
9514.2
5988.6
688.9
9426.5
0100020003000400050006000700080009000
10000
Health cost(N=14)
Propertyreplacement
(N=101)
Leaving home(N=115)
Accessed otherservices (N=7)
Avg WeightedExpenditure
(N=179)
Average Annual Expenditure (000VNDs)

116
11.4.2. Indirect/opportunity cost: missed work and care work
Experiences of violent incidents may result in injuries but also absenteeism from work due to
either physical or mental harm, time to access services or time to deal with impact on children
and other family members. Additionally, violence impacts women’s ability to do unpaid
household and care work. Women also said that their husbands miss work due to the violence
they have perpetrated. Research has shown that the act of perpetration of violence has impacts
on the perpetrator often leaving the house or not going to work.84 In the 2012 Viet Nam cost of
violence study,85 the same question was asked of women, and they said that on average men
missed 6 days in past 12 months (Figure 83).
Figure 83: Proportion of ever-married/partnered women experiencing physical and/or sexual violence by a husband/partner in the last 12 months and missing work (including care work) due to physical and/or sexual violence, and mean number of days missed, Viet Nam 2019
Approximately 12 per cent of working women who experienced physical and/or sexual violence
missed work on average for about 8 days (Figure 83). An additional 7 per cent of all women who
experienced physical and/or sexual violence in the last 12 months missed care work for about 8
days. A slightly larger proportion (9.7 per cent) of women experiencing violence in the last 12
months said that their husbands missed work on average for 6 days. In the appended technical
report, a more detailed analysis indicates there is a variation of missed work by different types
of employment. Women in agricultural self-employment missed nearly 10 days on average
compared with 3.6 days for those self-employed non-agriculture industries. This suggests there
is a need to further explore the differentiated impacts of violence on women in different
categories of employment and sectors to understand the impact on economy.
84 This is a finding confirmed in other studies – for example in Ghana 2019 study women reported that husbands
missed about 4 days (Asante, et al, 2019). In Egypt study it was estimated that women’s partners missed equivalent of 200,000 days in a year (Duvvury, et al, 2015). 85 Duvvury, N., Nguyen, H.M., & Carney, P. 2012. Estimating the Costs of Domestic Violence Against Women in
Viet Nam, UnWomen Viet Nam.
12
0710
08 08
06
00
01
02
03
04
05
06
07
08
09
0
10
20
30
40
50
Missed work(N=53)
Missed care work(N=54)
Missed work of husband(N=45)
Propotion of IPV survivors Means/day work missed
Percentage of women experiencingphysical and/or sexual violence in last 12 monthsand missing work
Mean days ofwork missed

117
11.4.3. Productivity loss for the economy
An important dimension of economic costing of violence is the productivity loss due to
experience of violence by an intimate partner. As previously highlighted women experiencing
physical and/or sexual violence also said that they had poorer health status and more problems
in terms of concentration or disruption in the workplace.
The data collected indicates that violence interrupted women’s work (11.9 per cent), affected
their concentration at work (14.7 per cent), required them to take time-off due to sickness (5.7
per cent) and 1.9 per cent said they lost self-confidence (Figure 84). These together point to the
fact that productivity loss could be quite significant.
Figure 84: Proportion of ever-married/partnered women experiencing physical and/or sexual violence by a husband/partner in their lifetime, and impact on their work (N= 1,791), Viet Nam, 2019*
*Total does not equal to 100 as multiple responses were possible
As discussed in the methodology these impacts of the violence continue to affect women over
their lifetime and are often reflected in their earnings. A simple analysis of working women’s
earnings indicates that those who experienced violence had lower earnings than those without
violence (Table 11).
5.1
1.9
5.7
11.9
14.7
72.2
0 20 40 60 80
Not applicable/ not working
Lost confidence in own ability
Unable to work/ sick leave
Partner disrupted work
Unable to concentrate
Work not disrupted
Percentage of ever-married/partnered women who experienced physical and/or sexual violence in their lifetime

118
Table 11: Average earnings of ever-married/partnered working women by their experience of violence by a husband/partner, Viet Nam 2019
Number of women (unweighted)
Average Monthly Earnings (‘000 VNDs)
Average Yearly Earnings (‘000 VNDs)
Total number of ever-married/partnered working women
5 055 3 582.8 39 736.9
Not experienced any violence by a husband/partner 3 403 3 711.4 41 046.3
Ever experienced physical and/or sexual violence by a husband/partner
1 652 3 315.3 37 015.0
Difference (women with no violence – women with violence)
396.1 4 031.3
P-Value* 0.000015 0.000255
Other variables that influence wages need to be controlled for to ensure that the difference is
indeed explained by the experience of violence. To test whether the experience of violence
accounts for the difference in earnings, statistical analysis was undertaken to test the level of
influence of violence on overall annual income of all working women. The method of estimation
and the regression models used are explained in the appended technical report.
The results indicate that the experience of physical and/or sexual violence at least once in a
lifetime results in a decline in annual earnings by almost 31.1 per cent compared with women
not experiencing violence. Applying this difference in earnings to the total number of working
women in Viet Nam estimates the total productivity loss for the overall economy as 1.81 per
cent of GDP in 2019 (Table 12).
Table 12: Overall estimate of productivity loss of working women due to lifetime experience of physical and/or sexual violence by a husband/partner, Viet Nam 2019
(a) Number of
women working
aged 15-64, 2019
Count
(b) Prevalence of
lifetime physical and/or sexual
violence among
working women, 2019
(c) Estimated number of
working women facing
violence (a * b)
Count
(d) Average yearly
income of working
women with no husband/
partner violence
’000 VNDs
(e) Estimated 30.8%a
reduction in income for
women experiencing
husband/ partner violence
’000 VNDs
(f) Total Productivity
Loss for all working women
experiencing physical and/or sexual violence
(c * e)
billion VNDs
% 2018 GDP*
25,562,975 31.1% 7,950,085 41,046.3 12,642.3 100,507 1.81%
a Estimated by authors (see Appended Technical Report for estimation details)
*2018 preliminary GDP 5,542,332 billion VNDs
The total productivity loss due to the physical and/or sexual violence comes to 100,507 billion
VDS, which is equivalent to 1.81 per cent of the 2018 GDP.86 In other words, the 1.81 per cent
86 Viet Nam GDP figures have been revised upward by about 25 per cent between 2010 and 2017 to account for
a higher rate of annual growth in this period. There is no final revised GDP figure available 2018, but if we

119
of GDP represents the invisible loss to the economy, and or in the scenario of no violence,
the gain in output that could be realized.
11.5. National estimates of costs for Viet Nam economy
National estimates of the out-of-pocket expenditures and the opportunity costs of missed
workdays can be derived using the national population of women in 2018, the national
prevalence rate for current physical and/or sexual violence, the proportion of women survivors
incurring expenditure, and the mean expenditure.
Table 13: National estimate out-of-pocket expenditures in the past 12 months, Viet Nam 2019
Cost Category Number of women
reporting health costs (Weighted)
Count
Average cost of a women
incurring cost
‘000 VNDs
National estimate
number of women exp violence and
incurring costa
Count
National estimate of costs
(‘000 VNDs)
Health costs outpatient 11 1 119.3 62 881 70 385 725
Health costs inpatient 5 5 240.2 27 035 141 668 715
Other services 7 688.9 36 054 24 838 275
Replacement of property 101 9 514.2 554 439 5 275 065 816
Cost of leaving home 115 5 988.6 631 201 3 799 999 837
Total OPE 22 551.2 9 291 958 368
Note: The estimates for health cost and other services should be interpreted with great caution, given the small sample size. a Estimation by authors (see Technical Report for details)
The total estimate of out-of-pocket expenditure comes to 9,292 billion VNDS in 2018 (or about
0.1667 per cent of GDP). If the health cost and other services cost is excluded, the overall
expenditure come to 9,075 billion VND (which represents costs for replacement of property and
leaving home; note that this is 10 times the expenditure for services).
Following similar method of extrapolation, the national estimate of income loss due to
experience of physical and/or sexual violence comes to total of 974.9 billion VNDs. (Figure 85).
assume actual GDP is 25 per cent higher than the preliminary GPD figure for 2018, then it would be 6,927,915 billion VNDS and the productivity loss would come to 1.45 per cent of GDP.

120
Figure 85: National estimate of loss of income for ever-married/partnered working women due to experience of physical and/or sexual violence in the last 12 months, Viet Nam 2019 (billion VNDs)
If we consider the visible costs (out-of-pocket expenditure and absenteeism) and the invisible
costs (the productivity loss), the total loss to the economy stands at 2.0 per cent of GDP (Table
14). The productivity loss, which is often not immediately visible, is the largest component of the
total cost. This scale of loss highlights emphatically the detrimental impact of physical and
sexual violence for the overall economic well-being of women and their families in Viet Nam. For
the government, this cost estimate indicates the size of the fiscal space that is potentially
available if husband/partner violence prevalence is reduced through comprehensive set of
prevention interventions.
Table 14: National estimate of costs for the Viet Nam economy in the past 12 months, Viet Nam 2019, by cost category
Billion VNDs % of GDP
Out-of-Pocket Expenditures 9292 0.1667
Foregone Income 975.7 0.0176
Productivity Loss 100507 1.81
Total 2.0
11.6. Comparison of results to other studies and with the 2012 costing study in
Viet Nam
The key results of this study are broadly in line with studies conducted in other countries. In
Egypt, Ghana and Pakistan, it was found, as in Viet Nam, few women seek help from formal
services. The national estimate out-of-pocket expenditures (OPE) is as low as in Viet Nam. For
example, in Ghana, OPE amounted to less than 0.031 per cent of 2016 Ghana GDP and, in
Egypt, 0.0032 per cent of 2015 Egypt GDP.
For the women who incur these expenses, the cost is high. In Ghana and Pakistan, the OPE
was equivalent to 10 per cent and 19 per cent of the mean per capita expenditure on non-food
consumption as per their Household Living Standard Survey.
The days missed from work due to experience of physical and/or sexual violence of 8 days in
Viet Nam is similar to countries such as Egypt, Ghana or the United States. Working women
322.2
421.7
231
0
50
100
150
200
250
300
350
400
450
Missed work Missed work of husband Missed care work
Loss of income billion VNDs
121
experiencing violence in the past 12 months missed about 8 days in Egypt (2015), 11 days in
Ghana (2019), and 7 to 10 days in US (2003).
Reduced income in Viet Nam for women experiencing physical and/or or sexual violence is
similar to that of a 2013 Tanzania study, which found that women experiencing physical and/or
sexual violence in the past 12 months earned 29 per cent less per week than women not
experiencing violence. This translated into a productivity loss equivalent to 1.22 per cent of
Tanzania’s 2010 GDP. Broadly, the findings of this study are in line with other recent studies in
the developing world confirming the reliability of the current study estimates.
The findings of this research are not directly comparable to the earlier Viet Nam study in 2012
(economic loss) as the methodology is completely different. The 2012 study explored, in detail,
costs per incident to derive unit costs per incident rather than aggregate costs per woman.
While the scale of national estimates of costs are different, both studies indicate that out-of-
pocket expenditures across different cost categories constitute a sizeable proportion of women’s
income. For example, the average out-of-pocket expenditure in 2012 was 21 per cent of
women’s average monthly income. In 2019, the average out-of-pocket expenditure come to
about 24 per cent of women’s average annual income. If the expenditures by women due to
violence is one quarter of the annual income of women, this is a cause for serious concern.
A difference between 2012 and 2019 findings is that income loss has been measured
differently. The 2019 estimate does not factor in that women experience multiple incidents in the
last 12 months. Both studies estimated overall productivity loss using a similar methodology.
The 2012 study found that experience of violence led to a reduction in earnings by 35 per cent,
and in 2019 it was 30.8 per cent. The overall productivity loss is similar in both studies is broadly
in the same range – 1.78 per cent in 2012 and 1.81 per cent in 2018.87
The key message for policymakers that the costs for women and their household is significant
accounting for approximately one quarter of the annual income of women experiencing
physical and/or sexual violence in the past 12 months, posing a strong threat to their
economic insecurity. Income of households may rise through economic expansion but the
continuation of the high level of physical and/or sexual violence can in fact drain the resources
gained.
The second key message is that productivity loss due to physical and/or sexual violence by a
husband/partner is significant and costly. Husband/partner violence inflicts a constriction on a
country’s economic space through the invisible loss of reduced output.
87 In terms of revised GDP figures, the productivity loss comes to 1.65 per cent in 2010 and 1.45 per cent in 2018.

122
12. Risk factors associated with violence against women by a
husband/partner
Key findings from this chapter
● Among the characteristics of women, significant risk associations were found with
primary schooling compared with no schooling, women’s other experiences with
violence (non-partner physical violence, non-partner sexual violence, unwanted,
forced or coerced first sex and witnessing mother being beaten), and with attitudes
tolerant towards wife beating.
● Among husband/partner characteristics, the higher the educational attainment the
lower the risk of violence. Husband/partner alcohol use, fighting with other men and
extramarital relationships, were significantly associated with violence.
● Intergenerational exposure to violence, the mother of the husband/partner being
abused, and husband/partner abused as child, were also significantly associated
with higher rates of violence.
● At the relational level, women who contributed financially more than their husbands
or partners to the household were at significantly higher risk of violence. In addition,
poverty was significantly associated with higher violence.
This chapter presents the findings from risk-factor analysis to identify the characteristics that may
put women at risk of experiencing violence by a husband/partner. The analysis uses data from
violence experienced in the last 12 months.
12.1. Method used for risk-factor analysis
The framework for this analysis draws on that conducted using the national study on violence
against women in Viet Nam 2010.88 The 2010 study explored 40 factors associated with current
violence by a husband/partner. Such factors included characteristics related to the woman and
her husband/partner that may result in experiencing violence by a husband/partner in the 12
months prior the interview. This analysis explores these same set of characteristics. A multivariate
logistic regression analysis was utilized to identify the risk characteristics. The results of the
analysis are instrumental to inform future decision-making, policy and strategic development
plans related to violence against women in Viet Nam.
Sub-sample for statistical analysis
This analysis uses data from a sub-sample of 4,240 women. The sub-sample consisted of 483
ever-married/partnered women whose current or most recent husband/partner was physically
88 Jansen HAFM, Ng Nguyen TV and Hoang TA. 2016. Exploring risk factors associated with intimate partner violence in Viet Nam: results from a cross-sectional national survey. Int J Public Health; 61:923–34. https://doi.org/10.1007/s00038-016-0879-8.

123
and/or sexually violent towards them in the past 12 months, and 3,757 ever-married/partnered
women who did not mention any physical or sexual violence by a husband/partner in their lifetime
(see shaded boxes, Figure 86).
Only those women whose current or most recent husband/partner was violent were chosen (and
not those who experienced violence by a previous husband/partner only). This was because data
on husband/partner characteristics were collected for the current or most recent husband/partner
only. Thus, the 128 women who experienced physical and/or sexual violence by a previous
husband/partner only were excluded from the analysis. The 1,180 women, who experienced
violence by their current/most recent husband/partner, but not in the 12 months preceding the
survey, were also excluded so that any association was not diluted by violence in the past.
Figure 86: Numbers of women in the survey according to their partnership status and their experience of physical and/or sexual violence by a husband/partner, Viet Nam 2019

124
Variables used in the analysis
Outcome variable: physical and/or sexual violence by a husband/partner in the past 12 months
The outcome variable (also referred to as “dependent variable”) in this analysis is physical and/or
sexual violence by a current/most recent husband/partner. Any acts of physical and/or sexual
violence are included.
Potential risk factors for physical and/or sexual violence
A total of 39 factors were explored in the analysis. One characteristic, whether a woman can rely
on her neighbours help when there is illness in the family, was explored in 2010 but was not asked
in the 2019 survey. Factors included variables relating to the woman and her husband/partner
such as demographic characteristics, past experience with violence, attitudes towards wife
beating (woman), and behaviours (woman’s husband/partner); variables relating to the couple
such as relative socioeconomic status, and household wealth; children (woman); and women’s
social capital. Finally, two geographical variables were also included, region, and urban/rural
location. A list of all the factors explore and subcategories is included in Table 15.
Table 15: Independent variables used for risk factor analysis for current violence by a husband/partner (categories that are underlined are used as the baseline or reference category), Viet Nam 2019
Variables Categories
Woman’s characteristics
Demographic
Age group 15-17, 18-24, 25-29, 30-39, 40-49, 50-64
Education No education, Primary, Secondary, Higher
Current partnership status Currently married, Dating, Separated/divorced, Widowed
Age at first marriage <20, 20-29, 30+, Never-married/cohabited
Ethnic group Kinh, other (non-Kinh)
Religion No religion, any religion
Employment status Not working, salaried paid work, self-employed agriculture, self-employed non-agriculture
Women’s past experience with violence
Physical violence by others since 15 years No, Yes
Sexual violence by others since 15 years No, Yes
Childhood sexual abuse before 15 years No, Yes
Age at first sex <18, 18-21, 22+, Not had sex
Nature of first sexual experience Wanted to have sex, Unwanted/coerced or forced, Not had sex
Woman’s mother beaten by her husband/partner No/parents did not live together, Yes, Don’t know
Woman’s attitudes
Attitudes towards wife beating Never justified, At least one reason to hit
Partner’s characteristics

125
Demographic
Age group <30, 30-39, 40-49, 50+
Education No education, Primary, Secondary, Higher
Employment status Working, Unemployed, Not seeking/unable to work
Partner’s behaviour
Alcohol consumption Never/don’t know, Daily, Weekly, Monthly, Less than monthly
Drug use Never, Ever
Fighting with other men No/don’t know, Yes
Having extramarital relationships No/don’t know, Yes
Partner’s experience with violence
Partner’s mother abused No, Yes, Don’t know
Partner abused as a child No, Yes, Don’t know
Characteristics of couple/relationship
Relational characteristics
Age difference His age higher 0-2 years, Her age higher, His age higher 3-8 years, His age higher 9+ years
Educational level difference No difference, His education higher, Her education higher
Relative financial contribution to household Less than husband/partner, Same as husband/partner, More than husband/partner, Woman not working, No answer
Woman’s role in husband/partner choice Woman or both chose, Other party chose, Never-married/cohabited, No answer
Children of respondent
Number of children born alive No children, 1, 2, 3-4, 5+
Sex of children No children, Only son(s), Only daughter(s), Son(s) & daughter(s)
Socioeconomic status
Household assets index89 Low, Middle, High
Social capital
Proximity to woman’s family No, Yes/living with parents or family
Frequency of contact with woman’s family At least once a week, Less than once a week, No answer
Can count on family members for support No/don’t know/no answer, Yes
Living with woman’s family No, Yes
Living with husband/partner’s family No, Yes
Respondent grew up in same community No, Yes
Respondent is a member of any group No, Yes
Geographical characteristics
89 For calculation of assets index see Annex VI

126
Regions Northern Midlands and Mountains, Red River Delta, North and South Central Coast, Central Highlands, Southeast, Mekong River Delta
Urban/rural
Urban, Rural
Analysis strategy for risk-factor analysis
Using the sub-sample as described above, univariate logistic regression was used to estimate
the crude associations between each potential risk factor and violence by a husband/partner in
the past 12 month. Multivariate logistic regression was used to measure associations
accounting for the effects of a number of factors simultaneously.
Results are expressed as odds ratios, a ratio of the odds of violence in a group with the presence
of a certain characteristic compared to the odds of violence in a group with the absence of said
characteristic (reference group). A crude odds ratio is the result from the univariate analysis that
considers the factor of interest and adjusted only for women’s age and geographical
characteristics. Adjusted odds ratios are the results of the multivariate analysis and they reflect
the odds that remain, when the effect of all other factors is also simultaneously accounted for.
For the univariate logistic regression, a probability value (p-value) of 0.10 or less was considered
significant. Variables associated with husband/partner violence in the univariate regression were
subsequently included in an intermediate multivariate logistic regression model as an intermediate
step to find out final variables to be used in the final logistic model. Woman’s age, region and
urban/rural factors were also included in the intermediate and final models regardless of the p-
value (age as a default effect modifier and geographical characteristics as fixed factors).
For the intermediate multivariable logistic regression model, a p-value of 0.10 or less was
considered significant to be included in the final model (together with age, region, and urban/rural
location). For this final model, a p-value of 0.05 or less was considered significant to determine
which factors were independently associated with husband/partner violence. All analyses were
conducted using STATA version 15.0 and adjusted for weights, clustering and strata.
12.2. Risk factors for currently experiencing violence by a husband/partner
against women
Using the sub-sample described in the methodology section, the number of ever-
married/partnered women in each category and for each factor, and the proportion (weighted) of
women experiencing current violence by a husband/partner is shown in Table 16 at the end of
this chapter. Also shown in Table 16 are the results of the risk-factor analysis that is, the results
from the univariate logistic regressions and the multivariate logistic regressions (intermediate and
final models) between each described covariate and current physical or sexual violence by a
husband/partner.
Women’s sociodemographic characteristics
This analysis explored seven aspects of women’s sociodemographic characteristics: age;
partnership status; age at first marriage; religion; ethnicity; educational attainment and
employment status. Women who are younger and marry at young ages are hypothesized to be
at increased risk of violence because their youth and relative inexperience can constrain their

127
relationship power.90 Other characteristics with constraining influences may also be associated
with risk of violence. For example, religions that regard women’s roles conservatively and that
play a strong role in governing interactions in a community may increase a woman’s risk of
violence if she is perceived to have transgressed gendered role expectations.91 Finally, theories
suggest that women who are economically dependent on their husband/partner are at greater risk
of violence. This is because with few economic resources, abused women cannot easily leave
their husband/partner and are less able to negotiate change.92 Accordingly, women’s higher
educational attainment and employment should be associated with lower risk of current
husband/partner violence. However, while aspects of women’s empowerment such as education,
economic independence and ownership of capital assets have been found to be protective in
some settings, it has been found to have a risk association in others.93
Age: Respondents in this study were aged between 15 and 64 years. This age range was wider
than the 2010 survey when women were aged 18 to 60 years. Women’s ages were organized
into the following categories: 15-17, 18-24, 25-29, 30-39, 40-49 and 50-64. Respondents aged
between 15 and 24 years were disaggregated to enable risk of husband/partner violence to be
assessed among adolescent girls (15 to 17 years) and young adult women (18 to 24 years). The
reference age category used was 25 to 29 years to ensure an adequate sample size for
comparisons.
Prevalence of current husband/partner violence was highest among women aged 25 to 29 years
and lowest among respondents aged 15 to 17 years. In the univariate analysis, all age categories
displayed a lower risk association with violence when compared with the reference 25 to 29 year
age category, however, only women in the oldest age category (50 to 64 years) had a statistically
significant lower risk of current husband/partner violence. In the final model, women in the two
oldest age categories—40 to 49, and 50 to 64—had significantly lower risk of violence. Moreover,
among women aged 30 years or older, the odds of current husband/partner violence decreased
by age category.
Education: Women who had primary schooling had the highest prevalence of violence closely
followed by women who had never attended school. For the regression analyses, the reference
category was set at “Never attended school”. In the univariate analysis, current husband/partner
violence was significantly lower among women who had attained “Higher education” defined as
90 Glass N, Fredland N, Campbell J, Yonas M, Sharps P, Kub J. 2003. Adolescent dating violence: prevalence,
risk factors, health outcomes, and implications for clinical practice. J Obstet Gynecol Neonatal Nurs; 32(2):227–38; Raj A, Saggurti N, Lawrence D, Balaiah D, Silverman JG. 2010. Association between adolescent marriage and marital violence among young adult women in India. Int J Gynaecol Obstet.; 110(1):35–9; and Decker MR, Latimore AD, Yasutake S, Haviland M, Ahmed S, Blum RW, Sonenstein F, Astone AM. 2015. Gender-based violence against adolescent and young adult women in low- and middle-income countries. J Adolesc Health; 56(2):188–96. 91 Djamba, Y. 1997. Theoretical Perspectives on Female Sexual Behaviour in Africa: A Review and Conceptual
Model. African Journal of Reproductive Health 1997 1 (2): 67–78. doi:10.2307/3583377; and Fiaveh D, Izugbara C, Okyerefo M, Reysoo F, and Fayorsey C. 2015. Constructions of Masculinity and Femininity and Sexual Risk Negotiation Practices among Women in Urban Ghana. Culture, Health & Sexuality; 17 (5): 650–662. doi:10.1080/13691058.2014.989264. 92 Gelles RJ. 1976. Abused wives: why do they stay? J. Marriage Fam. 38 (4),659e668; and Kalmuss DS and
Straus MA. 1982. Wife's marital dependency and wife abuse. J. Marriage Fam.; 44 (2), 277e286. 93 Vyas S and Watts C. 2009. How does economic empowerment affect women’s risk of intimate partner violence
in low and middle income country settings?: a systematic review of published evidence. J Int Dev.; 21:577–602; and Peterman A, Pereira A, Bleck J, Palermo TM, Yount KM. 2017. Women’s individual asset ownership and experience of intimate partner violence: evidence from 28 international surveys. Am J Public Health.; 107(5):747–55. https://doi.org/10.2105/AJPH.2017.303694.

128
college or undergraduate university or higher. In the final model, however, this significant lower
risk association disappeared. Moreover, compared to no schooling, some primary education was
significantly associated with higher risk of violence.
Current partnership status: The vast majority of women were married and very few were
cohabiting and not married. Therefore, these two categories were combined and set as the
reference category. In the univariate model, respondents in all three other categories: divorced or
separated; widowed; or dating, had significantly lower risk of current husband/partner violence.
When adjusting for other covariates in the intermediate model, these associations became
insignificant and therefore, partnership status was dropped from the final model.
Age of first marriage: Conforming to expectations, respondents who married at a young age (19
or younger) experienced the highest rates of current husband/partner violence. In the univariate
model, first marriage at age 20 to 29 years was significantly associated with lower risk of violence.
This statistically significant association was not significant in the intermediate model and so age
at first marriage was not included in the final model.
Ethnic group: The majority (83.8 per cent) of women in this sample self-reported as belonging
to the Kinh ethnic tribe. In the univariate analysis, belonging to an “other” ethnic group displayed
a marginally significant risk association with current husband/partner violence. The factor was not
significant in the intermediate model and therefore, ethnic group was not included in the final
multivariate model.
Religion: Over three quarters of respondents had no religious affiliation. In the univariate analysis
no significant association was found between women with a religious affiliation and violence by a
husband/partner when compared with women without religion. Religion was not included in either
(intermediate or final) multivariate model.
Employment status: Four different categories of employment status were explored with current
husband/partner violence: not working (the reference category); salaried paid work; self-
employed agriculture; and self-employed non-agriculture. Although the vast majority of women
were working, almost one in ten women said that they were not working. In the univariate analysis,
distinctions between types of work and women's experiences of current violence were found.
Women who were self-employed in the non-agriculture sector were significantly less likely to have
experienced violence in the past year when compared with women who were not working.
Likewise, women in paid/salaried work were less likely to have experienced violence although this
result was not significant. Employment was explored further in the intermediate model and both
paid/salaried work and self-employed non-agricultural work displayed statistically significant lower
risk associations with violence by a husband/partner, however, only self-employed non-
agricultural work was significant in the final model.
Women’s experiences with other forms of violence
Other forms of abuse experienced by women and girls have been hypothesized to be associated
with higher rates of violence by a husband/partner. Research suggests that early experiences of
violence, either childhood violence or witnessing their mother being beaten, may reinforce
women’s notions of inferiority or acceptance of abuse later on in life.94 Intergenerational exposure
94 Jewkes RK. 2002. Intimate partner violence: causes and prevention. Lancet; 359(9315): 1423–1429.doi:10.1016/S0140- 6736(02)08357-5.

129
to violence has been consistently found to increase women's risk of violence.95 Likewise, early
sexual debut has been associated with violence by a husband/partner, possibly because it has a
disempowering effect on women who are then less able to protect themselves later in life.96
Physical violence by others since age 15: Women who had experienced physical violence by
a non-partner since the age of 15 were significantly more likely to experience current
husband/partner violence, compared with women who had not experienced such violence.
Sexual violence by other since age 15: Women who had experienced sexual violence by a
non-partner since the age of 15 years were significantly more likely to experience current
husband/partner violence, compared with women who had not experienced such violence.
Childhood sexual abuse: Childhood sexual abuse was significantly associated with current
husband/partner violence at the univariate level. The significant association dropped in the
intermediate model and the variable was, therefore, not included in the final model.
Age at first sex: In the univariate analysis, compared with women in the reference category
(women whose age at first sex was at less than 18 years) women experiencing first sex at a higher
age were significantly less likely to experience current husband/partner violence. This factor was
not significant in the intermediate model and was therefore, not included in the final model.
Nature of first sexual experience: In the univariate model and in the multivariate final model,
women who said their first sexual experience was unwanted or coerced or forced were
significantly more likely to experience current husband/partner violence when compared with
women who said they wanted their first sexual experience.
Woman's mother beaten by her husband/partner: Women who said that their mothers had
been beaten by their mother’s husband/partner when they (respondents) were a child, were
significantly more likely to experience current husband/partner violence.
Women's attitudes and beliefs on wife beating
Rates of wife abuse have been found to be strongly associated with acceptance towards the
physical chastisement of women.97
Attitudes towards wife beating: Women's affirmative response to at least one justification for
wife beating was significantly associated with higher risk of violence by a husband/partner, and
at both the univariate level and in the final model.
Partner sociodemographic characteristics
95Abramsky T, Watts CH, Garcia-Moreno C, Devries K, Kiss L, Ellsberg M, Jansen HAFM, Heise L. 2011. What factors are associated with recent intimate partner violence? Findings from the WHO multi-country study on women’s health and domestic violence. BMC Public Health; 11:109.; and Vyas S and Heise L. 2016. How do area level socioeconomic status and gender norms affect partner violence against women? Evidence from Tanzania. Int J Public Health.; 61:971–80. https://doi.org/10.1007/s00038-016-0876-y. 96 Koenig MA, Lutalo T, Zhao F, Nalugoda F, Wabwire-Mangen F, Kiwanuka N, et al. 2003. Domestic
violence in rural Uganda: evidence from a community-based study. Bull World Health Organ.; 81(1):53–60. 97 Heise L. 1998. Violence against women: an integrated, ecological framework. Violence Against Women.
4:262–290

130
Three indicators of husband/partner sociodemographic characteristics were explored: age;
educational attainment; and employment status. Researchers have argued that in addition to
economic resources (earnings, social status and education attainment) violence is an additional
resource that men with low economic status are more likely to draw upon to compensate.98 This
theory, therefore, sees violence as an additional resource that men can use to maintain
dominance within the family, and that there will be a correlation between poverty and violence by
a husband/partner.
Partner age group: Partner age was not significantly associated with current husband/partner
violence at the univariate level and so was not included in the intermediate or final models.
Partner education: Prevalence of current husband/partner violence decreased by educational
attainment. For example, 17.9 per cent of the women married or married/partnered with men who
had no education experienced violence by a husband/partner in the past 12 months, and this
compares with 7.7 per cent among women married/partnered with men who had attained higher
education. At the univariate level, when compared with women whose husband/partner had no
education, women whose husband/partner had attained primary or secondary or higher education
had significantly lower risks of violence from a current husband/partner. Moreover, the higher the
educational level of the woman’s husband/partner, the lower her risk of current husband/partner
violence. In the final model, significant lower risk associations with primary and secondary
educational attainment of the husband/partner remained.
Partner employment status: Husband/partner employment status was categorized into working
(the reference category), unemployed and seeking work, and not working and unable to work
because of illness or studying. In the univariate analysis, compared with women whose
husband/partner was working, women whose husband/partner was unemployed were at
significantly higher risk of violence. By contrast, women whose husband/partner was not working
and were unable to work were at significantly lower risk of violence. In the final model, the
significant lower risk association with not working and unable to work was not significant at the 5
per cent level.
Husband/partner's behavioural characteristics
Four behavioural characteristics, which can also be viewed as expressions of masculinity, were
explored: alcohol use, drug use, fighting with other men and extramarital relationships.
Husband/partner engagement in extramarital relations has been found to elevate women’s risk of
violence either because it is an indicator of women’s vulnerability or because it raises marital
conflict.99 An in-depth analysis from 14 sub-Saharan Africa countries found significant correlations
between men’s alcohol use and violence by a husband/partner.100 The authors concluded that the
98 Goode W. 1971. Force and violence in the family. J. Marriage Fam.; 33, 624e636. 99 Heise L. 1998. Violence against women: an integrated, ecological framework. Violence Against
Women; 4:262–290; and McCloskey LA, Williams C, Larsen U. 2005. Gender inequality and intimate partner violence among women in Moshi, Tanzania. Int Fam Plan Perspect.; 31(3):124–30.
100 Greene MC, Kane JC, Tol WA. 2017. Alcohol use and intimate partner violence among women and their partners in sub-Saharan Africa. Global Mental Health.;4:e13. https://doi.org/10.1017/gmh.2017.9.
131
most likely causes were behavioural disinhibition—that alcohol use impairs cognitive functioning
and increases aggression—and relationship dissatisfaction.101
Husband/partner alcohol consumption: Compared with women whose husband/partner never
drank alcohol, women whose husband/partner drank alcohol daily, weekly or monthly were at
significantly higher risk of current violence in the univariate model. In the multivariate model, the
significant risk associations with husband/partner daily or weekly alcohol consumption remained.
Husband/partner drug use: Prevalence of current husband/partner violence was almost twice
as high among women who said their husband/partner had ever used drugs compared with
women who said their husband/partner never used drugs. However, no significant result was
found in the univariate analysis and therefore, husband/partner drug use was not included in the
multivariate models.
Husband/partner fighting with other men: Women who said that their husband/partner had
been involved in fights with other men since she had known him were at significantly higher risk
of current violence.
Husband/partner having extramarital relations: Women who said that their husband/partner
was having extramarital relations were significantly more likely to report current husband/partner
violence.
Husband/partner experience with violence in childhood
Overwhelming evidence exists on the relationship between men witnessing their mother being
abused and then later abusing a wife/partner themselves.102 In addition, evidence exists on the
relationship between men who were themselves abused as a child and later relationship abuse.103
Partner mother abused: Women who said their husband/partner's mother had been abused by
her husband/partner were significantly more likely to experience current violence in the univariate
and in the final multivariate models.
Partner abused as a child: Women who said their husband/partner had been beaten as a child
were significantly more likely to experience current violence in the univariate and in the final
multivariate models.
Characteristics of the couple/relationship
Three relational-level variables were explored: relative age; relative education; and relative
contribution to the household. The latter two characteristics enable an exploration of whether
economic or status differentials that favour women lead to higher rates of violence as asserted by
relative resource theory.104 A fourth characteristic, woman’s role in husband/partner choice, was
also explored.
101 Ibid. 102 Hotaling GT, Sugarman DB. 1986. An analysis of risk markers in husbands to wife violence: The current state of knowledge. Violence and Victims; 1, 101-124. 103 Ibid. 104 Macmillan R, Gartner R. 1999. When she brings home the bacon: labor-force participation and the risk of
spousal violence against women. J Marriage Fam.;61:947–58.

132
Age difference: No statistically significant association between age difference and current
husband/partner violence was found in the univariate analysis. Therefore, age difference between
women and their husband/partner was not explored in the multivariate model.
Educational level difference: Relative education was measured by categorizing respondents
into having a lower educational level than their husband/partner, the same level of education (the
reference category), or a higher level of education. In the univariate model, women who had a
higher level of education than their husband/partner had a significantly higher risk of experiencing
current violence when compared with women at the same level of education as their
husband/partner. The characteristic was included in an intermediate model that excluded both
the woman's and her husband/partner educational level, because of collinearity, but was found to
be not significant. Therefore, relative education was not included in the final model.
Relative financial contribution to the household: The reference group consisted of women
who said that they contributed the same as their husband/partner. In the univariate analysis, the
group of women who said that they contributed more than their husband/partner were significantly
more likely to experience violence, and women who were not working at all, were significantly
less likely to experience violence. In the final model, both these significant associations remained.
Woman's role in husband/partner choice: There was no significant association between
whether or not the woman had a role in her choice of husband/partner and experience of current
husband/partner violence.
Children of respondent
Two factors explored the association between children and current husband/partner violence:
number of children born alive and sex of the children.
Number of children born alive: The reference category was respondents without children and
compared with this group, women having any number of children born alive were significantly
more likely to experience current husband/partner violence in the univariate analysis. These
significant associations, however, disappeared in the intermediate model.
Sex of children: Women having sons only was set as the reference category. There was no
statistically significant relationship between having daughters only or having sons and daughters
with violence by a husband/partner. Therefore, sex of children was not included in the final model.
Household socioeconomic status
Low household socioeconomic status (poverty) has been consistently found to be associated with
higher rates of violence by a husband/partner in low-and middle-income countries.105 Theory
suggests that the stress of poverty leads men to become violent towards their wives.106 In this
study, a household assets index was used as a proxy for household socioeconomic status
households were classified into one of three groups: low, middle or high.107
105 Vyas S and Watts C. 2009. How does economic empowerment affect women’s risk of intimate partner
violence in low and middle income country settings?: a systematic review of published evidence. J Int Dev.; 21:577–602. 106 Goode W. 1971. Force and violence in the family. J. Marriage Fam.; 33, 624e636. 107 Vyas S and Kumaranayake L. 2006. How to do (or not to do).Constructing socio-economic status indices:
how to use principal components analysis. Health Policy Plan.; 21:459–468.

133
Household assets index: In the univariate analysis, compared with women living in the poorest
households, as measured by lowest level of household assets, women in the middle or highest
asset index households had significantly lower risk of current husband/partner violence. In the
final model, the association with middle level of assets remained significantly lower, but the
relationship with the highest asset index became non-significant.
Social capital
Research suggests an inverse relationship between women’s family and social networks and
violence by a husband/partner.108 It may be that women with strong social ties are more able to
draw on their family or friends to intervene in cases of violence. On the other hand, social isolation
has been found to be strongly associated with violence by a husband/partner.109 Seven indicators
of social capital were explored in this analysis: women’s proximity to their family; frequency of
contact with natal family; being able to count on family for support; living with natal family; living
with husband/partner’s family; growing up in the same community; and membership of a group.
However, very few were significantly associated with current husband/partner violence.
Proximity to woman's family: There was no evidence in the univariate analysis of a significant
association between physical proximity to the woman's family and current husband/partner
violence.
Frequency of contact with woman's family: In the univariate model, women who spoke to their
family less than once a week were significantly more likely to experience current husband/partner
violence compared with women who spoke with their family at least once a week. This significant
risk association continued in the intermediate and in the final model.
Woman can count on support from her family: Counting on family for support was not
significantly associated with current husband/partner violence in the univariate model.
Living with the woman's family: Living with the respondent’s family was not significantly
associated with current husband/partner violence in the univariate model.
Living with her husband/partner's family: Women living with their partner’s family were not
significantly associated with partner violence in the univariate model.
Respondent grew up in the same community: In the univariate model, women who grew up in
the same community were significantly less likely to have experienced current husband/partner
violence. This association was not significant in the intermediate model and was therefore,
dropped from the final model.
Respondent is a member of any group: Membership of a group or organization was not
significantly associated with current husband/partner violence in the univariate model.
Geographical characteristics
108 Heise L. 1998. Violence against women: an integrated, ecological framework. Violence Against Women;
4:262–290. 109 Dobash R and Dobash R. 1979. Violence against wives: a case against patriarchy. New York: Free Press.
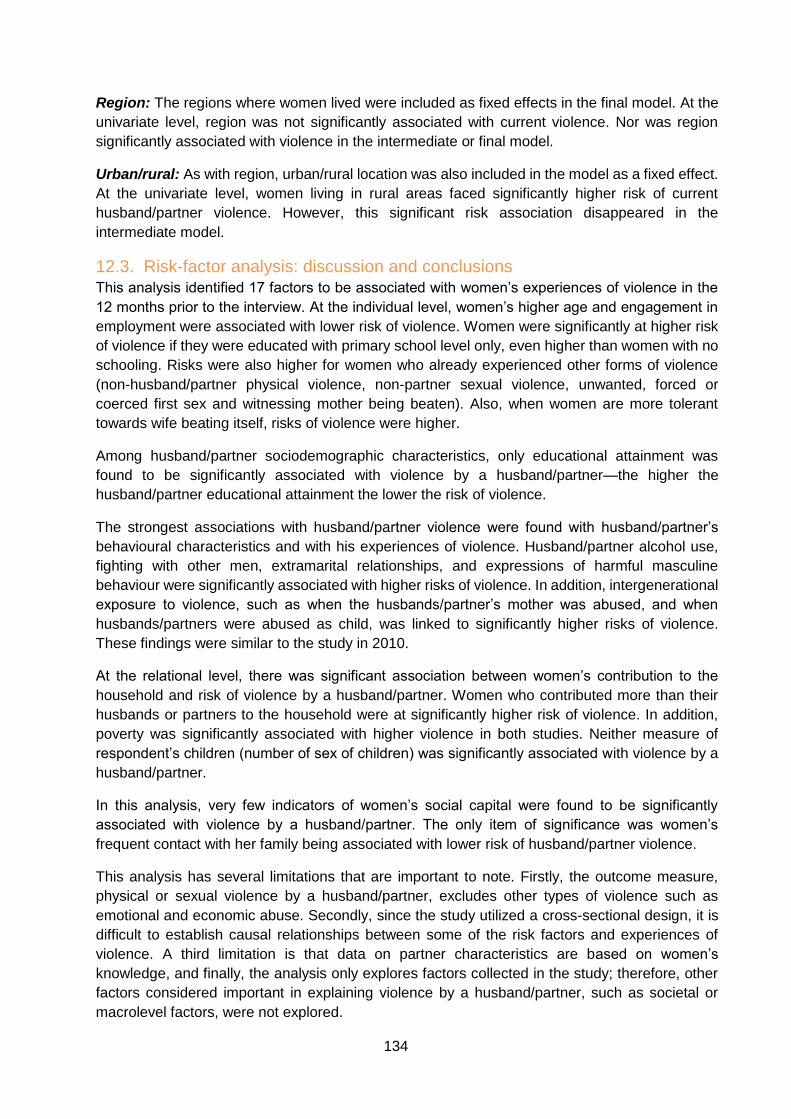
134
Region: The regions where women lived were included as fixed effects in the final model. At the
univariate level, region was not significantly associated with current violence. Nor was region
significantly associated with violence in the intermediate or final model.
Urban/rural: As with region, urban/rural location was also included in the model as a fixed effect.
At the univariate level, women living in rural areas faced significantly higher risk of current
husband/partner violence. However, this significant risk association disappeared in the
intermediate model.
12.3. Risk-factor analysis: discussion and conclusions
This analysis identified 17 factors to be associated with women’s experiences of violence in the
12 months prior to the interview. At the individual level, women’s higher age and engagement in
employment were associated with lower risk of violence. Women were significantly at higher risk
of violence if they were educated with primary school level only, even higher than women with no
schooling. Risks were also higher for women who already experienced other forms of violence
(non-husband/partner physical violence, non-partner sexual violence, unwanted, forced or
coerced first sex and witnessing mother being beaten). Also, when women are more tolerant
towards wife beating itself, risks of violence were higher.
Among husband/partner sociodemographic characteristics, only educational attainment was
found to be significantly associated with violence by a husband/partner—the higher the
husband/partner educational attainment the lower the risk of violence.
The strongest associations with husband/partner violence were found with husband/partner’s
behavioural characteristics and with his experiences of violence. Husband/partner alcohol use,
fighting with other men, extramarital relationships, and expressions of harmful masculine
behaviour were significantly associated with higher risks of violence. In addition, intergenerational
exposure to violence, such as when the husbands/partner’s mother was abused, and when
husbands/partners were abused as child, was linked to significantly higher risks of violence.
These findings were similar to the study in 2010.
At the relational level, there was significant association between women’s contribution to the
household and risk of violence by a husband/partner. Women who contributed more than their
husbands or partners to the household were at significantly higher risk of violence. In addition,
poverty was significantly associated with higher violence in both studies. Neither measure of
respondent’s children (number of sex of children) was significantly associated with violence by a
husband/partner.
In this analysis, very few indicators of women’s social capital were found to be significantly
associated with violence by a husband/partner. The only item of significance was women’s
frequent contact with her family being associated with lower risk of husband/partner violence.
This analysis has several limitations that are important to note. Firstly, the outcome measure,
physical or sexual violence by a husband/partner, excludes other types of violence such as
emotional and economic abuse. Secondly, since the study utilized a cross-sectional design, it is
difficult to establish causal relationships between some of the risk factors and experiences of
violence. A third limitation is that data on partner characteristics are based on women’s
knowledge, and finally, the analysis only explores factors collected in the study; therefore, other
factors considered important in explaining violence by a husband/partner, such as societal or
macrolevel factors, were not explored.

135
Despite these limitations, the findings at the individual and relationship level reveal systematic
patterns in women’s experiences of current husband/partner violence in Viet Nam, enabling
potential courses of action to mitigate violence against women in the country.

331
Table 16: Univariate and multivariate logistic regression for risk-factor analysis to identify risk factors for physical and/or sexual partner violence in the last 12 months, Viet Nam 2019
Multivariate logistic regression
Weighted chi-
sq p-value
Univariate logistic regression
Intermediate model Final model
N=4,24
0 %
% violenc
e
OR
p-value
95% CI AOR p-
value 95 % CI AOR
p-value
95 % CI
Woman's characteristics
Demographic
Age group
15-17 53 1.7 5.2 0.207 0.36 0.140 0.10 1.40 0.64 0.692 0.07 5.94 0.58 0.633 0.06 5.63
18-24 278 7.9 10.3 0.74 0.230 0.44 1.22 0.79 0.456 0.43 1.47 0.72 0.282 0.40 1.31
25-29 516 11.8 13.4 1 1
30-39 1 318 27.3 12.7 0.97 0.876 0.69 1.37 0.64 0.042 0.42 0.98 0.71 0.081 0.49 1.04
40-49 1 121 26.1 11.6 0.87 0.460 0.60 1.26 0.56 0.014 0.36 0.89 0.63 0.029 0.41 0.95
50-64 954 25.3 9.5 0.67 0.058 0.45 1.01 0.41 0.001 0.24 0.69 0.43 0.001 0.27 0.71
Education
No education 692 16.8 13.3 0.002 1 1 1
Primary 902 21.7 13.7 0.96 0.795 0.67 1.35 1.42 0.086 0.95 2.12 1.49 0.047 1.01 2.21
Secondary 1 953 47.2 11.0 0.65 0.004 0.48 0.87 1.20 0.388 0.79 1.82 1.24 0.305 0.82 1.87
Higher 693 14.2 6.9
0.37 <0.00
1 0.24 0.58 0.66 0.230 0.33 1.31 0.69 0.270 0.35 1.34
Partnership status
Currently married
3 804 87.6 12.5
0.001 1 1
Dating relationship
119 3.3 3.5
0.25 0.050 0.06 1.00 2.25 0.404 0.33 15.23
Separated or divorced
164 4.9 3.3
0.25 0.005 0.10 0.65 0.64 0.552 0.14 2.83
Widowed 153 4.2 3.3 0.28 0.097 0.06 1.26 0.45 0.407 0.07 2.98

137
Age at first marriage
19 or younger 1 048 15.1 <0.00
1 1 1
20-29 2 781 10.8 0.71 0.026 0.53 0.96 0.86 0.555 0.52 1.42
30+ 231 10.7 0.82 0.500 0.46 1.46 1.15 0.704 0.55 2.42
Never-married/cohabited
180 0.6
0.03 <0.00
1 0.01 0.15 0.55 0.584 0.06 4.70
Ethnic group
Kinh 3 470 82.3 10.9 0.135 1 1
Other 770 17.7 13.7 1.44 0.099 0.93 2.21 0.93 0.807 0.54 1.62
Religion
No religion 3 286 77.5 11.5 0.776 1
Other 954 22.5 11.0 1.08 0.677 0.75 1.57
Employment status
Not working 397 10.3 10.9 0.005 1 1 1
Salaried 1 640 36.3 10.1 0.69 0.119 0.44 1.10 0.63 0.075 0.38 1.05 0.63 0.072 0.38 1.04
Agriculture self
1 230 30.9 14.6
1.16 0.538 0.71 1.90 0.91 0.740 0.53 1.57 0.89 0.673 0.53 1.51
Non-agriculture self
973 22.5 9.2
0.67 0.091 0.42 1.07 0.56 0.027 0.33 0.93 0.56 0.026 0.34 0.93
Woman's past experiences with violence
Non-partner physical violence since 15
No 3 853 90.0 10.3
<0.001
1 1 1
Yes 386 10.0 20.9
2.42 <0.00
1 1.64 3.56 1.98 0.021 1.11 3.53 1.92 0.022 1.10 3.37
Non-partner sexual violence since 15
No 3 906 91.4 10.5
<0.001
1 1 1
Yes 333 8.6 20.6
2.18 <0.00
1 1.57 3.03 1.63 0.034 1.04 2.55 1.64 0.026 1.06 2.53
Childhood sexual abuse
No 4 183 9.9 11.3 0.196 1 1
138
Yes 57 1.4 16.8 1.50 0.258 0.74 3.06 0.70 0.405 0.31 1.61
Age at first sex
<18 289 6.9 18.4 <0.00
1 1 1
18-21 1 698 42.1 12.3 0.66 0.020 0.46 0.94 0.93 0.785 0.57 1.52
22+ 2 094 46.1 10.6 0.59 0.003 0.42 0.84 1.13 0.679 0.62 2.06
Not had sex 156 5.0 0.2
0.01 <0.00
1 0.00 0.07 0.03 0.016 0.00 0.53
Nature of first sex
Wanted to have sex
3 908 90.9 11.3 <0.00
1 1 1 1
Unwanted/coerced or forced
171 4.1 26.7
3.02 <0.00
1 1.86 4.91 2.05 0.006 1.23 3.41 1.95 0.008 1.19 3.20
Not had sex 156 5.0 0.2
0.01 <0.00
1 0.00 0.11 Omitted 0.03 0.002 0.00 0.27
Woman's mother beaten by her partner
No/parents not live together
3 174 74.8 8.9
<0.001
1 1 1
Yes 911 21.6 19.6
2.54 <0.00
1 1.97 3.26 1.85
<0.001
1.42 2.40 1.82 <0.001 1.40 2.37
Don't know 155 3.6 13.7 1.52 0.190 0.81 2.84 1.26 0.527 0.62 2.55 1.23 0.564 0.61 2.47
Attitudes
Attitudes on wife beating
No reason to hit
2 170 49.6 8.3 <0.00
1 1 1 1
Reason to hit 2 070 50.4 14.4
1.88 <0.00
1 1.45 2.45 1.30 0.058 0.99 1.70 1.32 0.041 1.01 1.72
Partner characteristics
Demographic
Age group
29 or younger 527 14.3 10.9 0.052
2 1
30-39 1 210 25.3 13.0 0.96 0.909 0.50 1.84
40-49 1 194 27.4 12.9 0.90 0.763 0.46 1.76
50+ 1 309 33.1 9.1 0.56 0.138 0.26 1.21

139
Education
No education 539 13.4 17.9 <0.00
1 1 1 1
Primary 889 20.7 12.9 0.62 0.008 0.43 0.88 0.61 0.008 0.42 0.88 0.61 0.010 0.42 0.89
Secondary 2 122 51.4 10.1
0.41 <0.00
1 0.30 0.57 0.54 0.003 0.36 0.81 0.55 0.006 0.36 0.84
Higher 690 14.5 7.7
0.31 <0.00
1 0.19 0.50 0.74 0.391 0.37 1.48 0.75 0.434 0.37 1.53
Employment status
Working 3 893 1.2 11.7 0.001 1 1 1
Unemployed 55 91.4 25.7 2.87 0.025 1.14 7.21 2.11 0.150 0.76 5.85 2.04 0.181 0.71 5.84
Unable to work
292 7.4 5.1
0.49 0.029 0.26 0.93 0.55 0.085 0.28 1.09 0.56 0.085 0.29 1.08
Partner behavioural characteristics
Alcohol consumption
Never/don't know
439 10.4 0.6 <0.00
1 1 1 1
Daily 548 13.0 28.0
5.83 <0.00
1 3.33
10.19
3.82 <0.00
1 2.15 6.77 3.82 <0.001 2.13 6.83
Weekly 743 17.2 13.9 2.34 0.002 1.36 4.03 1.83 0.053 0.99 3.38 1.83 0.053 0.99 3.36
Monthly 1 023 24.0 9.3 1.49 0.178 0.83 2.67 1.22 0.523 0.67 2.22 1.23 0.496 0.67 2.26
Less than monthly
1 487 35.5 7.1
1.11 0.687 0.66 1.88 1.20 0.513 0.69 2.09 1.21 0.503 0.69 2.13
Drug use
Never 4 200 99.2 11.3
0.1903
1
Ever 40 0.8 19.0 1.81 0.194 0.74 4.47
Fighting with other men
No/don't know
4 074 96.2 10.3 <0.00
1 1 1 1
Yes 166 3.8 39.3
6.19 <0.00
1 3.98 9.64 3.64
<0.001
2.13 6.25 3.67 <0.001 2.18 6.17
Extramarital relationships
No or don't know
4 026 94.6 10.2 <0.00
1 1 1 1
Yes or maybe 214 5.4 31.7
4.60 <0.00
1 3.04 6.96 3.46
<0.001
2.04 5.87 3.55 <0.001 2.07 6.10
Partner's experience with violence

140
Partner's mother abused
No 3 136 73.2 9.5 <0.00
1 1 1 1
Yes 331 8.3 30.4
4.29 <0.00
1 3.04 6.06 1.85 0.006 1.20 2.86 1.87 0.005 1.21 2.88
Don't know 773 18.5 10.3 1.14 0.434 0.82 1.60 1.01 0.937 0.71 1.44 1.02 0.929 0.72 1.44
Partner abused as a child
No 2 266 52.5 8.0 <0.00
1 1 1 1
Yes 1 022 24.1 18.7
2.57 <0.00
1 1.97 3.36 1.79 0.001 1.28 2.50 1.79 0.001 1.29 2.50
Don't know 952 23.4 11.3 1.47 0.023 1.06 2.04 1.31 0.121 0.93 1.85 1.31 0.111 0.94 1.84
Characteristics of the couple/ relationship
Relational characteristics
Age difference
His age > her age 0-2 years
1 649 40.4 11.0
0.722 1
Her age higher than his
442 10.1 12.6
1.18 0.414 0.80 1.74
His age > her age 3-8 years
1 829 43.0 11.7
1.01 0.941 0.76 1.34
His age > her age 9+ years
320 6.4 9.5
0.84 0.487 0.52 1.36
Educational difference
No difference 2 550 60.0 11.0 0.159 1
His education higher
947 22.7 10.5
1.01 0.928 0.74 1.38
Her education higher
743 17.4 14.0
1.34 0.066 0.98 1.84
Relative contribution to the household
Less than partner
2 564 47.2 11.2 <0.00
1 0.85 0.380 0.60 1.22 0.76 0.150 0.53 1.10 0.78 0.204 0.54 1.14
Same as partner
1 490 25.4 12.3
1 1 1
More than partner
838 14.2 17.5
1.63 0.011 1.12 2.38 1.56 0.031 1.04 2.33 1.60 0.025 1.06 2.40
Woman not earning
361 2.8 1.5
0.12 0.004 0.03 0.50 0.19 0.059 0.03 1.06 0.13 0.009 0.03 0.59

141
No answer 723 10.4 4.4 0.34 0.007 0.16 0.74 0.60 0.484 0.14 2.54 0.38 0.016 0.18 0.83
Woman's role in partner choice
Respondent or both chose
3 600 83.3 11.8 <0.00
1 1
Other party chose
309 8.0 13.5
1.40 0.149 0.89 2.21
Never-married/cohabited
182 5.5 0.6
0.04 <0.00
1 0.01 0.18
No answer 149 3.3 14.7 1.39 0.180 0.86 2.24
Children of respondent
Number of children born alive
No children 318 8.9 4.1 0.006 1 1
1 child 773 17.7 10.4
3.10 <0.00
1 1.66 5.79 1.03 0.934 0.52 2.05
2 children 2 045 44.5 12.7
4.06 <0.00
1 2.11 7.81 1.48 0.302 0.70 3.14
3-4 children 957 24.6 12.6
4.28 <0.00
1 2.09 8.74 1.35 0.468 0.60 3.01
5+ children 147 4.3 9.8
3.72 <0.00
1 1.38
10.04
1.14 0.794 0.42 3.11
Sex of children
No children 318 8.9 4.1 <0.00
1 0.28
<0.001
0.15 0.52
Only son(s) 1 215 25.2 11.9 1
Only daughter(s)
784 19.3 9.1
0.74 0.111 0.51 1.07
Son(s) and daughter(s)
1 903 46.6 13.4
1.18 0.238 0.89 1.57
Socioeconomic status
Asset index
Low 981 22.5 15.6 0.002 1 1 1
Middle 1 702 40.6 9.4
0.51 <0.00
1 0.37 0.71 0.62 0.019 0.41 0.92 0.64 0.026 0.43 0.95
High 1 552 36.9 11.0
0.52 <0.00
1 0.37 0.74 0.80 0.371 0.50 1.30 0.84 0.450 0.54 1.32
Social capital
Proximity to woman's family
No 1 233 27.3 12.32 0.342 1

142
yes (close together)
3 007 72.7 11.02
0.88 0.322 0.69 1.13
Frequency of contact with woman's family
At least once a week
2 981 69.9 9.93 <0.00
1 1 1 1
Less than once a week
1 168 27.4 15.83
1.82 <0.00
1 1.44 2.30 1.55
<0.001
1.24 1.94 1.63 <0.001 1.29 2.07
No answer 91 2.8 3.85 0.41 0.166 0.12 1.46 1.25 0.750 0.32 4.90 1.49 0.550 0.40 5.55
Can count on support from family members
No/don't know/no answer
711 16.6 12.3
0.483 1
Yes 3 529 83.4 11.19 0.79 0.138 0.58 1.08
Living with woman's family
No 3 845 89.7 11.56 0.413 1
Yes 392 10.3 9.77 0.88 0.576 0.56 1.38
Living with partner's family
No 3 366 76.0 10.65 0.049 1
Yes 871 24.0 13.68 1.23 0.145 0.93 1.62
Respondent grew up in same community
No 2 845 63.3 12.65 0.017 1 1
Yes 1 395 36.7 9.18 0.68 0.011 0.51 0.92 0.83 0.224 0.61 1.12
Respondent is a member of any group
No 1 820 44.0 10.81 0.466 1
Yes 2 420 56.0 11.82 0.97 0.835 0.75 1.26
Geographical location
Region
N. midlands/mountains
628 13.8 10.81
0.121 1 1 1
Red River Delta
832 21.5 14.58
1.58 0.066 0.97 2.56 1.73 0.137 0.84 3.57 1.73 0.086 0.93 3.23
North & South Central Coast
838 22.0 11.7
1.15 0.582 0.70 1.86 1.15 0.680 0.60 2.20 1.09 0.753 0.62 1.92

143
Central Highlands
368 4.7 14.41
1.50 0.058 0.99 2.29 1.11 0.708 0.63 1.97 1.08 0.771 0.64 1.82
Southeast 776 16.5 9.23 1.07 0.751 0.71 1.59 1.32 0.418 0.67 2.60 1.28 0.390 0.73 2.25
Mekong River Delta
798 21.5 9.19
0.87 0.534 0.57 1.34 0.78 0.473 0.39 1.55 0.78 0.416 0.43 1.42
Urban/rural
Urban 2 441 66.4 12.85 0.001 1 1 1
Rural 1 799 33.6 8.46
1.68 <0.00
1 1.29 2.19 1.23 0.192 0.90 1.69 1.22 0.218 0.89 1.69

331
13. Comparison of violence against women between 2010 and
2019
Key findings from this chapter
● With the exception of sexual violence, the prevalence of all forms of violence by a
husband/partner is lower in 2019 compared with 2010 for lifetime and past 12
months.
● For physical violence, the differences between 2019 and 2010 are especially
noticeable in younger women. Younger women are experiencing relatively less
physical violence in 2019 compared with women of the same age in 2010.
● The prevalence of sexual violence by a husband/partner is higher in 2019 as
compared with 2010 (13 per cent compared with 10 per cent respectively across the
lifetime). When looking at the age distribution, especially younger women in 2019
are experiencing relatively higher levels of sexual violence compared with women
of the same age in 2010.
● Non-partner physical violence since age 15 was slightly higher (11.4 per cent of all
women in 2019 compared with 9.9 per cent in 2010).
● Non-partner sexual violence since age 15 was considerably higher at 9.0 per cent
in 2019 compared with 2.3 per cent in 2010 (it should be noted that in 2019 more
types of acts of sexual violence were included).
● Childhood sexual abuse was experienced by 4.4 per cent of women in 2019
compared with 2.8 per cent in 2010.
● While the overall percentage of women who agreed that wives should obey
husbands in 2019 is similar to 2010, the data show that younger women were less
likely to hold these views and that the difference in attitudes between younger and
older women has increased.
The 2019 study was the second national prevalence study on violence against women in Viet
Nam. In this chapter the results of this study will be compared with the 2010 study.
Results will show in detail that the prevalence rates of all forms of intimate partner violence, except
sexual violence, are lower in 2019 as compared with 2010. Rates of physical and sexual violence
by non-partners have increased, as have the proportions of women mentioning they experienced
sexual abuse as a child.
A comparison of the national averages on key indicators for the 2010 and 2019 studies are
provided in Table 17.

145
Table 17: Summary of key indicators on violence against women, Viet Nam 2010 and 2019.
Violence by a current or former husband/partner
Indicator 2010 (%) 2019 (%)
Physical partner violence Lifetime 31.5 26.1
Last 12 months 6.4 4.6
Sexual partner violence Lifetime 9.9 13.3
Last 12 months 4.2 5.7
Physical and/or sexual partner violence
Lifetime 34.3 32.0
Last 12 months 9.0 8.9
Emotional partner violence Lifetime 53.6 47.0
Last 12 months 25.4 19.3
Economic partner violence^ Lifetime 9.0 20.6
Last 12 months * 11.5
Controlling behaviours Lifetime 33.3 27.3
Last 12 months * 12.9
Coping with partner violence % of women who told no one about the husband/partner violence they experienced
49.6 49.6
% of women who sought help from the police 5.2 4.8
% of women who sought help from local leaders 6.3 3.6
% of women who sought help from a hospital or health professional
5.1 2.3
Violence by someone other than a current or former husband/partner
Indicator 2010 (%) 2019 (%)
Physical non-partner violence~ Lifetime 9.9 11.4
Last 12 months * 1.4
Sexual non-partner violence~ Lifetime 2.3 9.0
Last 12 months * 1.2
Child sexual abuse Ever before age 15 years 2.8 4.4
Attitudes to gender roles and violence against women
Indicator 2010 (%) 2019 (%)
Attitudes to gender roles and gender-based violence
% who agree that “A good wife obeys her husband even if she disagrees”
27.0 27.2
% who agree that “A man should show he is the boss” * 35.9
% of women who agree with one or more reasons for a man to hit his wife/partner
* 51.8
Notes:
^ There were major differences in the number of acts considered economic violence by a husband/partner in 2010 (2 acts) compared with 2019 (5 acts).
~ There were major differences in the number of acts considered sexual violence by a non-partner in 2010 (2 acts) compared with 2019 (6 acts). There were also more acts for physical violence by a non-partner asked about in 2019 (4 acts) compared with 2010 (2 acts).
* The indicator was not included in the report on findings in 2010.
When looking at comparative indicators between 2010 and 2019 it is important to note that
national averages can hide difference. Looking beyond the national averages it can be seen that
younger women especially, are experiencing relatively less physical violence by a

146
husband/partner in 2019 than older women, suggesting that change is happening for the better.
A different pattern is seen for sexual violence with younger women experiencing sexual violence
at a relatively higher rate. This could be a sign that sexual violence has increased, but it could
also indicate that young people are more open to talking about sex and sexual violence compared
with a decade ago.
To be able to truly establish a trend over time, there needs to be a time series with at least three
points. With this second survey we have two data points that allow some comparison, but there
are factors, limitations and words of caution that should be taken into consideration when
interpreting changes between 2010 and 2019 (Box 4).
Box 4: Considerations when interpreting change between the 2010 and 2019 survey
Comparing prevalence rates over time works differently for lifetime compared with violence in the last 12 months
With the same methods and same levels of quality of data, it is unlikely to see a big change in lifetime rates of violence after a 10-year interval. Once a woman has experienced violence it remains with her for her lifetime. The cohort that was interviewed in 2010 has a large overlap with the cohort that was interviewed in 2019 (the women that were 18 to 56 years old in 2010 would now be 8 years older and still be eligible to be interviewed). This also means that if you find big differences in lifetime prevalence, there may be another issue with the data.
The prevalence of violence in the last 12 months is more sensitive to change as this reflects what is happening during only a short period just before the interview. If there are changes in rates of violence, they should be first visible in the patterns of “current violence”.
Changes in context, policies and awareness affecting prevalence but also disclosure
The first time that this survey was done in Viet Nam the subject of violence against women was not commonly spoken about in the community. Since results of the 2010 study were released much has happened: services were established, policies were changed and public media campaigns may have led to increase in awareness of violence against women. It is hoped that these actions will have had a positive impact on violence reduction.
It should be realized that, paradoxically, in a context of more awareness, stigma can reduce and as a consequence, women may become more willing to disclose their experiences of violence, making the changes over time difficult to explain. Moreover, differences in willingness to disclose can affect different types of violence in different ways. This is especially true for types of violence that were highly taboo to talk about – such as sexual violence. Raised awareness is likely to cause an increase in disclosing these types of violence.
Differences in the questions in the questionnaire
Differences in the wording and the translation of questions are likely to affect the answers and thus potentially prevalence rates. In Viet Nam, care was taken to keep the violence questions as much as possible the same as in the first survey, including their translation. Differences between the number and type of acts of violence asked about in the two studies have been highlighted in the methods section of this report. Specific mention should be made of the measurement of economic violence by a husband/partner (in 2019 many more acts were included) and the measurement of non-partner violence (in 2019 more types and more acts of violence and more details on perpetrators were included). For controlling behaviours by partners in 2019 information was also gathered for the last 12 months whereas in 2010 this was only measured for lifetime.

147
Other differences in the methodology
Variations in methods can influence the disclosure of husband/partner and non-partner violence. In Viet Nam, the methods were largely the same between the two surveys. Similar approaches were taken to recruiting and training of interviewers (with a two-week special interviewer training in both surveys) and safety protocols. Worth mentioning is that in 2019 data were gathered using Computer Assisted Personal Interviews (CAPI) rather than with paper questionnaires. While sampling strategies were similar, another difference is the age range of the sample. To compensate for any difference that this may cause in prevalence measures, in this comparative chapter when comparing by age group we strictly compare with women in the age group 18-60, the age range used in 2010.
13.1. Husband/partner violence
Prevalence rates
Comparing the prevalence rates for violence by a husband/partner between 2010 and 2019
(Figure 87) we see the following patterns: the rates for lifetime and current physical, emotional
violence by a husband/partner and controlling behaviour are all lower in 2019 as compared with
2010. On the other hand, the lifetime prevalence of husband/partner sexual violence is higher in
2019 (13 per cent) as compared with 2010 (10 per cent) with last 12 months prevalence rates
for sexual violence being almost the same.
The findings for sexual violence stand out as they are contrary to what is seen for the other types
of violence. The reason for the increase in sexual violence by a husband/partner is not known.
We can speculate that there may have been a real increase in sexual violence, however, it is
more likely that the increase in awareness and understanding about this form of abuse may lead
women to be more willing to disclose their experience, especially because in 2010 sex and sexual
violence was a topic that was hardly ever discussed.

148
Figure 87: Prevalence of physical, sexual, physical and/or sexual, emotional violence by a husband/partner and controlling behaviour during lifetime and the last 12 months among ever-married/partnered women, with upper and lower 95 per cent confidence intervals, Viet Nam 2010 (N=4,561, aged 18-60) and 2019 (N=5,553, aged 15-64)
Note: Information on controlling behaviours ‘in the last 12 months’ was not collected in the 2010 survey. A confidence interval was not calculated on controlling behaviour in either 2010 or 2019.
To further explore the difference in prevalence rates of husband/partner violence across the two
surveys, prevalence of physical and of sexual violence among ever-married/partnered women
was examined by age group using the same age breakdown as in 2010.
For physical violence, prevalence over a lifetime and in the last 12 months (Figure 88 and Figure
89) are lower in 2019 among most age groups. This difference is relatively and absolutely larger
for younger women up to age 39. For example, 25 per cent of women aged 25 to 29 mentioned
lifetime physical violence by a husband/partner in 2010 compared with 19 per cent in 2019.
The differences suggest that especially younger women are now experiencing less physical
husband/partner violence compared with women in the same age groups a decade earlier.
31.526.1
6.4 4.69.9 13.3
4.2 5.7
34.3 32.0
9.0 8.9
53.647.0
25.419.3
33.327.3
12.9
0
20
40
60
80
100
2010 2019 2010 2019 2010 2019 2010 2019 2010 2019 2010 2019 2010 2019 2010 2019 2010 2019 2010 2019
Lifetime Last 12months
Lifetime Last 12months
Lifetime Last 12months
Lifetime Last 12months
Lifetime Last 12months
Physical violence Sexual violence Physical and/or sexualviolence
Emotional violence Controlling behaviour
percentage of ever-married/partnered women 2010 2019

149
Figure 88: Prevalence of physical violence by a husband/partner during lifetime among ever-married/partnered women by age group, Viet Nam 2010 (N=4,561) and 2019 (N=5,553)
Figure 89: Prevalence of physical violence by a husband/partner during last 12 months among ever-married/partnered women by age group, Viet Nam 2010 (N=4,561) and 2019 (N=5,553)
22.025.0
29.634.1
29.4
37.4 35.3 30.6
14.219.0
24.1 26.2
30.629.1 30.5 29.7
0
10
20
30
40
50
18-24 25-29 30-34 35-39 40-44 45-49 50-54 55-60
Age group (years)
2010 2019percentage of ever-married/partnered women
12.29.2 7.5 8.3 6.2 5.6 5.2
0.94.8 6.5 5.9 4.2 5.0 4.2 4.2 4.0
0
10
20
30
40
50
18-24 25-29 30-34 35-39 40-44 45-49 50-54 55-60
Age group (years)
2010 2019percentage of ever-married/partnered women

150
When examining the prevalence rates of sexual violence by a husband/partner among ever-
married/partnered women (Figure 90 and
Figure 91) they show the opposite pattern to those of physical violence: rates are somewhat
higher among women in most age groups in 2019 compared with 2010, but most notably in the
youngest age group 18 to 25. Reasons for this difference are unknown but since this is so unlike
the patterns for the other types of violence, there is reason to believe that there is unlikely to be
a real increase but instead, an increase in awareness, openness and willingness to mention it.
Increased awareness may in part be related to recognition of sexual violence as well as the impact
of social media.
Figure 90: Prevalence of sexual violence by a husband/partner during lifetime among ever-married/partnered women by age group, Viet Nam 2010 (N=4,561) and 2019 (N=5,553)
Figure 91: Prevalence of sexual violence by a husband/partner during last 12 months among ever-married/partnered women by age group, Viet Nam 2010 (N=4,561) and 2019 (N=5,553)
5,39,5 9,0 11,3 10,2
12,49,8 7,9
13,910,4
13,511,4 12,6
15,9 13,8 14,0
0
10
20
30
40
50
18-24 25-29 30-34 35-39 40-44 45-49 50-54 55-60Age group (years)
2010 2019percentage of ever-married/partnered women
3.87.0
4.7 5.5 5.2 3.9 2.1 0.8
7.3 7.1 8.35.7 6.1 4.6 4.7
2.4
0
10
20
30
40
50
18-24 25-29 30-34 35-39 40-44 45-49 50-54 55-60Age group (years)
2010 2019percentage of ever-married/partnered women

151
Perceived triggers of violence by a husband/partner
Perceptions of the triggers for husband/partner violence have changed between the two studies
(Figure 92). While the top four triggers named were the same in both 2010 and 2019, the
proportions of women mentioning them has changed. In 2010, drunkenness was the most
frequently mentioned (33.7 per cent), followed closely by ‘family problem/conflict’ (27.8 per cent)
and ‘money problems’ (24.7 per cent). In 2019 ‘family problem’ (50.8 per cent) was by far most
often mentioned. Remarkably, in 2010 ‘disobedience’ was mentioned by a much larger proportion
of women (22.6 per cent) compared with 2019 results (4.2 per cent). This is a positive finding
showing that in 2019 women are much less often blaming themselves for the violence that is
happening to them (including thinking that they deserve it).
Figure 92: Perceived triggers of physical violence by a husband/partner among ever-married/partnered women who experienced such violence, Viet Nam 2010 (N=1,393) and 2019 (N=1,471)
Help-seeking for violence by a husband/partner
In 2019, most women (90.4 per cent) who experienced physical and/or sexual violence by a
husband/partner did not seek help (Table 9.3 in Annex VIII). A few (4.8 per cent) went to the
police. This is very similar to the findings in 2010 when 87.1 per cent of women said they had not
sought help from authorities and only 5.2 per cent had gone to the police or People’s Committee
for assistance.
0.2
1.5
3.0
4.2
4.3
4.5
4.5
5.0
7.3
7.3
16.6
18.8
40.9
50.8
22.6
10.9
6.5
9.2
26.8
24.7
33.7
27.8
0 10 20 30 40 50 60
She is pregnant
Refuses sex
Unemployed
Disobedient
Wants to teach her a lesson
No food at home
No particular reason
Show he is boss
Jealous
Problem with work
Other problem
Money problem
Partner drunk
Family problem
Percentage of ever-married/partnered women who experienced physical violence by a husband/partner
2010
2019

152
Although there is not much difference in the proportion of women seeking help between 2010 and
2019 this does not indicate efforts to improve response to husband/partner violence are not
making a difference. It should be realized that questions on help-seeking have been asked to all
women who disclosed physical and/or sexual violence by a husband/partner no matter how long
ago. It should also be noted that policies and interventions have been in place for a relatively
short period of time. This survey may not have been able to categorically pick recent changes is
help-seeking behaviours, since it asked about help-seeking that happened at any time in a
woman’s life time. This is further compounded by the fact that still only very few women seek help
for services in Viet Nam.
Ensuring police, health services and other support agencies are available and well-equipped to
help women who report experiences of violence is essential. Ongoing investment into training to
understand the dynamics of violence against women and promotion of attitude changes so that
professionals do not blame victims and excuse perpetrators will result in improved services and
use of services by victim survivors. It could be useful to undertake qualitative research with
members of the helping professions to better understand any barriers to women reporting violence
and asking for help.
13.2. Non-husband/partner violence
Figure 93 shows comparative prevalence rates of violence by non-partners in 2019 and 2010.
Prevalence of all forms of non-partner violence since age 15 were higher in 2019 as compared
with 2010. Physical violence was slightly higher (11.4 per cent of all women) than in 2010 (9.9 per
cent). Non-partner sexual violence since age 15 was considerably higher at 9.0 per cent in 2019
compared with 2.3 per cent in 2010. Rates of child sexual abuse before age 15 were almost twice
as high in 2019 (4.4 per cent) than in 2010 (2.8 per cent).
As discussed in relation to the prevalence of violence, variation can be due to a change in
methodology (for sexual violence in 2019 more acts were included in the questions) and/or real
increases. Differences can also be attributed to an increase in awareness and recognition, as well
as willingness to disclose (sexual) violence to the interviewer.
It should be noted that in 2010, experiences of non-partner physical and sexual violence were
only measured since age 15 and not for the last 12 months.

153
Figure 93: Prevalence of non-partner physical and sexual violence since age 15 and child sexual abuse (before age 15) among all women, Viet Nam 2010 (N=4,838) and 2019 (N=5,976)
13.3. Attitudes to gender roles
Attitudes towards gender roles can reflect community acceptance of (some forms of) gender-
based violence as normal or justified. Attitudes, limited knowledge and understanding of violence
against women can also lead to blaming victims/survivors and excusing perpetrators.
Only two attitude questions were asked in 2010 and can be compared with 2019 results where
more questions were asked. As shown in Figure 94 response to attitude questions were similar
in the two surveys. In 2010, 27.0 per cent of women agreed with the statement that “a good wife
obeys her husband even if she disagrees” and in 2019, the rate was the same (27.2 per cent). At
first glance, this seems to reinforce the fact that attitudes take a long time to adjust – often a
generation.
9.9
2.3 2.8
11.49.0
4.4
0
10
20
30
40
50
Physical violence since age 15 Sexual violence since age 15 Child sexual abuse before age 15
Percentage of all women
2010 2019

154
Figure 94: Proportion of all women who said they agree with the statement that “a good wife obeys her husband even if she disagrees”, by location, Viet Nam 2010 (N=4,838) and 2019 (N=5,976)
Remarkably, when exploring attitude by age group, the difference in women’s attitudes shows a
strong and consistent intergenerational shift. While the overall percentage of women agreeing
that wives should obey husbands may not be different from a decade ago, exploring the data by
age shows that younger women have more positive views of their empowerment than older
women. Fewer younger women agree that women should obey their husbands (11.4 per cent of
women aged 18 to 24 compared with 14.3 per cent in 2010). Data in 2019 also showed a greater
difference between young women in support for this statement and older women, thereby
suggesting that attitudinal change might be happening among younger women, possibly because
they were more exposed to positive gender equality messages (Figure 95). Examining these
results by age group suggest that attitudes continue to change over time.
27.2 27.0
16.7 14.7
32.4 32.7
0
20
40
60
80
100
2018 2010
"A good wife obeys her husband even if she disagrees"
Percentage of all women
Total Urban Rural

155
Figure 95: Proportion of all women who said they agree with the statement “a good wife obeys her husband even if she disagrees”, by age group, Viet Nam 2010 (N=4,838) and 2019 (N=5,976)
Women with no formal education or a low level of education are more likely to agree with harmful
gender norms than women with higher education. While there is not much difference in attitudes
by education level between 2010 and 2019 (Figure 96), the pattern suggest that attitudes are very
different with educational level and shifting positively for those with higher education. It shows the
association between education and gender norms and provides encouraging evidence for
projects attempting behavioural change through education programmes.
Figure 96: Proportion of all women who said they agree with the statement “a good wife obeys her husband even if she disagrees”, among all women by education level, Viet Nam 2010 (N=4,838) and 2019 (N=5,976)
Note: The classification of levels of education was different between 2019 and 2010. In 2019 the categories for
education were: no education, primary, lower secondary, upper secondary, college and university and above. In 2010
the groupings were: not attended school; primary education; secondary education (shown as lower secondary in the
graph above); high school/vocational (shown as upper secondary in the graph above); and college, university.
14.3 19.325.2 29.4 27.1
30.7 30.5 35.4
13.7 11.4 12.819.9 21.6
31.2 34.741.3 41.8 42.6
0
20
40
60
80
100
15-17 18-24 25-29 30-34 35-39 40-44 45-49 50-54 55-60 61-64
Percentage of all women
Age groups (years)
2010 2019
43.8
29.2 31.9
5.1
49.2
34.027.6
15.0
5.0 3.0
0
20
40
60
80
100
No education Primary LowerSecondary
UpperSecondary
College University andabove
Percentage of all women
2010 2019

156
13.4. Risk-factor analysis: discussion and conclusions
This 2019 analysis identified 17 factors to be associated with women’s experiences of violence in
the 12 months to interview. This compared with 15 factors found in the 2010 study. Comparable
between the two studies included higher risk of violence associated with:
● women with primary schooling
● women’s experience of other violence
● partner alcohol use
● partner fighting with other men
● partner extramarital relationships
● intergenerational exposure to violence (partner mother abused, and partner abused as
child)
● women who contributed more than their husbands or partners to the household
● poverty
In both the 2010 and 2019 studies the strongest associations with violence by a husband/partner
were found with his behavioural characteristics and with experiences of violence.
There were differences between the 2010 and 2019 risk-factor analysis. In 2019, the higher the
educational attainment of the husband/partner the lower the risk of violence but this was not found
to be significant in 2010. In 2010, men’s higher age, was significantly associated with lower risk
of violence, but this relationship was not found in the 2019 analysis.
In 2010, not having children (compared with having one or more children) was significantly
associated with lower violence but this association did not appear in the 2019 analysis.
Finally, while geographical region was significantly associated with violence by a husband/partner
in 2010, there were no associations between geographical location and current husband/partner
violence in this study.
The 2019 analysis found that since the 2010 study, little has changed in Viet Nam in terms of
the risk factors placing women at higher risk of violence by their partners.

157
14. Conclusions and recommendations
14.1. General conclusions
Domestic and other forms of violence against women affects many women in Viet Nam with grave
consequences for them and their families. The prevalence of all types of violence, except sexual
violence, were lower in 2019 compared with 2010, which may be evidence that policies and
programmes are having affect. However, sexual violence was higher in 2019 than in 2010, and
almost two thirds of women still experienced one or more forms of violence in their lifetime.
Therefore, it should be recognised that the rate of change has been slow, showing that much
more concerted efforts are needed to eliminate violence against women in Viet Nam.
At the same time, it is important to recognise the positive changes which have taken place over
the past nine years since the first survey was conducted. Younger women seem to be
experiencing less violence and may have more equitable attitudes towards gender norms and
husband/partner violence. The gap between the experiences of older women versus younger
women seems to be widening.
Key findings from the 2019 study on violence against women are summarized as follows:
● Nearly two in three (62.9 per cent) women experienced physical, sexual, psychological
(emotional and controlling behaviours) and/or economic violence by a husband/partner at
some point in their life, and 31.6 per cent in the last 12 months.
● Except for sexual violence, prevalence of violence against women by husbands/partners
was lower in 2019 than in 2010 and this is especially true for younger women. Lifetime
sexual violence increased to 13.3% in 2019 from 9.9% in 2010.
● Husband/partner violence was experienced by far more women than non-partner violence
with significant consequences on their health, economic productivity, and well-being.
● Physical violence by a non-partner is mainly perpetrated by male family members and/or
friends/acquaintances (male or female), whereas sexual violence by a non-partner is
mainly perpetrated by male recent acquaintances, male friends/acquaintances or male
strangers.
● Women with disabilities have higher rates of all forms of violence by a husband/partner
than women without disabilities.
● Perceptions that a good wife should obey her husband even if she disagrees are still held
by more than a quarter of women (27.2 per cent) – same as in 2010 – but attitudes are
improving among younger women compared with older women.
● Women who experienced husband/partner violence have poorer general health, higher
probability of mental illness. They are also more likely to experience miscarriages,
stillbirths and abortions than women who do not experience violence.
● The intergenerational impacts of violence are evident – more women experiencing
violence by a husband/partner mentioned behavioural problems among their young
children. Being a child in a violent home is a risk factor for women ending up with a violent
husband/partner themselves and for men growing up to become perpetrators.

158
● Exactly as in the first study, half of the women who had experienced physical and/or sexual
violence by a husband/partner had told no one about it, and most women (90.4 per cent)
experiencing husband/partner violence did not seek any help. Only one in ten (9.6 per
cent) women sought help from formal services or authorities, and only 4.8 per cent from
the police.
● The economic costs of violence are significant with women who experienced violence in
the past 12 months spending about a quarter of their annual income on costs associated
with health care and/or replacing damaged/destroyed goods. It should be highlighted that
national productivity losses equivalent to 1.81 per cent of the 2018 Gross Domestic
Product.
● Low education (compared with no education), not working, having husband/partners with
expressions of harmful masculine behaviours (such as drinking, fighting with other men,
extramarital affairs), and experiencing or witnessing violence as a child, are characteristics
that put women at greater risk of husband/partner violence.
● The consistency of results between 2010 and 2019 across these different measures of
violence shows how robust the study is and what a valuable evidence base Viet Nam is
building for informing policies and programmes in the future.
Box 5: Considerations Strengths and limitations of the study
As in 2010, the 2019 study in Viet Nam used a methodology validated by the World Health
Organization for training and quality control. This methodology has been used cross-culturally for
almost two decades. The consistency of the results between the two studies also speaks for the
robustness and the high quality of the data.
It is important to realize that the findings reflect what women and girls were prepared to disclose
to the interviewers (who were trained to use methods to put women and girls at ease, interview in
private and ensure safety to increase disclosure). The considerable difference between the results
on child sexual abuse from the interview and the face card suggest that the reality of violence
could be higher than captured in the survey. As quantitative data are collected through a
household survey, there are groups of women not included such as: women living in institutions,
women with disabilities preventing them from independently completing the survey (e.g. cognitive
or hearing impairments), and women experiencing the most severe cases of violence (e.g. those
who are not at home because they are in hospital, or those who are incapacitated because of the
violence, isolated or locked up or too afraid to open doors). Finally, because of the cross-sectional
nature of the study only associations and not causality can be established.
14.2. Partner violence in Viet Nam and other countries in Asia and the Pacific
It is possible to make regional and international comparisons, particularly for physical and/or
sexual violence by a husband/partner, because relatively consistent measures have been used
by countries in Asia and the Pacific. It should be realized however that national prevalence rates
hide differences within countries as well as patterns within the prevalence measure, such as the
distribution of different acts of violence and frequencies of violent acts. Differences in questions
and methodologies used in the field are also not evident in the final rates. Ranking of countries is
not recommended and comparisons are provided as a guide to what has been found in the region.

159
In 2019, the prevalence of physical and/or sexual violence by a husband/partner in Viet Nam was
32.0 per cent for lifetime and 8.9 per cent for the last 12 months. Rates for Viet Nam and other
countries are shown in Figure 97 with the larger circles (shaded brown) representing lifetime rates
and the smaller orange circles within them showing current rates (last 12 months). The lifetime
prevalence of husband/partner violence ranges from 68 per cent of women in Papua New Guinea
to 15 per cent in the People’s Democratic Republic of Lao (Lao PDR) and in Japan. Rates for
husband/partner violence in the last 12 months are as high as 46 per cent of ever-
married/partnered women in Timor-Leste and Afghanistan to 4 per cent in Lao PDR and 6 per
cent in the Maldives.
Figure 97: Prevalence of physical and/or sexual violence by a husband/partner during lifetime and last 12 months for countries of Asia and the Pacific (latest year available between 2000 and June 2019)
Source: UNFPA Asia and the Pacific Regional Office. 2019. Regional Snapshot. kNOwVAWdata. Bangkok.
Two SDG indicators for Goal 5 can be produced from the 2019 study on violence against women
in Viet Nam. The first (indicator 5.2.1) relates to the physical, sexual and/or emotional violence by
a husband/partner in the last 12 months, which was 21.8 per cent of ever-married/partnered
women aged 15 to 64. Disaggregation by age, location and other characteristics are published in
the tables of this report and in Annex VIII.
The second, SDG indicator 5.2.2, is the prevalence of non-partner sexual violence in the last 12
months, which was 1.2 per cent of all women in Viet Nam in 2019. There are too few observations
to disaggregate this rate by age, location or other attributes.
Results for 2018: 32 per cent
lifetime and 9 per cent last 12
months

160
14.3. Recommendations and policy implications
The results of the 2019 study show that violence against women in Viet Nam remains prevalent
and it will require a variety of responses over time to substantially reduce it. In the 10 years since
the previous study there appears to be a positive shift in improving attitudes towards violence
among young women and women with higher levels of education. This suggests that information
and communication campaigns can impact generational change among the women who have
access to that information. However, the slow rate of change highlights that more than information
campaigns and law reforms are needed to eliminate violence. It is crucial that the 2019 study
results are used to inform a call for increased funding to step up effective actions in the areas of
policy, prevention and response.
Gender-based violence is a violation of basic human rights to life, physical integrity, health,
protection and security. Duty bearers are accountable to promote, protect and fulfil human rights,
especially of the most vulnerable population groups, including violence survivors. A structured
multisectoral approach involving all relevant agencies and organizations is needed to address
gender-based violence.
To address violence against women effectively, a structured, multi-sectoral approach involving all
relevant agencies and organizations is needed. These recommendations and policy implications
below have been developed in collaboration with stakeholders in Viet Nam. Experts from MOLISA
and the relevant sectors have guided the research team in documenting a comprehensive set of
recommended actions. They are based on the evidence provided by the 2019 study findings,
building on what was recommended in 2010 and responding to the national priorities and context
of violence against women in Viet Nam today.
As in the 2010 report, the recommendations are categorised under four main strategic pillars: (1)
Strengthening national commitment and action; (2) promoting violence prevention; (3) developing
appropriate responses and (4) supporting research, data collection and collaboration. While the
2010 report recommendations remain valid, they are also deepened based on new evidence from
the second national survey, informed by consultation with representatives from Ministries, national
and provincial level and local stakeholders.110
The recommendations and policy implications are presented below in a way that can be readily
extracted and shared for action planning and implementation.
110 National and Provincial Stakeholders consultation, Hanoi, 13 December 2019

161
Recommendations and policy implications of the National Study on
Violence against Women in Viet Nam 2019
1. Strengthening national commitment and action (policy)
1.1. Increase monitoring and tracking effective implementation of national policies
and laws on gender equality, prevention response to GBV, and alignment with
international commitments.
1.2. Review, evaluate, amend and revise existing national policies and laws aligning
with international commitments.
The Government of Viet Nam has a strong track record in formulating policy and legislation to
promote gender equality and women’s empowerment and to end violence against women. Viet
Nam was one of the first countries to ratify CEDAW, is a signatory to numerous other international
human rights treaties and is now working to achieve Sustainable Development Goal 5, “achieving
gender equality and empowering all women and girls”. Gender equality is enshrined in the
Constitution, in the Gender Equality Law and in the Domestic Violence Law and numerous
sectoral laws Gender-based violence is recognized as an area of priority in the National Strategy
for Gender Equality 2011–2020.
The Domestic Violence Law was reviewed in 2015–2016 with recommendations that the law
should be revised to: make clear the law’s intent, which is to prevent all forms of domestic
violence, and not to have a secondary intent of maintaining family unity; incorporate clear
definition of GBV and align the provisions on sexual violence with international standards, or a
minimum, with crimes to be prosecuted under the penal code 2015.
During 2017-2018, UNFPA supported MOLISA to conduct an independent review of the law on
gender equality. The review recommends the need to define harmful practices resulting in gender
inequality (e.g. gender-biased sex selection, sexual harassment, early or forced marriage); to
consider harmful practices as criminal; and to increase monetary sanctions for violations of
gender equality. The Law on Marriage and Family was revised in 2014.
Monitoring implementation of recommended changes in line with these recent reviews is timely,
and especially in areas highlighted in this report where there is room for improvement.
1.3. Review, revise, and supplement current policies and laws to ensure full
coverage and accessibility to support services for the most vulnerable groups
and groups that experience specific patterns of violence (e.g. child marriage and
dating violence). Allocate additional resources to understand barriers to help-
seeking among all women, especially vulnerable groups such as migrants,
ethnic minorities, youth and women with disabilities.
Despite the before-mentioned legal and policy frameworks in place to address gender-based
violence, challenges exist in relation to implementation, monitoring and evaluation, availability

162
and access of services and support and coordination. The qualitative research suggests that
perpetrators are unlikely to be held accountable, and currently only low-income households have
access to legal support. To increase access to legal support to all persons who experienced
violence, current conditions for eligibility could be removed. Moreover, policies are still weak with
regards to inclusion of the most vulnerable groups, such as migrants, ethnic minorities, youth and
women with a disability.
1.4. Introduce policies to promote prevention of and response to gender-based
violence by educating both women and men, especially young people, about
women’s rights, respectful relationships and social norms of gender equality.
In 2020 the revised youth law will be adopted providing an opportunity for stronger GBV
prevention and social norms work around GBV especially through schools and other education
structures. Once approved, this will provide a platform for the development of laws and policies
to better protect young people from violence.
1.5. Ensure adequate and sustained resource allocations are incorporated in
government budgets for effective implementation of interventions to prevent
gender-based violence, mitigate its impacts on women and promote robust
prosecution to signal no impunity for perpetrators of GBV.
Both the 2010 and 2019 report have established the significant economic costs for women,
households, communities and the overall economy. The gain for overall productivity in the
economy is significant – equivalent to nearly 1.8 per cent of the 2018 GDP. In fact, the various
out-of-pocket expenditures and loss of income that women experience is approximately 10,267
billion VNDs in 2019, which is equivalent to 0.68 per cent of government budget expenditure
(2018). It is imperative that government assess actual government expenditure and prioritize
budget allocations for prevention and service provision activities to counter the losses women are
experiencing currently.
1.6. Convene a state management agency on gender equality to lead coordination of
work on prevention and response to gender-based violence and violence
against women and girls
Establishing a cross-government agency to collaborate with the national management agency on
gender equality to coordinate the work on gender equality and prevention of and response to
gender-based violence will help to prevent overlap, save resources and ensure systems are
aligned. Member agencies should include the primary agencies and ministries responsible for
implementing prevention and response to GBV, domestic violence.
2. Increase violence prevention (early prevention before violence happens as well as
stopping violence)
2.1. Recognize the links between GBV and gender equality, develop, implement and
monitor programmes aimed at the prevention of gender-based violence by
promoting gender equality, in particular through public awareness and by
involving local communities.

163
Some salient research findings include that still many women believe that their husbands’ violent
behaviours are “normal”, although, encouragingly the proportion mentioning this is lower than a
decade ago. Efforts to challenge widespread tolerance and acceptance of many forms of violence
against women and children remain essential to address these deeply held beliefs about violent
behaviour in the family. Awareness about gender equality and gender-based violence, related
laws and policies, available services and support needs to be scaled up at the national level and,
in particular, at community the level.
Prevention strategies should include the education and mobilization of bystander activity to
sensitively intervene when gender inequality and violence is witnessed. In Vietnamese society to
be effective, it will be particularly important to mobilize men to call other men to account for their
actions and beliefs that diminish gender equality.
There have been many initiatives to promote gender equality and women’s rights through policy,
communication and media initiatives in Viet Nam gender equality, prevention and response to
GBV; the national month on prevention and control of domestic violence (June) and National
action month for gender equality, prevention and control of GBV (November - December).
Mass organizations such as the Women’s Union, Farmers’ Union and Youth Union have started
to incorporate gender equity and GBV messages in some of their communications. In addition,
non-governmental organizations and international non-government organisations have closely
collaborated with national management agencies, UN and development partners to deploy
communication initiatives with various models and modalities towards young people, people with
disabilities and LGBTI+ groups.
Many activities and communication campaigns have contributed to change perception and
behaviours of different people groups in communities.
As many information campaigns have been initiated since the 2010 study, it would be timely to
conduct a review and evaluation of their impact and effectiveness to inform future awareness-
raising activities. It would be prudent to include monitoring and evaluation of all initiatives going
forward. It should be noted that behavioural changes require long-term investment and consistent
messaging to be successful.
While the intergenerational transmission of violent behaviours occurs, it is not pre-determined.
Many violent men grow up in non-violent families and not all boys in violent families become
violent themselves. Therefore, while it is very important to stop learned behaviour within the
family, it is equally important to examine the social constructs of masculinity that exist in the wider
community
Preventing violence against women requires changing the gender-related attitudes, beliefs,
norms, stereotypes and values of both men, women and young people, including children.
Prevention efforts should include multimedia (especially social media) and other public awareness
activities to challenge gender inequality, violence supportive attitudes and behaviours; to counter
the attitudes and beliefs that condone husband/partner violence against women as normal and
acceptable; and to reduce the stigma, shame and denial about violence by a husband/partner.
These public awareness activities also should include a discussion of the impact of gender-based
violence on children, family, society and the country. Mass communication strategies and

164
community-based approaches should be strengthened (e.g. legal literacy programmes, local
media initiatives) as well as activities to target specific risk factors for violence such as alcohol
use. It is most effective to use various types of communication and awareness-raising strategies
such as community outreach, mobilization, mass media campaigns and face-to-face and peer
education.
There is also the need to strengthen the involvement of men and boys in prevention activities.
Men can be peer agents of change and can help other men understand the impact of violence to
their families and loved ones as well as to their own lives and well-being. Media strategies that
encourage men who are not violent to speak out against violence and challenge its acceptability
will help counter notions that all men condone violence.
In addition to sustained and coordinated campaigns at the national and community levels to raise
awareness about gender equality and GBV, it is also crucial to include changed norms into all
sectors and institutions that will reach the individual, family and community levels. These include
integrating gender equity norms into faith-based organizations, clan regulations, village
regulations, People’s Committees’ structures and practices and ensuring representation of
women in local decision-making positions.
Finally, improved, specialized capacity-building training and technical assistance for GBV-related
mass communication activities for influencing the public and for responsible media reporting will
be vital.
Expand the education curricula to include gender equality and prevention and response to GBV
to transform young people’s understanding and to make schools safer places. The results show
that a notable portion of children who grow up with violence normalize this as part of their
behaviour and lives as adults. In collaboration with recommendation 1.3, interrupting the cycle of
intergenerational violence involves sensitizing young people early. Sustainable prevention of GBV
will rely on transforming young people’s understandings of gender roles, how to communicate
about problems and how to resolve conflicts without violence. The education sector provides key
opportunities to sensitize students and teachers on issues that promote gender equity and GBV
prevention.
The education system in Viet Nam has begun to implement projects to integrate gender equality
and GBV prevention into curricula. These efforts should be scaled up, provided support and
evaluated while additional new promising practices are also introduced. In addition, other forms
of GBV that affect students (including child sexual abuse, sexual harassment, dating violence,
etc.) should be addressed. Teaching and administrative school staff and children should be
trained about how to prevent and respond to sexual harassment at schools. Finally, there should
be school-based and community-based services for youth relating to GBV, i.e. trained school
health providers or other staff who can identify and provide intervention services for child abuse,
child sexual abuse, date rape and other forms of violence.

165
2.3 Maximize intersectoral coordination and collaboration to continue to
substantially empower women to address violence in their lives through life
skills training, self-help groups, education, job training and legal and financial
support.
Substantially empowering women and girls to exercise control over their own decision-making is
a significant aspect of violence prevention and response. Activities that support women’s
empowerment include self-help and support groups, life skills training, education and vocational
training and legal and financial support that enable women to take desired actions. Similarly, these
trainings are also important for men and boys including themes of gender equality and respect for
women.
In addition, capacity-building for women and girls to understand their rights and to have skills in
addressing violence is important. All of these should go hand-in-hand with efforts to enhance the
participation of women and girls in decision-making processes both in the public and private
spheres.
Viet Nam has a strong record in narrowing gender parity in education and increasing women’s
participation in the labour force. Women’s double role – as caregivers and workers – can constrain
women’s ability to participate in formal employment and in decision-making at all levels. Greater
efforts need to focus on tackling gender-based discrimination, increasing women’s participation
in decision-making, ensuring equitable access to income- generating opportunities and social
protection and addressing violence against women and girls.
3. Developing and deploying appropriate, effective and high-quality response and
intervention solutions
1.1. Increase and coordinate multisector engagement and mobilization of community
leaders and local authorities to address violence against women, promote gender
equality, in particular through ensuring accountability of the functioning agencies
working on responses to perpetration of GBV and support for victims/survivors.
The findings showed that in the worst experiences of violence by a husband/partner, when a
woman feels that it is impossible for her to endure any longer or she feels that she or her child
are in immediate danger, she tends to seek help from local authorities. However, research results
indicate that often women do not feel adequately helped or supported by these authorities. Many
times, service providers are not well trained to respond in helpful ways and may unintentionally
blame women for the violence. When service providers do not respond in a supportive fashion,
women stay silent and endure continued violence and abuse under pressure to keep family
harmony.
Community leaders and local authorities, including the Women’s Union, Farmers’ Union and
Youth Union, play significant roles in raising awareness about gender-based violence issues and
legal frameworks, challenging norms and stereotypes, providing counselling support, preventing
violence through various interventions and handling perpetrators. Interventions and activities at
the community level should seek to engage local leaders and have the authority to mobilize their
support. They should be sensitized and provided with information about policies and legal
frameworks on gender-based violence, informed on effective practices and provided with accurate
understanding of the dynamics of GBV. Leaders from different sectors should work collaboratively

166
to provide holistic and sensitive responses to gender-based violence issues and should be held
accountable where appropriate. Specific GBV positions, across different levels could be helpful
to ensure effective coordination and collaboration of efforts.
1.2. Review current models of interventions.
To date Viet Nam has ample experience with a number of models of interventions, including the
centres providing support services for GBV/DV survivors and trafficked victims. These include
social work centres, shelters and safe houses, consultation rooms in schools and hospitals, as
well as telephone helpline. The implementation of mediation (as per the 2013 Law on Mediation
at grass roots level) and the free legal assistance have also been positive resources. It is good
time to review these models, whom they reach and who is excluded, what are the barriers to
access, what is the impact and what are the unintended consequences. A review of the
interventions would provide opportunity to learn from the experience for future directions.
Continue to test and scale-up new and different models of intervention that are potentially
effective. Review pilot programmes already launched and consider introducing well-researched
programmes for perpetrators that aim to change behaviour and break the cycle of violence. Small
scale projects with social work services have been successfully piloted in Viet Nam to expand the
response to victims and should be scaled up.
1.3. Strengthen implementation of an essential services package111 of GBV prevention
and response, treatment and support, accessible and affordable to everyone in Viet
Nam.
The report shows that despite a decade of campaigns women keep silent about their experience
of violence. They rarely seek help for various reasons, including stigma, social norms about family
harmony that pressure women to give in and accept the violence, limited awareness of services
and support networks and a lack of gender-sensitive treatment, protection and support services.
The research suggests that if the violence is serious women will seek help and disclose the
violence. However, precautions must be taken to assure their safety after disclosing their
situation.
Given the high levels of suffering and the impact that violence has on women, children, family,
society and the nation, women should be able to access an essential services package to ensure
that their rights are protected and realized. Service implementation should be strengthened in
terms of safety and security, emergency shelter, counselling services and self-help groups,
medical treatments and referral services and economic and legal support. These services need
to be available, accessible and affordable to all groups of the population.
111 See for example https://www.unfpa.org/essential-services-package-women-and-girls-subject-violence or
www.iawg.net/resources/minimum-initial-service-package-misp-resources

167
Lessons learned from services piloted and implemented in the past decade should be
documented and shared.112 Good practices should be replicated nationwide. To strengthen
implementation essential services to violence survivors nationally, the report calls for increased
political and financial commitments from the central and local levels.
1.4. Evaluate progress and continue to improve the health sector response to the
various impacts of violence against women.
The results show the diverse and far-reaching impact of violence on women’s and children’s
physical and mental health and emotional well-being. Establishing comprehensive health sector
responses to different forms of violence against women is of critical importance.
At the service level, responses to violence against women should be integrated into all areas of
care such as emergency services, sexual and reproductive health services (antenatal care, family
planning and post-abortion care), mental health services and HIV/AIDS-related services. Health
care providers are in many instances the first to learn about a situation of GBV, although as the
research showed, many women are reluctant to speak about what is happening to them, even if
they access health services for health problems due to violence.
Health care providers need to be trained about how to screen adequately for and sensitively
provide services and information to violence survivors. Medical treatment also should be
complemented by counselling and referral services. Health care providers should be equipped
with resources and infrastructure, as well as skills and knowledge about how to work
collaboratively with other sectors such as the police, judges and social workers to address
violence holistically against women.
Procedures and protocols should be implemented to ensure confidentiality and safety of abused
women and girls. MOH has commenced violence-related data collection and reporting within the
greater Health Management Information System (HMIS). The data should be reviewed and
publicly reported on. Health facilities may also reach out to the community to raise awareness of
their services.
Health care providers also may be victims and perpetrators of violence. Before the health system
can offer appropriate support and response, it needs to ensure there are knowledge and
awareness-raising programmes as well as response services in place for their own staff who may
recognize violence in their own relationships. In addition, GBV awareness should be included in
medical training curriculum.
At the policy level, the Ministry of Health issued the circular No. 24/2017TT-BYT dated in May
2017 providing guidance on the admission and provision of health care and reporting on patients
who are victims of domestic violence at medical clinics and health institutions.113 This was a
significant initiative by the health sector in responding to women and other users of health services
112 2012–2016 UNFPA supported MOCST to pilot the “minimum intervention package on DV”. The review of the model was conducted and a replication plan at nationwide level was recommended. From 2017–2019, UNFPA, UN women, UNODC and WHO have been supporting the Viet Nam pilot of the essential service package for GBV survivors. 113 Viet Nam Ministry of Health. 2017. Circular 24/2017/TT-BYT.

168
who experienced violence. Although efforts have been made to promote the distribution of this
circular, its implementation still remains a challenge, especially since it needs adequate financial
and human resources and commitments at all levels.
1.5. Strengthen capacity of relevant officers of MOLISA to increase effective
coordination of prevention and response to GBV.
Viet Nam has introduced a number of programs and services to address gender equality, as well
as prevent and respond to GBV. To avoid duplication of effort and ensure ongoing improvement
of these programs, a government management agency could be assigned to lead and coordinate
the initiatives. A lead agency could identify and replicate effective models for prevention and
response to GBV while continuing to enhance gender training and increasing community
awareness on attitudes towards GBV behaviour. The agency would have an important role of
coordinating information and collecting data on GBV and service providers for prevention and
response to GBV.
1.6. Continue to strengthen the capacity of the police and judicial system to
implement policies and legislation related to GBV/DV through sensitization
training, standard operating procedures and accountability mechanisms.
Results show that police and the formal legal system – the judiciary and the courts – are not often
approached by abused women. Besides the stigma and shame, the combination of low levels of
awareness among women about the availability and procedures to access legal aid services and
the lack of knowledge about GBV by the justice system gatekeepers creates significant barriers
for women accessing justice.
The police and judicial systems, including legal aid officers, legal aid centres and judges should
be equipped with skills and knowledge about policies and legal frameworks of GBV, about how
to provide gender-sensitive services to survivors and about how to approach and handle
perpetrators appropriately. Using formal systems to hold perpetrators to account for their use of
violence and controlling behaviour has been found to be one of the most effective methods of
reducing gender-based violence, and over time, preventing violence. Learning modules should
be co-developed by GBV specialists alongside police and member of the judiciary themselves.
In Viet Nam, there are a number of successful pilot models to sensitize and strengthen the
capacity of legal aid centres and police to provide support sensitively to women experiencing
violence. Legal aid service centres and the police should not play a passive role in combating
violence. These institutions should reach out to the communities to advertise their services,
improve awareness and increase the accessibility and availability of legal aid services for violence
survivors.

169
4. Supporting research, data collection and collaboration to address GBV
4.1 Invest in a review of international best practice bystander and perpetrator
programmes for intervening and stopping violence with a view to adapt and trial
programmes in Viet Nam.
Globally there have been many trials on changing attitudes, knowledge and understanding in
order to prevent and support intervention to stop GBV. There are Community attitudes surveys
and community education and messaging programmes, programmes encouraging bystanders
witnessing violence to intervene, especially men and boys, and perpetrator programmes. While
the evidence base of effectiveness overall is still inconclusive, there are some positive indications
of ways in which these programmes can have impact on different segments of the population.
Activities that hold perpetrators to account and change global understanding to reduce
acceptance of GBV are important areas for development. Viet Nam could explore the best
developed programmes to consider adaptation and trial in local communities.
4.2 Promote availability of the study to the research community in Viet Nam and
beyond to encourage use of the data for further research
The two national studies provide a wealth of data that can be explored further for secondary
research. For this to occur, a policy on data use should be developed and implemented that
explains criteria and conditions for such use (to avoid that data is misused, wrongly analysed
and to ensure that the study and the principal owners are properly acknowledged and have
cleared the secondary analysis). Further the data and tables as presented in the survey report
should be made available in easy format (excel) for ease of use and replication. A working
group should be set up to develop protocols and ensure appropriate implementation.
Membership of this working group should include the National Statistics office, MOLISA and
women’s support sector groups.
In addition, Viet Nam could strengthen other data recording of GBV in administrative data sets
held by health systems, service providers and legal systems. Cross-sector data recording will
enable more accurate measure of the frequency of service provision and cost to the service
system.
Strengthen the evidence base to improve policies, laws and quality services on prevention
and response to GBV that is relevant to Viet Nam through further in depth research on this
area. Further research projects and activities are needed to provide relevant statistics and current
understanding about gender attitudes and other drivers of GBV among majority and minority
populations and among marginalized groups who were not included in this research project. There
is still a big gap of knowledge and evidence in the area of gender-based violence in Viet Nam.
Results of this study were presented in three separate stakeholder consultations to help
contextualize the findings and collaboratively develop key recommendations. Discussion about
the findings also identified areas for further programme planning and research including:
- Research around the current shelter and health care services: Are they gender-sensitive
and are their responses to victims/survivors appropriate. What is their coverage
nationwide?

170
- Research among health care providers to understand the barriers within the system that
prevent GBV detection, and responses when GBV is identified.
- Research on communication and advocacy campaigns: What are the current messages,
are they gender-sensitive and appropriate, how are they understood, can they be
improved to have more effect, what are the best mechanisms for communication across
different population cohorts and contexts?
- On mediation: Are the regulations in the 2013 Law on reconciliation/mediation working?
Which case are seen? Does the law help to reduce GBV?
- Who has access to legal support in cases of GBV? What barriers remain to access the
legal services in cases of GBV?
- On police response: Work collaboratively with police to co-develop suitable training
modules; research around current police practice, understanding of police attitudes and
knowledge about GBV in order to improve responses. Research with victims/survivors
who have called police can be helpful to illustrate examples to the police? What
perceived barriers do victims/survivors hold that prevents them from calling police?
- Establishing a national data system to collate incidents of GBV across the service sector.
Measuring incidents of violence in the service system will assist response improvement
as organizations come to identify GBV among their clients.
- As programmes and services evolve, ensure systems for collecting administrative data
are set up with comparable minimum data requirements.
It is also significantly important to continue to monitor the prevalence of VAW by conducting this
national survey regularly – for example, every seven to ten years. The Government should
consider including this survey into national survey plans, and with budget allocated.

171
References Abramsky T, Watts CH, Garcia-Moreno C, Devries K, Kiss L, Ellsberg M, Jansen HAFM, Heise L. 2011.
What factors are associated with recent intimate partner violence? Findings from the WHO multi-country
study on women’s health and domestic violence. BMC Public Health; 11:109.
Ansara DL, Hindin MJ. 2010. Formal and informal help seeking associated with women’s men’s
experiences of intimate partner violence in Canada. Soc Sci Med 2010; 70: 1011-18.
Asante F, Fenny A, Dzudzor M, Chadha M, Scriver S, Ballantine C, Sabir M, & Duvvury N. 2019.
Economic and Social Costs of Violence Against Women and Girls in Ghana: Country: Technical Report.
Galway: NUI Galway.
Barbieri M and Bélanger D. 2009. Reconfiguring Families in Contemporary Viet Nam. Stanford University
Press.
Black CM. 2001. Intimate partner violence and adverse health consequences: implications for clinicians.
Am J Lifestyle Med: 5: 428-39.
Bonomi AE. Anderson ML, Rivara FP, Thompson RS. 2009. Health care utilization and cost associated
with physical and nonphysical-only intimate partner violence. Health Serv Res: 44: 1052-67.
Center for Creative Initiatives in Health and Population (CCIHP). 2019. ICPD+25 monitoring report.
Decker MR, Latimore AD, Yasutake S, Haviland M, Ahmed S, Blum RW, Sonenstein F, Astone AM. 2015.
Gender-based violence against adolescent and young adult women in low- and middle-income countries.
J Adolesc Health; 56(2):188–96.
Djamba, Y. 1997. Theoretical Perspectives on Female Sexual Behaviour in Africa: A Review and
Conceptual Model. African Journal of Reproductive Health 1997 1 (2): 67–78. doi:10.2307/3583377
Dobash R and Dobash R. 1979. Violence against wives: a case against patriarchy. New York: Free
Press.
Duvvury N, Minh N, & Carney P. 2012. Estimating the cost of domestic violence against women in Viet
Nam. 1st edition. Hanoi, Viet Nam: UN Women.
Duvvury N, Marcos M, Gadallah M, Attia S, El Adly N, Mageed W, and Haddad G. 2016. The Egypt
Economic Cost of Gender Based Violence Survey (ECGBVS). Cairo: UNFPA.
Elmusharaf K, Scriver S, Chadha M, Ballantine C, Sabir M, Raghavendra S, & Edopu P. 2019. Economic
and Social Costs of Violence Against Women and Girls in South Sudan: Country Technical Report.
Galway: NUI Galway.
Fiaveh D, Izugbara C, Okyerefo M, Reysoo F, and Fayorsey C. 2015. Constructions of Masculinity and
Femininity and Sexual Risk Negotiation Practices among Women in Urban Ghana. Culture, Health &
Sexuality; 17 (5): 650–662. doi:10.1080/13691058.2014.989264.
Garcia-Moreno C et al. 2015. Addressing Violence Against Women: A Call to Action, The Lancet 385, no.
9978.
Garcia-Moreno C, Jansen HAFM, Ellsberg M, Heise L and Watts C. 2005. WHO multi-country study on
women’s health and domestic violence against women. Initial results on prevalence, health outcomes
and women’s responses. WHO, Geneva.
Gelles RJ. 1976. Abused wives: why do they stay? J. Marriage Fam. 38 (4),659e668.

172
Ghaus K, Ali A, Anis R, Areeb T, Sabir M, Chadha M, Ballantine C, Scriver S, & Duvvury N. 2019.
Economic and Social Costs of Violence Against Women and Girls in Pakistan: Country Technical Report.
Galway: NUI Galway.
Glass N, Fredland N, Campbell J, Yonas M, Sharps P, Kub J. 2003. Adolescent dating violence:
prevalence, risk factors, health outcomes, and implications for clinical practice. J Obstet Gynecol
Neonatal Nurs; 32(2):227–38.
Goode W. 1971. Force and violence in the family. J. Marriage Fam.; 33, 624e636.
Greene MC, Kane JC, Tol WA. 2017. Alcohol use and intimate partner violence among women and their
partners in sub-Saharan Africa. Global Mental Health.;4:e13. https://doi.org/10.1017/gmh.2017.9.
Heise L. 1998. Violence against women: an integrated, ecological framework. Violence Against Women;
4:262–290
Heise L, Ellsberg M and Gottemoeller M. 1999. Ending Violence Against Women, Population Reports 27,
no. 4.
Heise L and Kotsadam A. 2015. Cross- National and Multilevel Correlates of Partner Violence: An
Analysis of Data from Population- Based Surveys. The Lancet Global Health 3, no. 6.
HelpAge International. 2018. Global AgeWatch Insight Viet Nam Report Card. HelpAge: Viet Nam.
Horton P et al. 2001. Heterosexual Masculinity in Contemporary Viet Nam. Men and Masculinities 14, no.
5, 542-564.
Hotaling GT, Sugarman DB. 1986. An analysis of risk markers in husbands to wife violence: The current
state of knowledge. Violence and Victims; 1, 101-124.
Humphreys J, Epel ES, Cooper BA, Lin J, Blackburn EH, Lee KA. 2012. Telomere shortening in formerly
abused and never abused women. Bio Res Nurs 2012; 14: 115-23.
Jansen HAFM et al. 2004. Interviewer Training in the WHO Multi-Country Study on Women’s Health and
Domestic Violence. Domestic violence, 10(7):831-849
Jansen HAFM, Ng Nguyen TV and Hoang TA. 2013. Why do some Women Experience Violence More
than the Others? Viet Nam: UNFPA.
______. 2016. Exploring risk factors associated with intimate partner violence in Viet Nam: results from a
cross-sectional national survey. Int J Public Health;61:923–34. https://doi.org/10.1007/s00038-016-0879-
8.
Jewkes RK. 2002. Intimate partner violence: causes and prevention. Lancet; 359(9315): 1423–
1429.doi:10.1016/S0140- 6736(02)08357-5.
Kalmuss DS and Straus MA. 1982. Wife's marital dependency and wife abuse. J. Marriage Fam.; 44 (2),
277e286.
Kessler RC, Green JG, Gruber MJ, Sampson NA, Bromet E, Cuitan M, Furukawa TA, Gureje O, Hinkov
H, Hu CY, Lara C, Lee S, Mneimneh Z, Myer L, Oakley-Browne M, Posada-Villa J, Sagar R, Viana MC &
Zaslavsky AM. 2010. Screening for Serious Mental Illness in the General Population with the K6
screening scale: results from the WHO World Mental Health (WMH) survey initiative, International Journal
of Methods in Psychiatric Research, Vol 19: 4-22.

173
Koenig MA, Lutalo T, Zhao F, Nalugoda F, Wabwire-Mangen F, Kiwanuka N, et al. 2003. Domestic
violence in rural Uganda: evidence from a community-based study. Bull World Health Organ.; 81(1):53–
60.
Krug EG et al., eds. 2002. World report on violence and health. Geneva, World Health Organization
Macmillan R, Gartner R. 1999. When she brings home the bacon: labour-force participation and the risk
of spousal violence against women. J Marriage Fam.;61:947–58.
McCloskey LA, Williams C, Larsen U. 2005. Gender inequality and intimate partner violence among
women in Moshi, Tanzania. Int Fam Plan Perspect.; 31(3):124–30.
McGlade, H. 2012. Our greatest challenge: Aboriginal children and human rights. Canberra: Aboriginal
Studies Press.
Nash ST. 2005. Through Black eyes: African American women’s constructions of their experiences with
intimate male partner violence. Violence Against Women, 11(11), 1420-1440.
National Center for Injury Prevention and Control (NCIPC). 2003. Costs of intimate partner violence
against women in the United States. Atlanta: Center for Disease Control.
Peterman A, Pereira A, Bleck J, Palermo TM, Yount KM. 2017. Women’s individual asset ownership and
experience of intimate partner violence: evidence from 28 international surveys. Am J Public Health.;
107(5):747–55. https://doi.org/10.2105/AJPH.2017.303694.
Prime Minister. 2015. Decision No. 1696/QD-TTg approving the National Action Programme on Gender
Equality for 2016-2020.
Raj A, Saggurti N, Lawrence D, Balaiah D, Silverman JG. 2010. Association between adolescent
marriage and marital violence among young adult women in India. Int J Gynaecol Obstet.; 110(1):35–9.
Rydstrom H. 2003. Encountering "Hot" Anger: Domestic Violence in Contemporary Viet Nam. (Special
Issue: Responses and Challenges to Violence Against Women in East and Southeast Asia), Violence
Against Women 9, no. 6.
Schuler SR et al. 2006. Constructions of Gender in Viet Nam: In Pursuit of the 'Three Criteria," Culture, Health & Sexuality 8, no. 5, 383-394. United Nations. 1979. Convention on the Elimination of All Forms of Discrimination against Women. https://www.ohchr.org/en/professionalinterest/pages/cedaw.aspx _______. 1993. Declaration on the Elimination of Violence against Women. United Nations General Assembly Resolution, document A/RES/48/104. New York, NY. https://www.ohchr.org/EN/ProfessionalInterest/Pages/ViolenceAgainstWomen.aspx UNFPA Asia and the Pacific Regional Office. August 2016. Measuring Prevalence of Violence against Women: Key terminology. kNOwVAWdata. Bangkok. _______. 2019. Violence against Women - Regional Snapshot. kNOwVAWdata. Bangkok. Viet Nam General Statistics Office. 2010. 'Keeping Silent is Dying': Results from the National Study on Domestic Violence Against Women in Viet Nam. Hanoi, Viet Nam: GSO. _______. 2012. Multiple Indicator Cluster Survey Viet Nam 2011: Key Findings Hanoi, Viet Nam: GSO. _______. 2014. Viet Nam 2013-2014 Multiple Indicator Cluster Survey (MICS). Hanoi: GSO. _______. 2019. Preliminary results of Population and Household Census. GSO. Hanoi, Viet Nam.

174
Viet Nam Ministry of Health. 2009. Circular 16/2009/TT-BYT. Viet Nam National Assembly. 2006. Law on Gender Equality. Hanoi, Viet Nam. _______. 2007. Law on Domestic Violence Prevention and Control, Vol. 02/2007/QH12 Hanoi, Viet Nam. _______. 2013. Constitution of the Socialist Republic of Viet Nam. Hanoi, Viet Nam. _______. 2014. Marriage and Family Law. Hanoi, Viet Nam. Viet Nam News. 2019. GDP in first three quarters climbs to 9-year high. https://Viet Namnews.vn/economy/536134/gdp-in-first-three-quarters-climbs-to-9-year-high.html#cWHEMmiH5ZukyxLw.97 Vyas S and Kumaranayake L. 2006. How to do (or not to do). Constructing socio-economic status
indices: how to use principal components analysis. Health Policy Plan.; 21:459–468
Vyas S and Watts C. 2009. How does economic empowerment affect women’s risk of intimate partner
violence in low and middle income country settings? A systematic review of published evidence. J Int
Dev.; 21:577–602.
Vyas S and Heise L. 2016. How do area level socioeconomic status and gender norms affect partner
violence against women? Evidence from Tanzania. Int J Public Health.; 61:971–80.
https://doi.org/10.1007/s00038-016-0876-y.
Vyas S. 2013. “Estimating the Association between Women’s Earnings and Partner Violence: Evidence
from the 2008–2009 Tanzania National Panel Survey.” Women’s Voice, Agency, and Participation
Research Paper 2, World Bank, Washington, DC
Washington Group on Disability Statistics: Short Set of Disability Questions. http://www.washingtongroup-
disability.com/washington-group-question-sets/short-set-of-disability-questions/
WHO. 2001. Putting women first: Ethical and safety recommendations for research on domestic violence
against women. Geneva, World Health Organization.
http://whqlibdoc.who.int/hq/2001/WHO_FCH_GWH_01.1.pdf
WHO, London School of Hygiene and Tropical Medicine. 2010. Preventing intimate partner and sexual
violence against women: taking action and generating evidence. Geneva: World Health Organization.
______. 2013. Global and regional estimates of violence against women: prevalence and health effects of
intimate partner violence and non-partner sexual violence. Geneva: World Health Organization.
World Bank. 2014. Voice and agency: empowering women and girls for shared prosperity. Washington,
DC: World Bank.
Yount KM et al. 2014. Measuring Attitudes about Intimate Partner Violence Against Women: The ATT-IPV
Scale. Demography 51, no. 4, 1551-1572.

175
ANNEXES
Annex I: Research team, field staff and task force members
Research team
Dr. Kristin Diemer, Lead Consultant, the University of Melbourne, Australia
Dr Henrica A.F.M. (Henriette) Jansen, Technical Advisor, Violence against Women, Research and Data, / Technical lead kNOwVAWdata, UNFPA Asia and the Pacific Regional Office (APRO)
Dr. Nata Duvvury, Costing Consultant, Centre for Global Women’s Studies, National University of Ireland, Galway, Ireland
Ms. Jessica Gardner, Data Analysis & Gender Statistics Consultant
Ms. Hoang Tu Anh, Qualitative Consultant, Co-director of the Center for Creative Initiatives in Health and Population (CCIHP)
Ms. Phan Thi Minh Hien, Data Analysis Consultant
Dr. Seema Vyas, Risk Indicator, Gender and Development Consultant
Advisory group
Ms. Mia Urbano, Regional Social Development Specialist, South East Asia Region, Department of Foreign Affairs and Trade, Australian Embassy
Ms. Than Thi Thien Huong, Gender Specialist, Department of Foreign Affairs and Trade, Australian Embassy
Ms. Ingrid FitzGerald, Technical Adviser, Gender and Human Rights, United Nations Population Fund, Asia and the Pacific Regional Office (UNFPA APRO)
Dr Henrica A.F.M. (Henriette) Jansen, Technical Advisor, Violence against Women, Research and Data, / Technical lead kNOwVAWdata, UNFPA Asia and the Pacific Regional Office (APRO)
Mr. Le Bach Duong, Assistant Representative of UNFPA Country Office in Viet Nam
Ms. Le Thi Phuong Mai, Population and Development Specialist, Data for Development, UNFPA Country Office in Viet Nam
Ms. Nguyen Ngoc Quynh, Program Analyst, Inclusive Growth & Social Protection, UNFPA Country Office in Viet Nam
Ms. Ha Thi Quynh Anh, Programme Specialist, Gender and Human Rights, UNFPA Country Office in Viet Nam
Ms. Nguyen Thi Nga, Programme Analyst, Domestic Violence and Gender Based Violence, UNFPA Country Office in Viet Nam
Mr. Pham Ngoc Tien, Director of Gender Equality Department, MOLISA
Ms. Tran Thi Bich Loan, Vice Director of Gender Equality Department, MOLISA
Mr. Do Anh Kiem, Director of Social and Environmental Statistics Department, GSO. Ms. Nguyen Thi Viet Nga, Expert, Social and Environmental Statistics Department,
GSO.

176
Ms. Nguyen Thu Ha, Expert, Department of Family, Ministry of Culture, Sports, and Tourism (MOCST)
Ms. Dao Thi Vi Phuong, Vice Director of Legal and Policy Department, Viet Nam Women Union
Mr. Vu Manh Loi, Vietnam Academy of Social Sciences (VASS)
Ms. Khuat Thu Hong, Director of the Institute for Social Development Studies (ISDS)
Other staff and consultants from GSO
1. Cao Thanh Son
2. Ngo Doan Thang
3. Nguyen Đuc Hạnh
4. Nguyen Phuong Anh
5. Nguyen Quang Phuong
6. Nguyen Thanh Liem
7. Nguyen Thanh Ngọc
8. Nguyen Thanh Tu
9. Nguyen Thi Bich Phuong
10. Nguyen Thi Hon
11. Nguyen Thi Khanh Huyen
12. Nguyen Thi Quy Ngoc
13. Nguyen Thi Thanh Tam
14. Nong Thi Dieu Linh
15. Pham Duc Duong
16. Pham Thi Hanh
17. Pham Xuan Luong
18. Than Viet Dung
19. To Thuy Hanh
20. Vo Thanh Son
21. Vu Thi Bich Thao
22. Vuong Trong Thanh
List of interviewers for quantitative survey
1. Nguyen Thu Thuy
2. Tran Thi Thuy
3. Ngo Thi Thanh Huyen
4. Ho Thi Hoang Long
5. Tran Thi Ngoc Dung
6. Nguyen Thi Tham
7. Vu Thi Thanh Tam
8. Nguyen Thi Loan
9. Nguyen Thi Thu Huong
10. Ngo Thi Hoa
11. Luan Thi Hoa
12. Nguyen Thi Nhu Thuy
13. Nguyen Thi Ngoc Thang

177
14. Pham Thi Hong
15. Nguyen Thi Phuong
16. Pham Thi Thinh
17. Nguyen Thi Nhu Hang
18. Đinh Ngoc Bich
19. Nguyen Thị Duyen
20. Đo Thi Lua
21. Nguyen Thi Ngan
22. Nguyen Thi Thanh Thuy
23. Trieu Thi Hien
24. Ngo Ngoc Huong
25. Bui Hoang Quyen
26. Tran Thi Ngoc Anh
27. Tran Thi Thuy
28. Hoang Thi Thanh Tam
29. Vu Thi Kim Quy
30. Đo Thi Huong
31. Vuong Thuy Quynh
32. Vu Minh Họa
33. Nguyen Thi Ha
34. Nguyen Thi Thu
35. Nguyen Thi Khanh
36. Nguyen Thi Thuy
37. Phung Thi Toan
38. Vu Thi
39. Vu Le Huyen
40. Nguyen Kim Thao
41. Pham Thanh Huyen
42. Trinh Thi Muoi
43. Pham Thi Huyen
44. Nguyen Thi Ngoc Lien
45. Bui Thi Ngoc Thuy
46. Hoang Quynh Que
47. Đao Thị Hong Gam
48. Pham Thanh Phuong
49. Vo Thi Thuy Duong
50. Hoang Thi Thuy
51. Đau Thi Ha
52. Huynh Thi Thanh Van
53. Pham Mai Le
54. Tran Thi Tuyet Trinh
55. Nguyen Thi Nga
56. Thai Thi Hai Duyen
57. Tran Thi Ngoc Mai
58. Phan Thi My Linh
59. Nguyen Ly Minh Tuyet
60. Phan Thi Bach Yen
61. Đo Thi Quyen
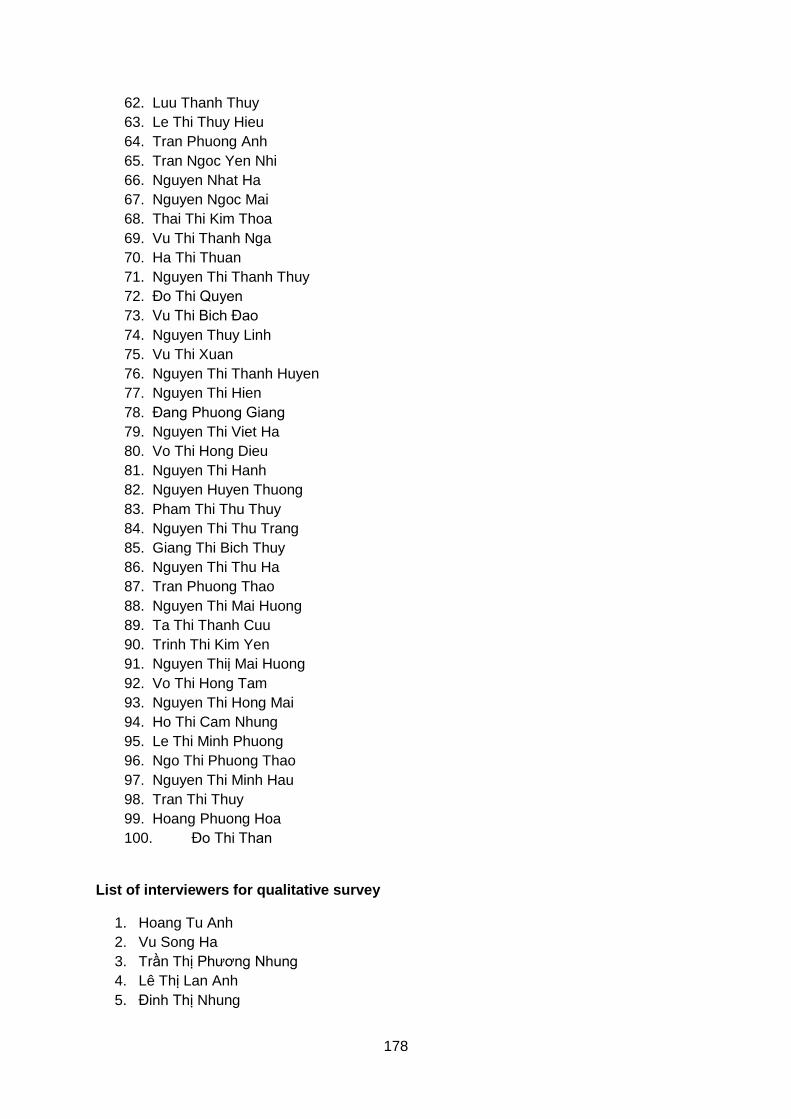
178
62. Luu Thanh Thuy
63. Le Thi Thuy Hieu
64. Tran Phuong Anh
65. Tran Ngoc Yen Nhi
66. Nguyen Nhat Ha
67. Nguyen Ngoc Mai
68. Thai Thi Kim Thoa
69. Vu Thi Thanh Nga
70. Ha Thi Thuan
71. Nguyen Thi Thanh Thuy
72. Đo Thi Quyen
73. Vu Thi Bich Đao
74. Nguyen Thuy Linh
75. Vu Thi Xuan
76. Nguyen Thi Thanh Huyen
77. Nguyen Thi Hien
78. Đang Phuong Giang
79. Nguyen Thi Viet Ha
80. Vo Thi Hong Dieu
81. Nguyen Thi Hanh
82. Nguyen Huyen Thuong
83. Pham Thi Thu Thuy
84. Nguyen Thi Thu Trang
85. Giang Thi Bich Thuy
86. Nguyen Thi Thu Ha
87. Tran Phuong Thao
88. Nguyen Thi Mai Huong
89. Ta Thi Thanh Cuu
90. Trinh Thi Kim Yen
91. Nguyen Thiị Mai Huong
92. Vo Thi Hong Tam
93. Nguyen Thi Hong Mai
94. Ho Thi Cam Nhung
95. Le Thi Minh Phuong
96. Ngo Thi Phuong Thao
97. Nguyen Thi Minh Hau
98. Tran Thi Thuy
99. Hoang Phuong Hoa
100. Đo Thi Than
List of interviewers for qualitative survey
1. Hoang Tu Anh
2. Vu Song Ha
3. Trần Thị Phương Nhung
4. Lê Thị Lan Anh
5. Đinh Thị Nhung

179
6. Nguyễn Thị Văn
7. Đinh Thị Phương Nga
8. Phạm Thị Vân
9. Phạm Kiều Linh
10. Nguyễn Lê Hoài Anh
11. Nguyễn Thị Minh Hải
12. Phạm Thu Trang
13. Lê Thu Giang
Editor
Beyon Jargon LCC, USA

180
Annex II: Glossary of terms
The UNFPA kNOwVAWdata knowledge product on key terminology has been used as a basis for
the definitions and description in this table.114 For some terms, national/legal definitions are
included.
Term Description
Controlling behaviours When the husband/intimate partner prevents her from seeing friends; limits her contact with family; insists on knowing where she is at all times; insists that she ask permission to seek health care. Also see Psychological violence
Domestic violence Domestic violence (DV) refers to abusive behaviour (physical, sexual, emotional violence and neglect) that occurs within the private, domestic sphere, generally between individuals who are related through blood or intimacy. In most contexts, ‘intimate partner violence’ (IPV) is the main type of domestic violence, but in some societies violence by in-laws can also be the most dominant form. The term, ‘domestic violence’ should be used carefully in order to avoid confusion, since (1) it overlaps with ‘intimate partner violence’ and ‘gender-based violence’ and (2) it is not confined to women. For example, domestic violence also includes child abuse and elderly abuse in the domestic sphere. Legal definitions of domestic violence vary among countries; they often include violence against domestic workers who live in the same household. In Viet Nam there are eight acts of violence defined in the domestic violence law.
Gender-based violence Gender-based violence (GBV), in its original meaning, is ‘violence that is directed against a woman because she is a woman, or violence that affects women disproportionately. It includes acts that inflict physical, mental or sexual harm or suffering, threats of such acts, coercion and other deprivations of liberty’. (…) ‘Gender-based violence, which impairs or nullifies the enjoyment by women of human rights and fundamental freedoms under general international law or under human rights conventions, is discrimination within the meaning of Article 1 of the Convention on the Elimination of All Forms of Discrimination Against Women.’115 While the terms ‘gender-based violence’ and ‘violence against women’ are frequently used interchangeably in literature and by advocates, the term ‘gender-based violence’ highlights the gender dimension, in other words, the relationship between (1) women’s subordinate status in society and (2) their increased vulnerability to violence because of unequal power relations and gender roles. The use of the term ‘gender-based violence’ provides a context in which to examine and understand the phenomenon of violence against women. It shifts the focus from women as victims to gender and the unequal power relationships between women and men created and maintained by gender stereotypes as the basic underlying cause of violence against women. This also means that women can be victims of gender-based violence perpetrated by
114 UNFPA Asia and the Pacific Regional Office. August 2016. Measuring Prevalence of Violence
against Women: Key terminology. kNOwVAWdata. Bangkok. 115 General recommendations made by the Committee on the Elimination of All Forms of Discrimination against Women, 1992.

181
other women to reinforce the patriarchal order, as for example from their own mother or their mother-in-law. It is important to note that the term is increasingly being used to include the notion that men and boys may also be victims of gender-based violence, especially sexual violence, as are those who step out of strict/ traditional gender roles, including LGBTI.
Violence against women Violence against women (VAW) is defined by the United Nations as “any act of gender-based violence that results in, or is likely to result in, physical, sexual, or psychological harm or suffering to women, including threats of such acts, coercion or arbitrary deprivation of liberty, whether occurring in public or private life.” It encompasses, but is not limited to:
● physical, sexual and psychological violence occurring in the
family, including battering, sexual abuse of female children in the
household, dowry-related violence, marital rape, female genital
mutilation and other traditional practices harmful to women;
● non-spousal violence and violence related to exploitation;
● physical, sexual and psychological violence occurring within the
general community, including rape, sexual abuse, sexual
harassment and intimidation at work, in educational institutions
and elsewhere;
● trafficking in women and forced prostitution; and
● physical, sexual and psychological violence perpetrated or
condoned by the state, wherever it occurs.
Economic violence ‘Economic violence’ includes denying a woman access to and control over asic resources. It causes, or attempts to cause, an individual to become financially dependent on another person, by obstructing their access to or control over resources and/or independent economic activity. It includes acts such as the denial of funds, refusal to contribute financially, denial of food and basic needs, and controlling access to health care or employment. Questions to identify economic abuse vary depending on context, but may include: “Does your partner NOT trust you with, or let you have, money?” or “Does your partner control money that you earn or receive?” or “Does your partner prevent you working for money?” Note that these acts are sometimes also considered controlling behaviours.
Emotional abuse Belittling, humiliating (e.g., constant criticism), verbal insults and name-calling; doing things that make her feel scared or intimidated; threats by words or gestures to harm her or someone she cares about. Also see Psychological violence
Psychological violence “Psychological violence” (often also referred to as “emotional violence”) refers to any act or omission that damages the self-esteem, identity or development of the individual. It includes, but is not limited to, humiliation, threatening loss of custody of children, forced isolation from family or friends, threatening to harm the individual or someone they care about, repeated yelling or degradation, inducing fear through intimidating words or gestures, controlling behaviour, and the destruction of possessions.

182
Physical violence ‘Physical violence’ refers to the intentional use of physical force with the potential for causing death, injury or harm.
Sexual violence Sexual violence refers to any sexual act or attempt to obtain a sexual act, or unwanted sexual comments or acts to traffic, that are directed against a person’s sexuality using coercion by anyone, regardless of their relationship to the victim, in any setting, including at home and at work.
Gender ‘Gender’ refers to the norms, roles and social relations between men and women. It is socially constructed. Gender roles are learned, changeable over time and vary widely both within and between cultures. Gender is a socio-economic variable to analyze roles, responsibilities, constraints, opportunities and needs of men and women in any context.
Sex The term “sex” refers to biologically and genetically determined differences between men and women that are generally permanent and universal.
Gender norms These are social expectations that define what is considered appropriate behaviour for women and men. The different roles and behaviours of females and males, and of children as well as adults, are shaped and reinforced by gender norms within society.
Gender roles These are learned behaviours in a given society/community or other social group that condition which activities, tasks and responsibilities are perceived as masculine or feminine. Gender roles are affected by age, class, race, ethnicity, religion and ideology, and also by the geographical, economic and political environment. Changes in gender roles often occur in response to changing economic, natural or political circumstances, including development efforts or macro-economic policies, or other forces both national and international. The gender roles of men and women within a given social context may be flexible or rigid, similar or different, and complementary or conflicting.
Intimate partner An intimate partner is a person with whom one has a close personal relationship that may be characterized by the partners’ (1) emotional connectedness, (2) regular contact, (3) on-going physical contact and sexual behaviour, (4) identity as a couple or (5) familiarity with and knowledge about each other’s lives. The relationship need not involve all of these dimensions. Intimate partner relationships include current or former:
• spouses (married spouses, common-law spouses, civil union
spouses, domestic partners)
• boyfriends/girlfriends
• dating partners; and
• ongoing sexual partners.
Intimate partners may or may not be cohabitating. They can be opposite sex or same-sex. And if the victim and the perpetrator have a child in common, and a previous relationship but no current relationship, then by definition they fit into the category of ‘former intimate partners’. Countries differ as to what constitutes common-law (de facto) marriage. Other societies have no concept of a partner that is NOT a spouse; such societies don’t recognize ‘partnerships’ between men and women outside of marriage.

183
Intimate partner violence Intimate Partner Violence (IPV) usually consists of a pattern of assaultive and coercive behaviours, including physical, sexual and psychological attacks, as well as economic coercion, by a current or former intimate partner. It can occur within heterosexual or same-sex relationships and does not require sexual relations. Garcia-Moreno et al define intimate partner violence as “behaviour in an intimate relationship that causes physical, sexual or psychological harm, including physical aggression, sexual coercion, and psychological abuse and controlling behaviours.”116
Non-partner In surveys on violence against women, the term ‘non-partners’ is sometimes used for anyone who is not perceived to be a ‘partner’ according to the way the term ‘partner’ is understood in that country or context. ‘Non-partners’ can therefore include parents, in-laws and other relatives, friends, neighbours, colleagues, acquaintances and strangers.
Prevalence “Prevalence” is a central term used when presenting results of a survey on violence against women. The prevalence of violence against women refers to the proportion of women who have experienced violence as part of the population of women ‘at risk’. Prevalence rates are thus based on counting people rather than events or incidents. For some types of violence, such as sexual violence, all women may be considered to be “at risk”. For others, such as intimate violence by a husband/partner, only women who have, or have had, an intimate partner would be considered “at risk”. Prevalence estimates usually present the percentage of women who have experienced violence either during the previous 12 months (also sometimes called ‘prevalence rate of current violence’) or at any time in their life (‘prevalence rate of lifetime violence’ or ‘lifetime prevalence’).
116 Garcia-Moreno C, Jansen HAFM, Ellsberg M, Heise L and Watts C. 2005. WHO multi-country
study on women’s health and domestic violence against women. Initial results on prevalence, health
outcomes and women’s responses. WHO, Geneva.

184
Annex III: Sample design and weighting
Sample design
1. Sample size calculation
When calculating the sample size and allocating samples, we need to take into account the
number of events to be collected for the main research indicators and ensure they are sufficient
to represent the areas and urban/rural locations of the areas.
The estimate is considered to be accurate if the margin of error compared with the expected ratio
does not exceed 5 per cent. Here we take the margin error d = 0.05 to determine the sample size.
With the probability (P) being the rate of interest (in our case the estimated prevalence rate) and
d being the margin of error, the sample size is calculated as follows:
For our sample size calculation we estimate P to be = 58 per cent, which is the lifetime prevalence
of physical or sexual or emotional violence by a husband/partner as measured in the 2010 survey
(Table 18).
Table 18: Possible sample sizes for a range of margins of error
Probability
The
margin of
error
Sample size
for 01
stratum
Sample size for
12 strata
P d n n x 12
0.58 0.01 9 744 116 928
0.58 0.02 2 436 29 232
0.58 0.03 1 083 12 992
0.58 0.04 609 7 308
0.58 0.05 390 4 677
0.58 0.06 271 3 248
0.58 0.07 199 2 386
0.58 0.08 152 1 827
0.58 0.09 120 1 444
0.58 0.1 97 1 169
It is expected that people's current awareness of violence against women has been raised but the
current probability of experiencing violence by a husband/partner cannot be known in advance,
so to be on the conservative side an average of P = 0.5 should be used (Table 19).
2 2
/ 20 2 2
( ) (1 ) (2) (1 )z P P P Pn
d d

185
Table 19: Margin of error using an average probability P of 0.5
Probability The
margin
of error
Sample size
for 01
stratum
Sample size for
12 strata
P d n n x 12
0.5 0.05 400 4 800
2. Adjustment of non-response rate
Based on the calculation from the 2010 survey data: we can see that in an enumeration area
where 12 women/12 HHs were selected, the survey has reached an average of 10.5 women/area
and the response rate is reached 87.55 per cent.
nadj = 4,800 / 87.55% = 5,482
3. Adjustment of design effect
For all calculations on the VAW 2010 survey, all of the design effect coefficients were small and
approximately equal 1.
4. Adjustment for expansion of the range of survey ages
Based on the results of the Population Change Survey dated 01 April 2016 (Table 2, page 138),
the proportion of female population/total female population of the two age groups of 15 to 17 and
60 to 64 years old accounts for 4.19 per cent and 4.23 per cent respectively.
Therefore, when expanding the age group, it is necessary to increase the number of samples
from 8 per cent to 10 per cent of the total number of samples, to ensure that both studies have
similar precision when looking at the age group 18 to 60 years old.
nmr = n * (1+r) = 5,482 * 1.09 = 6,000
On the basis of the above, it is suggested to aim for a sample size of 6,000 households (HHs) and
survey 12 HHs/areas (500 areas totally).
5. Sampling distribution
The total sample size of the survey (6,000 HHs) was distributed to six areas in proportion to the
square root of the population size. This method when used to allocate the number of HHs to areas
is not proportional to the population size of each area, but it allocates a relatively higher proportion
to the areas with small population sizes and vice versa.
, expected response rateadj
nn R
R
fin adjn deff n
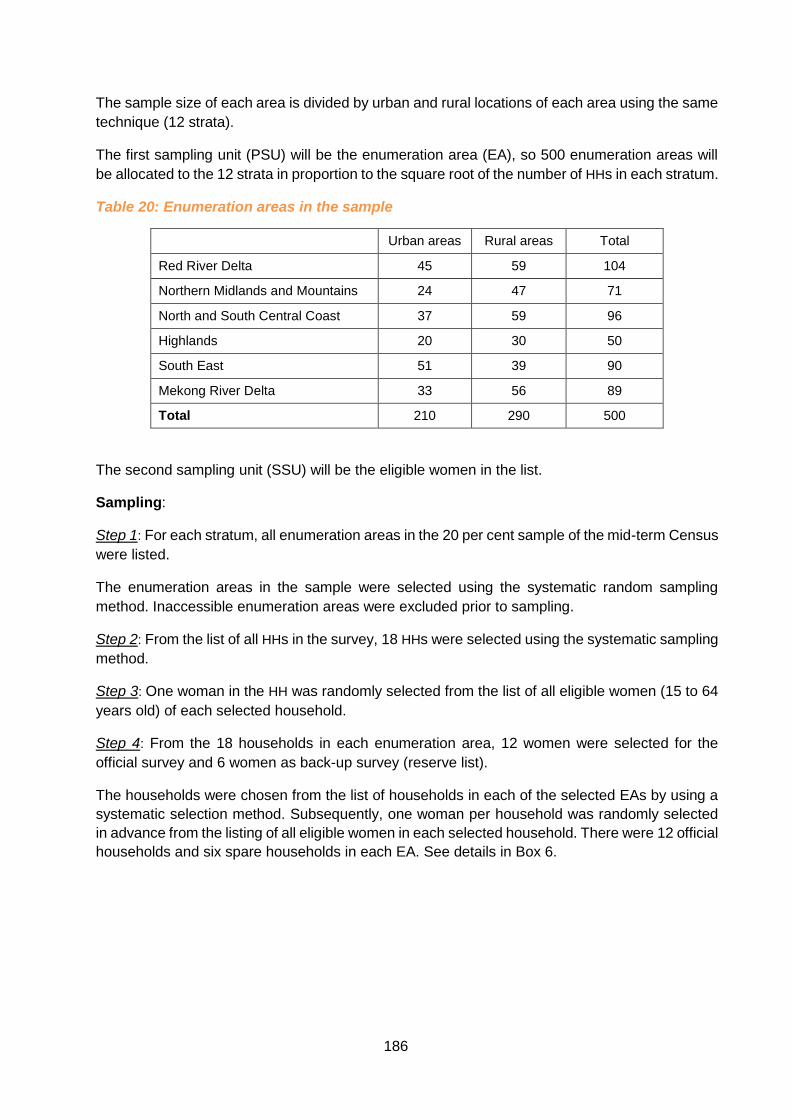
186
The sample size of each area is divided by urban and rural locations of each area using the same
technique (12 strata).
The first sampling unit (PSU) will be the enumeration area (EA), so 500 enumeration areas will
be allocated to the 12 strata in proportion to the square root of the number of HHs in each stratum.
Table 20: Enumeration areas in the sample
Urban areas Rural areas Total
Red River Delta 45 59 104
Northern Midlands and Mountains 24 47 71
North and South Central Coast 37 59 96
Highlands 20 30 50
South East 51 39 90
Mekong River Delta 33 56 89
Total 210 290 500
The second sampling unit (SSU) will be the eligible women in the list.
Sampling:
Step 1: For each stratum, all enumeration areas in the 20 per cent sample of the mid-term Census
were listed.
The enumeration areas in the sample were selected using the systematic random sampling
method. Inaccessible enumeration areas were excluded prior to sampling.
Step 2: From the list of all HHs in the survey, 18 HHs were selected using the systematic sampling
method.
Step 3: One woman in the HH was randomly selected from the list of all eligible women (15 to 64
years old) of each selected household.
Step 4: From the 18 households in each enumeration area, 12 women were selected for the
official survey and 6 women as back-up survey (reserve list).
The households were chosen from the list of households in each of the selected EAs by using a
systematic selection method. Subsequently, one woman per household was randomly selected
in advance from the listing of all eligible women in each selected household. There were 12 official
households and six spare households in each EA. See details in Box 6.

187
Box 6: Selection of households and eligible women in the enumeration areas
● For each selected EA, a list of households was available; this list was updated for the survey.
● From the household list for the EA, 18 households were selected systematically. ● For each of the 18 households, a list of all eligible (18 to 60 years old) female
household members, including their ages and relationship to head-of-household, was prepared. (In the field, team leaders with local staff reviewed and, if needed, corrected this list.)
● If there was more than one eligible woman in a household, one was selected randomly and indicated on the list as the woman to be interviewed.
● From the list of 18 households, one of every three was selected systematically as a spare so that the list contained 12 official households and six spares.
● Women selected from official households officially were invited for an interview. ● Women selected from spare households only would be invited if a replacement
was necessary, according to the following rules: ― If fewer than 10 officially selected women were interviewed (because some did
not show up, or refused at the beginning, or there were not enough households with eligible women, or the selected woman was incapacitated and could not participate in the survey), replacements and additions were made.
― The replacement would be the selected woman in the spare household with the nearest ID code on the list (if two households were the same distance, the household with the smaller ID code needed to be picked).
― A woman could not be replaced by a woman from the same household. ― A respondent who refused to continue in the middle of the interview was
considered a participant and could not be replaced. ― In the event all spare women were used for replacements but there were still
fewer than 10 women participating in the survey, no other women would be used for a replacement or addition.
The above modification of the principle of no replacement has been introduced to reduce
the chance that some EAs may be underrepresented because of a nonresponse or if there
were households without eligible women. This adaptation attempts to make sure that, in
most EAs, a minimum of 10 women (and in all EAs, at the most 12 women) would be
interviewed.
All selected women in one EA received an official written invitation to arrive on a certain day and
time at the commune house to be interviewed. No one was interviewed in their own household.
As a rule, all interviews for one EA would be completed in one day.
Calculating household weights and women's weights Weights are calculated to correct for differences in sampling probability, which is different for each
sampling stratum. These are applied to the study findings so that they correctly reflect the rates
in the actual population.
These weights are the inverse of the probability of selected samples and are calculated separately
for each stratum.
Steps in the sample selection:
(1) Distribute that sample over the strata according to the square root method;

188
(2) Select the enumeration areas in each stratum;
(3) Select sample HHs in each enumeration area;
(4) Select one woman aged 15 to 64 in each selected HHs.
For household level we calculate weights as follows: Wkj = W1k. W2h. W3kj
In which:
The sampling weights in the first step: 𝑊1𝑘 =𝐴𝑘
𝐴𝑘20
Ak = The total number of HHs in stratum k
Ak20 = Total HHs in the 20% sample of the mid-term 2014 Census of stratum k
The sampling weights in the second step: 𝑊2ℎ =𝐴𝑘20
𝐴𝑘𝑠
Ak20 = Total HHs in the 20% sample of the mid-term 2014 Census of stratum k
Aks = Total number of HHs of all enumeration areas selected in stratum k
The sampling weights in the third step: 𝑊3𝑘𝑗 =𝑀𝑘𝑗
𝑚𝑘𝑗
Mkj = Number of HHs in list of enumeration areas j in stratum k
mkj = Number of HHs interviewed in enumeration area j in stratum k
“Household weight” is applied to each HH in the data set, becoming:
𝑊𝑘𝑗 =𝐴𝑘
𝐴𝑘20.𝐴𝑘20
𝐴𝑘𝑠.𝑀𝑘𝑗
𝑚𝑘𝑗
“Women's weight” is equal to the HH weight multiplied by the total number of women in the
survey (aged 15 to 64) of that HH.
The final survey weights were normalized so that the total number of weighted cases was equal
to the total number of unweighted cases at the national level, for both household weights and
individual women’s weights. The normalized weights are relative weights that are valid for
estimating means, proportions and ratios but are not valid for estimating population totals or
pooled data.

331
Annex IV: Economic costs of physical and/or sexual violence
This Annex provides the detailed explanation of the calculation of the cost of violence presented
in Chapter 11.
Introduction
A new aspect of the second National Study on Violence against Women 2019 is the addition of
questions to explore the economic costs borne by women as a consequence of experiencing
violence by a husband/partner. Estimates of the costs of husband/partner violence are critical to
advocate the need to address this violence also to highlight the economic gains that can be
realized by government with decline in prevalence rate of husband/partner violence.
Costing framework
The economic impacts of husband/partner violence are multiple and range from short terms to
medium and long-term impacts. Immediate impacts include physical or mental harm, inability to
do work paid or unpaid (absenteeism). On the other hand, medium term to long-term impacts
include loss of quality of life due to chronic pain and suffering, loss of productivity, reduced labour
force participation or intergenerational loss such as lower human capital of children, and so on.
The costing of all the various impacts is fairly complex given issues of data availability, lack of
methods to monetize some of the medium and long-term impacts and distinguishing the
interaction between the different impacts to produce a total estimate of the economic costs
associated with violence against women and girls. Thus, most costing studies produce at best
partial estimates than capture the myriad impacts. However even partial estimates are significant
and are useful to highlight the potential impact of violence against women on deepening economic
insecurity of women and their households, establishing the consumption and welfare loss for
women and children, and the destabilizing impact of violence on the overall economy. Given these
complexities, the current study has focused on establishing the costs of impacts that can be
monetized, i.e. the focus is on estimating direct and indirect monetary costs experienced by
women and their households, and the national estimates of these costs. The estimates presented
in this report however do not include the cost of provision of services, which are difficult to
establish through a survey of women’s health and their experiences in accessing services.
Estimation methodology
In this study different types of costs have been considered to estimate the cost of physical
and/or sexual violence by a husband/partner experienced in the last 12 months (more precisely:
in the 12 months preceding the survey). These costs include direct (out-of-pocket) costs and
indirect costs at the household level. The household level cost is the cost /woman in the last 12
months based on information collected from one woman per household who experiences
husband/partner violence and incurred the specific types of costs. Table 21: presents the
elements that have been considered for the husband/partner violence cost estimations.
Additionally, the productivity loss for the national economy is also estimated, which is based on
lifetime experience of violence by a husband/partner.

190
Table 21: Elements of husband/partner violence cost estimation
Costs Elements
Out-of-pocket cost Health care expenses, police fees (formal and informal, including for arrest), shelter, filing cases, costs incurred in courts, replacement costs for property damaged, transport costs
Indirect cost Days lost from paid work by the women and their husbands; days lost in unpaid household production and reproduction (commonly referred to as care work),
Productivity loss for the economy Measured as the income differential between women experiencing violence and those not experiencing violence
Out-of-pocket costs were calculated for each woman experiencing physical and/or sexual
violence in the last 12 months for each type of expense based on the following equation:
Where TOPC is total out-of-pocket cost, 𝐶𝑖𝑠 represents the disclosed cost for each service for
each woman experiencing violence as outlined in the table above. Costs of each specific service
included various elements such as fees, transport and/or material costs. Unit cost for accessing
each service or replacing property was calculated by averaging the total cost by the number of
women with this expense.
In terms of indirect costs, average number of days of lost in the last 12 months was calculated by
taking the mean of number of days women missed work and their partners missed work. For care
work (i.e. unpaid household production and reproductive work such as cooking, cleaning, care of
children, etc.) missed, the number of days missed by each woman reporting missed care work
was calculated as follows:
Where MCW is Missed Care Work, i individual woman, t is the care activity, DFS is days fully
stopped care activity t, DPS is days partially stopped care activity t, and 𝐻 is the average hours
spent on care activity in a day. The sum of hours care work missed across all tasks is divided by
the hours spent of care activities in a day to derive days missed of care work.
Given the low disclosure rate of women on these specific costs and with the understanding that
the major impact of violence in contexts of limited services is on work, we have focused on
estimating productivity loss through two stage least squares regression with yearly income. It is
widely understood in the economic literature that earnings/income represent a productivity of an
individual. Moreover, productivity loss occurs over time and captures temporal dimension of the
violence impact on a woman’s life.

191
It is commonly accepted wages or earnings are influenced by some standard factors including
age, education, employment experience, type of employment/contract, family socioeconomic
status, access to economic opportunities and economic profile of the region. Physical and/or
sexual violence by a husband/partner is an important factor to consider, though a main reservation
is that earnings and husband/partner violence are closely interrelated and thus difficult to establish
causation, i.e. that change in wage/earning is a result of husband/partner violence. A common
strategy used to overcome this endogeneity problem is instrumental variable regression. The logic
is to find a variable that predicts the probability of physical and/or sexual violence by a
husband/partner but is not related to wage/earning and thus achieve an estimation that is solely
reflective of the casual relationship between husband/partner violence and earnings (this is further
explained in Annex IVa). As the survey did not probe earnings with women, the earnings variable
for each woman had to be calculated based on woman’s/husband’s employment status,
occupation profile and locality. The steps involved in calculating the yearly income/earning are
outlined in Annex IVa.
Results I: Work, income and prevalence of violence
Economic Activity and Reproductive Work
An important feature of Vietnamese economy is the very high participation of women in
economic activity. The survey results confirm this high economic participation with more than
85.3 per cent of women working across urban and rural areas (Figure 98).
Figure 98: Distribution of all women in the survey by work status, Viet Nam 2019
Interestingly the proportion of women not working is slightly higher in urban areas compared
with rural areas.
With respect to type of employment, about 40 per cent of women are in wage/salaried
employment, which is considerably higher in urban areas (Table 22). There is also a distinct
87.481.3
85.3
12.618.7
14.7
0
10
20
30
40
50
60
70
80
90
100
N= 3475 N=2501 N=5976
Rural (%) Urban (%) Total (%)
Working Non-working

192
difference in the type of self-employment between rural and urban areas, with self-employment
(agriculture) dominant in rural areas but not in the urban areas.
Table 22: Distribution of type of employment among all working women, Viet Nam 2019 (N=5,234)
(Weighted Percentages)
Rural (%) N=3,122
Urban (%) N=2,112
Total (%) N=5,234
Type of employment:
Waged/salaried 32.2 56.9 40.0
Self-employed (Agriculture) 46.9 8.4 34.7
Self-employed (Non-agriculture) 20.9 34.7 25.3
Women engage not only in market-oriented work but also undertake care work in the
household. Women in both rural and urban areas, on average, undertook an additional 5 hours
per day for care work tasks (Figure 99). The data suggest most women have a double burden of
work and thus very long working days.
Figure 99: Average hours of care work done daily by activity, among all women, Viet Nam 2019 (N=5,976)
Another important dimension to consider which influences the earnings of women is distribution
of working women by occupation. Despite the high level of participation of women in economic
activity, most women are involved in largely unskilled work as indicated in Table 23.
Table 23: Distribution of all working women aged 15-64, by occupation, Viet Nam 2019
5.06
1.58
1.15
3.07
1.932.13
1.42
4.2 1.37 1.21 2.93 1.93 2.04 1.33
4.77
1.561.15
3.03
1.932.1
1.39
0
1
2
3
4
5
6
Total Collectingfirewood
Fetchingwater
Caring forchildren
Caring forothers
Domesticchores
Other
Num
ber
of
horu
s
Rural Urban Total

193
Occupation Number of women
(unweighted) Number of women
(weighted) %
(weighted)
Total 5 234 5 100 100.0
Professionals, semi and skilled 677 576 11.3
Clerical and sales 846 834 16.4
Skilled agr, fisheries, mining 169 176 3.5
Crafts and machine operators 549 581 11.4
Simple labour 2 979 2 920 57.2
Others 14 14 0.2
A smaller proportion of women (11.3 per cent) engage in professional occupations with the
highest level of skill and higher earnings. Monthly earnings for each working woman were
estimated drawing on detailed earnings by occupation provided in the Viet Nam Household
Living Standards Survey (VHLSS).117 The distribution of monthly earnings of working women is
provided in Table 24. The distribution of women by level of skill reflects the distribution of
income given in Table 24.
Table 24: Distribution of all working women’s monthly income among working women aged 15-64, Viet Nam 2019
Monthly income in ‘000 VNDs Number of women
(unweighted) Number of women
(weighted) %
(weighted)
Total 5,234 5,100 100.0
No incomea 109 100 2.0
Less than 1000 602 621 12.2
1000 - 2500 1,262 1,326 26.0
2501 - 5000 1,749 1,738 34.1
5001 - 10000 1,447 1,265 24.8
> 10000 65 50 1.0 a These are a small group of women contributing to the household enterprise and thus have no independent income
While only a small proportion have no income (2 per cent), a majority of working women (60.1
per cent) in the survey earned between 1,000,000 and 5,000,000 VNDs. Nearly 52.1 per cent of
the women are below the average monthly earning of about 3,582,000 VND as per VHLSS
survey. All married/partnered women were queried regarding their husband’s working status
and occupation. Using the same estimation method as that applied for deriving women’s
monthly earnings, husband’s monthly income was also estimated (Table 25). In terms of
husband’s monthly income as per the survey data, the distribution is more skewed with nearly
47.5 per cent of men earning in the range of 5,001,000 to 10,000,000 compared with 24.8 per
cent of women.
Table 25: Distribution of husband’s monthly income among all married/partnered women, Viet Nam 2019
117 See Annex IVa for detailed explanation on how earnings for working women were estimated.

194
Monthly income in ‘000 VNDs Number of women
(unweighted) Number of women
(weighted) %
(weighted)
Total 5 553 5 415 100.0
No income 21 18 0.3
Less than 1 000 33 36 0.7
1 000 - 2 500 259 276 5.1
2 501 - 5 000 2 003 2 069 38.2
5 001 - 10 000 2 723 2 571 47.5
> 10 000 514 444 8.2
While only a small proportion have no income (0.3 per cent), a majority of husbands (58.8 per
cent) are below the average monthly earning of about 5,975,000 VND
Prevalence of Violence among Working Women
In this chapter we also explore the prevalence of violence among different categories of working
women to understand the potential economic loss due to husband/partner violence (see Table 26
for definitions of different categories of employment as per the VHLSS.
Table 26: Categories of employment among working women, Viet Nam 2019
Category of Employment Definition
Wage/Salaried Employment Working for a third-party in return for payment in money or in-kind. Payment can be hourly, daily, weekly, fortnightly, monthly or yearly. Payment inclusive of benefits such as sick leave, holiday pay, pension benefits, etc. is commonly referred to as salary.
Self- Employment (Non – Agricultural) Working for own business/enterprise in non-agricultural activities producing goods and services for sale (such as running a small business such as a tea shop, small grocery store, street vendor, running a hair salon, garment shop or consulting work).
Self-Employment (Agricultural) Working for own farm, fisheries enterprise or forestry related productions.
In the sample, ever-married/partnered working women had a slightly higher lifetime prevalence of
physical and/or sexual violence than those not working – 31.1 per cent compared with 27.8 per
cent. However, within working women there is an interesting variation in prevalence by type of
employment (Table 27). Self-employed women in agriculture have the highest prevalence rates
across all types of violence by a husband/partner both in lifetime and in the past 12 months. The
prevalence rates of self-employed women in non-agricultural activities are slightly higher than the
prevalence rates for wage/salaried women with respect to lifetime violence by a husband/partner
of different types. In terms of wage/salaried women, the prevalence of violence is lower than the
other categories of employment. The single exception is that lifetime and current sexual violence
is higher for wage/salaried women than self-employed women (non-agricultural).

195
Table 27: Prevalence of different types of violence among ever-married/partnered working women 15 to 64 years old, Viet Nam 2019
Unit: Weighted Percentage
Lifetime
prevalence
Current prevalenc
e
Among working women 15-64 years old: (N=5,234)
Physical violence by partner 25.2 4.5
Sexual violence by partner 12.6 5.4
Physical/sexual violence by partner 31.1 8.6
Among waged/salaried women 15-64 years old: (N=2,177)
Physical violence by partner 21.6 3.8
Sexual violence by partner 12.3 5.2
Physical/sexual violence by partner 27.4 7.7
Among self-employed (Agriculture) women 15-64 years old: (N=1,707)
Physical violence by partner 29.7 6.3
Sexual violence by partner 14.1 6.5
Physical/sexual violence by partner 36.3 11.0
Among self-employed (Non-agriculture) women 15-64 years old: (N=1,350)
Physical violence by partner 24.8 3.2
Sexual violence by partner 11.1 4.3
Physical/sexual violence by partner 29.9 6.7 * The percentages are based on weighted analysis and all numbers are unweighted
Results II: Costs incurred due to husband/partner violence
Out of-pocket expenditures
The out-of-pocket expenditures are a reflection of the extent to which women access services to
mitigate the negative impacts of violence experienced by women. For the estimation of costs,
we will limit the cost analysis to the last 12 months given issues of recall of expenditures over
the lifetime. We consider below the help-seeking by women and the associated costs for health
sector, police and judicial services. We also explore the cost of replacing or repairing broken
durable consumption goods such as furniture, electronics, vehicles and utensils. We also
explore the costs of leaving home for those women survivors who sought refuge with a shelter,
family and/or friends.
Health costs
As presented in Chapter 8, one quarter of ever-married/partnered women experiencing lifetime
physical and/or sexual violence by a husband/partner experienced injuries and about 3.7 per cent
of women in the last 12 months. Among these women who had injury in the last 12 months (n=14),
all of them sought outpatient care (Table 28). Among the women who sought outpatient care, the
overall average expenditure was 1,119 (‘000 VNDs).

196
Table 28: Average health care-related costs incurred (per woman/household) in the last 12 months among women injured in the last 12 months (N=14) for outpatient care (‘000 VNDs), Viet Nam 2019
Experienced violencea,c
(N=14)
Standard deviation
95% Confidence interval
Lower Upper
Mean Expenditureb, d 1,119.3 3,558.4 -985.6 3,224.3
Doctors’ Fee 634.8 2,116.4 -663.3 1,932.9
Laboratory tests 865.5 2,026.5 -1,383.3 3,114.3
Medicines 248.1 447.1 -36.0 532.2
Transport 130.3 184.9 -21.3 281.8 Notes: a All women in this table either experienced physical violence or/ and sexual violence
b The averages are based on weighted analysis and all numbers are unweighted c Mean calculated per women who reported the specific expenditure, n=14 d The sample size is small and thus estimates need to treated with caution as they are not representative.
Women were also asked regarding hospitalization both for physical and/or sexual violence by a
husband/partner experience at least once in her lifetime and as well as in the last 12 months.
About 8 per cent of all husband/partner violence survivors (n=36) had been hospitalized in their
lifetime and of these women 13 per cent (n=5) were hospitalized in the last 12 months. Women
who were hospitalized in the last 12 months stayed for a total of 66 days or an average of 13.5
days. The costs incurred included hospital related costs for fees and room rent, food, transport,
medicine and laboratory tests, and cost of family members inclusive of their food and
accommodation and the mean expenditure across the five who reported expenditures came to
5,240 (‘000 VNDs). Though the samples incurring costs are small, they are in line with the
reported average expenditure by women in the VHLSS 2016 data in the last 12 months, which
was 5,349 (‘000 VNDs) for hospital treatment and 1,238.2 (‘000 VNDs) for outpatient treatment.
Total weighted average of out-of-pocket expenditure for women experiencing physical and/ sexual
violence by a husband/partner inclusive of outpatient care and hospitalization comes to 2,705.5
(‘000 VNDs) – this equals the average yearly expenditure women headed household on health
as per the VHLSS 2016 report which was 2,944.5 (‘000 VNDs) in 2019 prices. Overall health care
expenditure accounts for 7.3 per cent of annual earning of ever-married/partnered women
experiencing physical and/or sexual husband/partner violence and incurring health expenses in
the last 12 months.
Other services
Overall help-seeking by women who experienced physical and/or sexual violence by a
husband/partner (in the last 12 months to other service is extremely low, not exceeding 1.2 per
cent of women experiencing violence (N=8). The expenses incurred by women to these service
providers was also quite low, with the exception of court probably due to higher fees. The specific
costs varied from 32.9 (‘000 VNDs) for police assistance to 1,108.8 (‘000 VNDs) for court
assistance to 769 (‘000 VNDs) for assistance from women’s organizations. Overall the mean
expenditure of the women who incurred expenses for accessing services came to about 688.9
(‘000 VNDs).

197
Cost to replace damaged property
An important cost that women incur, and which is rarely recognized, is the cost involved in
replacing property that is damaged in the course of violent incidents within the home. The damage
ranges from replacing and/or repairing a range of consumer goods including furniture, electronic
goods, vehicles, dishes and so on. Of the total number of women experiencing physical and/or
sexual violence in the last 12 months nearly 27 per cent (n=108) incurred expenditure for replacing
property. The cost incurred in urban area is nearly 10 times more than in rural areas reflecting
greater consumption (in terms of both level and higher value) of consumer durable goods in urban
households (Table 29). On the average the annual cost of replacing property by women
experiencing physical and/or sexual violence and reporting this expenditure is 9,514.2 (‘000
VNDs), which is equivalent to 25.7 per cent of annual earning of ever-married/partnered women
experiencing physical and/or sexual violence in the last 12 months and having to replace or repair
damaged property.
Table 29: Average cost to replace damaged property ('000 VNDs), among women who experienced physical/sexual violence in the last 12 month and incurred expenditure, Viet Nam 2019
Average costa
Standard deviation
95% confidence interval
Lower Upper
Totalb (N=108) 9,514.2 50,975.3 -640.8 19,669.3
Urban (N=31) 28,832.4 99,514.4 -10,386.3 68,051.1
Rural (N=77) 2,883.8 4,111.8 1,934.5 3,833.2 Notes: a All women in this table either experienced physical violence or/ and sexual violence
b The averages are based on weighted analysis and all numbers are unweighted.
Costs to leave home
Women also incur significant costs for leaving home when the violence becomes difficult to
negotiate. Thirty per cent (n=115) of ever-married/partnered women experiencing physical
and/or sexual violence in the last year also left home because of the violence (during the last 12
months). Women left home on average for 10.3 days. While most women stayed with family and
friends (parents, relatives, neighbours and friends) they did incur costs for their stay, food and
transport. The average expenditure for women came to 5,988.6 ‘000 (VNDs), or about 16.2 per
cent of annual income of violence survivors who left home in the last months (Table 30).
Surprisingly, transport was unusually high for women who experienced physical violence, which
needs to be further explored.
Table 30: Average cost per woman incurred when left home in the last time ('000 VNDs), among ever-married/partnered women who experienced physical/sexual violence by a husband/partner in the last 12 month, Viet Nam 2019
Experiencing violencea
(N=115)
Standard deviation
95 per cent Confidence interval
Lower Upper

198
Totalb 5,988.6 39,425.0 -1,372.4 13,349.6
Costs for stay and food
794.7 5,286.7
-192.4 1,781.7
Transport cost 5,348.1 39,746.3 -2,182.2 12,878.4 Notes: a All women in this table either experienced physical violence or/ and sexual violence
b The averages are based on weighted analysis and all numbers are unweighted.
The out-of-pocket expenditure across the various types of cost categories as a result of physical
and/or sexual violence ranged from 2 per cent to 26 per cent of the annual income of women
survivors of physical and/or sexual violence who incurred these specific costs (see Table 31).
Overall, the weighted average out-of-pocket expenditure across all women who incurred
expenditures came to 9,426.5 (’000 VNDs) or about 25.5 per cent of the annual income of
husband/partner violence survivors.
Table 31: Proportion of out-of-pocket expenditure incurred by ever-married/partnered survivors of physical and/or sexual violence by a husband/partner as proportion women survivors’ annual income, Viet Nam 2019
Number of women reporting
costs (weighted N)
Proportion of violence Survivors
Reporting Costs a (%)
Average annual
expenditure (’000 VNDs)
Proportion of violence
survivors’ annual income
b (%)
Health cost 14 8.0 2,705.5 7.3
Property replacement 101 56.2 9,514.2 25.7
Leaving home 115 64.0 5,988.6 16.2
Accessed other services 7 3.7 688.9 1.9
Avg Weighted Expenditure 179 9,426.5 25.5 Notes: a More than one answer could be given, therefore the total percentage is greater than 100 per cent
b Annual earning of ever-married/partnered women experiencing physical and/or sexual husband/partner violence in the last 12 months = 37015 (’000 VNDs)
Missed days of work/care work
Experiences of violent incidents may lead not only to injury but also absenteeism from work due
to either physical or mental harm, time to access services, or time to deal with impact on
children and other family members. Additionally, violence impacts women’s ability to do unpaid
household and care work. Women were asked about the impact of violence on husbands and
their ability to do work. Approximately 12.1 per cent of violence survivors said they missed on
average 7.9 days or total of 418 days (see Table 32). Women also said that husbands missed
on average 6 days for a total 272 days. Moreover 7 per cent of women missed on average 8
days, or a total of 273 days of care work in the past 12 months.
Table 32: Missed days of work/care work by women experiencing physical and sexual violence in the past 12 months, Viet Nam 2019

199
Type
Number of women missing
work due to violence
(weighted)
Mean days/per woman
Total missed
days
95 per cent confidence
interval
Number of women
experiencing
violence (weighted)
% of women
experiencing
violence Lower Upper
Missed work 53 7.9 418 300 536 437 12.1
Missed care work 34 8 273 149 397 483 7.0
Missed work of husband
45 6
272 144 401 465 9.7
A more disaggregated look at missed work by type of employment (see Table 33) suggests that
the rate of absenteeism is varied. Women who are self-employed in agricultural activities
(agriculture, forestry and fisheries) had the highest number of missed days (on average of 10
days/per woman) or a total of 295 days compared with wage salaried women (on average of 6.9
days/per woman) and self-employed women non-agriculture (on average of 3.6 days/per
woman). This is in line with the fact that they experienced levels of violence at much higher rate
than the other two groups and may reflect the likelihood that their work involves more physical
labour and therefore also more likely to be impacted by injuries.
Table 33: Missed days of work by type of employment among working women due to experience of physical and sexual violence in the past 12 months, Viet Nam 2019
Type
Number of women missing work in sample (weighted)
Mean missed days/per woman
Missed days
95% confidence interval Number of
women experiencing violence (weighted)
% of women experiencing violence
Lower Upper
Waged/salaried 10 6.9 69 33 104 156 6.6
Self-employed (Agriculture)
29 10 295 190 400 194 14.8
Self-employed (Non-agriculture)
14 3.6 55 35 74 86 16.1
NATIONAL ESTIMATES
National estimates of the costs at the household level are provided in this section. The steps
and assumptions involved in these national estimates are provided in Annex IVa.
National estimate out-of-pocket expenditures (OPE)
The national estimate of out-of-pocket expenditures was derived using the national population of
women in 2018, the national prevalence rate for current physical and/or sexual violence and the
preliminary 2018 GDP (See Table 35).

200
Women in Viet Nam who experienced violence and accessed services, leaving home or
replacing/repairing damaged property incurred a total cost of nearly 10 billion VNDs in 2019
(see Table 34). This was equivalent to 0.1677 per cent of the 2018 GDP. This suggests that
women and households in Viet Nam could have had an additional expenditure of 10 billion
VNDs on other types of productive consumption such as spending on children’s education or
improving children’s health or developing new abilities or simply increasing spending for
pleasure and well-being.
Table 34: National estimate out-of-pocket expenditures in the past 12 months, Viet Nam 2019
Cost category
Number of women
incurring costs
(Weighted)
Average cost of a women
incurring cost (‘000
VNDs)
National estimate
number of women exp violence and incurring cost
National estimate of costs
(‘000 VNDs) % of GDP
Health costs outpatient 11 1,119.3 62,881 70,385,725 0.0013
Health costs inpatient 5 5,240.2 27,035 141,668,715 0.0026
Other services 7 688.9 36,054 24,838,275 0.0004
Replacement of property 101 9,514.2 554,439 5,275,065,816 0.0952
Cost of leaving home 115 5,988.6 631,201 3,799,999,837 0.0682
Total OPE 22,551.2 9,291,958,368 0.1677
Table 35: National estimate of number of women experiencing physical and sexual violence in past 12 months, Viet Nam 2019
Number of women 15-64 years old of national* 32,873,473 persons
Prevalence rate of physical or/and sexual violence in the past 12 months among all women
8.09%
National estimate number of women exp violence in the past 12 months 2,658,581 persons
2018 preliminary GDP* 5,542,332 billion VNDs Note: *Data from General Statistics Office, 2018. It should be noted GDP has been recently revised upward by 25 per
cent, however no final revised GDP figure is available as of this report.

201
National estimate lost work days (Missed work, care work and husband’s work)
National estimates of the lost work days were extrapolated from the unit days lost by women
using the mean days of missed work, current prevalence rate, proportion of women missing
work and the national estimate of women 15 to 64. (See Annex IVa for note on calculations)
Women missed a total of 2,097,313 workdays due to violence and an additional 1,498,564 days
were missed by their husbands. In addition, all women who experienced violence in the last 12
months missed 1,503,637 care work days.
Table 36: National estimate of lost workdays per annum among women experiencing violence by a husband/partner (physical and/or sexual) in the 12 months preceding the survey, Viet Nam 2019
Missed days
Sample estimates
Prevalen
ce of
violence
National
estimate of
number of
women
missing
work
National estimate - LOST
WORKDAYS
Mean
days
lost
95%
confidence
interval
Proport
ion
missing
work
Total
days
lost
95% confidence
interval
Lower Upper Lower Upper
Missed work
(women) 7.9 5.7 10.1 0.1213 0.0856 25,562,975* 2,097,313 1,505,908 2,688,718
Waged/salaried 6.6 3.2 10.0 0.0663
0.076
7 10,443,173 351,672 170,719 532,624
Self-employed
(Agriculture)
10.3 6.6 13.9 0.1481 0.109
8 8,757,630 1,460,509 94,752 1,979,266
Self-employed
(Non-agriculture)
4.0 2.5 5.4 0.1607 0.066
7 6,362,172 269,478 172,889 366,067
Missed work
husband 6.0 3.2 8.9 0.0972 0.0778 32,873,473 1,498,564 793,251 2,203,877
Missed care
work (women) 8.1 4.4 11.8 0.0696 0.0809 32,873,473 1,503,637 820,098 2,187,176
Total missed work and care days for women 5 099 514
*National estimate working women derived from national population of women 15 to 64 and the employment rate from the LFS2018 = 77.8 per cent; national population of women 15 to 64 years old = 32,873,473 person
The estimation also shows that nearly 70 per cent of the total workdays lost were by women
engaged in agricultural self-employment, which has impacts on the output of the agricultural
sector. Out of the total 5,099,514 work days lost, nearly 30 per cent of total workdays missed
were accounted missed care work days. The reduction in care work has important implications
for the well-being of families, given the care work is seen as essential to the sustenance and
survival of families, particularly among the poor.

202
National estimate of loss of income per annum (missed work, care work and husband’s
work)
Overall the lost workdays translate into missed income 322 billion VNDs due to women’s
absenteeism, 422 billion due to husband’s absenteeism, and 231 billion from care work – for a
total income loss of about 975 billion VNDs. The foregone income for working women
experiencing violence, based on their yearly earnings of 37,015(’000 VNDs) comes to 3.28 per
cent of their earnings (Table 37).
Table 37: National estimate loss of women’s income per annum due to physical and/or sexual violence in the preceding 12 months, Viet Nam 2019
Missed days
Sample estimates Total
Number
of
women
missing
work
National estimate - LOSS OF
INCOME
Mean
days
Proportion
missing
work
Average
daily
income
(‘000
VNDs)
Loss of
income
‘000
VNDs
95% confidence
interval
Lower Upper
Missed work 7.9 0.1213 153.6 25,562,975 322,116,066 231,285,032 412,947,100
Waged/salaried 6.6 0.0663 222.0 10,443,173 78,078,338 37,903,128 118,253,547
Self-employed
(Agriculture) 10.3 0.1481 59.6 8,757,630 87,051,169 56,131,543 117,970,795
Self-employed (Non-
agriculture) 4.0 0.1607 174.3 6,362,172 46,965,066 30,131,431 63,798,700
Missed work of
husband 6.0 0.0972 281.5 32,873,473 421,785,557 223,268,272 620,302,841
Missed care work 8.1 0.0696 153.6 32,873,473 230,936,209 125,954,815 335,917,604
The various annual costs incurred due to physical and/or sexual violence in the last 12 months
comes to a total of 10,267 billion VNDs or about 0.18 per cent of 2018 GDP (Table 38). This
amount is equivalent to about 0.68 per cent of 2018 government expenditure.
Table 38: Various annual costs to government budget due to physical or/and sexual violence in the past 12 months, Viet Nam 2019
Number of
Women National estimate
(‘000 VNDs) % of GDP
A) OUT-OF-POCKET EXPENDITURES 9,291,958,368 0.1667
Health costs outpatient 62,881 70,385,725 0.0013
Health costs inpatient 27,035 141,668,715 0.0026
Other services 36,054 24,838,275 0.0004
Replacement of property 554,439 5,275,065,816 0.0952
Cost of leaving home 631,201 3,779,999,837 0.0682
B) FOREGONE INCOME 974,667,385 0.0176
Missed work by women 265,678 322,087,986 0.0058
Missed work by husband 248,646 421,785,557 0.0076
Missed care work 184,959 230,793,843 0.0042
TOTAL (A + B) 10,266,625,754 0.1843

203
PRODUCTIVITY LOSS
An important dimension of macrocost is the productivity loss due to experience of domestic
violence by an intimate partner. As previously highlighted women experiencing violence did report
that they had poorer health status and more problems in terms of concentration or disruption in
the workplace. The data collected indicates that violence interrupted women’s work (11.9 per
cent), affected their concentration at work (14.7 per cent), required them to take time-off due to
sickness (5.7 per cent) and 1.9 per cent lost self-confidence (Table 39). These together point to
the fact that productivity loss could be quite significant.
Table 39: Proportion of women who self-reported impact of violence on work, Viet Nam 2019
Number of women (unweighted) (N=1,791)
Number of women (weighted) (N=1,734)
%
Unable to concentrate 260 256 14.7
Unable to work/ sick leave 110 100 5.7
Partner disrupted work 219 206 11.9
Lost confidence in own ability 36 34 1.9
Other 7 9 0.5
Work not disrupted 1,288 1,252 72.2
Not applicable (not working for money) 91 86 5.0
Productivity loss is cumulative including interrupted work, increasing problems at work with
tardiness, lack of focus, accidents at work and problems with management. These various
dimensions of lower or fluctuating productivity manifest in lower earnings. Thus, a simple
comparison of average earnings between women experiencing and not experiencing physical
and/or sexual violence should indicate a statistically significant difference. In Viet Nam, we see
that there is indeed a significant difference in monthly earnings. Ever-married/partnered women
who have not experienced violence have an average monthly earning of 3,711,000 VND
compared with 3,315,000 VND for those who have experienced violence - a difference of nearly
396,000 VND (Table 40).

204
Table 40: Average earnings of working women by experience of physical and/or sexual violence, Viet Nam 2019
Number of
women (unweighted)
Number of women
(weighted)
Average monthly earnings
(‘000 VNDs)
Average yearly
earnings (‘000 VNDs)
According to all women who do work for money
5,234 5,100 3,581.6 39,593.0
Never-married/ partnered women 179 214 3,555.2 36,285.7
Ever-married/ partnered women 5,055 4,885 3,582.8 39,736.9
According to experience of husband/ partner violence (ever-married/ partnered women and do work for money)
5,055 4,885 3,582.8 39,736.9
Not experienced any violence by a husband/ partner
3,403 3,299 3,711.4 41,046.3
Ever experienced physical or sexual violence
1,652 1,587 3,315.3 37,015.0
P-Value* 0.000015 0.000255
According to type of husband/ partner violence
5,055 4,885 3,582.8 39,736.9
No violence 3,403 3,299 3,709.9 41,025.9
Sexual only 294 302 3,669.3 41,174.6
Physical only 1,016 942 3,178.8 35,428.7
Both sexual and physical 342 343 3,379.0 37,714.6
* t-test for equality of mean's P-value for the difference between women who experienced violence and who did not
experience physical and/or sexual violence by a husband/partner
The simple difference in yearly income suggest women experiencing violence have 10 per cent
lower yearly income than women not experiencing violence. However, this simple difference does
not act into account the various others factors that influence income and productivity loss. To
more rigorously establish the productivity loss due to violence in particular, we have undertaken
a two state least squares instrumental regression on yearly income of women, controlling other
factors that also influence income. Yearly income was taken as the variable to measure
productivity impact, as it is a product of both wage and time spent in work.
The basic model specified for the regression included physical and/or sexual violence
experienced in lifetime of ever-married/ married/partnered working women, urban/rural residence,
region, age, education, type of employment and household assets index. However, violence in
the model is often considered as an endogenous variable (that is, violence and income are
considered interrelated) and therefore, low income may increase probability of violence and vice
versa. To overcome the endogeneity of violence, a two-step instrumental regression was
conducted to estimate casual impact of violence. In this regression method, an instrumental
variable, a variable that is related to the probability of husband/partner violence but has no
independent relation to women’s yearly income, is identified. The two-step regression consists of
first running a regression to estimate the predicted probability of husband/partner violence, which
is then substituted into main regression on yearly income.
In the Annex IVa detailed explanation of the methods undertaken for instrument regression is
given including the various instrumental variables that were tested. In this analysis, two robust
instrumental variables were identified: 1) men’s childhood exposure to violence (comprising men
witnessing violence against their mother and/or men experiencing being beaten in childhood) and

205
2) men’s own experience of violence (being beaten in childhood). Both these variables had strong
association with husband/partner violence but no independent relationship with yearly income of
the woman. Table 41 provides the main results of this analysis.

206
Table 41: Estimation of productivity loss (Propensity Score Matching and Two Stage Least Squares Instrumental Variable Regression), Viet Nam 2019
Mode 1* Model 2**
Unstandardized
Coefficients
Standardized
Coefficients Sig.
Unstandardized
Coefficients
Standardized
Coefficients Sig.
Constant 8.881 0.000 8.699 0.000
Violence in lifetime -0.223 -0.033 0.041 -0.308 -0.043 0.021
Education qualification
Base Category: No education
Primary 0.166 0.082 0.000 0.182 0.090 0.000
Lower Secondary 0.216 0.114 0.000 0.226 0.119 0.000
Upper Secondary 0.363 0.153 0.000 0.357 0.149 0.000
College 0.558 0.103 0.000 0.579 0.102 0.000
University and above 0.639 0.201 0.000 0.635 0.199 0.000
Other 0.429 0.027 0.008 0.468 0.034 0.001
Age groups
Base Category: 15-19
20-24 0.674 0.142 0.001 0.840 0.176 0.000
25-29 1.127 0.362 0.000 1.319 0.422 0.000
30-34 1.243 0.511 0.000 1.440 0.583 0.000
35-39 1.391 0.588 0.000 1.594 0.671 0.000
40-44 1.416 0.603 0.000 1.617 0.689 0.000
45-49 1.397 0.578 0.000 1.616 0.678 0.000
50-54 1.337 0.547 0.000 1.545 0.627 0.000
55-64 1.220 0.422 0.000 1.433 0.493 0.000
Household assets index
Base Category: Lower
Medium 0.143 0.081 0.000 0.130 0.073 0.000
Higher 0.194 0.106 0.000 0.166 0.091 0.000
Type of employment
Base Category: Waged/salaried
Self-employed (Agriculture) -1.048 -0.585 0.000 -1.055 -0.588 0.000
Self-employed (Non-agriculture)
-0.065 -0.032 0.009 -0.082 -0.040 0.001
The geographic region
Base Category: Northern Midlands and Mountains
Red River Delta 0.243 0.123 0.000 0.282 0.142 0.000
North and South Central Coast 0.132 0.061 0.000 0.150 0.069 0.000
Central Highlands 0.341 0.133 0.000 0.376 0.146 0.000
Southeast 0.378 0.151 0.000 0.393 0.156 0.000
Mekong River Delta 0.110 0.042 0.003 0.113 0.043 0.003
Urban/rural area
Base Category: Rural
Urban 0.127 0.070 0.000 0.141 0.077 0.000
Number = 3 235 3 244
* Model 1: Regression of income (LN income) with instrument variable is men childhood's exposure to husband/partner violence (including witnessing his mother being beaten and himself being beaten) and independent variables are lifetime physical or sexual violence by a husband/partner and women's characteristics. ** Model 2: Regression of income (LN income) with instrument variable is men childhood's experience (only himself being beaten) and independent variables are lifetime physical or sexual violence by a husband/partner and women's characteristics.
The second model is slightly more robust give that the p-value increases in significance, though
the sample size is only marginally different. The regression results of the second model indicate
that a 1 per cent in the probability of experience of physical and/or sexual violence at least once
in a lifetime results in a decline in earnings by almost 30.8 per cent (Table 41). The productivity
loss due to lifetime experience of physical and sexual violence is estimated by applying this

207
estimated reduction of income to the economically active women in Viet Nam in 2018 and who
experienced physical and/or sexual violence in the lifetime (Table 42).
Table 42: Overall estimate of productivity loss of working women
No. of women working 15 to 64,
2018
Prevalence of lifetime physical
and sexual violence ever-
married/partnered working women
Number of Working women facing
violence
Average Yearly income of ever-
married/partnered working women with
no violence (’000 VNDS)
Reduction in income for women
experiencing husband/partner
violence (’000 VNDS)
Total Productivity Loss (billion
VNDS)
per cent 2018 GDP*
25,562,975
31.1 7,950,085 41,046.3 12,642.3 10,0507 1.81 per cent
*2018 preliminary GDP- 5,542,332 billion VNDs. This is likely to be revised upward by 25 per cent, though no final estimate of GDP is available. With a revised GDP, the productivity loss would slightly decline to 1.45 per cent of GDP.
The productivity loss estimated suggests that because of the violence experienced by women
over their lifetime, their overall productivity is lower than that of women not experiencing physical
and/or sexual violence. This lower productivity loss is measured in the lower wages of violence
survivors. It is important to understand that the productivity loss is the invisible loss that impacts
the economic output of an economy. In fact, the productivity loss can be seen as the amount by
which economic output could be higher in the scenario of no violence. Unless there is a change
in the prevalence of violence, the results suggest that the economy would continue to operate at
a suboptimal level constraining growth and development. The earlier analysis also suggested
there are visible costs for survivors of husband/partner violence in terms of monetary out-of-
pocket expenditures and foregone income from missed work due to husband/partner violence
(see Table 18). Thus, if we consider the visible costs (out-of-pocket expenditure and absenteeism)
and the invisible costs (the productivity loss), the total loss to the economy stands at 2.0 per cent
of GDP. This scale of loss highlights emphatically the detrimental impact of physical and sexual
violence for the overall economic well-being of women and their families in Viet Nam.

208
Annex IVa : Estimation notes
Calculating yearly income/earnings
As direct wage questions were not asked in the questionnaire wages for each employed woman
had to be calculate using data from Labour Force Survey 2018 (LFS 2018).
Steps involved: First, a women’s profile monthly income was built from the LFS2018 data set.
This profile was developed to include information about similar personal characteristics included
in the survey: urban/rural area, geographic region, age, marital status, education status, type of
employment, occupation and monthly income. Then, we merge this profile to the survey data set
and created a new variable (the monthly income). If each record (woman) in the survey data set
satisfies a set of specific characteristics of the profile, a corresponding value of the profile was
assigned. Through this process each woman was assigned a monthly income to calculate
yearly income.

209
Table 43: Profile and corresponding variables in the survey data set, Viet Nam 2019
Variables of profile Value Corresponding question in survey data set (Variable)
INC_monthly_wife: Monthly income
> 0 New variable*
ur_ru: Urban/rural area
1 = Urban 2 = Rural
Urban/rural
region: The geographic region
1 = Northern Midlands and Mountains 2 = Red River Delta 3 = North and South Central Coast 4 = Central Highlands 5 = Southeast 6 = Mekong River Delta
Created from the ‘Province’ variable
age_wife: Age 15, 16, 17, …., 62, 63, 64 Q107
marriage: Marital status
1 = Never partnered 2 = Currently having a partner 3 = Widowed 4 = Divorced 5 = Separated
Created from Q119, Q120a, Q120b, Q121
edu_wife: Education qualification
1 = No education 2 = Primary 3 = Lower Secondary 4 = Upper Secondary 5 = College 6 = University and above 7 = Other
Created from Q111.a1
emp_status: Type of employment
1 = Waged/salaried 2 = Self-employed (Agriculture) 3 = Self-employed (Non-agriculture)
Q112.04
job: Occupation
1 = Manager 2 = High-level expert 3 = Average-level expert 4 = Office staff 5 = Service and sales staff 6 = Skilled labourers in agriculture, forestry and fisheries 7 = Manual labourer and related occupations 8 = Machine assembling and operating workers 9 = Low-skilled labourers 0 = Members of the armed force
Q112.06b
* Missing values replaced by the average monthly earning from LFS2018 data set
After obtaining the woman’s monthly income in the survey, we also explored the data to
establish the average number of months worked by each women (q112.05a) to calculate the
yearly income by the following formula: Yearly income = number of months worked in year x
monthly income.
National estimates
Estimating national lost workdays

210
National estimate - LOST WORK DAYS = The prevalence of physical and/or sexual violence by
a husband/partner x national number of women 15 to 64 years old x proportion missing work x
mean days.
For missed work by women: The prevalence of physical and/or sexual husband/partner
violence among working women x the number of working women 15 to 64 years old of national x
proportion missing work x mean days missed.
- Waged/salaried: Calculation among waged/salaried working women.
- Self-employed (agriculture): Calculation among agriculture working women.
- Self-employed (non-agriculture): Calculation among non-agriculture working women.
For missed work of husband: The prevalence of husband/partner violence among all currently
married/partnered women x the national population women 15 to 64 years old x proportion
missing work x mean days.
For missed care work: The prevalence rate of physical and/or sexual lPV among ever-
married/partnered women x the national population of women 15 to 64 years old x proportion
missing care work x mean days missed
Estimating national loss of income
National estimate – LOSS OF INCOME = Prevalence of physical and/or sexual husband/partner
violence x national population of women 15 to 64 years old x proportion missing work x mean
days x average daily income.
For missed work: The prevalence of physical and/or sexual husband/partner violence among
working women 15 to 64 years old, the national number of working women 15 to 64 years old and
the average daily income among working women without violence applied to calculate.
- Waged/salaried: Calculation among waged/salaried working women
- Self-employed (agriculture): Calculation among agriculture working women
- Self-employed (non-agriculture): Calculation among non-agriculture working women
For missed work of husband/partner: The prevalence of husband/partner violence among all
currently married/partnered women, the number of women 15 to 64 years old of national and the
average daily income of husband/partner among all currently married/partnered women without
violence applied to calculate.
For missed care work: The prevalence rate of husband/partner violence among ever-
married/partnered married/partnered women, the national population of women 15 to 64 years
old x proportion missing care work x the average daily income among married/partnered women.
Productivity loss
To estimate the productivity loss for working women we specified the following model:
Log_yearly_inc = f (lifetime husband/partner violence phy/sex, age, education, employment,
household asset index, location and geographical region)

211
This is model is a modification of the standard Mincer wage equation, which is widely used in
economic analysis, by introducing lifetime experience of husband/partner violence (physical
and/or sexual violence). Given the that the relationship between yearly income and
husband/partner violence is bidirectional, the productivity loss due to experience of physical
and/or sexual violence was estimated using a two-step least squares (2SLS) regression
analysis using instrumental variables. This involves the following steps:
1) Identifying the relevant independent variables that predict the dependent income variable based on a conceptual understanding of the interaction between income and the independent variables.
2) Identifying instrumental variables to address issue of endogeneity. Usually the basic analysis is often problematic given that the interaction between the independent and dependent variable may be endogenous (i.e. that there is a bidirectional relationship). An accepted method to overcome this endogeneity is using instrumental variables that have no relation to the dependent variable but do predict the independent variable. In this way then it is expected that the impact of independent variable is only via the instrumental variable(s), thus the resulting estimate(s) capture the casual impact on the dependent variable.
There are three specific methods that can be used to undertake the 2 SLS:
1) In method 1, the first step regression is undertaken on the independent variable of interest (husband/partner violence) with its predictors (including the dependent variable (yearly income). This will help to identify robust predictors of husband/partner violence with no correlation to yearly income). These instrumental variables are included in the second step, which is the regression of yearly income on husband/partner violence and set of instrumental variables, set of women’s characteristics, household characteristics and regional factors).
2) A second method involves using the first step regression to develop a new predicted husband/partner violence variable based on the coefficients of the instrumental variables. This new predicted variable replaces the original husband/partner violence variable in the second step regression of yearly income.
3) In method 3, the focus is on ensuring that the sample of women respondents with and without experience of violence are matched on key characteristics to correct for any selection bias and have a fully randomized sample. The 2SLS is then run on the matched sample. We employed the method Propensity score matching (PSM) to produce matched sub-sample to do the second step regression.
In the analysis conducted, the third method proved most robust.
In terms of instrumental variables, three instruments were tested: a) men’s exposure to violence
in childhood (witnessing violence against mother and own experience of physical violence), b)
men’s experience of violence in childhood (own experience of physical violence), and c) frequency
of quarrels between husband and wife. The first regression of predictors of husband/partner
violence found robust relationships with men’s experience of violence in childhood followed by
men’s exposure to violence in childhood and then frequency of quarrels (which, however, had the
least p-value). We therefore tested two separate models to assess the impact of lifetime
experience of physical and/or sexual violence on women’s income. In Model 1 the specification
included lifetime experience of physical and/or sexual violence, instrumental variable men’s
childhood exposure to violence, women’s characteristics (age, education, type of employment,
household assets, location and geographical region. In Model 2 the instrumental variable was
replaced with men’s own childhood experience of violence.

212
Annex V: Definition of disability
The definition of disability in the Viet Nam survey on violence against women is based around
recommendations on disability statistics from the Washington Group – the United Nations body
leading standard setting in this area.118 A short set of questions determine if people have no
difficulty, some difficulty, a lot of difficulty or cannot do at all in six areas of functioning: seeing,
hearing, walking or climbing stairs, remembering or concentrating, self-care (washing or
dressing), communicating (understanding or being understood by others). See Table 44 for how
the questions are asked in the survey and the categories for response.
Table 44: Questions and response categories used to identify women with one of more forms of disability, Viet Nam 2019
Number Question asked Response categories
201 WG
The next questions ask about difficulties you may have doing certain activities because of a health problem. Do you have difficulty seeing, even if wearing glasses?
NO – NO DIFFICULTY 1 YES – SOME DIFFICULTY 2 YES – A LOT OF DIFFICULTY 3 CANNOT DO AT ALL 4 REFUSED/NO ANSWER 9
202 WG
Do you have difficulty hearing, even if using a hearing aid?
NO – NO DIFFICULTY 1 YES – SOME DIFFICULTY 2 YES – A LOT OF DIFFICULTY 3 CANNOT DO AT ALL 4 REFUSED/NO ANSWER 9
203 WG
Do you have difficulty walking or climbing steps? NO – NO DIFFICULTY 1 YES – SOME DIFFICULTY 2 YES – A LOT OF DIFFICULTY 3 CANNOT DO AT ALL 4 REFUSED/NO ANSWER 9
204 WG
Do you have difficulty remembering or concentrating?
NO – NO DIFFICULTY 1 YES – SOME DIFFICULTY 2 YES – A LOT OF DIFFICULTY 3 CANNOT DO AT ALL 4 REFUSED/NO ANSWER 9
205 WG
Do you have difficulty (with self-care such as) was washing all over or dressing?
NO – NO DIFFICULTY 1 YES – SOME DIFFICULTY 2 YES – A LOT OF DIFFICULTY 3 CANNOT DO AT ALL 4 REFUSED/NO ANSWER 9
206 WG
Using your usual (customary) language, do you have difficulty communicating, for example, understanding or being understood?
NO – NO DIFFICULTY 1 YES – SOME DIFFICULTY 2 YES – A LOT OF DIFFICULTY 3 CANNOT DO AT ALL 4 REFUSED/NO ANSWER 9
118 Washington Group on Disability Statistics: Short set of disability questions. www.washingtongroup-disability.com/washington-group-question-sets/short-set-of-disability-questions/

213
Based on the Washington Group recommended definitions, people who have a lot of difficulty or cannot do at all one or more of the six domains are considered to have a disability. Among the 5,976 respondents, 9.0 per cent have one or more forms of disability (weighted data). Half the respondents (49.6 per cent) had no difficulty in any of the six domains and 41.4 per cent had some difficulty (Figure 100). Analysis in Chapter 6 presents data on women with a disability as the combination of those who have a lot of difficulty or cannot do at all in one or more of the six domains. Women have a disability status based on the highest level of difficulty they have. Further breakdowns on the forms of disability and characteristics of women with and without a disability are available within the data collected but are not published in this report. Figure 100: Disability status of respondents based on responses to Washington Group questions among all women (N=5,976), Viet Nam 2019
No difficulty (in one or
more domains)
49.6%
Some difficulty41.4% A lot of
difficulty8.7%
Cannot do at all
0.3%
9.0% of
respondents
have a
disability

214
Annex VI: Method to Develop a Household Assets Index for the Viet Nam Violence
against Women Study
1. INTRODUCTION
The 2019 study Journey for change: Results of the National Study on Violence against Women
in Viet Nam 2019 collected information on household ownership of a range of durable assets.
Ownership of these assets is assumed to reflect different dimensions of household socioeconomic
status (SES). This summary report describes the method used to develop a single measure or
index of asset ownership using this information, an approach that was used to construct an asset-
based index for the 2010 Viet Nam VAW survey. A key issue in deriving a single measure index
of asset ownership using different indicators is how to assign weights to the individual variables.
Principal components analysis (PCA) is a commonly used approach to statistically derive weights
for asset-based household SES indices. PCA is a multivariate statistical technique that reduces
the number of variables in a data set into a smaller number of components. Each component is a
weighted combination of the original variables. The higher the degree of correlation among the
original variables in the data, the fewer components required to capture the common information.
An important property of the components derived is that they are uncorrelated, therefore each
component captures a unique dimension in the data. Section 2 details the steps taken to derive
a PCA-based asset index.
2. METHOD
Based on developed approaches, this study undertook three steps to derive an asset-based SES
index using PCA: first, a descriptive analysis; second, the construction of the asset-based SES
index; and third, the classification of households into SES groups.119 The analysis was conducted
using STATA version 15.0 statistical software.
2.1 Descriptive analysis
The first step was to conduct descriptive analysis that involved establishing the overall sample
size, the frequency of each variable, and patterns of missing data for individual variables. This
descriptive analysis was essential exploratory work to ensure data quality, and appropriate data
coding and recoding for further analysis.
Overall sample size
A household selection form and questionnaire was administered and completed in 5,977
households (2,501 urban; 3,476 rural). The household questionnaire gathered information on
different asset indicators and the asset-based SES index was constructed using data from all
5,977 households.
Frequency analysis
The purpose of the frequency analysis was to establish the extent to which the variables were
distributed across households and to inform subsequent coding of the variables. An issue with
PCA is that it works best when asset variables are correlated, but also when the distribution of
variables varies across households. It is the assets that are more unequally distributed between
households that are given more weight in PCA. For example, an asset that all households own or
119 Vyas S and Kumaranayake L. 2006. How to do (or not to do). Constructing socio-economic status indices:
how to use principal components analysis. Health Policy Plan; 21:459–468.

215
which no households own would exhibit no variation between households and would carry a
weight close to zero from a PCA. A second issue with PCA is that data in categorical form are not
suitable for inclusion in the analysis. This is because the categories are converted into a
quantitative scale that does not have any meaning. To avoid this, qualitative categorical variables
are recoded into binary variables.
The Viet Nam survey data gathered information on source of drinking water; type of toilet facility;
main type material used in the roof; ownership of a range of household durable items; ownership
of five different types of vehicles; land ownership; and the number of rooms in the house used for
sleeping and the total number of people in the household. A description and frequency distribution
of the variables for Viet Nam total sample (urban and rural location combined) and for the Viet
Nam urban sample and the Viet Nam rural sample separately is shown in Table 45.

216
Table 45: Description and frequency of SES variables, Viet Nam 2019
Variable long name (short name) / Variable type
Variable label Total
sample (N=5,977)
Urban (N=2,501
)
Rural (N=3,476)
Main source of drinking water (q1) / categorical
Piped into dwelling 48.6 74.7 29.9
Piped tap/ standpipe 0.4 0.3 0.4
Tube well, borehole 18.7 9.8 25.0
Protected well 14.0 7.1 18.9
Unprotected well 1.8 0.5 2.7
Protected spring 3.7 1.5 5.3
Unprotected spring 1.8 0.3 2.9
Don't know / remember 2.8 3.4 2.4
Refuse / no answer 7.6 2.2 11.5
Other 0.7 0.2 1.0
Kind of toilet facility (s2) / categorical
Septic / semi-septic tank 79.4 91.2 70.9
Flush / sulabh 6.5 5.1 7.6
Ventilated improved pit 0.5 0.4 0.6
Double septic tank 3.3 0.6 5.2
Bucket 0.1 0.0 0.2
Hanging latrine 3.2 1.6 4.3
No facility bush field 2.9 0.5 4.6
Other 4.0 0.5 6.5
Main material used in roof (s3) / categorical
Reinforcement concrete 26.7 36.3 19.8
Tiles (cement, terracotta) 17.5 10.1 22.8
Root slabs (cement, metal) 54.0 53.1 54.7
Leaves/ straw/ rolled roofing 1.5 0.2 2.5
Other 0.3 0.3 0.2
Don't know/ don't remember 0.0 0.0 0.0
Electricity (s4_1) / nominal
Yes 99.7 100.0 99.6
No 0.3 0.0 0.4
Radio (s4_2) / nominal
Yes 12.2 11.5 12.7
No 87.7 88.5 87.2
Don't know 0.1 0.0 0.1
Television (s4_3) / nominal
Yes 93.4 95.2 92.1
No 6.6 4.8 7.9
Don't know 0.0 0.0 0.1
Telephone (s4_4) / nominal
Yes 97.4 98.9 96.3
No 2.6 1.1 3.7
Refrigerator (s4_5) / nominal
Yes 84.0 92.2 78.0
No 16.0 7.7 22.0
Don't know 0.0 0.0 0.0
Computer (s4_6) / nominal
Yes 36.1 54.4 23.0
No 63.8 45.6 77.0
Don't know 0.0 0.0 0.0
Washing machine (s4_7) / nominal
Yes 57.0 76.0 43.3
No 43.0 24.0 56.6
Don't know 0.0 0.0 0.1
Water heater (s4_8) / nominal
Yes 42.7 58.0 31.6
No 57.3 42.0 68.3
Don't know 0.1 0.0 0.1
Air conditioner (s4_9) / nominal
Yes 32.5 50.8 19.4
No 67.4 49.2 80.5
Don't know 0.1 0.0 0.1

217
Bicycle (s5_1) / nominal
Yes 56.6 51.9 60.0
No 43.3 48.1 40.0
Don't know 0.0 0.0 0.0
Motorcycle (s5_2) / nominal
Yes 93.4 95.1 92.1
No 6.6 4.8 7.9
Don't know 0.0 0.0 0.0
Car (s5_3) / nominal
Yes 7.9 13.5 3.9
No 91.9 86.4 95.9
Don't know 0.1 0.1 0.2
Boat (s5_4) / nominal
Yes 5.0 2.2 7.0
No 94.9 97.7 92.8
Don't know 0.1 0.1 0.2
Electronic bicycle or motorcycle s5_5) / nominal
Yes 13.9 14.2 13.6
No 86.0 85.8 86.2
Don't know 0.1 0.1 0.1
Ownership of land or house or apartment (s6) / nominal
Yes 90.4 86.9 93.0
No 9.4 12.9 6.9
Don't know 0.1 0.1 0.1
Refuse / no answer 0.1 0.1 0.1
How many rooms used for sleeping (s7) / nominal
1 29.5 27.6 30.9
2 45.6 43.5 47.1
3 20.6 23.4 18.6
4 3.8 4.7 3.2
5 0.4 0.7 0.2
6 0.0 0.0 0.0
The findings reveal that across the total sample, there was variation in the main sources of
drinking water, and main material used in the roof, but less variation in type of toilet facility. The
majority of households use one of three sources of drinking water: piped water into the dwelling;
tube well or borehole; or protected deep well. Though smaller in percentage terms, the number
of households that cited their main source of water came from a spring (protected or unprotected)
was not negligibly small (n=328). Moreover, a sizeable proportion (10.4 per cent) either did not
know or did not answer. In terms of sanitation facility, one category dominates, the septic/semi-
septic tank identified by almost 80 per cent of households. Among the remaining households, the
type of toilet facilities included: a sulabh flush toilet (6.5 per cent); double septic tank 3.3 per cent
and “other” type of facility (4.0 per cent). Slightly over one half of households indicated that the
main material used in the roof was a root slab (54 per cent), and among the remaining households,
the main material used was split primarily between concrete (26.7 per cent) and tiles (17.5 per
cent).
All except 15 households have electricity and the vast majority (over 90.0 per cent) have a
television and/or a telephone. Less than one half of households, however, have a computer and/or
a water heater. While the majority of households have a motorcycle (93.4 per cent), less than 10
per cent have a car and 13.9 per cent have an electronic bicycle or motorcycle.
The distribution of the SES indicators across the total sample, to some extent, masked the
variation by urban and rural location. For example, in the Viet Nam urban almost three quarters
(74.7 per cent) of the household’s main source of drinking water is piped into the residence and
91.2 per cent have a semi or septic tank flush toilet. This compares with 29.9 per cent and 70.9
per cent respectively in Viet Nam rural. The distribution of main roofing material is less varied
between the two settings, however, a greater proportion of households (36.3 per cent) in Viet

218
Nam urban have a roof made from concrete. Ownership of all household durable items is higher
in the Viet Nam urban than in Viet Nam rural—most notably ownership of a computer (54.4 per
cent urban and 23.0 per cent rural); washing machine (76.0 per cent urban and 43.3 per cent
rural); water heater (58.0 per cent urban and 31.6 per cent rural) and air-conditioning unit (50.8
per cent urban and 19.4 per cent rural). The mean number of rooms in the household used for
sleeping is slightly higher in urban areas (2.07 rooms) compared with rural areas (1.95 rooms),
however, the mean number of people in the household is slightly higher in rural areas (4.26)
compared with urban areas (4.11).
2.2 Analytical approach
Given the differences in distribution of the asset indicators by urban and rural split, three separate
PCA analyses were run: Viet Nam total sample; Viet Nam urban sample; and Viet Nam rural
sample. The purpose of this was to assess whether an asset index created using the total sample
masked the variation in household SES in the urban and the rural samples.
Coding of variables
The coding for each asset indicator is presented in Table 46. To some extent, the coding matched
that which was done for the 2010 VAW survey. For main source of drinking water, five separate
binary variables were created: whether or not the household’s main source of water was piped
(into dwelling and tap/standpipe); tube well or borehole; well (protected well or unprotected well);
spring (protected spring or unprotected spring); and other. The fifth category, “other”, grouped
together the “other” sources of drinking water that yielded a low frequency with don’t know/refused
to answer responses. Given the vast majority of households have a ‘septic/semi-septic tank’ toilet
facility, a binary variable was created that combined sanitation facilities using a flush system
(septic/semi-septic tank, flush / sulabh, and double septic tank) coded as 1. All other rudimentary
types (latrines, no facility, bucket, and other) were combined and coded as 0. Three binary
variables were created for main material used in the roof: concrete or tiles, root slabs, and other
(a combination of rudimentary materials).
All household durable assets, type of vehicle and land ownership remained as separate binary
variables. A “crowding” index was created as the ratio between the number of people in the
household and the number of rooms in the house for sleeping.
Inclusion of variables in PCA analyses
Based on the frequency distribution for the Viet Nam total sample (urban and rural combined) and
for the rural only sample, all variables, with the exception of electricity, were considered for
inclusion in the PCA analysis. Electricity was excluded because virtually all households had
electricity and therefore the variable would exhibit virtually zero variation.

219
Table 46: Description of SES variables used in PCA analysis, Viet Nam 2019
Variable label Type of variable
Value labels
Piped water into dwelling / standpipe Binary No=0 Yes=1
Tube well, borehole Binary No=0 Yes=1
Well (protected or unprotected) Binary No=0 Yes=1
Spring (protected or unprotected) Binary No=0 Yes=1
Other / refused / don't know Binary No=0 Yes=1
Septic tank / sulabh / double septic tank Binary No=0 Yes=1
Concrete / tiles Binary No=0 Yes=1
Root slab Binary No=0 Yes=1
Rudimentary / don't know Binary No=0 Yes=1
Electricity Binary No=0 Yes=1
Radio Binary No=0 Yes=1
Television Binary No=0 Yes=1
Telephone Binary No=0 Yes=1
Refrigerator Binary No=0 Yes=1
Computer Binary No=0 Yes=1
Washing machine Binary No=0 Yes=1
Water heater Binary No=0 Yes=1
Air-conditioning unit Binary No=0 Yes=1
Bicycle Binary No=0 Yes=1
Motorcycle Binary No=0 Yes=1
Car Binary No=0 Yes=1
Boat Binary No=0 Yes=1
Electric bike / motorcycle Binary No=0 Yes=1
Land Binary No=0 Yes=1
Crowding index Continuous 0.33 - 9.00

220
3. PRINCIPAL COMPONENTS ANALYSIS
The first principal component is considered a measure of SES and is therefore retained. The
output from a PCA is a table of factor scores or weights for each variable. Generally, an asset
variable with a positive factor score is associated with higher SES, and conversely a variable with
a negative factor score is associated with lower SES. PCA was conducted using all the asset
variables (with the exception of electricity) described in Table 46.120 The results from the final PCA
models (total sample; Viet Nam urban and Viet Nam rural) are shown in Table 47 and Table 48.
Asset index – Viet Nam total sample (urban and rural combined)
When considering the results for Viet Nam total sample, a household that obtains piped water,
has a septic, semi-septic/sulabh flush/ or double septic tank toilet, and has a concrete roof would
attain a higher SES score (Table 47). All other household infrastructure variables were associated
with lower SES, with the main drinking water source from a spring and a roof made from a root
slab displaying the greatest negative weights. Households with more durable assets would attain
a higher SES score with the variables refrigerator, computer, washing machine, water heater and
air-conditioning units displaying high weights. With the exception of owning a boat, household
ownership of any of the other four types of transport was associated with higher SES—household
ownership of a car yielded the highest weight. Ownership of land was marginally associated with
higher SES—reflecting that the majority of households, in both urban and rural Viet Nam, own
land. Higher household crowding was associated with lower SES.
120 In STATA, when specifying PCA, the user is given the choice of deriving eigenvectors (weights)
from either the correlation matrix or the co-variance matrix of the data. If the raw data has been standardized, then PCA should use the co-variance matrix. As the data was not standardized, and they are therefore not expressed in the same units, the analysis specified the correlation matrix—the default in STATA—to ensure that all data have equal weight. For example, crowding is a quantitative variable and has greater variance than the other binary variables, and would therefore dominate the first principal component if the co-variance matrix was used.

221
Table 47: Results from principal components analysis – total sample, Viet Nam 2019
Total sample (N=5,997)
Variable Mean Std dev PC Score
Piped water into dwelling/standpipe 0.490 0.500 0.213
Tube well / borehole 0.187 0.390 -0.042
Well (protected / unprotected) 0.157 0.364 -0.105
Spring (protected / unprotected) 0.055 0.228 -0.161
Other / refused / don't know 0.111 0.314 -0.049
Flush toilet 0.893 0.310 0.259
Concrete / cement 0.442 0.497 0.262
Root slab 0.540 0.498 -0.235
Rudimentary / don't know 0.018 0.133 -0.097
Radio 0.122 0.327 0.084
Television 0.934 0.249 0.190
Telephone 0.974 0.159 0.127
Refrigerator 0.840 0.367 0.303
Computer 0.361 0.480 0.283
Washing machine 0.570 0.495 0.352
Water heater 0.427 0.495 0.353
Air-conditioning 0.325 0.468 0.333
Bicycle 0.566 0.496 0.093
Motorbike 0.934 0.249 0.127
Car 0.079 0.270 0.171
Boat 0.050 0.218 -0.101
Electronic bike / motorbike 0.139 0.345 0.130
Land / house / apartment 0.904 0.294 0.065
Crowding index 2.354 1.134 -0.194
Note: Shading indicates positive PCA
Asset index – Viet Nam urban sample and rural sample
When considering the weights derived from the urban and rural sample separately, for the Viet
Nam urban analysis, the sign of the weights was similar to that derived from the Viet Nam total
sample analysis (Table 3.2 and Table 3.3 in Annex VIII). The weights associated with the
household asset durables, and the types of vehicles were generally of a similar magnitude. In Viet
Nam rural, there were few differences, compared with the Viet Nam total sample, in the sign
associated with the different asset indicators. The weights associated with having a tube well or
borehole and for “other” for the main source of drinking water were positive indicating higher SES.

222
Table 48: Results from principal components analysis – urban and rural separated, Viet Nam 2019
Urban (N=2501) Rural (N=3496)
Variable Mean Std dev
PC Score
Mean Std dev
PC Score
Piped water into dwelling/standpipe
0.750 0.433 0.169 0.303 0.460 0.131
Tube well / borehole 0.098 0.297 -0.080 0.250 0.433 0.044
Well (protected / unprotected) 0.076 0.266 -0.080 0.216 0.411 -0.077
Spring (protected / unprotected) 0.018 0.133 -0.056 0.081 0.274 -0.197
Other / refused / don't know 0.058 0.234 -0.087 0.149 0.356 0.017
Flush toilet 0.970 0.172 0.175 0.837 0.369 0.286
Concrete / cement 0.464 0.499 0.323 0.425 0.494 0.274
Root slab 0.531 0.499 -0.318 0.547 0.498 -0.236
Rudimentary / don't know 0.005 0.069 -0.036 0.028 0.164 -0.110
Radio 0.115 0.319 0.096 0.127 0.333 0.103
Television 0.952 0.214 0.189 0.921 0.270 0.211
Telephone 0.989 0.103 0.110 0.963 0.189 0.134
Refrigerator 0.922 0.268 0.263 0.780 0.414 0.330
Computer 0.544 0.498 0.286 0.230 0.421 0.237
Washing machine 0.760 0.427 0.343 0.433 0.496 0.342
Water heater 0.580 0.494 0.368 0.316 0.465 0.344
Air-conditioning 0.508 0.500 0.351 0.194 0.395 0.297
Bicycle 0.519 0.500 0.059 0.600 0.490 0.178
Motorbike 0.951 0.215 0.130 0.921 0.270 0.128
Car 0.135 0.342 0.185 0.039 0.195 0.125
Boat 0.022 0.147 -0.116 0.070 0.256 -0.075
Electronic bike / motorbike 0.142 0.349 0.104 0.136 0.343 0.177
Land / house / apartment 0.869 0.338 0.143 0.930 0.255 0.068
Crowding index 2.208 1.030 -0.166 2.459 1.191 -0.212
Note: Shading indicates positive PCA
3.2 Classification of households into SES group
Classification of households into SES group – Viet Nam total sample (urban and rural
combined)
Using the factor scores from the first principal component as weights, a dependent variable can
then be constructed for each household that has a mean equal to zero, and a standard deviation
equal to one. This dependent variable can be regarded as the household’s SES score, and the
higher the household SES score, the higher the implied SES of that household. A histogram of
the household SES scores using the Viet Nam total sample data is shown in Figure 101. The
figure reveals that the distribution of the household SES score is slightly left skewed towards
“higher” SES.

223
Figure 101: Distribution of household SES score in Viet Nam (urban & rural combined), Viet Nam 2019
To differentiate households into broad SES categories studies have used cut-off points –most
commonly an arbitrarily defined disaggregation e.g. terciles or quintiles. Another method is to use
a data driven approach – cluster analysis – to derive SES categories. Cluster analysis was used
in the WHO Multi-country Study on Women’s Health and Domestic Violence against Women to
derive “low”, “middle” and “high” SES categories.
For this study both methods to classify households into SES groups were explored using the Viet
Nam total sample. First households were ranked according to their SES score and were then split
into three equal sized groups “terciles”. The second approach used K-means cluster analysis to
group households into three clusters. The mean SES score for each SES category, derived using
both methods, is shown in Table 49. The differences in the mean SES score between the SES
groups are similar for both methods. For example, the difference in the mean SES score between
the low and middle SES group is 2.456 for the tercile method and 2.553 for the cluster method
and between the high and middle SES group is 2.195 for the tercile method and 2.498 for the
cluster method.
Using the cluster method, slightly less than one quarter of households (23.0 per cent) are
classified in the low SES group, 40.6 per cent are classified as middle SES and 36.1 per cent
classified as high SES. When comparing the distribution of households across SES groups for
the two methods, 86.5 per cent were similarly classified. The difference in the distribution of
household SES classification resulting from the two approaches arises predominantly in
households classified as low SES using the tercile approach that are classified as middle SES
using the cluster approach.

224
Table 49: Mean socioeconomic scores by SES group (N=5,997), Viet Nam 2019
Terciles Cluster
Low Medium High Low Medium High
N 1 993 1 992 1 992 1 377 2 434 2 166
Per cent 33.2 33.2 33.2 23.0 40.7 36.2
Mean SES score -2.368 0.087 2.282 -2.870 -0.317 2.181
Std dev 1.127 0.578 0.714 1.002 0.713 0.765
Min -6.950 -0.891 1.122 -6.950 -1.593 0.934
Max -0.898 1.110 4.055 -1.599 0.929 4.055
Internal coherence compares the mean value of each asset variable by SES group in order to
assess whether ownership differs by group—ownership of higher SES indicators should ideally
be highest in the high SES group and lowest in the low SES group. Table 50 show the mean
ownership levels of the SES indicator variables by both the tercile and cluster derived SES groups.
The purpose of this analysis is primarily to assess whether the different SES indicators vary in
the level of ownership by SES group. However, because the vast majority (86.5 per cent) of
households are similarly classified using the two approaches, the mean ownership levels are
similar—the classification of households into the high SES households is virtually identical using
both the tercile and cluster approaches, and therefore, the mean ownership levels of each SES
indicators are the same. The findings reveal that the distribution of SES indicators across the SES
groups is, as expected, similar using both approaches with the cluster approach very marginally
displaying greater differences in ownership of SES indicators across the SES groups.
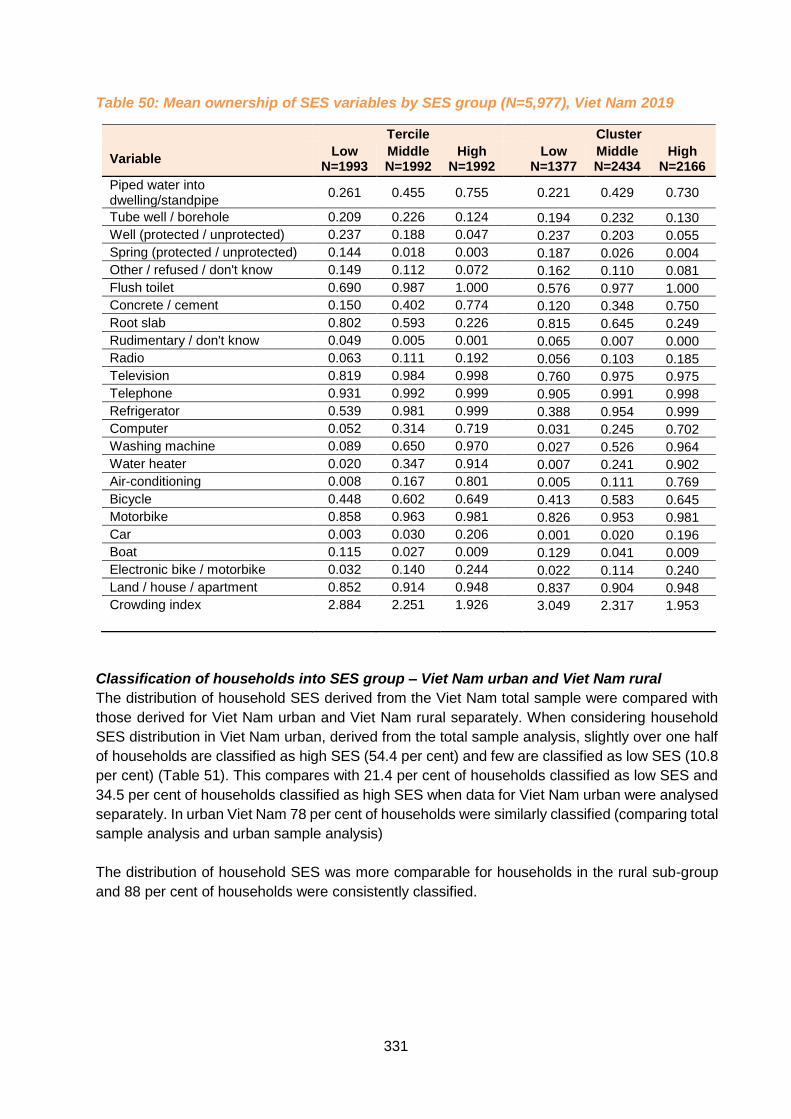
331
Table 50: Mean ownership of SES variables by SES group (N=5,977), Viet Nam 2019
Tercile Cluster
Variable Low
N=1993 Middle N=1992
High N=1992
Low N=1377
Middle N=2434
High N=2166
Piped water into dwelling/standpipe
0.261 0.455 0.755 0.221 0.429 0.730
Tube well / borehole 0.209 0.226 0.124 0.194 0.232 0.130
Well (protected / unprotected) 0.237 0.188 0.047 0.237 0.203 0.055
Spring (protected / unprotected) 0.144 0.018 0.003 0.187 0.026 0.004
Other / refused / don't know 0.149 0.112 0.072 0.162 0.110 0.081
Flush toilet 0.690 0.987 1.000 0.576 0.977 1.000
Concrete / cement 0.150 0.402 0.774 0.120 0.348 0.750
Root slab 0.802 0.593 0.226 0.815 0.645 0.249
Rudimentary / don't know 0.049 0.005 0.001 0.065 0.007 0.000
Radio 0.063 0.111 0.192 0.056 0.103 0.185
Television 0.819 0.984 0.998 0.760 0.975 0.975
Telephone 0.931 0.992 0.999 0.905 0.991 0.998
Refrigerator 0.539 0.981 0.999 0.388 0.954 0.999
Computer 0.052 0.314 0.719 0.031 0.245 0.702
Washing machine 0.089 0.650 0.970 0.027 0.526 0.964
Water heater 0.020 0.347 0.914 0.007 0.241 0.902
Air-conditioning 0.008 0.167 0.801 0.005 0.111 0.769
Bicycle 0.448 0.602 0.649 0.413 0.583 0.645
Motorbike 0.858 0.963 0.981 0.826 0.953 0.981
Car 0.003 0.030 0.206 0.001 0.020 0.196
Boat 0.115 0.027 0.009 0.129 0.041 0.009
Electronic bike / motorbike 0.032 0.140 0.244 0.022 0.114 0.240
Land / house / apartment 0.852 0.914 0.948 0.837 0.904 0.948
Crowding index 2.884 2.251 1.926 3.049 2.317 1.953
Classification of households into SES group – Viet Nam urban and Viet Nam rural
The distribution of household SES derived from the Viet Nam total sample were compared with
those derived for Viet Nam urban and Viet Nam rural separately. When considering household
SES distribution in Viet Nam urban, derived from the total sample analysis, slightly over one half
of households are classified as high SES (54.4 per cent) and few are classified as low SES (10.8
per cent) (Table 51). This compares with 21.4 per cent of households classified as low SES and
34.5 per cent of households classified as high SES when data for Viet Nam urban were analysed
separately. In urban Viet Nam 78 per cent of households were similarly classified (comparing total
sample analysis and urban sample analysis)
The distribution of household SES was more comparable for households in the rural sub-group
and 88 per cent of households were consistently classified.

226
Table 51: Distribution of household SES by urban and rural location (total sample analysis; urban sample analysis and rural sample analysis), Viet Nam 2019
Viet Nam (total sample) Viet Nam urban Viet Nam
rural
SES group
Urban per cent
N=(2,501)
Rural per cent
(N=3,476) per cent (N=2,501)
per cent (N=3,476)
Low 10.8 31.9 21.4 26.7
Middle 34.8 45.0 35.2 43.4
High 54.4 23.2 34.5 29.9
4. SUMMARY
This summary report describes how a PCA-based SES index was created using the Viet Nam
VAW survey data. Three PCA-based indices were derived: Viet Nam total (urban and rural
combined); Viet Nam urban; and Viet Nam rural. From the PCA analysis using the total sample,
households were classified into SES groups using both terciles and cluster analysis approaches.
An assessment of the internal coherence concluded that both methods performed similarly in
disaggregating SES, although the cluster method slightly more disaggregated households. When
considering the distribution of household SES by urban and rural location (from the results using
of the total sample analysis), slightly over one half of households were classified as high SES in
the urban location. Therefore, separate PCA-based indices were generated for the urban and the
rural samples, and it is recommended that this SES indicator is used if separate urban and rural
analyses are to be conducted.

227
Annex VIIa: Questionnaire
WHO questionnaire – building on Asia and Pacific
kNOwVAWdata course version 12.03 (Nov. 2017)
Includes costing questions and Viet Nam specific
adaptations
[Women’s health and life experiences]
17 October 2018

228
ADMINISTRATION FORM
CITY/PROVINCE:………………………………………
DISTRICT:……………………………………………
COMMUNE:………………………………………………
EA: ………………………………………………
SELECTED WOMAN NUMBER:……….…………………………………
URBAN/RURAL:…………………...………………………………………
…
URBAN…………………1
RURAL:……………….2
RESULT CODE:
COMPLETED 1
PARTLY COMPLETED 2
NON COMPLETED
REFUSED 3
UNABLE TO INTERVIEW 4
OUT OF AGE 15-64 5
NOT SELECTED WOMAN 6
229
INTERVIEWER:…………………………………………………………………
…
SUPERVISOR:…………………………………………………………
DATE ……………………………………………………
_ _ / _ _ / 20_
_

230
INDIVIDUAL CONSENT FORM FOR WOMAN’S QUESTIONNAIRE
Hello, my name is *. I work for *. We are conducting a survey on the whole country to learn about [SAFE
NAME]. You have been chosen by chance to participate in the study.
I want to assure you that all of your answers will be kept strictly confidential. I will not keep a record of your
name or address. You have the right to stop the interview at any time, or to skip any questions that you
don’t want to answer. There are no right or wrong answers. Some of the topics may be difficult to discuss,
but many women have found it useful to have the opportunity to talk.
Your participation is completely voluntary but your experiences could be very helpful to other women in
COUNTRY.
Do you have any questions?
(The interview takes approximately * minutes to complete.) Do you agree to be interviewed?
NOTE WHETHER RESPONDENT AGREES TO INTERVIEW OR NOT
[ ] DOES NOT AGREE TO BE INTERVIEWED THANK PARTICIPANT FOR HER TIME
AND END
[ ] AGREES TO BE INTERVIEWED
______________________________________________________
TO BE COMPLETED BY INTERVIEWER
I CERTIFY THAT I HAVE READ THE ABOVE CONSENT PROCEDURE TO THE PARTICIPANT.
SIGNED:
____________________________________________________________

231
RECORD TIME TO START
HOUSEHOLD INFORMATION
QUESTIONS & FILTERS CODING CATEGORIES
QUESTIONS 1-6: COUNTRY-SPECIFIC SOCIOECONOMIC INDICATORS, TO BE ADAPTED IN EACH
COUNTRY
0c Firstly, could you please tell me some about
yourself. What is your name?
COMPARE WITH SELECTED WOMAN’S NAME
APPEARED ON THE TABLET
- IF DIFFERENT: DOUBLE CHECK IF THE RESPONDENT IS THE RIGHT SELECTED WOMAN
- IF THE SAME => CONTINUE
RIGHT 1
WRONG NAME 2
WRONG RESPONDENT 3
⇨ STOP INTERVIEWING REPLACED RESPONDENT 4
0d ENTRY THE RIGHT NAME OF THE WOMAN
10
6
What is your date of birth?
DAY [ ][ ]
MONTH [ ][ ]
YEAR [ ][ ][ ][ ]
DON’T KNOW YEAR 9998
REFUSED/NO ANSWER 9999
10
7 How old are you? COMPLETED YEAR CHECKING IF:
THE WOMAN IS OUT OF AGE 15-64 => FINISH
IN THE AGE OF 15-64 => CONTINUE
AGE (YEARS) [ ][ ]
COMPARE WITH THE BIRTH DATE OF
SELECTED WOMAN
- IF DIFFERENT: DOUBLE CHECK IF THE RESPONDENT IS THE RIGHT SELECTED WOMAN
IF THE SAME => CONTINUE

232
0 If you don’t mind, I would like to ask you a few
questions about your household.
How many members in your family?
MEMBERS..................................................[ ][ ]
0a How many women aged between 15-64 in your
family?
WOMEN..................................................[ ][ ]
1 What is the main source of drinking-water for your household?
PIPER WATER
PIPED INTO DWELLING...................................01
PIPED TAP/STANDPIPE....................................02
TUBE WELL, BOREHOLE...................................03
DUG WELL
PROTECTED WELL...........................................04
UNPROTECTED WELL.....................................05
WATER FROM SPRING
PROTECTED SPRING........................................06
UNPROTECTED SPRING..................................07
WATER VENDOR (TANKER/TRUCK, BOTTLED
WATER).............................................................08
RAINWATER COLLECTION...............................09
OTHER__________________................................96
DON’T KNOW/DON’T REMEMBER 98
REFUSED/NO ANSWER ...................99

233
2 What kind of toilet facility does your household
have?
SEPTIC/SEMI-SEPTIC TANK..............................01
FLUSH/SUILABH...................................................02
VENTILATED IMPROVED PIT.........................03
DOUBLE SEPTIC TANK.....................................04
BUCKET.............................................................05
HANGING LATRINE..........................................06
NO FACILITY, BUSH, FIELD............................07
OTHER (SPECIFY)_________________..........96
DON’T KNOW/DON’T REMEMBER 98
REFUSED/NO ANSWER ...................99
3 What are the main materials used in the roof?
REINFORCEMENT CONCRETE...........................1
TILES (CEMENT, TERRACOTTA).......................2
ROOT SLABS (CEMENT, METAL)......................3
LEAVES/STRAW/ROLLED ROOFING..................4
OTHER: _______________________________ 6
DON’T KNOW/DON’T REMEMBER 8
REFUSED/NO ANSWER 9
4 Does your household have:
a) Electricity b) A radio c) A television d) A telephone/Mobile phone/tablet e) A refrigerator f) Computer g) Washing machine h) Water heater i) Air conditioner
a) ELECTRICITY
b) RADIO
c) TELEVISION
d)TELEPHONE/
MOBILE/TABLET
e) REFRIGERATOR
f) COMPUTER
g) WASHING MACHINE
h) WATER HEATER
i) CONDITIONER
YES
1
1
1
1
1
1
1
1
1
NO
2
2
2
2
2
2
2
2
2
DK
8
8
8
8
8
8
8
8
8

234
5 Does any member of your household own:?
a) A bicycle? b) A motorbike? c) A car? d) A boat e) Electric bicycle
a) BICYCLE
b) MOTORCYCLE
c) CAR
d) BOAT
YES
1
1
1
1
NO
2
2
2
2
DK
8
8
8
8
6 Do people in your household own any
land/house/apartment (including current dwelling)?
YES 1
NO 2
DON’T KNOW/DON’T REMEMBER 8
REFUSED/NO ANSWER 9
7 How many rooms in your household are used for
sleeping?
NUMBER OF ROOMS [ ][ ]
8 REMOVED
9 REMOVED
10

235
DATE OF INTERVIEW: day [ ][ ] month [ ][ ] year [ ][ ][ ][ ]
100. RECORD THE START TIME OF THE WOMAN’S
INTERVIEW (24H SYSTEM)
HH:MM [ ][ ]:[ ][ ] (00-24 h)
SECTION 1 RESPONDENT AND HER COMMUNITY
I would like to start by asking you some questions about yourself.
QUESTIONS & FILTERS CODING CATEGORIES SKIP
TO
101 REMOVED
102
103
104
105
106 MOVED TO THE BEGINING
107 MOVED TO THE BEGINING
108 How long have you been living continuously in COMMUNITY NAME?
NUMBER OF YEARS [ ][ ]
LESS THAN 1 YEAR 00
LIVED ALL HER LIFE 95
DON’T KNOW/DON’T REMEMBER98
REFUSED/NO ANSWER 99
108a What is your religion?
NO RELIGION 01

236
BUDDHIST...........................................
......... 02
CATHOLIC 03
PROTESTANT 04
HOA HAO
BUDDHIST..................................05
ISLAM
06
OTHER : _____________________
96
DON’T KNOW/DON’T REMEMBER98
REFUSED/NO ANSWER 99
108 b What ethnic group do you identify with most?
KINH 01
TAY 02
THAI 03
MUONG 04
KHMER.............................................................
..05
CHINESE 06
NUNG 07
MONG...............................................................
..08
DAO 09
OTHER (SPECIFY) ______________ 96
DON’T KNOW/DON’T REMEMBER 98
REFUSED/NO ANSWER 99
109 REMOVED

237
110
111 a1 What is the highest general educational
qualification that you achieved? MARK HIGHEST
LEVEL.
NEVER ATTEND SCHOOL.........................00
NO QUALIFICATION 1
PRIMARY......................................................2
LOWER SECONDARY 3
UPER SECONDARY 4
COLLEGE 5
UNIVERSITY 6
MASTER 7
DOCTOR 8
OTHER
(Specify)______________________96DON’T
KNOW/DON’T REMEMBER ...98
REFUSED/NO
ANSWER.................................99
111 a2 What is the highest vocational qualification that you
achieved? MARK HIGHEST LEVEL.
NO QUALIFICATION...................................0
PRIMARY 1
ELEMENTARY 2
MIDLE-LEVEL 3
COLLEGE 4
OTHER
(Specify)______________________96
DON’T KNOW/DON’T REMEMBER ...98
REFUSED/NO
ANSWER.................................99
111a3 How many years have you attended school? YEARS: [ ][ ]
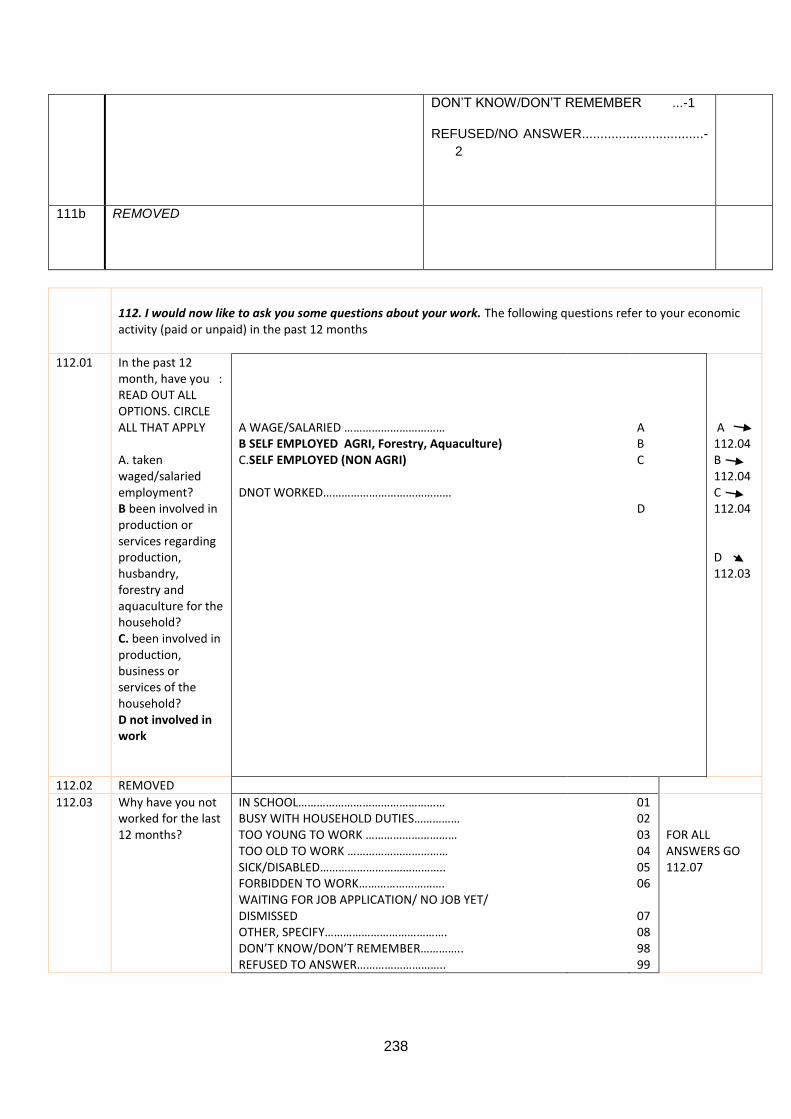
238
DON’T KNOW/DON’T REMEMBER ...-1
REFUSED/NO ANSWER.................................-
2
111b REMOVED
112. I would now like to ask you some questions about your work. The following questions refer to your economic activity (paid or unpaid) in the past 12 months
112.01 In the past 12 month, have you : READ OUT ALL OPTIONS. CIRCLE ALL THAT APPLY A. taken waged/salaried employment? B been involved in production or services regarding production, husbandry, forestry and aquaculture for the household? C. been involved in production, business or services of the household? D not involved in work
A WAGE/SALARIED …………………………… B SELF EMPLOYED AGRI, Forestry, Aquaculture) C.SELF EMPLOYED (NON AGRI) DNOT WORKED……………………………………
A B C D
A 112.04 B 112.04 C 112.04 D 112.03
112.02 REMOVED
112.03 Why have you not worked for the last 12 months?
IN SCHOOL………………………………………… BUSY WITH HOUSEHOLD DUTIES…………… TOO YOUNG TO WORK ………………………… TOO OLD TO WORK …………………………… SICK/DISABLED………………………………….. FORBIDDEN TO WORK………………………. WAITING FOR JOB APPLICATION/ NO JOB YET/ DISMISSED OTHER, SPECIFY…………………………………. DON’T KNOW/DON’T REMEMBER………….. REFUSED TO ANSWER………………………..
01 02 03 04 05 06 07 08 98 99
FOR ALL ANSWERS GO 112.07

239
112.04 What was your main work in the last 12 months?
SALARY OR WAGE EMPLOYMENT…………………01 SELF EMPLOYMENT IN AGRICULTURE, FORESTRY, FISHERY………………………………….02 SELF EMPLOYMENT in PRODUCTION BUSINESS, SERVICES……………………………...….03
112.05a In the last 12 months, how many months did you work in your main work? INTERVIEWER TO PROBE FOR ESTIMATE
NUMBER OF MONTHS [ ][ ] NUMBER OF DAYS/MONTH [ ][ ]
112.05b In the last 12 months, How many days in month did you work? INTERVIEWER TO PROBE FOR ESTIMATE
NUMBER OF MONTHS [ ][ ] NUMBER OF DAYS/MONTH [ ][ ]
112.05c In these working days, how many hours did you spend per day on average? INTERVIEWER TO PROBE FOR ESTIMATE
NUMBER OF MONTHS [ ][ ] NUMBER OF DAYS/MONTH [ ][ ]
112.6a Could you describe your main work?
__________________________________
112.06b In the last 12 months, what was your occupation in your main work? Interviewer probe with woman what she does? I lead an organisation, I cut grass, I sell food, I work in a shop, etc.
MANAGER………………………………………………01 HIGH LEVEL EXPERT 02 AVERAGE-LEVEL EXPERT....................03 OFFICE STAFF 04
SERVICE AND SALES STAFF...................05
SKILLED LABORERS IN AGRICULTURE, FORESTRY AND FISHERIES....................06 MANUAL LABORER AND RELATED OCCUPATIONS..........................................07
MACHINE ASSEMBLING AND OPERATING WORKERS.............................08

240
LOW-SKILLED LABORERS......................09
MEMBERS OF THE ARMED FORCE........10
OTHER: ____________________________ 96
DON’T KNOW/DON’T REMEMBER 98 REFUSED/NO ANSWER 99
112.07 Drop
112.08 In the last week, how many hours on average did you spend per day on the following: a) collecting
firewood (or
other fuels)?
b) fetching
water?
c) Caring for
children
d) Caring for
other family
members/sick
persons
e) Domestic
chores
f) Other
a) COLLECTING FIREWOOD
b) FETCHING WATER c) CARING FOR CHILDREN d) CARING FOR OTHERS
e) DOMESTIC CHORES
f) OTHER
HOURS [ ][ ] [ ][ ] [ ][ ] [ ][ ] [ ][ ] [ ][ ]
112 REMOVED
113 Do any of your family of birth live close
enough by that you can easily see/visit them?
YES 1
NO 2
LIVING WITH FAMILY OF BIRTH 3
DON’T KNOW/DON’T REMEMBER 8
REFUSED/NO ANSWER 9
⇒ 115
114 How often do you see or talk to a member of
your family of birth? Would you say at least
once a week, once a month, once a year, or
never?
DAILY/AT LEAST ONCE A WEEK 1
AT LEAST ONCE A MONTH 2
AT LEAST ONCE A YEAR 3
NEVER (HARDLY EVER) 4
DON’T KNOW/DON’T REMEMBER 8

241
REFUSED/NO ANSWER 9
115 When you need help or have a problem, can
you usually count on members of your family
of birth for support?
YES 1
NO 2
DON’T KNOW/DON’T REMEMBER 8
REFUSED/NO ANSWER 9
116 REMOVED Are
you a member of
any association or
group
IF ANY: What are
those
associations/group
s
IF NO, PROBE:
such as Women’s
association,
Farmer’s
association or other
groups in the
community.
IF NO A => 118
116b. How often do you involve in?
(JUST ASK FOR MARKED
OPTIONS IN 116a)
Severa
l times
in a
week
Severa
l times
in a
week
Severa
l times
in a
week
Neve
r
COMMUNIST
PARTY/YOUTH’S
UNION/LABOR’S UNION........ B 1 2 3 4
VOLUNTEER ASSOCIATION
…………………. C 1 2 3 4
SPORT CLUB/ART
CLUB……….
OCCUPATION
ASSOCIATION…………… D 1 2 3 4
FARMER’S
ASSOCATION/AGRICULTURE
EXTENSION
ASSOCIATION…………………. E 1 2 3 4
WOMEN’S ASSOCIATION……. F 1 2 3 4
RELIGIOUS ORGANIZATION... G 1 2 3 4
VESTERAN’S
ASSOCATION…. H 1 2 3 4
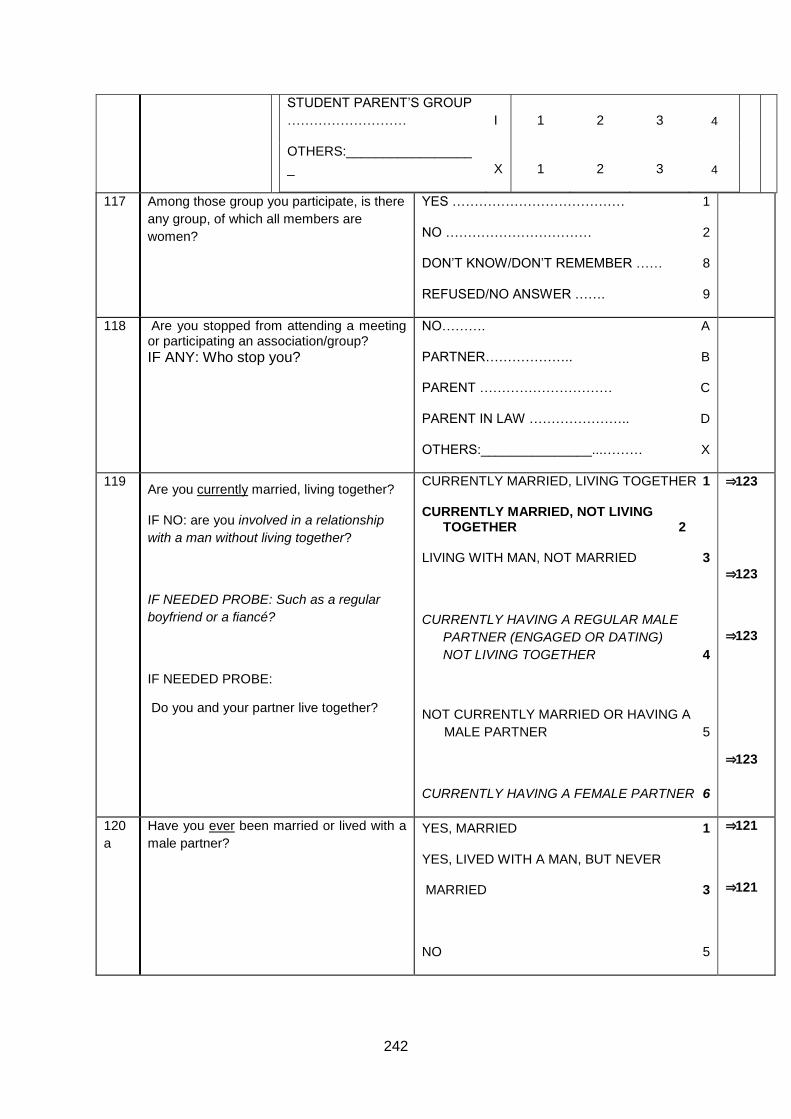
242
STUDENT PARENT’S GROUP
……………………… I 1 2 3 4
OTHERS:_________________
_ X 1 2 3 4
117 Among those group you participate, is there
any group, of which all members are
women?
YES ………………………………… 1
NO …………………………… 2
DON’T KNOW/DON’T REMEMBER …… 8
REFUSED/NO ANSWER ……. 9
118 Are you stopped from attending a meeting or participating an association/group?
IF ANY: Who stop you?
NO………. A
PARTNER……………….. B
PARENT ………………………… C
PARENT IN LAW ………………….. D
OTHERS:_______________...……… X
119 Are you currently married, living together?
IF NO: are you involved in a relationship
with a man without living together?
IF NEEDED PROBE: Such as a regular
boyfriend or a fiancé?
IF NEEDED PROBE:
Do you and your partner live together?
CURRENTLY MARRIED, LIVING TOGETHER 1 CURRENTLY MARRIED, NOT LIVING
TOGETHER 2 LIVING WITH MAN, NOT MARRIED 3
CURRENTLY HAVING A REGULAR MALE
PARTNER (ENGAGED OR DATING)
NOT LIVING TOGETHER 4
NOT CURRENTLY MARRIED OR HAVING A
MALE PARTNER 5
CURRENTLY HAVING A FEMALE PARTNER 6
⇒123
⇒123
⇒123
⇒123
120
a
Have you ever been married or lived with a
male partner?
YES, MARRIED 1
YES, LIVED WITH A MAN, BUT NEVER
MARRIED 3
NO 5
⇒121
⇒121

243
120
b
Have you ever been involved in a
relationship with a man without living
together (such as being engaged or dating)?
YES 1
NO 2
REFUSED/NO ANSWER 9
⇒1101
⇒1101
121 Did the last partnership with a man end in
divorce or separation, or did your
husband/partner die?
COUNTRY-SPECIFIC CODES CAN BE
ADDED
DIVORCED 1
SEPARATED/BROKEN UP 2
WIDOWED/PARTNER DIED 3
DON’T KNOW/DON’T REMEMBER 8
REFUSED/NO ANSWER 9
⇒123
122 Was the divorce/separation initiated by you,
by your husband/partner, or did you both
decide that you should separate?
RESPONDENT 1
HUSBAND/PARTNER 2
BOTH (RESPONDENT AND PARTNER) 3
OTHER: ____________________________ 6
DON’T KNOW/DON’T REMEMBER 8
REFUSED/NO ANSWER 9
123 How many times in your life have you been
married and/or lived together with a man?
(INCLUDE CURRENT PARTNER IF LIVING TOGETHER)
NUMBER OF TIMES MARRIED OR
LIVED TOGETHER [ ][ ]
NEVER MARRIED OR LIVED TOGETHER 00
DON’T KNOW/DON’T REMEMBER 98
REFUSED/NO ANSWER 99
⇒1101
123
a
How old were you the first time you were
married or lived together with a man?
AGE IN YEARS [ ][ ]
DON’T KNOW/DON’T REMEMBER 98
REFUSED/NO ANSWER 99

244
BEFORE CONTNUING REVIEW RESPONSES IN 119, 120 and 123 AND MARK MARITAL STATUS ON
REFERENCE SHEET, BOX A.
124 The next few questions are about your
current or most recent partnership.
Do/did you live together (in the same home)
with your husband/partner’s parents or
relatives, or with your own parents or
relatives?
NOT LIVING WITH HUSBAND’S OR OWN
PARENTS 1
HIS FAMILY 2
HER FAMILY 3
WITH BOTH HIS AND HER RELATIVES 4
N/A NOT LIVING WITH PARTNER 7
DON’T KNOW/DON’T REMEMBER 8
REFUSED/NO ANSWER 9
125 REMOVED
126 REMOVED
127 REMOVED
128 REMOVED
129 Did you have any kind of marriage
ceremony to formalize the union? What
type of ceremony did you have?
MARK ALL THAT APPLY
NONE A
CIVIL MARRIAGE B
RELIGIOUS MARRIAGE C
CUSTOMARY MARRIAGE D
OTHER: ____________________________ X
⇒1101
130 In what year was the (first) ceremony
performed?
(THIS REFERS TO CURRENT/LAST
RELATIONSHIP)
YEAR [ ][ ][ ][ ]
DON’T KNOW 9998
REFUSED/NO ANSWER 9999
131 Did you yourself choose your current/most recent husband, did someone else choose him for you, or did he choose you?
IF SHE DID NOT CHOOSE HERSELF,
PROBE:
BOTH CHOSE 1
RESPONDENT CHOSE 2
RESPONDENT’S FAMILY CHOSE 3
HUSBAND/PARTNER CHOSE 4
HUSBAND/PARTNER’S FAMILY CHOSE 5
OTHER: ____________________________ 6
⇒133
⇒133

245
Who chose your current/most recent
husband for you?
DON’T KNOW/DON’T REMEMBER 8
REFUSED/NO ANSWER 9
132 Before the marriage with your current /most recent husband, were you asked whether you wanted to marry him or not?
YES 1
NO 2
DON’T KNOW/DON’T REMEMBER 8
REFUSED/NO ANSWER 9
133 REMOVED
134 REMOVED
135 REMOVED
Now I would like to ask you some questions about things that you own and your earnings. We need this information to understand the financial position of women nowadays.
1101 Please tell me if you own any of the following, either by yourself or with someone else: a) Land b) Your house c) A company or business d) Large animals (cows, horses,
etc.) e) Small animals (chickens, pigs,
goats….) f) Produce or crops from certain
fields or trees g) Durables (Television, bed,
cooker....) h) Jewelry, gold or other valuable
assets i) Car, motorbike j) Bank deposits k) Other property, specify
FOR EACH, PROBE: Do you own this on your own, or do you own it with others?
YES NO
Own with Don’t
by self others own
a) LAND b) HOUSE c) COMPANY d) LARGE ANIMALS e) SMALL ANIMALS f) PRODUCE g) DURABLES h) JEWLRY i) CAR, MOTORBIKE j) BANK DEPOSITS k) OTHER PROPERTY:
____________________
_
1 2 3
1 2 3
1 2 3
1 2 3
1 2 3
1 2 3
1 2 3
1 2 3
1 2 3
1 2 3
1 2 3

246
ADD CONTEXT SPECIFIC CATEGORIES
1102 REMOVED
* CHECK:
Ref. sheet,
Box A
(s11mar)
CURRENTLY
MARRIED/CURRENTLY LIVING
WITH A MAN
(Option K) [
]
⇓
(1)
NOT CURRENTLY MARRIED OR LIVING
WITH A MAN/CURRENT OR PAST MALE
DATING PARTNER (Options L, M, N)
[ ] ⇒
(2)
⇒S.2
CHECK
111c?
REMOVED
1103 Are you able to spend the money you
earn how you want yourself, or do you
have to give all or part of the money to
your husband/partner?
SELF/OWN CHOICE 1
GIVE PART TO HUSBAND/PARTNER 2
GIVE ALL TO HUSBAND/PARTNER 3
DON’T KNOW 8
REFUSED/NO ANSWER 9
1104 Would you say that the money that you bring into the family is more than what your husband/partner contributes, less than what he contributes, or about the same as he contributes?
MORE THAN HUSBAND/PARTNER 1
LESS THAN HUSBAND/PARTNER 2
ABOUT THE SAME 3
DO NOT KNOW 8
REFUSED/NO ANSWER 9

247
SECTION 2 GENERAL HEALTH
201 I would now like to ask a few questions about
your health and use of health services.
In general, would you describe your overall
health as excellent, good, fair, poor or very
poor?
EXCELLENT 1
GOOD 2
FAIR 3
POOR 4
VERY POOR 5
DON’T KNOW/DON’T REMEMBER 8
REFUSED/NO ANSWER 9
201
WG
The next questions ask about difficulties you
may have doing certain activities because of a
health problem.
Do you have difficulty seeing, even if wearing
glasses?
NO – NO DIFFICULTY 1
YES – SOME DIFFICULTY 2
YES – A LOT OF DIFFICULTY 3
CANNOT DO AT ALL 4
REFUSED/NO ANSWER 9
202
WG
Do you have difficulty hearing, even if using a
hearing aid?
NO – NO DIFFICULTY 1
YES – SOME DIFFICULTY 2
YES – A LOT OF DIFFICULTY 3
CANNOT DO AT ALL 4
REFUSED/NO ANSWER 9
203
WG
Do you have difficulty walking or climbing
steps?
NO – NO DIFFICULTY 1
YES – SOME DIFFICULTY 2
YES – A LOT OF DIFFICULTY 3
CANNOT DO AT ALL 4
REFUSED/NO ANSWER 9
204
WG
Do you have difficulty remembering or
concentrating?
NO – NO DIFFICULTY 1
YES – SOME DIFFICULTY 2
YES – A LOT OF DIFFICULTY 3
CANNOT DO AT ALL 4

248
REFUSED/NO ANSWER 9
205
WG
Do you have difficulty (with self-care such as)
was washing all over or dressing?
NO – NO DIFFICULTY 1
YES – SOME DIFFICULTY 2
YES – A LOT OF DIFFICULTY 3
CANNOT DO AT ALL 4
REFUSED/NO ANSWER 9
206
WG
Using your usual (customary) language, do
you have difficulty communicating, for
example, understanding or being understood?
NO – NO DIFFICULTY 1
YES – SOME DIFFICULTY 2
YES – A LOT OF DIFFICULTY 3
CANNOT DO AT ALL 4
REFUSED/NO ANSWER 9
201 a REMOVED
202 REMOVED
203 REMOVED
204 In the past 4 weeks have you been in pain or
discomfort?
Please choose from the following 5 options.
Would you say not at all, slight pain or
discomfort, moderate, severe or extreme pain
or discomfort?
NO PAIN OR DISCOMFORT 1
SLIGHT PAIN OR DISCOMFORT 2
MODERATE PAIN OR DISCOMFORT 3
SEVERE PAIN OR DISCOMFORT 4
EXTREME PAIN OR DISCOMFORT 5
DON’T KNOW/DON’T REMEMBER 8
REFUSED/NO ANSWER 9
205 REMOVED
206 REMOVED
207 REMOVED

249
208 In the past 4 weeks, did you consult a doctor or other professional or traditional health worker because you yourself were sick? IF YES: Whom did you consult? PROBE: Did you also see anyone else?
NO ONE CONSULTED A🡺 209
DOCTOR B
NURSE (AUXILIARY) C
MIDWIFE D
COUNSELLOR E
PHARMACIST F
TRADITIONAL HEALER G
TRADITIONAL BIRTH ATTENDANT H
OTHER: _________________________________
X
209Ne
w
(Kessle
r6)
During the last 30 days (4 weeks), how
much of the time did you feel
__________?All of the time, most of the
time, some of the time, a little of the time,
not at all:
a) Nervous
b) Hopeless
c) Restless or fidgety
d) So depressed that nothing could
cheer you up
e) That everything was an effort
f) Worthless
ALL OF
THE
TIME
4
4
4
4
4
4
MOST
OF THE
TIME
3
3
3
3
3
3
SOME
OF THE
TIME
2
2
2
2
2
2
A LITTLE
OF THE
TIME
1
1
1
1
1
1
NONE
OF THE
TIME
0
0
0
0
0
0
209 SRQ20 REMOVED
210 Just now we talked about problems that may
have bothered you in the past 4 weeks. I
would like to ask you now: In your life, have
you ever seriously thought about ending your
life?
YES 1
NO 2
DON’T KNOW/DON’T REMEMBER 8
REFUSED/NO ANSWER 9
⇒212

250
210a Have you thought seriously about ending your
life in the last 12 months?
YES 1
NO 2
DON’T KNOW/DON’T REMEMBER 8
REFUSED/NO ANSWER 9
211 Have you ever tried to take your life? YES 1
NO 2
DON’T KNOW/DON’T REMEMBER 8
REFUSED/NO ANSWER 9
⇒212
⇒212
⇒212
211 a Have you tried to take your life in the past 12
months?
YES 1
NO 2
DON’T KNOW/DON’T REMEMBER 8
REFUSED/NO ANSWER 9
211b At the time when you tried to take your life, did
you require medical care or hospitalization?
YES 1
NO 2
DON’T KNOW/DON’T REMEMBER 8
REFUSED/NO ANSWER 9
212 In the past 12 months, have you had an
operation (other than a caesarean section)?
YES 1
NO 2
DON’T KNOW/DON’T REMEMBER 8
REFUSED/NO ANSWER 9
213
In the past 12 months, did you have to spend
any nights in a hospital because you were sick
(other than to give birth)?
IF YES: How many nights in the past 12
months?
(IF DON’T KNOW GET ESTIMATE)
NIGHTS IN HOSPITAL [ ][ ]
NONE 00
DON’T KNOW/DON’T REMEMBER 98
REFUSED/NO ANSWER 99
213a REMOVED
213b REMOVED
213c REMOVED
213 d REMOVED

251
214 Do you now smoke….…. 1. Daily? 2. Occasionally? 3. Not at all?
DAILY 1
OCCASIONALLY 2
NOT AT ALL 3
DON’T KNOW/DON’T REMEMBER 8
REFUSED/NO ANSWER 9
⇒216
⇒216
215 Have you ever smoked in your life? Did you ever smoke…. 1. Daily? (smoking at least once a day) 2. Occasionally? (at least 100 cigarettes, but
never daily) 3. Not at all? (not at all, or less than 100
cigarettes in your lifetime)
DAILY 1
OCCASIONALLY 2
NOT AT ALL 3
DON’T KNOW/DON’T REMEMBER 8
REFUSED/NO ANSWER 9
216 How often do you drink alcohol? Would you
say:
1. Every day or nearly every day 2. Once or twice a week 3. 1 – 3 times a month 4. Occasionally, less than once a month 5. Never/Stopped more than a year ago
EVERY DAY OR NEARLY EVERY DAY 1
ONCE OR TWICE A WEEK 2
1 – 3 TIMES IN A MONTH 3
LESS THAN ONCE A MONTH 4
NEVER 5
DON’T KNOW/DON’T REMEMBER 8
REFUSED/NO ANSWER 9
⇒219
217 On the days that you drank in the past 4
weeks, about how many alcoholic drinks did
you usually have a day?
USUAL NUMBER OF DRINKS [ ][ ]
NO ALCOHOLIC DRINKS IN PAST 4 WEEKS 00

252
218 In the past 12 months, have you experienced any of the following problems, related to your drinking? a) money problems b) health problems c) conflict with family or friends d) problems with authorities (police, etc) other, specify.
x) OTHER: _________________
YES
1 1 1 1 1
NO 2 2 2 2 2
219 Did you ever use drugs (e.g. marijuana,
cannabis)? Would you say:
1. Every day or nearly every day 2. Once or twice a week 3. 1 – 3 times a month 4. Occasionally, less than once a month 5. Never/Stopped more than a year ago
EVERY DAY OR NEARLY EVERY DAY 1
ONCE OR TWICE A WEEK 2
1 – 3 TIMES IN A MONTH 3
LESS THAN ONCE A MONTH 4
NEVER 5
DON’T KNOW/DON’T REMEMBER 8
REFUSED/NO ANSWER 9
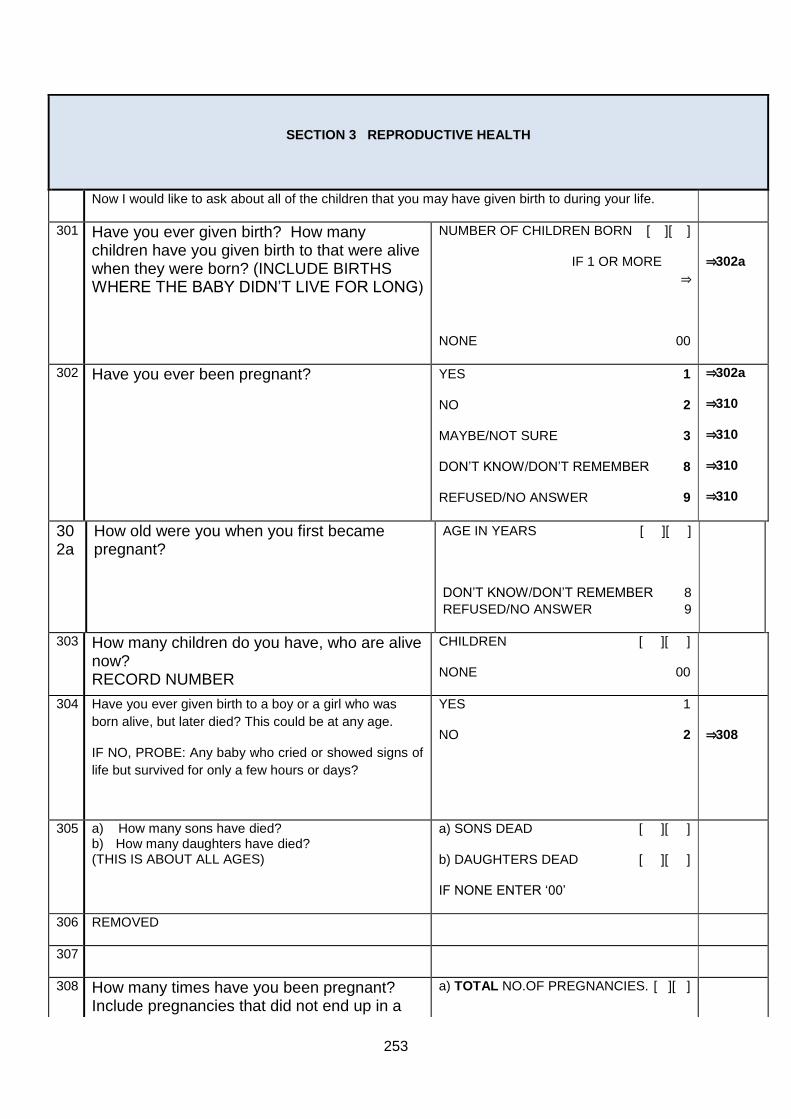
253
SECTION 3 REPRODUCTIVE HEALTH
Now I would like to ask about all of the children that you may have given birth to during your life.
301 Have you ever given birth? How many children have you given birth to that were alive when they were born? (INCLUDE BIRTHS WHERE THE BABY DIDN’T LIVE FOR LONG)
NUMBER OF CHILDREN BORN [ ][ ]
IF 1 OR MORE
⇒
NONE 00
⇒302a
302 Have you ever been pregnant?
YES 1
NO 2
MAYBE/NOT SURE 3
DON’T KNOW/DON’T REMEMBER 8
REFUSED/NO ANSWER 9
⇒302a
⇒310
⇒310
⇒310
⇒310
302a
How old were you when you first became pregnant?
AGE IN YEARS [ ][ ]
DON’T KNOW/DON’T REMEMBER 8
REFUSED/NO ANSWER 9
303 How many children do you have, who are alive now? RECORD NUMBER
CHILDREN [ ][ ]
NONE 00
304 Have you ever given birth to a boy or a girl who was
born alive, but later died? This could be at any age.
IF NO, PROBE: Any baby who cried or showed signs of
life but survived for only a few hours or days?
YES 1
NO 2
⇒308
305 a) How many sons have died? b) How many daughters have died? (THIS IS ABOUT ALL AGES)
a) SONS DEAD [ ][ ]
b) DAUGHTERS DEAD [ ][ ]
IF NONE ENTER ‘00’
306 REMOVED
307
308 How many times have you been pregnant? Include pregnancies that did not end up in a
a) TOTAL NO.OF PREGNANCIES. [ ][ ]

254
live birth, and if you are pregnant now, your current pregnancy? PROBE: How many pregnancies were with twins, triplets?
b) PREGNANCIES WITH TWINS [ ]
c) PREGNANCIES WITH TRIPLETS [ ]
309 Have you ever had a pregnancy that miscarried, or ended
in a stillbirth? Or an abortion?
PROBE: How many times did you miscarry, how many
times did you have a stillbirth, and how many times did
you abort?
a) MISCARRIAGES [ ][ ]
b) STILLBIRTHS [ ][ ]
c) ABORTIONS [ ][ ]
IF NONE ENTER ‘00’
310 Are you pregnant now? YES 1
NO 2
MAYBE 3
⇒ A
⇒ B
⇒ B
DO EITHER A OR B: IF PREGNANT NOW ==>
IF NOT PREGNANT NOW ==> VERIFY THAT ADDITION ADDS UP TO THE SAME FIGURE. IF NOT, PROBE AGAIN AND CORRECT.
A. [301] ____ + [309 a+b+c] _____ + 1 = [308a] _____+ [308b] ____ + [ 2x308c] ____ =
___
B. [301] ____ + [309 a+b+c] _____ = [308a] _____+ [308b] ____ + [ 2x308c] ____ =
___
311 Have you ever used anything, or tried in any way, to
delay or avoid getting pregnant? YES 1
NO 2
N.A. (NEVER HAD INTERCOURSE) 7
DON’T KNOW/DON’T REMEMBER 8
REFUSED/NO ANSWER 9
⇒315
⇒S.5
312 Are you currently doing something, or using any
method, to delay or avoid getting pregnant?
YES 1
NO 2
DON’T KNOW/DON’T REMEMBER 8
REFUSED/NO ANSWER 9
⇒315

255
313 What (main) method are you currently using?
IF MORE THAN ONE, ONLY MARK MAIN METHOD
PILL/TABLETS 01
INJECTABLES 02
IMPLANTS (NORPLANT) 03
IUD 04
DIAPHRAGM/FOAM/JELLY 05
CALENDAR/MUCUS METHOD 06
FEMALE STERILIZATION 07
CONDOMS 08
MALE STERILIZATION 09
WITHDRAWAL 10
HERBS 11
OTHER:___________________________
_ 96
DON’T KNOW/DON’T REMEMBER 98
REFUSED/NO ANSWER 99
314 REMOVED
315 Has/did your current/most recent husband/partner ever refused to use a method or tried to stop you from using a method to avoid getting pregnant?
YES 1
NO 2
HE DOES NOT KNOW SHE USES A
METHOD 3
N.A. (NEVER HAD A PARTNER).... 7
DON’T KNOW/DON’T REMEMBER 8
REFUSED/NO ANSWER 9
⇒S.4
316 REMOVED
317 REMOVED
317
a REMOVED
318 REMOVED
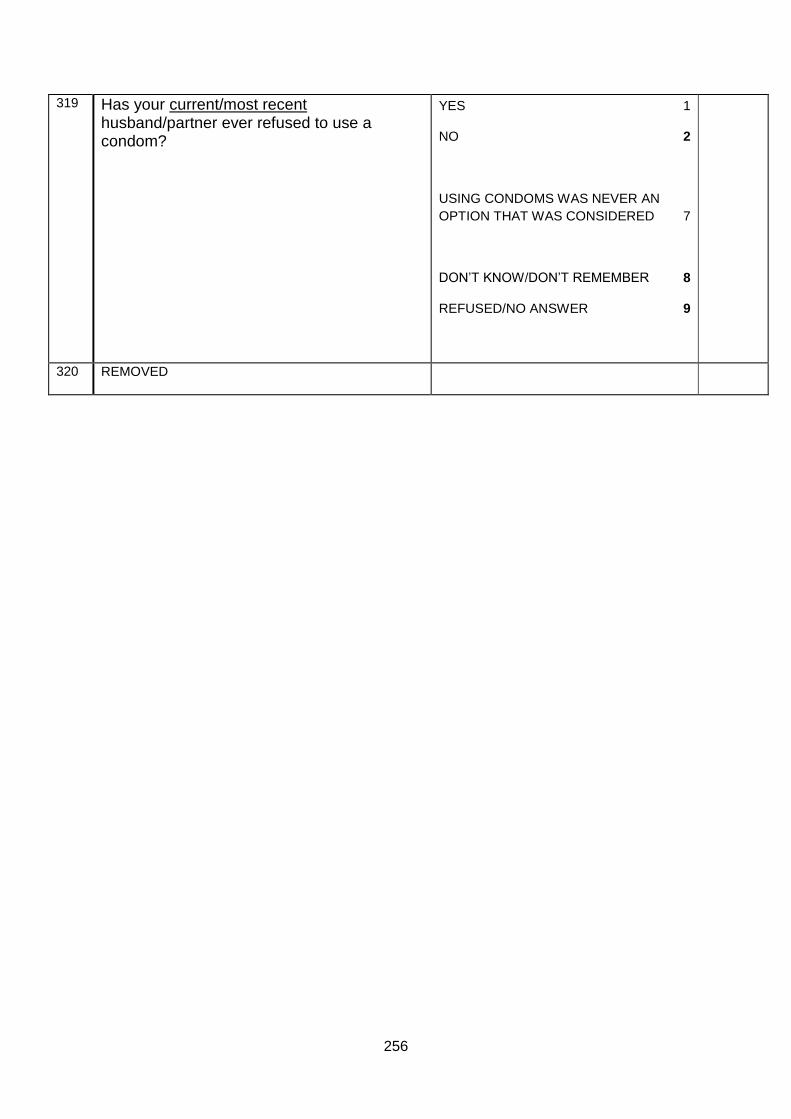
256
319 Has your current/most recent husband/partner ever refused to use a condom?
YES 1
NO 2
USING CONDOMS WAS NEVER AN
OPTION THAT WAS CONSIDERED 7
DON’T KNOW/DON’T REMEMBER 8
REFUSED/NO ANSWER 9
320 REMOVED

257
BEFORE STARTING WITH SECTION 4:
REVIEW RESPONSES AND MARK REPRODUCTIVE HISTORY ON REFERENCE SHEET, BOX B.
SECTION 4 CHILDREN
CHECK:
Ref. Sheet, box B, point Q
(s4bir)
ANY LIVE BIRTHS
[ ]
⇓
(1)
NO LIVE BIRTHS [ ] ⇒
(2)
⇒S.5
401 I would like to ask about the last time that you gave birth
(Live birth, regardless of whether the child is still alive or
not). What is the date of birth of this child?
DAY [ ][ ]
MONTH [ ][ ]
YEAR [ ][ ][ ][ ]
DON’T KNOW/DON’T REMEMBER 8
REFUSED/NO ANSWER 9
402 What name was given to your last born child?
Is (NAME) a boy or a girl?
NAME: ____________________
BOY 1
GIRL 2
403 Is your last born child (NAME) still alive? YES 1
NO 2
⇒405
404 How old was (NAME) at his/her last birthday? RECORD AGE IN COMPLETED YEARS CHECK AGE WITH BIRTH DATE
AGE IN YEARS [ ][ ]
IF NOT YET COMPLETED 1 YEAR 00
⇒406
⇒406
405 How old was (NAME) when he/she died? YEARS [ ][ ]
MONTHS (IF LESS THAN 1 YEAR) [ ][ ]
DAYS (IF LESS THAN 1 MONTH) [ ][ ]
406 CHECK IF DATE OF BIRTH OF LAST CHILD (IN Q401) IS MORE OR LESS THAN 5 YEARS AGO
5 OR MORE YEARS AGO 1
LESS THAN 5 YEARS AGO 2
⇒417

258
407 I would like to ask you about your last pregnancy. At the
time you became pregnant with this child (NAME), did
you want to become pregnant then, did you want to wait
until later, did you want no (more) children, or did you
not mind either way?
BECOME PREGNANT THEN 1
WAIT UNTIL LATER 2
NOT WANT CHILDREN 3
NOT MIND EITHER WAY 4
DON’T KNOW/DON’T REMEMBER 8
REFUSED/NO ANSWER 9
408 At the time you became pregnant with this child (NAME),
did your husband/partner want you to become pregnant
then, did he want to wait until later, did he want no
(more) children at all, or did he not mind either way?
BECOME PREGNANT THEN 1
WAIT UNTIL LATER 2
NOT WANT CHILDREN 3
NOT MIND EITHER WAY 4
DON’T KNOW/DON’T REMEMBER 8
REFUSED/NO ANSWER 9
409 When you were pregnant with this child (NAME), did you
see anyone for an antenatal check?
IF YES: Whom did you see?
Anyone else?
MARK ALL THAT APPLY
NO ONE A
DOCTOR B
OBSTETRICIAN/GYNAECOLOGIST C
NURSE/MIDWIFE D
AUXILIARY NURSE E
TRADITIONAL BIRTH ATTENDANT F
OTHER:_____________________________
_______________________________ X
410 Did your husband/partner stop you, encourage you, or have no interest in whether you received antenatal care for your pregnancy?
STOP 1
ENCOURAGE 2
NO INTEREST 3
DON’T KNOW/DON’T REMEMBER 8
REFUSED/NO ANSWER 9
411 When you were pregnant with this child (NAME), did your husband/partner have preference for a son, a daughter or did it not matter to him whether it was a boy or a girl?
SON 1
DAUGHTER 2
DID NOT MATTER 3

259
DON’T KNOW/DON’T REMEMBER 8
REFUSED/NO ANSWER 9
412 During this pregnancy, did you consume any alcoholic
drinks?
YES 1
NO 2
DON’T KNOW/DON’T REMEMBER 8
REFUSED/NO ANSWER 9
413 During this pregnancy, did you smoke any cigarettes or use tobacco?
YES 1
NO 2
DON’T KNOW/DON’T REMEMBER 8
REFUSED/NO ANSWER 9
414 Were you given a (postnatal) check-up at any time
during the 6 weeks after delivery?
YES 1
NO 2
NO, CHILD NOT YET SIX WEEKS OLD 3
DON’T KNOW/DON’T REMEMBER 8
REFUSED/NO ANSWER 9
415 Was this child (NAME) weighed at birth?
YES 1
NO 2
DON’T KNOW /DON’T REMEMBER 8
REFUSED/NO ANSWER 9
⇒417
⇒417
416 How much did he/she weigh?
RECORD FROM HEALTH CARD WHERE POSSIBLE
KG FROM CARD [ ].[ ] 1
KG FROM RECALL [ ].[ ] 2
DON’T KNOW/DON’T REMEMBER 8
REFUSED/NO ANSWER 9
417 Do you have any children aged between 5 and 12 years? How many? (include 5-year-old and 12-year-old children)
NUMBER [ ][ ]
NONE 00
⇒S.5
418 REMOVED
419

260
420 Do any of these children (ages 5-12 years):
a) Have frequent nightmares? b) x c) Wet their bed often? d) Are any of these children very timid or withdrawn? e) Are any of them aggressive with you or other
children?
a) NIGHTMARES
c) WET BED d) TIMID e) AGGRESSIVE
YES
1
1
1
1
NO
2
2
2
2
DK
8
8
8
8
421 Of these children (ages 5-12 years), how many of your boys and how many of your girls have ever run away from home?
a) NUMBER OF BOYS RUN AWAY [ ]
b) NUMBER OF GIRLS RUN AWAY [ ]
IF NONE ENTER ‘0’
422 REMOVED
423 Have any of these children had to repeat (failed) a year at school?
MAKE SURE ONLY CHILDREN AGED 5-12 YEARS.
YES 1
NO 2
DON’T KNOW/DON’T REMEMBER 8
REFUSED/NO ANSWER 9
424 Have any of these children stopped school for a while or
dropped out of school? Could this be asked of the last
12 months? MAKE SURE ONLY CHILDREN AGED 5-
12 YEARS.
YES 1
NO 2
DON’T KNOW/DON’T REMEMBER 8
REFUSED/NO ANSWER 9

261
SECTION 5 CURRENT OR MOST RECENT HUSBAND/PARTNER
CHECK:
Ref. sheet,
Box A
(s5mar)
CURRENTLY
MARRIED, OR
LIVING WITH A
MAN/ENGAGED
OR DATING A
MALE PARTNER
(Options K, L) [
]
⇓
(1)
FORMERLY
MARRIED/LIVING
WITH A
MAN/ENGAGED OR
DATING A MALE
PARTNER
(Option M) [ ]
⇓
(2)
NEVER MARRIED/NEVER
LIVED WITH A MAN
(NEVER MALE
PARTNER)
(Option N) [ ] ⇒
(3)
⇒S.6
501 I would now like you to tell me a little about your current/most recent husband/partner. How old is your husband/partner (completed years)? PROBE: MORE OR LESS IF MOST RECENT HUSBAND/PARTNER DIED: How old would he be now if he were alive?
AGE (YEARS) [ ][ ]
502 In what year was he born? YEAR [ ][ ][ ][ ]
DON’T KNOW/DON’T REMEMBER 9998
REFUSED/NO ANSWER 9999
502 a Where is he from? Is he from
the same community or town
as you?
SAME COMMUNE 1
ANOTHER COMMINE 2
ANOTHER PROVINCE/CITY 3
ANOTHER COUNTRY 4
OTHER: ___________________________
6
DON’T KNOW/DON’T REMEMBER 8

262
REFUSED/NO ANSWER 9
503 REMOVED
504
505 a1 What is the highest general
educational qualification that
he achieved? MARK
HIGHEST LEVEL.
NEVER ATTEND SCHOOL.........................00
NO QUALIFICATION 1
PRIMARY......................................................2
LOWER SECONDARY 3
UPER SECONDARY 4
COLLEGE 5
UNIVERSITY 6
MASTER 7
DOCTOR 8
OTHER (Specify)______________________96
DON’T KNOW/DON’T REMEMBER ...98
REFUSED/NO ANSWER.................................99
505 a2 What is the highest
vocational qualification that
he achieved? MARK
HIGHEST LEVEL.
NO QUALIFICATION...................................0
PRIMARY 1
ELEMENTARY 2
MIDLE-LEVEL 3
COLLEGE 4
OTHER (Specify)______________________96
DON’T KNOW/DON’T REMEMBER ...98
REFUSED/NO ANSWER.................................99
505a3 How many years has he
attended school?
YEARS: [ ][ ]

263
506 IF CURRENTLY WITH HUSBAND/PARTNER: Is he currently working, looking for work or unemployed, retired or studying? IF NOT CURRENTLY WITH HUSBAND/PARTNER: Towards the end of your relationship was he working, looking for work or unemployed, retired or studying?
WORKING 1
LOOKING FOR WORK/UNEMPLOYED 2
RETIRED 3
STUDENT 4
DISABLED/LONG TERM SICK 5
DON’T KNOW/DON’T REMEMBER 8
REFUSED/NO ANSWER 9
⇒508
⇒508
⇒509
507 When did his last job finish?
Was it in the past 4 weeks,
between 4 weeks and 12
months ago, or before that?
(FOR MOST RECENT
HUSBAND/PARTNER: in the
last 4 weeks or in the last 12
months of your relationship?)
IN THE PAST 4 WEEKS 1
4 WKS - 12 MONTHS AGO 2
MORE THAN 12 MONTHS AGO 3
NEVER HAD A JOB 4
DON’T KNOW/DON’T REMEMBER 8
REFUSED/NO ANSWER 9
⇒509
508 What kind of work does/did he
normally do?
SPECIFY KIND OF WORK
HIGH LEVEL EXPERT 01
AVERAGE-LEVEL EXPERT....................02
OFFICE STAFF 03
SERVICE AND SALES STAFF...................04
SKILLED LABORERS IN AGRICULTURE, FORESTRY AND FISHERIES....................05 MANUAL LABORER AND RELATED OCCUPATIONS..........................................06
MACHINE ASSEMBLING AND OPERATING WORKERS.............................06
LOW-SKILLED LABORERS......................07
MEMBERS OF THE ARMED FORCE........08
OTHER: ____________________________ 96
DON’T KNOW/DON’T REMEMBER 98
REFUSED/NO ANSWER 99

264
509 How often does/did your husband/partner drink alcohol? 1. Every day or nearly every
day 2. Once or twice a week 3. 1–3 times a month 4. Occasionally, less than
once a month 5. Never/
EVERY DAY OR NEARLY EVERY DAY 1
ONCE OR TWICE A WEEK 2
1–3 TIMES IN A MONTH 3
LESS THAN ONCE A MONTH 4
NEVER 5
DON’T KNOW/DON’T REMEMBER 8
REFUSED/NO ANSWER 9
⇒512
510 In the past 12 months (In the last 12 months of your last relationship), how often have you seen (did you see) your husband/partner drunk? Would you say most days, weekly, once a month, less than once a month, or never?
MOST DAYS 1
WEEKLY 2
ONCE A MONTH 3
LESS THAN ONCE A MONTH 4
NEVER 5
DON’T KNOW/DON’T REMEMBER 8
REFUSED/NO ANSWER 9
5
1
1
In the past 12 months (In the last 12 months of your relationship), have you experienced any of the following problems, related to your husband/partner’s drinking? a) Money problems b) Family problems x) Any other problems, specify.
a) MONEY PROBLEMS b) FAMILY PROBLEMS
x) OTHER: _______________
YES
1 1 1
NO 2 2 2
512 Does/did your husband/partner ever use drugs (e.g. marijuana, cannabis)? Would you say:
1. Every day or nearly every day
2. Once or twice a week
EVERY DAY OR NEARLY EVERY DAY 1
ONCE OR TWICE A WEEK 2
1 – 3 TIMES IN A MONTH 3
LESS THAN ONCE A MONTH 4

265
3. 1 – 3 times a month 4. Occasionally, less than
once a month 5. Never
NEVER 5
IN THE PAST, NOT NOW 6
DON’T KNOW /DON’T REMEMBER 8
REFUSED/NO ANSWER 9
513 Since you have known him,
has he ever been involved in a
physical fight with another
man?
YES 1
NO 2
DON’T KNOW /DON’T REMEMBER 8
REFUSED/NO ANSWER 9
⇒515
⇒515
514 In the past 12 months (In the last 12 months of the relationship), has this happened once or twice, a few times, many times or never?
NEVER (NOT IN PAST 12 MONTHS) 1
ONCE OR TWICE 2
A FEW (3-5) TIMES 3
MANY (MORE THAN 5) TIMES 4
DON’T KNOW /DON’T REMEMBER 8
REFUSED/NO ANSWER 9
515 Has your current/most recent
husband/partner had a
relationship with any other
women while being with you?
YES 1
NO 2
MAY HAVE 3
DON’T KNOW /DON’T REMEMBER 8
REFUSED/NO ANSWER 9
⇒1008
⇒1008
516 Has your current/most recent husband/partner had children with any other woman while being with you?
YES 1
NO 2
MAY HAVE 3
DON’T KNOW /DON’T REMEMBER 8
REFUSED/NO ANSWER 9
1008 As far as you know,
was your (most recent)
husband/partner’s
mother hit or beaten by
her husband/partner?
YES 1
NO 2
PARENTS DID NOT LIVE TOGETHER 3
DON’T KNOW 8

266
REFUSED/NO ANSWER 9
1010 As far as you know, was your (most recent) husband/partner himself hit or beaten regularly by someone in his family, when he was a child?
YES 1
NO 2
DON’T KNOW 8
REFUSED/NO ANSWER 9
SECTION 6 ATTITUDES
In this community and elsewhere, people have different ideas about families and what
is acceptable behaviour for men and women in the home. I am going to read you a list
of statements, and I would like you to tell me whether you generally agree or disagree
with the statement. There are no right or wrong answers.
60
1 In your opinion, a good wife obeys her husband even if she disagrees
AGREE 1
DISAGREE 2
DON’T KNOW 8
REFUSED/NO ANSWER 9
601
60
3 In your opinion, It is important for a man to show his wife who is the boss
AGREE 1
DISAGREE 2
DON’T KNOW 8
REFUSED/NO ANSWER 9
60
4
60
5
In your opinion, It’s a wife’s obligation to have sex with her husband, even if she does not feel like it.
AGREE 1
DISAGREE 2
DON’T KNOW 8
REFUSED/NO ANSWER 9
60
6
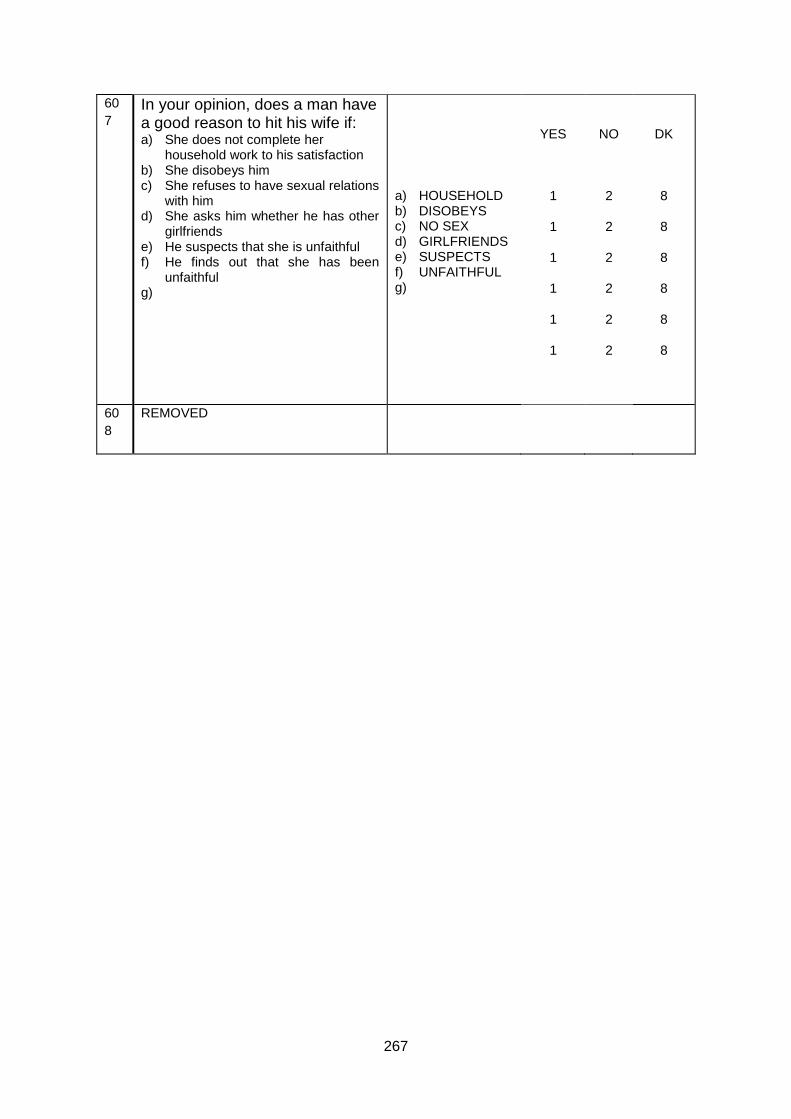
267
60
7 In your opinion, does a man have a good reason to hit his wife if: a) She does not complete her
household work to his satisfaction b) She disobeys him c) She refuses to have sexual relations
with him d) She asks him whether he has other
girlfriends e) He suspects that she is unfaithful f) He finds out that she has been
unfaithful g)
a) HOUSEHOLD b) DISOBEYS c) NO SEX d) GIRLFRIENDS e) SUSPECTS f) UNFAITHFUL g)
YES
1
1
1
1
1
1
NO
2
2
2
2
2
2
DK
8
8
8
8
8
8
60
8
REMOVED

268
SECTION 7 RESPONDENT AND HER HUSBAND/PARTNER
CHECK:
Ref. sheet, Box
A
(s7mar)
EVER MARRIED/EVER LIVING
WITH A MAN/MALE PARTNER
(Options K, L, M)
[ ]
⇓
(1)
NEVER MARRIED/NEVER
LIVED WITH A MAN/NEVER
MALE PARTNER
(Option N) [
] ⇒
(2)
⇒S.10
When two people marry or live together, they usually share both good and bad moments. I would now like to ask you some questions about your current and past relationships and how your husband/partner treats (treated) you. If anyone interrupts us I will change the topic of conversation. I would again like to assure you that your answers will be kept confidential, and that you do not have to answer any questions that you do not want to. May I continue?
701 In general, do (did) you and your (current or most recent) husband/partner discuss the following topics together: a) Things that have happened to
him in the day b) Things that happen to you during
the day c) Your worries or feelings d) His worries or feelings
g) HIS DAY h) YOUR DAY i) YOUR
WORRIES j) HIS
WORRIES
YES
1
1
1
1
NO
2
2
2
2
DK
8
8
8
8
702 In your relationship with your (current
or most recent) husband/partner, how
often would you say that you
quarrelled? Would you say rarely,
sometimes or often?
RARELY 1
SOMETIMES 2
OFTEN 3
DON’T KNOW/DON’T REMEMBER 8
REFUSED/NO ANSWER 9

269
703 I am now going to ask
you about some
situations that are true for
many women. Does/did
your current/most recent
or any husband/partner
generally do/did any of
the following?
a) Tries to keep you from seeing your friends
b) Tries to restrict contact with your family of birth
c) Insists on knowing where you are at all times
d) e) Gets angry if you
speak with another man
f) Is often suspicious that you are unfaithful
g) Expects you to ask his permission before seeking health care for yourself
A)
a) SEEING FRIENDS
b) CONTACT FAMILY
c) WANTS TO KNOW
e) GETS ANGRY
f) SUSPICIOUS
g) HEALTH CARE
YES
1
1
1
1
1
1
NO
2
2
2
2
2
2
B) ONLY ASK IF
‘YES’ IN 703A
Has this
happened in the
past 12 months?
YES NO
1 2
1 2
1 2
1 2
1 2
1 2
CHECK:
Question
703
MARK WHEN YES FOR ANY
ACT (AT LEAST ONE “1”
CIRCLED IN COLUMN A)
[ ]
⇓
MARK WHEN ALL ANSWERS NO
CIRCLED (ONLY “2” CIRCLED IN
COLUMN A)
[ ]
⇒703
N
703 k Who did the things you
just mentioned?
(MENTION ACTS
REPORTED IN 703)
Was it your current or
most recent
husband/partner, any
other husband or
CURRENT/MOST RECENT HUSBAND/
PARTNER 1
PREVIOUS HUSBAND/PARTNER 2
BOTH 3
DON’T KNOW/DON’T REMEMBER 8

270
partner that you may
have had before or
both?
REFUSED/NO ANSWER 9
703
N
Does/did your
current/most recent or
any husband/partner
generally do any of the
following?
h) Prohibits you from getting a job, going to work, trading, earning money or participating in income generation projects?
i) Takes your earnings from you against your will?
j) Refuses to give you money you needed for household expenses even when he has money for other things (such as alcohol and cigarettes)?
k) Expects your financial responsibility for his big family and himself
l) Expects you to ask his permission before buying anything for yourself
A)
h) PROHIBITED WORK
i) TAKEN EARNING
j) REFUSED MONEY
k) FINANCIAL RESPONSIBILITY
l) FINANCIAL PERMISSION
YES
1
1
1
1
1
NO
2
2
2
2
2
B) ONLY ASK IF
‘YES’ IN 703A
Has this
happened in the
past 12 months?
YES NO
1 2
1 2
1 2
1 2
1 2
CHECK:
Question
703N
MARK WHEN YES FOR ANY
ACT (AT LEAST ONE “1”
CIRCLED IN COLUMN A)
[ ]
⇓
MARK WHEN ALL ANSWERS NO
CIRCLED (ONLY “2” CIRCLED IN
COLUMN A)
[ ]
⇒704

271
704N k Who did the things you
just mentioned?
(MENTION ACTS
REPORTED IN 703N)
Was it your current or
most recent
husband/partner, any
other husband or
partner that you may
have had before or
both?
CURRENT/MOST RECENT HUSBAND/
PARTNER 1
PREVIOUS HUSBAND/PARTNER 2
BOTH 3
DON’T KNOW/DON’T REMEMBER 8
REFUSED/NO ANSWER 9
704 The next questions are
about things that happen
to many women, and that
your current partner, or
any other partner may
have done to you.
Has your current
husband/partner, or any
other partner ever…?
A)
(If YES
continue
with B.
If NO
skip to
next
item)
YES
NO
B)
Has this happened in the past 12 months? (If YES ask
C and D. If
NO, ask D
only)
YES NO
C)
In the past 12 months would you say that this has happened once, a few times or many times? One Few Many
D)
Did this happen
before the past
12 months?
IF YES: would you say that this has happened once, a few times or many times?
No One Few
Many
a) Insulted you or made you feel bad about yourself?
b) Belittled or humiliated you in front of other people?
c) Done things to scare or intimidate you on purpose (e.g. by the way he looked at you, by yelling and smashing things)?
d) Verbally threatened to hurt you or someone you care about?
1 2
1 2
1 2
1 2
1 2
1 2
1 2
1 2
1 2
3
1 2
3
1 2
3
1 2
3
0 1 2
3
0 1 2
3
0 1 2
3
0 1 2
3
CHECK: MARK WHEN YES FOR ANY
ACT (AT LEAST ONE “1”
CIRCLED IN COLUMN A)
MARK WHEN ALL ANSWERS NO
CIRCLED (ONLY “2” CIRCLED IN

272
Question
704
[ ]
⇓
COLUMN A)
[ ]
⇒705
704 e Who did the things you
just mentioned?
(MENTION ACTS
REPORTED IN 704)
Was it your current or
most recent
husband/partner, any
other husband or
partner that you may
have had before or
both?
CURRENT/MOST RECENT HUSBAND/
PARTNER 1
PREVIOUS HUSBAND/PARTNER 2
BOTH 3
DON’T KNOW/DON’T REMEMBER 8
REFUSED/NO ANSWER 9
705
Has he or any other
partner ever….
A)
(If YES
continue
with B.
If NO
skip to
next
item)
YES NO
B)
Has this happened in the past 12 months? (If YES ask
C and D. If
NO, ask D
only)
YES NO
C)
In the past 12 months would you say that this has happened once, a few times or many times? One Few Many
D)
Did this happen
before the past
12 months?
IF YES: would
you say that this
has happened
once, a few times
or many times?
No One Few
Many
a) Slapped you or thrown something at you that could hurt you?
b) Pushed you or shoved you or pulled your hair?
c) Hit you with his fist or with something else that could hurt you?
d) Kicked you, dragged you or beaten you up?
e) Choked or burnt you on purpose?
f) Threatened with or actually used a gun, knife or other weapon against you?
1 2
1 2
1 2
1 2
1 2
1 2
1 2
1 2
1 2
1 2
1 2
3
1 2
3
1 2
3
1 2
3
0 1 2
3
0 1 2
3
0 1 2
3
0 1 2
3
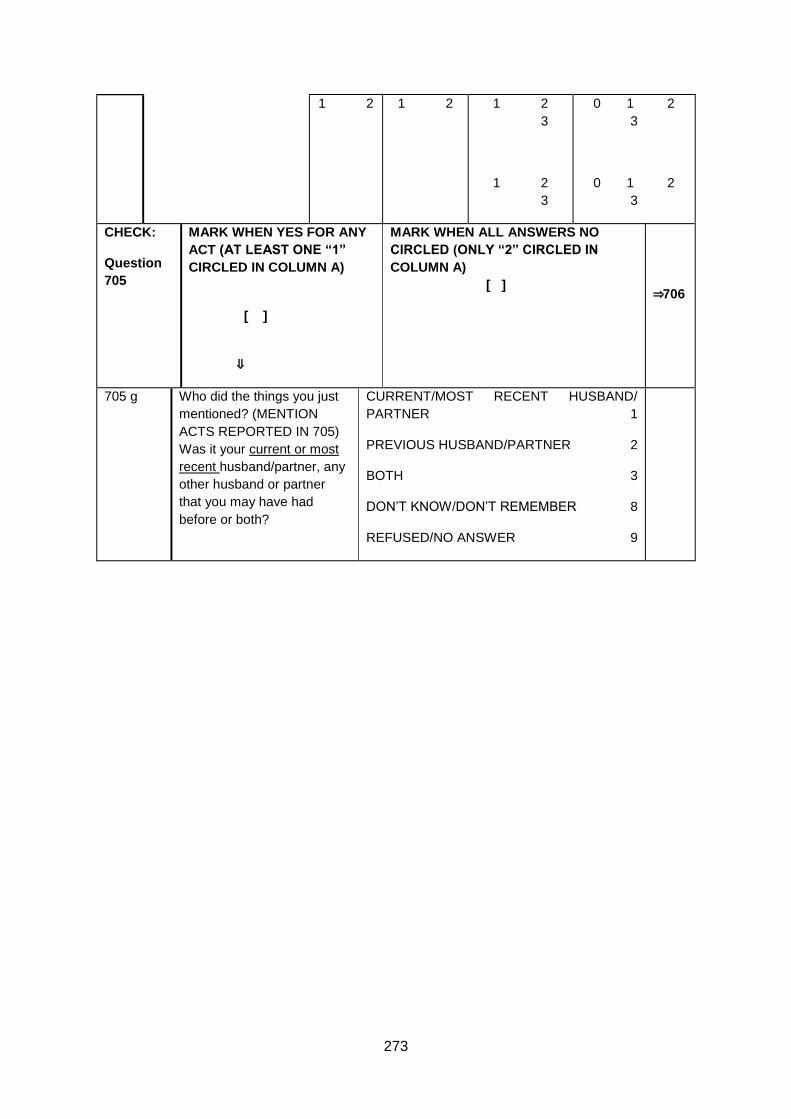
273
1 2
1 2
1 2
3
1 2
3
0 1 2
3
0 1 2
3
CHECK:
Question
705
MARK WHEN YES FOR ANY
ACT (AT LEAST ONE “1”
CIRCLED IN COLUMN A)
[ ]
⇓
MARK WHEN ALL ANSWERS NO
CIRCLED (ONLY “2” CIRCLED IN
COLUMN A)
[ ]
⇒706
705 g Who did the things you just
mentioned? (MENTION
ACTS REPORTED IN 705)
Was it your current or most
recent husband/partner, any
other husband or partner
that you may have had
before or both?
CURRENT/MOST RECENT HUSBAND/
PARTNER 1
PREVIOUS HUSBAND/PARTNER 2
BOTH 3
DON’T KNOW/DON’T REMEMBER 8
REFUSED/NO ANSWER 9

274
706
A)
(If YES
continue
with B.
If NO
skip to
next item)
YES NO
B)
Has this happened in the past 12 months? (If YES
ask C
and D. If
NO, ask
D only)
YES
NO
C)
In the past 12 months would you say that this has happened once, a few times or many times? One Few Many
D)
Did this
happen
before the
past 12
months?
IF YES:
would you
say that
this has
happened
once, a
few times
or many
times?
No One
Few
Many
a) Did your current husband/partner or any other husband/partner ever force you to have sexual intercourse when you did not want to, for example by threatening you or holding you down? IF NECESSARY: We define
sexual intercourse as
vaginal, oral or anal
penetration.
b) Did you ever have sexual intercourse you did not want to because you were afraid of what your partner or any other husband or partner might do if you refused?
c) Did your husband/partner or any other husband or partner ever force you to do anything else sexual that you did not want or that you found degrading or humiliating?
1 2
1 2
1 2
1
2
1
2
1 2
3
1 2
3
1 2
3
0 1
2 3
0 1
2 3
0 1
2 3

275
1
2
CHECK:
Question
706
MARK WHEN YES FOR ANY ACT
(AT LEAST ONE “1” CIRCLED IN
COLUMN A)
[ ]
⇓
MARK WHEN ALL ANSWERS NO
CIRCLED (ONLY “2” CIRCLED IN
COLUMN A) [ ]
⇒
7
0
7
706 d Who did the things you just mentioned?
(MENTION ACTS REPORTED IN 706)
Was this your current or most recent
husband/partner, any other husband or
partner that you may have had before or
both?
CURRENT/MOST RECENT HUSBAND/
PARTNER 1
PREVIOUS HUSBAND/PARTNER 2
BOTH 3
DON’T KNOW/DON’T REMEMBER 8
REFUSED/NO ANSWER 9
707 VERIFY WHETHER ANSWERED YES TO ANY QUESTION ON PHYSICAL VIOLENCE, SEE QUESTION 705
YES, PHYSICAL VIOLENCE 1
NO PHYSICAL VIOLENCE 2
M
A
R
K
I
N
B
O
X
C
708 VERIFY WHETHER ANSWERED YES TO ANY QUESTION ON SEXUAL VIOLENCE, SEE QUESTION 706
YES, SEXUAL VIOLENCE 1
NO SEXUAL VIOLENCE 2
M
A
R
K
I
N
B

276
O
X
C
708
N
How many incidents happened in the past 12 months in which current or most recent husband/partner used one or more of any economic, psychological, physical and sexual of the behaviours that I asked you about? Any incident can include one or more behaviours you have experienced
PREFERABLE TO GET PRECISE NUMBER, PROBE FOR ESTIMATE
NUMBER OF INCIDENTS [ ][ ][ ]
REFUSED/NO ANSWER 999
708a Are you or have you been afraid of your current/most recent husband or partner (in the present)? Would you say never, sometimes, many times, most/all of the time?
MAKE SURE YOU REFER TO HER SITUATION NOWADAYS EVEN IF SHE IS NO LONGER WITH HER HUSBAND/PARTNER
NEVER 1
SOMETIMES 2
MANY TIMES 3
MOST/ALL OF THE TIMES 4
IN THE PAST (NO LONGER AFRAID NOW) 7
DON’T KNOW/DON’T REMEMBER 8
REFUSED/NO ANSWER 9
905 Have you ever, hit or beaten your husband/partner when he was not hitting or beating you?
IF YES: How often? Would you say once, several times or many times?
NEVER 1
ONCE 2
2-5 TIMES 3
> 5TIMES 4
DON’T KNOW/DON’T REMEMBER 8
REFUSED/NO ANSWER …….9
CHECK
:
Ref.
sheet,
Box B
(s7preg
)
(s7prnu
m)
EVER BEEN PREGNANT (option P) (1) [ ]
⇓
NUMBER OF PREGNANCIES (option T) [ ][
]
⇓
NEVER
PREGNAN
T
(2) [
] ⇒
⇒s
8

277
(s7prcur
)
CURRENTLY PREGNANT? (option S)
YES….1
NO…. 2
⇓
709 You said that you have been pregnant
TOTAL times. Was there ever a time when
you were pushed, slapped, hit, kicked or
beaten by (any of) your husband/partner(s)
while you were pregnant?
YES 1
NO 2
DON’T KNOW/DON’T
REMEMBER 8
REFUSED/NO ANSWER 9
⇒
S8
⇒
S8
⇒
S8
710
IF RESPONDENT WAS PREGNANT ONLY
ONCE, ENTER “01”
IF RESPONDENT WAS PREGNANT MORE
THAN ONCE: Did this happen in one
pregnancy, or more than one pregnancy? In
how many pregnancies did this happen (in
how many pregnancies were you pushed,
slapped, hit, kicked or beaten)?
NUMBER OF PREGNANCIES IN
WHICH THIS HAPPENED [ ][ ]
71
0a
Did this happen in the last pregnancy?
IF RESPONDENT WAS PREGNANT ONLY
ONCE, CIRCLE CODE ‘1’.
YES 1
NO 2
DON’T KNOW/DON’T REMEMBER 8
REFUSED/NO ANSWER 9
711 Were you ever punched or kicked in the
abdomen while you were pregnant?
YES 1
NO 2
DON’T KNOW/DON’T REMEMBER 8
REFUSED/NO ANSWER 9
IF VIOLENCE REPORTED IN ONE PREGNANCY, REFER TO THAT PARTICULAR
PREGNANCY
IF VIOLENCE REPORTED IN MORE THAN ONE PREGNANCY, THE FOLLOWING
QUESTIONS REFER TO THE LAST/MOST RECENT PREGNANCY IN WHICH VIOLENCE
REPORTED
712 During the most recent pregnancy in which
you were beaten, was the husband/partner
who did this to you the father of the child?
YES 1
NO 2

278
DON’T KNOW /DON’T REMEMBER 8
REFUSED/NO ANSWER 9
71
3
a
Was the man who did this your current or
most recent husband/partner?
YES 1
NO 2
DON’T KNOW/DON’T REMEMBER 8
REFUSED/NO ANSWER 9
71
4
Had the same person also done such things
to you before you were pregnant?
YES 1
NO 2
DON’T KNOW/DON’T REMEMBER 8
REFUSED/NO ANSWER 9
⇒
S
8
⇒
S
8
71
5
Compared to before you were pregnant, did
the slapping/beating (REFER TO
RESPONDENT’S PREVIOUS ANSWERS)
get less, stay about the same, or get worse
while you were pregnant? By worse I mean,
more frequent or more severe.
GOT LESS 1
STAYED ABOUT THE SAME 2
GOT WORSE 3
DON’T KNOW/DON’T REMEMBER 8
REFUSED/NO ANSWER 9
716 (removed)

279
SECTION 8 INJURIES
CHECK:
Ref. sheet Box
C
(S8phsex)
WOMAN EXPERIENCED PHYSICAL
AND/OR SEXUAL VIOLENCE
(“YES” TO Option U or V) [ ]
⇓
(1)
WOMAN HAS NOT EXPERIENCED
PHYSICAL OR SEXUAL
VIOLENCE
(“NO” to BOTH Option U and V)
[ ] ⇒
(2)
⇒S.1
0
I would now like to learn more about the injuries that you experienced from (any of) your husband/partner’s acts that we have talked about (MAY NEED TO REFER TO SPECIFIC ACTS RESPONDENT MENTIONED IN SECTION 7). By injury, I mean any form of physical harm, including cuts, sprains, burns, broken bones or broken teeth, or other things like this.
801 Have you ever been injured as a result of these acts by (any of) your husband/partner(s). Please think of the acts that we talked about before.
YES 1
NO 2
DON’T KNOW/DON’T REMEMBER 8
REFUSED/NO ANSWER 9
⇒S9
802 A In your life, how many times were you injured by
(any of) your husband(s)/partner(s)?
Would you say once, several times or many times?
ONCE 1 SEVERAL (2-5) TIMES 2
MANY (MORE THAN 5) TIMES 3
DON’T KNOW/DON’T REMEMBER 8
REFUSED/NO ANSWER 9
802 B Has this happened in the past 12 months? YES 1
NO 2
DON’T KNOW/DON’T REMEMBER 8
REFUSED/NO ANSWER 9
803 A
What type of
injury did you
have? Please
mention any
b) ONLY ASK FOR RESPONSES MARKED IN 803a:
Has this happened in the past 12 months?

280
injury due to (any
of) your
husband/partners
acts, no matter
how long ago it
happened.
MARK ALL
PROBE:
Any other injury?
CUTS, PUNCTURES, BITES A
SCRATCH, ABRASION, BRUISES B
SPRAINS, DISLOCATIONS C
BURNS D
PENETRATING INJURY, DEEP CUTS,
GASHES E
BROKEN EARDRUM, EYE INJURIES F
FRACTURES, BROKEN BONES G
BROKEN TEETH H
INTERNAL INJURIES I
OTHER (specify): ____________________
X
YES NO DK
1
1
1
1
1
1
1
1
1
1
2
2
2
2
2
2
2
2
2
2
8
8
8
8
8
8
8
8
8
8
804 A REMOVED
804 b
REMOVED
805 a In your life, were you ever hurt badly enough by (any of) your husband/partner(s) that you needed health care (even if you did not receive it)? IF YES: How many times? IF NOT SURE: More or less?
TIMES NEEDED HEALTH CARE [ ][ ]
REFUSED/NO ANSWER 99
NOT NEEDED 00
⇒S.9
805
b
Has this happened in the past 12 months? YES 1
NO 2
DON’T KNOW/DON’T REMEMBER 8
REFUSED/NO ANSWER 9
806 In your life, did you ever receive health care for this injury (these injuries)? Would you say, sometimes or always or never?
YES, SOMETIMES 1
YES, ALWAYS 2
NO, NEVER 3
⇒S.9

281
DON’T KNOW/DON’T REMEMBER 8
REFUSED/NO ANSWER 9
806a In the past 12 months, did you receive health care for the injury/injuries?
YES………………………………………
……1
NO…………………………………………
…..2
DON’T KNOW/DON’T REMEMBER 8
REFUSED/NO ANSWER 9
⇒807
806b In the past 12 months how much did you spend to receive health care on fees, laboratory tests, medicines, transport? IF EXACT AMOUNT NOT KNOWN, ESTIMATE IS ACCEPTABLE ADAPT CELLS TO LOCAL CURRENCY
A...FEES…………………………[ ][ ][ ]
B. LABORATORY TESTS…………[ ][
][ ]
C. .MEDICINES………………….[ ][ ][
]
D. TRANSPORT………………….[ ][ ][
]
REFUSED/NO ANSWER 999
807 In your life, have you ever had to spend any nights in
a hospital due to the injury/injuries?
IF YES: How many nights? (MORE OR LESS)
NUMBER OF NIGHTS IN HOSPITAL [ ][ ]
IF NONE ENTER ‘00’
DON’T KNOW/DON’T REMEMBER -1
REFUSED/NO ANSWER -2
⇒808
807a In the past 12 months, how much expense did you
incur for all the nights you spent in the hospital
(IF EXACT AMOUNT NOT KNOWN, PROBE
ESTIMATE)
EXPENSE ……………[ ][ ][]
NONE ……………………….000
DON’T KNOW/DON’T REMEMBER….-
1
REFUSED/NO ANSWER -2
807b Did health insurance pay for you stay in hospital? All,
some, none
If SOME, inquire how many dayswerepaid by
insurance?
ALL………………………….1
SOME………………………2DAYS[ ][
NONE………………………..3

282
807c Did you incur other expense (related to the
hospitalization and not covered in 806b or 807b)
for:
a) food,
b) family member staying at hospital,
c) transport cost (include for victim and for family
members,
d) medicine,laboratory
x) other
How much?
IF EXACT AMOUNT NOT KNOWN, PROBE
ESTIMATE
A. FOOD…………. [ ][ ][ ]
B.COST FAMILY MEMBER STAY.[ ][ ][
]
C..TRANSPORT COST FOR
FAMILY MEMBERS… …[ ][ ][ ]
D. MEDICINE, LABORATORY ..[ ][ ] [
]
X. OTHER:…__________________[ ][
][ ]
808 Did you tell a health worker the real cause of your
injury?
YES 1
NO 2
DON’T KNOW/DON’T REMEMBER 8
REFUSED/NO ANSWER 9

283
SECTION 9 IMPACT AND COPING
THIS SECTION IS FOR WOMEN WHO REPORT PHYSICAL OR SEXUAL VIOLENCE BY
HUSBAND/PARTNER.
I would now like to ask you some questions about what effects your husband/partner’s acts has had on you . With
acts I mean… (REFER TO SPECIFIC ACTS THE RESPONDENT HAS MENTIONED IN SECTION 7).
IF REPORTED MORE THAN ONE VIOLENT HUSBAND/PARTNER, ADD: I would like you to answer these
questions in relation to the most recent/last husband/partner who did these things to you..
CHECK:
Ref. sheet Box
C
(S9phys)
WOMAN EXPERIENCED PHYSICAL
VIOLENCE
(“YES” TO Option U) [ ]
⇓
(1)
WOMAN HAS EXPERIENCED SEXUAL
VIOLENCE ONLY
(“NO” to Option U and “YES” to option V)
[ ] ⇒
(2)
⇒
9
0
6
901 Are there any particular situations that tend to
lead to (or trigger) your husband/partner’s
behaviour?
REFER TO ACTS OF PHYSICAL VIOLENCE
MENTIONED BEFORE.
PROBE: Any other situation?
MARK ALL MENTIONED
NO PARTICULAR REASON A
WHEN MAN DRUNK B
MONEY PROBLEMS C
DIFFICULTIES AT HIS WORK D
WHEN HE IS UNEMPLOYED E
NO FOOD AT HOME F
PROBLEMS WITH HIS OR HER FAMILY G
SHE IS PREGNANT H
HE IS JEALOUS OF HER I
SHE REFUSES SEX J
SHE IS DISOBEDIENT K

284
HE WANTS TO TEACH HER A LESSON,
EDUCATE OR DISCIPLINE HER L
HE WANT TO SHOW HE IS BOSS M
UNABLE TO GET PREGNANT N
HE HAS ENTERNAL RELATIONSHIP…………0
CHILDREN ARE ALL GIRLS.............................P
OTHER
(specify):__________________________ X
CHECK:
(Ref. sheet, Box B,
option R)
(s9child)
CHILDREN LIVING [ ]
⇓
(1)
NO CHILDREN ALIVE [ ] ⇒
(2)
⇒
9
0
4
902 For any of these incidents, were your children present or did they overhear you being beaten? IF YES: How often? Would you say once, several times or most of the time?
NEVER 1
ONCE 2
SEVERAL (2-5) TIMES 3
MANY TIMES/MOST OF THE TIME 4
DON’T KNOW 8
REFUSED/NO ANSWER 9
903
904 During the times that you were hit, did you ever fight back physically or to defend yourself?
IF YES: How often? Would you say once, several times or most of the time?
NEVER 1
ONCE 2
SEVERAL (2-5) TIMES 3
MANY TIMES/MOST OF THE TIME 4
DON’T KNOW/DON’T REMEMBER 8
REFUSED/NO ANSWER 9
⇒
9
0
6
904
a
What was the effect of you fighting back on the violence at the time? Would you say, that it had no effect, the violence became worse, the violence became less, or that the violence stopped, at least for the moment.
NO CHANGE/NO EFFECT 1
VIOLENCE BECAME WORSE 2
VIOLENCE BECAME LESS 3
VIOLENCE STOPPED 4
DON’T KNOW/DON’T REMEMBER 8

285
REFUSED/NO ANSWER 9
90
5
Moved
906 Would you say that your husband /partner’s behaviour towards you has affected your physical or mental health? Would you say, that it has had no effect, a little effect or a large effect? REFER TO SPECIFIC ACTS OF PHYSICAL AND/OR SEXUAL VIOLENCE SHE DESCRIBED EARLIER
NO EFFECT 1
A LITTLE 2
A LOT 3
DON’T KNOW/DON’T REMEMBER 8
REFUSED/NO ANSWER 9
907 In what way, if any, has your husband/partner’s
behaviour (the violence) disrupted your work or
other income-generating activities?
MARK ALL THAT APPLY
N/A (NO WORK FOR MONEY) A
WORK NOT DISRUPTED B
HUSBAND/PARTNER INTERRUPTED WORKC
UNABLE TO CONCENTRATE D
UNABLE TO WORK/SICK LEAVE E
LOST CONFIDENCE IN OWN ABILITY F
OTHER (specify): _________________________
X
⇒
9
0
7
c
⇒
9
0
7
c
907a How many days of work (or of income) have you
lost in the last 12 months because of your
husband / partner’s behaviour?
PROBE: More or less
NUMBER OF DAYS [ ][ ][ ]
DON’T KNOW/DON’T REMEMBER -1
REFUSED/NO ANSWER -2
907b How many days of housework were you unable
to do in the 12 months because of your
husband/partner’s behaviour?
NUMBER OF DAYS [ ][ ][ ]
DON’T KNOW/DON’T REMEMBER -1
REFUSED/NO ANSWER -2
907c How many days did your husband/partner miss
work in the past 12 months because of his
behaviour
NUMBER OF DAYS [ ][ ][ ]
DON’T KNOW/DON’T REMEMBER -1
REFUSED/NO ANSWER -2
907d Did this behaviour of your husband/partner (that
we talked about) result in destruction of property
YES…………………………… 1
NO…………………………….. 2
⇒
9

286
such as broken utensils, furniture, TV, mobile,
scooter?
DON’T KNOW/DON’T REMEMBER 998
REFUSED/NO ANSWER 999
0
8
907e Did you pay to have any of these replaced?
How much did you have to spend?’
PROBE: MORE OR LESS
AMOUNT……………. .[ ][ ][ ]
NOTHING REPLACED 000
DON’T KNOW/DON’T REMEMBER -1
REFUSED/NO ANSWER -2
908 Who have you told about his behaviour?
MARK ALL MENTIONED
PROBE: Anyone else?
NO ONE A
FRIENDS B
PARENTS C
BROTHER OR SISTER D
UNCLE OR AUNT E
HUSBAND/PARTNER’S FAMILY F
CHILDREN G
NEIGHBOURS H
POLICE I
DOCTOR/HEALTH WORKER J
PRIEST/RELIGIOUS LEADER K
COUNSELLOR L
NGO/WOMEN’S ORGANIZATION M
LOCAL LEADER N
OTHER
(specify):__________________________ X
909 REMOVED

287
910 A
Did you ever go to any
of the following for
help? READ EACH
ONE
a) Police b) Hospital or health
centre c) Social services d) Legal advice
centre
e) Court f) Shelter g) Local leader h) Women’s
organization (Use name)
j) Priest/Religious leader
x) Anywhere else? Where?
LOCALLY-SPECIFIC
OPTIONS CAN BE
ADDED
a) POLICE b) HEALTH c) SOCIAL d) LEGAL
e) COURT f) SHELTER g) LEADER h) ORGANIZATIO
N: ________________
j) RELIGIOUS LEADER
x) ELSEWHERE (specify) :________ ________________
YES
1
1
1
1
1
1
1
1
1
1
*
NO
2
2
2
2
2
2
2
2
2
2
**
910 b. ASK FOR THOSE MARKED YES in 910a. Were you
satisfied with
the help given?
YES
NO
1 2
1 2
1 2
1 2
1 2
1 2
1 2
1 2
1 2
1 2
910c. ASK FOR THOSE MARKED YES in 910a. Did you go for help in the last 12 months?
YES
NO
1
2
1
2
1
2
1
2
1
2
1
2
1
2
1
2
1
2

288
1
2
IF AT
LEAST
ONE
‘YES’
GO TO
910d
ELSE
GO TO
THE
CHECK
910
d
ASK ONLY FOR
THOSE THAT ARE
MARKED WITH YES
IN 910c
In the past 12 months
how many times did
you seek help?
a) Police b) Hospital or health
centre c) Social services d) Legal advice
centre
e) Court f) Shelter g) Local leader h) Women’s
organization (Use name)
j) Priest/Religious leader
a) POLICE b) HEALTH c) SOCIAL d) LEGAL
e) COURT f) SHELTER g) LEADER h) ORGANIZATIO
N: ________________
j) RELIGIOUS LEADER
NUMBER
OF
TIMES
[ ][ ]
[ ][ ]
[ ][ ]
[ ][ ]
[ ][ ]
[ ][ ]
[ ][ ]
910e
In the past 12
months how
much did you
spend to on
fees, transport,
phone call and
so on. PROBE
FOR
ESTIMATE
[ ][ ][ ]
[ ][ ][ ]
[ ][ ][ ]
[ ][ ][ ]
[ ][ ][ ]
[ ][ ][ ]
[ ][ ][ ]
[ ][ ][ ]

289
x) Anywhere else? Where?
x) ELSEWHERE (specify) :________ ________________
[ ][ ]
[ ][ ]
[ ][ ]
[ ][ ][ ]
[ ][ ][ ]
CHECK
:
Questio
n 910a *
**
(s9check)
MARK WHEN YES FOR ANY IN Q.
910a (AT LEAST ONE “1” CIRCLED IN
COLUMN MARKED WITH *)
[ ]
⇓
(1)
MARK WHEN ALL ANSWERS NO
CIRCLED (ONLY “2” CIRCLED **)
[ ]
(2)
⇒
9
1
2
911 What were the reasons that made
you go for help?
MARK ALL MENTIONED AND
GO TO 913
ENCOURAGED BY FRIENDS/FAMILY A
COULD NOT ENDURE MORE B
BADLY INJURED C
HE THREATENED OR TRIED TO KILL HER D
HE THREATENED OR HIT CHILDREN E
SAW THAT CHILDREN SUFFERING F
THROWN OUT OF THE HOME G
AFRAID SHE WOULD KILL HIM H
AFRAID HE WOULD KILL HER I
AFRAID HE WOULD HIT HER/MORE
VIOLENCE J
F
O
R
AL
L
O
PT
IO
N
S
G
O
T
O

290
OTHER (specify):
_______________________________
___________________________________
____ X
91
3
912 What were the reasons that you
did not go to any of these?
MARK ALL MENTIONED
DON’T KNOW/NO ANSWER A FEAR OF THREATS/CONSEQUENCES/ MORE VIOLENCE B VIOLENCE NORMAL/NOT SERIOUS C
EMBARRASSED/ASHAMED/AFRAID WOULD NOTBE BELIEVED OR WOULD BE BLAMED D BELIEVED NOT HELP/KNOW OTHER WOMEN
NOTHELPED E
AFRAID WOULD END RELATIONSHIP F
AFRAID WOULD LOSE CHILDREN G
BRING BAD NAME TO FAMILY H
DID NOT KNOW HER OPTIONS I OTHER (specify): ________________________________ ________________________________________________ X
913 Is there anyone that you would
like (have liked) to receive
(more) help from? Who?
MARK ALL MENTIONED
CAN ADD COUNTRY-SPECIFIC OPTIONS
NO ONE MENTIONED A
HIS RELATIVES B
HER RELATIVES C
FRIENDS/NEIGHBOURS D
HEALTH CENTRE E
POLICE
F
PRIEST/RELIGIOUS LEADER G
SOCIAL WORKER I
OTHER(specify): ____________________________ X

291
914 Did you ever leave, even if only overnight, because of his behaviour? IF YES: How many times?
(MORE OR LESS)
NUMBER OF TIMES LEFT [ ][ ]
NEVER 00
N.A. (NOT LIVING TOGETHER) 97
DON’T KNOW/DON’T REMEMBER 98
REFUSED/NO ANSWER 99
⇒9
19
⇒
S.
10
914 When was last time you left because of his behaviour?
PAST 12
MONTHS………………………………….1
BEFORE THE PAST 12
MONTHS………………….2
915 What were the reasons why you
left the last time?
MARK ALL MENTIONED
NO PARTICULAR INCIDENT A
ENCOURAGED BY FRIENDS/FAMILY B
COULD NOT ENDURE MORE C
BADLY INJURED D
HE THREATENED OR TRIED TO KILL HER E
HE THREATENED OR HIT CHILDREN F
SAW THAT CHILDREN SUFFERING G
THROWN OUT OF THE HOME H
AFRAID SHE WOULD KILL HIM I
ENCOURAGED BY ORGANIZATION:
_____________ J
AFRAID HE WOULD KILL HER K
OTHER (specify):
________________________________ X
916 Where did you go the last time?
MARK ONE
HER RELATIVES 01
HIS RELATIVES 02
HER FRIENDS/NEIGHBOURS 03
HOTEL/LODGINGS 04
STREET 05
CHURCH/TEMPLE 06

292
SHELTER 07
OTHER (specify):
________________________________ 96
DON’T KNOW/DON’T REMEMBER 98
REFUSED/NO ANSWER 99
917 How long did you stay away
the last time?
RECORD NUMBER OF
DAYS OR MONTHS
NUMBER OF DAYS (IF LESS THAN 1 MONTH) [ ][
] ..1
NUMBER OF MONTHS (IF 1 MONTH OR MORE) [ ][
] ..2
LEFT HUSBAND/PARTNER / DID NOT RETURN/ NOT WITH HUSBAND/PARTNER 3
⇒
S.
10
917
a
How much did you spend for
accommodation and food for
the last time you were
away? (Prompt if gave
money to stay with parents,
friends)
ACCOMMODATION AND FOOD………….[ ][ ][ ]
DID NOT SPEND ANYTHING 000
DON’T KNOW/DON’T REMEMBER 998
REFUSED/NO ANSWER 999
918 What were the reasons that you returned?
MARK ALL MENTIONED AND
GO TO SECTION 10
DIDN’T WANT TO LEAVE CHILDREN A
SANCTITY OF MARRIAGE B
FOR SAKE OF FAMILY/CHILDREN
(FAMILY HONOUR) C
COULDN’T SUPPORT CHILDREN D
LOVED HIM E
HE ASKED HER TO GO BACK F
FAMILY SAID TO RETURN G
FORGAVE HIM H
THOUGHT HE WOULD CHANGE I
THREATENED HER/CHILDREN J
F
O
R
AL
L
O
PT
IO
N
S
G
O
T
O

293
COULD NOT STAY THERE (WHERE SHE
WENT) K
VIOLENCE NORMAL/NOT SERIOUS L
THE CHILDREN NEED A FATHER/BOTH
PARENTS M
OTHER (specify):
_____________________________ X
Se
cti
on
10
919 What were the reasons that
made you stay?
MARK ALL MENTIONED
DIDN’T WANT TO LEAVE CHILDREN A
SANCTITY OF MARRIAGE B DIDN’T WANT TO BRING SHAME
ON FAMILY C COULDN’T SUPPORT CHILDREN D
LOVED HIM E
DIDN’T WANT TO BE SINGLE F
FAMILY SAID TO STAY G
FORGAVE HIM H
THOUGHT HE WOULD CHANGE I
THREATENED HER/CHILDREN J
NOWHERE TO GO K
VIOLENCE NORMAL/NOT SERIOUS L
THE CHILDREN NEED A FATHER/BOTH
PARENTS M
OTHER (specify):
______________________________ X

294
SECTION 10 OTHER EXPERIENCES
N01 READ TO RESPONDENT: In their lives, many women have unwanted experiences and experience different forms of maltreatment and violence from all kinds of people, men or women. These may be relatives, other people that they know, and/or strangers. If you don’t mind, I would like to ask you about some of these situations. Everything that you say will be kept confidential. I will first ask about what has happened since you were 15 years old (from age 15 onwards until now), and thereafter during the past 12 months. FOR WOMEN WHO WERE EVER MARRIED OR PARTNERED ADD: These questions are about people other than your husband/partner(s).
N02 A.Since the age of 15 until now, has anyone ever done any of the following to you: Slapped, hit, beaten, kicked or done anything else to hurt
you?
a) Thrown something at you? Pushed you or pulled your hair?
b) Choked or burnt you on purpose? c) Threatened with or actually used a gun, knife or other
weapon against you?
A. YES
1 1 1 1
NO
2
2
2
2
B.IF YES: Has this happened in the past 12 months?
YES NO DK 1 2 8 1 2 8 1 2 8 1 2 8
CHECK N02
AT LEAST ONE ‘1’ MARKED IN COLUMN A. [ ]
ONLY ‘2’ MARKED [ ]⇒ N06
N03 a) Who did this to you? PROBE: Anyone else?How about a relative? How about someone at school or work? How about a friend or neighbour?A stranger or anyone else? DO NOT READ OUT THE LIST MARK LETTER FOR ALL MENTIONED PARENT A
PARENT-IN-LAW B SIBLING (BROTHER OR SISTER) C OTHER FAMILY MEMBER D SOMEONE AT WORK E FRIEND/ACQUAINTANCE F RECENT ACQUAINTANC G COMPLETE STRANGER H TEACHER I DOCTOR/HEALTH STAFF J RELIGIOUS LEADER K POLICE/ SOLDIER L
b) INDICATE SEX FOR EACH PERSON MENTIONED MALE FEMALE
c) ASK ONLY FOR THOSE MARKED in N03 a).
How many times did this happen since you were 15? Once, a few times, or many times? ONCE FEW MANY
d) ASK ONLY FOR THOSE MARKED in a). How many times did this happen in the past 12 months? Once, a few times, or many times?
NO ONCE FEW MANY
1 1 1 1 1 1 1 1 1 1
2 2 2 2 2 2 2 2 2 2
1 2 3 1 2 3 1 2 3 1 2 3 1 2 3 1 2 3 1 2 3 1 2 3 1 2 3 1 2 3
0 1 2 3 0 1 2 3 0 1 2 3 0 1 2 3 0 1 2 3

295
OTHER (specify) _________________ W OTHER (specify) ____________ X
1 1 1 1
2 2 2 2
1 2 3 1 2 3 1 2 3 1 2 3
0 1 2 3 0 1 2 3 0 1 2 3 0 1 2 3 0 1 2 3 0 1 2 3 0 1 2 3 0 1 2 3 0 1 2 3
N04
N05

296
N06 Now I would like to ask you about other unwanted experiences you may have had. Again, I want you to think about any person, man or woman. FOR WOMEN WHO EVER HAD A PARTNER ADD IF NECESSARY: except your husband/male partner.
Since the age of 15 until now, has anyone (other than your male partner) ever forced you into sexual
intercourse when you did not want to, for example by threatening you, holding you down, or putting you
in a situation where you could not say no. Remember to include people you have known as well as
strangers. Please at this point exclude attempts to force you to have sex, but did not succeed.
Has anyone (other than your male partner) ever forced you to have sex when you were too drunk or
drugged to refuse?
IF NECESSARY: We define sexual intercourse as vaginal, oral or anal penetration. NOTE THAT THESE QUESTIONS ARE ABOUT RAPES THAT ACTUALLY HAPPENED
YES 1 1
NO 2 2
IF ALL TWO ANSWERS ARE NO 🡪 N08

297
N06c Has any of this happened in the past 12 months? YES
……………
………..1
NO ………………………2 DON’T KNOW………….8
N06d How old were you the first time it happened [more or less] NOTE THAT IT COULD BE POSSIBLE THAT THE FIRST TIME IT HAPPENED WAS BEFORE AGE 15.
[ ][ ]
years
DON’T KNOW………….98
N06e a) Have you been forced or persuaded to have sex against your will with more than one man at the same time?
YES
……………
………..1
NO ………………………2 DON’T KNOW………….8
N07 a) Who did this to you? PROBE: Anyone else? How about a relative? How about someone at school or work? How about a friend or neighbour? A stranger or anyone else? DO NOT READ OUT THE LIST MARK LETTER FOR ALL MENTIONED PARENT A
PARENT-IN-LAW B SIBLING (BROTHER OR SISTER) C OTHER FAMILY MEMBER D SOMEONE AT WORK E FRIEND/ACQUAINTANCE F RECENT ACQUAINTANC G COMPLETE STRANGER H TEACHER I DOCTOR/HEALTH STAFF J RELIGIOUS LEADER K POLICE/ SOLDIER L
b) INDICATE SEX FOR EACH PERSON MENTIONED MALE FEMALE
c) ASK ONLY FOR THOSE MARKED in N03 a). How many times did this happen since you were 15? Once, a few times, or many times? ONCE FEW MANY
REMOVED
1
1 1 1 1 1 1 1 1 1 1 1 1
2 2 2 2 2 2 2 2 2 2 2 2 2
1 2 3 1 2 3 1 2 3 1 2 3
1 2 3 1 2 3 1 2 3 1 2 3
1 2 3 1 2 3 1 2 3 1 2 3
1 2 3
1 2 3

298
OTHER (specify) _________________ W OTHER (specify) ____________ X
1
2
N07c
N07d
N07e I am now going to ask you about your experience of forced sex. When was the most recent incident that you were forced to have sex?
LESS THAN ONE YEAR AGO 1
BETWEEN ONE AND FIVE YEARS AGO
2
LONGER THAN FIVE YEARS AGO 3
REFUSED/NO ANSWER 9
N07f Where did this (the most recent) incident occur?
YOUR OWN HOME OR YARD 1
HIS OR SOMEONE ELSE HOME OR
YARD 2
STREET, ALLEY, PARKING LOT, CAR 3
PUBLIC TRANSPORT 4
RURAL AREAS, WOODS, PARK,
CAMPGROUND 5
SCHOOL, COLLEGE, CAMPUS 6
CARE INSTITUTION/PRISON 7
BAR, DANCE CLUB, POOL HALL 8
OFFICE BUILDING, SHOP, PUBLIC
BUILDING 9
OTHER
(SPECIFY)______________________ 96
DON’T KNOW/CAN’T REMEMBER 98
REFUSED/NO ANSWER 99
N07g Did you report the incident to the police? Please respond about the most recent incident.
YES…………………………................…
… 1
NO……………………………….................
.2
REFUSED/NO ANSWER 9
⇒N0
7j
N07h How did the police respond?
THEY OPENED A CASE......
……….......... 1

299
COUNTRY SPECIFIC CODING
THEY SENT ME AWAY
………................ 2
OTHER
……………………………............. 3
REFUSED/NO ANSWER 9
N07i
Was the person who did this to you arrested and convicted?
NOT
ARRESTED…………................…..… 1
ARRESTED BUT NOT
CONVICTED......... 2
CONVICTED………………………………
3
REFUSED/NO ANSWER 9
N07j Did you report it to a health service (doctor or nurse)?
YES…………………………................…
… 1
NO……………………………….................
. 2
REFUSED/NO ANSWER 9
⇒N0
7m
N07k Were you offered any medication/treatment for preventing pregnancy?
YES…………………………................…
… 1
NO……………………………….................
. 2
DON’T
KNOW.............................................. 8
REFUSED/NO ANSWER 9
N07l Were you offered any medication/treatment for preventing transmission of HIV (PEP)?
YES…………………………................…
… 1
NO……………………………….................
. 2
DON’T
KNOW.............................................. 8
REFUSED/NO ANSWER 9
N07m Did you receive (formal) counselling with regards to the incident that you experienced?
YES…………………………................…
… 1
NO……………………………….................
. 2
REFUSED/NO ANSWER 9
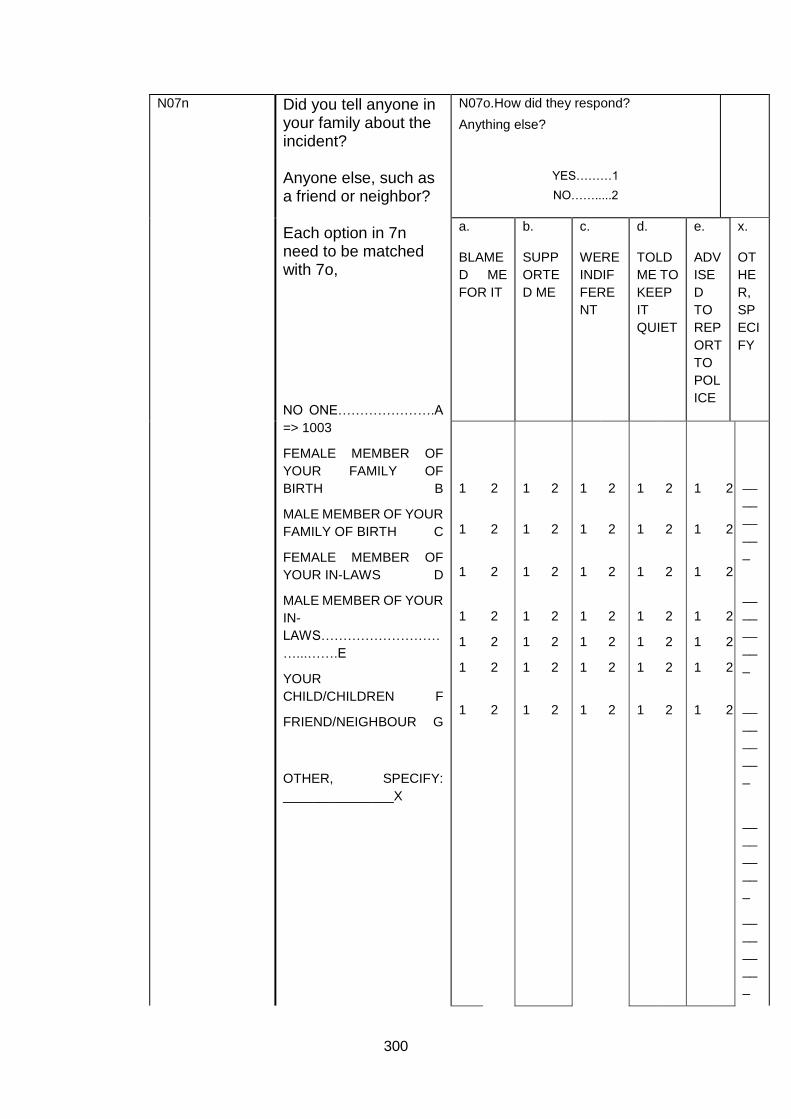
300
N07n Did you tell anyone in your family about the incident? Anyone else, such as a friend or neighbor? Each option in 7n need to be matched with 7o,
NO ONE………………….A
=> 1003
FEMALE MEMBER OF
YOUR FAMILY OF
BIRTH B
MALE MEMBER OF YOUR
FAMILY OF BIRTH C
FEMALE MEMBER OF
YOUR IN-LAWS D
MALE MEMBER OF YOUR
IN-
LAWS………………………
…...…….E
YOUR
CHILD/CHILDREN F
FRIEND/NEIGHBOUR G
OTHER, SPECIFY:
_______________X
N07o.How did they respond?
Anything else?
YES………1
NO…….....2
a.
BLAME
D ME
FOR IT
b.
SUPP
ORTE
D ME
c.
WERE
INDIF
FERE
NT
d.
TOLD
ME TO
KEEP
IT
QUIET
e.
ADV
ISE
D
TO
REP
ORT
TO
POL
ICE
x.
OT
HE
R,
SP
ECI
FY
1
1
1
1
1
1
1
2
2
2
2
2
2
2
1
1
1
1
1
1
1
2
2
2
2
2
2
2
1
1
1
1
1
1
1
2
2
2
2
2
2
2
1
1
1
1
1
1
1
2
2
2
2
2
2
2
1
1
1
1
1
1
1
2
2
2
2
2
2
2
__
__
__
__
_
__
__
__
__
_
__
__
__
__
_
__
__
__
__
_
__
__
__
__
_

301
__
__
__
__
_
__
__
__
__
_
Moved up to N06a
N08
Again, I want you to think about any person, man or woman. FOR WOMEN WHO EVER HAD A PARTNER ADD: except your husband/male partner. Apart from anything you may have mentioned, can you tell me if, since the age of 15 until now, any of the following has happened to you? Remember to include people you have known as well as strangers.
Has anyone attempted but NOT succeed to force you into sexual intercourse when you did not want to,
for example by holding you down or putting you in a situation where you could not say no?
A.
YES 1 1 1
NO
2
2
B.IF YES: Has this happened in the past 12 months?
YES NO DK 1 2 8 1 2 8 1 2 8

302
2
CHECK
N08
AT LEAST ONE ‘YES’ (‘1’) MARKED IN
COLUMN A. [ ]
⇓
ONLY ‘NO’ (‘2’) MARKED
[ ]⇒
⇒N09f
N08d How old were you the first time it happened [more or less] NOTE THAT IT COULD BE POSSIBLE THAT THE FIRST TIME IT HAPPENED WAS BEFORE AGE 15.
[ ][ ] years
DON’T KNOW………….98
N09 a) Who did this to you? PROBE: Anyone else? How about a relative? How about someone at school or work? How about a friend or neighbour? A stranger or anyone else? DO NOT READ OUT THE LIST MARK LETTER FOR ALL MENTIONED PARENT A
PARENT-IN-LAW B SIBLING (BROTHER OR SISTER) C OTHER FAMILY MEMBER D SOMEONE AT WORK E
b) INDICATE SEX FOR EACH PERSON MENTIONED MALE FEMALE
c) ASK ONLY FOR THOSE MARKED in N03 a). How many times did this happen since you were 15? Once, a few times, or many times? ONCE FEW MANY
REMOVED

303
FRIEND/ACQUAINTANCE F RECENT ACQUAINTANC G COMPLETE STRANGER H TEACHER I DOCTOR/HEALTH STAFF J RELIGIOUS LEADER K POLICE/ SOLDIER L OTHER (specify)_________________ W OTHER (specify) ____________ X
1 1 1 1 1 1 1 1 1 1 1 1 1 1
2 2 2 2 2 2 2 2 2 2 2 2 2 2
1 2 3
1 2 3
1 2 3
1 2 3
1
2 3 1
2 3 1
2 3 1
2 3
1 2 3
1 2 3
1 2 3
1 2 3
1
2 3
1 2 3

304
N09e Where did this (the most recent) incident occur?
YOUR OWN HOME OR YARD 1
HIS OR SOMEONE ELSE HOME OR YARD 2
STREET, ALLEY, PARKING LOT, CAR 3
PUBLIC TRANSPORT 4
RURAL AREAS, WOODS, PARK,
CAMPGROUND 5
SCHOOL, COLLEGE, CAMPUS 6
CARE INSTITUTION/PRISON 7
BAR, DANCE CLUB, POOL HALL 8
OFFICE BUILDING, SHOP, PUBLIC BUILDING 9
HOTEL/MOTEL/HOSTEL………………………..…
…10
OTHER (SPECIFY)______________________ 96
DON’T KNOW/CAN’T REMEMBER 98
REFUSED/NO ANSWER 99
N09c
N09d
N09f Have you ever been asked to perform sexual acts against your will in order to get a job or keep your job, or to get promoted? OPTIONAL QUESTION
YES................................................................ 1
NO.................................................................. 2
N/A NEVER WORKED................................ 7
REFUSED/NO ANSWER 9
N09g Have you ever been asked to perform sexual acts against your will in order to pass an exam or get good grades at school? (The acts do not need to have happened). THE ACT MAY NOT HAVE HAPPENED OPTIONAL QUESTION
YES................................................................ 1
NO.................................................................. 2
NEVER WENT TO SCHOOL....................... 7
REFUSED/NO ANSWER 9
N09h Have you ever been groped, sexually touched or had someone
YES................................................................ 1

305
rubbing against you in the bus or another public space?
NO.................................................................. 2
REFUSED/NO ANSWER 9
N09i Have you ever received personal electronic messages with sexual content (e.g. remarks, invitations, pictures) that were hurtful to you or made you feel uncomfortable? For example, via Facebook, cellphone, e-mail, excluding spam
YES................................................................ 1
NO.................................................................. 2
DOES NOT USE ELECTRONIC MEDIA 7
REFUSED/NO ANSWER 9
NEW OPTIONAL QUESTION ON LOCATION OF SEXUAL HARASSMENT CAN BE INCLUDED

306
1003 When you were a girl, before you were 15 years old, do you remember if any-one in your family ever touched you sexually against your will, or made you do something sexual that you didn’t want to? For example, has any of these things ever happened to you? - touching of breasts or private parts - making sexual remarks or showing sexual explicit pictures against your will - making you touch their private parts - having sex or trying to have sex with you IF NO: CONTINUE PROMPTING:
How about someone at school? How about a friend or neighbour? Has anyone else done this to you? IF YES CONTINUE WITH 1003a
YES …..1 NO ……2
1004
1003
a)
a)IF YES: Who did this to you? We do not need to know the name of this person.
CONTINUE:
How about someone at school?
How about a friend or neighbour?
Has anyone else done this to you?
DO NOT READ OUT THE LIST MARK LETTER FOR ALL MENTIONED PARENT A
PARENT-IN-LAW B SIBLING (BROTHER OR SISTER) C OTHER FAMILY MEMBER D
INDICATE SEX OF
EACH PERSON
MENTIONED
MALE FEMALE
ASK ONLY FOR THOSE
MARKED IN 1003a
b) How
old were
you when
it
happened
with this
person
for the
first time?
(more or
less)
c) How
old was
this
person?
PROBE:
roughly
(more or
less).
d)
How
man
y
time
s
did
this
hap
pen
?
O
nc
e
F
e
w
t
i
m
M
a
n
y
t
i

307
SOMEONE AT WORK E FRIEND/ACQUAINTANCE F RECENT ACQUAINTANC G COMPLETE STRANGER H TEACHER I DOCTOR/HEALTH STAFF J RELIGIOUS LEADER K POLICE/ SOLDIER L OTHER (specify) _________________ W OTHER (specify) ____________
X
e
s
m
e
s
1
1
1
1
1
1
1
1
1
1
1
1
1
1
2
2
2
2
2
2
2
2
2
2
2
2
2
2
[ ][ ]
[ ][ ]
[ ][ ]
[ ][ ]
[ ][ ]
[ ][ ]
[ ][ ]
[ ][ ]
[ ][ ]
[ ][ ]
[ ][ ]
[ ][ ]
[ ][ ]
[ ][ ]
[ ][ ]
[ ][ ]
[ ][ ]
[ ][ ]
[ ][ ]
[ ][ ]
[ ][ ]
[ ][ ]
[ ][ ]
[ ][ ]
[ ][ ]
[ ][ ]
[ ][ ]
[ ][ ]
DK = 98
1
1
1
1
1
1
1
1
1
1
1
1
1
1
2
2
2
2
2
2
2
2
2
2
2
2
2
2
3
3
3
3
3
3
3
3
3
3
3
3
3
3
1003e During any of the instances you mentioned before of sexual things that happened before you were 15 years, did this person put his penis or something else into your vagina, your backside (anus), or mouth?
YES 1
NO 2
DON’T KNOW 8
REFUSED/NO ANSWER 9

308
1003f
REMOVED
1004
How old were you when you first had sexual
intercourse?
IF NECESSARY: We define sexual intercourse
as vaginal, oral or anal penetration.
AGE YEARS (MORE OR LESS) [ ][ ]
NOT HAD SEX 95
REFUSED/NO ANSWER 99
⇒
1
0
0
6
1005
How would you describe the first time that you
had sexual intercourse? Would you say that you
wanted to have sex, you did not want to have
sex but it happened anyway, or were you forced
to have sex?
WANTED TO HAVE SEX 1
NOT WANT BUT HAD SEX 2
FORCED TO HAVE SEX 3
DON’T KNOW/DON’T REMEMBER 8
REFUSED/NO ANSWER 9
1005c The first time you had sexual intercourse, was
this with your (future) husband/cohabiting
partner, or was it with someone else?
(FUTURE) HUSBAND/PARTNER… 1
SOMEONE ELSE MORE OR LESS
YOUR OWN AGE 2
SOMEONE ELSE WHO WAS OLDER 3
DON’T KNOW/DON’T
REMEMBER………..8
REFUSED /NO ANSWER 9
1005a
The number of sexual partners women have
had differs a lot from person to person. Some
women report having had one sex partner,
some 2 or more, and still others report many,
even 50 or more. In your life how many different
men have you had sex with?
IF NEEDED PROBE: More or less; I do not
need to know the exact number.
IN COUNTRIES WITH RELATIVELY HIGH
HIV/AIDS RISK
PARTNERS [ ][
][ ]
DON’T KNOW/DON’T REMEMBER 998
REFUSED/NO ANSWER 999
1005b
IF ONE PARTNER IN 1005a; ASK:
Did you have sex in the past 12 months? IF
YES, ENTER “01”
PARTNERS [ ][ ]
NONE 00

309
IF MORE THAN ONE PARTNER IN 1005a,
ASK
With how many of these men did you have sex
in the past 12 months?
INCLUDE CURRENT PARTNER IN TOTAL
IN COUNTRIES WITH RELATIVELY HIGH
HIV/AIDS RISK
DON’T KNOW/DON’T REMEMBER 98
REFUSED/NO ANSWER 99
1006 When you were a child, was your mother
hit by your father (or her husband or
boyfriend)?
YES 1
NO 2
PARENTS DID NOT LIVE TOGETHER 3
DON’T KNOW 8
REFUSED/NO ANSWER 9
1007 When you were a child (before age 15),
did anyone in your family ever:
a) Slapped or spanked you (with hand)?
b) Beat or kicked you or hit you with fist?
c) Hit you with a belt, stick, broom or something else?
d) Tied you with a rope?
e) Insulted or humiliated you regularly?
f) Scold and curse you regularly? x) Anything else? Specify:
________________________
a) SLAPPED b) BEAT,
KICKED c) HIT WITH
OBJECT
d) TIED WITH ROPE
e) INSULTED x) ANYTHING
ELSE
YES
1
1
1
1
1
1
NO
2
2
2
2
2
2
DK
8
8
8
8
8
8
REMOVED; moved to Section 5

310
SECTION 11 [moved to section 1)
SECTION 12 COMPLETION OF INTERVIEW
1201 I would now like to give you a card. On this card are two pictures. No other information is written on the card. The first picture is of a sad face, the second is of a happy face.
No matter what you have already told me, I would like you to put a mark below the sad face if someone has ever touched you sexually, or made you do something sexual that you didn’t want to, before you were 15 years old (when you were a girl younger than 15 years old). For example, has any of these things ever happened to you? - touching of breasts or private parts - making sexual remarks or showing sexual explicit pictures against your will - making you touch their private parts - having sex or trying to have sex with you Please put a mark below the happy face if this has never
happened to you.
Once you have marked the card, please fold it over and put it in
this envelope. This will ensure that I do not know your answer.
GIVE RESPONDENT CARD AND PEN. MAKE SURE THAT THE RESPONDENT FOLDS THE CARD; PUTS IT IN THE ENVELOPE; AND SEALS THE ENVELOPE BEFORE GIVING IT BACK TO YOU. ON LEAVING THE INTERVIEW SECURELY ATTACH THE ENVELOPE TO THE QUESTIONNAIRE (OR WRITE THE QUESTIONNAIRE CODE ON THE ENVELOPE).
CARD GIVEN
FOR
COMPLETIO
N 1
CARD NOT
GIVEN FOR
COMPLETIO
N 2
1202
We have now finished the interview. Do you have any comments, or is there anything
else you would like to add?

311
___________________________________________________________________
___________________________________________________________________
___________________________________________________________________
___________________________________________________________________
___________________________________________________________________
___________________________________________________________________
___________________________________________________________________
___________________________________________________________________
___________________________________________________________________
__________________________________
1202a Do you have any recommendations or suggestions that could help to stop domestic
violence against women in this country?
___________________________________________________________________
___________________________________________________________________
___________________________________________________________________
___________________________________________________________________
___________________________________________________________________
___________________________________________________________________
___________________________________________________________________
___________________________________________________________________
___________________________________________________________________
___________________________________________________________________
__________________________________________________
1203 I have asked you about many difficult things. How has talking about these things made you feel?
WRITE DOWN ANY SPECIFIC RESPONSE GIVEN BY RESPONDENT
________________________________________________________________________________________________________________________________________________________________________________________________________________________________________________________________________________________________________________________________________________________________________________________________________________________________________________________________
GOOD/BETTER 1
BAD/WORSE 2
SAME/ NO
DIFFERENCE 3
1204 Finally, do you agree that we may contact you again if we need to ask a few more questions for clarification? COUNTRIES TO SPECIFY TIME PERIOD DEPENDING ON WHEN THEY PLAN TO DO QUALITY CONTROL VISITS
YES 1
NO 2
1205 May I have your phone number just in case we need to clarify some information?
PHONE NUMBER:

312
FINISH ONE – IF RESPONDENT HAS DISCLOSED PROBLEMS/VIOLENCE
I would like to thank you very much for helping us. I appreciate the time that you have taken. I realize that these questions may have been difficult for you to answer, but it is only by hearing from women themselves that we can really understand about their health and experiences of violence.
From what you have told us, I can tell that you have had some very difficult times in
your life. No one has the right to treat someone else in that way. However, from what
you have told me I can see also that you are strong, and have survived through some
difficult circumstances.
Here is a list of organizations that provide support, legal advice and counselling
services to women in STUDY LOCATION. Please do contact them if you would like
to talk over your situation with anyone. Their services are free, and they will keep
anything that you say confidential. You can go whenever you feel ready to, either soon
or later on.
FINISH TWO - IF RESPONDENT HAS NOT DISCLOSED PROBLEMS/VIOLENCE
I would like to thank you very much for helping us. I appreciate the time that you have
taken. I realize that these questions may have been difficult for you to answer, but it is
only by hearing from women themselves that we can really understand about women’s
health and experiences in life.
In case you ever hear of another woman who needs help, here is a list of organizations
that provide support, legal advice and counselling services to women in STUDY
LOCATION. Please do contact them if you or any of your friends or relatives need
help. Their services are free, and they will keep anything that anyone says to them
confidential.
1205 RECORD TIME OF END OF INTERVIEW: HH:MM [ ][ ]:[ ][ ] (00-24 h)
1206 ASK THE RESPONDENT. How long did you think the interview lasted? THIS SHOULD BE
HER OWN ESTIMATE
Hours [ ] Minutes [ ][ ]

313
INTERVIEWER COMMENTS TO BE COMPLETED AFTER INTERVIEW
___________________________________________________________________________________
___________________________________________________________________________________
___________________________________________________________________________________
___________________________________________________________________________________
___________________________________________________________________________________
___________________________________________________________________________________
___________________________________________________________________________________
___________________________________________________________________________________
___________________________________________________________________________________
___________________________________________________________________________________
___________________________________________________________________________________
___________________________________________________________________________________
___________________________________________________________________________________
___________________________________________________________________________________
___________________________________________________________________________________
___________________________________________________________________________________
___________________________________________________________________________________
___________________________________________________________________________________
___________________________________________________________________________________
___________________________________________________________________________________
___________________________________________________________________________________
___________________________________________________________________________________
___________________________________________________________________________________
___________________________________________________________________________________
___________________________________________________________________________________
___________________________________________________________________________________
___________________________________________________________________________________
___________________________________________________________________________________
___________________________________________________________________________________
___________________________________________________________________________________
___________________________________________________________________________________
___________________________________________________________________________________
________________________________________________________________________
FOR OFFICE USE ONLY:
1 SAD
2 HAPPY
3 NOT CLEAR
4 CARD EMPTY
5 NO CARD

314
REFERENCE SHEET (THIS WILL BE USED IF VIOLENCE QUESTIONS APPLIED TO ALL WOMEN WHO EVER HAD A HUSBAND/PARTNER, CURRENT OR PAST)
Box A. MARITAL STATUS
Copy exactly from Q119 and 120. Follow arrows and mark only ONE of the following for marital
status:
11
9 Are you currently
married, living
together or involved in
a relationship with a
man without living
together?
CURRENTLY MARRIED AND LIVING TOGETHER 1
CURRENTLY MARRIED NOT LIVING TOGETHER 2
LIVING WITH MAN, NOT MARRIED 3
CURRENTLY HAVING A REGULAR
PARTNER (ENGAGED, DATING ),
NOT LIVING TOGETHER 4
NOT CURRENTLY MARRIED OR LIVING
WITH A MAN (NOT INVOLVED IN A
RELATIONSHIP WITH A MAN) 5
CURRENTLY HAVING FEMALE PARTNER 6
[ ] Currently
married and/or living
with man (K)
[ ] Currently with regular partner; dating relationship (L) [ ] Previously married/previously lived with man; no current (dating) relationship (M1) [ ] Previously had (dating) relationship(M2)
12
0a
Have you ever been
married or lived with a
male partner?
YES, MARRIED 1
LIVED WITH A MAN, NOT MARRIED… .3
NO 5
12
0b
Have you ever been
involved in a
relationship with a
man without living
together (such as
being engaged or
dating)?
YES…………… 1
NO… 2
[ ] Never married
/never lived with
man; never(dating )
relationship (N)
123. Number of times married/lived together with man: [ ][ ] (O)
Box B. REPRODUCTIVE HISTORY

315
Check and complete ALL that applies for reproductive history of respondent:
(P) Respondent has been pregnant at least once (Question 308, 1 or more) [ ] Yes [ ] No
(Q) Respondent had at least one child born alive (Question 301, 1 or more) [ ] Yes [ ] No
(R) Respondent has children who are alive (Question 303, 1 or more) [ ] Yes [ ] No
(S) Respondent is currently pregnant (Question 310, option 1) [ ] Yes [ ] No
(T) Number of pregnancies reported (Question 308): [ ][ ]
Box C. VIOLENCE BY HUSBAND/PARTNER
Check and complete ALL that applies for respondent:
(U) Respondent has been victim of physical violence (Question 707) [ ] Yes [ ] No (V) Respondent has been victim of sexual violence (Question 708) [ ] Yes [ ] No

316
Annex VIIb: Differences between Viet Nam's questionnaire version 2010 and 2019
● Eligbile age range is 15-64 (instead of 18-60)
● 4: Combined "d) Land phone and e) Mobile phone" into one code "d) Mobile/ land/
tablet"
● Added g) Washing machine; h) water heater; i) Air conditioner
● 5: Added more assets d) Canoe/boat; e) Electric bicycle/ electric motorbike
● Deleted question 8, 9, 101-107
● 108a, 108b: Questions about ethnicity and religion – Adjusted to the Vietnamese
context
● Deleted question 109, 110
● 111: Question about women's education – Adjusted to the current Vietnamese
context, replaced with 111a1, 111a2, 111a3
● 112.01-112.08: More questions about women's jobs
● Deleted question 112
● 119: Added answer codes to match the current context
● Deleted question 122b about the reason for parting/ splitting
● 123a: Added questions about the age of getting married for the 1st time/ living with
the 1st partner
● Deleted question 125
● 1101, 1103, 1104: Added questions about property ownership
● 201-204: Adjusted questions about vision, hearing, walking, memorizing, focusing,
using language, health status
● 209: Adjusted to only 6 codes
● 213a-213e: deleted
● 303: Added questions about the number of sons and daughters
● 306-307, 316-318, 320: Deleted
● 417-424: Asking children aged 5-12 instead of 6-11
● 503-504: Deleted
● 505a, 505b: Questions about the education of a husband/ partner – Adjusted to
the Vietnamese context, replaced with 505a1, 505a2, 505a3
● 508: Questions about the type of work of a husband/ partner - Adjusted to the
Vietnamese context
● 602, 604, 608: Deleted
● 703N, 704nk: Added questions about economic violence and who caused it
● 708N: Added questions about how many times violent acts have happened

317
● 806a-807b: Added questions about violence costs - Adjusted to the Vietnamese
context, clearly divided the costs in to inpatient and outpatient costs
● 901: Added 5 answer codes (L, M, N, O, P) to fit the Vietnamese context
● 903: Deleted
● 910d: Added questions about seeking help in the past 12 months
● Section 10: Redesigned questions about the violence experienced by women
since the age of 15 up to now and in the last 12 months caused by someone other
than their husband/ partner; violent acts experienced by women when they were
under 15 years of age.
● Section 11: Deleted and incorporated into section 1

318
Annex VIII: Data tables
Table 3.1. Households selected and completed interviews (unweighted), Viet Nam 2019 322
Table 3.2. Characteristics of all respondents and all ever-partnered respondents in the sample
(unweighted and weighted), Viet Nam 2019 323
Table 3.3. Characteristics of respondents in the sample (unweighted and weighted) and female
population age 15-64 years in the general population (based on last population census), Viet
Nam 2019 327
Table 3.4. Prevalence of partner violence, unweighted and weighted, Viet Nam 2019 331
Table 3.5. Women's satisfaction upon completion of interview, according to experience of
partner violence, Viet Nam 2019 332
Table 3.6. Proportion of women owning certain assets, either by herself or with someone else,
as reported in the survey (N=5976), Viet Nam 2019 333
Table 3.7. Proportion of women earning money by herself and the way they are earning money,
among all respondents (N=5976), Viet Nam 2019 334
Table 4.1. Prevalence of physical, sexual and physical and/or sexual partner violence, among
ever-partnered women, Viet Nam 2019 335
Table 4.2. Prevalence of specific acts of physical violence by husbands/partners, among ever-
partnered women, Viet Nam 2019 339
Table 4.3. Lifetime prevalence of physical partner violence, by severity, among ever-partnered
women, Viet Nam 2019 340
Table 4.4. Prevalence of specific acts of physical violence by husbands/partners in the past 12
months, and frequency distribution of number of times the acts happened, Viet Nam 2019343
Table 4.5. Proportion of women who reported physical violence in pregnancy, among ever-
pregnant women, Viet Nam 2019 344
Table 4.6. Characteristics of violence during pregnancy, among ever-pregnant women, Viet
Nam 2019 348
Table 4.7. Prevalence of specific acts of sexual violence by husbands/partners among ever-
partnered women, Viet Nam 2019 351
Table 4.8. Prevalence of specific acts of sexual violence by husbands/partners in the past 12
months, and frequency distribution of number of times the acts happened, Viet Nam 2019352
Table 4.9. Prevalence of emotional partner violence, among ever-partnered women, Viet Nam
2019 353
Tay
Table 4.10. Lifetime and current prevalence of specific acts of emotional partner violence, and
frequency of these acts in the past 12 months, among ever-partnered women, Viet Nam 2019
356
Table 4.11.a Prevalence of specific controlling behaviours by partners during lifetime, among
ever-partnered women, Viet Nam 2019 357
Age group of respondent (for comparison to 2010) 361
Table 4.11.b Prevalence of specific controlling behaviours by partners in the past 12 months,
among ever-partnered women, Viet Nam 2019 396
Table 4.12a Prevalence of economic abusive acts by partners during lifetime, among ever-
partnered women, Viet Nam 2019 365
Table 4.12b Prevalence of economic abusive acts by partners during last 12 months, among
ever-partnered women, Viet Nam 2019 368

319
Table 4.13. Percentage of women who reported they ever initiated violence against partner, and
frequency distribution of number of times it happened, among ever-partnered women, Viet Nam
2019 372
Table 5.1. Prevalence and frequency of physical violence by non-partners since the age of 15
and in the past 12 months, among all interviewed women, Viet Nam 2019 376
Table 5.2. Percentage of all interviewed women who reported physical violence by non-
partners, by number and type of perpetrator (N=5976), Viet Nam 2019 381
Table 5.3. Prevalence of sexual violence by non-partners since the age of 15 and in the past 12
months, among all interviewed women, Viet Nam 2019 383
Table 5.4a. Percentage of all interviewed women who reported sexual violence by non-partners
since age 15 and in past 12 months, by frequency, number and type of perpetrator, Viet Nam
2019 388
Table 5.4.b Place of occurrence of sexual violence by non-partner by type of violence and
timing of most recent incident, among women who experienced sexual non-partner violence,
Viet Nam 2019 390
Table 5.5. Prevalence of child sexual abuse by non-partners, before the age of 15 years, among
all interviewed women, Viet Nam 2019 392
Table 5.6. Percentage of all interviewed women who reported childhood sexual abuse during
the interview (not by anonymous card), by frequency, age that it occurred, number and type of
perpetrator (N=5976), Viet Nam 2019 395
Table 5.7. Overlap of non-partner and partner violence among all women (N=5976), Viet Nam
2019 397
Table 5.8a. Age of first sexual intercourse, among all interviewed women, Viet Nam 2019398
Table 5.8b. Age of first sexual intercourse, among interviewed women who have ever had sex,
Viet Nam 2019 401
Table 5.9a. Nature of first sexual experience, among women who ever had sex, Viet Nam 2019
404
Table 5.9b. Nature of first sexual experience by age of first sexual intercourse, among women
who ever had sex, Viet Nam 2019 407
Table 5.10. Overlap of different types of partner violence, Viet Nam 2019 408
Table 5.11. Prevalence of different types of partner and non-partner violence, among women
15-49, 18-60 and 15-64 years old, Viet Nam 2019 409
Table 5.12. Prevalence of sexual harassment, among all interviewed women, Viet Nam 2019
411
Table 6.1. Gender attitudes. Proportion of interviewed women who said they agree with specific
statements presented to them (N=5976), Viet Nam 2019 415
Table 6.2. Attitudes around physical partner violence. Proportion of interviewed women who
said they agree that a man has good reason to hit his wife for reasons stated below (N=5976),
Viet Nam 2019 419
Table 6.3. Situations leading to violence among women who ever experienced physical partner
violence (N=1471), Viet Nam 2019 424
Table 7.1. Percentage of women reporting injuries as a result of physical and/or sexual partner
violence, Viet Nam 2019 428
Table 7.2. Prevalence, frequency and type of injuries and health service use for women who
were injured due to physical and/or sexual partner violence, Viet Nam 2019 432
Table 7.3. Self-reported impact of violence on women's health and well-being, among women
who reported physical and/or sexual partner violence, Viet Nam 2019 434

320
Table 7.4.a. Self-reported impact of violence on women's work, among women who reported
physical and/or sexual partner violence, Viet Nam 2019 438
Table 7.4.b. Self-reported nature of impact of violence on women's work, among women who do
work for money and who reported physical and/or sexual partner violence, Viet Nam 2019442
Table 7.5.a. General, physical and mental health problems reported among ever-partnered
women, according to women's experience of physical and/or sexual partner violence, Viet Nam
2019 446
Table 7.5.b. Mental health problems reported among ever-partnered women, according to
women's experience of emotional partner violence, Viet Nam 2019 448
Table 7.6. Use of health services and medication among ever-partnered women, according to
their experience of physical and/or sexual partner violence, Viet Nam 2019 449
Table 7.7. Reproductive health outcomes reported by women, according to their experience of
physical and/or sexual partner violence, Viet Nam 2019 450
Table 7.8. Factors related to last pregnancy, among women with live birth in the past 5 years,
according to the women's experience of physical and/or sexual partner violence, Viet Nam
2019 452
Table 7.9. Use of contraception reported by women, according to their experience of physical
and/or sexual partner violence, Viet Nam 2019 453
Table 8.1. Children's well-being as reported by women with children 5-12 years old, according
to the women's experience of physical and/or sexual partner violence, Viet Nam 2019 454
Table 8.1.a Children's well-being as reported by women with children 5-12 years old and who
have experienced physical and/or sexual partner violence, according to how frequently her
children witnessed the violence, Viet Nam 2019 455
Table 8.2. Children witnessing the violence, according to women who ever experienced physical
partner violence, Viet Nam 2019 456
Table 8.3. Percentage of respondents reporting violence against her mother, against her
partner's mother or against her partner when he was a child, among ever-partnered women,
according to women’s experience of partner violence, Viet Nam 2019 457
Table 9.1. Percentage of women who had told others, and persons to whom they told about the
violence, among women experiencing physical and/or sexual partner violence (N=1,791), Viet
Nam 2019 459
Table 9.2. Percentage of women who mentioned they would have liked more help, and from
whom, among women experiencing physical and/or sexual partner violence (N=1791), Viet Nam
2019 461
Table 9.3. Percentage of women who sought help from agencies/persons in authority, and
satisfaction with support received, among women who experienced physical and/or sexual
partner violence (N=1791), Viet Nam 2019 462
Table 9.4. Main reasons for seeking support from agencies, as mentioned by women who
experienced physical and/or sexual partner violence and who sought help (N=185), Viet Nam
2019 463
Table 9.5. Main reasons for not seeking support from agencies, as mentioned by women who
experienced physical and/or sexual partner violence and who did not seek help (N=1606), Viet
Nam 2019 464
Table 9.6. Percentage of women who ever left home because of violence, among women who
experienced physical and/or sexual partner violence, Viet Nam 2019 465
Table 9.7. Main reasons for leaving home last time she left, as mentioned by women who
experienced physical and/or sexual partner violence and who left home (N=352), Viet Nam
2019 467

321
Table 9.8. Main reasons for returning, as mentioned by women who experienced physical
and/or sexual partner violence, who left home and returned (N=352), Viet Nam 2019 468
Table 9.9. Main reasons for not leaving home, as mentioned by women who experienced
physical and/or sexual partner violence and who never left home (N=1433), Viet Nam 2019469
Table 9.10. Retaliation/fighting back, among women reporting physical partner violence
(N=1471), Viet Nam 2019 471
Table 9.11. Effect of fighting back, among women who ever fought back because of physical
partner violence (N=301), Viet Nam 2019 472
Table 9.12. Financial autonomy among ever-partnered women, according to the women's
experience of physical and/or sexual partner violence, Viet Nam 2019 473

322
Table 3.1. Households selected and completed interviews (unweighted), Viet Nam 2019
Total Urban Rural Northern Midlands and
Mountains
Red River Delta North and South Central Coast
Central Highlands
Southeast Mekong River Delta
Number % Number % Number % Number % Number % Number % Number % Number % Number %
Total number of households in the sample 63072 100.0 25808 40.9 37264 59.1 9120
14.5 14143
22.4 12182 19.3
6355
10.1 10659
16.9 10613
16.8
Households do not qualify 10706 100.0 4339 40.5 6367 59.5 1121
10.5 3054
28.5 2029 19.0 714 6.7 1907
17.8 1881
17.6
Total number of households selected (official and reserve) 9000 100.0 3780 42.0 5220 58.0 1278
14.2 1872
20.8 1728 19.2 900
10.0 1620
18.0 1602
17.8
Total number of official households selected 6000 2520 3480 852 1248 1152 600 1080 1068
Total number of reserve households selected 3000 1260 1740 426 624 576 300 540 534 Total number of households completed interview (official and reserve) 5976 100.0 2501 41.9 3475 58.1 851
14.2 1248
20.9 1147 19.2 597
10.0 1065
17.8 1068
17.9
Total number of official households completed interview (% of selected) 4239 70.9 1718 68.7 2521 72.5 626
73.6 904
72.4 829 72.3 425
71.2 705
66.2 750
70.2
Total number of reserve households completed interview 1737 100.0 783 45.1 954 54.9 225
13.0 344
19.8 318 18.3 172 9.9 360
20.7 318
18.3

323
Table 3.2. Characteristics of all respondents and all ever-partnered respondents in the sample (unweighted and weighted), Viet Nam 2019
Urban (unweighted) Rural (unweighted) Total (unweighted) Total (weighted*)
All
respondents Ever-
Partnered All
respondents Ever-
Partnered All
respondents Ever-
Partnered All
respondents Ever-
Partnered
Numb
er % Numb
er % Numb
er % Numb
er % Numb
er % Numb
er % Numb
er % Numb
er %
Total 2501 100.
0 2303 100.
0 3475 100.
0 3250 100.
0 5976 100.
0 5553 100.
0 5976 100.
0 5415 100.
0
Division Northern Midlands and
Mountains 288 11.5 272 11.8 563 16.2 533 16.4 851 14.2 805 14.5 796 13.3 735 13.6
Red River Delta 540 21.6 504 21.9 708 20.4 652 20.1 1248 20.9 1156 20.8 1410 23.6 1273 23.5
North and South Central Coast 442 17.7 410 17.8 705 20.3 668 20.6 1147 19.2 1078 19.4 1265 21.2 1166 21.5
Central Highlands 237 9.5 222 9.6 360 10.4 339 10.4 597 10.0 561 10.1 327 5.5 301 5.6
Southeast 598 23.9 544 23.6 467 13.4 426 13.1 1065 17.8 970 17.5 972 16.3 848 15.7
Mekong River Delta 396 15.8 351 15.2 672 19.3 632 19.4 1068 17.9 983 17.7 1205 20.2 1092 20.2
Religion
No Religion 1934 77.3 1782 77.4 2691 77.4 2515 77.4 4625 77.4 4297 77.4 4669 78.1 4229 78.1
Buddhist 365 14.6 331 14.4 278 8.0 261 8.0 643 10.8 592 10.7 632 10.6 567 10.5
Catholic 163 6.5 151 6.6 343 9.9 319 9.8 506 8.5 470 8.5 495 8.3 449 8.3
Protestant 7 0.3 7 0.3 49 1.4 47 1.4 56 0.9 54 1.0 46 0.8 44 0.8
Hoa Hao Buddhist 14 0.6 14 0.6 41 1.2 38 1.2 55 0.9 52 0.9 56 0.9 53 1.0
Other 18 0.7 18 0.8 72 2.1 70 2.2 90 1.5 88 1.6 76 1.3 73 1.3
Education of respondent
No education 228.0 9.1 217 9.4 736 21.2 719 22.1 964 16.1 936 16.9 951 15.9 915 16.9
Primary 397 15.9 379 16.5 871 25.1 852 26.2 1268 21.2 1231 22.2 1284 21.5 1231 22.7

324
Lower Secondary 665 26.6 568 24.7 1112 32.0 975 30.0 1777 29.7 1543 27.8 1920 32.1 1599 29.5
Upper Secondary 575 23.0 526 22.8 503 14.5 468 14.4 1078 18.0 994 17.9 1059 17.7 952 17.6
College 129 5.2 123 5.3 83 2.4 77 2.4 212 3.5 200 3.6 195 3.3 182 3.4
University and above 495 19.8 480 20.8 159 4.6 148 4.6 654 10.9 628 11.3 542 9.1 513 9.5
Other 12 0.5 10 0.4 11 0.3 11 0.3 23 0.4 21 0.4 25 0.4 24 0.4
Ethnicity
Kinh 2287 91.4 2111 91.7 2676 77.0 2485 76.5 4963 83.0 4596 82.8 5011 83.8 4525 83.6
Tay 41 1.6 39 1.7 102 2.9 96 3.0 143 2.4 135 2.4 125 2.1 113 2.1
Thai 38 1.5 35 1.5 127 3.7 125 3.8 165 2.8 160 2.9 136 2.3 133 2.4
Muong 8 0.3 8 0.3 60 1.7 58 1.8 68 1.1 66 1.2 86 1.4 83 1.5
Khmer 46 1.8 42 1.8 69 2.0 66 2.0 115 1.9 108 1.9 130 2.2 121 2.2
Chinese 36 1.4 25 1.1 4 0.1 3 0.1 40 0.7 28 0.5 52 0.9 30 0.6
Nung 27 1.1 26 1.1 47 1.4 45 1.4 74 1.2 71 1.3 51 0.9 49 0.9
Mong 2 0.1 2 0.1 39 1.1 34 1.0 41 0.7 36 0.6 45 0.8 36 0.7
Dao 1 0.0 1 0.0 54 1.6 53 1.6 55 0.9 54 1.0 51 0.9 50 0.9
Other 15 0.6 14 0.6 295 8.5 284 8.7 310 5.2 298 5.4 288 4.8 273 5.0
Age group of respondent
15-19 147 5.9 38 1.7 210 6.0 58 1.8 357 6.0 96 1.7 501 8.4 128 2.4
20-24 129 5.2 99 4.3 203 5.8 177 5.4 332 5.6 276 5.0 380 6.4 313 5.8
25-29 258 10.3 246 10.7 367 10.6 358 11.0 625 10.5 604 10.9 588 9.8 565 10.4
30-34 340 13.6 333 14.5 479 13.8 476 14.6 819 13.7 809 14.6 706 11.8 696 12.8
35-39 396 15.8 392 17.0 471 13.6 468 14.4 867 14.5 860 15.5 748 12.5 738 13.6
40-44 346 13.8 338 14.7 432 12.4 429 13.2 778 13.0 767 13.8 733 12.3 723 13.4
45-49 323 12.9 313 13.6 476 13.7 464 14.3 799 13.4 777 14.0 795 13.3 770 14.2
50-54 320 12.8 310 13.5 417 12.0 411 12.6 737 12.3 721 13.0 760 12.7 743 13.7
55-64 242 9.7 234 10.2 420 12.1 409 12.6 662 11.1 643 11.6 764 12.8 738 13.6
Age group of respondent (the comparison 2010-2019)
15-17 110 4.4 23 1.0 166 4.8 31 1.0 276 4.6 54 1.0 386 6.5 71 1.3

325
18-24 166 6.6 114 5.0 247 7.1 204 6.3 413 6.9 318 5.7 495 8.3 371 6.8
25-29 258 10.3 246 10.7 367 10.6 358 11.0 625 10.5 604 10.9 588 9.8 565 10.4
30-34 340 13.6 333 14.5 479 13.8 476 14.6 819 13.7 809 14.6 706 11.8 696 12.8
35-39 396 15.8 392 17.0 471 13.6 468 14.4 867 14.5 860 15.5 748 12.5 738 13.6
40-44 346 13.8 338 14.7 432 12.4 429 13.2 778 13.0 767 13.8 733 12.3 723 13.4
45-49 323 12.9 313 13.6 476 13.7 464 14.3 799 13.4 777 14.0 795 13.3 770 14.2
50-54 320 12.8 310 13.5 417 12.0 411 12.6 737 12.3 721 13.0 760 12.7 743 13.7
55-60 206 8.2 199 8.6 359 10.3 350 10.8 565 9.5 549 9.9 655 11.0 632 11.7
61-64 36 1.4 35 1.5 61 1.8 59 1.8 97 1.6 94 1.7 109 1.8 106 2.0
Current Partnership status
Never partnered 198 7.9 0 0.0 224 6.4 0 0.0 422 7.1 0 0.0 560 9.4 0 0.0
Currently married 1990 79.6 1990 86.4 2925 84.2 2925 90.0 4915 82.2 4915 88.5 4705 78.7 4705 86.9
Living with man (not married) 6 0.2 6 0.3 5 0.1 5 0.2 11 0.2 11 0.2 9 0.1 9 0.2
Regular partner (dating) 78 3.1 78 3.4 56 1.6 56 1.7 134 2.2 134 2.4 152 2.5 152 2.8
Divorced/separated 136 5.4 136 5.9 118 3.4 118 3.6 254 4.3 254 4.6 287 4.8 287 5.3
Widowed 93 3.7 93 4.0 146 4.2 146 4.5 239 4.0 239 4.3 263 4.4 263 4.8
Household assets index
Lower 270 10.8 237 10.3 1099 31.6 1037 31.9 1369 22.9 1274 22.9 1315 22.0 1196 22.1
Medium 870 34.8 801 34.8 1564 45.0 1459 44.9 2434 40.7 2260 40.7 2431 40.7 2208 40.8
Higher 1361 54.4 1265 54.9 805 23.2 747 23.0 2166 36.2 2012 36.2 2220 37.1 2001 37.0
Disability status Disability 1 (the level of inclusion is at least one domain/question is coded SOME DIFFICULTY or A LOT OF DIFFICULTY or CANNOT DO AT ALL)
No difficulty (in one or more domains) 1375 55.0 1256 54.5 1637 47.1 1498 46.1 3012 50.4 2754 49.6 2962 49.6 2616 48.3
Some difficulty 987 39.5 923 40.1 1477 42.5 1412 43.4 2464 41.2 2335 42.0 2474 41.4 2301 42.5
A lot of difficulty 137 5.5 122 5.3 340 9.8 322 9.9 477 8.0 444 8.0 522 8.7 483 8.9
Cannot do at all 2 0.1 2 0.1 21 0.6 18 0.6 23 0.4 20 0.4 19 0.3 16 0.3 Disability 2 (the level of inclusion is at least 2 domains/questions are coded SOME DIFFICULTY or any 1 domain/question is coded A LOT OF DIFFICULTY or CANNOT DO AT ALL)
Without disability 1919 76.7 1764 76.6 2376 68.4 2196 67.6 4295 71.9 3960 71.3 4211 70.5 3760 69.4

326
With disability 582 23.3 539 23.4 1099 31.6 1054 32.4 1681 28.1 1593 28.7 1765 29.5 1655 30.6 Disability 3 (the level of inclusion is any 1 domain/question is coded A LOT OF DIFFICULTY or CANNOT DO AT ALL)
Without disability 2362 94.4 2179 94.6 3114 89.6 2910 89.5 5476 91.6 5089 91.6 5436 91.0 4916 90.8
With disability 139 5.6 124 5.4 361 10.4 340 10.5 500 8.4 464 8.4 540 9.0 499 9.2
* Women sampling weights have been applied to correct for differences in selection probability of households and for differences in numbers of eligible women within
households

327
Table 3.3. Characteristics of respondents in the sample (unweighted and weighted) and female population age 15-64 years in the general population (based on last population census), Viet Nam 2019
Unweighted Weighted* Census (2009)
All respondents All respondents Female population 15-64
Number % Number % Number %
Total 5976 100.0 5976 100.0 29,922,792 100.0
Urban- Rural
Urban 2501 41.9 1990 33.3 9,581,213 32.0
Rural 3475 58.1 3986 66.7 20,341,579 68.0
Division
Northern Midlands and Mountains 851 14.2 796 13.3 3,716,129 12.4
Red River Delta 1248 20.9 1410 23.6 6,881,586 23.0
North and South Central Coast 1147 19.2 1265 21.2 6,290,112 21.0
Central Highlands 597 10.0 327 5.5 1,611,394 5.4
Southeast 1065 17.8 972 16.3 5,366,849 17.9
Mekong River Delta 1068 17.9 1205 20.2 6,056,722 20.2
Religion
No Religion 4625 77.4 4669 78.1 24,414,147 81.6
Buddhist 643 10.8 632 10.6 2,471,611 8.3
Catholic 506 8.5 495 8.3 1,938,625 6.5
Protestant 56 0.9 46 0.8 221,799 0.7
Hoa Hao Buddhist 55 0.9 56 0.9 503,945 1.7
Other 90 1.5 76 1.3 372,665 1.2
Education of respondent
No education 964 16.1 951 15.9 1,520,925 5.1
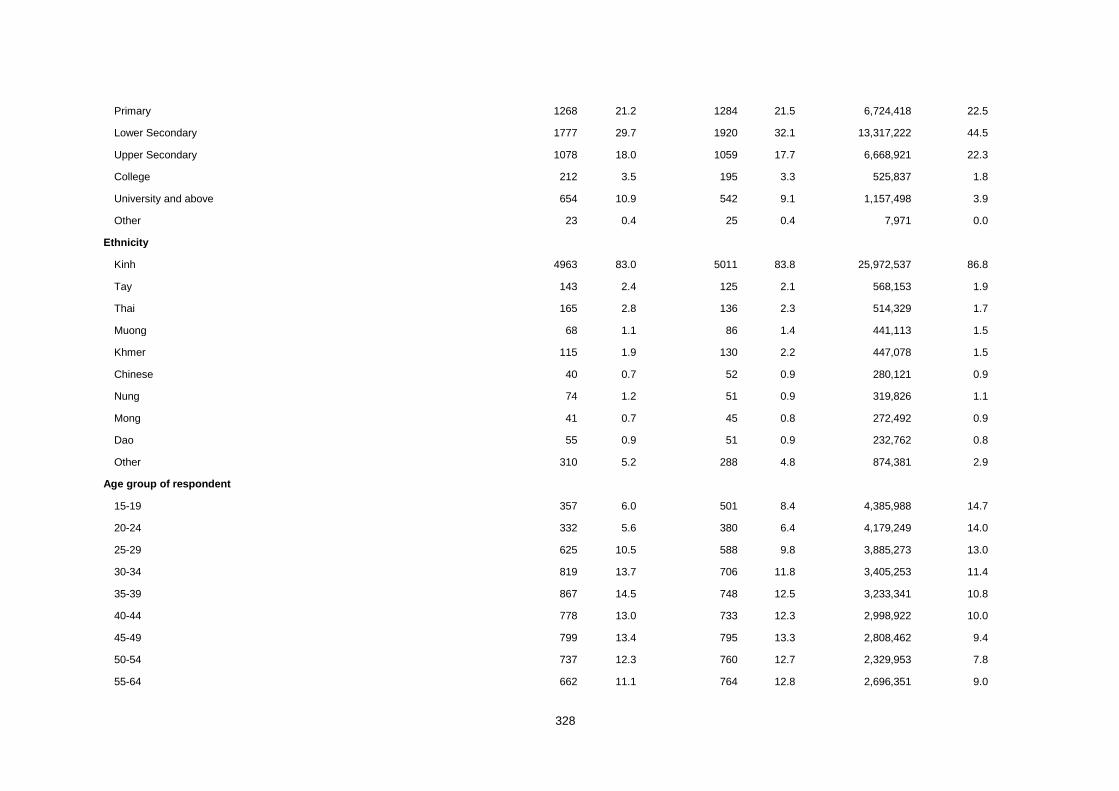
328
Primary 1268 21.2 1284 21.5 6,724,418 22.5
Lower Secondary 1777 29.7 1920 32.1 13,317,222 44.5
Upper Secondary 1078 18.0 1059 17.7 6,668,921 22.3
College 212 3.5 195 3.3 525,837 1.8
University and above 654 10.9 542 9.1 1,157,498 3.9
Other 23 0.4 25 0.4 7,971 0.0
Ethnicity
Kinh 4963 83.0 5011 83.8 25,972,537 86.8
Tay 143 2.4 125 2.1 568,153 1.9
Thai 165 2.8 136 2.3 514,329 1.7
Muong 68 1.1 86 1.4 441,113 1.5
Khmer 115 1.9 130 2.2 447,078 1.5
Chinese 40 0.7 52 0.9 280,121 0.9
Nung 74 1.2 51 0.9 319,826 1.1
Mong 41 0.7 45 0.8 272,492 0.9
Dao 55 0.9 51 0.9 232,762 0.8
Other 310 5.2 288 4.8 874,381 2.9
Age group of respondent
15-19 357 6.0 501 8.4 4,385,988 14.7
20-24 332 5.6 380 6.4 4,179,249 14.0
25-29 625 10.5 588 9.8 3,885,273 13.0
30-34 819 13.7 706 11.8 3,405,253 11.4
35-39 867 14.5 748 12.5 3,233,341 10.8
40-44 778 13.0 733 12.3 2,998,922 10.0
45-49 799 13.4 795 13.3 2,808,462 9.4
50-54 737 12.3 760 12.7 2,329,953 7.8
55-64 662 11.1 764 12.8 2,696,351 9.0

329
Age group of respondent (the comparison 2010-2019)
15-17 276 4.6 386 6.5 2,555,118 8.5
18-24 413 6.9 495 8.3 6,010,119 20.1
25-29 625 10.5 588 9.8 3,885,273 13.0
30-34 819 13.7 706 11.8 3,405,253 11.4
35-39 867 14.5 748 12.5 3,233,341 10.8
40-44 778 13.0 733 12.3 2,998,922 10.0
45-49 799 13.4 795 13.3 2,808,462 9.4
50-54 737 12.3 760 12.7 2,329,953 7.8
55-60 565 9.5 655 11.0 1,882,841 6.3
61-64 97 1.6 109 1.8 813,510 2.7
Current Partnership status
Never partnered 422 7.1 560 9.4 na na
Currently married 4915 82.2 4705 78.7 na na
Living with man (not married) 11 0.2 9 0.1 na na
Regular partner (dating) 134 2.2 152 2.5 na na
Divorced/separated 254 4.3 287 4.8 na na
Widowed 239 4.0 263 4.4 na na
Household assets index
Lower 1369 22.9 1315 22.0 na na
Medium 2434 40.7 2431 40.7 na na
Higher 2166 36.2 2220 37.1 na na
Disability status
No difficulty (in one or more domains) 3012 50.4 2962 49.6 na na
Some difficulty 2464 41.2 2474 41.4 na na
A lot of difficulty 477 8.0 522 8.7 na na

330
Cannot do at all 23 0.4 19 0.3 na na
Disability 2 (the level of inclusion is at least 2 domains/questions are coded SOME DIFFICULTY or any 1 domain/question is coded A LOT OF DIFFICULTY or CANNOT DO AT ALL)
Without disability 4295 71.9 4211 70.5 na na
With disability 1681 28.1 1765 29.5 na na
Disability 3 (the level of inclusion is any 1 domain/question is coded A LOT OF DIFFICULTY or CANNOT DO AT ALL)
Without disability 5476 91.6 5436 91.0 na na
With disability 500 8.4 540 9.0 na na
* Women sampling weights have been applied to correct for differences in selection probability of households and for differences in numbers of eligible women within households
na: not available

331
Table 3.4. Prevalence of partner violence, unweighted and weighted, Viet Nam 2019
Prevalence unweighted
Prevalence weighted using households sampling
weights* Prevalence, weighted using women sampling weights**
Type of partner violence % 95% CI % 95% CI % 95% CI
Lifetime physical violence 26.5 25.
3 - 27.
7 26.3 25.
1 - 27.
5 26.1 24.9 - 27.
3
Current physical violence 4.7 4.2 - 5.3 4.7 4.2 - 5.3 4.6 4.1 - 5.2
Lifetime sexual violence 12.5 11.
6 - 13.
4 13.3 12.
4 - 14.
2 13.3 12.3 - 14.
2
Current sexual violence 5.5 4.9 - 6.1 6.0 5.4 - 6.6 5.7 5.1 - 6.3
Lifetime physical and/or sexual violence 32.3 31.
0 - 33.
5 32.3 31.
0 - 33.
5 32.0 30.8 - 33.
3
Current physical and/or sexual violence 8.8 8.1 - 9.6 9.2 8.4 - 9.9 8.9 8.2 - 9.7
Lifetime emotional violence 46.0 44.
6 - 47.
3 47.5 46.
2 - 48.
9 47.0 45.6 - 48.
3
Current emotional violence 19.2 18.
1 - 20.
3 19.9 18.
8 - 21.
0 19.3 18.3 - 20.
4
* Household sampling weights have been applied to correct for differences in selection probability of households
** Women sampling weights have been applied to correct for differences in selection probability of households and for differences in numbers of eligible women within households.

332
Table 3.5. Women's satisfaction upon completion of interview, according to experience of partner violence, Viet Nam 2019
By experience of partner violence
All ever-partnered
respondents (%)
(n=5553) No violence
(%) (n=3757)
Only sexual violence
(%) (n=320)
Only physical violence
(%) (n=1095)
Both physical and sexual
violence (%)
(n=376)
The interview made you feel..
Good/better 63.1 59.6 68.4 68.4 78.4
Same/ no difference 36.3 40.2 31.5 30.4 20.1
Worse 0.5 0.2 0.1 1.1 1.6
Not stated 0.1 0.0 0.0 0.1 0.0
Agreed to be contacted again
Yes 95.7 95.6 96.4 95.5 97.5
No 4.2 4.4 3.6 4.4 2.5
Not stated 0.1 0.0 0.0 0.1 0.0
* The percentages are based on weighted analysis and all numbers are unweighted.

333
Table 3.6. Proportion of women owning certain assets, either by herself or with someone else, as reported in the survey (N=5976), Viet Nam 2019
Yes, own by herself
(%)
Yes, own with others
(%)
No, don't own (%)
Land 14.4 38.6 47.0
House 14.7 50.3 35.0
Company or bussiness 0.5 1.7 97.8 Large animals (cows, horses, etc.) 2.9 11.3 85.8 Small animals (chickens, pigs, goats, etc.) 9.1 28.0 62.9 Crops from certain fields or trees 7.7 31.5 60.9
Large household items (TV, bed, cooker) 18.9 66.2 15.0 Jewellery, gold or other valuables 44.6 14.3 41.0
Motor car 35.5 42.5 22.0
Savings in the bank 9.9 9.4 80.7
Other property 1.5 1.3 97.1
* The percentages are based on weighted analysis and all numbers are unweighted.
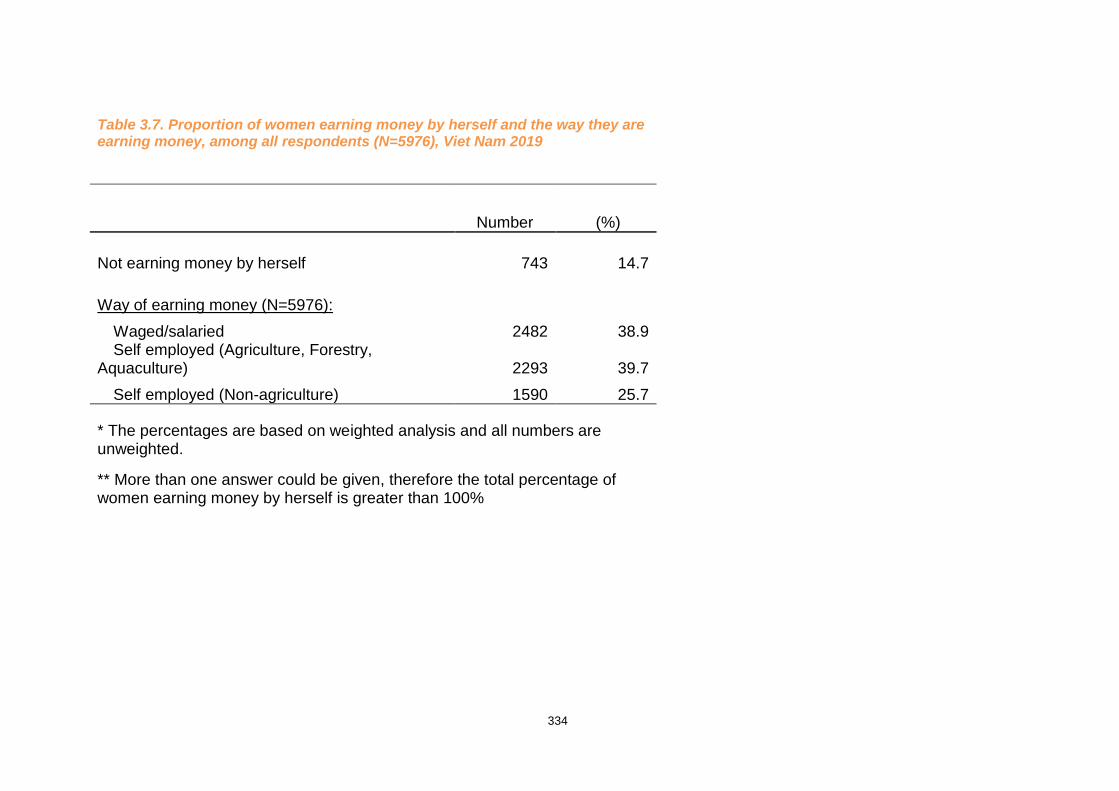
334
Table 3.7. Proportion of women earning money by herself and the way they are earning money, among all respondents (N=5976), Viet Nam 2019
Number (%)
Not earning money by herself 743 14.7
Way of earning money (N=5976):
Waged/salaried 2482 38.9 Self employed (Agriculture, Forestry,
Aquaculture) 2293 39.7
Self employed (Non-agriculture) 1590 25.7
* The percentages are based on weighted analysis and all numbers are unweighted.
** More than one answer could be given, therefore the total percentage of women earning money by herself is greater than 100%
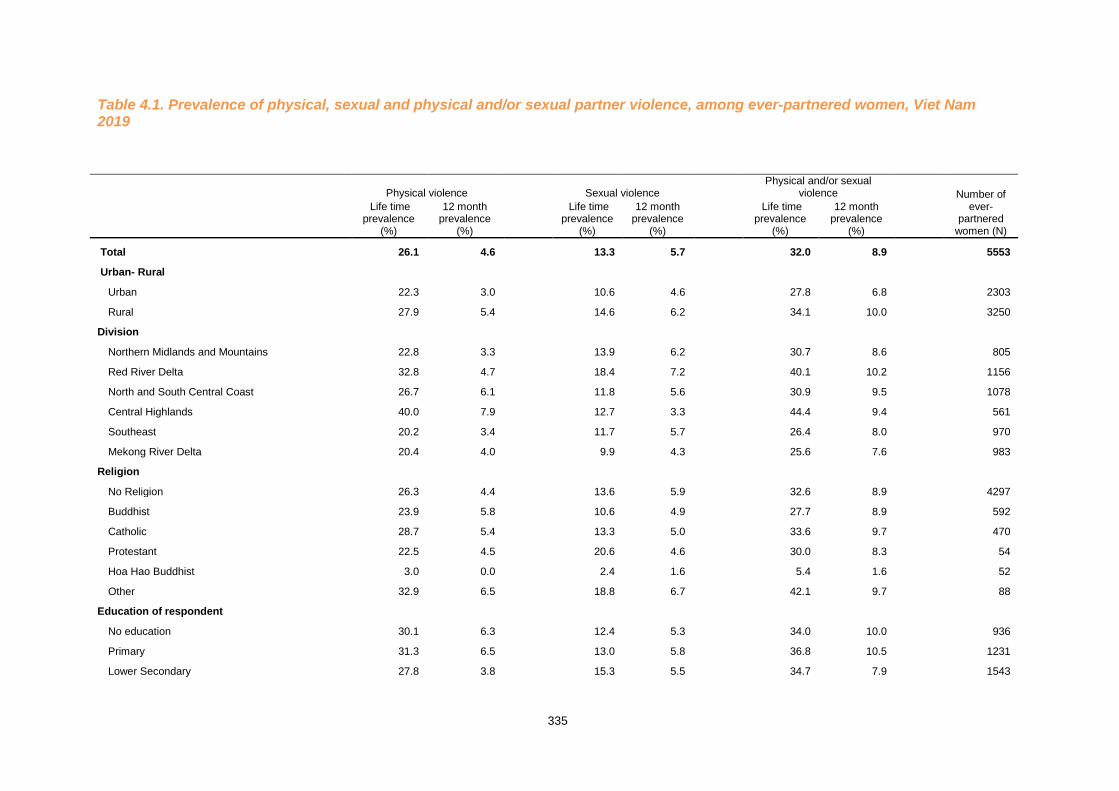
335
Table 4.1. Prevalence of physical, sexual and physical and/or sexual partner violence, among ever-partnered women, Viet Nam 2019
Physical violence Sexual violence Physical and/or sexual
violence Number of ever-
partnered women (N)
Life time prevalence
(%)
12 month prevalence
(%)
Life time prevalence
(%)
12 month prevalence
(%)
Life time prevalence
(%)
12 month prevalence
(%)
Total 26.1 4.6 13.3 5.7 32.0 8.9 5553
Urban- Rural
Urban 22.3 3.0 10.6 4.6 27.8 6.8 2303
Rural 27.9 5.4 14.6 6.2 34.1 10.0 3250
Division
Northern Midlands and Mountains 22.8 3.3 13.9 6.2 30.7 8.6 805
Red River Delta 32.8 4.7 18.4 7.2 40.1 10.2 1156
North and South Central Coast 26.7 6.1 11.8 5.6 30.9 9.5 1078
Central Highlands 40.0 7.9 12.7 3.3 44.4 9.4 561
Southeast 20.2 3.4 11.7 5.7 26.4 8.0 970
Mekong River Delta 20.4 4.0 9.9 4.3 25.6 7.6 983
Religion
No Religion 26.3 4.4 13.6 5.9 32.6 8.9 4297
Buddhist 23.9 5.8 10.6 4.9 27.7 8.9 592
Catholic 28.7 5.4 13.3 5.0 33.6 9.7 470
Protestant 22.5 4.5 20.6 4.6 30.0 8.3 54
Hoa Hao Buddhist 3.0 0.0 2.4 1.6 5.4 1.6 52
Other 32.9 6.5 18.8 6.7 42.1 9.7 88
Education of respondent
No education 30.1 6.3 12.4 5.3 34.0 10.0 936
Primary 31.3 6.5 13.0 5.8 36.8 10.5 1231
Lower Secondary 27.8 3.8 15.3 5.5 34.7 7.9 1543

336
Upper Secondary 21.3 3.7 13.0 6.9 27.5 9.4 994
College 17.7 3.9 12.4 7.0 23.9 8.7 200
University and above 12.3 1.3 10.4 4.3 19.8 4.9 628
Other (36.7) (19.2) (1.9) (1.9) (36.7) (21.1) 21
Ethnicity
Kinh 26.6 4.1 13.4 5.5 32.7 8.3 4596
Tay 16.0 6.3 11.7 5.7 24.6 10.7 135
Thai 15.4 2.2 4.0 2.7 17.4 4.9 160
Muong 17.9 3.0 7.1 3.9 20.3 4.9 66
Khmer 12.5 4.1 4.3 3.1 14.6 5.9 108
Chinese 30.4 8.1 12.6 8.1 30.4 8.1 28
Nung 24.1 9.6 23.8 17.3 42.8 25.8 71
Mong 10.2 4.8 5.1 0.0 12.1 4.8 36
Dao 15.7 3.9 15.8 12.0 24.6 13.9 54
Other 38.6 13.7 19.9 8.7 45.0 19.6 298
Age group of respondent
15-19 4.2 2.4 5.9 5.9 7.9 7.0 96
20-24 15.4 4.7 15.2 7.4 23.2 9.5 276
25-29 19.0 6.5 10.4 7.1 24.9 12.0 604
30-34 24.1 5.9 13.5 8.3 30.4 12.1 809
35-39 26.2 4.2 11.4 5.7 31.6 8.5 860
40-44 30.6 5.0 12.6 6.1 35.7 9.8 767
45-49 29.1 4.2 15.9 4.6 36.0 7.6 777
50-54 30.5 4.2 13.8 4.7 37.2 7.6 721
55-64 29.3 3.5 14.7 3.0 34.3 6.2 643
Age group of respondent (for comparison to 2010)
15-17 1.3 0.0 5.1 5.1 6.4 5.1 54
18-24 14.2 4.8 13.9 7.3 21.1 9.5 318
25-29 19.0 6.5 10.4 7.1 24.9 12.0 604
30-34 24.1 5.9 13.5 8.3 30.4 12.1 809

337
35-39 26.2 4.2 11.4 5.7 31.6 8.5 860
40-44 30.6 5.0 12.6 6.1 35.7 9.8 767
45-49 29.1 4.2 15.9 4.6 36.0 7.6 777
50-54 30.5 4.2 13.8 4.7 37.2 7.6 721
55-60 29.7 4.0 14.0 2.4 35.2 6.0 549
61-64 26.7 0.8 18.6 7.1 29.0 7.1 94
Household assets index
Lower 29.0 8.2 13.0 6.4 34.2 12.7 1274
Medium 25.2 3.4 11.9 5.2 30.9 7.4 2260
Higher 25.2 3.9 14.8 5.7 31.9 8.4 2012
Disability status
Disability 1 (the level of inclusion is at least one domain/question is coded SOME DIFFICULTY or A LOT OF DIFFICULTY or CANNOT DO AT ALL)
No difficulty (in one or more domains) 21.7 3.7 10.0 4.0 27.0 6.8 2754
Some difficulty 29.5 5.4 15.5 7.6 36.3 11.1 2335
A lot of difficulty 33.9 6.3 20.4 6.0 39.7 10.5 444
Cannot do at all (6.9) (0.0) (0.0) (0.0) (6.9) (0.0) 20
Disability 2 (the level of inclusion is at least 2 domains/questions are coded SOME DIFFICULTY or any 1 domain/question is coded A LOT OF DIFFICULTY or CANNOT DO AT ALL)
Without disability 23.3 4.1 12.0 5.5 29.4 8.3 3960
With disability 32.2 6.0 16.1 6.0 37.9 10.4 1593
Disability 3 (the level of inclusion is any 1 domain/question is coded A LOT OF DIFFICULTY or CANNOT DO AT ALL)
Without disability 25.3 4.5 12.6 5.7 31.3 8.8 5089
With disability 33.0 6.1 19.8 5.8 38.7 10.1 464
Current Partnership status
Currently married 26.3 4.9 13.4 6.4 32.5 9.7 4915
Living with man (not married) (33.5) (3.7) (8.7) (0.0) (33.5) (3.7) 11
Regular partner (dating) 6.2 2.8 7.8 1.7 13.2 4.5 134
Divorced/separated 27.7 3.7 13.5 1.6 31.6 3.7 254
Widowed 31.3 3.0 13.6 0.0 35.5 3.0 239

338
Employment status
Not earning money by herself 23.7 4.4 13.8 5.7 27.8 8.8 743
Waged/salaried 23.0 4.0 13.1 5.5 29.2 8.2 2177 Self employed (Agriculture, Forestry,
Aquaculture) 30.3 6.4 14.4 6.7 37.0 11.2 1707
Self employed (Non agriculture) 26.0 3.3 11.6 4.5 31.3 7.0 1350
* The percentages are based on weighted analysis and all numbers are unweighted.
(xx) Percentages in parentheses are based on fewer than 25 unweighted cases

339
Table 4.2. Prevalence of specific acts of physical violence by husbands/partners, among ever-partnered women, Viet Nam 2019
Urban (N=2303) Rural (N=3250) Total (N=5553)
Ever
happened (%)
During past 12 months
(%) Ever
happened (%)
During past 12 months
(%) Ever
happened (%)
During past 12 months
(%)
Slapped, threw something 19.7 2.6 25.2 4.1 23.4 3.6
Pushed or shoved 7.2 1.4 8.6 2.8 8.1 2.3
Hit with a fist or something else 5.3 0.7 7.7 2.2 6.9 1.7
Kicked, dragged, beat 2.7 0.3 5.3 1.2 4.4 0.9
Choked or burnt on purpose 1.8 0.1 2.5 0.8 2.3 0.6 Threatened with or used a gun, knife or weapon 1.6 0.2 2.3 0.7 2.1 0.5
At least one act of physical violence 22.3 3.0 27.9 5.4 26.1 4.6
* The percentages are based on weighted analysis and all numbers are unweighted.

340
Table 4.3. Lifetime prevalence of physical partner violence, by severity, among ever-partnered women, Viet Nam 2019
Moderate physical violence
(%)
Severe physical violence
(%)
Number of ever-partnered women
(N)
Total 14.8 11.2 5553
Urban- Rural
Urban 13.1 9.2 2303
Rural 15.7 12.2 3250
Division
Northern Midlands and Mountains 15.4 7.4 805
Red River Delta 20.3 12.5 1156
North and South Central Coast 12.9 13.8 1078
Central Highlands 19.1 20.9 561
Southeast 11.5 8.7 970
Mekong River Delta 11.5 8.9 983
Religion
No Religion 15.5 10.8 4297
Buddhist 11.6 12.3 592
Catholic 14.7 14.0 470
Protestant 12.9 9.7 54
Hoa Hao Buddhist 1.2 1.8 52
Other 14.8 18.1 88
Education of respondent
No education 15.3 14.7 936
Primary 16.7 14.7 1231
Lower Secondary 15.7 12.1 1543

341
Upper Secondary 13.5 7.8 994
College 12.9 4.8 200
University and above 9.3 3.0 628
Other (28.4
) (8.3
) 21
Ethnicity
Kinh 15.3 11.3 4596
Tay 5.6 10.4 135
Thai 11.6 3.8 160
Muong 9.9 8.0 66
Khmer 6.2 6.3 108
Chinese 17.1 13.3 28
Nung 16.1 8.0 71
Mong 3.1 7.1 36
Dao 13.8 1.9 54
Other 19.2 19.4 298
Age group of respondent
15-19 1.1 3.1 96
20-24 9.7 5.7 276
25-29 13.4 5.6 604
30-34 13.5 10.6 809
35-39 16.1 10.1 860
40-44 17.9 12.7 767
45-49 17.8 11.4 777
50-54 15.3 15.3 721
55-64 14.0 15.3 643
Age group of respondent (for comparison to 2010)
15-17 0.0 1.3 54
18-24 8.6 5.7 318
25-29 13.4 5.6 604

342
30-34 13.5 10.6 809
35-39 16.1 10.1 860
40-44 17.9 12.7 767
45-49 17.8 11.4 777
50-54 15.3 15.3 721
55-60 14.4 15.3 549
61-64 11.2 15.6 94
Household assets index
Lower 15.1 13.9 1274
Medium 13.8 11.4 2260
Higher 15.7 9.5 2012
Disability status
Disability 1 (the level of inclusion is at least one domain/question is coded SOME DIFFICULTY or A LOT OF DIFFICULTY or CANNOT DO AT ALL)
No difficulty (in one or more domains) 13.7 8.0 2754
Some difficulty 16.1 13.4 2335
A lot of difficulty 15.3 18.6 444
Cannot do at all (6.9) (0.0) 20
Disability 2 (the level of inclusion is at least 2 domains/questions are coded SOME DIFFICULTY or any 1 domain/question is coded A LOT OF DIFFICULTY or CANNOT DO AT ALL)
Without disability 14.1 9.2 3960
With disability 16.4 15.8 1593 Disability 3 (the level of inclusion is any 1 domain/question is coded A LOT OF DIFFICULTY or CANNOT DO AT ALL)
Without disability 14.8 10.5 5089
With disability 15.0 18.0 464
* The percentages are based on weighted analysis and all numbers are unweighted. (xx) Percentages in parentheses are based on fewer than 25 unweighted cases

343
Table 4.4. Prevalence of specific acts of physical violence by husbands/partners in the past 12 months, and frequency distribution of number of times the acts happened, Viet Nam 2019
Urban (N=2303) Rural (N=3250) Total (N=5553)
Happened in past 12 months
(%) One time (%)
Few times (%)
Many times (%)
Happened in past 12 months
(%) One time (%)
Few times (%)
Many times (%)
Happened in past 12 months
(%) One time (%)
Few times (%)
Many times (%)
Slapped you or thrown something 2.6 37.7 47.3 15.0 4.1 33.2 48.8 18.0 3.6 34.2 48.5 17.3 Pushed you or shoved you 1.4 24.5 65.4 10.2 2.8 10.4 70.5 19.1 2.3 13.8 69.3 17.0 Hit you with his fist or with something else 0.7 (28.0) (65.2) (6.8) 2.2 23.2 48.6 28.2 1.7 23.9 50.9 25.2 Kicked or dragged you 0.3 (17.6) (72.3) (10.1) 1.2 27.0 51.9 21.2 0.9 26.0 53.9 20.0 Choked or burnt you 0.1 (18.5) (81.5) (0.0) 0.8 35.1 36.7 28.2 0.6 33.9 40.1 26.0 Threatened with or used weapon 0.2 (20.3) (79.7) (0.0) 0.7 (38.7) (40.2)
(21.1) 0.5 (35.6)
(46.9) (17.5)
* The percentages are based on weighted analysis and all numbers are unweighted. (xx) Percentages in parentheses are based on fewer than 25 unweighted cases

344
Table 4.5. Proportion of women who reported physical violence in pregnancy, among ever-pregnant women, Viet Nam 2019
Experienced violence during
pregnancy (%)
Number of ever-pregnant women
(N)
Total 3.4 5236
Urban- Rural
Urban 2.5 2133
Rural 3.8 3103
Division Northern Midlands and
Mountains 2.4 774
Red River Delta 4.4 1110
North and South Central Coast 3.8 1026
Central Highlands 6.9 528
Southeast 2.4 867
Mekong River Delta 2.1 931
Religion
No Religion 3.2 4056
Buddhist 3.4 563
Catholic 5.5 434
Protestant 0.0 48
Hoa Hao Buddhist 0.0 52
Other 1.5 83
Education of respondent
No education 3.9 916

345
Primary 4.2 1189
Lower Secondary 3.9 1454
Upper Secondary 2.0 910
College 2.5 175
University and above 1.4 573
Other (0.0
) 19
Ethnicity
Kinh 3.5 4338
Tay 0.6 127
Thai 0.0 155
Muong 0.0 62
Khmer 1.7 103
Chinese 0.0 25
Nung 6.0 65
Mong 3.7 33
Dao 2.2 50
Other 5.5 277
Age group of respondent
15-19 (0.0
) 21
20-24 5.1 187
25-29 3.0 547
30-34 2.5 787
35-39 2.9 846
40-44 3.0 755
45-49 3.8 761
50-54 2.5 703
55-64 5.1 629
Age group of respondent (for comparison to 2010)

346
15-17 (0.0
) 8
18-24 4.7 200
25-29 3.0 547
30-34 2.5 787
35-39 2.9 846
40-44 3.0 755
45-49 3.8 761
50-54 2.5 703
55-60 5.2 538
61-64 4.5 91
Household assets index
Lower 4.5 1194
Medium 3.2 2130
Higher 2.8 1905
Disability status Disability 1 (the level of inclusion is at least one domain/question is coded SOME DIFFICULTY or A LOT OF DIFFICULTY or CANNOT DO AT ALL)
No difficulty (in one or more domains)
1.9 2556
Some difficulty 4.7 2229
A lot of difficulty 4.8 431
Cannot do at all (0.0) 20
Disability 2 (the level of inclusion is at least 2 domains/questions are coded SOME DIFFICULTY or any 1 domain/question is coded A LOT OF DIFFICULTY or CANNOT DO AT ALL)
Without disability 2.9 3701
With disability 4.4 1535

347
Disability 3 (the level of inclusion is any 1 domain/question is coded A LOT OF DIFFICULTY or CANNOT DO AT ALL)
Without disability 3.2 4785
With disability 4.6 451
* The percentages are based on weighted analysis and all numbers are unweighted. (xx) Percentages in parentheses are based on fewer than 25 unweighted cases

348
Table 4.6. Characteristics of violence during pregnancy, among ever-pregnant women, Viet Nam 2019
Ever pregnant women Women ever beaten during a pregnancy Women beaten during pregnancy by the same person as
before the pregnancy
Ever beaten during a
pregnancy (%)
Total no. of ever
pregnant women
(N)
Punched or kiched in abdomen
(%)
Beaten in most recent
pregnancy by father of child
(%)
Living with person who
beat her while pregnant
(%)
Beaten by same person as before the pregnancy
(%)
Total no. of women ever
beaten in pregnancy
(N)
Beating got worse during pregnancy
(%)
Beating stayed the
same (%)
Beating got less (%)
Total no. of women beaten by the same person
before the pregnancy
(N)
Total 3.4 5236 18.2 97.9 92.3 81.7 186 11.8 21.4 65.3 156
Urban- Rural
Urban 2.5 2133 20.8 95.5 77.8 81.9 59 13.9 27.0 59.1 49
Rural 3.8 3103 17.5 98.6 96.8 81.6 127 11.2 19.7 67.2 107
Division
Northern Midlands and Mountains 2.4 774 (6.0) (100.0) (94.0) (77.9) 20 (14.5) (18.4) (67.1) 17
Red River Delta 4.4 1110 18.2 93.4 97.1 81.6 43 5.1 17.9 72.5 35
North and South Central Coast 3.8 1026 16.4 100.0 94.8 80.0 43 7.7 29.8 62.6 38
Central Highlands 6.9 528 12.7 98.8 93.4 81.0 38 6.4 35.9 57.7 31
Southeast 2.4 867 (38.0) (96.1) (59.4) (79.5) 21 (29.1) (5.9) (65.0) 16
Mekong River Delta 2.1 931 (20.5) (100.0) (100.0) (90.4) 21 (24.6) (16.8) (58.7) 19
Religion
No Religion 3.2 4056 17.9 97.0 92.9 78.9 142 12.3 23.7 62.1 116
Buddhist 3.4 563 (13.4) (100.0) (100.0) (90.0) 21 (0.0) (18.9) (81.1) 18
Catholic 5.5 434 (25.4) (100.0) (81.5) (89.8) 20 (16.6) (13.8) (69.6) 19
Protestant 0.0 48 (0.0) (0.0) (0.0) (0.0) 1 (0.0) (0.0) (0.0) 1
Hoa Hao Buddhist 0.0 52 (0.0) (0.0) (0.0) (0.0) 0 (0.0) (0.0) (0.0) 0
Other 1.5 83 (0.0) (100.0) (100.0) (100.0) 2 (66.4) (0.0) (33.6) 2
Education of respondent

349
No education 3.9 916 17.6 100.0 95.3 83.1 50 8.6 23.0 68.5 46
Primary 4.2 1189 20.7 96.9 86.4 88.7 49 11.3 13.0 75.7 41
Lower Secondary 3.9 1454 14.9 95.4 93.9 76.5 52 12.0 26.1 61.9 42
Upper Secondary 2.0 910 (25.3) (100.0) (100.0) (83.4) 21 (11.0) (27.9) (47.0) 17
College 2.5 175 (0.0) (100.0) (71.8) (71.8) 3 (74.7) (25.3) (0.0) 2
University and above 1.4 573 (26.1) (96.5) (100.0) (67.9) 11 (0.0) (25.0) (75.0) 8
Other (0.0) 19 (0.0) (0.0) (0.0) (0.0) 0 (0.0) (0.0) (0.0) 0
Ethnicity
Kinh 3.5 4338 18.6 97.6 91.2 79.9 149 12.1 22.4 63.9 122
Tay 0.6 127 (0.0) (100.0) (100.0) (100.0) 2 (100.0) (0.0) (0.0) 2
Thai 0.0 155 (0.0) (0.0) (0.0) (0.0) 1 (0.0) (0.0) (0.0) 1
Muong 0.0 62 (0.0) (0.0) (0.0) (0.0) 0 (0.0) (0.0) (0.0) 0
Khmer 1.7 103 (0.0) (100.0) (100.0) (100.0) 3 (0.0) (32.8 (67.2) 3
Chinese 0.0 25 (0.0) (0.0) (0.0) (0.0) 0 (0.0) (0.0) (0.0) 0
Nung 6.0 65 (14.2) (100.0) (100.0) (100.0) 6 (0.0) (36.1) (63.9) 6
Mong 3.7 33 (0.0) (100.0) (100.0) (100.0) 1 (0.0) (0.0) (100.0) 1
Dao 2.2 50 (79.8) (100.0) (100.0) (100.0) 2 (0.0) (79.8) (20.2) 2
Other 5.5 277 (15.8) (100.0) (100.0) (90.4) 22 (12.1) (6.1) (81.8) 19
Age group of respondent
15-19 (0.0) 21 (0.0) (0.0) (0.0) (0.0) 1 (0.0) (0.0) (0.0) 1
20-24 5.1 187 (0.0) (100.0) (100.0) (44.0) 6 (9.7) (0.0) (90.3) 4
25-29 3.0 547 (10.1) (100.0) (100.0) (78.9) 21 (17.5) (31.4) (51.2) 17
30-34 2.5 787 (16.1) (100.0) (97.3) (91.1) 23 (14.1) (4.4) (82.4) 21
35-39 2.9 846 3.2 96.8 91.7 76.6 28 (12.6) (13.4) (74.0) 21
40-44 3.0 755 9.1 99.0 95.4 79.6 30 (13.4) (33.6) (53.0) 24
45-49 3.8 761 6.7 102.9 93.1 91.2 34 11.2 22.5 66.3 33
50-54 2.5 703 (23.2) (80.5) (88.5) (63.3) 21 (9.5) (25.3) (65.1) 16
55-64 5.1 629 (48.5) (100.0) (84.7) (95.0) 22 (9.4) (24.2) (60.7) 19 Household assets index

350
Lower 4.5 1194 24.1 100.0 92.9 84.3 64 12.8 25.8 61.4 54
Medium 3.2 2130 14.6 97.2 94.1 80.5 72 18.2 19.5 62.4 61
Higher 2.8 1905 17.3 96.6 89.6 80.7 50 2.8 19.5 73.0 41
Disability status
Disability 1 (the level of inclusion is at least one domain/question is coded SOME DIFFICULTY or A LOT OF DIFFICULTY or CANNOT DO AT ALL) No difficulty (in one or
more domains) 1.9 2556 8.6 99.5 89.5 82.0 58 9.2 12.6 78.2 47
Some difficulty 4.7 2229 19.6 99.3 93.3 81.8 105 14.5 24.1 59.0 89
A lot of difficulty 4.8 431 (32.0) (87.9) (94.0) (80.6) 23 (4.8) (27.4) (67.8) 20
Cannot do at all (0.0) 20 (0.0) (0.0) (0.0) (0.0) 0 (0.0) (0.0) (0.0) 0
Disability 2 (the level of inclusion is at least 2 domains/questions are coded SOME DIFFICULTY or any 1 domain/question is coded A LOT OF DIFFICULTY or CANNOT DO AT ALL)
Without disability 2.9 3701 12.3 99.1 87.9 75.0 108 13.3 15.1 71.6 85
With disability 4.4 1535 26.4 95.0 97.5 89.9 78 10.1 28.8 58.1 71
Disability 3 (the level of inclusion is any 1 domain/question is coded A LOT OF DIFFICULTY or CANNOT DO AT ALL)
Without disability 3.2 4785 16.1 98.8 91.6 81.4 163 12.9 20.5 64.9 136
With disability 4.6 451 (32.0) (87.9) (94.0) (80.6) 23 (4.8) (27.4) (67.8) 20
* The percentages are based on weighted analysis and all numbers are unweighted.
(xx) Percentages in parentheses are based on fewer than 25 unweighted cases

351
Table 4.7. Prevalence of specific acts of sexual violence by husbands/partners among ever-partnered women, Viet Nam 2019
Urban (N=2303) Rural (N=3250) Total (N=5553)
Ever happened
(%)
During past 12 months
(%)
Ever happened
(%)
During past 12 months
(%)
Ever happened
(%)
During past 12 months
(%)
Forced to have sexual intercourse when she did not want to
7.3 3.2 10.7 4.4 9.6 4.0
Had sexual intercourse she did not want to because she was afraid of what your partner might do
6.0 2.5 8.6 3.9 7.8 3.4
Forced to perform degrading or humiliating sexual act
0.9 0.2 1.3 0.5 1.2 0.4
At least one act of sexual violence 10.6 4.6 14.6 6.2 13.3 5.7
* The percentages are based on weighted analysis and all numbers are unweighted.

352
Table 4.8. Prevalence of specific acts of sexual violence by husbands/partners in the past 12 months, and frequency distribution of number of times the acts happened, Viet Nam 2019
Urban (N=2303) Rural (N=3250) Total (N=5553)
Happened in past 12 months
(%) One time
(%)
Few times (%)
Many times (%)
Happened in
past 12 months
(%) One time
(%)
Few times (%)
Many times (%)
Happened in past 12 months
(%) One time
(%)
Few times (%)
Many times (%)
Forced to have sexual intercourse when she did not want to
3.2 3.6 83.8 12.6 4.4 15.5 66.9 17.6 4.0 12.4 71.3 16.3
Had sexual intercourse she did not want to because she was afraid of what your partner might do
2.5 15.1 75.2 9.6 3.9 11.1 76.9 11.9 3.4 12.1 76.5 11.4
Forced to perform degrading or humiliating sexual act
0.2 (0.0) (89.1) (10.9) 0.5 (17.7) (65.5) (16.8) 0.4 (14.4) (69.9) (15.7)
* The percentages are based on weighted analysis and all numbers are unweighted (xx) Percentages in parentheses are based on fewer than 25 unweighted cases

353
Table 4.9. Prevalence of emotional partner violence, among ever-partnered women, Viet Nam 2019
Lifetime prevalence
(%)
12 months prevalence
(%)
Number of ever partnered women
(N)
Total 47.0 19.3 5553
Urban- Rural
Urban 41.4 16.0 2303
Rural 49.7 20.9 3250
Division
Northern Midlands and Mountains 40.9 16.4 805
Red River Delta 66.9 27.5 1156
North and South Central Coast 51.9 21.8 1078
Central Highlands 56.4 24.0 561
Southeast 30.0 10.8 970
Mekong River Delta 33.2 14.4 983
Religion
No Religion 49.3 20.5 4297
Buddhist 37.8 12.9 592
Catholic 44.6 19.5 470
Protestant 31.1 12.8 54
Hoa Hao Buddhist 5.8 5.8 52
Other 39.8 13.3 88
Education of respondent
No education 43.5 18.6 936
Primary 46.5 20.1 1231
Lower Secondary 54.2 20.0 1543
Upper Secondary 43.7 18.8 994
College 42.7 17.8 200

354
University and above 39.8 18.0 628
Other (37.4) (25.9
) 21
Ethnicity
Kinh 47.7 19.2 4596
Tay 38.5 7.5 135
Thai 42.0 17.2 160
Muong 35.2 18.8 66
Khmer 40.3 10.0 108
Chinese 35.0 9.4 28
Nung 56.3 34.9 71
Mong 21.9 5.8 36
Dao 30.5 26.4 54
Other 53.0 30.5 298
Age group of respondent
15-19 22.5 12.9 96
20-24 35.1 22.3 276
25-29 44.0 26.2 604
30-34 47.2 23.9 809
35-39 47.3 19.5 860
40-44 47.2 21.8 767
45-49 51.5 16.9 777
50-54 50.6 14.5 721
55-64 49.5 14.4 643
Age group of respondent (for comparison to 2010)
15-17 18.7 12.2 54
18-24 33.9 21.0 318
25-29 44.0 26.2 604
30-34 47.2 23.9 809
35-39 47.3 19.5 860
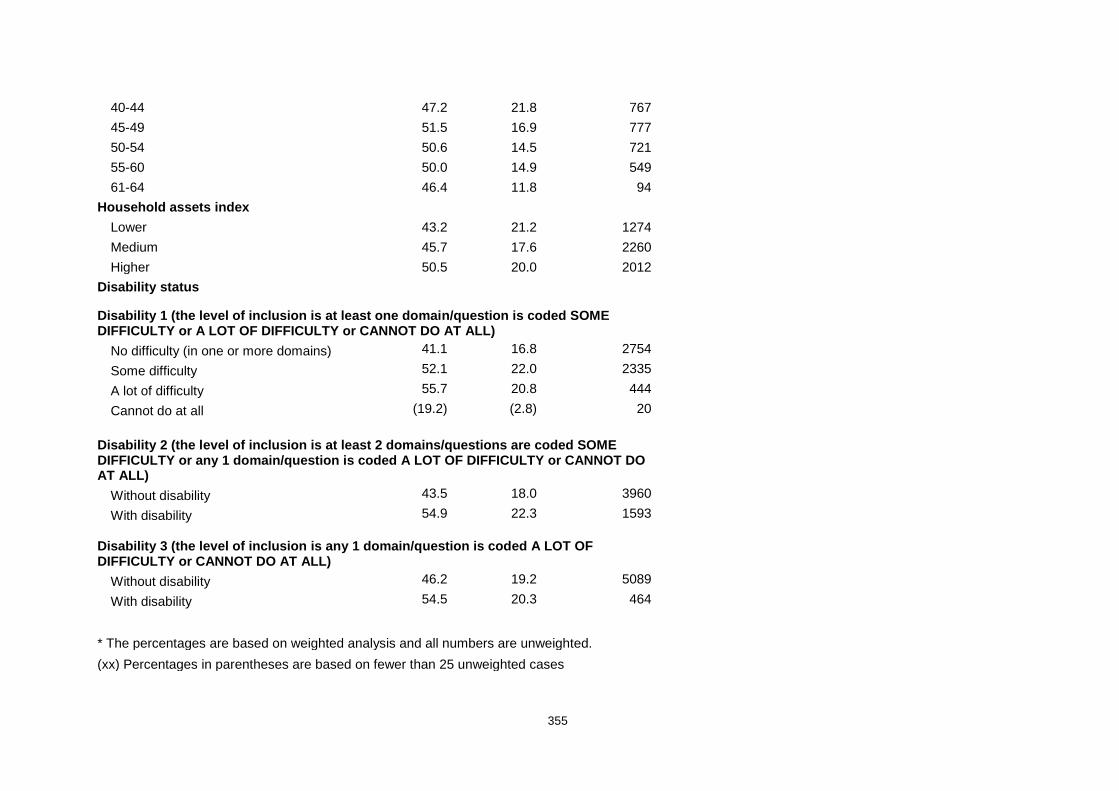
355
40-44 47.2 21.8 767
45-49 51.5 16.9 777
50-54 50.6 14.5 721
55-60 50.0 14.9 549
61-64 46.4 11.8 94
Household assets index
Lower 43.2 21.2 1274
Medium 45.7 17.6 2260
Higher 50.5 20.0 2012
Disability status
Disability 1 (the level of inclusion is at least one domain/question is coded SOME DIFFICULTY or A LOT OF DIFFICULTY or CANNOT DO AT ALL)
No difficulty (in one or more domains) 41.1 16.8 2754
Some difficulty 52.1 22.0 2335
A lot of difficulty 55.7 20.8 444
Cannot do at all (19.2) (2.8) 20
Disability 2 (the level of inclusion is at least 2 domains/questions are coded SOME DIFFICULTY or any 1 domain/question is coded A LOT OF DIFFICULTY or CANNOT DO AT ALL)
Without disability 43.5 18.0 3960
With disability 54.9 22.3 1593
Disability 3 (the level of inclusion is any 1 domain/question is coded A LOT OF DIFFICULTY or CANNOT DO AT ALL)
Without disability 46.2 19.2 5089
With disability 54.5 20.3 464
* The percentages are based on weighted analysis and all numbers are unweighted.
(xx) Percentages in parentheses are based on fewer than 25 unweighted cases

356
Table 4.10. Lifetime and current prevalence of specific acts of emotional partner violence, and frequency of these acts in the past 12 months, among ever-partnered women, Viet Nam 2019
Among ever-partnered
women (N=5553)
Frequency distribution of number of times acts happened in past 12
months
Lifetime prevalence
(%)
12 months prevalenc
e (%)
One time (%)
Few times (%)
Many times (%)
Insulted you or made you feel bad 25.0 9.9 14.3 63.7 22.0
Belittled or humiliated 10.9 4.5 15.1 58.9 25.9
Scared or intimidated you 38.7 15.0 18.9 67.4 13.6
Threatened to hurt you or someone you care about 15.3 4.6 17.4 60.4 22.2
* The percentages are based on weighted analysis and all numbers are unweighted.
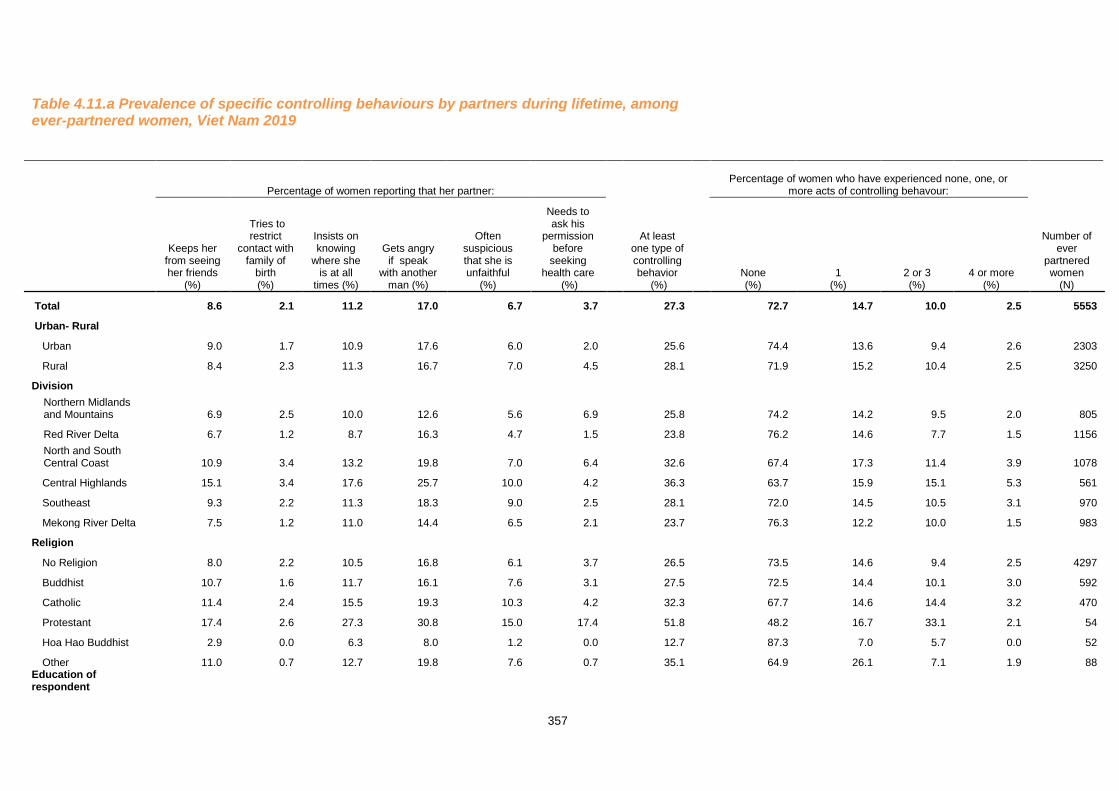
357
Table 4.11.a Prevalence of specific controlling behaviours by partners during lifetime, among ever-partnered women, Viet Nam 2019
Percentage of women reporting that her partner: Percentage of women who have experienced none, one, or
more acts of controlling behavour:
Keeps her from seeing her friends
(%)
Tries to restrict
contact with family of
birth (%)
Insists on knowing
where she is at all
times (%)
Gets angry if speak
with another man (%)
Often suspicious that she is unfaithful
(%)
Needs to ask his
permission before
seeking health care
(%)
At least one type of controlling behavior
(%) None (%)
1 (%)
2 or 3 (%)
4 or more (%)
Number of ever
partnered women
(N)
Total 8.6 2.1 11.2 17.0 6.7 3.7 27.3 72.7 14.7 10.0 2.5 5553
Urban- Rural
Urban 9.0 1.7 10.9 17.6 6.0 2.0 25.6 74.4 13.6 9.4 2.6 2303
Rural 8.4 2.3 11.3 16.7 7.0 4.5 28.1 71.9 15.2 10.4 2.5 3250
Division
Northern Midlands and Mountains 6.9 2.5 10.0 12.6 5.6 6.9 25.8 74.2 14.2 9.5 2.0 805
Red River Delta 6.7 1.2 8.7 16.3 4.7 1.5 23.8 76.2 14.6 7.7 1.5 1156
North and South Central Coast 10.9 3.4 13.2 19.8 7.0 6.4 32.6 67.4 17.3 11.4 3.9 1078
Central Highlands 15.1 3.4 17.6 25.7 10.0 4.2 36.3 63.7 15.9 15.1 5.3 561
Southeast 9.3 2.2 11.3 18.3 9.0 2.5 28.1 72.0 14.5 10.5 3.1 970
Mekong River Delta 7.5 1.2 11.0 14.4 6.5 2.1 23.7 76.3 12.2 10.0 1.5 983
Religion
No Religion 8.0 2.2 10.5 16.8 6.1 3.7 26.5 73.5 14.6 9.4 2.5 4297
Buddhist 10.7 1.6 11.7 16.1 7.6 3.1 27.5 72.5 14.4 10.1 3.0 592
Catholic 11.4 2.4 15.5 19.3 10.3 4.2 32.3 67.7 14.6 14.4 3.2 470
Protestant 17.4 2.6 27.3 30.8 15.0 17.4 51.8 48.2 16.7 33.1 2.1 54
Hoa Hao Buddhist 2.9 0.0 6.3 8.0 1.2 0.0 12.7 87.3 7.0 5.7 0.0 52
Other 11.0 0.7 12.7 19.8 7.6 0.7 35.1 64.9 26.1 7.1 1.9 88 Education of respondent

358
No education 10.3 2.9 11.9 14.6 9.2 6.0 30.0 70.0 14.5 13.3 2.2 936
Primary 9.2 2.9 12.1 14.2 6.1 4.3 26.4 73.6 14.3 8.9 3.2 1231
Lower Secondary 8.2 2.3 10.7 19.3 6.8 4.3 27.3 72.7 14.8 9.0 3.5 1543
Upper Secondary 8.2 1.0 11.8 18.7 5.5 1.9 28.2 71.9 15.6 11.2 1.3 994
College 8.8 0.6 12.7 21.5 7.1 0.3 29.4 70.6 16.5 10.7 2.2 200
University and above 6.4 0.6 8.3 16.7 5.3 0.9 23.0 77.0 13.6 8.3 1.1 628
Other 13.3 1.9 1.9 3.0 1.9 4.4 15.7 (84.3) (10.8) (3.0) (1.9) 21
Ethnicity
Kinh 8.3 2.0 10.7 16.7 6.1 2.8 26.0 74.0 14.2 9.4 2.3 4596
Tay 5.5 0.3 13.7 19.5 10.1 11.0 35.4 64.6 15.6 18.7 1.2 135
Thai 3.8 1.1 6.4 8.1 2.3 5.8 18.2 81.8 11.6 6.6 0.0 160
Muong 10.2 0.0 4.4 9.4 10.0 4.8 23.5 76.5 16.1 3.8 3.6 66
Khmer 8.5 0.5 4.2 13.6 7.4 2.9 21.9 78.1 12.3 8.3 1.3 108
Chinese 19.6 0.0 21.4 20.2 15.6 0.0 29.4 71.7 12.6 0.7 15.0 28
Nung 7.6 4.5 6.0 10.5 3.3 4.6 18.6 81.4 12.6 1.9 4.2 71
Mong 15.2 8.9 23.2 16.0 8.0 34.5 54.7 45.3 30.5 17.5 6.6 36
Dao 8.5 4.8 30.8 13.6 10.1 16.9 51.3 48.7 28.4 20.5 2.3 54
Other 15.8 4.5 20.4 30.6 14.5 8.4 47.5 52.5 21.4 20.4 5.7 298 Age group of respondent
15-19 10.2 0.0 30.0 53.0 16.0 3.7 64.3 35.7 32.0 29.9 2.3 96
20-24 12.4 1.7 19.7 35.2 13.3 4.7 45.4 54.6 22.5 16.5 6.3 276
25-29 5.8 1.0 13.3 24.1 5.3 4.0 31.2 68.8 16.9 12.6 1.7 604
30-34 8.4 1.6 10.6 17.8 7.6 3.2 28.0 72.0 16.6 8.4 3.0 809
35-39 9.4 1.5 12.0 16.0 6.1 4.1 27.2 72.8 15.0 9.8 2.4 860
40-44 9.1 2.0 11.2 13.2 5.9 3.9 24.8 75.3 14.0 8.0 2.7 767
45-49 8.7 3.1 10.5 12.8 5.6 4.0 25.0 75.1 14.9 7.0 3.0 777
50-54 9.6 3.4 7.4 12.0 5.2 4.0 22.4 77.7 11.5 8.6 2.2 721
55-64 6.8 2.4 7.2 11.0 6.3 2.4 19.6 80.5 8.4 10.2 1.0 643

359
Age group of respondent (for comparison to 2010)
15-17 6.7 0.0 38.1 65.5 22.6 6.7 80.3 19.7 40.5 36.6 3.1 54
18-24 12.8 1.4 19.8 35.6 12.5 4.0 45.3 54.7 22.4 17.3 5.5 318
25-29 5.8 1.0 13.3 24.1 5.3 4.0 31.2 68.8 16.9 12.6 1.7 604
30-34 8.4 1.6 10.6 17.8 7.6 3.2 28.0 72.0 16.6 8.4 3.0 809
35-39 9.4 1.5 12.0 16.0 6.1 4.1 27.2 72.8 15.0 9.8 2.4 860
40-44 9.1 2.0 11.2 13.2 5.9 3.9 24.7 75.3 14.0 8.0 2.7 767
45-49 8.7 3.1 10.5 12.8 5.6 4.0 24.9 75.1 14.9 7.0 3.0 777
50-54 9.6 3.4 7.4 12.0 5.2 4.0 22.3 77.7 11.5 8.6 2.2 721
55-60 7.3 2.6 7.0 10.8 6.0 2.8 19.2 80.8 7.9 10.2 1.1 549
61-64 3.9 1.1 8.2 11.9 8.1 0.2 21.7 78.3 11.3 10.0 0.4 94 Household assets index
Lower 10.1 3.7 13.9 18.4 8.6 6.7 32.7 67.3 16.6 12.7 3.3 1274
Medium 8.5 2.3 10.6 16.5 6.8 4.1 26.7 73.3 14.1 10.0 2.6 2260
Higher 7.9 0.9 10.3 16.7 5.3 1.5 24.7 75.3 14.2 8.4 2.0 2012
Disability status Disability 1 (the level of inclusion is at least one domain/question is coded SOME DIFFICULTY or A LOT OF DIFFICULTY or CANNOT DO AT ALL)
No difficulty (in one or more domains)
7.2 1.2 9.5 16.2 5.2 2.3 24.1 76.0 13.8 8.2 2.0 2754
Some difficulty 9.9 2.6 12.9 17.8 7.7 5.1 29.7 70.3 14.9 11.6 3.2 2335
A lot of difficulty 10.8 4.8 12.9 17.8 9.5 4.7 34.4 65.6 19.0 12.8 2.6 444
Cannot do at all 0.0 0.0 0.0 0.0 0.0 7.1 7.1 (92.9) (7.1) (0.0) (0.0) 20
Disability 2 (the level of inclusion is at least 2 domains/questions are coded SOME DIFFICULTY or any 1 domain/question is coded A LOT OF DIFFICULTY or CANNOT DO AT ALL)
Without disability 7.7 1.4 10.3 16.9 5.9 2.8 25.7 74.3 14.6 8.9 2.2 3960
With disability 10.9 3.8 13.2 17.3 8.4 5.8 30.9 69.1 14.9 12.7 3.3 1593 Disability 3 (the level of inclusion is any 1 domain/question is coded A LOT OF DIFFICULTY or CANNOT DO AT ALL)
Without disability 8.5 1.9 11.1 17.0 6.4 3.6 26.7 73.3 14.3 9.8 2.5 5089
With disability 10.5 4.6 12.5 17.2 9.2 4.8 33.5 66.5 18.6 12.4 2.5 464

360
By experience of partner violence*
No violence 4.4 0.4 7.4 11.8 3.5 2.8 19.4 80.6 12.1 6.6 0.7 3757 Sexual and/ or
physical 17.5 5.7 19.2 28.1 13.4 5.5 44.0 56.0 20.2 17.4 6.4 1791
By type of violence*
Physical only 15.2 4.1 15.6 22.3 10.2 4.1 38.9 61.1 20.3 14.8 3.8 1095
Sexual only 12.5 1.3 15.7 28.9 9.8 6.5 41.4 58.6 22.1 15.4 3.9 320 Both sexual and
physical 27.8 13.2 31.5 42.3 24.8 8.4 59.2 40.8 18.2 25.8 15.2 376
* Note that questions on controlling behaviours have been asked for current and most recent partner only while the experience of physical or sexual violence - for some of the women - may have been reported for a previous partner (results here shown are therfore somewhat biased towards underestimating the association between controlling behaviours and physical or sexual violence).
** The percentages are based on weighted analysis and all numbers are unweighted.
(xx) Percentages in parentheses are based on fewer than 25 unweighted cases

361
Table 4.11.b
Percentage of women reporting that her partner: Percentage of women who have experienced none, one, or more
acts of controlling behavour:
Keeps her from
seeing her friends
(%)
Tries to restrict contact
with family of
birth (%)
Insists on knowing
where she is at all
times (%)
Gets angry if speak
with another man (%)
Often suspicious that she is unfaithful
(%)
Needs to ask his
permission before seeking health care (%)
At least one type of
controlling behavior
(%) None (%)
1 (%)
2 or 3 (%)
4 or more (%)
Number of ever
partnered women
(N)
Total 3.8 0.8 6.8 6.4 2.9 1.6 12.9 87.1 7.1 4.8 1.1 5553
Urban- Rural
Urban 3.7 0.3 6.1 7.2 3.0 0.7 11.6 88.4 5.8 4.9 0.9 2303
Rural 3.9 1.0 7.1 6.0 2.9 2.1 13.5 86.5 7.7 4.7 1.1 3250
Division
Northern Midlands and Mountains 3.1 0.9 5.0 3.8 2.0 1.6 10.9 89.1 8.0 2.0 0.9 805
Red River Delta 2.9 0.2 4.7 5.5 1.9 0.7 9.3 90.7 4.7 4.3 0.3 1156
North and South Central Coast 5.2 1.8 9.1 7.4 2.8 3.2 16.0 84.0 8.4 5.9 1.8 1078
Central Highlands 5.8 1.4 12.0 11.9 4.6 1.2 19.2 80.8 9.5 7.6 2.2 561
Southeast 4.0 0.6 5.8 7.9 4.3 1.0 12.9 87.2 6.6 4.3 1.9 970
Mekong River Delta 3.1 0.3 7.5 5.5 3.4 1.6 13.4 86.6 7.5 5.6 0.3 983
Religion
No Religion 3.3 0.8 6.4 6.2 2.8 1.5 12.2 87.8 6.9 4.3 1.0 4297
Buddhist 5.1 0.6 7.6 6.1 2.6 2.3 13.5 86.6 6.6 5.5 1.4 592
Catholic 6.0 0.7 9.1 8.8 5.1 2.0 17.3 82.7 7.9 7.5 1.9 470
Protestant 12.
3 0.8 18.4 13.1 7.9 4.7 30.2 69.8 11.4 18.9 0.0 54
Hoa Hao Buddhist 0.0 0.0 4.0 2.9 0.0 0.0 6.9 93.1 6.9 0.0 0.0 52

362
Other 5.8 0.0 7.6 5.8 0.0 0.0 16.4 83.6 13.7 2.7 0.0 88
Education of respondent
No education 4.4 1.2 7.3 5.4 3.9 2.1 15.3 84.7 9.3 5.1 0.9 936
Primary 4.9 1.0 7.7 6.1 3.3 2.4 13.6 86.4 6.6 5.2 1.8 1231
Lower Secondary 3.7 0.8 6.3 7.5 2.7 1.8 12.3 87.7 6.5 4.6 1.2 1543
Upper Secondary 3.3 0.5 7.4 7.1 2.4 0.7 13.1 86.9 7.4 4.9 0.7 994
College 2.1 0.0 7.0 5.3 2.9 0.3 12.6 87.4 8.1 4.5 0.0 200
University and above 2.2 0.1 4.4 5.1 1.9 0.5 8.7 91.3 4.9 3.6 0.2 628
Other 1.9 1.9 1.9 3.0 1.9 0.0 4.9 (95.1
) (3.0) (0.0) (1.9) 21
Ethnicity
Kinh 3.6 0.7 6.5 6.0 2.6 1.4 12.0 88.0 6.4 4.7 0.9 4596
Tay 2.0 0.0 5.3 4.5 1.3 0.8 9.6 90.4 6.7 2.9 0.0 135
Thai 0.5 1.1 2.8 5.1 0.3 3.2 10.7 89.3 8.7 2.0 0.0 160
Muong 1.0 0.0 4.4 1.9 4.8 4.0 7.4 92.6 3.6 1.9 1.9 66
Khmer 2.8 0.0 2.0 7.4 4.2 2.1 9.8 90.2 4.8 4.2 0.8 108
Chinese 11.
3 0.0 8.1 11.9 8.1 0.0 15.6 85.0 7.0 0.0 8.1 28
Nung 6.8 3.3 4.5 8.1 1.7 0.8 12.4 87.6 7.9 1.2 3.3 71
Mong 4.8 0.0 13.0 0.0 1.5 9.4 25.6 74.4 24.1 1.5 0.0 36
Dao 8.5 0.4 14.1 6.5 7.1 5.0 32.0 68.0 23.5 8.1 0.4 54
Other 9.1 2.6 15.5 15.8 8.2 2.7 27.5 72.5 13.4 10.5 3.5 298
Age group of respondent
15-19 8.1 0.0 19.9 33.2 9.0 2.4 38.2 61.8 14.7 22.9 0.6 96
20-24 7.0 0.5 12.5 17.4 5.8 1.7 24.5 75.5 12.8 8.3 3.4 276
25-29 3.1 0.5 8.4 9.6 2.8 2.6 16.4 83.6 8.7 7.2 0.5 604
30-34 4.7 0.8 6.9 6.9 4.0 1.6 14.0 86.0 8.3 4.3 1.4 809
35-39 3.6 0.6 6.8 6.1 2.6 1.5 12.2 87.8 6.3 5.3 0.6 860
40-44 3.5 0.9 6.2 3.7 2.2 2.3 10.8 89.2 6.1 3.7 1.0 767
45-49 3.2 1.4 7.2 4.4 2.7 1.0 11.4 88.6 6.8 3.0 1.7 777
50-54 3.7 0.9 4.3 4.2 2.3 1.8 9.8 90.3 5.5 3.1 1.2 721

363
55-64 2.7 0.5 3.6 1.5 1.7 0.5 7.3 92.7 4.4 2.9 0.0 643
Age group of respondent (for comparison to 2010)
15-17 5.5 0.0 21.7 44.2 15.4 4.3 51.7 48.3 21.7 29.9 0.0 54
18-24 7.7 0.4 13.3 17.8 5.1 1.5 24.0 76.0 11.7 9.2 3.1 318
25-29 3.1 0.5 8.4 9.6 2.8 2.6 16.4 83.6 8.7 7.2 0.5 604
30-34 4.7 0.8 6.9 6.9 4.0 1.6 14.0 86.0 8.3 4.3 1.4 809
35-39 3.6 0.6 6.8 6.1 2.6 1.5 12.2 87.8 6.3 5.3 0.6 860
40-44 3.5 0.9 6.2 3.7 2.2 2.3 10.8 89.2 6.1 3.7 1.0 767
45-49 3.2 1.4 7.2 4.4 2.7 1.0 11.4 88.6 6.8 3.0 1.7 777
50-54 3.8 0.9 4.3 4.2 2.3 1.8 9.7 90.3 5.5 3.1 1.2 721
55-60 3.2 0.6 3.7 1.2 1.9 0.6 7.3 92.7 3.9 3.4 0.0 549
61-64 0.0 0.0 3.2 3.1 1.0 0.0 7.3 92.7 7.3 0.0 0.0 94
Household assets index
Lower 5.4 1.6 9.4 8.1 3.5 2.7 17.5 82.5 9.6 6.4 1.5 1274
Medium 3.4 0.7 6.1 6.1 3.0 1.7 12.5 87.5 7.3 4.1 1.1 2260
Higher 3.3 0.3 6.1 5.7 2.4 0.8 10.5 89.5 5.2 4.5 0.8 2012
Disability status
No difficulty (in one or
more domains) 3.2 0.5 5.6 6.1 2.4 0.9 11.0 89.0 6.1 4.2 0.7 2754
Some difficulty 4.0 1.0 8.1 7.1 3.3 2.3 14.6 85.4 8.0 5.3 1.4 2335
A lot of difficulty 6.5 1.6 7.8 5.4 4.4 1.9 15.4 84.6 8.3 5.6 1.5 444
Cannot do at all 0.0 0.0 0.0 0.0 0.0 0.0 0.0 (100) (0.0) (0.0) (0.0) 20
Without disability 3.2 0.5 5.9 6.4 2.7 1.2 11.9 88.1 6.8 4.4 0.7 3960
With disability 5.2 1.5 8.8 6.5 3.5 2.6 15.1 84.9 7.7 5.7 1.8 1593 Disability 3 (the level of inclusion is any 1 domain/question is coded A LOT OF DIFFICULTY or CANNOT DO AT ALL)
Without disability 3.6 0.7 6.8 6.5 2.8 1.6 12.7 87.3 7.0 4.7 1.0 5089
With disability 6.3 1.6 7.5 5.2 4.2 1.9 14.9 85.1 8.0 5.4 1.5 464
By experience of partner violence*

364
No violence 1.8 0.2 4.5 4.3 1.6 1.0 8.8 91.2 5.7 2.8 0.3 3757
Sexual and/ or physical 8.0 2.1 11.9 11.0 5.7 2.9 21.5 78.5 9.9 9.0 2.6 1791
By type of violence*
Physical only 6.3 1.2 8.3 7.5 4.2 2.4 17.1 82.9 9.2 6.6 1.4 1095
Sexual only 3.5 0.7 10.1 11.0 4.7 3.1 18.0 82.0 7.7 9.6 0.6 320
Both sexual and physical 16.
1 5.5 22.4 19.8 10.3 3.9 35.8 64.3 13.7 14.7 7.3 376
** The percentages are based on weighted analysis and all numbers are unweighted.
(xx) Percentages in parentheses are based on fewer than 25 unweighted cases

365
Table 4.12a Prevalence of economic abusive acts by partners during lifetime, among ever-partnered women, Viet Nam 2019
Prohibits from getting
a job or generating
income (%)
Taken away what she earned or
saved (%)
Refused to give money
(%)
Expects her to take
financial responsibility for him and his family
(%)
Expects her to ask
permission before buying
anything for herself (%)
At least one acts (%)
Number of ever partnered
women for whom questions were
applicable (N)
Total 11.5 6.0 6.3 2.0 3.7 20.6 5553
Urban- Rural
Urban 9.1 5.1 5.7 1.6 2.6 17.4 2303
Rural 12.7 6.4 6.6 2.3 4.2 22.2 3250
Division
Northern Midlands and Mountains 10.0 7.4 7.2 1.7 4.3 19.5 805
Red River Delta 11.2 6.3 5.7 2.3 2.2 20.1 1156
North and South Central Coast 15.1 6.1 6.2 3.2 5.0 23.5 1078
Central Highlands 13.1 7.2 6.0 2.0 4.3 24.9 561
Southeast 7.9 5.4 7.3 1.5 2.7 18.7 970
Mekong River Delta 11.4 4.6 5.8 1.1 4.2 19.4 983
Religion
No Religion 11.2 6.1 6.4 2.2 3.8 20.6 4297
Buddhist 13.0 6.1 6.2 1.3 4.2 21.1 592
Catholic 13.2 5.4 5.6 1.9 1.7 20.7 470
Protestant 11.1 8.9 1.8 2.4 11.7 31.6 54
Hoa Hao Buddhist 2.4 0.0 2.9 0.0 0.0 5.3 52
Other 11.4 7.8 9.2 1.9 3.9 25.0 88
Education of respondent
No education 8.7 7.8 8.2 2.4 6.2 21.4 936

366
Primary 11.3 6.5 5.7 1.8 3.0 20.4 1231
Lower Secondary 15.1 6.6 8.3 2.4 4.6 25.3 1543
Upper Secondary 12.1 4.8 4.3 1.0 2.5 18.8 994
College 8.7 1.6 2.5 2.3 1.4 13.2 200
University and above 6.2 2.3 2.2 1.8 0.8 10.6 628
Other (3.9) (27.3) (29.2) (19.2) (8.1) (31.2) 21
Ethnicity
Kinh 11.5 5.4 6.2 1.9 3.1 19.9 4596
Tay 12.3 10.9 6.4 1.6 8.3 28.1 135
Thai 4.4 2.2 1.3 0.0 3.7 10.5 160
Muong 8.7 0.8 4.0 0.0 0.0 13.5 66
Khmer 10.3 5.4 2.1 1.3 3.5 17.3 108
Chinese 1.4 2.7 11.4 2.7 3.9 12.7 28
Nung 20.1 5.4 4.1 1.1 3.3 23.9 71
Mong 8.1 10.1 8.9 3.8 16.8 29.3 36
Dao 24.3 18.6 13.1 7.9 7.8 45.8 54
Other 13.6 15.2 11.8 5.7 9.8 33.5 298
Age group of respondent
15-19 16.2 2.1 0.0 1.2 4.5 19.7 96
20-24 14.6 4.1 3.7 3.7 4.4 22.2 276
25-29 11.8 4.1 5.7 1.6 3.5 21.1 604
30-34 15.1 5.3 5.3 1.9 4.0 22.8 809
35-39 13.2 5.7 4.9 1.9 3.1 19.6 860
40-44 10.1 6.6 6.2 3.2 3.2 19.5 767
45-49 9.8 5.9 6.7 1.5 4.3 19.0 777
50-54 11.7 7.4 8.0 1.5 4.1 23.7 721
55-64 7.0 7.8 9.3 2.0 3.2 18.6 643 Age group of respondent (for comparison to 2010)
15-17 19.6 0.0 0.0 0.0 6.6 21.8 54

367
18-24 14.2 4.2 3.1 3.5 4.0 21.4 318
25-29 11.8 4.1 5.7 1.6 3.5 21.1 604
30-34 15.1 5.3 5.3 1.9 4.0 22.8 809
35-39 13.2 5.7 4.9 1.9 3.1 19.6 860
40-44 10.1 6.6 6.2 3.2 3.2 19.5 767
45-49 9.8 5.9 6.7 1.5 4.3 19.0 777
50-54 11.7 7.4 8.0 1.5 4.1 23.7 721
55-60 7.7 7.5 8.9 2.2 2.5 18.7 549
61-64 3.0 10.0 11.9 0.7 7.4 17.6 94
Household assets index
Lower 11.7 9.0 8.5 2.6 6.4 25.1 1274
Medium 11.8 5.6 6.4 2.1 3.9 20.6 2260
Higher 11.1 4.6 4.9 1.6 1.8 18.1 2012
Disability status
Disability 1 (the level of inclusion is at least one domain/question is coded SOME DIFFICULTY or A LOT OF DIFFICULTY or CANNOT DO AT ALL) No difficulty (in one or more
domains) 10.3 4.5 4.7 1.6 2.4 17.6 2754
Some difficulty 12.7 7.1 7.4 2.4 4.8 23.3 2335
A lot of difficulty 12.8 8.6 10.0 2.2 5.2 25.1 444
Cannot do at all (0.0) (0.0) (3.5) (3.5) (0.0) (3.5) 20
Disability 2 (the level of inclusion is at least 2 domains/questions are coded SOME DIFFICULTY or any 1 domain/question is coded A LOT OF DIFFICULTY or CANNOT DO AT ALL)
Without disability 10.8 4.9 5.2 1.7 2.7 18.6 3960
With disability 13.2 8.4 8.8 2.8 6.0 25.3 1593
Disability 3 (the level of inclusion is any 1 domain/question is coded A LOT OF DIFFICULTY or CANNOT DO AT ALL)
Without disability 11.4 5.7 6.0 2.0 3.6 20.2 5089
With disability 12.3 8.3 9.8 2.2 5.1 24.4 464
* The percentages are based on weighted analysis and all numbers are unweighted.

368
(xx) Percentages in parentheses are based on fewer than 25 unweighted cases
Table 4.12b Prevalence of economic abusive acts by partners during last 12 months, among ever-partnered women, Viet Nam 2019
Prohibits from getting a job or
generating income
(%)
Taken away what she earned or
saved (%)
Refused to give money
(%)
Expects her to take financial responsibility
for him and his family (%)
Expects her to ask
permission before buying
anything for herself (%)
At least one acts (%)
Number of ever partnered
women for whom questions were
applicable (N)
Total 6.4 2.5 3.0 1.0 1.9 11.5 5553
Urban- Rural
Urban 4.2 1.8 2.4 0.5 1.1 8.1 2303
Rural 7.5 2.8 3.3 1.2 2.3 13.1 3250
Division
Northern Midlands and Mountains 5.3 2.3 3.4 0.6 2.4 10.1 805
Red River Delta 5.6 2.4 2.5 0.8 0.9 9.6 1156
North and South Central Coast 9.1 3.2 3.8 1.7 2.7 15.0 1078
Central Highlands 6.6 4.2 2.0 1.2 2.2 13.6 561
Southeast 4.0 2.8 3.2 0.8 1.3 10.1 970
Mekong River Delta 7.1 1.2 2.8 0.6 2.3 11.2 983
Religion
No Religion 6.1 2.5 3.0 1.0 2.0 11.2 4297
Buddhist 8.6 2.1 3.7 0.5 2.1 12.5 592
Catholic 8.0 3.3 2.4 0.9 0.6 12.6 470
Protestant 7.1 0.8 0.9 2.4 10.9 20.8 54
Hoa Hao Buddhist 2.4 0.0 0.0 0.0 0.0 2.4 52
Other 1.8 3.4 4.8 1.9 2.3 10.1 88

369
Education of respondent
No education 4.0 2.9 4.1 1.4 3.1 11.6 936
Primary 6.9 2.5 3.2 0.9 2.1 12.0 1231
Lower Secondary 9.2 2.8 3.3 0.8 1.8 14.1 1543
Upper Secondary 5.8 2.1 1.9 0.6 1.3 9.8 994
College 3.4 0.9 2.0 0.5 1.4 6.5 200
University and above 3.5 0.6 1.5 0.6 0.4 5.6 628
Other (0.0) (27.3) (21.1) (19.2) (8.1) (29.2) 21
Ethnicity
Kinh 6.1 2.0 2.8 0.7 1.5 10.5 4596
Tay 4.9 5.9 1.6 1.6 4.7 13.9 135
Thai 3.4 1.6 0.8 0.0 1.6 6.4 160
Muong 8.7 0.0 1.1 0.0 0.0 9.7 66
Khmer 8.8 1.5 2.1 1.3 0.8 11.4 108
Chinese 1.3 0.0 4.5 0.0 0.0 5.9 28
Nung 10.6 1.0 3.6 1.1 3.3 11.6 71
Mong 6.2 0.0 1.6 0.0 11.1 17.3 36
Dao 18.1 8.3 7.7 7.9 7.8 28.6 54
Other 10.5 10.1 8.3 5.0 7.3 26.4 298
Age group of respondent
15-19 10.9 2.1 0.0 1.2 4.5 14.5 96
20-24 10.9 1.8 1.3 1.2 2.5 15.1 276
25-29 7.8 2.9 3.3 1.3 2.3 13.8 604
30-34 10.5 2.5 3.0 0.9 2.6 15.1 809
35-39 8.0 2.8 2.8 1.0 1.7 12.4 860
40-44 4.2 3.0 2.8 1.9 2.2 9.8 767
45-49 4.7 2.7 3.8 0.3 2.5 10.7 777
50-54 4.4 1.5 2.6 0.4 0.8 8.8 721

370
55-64 3.3 2.4 4.1 0.8 0.9 8.3 643 Age group of respondent (for comparison to 2010)
15-17 11.6 0.0 0.0 0.0 6.6 13.8 54
18-24 10.8 2.2 1.1 1.4 2.4 15.2 318
25-29 7.8 2.9 3.3 1.3 2.3 13.8 604
30-34 10.5 2.5 3.0 0.9 2.6 15.1 809
35-39 8.0 2.8 2.8 1.0 1.7 12.4 860
40-44 4.2 3.0 2.8 1.9 2.2 9.8 767
45-49 4.7 2.7 3.8 0.3 2.5 10.7 777
50-54 4.4 1.5 2.6 0.4 0.8 8.8 721
55-60 3.7 2.6 4.0 0.8 0.3 8.5 549
61-64 0.8 0.7 4.6 0.7 4.6 6.9 94
Household assets index
Lower 7.4 3.9 4.6 1.8 4.0 15.4 1274
Medium 7.1 2.1 2.8 0.9 1.9 11.5 2260
Higher 5.2 2.1 2.4 0.6 0.7 9.1 2012
Disability status
Disability 1 (the level of inclusion is at least one domain/question is coded SOME DIFFICULTY or A LOT OF DIFFICULTY or CANNOT DO AT ALL)
No difficulty (in one or more domains) 6.1 2.0 2.0 0.7 1.2 10.0 2754
Some difficulty 6.7 2.7 3.4 1.1 2.5 12.2 2335
A lot of difficulty 7.1 3.7 6.9 1.5 3.4 16.2 444
Cannot do at all (0.0) (0.0) (0.0) (0.0) (0.0) (0.0) 20
Disability 2 (the level of inclusion is at least 2 domains/questions are coded SOME DIFFICULTY or any 1 domain/question is coded A LOT OF DIFFICULTY or CANNOT DO AT ALL)
Without disability 6.1 2.1 2.4 0.7 1.2 10.3 3960
With disability 7.1 3.3 4.4 1.5 3.5 14.2 1593
Disability 3 (the level of inclusion is any 1 domain/question is coded A LOT OF DIFFICULTY or CANNOT DO AT ALL)

371
Without disability 6.4 2.4 2.7 0.9 1.8 11.0 5089
With disability 6.8 3.6 6.7 1.5 3.3 15.7 464
* The percentages are based on weighted analysis and all numbers are unweighted.
(xx) Percentages in parentheses are based on fewer than 25 unweighted cases

372
Table 4.13. Percentage of women who reported they ever initiated violence against partner, and frequency distribution of number of times it happened, among ever-partnered women, Viet Nam 2019
Frequency distribution of number of times initiated
violence
Ever initiated violence against
partner (%)
Number of ever-partnered women
(N) One time
(%) 2-5 times
(%)
More than 5 times (%)
Total 4.3 5553 53.3 41.8 4.9
Urban- Rural
Urban 5.0 2303 50.6 40.9 8.5
Rural 4.0 3250 54.9 42.4 2.7
Division
Northern Midlands and Mountains 2.6 805 72.4 19.0 8.6
Red River Delta 3.2 1156 55.6 40.2 4.1
North and South Central Coast 4.4 1078 49.3 46.7 4.1
Central Highlands 8.1 561 58.6 33.7 7.7
Southeast 6.3 970 49.2 45.4 5.4
Mekong River Delta 4.3 983 49.4 47.7 2.9
Religion
No Religion 4.0 4297 52.5 44.0 3.6
Buddhist 5.1 592 41.2 42.0 16.8
Catholic 7.0 470 68.4 29.3 2.3
Protestant 6.4 54 16.1 83.9 0.0
Hoa Hao Buddhist 4.3 52 66.7 33.3 0.0
Other 3.7 88 82.3 17.7 0.0
Education of respondent
No education 5.3 936 46.9 45.6 7.5
Primary 3.3 1231 40.4 56.9 2.7

373
Lower Secondary 3.6 1543 63.2 30.7 6.1
Upper Secondary 4.6 994 55.4 42.8 1.8
College 7.7 200 56.7 35.6 7.8
University and above 4.8 628 47.3 46.9 5.8
Other (25.4) 21 (100.0) (0.0) (0.0)
Ethnicity
Kinh 4.1 4596 50.9 45.1 4.0
Tay 4.1 135 82.2 17.8 0.0
Thai 4.7 160 58.5 22.1 19.4
Muong 0.0 66 0.0 0.0 0.0
Khmer 2.8 108 38.4 21.4 40.2
Chinese 14.3 28 88.0 12.0 0.0
Nung 2.1 71 39.0 15.5 45.5
Mong 7.6 36 75.0 25.0 0.0
Dao 0.0 54 0.0 0.0 0.0
Other 10.8 298 57.6 38.8 3.6
Age group of respondent
15-19 11.1 96 52.3 38.9 8.8
20-24 9.6 276 56.8 40.5 2.6
25-29 4.5 604 35.3 60.5 4.2
30-34 6.5 809 55.1 41.6 3.3
35-39 4.1 860 62.4 24.0 13.6
40-44 3.2 767 47.4 52.6 0.0
45-49 2.7 777 58.1 41.9 0.0
50-54 2.6 721 52.1 35.8 12.1
55-64 3.6 643 55.4 42.6 2.0
Age group of respondent (for comparison to 2010)
15-17 15.7 54 45.3 43.5 11.3
18-24 9.0 318 58.8 38.9 2.4
25-29 4.5 604 35.3 60.5 4.2

374
30-34 6.5 809 55.1 41.6 3.3
35-39 4.1 860 62.4 24.0 13.6
40-44 3.2 767 47.4 52.6 0.0
45-49 2.7 777 58.1 41.9 0.0
50-54 2.6 721 52.1 35.8 12.1
55-60 4.2 549 55.4 42.6 2.0
61-64 0.0 94 0.0 0.0 0.0
Household assets index
Lower 5.7 1274 59.6 33.5 6.9
Medium 4.0 2260 48.0 47.3 4.7
Higher 3.9 2012 53.7 43.0 3.4
Disability status
Disability 1 (the level of inclusion is at least one domain/question is coded SOME DIFFICULTY or A LOT OF DIFFICULTY or CANNOT DO AT ALL)
No difficulty (in one or more domains) 4.4 2754 58.6 34.9 6.5
Some difficulty 4.3 2335 49.7 46.3 4.0
A lot of difficulty 4.1 444 (39.7) (60.3) (0.0)
Cannot do at all (0.0) 20 (0.0) (0.0) (0.0)
Disability 2 (the level of inclusion is at least 2 domains/questions are coded SOME DIFFICULTY or any 1 domain/question is coded A LOT OF DIFFICULTY or CANNOT DO AT ALL)
Without disability 4.8 3960 52.4 41.6 6.0
With disability 3.4 1593 56.1 42.6 1.3
Disability 3 (the level of inclusion is any 1 domain/question is coded A LOT OF DIFFICULTY or CANNOT DO AT ALL)
Without disability 4.4 5089 54.5 40.2 5.3
With disability 3.9 464 (39.7) (60.3) (0.0)
By experience of physical or sexual partner violence
No violence 2.8 3757 52.8 43.8 3.5
Physical or sexual violence 7.7 1791 53.6 40.4 6.0

375
* The percentages are based on weighted analysis and all numbers are unweighted.
(xx) Percentages in parentheses are based on fewer than 25 unweighted cases

376
Table 5.1. Prevalence and frequency of physical violence by non-partners since the age of 15 and in the past 12 months, among all women, Viet Nam 2019
Since age 15 Past 12 months
Ever had non-
partner physical violence
since age 15
(%)
Frequency distribution of physical violence by non-partners
Physical violence with
injuries (%)
Had non-partner physical
violence in past 12 months
(%)
Frequency distribution of physical violence by non-partners
Physical violence
with injuries
(%)
Physical violence by
any person 1 time (%)
Physical violence by any person a few (2-5)
times (%)
Physical violence by any person
many (> 5) times
(%)
Physical violence by
any person 1 time (%)
Physical violence by any
person a few (2-5)
times (%)
Physical violence by any person many (> 5)
times (%)
Number of
women interview
ed (N)
Total 11.4 78.3 14.5
7.3 0.4 1.4 90.3
6.0 3.8
0.05 5976
Urban- Rural
Urban 11.7 81.7 14.1
4.2 0.2 1.4 96.5
3.5 0.0
0.04 2501
Rural 11.2 76.4 14.7
8.9 0.5 1.3 86.8
7.4 5.8
0.06
3475
Division Northern Midlands and Mountains
11.9 71.9 20.3
7.8 0.1 1.1 (73.0)
(27.0) (0.0)
0.00
851
Red River Delta
14.8 80.9 15.4
3.7 0.3 1.9 (84.5)
(9.0) (6.6)
0.04
1248
North and South Central Coast
12.5 76.1 12.0
11.9 0.9 0.9 (88.7)
(0.0) (11.3)
0.18
1147
Central Highlands
15.4 70.4 21.2
8.3 1.1 2.6 (100.0)
(0.0) (0.0)
0.05
597

377
Southeast 8.9 85.3 8.0
6.7 0.2 1.7 (100.0)
(0.0) (0.0)
0.00
1065
Mekong River Delta
6.8 80.5 12.9
6.6 0.4 0.8 (100.0)
(0.0) (0.0)
0.00
1068
Religion
No Religion 11.5 77.5 15.9
6.6 0.4 1.5 88.7
7.0 4.4
0.03
4625
Buddhist 12.0 85.3 6.5
8.2 0.4 0.5 (100.0)
(0.0) (0.0)
0.27
643
Catholic 11.5 81.9 10.0
8.1 0.3 1.4 (100.0)
(0.0) (0.0)
0.00
506
Protestant 11.6 38.2 30.4
31.4 5.4 3.4 (100.0)
(0.0) (0.0)
0.00
56
Hoa Hao Buddhist
0.0 0.0 0.0
0.0 0.0 0.0 (0.0)
(0.0) (0.0)
0.00
55
Other 7.9 62.5 15.0
22.6 0.0 0.0 (0.0)
(0.0) (0.0)
0.00
90
Education of respondent
No education 9.6 81.8 12.1
6.1 0.4 0.8 (100.0)
(0.0) (0.0)
0.02
964
Primary 7.9 76.9 10.2
12.9 0.4 0.6 (84.7)
(0.0) (15.3)
0.22
1268
Lower Secondary
13.6 77.6 16.3
6.1 0.7 2.7 92.1
4.5 3.3
0.00
1777
Upper Secondary
14.6 76.5 16.1
7.3 0.2 1.0 (78.0)
(22.0) (0.0)
0.00
1078
College 9.7 80.8 9.0
10.2 0.0 0.6 (100.0)
(0.0) (0.0)
0.00
212
University and above
9.4 82.2 14.9
2.9 0.1 0.3 (100.0)
(0.0) (0.0)
0.00
654
Other (0.0) (0.0) (0.0)
(0.0) (0.0) (0.0) (0.0)
(0.0) (0.0)
(0.00)
23
Ethnicity
Kinh 11.2 78.3 13.7
8.0 0.4 1.4 93.8
3.6 2.6
0.03
4963
Tay 12.0 87.1 0.0
12.9 0.8 0.8 (100.0)
(0.0) (0.0)
0.00
143

378
Thai 7.1 87.4 12.6
0.0 0.0 0.0 (0.0)
(0.0) (0.0)
0.00
165
Muong 17.0 87.1 12.9
0.0 0.0 1.9 (100.0)
(0.0) (0.0)
0.00
68
Khmer 7.9 100.0 0.0
0.0 0.0 0.0 (0.0)
(0.0) (0.0)
0.00
115
Chinese 8.6 69.5 30.5
0.0 3.4 0.0 (0.0)
(0.0) (0.0)
0.00
40
Nung 19.8 49.3 48.5
2.3 0.3 0.3 (100.0)
(0.0) (0.0)
0.31
74
Mong 2.6 100.0 0.0
0.0 0.0 0.0 (0.0)
(0.0) (0.0)
0.00
41
Dao 2.9 60.0 40.0
0.0 0.0 0.0 (0.0)
(0.0) (0.0)
0.00
55
Other 17.3 72.4 22.6
4.9 0.8 3.4 (61.9)
(25.1) (13.0)
0.41
310
Age group of respondent
15-19 23.8 69.5 26.6
4.0 0.0 10.4 88.9
9.0 2.2
0.00
357
20-24 16.6 74.7 22.6
2.7 0.0 2.7 (94.2)
(0.0) (5.8)
0.00
332
25-29 11.5 82.9 13.2
3.8 0.0 0.9 (100.0)
(0.0) (0.0)
0.03
625
30-34 10.2 79.3 9.8
10.9 0.5 0.5 (63.8)
(0.0) (36.2)
0.17
819
35-39 7.0 86.4 6.8
6.8 0.3 0.4 (100.0)
(0.0) (0.0)
0.15
867
40-44 9.5 83.8 11.9
4.3 0.3 0.2 (100.0)
(0.0) (0.0)
0.00
778
45-49 10.6 82.1 9.7
8.2 0.5 0.1 (100.0)
(0.0) (0.0)
0.00
799
50-54 8.8 77.4 11.8
10.8 0.8 0.3 (100.0)
(0.0) (0.0)
0.00
737
55-64 11.0 75.8 10.1
14.1 0.9 0.4 (100.0)
(0.0) (0.0)
0.07
662
Age group of respondent (the comparison 2010-2019)

379
15-17 23.9 68.4 27.1
4.4 0.0 12.7 92.9
4.8 2.3
0.00
276
18-24 18.2 74.2 23.2
2.6 0.0 2.6 (78.0)
(17.5) (4.5)
0.00
413
25-29 11.5 82.9 13.2
3.8 0.0 0.9 (100.0)
(0.0) (0.0)
0.03
625
30-34 10.2 79.3 9.8
10.9 0.5 0.5 (63.8)
(0.0) (36.2)
0.17
819
35-39 7.0 86.4 6.8
6.8 0.3 0.4 (100.0)
(0.0) (0.0)
0.15
867
40-44 9.5 83.8 11.9
4.3 0.3 0.2 (100.0)
(0.0) (0.0)
0.00
778
45-49 10.6 82.1 9.7
8.2 0.5 0.1 (100.0)
(0.0) (0.0)
0.00
799
50-54 8.8 77.4 11.8
10.8 0.8 0.3 (100.0)
(0.0) (0.0)
0.00
737
55-60 10.2 77.8 9.4
12.8 0.9 0.2 (100.0)
(0.0) (0.0)
0.09
565
61-64 16.0 (68.0) (12.9)
(19.0) 0.8 1.5 (100.0)
(0.0) (0.0)
0.00
97
Household assets index
Lower 9.9 74.5 15.2
10.4 0.8 1.6 (93.4)
(0.0) (6.6)
0.10
1369
Medium 11.0 75.1 14.2
10.7 0.4 1.4 83.6
11.2 5.2
0.07
2434
Higher 12.7 82.9 14.5
2.6 0.3 1.2 (96.4)
(3.6) (0.0)
0.00
2166
Disability status Disability 1 (the level of inclusion is at least one domain/question is coded SOME DIFFICULTY or A LOT OF DIFFICULTY or CANNOT DO AT ALL)

380
No difficulty (in one or more domains)
10.1 79.2 16.6 4.2 0.1 1.2 96.2 3.8 0.0
0.04
3012
Some difficulty 12.
7 76.7 13.1 10.
2 0.7 1.6 85.0 8.7 6.2 0.0
8 2464
A lot of difficulty
11.8 81.8 10.5 7.6 1.0 0.8 (85.6)
(0.0) (14.4)
0.00
477
Cannot do at all
(24.2) (77.1) (22.9)
(0.0) (3.0) (0.0) (0.0)
(0.0) (0.0)
(0.00) 23
Disability 2 (the level of inclusion is at least 2 domains/questions are coded SOME DIFFICULTY or any 1 domain/question is coded A LOT OF DIFFICULTY or CANNOT DO AT ALL)
Without
disability 10.
5 76.4 16.9 6.6 0.2 1.4 91.7 8.3 0.0 0.0
3 4295
With disability 13.
4 81.7 9.9 8.5 0.9 1.2 (86.7) (0.0
) (13.3) 0.1
1 1681
Disability 3 (the level of inclusion is any 1 domain/question is coded A LOT OF DIFFICULTY or CANNOT DO AT ALL)
Without
disability 11.
3 77.9 14.8 7.3 0.4 1.4 90.5 6.3 3.2 0.0
6 5476
With disability
12.3 81.5 11.4
7.1 1.0 0.8 (85.6)
(0.0) (14.4)
0.00
500
* If more than one perpetrator was mentioned, the frequency reported in this table is based on the perpetrator with the highest frequency
** The percentages are based on weighted analysis and all numbers are unweighted.
(xx) Percentages in parentheses are based on fewer than 25 unweighted cases

381
Table 5.2. Percentage of all interviewed women who reported physical violence by non-partners, by number and type of perpetrator (N=5976), Viet Nam 2019
Physical violence since
age 15 years old Physical violence in the
past 12 months Number % Number %
Total 630 11.4 66 1.4
Number of perpetrators
One perpetrator 563 10.1 58 1.2
More than one perpetrator 67 1.2 8 0.2
Type of perpetrator (grouped)
Male family member(s) 223 3.6 19 0.4
Female family member(s) 122 2.1 9 0.2
Male other(s) 159 3.3 19 0.4
Female others(s) 178 3.3 24 0.5
Type of perpetrator (detail)
Father/stepfather 115 1.8 9 0.2
Mother/stepmother 75 1.3 6 0.1
Father in law 10 0.1 2 0.0
Mother in law 16 0.3 1 0.0
Brother 60 1.2 4 0.1

382
Sister 17 0.3 1 0.0
Other male family member 44 0.6 5 0.1
Other female family member 17 0.2 1 0.0
Someone at work - male 7 0.1 1 0.0
Someone at work - female 7 0.1 2 0.0
Friend/acquaintance - male 99 2.3 15 0.3
Friend/acquaintance - female 124 2.3 15 0.4
Recent acquaintance - male 0 0.1 0 0.0
Recent acquaintance - female 5 0.1 2 0.1
Complete stranger - male 30 0.5 3 0.1
Complete stranger - female 11 0.2 1 0.0
Teacher - male 1 0.0 0 0.0
Teacher - female 4 0.1 1 0.0
Doctor/Health staff - male 0 0.0 0 0.0
Doctor/Health staff - female 0 0.0 0 0.0
Religious leader - male 0 0.0 0 0.0
Religious leader - female 0 0.0 0 0.0
Police/Soldier - male 0 0.0 0 0.0
Police/Soldier - female 0 0.0 0 0.0
Other - male 28 0.4 2 0.1
Other - female 33 0.6 5 0.1
* The percentages are based on weighted analysis and all numbers are unweighted.

383
Table 5.3. Prevalence of sexual violence by non-partners since the age of 15 and in the past 12 months, among all women, Viet Nam 2019
Since age 15 Past 12 months
Forced intercourse
(%)
Attempted intercourse or
other unwanted
sexual acts (%)
Any sexual violence
(%)
Forced intercourse
(%)
Attempted intercourse or
other unwanted
sexual acts (%)
Any sexual violence
(%)
Number of women
interviewed (N)
Total 0.6 8.4 9.0 0.1 1.1 1.2 5976
Urban- Rural
Urban 0.6 9.1 9.7 0.0 1.4 1.4 2501
Rural 0.6 8.0 8.6 0.1 1.0 1.1 3475
Division Northern Midlands and Mountains
0.6 7.1 7.7 0.0 0.7 0.7 851
Red River Delta 0.4 11.0 11.4 0.1 1.1 1.2 1248
North and South Central Coast
1.3 9.6 10.7 0.4 1.3 1.6 1147
Central Highlands 0.6 10.1 10.5 0.0 1.6 1.6 597
Southeast 0.7 7.5 8.2 0.0 1.3 1.4 1065
Mekong River Delta 0.2 5.2 5.4 0.0 0.8 0.8 1068
Religion

384
No Religion 0.7 8.8 9.4 0.1 1.1 1.2 4625
Buddhist 0.0 4.8 4.8 0.0 0.7 0.7 643
Catholic 0.8 11.3 12.0 0.1 1.6 1.7 506
Protestant 0.0 5.5 5.5 0.0 0.0 0.0 56
Hoa Hao Buddhist 0.0 1.5 1.5 0.0 0.0 0.0 55
Other 2.9 4.3 7.3 2.9 0.0 2.9 90
Education of respondent
No education 0.7 4.8 5.6 0.1 0.5 0.7 964
Primary 0.7 6.4 7.2 0.0 0.7 0.7 1268
Lower Secondary 0.3 7.1 7.4 0.2 1.4 1.6 1777
Upper Secondary 0.6 11.1 11.7 0.0 1.0 1.0 1078
College 1.6 15.6 17.2 0.0 3.9 3.9 212
University and above 0.9 15.9 16.6 0.0 1.2 1.2 654
Other 0.0 12.2 12.2 0.0 0.0 0.0 23
Ethnicity
Kinh 0.6 8.6 9.2 0.1 1.1 1.2 4963
Tay 0.0 13.2 13.2 0.0 2.1 2.1 143
Thai 0.2 3.1 3.3 0.0 0.0 0.0 165

385
Muong 0.0 13.4 13.4 0.0 1.0 1.0 68
Khmer 0.0 3.9 3.9 0.0 0.6 0.6 115
Chinese 1.9 6.0 7.8 0.0 0.0 0.0 40
Nung 0.0 10.2 10.2 0.0 1.5 1.5 74
Mong 0.0 9.7 9.7 0.0 0.0 0.0 41
Dao 0.0 2.7 2.7 0.0 1.2 1.2 55
Other 1.6 6.4 7.5 0.9 2.1 2.6 310
Age group of respondent
15-19 1.0 8.5 9.1 1.0 4.8 5.4 357
20-24 1.1 16.9 18.0 0.0 3.6 3.6 332
25-29 0.8 13.1 13.9 0.1 1.9 2.0 625
30-34 1.5 10.7 12.2 0.1 0.7 0.8 819
35-39 0.5 7.6 8.1 0.0 0.8 0.8 867
40-44 0.5 5.7 6.1 0.0 0.2 0.2 778
45-49 0.0 6.2 6.2 0.0 0.3 0.3 799
50-54 0.2 7.2 7.3 0.0 0.2 0.2 737
55-64 0.5 5.3 5.8 0.0 0.2 0.2 662

386
Age group of respondent (the comparison 2010-2019)
15-17 0.9 6.1 6.7 0.9 4.5 5.1 276
18-24 1.1 16.8 17.9 0.2 4.1 4.4 413
25-29 0.8 13.1 13.9 0.1 1.9 2.0 625
30-34 1.5 10.7 12.2 0.1 0.7 0.8 819
35-39 0.5 7.6 8.1 0.0 0.8 0.8 867
40-44 0.5 5.7 6.1 0.0 0.2 0.2 778
45-49 0.0 6.2 6.2 0.0 0.3 0.3 799
50-54 0.2 7.2 7.3 0.0 0.2 0.2 737
55-60 0.3 4.5 4.8 0.0 0.2 0.2 565
61-64 2.1 10.2 12.3 0.0 0.0 0.0 97
Household assets index
Lower 0.7 5.4 6.0 0.1 1.3 1.4 1369
Medium 0.7 7.8 8.5 0.2 0.8 1.0 2434
Higher 0.4 10.9 11.3 0.0 1.3 1.3 2166
Disability status Disability 1 (the level of inclusion is at least one domain/question is coded SOME DIFFICULTY or A LOT OF DIFFICULTY or CANNOT DO AT ALL)
No difficulty (in one or more domains)
0.7 8.1 8.8 0.0 1.2 1.2 3012

387
Some difficulty 0.6 8.8 9.3 0.2 1.0 1.1 2464
A lot of difficulty 0.4 8.1 8.4 0.2 1.3 1.5 477
Cannot do at all 3.6 2.4 6.0 0.0 2.4 2.4 23
Disability 2 (the level of inclusion is at least 2 domains/questions are coded SOME DIFFICULTY or any 1 domain/question is coded A LOT OF DIFFICULTY or CANNOT DO AT ALL)
Without disability 0.6 8.3 8.8 0.0 1.2 1.2 4295
With disability 0.7 8.7 9.3 0.3 0.8 1.1 1681
Disability 3 (the level of inclusion is any 1 domain/question is coded A LOT OF DIFFICULTY or CANNOT DO AT ALL)
Without disability 0.6 8.5 9.0 0.1 1.1 1.1 5476
With disability 0.5 7.9 8.4 0.2 1.3 1.6 500
* The percentages are based on weighted analysis and all numbers are unweighted.
(xx) Percentages in parentheses are based on fewer than 25 unweighted cases

388
Table 5.4a. Percentage of all interviewed women who reported sexual violence by non-partners since age 15 and in past 12 months, by frequency, number and type of perpetrator, Viet Nam 2019
Since age 15 Past 12 months
Forced intercourse
Attempted intercourse or other unwanted
sexual acts Forced intercourse
Attempted intercourse or other
unwanted sexual acts
Number % Number % Number % Number %
Total 33 0.6 479 8.4 5 0.1 61 1.1
Frequency*
Once by any one perpetrator 30 0.6 440 7.8 3 0.1 47 0.9
Few times by any perpetrator 1 0.0 34 0.6 1 0.0 12 0.2
Many times by any perpetrator 2 0.0 5 0.1 1 0.0 2 0.0
Number of perpetrators
One perpetrator 32 0.6 447 7.8 5 0.1 59 1.1
More than one perpetrator 1 0.0 32 0.6 0 0.0 2 0.0
Type of perpetrator (grouped)
Male family member(s) 3 0.1 13 0.2 1 0.0 1 0.0

389
Female family member(s) 0 0.0 0 0.0 0 0.0 0 0.0
Male other(s) 30 0.6 463 8.2 4 0.1 57 1.0
Female others(s) 0 0.0 5 0.1 0 0.0 3 0.1
Type of perpetrator (detail)
Father/stepfather 1 0.0 0 0.0 0 0.0 0 0.0
Other male family member 2 0.1 13 0.2 1 0.0 1 0.0
Someone at work - male 0 0.0 27 0.4 0 0.0 5 0.1
Someone at work - female 0 0.0 1 0.0 0 0.0 1 0.0
Friend/acquaintance - male 17 0.3 164 3.0 1 0.0 20 0.4 Friend/acquaintance -
female 0 0.0 3 0.1 0 0.0 2 0.0
Recent acquaintance - male 6 0.1 23 0.4 1 0.0 3 0.1
Complete stranger - male 7 0.1 253 4.4 2 0.0 26 0.4
Teacher - male 0 0.0 3 0.0 0 0.0 0 0.0
Doctor/Health staff - male 0 0.0 5 0.1 0 0.0 2 0.0
Other - male 2 0.0 20 0.5 0 0.0 2 0.0
* If more than one perpetrator was mentioned, the frequency reported in this table is based on the perpetrator with the highest frequency ** The percentages are based on weighted analysis and all numbers are unweighted.

390
Table 5.4.b Place of occurrence of sexual violence by non-partner by type of violence and timing of most recent incident, among women who experienced sexual non-partner violence, Viet Nam 2019
Forced sex (N=33) Attempted intercourse or other unwanted
sexual acts
(N=479)
Any sexual
violence (N=509)
Most recent incident
Total (%) (n=33)
Total (%)
Total (%)
Place of occurrence
Less than one year ago (%)
(n=5)
Between one and five
years ago (%) (n=1)
Longer than five
years ago (%) (n=27)
Own home or yard (63.3
) (0.0) 16.
1 22.
9 13.7 14.
3
His or someone else's home or yard (0.0) (100.0
) 33.
4 31.
5 0.0 2.0
Street, alley, parking lot, car (22.5
) (0.0) 10.
5 11.
9 43.5 41.
3
Public transport (0.0) (0.0) 0.0 0.0 7.2 6.8 Rural areas, woods, park,
campground (0.0) (0.0) 15.
8 12.
4 6.1 6.6
School, college, campus (0.0) (0.0) 0.0 0.0 5.6 5.2
Care institution/prison (0.0) (0.0) 0.0 0.0 0.3 0.3
Bar, dance hall, pool hall (0.0) (0.0) 0.0 0.0 0.0 0.0
Office building, shop, public building (0.0) (0.0) 3.1 2.4 8.8 8.4
Hotel/motel (0.0) (0.0) 11.
4 9.0 1.0 1.6
Other (14.2
) (0.0) 9.6 9.9 13.8 13.
6

391
** The percentages are based on weighted analysis and all numbers are unweighted.
(xx) Percentages in parentheses are based on fewer than 25 unweighted cases

392
Table 5.5. Prevalence of child sexual abuse by non-partners, before the age of 15 years, among all women, Viet Nam 2019
Sexual abuse before age 15
Face to face interview Card Interview or/and card
Number of women
interviewed (N)
Number % Number % Number %
Total 90 1.6 234 4.0 254 4.4 5976
Urban- Rural
Urban 50 2.2 95 3.9 110 4.6 2501
Rural 40 1.3 139 4.1 144 4.3 3475
Division
Northern Midlands and Mountains 3 0.3 36 3.6 36 3.6 851
Red River Delta 36 2.8 68 5.8 75 6.4 1248
North and South Central Coast 13 1.4 40 3.6 43 4.0 1147
Central Highlands 13 2.6 26 4.5 31 5.7 597
Southeast 18 1.8 35 3.4 39 3.8 1065
Mekong River Delta 7 0.8 29 3.1 30 3.2 1068
Religion
No Religion 69 1.5 191 4.1 205 4.4 4625
Buddhist 9 1.4 18 2.7 21 3.1 643
Catholic 11 2.9 18 5.6 21 6.4 506
Protestant 1 4.8 3 7.5 3 7.5 56
Hoa Hao Buddhist 0 0.0 0 0.0 0 0.0 55

393
Other 0 0.0 3 2.1 3 2.1 90
Education of respondent
No education 8 1.1 50 5.9 50 5.9 964
Primary 10 1.1 37 3.3 40 3.8 1268
Lower Secondary 24 1.4 59 3.1 66 3.6 1777
Upper Secondary 18 1.7 36 3.1 38 3.3 1078
College 5 2.2 12 6.0 12 6.0 212
University and above 24 3.9 39 6.8 46 7.8 654
Other 1 (1.8) 1 (3.3) 2 (5.2) 23
Ethnicity
Kinh 83 1.7 183 4.0 202 4.4 4963
Tay 1 0.7 5 4.5 5 4.5 143
Thai 1 1.0 5 2.2 5 2.2 165
Muong 2 1.6 6 6.3 6 6.3 68
Khmer 0 0.0 2 1.2 2 1.2 115
Chinese 0 0.0 0 0.0 0 0.0 40
Nung 1 1.4 6 10.1 6 10.1 74
Mong 0 0.0 1 4.5 1 4.5 41
Dao 0 0.0 7 8.4 7 8.4 55
Other 2 1.0 18 5.4 19 6.0 310
Age group of respondent
15-19 12 3.1 19 4.5 22 5.6 357
20-24 9 2.1 17 5.0 19 5.6 332
25-29 18 2.9 28 5.0 35 6.1 625
30-34 15 2.2 47 6.4 48 6.5 819
35-39 12 1.7 33 3.6 37 4.4 867
40-44 7 0.8 24 3.2 26 3.3 778
45-49 6 0.7 22 2.3 22 2.3 799
50-54 7 1.2 23 3.5 24 3.7 737
55-64 4 0.5 21 4.0 21 4.0 662

394
Household assets index
Lower 10 0.8 61 5.1 64 5.4 1369
Medium 30 1.4 81 3.3 84 3.5 2434
Higher 50 2.2 92 4.3 106 4.9 2166
Disability status
Disability 1 (the level of inclusion is at least one domain/question is coded SOME DIFFICULTY or A LOT OF DIFFICULTY or CANNOT DO AT ALL)
No difficulty (in one or more domains) 48 1.8 105 3.7 118 4.3 3012
Some difficulty 35 1.2 98 3.9 105 4.1 2464
A lot of difficulty 7 1.8 28 6.4 28 6.4 477
Cannot do at all 0 (0.0) 3 (6.7) 3 (6.7) 23
Disability 2 (the level of inclusion is at least 2 domains/questions are coded SOME DIFFICULTY or any 1 domain/question is coded A LOT OF DIFFICULTY or CANNOT DO AT ALL)
Without disability 69 1.7 151 3.6 170 4.1 4295
With disability 21 1.3 83 5.2 84 5.2 1681
Disability 3 (the level of inclusion is any 1 domain/question is coded A LOT OF DIFFICULTY or CANNOT DO AT ALL)
Without disability 83 1.6 203 3.8 223 4.2 5476
With disability 7 1.7 31 6.4 31 6.4 500
* The percentages are based on weighted analysis and all numbers are unweighted.
(xx) Percentages in parentheses are based on fewer than 25 unweighted cases

395
Table 5.6. Percentage of all interviewed women who reported childhood sexual abuse during the interview (not by anonymous card), by frequency, age that it occurred, number and type of perpetrator (N=5976), Viet Nam 2019
Sexual abuse before age 15
years old
Number %
Total 90 1.6
Age of sexual abuse before age 15
0-4 0 0.0
5-9 21 0.3
10-14 69 1.3
Frequency of sexual abuse*
once, twice 79 1.4
few times 6 0.1
many times 5 0.1
Number of perpetrators
One perpetrator 89 1.6
More that one perpetrator 1 0.0
Type of perpetrator (grouped)
Male family member(s) 26 0.4
Female family member(s) 0 0.0

396
Male other(s) 64 1.1
Female others(s) 0 0.0
Type of perpetrator (detail)
Father/stepfather 3 0.04
Brother 1 0.03
Other male family member 22 0.37
Friend/acquaintance - male 32 0.56
Recent acquaintance - male 1 0.01
Complete stranger - male 25 0.48
Other - male 7 0.10
* If more than one perpetrator was mentioned, the frequency reported in this table is based on the perpetrator with the highest frequency ** The percentages are based on weighted analysis and all numbers are unweighted.
Note: the question on perpetrator of child sexual abuse could only be asked of women who reported this form of violence during the interview. The larger number of women who disclosed their experience anonymously using the face card at the end of the interview could not be asked this question.

397
Table 5.7. Overlap of non-partner and partner violence among all women (N=5976), Viet Nam 2019
Non-partner violence
(%) Partner violence*
(%)
Partner or non-partner violence
(%)
Physical violence 11.4 23.6 31.9
Sexual violence 9.0 12.0 18.8
Physical and/or sexual violence 18.0 29.0 40.3
* The prevalence rates for partner violence are slightly lower here compared to the tables in chapter 4 because all women and not all-partnered women are taken as denominator.
** The percentages are based on weighted analysis and all numbers are unweighted.

398
Table 5.8a. Age of first sexual intercourse, among all women, Viet Nam 2019
Not had sex
(%) <15 (%)
15-17 (%)
18-21 (%)
22+ (%)
Refused/ no answer
(%)
Number of women
interviewed
Total 12.8 0.4 6.2 40.4 40.1 0.1 5976
Urban- Rural
Urban 16.1 0.1 2.7 30.9 50.1 0.1 2501
Rural 11.2 0.5 7.9 45.2 35.2 0.0 3475
Division Northern Midlands and
Mountains 9.2 1.4 12.9 44.2 32.3 0.0 851
Red River Delta 12.2 0.2 3.8 44.8 38.9 0.1 1248
North and South Central Coast 11.0 0.3 5.3 40.6 42.7 0.1 1147
Central Highlands 12.4 0.7 14.3 37.4 35.2 0.0 597
Southeast 19.6 0.0 2.7 31.0 46.6 0.1 1065
Mekong River Delta 12.5 0.1 6.2 41.0 40.2 0.0 1068
Religion
No Religion 12.7 0.5 6.2 39.8 40.8 0.0 4625
Buddhist 14.0 0.1 3.9 40.7 41.3 0.0 643
Catholic 14.6 0.0 6.6 44.9 33.8 0.2 506
Protestant 5.1 1.2 36.8 29.4 27.5 0.0 56
Hoa Hao Buddhist 4.8 0.0 3.5 48.1 43.6 0.0 55
Other 7.7 0.0 4.3 49.2 38.7 0.0 90
Education of respondent
No education 4.0 1.3 14.1 50.3 30.3 0.1 964
Primary 5.7 0.4 9.1 48.5 36.3 0.1 1268
Lower Secondary 20.4 0.1 5.3 44.2 30.0 0.0 1777
Upper Secondary 17.2 0.2 1.2 33.5 47.9 0.0 1078

399
College 12.7 0.0 0.8 16.8 69.7 0.0 212
University and above 10.3 0.2 0.2 13.1 76.0 0.1 654
Other (5.8) (0.0) (10.0) (26.4) (57.8) (0.0) 23
Ethnicity
Kinh 13.2 0.1 3.9 39.8 43.0 0.1 4963
Tay 13.6 0.8 4.9 44.7 36.1 0.0 143
Thai 4.1 2.7 27.9 48.4 16.9 0.0 165
Muong 4.6 0.0 8.0 43.2 44.3 0.0 68
Khmer 9.5 0.5 7.9 51.1 31.1 0.0 115
Chinese 47.2 0.0 0.0 15.2 37.6 0.0 40
Nung 6.9 0.3 7.1 45.8 39.9 0.0 74
Mong 28.6 6.2 37.3 23.6 4.3 0.0 41
Dao 1.1 5.1 31.0 55.7 7.1 0.0 55
Other 8.4 2.6 27.5 44.0 17.5 0.0 310
Age group of respondent
15-19 90.2 0.7 7.1 2.0 0.0 0.0 357
20-24 36.5 0.9 14.0 42.3 6.4 0.0 332
25-29 8.8 0.4 6.4 42.7 41.6 0.1 625
30-34 1.8 0.5 7.7 35.7 54.2 0.0 819
35-39 2.1 0.5 5.1 40.2 52.1 0.1 867
40-44 2.1 0.5 6.6 41.3 49.5 0.0 778
45-49 3.7 0.1 4.3 54.1 37.7 0.1 799
50-54 2.8 0.1 4.9 44.2 48.0 0.0 737
55-64 3.8 0.1 4.1 48.7 43.3 0.1 662
Age group of respondent (the comparison 2010-2019)
15-17 95.2 0.3 4.5 0.0 0.0 0.0 276
18-24 45.1 1.2 14.5 34.4 4.9 0.0 413
25-29 8.8 0.4 6.4 42.7 41.6 0.1 625
30-34 1.8 0.5 7.7 35.7 54.2 0.0 819
35-39 2.1 0.5 5.1 40.2 52.1 0.1 867

400
40-44 2.1 0.5 6.6 41.3 49.5 0.0 778
45-49 3.7 0.1 4.3 54.1 37.7 0.1 799
50-54 2.8 0.1 4.9 44.2 48.0 0.0 737
55-60 3.8 0.1 4.0 47.7 44.3 0.1 565
61-64 3.9 0.0 4.6 54.8 36.7 0.0 97
Household assets index
Lower 11.8 1.2 14.2 44.3 28.5 0.0 1369
Medium 12.5 0.1 4.9 41.1 41.2 0.1 2434
Higher 13.8 0.1 2.9 37.3 45.9 0.1 2166
Disability status Disability 1 (the level of inclusion is at least one domain/question is coded SOME DIFFICULTY or A LOT OF DIFFICULTY or CANNOT DO AT ALL)
No difficulty (in one or more
domains) 16.4 0.3 5.6 37.6 40.2 0.0 3012
Some difficulty 9.3 0.4 5.8 43.3 41.3 0.0 2464
A lot of difficulty 9.2 0.9 11.1 43.4 35.2 0.3 477
Cannot do at all (13.8
) (6.2) (21.8) (31.3) (27.0) (0.0) 23
Disability 2 (the level of inclusion is at least 2 domains/questions are coded SOME DIFFICULTY or any 1 domain/question is coded A LOT OF DIFFICULTY or CANNOT DO AT ALL)
Without disability 14.8 0.3 5.9 38.3 40.7 0.0 4295
With disability 8.0 0.5 7.0 45.5 38.8 0.1 1681
Disability 3 (the level of inclusion is any 1 domain/question is coded A LOT OF DIFFICULTY or CANNOT DO AT ALL)
Without disability 13.2 0.3 5.7 40.2 40.7 0.0 5476
With disability 9.3 1.0 11.4 42.9 34.9 0.3 500
* The percentages are based on weighted analysis and all numbers are unweighted.
(xx) Percentages in parentheses are based on fewer than 25 unweighted cases

401
Table 5.8b. Age of first sexual intercourse, among interviewed women who have ever had sex, Viet Nam 2019
<15 (%)
15-17 (%)
18-21 (%)
22+ (%)
Number of interviewed
women who ever had sex
Total 0.4 7.1 46.4 46.1 5390
Urban- Rural
Urban 0.1 3.3 36.8 59.8 2211
Rural 0.6 8.9 50.9 39.6 3179
Division
Northern Midlands and Mountains 1.5 14.2 48.7 35.6 792
Red River Delta 0.2 4.3 51.1 44.4 1133
North and South Central Coast 0.4 5.9 45.7 48.0 1051
Central Highlands 0.8 16.3 42.7 40.2 544
Southeast 0.1 3.4 38.6 58.0 916
Mekong River Delta 0.1 7.0 46.8 46.0 954
Religion
No Religion 0.5 7.1 45.6 46.7 4176
Buddhist 0.1 4.5 47.3 48.0 574
Catholic 0.0 7.8 52.6 39.6 449
Protestant 1.3 38.8 31.0 29.0 54
Hoa Hao Buddhist 0.0 3.7 50.6 45.8 52
Other 0.0 4.7 53.3 42.0 85
Education of respondent
No education 1.3 14.7 52.4 31.6 934
Primary 0.5 9.6 51.5 38.5 1215
Lower Secondary 0.1 6.7 55.6 37.7 1488
Upper Secondary 0.3 1.4 40.5 57.9 940

402
College 0.0 0.9 19.3 79.8 190
University and above 0.2 0.2 14.7 84.8 602
Other (0.0) (10.6) (28.0) (61.4) 21
Ethnicity
Kinh 0.1 4.4 45.8 49.6 4457
Tay 1.0 5.6 51.7 41.7 131
Thai 2.8 29.1 50.5 17.6 158
Muong 0.0 8.4 45.2 46.4 65
Khmer 0.5 8.7 56.4 34.3 105
Chinese 0.0 0.0 28.8 71.2 26
Nung 0.3 7.6 49.2 42.8 68
Mong 8.6 52.3 33.1 6.0 34
Dao 5.1 31.3 56.4 7.2 54
Other 2.9 30.1 48.0 19.1 291
Age group of respondent
15-19 7.3 72.5 20.1 0.0 38
20-24 1.4 22.0 66.5 10.0 221
25-29 0.4 7.1 46.9 45.6 580
30-34 0.5 7.9 36.4 55.2 806
35-39 0.5 5.2 41.1 53.2 856
40-44 0.5 6.7 42.2 50.5 762
45-49 0.1 4.5 56.2 39.2 772
50-54 0.1 5.0 45.5 49.3 716
55-64 0.1 4.2 50.7 45.0 639
Age group of respondent (the comparison 2010-2019)
15-17 (6.6) (93.4) (0.0) (0.0) 13
18-24 2.2 26.3 62.6 8.9 246
25-29 0.4 7.1 46.9 45.6 580
30-34 0.5 7.9 36.4 55.2 806
35-39 0.5 5.2 41.1 53.2 856
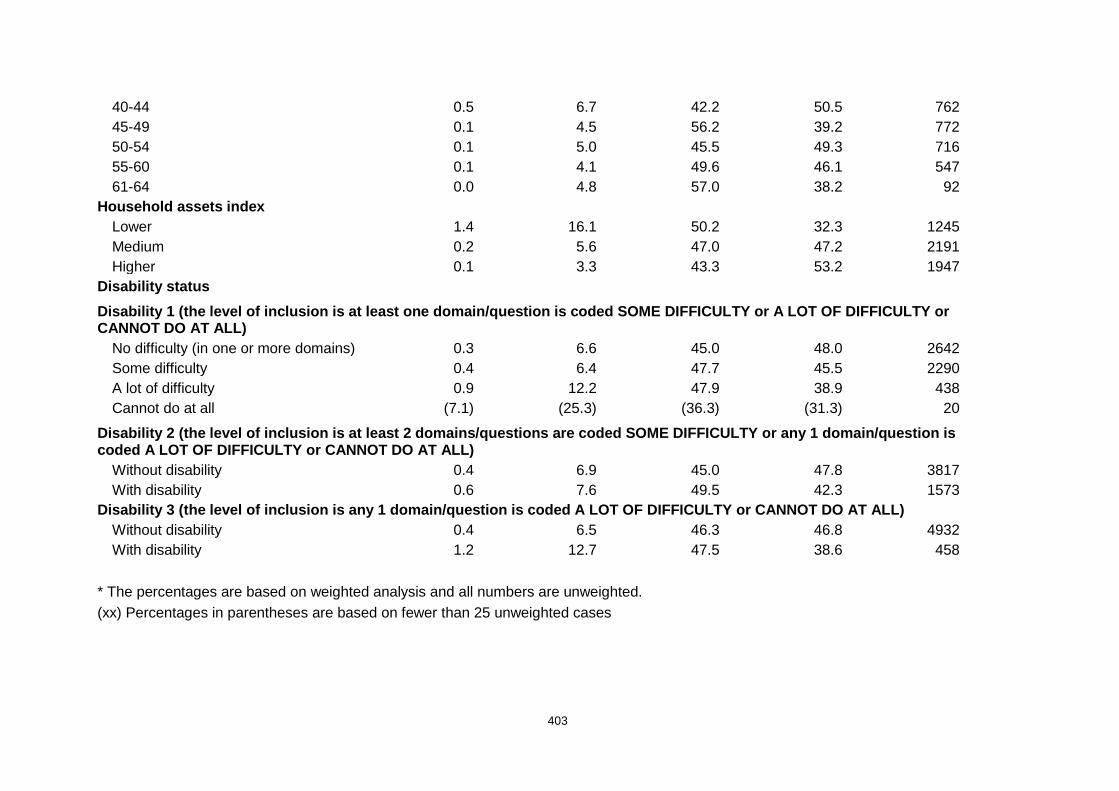
403
40-44 0.5 6.7 42.2 50.5 762
45-49 0.1 4.5 56.2 39.2 772
50-54 0.1 5.0 45.5 49.3 716
55-60 0.1 4.1 49.6 46.1 547
61-64 0.0 4.8 57.0 38.2 92
Household assets index
Lower 1.4 16.1 50.2 32.3 1245
Medium 0.2 5.6 47.0 47.2 2191
Higher 0.1 3.3 43.3 53.2 1947
Disability status
Disability 1 (the level of inclusion is at least one domain/question is coded SOME DIFFICULTY or A LOT OF DIFFICULTY or CANNOT DO AT ALL)
No difficulty (in one or more domains) 0.3 6.6 45.0 48.0 2642
Some difficulty 0.4 6.4 47.7 45.5 2290
A lot of difficulty 0.9 12.2 47.9 38.9 438
Cannot do at all (7.1) (25.3) (36.3) (31.3) 20
Disability 2 (the level of inclusion is at least 2 domains/questions are coded SOME DIFFICULTY or any 1 domain/question is coded A LOT OF DIFFICULTY or CANNOT DO AT ALL)
Without disability 0.4 6.9 45.0 47.8 3817
With disability 0.6 7.6 49.5 42.3 1573
Disability 3 (the level of inclusion is any 1 domain/question is coded A LOT OF DIFFICULTY or CANNOT DO AT ALL)
Without disability 0.4 6.5 46.3 46.8 4932
With disability 1.2 12.7 47.5 38.6 458
* The percentages are based on weighted analysis and all numbers are unweighted.
(xx) Percentages in parentheses are based on fewer than 25 unweighted cases

404
Table 5.9a. Nature of first sexual experience, among women who ever had sex, Viet Nam 2019
Wanted to have sex (%)
Did not want but had sex
(%)
Forced to have sex (%)
Number of interviewed women who ever had sex
Total 95.1 4.1 0.8 5390
Urban- Rural
Urban 96.7 2.6 0.4 2211
Rural 94.3 4.8 0.9 3179
Division
Northern Midlands and Mountains 92.3 7.4 0.2 792
Red River Delta 98.3 0.9 0.8 1133
North and South Central Coast 93.9 4.4 1.5 1051
Central Highlands 95.8 3.4 0.9 544
Southeast 95.6 3.6 0.6 916
Mekong River Delta 93.9 5.7 0.4 954
Religion
No Religion 95.4 3.6 0.9 4176
Buddhist 92.9 6.6 0.5 574
Catholic 95.9 3.9 0.2 449
Protestant 83.3 14.7 2.1 54
Hoa Hao Buddhist 94.2 5.8 0.0 52
Other 94.4 5.6 0.0 85
Education of respondent
No education 92.0 7.1 0.9 934
Primary 94.1 5.4 0.3 1215
Lower Secondary 96.8 2.5 0.6 1488
Upper Secondary 95.9 3.3 0.8 940

405
College 95.0 3.0 1.7 190
University and above 96.7 1.5 1.9 602
Other (92.6) (7.4) (0.0) 21
Ethnicity
Kinh 95.8 3.4 0.7 4457
Tay 88.1 11.9 0.0 131
Thai 95.7 4.3 0.0 158
Muong 97.1 2.9 0.0 65
Khmer 93.8 6.2 0.0 105
Chinese 100.0 0.0 0.0 26
Nung 96.6 2.7 0.7 68
Mong 81.2 18.8 0.0 34
Dao 83.1 16.5 0.4 54
Other 88.4 7.6 4.0 291
Age group of respondent
15-19 77.5 13.6 8.9 38
20-24 88.1 7.4 4.5 221
25-29 96.0 2.4 1.2 580
30-34 95.7 3.1 1.1 806
35-39 96.2 3.1 0.6 856
40-44 97.3 2.1 0.4 762
45-49 94.3 5.5 0.2 772
50-54 95.8 4.1 0.2 716
55-64 94.1 5.8 0.0 639
Age group of respondent (the comparison 2010-2019)
15-17 87.8 12.2 0.0 13
18-24 86.2 8.2 5.6 246
25-29 96.3 2.5 1.2 580
30-34 95.8 3.1 1.1 806
35-39 96.3 3.1 0.6 856

406
40-44 97.5 2.1 0.4 762
45-49 94.3 5.5 0.2 772
50-54 95.8 4.1 0.2 716
55-60 93.5 6.4 0.0 547
61-64 97.7 2.3 0.0 92
Household assets index
Lower 92.3 6.3 1.2 1245
Medium 94.7 4.8 0.4 2191
Higher 97.1 1.9 0.9 1947
Disability status
Disability 1 (the level of inclusion is at least one domain/question is coded SOME DIFFICULTY or A LOT OF DIFFICULTY or CANNOT DO AT ALL)
No difficulty (in one or more domains) 95.8 3.4 0.7 2642
Some difficulty 95.7 3.5 0.7 2290
A lot of difficulty 88.2 10.4 1.1 438
Cannot do at all (98.2) (0.0) (1.8) 20
Disability 2 (the level of inclusion is at least 2 domains/questions are coded SOME DIFFICULTY or any 1 domain/question is coded A LOT OF DIFFICULTY or CANNOT DO AT ALL)
Without disability 95.6 3.6 0.7 3817
With disability 93.8 5.1 1.0 1573
Disability 3 (the level of inclusion is any 1 domain/question is coded A LOT OF DIFFICULTY or CANNOT DO AT ALL)
Without disability 95.7 3.4 0.7 4932
With disability 88.6 10.1 1.1 458
* The percentages are based on weighted analysis and all numbers are unweighted.
(xx) Percentages in parentheses are based on fewer than 25 unweighted cases

407
Table 5.9b. Nature of first sexual experience by age of first sexual intercourse, among women who ever had sex, Viet Nam 2019
Age of first sexual intercourse
Wanted to have sex
(%)
Did not want but had sex
(%)
Forced to have sex
(%)
Number of women
interviewed
Total 95.1 4.1 0.8 5390
<15 (76.2) (0.0) (23.8) 23
15-17 88.7 8.1 3.2 372
18-21 93.9 5.4 0.6 2373
22+ 97.4 2.1 0.4 2622
* The percentages are based on weighted analysis and all numbers are unweighted. (xx) Percentages in parentheses are based on fewer than 25 unweighted cases
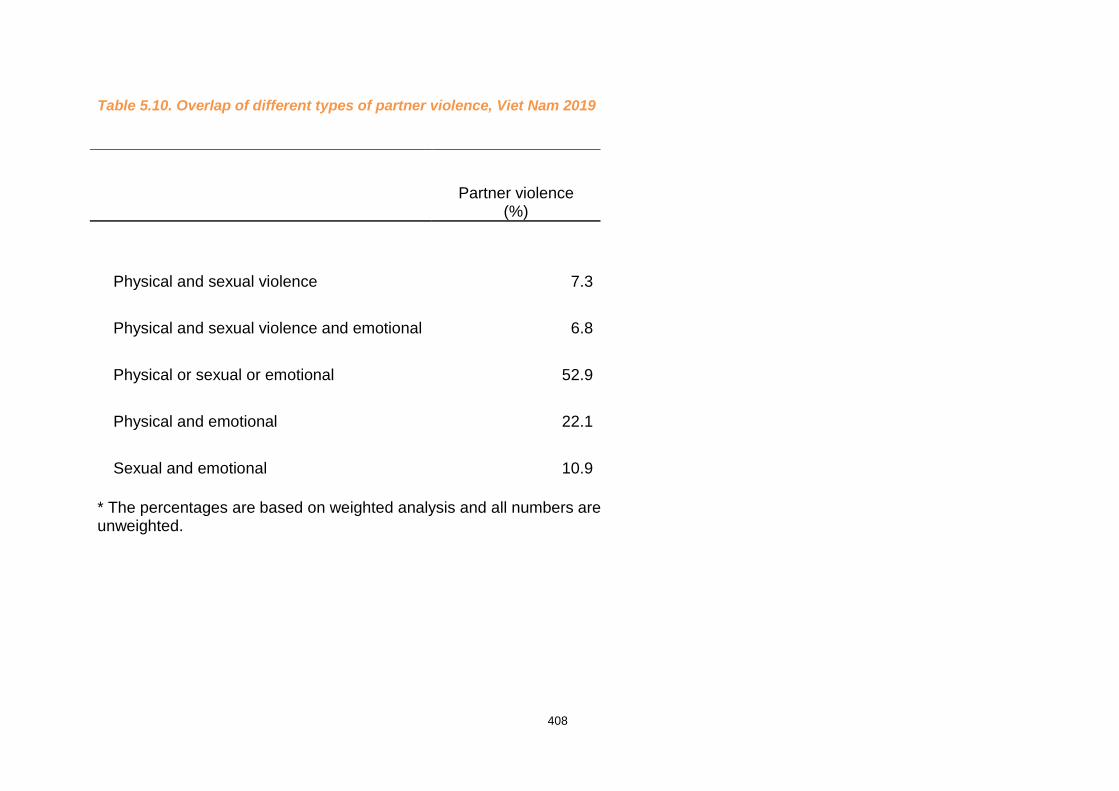
408
Table 5.10. Overlap of different types of partner violence, Viet Nam 2019
Partner violence
(%)
Physical and sexual violence 7.3
Physical and sexual violence and emotional 6.8
Physical or sexual or emotional 52.9
Physical and emotional 22.1
Sexual and emotional 10.9
* The percentages are based on weighted analysis and all numbers are unweighted.

409
Table 5.11. Prevalence of different types of partner and non-partner violence, among women 15-49, 18-60 and 15-64 years old, Viet Nam 2019
Among women 15-49
years old Among women 18-60
years old Among women 15-64
years old
Table with equivalent
data for 15-64
years old
Life time prevalence
(%)
12 month prevalence
(%)
Life time prevalence
(%)
12 month prevalence
(%)
Life time prevalence
(%)
12 month prevalence
(%)
Among ever-partnered women N=4189 N=5404 N=5553
Physical violence by partner 24.6 4.9 26.4 4.8 26.1 4.6 4.1
Sexual violence by partner 12.9 6.4 13.3 5.7 13.3 5.7 4.1
Physical or sexual violence by partner 30.6 9.7 32.4 9.0 32.0 8.9 4.1
Emotional violence by partner 45.8 21.1 47.4 19.6 47.0 19.
3 4.9
Physical or sexual or emotional violence by partner 51.5 23.8 53.2 22.0 52.9
21.8
Figure 4.18
Controlling behaviours by partner 29.7 14.5 26.7 12.5 27.3 12.
9
Psychological violence (Emotional violence or controlling behaviours) by partner 56.7 28.8 55.8 25.9 56.1
26.0
Physical or sexual or psychological violence by partner 60.4 30.7 60.0 27.7 60.2
27.8
Among ever-pregnant women N=3902 N=5140 N=5236
Physical violence in pregnancy 3.2 na 3.3 na 3.4 na 4.5

410
Among all women N=4577 N=5603 N=5976
Physical violence since age 15 by non-partner 11.9 1.7 10.4 0.5 11.4 1.4
5.1, 5.4
Sexual violence since age 15 by non-partner 9.8 1.5 9.1 0.9 9.0 1.2
5.2 (sex violence
combined), 5.4
Physical or sexual violence by non-partner since age 15 19.2 3.1 17.2 1.5 18.0 2.4
5.4 (first column)
Physical violence by partner (among all women) 21.7 4.4 25.2 4.6 23.6 4.2
5.4
Sexual violence by partner (among all women) 11.4 5.6 12.7 5.4 12.0 5.2
5.4
Physical or sexual violence by partner (among all women) 27.1 8.6 31.0 8.6 29.0 8.1
5.4
Physical or sexual violence by partner or non-partner since age 15 35.4 10.2 37.5 9.0 36.7 9.3
5.4
Child sexual abuse before age 15 4.6 na 4.4 na 4.4 na
5.5 (interview or card)
* The percentages are based on weighted analysis and all numbers are unweighted.
na: Not apply

411
Table 5.12. Prevalence of sexual harassment, among all women, Viet Nam 2019
Lifetime
Asked to perform
sexual acts to get a job, keep a job or be promoted
(%)
Asked to perform
sexual acts to pass an
exam or get good grades
at school (%)
Groped or touched
sexually on a bus or other public place
(%)
Received unwanted personal electronic messages with sexual content (%)
Any form of sexual
harassment (%)
Number of women
interviewed (N)
Total 0.4 0.2 4.9 7.6 11.4 5976
Urban- Rural
Urban 0.6 0.2 7.7 10.8 16.6 2501
Rural 0.2 0.1 3.4 6.1 8.7 3475
Division
Northern Midlands and Mountains 0.4 0.2 3.1 5.4 7.6 851
Red River Delta 0.4 0.4 7.2 8.0 13.6 1248
North and South Central Coast 0.3 0.2 5.2 7.1 11.0 1147
Central Highlands 0.4 0.1 4.8 8.7 13.1 597
Southeast 0.2 0.0 5.8 11.9 16.0 1065
Mekong River Delta 0.4 0.0 2.1 5.5 7.3 1068
Religion
No Religion 0.3 0.2 5.1 7.4 11.3 4625
Buddhist 0.8 0.0 3.4 7.9 10.7 643
Catholic 0.0 0.1 5.2 10.1 14.2 506
Protestant 0.0 0.0 8.4 12.9 17.6 56
Hoa Hao Buddhist 0.0 0.0 0.0 2.7 2.7 55
Other 0.0 0.0 1.1 3.5 4.6 90

412
Education of respondent
No education 0.3 0.0 1.6 1.9 3.6 964
Primary 0.0 0.3 2.2 3.5 5.3 1268
Lower Secondary 0.1 0.0 3.9 7.9 11.1 1777
Upper Secondary 1.0 0.0 6.8 12.5 16.9 1078
College 1.7 1.1 11.7 13.8 23.3 212
University and above 0.5 0.5 14.0 15.5 25.7 654
Other (0.0) (0.0) (0.0) (1.3) (1.3) 23
Ethnicity
Kinh 0.4 0.1 5.3 7.7 11.7 4963
Tay 0.0 1.3 3.0 6.6 9.6 143
Thai 0.0 0.0 2.3 4.4 6.7 165
Muong 0.0 0.0 10.1 16.5 22.0 68
Khmer 0.0 0.0 0.0 9.9 9.9 115
Chinese 0.0 0.0 7.6 7.4 12.3 40
Nung 0.0 0.7 3.8 6.1 9.2 74
Mong 0.0 0.0 0.0 0.0 0.0 41
Dao 0.0 0.0 0.0 4.6 4.6 55
Other 0.6 0.5 1.6 7.5 8.2 310
Age group of respondent
15-19 0.6 0.3 5.1 20.4 22.9 357
20-24 0.4 0.0 5.2 16.9 19.8 332
25-29 0.4 0.4 8.2 14.9 21.3 625
30-34 0.6 0.1 7.7 12.1 17.0 819
35-39 0.5 0.2 4.0 4.9 8.5 867
40-44 0.2 0.0 3.6 4.0 7.2 778
45-49 0.2 0.0 3.4 2.3 5.0 799
50-54 0.1 0.2 4.1 2.3 6.1 737

413
55-64 0.5 0.3 3.5 2.1 5.2 662
Age group of respondent (the comparison 2010-2019)
15-17 0.0 0.0 4.4 19.8 21.6 276
18-24 0.9 0.3 5.7 18.1 21.5 413
25-29 0.4 0.4 8.2 14.9 21.3 625
30-34 0.6 0.1 7.7 12.1 17.0 819
35-39 0.5 0.2 4.0 4.9 8.5 867
40-44 0.2 0.0 3.6 4.0 7.2 778
45-49 0.2 0.0 3.4 2.3 5.0 799
50-54 0.1 0.2 4.1 2.3 6.1 737
55-60 0.5 0.3 3.3 2.4 5.2 565
61-64 0.5 (0.0) (4.9) (0.0) 5.4 97
Household assets index
Lower 0.1 0.2 1.5 4.2 5.4 1369
Medium 0.4 0.1 4.0 6.6 10.1 2434
Higher 0.4 0.2 7.8 10.9 16.3 2166
Disability status
Disability 1 (the level of inclusion is at least one domain/question is coded SOME DIFFICULTY or A LOT OF DIFFICULTY or CANNOT DO AT ALL)
No difficulty (in one or more domains) 0.3 0.1 5.5 8.5 12.7 3012
Some difficulty 0.4 0.1 4.2 7.3 10.6 2464
A lot of difficulty 0.5 0.6 4.5 3.7 6.8 477
Cannot do at all (0.0) (0.0) (0.0) (20.0) (20.0) 23
Disability 2 (the level of inclusion is at least 2 domains/questions are coded SOME DIFFICULTY or any 1 domain/question is coded A LOT OF DIFFICULTY or CANNOT DO AT ALL)
Without disability 0.3 0.1 5.2 8.5 12.4 4295
With disability 0.6 0.3 4.2 5.8 8.7 1681
Disability 3 (the level of inclusion is any 1 domain/question is coded A LOT OF DIFFICULTY or CANNOT DO AT ALL)

414
Without disability 0.3 0.1 4.9 8.0 11.8 5476
With disability 0.4 0.6 4.4 4.3 7.3 500
** The percentages are based on weighted analysis and all numbers are unweighted.
(xx) Percentages in parentheses are based on fewer than 25 unweighted cases
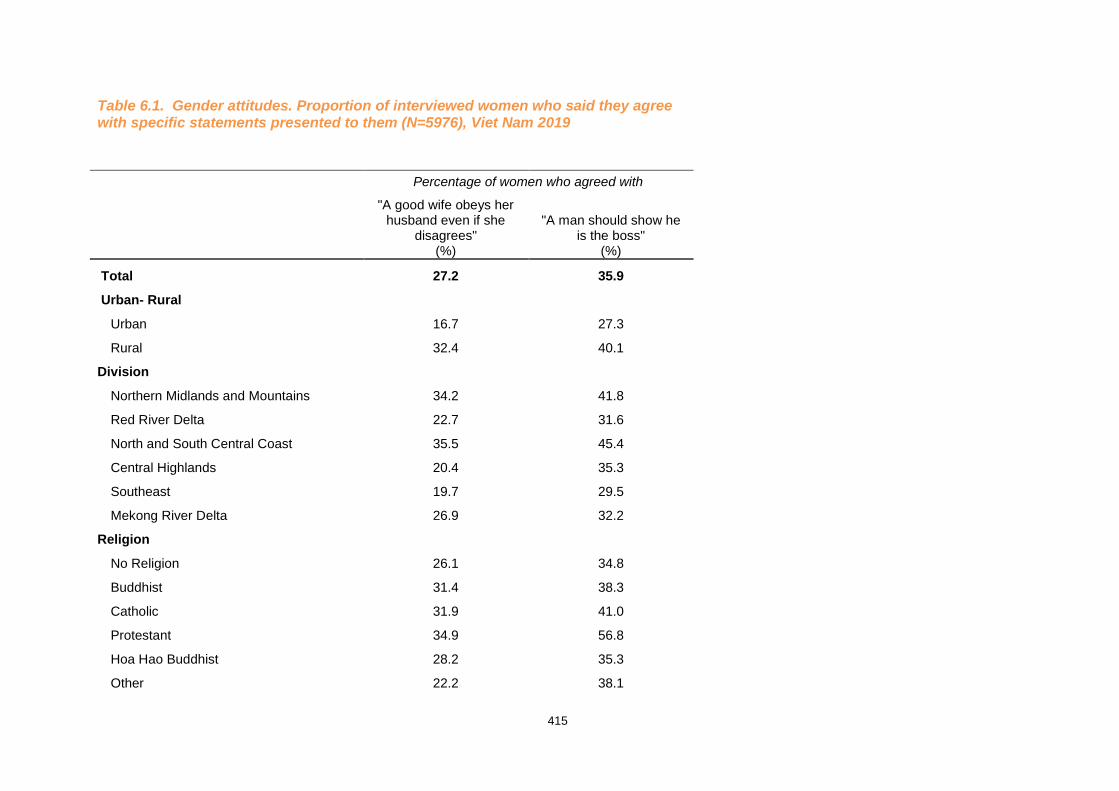
415
Table 6.1. Gender attitudes. Proportion of interviewed women who said they agree with specific statements presented to them (N=5976), Viet Nam 2019
Percentage of women who agreed with
"A good wife obeys her husband even if she
disagrees" (%)
"A man should show he is the boss"
(%)
Total 27.2 35.9
Urban- Rural
Urban 16.7 27.3
Rural 32.4 40.1
Division
Northern Midlands and Mountains 34.2 41.8
Red River Delta 22.7 31.6
North and South Central Coast 35.5 45.4
Central Highlands 20.4 35.3
Southeast 19.7 29.5
Mekong River Delta 26.9 32.2
Religion
No Religion 26.1 34.8
Buddhist 31.4 38.3
Catholic 31.9 41.0
Protestant 34.9 56.8
Hoa Hao Buddhist 28.2 35.3
Other 22.2 38.1

416
Education of respondent
No education 49.2 50.9
Primary 34.0 41.8
Lower Secondary 27.6 38.3
Upper Secondary 15.0 24.7
College 5.0 16.4
University and above 3.0 15.5
Other (29.5) (36.0)
Ethnicity
Kinh 25.1 33.7
Tay 30.1 50.1
Thai 45.0 48.5
Muong 31.7 43.4
Khmer 41.9 40.9
Chinese 6.8 20.6
Nung 21.9 32.9
Mong 65.5 62.6
Dao 51.9 49.2
Other 39.8 53.4
Age group of respondent
15-19 12.3 20.6
20-24 12.5 21.8
25-29 12.8 27.0
30-34 19.9 28.3
35-39 21.6 33.4

417
40-44 31.2 36.6
45-49 34.7 45.8
50-54 41.3 47.1
55-64 41.9 47.0
Age group of respondent (the comparison 2010-2019)
15-17 13.7 21.8
18-24 11.4 20.6
25-29 12.8 27.0
30-34 19.9 28.3
35-39 21.6 33.4
40-44 31.2 36.6
45-49 34.7 45.8
50-54 41.3 47.1
55-60 41.8 46.6
61-64 42.6 49.6
Household assets index
Lower 37.0 45.2
Medium 29.8 37.2
Higher 18.6 29.0
Disability status
Disability 1 (the level of inclusion is at least one domain/question is coded SOME DIFFICULTY or A LOT OF DIFFICULTY or CANNOT DO AT ALL)
No difficulty (in one or more domains) 20.0 30.7
Some difficulty 32.3 39.0

418
A lot of difficulty 43.3 50.1
Cannot do at all (46.7) (43.6) Disability 2 (the level of inclusion is at least 2 domains/questions are coded SOME DIFFICULTY or any 1 domain/question is coded A LOT OF DIFFICULTY or CANNOT DO AT ALL)
Without disability 22.6 31.9
With disability 38.2 45.2
Disability 3 (the level of inclusion is any 1 domain/question is coded A LOT OF DIFFICULTY or CANNOT DO AT ALL)
Without disability 25.6 34.5
With disability 43.4 49.9
According to experience of partner violence (N=5553)
All ever-partnered women
No violence 27.2 35.0
Sexual and/or physical 32.2 42.2
* The percentages are based on weighted analysis and all numbers are unweighted.
(xx) Percentages in parentheses are based on fewer than 25 unweighted cases

419
Table 6.2. Attitudes around physical partner violence. Proportion of interviewed women who said they agree that a man has good reason to hit his wife for reasons stated below (N=5976), Viet Nam 2019
Percentage of women who agree that a man has a good reason to hit his wife if: Percentage of women who
agree with:
"Reason to hit: not
complete housework"
(%)
"Reason to hit: wife disobeys
him" (%)
"Reason to hit: wife
refuses sex" (%)
"Reason to hit: wife
asks about girl friends"
(%)
"Reason to hit: husband
suspects wife
unfaithful" (%)
"Reason to hit:
husband finds out
wife unfaithful"
(%)
"Reason to hit: wife does not take care of children"
(%)
One or more of the
reasons mentioned
(%)
None of the reasons
mentioned (%)
Total 9.3 12.2 7.7 4.1 7.2 45.2 27.0 51.8 48.2
Urban- Rural
Urban 5.4 7.2 4.6 1.9 4.7 34.7 20.9 40.6 59.4
Rural 11.3 14.7 9.3 5.3 8.4 50.4 30.0 57.4 42.6
Division
Northern Midlands and Mountains 8.4 11.8 7.4 5.3 6.3 36.3 23.8 44.7 55.3
Red River Delta 7.3 10.4 5.7 1.3 4.8 40.0 21.8 45.3 54.7
North and South Central Coast 14.0 19.8 11.0 7.5 10.7 55.2 36.5 63.5 36.5
Central Highlands 12.7 12.0 7.0 5.8 6.2 46.9 33.4 53.7 46.3
Southeast 5.6 6.5 4.5 2.7 7.3 35.3 22.2 42.4 57.6
Mekong River Delta 9.5 11.3 9.7 4.0 7.2 54.0 27.3 58.9 41.1
Religion
No Religion 8.9 11.9 7.6 3.9 6.7 44.9 26.5 51.8 48.2
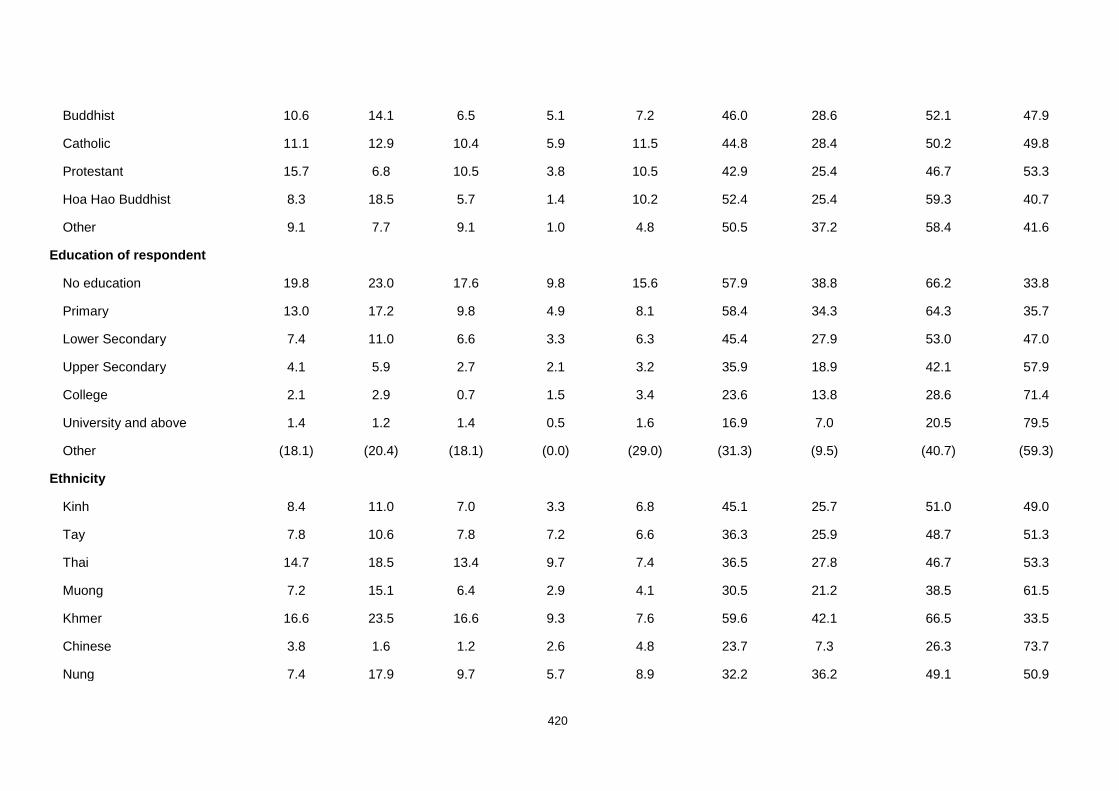
420
Buddhist 10.6 14.1 6.5 5.1 7.2 46.0 28.6 52.1 47.9
Catholic 11.1 12.9 10.4 5.9 11.5 44.8 28.4 50.2 49.8
Protestant 15.7 6.8 10.5 3.8 10.5 42.9 25.4 46.7 53.3
Hoa Hao Buddhist 8.3 18.5 5.7 1.4 10.2 52.4 25.4 59.3 40.7
Other 9.1 7.7 9.1 1.0 4.8 50.5 37.2 58.4 41.6
Education of respondent
No education 19.8 23.0 17.6 9.8 15.6 57.9 38.8 66.2 33.8
Primary 13.0 17.2 9.8 4.9 8.1 58.4 34.3 64.3 35.7
Lower Secondary 7.4 11.0 6.6 3.3 6.3 45.4 27.9 53.0 47.0
Upper Secondary 4.1 5.9 2.7 2.1 3.2 35.9 18.9 42.1 57.9
College 2.1 2.9 0.7 1.5 3.4 23.6 13.8 28.6 71.4
University and above 1.4 1.2 1.4 0.5 1.6 16.9 7.0 20.5 79.5
Other (18.1) (20.4) (18.1) (0.0) (29.0) (31.3) (9.5) (40.7) (59.3)
Ethnicity
Kinh 8.4 11.0 7.0 3.3 6.8 45.1 25.7 51.0 49.0
Tay 7.8 10.6 7.8 7.2 6.6 36.3 25.9 48.7 51.3
Thai 14.7 18.5 13.4 9.7 7.4 36.5 27.8 46.7 53.3
Muong 7.2 15.1 6.4 2.9 4.1 30.5 21.2 38.5 61.5
Khmer 16.6 23.5 16.6 9.3 7.6 59.6 42.1 66.5 33.5
Chinese 3.8 1.6 1.2 2.6 4.8 23.7 7.3 26.3 73.7
Nung 7.4 17.9 9.7 5.7 8.9 32.2 36.2 49.1 50.9

421
Mong 11.0 14.2 20.6 16.7 17.9 54.7 32.8 64.3 35.7
Dao 18.3 21.1 2.1 5.1 7.4 29.2 30.9 48.4 51.6
Other 20.1 24.4 14.2 9.8 13.1 59.8 43.7 70.3 29.7
Age group of respondent
15-19 4.9 8.2 2.4 3.6 4.8 28.9 20.2 38.0 62.0
20-24 4.7 7.9 4.6 4.8 5.1 36.3 24.5 44.0 56.0
25-29 3.5 4.6 1.9 2.2 4.5 37.0 19.5 42.5 57.5
30-34 7.1 8.5 5.8 3.7 6.3 44.3 22.7 51.9 48.1
35-39 7.9 8.6 5.6 2.6 6.5 46.5 26.2 51.1 48.9
40-44 9.3 14.3 7.4 4.2 6.1 46.6 26.8 54.6 45.4
45-49 12.4 15.4 10.6 4.3 9.4 51.2 32.1 57.8 42.2
50-54 13.9 17.5 11.4 6.0 9.2 52.3 31.5 58.1 41.9
55-64 14.7 19.2 14.7 5.4 10.0 51.2 33.3 57.2 42.8 Age group of respondent (the comparison 2010-2019)
15-17 4.3 7.2 2.0 3.0 3.8 27.7 17.1 36.3 63.7
18-24 5.3 8.8 4.4 5.0 5.8 35.5 25.9 44.0 56.0
25-29 3.5 4.6 1.9 2.2 4.5 37.0 19.5 42.5 57.5
30-34 7.1 8.5 5.8 3.7 6.3 44.3 22.7 51.9 48.1
35-39 7.9 8.6 5.6 2.6 6.5 46.5 26.2 51.1 48.9
40-44 9.3 14.3 7.4 4.2 6.1 46.6 26.8 54.6 45.4

422
45-49 12.4 15.4 10.6 4.3 9.4 51.2 32.1 57.8 42.2
50-54 13.9 17.5 11.4 6.0 9.2 52.3 31.5 58.1 41.9
55-60 13.2 18.5 14.1 5.4 9.8 50.2 33.0 56.7 43.3
61-64 23.7 23.3 18.7 5.4 11.4 57.1 35.5 60.4 39.6
Household assets index
Lower 12.8 17.0 11.9 7.3 11.0 56.0 35.4 64.2 35.8
Medium 11.0 14.2 8.7 4.5 7.7 47.6 29.8 55.7 44.3
Higher 5.5 7.3 4.3 1.9 4.4 35.9 19.0 40.1 59.9
Disability status Disability 1 (the level of inclusion is at least one domain/question is coded SOME DIFFICULTY or A LOT OF DIFFICULTY or CANNOT DO AT ALL)
No difficulty (in one or more domains) 6.3 8.3 5.9 2.8 5.5 39.3 22.5 44.9 55.1
Some difficulty 11.8 14.8 8.8 5.0 8.3 50.0 30.8 57.5 42.5
A lot of difficulty 14.6 21.6 12.6 7.8 11.4 56.3 34.7 64.6 35.4
Cannot do at all (12.4) (19.1) (13.3) (4.7) (9.7) (23.7) (22.2) (26.3) (73.7) Disability 2 (the level of inclusion is at least 2 domains/questions are coded SOME DIFFICULTY or any 1 domain/question is coded A LOT OF DIFFICULTY or CANNOT DO AT ALL)
Without disability 7.8 9.5 6.0 3.5 5.8 41.5 24.2 47.7 52.3
With disability 12.9 18.7 11.7 5.8 10.5 53.8 33.5 61.5 38.5 Disability 3 (the level of inclusion is any 1 domain/question is coded A LOT OF DIFFICULTY or CANNOT DO AT ALL)
Without disability 8.8 11.3 7.2 3.8 6.8 44.2 26.3 50.7 49.3
With disability 14.6 21.5 12.6 7.6 11.4 55.2 34.2 63.3 36.7

423
According to experience of partner violence (N=5553)
All ever-partnered women
No violence 8.7 11.2 6.9 4.0 7.1 42.3 24.5 48.7 51.3
Sexual and/or physical 11.8 15.9 11.0 4.9 8.3 56.5 35.5 63.7 36.3
* The percentages are based on weighted analysis and all numbers are unweighted. (xx) Percentages in parentheses are based on fewer than 25 unweighted cases

424
Table 6.3. Situations leading to violence among women who ever experienced physical partner violence (N=1471), Viet Nam 2019
No particular reason
(%)
Partner drunk
(%)
Money problem
s (%)
Problem with work (%)
Un-employe
d (%)
No food
at home (%)
Family problem
(%)
She is pregnant
(%)
Jealousy
(%)
Refuses sex (%)
Dis-obedien
t (%)
Wants to
teach her a lesson (%)
Show he is boss (%)
Other problem
s (%)
Total 4.5 40.9 18.8 7.3 3.0 4.5 50.8 0.2 7.3 1.5 4.2 4.3 5.0 16.6
Urban- Rural
Urban 4.5 37.0 18.3 6.8 3.3 2.3 49.6 0.0 7.3 0.8 3.9 2.6 5.2 16.4
Rural 4.6 42.4 19.0 7.5 2.9 5.3 51.2 0.2 7.3 1.8 4.3 4.9 4.9 16.6
Division
Northern Midlands and Mountains 3.9 39.3 11.9 5.3 2.9 6.1 50.7 0.9 9.3 3.5 1.8 3.2 3.6 21.1
Red River Delta 4.1 23.8 26.5 11.1 1.9 6.2 63.0 0.0 5.7 1.7 2.6 3.1 5.3 21.3
North and South Central Coast 6.2 44.0 12.8 7.5 4.3 4.9 46.3 0.0 6.2 0.6 6.5 1.8 3.1 13.5
Central Highlands 3.3 52.4 20.4 6.5 3.2 1.7 52.7 0.0 10.3 2.8 10.0 14.9 11.3 6.8
Southeast 4.2 45.8 18.0 5.6 4.0 4.5 43.3 0.0 8.8 0.3 1.8 3.5 5.2 10.8
Mekong River Delta 4.4 59.9 18.1 3.3 2.4 0.8 38.8 0.3 7.6 1.2 4.6 5.5 4.5 18.3
Religion
No Religion 4.4 39.8 17.7 7.7 2.9 4.8 51.6 0.2 7.3 1.7 4.1 4.2 4.1 17.2
Buddhist 5.4 50.2 22.0 4.5 0.7 0.8 42.1 0.0 6.2 1.4 6.1 3.3 9.4 9.9
Catholic 3.9 36.1 27.1 7.8 5.9 6.5 58.7 0.0 7.4 0.0 2.9 3.7 8.6 17.8
Protestant (20.4) (49.6) (0.0) (3.8) (0.0) (0.0) (41.7) (0.0) (16.6) (9.2) (9.6) (13.2) (13.2) (17.7)
Hoa Hao Buddhist (0.0) (100.0) (0.0) (0.0) (0.0) (0.0) (0.0) (0.0) (0.0) (0.0) (0.0) (0.0) (0.0) (0.0)
Other 2.8 57.5 18.0 5.5 4.8 2.9 27.1 0.0 11.2 0.0 3.8 12.8 0.0 17.9

425
Education of respondent
No education 6.1 54.0 15.7 4.1 1.8 4.7 36.6 0.6 6.5 1.0 4.2 5.6 3.1 14.6
Primary 4.4 46.3 17.4 6.1 2.9 4.9 51.6 0.0 7.5 1.3 3.4 4.1 5.6 20.0
Lower Secondary 2.7 35.4 24.1 9.8 3.9 6.2 55.1 0.1 7.4 2.4 4.6 3.8 4.2 16.6
Upper Secondary 5.8 28.9 15.8 8.1 2.4 1.8 60.8 0.0 4.7 0.7 6.2 5.1 6.2 14.3
College 10.2 22.1 15.7 6.4 8.5 0.0 35.7 0.0 18.5 2.7 1.4 1.4 12.3 10.7
University and above 4.8 30.6 18.5 10.2 1.3 0.0 53.1 0.0 12.8 0.6 2.1 2.1 4.0 16.0
Other (0.0) (93.3) (0.0) (0.0) (0.0) (0.0) (47.8) (0.0) (0.0) (0.0) (0.0) (0.0) (28.0) (0.0)
Ethnicity
Kinh 4.5 38.1 19.8 8.0 3.1 4.3 52.8 0.1 6.7 1.4 4.0 4.4 5.6 17.5
Tay (0.0) (65.2) (8.4) (5.8) (3.6) (23.8) (42.2) (3.6) (2.8) (0.0) (0.0) (0.0) (0.0) (5.3)
Thai 0.0 79.7 10.2 5.7 0.0 3.2 24.4 0.0 11.7 0.0 0.0 0.0 0.0 9.7
Muong (0.0) (48.7) (15.5) (0.0) (0.0) (0.0) (29.9) (0.0) (7.9) (10.8) (4.6) (0.0) (0.0) (21.0)
Khmer (0.0) (32.8) (28.1) (0.0) (0.0) (0.0) (63.6) (0.0) (19.2) (4.4) (15.7) (4.4) (0.0) (6.8)
Chinese (0.0) (52.3) (15.1) (0.0) (14.8) (0.0) (14.8) (0.0) (5.4) (0.0) (0.0) (0.0) (0.0) (0.0)
Nung (6.5) (40.9) (19.9) (1.3) (6.8) (1.3) (38.5) (0.0) (6.8) (3.4) (6.6) (0.0) (4.8) (23.7)
Mong (15.2) (0.0) (0.0) (0.0) (0.0) (0.0) (47.0) (0.0) (6.4) (0.0) (15.2) (0.0) (0.0) (31.5)
Dao (0.0) (42.8) (9.8) (2.5) (2.5) (19.7) (42.3) (0.0) (12.1) (0.0) (0.0) (0.0) (0.0) (5.0)
Other 7.8 61.2 12.2 4.6 2.3 4.2 40.6 0.0 12.7 1.3 5.9 6.6 2.9 11.1 Age group of respondent
15-19 (0.0) (60.9) (0.0) (0.0) (0.0) (0.0) (56.5) (0.0) (67.1) (0.0) (16.8) (45.3) (0.0) (0.0)
20-24 13.5 23.1 19.5 9.1 2.9 0.0 51.9 0.0 3.9 7.3 14.5 0.7 3.7 10.1
25-29 2.6 35.3 17.5 3.4 4.4 2.0 49.0 0.0 8.6 1.4 5.3 3.5 3.0 11.2
30-34 6.1 43.8 19.2 6.3 5.2 3.9 56.2 0.4 8.8 1.2 2.5 4.9 3.9 13.0
35-39 6.0 40.4 18.3 10.4 1.4 2.7 48.2 0.4 7.5 0.0 5.7 7.8 4.3 12.9

426
40-44 6.1 37.9 16.4 5.5 2.0 4.4 49.7 0.3 4.5 0.7 3.8 3.3 4.7 19.0
45-49 2.8 48.6 17.0 8.5 3.7 5.8 48.0 0.0 9.7 1.4 3.9 4.1 6.4 16.6
50-54 3.8 44.0 17.7 8.7 3.9 5.0 48.4 0.0 6.2 1.6 1.9 2.8 2.6 20.5
55-64 2.2 37.2 25.6 6.3 1.3 6.9 55.9 0.0 6.3 2.7 4.1 3.4 9.2 20.5 Age group of respondent (the comparison 2010-2019)
15-17 0.0 0.0 0.0 0.0 0.0 0.0 0.0 0.0 100.0 0.0 100.0 100.0 0.0 0.0
18-24 12.3 27.4 17.9 8.4 2.6 0.0 53.3 0.0 8.7 6.7 13.2 3.5 3.4 9.3
25-29 2.6 35.3 17.5 3.4 4.4 2.0 49.0 0.0 8.6 1.4 5.3 3.5 3.0 11.2
30-34 6.1 43.8 19.2 6.3 5.2 3.9 56.2 0.4 8.8 1.2 2.5 4.9 3.9 13.0
35-39 6.0 40.4 18.3 10.4 1.4 2.7 48.2 0.4 7.5 0.0 5.7 7.8 4.3 12.9
40-44 6.1 37.9 16.4 5.5 2.0 4.4 49.7 0.3 4.5 0.7 3.8 3.3 4.7 19.0
45-49 2.8 48.6 17.0 8.5 3.7 5.8 48.0 0.0 9.7 1.4 3.9 4.1 6.4 16.6
50-54 3.8 44.0 17.7 8.7 3.9 5.0 48.4 0.0 6.2 1.6 1.9 2.8 2.6 20.5
55-60 2.2 37.9 24.9 4.7 1.5 6.4 55.0 0.0 6.8 3.1 4.3 3.9 10.4 20.1
61-64 1.8 32.6 30.2 17.0 0.0 10.3 62.1 0.0 2.5 0.0 2.4 0.0 1.5 22.9 Household assets index
Lower 4.6 58.8 17.1 4.0 1.9 4.1 38.8 0.5 9.3 3.1 5.4 5.8 4.3 16.7
Medium 5.0 40.9 19.6 7.4 4.0 4.7 52.0 0.1 6.1 1.1 4.5 4.4 4.1 15.2
Higher 4.0 28.3 19.2 9.5 2.6 4.5 57.8 0.0 7.3 0.9 3.1 3.1 6.4 17.9
Disability status Disability 1 (the level of inclusion is at least one domain/question is coded SOME DIFFICULTY or A LOT OF DIFFICULTY or CANNOT DO AT ALL)
No difficulty (in one or more domains) 5.6 38.7 17.0 7.4 3.0 1.8 53.3 0.2 6.5 1.4 3.1 2.7 4.3 16.0
Some difficulty 3.8 40.3 18.7 8.5 3.1 5.4 48.6 0.0 8.2 1.5 5.1 5.0 6.0 14.4
A lot of difficulty 3.7 51.4 25.9 2.5 2.6 9.8 50.7 0.5 6.7 2.0 4.4 6.5 3.6 27.6
Cannot do at all (0.0) (0.0) (0.0) (0.0) (0.0) (0.0) (100.0) (0.0) (0.0) (0.0) (0.0) (0.0) (0.0) (0.0)

427
Disability 2 (the level of inclusion is at least 2 domains/questions are coded SOME DIFFICULTY or any 1 domain/question is coded A LOT OF DIFFICULTY or CANNOT DO AT ALL)
Without disability 5.0 38.0 17.3 7.1 2.8 2.0 50.8 0.2 7.1 1.5 3.5 4.2 4.8 15.4
With disability 3.8 45.6 21.3 7.7 3.3 8.4 50.7 0.2 7.6 1.4 5.4 4.3 5.3 18.4 Disability 3 (the level of inclusion is any 1 domain/question is coded A LOT OF DIFFICULTY or CANNOT DO AT ALL)
Without disability 4.7 39.6 17.9 8.0 3.1 3.8 50.7 0.1 7.4 1.4 4.2 4.0 5.2 15.1
With disability 3.7 51.0 25.7 2.5 2.6 9.8 51.0 0.5 6.7 2.0 4.3 6.4 3.6 27.4
* The percentages are based on weighted analysis and all numbers are unweighted. (xx) Percentages in parentheses are based on fewer than 25 unweighted cases

428
Table 7.1. Percentage of women reporting injuries as a result of physical and/or sexual partner violence, Viet Nam 2019
Ever injured
(%)
Number of women reporting partner
violence (N)
Total 23.3 1791
Urban- Rural
Urban 21.3 663
Rural 24.0 1128
Division
Northern Midlands and Mountains 12.5 233
Red River Delta 19.4 444
North and South Central Coast 28.8 355
Central Highlands 33.8 245
Southeast 22.9 270
Mekong River Delta 27.2 244
Religion
No Religion 21.7 1381
Buddhist 32.1 181
Catholic 26.7 163
Protestant (19.7) 20
Hoa Hao Buddhist (33.0) 4
Other 30.3 42
Education of respondent

429
No education 30.3 340
Primary 28.1 456
Lower Secondary 20.6 528
Upper Secondary 18.7 278
College 16.8 49
University and above 9.4 135
Other (22.7) 5
Ethnicity
Kinh 23.1 1499
Tay 31.2 33
Thai 3.9 33
Muong (24.6) 13
Khmer (28.2) 20
Chinese (29.0) 8
Nung 11.4 27
Mong (0.0) 6
Dao (7.9) 14
Other 30.2 138
Age group of respondent
15-19 (8.9) 9
20-24 13.2 61
25-29 15.9 166
30-34 23.0 247
35-39 20.2 273
40-44 23.6 269
45-49 22.6 282

430
50-54 26.0 262
55-64 31.1 222
Age group of respondent (the comparison 2010-2019)
15-17 20.0 4
18-24 12.2 66
25-29 15.9 166
30-34 23.0 247
35-39 20.2 273
40-44 23.6 269
45-49 22.6 282
50-54 26.0 262
55-60 31.5 193
61-64 28.4 29
Household assets index
Lower 27.9 447
Medium 24.2 727
Higher 19.4 614
Disability status
Disability 1 (the level of inclusion is at least one domain/question is coded SOME DIFFICULTY or A LOT OF DIFFICULTY or CANNOT DO AT ALL)
No difficulty (in one or more domains) 19.1 773
Some difficulty 25.3 838
A lot of difficulty 29.7 178
Cannot do at all (0.0) 2

431
Disability 2 (the level of inclusion is at least 2 domains/questions are coded SOME DIFFICULTY or any 1 domain/question is coded A LOT OF DIFFICULTY or CANNOT DO AT ALL)
Without disability 19.5 1187
With disability 29.9 604
Disability 3 (the level of inclusion is any 1 domain/question is coded A LOT OF DIFFICULTY or CANNOT DO AT ALL)
Without disability 22.5 1611
With disability 29.6 180
By type of partner violence
Physical only 23.8 1095
Sexual only 0.2 320
Physical and sexual 40.6 376
* The percentages are based on weighted analysis and all numbers are unweighted.
(xx) Percentages in parentheses are based on fewer than 25 unweighted cases

432
Table 7.2. Prevalence, frequency and type of injuries and health service use for women who were injured due to physical and/or sexual partner violence, Viet Nam 2019
a. Prevalence, frequency, use of services n %
Injuries among women reporting partner violence (N=1791)
Ever injured due to partner violence 438 23.3
Injured in the past 12 months 75 3.7
Ever hurt enough to need health care 160 8.0
Frequency injured among ever injured (N=438)
One time 148 33.9
2 - 5 times 186 44.1
More than 5 times 103 21.8
Among women hurt enough to need health care (N=160)
Proportion needed health care in the past 12 months 21 13.2
Proportion ever received health care for injuries 111 66.3
Among women who received health care for injuries (N=111)
Proportion who spent at least 1 night in hospital due to injury 8 9.2
Proportion who told health worker about real cause of injury 52 44.6

433
During lifetime In past 12 months
b. Type of injury n % n %
Type of injury among ever injured (N=438)
Cuts, puncture, bites 9 2.1 2 0.5
Scratch, abrasion and bruises 368 83.2 66 14.1
Sprains, dislocations 25 6.0 5 0.8
Burns 8 1.3 2 0.3
Penetrating injuries, deep cuts 46 9.7 10 2.7
Broken ear drum, eye injuries 57 12.2 8 1.1
Fractures, broken bones 15 2.7 2 0.2
Broken teeth 4 0.6 0 0.0
Internal injuries 46 12.4 14 4.0
Other 51 14.1 6 1.2
* The percentages are based on weighted analysis and all numbers are unweighted.

434
Table 7.3. Self-reported impact of violence on women's health and well-being, among women who reported physical and/or sexual partner violence, Viet Nam 2019
Self-reported impact on health (N=1791)
No effect (%)
A little (%) A lot (%)
Total 37.3 37.3 25.3
Urban- Rural
Urban 37.0 38.1 24.7
Rural 37.5 36.9 25.6
Division
Northern Midlands and Mountains 48.8 39.3 11.9
Red River Delta 28.0 47.1 24.9
North and South Central Coast 37.1 33.7 29.1
Central Highlands 33.9 30.8 35.3
Southeast 44.2 28.4 27.0
Mekong River Delta 41.7 32.3 26.0
Religion
No Religion 36.9 38.1 24.9
Buddhist 39.3 33.3 27.4
Catholic 38.5 35.2 26.4
Protestant (32.9) (20.9) (46.2)
Hoa Hao Buddhist (38.0) (62.0) (0.0)
Other 41.5 35.3 23.2
Education of respondent
No education 39.9 30.8 29.2
Primary 35.7 35.9 28.4

435
Lower Secondary 36.9 40.5 22.5
Upper Secondary 36.3 39.3 24.4
College 42.1 40.0 17.9
University and above 37.8 39.5 22.7
Other (58.9) (35.9) (5.2)
Ethnicity
Kinh 37.2 38.0 24.8
Tay 54.5 28.3 17.2
Thai 48.3 43.6 8.1
Muong (49.4) (23.7) (26.9)
Khmer (21.6) (50.0) (28.4)
Chinese (31.6) (14.6) (53.8)
Nung 57.4 28.2 14.4
Mong (78.8) (21.2) (0.0)
Dao (36.7) (45.3) (18.0)
Other 29.7 32.5 37.9
Age group of respondent
15-19 (18.1) (40.5) (41.4)
20-24 35.7 33.2 31.1
25-29 32.1 43.4 24.5
30-34 40.3 35.6 24.1
35-39 40.3 37.8 21.9
40-44 34.0 41.0 25.0
45-49 40.9 36.8 22.0
50-54 39.3 34.8 25.7
55-64 33.6 35.2 31.2

436
Age group of respondent (the comparison 2010-2019)
15-17 (9.0) (64.9) (26.1)
18-24 35.0 32.3 32.8
25-29 32.1 43.4 24.5
30-34 40.3 35.6 24.1
35-39 40.3 37.8 21.9
40-44 34.0 41.0 25.0
45-49 40.9 36.8 22.0
50-54 39.3 34.8 25.7
55-60 33.5 34.8 31.7
61-64 34.6 37.9 27.5
Household assets index
Lower 38.9 30.6 30.4
Medium 40.9 35.6 23.4
Higher 32.7 43.0 24.3
Disability status
Disability 1 (the level of inclusion is at least one domain/question is coded SOME DIFFICULTY or A LOT OF DIFFICULTY or CANNOT DO AT ALL)
No difficulty (in one or more domains) 43.0 35.2 21.6
Some difficulty 33.6 38.4 27.9
A lot of difficulty 32.7 40.0 27.3
Cannot do at all (26.0) (0.0) (74.0)
Disability 2 (the level of inclusion is at least 2 domains/questions are coded SOME DIFFICULTY or any 1 domain/question is coded A LOT OF DIFFICULTY or CANNOT DO AT ALL)

437
Without disability 40.8 36.9 22.2
With disability 31.3 37.8 30.9
Disability 3 (the level of inclusion is any 1 domain/question is coded A LOT OF DIFFICULTY or CANNOT DO AT ALL)
Without disability 37.9 36.9 25.0
With disability 32.7 39.7 27.6
* The percentages are based on weighted analysis and all numbers are unweighted.
(xx) Percentages in parentheses are based on fewer than 25 unweighted cases

438
Table 7.4.a. Self-reported impact of violence on women's work, among women who reported physical and/or sexual partner violence, Viet Nam 2019
Self-reported impact on work (N=1791)
Unable to concentrate
(%)
Unable to work/ sick
leave (%)
Partner disrupted
work (%)
Lost confidence in
own ability (%)
Other (%)
Work not disrupted
(%)
Not applicable
(not working for money)
(%)
Total 14.7 5.7 11.9 1.9 0.5 72.2 5.0
Urban- Rural
Urban 15.7 4.3 11.9 1.9 0.7 71.6 5.3
Rural 14.4 6.3 11.9 1.9 0.4 72.4 4.8
Division
Northern Midlands and Mountains 8.3 4.6 11.7 0.6 0.0 79.5 2.8
Red River Delta 21.2 4.6 10.1 0.7 0.8 69.8 3.9
North and South Central Coast 12.0 7.5 13.5 4.5 0.1 75.1 3.9
Central Highlands 12.6 9.5 13.4 1.5 0.0 70.5 5.6
Southeast 15.0 3.8 11.8 3.6 0.4 71.4 4.7
Mekong River Delta 12.4 6.3 12.6 1.0 1.2 68.4 10.0
Religion
No Religion 14.5 5.5 11.2 1.6 0.6 73.1 4.8
Buddhist 12.8 4.1 10.3 3.1 0.0 69.7 8.0
Catholic 20.3 11.3 18.4 3.9 0.0 67.6 2.7
Protestant (9.9) (0.0) (16.7) (0.0) (0.0) (70.5) (9.9)
Hoa Hao Buddhist (0.0) (0.0) (33.0) (0.0) (0.0) (67.0) (0.0)
Other 12.5 1.6 17.1 1.2 0.0 68.7 5.7
Education of respondent

439
No education 11.6 7.2 12.7 2.9 0.5 70.7 6.8
Primary 14.0 7.3 15.8 2.2 0.7 71.1 4.5
Lower Secondary 14.6 4.2 9.4 1.1 0.4 72.2 6.6
Upper Secondary 17.8 6.0 11.3 2.9 0.2 74.2 1.7
College 16.2 4.4 6.0 0.0 2.6 75.4 3.3
University and above 19.7 2.8 9.4 0.8 0.0 73.8 2.4
Other (18.4) (0.0) (18.4) (0.0) (0.0) (81.6) (0.0)
Ethnicity
Kinh 15.7 5.4 11.8 1.7 0.6 72.2 4.7
Tay 9.5 4.8 21.2 4.7 0.0 55.2 12.7
Thai 1.0 0.0 3.9 0.0 0.0 95.0 0.0
Muong (8.2) (12.2) (21.8) (8.2) (0.0) (78.2) (0.0)
Khmer (15.4) (7.4) (14.5) (3.8) (0.0) (73.1) (3.6)
Chinese (0.0) (0.0) (14.8) (0.0) (0.0) (58.6) (26.6)
Nung 4.3 9.7 15.0 0.0 0.0 83.1 0.0
Mong (15.8) (0.0) (0.0) (0.0) (0.0) (57.4) (26.8)
Dao (0.0) (1.6) (0.0) (0.0) (0.0) (90.6) (7.8)
Other 12.4 10.4 12.0 4.8 0.0 68.4 6.1
Age group of respondent
15-19 (11.7) (0.0) (11.7) (11.7) (0.0) (67.7) (20.6)
20-24 18.0 5.4 6.1 7.5 0.0 69.7 5.0
25-29 12.4 2.5 4.2 1.2 0.0 76.5 8.1
30-34 13.9 4.8 9.4 2.7 0.5 75.9 4.8
35-39 13.9 3.3 10.4 1.0 0.0 74.3 5.2
40-44 14.2 4.4 14.1 1.6 0.3 72.0 3.4
45-49 14.2 6.8 11.4 1.7 0.2 73.7 5.0

440
50-54 12.2 5.0 14.7 1.4 0.6 69.5 5.6
55-64 20.6 11.9 16.7 1.9 1.8 67.1 3.4
Age group of respondent (the comparison 2010-2019)
15-17 (0.0) (0.0) (0.0) (0.0) (0.0) (80.0) (20.0)
18-24 18.2 5.0 7.2 8.4 0.0 68.8 6.1
25-29 12.4 2.5 4.2 1.2 0.0 76.5 8.1
30-34 13.9 4.8 9.4 2.7 0.5 75.9 4.8
35-39 13.9 3.3 10.4 1.0 0.0 74.3 5.2
40-44 14.2 4.4 14.1 1.6 0.3 72.0 3.4
45-49 14.2 6.8 11.4 1.7 0.2 73.7 5.0
50-54 12.2 5.0 14.7 1.4 0.6 69.5 5.6
55-60 19.8 10.4 15.3 2.1 2.1 67.8 3.8
61-64 26.6 23.2 27.3 0.0 0.0 61.6 0.0
Household assets index
Lower 14.3 9.5 15.4 2.8 0.8 67.1 6.7
Medium 11.9 4.5 11.1 2.4 0.2 74.7 5.2
Higher 18.1 4.7 10.6 0.9 0.6 72.5 3.7
Disability status
Disability 1 (the level of inclusion is at least one domain/question is coded SOME DIFFICULTY or A LOT OF DIFFICULTY or CANNOT DO AT ALL)
No difficulty (in one or more domains) 12.9 4.3 9.9 1.2 0.6 75.2 5.4
Some difficulty 17.1 6.6 13.2 2.0 0.2 69.9 4.4
A lot of difficulty 11.4 7.2 13.8 4.8 1.3 70.8 6.2
Cannot do at all (0.0) (0.0) (0.0) (0.0) (0.0) (100.0) (0.0)
Disability 2 (the level of inclusion is at least 2 domains/questions are coded SOME DIFFICULTY or any 1 domain/question is coded A LOT OF DIFFICULTY or CANNOT DO AT ALL)
Without disability 13.5 4.8 10.5 1.2 0.5 74.7 5.0

441
With disability 16.9 7.5 14.3 3.3 0.5 67.8 5.0
Disability 3 (the level of inclusion is any 1 domain/question is coded A LOT OF DIFFICULTY or CANNOT DO AT ALL)
Without disability 15.2 5.6 11.7 1.6 0.4 72.3 4.8
With disability 11.3 7.2 13.7 4.8 1.2 71.0 6.1
* The percentages are based on weighted analysis and all numbers are unweighted.
(xx) Percentages in parentheses are based on fewer than 25 unweighted cases

442
Table 7.4.b. Self-reported nature of impact of violence on women's work, among women who do work for money and who reported physical and/or sexual partner violence, Viet Nam 2019
Self-reported impact on work (N=1652)
Unable to concentrate
(%)
Unable to work/ sick
leave (%)
Partner disrupted work
(%)
Lost confidence in own ability
(%) Other (%)
Work not disrupted (%)
Total 14.6 5.3 11.9 1.8 0.4 73.5
Urban- Rural
Urban 16.1 3.6 11.7 2.0 0.8 72.2
Rural 14.1 6.0 12.0 1.7 0.3 74.0
Division
Northern Midlands and Mountains 8.7 4.3 12.3 0.6 0.0 79.0
Red River Delta 20.9 3.7 9.9 0.3 0.3 71.6
North and South Central Coast 11.8 7.7 13.7 4.5 0.1 75.8
Central Highlands 12.9 10.0 13.8 1.6 0.0 70.5
Southeast 14.1 2.5 10.2 3.0 0.4 73.3
Mekong River Delta 12.6 6.1 13.4 1.2 1.4 71.0
Religion
No Religion 14.6 5.2 11.1 1.7 0.5 74.3
Buddhist 14.1 4.3 11.6 3.7 0.0 68.5
Catholic 16.7 9.4 16.9 1.2 0.0 71.6
Protestant (11.1) (0.0) (18.7) (0.0) (0.0) (66.9)
Hoa Hao Buddhist (0.0) (0.0) (33.0) (0.0) (0.0) (67.0)
Other 9.6 0.0 18.9 1.3 0.0 75.9
Education of respondent

443
No education 12.3 7.5 13.6 3.3 0.6 70.7
Primary 12.2 6.3 15.3 1.8 0.2 72.8
Lower Secondary 14.7 3.9 8.9 0.8 0.4 74.4
Upper Secondary 18.2 5.4 11.9 2.7 0.2 75.3
College 17.1 4.7 6.4 0.0 2.8 77.5
University and above 21.8 3.0 9.2 0.8 0.0 73.4
Other (18.4) (0.0) (18.4) (0.0) (0.0) (81.6)
Ethnicity
Kinh 15.5 4.8 11.7 1.4 0.5 73.8
Tay 9.9 5.1 22.3 5.0 0.0 53.0
Thai 1.0 0.0 3.9 0.0 0.0 95.0
Muong (8.2) (12.2) (21.8) (8.2) (0.0) (78.2)
Khmer (15.9) (7.7) (15.1) (4.0) (0.0) (75.8)
Chinese (0.0) (0.0) (14.8) (0.0) (0.0) (58.6)
Nung 4.3 9.7 15.0 0.0 0.0 83.1
Mong (15.8) (0.0) (0.0) (0.0) (0.0) (57.4)
Dao (0.0) (1.6) (0.0) (0.0) (0.0) (90.6)
Other 13.1 10.9 12.6 5.0 0.0 68.5
Age group of respondent
15-19 (21.2) (0.0) (21.2) (21.2) (0.0) (78.8)
20-24 19.3 5.8 6.6 8.0 0.0 67.4
25-29 12.7 2.8 4.2 1.3 0.0 82.3
30-34 14.5 5.0 9.8 1.8 0.6 78.0
35-39 14.1 3.1 10.8 1.0 0.0 74.2
40-44 14.2 4.6 14.0 1.6 0.3 72.8
45-49 13.5 7.0 11.9 1.0 0.2 74.0

444
50-54 12.6 5.1 14.7 1.5 0.7 69.6
55-64 19.3 9.0 15.4 1.8 1.1 70.0
Age group of respondent (the comparison 2010-2019)
15-17 (0.0) (0.0) (0.0) (0.0) (0.0) (100.0)
18-24 19.8 5.4 7.8 9.2 0.0 67.8
25-29 12.7 2.8 4.2 1.3 0.0 82.3
30-34 14.5 5.0 9.8 1.8 0.6 78.0
35-39 14.1 3.1 10.8 1.0 0.0 74.2
40-44 14.2 4.6 14.0 1.6 0.3 72.8
45-49 13.5 7.0 11.9 1.0 0.2 74.0
50-54 12.6 5.1 14.7 1.5 0.7 69.6
55-60 20.3 8.9 15.4 2.1 1.3 69.7
61-64 10.9 9.8 15.6 0.0 0.0 72.3
Household assets index
Lower 14.3 9.2 15.5 3.2 0.9 68.7
Medium 11.3 4.1 11.1 2.1 0.2 76.0
Higher 18.4 4.3 10.5 0.7 0.3 73.7
Disability status
Disability 1 (the level of inclusion is at least one domain/question is coded SOME DIFFICULTY or A LOT OF DIFFICULTY or CANNOT DO AT ALL)
No difficulty (in one or more domains) 13.1 4.3 10.0 1.2 0.7 76.7
Some difficulty 16.9 5.9 13.0 1.7 0.2 70.8
A lot of difficulty 10.3 6.9 14.7 4.5 0.0 72.9
Cannot do at all (0.0) (0.0) (0.0) (0.0) (0.0) (100.0)
Disability 2 (the level of inclusion is at least 2 domains/questions are coded SOME DIFFICULTY or any 1 domain/question is coded A LOT OF DIFFICULTY or CANNOT DO AT ALL)

445
Without disability 13.6 4.4 10.3 1.3 0.5 76.0
With disability 16.6 7.0 14.9 2.8 0.2 68.9
Disability 3 (the level of inclusion is any 1 domain/question is coded A LOT OF DIFFICULTY or CANNOT DO AT ALL)
Without disability 15.1 5.2 11.6 1.5 0.4 73.6
With disability 10.3 6.9 14.6 4.4 0.0 73.0
* The percentages are based on weighted analysis and all numbers are unweighted.
(xx) Percentages in parentheses are based on fewer than 25 unweighted cases

446
Table 7.5.a. General, physical and mental health problems reported among ever-partnered women, according to women's experience of physical and/or sexual partner violence, Viet Nam 2019
By urban/rural area Total Country
Urban (N=2303) Rural (N=3250) Total (N=5553)
No Violence (N=1637)
%
Physical/ sexual Violence (N=666)
% P-value*
All partnered women
(N=2303) %
No Violence (N=2120)
%
Physical/ sexual
Violence (N=1130)
% P-value*
All partnered women (N=3250) %
No Violence (N=3757) %
Physical/ sexual
Violence (N=1796)
% P-value*
All partnered women (N=5553) %
General health status
Good or Excellent 48.4 37.5 0.000 45.3 38.7 28.1 0.000 35.1 42.1 30.8 0.000 38.4
Fair 46.5 52.9 0.015 48.3 48.6 57.3 0.000 51.6 47.9 56.1 0.000 50.5
Poor or very poor 5.2 9.6 0.003 6.4 12.7 14.6 0.119 13.3 10.1 13.2 0.001 11.1 Emotional distress in past 4 weeks as measured by The Kessler Psychological Distress Scale (K6+)
0-6 91.0 83.4 0.000 88.9 86.5 74.9 0.000 82.6 88.1 77.3 0.000 84.6
7-12 7.4 10.9 0.029 8.4 10.6 17.4 0.000 12.9 9.5 15.6 0.000 11.4
13-18 1.1 4.3 0.001 2.0 2.4 6.3 0.000 3.8 2.0 5.8 0.000 3.2
19-24 0.6 1.4 0.178 0.8 0.4 1.4 0.007 0.7 0.5 1.4 0.003 0.8
Mean K6+ score** 1.9 3.3 0.000 2.3 2.6 4.1 0.000 3.1 2.4 3.9 0.000 2.8
Median K6+ score 0.0 1.0 0.0 1.0 2.0 1.0 1.0 2.0 1.0
Ever thought about suicide 7.3 18.6 0.000 10.4 7.1 21.9 0.000 12.2 7.2 21.0 0.000 11.6

447
Ever attempted suicide 0.8 3.4 0.002 1.5 0.6 2.6 0.000 1.3 0.6 2.8 0.000 1.3
* t-test for equality of means, P-value for the difference between women who experienced violence and who did not experience physical and/or sexual partner violence ** The Kessler Psychological Distress Scale (K6+) is a 6-item self-report measure of psychological distress intended to be used as a quick tool to assess risk for serious mental illness in the general population
*** The percentages are based on weighted analysis and all numbers are unweighted.

448
Table 7.5.b. Mental health problems reported among ever-partnered women, according to women's experience of emotional partner violence, Viet Nam 2019
Women who did not report physical and/or sexual
partner violence Women who reported physical and/or sexual partner
violence
No Violence (N=2660)
%
Emotional violence
alone (N=1097)
% P-value*
Ever-partnered women without
phys/sex violence (N=3757)
%
Physical and/or sexual
violence without
emotional abuse
(N= 340) %
Physical and/or sexual
violence with
emotional abuse
(N=1456) % P-value*
Ever-partnered
women with phys/sex violence (N=1796)
%
Total ever-partnered women
(N=5553) %
Emotional distress in past 4 weeks as measured by The Kessler Psychological Distress Scale (K6+)
0-6 89.7 84.4 0.000 88.1 85.0 75.6 0.000 77.3 84.6
7-12 8.4 12.0 0.001 9.5 12.1 16.3 0.040 15.6 11.4
13-18 1.4 3.2 0.001 2.0 2.3 6.5 0.000 5.8 3.2
19-24 0.5 0.4 0.600 0.5 0.6 1.5 0.087 1.4 0.8
Mean K6+ score** 2.2 2.8 0.000 2.4 2.8 4.1 0.000 3.9 2.8
Median K6+ score 0.0 1.0 1.0 1.0 2.0 2.0 1.0
Ever thought about suicide 6.2 9.4 0.001 7.2 12.5 22.9 0.000 21.0 11.6
Ever attempted suicide 0.3 1.4 0.003 0.6 0.7 3.3 0.000 2.8 1.3
* t-test for equality of means, P-value for the difference between women who experienced violence and who did not experience physical and/or sexual partner violence
** The Kessler Psychological Distress Scale (K6+) is a 6-item self-report measure of psychological distress intended to be used as a quick tool to assess risk for serious mental illness in the general population *** The percentages are based on weighted analysis and all numbers are unweighted.

449
Table 7.6. Use of health services and medication among ever-partnered women, according to their experience of physical and/or sexual partner violence, Viet Nam 2019
No Violence
(%)
Physical/sexual violence
(%) P-value* All respondents
(%)
Use of services in the past 12 months (N=5553)
Had an operation (other than caesarean section) 3.2 4.2 0.063 3.5
Spent at least on night in a hospital 8.8 13.5 0.000 10.3
* The percentages are based on weighted analysis and all numbers are unweighted.
* t-test for equality of means, P-value for the difference between women who experienced violence and who did not experience physical and/or sexual partner violence
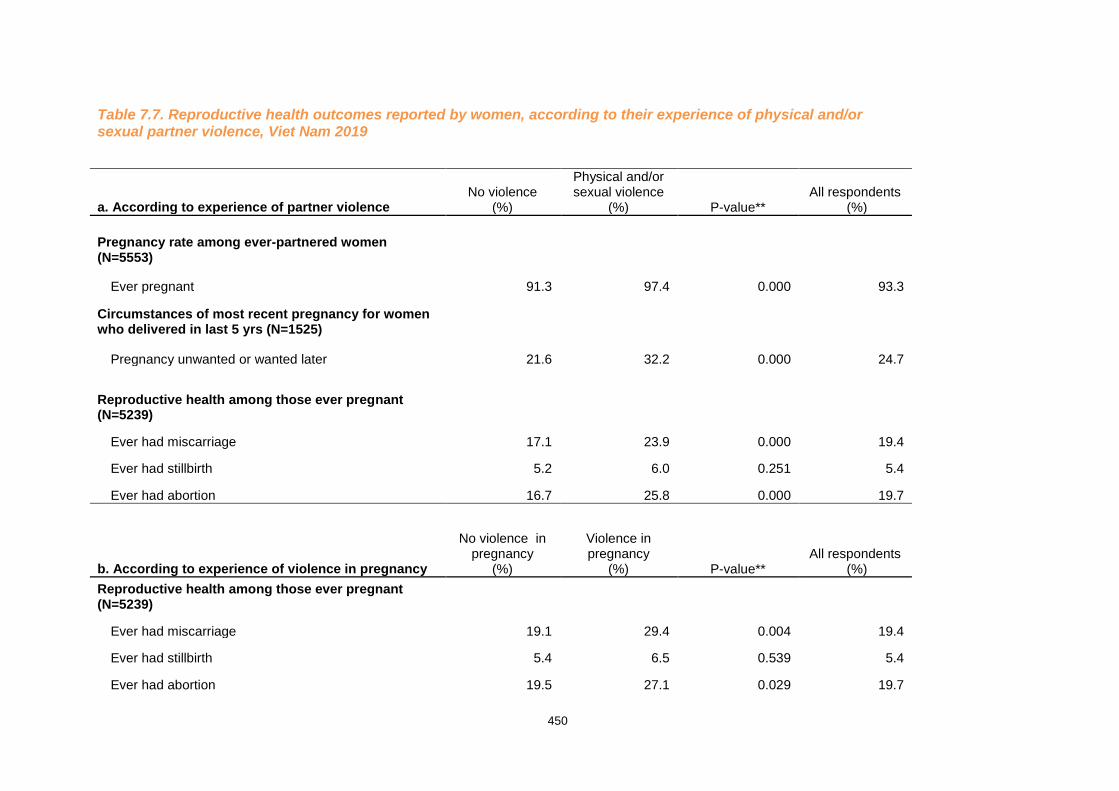
450
Table 7.7. Reproductive health outcomes reported by women, according to their experience of physical and/or sexual partner violence, Viet Nam 2019
a. According to experience of partner violence No violence
(%)
Physical and/or sexual violence
(%) P-value** All respondents
(%)
Pregnancy rate among ever-partnered women (N=5553)
Ever pregnant 91.3 97.4 0.000 93.3
Circumstances of most recent pregnancy for women who delivered in last 5 yrs (N=1525)
Pregnancy unwanted or wanted later 21.6 32.2 0.000 24.7
Reproductive health among those ever pregnant (N=5239)
Ever had miscarriage 17.1 23.9 0.000 19.4
Ever had stillbirth 5.2 6.0 0.251 5.4
Ever had abortion 16.7 25.8 0.000 19.7
b. According to experience of violence in pregnancy
No violence in pregnancy
(%)
Violence in pregnancy
(%) P-value** All respondents
(%)
Reproductive health among those ever pregnant (N=5239)
Ever had miscarriage 19.1 29.4 0.004 19.4
Ever had stillbirth 5.4 6.5 0.539 5.4
Ever had abortion 19.5 27.1 0.029 19.7

451
* The percentages are based on weighted analysis and all numbers are unweighted.
** t-test for equality of means, P-value for the difference between women who experienced violence and who did not experience physical and/or sexual partner violence

452
Table 7.8. Factors related to last pregnancy, among women with live birth in the past 5 years, according to the women's experience of physical and/or sexual partner violence, Viet Nam 2019
No Violence (N= 1066)
(%)
With physical and/or sexual
partner violence (N=459)
(%) P-value**
All women (N=1525)
(%)
Respondent did not want this pregnancy then (unwanted or mistimed pregnancy) 21.6 32.2 0.000 24.7
Partner did not want this pregnancy then 4.1 12.1 0.000 6.4
Partner wanted a son 19.8 31.0 0.000 23.0
Respondent used alcohol during pregnancy 3.5 3.8 0.762 3.6
Respondent smoked during this pregnancy 0.0 1.2 0.028 0.4
Postnatal check-up not done 58.7 68.3 0.001 61.5
* The percentages are based on weighted analysis and all numbers are unweighted.
** t-test for equality of means, P-value for the difference between women who experienced violence and who did not experience physical and/or sexual partner violence

453
Table 7.9. Use of contraception reported by women, according to their experience of physical and/or sexual partner violence, Viet Nam 2019
No Violence
(%)
Physical and/or sexual violence
(%) P-value** All respondents
(%)
Among all ever-partnered women who ever had sex (N=5383)
Ever using a method to prevent/delay pregnancy 83.0 89.6 0.000 85.2
Currently using a method to prevent/delay pregnancy 57.4 58.5 0.466 57.7
Partner has ever refused/stopped contraception 3.0 5.3 0.000 3.8
Ever used a condom with current or most recent partner 11.2 9.2 0.019 10.5
Current or most recent partner ever refused to use condom 4.8 7.3 0.001 5.7
Among women currently using contraception (N=3208)
Current partner knows she is using contraception 99.8 99.1 0.024 99.6
Current partner does not know she is using contraception 0.1 0.6 0.034 0.3 * The percentages are based on weighted analysis and all numbers are unweighted.
** t-test for equality of means, P-value for the difference between women who experienced violence and who did not experience physical and/or sexual partner violence

454
Table 8.1. Children's well-being as reported by women with children 5-12 years old, according to the women's experience of physical and/or sexual partner violence, Viet Nam 2019
Proportion of women reporting that at least one of her children (aged 5-12 years) had the following:
No Violence (N=1567)
(%)
With physical or sexual partner
violence (N=771)
(%) P-value**
All women (N=2338)
(%)
Nightmares 12.6 21.7 0.000 15.6
Bedwetting 14.7 18.4 0.036 15.9
Child quiet / withdrawn 22.8 29.9 0.001 25.2
Child aggressive 9.4 16.6 0.000 11.8
Two or more of above problems 40.6 56.0 0.000 45.8
Child has failed / had to repeat a year at school 1.8 2.9 0.142 2.2 Child has stopped school / dropped out of school 2.4 3.2 0.274 2.6
* The percentages are based on weighted analysis and all numbers are unweighted.
** t-test for equality of means, P-value for the difference between women who experienced violence and who did not experience physical and/or sexual partner violence

455
Table 8.1.a Children's well-being as reported by women with children 5-12 years old and who have experienced physical and/or sexual partner violence, according to how frequently her children witnessed the violence, Viet Nam 2019
Proportion of women with physical or sexual partner violence reporting that at least one of her children (aged 5-12 years) had the following:
How frequently children witness violence (as reported by the woman)
Total % Number
Never (N=270) (%)
Once or twice (N=127) (%)
Several times (N=123) (%)
Many times (N=122) (%)
Nightmares 22.7 17.4 23.2 29.5 22.8 146
Bedwetting 20.7 10.6 16.9 20.0 17.6 118
Child quiet / withdrawn 27.5 23.2 36.2 32.6 29.6 183
Child aggressive 18.4 14.1 8.5 25.8 16.6 106
Two or more of above problems 58.7 45.0 58.3 58.2 55.7 353
Child has failed / had to repeat a year at school (4.4) (2.3) (3.3) (0.9) (3.1) 17
Child has stopped school / dropped out of school (2.8) (0.0) (3.0) (10.1) (3.6) 22
* The percentages are based on weighted analysis and all numbers are unweighted ** t-test for equality of means, P-value for the difference between women who experienced violence and who did not experience physical and/or sexual partner violence
*** The total number of women in this table is 647 because Q902 (on witnessing) was only asked from women who have experienced physical violence (excluding women who experience sexual violence without physical violence). This figure and the %s in the colum are different from those in table 8.1 (which reflects the 771 women who experienced physical and/or sexual violence
(xx) Percentages in parentheses are based on fewer than 25 unweighted cases
All women (N=647)

456
Table 8.2. Children witnessing the violence, according to women who ever experienced physical partner violence, Viet Nam 2019
By urban/rural area By division
Urban (N=523)
(%)
Rural (N=914)
(%)
Northern Midlands
and Mountains (N=180)
(%)
Red River Delta
(N=353) (%)
North and South
Central Coast
(N=298) (%)
Central Highlands (N=213)
(%)
Southeast (N=204)
(%)
Mekong River Delta
(N=189) (%)
Total
(N=1437) (%)
Never 44.5 35.3 35.3 39.3 38.8 39.4 38.2 34.7 37.9
Once 21.5 19.4 26.8 22.9 16.1 17.4 17.3 18.3 20.0
Several (2-5) times 19.4 25.5 19.2 27.0 20.6 18.1 26.2 26.7 23.8
Many times / Most of the time 13.9 19.0 17.6 10.0 23.2 25.0 18.3 19.5 17.6
Don't know, refuse 0.7 0.8 1.0 0.9 1.2 0.0 0.0 0.8 0.8
* The percentages are based on weighted analysis and all numbers are unweighted.

457
Table 8.3. Percentage of respondents reporting violence against her mother, against her partner's mother or against her partner when he was a child, among ever-partnered women, according to women’s experience of partner violence, Viet Nam 2019
Proportion of women who reported that…
Her mother was hit by mother's
husband (N=1324) (%)
Partner's mother was hit by mother's
husband (N=510)
(%)
Partner was hit as a child (N=1439)
(%)
According to all ever-partnered women 23.9 9.7 25.9
According to experience of partner violence
Not experienced any partner violence 19.6 6.5 22.0
Ever experienced physical or sexual violence 32.9 16.4 34.1
P-value** 0.000 0.000 0.000
According to type of partner violence
No violence 19.6 6.5 22.1
Sexual only 32.8 16.5 33.0
Physical only 27.4 8.5 29.5
Both sexual and physical 37.6 22.5 40.7
According to severity of physical partner violence
No physical violence 20.2 6.7 22.6
Moderate physical violence 34.8 16.6 33.4

458
Severe physical violence 32.8 21.1 38.4
* The percentages are based on weighted analysis and all numbers are unweighted.
** t-test for equality of means, P-value for the difference between women who experienced violence and who did not experience physical and/or sexual partner violence

459
Table 9.1. Percentage of women who had told others, and persons to whom they told about the violence, among women experiencing physical and/or sexual partner violence (N=1,791), Viet Nam 2019
People told*
By urban/rural area By division Country
Urban (N=663)
(%)
Rural (N=112
8) (%)
Northern Midlands
and Mountains (N=233)
(%)
Red River Delta
(N=444) (%)
North and South
Central Coast
(N=355) (%)
Central Highlands (N=245)
(%)
Southeast (N=270)
(%)
Mekong River Delta
(N=244) (%)
number Total
(N=1791) (%)
No one 52.5 48.5 51.8 43.9 55.0 46.7 55.8 47.6 910 49.6
Friends 17.3 14.1 16.4 15.2 16.6 20.3 10.6 12.2 295 15.0
Family members 39.3 44.3 42.8 49.5 37.0 41.1 38.8 42.4 737 42.9
Parents 21.3 20.5 22.7 20.7 19.8 22.6 21.0 19.6 372 20.8
Brother or sister 22.0 21.9 23.8 28.9 17.0 16.8 20.8 17.3 388 21.9
Uncle or aunt 3.7 4.7 7.7 4.4 3.8 2.4 3.2 4.6 78 4.4
Husband/partner’s family 16.6 22.1 29.3 24.9 12.8 17.6 15.8 20.7 342 20.6
Children 5.1 6.7 9.6 5.4 4.1 3.5 5.7 9.7 110 6.3
Neighbours 5.2 12.9 9.8 13.2 9.0 7.1 9.5 12.1 191 10.7
Police 2.5 2.1 1.7 2.6 1.0 0.3 1.6 4.9 38 2.2
Doctor/health worker 1.2 0.9 1.1 1.1 0.9 0.8 0.2 1.4 20 1.0
Priest/Religious leader 0.0 0.1 0.0 0.2 0.0 0.0 0.2 0.0 2 0.1
Counsellor 0.0 0.0 0.0 0.0 0.0 0.0 0.0 0.0 0 0.0
Ngo/women’s organization
1.0 1.1 1.8 0.8 1.8 0.0 0.3 1.4 23 1.1

460
Local leader 1.7 1.6 2.3 0.9 1.6 0.5 1.4 3.1 36 1.6
Other 0.2 0.0 0.0 0.0 0.1 0.5 0.3 0.0 5 0.1
* More than one answer could be given, therefore the total percentage is greater than 100% * The percentages are based on weighted analysis and all numbers are unweighted.

461
Table 9.2. Percentage of women who mentioned they would have liked more help, and from whom, among women experiencing physical and/or sexual partner violence (N=1791), Viet Nam 2019
By urban/rural
area By division Country
Wanted more help from… *
Urban (N=663)
(%)
Rural (N=1128)
(%)
Northern Midlands
and Mountains (N=233)
(%)
Red River Delta
(N=444) (%)
North and South
Central Coast
(N=355) (%)
Central Highlands (N=245)
(%)
Southeast (N=270)
(%)
Mekong River Delta
(N=244) (%)
number Total
(N=1791) (%)
No one mentioned 61.3 57.3 58.4 50.7 56.8 57.1 65.3 69.8 1,066 58.4
His relatives 16.6 19.4 24.3 29.7 12.3 12.5 11.2 11.0 318 18.6
Her relatives 20.1 22.4 26.0 23.3 20.5 26.8 22.7 14.1 379 21.8
Friends/neighbours 9.5 8.9 13.9 9.0 11.2 17.3 5.1 2.0 197 9.1
Health centre 0.7 0.4 0.5 0.9 0.3 0.3 0.2 0.2 10 0.5
Police 3.1 3.4 3.6 2.9 3.7 2.3 4.0 3.2 58 3.3
Priest/Religious leader 0.1 0.3 0.0 0.3 0.6 0.0 0.3 0.0 4 0.2
Social worker 4.2 6.3 6.4 4.1 9.0 4.9 4.8 5.0 107 5.7
Other 1.3 1.6 0.2 2.0 1.4 0.1 1.0 2.8 23 1.5
* More than one answer could be given, therefore the total percentage is greater than 100%
* The percentages are based on weighted analysis and all numbers are unweighted.

462
Table 9.3. Percentage of women who sought help from agencies/persons in authority, and satisfaction with support received, among women who experienced physical and/or sexual partner violence (N=1791), Viet Nam 2019
To whom went for support Satisfied with support
received**
Number % Number %
Not ever gone anywhere for help 1606 90.4
Police 88 4.8 60 67.2
Hospital or health centre 52 2.3 49 95.7
Social services 3 0.1 2 (66.4)
Legal advice centre 8 0.4 7 (89.6)
Court 44 1.9 36 83.3
Shelter 4 0.1 3 (75.9)
Local leader 69 3.6 51 75.2
Women's organization 39 2.3 33 78.2
Priest/Religious leader 6 0.2 4 (75.5)
Anywhere else 25 1.4 24 98.0
* The percentages are based on weighted analysis and all numbers are unweighted.
** Satisfied with support received is reflected as percentage of women who went for these specific agencies/persons
(xx) Percentages in parentheses are based on fewer than 25 unweighted cases

463
Table 9.4. Main reasons for seeking support from agencies, as mentioned by women who experienced physical and/or sexual partner violence and who sought help (N=185), Viet Nam 2019
Reason for seeking support * number %
Encouraged by friends/family 23 11.9
Could not endure more 129 72.3
Badly injured 37 15.1
He threatened or tried to kill her 17 7.6
He threatened or hit children 10 6.0
Saw that children suffering 18 12.7
Thrown out of the home 18 8.4
Afraid she would kill him 0 0.0
Afraid he would kill her 15 7.9
Afraid he would hit her/more violence 49 25.5
Other 20 13.1
* More than one answer could be given, therefore the total percentage is greater than 100% ** The percentages are based on weighted analysis and all numbers are unweighted.

464
Table 9.5. Main reasons for not seeking support from agencies, as mentioned by women who experienced physical and/or sexual partner violence and who did not seek help (N=1606), Viet Nam 2019
Reason for not seeking support * number %
Don’t know/no answer 34 2.6
Fear of threats/consequences/ more violence 79 5.0
Violence normal/not serious 798 48.4
Embarrassed/ashamed/afraid would not be believed or would be blamed 350 20.2
Believed not help/know other women not helped 57 3.8
Afraid would end relationship 50 3.8
Afraid would lose children 59 4.0
Bring bad name to family 575 35.8
Did not know her options 32 1.7
Other 186 12.5
* More than one answer could be given, therefore the total percentage is greater than 100%
** The percentages are based on weighted analysis and all numbers are unweighted.

465
Table 9.6. Percentage of women who ever left home because of violence, among women who experienced physical and/or sexual partner violence, Viet Nam 2019
By urban/rural area By division Country
Urban (N=663)
(%)
Rural (N=1128)
(%)
Northern Midlands
and Mountains (N=233)
(%)
Red River Delta
(N=444) (%)
North and South
Central Coast
(N=355) (%)
Central Highlands (N=245)
(%)
Southeast (N=270)
(%)
Mekong River Delta
(N=244) (%)
Number
Total (N=1791)
(%
Ever left home because of violence 18.9 19.5 16.1 16.9 17.9 15.8 22.9 26.8 352 19.3
Number of times leaving home
Never 80.5 80.3 83.9 82.8 81.8 82.4 76.8 73.2 1,433 80.4
Once 8.3 9.1 8.6 7.9 8.8 5.2 10.2 11.7 161 8.9
2 - 5 times 9.1 6.8 4.1 5.8 6.0 7.8 10.7 12.4 137 7.5
More than 5 times 1.5 3.5 3.4 3.1 3.1 2.8 2.0 2.7 54 2.9
Refused/No answer** 0.6 0.2 0.0 0.3 0.3 1.9 0.3 0.0 6 0.3
Mean number of days away last time*** 25.2 18.4 14.3 30.5 11.0 12.1 27.0 17.1 20.1
Where she went last time? (N=352)
Her relatives 51.1 65.4 52.2 56.2 67.0 72.8 39.0 79.1 214 61.4
His relatives 9.9 10.4 34.4 9.8 3.9 1.9 9.0 7.8 33 10.3
Her friends/neighbours 16.3 9.9 6.0 15.7 9.0 12.8 21.9 4.7 39 11.6
Hotel/Lodgings 8.3 2.3 0.0 6.5 1.6 0.9 8.6 2.5 15 3.9
Street 8.9 2.7 3.4 4.2 5.5 3.8 7.8 2.0 18 4.4
Church/Temple 0.4 1.1 0.0 2.5 0.0 1.8 0.9 0.0 3 0.9

466
Shelter 0.0 0.0 0.0 0.0 0.0 0.0 0.0 0.0 0 0.0
Other 5.2 8.3 4.0 5.0 13.0 5.9 12.8 4.0 30 7.5
* The percentages are based on weighted analysis and all numbers are unweighted.
** Those who "Refused/No answer" will not be counted in the total number of people left home or never left home (N=6).
*** Note that this is not a percentage but an average number of days for each of the subgroups

467
Table 9.7. Main reasons for leaving home last time she left, as mentioned by women who experienced physical and/or sexual partner violence and who left home (N=352), Viet Nam 2019
Reasons for leaving home * number %
No particular incident 9 1.4
Encouraged by friends/family 14 3.0
Could not endure more 227 65.2
Badly injured 28 8.2
He threatened or tried to kill her 29 7.2
He threatened or hit children 10 3.0
Saw that children suffering 15 4.5
Thrown out of the home 66 19.2
Afraid she would kill him 2 0.6
Encouraged by organization: 0 0.0
Afraid he would kill her 18 5.7
Other 33 8.9
* More than one answer could be given, therefore the total percentage is greater than 100%
* The percentages are based on weighted analysis and all numbers are unweighted.

468
Table 9.8. Main reasons for returning, as mentioned by women who experienced physical and/or sexual partner violence, who left home and returned (N=352), Viet Nam 2019
Reasons for returning * number %
Didn’t want to leave children 169 50.4
Sanctity of marriage 14 3.6
For sake of family/children 59 18.3
Couldn’t support children 9 1.7
Loved him 22 6.2
He asked her to go back 91 26.0
Family said to return 41 12.9
Forgave him 88 25.5
Thought he would change 46 12.5
Threatened her/children 11 4.6 Could not stay there (where she
went) 13 3.9
Violence normal/not serious 16 4.1
Children need a father/both parents 40 11.0
Other 24 5.4
* More than one answer could be given, therefore the total percentage is greater than 100%
* The percentages are based on weighted analysis and all numbers are unweighted.

469
Table 9.9. Main reasons for not leaving home, as mentioned by women who experienced physical and/or sexual partner violence and who never left home (N=1433), Viet Nam 2019
Reasons for not leaving home * number %
Didn’t want to leave children 538 38.0
Sanctity of marriage 100 6.9
Didn’t want to bring shame 373 25.8
Couldn’t support children 13 0.9
Loved him 182 12.7
Didn’t want to be single 5 0.2
Family said to stay 4 0.3
Forgave him 255 18.1
Thought he would change 123 8.3
Threatened her/children 3 0.2
Nowhere to go 5 0.3
Violence normal/not serious 536 36.8
Traditional reconciliation 76 4.5
Other 124 10.5

470
* More than one answer could be given, therefore the total percentage is greater than 100%
* The percentages are based on weighted analysis and all numbers are unweighted.

471
Table 9.10. Retaliation/fighting back, among women reporting physical partner violence (N=1471), Viet Nam 2019
By urban/rural area
Whether ever fought back Urban
(N=539) (%)
Rural (N=932)
(%) number
Total (N=1471)
(%)
Never 77.0 82.2 1170 80.8
Once or twice 11.0 8.2 142 8.9
Several times 8.6 7.0 115 7.4
Many times 3.4 2.5 43 2.7
Refused/No answer 0.0 0.2 1 0.1
* The percentages are based on weighted analysis and all numbers are unweighted.

472
Table 9.11. Effect of fighting back, among women who ever fought back because of physical partner violence (N=301), Viet Nam 2019
By urban/rural area
Result of retaliation Urban
(N=123) (%)
Rural (N=178)
(%) number
Total (N=301)
(%)
No change 24.0 25.4 74 25.0
Violence became worse 13.4 19.7 50 17.6
Violence became less 28.4 31.5 88 30.5
Violence stopped 33.9 22.5 87 26.3
Don't know/refused 0.2 0.9 2 0.7
* The percentages are based on weighted analysis and all numbers are unweighted.

473
Table 9.12. Financial autonomy among ever-partnered women, according to the women's experience of physical and/or sexual partner violence, Viet Nam 2019
No Violence
(%)
With physical and/or sexual
partner violence
(%) P-value*
All women
(%)
Among all ever-partnered women who earned cash (N= 5055) Respondent able to decide herself how she spends her money 84.6 85.1 0.612 84.8
Respondent contributing more than husband/partner to the family budget 14.3 18.5 0.000 15.7
Among all ever-partnered women (N=5553)
Respondent ever gave up or refused a job because husband did not want her to work 8.0 18.9 0.000 11.5
Respondent's husband took her earnings or savings against her will at least once 1.8 14.8 0.000 6.0
Respondent's husband refused to give money for household expenses when he had money, at least once 2.3 14.7 0.000 6.3
* t-test for equality of means, P-value for the difference between women who experienced violence and who did not experience physical and/or sexual partner violence
The percentages are based on weighted analysis and all numbers are unweighted.