Puntland Report 2020 | UNFPA Somalia
277
Puntland Report 2020 Somali Health and Demographic Survey
-
Upload
khangminh22 -
Category
Documents
-
view
6 -
download
0
Transcript of Puntland Report 2020 | UNFPA Somalia

PuntlandReport 2020Somali Health and Demographic Survey

The information contained in this publication may be reproduced, stored in a retrieval system or transmitted, in any form or by any means, electronic, mechanical, photocopying, recording or otherwise, without prior permission but with acknowledgement of this publication as a source.
Suggested citation:Puntland Statistics Department, Puntland State of Somalia. The Puntland Health and Demographic Survey 2020.
Additional information about the survey can be obtained from:Puntland Statistics Department, Ministry of Planning, Economic Development and International Cooperation, Puntland State of Somalia.
Email:[email protected]
Website:http://www.mopicplgov.nethttps://www.moh.pl.sohttp://www.pl.statistics.so
Telephone no.:+252 906796747 or 00-252-5-843114
Social media:https://www.facebook.com/mopicplhttps://www.facebook.com/ministryOfHealthPuntlamd/https://twitter.com/PSD_MoPIC
This report was produced by the Puntland State of Somalia, with support from the United Nations Population Fund, Somalia and key donors.

With technical support from:
With financial contribution from:
PuntlandReport 2020Somali Health and Demographic Survey

Puntland Report 2020Somali Health and Demographic Survey (SDHS)IV

V
The Puntland Health and Demographic Survey (PLHDS) was realized with the commitment and dedication of several organizations and individuals. The statistical team at the Department of Statistics of the Ministry of Planning, Economic Development and International cooperation of Puntland of States and Puntland Ministry of health were instrumental in ensuring all stages of the survey were carried out with attention to detail. In respond to the State’s demand to have data for better planning and policymaking, the following experts steered all technical processes for the PLHDS: Abdifatah Mohamed Abdulle (Director of Statistics, Ministry of Planning, Economic Development and International Cooperation), Abdi Mohamoud Ali (PLHDS Coordinator), Abdinasir Ali Dahir (Technical Lead and Demographer).
The United Kingdom Department for International Development (DfID), The Government of Sweden, The Government of Finland, The Government of Italy, The Italian Agency for Development Cooperation (AICS) and The Swiss Agency for Development and Cooperation provided key financial support that went into creating a legacy for the country—data and skilled personnel. We particularly would like to acknowledge the guidance of Joanne McFadden of The United Kingdom Department for International Development (DfID).
We would like to express our sincere gratitude to the United Nations Population Fund for working together with our teams every step of the way, and for developing their capacity and skills in several areas. This survey would not have been realized without the support and leadership of Anders Thomsen (Representative, UNFPA Somalia) and Walter Mendonça Filho (Deputy Representative, UNFPA Somalia). We would like to single out Mariam Alwi (Population Development Specialist and Head of Population and Development Unit, UNFPA Somalia) for her dedication to Somalis, and devotion and patience in steering this mission.
The contributions of the UNFPA Somalia team of experts, without whom the survey would not have come to fruition are also recognized. These are Richard Ng’etich (Statistician), Felix
Acknowledgments

Puntland Report 2020Somali Health and Demographic Survey (SDHS)VI
Mulama (Demographer) and Umikaltuma Ibrahim (GIS Analyst). We remain indebted to Nikolai Botev (Former Representative, UNFPA Somalia) for his unparalleled commitment and guidance at every stage of the survey during his tenure and his support in technical editing and review afterwards. The peer group of experts in different fields that provided valuable input and time to the report include Dr Daniel Shiloh and his team (Louisa Blackwell, Merad Salah and Daniel Ayoubkhani) from Methodology Advisory Services, Office for National Statistics, United Kingdom, Peter Lundquist and Anna Nyman from Statistics Sweden, Dr Tareq Alkebsi, Yemen Central Statistics Office, Dr. Abdallah Abdelaziz Zoubi (immediate former PD Advisor, ASRO) and Helge Brunborg, Vebjorn Aalandslid and Per Schoning from Statistics Norway. We remain grateful to Philip Hughes (GIS Administrator, United Nations Support Office in Somalia) who provided much-needed satellite imagery to aid in the development of the survey frame. We would also like to thank the UNFPA Rwanda Country Office for their support during technical workshops held for the survey and recognize the advice and guidance of Yusuf Murangwa (Director General, National Institute of Statistics of Rwanda) and his team.
Finally, this report is the culmination of a wide range of efforts from Somali respondents, enumerators, supervisors, quality assurance teams and other field personnel, who sometimes had to brave conflict, poor weather and limited infrastructure in their quest to collect the data that made this report possible. Thanks to each one of them.

VII
It is a great pleasure for the Ministry of Planning, Economic Development and International cooperation with the Ministry of Health to present the findings of the Puntland Health and Demographic Survey (PLHDS), conducted from 2018-2019. This survey marks the first time that such data has been produced in the history of Somalia. It provides long-awaited information required by policy- and decision-makers, and all other relevant stakeholders to make evidence-based programme and policy decisions that deliver effective services to Puntland. The survey findings will enable Puntland State of Somalia to monitor its respective sectors in Puntland’s Development Plan, including those relating to improving the lives of women and children, and overall health in Puntland. The report presents more than just numbers—offering valuable nuggets of information to the Ministry of Health and our partners to strive at all levels to promote universal access to reproductive health care and rights. The survey findings will also offer a glimpse into social behaviour in our communities and encourage our people to adopt positive behavioural changes to improve their own lives.
These crucial findings are a result of the great efforts of UNFPA Somalia’s Population and Development Unit that collaborated at every stage with technical teams from Puntland State statistical office—along with all the personnel who have worked on this survey. These professionals worked together diligently to complete every phase of work according to the planned timetable in a challenging environment.
We also remain grateful to the donors of this undertaking—the UK Department for International Development (DFID), the Government of Sweden, the Government of Finland, the Government of Italy, the Italian Agency for Development Cooperation (AICS), the Swiss Agency for Development and Cooperation for their generous contributions, which have created a product that will help turn the dreams of Puntland Population to reality. We look forward to seeing the findings from this report shaping vital plans in Puntland, including the response of the international community to support the Strategic Plans to attain the Sustainable Development Goals, and response plans for diseases and emergencies, such as the
Foreword

Puntland Report 2020Somali Health and Demographic Survey (SDHS)VIII
ongoing COVID-19 pandemic, locust invasion, and recurrent drought and floods. It is our hope that this report will be used and analyzed even further to drive more positive changes in Puntland.
Hon Abdiqafar Elmi Hage
Minister of Planning, Economic Development and International Cooperation, Puntland
Hon Dr. Jama Farah Hassan
Minister of Health, Puntland

IX

Puntland Report 2020Somali Health and Demographic Survey (SDHS)X
Acronyms
AIDS Acquired Immunodeficiency Syndrome
ANC Antenatal Care
ARI Acute Respiratory Infections
ART Antiretroviral Therapy
ASFRs Age-Specific Fertility Rates
BCG Bacillus Calmette-Guérin [tuberculosis vaccine]
BMI Body Mass Index
CAPI Computer-Assisted Personal Interviewing
CBR Crude Birth Rate
CEB Children Ever Born
CM Centimeter
CPR Contraceptive Prevalence Rate
CRVS Civil Registration and Vital Statistics
C-section Cesarean Section
CSPro Census and Survey Processing System
DANIDA Danish International Development Agency
DfID Department for International Development
DHS Demographic and Health Surveys
DNS Directorate of National Statistics
DPT Diphtheria, Pertussis and Tetanus Vaccine
EAs Enumeration Areas
EPHS Essential Package of Health Services
FGM/C Female Genital Mutilation/Cutting
FGS Federal Government of Somalia
GAR Gross Attendance Ratios
GBV Gender-Based Violence
GDP Gross Domestic Product
GFR General Fertility Rate
GIS Geographic Information System
GPI Gender Parity Index
HC Health Centers
HIV Human Immunodeficiency Virus
ICPD Internal Conference on Population Development
IUD Intra Uterine Device
IYCF Infant and Young Child Feeding
KG Kilogram
LAM Lactational Amenorrhea
MCH Maternal Child Health
MICS Multiple Indicator Cluster

XI
MMR Maternal Mortality Ratio
MOH Ministry of Health
MoPIED Ministry of Planning, Investment and Economic Development
MTCT Mother-to-child transmission
NA Not Applicable
NAR Net Attendance Ratios
NDP National Development Plan
NLWs Nomadic Link Workers
ORS Oral Rehydration Salts
ORT Oral Rehydration Therapy
P & D Population and Development
PAPFAM Pan Arab Project for Family Health
PESS Population Estimation Survey of Somalia
PHU Primary Health Unit
PNC Postnatal Care
PPS Probability Proportional to Size
PSU Primary Sampling Units
RHF Recommended Home Fluids
SD Standard Deviation
SDGs Sustainable Development Goals
SGBV Sexual and Gender-Based Violence
SHDS Somali Health and Demographic Survey
SHS Second-Hand Smoke
SNBS Somali National Bureau of Statistics
SPSS Statistical Package for the Social Science
SSUs Secondary Sampling Units
STD Sexually Transmitted Diseases
STIs Sexually Transmitted Infections
TBA Traditional Birth Attendant
TFR Total Fertility Rate
TNG Transitional National Government
ToTs Training of Trainers
TTI Tetanus Toxoid injections
UNFPA United Nations Population Fund
UNICEF United Nations Children’s Fund
US United States
USD United States Dollar
USUs Ultimate Sampling Units
WHO World Health Organization

Puntland Report 2020Somali Health and Demographic Survey (SDHS)XII
Contents

XIII

Puntland Report 2020Somali Health and Demographic Survey (SDHS)XIV
List of Tables

1

IntroductionCHAPTER 1


Puntland Report 2020Somali Health and Demographic Survey (SDHS)4
State Context
Geography
Puntland lies Northeastern part of Somalia with total area of 212,510. The name “Puntland” is derived from the Land of Punt mentioned in ancient Egyptian sources. Puntland is bordered by Somaliland to its west, the Gulf of Aden in the north, the Guardafui Channel in the northeast, the Somali Sea in the southeast, the Galmudug State in the south, and Ethiopia in the southwest. There are several major geographical apexes in Puntland, including the Cape Guardafui which forms the tip of the Horn of Africa, Ras Hafun the easternmost place on the entire African continent. Like the rest of Somalia Puntland has a tropical hot climate, with little seasonal variations and daily temperatures that vary from 27°C to 37°C. The country experiences low annual rainfall and four seasons: Gu’ and Deyr are the rainy seasons and Haga and Jilal are the dry seasons. Over the years, however, changing, unpredictable climate patterns have resulted in recurrent floods and drought experienced across the country.
Demography
The first population and housing census for Somalia, conducted in 1975, published limited results. Findings from the second population census carried out in 1986 were not published officially, as they were considered to suffer from significant biases, especially over-counting. Since then, it has not been possible to conduct another census as the ongoing conflict in the country did not permit it.
The Population Estimation Survey of Somalia (PESS 2014) estimated that 51 percent of the population live in urban areas, 23 percent in rural areas and 26 percent in nomadic areas. Forty-nine percent of the total population are female, of which 50 percent are women of reproductive age (15-49 years). Children under five years of age
1Chapter 1
IntroductionMogadishu is one of the old cities in East Africa along the coast of the Indian Ocean. Over many centuries, it has emerged as the most important urban trade centre in Somalia. Geographically, Mogadishu is, situated strategically along the Indian Ocean coast. Since independence, Mogadishu is the capital city of Somalia.

5
accounted for 14 percent of the population, while persons aged 65 years and above made up 2 percent of the total population. Seventeen percent of the population comprised persons between five and nine years, whereas 53 percent of the population were within the 15-64 age bracket. The PESS 2014 is the most recent nationwide population estimation exercise undertaken in Somalia.
History and Politics
Puntland State of Somalia (PSS), was established in August 1998 after a decision made by the traditional and political leaders. The structure of Puntland State consists of the Judiciary, Legislative (House of Representatives) and the Executive (the President and his nominated Council of Ministries.
Somali and Arabic constitute the state’s two official languages, English and Italian are widely spoken. About 100% of residents of Puntland adhere to Islam which is a religion that has been predominant in Somalia for centuries (puntland, 2008).
Economy
The Livestock sector dominates the economy of the Puntland regions. Livestock products not only contribute to the livelihood of the nomads but also form a substantial portion of the daily food intake of the population living in rural and urban areas. The economy of Puntland is largely dependent on livestock exports, which contribute approximately 80% of foreign exchange earnings, 40% of the GDP and 60% of employment opportunities. Despite the economic importance of the sector, pastoralists survive in very difficult and fragile conditions characterised by the prevailing arid and semi-arid environment. Remittance from the Diaspora has also played a major role in the economy.
The State has 1600 km of coastline, which is abundant with fish and other natural marine resources. The fishing industry provides direct employment to thousands of people during the eight-month/fishing season, as well as indirect employment for example people working in restaurants and enterprises. During the fishing season, temporary settlements are created along the coastline where women take goods for sale to earn income. The fishing industry is ranked as the second highest income earner for the community of Puntland after livestock (Puntland, 2003). Additional economic products of the State include frankincense, myrrh, gum Arabic, manufacturing and agriculture (puntland, 2008).
Health Status
As in other parts of Somalia, the Puntland health situation is one of the worst in the world; without concerted and coordinated efforts

Puntland Report 2020Somali Health and Demographic Survey (SDHS)6
to revitalize the health system, the state will be unable to achieve its SDGs related to health and nutrition. The burden of disease is heavily dominated by communicable diseases, reproductive health and under-nutrition issues. However, non-communicable diseases and mental illness are on the rise (WHO 2015).
Life expectancy in Puntland is estimated to be 53 and 56 years respectively for males and females. One in 7 children dies before their fifth birthday. Infant mortality in Puntland stands at 85 per l, 000 live births. The morbidity and mortality trends have remained the same for years, with the general population affected by the same diseases, including diarrhoea, acute respiratory infections (ARI), malaria, malnutrition, and other vaccine-preventable diseases (MOH, 2018).
The adult HIV prevalence rate in 2014 was estimated at 0.55 percent (UNAIDS 2014), however other health indicators remain poor. This could be attributed to the poor state of the health system that continues to suffer from a lack of resources and adequate data to inform planning. This is particularly noticeable in reproductive health, an area largely dependent on the adequacy and availability of health services, which are features of a well-functioning health system.
The Ministry of Health (MOH) works to support Puntland people in attaining better health, which will enable them to participate in economic and social development and to contribute to the alleviation of poverty (Ministry of Health, 2014). To attain this goal, the government’s policy for the health sector is centred on the following priorities:
| Service delivery: Scaling up of essential and basic health and nutrition services (EPHS)
| Human resources for health: Overcoming the crisis of human resources for health
| Leadership and governance: Improving governance and leadership of the health system
| Medicines, medical supplies and technologies: Enhancing access to essential medicines and technologies
| Health information system: Providing a functioning health information system
| Health financing: Health financing for progress towards Universal Health Coverage (UHC)
| Health infrastructure: Improving health sector physical infrastructure
| Emergency preparedness and response: Enhancing health emergency preparedness and response

7
| Social determinants of health: Promoting action on social determinants of health and health in all policies
Survey Objectives and Organization
The main objective of the Somali Health and Demographic Survey (SHDS) was to provide evidence on the health and demographic characteristics of the Puntland population and Somali population in general that will guide the development of programmes and formulation of effective policies. This information would also help monitor and evaluate national, sub-national and sector development plans, including the Sustainable Development Goals (SDGs), both by the government and development partners. The specific objectives of the SHDS were to:
| Estimate maternal and adult mortality
| Examine basic indicators of maternal and child health
| Measure fertility and birth spacing
| Describe patterns of knowledge and awareness of the Human Immunodeficiency Virus (HIV) and other sexually transmitted infections
| Estimate infant and child mortality
| Understand the extent and patterns of gender-based violence and female circumcision
Sample Design
The sample for the SHDS was designed to provide estimates of key indicators for the state as a whole, for each of the five pre-war geographical regions in Puntland, which are the State’s first-level administrative divisions, as well as separately for urban, rural and nomadic areas. Each region was stratified into urban, rural and nomadic areas, yielding a total of 15 sampling strata.
Up-to-date, high-resolution satellite imagery, as well as on-the-ground knowledge of staff from the respective ministries of planning, all dwelling structures were digitized in urban and rural areas. Enumeration Areas (EAs) were formed on-screen through a spatial count of dwelling structures in a Geographic Information System (GIS) software. Thereafter, a sample ground verification of the digitized structures was carried out for large urban and rural areas and necessary adjustments made to the frame. Each EA created had a minimum of 50 and a maximum of 149 dwelling structures. In Puntland a total of 1773 EAs were digitized (1,058 in urban and 715 in rural), which formed the final frame. The nomadic frame comprised an updated list of Temporary Nomadic Settlements (TNS) obtained from nomadic link workers who are

Puntland Report 2020Somali Health and Demographic Survey (SDHS)8
tied to these nomadic settlements. A total of 1,338 TNS formed the SHDS nomadic sampling frame.
The SHDS followed a three-stage stratified cluster sample design in urban and rural strata with a probability proportional to size, for the sampling of Primary Sampling Units (PSU) and Secondary Sampling Units (SSU) (respectively at the first and second stage), and systematic sampling of Households (HHs) at the third stage. For the nomadic stratum, a two-stage stratified cluster sample design was applied with a probability proportional to size for sampling of PSUs at the first stage and systematic sampling of HHs at the second stage. To ensure that the survey precision is comparable across regions, PSUs were allocated equally to all regions with slight adjustments in two regions.
Within each stratum, a sample of 35 EAs was selected independently, with probability proportional to the number of digitized dwelling structures. In the urban and rural selected EAs, all households were listed and information on births and deaths was recorded through the maternal mortality questionnaire. The data collected in this first phase was cleaned and a summary of households listed per EA formed the sampling frames for the second phase. In the second stage, 10 EAs were sampled out of the possible 35 that were listed, using probability proportional to the number of households. All households in each of these 10 EAs were serialized based on their location in the EA and 30 of these households sampled for the survey. The serialization was done to ensure distribution of the households interviewed for the survey in the EA sampled. A total of 100 EAs were allocated to urban and rural strata (50 EAs each), while in the third stage, 30 households were selected from the listed households in every EA to yield a total of 3300 households from 149 EAs covered (50 EAs in urban, 49 EAs in rural and 50 EAs in nomadic) out of the sampled 150 EAs.
In nomadic areas, a sample of 10 EAs (in this case TNS) were selected from each nomadic stratum, with probability proportional to the number of estimated households. A complete listing of households was carried out in the selected TNS followed by the selection of 30 households for the main survey interview. In those TNS with less than 30 households, all households were interviewed for the main survey. All eligible ever-married women aged 12 to 49 and never-married women aged 15 to 49 were interviewed in the selected households, while the household questionnaire was administered to all households selected. The maternal mortality questionnaire was administered to all households in each sampled TNS.
Nomadic households reside temporarily in areas known as Temporary Nomadic Settlements (TNS) for as long as they can access pasture and water in these locations. The duration of their stay in such places is mainly dependent on the amount of rain that falls within that season and how long the season will last. During the long rains, the nomads would be stationed in one location, between 60 to 90 days, and for the short rains they spend about 45 days, based on anecdotal information. In the dry seasons, nomads move long distances, including across regions, and into neighbouring countries in search of water and pasture.
Nomadic settlements usually affiliate themselves with local settlements along their paths of movement.
References to ‘nomadic areas’ in the SHDS report are made to locations where survey teams visited households within temporary nomadic settlements.
BOX 1 Nomadic households

9
Questionnaires
Four types of questionnaires were used in the SHDS 2020: The Maternal Mortality Questionnaire, the Household Questionnaire and two individual questionnaires—Ever-married Woman’s Questionnaire and Never-married Woman’s Questionnaire.
Maternal Mortality Questionnaire
A stand-alone Maternal Mortality Questionnaire was used in all households during the listing phase to identify maternal deaths in the two years preceding the survey. This allowed the estimation of the Maternal Mortality Ratio (MMR) using a direct method. The methodology was adopted from the Yemen National Health and Demographic Survey carried out in 2013 and was used to obtain a more current estimate of the maternal mortality in Somalia.
Household and Individual Questionnaires
The Household Questionnaire, Ever-married Woman’s Questionnaire, and Never-married Woman’s Questionnaire were based on The Demographic and Health Surveys (DHS) Program’s standard Demographic and Health Survey Questionnaires (DHS7) and the 2013 Yemen Health and Demographic Survey instruments, and was adapted to reflect the relevant population and health issues in the Somali context.
Input was solicited from various stakeholders representing government agencies, particularly the ministries of health and planning, as well as international development partners. After the preparation of the questionnaires in English, they were translated into Somali. The questionnaires were further tested and refined in the field to ensure that cultural and religious sensitive questions were appropriately worded.
The Household Questionnaire was used to list all the regular members of and visitors to the selected households. Basic demographic information was collected on the characteristics of each person listed, including his or her age, sex, marital status, education, and relationship to the head of the household. For children under the age of 18, parents’ survival status was determined. The data obtained from the Household Questionnaire was used to identify ever- and never-married women eligible to be interviewed with the relevant individual questionnaire and those persons eligible for anthropometric measurements. The Household Questionnaire also collected information on the characteristics of the household’s dwelling unit, such as their source of drinking water; type of sanitation facility; materials used for the floor, walls, and roof of the dwelling unit; and ownership of various durable goods. In addition, the questionnaire included questions about

Puntland Report 2020Somali Health and Demographic Survey (SDHS)10
disability, as well as out-of-pocket expenditure on health.
The Ever-married Woman’s Questionnaire was used to collect information from all women aged 12 to 49 years who were currently married, divorced, abandoned, or widowed. In all households, eligible women were asked questions on the following topics:
| Background characteristics, such as age, education, literacy and media exposure
| Birth history and child mortality
| Knowledge and use of family planning methods
| Antenatal care, delivery, and postnatal care
| Breastfeeding and infant feeding practices
| Vaccinations and children’s illnesses
| Marriage and sexual activity
| Fertility preferences
| Women’s work and partners’ work background characteristics
| Knowledge of HIV/AIDS and methods of HIV transmission
| Adult and pregnancy-related mortality
The Never-married Woman’s Questionnaire was used to collect information from all women aged 15 to 49 years who had never been married. In all households, eligible women were asked questions on the following topics:
| Background characteristics, such as age, education, literacy and media exposure
| Violence against women
In this survey, Computer-Assisted Personal Interviewing (CAPI) was used, with interviewers using smart phones to record responses during interviews. The phones were equipped with Bluetooth technology to enable remote electronic transfer of completed questionnaires from interviewers to supervisors. Supervisors transferred completed files to the CSWeb server 1whenever internet connectivity was available. Any revision to the questionnaire was received by the supervisors and interviewers by simply synchronizing their phones with the CSWeb server, which was created specifically for the SHDS. The CAPI data collection system employed in the SHDS 2020 was developed by UNFPA using the mobile version of the Census and Survey Processing
1 CSWeb is a web application that facilitates the secure transfer of questionnaires or files between a user’s tools (with CSEntry) and a web server.

11
System (CSPro)2. The CSPro software was developed jointly by the U.S. Census Bureau, the DHS Program and Serpro S.A.
TrainingTraining for the SHDS was two-phased: for the Listing/Maternal Mortality Ratio (MMR) data collectors and for the Main Survey data collectors (those administering the household, ever-married woman and never-married woman questionnaires).
Listing and MMR Training
Training of Trainers (ToT) sessions were conducted in two locations: Garowe and Hargeisa, facilitated by technical staff from UNFPA. Seven trainers were trained in household listing concepts (identification of structures, dwelling units, and EA boundaries), interviewing techniques, interviewers’ and supervisors’ roles, age probing techniques, fieldwork procedures, sampling techniques, importance of data on births and deaths, recognizing and handling age inconsistencies, identification of maternal deaths and CSPro mobile data collection application. Thereafter, these trainers transferred this knowledge and skills to 45 data collectors from across the state in Garowe, Bossaso and Galkacyo, A pretest was carried out using both paper questionnaires and CAPI to assess the understanding of the trainees. Modifications were made to the questionnaire and survey methods, based on lessons drawn from the pretest. Participants were assessed through both theoretical evaluations in class as well as observations made on their survey implementation during the pretest.
Main Survey Training
The UNFPA technical team trained 19 master trainers in October 2017 in Kigali, Rwanda, five of the master trainers came from Puntland. These master trainers were all Somali health and demographic professionals who participated in the development and review of data collection tools. Consequently, along with the master trainers, UNFPA trained 51 trainers of trainers inside the country. Finally, 97 supervisors and interviewers—89 women (constituting 90 percent of the data collectors who had been drawn from the medical profession (nurses, midwives and doctors). At the end of each training, a pretest was conducted using manual questionnaires and CAPI to ensure that all the trainees had acquired a minimum level of knowledge and skills required for the SHDS. The selection of supervisors was based on performance in both in-class assessments and field pretests.
Fieldwork
2 CSPro is a public domain software package that allows users to enter, edit, tabulate and disseminate census and survey data.

Puntland Report 2020Somali Health and Demographic Survey (SDHS)12
Data collection in urban and rural areas was carried out in two distinct phases: listing/MMR and main survey. Data collection in the nomadic areas was carried out almost simultaneously due to the mobility of nomadic households.
Listing and MMR Data Collection
The listing of households and MMR data collection began in February 2018 and was completed in January 2019 for urban and rural areas.
Fieldwork was carried out by 22 teams, each consisting of one supervisor, four enumerators and a driver. An Android platform developed in CSPro was used for data collection. Each team was assigned mobile phones (one for each enumerator and one for the supervisor), EA Maps (in A0 and A3 sizes), EA Google Earth files, control sheets, notebooks, pens and document folders. In addition, 34 data quality controllers (trainers, Geographical Information Systems (GIS) staff, survey/state directors, and regional coordinators) were coordinating and supervising fieldwork. In security-compromised areas, survey teams were supported by security guards and facilitators in the field.
Main Survey Data Collection
The trained interviewers and supervisors were deployed to collect data from 30 selected households in each of the 10 sampled enumeration areas in each region-stratum. Selected households were obtained from a complete list of households in the EA. Data collectors were supported by the listing team who were well-versed in reading maps and could identify the EA boundaries as well as the selected households. Each interviewer collected data from approximately two households per day.
The nomadic households were listed a day prior to the day of enumeration in each TNS to obtain a current and complete list of households. During listing, coordinates of all nomadic household structures and the names of the head of each household were recorded. A sample of 30 households was then selected by the listing team and given to the supervisors of the enumerating team on their first day of enumeration. After this, supervisors allocated households to be interviewed to enumerators. The MMR questionnaire was administered by both listing and enumerating teams in nomadic areas. The enumerating team collected this data from the 30 sampled households, while the listing team collected data on maternal deaths from the remaining unsampled households in the TNS.
Data ProcessingData processing for the SHDS was carried out by a core team of 17

13
people drawn from in-country statistical offices and UNFPA, with several members playing multiple roles. All team members had previously participated in the training and fieldwork for the SHDS.
Data from the SHDS was sent to a cloud CSWeb server that was protected by a password and the electronic files were downloaded as csdb files that were exported to Statistical Product and Service Solutions (SPSS)3 and Stata4 for data processing. Three people served as CSPro data administrators. They were responsible for downloading the data from server instances and merging them, following which, a larger team worked on producing the six DHS standard type files, which were then handed over to other data processing teams. A team of three Geographical Information System (GIS) specialists carried out spatial editing of all household records from the server, assigning them to the correctly sampled EA codes. Concurrently, the data tabulation and re-coding teams produced the tabulation plan and re-coding manual following DHS standards but contextualized to the SHDS. Two team members were tasked with computing the sampling and survey weights.
Response RatesTable 1.1 presents response rates for the SHDS 2020. A total of 3,693 households were selected for the sample, of which 3637 were occupied. Of the occupied households, 3625 were successfully interviewed, yielding a response rate of 99 percent. The response rate was similar throughout all the three places of residence. The SHDS 2020 interviewed 5426 women in Puntland – 3728 ever-married women and 1698 never-married women.
Quality AssuranceA variety of tools and mechanisms were used as part of the quality assurance arrangements throughout the implementation of the SHDS 2020. These included a consultative approach to critical decision making, extensive training and competitive recruitment of survey personnel, independent third-party monitoring, the Global Positioning System (GPS) tracking of field operations, peer review arrangements and validation meetings.
Consultative approach to critical decision making – all key decisions concerning the survey—its methodology, instruments, field work, tabulation plan, reports and data access— were discussed, designed and formulated following extensive consultations with Somali government partners, national and international experts and development partners where applicable. The idea was to draw on the widest possible expertise, as well as
3 SPSS is a software package used for statistical analysis. SPSS originally stood for Statistical Package for the Social Science.
4 A statistical software for data science.

Puntland Report 2020Somali Health and Demographic Survey (SDHS)14
to ensure validation and in-country ownership.
Extensive training and competitive recruitment of survey personnel – given the national execution of the survey, UNFPA put in place an extensive training programme for survey personnel that worked on a “cascade” principle, with training of trainers at various levels. In each training, a test was administered at the end, and trainees who scored 80 percent and above were retained for participation in the survey.
Learning and Monitoring Programme for Somalia (LAMPS)–an Independent Third-Party Monitoring (TPM), engaged by the Department for International Development (DfID), provided periodical monitoring of SHDS activities throughout the survey’s implementation phase. The activities selected for verification, as well as field teams and beneficiaries to interview, were all randomly selected by the LAMPS teams throughout the entire phase of the survey. The findings from LAMPS provided the SHDS technical team with specific areas in which to improve the quality of SHDS training and collection of data from selected households. LAMPS consistently rated SHDS activities as delivered according to how they were designed and planned.
GPS tracking of field operations – During field data collection, the SHDS employed the use of handheld devices with embedded GPS, which allowed geo-referencing and the collection of geo-located data. It also enabled the tracking of fieldwork and ensured that the sample design is adhered to. Further, the geo-referenced data aided in data editing.
Consistency checks of the data – Geo-referenced listed data was cross-checked with digitized dwelling structures to ensure listing was undertaken in the correct EAs. Similarly, during the main survey, information collected during listing—which include coordinates, names of household members and other landmarks—helped to ensure teams visited the correct households. Further, listing information on the target population, women of child-bearing age and children under five years of age, aided in monitoring data collection by the main survey team.
Peer review arrangements – UNFPA approached prominent experts in the various fields related to the SHDS survey, including from the League of Arab States Pan Arab Project for Family Health (PAPFAM) expert group, National Statistical Offices (Statistics Norway, Statistics Sweden and Office for National Statistics), UN Habitat, and academia, to serve as peer reviewers of key aspects of SHDS and its outcomes. These included the sample design, methodology for covering the nomadic population, the use of GIS and satellite imagery in the preparations for the survey, the use of Brass-type techniques for the analysis of the survey data, and the

15
SHDS reports themselves.
Validation forums – The Somali partners and international experts have reviewed the SHDS data, reports and other outcomes of the survey with the aim to validating the processes and findings.
Am, solenduciur si di videnim odipid quia velest alit, volorat uribus. Qui beri quianihic tes adit facia
UN
IST
PH
OT
O /
ST
UA
RT
PR
ICE

Household and Housing Characteristics
CHAPTER 2

©A
U U
N I
ST P
HO
TO
/ T
OB
IN J
ON
ES.
Key Findings

Puntland Report 2020Somali Health and Demographic Survey (SDHS)18
BOX 2.1 Key definitions
HouseholdA person or group of related or unrelated persons who live together in the same dwelling unit(s) or in connected premises, who acknowledge one adult, male or female, as the head of the household, who share the same housekeeping arrangements, and who are considered a single unit.
De facto populationAll persons who stayed in the selected households the night before the interview (whether usual residents or visitors).
De jure populationAll persons who are usual residents of the selected households, whether or not they stayed in the household the night before the interview.
Age in completed years (Age at last birthday)This is the most common definition of age, where it is expressed as the number of completed years lived by a person. Other definitions include exact age, which is used mostly for modelling purposes, and age reached during the year.
The SHDS 2020 collected information from all usual residents of a selected household (de jure population) and persons who had stayed in the surveyed household the night before the interview (de facto population). Although the difference between these two populations is small, to avoid double counting, all tables in this report refer to the de facto population, unless otherwise specified.
Age and Sex CompositionAge and sex are important demographic variables that are the primary basis of demographic classification in vital statistics, census and surveys. They are the basis for studying patterns of mortality, fertility, fertility preference, age at first marriage and other information about the inhabitants of a country.
The SHDS 2020 collected information on age in completed years for each household member. When the age was not known, interviewers inquired further for dates of birth in the Gregorian calendar/Somali historical calendar. Age was then calculated using conversion charts, specifically designed for this purpose.
Table 2.1 presents the distribution of the household members, by age, residence (urban, rural and nomadic) and sex. In Puntland, the SHDS surveyed 31170 people of whom 48 percent were males and 52 percent females.
Youth between 15-29 years of age constitute 22 percent of the household members, while the older persons (65 years and above) comprise only 3 percent of the total household members. Forty-two percent of the household members are within the working age of 15-64 years, highlighting the need to create jobs and ensure that
2Chapter 2
Household and Housing CharacteristicsThis chapter presents the socioeconomic characteristics of the household members that were covered by the Somali Health and Demographic Survey 2020. Information collected includes respondents’ age, sex, type of residence (urban, rural and nomadic household members) and educational status, as well as household facilities, characteristics and possessions. The profile of the households presented in this chapter will assist in understanding the results of the SHDS 2020 in the subsequent chapters, while serving as a foundation for social and economic development planning. The domain of coverage for the SHDS was the 18 pre-war regions of Somalia. In the Puntland State of Somalia, the survey covered five regions; Bari, Nugaal, Mudug, Sool and Sanaag.

19
training or education offered addresses the needs of the labour market.
Thirty-nine percent of female household members are within childbearing age (15-49 years), which is the same at the national level. This can have implications on Puntland and the country’s future birth rates. The large number of potential mothers creates a population momentum and is a strong indication of a potential spike in population growth that Puntland is likely to experience in the coming years. The medium variant of the latest revision of the UN population prospects (United Nations, 2019) projects that the population of Somalia could more than double in the next 30 years to close to 35 million in 2050. These projections need to be considered by the relevant public authorities and encourage stakeholders to consider preparing for the provision of adequate social services.
The age structure of the household members is typical of a society with a young population. Somalia has one of the highest fertility rates in the world. Like the rest of Somalia, Puntland has a broad-based age pyramid, with 62 percent of the household members below 18 years which is the same as the national. level. The sex and age distribution of the household members is presented in the population pyramid (Figure 2.1).
The population pyramids in Figure 2.1 are in line with the national population pyramid which is typical of a developing country’s population where there is high fertility and mortality, which, demographically, present a young population. There are more boys than girls among children under 15 years of age, and more women than men at older age groups. This is a pattern observed universally, which is driven by the sex ratio at birth (under normal circumstances around 105 boys are born for every 100 girls) and by the sex differences in mortality as women generally have lower death rates compared to men.
Regardless of the type of residence, the age pyramids in Figure 2.1 sharply taper to become narrower above the age of 55, this indicates high mortality rates among older age groups. Like the rest of Somalia, the Puntland population is demographically very young, with around two-thirds of the population aged below 20 years of age and around three-quarters at 78 percent aged below 30 years.
The pyramids in Figure 2.1 have patterns that are like Figure 2.2 which presents the population pyramid from the Population Estimation Survey (PESS), Somalia, 2014 (UNFPA 2014). Overall, the number of household members between 50-54 years has increased, compared to the same category in the PESS. A notable feature of the 2014 PESS age pyramid is the relatively low proportion of the age group 0-4, which is the result of under-counting young
22.0 18.0 14.0 10.0 6.0 2.0 2.0 6.0 10.0 14.0 18.0 22.0
<55-9
10-1415-19
20-2425-2930-3435-39
40-4445-4950-5455-5960-6465-6970-7475-79
80+
Urban population distribution by age and sex
Female Male
22.0 18.0 14.0 10.0 6.0 2.0 2.0 6.0 10.0 14.0 18.0
<55-9
10-1415-19
20-2425-2930-3435-39
40-4445-4950-5455-5960-6465-6970-7475-79
80+
Nomadic population distribution by age and sex
Female Male
22.0 18.0 14.0 10.0 6.0 2.0 2.0 6.0 10.0 14.0 18.0 22.0
<55-9
10-1415-19
20-2425-2930-3435-39
40-4445-4950-5455-5960-6465-6970-7475-79
80+
Rural population distribution by age and sex
Female Male
22.0 18.0 14.0 10.0 6.0 2.0 2.0 6.0 10.0 14.0 18.0 22.0
<55-9
10-1415-19
20-2425-2930-3435-39
40-4445-4950-5455-5960-6465-6970-7475-79
80+
Total population distribution by age and sex
Female Male
Figure 2.1 Distribution of population by age and sex according to residence, SHDS 2020
Urban population distribution by age and sex
Nomadic population distribution by age and sex
Rural population distribution by age and sex
Total population distribution by age and sex

Puntland Report 2020Somali Health and Demographic Survey (SDHS)20
children. The fact that the under-counting is not so pronounced in the 2020 SHDS data attests to the quality of the survey and may be due to the use of mobile phone technology during data collection.
Household CompositionTable 2.2 shows the distribution of households covered in Puntland by the sex of the head of household and the number of household members, according to urban, rural and nomadic residences. Thirty-one percent of households are headed by women, 33 percent in urban households, 38 percent in rural households, and 22 percent in nomadic households) (Figure 2.3). The region with the highest percent of female headed households is Mudug at 34 percent while the least is Nugaal at 27 percent.
The average household size is 6 persons, compared to 6.2 persons at the national level which is not far from the number recorded in the PESS 2014 (5.9 persons per household) (UNFPA 2014). Urban households, which have 6.6 persons per household, are slightly larger than rural households, with 5.8 persons per household. Nomadic households have the lowest average household size with 5.4 persons.
According to the 2014 PESS, the nomadic and urban households had the highest average household sizes, at 6.5 and 6.4 persons respectively, rural areas had a household size of 5.8 persons. An improved methodology for enumerating nomadic households was adopted in the SHDS 2020. This could explain the deviation from the 2014 PESS that showed that mean household size was largest among the nomads. The average household size varies modestly among the regions, ranging from 6.2 in Mudug, 6.1 in Nugaal and 5.7 in Sanaag.
Table 2.2 indicates that 32 percent of households have a foster child and/or orphaned children, 18 percent have foster children, 14 percent have single orphans and 5 percent have double orphans. There is a marginal difference in the number of households with foster children between the three types of residence. Urban households have the highest proportion of foster and/orphaned children in their households at 33 percent, followed by rural and nomadic households at 31 percent for each. Among the regions, Mudug has the highest share of households with foster and/orphaned children at 37 percent while Bari has the least at 24 percent.
EducationThe level of education is a critically important characteristic, as it affects behaviour, including health-related behaviours and choices made in relation to reproduction, contraceptive use, child health,
77.667.5 61.6
22.432.5 38.4
Nomadic Urban Rural
Male Female
Figure 2.1 Household headship
Percent distribution of households by sex of head of household and type of residence

21
and hygiene. Access to education is considered a human right that inherently influences the development of a country. It is one of the key national responses that would guarantee orphans and children from vulnerable backgrounds equal access to better lives as they grow up.
Educational attainment
Information on educational attainment of male and female household members aged six and above is presented in Table 2.3a and Table 2.3b. The survey results indicate that educational attainment varies across age groups. The age group with the lowest number of people with no education is 15-19 among male household members at 14 percent and 15-19 among female household members at 17 percent.
Among the male household members, those in the age group 45-49 have more people at 19 percent with completed secondary education. Female household members show slight variations across different age groups with those in age cohorts 15-19 and those in 45-49 being more likely to have completed secondary education at 11 percent and 13 percent compared to the other age groups.
Nine percent of males in the urban have completed secondary education compared to 6 and 1 percent among the rural and nomadic residents respectively. Six percent of males in Mudug have completed secondary education compared to 5 percent in Sool. Six
Figure 2.4 Educational attainment by sex
Percent distribution of the de facto male and female populations aged six and over by educational attainment
30.1
41.3
3.7
8.4 6.9 6.03.7
33.3
45.7
5.2 6.74.6 3.8
0.7
NoEducation
SomePrimary
CompletedPrimary
SomeSecondary
CompletedSecondary
HigherEducation
Don't Know
Male Female

Puntland Report 2020Somali Health and Demographic Survey (SDHS)22
percent of women in urban have completed secondary education while less than one percent in the nomadic have completed secondary education. Women in Sool and Sanaag are least likely to complete secondary education at 3 percent and Mudug has the highest percent of women with secondary education at 6 percent.
Figure 2.4 compares educational attainment by sex. Educational attainment is higher for men than it is for women. Overall, 30 percent of men and boys aged 6 and above have never been to school, compared to 33 percent of women and girls aged 6 and above. Forty-six percent of female household members and 41 percent of the male household members have had some primary education. Twenty-one percent of men have attended secondary or higher schooling, compared to 16 percent of women.
The chances of progression to higher education are slightly better for urban dwellers compared to people living in rural and nomadic areas, as educational facilities are concentrated in the urban centres. Nomadic household members are the most disadvantaged in terms of accessing education.
Seventy-six percent of males residing in the nomadic areas have no education compared to 27 and 22 percent among rural and urban male residents respectively. Among the females, 82 percent of nomadic residents have no education compared to 33 and 26 percent among rural and urban residents respectively.
Figure 2.5 Educational attainment by sex
Percent distribution of the de facto male and female populations aged six and over with no education by region and type of residence
76.0
26.721.8
44.6
26.3 25.2 24.5 22.6
82.2
32.226.1
43.2
33.125.5
32.024.3
Nomadic Rural Urban Mudug Sool Sanaag Bari Nugaal
Type of residence Region
Male Female

23
Regionally Mudug has the highest proportion of males with no education at 45 percent while Nugaal has the least at 23 percent. Among the females, those residing in Mudug have the highest level of those with no education at 43 percent while those in Nugaal have the least percent of those with no education at 24 percent (Figure 2.5).
School Attendance Ratios
Table 2.4 presents data on net attendance ratios (NARs) and gross attendance ratios (GARs) by school level, sex, and place of residence. The NAR is the percentage of the school-age population that attends primary school (age 6 -13) or secondary school (age14 -17). The GAR for primary schooling is measured as the total number of primary school students relative to the official primary-school-age population; similarly, GAR for secondary schooling relates the number of secondary school students relative to the official secondary-school-age population. The GAR is nearly always higher than the NAR for the same level because the GAR includes participation by those who may be older or younger than the official age group for that level. A NAR of 100 percent would indicate that all those in the official age range for the specific level are attending school at that level. The GAR can exceed 100 if there is significant overage or under-age participation at a given level of schooling.
Eighteen percent of the total children attending primary school are of the right age for that level. At secondary level, 16 percent of the total children attending are of the right age for the level.
As shown in Figure 2.6 the NAR for boys is higher than that for girls at the primary level at 22 percent and 14 percent, respectively. Likewise, the NAR is higher for males than females at the secondary level at 20 percent and 13 percent, respectively.
The GAR is higher for males compared to females, at 38 and 24 percent respectively at the primary-school level, and 37 and 23 percent, respectively, at the secondary-school level, indicating higher school attendance among males than females.
As shown in Figure 2.7, urban areas have the highest NAR at primary level 29 percent while the nomadic have less than one percent. The NAR at secondary level is less than one percent for both urban and rural. of both NAR and GAR increase with an increase in wealth for both primary and secondary levels.
As presented in Table 2.4, regionally, Nugaal highest and Sool least NAR at both primary and secondary level-28 and 9 percent for primary respectively and for secondary at 25 and 8 percent respectively.
Figure 2.6 School attendance ratios
Net Attendance Ratio (NAR) and Gross Attendance Ratio (GAR) for the de facto household population by sex and level of schooling
21.9
14.3
19.9
13.4
37.7
23.6
37.3
23.3
Male Female Male Female
Primary Secondary
NAR GAR
29.1
18.0
0.0
26.9
16.4
0.0
Urban Rural Nomadic
Primary NAR Secondary NAR
Figure 2.7 Total net attendance ratios
Total net attendance ratios by type of residence

Puntland Report 2020Somali Health and Demographic Survey (SDHS)24
Figure 2.8 Household drinking water sources
percent distribution of household drinking water sources by type of residence
Housing Characteristics
Water Supply
Access to clean drinking water is one of the Sustainable Development Goals (SDGs) and a target outlined in Somalia’s National Development Plan (NDP) 9. The different types of water sources and sanitation facilities available to a population are important determinants of health, particularly among children. Good hygienic and sanitation practices can reduce exposure to and repercussions of preventable diseases. Conversely, poor quality of water and water scarcity also shape livelihood choices.
The source of drinking water for a household is an indicator of how safe it is to consume that water. Sources that are likely to provide uncontaminated water that is suitable for drinking are known as improved water sources (Table 2.5). These include piped water, protected dug wells, tube wells or boreholes, rainwater, and bottled water. The lack of ready access to a water source may limit the quantity of suitable drinking water that is available to a household. Even where water is obtained from an improved source, if it is fetched from a source that is not immediately accessible to a household, it may be contaminated during transportation or storage. By treating water effectively at home, families can improve the quality of household drinking water.
The prevalence of preventable, water-borne diseases such as diarrhoea and dysentery in Puntland can be reduced by introducing and using improved water sources that are readily available to the households. According to the survey, 58 percent of households get their drinking water from improved water sources. Seventy-one percent of urban households in Puntland have access to improved water sources, while 21 percent of rural households and 37 percent of nomadic households have access to improved water sources (Table 2.5a and Figure 2.8)
Regionally, Sool has the lowest proportion of households that obtain their drinking water from improved water sources at 21 percent compared to households in Mudug which have the highest proportion at 72 percent. Percentages of the households in Sanaag, Bari and Nugaal who get their drinking water from improved water sources are 42, 65 and 64 percent respectively.
Twenty-seven percent of household members have access to piped water into their dwelling, yard or plot. Nineteen percent of households have to travel for at least 30 minutes or more to get water. Nomadic household members spend more time getting water probably for longer distances due to water availability. Forty-four percent of nomadic households, 10 percent of rural and 7 percent of urban households travel more than 30 minutes, to access improved water sources.
70.7 62.4
37.1
29.3 37.6
62.9
Urban Rural Nomadic
Improved source Unimproved source

25
Figure 2.9 Household sanitation facilities
Percent distribution of households by type of toilet/latrine facilities in use and type of residence
As shown in Table 2.5b, only 8 percent of households in Puntland treat water before drinking, 11 percent of both urban and rural households. It is reported that nomadic households do not use any appropriate treatment methods for drinking water.
The most common method of water treatment is boiling, used by 5 percent of households, at 6 percent in urban households and 8 percent in rural settings. None of the nomadic households use bleaching/chlorination.
Among the regions, percentages of households using an appropriate treatment method were higher in Bari (at 10 percent), Nugaal (11 percent) and Mudug (at 9 percent) and lower in Sool and Sanaag at 3 percent each.
Sanitation Facilities
With adequate sanitation and means of disposal of human excreta, which are both fundamental needs and human rights—as well as with personal hygiene—people are assured of the ability to maintain their dignity and protection from various diseases.
The inadequate disposal of human excreta and personal hygiene is associated with a range of diseases including diarrhoeal diseases. Improved sanitation can reduce diarrheal disease by more than a third (Cairncross S., Hunt C., Boisson S., et al. 2010), and can significantly lessen the adverse health impacts of other disorders responsible for death and disease among millions of children in developing countries. An improved sanitation facility is defined as one that hygienically separates human excreta from human contact. Improved sanitation facilities for excreta disposal include flush or pour flush to a piped sewer system, septic tank, or pit latrine; ventilated improved pit latrine, pit latrine with slab, and use of a composting toilet. The SHDS considers improved toilets as those that flush or pour flush into a piped sewer system or septic tank.
A household is classified as having an improved toilet if the toilet is used only by members of one household (i.e. it is not shared) and if the facility used by the household separates the waste from human contact as proposed by WHO and UNICEF (UNICEF 2012).
Table 2.6 shows that 54 percent of households in Puntland use sanitation facilities with basic sanitation services that would be considered as improved toilet facilities.
Access to improved sanitation facilities within households varies greatly between urban, rural and nomadic residences, as shown in Table 2.6. Majority of households in urban and rural areas have access to improved toilet facilities at 77 and 68 percent
76.868.4
1.0
53.6
17.920.3
5.2
15.2
5.3 11.3
93.7
31.2
Urban Rural Nomadic Total
Improved facility
Unimproved facility
Open defecation

Puntland Report 2020Somali Health and Demographic Survey (SDHS)26
respectively, compared to nomadic households at one percent. Regionally, Nugaal has the highest proportion of households that use improved toilet facilities at 73 percent and Sool has the least at 27 percent.
As indicated in Figure 2.9, the prevalence and use of open defecation is higher in nomadic settings at 94 percent than in rural and urban settings at 11 and 5 percent respectively.
Flooring Material, Lighting and Cooking Arrangements
Table 2.7 presents the distribution of households by dwelling characteristics and amenities. In Puntland, 34 percent of households use electricity compared to the national rate of 44 percent, with variations in geographical locations and type of residence. In urban areas, 70 percent of households use electricity for lighting, compared to 28 percent of rural households, and less than one percent in nomadic households.
The type of flooring used in a house can be indicative of the lifestyle its inhabitants have. Across Puntland, more than half of households have floors made of earth or sand at 51 percent. In urban residences 56 percent of households use ceramic tiles and cement for flooring, compared to 56 percent of rural households. Regionally, Nugaal has the highest proportion of households using ceramic tiles and cement for flooring at 70 percent while Mudug has the lowest proportion at 28 percent.
Firewood is the most common source of fuel used for cooking in nomadic and rural areas, at 94 and 68 percent respectively. In urban areas, 42 percent of households use charcoal for cooking, compared to 22 percent in rural areas and 2 percent in nomadic areas.
Household PossessionsInformation on the ownership of durable goods and other possessions is presented in Table 2.8. The availability of durable consumer goods is an indicator of a household’s socioeconomic status and access to various benefits. For example, access to the radio can increase exposure to innovative ideas, whereas transport vehicles can provide access to services outside of the local area.
As shown in figure 2.10, only 11 percent of households in Puntland own a television, and 66 percent own a mobile telephone.
Keeping up with technological advances and connecting with friends and family is a top priority in majority of households: Seventy-four percent of people living in urban households, 66 percent in rural households and 59 percent of nomadic households

27
own simple mobile telephones with access to FM Radio.
Seventy-six percent of people living in Nugaal region use simple mobile telephones and 10 percent use internet. People in Sanaag had the least proportion of mobile phone ownership at 61 percent compared to other regions.
Figure 2.10 Household possessions
Figure 2.11 Household effects
Percent of household possessions
Percent of households effects ownership by type of residence
66.452.2
38.416.2
10.75.7
5.24.64.54.24.2
2.82.3
1.31.0
0.70.50.40.2
Mobile phone
Livestock lostOwnership of livestock
TelevisionRadio
Non-mobile telephoneAirconditioner/fan
Computer Car/truck
InternetRefrigerator
Animal ploughOwnership of agriculture land
Donkey cartBicycle
Motorcycle/scooterBoat/canoe
TractorRicksaw
73.8
25.4 21.7
11.3 9.2 8.5
65.7
5.5
17.9
1.5 1.7 3.3
59.4
0.4
8.8
0.3 1.3 3.5
Mobilephone
Television Radio Computer Internet Non-mobiletelephone
Urban Rural Nomadic

Puntland Report 2020Somali Health and Demographic Survey (SDHS)28
In addition to the above, 22 percent of urban households, 18 percent of rural households and 9 percent of nomadic households own radios as well (Figure 2.11).
Eight percent of urban households own a car or truck. As is the case throughout the country, families in Puntland value livestock and regard them as assets: Almost all nomadic households own livestock at 95 percent while 46 percent of rural households and 17 percent of urban households own livestock.
Household WealthIn addition to presenting standard background characteristics, many of the results in this report are shown by wealth quintiles, an indicator of the economic status of households. The SHDS 2020 did not collect data on consumption or income, but the information collected on dwelling and household characteristics, consumer goods, and assets is used as a measure of socio-economic status. The resulting wealth index is an indicator of relative level of wealth that is used as a proxy for expenditure and income measures. Each household asset for which information is collected is assigned a ‘weight’ or ‘factor score’ generated through Principal Components Analysis (PCA). The resulting asset scores are standardized in relation to a standard normal distribution with a mean of zero and a standard deviation of one.
Table 2.9 shows the distribution of the household members into five wealth quintiles (five equally divided levels) based on the wealth
Figure 2.11 Wealth quintiles
Percent distribution of de-jure household members by wealth quintiles and type of residence
2.4
15.0
24.431.8
26.3
11.4
26.434.6
18.0
9.5
90.4
4.2 2.2 2.80.4
Lowest Second Middle Fourth Highest
Urban Rural Nomadic

29
index by place of residence and region. These distributions indicate the degree to which wealth is evenly (or unevenly) distributed across Puntland.
Figure 2.12 shows wealth quintile categories. As expected, according to the SHDS findings, urban areas are wealthier than rural and nomadic areas. Within urban households, 26 percent belong to the highest wealth quintile, followed by 10 percent in rural areas and less than one percent in nomadic areas, indicating that the most affluent or wealthier households live in urban settings. Among the regions, Nugaal has the highest proportion of wealthier households at 22 percent, while Sool and Sanaag have the least proportion at 7 and 8 percent respectively.
Birth RegistrationThe registration of births is the inscription of the facts of a birth into an official log. A birth certificate is issued as proof of the registration of birth. Information on the registration of births was collected in the household interview by asking whether children under the age of 5 had a birth certificate. If the interviewer was informed that the child did not have a birth certificate, then he/she probed further to ascertain whether the child’s birth had been registered with the civil authority.
Almost all children did not have a birth certificate. Five percent of children under two years were registered and less than one percent had a birth certificate. These figures may be significantly low due to the lack of civil registration and the lack of a vital statistics system in Puntland. The levels of registration were generally low and no significant variations were recorded across the regions and places of residence, as shown in Table 2.10.

Puntland Report 2020Somali Health and Demographic Survey (SDHS)30
Perc
ent d
istr
ibut
ions
of t
he d
e fa
cto
hous
ehol
d po
pula
tion
by
vari
ous
age
grou
ps a
nd p
erce
ntag
e of
the
de fa
cto
hous
ehol
d po
pula
tion
age
10
-19,
acc
ordi
ng to
sex
and
resi
denc
e,
SHD
S 20
20
"Bac
kgro
und
char
acte
rist
ics"
Urb
anR
ural
Nom
adic
Tota
l
Mal
eFe
mal
eTo
tal
Mal
eFe
mal
eTo
tal
Mal
eFe
mal
eTo
tal
Mal
eFe
mal
eTo
tal
Age <5
20.1
17.1
18.6
22.2
18.4
20.2
22.2
21.4
21.8
21.4
18.8
20.0
5-9
20.3
17.6
18.9
22.5
18.3
20.2
20.6
18.9
19.7
21.1
18.2
19.6
10-1
416
.114
.515
.316
.615
.215
.813
.413
.613
.515
.414
.514
.9
15-1
911
.313
.612
.510
.210
.610
.48
.510
.89.
610
.111
.811
.0
20-2
46.
17.
56.
83.
55.
84
.76.
26.
76.
45.
36.
76.
1
25-2
94
.37.
05.
73.
17.
25.
35.
46.
55.
94
.36.
95.
7
30-3
44
.45.
55.
03.
75.
34
.65.
45.
35.
34
.55.
45.
0
35-3
93.
84
.44
.23.
14
.84
.03.
44
.13.
83.
54
.54
.0
40
-44
3.9
2.5
3.2
4.2
2.7
3.4
4.1
2.3
3.2
4.1
2.5
3.3
45-
491.
91.
21.
61.
81.
41.
61.
91.
11.
51.
91.
31.
6
50-5
42.
73.
43.
12.
63.
02.
82.
43.
63.
02.
63.
43.
0
55-5
91.
10
.91.
01.
01.
21.
11.
31.
51.
41.
11.
21.
1
60-6
41.
51.
51.
52.
11.
81.
92.
02.
02.
01.
81.
71.
8
65-6
90
.30
.60
.50
.30
.80
.60
.70
.60
.60
.40
.60
.5
70-7
40
.91.
11.
01.
01.
51.
31.
20
.81.
01.
01.
11.
1
75-7
90
.20
.20
.20
.30
.30
.30
.30
.40
.30
.20
.30
.3
80+
1.0
1.1
1.1
1.5
1.7
1.6
1.0
0.6
0.8
1.2
1.2
1.2
Tota
l10
010
010
010
010
010
010
010
010
010
010
010
0
Dep
ende
ncy
Age
Gro
ups
0-1
456
.64
9.2
52.7
61.3
51.9
56.3
56.3
53.9
55.1
57.9
51.4
54.5
15-6
44
1.1
47.
84
4.6
35.4
43.
839
.94
0.6
43.
74
2.2
39.2
45.
34
2.4
65+
2.4
3.1
2.7
3.2
4.3
3.8
3.2
2.4
2.8
2.9
3.3
3.1
Tota
l10
010
010
010
010
010
010
010
010
010
010
010
0
Chi
ld a
nd a
dult
pop
ulat
ions
0-1
763
.657
.260
.367
.958
.763
.061
.761
.261
.464
.358
.861
.5
18+
36.4
42.
839
.732
.14
1.3
37.0
38.3
38.8
38.6
35.7
41.
238
.5
Tota
l10
010
010
010
010
010
010
010
010
010
010
010
0
Ado
lesc
ents
10-1
927
.428
.127
.826
.825
.826
.221
.924
.423
.125
.526
.325
.9
Num
ber
of p
erso
ns 5
,732
6
,312
1
2,0
43
4,4
90
5,1
66
9,6
56
4,6
95
4,7
76
9,4
71
14
,916
1
6,25
3 31
,170
Tab
le 2
.1
Hou
seho
ld p
opul
atio
n by
age
, sex
, and
resi
denc
e

31
Table 2.2 Household composition
Percent distribution of households by sex of head of household and by household size; mean size of household, and percentage of households with orphans and foster children under 18 years of age, according to residence SHDS 2020
Background characteristics
Types of residence Region of residence
Urban Rural Nomadic Sool Sanaag Bari Nugaal Mudug Total
Household Headship
Male 67.5 61.6 77.6 67.8 69.8 70.4 72.8 66.1 69
Female 32.5 38.4 22.4 32.2 30.2 29.6 27.2 33.9 31
Total 100.0 100.0 100.0 100.0 100.0 100.0 100.0 100.0 100
Number of usual members
1 1.5 4.2 2.4 2.5 4.0 3.1 2.7 1.5 3
2 4.1 6.2 8.2 6.3 7.6 6.1 5.9 5.4 6
3 7.6 11.0 11.5 10.1 9.0 10.8 10.3 9.7 10
4 11.3 13.1 14.9 13.5 14.3 13.6 12.1 11.8 13
5 13.0 13.2 16.0 15.9 14.2 13.8 14.9 13.0 14
6 14.5 14.0 16.0 14.8 15.5 14.2 12.5 15.9 15
7 14.0 12.9 13.0 12.4 11.6 13.3 12.9 15.1 13
8 10.9 9.9 8.7 10.2 8.7 10.2 10.4 9.8 10
9+ 23.0 15.5 9.3 14.2 14.9 14.9 18.2 17.9 16
Total 100.0 100.0 99.9 100.0 99.9 100.0 100.0 100.0 100
Mean size of households
6.6 5.8 5.4 5.8 5.7 5.8 6.1 6.2 6
Percentage of households with orphans and foster children under 18
Foster children 1 18.6 18.2 15.9 21.5 20.9 9.7 18.9 20.3 17.6
Double orphans 5.1 4.5 5.3 2.3 2.9 5.8 8.3 5.6 5.0
Single orphans 2 16.0 13.7 13.5 13.4 12.4 13.7 15.9 16.3 14.4
Foster and/or orphan children
33.4 30.6 30.5 31.9 32.0 24.3 34.7 36.5 31.5
Number of households 1,855 1,702 1,768 772 985 1,414 637 1,517 5,326
Note: Table is based on de jure household members, i.e., usual residents
1 Foster children are those under age 18 years of age living in households with neither their mother nor their father present2 Includes children with one dead parent and an unknown survival status of the other parent

Puntland Report 2020Somali Health and Demographic Survey (SDHS)32
Percent distribution of the de facto male household members age six and over by highest level of schooling attended or completed and median years completed, according to background characteristics, SHDS 2020
Background
Characteristics
Educational attainment of the household members
No
Education
Some
Primary
Completed
Primary1
Some
Secondary
Completed
Secondary2
Higher
Education
Don't
KnowTotal
Number
of males
Median
years
completed
Age
6-9 51.9 48.1 0.0 0.0 0.0 0.0 0.0 100.0 1,184 2.0
10-14 23.7 71.6 2.0 2.7 0.0 0.0 0.0 100.0 1,554 4.0
15-19 14.0 34.6 8.0 26.2 12.2 4.2 0.8 100.0 969 8.0
20-24 18.7 15.9 3.8 21.3 18.4 20.0 2.0 100.0 386 11.0
25-29 22.6 14.5 7.3 13.3 12.3 21.7 8.3 100.0 272 11.0
30-34 32.2 17.8 3.8 4.1 12.6 19.7 9.9 100.0 258 12.0
35-39 37.2 17.8 4.6 6.4 13.1 7.1 13.9 100.0 201 9.0
40-44 28.4 11.6 9.0 4.7 14.5 12.3 19.6 100.0 239 11.8
45-49 33.2 13.0 6.2 6.0 18.7 8.0 14.8 100.0 94 12.0
50-54 35.5 17.4 6.2 3.7 13.9 15.7 7.5 100.0 151 12.0
55-59 33.4 14.4 0.0 1.9 14.7 19.3 16.3 100.0 58 12.0
60-64 39.1 8.6 5.9 1.5 8.6 11.2 25.1 100.0 79 12.0
65+ 53.5 10.1 2.9 6.0 9.9 7.3 10.3 100.0 112 11.0
Residence
Urban 21.8 41.5 4.1 11.2 8.6 9.2 3.5 100.0 2,900 7.0
Rural 26.7 50.1 4.1 7.0 6.1 3.1 3.0 100.0 1,989 5.0
Nomadic 76.0 14.1 0.9 0.8 1.4 0.3 6.4 100.0 670 3.0
Regions
Sool 26.3 45.4 3.9 8.4 5.2 6.4 4.4 100.0 585 5.0
Sanaag 25.2 47.1 4.8 9.2 6.9 4.3 2.4 100.0 850 5.0
Bari 24.5 45.8 3.1 9.0 7.2 5.3 5.1 100.0 1,741 5.0
Nugaal 22.6 41.8 3.3 11.3 8.9 9.7 2.4 100.0 829 7.0
Mudug 44.6 31.1 3.9 5.9 6.0 5.4 3.1 100.0 1,553 6.0
Total 30.1 41.3 3.7 8.4 6.9 6.0 3.7 100.0 5,558 6.0
1 Completed 8th grade at the primary level2 Completed 12th grade at the secondary level
Table 2.3a Educational attainment of the male household members

33
Percent distribution of the de facto female household members age six and over by highest level of schooling attended or completed and median years completed, according to background characteristics, SHDS 2020
Background Characteristics
Educational attainment of the household members
Number of
females
Median years
completed No Education
Some Primary
Completed Primary 1
Some Secondary
Completed Secondary
2
Higher Education
Don't Know
Total
Age
6-9 47.9 52.1 0.0 0.0 0.0 0.0 0.0 100.0 833 3
10-14 25.6 68.8 3.4 2.2 0.0 0.0 0.0 100.0 1,446 4.0
15-19 17.4 36.6 9.6 20.2 11.1 4.5 0.6 100.0 987 8.0
20-24 20.6 31.3 6.7 13.3 9.1 18.4 0.7 100.0 455 9.0
25-29 35.3 33.7 8.5 3.1 8.5 9.2 1.6 100.0 399 7.0
30-34 35.2 41.4 5.5 5.4 5.1 4.8 2.6 100.0 268 6.0
35-39 43.1 39.7 6.1 1.8 6.0 2.7 0.6 100.0 170 5.0
40-44 55.0 25.7 4.2 4.2 8.0 0.0 3.0 100.0 78 4.0
45-49 46.5 14.8 9.3 4.8 12.5 6.9 5.2 100.0 44 9.0
50-54 39.3 18.8 14.8 8.6 8.9 7.9 1.7 100.0 98 8.0
55-59 62.0 15.5 6.7 0.0 5.6 1.4 8.9 100.0 42 6.3
60-64 38.4 31.6 13.6 5.5 4.1 0.0 6.8 100.0 30 4.0
65+ 82.5 10.4 0.0 5.5 0.0 0.0 1.6 100.0 38 6.2
Residence
Urban 26.1 45.3 6.3 9.3 6.3 6.1 0.6 100.0 2,747 6
Rural 32.2 53.7 4.6 4.5 3.2 1.3 0.5 100.0 1,873 4
Nomadic 82.2 14.8 0.7 0.0 0.0 0.2 2.2 100.0 450 3
Region
Sool 33.1 51.8 3.8 5.4 2.5 2.8 0.6 100.0 570 4.0
Sanaag 25.5 53.8 5.9 8.7 2.7 2.6 0.7 100.0 707 5.0
Bari 32.0 48.2 5.4 6.0 4.1 3.2 1.0 100.0 1,489 5.0
Nugaal 24.3 47.7 4.5 8.3 5.4 8.9 0.9 100.0 801 6.0
Mudug 43.2 36.0 5.4 6.0 6.3 2.6 0.3 100.0 1,503 6.0
Total 33.3 45.7 5.2 6.7 4.6 3.8 0.7 100.0 5,070 5.01 Completed 8th grade at the primary level2 Completed 12th grade at the secondary level
Table 2.3b Educational attainment of the female household members

Puntland Report 2020Somali Health and Demographic Survey (SDHS)34
Table 2.4 School attendance ratio
Net attendance ratios (NAR) and gross attendance ratios (GAR) for the de facto household members by sex and level of schooling and Gender Parity Index (GPI
Background Characteristics
PRIMARY SCHOOL: Net Attendance Ratio 1 PRIMARY SCHOOL: Gross Attendance Ratio 2
Male Female TotalGender
Parity Index 3
Male Female TotalGender Parity
Index 3
Primary
Residence
Urban 35.2 24.2 29.1 0.7 62.2 40.7 50.3 0.7
Rural 23.4 13.5 18.0 0.6 37.0 21.1 28.3 0.6
Nomadic 0.0 0.0 0.0 0.0 1.2 0.0 0.5 0.0
Region
Sool 11.6 6.9 9.2 0.6 22.1 12.9 17.4 0.6
Sanaag 17.4 15.4 16.4 0.9 30.9 24.8 28.1 0.8
Bari 24.6 15.3 20.0 0.6 45.2 26.1 35.7 0.6
Nugaal 37.0 20.8 28.1 0.6 57.1 33.5 44.1 0.6
Mudug 20.7 13.4 16.0 0.7 33.9 21.6 25.9 0.6
Wealth
Lowest 0.3 0.8 0.6 2.5 1.9 1.3 1.6 0.7
Second 14.8 6.3 9.8 0.4 22.4 8.5 14.2 0.4
Middle 24.9 17.6 21.0 0.7 48.9 26.6 37.0 0.5
Fourth 32.7 19.4 25.8 0.6 52.8 33.3 42.7 0.6
Highest 48.0 33.6 39.6 0.7 79.3 58.3 67.1 0.7
Total 22 14 18 1 38 24 30 1
Secondary
Residence
Urban 32.0 22.7 26.9 0.7 60.5 40.1 49.3 0.7
Rural 21.1 12.6 16.4 0.6 37.7 20.9 28.4 0.6
Nomadic 0.0 0.0 0.0 1.2 0.0 0.5 0.0
Region
Sool 9.9 6.2 8.0 0.6 21.8 12.6 17.2 0.6
Sanaag 14.4 14.8 14.5 1.0 30.0 24.2 27.3 0.8
Bari 21.9 14.8 18.3 0.7 45.3 25.1 35.0 0.6
Nugaal 34.9 16.8 25.0 0.5 56.5 33.5 44.0 0.6
Mudug 19.9 13.1 15.5 0.7 33.3 21.5 25.6 0.6
Wealth
Lowest 0.5 0.8 0.6 1.7 1.9 1.2 1.5 0.7
Second 12.9 6.1 8.9 0.5 22.1 8.3 13.9 0.4
Middle 22.2 15.2 18.4 0.7 49.7 26.1 36.9 0.5
Fourth 29.0 18.4 23.4 0.6 52.4 32.2 41.8 0.6
Highest 46.3 33.0 38.6 0.7 79.2 59.3 67.8 0.7
Total 20 13 16 1 37 23 30 1
1 The NAR for primary school is the percentage of the primary-school-age (6-13 years) population that is attending primary school. The NAR for secondary school is the percentage of the secondary-school-age (14-18 years) population that is attending secondary school. By definition, the NAR cannot exceed 100 percent.2 The GAR for primary school is the total number of primary school students, expressed as a percentage of the official primary- school-age population.The GAR for secondary school is the total number of secondary school students, expressed as a percentage of the official secondary- school-age populationIf there are significant numbers of overage and under-age students at a given level of schooling, the GAR can exceed 100 percent.3 The Gender Parity Index for primary school is the ratio of the primary school NAR (or GAR) for females to the NAR (or GAR) for males. The Gender Parity Index for secondary school is the ratio of the secondary school NAR (or GAR) for females to the NAR (or GAR) for males.

35
Percent distribution of households by source of drinking water and by time to obtain drinking water; percentage of households with basic drinking water service and percentage with limited drinking water service, according to residence, SHDS, 2020
Background Characteristics
Types of residenceRegion of residence
Urban Rural Nomadic Sool Sanaag Bari Nugaal Mudug Total
Source of drinking water
Improved source 70.7 62.4 37.1 31.8 41.7 64.9 63.5 71.9 58
Piped water into dwelling/ yard/plot
49.3 26.7 0.1 2.2 4.2 26.0 36.2 51.0 27
Piped to neighbor 2.7 2.6 0.2 0.4 1.2 2.8 2.8 1.9 2
Public tab/ standpipe
3.2 2.7 0.2 0.4 1.5 4.4 3.6 0.7 2
Tube well/ borehole 2.3 4.2 2.3 3.8 3.9 2.9 2.9 1.9 3
Protected dug well 9.4 17.0 7.1 10.3 15.1 20.1 4.5 3.7 11
Protected spring 1.7 3.6 5.1 5.7 5.8 1.9 0.8 3.0 3
Rainwater 1.0 4.4 22.0 8.7 9.7 4.7 11.7 9.5 8
Bottled water 1.1 1.2 0.1 0.1 0.2 2.0 0.9 0.4 1
Non-improved source 29.3 37.6 62.9 68.2 58.3 35.1 36.5 28.1 42
Unprotected well 4.6 10.1 34.5 25.4 20.4 9.9 7.4 15.8 15
Unprotected spring 0.6 1.6 9.7 7.1 5.6 1.2 2.0 3.9 4
Tanker truck/cart with drum
21.2 20.7 9.3 26.8 27.5 20.5 18.7 3.5 17
Water Kiosk 0.2 0.7 0.3 1.5 0.2 1.0 0
Surface water 0.5 3.2 6.8 4.6 2.5 0.4 5.6 4.6 3
Others 1.6 0.9 1.9 2.1 1.5 2.5 1.6 0.2 1
Missing 0.4 0.4 0.3 0.6 1.0 0.3 0.0 0.1 0
Total 100 100 100 100 100 100 100 100 100
Time to obtain
drinking water
(round trip)
Water on premises 73.7 61.9 10.2 23.8 28.5 62.6 65.4 60.7 50.7
Less than 30 minutes
16.5 25.8 42.9 42.0 36.5 28.2 23.6 15.8 27.4
30 minutes or longer
7.2 9.5 43.9 25.4 32.0 7.6 10.4 22.1 19.1
DK/Missing 2.6 2.7 3.0 8.9 3.0 1.6 0.6 1.5 2.7
Drinking Water
Service
Basic drinking water service
67.6 57.8 20.7 21.2 29.9 60.8 58.8 64.2 50.3
Percentage with limited drinking water service
2.3 3.6 14.7 7.9 10.3 3.0 4.2 7.5 6.5
Number of households
12,365 10,032 9,804 4,619 5,779 8,372 3,954 9,476 32,201
1 Includes water piped to a neighbor and those reporting a round trip collection time of zero minutes 2 Defined as drinking water from an improved source, provided either water is on the premises or round-trip collection time is 30 minutes or less Includes safely managed 3 Drinking water from an improved source, provided round-trip collection time is more than 30 minutes”
Table 2.5a Household drinking water

Puntland Report 2020Somali Health and Demographic Survey (SDHS)36
Percent distribution of households by using various methods to treat drinking water, and percentage using an appropriate treatment method, according to residence, SHDS 2020
Water treatment Method
Types of residence Region of residence
Urban Rural Nomadic Sool Sanaag Bari Nugaal Mudug Total
Water treatment prior to drinking
Boiled 6.1 7.9 0.0 1.8 2.3 5.2 5.5 7.1 4.8
Bleach/chlorine added
5.6 3.5 0.0 1.8 0.9 5.5 5.4 2.5 3.3
Strained through cloth
0.1 0.0 0.0 0.2 0.0 0.1 0.0 0.0 0.1
Ceramic, sand or other filter
0.5 0.2 0.0 0.1 0.0 0.7 0.3 0.0 0.2
Solar disinfection
0.0 0.0 0.0 0.2 0.0 0.0 0.0 0.0 0.0
Let it stand and settle
0.0 0.0 0.0 0.1 0.0 0.0 0.0 0.0 0.0
Other treatment 0.5 1.1 0.0 0.2 0.7 0.6 0.8 0.5 0.6
No treatment 87.0 88.0 98.0 95.3 95.9 87.9 86.6 89.3 90.6
Don't Know 12.4 11.8 2.0 4.4 4.1 11.6 13.0 10.3 9.0
Percentage using an appropriate treatment method 1
11.1 10.5 0.0 2.8 3.0 9.7 10.8 9.3 7.5
Number of households
12,311 9,994 9,775 4591.0 5724.0 8344.4 3952.7 9468.4 32080.5
Respondents may report multiple treatment methods so the sum of treatment may exceed 100 percent.1 Appropriate water treatment methods include boiling, bleaching, straining, filtering and solar disinfecting This table is for population only, household section is missing and regional comparison is also missing
Table 2.5b Treatment of household drinking water

37
Percent distribution of households by type of toilet/latrine facilities, percent distribution of households with a toilet/latrine facility by location of the facility, percentage of households with basic sanitation services, and percentage with limited sanitation services, according to residence, SHDS 2020
Households Region of residence
Type of toilet/latrine facility
Urban Rural Nomadic Sool Sanaag Bari Nugaal Mudug Total
Improved facility 76.8 68.4 1.0 27.2 36.6 61.5 73.2 60.6 53.6
Flush/pour to piped sewer system
5.7 5.4 0.0 1.1 3.7 4.5 2.1 6.2 4.1
Flush/pour to septic tank 7.2 5.7 0.0 0.7 2.6 5.9 2.8 7.8 4.8
Flush/pour to a pit latrine 40.3 35.0 0.3 9.7 10.3 40.0 41.7 30.0 27.8
Ventilated improved pit (VIP) latrine
6.8 10.2 0.1 4.7 9.8 7.3 4.4 4.2 6.0
Pit latrine with a slab 16.7 12.0 0.6 11.0 10.2 3.8 22.2 12.4 10.9
Non-improved facility 17.9 20.3 5.2 17.5 16.1 22.3 10.5 9.7 15.2
Flush to some where else 2.0 2.8 0.4 0.4 0.0 4.0 1.4 1.8 1.8
Flush/pour flush, don't know where
0.2 0.9 0.1 0.0 0.0 0.8 0.2 0.5 0.4
Pit latrine without slab/Open latrine
14.5 15.0 2.0 14.1 13.2 15.5 7.1 7.0 11.3
Bucket toilet 0.6 1.3 0.4 2.3 0.5 0.6 1.2 0.2 0.8
Hanging toilet/hanging latrine
0.4 0.1 0.0 0.4 0.0 0.3 0.0 0.2 0.2
Others 0.3 0.3 2.3 0.3 2.4 1.2 0.6 0.0 0.8
Open Defecation 5.3 11.3 93.7 55.4 47.4 16.3 16.3 29.8 31.2
Percentage with basic sanitation service 1
56.6 49.9 0.6 20.3 30.1 42.1 47.2 47.8 39.3
Percentage with limited sanitation service 2
20.2 18.5 0.5 6.9 6.5 19.3 26.1 12.8 14.3
Number of households 95,586 70,014 61,884 32,035 39,504 58,048 29,721 68,176 227,484
Location of the facility
In own dwelling 47.6 29.1 10.1 48.2 36.7 26.8 40.5 47 37.9
In own Yard/Plot 38.9 49.2 18.3 30.8 45 49.5 33.8 42.3 42.7
Else Where 13.5 21.8 71.5 21 18.2 23.8 25.7 10.7 19.4
Number of households 1276 1103 91 229 313 841 378 709 24701 Defined as use of improved facilities that are not shared with other households. Includes safely managed sanitation service, which is not shown separately."2 Defined as use of improved facilities shared by 2 or more household.
Table 2.6 Household sanitation facilities

Puntland Report 2020Somali Health and Demographic Survey (SDHS)38
Table 2.7 Household characteristics and social amenities
Percent distribution of households by housing characteristics, percentage using solid fuel for cooking; and percent distribution by frequency of smoking in the home, according to residence, SHDS 2020
Housing CharacteristicsTypes of residence Region of residence
Urban Rural Nomadic Sool Sanaag Bari Nugaal Mudug Total
Electricity
Yes 70.4 28.4 0.1 21.4 26.7 46.4 48.0 34.2 35.9
No 29.6 71.6 99.9 78.6 73.3 53.6 52.0 65.8 64.1
Total 100.0 100.0 100.0 100.0 100.0 100.0 100.0 100.0 100.0
Flooring material
Earth/Sand 31.0 38.9 86.8 56.3 56.7 37.7 17.7 68.8 50.5
Dung 0.9 0.4 0.7 0.3 0.4 1.5 0.3 0.4 0.7
Grass 1.3 1.5 7.9 7.0 3.0 3.4 6.4 0.5 3.4
Wooden Planks 1.2 0.9 0.2 0.4 0.1 1.4 1.3 0.8 0.8
Palm/Bamboo 1.4 1.4 3.1 2.8 0.3 2.4 2.6 1.7 1.9
Parquet/Polished wood 0.1 0.4 0.0 0.0 0.1 0.3 0.4 0.0 0.2
Vinyl/Asphalt Strips 0.0 0.1 0.0 0.1 0.1 0.0 0.1 0.0 0.0
Ceramic Tiles 11.1 2.7 0.0 5.5 3.2 4.1 9.9 5.0 5.1
Cement 51.0 53.0 0.5 27.1 35.9 46.4 59.8 22.1 36.2
Carpet 1.8 0.6 0.6 0.1 0.2 2.7 0.8 0.6 1.0
Others 0.2 0.1 0.2 0.4 0.0 0.0 0.7 0.1 0.2
Total 100.0 100.0 100.0 99.9 100.0 100.0 100.0 100.0 100.0
Flooring material
One 27.5 42.6 94.0 66.0 55.5 48.2 45.2 50.9 52.5
Two 30.9 38.7 5.9 17.8 24.8 31.6 25.2 25.1 25.7
Three or more 41.6 18.7 0.1 16.2 19.8 20.2 29.6 24.0 21.8
Total 100.0 100.0 100.0 100.0 100.0 100.0 100.0 100.0 100.0
Place for cooking
In the house 44.5 35.1 9.7 24.2 30.1 33.9 39.5 28.7 31.0
In a separate building 37.1 35.4 9.7 27.0 23.5 31.0 27.9 29.3 28.2
Outdoors 17.9 29.1 78.2 48.0 44.8 34.2 32.3 40.7 39.8
Others 0.5 0.4 2.3 0.8 1.6 0.9 0.3 1.2 1.0
Total 100.0 100.0 100.0 100.0 100.0 100.0 100.0 100.0 100.0
Cooking fuel
Electricity 4.6 0.5 0.0 2.0 0.9 1.6 4.6 1.7 1.9
LPG/natural gas/ biogas 12.0 3.0 0.1 1.1 1.6 11.1 11.3 2.8 5.6
Kerosene 4.2 2.2 0.3 1.3 0.8 5.1 0.1 2.4 2.4
Firewood 35.4 68.4 94.3 74.9 69.5 60.8 59.7 58.8 63.6
Charcoal 42.1 22.0 2.2 20.4 23.7 18.5 21.5 30.6 23.7
Straw/shrubs/grass 0.3 1.7 0.0 0.0 0.0 0.0 0.0 2.2 0.6
Agricultural crop 1.3 2.0 2.7 0.3 3.3 2.5 2.5 1.3 2.0
Animal dung 0.0 0.1 0.0 0.0 0.0 0.0 0.0 0.1 0.0
No food cooked in the household
0.2 0.1 0.2 0.1 0.1 0.2 0.2 0.2 0.2
Other 0.0 0.0 0.1 0.0 0.0 0.0 0.1 0.0 0.0
Total 100.0 100.0 100.0 100.0 100.0 100.0 100.0 100.0 100.0
Percentage using solid fuel for cooking1
79.0 94.2 99.3 95.5 96.5 81.9 83.7 92.9 89.9
Percentage using clean fuel for cooking2
16.6 3.5 0.1 3.1 2.5 12.8 15.9 4.5 7.5
Household Members 12,311 9,994 9,775 4,591 5,724 8,344 3,953 9,468 32,080
LPG = Liquid petroleum gas1 Includes coal/lignite, charcoal, wood, straw/shrubs/grass, agricultural crops, and animal dung2 Includes electricity and LPG/natural gas/biogas

39
Table 2.8 Household possessions
Percentage of households possessing various household effects, means of transportation
Possessions Types of residence Region of residence
Urban Rural Nomadic Sool Sanaag Bari Nugaal Mudug Total
Household effects
Radio 21.7 17.9 8.8 8.9 7.2 19.0 19.3 21.8 16.2
Television 25.4 5.5 0.4 6.6 7.2 12.9 16.0 11.0 10.7
Refrigerator 9.9 2.4 0.1 3.3 2.2 3.5 9.5 4.5 4.2
Mobile phone 73.8 65.7 59.4 67.1 61.3 63.3 75.5 68.6 66.4
Non-mobile telephone
8.5 3.3 3.5 3.6 2.3 6.8 8.0 5.2 5.2
Computer 11.3 1.5 0.3 2.0 1.6 4.5 10.7 5.0 4.5
Internet 9.2 1.7 1.3 1.9 2.1 4.1 10.1 4.2 4.2
Air conditioner/Fan
13.2 2.0 1.4 3.1 1.3 6.7 12.2 6.2 5.7
Means of transport
Bicycle 2.4 0.2 1.2 0.5 0.7 1.8 2.6 1.2 1.3
Motorcycle/scoote
1.1 0.0 0.2 0.1 0.2 0.6 0.5 0.7 0.5
Donkey cart 1.2 0.2 1.6 1.7 0.5 1.0 0.5 1.3 1.0
Car/truck 7.5 4.7 1.6 2.9 3.6 4.6 9.5 4.1 4.6
Boat /Canoe 0.6 0.6 0.8 0.3 0.4 1.2 0.7 0.4 0.7
Tractor 0.4 0.1 0.2 0.2 0.2 0.4 0.1 0.2 0.2
Rickshaw 1.1 0.1 0.1 0.6 0.1 0.2 0.6 0.8 0.4
Animal plough 0.6 0.4 6.0 2.8 1.7 1.4 1.8 3.7 2.3
Ownership of agriculture land
2.1 4.5 2.0 3.2 3.2 4.6 3.4 0.5 2.8
Ownership of livestock1
16.9 46.3 94.7 69.0 68.7 30.6 40.2 57.9 52.2
Livestock lost1 11.8 33.8 70.6 62.9 52.4 17.4 26.5 41.3 38.4
Number of households
1,855 1,702 1,768 772 985 1,414 637 1,517 5,326
1 Camels, cattle, sheep, goats, horses, donkeys, poultry.

Puntland Report 2020Somali Health and Demographic Survey (SDHS)40
Table 2.9 Wealth quintiles
Table 2.10 Birth registration of children under age five
Percent distribution of de-jure household members by wealth quintiles and the Gini coefficient, according to residence and region, SHDS 2020
Wealth quintile Number of persons
Gini coefficientResidence/region Lowest Second Middle Fourth Highest Total
Residence
Urban 2.4 15.0 24.4 31.8 26.3 100.0 8,146 0.4
Rural 11.4 26.4 34.6 18.0 9.5 100.0 6,645 0.5
Nomadic 90.4 4.2 2.2 2.8 0.4 100.0 6,389 0.4
Region
Sool 52.9 13.1 14.4 13.1 6.6 100.0 2,994 0.3
Sanaag 50.8 7.0 15.5 18.8 8.0 100.0 3,744 0.3
Bari 12.8 23.1 27.8 21.7 14.6 100.0 5,501 0.3
Nugaal 14.5 12.6 27.1 24.3 21.5 100.0 2,684 0.4
Mudug 34.4 15.7 18.7 16.4 14.9 100.0 6,258 0.3
Total 31.8 15.3 20.9 18.7 13.2 100.0 21,181 0.3
Percentage of de jure children under five years of age whose births are registered with the civil authorities, according to background characteristics, SHDS 2020
Background characteristics
Children whose births are registered
Percentage who had birth certificate
Percentage who did not have birth certificate
Percentage registered Number of children
Age
<2 0.3 4.5 4.7 2,217
2-4 0.3 4.2 4.5 4,058
Sex
Male 0.4 4.3 4.6 3,211
Female 0.2 4.3 4.5 3,064
Residence
Urban 0.6 6.1 6.7 2,248
Rural 0.2 5.0 5.2 1,967
Nomadic 0.0 1.6 1.6 2,060
Regions
Sool 0.7 4.7 5.4 924
Sanaag 0.5 3.8 4.3 1,084
Bari 0.3 6.4 6.7 1,531
Nugaal 0.1 3.7 3.8 738
Mudug 0.0 3.0 3.0 1,998
Total 0.3 4.3 4.6 6,275

41

Characteristics of the Respondents
CHAPTER 3

©A
U U
N I
ST P
HO
TO
/ T
OB
IN J
ON
ES.
Key Findings

Puntland Report 2020Somali Health and Demographic Survey (SDHS)44
This information is useful in understanding the factors that affect the life of women in the reproductive age group and provides a context for the interpretation of demographic and health indicators.
Background Characteristics of Respondents
Information on the background characteristics of women aged 15-49 interviewed in the SHDS 2020 is presented in Table 3.1. by age, marital status, type of residence, education and wealth quintile. Thirty percent of women were aged 15-19 - 79 percent of never married women and 8 percent of ever married women were aged 15-19.
Sixty percent of women were currently married while 31 percent had never been married, 6 percent were divorced or separated and 3 percent were widowed.
More women lived in nomadic than urban and rural areas. Thirty-six percent of all women resided in nomadic areas whereas rural and urban had 32 percent.
Educational attainment among the respondents in Puntland was low; 74 percent of all women had never attended school compared to 75 percent nationally. Eighty-two percent of ever-married women had no education compared to 57 percent of never-married women.
Eighteen percent of ever-married women and 28 percent of never-married women were from the wealthiest households.
3Chapter 3
Characteristics of the RespondentsThis chapter presents information on the individual demographic and socioeconomic characteristics of the survey respondents who were interviewed in Puntland for the SHDS 2020. For information presented in this chapter, enumerators administered questions to never-married and ever-married women. Questions on educational attainment, literacy, exposure to mass media and internet use were administered to both never-married and ever-married women, whereas questions on employment status, occupation, health insurance coverage and use of tobacco were only administered to ever-married women.

45
Educational Attainment
Table 3.2 presents the distribution of women aged 15-49 by educational attainment and median years of schooling completed according to background characteristics.
The findings show that educational attainment among women in Puntland is very low. Overall, 74 percent of women aged 15-49 have not attended any formal schooling. Thirteen percent of women have some levels of primary education, but only 4 percent completed primary schooling. Moreover, 5 percent of women attended secondary school, but only 3 percent completed secondary education. Three percent of the respondents have completed higher levels of education (Figure 3.1).
Educational attainment decreases as the age of the women increases except for age group 45-49. The percentage of women who have some level of primary education is highest among women aged 15-19 at 17 percent and lowest among women aged 40-44 and 45-49 at 5 and 4 percent respectively.
The differences in educational attainment among women aged 15-49 in urban, rural and nomadic areas is pronounced. Ninety-six percent of the women living in nomadic areas have never attended formal schooling compared to 71 percent in rural areas and 56 percent in urban areas.
There are significant differences across regions. Percentage of women who have attended at least some secondary education is highest in Nugaal at 8 percent, followed by Mudug at 6 percent and lowest in Sool at 3 percent.
Educational attainment increases with increasing levels of wealth. The proportion of women with no education is highest in the lowest wealth quintile at 96 percent and lowest in the highest wealth quintile at 45 percent.
LiteracyAdult literacy is defined as the percentage of the population aged 15 years and over who are both able to read and write, with an understanding, a short simple statement on their everyday lives (UNESCO Institute for Statistics, 2013).
The SHDS 2020 assessed literacy levels among women aged 15-49 who had never been to school or who had primary or secondary levels of education by asking them to read all or part of a sentence in English or Somali. Anyone who could read a sentence in any other language was also considered a literate person. Those with a higher level of education were assumed to be literate without administering a reading test. Table 3.3 presents the literacy of the
Figure 3.1 Educational attainment
Percent distribution of women aged 15-49 by highest level of schooling attended or completed
73.7
12.5
3.5
5.0
2.5
2.7
No Education
Some Primary
Completed Primary
Some Secondary
Completed Secondary
Higher Education
Figure 3.2 Literacy
Percent of women aged 15-49 by literacy and age
46.3
37.5
27.824.1 21.8
17.3 17.6
15-19 20-24 25-29 30-34 35-39 40-44 45-49

Puntland Report 2020Somali Health and Demographic Survey (SDHS)46
respondents by background characteristics. The table shows that 33 percent of women in Puntland aged 15-49 are literate.
As shown in Figure 3.2, literacy levels generally decrease with age; literacy is highest among women aged 15-19 at 48 percent and lowest among those aged 40-44 at 18 percent.
Literacy among women aged 15-49 varies by place of residence. Fifty-two percent of women living in urban areas are literate compared to 37 percent in rural areas. Nomadic areas have the lowest proportion of literate women at 7 percent. For the regions, women in Nugaal, Mudug, and Bari have the highest literacy rates at 34 percent or higher, compared to Sool and Sanaag at 27 and 29 percent respectively. (Figure 3.3).
Further analysis by wealth levels show that literacy levels increase with wealth status. Women from wealthier households are more literate at 66 percent compared to women from poorer households at 8 percent.
Exposure to Mass MediaThe SHDS 2020 collected information on the exposure of respondents to both broadcast and print media for Puntland. Respondents were asked how often they read a newspaper, watch television, or listen to the radio. This information indicates the extent to which women are regularly exposed to mass media and can be used in the development of educational programmes, to convey messages to the public about government policies, disseminate health information, report the opinions of people on health issues and other societal matters, as well as serve as a tool to observe public sentiments on important issues.
Table 3.4 shows that 88 percent of the respondents did not access any of the three forms of media—newspaper, radio and television—at least once a week. Watching television was the most common use of media—8 percent of the respondents in Puntland watch television at least once a week compared to national level which is 11 percent (SHDS 2020); 7 percent listen to the radio at least once a week; and 4 percent read newspapers at least once a week.
Exposure to media increases with both education and wealth. While less than one percent of the respondents with no education read a newspaper at least once a week, 38 percent of the respondents with higher education do so. Similarly, while 4 percent of respondents with no education watch television at least once a week, 47 percent of the respondents with higher education watch television at least once a week.
Figure 3.4 presents the percentage of women aged 15-49 exposed to mass media by wealth quintile. Less than one percent of the
Figure 3.3 Literacy by geographical area
Percent of women aged 15-49 by literacy and region
43.4
34.3 33.6
28.6 27.2
Nugaal Bari Mudug Sanaag Sool

47
respondents in the lowest wealth quintile watch television at least once a week, compared to 25 percent in the highest quintile. Likewise, 1 percent of the respondents in the lowest quintile listen to the radio at least once a week, compared to 16 percent in the highest quintile.
Internet UseGlobally, women are 23 percent less likely than men to use mobile internet. In Sub-Saharan Africa, women are 41 percent less likely than men to use mobile internet (Broadband Commission for Sustainable Development, 2019). The internet is an important tool for accessing information. Furthermore, studies have shown that women use the internet more often for health-related information searches than men. When their access is hindered, chances are women are slower to have access to important information for their families.
The SHDS collected information about women’s use of the internet: women aged 15-49 were asked whether they had ever used the internet and, if they had, whether they used it in the 12 months preceding the survey. Interviewers also enquired how often women had used the internet in the month preceding the survey.
Table 3.5 shows that 17 percent of the respondents had used the internet at least once and 15 percent had used the internet in the past 12 months preceding the survey.
Use of the internet generally decreases with increase in age; 24
Figure 3.5 Internet use by geographical area
Percent of women aged 15-49 who have ever used the internet by region
Figure 3.4 Exposure to mass media
Percent of women aged 15-49 who are exposed to specific media on a weekly basis by wealth status
0.4
0.5
1.0
0.3 1.2
98.8
0.2 1.1 3.
7
0.2 4
.0
96.0
1.4 3.5
5.2
0.5 6.
5
93.5
4.3 7.
6
7.5
2.2 12
.3
87.
7
12.0
25.1
15.8
5.6
33.2
66.8
Reads anewspaper
Watchestelevision
Listensto radio
Accesses allthree media
Accesses anythree media
Accesses none ofthe three media
Lowest Second Middle Fourth Highest
29.8
18.916.2
13.411.6
Nugaal Bari Mudug Sanaag Sool

Puntland Report 2020Somali Health and Demographic Survey (SDHS)48
percent of women aged 15-19 had used the internet, compared to 5 percent of women aged 40-44.
Thirty-four percent of women living in urban areas had used the internet at least once, compared to 12 percent and one percent of women living in rural and nomadic areas respectively.
Women in Sool and Sanaag regions had the least percentage of ever used internet - 13 and 12 percent and used internet in the past 12 months - 12 and 11 percent respectively. Thirty percent of women in Nugaal and 19 percent of women in Bari had ever used the internet. 16 percent of women in Mudug had used the internet (Figure 3.5).
Internet usage also increases with educational attainment and wealth status. Ninety-one percent of women with higher education had ever used the internet, compared to 6 percent of women with no education (Figure 3.6). Moreover, 46 percent of women in the highest quintile had ever used the internet, compared to one percent of women in the lowest.
Employment StatusIn the SHDS 2020, ever-married women aged 15-49 were asked about their employment status in the seven days preceding the survey, as well as whether they had done any work in the 12 months prior to the survey. Respondents were categorized as currently employed if they had worked in the seven days preceding the survey. Table 3.6 shows the employment status of ever-married women by background characteristics.
The employment status of the respondents was low. Eight percent of ever-married women in Puntland were currently employed at the time the survey was conducted, while one percent were not currently employed but had worked in the 12 months preceding the survey. Ninety-one percent of the respondents had not done any work in the 12 months prior to the survey.
Employment varies by number of living children— 6 percent for women with no living children and 5 percent of those with one to two children, 8 percent for those with three to four children and 11 percent for women with 5 or more children.
The proportion of ever-married women who are currently employed increases with age except age group 15-19; it is lowest among ever-married women aged 20-24 at 4 percent and highest among those aged 45-49 at 16 percent (Figure 3.7).
Employment varies by place of residence, regions and wealth status of the household. Among women from nomadic areas, 2 percent
Figure 3.6 Internet use
Percent of women aged 15-49 who have ever used the internet by education level
5.9
31.3
68.2
90.5
NoEducation
Primary Secondary Higher
Figure 3.7 Employment status
Percent of ever-married women aged 15-49 currently employed by age
4.9
15-19
4.2
20-24
7.1
25-29
7.8
30-34
10.2
35-39
14.9
40-44
15.8
45-49

49
were currently employed, compared to 13 percent and 10 percent of women from urban and rural areas respectively. More women from wealthier households were employed than in poorer ones; 13 percent of women in the highest quintile were currently employed compared to 3 percent of women in the lowest.
Among the regions, Sool had least percentage of women employed at 5 percent while Nugaal and Bari had highest percentages of women employed, at 13 and 12 percent respectively (Figure 3.8).
Type of EmploymentTable 3.7 shows the distribution of ever-married women aged 15-49 who were employed in the 12 months preceding the survey by type of earnings and employer, as well as continuity of employment, by whether their work is agricultural or non-agricultural.
Overall, 74 percent of the respondents were paid in cash only while 16 percent were not paid for their work. Sixty-six percent of the respondents working in agriculture were paid in cash only for their work, while 34 percent were not paid at all. Women in non-agricultural work were mainly paid in cash only at 77 percent, whereas 8 percent were paid in cash and in kind, 5 percent were paid in kind only and 11 percent were not paid (Figure 3.9).
Fifty-two percent of the currently employed women aged 15-49 were self-employed. Fourty-nine percent of women in agricultural work were employed by a family member. Over half of women
Figure 3.8 Employment status by geographical area
Percent of ever-married women aged 15-49 currently employed by region
Nugaal Bari Mudug Sanaag Sool
12.8 11.77.1
5.94.8
Figure 3.9 Type of employment and earnings
Percent of ever-married women aged 15-49 employed in the 12 months preceding the survey by type of earnings
66.2
0 0
33.8
76.5
8
4.6 11
74.1
6.2
3.5 16
.2
Cash only Cash and in-kind In-kind only Not paid
Agricultural work Non-Agricultural work Total

Puntland Report 2020Somali Health and Demographic Survey (SDHS)50
engaged in non-agricultural work were self-employed at 52 percent.
Sixty percent of women aged 15-49 were employed all year round. Both women engaged in agricultural and non-agricultural work were mostly employed all year round at 68 and 58 percent respectively.
Health Insurance CoverageThe World Health Organization (WHO) considers health insurance a promising means for achieving universal health care coverage (WHO, 2010).
In the SHDS 2020, ever-married women aged 15-49 were asked whether they were covered by health insurance and the type of health insurance they were using. Table 3.8 presents the distribution of health insurance coverage. The survey shows that almost all women (99.7 percent) did not have health insurance.
Use of TobaccoTobacco use and second-hand smoke (SHS) exposure during pregnancy have adverse health effects on women and infants. Women who smoke are more likely than non-smokers to experience infertility and delays in conceiving. Maternal smoking during pregnancy increases risks of prematurity, stillbirth, and neonatal death and may cause a reduction in breast milk (WHO, 2010).
Ever-married women aged 15-49 were asked about their smoking habits. Table 3.9 shows the distribution of cigarette smokers and the percentage of women who use various types of tobacco by background characteristics.
Overall, 3 percent of ever-married women smoke cigarettes or use any type of tobacco. There is a slight variation among women of various age groups. Three percent of women in all age groups except 30-34, 40-44 and 45-49 use any type of tobacco.
Figure 3.10 shows that 4 percent of women in urban and rural areas use any type of tobacco compared to 1 percent of women in nomadic areas. The figure also indicates that Bari region has the highest proportion of women who use any type of tobacco at 7 percent. Sanaag has lowest proportion of women who use any type of tobacco at less than 1 percent.
Figure 3.10 Use of tobacco
Percent of ever-married women aged 15-49 who use any type of tobacco by region
Nugaal Bari Mudug Sanaag Sool
7.4
2.21.3
1.10.8

51

Puntland Report 2020Somali Health and Demographic Survey (SDHS)52
Percentage of all women aged 15-49 by selected background characteristics, SHDS 2020
Background
characteristics
Marital Status
Ever married Women Never married women Women
Weighted
percentage
Weighted
number
Unweighted
number
Weighted
percentage
Weighted
number
Unweighted
number
Weighted
percentage
Weighted
number
Unweighted
number
Age
15-19 8.2 304 304 79.1 1,346
1,306 30.4 1,651 1,610
20-24 17.6 657 655 15.9 270 296 17.1 928 951
25-29 23.9 889 886 3.4 58 68 17.5 947 954
30-34 19.3 720 725 1.0 17 19 13.6 737 744
35-39 16.5 615 615 0.2 3 3 11.4 619 618
40-44 9.0 336 338 0.4 6 6 6.3 342 344
45-49 5.4 202 205 N/A N/A N/A 3.7 202 205
Marital status
Never Married N/A N/A N/A 100.0 1,701 1,698 31.4 1,701 1,698
Married 86.6 3,226 3,253 N/A N/A N/A 59.5 3,226 3,253
Divorced 8.8 328 317 N/A N/A N/A 6.0 328 317
Widowed 4.6 171 158 N/A N/A N/A 3.2 171 158
Residence
Urban 28.3 1,055 1,137 40.0 681 773 32.0 1,736 1,910
Rural 32.9 1,227 1,168 30.5 518 471 32.2 1,745 1,639
Nomadic 38.7 1,443 1,423 29.5 502 454 35.8 1,945 1,877
Education
No Education 82.4 3,068 3,063 57.0 969 937 74.4 4,037 4,000
Primary 13.1 487 495 22.6 385 400 16.1 872 895
Secondary 3.2 118 124 16.0 271 267 7.2 390 391
Higher 1.4 51 46 4.4 75 94 2.3 127 140
Wealth quintile
Lowest 22.4 835 899 16.3 278 265 20.5 1,113 1,164
Second 20.8 774 732 13.5 230 221 18.5 1,004 953
Middle 17.3 644 629 18.5 315 284 17.7 959 913
Fourth 21.3 795 788 24.2 411 425 22.2 1,206 1,213
Highest 18.2 677 680 27.5 467 503 21.1 1,144 1,183
Total 100.0 3,725 3,728 100.0 1,701 1,698 100.0 5,426 5,426
Note: Education categories refer to the highest level of education attended, whether or not that level was completedn/a = Not applicable
Table 3.1 Birth registration of children under age five

53
Percent distribution of all women aged 15-49 by highest level of schooling attended or completed, and median years completed, according to background characteristics, SHDS 2020
Background Characteristics
Educational attainment of the household members Median years
completed
Number of
women No
Education Some
Primary Completed
Primary 1
Some Secondary
Completed Secondary 2
Higher Education
Total
Age
15-19 60.8 16.5 5.9 11.0 3.7 2.0 100.0 0.0 1,666
20-24 68.6 12.9 3.4 5.7 2.8 6.6 100.0 0.0 926
25-29 77.8 11.4 3.3 1.8 2.3 3.5 100.0 0.0 956
30-34 81.1 12.4 2.2 1.7 1.3 1.2 100.0 0.0 734
35-39 86.6 9.5 0.9 0.3 1.6 1.1 100.0 0.0 619
40-44 91.7 5.1 1.1 0.9 1.2 0.0 100.0 0.0 345
45-49 89.0 4.2 2.0 1.1 2.0 1.7 100.0 0.0 180
Residence
Urban 55.9 17.1 6.0 9.8 5.1 6.1 100.0 0.0 2,102
Rural 71.0 17.6 4.0 4.4 1.9 1.2 100.0 0.0 1,524
Nomadic 96.8 2.9 0.2 0.0 0.1 0.1 100.0 0.0 1,800
Region
Sool 78.8 12.5 2.7 3.1 1.2 1.8 100.0 0.0 742
Sanaag 77.2 11.3 3.3 4.6 1.7 2.1 100.0 0.0 990
Bari 73.1 13.1 2.8 4.4 3.7 3.0 100.0 0.0 1,254
Nugaal 61.0 15.6 4.5 8.2 4.0 6.7 100.0 0.0 554
Mudug 74.1 11.9 4.2 5.5 2.3 2.1 100.0 0.0 1,886
Wealth quintile
Lowest 96.2 3.2 0.4 0.0 0.0 0.2 100.0 0.0 1,166
Second 91.3 7.6 0.7 0.2 0.3 0.0 100.0 0.0 868
Middle 77.7 14.2 2.8 3.9 1.1 0.4 100.0 0.0 1,003
Fourth 65.6 17.7 4.4 6.5 3.5 2.3 100.0 0.0 1,154
Highest 44.5 18.6 8.3 12.7 6.6 9.2 100.0 4.0 1,235
Total 73.7 12.5 3.5 5.0 2.5 2.7 100.0 0.0 5,426 1 Completed 8th grade at the primary level2 Completed 12th grade at the secondary level
Table 3.2 Educational attainment

Puntland Report 2020Somali Health and Demographic Survey (SDHS)54
Table 3.3 Literacy: Women
Percent distribution of women age 15-49 by level of schooling attended and level of literacy, and percentage literate, according to background characteristics, SHDS 2020
Background Characteristics
No schooling or primary school or Secondary
Total
Percentage
literate 1
Number of
women Higher
Education
Can read
a whole
sentence
Can read
part of the
sentence
Cannot
read at all
No card
with
required
language
Blind/
visually
impaired
Age
15-24 3.6 22.6 16.9 56.1 0.4 0.3 100.0 43.2 2,592
15-19 1.9 27.3 17.1 53.2 0.3 0.2 100.0 46.3 1,666
20-24 6.6 14.3 16.6 61.4 0.6 0.5 100.0 37.5 926
25-29 3.5 8.0 16.5 70.2 1.5 0.4 100.0 28.0 956
30-34 1.2 8.3 14.5 74.4 1.2 0.3 100.0 24.1 734
35-39 1.1 4.7 16.1 76.1 1.9 0.2 100.0 21.8 619
40-44 0.0 4.1 13.1 81.3 1.4 0.0 100.0 17.3 345
45-49 1.7 6.1 9.9 79.8 2.3 0.3 100.0 17.6 180
Residence
Urban 6.1 24.0 21.5 47.3 0.8 0.4 100.0 51.6 2,102
Rural 1.1 15.6 21.9 61.1 0.3 0.1 100.0 38.6 1,524
Nomadic 0.1 2.0 4.4 91.3 1.9 0.4 100.0 6.5 1,800
Region
Sool 1.8 11.3 14.2 71.6 0.3 0.9 100.0 27.2 742
Sanaag 2.1 15.5 11.0 68.9 2.0 0.5 100.0 28.6 990
Bari 3.0 14.1 17.3 65.6 0.1 0.0 100.0 34.3 1,254
Nugaal 6.7 12.2 24.5 54.6 1.2 0.7 100.0 43.4 554
Mudug 2.0 15.8 15.9 65.1 1.3 0.0 100.0 33.6 1,886
Wealth quintile
Lowest 0.1 2.5 5.5 90.1 1.2 0.6 100.0 8.1 1,166
Second 0.0 3.9 6.8 88.2 1.2 0.0 100.0 10.6 868
Middle 0.4 10.3 19.1 69.8 0.4 0.0 100.0 29.8 1,003
Fourth 2.3 19.5 20.8 56.0 1.0 0.4 100.0 42.7 1,154
Highest 9.2 31.4 25.2 32.9 1.1 0.3 100.0 65.8 1,235
Total 2.7 14.4 15.9 65.7 1.0 0.3 100.0 33.0 5,426
1 Refers to women who attended higher education and women who can read a whole sentence or part of the sentence

55
Percentage of all women aged 15-49 who are exposed to specific media on a weekly basis, according to background characteristics, SHDS 2020
Background characteristics
Reads a
newspaper
at least
once a week
Watches
television at
least once a
week
Listens to
radio at least
once a week
Accesses all
three media
at least once
a week
Accesses any
three media
at least once a
week
Accesses none
of the three
media at least
once a week
Number of
women
Age
15-19 6.7 10.4 7.5 3.2 14.9 85.1 1,666
20-24 4.8 9.0 6.6 1.7 12.0 88.0 926
25-29 2.7 7.3 6.8 1.3 11.4 88.6 956
30-34 2.7 7.3 8.1 2.0 12.0 88.0 734
35-39 2.1 4.2 5.8 0.7 8.4 91.6 619
40-44 0.0 6.3 4.3 0.0 7.9 92.1 345
45-49 1.4 11.0 9.3 1.4 15.4 84.6 180
Residence
Urban 8.3 18.0 13.4 4.0 25.1 74.9 2,102
Rural 2.7 4.3 5.0 1.3 7.6 92.4 1,524
Nomadic 0.1 0.2 1.1 0.0 1.3 98.7 1,800
Region
Sool 0.7 6.0 1.3 0.2 7.0 93.0 742
Sanaag 2.3 6.5 3.3 1.3 8.4 91.6 990
Bari 5.7 11.4 13.5 2.6 19.3 80.7 1,254
Nugaal 6.2 13.7 11.1 3.6 18.0 82.0 554
Mudug 4.5 6.4 5.5 1.9 10.0 90.0 1,886
Education
No Education 0.5 3.4 3.5 0.2 5.8 94.2 3,997
Primary 7.4 15.0 11.2 3.7 21.9 78.1 873
Secondary 18.8 28.0 20.4 8.6 36.9 63.1 411
Higher 37.9 46.6 39.8 20.6 62.9 37.1 145
Wealth quintile
Lowest 0.4 0.5 1.0 0.3 1.2 98.8 1,166
Second 0.2 1.1 3.7 0.2 4.0 96.0 868
Middle 1.4 3.5 5.2 0.5 6.5 93.5 1,003
Fourth 4.3 7.6 7.5 2.2 12.3 87.7 1,154
Highest 12.0 25.1 15.8 5.6 33.2 66.8 1,235
Total 4.0 8.3 7.0 1.9 12.3 87.7 5,426
Table 3.4 Exposure to mass media

Puntland Report 2020Somali Health and Demographic Survey (SDHS)56
Table 3.5 Internet use
Percentage of women aged 15-49 who have ever used the Internet, and percentage who have used the Internet in the past 12 months; and among women who have used the internet in the past 12 months, percent distribution by frequency of Internet use in the past month, according to background characteristics, SHDS 2020
Background characteristicsNumber
of women
Among women who have used the internet in
the past 12 months, percentage who, in the
past month, used the internet
TotalNumber
of womenEver used
the internet
Used the
internet in
the past 12
months
Almost
every day
At least
once a
week
Less than
once a
week
Not at
all
Age
15-19 23.8 22.0 1,666 61.2 25.2 6.1 7.5 100.0 366
20-24 25.4 23.3 926 62.4 21.0 7.5 9.2 100.0 216
25-29 15.5 13.5 956 72.0 18.8 5.4 3.8 100.0 129
30-34 9.3 9.0 734 64.6 20.0 2.5 13.0 100.0 66
35-39 7.2 5.5 619 (59.0) (7.0) (10.4) (23.6) 100.0 34
40-44 4.8 3.6 345 * * * * 100.0 13
45-49 7.3 4.5 180 * * * * 100.0 8
Residence
Urban 34.4 31.9 2,102 64.8 21.7 5.5 7.9 100.0 670
Rural 11.9 9.9 1,524 60.9 21.2 7.5 10.4 100.0 151
Nomadic 1.0 0.6 1,800 * * * * 100.0 11
Regions
Sool 13.4 12.0 742 75.3 14.2 3.1 7.5 100.0 89
Sanaag 11.6 11.0 990 60.2 26.1 7.6 6.1 100.0 109
Bari 18.9 16.0 1,254 49.8 33.2 6.7 10.3 100.0 200
Nugaal 29.8 28.4 554 73.6 11.3 5.2 9.8 100.0 157
Mudug 16.2 14.6 1,886 64.7 19.6 6.8 8.9 100.0 276
Education
No Education 5.9 5.0 3,997 49.4 23.9 9.9 16.8 100.0 199
Primary 31.3 27.3 873 61.7 24.0 7.1 7.2 100.0 238
Secondary 68.2 65.1 411 67.7 20.7 5.1 6.6 100.0 268
Higher 90.5 87.7 145 79.1 15.2 0.9 4.7 100.0 127
Wealth quintile
Lowest 1.0 0.7 1,166 * * * * 100.0 8
Second 1.7 0.8 868 * * * * 100.0 7
Middle 10.0 8.5 1,003 39.2 24.3 10.1 26.4 100.0 85
Fourth 19.2 17.0 1,154 64.6 20.7 6.9 7.8 100.0 196
Highest 46.4 43.3 1,235 68.0 21.4 4.9 5.7 100.0 535
Total 17.0 15.3 5,426 63.3 21.6 6.2 8.9 100.0 831
"Note: Figures in parentheses are based on 25-49 unweighted cases. An asterisk indicates that a figure is based on fewer than 25 unweighted cases and has been suppressed."

57
Percent distribution of ever-married women aged 15-49 by employment status, according to background characteristics, SHDS 2020
Background characteristics
Employed in the 12 months preceding the survey
TotalNumber of ever married womenCurrently
employed 1
Not currently employed
Not employed in the 12 months preceding the
survey
Age
15-19 4.9 0.3 94.8 100.0 300
20-24 4.2 0.8 94.9 100.0 633
25-29 7.1 0.5 92.4 100.0 889
30-34 7.8 1.1 91.1 100.0 717
35-39 10.2 1.4 88.4 100.0 616
40-44 14.9 2.8 82.3 100.0 339
45-49 15.8 3.7 80.6 100.0 180
Number of living children
0 6.2 2.1 91.7 100.0 428
1-2 5.4 1.0 93.6 100.0 858
3-4 8.4 1.2 90.4 100.0 1,039
5+ 10.5 1.0 88.5 100.0 1,351
Residence
Urban 13.0 1.5 85.5 100.0 1,271
Rural 9.9 1.9 88.2 100.0 1,074
Nomadic 2.3 0.3 97.4 100.0 1,330
Region
Sool 4.8 0.1 95.1 100.0 527
Sanaag 5.9 0.6 93.5 100.0 720
Bari 11.7 3.6 84.7 100.0 870
Nugaal 12.8 1.3 85.9 100.0 372
Mudug 7.1 0.3 92.6 100.0 1,186
Education
No Education 7.4 1.2 91.4 100.0 3,011
Primary 9.8 0.7 89.5 100.0 481
Secondary 10.7 2.8 86.6 100.0 135
Higher (37.8) (0.0) (62.2) 100.0 49
Wealth quintile
Lowest 2.5 0.3 97.3 100.0 859
Second 6.3 1.1 92.6 100.0 666
Middle 11.8 1.9 86.2 100.0 685
Fourth 9.0 1.2 89.8 100.0 748
Highest 12.6 1.7 85.7 100.0 717
Total 8.2 1.2 90.6 100.0 3,675 1Currently employed’ is defined as having done work in the seven days preceding the survey. Includes persons who did not work in the seven days preceding the survey but who are regularly employed and were absent from work for leave illness, vacation or any other such reason.
Table 3.6 Employment status

Puntland Report 2020Somali Health and Demographic Survey (SDHS)58
Table 3.7 Type of employment
Percent distribution of ever-married women aged 15-49 employed in the 12 months preceding the survey by type of earnings, type of employer, and continuity of employment, according to type of employment (agricultural or non-agricultural), SHDS 2020
Background characteristics Agricultural work Non-Agricultural work Total
Type of earning
Cash only 66.2 76.5 74.1
Cash and in-kind 0.0 8.0 6.2
In-kind only 0.0 4.6 3.5
Not paid 33.8 11.0 16.2
Total 100.0 100.0 100.0
Type of employer
Employed by family member 48.6 17.2 24.3
Employed by non-family member
0.0 30.9 24.0
Self-employed 51.4 51.8 51.7
Total 100.0 100.0 100.0
Continuity of employment
All year 67.6 57.9 60.1
Seasonal 11.9 20.7 18.7
Occasional 20.5 21.5 21.3
Total 100.0 100.0 100.0
Number of women employed during the past 12 months
13 44 56

59
Percentage of ever-married women aged 15-49 with specific types of health insurance coverage, and percentage with any health insurance, according to background characteristics, SHDS 2020
Background characteristics
Social security
Other employer-
based insurance
Mutual Health Organization/
community based
insurance
Privately purchased
commercial insurance
Other NoneNumber of
women
Age
15-19 0.0 0.0 0.2 0.0 0.0 99.8 300
20-24 0.0 0.2 0.0 0.0 0.0 99.8 633
25-29 0.0 0.1 0.0 0.3 0.0 99.6 889
30-34 0.0 0.2 0.0 0.0 0.0 99.8 717
35-39 0.0 0.0 0.0 0.0 0.0 100.0 616
40-44 0.0 0.0 0.0 0.6 0.1 99.3 339
45-49 0.0 0.0 0.0 0.0 0.0 100.0 180
Residence
Urban 0.0 0.3 0.0 0.3 0.0 99.4 1,271
Rural 0.0 0.0 0.1 0.0 0.0 99.9 1,074
Nomadic 0.0 0.0 0.0 0.1 0.0 99.9 1,330
Region
Sool 0.0 0.0 0.0 0.0 0.0 100.0 527
Sanaag 0.0 0.1 0.1 0.1 0.00 99.7 720
Bari 0.0 0.0 0.0 0.5 0.0 99.5 870
Nugaal 0.0 0.8 0.0 0.0 0.10 99.1 372
Mudug 0.0 0.0 0.0 0.0 0.0 100.0 1,186
Education
No Education 0.0 0.0 0.0 0.1 0.0 99.9 3,011
Primary 0.0 0.1 0.1 0.0 0.0 99.8 481
Secondary 0.0 0.0 0.0 1.5 0.0 98.5 135
Higher (0.0) (4.1) (0.0) (0.0) (0.0) (95.9) 49
Wealth
Lowest 0.0 0.0 0.0 0.0 0.0 100.0 859
Second 0.0 0.0 0.0 0.1 0.0 99.9 666
Middle 0.0 0.0 0.0 0.0 0.0 100.0 685
Fourth 0.0 0.0 0.0 0.0 0.0 100.0 748
Highest 0.0 0.5 0.1 0.6 0.0 98.9 717
Total 0.0 0.1 0.0 0.1 0.0 99.7 3,675
Table 3.8 Health insurance coverage

Puntland Report 2020Somali Health and Demographic Survey (SDHS)60
Table 3.9 Use of tobacco
Percentage of ever-married women aged 15-49 who use various tobacco products, according to background characteristics, SHDS 2020
Background characteristics
Percentage who Smoke
CigarettesOther types of
tobaccoAny type of tobacco Number of women
Age
15-19 3.2 0.0 3.2 300
20-24 2.9 0.2 2.9 633
25-29 2.7 0.5 2.9 889
30-34 2.2 0.6 2.3 717
35-39 2.6 0.6 2.6 616
40-44 3.6 0.6 3.6 339
45-49 0.9 0.0 0.9 180
Residence
Urban 3.3 0.8 3.5 1,271
Rural 3.9 0.5 4.0 1,074
Nomadic 1.0 0.0 1.0 1,330
Region
Sool 1.1 0.0 1.1 527
Sanaag 0.8 0.0 0.8 720
Bari 7.2 1.5 7.4 870
Nugaal 2.1 0.7 2.2 372
Mudug 1.3 0.0 1.3 1,186
Education
No Education 2.8 0.5 2.9 3,011
Primary 1.6 0.4 1.6 481
Secondary 3.5 0.0 3.5 135
Higher (1.1) (0.0) (1.1) 49
Wealth quintile
Lowest 1.0 0.0 1.0 859
Second 2.1 0.7 2.1 666
Middle 5.4 1.0 5.7 685
Fourth 3.4 0.1 3.5 748
Highest 1.8 0.6 1.8 717
Total 2.6 0.4 2.7 3,675

61

Marriage, Fertility, Fertility Preference and Birth Spacing
CHAPTER 4

©A
U U
N I
ST P
HO
TO
/ T
OB
IN J
ON
ES.
Key Findings

Puntland Report 2020Somali Health and Demographic Survey (SDHS)64
Some of these factors, including proximate determinants such as age at marriage, timing of fertility, and birth spacing, age at first birth and inter-birth intervals among others, are presented in this chapter. It also examines the key factors that determine the exposure to the risk of pregnancy. Information presented pertains to women of reproductive age
Information on marriage helps to determine the extent to which a woman is exposed to the risk of pregnancy, and is therefore important to the understanding of fertility levels and trends. Populations in which women marry at a young age tend to initiate childbearing early, and thus have higher fertility rates in general. Marriage and fertility are closely linked in Puntland, because childbearing takes place within the context of marriage.
Marital statusThe SHDS 2020 classified marital status as never-married, currently married, divorced or widowed. Table 4.1 and Figure 4.1 show the distribution of women aged 15-49 by their current marital status and according to age. Marriage among Puntland women is virtually universal, with all women aged 45-49 having entered into a marital union.
Overall, 32 percent of women aged 15-49 were never married, 58 percent were currently married, 7 percent were divorced and 3 percent were widowed at the time of the survey.
The percentage of women who have never married decreases sharply with increasing age, from 83 percent among those aged 15-19 to less than 1 percent for women aged 35-39. Almost all Puntland women are married by the age of 35. The percentage of currently married women increases with age and peaks at the 35-39 age group at 86 percent. Widowhood significantly increases and peaks among women of age group 45-49 at 18 percent. The
4Chapter 4
Characteristics of the RespondentsEstimates have been suggesting that Somalia has one of the highest fertility levels in the world, second only to Niger according to the latest revision of the UN World Population Prospects (United Nations 2019). The data on marriage and fertility collected as part of the SHDS 2020 allows the validation of these estimates and helps gain better insight into what is behind fertility levels and trends.

65
percentage of divorced women generally increases with increasing age from 3 percent among those aged 15-19 and peaks among age group 40-44 at 12 percent.
Age at first marriage The age at first marriage is an important indicator of exposure to the risk of conception and childbirth, especially in a society in which almost all births occur within marriage. Women who marry early will, on average, have a longer exposure to the risk of pregnancy and a greater number of births in their reproductive years. Information on age at first marriage was obtained by asking all ever-married women the month and year in which they got married to their first husbands, while similar information for men was obtained from the household roster.
Table 4.2 shows the percentage of ever-married women aged 15-49 by specific exact ages and median age at first marriage. Overall, 10 percent of women in the age group 20-49 and 25-49 entered their first marriage by the age of 15, Twenty three percent of women aged 20-49 and twenty two percent of women aged 25-49 were married for the first time by the age of 18, while 32 percent of women aged 20-49 and 25-49 married for the first time by the time they turned 20. The median age at first marriage for women aged 25-49 is 21 years.
There is slight variation among regions in age at first marriage and median age at first marriage. Women in Mudug are more likely to
Figure 4.1 Current marital status of women aged 15-49
Percent distribution of women aged 15-49 by current marital status
15-19 20-24 25-29 30-34 35-39 40-44 45-49
82.
0
31.6
7.0
2.2
0.4 1.8 0
15.0
59.6
83.
0
85.
2
86.
4
79.8
71.6
2.5 7.
9
8.0 8.0
8.0 11
.9
10.2
Never Married Currently Married Divorced Widowed

Puntland Report 2020Somali Health and Demographic Survey (SDHS)66
enter their first marriage below 20 years of age compared to other women in Puntland, the median age at first marriage is also lowest in Mudug at 20 years of age.
Table 4.3 shows the percentage of men aged 15-64 who were first married, by specific exact ages and the median age at first marriage. Overall, less than 1 percent of men in the age group 20-49 entered into their first marriage by the age of 15 and 8 percent by the age of 18. Ten percent of the men aged 25-64 had never-married. The median age at first marriage for men aged 25-64 is 24 years.
Early MarriageEarly marriage is still widely practiced in many parts of the world, including Somalia, even though it violates the rights of young people (particularly girls) and has widespread and long-term consequences. Somali parents encourage the marriage of their daughters while they are still young, in the hope that marriage will benefit the girls both financially and socially, while also relieving financial burdens on the family. This traditional practice prevents young girls from realizing their full potential in life, limiting their physical, psychological and economic development. Duration of exposure to the risk of pregnancy depends primarily on the age at which women first marry. Early marriage often results in early childbearing, which has a detrimental effect on the health of both the mother and child. It also often leads to a longer reproductive period and higher levels of fertility. In many countries, the postponement of marriage greatly reduces childbearing rates.
As seen in Table 4.2, 10 percent of women aged 25-49 and 20-49 had already married by the time they turned 15. Twenty-three percent of women aged 20-49 and 22 percent of women aged 25-49, were first married by the age of 18 (Figure 4.2).
A comparison by regions show that women in Mudug tend to marry at younger ages than women in other Puntland regions; 11 percent and 20 percent of women in Mudug married at age 15 and 18 respectively.
Fertility This section examines a number of issues related to fertility and childbearing, including fertility levels, age at which women initiate childbearing, fertility preference, and other determinants of fertility. The knowledge of current and cumulative fertility is central to understanding population dynamics and the factors that influence the size and age structure of a population. It is also essential in monitoring the progress and evaluating the impact of population and health programmes in Puntland. Using the
Figure 4.2 Age at first marriage
Percent of women age 15-49 who were first married by specific exact ages
10.3
22.6
31.5 35
.6
52.0
10.3
22.4
32.4
47.
4
69.2
15 18 20 22 25
20-49 25-49

67
information collected during the SHDS, it is possible to estimate the current level of fertility, identify trends, and highlight variations in fertility according to certain characteristics. During the survey, interviewers asked all ever-married women aged 15-49 in the sampled households about the total number of children they had ever given birth to, alive or dead, the sex of the children, those that are living within the household, and children living elsewhere. Following this, interviewers compiled a complete history of births for each respondent, from the earliest to the most recent birth, recording for each of them the type of birth (single or multiple), survival status, gender and date of birth.
Current Fertility
The most used measures of current fertility are the total fertility rate (TFR) and one of its components—age-specific fertility rates (ASFRs). The TFR is a summary measure of fertility and is interpreted as the number of children a woman would have by the end of her child-bearing years if she were to experience the currently observed ASFRs. The TFR estimates compiled during the SHDS 2020 refer to the three years preceding the survey. The ASFR was calculated as the number of live births by women in a given age group divided by the number of woman-years in that age group during the specified period.
Generally, across most of the age groups, women residing in nomadic households have higher ASFRs compared to those in rural and urban settings However, in the age group 30-34 years, women
Figure 4.3 Age-specific fertility rates by residence
Percent of women age 15-49 who were first married by specific exact age
0
50
100
150
200
250
300
350
400
15-19 20-24 25-29 30-34 35-39 40-44 45-49
Bir
th p
er 1
,00
0 w
omen
Urban Rural Nomadic
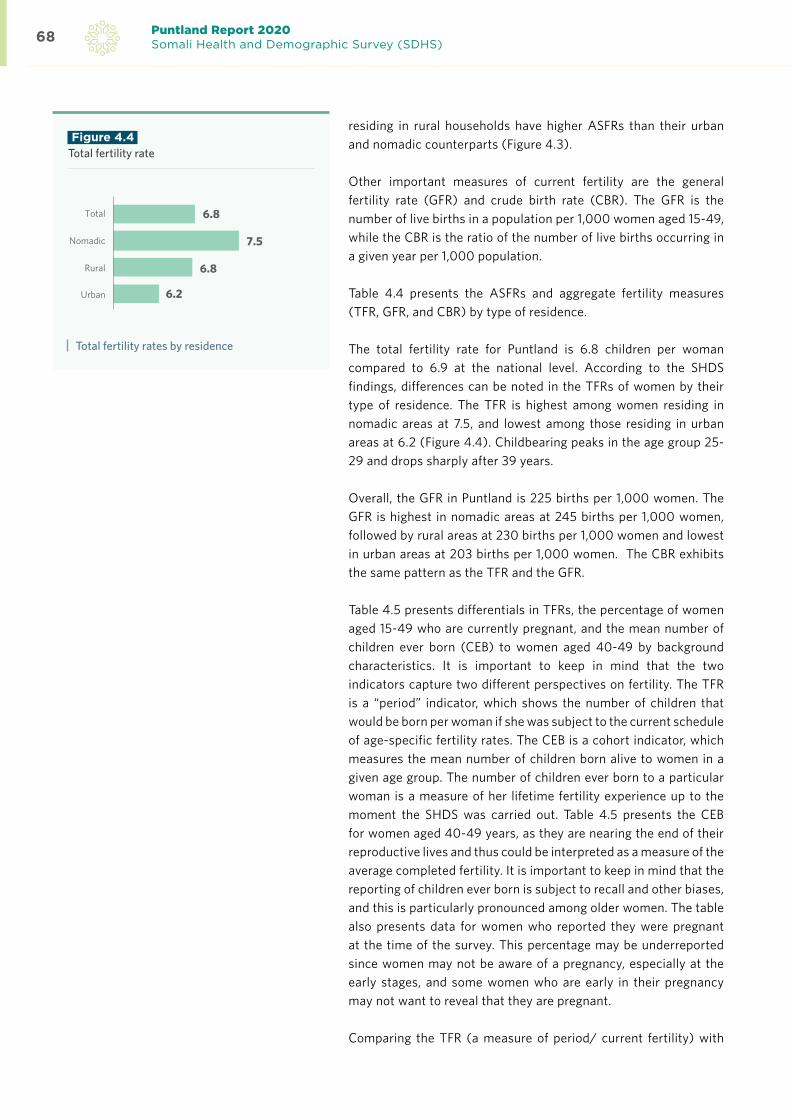
Puntland Report 2020Somali Health and Demographic Survey (SDHS)68
residing in rural households have higher ASFRs than their urban and nomadic counterparts (Figure 4.3).
Other important measures of current fertility are the general fertility rate (GFR) and crude birth rate (CBR). The GFR is the number of live births in a population per 1,000 women aged 15-49, while the CBR is the ratio of the number of live births occurring in a given year per 1,000 population.
Table 4.4 presents the ASFRs and aggregate fertility measures (TFR, GFR, and CBR) by type of residence.
The total fertility rate for Puntland is 6.8 children per woman compared to 6.9 at the national level. According to the SHDS findings, differences can be noted in the TFRs of women by their type of residence. The TFR is highest among women residing in nomadic areas at 7.5, and lowest among those residing in urban areas at 6.2 (Figure 4.4). Childbearing peaks in the age group 25-29 and drops sharply after 39 years.
Overall, the GFR in Puntland is 225 births per 1,000 women. The GFR is highest in nomadic areas at 245 births per 1,000 women, followed by rural areas at 230 births per 1,000 women and lowest in urban areas at 203 births per 1,000 women. The CBR exhibits the same pattern as the TFR and the GFR.
Table 4.5 presents differentials in TFRs, the percentage of women aged 15-49 who are currently pregnant, and the mean number of children ever born (CEB) to women aged 40-49 by background characteristics. It is important to keep in mind that the two indicators capture two different perspectives on fertility. The TFR is a “period” indicator, which shows the number of children that would be born per woman if she was subject to the current schedule of age-specific fertility rates. The CEB is a cohort indicator, which measures the mean number of children born alive to women in a given age group. The number of children ever born to a particular woman is a measure of her lifetime fertility experience up to the moment the SHDS was carried out. Table 4.5 presents the CEB for women aged 40-49 years, as they are nearing the end of their reproductive lives and thus could be interpreted as a measure of the average completed fertility. It is important to keep in mind that the reporting of children ever born is subject to recall and other biases, and this is particularly pronounced among older women. The table also presents data for women who reported they were pregnant at the time of the survey. This percentage may be underreported since women may not be aware of a pregnancy, especially at the early stages, and some women who are early in their pregnancy may not want to reveal that they are pregnant.
Comparing the TFR (a measure of period/ current fertility) with
Figure 4.4 Total fertility rate
Total fertility rates by residence
7.5
6.2Urban
6.8Rural
Nomadic
6.8Total

69
the mean number of CEB among women aged 40 to 49 completed fertility (a measure of cohort/past fertility) provides important insights in fertility patterns and trends. If fertility remained stable over time and women accurately reported the number of children, they have ever born alive, the TFR and mean CEB for women aged 40-49 would be equal. The SHDS indicates that in Puntland there is a very slight difference between the TFR (6.8) and mean CEB for women aged 40-49 years (7.4).
As Table 4.5 indicates, the TFR is consistently lower than the mean number of children ever born for women aged 40-49. This is likely to be attributed to the afore mentioned problems with recall and other biases in reporting CEB. The magnitude of the differences suggests though that the current fertility levels in Puntland might be lower than in the past. A forthcoming specialized thematic report will investigate this in more detail. Notably, this pattern holds across places of residence and women’s education levels. In terms of differences in TFR by place of residence, Table 4.5 indicates that fertility is lowest among women living in urban areas at 6.2 and highest among those living in nomadic areas at 7.5. The largest fertility differentials are associated with educational background (Figure 4.5). For women with no education, the TFR is about twice as high at 7.0 as that for women with higher education at 3.3. Notably, the difference in TFR between women with no education and those with primary education is relatively small.
Among the regions, the total fertility rate is highest in Sool at 7.9 and lowest in Bari at 6.1.
The percentage of women who reported being pregnant at the time of the survey is also presented in Table 4.5. Sixteen percent of women were pregnant at the time of the survey. Nomadic women are more likely to be pregnant at17 percent than rural and urban women at 15 and 14 percent respectively. Similar as the TFR, the proportion of women who are currently pregnant is highest in Sool at18 percent and lowest in Bari at13 percent. There is no pattern between the proportion of currently pregnant women and levels of education. Generally, there is a decline of the proportion of currently pregnant women with increasing wealth status of the households from 18 percent in the lowest wealth quintile to 15 percent in highest wealth quintile.
Information on the number of CEB for Puntland is presented in Table 4.6 for ever-married women and currently married women. On average, ever-married women aged 45-49 have given birth to 6.1 children, of whom 5.5 survived until the time the survey was conducted. Of the 6.4 children born on average to currently married women aged 45-49, 5.9 survived until the time the survey was conducted. The difference in fertility between the two groups could be attributed to the fact that it is almost universal that children

Puntland Report 2020Somali Health and Demographic Survey (SDHS)70
are born within marriage across the country. The dissolution of marriage, particularly at early ages of childbearing, reduces the exposure to the risk of pregnancy and childbearing. The mean number of CEB increases with age, reflecting the natural family building process. For example, among ever-married women, the average number of live births for the age group 25-29 is 3.6, while women of 35-39 years reported an average of 5.6 children. Among currently married women, the mean CEB to women of 25-29 years is 3.7, 5.8 for women in the 35-39 age group and 6.4 among women aged 45-49.
Inter-Birth Intervals
The inter-birth interval, defined as the period between two consecutive births. Information on birth intervals provides insight into birth spacing patterns, which affect fertility as well as maternal, infant, and childhood mortality. Studies have shown that short birth intervals are associated with increased risk of death for mother and baby, particularly when the birth interval is less than 24 months.
Table 4.7 shows the percent distribution of non-first births in the five years preceding the survey by number of months since the preceding birth, according to background characteristics. The median birth interval in Puntland is 21 months. The median number of months since a preceding birth increases significantly with age, from 12 months among mothers aged 15-19 to 24 months among mothers aged 40-49. The median birth interval also increased slightly with the increase of the birth order from 20 months for birth order 2-3 to 22 months for birth order 4-6. The median birth interval in urban and rural areas (23 months) is slightly higher than in nomadic areas (19 months). Women with secondary and higher education have a longer median birth interval (24 months) than women with no education (20 months). Women in Nugaal and Bari have a longer median birth interval(24 months) than women in other regions.
There is no marked difference in the length of the median birth interval by wealth quintiles.
Menopause Women are considered to have reached menopause if they are neither pregnant nor postpartum amenorrhoeic and have not had a menstrual period in the six months before the survey; if they report being menopausal; or having had a hysterectomy; or if they have never menstruated.
Table 4.8 shows that, overall, 19 percent of women aged 30-49 are menopausal. As could be expected, the proportion of menopausal

71
women increases with increasing age.
Age at First BirthThe age at which childbearing commences is an important determinant of the overall level of fertility, as well as the health and well-being of the mother and child. The data on age at first birth is sometimes affected by reporting errors, such as misreporting the woman’s age, underreporting of first births, and misreporting the first child’s date of birth. Such errors are usually more pronounced among older women.
Table 4.9 shows the percentage of women by age at first birth according to their current age. The survey shows that the median age at first birth for Puntland among women aged 25-49 is 23 years.
Teenage Pregnancy and MotherhoodTeenage pregnancy and motherhood is defined as the percentage of women aged 15-19 who are pregnant with their first child at the time of the survey, or have had a live birth or have begun childbearing, according to the DHS program (Croft T et al. 2018).
Childbearing under the age of 20 has major health implications for both the mother and the child. Likewise, pregnancy under the age of 20 has adverse social consequences, especially for female education, as women who become mothers under the age of 20 are likely not to complete their education. The percentage of teenage women (aged 15-19) who are mothers or pregnant with their first child is shown in table 4.10. The data indicates that 11 percent of the Puntland girls aged 15-19 fall in this category, 10 percent having already given birth to a child and 2 percent being pregnant with their first child. The proportion of teenagers who have begun childbearing rises rapidly with age. One percent of women aged 15 have started childbearing, but by the age of 19, 34 percent of women have had a baby or are pregnant with their first child.
There are significant differences in background characteristics – while 14 percent of girls aged 15-19 in nomadic areas are already mothers or pregnant with their first child, this proportion in urban areas is 8 percent. Teenage childbearing is lowest in Mudug at 7 percent and highest in Nugaal at17 percent. Early childbearing is inversely related to educational level. Many teenagers with no education at 15 percent have begun childbearing than those with secondary education at 5 percent. Sixteen percent of the girls aged 15-19 in the poorest households have started childbearing, compared to 7 percent of girls of the same age in the wealthiest households (Figure 4.5).
Figure 4.5 Total fertility rate
Total fertility rates by residence
15.1
Sool
14.5
Sanaag
12.2
Bari
16.5
Nugaal
7.3
Mudug

Puntland Report 2020Somali Health and Demographic Survey (SDHS)72
Fertility Preferences
Information on fertility preferences can help assess the desire for children, ideal number of children, the extent of wanted, mistimed and unintended pregnancies. Data on fertility preferences may suggest the way in which fertility trends and patterns are likely to evolve in the future. This section presents SHDS data on whether and when married women desire more children and the desire to limit children, by background characteristics. It also presents the reported ideal number of children, the mean ideal number of children, and whether the last birth was intended at the time of conception.
Fertility Preferences by Number of Living Children
Table 4.11 presents the percent distribution of currently married women by their desire for more children, according to the number of living children they had, as stated at the time the survey was conducted. Overall, 62 percent of currently married women want to have a child soon, 19 percent are undecided on whether to have another child, and 14 percent do not want any more children. Women’s desire to have another child soon decreases with increasing number of living children, 72 percent of currently married women with no living children want to have a child soon, while 55 percent of women with six or more children want to have another child soon. Only 2 percent of currently married women wanted to have another child later.
Desire to Limit Childbearing
Table 4.12 shows the percentage of currently married women who want no more children by the number of living children they already have, according to background characteristics. Overall, 14 percent of currently married women are willing to stop childbearing. The desire to limit childbearing increases as the number of living children increases, from zero percent among married women with no living children to 19 percent among women with six or more living children. Analysis by women’s residence shows that, generally, nomadic women are less likely to want no more children at 12 percent compared to urban and rural women at 16 and 14 percent, respectively.
Among the regions, there are variations on limiting of children by currently married women; Bari and Nugaal have the highest proportions of women who want to limit childbearing at18 and 17 percent, respectively, while Mudug and Sool have the lowest proportion of women who want to limit childbearing at11 percent each. There is no clear relationship between education or wealth and wanting no more children. However, sixteen percent of women with no education want to limit childbearing, as compared with 8

73
percent of those with secondary education. By wealth, women in the middle wealth quintile are more likely to want no more children at18 percent than women in the lowest wealth quintile at12 percent.
Ideal Number of Children
In order to obtain a greater insight into fertility preferences among Puntland women, the SHDS interviewers asked all ever-married women, regardless of the number of living children they have, a hypothetical question about the number of children they would choose to have if they could start their reproductive lives again. Respondents with no children were asked: “If you could choose exactly the number of children to have in your whole life, how many would that be?, Respondents who had children were asked: “If you could go back to the time when you did not have any children and could choose exactly the number of children to have in your whole life, how many would that be?.
Table 4.13 shows the percent distribution of women aged 15-49 by their opinions on their ideal number of children, and mean ideal number of children for all respondents, as well as for currently married respondents, according to the number of living children they have. It indicates that the Puntland women desire large families. Overall, 90 percent of women consider six or more children to be the ideal family size. Two percent stated their ideal number of children is four, and 2 percent of women consider the ideal family size to be three children or fewer.
If currently married women in Puntland could choose their ideal number of children, they would like to have 10.6 children on average. There is no difference between the mean ideal number of children for ever-married women and currently married women.
Among the currently married women who have no living children, the mean ideal number of children is 9.8, while among the ever-married women with no living children, the mean ideal number of children is 9.6. It is interesting to note that women with four and more living children are more likely to desire more children than women with three and fewer living children.
Fertility Planning
Information collected as part of the SHDS 2020 provides an opportunity to estimate the levels of unintended fertility. This information provides an insight into the degree to which couples are able to control fertility. Women aged 15-49 were asked a series of questions about each child born to them in the five years preceding the survey, as well as any current pregnancy, to determine whether the birth or pregnancy was intended at the time of conception, intended later, or not intended at all. In assessing these results, it is important to recognise that women may declare a previously
Figure 4.6 Fertility planning status
Percent distribution of births to women aged 15-49 in the five years preceding the survey by planning status of the birth
66.7Wanted then
22.3
11.0
Wanted later
Wanted no more

Puntland Report 2020Somali Health and Demographic Survey (SDHS)74
unintended birth or current pregnancy as intended, and this rationalisation would result in an underestimate of the true extent of unintended births.
Table 4.14 summarizes the planning status of births in the five years preceding the survey: whether the birth was intended at the time of conception, intended later, or not intended at all. Overall, about two-thirds of births (67 percent) were wanted at the time they occurred, while 22 percent were intended later and around 11 percent were born to mothers who intended to have no more children (Figure 4.6). First- and second- order births were more likely to have been intended at 70 and 67 percent, respectively than third- or higher- order births at64 and 61 percent respectively. A larger proportion of births to older women are unintended than those to younger women. While only 11 percent of births to women under-age of 20 are unintended, 20 percent of births to women aged 40-44 are unintended.
Birth SpacingCouples can use contraceptive methods to better space their children. Information on contraceptive use is of interest to policymakers, programme managers, and researchers in population and birth spacing. This section describes women’s knowledge and use of contraceptive methods and the need and demand for birth spacing.
Knowledge of Contraceptive Methods
The knowledge of contraceptive methods is a precondition for their proper use. Information regarding knowledge of birth spacing methods was gathered by asking the respondent first about ways or methods by which the couple could delay or avoid pregnancy. If the respondent failed to mention any of the methods included in the questionnaire, the interviewer described the method and asked the respondent whether she had heard about it. No questions were asked to obtain information about the depth of knowledge. Contraceptive methods used for the survey were classified into two broad categories: modern methods and traditional methods. Modern methods include the pill, the intrauterine device (IUD), injectables, implants, the male and the female condom, the diaphragm, the lactational amenorrhea method (LAM), and emergency contraception. Traditional methods include rhythm (periodic abstinence) and withdrawal.
Table 4.15 presents data on the knowledge of contraceptive methods. Overall, 62 percent of ever-married women have heard of at least one method of contraception. Modern contraceptive methods are more widely known than traditional methods. Sixty-two percent of ever-married women and 63 percent of currently married women

75
Figure 4.3 Knowledge of contraceptive methods
Percentage of all ever-married women, currently married women 15-49 who have heard of any contraceptivemethod, by specific method
know of any modern method, while 20 percent of ever-married women and currently married women know of a traditional method (Figure 4.8). The known modern contraceptive methods among women in Puntland include: IUD, injectables, implants, pills, male condom, female condom, emergency contraception, standard days method, and Lactational Amenorrhea (LAM). The most well-known modern method among currently married women is LAM at 54 percent and the least well-known is the female condom at 11 percent (Figure 4.8).
Table 4.16 presents data on the knowledge of contraceptive methods by background characteristics. Knowledge of contraception is highest among women aged 20 years and above, at 59 percent and above compared to women under 20 years at 48 percent. Currently married women in urban areas are more likely to know of any modern contraceptive at 73 percent compared to currently married women in rural and nomadic areas at 64 and 53 percent respectively.
Among the regions, currently married women in Nugaal are best informed about modern contraception as 67 percent have heard of at least one modern method of contraception compared to women
62
61.3
52.7
33.8
28.5
24.5
19.5
17.9
16.7
16.7
14.8
13.9
13.2
11.5
1.6
0.6
62.9
62.1
53.5
33.4
28.2
24.2
19.6
17.6
16.6
16.6
14.8
13.9
13.1
11.4
1.6
0.5
Any method
Any modern method
LactationalAmenorrhea (LAM)
pills
Injectables
Implants
Any traditional method
Male condom
Withdrawal
IUD
Standard days method
Emergencycontraception
Rythm
Female condom
Traditional method
Other modernmethod
Currently married women All ever married women

Puntland Report 2020Somali Health and Demographic Survey (SDHS)76
in Bari and Sanaag who are least informed at 61 percent. As could be expected, women with higher education are best informed about modern contraception, as 89 percent have heard of at least one modern method compared to those with no education at 58 percent.
Contraceptive Use One of the most frequently used indicators for assessing the success of birth spacing programmes is examining the current level of contraceptive use by determining the current level of contraceptive prevalence rate (CPR). CPR is percentage of currently women of reproductive age who use any contraceptive method at a particular point in time. This is also widely used as a measure in the analysis of determinants of fertility. Table 4.17 shows the distribution of currently married women who were using modern contraception by age. Overall, 8 percent of the currently married women are using any contraceptive method and 1 percent are using any modern methods. The use of contraception among currently married women decreases with increasing age. Thirteen percent of women aged 15-19 are using contraceptives compared to 2 percent of those aged 40-44.
Table 4.18 presents the percent distribution of currently married women by their use of contraceptive methods, according to background characteristics. This table allows a comparison of levels of current contraceptive use across major population groups and an examination of differences in use in the various subgroups.
The use of any modern contraceptive method decreases with increasing number of living children, from 4 percent for those with 1-2 living children to 1 percent for those with more than 5 living children.
Women in urban areas are more likely to use any modern contraceptive methods at 3 percent than women in rural and nomadic areas at less than 1 percent. The CPR is 11 percent in urban areas, compared to 9 and 5 percent in rural and nomadic areas respectively.
By region, use of any method is highest in Nugaal at11 percent and lowest in Sanaag at 6 percent each. There is no clear pattern between education level of women and use of contraception.
Knowledge of Fertile Period
To examine a woman’s knowledge of the reproductive process, respondents were asked whether there were certain days between the menstrual periods when a woman was more likely to become pregnant if she had sexual intercourse. Women who responded that the fertile period is “halfway between two menstrual periods”

77
were considered to have correct knowledge of their fertile period.
Table 4.19 shows the percentage of ever-married women aged 15-49 with correct knowledge of the fertile period during the ovulation cycle, according to age. Overall, only 7 percent of ever-married women correctly reported the most fertile time as being halfway between two menstrual periods.
Generally, correct knowledge on fertile period increases with increasing age. Among young ever-married women (15-19 years of age), 6 percent had corrected knowledge of the fertile period compared to 9 percent of women aged 45-49.
Need and Demand for Birth Spacing
One of the major concerns of birth spacing programmes is to assess the size of the potential demand for contraception and to identify women who are in need of contraceptive services. Table 4.20 presents estimates of unmet need, met need, and the total demand for birth spacing. The table also shows the percentage of the total demand that is satisfied. Women who are currently married and who either do not want any more children or want to wait two or more years before having another child, but are not using contraception, are considered to have an ‘unmet need’ for birth spacing. Women with a ‘met need’ for birth spacing are those who are currently using contraception. The total demand for birth spacing is the sum of unmet needs and met needs.
Overall, 37 percent of currently married women have an unmet need for birth spacing services (28 percent for spacing births and 9 percent for stopping childbearing). One percent of married women are currently using a contraceptive method or have a met need for either birth spacing or limiting childbearing. Thirty-eight percent of currently married women have a demand for birth spacing (29 percent for birth spacing and 9 percent for limiting childbearing). At present, only 3 percent of the potential demand for birth spacing is being met. This means that if all married women who said they want to space the births of their children, or limit their number of children were to use birth spacing methods, the contraceptive prevalence rate would increase from 1 percent to 38 percent.
Analysis by age shows that the unmet need for birth spacing is highest among women aged 30-34 at 40 percent, and lowest among women aged 45-49 at 30 percent. There is no variation in unmet need for birth spacing by type of residence. By region, unmet need is highest in Nugaal at 43 percent and lowest in Bari at 35 percent. Unmet needs decreases with increasing education, it is highest among women with no education at 38 percent and lowest among those with higher education at 23 percent. There is slight variation in the total demand for birth spacing among currently married women from households of different wealth status. Unmet

Puntland Report 2020Somali Health and Demographic Survey (SDHS)78
need is lowest among women from wealthier households, at 35 percent, and highest among women in the middle wealth quintile, at 41 percent.
Exposure to Birth Spacing Messages
The role of the media in promoting birth spacing is essential in bringing information to different target groups. Data on the level of exposure to media, such as the radio, television, and papers/ magazines are important for programme managers and planners to effectively target population subgroups for information, education, and communication campaigns. To assess the effectiveness of such media on the dissemination of birth spacing information, interviewing teams asked ever-married women whether they had heard messages about birth spacing on the radio or seen related messages on television or in newspapers/magazines during the few months preceding the survey.
Table 4.21 presents the distribution of ever married women aged 15-49 who heard or saw a birth spacing message on radio, television, newspaper/magazine, or mobile phone in the past few months preceding the survey, according to background characteristics. Overall, 13 percent of women have heard a message related to birth spacing on the radio, 9 percent have seen a message on birth spacing on television, and 5 percent read a message on birth spacing in a newspaper.
Seventeen percent of women had been exposed to birth spacing messages at least through one of these media. As expected, women in Urban areas are more likely to have been exposed to birth spacing messages in the media compared to women in Nomadic and rural areas (29 percent, 4 percent and 17 percent respectively)By region, women in Nugaal are most likely to be exposed to birth spacing messages on the radio at 27 percent, the television and newspaper are also the most important source for women in Nugaal at19 percent and 10 percent respectively.
Women in Sool are least likely to be exposed to birth spacing messages from any media source at 8 percent. Exposure to birth spacing messages either through radio, television, newspaper increases with the level of education and wealth quintiles.
Only three percent of women had been exposed to birth spacing message in all the specified media sources. Exposure to all three media sources on birth spacing is highest among women in urban area at 6 percent, women in Nugaal at 10 percent and women in the highest wealth quintile at 8 percent.

79

Puntland Report 2020Somali Health and Demographic Survey (SDHS)80
Percent distribution of women aged 15-49 by current marital status and age, SHDS 2020
Age Never MarriedCurrently Married
Divorced Widowed TotalNumber of
women
15-19 82.0 15.0 2.5 0.4 100.0 1,666
20-24 31.6 59.6 7.9 0.9 100.0 926
25-29 7.0 83.0 8.1 1.9 100.0 956
30-34 2.2 85.3 8.1 4.4 100.0 734
35-39 0.4 86.4 8.1 5.1 100.0 619
40-44 1.8 79.8 11.9 6.5 100.0 345
45-49 0.0 71.6 10.2 18.3 100.0 180
Total 32.3 58.3 6.7 2.8 100.0 5,426
Table 4.1 Use of tobacco
Table 4.2 Age at first marriage
Percentage of women aged 15-49 who were first married by specific exact ages, and median age at first marriage, according to current age, SHDS 2021
Current age
Percentage first married by exact age:
15 18 20 22 25Percentage
of never married
Number of respondents
Median age at first
marriage
15-19 5.0 n/a n/a n/a n/a 81.1 1,610 a
20-24 10.3 23.1 28.7 n/a n/a 31.1 951 a
25-29 7.9 20.4 28.9 43.5 63.9 7.1 954 21.0
30-34 19.1 26.9 36.6 51.5 75.8 2.6 744 21.0
35-39 6.0 20.1 30.1 46.9 72.2 0.5 618 22.0
40-44 6.1 21.2 34.3 47.7 65.1 1.7 344 22.0
45-49 10.2 24.9 37.1 51.7 67.8 0.0 205 21.0
20-49 10.3 22.6 31.5 35.6 52.0 10.3 3,816 a
25-49 10.3 22.4 32.4 47.4 69.2 3.4 2,865 21.0
Region
Sool 8.9 17.4 22.2 25.0 37.0 29.7 1,254 21.0
Sanaag 9.7 16.8 23.5 25.9 36.2 29.0 1,377 21.0
Bari 6.6 13.3 20.4 25.1 37.4 30.5 847 21.0
Nugaal 6.1 10.0 15.6 22.1 34.5 29.8 838 22.0
Mudug 11.0 19.5 26.5 26.1 37.4 37.7 1,110 20.0
Note: The age at first marriage is defined as the age at which the respondent got married to her first spousen/a = Not applicable due to censoringa = Omitted because less than 50 percent of the women got married for the first time before reaching the beginning of the age group

81
Table 4.3 Age at first marriage for Male
Percentage of men age 15-64 who were first married by specific exact ages, and median age at first marriage, according to current age, SHDS 2020
Current age
Percentage first married by exact age:Percentage of never married
Number of respondents
Median age at first
marriage15 18 20 22 25
15-19 97.7 1,560 a
20-24 0.4 6.1 12.8 0.0 0.0 74.4 831 a
25-29 0.3 9.0 18.4 30.5 52.0 34.3 680 22
30-34 1.2 9.0 18.2 32.4 53.9 10.6 725 23
35-39 0.7 8.7 18.6 36.4 50.1 4.4 554 24
40-44 0.7 8.0 15.4 34.6 44.1 3.2 665 25
45-49 0.7 6.4 15.3 33.5 42.9 4.2 308 25
50-54 0.1 7.5 15.1 33.0 41.0 1.6 434 25
55-59 6.7 14.8 36.8 46.3 1.9 175 25
60-64 0.3 11.8 16.6 44.8 53.7 3.3 304 22
20-49 0.6 7.9 16.4 26.0 38.5 26.2 3,764 23
25-49 0.7 8.4 17.4 33.4 49.3 12.6 2,933 a
20-64 0.6 8.1 16.2 28.3 40.0 21.5 4,677 a
25-64 0.6 8.5 16.9 34.4 48.6 10.1 3,846 24
Note: The age at first marriage is defined as the age at which the respondent got married to her first spousen/a = Not applicable due to censoringa = Omitted because less than 50 percent of the women got married for the first time before reaching the beginning of the age group

Puntland Report 2020Somali Health and Demographic Survey (SDHS)82
Table 4.4 Current Fertility
Age-specific and total fertility rate, the general fertility rate, and the crudde birth rate for the three years preceding the survey, by Residence SHDS 2020
Age group Residence
Urban Rural Nomadic Total
15-19 78 107 145 107
20-24 302 316 343 320
25-29 320 315 340 326
30-34 299 328 281 303
35-39 177 174 198 183
40-44 59 93 117 87
45-49 9 19 72 35
TFR (15-49) 6.2 6.8 7.5 6.8
GFR 203 230 245 225
CBR 42.9 43.2 44.0 43.7
Notes: Age-specific fertility rates are per 1,000 women.Rates for age group 45-49 may be slightly biased due to truncation.Rates are for the period 1-36 months prior to interview.TFR: Total fertility rate expressed per womenGFR: General fertility rate expressed per 1,000 women aged 15-49CBR: Crude birth rate expressed per 1,000 population

83
Table 4.5 Fertility by background characteristics
Total fertility rate for the three years preceding the survey, percentage of women age 15-49 currently pregnant, and mean number of children ever born to women age 40-49 years, by background characteristics, SHDS, 2020
Background characteristics Total Fertility RatePercentage women age 15-49
currently pregnantMean number of children ever
born to women age 40-49
Type of residence
Urban 6.2 13.9 6.9
Rural 6.8 15.2 7.1
Nomadic 7.5 17.4 9.0
Region
Sool 7.9 17.7 8.6
Sanaag 7.7 15.0 7.6
Bari 6.1 13.2 6.8
Nugaal 7.0 15.2 7.4
Mudug 6.3 16.7 7.3
Education
No Education 7.1 14.6 8.4
Primary 6.8 17.6 9.9
Secondary 4.2 28.6 6.9
Higher 3.3 16.3 8.6
Wealth quintile
Lowest 7.3 17.9 7.3
Second 8.0 17.1 8.6
Middle 6.8 13.1 7.0
Fourth 7.0 14.5 7.1
Highest 5.4 14.7 7.4
Total 6.8 15.5 7.4
Note: Total fertility rates are for the period 1-36 months preceding the interview

Puntland Report 2020Somali Health and Demographic Survey (SDHS)84
Perc
ent d
istr
ibut
ion
of a
ll w
omen
and
cur
rent
ly m
arri
ed w
omen
age
15
- 49
by n
umbe
r of
chi
ldre
n ev
er b
orn,
mea
n nu
mbe
r of
chi
ldre
n ev
er b
orn
and
mea
n nu
mbe
r of
livi
ng c
hild
ren,
ac
cord
ing
to a
ge g
roup
, SH
DS
2020
Age
Num
ber
of c
hild
ren
ever
bor
nTo
tal
Num
ber
of
wom
en
Mea
n nu
mbe
r of
ch
ildre
n ev
er
born
Mea
n nu
mbe
r of
liv
ing
child
ren
01
23
45
67
89
10+
All
ever
mar
ried
w
omen
15-1
947
.433
.215
.24
.30
.00
.00
.00
.00
.0
0.0
0.0
100
300
0.8
0.8
20-2
417
.619
.627
.122
.410
.62.
70
.00
.00
.0 0
.00
.010
063
32
1.9
25-2
97.
87.
113
.620
.920
.812
.58.
26.
51.6
0.6
0.5
100
889
3.6
3.4
30-3
45.
83.
49.
214
.114
.316
.413
.59.
97.
22.
63.
610
071
74
.74
.5
35-3
95.
02.
45.
89.
711
.214
.211
.815
.09.
17.
97.
910
061
65.
65.
3
40
-44
4.8
1.3
6.6
8.1
7.4
15.8
15.4
11.5
9.8
6.6
12.7
100
339
6.0
5.5
45-
495.
80
.36.
210
.18.
611
.414
.211
.97.
611
.412
.410
018
06.
15.
5
Tota
l11
.59.
012
.914
.912
.611
.18.
77.
74
.63.
13.
910
0 3
,675
4
.03.
8
Cur
rent
ly m
arri
ed
wom
en
15-1
94
6.3
32.5
16.9
4.3
0.0
0.0
0.0
0.0
0.0
0.0
0.0
100
250
0.8
0.8
20-2
416
.918
.226
.724
.411
.42.
40
.00
.00
.00
.00
.010
055
22.
02.
0
25-2
97.
06.
212
.922
.020
.612
.98.
76.
81.
80
.50
.610
079
43.
73.
5
30-3
44
.82.
68.
813
.914
.116
.415
.010
.17.
42.
93.
810
062
64
.94
.7
35-3
94
.22.
05.
39.
410
.714
.311
.815
.69.
28.
88.
610
053
55.
85.
5
40
-44
4.4
0.7
5.7
7.0
7.9
14.7
15.6
12.2
11.5
6.9
13.5
100
276
6.2
5.8
45-
491.
50
.05.
711
.57.
015
.215
.59.
77.
612
.813
.310
012
96.
45.
9
Tota
l10
.58
.312
.615
.512
.811
.29.
17.
84
.83.
34
.110
0 3
,161
4
.13.
9
Tab
le 4
.5
Chi
ldre
n ev
er b
orn
and
livin
g

85
Percentage of women age 30-49 who are menopausal, by age, SHDS, 2020
Age Percentage Menopausal 1 Number of women
30-34 15.8 734
35-39 17.6 619
40-41 19.5 271
42-43 19.3 59
44-45 31.8 123
46-47 (24.0) 32
48-49 (41.9) 40
Total 18.7 1,878
1 Percentage of women who are not pregnant and not postpartum amenorrheic whose last menstrual period occurred six or more months preceding the survey
Table 4.8 Menopause
Table 4.9 Age at first birth
Percentage of women age 15-49 who gave birth by specific exact ages, percentage who have never given birth, and median age at first birth, according to current age, SHDS 2020
Current age Percentage who gave birth by exact age:Percentage who never given birth
Number of women
Median age at first
birth
15 18 20 22 25
15-19 0.1 n/a n/a n/a n/a 83.5 1,610 a
20-24 0.7 10.0 21.8 n/a n/a 34.3 951 a
25-29 1.2 9.3 21.0 40.3 65.2 9.3 954 22.0
30-34 2.0 9.8 21.1 39.2 67.5 4.6 744 22.0
35-39 0.5 5.2 15.2 30.7 60.5 0.8 618 23.0
40-44 1.5 7.0 12.5 26.5 51.2 2.0 344 24.0
45-49 0.5 5.4 9.3 19.0 34.1 2.0 205 26.0
20-49 1.1 8.5 18.9 26.1 45.7 12.2 3,816 a
25-49 1.2 8.0 17.9 34.8 60.9 4.9 2,865 23.0
Na = Not applicable due to censoringa = Omitted because less than 50 percent of women had a birth before reaching the beginning of the age group

Puntland Report 2020Somali Health and Demographic Survey (SDHS)86
Percentage of women aged 15-19 who have had a live birth or who are pregnant with their first child, and percentage who have begun childbearing, SHDS 2020
Background characteristics
Percentage of women age 15-19 who:
Number of women Have had a live birth
Are pregnant with first child
Percentage who have begun childbearing
Age group
15-19 9.5 1.9 11.4 1,666
15 0.1 0.9 1.1 460
16 0.6 0.3 1.0 345
17 8.7 2.6 11.3 276
18 17.2 3.3 20.5 351
19 30.4 3.2 33.6 234
Types of residence
Urban 7.1 1.3 8.3 700
Rural 10.7 2.1 12.8 428
Nomadic 11.7 2.6 14.3 538
Region
Sool 12.8 2.3 15.1 202
Sanaag 14.1 0.4 14.5 275
Bari 10.7 1.4 12.2 355
Nugaal 13.7 2.8 16.5 171
Mudug 4.8 2.4 7.3 663
Education
No Education 11.9 2.6 14.5 1,012
Primary 7.2 1.3 8.5 376
Secondary 4.4 0.2 4.6 246
Higher (1.7) (0) (1.7) 32
Wealth quintile
Lowest 12.8 2.9 15.7 352
Second 12.2 2.8 14.9 233
Middle 10.9 1.5 12.4 316
Fourth 6.9 1.8 8.8 347
Highest 6.3 1.0 7.3 418
Total 9.5 1.9 11.4 1,666
Note: Figures in parentheses are based on 25-49 unweighted cases.
Table 4.10 Teenage pregnancy and motherhood

87
Table 4.11 Fertility preferences by number of living children
Percent distribution of currently married women age 15-49 by desire for children, according to number of living children, SHDS 2020
Desire for children
Number of living children 1
Total 15-490 1 2 3 4 5 6+
Have another soon 2 71.5 73.4 66.1 62.6 60.5 61.8 54.5 62.2
Have another later 3 0.1 3.1 2.2 1.9 1.7 1.8 3.3 2.3
Undecided 20.8 13.0 17.6 19.3 21.4 17.0 19.4 18.7
Want no more 0.0 8.0 11.4 13.9 14.6 16.8 19.3 13.8
Declared infecund 7.6 2.5 2.7 2.3 1.8 2.5 3.4 3.1
Total 100.0 100.0 100.0 100.0 100.0 100.0 100.0 100.0
Number of respondents 278 287 399 501 426 380 890 3,161
1 The number of living children includes current pregnancy for women2 Wants next birth within 2 years3 Wants to delay next birth for 2 or more years

Puntland Report 2020Somali Health and Demographic Survey (SDHS)88
Percentage of currently married women age 15-49 who want no more children, by number of living children, according to background characteristics,SHDS 2020
Background characteristics
Number of living children1
Total0 1 2 3 4 5 6+
Types of residence
Urban 0.0 8.7 15.9 16.5 14.5 23.3 19.8 15.9
Rural 0.0 8.4 9.0 14.8 12.3 14.8 20.7 13.8
Nomadic 0.0 7.1 9.5 11.0 16.2 12.9 17.6 12.0
Region
Sool 0.0 3.8 14.7 8.2 11.7 12.1 15.9 11.3
Sanaag 0.0 11.5 8.2 14.2 15.3 16.5 22.1 14.4
Bari 0.0 9.3 26.4 21.3 15.6 23.3 18.2 17.5
Nugaal 0.0 10.1 6.7 20.5 17.2 16.4 28.5 17.2
Mudug 0.0 6.1 3.4 9.3 14.2 14.7 17.2 10.9
Education
No Education 0.0 8.1 14.1 16.1 16.8 19.2 20.4 15.5
Primary 0.0 7.0 0.0 2.6 5.6 6.1 12.0 6.0
Secondary 0.0 13.4 0.0 5.8 0.0 0.0 36.8 7.8
Higher 0.0 0.0 (26.3) (11.7) (0.0) (0.0) (0.0) (2.6)
Wealth quintile
Lowest 0.0 6.3 11.0 12.2 17.2 12.3 15.2 11.8
Second 0.0 9.9 6.7 18.8 10.3 11.8 19.2 13.1
Middle 0.0 5.5 20.6 20.6 13.4 26.6 22.5 17.9
Fourth 0.0 12.0 10.4 10.4 13.8 16.7 21.2 14.3
Highest 0.0 7.4 9.8 9.5 17.1 17.2 18.7 12.7
Total 0.0 8.0 11.4 13.9 14.6 16.8 19.3 13.8
Note: Women who have been sterilized are considered to want no more children.1 The number of living children includes the current pregnancy.Note: Figures in parentheses are based on 25-49 unweighted cases.
Table 4.12 Desire to limit childbearing: Women

89
Table 4.13 Ideal number of children
Percent distribution of women 15-49 by ideal number of children, and mean ideal number of children for all respondents and for currently married respondents, according to the number of living children, SHDS 2020
Number of living children 1Total
0 1 2 3 4 5 6+
Ideal number of children
1 2.0 1.6 0.0 0.0 0.0 0.0 0.2 0.4
2 3.1 1.9 2.4 1.4 0.5 1.8 0.2 1.4
3 2.9 0.2 1.8 4.1 1.3 0.5 0.9 1.7
4 2.4 3.1 3.5 1.0 2.1 1.3 1.0 1.9
5 8.9 6.9 7.5 7.7 2.9 2.8 2.0 5.1
6+ 80.7 86.3 84.8 85.7 93.3 93.6 95.6 89.6
Total 100.0 100.0 100.0 100.0 100.0 100.0 100.0 100
Number of women
268 280 376 421 361 322 689 2,718
Mean ideal number of children for: 2
All Ever Married women
9.6 9.8 9.9 10.0 10.7 10.7 12.0 10.6
Number of women
268 280 376 421 361 322 689 2718
Mean ideal number of children for currently married women
Currently married women
9.8 9.8 9.7 10.1 10.8 10.8 12.1 10.6
Number of currently married women
209 219 315 374 315 287 620 2339
1 The number of living children includes current pregnancy for women2 Means are calculated excluding respondents who gave non-numeric responses.

Puntland Report 2020Somali Health and Demographic Survey (SDHS)90
Percent distribution of births to women age 15-49 in the five years preceding the survey (including current pregnancies), by planning status of the birth, according to birth order and mother's age at birth, SHDS, 2020
Birth order and mother's age at
birth
Planning status of birthTotal Number of births
Wanted then Wanted later Wanted no more
Birth order
1 69.5 20.2 10.3 100.0 2,433
2 65.7 22.9 11.4 100.0 1,887
3 63.9 24.1 12.0 100.0 978
4+ 60.6 28.7 10.7 100.0 384
Mother's age at birth
<20 64.7 24.3 11.0 100.0 823
20-24 69.7 22.2 8.1 100.0 1,676
25-29 66.5 23.1 10.4 100.0 1,564
30-34 66.1 21.6 12.3 100.0 1,001
35-39 62.4 20.0 17.7 100.0 507
40-44 64.3 16.2 19.5 100.0 101
45-49 * * * 100.0 10
Total 1 66.7 22.3 11.0 100.0 5,682
Note: Figures in asterisks are based on fewer than 25 unweighted cases
Table 4.14 Fertility planning status
Table 4.15 Knowledge of contraceptive methods
Percentage of all women, currently married women 15-49 who have heard of any contraceptive method, by specific method, SHDS, 2020
Method All ever married women Currently married women
Any method 62.0 62.9
Any modern method 61.3 62.1
IUD 16.7 16.6
Injectables 28.5 28.2
Implants 24.5 24.2
pills 33.8 33.4
Male condom 17.9 17.6
Female condom 11.5 11.4
Emergency contraception 13.9 13.9
Standard days method 14.8 14.8
Lactational Amenorrhea (LAM)
52.7 53.5
Other modern method 0.6 0.5
Any traditional method 19.5 19.6
Rythm 13.2 13.1
Withdrawal 16.7 16.6
Traditional method 1.6 1.6
Mean number of methods known by women 15-49
2.5 2.5
Number of respondents 3675 3161

91
Percentage of currently married women aged 15-49 who have heard of at least one contraceptive method and who have heard of at least one modern method, by background characteristics, SHDS 2020
Background characteristic Heard of any method Heard of any modern method Number of women
Age
15-19 48.3 47.9 250
20-24 62.6 61.6 552
25-29 66.4 65.6 794
30-34 63.6 62.8 626
35-39 65.6 65.0 535
40-44 58.5 57.2 276
45-49 66.2 66.2 129
Types of residence
Urban 73.7 73.2 1,056
Rural 64.4 63.9 885
Nomadic 52.5 51.2 1,221
Region
Sool 61.6 61.5 479
Sanaag 60.9 60.0 650
Bari 61.2 61.1 720
Nugaal 66.5 66.2 321
Mudug 64.9 63.2 992
Education
No education 58.7 57.9 2,595
Primary 81.8 81.1 417
Secondary 80.7 79.3 106
Higher (89.0) (89.0) 43
Wealth quintile
Lowest 51.5 50.3 793
Second 60.4 59.9 584
Middle 62.9 62.1 578
Fourth 70.0 69.6 620
Highest 73.3 72.4 587
Total 15-49 62.9 62.1 3,161
Note: Figures in Parentheses are based on 25-49 unweighted cases
Table 4.16 Knowledge of contraceptive methods by background characteristics

Puntland Report 2020Somali Health and Demographic Survey (SDHS)92
Tab
le 4
.17
Cur
rent
use
of c
ontr
acep
tion
by
age
Perc
ent d
istr
ibut
ion
of a
ll w
omen
, cur
rent
ly m
arri
ed w
omen
, and
sex
ually
act
ive
unm
arri
ed w
omen
age
15-
49 b
y co
ntra
cept
ive
met
hod
curr
entl
y us
ed, a
ccor
ding
to a
ge, S
HD
S 20
20
Age
Any
m
etho
d
Any
m
oder
n m
etho
d
Mod
ern
met
hod
Any
tr
adit
iona
l m
etho
d
Trad
itio
nal M
etho
dN
ot
curr
entl
y us
ing
Tota
l
Num
ber
of w
omen
cu
rren
tly
mar
ried
IUD
Inje
ctab
les
Impl
ants
Pills
cond
omLa
ctat
iona
l A
men
orrh
ea
(LA
M)
Rhy
thm
Wit
hdra
wal
15-1
912
.51.
41.
00
.00
.50
.00
.00
.011
.111
.10
.08
7.5
100
.0 2
08
20-2
411
.30
.60
.00
.10
.00
.10
.00
.310
.710
.70
.08
8.7
100
.0 4
46
25-2
99.
61.
30
.00
.20
.50
.60
.00
.18
.38
.30
.090
.410
0.0
64
1
30-3
48
.62.
30
.20
.21.
00
.60
.10
.26.
36.
30
.091
.410
0.0
516
35-3
95.
80
.70
.00
.10
.00
.40
.00
.15.
15.
10
.094
.210
0.0
473
40
-44
2.0
1.6
0.0
0.0
0.8
0.2
0.0
0.6
0.5
0.5
0.0
98.0
100
.0 2
65
45-
490
.00
.00
.00
.00
.00
.00
.00
.00
.00
.00
.010
0.0
100
.0 1
27
Tota
l8
.01.
20
.10
.10
.40
.40
.00
.26.
86.
80
.092
.010
0.0
2,6
75
Not
e: If
mor
e th
an o
ne m
etho
d is
use
d, o
nly
the
mos
t eff
ecti
ve m
etho
d is
con
side
red
in th
is ta
bula
tion
n/a
= N
ot a
pplic
able
LAM
= L
acta
tion
al a
men
orrh
oea
met
hod

93
Perc
ent d
istr
ibut
ion
of c
urre
ntly
mar
ried
wom
en a
ge 1
5-49
by
cont
race
ptiv
e m
etho
d cu
rren
tly
used
, acc
ordi
ng to
bac
kgro
und
char
acte
rist
ics,
SH
DS
2020
Bac
kgro
und
char
acte
rist
icA
ny
met
hod
Any
m
oder
n m
etho
d
Mod
ern
met
hod
Any
tr
adit
iona
l m
etho
d
Trad
itio
nal
met
hod
Not
cu
rren
tly
usin
gTo
tal
Num
ber
of
wom
en
curr
entl
y m
arri
edIU
D In
ject
able
sIm
plan
tsPi
llsco
ndom
Lac
tati
onal
A
men
orrh
ea
(LA
M)
Rhy
thm
Wit
hdra
wal
Num
ber
of
livin
g ch
ildre
n
0*
**
**
**
**
*0
.010
0.0
100
.01
1-2
(8.0
)4
.2)
'(0
.0)
'(0
.0)
'(0
.0)
'(0
.0)
(0.0
)(4
.2)
(3.8
)(3
.8)
0.0
92
.010
0.0
36
3-4
10.5
1.41.4
9.1
9.1
0.0
89
.510
0.0
120
5+7.
91.
20
.10
.10
.40
.30
.00
.26.
76.
70
.0
92.1
100
.025
18
Type
s of
re
side
nce
Urb
an10
.92.
90
.30
.31.
20
.90
.00
.28.
18.
10
.0
89.1
100
.0 9
10
Rura
l8.
70
.90
.00
.10
.00
.20
.10
.47.
87.
80
.0
91.3
100
.0 7
48
Nom
adic
5.0
0.1
0.0
0.0
0.0
0.0
0.0
0.1
4.9
4.9
0.0
95
.010
0.0
1,0
17
Reg
ion
Sool
7.2
0.9
0.0
0.4
0.0
0.1
0.0
0.3
6.3
6.3
0.0
92
.810
0.0
394
Sana
ag6.
40
.80
.00
.30
.00
.20
.00
.25.
65.
60
.0
93.6
100
.055
6
Bari
8.2
1.90
.30
.01.0
0.6
0.0
0.0
6.3
6.3
0.0
91
.810
0.0
624
Nug
aal
10.7
1.90
.40
.00
.70
.00
.20
.68.
98.
90
.0
89.3
100
.027
2
Mud
ug8.
61.1
0.0
0.0
0.4
0.5
0.0
0.2
7.5
7.5
0.0
91
.410
0.0
829
Educ
atio
n
No
educ
atio
n6.
90
.50
.10
.10
.10
.10
.00
.16.
46.
40
.0
93.1
100
.0 2
,222
Prim
ary
14.3
4.6
0.0
0.3
2.4
1.70
.00
.29.
79.
70
.0
85.7
100
.0 3
40
Seco
ndar
y10
.96.
30
.00
.80
.02.
80
.02.
74
.64
.6(0
.0)
89.1
100
.0 7
7
Hig
her
(12.
3)(2
.7)
(2.7
)(0
.0)
(0.0
)(0
.0)
(0.0
)(0
.0)
(9.5
)(9
.5)
0.0
87
.710
0.0
37
Tota
l8
.01.
20
.10
.10
.40
.40
.00
.26.
86.
80
.0
92.0
100
.0 2
,675
Not
e: If
mor
e th
an o
ne m
etho
d is
use
d, o
nly
the
mos
t eff
ecti
ve m
etho
d is
con
side
red
in th
is ta
bula
tion
.LA
M =
Lac
tati
onal
am
enor
rhea
met
hod
Tab
le 4
.18
Cur
rent
use
of c
ontr
acep
tion
by
back
grou
nd c
hara
cter
isti
cs

Puntland Report 2020Somali Health and Demographic Survey (SDHS)94
Percentage of ever married women age 15-49 with correct knowledge of the fertile period during the ovulatory cycle, according to age, SHDS 2020
AgePercentage with correct knowledge of the
fertile periodNumber of ever Married women
15-19 5.9 300
20-24 7.7 633
25-29 7.4 889
30-34 7.0 717
35-39 7.8 616
40-44 6.3 339
45-49 9.0 180
Total 7.3 3,675
Note: Correct knowledge of the fertile period is defined as halfway between two menstrual periods
Table 4.19 Knowledge of fertile period by age

95
Perc
enta
ge o
f cur
rent
ly m
arri
ed w
omen
age
d 15
-49
wit
h un
met
nee
d fo
r bi
rth
spac
ing,
per
cent
age
wit
h m
et n
eed
for
birt
h sp
acin
g, th
e to
tal d
eman
d fo
r bi
rth
spac
ing,
and
the
perc
enta
ge o
f the
dem
and
for
cont
race
ptio
n th
at is
sat
isfie
d, b
y ba
ckgr
ound
cha
ract
eris
tics
, SH
DS
2020
Bac
kgro
und
char
acte
rist
ic
Unm
et n
eed
for
birt
h sp
acin
g
Tota
l
Met
nee
d fo
r bi
rth
spac
ing
(cur
rent
ly u
sing
)To
tal
Tota
l dem
and
for
birt
h sp
acin
g 1
Tota
lPe
rcen
tage
of
dem
and
sati
sfie
d 2
Perc
enta
ge o
f dem
and
sati
sfie
d by
mod
ern
met
hod
Num
ber o
f w
omen
For
spac
ing
For
limit
ing
For
spac
ing
For
limit
ing
For
spac
ing
For
limit
ing
Age 15
-19
30.1
4.7
34.8
0.4
0.8
1.2
30.5
5.5
36.0
3.3
3.3
250
20-2
428
.33.
631
.90
.50
.00
.528
.83.
632
.41.
51.
555
2
25-2
932
.06.
638
.60
.90
.41.
332
.97.
039
.93.
33.
379
4
30-3
430
.19.
739
.81.
80
.11.9
31.9
9.8
41.7
4.5
4.5
626
35-3
926
.512
.338
.80
.10
.50
.626
.612
.839
.41.
51.
553
5
40
-44
21.8
17.0
38.8
0.9
0.6
1.5
22.7
17.6
40
.33.
83.
827
6
45-
4915
.914
.530
.40
.00
.00
.015
.914
.530
.40
.00
.012
9
Res
iden
ce
Urb
an26
.610
.737
.31.
80
.92.
728
.411
.54
0.0
6.7
6.7
1,0
56
Rura
l27
.39.
336
.70
.70
.10
.728
.09.
437
.42.
02.
0 8
85
Nom
adic
30.6
6.6
37.2
0.0
0.1
0.1
30.6
6.7
37.2
0.1
0.1
1,2
21
Reg
ion
Sool
31.7
6.3
38.0
0.6
0.1
0.7
32.3
6.4
38.7
1.8
1.8
479
Sana
ag27
.39.
636
.90
.50
.10
.627
.99.
737
.61.7
1.765
0
Bari
23.0
12.0
35.1
1.10
.81.9
24.1
12.9
37.0
5.2
5.2
720
Nug
aal
34.2
9.2
43.
41.1
0.5
1.635
.39.
74
4.9
3.5
3.5
321
Mud
ug29
.46.
836
.20
.80
.20
.930
.16.
937
.12.
52.
599
2
Educ
atio
n
No
Educ
atio
n28
.010
.037
.90
.20
.30
.528
.210
.338
.51.4
1.4 2
,597
Prim
ary
33.2
2.5
35.8
3.4
0.4
3.7
36.6
2.9
39.5
9.5
9.5
417
Seco
ndar
y22
.04
.426
.44
.50
.04
.526
.54
.431
.014
.614
.6 1
06
Hig
her
(20
.3)
(2.6
)(2
2.9)
(2.4
)(0
.0)
(2.4
)(2
2.7)
(2.6
)(2
5.3)
(9.6
)(9
.6)
42
Wea
lth
quit
ile
Low
est
28.6
6.1
34.7
0.0
0.0
0.0
28.6
6.1
34.7
0.0
0.0
793
Seco
nd29
.48.
337
.70
.10
.10
.229
.58.
437
.90
.50
.5 5
84
Mid
dle
28.7
12.1
40
.80
.61.0
1.629
.413
.14
2.4
3.7
3.7
578
Four
th29
.29.
638
.80
.80
.21.0
30.0
9.8
39.8
2.6
2.6
620
Hig
hest
25.8
8.4
34.1
2.7
0.4
3.2
28.5
8.8
37.3
8.5
8.5
587
Tota
l28
.48
.737
.10
.80
.31.
129
.19.
038
.22.
92.
9 3
,161
Not
e: N
umbe
rs in
this
tabl
e co
rres
pond
to th
e re
vise
d de
finit
ion
of u
nmet
nee
d de
scri
bed
in B
radl
ey e
t al.,
20
12.
1Tot
al d
eman
d is
the
sum
of u
nmet
nee
d an
d m
et n
eed.
2Pe
rcen
tage
of d
eman
d sa
tisf
ied
is m
et n
eed
divi
ded
by to
tal d
eman
d.3
Mod
ern
met
hods
incl
ude
pill,
IUD
, inj
ecta
bles
, im
plan
ts, m
ale
cond
om, f
emal
e co
ndom
, and
lact
atio
nal a
men
orrh
ea m
etho
d (L
AM
).N
ote:
Fig
ures
in p
aren
thes
es a
re b
ased
on
25-4
9 un
wei
ghte
d ca
ses.
An
aste
risk
indi
cate
s th
at a
figu
re is
bas
ed o
n fe
wer
than
25
unw
eigh
ted
case
s an
d ha
s be
en s
uppr
esse
d.
Tab
le 4
.20
N
eed
and
dem
and
for
birt
h sp
acin
g am
ong
curr
entl
y m
arri
ed w
omen

Puntland Report 2020Somali Health and Demographic Survey (SDHS)96
Percentage of ever married women age 15-49 who heard or saw a birth spacing message on radio, on television, in a newspaper or magazine, or on a mobile phone in the past few months, according to background characteristics, SHDS 2020
Background characteristic
Radio Television NewspaperAny of these three media
source
All of these three media
source
None of these three media
sources
Number of women
Types of residence
Urban 21.1 18.0 10.3 29.4 5.9 70.6 1,271
Rural 14.2 8.7 5.4 17.0 3.7 83.0 1,074
Nomadic 3.8 0.5 0.6 4.3 0.2 95.7 1,330
Region
Sool 4.4 4.5 2.0 7.7 0.8 92.3 527
Sanaag 7.5 6.6 2.0 11.8 1.0 88.2 720
Bari 17.0 10.5 7.7 22.5 3.1 77.5 870
Nugaal 27.1 19.0 11.2 29.4 9.8 70.6 372
Mudug 12.2 8.2 5.4 15.4 3.6 84.6 1,186
Education
No Education
9.7 5.5 3.1 12.6 1.6 87.4 3,011
Primary 22.5 19.2 10.2 29.6 5.9 70.4 481
Secondary 34.6 35.9 26.3 45.8 20.7 54.2 135
Higher (50.2) (45.8) (43.0) (62.2) (26.1) (37.8) 49
Wealth quintile
Lowest 3.4 1.1 1.1 4.2 0.5 95.8 859
Second 6.5 1.4 1.3 7.1 0.7 92.9 666
Middle 12.2 6.0 4.5 14.9 1.9 85.1 685
Fourth 17.2 12.9 7.5 23.4 4.5 76.6 748
Highest 25.9 24.1 13.0 35.3 8.4 64.7 717
Total 15-49 12.8 9.0 5.4 16.7 3.2 83.3 3,675
Note: Figures in parentheses are based on 20-49 unweighted cases
Table 4.21 Exposure to Birth Spacing messages

97

Maternal and Newborn Health
CHAPTER 5

©A
U U
N I
ST P
HO
TO
/ T
OB
IN J
ON
ES.
Key Findings

Puntland Report 2020Somali Health and Demographic Survey (SDHS)100
The survey results provide an opportunity to identify critical issues affecting the health status of women and children in Puntland. This information will assist policy makers, planners and other collaborators in the health sector to formulate appropriate strategies and interventions to improve maternal, new-born and child health services across Somalia.
Antenatal CareThe health care that a mother receives during pregnancy and at the time of delivery, known as antenatal care, is important for the survival and well-being of both the mother and new-born child. The ANC from nurse or trained personnel is vital in monitoring a pregnancy and reducing the risks related to morbidity and mortality for the mother and child during pregnancy and delivery.
A well-designed and well-implemented ANC programme facilitates the timely detection and treatment of problems during pregnancy. In developing countries in particular, the prevention and treatment of malaria in pregnant women, management of anaemia during pregnancy, and treatment of sexually transmitted infections (STIs) can significantly improve foetal outcomes and improve maternal health. During the antenatal period, interventions such as the administering of tetanus immunization can be life-saving for both the mother and child.
During the 2020 SHDS, women who had given birth in the five years preceding the survey were asked about the type of ANC provider they had used; the number of ANC visits they had made; the stage of pregnancy they were in at the time of their first visit; and services and information provided during ANC. For women with two or more live births during the five-year period, data on ANC refers to the most recent birth only.
5Chapter 5
Maternal and Newborn Health This chapter presents crucial findings on maternal health, including information on the provision of antenatal care (ANC), delivery, and postnatal care (PNC). These services support key strategic and health policy objectives in Somalia, particularly the reduction of maternal morbidity and mortality.

101
Antenatal Care CoverageTable 5.1 shows the percent distribution of women who had a birth in the five years prior to the survey, by ANC provider during pregnancy. Overall, 73 percent of women in Puntland did not attend ANC during their most recent pregnancy in the five years prior to the survey. Among those who attended ANC, 26 percent received ANC from trained personnel (doctors/clinical officers, nurses, midwives and auxiliary midwives) at least once. Ten percent of women received ANC from doctors/clinical officers, and 16 percent received care from midwives, nurses or auxiliary midwives.
The percentage of mothers receiving ANC from a skilled provider, increases from 25 percent for those below 20 years to 27 percent for those aged 20-34 and then decreases to 21 percent for those aged 35-49.
Figure 5.1 presents ANC received from skilled personnel by type of residence. Forty-four percent of women living in urban areas received ANC from skilled personnel, compared to rural and nomadic areas at 28 and 8 percent respectively.
Among the regions, women who received ANC from skilled personnel were highest in Nugaal at 40 percent and lowest in Mudug and Sool at 23 and 22 percent respectively.
Education levels and the wealth status of women were strongly associated with their use of ANC from a skilled health care provider. Seventy-two percent of women with higher education received antenatal care from a skilled provider, compared to 20 percent of women with no education. Forty-nine percent of women from wealthier households received ANC from a skilled provider compared to 7 percent of women from poorer households.
Number and Timing of Antenatal Visits
Antenatal care is more beneficial in preventing adverse outcomes of pregnancy when it is sought early in the pregnancy and is continued throughout pregnancy. Health professionals recommend that the first antenatal visit should occur within the first three months of the pregnancy and that visits continue on a monthly basis through week 28 of pregnancy, and then every two weeks up to week 36 (or until birth). If the first antenatal visit is made during the third month of pregnancy and then visits occur as regularly as recommended, a total of at least 12 to 13 antenatal visits should have been made.
Table 5.2 presents data on the percent distribution of women aged 15-49 who had a live birth in the five years preceding the survey by number of antenatal care (ANC) visits for the most recent live birth by background characteristics. Among women who had a live
Figure 5.1 Skilled assistance received during ANC by the type of residence
Figure 5.2 Source of antenatal care
Percentage receiving antenatal care from skilled provider the type of residence
Percent distribution of mothers who had children in the five years before the survey, by source of antenatal care received during pregnancy
27.7
7.5
Urban Rural Nomadic
43.7
No ANC73.2
Doctor/ClinicalOfficer
10.0
Nurse/AuxilliaryMidwife/Midwife
15.6
TBA/other/relative1.1

Puntland Report 2020Somali Health and Demographic Survey (SDHS)102
birth in the five years preceding the survey. Seventy-three percent had made no visits in their most recent pregnancy in the five years preceding the survey Twelve percent of women residing in the urban areas had made four or more ANC visits compared to women from rural and nomadic areas at 6 and 1 percent respectively.
Twenty nine percent of women make their first antenatal care visit before the fourth month of pregnancy. Urban women have a larger percentage of women who delay ANC to the last trimester—4 percent made their first ANC visit in or after the eighth month, as compared to 3 and 1 percent among women in rural and nomadic areas respectively. The median length of pregnancy at the first antenatal care visit is 5 months.
Components of Antenatal Care
The content of antenatal care is an essential component of the quality of maternal health services being delivered. In addition to receiving basic care, every pregnant woman should be monitored for complications. Ensuring that pregnant women receive information and undergo screening for complications should be a routine part of all antenatal care visits. To assess antenatal care services, respondents were asked whether they had been advised of complications or received certain screening tests during at least one of the antenatal care visits.
Table 5.3 presents information on the content of antenatal services, including the percentages of women who took iron supplements, took drugs for intestinal parasites, were informed of the signs of pregnancy complications, and received selected routine services during antenatal care visits for their most recent birth in the five years preceding the survey.
Overall, 9 percent of women took iron tablets during the pregnancy of their last birth while only 1 percent of women took drugs to treat intestinal worms. Among other antenatal care services, 87 percent of women who received antenatal care had their blood pressure measured, 63 percent had a urine sample taken, and 67 percent had a blood sample taken.
Women in urban households are more likely to receive ANC component or services compared to those in other population domains. Urban women are more likely to take iron supplements at 16 percent compared to rural and nomadic women at 10 and 3 percent respectively. Regionally, the percentage of women who took iron tablets was highest in Nugaal at 15 percent and lowest in Sool at 6 percent (Figure 5.4).
The proportion of women who took iron supplements increases steadily with an increase in both education and wealth quintile. Twenty-eight percent of women with higher education took iron
Figure 5.3 ANC visits made by pregnant women
Percent distribution of women aged 15-49 who had a live birth in the five years preceding the survey, and attended antenatal care (ANC) by number of anc visits for the most recent live birth
15.7
None73.3
2-314.8
4+6.0
Don't know/missing
0.3
Figure 5.4 Iron tablets by the type of residence
Among women with a live birth in the past five years, the percentage who during the pregnancy for their last birth
10.4
2.6
Urban Rural Nomadic
16.2

103
supplements compared to 8 percent of those with no education. Women from richer households are more likely to take iron tablets at 17 percent compared to women from poorer households at 3 percent.
Tetanus Toxoid
Tetanus toxoid injections are given during pregnancy to prevent neonatal tetanus, a leading cause of early infant death in many developing countries, often attributed to poor hygiene during delivery. For full protection of her newborn baby, a pregnant woman should receive at least two injections of the vaccine during pregnancy. If a woman has been vaccinated during a previous pregnancy, she may only require one or no doses for the next pregnancy. Five doses are considered to provide protection for a lifetime.
Table 5.4 presents the percentage of women aged 15-49 with a live birth in the five years preceding the survey who received two or more tetanus toxoid injections during their most recent pregnancy and the percentage whose last birth was protected against neonatal tetanus.
Results show that very few pregnant women get vaccinated against tetanus in Puntland, despite the need for vaccination. Overall, 13 percent of women received two or more tetanus toxoid injections during the pregnancy of their last live birth and 22 percent of births were protected against neonatal tetanus.
Twenty-four percent of women in urban areas got tetanus injections and 38 percent were protected against neonatal tetanus, while 1 percent of women in nomadic areas got tetanus injections and 3 percent were protected against neonatal tetanus.
Regionally, women in Nugaal had the highest of proportion of who got tetanus injections at 26 percent and highest protection against neonatal tetanus at 36 percent whereas women in Sool had the lowest proportion of those who got tetanus injections at 6 percent and lowest protection against neonatal tetanus at14 percent (Figure 5.5).
The proportion of births protected against tetanus increases with the mothers educational level: 33 percent of mothers with higher education have births protected against neonatal tetanus, compared to 10 percent of mothers with no education. The proportion of mothers receiving tetanus vaccinations increases with an increase in level of wealth; less than one percent for the lowest wealth quintile and 24 percent for the highest wealth quintile.
Figure 5.5 Iron tablets by the type of residence
Among women with a live birth in the past five years, the percentage who during the pregnancy for their last birth
5.99.0
17.1
25.8
12.014.1
18.0
27.7
35.7
19.6
Sool Sanaag Bari Nugaal Mudug
Percentage receiving two or more injections during last pregnancy
Percentage whose last live birth was protected against neonatal tetanus

Puntland Report 2020Somali Health and Demographic Survey (SDHS)104
Assistance During Delivery
To reduce maternal and neonatal morbidity and mortality, there is a need for every child to be delivered with the assistance of trained skilled birth attendant. Table 5.5 shows the percent distribution of births in the five years preceding the survey by the type of medical assistants available at the time of delivery, births attended by a skilled health provider, and births delivered by caesarean section (C-section), according to background characteristics.
Overall, 33 percent of births in Puntland were delivered with the assistance of a skilled health professional, which includes a doctor/clinical officer, nurse, midwife or auxiliary midwife. Over half (56 percent) of births were delivered with the assistance of a traditional birth attendant (TBA) and 2 percent were delivered through C-section (Figure 5.7).
Analysis by age shows that mothers aged 20-34 years are more likely to be assisted by skilled birth attendants at 34 percent than those under 20 years and those aged 35-49 at 30 percent each. ANC attendance influences if a woman will seek skilled attendance during delivery. Eighty percent of women who made four or more ANC visits, were delivered by a skilled birth attendant compared to those who made 1-3 visits at 60 percent and those who did not make any ANC visits at 27 percent.
Among the births there were delivered outside a health facility, 18 percent were delivered by a skilled birth attendant.
Among the places of residence and regions, the percentage of women assisted by skilled personnel is higher in the urban areas at 61 percent and lower in the rural and nomadic areas at 32 and 8 percent respectively. The percentage of women assisted by skilled personnel is highest in Bari at 47 percent and lowest in Sool at 18 percent.
As expected, mothers’ education levels impact on type of delivery care they receive. Mothers with no education and mothers from poorest households are less likely to be assisted by skilled personnel at 27 and 9 percent respectively compared to mothers with higher education and those from richest households at 75 and 66 percent respectively.
Place of Delivery
Delivery within a health facility is key in reducing health risks to both the mother and baby. Proper medical attention and hygienic conditions during delivery reduce the risks of complications and infection that can cause mortality in either the mother or baby.
Figure 5.6 Assistance during delivery
Figure 5.7 Place of delivery
Percent distribution of live births in the five years preceding the survey by person providing assistance during delivery
Percent distribution of live births in the five years preceding the survey by place of delivery
No one3.0
Skilled Provider32.6
Relative/other8.1
Traditionalbirth attendant
56.3
Health Facility18.7
Home81.1
Other0.2

105
Table 5.6 shows the percent distribution of live births in the five years preceding the survey by place of delivery and percentage delivered in a health facility according to background characteristics in Puntland. According to the findings, 16 percent of births in the five years preceding the survey were delivered in a public sector, compared to only 2 percent in a private sectors and 81 percent at home (Figure 5.9).
Among the types of residence, 37 percent of births in urban areas were delivered in a health facility compared to rural and nomadic areas at 16 and 4 percent respectively.
Bari and Nugaal regions have the largest proportion of women who delivered at a health facility at 24 percent each while Sanaag has the least proportion at 10 percent.
Education and wealth have an impact on the uptake of delivery services at health facilities. Sixty-three percent of those with higher education deliver at health facilities, compared to13 percent of those with no education. Similarly, 43 percent of women from the wealthiest households deliver in health facilities, compared to 4 percent of women from the poorest households.
Postnatal Care and Practices Generally, a large number of maternal and neonatal deaths occur during the first 48 hours after delivery. To address this, safe motherhood programmes have increased their emphasis on the importance of postnatal care, encouraging that all women receive a health check-up within two days of delivery. To assess the extent of use of postnatal care in Puntland, respondents who had given birth in the five years preceding the survey were asked whether they had received a health check after the delivery of their last birth. Table 5.7 shows the timing of the first postnatal check-up for women giving birth in the two years preceding the survey. The findings show that only10 percent of mothers had a postnatal check-up within the first four hours after delivery. Eighty-nine percent of the mothers did not receive any postnatal check-up after child birth.
For those who received care, 9 percent received it within the l first four hours of delivery. Women are more likely to seek postnatal care for their first births compared to subsequent births. Further, 44 percent of women who gave birth in a health facility had a postnatal check-up within the first two days after birth.
Urban women were more likely to receive postnatal care within the first two days after birth at 21 percent compared to those in rural and nomadic areas at 7 and 2 percent respectively. Among the regions, percentage of mothers who received postnatal check-up within the first two days after child birth was highest in Nugaal at
Figure 5.8 Timing of first postnatal check-up for the mothers by Place of residence and Regions
Percentage of women with a postnatal checkup in the first two days after birth
Typ
es o
f r
esid
ence
Regi
on
20.8
6.9
2.2
21.5
10.0
9.9
7.8
6.1
Urban
Rural
Nomadic
Nugaal
Mudug
Sool
Bari
Sanaag

Puntland Report 2020Somali Health and Demographic Survey (SDHS)106
22 percent and lowest in Sanaag at 6 percent (Figure 5.10).
Additionally, women from wealthier households were more likely to receive postnatal care within two days of delivery at 25 percent compared to women from poorer households at 2 percent.
Table 5.8 shows the percent distribution of last births in the two years preceding the survey by time after birth of first postnatal check-up, and births with a postnatal check-up in the first two days after birth, according to background characteristics. Overall, 91 percent of new-borns received no postnatal care. There are no marked variations in uptake of postnatal care services within the first two days of birth, by mother’s age.
Among the new-borns delivered in a health facility, 41 percent had their first postnatal check-up within two days of birth.
New-borns born to urban women are more likely to receive postnatal check-up within the first 2 days of birth at 21 percent than those born to rural and nomadic women at 5 and 2 percent respectively.
Among the regions, Nugaal had the highest percentage of new-borns who had their first postnatal check-up within two days after birth at 23 percent compared to Sanaag with the lowest proportion at 5 percent.
Postnatal checks within the first two days of birth increases with an increase in mother’s level of education 7 percent among mothers with no education and 30 percent among mothers with secondary education.
The wealth status of the household, had an influence on new-borns postnatal check-up. New-borns from wealthier households were more likely to receive postnatal check-up within two days after birth at 23 percent compared to those from poorer households at 2 percent.
Obstetric FistulaObstetric fistula is a medical condition consisting of an abnormal opening between the vagina and bladder or between the vagina and rectum. A woman with fistula experiences an uncontrollable leakage of urine and/or feces from her vagina. Although largely eradicated in the developed world due to improved obstetric care, fistula continues to have devastating effects on the lives of many women in Somalia. Vaginal fistula usually results from prolonged obstructed labor (Peterman, 2008).
In SHDS 2020, ever-married women were asked whether they had heard of a medical condition in which women experience constant

107
leakage of stool or urine from their vagina that usually occurs after a difficult childbirth but may occur after sexual assault or after pelvic surgery.
Table 5.9 shows percentage of ever-married women age 15-49 who have heard of obstetric fistula and percentage who have experienced obstetric fistula. Overall 53 percent of ever-married women had heard of the problem, but only 3 percent of the women reported they had experienced symptoms consistent with fistula. Obstetric fistula is highly stigmatized and respondents may choose not to report such a “socially undesirable” condition. Consequently, the occurrence of fistula may be underreported in the SHDS 2020, and the actual prevalence may be much higher than 3 percent of married women, constituting a severe threat to maternal health. Thus, the SHDS 2020 findings should be interpreted with caution.
Among the ever-married women, women aged 15-19 have the least proportion of those that had heard of obstetric fistula at 39 percent compared to ever married women aged 45-49 at 59. Experience of obstetric fistula is also highest among older women at 6 percent compared to less than one percent reported among those of age 15-19. Figure 5.11 shows that urban women were more likely to experience symptoms consistent with a fistula at 4 percent, compared to women in rural and nomadic at 3 percent each. Among the regions, Bari had the highest percentage of women who had reported they had experienced symptoms consistent with obstetric fistula at 5 percent and Sool had the lowest percentage at 2 percent.
The table 5.9 shows that women’s awareness of fistula is not related to their level of education of wealth status.
Women who reported experiencing symptoms consistent with fistula were asked whether the problem started after a natural delivery, after still birth or in some other way. As shown in Table 5.10, 39 percent of women said the leakage started after a delivery, 23 percent of the women said the leakage started after still birth and 38 percent said it came in some other way.
Women were also asked if they sought treatment for the fistula. As shown in Table 5.11, 65 percent of ever-married women who have experienced fistula did not seek treatment, 24 percent of the women sought assistance from Doctor/Clinical officer while 8 percent went to a nurse or midwife for treatment.
Problems in Accessing Health Care The SHDS 2020 included a series of questions designed to obtain information on the problem’s women face in obtaining health care services for themselves. This information is particularly important
Figure 5.9 Obstetric fistula experience by geographical location
Percentage of ever-married women aged 15-49 who have experienced obstetric fistula
2.7
2.9
4.2
2.0
2.7
2.7
4.2
4.9
Rural
Nomadic
Urban
Sool
Sanaag
Mudug
Nugaal
Bari
Typ
es o
f r
esid
ence
Regi
on

Puntland Report 2020Somali Health and Demographic Survey (SDHS)108
in understanding and addressing the barriers women may face in seeking care during pregnancy and, particularly, during child delivery. To obtain this information, women aged 15-49 were asked whether each of the following factors would be a big problem or not for them in obtaining health services: getting permission to go facilities, getting money for treatment, the distance to the health facility, and not wanting to go alone. Table 5.9 shows the percentages of respondents who consider the individual factors to be a big problem, and the percentages reporting at least one of the specified factors to be a big challenge, according to background characteristics.
Overall, 72 percent of women face at least one problem accessing health care. The majority at 63 percent perceived lack of money as a barrier to their access to health services, 58 percent cited the distance to a health facility as a challenge, while 42 percent mentioned not wanting to go alone as a deterrent. Thirty-five percent of all women cited obtaining permission from the husband as a big problem.
The employment status over the past 12 months preceding the survey, had an influence on the women’s access to health services. Women who were employed for cash were least likely to have at least one problem accessing health care at 65 percent compared to the unemployed women at 73 percent and those employed but not for cash at 70 percent.
Figure 5.12 shows that nomadic and rural women are more likely to have r at least one problem accessing health care at 83 and 71 percent respectively, compared to women from urban areas at 61 percent.
Among the regions, women in Sanaag were more likely to have at least one problem in accessing health care at 80 percent compared to women in Nugaal at 60 percent.
The probability of women having at least one problem accessing health care decreases with increasing level of education; 73 percent of women with no education are likely to encounter at least one problem accessing health care compared to60 percent of those with secondary level of education. Women from wealthier households are less likely to encounter at least one problem accessing health care at 57 percent compared to women from poorer households at 89 percent (Figure 5.13).
Figure 5.10 Problems in accessing health care by geographical locations
Figure 5.11 Problems in accessing health care by Background Characteristics
Percentage of women age 15-49 who reported that they have At least one problem accessing health care
Percentage of women age 15-49 who reported that they have At least one problem accessing health care
60.2
64.7
71.0
76.5
79.5
61.3
71.2
82.5
Nugaal
Bari
Sool
Mudug
Sanaag
Urban
Rural
Nomadic
Regi
ons
Resi
denc
e
88.6
73.5
67.4
69.2
57.4
38.0
60.1
69.0
73.4
Lowest
Second
Middle
Fourth
Highest
Higher
Secondary
Primary
No Education
Wea
lth
Educ
atio
n

109

Puntland Report 2020Somali Health and Demographic Survey (SDHS)110
Percent distribution of ever married women age 15-49 who had a live birth in the 5 years preceding the survey by antenatal care (ANC) provider during SHDS 2020
Background characteristics
Person providing assistance during ANC
Total
Skilled assistance
during ANC
Number of women
Doctor/Clinical Officer
Nurse/Auxilliary Midwife/Midwife
TBA/other/relative
No ANC
Mother’s age at birth
<20 10.9 14.2 0.9 74.0 100.0 25.1 560
20-34 9.8 16.7 1.3 72.2 100.0 26.5 1,847
35-49 9.4 11.4 0.7 78.4 100.0 20.9 288
Birth Order
1 10.0 15.6 1.2 73.3 100.0 25.6 2,692
2-3 * * * * * 2
6+ * * * * 2
Type of residence
Urban 15.3 28.4 1.1 55.1 100.0 43.7 920
Rural 11.0 16.6 1.3 71.1 100.0 27.7 765
Nomadic 4.3 3.1 1.1 91.5 100.0 7.5 1,010
Region
Sool 7.1 14.9 1.1 76.9 100.0 22.0 421
Sanaag 6.3 15.7 1.1 76.7 100.0 22.1 544
Bari 9.9 19.3 1.0 69.9 100.0 29.1 593
Nugaal 15.8 24.3 0.8 59.1 100.0 40.1 275
Mudug 11.9 10.6 1.4 76.1 100.0 22.5 863
Education
No education 7.2 12.4 1.1 79.3 100.0 19.6 2,191
Primary 18.5 30.5 2.0 49.0 100.0 49.0 374
Secondary 27.4 26.4 0.0 46.1 100.0 53.9 97
Higher (46.1) (25.8) 0.0 (28.1) 100.0 (71.9) 33
Wealth quintile
Lowest 3.9 3.9 0.7 91.6 100.0 7.7 650
Second 5.1 8.3 1.2 85.4 100.0 13.4 503
Middle 6.7 16.3 0.8 76.0 100.0 23.0 499
Fourth 12.2 26.8 1.6 59.4 100.0 39.0 551
Highest 23.9 25.3 1.5 49.3 100.0 49.2 492
Total 10.0 15.6 1.1 73.2 100.0 25.6 2,695
Table 5.1 Antenatal Care

111
Table 5.2 Number of antenatal care visits and timing of first visit
Percent distribution of women age 15-49 who had a live birth in the five years preceding the survey by number of antenatal care (ANC) visits for the most recent live birth, and by the timing of the first visit, and among women with ANC, median months pregnant at first visit, according to residence, SHDS 2020
Number and timing of ANC visits
ResidenceTotal
Urban Rural Nomadic
None 55.1 71.1 91.5 73.3
1 6.6 6.0 4.6 5.7
2-3 26.1 17.0 2.9 14.8
4+ 12.2 5.7 0.6 6.0
Don't know/missing 0.1 0.3 0.5 0.3
Total 100.0 100.0 100.0 100.0
<4 16.0 10.2 2.9 29.1
4-5 15.5 9.1 1.7 26.3
6-7 9.6 6.2 2.0 17.8
8+ 3.6 2.8 1.4 8.2
Don't know/missing 0.2 0.6 0.4 1.2
Total 100.0 100.0 100.0 100
Number of women 920 765 1,010 740
Median months pregnant at first visit (for those with ANC
5.0 5.0 5.0 5.0
Nomber of women with ANC
414 221 86 740

Puntland Report 2020Somali Health and Demographic Survey (SDHS)112
Among women age 15-49 with a live birth in the five years preceding the survey, the percentage who took iron tablets or syrup and drugs for intestinal parasites during the pregnancy of the most recent birth, and among women receiving antenatal care (ANC) for the most recent live birth in the five years preceding the survey, the percentage receiving specific antenatal services, according to background characteristics, SHDS 2020
Background characteristics
Among women with a live birth in the past five years, the
percentage who during the pregnancy for their last birth:
Number of women with a live birth in the past five
years
Among women who received ANC for their most recent birth in the past 5 years, the
percentage with the selected services:
Number of
women with
ANC for their most
recent birth
Took iron tablets or
syrup
Took intestinal parasite
drugs
Blood pressure
measured
Urine sample taken
Blood sample taken
Mother’s age at birth
<20 14.1 0.9 781 85.8 58.9 60.6 146
20-34 10.1 0.8 3,643 89.1 64.5 70.1 513
35-49 4.0 0.3 517 76.4 61.3 58.0 62
Birth order
1 22.2 1.7 2,507 87.3 63.0 67.0 719
2-3 * * 2,334 * * * 2
4-5 0.0 0.0 97 0.0 0.0 0.0 0
6+ * * 3 * * * 0
Type of residence
Urban 16.2 1.3 1,684 89.6 64.4 70.8 414
Rural 10.4 0.7 1,431 84.6 59.5 59.8 221
Nomadic 2.6 0.2 1,826 83.4 65.7 68.3 86
Region
Sool 5.8 0.2 782 93.9 60.2 58.0 97
Sanaag 7.4 0.1 1,014 92.4 49.6 50.2 127
Bari 13.5 1.2 1,039 81.9 54.0 59.4 178
Nugaal 15.4 1.7 495 87.9 69.5 74.7 112
Mudug 8.0 0.8 1,611 85.6 77.0 84.3 207
Education
No Education 7.5 0.6 3,981 84.8 57.8 62.0 454
Primary 16.6 1.0 742 90.2 69.4 72.7 191
Secondary 19.7 0.8 162 94.3 74.0 79.4 52
Higher 27.8 6.0 56 (97.8) (87.3) (91.4) 24
Wealth quintile
Lowest 2.5 0.2 1,174 82.2 58.4 64.4 55
Second 5.6 0.1 936 88.6 60.6 56.8 73
Middle 10.9 1.2 925 84.2 58.8 65.0 120
Fourth 14.1 1.3 1,066 87.9 57.0 65.8 224
Highest 16.5 0.8 840 89.1 72.2 72.9 249
Total 9.4 0.7 4,941 87.3 63.0 67.1 721
Note: An asterisk indicates that a figure is based on fewer than 25 unweighted cases and has been suppressed
Table 5.3 Components of antenatal care

113
Table 5.4 Tetanus toxoid injections
Among mothers age 15-49 with a live birth in the five years preceding the survey, the percentage receiving two or more tetanus toxoid injections (TTI) during the pregnancy for the last live birth and the percentage whose last live birth was protected against neonatal tetanus, according to background characteristics, SHDS 2020
Background characteristicsPercentage receiving two or more injections during last
pregnancy
Percentage whose last live birth was protected against
neonatal tetanus 1
Number of mothers
Mother’s age of birth
<20 9.2 18.3 560
20-34 14.6 23.2 1,847
35-49 9.8 20.1 288
Birth Order
1 11.9 22.2 734
2-3 12.6 21.2 1,662
4-5 17.6 24.4 281
6+ * * 18
Type of residence
Urban 24.4 38.1 920
Rural 15.0 26.6 765
Nomadic 1.0 3.4 1,010
Region
Sool 5.9 14.1 421
Sanaag 9.0 18.0 544
Bari 17.1 27.7 593
Nugaal 25.8 35.7 275
Mudug 12.0 19.6 863
Education
No Education 9.8 16.6 2,191
Primary 26.0 44.9 374
Secondary 26.1 39.8 97
Higher (32.7) (54.8) 33
Wealth quintiles
Lowest 0.7 3.9 650
Second 7.0 12.4 503
Middle 15.5 26.3 499
Fourth 20.7 32.7 551
Highest 23.9 38.6 492
Total 13.0 21.9 2,695 1 Includes mothers with two injections during the pregnancy of her last birth, or two or more injections (the last within 3 years of the last live birth), or three or more injections (the last within 5 years of the last birth), or four or more injections (the last within 10 years of the last live birth), or five or more injections at any time prior to the last birthNote: Figures in parentheses are based on 25-49 unweighted cases.

Puntland Report 2020Somali Health and Demographic Survey (SDHS)114
Perc
ent d
istr
ibut
ion
of li
ve b
irth
s in
the
five
year
s pr
eced
ing
the
surv
ey b
y pe
rson
pro
vidi
ng a
ssis
tanc
e du
ring
del
iver
y, p
erce
ntag
e of
bir
ths
assi
sted
by
a sk
illed
pro
vide
r, an
d th
e pe
rcen
tage
de
liver
ed b
y ca
esar
ian-
sect
ion,
acc
ordi
ng to
bac
kgro
und
char
acte
rist
ics,
SH
DS
2020
Bac
kgro
und
char
acte
rist
ics
Pers
on p
rovi
ding
ass
ista
nce
duri
ng d
eliv
ery
Tota
lPe
rcen
tage
de
liver
ed b
y sk
illed
pro
vide
r 1
Perc
enta
ge
deliv
ered
by
C-s
ecti
on
Num
ber
of
birt
hD
octo
r
Nur
se/
Aux
iliar
y M
idw
ife/
Mid
wif
e
Trad
itio
nal b
irth
at
tend
ant
Rel
ativ
e/ot
her
No
one
Mot
her’
s ag
e of
bir
th
<20
6.2
23.7
56.6
10.1
3.4
100
.029
.91.
9 8
23
20-3
47.
026
.756
.27.
62.
610
0.0
33.7
2.0
4,2
41
35-4
95.
823
.757
.18
.64
.810
0.0
29.6
0.4
699
Bir
th o
rder
17.
926
.055
.28
.22.
710
0.0
33.9
2.4
2,5
03
2-3
6.1
25.8
56.5
8.3
3.2
100
.031
.91.
3 2
,875
4-5
3.6
27.2
60.6
5.7
2.9
100
.030
.71.
2 3
60
6+(7
.8)
(12.
1)(8
0.1
)(0
.0)
(0.0
)10
0.0
19.9
7.8
26
Ant
enat
al c
are
visi
ts
Non
e6.
819
.861
.09.
13.
410
0.0
26.6
1.4
1,9
74
2-3
12.7
47.
636
.42.
31.
010
0.0
60.4
4.8
551
4+
13.1
66.8
18.3
1.9
100
.079
.94
.2 1
61
Don
't kn
ow/m
issi
ng*
**
**
100
.018
.60
.0 8
Plac
e of
del
iver
y
Hea
lth
faci
lity
22.5
72.7
3.9
0.3
0.6
100
.095
.29.
5 1
,076
Else
whe
re3.
115
.268
.49.
93.
510
0.0
18.3
0.0
4,6
87
Plac
e of
res
iden
ce
Urb
an13
.24
7.6
35.2
2.7
1.4
100
.060
.83.
1 1
,958
Rura
l7.
025
.161
.93.
92.
110
0.0
32.1
2.4
1,6
14
Nom
adic
0.8
7.1
71.1
15.9
5.1
100
.07.
90
.1 2
,191
Tab
le 5
.5
Ass
ista
nce
duri
ng d
eliv
ery

115
Tab
le 5
.5
(Con
t’d)
Ass
ista
nce
duri
ng d
eliv
ery
Reg
ions
Sool
2.0
16.1
60.4
16.6
4.8
100
.018
.11.
1 9
26
Sana
ag2.
716
.666
.912
.01.
810
0.0
19.3
0.7
1,1
96
Bari
15.3
31.5
49.
81.
42.
010
0.0
46.
83.
0 1
,177
Nug
aal
5.9
36.3
44
.84
.38
.810
0.0
42.
12.
3 5
84
Mud
ug6.
629
.955
.26.
71.
610
0.0
36.5
1.8
1,8
80
Educ
atio
n
No
Educ
atio
n5.
321
.260
.69.
33.
610
0.0
26.5
1.0
4,6
84
Prim
ary
11.2
45.
24
0.0
3.3
0.3
100
.056
.43.
5 8
37
Seco
ndar
y17
.950
.231
.90
.00
.010
0.0
68.1
11.9
177
Hig
her
21.5
53.3
25.2
0.0
0.0
100
.074
.84
.0 6
5
Wea
lth
quin
tile
Low
est
1.0
8.2
67.8
19.5
3.4
100
.09.
20
.1 1
,424
Seco
nd1.
811
.071
.79.
75.
810
0.0
12.8
0.2
1,1
13
Mid
dle
7.8
25.6
59.8
3.0
3.8
100
.033
.41.
4 1
,04
8
Four
th9.
04
1.8
46.
02.
40
.810
0.0
50.8
3.2
1,2
06
Hig
hest
16.8
49.
630
.91.
80
.910
0.0
66.4
4.6
973
Tota
l 6.
725
.956
.38
.13.
010
0.0
32.6
1.8
5,7
63
Not
e: If
the
resp
onde
nt m
enti
oned
mor
e th
an o
ne p
erso
n at
tend
ing
duri
ng d
eliv
ery,
onl
y th
e m
ost q
ualif
ied
pers
on is
con
side
red
in th
is ta
bula
tion
.1
Skill
ed p
rovi
der
incl
udes
doc
tor/
clin
ical
off
icer
or
nurs
e/m
idw
ife/a
uxili
ary
mid
wife
2 In
clud
es o
nly
the
mos
t rec
ent b
irth
in th
e fiv
e ye
ars
prec
edin
g th
e su
rvey
Perc
ent d
istr
ibut
ion
of li
ve b
irth
s in
the
five
year
s pr
eced
ing
the
surv
ey b
y pe
rson
pro
vidi
ng a
ssis
tanc
e du
ring
del
iver
y, p
erce
ntag
e of
bir
ths
assi
sted
by
a sk
illed
pro
vide
r, an
d th
e pe
rcen
tage
de
liver
ed b
y ca
esar
ian-
sect
ion,
acc
ordi
ng to
bac
kgro
und
char
acte
rist
ics,
SH
DS
2020
Bac
kgro
und
char
acte
rist
ics
Pers
on p
rovi
ding
ass
ista
nce
duri
ng d
eliv
ery
Tota
lPe
rcen
tage
de
liver
ed b
y sk
illed
pro
vide
r 1
Perc
enta
ge
deliv
ered
by
C-s
ecti
on
Num
ber
of
birt
hD
octo
r
Nur
se/
Aux
iliar
y M
idw
ife/
Mid
wif
e
Trad
itio
nal b
irth
at
tend
ant
Rel
ativ
e/ot
her
No
one

Puntland Report 2020Somali Health and Demographic Survey (SDHS)116
Percent distribution of live births in the five years preceding the survey by place of delivery and percentage delivered in a health facility, according to background characteristics, SHDS 2020
Background characteristics
Health facility
Public sector
Private sector
Home Other TotalPercentage
delivered in a health facility
Number of births
Mother’s age at birth
<20 14.7 2.3 82.5 0.6 100.0 17.0 823
20-34 17.1 2.3 80.4 0.2 100.0 19.4 4,241
35-49 14.0 2.0 83.6 0.3 100.0 16.0 699
Birth order
1 17.0 2.1 80.6 0.2 100.0 19.2 2,503
2-3 15.9 2.3 81.5 0.3 100.0 18.2 2,875
4-5 16.0 3.1 80.7 0.2 100.0 19.2 360
6+ (15.7) (2.1) (82.2) (0.0) 100.0 17.8 26
Antenatal care visits1
None 11.2 1.0 87.5 0.3 100.0 12.2 1,974
1-3 36.2 5.8 57.7 0.3 100.0 42.0 551
4+ 49.1 16.9 33.9 0.0 100.0 66.1 161
Don't know/missing * * * * 100.0 18.6 8
Place of residence
Urban 33.3 4.1 62.5 0.2 100.0 37.3 1,958 Rural 14.7 1.6 83.3 0.5 100.0 16.2 1,614 Nomadic 2.6 1.2 96.0 0.2 100.0 3.8 2,191
Region
Sool 10.0 2.6 87.2 0.2 100.0 12.6 926 Sanaag 8.1 2.0 89.6 0.3 100.0 10.1 1,196 Bari 23.5 0.9 75.5 0.2 100.0 24.3 1,177 Nugaal 21.7 2.7 75.3 0.3 100.0 24.4 584 Mudug 18.8 3.1 77.9 0.2 100.0 21.8 1,880
Education
No Education 11.7 1.4 86.7 0.2 100.0 13.1 4,684 Primary 35.8 4.0 59.5 0.7 100.0 39.8 837 Secondary 37.9 12.3 49.8 0.0 100.0 50.2 177 Higher 49.2 13.5 37.3 0.0 100.0 62.7 65
Wealth quintile
Lowest 2.8 1.4 95.6 0.3 100.0 4.1 1,424
Second 6.0 0.7 93.2 0.1 100.0 6.7 1,113
Middle 16.9 1.1 81.8 0.2 100.0 17.9 1,048
Fourth 25.2 2.8 71.9 0.1 100.0 28.0 1,206
Highest 36.9 6.1 56.5 0.5 100.0 42.9 973
Total 16.4 2.3 81.1 0.2 100.0 18.7 5,763 1 Includes only the most recent birth in the five years preceding the survey.
Table 5.6 Place of delivery

117
Table 5.7 Place of delivery
Among women aged 15-49 giving birth in the two years preceding the survey, the percent distribution of the mother’s first postnatal check-up for the last live birth by time after delivery, and the percentage of woman with a live birth in the two years preceding the survey who received a postnatal checkup in the first two days after giving birth, according to background characteristics, SHDS 2020
Background characteristics
Time after delivery of mothers first postnatal checkup
Total
Percentage of women with a postnatal
checkup in the first two days
after birth
Number of women
Less than 4 hours
4-23 hours
1-2 days
3-6 days
7-41 days
Don't know
No postnatal checkup1
Mother’s age at birth
<20 8.7 0.5 1.2 0.3 0.0 0.9 88.5 100.0 10.3 437
20-34 8.5 0.5 0.5 0.1 0.2 0.5 89.7 100.0 9.6 1,137
35-49 9.6 0.0 0.0 0.0 0.0 1.5 88.8 100.0 9.6 114
Birth order
1 14.2 0.2 0.9 0.0 0.6 1.0 83.0 100.0 15.3 311
2-3 7.2 0.6 0.6 0.1 0.0 0.6 90.9 100.0 8.4 1,128
4+ 8.3 0.4 0.3 0.2 0.0 0.2 90.5 100.0 9.0 250
Place of delivery
Health facility 38.6 2.2 2.9 0.5 0.5 2.9 52.5 100.0 43.8 378
Elsewhere 0.0 0.0 0.0 0.0 0.0 0.0 100.0 100.0 0.0 1,310
Place of residence
Urban 19.1 1.1 0.6 0.0 0.4 1.4 77.5 100.0 20.8 569
Rural 6.0 0.5 0.5 0.2 0.0 0.5 92.4 100.0 6.9 470
Nomadic 1.4 0.0 0.8 0.1 0.0 0.1 97.6 100.0 2.2 648
Region
Sool 8.8 0.4 0.7 0.6 0.0 0.6 88.9 100.0 9.9 276
Sanaag 4.7 0.5 0.8 0.0 0.0 0.2 93.9 100.0 6.1 361
Bari 7.1 0.0 0.7 0.0 0.6 1.6 90.1 100.0 7.8 357
Nugaal 20.0 0.6 0.9 0.0 0.0 0.0 78.5 100.0 21.5 167
Mudug 8.7 0.9 0.4 0.0 0.0 0.6 89.5 100.0 10.0 526
Education
No education 5.3 0.3 0.7 0.0 0.1 0.6 93.0 100.0 6.2 1,348
Primary 16.6 1.6 0.5 0.4 0.0 1.2 79.7 100.0 18.9 257
Secondary 36.2 0.9 1.0 0.0 0.0 0.0 61.9 100.0 38.1 61
Higher Education * * * * * * * 100.0 47.3 21
Wealth quintile
Lowest 1.3 0.1 0.6 0.2 0.0 0.2 97.7 100.0 2.0 405
Second 2.7 0.0 1.2 0.0 0.0 0.0 96.1 100.0 3.9 324
Middle 6.6 0.5 0.2 0.4 0.0 0.6 91.7 100.0 7.3 301
Fourth 12.2 0.5 0.8 0.0 0.0 0.6 86.0 100.0 13.5 351
Highest 22.5 1.5 0.4 0.0 0.7 2.2 72.8 100.0 24.5 306
Total 8.6 0.5 0.6 0.1 0.1 0.7 89.4 100.0 9.8 1,688 1 Includes women who received a check-up after 41 days

Puntland Report 2020Somali Health and Demographic Survey (SDHS)118
Percent distribution of last births in the two years preceding the survey by time after birth of first postnatal checkup, and the percentage of births with a postnatal checkup in the first two days after birth, according to background characteristics, SHDS 2020
Background characteristics
Time after birth of newborn's first postnatal checkup
Total
Percentage of births with
a postnatal checkup in
the first two days after
birth
Number of births1-3 hours
4-23 hours
1-2 days3-6
daysDon't know
No postnatal checkup 1
Mother’s age at birth
<20 6.9 1.1 0.2 0.1 0.1 91.6 100.0 8.2 437
20-34 8.7 0.4 0.5 0.3 0.0 90.1 100.0 9.6 1,137
35-49 8.3 0.0 1.3 0.0 0.0 90.4 100.0 9.6 114
Birth order
1 13.4 0.2 1.1 0.0 0.0 85.3 100.0 14.7 311
2-3 7.1 0.7 0.4 0.3 0.0 91.5 100.0 8.2 1,128
4+ 6.7 0.6 0.0 0.2 0.0 92.5 100.0 7.3 250
Place of delivery
Health facility 36.7 2.6 2.0 1.0 0.1 57.6 100.0 41.3 378
Elsewhere 0.0 0.0 0.0 0.0 0.0 100.0 100.0 0.0 1,310
Place of residence
Urban 18.9 1.2 0.9 0.4 0.1 78.6 100.0 21.0 569
Rural 3.9 0.4 0.6 0.2 0.0 94.9 100.0 4.9 470
Nomadic 2.0 0.1 0.0 0.1 0.0 97.8 100.0 2.1 648
Region
Sool 9.1 0.4 0.2 0.4 0.2 89.6 100.0 9.7 276
Sanaag 5.4 0.0 0.0 0.0 0.0 94.6 100.0 5.4 361
Bari 7.3 0.6 0.6 0.6 0.0 91.0 100.0 8.4 357
Nugaal 21.4 0.3 1.2 0.3 0.0 76.7 100.0 22.9 167
Mudug 6.1 1.1 0.6 0.0 0.0 92.2 100.0 7.8 526
Education
No Education 6.0 0.6 0.1 0.1 0.0 93.2 100.0 6.7 1,348
Primary 12.3 0.8 1.4 0.2 0.0 85.3 100.0 14.5 257
Secondary 26.7 0.0 3.4 3.3 0.9 65.8 100.0 30.1 61
Higher (0.0) (0.0) (0.0) (0.0) (0.0) (0.0) 100 (0.0) 21
Wealth quintile
Lowest 2.0 0.0 0.0 0.2 0.0 97.8 100.0 2.0 405
Second 3.2 0.2 0.0 0.0 0.0 96.6 100.0 3.4 324
Middle 5.5 0.5 0.5 0.2 0.0 93.4 100.0 6.5 301
Fourth 12.7 0.6 0.0 0.2 0.2 86.4 100.0 13.3 351
Highest 19.3 1.8 2.0 0.7 0.0 76.3 100.0 23.1 306
Total 8.2 0.6 0.5 0.2 0.0 90.5 100.0 9.2 1,688
1 Includes newborns who received a check-up after the first week
Table 5.8 Timing of first postnatal checkup for the newborn

119
Table 5.9 Obstetric fistula
Percentage of ever-married women age 15-49 who have heard of obstetric fistula and percentage who have experienced obstetric fistula, according to background characteristics,SHDS 2020
Background characteristic heard obstetric fistula experienced obstetric fistulaNumber of ever married
women
Age
15-19 38.6 0.6 300
20-24 49.3 2.1 633
25-29 54.8 3.6 889
30-34 54.5 2.6 717
35-39 58.0 5.2 616
40-44 54.8 3.3 339
45-49 59.1 6.3 180
Types of residence
Urban 58.6 4.2 1271
Rural 54.8 2.7 1074
Nomadic 46.9 2.9 1330
Region
Sool 49.5 2.0 527
Sanaag 58.6 2.7 720
Bari 46.1 4.9 870
Nugaal 55.2 4.2 372
Mudug 56.1 2.7 1186
Mother's education
No education 50.3 3.2 3011
Primary 68.5 3.9 481
Secondary 60.8 3.4 135
Higher (59.6) (0.0) 49
Wealth quitile
Lowest 52.9 2.4 859
Second 43.3 2.3 666
Middle 46.1 4.5 685
Fourth 59.3 2.9 748
Highest 63.3 4.3 717
Total 53.2 3.3 3675

Puntland Report 2020Somali Health and Demographic Survey (SDHS)120
Percent distribution of ever-married women who have experienced obstetric fistula, by origin and time to onset according to background characteristics SHDS 2020
Origin of fistula Total
After delivery 39.4
After still birth 22.5
Neither 38.2
Number of ever married women who experienced fistula 120
Table 5.10 Origin of fistula
Table 5.11 Treatment
Percent distribution of ever-married women age 15-49 who sought Fistula treatment by according to background characteristic, SHDS 2020
Source of treatment Total
did not seek 65.1
Doctor/Clinical officer 24.0
Nurse/Midwife 8.3
Other 2.5
Number of ever married women who experienced Fistula 120

121
Percentage of women age 15-49 who reported that they have serious problems in accessing health care for themselves when they are sick, by type of problem, according to background characteristics, SHDS 2020
Background
characteristics
Problems in accessing health careNumber of Ever
Married WomenGetting permission
to go for treatment
Getting money for
treatment
Distance to health
facility
Not wanting to go
alone
At least one problem
accessing health care
Age
15-19 29.4 59.3 52.3 39.5 67.8 300
20-34 35.0 64.3 58.6 42.1 73.1 2,240
35-49 35.5 62.5 57.9 42.9 70.5 1,135
Number of living
children
0 * * * * * 1
1-2 32.6 70.6 51.3 33.5 70.6 61
3-4 33.0 61.7 51.5 43.5 72.6 168
5+ 34.8 63.3 58.3 42.2 71.8 3,445
Marital status
Married 35.3 64.4 59.1 42.7 72.7 3,161
Divorced/ widowed 31.3 56.6 50.5 38.5 66.3 514
Employed past 12
months
Not employed 35.1 64.3 58.9 42.9 72.5 3,298
Employed for cash 31.4 54.1 48.0 34.5 65.4 303
Employed not for cash
30.2 58.6 53.9 39.3 70.3 74
Residence
Urban 28.4 54.0 41.6 30.4 61.3 1,271
Rural 35.3 61.6 55.7 39.2 71.2 1,074
Nomadic 40.3 73.7 75.2 55.8 82.5 1,330
Regions
Sool 41.5 65.3 62.1 43.8 71.0 527
Sanaag 43.4 71.3 69.7 51.2 79.5 720
Bari 20.7 52.9 39.8 28.4 64.7 870
Nugaal 30.5 49.7 47.1 32.4 60.2 372
Mudug 38.0 69.5 65.5 49.1 76.5 1,186
Education
No Education 36.3 65.3 60.7 44.4 73.4 3,011
Primary 30.7 59.0 50.5 35.9 69.0 481
Secondary 21.5 48.2 32.9 24.8 60.1 135
Higher (12.5) (24.2) (27.1) (15.8) (38.0) 49
Wealth
Lowest 45.7 81.1 81.5 60.0 88.6 859
Second 34.8 64.1 65.0 45.9 73.5 666
Middle 35.0 59.0 50.1 37.4 67.4 685
Fourth 32.3 59.6 50.4 38.1 69.2 748
Highest 23.7 49.4 38.3 25.9 57.4 717
Total 34.7 63.3 57.9 42.2 71.8 3,675
Note: An asterisk indicates that a figure is based on fewer than 25 unweighted cases and has been suppressed.
Table 5.12 Problems in accessing health care

Child Health CHAPTER 6

©A
U U
N I
ST P
HO
TO
/ T
OB
IN J
ON
ES.
Key Findings

Puntland Report 2020Somali Health and Demographic Survey (SDHS)124
Birth Weight
Birth weight is a major determinant of infant and child health, as low birth weight is associated with fetal and neonatal morbidity, inhibited physical and cognitive development, and chronic diseases later in life. Birth weight is used as a summary indicator of the challenges that a public health system faces, including long-term maternal malnutrition, ill health, and poor health care during pregnancy. Children whose birth weight is less than 2.5 kilograms, or children reported to be “very small” or “smaller than average,” are considered to have a higher risk of early childhood death than average children (WHO 2014).
The SHDS 2020 recorded births occurring during the five years preceding the survey. Birth weight was recorded in the Ever-Married Woman’s Questionnaire, based on either written record or the mother’s verbal report. As the birth weight may not have been known for many babies, the mother’s estimate of the baby’s size at birth was also obtained. Even though such an estimate is subjective, it can be a useful estimate for the weight of the child.
Table 6.1 presents information on child weight at birth by background characteristics. It shows that the birth weight was reported for only 7 percent of the live births occurring in the five years preceding the survey. Fourteen percent of the infants had low birth weight (less than 2.5 kg). According to the findings presented, more underweight births were reported among the mothers aged 20-34, at 15 percent, compared to 10 percent of underweight births reported by mothers of aged under 20 years and those aged 35-49 . These percentages are to be used with caution due to very small sample sizes.
The proportion of all births that have a reported birth weight were higher among the urban children at 15 percent, compared to rural
6Chapter 6
Child Health
This chapter presents findings from the SHDS that relate to children’s health. These include the characteristics of newborns (birth weight), vaccination status of children, symptoms of acute respiratory infection (ARI), fever, diarrhoea and treatment of childhood illnesses. Information collected on child health from the SHDS 2020 is expected to assist policy makers and programme managers in formulating appropriate strategies and interventions to improve the health of children in Puntland and sanitation in their environment.

125
and urban areas at 5 and 1 percent respectively. Among the regions, the proportion of all births that have a reported birth weight were highest in Nugaal at 11 percent and lowest in Sool at 3 percent.
The proportion of all births that have a reported birth weight increased with increasing level of education from 4 percent of children belonging to mothers with no education to 38 percent of children belonging to mothers with higher level of education. Similarly, the, proportion of all births that have a reported birth weight increased with increasing wealth status of households from less than one percent of children belonging to mothers from the poorest households to 18 percent of children belonging to mothers from the wealthiest households (Figure 6.1).
Vaccination of ChildrenAccording to WHO, a child is considered fully vaccinated if he or she has received a BCG vaccination against tuberculosis; three doses of the diphtheria, pertussis and tetanus (DPT) vaccine; at least three doses of the polio vaccine; and one dose of the measles vaccine. The SHDS 2020 collected information on the coverage of these vaccinations among the children born in the five years preceding the survey.
Following internationally recommended procedures, information on vaccination coverage was obtained in two ways in the survey—from child health cards and from mothers’ verbal reports. All mothers were asked to show the interviewer the child health cards on which immunization dates were recorded for all children born in the five years preceding the survey. If a card was available, the interviewer recorded the dates of each vaccination received by the child. If a card showed that the child was not fully vaccinated, the mother was then asked whether the child had received other vaccinations that were not recorded on the card, and these too were noted. If a child never received a health card or if the mother was unable to show the card to the interviewer, the vaccination information for the child was based on the mother’s report. Questions were asked for each type of vaccine. Mothers were asked to recall whether the child had received BCG, polio, pentavalent and measles vaccinations. If the mother indicated that the child had received the polio or pentavalent vaccines, she was asked about the number of doses that the child received. The results presented here are based on both information from the health card and the mother’s report for those without a card.
Table 6.2 presents data on the vaccination coverage for children aged 12-23 months, the age by which they should have received all vaccinations. Mothers were able to present health cards for 2 percent of these children.
Figure 6.1 Child’s weight and size at birth by wealth quantile
Figure 6.2 Vaccination coverage for children aged 12-23 months
Percentage of all births that have a reported birth weight in the five years preceding the survey by wealth quintile
Percentage of children aged 12-23 months who received specific vaccines
0.6
Lowest
2.6
Second
5.7
Middle
10.8
Fourth
17.5
Highest
76.6
21.0
11.9
11.3
10.1
8.8
No vaccinations
BCG
Polio
Measles
DPT
All basic vaccinations

Puntland Report 2020Somali Health and Demographic Survey (SDHS)126
Overall, only 9 percent of children aged 12-23 months are fully vaccinated, meaning that they received the basic vaccinations (one BCG vaccine, three doses of pentavalent and polio vaccines, and one dose of measles vaccine) at any time before the survey was conducted (Figure 6.2). Twenty-one percent of children had received BCG at any time before the survey, 23 percent received the first dose of pentavalent vaccine, and 23 percent received the first dose of polio. Ten percent of children completed the required three doses of the pentavalent vaccine and 12percent of the children received the three doses of polio vaccine. Twelve percent of children had been vaccinated against measles.
There is variation by place of residence; 15 percent of children in urban areas had received all basic vaccinations, compared to less than 1 percent of children in nomadic areas.
Among the regions, Bari had the highest percentage of children that received all basic vaccinations at 13 percent, while Mudug had the least percentage at 6 percent (Figure 6.3).
Vaccination coverage improved with the increasing household wealth. One percent of children from the lowest wealth quintile households had received all the basic vaccinations compared to 23 of the children from highest wealth quintile households.
Symptoms of Acute Respiratory Infection
Acute Respiratory Infection (ARI) is a serious infection that prevents normal breathing. It usually begins as a viral infection in the nose, trachea (windpipe) or lungs. If the infection is not treated, it can spread to the entire respiratory system. Early diagnosis and treatment with antibiotics can prevent a large proportion of deaths caused by ARI. According to WHO, ARI is one of the leading causes of childhood morbidity and mortality throughout the world. In the SHDS 2020, the prevalence of ARI was estimated by asking mothers whether their children under the age of 5 had been ill with a cough accompanied by short, rapid breathing in the two weeks preceding the survey. These are typical symptoms of ARI.
Table 6.3 shows the percentage of children who had symptoms of ARI in the two weeks before the survey and the percentage for whom advice or treatment was sought from a health facility or provider. It also shows the percentage of children who received antibiotics as treatment.
Overall 3 percent of children under the age of 5 years experienced ARI symptoms during the two weeks preceding the survey. Further, 16 percent of children who were reported to have experienced ARI had received antibiotics, and 20 percent of these children received
Figure 6.3 Vaccination coverage
Figure 6.4 Children with ARI symptoms by age
Percentage of children aged 12-23 months who received specific vaccines by type of resident
Percent of children with ARI symptoms in the two weeks preceding the survey
12.0
0.7
Urban Rural Nomadic
15.0
2.9
0-5
3.7
6-11
3.6
12-23
3.1
24-35
2.0
36-47
1.4
48-59
Age in Monthes

127
advice or treatment from a health facility or provider.
The proportion of children with symptoms of ARI in the two weeks preceding the survey was higher among age groups of 6-11 and 12-23 months at 4 percent compared to the other age groups (Figure 6.4). The proportion of children with symptoms of ARI varies based on the type of cooking fuel used in households; households that use clean energy were less likely to report children suffering from ARI, compared to households using crude sources of energy for cooking. More children suffered from ARI in households that cooked meals using kerosene, firewood or charcoal at 3 percent
Among the regions, Bari had the highest percentage of children with ARI symptoms in the two weeks preceding the survey at 6 percent compared to Mudug with the lowest proportion at 1 percent.
FeverFever is an abnormally high body temperature that is usually accompanied by shivering, headache, and restlessness. Fever is a symptom of many illnesses, including malaria, pneumonia, the common cold, and influenza among other infections. In the SHDS 2020, mothers were asked whether their children under the age of 5 had been ill with fever in the two weeks before the survey. For children with fever, mothers in Puntland were also asked about the actions they took to treat the fever, including whether the child had been given any drug to treat the fever, and if yes what type of drugs were given to the child.
Table 6.4 shows the distribution of children who; had a fever in the two weeks preceding the survey; advice or treatment was sought from a health facility or provider, who took antimalarial drugs, and who received antibiotics as treatment, by their background characteristics and those of their mothers. Overall, 6 percent of children under the age of 5 had a fever during the two weeks preceding the survey. Treatment from a health facility or provider was sought for 51 percent of children with fever; however, only 7 percent were taken for treatment the same day or the day after they developed the fever. fourty percent of children with fever were given antibiotics for the illness.
The prevalence of fever varied with the age of the child, as children less than 24 months of age were more likely to have fever (Figure 6.5).
The proportion of children with fever for whom advice or treatment was sought was higher in rural and urban areas at 46 and 42 percent respectively compared to only 9 percent in nomadic areas. The proportion of children who were treated the same day or the next day was higher in urban and rural areas at 13 percent compared to
Figure 6.5 Children with fever by age
Percentage with fever Among children under age five
7.2
0-5
7.5
6-11
8.3
12-23
5.3
24-35
4.0
36-47
3.6
48-59
Age in Monthes

Puntland Report 2020Somali Health and Demographic Survey (SDHS)128
only 2 percent in nomadic areas. Similarly, the proportion children who received antibiotics was higher among urban children at 31 percent, followed by rural at 25 percent and lowest in nomadic areas at 2 percent (Table 6.4).
Among the regions, the proportion of children for whom advice or treatment was sought was highest in Nugaal at 51 percent and lowest in Sool at 24 percent.
The proportion of children for whom advice or treatment was sought increased with increasing wealth status of the household from 12 percent of the poorest households to 58 percent of the richest households. areas. The proportion of children who were treated the same day or the next day was higher in urban and rural areas at 13 percent compared to only 2 percent in nomadic areas. Similarly, the proportion children who received antibiotics was higher among urban children at 31 percent, followed by rural at 25 percent and lowest in nomadic areas at 2 percent (Table 6.4).
Among the regions, the proportion of children for whom advice or treatment was sought was highest in Nugaal at 51 percent and lowest in Sool at 24 percent.
The proportion of children for whom advice or treatment was sought increased with increasing wealth status of the household from 12 percent of the poorest households to 58 percent of the richest households.
Diarrhoeal DiseasesDehydration caused by severe diarrhoea is a major cause of morbidity and mortality among young children, although the condition can be easily treated with oral rehydration therapy (ORT). Cases of diarrhoea are related to the use of contaminated water and unhygienic practices in food preparation and disposal of excreta. The SHDS 2020 collected information on the prevalence of diarrhoea among children in Puntland by asking mothers whether their children under the age of 5 years had diarrhoea during the two weeks before the survey. If a child was identified as having had diarrhoea, information was collected on the treatment and feeding practices during the episode.
Table 6.5 presents data on the percentage of children under age 5 who had diarrhoea during the two weeks preceding the survey, by selected background characteristics. Overall, 5 percent of children under the age of 5 years had diarrhoea. Children with diarrhoea for whom advice or treatment was sought from a health facility or provider was 45 percent.
The prevalence of diarrhoea varied with the age of the child, as children less than 24 months of age were more likely to have
Figure 6.6 Children with diarrhoea
Percent of children with diarrhoea by type of resident
3.9 3.6
Urban Rural Nomadic
6.7

129
diarrhoea (Figure 6.8). Advice or treatment was more likely to be sought for male children with diarrhea at 49 percent than female children at 42 percent.
Figure 6.6 shows that children in the urban areas are more likely to have diarrhoea at 7 percent than those in the rural and nomadic areas at 4 percent. The proportion of children with diarrhoea for whom advice or treatment was sought from a health facility or provider was highest in urban areas at 58 percent and lowest in nomadic areas at 25 percent.
Among the regions, Nugaal had the highest prevalence of diarrhoea at 9 percent while Sanaag had the lowest at 3 percent. The proportion of children with diarrhoea for whom advice or treatment was sought from a health facility or provider was highest in Nugaal at 55 percent and lowest in Sanaag at 27 percent.
The proportion of children with diarrhoea for whom advice or treatment was sought from a health facility or provider increased with increasing household wealth status; from 23 percent among the poorest households to 70 percent among the richest households.
Treatment of Childhood Illnesses Figure 6.8 presents a summary of the survey results regarding the prevalence and treatment of childhood illnesses. During the 2 weeks before the survey, 6 percent of children under age 6 had a fever, while 5 percent had diarrhoea and 3 percent had ARI symptoms. Advice or treatment was sought for 45 percent of children with diarrhoea, 35 percent with fever, and 20 percent of children with ARI.
Disposal of Children’s StoolsThe proper disposal of children’s faeces is important in preventing the spread of diseases. If human faeces are left uncontained, disease may spread by others who come into direct contact with it, or by animal contact with the faeces.
Table 6.6 presents information on the disposal of the stools of children under the age of 5 by background characteristics. The information was derived from asking ever-married women what was done to dispose of the stools the last time their youngest child under age 5 passed stools. Overall, 44 percent of the children who live with their mother had their last stool disposed of safely.
Appropriate disposal of stools increases with increasing age of the child probably because older children are more likely to use a toilet or latrine where it is available. Children in urban areas and
Figure 6.7 Percent of children with Diarrhoea by age
Figure 6.8 Prevalence and Treatment of childhood illnesses
5.3
6.8
7.2
4.5
3.7
2.7
0
1
2
3
4
5
6
7
8
0-5 6-11 12 -23 24-35 36-47 48-59
Age in months
2.64.8 5.6
19.6
45.4
34.9
ARI diarrhea Fever
Prevalence Treatment
Percent of children under age five treated for childhood illnesses in the two weeks preceding the survey

Puntland Report 2020Somali Health and Demographic Survey (SDHS)130
rural areas were more likely to have their stools safely disposed at 68 and 64 percent respectively than those in nomadic areas at 6 percent. Safe stool disposal is related to maternal education and wealth status. Among mothers with secondary education, 80 percent of children had their stool safely disposed, which is double those reporting safe stool disposal among children of mothers with no education, at 38 percent. Safe disposal of stool of children under the age of 5 increased with increasing wealth status of the household from 7 percent of children from the poorest households to 73 percent of children from the wealthiest households.
Figure 6.8 Disposal of children’s stools
Percent distribution of youngest children under age five, living with the mother, by the manner of disposal of the child’s last faecal matter
5.3
9.1
17.3
17.3
21.4
29.0
Buried
Thrown intogarbage
Put/rinsed intotoilet or latrine
Put/rinsed intodrain or ditch
Child used toilet latrine
Left in the open

131

Puntland Report 2020Somali Health and Demographic Survey (SDHS)132
Percentage of live births in the five years preceding the survey that have a reported birth weight; among live births in the five years preceding the survey with a reported birth weight, percent distribution by birth weight; and percent distribution of all live births in the five years preceding the survey by mother’s estimate of baby’s size at birth, according to background characteristics, SHDS 2020
Background characteristics
Percent distribution of all live births by size of child at birth
Total
Percentage of all births
that have a reported
birth weight1
Number of births
Births with a reported birth weight1
Very small
Smaller than
average
Average or larger
Less than 2.5 kg
Number of births
Mother's age at birth
<20 4.5 6.6 89.0 100.0 7.8 705 9.7 55
20-34 5.1 3.1 91.8 100.0 7.4 3,672 15.0 270
35-49 4.5 3.0 92.6 100.0 5.8 600 (10.0) 35
Birth order
1 5.8 4.3 90.0 100.0 9.7 2,333 13.4 227
2-3 4.2 2.9 92.9 100.0 5.2 2,435 13.6 127
4-5 4.3 3.8 92.0 100.0 2.8 205 * 6
Mother's smoking status
Smokes cigarettes/tobacco
1.5 0.6 97.8 100.0 15.2 100 * 15
Does not smoke
5.0 3.7 91.4 100.0 7.1 4,877 13.0 345
Type of residence
Urban 5.6 4.0 90.4 100.0 15.2 1,810 11.0 275
Rural 3.2 4.1 92.7 100.0 5.1 1,420 20.3 73
Nomadic 5.6 2.8 91.7 100.0 0.7 1,748 * 12
Region
Sool 6.6 2.3 91.0 100.0 3.4 712 (15.7) 24
Sanaag 1.6 3.2 95.2 100.0 3.9 1,065 (8.1) 41
Bari 6.4 4.6 89.0 100.0 6.9 1,065 10.1 74
Nugaal 8.5 1.4 90.1 100.0 11.3 499 10.8 57
Mudug 4.3 4.4 91.3 100.0 10.1 1,636 17.4 164
Education
No Education 5.1 3.4 91.5 100.0 4.3 3,987 16.3 170
Primary 4.7 5.0 90.2 100.0 16.4 757 12.2 124
Secondary 3.0 2.6 94.4 100.0 24.8 169 (15.3) 42
Higher 0.8 0.0 99.2 100.0 37.5 64 (0.0) 24
Wealth quintile
Lowest 4.3 1.9 93.8 100.0 0.6 1,146 * 7
Second 6.2 5.1 88.7 100.0 2.6 913 (9.0) 24
Middle 4.9 4.8 90.3 100.0 5.7 925 25.0 53
Fourth 4.9 3.8 91.3 100.0 10.8 1,093 8.1 118
Highest 4.5 2.7 92.8 100.0 17.5 902 13.2 158
Total 4.9 3.6 91.5 100.0 7.2 4,978 13.7 3601 Based on either a written record or the mother's recallNote: Figures in parentheses are based on 25-49 unweighted cases. An asterisk indicates that a figure is based on fewer than 25 unweighted cases and has been suppressed.
Table 6.1 Child’s weight and size at birth

133
Perc
enta
ge o
f chi
ldre
n ag
ed 1
2-23
mon
ths
who
rece
ived
spe
cific
vac
cine
s at
any
tim
e be
fore
the
surv
ey (
acco
rdin
g to
a v
acci
nati
on c
ard
or th
e m
othe
r’s re
port
), a
nd p
erce
ntag
e w
ith
a va
ccin
atio
n ca
rd, b
y ba
ckgr
ound
cha
ract
eris
tics
, SH
DS
2020
Bac
kgro
und
char
acte
rist
ics
BCG
DPT
Polio
1
Mea
sles
All
basi
c
vacc
inat
ions
2N
o va
ccin
atio
ns
perc
enta
ge w
ith
a va
ccin
atio
n
card
see
n
Num
ber
of
child
ren
12
30
12
3
Sex M
ale
21.1
22.5
9.8
9.6
21.4
22.9
11.0
10.8
10.2
8.3
76.6
1.7
48
6
Fem
ale
20.8
22.5
11.6
10.7
21.4
23.1
14.1
13.2
12.7
9.4
76.7
2.0
40
2
Bir
th o
rder
131
.735
.024
.622
.532
.434
.626
.824
.423
.020
.763
.65.
88
4
2-3
25.6
27.6
14.4
14.1
26.2
28.1
16.7
16.0
15.4
12.0
71.5
1.0
314
4-5
14.7
15.0
4.1
3.5
14.7
15.7
5.2
5.2
5.2
3.2
84
.32.
423
7
6+17
.619
.07.
47.
418
.019
.59.
18
.88
.16.
08
0.1
1.0
253
Type
of r
esid
ence
Urb
an38
.139
.416
.315
.939
.04
0.0
19.8
18.9
18.3
15.0
60.0
4.3
301
Rura
l23
.725
.614
.713
.923
.725
.515
.615
.014
.812
.073
.51.
425
5
Nom
adic
3.4
4.8
2.4
2.1
3.7
5.6
3.3
3.1
2.3
0.7
94.1
0.0
332
Reg
ion
Sool
16.9
18.4
9.9
9.5
17.6
18.9
9.5
9.5
9.5
8.0
81.
10
.714
6
Sana
ag16
.920
.213
.312
.117
.820
.514
.714
.413
.19.
578
.50
.719
0
Bari
26.9
27.8
14.2
14.2
26.9
29.1
17.1
15.7
15.4
13.3
70.9
3.9
193
Nug
aal
24.7
24.7
7.6
7.6
25.7
27.0
12.6
12.6
10.6
7.6
73.0
5.0
101
Mud
ug20
.421
.67.
67.
020
.421
.08
.88
.28
.25.
878
.40
.625
8
Mot
her'
s ed
ucat
ion
No
Educ
atio
n14
.815
.97.
36.
914
.916
.48
.58
.07.
45.
98
3.1
1.5
709
Prim
ary
43.
04
6.6
18.8
17.7
45.
34
7.3
24.0
23.1
22.3
14.1
52.7
2.7
135
Seco
ndar
y(4
7.7)
(49.
2)(4
0.9
)(4
0.9
)(4
7.7)
(47.
7)(4
0.9
)(4
0.9
)(4
0.9
)(3
9.3)
(50
.8)
(6.5
)35
Hig
her
**
**
**
**
**
**
9
Wea
lth
quin
tile
Low
est
3.8
5.7
3.6
3.1
4.3
6.7
4.7
4.7
3.4
1.2
92.6
0.0
216
Seco
nd7.
48
.33.
83.
57.
78
.64
.23.
83.
52.
691
.40
.016
9
Mid
dle
21.7
22.0
9.6
8.6
22.0
22.6
14.4
12.2
11.6
8.3
77.4
1.2
161
Four
th30
.631
.412
.612
.631
.132
.914
.514
.513
.911
.767
.14
.418
6
Hig
hest
47.
451
.026
.525
.74
7.8
49.
727
.527
.127
.122
.94
9.0
3.9
156
Tota
l21
.022
.510
.610
.121
.423
.012
.411
.911
.38
.876
.61.
88
88
1 Pol
io 0
is th
e po
lio v
acci
nati
on g
iven
at b
irth
2 BC
G, m
easl
es, a
nd th
ree
dose
s ea
ch o
f DPT
and
pol
io v
acci
ne (
excl
udin
g po
lio v
acci
ne g
iven
at b
irth
)N
ote:
Fig
ures
in p
aren
thes
es a
re b
ased
on
25-4
9 un
wei
ghte
d ca
ses.
An
aste
risk
indi
cate
s th
at a
figu
re is
bas
ed o
n fe
wer
than
25
unw
eigh
ted
case
s an
d ha
s be
en s
uppr
esse
d.
Tab
le 6
.2
Vac
cina
tion
s by
bac
kgro
und
char
acte
rist
ics

Puntland Report 2020Somali Health and Demographic Survey (SDHS)134
Among children under age five, the percentage who had symptoms of acute respiratory infection (ARI) in the two weeks preceding the survey and among children with symptoms of ARI, the percentage for whom advice or treatment was sought from a health facility or provider and the percentage who received antibiotics as treatment, according to background characteristics, SHDS 2020
Background characteristics
Among children under age five: Among children under age five with symptoms of ARI:Number of
childrenPercentage with symptoms of ARI1
Number of children
Percentage for whom advice or treatment was sought from a health facility or provider
Percentage who received antibiotics
Age in months
0-5 2.9 486 * * 14
6-11 3.7 415 * * 15
12-23 3.6 857 (40.5) (23.3) 30
24-35 3.1 997 (15.5) (16.8) 31
36-47 2 1,025 * * 21
48-59 1.4 954 * * 13
Sex
Male 2.8 2,478 18.9 17.7 70
Female 2.4 2,257 20.4 12.7 55
Cooking fuel
Electricity or gas 1.2 108 * * 1
Kerosene 2.9 31 * * 1
Firewood 2.6 591 (11.4) (11.4) 15
Charcoal 2.5 349 * * 9
Straw/Shrubs/Grass * 8 * * 0
Agricultural crops 0 18 * * 0
Other fuel * 2 * * 0
No food cooked in household
* 8 * * 1
Missing 2.7 3,619 19.6 15.2 98
Type of residence
Urban 3.4 1,760 14.4 16.9 60
Rural 3 1,365 (34.5) (20.0) 41
Nomadic 1.5 1,609 (6.5) (4.3) 24
Region
Sool 2.6 644 (14) (10.8) 17
Sanaag 1.9 834 (22) (20.7) 16
Bari 5.5 1,031 20.1 15.5 57
Nugaal 2.3 507 * * 12
Mudug 1.3 1,718 * * 23
Mother's education
No Education 2.7 3,775 18.3 16.8 103
Primary 2.2 731 * * 16
Secondary 3.3 169 * * 6
Higher 0 60 * * 0
Wealth quintile
Lowest 1 1,014 * * 10
Second 2.5 866 (15.4) (0.0) 22
Middle 3.8 923 (22.4) (18.1) 35
Fourth 2.9 1,072 (31.3) (29.4) 31
Highest 3.1 860 * * 27
Total 2.6 4,734 19.6 15.5 124
1 Symptoms of ARI (cough accompanied by short, rapid breathing which was chest-related and/or by difficult breathing which was chest-related) is considered a proxy for pneumonia
Table 6.3 Prevalence and treatment of symptoms of ARI

135
Among children under age five, the percentage who had a fever in the two weeks preceding the survey and among children with fever, the percentage for whom advice or treatment was sought from a health facility or provider, percentage who took antimalarial drugs, and the percentage who received antibiotics as treatment, by background characteristics, SHDS 2020
Background characteristics
Among children under the age of five:
Among children under age five with fever:
Number of children with
feverPercentage with fever
Number of children
Percentage for whom advice or
treatment was sought
Percentage for whom treatment
was sought same or next
day
Percentage who took antibiotic
drugs
Age in months
0-5 7.2 490 (13.4) (0.0) (17.1) 36
6-11 7.5 424 (37.9) (12.3) (22.6) 32
12-23 8.3 874 46.1 11.5 24.1 73
24-35 5.3 1,005 40.3 10.0 23.1 54
36-47 4.0 1,038 (18.3) (7.6) (13.7) 41
48-59 3.6 967 (42.2) (16.5) (26.9) 34
Sex
Male 5.9 2,508 30.7 9.4 21.8 147
Female 5.3 2,290 40.0 10.3 21.3 122
Type of residence
Urban 6.9 1,631 41.6 12.9 30.7 113
Rural 6.4 1,385 46.3 11.9 25.2 88
Nomadic 3.8 1,783 9.0 1.9 1.5 68
Region
Sool 5.6 760 (23.8) (6.9) (11.5) 43
Sanaag 4.1 979 (40.8) (18.2) (17.1) 40
Bari 7.0 1,003 37.4 7.8 31.1 70
Nugaal 9.8 478 (50.7) (16.3) (32.4) 47
Mudug 4.4 1,580 25.0 4.4 13.2 69
Education
No education 5.3 3,868 30.3 7.1 18.3 207
Primary 7.1 716 41.5 10.8 26.8 51
Secondary 6.1 160 * * * 10
Higher 3.8 56 * * * 2
Wealth quintile
Lowest 4.2 1,138 (11.6) (2.5) (2.5) 48
Second 4.7 912 (14.9) (1.5) (1.3) 43
Middle 7.5 893 31.8 11.9 17.0 67
Fourth 5.2 1,035 51.3 6.8 39.5 54
Highest 7.0 822 57.5 22.4 40.8 58
Total 5.6 4,799 34.9 9.8 21.5 269
Note: Figures in parentheses are based on 25-49 unweighted cases. An asterisk indicates that a figure is based on fewer than 25 unweighted cases and has been suppressed.
Table 6.4 Prevalence and treatment of fever

Puntland Report 2020Somali Health and Demographic Survey (SDHS)136
Table 6.5 Diarrhea treatment
Among children under age five who had diarrhea in the two weeks preceding the survey, the percentage for whom advice or treatment was sought from a health facility or provider, the percentage given oral rehydration therapy (ORT), the percentage given increased fluids, the percentage given ORT or increased fluids, and the percentage given other treatments, by background characteristics, SHDS 2020
Background characteristics
Percentage with diarrhea
Number of children
Percentage of children with diarrhea for whom advice or treatment was
sought from a health facility or provider
Number of children with Diarrhea
Age in months
0-5 5.3 490 (27.8) 26
6-11 6.8 424 (64.8) 29
12-23 7.2 874 55.0 63
24-35 4.5 1,005 (44.3) 46
36-47 3.7 1,038 (37.0) 39
48-59 2.7 967 (33.1) 26
Sex
Male 4.5 2,508 48.5 113
Female 5.0 2,290 42.4 115
Type of residence
Urban 6.7 1,631 57.9 109
Rural 3.9 1,385 45.2 54
Nomadic 3.6 1,783 24.5 65
Region
Sool 4.2 760 (30.2) 32
Sanaag 3.0 979 (27.0) 30
Bari 6.9 1,003 53.5 69
Nugaal 8.7 478 (54.9) 41
Mudug 3.6 1,580 46.9 56
Mother's education
No Education 4.5 3,868 41.3 176
Primary 5.8 716 (55.3) 41
Secondary 6.4 160 * 10
Higher 1.8 56 * 1
Wealth quintile
Lowest 4.2 1,138 (23.2) 48
Second 3.8 912 (31.0) 35
Middle 5.9 893 37.5 53
Fourth 5.6 1,035 65.2 58
Highest 4.2 822 (69.7) 35
Total 4.8 4,798.87 45.4 228
Note: ORT includes fluid prepared from oral rehydration salt (ORS) packets, pre-packaged ORS fluid, and recommended home fluids (RHF).Note: Figures in parentheses are based on 20-49 unweighted cases. An asterisk indicates that a figure is based on fewer than 20 unweighted cases and has been suppressed.

137
Percent distribution of youngest children under age five living with the mother by the manner of disposal of the child’s last fecal matter, and percentage of children whose stools are disposed of safely, according to background characteristics, SHDS 2020
Background characteristics
Manner of disposal of children's stools
Total
Percentage of children
whose stools were disposed of
safely1
Number of
childrenChild used
toilet latrine
Put/rinsed
into toilet or latrine
Buried
Put/rinsed
into drain or
ditch
Thrown into
garbage
Left in the open
Age of child in months
0-5 21.5 16.7 3.7 22.1 10.2 25.7 100.0 41.9 466
6-11 14.9 12.1 7.5 21.8 9.7 33.9 100.0 34.5 416
12-23 20.9 19.5 4.0 16.4 9.4 29.7 100.0 44.5 851
24-35 22.5 18.8 5.8 17.8 8.3 26.8 100.0 47.1 965
36-47 21.4 16.3 6.1 16.6 9.4 30.2 100.0 43.8 996
48-59 23.7 17.3 5.1 16.8 8.4 28.8 100.0 46.0 926
Type of residence
Urban 33.3 24.8 9.8 18.8 7.6 5.7 100.0 67.9 1,580
Rural 29.4 29.1 5.5 18.7 8.4 8.9 100.0 64.0 1,351
Nomadic 3.9 0.8 1.0 16.3 11.1 66.9 100.0 5.7 1,688
Region
Sool 13.5 13.8 3.5 23.5 11.9 33.9 100.0 30.8 719
Sanaag 15.4 10.2 2.3 20.2 8.9 43.1 100.0 27.9 919
Bari 28.3 21.1 6.2 16.2 12.1 16.0 100.0 55.7 964
Nugaal 27.1 20.6 5.8 11.0 17.4 18.2 100.0 53.4 446
Mudug 22.7 19.8 7.2 17.0 3.8 29.5 100.0 49.7 1,571
Mother's education
No Education 19.1 14.2 4.3 18.4 10.1 33.8 100.0 37.6 3,722
Primary 29.9 28.4 10.1 15.8 5.0 10.7 100.0 68.5 696
Secondary 32.1 41.2 6.7 13.9 4.7 1.5 100.0 80.0 150
Higher 42.0 23.2 11.4 17.5 2.1 3.8 100.0 76.6 51
Wealth quintile
Lowest 4.7 1.3 1.4 18.5 10.5 63.6 100.0 7.4 1,097
Second 9.5 8.2 2.2 15.6 11.2 53.3 100.0 19.8 859
Middle 32.1 26.9 5.4 17.7 10.3 7.6 100.0 64.3 873
Fourth 31.0 25.8 7.7 21.2 7.8 6.5 100.0 64.5 999
Highest 33.8 28.0 11.0 15.5 5.1 6.6 100.0 72.9 791
Total 21.4 17.3 5.3 17.9 9.1 29.0 100.0 44.0 4,619 1 Children’s stools are considered to be disposed of safely if the child used a toilet or latrine, if the fecal matter was put/rinsed into a toilet or latrine or if it was buriedNote: Figures in parentheses are based on 20-49 unweighted cases.
Table 6.6 Disposal of children’s stools

Child Nutrition and Feeding Practices and Nutritional Status of Women
CHAPTER 7

©A
U U
N I
ST P
HO
TO
/ T
OB
IN J
ON
ES.
Key Findings

Puntland Report 2020Somali Health and Demographic Survey (SDHS)140
Nutritional status is determined by multifaceted interactions between food availability, affordability, accessibility and consumption and infections. Nutrition is a substance that provides energy, promotes growth, and nourishes the body. Nutritional status influences an individual’s growth and development, productivity, reproductive success and susceptibility to diseases. Good nutritional status is very critical for the growth and development of children particularly those who are under two years. Women’s nutrition has a direct effect on their health and the health of their children. Nutritional deficiencies among women may lead to anemia, infections and pregnancy complications that may result in premature birth or death. Nutritional deficiency among children especially under five years of age can lead to childhood illnesses such as diarrhea and respiratory diseases and nutritional problems such as wasting and stunting.
Nutrition of Children and WomenNutritional status of women and children can be measured in different ways such as anthropometric, biochemical, clinical and dietary methods. These methods of assessment differ in how and when they are conducted. In SHDS 2020 the anthropometric and dietary methods were used for assessing the nutritional status of women aged 15 to 49 years and children aged 0 to 5 years. The dietary method inquired about feeding practices of infants and children. While the anthropometric assessment measured the height and weight of women aged 15-49 and children under the age of five in the sampled households. The equipment used for height and weight measurements was SECA scale (for weight), height board (height for children under five) and SECA (height for adult).
7Chapter 7
Child Nutrition and Feeding Practices and Nutritional Status of Women This chapter presents findings from the SHDS that relate to children’s health. These include the characteristics of newborns (birth weight), vaccination status of children, symptoms of acute respiratory infection (ARI), fever, diarrhoea and treatment of childhood illnesses. Information collected on child health from the SHDS 2020 is expected to assist policy makers and programme managers in formulating appropriate strategies and interventions to improve the health of children in Puntland and sanitation in their environment.

141
The SHDS 2020 followed the standard method of taking height and weight of women and children. Women’s weight was taken by putting the weighing scale on a flat surface to ensure it is balanced and letting the woman stand on it facing forward and their posture vertical. Children under two years of age were measured lying down (supine position) whereas children above two years were measured in standing position. The enumerating teams received training before deploying to the field. Training involved class sessions and field pilot-test on how to measure weight and length/height of children and women. The enumerators were medical professionals - midwives, nurses, public health and doctors. In SHDS 2020, standardized nutritional indicators were generated using WHO Anthropic tool for nutritional survey data analyses. The below measurements were used to generate the nutritional indicators: -
1. Low weight for age (underweight)
2. Low height for age (stunting)
3. Low weight for height (wasting)
Stunting, or low height-for-age, is a sign of chronic undernutrition that reflects failure to receive adequate nutrition over a long period. Stunting can also be affected by recurrent and chronic illness. Wasting, or low weight-for-height, is a measure of acute undernutrition and represents the failure to receive adequate nutrition in the period immediately before the survey. Wasting may result from inadequate food intake or from a recent episode of illness causing weight loss. Underweight, or low weight-for-age, is a composite index of weight-for-height and height-for-age. Thus, it includes both acute (wasting) and chronic (stunting) undernutrition.
Stunting (assessed via height-for-age): Height-for-age is a measure of linear growth retardation and cumulative growth deficits. Children whose height-for-age Z-score is below minus two standard deviations (-2 SD) from the median of the reference population are considered short for their age (stunted), or chronically undernourished. Children whose Z-score is below minus three standard deviations (-3 SD) from the median are considered severely stunted.
Wasting (assessed via weight-for-height): The weight-for-height index measures body mass in relation to body height or length and describes acute nutritional status. Children whose weight-for-height Z-score is below minus two standard deviations (-2 SD) from the median of the reference population are considered thin (wasted), or acutely undernourished. Children whose Z-score is below minus three standard deviations (-3 SD) from the median are considered severely wasted.
Underweight (assessed via weight-for-age): Weight-for-age is a

Puntland Report 2020Somali Health and Demographic Survey (SDHS)142
composite index of height-for-age and weight-for-height. It takes into account both acute and chronic undernutrition. Children whose weight-for-age Z-score is below minus two standard deviations (-2 SD) from the median of the reference population are classified as underweight. Children whose Z-score is below minus three standard deviations (-3 SD) from the median are considered severely underweight.
The means of the Z-scores for height-for-age, weight-for-height, and weight-for-age are also calculated as summary statistics representing the nutritional status of children in a population. These mean scores describe the nutritional status of the entire population of children without the use of a cut-off point. A mean Z-score of less than 0 (i.e., a negative mean value for stunting, wasting, or underweight) suggests a downward shift in the entire sample population’s nutritional status relative to the reference population. The farther away mean Z-scores are from 0, the higher the prevalence of undernutrition.
Nutritional Status of ChildrenNutrition status of children is affected by different factors such as the mother’s nutritional status, socio economic status, educational background or children’s poor health condition. Like the rest of Somalia, nutritional status of Puntland children is relatively poor due to several reasons, such as low economic conditions of Somali
Figure 7.1 Nutritional status of children
Percent of children under five years classified as malnourished according to three anthropometric indices of nutritional status
0.0
5.0
10.0
15.0
20.0
25.0
30.0
35.0
40.0
45.0
0 1 2 3 4 5 6 7 8 9 10 11 12 13 14 15 16 17 18 19 20 21 22 23 24 25 26 27 28 29 30 31 32 33 34 35 36 37 38 39 40 41 42 43 44 45 46 47 48 49 50 51 52 53 54 55 56 57 58 59
Stunting Wasting Underweight

143
households, and severe drought that has affected the country in recent years. Under-nourishment in children is usually associated with high mortality and morbidity rates. Nutritional deficit also hinders children’s long term physical and mental development.
In SHDS 2020 the height and weight measurements of children below 5 years of age were taken in addition to the inquiry of their dietary intake. Children’s height/length, weight, and age data were used to calculate three indices: height-for-age, weight for- height, and weight-for-age. As WHO standards indicate, indicators such as height for age, weight for height and weight for age or stunting, can be used to calculate the nutritional status of children under five.
Table 7.1 shows the nutritional status of children under-five years according to three anthropometric indices - height for age, weight for height and weight for age. Overall, 25 percent of children under the age of five are stunted, 16 percent are severely stunted, 11 percent are wasted, 6 percent are severely wasted, 25 percent are underweight, and 15 percent are severely underweight.
The prevalence of stunting generally increases with an increase in age peaking at 16 months (39 percent) before generally declining thereafter. The proportions of stunting (-2 SD) and severe stunting (-3 SD) are highest among children aged 12-17 months at 31 and 20 percent respectively (Figure 7.1).
Stunting is higher among male children at 26 percent than female children at 23 percent.
By type of residence, rural areas had the highest prevalence of stunting at 33 percent while nomadic areas had the lowest prevalence at 16 percent.
Regionally, Bari has the highest prevalence of stunting at 35 percent while Nugaal has the lowest prevalence at 19 percent.
Stunting generally declines with an increase in the mother’s education from 27 percent of children of mothers with no education to 20 percent of children of mothers with secondary education.
Initiation of breastfeedingThe World Health Organisation (WHO) recommends early initiation of breastfeeding within the first hour of birth. The first breast milk contains a substance called ‘colostrum’, which contains a high concentration of antibodies and nutrients. It protects babies from the onset of diseases. Breastfeeding is also beneficial for mothers as it is known to reduce the risks of breast and ovarian cancers and postpartum depression. Early suckling improves the
Figure 7.2 Children who are Underweight by Region
Percentage of children under five years classified as underweight
20.619.2
37.7
10.6
26.8
Sool Sanaag Bari Nugaal Mudug

Puntland Report 2020Somali Health and Demographic Survey (SDHS)144
production of milk and creates a bond between a mother and child. As a result, WHO recommends children be exclusively breastfed in the first six months of their life and that mothers should continue breastfeeding up to two years, while providing complementary foods.
Table 7.2 shows that in total, 88 percent of children had ever been breastfed regardless of whether initiation of breastfeeding was within the first hour of birth or continuation of breastfeeding up to two years. Furthermore, 65 percent of children started breastfeeding within the first hour of their birth.
As presented in Figure 7.3, children from nomadic areas are less likely to be breastfed within the first hour of birth at 55 percent, compared to 72 and 70 percent of children from urban and rural areas respectively. Regionally, children in Bari are more likely to be breastfed within the first hour of birth at 73 percent compared to children in the other regions.
It is notable that children born in health facilities or delivered with the assistance of health professionals were more likely to have been breastfed in the first hour of birth compared to children born at home with the delivery assisted either by a traditional birth attendant or by no one. Seventy-eight percent of children born in health facilities started breastfeeding within the first hour of birth compared to 61 percent of children who were born at home. Children from the wealthiest households were more likely to have been breastfed in the first hour of birth compared to children of mothers from the poorest households (Table 7.2).
Breast feeding status by ageIn the SHDS 2020, ever-married women who had children were asked if they had ever breastfed their babies, how long after birth they put the baby to the breast (for the last child), if anything was given other than breast milk in the first three days of life (for the last child), if they were still breastfeeding their last child, if they had given their children micronutrient powder, and if they were ready to use therapeutic (PlumpyNut), or ready to use supplemental food (PlumpyDoz). The enumerators used the local names of these foods for the respondents to clearly understand the questions.
Table 7.3 and Figure 7.4 shows the percentage distribution of children less than two years of age by breastfeeding status, currently breastfeeding and percentage of all children under-two years of age using nipple feeding bottles according to age in months. Thirty-two percent of children under 6 months are exclusively breastfed and the percentage of exclusive breastfeeding declines with age from 39 percent in 0-1 months to 26 percent among children of 4-5 months. Contrary to the recommendation that children under the age of six months be exclusively breastfed, many infants under
Figure 7.3 Initial Breastfeeding
Figure 7.4 Breastfeeding status by age
Percentage who started breastfeeding within the first hour of birth by place of residence
Percent of children under age two by breastfeeding status
69.8
54.9
Urban Rural Nomadic
72.2
0-1 2-3 4-5 6-8 9-11 12-17 18-23
Not breastfeeding
Exclusively breastfeeding
Breastfeeding and consuming plain water only

145
31.8
25.5
46.3
43.5
40.9
29.7
49.8
45.6
IYCF 2: Exclusive breastfeedingunder 6 months
Exclusive breastfeeding at4-5 months of age
IYCF 3: Continue breastfeedingat 1 year
IYCF 4: Introduction of solid, semisolidor soft foods (6-8 months)
IYCF 10: Continuedbreastfeeding at 2 years
IYCF 11: Age appropriatebreastfeeding (0-23 months)
IYCF 12: Predominant breastfeeding(0-5 months)
IYCF 14: Bottle feeding(0-23 months)
6 months are also fed with other liquids in addition to breast milk such as water at 14 percent, other milk at 16 percent, and non-milk liquids at 4 percent. Moreover, 19 percent of infants begin complementary foods before 6 months of age. Fifteen percent of children under the age of 6 months were not breastfeeding at the time of the survey. Forty-one percent of children under-two years of age are currently breastfed while forty-three percent are using a feeding bottle with nipple.
Infant and Young Child Feeding (IYCF) indicators on breastfeeding status
Figure 7.5 shows that 32 percent of children under six months of age are exclusively breastfed while 50 percent of children under age 6 months are predominantly breastfed. Forty-six percent of children are still breastfeeding at age 1, and 41 percent are breastfeeding at age 2. Overall, 44 percent of children were introduced to complementary foods at 6-8 months and 30 percent of children under the age of 2 are breastfed appropriately for their age. Furthermore, 46 percent of children aged 0-23 months are bottle fed.
Types of complementary foodsComplementary foods are recommended to be given to children when breastfeeding is no longer adequate for children’s needs. The period for complementary feeding usually starts from four to six months. At this age, children are vulnerable to malnutrition. Complementary feeding should be timely meaning that all infants should begin receiving foods in addition to the breast milk from six months onwards. However, foods to be given to children should be appropriate for their age and nutritional needs. Mothers or caregivers should take appropriate measures when preparing the foods and ensure its safety by minimizing the risk of food contamination.
Table 7.4 shows the foods consumed by children under two years of age who were living with the mother during the day or night preceding the survey according to the breastfeeding status. The data shows that 15 percent of breastfed children under two years and 15 percent of non-breastfed children under two years are fed with infant milk formula. Thirty-two percent of breastfed children are getting other liquids in addition to breast milk compared to 40 percent who are not breastfed.
Overall, 42 percent of breastfed children under two years of age and 57 percent of non-breastfed children under two years of age received solid or semi-solid complementary foods in addition to breast milk. Twenty-six percent of breastfed children between 0-23
Figure 7.5 IYCF indicators on breastfeeding status
Indicators on breastfeeding by age in months

Puntland Report 2020Somali Health and Demographic Survey (SDHS)146
months received foods made from grains, whereas 17 percent of the same children had fruits and vegetables rich in vitamin A. Fifteen percent of breastfed children and 17 percent of non-breastfed children aged between 0-23 months were given milk products (cheese, yoghurt and other). Fifty-seven percent of children aged 0-23 months who were not breastfeeding received solid or semi-solid foods from any sources.
With respect to dietary intake of children by their breastfeeding status, a higher proportion of solid and semi-solid foods are being consumed by non-breastfed children. Thirty-four percent of non-breastfeeding children receive other types of milk and 40 percent receive other liquids. Supplementary foods given to children are fruits and vegetables rich in vitamin A, and meat, fish, poultry, and eggs.
Infant and Young Child Feeding (IYCF) practices
Optimal Infant and Young Child Feeding practices are essential for child growth and development. The period during pregnancy and children’s first two years of life are considered as a critical window for their growth and prevention of childhood illnesses. IYCF global strategy was first issued in 2002 jointly by WHO and UNICEF to reverse the disturbing trends of infant and child feeding practices. The main objective of the strategy is to improve, promote IYCF practices and as result to decrease the child morbidity and mortality.
Table 7.5 shows the distribution of children aged between 6-23 months living with their mother who were being fed according to the three IYCF practices based on the breastfeeding status, number of food groups and times they were being fed during the day or night preceding the survey. The UNICEF recommended IYCF practices to be followed based on breastfeeding status and the age of children. Children from 6-8 months on breastfeeding are recommended to be fed with four different groups of food per day with a minimum meal frequency of two times whereas children of 9-23 months need to be fed with four or more different groups of food per day with a minimum meal frequency of three. In non-breastfeeding children, it is recommended that they be given four different groups of foods with a minimum meal frequency of four times.
Overall, 15 percent of breastfed children between 6-23 months were fed four or more different groups of food in the day or night preceding the survey and 33 percent were fed the minimum meal frequency in the night or day before the survey. Only 8 percent among the breastfed children 6-23 months old were fed four or
Figure 7.6 IYCF practices by wealth quintile
Percentage of youngest children age 6-23 months living with their mother by wealth quintile
1.1
0.8
4.7
5.6
7.7
Lowest
Second
Middle
Fourth
Highest

147
more different groups of foods with a minimum number of times that is required.
Twenty-one percent of non-breastfeeding children were fed on milk or milk products whereas, 14 percent of the same children were fed four or more different groups of food in the night or day preceding the survey. Minimum meal frequency among the non-breastfeeding children, 21 percent of them were fed the minimum meal frequency. Only 3 percent of non-breastfeeding children were fed as recommended by the IYCF guideline.
Overall, only 4 percent of all the children aged between 6-23 months were fed in line with the three IYCF practices in the night or day prior to the survey, while 11 percent of the same children were fed with four or more different groups of foods. Twenty percent of children aged between 6-23 months had the recommended minimum meal frequency.
There are notable differences according to type of residence in the proportion of all children (both breastfed and non-breastfed) aged between 6-23 months fed according to the recommended three IYCF practices; from 7 percent in urban areas to less than one percent in nomadic areas. Regionally, Nugaal has the highest proportion of children aged 6-23 months fed according to the recommended three IYCF practices at 5 percent, while Sool region has the lowest proportion at 2 percent.
There is a steady increase in the proportion of children fed according to the recommended three IYCF practices as mother’s education increases from 2 percent among children whose mothers have no education to 17 percent among children whose mothers have secondary school education. As expected, children from the wealthiest households are more likely to be fed according to the recommended three IYCF practices at 8 percent compared to children from the poorest households at 1 percent (Figure 7.6).
Micronutrients intake among childrenMicronutrients which consist of vitamins and minerals are essential for child development and prevention against illnesses. The age from 6 to 59 months is a critical window for children’s health and well-being. Vitamin A and Iron are key micronutrients, thus the need for supplementation. The deficiency of these micronutrients can result in a weak immune system, blindness, stunting or anemia.
In SHDS 2020, ever-married women were asked if children aged 6-23 months consumed foods rich in vitamin A and iron in the day or night preceding the survey, and records were made to reflect those who had received any of these supplements.
Table 7.6 shows that 30 percent of children aged between 6-23

Puntland Report 2020Somali Health and Demographic Survey (SDHS)148
months had consumed foods rich in vitamin A in the night or day preceding the survey, while 20 percent had consumed foods rich in iron. The findings further reveal that 6 percent of children aged 6-59 months were given iron supplementation in the seven days preceding the survey. Similarly, only 6 percent of children aged 6-59 months were given deworming drugs during the past six months preceding the survey. In general, the proportion of children consuming foods rich in vitamin A and iron and the proportion receiving deworming medication increases with increasing household wealth.
Analysis by place of residence shows that a large proportion of children aged between 6-23 months in urban areas that received vitamin A supplements are at 42 percent, followed by those who live in rural areas at 35 percent while nomadic children received the least vitamin A supplements at 15 percent (Figure 7.7). Regionally, the percentage of children who have received vitamin A supplements was highest in Mudug and Nugaal at 38 percent and lowest in Sool at 15 percent.
Nutritional status of womenNutrition of women is vital for women’s health and pregnancy outcomes. In SHDS 2020 women’s nutritional status was calculated by measuring the body mass index (BMI). BMI is a screening tool that can indicate whether the person is underweight, has normal weight or is overweight. BMI is calculated by dividing the weight (kg) of the person by height (m) square. The ranges of BMI are <18.5 (underweight), 18.5-24.9 (normal), 25.0-29.9 (overweight) and >=30 (obese). If the person’s BMI is outside of normal range, their health risk might increase significantly. Having too much weight can lead to varieties of health conditions such as diabetes 2, cardiovascular problems and high blood pressure. If the weight of the person is below the normal range the risk of adverse pregnancy outcomes and overall poor health status increases.
Table 7.7 shows the percentage distribution of women aged 15-49, with height under 145 cm, mean Body Mass Index (BMI), and those with specific BMI levels, by background characteristics. Seven percent of women had a height below 145 cm. Generally, women with short stature have a higher risk of having obstructed labor due to cephalopelvic disproportion (Surapanthapisit & Thitadilok, 2006). Sixty-two percent of women have a normal body mass index (between 18.5 and 24.9) while 19 percent of women aged 15-49 are thin with BMI of less than 18.5. Fourteen percent of women are overweight with a body mass index of 25.0 – 29.9 and 5 percent of women are obese.
The proportion of overweight women increases with an increase in age, as women aged 40-49 at 21 percent are significantly more likely to be overweight compared to women aged 15-19 at 12 percent.
Figure 7.7 children consuming foods rich in vitamin A and iron by type of resident
Percentage who consumed foods rich in vitamin A and iron in past 24 hours
41.5
34.9
14.9
31.6
21.5
10.7
Urban
Rural
Nomadic
consumed foods rich in iron
consumed foods rich in vitamin A

149
Nomadic areas have the highest percentage of thin women at 32 percent, followed by rural areas at 20 percent and 11 percent in urban areas. Similarly, the percentage of overweight women is highest in urban areas at 19 percent and lowest in nomadic areas at 6 percent. Regionally, Sanaag has the highest percentage of thin women at 31 percent, compared to Nugaal with the lowest percentage at 11 percent each.
The percentage of thin women tends to decrease with increasing levels of education, from 21 percent among women with no education to 14 percent among those with secondary education. Similarly, the percentage of overweight women tends to increase with an increase in education from 13 percent among women with no education to 19 percent among those with higher education.
The percentage of thin women tends to decrease with an increase in wealth status of the households, from 30 percent among women from the poorest households to 14 percent among those from the wealthiest households. Similarly, the percentage of overweight women tends to increase with an increase in wealth status of the households, from 7 percent among women from the poorest households to 20 percent among those from the fourth wealth quintile.
Micronutrient intake among womenMicronutrients deficiency is a global public health problem. Largely, deficiency is observed in minerals and vitamins affecting the health of mothers and, indirectly, the nutritional status and development of children. Iron supplementation for women during pregnancy is vital for mothers’ and babies’ health. Iron supplementation has an impact on the health of the mother during pregnancy, delivery or the post-partum stage as its severe deficiency may lead to anaemia, spontaneous abortion or low birth weight. Additionally, the strategy of deworming is a public health intervention for pregnant women recommended by WHO. Preventive deworming using a single dose of Albendazole or Mebendazole is recommended for pregnant women in areas where prevalence of hookworms or T. trichiura infection and anaemia is a public health problem. This is to curb the effects of helminths diseases on the health of pregnant women.
Table 7.8 and Figure 7.8 show the percentage of women who took iron tablets or syrup and deworming during the pregnancy and percentage who took deworming medication. Overall, only 2 percent of women reported that they had taken iron supplementation for the recommended 90 days or more during their last pregnancy. Similarly, only 2 percent of women took deworming medication.
Women in urban areas were more likely to have taken iron supplements during pregnancy for at least 90 days at 4 percent
Figure 7.7 Iron tables and deworming
Percentage of women who took iron supplements for at least 90 days and deworming by type of residence.
4.4
1.0
0.3
2.7
1.5
0.9
Urban
Rural
Nomadic
Deworming Medication
Iron tablets or syrup
percentage of women who took iron supplements for at least 90 days and deworming by type of residence.
4.4
1.0
0.3
2.7
1.5
0.9
Urban
Rural
Nomadic
Deworming Medication
Iron tablets or syrup

Puntland Report 2020Somali Health and Demographic Survey (SDHS)150
compared to women from rural and nomadic areas at less than 1 percent each. A similar trend is observed on the percentage of women who took deworming medication during pregnancy of their last birth; it is highest in urban areas at 3 percent and lowest in nomadic areas at 1 percent.
Regionally, the percentage of women who took iron supplements during pregnancy for at least 90 days was highest in Nugaal and Sanaag at 3 percent each and lowest in Sool and Bari at 1 percent each.

151

Puntland Report 2020Somali Health and Demographic Survey (SDHS)152
Perc
enta
ge o
f chi
ldre
n un
der
five
year
s cl
assi
fied
as m
alno
uris
hed
acco
rdin
g to
thre
e an
thro
pom
etri
c in
dice
s of
nut
riti
onal
sta
tus:
hei
ght-
for
age,
wei
ght-
for-
heig
ht, a
nd w
eigh
t-fo
r-ag
e, b
y ba
ckgr
ound
cha
ract
eris
tics
, SH
DS
2020
Hei
ght-
for-
age1
Wei
ght-
for-
Hei
ght
Wei
ght-
for-
age
Bac
kgro
und
char
acte
rist
ics
Perc
enta
ge
belo
w -3
SD
Perc
enta
ge
belo
w -2
SD
2
Mea
n Z-
scor
e (S
D)
Num
ber
of
child
ren
Perc
enta
ge
belo
w -3
SD
Perc
enta
ge
belo
w -2
SD
2
Mea
n Z-
scor
e (S
D)
Num
ber
of
child
ren
Perc
enta
ge
belo
w -3
SD
Perc
enta
ge
belo
w -2
SD
2
Mea
n Z
-sco
re
(SD
)
Num
ber
of
child
ren
Age
in m
onth
s
0-5
11.4
17.3
4.5
837.
214
.11.
313
621
.928
.22.
032
4
6-8
19.0
26.5
4.5
669.
415
.91.
577
15.1
28.6
2.4
164
9-11
(14
.5)
(22.
4)
(4.2
)38
11.3
18.3
0.9
5014
.620
.22.
610
3
12-1
719
.930
.72.
120
54
.510
.21.6
144
12.3
23.1
0.6
231
18-2
314
.624
.11.1
756.
48.
61.1
558.
220
.90
.492
24-3
517
.729
.31.
832
85.
59.
81.
320
414
.524
.90
.64
05
36-4
713
.222
.23.
126
34
.710
.71.
225
915
.626
.61.
357
9
48-
5916
.625
.62.
828
45.
010
.31.0
216
15.7
25.3
1.150
5
Sex M
ale
16.4
25.2
2.8
681
10.9
10.5
1.2
579
24.4
21.0
1.2
1,2
30
Fem
ale
15.4
25.6
2.7
661
11.2
10.6
1.3
562
26.1
19.3
1.0 1
,174
Size
at b
irth
Ver
y sm
all
(10
.5)
(17.
1)(2
.9)
38(6
.2)
(15.
4)
(0.7
)49
13.6
18.9
1.3
92
Smal
l(1
7.0
)(3
0.3
)(3
.0)
36(8
.2)
(12.
0)
(1.6
)26
21.7
29.4
1.461
Ave
rage
or
larg
er16
.927
.32.
895
95.
610
.61.
377
416
.027
.51.1
1,6
10
Mot
her'
s nu
trit
iona
l sta
tus4
Thi
n (B
MI <
18
.5)
(18.
7)(3
3.4
)(2
.0)
29*
**
9(1
3.5)
(22.
9)(1
.1)4
0
Nor
mal
(BM
I 18
.5-2
4.9
)14
.522
.32.
685
7.0
12.8
1.3
9213
.223
.61.
217
5
Ove
rwei
ght/
obes
e (B
MI >
=
25)
15.0
21.1
3.0
45
8.7
14.5
1.2
5215
.628
.11.4
114
Type
Res
iden
ce
Urb
an17
.827
.93.
051
74
.48.
81.1
335
19.9
30.4
1.191
3
Rura
l20
.232
.53.
152
65.
49.
11.
836
616
.328
.81.0
706
Tab
le 7
.1
Nut
riti
onal
sta
tus
of c
hild
ren

153
Tab
le 7
.1
(Con
t’d)
Nut
riti
onal
sta
tus
of c
hild
ren
Nom
adic
10.3
16.4
2.1
298
7.2
15.1
0.9
44
09.
016
.81.
378
4
Reg
ion
Sool
13.2
25.1
1.619
67.
013
.10
.816
29.
520
.60
.930
6
Sana
ag14
.323
.81.4
227
6.8
14.5
0.5
186
8.9
19.2
0.7
352
Bari
25.3
35.1
3.5
44
44
.58.
41.
222
226
.237
.70
.764
7
Nug
aal
7.0
19.1
2.7
118
6.7
13.8
0.7
132
5.0
10.6
2.0
262
Mud
ug14
.421
.33.
435
74
.89.
12.
04
3916
.426
.81.4
837
Educ
atio
n
No
educ
atio
n16
.026
.52.
873
45.
911
.21.4
624
1626
.41.1
1,16
3
Prim
ary
16.1
24.7
2.5
40
15.
310
.41.1
332
14.7
24.7
1.1 6
45
Seco
ndar
y14
.420
.42.
361
(4.0
)(8
.5)
(0.6
)49
11.9
20.3
1.5
116
Hig
her
educ
atio
n*
**
13*
**
11(1
8.8)
(24
.2)
(1.6
) 3
0
Wea
lth
Low
est
10.9
18.3
2.0
350
6.9
14.4
0.9
431
9.3
17.8
1.2
793
Seco
nd17
.927
.83.
222
64
.69.
91.7
196
21.4
32.7
1.2
431
Mid
dle
18.5
28.7
3.3
304
5.3
9.2
1.423
021
.131
.61.0
503
Four
th20
.931
.92.
930
44
.37.
21.
215
916
.228
.61.1
44
0
Hig
hest
17.1
28.4
3.0
157
5.8
11.1
1.5
125
11.8
21.9
1.2
235
Tota
l 15
.925
.42.
7 1
,34
1 5.
711
.01.
2 1
,14
1 15
.125
.21.
1 2
,40
3
Perc
enta
ge o
f chi
ldre
n un
der
five
year
s cl
assi
fied
as m
alno
uris
hed
acco
rdin
g to
thre
e an
thro
pom
etri
c in
dice
s of
nut
riti
onal
sta
tus:
hei
ght-
for
age,
wei
ght-
for-
heig
ht, a
nd w
eigh
t-fo
r-ag
e, b
y ba
ckgr
ound
cha
ract
eris
tics
, SH
DS
2020
Hei
ght-
for-
age1
Wei
ght-
for-
Hei
ght
Wei
ght-
for-
age
Bac
kgro
und
char
acte
rist
ics
Perc
enta
ge
belo
w -3
SD
Perc
enta
ge
belo
w -2
SD
2
Mea
n Z-
scor
e (S
D)
Num
ber
of
child
ren
Perc
enta
ge
belo
w -3
SD
Perc
enta
ge
belo
w -2
SD
2
Mea
n Z-
scor
e (S
D)
Num
ber
of
child
ren
Perc
enta
ge
belo
w -3
SD
Perc
enta
ge
belo
w -2
SD
2
Mea
n Z
-sco
re
(SD
)
Num
ber
of
child
ren

Puntland Report 2020Somali Health and Demographic Survey (SDHS)154
Among last-born children who were born in the two years preceding the survey, the percentage who were ever breastfed and the percentage who started breastfeeding within one hour and within one day of birth and a the percentage who received a pre-lacteal feed, by background characteristics, SHDS 2020
Background Characteristics
Among last-born children born in the past two years:Among last-born children born
in the past two years:
Percentage ever breastfed
Percentage who started
breastfeeding within 1 hour of
birth
Percentage who started
breastfeeding within 1 day of
birth1
Number of last-born children
Percentage who received a
prelacteal feed2
Number of last-born children
ever breastfed
Sex
Male 88.7 64.1 86.6 881 40.3 781
Female 86.6 65.7 84.6 807 40.9 699
Assistance at delivery
Health personnel 87.2 72.0 86.2 638 41.1 557
Traditional birth attendant
88.9 61.6 86.8 885 38.9 787
Relative/friend 91.2 67.7 83.4 118 46.4 108
Other * * * 5 * 5
No one (57.5) (20.2) (55.4) 41 (58.1) 24
Place of delivery
Health facility 93.1 77.6 92.6 378 39.6 352
At home 86.2 61.3 83.8 1,303 40.9 1,123
Other * * * 7 * 5
Type of residence
Urban 92.3 72.2 90.9 569 38.0 526
Rural 89.6 69.8 87.1 470 43.6 422
Nomadic 82.2 54.9 79.9 648 40.8 532
Region
Sool 91.0 64.9 86.9 276 42.2 251
Sanaag 87.2 65.1 86.1 361 33.3 315
Bari 84.3 73.1 83.8 357 38.0 301
Nugaal 93.6 60.7 89.9 167 41.1 156
Mudug 86.7 60.4 84.4 526 46.3 456
Education
No Education 86.1 62.6 84.0 1,348 40.1 1,160
Primary 95.4 73.0 93.2 257 40.5 246
Secondary 93.7 81.8 92.1 61 43.0 57
Higher (79.5) (62.3) (79.5) 21 * 17
Wealth quintile
Lowest 85.5 57.3 83.2 405 39.8 346
Second 82.2 57.5 79.8 324 39.4 266
Middle 85.8 61.5 84.0 301 44.3 258
Fourth 91.7 70.7 90.0 351 36.1 322
Highest 93.6 79.2 91.5 306 44.4 287
Total 87.7 64.9 85.6 1,688 40.6 1,480
Table 7.2 Initial breastfeeding

155
Tab
le 7
.3
Brea
stfe
edin
g St
atus
by
age
Perc
ent d
istr
ibut
ion
of y
oung
est c
hild
ren
unde
r tw
o ye
ars
who
are
livi
ng w
ith
thei
r m
othe
r by
bre
astf
eedi
ng s
tatu
s an
d th
e pe
rcen
tage
cur
rent
ly b
reas
tfee
ding
; and
the
perc
enta
ge o
f all
child
ren
unde
r tw
o ye
ars
usin
g a
bott
le w
ith
a ni
pple
, acc
ordi
ng to
age
in m
onth
s, S
HD
S 20
20
Age
in
mon
ths
Not
br
east
feed
ing
Bre
astf
eedi
ng s
tatu
s:
Tota
lC
urre
ntly
br
east
feed
ing
Num
ber
of
youn
gest
ch
ildre
n un
der
two
year
s liv
ing
wit
h th
e m
othe
r
Perc
enta
ge
usin
g a
bott
le w
ith
a ni
pple
Num
ber
of a
ll ch
ildre
n un
der
two
year
s
Excl
usiv
ely
brea
stfe
edin
g
Bre
astf
eedi
ng
and
cons
umin
g pl
ain
wat
er
only
Bre
astf
eedi
ng
and
cons
umin
g no
n-m
ilk
liqui
ds 1
Bre
astf
eedi
ng
and
cons
umin
g ot
her
milk
Bre
astf
eedi
ng
and
cons
umin
g co
mpl
emen
tary
fo
ods
0-1
11.3
39.2
15.2
4.6
15.2
14.5
100
.088
.717
4.6
24.8
175
2-3
15.3
29.3
14.2
2.1
19.4
19.7
100
.084
.717
8.6
35.6
179
4-5
19.4
25.5
13.7
4.1
14.0
23.3
100
.080
.613
1.047
.913
1
6-8
23.4
16.4
8.9
7.1
11.7
32.4
100
.076
.623
0.0
51.2
230
9-11
37.3
15.2
4.3
3.0
4.9
35.4
100
.062
.718
0.1
54.0
180
12-1
755
.67.
42.
53.
34
.227
.010
0.0
44
.451
9.3
51.6
519
18-2
369
.70
.01.9
2.0
2.2
24.1
100
.038
.422
2.3
42.
022
2
0-3
13.3
34.2
14.7
3.3
17.3
17.1
100
.086
.735
3.2
30.3
353
0-5
15.0
31.8
14.4
3.6
16.4
18.8
100
.085
.04
84.2
35.1
484
6-9
24.6
16.1
7.3
6.9
11.3
33.8
100
.075
.429
3.5
54.1
293
12-1
553
.77.
32.
33.
54
.828
.410
0.0
46.
34
45.
753
.24
46
12-2
359
.85.
22.
32.
93.
626
.110
0.0
42.
674
1.5
48.
774
2
20-2
367
.60
.02.
33.
01.0
26.1
100
.04
0.9
128.
94
3.2
129
Not
e: B
reas
tfee
ding
sta
tus
refe
rs to
a "
24-h
our"
per
iod
(yes
terd
ay a
nd la
st n
ight
). C
hild
ren
who
are
cla
ssifi
ed a
s br
east
feed
ing
and
cons
umin
g pl
ain
wat
er o
nly
cons
umed
no
liqui
d or
sol
id s
uppl
emen
ts. T
he c
ateg
orie
s of
not
bre
astf
eedi
ng,
excl
usiv
ely
brea
stfe
d, b
reas
tfee
ding
and
con
sum
ing
plai
n w
ater
, non
-milk
liqu
ids,
oth
er m
ilk, a
nd c
ompl
emen
tary
food
s (s
olid
s an
d se
mi-
solid
s) a
re h
iera
rchi
cal a
nd m
utua
lly e
xclu
sive
, and
thei
r pe
rcen
tage
s ad
d to
10
0 p
erce
nt.
Thu
s ch
ildre
n w
ho re
ceiv
e br
east
milk
and
non
-milk
liqu
ids
and
who
do
not r
ecei
ve o
ther
milk
and
who
do
not r
ecei
ve c
ompl
emen
tary
food
s ar
e cl
assi
fied
in th
e no
n-m
ilk li
quid
cat
egor
y ev
en th
ough
they
may
als
o ge
t pla
in w
ater
. Any
chi
ldre
n w
ho g
et c
ompl
emen
tary
food
are
cla
ssifi
ed in
that
cat
egor
y as
long
as
they
are
bre
astf
eedi
ng a
s w
ell.
1 Non
-milk
liqu
ids
incl
ude
juic
e, ju
ice
drin
ks, c
lear
bro
th o
r ot
her
liqui
ds

Puntland Report 2020Somali Health and Demographic Survey (SDHS)156
Perc
ent d
istr
ibut
ion
of y
oung
est c
hild
ren
unde
r tw
o ye
ars
who
are
livi
ng w
ith
thei
r m
othe
r by
bre
astf
eedi
ng s
tatu
s an
d th
e pe
rcen
tage
cur
rent
ly b
reas
tfee
ding
; and
the
perc
enta
ge o
f all
child
ren
unde
r tw
o ye
ars
usin
g a
bott
le w
ith
a ni
pple
, acc
ordi
ng to
age
in m
onth
s, S
HD
S 20
20
Age
in m
onth
sN
ot
brea
stfe
edin
g
Bre
astf
eedi
ng s
tatu
s:
Tota
lC
urre
ntly
br
east
feed
ing
Num
ber
of
youn
gest
ch
ildre
n un
der
two
year
s liv
ing
wit
h th
e m
othe
r
Perc
enta
ge
usin
g a
bott
le w
ith
a ni
pple
Num
ber
of a
ll ch
ildre
n un
der
two
year
s
Excl
usiv
ely
brea
stfe
edin
g
Bre
astf
eedi
ng
and
cons
umin
g pl
ain
wat
er
only
Bre
astf
eedi
ng
and
cons
umin
g no
n-m
ilk
liqui
ds 1
Bre
astf
eedi
ng
and
cons
umin
g ot
her
milk
Bre
astf
eedi
ng
and
cons
umin
g co
mpl
emen
tary
fo
ods
0-1
11.3
39.2
15.2
4.6
15.2
14.5
100
.088
.717
4.6
24.8
175
2-3
15.3
29.3
14.2
2.1
19.4
19.7
100
.084
.717
8.6
35.6
179
4-5
19.4
25.5
13.7
4.1
14.0
23.3
100
.080
.613
1.047
.913
1
6-8
23.4
16.4
8.9
7.1
11.7
32.4
100
.076
.623
0.0
51.2
230
9-11
37.3
15.2
4.3
3.0
4.9
35.4
100
.062
.718
0.1
54.0
180
12-1
755
.67.
42.
53.
34
.227
.010
0.0
44
.451
9.3
51.6
519
18-2
369
.70
.01.9
2.0
2.2
24.1
100
.038
.422
2.3
42.
022
2
0-3
13.3
34.2
14.7
3.3
17.3
17.1
100
.086
.735
3.2
30.3
353
0-5
15.0
31.8
14.4
3.6
16.4
18.8
100
.085
.04
84.2
35.1
484
6-9
24.6
16.1
7.3
6.9
11.3
33.8
100
.075
.429
3.5
54.1
293
12-1
553
.77.
32.
33.
54
.828
.410
0.0
46.
34
45.
753
.24
46
12-2
359
.85.
22.
32.
93.
626
.110
0.0
42.
674
1.5
48.
774
2
20-2
367
.60
.02.
33.
01.0
26.1
100
.04
0.9
128.
94
3.2
129
Not
e: B
reas
tfee
ding
sta
tus
refe
rs to
a "
24-h
our"
per
iod
(yes
terd
ay a
nd la
st n
ight
). C
hild
ren
who
are
cla
ssifi
ed a
s br
east
feed
ing
and
cons
umin
g pl
ain
wat
er o
nly
cons
umed
no
liqui
d or
sol
id s
uppl
emen
ts. T
he c
ateg
orie
s of
not
bre
astf
eedi
ng,
excl
usiv
ely
brea
stfe
d, b
reas
tfee
ding
and
con
sum
ing
plai
n w
ater
, non
-milk
liqu
ids,
oth
er m
ilk, a
nd c
ompl
emen
tary
food
s (s
olid
s an
d se
mi-
solid
s) a
re h
iera
rchi
cal a
nd m
utua
lly e
xclu
sive
, and
thei
r pe
rcen
tage
s ad
d to
10
0 p
erce
nt.
Thu
s ch
ildre
n w
ho re
ceiv
e br
east
milk
and
non
-milk
liqu
ids
and
who
do
not r
ecei
ve o
ther
milk
and
who
do
not r
ecei
ve c
ompl
emen
tary
food
s ar
e cl
assi
fied
in th
e no
n-m
ilk li
quid
cat
egor
y ev
en th
ough
they
may
als
o ge
t pla
in w
ater
. Any
chi
ldre
n w
ho g
et c
ompl
emen
tary
food
are
cla
ssifi
ed in
that
cat
egor
y as
long
as
they
are
bre
astf
eedi
ng a
s w
ell.
1 Non
-milk
liqu
ids
incl
ude
juic
e, ju
ice
drin
ks, c
lear
bro
th o
r ot
her
liqui
ds
Tab
le 7
.3
Brea
stfe
edin
g St
atus
by
age

157
Perc
enta
ge o
f you
nges
t chi
ldre
n un
der
two
year
s of
age
who
are
livi
ng w
ith
the
mot
her
by ty
pe o
f foo
ds c
onsu
med
in th
e da
y or
nig
ht p
rece
ding
the
inte
rvie
w, a
ccor
ding
to b
reas
tfee
ding
st
atus
and
age
, SH
DS,
20
20
Age
in m
onth
s
Liqu
ids
Solid
or
sem
i sol
id fo
ods
Num
ber
of
child
ren
Infa
nt
form
ula
Oth
er
milk
1
Oth
er
liqui
dsFo
rtif
ied
baby
food
Food
m
ade
from
gr
ains
Frui
ts a
nd
vege
tabl
es
rich
in
vita
min
A
Oth
er
frui
ts a
nd
vege
tabl
es
Food
m
ade
from
ro
ots
and
tube
rs
Food
m
ade
from
le
gum
es
and
nuts
Mea
t,
fish
and
po
ultr
yEg
gs
Che
ese,
yo
gurt
, ot
her
milk
pr
oduc
t
Any
so
lid o
r se
mis
olid
fo
od
BR
EAST
FEED
ING
CH
ILD
REN
0-1
12.6
13.7
14.5
2.6
8.5
7.5
0.0
2.1
1.02.
91.0
5.8
15.9
149
2-3
21.6
13.6
16.6
5.1
12.4
7.0
2.4
1.5
2.0
2.8
3.4
7.1
23.1
147
4-5
16.3
19.1
22.6
2.2
13.4
8.0
0.0
1.5
1.5
2.6
0.0
5.6
26.4
98
6-8
13.9
35.2
30.8
6.8
20.1
17.5
7.1
8.0
7.1
11.8
6.5
23.9
47.8
170
9-11
13.7
32.9
36.8
18.6
35.2
21.6
7.4
11.6
10.2
13.5
12.1
18.1
56.3
109
12-1
715
.939
.053
.015
.14
3.9
28.5
11.0
15.3
10.3
25.0
11.0
20.9
62.0
218
18-2
36.
035
.64
4.6
8.0
45.
925
.27.
013
.311
.517
.513
.119
.560
.779
6-23
13.5
36.2
42.
312
.335
.623
.58.
612
.29.
517
.910
.121
.156
.557
6
Tota
l14
.927
.632
.18.
725
.717
.05.
57.
96.
211
.86.
715
.04
2.2
970
NO
NB
REA
STFE
EDIN
G C
HIL
DR
EN
0-1
**
**
**
**
**
**
*17
2-3
(5.2
)(2
7.9)
(20
.3)
(0.0
)(1
.8)
(34
.4)
(5.2
)(0
.0)
(0.0
)(1
.8)
0.0
)(0
.0)
(4.1)
(41.6
)29
4-5
(8.1)
(21.
2)(9
.9)
(12.
5)(4
.0)
(13.
9)(0
.0)
(4.0
)(0
.0)
(10
.0)
(5.9
)(1
1.2)
(37.
7)25
6-8
13.2
28.4
32.9
7.1
24.0
7.9
4.1
3.8
5.4
8.0
2.7
10.9
45.
655
9-11
9.0
36.7
30.6
14.2
33.5
13.1
6.2
10.1
8.5
11.2
6.4
21.0
59.6
77
12-1
715
.736
.34
3.6
11.5
39.5
27.5
7.6
16.9
9.0
20.6
10.5
18.9
60.6
339
18-2
318
.034
.14
8.8
17.3
42.
323
.610
.913
.48.
918
.57.
518
.258
.919
1
6-23
15.4
35.0
42.
713
.138
.323
.18.
114
.08.
617
.98.
518
.358
.866
1
Tota
l15
.134
.24
0.4
12.5
36.9
22.2
7.3
13.0
7.9
16.9
7.9
17.0
56.8
732
Not
e: B
reas
tfee
ding
sta
tus
and
food
con
sum
ed re
fer
to a
“24
-hou
r” p
erio
d (y
este
rday
and
last
nig
ht).
1 Oth
er m
ilk in
clud
es fr
esh,
tinn
ed a
nd p
owde
red
anim
al m
ilk2 D
oes
not i
nclu
de p
lain
wat
er. I
nclu
des
juic
e, ju
ice
drin
ks, c
lear
bro
th, o
r ot
her
non-
milk
liqu
ids.
3 Incl
udes
fort
ified
bab
y fo
od4 In
clud
es [
list f
ruit
s an
d ve
geta
bles
incl
uded
in th
e qu
esti
onna
ire
such
as
pum
pkin
, red
or
yello
w y
ams
or s
quas
h, c
arro
ts, r
ed s
wee
t pot
atoe
s, d
ark
gree
n le
afy
vege
tabl
es, m
ango
es, p
apay
as, a
nd o
ther
loca
lly g
row
n fr
uits
and
veg
etab
les
that
ar
e ri
ch in
vit
amin
A]
Tab
le 7
.4
Food
s an
d liq
uids
con
sum
ed b
y ch
ildre
n in
the
day
or n
ight
pre
cedi
ng th
e in
terv
iew

Puntland Report 2020Somali Health and Demographic Survey (SDHS)158
Tab
le 7
.5
Infa
nt a
nd y
oung
chi
ld fe
edin
g (I
YC
F) p
ract
ices
Perc
enta
ge o
f you
nges
t chi
ldre
n ag
e 6-
23 m
onth
s liv
ing
wit
h th
eir
mot
her
who
are
fed
acco
rdin
g to
thre
e IY
CF
prac
tice
s ba
sed
on b
reas
tfee
ding
sta
tus,
num
ber
of fo
od g
roup
s, a
nd ti
mes
they
ar
e fe
d du
ring
the
day
or
nigh
t pre
cedi
ng th
e su
rvey
, by
back
grou
nd c
hara
cter
isti
cs, S
HD
S, 2
020
Bac
kgro
und
char
acte
rist
ic
Am
ong
brea
stfe
d ch
ildre
n 6-
23
mon
ths,
per
cent
age
fed:
Num
ber
of
brea
stfe
d ch
ildre
n 6-
23
mon
ths
Am
ong
non-
brea
stfe
d ch
ildre
n 6-
23 m
onth
s,
perc
enta
ge fe
d:N
umbe
r of
non
-br
east
fed
child
ren
6-23
m
onth
s
Am
ong
all c
hild
ren
6-23
mon
ths,
per
cent
age
fed:
Num
ber
of
child
ren
6-23
m
onth
s4
+ fo
od
grou
ps 1
Min
imum
m
eal
freq
uenc
y 2
Bot
h 4
+ fo
od
grou
ps
and
min
i-m
um m
eal
freq
uenc
y
Milk
or
milk
pr
oduc
ts 3
4+
food
gr
oups
1
Min
imum
m
eal
freq
uenc
y 4
Wit
h 3
IYC
F pr
acti
ces
5
Bre
ast
milk
, milk
or
milk
pr
oduc
ts 6
4+
food
gr
oups
1
Min
imum
m
eal
freq
uenc
y 7
Wit
h 3
IYC
F pr
acti
ces
Age 6-
88.
530
.45.
617
017
.34
.825
.50
.055
79.8
7.6
29.2
4.2
225
9-11
15.3
28.4
7.0
109
10.5
7.5
13.0
0.7
7763
.012
.122
.04
.418
6
12-1
719
.337
.310
.421
822
.517
.023
.62.
433
952
.917
.929
.05.
555
7
18-2
315
.936
.410
.179
23.1
15.0
19.3
4.5
191
45.
615
.324
.36.
127
0
Sex M
ale
15.1
33.1
8.5
304
23.9
14.4
23.2
3.4
384
66.8
11.0
20.6
4.2
649
Fem
ale
14.7
33.8
8.1
272
17.6
14.3
19.2
1.8
348
64.3
11.5
19.5
3.4
588
Type
s of
res
iden
ce
Urb
an28
.739
.916
.518
728
.724
.026
.15.
722
871
.218
.822
.57.
339
0
Rura
l17
.64
3.1
9.3
159
21.5
16.0
24.4
2.0
201
66.7
13.0
24.6
3.9
343
Nom
adic
1.921
.51.0
231
14.5
6.0
15.7
0.7
304
59.9
3.3
14.7
0.7
503
Reg
ion
Sool
3.9
36.6
3.9
9913
.66.
021
.51.0
123
61.8
3.8
22.2
1.8
212
Sana
ag14
.838
.811
.111
522
.96.
625
.12.
215
765
.47.
422
.04
.425
5
Bari
15.2
26.6
10.4
113
19.6
13.7
15.9
1.415
466
.610
.314
.93.
725
8
Nug
aal
17.8
46.
410
.657
19.7
17.3
21.9
3.0
7565
.013
.723
.84
.612
6
Mud
ug19
.628
.87.
119
224
.924
.222
.34
.622
267
.317
.820
.04
.438
7
Mot
her'
s ed
ucat
ion
No
Educ
atio
n9.
029
.54
.64
5319
.412
.119
.81.9
604
64.1
8.3
18.2
2.3
995

159
Tab
le 7
.5
(Con
t’d)
Infa
nt a
nd y
oung
chi
ld fe
edin
g (I
YC
F) p
ract
ices
Prim
ary
34.4
41.2
18.2
9123
.923
.926
.45.
197
70.3
22.1
24.6
8.3
181
Seco
ndar
y34
.866
.230
.724
42.
931
.936
.011
.1(2
3.2)
(78.
4)
(26.
0)
(40
.1)(1
6.5)
48
Hig
her
**
*7
23.7
8.2
23.7
0.0
**
**
*14
Wea
lth
quin
tile
Low
est
2.8
22.8
1.5
156
13.1
8.7
18.5
1.2
178
61.4
4.5
16.1
1.131
9
Seco
nd3.
626
.42.
099
21.3
5.3
16.8
0.4
157
62.6
3.3
16.0
0.8
233
Mid
dle
16.8
42.
810
.190
20.3
18.6
21.6
4.4
128
66.1
12.5
21.8
4.7
207
Four
th21
.239
.212
.811
324
.117
.623
.24
.016
365
.114
.922
.35.
626
4
Hig
hest
32.8
40
.816
.911
928
.726
.229
.13.
810
674
.523
.025
.37.
721
6
Tota
l14
.933
.48
.357
620
.814
.321
.32.
673
265
.611
.220
.13.
812
371 F
ood
grou
ps: a
. inf
ant f
orm
ula,
milk
oth
er th
an b
reas
t milk
, che
ese
or y
ogur
t or
othe
r m
ilk p
rodu
cts;
b. f
oods
mad
e fr
om g
rain
s, ro
ots,
and
tube
rs, i
nclu
ding
por
ridg
e an
d fo
rtifi
ed b
aby
food
from
gra
ins;
c. v
itam
in A
-ric
h fr
uits
and
veg
etab
les
(and
red
palm
oil)
; d. o
ther
frui
ts a
nd v
eget
able
s; e
. egg
s; f.
mea
t, po
ultr
y, fi
sh, a
nd s
hellf
ish
(and
org
an m
eats
); g
. leg
umes
and
nut
s.2 F
or b
reas
tfed
chi
ldre
n, m
inim
um m
eal f
requ
ency
is re
ceiv
ing
solid
or
sem
i-so
lid fo
od a
t lea
st tw
ice
a da
y fo
r in
fant
s 6-
8 m
onth
s an
d at
leas
t thr
ee ti
mes
a d
ay fo
r ch
ildre
n 9-
23 m
onth
s3 In
clud
es tw
o or
mor
e fe
edin
gs o
f com
mer
cial
infa
nt fo
rmul
a, fr
esh,
tinn
ed a
nd p
owde
red
anim
al m
ilk, a
nd y
ogur
t4 F
or n
on-b
reas
tfed
chi
ldre
n ag
e 6-
23 m
onth
s, m
inim
um m
eal f
requ
ency
is re
ceiv
ing
solid
or
sem
i-so
lid fo
od o
r m
ilk fe
eds
at le
ast f
our
tim
es a
day
5 Non
-bre
astf
ed c
hild
ren
age
6-23
mon
ths
are
cons
ider
ed to
be
fed
wit
h a
min
imum
sta
ndar
d of
thre
e In
fant
and
you
ng c
hild
feed
ing
prac
tice
s if
they
rece
ive
othe
r m
ilk o
r m
ilk p
rodu
cts
at le
ast t
wic
e a
day,
rece
ive
the
min
imum
mea
l fre
quen
cy,
and
rece
ive
solid
or
sem
i-so
lid fo
ods
from
at l
east
four
food
gro
ups
not i
nclu
ding
the
milk
/milk
pro
duct
gro
up6 B
reas
tfee
ding
, or
not b
reas
tfee
ding
and
rece
ivin
g tw
o or
mor
e fe
edin
gs o
f com
mer
cial
infa
nt fo
rmul
a, fr
esh,
tinn
ed, a
nd p
owde
red
anim
al m
ilk, a
nd y
ogur
t7 C
hild
ren
are
fed
the
min
imum
reco
mm
ende
d nu
mbe
r of
tim
es p
er d
ay a
ccor
ding
to th
eir
age
and
brea
stfe
edin
g st
atus
as
desc
ribe
d in
foot
note
s 2
and
4
Perc
enta
ge o
f you
nges
t chi
ldre
n ag
e 6-
23 m
onth
s liv
ing
wit
h th
eir
mot
her
who
are
fed
acco
rdin
g to
thre
e IY
CF
prac
tice
s ba
sed
on b
reas
tfee
ding
sta
tus,
num
ber
of fo
od g
roup
s, a
nd ti
mes
they
ar
e fe
d du
ring
the
day
or
nigh
t pre
cedi
ng th
e su
rvey
, by
back
grou
nd c
hara
cter
isti
cs, S
HD
S, 2
020
Bac
kgro
und
char
acte
rist
ic
Am
ong
brea
stfe
d ch
ildre
n 6-
23
mon
ths,
per
cent
age
fed:
Num
ber
of
brea
stfe
d ch
ildre
n 6-
23
mon
ths
Am
ong
non-
brea
stfe
d ch
ildre
n 6-
23 m
onth
s,
perc
enta
ge fe
d:N
umbe
r of
non
-br
east
fed
child
ren
6-23
m
onth
s
Am
ong
all c
hild
ren
6-23
mon
ths,
per
cent
age
fed:
Num
ber
of
child
ren
6-23
m
onth
s4
+ fo
od
grou
ps 1
Min
imum
m
eal
freq
uenc
y 2
Bot
h 4
+ fo
od
grou
ps
and
min
i-m
um m
eal
freq
uenc
y
Milk
or
milk
pr
oduc
ts 3
4+
food
gr
oups
1
Min
imum
m
eal
freq
uenc
y 4
Wit
h 3
IYC
F pr
acti
ces
5
Bre
ast
milk
, milk
or
milk
pr
oduc
ts 6
4+
food
gr
oups
1
Min
imum
m
eal
freq
uenc
y 7
Wit
h 3
IYC
F pr
acti
ces

Puntland Report 2020Somali Health and Demographic Survey (SDHS)160
Table 7.6 Micronutrient intake among children
Among youngest children age 6-23 months who are living with their mother, the percentages who consumed vitamin A-rich and iron-rich foods in the day or night preceding the survey, and among all children 6-59 months, the percentages who were given vitamin A supplements in the six months preceding the survey, who were given iron supplements in the past seven days, and who were given deworming medication by background characteristics, SHDS 2020
Background characteristics
Among youngest children age 6-23 months living with the mother: Among all children age 6-59 months:
Percentage who consumed foods rich
in vitamin A in past 24 hours1
Percentage who consumed foods rich in iron in past 24
hours2
Number of children age
Percentage given iron supple- ments
in past 7 days
Percentage given deworming
medication in past 6 months3
Number of children
Age in months
6-8 18.1 11.1 234 4.3 2.8 234
9-11 23.8 15.6 191 5.0 2.7 191
12-17 34.4 25.1 583 4.8 5.8 583
18-23 29.8 21.0 291 5.0 8.3 291
24-35 n/a n/a n/a 7.7 6.9 1,005
36-47 n/a n/a n/a 6.1 4.9 1,038
48-59 n/a n/a n/a 5.5 5.9 967
Sex
Male 29.8 21.4 683 6.2 6.1 2,249
Female 27.9 18.9 616 5.6 5.3 2,059
Breastfeeding 27.5 19.5 605 7.4 7.1 750
Not breastfeeding
30.1 20.9 694 5.6 5.5 3,559
Mother's age
15-19 27.5 7.8 95 2.5 1.6 157
20-29 26.9 19.3 694 6.6 6.4 2,214
30-39 33.3 24.8 443 4.9 5.1 1,658
40-49 22.6 17.7 66 9.1 7.0 279
Type of residence
Urban 41.5 31.6 403 11.6 10.8 1,431
Rural 34.9 21.5 372 6.2 6.2 1,249
Nomadic 14.9 10.7 524 0.8 1.0 1,628
Region
Sool 15.4 10.5 219 2.8 2.6 692
Sanaag 21.6 15.1 273 4.0 3.3 865
Bari 28.2 18.0 267 6.4 6.7 892
Nugaal 38.3 26.2 133 8.9 8.2 423
Mudug 38.3 28.4 407 7.4 7.5 1,436
Education
No Education 24.2 16.4 1,040 4.8 4.8 3,477
Primary 43.9 33.4 196 11.7 9.4 637
Secondary 58.1 41.4 48 5.2 7.2 146
Higher * * 15 (12.7) (22.1) 49
Wealth quintiles
Lowest 15.8 12.2 331 0.5 1.6 1,045
Second 18.5 12.0 245 3.1 3.3 815
Middle 36.0 22.4 221 7.2 5.6 794
Fourth 32.6 25.9 273 9.8 9.5 930
Highest 47.6 31.9 229 10.5 9.8 725
Total 28.9 20.2 1,299 5.9 5.8 4,308
Note: Information on vitamin A is based on both mother’s recall and the immunization card (where available). Information on iron supplements and deworming medication is based on the mother’s recall.n/a = Not applicableFigures in parentheses are based on 25-49 unweighted cases.Includes meat (and organ meat), fish, poultry, eggs, pumpkin, red or yellow yams or squash, carrots, red sweet potatoes, dark green leafy vegetables, mango, papaya, and other locally grown fruits and vegetables that are rich in vitamin A, and red palm oil 1Includes meat (including organ meat), fish, poultry, and eggs

161
Am
ong
wom
en a
ged
15-4
9, th
e pe
rcen
tage
wit
h he
ight
und
er 1
45
cm, m
ean
Body
Mas
s In
dex
(BM
I), a
nd th
e pe
rcen
tage
wit
h sp
ecifi
c BM
I lev
els,
by
back
grou
nd c
hara
cter
isti
cs, S
HD
S 20
20
Bod
y M
ass
Inde
x 1
Bac
kgro
und
Cha
ract
eris
tics
Hei
ght
Nor
mal
Thi
nO
verw
eigh
t/ob
ese
Num
ber
of w
omen
Pe
rcen
tage
be
low
14
5 cm
Num
ber
of
wom
en
Mea
n bo
dy
max
in
dex
(BM
I)
18.5
-24
.9
(Tot
al
norm
al)
<18
.5
(Tot
al
thin
)
17.0
-18
.4
(Mild
ly
thin
)
<17
(Mod
erat
ely
and
seve
rely
th
in)
>=25
.0
(Tot
al
over
w
eigh
t an
d ob
ese)
25.0
-29.
9 (O
verw
eigh
t)30
.0 +
(o
bese
)
Age 15
-19
7.4
491
21.9
62.4
21.0
12.8
8.3
16.6
11.6
5.0
44
3
20-2
93.
028
822
.163
.117
.39.
47.
919
.615
.73.
924
7
30-3
911
.690
22.3
62.3
18.8
12.1
6.7
18.9
12.5
6.4
68
40
-49
10.6
55.6
(23.
8)(5
8.4
)(1
2.0
)(9
.2)
(2.8
)(2
9.5)
(21.4
)(8
.1)4
2
Type
of r
esid
ence
Urb
an5.
939
923
.262
.810
.97.
33.
526
.418
.77.
735
2
Rura
l11
.426
822
.063
.419
.511
.48.
117
.112
.94
.221
6
Nom
adic
2.8
258
20.5
60.9
31.6
17.9
13.7
7.5
6.1
1.3
233
Reg
ion
Sool
7.5
110
22.2
59.0
22.3
11.7
10.6
18.7
14.7
4.0
91
Sana
ag9.
612
521
.453
.131
.019
.211
.815
.911
.24
.798
Bari
10.3
165
22.0
50.7
27.5
15.2
12.3
21.8
16.0
5.9
121
Nug
aal
3.7
117
23.1
64.5
10.7
4.9
5.8
24.8
18.0
6.8
106
Mud
ug4
.84
08
22.1
68.7
15.2
10.1
5.1
16.1
11.7
4.4
384
Educ
atio
n
No
educ
atio
n6.
366
522
.061
.421
.012
.68.
417
.512
.64
.958
5
Prim
ary
10.2
135
22.7
66.0
14.0
7.2
6.8
20.1
17.6
2.5
106
Seco
ndar
y7.
878
22.5
66.0
14.1
10.5
3.6
19.9
11.1
8.8
70
Hig
her
educ
atio
n0
.047
22.4
60.4
15.8
7.7
8.1
23.8
19.3
4.5
39
Wea
lth
quin
tile
Tab
le 7
.7
Nut
riti
onal
sta
tus
of w
omen

Puntland Report 2020Somali Health and Demographic Survey (SDHS)162
Low
est
4.8
259
20.6
63.1
29.5
16.4
13.1
7.4
6.6
0.8
231
Seco
nd8.
111
522
.162
.420
.713
.07.
716
.912
.74
.297
Mid
dle
11.1
169
22.5
58.4
20.2
13.4
6.7
21.5
14.9
6.5
142
Four
th6.
519
523
.065
.68.
64
.54
.125
.819
.76.
116
6
Hig
hest
4.4
187
23.1
61.8
13.7
9.1
4.7
24.5
16.0
8.6
164
Tot
al
6.6
925
22.1
62.4
19.2
11.5
7.7
18.4
13.5
4.9
80
1
Not
e: T
he B
ody
Mas
s In
dex
(BM
I) is
exp
ress
ed a
s th
e ra
tio
of w
eigh
t in
kilo
gram
s to
the
squa
re o
f hei
ght i
n m
eter
s (k
g/m
2).
1 E
xclu
des
preg
nant
wom
en a
nd w
omen
wit
h a
birt
h in
the
prec
edin
g 2
mon
ths
Am
ong
wom
en a
ged
15-4
9, th
e pe
rcen
tage
wit
h he
ight
und
er 1
45
cm, m
ean
Body
Mas
s In
dex
(BM
I), a
nd th
e pe
rcen
tage
wit
h sp
ecifi
c BM
I lev
els,
by
back
grou
nd c
hara
cter
isti
cs, S
HD
S 20
20
Bod
y M
ass
Inde
x 1
Bac
kgro
und
Cha
ract
eris
tics
Hei
ght
Nor
mal
Thi
nO
verw
eigh
t/ob
ese
Num
ber
of w
omen
Pe
rcen
tage
be
low
14
5 cm
Num
ber
of
wom
en
Mea
n bo
dy
max
in
dex
(BM
I)
18.5
-24
.9
(Tot
al
norm
al)
<18
.5
(Tot
al
thin
)
17.0
-18
.4
(Mild
ly
thin
)
<17
(Mod
erat
ely
and
seve
rely
th
in)
>=25
.0
(Tot
al
over
w
eigh
t an
d ob
ese)
25.0
-29.
9 (O
verw
eigh
t)30
.0 +
(o
bese
)
Tab
le 7
.7
(C
ont’d
) N
utri
tion
al s
tatu
s of
wom
en

163
Among women age 15-49 with a child born in the 5 years preceding the survey, percent distribution by number of days they took iron tablets or syrup during the pregnancy of the last child, and percentage who took deworming medication during the pregnancy of the last child according to background characteristics, SHDS 2020
Background Characteristics
Number of days women took iron tablets or syrup during pregnancy of last birth
Percentage of women who took deworming
medication during pregnancy of last birth
Number of women
None <60 60-89 90+ Total
Age
15-19 74.7 20.9 1.7 2.7 100.0 2.1 97
20-29 72.7 22.0 2.5 2.8 100.0 1.8 285
30-39 76.6 20.6 1.9 0.9 100.0 2.2 236
40-49 79.7 18.0 0.6 1.7 100.0 0.0 89
Type of residence
Urban 58.4 34.2 3.0 4.4 100.0 2.7 258
Rural 74.6 22.8 1.6 1.0 100.0 1.5 208
Nomadic 93.7 4.9 1.2 0.3 100.0 0.9 240
Region
Sool 84.8 13.5 0.6 1.2 100.0 0.0 93
Sanaag 81.6 12.2 3.2 3.1 100.0 0.0 131
Bari 68.5 27.8 2.3 1.4 100.0 2.1 189
Nugaal 65.6 28.2 3.5 2.7 100.0 4.1 73
Mudug 76.1 20.9 1.0 2.0 100.0 2.4 220
Education
No Education 82.4 15.2 1.4 1.0 100.0 1.2 562
Primary 47.4 44.1 4.2 4.4 100.0 3.3 92
Secondary (52.4) (40.5) (2.7) (4.3) 100.0 0.0 38
Higher * * * * * * 15
Wealth quintile
Lowest 94.2 4.5 1.4 0.0 100.0 1.4 159
Second 87.1 10.6 1.2 1.1 100.0 0.0 110
Middle 78.5 20.6 0.9 0.0 100.0 3.5 130
Fourth 61.6 32.0 3.0 3.5 100.0 0.7 135
Highest 58.2 34.0 3.0 4.8 100.0 2.6 173
Total 75.1 20.9 2.0 2.0 100.0 1.7 706
Note: Figures in parentheses are based on 25-49 unweighted cases.
Table 7.8 Micronutrient intake among mothers

HIV/AIDS-Related Knowledge, Beliefs and Attitudes
CHAPTER 8

©A
U U
N I
ST P
HO
TO
/ T
OB
IN J
ON
ES.
Key Findings

Puntland Report 2020Somali Health and Demographic Survey (SDHS)166
The objective of this chapter is to provide data and trends on HIV/AIDS knowledge, attitudes, and behaviour, including HIV/AIDS prevention methods, mother-to-child transmission of HIV/AIDS and stigma.
HIV/AIDS is not a major epidemic in Puntland and most people in Puntland and Somalia associate HIV/AIDS with people who commit sexual sins. The HIV/AIDS prevalence among the adult population in Puntland was estimated to be very low, at about 0.59 percent with an estimated figure of 3,832 and estimated deaths of 246. But later rounds in 2014 of Ante Natal Care (ANC) sentinel surveillance found mean HIV prevalence rates of 0.22 percent in Puntland (UNAIDS, 2014). However, the actual prevalence may be higher as a result of undetected infections.
The future course of the situation of HIV/AIDS in Somalia depends on many variables: levels of knowledge about HIV/AIDS among the general population, social stigmatization, modification of risk behaviour, access to high-quality services for STIs, provision and uptake of HIV counseling and testing, and access to care and antiretroviral therapy (ART), including prevention and treatment of opportunistic infections 1.
Knowledge of HIV/AIDSThe SHDS 2020 obtained information from women aged 15-49 on their knowledge, perceptions, and behaviours related to HIV/ AIDS, as well awareness of modes of HIV/ AIDS transmission. The survey also collected information on knowledge about which behaviours could prevent the spread of HIV/ AIDS. Respondents
1 These are infections that occur more often, and are more severe, in people with weak immune systems.
8Chapter 8
HIV/AIDS-Related Knowledge, Beliefs and AttitudesThe SHDS 2020 collected information on the knowledge of and attitudes around Human Immunodeficiency Virus/Acquired Immunodeficiency Syndrome (HIV/AIDS) and knowledge of other sexually transmitted infections (STIs) from all ever-married women. The survey also collected data on self-reported prevalence of sexually transmitted infections among ever-married women.
Figure 8.1 Knowledge of HIV/AIDS by region
Percent of women aged 15-49 who had ever heard about HIV/AIDS by region
69.7
67.7
64.864.2
59.3
Sanaag Nugaal Mudug Bari Sool

167
were asked whether they had heard of HIV/AIDS and those who had heard were then asked questions on how the infection could be avoided.
Table 8.1 provides information on women’s awareness of HIV/AIDS. Overall, 65 percent of women aged 15-49 have heard of HIV/AIDS, the national awareness level among women of the same age bracket is 66 percent. The proportion of women who have heard of HIV/AIDS was lower among those in nomadic and rural areas at 47 and 67 percent respectively than urban areas at 79 percent. Among the regions, Sanaag had the highest HIV/AIDS awareness at 70 percent while Sool had the lowest awareness at 59 percent (Figure 8.1).
Fifty-seven percent of women who have not attended school had heard about HIV/ AIDS, compared 96 percent of those with higher education. Awareness of HIV/AIDS is higher among the wealthier households at 83 percent compared to poorer households at 47 percent (Figure 8.2).
It is worrying that less than half of women residing in the nomadic areas and those from poor households are not aware of HIV/AIDS.
Misconceptions about HIV/AIDS Table 8.2 presents data on the misconceptions about HIV/AIDS transmission in Puntland (e.g. that HIV/AIDS can be transmitted by mosquito bites and that it can be transmitted by sharing food with someone who has HIV/AIDS). Thirty-nine percent of women were aware that a healthy-looking person can be carrying the HIV/AIDS virus. Thirty percent of women know that HIV/AIDS cannot be transmitted through mosquito bites and 38 percent of women know that the HIV/AIDS virus cannot be transmitted by supernatural means. Thirty-four percent of women understand that people cannot be infected by sharing food with a person who has HIV/AIDS.
Table 8.2 indicates that only 13 percent of all women aged 15-49 rejected the two most common misconceptions about HIV/AIDS in Puntland (i.e. HIV/AIDS can be transmitted by mosquito bites or HIV/AIDS virus cannot be transmitted by supernatural means) and are also aware that a healthy-looking person can have HIV/AIDS. Knowledge of HIV/AIDS increased with levels of education. The Table also includes a composite measure on knowledge of HIV/AIDS. Only 6 percent of the interviewed women have comprehensive knowledge of HIV/AIDS.
Among women residing in the urban, 23 percent are likely to reject the two common most misconceptions compared to 2 percent among those residing in the nomadic areas. Comprehensive
Figure 8.2 Knowledge of HIV/AIDS by wealth quintile
Percent of women aged 15-49 who had ever heard about HIV/AIDS by wealth quintile
47.4
53.7
62.9
74.1
83.2
Lowest Second Middle Fourth Highest

Puntland Report 2020Somali Health and Demographic Survey (SDHS)168
knowledge is higher among women in the urban at 8 percent and lowest among those in the nomadic at 4 percent. Comprehensive knowledge is highest among women aged 20-24 and the percentage of women with comprehensive knowledge reduces with increase in age. There are no observed variations in terms of age on the likelihood of rejecting the two most common misconceptions on HIV/AIDS.
Across the regions, women in Nugaal are more likely to reject the two most common misconceptions on HIV/AIDS at 22 percent, and while those Sool are the least likely at 8 percent. Comprehensive knowledge is highest among women residing in Bari.
Eight percent of women with no education are least likely to reject the two most common misconceptions on HIV/AIDS and have the least proportion of those with comprehensive knowledge about HIV/AIDS at 5 percent, compared to 42 and 17 percent for rejecting two common most misconceptions and comprehensive knowledge among women with higher level of education (Figure 8.3 and Table 8.2).
Knowledge about Mother-to-Child Transmission
To assess knowledge about mother-to-child transmission of HIV/AIDS, both ever-married and never-married women interviewed in the SHDS 2020 were asked whether HIV/AIDS can be transmitted from a mother to her child during pregnancy, during delivery, and through breastfeeding. They were also asked whether the risk of mother-to-child transmission (MTCT) of HIV/AIDS can be reduced by the mother taking special drugs during pregnancy.
Table 8.3 presents data on the knowledge about mother-to-child transmission among women aged 15-49 by background characteristics (see also Figure 8.4). It shows that 40 percent of women know that HIV/AIDS can be transmitted during pregnancy, 43 percent know that it can be transmitted during delivery, and 44 percent know that it can be transmitted through breastfeeding, whereas 33 percent of the respondents believe HIV/AIDS can be transmitted by all three means. Twenty-nine percent of the women know that the risk of mother-to-child transmission can be reduced if the mother takes special drugs during pregnancy.
Among the places of residence, knowledge of prevention of mother-to-child transmission of HIV/AIDS is highest in urban areas at 37 percent and lowest in nomadic areas at 17 percent. There are variations among the regions on the knowledge of prevention of mother-to-child transmission of HIV/AIDS; it is highest in Nugaal at 36 percent and lowest in Sool at 25 percent.
Figure 8.3 Women with comprehensive knowledge about HIV/AIDS
Figure 8.4 Knowledge of prevention of mother-to-child transmission of HIV/AIDS
Percent of women aged 15-49 with comprehensive knowledge about HIV/AIDS by level of education
Percent of women aged 15-49 who know that HIV/AIDS can be transmitted from mother to child
4.7
7.8
12.3
17.2
No Education Primary Secondary Higher
40.343.0 43.6
33.2
Duringpregnancy
Duringdelivery
By breast-feeding
By allthree
means

169
Knowledge of prevention of mother-to-child transmission of HIV/AIDS is higher among women with higher education at 68 percent compared to women with no education at 22 percent.
Attitudes toward People Living with HIV/AIDS
Like the rest of Somalia, many people in Puntland believe that HIV/AIDS is a disease for people who have committed bad deeds. Extensive stigma and discrimination against people living with HIV/ADS can adversely affect both people’s willingness to be tested and their adherence to antiretroviral therapy (ART). For instance, people may hesitate to take an HIV test because they are afraid of how other people will react if the test result is positive.
Indeed, HIV/AIDS-related stigma and discrimination undermine HIV/AIDS prevention as it stops people seeking information about how to reduce their risk of exposure to HIV/AIDS and adopt safer behaviour, as they believe such inquiries may raise suspicion about their status. Tackling stigma and discrimination is, thus, an important factor for the success of programmes targeting HIV/AIDS prevention and control.
In the SHDS 2020, both ever-married and never-married women who had heard of HIV/AIDS were asked several questions to assess the level of stigma associated with HIV/AIDS. Respondents were asked about their willingness or unwillingness to take care of a member of their family with HIV/AIDS in their own household, to buy vegetables from an infected shopkeeper or vendor, and to let others know the HIV/AIDS status of family members.
Table 8.4 presents data for women aged 15-49 who have heard of HIV/AIDS and their attitudes towards people living with HIV/AIDS, by background characteristics. Overall, 52 percent of women think that children living with HIV/AIDS should not attend school with children who are not infected by HIV/AIDS. In addition, 58 percent of the women said they would not buy fresh vegetables from a shopkeeper who is HIV-positive. Further, 43 percent of the respondents had discriminatory attitudes towards people living with HIV/AIDS.
As presented in Figure 8.5 and Table 8.4 younger women and never married are less likely to discriminate against people with HIV/AIDS compared to older women and women who are currently married. Forty-eight percent of women residing in the rural areas have discriminatory attitudes towards people living with HIV/AIDS compared to 40 percent and 41 percent among those residing in the nomadic and urban areas respectively. Stigma against people with HIV/AIDS is lower among people residing in Mudug region at 36 percent and higher among people residing in Sanaag region at
Figure 8.6 Discriminatory attitudes towards people living with HIV/AIDS by education
Figure 8.5 Discriminatory attitudes towards people living with HIV/AIDS by age
Percent of women aged 15-49 with discriminatory attitudes towards people living with HIV/AIDS
Percent of women aged 15-49 with discriminatory attitudes towards people living with HIV/AIDS
11.1
25.5
65.9
0.4
No advice or treatment
Public Sector
Private sector
Other sources
40.0 39.2 41.346.5
43.347.9
15-24 15-19 20-24 25-29 30-39 40-49

Puntland Report 2020Somali Health and Demographic Survey (SDHS)170
52 percent.
Figure 8.6 indicates that stigma against people with HIV/AIDS is higher among people in no education at 46 percent and lowest among those with higher level of education at 23 percent. Forty-five percent of women from lowest wealth quintile and 39 percent of those from the highest wealth quintile have discriminatory attitudes towards people living with HIV/AIDS (Table 8.4).
Self-reporting of Sexually Transmitted Infections
The SHDS 2020 gathered information about sexually transmitted infections or symptoms. Ever-married women aged 15-49 were asked whether they had a sexually transmitted infection or symptoms (bad smell, abnormal discharge from the vagina, or a genital sore or ulcer) in the 12 months prior to the survey.
Table 8.5 shows the self-reported prevalence of STIs and STI symptoms. Only 9 percent of ever-married women reported that they had an STI in the 12 months preceding the survey, 8 percent had a bad smell, or an abnormal discharge, and 4 percent had a genital sore or ulcer. In total, 11 percent of women reported having an STI/ genital discharge/ sore or ulcer symptoms.
Variations in self-reported prevalence of STIs and STI symptoms by background characteristics are also presented in Table 8.5. The prevalence of STIs or STI symptoms is higher among currently married women at 9 percent compared to 6 percent among those who are divorced/separated or widowed. The prevalence varies by age, education, and wealth quintile. The proportion of those presenting with STI/ genital discharge/ sore or ulcer is highest among those aged 30-39 at 12 percent and lowest among those aged 15-19 at 6 percent. The prevalence of STIs is almost twice as high among urban and rural women, compared to nomadic women at 10, 11 and 5 percent respectively. The proportion of those presenting with STI/ genital discharge/ sore or ulcer is highest in urban areas at 14 percent and lowest in nomadic areas at 5 percent.
Among the regions, the proportion of those presenting with STIs is highest in Bari and Nugaal at 11 percent each and lowest in Sanaag at 6 percent.
Table 8.6 and Figure 8.7 show the percentage of women aged 15-49 reporting an STI or symptoms of an STI in the 12 months preceding the survey who sought advice or treatment. According to the findings, women are likely to seek treatment in more than one place.
Thirty-four percent of women who had an STI or STI symptoms
Figure 8.7 Source of advice or treatment for STIs
Percent of women aged 15-49 reporting an STI or symptoms of an STI in the past 12 months who sought advice or treatment
11.1
25.5
65.9
0.4
No advice or treatment
Public Sector
Private sector
Other sources

171
sought advice or treatment from public and private sectors; 26 percent of ever-married women who had an STI/STI symptoms sought advice from the public health sector and 11 percent got advice from the private sector. Sixty-six percent of the ever-married women who had an STI or STI symptoms did not seek advice or treatment.

Puntland Report 2020Somali Health and Demographic Survey (SDHS)172
Percentage of women aged 15-49 who had heard about HIV/AIDS by background characteristics, SHDS 2020
Background characteristicsPercentage of women who had ever heard
about HIV/AIDSNumber of women
Age
15-19 57.6 1,666
20-24 69.2 926
25-29 67.7 956
30-39 69.3 1,353
40-49 66.1 525
Type of residence
Urban 79.4 2,102
Rural 66.8 1,524
Nomadic 47.0 1,800
Region
Sool 59.3 742
Sanaag 69.7 990
Bari 64.2 1,254
Nugaal 67.7 554
Mudug 64.8 1,886
Education
No Education 57.4 3,997
Primary 82.4 873
Secondary 92.1 411
Higher 95.8 145
Wealth quintile
Lowest 47.4 1,166
Second 53.7 868
Middle 62.9 1,003
Fourth 74.1 1,154
Highest 83.2 1,235
Total 15-49 65.1 5,426
Table 8.1 Knowledge of HIV

173
Table 8.2 Comprehensive knowledge about HIV/AIDS
Percentage of women aged 15-49 who say that a healthy-looking person can have HIV/AIDS and who, in response to prompted questions, correctly reject local misconceptions about transmission or prevention of HIV/AIDS, and the percentage with a comprehensive knowledge about HIV/AIDS by background characteristics, SHDS 2020
Background characteristics
Percentage of women who say that:Percentage
who say that a healthy-looking
person can have HIV/AIDS and who reject the two most common local
misconceptions1
Percentage with a
comprehensive knowledge about HIV/
AIDS 2
Number of respondents
A healthy-looking
person can have HIV/
AIDS
HIV/AIDS cannot be
transmitted by mosquito
bites
HIV/AIDS cannot be
transmitted by
supernatural means
A person cannot become infected
by sharing food with a person who
has HIV/AIDS
Age
15-19 35.2 27.0 34.0 31.7 12.7 5.6 1,666
20-24 42.5 32.0 40.6 35.8 13.0 8.5 926
25-29 40.3 30.6 39.0 35.7 13.5 6.5 956
30-39 40.5 32.5 39.4 36.7 13.3 5.5 1,353
40-49 38.7 27.5 36.0 32.0 12.8 4.3 525
Type of residence
Urban 53.0 42.8 52.0 50.7 23.0 8.4 2,102
Rural 40.7 28.8 38.1 34.0 12.5 5.9 1,524
Nomadic 21.2 15.8 20.2 15.6 2.1 3.7 1,800
Region
Sool 34.1 20.8 32.4 24.8 7.5 5.9 742
Sanaag 38.4 29.9 36.5 36.5 10.4 4.7 990
Bari 38.9 33.2 37.9 35.8 14.0 7.3 1,254
Nugaal 45.5 34.9 45.4 39.8 22.0 3.9 554
Mudug 39.4 29.8 37.6 34.5 13.5 6.8 1,886
Education
No Education 31.2 23.6 30.2 26.3 8.3 4.7 3,997
Primary 55.0 39.1 54.0 52.5 21.0 7.8 873
Secondary 67.9 59.2 61.7 63.3 32.3 12.3 411
Higher 74.9 67.2 72.0 66.3 42.4 17.2 145
Total 15-49 39.0 29.9 37.6 34.4 13.1 6.1 5,426
1 The two most common local misconceptions are that HIV/AIDS can be spread by mosquitoes and supernatural means.2 Comprehensive knowledge means knowing that consistent use of condoms during sexual intercourse and having an uninfected husband can reduce the chance of getting AIDS, knowing that a healthy-looking person can have HIV, and rejecting the two most common local misconceptions about transmission or prevention of HIV.

Puntland Report 2020Somali Health and Demographic Survey (SDHS)174
Percentage of women aged 15-49 who know that HIV/AIDS can be transmitted from mother to child by breastfeeding and that the risk of mother-to-child transmission (MTCT) of HIV/AIDS can be reduced by the mother taking special drugs during pregnancy, by background characteristics, SHDS 2020
Background characteristics
Percentage who know that HIV/AIDS can be transmitted from mother to child
Percentage who know that the risk of MTCT
can be reduced by mother
taking special drugs
Number of respondentsDuring
pregnancyDuring delivery
By breastfeeding
By all three means
Age
15-19 36.0 37.1 39.9 28.9 27.3 1,666
20-24 41.9 45.7 47.5 34.8 32.5 926
25-29 42.4 45.8 44.7 35.5 28.9 956
30-39 43.0 46.4 45.9 36.7 29.1 1,353
40-49 40.3 43.5 40.7 30.5 26.1 525
Type of residence
Urban 50.5 54.3 55.4 40.7 37.3 2,102
Rural 43.4 46.8 45.3 34.9 30.8 1,524
Nomadic 25.8 26.7 28.4 22.9 17.1 1,800
Region
Sool 42.4 42.1 44.5 38.2 24.8 742
Sanaag 43.4 46.4 48.3 36.8 28.8 990
Bari 39.2 42.1 42.9 30.7 29.5 1,254
Nugaal 48.2 52.8 52.0 43.8 35.6 554
Mudug 36.3 39.3 38.8 27.8 27.8 1,886
Education
No Education 33.8 35.6 36.0 28.3 22.3 3,997
Primary 53.1 58.0 60.4 42.2 40.0 873
Secondary 64.3 69.0 68.3 49.8 53.8 411
Higher 75.9 84.3 83.3 65.9 67.9 145
Total 15-49 40.3 43.0 43.6 33.2 28.8 5,426
Table 8.3 Knowledge of prevention of mother-to-child transmission of HIV/AIDS

175
Table 8.4 Discriminatory attitudes towards people living with HIV/AIDS
Women aged 15-49 who have heard of HIV/AIDS, and have discriminatory attitudes towards people living with HIV/AIDS, according to background characteristics, SHDS 2020
Background characteristics
Women
Number of women who have heard of HIV/AIDS
Percentage who do not think that children living with HIV/AIDS
should be able to attend school with children
who are HIV negative
Percentage who would not buy fresh vegetables from a
shopkeeper who has HIV/AIDS
Percentage with discriminatory attitudes
towards people living with HIV/AIDS1
Age
15-24 50.6 54.8 40.0 1,600
15-19 50.3 54.1 39.2 959
20-24 51.0 55.7 41.3 640
25-29 52.4 61.3 46.5 648
30-39 50.8 59.8 43.3 938
40-49 55.8 66.2 47.9 347
Marital status
Never-married 48.2 53.6 37.5 1,094
Married 53.0 60.6 45.4 2,075
Divorced/widowed 52.4 61.0 44.3 364
Type of residence
Urban 49.7 58.4 40.9 1,669
Rural 58.2 62.9 48.2 1,017
Nomadic 46.8 53.1 40.2 847
Region
Sool 55.2 61.7 47.3 440
Sanaag 59.6 67.5 52.3 690
Bari 52.1 58.7 42.4 806
Nugaal 50.7 60.4 42.6 375
Mudug 45.4 51.4 36.3 1,222
Education
No Education 54.4 60.8 46.3 2,296
Primary 49.2 59.1 40.4 719
Secondary 43.9 48.9 33.7 379
Higher 34.8 42.3 23.2 139
Wealth quintile
Lowest 52.0 56.7 45.1 552
Second 45.2 54.3 38.3 467
Middle 54.0 61.7 43.9 631
Fourth 57.1 62.5 47.4 856
Highest 47.7 55.9 39.4 1,027
Total 15-49 51.5 58.4 42.9 3,532 1 Percentage who do not think that children living with HIV should be able to attend school with children who are HIV negative and/or would not buy fresh

Puntland Report 2020Somali Health and Demographic Survey (SDHS)176
Women aged 15-49 who have heard of HIV/AIDS, and have discriminatory attitudes towards people living with HIV/AIDS, according to background characteristics, SHDS 2020
Background characteristics
Women
Number of women who have heard of
HIV/AIDS
Percentage who do not think that children living with HIV/AIDS
should be able to attend school with children
who are HIV negative
Percentage who would not buy fresh vegetables from a
shopkeeper who has HIV/AIDS
Percentage with discriminatory
attitudes towards people living with HIV/
AIDS1
Age
15-24 50.6 54.8 40.0 1,600
15-19 50.3 54.1 39.2 959
20-24 51.0 55.7 41.3 640
25-29 52.4 61.3 46.5 648
30-39 50.8 59.8 43.3 938
40-49 55.8 66.2 47.9 347
Marital status
Never-married 48.2 53.6 37.5 1,094
Married 53.0 60.6 45.4 2,075
Divorced/widowed 52.4 61.0 44.3 364
Type of residence
Urban 49.7 58.4 40.9 1,669
Rural 58.2 62.9 48.2 1,017
Nomadic 46.8 53.1 40.2 847
Region
Sool 55.2 61.7 47.3 440
Sanaag 59.6 67.5 52.3 690
Bari 52.1 58.7 42.4 806
Nugaal 50.7 60.4 42.6 375
Mudug 45.4 51.4 36.3 1,222
Education
No Education 54.4 60.8 46.3 2,296
Primary 49.2 59.1 40.4 719
Secondary 43.9 48.9 33.7 379
Higher 34.8 42.3 23.2 139
Wealth quintile
Lowest 52.0 56.7 45.1 552
Second 45.2 54.3 38.3 467
Middle 54.0 61.7 43.9 631
Fourth 57.1 62.5 47.4 856
Highest 47.7 55.9 39.4 1,027
Total 15-49 51.5 58.4 42.9 3,532 1 Percentage who do not think that children living with HIV should be able to attend school with children who are HIV negative and/or would not buy fresh
Table 8.4 Discriminatory attitudes towards people living with HIV/AIDS

177
Among women aged 15-49 who ever had sexual intercourse, the percentage reporting having an STI and/or symptoms of an STI in the 12 months preceding the survey, by background characteristics, SHDS 2020
Background characteristics
Percentage of respondents who reported having in the past 12 months:
Number of ever-married womenSTI
Bad-smelling/ abnormal genital
discharge
Genital sore or ulcer
STI/ genital discharge/ sore or
ulcer
Age
15-19 4.1 4.6 2.2 6.3 300
20-24 7.3 6.4 3.1 9.2 633
25-29 8.6 6.9 3.2 10.2 889
30-39 10.1 9.6 4.6 12.1 1,334
40-49 8.4 7.5 4.5 11.2 519
Marital status
Married 9.0 7.6 4.1 10.5 3,161
Divorced/separated/widowed
6.0 7.9 2.3 10.5 514
Type of residence
Urban 10.4 10.1 4.9 14.2 1,271
Rural 11.2 9.7 5.4 12.8 1,074
Nomadic 4.6 3.7 1.5 5.3 1,330
Region
Sool 7.9 7.1 3.5 9.5 527
Sanaag 6.4 5.2 1.4 7.5 720
Bari 10.8 10.2 4.9 14.1 870
Nugaal 11.3 9.4 4.8 13.7 372
Mudug 7.6 7.1 4.3 9.3 1,186
Education
No Education 7.9 7.2 3.5 9.8 3,011
Primary 10.0 8.7 4.9 12.5 481
Secondary 15.9 12.7 5.6 19.0 135
Higher (11.7) (10.2) (5.1) (13.6) 49
Wealth quintile
Lowest 5.1 4.0 2.1 5.5 859
Second 5.9 5.3 1.9 7.3 666
Middle 10.9 10.5 5.6 14.2 685
Fourth 11.2 11.4 5.9 14.4 748
Highest 10.1 7.6 3.8 12.1 717
Total 15-49 8.5 7.7 3.8 10.5 3,675
Table 8.5 Self-reported prevalence of sexually transmitted infections (STIs) and STI symptoms

Puntland Report 2020Somali Health and Demographic Survey (SDHS)178
Percentage of women aged 15-49 reporting an STI or symptoms of an STI in the past 12 months who sought advice or treatment, SHDS 2020
Background characteristics Percentage of Women
Public Sector 25.5
Government Hospital 10.1
Referral Health Center 2.6
MCH/HC 14.3
Primary Health Unit (PHU) 0.3
Mobile Clinic 0.4
Other Public Sector
Private sector 11.1
Clinical 8.8
Pharmacy 2.8
Other Private Medical Sector 0.1
Other sources 0.4
No advice or treatment 65.9
Number with STD or symptoms of STD 387
Number of women 387
Note: The categories are not mutually exclusive and the sum of percentages may exceed 100 percent.
Table 8.6 Women seeking treatment for STIs

179

Gender Based Violence
CHAPTER 9

©A
U U
N I
ST P
HO
TO
/ T
OB
IN J
ON
ES.
Key Findings

Puntland Report 2020Somali Health and Demographic Survey (SDHS)182
Measurements of Violence
Puntland Health and demographic report was generated from the main Somali Health and Demography Survey data. The SHDS 2020 had sections designated for the collection of information on domestic violence and other forms of discrimination against women. Information was obtained from ever-married women and never-married women aged 15-49 who were either usual residents, or guests who slept in the house the night preceding the day of the interview. Enumerators asked the respondents questions on their opinions regarding the definition of domestic violence, opinions on the most common perpetrators of violent acts against women, experiences of violence, whether physical, sexual or emotional, perpetrators of physical violence. They also asked respondents about their experience of violence during pregnancy, spousal violence, injuries due to spousal violence, and help-seeking behaviours for those who have experienced violence.
Specifically, the enumerators asked never-married and ever-married women in Puntland about physical violence perpetuated on them. The survey also measured sexual and emotional violence committed by the current spouse (for currently married women) and by the most recent spouse (for divorced or widowed women).
The collection of data on GBV is often marred by under-reporting due to the culture of silence around the topic. In order to encourage disclosure, respondents were asked about any experiences they have had with specific acts of violence. This ensured there were no misunderstandings on the meaning of ‘violence’ among respondents.
9Chapter 9
Gender Based Violence
In 2015, the UN General Assembly adopted 17 Sustainable Developments Goals (SDGs), including Goal 5, which calls for the elimination of all forms of violence and discriminatory acts against all women and girls. Violence against women can be described as a violation of human rights, and as a form of discrimination against women, resulting in physical, sexual, psychological and economic harm. It may lead to depression, anxiety disorders, post-traumatic stress disorder, permanent injuries, sleeplessness and, sometimes, death. Over the years, Somali women have overlooked some forms of violence as norms, as is the case in many countries.

183
The following set of questions were asked to the respective respondents. ‘Did the perpetrator ever:’
Physical violence: push you, shake you, or throw something at you; kick you, drag you, or beat you up; try to choke you or burn you on purpose; or threaten or attack you with a knife, gun, or any other weapon.
Sexual violence: physically force you to have sexual intercourse with him even when you did not want to, physically force you to perform any other sexual acts you did not want to, force you with threats or in any other way to perform sexual acts you did not want to, in the last 12 months preceding the survey, or physically force you to have sexual intercourse.
Emotional violence: say or do something to humiliate you in front of others, threaten to hurt or harm you or someone close to you, or insult you or make you feel bad about yourself.
In the SHDS 2020, women were asked questions regarding sexual spousal violence acts. These questions were not asked to never-married women, because the questions would be considered anomalous given the cultural context in Somalia.
Ethical Considerations in SHDSEnsuring the confidentiality and privacy of respondents was obligatory for the enumerators during and after the SHDS 2020 interviews. All the enumerators were provided rigorous training sessions on how to build rapport with the respondents, make a good impression, obtain respondents’ consent, assuring confidentiality, and interviewing the respondents alone. In addition to the general training sessions, efforts were made to continuously remind the enumerators about the need to ensure the complete privacy of respondents.
Moreover, for the GBV section, enumerators had to seek consent and explain to the respondents before each interview began. Respondents were informed on the use of the information collected, and that the outcome of the survey will be used to inform policies and formulate programs that address the identified needs and gaps in Somali women’s lives.
The women interviewed for this section were only eligible when their privacy was completely secured. This was to avoid any repercussions to the respondent and interviewer, given the sensitivity of the subject in the Somali cultural context. In addition, the enumerators (midwives and medical practitioners) who collected this information from respondents were all women to minimize any sensitivities involved and ensure respondents felt

Puntland Report 2020Somali Health and Demographic Survey (SDHS)184
comfortable discussing this topic.
Opinions about Domestic ViolenceAll women respondents sampled for the SHDS 2020 in Puntland were asked about their views about domestic violence. Specifically, they were asked whether domestic violence means:
| Physical abuse
| No participation in household decision-making
| No participation in decision-making regarding children
| Better treatment of males than females
| Failure to meet basic living costs
| Denial of education
| Forced marriage
| Rape
| Sexual harassment
| Forced labor
Figure 9.1 Acts that mean domestic violence
Percent of women aged 15-49 who understand domestic violence to mean various specified acts, according to marital status
20.8
18.5
18.2
19.2
17.9
21.7
22.5
22.5
21.2
22.3
1.3
32.6
27.1
27.8
28.4
26.0
30.1
32.4
29.7
30.5
31.7
2.2
Physical abuse
No participation in decision making for household
No participation in decision making for children
Better treatment of males than females
Failing to meet basic living costs
Denial of education
Forced Marriage
Rape
Sexual harassment
Forced labour
Other
Married Never Married

185
Table 9.1 shows the percentage of women aged 15-49 who understand domestic violence to mean specific acts according to their background characteristics. Findings show that over half of women in Puntland believed that most of the specified acts asked constituted domestic violence. Fifty percent plus of women considered physical abuse, denial of education, forced marriage, rape, sexual harassment, forced labour as forms of domestic violence. These state level figures are not much different from national estimates.
Women from urban areas have a better understanding of acts that constitute domestic violence compared to women from both rural, and nomadic areas. For instance, 64 percent of women in urban areas identify physical abuse as an act of violence against women, while the corresponding percentages for women from rural and nomadic areas are 57 and 54 percent respectively.
In Puntland, ever-married women aged 15-49 are more knowledgeable than never-married women on the understanding of domestic violence (Figure 9.1). This contradicts the national-level findings, where never-married women are more knowledgeable that ever-married women.
Educational attainment plays a role in the understanding of domestic violence. Women with secondary and higher education generally have a better understanding of acts that constitute domestic violence than women with no education or primary education
At region level, Physical abuse, denial of education right, forced marriage and rape were the acts that women in all regions in Puntland identified with the highest scores compared other crimes in the list.
Women’s Experience of Physical Violence
Table 9.2 presents women aged 15-49 who had ever experienced physical violence since the age of 12 and those that reported they experienced physical violence in the 12 months preceding the survey. The result shows that 15 percent of women aged 15-49 have experienced physical violence since the age of 12, while 8 percent had experienced often or sometimes physical violence in the 12 months preceding the survey.
Similar to the national data, younger women in Puntland are more likely to experience physical violence compared to the other age groups; 17 percent of women aged 15-19 had experienced physical violence since the age of 12 and13 percent experienced physical violence in the 12 months preceding the survey. Among older

Puntland Report 2020Somali Health and Demographic Survey (SDHS)186
women aged 45-49, 10 percent had ever experienced physical violence since the age of 12 while 2 percent reported facing physical violence in the 12 months preceding the survey (Figure 9.2).
Percent of women aged 15-49 who have ever experienced physical violence since age 12 and percentage who have experienced violence during the 12 months preceding the survey by age
Additionally, Physical violence in Puntland is highest among urban women at 18 percent and lowest among Nomadic women at 12 percent (Figure 9.3).
Percentage of women aged 15-49 who have ever experienced physical violence since age 12 by region and residence
As depicted in figure 9.3, Bari and Mudug regions have the highest rate at 19 and 15 percent respectively, of women aged between 15-49 years that have ever experienced physical violence since age 12, while Sool region has the lowest rate at 9 percent. There is a significant variance in terms of women’s education level and the possibility she could experience physical violence. Women with higher education attainment reported the highest rate of physical violence at 19 percent while women who never attended school and those who have attained secondary level reported the lowest rate of 14 percent. Furthermore, in terms of wealth status, women from the middle wealth quintile reported the highest rate of physical violence at 19 percent. Seventeen percent of women from the highest wealth quintile reported to have ever experienced physical violence, while women from the lowest and second wealth quintiles reported the lowest rate of physical violence at 13 percent.
Figure 9.2 Physical Violence
Percent of women aged 15-49 who have ever experienced physical violence since age 12 and percentage who have experienced violence during the 12 months preceding the survey by age
17.2
14.715.5
10.1
12.9 13.4
9.8
12.7
8.3 7.6
3.4 3.5
5.7
2.2
15-19 20-24 25-29 30-34 35-39 40-44 45-49
Since age 12 Last 12 months before surveying
Figure 9.3 Physical Violence
Percentage of women aged 15-49 who have ever experienced physical violence since age 12 by region and residence
17.6
13.2
12.2
9.4
12.2
19.0
14.2
15.0
Urban
Rural
Nomadic
Sool
Sanaag
Bari
Nugaal
Mudug
Resi
denc
eRe
gion
s

187
Perpetrators of physical violence
Table 9.3 illustrates the opinions of women aged 15-49 regarding who they consider are the most common perpetrators of violence against women. More than half (52 percent) of women believe that husbands are the most individuals that commit violent acts against women in Puntland. However, husband violence decreases with the age among women. For example, 45 percent of women aged 45-49 experienced husband violence, compared to 57 percent of women aged 15-19.
Among the regions, the proportion of women who reported husbands as perpetrators of violence against women was highest in Sanaag at 59 percent and lowest in Bari at 45 percent.
At residence level, women in urban areas are more subjected to violent acts by the husband at 54 percent than rural and nomadic areas at 51 and 49 percent respectively.
Furthermore, data shows that other relative’s group are the second perpetrators after husbands in perpetrating violence against women at 17 percent. Fathers/ stepfathers are the third in perpetrating violence against women at 16 percent. Daughter or son are the least perpetrators; they commit 3 percent of the all physical violence against women. Employer someone at work were reported as perpetrators of violence acts against women at 5 percent.
As part of the survey, women aged 15-49 who had experienced physical violence since the age of 12 were asked who committed the acts of violence against them. Respondents could report multiple perpetrators based on their experience.
As presented in Table 9.4, 58 percent of ever-married women aged 15-49 in Puntland who had experienced physical violence reported the most common perpetrators were their respective husbands. A similar indicator at the national level was reported at 62 percent (SHDS, 2020). Twenty-four percent of ever-married women stated that the mother/ stepmother had committed the acts of violence against them. Among never-married women, 28 percent reported perpetrators were their mothers/stepmothers, while 30 percent of never-married women had experienced physical violence perpetrated by a relative that is not an immediate family member.
Violence during PregnancyEver-married women who had been pregnant before were asked about their experiences of physical violence during pregnancy. Specifically, they were asked whether anyone had ever hit, slapped, kicked, or done anything else that hurt them physically. Table 9.5 presents the findings on ever-married women aged 15-49 in
Figure 9.4 Physical Violence Frequency
Percentage of women aged 15-49 who have ever experienced physical violence by the residence
17.6
4.45.3
9.8
13.2
4.6
2.7
7.2
12.2
3.92.5
6.4
since age 12 Often Sometimes Last 12 monthsbefore survey
Urban Rural Nomadic

Puntland Report 2020Somali Health and Demographic Survey (SDHS)188
Puntland who had experienced violence during pregnancy. Six percent experienced violence during pregnancy which is the same as the National level percentage. Furthermore, the data shows that 12 percent of currently divorced women had experienced violence during pregnancy, compared to 10 percent at National level. Women in urban areas experienced more violence during pregnancy at 9 percent than rural and nomadic women at 3 percent each; this indicator does not vary much between the Puntland report and national level report.
Among the regions, women in Bari and Nugal are more likely to experience physical violence during pregnancy at 9 percent each, compared to Sool and Sanaag at percent 3 each.
Spousal Violence Table 9.6 presents spousal violence experienced by the ever-married women aged 15-49 who reported emotional, physical or sexual violence by their current or most recent husband in the 12 months preceding the survey. Eleven percent of ever-married women had been physically abused by a spouse, while 4 percent experienced emotional abuse by a spouse. The patterns of spousal violence increase with the number of children a woman has. Six percent of women with five or more children reported spousal violence compared to 2 percent of women with no children. Women from urban areas experienced more physical abuse than women in rural and nomadic areas at 16, 9 and 8 percent, respectively. Among the regions, women in Bari and Nugal are more likely to have experienced spousal violence at17 percent compared to Sool at11 percent.
Injuries to Women due to Spousal Violence
Table 9.7 presents findings among ever-married women aged 15-49 who had sustained injuries due to domestic violence committed by their current or most recent spouses. 32 percent of ever-married women who have ever experienced physical violence by their current or most recent husband reported having had injuries as a result, compared to 35 percent at the National level.
Among ever-married women aged 15-49 who had experienced any violence, 23 percent reported they had cuts, bruises or aches; 19 percent had eye injuries, dislocations, sprains or burns; and 14 percent had deep wounds, broken bones or teeth, or any other serious wounds as a result of spousal violence.
Figure 9.5 Injuries to women due to spousal violence
Percent of ever-married women aged 15-49 who have experienced specific types of spousal violence by types of injuries resulting from the violence
23.3
19.1
14.3
31.7
Cuts, bruises, oraches
Eye injuries, sprains,dislocations, or burns
Deep wounds, broken bones,broken teeth, or any other serious injury
Any injury

189
Help-seeking behaviors
Help-seeking behaviors refer to women’s responses to their experiences of violence committed by anyone. The SHDS interviewers inquired whether women who had been subjected to violence had sought any help. Table 9.8 shows that only 15 percent of ever-married women aged 15-49 who had experienced emotional, physical or sexual violence had sought help, compared to 17 percent at the National level. Further, the findings show that women experiencing both physical and sexual violence only were more likely to seek help at 25 percent compared to those who experienced sexual violence only at 3 percent or physical violence only at12 percent. There is not much difference between formerly married women and currently married women who had been subjected to violence in terms of seeking help with proportions of 11 and 16 percent, respectively compared to 29 and 16 percent respectively at the National level.
The findings further show that urban and rural women are more likely to seek help at 19 and 17 percent respectively compared to women from nomadic areas at 6 percent. The corresponding national proportions for this indicator for urban, rural and nomadic places of residence are 23, 12 and 10 percent respectively.
Places where Violence Against Women usually happens
Table 9.9 shows opinions regarding the most common places of violent acts against women. Women believe that the most violent crimes against women take place at homes, and streets at 67 and 11 percent respectively. The level of home violence increases with age of women. For example, 73 percent of women of aged 45-49 experienced home violence, compared to 65 percent of women aged 15-19.
The differences of home violence are minimal among the places of residence; urban at 68 percent, rural at 65 percent and nomadic at 67 percent. Among the regions, Sanaag and Sool have the highest rates of women who had been subjected to home violence at 78 and 73 percent respectively, and slightly lower in Bari and Nugal at 62 and 60 percent respectively. And finally, Never-married women are less likely to experience violence at home than ever married women.
Among the women with no education, 68 percent reported home violence, compared to 65 percent of women with higher education. Women from the lowest wealth quintile households are more likely to experience violence at work at 15 percent compared to the other wealth quintiles at 10 percent and below.
Figure 9.5 Place of violence act
Percent distribution of all women aged 15-49 according to the place where violence most violence occurs.
67.4
8.8
10.5
3.0
1.7
5.1
0.7
0.7
2.0
At home
Workplace
Street
School
Water point
Rural/grazing areas
Market place
Neighborhood
Other

Puntland Report 2020Somali Health and Demographic Survey (SDHS)190
Perc
enta
ge o
f all
wom
en a
ged
15-4
9 w
ho u
nder
stan
d do
mes
tic
viol
ence
to m
ean
vari
ous
spec
ified
act
s, b
y ba
ckgr
ound
cha
ract
eris
tics
, SH
DS
2020
Bac
kgro
und
char
acte
rist
ics
Opi
nion
/act
s th
at m
ean
dom
esti
c vi
olen
ce
Phys
ical
abu
se
No
part
icip
atio
n in
dec
isio
n m
akin
g fo
r ho
useh
old
No
part
icip
atio
n in
dec
isio
n m
akin
g fo
r ch
ildre
n
Bet
ter
trea
tmen
t of
mal
es
than
fe
mal
es
Faili
ng
to m
eet
basi
c liv
ing
cost
s
Den
ial o
f ed
ucat
ion
For
ced
Mar
riag
e R
ape
Sex
ual
hara
ssm
ent
For
ced
labo
ur O
ther
Tota
l nu
mbe
r of
W
omen
Age 15
-19
61.9
53.9
52.9
57.2
53.0
63.2
66.6
66.1
62.2
66.1
3.4
1,6
66
20-2
462
.653
.154
.656
.452
.062
.265
.662
.863
.065
.06.
0 9
26
25-2
956
.64
6.5
48
.24
9.1
43.
852
.356
.752
.352
.154
.64
.4 9
56
30-3
455
.94
5.1
46.
54
5.9
41.
950
.352
.94
9.7
50.5
52.7
3.4
734
35-3
955
.94
8.6
49.
84
8.0
45.
851
.455
.94
8.4
51.8
52.7
3.9
619
40
-44
53.7
46.
84
6.6
47.
24
4.8
53.0
55.6
46.
750
.953
.02.
5 3
45
45-
4950
.84
6.7
44
.74
6.3
44
.251
.150
.54
9.5
50.1
52.8
3.2
18
0
Type
of R
esid
ence
Urb
an63
.654
.154
.056
.750
.863
.865
.761
.961
.363
.84
.9 2
,10
2
Rura
l57
.34
9.4
50.6
51.2
47.
859
.560
.956
.555
.858
.33.
5 1
,524
Nom
adic
54.2
45.
64
6.4
47.
44
5.1
46.
953
.751
.952
.054
.83.
4 1
,80
0
Reg
ions
Sool
61.5
50.8
52.1
52.4
48
.560
.763
.562
.259
.861
.54
.7 7
42.
0
Sana
ag64
.959
.060
.362
.154
.164
.467
.765
.864
.567
.610
.4 9
90.1
Bari
43.
737
.837
.138
.936
.04
5.0
48
.24
5.8
42.
44
6.8
0.7
1,2
53.9
Nug
aal
58.8
44
.34
5.0
44
.34
1.1
52.1
56.6
49.
451
.353
.23.
2 5
53.7
Mud
ug64
.354
.755
.257
.654
.761
.064
.560
.362
.464
.12.
8 1,
88
6.3
Mar
ital
Sta
tus
Nev
er M
arri
ed20
.818
.518
.219
.217
.921
.722
.522
.521
.222
.31.
3 1
,751
Mar
ried
32.6
27.1
27.8
28.4
26.0
30.1
32.4
29.7
30.5
31.7
2.2
3,1
61
Div
orce
d3.
83.
13.
23.
22.
93.
73.
93.
53.
63.
80
.3 3
61
Wid
owed
1.5
1.3
1.3
1.3
1.2
1.5
1.5
1.4
1.4
1.5
0.2
152
Tab
le 9
.1
Act
s th
at m
ean
dom
esti
c vi
olen
ce

191
Tab
le 9
.1
(C
ont’d
) A
cts
that
mea
n do
mes
tic
viol
ence
Educ
atio
n
No
Educ
atio
n55
.84
7.4
48
.24
9.2
46.
552
.756
.953
.453
.656
.43.
8 3
,997
Prim
ary
64.0
53.4
55.1
57.5
49.
965
.567
.064
.662
.365
.34
.48
73
Seco
ndar
y71
.563
.259
.263
.356
.574
.474
.970
.568
.568
.44
.54
11
Hig
her
71.0
62.5
61.4
64.5
57.3
72.6
76.5
76.4
75.0
75.2
5.3
145
Wea
lth
Qui
ntile
Low
est
62.5
52.3
53.8
55.5
52.5
54.2
61.5
58.5
60.6
63.1
3.5
1,1
66
Seco
nd4
6.2
39.5
39.2
39.8
37.8
42.
84
7.1
46.
94
5.0
47.
43.
4 8
68
Mid
dle
55.0
46.
44
7.4
48
.24
4.8
54.6
56.4
52.8
51.8
55.4
4.1
1,0
03
Four
th65
.556
.657
.159
.755
.365
.867
.962
.561
.063
.54
.5 1
,154
Hig
hest
60.5
51.9
51.7
53.4
47.
063
.164
.961
.361
.263
.24
.4 1
,235
Tota
l 58
.750
.050
.552
.04
8.1
57.0
60.4
57.1
56.7
59.3
4.0
5,4
26
Perc
enta
ge o
f all
wom
en a
ged
15-4
9 w
ho u
nder
stan
d do
mes
tic
viol
ence
to m
ean
vari
ous
spec
ified
act
s, b
y ba
ckgr
ound
cha
ract
eris
tics
, SH
DS
2020
Bac
kgro
und
char
acte
rist
ics
Opi
nion
/act
s th
at m
ean
dom
esti
c vi
olen
ce
Phys
ical
abu
se
No
part
icip
atio
n in
dec
isio
n m
akin
g fo
r ho
useh
old
No
part
icip
atio
n in
dec
isio
n m
akin
g fo
r ch
ildre
n
Bet
ter
trea
tmen
t of
mal
es
than
fe
mal
es
Faili
ng
to m
eet
basi
c liv
ing
cost
s
Den
ial o
f ed
ucat
ion
For
ced
Mar
riag
e R
ape
Sex
ual
hara
ssm
ent
For
ced
labo
ur O
ther
Tota
l nu
mbe
r of
W
omen

Puntland Report 2020Somali Health and Demographic Survey (SDHS)192
Percentage of women aged 15-49 who have ever experienced physical violence since age 12 and percentage who have experienced violence during the 12 months preceding the survey, by background characteristics, SHDS 2020 2020
Background Characteristics
Percentage who have experienced physical violence in the past 12 months
Ever experienced physical violence
since age 12
Total number of WomenOften Sometimes often or sometimes
Age
15-19 17.2 7.4 5.3 12.7 1,666
20-24 14.7 3.8 4.4 8.3 926
25-29 15.5 4.1 3.5 7.6 956
30-34 10.1 1.4 2.0 3.4 734
35-39 12.9 2.0 1.4 3.5 619
40-44 13.4 3.1 2.7 5.7 345
45-49 9.8 1.3 0.9 2.2 180
Types of residence
Urban 17.6 4.4 5.3 9.8 2,102
Rural 13.2 4.6 2.7 7.2 1,524
Nomadic 12.2 3.9 2.5 6.4 1,800
Region
Sool 9.4 2.3 2.5 4.8 742
Sanaag 12.2 2.5 3.0 5.5 990
Bari 19.0 6.1 5.8 11.9 1,254
Nugaal 14.2 3.0 3.5 6.5 554
Mudug 15.0 5.1 3.1 8.2 1,886
Current Marital Status
Never Married 6.1 2.7 2.0 4.7 1,751
Married 7.1 1.3 1.4 2.8 3,161
Divorced 1.0 0.2 0.2 0.4 361
Widowed 0.2 0.1 0.0 0.1 152
Education Level
No Education 14.0 4.1 3.3 7.3 3,997
Primary 16.5 5.2 4.6 9.8 873
Secondary 13.8 4.0 3.7 7.7 411
Higher 19.2 5.7 8.2 13.9 145
Wealth Quintile
Lowest 12.0 4.4 2.2 6.6 1,166
Second 12.4 2.3 3.4 5.6 868
Middle 19.0 5.4 5.0 10.5 1,003
Fourth 12.8 3.8 3.2 7.0 1,154
Highest 16.5 5.1 4.5 9.6 1,235
Total 14.6 4.3 3.6 7.9 5,426
Table 9.2 Presents Experience of physical violence

193
Tab
le 9
.3
Opi
nion
s re
gard
ing
the
mos
t com
mon
per
petr
ator
of v
iole
nt a
cts
agai
nst w
omen
Perc
ent d
istr
ibut
ion
of a
ll w
omen
acc
ordi
ng to
the
pers
on w
ho, i
n th
eir
opin
ion,
is th
e m
ost c
omm
on p
erpe
trat
or o
f vio
lent
act
s ag
ains
t wom
en, b
y ba
ckgr
ound
cha
ract
eris
tics
, SH
DS
2020
Bac
kgro
und
Cha
ract
eris
tics
Indi
vidu
al w
ho c
omm
its
the
mos
t vio
lent
act
s ag
ains
t wom
en
Hus
band
Mot
her/
Step
-m
othe
rFa
ther
/Ste
p-fa
ther
Si
ster
/Bro
ther
Dau
ghte
r/So
nO
ther
R
elat
ive
In-
law
sTe
ache
rEm
ploy
er/
Som
eone
at
wor
k
Polic
e/A
So
ldie
rTo
tal n
umbe
r of
Wom
en
Age 15
-19
56.6
18.1
19.1
9.4
4.5
21.2
7.2
12.7
5.5
8.1
1,6
66
20
-24
53.6
14.4
15.7
7.1
1.8
16.6
8.2
10.5
6.1
7.5
926
25-2
951
.313
.313
.45.
72.
014
.66.
66.
34
.35.
4 9
56
30-3
44
8.3
10.0
13.8
4.1
1.410
.07.
16.
73.
04
.2 7
34
35-3
94
4.5
11.6
15.4
5.6
2.1
15.0
4.4
6.5
3.6
6.5
619
40
-44
46.
311
.313
.85.
02.
011
.74
.04
.22.
74
.1 3
45
45-
494
5.1
7.4
13.5
9.0
2.3
12.1
5.0
6.2
1.75.
7 1
80
Type
s of
Res
iden
ce
Urb
an54
.413
.016
.97.
62.
616
.26.
310
.95.
88.
0 2
,102
Rura
l50
.815
.218
.47.
82.
915
.05.
88.
94
.38.
1 1
,524
Nom
adic
49.1
14.3
12.4
5.4
2.5
17.0
7.7
6.7
3.3
3.4
1,8
00
Reg
ion
Sool
54.1
10.9
13.1
6.8
1.2
16.2
3.3
3.1
4.7
6.5
74
2
Sana
ag59
.418
.716
.96.
21.
310
.75.
23.
81.
83.
1 9
90
Bari
44
.814
.614
.24
.01.
88.
43.
66.
93.
87.
0 1
,254
Nug
aal
50.2
11.8
8.5
4.8
0.9
8.0
2.5
5.4
4.7
6.5
554
Mud
ug51
.513
.119
.79.
95.
126
.411
.916
.26.
47.
9 1
,886
Cur
rent
mar
ital
sta
tus
Nev
er M
arri
ed58
.519
.719
.910
.44
.621
.38.
314
.56.
78.
9 1
,751
Mar
ried
48.
711
.013
.75.
01.
813
.65.
96.
33.
55.
2 3
,161
Div
orce
d4
6.8
12.7
14.4
5.7
1.414
.05.
96.
53.
76.
6 3
61
Wid
owed
44
.013
.416
.38.
61.7
13.5
3.7
4.6
4.0
4.5
152
Educ
atio
n
No
Educ
atio
n49
.913
.215
.17.
02.
816
.16.
87.
84
.15.
5 3
,997

Puntland Report 2020Somali Health and Demographic Survey (SDHS)194
Prim
ary
56.2
17.3
18.0
6.4
1.615
.05.
311
.24
.98.
1 8
73
Sec
onda
ry52
.714
.219
.57.
73.
919
.47.
012
.57.
910
.8 4
11
Hig
her
68.7
16.4
12.6
5.4
1.112
.58.
416
.05.
210
.3 1
45
Wea
lth
quin
tile
Low
est
52.5
15.2
14.0
6.3
3.5
21.9
10.9
8.7
4.5
4.4
1,16
6
Seco
nd4
6.0
13.1
12.8
5.4
1.09.
72.
42.
82.
54
.1 8
68
Mid
dle
49.4
11.8
18.4
7.9
3.3
15.9
7.2
9.0
3.9
7.5
1,0
03
Four
th53
.215
.316
.48.
23.
219
.06.
612
.34
.68.
6 1
,154
Hig
hest
55.1
14.2
17.2
6.6
2.0
12.6
5.1
10.2
6.4
7.3
1,2
35
Tota
l51
.614
.015
.86.
92.
716
.16.
68
.94
.56.
5 5
,426
Tab
le 9
.3
(C
ont’d
) O
pini
ons
rega
rdin
g th
e m
ost c
omm
on p
erpe
trat
or o
f vio
lent
act
s ag
ains
t wom
en
Perc
ent d
istr
ibut
ion
of a
ll w
omen
acc
ordi
ng to
the
pers
on w
ho, i
n th
eir
opin
ion,
is th
e m
ost c
omm
on p
erpe
trat
or o
f vio
lent
act
s ag
ains
t wom
en, b
y ba
ckgr
ound
cha
ract
eris
tics
, SH
DS
2020
Bac
kgro
und
Cha
ract
eris
tics
Indi
vidu
al w
ho c
omm
its
the
mos
t vio
lent
act
s ag
ains
t wom
en
Hus
band
Mot
her/
Step
-m
othe
rFa
ther
/Ste
p-fa
ther
Si
ster
/Bro
ther
Dau
ghte
r/So
nO
ther
R
elat
ive
In-
law
sTe
ache
rEm
ploy
er/
Som
eone
at
wor
k
Polic
e/A
So
ldie
rTo
tal n
umbe
r of
Wom
en

195
Among women age 15-49 who have experienced physical violence since age 10, percentage who report specific persons who committed the violence according to the respondents current marital status, SHDS 2020
Background characteristics Ever Married Never Married Total
Persons committing violence
Husband 58.4 n/a 33.7
Mother/step-mother 24.1 27.8 24.4
Father/step-father 11.0 13.5 11.0
Sister/brother 10.4 15.9 11.3
Daughter/son 2.4 17.6 7.2
Other Relative 6.7 29.1 13.6
Mother-in-law 1.9 n/a 10.5
Father-in-law 0.1 n/a 8.3
Other-in-law 0.1 n/a 1.1
Neighbour 6.2 6.6 6.3
Teacher 5.0 1.9 3.4
Employer/someone at work 1.1 9.5 3.4
Police/soldier 1.0 n/a 0.6
Militia/gangs 0.9 n/a 0.5
Other 2.5 n/a 1.4
Number of women 455 215 670
n/a- not applicable
Table 9.4 Persons committing physical Violence

Puntland Report 2020Somali Health and Demographic Survey (SDHS)196
Table 9.5 Experience of violence During pregnancy
Among of ever married women age 15-49 who have ever been pregnant, percentage who have ever experienced physical violence during pregnancy, by background characteristics, SHDS 2020
Background Characteristics Percentage who have experienced
violence during pregnancy Total number of Women
Age
15-19 1.8 300
20-24 2.7 633
25-29 3.7 889
30-34 2.5 717
35-39 2.5 616
40-44 3.8 339
45-49 3.1 180
Residence
Urban 4.0 1,271
Rural 3.3 1,074
Nomadic 1.6 1,330
Region
Sool 1.8 527
Sanaag 2.0 720
Bari 4.3 870
Nugaal 4.2 372
Mudug 2.6 1,186
Marital Status
Married 3.0 3,161
Divorced 2.6 361
Widowed 1.4 152
Education
No Education 3.0 3,011
Primary 2.4 481
Secondary 3.1 135
Higher (3.1) 49
Wealth
Lowest 1.3 859
Second 3.1 666
Middle 5.3 685
Fourth 2.9 748
Highest 2.5 717
Total 2.9 3,675

197
Percentage of ever-married women age 15-49 who have ever experienced emotional, physical or sexual violence committed by their husband, by background characteristics, SHDS 2020
Background Characteristics
Percentage of women whose husband did:
Physical Abuse
Sexual Violence
Emotional Physical
and Sexual violence
Physical and Sexual and Emotional violence
Physical or Sexual violence
Physical or Sexual or Emotional violence
Number of ever married
women
Age
15-19 9.9 2.7 5.6 1.4 0.0 11.2 15.7 298
20-24 9.8 3.1 2.5 2.0 0.6 10.9 12.3 627
25-29 13.5 4.1 5.1 3.1 0.6 14.5 17.1 873
30-39 10.3 3.0 4.4 2.2 0.8 11.0 13.2 1,298
40-49 11.2 3.8 2.6 2.1 0.0 12.8 14.2 510
Residence
Urban 16.1 4.3 5.9 3.1 0.6 17.3 20.3 1,251
Rural 9.1 3.8 2.5 2.5 0.5 10.5 11.8 1,038
Nomadic 7.8 2.1 3.6 1.5 0.6 8.5 10.7 1,317
Region
Sool 7.4 2.8 2.7 1.1 0.2 9.1 10.3 522
Sanaag 11.3 2.2 2.3 1.7 0.3 11.7 13.4 715
Bari 14.3 4.6 5.1 4.0 0.9 14.9 17.0 827
Nugaal 10.2 4.4 6.8 2.1 0.3 12.4 17.1 365
Mudug 10.5 3.2 4.3 2.1 0.8 11.6 14.0 1,176
Number of living children
0 1.1 0.4 0.5 0.3 0.1 1.2 1.6 416
1-2 2.8 0.9 0.9 0.7 0.1 3.0 3.5 846
3-4 3.1 0.8 1.1 0.6 0.2 3.4 3.8 1,011
5+ 4.1 1.2 1.5 0.8 0.1 4.5 5.4 1,332
Marital status
Currently Married 10.6 3.5 4.7 2.4 0.6 11.8 14.4 3,104
Formerly Married 13.8 2.3 2.0 0.0 14.2 14.2 501
Employed in the 12 months preceding the survey
employed 14.3 7.7 5.5 5.2 0.0 16.8 20.4 320
Not employed 10.7 2.9 3.9 2.0 0.6 11.6 13.8 3,285
Education
No Education 10.2 3.4 4.1 2.4 0.6 11.3 13.6 2,952
Primary 14.8 3.4 3.6 2.2 0.4 16.0 17.9 474
Secondary 15.7 2.5 6.1 2.5 1.3 15.7 18.8 130
Higher (13.1) (3.1) (0.0) (1.1) (0.0) (15.2) (15.2) 49
Wealth
Lowest 7.6 2.1 3.9 1.4 0.6 8.3 10.7 853
Second 10.1 3.3 2.5 2.3 0.5 11.0 12.1 656
Middle 14.5 5.9 6.6 4.8 1.2 15.6 18.8 661
Fourth 10.5 3.3 2.6 1.6 0.2 12.2 13.4 726
Highest 13.5 2.7 4.9 1.9 0.4 14.3 17.7 709
Total 11.1 3.4 4.1 2.3 0.6 12.1 14.3 3,606
Note: Husband/spouse refers to the current husband for currently married women and the most recent husband for divorced, or widowed women
Table 9.6 Spousal violence by background characteristics

Puntland Report 2020Somali Health and Demographic Survey (SDHS)198
Percentage of ever-married women aged 15-49 who have experienced specific types of spousal violence by types of injuries resulting from the violence, according to whether they ever experienced violence or experienced it in the 12 months preceding the survey, SHDS 2020
Background characteristic
Injuries experienced
Number of womenCuts, bruises, or
aches
Eye injuries, sprains, dislocations, or
burns
Deep wounds, broken bones,
broken teeth, or any other serious injury
Any injury
Experienced any violence
Ever 23.3 19.1 14.3 31.7 225
in the past 12 Months
25.7 21.4 14.3 34.1 192
Age
15-19 * * * * 14
20-24 (16.3) (9.6) (3.2) (23.56) 43
25-29 24.7 21.5 12.9 34 70
30-34 (16.3) (14.3) (11.7) (28.0) 37
35-39 (34.5) (28.4) (22.9) (34.5) 39
40-44 * * * * 20
45-49 * * * * 7
Total 15-49 23.3 19.1 14.3 31.7 225
Table 9.7 Injuries to women due to spousal violence

199
Percentage of ever-married women age 15-49 who have ever experienced emotional, physical or sexual violence committed by background characteristics, SHDS, 2020
Background CharacteristicsSought help
Total Number of ever married women Yes No
Type of violence experienced
Physical Abuse 11.8 88.2 100.0 187
Sexual Violence 3.1 96.9 100.0 17
Physical and Sexual violence 24.6 75.4 100.0 93
Age
15-19 * * 100.0 22
20-24 11.9 88.1 100.0 51
25-29 16.9 83.1 100.0 86
30-34 13.2 86.8 100.0 51
35-39 18.0 82.0 100.0 52
40-44 (20.6) (79.4) 100.0 23
45-49 * * 100.0 11
Type of residence
Urban 18.9 81.1 100.0 154
Rural 16.6 83.4 100.0 69
Nomadic 6.7 93.3 100.0 74
Region
Sool (15.0) (85.0) 100.0 34
Sanaag (22.1) -77.9 100.0 37
Bari 22.6 77.4 100.0 89
Nugaal (11.2) (88.8) 100.0 41
Mudug 7.8 92.2 100.0 96
Number of living children
0 (20.2) (79.8) 100.0 24
1-2 8.7 91.3 100.0 69
3-4 12.1 87.9 100.0 93
5+ 21.0 79.0 100.0 111
Marital status
Currently Married 15.8 84.2 100.0 269
Formerly Married (11.0) -89.0 100.0 28
Employment in the 12 months
Employed (25.7) (74.3) 100.0 33
Not employed 14.0 86.0 100.0 264
Education
No Education 17.0 83.0 100.0 238
Primary 9.5 90.5 100.0 47
Secondary * * 100.0 10
Higher * * 100.0 3
Wealth quintile
Lowest 5.7 94.3 100.0 48
Second 20.7 79.3 100.0 45
Middle 18.5 81.5 100.0 89
Fourth 9.7 90.3 100.0 57
Highest 19.7 80.3 100.0 58
Total 15 84 100.0 297
Note: Figures in parentheses are based on 25-49 unweighted cases. An asterisk indicates that a figure is based on fewer than 25unweighted cases and has been suppressed.
Table 9.7 Help seeking to stop violence

Puntland Report 2020Somali Health and Demographic Survey (SDHS)200
Percent distribution of all women aged 15-49 according to the place where, in their opinion, most of the violent acts against women occur, by background characteristics, SHDS 2020
Where do most violent acts take place
Background characteristics
At home Workplace Street SchoolWater
point
Rural/
grazing
areas
Market
placeNeighborhood Other Total
Total
number
of
Women
Age
15-19 65.2 10.6 10.8 4.3 1.9 4.8 0.0 0.0 2.4 100.0 1,571
20-24 66.9 8.6 10.2 2.9 1.8 6.6 0.4 0.2 2.4 100.0 737
25-29 67.8 10.0 10.7 1.7 1.9 4.0 1.9 1.1 1.0 100.0 651
30-34 69.4 6.3 8.9 2.4 1.7 6.3 1.6 2.1 1.3 100.0 468
35-39 71.3 6.2 11.7 2.3 0.4 5.0 0.5 1.6 1.0 100.0 386
40-44 70.1 5.9 11.3 2.0 3.5 2.7 1.2 0.2 3.0 100.0 227
45-49 73.1 4.0 8.5 0.6 0.0 7.7 1.2 2.2 2.7 100.0 97
Types of residence
Urban 68.4 8.8 12.1 3.8 1.0 3.1 0.9 0.7 1.2 100.0 1,694
Rural 65.4 6.4 12.2 3.5 2.6 5.7 0.8 1.1 2.3 100.0 1,163
Nomadic 67.9 11.0 6.9 1.6 2.0 7.3 0.4 0.3 2.6 100.0 1,280
Region
Sool 72.3 3.7 8.9 0.8 1.3 10.4 1.1 0.7 0.7 100.0 562
Sanaag 78.2 3.0 6.9 2.6 1.2 3.0 0.2 0.2 4.7 100.0 791
Bari 62.1 6.1 17.7 5.1 3.6 4.0 0.4 0.3 0.7 100.0 836
Nugaal 60.1 5.6 16.9 3.6 0.6 6.4 1.1 0.2 5.5 100.0 427
Mudug 65.0 16.1 7.3 2.8 1.5 4.6 0.8 1.2 0.7 100.0 1,521
Marital Status
Never Married
62.8 10.9 11.2 4.6 2.0 6.2 0.0 0.0 2.4 100.0 1,749
Married 71.4 7.2 9.7 1.9 1.6 4.3 1.1 1.2 1.8 100.0 2,047
Divorced 68.9 7.6 12.8 2.1 1.1 3.6 2.6 0.8 0.4 100.0 244
Widowed 64.1 6.6 10.4 2.4 3.3 8.0 0.6 1.6 3.1 100.0 96
Education
No Education 68.2 9.5 9.8 2.0 2.0 5.3 0.7 0.6 1.9 100.0 2,899
Primary 67.7 4.9 11.0 5.4 1.1 5.7 0.9 0.8 2.4 100.0 733
Secondary 61.6 11.0 13.9 5.7 1.1 3.3 0.9 0.8 1.7 100.0 372
Higher 64.8 10.3 13.8 4.4 2.2 3.8 0.0 0.0 0.8 100.0 134
Wealth
Lowest 67.7 13.4 7.4 1.8 1.6 4.8 0.4 0.5 2.5 100.0 908
Second 68.3 5.1 8.7 1.0 3.3 9.8 0.5 0.4 2.9 100.0 558
Middle 65.8 9.4 14.1 2.3 1.8 3.4 0.9 1.2 1.2 100.0 748
Fourth 69.1 7.0 9.3 4.7 1.4 4.6 0.9 0.6 2.2 100.0 943
Highest 66.1 8.0 12.9 4.3 1.3 4.6 0.8 0.6 1.4 100.0 980
Total 67.4 8.8 10.5 3.0 1.7 5.1 0.7 0.7 2.0 100.0 4,137
Table 9.9 Opinions regarding the most common places of violent acts against women

201

Female Genital Mutilation/Cutting
CHAPTER 10

©A
U U
N I
ST P
HO
TO
/ T
OB
IN J
ON
ES.
Key Findings

Puntland Report 2020Somali Health and Demographic Survey (SDHS)204
In the SHDS 2020, both ever-married women and never-married women were asked a series of questions about FGM/C, including whether they had been subjected to it. Women who had undergone the practice were asked at which age it was done, the type of FGM/C they underwent, their religious and cultural perception about the practice, and opinions on whether the practice should continue or not.
Mothers with daughters were asked if their daughters underwent female circumcision, the age at which it happened, and the type of FGM/C performed among other questions.
The SHDS 2020 used the definitions below of types of female circumcision:
a. Excision of the clitoral hood (prepuce), with or without excision of part or all the clitoris (Sunni)
b. Excision of the clitoris with partial or total excision of the labia minora (Intermediate)
c. Excision of part or all of the external genitalia and stitching/narrowing of the vaginal opening; or all other procedures that involve pricking, piercing, stretching; or incising of the clitoris and/or labia; introduction of corrosive substances into the vagina to narrow it (Pharaonic)
Prevalence of Female Genital Mutilation/Cutting Table 10.1 presents the percentage of women aged 15-49 who have undergone female circumcision by background characteristics. Overall, 99 percent of women in Puntland have undergone female circumcision. Pharaonic is the most common type, which has been
10Chapter 10
Female Genital Mutilation/Cutting
Female Genital Mutilation/Cutting (FGM/C) has been practiced in Puntland for many decades. The practice is considered harmful, because it poses a potential risk to the health and well-being of women and girls who are subjected to it. FGM/C is regarded as a violation of the Convention on the Rights of the Child (General Assembly, United Nations, 1990).

205
performed on 59 percent of the women. The findings show that 14 percent of women have undergone the Intermediate type, while 24 percent have undergone the Sunni type. Three percent did not know the type of female circumcision they had undergone earlier in their lives.
Figure 10.1 Type of FGM/C by type of residence
Figure 10.3 Type of FGM/C by region
Figure 10.2 Type of FGM/C by level of education
Figure 10.4 Type of FGM/C by wealth status
Percent distribution of women aged 15-49 by types of FGM/C
Percent distribution of women aged 15-49 by types of FGM/C
Percent distribution of women aged 15-49 by types of FGM/C
Percent distribution of women aged 15-49 by types of FGM/C
Sunni Intermediate Pharaonic Don't know
35.0
21.9
11.112.6 16
.2
15.0
50.1
59.2
71.0
2.3
2.7
3.0
Urban Rural Nomadic
18.7 22
.4
36
26.8
16.9
8.5 11
.9 13.5 15
.8 18.6
70.6
62.7
47.
9
56.6 61
.4
2.2 3
2.6
0.8 3.
1
Sool Sanaag Bari Nugaal Mudug
Sunni Intermediate Pharaonic Don't know
17.8
32
47.
5 50.6
13.6 15
.9
14.7
22.7
65.9
49.
2
35.4
26.7
2.7 2.9
2.4
0
No Education Primary Secondary Higher
Sunni Intermediate Pharaonic Don't know
11.5 14
.4
24.9 28
.3
15.7
12.7
12.9 14
.3
15.4
71.0
68.5
59.1
54.7
47.
8
1.8 4
.4
3.0
2.7
1.8
Lowest Second Middle Fourth Highest
Sunni Intermediate Pharaonic Don't know

Puntland Report 2020Somali Health and Demographic Survey (SDHS)206
Among the places of residence, the highest percentage of the worst form of FGM/C –the Pharaonic type was recorded in nomadic areas at 71 percent, followed by rural and urban areas at 59 and 50 percent respectively. Conversely, Sunni type of FGM/C is second highest in urban areas at 35 percent, followed by rural and nomadic areas at 22 and 11 percent respectively (Figure 10.1)
Figure 10.2 shows that 66 percent of women with no education underwent the worst type of female circumcision. Twenty-seven percent of women with the highest level of education underwent the less severe form of female circumcision. Further investigation is needed to understand this relationship because at the time the respondents underwent female circumcision, their guardians e.g. parents or grandparents had made the decision on the type of female circumcision to be performed.
Figure 10.3 shows that Sool region has the largest proportion of women who have undergone Pharaonic type of FGM/C at 71 percent while Bari has least proportion of Pharaonic type at 48 percent and highest proportion of women who have undergone Sunni type at 36 percent.
Figure 10.4 shows that 71 percent of women from the lowest wealth quintile underwent Pharaonic type compared to 48 percent of the women from highest wealth quintile.
Opinions on Female Genital Mutilation/Cutting
Table 10.2 presents the percentage distribution of women aged 15-49 by their religious beliefs regarding FGM/C practices, according to their ages and other background characteristics. Among circumcised women, 75 percent believe that FGM/C is a religious requirement. There is little variation in the women’s beliefs by age as 79 percent of the women within the age group 15-19 believe it is a religious requirement, compared to 73 percent of those in the age group 45-49.
There is little variation on beliefs around FGM/C practices by place of residence; nomadic is highest proportion of women who believe it is a religious requirement at 79 percent, followed by rural and urban areas at 77 and 69 percent respectively.
There is a notable variation in opinions among women in terms of education— 76 percent of women with no education believe that it is a religious requirement to undergo FGM/C, compared to 48 percent of those with higher education (Figure 10.5).
Among the regions, there is a slight variation regarding beliefs on religious requirement to undergo FGM/C. Sanaag and Bari
Figure 10.5 Opinions on FGM/C by level of education
Figure 10.6 Opinions on FGM/C by region
Percent distribution of women aged 15-49 by whether FGM/C is required by religion according to education
Percent distribution of women aged 15-49 by whether FGM/C is required by religion according to region
76.2
70.3
66.8
47.
8
21.5 28
.6 31.6
48
.7
2.3
1.1
1.6 3.
6
No education Primary Secondary HigherEducation
Required by religion Not required by religion Don’t know
71.4
79.3
77.7
72.5
71.3
25.4
18.2 20
.3 25.9
27.1
3.2
2.5 2 1.
6
1.6
Sool Sanaag Bari Nugaal Mudug
Required by religion Not required by religion Don’t know

207
regions have the largest proportion of women who believe that it is a religious requirement to undergo FGM/C at 79 and 77 percent respectively, while Sool and Mudug have the lowest proportion at 71 percent each (Figure 10.6).
Wealth status plays a role in shaping women’s beliefs about FGM/C: 80 percent of women from the poorest households believe FGM/C is a religious requirement compared to 63 percent from wealthiest households who hold the same beliefs (Figure 10.7).
Age at Female Genital Mutilation/Cutting
Table 10.3 shows the percent distribution of women aged 15-49 by the age when they had undergone FGM/C, according to their background characteristics. Women were asked how old they were when they underwent FGM/C. In Puntland, FGM/C is performed throughout childhood. Seventy percent of women in Puntland were circumcised when they were between ages 5 – 9 compared to 71 percent at the national level. Further 29 percent of the women were circumcised between ages 10-14, less than 1 percent at age 15 or older, and less than 1 percent were circumcised when they were younger than 5 years (Figure 10.8).
The current levels of education of women aged 15-49 and wealth status of Households tend to have little effect or influence on the age at which women underwent FGM/C.
Among the places of residence, the percentage of women who were circumcised at the age of 5-9 was highest in urban areas at 72 percent compared to nomadic and rural areas at 70 and 67 percent respectively (Figure 10.9).
Female Genital Mutilation/Cutting Practice on Daughters
Ever-married women aged 15-49 who had daughters were asked if any of their daughters had undergone FGM/C and, if so, how old the girl was when she underwent the practice, and who performed it among other questions. It should be noted that mothers may not have been able to recall the exact age at which their daughters underwent FGM/C.
Table 10.4 shows the percent of girls of age 0-14 years who underwent female circumcision by age and their mothers’ background characteristics. The results indicate that about 3 percent of girls were cut at the age of 0-4, 25 percent of daughters were cut at the ages of 5-9 and 74 percent of daughters within the age of 10-14 years underwent the practice. In terms of place of
Figure 10.7 Opinions on FGM/C by wealth status
Figure 10.8 Age at female genital mutilation/cutting
Percent distribution of women aged 15-49 by whether FGM/C is required by religion based on wealth status
Percent distribution of women aged 15-49 who underwent FGM/C by age when it was done
76.2
70.3
66.8
47.
8
21.5 28
.6 31.6
48
.7
2.3
1.1
1.6 3.
6
No education Primary Secondary HigherEducation
Required by religion Not required by religion Don’t know
10-1428.7
15+0.7
Don’t know0.6
<50.3
5-969.7

Puntland Report 2020Somali Health and Demographic Survey (SDHS)208
residence, the prevalence of FGM/C among girls aged 10- 14 was 71 percent in urban areas, 75 percent in rural areas and 76 percent in nomadic areas.
The age at FGM/C for daughters differs from that of their mothers. In fact, majority of mothers underwent FGM/C at ages 5-9 years and in contrast, the daughters were circumcised at slightly older ages of 10-14. The educational level of the mother has an influence on the FGM/C practice on their daughters. Twenty-five percent of the daughters of mothers with no education were circumcised at the age of 0-14 years compared to 4 percent of the daughters of mothers with higher education. Meanwhile, the wealth quintile has no major impact on the prevalence of FGM/C.
Among the regions, the prevalence of circumcision of girls aged 10-14 is highest in Mudug at 87 percent and lowest in Sool at 64 percent.
Attitudes towards Female Genital Mutilation/Cutting
Both ever-married and never-married women aged 15-49 were asked whether the FGM/C practice should be continued or stopped. Table 10.5 shows the percentage distribution of women aged 15-49 by their opinion on the practice of FGM/C. Overall 79 percent of the women believe that FGM/C practice should continue, while 16 percent believe that the practice should be stopped.
The opinion on whether the practice of FGM/C should be continued or not, decreased as the wealth status of the household increased. Eighty-three percent of women from the poorest households would like the practice to continue compared to 72 percent of women from wealthier households.
Figure 10.7 shows that the percentage of women who believe that the practice needs to be continued is highest in nomadic areas at 84 percent and lowest in urban areas with 73 percent.
Among the regions, the percentage of women who believe that FGM/C practice needs to be continued is highest in Mudug at 83 percent and lowest in Sool at 70 percent (Figure 10.10).
Figure 10.11 provides a comparison between those with no schooling and those with higher education on the discontinuation of FGM / C. Eighty-one percent of women without education agree that FGM / C practice should be continued, compared to 58 percent of women with higher education. The proportion with higher education who would like the practice to be continued at the national level is 44 percent.
Figure 10.9 Age at female genital mutilation/cutting by type of residence
Percent distribution of women aged 15-49 who underwent FGM/C by age when it was done
0.3
0.3
0.4
71.5
67 69.6
27.1 31
.8
27.9
0.6
0.7
0.9
0.6
0.3 1.1
Urban Rural Nomadic
<5 5 to 9 10 to 14 15+ Don’t know

209
Figure 10.10 Opinion on continuation of FGM/C by region and type of residence
Figure 10.11 Opinions on continuation of female circumcision by level of education
Percent distribution of women aged 15-49 by opinion to continue FGM/C
Percent distribution of women aged 15-49 by opinion on continuation of FGM/C
72.8
81.2 83.6 83.0 80.3 79.1 78.4
70.2
Urban Rural Nomadic Mudug Bari Sanaag Nugaal Sool
Residence Regions8
0.5
75.8
71.2
58.1
14.3 18
.1 25.4
33.9
4.3 5.
9
2.5
8
1
0.3 0.9 0
No Education Primary Secondary Higher
Continued Stopped Depends Don't Know

Puntland Report 2020Somali Health and Demographic Survey (SDHS)210
Table 10.1 Prevalence of Female circumcision
Percentage of women 15-49 who have undergone FGM/C, and percent distribution of women have undergone FGM/C by type according to background characteristics, SHDS, 2020
Type of circumcision
Number of women who have
undergone FGM/C
Background characteristics
Percentage of women who have
undergone FGM/C
Number of women
Sunni Intermediate Pharaonic Don't know Total
Age
15-19 99.0 1446 37.8 14.8 42.2 5.1 100.0 1,431
20-24 98.7 816 24.5 19.2 53.7 2.5 100.0 806
25-29 99.3 820 18.7 14.3 65.8 1.2 100.0 814
30-34 99.4 627 14.4 13.2 71.0 1.4 100.0 623
35-39 99.1 516 12.4 9.7 76.4 1.4 100.0 511
40-44 99.8 275 9.1 12.0 78.3 0.6 100.0 275
45-49 100.0 153 11.6 9.3 79.1 0.0 100.0 153
Type of Residence
Urban 99.2 1825 35.0 12.6 50.1 2.3 100.0 1,810
Rural 99.0 1325 21.9 16.2 59.2 2.7 100.0 1,312
Nomadic 99.2 1504 11.1 15.0 71.0 3.0 100.0 1,491
Region
Sool 99.6 660 18.7 8.5 70.6 2.2 100.0 657
Sanaag 99.9 928 22.4 11.9 62.7 3.0 100.0 927
Bari 98.7 1051 36.0 13.5 47.9 2.6 100.0 1,038
Nugaal 99.3 468 26.8 15.8 56.6 0.8 100.0 465
Mudug 98.8 1547 16.9 18.6 61.4 3.1 100.0 1,527
Education
No Education 99.0 3355 17.8 13.6 65.9 2.7 100.0 3,322
Primary 99.8 792 32.0 15.9 49.2 2.9 100.0 791
Secondary 98.9 374 47.5 14.7 35.4 2.4 100.0 370
Higher 98.1 133 50.6 22.7 26.7 0.0 100.0 131
Wealth
Lowest 99.2 1022 11.5 15.7 71.0 1.8 100.0 1,014
Second 99.5 693 14.4 12.7 68.5 4.4 100.0 690
Middle 98.1 805 24.9 12.9 59.1 3.0 100.0 790
Fourth 99.6 1017 28.3 14.3 54.7 2.7 100.0 1,013
Highest 99.2 1116 35.0 15.4 47.8 1.8 100.0 1,107
Total 99.1 4654 23.6 14.4 59.4 2.6 100.0 4,614

211
Table 10.2 Opinions about whether circumcision is required by religion
Percent distribution of women age 15-49 who have heard of female circumcision by opinion on whether their religion requires female circumcision, according to background characteristics, SHDS 2020
Background characteristics
Religion
Total number of WomenRequired by religion Not required by
religionDon’t know
Circumcision status
Circumcised 74.7 23.2 2.1 3,075
Not circumcised (62.2) (37.8) (0) 21
Age
15-19 78.6 17.8 3.7 242
20-24 73.7 24.1 2.3 549
25-29 71.8 26.7 1.5 758
30-34 75.8 22.0 2.2 613
35-39 74.4 23.2 2.4 514
40-44 79.5 18.4 2.2 269
45-49 73.0 25.9 1.1 151
Types of residence
Urban 68.8 29.4 1.7 1,059
Rural 76.5 21.0 2.5 909
Nomadic 78.5 19.3 2.2 1,127
Regions
Sool 71.4 25.4 3.2 462
Sanaag 79.3 18.2 2.5 667
Bari 77.7 20.3 2.0 698
Nugaal 72.5 25.9 1.6 298
Mudug 71.3 27.1 1.6 971
Education
No education 76.2 21.5 2.3 2,506
Primary 70.3 28.6 1.1 433
Secondary 66.8 31.6 1.6 114
Higher Education 47.8 48.7 3.6 42
Wealth quintile
Lowest 79.9 17.6 2.5 767
Second 73.9 24.7 1.4 535
Middle 77.0 20.8 2.3 529
Fourth 78.6 19.8 1.7 628
Highest 63.0 34.5 2.6 636
Total 74.6 23.3 2.1 3,096

Puntland Report 2020Somali Health and Demographic Survey (SDHS)212
Table 10.3 Age at Female Genital Mutilation/Cutting
Percent distribution of women aged 15-49 who underwent FGM/C by age when it was done, according to background characteristics, SHDS 2020
Background characteristics
Age at CircumcisionTotal
Number of Circumcised
women <5 5 to 9 10 to 14 15+ Don’t know
Age
15-19 1.0 71.9 25.8 0.6 0.7 100.0 1,431
20-24 0.1 71.4 27.4 0.7 0.4 100.0 806
25-29 0.0 71.6 26.6 0.7 1.1 100.0 814
30-39 0.0 65.5 33.1 0.8 0.6 100.0 1,134
40-49 0.0 65.9 32.9 1.0 0.1 100.0 428
Residence
Urban 0.3 71.5 27.1 0.6 0.6 100.0 1,810
Rural 0.3 67.0 31.8 0.7 0.3 100.0 1,312
Nomadic 0.4 69.6 27.9 0.9 1.1 100.0 1,491
Regions
Sool 0.1 63.5 35.4 1.0 0.1 100.0 657
Sanaag 0.1 67.2 31.1 0.9 0.8 100.0 927
Bari 0.0 73.7 25.2 0.8 0.3 100.0 1,038
Nugaal 0.5 78.6 19.8 0.9 0.2 100.0 465
Mudug 0.7 68.2 29.4 0.4 1.2 100.0 1,527
Education
No education 0.3 68.5 29.9 0.7 0.6 100.0 3,322
Primary 0.3 71.2 26.7 1.0 0.9 100.0 791
Secondary 0.6 72.8 25.5 0.4 0.7 100.0 370
Higher education 0.8 80.5 18.7 0.0 0.0 100.0 131
Wealth Quintiles
Lowest 0.6 68.3 29.5 1.0 0.6 100.0 1,014
Second 0.0 72.9 25.0 0.6 1.5 100.0 690
Middle 0.2 69.7 29.1 0.9 0.2 100.0 790
Fourth 0.3 67.0 31.6 0.6 0.4 100.0 1,013
Highest 0.3 71.2 27.2 0.6 0.7 100.0 1,107
Total 0.3 69.6 28.7 0.7 0.6 100.0 4,614

213
Table 10.4 Circumcision of girl’s aged 0-14 by mother’s background characteristics
Percentage of girls age 0-14 who are circumcised, according to age and mother’s background characteristics, Somalia 2019
Background characteristics
Circumcision of girls by age Total girls 0-14 circumcised
Total girls
0-4 5-9 10-14
Mother's Circumcisions
Circumcised 2.8 25.4 73.8 24.1 4,697
Not Circumcised (0) (0) (0) 26.3 30
Types of residence
Urban 3.1 25.3 71.4 24.3 1,619
Rural 4.4 28.2 74.8 26.8 1,387
Nomadic 1.5 22.9 76.1 22.1 1,721
Regions
Sool 3.7 21.3 64.2 20.3 782
Sanaag 2.7 23.9 67.3 23.0 1,041
Bari 2.4 28.8 71.6 27.4 1,056
Nugaal 3.2 30.0 79.8 25.2 457
Mudug 2.5 24.3 86.6 24.5 1,391
Education
No Education 2.8 26.5 74.4 25.2 3,885
Primary 3.0 22.6 76.0 22.1 671
Secondary 4.5 10.6 55.1 13.4 126
Higher (0) (9.1) (0) (3.5) 45
Wealth
Lowest 2.5 22.1 68.9 21.1 1,112
Second 2.2 25.2 74.6 23.5 893
Middle 2.6 28.5 75.1 26.5 852
Fourth 3.6 25.9 77.4 25.5 1,015
Highest 3.2 25.8 75.3 25.1 856
Total 2.8 25.3 74.1 24.2 4,727
Note: The circumcision status of girls is reported by their mothers.An asterisk indicates that a figure is based on fewer than 25 unweighted cases and has been suppressed

Puntland Report 2020Somali Health and Demographic Survey (SDHS)214
Table 10.5 Opinions about whether practice of circumcision should continue
Percent distribution of women age 15-49 who head of female circumcision by opinion on whether the practice of circumcision should be continue by background characteristics, SHDS 2020
Background characteristics
Opinion to continue circumcision or notTotal
Number of womenContinued Stopped Depends Don't Know
Female circumcision status
Circumcised 79.2 15.5 4.5 0.8 100.0 3,075
Not circumcised
(83.3) (16.7) (0) (0) 100.0 21
Age
15-19 79.3 14.8 6.0 0.0 100.0 242
20-24 77.1 17.0 4.5 1.5 100.0 549
25-29 78.6 15.3 5.4 0.8 100.0 758
30-34 81.6 13.1 4.6 0.7 100.0 613
35-39 77.9 17.8 3.3 1.1 100.0 514
40-44 80.5 14.9 3.8 0.8 100.0 269
45-49 82.3 14.8 2.9 0.0 100.0 151
Residence
Urban 72.8 22.7 3.8 0.7 100.0 1,059
Rural 81.2 15.0 3.5 0.3 100.0 909
Nomadic 83.6 9.1 5.9 1.4 100.0 1,127
Regions
Sool 70.2 21.7 7.6 0.5 100.0 462
Sanaag 79.1 12.2 7.5 1.2 100.0 667
Bari 80.3 17.4 1.9 0.4 100.0 698
Nugaal 78.4 17.4 3.5 0.7 100.0 298
Mudug 83.0 12.8 3.1 1.1 100.0 971
Education
No Education 80.5 14.3 4.3 1.0 100.0 2,506
Primary 75.8 18.1 5.9 0.3 100.0 433
Secondary 71.2 25.4 2.5 0.9 100.0 114
Higher (58.1) (33.9) (8.0) (0) 100.0 42
Wealth
Lowest 83.1 9.5 5.7 1.7 100.0 767
Second 78.0 14.8 6.1 1.1 100.0 535
Middle 80.4 16.8 2.2 0.6 100.0 529
Fourth 81.8 14.2 3.6 0.3 100.0 628
Highest 71.8 23.3 4.5 0.3 100.0 636
Total 79.2 15.5 4.5 0.8 100.0 3,096

215

Women’s Empowerment
CHAPTER 11

©A
U U
N I
ST P
HO
TO
/ T
OB
IN J
ON
ES.
Key Findings

Puntland Report 2020Somali Health and Demographic Survey (SDHS)218
Over the years, several attempts have been made to improve life for Somali women. The Provisional Constitution of Somalia has several positive implications for the status of women involvement in leadership and decision making. However, most Somali women are still either excluded from decision-making and asset ownership or operate through a patriarchal filter in these areas – mainly due to cultural restrictions on their movement, and asset ownership.
Women’s employmentTable 11.1 shows the percentage distribution of currently married women who were employed in the 12 months preceding the survey by age and by type of earnings. Generally, employment is assumed to go hand in hand with payment for work. However, not all Somali women receive earnings for the work they do, and among those who do receive earnings, not all receive cash. Sixty-seven percent of currently married women who were employed at any time in the 12 months preceding the survey received earnings in cash, 14 percent were paid in cash and in kind, 6 percent received their earnings in kind only and the remaining 13 percent were not paid at all.
Control over Wives’ Earnings Access to/and control of financial resources are critical variables for women’s empowerment and poverty reduction. Employment and cash earnings are more likely to contribute to the economic and social empowerment of women, particularly if they perceive their earnings as significant relative to those of their husband and important to the welfare of the household. It can contribute to improving power and autonomy in decision making that impact on women as individuals and their families.
11Chapter 11
Women’s Empowerment
This chapter focuses on women’s empowerment in Puntland in terms of employment, earnings, control over earnings and ownership of assets. It also explores women’s ownership and use of bank accounts and mobile phones. The SHDS asked specific questions to define two different indicators of women’s empowerment: their participation in household decision-making and attitudes towards wife beating.

219
To assess women’s autonomy, currently married women aged 15-49 who earned cash for their work in the 12 months preceding the survey were asked who the main decision maker is regarding the use of their earnings. This information allowed an assessment of women’s control over their own earnings. Table 11.2 and Figure 11.1 show the degree of control women have over the use of their earnings, with 56 percent of currently married women reported that they decide on their own how their earnings will be used, while 37 percent decide jointly with their husbands. Seven percent reported their husband is the main decision maker and controls their cash earnings.
Table 11.2 shows that, 31 percent of women earn more than their husbands, while 37 percent earn less than their husbands. Only 2 percent earn an equal amount to their husbands’ earnings. Twenty-three percent of the currently married women did not know whether their earnings were low or higher than their husbands’, mostly because they are not privy to information about their husbands’ earnings.
Control over Husbands’ EarningsTable 11.3 shows that 31 percent of the currently married women aged 15-49 whose husbands earn cash report that decisions about the use of the husbands’ cash earnings are made jointly, and slightly fewer women, at 33 percent, reported that the husband is the main decision maker. Thirty-six percent reported that the wife is the main decision maker on how the husband’s cash earnings are used.
Ownership of AssetsOwnership of and control over assets, such as land and housing, are important factors that contribute to improving women’s status. Ownership of land and property plays an important role in strengthening women’s agency. Land is a key productive and economic asset. It provides opportunity multiple benefits to individuals and households, including a secure place to live, livelihood, protection during emergencies, and collateral when needed. In the SHDS, ever-married women were asked whether they own a house and land alone or jointly with their husband.
Table 11.4 shows the percent distribution of ever-married women aged 15-49 by ownership of a house and land. Women are more likely to own a house than land. Overall,3 percent of women own land and 9 percent own a house either alone or jointly. The ownership of property increases with increasing age. For example, 24 percent of women of age 45-49 years own a house, compared to 2 percent of women aged 15-19. A similar pattern is also observed in land ownership. Eight percent of women aged 45-49 own land,
Figure 11.1 Control over wives’ earnings
Percent distribution of currently married women aged 15-49 with income for the last 12 months preceding survey and who makes decisions over their cash earnings
Wife andhusband jointly
37
Mainly husband7
Mainly wife56

Puntland Report 2020Somali Health and Demographic Survey (SDHS)220
compared to one percent of women aged 15-19.
Figure 11.2 shows percent distribution of asset ownership by geographical areas. It shows that women in rural areas are more likely to own a house at 11 percent compared to women in nomadic and rural areas at 9 and 7 percent respectively. Similarly, women in rural areas are more likely to own land at 4 percent compared to women in urban and nomadic areas at 3 percent each.
Among the regions, women in Bari are more likely to own a house at 11 percent compared to women in Sool, Mudug and Nugaal at 8 percent. A similar trend is observed in the ownership of land where Bari and Nugaal have the highest proportion at 4 percent compared to Sool with the lowest proportion at 1 percent.
Ownership and Use of Bank Accounts and Mobile Phones
Ownership of a bank account and a mobile phone are reflections of autonomy, social functioning, and financial independence. In the SHDS, women were asked if they had an account in a bank or any other financial institution that they themselves used, and if they owned a mobile phone. Those who owned a mobile phone were further asked if they used the phone for financial transactions. Table 11.5 shows that only 4 percent of women have a bank account
6.9
11.0
9.0
10.5
8.6 8.2 8.2 8.0
2.83.9
2.7
4.3
2.4
3.5 3.3
1.3
Urban Rural Nomadic Bari Sanaag Nugaal Mudug Sool
Type of Residence Region
Owns a house alone Owns land alone
Figure 11.2 Ownership of assets
Percent distribution of ever married women aged 15-49 by ownership of housing and land by type of residence and region

221
that they use. However, three-quarters (73 percent) of women own a mobile phone, and among those with a mobile phone, 61 percent use their phones for financial transactions. This is could be attributed to the devaluation of the Somali shilling and lack of small denomination, as well as convenience, which makes mobile money the preferred mode of payment for women throughout the country
The percentage of women who have a bank account and a mobile phone increases as education levels increase. For example, among women with no education, 3 percent own and use a bank account compared to 35 percent of women with higher education. Similarly, among women with no education, 70 percent have mobile phones, compared to 97 percent of those with higher education (Figure 11.3).
Women from the highest wealth quintile are more likely than women from other wealth quintiles to have and use a bank account, own a mobile phone and use a mobile phone for financial transactions. Women from the wealthiest households, at 10 percent own and use a bank account, compared to those from the poorest households at 2 percent. Forty-two percent of women from the poorest households use a mobile phone for financial transactions, compared to 82 percent of women from the wealthiest households (Table 11.5).
Figure 11.3 Ownership of bank account and mobile phones
Percent of women aged 15-49 who have and use a bank account and own a mobile phone by education level
2.6 4.9 8.1
35.1
69.679
86.997.2
No Education Primary Secondary Higher
Have and use a bank account Own a mobile phone
7.72.5 1.9 2.8 2.4 3.9
9.54.6
80.676.9
61.3
71.3 73 73.5
82.7
71
Urban Rural Nomadic Sool Sanaag Bari Nugaal Mudug
Types of residence Region
Have and use a bank account Own a mobile phone
Figure 11.4 Ownership of bank account and mobile
Percent of women aged 15-49 who have and use a bank account and own a mobile phone by type of residence and region

Puntland Report 2020Somali Health and Demographic Survey (SDHS)222
Women in urban areas are more likely to have and use a bank account, own a mobile phone and use a mobile phone for financial transactions than those from rural and nomadic areas. Eighty-one percent of women from urban areas own a mobile phone compared to rural and nomadic women at 77 and 61 percent respectively.
The percentages of those with a bank account, mobile phone and use mobile phones for financial transactions are much higher in Nugaal region than in other regions. Seventy-two percent of women in Nugaal use mobiles phones for financial transactions compared to women in Sool and Bari at 57 percent (Table 11.5).
Women’s Participation in Decision-Making
Participation in household decision-making is an essential aspect of women’s empowerment and reflects women’s status and the level of influence women have within their own household and environment. As part of the SHDS, currently married women were asked about their participation in decisions about their own health care, major household purchases and visits they make to their family or relatives.
Table 11.6 shows that 48 percent of women indicated that decisions on their own health care are made mainly by their husbands, 24 percent make decisions regarding their own health care jointly with their husbands, while 26 percent mainly make these decisions on their own. A similar pattern is observed regarding major household purchases, with 39 percent of women indicating that their husbands make decisions for major household purchases. Forty-eight percent of women state their husbands make decisions for visits to family or relatives. Generally, men have more influence in household decision-making than women.
Attitudes towards Wife BeatingAs part of the SHDS, all women aged 15-49 were asked if they agree that a husband is justified in hitting or beating his wife under each of the following five circumstances: she neglects household duties, she argues with him, she goes out without telling him, she wastes resources, she neglects the children, and she refuses to have sex with him. If respondents answer “yes” in at least one circumstance, they are considered to have attitudes justifying wife beating.
Table 11.7 shows 35 percent of all women believe that a husband is justified in beating his wife for at least one of the six specified reasons. Overall, 23 percent of the women believe that wife beating is justified if the wife neglects household duties. Twenty-two percent believe that wife beating is justified if she argues with

223
him, while 22 percent believe that wife beating is justified if she neglects the children.
The percentage who believe that a husband is justified in beating his wife for at least one of the six specified reasons, generally decreases as the age of women increases. It is high among young women aged 15 -19 at 45 percent compared to older women aged 45 -49 at 20 percent.
Summary Indices of Women’s Empowerment
Responses from women on their participation in making household decisions and their attitudes towards wife beating can be summarized into two separate indices. The first index is the number of decisions in which women participate alone or jointly with their husbands (see Table 11.6 for the list of decisions). This index ranges in value from 0 to 3 and is positively related to women’s empowerment, which means, the higher the value, the greater the respondent’s level of empowerment. It reflects the degree of decision-making and control that women can exercise in areas that directly affect their lives and environments.
Table 11.8 shows that there is a positive relationship between women’s disapproval of wife beating and their participation in decision making. The percentage of women who disagree with all the reasons that justify wife beating increases with the increase of the index, from 63 percent among women who do not participate in any of the household decisions to 70 percent of women who participate in all three decisions.
The second index is the number of reasons why the respondent believes that a husband is justified in beating his wife (see Table 11.7 for the list of reasons). This index ranges in value from 0 to 6. A lower score on this indicator is interpreted as reflecting a greater sense of autonomy, self-esteem, and a higher status.
The percentage of women participating in all the household decisions decreases with the number of reasons women accept as justifying wife beating, from 40 percent among women who do not agree that wife beating is justified for any reason to 40 percent among women who accept that wife beating is justified in all six specified reasons.
Figure 11.5 Attitude towards wife beating
Percent of women aged 15-49 who agree with at least one specific reason for wife beating by wealth quintile
39.1
27.2
39.5
35.3
30.9
Lowest
Second
Middle
Fourth
Highest

Puntland Report 2020Somali Health and Demographic Survey (SDHS)224
Table 11.1 Employment and cash earnings of currently married women and men
Percentage of currently married women age 15-49 who were employed at any time in the past 12 months and the percent distribution of currently married women employed in the past 12 months by type of earnings, according to age, SHDS 2020
Among currently married
respondents:
Number of respondents
Percent distribution of currently married respondents employed in past 12 months, by type of earnings
TotalNumber of
respondents
AgePercentage
employed in past
12 months
Number of
respondentsCash only
Cash and in-
kindIn-kind only Not paid
15 - 19 4.7 246 * * * * 100.0 12
20 - 24 4.7 552 (44.8) (19.2) (4.9) (31.1) 100.0 26
25 - 29 8.2 794 74.4 7.0 4.1 14.6 100.0 65
30 - 34 10.0 626 70.6 13.4 8.4 7.6 100.0 63
35 - 39 12.8 535 78.0 9.1 5.4 7.5 100.0 68
40 - 44 16.6 276 (50.3) (26.7) (2.2) (20.8) 100.0 46
45 - 49 19.5 128 (71.6) (15.5) (4.9) (8.0) 100.0 25
Total 15-49 9.6 3,161 67.2 14.0 5.6 13.1 100.0 304
Note: Figures in parentheses are based on 25-49 unweighted cases. An asterisk indicates that a figure is based on fewer than 25 unweighted cases and has been suppressed.

225
Tab
le 1
1.2a
C
ontr
ol o
ver
wom
en’s
cas
h ea
rnin
gs a
nd re
lati
ve m
agni
tude
of w
omen
’s c
ash
earn
ings
Perc
ent d
istr
ibut
ion
of c
urre
ntly
mar
ried
wom
en a
ge 1
5-49
who
rece
ived
cas
h ea
rnin
gs fo
r em
ploy
men
t in
the
12 m
onth
s pr
eced
ing
the
surv
ey b
y pe
rson
who
dec
ides
how
wife
's c
ash
earn
ings
are
use
d an
d by
whe
ther
she
ear
ned
mor
e or
less
than
her
hus
band
, acc
ordi
ng to
bac
kgro
und
char
acte
rist
ics,
SH
DS
2020
Bac
kgro
und
char
acte
rist
ics
Pers
on w
ho d
ecid
es h
ow w
ife'
s ca
sh
earn
ings
are
use
d:
Tota
l
Res
pond
ent e
arns
mor
e th
an h
usba
nd/p
artn
er
Tota
lN
umbe
r of
wom
enM
ainl
y w
ife
Wif
e an
d hu
sban
d jo
intl
y
Mai
nly
husb
and
Mor
e th
an h
imLe
ss
than
hi
m
Abo
ut th
e sa
me
Hus
band
has
no
earn
ings
Don
't
Kno
w
Age 15
-19
**
*10
0.0
**
**
*10
0.0
9
20-2
4*
**
100
.0*
**
**
100
.017
25-2
958
.835
.55.
710
0.0
26.6
53.0
0.0
2.2
18.3
100
.053
30-3
451
.529
.818
.610
0.0
15.7
45.
88
.25.
025
.310
0.0
53
35-3
954
.838
.96.
310
0.0
38.7
26.4
0.0
6.4
28.6
100
.059
40
-44
(61.
9)(3
6.6)
(1.5
)10
0.0
(35.
3)(2
9.0
)(4
.3)
(15.
8)
(15.
6)10
0.0
35
45-
49(6
2.3)
(37.
7)(0
)10
0.0
(38
.5)
(31.
7)(0
.0)
(12.
3)(1
7.6)
100
.022
Num
ber
of li
ving
chi
ldre
n
0(5
5.0
)(3
9.3)
(5.7
)10
0.0
(33.
3)(3
0.1
)(0
.0)
(7.6
)(2
9.0
)10
0.0
27
1-2
(47.
3)(5
2.7)
(0)
100
.0(3
1.0
)(3
0.6
)(0
.0)
(7.4
)(3
1.1)
100
.029
3-4
52.6
38.2
9.2
100
.034
.94
0.2
4.7
6.0
14.2
100
.068
5+60
.631
.87.
610
0.0
29.1
37.5
2.1
7.4
23.9
100
.012
2
Type
s of
res
iden
ce
Urb
an50
.54
3.0
6.5
100
.032
.14
0.0
1.5
7.5
18.9
100
.014
0
Rura
l63
.429
.47.
210
0.0
31.4
33.7
3.9
6.2
24.7
100
.098
Nom
adic
**
*10
0.0
**
**
*10
0.0
9
Reg
ion
Sool
**
*10
0.0
**
**
*10
0.0
11
Sana
ag(5
8.4
)(4
0.0
)(1
.6)
100
.0(2
8.0
)(1
8.4
)(0
.0)
(16.
5)(3
7.1)
100
.035
Bari
51.2
39.0
9.8
100
.030
.14
9.5
1.7
3.6
15.1
100
.010
3
Nug
aal
(53.
9)(4
1.8
)(4
.2)
100
.0(4
1.3)
(35.
6)(0
.0)
(6.2
)(1
6.9)
100
.032
Mud
ug63
.229
.86.
910
0.0
32.2
27.7
4.6
4.6
30.9
100
.066

Puntland Report 2020Somali Health and Demographic Survey (SDHS)226
Hig
hest
edu
cati
onal
leve
l
No
educ
atio
n57
.534
.38
.210
0.0
30.6
35.5
2.9
6.6
24.4
100
.018
4
Prim
ary
(56.
8)
(38
.5)
(4.6
)10
0.0
(25.
1)(4
4.7
)(0
.0)
(14
.3)
(15.
9)10
0.0
32
Seco
ndar
y*
**
100
.0*
**
**
100
.013
Hig
her
Educ
atio
n*
**
100
.0*
**
**
100
.017
Wea
lth
quin
tile
Low
est
**
*10
0.0
8.0
**
**
100
.09
Seco
nd(5
6.3)
(33.
4)
(10
.3)
100
.0(3
1.4
)(4
1.6)
(6.3
)(7
.0)
(13.
6)10
0.0
36
Mid
dle
51.1
43.
75.
110
0.0
31.0
43.
02.
27.
116
.710
0.0
69
Four
th57
.135
.17.
810
0.0
35.4
31.6
0.0
8.7
24.3
100
.063
Hig
hest
56.0
37.5
6.5
100
.030
.636
.92.
95.
324
.310
0.0
70
Tota
l56
.236
.96.
910
0.0
31.4
36.6
2.4
7.0
22.6
100
.024
7
Not
e: F
igur
es in
par
enth
eses
are
bas
ed o
n 25
-49
unw
eigh
ted
case
s. A
n as
teri
sk in
dica
tes
that
a fi
gure
is b
ased
on
few
er th
an 2
5 un
wei
ghte
d ca
ses
and
has
been
sup
pres
sed,
SHD
S, 2
020
Perc
ent d
istr
ibut
ion
of c
urre
ntly
mar
ried
wom
en a
ge 1
5-49
who
rece
ived
cas
h ea
rnin
gs fo
r em
ploy
men
t in
the
12 m
onth
s pr
eced
ing
the
surv
ey b
y pe
rson
who
dec
ides
how
wife
's c
ash
earn
ings
are
use
d an
d by
whe
ther
she
ear
ned
mor
e or
less
than
her
hus
band
, acc
ordi
ng to
bac
kgro
und
char
acte
rist
ics,
SH
DS
2020
Bac
kgro
und
char
acte
rist
ics
Pers
on w
ho d
ecid
es h
ow w
ife'
s ca
sh
earn
ings
are
use
d:
Tota
l
Res
pond
ent e
arns
mor
e th
an h
usba
nd/p
artn
er
Tota
lN
umbe
r of
wom
enM
ainl
y w
ife
Wif
e an
d hu
sban
d jo
intl
y
Mai
nly
husb
and
Mor
e th
an h
imLe
ss
than
hi
m
Abo
ut th
e sa
me
Hus
band
has
no
earn
ings
Don
't
Kno
w
Tab
le 1
1.2a
(
Con
t’d)
Con
trol
ove
r w
omen
’s c
ash
earn
ings
and
rela
tive
mag
nitu
de o
f wom
en’s
cas
h ea
rnin
gs

227
Table 11.2b Control over husband’s cash earnings
Percent distributions of currently married women age 15-49 whose husbands receive cash earnings by person who decides how husband’s cash earnings are used, according to background characteristics, SHDS 2020
Background characteristics
Person who decides how husband's cash earnings are used
TotalNumber of currently
married women Mainly wifeWife and husband
Mainly husband Other
Age group
15-19 * * * * 100.0 15
20-24 (21.7) (41.1) (30.7) (6.4) 100.0 24
25-29 37.8 23.7 38.6 0.0 100.0 59
30-34 30.0 26.3 43.7 0.0 100.0 53
35-39 29.2 47.0 23.8 0.0 100.0 56
40-44 (42.4) (28.9) (28.7) (0.0) 100.0 39
45-49 (47.3) (21.3) (31.4) (0.0) 100.0 22
Number of living children
0 (48.4) (22.5) (29.1) (0.0) 100.0 28
1-2 (25.4) (43.9) (30.7) (0.0) 100.0 39
3-4 34.6 29.3 36.1 0.0 100.0 77
5+ 36.8 29.8 32.2 1.2 100.0 125
Types of residence
Urban 33.0 31.6 34.4 1.0 100.0 144
Rural 45.7 30.0 24.4 0.0 100.0 92
Nomadic (19.2) (30.9) (50.0) (0.0) 100.0 32
Region
Sool * * * * 100.0 18
Sanaag (47.7) (30.7) (21.5) (0.0) 100.0 38
Bari 28.5 22.7 48.7 0.0 100.0 106
Nugaal (35.2) (46.7) (18.1) (0.0) 100.0 41
Mudug 42.1 29.6 26.1 2.3 100.0 66
EDUCATION
No education 38.2 29.2 32.7 0.0 100.0 204
Primary (33.2) (33.2) (33.6) (0.0) 100.0 35
Secondary * * * * 100.0 12
Higher * * * * 100.0 18
Wealth quintile
Lowest (29.8) (16.5) (53.7) (0.0) 100.0 22
Second (25.6) (37.0) (37.4) (0.0) 100.0 42
Middle 39.3 30.7 30.0 0.0 100.0 73
Fourth 34.4 38.6 27.0 0.0 100.0 58
Highest 40.8 26.0 31.2 2.0 100.0 74
Total 35.7 30.9 32.8 0.6 100.0 269

Puntland Report 2020Somali Health and Demographic Survey (SDHS)228
Table 11.3 Ownership of assets
Percent distribution of ever married women age 15-49 by ownership of housing and land, according to background characteristics, SHDS 2020
Background characteristic
Owns a house alone or jointly
Total
Owns land alone or jointly
Total
Total number
of Women
Alone Jointly
Both alone and
jointly
Does not own
Alone Jointly
Both alone and
jointly
Does not own
Age
15-19 1.8 2.6 2.7 92.9 100.0 0.8 1.4 0.9 97.0 100.0 1,666
20-24 6.2 13.0 9.9 70.8 100.0 1.6 6.1 4.1 88.1 100.0 926
25-29 10.1 17.0 12.2 60.7 100.0 4.1 8.1 5.8 82.1 100.0 956
30-34 12.7 19.0 13.6 54.7 100.0 4.1 9.7 4.3 81.9 100.0 734
35-39 15.5 20.6 15.9 47.9 100.0 6.0 8.5 5.3 80.2 100.0 619
40-44 16.6 21.4 18.2 43.8 100.0 5.8 8.3 6.8 79.1 100.0 345
45-49 24.3 15.4 15.6 44.8 100.0 8.2 8.1 4.4 79.3 100.0 180
Types of residence
Urban 6.9 9.8 5.5 77.9 100.0 2.8 3.6 1.9 91.7 100.0 2,102
Rural 11.0 10.0 11.4 67.6 100.0 3.9 4.1 3.8 88.2 100.0 1,524
Nomadic 9.0 18.8 14.1 58.1 100.0 2.7 10.4 5.8 81.1 100.0 1,800
Region
Sool 8.0 12.7 12.3 67.1 100.0 1.3 4.1 3.1 91.5 100.0 742
Sanaag 8.6 15.1 10.9 65.4 100.0 2.4 5.7 3.5 88.5 100.0 990
Bari 10.5 12.2 9.7 67.6 100.0 4.3 7.4 4.8 83.5 100.0 1,254
Nugaal 8.2 9.8 12.8 69.2 100.0 3.5 4.9 4.0 87.6 100.0 554
Mudug 8.2 13.0 8.0 70.9 100.0 3.3 6.2 3.4 87.1 100.0 1,886
Education
No education 9.8 15.0 11.7 63.4 100.0 3.7 7.3 4.5 84.5 100.0 3,997
Primary 6.3 8.0 5.8 79.9 100.0 1.8 2.5 1.5 94.2 100.0 873
Secondary 5.2 4.9 4.0 85.9 100.0 0.6 2.2 1.4 95.8 100.0 411
Higher 3.5 3.5 4.4 88.6 100.0 1.7 1.0 2.9 94.3 100.0 145
Wealth quintile
Lowest 9.9 20.6 12.9 56.6 100.0 3.1 10.8 4.0 82.1 100.0 1,166
Second 7.1 16.0 14.4 62.4 100.0 2.0 8.0 7.3 82.7 100.0 868
Middle 12.0 11.4 8.4 68.3 100.0 4.3 5.2 3.5 87.1 100.0 1,003
Fourth 9.5 8.3 9.3 72.9 100.0 4.5 3.5 2.1 89.9 100.0 1,154
Highest 5.5 8.7 6.0 79.8 100.0 1.6 2.8 2.9 92.6 100.0 1,235
Total number of Women
8.7 12.8 10.0 68.4 100.0 3.1 6.0 3.8 87.2 100.0 5,426

229
Table 11.4 Ownership and use of bank accounts and mobile phones
Percentage of women age 15-49 who use an account in a bank or other financial institution, percentage who own a mobile phone among women who own a mobile phone, percentage who use it for financial transactions, according to background characteristics, SHDS 2020
Background characteristicHave and use a bank account
Own a mobile phone
Number of women
Use mobile phone for financial
transactions
Number of women who own a mobile phone
Age
15-19 3.0 54.8 1666 44.9 912
20-24 4.8 78.1 926 66.4 723
25-29 4.9 82.4 956 68.9 788
30-34 5.5 82.2 734 67.5 603
35-39 3.9 81.7 619 69.3 505
40-44 5.2 81.4 345 68.1 281
45-49 5.0 87.3 180 72.8 157
Types of residence
Urban 7.7 80.6 2102 72.5 1,694
Rural 2.5 76.9 1524 67.1 1,172
Nomadic 1.9 61.3 1800 42.6 1,104
Region
Sool 2.8 71.3 742 56.5 529
Sanaag 2.4 73.0 990 58.7 722
Bari 3.9 73.5 1254 57.4 921
Nugaal 9.5 82.7 554 72.3 458
Mudug 4.6 71.0 1886 63.2 1,339
Education
No Education 2.6 69.6 3997 55.1 2,782
Primary 4.9 79.0 873 73.8 689
Secondary 8.1 86.9 411 80.1 357
Higher 35.1 97.2 145 96.0 141
Wealth quitile
Lowest 1.9 58.8 1166 42.2 685
Second 1.8 65.9 868 46.4 572
Middle 2.5 70.1 1003 57.1 703
Fourth 4.2 79.2 1154 72.1 914
Highest 9.8 88.7 1235 82.1 1,096
Total 4.3 73.2 5426 61.1 3,970

Puntland Report 2020Somali Health and Demographic Survey (SDHS)230
Percent distribution of currently married women age 15-49 by person who usually makes decisions about various issues, SHDS, 2020
Decision Mainly wifeWife and husband
jointly
Mainly husband
Someone else Other Total Number
Own health care 23.0 35.9 40.1 0.4 0.0 100.0 3,161
Major household purchases
22.9 36.5 39.4 0.0 0.1 100.0 3,161
Visits to her family or relatives
26.4 24.1 48.3 0.0 0.0 100.0 3,161
Table 11.5 Participation in decision making

231
Table 11.6 Attitude toward wife beating: Women
Percentage of all women age 15-49 who agree that a husband is justified in hitting or beating his wife for specific reasons, by background characteristics, SHDS, 2020
Background characteristics
Husband is justified in hitting or beating his wife if she: Percentage who agree
with at least one specified
reason
Number of women
neglects household
duties
she argues with him
Goes out without telling
him
wastes resources
Neglects the children
refuses to have sex with him
Age
15-19 28.9 28.8 26.3 29.6 28.3 27.5 44.5 1,666
20-24 24.6 23.0 22.9 22.7 22.3 21.5 36.1 926
25-29 18.2 16.9 16.8 18.2 19.6 18.6 28.6 956
30-34 18.6 18.1 17.8 17.6 17.7 17.7 28.5 734
35-39 21.2 21.7 18.4 18.4 20.5 20.3 30.2 619
40-44 18.7 16.7 15.7 19.2 18.5 16.7 27.5 345
45-49 14.8 13.4 14.1 15.9 13.7 16.2 19.5 180
Employment
Not employed 18.7 18.3 17.0 18.5 18.5 18.8 28.7 3,260
Employed for cash 22.2 23.4 19.6 19.4 19.6 19.0 28.7 255
Employed, not for cash
13.2 18.5 9.7 21.7 13.2 23.9 31.7 65
Number of living children
0 28.6 27.5 26.3 27.9 27.4 26.3 43.7 2,179
1-2 18.2 19.2 15.9 20.0 18.0 19.0 28.9 858
3-4 19.9 17.7 18.8 17.6 19.6 19.6 29.4 1,039
5+ 19.0 19.0 17.1 18.6 18.8 17.6 27.4 1,351
Residence
Urban 22.5 23.2 21.8 23.4 23.3 21.5 35.1 2,102
Rural 22.4 23.0 20.6 22.0 23.4 22.1 35.2 1,524
Nomadic 23.7 20.3 20.2 21.5 20.1 21.6 33.5 1,800
Region
Sool 24.7 25.6 21.6 26.3 24.4 25.4 33.3 742
Sanaag 27.4 27.6 26.2 28.4 27.8 26.8 37.0 990
Bari 22.0 23.8 18.8 23.9 21.7 20.9 36.5 1,254
Nugaal 16.3 16.7 18.1 16.1 20.1 17.3 30.4 554
Mudug 22.3 18.5 20.2 18.5 19.6 19.4 33.8 1,886
Mother's education
No education 22.8 21.1 19.6 21.8 21.4 21.3 33.6 3,997
Primary 22.5 24.9 22.6 24.0 23.6 23.6 36.6 873
Secondary 22.2 24.7 27.0 23.1 24.5 20.0 36.6 411
Higher 30.7 29.4 30.2 26.4 32.0 26.4 45.1 145
Wealth quintile
Lowest 29.3 24.5 23.8 26.2 24.2 26.6 39.1 1,166
Second 16.5 16.5 16.3 17.8 16.8 17.4 27.2 868
Middle 26.8 27.3 22.0 26.3 25.3 25.5 39.5 1,003
Fourth 21.5 22.8 22.5 22.6 24.2 20.4 35.3 1,154
Highest 19.4 19.3 19.2 18.6 20.1 18.2 30.9 1,235
Total 22.9 22.2 20.9 22.4 22.3 21.7 34.6 5,426

Puntland Report 2020Somali Health and Demographic Survey (SDHS)232
Percentage of currently married women age 15-49 who participate in all decision making and the percentage who disagree with all of the reasons justifying wife-beating, by value on each of the indicators of women empowerment, SHDS, 2020
Empowerment indicatorPercentage who participate in
all decision making
Percentage who disagree with all the reasons justifying wife
beatingNumber of women
Number of decisions in which women participate
0 0.0 62.6 884
1-2 0.0 65.5 1,073
3 100.0 70.4 1,205
Number of reasons for which wife beating is justified
0 40.3 100.0 2,104
1-2 28.2 0.0 309
3-4 28.9 0.0 225
5-6 39.1 0.0 523
na = Not applicable
Table 11.7 Indicators of women’s empowerment

233

Chronic Diseases, Disability, Out-of-Pocket Health Expenditure and Social Habits
CHAPTER 12

©A
U U
N I
ST P
HO
TO
/ T
OB
IN J
ON
ES.
Key Findings

Puntland Report 2020Somali Health and Demographic Survey (SDHS)236
Introduction
Chronic diseases are defined broadly as conditions that last 1 year or more and require ongoing medical attention or limit activities of daily living or both according to the National Center for Chronic Disease and Prevention and Health Promotion of the United States of America (CDC , 2020). Chronic diseases generally cannot be prevented by vaccines or cured by medication and can lead to long-term disability. They place burdens and demands on a health care system and are a leading cause of death worldwide.
The SHDS obtained information from household respondents whether each household member suffered from one or more chronic diseases and whether the disease was diagnosed by a physician and treated. Further to this, the survey gathered information about household members suffering from any physical, mental, or other state that limited them from engaging in their normal activities.
Interviewers obtained information from the household respondents if any household member had been injured. If the answer to any of these questions was affirmative, follow-up questions were asked about the type of disease, disability, and/or injury.
Interviewers also gathered information on sicknesses that families experienced over the one month preceding the survey, in addition to expenditure on health services received.
Prevalence of Chronic DiseasesTable 12.1 presents data on household members who have at least one chronic disease. Overall, 5 percent of household members in
12Chapter 12
Chronic Diseases, Disability, Out-of-Pocket Health Expenditure and Social HabitsThis chapter presents information on the prevalence, diagnosis, and treatment of chronic diseases in Puntland. It also offers information on the prevalence of disability, the origin and age at onset of disability, and care and support available for people with disabilities. Based on the findings of the SHDS, information on out-of-pocket health expenditure and selected social habits is also presented in this chapter.

237
Puntland were reported to be suffering from at least one chronic disease, compared to 6 percent at the national level.
Urban household members have a slightly higher reported prevalence of chronic diseases at 7 percent compared to rural and nomadic household members at 5 and 4 percent respectively. The comparison between men and women showed that more women than men have at least one chronic disease, at 6 and 4 percent respectively.
As noted, disease prevalence increases rapidly with increasing age. The prevalence of people with at least one chronic disease increases from 2 percent in the age group 0-4 years to 18 percent in people over 70 years of age (see Table 12.1 and Figure 12.1). The prevalence of at least on chronic disease is highest among urban household members at 7 percent compared to rural and nomadic household members at 5 and 4 percent respectively.
Household members in Sool Region have a slightly higher reported prevalence of chronic diseases at 7 percent compared to household members in the other regions. Sanaag region had least prevalence of chronic diseases at 4 percent.
The prevalence of at least one chronic disease increased from 4 percent of those in the lowest wealth quintile or poorest households to 6 percent of those in the wealthiest or highest quintile.
Figure 12.2 Prevalence of chronic diseases by region
Percentage of household members who have at least one chronic disease by region
7.1
5.75.2 5.0
4.0
Sool Nugaal Mudug Bari Sanaag
1.4 2.0 1.73.4
4.8 5.3 5.8
8.510.5
16.4 15.3
21.8 20.923.2
33.2
0-4 5-9 10-14 15-19 20-24 25-29 30-34 35-39 40-44 45-49 50-54 55-59 60-64 65-69 70+
Figure 12.1 Prevalence of chronic diseases by age
Percentage of household members who have at least one chronic disease by age

Puntland Report 2020Somali Health and Demographic Survey (SDHS)238
Diagnosis and Treatment of Chronic Diseases
Table 12.2 presents data on the distribution of household members who have specific chronic diseases diagnosed by a physician and those who get treatment regularly. The findings show that, overall, 4 percent of household members are reported to have been diagnosed by a physician and 2 percent are undergoing regular treatment for a chronic disease.
Women have slightly higher chronic diseases that were diagnosed by a physician than men at 5 and 4 percent, respectively. Same percentage of women and men are undergoing regular treatment for the diseases, at 2 percent each. More urban residents reported having been diagnosed by a physician, at 6 percent, compared to rural and nomadic residents at 4 and 2 percent, respectively. Similarly, more urban residents at 3 percent, reported they received treatment for chronic diseases, compared to rural and nomadic residents at 2 and 1 percent respectively. Despite there being health facilities available within the cities, the difference in the overall frequency of diagnosis and treatment between urban and rural settings is small.
The percentage of household members diagnosed by a physician with at least one chronic disease and those who received treatment regularly increased as wealth levels increased. Five percent of household members in the wealthiest or highest wealth quintile were diagnosed by a physician, while 4 percent received treatment. In contrast, 3 percent of household members from the lowest wealth quintile or poorest households were diagnosed by a physician, and 1 percent received treatment.
0-4 5-9 10-14 15-19 20-24 25-29 30-34 35-39 40-44 45-49 50-54 55-59 60-64 65-69 70+
Diagnosed Treated
0.9 1.2 1.32.9 3.6 3.6
4.66.1
8.1
13.812.6
17.7 16.8
20.4
26.2
0.5 0.6 0.4 1.3 1.7 1.8 2.6 3.14.7
7.5 7.7
11.09.3
12.5
16.5
Figure 12.3 Chronic diseases diagnosed and treated
Percentage of household members who have at least one chronic disease, diagnosed by a physician, and who get treatment

239
Figure 12.3 compares household members whose chronic diseases were diagnosed by a physician against those who get treatment for chronic diseases regularly. The findings indicate that more of those diagnosed in the younger age groups are treated, compared to those in the older age groups. In the age group 10-14 years, 1 percent were diagnosed by a physician, while 1 percent received treatment. In the age group 60-64 years, 17 percent were reported to have been diagnosed by a physician, while 9 percent received treatment for chronic diseases they have.
Table 12.3 and figure 12.4 presents the prevalence of the most common specific chronic diseases in Puntland diagnosed by a physician, by type of condition, place of residence and sex. The findings show that the most common chronic diseases household members have are blood pressure anomalies/hypertension, which affects 32 percent of household members, and diabetes, which affects 14 percent of the household members. Twelve percent of household members are suffering from kidney diseases, and another 9 percent suffer from chronic headaches. Nine percent are suffering from liver disease and eight percent of household members are suffering from Asthma and another 7 percent have gastritis/ulcers and 6 percent have mental illness. Other diseases that are common include Arthritis at 6 percent, heart disease at 5 percent, chronic back pain at 5 percent, and anaemia at 5 percent.
The table shows that more rural and urban residents were diagnosed with blood pressure, at 37 and 31 percent respectively, compared to those residing in nomadic areas, at 26 percent. More urban residents, at 17 percent, than rural residents, at 12 percent, were diagnosed with diabetes. Even fewer cases of diabetes were diagnosed among nomadic households, at 7 percent. More women than men were reported to have been diagnosed with hypertension and kidney disease at 36 percent versus 26 percent, and 13 percent versus 10 percent respectively. More men than women were reported to have been diagnosed with diabetes, mental illnesses, and liver diseases, at 17 percent versus 11 percent, 7 percent versus 6 percent, and 10 versus 8 percent respectively.
The findings further show that, overall, more nomadic household members than urban and rural ones were diagnosed with kidney diseases, liver diseases, chronic back pain and anaemia, at 13, 16, 12 and 7 percent respectively.
Table 12.3 and figure 12.4 presents the prevalence of the most common specific chronic diseases in Puntland diagnosed by a physician, by type of condition, place of residence and sex. The findings show that the most common chronic diseases household members have are blood pressure anomalies/hypertension, which affects 32 percent of household members, and diabetes, which affects 14 percent of the household members. Twelve percent
Figure 12.4 Common chronic diseases
Percentage of household members who have specific chronic diseases diagnosed by a physician
32.0
13.7
11.7
9.5
9.0
8.8
8.0
6.4
6.2
6.2
5.3
5.0
4.8
4.1
3.8
Blood Pressure
Diabetes
Kidney Disease
Others
Chronic Headache
Liver Disease
Asthma
Inflammation/Ulcers
Mental/Psychological Illness
Arthritis
Heart Disease
Anemia
Chronic Back Pain
Skin Disease
Epilepsy

Puntland Report 2020Somali Health and Demographic Survey (SDHS)240
of household members are suffering from kidney diseases, and another 9 percent suffer from chronic headaches. Nine percent are suffering from liver disease and eight percent of household members are suffering from Asthma and another 7 percent have gastritis/ulcers and 6 percent have mental illness. Other diseases that are common include Arthritis at 6 percent, heart disease at 5 percent, chronic back pain at 5 percent, and anaemia at 5 percent.
The table shows that more rural and urban residents were diagnosed with blood pressure, at 37 and 31 percent respectively, compared to those residing in nomadic areas, at 26 percent. More urban residents, at 17 percent, than rural residents, at 12 percent, were diagnosed with diabetes. Even fewer cases of diabetes were diagnosed among nomadic households, at 7 percent. More women than men were reported to have been diagnosed with hypertension and kidney disease at 36 percent versus 26 percent, and 13 percent versus 10 percent respectively. More men than women were reported to have been diagnosed with diabetes, mental illnesses, and liver diseases, at 17 percent versus 11 percent, 7 percent versus 6 percent, and 10 versus 8 percent respectively.
The findings further show that, overall, more nomadic household members than urban and rural ones were diagnosed with kidney diseases, liver diseases, chronic back pain and anaemia, at 13, 16, 12 and 7 percent respectively.
Prevalence of Disability Table 12.4 presents data on the distribution of the prevalence of disability of household members by sex, age, wealth quintiles and residence. It should be noted that respondents’ reports of disability
Figure 12.5 Disability prevalence by age
Prevalence of household members with disabilities
3.6 2.9 3.0 2.6 2.6 2.9 2.8 2.9 3.54.8
5.88.1
10.7
15.1
29.7
<5 5-9 10-14 15-19 20-24 25-29 30-34 35-39 40-44 45-49 50-54 55-59 60-64 65-69 70+

241
were not verified by a clinical diagnosis; therefore, the percentages presented should be interpreted with caution.
Overall, 4 percent of the population in Puntland suffers from disabilities, according to findings from the SHDS1. The prevalence of disability among females and males is the same, at 4 percent. In the youngest age group, 4 percent of under-fives suffer from disabilities. The prevalence of disability is 3-15 percent in the age groups 5-9 to 65-69 before rising to 30 percent for those aged 70 years and above. The pattern of people suffering from disabilities in both urban and rural areas is the same at 5 percent each compared to nomadic areas at 2 percent.
The most common disability reported in all the three types of residences was challenges with sight, at 2 percent in both urban and rural areas and 1 percent in nomadic areas.
Household members in Mudug, Nugaal and Sool have higher prevalence of disability with 5 percent each, compared to Sanaag and Bari at 3 percent each.
Household members from the lowest wealth quintile or poorest households have lower prevalence of disabilities at 3 percent compared to the other wealth quintiles. Household members from the other four wealth quintiles had prevalence of disability ranging from 4 and 6 percent.
Figure 12.5 presents the prevalence of disability by age group. It shows a “J-shaped” curve, with the prevalence of disability increasing sharply with age for those aged 70 years and above.
Figure 12.6 shows the prevalence of the most common types of disabilities. These include disabilities in sight, hearing and mobility impairments, followed by mental health and speech disabilities.
Origin and Age at Onset of Disability Table 12.5 presents data on the onset and causes of disability. For any household member with a disability, respondents were asked about the main reason for or cause of the disability. The analysis indicates that ageing and congenital (birth-related) problems were the main cause of disabilities. Ageing accounts for 25 percent and congenital problems accounts for 13 percent of disabilities, whereas other diseases and injuries/accidents each account for an additional 21 and 12 percent respectively. The percentage of those suffering from congenital causes of disability declines with increasing age, while disabilities associated with ageing increases
1 The SHDS questionnaires referred to visual and hearing impairments, speech/communica-tion challenges, mobility impairment, learning challenges, self-care challenges and mental health challenges as disabilities.
Figure 12.6 Common types of disabilities
Percentage of household members suffering from specific types of disabilities
1.7
1.2
1.2
0.8
0.4
0.4
0.1
Sight
Mobility
Hearing
Mental
Speech
Self-care
Learning

Puntland Report 2020Somali Health and Demographic Survey (SDHS)242
with increasing age. The findings from age groups 40-44 to 65-69 needs to be interpreted with caution because of the small sample sizes.
Ageing accounts for a larger proportion of disabilities among women, at 30 percent, than men, at 19 percent, while congenital diseases account for a larger proportion of disabilities among men, at 15 percent than women, at 11 percent.
Table 12.6 presents data on the age at onset of disability. Differences by type of residence are minimal. Differences by sex and age group are substantial. As expected, by definition, younger disabled people, the onset of disability occurred at an earlier age. Overall, 29 percent of household population reported onset of disability to have started when they were under the age of five (Figure 12.7). Thirty-six percent of males and 24 percent of females stated that they had first experienced their disabilities under the age of five. Also, the most common disability reported to have started during this period is speech, at 58 percent. Slightly more urban household members, at 29 percent, reported their disabilities started while they were under the age of five, compared to nomadic and rural areas at 32 and 28 percent.
Among the regions, the percentage of those whose onset of disability was under the age of five was highest in Nugaal at 34 percent and lowest in Sool at 23 percent.
Figure 12.7 Age at onset of disability
Percentage distribution of disabled people according to age at onset of disability
29.3
7.9
10.4
7.55.9
8.410.0 10.5 10.1
<5 5-9 10-19 20-29 30-39 40- 49 50-59 60-69 70+

243
Care and Support for Persons with Disabilities
Table 12.7 presents the percentage distribution of persons with disabilities who received any kind of care and support for their conditions during the 12 months prior to the survey, by background characteristics. This includes medical care, welfare, financial support, and nutritional support. The findings indicate that 41 percent of persons with disabilities in Puntland had not received any care or support for their condition in the 12 months preceding the survey.
Sixty-one percent of disabled household members received medical care, while 1 percent received welfare, 3 percent received financial support and 1 percent received nutritional support. Forty-one percent of both men and women said they had not received any medical care, welfare, financial or nutritional support for their disability in the 12 months preceding the survey.
Household Out-of-Pocket Health Expenditure
Out-of-pocket payments are expenditures borne directly by a patient where insurance does not cover the cost of the health service (OECD 2006). These expenses could be medical as well as non-medical. Out-of-pocket medical expenditures could be payments towards doctors’ fees, medicine, diagnostics, operations, ambulance services, etc. (OECD 2006). Overall, health expenditure could amount to catastrophic levels that plunge families deeper into poverty. The World Bank defines catastrophic health expenditure as payments for health services exceeding 40 percent of household disposable income after subsistence needs are met.
Since the collapse of the Somali health care infrastructure three decades ago, most of the Somali households have not had any form of financial protection and were forced to make out-of-pocket payments when they fell sick. Often, families’ resort to borrowing money or selling assets to meet these expenditures.
The SHDS 2020 collected information on out-of-pocket expenditure. In the Household Questionnaire, households were asked whether advice or treatment was sought for any household member’s health conditions and the source this advice or treatment was obtained. They were also asked how much money the household spent on treatment and health care services in the one month preceding the survey. The survey also gathered information about what financial sources the household used to pay for any health expenditure.
Table 12.8 shows that 60 percent of households in Puntland had at
Figure 12.8 Support received by household members for people with disabilities
Percentage of household members suffering from specific types of disabilities
60.7
41.0
3.30.8 0.6
Medical No Support Financial Welfare Nutritional

Puntland Report 2020Somali Health and Demographic Survey (SDHS)244
least one household member sick in the last month preceding the survey and sought advice or treatment for the household member.
Figure12.9 shows that 20 percent of households had visited a government hospital for advice or treatment compared to 24 percent who had visited private hospitals, clinics, or doctors. Seven percent of households had sought advice or treatment from pharmacies compared to 9 percent from Mother Child Health (MCH) clinics and/or health centres (HC).
Figure12.10 indicates that 68 percent of urban households and 67 percent of rural households sought medical advice or treatment for their health problems. Nomadic households were the least likely to seek medical advice and treatment, at 32 percent.
Furthermore, Figure 12.10 shows that the percentage of the household members who sought medical advice and treatment was highest in Nugaal region at 70 percent and lowest in Sool at 51 percent.
Table 12.9 and Figure 12.11 presents data on the financial sources that households in Puntland used to pay for health expenditures. Forty-nine percent of households reported they pay for their health expenses from their income. Twenty-two percent of households reported their relatives or friends supported them to pay their health expenses. Fifteen percent borrowed money to pay for their health expenditure and 13 percent of the households sold assets to cover their health expenses. Only 3 percent of households used insurance for their health expenses.
Three percent of households in urban and rural areas used insurance to cover their health expenditure. Fifty- seven percent of the urban and 43 percent rural households used their income to pay for medical expenses compared to 31 percent of nomadic households.
Among the regions, Nugaal has the highest percentage of households who pay for their health expenses from their income at 66 percent compared to Sool with the lowest percentage at 33 percent. The data also shows that households from Sanaag region are more likely to borrow money when paying for health expenses at 32 percent compared to Nugaal at 10 percent.
Table 12.10 presents data on the amount of money the household spent on treatment and health care services during the month before the start of the survey. The largest proportion of households at 28 percent had spent between US$1 and US$49 for treatment and health care services during this period. Similarly, 24 percent of the respondents had spent between US$50 and US$99, 22 percent had spent US$100-199 and 19 percent had spent US$300 or more.
Figure 12.9 Source of advice or treatment
Figure 12.10 Household members who sought any advice or treatment
Percentage of household members who have been sick and where they sought advice/treatment
Percentage of household members who have been sick and sought any advice or treatment by region
24.2
19.5
8.5
6.7
3.7
2.2
1.5
1.4
1.4
0.6
Private…
Government Hospital
MCH/HC
Pharmacy
Referral Health Centre
Primary Health Unit
Mobile Clinic
Other Private Medical…
Others
Other Public Sector
70.165.9
56.252.7 51.2
Nugaal Bari Mudug Sanaag Sool

245
Tobacco Use and Khat2 Chewing
Tobacco use is not only a risk factor for medical conditions, but it also contributes to poverty by diverting household spending from basic needs, such as food and shelter, to tobacco. This spending behaviour is difficult to curb because tobacco is so addictive. The economic costs of tobacco use are substantial and include significant health care costs for treating the disease caused by tobacco use as well as the lost human capital that results from tobacco-attributable morbidity and mortality (WHO 2019).
Information about the use of tobacco and chewing of Khat was collected from household members aged 10 years or older, who were asked whether they smoke or use any kind of tobacco or chew Khat.
Table 12.11 presents the percentage of household members who smoke cigarettes or use tobacco, by background characteristics. The findings indicate that 5 percent of Puntland household members smoke cigarettes or use tobacco products. Cigarette smoking or any other use of tobacco is rare among women at 1 percent, whereas 9 percent of men smoke or use other tobacco products. The use of tobacco generally increases with increasing age.
The use of tobacco or smoking by household members slightly varies by place of residence; urban and nomadic areas have the highest proportion at 5 percent and 6 percent compared to rural areas at 3 percent.
Among the regions, the proportion of household members in Sanaag who had been smoking or using tobacco was slightly higher at 6 percent and lower in Mudug at 3 percent.
Figure 12.12 shows that the use of tobacco or cigarette smoking decreases with increasing household wealth.
Household members with no education and those with secondary-level of education are more likely to smoke at 5 and 4 percent respectively, than household members with primary-level education or higher education at 2 and 3 percent respectively.
Table 12.12 presents the distribution of household members who chew Khat by background characteristics. It shows that 4 percent of members of Puntland households chew Khat or have chewed Khat compared to 5 percent nationally. There are notable gender differences in this practice; less than one percent of women chew or have chewed Khat, compared to 9 percent of men. Among all
2 Khat (also spelt ‘Qat’) is a plant found in the Horn of Africa and the Arabian Peninsula. Khat leaves are chewed as a stimulant and are said to cause euphoric effects.
Figure 12.11 Source of payment of health services
Figure 12.12 Smoking/tobacco use
Percentage distribution of financial sources used for health services in the month preceding the survey by households
Percentage of household members who smoke cigarettes or use tobacco by wealth quintile
48.7
22.3
14.9
13.3
3.5
2.7
2.3
Income
Relatives/Friends
Borrowing
Sold Assets
Savings
Insurance
Other
5.86.3
3.93.5 3.6
Lowest Second Middle Fourth Highest

Puntland Report 2020Somali Health and Demographic Survey (SDHS)246
age groups, it can be noted that the practice of chewing Khat generally increases with the age of household members, peaking at 12 percent at the age group 45-49 but start declining from there.
Rural dwellers are less likely to chew Khat at 3 percent, compared to people living in urban and nomadic households at 5 percent each.
Khat consumption varied among the household members in the regions. The proportion of those who chew Khat is highest in Sanaag at 7 percent compared to lowest in Mudug at 3 percent.
Khat consumption also varied among people with different education levels and wealth status — 6 percent of household members with no education and 4 percent of household members with secondary education chewed Khat, while 2 percent of those with primary education and 3 percent of those with higher education chewed Khat. Comparison by wealth quintiles indicates that the poorer household members are more likely to chew Khat.
Figure 12.13 compares the percentage of household members who chew Khat and household members who smoke cigarettes or using any sort of tobacco. It shows that both the use of tobacco and chewing of Khat generally increases with age and reaches a peak at the ages 45-49 and then declines in the older ages.

247

Puntland Report 2020Somali Health and Demographic Survey (SDHS)248
Table 12.1 Prevalence of chronic diseases
Percentage of household members who have at least one chronic disease diagnosed by a physician, and who get treatment regularly, by background characteristics, SHDS 2020
Background characteristicsPercentage of HH members who have at
least one chronic diseaseNumber of Persons
Sex of household member
Male 4.4 15,436
Female 6.1 16,635
Age
0-4 1.4 6,324
5-9 2.0 6,151
10-14 1.7 4,712
15-19 3.4 3,563
20-24 4.8 1,958
25-29 5.3 1,840
30-34 5.8 1,617
35-39 8.5 1,311
40-44 10.5 1,092
45-49 16.4 517
50-54 15.3 1,003
55-59 21.8 373
60-64 20.9 598
65-69 23.2 177
70+ 33.2 835
Residence
Urban 6.6 12,310
Rural 5.2 9,991
Nomadic 3.6 9,771
Region
Sool 7.1 4,587
Sanaag 4.0 5,720
Bari 5.0 8,343
Nugaal 5.7 3,953
Mudug 5.2 9,468
Wealth Quintile
Lowest 3.9 10,274
Second 5.6 4,904
Middle 6.1 6,697
Fourth 6.1 5,982
Highest 5.7 4,214
Total 1 5.3 32,071 1 Total includes household members with information on age missing.

249
Percentage of household members who have at least one chronic disease diagnosed by a physician, and who get treatment regularly, by background characteristics, SHDS 2020
Background characteristicsPercentage of HH members
who have at least one chronic diagnosed by physician
Percentage of HH Members who have at least one chronic
and get treatedNumber of Persons
Sex
Male 3.5 2.0 15,436
Female 4.6 2.4 16,635
Age
0-4 0.9 0.5 6,324
5-9 1.2 0.6 6,151
10-14 1.3 0.4 4,712
15-19 2.9 1.3 3,563
20-24 3.6 1.7 1,958
25-29 3.6 1.8 1,840
30-34 4.6 2.6 1,617
35-39 6.1 3.1 1,311
40-44 8.1 4.7 1,092
45-49 13.8 7.5 517
50-54 12.6 7.7 1,003
55-59 17.7 11.0 373
60-64 16.8 9.3 598
65-69 20.4 12.5 177
70+ 26.2 16.5 835
Residence
Urban 5.5 3.2 12,310
Rural 4.0 2.3 9,991
Nomadic 2.2 0.9 9,771
Region
Sool 5.1 2.3 4,587
Sanaag 3.4 1.9 5,720
Bari 3.8 1.8 8,343
Nugaal 4.6 3.0 3,953
Mudug 3.9 2.4 9,468
Wealth Quintile
Lowest 2.5 1.0 10,274
Second 3.8 1.9 4,904
Middle 4.9 2.6 6,697
Fourth 5.2 3.1 5,982
Highest 5.2 3.7 4,214
Total 1 4.0 2.2 32,071 1 Total includes household members with information on age missing.
Table 12.2 Prevalence of chronic diseases diagnosed by a physician

Puntland Report 2020Somali Health and Demographic Survey (SDHS)250
Table 12.3 Prevalence of specific chronic diseases
Percentage of household members who have specific chronic diseases diagnosed by a physician, by place of residence and sex, SHDS 2020
Type of disease
Types of residence Sex of household member
Urban Rural Nomadic Male Female Total
Blood Pressure 31.1 36.9 26.0 25.9 36.4 32
Diabetes 16.6 12.3 7.4 17.2 11.2 14
Inflammation/Ulcers
7.6 5.4 4.4 5.4 7.1 6
Anemia 5.8 2.6 7.1 3.8 5.9 5
Sickle Cell Anemia 0.4 1.0 0.6 0.7 0.6 1
Heart Disease 6.1 5.0 3.3 3.7 6.4 5
Kidney Disease 12.1 10.4 12.8 10.3 12.6 12
Liver Disease 8.1 5.9 15.9 10.2 7.8 9
Arthritis 6.0 6.2 6.7 4.8 7.2 6
Tuberculosis 2.7 2.1 1.5 3.0 1.9 2
Chronic Headache 8.2 9.9 9.7 8.6 9.3 9
Stroke 2.5 2.2 1.7 3.6 1.4 2
Epilepsy 3.5 5.1 2.2 4.5 3.2 4
Prostatic Hypertrophy
1.2 0.8 6.6 2.2 1.9 2
Cataract 1.3 1.0 0.9 1.0 1.3 1
Chronic Back Pain 3.8 2.8 11.5 3.9 5.4 5
Mental/Psychological Illness
7.1 5.4 5.1 6.6 6.0 6
Skin Disease 5.0 1.8 5.6 2.7 5.1 4
Cancerous Tumors 0.8 0.9 2.2 0.7 1.3 1
Asthma 7.9 7.7 8.7 8.0 7.9 8
Others 8.0 9.4 14.5 9.8 9.3 10
Household numbers
676 405 220 539 762 1,301

251
Prevalence of household members with disabilities, and percentage who suffer from specific types of disabilities, by background characteristics, SHDS 2020
Background Characteristics
Prevalence of disabled
personsTotal
Among household members with disabilities, percentage who suffer from specific types of disabilities
Number of household members
with disabilities
Sight Hearing Speech Learning Mobility Self-care Mental
Sex of household
member
Male 3.8 15,436 1.4 1.0 0.4 0.1 1.1 0.3 0.8 592
Female 4.4 16,635 1.9 1.3 0.4 0.1 1.2 0.4 0.8 724
Age
<5 3.6 6,324 1.3 1.0 0.5 0.0 1.1 0.2 0.8 231
5-9 2.9 6,151 0.7 0.8 0.5 0.1 0.8 0.2 0.8 176
10-14 3.0 4,712 1.2 0.8 0.4 0.1 0.6 0.4 0.6 140
15-19 2.6 3,563 0.9 0.8 0.3 0.1 0.7 0.2 0.7 91
20-24 2.6 1,958 0.9 0.9 0.1 0.1 0.6 0.2 0.6 50
25-29 2.9 1,840 0.7 1.1 0.1 0.8 0.2 1.0 54
30-34 2.8 1,617 (0.6) (0.5) (0.4) (0.1) (0.7) (0.2) (1.3) 45
35-39 2.9 1,311 (0.6) (0.9) (0.3) (0.1) (0.8) (0.7) (0.8) 37
40-44 3.5 1,092 (1.2) (0.6) (0.3) (0.1) (1.3) (0.2) (0.7) 38
45-49 4.8 517 (1.3) (0.9) (0.0) (0.3) (1.5) (0.3) (1.1) 25
50-54 5.8 1,003 2.3 0.8 0.1 0.0 2.0 0.6 0.8 59
55-59 8.1 373 5.0 (1.5) (0.1) (0.4) (2.3) (1.0) (0.0) 30
60-64 10.7 598 6.8 2.6 0.5 0.2 2.6 0.9 0.6 64
65-69 15.1 177 (11.0) (3.9) (0.7) '(0.0) (3.8) (2.2) (0.0) 27
70+ 29.7 835 19.2 10.9 2.5 1.8 9.7 3.0 3.1 248
Residence
Urban 5.1 12,310 2.1 1.4 0.6 0.2 1.4 0.6 1.3 632
Rural 5.1 9,991 2.1 1.5 0.5 0.1 1.7 0.3 0.8 511
Nomadic 1.8 9,771 0.8 0.5 0.2 0.1 0.4 0.2 0.2 173
Region
Sool 4.5 4,587 2.3 1.4 0.3 0.1 1.2 0.4 0.8 208
Sanaag 3.0 5,720 1.2 0.8 0.2 0.3 1.0 0.1 0.5 174
Bari 3.4 8,343 0.8 1.1 0.3 1.0 0.3 0.7 284
Nugaal 4.7 3,953 1.8 1.2 0.6 0.1 1.0 0.2 1.2 184
Mudug 4.9 9,468 2.4 1.4 0.6 0.1 1.5 0.7 1.0 466
Wealth Quintiles
Lowest 2.5 10,274 1.0 0.7 0.2 0.1 0.6 0.3 0.4 253
Second 6.1 4,904 2.1 2.1 0.7 0.0 1.5 0.5 1.1 297
Middle 4.6 6,697 2.1 1.2 0.5 0.1 1.2 0.3 1.0 310
Fourth 5.0 5,982 2.2 1.3 0.4 0.2 1.8 0.5 1.0 302
Highest 3.7 4,214 1.5 1.0 0.6 0.2 1.3 0.3 1.0 155
Total 1 4.1 32,071 1.7 1.2 0.4 0.1 1.2 0.4 0.8 1,316
1 Total includes household members with missing information on age.A person may have two reported diseases; consequently, the percentages reflect this information
Table 12.4 Prevalence of disability and common types of disability

Puntland Report 2020Somali Health and Demographic Survey (SDHS)252
Percentage distribution of disabled people according to the origin of disabilities, by background characteristics, SHDS 2020
Background Characteristics
Origin of disabilitiespeople with
disabilityCongenital Contagious"Child birth conditions"
Other Disease
Abuse AgingInjury
AccidentWitchcraft Other
Don’t know
sex
Male 14.9 8.2 10.5 21.8 0.4 19.1 12.5 0.2 4.1 8.3 362
Female 11.0 8.6 5.1 20.3 0.3 29.5 11.8 0.2 5.9 7.2 454
Age
<5 (41.1) (9.3) (21.1) (7.7) (4.2) (0.0) (11.1) (1.1) (0.0) (4.4) 36
5-9 25.0 13.0 20.9 25.2 0.0 0.0 4.9 0.0 0.8 10.2 73
10-14 23.3 8.5 19.3 23.9 0.0 0.0 13.9 0.0 1.4 9.7 68
15-19 (30.1) (4.2) (10.3) (34.0) (0.0) (0.0) (11.0) (1.5) (2.4) (6.5) 39
20-24 (25.1) (5.1) (10.5) (30.1) (0.0) (0.0) (17.7) (0.0) (3.4) (8.1) 36
25-29 (13.7) (5.1) (13.9) (21.4) (0.0) (0.0) (19.2) (1.4) (3.1) (22.3) 40
30-34 (15.7) (12.8) (4.2) (25.2) (0.0) (0.0) (19.4) (0.0) (17.1) (5.5) 36
35-39 (17.4) (25.7) (4.5) (33.5) (0.0) (0.0) (14.1) (0.0) (0.0) (4.7) 34
40-44 (17.4) (7.3) (10.9) (36.6) (0.0) (0.0) (20.9) (0.0) (1.8) (5.0) 34
45-49 (2.3) (13.0) (2.5) (24.5) (6.2) (5.0) (13.0) (0.0) (21.8) (11.6) 24
50-54 5.0 7.2 2.3 23.6 0.0 12.2 26.4 0.0 9.4 13.9 51
55-59 (5.5) (10.7) (0.0) (7.3) (0.0) (25.3) (31.9) (0.0) (4.1) (15.1) 30
60-64 2.1 4.7 3.8 24.2 0.0 51.4 4.1 0.0 4.3 5.4 57
65-69 (0.0) (9.7) (0.0) (19.2) (0.0) (49.4) (10.9) (0.0) (8.3) (2.4) 26
70+ 2.5 5.9 0.6 12.8 0.0 62.4 5.7 0.0 6.0 4.1 234
Residence
Urban 10.6 7.8 8.1 20.8 0.8 21.1 14.5 0.2 7.5 8.7 358
Rural 16.7 7.2 6.7 21.2 0.0 28.1 11.4 0.2 2.8 5.7 286
Nomadic 10.9 11.7 7.5 21.0 0.0 27.6 8.3 0.2 3.9 8.9 173
Region
Sool 8.1 13.4 3.1 24.6 0.0 33.7 8.2 0.0 4.0 5.0 132
Sanaag 13.6 15.1 7.6 11.1 0.0 28.6 13.6 1.0 1.4 8.0 113
Bari 13.5 9.5 2.6 21.2 0.0 17.1 18.6 0.0 5.3 12.1 163
Nugaal 10.4 3.5 10.5 17.0 0.0 21.1 19.7 0.3 4.5 13.1 114
Mudug 15.1 4.9 11.0 24.6 1.0 25.4 6.7 0.0 7.1 4.2 294
Total 12.8 8.4 7.5 21.0 0.4 24.9 12.1 0.2 5.1 7.7 816
Table 12.5 Origin of disabilities

253
Percentage distribution of disabled people according to age at onset of disability, by background characteristics, SHDS 2020
Background characteristics
Age at the onset of disability Number of households<5 9-May 19-Oct 20-29 30-39 40- 49 50-59 60-69 70+
Sex
Male 36.2 9.7 9.0 7.0 6.7 6.3 7.8 8.3 8.9 358
Female 23.8 6.5 11.5 7.8 5.3 10.1 11.8 12.2 11.0 454
Age
<5 100.0 36
5-9 83.2 16.8 73
10-14 61.4 16.4 22.2 67
15-19 46.5 12.0 41.5 39
20-24 52.7 17.3 22.5 7.4 36
25-29 26.3 10.7 26.2 36.9 40
30-34 22.0 17.5 14.6 36.3 9.6 36
35-39 30.1 8.0 21.3 20.7 19.8 34
40-44 27.1 9.6 13.3 13.7 34.4 1.8 34
45-49 4.8 24.3 22.3 12.5 36.1 24
50-54 8.2 1.3 5.7 5.4 15.8 47.7 15.9 49
55-59 9.8 10.8 4.1 10.2 14.9 15.2 35.0 30
60-64 9.5 3.2 0.7 6.1 3.2 19.1 47.9 10.5 57
65-69 10.5 5.2 1.6 23.1 22.9 13.4 23.3 24
70+ 4.1 2.9 3.4 1.6 1.5 6.4 13.8 31.4 34.9 234
Types of disability
Sight 15.8 6.7 7.8 4.0 6.5 13.8 13.6 16.3 15.4 346
Hearing 30.8 8.5 10.0 6.7 3.2 8.8 7.3 12.5 12.1 237
Speech 58.2 11.2 2.0 4.3 2.5 2.1 5.3 3.8 10.5 86
Learning 25.8 2.8 3.6 5.5 9.0 2.3 12.0 18.6 20.6 28
Mobility 24.3 5.5 9.1 8.3 7.6 6.5 11.7 12.8 14.1 234
Self-Care 20.8 3.3 9.3 12.5 10.7 10.9 7.3 6.6 18.6 76
Mental 45.7 7.3 12.5 14.2 3.9 4.4 6.3 1.2 4.5 142
Residence
Urban 29.3 8.1 12.2 9.4 5.7 7.8 9.6 9.2 8.7 358
Rural 27.6 5.8 8.8 6.7 5.4 8.8 11.2 12.0 13.6 286
Nomadic 32.1 11.1 9.4 4.6 7.2 9.3 8.7 10.6 7.1 169
Region
Sool 22.8 6.0 13.2 7.2 5.6 8.9 8.4 16.4 11.5 132
Sanaag 29.7 4.2 7.5 6.1 7.5 4.7 12.5 16.4 11.3 113
Bari 32.3 14.5 10.1 6.1 4.8 4.0 11.7 8.7 7.7 163
Nugaal 34.3 6.0 15.2 6.6 7.2 12.3 7.7 3.5 7.3 114
Mudug 28.4 7.3 8.7 9.1 5.5 10.7 9.7 9.2 11.4 290
Total 29.3 7.9 10.4 7.5 5.9 8.4 10.0 10.5 10.1 812
Table 12.6 Age at onset of disability

Puntland Report 2020Somali Health and Demographic Survey (SDHS)254
Table 12.7 Care and support received for persons with disabilities
Percentage distribution of disabled people who received any kind of care, and support for their disabilities in the last 12 months by background characteristics, SHDS 2020
Background characteristics
Care and Support Received Number of PersonsMedical Welfare Financial Nutritional No Support
Sex of household member
Male 59.6 0.9 3.8 0.7 41.2 592
Female 61.7 0.6 2.9 0.6 40.9 724
Age
0-4 18.7 0.0 2.5 0.5 75.5 231
5-9 40.5 0.7 3.1 1.4 59.1 176
10-14 49.6 0.9 2.1 0.0 41.2 140
15-19 40.5 0.0 6.7 1.8 56.1 91
20-24 73.7 3.0 0.0 0.0 32.6 50
25-29 67.5 2.8 4.8 0.0 35.0 54
30-34 (75.5) (1.2) (2.9) (0.0) (23.2) 45
35-39 (86.4) (0.0) (4.0) (0.0) (16.6) 37
40-44 91.4 1.6 5.6 4.0 (17.4) 38
45-49 (97.6) (0.0) (0.0) (0.0) (2.4) 25
50-54 86.9 0.0 1.0 0.0 17.8 59
55-59 (84.1) (0.0) (14.1) (0.0) (10.7) 30
60-64 85.8 0.0 4.0 0.0 26.6 64
65-69 (95.5) (2.2) (0.0) (0.0) (15.2) 27
70+ 89.5 1.2 3.4 0.7 23.6 248
Residence
Urban 56.2 0.8 2.8 0.8 45.4 632
Rural 54.8 0.8 3.6 0.6 48.1 511
Nomadic 94.7 0.4 4.3 0.0 3.8 173
Region
Sool 61.0 3.1 3.1 0.0 35.8 208
Sanaag 65.1 0.0 1.6 0.0 38.4 174
Bari 56.3 0.2 1.6 0.0 44.7 284
Nugaal 61.3 0.0 2.8 2.0 43.6 184
Mudug 61.4 0.6 5.4 1.0 41.1 466
Wealth
Lowest 81.9 0.5 3.7 0.0 20.9 253
Second 53.1 0.8 1.6 1.0 45.0 297
Middle 55.8 1.9 4.5 0.0 43.6 310
Fourth 59.6 0.2 1.6 1.0 47.8 302
Highest 52.6 0.0 7.1 1.6 47.7 155
Total 60.7 0.8 3.3 0.6 41.0 1,316

255
Percentage distribution of financial sources used for health services by households in the last month by background characteristics, SHDS 2020
Background characteristics
Financial sources for health servicesNumber of householdsIncome Insurance Savings Borrowing
Relatives/Friends
Sold Assets
Other
Residence
Urban 57.4 3.2 4.1 15.7 22.9 13.2 1.9 230
Rural 42.6 2.9 1.9 15.3 17.7 10.2 1.6 180
Nomadic 31.4 0.0 6.2 9.5 35.5 24.9 6.7 52
Region
Sool 33.2 0.0 2.7 10.5 18.1 10.4 7.9 46
Sanaag 56.1 1.2 0.0 31.7 21.4 10.7 6.0 51
Bari 41.1 2.7 2.7 13.7 21.1 11.9 1.4 157
Nugaal 66.4 0.0 2.0 9.7 4.9 8.1 0.6 62
Mudug 51.7 5.3 6.5 13.8 32.5 19.0 1.0 146
Total 48.7 2.7 3.5 14.9 22.3 13.3 2.3 462
Table 12.9 Financial sources used to pay for health services
Table 12.10 Amount in health expenses
Amount of money that households incurred for health services in the last month by background characteristics, SHDS 2020
Amount in health expenses in US$ Number of Households1-49 50-99 100 -199 200- 299 300+ Total
Residence
Urban 36.9 25.7 20.6 3.0 13.8 100.0 209
Rural 23.5 19.4 22.3 8.8 26.0 100.0 176
Nomadic 8.6 35.9 23.6 14.2 17.7 100.0 52
Regions
Sool (33.2) (17.9) (20.2) (13.7) (14.9) 100.0 44
Sanaag (21.1) (25.9) (16.1) (6.6) (30.3) 100.0 48
Bari 29.1 23.9 21.5 4.0 21.5 100.0 144
Nugaal 28.5 27.8 26.9 4.0 12.8 100.0 59
Mudug 27.9 24.8 21.9 8.3 17.0 100.0 142
Wealth Quintiles
Lowest 24.0 28.5 20.8 8.6 18.1 100.0 124
Second 31.4 26.5 24.7 2.8 14.7 100.0 92
Middle 23.5 26.1 18.4 4.4 27.6 100.0 86
Fourth 42.4 24.1 17.7 5.8 9.9 100.0 66
Highest 23.4 12.0 27.1 12.1 25.4 100.0 69
Total 28.1 24.4 21.6 6.7 19.2 100.0 437

Puntland Report 2020Somali Health and Demographic Survey (SDHS)256
Table 12.11 Smoking or using tobacco
Percentage of household members who smoke cigarettes or use tobacco by background characteristics, SHDS 2020
Background characteristicsPercentage of household members who
smoke cigarettes or use tobacco Number of Household members
Sex
Male 8.8 9,037
Female 1.2 10,559
Age
10-14 0.6 4,712
15-19 1.5 3,563
20-24 4.9 1,958
25-29 7.0 1,840
30-34 9.8 1,617
35-39 8.8 1,311
40-44 9.4 1,092
45-49 12.4 517
50-54 6.2 1,003
55-59 7.4 373
60-64 6.8 598
65-69 4.5 177
70+ 4.5 835
Residence
Urban 4.9 7,750
Rural 3.4 6,041
Nomadic 5.9 5,805
Region
Sool 5.3 2,796
Sanaag 6.4 3,597
Bari 4.8 5,093
Nugaal 4.4 2,479
Mudug 3.4 5,631
Education
No Education 5.7 13,320
Primary 2.2 4,178
Secondary 3.7 1,537
Higher 2.7 561
Wealth quintiles
Lowest 5.8 6,077
Second 6.3 2,863
Middle 3.9 4,065
Fourth 3.5 3,789
Highest 3.6 2,803
Total 4.7 19,596

257
Percentage of household members who use Khat by background characteristics, SHDS 2020
Background characteristicsPercentage of household members who use
Qat Number of Household
members
Sex
Male 9.0 9,037
Female 0.7 10,559
Age
10-14 0.5 4,712
15-19 1.1 3,563
20-24 4.7 1,958
25-29 7.2 1,840
30-34 10.3 1,617
35-39 8.2 1,311
40-44 10.4 1,092
45-49 11.6 517
50-54 5.8 1,003
55-59 7.1 373
60-64 6.4 598
65-69 3.6 177
70+ 2.9 835
Residence
Urban 4.8 7,750
Rural 3.4 6,041
Nomadic 5.3 5,805
Regions
Sool 5.0 2,796
Sanaag 6.5 3,597
Bari 4.7 5,093
Nugaal 4.1 2,479
Mudug 3.1 5,631
Education
No Education 5.5 13,320
Primary 2.1 4,178
Secondary 3.6 1,537
Higher 2.9 561
Wealth Quintiles
Lowest 5.3 6,077
Second 6.2 2,863
Middle 4.1 4,065
Fourth 3.2 3,789
Highest 3.5 2,803
Total 4.5 19,596
Table 12.12 Using of Khat

Puntland Report 2020Somali Health and Demographic Survey (SDHS)258

259

Puntland Report 2020Somali Health and Demographic Survey (SDHS)260

261

Puntland Report 2020Somali Health and Demographic Survey (SDHS)262

263