
01. Manures – types, composition and ... - CUTM Courseware
195
01. Manures – types, composition and value – sources There are many ways of classifying the fertilizers and manures, the classification being based on one or two properties of the materials. Nature of source 1.Natural manures 2.Artificial manures 3.Mineral manures Nutrient content 1.Single manures 2.Compound manures Nutrient element present 1.Complete manures 2.Incomplete manures Nature of the materials 1.Organic manures 2.Inorganic manures 3.Indirect manures Nature of action 1.General manures 2.Special manures 3.Stimulative substances 4.Soil amendments or soil conditioners Critical consideration of the above-mentioned classification reveals that none of the classification is satisfactory. Each of the classification is based on only one property and nay not be suitable to cover wide range of materials. They are generally classified in to Bulky organic manure and concentrated organic manures ORGANIC MANURES The word manure derived from the French "Manoeuvrer', means to manipulate, to work, to produce crop. In general manure means excreta of animals. The term bulky organic manure generally includes those materials of natural origin, organic in composition having greater volume per unit content of nutrients and being used to
-
Upload
khangminh22 -
Category
Documents
-
view
0 -
download
0
Transcript of 01. Manures – types, composition and ... - CUTM Courseware

01. Manures – types, composition and value – sources
There are many ways of classifying the fertilizers and manures, the classification being
based on one or two properties of the materials.
Nature of source
1.Natural manures
2.Artificial manures
3.Mineral manures
Nutrient content
1.Single manures
2.Compound manures
Nutrient element present
1.Complete manures
2.Incomplete manures
Nature of the materials
1.Organic manures
2.Inorganic manures
3.Indirect manures
Nature of action
1.General manures
2.Special manures
3.Stimulative substances
4.Soil amendments or soil conditioners
Critical consideration of the above-mentioned classification reveals that none of
the classification is satisfactory. Each of the classification is based on only one property
and nay not be suitable to cover wide range of materials.
They are generally classified in to Bulky organic manure and concentrated organic
manures
ORGANIC MANURES
The word manure derived from the French "Manoeuvrer', means to manipulate,
to work, to produce crop. In general manure means excreta of animals. The term bulky
organic manure generally includes those materials of natural origin, organic in
composition having greater volume per unit content of nutrients and being used to

increase the nutrient status of the soils as well as organic matter content of soils. They
are obtained mainly as natural products. The materials included in this group are
farmyard manure, compost, sewage sludge and green manure. Of these FYM, compost
and green manure are the most important and widely used bulky organic manures.
Farm Yard Manure (FYM)
The FYM refers to the refuse from farm animals, mainly sheep, cattle and poultry.
This is one of the oldest manure known and is highly valued for its many of the beneficial
properties that are said to be produced when this manure is added to the soil. It not only
adds the constituents to the soil but also adds organic matter to the soil.
Composition of farm manure
Several factors influence the composition of farm manure and they are the
following
1. Source of manure
2. Feed of the animals
3. Age of the animals
4. Condition of the animals
5. Manner of storage and handling
6. Litter use etc.,
On an average the composition of FYM is usually 0.5 % N, .25 % P2O5 and 0.5 %
K2O.
Methods of collection
Many methods of collecting the cattle manure are in vogue and this include,
1. Use of ordinary cattle shed with kacha floor
2. Use of cattle shed with impermeable floor and provision for collecting urine in
separate urine pit
3. Dry earth system
4. Loose box system
5. Other special methods
The method of collection and storage is the most important factor which decides the final
composition of the manure. The following are recognized methods of storing FYM
1. The heap method

2. The pit method
Various losses during collection and storage of FYM can be prevented or atleast
minimized by adopting the following procedures
1. Better methods of collection
2. Better methods of storage
3. Use of cow dung gas plant
4. Use of chemical preservatives like gypsum, superphosphate etc
Organic Wastes :
Organic wastes are the wastes of biological / animal / agro-industry origin and
can be converted to valuable manure by composting. The various organic wastes can be
classified as follows,
Sources of Organic Wastes
Agriculture Animal
Husbandry
Agro-industries Municipal Activities
∗ Crop residues (paddy
straw, sugacane
trash etc)
∗ Weeds
∗ Dairy
∗ Goat / Sheep
∗ Poultry
∗ Piggery
∗ Sugar Indutry
(Pressmud)
∗ Coir Industry (Ciorpith)
∗ Fruits / vegetables
processing industries
∗ Sago Industry
∗ Household /
municipal solid
waste
∗ Market waste
(Vegetable/ fruit /
flower market)

02. Green manures-Oilcakes-Sewage sludge-Biogas plant slurry-Plant and animal
refuges
GREEN MANURES
Green manure:
Growing the plants in-situ and incorporation in the field.
Green leaf manure
Addition of green or plant tissues obtained from elsewhere viz., trees, herbs, shrubs
pruning andunwanted weeds.
Benefit of Green manure or Green leaf manures
a. Addition of organic matter.
b. Adds Nutrient – Macro, Secondary and micro nutrients.
c. It improves physical condition of soil.
d. Act as a soil amendment to reclamation of problem soils.
e. It act as a cover or catch crop to prevent soil erosion, conserve moisture, prevent
nutrient leaching.
f. Leguminous crops fix the atmospheric – N by the roots and improves N status of the
soil.
Characteristics of Green manure
1. It should have rapid growth and shorter duration so that can be fitted in a crop rotation
2. It should yield abundant biomass and should be succulent to have rapid
decomposition
3. It should have the ability to grow on poor soils.
Nutrient content of agricultural wastes
Agricultural wastes N P2O5 K2O
Sugarcane Begasse 0.25 0.12 0.20
Sugarcane Begasse
compost
1.40 0.45 0.60
Sugarcane Begasse
Press mud
1 – 1.5 2.0 -

Press mud – compost 1.5 1.5 -
Saw dust Traces 0.2 -
0.25
Tobacco waste 0.5 – 1.0 0.8 1.0
Tobacco seed cake 4 – 4.5 7 – 15 5 – 5.5
Tea waste 2.8 – 3.6 03. – 0.4 1 – 2
Cotton dust 1 – 1.5 - -
Textile waste 1 – 1.5 - -
Nutrient content of Commonly used Concentrated manures
Oil cake N P2O5 K2O
Groundnut cake (Decordicated) 7.8 1.5 –
1.9
1.4
Lin seed cake 5.5 1.4 1.2
Mustard cake 4.5 1.5 1.0
Neem cake 5.2 1.0 1.4
Niger cake 4.8 1.8 1.0
Pungam cake 2.5 1.0 1.0
Safflower (decordicated) 7.8 2.2 2.0
Sesamum 6.2 2.0 1.2
Castor 5.8 1.8 1.0
Coconut 3.2 1.8 1.7
Slaughter House wastes
Wastes N P2O5 K2O
Blood meal 10 – 12 1.2 1.0
Meat meal 10.5 2.5 0.5
Fish meal 4 -10 3 – 9 0.3 – 1.5
Horn – Hoff meal 13 - -

Leather - waste 7 0.1 0.2
Hair and wool waste 12.3 0.1 0.3
Sewage water 25ppm 5 ppm 15 ppm
Sludge 1.5 – 3.5 0.75 – 4 0.3 – 0.6
Nutrients content of Commonly used Green manures
Green manure N % P2O5% K2O %
Sunhemp 0.5 0.1 0.4
Danicha 1.1 0.2 0.4
Sesbania 0.7 0.1 0.6
Pelli pesera 0.7 0.2 0.4
Cluster bean 0.3 0.1 0.3
Cow pea 0.7 0.2 0.6
Green leaf manure
Kolungi 0.7 0.1 0.4
Calotropis 0.3 0.1 0.6
Pungam 1.2 0.2 0.8
Glyricidia 0.8 0.1 0.7
Puvarasu 0.8 0.2 0.9
Guano - Birds Excreta or bat Dung
Guano 2.6 4.2 0.6

03. Composting of organic wastes – composting technologies
COMPOSTING OF ORGANIC WASTES
Composting is a process of allowing organic materials to decompose more or
less controlled conditions to produce stabilized product that can be used as a manure or
soil amendment. Composting is basically a microbial process, which change the property
of the organic material or mixtures.
Compost is the material resulting from the decomposition of plant residues under
the action of bacteria and fungi. Composting is simply an acceleration of natural process
or organic matter mineralization. The final product is dark brown in colour and resembles
FYM in its properties and appearance.
Essential requirements for composting
A bulky organic manure
A suitable starter
Addition of enough water
Aeration
Main systems of composting
ADCO process (Hutchinson and Richards of England)
Activated compost process (Fowler and Rege)
The Indore process (Howard and Wad)
The Bangalore process (C.N.Acharya)
The coimbatore method
Benefits of composting:
∗ Enables clean environment
∗ Absorbs odors, degrade toxic substances and heavy metals
∗ Avoids un-necessary dumping of wastes
∗ Supply valuable organic manure
Composting technologies
1. Crop residue composting
Collect the available crop residues and weeds
Shred them to a size of 2 to 2.5 cm length
Mix these wastes with green residues (freshly collected), if available
Form the compost heap ( 4 feet height)
Add the bio-inoculants (2 kg of bio-mineralizer or 40 kg of cowdung for 1 tonne of
waste)

Properly aerate the compost either by providing perforated PVC pipes or by
mechanical turning
Maintain the moisture at 60 % by regular watering
The compost will mature in 60 days
2. Vermi-composting
Vermicomposting is a process of degradation of organic wastes by earthworms.
The species like Eisenia foetida and Eudrilus eugeniae are effective in converting the
agricultural wastes into compost. The various steps involved in making vermicompost
are as follows
Methods followed:
Heap method
Pit method – aboveground and belowground
Belowground method pit size : 10 X 1 X 0.3 m
Each layer : 6-7cm thick
Sprinkle water once in 8-10 days
Release : 2-2.5 kg worms / pit
Steps:
Collect the predigested wastes and mix cattle dung @ 30 %.
Place it in the pit/container layer by layer
Moist the residues at 60 % moisture
Allow the verms in to the feed material / residues @ 1 kg/ tonne of residue
Protect the pit or container from ants and rats (which are the enemies of
verms)
The residue will be composted in 30 to 40 days
Remove the composted materials layer by layer at a weekly interval so as
To avoid any damage /disturbance to the feeding verms.
Nutritive value of vermicompost
The nutrients content in vermicompost vary depending on the waste materials
that is being used for compost preparation. If the waste materials are heterogeneous
one, there will be wide range of nutrients available in the compost. If the waste materials
are homogenous one, there will be only certain nutrients are available. The common
available nutrients in vermicompost is as follows
Organic carbon = 9.5 – 17.98%
Nitrogen = 0.5 – 1.50%

Phosphorous = 0.1 – 0.30%
Potassium = 0.15 – 0.56%
Sodium = 0.06 – 0.30%
Calcium and Magnesium = 22.67 to 47.60 meq/100g
Copper = 2 – 9.50 mg kg-1
Iron = 2 – 9.30 mg kg-1
Zinc = 5.70 – 11.50 mg kg-1
Sulphur = 128 – 548 mg kg-
3. Coirpith composting
Coirpith is an agricultural waste produced from the coir industry. Approximately
180 grams of coirpith is obtained from the husk of one coconut. Coirpith contains Carbon
: Nitrogen in the ratio of 112:1 and contains 75 per cent lignin which does not permit
natural composting as in other agricultural wastes.
Mushroom Pleurotus has the capacity to degrade part of the lignin present in
coirpith by production of enzymes like cellulases and lactases. The carbon: nitrogen ratio
of coirpith is reduced from 112:1 to 24:1 as a result of composting.
Composting method
Select a shaded place of 5 x 3 m dimension and level it after removing weeds. Spread
100 kg of coirpith uniformly. Spread 100 g of Pleurotus spawn on this and cover with a
second layer of 100 kg of coirpith. On the surface of the second layer, spread one kg of
urea uniformly.
Repeat this sandwiching of one layer of coirpith with spawn followed by another layer of
coirpith with urea up to one metre height.
Sprinkle water to keep the heap moist. Allow the heap to decompose for one month.
Manure conversion
The coirpith is converted into good manure after 30 to 40 days and the lignin content is
reduced from 40 per cent to 30 per cent. The nitrogen content is increased from 0.20 per
cent to 1.06 per cent. Coirpith compost contains macronutrients and micronutrients. It
can absorb water up to eight times its weight. Coirpith, when added to sandy soil at 2 per
cent increases the water holding capacity up to 40 per cent. It can be applied to a wide
variety of crops and can be used to prepare potting mixture and can be applied as
organic manure in kitchen gardens.
4. Composting of crop residues and weeds:

Composting is one of the useful ways for utilizing the some of the weeds and
noncommercial plants like Parthenium, Water hyacinth, lpomoea etc. instead of their
eradication. The plants can be composted using Trichoderma viridi and Pleurotus sajor-
caju as a microbial consortium with supplementation of urea. Select an elevated shady
area of a thatched shed and mark an area of 5x1.5 meter. Cut the composting materials
into 10 – 15 cm size. Spread 100 kg of these materials over the marked area. Sprinkle 1
bottle of microbial consortia over this layer. Again spread another 100 kg of composting
materials over this layer. Spread 1 kg of urea uniformly over this layer. Likewise repeat
these processes of spreading composting materials, then microbial consortia, again
composting materials followed by urea application until a minimum of 1-meter height is
reached. Sprinkle water to attain a moisture level of 50% to 60%. The surface of the
heap is covered with a thin layer of soil. Water should be sprinkled depending upon the
necessity to maintain the moisture around 50%. A turning is given at the end 20 days to
give a thorough mixing of outside material with that of the inside ones. The bio-converted
compost will be ready in about 40 days time.
5. Method of composting the Municipal Solid Wastes
Biodegradable municipal solid waste should be separated and collected for
composting. Five hundred kg of material should be heaped in the compost yard. In that
heaped waste, 1 kg of TNAU microbial consortium should be applied in the form of slurry
to cover the full waste material. This 1 kg microbial consortium can be mixed with 5 litres
of water to make slurry. This slurry is sufficient to cover 0.5 tonne of material Then, 50
kg of cowdung should be mixed with 30 litre of water to form cowdung slurry. This cow
dung slurry should be sprayed over the heap of municipal solid waste Then, 1 kg of urea
should be mixed with solid waste. 60% moisture should be maintained through out the
period of composting. Compost should be turned up once in 15 days to create good
aeration, and for thorough mixing. Because of this practice, a uniform composted
material will be obtained. Solid waste can be composted with in 90 days by this method
with the indication of reduction in the volume, appearance of dark coloured materials and
a small of earthy odour After the completion of composting, compost should be sieved
through normal mesh to separate unwanted and partially composted material
6. Value addition of poultry waste compost
A known quantity of poultry droppings and coir pith @ 4:5 ratio should be mixed
well to attain a C/N ratio of 25:1 to 30:1 which is considered to be the optimum C/N ratio

for compositing. Pleurotus sajor-caju, a lignocellulolytic organism, should be inoculated
into the mix @ 2 packets per tonne of waste in order to speed up the composting
process. The mix should be heaped under the shade. The moisture content of the mix
should be maintained within 40 – 50%. Periodical turning should be given on 21st, 28th
and 35th day of composting. Another two packets of Pleurotus sajor – caju is to be
added when turning is given on the 28th day of composting. A good quality compost will
be obtained in 45 days, which contains 2.08% N, 1.93 % P and 1.41 % K with C/N ratio
of 10-16
7. Enriched Farm Yard Manure (EFYM)/ Reinforced FYM
Phosphorus content in FYM is relatively low and complete utilization of nitrogen
and potassium in the manure is seldom realized. Hence, heavy quantities intended to
supply the needed quantity of phosphorus will result in wastage of nitrogen in most soils.
To overcome this P insufficiency, addition of superphosphate to the manure is
recommended and the process is called reinforcing / enriching and the resultant material
is called “enriched farmyard manure”. The Single Super Phosphate (SSP) can be
sprinkled either in the cattle shed or on the manure heap. Rock phosphate can also be
recommended for this purpose.
Factors affecting the Composting Process:
I. The Type and Composition of the Organic Waste
II. The Availability Of Microorganism
III. Aeration
IV. The C, N and P Ratios
V. Moisture Content
VI. Temperature
VII. pH
VIII. Time
Preparation of Coir Waste Compost Using Yeast Sludge:
Yeast sludge is a waste product by alcohol distilleries @ 2t/day. This
waste contain 6% N, 0.3% P and 0.9% K with other micronutrients, vitamins and growth
promoting substances. The coir waste should be sieved so as to remove all the fibrous
materials. For one tone of coir waste 200 kg of yeast sludge and 10 kg of rock
phosphate should be added and mixed thoroughly. Moisture should be maintained at
60%. After mixing the material should be formed as heap. Within 4-5 days the
temperature of the heap will be raised to 50-60° C. Within 40 to 50 days the coir waste
and yeast sludge will become as mature compost. The matured compost will turn from

brown to black. There will not be any odor. The volume of the compost heap will be
reduced to 1/3. The temperature of the heap will be 25-30°c and it should be constant.
The compost will be very light and fine textured. The compost prepared by this means of
above method contains N-1.09%, P-1.35%, K-1.95% besides copper, manganese, iron
and zinc. This compost doesn’t have any phytotoxicity and used for all agricultural crops.
C. Preparation of sugarcane trash compost using yeast sludge:
sugarcane trash collected from sugarcane field has to be cut into small bits using
chaff cutter or shredder to a size of 1-2cm. for every tone of sugarcane trash 200 kg of
yeast sludge and 10kg of rock phosphate are added and mixed thoroughly. Moisture is
maintained at 60%. the heap is formed to a height of 1-1½ m. within 45-50 days
sugarcane trash compost will be ready for application to crops. The sugarcane trash
compost consists of N-1.2%, P-0.7%, K-1.5% and considerable quantities of
micronutrients. This compost can be applied at the rate of 5t/ha.
d. Japanese method of composting:
Instead of pits in conventional composting system, vats of 18-30’ in
length, 3-4’ in width and 2.5-3.0’ height are made of bamboo stakes of 2.5-3.0’ width. For
growth a non-leaky surface is prepared with broken stone stable or brick and plastered
with cement. About 2 feet space is kept free on one side of the vat to facilitate turning
the residues regularly. Sliced and broken pieces of coconut, shells, leaves, fibrous
materials, tender tree barks or pieces form the bottom 10-15 cm layer. Second layer of
dry leaves, grass residues, groundnut haulms are of 10-15 cm height. Cow dung, urine,
biogas slurry are sprinkled over and this layer of soil and ash is spread over. Nitrogen
rich green leaves of pongamia, albizzia, daincha, sesbania and crop residues forms third
layer of 10-15 cm. Fourth layer of 10-15cm contains organic wastes rich in phosphorous
and potash. Over these 2-3 buckets of cow dung and biogas slurry are sprinkled. Fifth
layer contains paddy or ragi straw that is rich in carbon and provides energy for
microorganisms. Sixth layer contains exclusively of dried and powdered cow dung of 20-
30cm. Over these small quantities of old compost, tank silt and ash are sprinkled. For
rapid degradation Aspergillus, Penicillium, Trichoderma should be inoculated. Pleurotus
and Polyporus should be inoculated for degradation of high lignin contained residues.
Azotobacter and Phosphobacteria can be mixed for enriching the composts.
General Properties Of Commercially Accepted Compost.:
N % >2 Color Brown Black
C: N <20 Odor Earthy
Ash % 10-20 Water Holding Capacity (%) 150-200

Moisture %10-20 CEC (Meq 100 g-1) 75-100
P % 0.15-1.5 Reducing Sugar (%) <35%

04. Classification of fertilizers – N, P and K fertilizers
Classification of fertilizers
Commercial N, both organic and inorganic is desired from a wide variety of
materials which are found to differ very widely in their sources, properties, method of
preparation and their reactions in the soil. Classification based on chemical form seems
to be more satisfactory as indicated below.
Nitrogenous Phosphatic Potassic Compound Mixed
Fertilizers and manures
Bulky organic manures (FYM,compost, Green manure)
Concentrated organic manures Oil cakes Guano
Artificial fertilizers
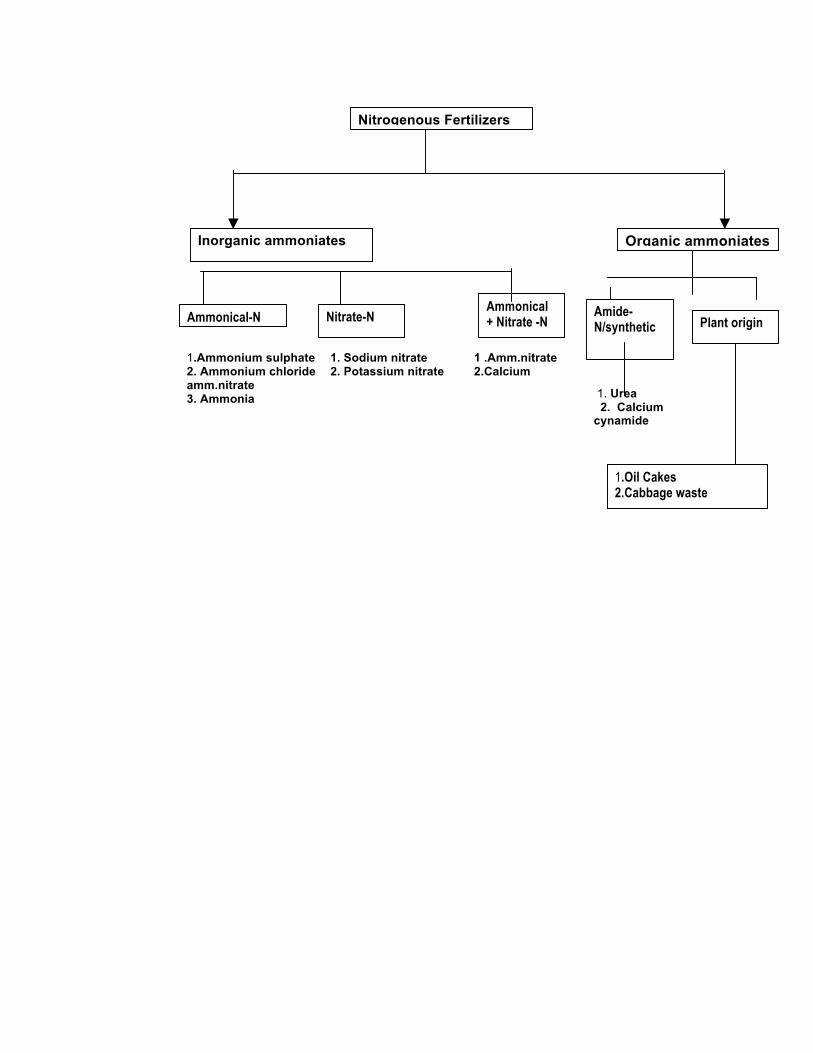
Nitrogenous Fertilizers
Inorganic ammoniates Organic ammoniates
Ammonical-N Nitrate-N Ammonical + Nitrate -N
Amide-N/synthetic Plant origin
1.Oil Cakes 2.Cabbage waste
1.Ammonium sulphate 1. Sodium nitrate 1 .Amm.nitrate 2. Ammonium chloride 2. Potassium nitrate 2.Calcium amm.nitrate 3. Ammonia 1. Urea
2. Calcium cynamide

The nitrogen content of different nitrogenous fertilizers is given below
Sl.No Name of the
fertilizer
N
content (%)
Form of N
1 Sodium nitrate
(NaNO3)
16.0 Nitrate (NO3)
2 Potassium nitrate
(KNO3)
12.5-13.5 Nitrate
3. Ammonium sulphate (NH4)2
SO4
20.6 NH4
(Ammonia)
4. Ammonium chloride (NH4
Cl)
26.0 NH4
5. Ammophos - A 11.0 NH4
6. Ammophos – B 16.0 NH4
7. Ammonium Nitrate (NH4) 33.0 NH4 – 16.5
NO3 – 16.5
8. Ammonium sulphate nitrate 25.6 NH4 – 19.5
NO3 – 6.6
9. Urea (CO (NH2)2) 46.0 Amide
10. Calcium cyan amide
(CaCN2)
20.6 Amide
11. Dried blood 3-14 Protein(organic)
12. Groundnut cake 8.0 Protein(organic)
13. Meat meal 09.0-11. Protein
(organic)
14. Guano 10.0 Protein
(organic)

PHOSPHATIC FERTILIZERS
Natural Ground rock phosphate Bone meal Bone meal
Treated or processed Super phosphate Bone char
Industrial byproduct Basic slag
Chemical or synthetic Ammonium phosphate
POTASSIC
Natural Potash mineral Processed
MOP SOP
Synthetic Pot.nitrate Pot.phosphate

13. SECONDARY AND MICRONUTRIENT FRTILIZERS-Manufacturing of Zinc
sulphate and Ferrous sulphate
Zinc
Zinc is the fourth most common metal in use, trailing only iron, aluminium, and copper
with an annual production of about 12 million tonnes.[14] The world's largest zinc
producer is Nyrstar, a merger of the Australian OZ Minerals and the Belgian
Umicore.[74] About 70% of the world's zinc originates from mining, while the remaining
30% comes from recycling secondary zinc.[] Commercially pure zinc is known as Special
High Grade, often abbreviated SHG, and is 99.995% pure.
Worldwide, 95% of the zinc is mined from sulfidic ore deposits, in which sphalerite ZnS is
nearly always mixed with the sulfides of copper, lead and iron.[77] There are zinc mines
throughout the world, with the main mining areas being China, Australia and Peru. China
produced 29% of the global zinc output in 2010.
Zinc metal is produced using extractive metallurgy.[78] After grinding the ore, froth
flotation, which selectively separates minerals from gangue by taking advantage of
differences in their hydrophobicity, is used to get an ore concentrate.[78] A final
concentration of zinc of about 50% is reached by this process with the remainder of the
concentrate being sulfur (32%), iron (13%), and SiO2 (5%).[78]
Roasting converts the zinc sulfide concentrate produced during processing to zinc
oxide:[77]
2 ZnS + 3 O2 → 2 ZnO + 2 SO2
The sulfur dioxide is used for the production of sulfuric acid, which is necessary for the
leaching process. If deposits of zinc carbonate, zinc silicate or zinc spinel, like the
Skorpion Deposit in Namibia are used for zinc production the roasting can be omitted.
For further processing two basic methods are used: pyrometallurgy or electrowinning.
Pyrometallurgy processing reduces zinc oxide with carbon or carbon monoxide at 950 °C
(1,740 °F) into the metal, which is distilled as zinc vapor.[80] The zinc vapor is collected
in a condenser.[77] The below set of equations demonstrate this process
2 ZnO + C → 2 Zn + CO2
ZnO + CO → Zn + CO2
Electrowinning processing leaches zinc from the ore concentrate by sulfuric acid

ZnO + H2SO4 → ZnSO4 + H2O
After this step electrolysis is used to produce zinc metal.[77]
2 ZnSO4 + 2 H2O → 2 Zn + 2 H2SO4 + O2
The sulfuric acid regenerated is recycled to the leaching step.
Ferrous Sulfate
In the finishing of steel prior to plating or coating, the steel sheet or rod is passed
through pickling baths of sulfuric acid. This treatment produces large quantities of iron(II)
sulfate as a by-product.[2]
Fe + H2SO4 → FeSO4 + H2
Another source of large amounts results from the production of titanium dioxide from
ilmenite via the sulfate process.
Ferrous sulfate is also prepared commercially by oxidation of pyrite:
2 FeS2 + 7 O2 + 2 H2O → 2 FeSO4 + 2 H2SO4
[edit]
Reactions
On heating, iron(II) sulfate first loses its water of crystallization and the original green
crystals are converted into a dirty-yellow anhydrous solid. When further heated, the
anhydrous material releases sulfur dioxide and white fumes of sulfur trioxide, leaving a
reddish-brown iron(III) oxide. Decomposition of iron(II) sulfate begins at about 480 °C.
2 FeSO4 → Fe2O3 + SO2 + SO3
Like all iron(II) salts, iron(II) sulfate is a reducing agent. For example, it reduces nitric
acid to nitrogen oxide and chlorine to chloride:
6 FeSO4 + 3 H2SO4 + 2 HNO3 → 3 Fe2(SO4)3 + 4 H2O + 2 NO
6 FeSO4 + 3 Cl2 → 2 Fe2(SO4)3 + 2 FeCl3
Ferrous sulfate outside titanium dioxide factory in Kaanaa, Pori.
Upon exposure to air, it oxidizes to form a corrosive brown-yellow coating of basic ferric
sulfate, which is an adduct of ferric oxide and ferric sulfate:
12 FeSO4 + 3 O2 → 4 Fe2(SO4)3 + 2 Fe2O3

15. Mixed fertilizers – sources – preparations- their compatibility – advantages
Mixed fertilizers
For over hundred years the mixed fertilizers are in use besides straight fertilizers.
Many fertilizer mixtures are made available now and this account for a major portion of
the consumption of N, P and K. Present day statistics show that numerous grades of
fertilizers mixtures are manufactured and the fertilizer mixing industry is being
considered as one of the major agro- industry.
The following are some of the common term frequently used in the mixed
fertilizer industry.
Fertilizer : The substance which is used for the supply of plant nutrients
Mixed fertilizer : A mixture of more than one straight fertilizer which can supply more
than one plant nutrient element
Complete fertilizer : A single fertilizer material containing the entire three major plant
nutrients viz, N, P and K
Fertilizer grade : This refers to the minimum guarantee with regard to the nutrient
content of the fertilizer mixture in terms of N, P and K.
Fertilizer formula : This related to the quantitative expression of the analysis of the
different ingredients included in the mixed fertilizer in terms of N, P and K.
Fertilizer ratio : This indicates the relative percentage of N, P2O5 and K2O in the
manure mixture.
Acidic fertilizer : Fertilizer capable of increasing the acidity of the soil by continued
applications.
Basic fertilizer : Fertilizers which increase the pH and the soil on continued use by
leaving a basic residue in the soil.
Neutral fertilizer : Materials which are neither increasing nor decreasing the pH of the
soil
Filler : It is called as the ‘make-weight’ material added to the fertilizer mixtures.
Filler materials are inert materials like sand, saw dust etc, are added to make up the
difference between weight of ingredients added to supply the plant nutrients in a tonne
and the final weight viz., 1,000 kg.

Advantages
All the three major plant nutrients are made available in one and the same material.
There is saving of time and labour. The residual effects will not be there. The fertilizer
mixtures are usually prepared taking into account the acidic or alkaline nature of the
ingredients, and other chemical reactions. Hence, some of the residual effects like
acidity
will not be there. Usually mixed fertilizer are prepared to suit a group of crops and soils.
Disadvantages
Specific needs of crops and deficiency of individual nutrient elements cannot be
satisfied by using mixed fertilizers as efficiently as in the case of straight fertilizers.
The use of mixed fertilizer in such cases of specific needs will be a waste as other
nutrients are also added to the soil.
Unit cost of the various nutrients contained in the mixed fertilizer will always be
higher when compared to the unity cost of nutrients contained in the straight
fertilizers.
Improper mixing and storage of fertilizers can result in large nutrient losses. Some
important aspects to consider in fertilizer mixing and storage include the following:
• Urea should not be mixed with ammonium calcium nitrate (CAN), KCl, SSP or
TSP.
• Urea can be mixed with most other fertilizers but fertilizer mixtures containing
urea should be applied immediately after mixing. Do not store fertilizer mixtures
containing urea.
• Ammonium phosphates and super phosphates should not be mixed with lime,
slag, rock phosphate or CAN.
• Potassium chloride and sulfate of potash can be mixed with most fertilizers, but
mixtures of these fertilizers with urea and calcium ammonium nitrate should not
be stored.
• CAN should not be mixed with basic slag but can be mixed with urea, single
superphosphate, and ammonium phosphates immediately prior to application.
Do not store fertilizers in damp or dirty places. Make sure that bags of fertilizer in the
store do not absorb moisture from leaky roofs or water seepage through walls and floors.
Preparation of mixed fertilizers

Many kinds of materials are used in the manufacture of fertilizer mixtures. The
materials are found to be highly varying in their properties. However, only a limited
number of materials are being used like (NH4)2SO4, CO(NH2)2, Super phosphate,
ammonium phosphate, muriate of potash, limestone, gypsum and some fillers.
The manufacture of fertilizer mixtures usually involves the weighing and
proportioning of ingredients that are used, sieving and sizing of the various ingredients,
mixing the different materials and packing. All the above operations are done both
mechanically and by hand operation. Different kinds of machineries are being used.
Guide for mixing
To determine the amount of individual fertilizer in a mixture, the quantity is
calculated as follows.
(Percentage of plant nutrient desired x (Weight of final mixture)
in the mixture)
Quantity =
(The Percentage of the plant nutrient in the straight fertilizer)
R x T
A =
P
R = Percentage in the mixture
T = Final weight of the mixture
P = Percentage in the straight fertilizer.
To prepare a mixture of 10: 5: 10 using (NH4)2SO4, (20% N), Super phosphate
(16% P2O5) and muriate of potash (60% K2O), the following quantities will be required
per tonne (1,000 kg).
10 x 1000
1. Ammonium sulphate = = 500 Kg.
20
5 x 1000

2. Super phosphate = = 312.5 Kg.
16
10 x 1000
3. Muriate of potash = = 166.5 Kg.
60 _______________
Total = 979.0 Kg .
Filler = 1000 – 979 = 21 Kg.
If the total calculated weight exceeds the final weight, a mixture of that ratio can
not be prepared.
Changes that occur while manufacturing mixed fertilizer
The ingredients used in fertilizer mixtures vary widely in their physical and
chemical characteristics. When such widely varying materials in physical and chemical
properties are mixed together, naturally many changes are expected to take place during
or after the mixing. Some changes will be of physical nature and some will be of
chemical nature. The following are the most important physical changes that will take
place during or after the mixing of fertilizers.
Hygroscopicity
It is a property of any substance which absorbs from air and gets converted to
semi- solid or liquid condition. Fertilizer like Ca(NO3)2, NH4NO3, NaNO3 and CO(NH2)2
are capable of absorbing moisture from air and become hygroscopic. In such cases
handling will be very difficult for such mixtures.
Caking up
Moisture present in some of the ingredients is responsible for caking up.
Moisture dissolves some of the easily soluble ingredients and forms a saturated solution.
This saturated solution on evaporation gives out crystals which knit together forming
larger lumps.
The caking up can be prevented by the use of certain kind of materials called as
‘conditioners’. The commonly used conditioners are groundnut hulls, lime, clay etc.
Another was of preventing the caking up is manufacture of granulated fertilizer mixture.
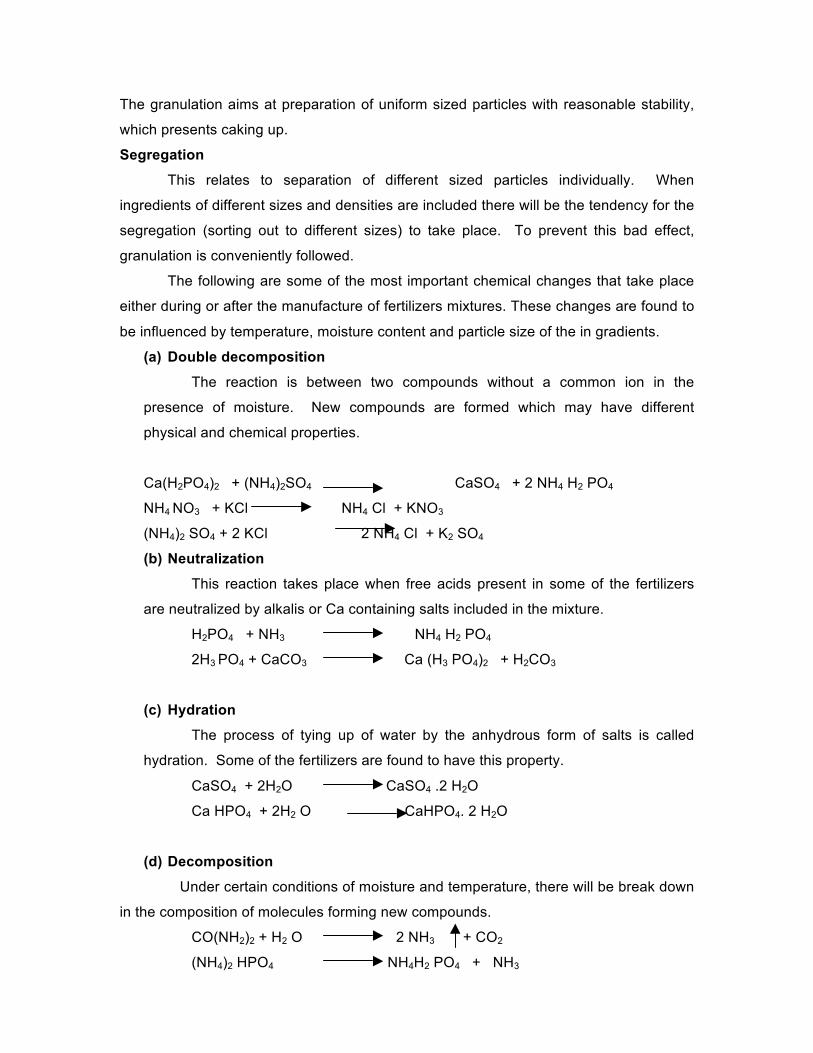
The granulation aims at preparation of uniform sized particles with reasonable stability,
which presents caking up.
Segregation
This relates to separation of different sized particles individually. When
ingredients of different sizes and densities are included there will be the tendency for the
segregation (sorting out to different sizes) to take place. To prevent this bad effect,
granulation is conveniently followed.
The following are some of the most important chemical changes that take place
either during or after the manufacture of fertilizers mixtures. These changes are found to
be influenced by temperature, moisture content and particle size of the in gradients.
(a) Double decomposition
The reaction is between two compounds without a common ion in the
presence of moisture. New compounds are formed which may have different
physical and chemical properties.
Ca(H2PO4)2 + (NH4)2SO4 CaSO4 + 2 NH4 H2 PO4
NH4 NO3 + KCl NH4 Cl + KNO3
(NH4)2 SO4 + 2 KCl 2 NH4 Cl + K2 SO4
(b) Neutralization
This reaction takes place when free acids present in some of the fertilizers
are neutralized by alkalis or Ca containing salts included in the mixture.
H2PO4 + NH3 NH4 H2 PO4
2H3 PO4 + CaCO3 Ca (H3 PO4)2 + H2CO3
(c) Hydration
The process of tying up of water by the anhydrous form of salts is called
hydration. Some of the fertilizers are found to have this property.
CaSO4 + 2H2O CaSO4 .2 H2O
Ca HPO4 + 2H2 O CaHPO4. 2 H2O
(d) Decomposition
Under certain conditions of moisture and temperature, there will be break down
in the composition of molecules forming new compounds.
CO(NH2)2 + H2 O 2 NH3 + CO2
(NH4)2 HPO4 NH4H2 PO4 + NH3

However, the following important principles must be taken into consideration while
preparing mixed fertilizers.
1. All fertilizers containing ammonia are not mixed directly with the basic
fertilizers (e.g. RP, limestone, basic slag, CaCN2) as reaction will take place
resulting in the loss of gaseous NH3.
2. The water – soluble phosphates are not mixed with those materials which
contain free lime (e.g) lime stone, CaCN2) as there will be reaction towards
the reversing of water – soluble phosphate to water – insoluble phosphates.
3. Hygroscopic fertilizers are not included as they will facilitate caking up.
4. The acidic fertilizers are likely to produce some free acids which may
damage the container or packing materials.
Manufacturing process
The principal steps in the manufacture of solid mixed fertilizers are calculating,
weighing, sieving, sizing, mixing the materials and packing the product.
Calculating and weighing
With a good weighing device the calculated quantities of the various
ingredients are weighed accurately for preparing mixtures.
(1) Seiving and sizing
If the raw materials have undergone too much of caking in the storage piles, it
may be necessary to subject them to preliminary grinding, sieving and sizing. The
raw materials must be converted into uniform sized particles to have effective making
and to avoid segregation during subsequent handling.
(2) Mixing
Many kinds of fertilizer mixing machines have been proposed and used at present.
Rotary drum type is found to be more common than the vertical cylinder type. Weighed
quantities of different materials are introduced into the mixer and mixed thoroughly.
(3) Packing
Equipments for packing fertilizer mixture range from the simplest types of hand operated
facilities to highly sophisticated automatic machines.
Granular mixtures
Compared to pulverized or powdered mixture, the advantages of granular
mixtures are reduced caking up tendency, less dusting loss and easy handling. Of late,
attention is found in the manufacture of only granular mixtures.

19.FERTILIZERS CONTROL ORDER (FCO) 1985
ORDER
Under the Essential Commodities Act, 1955 (10 of 1955), the Central Government
makes the Fertilizers (Control) Order, 1985. It shall come into force on the date of its
publication in the Official Gazette. In this Order,some of the definitions are used
Act means the Essential Commodities Act, 1955 (10 of 1955).
"certificate of source" means a certificate given by a State Government, Commodity
Board, manufacturer, + importer, pool handling agency
Commodity Board means the Coffee Board constituted under section 4 of the Coffee Act,
1942 (7 of 1942) or the Rubber Board constituted under section 4 of the Rubber Act, 1947
(24 of 1947)
compound or complex fertilizers means a fertilizers containing two or more nutrients
during the production of which chemical reaction takes place
controller means the person appointed as Controller of Fertilizers by the Central
Government and includes any other person empowered by the Central Government to
exercise or perform all or any of the powers, of the Controller under this Order.
"dealer" means a person carrying on the business of selling fertilizers whether wholesale
or retail or industrial use* and includes a manufacturer, +Importer, and a pool handling
agency carrying on such business and the agents of such person, manufacturer, +importer
or pool handling agency.
fertilizer means any substance used or intended to be used as a fertilizer of the soil
and/or crop and specified in Part A of Schedule I and includes a mixture of fertilizers and
special mixture of fertilizers.
"grade" means the nutrient element contents in the fertilizer expressed in percentage
"granulated mixture" means a mixture of fertilizers made by intimately mixing two or more
fertilizers with or without inert material, and granulating them together, without involving any
chemical reaction.

“importer" means a person who imports fertilizers in accordance with the Export and
Import Policy of the Central Government, as amended from time to time.
inspector" means an Inspector of Fertilizers appointed under clause 27.
"manufacturer" means a person who produces fertilizers or mixtures of fertilizers and the
expression "manufacture" with its grammatical variations shall be construed accordingly.
"mixture of fertilizers" ***means a mixture of fertilizers made by physical mixing two or
more fertilizers with or without inert material in physical or granular form and includes a
mixture of NPK fertilizers, a mixture of micronutrient fertilizers and a mixture of NPK with
micronutrient fertilizers.
"physical mixture" means a mixture of fertilizers made by physically mixing two or more
fertilizers with or without inert material necessary to make a required grade, without
involving any chemical reaction.
"prescribed standard" means-in relation to a fertilizers included in column 1 of Part A of
Schedule-I, the standard set out in the corresponding entry in column 2, subject to the limits
of permissible variation as specified in Part B of that Schedule
PRICE CONTROL-Fixation of prices of fertilizers
The Central Government may, with a view to regulate equitable distribution of
fertilizers and making fertilizers available at fair prices, by notification in the Official Gazette,
fix the maximum prices or rates at which any fertilizers may be sold by a dealer,
manufacturer, +importer or a pool handling agency. The Central Government may consider
the local conditions of any area, the period of storage of fertilizers and other relevant
circumstances, fix different prices or rates for fertilizers having different periods of storage or
for different areas or for different classes of consumers. No dealer, manufacturer +importer
or pool handling agency shall sell or offer for sale any fertilizers at a price exceeding the
maximum price or rate fixed under this clause.
Display of stock position and price list of fertilizers
Every dealer, who makes or offers to make a retail sale of any fertilizers, shall prominently
display in his place of business:-the quantities of opening stock of different fertilizers
held by him on each day & a list of prices or rates of such fertilizers fixed under clause 3
and for the time being in force.
Issue of cash/credit memorandum

Every dealer shall issue a cash or credit memorandum to a purchaser of a fertilizers in FormM*
CONTROL ON DISTRIBUTION OF FERTILIZERS BY MANUFACTURER/ IMPORTER
Allocation of fertilizers to various States
The Central Government may, with a view to secure equitable distribution and availability
of fertilizers to the farmers in time, by notification in the Official Gazette, direct any
manufacturer/importer to sell the fertilizers produced by him in such quantities and in such
State or States and within such period as may be specified in the said notification.
AUTHORISATION OR REGISTRATION OF DEALERS”
Registration of Industrial dealers and authorization of other dealers
No person shall sell, offer for sale or carry on the business of selling of fertilizer at any
place as wholesale dealer or retail dealer except under and in accordance with clause 8:
Application for intimation or registration
Every person intending to sell or offer for sale or carrying on the business of selling of
fertilizer as Industrial Dealer shall obtain a certificate of registration from the controller by
making an application in Form A together with the fee prescribed While, a manufacturer,
an importer, a pool handling agency, wholesaler and a retail dealer intending to sell or
offer for sale shall make a Memorandum of Intimation to the Notified Authority, in Form A1
duly filled in, in duplicate, together with the fee prescribed under clause 36 and certificate
of source in Form O.
On receipt of a Memorandum of Intimation, complete in all respects, the Notified Authority
shall issue an acknowledgement of receipt in Form A2 and it shall be deemed to be an
authorization letter granted and the concerned person as authorised dealer for the
purposes of this Order.
A certificate of registration granted before the commencement of the Fertilizers
(Control) Amendment Order, 2003, shall be deemed to be an authorization letter granted
under the provisions of this Order: when the applicant is a State Government, a
manufacturer or an importer or a pool-handling agency, it shall not be necessary for it or
him to submit Form O.

Grant or refusal of certificate of registration
The Controller, shall grant a certificate of registration in Form 'B’ within thirty days of the
receipt of application to any person who applies for it under clause 8; no certificate of
registration shall be granted to a person: -if his previous certificate of registration is under
suspension; or
it has been cancelled within a period of one year immediately preceding the date of
application;or if he has been convicted of an offence under the Act, or if he fails to enclose
with the application a certificate of source ; or
if the application is incomplete in any respect;
Period of validity of certificate of registration and letter of authorization
Every certificate of registration granted, be valid for a period of three years from the
date of its issue.
Renewal of certificates of registration and authorization letters
Every holder of a certificate of registration granted make an application for renewal to the
Controller, in Form C, or to the Notified Authority in Form A1, respectively, in duplicate,
together with the fee prescribed under clause 36 for such renewal and a certificate of source
as required under clause 8.
Manufacture of Mixtures of Fertilizers - Restriction on preparation of mixtures of
fertilizer
No person shall carry on the business of preparing any mixture of fertilizers. or special
mixture of fertilizers except under and in accordance with the terms and conditions of a
certificate of manufacture granted to him under clauses 15 or 16.
Standards of mixtures of Fertilizers
Subject to the other provisions of the order, no person shall manufacture any *mixture of
fertilizers whether of solid or liquid fertilizers unless such mixture conforms to the standards
set out in the notification to be issued by the Central Government in the Official Gazette;
Application for certificate of manufacture of mixtures of fertilizers

Every person desiring to obtain a certificate of manufacture for preparation of any mixture of
fertilizers or special mixture of fertilizers shall possess such mixture, *and possess the
minimum laboratory facility as specified in clause 21A of this Order.
An applicant shall make an application to the registering authority if he is an applicant for a
certificate of manufacture for any mixture of fertilizers in Form D, in duplicate, together with
the fee prescribed there for under clause 36; or,
if he is an applicant for a certificate of manufacture for any special mixture, in Form E, in
duplicate, together with the fee prescribed there for under the said clause 36 and an attested
copy of the requisition of the purchaser.
Grant or refusal of certificate of manufacture for preparation of mixtures of fertilizers
On receipt of an application under clause 14, the registering authority shall, by order in writing,
grant or refuse within forty-five days from the date of receipt of the application, furnish
to the applicant a copy of the order so passed;
to the applicant in Form G
Period of validity of a certificate of manufacture for preparation of mixtures of fertilizers
Every certificate of manufacture granted under clause 15 for preparation of a mixture of
fertilizers shall, unless suspended or cancelled, be valid for a period of three years from the
date of issue.
Renewal of certificate of manufacture for preparation of mixtures of fertilizers
Every holder of a certificate of manufacture for preparation of a mixture of fertilizers desiring to
renew the certificate, shall, before the date of expiry of the said certificate of manufacture
make an application to the registering authority in Form D in duplicate, together with the fee
prescribed for this purpose under clause 36.
Manufacturers/Importers pool handling agencies to comply with certain requirements
in regard to packing and marking, etc.2
Every manufacturer/importer and pool handling agency shall, in regard to packing and
marking of containers of fertilizers, comply with the following requirements, namely:-Every
container in which any fertilizers is packed shall conspicuously be Superscribed with the word
“FERTILIZERS” and shall bear only such particulars in case of containers the gross weight of
which is 5 kg or less, no such printing of superscription and other particular shall be necessary

if such super superscription and other particulars are printed on a separate label which is
securely affixed to such container. in case fertilizer bags are in cut, torn or damaged condition
during transportation or is handling during loading or unloading operation, the manufacturer of
such fertilizer may, under intimation to the State Government and the Central Government,
repack the fertilizer in new bags or restandardise the quantity in terms of declared weight.
Every fertilizers bag in which any fertilizers is packed for sale shall be of such weight and size
as may be specified by the Central Government from time to time in this behalf
Manufacturers to comply with certain requirements for laboratory facilities:-
Every manufacturer shall, in order to ensure quality of their product, possess minimum
laboratory facility, as may be specified from time to time by the Controller.
Disposal of non-standard fertilizers
Notwithstanding anything contained In this Order, a person may sell, offer for sale, stock or
exhibit for sale or distribute, [any fertillser except any fertillser imported by the Central
Government] which, not being an adulterated fertilizers, does not conform to the prescribed
standard (hereinafter in this Order referred to as non-standard fertilizers) subject to the
conditions that:- the container of such non-standard fertilizers is conspicuously super scribed
in red colour with the words "non-standard" and also with the sign "X"; and an application for
the disposal of non-standard fertilizers in Form H is submitted to the [Notified authority] to
grant a certificate of authorization for sale of such fertilizers and a certificate of authorization
with regard to their disposal and price is obtained in Form such non-standard fertilizers shall
be sold only to the manufacturers of mixtures of fertilizers or special mixtures of fertilizers or
research farms of Government or Universities or such bodies. The price per unit of the non-
standard fertilizers shall be fixed by the notified authority If a manufacture or importer detects
or as reasonable doubt about the standard of the fertilizer manufactured or imported by him,
and dispatched for sale as deteriorated in quality during transit due to natural calamity and is
not of the prescribed standards, he may, within fifteen days from the date of dispatch from
factory or port, apply with detailed justifications to the Central Government for obtaining
permission for reprocessing the same in a factory to meet the prescribed standards and the
Central Government may, after considering the facts, permit the re-processing of such
fertilizer on the terms and conditions as may be notified by the Central Government in this
behalf.

ENFORCEMENT AUTHORITIES
Appointment of registering authority The State Government may, appoint such number of
persons, as it thinks necessary, to be registering authorities for the purpose of this Order for
industrial dealers, and may, define the limits of local area within which each such registering
authority shall exercise his jurisdiction.
Notified Authority- The State Government may, appoint such number of persons, to be
Notified Authorities for the purpose of this Order and define the local limits within which each
such Notified Authority shall exercise his jurisdiction.
Appointment of inspectors-The State Government, or the Central Government may, by
notification in the Official Gazette appoint such number of persons, to be inspectors of
fertilizers for the purpose of this Order, and may, in any such notification, define the limits of
local area within which each such inspector shall exercise his jurisdictions.
Qualifications for appointment of fertilizers Inspectors
No person shall be eligible for appointment as Fertilizers Inspector under this Order unless
he possesses the following qualifications, namely:-Graduate In agriculture or science with
chemistry as one of the subjects, from a recognized university; and
Training or experience in the quality control of fertilizers and working in the State or Central
Government Department of Agriculture.
Powers of Inspectors
An inspector may, with a view to securing compliance with this Order:- require any
manufacturer, +importer, pool handling agency, wholesale dealer or retail dealer to give any
information in his possession with respect to the manufacture, storage and disposal of any
fertilizer manufactured or, in any manner handled by him
draw samples of any fertilizers in accordance with the procedure of drawal of samples laid
down in Schedule II. Provided that the inspector shall prepare the sampling details in
duplicate In Form J, and hand over one copy of the same to the dealer or his representative
from whom the sample has been drawn;
enter upon and search any premises where any fertilizers is manufactured/ Imported or
stored or exhibited for sale,;
seize any books of accounts or documents relating to manufacture, storage or sale of
fertilizers, etc. in respect of which he has reason to believe that any contravention of this

Order has been or is being or is about to be committed; Where any fertilizers is seized by an
inspector under this clause, he shall forthwith report the fact of such seizure to the collector
whereupon the provisions of sections 6A, 6B, 6C, 6D and 6E of the Act, shall apply to the
custody, disposal and confiscation of such fertilizers. Every person, if so required by an
inspector, shall be bound to afford all necessary facilities to him for the purpose of enabling
him to exercise his powers under sub-clause (1).
ANALYSIS OF SAMPLES
Laboratory for analysis
A fertilizer sample, drawn by an inspector, shall be analyzed in accordance with the
instructions contained in Schedule II in the -Central Fertilizers Quality Control and
Training Institute, **Faridabad or Regional Fertilizers Control Laboratories at Bombay,
Madras or Kalyani (Calcutta) or in any other laboratory notified for this purpose by the
State Government [with the prior approval of the Central Government. Every laboratory in
order to ensure accurate analysis, of fertilizers samples, possess minimum equipment and
other laboratory facilities, as may be specified from time to time by the Controller in this
behalf
Qualifications for appointment of fertilizers analyst in the fertilizer control
laboratories
No person shall be eligible for appointment as fertilizers analyst for analysis of fertilizers
samples in the laboratories notified under clause 29 of the Order, unless he possesses the
following qualifications, namely:-graduate in Agriculture or Science with chemistry as one of
the subjects from a recognized university; and
training In fertilizers quality control and analysis at Central Fertlllzer Quality Control and
Training Institute, Faridabad.
Provided that the fertilizers analysts appointed before the commencement of this Order, who
do not possess the requisite training, shall undergo prescribed training, within a period of
three years, in the Central Fertilizers Quality Control " and Training Institute, Faridabad from
the date of commencement of this Order.
Laboratories for refree analysis

Every laboratory referred to in sub-clause (1) of clause 29 shall be designated as referee
laboratory for the purpose of analysis of any sample of fertilizers :
Provided that no such laboratory which carried out the first analysis of the fertilizers sample
shall be so designated in respect of that sample:
Further in respect of any sample the analysis of which has been challenged, may be sent for
referee analysis to any one of the other laboratories except those which are located in the
State or where the first analysis has been done.
Central Fertilizers Quality Control and Training Institute and Regional laboratories shall be
considered as one group of laboratories and a sample first analysed by any one of them, shall
not be sent for referee analysis to any other in that group, but only to any other laboratory
notified by a State Government.
Time limit for analysis, and communication of result
Where sample of a fertilizer has been drawn, the same shall be dispatched along with a
memorandum in Form K to the laboratory for analysis within a period of seven days from the
date of Its drawl. The laboratory shall analyze the sample and forward the analysis report in
Form L within [30 days] from the date of receipt of the sample in the laboratory to the authority
specified in the said memorandum.
The authority to whom the analysis report is sent under sub-clause (2) shall communicate the
result of the analysis to the dealer/manufacturer/Importer/pool handling agency from whom
the sample was drawn within [15 days] from the date of receipt of the analysis report of the
laboratory.
Maintenance of records and submission of returns, etc.
The controller may by an order made in writing direct the dealers. manufacturers/ importers,
and pool handling agencies:- to maintain such books of accounts, records, etc. relating to
their business in Form 'N'. and to submit to such authority, returns and statements in such
form and containing such information relating to their business and within such time as may
be specified in that order. Where a person holds certificates of registration for retail sale and
wholesale sale of fertilizers, he shall maintain separate books of accounts for these two types
of sales made by him.
Fees
The fees payable for grant, amendment or renewal of an authorization letter or certificate of
registration or certificate of manufacture a duplicate of such certificates or, renewal thereof

under this Order shall be such as the State Government may, from time to time fix, subject to
the maximum fees fixed for different purposes by the Central Government and different fees
may be fixed for different purposes or for different classes of dealers or for different types of
mixtures of fertilizers or special mixture. Any fee paid under sub-clause (1) shall not be
refundable unless the grant or renewal of any certificate of registration or certificate of
manufacture or duplicate copy of such certificate or renewal under this Order has been
refused.
The fees payable for grant, amendment, renewal or duplicate copy of certificate of registration
for industrial dealer and the authority to whom and the manner in which such fee shall be paid,
shall be such as may be specified by the Controller from time to time by notification in the
Official Gazette*

01. Manures – types, composition and value – sources
There are many ways of classifying the fertilizers and manures, the classification being
based on one or two properties of the materials.
Nature of source
1.Natural manures
2.Artificial manures
3.Mineral manures
Nutrient content
1.Single manures
2.Compound manures
Nutrient element present
1.Complete manures
2.Incomplete manures
Nature of the materials
1.Organic manures
2.Inorganic manures
3.Indirect manures
Nature of action
1.General manures
2.Special manures
3.Stimulative substances
4.Soil amendments or soil conditioners
Critical consideration of the above-mentioned classification reveals that none of
the classification is satisfactory. Each of the classification is based on only one property
and nay not be suitable to cover wide range of materials.
They are generally classified in to Bulky organic manure and concentrated organic
manures
ORGANIC MANURES
The word manure derived from the French "Manoeuvrer', means to manipulate,
to work, to produce crop. In general manure means excreta of animals. The term bulky
organic manure generally includes those materials of natural origin, organic in
composition having greater volume per unit content of nutrients and being used to

increase the nutrient status of the soils as well as organic matter content of soils. They
are obtained mainly as natural products. The materials included in this group are
farmyard manure, compost, sewage sludge and green manure. Of these FYM, compost
and green manure are the most important and widely used bulky organic manures.
Farm Yard Manure (FYM)
The FYM refers to the refuse from farm animals, mainly sheep, cattle and poultry.
This is one of the oldest manure known and is highly valued for its many of the beneficial
properties that are said to be produced when this manure is added to the soil. It not only
adds the constituents to the soil but also adds organic matter to the soil.
Composition of farm manure
Several factors influence the composition of farm manure and they are the
following
1. Source of manure
2. Feed of the animals
3. Age of the animals
4. Condition of the animals
5. Manner of storage and handling
6. Litter use etc.,
On an average the composition of FYM is usually 0.5 % N, .25 % P2O5 and 0.5 %
K2O.
Methods of collection
Many methods of collecting the cattle manure are in vogue and this include,
1. Use of ordinary cattle shed with kacha floor
2. Use of cattle shed with impermeable floor and provision for collecting urine in
separate urine pit
3. Dry earth system
4. Loose box system
5. Other special methods
The method of collection and storage is the most important factor which decides the final
composition of the manure. The following are recognized methods of storing FYM
1. The heap method

2. The pit method
Various losses during collection and storage of FYM can be prevented or atleast
minimized by adopting the following procedures
1. Better methods of collection
2. Better methods of storage
3. Use of cow dung gas plant
4. Use of chemical preservatives like gypsum, superphosphate etc
Organic Wastes :
Organic wastes are the wastes of biological / animal / agro-industry origin and
can be converted to valuable manure by composting. The various organic wastes can be
classified as follows,
Sources of Organic Wastes
Agriculture Animal
Husbandry
Agro-industries Municipal Activities
∗ Crop residues (paddy
straw, sugacane
trash etc)
∗ Weeds
∗ Dairy
∗ Goat / Sheep
∗ Poultry
∗ Piggery
∗ Sugar Indutry
(Pressmud)
∗ Coir Industry (Ciorpith)
∗ Fruits / vegetables
processing industries
∗ Sago Industry
∗ Household /
municipal solid
waste
∗ Market waste
(Vegetable/ fruit /
flower market)

02. Green manures-Oilcakes-Sewage sludge-Biogas plant slurry-Plant and animal
refuges
GREEN MANURES
Green manure:
Growing the plants in-situ and incorporation in the field.
Green leaf manure
Addition of green or plant tissues obtained from elsewhere viz., trees, herbs, shrubs
pruning andunwanted weeds.
Benefit of Green manure or Green leaf manures
a. Addition of organic matter.
b. Adds Nutrient – Macro, Secondary and micro nutrients.
c. It improves physical condition of soil.
d. Act as a soil amendment to reclamation of problem soils.
e. It act as a cover or catch crop to prevent soil erosion, conserve moisture, prevent
nutrient leaching.
f. Leguminous crops fix the atmospheric – N by the roots and improves N status of the
soil.
Characteristics of Green manure
1. It should have rapid growth and shorter duration so that can be fitted in a crop rotation
2. It should yield abundant biomass and should be succulent to have rapid
decomposition
3. It should have the ability to grow on poor soils.
Nutrient content of agricultural wastes
Agricultural wastes N P2O5 K2O
Sugarcane Begasse 0.25 0.12 0.20
Sugarcane Begasse
compost
1.40 0.45 0.60
Sugarcane Begasse
Press mud
1 – 1.5 2.0 -

Press mud – compost 1.5 1.5 -
Saw dust Traces 0.2 -
0.25
Tobacco waste 0.5 – 1.0 0.8 1.0
Tobacco seed cake 4 – 4.5 7 – 15 5 – 5.5
Tea waste 2.8 – 3.6 03. – 0.4 1 – 2
Cotton dust 1 – 1.5 - -
Textile waste 1 – 1.5 - -
Nutrient content of Commonly used Concentrated manures
Oil cake N P2O5 K2O
Groundnut cake (Decordicated) 7.8 1.5 –
1.9
1.4
Lin seed cake 5.5 1.4 1.2
Mustard cake 4.5 1.5 1.0
Neem cake 5.2 1.0 1.4
Niger cake 4.8 1.8 1.0
Pungam cake 2.5 1.0 1.0
Safflower (decordicated) 7.8 2.2 2.0
Sesamum 6.2 2.0 1.2
Castor 5.8 1.8 1.0
Coconut 3.2 1.8 1.7
Slaughter House wastes
Wastes N P2O5 K2O
Blood meal 10 – 12 1.2 1.0
Meat meal 10.5 2.5 0.5
Fish meal 4 -10 3 – 9 0.3 – 1.5
Horn – Hoff meal 13 - -

Leather - waste 7 0.1 0.2
Hair and wool waste 12.3 0.1 0.3
Sewage water 25ppm 5 ppm 15 ppm
Sludge 1.5 – 3.5 0.75 – 4 0.3 – 0.6
Nutrients content of Commonly used Green manures
Green manure N % P2O5% K2O %
Sunhemp 0.5 0.1 0.4
Danicha 1.1 0.2 0.4
Sesbania 0.7 0.1 0.6
Pelli pesera 0.7 0.2 0.4
Cluster bean 0.3 0.1 0.3
Cow pea 0.7 0.2 0.6
Green leaf manure
Kolungi 0.7 0.1 0.4
Calotropis 0.3 0.1 0.6
Pungam 1.2 0.2 0.8
Glyricidia 0.8 0.1 0.7
Puvarasu 0.8 0.2 0.9
Guano - Birds Excreta or bat Dung
Guano 2.6 4.2 0.6

03. Composting of organic wastes – composting technologies
COMPOSTING OF ORGANIC WASTES
Composting is a process of allowing organic materials to decompose more or
less controlled conditions to produce stabilized product that can be used as a manure or
soil amendment. Composting is basically a microbial process, which change the property
of the organic material or mixtures.
Compost is the material resulting from the decomposition of plant residues under
the action of bacteria and fungi. Composting is simply an acceleration of natural process
or organic matter mineralization. The final product is dark brown in colour and resembles
FYM in its properties and appearance.
Essential requirements for composting
A bulky organic manure
A suitable starter
Addition of enough water
Aeration
Main systems of composting
ADCO process (Hutchinson and Richards of England)
Activated compost process (Fowler and Rege)
The Indore process (Howard and Wad)
The Bangalore process (C.N.Acharya)
The coimbatore method
Benefits of composting:
∗ Enables clean environment
∗ Absorbs odors, degrade toxic substances and heavy metals
∗ Avoids un-necessary dumping of wastes
∗ Supply valuable organic manure
Composting technologies
1. Crop residue composting
Collect the available crop residues and weeds
Shred them to a size of 2 to 2.5 cm length
Mix these wastes with green residues (freshly collected), if available
Form the compost heap ( 4 feet height)
Add the bio-inoculants (2 kg of bio-mineralizer or 40 kg of cowdung for 1 tonne of
waste)

Properly aerate the compost either by providing perforated PVC pipes or by
mechanical turning
Maintain the moisture at 60 % by regular watering
The compost will mature in 60 days
2. Vermi-composting
Vermicomposting is a process of degradation of organic wastes by earthworms.
The species like Eisenia foetida and Eudrilus eugeniae are effective in converting the
agricultural wastes into compost. The various steps involved in making vermicompost
are as follows
Methods followed:
Heap method
Pit method – aboveground and belowground
Belowground method pit size : 10 X 1 X 0.3 m
Each layer : 6-7cm thick
Sprinkle water once in 8-10 days
Release : 2-2.5 kg worms / pit
Steps:
Collect the predigested wastes and mix cattle dung @ 30 %.
Place it in the pit/container layer by layer
Moist the residues at 60 % moisture
Allow the verms in to the feed material / residues @ 1 kg/ tonne of residue
Protect the pit or container from ants and rats (which are the enemies of
verms)
The residue will be composted in 30 to 40 days
Remove the composted materials layer by layer at a weekly interval so as
To avoid any damage /disturbance to the feeding verms.
Nutritive value of vermicompost
The nutrients content in vermicompost vary depending on the waste materials
that is being used for compost preparation. If the waste materials are heterogeneous
one, there will be wide range of nutrients available in the compost. If the waste materials
are homogenous one, there will be only certain nutrients are available. The common
available nutrients in vermicompost is as follows
Organic carbon = 9.5 – 17.98%
Nitrogen = 0.5 – 1.50%

Phosphorous = 0.1 – 0.30%
Potassium = 0.15 – 0.56%
Sodium = 0.06 – 0.30%
Calcium and Magnesium = 22.67 to 47.60 meq/100g
Copper = 2 – 9.50 mg kg-1
Iron = 2 – 9.30 mg kg-1
Zinc = 5.70 – 11.50 mg kg-1
Sulphur = 128 – 548 mg kg-
3. Coirpith composting
Coirpith is an agricultural waste produced from the coir industry. Approximately
180 grams of coirpith is obtained from the husk of one coconut. Coirpith contains Carbon
: Nitrogen in the ratio of 112:1 and contains 75 per cent lignin which does not permit
natural composting as in other agricultural wastes.
Mushroom Pleurotus has the capacity to degrade part of the lignin present in
coirpith by production of enzymes like cellulases and lactases. The carbon: nitrogen ratio
of coirpith is reduced from 112:1 to 24:1 as a result of composting.
Composting method
Select a shaded place of 5 x 3 m dimension and level it after removing weeds. Spread
100 kg of coirpith uniformly. Spread 100 g of Pleurotus spawn on this and cover with a
second layer of 100 kg of coirpith. On the surface of the second layer, spread one kg of
urea uniformly.
Repeat this sandwiching of one layer of coirpith with spawn followed by another layer of
coirpith with urea up to one metre height.
Sprinkle water to keep the heap moist. Allow the heap to decompose for one month.
Manure conversion
The coirpith is converted into good manure after 30 to 40 days and the lignin content is
reduced from 40 per cent to 30 per cent. The nitrogen content is increased from 0.20 per
cent to 1.06 per cent. Coirpith compost contains macronutrients and micronutrients. It
can absorb water up to eight times its weight. Coirpith, when added to sandy soil at 2 per
cent increases the water holding capacity up to 40 per cent. It can be applied to a wide
variety of crops and can be used to prepare potting mixture and can be applied as
organic manure in kitchen gardens.
4. Composting of crop residues and weeds:

Composting is one of the useful ways for utilizing the some of the weeds and
noncommercial plants like Parthenium, Water hyacinth, lpomoea etc. instead of their
eradication. The plants can be composted using Trichoderma viridi and Pleurotus sajor-
caju as a microbial consortium with supplementation of urea. Select an elevated shady
area of a thatched shed and mark an area of 5x1.5 meter. Cut the composting materials
into 10 – 15 cm size. Spread 100 kg of these materials over the marked area. Sprinkle 1
bottle of microbial consortia over this layer. Again spread another 100 kg of composting
materials over this layer. Spread 1 kg of urea uniformly over this layer. Likewise repeat
these processes of spreading composting materials, then microbial consortia, again
composting materials followed by urea application until a minimum of 1-meter height is
reached. Sprinkle water to attain a moisture level of 50% to 60%. The surface of the
heap is covered with a thin layer of soil. Water should be sprinkled depending upon the
necessity to maintain the moisture around 50%. A turning is given at the end 20 days to
give a thorough mixing of outside material with that of the inside ones. The bio-converted
compost will be ready in about 40 days time.
5. Method of composting the Municipal Solid Wastes
Biodegradable municipal solid waste should be separated and collected for
composting. Five hundred kg of material should be heaped in the compost yard. In that
heaped waste, 1 kg of TNAU microbial consortium should be applied in the form of slurry
to cover the full waste material. This 1 kg microbial consortium can be mixed with 5 litres
of water to make slurry. This slurry is sufficient to cover 0.5 tonne of material Then, 50
kg of cowdung should be mixed with 30 litre of water to form cowdung slurry. This cow
dung slurry should be sprayed over the heap of municipal solid waste Then, 1 kg of urea
should be mixed with solid waste. 60% moisture should be maintained through out the
period of composting. Compost should be turned up once in 15 days to create good
aeration, and for thorough mixing. Because of this practice, a uniform composted
material will be obtained. Solid waste can be composted with in 90 days by this method
with the indication of reduction in the volume, appearance of dark coloured materials and
a small of earthy odour After the completion of composting, compost should be sieved
through normal mesh to separate unwanted and partially composted material
6. Value addition of poultry waste compost
A known quantity of poultry droppings and coir pith @ 4:5 ratio should be mixed
well to attain a C/N ratio of 25:1 to 30:1 which is considered to be the optimum C/N ratio

for compositing. Pleurotus sajor-caju, a lignocellulolytic organism, should be inoculated
into the mix @ 2 packets per tonne of waste in order to speed up the composting
process. The mix should be heaped under the shade. The moisture content of the mix
should be maintained within 40 – 50%. Periodical turning should be given on 21st, 28th
and 35th day of composting. Another two packets of Pleurotus sajor – caju is to be
added when turning is given on the 28th day of composting. A good quality compost will
be obtained in 45 days, which contains 2.08% N, 1.93 % P and 1.41 % K with C/N ratio
of 10-16
7. Enriched Farm Yard Manure (EFYM)/ Reinforced FYM
Phosphorus content in FYM is relatively low and complete utilization of nitrogen
and potassium in the manure is seldom realized. Hence, heavy quantities intended to
supply the needed quantity of phosphorus will result in wastage of nitrogen in most soils.
To overcome this P insufficiency, addition of superphosphate to the manure is
recommended and the process is called reinforcing / enriching and the resultant material
is called “enriched farmyard manure”. The Single Super Phosphate (SSP) can be
sprinkled either in the cattle shed or on the manure heap. Rock phosphate can also be
recommended for this purpose.
Factors affecting the Composting Process:
I. The Type and Composition of the Organic Waste
II. The Availability Of Microorganism
III. Aeration
IV. The C, N and P Ratios
V. Moisture Content
VI. Temperature
VII. pH
VIII. Time
Preparation of Coir Waste Compost Using Yeast Sludge:
Yeast sludge is a waste product by alcohol distilleries @ 2t/day. This
waste contain 6% N, 0.3% P and 0.9% K with other micronutrients, vitamins and growth
promoting substances. The coir waste should be sieved so as to remove all the fibrous
materials. For one tone of coir waste 200 kg of yeast sludge and 10 kg of rock
phosphate should be added and mixed thoroughly. Moisture should be maintained at
60%. After mixing the material should be formed as heap. Within 4-5 days the
temperature of the heap will be raised to 50-60° C. Within 40 to 50 days the coir waste
and yeast sludge will become as mature compost. The matured compost will turn from
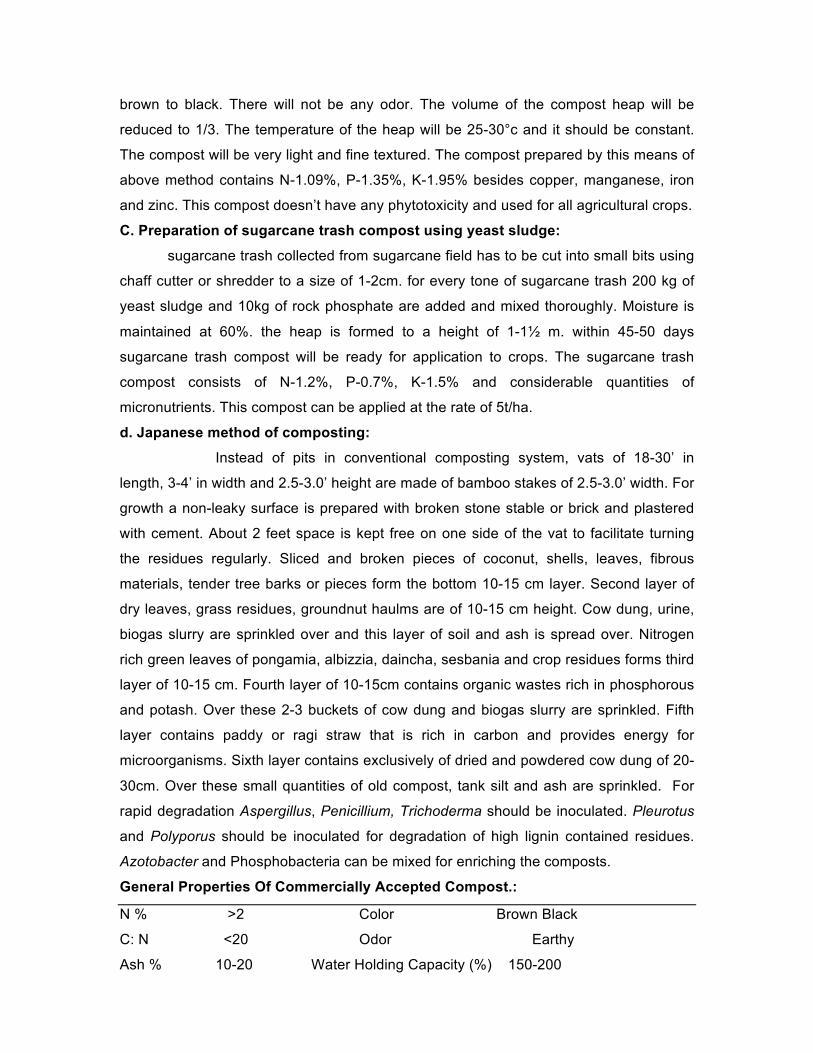
brown to black. There will not be any odor. The volume of the compost heap will be
reduced to 1/3. The temperature of the heap will be 25-30°c and it should be constant.
The compost will be very light and fine textured. The compost prepared by this means of
above method contains N-1.09%, P-1.35%, K-1.95% besides copper, manganese, iron
and zinc. This compost doesn’t have any phytotoxicity and used for all agricultural crops.
C. Preparation of sugarcane trash compost using yeast sludge:
sugarcane trash collected from sugarcane field has to be cut into small bits using
chaff cutter or shredder to a size of 1-2cm. for every tone of sugarcane trash 200 kg of
yeast sludge and 10kg of rock phosphate are added and mixed thoroughly. Moisture is
maintained at 60%. the heap is formed to a height of 1-1½ m. within 45-50 days
sugarcane trash compost will be ready for application to crops. The sugarcane trash
compost consists of N-1.2%, P-0.7%, K-1.5% and considerable quantities of
micronutrients. This compost can be applied at the rate of 5t/ha.
d. Japanese method of composting:
Instead of pits in conventional composting system, vats of 18-30’ in
length, 3-4’ in width and 2.5-3.0’ height are made of bamboo stakes of 2.5-3.0’ width. For
growth a non-leaky surface is prepared with broken stone stable or brick and plastered
with cement. About 2 feet space is kept free on one side of the vat to facilitate turning
the residues regularly. Sliced and broken pieces of coconut, shells, leaves, fibrous
materials, tender tree barks or pieces form the bottom 10-15 cm layer. Second layer of
dry leaves, grass residues, groundnut haulms are of 10-15 cm height. Cow dung, urine,
biogas slurry are sprinkled over and this layer of soil and ash is spread over. Nitrogen
rich green leaves of pongamia, albizzia, daincha, sesbania and crop residues forms third
layer of 10-15 cm. Fourth layer of 10-15cm contains organic wastes rich in phosphorous
and potash. Over these 2-3 buckets of cow dung and biogas slurry are sprinkled. Fifth
layer contains paddy or ragi straw that is rich in carbon and provides energy for
microorganisms. Sixth layer contains exclusively of dried and powdered cow dung of 20-
30cm. Over these small quantities of old compost, tank silt and ash are sprinkled. For
rapid degradation Aspergillus, Penicillium, Trichoderma should be inoculated. Pleurotus
and Polyporus should be inoculated for degradation of high lignin contained residues.
Azotobacter and Phosphobacteria can be mixed for enriching the composts.
General Properties Of Commercially Accepted Compost.:
N % >2 Color Brown Black
C: N <20 Odor Earthy
Ash % 10-20 Water Holding Capacity (%) 150-200

Moisture %10-20 CEC (Meq 100 g-1) 75-100
P % 0.15-1.5 Reducing Sugar (%) <35%

04. Classification of fertilizers – N, P and K fertilizers
Classification of fertilizers
Commercial N, both organic and inorganic is desired from a wide variety of
materials which are found to differ very widely in their sources, properties, method of
preparation and their reactions in the soil. Classification based on chemical form seems
to be more satisfactory as indicated below.
Nitrogenous Phosphatic Potassic Compound Mixed
Fertilizers and manures
Bulky organic manures (FYM,compost, Green manure)
Concentrated organic manures Oil cakes Guano
Artificial fertilizers

Nitrogenous Fertilizers
Inorganic ammoniates Organic ammoniates
Ammonical-N Nitrate-N Ammonical + Nitrate -N
Amide-N/synthetic Plant origin
1.Oil Cakes 2.Cabbage waste
1.Ammonium sulphate 1. Sodium nitrate 1 .Amm.nitrate 2. Ammonium chloride 2. Potassium nitrate 2.Calcium amm.nitrate 3. Ammonia 1. Urea
2. Calcium cynamide

The nitrogen content of different nitrogenous fertilizers is given below
Sl.No Name of the
fertilizer
N
content (%)
Form of N
1 Sodium nitrate
(NaNO3)
16.0 Nitrate (NO3)
2 Potassium nitrate
(KNO3)
12.5-13.5 Nitrate
3. Ammonium sulphate (NH4)2
SO4
20.6 NH4
(Ammonia)
4. Ammonium chloride (NH4
Cl)
26.0 NH4
5. Ammophos - A 11.0 NH4
6. Ammophos – B 16.0 NH4
7. Ammonium Nitrate (NH4) 33.0 NH4 – 16.5
NO3 – 16.5
8. Ammonium sulphate nitrate 25.6 NH4 – 19.5
NO3 – 6.6
9. Urea (CO (NH2)2) 46.0 Amide
10. Calcium cyan amide
(CaCN2)
20.6 Amide
11. Dried blood 3-14 Protein(organic)
12. Groundnut cake 8.0 Protein(organic)
13. Meat meal 09.0-11. Protein
(organic)
14. Guano 10.0 Protein
(organic)

PHOSPHATIC FERTILIZERS
Natural Ground rock phosphate Bone meal Bone meal
Treated or processed Super phosphate Bone char
Industrial byproduct Basic slag
Chemical or synthetic Ammonium phosphate
POTASSIC
Natural Potash mineral Processed
MOP SOP
Synthetic Pot.nitrate Pot.phosphate

13. SECONDARY AND MICRONUTRIENT FRTILIZERS-Manufacturing of Zinc
sulphate and Ferrous sulphate
Zinc
Zinc is the fourth most common metal in use, trailing only iron, aluminium, and copper
with an annual production of about 12 million tonnes.[14] The world's largest zinc
producer is Nyrstar, a merger of the Australian OZ Minerals and the Belgian
Umicore.[74] About 70% of the world's zinc originates from mining, while the remaining
30% comes from recycling secondary zinc.[] Commercially pure zinc is known as Special
High Grade, often abbreviated SHG, and is 99.995% pure.
Worldwide, 95% of the zinc is mined from sulfidic ore deposits, in which sphalerite ZnS is
nearly always mixed with the sulfides of copper, lead and iron.[77] There are zinc mines
throughout the world, with the main mining areas being China, Australia and Peru. China
produced 29% of the global zinc output in 2010.
Zinc metal is produced using extractive metallurgy.[78] After grinding the ore, froth
flotation, which selectively separates minerals from gangue by taking advantage of
differences in their hydrophobicity, is used to get an ore concentrate.[78] A final
concentration of zinc of about 50% is reached by this process with the remainder of the
concentrate being sulfur (32%), iron (13%), and SiO2 (5%).[78]
Roasting converts the zinc sulfide concentrate produced during processing to zinc
oxide:[77]
2 ZnS + 3 O2 → 2 ZnO + 2 SO2
The sulfur dioxide is used for the production of sulfuric acid, which is necessary for the
leaching process. If deposits of zinc carbonate, zinc silicate or zinc spinel, like the
Skorpion Deposit in Namibia are used for zinc production the roasting can be omitted.
For further processing two basic methods are used: pyrometallurgy or electrowinning.
Pyrometallurgy processing reduces zinc oxide with carbon or carbon monoxide at 950 °C
(1,740 °F) into the metal, which is distilled as zinc vapor.[80] The zinc vapor is collected
in a condenser.[77] The below set of equations demonstrate this process
2 ZnO + C → 2 Zn + CO2
ZnO + CO → Zn + CO2
Electrowinning processing leaches zinc from the ore concentrate by sulfuric acid

ZnO + H2SO4 → ZnSO4 + H2O
After this step electrolysis is used to produce zinc metal.[77]
2 ZnSO4 + 2 H2O → 2 Zn + 2 H2SO4 + O2
The sulfuric acid regenerated is recycled to the leaching step.
Ferrous Sulfate
In the finishing of steel prior to plating or coating, the steel sheet or rod is passed
through pickling baths of sulfuric acid. This treatment produces large quantities of iron(II)
sulfate as a by-product.[2]
Fe + H2SO4 → FeSO4 + H2
Another source of large amounts results from the production of titanium dioxide from
ilmenite via the sulfate process.
Ferrous sulfate is also prepared commercially by oxidation of pyrite:
2 FeS2 + 7 O2 + 2 H2O → 2 FeSO4 + 2 H2SO4
[edit]
Reactions
On heating, iron(II) sulfate first loses its water of crystallization and the original green
crystals are converted into a dirty-yellow anhydrous solid. When further heated, the
anhydrous material releases sulfur dioxide and white fumes of sulfur trioxide, leaving a
reddish-brown iron(III) oxide. Decomposition of iron(II) sulfate begins at about 480 °C.
2 FeSO4 → Fe2O3 + SO2 + SO3
Like all iron(II) salts, iron(II) sulfate is a reducing agent. For example, it reduces nitric
acid to nitrogen oxide and chlorine to chloride:
6 FeSO4 + 3 H2SO4 + 2 HNO3 → 3 Fe2(SO4)3 + 4 H2O + 2 NO
6 FeSO4 + 3 Cl2 → 2 Fe2(SO4)3 + 2 FeCl3
Ferrous sulfate outside titanium dioxide factory in Kaanaa, Pori.
Upon exposure to air, it oxidizes to form a corrosive brown-yellow coating of basic ferric
sulfate, which is an adduct of ferric oxide and ferric sulfate:
12 FeSO4 + 3 O2 → 4 Fe2(SO4)3 + 2 Fe2O3

15. Mixed fertilizers – sources – preparations- their compatibility – advantages
Mixed fertilizers
For over hundred years the mixed fertilizers are in use besides straight fertilizers.
Many fertilizer mixtures are made available now and this account for a major portion of
the consumption of N, P and K. Present day statistics show that numerous grades of
fertilizers mixtures are manufactured and the fertilizer mixing industry is being
considered as one of the major agro- industry.
The following are some of the common term frequently used in the mixed
fertilizer industry.
Fertilizer : The substance which is used for the supply of plant nutrients
Mixed fertilizer : A mixture of more than one straight fertilizer which can supply more
than one plant nutrient element
Complete fertilizer : A single fertilizer material containing the entire three major plant
nutrients viz, N, P and K
Fertilizer grade : This refers to the minimum guarantee with regard to the nutrient
content of the fertilizer mixture in terms of N, P and K.
Fertilizer formula : This related to the quantitative expression of the analysis of the
different ingredients included in the mixed fertilizer in terms of N, P and K.
Fertilizer ratio : This indicates the relative percentage of N, P2O5 and K2O in the
manure mixture.
Acidic fertilizer : Fertilizer capable of increasing the acidity of the soil by continued
applications.
Basic fertilizer : Fertilizers which increase the pH and the soil on continued use by
leaving a basic residue in the soil.
Neutral fertilizer : Materials which are neither increasing nor decreasing the pH of the
soil
Filler : It is called as the ‘make-weight’ material added to the fertilizer mixtures.
Filler materials are inert materials like sand, saw dust etc, are added to make up the
difference between weight of ingredients added to supply the plant nutrients in a tonne
and the final weight viz., 1,000 kg.

Advantages
All the three major plant nutrients are made available in one and the same material.
There is saving of time and labour. The residual effects will not be there. The fertilizer
mixtures are usually prepared taking into account the acidic or alkaline nature of the
ingredients, and other chemical reactions. Hence, some of the residual effects like
acidity
will not be there. Usually mixed fertilizer are prepared to suit a group of crops and soils.
Disadvantages
Specific needs of crops and deficiency of individual nutrient elements cannot be
satisfied by using mixed fertilizers as efficiently as in the case of straight fertilizers.
The use of mixed fertilizer in such cases of specific needs will be a waste as other
nutrients are also added to the soil.
Unit cost of the various nutrients contained in the mixed fertilizer will always be
higher when compared to the unity cost of nutrients contained in the straight
fertilizers.
Improper mixing and storage of fertilizers can result in large nutrient losses. Some
important aspects to consider in fertilizer mixing and storage include the following:
• Urea should not be mixed with ammonium calcium nitrate (CAN), KCl, SSP or
TSP.
• Urea can be mixed with most other fertilizers but fertilizer mixtures containing
urea should be applied immediately after mixing. Do not store fertilizer mixtures
containing urea.
• Ammonium phosphates and super phosphates should not be mixed with lime,
slag, rock phosphate or CAN.
• Potassium chloride and sulfate of potash can be mixed with most fertilizers, but
mixtures of these fertilizers with urea and calcium ammonium nitrate should not
be stored.
• CAN should not be mixed with basic slag but can be mixed with urea, single
superphosphate, and ammonium phosphates immediately prior to application.
Do not store fertilizers in damp or dirty places. Make sure that bags of fertilizer in the
store do not absorb moisture from leaky roofs or water seepage through walls and floors.
Preparation of mixed fertilizers

Many kinds of materials are used in the manufacture of fertilizer mixtures. The
materials are found to be highly varying in their properties. However, only a limited
number of materials are being used like (NH4)2SO4, CO(NH2)2, Super phosphate,
ammonium phosphate, muriate of potash, limestone, gypsum and some fillers.
The manufacture of fertilizer mixtures usually involves the weighing and
proportioning of ingredients that are used, sieving and sizing of the various ingredients,
mixing the different materials and packing. All the above operations are done both
mechanically and by hand operation. Different kinds of machineries are being used.
Guide for mixing
To determine the amount of individual fertilizer in a mixture, the quantity is
calculated as follows.
(Percentage of plant nutrient desired x (Weight of final mixture)
in the mixture)
Quantity =
(The Percentage of the plant nutrient in the straight fertilizer)
R x T
A =
P
R = Percentage in the mixture
T = Final weight of the mixture
P = Percentage in the straight fertilizer.
To prepare a mixture of 10: 5: 10 using (NH4)2SO4, (20% N), Super phosphate
(16% P2O5) and muriate of potash (60% K2O), the following quantities will be required
per tonne (1,000 kg).
10 x 1000
1. Ammonium sulphate = = 500 Kg.
20
5 x 1000

2. Super phosphate = = 312.5 Kg.
16
10 x 1000
3. Muriate of potash = = 166.5 Kg.
60 _______________
Total = 979.0 Kg .
Filler = 1000 – 979 = 21 Kg.
If the total calculated weight exceeds the final weight, a mixture of that ratio can
not be prepared.
Changes that occur while manufacturing mixed fertilizer
The ingredients used in fertilizer mixtures vary widely in their physical and
chemical characteristics. When such widely varying materials in physical and chemical
properties are mixed together, naturally many changes are expected to take place during
or after the mixing. Some changes will be of physical nature and some will be of
chemical nature. The following are the most important physical changes that will take
place during or after the mixing of fertilizers.
Hygroscopicity
It is a property of any substance which absorbs from air and gets converted to
semi- solid or liquid condition. Fertilizer like Ca(NO3)2, NH4NO3, NaNO3 and CO(NH2)2
are capable of absorbing moisture from air and become hygroscopic. In such cases
handling will be very difficult for such mixtures.
Caking up
Moisture present in some of the ingredients is responsible for caking up.
Moisture dissolves some of the easily soluble ingredients and forms a saturated solution.
This saturated solution on evaporation gives out crystals which knit together forming
larger lumps.
The caking up can be prevented by the use of certain kind of materials called as
‘conditioners’. The commonly used conditioners are groundnut hulls, lime, clay etc.
Another was of preventing the caking up is manufacture of granulated fertilizer mixture.

The granulation aims at preparation of uniform sized particles with reasonable stability,
which presents caking up.
Segregation
This relates to separation of different sized particles individually. When
ingredients of different sizes and densities are included there will be the tendency for the
segregation (sorting out to different sizes) to take place. To prevent this bad effect,
granulation is conveniently followed.
The following are some of the most important chemical changes that take place
either during or after the manufacture of fertilizers mixtures. These changes are found to
be influenced by temperature, moisture content and particle size of the in gradients.
(a) Double decomposition
The reaction is between two compounds without a common ion in the
presence of moisture. New compounds are formed which may have different
physical and chemical properties.
Ca(H2PO4)2 + (NH4)2SO4 CaSO4 + 2 NH4 H2 PO4
NH4 NO3 + KCl NH4 Cl + KNO3
(NH4)2 SO4 + 2 KCl 2 NH4 Cl + K2 SO4
(b) Neutralization
This reaction takes place when free acids present in some of the fertilizers
are neutralized by alkalis or Ca containing salts included in the mixture.
H2PO4 + NH3 NH4 H2 PO4
2H3 PO4 + CaCO3 Ca (H3 PO4)2 + H2CO3
(c) Hydration
The process of tying up of water by the anhydrous form of salts is called
hydration. Some of the fertilizers are found to have this property.
CaSO4 + 2H2O CaSO4 .2 H2O
Ca HPO4 + 2H2 O CaHPO4. 2 H2O
(d) Decomposition
Under certain conditions of moisture and temperature, there will be break down
in the composition of molecules forming new compounds.
CO(NH2)2 + H2 O 2 NH3 + CO2
(NH4)2 HPO4 NH4H2 PO4 + NH3

However, the following important principles must be taken into consideration while
preparing mixed fertilizers.
1. All fertilizers containing ammonia are not mixed directly with the basic
fertilizers (e.g. RP, limestone, basic slag, CaCN2) as reaction will take place
resulting in the loss of gaseous NH3.
2. The water – soluble phosphates are not mixed with those materials which
contain free lime (e.g) lime stone, CaCN2) as there will be reaction towards
the reversing of water – soluble phosphate to water – insoluble phosphates.
3. Hygroscopic fertilizers are not included as they will facilitate caking up.
4. The acidic fertilizers are likely to produce some free acids which may
damage the container or packing materials.
Manufacturing process
The principal steps in the manufacture of solid mixed fertilizers are calculating,
weighing, sieving, sizing, mixing the materials and packing the product.
Calculating and weighing
With a good weighing device the calculated quantities of the various
ingredients are weighed accurately for preparing mixtures.
(1) Seiving and sizing
If the raw materials have undergone too much of caking in the storage piles, it
may be necessary to subject them to preliminary grinding, sieving and sizing. The
raw materials must be converted into uniform sized particles to have effective making
and to avoid segregation during subsequent handling.
(2) Mixing
Many kinds of fertilizer mixing machines have been proposed and used at present.
Rotary drum type is found to be more common than the vertical cylinder type. Weighed
quantities of different materials are introduced into the mixer and mixed thoroughly.
(3) Packing
Equipments for packing fertilizer mixture range from the simplest types of hand operated
facilities to highly sophisticated automatic machines.
Granular mixtures
Compared to pulverized or powdered mixture, the advantages of granular
mixtures are reduced caking up tendency, less dusting loss and easy handling. Of late,
attention is found in the manufacture of only granular mixtures.

19.FERTILIZERS CONTROL ORDER (FCO) 1985
ORDER
Under the Essential Commodities Act, 1955 (10 of 1955), the Central Government
makes the Fertilizers (Control) Order, 1985. It shall come into force on the date of its
publication in the Official Gazette. In this Order,some of the definitions are used
Act means the Essential Commodities Act, 1955 (10 of 1955).
"certificate of source" means a certificate given by a State Government, Commodity
Board, manufacturer, + importer, pool handling agency
Commodity Board means the Coffee Board constituted under section 4 of the Coffee Act,
1942 (7 of 1942) or the Rubber Board constituted under section 4 of the Rubber Act, 1947
(24 of 1947)
compound or complex fertilizers means a fertilizers containing two or more nutrients
during the production of which chemical reaction takes place
controller means the person appointed as Controller of Fertilizers by the Central
Government and includes any other person empowered by the Central Government to
exercise or perform all or any of the powers, of the Controller under this Order.
"dealer" means a person carrying on the business of selling fertilizers whether wholesale
or retail or industrial use* and includes a manufacturer, +Importer, and a pool handling
agency carrying on such business and the agents of such person, manufacturer, +importer
or pool handling agency.
fertilizer means any substance used or intended to be used as a fertilizer of the soil
and/or crop and specified in Part A of Schedule I and includes a mixture of fertilizers and
special mixture of fertilizers.
"grade" means the nutrient element contents in the fertilizer expressed in percentage
"granulated mixture" means a mixture of fertilizers made by intimately mixing two or more
fertilizers with or without inert material, and granulating them together, without involving any
chemical reaction.

“importer" means a person who imports fertilizers in accordance with the Export and
Import Policy of the Central Government, as amended from time to time.
inspector" means an Inspector of Fertilizers appointed under clause 27.
"manufacturer" means a person who produces fertilizers or mixtures of fertilizers and the
expression "manufacture" with its grammatical variations shall be construed accordingly.
"mixture of fertilizers" ***means a mixture of fertilizers made by physical mixing two or
more fertilizers with or without inert material in physical or granular form and includes a
mixture of NPK fertilizers, a mixture of micronutrient fertilizers and a mixture of NPK with
micronutrient fertilizers.
"physical mixture" means a mixture of fertilizers made by physically mixing two or more
fertilizers with or without inert material necessary to make a required grade, without
involving any chemical reaction.
"prescribed standard" means-in relation to a fertilizers included in column 1 of Part A of
Schedule-I, the standard set out in the corresponding entry in column 2, subject to the limits
of permissible variation as specified in Part B of that Schedule
PRICE CONTROL-Fixation of prices of fertilizers
The Central Government may, with a view to regulate equitable distribution of
fertilizers and making fertilizers available at fair prices, by notification in the Official Gazette,
fix the maximum prices or rates at which any fertilizers may be sold by a dealer,
manufacturer, +importer or a pool handling agency. The Central Government may consider
the local conditions of any area, the period of storage of fertilizers and other relevant
circumstances, fix different prices or rates for fertilizers having different periods of storage or
for different areas or for different classes of consumers. No dealer, manufacturer +importer
or pool handling agency shall sell or offer for sale any fertilizers at a price exceeding the
maximum price or rate fixed under this clause.
Display of stock position and price list of fertilizers
Every dealer, who makes or offers to make a retail sale of any fertilizers, shall prominently
display in his place of business:-the quantities of opening stock of different fertilizers
held by him on each day & a list of prices or rates of such fertilizers fixed under clause 3
and for the time being in force.
Issue of cash/credit memorandum

Every dealer shall issue a cash or credit memorandum to a purchaser of a fertilizers in FormM*
CONTROL ON DISTRIBUTION OF FERTILIZERS BY MANUFACTURER/ IMPORTER
Allocation of fertilizers to various States
The Central Government may, with a view to secure equitable distribution and availability
of fertilizers to the farmers in time, by notification in the Official Gazette, direct any
manufacturer/importer to sell the fertilizers produced by him in such quantities and in such
State or States and within such period as may be specified in the said notification.
AUTHORISATION OR REGISTRATION OF DEALERS”
Registration of Industrial dealers and authorization of other dealers
No person shall sell, offer for sale or carry on the business of selling of fertilizer at any
place as wholesale dealer or retail dealer except under and in accordance with clause 8:
Application for intimation or registration
Every person intending to sell or offer for sale or carrying on the business of selling of
fertilizer as Industrial Dealer shall obtain a certificate of registration from the controller by
making an application in Form A together with the fee prescribed While, a manufacturer,
an importer, a pool handling agency, wholesaler and a retail dealer intending to sell or
offer for sale shall make a Memorandum of Intimation to the Notified Authority, in Form A1
duly filled in, in duplicate, together with the fee prescribed under clause 36 and certificate
of source in Form O.
On receipt of a Memorandum of Intimation, complete in all respects, the Notified Authority
shall issue an acknowledgement of receipt in Form A2 and it shall be deemed to be an
authorization letter granted and the concerned person as authorised dealer for the
purposes of this Order.
A certificate of registration granted before the commencement of the Fertilizers
(Control) Amendment Order, 2003, shall be deemed to be an authorization letter granted
under the provisions of this Order: when the applicant is a State Government, a
manufacturer or an importer or a pool-handling agency, it shall not be necessary for it or
him to submit Form O.

Grant or refusal of certificate of registration
The Controller, shall grant a certificate of registration in Form 'B’ within thirty days of the
receipt of application to any person who applies for it under clause 8; no certificate of
registration shall be granted to a person: -if his previous certificate of registration is under
suspension; or
it has been cancelled within a period of one year immediately preceding the date of
application;or if he has been convicted of an offence under the Act, or if he fails to enclose
with the application a certificate of source ; or
if the application is incomplete in any respect;
Period of validity of certificate of registration and letter of authorization
Every certificate of registration granted, be valid for a period of three years from the
date of its issue.
Renewal of certificates of registration and authorization letters
Every holder of a certificate of registration granted make an application for renewal to the
Controller, in Form C, or to the Notified Authority in Form A1, respectively, in duplicate,
together with the fee prescribed under clause 36 for such renewal and a certificate of source
as required under clause 8.
Manufacture of Mixtures of Fertilizers - Restriction on preparation of mixtures of
fertilizer
No person shall carry on the business of preparing any mixture of fertilizers. or special
mixture of fertilizers except under and in accordance with the terms and conditions of a
certificate of manufacture granted to him under clauses 15 or 16.
Standards of mixtures of Fertilizers
Subject to the other provisions of the order, no person shall manufacture any *mixture of
fertilizers whether of solid or liquid fertilizers unless such mixture conforms to the standards
set out in the notification to be issued by the Central Government in the Official Gazette;
Application for certificate of manufacture of mixtures of fertilizers

Every person desiring to obtain a certificate of manufacture for preparation of any mixture of
fertilizers or special mixture of fertilizers shall possess such mixture, *and possess the
minimum laboratory facility as specified in clause 21A of this Order.
An applicant shall make an application to the registering authority if he is an applicant for a
certificate of manufacture for any mixture of fertilizers in Form D, in duplicate, together with
the fee prescribed there for under clause 36; or,
if he is an applicant for a certificate of manufacture for any special mixture, in Form E, in
duplicate, together with the fee prescribed there for under the said clause 36 and an attested
copy of the requisition of the purchaser.
Grant or refusal of certificate of manufacture for preparation of mixtures of fertilizers
On receipt of an application under clause 14, the registering authority shall, by order in writing,
grant or refuse within forty-five days from the date of receipt of the application, furnish
to the applicant a copy of the order so passed;
to the applicant in Form G
Period of validity of a certificate of manufacture for preparation of mixtures of fertilizers
Every certificate of manufacture granted under clause 15 for preparation of a mixture of
fertilizers shall, unless suspended or cancelled, be valid for a period of three years from the
date of issue.
Renewal of certificate of manufacture for preparation of mixtures of fertilizers
Every holder of a certificate of manufacture for preparation of a mixture of fertilizers desiring to
renew the certificate, shall, before the date of expiry of the said certificate of manufacture
make an application to the registering authority in Form D in duplicate, together with the fee
prescribed for this purpose under clause 36.
Manufacturers/Importers pool handling agencies to comply with certain requirements
in regard to packing and marking, etc.2
Every manufacturer/importer and pool handling agency shall, in regard to packing and
marking of containers of fertilizers, comply with the following requirements, namely:-Every
container in which any fertilizers is packed shall conspicuously be Superscribed with the word
“FERTILIZERS” and shall bear only such particulars in case of containers the gross weight of
which is 5 kg or less, no such printing of superscription and other particular shall be necessary

if such super superscription and other particulars are printed on a separate label which is
securely affixed to such container. in case fertilizer bags are in cut, torn or damaged condition
during transportation or is handling during loading or unloading operation, the manufacturer of
such fertilizer may, under intimation to the State Government and the Central Government,
repack the fertilizer in new bags or restandardise the quantity in terms of declared weight.
Every fertilizers bag in which any fertilizers is packed for sale shall be of such weight and size
as may be specified by the Central Government from time to time in this behalf
Manufacturers to comply with certain requirements for laboratory facilities:-
Every manufacturer shall, in order to ensure quality of their product, possess minimum
laboratory facility, as may be specified from time to time by the Controller.
Disposal of non-standard fertilizers
Notwithstanding anything contained In this Order, a person may sell, offer for sale, stock or
exhibit for sale or distribute, [any fertillser except any fertillser imported by the Central
Government] which, not being an adulterated fertilizers, does not conform to the prescribed
standard (hereinafter in this Order referred to as non-standard fertilizers) subject to the
conditions that:- the container of such non-standard fertilizers is conspicuously super scribed
in red colour with the words "non-standard" and also with the sign "X"; and an application for
the disposal of non-standard fertilizers in Form H is submitted to the [Notified authority] to
grant a certificate of authorization for sale of such fertilizers and a certificate of authorization
with regard to their disposal and price is obtained in Form such non-standard fertilizers shall
be sold only to the manufacturers of mixtures of fertilizers or special mixtures of fertilizers or
research farms of Government or Universities or such bodies. The price per unit of the non-
standard fertilizers shall be fixed by the notified authority If a manufacture or importer detects
or as reasonable doubt about the standard of the fertilizer manufactured or imported by him,
and dispatched for sale as deteriorated in quality during transit due to natural calamity and is
not of the prescribed standards, he may, within fifteen days from the date of dispatch from
factory or port, apply with detailed justifications to the Central Government for obtaining
permission for reprocessing the same in a factory to meet the prescribed standards and the
Central Government may, after considering the facts, permit the re-processing of such
fertilizer on the terms and conditions as may be notified by the Central Government in this
behalf.

ENFORCEMENT AUTHORITIES
Appointment of registering authority The State Government may, appoint such number of
persons, as it thinks necessary, to be registering authorities for the purpose of this Order for
industrial dealers, and may, define the limits of local area within which each such registering
authority shall exercise his jurisdiction.
Notified Authority- The State Government may, appoint such number of persons, to be
Notified Authorities for the purpose of this Order and define the local limits within which each
such Notified Authority shall exercise his jurisdiction.
Appointment of inspectors-The State Government, or the Central Government may, by
notification in the Official Gazette appoint such number of persons, to be inspectors of
fertilizers for the purpose of this Order, and may, in any such notification, define the limits of
local area within which each such inspector shall exercise his jurisdictions.
Qualifications for appointment of fertilizers Inspectors
No person shall be eligible for appointment as Fertilizers Inspector under this Order unless
he possesses the following qualifications, namely:-Graduate In agriculture or science with
chemistry as one of the subjects, from a recognized university; and
Training or experience in the quality control of fertilizers and working in the State or Central
Government Department of Agriculture.
Powers of Inspectors
An inspector may, with a view to securing compliance with this Order:- require any
manufacturer, +importer, pool handling agency, wholesale dealer or retail dealer to give any
information in his possession with respect to the manufacture, storage and disposal of any
fertilizer manufactured or, in any manner handled by him
draw samples of any fertilizers in accordance with the procedure of drawal of samples laid
down in Schedule II. Provided that the inspector shall prepare the sampling details in
duplicate In Form J, and hand over one copy of the same to the dealer or his representative
from whom the sample has been drawn;
enter upon and search any premises where any fertilizers is manufactured/ Imported or
stored or exhibited for sale,;
seize any books of accounts or documents relating to manufacture, storage or sale of
fertilizers, etc. in respect of which he has reason to believe that any contravention of this

Order has been or is being or is about to be committed; Where any fertilizers is seized by an
inspector under this clause, he shall forthwith report the fact of such seizure to the collector
whereupon the provisions of sections 6A, 6B, 6C, 6D and 6E of the Act, shall apply to the
custody, disposal and confiscation of such fertilizers. Every person, if so required by an
inspector, shall be bound to afford all necessary facilities to him for the purpose of enabling
him to exercise his powers under sub-clause (1).
ANALYSIS OF SAMPLES
Laboratory for analysis
A fertilizer sample, drawn by an inspector, shall be analyzed in accordance with the
instructions contained in Schedule II in the -Central Fertilizers Quality Control and
Training Institute, **Faridabad or Regional Fertilizers Control Laboratories at Bombay,
Madras or Kalyani (Calcutta) or in any other laboratory notified for this purpose by the
State Government [with the prior approval of the Central Government. Every laboratory in
order to ensure accurate analysis, of fertilizers samples, possess minimum equipment and
other laboratory facilities, as may be specified from time to time by the Controller in this
behalf
Qualifications for appointment of fertilizers analyst in the fertilizer control
laboratories
No person shall be eligible for appointment as fertilizers analyst for analysis of fertilizers
samples in the laboratories notified under clause 29 of the Order, unless he possesses the
following qualifications, namely:-graduate in Agriculture or Science with chemistry as one of
the subjects from a recognized university; and
training In fertilizers quality control and analysis at Central Fertlllzer Quality Control and
Training Institute, Faridabad.
Provided that the fertilizers analysts appointed before the commencement of this Order, who
do not possess the requisite training, shall undergo prescribed training, within a period of
three years, in the Central Fertilizers Quality Control " and Training Institute, Faridabad from
the date of commencement of this Order.
Laboratories for refree analysis

Every laboratory referred to in sub-clause (1) of clause 29 shall be designated as referee
laboratory for the purpose of analysis of any sample of fertilizers :
Provided that no such laboratory which carried out the first analysis of the fertilizers sample
shall be so designated in respect of that sample:
Further in respect of any sample the analysis of which has been challenged, may be sent for
referee analysis to any one of the other laboratories except those which are located in the
State or where the first analysis has been done.
Central Fertilizers Quality Control and Training Institute and Regional laboratories shall be
considered as one group of laboratories and a sample first analysed by any one of them, shall
not be sent for referee analysis to any other in that group, but only to any other laboratory
notified by a State Government.
Time limit for analysis, and communication of result
Where sample of a fertilizer has been drawn, the same shall be dispatched along with a
memorandum in Form K to the laboratory for analysis within a period of seven days from the
date of Its drawl. The laboratory shall analyze the sample and forward the analysis report in
Form L within [30 days] from the date of receipt of the sample in the laboratory to the authority
specified in the said memorandum.
The authority to whom the analysis report is sent under sub-clause (2) shall communicate the
result of the analysis to the dealer/manufacturer/Importer/pool handling agency from whom
the sample was drawn within [15 days] from the date of receipt of the analysis report of the
laboratory.
Maintenance of records and submission of returns, etc.
The controller may by an order made in writing direct the dealers. manufacturers/ importers,
and pool handling agencies:- to maintain such books of accounts, records, etc. relating to
their business in Form 'N'. and to submit to such authority, returns and statements in such
form and containing such information relating to their business and within such time as may
be specified in that order. Where a person holds certificates of registration for retail sale and
wholesale sale of fertilizers, he shall maintain separate books of accounts for these two types
of sales made by him.
Fees
The fees payable for grant, amendment or renewal of an authorization letter or certificate of
registration or certificate of manufacture a duplicate of such certificates or, renewal thereof

under this Order shall be such as the State Government may, from time to time fix, subject to
the maximum fees fixed for different purposes by the Central Government and different fees
may be fixed for different purposes or for different classes of dealers or for different types of
mixtures of fertilizers or special mixture. Any fee paid under sub-clause (1) shall not be
refundable unless the grant or renewal of any certificate of registration or certificate of
manufacture or duplicate copy of such certificate or renewal under this Order has been
refused.
The fees payable for grant, amendment, renewal or duplicate copy of certificate of registration
for industrial dealer and the authority to whom and the manner in which such fee shall be paid,
shall be such as may be specified by the Controller from time to time by notification in the
Official Gazette*

01
Learning objective :
To understand the importance of soil fertility
To study the essential nutrients in plant growth
Crops depend on extrinsic and intrinsic factors for their growth and environment to provide them with basic necessities for photosynthesis. These essential plant growth factors include:
• light • heat • air • water • nutrients • physical support
If any one factor, or combination of factors, is in limited supply, plant growth will be adversely affected. The importance of each of the plant growth factors and the proper combination of these factors for normal plant growth is best described by the principle of limiting factors. This principle states: "The level of crop production can be no greater than that allowed by the most limiting of the essential plant growth factors." The principle of limiting factors can be compared to that of a barrel having staves of different lengths with each stave representing a plant growth factor.
Crop yield and quality depends upon the essential growth factors and the many interrelated soil, plant, environmental and agronomic factors or variables. Within this system, some of these factors cannot be controlled; others can be controlled and are manageable.
Soil is one of the key factors affecting plant growth as observed in the figure. The major functions of the soil are to provide plants with nutrients, water and oxygen.
Soil as a source of plant nutrients - Essential and beneficial elements, criteria of essentiality

Crop Production Factors
FAO has listed seven important soil qualities which affect crop growth as given below.
Soil Qualities Soil Characteristics SQ1 Nutrient availability Soil texture, soil organic carbon, soil pH, total exchangeable
bases SQ2 Nutrient retention
capacity Soil Organic carbon, Soil texture, base saturation, cation exchange capacity of soil and of clay fraction
SQ3 Rooting conditions Soil textures, bulk density, coarse fragments, vertic soil properties and soil phases affecting root penetration and soil

depth and soil volume SQ4 Oxygen availability
to roots Soil drainage and soil phases affecting soil drainage
SQ5 Excess salts. Soil salinity, soil sodicity and soil phases influencing salt conditions
SQ6 Toxicity Calcium carbonate and gypsum SQ7 Workability
(constraining field management)
Soil texture, effective soil depth/volume, and soil phases constraining soil management (soil depth, rock outcrop, stoniness, gravel/concretions and hardpans)
Soil fertility is the key to sustainable agriculture. Soil fertility is defined in several ways.
Soil fertility
“Soil fertility is the ability of the soil to supply essential plant nutrients during growth period of the plants, without toxic concentration of any nutrients”. i.e “the capacity of soil to supply nutrient in available to crop”.
Soil productivity “Soil productivity is ability of soil to produce a particular crop or sequence of crops under a specified mgt system” i.e the crop producing capacity of soil”.
All the productive soils are fertile but all the fertile soils may not be productive
Sometimes even if the soil is fertile, they are subjected to drought or other unsatisfactory growth factors or management practices.
History of development of soil fertility
Francis Bacon (1591- 1624) suggested that the principle nourishment of plants was water and the main purpose of the soil was to keep plants erect and to protect from heat and cold.
Jan Baptiste Van Helmont (1577 – 1644) was reported that water was sole nutrient of plants.
Robert Boyle (1627 – 1691) an England scientist confirmed the findings of Van Helmont and proved that plant synthesis salts, spirits and oil etc from H2O.
Anthur Young (1741 – 1820) an English agriculturist conducted pot experiment using Barley as a test crop under sand culture condition. He added charcoal, train oil, poultry dung, spirits of wine, oster shells and numerous other materials and he conduced that some of the materials were produced higher plant growth.
Priestly (1800) established the essentiality of O2 for the plant growth.

J.B. Boussingault (1802-1882) French chemist conducted field experiment and maintained balance sheet. He was first scientist to conduct field experiment. He is considered as father of field experiments.
Justus Von Liebig (1835) suggested that
a. Most of the carbon in plants comes from the CO2 of the atmosphere. b. Hydrogen and O2 comes from H2O. c. Alkaline metals are needed for neutralization of acids formed by plants as a result of
their metabolic activities. d. Phosphorus is necessary for seed formation. e. Plant absorb every thing from the soil but excrete from their roots those materials
that are not essential.
The field may contain some nutrient in excess, some in optimum and some in least, but the limiting factor for growth is the least available nutrient. The law of Mn, stated by Liebig in 1862, is a simple but logical guide for predicting crop response to fertilization. This law states that, “the level of plant production cannot be grater than that allowed by the most limiting of the essential plant growth factors”. The contributions made by Liebig to the advancement of agriculture were monumental and he is recognized as the father of Agricultural chemistry.
J.B. Lawes and J. H. Gilbert (1843) established permanent manurial experiment at Rothemsted Agricultural experiment station at England. They conducted field experiments for twelve years and their findings were
a. Crop requires both P and K, but the composition of the plant ash is no measure of the amounts of these constituents required by the plant.
b. No legume crop require N. without this element, no growth will be obtained regardless of the quantities of P and K present. The amount of ammonium contributed by the atmosphere is insufficient for the needs of the crop.
c. Soil fertility can be maintained for some years by chemical fertilizers. d. The beneficial effect of fallow lies in the increases in the available N compounds in
the soil.
Robert Warrington England showed that the nitrification could be supported by carbon disulphide and chloroform and that it would be stopped by adding a small amount of unsterilized soil. He demonstrated that the reaction was two step phenomenon. First NH3 being converted to nitrites and the nitrites to nitrites.
Essential and Beneficial elements
“A mineral element is considered to be essential for plant growth and development if the element is involved in plant metabolic functions and the plant cannot complete its life cycle without the element”.

There are seventeen essential elements required for plant growth viz., C, H, O, N, P, K, Ca, Mg, S, Fe, Mn, Zn, Cu, B, Mo, Cl, Ni,
The following is the essentiality criteria described by Arnon and Stout (1939)
1. A plant must be unable to complete its life cycle in the absence of the mineral element.
2. The function of the element must not be replaceable by another mineral element.
3. The element must be directly involved in plant metabolism.
Beneficial Nutrients/Elements: Beneficial elements are the mineral elements that stimulate the growth and exhibit beneficial effects at very low concentration or which are essential only for certain plant species or under specific conditions are called as “beneficial elements”.Eg.Na,Va,Co,Si
D.J.Nicholas coined the term “functional or metabolic nutrient”
Any mineral element that functions in plant metabolism, whether or not its action is specific. (Cl, Si, Na, Va, Co, Se)
The following table gives the essentiality of elements established by different scientists
Essentiality of the elements established by
Carbon : Priestly (1800)
Nitrogen : Theodore De saussure (1804)
Ca, Mg, K, S : Carl sprengel (1839)
Phosphorus : Von Liebig (1844)
Iron (Fe) : E. Greiss (1844)
Manganese (Mn) : J.S. Hargue (1922)
Zinc(Zn) : Sommer and Lipman (1926)
Copper (Cu) : Sommer, Lipman and Mc Kenny (1931)
Molybdenum (Mo) : Arnon and Stout (1939)
Sodium (Na) : Brownell and wood (1957)
Cobalt(Co) : Ahamed and Evans (1959)
Boron(B) : Warring ton (1923)
Chlorine (Cl )
Nickel
:
:
Broyer (1954)
Brown et.al.(1987)

Classification of Essential Elements
1) Based on the amount required by the plant i) Major nutrients – required in large quantities eg. N,P,K ii) Secondary nutrients – required in lesser quantities compared to Major nutrients eg.
Ca,Mg,S iii) Micronutrients- required in trace quantities eg. Fe, Mn, Zn, Cu, B, Mo
Classification based on the role of element in plant system
(According to TRUOG, 1954)
Structural Elements : C, H, O
ii). Accessory structural elements : N. P. S
iii). Regulator & Carriers : K, Ca, Mg
iv). Catalyst & Activators : Fe, Mn, Zn, Cu, Mo, Cl, B
References
Nyle C. Brady (1996).The Nature and Properties of soils. Tenth edition. Prentice hall of India Pvt.Ltd,New Delhi.
Tisdale,S.L.,Nelson,W.L.,Beaton,J.D.,Havlin,J.L.1997.Soil fertility and Fertilizers.Fifth edition, Prentice hall of India Pvt.Ltd,New Delhi. http://www.fao.org/nr/land/soils/harmonized-world-soil-database/soil-quality-for-crop-production/en/
https://athene.umb.no/emner/pub/EDS215/LectureSoil.htm
http://www.canolacouncil.org/crop-production/canola-grower's-manual-contents/chapter-1-the-basis-of-canola-yields/the-basis-of-canola-yields
Fischer, G., F. Nachtergaele, S. Prieler, H.T. van Velthuizen, L. Verelst, D. Wiberg, 2008. Global Agro-ecological Zones Assessment for Agriculture (GAEZ 2008). IIASA, Laxenburg, Austria and FAO, Rome, Italy.
http://www3.ag.purdue.edu/counties/vanderburgh/SiteCollectionDocuments/MG2011%20Lectures/Plant%20Nutrition%20Quiz%20KEY.pdf
Questions to ponder

1) How are the essential elements essential to crops?
2) Which elements are considered to be essential for crop growth? 3) Why is some nutrient deficiencies exhibited in older leaves, while other nutrient deficiencies
show up first on newer leaves? 4) What are beneficial elements? 5) What is the difference between major and micronutrient?

05.
Learning objective :
To know the functions of each nutrient in plant
Primary or major nutrients: are those nutrients required relatively in large quantities by the plants for its growth and development. Ex: N, P and K.
Secondary nutrients: are those nutrients which are required by plants in moderate amounts and given secondary importance in its supply and management.
Ex: Ca, Mg and S.
Micronutrients: The nutrients which are utilized by plants in relatively smaller quantities for their growth and development, but these are equally important & essential to plants as macronutrients.
Ex: Fe, Mn, Zn, Cu, B, Mo, Cl and Ni.
Plant Nutrients
Sixteen elements are considered essential for plants. They are grouped based on their
relative abundance in plants.
Many non-essential elements are also found in plants that account for over 60
elements. Al is absorbed when soil solution is rich in Al ions. When plant materials is
burned, the remaining plant ash contains all the essential and non-essential elements
except C, H, O, N, S. Macro nutrients are absorbed in 30-100 times in proportion to that of
micronutrients.
Essential Nutrients
Macronutrients Micronutrients Non-
mineral
Nutrients Primar
y Secondary By all plants Some
Forms of nutrients in soil and their functions in plants
1 (3/4)

C N Ca Fe B Na
H P Mg Mn Cl Co
O K S Zn Mo Va
Cu Ni
Si
Chemical nature
Metals K, Ca, Mg, Fe, Mn, Zn, Cu,
Non-metals C, H, O, N, P, S, Cl
The plant content of mineral elements is affected by many factors and their
concentration in crops varies considerably.
Nutrient Relative concentration
(Times)
Concentration
(%)
Primary N, K 400-1000 1-1.5
P 30 0.1-0.3
Secondar
y
Ca, Mg 100-200
0.2-0.5
S 30 0.1
Micro Fe, Mn, B 1-2 0.002-0.01
Others <1 <0.002

2 Plant Nutrients
Concentration, Mobility, forms, functions
A mineral element is considered essential to plant growth and development if the element
is involved in plant metabolic functions and the plant cannot complete its life cycle without the
element. Terms commonly used to describe level of nutrients in plants are
Deficient
When the concentration of an essential element is low enough to limit yield severely and distinct
deficiency symptoms are visible then that element is said to be deficient. Extreme deficiencies
can result in plant death. With moderate or slight deficiencies, symptoms may not be visible, but
yields will still be reduced.
Critical range
The nutrient concentration in the plant below which a yield response to added nutrient occurs.
Critical level or ranges vary among plants and nutrients but occur somewhere in the transition
between nutrient deficiency and sufficiency.
1 (4/4)
Critical range
Transition
Sufficient
Excessive
or toxic Deficient
Steenberg effect
NUTRIENT CONCENTRATION IN TISSUE
PLANT YIELD

Sufficient
Concentration range in which added nutrients will not increase yield but can increase nutrient
concentration. The term luxury consumption is used to describe nutrient absorption by the plant
that does not influence yield.
Excessive or toxic
When the concentration of essential or other elements is high enough to reduce plant growth and
yield then it is said to be toxic. Excessive nutrient concentration can cause an imbalance in other
essential nutrients, which also can reduce yield
Concentration and plants yield
Yield is severely affected when a nutrient
is deficient. When deficiency is corrected, growth
increases more rapidly. Under severe deficiency,
rapid increase in growth with added nutrient can
cause a small decrease in nutrient concentration
due to dilution effect. This is called the
Steenberg effect
Luxury consumption
Nutrient sufficiency occurs over a wide
concentration range, wherein yield is unaffected.
Increase in nutrient concentration above the
critical range indicates that the plant is absorbing
nutrient above that needed for maximum yield.
This luxury consumption is common in most plants. Elements absorbed in excessive quantities
Forms of nutrients for
Plant absorption
N NH4+, NO3
-, organic N
P H2PO4
- (Primary) and HPO42-
(Secondary) Orthophosphates
K K+
Ca Ca++
Mg Mg++
S SO3- (Sulphite) and SO4
-
Fe Fe++ (Ferrous), Fe+++ (Ferric)
Mn Mn++ (Manganous) and Mn+++
(Manganic)
Zn Zn++
Cu Cu+ (Cuprous) and Cu++
(Cupric)
B BO3- and other forms
Mo MoO4-- (Molybdate)
Cl Cl-
1 (2/8)

can reduce plant yield directly through toxicity or indirectly by reducing concentration of other
nutrient below critical ranges.
Functions of nutrients in plants:
Nutrient Functions
Major nutrients
Nitrogen Basic component of proteins and chlorophyll (the pigment that gives plants their green colour). Plays an essential role in plant growth. Also feeds microorganisms in the soil
Phosphorus Plays an important role in root growth and promotes the establishment of young plants, flowering, fruiting and ripening, photosynthesis, respiration and overall plant growth.
Potassium Moves through the plant. Promotes the movement of sugars, turgor and stem rigidity. Also increases the plant’s overall resistance to cold, diseases, insect pests, etc. Promotes the formation of flower buds, the hardening-off of woody plants and fruiting.
Secondary nutrients Calcium Plays a vital role in plant structure, because it is part
of cell walls and holds them together. Promotes the development of the root system and the ripening of fruit and seeds. Found in the growing parts of plants (apex and buds).
Magnesium An important part of chlorophyll. Helps fruit ripen
and seeds germinate. Reinforces cell walls and promotes the absorption of phosphorous, nitrogen and sulphur by plants
Sulphur A component of several proteins, enzymes and
vitamins. Contributes to chlorophyll production. Helps plants absorb potassium, calcium and magnesium.
Micronutrients

Iron Essential to chlorophyll production. Also contributes to the formation of some enzymes and amino acids.
Boron Essential to overall plant health and tissue growth.
Promotes the formation of fruit and the absorption of water.
Manganese Promotes seed germination and speeds plant
maturity. Plays an important role in photosynthesis by contributing to chlorophyll production. Essential for nitrogen assimilation and protein formation.
Molybdenum Essential for nitrogen assimilation by plants and
nitrogen fixation by bacteria. This means that it is needed for the production of nitrogen-based proteins.
Chlorine Stimulates photosynthesis.
Copper Activates various enzymes. Also plays a role in
chlorophyll production Zinc Plays an important role in the synthesis of proteins,
enzymes and growth hormones.
Nickel Key component of selected enzymes involved in N
metabolism and biological N fixation. Beneficial elements Silicon Strengthens cell walls, energy transfer & drought
resistance Reduces water loss & prevents fungal infection.
Cobalt Essential in N fixation
Sodium Na replaces K in certain functions in halophytes plants
For C4 plants having dicarboxylic photosynthetic pathway
Vanadium Essential for green algae

Forms of elements in Mineral soil
Macro elements are available in (1) Solid (2) Cations (3) Cations in soil solution
Nutrients Mineral / solid Cations Soil solution as ions
N Organic compounds and Amino acids NH4+ NH4
+, NO2-, NO3
-
P Organic compounds, nucleic acid and inorganic compounds. Ca, Fe, Al, PO4’s
- H2PO4-, HPO4
-
K Feldspar, mica, silicate clays K+ K+
Ca Feldspar, hornblende, lime stone Ca2+ Ca2+
Mg Mica, Hornblende, lime stone Mg2+ Mg2+
S Organic sources – protein, amino acids
inorganic sources – Gypsum, pyrites .
-
-
HSO4-, SO3
2-
SO42-
Forms of nutrient element absorbed by plants
Nutrient element Forms absorbed
C Mainly through leaves - CO2
H HOH (Hydrogen from H2O) – H+
O CO2 mainly through leaves – O42-, ,OH-, CO3
2-
N NH4+, NO3
K K+
Ca Ca2+
Mg Mg2+
S SO42-
Fe Fe2+ (Ferrous), Fe3+ (ferric)
Mn Mn2+ (Manganous), Mn4+ (Manganic)

Zn Zn2+
Cu Cu+ (cuprous), Cu2+ (Cupric)
Co CO2+
Na Na+
Si Si (OH)4
Cl Cl-
B H3BO3 (Boric acid) H2 BO3- (Borate)
Mo Mo O42-

References: Tisdale,S.L.,Nelson,W.L.,Beaton,J.D.,Havlin,J.L.1997.Soil fertility and Fertilizers.Fifth edition, Prentice hall of India Pvt.Ltd,New Delhi. http://www.ctahr.hawaii.edu/oc/freepubs/pdf/pnm3. From:J. A. Silva and R. Uchida, eds. College of Tropical Agriculture and Human Resources, University of Hawaii at Manoa, ©2000 http://edis.ifas.ufl.edu/hs1191 Questions to ponder 1)How will you differentiate between N and K deficiencies of corn visually?
2) What is luxury consumption?
3)Which element is absorbed both in anionic and cationic forms?
4) Which element is specifically involved in nitrate reduction in plants?
5)Name the nutrients whos deficiencies are first exhibited in the apical region of the growing plant?

06.
Learning objectives
a. Understand ways in which nutrients in the soil reach plant roots b. To know how plant roots absorb nutrients and move inside plants
Nutrients must reach the surface of a root for plant uptake of essential elements to occur There are three major mechanism of movement of ions from soil to roots. They are
Root interception
Root interception occurs when a nutrient comes into physical contact with the root surface. As a general rule, the occurrence of root interception increases as the root surface area and mass increases, thus enabling the plant to explore a greater amount of soil. Root interception may be enhanced by mycorrhizal fungi, which colonize roots and increases root exploration into the soil. Root interception is responsible for an appreciable amount of calcium uptake, and some amounts of magnesium, zinc and manganese. The CEC of roots for monocots is 10 - 30 meq/100 g and takes up monovalent cations more readily and that of Dicots is 40 - 100 meq/100 g and takes up divalent cations more readily. The quantity of nutrients intercepted by roots depends on the soil concentration of nutrients and volume of soil displaced by root system
Factors affecting root interception
a. Anything that restricts root growth i. Dry soil ii. Compaction iii. Low soil pH iv. Poor aeration v. Root disease, insects, nematodes vi. High or low soil temperature
b. Root growth is necessary for all three mechanisms of nutrient supply, but absolutely essential for root interception to occur
Mass flow:
Mass flow occurs when nutrients are transported to the surface of roots by the movement of water in the soil (i.e. percolation, transpiration, or evaporation). The rate of water flow governs the amount of nutrients that are transported to the root surface. Therefore, mass flow decreases are soil water decreases. Most of the nitrogen, calcium, magnesium, sulfur, copper, boron, manganese and molybdenum move to the root by mass flow. Quantity of nutrients transported is proportional to:
i. Rate of flow (volume of water transpired) ii. Solution concentration of nutrient
Mechanism of nutrient transport in plants

Nutrients supplied primarily by mass flow are considered mobile nutrients. e.g. N, S, B
Factors affecting mass flow
a. Soil water content i. Dry soil where there is no nutrient movement
b. Temperature i. Low temperature reduces transpiration and evaporation
c. Size of root system i. Affects water uptake and therefore movement ii. Root density much less critical for nutrient supply by mass flow than for root
interception and diffusion
Diffusion:
Diffusion is the movement of a particular nutrient along a concentration gradient. When there is a difference in concentration of a particular nutrient within the soil solution, the nutrient will move from an area of higher concentration to an area of lower concentration. This phenomenon is observed when adding sugar to water. As the sugar dissolves, it moves through parts of the water with lower sugar concentration until it is evenly distributed, or uniformly concentrated. Diffusion delivers appreciable amounts of phosphorus, potassium, zinc, and iron to the root surface. Diffusion is a relatively slow process compared to the mass flow of nutrients with water movement toward the root. Nutrients supplied primarily by diffusion are considered immobile nutrients e.g. P, K
Factors affecting diffusion
a. Fick’s law is given as dC/dt = De * A * dC/dX
dC/dt = diffusion rate (change in concentration over time) De = effective diffusion coefficient A = cross sectional area for diffusion dC/dX = concentration gradient (change in concentration over distance)
Diffusion rate is directly proportional to concentration gradient, diffusion coefficient, and the area available for diffusion to occur
b. Effective diffusion coefficient
Effective diffusion coefficient De = Dw * q * (1/T) * (1/b) where
Dw = diffusion coefficient in water q = volumetric soil water content T = tortuosity factor b = soil buffering capacity
a. Diffusion coefficient in water (Dw) i. Includes a temperature factor

ii. Colder = slower diffusion b. Soil water content
i. Drier soil = slower diffusion ii. Less water = less area to diffuse through
c. Tortuosity i. Pathways through soil are not direct ii. Around soil particles, through thin water films iii. Affected by texture and water content
1. More clay = longer diffusion pathway 2. Thinner water films = longer path
d. Buffering capacity i. Nutrients can be removed by adsorption as they move through soil, reducing
diffusion rate c. How far can nutrients diffuse in a growing season?
a. Diffusion distances are very short i. K ~ 0.2 cm ii. P ~ 0.02 cm
b. Size and density of plant root systems is very important for nutrients supplied by diffusion
c. Has implications for fertilizer placement
Ion traffic into the root Mineral nutrients absorbed from the root has to be carried to the xylem. This transport follows two pathways namely apoplastic pathway and symplastic pathway.
In apoplastic pathway, mineral nutrients along with water moves from cell to cell through spaces between cell wall by diffusion. The ions, which enter the cell wall of the epidermis move across cell wall of cortex, cytoplasm of endodermis, cell walls of pericycle and finally reach the xylem.
In symplastic pathway, mineral nutrients entering the cytoplasm of the epidermis move across the
cytoplasm of the cortex, endodermis of pericycle through plasmodesmata and finally reach the xylem.

Translocation of solutes P.R. Stout and Dr. Hoagland have proved that mineral nutrients absorbed by the roots are translocated through the xylem vessel. Mineral salts dissolved in water moves up along the xylem vessel to be
transported to all the parts of the plant body. Translocation is aided, by transpiration. As water is continuously lost by transpiration on the upper surfaces of the plant, it creates a transpirational pull, by
which water along with mineral salts is pulled up along the xylem vessel.
Active absorption of energy can be achieved only by an input of energy. Following evidences show the involvement of metabolic energy in the absorption of mineral salts.
• Higher rate of respiration increases the salt accumulation inside the cell.
• Respiratory inhibitors check the process of salt uptake.
• By decreasing oxygen content in the medium, the salt absorption is also decreased.
These evidences indicate that salt absorption is directly connected with respiratory rate and energy level in the plant body, as active absorption requires utilization of energy.
References:
http://www.ctahr.hawaii.edu/mauisoil/c_relationship.aspx
http://www.tutorvista.com/content/biology/biology-iv/plant-nutrition/active-absorption.php
Tisdale,S.L.,Nelson,W.L.,Beaton,J.D.,Havlin,J.L.1997.Soil fertility and Fertilizers.Fifth edition, Prentice hall of India Pvt.Ltd,New Delhi. Questions to ponder
1) What is contact exchange? 2) What soil factors influence diffusion of nutrients to roots? 3) What is diffusion? 4) Why is anion adsorption little important in agricultural soils? 5) What is the mechanism of active absorption of iron by roots?

7
Learning objectives
a. To understand the transformation of nitrogen b. To know the factors affecting the availability of nitrogen c. To understand the deficiency symptoms of Nitrogen and corrective measures
Nitrogen
The cheap source of N is the crop residues in temperate region. In tropical soils, the total N content is 0.03 - 0.1 %. Rainfall is also source of N at 4.6 kg of N / ha is received ha-1 yr -1. It is converted to NO3 during lighting addition of organic matter and fertilizer is other major sources. Nitrogen is an essential constituent of protein and also other non protein compounds of great physiological importance in plant metabolism. It is an integral part of chlorophyll, which is primary observer of light energy needed for photosynthesis. Nitrogen also imparts vigorous vegetative growth and governs the utilization of P,K and other elements
Forms of soil nitrogen
Inorganic forms N Organic forms of soil
1. Ammonium NH4+ Amide form (NH2)
2. Nitrite NO2- Plant absorbs N as both
3. Nitrate NO3- NH4
-, NO3-.
4. Elemental N (No)
Losses of Nitrogen
1. Crop removal 2. Leaching (or) drainage (11-18% loss) 3. Gaseous losses as NH4 or elemental N2 4. Volatilization. 5. Erosion (8 – 15 kg ha-1yr-1). 6. Ammonia fixation by clays 7. Immobilization in organic materials.
N transformations in soils
a. N - Mineralisation b. Aminisation c. Conversation of urea
Nitrogen – Transformation, factors affecting nitrogen availability ,deficiency and toxicity symptoms
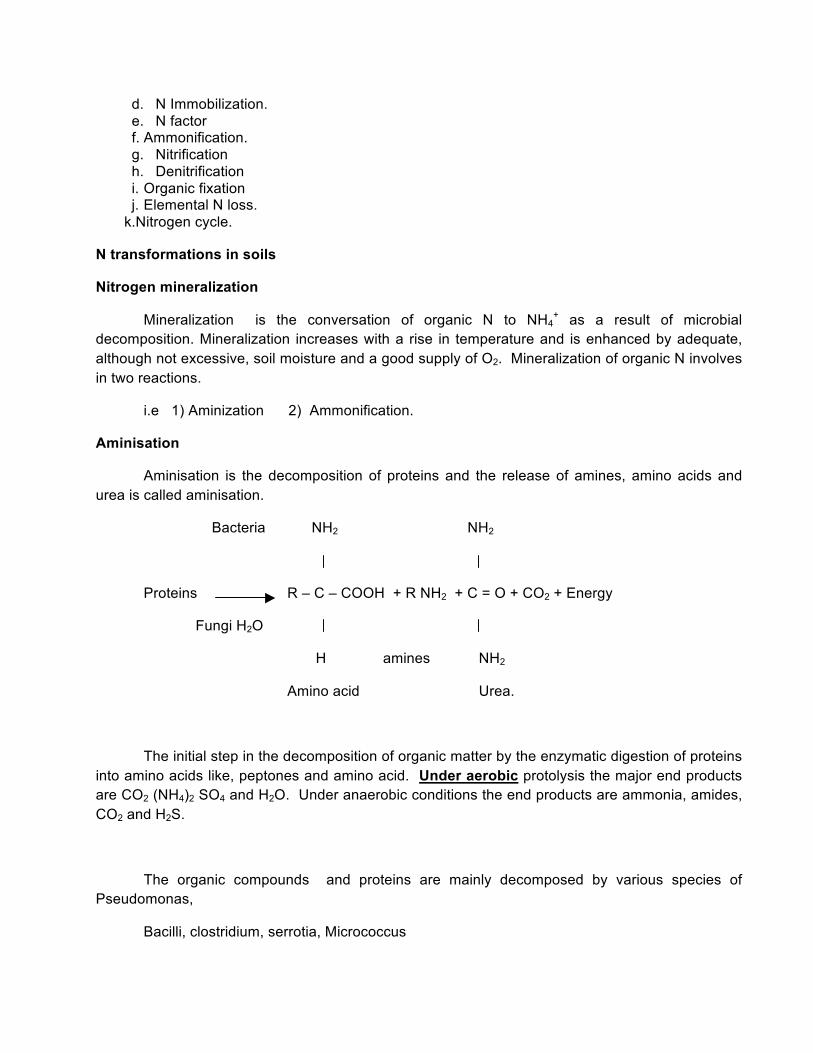
d. N Immobilization. e. N factor f. Ammonification. g. Nitrification h. Denitrification i. Organic fixation j. Elemental N loss.
k.Nitrogen cycle.
N transformations in soils
Nitrogen mineralization
Mineralization is the conversation of organic N to NH4+ as a result of microbial
decomposition. Mineralization increases with a rise in temperature and is enhanced by adequate, although not excessive, soil moisture and a good supply of O2. Mineralization of organic N involves in two reactions.
i.e 1) Aminization 2) Ammonification.
Aminisation
Aminisation is the decomposition of proteins and the release of amines, amino acids and urea is called aminisation.
Bacteria NH2 NH2
Proteins R – C – COOH + R NH2 + C = O + CO2 + Energy
Fungi H2O
H amines NH2
Amino acid Urea.
The initial step in the decomposition of organic matter by the enzymatic digestion of proteins into amino acids like, peptones and amino acid. Under aerobic protolysis the major end products are CO2 (NH4)2 SO4 and H2O. Under anaerobic conditions the end products are ammonia, amides, CO2 and H2S.
The organic compounds and proteins are mainly decomposed by various species of Pseudomonas,
Bacilli, clostridium, serrotia, Micrococcus

Generally in the neutral and sodic soils, bacteria are active and in acidic soils fungi are active.
Conversion of urea
Urea is a product of ammonization. The hydrolysis of urea by the action of increases enzyme is effected by Bacilli micrococcus, Pseudomonas, clostridium, Aeromobactor and coryne bactor.
Co (NH2) + H+ + 2H2O 2NH4+ + HCO3
-
NH4+ NH3 + H+
2NH3 + H2 CO3 (NH4)2 CO3 NH4+ + CO3
2-.
The optimum H2O holding capacity for these reactions is 50 – 75 and optimum temperature is 30 – 50°C.
The NH4 can be utilized by microorganisams and root of higher plants. Some of the released NH3 is fixed by clay especially illite. A major portion is oxidized to nitrate form. In the second reaction NO2
- is further oxidized to NO3- by nitrobactor
2 NO2- + O2 2 NO3
-.
Nitrogen immobilization
“Immobilisation is the process of conversion of inorganic N (NH4+ or NO3
-) to organic N and it is basically the reverse of N mineralization”.
The Microorganisms accumulate NH4 N and NO3 – N in the form of protein, nucleic acid and other complexes. If C:N ratio is wider than 30, it favours immobilization and lesser C:N ratio encourage mineralization.
N factor
N factor is the No of units of in organic nitrogen immobilized for each 100 units of materials under going decomposition”. The average values for the nitrogen factor vary from 0.1 or < to 1.3.
Ammonification
“Amines and Aminoacids produced during aminisation of organic N are decomposed by other heterotrophs with release of NH4
+ is termed Ammonifcation

R – NH2 + H2O NH3 + R – OH + energy
H2O NH4+ + OH –
Nitrification
Nitrification is the process of biological oxidation by which the NH4- Cal form of N converts to nitrate form of N. There are two steps. (a) NH4 is converted first to NO2
- and then to NO3-.
Nitrosomonas
2NH4 + 3O2 2 NO2- + 2 H2O + 4 H+
Nitrosomonas are obligate autotropic bacteria that obtain their energy from the oxidations of N and their C from CO2.
Others autotrophic bacteria Nitrosolobus, Nitrospira and nitroso vibrio and to some extend heterotrophic bacteria also can oxidize NH4
+ and other N reduces, compounds to NO3-.
Losses of Nitrogen
The major losses of N from the soil are due to (1) crop removal and leaching, however under certain conditions inorganic N ions can be converted to gases and lost to the atmosphere. The primary pathway of gaseous N losses are
1. Denitrification 2. NH3 volatilization.
Denitrification
Denitrification is the biochemical reduction of NO3N or NO2N to gaseous N, either as molecular Nitrogen or an oxide of Nitrogen. The most probable bio chemical pathway is
NO3 NO2 NO N2O N2
Nitrate Nitrite Nitric Nitrous Nitrogen
oxide oxide
Nitrogen fixation
The conversation of elemental nitrogen to organic forms readily use able in biological process. Vermicullite and illite are capable of fixing NH4
+ by a replacement of K- or Na+ for interlayer cations in the expended lattice of clay minerals. The radius of NH4 ion 0.143° A. K+ ion 0.133°A.

Because of NH4 and K have more or less same charge, they easily replace each other in the exchange sites.
Organic fixation
It the soil has more organic matter the NH4 will lockup as a complex. There complex are called Chelates. It release the nutrients only after its molecular break down. The facultative aerobic bacteria tiles pseudomonas, bacillus, porococcus are responsible for denitrification. It also depends upon the texture of soil. In heavy clay soils loss is upto 50% of added fertilizer.
Elemental N loss
It is due to chemical reduction. If chemical fertilizer containing amide (or) NH4 form of N, it may be oxidized to elemental N and lost.
2NHO2 + CO(NH2)2 CO2 + 3H2O +2 NH2
Sources of N leading to N and NO2 gaseous loss
1. Denitrification NO3
- NO2- NO N2O N2
2. Nitrification NH4
- NH2OH NO2 NO3-
3. Nitrates and Ammonium NH4
+ + NO2- N2 + 2H2O
4. Nitriates and aminoacids. HNO2 + RNH2 N2 + ROH + H2O
5. Lignin : HNO2 + lignin N2 + N2O + CH3O NO
6. Phenols : Phenol N2 + N2O + Organic residue
7.Decomposition of nitrous acid / reaction with metal cations.
3 HNO2 2NO + 2 HNO3 + H2O
Mn2+ + HNO2 + H+ Mn3+ + NO + H2O
Fe2+ + HNO2 + H Fe 3+ + NO + H2O
8. NH3 Gas
9. Urea : (NH4)2CO + H2O 2NH3 + CO2

10. NH4 Salts : NH4 + OH NH3 + H2O
11. Decomposition of residues and manures
Release and volatilization of NH3
Nitrogen cycle
The cycling of N in the soil – plant – atmosphere system involves many transformations of N between inorganic and organic forms.
The N cycle can be divided into
1. N inputs or gains. 2. N outputs of losses 3. N cycling with in the soil.
1. N in plant and animal residues and N derived from the atmosphere through electrical, combustion, biological and industrial process is added to the soil.
2. N in the residues is mobilized as NH4 by soil organisms as an end product of residue decomposition, plant roots absorb a portion of the NH4.
3. Much of the NH4 is converted to No3- by nitrifying bacteria in a process called
nitrifications. 4. NO3 is taken up by the plant roots and is used to produce the protein in crops that are
eaten by humans or fed to live stocks. 5. Some NO3 is lost to ground H2O or drainage systems as a results of downward
movement through the soil in perculating H2O. 6. Some NO3 is consorted by denitrifying bacteria in to N2 and N2O that escape into the
atmosphere, completely the cycle.
The nitrogen cycle Source: http://www.physicalgeography.net

Important microorganisms in BNF
Organism
s Properties Active location
Azotobac
ter
Aerobic,
free living
Soil, water,
rhizosphere, leaf
surface
Azospirill
um
Micro
aerobic
rhizobacteri
a; free
fixers
Free living in
Rhizosphere;
Colonize roots of
cereals and also gives
phytotonic effect
Rhizobiu
m
Symbiotic Root nodules of
legumes
Actinomy
cetes,
Frankia,
Beijerinck
ia
Symbiotic Non leguminous
forest tree roots, leaf
surfaces
Cyanoba
cteria
Photo
autotrophic
Anabaena -
symbiotic
In wetland flood
water; Anabaena
associate with Azolla
Symbiotic N fixation
The symbiosis is the mutually beneficial relationship between host plant and
bacteria. The location of association is in root or stem nodules, inside cavities, or by
colonizing and penetrating plant tissue.

Legume (nodule forming)
Legumes and bacteria of the genera Rhizobium and Bradyrhizobium provide
the major biological source of fixed N (40-60%) in agricultural soils. These organisms
infect the root hairs and the cortical cells, ultimately inducing the formation root nodules
that serve as the site of N fixation. The host plant supplies the bacteria with
carbohydrates for energy and the bacteria reciprocate by supplying the plant with fixed N
compound.
Effective nodules cluster on primary roots and have pink to red centers. The red colour of
the nodule is attributed to the occurrence of leghemoglobin. The quantity of N fixed by properly
nodulated legume averages about 75% of the total N used for the plant growth. The amount of
BNF varies with Rhizobium strain, host plant, and environment.
Yield of non-legume crops often increase when they are grown following legumes
(e.g. maize after soybean). Maximum N fixation occurs only when available soil N is at a
minimum. When optimum conditions for N fixation is not prevailing, a legume crop can
deplete soil N greatly, more than a cereal, if the legume grown is not incorporated into
the same soil.
Fixer Host plant
Alfalfa, clover, peas, bean, soybean Rhizobium
Gliricidia, Leuceana, Sesbania, Mimosa, Acacia
Bradyrhizobium Cowpea, groundnut, red gram
Non-legume (nodule forming)
Roots of many species of angiosperm trees like casuarina in forests and wetlands
form distinct nodules when infected with Actinomycetes of the genus Frankia.
Non-legume (non-nodule forming)
3 (3/4)

Azospirillum, Azotobacter, and Azorhizobium, dominant N fixers in cereals like rice,
wheat, corn, sorghum, millets can grow on root surfaces and penetrate root tissues. The
organisms use carbohydrates of root exudates as source of energy. They also induce crop
growth by hormonal action. The organism Beijerinckia fixes N on leaf surfaces of tropical plants.
The Anabaena blue green algae (Cyanobacteria) inhabit cavities in the leaves of the
floating water fern Azolla and fix quantities of N comparable to those of the better Rhizobium-
legume complex. It could fix about 30-105 kg N/ season taking care of 75% N requirement of
rice.
Nonsymbiotic N fixation
In wetland floodwater photoautotrophic Cyanobacteria independently do
photosynthesis and fix N up to 20–30 kg N/ ha/ year. The excess ammonia is excreted in
floodwater, which is beneficially absorbed by rice plants.
Free-living heterotroph bacteria like Azotobacter and Beijerinckia in aerobic upland
soils and Clostridium in anaerobic wetland soils effectively fix N in pockets where O2 supply is
limited. Fixation depends upon the pH, soil N level, and source of organic matter.
Industrial fixation of N Commercially produced N is the most important source of plant nutrient in
agriculture. Industrial N fixation is by Haber-Bosch process, in which H2 and N2 gases
react to form NH3 under high temperature (1200O C) and pressure (500 atm). Anhydrous
NH3 can directly be used as fertilizer or combined to other ions as solid forms.
N additions from atmosphere
Ammonia escapes in to atmosphere from soils, manures, and industries because of volatilization. Organic N compounds remain in fine dust of air lifted from earth surface. Rainfall brings down to soil NH3, NO3
-, NO2-, N2O, and organic N. About 10 to 20% of the
NO3- in the rainfall is due to fixation of N2 by energy of lightning.
Deficiency and toxicity symptoms of Nitrogen in plants
Deficiency of N:
1. Plants are stunted and yellow in appearance. 2. The loss of protein N from chloroplasts. In older leaves produces the yellowing or chlorosis.
It appears first on the lower leaves, the upper leaves remain green, while under severe N deficiency lower leaves will turn brown and die.
3. The necrosis begins at the leaf tip and progress along the midrib until the leaf is dead. In cauliflower - young leaves turn pale yellow and old leaves become orange.
In coffee - Veins becomes yellow and new leaves are very small.
Tomato - Stem become purple and hard. Flower buds become yellow and flower dropping rate also increases
Excess of Nitrogen (Toxicity of nitrogen)
a. Causes excess vegetative growth, dark green leaves, lodging, maturity is delayed with increases susceptibility to pest and disease.
b. In cotton, weak fibre are resulted. In rice, lodging is common.
c. Lengthening of crop duration and narrow leaf.
d. Slender shoot, profuse vegetation, thick peel and skin will be rough and leathery in the case of citrus.
e. Excess N in coffee plant, interferes the K uptake causing imbalance between N and K.
References
Tisdale,S.L.,Nelson,W.L.,Beaton,J.D.,Havlin,J.L.1997.Soil fertility and Fertilizers.Fifth edition, Prentice hall of India Pvt.Ltd,New Delhi. Singh, S.S.1995.Soil fertility and Nutrient Management. Kalyani Publishers,Ludhiana. Maliwal,G.L. and Somani,L.L. 2011.Soil Technology.Agrotech Publishing academy, Udaipur. Questions to ponder
1) How does the soil pH affect the nitrogen availability? 2) What climatic factors influence nitrogen availability to crops? 3) What is nitrogen fixation? 4) What is C: N ratio? 5) How does salinity affect nitrogen availability?

8
Learning objectives
a. To understand the transformation of phosphorus b. To know the factors affecting the fixation of phosphorus c. To understand the deficiency symptoms of Phosphorus
Phosphorus
Phosphorus is taken up by the plant in the form of H2PO4- HPO4
= PO4-= through diffusion
and mass flow action.
The P availability mainly depends on pH. In acid soils (Al & Fe) the presence of Al, Fe, Mn, P gets fixed as AlPO4, FePO4 and not available to the plants. Some times as CaPO4. these are insoluble in H2O.
Under hilly areas (or) high rainfall areas, all the cations will be leached leaving Fe, Al and Mn. The P availability will be reduced.
Ideal pH for available P = 6.5 - 7.5. If pH > 8.5 the fixation will be more. < 6.5 the fixation will be more.
Forms of P
Organic P : Nucleic acid and Phospho lipids
Rock Phosphate - acid soluble. If the organic matter content is high the availability of P is more since it is soluble in acid. It is highly suited to plantation crops. Rock Phosphates is black in colour. Roots also exudates acids, which will solublises the P.
Fixation is high so the P2O5 deficiency is 15 – 35%.
P is present as Apatities
1. Chlor - Ca10 (PO4)6 Cl2.
2. Fluor - Ca10(PO4)6 F2.
3. Carbonate - Ca10(PO4)6 Co3.
4. Hydroxy - Ca10(PO4)6 (OH)2.
Phosphorus – Transformation, factors affecting Phosphorus availability, deficiency and toxicity symptoms

Based on solubility the P fertilizers can be grouped into 4 groups.
1. H2O soluble : (i) SSP 16% P as H2O soluble
P : (ii)TSP 45% P as H2O soluble
2. Citrate soluble : Dicalcium PO4 34% P2O5. P : Tricalcium PO4 24%
3. Acid soluble P : Anhydrious Rock phosphate 16 - 18 %
4. Both H2O and citrate soluble P: Kotka PO4 25% P2O5.
Rock phosphate is obtained in Bihar: Singlahe
Rajaithan: Udaipur
Uttar Pradesh: Mussoorri
Andhra Pradesh: Kasi pattinam
Phosphorus occurs in most plants in concentrations between 0.1 and 0.4%. Plants absorb either H2Po4
- or H + PO42- ortho PO4 ions Absorption of H2PO4
- is greatest at low pH values, where as uptake of HPO4
2- is greater at higher values of soil pH, plant uptake of HPO4- is much slower
than H2PO4-.
Functions of P
1. It has a greater role in energy storage and transfer. 2. It is a constituent of nucleic acid, phytin and phospholipids 3. It is essential for cell division and development 4. P compounds act as energy currency within plants. The most common P energy
currency is that found in ADP and ATP. Transfer of the energy rich PO4 molecules from ATP to energy requiring substances in the plant is known as “Phosphorylation”
5. It stimulates early root development and growth and there by helps to establish seedlings quickly.
6. It gives rapid and vigorous start to plants strengthen’s straw and decreasess lodging tendency.
7. It is essential for seed formation because larger quantities of P is found in seed and fruit- phytic acid is the principle storage from of phosphorus in seeds.
8. It increases the activity of Rhizobia and increases the formation of root nodules.
Soil P its origin and Nature
Soil P exists in many primary and secondary compounds. The apatite group of primary mineral is the original source i.e. 55% of soil P.

a) Aluminium and Iron Phosphates
In the initial stages of acid weathering Po4 becomes increasingly bound to Fe3+ and Al3+ ions released from silicate minerals by replacing OH- from hydroxyl minerals or oxygen from oxide minerals. FePO4 and ZnPO4 has been found in H2O logged or poorly drained soils, sand and silt fraction of some soils.
Calcium phosphates
The group of compounds form an important category in the young soils and the matured soils of neutral to alkaline pH ranges. The CaPO4 found either in stable or metastable state in the soil fertilizer reaction zones.
Eg. Fluorapatite - Ca10(PO4)3 Fe
Carbonate apatite - Ca10(PO4)3 Co3
Dlcalcium Po4 - Ca HPO4 2H2O
Monocalcium Po4 - CaH2PO4 H2O.
Organic phosphates
It is derived secondarily by the addition of organic matter to the soil through the growth of plants and the deposition of plant residues. The soil micro organic synthesize organic PO4 compounds and accumulate in the soil mixed with derived from plant tissues. It constitute 20 – 30% of total soil P. The major classes of organic compounds in soils are
a. Phospholipids (0.6 – 0.9%) b. Phospho proteins of nucleic acid ( 0.6 – 2.4%) c. Phosphorylated sugar d. Phytin and Inositol PO4
The ideal C : N : P : S ratio in soils are
a. Calcarious 113 : 10 : 1.3 : 1.3
b. Non calcarious 147 : 10 : 2.5 : 1.4
c. Indian soils 144 : 10 : 1.4 : 1.8

Chemistry of solid phosphorus compounds and their equilibrium
The PO4 concentration in soil solution is governed by the heterogenous equilibrium.
P adsorbed in soil Po4 P in soil solution ‘ P’ precipitated in soil solution.
The reactions involved in soil Po4 equilibrium are dissolution, precipitation, solubility product principle.
By using radio active p32 Larsen (1952) characterized the total soil PO4 into Labile and Non labile fractions and found the size of the labile pool primarily depended on soil properties and not a function of the total content of inorganic P. he correlated and equilibrium of
Non labile soil P Labile soil P P in soil solution.
Fixation of phosphorus in soil
“It is the way of removal of PO4 from solution by soil which reduces the amount that plant roots can absorb”.
The factors affecting P fixation are.
1. clay minerals
The PO4 is fixed by clay minerals by reacting with soluble aluminum which originates from the exchanges sites or from lattice dissociation to from a highly insoluble AlPo4.
2. Iron and Aluminum (fixation in acid soils)
The formation of Iron and aluminium PO4 in the soil results from the combination of P with these metals in solution and their oxides hydroxides in acid soil.
2Al + 3 H2Po4 → Al2 (PO4)3 + 2 H2O + 2H+
3. Exchange cations and calcium carbonate (Fixation alkaline soils)
In calcareous soils, free Ca CO3 is a potent sources for ‘P’ fixation. P fixation in calcareous soil involved a rapid monolayer sorption of P in dilute concentration In CaCo3 surfaces and form less soluble compounds of di and tricalcium PO4.
Ca(H2 Po4)2 + 2 CaCo3 Ca3(Po4)2 + 2Co2 + 2 H2O

4. Organic matter
Organic Po4 can be fixed by soil organic matter also influences in Organic Po4 fixation. The acids produced during the transformations of Organic matter could decreases the pH and increases fixation by the solubilization of Fe and Al.
P Fixation in soil in affected by
1. Nature and Amount of soil minerals
Soils have high amount of Fe and Al oxides, crystalline hydrous metal oxides are usually capable of retaining more P than amorphous forms. P adsorbed to a greater extend by 1 : 1 than 2: 1 clays. The greater amounts P fixed by 1 : 1 clays is probably due to the higher amounts of Fe and Al oxides, associated with kaolinite clays that are predominate in highly weathered soils. Soils containing large quantities of clay will fix more P than soils with low clay content.
2. Soil pH
a. Fixation of P by Fe and Al oxides decreases with increasing pH.
b. P availability is more in soils at a max in the pH range of 5.5 to 6.5
c. At low pH values, Fe and Al ions reacts with to from al Po4 and FePo4 oxides.
d. As the pH increases, the activity of Fe and Al decreases and the results of higher amount of P librates into soil solution.
Above pH 7.0, Ca2+ can precipitate with P as Ca –PO4
mineral and P availability again decreases.
3. Cation effects
Divalent cations enhance the P fixation than monovalent cations.
4. Anion effects
Both organic and Inorganic anions can compete with P for adsorption sites, resulting in decreases the fixation of P.

5. Organic matter
Addition of organic matter to soils increased P availability by
a. Formation of organoPo4 complexes that are more easily assimilate by plants. b. Anion replacement of H2Po4
- on adsorption sites. c. Coating of Fe and Al particles by humus to form a productive cover and thus reduce the
P fixation. 6. Temperature
The rate of most chemical and biological reactions increases with increasing temperature. Mineralization of P from soil organic matter is dependent on soil biological activity an increases in temperature.
7. Flooding
In most soils there is an increases in available P after flooding largely due to conversion of Fe3+ PO4 to soluble Fe2+ PO4 and hydrolysis of Al PO4 and thereby prevent the fixation of P in soils.
8. R2O3 : P2O5 (Ratio)
“R2O3 : P2O5 (Ratio) is a measure of amount of P present in the soil”. A wide ratio indicates a small P fixation and vice versa. When the ratio is narrow P fixation is more.
9. Addition of Zn So4
It may also cause P deficiency since it forms insoluble complex with P. This can be averted by addition of ZnSo4 more and more.
P Cycle
“Process by which P moves form solid and liquid phase and transformation is called P cycle”. P is taken mostly by diffusion in plants.
I. The decreases in soil solution P concentration with absorption by plants roots is buffered by both inorganic and organic fractions in soils.
Primary and secondary P minerals dissolve to re supply H2PO4- / HPO4
= in soluble.
Inorganic P adsorbed on mineral and clay surfaces as H2PO4- or HPO4
= (liable inorganic P) also can desorbs to buffer decreases in soil solution P. Numerous soil micro organic digest plant residues containing P and produce many organic plant compounds in soil and it can be mineralized through microbial activity to supply solution P.
H2O soluble fertilizer P applied to soil readily dissolves and increases the concentration of soil solution.

II. In addition to uptake of P by roots, solution P can be adsorbed on minerals surfaces and precipitated as organic P and these organic P compounds are more resistant to microbial degradation.
Soil solution P is called Intensity factor, while organic and inorganic labile P fractions are collectively Quantity factor.
Maintenance of solution P concentration for adequate P nutrition in the plant depends on the ability of labile P to replace soil solution P. “The ratio of quantity to intensity factor in called the capacity factor, “which express the relative ability of the soil to buffer changes in soil solution”.
P cycle can be simplified to Soil solution labile P Non labile P
(Inorganic) (Organic)
Plant resides
P fertilizer Puptake
Primary Solution Bacteria, fungi actinomycetes
Sec.min. P Microbial P protozoa nematodes Chemically and
Physically protected
organic P, non labile P
Labile Inorganic P Labile Organic P

Source: http://phsgirard.org/Biology/Ecology/PhosphorusCycle.jpg
Y value / L value (Larsens Value)
Larsen measured the quantity of soil P involved in the isotopic dilution of applied radio active P during a growing season. It is used to calculate P supply of the soil.
L (or) Y = K x (Co - C)
C
Where, L = Avail P in soil
Co = K x total P in the Plant
C = K x P taken by the plant
K = Proportionality constant.
Deficiency symptoms
P is mobile in plants and when a deficiency occurs it is translocated from older tissues to the active meristematic regions.
1. It arrests metabolism resulting in reduction of total N of Plants.

2. Reduced sugar content.
3. Premature leaf fall.
4. Develops necrotic area on the leaf petiole and in the fruit
5. Leaves will show characteristic bluish green colour.
Toxicity of phosphorus
a. Profuse root growth i.e. lateral and fibrous root lets. b. It develops normal growth having green leaf colour. c. It may cause in some cases trace elements deficiencies i.e. Zinc and Iron.
References
Tisdale,S.L.,Nelson,W.L.,Beaton,J.D.,Havlin,J.L.1997.Soil fertility and Fertilizers.Fifth edition, Prentice hall of India Pvt.Ltd,New Delhi. Singh, S.S.1995.Soil fertility and Nutrient Management. Kalyani Publishers,Ludhiana. http://phsgirard.org/Biology/Ecology/PhosphorusCycle.jpg Questions to ponder
1) What is the role of soil pH in P availability? 2) P fixation is a blessing in disguise.How? 3) What are the natural sources of P? 4) What is C: P ratio? 5) How does calcareousness affect P availability?

9.
Learning objectives
a. To understand the transformation of Potassium b. To study the forms of K and factors affecting K availability c. To understand the deficiency symptoms of Potassium
Potassium
The potassium ion (K+) is actively taken up soil solution by plant roots. The concentration of K+ in vegetative tissue ranges from 1 to 4% on dry matter basis.
Functions of potassium
1. Essential for photosynthesis, development of chlorophyll. 2. It improves vigour of the plants to enable to with stand adverse climatic conditions. 3. Reduces lodging in cereal crops. 4. It regulates stomata opening and closing. 5. It regulates the movement of ions with in the plants and hence it is called traffic policeman of
the plant. 6. Activation of enzymes, enzyme synthesis, peptide bonds synthesis. 7. Regulates H2O imbalance within the plant.
Sources of K
The micas and fieldspars constitute the major K bearing minerals which on weathering slowly release K to the soil.
(Muscovite and biotite) (Orthoclase and microcline)
K-Feldspar: KAlSi3O10.
Courtesy: http://ocw.mit.edu/ans7870/12/12.108/f04/imagegallery/lab3/lab3-32.html
Potassium – Transformation, factors affecting Potassium availability, deficiency and toxicity symptoms

Forms of potassium in soils
a. Water soluble K. b. Exchangeable K. c. Fixed or Non exchangeable K. d. Lattice or Mineral K.
The different forms are in dynamic equilibrium with one another and represented as follows.
Slow fast
Fixed K Exchangeable K H2O soluble K
Lattice Reserve K
Water soluble K
The Concentration of H2O soluble K in soil depends on (a) type of day (b) H2O content (c) Intensity of leaching (d) Amount of exchange K (e) Kind and concentration of other ions.
The dilution of the soil, increases the concentration of H2O soluble K and drying decreases it. The uptake of K is influenced by the presence of other cations, ie Ca2+ and Mg2+, Al3+ (acidic soils) and Na+ in salt affected soils.
The activity ratio (AReK ) = Activity of K+
√ activity of Ca2+ and Mg2+
(or)
= ak
√aCa- Mg
2. Exchangeable K
The K adsorbed on soil clay complex and replaceable with neutral salts in relatively short time. The Cl reacts with soil Ca and form Ca Cl2 which is leached by high rainfall. Hence K is called as Decalcifier
3. Non exchangeable or Fixed K
Added K which is firmly bound by the soil and not immediately replaceable with neutral salts.
4. Lattice K or Mineral K
Muscovite, biotite and K feldspar. The capacity of soils to release lattice K by weathering depends on the content of K minerals and soil texture.

Potassium fixation
The important of K fixation is to regulate the supply of the soil a for the plants and protects it against loss through leaching.
In the dynamics of soil Potassium, the phenomenon of fixation of exchange K and the liberation of non-exchange K play an important role. K ions are relatively small to enter the silica sheets where they are held firmly by electrostatic forces. The presence of K+ ions can block the release of fixed NH4
+ and vice visa.
Factors affecting K fixation.
1. Soil texture : Increases the texture grater will be fixation and vice visa. 2. Wetting and drying: Fixation is more under dry condition than wet condition. 3. Type of day min: Fixation is more in 2:1 type than 1: 1 type 4. Freezing and thawing : Enhances the fixation of K depends their clay mineralogy and
degree of weathering 5. Soil pH : A decreases in pH reduces the K fixation either as result of competition of H3O+
for the inter layer exchange position. Liming also favors for the fixation of K. Factors affecting K availability in plants
a. Kind of clay minerals: Soils containing vermiculite or montmorilonite will have more K than kaolinite clay soils.
b. Cation exchange capacity: Increases texture soils having higher CEC and can hold more exchange K.
c. Amount of exchangeable K: More K in soil solution leads to
Higher fixation.
d. Subsoil K and rooting depth: Low soil temperature may exhibit K release and diffusion, thus increasing crop response to K
e.Soil moisture: fertilization increasing K levels or moisture contain will accelerate K diffusion.
6. Soil temperature : The reduced temperature slow down plant process plant growth and rate of K uptake.
7. Soil aeration : Under high moisture levels or incompact soils root growth is restricted, O2 supply is lowered and absorptions of K is slowed.
8. Soil pH : In very acid soils, toxic amount of exchange Al3+ and Mn2+ create unfavorable root environment for uptake of K and other nutrients.
9. Ca and Mg : K uptake would be reduced as Ca2+ and Mg2+ are increased or uptake of these two cations would be reduced as the available supply of K is increased.
10.Tillage: Tillage is increased that K availability is reduced because of increases compaction, less aeration and lower temperature.

Plant factors affecting K availability
1. CEC of Roots :Important for determining the ability of plants to absorb like more slowly available forms of soil K.
2. Root system and crop :Higher root density, higher the removal of exchange K and soil solution K. Fibrous root system absorbs more K than tap root system.
3. Variety or Hybrid :Hybrid absorbs more K than variety.
4. Plant population :Higher plant population and closer spacing increased the K removal.
Deficiency symptoms
1. Plant becomes stunted in growth with shortening of internodes and busy in appearance. 2. K deficiency in plants show reduced rate of photosynthesis. 3. Chlorosis, yellowing of leafs and leaf scarch in case of fruits trees. Rice : The leave tips will dark brown in colour and blades will blueish green, chlorotic and necrotic are seen.
Banana : Deficiency is seen in the margin and bottom of leaves.
Grapes : Leaves are yellow with brown spots which are necrotic, brittle with uneven ripening.
References
Tisdale,S.L.,Nelson,W.L.,Beaton,J.D.,Havlin,J.L.1997.Soil fertility and Fertilizers.Fifth edition, Prentice hall of India Pvt.Ltd,New Delhi. Singh, S.S.1995.Soil fertility and Nutrient Management. Kalyani Publishers,Ludhiana. http://ocw.mit.edu
Questions to ponder
1) What is luxury consumption? 2) What is activity ratio and what does it measure? 3) How does CEC affect the amount of K in solution? 4) What is the effect of K: Ca ratio in K availabity? 5) Does fixed K tend to become available to plants?

10.
Learning objectives
a. To understand the transformation of secondary elements b. To study the forms of secondary nutrients and factors affecting the availability c. To understand the deficiency symptoms of secondary nutrients
Calcium
Calcium is absorbed by plants as Ca2+ and its concentration ranges from 0.2 to 1.0% and it is supplied through mass flow method.
Functions of calcium
1. It is immobile in plants and hence the deficiency is observed in younger leaves. 2. It is a constituent of cell wall and increases in stiffness of plants. 3. Promotes root development and growth of plants, root elongation and cell division. 4. Helps to translocate the sugar in the plants. 5. It involves chromosome stability and that it is a constituent of chromosome structure. 6. Affects translocation of CHO in plants. 7. Encourages seed production. 8. Activates enzyme phosphate and kinease. 9. Accumulated protein during respiration by mitochondria and it increases their protein content. 10. It binds DNA to protein molecules.
Deficiency of calcium
a. Young leaves of terminal buds dieback at the tip and margins. b. Normal growth in affected. c. Root may become short, stubby and brown. d. Causes acidity of soil. e. Cell may become rigid and brittle. f. Young leaves of cereals remain folded.
Secondary nutrients – Transformation, factors affecting nutrient availability, deficiency and toxicity symptoms

Sources of soil calcium
Earth crust contains about 3.64%. The important source of calcium is anorthite (Ca Al2, Si2O3). Generally arid region soils contain high amount of Ca regard less of texture, low rainfall and little leaching.
In arid and semiarid regions Calcite (CaCo3)
Dolomite (Ca, Mg, (Co3)2)
Gypsum (CaSo4, 2H2O)
In humid regions, even the soils formed from limestone are frequently acid in the surface layers because of the removal of Ca and other cations by leaching.
Calcium transformations in soils
In acid and humid region soils ca occurs largely in exchange form and as primary minerals. In most of these soils Ca2+, Al 3+ and H+ dominates the exchange complex.
The forms of Ca are
1)Solution Ca2+ / Mg2+
2)Exchangeable Ca/Mg
3)Mineral Ca/Mg.
The activity of solution Ca is decreased by leaching or plant removal. If solution Ca is increased, the equilibrium shifts in the opposite direction with subsequent desorption of some of the Ca2++ by the exchange complex. The rate of solution Ca is less complex than of K+. It may be (a) Lost in drainage H2O’s. (b) absorbed by organisms (c) adsorbed on the CEC (d) Repricipitated as secondary calcium compound.
Factors affecting Ca2+ availability
1. Total Ca supply :Sandy acidic soils with low CEC having less Ca.
2. Soil pH:In acid soils Ca is not readily available to plants at low concentration.
3. CEC:Soils having low CEC might will supply more Ca2+.
4. % Ca saturation:High Ca2+ saturation indicates favourable pH for plant growth and microbial activity.
5. Type of soil colloid: 2 : 1 type require higher Ca saturation than 1: 1 type.
6. Ratio of Ca2+ to other cations : Increasing the Al3+ conc. in soil solution reduces Ca uptake in plant.

Magnesium
Magnesium is absorbed as Mg2+ and the concentration in crop varies between 0.1 and 0.6%. It was taken by plant by Mass flow and diffusion.
Functions of Mg in plants
1. Primary constituent of chlorophyll 2. Imports dark green Colour in leaves. 3. Serves as a structural components in ribosomes and stabilizing the ribosome configuration for
protein synthesis. 4. Involves numbers of physiological and biochemical function. 5. Activates phosphorylating enzymes in CHO metabolism. 6. Act as a cofactor for certain enzymes other than Po4 transfer enzyme. 7. Increases in the oil content of oil seed crops. 8. Regulates the uptake of other nutrients.
Deficiency of Magnesium
1. Interveinal chlorosis of the leaf in which only the leave veins remain green. 2. Stiff brittle, twisted leaves, wrinkled and distortion of leaves. 3. cotton –lower leaves may develop a reddish purple finally nicrotic (Redding of leaves) 4. In brassica, Chlorosis with interveinal mottling uniformly distributed in older leaves while the
other vascular tissues remain green. This condition is called “Puckering”. Sources of soil Magnesium
It constitutes 1.93% of earth crust
Primarily minerals (a) Biotite (b) Dolomite (c) Hornblende (d) olivine (e) serpentine.
Secondary minerals (a) Chlorite (b) Illite (c) Montmorillonite.
In arid region substantial amount of Mg present as Epsomite (Mg So4 7H2O)
Forms of Mg in the soil
1. It occurs predominately as exchange and solution mg. 2. Coarse text soil exhibits the greatest potential for Mg deficiencies. 3. Competition bet NH4
+ and Mg2+ also lower the Mg2+ availability to crops.
Losses of Mg
It is leached by soils and it depends on the Mg content, rate of weathering, intensity of weathering and uptake of plants.
Sulphur
Sulphur is absorbed by plant roots as So42- ions. Concentration of S in plants range between 0.1 and
0.4%.
Functions of sulphur
1. Essential for synthesis of sulphur containing amino acids cystine, cysteine and methionine.

2. Essential for synthesis of other metabolites including Co-enzyme A., Biotin, Thiamin of vitamin B and Glutothione.
3. Synthesis of chlorophyll. 4. It is a vital part of ferredoxins i.e Fe – S – protein occurring in the chloroplasts. 5. Responsible for the characteristic smell or odor and taste of mustard, onion and Garlic.
(Puncy smell) 6. Enhances the oil formation in crops (Soya bean) 7. Increasing root growth. 8. Stimulate seed formation. 9. Promote nodule formation – Leguminous species.
Deficiency of sulphur
a. Stunted growth pale green to yellow colour. b. Immobile in plants and plants symptoms start first at younger leaves. c. Poor seed set in rapeseed. d. Tea –Tea yellows.
Sources of sulphur
1. Amount has <0.05 ppm in the form of So2. 2. Earth crust contains 0.06 to 0.10%. 3. Sulphur bearing minerals Gypsum - CaSo4 2 H2O.
Epsomite - MgSo4, 7H2O
Mirabilite - Na2So4, 10 H2O.
Pyrite - FeS2.
4. Silicate min contains <0.01 % S. 5. Igneous rocks 0.02 to 0.07%
Sedimentary rocks 0.02 to 0.22%
Forms of sulphur in soil
Present both organic (90%) and Inorganic forms.
The inorganic forms are
1. Solution So42-.
2. Adsorbed So4= Readily available fraction.
3. Insoluble So4=
4. Reduced inorganic compounds. Factors affecting S oxidation in soils
a. Microbial population in soil. b. Characteristics of the ‘S’ source c. Soil environmental condition. d. Soil micro flora Chemolithotropic S bacteria Thiobacilli utilized energy from oxide of
Inorganic S for the fixation of Co2 in Organic matter. e. Soil temperature
An increase in temperature increases the S oxidation rate in soil. Ideal temperature 25 – 40°C.

f. Soil moisture and aeration
S oxidizing bacteria are mostly aerobic and their activity will decline if O2 is lacking due to H2O logging. Favourable moisture is field capacity moisture.
g. Soil pH: Optimum pH 4.0 or lower.
S transformation in soils
Numerous transformations of S in soil occur from inorganic to organic forms due to the presence of hetero tropic micro organic viz.,. Thiobacillus, chlorabium, Desulfotomaculam and Desulfovibrio. When plant and animal residues are returned to the soil they are digested by microorganism releasing of the S as So4
=. Most of the S remains in organic form and becomes part of soil humus. The S supply to plants in largely depend on the So4
= released from the organic soil fractions and from the plant and animal residues.
S Mineralization and immobilization
Mineralization of “S” is the conversion of organic S to inorganic So4=.
Immobilisation is the conversion of So4= to organic S.
Sulphur cycle
http://www.agweb.com/assets/1/9/NewsMainImage/sulfur_cycle2.jpg
Factors affecting S mineralization and Immobilization.
1. S content of organic matter
Mineralization of S depends on the S content of he decomposing material, smaller amounts of So4
= are liberated from low S containing residue.
2. Source of mineralizable sulphur :
Most of the available S removed by plants from the So4= fraction of labile S in soil Organic
matter.

3. Soil Temperature
Mineralization of S is impeded @ 10°C increases with increasing temperature from 20°C to 40°C and decreases of temperature >40°C.
4. Soil moisture
Mineralization occurs in optimum moisture conditions.
5. Soil pH
S released is directly proportional to pH up to pH 7.5. Above 7.5 mineralization increases more rapidly.
6. Absence or presence of plants.
Soils mineralization more S in the presence of growing plants than in their absence.
7. Time and cultivation
8. S Volatilization
Volatile S compounds are produced through microbial transformations under both aerobic and anaerobic conditions. The volatile compounds are dimethyl sulfide (CH3 SCH3) (CS2) Carbandi sulphide and mercaptons (CH3SH).
In low organic matter soils, S volatilization is negligible and increases with increasing organic matter content.
Practical aspects of S transformations.
1. Crops grown on coarse texture soils are generally more susceptible to S deficiency because these soils having low organic matter content and So4
= leaching. 2. Leaching losses of So4
= can occur highly on coarse texture soils under high rainfall. Under such conditions, So4
= containing fertilizers maybe applied more frequently 3. Immobilization of added S can occur in soils having a high. C/S or N/S ratio. S
mineralisation is favored in soils with a low C/S or N/S ratio. S availability generally increases with organic matter content.
4. Actual amount of S needed will depend on the balance between all soil additions of S by precipitation, air, irrigation H2O, crop residues fertilizers, Agriculture Chemicals and all losses through crop removal. Leaching and erosion.
References
Tisdale,S.L.,Nelson,W.L.,Beaton,J.D.,Havlin,J.L.1997.Soil fertility and Fertilizers.Fifth edition, Prentice hall of India Pvt.Ltd,New Delhi. Singh, S.S.1995.Soil fertility and Nutrient Management. Kalyani Publishers,Ludhiana. http://agropedialabs.iitk.ac.in/agrilore http://technology.infomine.com/enviromine/ard/microorganisms/roleof.htm http://www.agweb.com/article/the_secrets_of_sulfur/

Questions to ponder
1) What is the importance of C:N:P:S ratio to the availability of soil sulphur? 2) Is Magnesium fixed in soils? 3) How is a low calcium soil condition usually corrected? 4) Which crops have high calcium requirement? 5) Can climate influence the availability and uptake of Calcium and Magnesium?

11.
Learning objectives
a. To understand the transformation of micronutrients b. To study the forms of micronutrients and factors affecting the availability c. To understand the deficiency symptoms of micro nutrients
Iron
Fe is absorbed by plants roots as Fe2+, Fe3+ and chelected irons. Sufficiency range of Fe in plant tissue is 50-250 ppm.
Functions of Iron
1. It helps in the synthesis of chlorophyll.
2. Structural component of porphyrin molecules like cytochromes, hematin, hemes, ferrichrome and hemoglobin. These substance are involved in oxidation-reduction reactors in respiration and photosynthesis.
3. Structural component of non hemine compounds like ferredoxins.
4. Constituent of enzyme systems Egl cytochrome oxidase, catalase, nitrogenase reaction in plants.
5. Component of flavoprotein like
FMN = Flavin mono nucleotides
FAD = Flavin Adinosine Dinudeotide.
Deficiency symptoms 1. Deficiency symptoms occurs in younger leaves since Fe is immobile element within plant. 2. It occurs in soils of calcareous or alkaline soils and poorly drained H2O logged soils. 3. Younger leaves develop interveinal chlorosis with progresses rapidly over the entire leaf.
Severe cases entire leaf turns yellow colour. Sources of iron
Earth crust contains about 5%
Primary and secondary minerals such as
1.Olivene,2.Pyrite3.Hematite,4.Goethite,5.Magrulite 6.limestone
Forms of iron
Fe occurs in Four major forms in soil.
Micro nutrients – Transformation, factors affecting nutrient availability, deficiency and toxicity symptoms

1. Primary and secondary minerals Fe
2. Adsorbed Fe
3. Organic Fe and
4. Solution Fe.
Soil solution Fe
It occurs primarily as Fe(OH)+2, Fe3+ concentration In solution is very low. In well-drained,
oxidized soils, the solution Fe2+ concentration is less than that of the dominant Fe3+ in solution. The pH dependent relationship for Fe3+ is described as
Fe (OH)3 (Soil) + 3H+ Fe3+ + 3H2O
For every increases in pH, Fe3+ concentration decreases 1000 fold. Oxidation - redn reactions, the result of change in O2 partial pressure, exert considerable influence on the amount of soluble Fe in the soil solution. The insoluble Fe3+ form predominates in well drained soils, while levels of soluble Fe2+ increases significantly when soils become H2O logged. In general, lowering Redox increases Fe2+ solubility, 10 fold for each unit decreases. in pH.
Over the normal pH range in soils, total solution Fe is not sufficient to meet plant requirements for Fe even in acid soils, where Fe deficiency Occur less frequently than in high pH and caleanous soils.
Schematic representation of Fe, Zn, Cu and Mn cycle
Mulch (straw)
Nutrient uptake by plants
Organic matter and microorganisms
Soil solution
Exchange and surface adsorption
Solid phase minerals and precipitates

Chelates
“Is a term derived from a Greek and meaning “Claw”.
Chelates are soluble organic compounds that bond with metals such as Fe, Zn, Cu and Mn increasing their solubility and their supply to plant roots.
“Natural organic cheleates in soils are products of microbial activity and degradation of soil organic matter and plant residues. Root exudates are capable complexing nutrients substantial quantities of organic completed. Fe can be cycled through crop residue and compounds of citric acid and oxalic acids have chelating properties.
Dynamics of chelation
“The dynamics of chelation increasing solubility and transport of micronutrients”.
During active plant uptake, the concentration of chelated Fe or other micronutrient is grater in the bulk solution than at root surface the chelated Fe diffuses to the root surface in response to concentration gradient. After Fe3+ dissociates from the chelates and diffused due to concentration gradient. As the unchelated Fe3+ concentration decreases insolution because of chelation, additional Fe is desorbed from minerals surfaces or Fe minerals dissolved to resupply solution Fe.
Synthetic chelates
In soils synthetic chelates behave similarly to natural organic chelates. The choice of a chelate to use as chelate depends 1. specific micronutrient ii. Solubility of chelate in the soil. When synthetic or natural chelates are added to soils and they are readily complex with cations in soil solution.
Egl : Citric acid and Oxalic acids, two natural chelates complex Al3+ at low pH, but when pH increasess above 5 or 6, Ca2+ and Mg2+ are more readily completed.
Diethylene triamine penta acetic acid (DTPA) and EDTA (Ethylene diamine tetra acetic acid) readily chelate Fe at pH < 7 and pH <6.5 respects. The chelate EDDHA (Ethylene Diamine dihydroxy phenyl acetic acid) will strongly complex Fe and is stable over the entire pH range. As a result Fe EDDHA is commonly used as an Fe fertilizer because it provides more plant available Fe than other chelates.
Factors affecting Fe availability
1. Soil pH, Bicarbanate and Carbonates
Fe deficiency is most often observed in high pH and calcareous soils in arid regions, but it may occur an acid soils that are very low in total Fe.
Irrigation waters and soil high in HCO3 may aggravate Fe deficiency Because of high pH levels associated with HCO3
- accumulation.
In calcarious soils having pH range of 7.3 to 8.5 have Fe deficiency due to the lowest solubility of soil Fe and the formation of bicarbonate ion.
CaCO3 + CO2 + H2O -- Ca2+ + 2HCO3-
2. Excessive H2O and poor aeration
Flooding and submergence of soils can improve Fe availability by increaseeasing Fe2+ canc. They actually buildup of toxic canc. of Fe2+ organic matter removed from the eroded portions of semi arid region calcareous net soils lime induced Fe deficiency will occur.
3. Organic matter
Additions of organic matter to well drained soils can improve Fe avail. Due to increases the Fe2+ solubility.
4. Interactions with other nutrients
Fe deficiency occur due to the accumulation of Cu, Mn, Zn, Mo and P. Fe availability decreasess when the soils are having more NO3
- than NH4+ deficiency of K or Zn can reduce Fe
translocation with in plants.
MANGANESE
Mn concentration in plant ranges from 20 to 500 ppm
Functions of Mn
1. Helps in chlorophyll formation
2. Involves in photosynthesis, particularly in evolution of O2.
3. Involves in oxidation - reduction - process in decarboxylation and hydrolysis reactions.
4. Involves in enzyme systems and various enzyme reactions in the citric acid cycle.
5. It is a substitute for Mg2+ in many of the phosphorylating and group transfer reactions.
Deficiency of Mn
1. Immobile in plant and def. starts in the younger leaves.
2. Interveinal chlorosis occur
Oats - Gray specks / streaks
Peas - Marsh spot
Sugarbeet - speckled yellow
Sugar cane - Pahala blight - midrib pale green and white.

3. Deficiency increasess asparatic acid and decreases glutamine
4. Increases respiration
5. Accumulation N compounds mainly as amines.
Sources of Mn
Earth crust contains 1000 ppm. Various oxides and hydroxides.
Manganite MnO (OH)
Braunite Mn2O3
Factors affecting Mn availability
1. Soil pH and carbonates
Liming to acid soils decreases solution and exch. Mn2+ due to precipitation Mn2+ as MnO2.
2. Excessive H2O and poor aeration
H2O logging will reduce O2 and lower redox potential will increases soluble Mn2+. Poor aeration increases Mn availability.
3. Organic matter
Increases solution and exchangeable Mn.
4. Climatic factor
Increases soil temp during the growing season improves Mn uptake, because of greater plant growth and root activity.
5. Soil micro org
Deficiency caused by soil organisms oxidizing Mn2+ to Mn4+.
Forms of Mn
i. Solution Mn2+
ii. Exchange Mn2+
iii. Organic bound Mn
iv. Mn Mineral
ZINC
Normal concentration in plant 25 to 150 ppm
Deficiency level is < 20 ppm

Toxic level is > 400 ppm
Zn is present in all parts of the plants. In general root contain more zinc than fruits.
Cereals : 27.8 ppm
Pulses : 34.8 ppm
Vegetables : 28.2 ppm
Fruits : 36.6 ppm
Functions of Zn
1. Essential to formation of growth harmones
2. Helps in reproduction of certain plants.
3. Stabilise rhibosomal fractions
4. Influence the activity of dehydrogenase enzymes
5. Involves in auxin metabolism like tryptophan synthetase.
Deficiency of Zn
1. Light yellow or white areas bet the veins of leaves particularly older leaves.
2. Death of tissue, discolored
3. Mal formation of fruits
4. Reduced growth hormone production.
Cotton : White bud (or) little leaf
Citrus : Mottle leaf
Potato : Fern leaf
Fruit trees : Rosette (Upnormal growth)
Paddy : Khaira
Foliar spray : 0.2 to 0.5% ZnSO4.
Sources of zinc
Soil : 10-300 ppm

Igneous rock : >10 ppm
Sedimentary : > 95 ppm
Forms of soil Zn
1. Solution Zn2+
2. Adsorbed Zn2+
3. Organically completed Zn2+
Factors affecting Zn availability
1. Soil pH : Avail of Zn decrease with increase soil pH Zn def occur in neutral and calcareous soil. At soil pH, Zn precipitates as insoluble amorphous soil Zn, which reduces Zn2+ in soil.
Al and Fe oxides, OM and CaCO3 increase with increasing pH.
2. Organic matter
3. Interaction with other nutrients
SO4 and N can increase the Zn uptake in plants.
Higher the soil pH, poor aeration greater the Zn deficiency
COPPER
Copper is absorbed by plants as cupric ion Cu2+
Normal concentration in plants 5-20 ppm.
Functions of copper
1. Essential for the synthesis of vitamin A
2. Act as a catalyst in respiration
3. Act as a “electron carrier” in enzyme which bring about oxidation reduction reactions in plants.
4. Constituent of chlorophyll.
Deficiency of copper
1. Chlorosis, withering and distortion of terminal buds.
2. Dead tissue appears along the tips and edges of leaves.
3. Multiple bud formation in the leaf axil and mal formation of leaves.
4. Guava - cracking of fruits and terminal bud die back
1. Heavy liming, excessive application of N and P - induces Cu deficiency.

Sources of copper
1. Igneous rock 10-100 ppm of Cu.
2. Sedimentary rock 4-45 ppm
3. Primary minerals contains
1. Chalcopyrite
2. Chalcocite
3. Bornite
4. Sedimentary minerals
Oxides, Carbonates, Silicates, Sulphates and Chlorides.
Forms of soil copper
1. Soil solution - ionic and completed
2. Cation exchange sites of clay and organic matter
3. Occluded and co-precipitated in soil oxide material.
4. Specific adsorption sites
5. Inorganic matter and living organisms
Factors affecting Cu availability
1. Soil texture
2. pH
3. CEE
4. Org matter content
5. Hydrous oxides
Soil texture
Sandy soils contain lower amounts of Cu than silt and clay soils.
pH
The concentration of Cu in soil solution decreases with increase in pH.
Interaction with other nutrients

Application of NPK fertilizer induce Cu deficiency
Increase N supply to crops reduce mobility of Cu in plants
High concentration of Zn, Fe and P in soil solution also can depress Cu absorption by plant roots.
BORON
B concentration in mono cotyledons and dicotyledons (20-60 ppm) varies between 6 and 18 ppm.
It is absorbed by plants as undissociated boric acid (H3BO3).
Functions of boron
1. New cell development in meristematic tissue.
2. Pollination, fruit / seed set.
3. Translocation of sugars, starches, N and P
4. Synthesis of proteins and amino acids.
5. Nodule formation in legumes
6. Regulation of CHO metabolism.
Deficiencies of Boron
1. Since it is immobile, deficiency Symptoms occurs in terminal bud growth.
2. Flowering and fruit development are restricted.
3. Sterility and mal formation of reproductive organs.
4. Thickened and curled leaves.
5. Discoloration, cracking or rotting of fruit, tubers or roots
Apple - Internal cracking.
Break down of internal tissue in root crops given rise to darkened areas referred to Brown heart / black heart : cotton - weeping disease.
Sources of boron
1. Non metal among the micronutrient
2. Low concentration in earth crust igneous rocks (<10 ppm)
3. Tourmaline and borosilicate contains B.

Forms of boron (Boron cycle)
B exists in 4 forms in soil.
1. Rocks and minerals.
2. Adsorbed on clay surface, Fe and Al oxides combined with O.M.
3. Boric acid (H3BO3) and 4 B (OH)-4 in soil solution.
Boron cycling between the solid and solution phase is very important because of the narrow range in solution concentration the separates deficiency and toxicity in crops.
Soil solution B
H3BO3 is the predominant species in soil solution at pH values ranging from 5-9. At pH > 9.2 H3BO3
- can hydrolyse to H4BO4-. It was taken by Massflow and Diffusion methods in plants.
Absorbed B
B adsorption and desorption can helps to reduce B leaching losses. Main B adsorption sites are
1. Broken Si - O and Al-O- bonds at the edge of clay min.
2. Amorphous hydroxide structure
3. Al and Fe oxides and hydroxides.
Factors affecting B availability
1. Soil texture : Fine text soils added B for longer period than coarse text soil.
Plants can take up larger quantity of B from sandy soils than fine text soil at equal concentration of H2O soluble B.
2. Type of clay : Mica > mont > kaolinite
3. Soil pH and liming : Less avail to plants with increase pH heavy liming lead to greater adsorption and reduced B uptake.
4. Organic matter : Avail of B in surface soil is high compared to subsurface soil.
5. Interactions with other cations
Occurrence of Ca in alkaline soil with restrict B availability. Increased K rates causes B toxicity.
6. Soil moisture
Restricted moist supply reduce the B availability in the root zone.

Boron cycle in soil
Mulch (straw)
MOLYBDENUM
Non metal anion absorbed as molybdate (MoO4). It is weak acid and form complex poly anions such as phosphomdybdate. Plant contains <1 ppm Mo.
Functions of Mo
1. Essential component of enzyme NO3 reductase, which catalyses NO3- to NO2
-.
2. Structural component of nitrogenase enzyme - involved in N fixation.
3. Essential for absorption and translocation of Fe in plant 6.
Deficiency of Mo
1. Inhibits flower formation
2. Imbalances various Amino Acids in plants.
Residue
decay
Uptake Fertilizer / manure
Organic B
Absorbed
B B
leaching
Primary and
secondary B
minerals
Solution B
H3BO3-‐
(H4BO4-‐)

3. Reduce activity of symbiotic and non symbiotic N fixation.
Cauliflower - Whip tail.
Sources of Mo
Earth crust 2 ppm : and range from 0.2 to 5 ppm.
Forms of Mo
1. Non exchangeable Mo in primary and secondary minerals.
2. Exchangeable Mo held by Fe and Al oxides.
3. Mo in soil solution
4. Organically bound Mo.
Mo in solution occurs mainly as Mo4=, HMoO4
-, H2MoO4o.
Factors affecting Mo availability
1. Soil pH and liming
Mo availability increases with increasing pH. Liming to correct acidity will increase Mo avail. Mo avail decrease with application of acid forming fertilizer (NH4)2SO4.
2. Reaction with Fe and Al
Strongly absorbed by Fe and Al oxides.
3. Interaction with other nutrients
Mg and P enhances Mo absorption by plants.
High level SO4 decrease Mo absorption by plants.
Cu and Mn decrease Mo uptake by plants.
NO3-N encourages Mo uptake
NH4-N reduces Mo uptake
The beneficial effect of NO3- nutrition is related to the release of OH ions.
CHLORINE
Normal concentration in plant is about 0.2-2.0%. Absorbed by plants as Cl- through roots and aerial parts.
Functions of chloride

1. Essential for biochemical reactions Osmotic cation neutralization reactors.
2. Act as a counter ion during rapid K fluxes.
3. Involves in the evaluation of O2 in photosynthesis.
4. Creates disease resistant by increase osmotic pressure in cell sap.
Deficiency of Cl
1. Partial wilting and loss of turgidity.
2. Necrosis, leaf bronzing and reduction in growth.
Sources of Cl
i. Igneous and metamorphic rocks
ii. Soluble salts such as NaCl, CaCl2 and Mgel2.
iii. Earth crust 0.02-0.05%.
It is mobile with in the plant it can be rapidly recycled through soil systems.
COBALT
Normal concentration of Co in dry matter - 0.02 - 0.5 ppm.
Functions of cobalt
1. Essential for M.O. fixing atmosphere. N. It forms vit. B12 during growth and development of symbiotic M.O.
2. Improves growth, transpiration and photosynthesis.
3. Take parts in leg hemoglobin metabolism and Rhibonucliotide reductase.
Deficiency
1. Acidic, highly leached, sandy soils with total Co low.
2. Calcareous and peaty soils.
Factors affecting : Co availability
1. Soil pH : Avail increase with increase in soil acidity, H2O logging conditions. 2. Liming and drainage practices - reduce co availability. 3. Application CoSO4 rectify the deficiency.

VANADIUM
Low concentration of Vanadium is beneficial for growth of Microorganisms.
Vanadium substitute for Mo in N fixation by Rhizobia.
Involves in Biological - oxidation-reduction reactions.
NICKEL
Nickel content in plant is 0.1 - 1.0 ppm dry matter basis.
Taken by plant as Ni2+
High levels of Ni may induce Zn or Fe deficiency
1. Ni - metal component of urease that catalyse reaction.
CO (NH2)2 + H2O 2NH3 + CO2.
2. Essential for N metabolism.
3. Stimulates nodule weight and yield of crops.
SODIUM
Functions
1. Essential for maintaining turgor and growth of Plants.
2. Helps oxalic acid accumulation in Plants.
3. Helps in stomatal opening and regulate NO3- reductase activity.
Sources of Na
Earth crust 2.8% soils
Minerals.
Forms of Na in soil
Solution, exchangeable Na and in silicate minerals.
In arid and semi arid soils Na exist in silicates, NaCl, Na2SO4
Na salts accumulating in poorly drained soils of arid and semi arid regions and causes soil salinity and sodicity.

Effect of Na on soil properties
Dispersing action of Na+ on clay and organic matter reduces soil aggregation, permeability to air and H2O, germination and root growth.
Sodium fertilizers
Sodium NO3 : 25% Na
Rhenania PO4 12% NA
Abundant element. in lithosphere and absorbed as monosilicic acid.
Cereals and grass contain 0.2 - 2.0%.
Functions of silica
1. Contributes structure of cell wall.
2. Contributes drought tolerance to crops.
3. Regulates photosynthesis.
4. De activates invertase enzyme activity in sugarcane resulting grater sucrose production.
Larger amounts of Si are accumulated in intracellular deposits known as ‘PLANT OPALS’.
5. Increased available P.
6. Responsible for plant disease resistance.
Sources of silicon
Earth crust : 27.6% Most abundant element in earth crust.
Soils 23-35%
Primary and secondary mineral and quartz - major source.
Quartz is the most common mineral in soil, comprising 90-95% of all sand and silt fractions.
Factors affecting Si availability
1. High H2O content encourages Si uptake
2. Heavy application of N decreases Si concentration
3. Liming decreases Si uptake in plants.
4. Acidification increases Si uptake
5. Fe and Al oxides influence Uptake of Si by plants.

Si fertilizers
1. Calcium silicate slag (CaAl2 Si2O4) - 18.21% Si
2. Calcium silicate (CaSiO3) - 31% Si.
3. Sodium metasilicate NaSiO3 - 23% Si.
Chelates
Chelate is a term derived from a Greek word meaning, “claw”. Chelates are soluble
organic compounds that bond with metals ions such as Fe3+/ Fe2+, Zn2+, Cu2+, Mn2+, and
other, thereby increasing their solubility and supply to plant roots. It is important particularly in
micronutrient availability.
Numerous natural organic compounds in soil, or synthetic compounds added to soils,
are able to complex or chelate ions of micronutrients.
Natural organic chelates in soils are products of microbial activity and degradation of
soil organic matter and plant residues. Root exudates also are capable of complexing
micronutrients.
The concentration of metal ions in solution and the quantity transported to the root by
mass flow and diffusion can be greatly increased through complexation with natural organic
chelating compounds in soil.
Substantial quantities of organic-complexed metal ions can be cycled through crop
residue, which remain available for the succeeding crop.
Many of the natural organic chelates have not been identified; however, compounds
like citric and oxalic acids have chelating properties.
Common synthetic chelates are:
Ethylene diamine tetra acetic acid (EDTA)
Diethylene triamine pentaacetic acid (DTPA)
Ethylene diamine di-o-hydroxy phenyl acetic acid (EDDHA)

References
Tisdale,S.L.,Nelson,W.L.,Beaton,J.D.,Havlin,J.L.1997.Soil fertility and Fertilizers.Fifth edition, Prentice hall of India Pvt.Ltd,New Delhi. Singh, S.S.1995.Soil fertility and Nutrient Management. Kalyani Publishers,Ludhiana. http://www.ncagr.gov/cyber/kidswrld/plant/nutrient.htm Mortvedt,J.J.et al.(Eds.).Micronutrients in Agriculture.No.4,Soil Science Society of America,Madison,Wisconsin,USA. Questions to ponder
1) What is the role of organic matter addition on micronutrient availability to plants? 2) How does Fe and Al oxides affect the micronutrient availability? 3) Why is copper deficiency often referred to as reclamation disease? 4) What are the ways to avert Fe chlorosis? 5) What are the common manganese fertilizer materials?

LECTURE 12
NUTRIENT DEFICIENCY AND TOXICITY
Causes and Symptoms
Nitrogen
When N supplies are more than sufficient, carbohydrates are converted to
proteins. Hence, vegetative portion is less with carbohydrates and more with
protein as protoplasm. As protoplasm are highly hydrated more succulence
results.
Excessive succulence may have a harmful effect. With cotton, a
weakening of the fiber; with grain crops, lodging particularly with a low K supply;
more susceptibility to disease and insect attack occurs.
N deficient plants become stunted and yellow in appearance. The loss of
protein N from chloroplasts in older leaves produces yellowing or chlorosis - indicative of N deficiency. Chlorosis appears first on lower leaves; upper leaves
remain green. Under severe N deficiency, lower leaves turn brown and die. This
necrosis begins at the leaf tip and progresses along the midrib until the entire leaf
is dead. The tendency of the young upper leaves to remain green as the lower
leaves yellow or die is an indication of the mobility of N in the plant.
Phosphorus
The marked effect of P deficiency is retarding overall growth; the striking
foliar symptoms that are evident with N or K deficiency are seldom observed for
P, In corn and some other grass species, purple discoloration of the leaves or
leaf edges appears.

Potassium
When K is limiting, characteristics deficiency symptoms appear in the
plant. Typical K deficiency symptoms in alfalfa are white spots on the leaf edges;
in corn nd banana chlorosis and necrosis of the leaf edges.
Since K is mobile in plant, visual deficiency symptoms appear first in the
lower old leaves, progressing toward the top with severity. K deficiency also
occurs in young leaves of high-yielding, fast maturing crops like cotton and
wheat. Another symptom is weakening of straw in grain crops, causing lodging in
small grains and stalk breakage in corn and sorghum, reducing crop yields.
In fact, serious yield reductions may occur without deficiency symptoms.
This phenomenon is termed hidden hunger and is not restricted to K alone.
Calcium
In corn, Ca2+ deficiency prevents the emergence and unfolding of new
leaves, the tips are almost colorless covered with a sticky gelatinous material that
causes them to adhere to one another.
In fruits and vegetables, the most frequent indicator of Ca2+ deficiency is
disorders in the storage tissues: Blossom-end rot in tomato, bitter pit of
apples. Often Ca2+ is an immobile element in the plant; hence, there is very little
translocation of Ca2+ to fruits and storage organs.
Magnesium
Deficiency symptoms often appear first on the lower leaves. In many
species, shortage of Mg2+ results in interveinal chlorosis of the leaf, in which only
22 (1/6)

veins remain green. In more advanced stages the leaf tissue becomes
uniformly pale yellow, then brown and necrotic. In cotton, the lower leaves may
develop a reddish-purple cast, gradually turning brown and finally necrotic.
Sulphur
S deficiency has a pronounced retarding effect on plant growth,
characterized by uniformly chlorotic plants - stunted, thin-stemmed, and
spindly. In many plants, these symptoms resemble those of N deficiency. Unlike
N, deficiency symptoms occur first in younger leaves.
S deficient cruciferous crops such as cabbage and rapeseed will initially
develop a reddish color on the underside of the leaves. In rapeseed the leaves
are also cupped inward. In cabbage, there is a reddening and purpling of both
upper and lower leaf surfaces; the cupped leaves turn back on themselves,
presenting flattened-to-concave surfaces on the upper side.
Boron
B deficiency symptoms appear as thickened, wilted, or curled leaves; a
thickened, cracked, or water-soaked condition of petioles and stems; and a
discoloration, cracking, or rotting of fruit, tubers, or roots.
Internal cork of apple is caused. In citrus fruits uneven thickness of the
peel, lumpy fruit, and gummy deposits result. The breakdown of internal tissues
in root crops appear as darkened areas and referred as brown heart or black heart.
22 (2/6)

Iron
Fe deficiency is most frequently seen in crops growing on calcareous or
alkaline soils. Fe chlorosis is exhibited by citrus and deciduous fruit crops, by
sorghum, grown in neutral to alkaline soils. Other crops are soybeans, beans,
corn, strawberries, avocado, vegetable crops, and many ornamentals.
Deficiency of Fe shows up first in young leaves, as a result, growth
ceases. The young leaves develop an interveinal chlorosis, which progresses
rapidly over the entire leaf. In severe cases, the leaves turn entirely white.
Fe toxicity causes nutritional disorders in rice grown on poorly drained,
submerged soils. This condition known as bronzing is associated with Fe levels
> 300 ppm in leaf blade of rice at tillering.
Manganese
In broad-leaved plants, interveinal chlorosis appears. Mn deficiency of
several crops is described by terms: gray speck of oats, marsh spot of peas, speckled yellows of sugar beets. Wheat plants low in Mn are often more
susceptible to root rot diseases.
Plants are injured by excessive amounts of Mn. Crinkle leaf of cotton is
an Mn toxicity observed in highly acid red yellow soils. Mn toxicity in tobacco,
soybeans, tree fruits, and rapeseed is noted on extremely acid soils.
Copper
Deficiencies of Cu are reported in numerous plants, although they are
more prevalent among crops growing in peat and muck soils. Crops most
9 (3/6) 22 (3/6)

susceptible to Cu deficiency include alfalfa, wheat, onions, carrots, clover, corn,
and fruit trees.
Symptoms vary with crops. In corn, the youngest leaves become yellow
and stunted, and if more severe, the young leaves turn pale and older leaves die
back. In advanced stages, dead tissue appears along the tips and edges of the
leaves in a pattern similar to that of K deficiency.
Cu-deficient small-grain plants lose color in young leaves, which break,
and die. In many vegetable crops, the leaves lack turgor, developing a bluish-
green cast, with chlorotic curl; flower production fails.
Zinc
Crops sensitive to Zn deficiency are corn, beans, citrus, flax, grapes,
onions, rice, and soybeans. Mildly sensitive crops are alfalfa, clovers, sorghum,
sudan grass, and tomatoes.
Deficiency symptoms appear frequently in leaves; sometimes in fruit or
branches or affect in overall development of the plant. Symptoms include light
green, yellow, or white areas between the veins of leaves particularly the older
lower leaves resulting in: Chlorotic leaf areas; Shortening of the stem rosette
appearance of the leaves; Malformation of the fruit, often with low or no yield.
White bud in corn and sorghum, little leaf in cotton, mottle leaf or
frenching in citrus crops, fern leaf in potato are described terms of Zn
deficiency.
Molybdenum
22 (4/6)

Mo is a structural component of nitrogenase enzyme that actively involves
in N2 fixation. Mo deficiency arrests biological N2 fixation. Legumes exploit soil N
supplies, turning soil to low N fertility, if the legume residues are not incorporated
in soil.
Chloride
As Cl- is the active osmotic agent, its deficiency results in partial wilting
and loss of leaf turgor. Chlorosis in younger leaves and an overall wilting of the
plants are the two most common symptoms of Cl- deficiency. Necrosis in some
plant parts, leaf bronzing, and reduction in root growth may be seen. Tissue
concentrations below 70 to 700 ppm are usually indicative of deficiency.
Symptoms high level of Cl- in wheat plants are increase total leaf water
potential and cell sap osmotic potential. Excess of Cl- can be harmful, and crops
vary widely in their tolerance to this condition. Tobacco, legumes are among the
most sensitive crops. Leaves of tobacco and potatoes thicken and tend to roll.
The storage quality of potato tubers is adversely affected.
Cobalt
The essentiality of Co is for the growth of symbiotic microorganisms such
as symbiotic rhizobium, free-living N2-fixing bacteria, and blue-green algae and in
the formation of vitamin B12. Hence, lack of cobalt affects N2 fixation in soil.
Silicon

Freckling, a necrotic leaf condition is a symptom of low Si in sugarcane
receiving direct sunlight due to Ultraviolet radiation. Adequate Si in sugarcane
plant filters out harmful ultraviolet radiation.
The oxidizing power of rice roots and accompanying tolerance to high
levels of Fe and Mn were dependent of Si nutrition. Si application is necessary
when Si concentration in rice straw falls below 11%. Many of the favorable
effects of Si on plant growth, such as disease resistance, stalk strength, and
reduction in lodging, have also been attributed to K.
Nickel
High levels of Ni may induce Zn or Fe deficiency because of cation
competition. Application of some sewage sludge may result in elevated levels of
Ni in crop plants.
22 (5/6)

LECTURE 13
. SOIL FERTILITY EVALUATION
Calibration, Correlation of crop responses, yield prediction,
fertilizer recommendation
SOIL TESTING RESEARCH IN INDIA
Farming is a business and, like all businesspersons, the farmer operates
farming business for profit. Obviously, to reach a decision before planting a crop,
a farmer needs all of the reliable information from the country’s soil evaluation
programme. In our country, system of fertility evaluation is being modified from
time to time in various stages incorporating crop response data.
Some Important landmarks in soil testing research in India:
Year Landmark
1953 Soil fertility and fertilizer use project
1955 Establishment of Soil Testing Laboratories
1956 All India Coordinated Agronomic Research
Project
1960s Establishment of Agricultural Universities
1967 All India Coordinated Research Project on Soil
Test Crop Response (STCR) correlation
1967 All India Coordinated Research Project on
Micronutrients in Soils and Plants
1970 All India Coordinated Research Project on Long
term Fertilizer Experiments
1980s Emphasis on fertilizer prescription for whole
8 (6/6) 22 (6/6)
23 (1/16)

cropping system based on initial soil tests.
Since Liebig’s time around 1840 many methods and approaches have
been tried to get a precise or workable basis for predicting the fertilizer
requirements of crops. The fertilizer use project initiated in 1953 following a
study by Stewart (1947) was the first systematic attempt in the whole of the
country to relate the knowledge of soils to the judicious use of fertilizers.
The establishment of soil testing laboratories was initiated in 1955-56.
The project on Model Agronomic Experiments on Experimental Farms
and Simple fertilizer trials on cultivators’ Fields was started in 1957. The Soil
Test Crop Response (STCR) correlation work carried out at Indian
Agricultural Research Institute, New Delhi had resulted in the selection of
soil test methods and categorizing the tests into low, medium, and high soil
fertility classes.
Soil fertility evaluation
Soils are very heterogeneous in respect to forms of nutrients they
contain, which greatly complicates the interpretation of Soil Test for
assessing fertilizer needs. The total amount of a nutrient present in a soil
offers little information relative to the amount of that nutrient which is
available. Numerous extracting solutions and procedures have been used to
remove nutrient elements from the soil, but none remove exactly the amount
that plant roots obtain.
This means that, in order to interpret the data, the results from each
analytical procedure must be correlated with the plant response obtained in
field experiments by applying that fertilizer nutrient.
By this calibration, the requirement of fertilizer is calculated for achieving
specific yield target. Soil fertility evaluation preferably employs a particular
method of calibration as per the utility of the outcome.

Crop Response Data
In nutrient rating experiments, soil test data is correlated with the
response of crop. The response is measured in terms of ‘percent yield’ or
‘percent yield increase’. Both represent the ratio of the yield obtained in
unfertilized soil (nutrient limiting deficient soil) to the yield in fertilizer nutrient
applied soil (non-limiting or nutrient sufficient soil). The yield in non-limiting
soil is otherwise known as maximum attainable yield or yield of standard
treatment with all nutrients applied.
While comparing native fertility, in experiments that are conducted at
different locations, percent yield is used.
Yield without fertilizer nutrient Percent yield =
Yield in standard treatment X 100
While conducting multi location trials, or a pot experiment in a single
location with soils brought from different locations, percent yield increase is
worked out for every level of fertilizer application. The highest yield obtained
in the experiment with all fertilizer nutrient applied, is taken as Maximum
attainable yield
Yield at fertilizer
nutrient level -
Yield without
fertilizer nutrient Percent yield
increase = Maximum attainable yield
X 100
The soils analyzed by standard nutrient extraction method are
grouped. The soil tests are calibrated into different fertility groups by various
procedures.
23 (2/16)

Present approaches in formulation of fertilizer recommendations extensively
used in India:
Soil testing programme was initially started adopting the International
soil fertility evaluation and improvement programme (Fitts, 1956). In this
approach much stress is laid on laboratory characterization, followed by
potted-plant studies ultimately leading to field - verification trials. These two
initial steps help in eliminating arbitrariness of field trials. However, this
approach had low adoption as it arrived one critical value below which
economic responses are possible. Later, many improvements were
suggested.
AGRONOMIC APPROACH
This is based on fertilizer rate experiments (recording yield at
increasing nutrient levels) conducted at many locations. The level at which
yields are high are recorded and averaged. From these results, the optimum
dose of fertilizer is recommended for a crop at given agro-climatic region.
Eg. A blanket dose of 120-50-50 kg/ha of N, P2O5, K2O respectively is
recommended for rice.
CRITICAL LIMIT APPROACH
Waugh and Fitts (1965) developed this technique which is largely
meant for less mobile nutrients like P, K and micronutrients. Soils vary
considerably in fixing capacities. Due to it a part of applied P, which is fixed
in soil, is not readily available to plants.

The method includes incubation study. For P, Soil is incubated for 72
hours with graded doses of soluble P in the form of monocalcium phosphate.
Then, the amount of phosphates released (extracted) with an extracting
reagent (Olsen or Bray) will be determined. The extracted P versus the
amount of P applied is plotted. If the relationship is unique, then for high P
fixing soils a larger amount of fertilizer P application is needed. This amount
of P fixed is estimated as X-value.
0
20
40
60
80
100
120
140
% Yield
Soil Test P
0 2 4 6 8 10 12 14 16 18 20 22
Critical limit
Responding population
Non-responding population
23 (6/16)

Then, in potted experiment fertilizer P is added at 0, 0.5X, X, 2X levels,
and the test crop was grown to find out the soil critical value. The percentage
yield obtained is plotted against the soil-test value for different soils. By using
a plastic overlay, these data are grouped into two populations as described by
Cate and Nelson (1965). The soil-test value where the vertical line crosses
the x-axis is designated as the soil critical limit.
Critical limit for the soil test value is the limit below which a positive
or economic response to added fertilizer is possible and above which the
response diminishes at a faster rate or vanishes.
The validity of critical value is verified by conducting verification trials
in the field locations where from the soil samples have been collected for pot
studies.

14. PREDICTING YIELDS USING NUTRIENT FUNCTIONS
Nutrient function Crop yield is a function of 4 major factors:
Yield = f (crop, soil, climate, management).
Nutrient functions are fitted using data obtained in experiments conducted
either in deductive or inductive approach.
Deductive approach
Deductive approach utilizes the natural variation in soil fertility for
calibrating soil test values. Multilocation trials are carried out with same set
of treatments. The responses are then fitted in the fertilizer prescription
models.
Colwell (1967) developed this approach on the basis that some
variables, which affect the response of crop to fertilizers, if omitted from the
correlation between soil test and crop response, led to poor correlations. To
prevent this difficulty, a calibration model was suggested based on the
generalization of coefficients of an orthogonal polynomial yield-response
model, which can include all the variables affecting the responses to
fertilizers.
Inductive approach
23 (7/16)

This approach is by creating fertility gradient artificially in a particular
experimental location by addition of fertilizers. The approach of inducing
fertility gradient (Ramamoorthy, 1970) aims at eliminating influence of the 3
out of 4 factors in the yield function, namely: crop, climate and management
in the experimental location.
A large field having wide variation in fertility is chosen in a location. It
is divided into 4 strips, which are treated with 4 doses of N, P and K
fertilizers, viz., control (N0P0K0), ½ normal dose (N½ P½ K½), normal dose
(N1P1K1) and double dose (N2P2K2). The normal doses are fixed based on
nutrient fixing capacity of the soil. Exhaustive crop like maize is grown.
The calibration crop experiment is then laid out. For the purpose of
correlation, 21 treatments having one untreated check plot are tested.
Quadratic Model:
Percentage of yield maximum concept (sufficiency concept)
This is commonly known as Mitscherlich and Bray approach. An
empirical relationship is developed between percent yield, soil test, and
fertilizer maximum yield (Bray, 1944).
23 (8/16)
0
20
60
80
100
40
0 2 4 6 8 10 12 14
Units of growth factor (soil and fertilizer)
% of maximum
yield Y = A (1-10- Cs b – C x)

Presently, this approach is modified and used by the Department of
Agriculture, Tamil Nadu for giving site-specific fertilizer recommendations.
The modified Mitscherlich-Bray equation is:
Log (A-Y) = Log A - Csb – Cx
Where, A = calculated maximum yield
Y = percentage yield
Cs = proportionality factor for soil nutrient
b = soil test value
x = dose of fertilizer added.
The maximum yield (A) is calculated by extrapolation.
Quadratic Model:
Regression model for maximum profit
The amount of fertilizer that produces the greatest profit per hectare is
called the optimum dressing (Cooke, 1972). Ramamoorthy (1974)
established a significant relationship between soil tests, added fertilizers and
crop yields by fitting a multiple regression of the quadratic form (orthogonal
polynomial yield-response model):
Y = A + b1SN + b2SP + b3SK + b4SN2 + b5SP2 + b6SK2
+ B7FN + b8FP + b9FK + b10FN2 + b11FP2 + b12FK2
+ b13SNFN + b14SPFP + b15SKFK
Where Y = Crop yield (kg/ ha)
A = Intercept
bi = Regression coefficient

SN, SP, SK = Available contents of soil N, soil P and Soil K
FN, FP, FK = Fertilizer N, Fertilizer P, Fertilizer K
Fertilizer calibrations for varying soil test value for obtaining maximum
profit per hectare could be derived where the response to added nutrient
follows the law of diminishing returns (Ramamoorthy, 1974)
Fertilizer adjustment equation is derived in the form:
FN = a - b SN – c R
FP2O5 = a - b SP – c R
FK20 = a - b SK – c R
Where,
Cost of fertilizer nutrient (Rs./kg) R =
Value of produce (Rs./kg)
Linear model:
Targeted Yield approach
Fertilizer recommendation must aim at providing balanced nutrition to
crops. Balanced nutrition should ensure the nutrients to be present in
available forms in adequate quantities and required proportion for the plant
in order to produce maximum yield. The requirement of nutrient to produce
the expected yield can be worked out based on nutrient uptake.
Nutrient requirement of crops
23 (9/16) 23 (10/16)

Nutrient Requirement (kg) to produce
100 kg of economic produce Crop
N P2O5 K2O
Rice 2.01 1.12 3.00
Wheat 2.45 0.86 3.28
Maize 2.63 1.39 3.58
Sorghum 2.24 1.33 3.40
Finger millet 2.98 1.13 3.90
Chick pea 4.63 0.84 4.96
Soya bean 6.68 1.77 4.44
Ground nut 5.81 1.96 3.01
Potato 0.39 0.14 0.49
Cotton 4.45 2.83 7.47
Liebig’s law of minimum states that the growth of plants is limited by
the plant nutrient element in the smallest quantity, when all others being
present in adequate amounts. This forms the basis for fertilizer application
for targeted yields, first advocated by Troug (1960) by significant linear relationship between the yield of grain and uptake of nutrients. Yield target
can be projected within the linear region of the response function.
This approach, popularly known as Soil Test Crop Response
Function (STCR), implies that for obtaining a specific yield (grain or any
other economic produce) a definite quantity of the nutrient must be taken up.
This value can be determined by the magnitude of the expected yield (T in
q/ha) and the nutrient requirement to produce unit quantity of that target (NR
in kg/ha).
Once it is known for a target yield, the fertilizer dose (FD kg/ha) can
be estimated.
11 (10/16)

It is done by taking into account the efficiency of soil contribution (CS
in percent) from the soil available nutrients (STV in kg/ha), and the efficiency
of fertilizer of fertilizer contribution (CF in percent) from the fertilizer nutrients
(FD in kg/ha) towards the total uptake.
NR CS FD =
CF X 100 T -
CF X STV
Where F and S stand for fertilizer and soil nutrient in Kg/ha and T is
yield target in q/ha.
23 (11/16)

LECTURE 15
FERTILITY EVALUATION BY PLANT ANALYSIS
Plant analysis is a useful diagnostic tool to ascertain if a nutrient has
been or is being assimilated. Plant analysis is also important in ascertaining
the nutrient requirements and nutrient status of plants during various stages
of growth.
A reasonably simple laboratory test of plant sample provides a
measure of nutrient availability in soil or nutrient status of plant at the time
the sample was collected. If these tests are to be useful in making fertilizer
recommendations, a coordinated laboratory-field research program must be
conducted in order to obtain the desired information.
Deficiency symptoms
Careful inspection of growing seedling or plants can help identify specific
nutrient stress. If a plant is lacking in a particular nutrient, characteristic
symptoms may appear. Nutrient deficiency symptoms must be related to
some function of the nutrient in the plant. Visual symptoms may be
caused by more than one nutrient. In a set of nutrient omission and
addition pot experiments, exact limiting nutrients can be identified.
Tissue tests
The concentration of the nutrients in the cell sap is usually a good
indication of how well the plant is supplied at the time of testing. These
semi-quantitative tests are intended mainly for verifying or predicting
deficiencies of N, P, K, S and several micronutrients.

Method: the plant parts may be chopped up and extracted with reagents.
The intensity of color developed is compared with standards and used as
a measure of nutrient concentration. Tissue tests are quick, easy to
conduct and interpret.
For tissue tests, the time of sampling and plant part to be sampled have
already been standardized for many crops. Tissue test can be done 5-6
times in a season and concentration can be monitored in the farm
premises.
There can be two peak periods of nutrient demand, one during maximum
vegetative growth and second during reproductive stage. Fertilization
can be done to maintain the peak concentration at critical stages.
Total plant analysis
As in tissue tests, a standardized method for time and method of
sampling of plant part are available for total analysis, which is done at
laboratory. The critical nutrient concentration is commonly used in
interpreting plant analysis results and diagnosing nutritional problems.
Diagnosis and Recommendation Integrated System (DRIS)
DRIS is a system that identifies all the nutritional factors limiting crop
production. Index values measure how far particular nutrients in the leaf
or plant are from optimum levels. Index values are used in the calibration
to classify yield factors in the order of limiting importance. To develop a
DRIS for a given crop, the following criteria are to be well considered.
23 (12/16)

All factors having effect on yield
Relationship among factors
Calibration norms
Continually refined recommendations
DRIS was developed based on nutrient ratios. When compared to
concentration that normally varies with season, nutrient ratio does not vary
much. When a nutrient ratio has an optimal value, optimum yield occurs
unless some other limiting factor reduces the yield.
N → N ↑ N ↓
P → P ↑ P ↓
Both numerator
and denominator
optimal
Both numerator
and denominator
excessive
Both numerator and
denominator
insufficient
When the ratio is too low a response in the numerator will be obtained
if it is limiting. If the nutrient in the denominator is excessive, a yield
response may or may not occur depending on the level of other yield factors.
23 (13/16)

K→
P→ →N
→K
N→ P→ Satisfactory nutrient balance
N/P
N/K K/P
K ↓
P ↑
N ↑
N ↓
P ↓
K ↑
Optimum nutrient balance
General diagram for a DRIS; constructed on nutrient ratios for N-P-K
When the ratio is too high the reverse it true. Usually N/S, K/Mg,
K/Ca, Ca + Mg /K, N/P ratios are commonly used. Initially relationship
among N-P-K is calibrated.
Thus, DRIS has several advantages to integrate much nutrient
concentration at various stages, in different seasons suitable for many
cultivars of a crop.
DRIS has been found suitable for several grain crops and perennial
fruit trees.
CROP LOGGING
An excellent example of the use of plant analysis in crop production is
the crop logging carried out for sugarcane in Hawaii. The crop log, which is
a graphic record of the progress of the crop, contains a series of chemical
23 (14/16)

and physical measurements. Critical nutrient concentration approach is
used in the crop log system.
In sugarcane, plant is sampled at 35 days and analyzed for N, sugar,
moisture and weight of young sheath tissue. Nutrients like P and K are
monitored at critical stages. Based on moisture, irrigation is scheduled.
Based on nutrient content, fertilizer application is done. By this record
keeping, the productivity of crop is increased.
BIOLOGICAL TESTS
Simpler and rapid laboratory/ green house techniques utilize small
quantity of soil to quantify nutrient supplying power of a soil.
Tests using higher plants:
Neubauer seedling method: The neubauer technique is based on the uptake
of nutrients by a large number of plants grown on a small amount soil. The roots thoroughly penetrate the soil, exhausting available nutrient supply within a short time. Usually 100 seedlings of rye or oats made to feed 100 g soil mixed with 50 g sand. Blank without soil is also run. Total P2O5 and
K2O uptake is calculated and blank value is detected to get root soluble P2O5 and K2O. Values designated as Neubauer Nos. (mg/ 100 g soil) are used to determine the deficiency. These tables give the maximum values of available macro and micronutrients for satisfactory yields of various crops.
23 (15/16)

Standard and Demont technique: It is a modified neubauer technique. Round cardboard cartons with bottom removed are nested in a container and filled with sand. Seeds are sown. After 2-3 weeks of growth, a carton containing
the plants is nested in a second carton holding 200 g soil or soil + fertilizer. When the mat of roots meets soil, it is allowed to feed for 3-4 days. Then nutrient uptake is estimated.
Deficiency test of sunflower for Boron
Sunflower is grown in the test soil supplied with nutrient solution with
all essential nutrients excepting boron. From the day of appearance of B
deficiency symptoms of leaves, the soil is identified as deficient (<28 days),
moderately deficient (28-36 days), and not deficient (>36 days).
Microbiological methods:
In the absence of nutrients, certain microorganisms exhibit behavior
similar to that of higher plants. For example, growth of Azotobacter or
Aspergillus niger reflects nutrient deficiency in the soil. The soil is grouped
from very deficient to not deficient in the respective elements, depending on
the amount of colony growth. In comparison with methods that utilize
growing of higher plants, microbiological methods are rapid, simple and
require little space.
Sacket and Stewart technique
23 (16/16)

For identifying P and K deficiency test soil is divided in to 4 portions. Solution containing soluble P, K, and P+K are added in 3 portions and one portion was allowed as check. They are inoculated with Azotobacter and incubated for 72 hrs. Based on colony growth deficiency is identified.
Melich Cunninghamella – plaque test:
Cunninghamella is sensitive for P. Test soil is mixed with nutrient
solution and a paste is prepared. The paste is spread on a clay dish.
Cunninghamella is inoculated at the centre and incubated for 5-6 days.
Based on the diameter of mycelial growth, the soil is diagnosed as deficient
(<10 cm), moderately deficient (11-21 cm), or not deficient (>22 cm).
Mulder Aspergillus niger test for Cu and Mg
Colours of mycelial and spores are used to delineate the deficiency of
Cu and Mg. This method is used for Mo, Co, Mn, S, Zn also.

LECTURE 16
SOIL TESTING AND CORRELATION
The composite samples obtained from fields are used in pot-
culture plant studies to assess the crop responses (in terms of dry matter) to
added fertilizers. Calibration of the responses to soil - test values was
obtained by using different methods. Fixation studies are conducted to
ascertain the capacity of soil to fix nutrient to be applied, finally, the results
are interpreted to confirm nutrient deficiencies, index soil fertility, and
establish “critical level” for each nutrient. The results are verified in the next
stage, in field experiments.
Fertility group/ Index
The International soil fertility evaluation and improvement programme
(Waugh and Fitts, 1965) advocated grouping of soils into low-medium-high
categories.
The method:
• Collection of representative soil samples and analysis by using
different extractants for the ‘available’ nutrient
• Conducting of potted-plant studies with graded doses of added
nutrient supplying all other nutrients to meet the crop requirement
• Computing of the percentage yield responses
• Plotting of the soil-test data obtained with different methods and the
percent yield response; and to find the scatter distribution for the best
correlating soils test methods. The scatter diagram will be generally
curvilinear. The response is less, as the soil test value increases.
• The general groups are low, medium and high
23 (3/16)

The fertility groups followed in Tamil Nadu
Available nutrients (kg/ ha) Fertility group
KMnO4-N NaHCO3-P NH4OAc-K
Low <280 < 11 < 118
Medium 280-450 11- 22 118-280
High >450 > 22 >280
This classification indicates that low classes of soils would markedly respond
to added fertilizers and high status of soils does not respond to them. In the
medium range, nothing could be predicted. In addition, by this grouping, it
was not possible to indicate how much fertilizer was to be added to get
economic yields. Thus, this grouping is qualitative. Arbitrarily, the
recommended dose of fertilizer for a crop is increased by 25% in low status
and reduced by 25 % in high status.
0
20
40
60
80
100
120
140
% Yield increase
Soil Test P
0 3 6 9 12 15 18 21 24 27 30 33
HIGH V. LOW LOW MEDIUM V. HIGH

Fertility index
Fertility index expresses the relative sufficiency as a percentage of soil nutrient amount adequate for optimum yields. The probability of a
response to fertilizer application increases with decreasing soil test level.
More than 85% of soils testing very low may give greater response and
profit. About 60-85% of soils, having medium soil test value may give little
profit. Around 15% soils with very high soil test may have little response.
In general, the very low to very high classification is easily understood by the
grower. However, separate group classification need to be done accounting
for greater variability associated with crops and soils.
Soil Test Rating Probability of Crop Response
(% Yield increase)
Fertility
Index
Very low 95–100 0-10
Low 70-95 10-25
Medium 40-70 25-50
High 10-40 50-100
Very High 0-10 100+
23 (5/16)

LECTURE 17
SOIL TESTING
Soil Testing, STL Functions
Soil Testing
Soil testing is defined as a ‘programme for procedural evaluation of
soil fertility by Rapid chemical analysis particularly to assess the available
nutrient status and reaction of a soil’.
A soil test is a chemical method for estimating nutrient supplying
power of a soil. Compared to plant analysis, the primary advantage of soil
testing is its ability to determine the nutrient status of the soil before the crop
is planted.
The result of a soil test is known as soil test value. A soil test value
measures a part of the total nutrient supply in the soil and represents only as
an index of nutrient ability.
Soil test do not measure the exact quantity of a nutrient potentially
taken up by a crop. To predict nutrient needs of crops a soil test must be
calibrated against the response of crops in nutrient rate experiments in
greenhouse and fields. Thereafter, interpretation and evaluation of the soil
test values primarily form the basis for fertilizer recommendation.
Soil test programmes have the following objectives:
• To provide an index of nutrient availability
• To predict the probability of profitable response to fertilizer

• To provide a basis for fertilizer recommendation
• To evaluate the soil fertility status and a county soil area or a
statewide basis by the use of the soil test summaries.
Phases of Soil Testing programme
1. Collecting the soil samples
2. Extraction and determining the available nutrients
3. Calibrating and interpreting the analytical results
4. Making the fertilizer recommendation and management
Soil sampling
The most critical aspect of soil testing is obtaining a soil sample that is
representative of the field. There is always a considerable opportunity for
sampling error. If a sample does not represent a field, it is impossible to
provide a reliable fertilizer recommendation.
The soils are normally heterogeneous, and wide variability can occur
even in a uniform fields. Intensive soil sampling is the most efficient way to
evaluate variability. The sampling error in a field is generally greater than
the error in the laboratory analysis.
Soil Unit: It is an area of soil to be represented by a composite sample.
After the soil unit is determined, the soil samples are collected throughout
the area. The number of samples for combining into each representative
composite sample varies from 5-20 samples in an area of an acre. Usually a
composite sample of one kg of soil is taken from a field.
The size of the area may be sometimes even less for areas that vary
in appearance, slope, drainage, soil types, past treatment These areas are
24 (1/4)

to be sampled for separately. The purpose of the procedure of making a
composite sample is to minimize the influence of any local non-uniformity in
the soil.
Normally for all field crops, sampling soil up to 15 cm depth is
practiced. For deep-rooted crops and tree crops samples up to 1-2 m
may be necessary. While sampling, first a uniform portion is taken from the
surface to the depth desired. Second, the same volume is obtained from
each area.
Preparation of the composite soil sample in the laboratory
It involves the following steps: Drying, grinding, sieving, mixing,
partitioning, weighing, and storing. Uniform mixing and sampling is done by
Quartering Technique:
The soil sample is coned in the center of the mixing sheet. Cone is
flattened and divided through the center with a flat wooden sheet. One half
is moved to the side quantitatively. Then each half is further divided into
half, the four quarters being separated into separate ‘quarters’. Two
diagonally ‘opposite quarters’ are discarded quantitatively. The two other
are mixed by rolling. This process is repeated, until 250-500 g composite
soil material is obtained.
For micronutrient analysis – sampling and processing of samples
should alone be done only with stainless steel materials, plastic, or wood to
avoid contamination.
The soil test values calibrated nutrient functions are advocated to the
farmers as a package of nutrient management that aims at judicious use of fertilizers. Ultimately any soil testing and interpretation must involve
24 (2/4)
24 (3/4)

‘economics’ because it is used to make a fertilizer recommendation to
achieve an economic goal that would give maximum profit per hectare of
land.
Extraction and determining the available nutrients
Many chemical extractants have been developed for use in soil
testing. The ability of an extractant to extract a plant nutrient in quantities
related to plant requirements depends on the reactions that control nutrient
supply and availability. The extractants commonly used in soil testing
programmes are given below.
Plant nutrient Common
extractant
Nutrient source
extracted
NO3- KCl, CaCl2 Solution
NH4+ KCl Solution -
Exchangeable
Available N KMnO4 - NaOH Mineralizable
Organic N
NH4F - HCl (Bray-
p)
Fe/ Al mineral
solubility
H2PO4-/ HPO4
2-
(Available P)
NaHCO3 - P
(Olsen-P)
Ca mineral solubility
K+(Available K) NH4OAc-K Exchangeable
Ca2+, Mg2+ EDTA Exchangeable
SO42- CaCl2 Solution AEC
Zn2+, Fe3+, Mn2+,
Cu2+
DTPA Chelation

H3BO30 Hot water Solution
Organic C Chromic acid Oxidizable C
SOIL TESTING LABORATORY
Soil Testing Laboratories of the Department of Agriculture funded by
State Government are functioning at identified centres in each district. Soil
testing services are also extended to the farming community in the Soil
Laboratories operated by Central government and Agricultural Universities.
The major functions of State Soil Testing Laboratory are:
• Analysis of soil samples which are collected from the farmers by the
Assistant Agricultural Officers for texture (by feel method), lime status,
Electrical conductivity, pH and available N, P and K status at lower
charges/ sample; and advocating fertilizer recommendation for different
crops. Available micronutrients will be analyzed on request.
• Analyzing irrigation water samples for EC, pH, cations, and anions;
Assessing their quality based on different parameters; and suggesting
suitable ameliorative measures for different soil condition and crops.
• Adopting two villages for a particular period by each soil testing
laboratory; collecting and analyzing the soil and irrigation water samples
at free of cost and advocating the recommendations.
• Collection of benchmark water samples from the wells marked in a
particular block/ water shed/ taluk. After analyzing the water samples for
different properties, water quality map will be prepared.
10 (4/8)

• Based on the soil test value for the soil samples collected during the
particular year they are rated as low, medium, and high; and village
fertility indices will be prepared.
• Conducting trials related to soil fertility to solve the site-specific problems.
Functions of mobile soil testing laboratory
• The staff of the Mobile STL will visit the villages, collecting and analyzing
the soil and irrigation water samples in the village itself and giving
recommendations immediately.
• Showing the audio-visual programmes through projectors in the villages
educating the importance of soil testing, plant protection measures and
other practices related to crop production.
• In addition, Mobile STL is carrying out other regular functions of
stationary soil-testing laboratory.
(4/4)

LECTURE 18
FERTILITY SURVEY AND MAPPING
Survey, village indices
Soil Fertility Survey
Soil survey essentially aims at taxonomical classification of soils in
well-defined units. The properties studied in the survey are ultimately used
to plot the extent of boundaries on a map. The maps are referred for various
purposes particularly for predicting yields based on soil fertility.
Fertility surveys are carried out in profile studies. Profiles in
representative locations in each soil series are opened and thoroughly
examined. From samples collected at different depthwise layer, soil
physical, chemical, and biological properties are thoroughly studied. The
factors limiting crop growth are identified in field and laboratory estimations.
Parameter on the depth of soil, rooting depth, bulk density, particle
density, porosity, water holding capacity, possible profile moisture storage,
soil reaction, salinity, total and available nutrients, presence of hard pans.
By interpretive analysis the fertility, data are grouped and used for mapping.
The division of Soil Survey and Land Use Planning of State
Department of agriculture, which is operating in selected districts of the
Tamil Nadu compiles the information and publish them as a Report. The
reports are available on cost basis to needy persons and institutions. The
results of survey are further classified and mapped by National Bureau of

Soil Survey and Land Use Planning located in Nagpur, Bangalore and in
many other locations in India. The Maps are distributed on cost basis for
their effective use. Soil Maps of Agro-climatic regions, fertility status,
irrigability, soil depth, crop suitability, salinity, etc are available.
Besides, the State Agricultural Universities and other national
Institutes conduct soil surveys and prepare maps on nutrient status marking
the macro and micronutrient deficient soils for ready recognition. The
remote sensing tools are also used in Mapping.
Village Fertility Indices and Mapping
In our country, the soil testing laboratories are functioning in all the
states. In Tamil Nadu, the soil testing and mobile soil testing laboratories
are functioning in almost all the districts.
One of the major functions of these laboratories is to analyze the soil
samples collected from the farmers for available N, P and K status. For
every year few taluk will be adopted. After analyzing the soil samples for
available NPK, they are grouped as low, medium and high based on the
soil test value as follows.
After grouping soils as low, medium or high, Village Fertility Index
(VFI) will be worked out for every revenue village.
NL + 2 NM + 3 NH VFI =
NL + NM + NH
Where NL, NM, NH are the number of soil samples falling under
the category low, medium and high, which are given weight of 1,2,3
3 (4/4) 25 (1/2)

respectively. Arbitrarily an index below 1.5 is low, between 1.5-2.5 is
medium, and above 2.5 is high.
Using these fertility indices, the current area wise fertilizer
recommendation for each crop can be modified. A soil fertility map may be
prepared in any outline map of block / taluk by plotting the index values
within the boundary of villages.
25 (2/2)

LECTURE 19 PERMANENT MANURIAL EXPERIMENTS
OPM, NPM, LTFE, Findings
Permanent Manurial Experiments
Permanent manurial experiments are conducted to study the long
term effect of continuous application of plant nutrients either singly or in
combination and with or without organic manure on crop yield, nutrient
uptake, and physico-chemical and biological properties of soil.
The first one started was the classical field experiment at
Rothamsted Experimental Station, Harpenden in England in 1854 by
Lawes and Gilbert.
Most of PMEs test common treatment combinations like: Fertilizer N
or P or K alone, Fertilizer N and K, Fertilizer N and P, Fertilizer NPK,
Farmyard Manure (FYM), Residual effect of FYM, Hand weeding, Zn or S
addition, Control (no manure), tillage, irrigation, etc.
Similar to Rothamsted experiment, in India PME was started at
Coimbatore in 1909 and this was the first of its kind in our country. This
called as Old Permanent Manurial experiment (OPM) is being conducted in
red soil (Alfisol) with cereal-cotton crop rotation under rainfed conditions.
Subsequently in 1925, a second experiment was started with the
same treatments and called as New Permanent Manurial (NPM) experiment
to test the effect under irrigated conditions.

In OPM and NPM a uniform fertilizer dose of 25-60-75 kg N, P2O5 and
K2O/ha is being applied in all these years. As these are designed with very
low dose of fertilizers and manures without any replication and
randomization, they do not match to the present day use pattern of fertilizer/
manure and statistical analysis.
Therefore, to study the effect of intensive cropping and manuring
new set of experimental design was implemented all over India by ICAR by a
coordinated scheme on Long Term Fertilizer Experiment (LTFE). During
1972, LTFEs were started at 11 centres and later further expanded at seven
more centres.
Under this scheme, a third experiment was started in 1972 at Coimbatore
called as Long Term Fertilizer Experiment (LTFE) in medium black soil
(Inceptisol) to test intensive cropping system with Ragi-maize cropping
system.
The major findings in these experiments are:
Application of single nutrient (N or P or K) alone resulted in lower crop
yield. Combination of NP and NPK gave higher yield.
Phosphorus became a limiting nutrient when it was not applied and it
reduced the yield to the extent of 50-60 per cent. Application of P
along with N, K, and FYM raised the available soil P from low to
medium status.
Potassium was depleted even when it is applied continuously.
26 (1/2)

Continuous use of N fertilizer alone reduced the soil productivity.
Addition of FYM with NPK significantly increased the crop yield to the
tune of 15-20 per cent over NPK alone. Addition of organic manure
improved pore space and water holding capacity of soil. Combined
application of organic manure and inorganic fertilizer not only
increased the yield of crops but also improved the soil productivity.
Population of bacteria, fungi, Actinomycetes and Azotobacter were
increased due to organic manure incorporation. The activities of
enzyme urease, dehydrogenase, cellulase, and amylase were favored
by organic manure application.

LECTURE 20
FERTILIZERS - USE AND LEGISLATION
Definition, Classification, Indian Scene, products,
consumption, Legislation
Fertilizers
Fertilizers are the materials either natural or manufactured, containing
nutrients essential for normal growth and development of plants. It may also
be defined that any material or substance intended for use as a nutrient
carrier in soil or crops for boosting crop yields.
In India, the use of artificial fertilizers was first initiated in 1896 when
imported Chilean nitrate was used as a fertilizer. By about 1905 calcium
nitrate, calcium cyanamide, ammonium sulphate, super phosphate and
potassium sulphate were also imported and used.
After the World War I, the Imperial Chemical Industries carried out
valuable field experiments on different crops particularly on rice with
ammonium sulphate during the period 1920-30, which established the
general superiority over other nitrogenous fertilizers. The manufacture of
ammonium sulphate in India was first started at Belegolla in Mysore in
1938 on a small scale.
Share of total fertilizer
consumption (%) in
India
Rice 40.5
Wheat 24.2
Sugarcane 8.7
Cotton 6.7
Groundnut 2.2
12 (2/2)
26 (2/2)

Later in 1947, its manufacture was started at Alwaye. In 1951, the
Government of India set up fertilizer factory at Sindri for the production of
ammonium sulphate in the public sector. Gradually several factories were
established and use of fertilizers become increasingly popular.
Presently India is the Third producer of N and P fertilizers in the
world.
Classification of fertilizers
The fertilizer materials may be classified in several ways
Based on fertilizer mixture behavior
Straight or simple nitrogenous, phosphatic or Potassic
fertilizers;
Complex fertilizers having more than one nutrient in single material
and fertilizers having more than one nutrient in single material
Fertilizer mixtures home mixed or factory mixed materials.
Based on their chemical reaction and nature
Acidic, neutral, and basic fertilizers
Based on nutrients present
Simple fertilizers which contain only one nutrient
(Single carrier)
Compound fertilizers which contain more than one nutrient
(Multinutrient carrier)

Physical properties of fertilizers:
Physical properties of fertilizers have bearing on bagging storage,
transportation, handling, and application. They are properties include –
hygroscopic nature, free moisture content, particle size, melting point,
solubility, specific gravity, segregation,
granule hardness, angle of response, drillability etc.,
Chemical properties of fertilizers:
Chemical properties include the nature and amount of nutrients
present, associated elements, their chemical reaction, and salt index.
These make a basis for their selection by the cultivators so that they may
achieve highest productivity with least damage to soil fertility and least unit
cost of fertilizers.
INDIAN FERTILIZER SCENE
India is the Third largest producer and consumer of fertilizers in the world.
At present, there are 59 large size fertilizer plants in the country manufacturing
range of fertilizers. The current installed capacity is 12.1 m tonnes per annum
(tpa).
This fertilizer sector is highly subsidized. It relies heavily on imports to
meet domestic demand. Indian Government incurs a total subsidy bill about 14%
of fiscal deficit every year.

The major grades of fertilizers are Nitrogenous (N), Phosphatic (P)
and Potassic (K). N accounts for 71%, P for 22%, and K for 7% of the total
fertilizer consumption. Potassic grade of fertilizer is totally imported and is
not manufactured in India.
Urea (85% of N fertilizer consumption) constitutes 58% of the total
consumption of fertilizers in India. Di-ammonium phosphate (DAP) accounts
for approximately 66% of consumption of phosphatic fertilizers.
The N based fertilizer uses indigenously available feedstock (raw
material) to produce ammonia, which is processed further to make urea.
Rock phosphate and potash, the key raw materials for Phosphatic
and Potassic fertilizers respectively are imported into India, due to lack of
domestic availability.
Before April 1, 1997, the State Governments fixed fertilizer prices at non-
remunerative levels. In addition, there were procedural delays in fixing prices
for each crop season, and delays in reimbursing subsidy to the producers.
The reimbursement price fixation is now done by the Central Government,
which may lead to more realistic price levels, and faster disbursements of
subsidies. 27 (3/8)

Consumption of Fertilizer by Nutrients (‘000 tonnes)
Year N P2O5 K2O Total
1951-52 58.7 6.9 - 65.6
1961-62 249.8 60.5 28.0 338.3
1971-72 1798.0 558.2 300.6 2656.8
1981-82 4068.7 1322.3 676.2 6067.2
1991-92 8046.3 3321.2 1360.6 12728.0
1992-93 8426.8 2843.8 883.9 12154.5
1993-94 8788.3 2669.3 908.7 12366.3
1994-95 9507.1 2931.7 1124.8 13563.6
1995-96 9822.8 2897.5 1155.8 13876.2
1996-97 10301.8 2976.8 1029.6 14308.1
1997-98 10901.8 3913.6 1372.5 16187.8
1998-99 11353.8 4112.2 1331.5 16797.5
1999-00 11592.7 4798.3 1678.7 18069.7
2000-01 10861.9 4212.4 1557.1 16631.4

Important Fertilizer Products in India
Grade (%)
Consumption
(1999-2000)
‘000 tonnes
Produced in India
Straight Nitrogenous
Urea 46 N 20277.66
Ammonium sulphate 20.6 N 638.10
Ammonium chloride 25 N 75.19
Calcium ammonium nitrate 25 N 347.25
Straight Phosphatic
Single super phosphate 16 P2O5 3600.99
Diammonium phosphate 18-46-0 6937.68
NP/NPK Complex Fertilizers N: P2O5: K2O
Ammonium Phosphate Sulphate 16-20-0 220.89
Nitro Phosphate with Potash 15-15-15 341.82
28-28-0 173.66 Urea Ammonium Phosphate
14-35-14 184.32
20-20-0 1531.56 Nitro Phosphate
23-23-0 222.19
10-26-26 529.79
12-32-16 499.45
17-17-17 681.00
Others
19-19-19 126.63
27 (4/8)

14-28-14 11.47
Imported Fertilizers
Straight Potassic
Muriate of potash 60 K2O 2049.24
Sulphate of potash 50 K2O 17.50
Straight Phosphatic
Rock phosphate 12-18 P2O5 102.96
27 (5/8)

LECTURE 21 PROSPECTS OF FERTILIZER USE
Growth in the future will have to come from an increase in cropping
intensity and productivity growth, which implies the higher use of fertilizers.
This is because during 1991-2000, food grain production grew at a rate of
1.7% (population growth over the same period: 1.9%), while net sown area
stagnated at 1.41 m hectares.
Agriculture constitutes 33% of GDP and farmers constitute over 60%
of the vote bank in India. Considering the importance and sensitivity of the
sector and the strong lobby of farmers in Indian politics, it is unlikely that the
government will frame a clear longterm policy in near future to resolve
problems faced by manufacturers. Hence, regulated pricing and subsidies is
likely to continue.
Availability of natural gas will be crucial to the fortunes of fertilizer
manufacturers as it is the preferred feedstock. Any reduction in availability
and changes in its pricing will affect production and profitability of the
companies in this sector.
In a much-deregulated environment, market forces will dictate the
competition. Distribution networks, cost competitiveness and regional
imbalances will assume importance. In such a scenario, efficient producers
and distributors will do well. Potash fertilizer will continue to be imported, as
it cannot be manufactured domestically due to the absence of supplies of
critical raw materials.
FERTILIZER LEGISLATION
27 (6/8)

Chemical fertilizers are becoming increasingly expensive day by day
due to hike of prices of petroleum, inflation etc., which tempts dealers to
adopt malpractices for earning more profits through adulteration, supplies of
underweight materials or blending of degraded fertilizers etc. Thus, the
farmers are ditched and often they fail to get good response of applied
fertilizers. Therefore, the laws regulating the manufacture and sale of
various fertilizers are essential to ensure that the consumer or the farmer is
supplied with fertilizers of standard quality.
Keeping these points in mind, the Government of India brought in the
fertilizer Control Act.
FERTILIZER CONTROL ACT
The Union Government of India promulgated the fertilizer Control Act
(F.C.O) in 1957 under the Essential Commodities Act, 1955 (section 3)
with a view to regulate fertilizer business in India.
The F.C.O. keeps a strict watch on quality control of fertilizers,
provides for the registration of dealers and statutory control of fertilizer prices
by Government. Therefore, everybody involved in fertilizer business as a
manufacturer, dealer or a salesperson, must have proper understanding of
the F.C.O. in order to avoid infringement of Government regulations.
The provisions given in the Order will also help the consumers/
farmers to know their rights and privileges in respect of fertilizer quality and
Authorities to be approached for their grievances regarding supply of sub-
standard materials, overcharging or containers of underweight supplies.
The F.C.O. is published by the Fertilizer Association of India (F.A.I.),
updated when ever felt necessary. The Order has provisions on quality for

each consumed fertilizer product and F.C.O. should be consulted under
infringement of any of them.
Control of Quality of Fertilizers
The F.C.O. has provisions to penalize manufactures, distributors, and
dealers for supply of spurious or adulterated fertilizers to consumers or
farmers. The F.C.O. has fixed specifications for various fertilizers, which
must be present in them failing which the legislation comes in force, and
guilty is punished.
Example: The specifications for urea
Moisture % by weight (Max.) … 1.00
Total nitrogen % by weight (Min.) … 46.00
Biuret % by weight (Max.) … 1.50
Particle size:
Granules must pass through IS sieve 320 and
Not less than 80% by weight shall be retained on IS sieve 100.
If it is in the form of prill, it shall pass IS sieve 200 and
Not less than 80% by weight shall be retained on IS sieve 100.
Example: The specifications for Rock phosphate
Particle size:
The material must completely pass through 6.3 mm IS sieve and not less
than 20 % material shall pass through 1.50 micron IS sieve.
Total P2O5 content is to be guaranteed by the dealer.
Example: The specifications for Potassium Schoenite
Moisture per cent by weight … 1.50
Potassium % (K2O) by weight (Max.) … 23.00
27 (7/8)

MgO % by weight (Min. on dry basis) … 10.0
Total chloride % (Cl) by weight (Max. on dry basis) … 2.5
Sodium % (as NaCl) (Max. on dry basis) … 1.60

LECTURE 22
Tolerance limit in Plant Nutrient for various fertilizers
Category Limit
Straight fertilizers
containing <20% plant
nutrients
: 0.1 Unit of nutrient
Straight fertilizers
containing >20% plant
nutrients
: 0.2 Unit of nutrient
Calcium ammonium nitrate : 0.3 Unit of nutrient
Complex/ Mixed fertilizers : 0.5 unit for each and maximum
of 2.5 % for all nutrients
Fertilizer Movement Control Order
The Fertilizer Movement Order (F.M.O.) was promulgated by
Government of India in April 1973 to ensure an equitable distribution of
fertilizers in various States. According to the fertilizer movement order, no
person or agency can export chemical fertilizers from any State. However,
Food Corporation of India, Warehousing Corporation of India and Indian
Potash Limited; materials like Rock phosphate, bone meal (both raw and
steamed) and zinc sulphate are exempted from the movement restriction.
Agency responsible for Enforcement of F.C.O
The Controller of Fertilizers for India, usually a Joint Secretary to the
Government of India (Ministry of Agriculture) is responsible for the
enforcement of F.C.O. throughout the country.
Electrical Conductivity of the soil saturation extract
Measurement of EC of the soil saturation extract is essential for the
assessment of saline soil for the plant growth.
<2 - Salinity effects mostly negligible
2-4 - Yields of very sensitive crops may be restricted
4-8 - Yields of many crops restricted
8-16 - Only tolerant crops yield satisfactorily
EC (dS m-1)
>16 - Only a few tolerant crops yield satisfactorily
Concentration of water soluble boron
The determination of water-soluble boron concentration is also
another criteria for characterization of saline soils. The critical limits of boron
concentration for the plant growth are given below.
<0.7 - Crops can grow (safe)
0.7-1.5 - Marginal
Boron
concentration
(ppm) >1.5 - Unsafe
Reclamation of Saline Soils
In saline soils, reclamation consists mainly in removing the excess salts.
This can be done either
• By scraping the salts from the surface (or)
10 (19/26)

• Washing them down into lower layers beyond the root zone preferably
completely out of the solum (or)
• By growing salt tolerant crops (or) by a combination of two (or) more of
these methods
Scraping helps to remove salts that have formed an encrustation on
the surface, but it is never very helpful in complete reclamation. Substantial
quantities of soluble salts are still present in the soil body and hinder plant
growth.
Salt tolerant crops
High salt tolerant crops - Rice, sugarcane, Sesbania, oats
Medium salt tolerant crops - Castor, cotton, sorghum, cumbu
Low salt tolerant crops - Pulses, pea, sunnhemp, sesamum
The growing of salt tolerant plants with a view to remove salts is also
not a practical proposition. Although these plants remove substantial
quantities of salts from the soil, comparatively larger quantities are still left
behind. Salt formation is a continuous process; hence, the reclamation is
never complete
LEACHING REQUIREMENT (LR) It may be defined as
The fraction of the irrigation water that must be leached through the
root zone to control the soil salinity at any specified level.
Where
LR - Leaching requirement in percentage
Ddw - Depth of drainage water in inches
Diw - Depth of irrigation water in inches
LR=

ECiw - EC of irrigation water (dSm-1)
ECdw - EC of drainage water (dSm-1)
If the soil is not free draining, artificial drains are opened (or) tile
drains laid underground to help to wash out the salts.
ALKALI SOIL (sodic/ Solonetz)
Alkali (or) sodic soil is defined as a soil having a conductivity of the
saturation extract less than 4 dS m-1 and an ESP of > 15. The pH is usually
between 8.5 and 10.0. Formerly these soils were called “black alkali soils”
Genesis/ origin
It is evident that soil colloids adsorb and retain cations on their
charged surfaces. Cation adsorption occurs due to electrical charges at the
surface of the soil colloids. While, adsorbed cations are combined
chemically with the soil colloids, they may be replaced by other cations that
occur in soil solution. The reaction of cation in solution that replaces an
adsorbed cation is called as cation exchange and is expressed as cmol (p+)
kg-1.
Calcium and magnesium are the principal cations found in the soil
solution and on the exchange complex of normal soils in arid regions. When
excess soluble salts accumulate in these soils, sodium frequently becomes
the dominant cation in the soil solution. In arid regions as the solution
becomes concentrated through evaporation or water absorption by plants,
the Ca2+ and Mg2+ are precipitated as CaSO4, CaCO3 and MgCO3 with a
corresponding increase in sodium concentration. When the Na+
concentration is more than 15% of the total cations a part of the original
exchangeable Ca2+ and Mg2+ replaced by sodium resulting in alkali soils.
10 (20/26)

Na+
Clay Ca2+ + 2 Na+ ↔ Clay + Ca2+
Na+
Though the reaction is reversible, Ca2+ are removed in drainage water
as soon as they formed. Hence, the reaction proceeds in one direction from
left to right only. The process whereby a normal soil is converted into an
alkali soil is known as “alkalization”.
Characteristics various methods are available to characterize
• A direct determination of exchangeable sodium
Exchangeable sodium = Total sodium - Soluble sodium
• The soil pH also gives an indication of soil alkalinity indirectly. An
increase in pH reading of 1.0 or more, with change in moisture content
from a low to high value has itself been found useful in some area for
detecting alakali conditions.
The higher the ESP, the higher is the soil pH.
• Sodium Adsorption Ratio (SAR)
The US Salinity Laboratory
developed the concept of
SAR to define the equilibrium between
soluble and exchangeable cations
(Na+, Ca2+, Mg2+ are concentrations in saturation extract in me L-1)
The value of SAR can be used for the determination of exchangeable
sodium percentage (ESP)
ESP =
SAR =
10 (21/26)

The following regression equation is also used to work out ESP
Y = 0.0673 + 0.035 X
Where Y - indicates ESP and X - indicates SAR
Soils having SAR value greater than 13 are considered as sodic soils.
Impact of soil sodicity
• Dispersion of soil colloids leads to development of compact soil
• Due to compactness of soil, aeration, hydraulic conductivity, drainage
and microbial activity are reduced
• High sodicity caused by Na2CO3 increases soil pH
• High hydroxyl (OH-) ion concentration has direct detrimental effect on
plants.
• Excess of Na+ induces the deficiencies of Ca2+ and Mg2+
• High pH in alkali soil decreases the availability of many plant nutrients
like P, Ca, N, Mg, Fe, Cu, and Zn.
10 (22/26)