
01 malathion 2014
20
Vol 21, No. 9;Sep 2014 119 [email protected] Analysis of pesticide residues in cucumber using highly sensitive ultra-performance liquid chromatography – tandem mass spectrometry Ayman Abdul Ghfar a , Saikh Mohammad Wabaidur a , Zeid Abdullah Alothman a, *, Masoom Raza Siddiqui a , Mohamed Habila a , Majed Albokari b , Ibrahim Mashhour b a Advanced Materials Research Chair, Department of Chemistry, College of Science, King Saud University, Riyadh- 11451, Saudi Arabia b Atomic Energy Research Institute, King Abdulaziz City for Science and Technology, Riyadh 11442, Saudi Arabia *Author to whom correspondence should be addressed: Email: [email protected], Phone: +966500505570; Fax: +96614675992
Transcript of 01 malathion 2014
Vol 21, No. 9;Sep 2014
Analysis of pesticide residues in cucumber using highly sensitive
ultra-performance liquid chromatography – tandem mass
spectrometry
Ayman Abdul Ghfara, Saikh Mohammad Wabaidur
a, Zeid Abdullah
Alothmana,
*, Masoom Raza Siddiquia, Mohamed Habila
a, Majed Albokari
b,
Ibrahim Mashhourb
aAdvanced Materials Research Chair, Department of Chemistry, College of Science,
King Saud University, Riyadh- 11451, Saudi Arabia bAtomic Energy Research Institute, King Abdulaziz City for Science and Technology,
Riyadh 11442, Saudi Arabia
*Author to whom correspondence should be addressed: Email:
[email protected], Phone: +966500505570; Fax: +96614675992

Vol 21, No. 9;Sep 2014
ABSTRACT In this study the determination of pesticide residues namely, malathion in
cucumber collected from local markets in Riyadh city has been carried out. Samples
of treated cucumbers were collected and analyzed during a 14 days period for
obtaining the residue amount of malathion. A liquid–liquid sampling technique has
been applied to ultra-performance liquid chromatography/tandem mass spectrometry
for analysis of residual malathion in cucumber. Multiple reactions monitoring for
two transitions was acquired while the transition with higher sensitivity used for
quantification and the transition with lower sensitivity used for confirmation analysis
of malathion. The proposed method has been validated by establishing performance
parameters such as percent recovery, precision, linear ranges, limits of detection
(0.0042 µg/ml) and limits of quantification (0.014 µg/ml). The obtained recoveries of
malathion in fresh cucumber samples of 10 replicates were found to be in the range
between 96.9 and 101.2% (%RSD ˂ 5.2) for two fortification levels (0.02 and 0.1
mg/kg). The intra-day and inter-day RSD values were obtained between 1.7 and
2.1%. The extracted cucumber samples have shown different level of contamination
upto certain time interval (7 days) and after that no residues between 11-14 days
were detected.
Keywords: Pesticide residue; Ultra Performance Liquid Chromatography; MS
Detector; Malathion

Vol 21, No. 9;Sep 2014
INTRODUCTION
Next to tomatoes, cabbage, and onions, cucumbers are the most widely
cultivated vegetable in the planet. Cucumbers are scientifically known as Cucumis
sativus and belong to the same botanical family as melons and squashes. Although,
they have not received as much attention as other vegetables in terms of health
benefits, but this widely-cultivated food provides a unique combination of nutrients,
including antioxidant (vitamin C, beta-carotene, and manganese), anti-inflammatory
and anti-cancer (Yang et al, 2006; Hedges and Lister; Wordpress). In addition,
cucumbers contain numerous flavonoid antioxidants, including quercetin, apigenin,
luteolin, and kaempferol
(http://www.whfoods.com/genpage.php?tname=foodspice&dbid=42).
Now a day, plenty of chemical compounds are being used in the field of
manufacturing agricultural commodities, thanks to their enormous demand in
modern agriculture. Pesticides are considered as essential groups of chemicals that
were developed and produced to control the agricultural pests. On one side great
success of pesticides in agricultural applications has led to an increase crop
production while on the other side the improper use of pesticides result in the
contamination of vegetable, fruits and other crops. A large number of
organophosphorous pesticides have been used as protectants to agricultural crops.
Among them, malathion (O, O-dimethyl dithiophosphate of diethyl
mercaptosuccinate) (M) is highly demanding. This is usually a broad spectrum, non-
systemic organophosphorous insecticide and has globally been used over 30 years on
a wide variety of crop sites including agriculture, nurseries, home and garden, and
public health (Tawab et al, 2006). Some residential and agricultural uses of this
pesticide in food and beverages can rather have high application rates and resulting
exposure to human health (Council Directive 90/642/EEC, 1990). The applications
of malathion in public health programs are also the significant route to human
exposure (Jury et al, 1987; Jury and Sposito, 1985).
The organophosphates pesticides are able to inhibit insect acetyl
cholinesterase and strongly interfere with neural transmission in other organisms,
including humans. Therefore, they represent a potential hazard for the environment
and human health, which demands the continuous assessment and monitoring of
these pesticides (Council Directive 80/778/EEC, 1980). Toxic symptoms results
from malathion exposure are breathing problems, headache, nausea and dizziness,
while the high exposure can produce fatal poisoning in human health (WHO/FAO,
1977; Mccarroll et al, 2000; Abou-Donia, 1992). On addition, when pesticides are
properly utilized and adequately monitored, there is a negligible risk for the
consumer’s health.
The required rates of application of malathion are varied under different agricultural
and climatic conditions from country to country and even between different regions
of the same country. Therefore, pesticide control is necessary for both the economic
and health reasons. In the recent time, cucumber, which is susceptible to insect and

Vol 21, No. 9;Sep 2014
various disease attacks, has been widely studied for its pesticide residues. Among
them, many studies have reported that the main pesticide residues are
organophosphorous pesticides (Mansour et al, 2009; Pan et al, 2002). Although
boiling, frying, roasting and blanching lead to a significant reduction of pesticide
residues in food stuffs (Chavarri et al, 2005; El-Behissy et al, 2001; Nagayama,
1996; Radwan et al, 2005; Randhawa et al, 2007; Soliman, 2001; Zabik et al, 2000)
but cucumber is most often eaten raw in salads and in cold soups. Therefore, there is
a little chance of complete removal of pesticides from raw cucumber before
consumption. Thus a highly sensitive method is required for the trace level
quantitation of malathion residue in cucumber.
The Commissions of the Food and Agriculture Organization (FAO) and
World Health Organization (WHO) have been established maximal residue limits
(MRLs) of pesticides in a variety of foods. In Europe, the maximum admissible
levels of pesticide residues in foodstuffs of animal or vegetal origin are defined
according to the criteria proposed by the European Council (Council Directive
97/41/EC, 1997), the limits depends on the type of pesticides and foods. But the
prevention of toxicological risks of human health, due to contaminated food consumption is
primary goal in food safety policy (Miller, 1987). Therefore, in the studied method an
attempt has been made to determine the pesticide residues in M sprayed cucumber samples
collected from the local markets in Riyadh city. The developed UPLC-MS/MS method is
rapid, sensitive and reproducible. The method was successfully applied to the determination
of M residues present in the sprayed raw cucumber.
EXPERIMENTAL
Materials and method: Malathion standard, HPLC grade acetonitrile, celite,
sodium chloride, petroleum ether, anhydrous sodium sulfate and florisil were
purchased from Sigma-Aldrich (St. Louis, MO, USA). Methanol and ethyl acetate
were purchased from BDH chemicals Ltd (Poole, England). Formic acid for mobile
phase preparation was obtained from Panreac (Barcelona, Spain). Water was purified
through a Milli–Q water purification system (Millipore Corporation, Bedford, MA,
USA). The stock solution of 10µg/ml of malathion standard was prepared in HPLC
grade acetonitrile and stored at 4 oC in the refrigerator. All other working standard
solutions were prepared immediately before use by diluting the stock solution with
the mobile phase Acetonitrile: 0.1% aqueous solution of formic acid (50:50, v/v).
INSTRUMENTATION
Ultra-performance liquid chromatography (UPLC): Chromatographic separation and
identification of M was achieved in less than 1 min. The method has been evaluated
for analysis accuracy of the analyte evaluated in cucumber samples. The
chromatographic separation of standard M was performed using an Acquity UPLC
system (Waters, Manchester, UK). The system was consisting of binary solvent
manager, sample manager and a column thermostat equipped with bridged ethyl
hybrid (BEH) C18 column (50mm × 2.1mm i.d, 1.7µm particle size) (Waters,

Vol 21, No. 9;Sep 2014
Mildford, MA, USA). The smaller size column particles are able to provide
improved peak resolution and high pressure with high liner velocity of the mobile
phase (Zou et al, 2013). All injected solutions were stored in the auto-sampler at 4
ºC. The partial loop with needle overfill mode was set up to inject the samples.
Acetonitrile was used as a strong wash, and 5% acetonitrile in water was used as a
weak wash solvent. The various composition of different mobile phse such as
methanol/water, acetonitrile/ water with 0.1% formic acid in isocratic elution was
used to get best peak separation of M. The column temperature was also varied to
see the effect on the chromatographic separation. The sample temperature was kept
at 10 ˚C and the volume injected for the analysis was 1µL.
Mass spectrometry: Mass spectrometry (MS) was carried out on a Micromass
Quattro Premier tandem mass spectrometer fitted with an ESI interface and
controlled by MassLynx V4.1 software (Waters, Manchester, UK). An Oerlikon
rotary pump, model Sogevac SV40 BI (France) provided the primary vacuum to the
mass spectrometer. MS ion source was used both positive and negative electrospray
ionization. The parameters affecting the ion transmission were optimized by infusing
a standard solution of analyte. High-purity nitrogen (99.99% purity) was produced
using a Peak Scientific NM30LA nitrogen generator (Inchinann, UK) and used as
nebulizing, desolvation and cone gas, while high purity argon (99.9999%) was used
as collision gas. Data acquisition was carried out with MassLynx V4.1 software.
Sample Analysis and storage: Five samples of cucumber were harvested after M
spraying at the following intervals; one day, four days, seven days, eleven days and
fourteen days. Each sample was chopped and divided into four subsamples (100 g
each) which were stored in individual polyethylene bags at -24 °C until extraction
was carried out.
Extraction Procedure: In order to clean up and real sample preparations, extraction
procedure was used in this study similar to that previously reported in the literature
(Islam et al, 2009) and briefly consisted of mixing 100 g of chopped sample of
cucumber with 10 g celite and 200 mL acetonitrile. The mixture was then
homogenized using a mixture grinder and then filtrated through Buchner funnel. The
filtrate was put into the separating funnel (SF) of 1000 ml and 100 ml petroleum
ether was added into it following by shaking for 2 min. After that 10 ml saturated
sodium chloride solution and 600 ml of milli-Q H2O was added and shaken
horizontally for 1 min and allowed the mixture to stand for some time. The lower
aqueous layer of the SF was removed while the upper organic solvent which
containing the analyte was washed with 100 ml milli-Q water twice. The organic
layer was transferred into a clean flask and 15 gm anhydrous sodium sulfate was
added to remove any aqueous traces. Then it was filtered and the filtrate was
concentrated using rotary evaporator (Buchi). The cleanup step of the extracts was

Vol 21, No. 9;Sep 2014
performed by using florisil column. The column was prepared by putting a piece of
glass wool in an empty chromatographic glass column, then 10 – 15 gram of
activated florisil (130 oC, 6 hours) was placed onto the glass wool which was kept
inside the column. Additionally, 1 gm of anhydrous sodium sulfate was spread on the
surface of the activated florisil. The column conditioning was performed by adding
40-50ml of petroleum ether. After that the concentrated extract was added to the
column and elution was performed with 200ml of a mixture of petroleum ether and
diethyl ether (50:50; v/v) with a flow rate 5 ml/min. After these clean up steps, again
the collected extracts were concentrated and then injected into UPLC–MS/MS
system. To avoid obstruction during the UPLC analysis the extracted samples were
filtered with 0.22 µm PVDF syringe filter prior to injection.
Validation Study: The following method parameters were determined to validate the
quality of the proposed method: linearity, recovery, precision, Limits of Detection
(LOD) and Limits of Quantification (LOQ). The recovery steps were performed by
spiking M solutions at two different fortification levels to fresh cucumber samples
that had not been treated with M pesticides. Both fortification levels were performed
in10 replicates to validate the method. The performance parameters of the proposed
analytical method such as precision (intra-day and inter day), lower limits, and linear
ranges were also determined. Analysis of samples was carried out by injecting 1 µL
of the sample into the UPLC-MS/MS system.
RESULTS AND DISCUSSION
Chromatographic conditions: The development of a high throughput analytical
technique for the analysis of M in cucumber using reversed phase UPLC is of high
awareness. The most important benefits of the UPLC columns, where particle size is
<2.0 μm, is that the efficiency does not drop when increasing the flow rates (Zou et
al, 2013; Wabaidur et al, 2013). Isocratic elution by means of single eluent such as
water, methanol and acetonitrile, and a mixture of two eluents (water/methanol,
water/methanol containing 0.1% formic acid, acetonitrile/water, and
acetonitrile/water containing 0.1% formic acid) of different composition were
compared to optimize the mobile phase. The best chromatographic separation was
achieved using a binary mobile phase consisting of a mixture of acetonitrile and
0.1% aqueous solution of formic acid (75:25, v/v), while the analytical column was
kept at room temperature. The optimal flow rate was chosen at 0.4 ml/min and the
analysis of M was achieved in less than 1 min. Figure 1 shows the UPLC–MS/MS
chromatogram of M (1 µg/ml) standards in multiple reaction monitoring (MRM)
acquisition modes.
Optimization of ESI-MS/MS conditions: The ESI-MS/MS conditions were
optimized by infusing standards of 1 µg/ml of M in both positive and negative
electrospray ionization (ESI) modes to dissolved efficiently the aqueous/organic

Vol 21, No. 9;Sep 2014
mobile phase and provide the maximum analyte response. In negative ESI mode, no
highly abundant analytes signal was appeared under different ion source parameters.
On the other hand, in the positive ESI mode a highly abundant analyte signal was
appeared at m/z 331. Hence, positive ESI mode was chosen for mass spectrometric
detection. On addition, the narrow chromatographic peaks (5 s width) required a fast
scanning analyzer to define the peaks with enough points which was provided by
triple quadrupole mass detector used in this work. The optimized MS/MS parameters
used for the analysis of M were as follows: capillary voltage, 3.0 kV; cone voltage,
22 V; source temperature, 120 ˚C; desolvation temperature, 300 ˚C; desolvation gas
flow rate, 600 L/h; cone gas flow rate, 60 L/h; collision gas flow, 0.10 ml/min. MRM
for two transitions of M was acquired while the most sensitive transition (331 > 127)
was used for quantification and the other one (331 > 99) for confirmation analysis
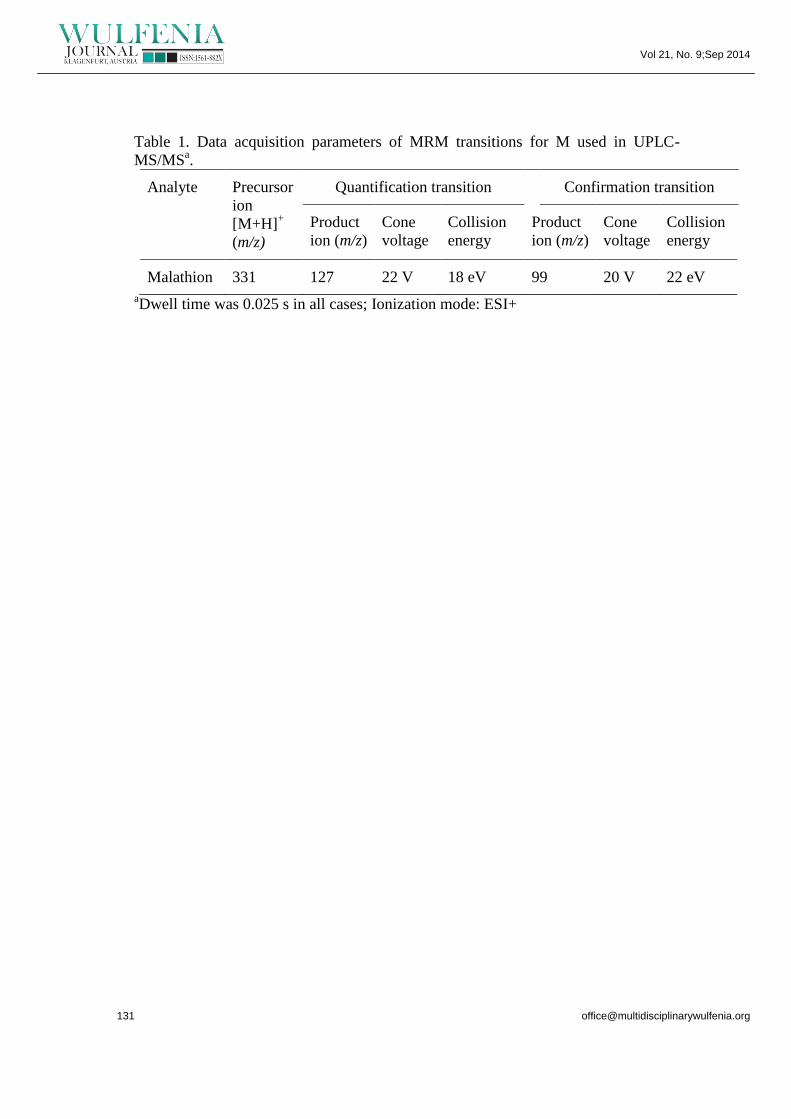
(Fig. 2b). The Optimized MS/MS parameters such as, precursor and product ions,
cone voltages and collision energies, dwell time are shown in Table 1.
Method validation: The performance of the developed analytical method was
evaluated by determining the quality parameters, such as, System suitability,
linearity, LOD, LOQ, repeatability (run-to-run precision), reproducibility (day-to-
day precision) and recovery.
Malathion Standard Calibration Curve and quantitation : The recommendation of
ICH guidelines (Q2 R1) considers system suitability as an important parameter for
the analytical methods. The system suitability test confirms that the performance of
the reagents, column and the instrument are appropriate for the analysis purpose.
Briscoe et al 2007, in his article recommended signal response, signal stability and
carry over as crucial factor to evaluate the system suitability. To establish the system
suitability of the developed method, six different samples of malathion standard
solution (1.0 µg ml-1
) were injected and the peak response was recorded. The
obtained data revealed that the RSD (%) of the peak area of six samples of malathion
was found to be less than 2 % which indicate good performance of the system. Other
parameter such as carryover was also checked by injecting six blank injections,
where no carryover was observed which also indicate the passing of the system
suitability test.
The linearity of the proposed method was determined by investigating the
detection signals of the analyte as a function of their concentration, with the aid of a
regression line by the method of least squares. The calibration curves were
constructed by plotting the peak area against M concentration and it was linear over
the range of 0.01 – 1.0 µg/ml. The correlation coefficient (r2) obtained was 0.999
(n=3). The LOD and LOQ values of the developed method were calculated. Usually,
LOD of the quantitative analysis indicates the lowest level of the analyte that can be
measured with definable statistical certainty in a sample and defined as the
concentration that give a signal equivalent to three times the signal to noise on

Vol 21, No. 9;Sep 2014
analysis. While, LOQ was calculated from the concentration of the analytes that
provided signals equal to ten times the signal to noise on analysis (Wabaidur et al,
2013). The calculated LOD (signal-to-noise ratio, 3:1) and LOQ (signalto-noise
ratio, 10:1) values of the analyzed compound were found to be 0.0042 and 0.014
µg/ml, respectively. Precision of the proposed method were evaluated by performing
intra and inter-day validation. The intra and inter-day precision were obtained by
determining the concentrations of spiked M in cucumber samples in six replicates for
three different concentration levels. The intra and inter-day precision were calculated
by repeating the assay method three times (six replicates of each concentration
levels) on the same day and on three consecutive days (six replicates of each
concentration levels each day), respectively, and the obtained results are presented in
table 2. High repeatability and reproducibility with RSD value lower than 2.5% was
achieved. The result confirms that liquid–liquid extraction in combination with
UPLC-MS/MS can be used in the routine analysis of M in sprayed cucumber sample.
All the obtained results are presented in table 2.
To assess the efficacy of liquid – liquid extraction, recovery studies at two
different spiking level of M were performed. Initially, 500 g of fresh chopped
cucumber samples that had not been treated with M were spiked with known
concentration of pure standard M to achieve the final concentrations of M in samples
0.02 mg/kg and 0.1 mg/kg. After that the spiked cucumber samples were extracted
and analyzed under optimal experimental conditions. The method was validated by
extracting and analyzing 10 replicates of each recovery assay and 10 blank samples
of cucumber. In samples the LOD and LOQ for target analyte was found 0.008 and
0.025 µg/mL respectively. The recovery rates were obtained in the range between
96.9 and 101.2%. The relative standard deviation (RSD) of recovery rates (n = 10)
was lower than 5.2% in both cases. The data indicates that the employed extraction
procedure was efficient for extracting M from sprayed cucumber samples.
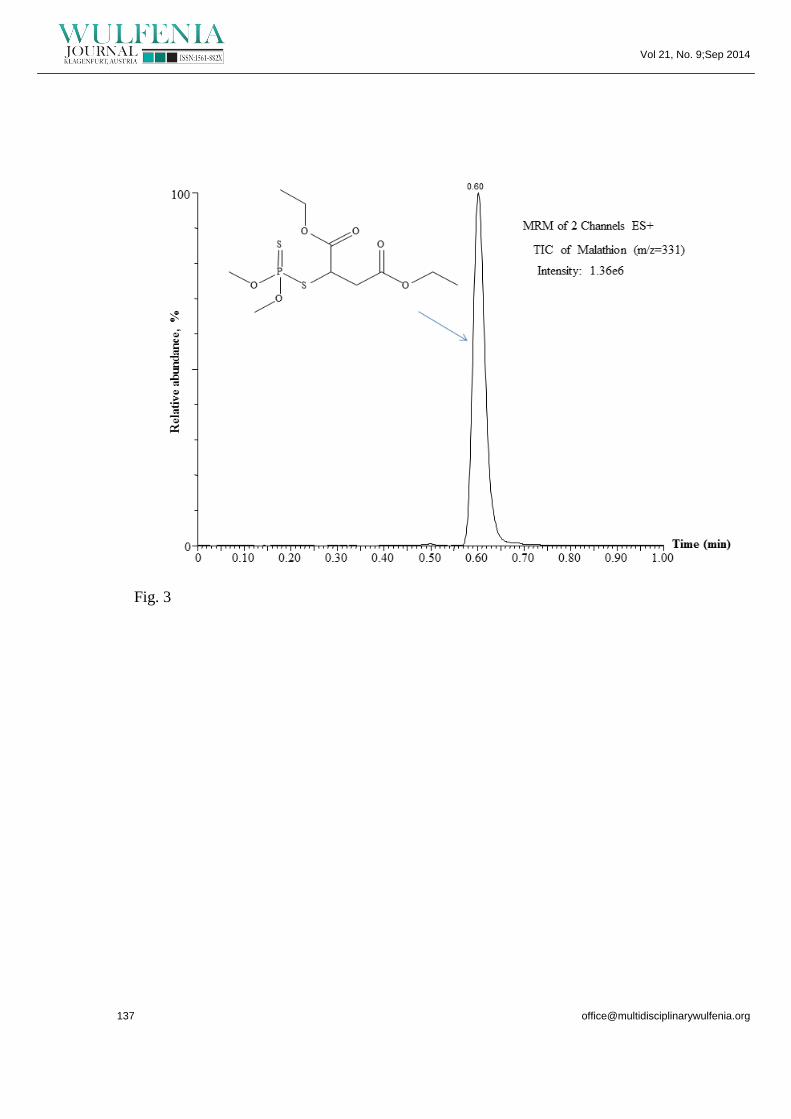
Analytical application: Extracts of cucumber samples typically contain many
compounds which produce interfering compounds at the retention time of the
interest. But, this proposed UPLC-MS/MS positive ion electrospray method for
estimation of residual M was provided good selectivity and sensitivity and enabling
the detection of the target compound in the cucumber extract. The selectivity offered
by MS/MS method enabled the detection of the M ion m/z 331 (Fig. 2a). The
subsequent quantitative diminuation analysis was performed using the most sensitive
transition (m/z 127), while the qualitative analysis was confirmed using the less
sensitive transition (m/z 99) (Fig 2b). The chromatograms did not show any
interference, as no detectable matrix peak was found in the retention time of M. The
recoveries of studied compound were calculated from the regression slope of the
added concentration versus the measured concentration of M standard. The
recoveries were found to be in the range of 89–98%, depending on the types of
Vol 21, No. 9;Sep 2014
extracted samples after certain time periods. Table 3 shows the M amount and
estimated recovery rates.
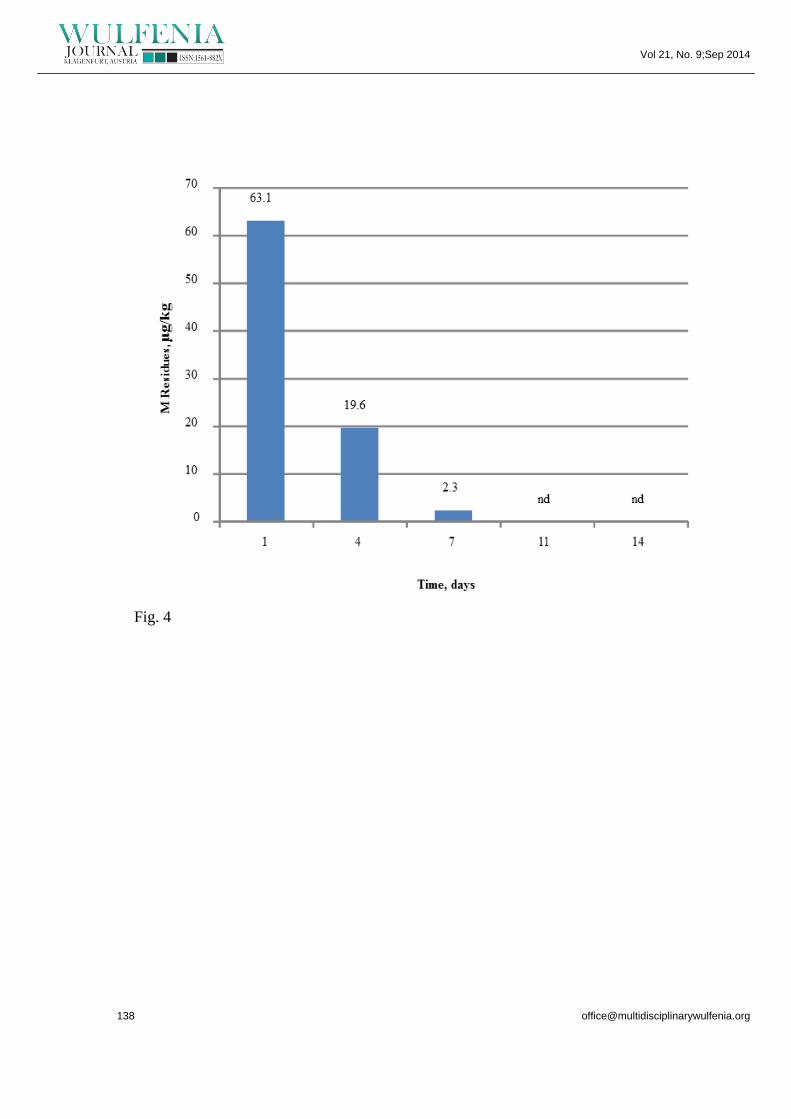
Diminution of Pesticide Residues Levels with Time : The highest residue levels of M
in cucumbers were found in the samples taken just after one day of the pesticide
application (63.1 µg/kg). Malathion was also detected in the samples taken after four
days of the application (19.6 µg/kg). Traces of M (2.3 µg/kg) was found in samples
taken after seven days of the applications. But the total losses of pesticide in the
experimental data were found between days 11 and 14. The loss parameters of M
with times are shown in figure 4. Therefore, from the obtained results (Fig. 4) it was
concluded that the malathion residues present in the cucumber extracts are below the
MRLs reported by FAO/WHO (1993).
CONCLUSIONS
A simple, reliable and fast UPLC-MS/MS method for residual
malathion determination in cucumber has been established. All the performance
parameters confirm the reliability of the developed method. The maximum residual
malathion was found after 1 day extracted samples (63.1 µg/kg ± 0.80, n = 4) and
most importantly the obtained values for each analysed samples are below MRLs
(200 µg/kg) of M (FAO/WHO, 1993). The obtained LOD and LOQ are 0.0 042 and
0.014 µg/ml, respectively. Therefore, it can be concluded that our method will be
helpful for monitoring of M in food samples in order to protect the human life for the
indiscriminate use of such pesticides. Aadditionally, the developed UPLC-MS/MS
method is suitable, rapid and precise to this purpose.
ACKNOWLEDGEMENT
The authors extend their appreciation to the Deanship of Scientific Research,
College of Science Research Center, King Saud University, Riyadh, Saudi Arabia for
supporting this project.

Vol 21, No. 9;Sep 2014
REFERENCES
Abou-Donia, M. B. (1992). Pesticides, in: Abou-Donia, M. B. (Ed.),
Neurotoxicology (pp. 437–478). Boca Raton, FL: CRC Press Publications.
Briscoe, C.J., Stiles, M.R., Hage, D.S. (2007). System suitability in bioanalytical
LC/MS/MS; Journal of Pharmaceutical and Biomedical Analysis, 44, 484-491.
Chavarri, M. J., Herrera, A., Arino, A. (2005). The decrease in pesticides in fruit and
vegetables during commercial processing. International Journal of Food
Science and Technology, 40, 205–211.
Council Directive 80/778/EEC of 15 July (1980) Relating to the quality of water
intended for human consumption.
Council Directive 90/642/EEC of 27 November (1990). On the fixing of maximum
levels for pesticide residues in and on fruit and vegetables. In Official Journal
of the European Communities (Vol. L350, p. 0071). Brussels: European
Community.
Council Directive 97/41/EC of 25 June 1997 amending Directives 76/895/EEC,
86/362/EEC, 86/363/EEC and 90/642/EEC (1997) Relating to the fixing of
maximum levels for pesticide residues in and on, respectively, fruit and
vegetables, cereals, foodstuffs of animal origin, and certain products of plant
origin, including fruit and vegetables.
El-Behissy, E.Y., King, R. D., Ahmed, M. M., Youssef, A. M. (2001). Fate of
postharvest-applied dichlorvos in stored and processed dates. Journal of
Agriculture and Food Chemistry, 49, 1239–1245.
FAO/WHO, 1993. Codex Alimentarius Commission, Codex Committeeon Pesticide
Residues, Havana, Cuba, Twentieth Session.
Hedges, L. J., Lister, C. E., Nutritional attributes of Indian vegetables, Plant & Food
Research Confidential Report No. 2291.
http://selfhelphealth.wordpress.com/category/weight-loss/
http://www.whfoods.com/genpage.php?tname=foodspice&dbid=42
Islam, S., Hossain, M. S., Nahar, N., Mosihuzzaman, M., Mamun, M. I. R. (2009).
Application of high performance liquid chromatography to the analysis of
pesticide residues in Eggplants. Journal of Applied Science, 9, 973-977.
Jury, W. A., Sposito, G. (1985). Field calibration and validation of solute transport
models for the unsaturated zone. Soil Science Society of America Journal, 49,
1331-1441.
Jury, W. A., Winer, A.M., Spencer, W. F., Focht, D. D. (1987). Transport and
transformations of organic chemicals in the soil-air-water ecosystem. Reviews
of Environmental Contamination and Toxicology, 99, 120-164.
Mansour, S. A., Belal, M. H., Abou-Arab, A. A., Gad, M. F. (2009). Monitoring of
pesticides and heavy metals in cucumber fruits produced from different
farming systems. Chemosphere 75, 601–609.
Vol 21, No. 9;Sep 2014
Mccarroll, L., Paton, M. G., Karunaratne, S. H., Jayasuryia, H. T., Kalpage, K. S.,
Hemingway, J. (2000). Insecticides and mosquito-borne disease. Nature 407,
407961.
Miller, K. (1987). Toxicological Aspects of Food. Elseviers Applied Science,
London.
Nagayama, T. (1996). Behavior of residual organophosphorus pesticides in
foodstuffs during leaching or cooking. Journal of Agriculture and Food
Chemistry, 44, 2388–2393.
Pan, C. P., Wang, L. M., Kong, X. Y., Jiang, S. R., Qian, C. F. (2002).
Determination of 15 organophosphorus pesticides in cucumber, tomato and
pepper samples by capillary gas chromatography with gel permeation
chromatographic clean-up. Se Pu 20, 565-568.
Radwan, M. A., Abu-Elamayem, M. M., Shiboob, M. H., Abdel-Aal, A. (2005).
Residual behaviour of profenofos on some field-grown vegetables and its
removal using various washing solutions and household processing. Food
Chemical Toxicology, 43, 553–557.
Randhawa, M. A., Anjum, F. M., Ahmed, A., Randhawa, M. S. (2007). Field
incurred chlorpyrifos and 3, 5, 6-trichloro-2-pyridinol residues in fresh and
processed vegetables. Food Chemistry, 103, 1016–1023.
Soliman, K. M. (2001). Changes in concentration of pesticide residues in potatoes
during washing and home preparation. Food Chemical Toxicology, 39, 887–
891.
Tawab Khan, I. A., Parvin, Z., Ahmed, R., Ahmed, M. (2006). Multi-residue
determination of organophosphorus pesticides and synthetic pyrotroides in
wheat. International Journal of Agriculture and Biology, 1, 182-185.
Wabaidur, S. M., Alothman, Z. A., Khan, M. R. (2013). A rapid method for the
simultaneous determination of L-ascorbic acid and acetylsalicylic acid in
aspirin C effervescent tablet by ultra performance liquid chromatography-
tandem mass spectrometry. Spectrochimica Acta Part A, 108, 20-25.
Wabaidur, S. M., Mohsin, K., Alothman, Z. A. (2013). Development of a Stability
Indicating UPLC-MS/MS Method for Rapid and Reliable Determination of
Fenofibrate in Marketed Product (Lypanthyl® 200M) and Human Plasma.
Journal of Pharmaceutical Drug Development, 1.
WHO/FAO, Data Sheets on Pesticides. 29 (1977)
Yang, R. Y., Tsou, S. C. S., Lee, T. C., Wu, W. J., Hanson, P. M., Kuo, G., Engle, L.
M., Lai, P. Y. (2006). Distribution of 127 edible plant species for antioxidant
activities by two assays. Journal of the Science of Food and Agriculture, 86,
2395-2403.
Zabik, M. J., Cash, J. N., Zabik, M. E., Jones, A. L., El-Hadidi, M. F. A. (2000).
Reduction of azinphos-methyl, chlorpyrifos, esfenvalerate, and methomyl
residues in processed apples. Journal of Agriculture and Food Chemistry, 48,
4199–4203.

Vol 21, No. 9;Sep 2014
Zou, W., She, J., Tolstikov, V. V. (2013). A Comprehensive Workflow of Mass
Spectrometry-Based Untargeted Metabolomics in Cancer Metabolic Biomarker
Discovery Using Human Plasma and Urine. Metabolites 3, 787-819.
Vol 21, No. 9;Sep 2014
Table 1. Data acquisition parameters of MRM transitions for M used in UPLC-
MS/MSa.
Analyte Precursor
ion
[M+H]+
(m/z)
Quantification transition Confirmation transition
Product
ion (m/z)
Cone
voltage
Collision
energy
Product
ion (m/z)
Cone
voltage
Collision
energy
Malathion 331 127 22 V 18 eV 99 20 V 22 eV
aDwell time was 0.025 s in all cases; Ionization mode: ESI+

Vol 21, No. 9;Sep 2014
Table 2. Quality parameters of the proposed UPLC-MS/MS method.
Analyte LODa (ppm) LOQ
b (ppm) Intra-day precision
(RSD%)c
Inter–day precision
(RSD%)c
Malathion 0.0042 0.014 1.7 2.1
a Limit of detection was calculated at a signal–to–noise ratio of 3.
b Limit of quantification was determined at a signal–to–noise ratio of 10.
c Relative standard deviation (n = 6).

Vol 21, No. 9;Sep 2014
Table 3. Malathion residues level in sprayed cucumber samples extracted after
certain time period and estimated recovery rates.
M extracted after
(Days) M ± SD (µg/kg)
a Recovery (%)
1 63.1 ±0.80 98
4 19.6±0.39 93
7 2.3±0.09 92
11 nd 89
14 nd 90
a, mean of three measurements; SD, Standard deviation obtained from addition
standard calibration curve; nd, not detected

Vol 21, No. 9;Sep 2014
Figure captions:
Figure 1. UPLC–MS/MS chromatogram of 1 μL injected malathion (1μg/ml)
standards in MRM mode.
Figure 2. (a) UPLC–MS/MS mass spectra of precursor ions of malathion (1μg/ml)
(m/z 331) in MRM mode, (b) UPLC–MS/MS spectra of product ions (m/z 127 and
m/z 99) of malathion in MRM mode.
Figure 3. UPLC–MS/MS chromatogram of cucumber extracts (extracted after 1-day
of the spray of malathion).
Figure 4. Diminution of malathion in cucumber with time.