0 s by - ERIC
73
IIIifl i m wit In!? Bulletin .1.glq F, 9 4-)41 N 0 s by H. F. K* g 1," Specialist for Health Education a ERMA SECURITY AGENCY P (=, -cum of duce E von %-ii er rA 1 Fr-1 w g 0 A 2 am fl - titre it McGrath, Cmunissioner qv 4 ; ' 4- 41. ,` . . Mr. ; -,kicTifN 4. ifif- T,, - - 2 7: . . . Oscar , Jcaing . , ; I " . . ';; . I . 9 &- ! -. - */ orto, rd; P ,
-
Upload
khangminh22 -
Category
Documents
-
view
0 -
download
0
Transcript of 0 s by - ERIC

111111111161111111111N1111111191111111161,11111I!!
IIIifl
imwit
In!?
Bulletin
.1.glq F, 9
4-)41
N 0 s
by H.
F. K* g 1,"
Specialist
for
Health
Education
a
ER
MA
SEC
UR
ITY
AG
EN
CY
P
(=, -cum
of duce
E von%-ii
er
a-..--.
rA1
Fr-1 w g 0 A 2am fl - titre
it
McG
rath,
Cm
unissioner
-
qv 4_
;'
4-41.
_
,` -
.
-
.
Mr. -
ac-,
; -,kicTifN
4.
ifif-
_
T,,- -
-
2 7:
. . .O
scar
,
Jcaing. ,;
I "
. . ';;. I
. 9 &- !-. - */ orto,
rd;
P
,


NO
MM
OV
ISM
ingn
MO
NIE
NN
ISM
iffilM
SN
IMM
EN
Um
mom
mo
1111
Ilio
Id'
i,111
'111
111
il ill
!,
L 41% m-r of cities int the ns ea_ aatepxervici, in 191.0
int f ritinawr of p.t-h( I
and 195c
a se
heel ger-tic-es report._,
and4ffcriezes T-cAp--4-Jn AI - Fan= umx at,- _ _
in Cities (Itwr 2 4---(X) te*19S0
sten ----- e-4 hitI(c6 Art)
I 1.
7pA
4 4gerieies responsible -Pr tiriiineirzi and adrntrustrring sch4health xertiees in eitieqTremds in the administrotion
c;ti of t(. 4-)r more popuultTrends in the (44-i-itinistra(ion of se 6-- N
tr-tral rt.,. population
1940 and 1Q50
ht-R-4 irsn ((p, 22 19549
r
eatth Aerracen in eitieffi65 -
IP
19L
!rends in he administration o loaf hLeh -I-from IO,C.NPU to a L-Hqfrulation sp III): 1922-19SO8 Pert-eraf of school sy terns rpriirig thc availability r-: ji)rnneo ,,k_41 health serriees,
Percent Xer;i_NA toms rewirting ntirrit---wrA oi meat-,
iea& nations .II 4 .
I.ei. a Fri in relitstreti mi-e pupil enrim N n A- entft-4,including rwrsonnei_ _ _
W. rerceat i srhs)ol A-1st-erns rerarting varicHLA extents to tchwil,elernen tarl schtxyl children are accompanied bv or or bothvctrents at medicoi etarninations _
11 . Percent of school svsterns reF---Irtmgmr-virlaelten I A f0 Which..the school ho.ds a con -rie-e tig th a Fmttrent Jo11ouin E- amedical examination of the child to plan for .1 f
.t Os I Mr =I I
rough... Pereent of school s-t stems rep-N)rtinE rorvi.. extent, to- _clothing .is ._...remoi.eo .t trsng :nation_J-_ ia rn-v--=-444e-a4 examinatton_
-1 3 . Percent of scht-Ku rep4frrting mrious esta,gisheoOths whereby teachers may refer chl.firen with s iidef Acts or health problems14. Percent of schooi ay terra reik_kr tins varying num bwrs of dent.
luch=1(
tit eat pitml iv-trek-11M in se EtPot,examma requi rincluding presch4x)i _
1.5. Percent of scl. systernA reporting peronneL by types whomake thtoI dental examina ons16. Percent of school systems rerting inrring extents qffo.14-7-tr.throuth by the seh4;p1 t that childr-en obtain &mast17.
S uFerviion a.64_5 eare
e r ce n t acare of
-0 V
en which proi- otcpri i madefor6 6
=Wren--- _ n
who-,w j mtars caruvot a ard to pkly jar such
18 . Percent of _ _ties inwhich extzliu uorute tmntmen t of teethr pES aMECODEV to &ChM:4 Chadre,
B19. Percent of &tame r 'Aida ==,,n-4m14, nursing la, ,
year ---pere,_ _ mow ff oeieams otrapr prof e,__=_.ston_af grour-s
c:7_3 120 . E t W. a t_N&
aut1470 and21. &lava of rasp,
Iv
ne Pfik _m 7-0 wm- -06,". %DOI haath artittees
3
1-
/ 9a- .6
9
29
35
37
having health_.
Comparison1930, 194G,
3. fairhealth gervicies
_______
ovItr 1-414:. _
Fts-t
5
6
9
10of rIth tti
1): _ _ 11u.frival I 11):
'7. oc serrliors its1
____
12
spfby types_
9. ay.1.1 0`. 411. __
mryingof
t
141.
systensi7:,46
tad
J
5 122
rjatiea
by 'neo---:%.ftoksi
-d- hick _ kszag y .
mit.-Jr,k !t
27
D.3
1
_
s- Al. re.
.:....---


NUMBER AND PERCENT OP 84:1100L MMUS
Wort Sours esionsa.: Arkansas, Louisiana, Okhthoma, and Texas.MOUNTAIN: Arizona, Colorado, Idaho, Montaaa, Nevada, New Mexico, Utah,and Wyoming.Nam: California, Oregon, and Washington.
Number of School SgstensaHaving Health Services
The school superintendents to whom the questionnaires were sent wereasked to check whether health services were available in their repec-five school systems. The following statement, intended to serve as aguide to the respondent in answering the question, appeared on thequestionnaire: "For the purposes of this questionnaire, the ONLY phasesof the school health service program to be considered are (a) the medicalexamination, and (6) the dental examination or inspection." In in-terpreting the data here presented, these qualifying remarks need to bekept in mind.
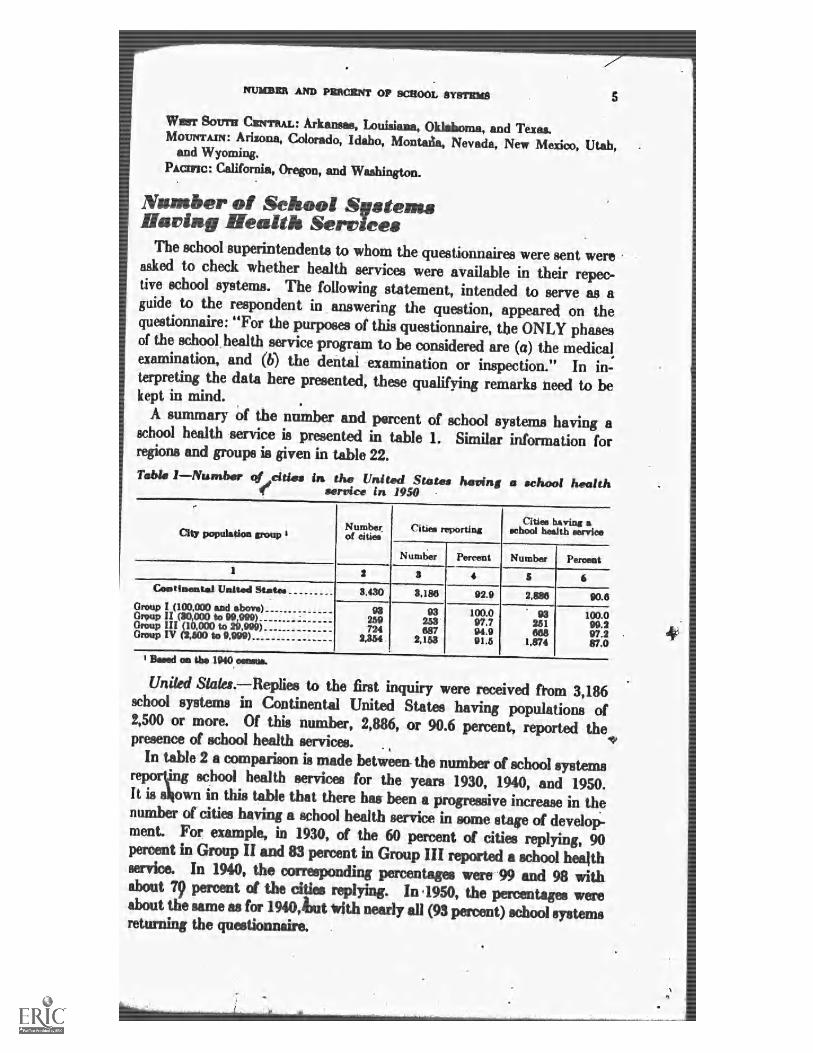
A summary of the number and percent of school systems having aschool health -service is presented in table 1. Similar information forregions and groups is given in table 22.Table 1Number qf cities in, the United States having a school healthservice in 1950
City population group
1
Numberof cities
Cities reportingCities having a
school health service
Number Percent
Cosstissental United StatesGroup I (100,000 and above)Group II (30,1)00 to 99,999)_Group III (10,000 to 29.999)Group IV (2,500 to 9,999)
2
3,430
93259724
2,354.
3 4
Number Percent
63,186
93253687
2,153
92.9 2,886 90.6
100.097.794.991.5
93251668
1,874
100.099.297.2
I Based ea the 1040. moms.
United States.Replies to the first inquiry were received from 3,186school systems in Continental United States having populations of2,500 or more. Of this number, 2,886, or 90.6 percent, reported thepresence of school health services. .
In table 2 a comparison is made between- the number of school systemsreporting sc.hool health services for the years 1930, 1940, and 1950.It is 8OWfl in this table that there has been a progressive increase in thnumber of cities having a school health service in some stage of develop-ment. For example, in 1930, of the 60 percent of cities replying, 90percent in Group II and 83 percent in Group III reported a school healthsaTice. In 1940, the corresponding percentages were-99 and 98 withabout 79 percent of the cities replying. In 41950, the percentages wereabout the same as for 1940,tut *ith nearly all (93 percent) school systemsreturning the questimmaire.
I.
p.
I
87.0AMAINNe=amilmi
dgo

Tab
le2.
----
Cor
npar
1son
qfth
enu
mbe
r of
heal
thse
rvic
esre
port
ed in
1930
,19
40, a
nd 1
950
City
pop
ulat
ion
1930
NIN
IMM
IPM
1111
1111
1111
1111
1111
1111
1111
1111
%
Num
-be
rof
citie
s
mis
sre
port
ing
1940
1960
441
Hea
lthse
rvic
esav
aila
ble
Num
-Pe
r-N
um-
Per-
ber
cent
ber
cent
34
56
Num
-be
rof
citie
s
Citi
esre
port
ing
Hea
lthse
rvic
esav
aila
ble
rwom
onN
um-
Per-
Num
-be
ree
ntbe
rPe
r-ee
nt
Num
-be
rof
citie
s
Citi
esre
port
ing
Hea
lthse
rvic
esav
aila
ble
Num
-be
r7
S10
Gro
up I
Gro
up I
I
TV
Gro
ws
Gro
up
70 181
514
4970
.049
100.
011
261
.910
190
.030
369
.026
2$3
.2
9371
78.3
7122
716
271
.416
166
649
774
.748
7
11 100.
099
.498
.0
1213
93'
9325
926
372
468
72,
354
2,16
3
Per-
cent
14
Num
-be
rPe
r-ce
nt
100.
097
.794
.991
.5
13
93 251
668
1137
4
16 100.
099
.297
.287
.03
U. 8
. OS
eeof
Edu
catio
n.&
Asa
Hea
thA
ctiv
ities
in19
90.
Jam
e. F
.R
oger
s,W
ashi
ngto
n, U
. 8.
Gov
ernm
ent
Prin
ting
Offi
ce,
1931
(Pam
phle
t No.
21).
(City
else
bas
edon
the
1920
oene
ns.j
Us.
a M
OO
Etb
soat
ion.
thaw
s &
mic
asin
City
Sch
ools
.Ja
mes
F.
Rog
ers.
Was
hing
ton,
U.
8.G
o4er
nmen
tPr
intin
g*l
ace.
1912
.(c
ity s
ize
base
don
the
1930
eins
ues)
$C
ity a
ide
base
den
the
1940
mom
s;al
soap
plie
s to
subs
eque
nt ta
bles
.z
r
-
r
IIrl
°11
)111
tr-t
l. 11
11 j
1
IA.6
6101
1Ahl
4.11
8.11
.11=
11
I
I_I
IIWII
lII!I,
Il
Id
!I
tab
I
-
MI1
1E11
119
1111
111,
111.
1..1
2!..M
. !II
r!II
Ihr,
lh!I
IlII
iIili
aLA
INU
All
I"
[11!
"1II
,.'e
fLI
!IJ
wA
sioh
"l
Id
,1',,
,,911
1111
1111
1111
1r0,
1:,0
.,--
,
I
-
I 11
lp S
e a,
61. .
....
11
I
1
'4
'
j
tl ...
......
1
lirIII
,-Y
r 01
111,
1 ni
III
HI
Mr
111I
11f.
1II
r.dl
iilID
-
"
'";
111
'
l'111
1111
1iii
ii V
I M
II
IIII
TfF
llI I
III
mII
IIt
' III
tiv
1141
111
IIIM
T,
4
_
-
tF 1
.
'
2


1111
1111
1111
1111
1111
11m
onom
min
8 MULTI! UR VI IN OTY SCHOOLS
with 97.0 percent and East North Central with 98.5 percent were theother regions.
Group III.Of the 724 cities.in the third group, consisting of citieswith populations of 10,4000 to 29,999, 687 replied to the questionnaireoOf this number, all except 19, or 97.2 percent, reported that they hadschool health services.
In 1930, of the 514 cities in this group, 303, or 59.0 percent, replied,of which number, 252, or 83.2 percent, reported health services. In1940, of the 665 school systems at that time in Group III, 497, or 74.7percent, replied to the questionnaire. Of this number, 487, or 98.0percent, reported health services in some stage of development.
Three of the nine regionsNew England, Middle Atlantic, andNal --reported that all school systems in Group III had health ser-vices. Four other regionsEast North Central, West North Central,South AtAntic, and Mountainreported between 95 and 99 percent withhealth services. The remaining two regions are Ea---st South Centralwith 86.2 percent and West South Central with 85.5 percent.
Group IV.There are 2,351 cities in Group IV, which includes thecities with populations of between 2,500 and 9,999. Of this number,2,153, or 91.5 percent, replied to the questionnaire. Of those replying,1,874, or 87.0 percent, reported that they had some type of school healthservice. Comparable figures for 1930 and 1940, are not available.
Only two regionsNew England and Middle Atlantiereported that100 percent of their cities in Group IV had health services. The otherseven regions ranged in percent as follows: Pacific (95.8), East NorthCentral (88.2), South Atlantic (88.1), Mountain (85.3), East South Cen-tral (83.5), West North Central (75.9), and West South Central (65.1).
Regions.Two of the nine regionsNew England and Middle Miamiticreport that all school systems have health services. The percen-taps of cities in the other seven regions having health services are, indescending order: Pacific (97.3), East North Central (91.5), SouthAtlantic (91.2), Mountain (n.3), East South Central (85.3), West NorthCentral (81.4), and West South Central (71.0).
On the LLasis of city dzpatent are as. follows:
=1--=rv-, thoseby 'oL reparting 15.9 than 90
Region and Group Areas!East North Central, Group IVSouth Atlantic, Group 1V
a. AN go ri IEast South Central, Group III 86iWest South f4ntral, Group 1VMountain, Group rv ..East South Central, Group IVWest North Central, Group IV 75.9VYt South Central, Group IV
.
_ _
115,
85.3. 83.5..... ..... ......
OD ip
4


cil4
1111
1111
111"
1111
1111
111M
1111
1111
1111
1111
1h11
111i
1111
1111
1111
1111
i
4
ADMIAISTRATION AND FINANCING OF PROGRAMS 11
44dasinistrationFor all the 2,886, cities reirting school health services, 601 percent
were administereti by the Board of Education; 10.9 percent by theBoard of Health; 23.0 jointly by Boards of Education. and Health; and5.9 percent by other authorities.
In 1940, for ail cities-of 10,000 and above, 73.4 percent were admin-istered by the Board of Education; 14.3 percent by the Baard of Health;and .12.6 percent by joint authority. There were no other administering
citiesagencies. In 1950, the tioard ot mucation a ton for of10,00 and above had or- rem 3A wrcent FvrcentBoard of Health administration from 14.3 Ex4rcent to 10 .0 v tereen. thejoint authority adnums. had increasM from 12.6 mrcent to 21.3percent; and "other" authontli inerea4ed from 0.0 to 3.1 percent.
Certain other comparisons *---twcztn 040 and 1950 for Groups I, II,and III ar-e shown in tables 5, 6, and 7.
Table 5. Trends h th administratfryn c4 mlitool hoa.th =Trims in cities oor hisom poputatto'n (Group I ) 192249
Reepcmeibk authoritypercent, by year
1922
Board of tducatkind Rmith
Joint
Total
51 .
di I
100
1930 1
3
(Va
140
100
1940
4
6531
40
I (X)
1950
eof
0
H With Seret4.-V.8 in My &hoe& Report a Mnt Committee on Health Problane in Education of theNaticaW Education Aakgintion and the Af.--_--txk.:an Medi Amociafians New York. ign. p. 4.
3 U. 84 Oftcue d Education. &400l Aea-.-nheit IPSO. By James F. Rogers. Washington.,U. S. C-k,-Inwt Printiva Meek 1931.
& *Sift el E4utirca. &freices jot City & By Jrn F. Rogtm. Ww.hington.U. & Government ?Snag* Offim
in Group I I 9Group 1.of the 93 r---&-Tin. PE LA or 61.3I A 1
ilinaleaml12, or 12.9 percent, the Board of Health; 21, Er 22.6 percent, joint ad- _
1 minktration; and 3, (xi 3.2 mama, other methods.1
i
I hb I- -4 --4 Q'%Uth.1i-----1,-..---A. arm' LAF,,,9
,Eat the Baal-id. ofpercent,
Fk1uction8 was the admin. istering agemy
Th parcent--2_, range bv . R i Ed tregions for mni cucaion a.
imir-ctra-NO 0 to CI V:t Wftt irth Central West South Central
Atlantic r Englami lowest.
Group 0.n= th g.v-1 =.-.7.11E have the Mowing percaitages
for adminisb*. ative atai____,Frity: Board d Education' , 66.1; Board of=fityn
Vz-
E
9 9 kint, adminktratim4.18.7; and other methods, 1.3,
_
ffgagm-
212 4=----026....,k2...4
-,A41111 citiesEducatIon ran
.uns koiup havinq admuartra-,free. 93.9 to 20.v wr----;_nt. I tl
to 65.6 the
had
100+IN - c - .w 411 BMW NM 4111.1
1
Board
Other
I,
......
$ $
"It
NI p 1111M M. I 1.11 r
2s
0
- - .11=11= S." = _I Au. a I -
61
1
&toga is
U. Heath1942.
cities
n ri,d
0.-FL
W4:1D
ti the i of intion by the a
$

1;11
1111
1111
1111
1111
1111
1111
1111
1111
1111
1111
1111
1111
11m
tlum
ws
ft
,
4
12 HEALTH &ER VICES HI CITY SCR00141
Table 6.Thwritis In th41) adml Li9 tre tion qf school health services in citiasfro*30 OW to 100,000 popula tion (Group II) 1922-14501.
Responsahk a u thort ty Poreent. by ywar
1 922
2Board 04 Education
77Board of Health10Joint 41 00Private
Health and °Lbw0Edum hotel th, and othiew
c
0Not stated1
Total
.....
1930
7814
01
1 940 '
4
INC
7121600
100100
asiA Servc,--41. friiihedis. Report of Joirit Comm:Mee H-111) Probland it E.4N atkmal Eiluontri A.miociatkin and the Ameenva M adios! Aseociatkm., New York. 1922.oolumn ioeforfile 46,000 to 100,000 poptdation.)$ U. a Ullks of F_.,-iacattos. &heti Reel& Aciaribas i. By JELmos F.U. & Government Printing Ofilak 193 1 .
& Oakes ifeek.4 Stwv-*. i OA, & By Jan-1- F. Rowse.U. & GOVIWIUMISI PTinting Othos. 190.
%motion ot the4. (This
Weiskingtow.
highest in Miidle Atlantic and Pacific and lowzA in Ent South Centraland South Atlantic.
Highest in the perventage of citimas the administrative agency is :New inti wAtlantk with 26.5 wrcent. Three regionsAISouth Central, 40-Mountainreport no citiesof fiNilth administration.
g the Rrmrd c Health3 percent and South
m North Ceniral, Wemin Group II under ikmrd
Joint administration ranges from 60.0 to 2.0 percent. It is the highestin East South Central and South Atlantic and lowest in Middle Atlantkand Pacific.
Group 1 1 1.Cities in the third city group indicated the followingagencies as the administrative authomities: Board j Educatim, 66.0percent; Board of Health, 8.1 permit; joint administratims, 22.2 per-cent; and other, 3.7 wirent.The pmentages cities in ilk group having the adminktratkm doneby Boards ci Edwatian range, by reOxvi, from 89.4 to 11.1 petcent.The highest percentage is in Middle Atlantk and West North Centraland lowest in South Atlantic and East South Cen al.Administration under Boards d Health varies fa= 31.7 to 0.0 pcortintwith $outh Atlantk and Enst uth Central being highwt and Mountainand *ddle Atlantk
Joint achninistraton ranges from 59.8 to 5.9 prrcent with .1 ith AtlanticaEd East iifl CMfltT81 having the higiwt vamitam and MiddleAtI34 C"-M J the lowest.
_d
1
.
. . .......
Or
_ -
etbeitt16
8 U. Mitt* -t
-
000
.
.4
Itt-

14ITILLLTU SZEIY10118 174 OTT beinX)14,8
Pt------awg mud oft artsEast South eel-Arai! Group 111South Atlantic., Group 1FAst §ii)uth Central, Group IVMountain-, Group III
.... 44 LI
p 4.0 0
38 8
34East North Cemtral, Group I53 !Stvuth Atlantic, G-t-txx 1 . ,o2 4Paclfic, Group 1V._
... _ . 30Wrot South Cenitr Gro; 1ip III . _ . _ .
50 0
1
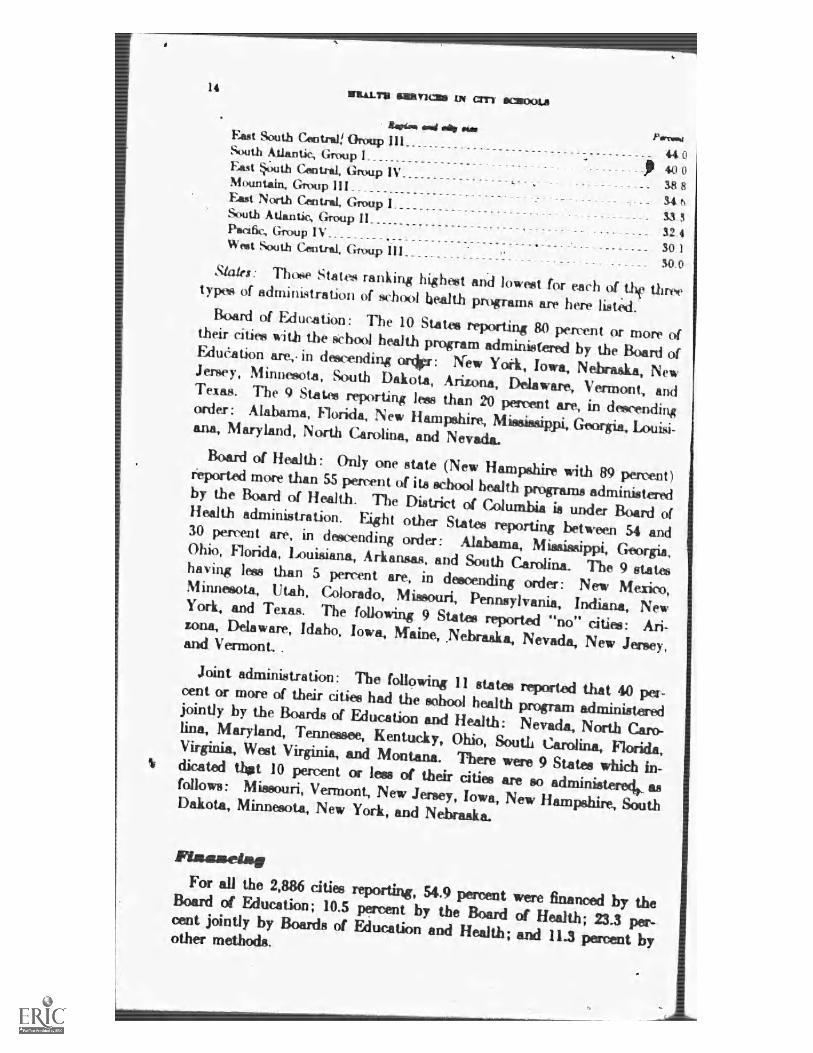
Sidles: Those ttit ranking highest anA lowest for each of tilt throetypoi of administration of school ilealtb programs are here listiNd.Board of Education: The 10 States reporting 80 percent or morl-b oftheir cities with the tkhool health prog-ram administered by tbe Boarii ofFAut'ation are, in &seem:ling or*: New Yoei, Iowa, Nebraska, NewJersey, Minntwta, South Dakota, Arizona, Delaware. Vermont., andTexas. The 9 Statitts reporting less than 20 percent are, in dewendi4order: Alabama, 1.1()I ida, New liamiAiire, Gtwgia, Louisi-ana, Maryland, North ( 'arolina, and Nevada.
Board of Health: Only one state (New Hampshire with 89 percent)r'eported more than S5 percent of it whool health proframs administeredby the Board of Health. The District af Columbia is under Board ofHealth administration. Eight other Stht ez. reporting between 54 and10 percent are. in deRcending order : Alabama, Misaiippi, Georg-ia,Ohio, Florida, Louihiana, Arkansas, and South Carolina. The Q staLhaving less than 5 percent are, in descending order: Nevi Mexim,Minnesota, Utah, Colorado, Mi.viouri, Pennsylvania, India; a, NewYork. and Tex, . The following 9 States reported "no" citDana, Delaware, Idaho, Iowa, gaine., _Nebraska, Nevada, New Jer-F-tand, Vermont.. .
Joint adrninistnition: The 1,4!: ?visa I 1 stat rçritd that 40 p-14-cnt, or mare of their cities had the sohxl health program administeredjointly by the Boards of Education and Health: Nevada, North Caro-lina, Maryland, Tennessee, Kentucky, Ohio, South Carolina, Flork:aVirginia, West Virginia, and Montana. There were 9 States wh -h in-dicattA thet 10 permlt or lees of their cities are so adminisfollows: Missouri, Vermont, New Jemey, Iowa, New Hampthire, SoutelDakota, Minnesota, New York, and Nekaska.
For all the 2a86 cities reporting, 54.9 yvrrimt were financed by theBoard of Education; 10.5 weent by the &lard of Health, 2.3cent jointly by Boards of Education and Health; and 11.3 percent byother methods.
;)-
Powell
.
Aii-:
1:34

tivid.INitifrk.Arwis AND nN4"41:11141'u uv rhol4 %hi ot 1 5
_40, for all citiesi of 10,000 and above, 75.4 pervent er financed
the -4,-(g_ --os of Education; 12.1 percent by the liaard f health; 9.2perrent jointly; arid 3.3 percent IPy other authorities. I I 45I0, the'
Board of Education financinpfor cities of 10A)0 and above dropped,(111 75.4 percent to 61.6 pert-flit Health i)epartment finani ma had
pped from 12.1 to 10.0 percent; joint financing had int-reR.-wdto 21.3 pervent: And abet autiierity had increased triiti
percent.3 .to 7
(roup I . Of 6, 93 cities in Group I, 56, or 60.2 perveT;t, reported
that the financing agency Y.4 as the Board of Education; 15, or 16.1 percent,
the Board of Health; 18, or 19.4 percent., jointly financod; and 4, or 4.3
percent, financk-ki by other methods.By regions, the perventspi of cities iii this roup having their school
health programs firlaiiced by Roirds of }.1k1cation range from 100.0 to.
percent. in nvat estolxiNortht [up:nest entrtd a id Pak iii and lowest ,
N England and South Atlantic.'4).0
virdsfor
Jointioun 'n
-x-inding percentages for cities havin,ofilie financing done bylealth range from SO.0 pit 'vent for :Neu 'England to 0.0 peroent
Western regionR.tinanrinit range() from 50.0 to 0.0 perrefit, beins highest iii
and South Atlantic and lowest in West North Central anii
A tlantk.
iNkap financing agency in tile second group is as follows:
Board of Education, 633 merit; Boart_ of Health, 13.5 percent; jointfinancing, 19.6 percent; and ber methods, 3.6 percent.
By ron the range for Roiird of Education financingIA)
h)w
30 percent.. It is highest in West North Central an_l Pacific andin East South Central and New England.
nNentages for cities finalimd by Ro,qrcht f Health are from
30.8 to 0 percent, with New England and East Svt entrai highestand \Veldt North Central, We,st Soutn Central, and MtuutAin reportinsno financing by this plan.
Joint financing for cities in Group 11 ranges from 50.0 to 8.2 percent,
being highest in East South Central and South Atlantic and lowest in
Middle Atlantic and East North CrntrA
Group I l .-In the third group, the financing agency is al, follows.
Board of Education, 61.1 percent; Board of Health 7.8 percx-xnt; joint
financing, 22.3 percent; and other methods, 8.8 percent.;By regions, the percentages being financed by Board of Education
range from 76.9 to 15.9 percent with West North Central and MiddleAtlantic highest and South Atlantic and East South Central lowest
The extent of financing by Boards of getalth woke from 28.0 to 0.6
Inrby
_had
from
Q.2
25.0in
offour
Mi4dle
1 .-The
is from 86.7
The
I.
f

4
16 BEAUS SERVICE& 4N CITY scam,.
percent,,, being highest in East South Central and South Atlanticlowest in Middld Atlantic and Pacific.'
Joint &awing ranges from 49.2 to 8.2 percentand Mountain highest and Middle Atlantic and Westlowest.
a
and
.tlanter.
Group IV.The financin, agency h Group IV is as follows: Eoarjof Education, 51.2 percent; Board of Health, 10.3 ir-&,nt; joint financing,24.4 percent; and other methods, 116 percent.
By regions, the range for Begird or Education financing is from 82.4to 94'percent with West North Central and.Middle Atlantic highest andsouq Atlantic and East South Central lowest.Corresponding percentages for cities where th
Board of Health range from, 31.9 to 2.4 gement with asst South Centraland South Atlantic highest and West Noilli Central and Newlowest.
Joint finahcing varies from 42.5 to 7.3 =meat for the nine regions:It it highest in South Atlantic, gast South Central and Pacific, andlowest in West North Central and Middle Atlantic.
&awing0 Is done by the
Regions.By citiesregions, the Percentages for ail t)by Boards of Education are highest in' West North enA .ir.tr l Middle At-lantic and Pacific and lowest in South Atlantic, East South Central strAdMountain. The range is from 82.0 to 15.0 percent.
Corresponding percentages for cities having the financing _iy ;amniaof Health range from 30-4..to 2.4 percent, being ht_Enest in 1=-:--,v, exmth... ,_... Q_ .
Central and South Atlantic and lowest in West North Central - -.....Nia t eAtlantic.-
joint financing ranges from 43.3 to 8.2 percent for the nine regions.it is highest in South Atlantic and la..4st South Central and loweit inWest North Central, and Middle Atlantic.
Personnel Availablelor Schoil Health Services
;-
. e extent to which school health service personnel, sue hysicians,nurse, dentists, and dental hygienists, are available in the various schoolsystems is indicated in table 8. More detailed information by regi_ nsand city groups is included in table 23. The percentages shown in ,--='--
two tables are basfx1 on the total number (3,186) of schwl systems Tpining. This numer includes the 30 cities which have no, school,
health senrice.yr.
ir.fWPtaitrw- ye8.Tne number, of "school systems having vigriow Endsof school health personnel is as follows: physicians, 2,004 or 62.9 F--f-r
*i .V.
-,f,!' .
ar;c74
with Southare
,
I
az
. .

P1111801,0114 AVM-LABIA 17
Table systms roporthig ieschool hoojth services, by type
-1Es'try f permneI for
aty populationPeanata &Kw giabala remniing perwanrAi, by type
Physkdan Nurse Dentist
Group IGrtiup NIP 1111.40 sp.&
Group ......Group IV
2
62.9
CA 681.871.956.4
4
Santa'hygienist
Others Nopersonnel 1
SSA
100.097.694.680.4
40.4
80.659.747.084.2
s..1L9
81.681.621.810.6
U.7 940.0
LS12.0
1 This column represents the school askew which reported that they bd no whoaBrig oonsecmintly no pereweL
cent; nurim, 2,720 or 85 percent; dentists, 1,286 or 40.4 percent ; dentalhygienists, 506 or 15.9 percent; other school health personnel, 372 or
= 11.7 percent; and "ncr .personnel, cities with no school health services,! 300 or 9.4
In general, such perwnnel was late- *- available along the seaboardStates and least available in the mountain and central States. Thelarger ciao had the highest percentages of professional perwnnel em-ployed, whereas the smaller communities had relatively leas help. Nearlyart the cities of 2,50 in populaiion and above had musing servioe or con-
_
sultants available,
city population groups:41w availability el poofein6A1 personnelon tile staffs of school-health services for cities al varying gas is herepresented.
Group I.-41f the 93 cities in Group I, 88, or 94.6 pacent, havephysicians; all have nurses; 75, or 80.6 percegt, have dentists; 48, or51.6 percent, have dental hygienists; and 37, or 39.8 percent, reportother personnel available.
Group Ile-Percentagm for the 253 cid% in the second group are:phyeiciaas, 81.;3 prcent; nums, 97.6 r-cmt; dentists, 59.7 percent;ental hygknists, 31.6 percent; other perimnnd, 182 and SC
noggperscaneL no wlicel heath malice, 0.8 precut.
Group /H.---Peroenti-4- fir tho 687 aim in the third gimp ere:71,09 Fermat; num", 9406 Fount; litizt--c 47.0 ,meint,;9
dentil hygienists, 21.8 .-_,rizan; other personnel, 11DO scIgI bcafth fieeviwe 2.8 mast
&Nip IV. wen 2,153 (Mkt mord* in Group FY 'rpax:adage of citim having varims personnel are: physicians, 664wont; nurses, A rkrmt; dentists, 34.2 pereaut; dental hygienists,
pht gfino
.
,r.
.X A. I. '- .T*
;44 P
-t
=11
OP
e.==i e cef *hoot
ORM.
Unitd States-b.'MI IP SI 4011
U 40 M. CI
5 . III111.14 4610 414 01.
y:=3
Z.-
5
146 111.114 ID ID GO 1-
r-a
ft
I.
ss-' - _
kJ&_
J.
0
dl
6. ;AIL
.
hittI
0 Wt.
_. ._14;
*)
. . -
, . !.,'''' i '.= ,i . :i - 4. : :. e 10
. e -4;),(... : 1.1 .4 V ..'
Y. . .412'. . 3 i ' ";:y e . : e W., i. ; ' 8 .'' . 1
,
.._ _,...
:
yt.12..ke, :

mn
TIM
1111
1111
r111
U
r
18 MAXIM 07.MVIM-=' IN MY &ROOL9
10.6 mment other 9
health service, 13.0 percent.o 0 n-5"--rInu' ana " "no
a tr, er&---03nnel, no school
Availability pmresston.---The relativeparsonnel by regions and city size follows.
0
Asystelans.---11.Jcent for Middle Atlantic
employment of
avail-biaty of prot'-m-sio_
ysicianq range-3 from 07
a a .Fko percent 17oi New ; to 3:cent for West South CentralBv city. 6.7.,igj02C7 '-'
A
IVGiulle_A
Nwsps.. e
and.it ranges from ri A e
0-D c%A -% TWOrlf.t.0 %. ; w,r
extent to waiter) nfrom 993 imr-o-mt in New England
forwi azT foriv t 56.
A
North
al
meraff .4 r- .
anercent Ior
emnlo yam% by%,-1 Middle97 wrecnt in °
to 62.4 percent in West South Central and "
Central. By city size, the range iS from80.4 percent for Group IV.
P---,vicra estt` in North%AA cant I I to
In 19511-2 according to the Public Health Service, Mg.H}-43 nursm
eluding' 139Aupervising nursez, were employed by local BoardR of RAu-cation. rrms-* figure indicates an increase of 51.8 wercent over the num-ber employed in 1941, as compared with a 24.6 percent increne in thetotal number of nurses in all fields for that ixricd. This number ofschool nurses also represents 23.9 percent of the 25,461 nurses in allfields in that year as compared with 19.6 percent in 1941.
These data indicate that during the past decade there have 1W--r1:1increases both in the total number of mew employed by local Boards ofEducation as well as in the relative percentage of all nurse so employed.
officialo, health agencies, by compari,--+-3n, employed 12,556nur-a in 1951, which figure represents an iwrease ci 31.4 percent over ,
the figuss for 1941. Load non-official agencies employed 4,774 nurse.in 1951 9 which figure represents a 17.7 percent decreaw from 9-
Den/it:b.The availability of dentists ranges, by regime, from 70.6percent for Middle Atlantic and 59.4 mrcent for New Englaml to 10 0pergent for Vitzt, South Central and 18.6 perutut for Mountain., Bycity size, the range mom 80.6 percent for Groun to " 9A
st-0-4, percent forGroup LV.
- . 1Wgj?
A, nos
ployed v 1, Dyxte t to which dental hygienists are
1 fee 32.9 percent in New 21.5for Pacific% anti zu.aon o percent .
foribr Middle AI = V-:=7*-0 V- A* A,
2 forforAwounwin, 3.0 vv tgi Antral, ana 2.8 -mem WestCentral.
AWn W-Wbo_
0- 0,=4
The medical examinatimas can ordinarily be grouriclassifications: the periodic examination requirtA of all stimPnts, the
6-71,
11 a "LT
_ . - - - # ..r.----40141,Atkvmdpr Pier Raft W.*%won
doodles_ ;-= Aiwa willissose ft Ckp
!Ji i. t ?wrier** of_
== 19111151===
by
per-
WestGroup X
are =-5-ons,
100 Group
v;:
is
emo
:4 111_,Int
South
44
CP
de no
-1 T _14r_

"
students and special oixamions. This study deals primarily with theexamination of athletes, and supplementary examinations for special
irma MEDICAL It4 ATION 19
medical examination required of all students.inInformation was requested on the questionnaire regard to the
number of examinations required of all pupils and the years in which suchexaminations are given. The questionnaire did not provide for in-formation as to whether the examination is given by schoolphysicians in the school or by private physicians in their offim.
Since parents should have an important role in the periodic examina-tion to assure a more adequate follow-through on the correction ofremedial defects, and for other reasons, information was also requestedabout the presence of parents at the examination and at school con-ferences to discuss the examination. These and related topics are herepresented.
Nossabor of e,i_lessiligxestsinations PeRE' Pupil
A considerable variaaon in the number of medmal examinations rt>.quireid of ail pupils in the elementary and secondary years exists betweencities, States and region& Si4me authorities believe that annual or bi-ennial examinations are needed, wher-eas others consider that less fre-
. quent examinations are dirable, particularly if they are rRore thorough.The question d availability of medkal wisonnel is a detethtng factorin the frwluerwy of examinations given in the public schools.
A summary of this subject for the Nation is presented in Table 9.TaNe 24 gives similar hifmamation by regions and city size. These
tables, and the discussion which follows, only concern the medical ex-amination requized o( each pupil. A large plOventage of the schools re-porting that they have "no" required examination do indicate that il)examinatkais are "offered" but not "required," and (2) that special ex-
- 'Follow; are given to athlete and others. These special examina-dons are also given in many of the cities which have the required exainina-tions for all pupil&
United Stales.The information for all cities reporting is, in percent,as follows:* no medical examination required, 17.0; 1 examination, 18.0;2 examinations, 7.9; 34 examinations, 21.6; 5-6 examinations, 16.4;7-8 examinations, 5.0; 9-10 examinatio6, 1.6; 11-12 er. II tions, 4.0;
%and 13-14 examinations, 8.5.Seventeen _percent &the school systems report that they require 1
I to 14 meaical examinftims. Many ci thee systems are actually report,-log that they have examinations annually, since some of them do not haveschool beyond the tighth grole. Those cities rep:meting 13 to 14 =mina-tions give one beim the child eaten . , and annually themafter.
;.
iu :xed
_

mon
omm
nmin
amm
omm
oim
umm
onm
mon
inni
m
HEALTH s--1_7AvIc118 IN CITY
Table 9.-Percent qf *chop! eyst8msexaminations required of oath pupi school,ionise!
mbers of rn"/Including per
City population groupNumber
citiesreporting
Percent reporting, by number cd medical examinaticesfor each pupil
1 2 3-4 5-6 7-8 9-10 11-12 13-141
United Stowe...Group IGroup IIGroup IIIGroup IV
2
1566
84211563708
3
17.0
4 6 7
I&O
17.8 6.012.8 10.0
19.0 al913.0 I 1&3
7.9 16.4
2.4 38.1 20386 30.3 19.08.5 19.4 30.08.2 20.2 14.4
5.0
10 11
4.0 1.5
2.4 0.0 7.1 5.96.6 1.0 2.4 10.47.3 , .9 4.1 11.54.0 LO 4.1 7.2
I The cities in Group IV represent a 50 eereent sanipling. we.. in order to weight Group IVcorrectly when mmputing the peroration in totals for "United Sss, the number of citic. I sashcolumn of Group IV ht.sk first bees doubled. This procedure has also been followed with other tablesrelated to the second questionnaire wises determining the final measles= for geographicalfor the United elates.
City population groups.-Groups I and II have approximately the sameranking frequency plans for medical examination& The rank for theplans most often reported, with percent shown, is as follows:
Group I-3-71 examinations (38.1); 5-6 examinations (20.3); no ex-amination (17.8) ; 1 examination (6.0) ; and 13-14 examinations (5.9).
Group 11.-3-4 examinations (30.3) ; 5-6 examinations (19.0); noexamination (12.8) ; 1344 examinations (10.4) ; apci I examination (10.0).
Group III.-5-6 examinations (20.0) ; 34 examinations (19.4); 1 ex-amination (15.3) ; no examination (13.0) ; and 1344 examinations (11.5).
Group IV.--1 examination (20.9) ; 3-4 examinations (20.2) no examination (19.0) ; 5-6 examinations (14.4) ; and 2 examinations (8.2).
Of the 250 cities which reported that they required no examination,15 were in Group I; 27 in Group II; 73 in Group III; and .135 in Group IV.
Of the 260 cities reporting that they required only 1 examination,5 were in Group 1; 21 in Group H; Ek" in Group III; and 143 in Group IV.
Resions.---Middle Atlantic reports the; Ethicist number of examinations,per pupil with all except two flag requiring at beast threeRanking first is the 5-6 examination plan and unei,tion plan.
tion for the other regions, with the plan ranking first, h asfollows: New England, 54 examination plan; Eist North Central andEast South Central, 34 eximination plan; West North Central, SouthAtlantic and Pacific, one examination plan; ai West South C--s%Tirt--and Maintain ,"no" examination plan.
The regions reporting the highest prow al their cities with norequired examination are: Mountain (40.0); West South Central(35.3); West North Central (27.3); and Paoli& )
emmula.
sm el
--
40,416 m. eg. a, a .....
4.41111111111."
i 411111111100,.-=-
!...... ,
11 ..
21.6
NO-
1.6
,
'
afti
;
examinations.
. ,.
.-4 1.1-:
9, r I ., yr.) , . ..
. .
r-w./
.6. :
. . - ;. '
4 '+.re
-a7.1
,
" 7-7 4, r ',..!1,.t.I.' '7 'r Yir;:ei1.7i17,1
of I'
0
I
regions
,
second,

211111 ML 'EXAMMArdM
Groff S. Wiblek itavriNoslieasiExaminations aro
_01 percent d theone or more medicalgrades in Wff tluinformation on this
1,556 cities which reported that they requiredexaminations of each pupil also indicated the grade orxsminatierm were most frequently given. Pertinent
I Isubject ICka17111V....044113# Wr
On marnindim-----43f the 20 cities reporting that theyone
ee IeA_tebn
. . .....aexh-irrinia-uon;il -1
A _o_
117 2 .- r ...1 n a
A.l t. , a. 6......v.,.. The r=mal0
required only121 irilicited that it was given as a preschool
rtj$J it as given Ln the kindergarten; and 87 statedTam-
13 eitic---;5 gave the examination in other grades.
TIED ezaitinalit'lms.---0-1 rill the citie=3 rev-v. 2 _ c4)0 I 99 ted the
.-.}:APA11(a
Ley reti ,7474 eX8M1riallortg Os eAchOf the 244 examination Erades .._,._,:.
_ _. ..v-1,:t--A
A%.,----Zr,61 L-t7ea
._ . '
prelchool mamma'tioi-2; 3 in km` dergarten; 69 in first grade; 56 in grades,38
.in and
....
IF_2-6; grad 7-9; in grades 10-.12
UU
I i naurnw nis years school.
/pe eiwrffeThree ceaminations 190.n.examinations art au pupils.
are weachool; WO in kmd°ergarten; 142 inOf A 1
f.ff 0=tff-ttNrov-%,
rewe no r-4=4' requiredII .. tion aract- involved, 30
urbt, grade 166 in gre4i-tzi 2-6.176 in grades oq7E-9* and in ffrades 10-12.p
Four or more examination-S.In imtawes where four or more exemina-tions are required, time tended to be a spacing letwwn 4118 ter0 COW preschool, lower elemogray grades, inte.---1iLmPte.
0 , a
..se-a.m,,,..a=---'--, nrygrides, upper elementary ce junk* high -L*41'..6-li grades, senior high scboolgrades, and a terminal examinatim. - The exaininations tended to begiven more frequently in preficlmol, kimiergarten and first-grade than inany other .canparable witd. The E---ertbr high &Alai years were nexti n
.1 with grades 2-6 being owest. Many of the schools which
retu-.ri-ftli --.---6 examinatkals gave the l'it one in ihe tenth or eleventh-ade raffia than in the twelfth grade.
Parents ff at ModiSeal Examissattassaiu
wale 4°- A p= medical namir,_twee1
a20in0that they will UlXientaig fh_ntr_- eiMiefiCe
_
gum*, *we ke... ...a te r =---_- --2 A iLv th .----.i I-7. ---,-,, -,------.
--._-_,==== = A4atgm ___=._. eto see that remedid *hots we oarrez44.gad to the frelmoy with Unhl-fni, azA
4Ei
saml nexuk, tfl- Reel°
1*I:1ogivsdatinre
_ rkv_ . ,.
7
S.
_ =
1
inn
Ion,
-L. 9
1-7-1-
thi.:-% are given
I cities
1
years so
- _-
J
_. . :. r
I--1 I 1 1: °6-
. .:
N"!': ,
, go, k110,4 fp:4V: L
., 1 ,
.;;A1".4. I '
"!,W .11,3-4 . T;t:1414. $i: ...4(1,1: °.-
. .. .
ita"
ely
1:kJ:, 4
1'Hipp
1111
1111
11fil
ilh11
1111
1IIM
IIIIII
nIlli
illim
iinlIl
iiM
1111
1111
1111
1111
are
umAira amivica IN OW
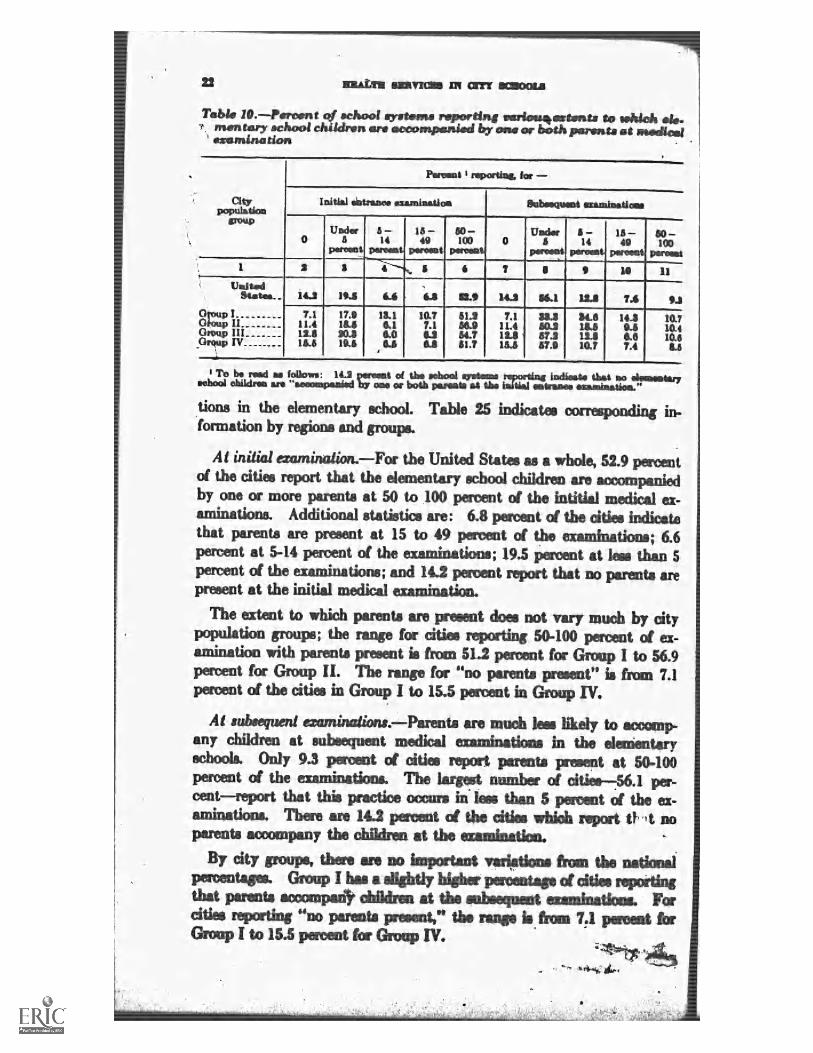
Table ---Pert,-tene c school =- systems -Fn to which AN.
school I oCe-ir- gi.ei "Paniled°
- &-= are Dv one or both parents at medicalexarama on
Citypopulation
group
Perrent mortis& far -Initial atrane* examination &.NN,Quen.t szarnami. aim
iCpermit
UnitedStates. 9J
Group I__Gimp IIGroup III.C1tAup W_
17.916.620.319.6
33250.257.957.9
10.710.410.6&5
I To read mo follows: 14.2 of tkm toehold systeno indkate t_tr- -At no - _
yahoo' children aiv "accompanied b- "tit tweets lit the tial =trams "
ions in the n -A
11._,11 y
formation by re=nons and4
S.-4a.1 aCNA 0oh Table 25 indicates
At initial examinalion. For the United States as a whole, 52.9 mi)entci the cities report that the elementary school children are amommniedby one or more parents at 50 to 100 percent of the intitial medical ex-aminaticma. Additional statistics are: 6.8 percent of the citiesthat parents are present at 15 to 49 percent of the examinations; 6.6percent at 5-14 percent of the examinations; 19.5 nercent at less than 5percent of the examinations; and 14.2 mime report that no parents areprawnt a4 initial medical examinations
T, toL-VI-1 111V-11
ainmatbangroups;
ea saMs WA A
the&
II.percent fir MI -a ED%_0,-
rwm-nt d cities in
parentsrange for
ifljt
A
.ff%LILO
Group
2gm m
= _ ri. . . a , ,= = , = = .1 aM .----- = w.- = a. yW
range V 66g m -1
Lo 15.5set
A'a -=`_=,-.,==a-
Niue
much=
-=F-
U LA V
Group
9
from 7.1
At subsequent , -= 5 firents are mue
a Rely to ww-mpi-elpnipntarychildrenany at A ff g
-
schools.perowt,
theexammatxtm9jiff 0, !..2apermit mt a,
tue 2 a aexaminations. ==ff I ri ri0
cent--; that thisgWtk*"&p:
0an 11- tia than
aminatims. There are 142 FriAnt ci theparents accanpany the chilthen at the examinatkm.
By city groups, th-.:40fttsges.thatQumGawp
A-2
'LL
9
important varigkma tram the wionala slightly highs percentage of tides moiling
parents wcanpani children at the athsequeekt examinations. Far"no parents present," the range is from 71 percent for
I to 15.5 wattmlt, far (hoop TV.
T-
1.1
- _
7"
a ---,Meenaa31
.....
a
IF
Under 6- la - WO-O is I 49 ice
portent preen' percent pareani-
3
JIM t1111...tataWa
7.1 1a.111.4 6.112. &O164 g...4
be
--===twoontitmorao,-
U 15 -0 6 14 49want lamest Kolas-
; 11
01.41 M.0 14.2 ,L.1 1LS
10.7 513 , 7.1 14.37.1 6.9 11.4 I&5 9.10.0 i 64. : 111.6 1- 6.6a.0 . 51.7 1&6 141.7 = 7.4
_NNW
-evaps.
111
0. _ .
corresponding
-
hi-
te
the
are presenttiOn cities 50-100 el' ex-
from 512; t for. 17,-..q_a[] I to 56.9
the - m
h,
V.
of cities reportI LJIhI
th occurs 6 t etc-
reporting
no. 1
tilqt, no
IrriL-C
11016001a
1 4 6
- SO-
II
_
14.2 19.1411==.
pereentGeo or
by cityreporting
I
lessmedical
parentsof per-
(if thecities wbioh report
16.
Group I has
ah.


IIII
IIII
IIIM
M I
III
illt"
111
P q:
rmi
24 MILTS 1111111M119 nq CM MIX=
clothing both for the elementary and coil. 91 school levels and for baysand girls. Table 12 gives the penuotages of cities reverting each type ofpractice.
Table l2.-Per-_-nt of school systems reptwting vwying xtents Wclothing is rnwid during a modical examinatim
Praetke
Pwoult T1IAg by whoa level sad an
Elementary soboois Beocadatr Paola
Bole Borg Obis1 4
No wi boo1 potkey. .No egothirt4 removedOuter (got-lung removed ogi17Erhoee and suxtkinge removed onlyftripped to wa--4, cab*Shoes and stockings removed and
stripped to geishaEntirelymftswes=1.11101
$411.4
&I7.02.0
18.9
24.0
17.46.1
11.91.1
16.6
20.66.4
08=1,11eng....
40.783
11.42.9
13.9
.1Clothing is removed more extensively during the medical examination
of elementary school boys than for Inky other group. The oombinedpercentages for "strit:--x---ii to the waist," "all and tockinp removedand stripped to waist," and "erairelv Ese as follows: de-mentary school boys, 50.9 wiwnt; demeritsecondary schmil boys, 45.0 Rercent; and/KT-cent.
6m
school aan .
The large cities more frequently have micies on the Platter of removalof clothing during examinations than do small cities. These cities
atlalso practice more complete removal d cl _ian do smallerci
As regards "no set school Rolky" in relation to the removal d clothingduring a medical examination, the .wreentages are: eienaltary schwlboys, 34.4 percent; elementary school girls, 37.4 percent; secaxiary schodboys, 44:9 percent; and secomlary sclxx:d girls, 46.7 percent
or HeaLA f=4.,4 Dehfretta
Information on the extent awl tyw of estalaithed metiKxls wivrebyteachers may refer children with sz:___--:---;5z7z,ttA detects or health wobi-7-msare here 'resented. Talge 13 arxi table 26 supigy infoematimtopk.
Moot schod sys4ms in the UrtitAmethrmi. rt nwre en"
health &erfollows SG
V -444-BP--
a
1E1 St4Ek
,====--- .6-w 41m_
_thgw are asrWA- Li ItOg
&r:-M tO Oftlia." 52 P4, .A
=
a
;La
L-7P
IE
4... .
a ..1 %_ .
.. Es
oftiveci . 41 MEW GPM,
Mid
-
*kb
'NEW
1
assgo. lot-- _99
. . . e;
1_1,-;
'es.
.1
---z-1,z-
1,177)/7/7
4.
On
t _ .
-
et.
,.

1 11
1111
1011
1110
1 11
1 11
1111
1111
1101
1111
1111
1101
1111
111
1111
0
1111174e13.--Percent f sch&-rd systems reportin4 various esteblishr methods
I'sphere taschm.* may niter children with suspected chtfocts or health
-r,bierns
TUN ININTAL IOLAWNA1-1
aty pormiatke group
Pareest reporting. by type of relarrral`
To hcxIhealth
1
thaits State*
Chow IliGrow Iv
2
e5.2ei.o%).4BLS
familytiihmoufh-amily
physicianTo otimut
3 4
42.4
46.447.441.141.5
By city groups, corrt- tape range for "to schA health::-:rvire" from 95.2 percent for .-zrUup I to 81.8 Er-e-4:_-Int. for Group IV ;
for "through family to family physician" frc-m 47A yjwcent. for Group IIto 41.5 percent for Grimip IV, and "to others" from 7.6 pertv,nt for GroupII to 4.1 meant for Grckip III.
By regiona, referral "to school hmtb_u_b servke" ranges nun 96.0 per-cent in New England to 77.2 p&ent in WeEt Smith Central. Rdaffral"through family to family physician" ranges from 54.7 percent for SouthAtlantic to 3L3 percent for Mountain. Referral by "other methods"varies from 16.0 percent for Pacific to 0.0 for Middle Atlantic.
The postal ExamactiviiThe dental health ezaminstion is considered to be a regular part of the
school imalth sarvke worm. Information is here presented on thbfollowing related topics: the numbest of dental examinatim; required offtch pupl; individuals making the dental examination; the follow-through by the school and the dentist; community methods of wovidingneeded dental care fa those who cannot affwd to pay 14 such services;and services through which sodium fltioride-treatme4 of the teeth can beobtained.
lessaber of ===._=---==f5 17.dialiitiOlie PEW PupilA summary of the number of tel examinations required of each
pupil airdled in ,sthod, induding weadwoi, is presented in table 14.Wee detailed information k shown in tabk 27.
It....... .
..----.=ma
7.27.64.1
riLA
eir
rel
I
,.
'Pa
-

1141
1111
1111
1111
1111
111
11
26 RILL= IMIRT142118 N (STY SMIXAJI
Table U. ---P *.fAcmpi ayitims reptwOng rng numbers doestale=,aiiiireark---*iz required qf each ~di enrc4lati irt pro-
Citypopulatios
gmtip
Numbee Id cities I
reporting. by number ot dental ezarninet)oo. for each papa
0 2
INIMMIQ111.71711MEMILI
2 3 4 6 1 6 7
7-4 10--10 11-12 I 13-14
9 10 11
tdStatos_
Gimp I.damp IIGroup 4HGrow IV
1.9 t 10.3 14.1
.0 114.3 16:1a.3 11_,2 14.72.8 8,9 16_1Lo la() IL?
4_2 2.6 LIILI7.19.24-5
2
2 0
I The fitâ in Grwp IV invrisent a :v3 pwt Thereforel mkt to wt Glow atome* nput4oa age piirows-:-, fur "United 8416,' 41:* nun:thew cii eitiee an w--Lunan d Grmp t has fait be= axtb. The 1ur b.s aim bean Wowed with other tbraeUod to the wvand queotiosnaire whim dmenothgag the 11041 peresstages fat geogropiderf regioso andfee the tlafted
Uniied The number ci delltal examinations required of twilpupil while airdied at scIx)ol was reported As MOWS : 110 examinatim,41.1 percent; 1 examinatim, 8.1 pimxtnt; 2 examinatkais, 2.9 pmcemt;3-4 cocanitinations, 10.3 percent; 5-6 examinations, 14.1 percent; 7-8examinations, 6.2 percept; 9-10 examinatims, 2.6 peretmt; 1142 examina-tions, 13.2 percent; and 1344 examinations, 1.5 permit.
Nearly 25 ix--Teent of the school systems require sev m* mznie dentalexaminations, which means that these examinatims are being givenannually in many of these chin.
There were 616 school system; whkth imikated that dm did Ilotmake dental examinatkmis d owl mil. Infixmatkol was reciumtettfrmn tinse systms as to whether provisims are made by thethe dental in-5.-t.km of th(vr,e children not examiwd by a private dfflast.gayest was ch.&2-ked by 40.7 perff-7--iit. 'The pevaltages by groum aiGreup 1, 65.2 pacent; Group if, 4!.8 percent; Grm.p Hi, -A =
Group iv; M.1.cite population The rank for the Oans most atf:n rejxrted
Is aS folbws:Grevp I.-1.1-12 examinations, 17.8 34 examinatiow,, 14.3
iw:-.---cent; 56 examinatiow 16.7 :.!reent; and 7-8 examinatims, 13.1 -fxr---arit. Grollp I ranked lowest in theeptwemtage ci "no" &Nita v-e,--;-nisaa-
dam with N.4 percent of the dtift rtvcctin'g.Group examinatkxs, 15.7 puma; 3-4 examinatkms, 14.2
tx2-mnt; 1142 =mina" 13.7 permit; and 7-8 examinatimit, 7.1Nrcent. About cam-third (32.7 permit) of the citke reveled "no"required e----±tal examinatkma.
Gioup 111.-6-6 examinatkat, 16.7 pelmet; 940 exambiatkan, 29.0pelmet; 1142 examinaticami, 15.8 percalt; and 7-8 examinatican, 9.2peroent. Nightly over mwthird (36.4 pwcalt) of t4e Mika in thilgroup,do not =pin delta sugninatims of all pup*
' I! . 4
rs; 46'. ..r
II'
i4_
I
1
L. _I: 44
1
1.,,2!4 41.1 3.1
-mil 0 Cs
0 .0 -
'
.6211 SLYMI 26.4W3 463
.
L4
S-4 6-6
3.P.1
.17.6all 12.7
.0 1iL8IFS 113 ,
tat --LL
_14
LI 1[Or
. !...41,_to
F* and
F*I.IF
11.-=
. t.st,%. -t.4 - . t ..
5
. ; sv . V** rf 1.4 .4...4 .17;5` ., I. ,r ;fic e' I * e ,
**It - '; A- _ - _


1111
1111
1111
1111
1111
1711
1111
1111
1111
1110
1111
1111
1111
1111
1111
1111
1111
1111
H10
111i
low
imm
omm
cmc
10,ftRE-U.
bli1 Dental 8n:7_=r_
it is also essential that, in addition to making denthere be plans for follifw-thrmigh by the school to tz-41.e
tain dent4 st persiion mid care folloing the eiamp ti In,pei dently of -L
The WtTe AM to indicate (1out u 'II a f llow-through to see that t
tenthildren v
Wine annually f lents] supervision ant. -are, and '2\a report is made tk the choo) by the dentist of sucl- vimmarks to the twii iutions are aflowri in table 16. Tb r
group; and reins 1.11 oiven m tab 6 Si and 58.
.-tr manor._
t chtldrvni oh-or ifidt,
=S. l_ey
at I alitit4flt to whicl=
Th(Irma tion
Tahiti* 16 P ----T-n t othooi aatri repar f.sni varyi-nfl i fr-n I at hroui h by the *hI Lc? ape the t childrrn c min dentaCUP.
( ty c-r-N1
.1:-
Val tad tato..
40percent repot1ax-4
RI R,A) ftv,ta :lomat war:L.414
whiel Ustf mx-w--lbacal sou rti emits
RAr. iszty I Ocaminb- No Elm-
+-4
47.5 2,1 .411 la. 7
Gr9up 1 411. Ow lin I"
Croup I
a 6
_
MI MD 00 . .
°map IIIGroup TV
......Mil,/.11110. -.111
The LIZ! rt-tuAh w.ain &dal69.3 pervent, which rq-K --A a fc
r-P _
N orwicAn
-
rkr-f.--There were 1,123 dties, or%rough by the school to gee that
the children visit a dentist at least orwv annually for dental supervisionand eare This idormation is furtbe- anal; as follows:
United St Date in rewd to thw rejxrting thiq pnx-edure"'bows "rtwu_ady," 47.5 percent;pmvision," 30.7 percent.
City grourA: The rancelady" is from 79.8 percentFar " 'ivomat,ional the rarle-e- c.
# 4OLT- -5 S
by city gryfor Group T
is from 13.1Mi-Tr.fm
1.6 -ifrcent; and "no
for Grlann iv. For "no profor Group l to 36.0 for Group ri.
66
are:
S
.3 Group Ivr-ertrwit tor GIN:my I &up .3.ithe range a from
The twt regkins having the highststr are MxklieWI
West
Damn r-LT
(
_
mei
movr: Ira are (11,. _
_
A
eisLoninpJian,_
ithools to `- 174 Cfsi :Tya denList
theAm-
iyzErtf
1
of '7-111,e.t,,-41troguk,'risk
2
rat,
1 -+-I. I.
:
I . 14.4skIt
_4,-,11
Giati
1.4 U ¶j
Kg..
Ort1.0 94 7 . 74. .o 1
16.6&IL 1
1 60..7
P9. 11!nay
. :--, rio .1-a_.:_i: repoi. _[i .64,
-Ho
11. ',[] "1 .. z i t for.-.
"t . .
, -.-11 .
I 1 .
_ .
Adantk wiga 70.7,
I I Central with And
r
. 0
11 *IP
9! ountam t


m
NIMMK1 811111111M111 31
Such treg!tments throuah public clinics in or out of school are re-portei mmt frequently in New England with 30.4 percent and SouthAtlantic with 12.8 percent and least frequently in West North Centralwith 5.1 percent and Mountain with 4.3 percent.
The regions reporting the highest and lowest percentages for a kern-bination of private dentist and public clinic are New England with 8.7percent and Pacific with 1.0'percent.
Schol Nursing ServicesThere are sever plaas for providing nursing service to schools in
the United States. The most common are: (1) throuEh iIieschool nursing service; (2) through generalized public health nursing ser-vice (found mast frequently in cities where the local Board of Healtheither finanm- or administers the school health program) ; and (3) througha combination of these two plans.
The replies to one question provided data concerning the extent towhich each of>these plans are uFt3d in the, school systems, The irlorma,-tion is given in iummary form in table 19 and by regions and city bioupsin table 31 on page 60.
Table 19.--Pereent qf school systems in which school raining I. proskied,by tYPe
CIO population
Perest et abaci wipes in labia sohool musing is provided thronik
Noprovision
. United Steles
Group IGroup IIGroup HIGroop IV
11.7
2.4 1 0.0
.4.2.4
113.57.5
1.9
United States.---For the miuntry as a whole, specialized sthc.d nurPriffservice is the most common plan with 54.1 permat of v_..e school syqt-Pmsso reporting. Another 30.6 percent of the &Awl Bysterns state thatthey have the generalized public health ñurshig servicT. A combinationof these MI) plans omura in 7.9 wrtent of the cities. Th are 1.7 ywr-.cent who repart ot_er plum.
The ning5,7nce!'tofthecitiereportthattheyhaveIprow
althmieh all ci the a-1W system tov2--=_9n 'or whool nuraing6_ 6 S
Wilkik311 gum Rhipaire was sent Imd Ferv.kmasly reprtol thatthey hugi echool kalith a w I Kg
=ff 11..7 latter group, 94.2 immenchad1-1 on tint first que3tionimare* that they had numing -14 ,w. s na
the two studies check on this 'mint,212792*-42-4
Ahr
-7- -7-1
14
poup
1voserA-
nursing
2
1W. 1
64.368.7
45.3
fie 4_
att11mil 3
*kw
4
411111.
4.0
mik
so
4/.'
:44
p:tk ." Li ,o
C;$. .; ,414,-r4.r1
'v. ' X P;1.4 f' lh 11 2:1f...1:
j24e_jiji-,
'- o
.
S.
4.-4" '..;:-1.41:?4' 44;.41 -
..., tat:?, 4'0°1 4,c11.7) fr4"..r 46*-4) r . -"et'. /
2 *, 142*.4.1_,,4t 44.4;14i,T .5".. L'
,
I,;s . ;!:-.I" 'z . , . .
. 1
71.


4
2111WAIL g_ 37
7. &fttwwl nuMng serrke -1 by tkn as follows: specialized
mbod :1-1.1:=4 service, 54 aeneralized nub& health nursing sets-_
vim= s emnbina. n the two plain, 8 permit; other plans,r-nd no rrovumi. for school nursing servke, 6 percent.
ii
-co
a=I eagles.
v
El-ratar ,. cm whoa health services
Infmnatim on asootki quediaanains
swNssmallmalr
251
i 24
211
-
U.& I Es El. mis se 46 Mils WORM 1SOWJA 712 701
ft
Percenta totalaumb
a
7.7
_
2
4.71 =i . .7.P
.4 110. I .1.0
2 1
l"
t
t=
-,..i.
itorn
_11 =
4% as
zl, I
_t.
. .
47,4201POOrcratI
.
f' r -=k,
mem._
1*.
tXt)
i121-6.T1.
IfWeta
-
D=.1' . 1410
=IS eMt.
_-
-1--..._.--..
,i
02tfl4 4 1
g
- . 2 g.(r'- "-
.
40
. \.'t4.
,L.-,' t '
t' .
r 'fq. q"et.4.i)` 4.4:`: -24f.-
14-11° a Tr f?Fe;
el o.-T Os
:1.~:" -. .4C .4"::14$4 1Z'_
. Pc1-4,11.,
WA 1
.t.-%
'.1 - i .! -_, . -1 0 s 9 I . ,...r I. .. v .
4, " 1....... ;i4 : --'..,..1- _tst 4.; ''':.' . ....'rt I., : 'JO . --". %, 4" . 4 .. - r o. . r-i 0.:..4-1.4...., .1;- 40, 't -. . : ,- ..:-.41..... .- .,... '1. A r e IA- - - i ,-t ..- . _ 1,14, ...,...... 4 eta) 4. - ,.. 4.. - ... A..ig C.; . .1.... IT .% -..914101: t .fr .. ' 4.p.L 1.4114110 ..,S- gthiCar-1 E1.41'..f:. ;
.._4._
-r.
I.1011A
to
a
-Di _
Total
Nor-4- tiktamEt
1014 1,11
INFIPMerscil
. .
; Saa
m=,1
Rib8
77.11
T.
fia, &01 1


st.
Im=..
i:
"g..0 st
ix=
1tx.
nmg".
ii4n
1e
,
t t i 1-a
!et
!!EftE !at
1:Eh,:
!!!!.Z
:::t
rlal! Mt!
1i'jir
1.0.
IR
moa
cpX
io.p
O
.m
ono
VMo+WO t
elbm
%t...,...s
......aa
1116..
[ lb
eibb
iroo.i.
ism.
..bE
I Su.
,p.
Ii$
gbb
Isic,
aa.;t
:
iIlia
:4
i
I? rism.
6x
est.
Ete
1BIII ! cal
trede em
lat
iLee
1ee
II?
.....
IS
nemom
8Ufto
6
«woo
.4
tir4e.
tiLme.....
worm
git=
1.0
4,
if
:CIA
,CHUt Mt
1rr
Kilt
Eca
tt
cal
E E
tI?
'
gm.
tego
,
11
St:w
it.cloo
14-440E
MA..
VIM
It
tit:
Irz
all
1
I I i
ME
!!!!
!E!!!
!61E
cHE!! Ece
1.E!!!
!.frit
;I?
8..0
II
;woo
sl
tow-iot
Seco N
tows'.V
111.6.E
.....0
aIs*
1rz
4/
0
EL.
!Em.
ifE:
!c
:Fief
Ecm.
t
.
ft=
EI?
''
i(
EI:ebb
is
s


v
,,,..!
...m
.1m
.11.
1111
11,1
111,
1111
1111
1111
1111
1111
11
Nue
AA
imIt
1111
,
mak
s as
idpo
l.iir
tlatio
ngr
ans
rele
nt11
1rj
-4/
4fli
bio
cif
sty-
stem
ma
rry
orti.
ng
.sith
es[
Tot
alsw
abs,
mor
tise
grou
parai
labl
efo
r sc
hool
heal
thse
rvic
es, e
ndby
rogi
kos
and
1
Ner
abir
sod
piw
asat
by
typo
al p
enm
eml
Ph:
nick
s
Nw
abs;
"'O
ars
psno
mai
r1
iCas
ehm
atel
Unl
oad
Sis
son
111
Nsw
ii1S
SLA
U11
1an
SaL
lene
laaL
iria
tinia
ILlis
t Moo
rsC
ames
as,
Ihm
eL rvIli
wat
Mom
sC
IEN
TIA
AL
.TL
.Wf!
2339
INA
Imo
91 A
I24
797
.4T
L966
094
.40.
4h
730
110.
4
90.4
69.7
47.0
14.2
$1.4
131
.444
111.
11
304
1
no9.
473
3191
.74
1709
.3IS
A.
41.4
1$I
air
441.
711
1999
.11
1341
81.7
SO
ISO
TS
AI
7031
1141
1.7
1SS
04 LI ILS
1 LS
S61
0.1.
yill.
I110
7
LI9
100.
01S
100.
0S
.364
96.6
173
64. 1
lie10
4 7
calo
me.
..m.m
mus
em
r-A
it-w
ggim
r-m
-ese
=m
1L-m
n-E
mes
e_yr
imm
irsA
mm
irea
t==
==
.
14.4
IIW
OSR
A
tom
mat
il1.
9
0 0
es

,
.011
n.
11,117111111,11.1.11111
1IIII
11101111.1111
11111111.11111111111_
1111
11P
III
IllUlIlIll
IIIIIJI
1111
1111
III
r
11111111
1111
jlP.ILi
tolt
-
-
Peoria
satitzt
go.401.
;10,0.11!,.",1
Witt
014
pAir,
egawti
ITwok,
blof
;Iowa
stif4
itteto'2,.....rot,
weripia
..
rikalitc
tsgitrinct
apio
saael
i
in
9
1
till
0'
0
1
-9
0
0
i
41)1
0'
0
049
7pact7,
I
Lt
gm.afl
firDS
1111111111
IPII
"4111111111'P
II"
111
lIII
"i'd11111111111P41041111...111111111111,11111110110tINIIIIIONIIIMIMLIIIIIIR1111110MOIRL.,
"RI
at
.
!..78
V'19
114
OrnI
01
Ire4)
oft
.
too
th1010
p
/2411"1-12*
IP"
4
ca
si
ir
Ai
damp
mi
044'
;LIIiciaaaFa-i..T.4
IR-
'
'ZI''C=1Pkr...**.rjr4;;.1:1=:=
;',-121"11=0
EtP114;:e_±111.r.,:17
z-,,Atir.
.
-,-1==r;17.1
7
CPI
91
11,
rip
1
TV(
-
0
tnt-
LIT
It,
TVS
"Mt-1r
-ILL
'-..Z1;;ZZIELmailigti=141;1;1
3=1111P1'
.
11
,
MOM..
110
;ri
rLI
1..
OSV,
i.1;I
arat
II
#
r
.
..'
t,,,ii,
-111.,
L.,,,...g,-L,
s.
zia,
.aaaiavpr;t4
4c.....-,,
a
:_'nias,...--
I
it
Jr...tzg,r,dipip._
E.
IPLZillgaiRgiiiripa.
c=1!-Q-cAprS
2er,-.
i
iIreg
IWI'
!
1t.1
ItlIA3
1
IN
p-So.
I'.
11P
0'
10
11
ZIPLP
l
Ir'''
,
ipI
,
L'90
VS
!Loili
ritY1,4
a
i:
-
..
WWI
-Lr,iit
_........,,
__
rtit
6
r.1.1;!
4'IMP
.iir
'
Sat
9
',se
Amor
144,
"Ii
.-
1J
.e.I
VoginT
egisLI
1.
ft_
a
46
II
-
.
-
AP
a,
el.
so
P
4111111111111.418111VPlit
1
-
65
.11P
.111
11,
W
;Ma
4:71:1
WWI
,210
'
4=1
II
;..
111
=z;;
zw-..anngiangx=1,-
=m11745F1I'31;ZR
-:144iiiilawP,
0!;;!..-1
ft
g.t
91
O
013
r1it
.14
VI.ri?
r
i11,
'
z
orse
-
crtyt
:1;.
1.1".I11111-11111111111
11111121111,-
99
.
91
1,1411901*
t 4,LI
rimow"roe
far_
4
§r
4111agpX-r,
.!,.tr.&.,.41A-="7"--4_Wd4Mi2P;
6--4
nt
;119
,
trio
11.
,
1
ovytv
ovei
imp
VII
':",
191
.......-.:f-7_-
"
'..:.-7.1.7..WIIIiiIiiii
4:-:-
:.,;:i:2Cgial.AP-114
-'=I
gegLIMIL"--MP1'
IL-ir;.'
'
:---.,--
14VW,''"`:"1
41
i'
I
f
11,.
'.:,,i
a616
a-1rt.Ii01
-
Iry
;I4Y41crar4
"I
Iiiii°,11112111
1WI
1114:111111111111111111Ii
1,11',:011111111
1111:,
11111111111111111111111111111121111112
tau
1411,
1111I111
Itgit
uum
NU
.(1IIIIi
,
,
ME
.....
111
7
,.
umaktato
AZ
lowzm
;Av.-
1071.711.,
;7
.
-
1:41
III
vv.
41
",66
iL
-
$
11
1
ID
i'PrIgm'
arm
461/:
,,11
.......
a,
aa.
11,
c-h.0
6
MO'
-
divot
4111,ab
74,;
°
of4
11
.111
10ElIn
11
IF/ti
LIM
1,1
.
p';.!

titill
IIII
IIII
II I
II V
Ili t
enia
lfirp
t tIll
tll11
1111
11W
IIIN
IER
IMIM
Illnl
q
MULTI* SWUM TN \CITY &MOUS
Region andpopulation group
Cv
J
Num.berof
cities
re%14°.
Table 24.--Numbar and roost school Tdefiztoqf each pupil enrWW in&school, gNumber of medical ... 0- done for each pupa
s4examination..
Per.seat
Continental United StatesTotal
Group IGroup IIGroup IIIGroup IV
Niw ENGLANDTotal
17.812.813.019.0
6.010.015.320.9
213
M. 1. 30.3
19.420.2
se AD ow .= ee a Omni alb a ob
droup IGroup IIGroup IIIGroup 4V
la 1101111 INIMM MI
so di MI la 11.4111 41111111.
MUMS Amperm
O .0 o .0O .0 0 .01 1.3 1 1.3O .0 ' 1 2.8
diw NIPS/b *MO AI
Group IGroupGroup IIIGroup IV
Ewer Norms Coma.Total
Group IGroup IIGroup IIIGroup IV
Plum Norm CZIMULLTotal
Group L.Group IIGroup IIIGroup IV
Sou= Amur=Total
Group IGroup IIGroup IIIGroup IV
EANT Sown Catania.Total_
Group L .....Grog) IIGroup IIIGroup IV
Warr Boma Candram.Total
Group IGroup IIGroup JIIGroup IV.,
$0.0
34.016.9
44$1.3
.04.04.2
411.1
6L340. I$1.042.4
26.717.015.317.9
27.3
44.430.824.127.8
VS.o 0 .o
7.7 0 .031.0 4 6.9$2.4 4 6.2
$33.346.216.111/=12==lit 2111111121111:1=31111=1COMMIt
31.6 n 12.6 17.7Vimer.
11.1 16.9 117.3 17
26.8 29
11.1 2 22.237.9 2 6.941.6 9 22.036.4 9 11.0
IIIMUSIONIM MEM=v;"
17.114.6
SSA H 16.24parpismormarnmAmIlfr
.025.016.6
.0
30.0 0.0 1
16.7 1$5.7 12
\a=mules=
25.0 140.038.3 1234.5 16
IP
12.e 0 .020.0 036.1, 120.1 7 12.7
111/11111/11111111.41111111111111111pt
110.026.050.041.1
14.4
$7.520.037.710.9
'The take fa Orow ri sepreseut a 60 moist eampthadc. Therefenh is order to weight Chomp IVetirmatli "ea owiAleur the Peree9UNIOn Wele for ulTaltqd SUI.4e, the Dumber of eft fa eikehcolumn of Group iv barn drat beat doubled. This proeekure_ bee aka been foamed th table,for the Unitedrelated to the mcdarationnairee when determining the Anal peroestagee for sad
Ot
44
--
.....
_ .
(e5nerai,343'Ns!
111
alb AD
siD
CM WO
off sp.
.... ....
...'VP
,c..
4111.1111. ONE
all !NO 40 MN"
.. 411.1110 NNW..... 0 4/1.40 4Iw
le
1645
151
7.51&120.5
.015319.09.6
20.
10$
20
.012.5
L 6.821.4
.
,, .1- ' :r . I St4:2- .; rve .;,) . 4. `:. I. 1'V !
*W.I.= 11'1 ta44.1, se%
--R
SVA.
I.s
s S. Z.
1 .t .
I. r; ....:21.2aL':"4rt.....:1'Ll

iinV
F117
1II
1Tii
It 1
111
Int P
IM I
II 0
11,1
q111
1111
1111
1111
111P
111
0lii
DEAIL TABIM
ffarifituntbor of medical orsminadons ree-e: _
by region dind city population group
45
5-6eliminations
Number of usedisarszsudnatioas for arab pupil
7-8 9-10examinations docks
11-12examination.
13-14essmingition
Per-cent
12
Num-ber
13
16.4
Per- Num-cent ber
14 15
LO 23
Per-cent
16
Num-ber
17
Per-gent
10 111
Per-twat
2=0
1.6
17 20.3 240 19.0 14
113 20.0 41102 14.4 2$
35 22.2 ID
3 M.05 18.6
20 26.7- 7 19.4
2.46.67.34.0
14.
O .03 11.1
10 1$.37 19.4
045
14
.0 61.9 5.9 23
292.0
4.6 143
7.12.4
'4.14.1
226551
6.910.411.57.2
.0 2O .0 31 1.4 7O .0 6
161 46.0
5 81.220 44.5
), 68 45.0) 68 47.6
ii11111111=11111=
1 6.36 13.3
20 13.210 7.0
20.011.19.3
25.0
714
1
13.6
W.026.918.72.8
O .08 6.9
.05.6
14
3
*18.72.24.62.1
113
2154947
21 11
22
12
3.0
O .0 04 7.5 03 e) 1
1
11 4.3
22
.004 6.9
3.9,...3.7
11.13.42.43.7
1.4
.0
.0
1.8
0.0
.0
.0
.0 4
4.1
.03.42,44.8
15-2
12.633232.5#2.9
0.2
.0
.0
.9
.0
LI
1.83.9
2.4
.0CI
0
0
0.0
.0
.0
.0
.0
.0
.0
.0
.0
0.0
.0
.0
.0
3
Humsber
11t art I No t I CIS.1
p.
ralr%1PlkgiaWormaMINNI
Num-ker
--1711.
63
111111111111=t1IPICillft-......" I R.
1
37 9.4 11
005 16.43
ms. it ,
24
5.2
3.310.33.2
-
0
41111MIP
.wo .1
grAZ
4 2.6- r i i
PIS011401-11=11610.
U.
..
, .. . 9.,..,- .,. 1 . , 2 .
;rii Cy "IpJ. -ii -... . . 2 . . : . . .n-.e -1
s1a
22.316.3
11.46.6
mv..4
0.o
20.20.973.7
6I
1 r
adiu2.1-9,11iyAmorirelea
4B4
364
2.09.1
.o
-
3
.0
.0
.e
3,0
.0
.06.22.6
;
4
2.6
6.7.0
1.78.2
1
tt."1111111.1.11106
4
a
11
.0
0100
0
.0
.8
0.11)
.0
.0
1 000
c oI 45.6 oo o i
I .1 al I I E._
00
..11-s1,-.0rseP0.
limaammosotammt-1,
AP
qv)
e.o..s .
.
a UriRcictg -clAn:i
.
: RRRR- 14,
RRRR : Wiss,
.
4
,
g.4
ft11/4 czo...o gl.
.
clow.m 0
s
0000
AS
qs1:1
,
t/42
0000
rIrt
0000
RR42"*...d.
1
04
...vv.....
1.4474;4Of1Sq0g=a4
V4
P41,0w-4!.144ei.
* :0=of
qq11:
.
Papo
onewv
.
s4
v400,10 Alh ao.pwil
!
1
1
v Ioii .4 oogwo, 04 Oeo"
.
I.
I1
i 1
.4 ..4
04 etRe"'
%iv:0 Re:RR i'D4 et2qct :
=4RRRR
.
z
ms oo-o e w cone, 4. 0000
I
1
I
4..
4p., ... ..
101
1
RRG!'"!on t- -"Tvt-p4moild
I.ms
RRR! :..1
RR:R
ov....."- ,
,
ono,.. °ova 41p4.-sr..m .4 000.. **woo
11
1
I g
. it 0.4*. !ti Me
cl'qq'qFal414
.
. ::: 3 pm : ;;::
1,
X n'S'
.
a omsv.. p.
0414O410 0pis
@MOW
.
00'000 = 00.44
.
k1_

mom
omm
ilino
min
emi
IIIM
ER
IMIll
iffN
I1
MN
IEM
ININ
IMM
INIM
IIIIII
IIIM
IIIIIR
EIff
ill
RIon andpopulation group1
MourrrAINTalGroup IGroup IIGroup IIIGroup IV
Pacona,Total
Group IGroup IIGroup IIIGroup IV
411.
WEALTH sr--Mvic= IN MTV 8cooLst r .ienf--9- a..a-Numb-zr and i4icent &i.,-.÷h.. I -...4 a.- - f-
. . ., - -M S re.,-1 _____.__-FF_ Y 1, -wpz-es w e -, -- v p w -- -, -- --- 0 w e w__-__ - ff _ ,,h,00rti,
._e 1,..includ: n.e----
3
Number of akedical ez.wairmtices for ea& pupil
Noxamination
oneexaminatke
Num-ber
3
74
Two0 Z. ri-:=4j0 n
4....1111111=111111wwww......,
Per- Num- Pee- Num-cent bow cent Lfr emkt
4 5 6
6(45
41
133
101546
127
18emombri..7- -"'"7-
31
a
1214
50.0 133.328.0 343.9 9
====41=111111=Ent
36
3-4exftmth
Mum- Per.b0 colt
9 19
18
0 .0SU
3 11.03 7.3
1 10.02 13.3
11 26.423 311.5
1The cities in Group IV movement a 50 peresi Mbwire.ecire&ly when o*zwtt1j the Ijj Wt.* foe "LToolema ed. Grow !V hes Int b=rarooL This proceduremisted to the questionnalre wimp doeuraluing Sloe hugkr the tinit-
0CI
7
46
109
2141.0$3.436.017.2
=INENIEm
19.6,==main=y111=.....=
40.040.0
144
in mthr to wedet Crwv IVaLe nur.-nb- of c1-7-- in wid3a&_,3 ..._cww-1 with oaltt tablapmeategem geographkel regions nod
p...!_"_ft ndI a =-t Irt 1
CO.M WINTALWIMID OTATES
Total_
Num-beTof
citkierevert-
ing
1,566
Group TmCroup IIGroup III_Group IV
41,
Nam? &MAIMTotal
Group IGriyup IIGMUD IIIGm---uip- IV
Mania AmAnnoTotal
Gm-4m T
Givan UGroup 1IIGroup IV
qv 411 41Io ea g.
eci:27eitise iswhims
whom el Orouprelated _Sp Ow mooed qfer an UniW Stoic&
84211
Noprovielou
TaWe 25.-Fationt -=,
Num-bs-
212
Pom-ona
4
elementerv hoL7ve igw.;--atotsi 4we mind tieme,
At tlwo initja o tr ezaJ s
Under 5 Peweent---5 %veal 14 Powomt
Num-ber t
6
14.11. 196 19.5
2472
110
141
10277536
3L5
1645
151143
11
7.1 15 1714911.4 a g 1&5MB 114 M.3
19.5=111
0155
30.012 44.437 &6.017 47.2
O .0O 02 1.32 1.4
4. ...4=111110:11=
5145152
$4.9
31.331.1
Num-ber t
64
15 Pereeat- 60 Percent-49 Percent 100 Pavoent
u -bow
Per- Numczat
11
Per-omit
12
197 6..13.16.16.0&II
9 48 51.2120 1111,,9
SOS 116.73418 51.7
10 6.9
3
1718
Iv riint a 30 p---:=---i-eset TI
3 P.2 822e=5
87.64&943.044.7
6
iy*7 =
044thgmgwurbILk$ This preNdum wit-htw- alma,rgre EL'Arsigaing the7'="
A 47yr-A. -
I I

I.
I."abb
CEgtrib
..MI!
E
ass
Ohes.
itin
1
t!!!
EEl I
1IA!
E
Nu.
.......cam
1
z
1 f!
MI
Ecal
ctitE
I
=u0.40
is
4www0
a,
048C
0ti
I!
riegb
Ctb
Cind
ill
V1I
.11
40,w.
se#
S.1s
if
LIC:
Cbat
Ccign
:m
i
ci ao,
0.
00.00
4
06
rf
:1
:di
!bb
CI?
opwoo
oPcoo
rf
bCbb
btbb
41
111F
4.000
T .0000
.r(
: 0
1tbbb
% rbbbb
CI?
gwicio
Pik000
oil
rf
1bub
.rbbb
.4
;1?
000-
we
0000
is
4;
crz
xl
; IT
1bbbg
?
:bbbb
CI?
lap

....a
lI
a
a =USE _MN IN CM 141100111
Table 25.--Extent to which dokneentary sgthoparents at tho maraca'oxonanotiongs, by rog
andpopWl&group
.
Num-At the initial or antrum sianklustios
beroftithe
reMit
Noprovon Under
5 permitII pmiert--14 percent
15 person--49 percent
SO weep.-100 mesas
Num-boa
Per-tent
Num-bat
Per-east
Num-bse
Per-oest
N.bee
Par-seat
Nam-bee
Per-seat
3 4 s iscaw NowaCanmu.
Total- $49 U 111.1 34 LT 16 L4 17 6.1 217
.
U.?Group IGroup IIGroup IIIGroup IV... _
Wser NonniCINITUAL
Total-chow IGroup IIGroup IIIGroup IV &
ilovirm Amur=Tetal_.Group IGroup II
Group Iir
EA/Or &MTNORMUZ
Total...............
.Group I..
15U
116156
38
2326
06
30.016.11L$17.9
1114
24
1414
20
1337.5
1L19.0
EU
00I7
11
.b
.02.64.5
7.7
121
13
7
6.7LSal
4.1
_gSOTs
U
smoiMOI4.600.3
U.10
1$5877
. _
101
24
1317 .17
22230.822.422.1
_
13.3
036
11__
U
1127
imffiamosimsg.......m....B9
11.17.73.49.1
L3
111$
t11
2237.71.7$0
8.3
44.530.1421.110.6
439
294183
121
13
11.17.024
15.9
1308
11.110.3
.0LI
0126
.0144.97.3
2355
22.310.31136.0
I1031SO
55460.0
int
10 11.2 12 13.3 a Li 7 14 Uit GLO
38
1856
112
0226
1 06
025.011.110.7
mi
10'47
20.0.0
22.212.5
0120
6
.012.511.1
.0
L3
0116
11
.0ILALI8.9
s.s25.013.36.37.3
449
U
is _
4 .9
1921
10.060.050.067.9
N,
44450.010.051.9INA
____ .4Group IIGroup IIIGroup IV
weer BOIT=CsarISAL
TotaL
Group IGroup IIGroup III°foul) II'
"Weal.Group IGroup II,Group II%Group IV
PACIFIC
. Teta.Group I
14 14.43
153465
0$9
14
.0KO26.525.5
103
ICI
12.5.0
Ls133
1106
12.56.7.0
104
2234
111 26.1 12 6
.... ..
LS
.
I.
93 14 64474 MS26
2541
32:0Nam-umzenng
132
015
12
II
.0 016.7 2WA 320.3 7
imacimmorimmioammenaualmimm
= 1 21
.031.312.017.1
17.1
0220
4
.033.3LO.0
acipmennamortAalmorma
2 .6
0011
Apo 12
I
.0A
4.012.2
9.3
11
1417
t100.01/416.7110.041.4
.
we10154563
03
1413
.0 320.0 1KT .11.0 11
10.00.7
13.310.4
2011
20.0.0
2.214
.
11I6
,
10.0 ,
13.3610.7
.
11
9USO
10.000.061.1OA
Group III.
Group IV
I The Alai IV represent SO preset sAar Rinssoporatorb Larder to wag/04 0447otwino the=n1Y
rolotO ot wood osostiosaskyfor the fiesta.

4
41o1
um
oil
IL
1111111
4
0 oloouo ulili III
B.W.Mtl 1 412
No
Number
111
2328
pacea0
Matt=- - -
s
77
M FR6 91
.#3 .
:r_2:ie 4:,7140492n
--44 464'1 -
15 5040'porton 1 peroent
Notkor NartiAer
1?
s t Nweitive Pereent
coz, 414 13.3
3 30.0 4 26.7 1 6.647.1 I 11.1 LT 9 17.054.3 6 1. 5.2 4.9 16 13.8
4 13 7.7 19 12.2 30 12.8
9.4 3 1.3 10 6.0
1 11.1 8 33. 1 11.1 2 22.24 $0.8 4 - 20.7 0 .0 . 1 7.7
. 33 60.4 3 8.6 2 3.4 3 5.251 N.2 3 . 6.5 0 .0 4 5.2
17 &1336 mit 12.4 U 4; 12: 6.6
1 11.1 2 . 22.3 8 33.3 k US 0 .02 7.0 14 43.2 e . 20.7 4 13.8 9 10.31 ! 25 61.0 5 122 1 7.3 7 i 17.1
13 13. 57 89.5 9.3 1.2 W.8.:,..ir,--- -__...-,,.-..-,_,..,....-, "----".'''''.--- 77=......'t :- '-'11C.--- .----4 r --..-.-1."---0..-----,: '-----. --:-..,===E i
le 11.2 42 1LS 13.3 11 112.5 11 ksa0 .0 2 c).0 2 40.0 1 1 .0 0 .02 25.0 25.0 1 12.5 1 WS : 3 25.02 11.1 1 II MA 4 22.2 2 11.1 : 0 .06 10.7 2i 50.0 , 10.7 7 12.5 9 16.1
1
0 .08 MAD
. 9 MO14 25..
=37."--17 "In!
19 1L5 le 9.0 le 9.41
1 12.5 1 12.54 126.7 1 6.70 .0 $ , 8.85 9.1 6 - 9.1
iz=w=:=f,---_-_-._ :,-,-,..-.;i4==i=z.-:--t-----r-s--------
.-- 50.0 2 25.0 .
NA 2 13.314 : . AI 1.2 3 23.5M ' as 7 12.7
1.---..--:-_-...,_:-,7:-,_;i,v11r-_--
Qc6 6 7c 1 1.7 12 16Z
o .0)- 0 ! 0 .0 : 0 .0..
100.01 16.7 4 : lieli 0 .0 0 .0 1 16.75 20.0 13 M., 3 12.0 0 .0 16.0li 29.3 20 : eke 7.3 1 2.4 2. 1
::73111wc-A--.INC=t1t -'''------------.. --'''- = 77,.------<:___----t.--it; -- !---- ----_ ---,..._ :
M SLR : ill 47A AG 1 LS _ AS 111.9 15 9.3
0 .0 4 MS 2 20.6 1 . 10.08 20.0 4 : 2L7 2 , 13.2 3 .,J) 3 20.0
1S i 36.7 17 : 87.8 4 8.9 4 11.9 1 -0. 17.7lir 21.0 : Ed 511.3 . 6 9.7 6 9.7 3 4.8
. f ,

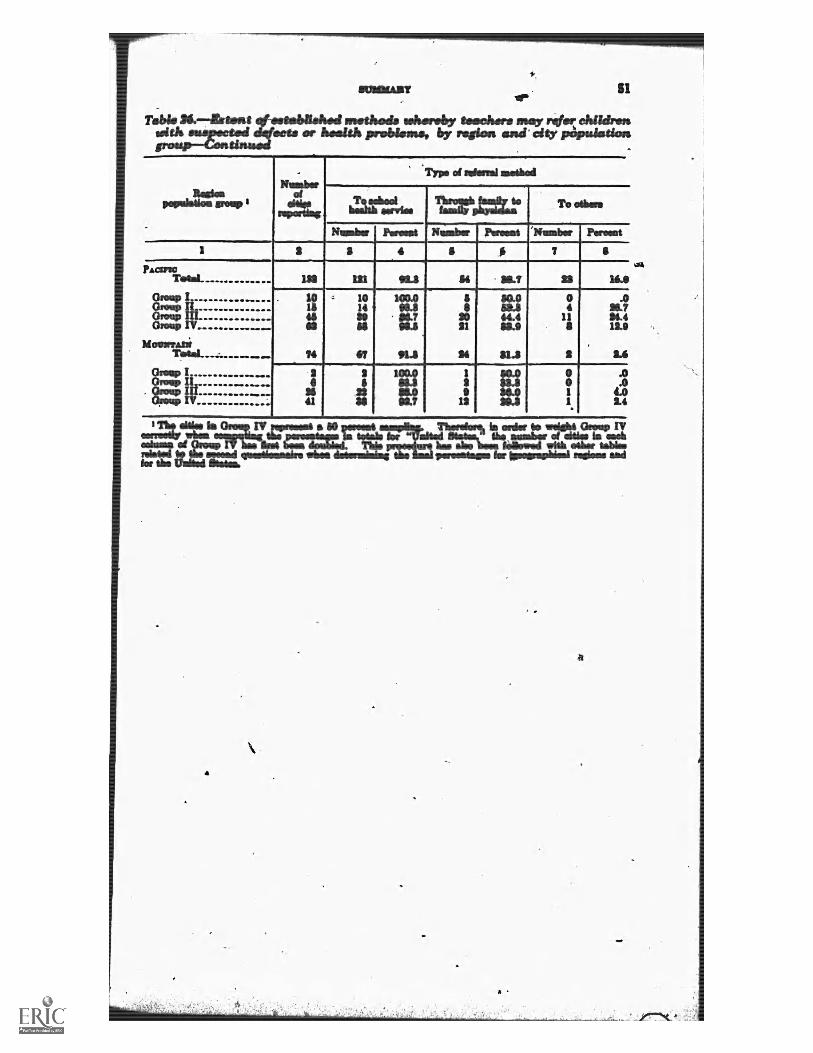


=trim
Louis
in,
number
4 dnta
asessidastiongroupamesizaty
inch
region
and
city
',copulation
4
Nulaba
at arta
smarthraliass
ter
awe
papa
r."..- -4
essmiassiose
,........
7-41
awalasdass
1-10'szaisisstions
11-12
esmaisatiosis
,
13-14
araakinatiago
..
N.
' Per*.
N.
No-
NIN
O-
Par-
Niue-
14-
Num
-
Per-tor
............
east
bar
mid
bar
ems
bar
mut
bar
twit
11 12 U 14 11 16 1? 11 19 a
2 1.6
2 16 1
,1.6
4 L2 LI
0 .0 0 A 0 .0 1 60.0
0 .00 .0 0 .0 ' 1 16.7
0 .0 0 .oI co 1 4.0
3 LO 1 ' 460
0 .01 L4 1 2.4
. 0 .0-
2.
CO
0 .0.
M i
11 Li 13 11.41
N 1 14 1 1.5
2 1 .4
$ $0.0
1 10.0
1 10.0
' 0 .0 1 10.03 IDA
11 11.4
0 .0 0 .0 1 & 70'
.0 41
MA
0 A 3 & 7 0 A1 IL 1 4 6.41
1 1.0
0 .0 0 .0
. -
'1
\.
'
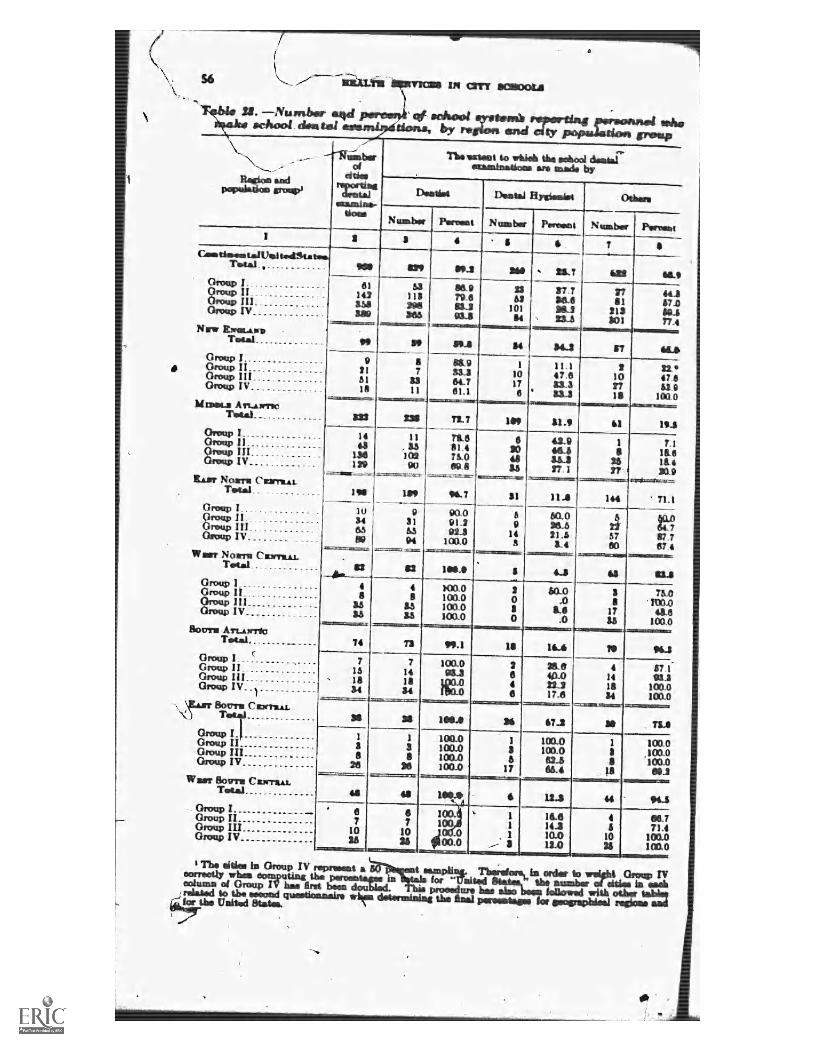
1111
1111
1111
1111
1111
1111
1111
1111
1111
1111
1111
1fill
ogni
lllin
ium
bim
mm
oim
miif
irom
imm
ehio
mom
miim
mon
nom
omm
omm
imm
mem
omm
imm
onII
IIII
II-I
III
III
INI
II
561.1 IN ern' 11C1WraL11
-NumNor arid car mfflool bensl rvertinagechtx-A etI=.-==,9167ri---:-.44s, by region and dtv LkD
papukti= &vino
1
s
MIBMyow
Thelertent o whi=1 the whoa demur%examinauck---:-4 &re made by
tattaariad
Gas talthatdlitataaTotal
Group IGroup IIGroup HIGmup IV
Nrw Elvot.e.waTotal. .... 99
I-- --- -- _ - .
Number I Pecom t
3
teia- . -
61142 118
.1.kM1
1-44
Group I 9Group . 11Group III.. 51Group 18
-- INkotal firotniet
N tun brs I Peres's) t41,-.- Number pampa4 6
111
61.0
10164
=31:11011.411==.:
so so.s
ktrumm An.A.rrinc232
Group I _
Group nOrryup III..or-=-..,kt----p IV_
M 953_364.761.1
94 69..6=-..._fr
1 0 47 6
Is4.44 V
CM jl3211111111111101=xsam.
- - . . ........
RAI? Nom.* C'earra.41._Total
Group IGroup I IGroupGroup IV
Wean- Nor-ra CelirreALTotal . .
1463
1S8129
11, 3410290
78.651.475..0ag .8
94. 7
6304834
5
44. 9
3412'7 . 1
11011
2e
1034
89
931
71810.4IC 9
164 71 .1
90 a91.2 992.3 14
1(10.0 3
Group I ....Group H... _
Group I IIGroup IV
BOUTS ATLITotal.
Group I. _
GroupGroup Ill.Group IV
787.787.4
=4211Iallimmum
. ...... 4 48
3.5as 3.5
109.0
103.0100.0100.0100.0
113.11
.0$6
.0==mit16,4
21& 6
22 217.8
38aip
4
. 4E,
...
Sours C lorraA.L.TotiGroup IGrcnip IIGroup IIIGroup IV
Worm Bows CascraLLTotal
Group IGroup HGroup HIGroup IV
74
713IS
73 W.1
141834
100.0
.00
=c=1
NCO
I M.0103.0lat).0100.0
100.0
1CCI.10
11001
se se
1
3
20
1026
1
3
4 57.11418 100.054 100.0
=1=111:440=2=1:11
67..2
1 100.03 1C10.06 62.5
17 66.4
6 12.3 94.5
I The cities In Grump IV represaitmirreetly when doni, the penalwItunn al Group IV has first bem dwa'related to tbe 610001bd waa.kw the united imams.
asmplirij. Theidore in icier km)oes=- Grimm IV
TILIIfor "Unitfti ' 0-4 a-UM it! -c-chprocedure has also - tol-;wed with oehow W=E-3choierminickg the final perewtemee fcm-- mime
/
2a
r
re
deft tm.I
ani4
-"""-
. .....
S.
?Tv-41mm
4ktor
r
_Lftem
ea9
7--
"m-10eararrligtstem
6E12
_0 11
IV .
.......
111.._ ....__.
St
:stauzg2c2=c.
es
II
- IP
`ea ft
:7151======
34
=12ttr
TL7
= I 7 7 I V' E I.
X=M111:=M111111=.
7
_
8
111===.......=d=t
1Cq
ag:Elet="="--1111:r
S I
44i
774
61 ISIS
IL*
14,421.18. 4
Pc=n; .---armenuse=-
6J3
54.00
0
9/L3,no
P
16
48
6
4.
710
1:
- -
t
trut,±.-t. "'-!!;6 -0
t *;.
001°-
1
1
60
73.0
4.0Uj Ica.o=-...-r42
.
96.3
16.1114.310.012.0
- _ , ,
4
,
-
a _
-

1111
1111
1111
1111
1111
1111
1111
1111
101E
MIN
NIII
MIN
111,
11,
III
III
IIII
MIl
ui31
091'
111
1101
III
D4A11..
U. -Number m4 percent cif school ?gra Katz personnel whoschool dents! tby rwpon ame cky ki.wpula titm gra.
C,oiUnud
1optiktU= tr.--7".----.4)
......==........-.=
Numberofdew
The extor whirl the school dentalexamir.s.ta,--au are matte by
Debie.1 vomit 1
exuniab..twee
V
Number Piratic t
1 4
*11=Number
a
aa-............-Oithites
Pix-Itezt Number
6
MoticlaswTotal IS
Grow . ,1
OfowGreta,
12
'Fetal
Group IOrms,Grow Hi_ .. ...civ
2 IWO1 MI 0 '
13 1R-1.012 It "10
2=4:fitaliCaW-et)
61
810
21
17.6$0 016 482.4
1
1
1312
64
58
2221
Per001:3
91.3
02_300.0
i00.0100.0
rile attain in Grow, IV tw.----at 50 percent aanipai r*erettvit.t .113 onUr tojbt Grow) 1-Vewner4,17 grime ea..N/ the t IS LOWS for t rata RIAL-tet, the utatzbin- oi 1.i-ft in eachtica-rs Osvap I v bet ckrut1. lids procedure also Nlovredrem6 to the mooed wtiesi Egotonaining =Lamb tot atocierautai rft-ICU andtara) Molted gtet-w-
Prab=L-- -Es tent fTL-r.throiih by t wheel to ciao the t that= obtintat supervision and c-wv, by realms and city population gmup
.....r.111MI.M.
rs.ftioo andrAwalatim irmaspl
/
1
Maud at fonow-thmvgb by awa*,..aaawo. t, tbe cii1dri *
at kart male - Ice &.47.4.W rriet%.rca and ets.re
. 4
Ccanursoms. Mom"STATUS
Total_ 1,566
armtp IOtvxp I
rp I I IGat-ljD I V
111,111Sr: 4%1014
v 01-.0
Now EIPOWDTotal
v 41,
41,
Ragillarty
Num-ber,
Per- N =-oast ber
I
Per-Cleat
1416 47.3 217
706
1frr MS It
1,-.5 65.4 SS64.4 110
Z16 40.3 108
RI146 $L 21
10 II la° 4 119 70.4 " 441 EU12 U.11 8
The shies is Group TV melontIT when ti
IL IILO19.523.7
.11.4
10.014.810.7 i22.8
Noprovides
I Per-sent
Extent to wbi tw-i-wortarr tr..t-h--^ to the school by
the dr---mi-A al =a rustsrydwrfki by the scb4xuI
RANcutojty
IMMII11=1M11111IMII.
Nuna-ber
Per,-neat
111
4
Gansiskynany
01111,110New- Pftr-ber cent
448 SILT
7.116 16.6
147 -%$6.0
-...
11 12
54 W2 17111 M.1 40226 M.1 128220 a W.? 131
48 ail 68 59-3 .04
-.421.822.7
26.9
U.6
Sit 121.825.0
1 10.0 4 44.4- 4 14.8 16 66.2
24 SILO 82 62.716 1 44.4 11 66.0
2
50 k------- ..B.t am, Thoratore, In oda- o w&ht Group Ivin f.fte.la tw. alkyl %PM.," the unibr In Watt
Iva ntwil = MU peopedurs bee oleo bom trail with other tables(WI:training the east perpoptasee for -rephical regions and
r,the tztnedkawirv whoa
tht theiSsik
SN,
4
,
--=
nt4e--Me
.
_
LI i .. ... -Ilf...........
41.
. . .........
40
_ -
a3-,
-2 i .
6
1 8 :
, fl
--,---_,..--,-.5. -mtztoz4._-
-
........110110111101YINI..
6
".--.0
7
91
aa.o
IXLO00.0
=sialgaguilsome
--77 ---' L-
CS i ..-P1T.ytiv, LI; -= _ _ tables
29.
c
air
".
- .._. 0 -0
.
..
fewer
otai
*:- ,-
:00. a S S ob
17
. N' r.7
bet
::::Ors: .
h.*
9
telt W.
H
1. 944
SI
#n-! E__
te-i!
-
I r.0'14, le 1
_ .
3.4.6
;
itte34
s,
es
..1
110
TIMMS , 57
robilemain
sad
04
1
. 43
Lacs
62.6
64.31210
AI
1
1
a
=at hes has bees with otherthe Goal
4
qf
Nowbow
ado'\jvagv.
$o visit dentist
Oommiosally
. _
h8= W
SI 1MI SO6 10.11
76as
Itt.26
11I
sthe pereestage
. I deOlibilida
111
"#
4


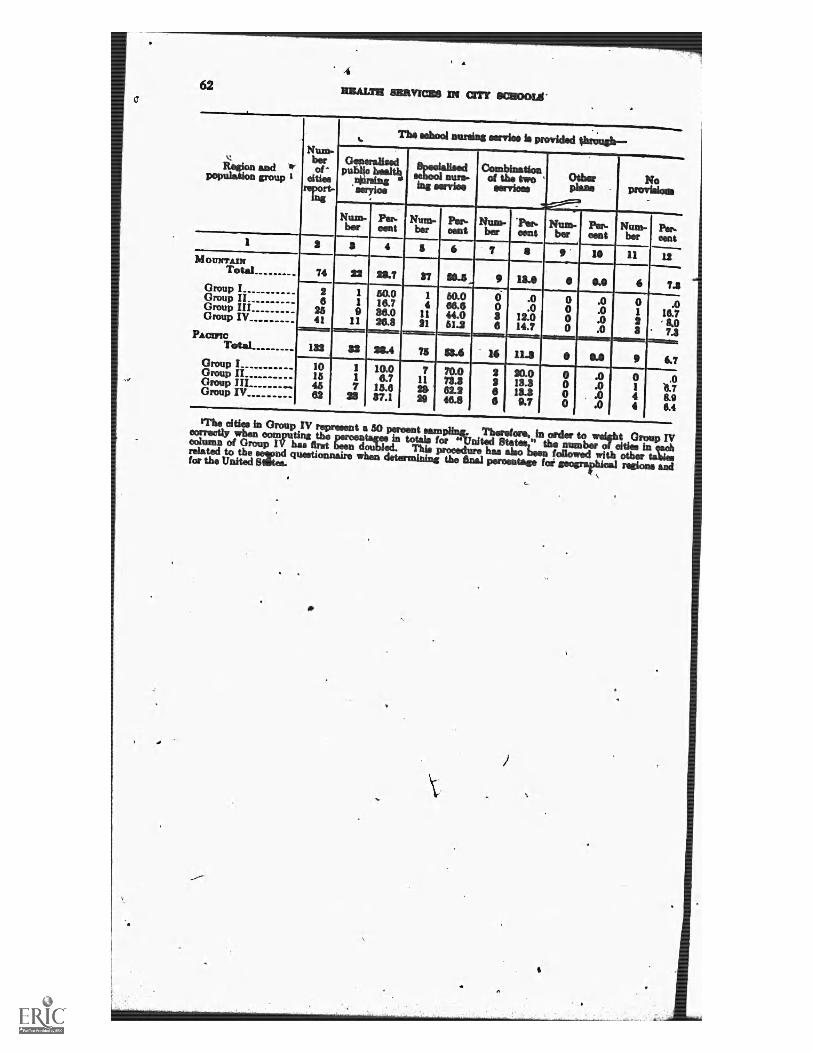
62/4
MIAMI 81111VIC118 IN OTT 11C11001Aa
Region andpopulation group
1
The school musing serviei is provkled 4hringit--Hum-berof
cities
rVirt
apeolAlimed Combinationoaisrare d the two '
Lni services
Num- Per.ber watt
S 4
Num- Pert- Num-ber cent ber
6 7
Other Noplans provisions
'Pao- Num- Per- Num-cent ber eent berPersent
MOUNTAINTotal 74 22 MT
Group I 2 I 50.0Group ..... 6 1 16.7Group III 26 9 36.0Group IV...- 41 11 26.3zimisanct ====ameniv=mnano
Total....OD 40 Io OD me 132 22 IBAGroup I 10 1 10.0Group II 15 1 6.7Group 45 7 15.8Group IV 62 211 37.1
$7
1 50.04 66. 0
11 44.0 321 51.3 6
cmgammog
MO
.0 0
.0 012.0 0
7 70.0 911 72.3 2
62.2 6N 46.6 6
14.7
11.41 6 7.11
.0 0 .0
.0
.0
.0
1 18.723 7.3
11.11 11 S 6.710.0 0 .0 0 .013.3 0 .0 1 '6.715.3 0 , .0 4 8.99.7 0 .0 4 6.4
'The eiths in Group IV represent 50 percent sampllaki Thowors. nrcke to weir GrouP IVtoffee* computing the . tik _in totals for WWI iltaUn," the number eitise in Is*column of Group IV has first I -II doud. This procedure has also beim followed with other tablesrelated to the eewnd questionnaire when determining the anal percentage foe geograrhical regions andfor the United Sates.
I.
c-
e
*1
Gem+p Ii
*reinsseryioo
......
IIMI. el gib
.....=MA
"..
- ma_
.
s:
-
_I, 9
0I
kuslosommitimr-i
10
0
SSA 16-
2/3
H 12
inen"1)1
NS.
. 5.


flCcR IN OTT %_____-rw-Cuata
4
Roam, JA F. School Medical Inwetkin In the United Stake. Qin**Bulletin, 3: 708-751, 1935. Health Organisations, Lewis of Nations.WHEATLEY, GEOME M. The Ph-idran."4 School MNlical Swim' New &viandJournal of Medicine. February 27, 1917. p. 305410.and HALLOCK GnAci T. Health Observation qf School Children. New York,McGraw-Hill Book Co., 1951. 491 p.
41.
%wort, CllAnuts C. Educational* of mekk-School lima 10: 72-79, M
Warns., Smarm M.
Seo Journal OfThe
et9ATA %.4 e School HealthThe American Journal ce Wealth, 41:
WORLD HEALTH ORGANIZATION. LrI Committee On Sk &vices. WorldHealth Organisation Technical IN 0.n 3
World Hem
0 02:tsi)
Organization, 36 p.
1
6
-491
*Jew
417,7
4
a
..
Po
p;
.4
64 NUL=,
.
.
,,
ot Service&Public 195L
Health. Report Series Geneva,
4
p
p
01.
*
..
4
it
II
/
46,
r
I
(
a
a
4
I
.4
.1
e-"Pga
t
1
t
N
%
p
0tr

AP
Pen
dix
nist
Que
stio
nnah
e
11,
Mite
.
sunn
y'O
rIIC
NO
CIL
1111
1ALT
I11
1111
1111
C11
11(T
his
surv
ey is
belie
sco
mes
cted
isun
writ
ten
with
the
Ass
eric
uee
.11
1 W
eigh
serv
isso
see
jar
aval
lsbi
e is
the
scho
uts
atyo
ur s
pasm
, Om
sk h
ers
Ca
alp
at b
etim
es, m
il re
hire
the
1011
711.
011
1111
gUdi
lldi
e qu
estio
n be
im&
Iisan
kse
rvis
se A
Usv
ella
bie
le th
e se
heol
sal
year
sys
sia.
che
ckhe
itel=
1,iiu
dse
am th
e qu
estio
ns w
hich
tabo
r.
ClO
mih
ority
iler
icia
gth
e sc
hool
hea
kbpr
ogra
mlli
ssrd
at I
dece
tiam
ED
Boa
rd a
t Bea
thor
Mea
th[-
.3O
ther
(sp
ecify
)
=O
E (
X) e
mih
ority
adi
niei
sSer
heg
the
echO
oibe
eith
prog
ram
:
Olk
as4
etM
entio
n;E
l Dot
ard
of B
est*
or Il
leul
th D
epar
zsee
t;N
ada
sisb
eere
d*
Dow
d et
Rea
th, g
We
mar
e sa
d ad
dres
s al
IWO
Mow
Oth
ar41
Pac
ell)
411=
1111
=C
S 0
10sa
e sr
son
i, ta
licat
bsi p
erso
na s
vaila
tike
for
scho
olhe
ath
serv
ices
:P
hysi
cies
;I
I les
yse;
Dat
um; D
Den
tal a
nim
ist ;
Oth
er (
spec
ile
islo
rmat
ios
Aup
plis
t(M
)*F
or th
epo
pose
s of
this
gres
tione
ines
the
ON
LYph
ases
al t
hesc
hool
Mat
hse
rvic
ep
to b
e ca
ssid
ered
are
(a)
the
med
ical
ota
rais
etis
a.an
t (b)
the
dent
alsz
eesi
ontio
uor
impe
ctiu
s.e
.11
U. &
010
VID
NIN
IIDIT
WM
!
IP
Irrr
a'"'
1
eele
t
1
111E
1E1
uolo
ici
a11
1a11
111"
linio
ltnto
- m
oan,
mo
Nin
o
N
1'14
1II
" I
_111
1111
VI
r11
.9 I
VD
111
1011
A
I
a
tn
r44
140'
40'o
rII
" p
!V
a a,
'a
VP
117
/1,1
41
1n, 1
1114
1e
1l
1o
001
ctn1
1,50
,1
I
71'
rt. 1.
IA,ti
lqu;
111
1,1
III
IWIl
1I,
PM
..
No
311
C1
II
"F'
'
1111
,1,
P ,1
ppa
1,1
at
4413
111,
-''14
-1
I
lip1,
m4
II
P 1
4JIn
rtrI
111
P1
1
r4
LT
r11
.,C
ehoe
l 41]
Ifl n
cc ,1
.111
e 11
1I
by.
rrt
14 [
mar
l1
Inbi
111
Inn
dal
II
".
1.N
N I
N,
I,P
1I4
111
"IM
P
E fa
ir np
ric, n
ampc
Ott)
)
161
11II
1111
1itil
II
II11
1111
1111
1i11
11-1
11.
1.I
IIII
1111
1111
1111
16I
1?11
11,
pow
npul
ii.ow
ilitil
o1,
1p7,
1,4,
1111
111
4.1
9M
illil
t III
III
III
i^,
111,
1111
11I
III
41,
1 ,
a c
; 6
al
41

I. a
HEALTH flialfIC118 IN CITY senotow
Second QuestionnaireFEDERAL SECURITY AGENCY
Office of Education 41111
Washington 25, D. C.FoRm RSX -(1950) Budget Aureau No. 51-50 12
Approval expires: June 30, 1951SURVEY OF SCHOOL HEALTH SERVICES*(This study has been planned in cooperation with the Public Health Service and thekmerican Medical Association, which had sent a supplementary inquiry to itslocal medical societies)
MINOT WRITE IN THIS SPACE
Information.supplied by__
(Name)
(Title)
... -
(Date)*The term school health services embraces the following school health activities:(1) First aid in aria ; (2) prevention and control of communicable diseases;(3) health appraisal (including medical examination and follow-through with thefamily to secure correction ci defects and adjustment oirtbe school program of childrento meet individual health needs) ; and (4) incilvidual health counseling.Total pupil enrollment in schools under your superviion(If , additional space for explanation or *nutmeat is needed, use back of ihisquestionnaire or attach additional sheets.)
........ UP IP Ea ID M 4.r ........I. How many periodic, general, medical examinitions including preschool exami-nation, if any are required of each pupil while he is enrolled in school? (Circlethe number indicating the present practice in your sciadol.' system.)None, 1, 2, 3, 4, 5, 6,, 7, 8, 9, 10(List any Weida' examinations, such as for athletic teams, under No. 15)2. Circle the usual grade(s) in which the periodic, general, medical examinationsindicated above are required.
Preschool, K, 1, 2, 6, 4, 5, 6, 7, 8, 9, it 10, 11, 123. Approximate]; what percentage of children are accompanied by one or bothparents (Check) 46
(a) At'the initial entrance examinon in the elementary schools? .*Under 5%; . 5%-14%-r 15%-49%; 5004-100% .(b) At inibeequent examinations in the elementary school?Under 5%; 590-14%;
. .15670- 5070-100%
4. Is a conference held with the parent (by teacher, principal, or a representativeof the school health service, either at the tin* ck the examination or shortlyafterward) to plan for the follow-dirough to secure medical or other cai-e?Yea, regularly.. _ _ _ ; Only for special Seldom ; No Jprovision for it
0
,
66
v.
a
"
r=1
,S4T
moo+
IMP
_
4111. ..... MY a
......................
S aCa a a lab a
411, al. E.
ID ow a. DO OD
...... S a S oD-o 5 5 0 owOD IND dia aCS
.
ossios55111.55; I
'A
1

1111
P11
1111
11 1
1111
1If
EllI
li II
II 1
1411
1111
1111
d
APPUNDIX
P
67
5. Is there an established method whereby teachers may refer children with sus-pected defects or health problems--(a) To the school health service?(b) Through tbe family to the family physician? Yes , No(c) , To others? (Please specify) .
6. 4To what extent is &Ailing reinoved jiuring general ,medical examination?(Check where appliosble.) A
1. No siva school policy . .
2. NO clothing removed . . . .
3. Outer clothing removed only . .
4, Shoes and stockinp removed only5. Stripped to waist only . .
6. Nos. 4 ind 5 combined . .
7. Entirely strip- . . . .
Bea. Oiria
&roomier&School Se4461
- - - S S - 4110
IlessentorlSeeola
&medlar,School
7. How many dental examinations are required of each pupil whil, he is enrolledin school? (Please cirok the number indicating the present typical practicein your school system.)(a) None, lt 2, 3, 4, 5, 6, 7, 8, 9, 10, 11, 12
(b) If "None," are provisions made Eiy the school for the dental inspection ofthose children Da examimd by a private dentist? Yes , No_ _
(c) If "Yes," bow many? 1, 2, 3, 4, 5, 6, 7,' 8, 9, 10,11, 12
8. Which of the following make school dental examinations? (Check one or more.)Dentist_ Dental hygieniit , Other (Specify)
9. (a) Is there follow-through by the schookto see that the children visit a dentistat least once annually for dental supervisiOn and care? v.
Yes, regularly , Occasipnally_ No provision for follow-through(b) I. there report made to the school by the dentist of such visits?Yes, rvularly Occesionaily , No proves for such reporting
1417 Does the community have any metbod(s) oi providing needed dental care forchildren whose fa ylies ORDINA afford to pay for strhipervices? yea 1
Notha answer is "Yea," -
(a) Are such services provided from public (tax) funds? Yes ;No
I.
(b) Are such service* provided by methods other than (a), such as private andsemiprivate clinics, &mild services, PTA, service clubs, etc.? YesNo....a .
Male describe briefly any such methods:
4.
(0) By a combination) of (a) and (b)? Yes , No.V*.
4
7-
-
-
4.
Yes_ __, No..
OD .. AMP
a
1---;-.-- -_9.------- '
......411.
.....'IMO, =11, MP
.4 am. r
om fs Er
AMP
4I .....
m WO 41
......ow 4,
41. 41.
S.
_
.
3
a,
......., .
, _ - - -
,
If0
................ .... 41* OD 4410 401 ....... OW,* *M.41. 4/0 1,1
41. ow
4, .. ,a. i.....! -' ,i-.,..:!-.). :... i. .4 ......, 1* . =
4.-...12,!,tri A ...-1 '.4.: !..i. e , .,..2.............-1.t_ -
.;: A."-;:f rii. 4itt *
OP ... .. . .44 ar or OP
ip OO.4114 mo,o0 go Ow me- ..... gg oo oo op
I. 4.
-,;."V


![The jet-cooled S 0→S 1 excitation spectrum of 1,6-epoxy-[10]annulene](https://static.fdokumen.com/doc/165x107/631e1beedc32ad07f3076a22/the-jet-cooled-s-0s-1-excitation-spectrum-of-16-epoxy-10annulene.jpg)