
Effect of co-firing on the properties of submicron aerosols from biomass combustion

JAAS
PAPER
Ope
n A
cces
s A
rtic
le. P
ublis
hed
on 1
0 D
ecem
ber
2014
. Dow
nloa
ded
on 0
8/07
/201
5 17
:35:
31.
Thi
s ar
ticle
is li
cens
ed u
nder
a C
reat
ive
Com
mon
s A
ttrib
utio
n 3.
0 U
npor
ted
Lic
ence
.
View Article OnlineView Journal | View Issue
Evidence for an u
aGetty Conservation Institute, Los Angeles, CbJ. Paul Getty Museum, Los Angeles, CA, UScAerospace Corporation, El Segundo, CA, USdNorthwestern University, Evanston, IL, USAeCEMES, CNRS, Universite de Toulouse, ToufESRF, Grenoble, FrancegLaboratoire d'archeologie moleculaire et str
FrancehUniversity of Utrecht, Utrecht, NederlandiStanford Synchrotron Radiation Lightsource
Cite this: J. Anal. At. Spectrom., 2015,30, 666
Received 30th October 2014Accepted 9th December 2014
DOI: 10.1039/c4ja00376d
www.rsc.org/jaas
666 | J. Anal. At. Spectrom., 2015, 30, 6
northodox firing sequenceemployed by the Berlin Painter: decipheringancient ceramic firing conditions through high-resolutionmaterial characterization and replication
I. Cianchetta,*a K. Trentelman,a J. Maish,b D. Saunders,b B. Foran,c M. Walton,d
Ph. Sciau,e T. Wang,e E. Pouyet,f M. Cotte,fg F. Meirer,h Y. Liu,i P. Pianettai and A. Mehtai
XANES spectroscopy was used to complement the results previously obtained with Raman spectroscopy by
the same group to determine the firing conditions used in the production of a single vessel painted by the
Berlin Painter in the 5th century B.C. The vessel, part of the collection of the J. Paul Getty Museum, presents
a complicated layered architecture of black and red gloss, with different stratigraphies present on the
interior and exterior surfaces. The study of two samples, one each from the interior and exterior surface
of the vessel, was performed with the complementary analytical techniques of X-ray nano- and micro-
spectroscopy (X-ray fluorescence spectroscopy (XRF) and full-field transmission X-ray micro-
spectroscopy (FF-XANES) across the Fe K edge), and supported by a replication study. The replicates,
made in a laboratory furnace providing complete control over the firing temperature and oxygen partial
pressure, provided a paradigm for the comparison of the mineralogical phases observed in the ancient
samples, which led to a deeper understanding of the firing conditions necessary for the production of
the Berlin Painter's vessel. Our results confirm the necessity of multiple firings and painting applications
to obtain the Berlin Painter's architecture and provide a further example of the multiplicity of techniques
and practices employed by the potters of the Kerameikos in ancient Athens.
Introduction
Athenian pottery, the ceramics produced in the Attica region ofGreece between the 6th and 4th centuries B.C., represents atechnological benchmark of antiquity. For decades, materialscientists and archaeologists have studied these black-gureand red-gure vessels1–14 (with gures painted directly in blackgloss, or le in reserve, respectively), but aspects of the paintingpractices and ring conditions by which they were produced arestill under debate. Together with black gloss, a red gloss,frequently referred to as Coral Red, is also sometimes found.9
Decorations and background washes were painted on the claybody with a dispersion of Fe-rich illitic clay, rened through thelevigation process, in which the carbonates and larger particles
A, USA. E-mail: [email protected]
A
A
louse, France
ucturale, LAMS, CNRS, UMR 8220, Paris,
, Palo Alto, CA, USA
66–676
are settled out from the clay, and the resulting ne fraction iscollected.2,8,15 The painted areas transform into vitried slipsduring ring, with the colour determined by the oxidation stateof the iron: black, produced by Fe2+ (in magnetite, Fe3O4, andhercynite FeAl2O4), is responsible for the black colour, while redis produced by Fe3+ (in hematite, a-Fe2O3, and maghemite,g-Fe2O3). Ancient potters had a sophisticated control over thering temperature and oxygen fugacity, and thus were able toselectively reduce or oxidize different decorative elements onthe vessels to create the striking red and black motifs charac-teristic of this production.
It has long been believed that the ring protocol for theproduction of all Athenian pottery was a single three-stage ringemploying alternating oxidizing–reducing–oxidizing conditionsin the kiln.1–3,14–17 Our study into the composition, morphologyand mineralogy of red and black gloss is building a picture thatsuggests this is an oversimplied view. Our study on Coral Red9
revealed that while, in some vessels, the red and black gloss hadsufficiently different compositions that may have allowed themto be produced together in a single ring, in other vesselsmultiple, separate, rings must have been employed. Anotherstudy, in which different applications of black gloss on a singlevessel fragment were compared, again suggested that multiplerounds of painting/ring were employed.10
This journal is © The Royal Society of Chemistry 2015
Paper JAAS
Ope
n A
cces
s A
rtic
le. P
ublis
hed
on 1
0 D
ecem
ber
2014
. Dow
nloa
ded
on 0
8/07
/201
5 17
:35:
31.
Thi
s ar
ticle
is li
cens
ed u
nder
a C
reat
ive
Com
mon
s A
ttrib
utio
n 3.
0 U
npor
ted
Lic
ence
.View Article Online
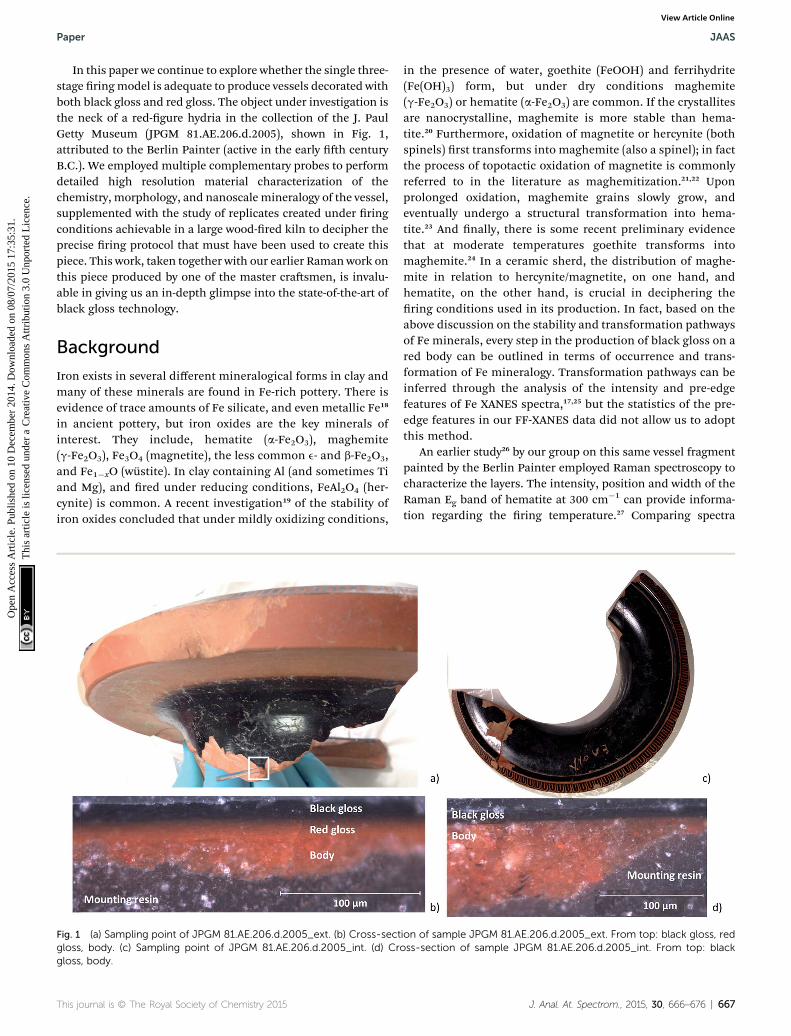
In this paper we continue to explore whether the single three-stage ringmodel is adequate to produce vessels decorated withboth black gloss and red gloss. The object under investigation isthe neck of a red-gure hydria in the collection of the J. PaulGetty Museum (JPGM 81.AE.206.d.2005), shown in Fig. 1,attributed to the Berlin Painter (active in the early h centuryB.C.). We employed multiple complementary probes to performdetailed high resolution material characterization of thechemistry, morphology, and nanoscale mineralogy of the vessel,supplemented with the study of replicates created under ringconditions achievable in a large wood-red kiln to decipher theprecise ring protocol that must have been used to create thispiece. This work, taken together with our earlier Raman work onthis piece produced by one of the master crasmen, is invalu-able in giving us an in-depth glimpse into the state-of-the-art ofblack gloss technology.
Background
Iron exists in several different mineralogical forms in clay andmany of these minerals are found in Fe-rich pottery. There isevidence of trace amounts of Fe silicate, and even metallic Fe18
in ancient pottery, but iron oxides are the key minerals ofinterest. They include, hematite (a-Fe2O3), maghemite(g-Fe2O3), Fe3O4 (magnetite), the less common e- and b-Fe2O3,and Fe1�xO (wustite). In clay containing Al (and sometimes Tiand Mg), and red under reducing conditions, FeAl2O4 (her-cynite) is common. A recent investigation19 of the stability ofiron oxides concluded that under mildly oxidizing conditions,
Fig. 1 (a) Sampling point of JPGM 81.AE.206.d.2005_ext. (b) Cross-sectgloss, body. (c) Sampling point of JPGM 81.AE.206.d.2005_int. (d) Crgloss, body.
This journal is © The Royal Society of Chemistry 2015
in the presence of water, goethite (FeOOH) and ferrihydrite(Fe(OH)3) form, but under dry conditions maghemite(g-Fe2O3) or hematite (a-Fe2O3) are common. If the crystallitesare nanocrystalline, maghemite is more stable than hema-tite.20 Furthermore, oxidation of magnetite or hercynite (bothspinels) rst transforms into maghemite (also a spinel); in factthe process of topotactic oxidation of magnetite is commonlyreferred to in the literature as maghemitization.21,22 Uponprolonged oxidation, maghemite grains slowly grow, andeventually undergo a structural transformation into hema-tite.23 And nally, there is some recent preliminary evidencethat at moderate temperatures goethite transforms intomaghemite.24 In a ceramic sherd, the distribution of maghe-mite in relation to hercynite/magnetite, on one hand, andhematite, on the other hand, is crucial in deciphering thering conditions used in its production. In fact, based on theabove discussion on the stability and transformation pathwaysof Fe minerals, every step in the production of black gloss on ared body can be outlined in terms of occurrence and trans-formation of Fe mineralogy. Transformation pathways can beinferred through the analysis of the intensity and pre-edgefeatures of Fe XANES spectra,17,25 but the statistics of the pre-edge features in our FF-XANES data did not allow us to adoptthis method.
An earlier study26 by our group on this same vessel fragmentpainted by the Berlin Painter employed Raman spectroscopy tocharacterize the layers. The intensity, position and width of theRaman Eg band of hematite at 300 cm�1 can provide informa-tion regarding the ring temperature.27 Comparing spectra
ion of sample JPGM 81.AE.206.d.2005_ext. From top: black gloss, redoss-section of sample JPGM 81.AE.206.d.2005_int. From top: black
J. Anal. At. Spectrom., 2015, 30, 666–676 | 667
JAAS Paper
Ope
n A
cces
s A
rtic
le. P
ublis
hed
on 1
0 D
ecem
ber
2014
. Dow
nloa
ded
on 0
8/07
/201
5 17
:35:
31.
Thi
s ar
ticle
is li
cens
ed u
nder
a C
reat
ive
Com
mon
s A
ttrib
utio
n 3.
0 U
npor
ted
Lic
ence
.View Article Online
from the red glossy layer and body of the ancient sherd to thoseobtained on replicate sherds red under controlled tempera-ture/atmospheric conditions, the results suggested a complexring scheme was employed in the production of the ancientvessel. Specically, the data demonstrated that two applicationsof rened clay and two separate rings were necessary toproduce the observed complex architecture. First, a homoge-neous application of clay was applied over the surface of thevessel, which was then red at high temperature, underoxidizing conditions, to create the even red gloss layer foundunderneath the black gloss and also on the outer surface of theneck (see Fig. 1). Second, the decorative motif (painted areasintended to be black) was applied and the vessel subjected to athree-stage (oxidation–reduction–oxidation) ring, with thetemperature of each stage successively lower than the previousto insure the retention of the desired vitried layers.
Raman spectroscopy, however, does not have equal sensitivityto all the mineralogical phases that might be present inceramics.7,18,28–31 In particular, although numerous diffractionstudies7,32–35 have reported the presence of hercynite in ceramics,the detection of pure hercynite with Raman spectroscopy hasnever been reported in the characterization of ancient pottery.The Raman spectrum of hercynite included in the RUFF projectdatabase36 is the only published spectrum found. Therefore,whether or not hercynite is present in ceramics cannot bedetermined by Raman spectroscopy. Raman spectroscopy alsohas lower sensitivity to maghemite compared to hematite. Sincethe presence of the g-phase of Fe3+ is diagnostic of the re-oxidation of Fe2+, and thus of critical importance for the deter-mination of the ring conditions, additional techniquesmust beemployed to ensure detection of all mineralogical phases.
The study presented here describes the use of X-ray absorp-tion near edge structure (XANES) spectroscopy to morecompletely characterize the iron species present in the glossyslips and the body clay of ancient ceramics. XANES is able tofully characterize the presence of hercynite, maghemite andhematite, providing additional insights into the ring condi-tions employed in their production. The identication ofmagnetite can be challenging since the dominant spectralcontrast in the Fe K edge X-ray absorption spectrum betweenpure magnetite and an equal proportion mixture of hercynite(Fe2+)/hematite (Fe3+) or hercynite (Fe2+)/maghemite (Fe3+) is inthe pre-edge features.37,38 Hence, the use of both Raman spec-troscopy and XANES allows a complete characterization of thematerials present in the ceramic slips, allowing the ringconditions used in their creation to be inferred.
ExperimentalSamples
Berlin Painter sherd. Two samples, one each from the exteriorand the interior (just beneath the overhanging lip) of the sherdwere taken from the locations indicated in Fig. 1a and c, respec-tively. Optical examination of the cross-section of the sample takenfrom the exterior (named JPGM 81.AE.206.d.2005_ext in Fig. 1b,henceforth referred to as EXT) clearly shows a layered structure: ablack gloss slip on top of a red glossy slip, both painted over the
668 | J. Anal. At. Spectrom., 2015, 30, 666–676
red body. Whereas the cross-section of the sample taken from theinterior (named JPGM 81.AE.206.d.2005_int in Fig. 1d, henceforthreferred to as INT), appears to show only two layers: the black glosson top of the red body.
Replicate sherds. Replicate sherds (tiles approximately 2 � 2cm) were made from raw commercial illite clay (Redart clay,Resco Products Inc., Pittsburgh PA). This choice is compatiblewith previous studies15,39–42 that have identied illite as the typeof clay used for the production of Greek ceramics. For the slip,the clay, mixed with 0.25 wt% of Na2(SiO2)nO (Caroline) andNaCO3 (Aldrich), was diluted until a specic gravity of 1.2 wasreached and then allowed to settle for 20 hours. The superna-tant was collected, dried and used in a dispersion to paint thetiles. In his replication experiments of Attic black gloss, Noble2
used sodium hexametaphosphate (Na6P6O18) in order to obtainthe ne fraction; potash (potassium carbonate, K2CO3) wassimilarly employed. In this work we used sodium silicate andsodium carbonate, deocculating agents that are commonlyused among the pottery community for the preparation of clayto be used for slips. The replicate sherds were red in a quartztube electric furnace (GSL 1600x, MTI Corporation) equippedwith a PID temperature control via SCR power control andoxygen sensor (DS oxygen probe, Australian Oxytrol Systems Pty.Ltd). For the rst oxidative stage (T1), two sets of replicatesherds were prepared: the temperature was increased at the rateof 12 �Cmin�1 to T1¼ 950 �C for one set, and T1¼ 800 �C for theother, and kept constant for 10 hours. For the subsequentreducing stage (T2), for both sets the temperature was broughtto T2 ¼ 850 �C, again at a rate of 12 �C min�1; a reducingenvironment was achieved with a continuous ux of 100 mLmin�1 (set with a mass ow controller Aalborg DFC26) of CO(compressed carbon monoxide tank, Advanced Specialty Gases)in the ring chamber. This temperature for the reducing stage,T2 ¼ 850 �C, is the same as that used in our previous replicationstudy in order to facilitate evaluation of the temperature andduration of the two oxidative stages. In the previous study eachof the three stages were held for only 30 minutes, and it wasfound that the temperature of the nal oxidizing stage (T3)needed to be less than 800 �C to prevent the re-oxidation ofblack Fe2+ to red Fe3+. In the current study, the sherds were re-oxidized at lower temperatures and for longer times: T3¼ 600 �Cand T3 ¼ 700 �C, each for 10 hours.
Cross-sections/thin sections. Samples measuring 5 mm � 5mm were cut from the replicates with a diamond saw (Buehler).Samples of gloss from the ancient sample (EXT and INT) wereremoved with a scalpel, resulting in fragments about 180 mm �50 mm. All the samples were embedded in resin (SpeciFix epoxyresin added with SpeciFix-20 curing agent, 5 : 1 ratio) and curedfor 24 hours at room temperature. Aer drying the embeddedsamples were polished with SiC paper (Buehler grinding paperP400, P600, P1200, P4000) to obtain thin sections of about 50 mm.
Analytical techniques
X-ray nano- and micro-spectroscopy. Two types of X-raymicro-spectroscopies were performed: X-ray uorescence
This journal is © The Royal Society of Chemistry 2015
Paper JAAS
Ope
n A
cces
s A
rtic
le. P
ublis
hed
on 1
0 D
ecem
ber
2014
. Dow
nloa
ded
on 0
8/07
/201
5 17
:35:
31.
Thi
s ar
ticle
is li
cens
ed u
nder
a C
reat
ive
Com
mon
s A
ttrib
utio
n 3.
0 U
npor
ted
Lic
ence
.View Article Online
spectroscopy (XRF) and full-eld transmission X-ray micro-spectroscopy (FF-XANES) across the Fe K edge.
XRF data were collected at the hard X-ray microprobe locatedat beamline 2–3 at the Stanford Synchrotron Radiation Light-ource (SSRL). Monochromatic radiation was extracted from thewhite beam bend magnet spectrum by two parallel Si(111)crystals, and focused to a 2 mm spot using a Rh-coated K–Bmirror pair. For XRF measurements the incident X-rays weremonochromatized to 10 keV. The data were collected by a singlechannel solid state detector (Vortex), and digitally processed toobtain the full uorescence spectrum at every point. The uo-rescence maps were analysed with the SMAK 1.10 sowarepackage.43
FF-XANES data were collected at beamline 6-2c at SSRL in thefull-eld transmission X-ray microscope (TXM) and at the X-raymicro-spectroscopy beamline ID21 at the European Synchro-tron Radiation Facility (ESRF), in full-eld conguration, at theFe K edge (7.1 keV). For the ESRF ID21 full-eld instrument, anundulator coupled with a xed-exit double-crystal mono-chromator equipped with a Si(111) crystal allowed selection ofthe energy of the primary radiation. The beam size was denedusing slits and the beam's spatial structures were smoothedusing an X-ray decoheror (graphite foil, 125 mm thick). Sampleswere mounted vertically, perpendicular to the beam, and radi-ographies were acquired with a detection ensemble comprisedof a scintillator, magnifying objective and CCD camera. TheESRF conguration resulted in images with a pixel size of 300nm and a eld of view of 630� 720 mm2; the SSRL congurationresulted in a nominal image resolution of 30 nm and a eld ofview of 30 � 30 mm2. At SSRL, three adjacent images werestitched together into a mosaic to extend the eld of view.Transmission full-eld images were collected from 7.05 to 7.25keV. Full-eld transmission images were compiled and regis-tered to eliminate misalignment and jitter either by Fast FourierTransform (FFT) or Scale Invariant Feature Transpose (SIFT).44
Each pixel of the thus registered and compiled image stackcontains a full X-ray absorption (XAS) spectrum. The rst 10–20(pre-edge) points and the last 20–50 (post-edge) points wereused to normalize the XAS. The difference between the averageof the pre-edge and the post-edge was extracted as the edgejump. Average variation in the pre-edge was calculated for eachimage-stack pixel, and if the edge jump for that pixel was lessthan 8 times the pre-edge variation, then that pixel was elimi-nated from further analysis. This edge-jump ltering mostlyremoved pixels with low absorbing areas, and even aerltering between 0.3–3 M pixels remained. The XAS spectra ofthe remaining pixels (edge-jump ltered) were normalized tomake the difference between the pre-edge and post-edge equalto unity. The energy at which the normalized XANES spectracrossed 0.5 was extracted for each retained pixel; the thusextracted edge position (edge shi) is directly related to theoxidation state of Fe. Further details of the FF-XANES experi-mental setup at SSRL and ESRF and data processing are givenelsewhere.45
The large number of XANES spectra available opens thepossibility of applying statistically driven unsupervised dataanalytics techniques, and our experience with such an approach
This journal is © The Royal Society of Chemistry 2015
will be reported in a separate publication. In here, we will staywith the traditional supervised and interactive curationapproach. In the supervised approach, we sampled spectra fromseveral interesting regions of the samples and compared themwith Fe mineralogical reference spectra maintained by theAdvance Lightsource, Lawrence Berkeley National Lab.46
ResultsBerlin painter sherd
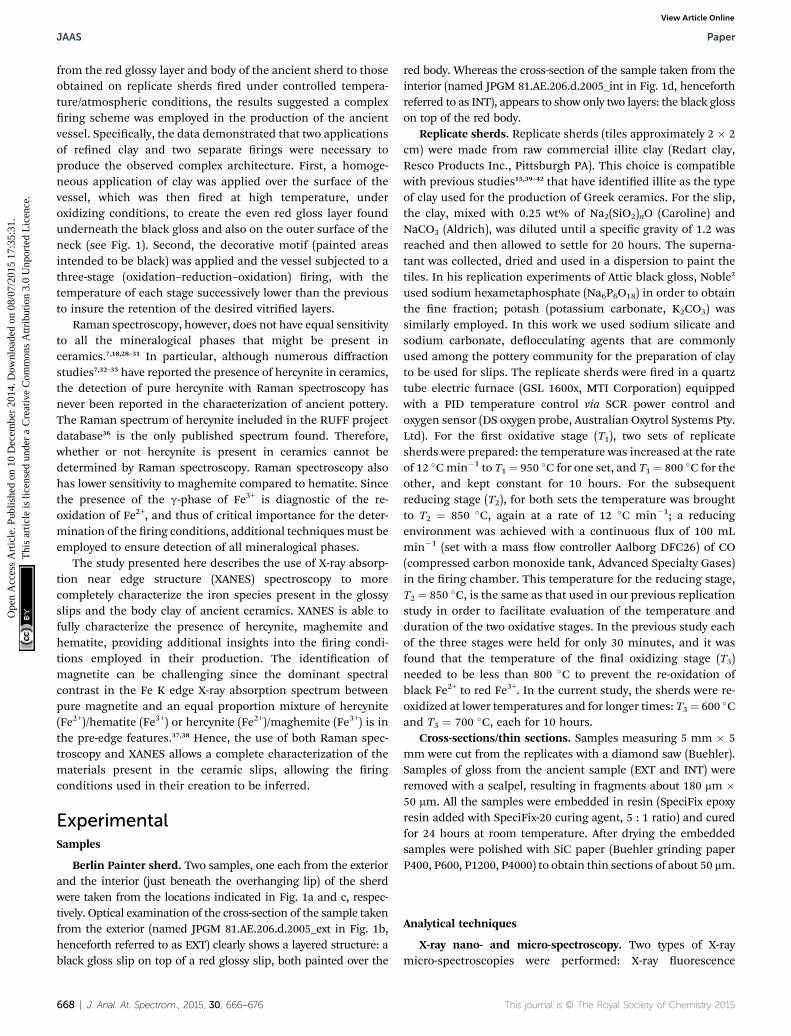
Fig. 2a and b, and 3a and b, show the optical image and cor-responding edge shi map derived from the FF-XANES datacollected at ESRF ID21 for the EXT and INT cross-sections of theancient sherd, respectively. The edge shi maps of both cross-sections show a thin reduced top layer over a more oxidizedbase; not an unexpected result.
For the sample from the exterior (EXT) surface, in which theobserved stratigraphy is black gloss over red gloss over red body,the average spectra of single pixel XANES acquired at beamlineID-21 in each of these three regions are shown in Fig. 2d (solidlines); reference spectra of the Fe minerals that appear to begood matches for each of the regions (hercynite, hematite andmaghemite) from the ALS XANES library are shown as dottedlines. The XANES spectrum for every retained pixel was t as alinear combination of the three identied reference mineralspectra. Fig. 2c shows an RGB map derived from the linearcombination least square (LCLS) t, with pure red assigned tohematite (the a-phase of Fe2O3), pure green assigned to her-cynite (FeAl2O4) and pure blue assigned to maghemite (theg-phase of Fe2O3). The elimination of any of the three referencespectra from the LCLS tting signicantly degrades the t for asubstantial number of pixels with large edge jump (and hencelow noise). Interestingly, the addition of other Fe minerals,notably magnetite (which was detected in this sample by Ramanspectroscopy), does not signicantly improve the LCLS t forpixels with a large edge jump. Furthermore, principal compo-nent analysis (not shown here) also indicates the presence of atleast three components and thus the choice of the three refer-ences appears reasonable based on the data. The phase mapshows that the black gloss is composed of hercynite, the redgloss is composed of hematite, and the body is a mixture ofmaghemite and hematite.
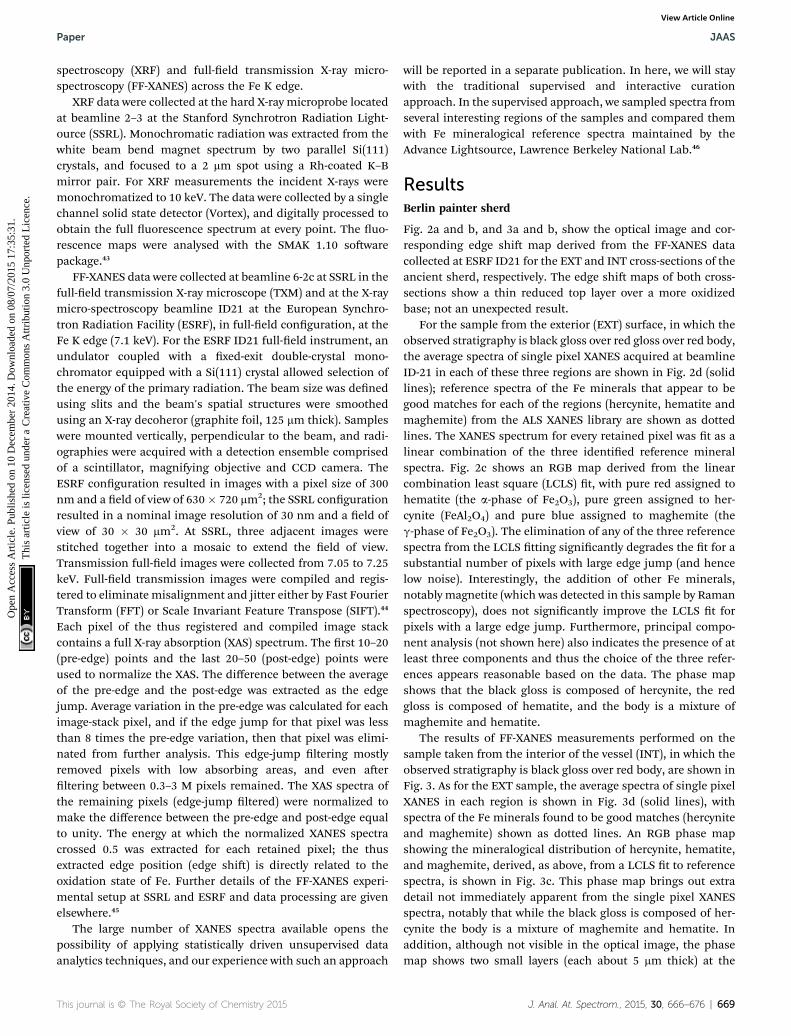
The results of FF-XANES measurements performed on thesample taken from the interior of the vessel (INT), in which theobserved stratigraphy is black gloss over red body, are shown inFig. 3. As for the EXT sample, the average spectra of single pixelXANES in each region is shown in Fig. 3d (solid lines), withspectra of the Fe minerals found to be good matches (hercyniteand maghemite) shown as dotted lines. An RGB phase mapshowing the mineralogical distribution of hercynite, hematite,and maghemite, derived, as above, from a LCLS t to referencespectra, is shown in Fig. 3c. This phase map brings out extradetail not immediately apparent from the single pixel XANESspectra, notably that while the black gloss is composed of her-cynite the body is a mixture of maghemite and hematite. Inaddition, although not visible in the optical image, the phasemap shows two small layers (each about 5 mm thick) at the
J. Anal. At. Spectrom., 2015, 30, 666–676 | 669
Fig. 2 (a) Optical photomicrograph of EXT. (b) Fe-edge position map with colour-energy scale. (c) RGB phase map generated by the fit of singlepixel XANES spectra with iron oxide standards. The map shows that the black gloss is composed of hercynite (green), the red gloss of hematite(red) and the body of a mixture of maghemite (blue) and hematite (red). (d) Averaged spectra of black gloss (solid green line), red gloss (solid redline) and body (solid blue line) collected at ESRF, BL ID-21 and standard spectra of hercynite (dotted green line), hematite (dotted red line) andmaghemite (dotted blue line).
JAAS Paper
Ope
n A
cces
s A
rtic
le. P
ublis
hed
on 1
0 D
ecem
ber
2014
. Dow
nloa
ded
on 0
8/07
/201
5 17
:35:
31.
Thi
s ar
ticle
is li
cens
ed u
nder
a C
reat
ive
Com
mon
s A
ttrib
utio
n 3.
0 U
npor
ted
Lic
ence
.View Article Online
interface between the black gloss and the body: a layer ofhematite over a layer of maghemite.
To better understand the slip stratigraphy for these twosamples, each of which show, to different extents, a reducedgloss layer over oxidized gloss layer(s), we need to compare the
Fig. 3 (a) Optical photomicrograph of INT. (b) Fe-edge position map withpixel XANES spectra with iron oxide standards. The map shows that thmaghemite and hematite. A small layer (about 5 mm) of hematite is observspectra of the black gloss (solid green line) and body (solid blue line) colleline) and maghemite (dotted blue line).
670 | J. Anal. At. Spectrom., 2015, 30, 666–676
high resolution FF-XANES measurements from beamline 6-2cwith optical and XRF measurements. Fig. 4a shows the opticalimage of the cross-section from the EXT sample, in which theblack gloss, red gloss and body are clearly visible. XRF maps(Fig. 4b) show that the body contains more Ca, present in large
colour-energy scale. (c) RGB phase map generated by the fit of singlee black gloss is composed of hercynite and the body of a mixture ofed at the interface between the black gloss and the body. (d) Averagedcted at ESRF, BL ID-21 and standard spectra of hercyinite (dotted green
This journal is © The Royal Society of Chemistry 2015

Paper JAAS
Ope
n A
cces
s A
rtic
le. P
ublis
hed
on 1
0 D
ecem
ber
2014
. Dow
nloa
ded
on 0
8/07
/201
5 17
:35:
31.
Thi
s ar
ticle
is li
cens
ed u
nder
a C
reat
ive
Com
mon
s A
ttrib
utio
n 3.
0 U
npor
ted
Lic
ence
.View Article Online
crystallites or clusters, than either of the gloss layers; otherwisethe bulk chemistry of two slips and the body are very similar(further details on the composition is given in our previousstudy26). Because the overall chemistry of both slips and thebody are very similar, X-ray absorbance of a uniformly thincross-section, below the Fe K edge, is a good measure of thelocal density and inversely related to the porosity. Fig. 4c showsthe absorbance of the EXT cross-section measured at beamline6-2c at 7080 eV (below the absorption edge of Fe), which clearlyshows that the body is signicantly more porous than the twogloss layers, and both gloss layers appear to have very compa-rable density. However, notably, the bottom of the red gloss(and very topmost surface of the black gloss) show slightlyincreased density. Fig. 4d shows the Fe K-edge-shimap for thecross-section, which indicates that, as expected, the iron in theblack gloss is reduced, while the iron in the red gloss and bodyare both oxidized, with patches of even higher oxidationthroughout the body. Furthermore, although not shown, thevery top surface (extending down no more than 1–2 mm) of theblack gloss layer, appears to be further reduced than the bulk ofthe black gloss layer. Fig. 4e shows the phase map for thesample (generated using the same LCLS method applied to thelower resolution data as shown in Fig. 2 and 3). This highresolution phase map clearly shows the distribution of her-cynite (green), hematite (red), and maghemite (blue) in the EXTcross-section: the heart of the black gloss layer is composedmostly of hercynite, the red gloss layer is composed mostly ofhematite, and the broad transition region between the twocontaining strands of maghemite in a hematite or hercynitematrix. The body, on the other hand, shows a mixture ofhematite and maghemite, with more dense grains composed ofhematite. The dense and granular nature of hematite regions in
Fig. 4 (a) Cross-section of sample EXT. (b) Ca XRF map. (c) X-ray absorcompared to the body. (d) Fe-edge positionmap. (e) RGB phase map genThe phase map shows that the black gloss is composed of hercynite (maghemite (blue) and hematite.
This journal is © The Royal Society of Chemistry 2015
the body is even clearer here than in the phase maps shown inFig. 2c and 3c.
Replicate sherds
Replication studies were conducted in order to help decipherthe ring sequences and other production processes necessaryto create a ceramic vessel with the morphological and miner-alogical distribution found in the Berlin Painter's sherd,described above. A series of replicates were produced to explorethe processing envelope achievable in a large wood-red kilnthat would enable the production of (a) a dense red gloss layer(such as that observed under the black gloss layer on the sampleEXT) and (b) a high quality black gloss layer over a fully oxidizedred body (such as that observed on the sample INT). In Table 1the ring conditions of the replicates thus produced arereported, together with the main mineralogical phases detectedin the body and the slip by Raman spectroscopy and by XANES.In the last column the denomination of the slip and the opticalimage of the cross-sections are also reported.
Formation of red gloss
In our previous study26 it was found that ring at T1 ¼ 1000 �Cfor only 30 minutes could induce hematite precipitation in theslip to form red gloss. However, this temperature is not believedto be realistically achievable in an ancient wood-red kiln,47 norwould such a short ring have been employed. Thus, in thepresent study we red the replicate sherds at lower tempera-tures and for longer times. Painted replicate sherds were red atT1 ¼ 950 �C under oxidizing conditions for 10 hours, thenreduced at T2 ¼ 850 �C for 30 minutes. As seen in Table 1, row 1,under these conditions the slip layer is transformed into a
ption image at 7080 eV showing different porosity in the two glosseserated by the fit of single pixel XANES spectra with iron oxide standards.green), the red gloss of hematite (red) and the body of a mixture of
J. Anal. At. Spectrom., 2015, 30, 666–676 | 671

Table 1 Firing conditions of replicates with relative colour of gloss and body and iron species detected
Row T1 (�C) T2 (�C) T3 (�C) Colour Main Fe species Denomination and cross sections
1 950 for 10 h 850 for 300 NAGloss Red Hematite (Raman, XANES)Body Black Hercynite (XANES), Magnetite (Raman)
2 950 for 10 h 850 for 300 800 for 300Gloss Red Hematite (Raman, XANES)Body Red Hematite (Raman), Hematite
+ Maghemite (XANES)
3 800 for 10 h 850 for 300 NA Gloss Black Hercynite (XANES), Magnetite (Raman)Body Black Hercynite (XANES), Magnetite (Raman)
4 800 for 10 h 850 for 300 800 for 300Gloss Black Hercynite (XANES), Magnetite (Raman)Body Red Hematite (Raman), Hematite +
Maghemite (XANES)
5 800 for 10 h 850 for 300 600 for 10 hGloss Black Hercynite (XANES), Magnetite (Raman)Body Red Hematite (Raman), Hematite +
Maghemite (XANES)
6 800 for 10 h 850 for 300 700 for 10 hGloss Brown/Red —Body Red —
JAAS Paper
Ope
n A
cces
s A
rtic
le. P
ublis
hed
on 1
0 D
ecem
ber
2014
. Dow
nloa
ded
on 0
8/07
/201
5 17
:35:
31.
Thi
s ar
ticle
is li
cens
ed u
nder
a C
reat
ive
Com
mon
s A
ttrib
utio
n 3.
0 U
npor
ted
Lic
ence
.View Article Online
vitried red gloss, with only a thin layer of black formed at thesurface during the reduction step (the body, being porous, iscompleted reduced by the CO). This same replicate was subse-quently re-oxidized at T3 ¼ 800 �C for 30 minutes (Table 1, row2) and now the body and the slip both appear red. These datashow that a longer ring at a lower temperature can produce thesame results as a shorter ring at a higher temperature.
Formation of black gloss
In our previous study26 black gloss was obtained by ringreplicate sherds under oxidizing conditions at either T1 ¼800 �C or 900 �C for 30minutes (followed by a reduction ring atT2 ¼ 850 �C for 30 minutes). Analogous to that observed for theformation of red gloss described above, ring at a lowertemperature (T1 ¼ 800 �C) for a longer time (10 hours) produceda homogenous, smooth black slip (Table 1, row 3) similar to that
672 | J. Anal. At. Spectrom., 2015, 30, 666–676
produced by ring at T1 ¼ 900 �C for 30 minutes. By contrast,ring at T1 ¼ 900 �C for 10 hours (image not shown) wassufficient to induce local precipitation of hematite in someareas of the slip, resulting in what is oen termed as “misred”:areas intended to be black have, in fact, turned red. Therefore,to produce black gloss using longer ring times, lowertemperatures, with T1 < 900 �C, should be used for the rstoxidizing stage in the ring sequence.
Re-oxidation of the body
Ideally, in the nal, re-oxidation step, the reduced iron in theporous clay body is reverted to an oxidized form, while the ironspecies in the vitried slips are unaffected, remaining either red(oxidized, formed at high temperatures in the initial oxidizingstage) or black (reduced, formed at lower temperatures in theinitial oxidizing stage). To test whether, like that observed in the
This journal is © The Royal Society of Chemistry 2015

Paper JAAS
Ope
n A
cces
s A
rtic
le. P
ublis
hed
on 1
0 D
ecem
ber
2014
. Dow
nloa
ded
on 0
8/07
/201
5 17
:35:
31.
Thi
s ar
ticle
is li
cens
ed u
nder
a C
reat
ive
Com
mon
s A
ttrib
utio
n 3.
0 U
npor
ted
Lic
ence
.View Article Online
initial oxidizing stage, ring at high temperatures for shorttimes yields similar results to ring at lower temperatures forlonger times, replicates red at T1 ¼ 800 �C (10 hours) were re-oxidized at T3 ¼ 800 �C for 30 minutes (Table 1, row 4) and atT3 ¼ 600 �C and 700 �C for 10 hours (Table 1, rows 5 and 6,respectively).
For the two samples subjected to longer ring times for there-oxidation step (10 hours), at T3 ¼ 600 �C the black gloss wasunaffected, while at T3 ¼ 700 �C the black gloss was re-oxidizedto red. By contrast, when a short ring time (30 minutes) wasused (see Table 1, row 4), even the higher temperature of T3 ¼800 �C did not induce re-oxidation of the black gloss; the glossremained black. Therefore, we conclude that to produce blackgloss using long ring times, the nal re-oxidation step shouldbe red at temperatures T3 < 700 �C, although higher temper-atures can be tolerated for shorter times.
XANES spectroscopy was used to characterize the mineralphases in the slips and the body of the replicate sherds. Phasemaps generated by the LCLS tting of the XANES spectra of thereplicates with the ALS standards are shown in Fig. 5. The samecolour coding used for the ancient sample was adopted here:pure red for hematite (a-Fe2O3), pure green for hercynite(FeAl2O4), and pure blue for maghemite (g-Fe2O3). Fig. 5bshows the phase map of the sample produced at T1 ¼ 950 �Cand T3 ¼ 800 �C (Table 1, row 2), in which a layer of red gloss isformed over a red body. The red gloss is seen to be mostly
Fig. 5 Cross-sections of replicates produced at different tempera-tures and duration of the firing steps. Relative RGB maps (red ¼hematite, green¼ hercynite, blue¼maghemite) generated by LCLS fitwith standards. (a) Cross-section of replicate sample fired at T1 ¼950 �C (10 h), T2 ¼ 850 �C (300), T3 ¼ 800 �C (300) showing red glossover red body. (b) RGB phase map of replicate sample in (a). (c) Cross-section of replicate sample fired at T1 ¼ 800 �C (10 h), T2 ¼ 850 �C(300), T3 ¼ 800 �C (300) showing black gloss over red body. (d) RGBphase map of replicate sample in (c). (e) Cross-section of replicatesample fired at T1 ¼ 800 �C (10 h), T2¼ 850 �C (300), T3 ¼ 600 �C (10 h)showing black gloss over red body. (f) RGB phase map of replicatesample in (e) (gloss detached from the body).
This journal is © The Royal Society of Chemistry 2015
composed of hematite, but a very thin layer of maghemite isobserved at the top surface; the body is a mixture of maghemiteand hematite. The phase maps of the two samples red at alower temperature, T1¼ 800 �C, and then re-oxidized at T3¼ 800�C for 30 minutes and T3 ¼ 600 �C for 10 hours (Table 1, rows 4and 5, and Fig. 5d and f, respectively), show the same miner-alogy: the black slip is composed of hercynite and the body is amixture of predominantly maghemite with hematite alsopresent, and the topmost layer slightly re-oxidized compared tothe bulk. Again, we have evidence that, like that observed in therst oxidizing step, two different conditions of re-oxidation –
high temperature/short time and lower temperature/longertime – lead to the same result: formation of maghemite, the g-phase of Fe2O3, together with hematite, the a-phase of Fe2O3, inthe body. It is worth noting that because of the lower sensitivityof Raman spectroscopy to maghemite its presence in the bodyonly became evident with the XANES studies, which indicate itis, in fact, the major phase present.
DiscussionReplicate sherds
A distinct Fe mineralogy is associated with a successful (i.e., theproduction of black gloss) three-step ring: Fe in the black glossis predominantly present as hercynite, whereas Fe in the redbody is predominantly found as maghemite, with hematite alsopresent. From our replication studies, for long ring times thehigh temperature boundary for the successful production ofblack gloss on a red body in a three step (oxidizing–reducing–oxidizing) ring sequence was found to be T1 < 900 �C for therst (oxidizing) step and T3 < 700 �C for the third (re-oxidizing)step (with the T2 upper boundary intermediate between T1 and T3).The boundaries move to lower temperatures as annealing timesare increased. Signicant infractions of this boundary, in either ofthe two oxidizing steps, result in reddening of the intended blackgloss and leads to the production of red gloss.
We have not fully explored the low temperature boundary, asthat is very heavily dominated by kinetics, although ourmeasurements suggest it is below 700 �C. Signicant trans-gression of the high temperature boundary during the reduc-tion phase can produce metallic Fe or even wustite, Fe1�xO, butthese phases are not common in Greek pottery5,37,42 as it is verydifficult to achieve elevated temperatures under very reducingconditions in a wood-red kiln, and thus we have not exploredthis regime in the replication studies.
Our replication studies show two pathways for forming red(oxidized) gloss in a three-stage ring sequence, but these twopathways result in very different microstructure and miner-alogy. If the matrix of the slip is sufficiently porous aer thesecond, reducing, stage, oxygen can easily permeate it and re-oxidize the gloss. This type of red gloss is formed through theprocess of maghemitization of the Fe2+ (ferrous) spinels (her-cynite and magnetite)21 and a signicant fraction of Fe3+ (ferric)ions thus produced will be in the maghemite phase. Higherpermeability of the red gloss layer than that of the black glosslayer is achieved through a change in the bulk clay chemistry(e.g., large calcite content). One of the two identied types of
J. Anal. At. Spectrom., 2015, 30, 666–676 | 673

JAAS Paper
Ope
n A
cces
s A
rtic
le. P
ublis
hed
on 1
0 D
ecem
ber
2014
. Dow
nloa
ded
on 0
8/07
/201
5 17
:35:
31.
Thi
s ar
ticle
is li
cens
ed u
nder
a C
reat
ive
Com
mon
s A
ttrib
utio
n 3.
0 U
npor
ted
Lic
ence
.View Article Online
Coral Red is consistent with being produced by this mecha-nism.9 The other pathway for forming red slips in a three-stagering is to make the matrix sufficiently impermeable in the rst(or before the rst) oxidative step so that it cannot be reduced inthe second stage. This can be achieved by a prolonged anneal-ing at elevated temperatures in which the aluminum–silicatematrix is almost fully vitried. Distinguishing material charac-teristics of red gloss produced by this pathway are an evenhigher degree of vitrication than black gloss and the presenceof large amounts of hematite. The second type of Coral Redpreviously observed, in which red and black gloss layers havesimilar chemistry,9 would have been produced through thismechanism.
Thus, our replication studies have shown that the miner-alogy associated with the three-stage ring envelope not onlyprovides “nger-prints” for deciphering the ring sequencefrom material characterization, it also provides the scienticfoundation for understanding nanoscale processes occurring atvarious stages of production of black and red glosses.
Berlin Painter sherd
The red gloss found on the EXT sample from the Berlin Paintersherd was found to be slightly more dense than the overlyingblack gloss (see Fig. 4c), and hence belongs to the secondcategory of red gloss described above. Furthermore, since thebulk chemistry of the red gloss is essentially indistinguishablefrom that of the black gloss (see Fig. 4b), the higher densitymust have been achieved by ring at a higher temperature. Thata high ring temperature was employed is conrmed by thepresence of a large amount of hematite in the heart of the redgloss layer, as shown in Fig. 4e. However, the high temperaturering needed to vitrify the red gloss would have also vitried theblack gloss (with identical chemistry), if it was present. There-fore we conclude that the decorative black gloss layer must havebeen applied aer the high temperature annealing thatproduced the red gloss, and red in a second, separate three-stage ring at lower temperature(s).
This seemingly difficult formation of a layer of black gloss ontop of a layer of red gloss is made possible by the differentbehaviour of iron containing aluminum–silicates underreducing or oxidizing conditions. The viscosity of iron con-taining silicates has been found to decrease under reducingconditions, and the glass transition temperature of thesecompounds is lower in presence of Fe2+ compared to Fe3+.48
Because the melting point of the top black layer is lower thanthat of the red gloss layer beneath it, it is possible to vitrify thetop slip without affecting the one underneath, while selectivelyreducing the upmost layer.
The presence of a thin, dense, oxidized layer under the blackgloss in the INT sample (visible in the mineralogical mapping(see Fig. 3c) but not optically), also supports the hypothesis thata second application of rened clay was applied aer the rstoxidative step. As noted above, this layer is actually comprisedof three layers: a thin maghemite layer at the interface with thebody, over which is found an equally thin hematite layer, whichlies directly under the main black gloss (hercynite) layer. The
674 | J. Anal. At. Spectrom., 2015, 30, 666–676
most likely scenario for creation of these thin layers, based onthe observed mineralogical distribution is an initial hightemperature ring followed by an application of the gloss layerand subsequent lower temperature oxidizing–reducing–oxidizing ring. Specically, the initial high temperature ring(annealing) used to create the thick red gloss layer on theexterior surface as described above also results in the formationof a thin hematite layer at the outer surface of the (unpainted)body clay on the interior of the vessel. This is followed bysubsequent painting of the decorative motif (areas intended tobe black) on both the interior and exterior surfaces, which isthen subjected to a second (three-stage) ring of the vessel.Because of the high density of the hematite layer thus produced,only the very bottom surface (in contact with the porous body) isreduced during the (reducing) stage of this second ring, whichin turn is transformed into maghemite in the third re-oxidizingstep.
The presence of signicant amounts of hematite in the bodyneeds further investigation to be fully understood. Themaghemitization of ferrous spinels depends strongly on manydifferent parameters: temperature,49 size and crystal face of theparticles,19,20,23 and chemistry of the clay.50 A high resolution 3Ddistribution of the hematite, maghemite and the open pores fora large region of the body would allow a better understanding ofthe re-oxidation process and the duration of the last ring stepbut such measurement is beyond the scope of the current work.
Conclusions
The comparison of the mineralogical phases in the sampleattributed to the Berlin Painter with those formed under knownconditions in the replication study conrms the results of ourpreviously reported Raman study26 and further renes ourunderstanding of the ring protocol employed for the produc-tion of the ancient sample JPGM 81.AE.206.d.2005. In partic-ular, the conditions required for the formation of the two Fe3+
phases, a-Fe2O3 (hematite) and g-Fe2O3 (maghemite), are verydifferent: temperatures as high as 950 �C are necessary toinduce hematite formation (in either the rst or third oxidizingstage of ring) while, depending on the duration of the last re-oxidation stage, temperatures lower than 800 �C are required toform maghemite. This means that, to achieve the gloss archi-tecture observed on the surface of the Berlin Painter vessel, inwhich a homogeneous red glossy layer is found underneath theblack gloss on the exterior surface, but only a very thin layer ofred gloss is found under the black gloss on the interior surface,two separate applications of slip and two separate rings musthave been performed. First, a homogeneous application of slipwas applied to the exterior surface, and the vessel was red athigh temperature to form hematite in the vitried slip. Thedecorations on the vessel (areas intended to be black) weresubsequently painted with a second application of slip followedby a three-stage ring, in which hercynite and magnetite wereformed in the black gloss, and hematite and maghemite wereformed in the body.
It is important to note that the key parameter to obtain thislayered structure is the large degree of vitrication of the two
This journal is © The Royal Society of Chemistry 2015

Paper JAAS
Ope
n A
cces
s A
rtic
le. P
ublis
hed
on 1
0 D
ecem
ber
2014
. Dow
nloa
ded
on 0
8/07
/201
5 17
:35:
31.
Thi
s ar
ticle
is li
cens
ed u
nder
a C
reat
ive
Com
mon
s A
ttrib
utio
n 3.
0 U
npor
ted
Lic
ence
.View Article Online
slips. In fact, aer the precipitation of hematite in the red glosslayer, the densication of the matrix prevents the reduction ofiron from occurring during the reducing step. However, it isnecessary to undergo a reducing step to form the black layer ontop, and thus the temperature used during the ring of the topblack layer had to be sufficiently high to guarantee the vitri-cation of the black gloss, but signicantly lower than 950 �C toavoid the precipitation of hematite.
The presence of a stratied structure, such as that observedin the Berlin Painter vessel, has not been encountered very oenin our studies. Thus, further investigations are necessary todetermine what factors (i.e., technological, aesthetic oreconomic) might have motivated – or enabled – the potter toundertake such a complex ring scheme, and how widespreadthis practice was among contemporary painters and potters.Nevertheless, this study presents yet more evidence supportingthe hypothesis that the ring practices of the Kerameikos artistswere more complex and less standardized that previouslythought, involving multiple rings10 and the sequential appli-cation of slips.
Acknowledgements
This material is based upon work supported by the NationalScience Foundation under Grant no.104808. Some of themeasurements reported in here were performed on beamline 6-2c at the Stanford Synchrotron Radiation Lightsource, a Direc-torate of SLAC National Accelerator Laboratory and an Office ofScience User Facility operated for the U.S. Department of EnergyOffice of Science by Stanford University. Other measurementswere performed on beamline ID21 at the European SynchrotronRadiation Facility (ESRF), Grenoble, France, as part of proposalHG27. We would like to thank B. Hesse and B. Fayard (ESRF)and S. Webb, C. Krest, and J. Hayter (SSRL)for their assistance.This work was partially supported by the NEXT labex throughthe PhD student mobility program.
Notes and references
1 C. F. Binns and A. D. Frazer, Am. J. Archaeol., 1929, 1–9.2 J. V. Noble, Am. J. Archaeol., 1960, 64, 307–313.3 M. Farnsworth and H. Wisely, Am. J. Archaeol., 1958, 62, 165–173.
4 G. M. A. Richter, The cra of Athenian pottery: an investigationof the technique of black-gured and red-gured Athenian vases,New Haven. 1923.
5 A. Kostikas, A. Simopoulos and N. H. Gangas, J. Phys. Colloq.,1974, 35, C1–C107–C101-115, DOI: 10.1051/jphyscol:1974133.
6 M. Walton, E. Doehne, K. Trentelman, G. Chiari, J. Maishand A. Buxbaum, in Papers on Special Techniques inAthenian Vases, ed. K. Lapatin and J. Paul Getty Museum,2008, pp. 95–104.
7 F. Ospitali, T. Sabetta, F. Tullini, M. C. Nannetti and G. DiLonardo, J. Raman Spectrosc., 2005, 36, 18–23, DOI:10.1002/jrs.1259.
This journal is © The Royal Society of Chemistry 2015
8 Y. Maniatis, E. Aloupi and A. D. Stalios, Archaeometry, 1993,35, 23–34, DOI: 10.1111/j.1475-4754.1993.tb01021.x.
9 M. Walton, K. Trentelman, E. Doehne, G. Chiari, J. Maishand A. Buxbaum, Archaeometry, 2009, 51, 383–396, DOI:10.1111/j.1475-4754.2008.00413.x.
10 M. S. Walton, K. Trentelman, M. Cummings, G. Poretti,J. Maish, D. Saunders, B. Foran, M. Brodie, A. Mehta andP. Vandiver, J. Am. Ceram. Soc., 2013, 96, 2031–2035, DOI:10.1111/jace.12395.
11 M. S. Walton, M. Svoboda, A. Mehta, S. Webb andK. Trentelman, Journal of Archaeological Science, 2010, 37,936–940, DOI: 10.1016/j.jas.2009.11.026.
12 M. Walton and K. Trentelman, Materials Research SocietySymposium: Materials Issues in Art and Archaeology VIII, 2007.
13 P. Artal-Isbrand and P. Klausmeyer, Stud. Conserv., 2013, 58,338–359, DOI: 10.1179/2047058412y.0000000077.
14 L. Kahn and J. Wissinger, in The Colors of Clay: SpecialTechniques in Athenian Vases, J Paul Getty Museum, LosAngeles. 2006.
15 W. D. Kingery, Archeomaterials, 1991, 5, 47–54.16 Y. Maniatis, A. Simopoulos, A. Kostikas and V. Perdikatsis, J.
Am. Ceram. Soc., 1983, 66, 773–781.17 L. Luhl, B. Hesse, I. Mantouvalou, M. Wilke, S. Mahlkow,
E. Aloupi-Siotis and B. Kanngiesser, Anal. Chem., 2014, 86,6924–6930, DOI: 10.1021/ac500990k.
18 F. Meirer, Y. Liu, E. Pouyet, B. Fayard, M. Cotte, C. Sanchez,J. C. Andrews, A. Mehta and P. Sciau, J. Anal. At. Spectrom.,2013, 28, 1870, DOI: 10.1039/c3ja50226k.
19 A. Navrotosky, L. Mazeina and J. Majzlan, Science, 2008, 319,1635–1638.
20 K. Haneda and A. H. Morrish, J. Phys., 1977, 38, 321–323.21 D. Dunlop and O. Ozdemir, Rock Magnetism: Fundamentals
and Frontiers, Cambridge University Press, Cambridge. 1997.22 H. Fischer, J. Luster and A. U. Gehring, GEOPHYS. J. INT.,
2007, 169, 909–916.23 K. F. McCarty, M. Monti, S. Nie, D. A. Siegel, E. Starodub,
F. El Gabaly, A. H. McDaniel, A. Shavorskiy, T. Tyliszczak,H. Bluhm, N. C. Bartelt and J. de la Figuera, J. Phys. Chem.C, 2014, 118, 19768–19777.
24 C. Nunes, E. C. Resende, I. R. Guimaraes, A. S. Anastacio andM. C. Guerreiro, Appl. Spectrosc., 2011, 65, 692–697.
25 M. Wilke, F. Farges, P. E. Petit, G. E. Brown, Jr and F. Martin,Am. Mineral., 2001, 86, 714–730.
26 I. Cianchetta, J. Maish, D. Saunders, M. Walton, A. Mehta,B. Foran and K. Trentelman, J. Raman Spectrosc., 2014, justaccepted.
27 A. Zoppi, C. Lofrumento, E. M. Castellucci andM. G. Migliorini, Ann. Chim., 2005, 95, 239–246.
28 Y. Leon, C. Lofrumento, A. Zoppi, R. Carles, E. M. Castellucciand P. Sciau, J. Raman Spectrosc., 2010, 41, 1550–1555, DOI:10.1002/jrs.2678.
29 Y. Leon, P. Sciau, P. Goudeau, N. Tamura, S. Webb andA. Mehta, Appl. Phys. A: Mater. Sci. Process., 2010, 99, 419–425, DOI: 10.1007/s00339-010-5628-x.
30 P. Sciau, Y. Leon, P. Goudeau, S. C. Fakra, S. Webb andA. Mehta, J. Anal. At. Spectrom., 2011, 26, 969, DOI:10.1039/c0ja00212g.
J. Anal. At. Spectrom., 2015, 30, 666–676 | 675
JAAS Paper
Ope
n A
cces
s A
rtic
le. P
ublis
hed
on 1
0 D
ecem
ber
2014
. Dow
nloa
ded
on 0
8/07
/201
5 17
:35:
31.
Thi
s ar
ticle
is li
cens
ed u
nder
a C
reat
ive
Com
mon
s A
ttrib
utio
n 3.
0 U
npor
ted
Lic
ence
.View Article Online
31 E. Aquilia, G. Barbera, G. Barone, V. Crupi, F. Longo,D. Majolino, P. Mazzoleni and V. Venuti, X-Ray Spectrom.,2013, 42, 38–44, DOI: 10.1002/xrs.2432.
32 V. S. F. Muralha, T. Rehren and R. J. H. Clark, J. RamanSpectrosc., 2011, 42, 2077–2084, DOI: 10.1002/jrs.2961.
33 H. Edwards and J. M. Chalmers, Raman Spectroscopy inArchaeology and Art History, RCS, 2005.
34 T. Broekmans, A. Adriaens and E. Pantos, Appl. Phys. A:Mater. Sci. Process., 2007, 90, 35–42, DOI: 10.1007/s00339-007-4227-y.
35 E. Gliozzo, I. W. Kirkman, E. Pantos and I. Memmi Turbanti,Archeometry, 2004, 46, 227–246.
36 .R. project.37 F. Bardelli, G. Barone, V. Crupi, F. Longo, G. Maisano,
D. Majolino, P. Mazzoleni and V. Venuti, J. SynchrotronRadiat., 2012, 19, 782–788, DOI: 10.1107/S0909049512023990.
38 D. Barilaro, V. Crupi, D. Majolino, V. Venuti, G. Barone,F. D'Acapito, F. Bardelli and F. Giannici, J. Appl. Phys.,2007, 101, 064909, DOI: 10.1063/1.2537908.
39 A. O. Shepard, Ceramics for the Archaeologist, CarnegieInstitution of Washington, Washington D.C., 1956.
676 | J. Anal. At. Spectrom., 2015, 30, 666–676
40 G. M. Ingo, E. Angelini, G. Bultrini, T. De Caro, L. Pandoland A. Mezzi, Surf. Interface Anal., 2002, 34, 328–336, DOI:10.1002/sia.1311.
41 G. M. Ingo, G. Bultrini, T. de Caro and C. Del Vais, Surf.Interface Anal., 2000, 30, 101–105.
42 C. C. Tang, E. J. MacLean, M. A. Roberts, D. T. Clarke,E. Pantos and A. J. N. W. Prag, J. Archaeol. Sci., 2001, 28,1015–1024, DOI: 10.1006/jasc.2000.0608.
43 S. Webb, 2014.44 P. Paleo, E. Pouyet and J. Kieffer, J. Synchrotron Radiat., 2014,
21, 456–461.45 B. Fayard, E. Pouyet, G. Berruyer, D. Bugnazet, C. Cornu,
M. Cotte and A. Sole, J. Phys.: Conf. Ser., 2013, 25, 1–4.46 XAS database of Fe compounds, Advanced Light Source (ALS),
Lawrence Berkeley National Laboratory, California, Website:http://xraysweb.lbl.gov/uxas/Databases/Overview.htm.
47 N. Cuomo di Caprio, Ceramiche in Archeologia 2, L'Erma diBretschneider., 2007.
48 L. C. Klein, B. V. Fasano and J. M. Wu, Lunar and PlanetaryScience Conference, 13th, Houston, TX.
49 I. I. Diakonov, Eur. J. Mineral., 1998, 10, 17–29.50 O. Helgason, H. P. Gunnlaugsson and S. Steinthorsson,
Hyperne Interact., 1992, 70, 981–984.
This journal is © The Royal Society of Chemistry 2015
Copyright © 2022 FDOKUMEN