東亞銀行有限公司 - The Bank of East Asia, Limited
61
The Bank of East Asia, Limited 東亞銀行有限公司 Banking Disclosure Statement For the period ended 30 June 2021 (Unaudited)
-
Upload
khangminh22 -
Category
Documents
-
view
1 -
download
0
Transcript of 東亞銀行有限公司 - The Bank of East Asia, Limited
The Bank of East Asia, Limited 東亞銀行有限公司
Banking Disclosure Statement For the period ended
30 June 2021
(Unaudited)
Table of contents
Introduction ................................................................................................................................................................................. 1
Template KM1: Key prudential ratios ............................................................................................................................................ 2
Template OV1: Overview of RWA ................................................................................................................................................ 3
Template CC1: Composition of regulatory capital ......................................................................................................................... 4
Template CC2: Reconciliation of regulatory capital to balance sheet ........................................................................................... 11
Template CCyB1: Geographical distribution of credit exposures used in countercyclical capital buffer (“CCyB”) ........................... 12
Template LR1: Summary comparison of accounting assets against leverage ratio exposure measure .......................................... 13
Template LR2: Leverage ratio (“LR”) .......................................................................................................................................... 14
Template LIQ1: Liquidity Coverage Ratio (“LCR”) ....................................................................................................................... 15
Template LIQ2: Net Stable Funding Ratio (“NSFR”) .................................................................................................................... 17
Template CR1: Credit quality of exposures ................................................................................................................................. 19
Template CR2: Changes in defaulted loans and debt securities .................................................................................................. 20
Template CR3: Overview of recognised credit risk mitigation ...................................................................................................... 21
Template CR4: Credit risk exposures and effects of recognised credit risk mitigation – for STC approach .................................... 22
Template CR5: Credit risk exposures by asset classes and by risk weights – for STC approach .................................................. 23
Template CR6: Credit risk exposures by portfolio and PD ranges – for IRB approach .................................................................. 24
Template CR7: Effects on RWA of recognised credit derivative contracts used as recognised credit risk mitigation – for IRB
approach ................................................................................................................................................................................... 28
Template CR8: RWA flow statements of credit risk exposures under IRB approach ..................................................................... 29
Template CR10: Specialised lending under supervisory slotting criteria approach and equities under simple risk-weight method –
for IRB approach ....................................................................................................................................................................... 30
Template CCR1: Analysis of counterparty default risk exposures (other than those to CCPs) by approaches ............................... 32
Template CCR2: CVA capital charge ......................................................................................................................................... 33
Template CCR3: Counterparty default risk exposures (other than those to CCPs) by asset classes and by risk weights – for STC
approach ................................................................................................................................................................................... 34
Template CCR4: Counterparty default risk exposures (other than those to CCPs) by portfolio and PD range – for IRB approach .. 35
Template CCR5: Composition of collateral for counterparty default risk exposures (including those for contracts or transactions
cleared through CCPs) .............................................................................................................................................................. 36
Template CCR6: Credit-related derivatives contracts .................................................................................................................. 37
Template CCR8: Exposures to CCPs ......................................................................................................................................... 38
Template MR1: Market risk under Standardised (market risk) approach (STM approach) ............................................................. 39
Template MR2: RWA flow statements of market risk exposures under IMM approach .................................................................. 40
Template MR3: IMM approach values for market risk exposures ................................................................................................. 41
Template MR4: Comparison of VaR estimates with gains or losses ............................................................................................. 42
Template KM2: Key metrics – LAC requirements for resolution entities (at LAC consolidation group level) ................................... 43
Template TLAC1: LAC composition of resolution entity (at LAC consolidation group level) ........................................................... 44
Template TLAC3: Resolution entity – creditor ranking at legal entity level .................................................................................... 46
Table CCA(A): Main features of regulatory capital instruments and non-capital LAC debt instruments .......................................... 47
International Claims ................................................................................................................................................................... 51
Mainland Activities ..................................................................................................................................................................... 52
Table of contents
Currency Concentration ............................................................................................................................................................. 54
Capital Buffer ............................................................................................................................................................................ 56
Countercyclical Capital Buffer Ratio ...................................................................................................................................... 56
Capital Conservation Buffer Ratio ......................................................................................................................................... 56
Higher Loss Absorbency Ratio .............................................................................................................................................. 56
Glossary ................................................................................................................................................................................... 57
The Bank of East Asia, Limited 東亞銀行有限公司
P. 1
Introduction
Purpose The information contained in this document is for The Bank of East Asia, Limited (“the Bank”) and its subsidiaries (together “the Group”), and is prepared in accordance with the Banking (Disclosure) Rules (“BDR”), Part 6 of the Financial Institutions (Resolution) (Loss-absorbing Capacity Requirements – Banking Sector) Rules (“LAC Rules”), and disclosure templates issued by the Hong Kong Monetary Authority (“HKMA”). These banking disclosures are governed by the Group’s disclosure policy, which has been approved by the Board. The disclosure policy sets out the governance, control and assurance requirements for publication of the document. While the banking disclosure statement is not required to be externally audited, the document has been subject to independent review in accordance with the Group’s policies on disclosure and its financial reporting and governance processes. Basis of preparation
Except where indicated otherwise, the financial information contained in this Banking Disclosure Statement has been prepared on the basis of regulatory scope of consolidation specified by the HKMA to the Bank. The basis of consolidation for regulatory purposes is different from that for accounting purposes. The banking disclosure statement
The HKMA has implemented the final standards on the Revised Pillar 3 Disclosure Requirements issued by the Basel Committee on Banking Supervision (“BCBS”) in January 2015, and also incorporated the BCBS Pillar 3 disclosure requirements – consolidated and enhanced framework finalized in March 2017 in the latest BDR and the LAC Rules. These disclosures are supplemented by specific additional requirements of the HKMA set out in the BDR and the LAC Rules. The banking disclosure statement includes the information required under the BDR and the LAC Rules. According to the BDR and the LAC Rules, disclosure of comparative information is not required unless otherwise specified in the standard disclosure templates.
The Bank of East Asia, Limited 東亞銀行有限公司
P. 2
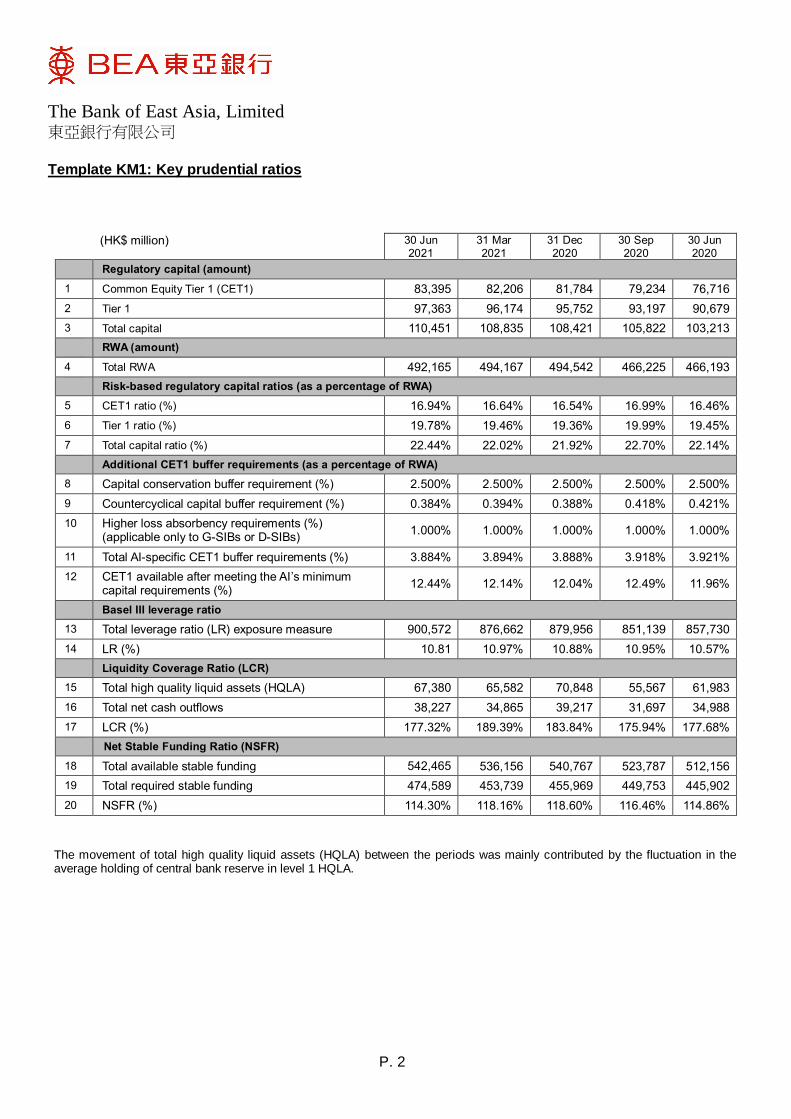
Template KM1: Key prudential ratios
(HK$ million) 30 Jun
2021 31 Mar 2021
31 Dec 2020
30 Sep 2020
30 Jun 2020
Regulatory capital (amount)
1 Common Equity Tier 1 (CET1) 83,395 82,206 81,784 79,234 76,716
2 Tier 1 97,363 96,174 95,752 93,197 90,679
3 Total capital 110,451 108,835 108,421 105,822 103,213
RWA (amount)
4 Total RWA 492,165 494,167 494,542 466,225 466,193
Risk-based regulatory capital ratios (as a percentage of RWA)
5 CET1 ratio (%) 16.94% 16.64% 16.54% 16.99% 16.46%
6 Tier 1 ratio (%) 19.78% 19.46% 19.36% 19.99% 19.45%
7 Total capital ratio (%) 22.44% 22.02% 21.92% 22.70% 22.14%
Additional CET1 buffer requirements (as a percentage of RWA)
8 Capital conservation buffer requirement (%) 2.500% 2.500% 2.500% 2.500% 2.500%
9 Countercyclical capital buffer requirement (%) 0.384% 0.394% 0.388% 0.418% 0.421%
10 Higher loss absorbency requirements (%) (applicable only to G-SIBs or D-SIBs)
1.000% 1.000% 1.000% 1.000% 1.000%
11 Total AI-specific CET1 buffer requirements (%) 3.884% 3.894% 3.888% 3.918% 3.921%
12 CET1 available after meeting the AI’s minimum capital requirements (%)
12.44% 12.14% 12.04% 12.49% 11.96%
Basel III leverage ratio
13 Total leverage ratio (LR) exposure measure 900,572 876,662 879,956 851,139 857,730
14 LR (%) 10.81 10.97% 10.88% 10.95% 10.57%
Liquidity Coverage Ratio (LCR)
15 Total high quality liquid assets (HQLA) 67,380 65,582 70,848 55,567 61,983
16 Total net cash outflows 38,227 34,865 39,217 31,697 34,988
17 LCR (%) 177.32% 189.39% 183.84% 175.94% 177.68%
Net Stable Funding Ratio (NSFR)
18 Total available stable funding 542,465 536,156 540,767 523,787 512,156
19 Total required stable funding 474,589 453,739 455,969 449,753 445,902
20 NSFR (%) 114.30% 118.16% 118.60% 116.46% 114.86%
The movement of total high quality liquid assets (HQLA) between the periods was mainly contributed by the fluctuation in the average holding of central bank reserve in level 1 HQLA.
The Bank of East Asia, Limited 東亞銀行有限公司
P. 3
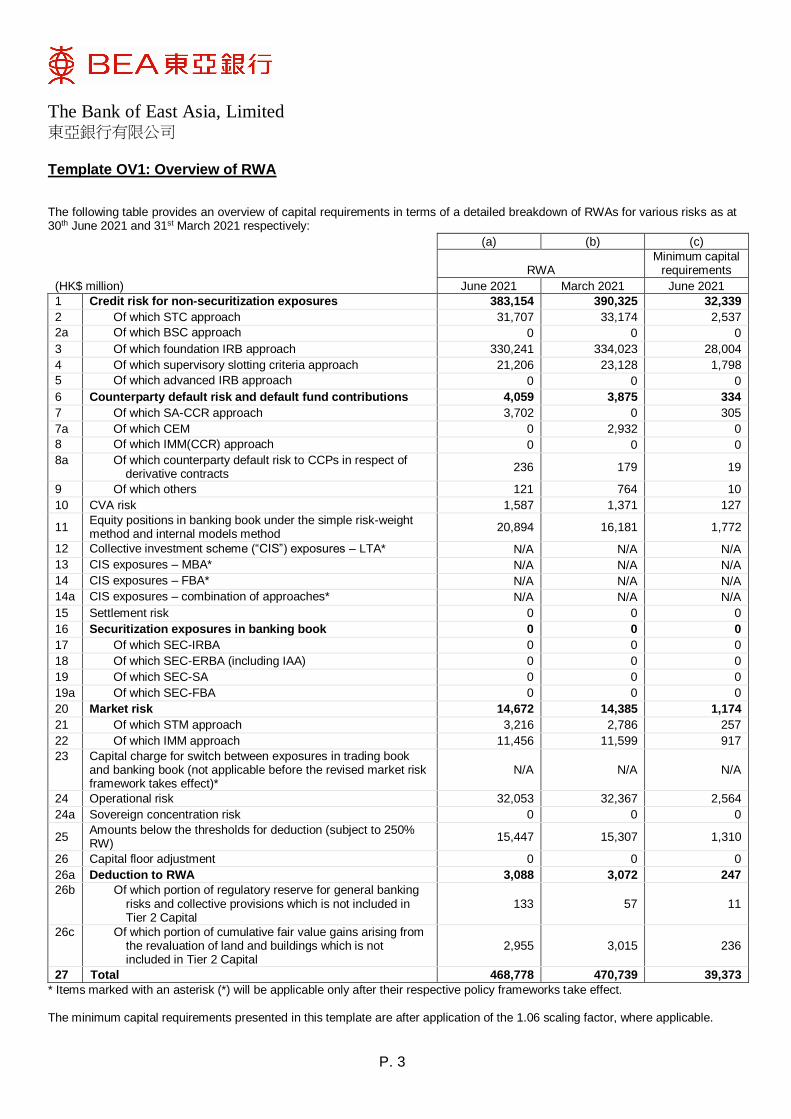
Template OV1: Overview of RWA The following table provides an overview of capital requirements in terms of a detailed breakdown of RWAs for various risks as at 30th June 2021 and 31st March 2021 respectively:
(HK$ million)
(a) (b) (c)
RWA Minimum capital
requirements
June 2021 March 2021 June 2021
1 Credit risk for non-securitization exposures 383,154 390,325 32,339
2 Of which STC approach 31,707 33,174 2,537
2a Of which BSC approach 0 0 0
3 Of which foundation IRB approach 330,241 334,023 28,004
4 Of which supervisory slotting criteria approach 21,206 23,128 1,798
5 Of which advanced IRB approach 0 0 0
6 Counterparty default risk and default fund contributions 4,059 3,875 334
7 Of which SA-CCR approach 3,702 0 305
7a Of which CEM 0 2,932 0
8 Of which IMM(CCR) approach 0 0 0
8a Of which counterparty default risk to CCPs in respect of derivative contracts
236 179 19
9 Of which others 121 764 10
10 CVA risk 1,587 1,371 127
11 Equity positions in banking book under the simple risk-weight method and internal models method
20,894 16,181 1,772
12 Collective investment scheme (“CIS”) exposures – LTA* N/A N/A N/A
13 CIS exposures – MBA* N/A N/A N/A
14 CIS exposures – FBA* N/A N/A N/A
14a CIS exposures – combination of approaches* N/A N/A N/A
15 Settlement risk 0 0 0
16 Securitization exposures in banking book 0 0 0
17 Of which SEC-IRBA 0 0 0
18 Of which SEC-ERBA (including IAA) 0 0 0
19 Of which SEC-SA 0 0 0
19a Of which SEC-FBA 0 0 0
20 Market risk 14,672 14,385 1,174
21 Of which STM approach 3,216 2,786 257
22 Of which IMM approach 11,456 11,599 917
23 Capital charge for switch between exposures in trading book and banking book (not applicable before the revised market risk framework takes effect)*
N/A N/A N/A
24 Operational risk 32,053 32,367 2,564
24a Sovereign concentration risk 0 0 0
25 Amounts below the thresholds for deduction (subject to 250% RW)
15,447 15,307 1,310
26 Capital floor adjustment 0 0 0
26a Deduction to RWA 3,088 3,072 247
26b
Of which portion of regulatory reserve for general banking risks and collective provisions which is not included in Tier 2 Capital
133 57 11
26c
Of which portion of cumulative fair value gains arising from the revaluation of land and buildings which is not included in Tier 2 Capital
2,955 3,015 236
27 Total 468,778 470,739 39,373
* Items marked with an asterisk (*) will be applicable only after their respective policy frameworks take effect. The minimum capital requirements presented in this template are after application of the 1.06 scaling factor, where applicable.
The Bank of East Asia, Limited 東亞銀行有限公司
P. 4
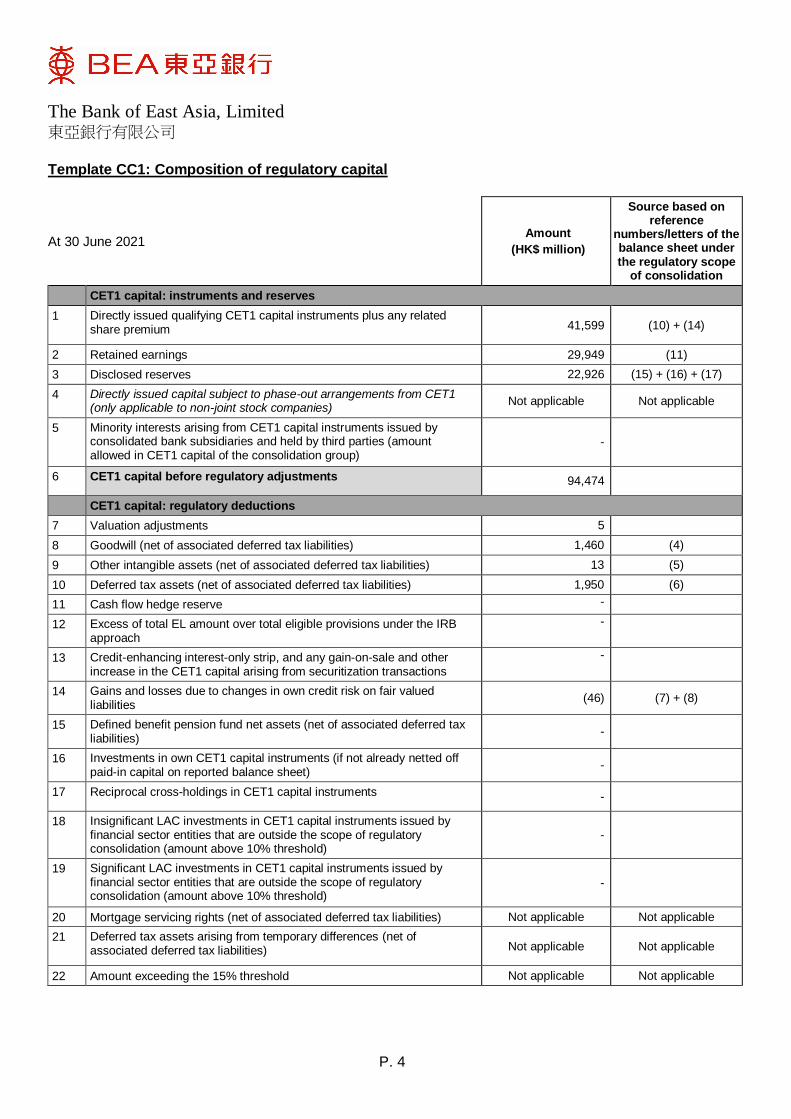
Template CC1: Composition of regulatory capital
At 30 June 2021 Amount
(HK$ million)
Source based on reference
numbers/letters of the balance sheet under the regulatory scope
of consolidation
CET1 capital: instruments and reserves
1 Directly issued qualifying CET1 capital instruments plus any related share premium 41,599 (10) + (14)
2 Retained earnings 29,949 (11)
3 Disclosed reserves 22,926 (15) + (16) + (17)
4 Directly issued capital subject to phase-out arrangements from CET1 (only applicable to non-joint stock companies)
Not applicable Not applicable
5 Minority interests arising from CET1 capital instruments issued by consolidated bank subsidiaries and held by third parties (amount allowed in CET1 capital of the consolidation group)
-
6 CET1 capital before regulatory adjustments 94,474
CET1 capital: regulatory deductions
7 Valuation adjustments 5
8 Goodwill (net of associated deferred tax liabilities) 1,460 (4)
9 Other intangible assets (net of associated deferred tax liabilities) 13 (5)
10 Deferred tax assets (net of associated deferred tax liabilities) 1,950 (6)
11 Cash flow hedge reserve -
12 Excess of total EL amount over total eligible provisions under the IRB approach
-
13 Credit-enhancing interest-only strip, and any gain-on-sale and other increase in the CET1 capital arising from securitization transactions
-
14 Gains and losses due to changes in own credit risk on fair valued liabilities
(46) (7) + (8)
15 Defined benefit pension fund net assets (net of associated deferred tax liabilities)
-
16 Investments in own CET1 capital instruments (if not already netted off paid-in capital on reported balance sheet)
-
17 Reciprocal cross-holdings in CET1 capital instruments -
18 Insignificant LAC investments in CET1 capital instruments issued by financial sector entities that are outside the scope of regulatory consolidation (amount above 10% threshold)
-
19 Significant LAC investments in CET1 capital instruments issued by financial sector entities that are outside the scope of regulatory consolidation (amount above 10% threshold)
-
20 Mortgage servicing rights (net of associated deferred tax liabilities) Not applicable Not applicable
21 Deferred tax assets arising from temporary differences (net of associated deferred tax liabilities) Not applicable Not applicable
22 Amount exceeding the 15% threshold Not applicable Not applicable
The Bank of East Asia, Limited 東亞銀行有限公司
P. 5
At 30 June 2021
Amount
(HK$ million)
Source based on reference
numbers/letters of the balance sheet under the regulatory scope
of consolidation
23 of which: significant investments in the ordinary share of financial sector entities
Not applicable Not applicable
24 of which: mortgage servicing rights Not applicable Not applicable
25 of which: deferred tax assets arising from temporary differences Not applicable Not applicable
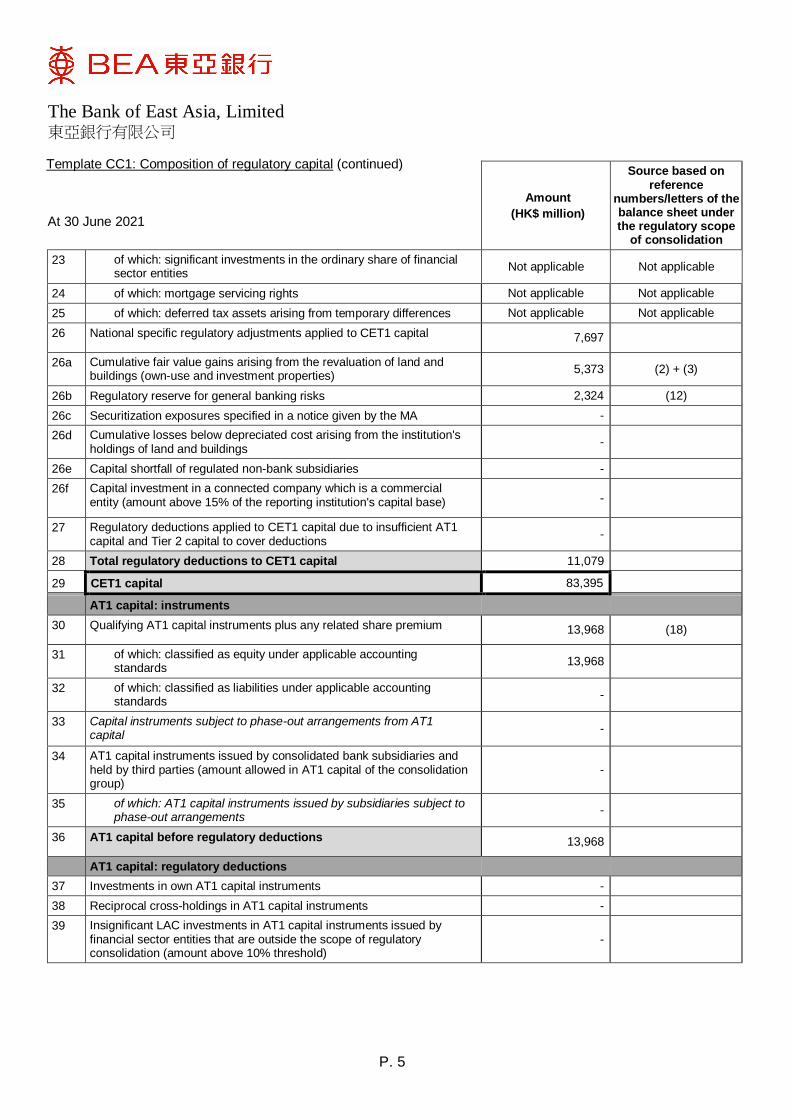
26 National specific regulatory adjustments applied to CET1 capital 7,697
26a Cumulative fair value gains arising from the revaluation of land and buildings (own-use and investment properties)
5,373 (2) + (3)
26b Regulatory reserve for general banking risks 2,324 (12)
26c Securitization exposures specified in a notice given by the MA -
26d Cumulative losses below depreciated cost arising from the institution's holdings of land and buildings
-
26e Capital shortfall of regulated non-bank subsidiaries -
26f Capital investment in a connected company which is a commercial entity (amount above 15% of the reporting institution's capital base) -
27 Regulatory deductions applied to CET1 capital due to insufficient AT1 capital and Tier 2 capital to cover deductions
-
28 Total regulatory deductions to CET1 capital 11,079
29 CET1 capital 83,395
AT1 capital: instruments
30 Qualifying AT1 capital instruments plus any related share premium 13,968 (18)
31 of which: classified as equity under applicable accounting standards
13,968
32 of which: classified as liabilities under applicable accounting standards
-
33 Capital instruments subject to phase-out arrangements from AT1 capital
-
34 AT1 capital instruments issued by consolidated bank subsidiaries and held by third parties (amount allowed in AT1 capital of the consolidation group)
-
35 of which: AT1 capital instruments issued by subsidiaries subject to phase-out arrangements
-
36 AT1 capital before regulatory deductions 13,968
AT1 capital: regulatory deductions
37 Investments in own AT1 capital instruments -
38 Reciprocal cross-holdings in AT1 capital instruments -
39 Insignificant LAC investments in AT1 capital instruments issued by financial sector entities that are outside the scope of regulatory consolidation (amount above 10% threshold)
-
Template CC1: Composition of regulatory capital (continued)
The Bank of East Asia, Limited 東亞銀行有限公司
P. 6
At 30 June 2021
Amount
(HK$ million)
Source based on reference
numbers/letters of the balance sheet under the regulatory scope
of consolidation
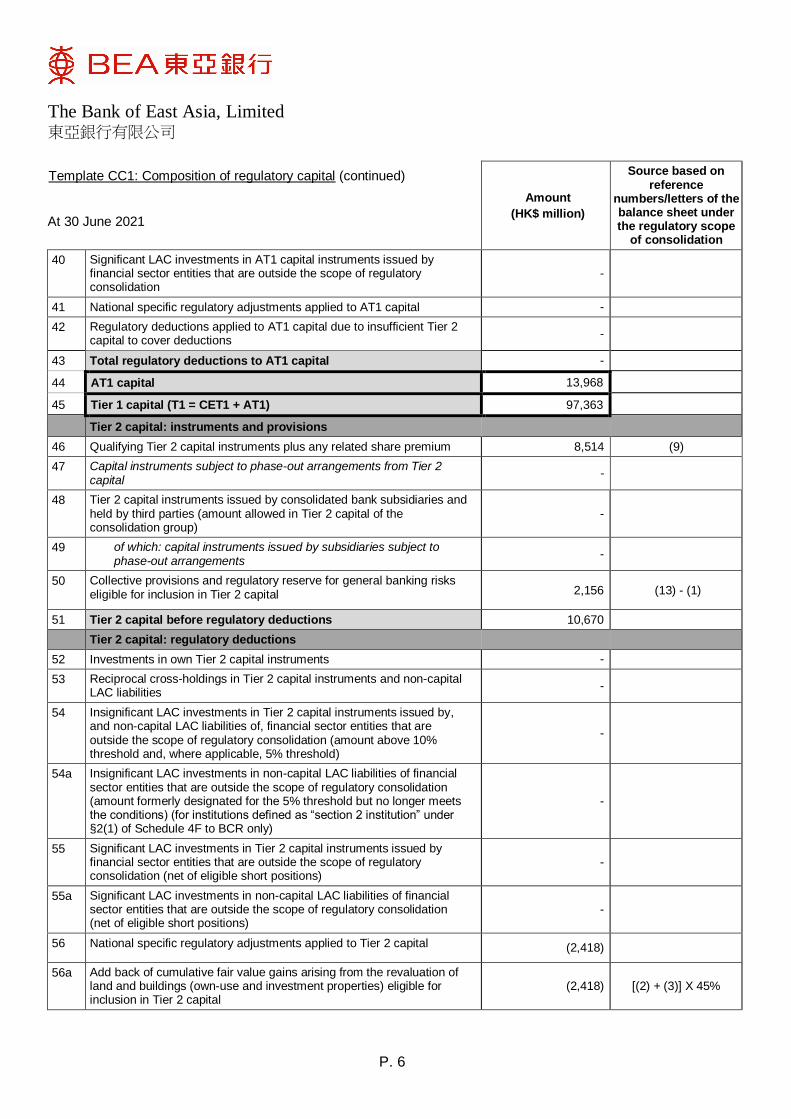
40 Significant LAC investments in AT1 capital instruments issued by financial sector entities that are outside the scope of regulatory consolidation
-
41 National specific regulatory adjustments applied to AT1 capital -
42 Regulatory deductions applied to AT1 capital due to insufficient Tier 2 capital to cover deductions
-
43 Total regulatory deductions to AT1 capital -
44 AT1 capital 13,968
45 Tier 1 capital (T1 = CET1 + AT1) 97,363
Tier 2 capital: instruments and provisions
46 Qualifying Tier 2 capital instruments plus any related share premium 8,514 (9)
47 Capital instruments subject to phase-out arrangements from Tier 2 capital
-
48 Tier 2 capital instruments issued by consolidated bank subsidiaries and held by third parties (amount allowed in Tier 2 capital of the consolidation group)
-
49 of which: capital instruments issued by subsidiaries subject to phase-out arrangements
-
50 Collective provisions and regulatory reserve for general banking risks eligible for inclusion in Tier 2 capital 2,156 (13) - (1)
51 Tier 2 capital before regulatory deductions 10,670
Tier 2 capital: regulatory deductions
52 Investments in own Tier 2 capital instruments -
53 Reciprocal cross-holdings in Tier 2 capital instruments and non-capital LAC liabilities
-
54 Insignificant LAC investments in Tier 2 capital instruments issued by, and non-capital LAC liabilities of, financial sector entities that are outside the scope of regulatory consolidation (amount above 10% threshold and, where applicable, 5% threshold)
-
54a Insignificant LAC investments in non-capital LAC liabilities of financial sector entities that are outside the scope of regulatory consolidation (amount formerly designated for the 5% threshold but no longer meets the conditions) (for institutions defined as “section 2 institution” under §2(1) of Schedule 4F to BCR only)
-
55 Significant LAC investments in Tier 2 capital instruments issued by financial sector entities that are outside the scope of regulatory consolidation (net of eligible short positions)
-
55a Significant LAC investments in non-capital LAC liabilities of financial sector entities that are outside the scope of regulatory consolidation (net of eligible short positions)
-
56 National specific regulatory adjustments applied to Tier 2 capital (2,418)
56a Add back of cumulative fair value gains arising from the revaluation of land and buildings (own-use and investment properties) eligible for inclusion in Tier 2 capital
(2,418) [(2) + (3)] X 45%
Template CC1: Composition of regulatory capital (continued)
The Bank of East Asia, Limited 東亞銀行有限公司
P. 7
At 30 June 2021
Amount
(HK$ million)
Source based on reference
numbers/letters of the balance sheet under the regulatory scope
of consolidation
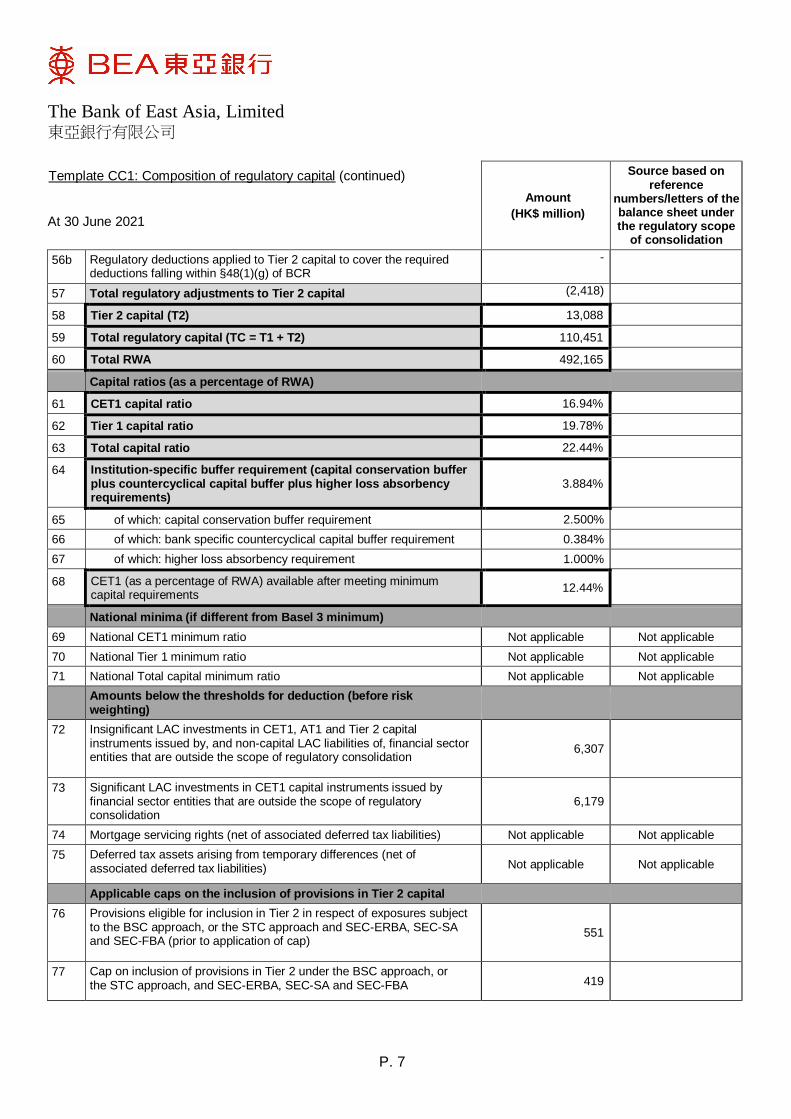
56b Regulatory deductions applied to Tier 2 capital to cover the required deductions falling within §48(1)(g) of BCR
-
57 Total regulatory adjustments to Tier 2 capital (2,418)
58 Tier 2 capital (T2) 13,088
59 Total regulatory capital (TC = T1 + T2) 110,451
60 Total RWA 492,165
Capital ratios (as a percentage of RWA)
61 CET1 capital ratio 16.94%
62 Tier 1 capital ratio 19.78%
63 Total capital ratio 22.44%
64 Institution-specific buffer requirement (capital conservation buffer plus countercyclical capital buffer plus higher loss absorbency requirements)
3.884%
65 of which: capital conservation buffer requirement 2.500%
66 of which: bank specific countercyclical capital buffer requirement 0.384%
67 of which: higher loss absorbency requirement 1.000%
68 CET1 (as a percentage of RWA) available after meeting minimum capital requirements
12.44%
National minima (if different from Basel 3 minimum)
69 National CET1 minimum ratio Not applicable Not applicable
70 National Tier 1 minimum ratio Not applicable Not applicable
71 National Total capital minimum ratio Not applicable Not applicable
Amounts below the thresholds for deduction (before risk weighting)
72 Insignificant LAC investments in CET1, AT1 and Tier 2 capital instruments issued by, and non-capital LAC liabilities of, financial sector entities that are outside the scope of regulatory consolidation
6,307
73 Significant LAC investments in CET1 capital instruments issued by financial sector entities that are outside the scope of regulatory consolidation
6,179
74 Mortgage servicing rights (net of associated deferred tax liabilities) Not applicable Not applicable
75 Deferred tax assets arising from temporary differences (net of associated deferred tax liabilities) Not applicable Not applicable
Applicable caps on the inclusion of provisions in Tier 2 capital
76 Provisions eligible for inclusion in Tier 2 in respect of exposures subject to the BSC approach, or the STC approach and SEC-ERBA, SEC-SA and SEC-FBA (prior to application of cap)
551
77 Cap on inclusion of provisions in Tier 2 under the BSC approach, or the STC approach, and SEC-ERBA, SEC-SA and SEC-FBA 419
Template CC1: Composition of regulatory capital (continued)
The Bank of East Asia, Limited 東亞銀行有限公司
P. 8
At 30 June 2021
Amount
(HK$ million)
Source based on reference
numbers/letters of the balance sheet under the regulatory scope
of consolidation
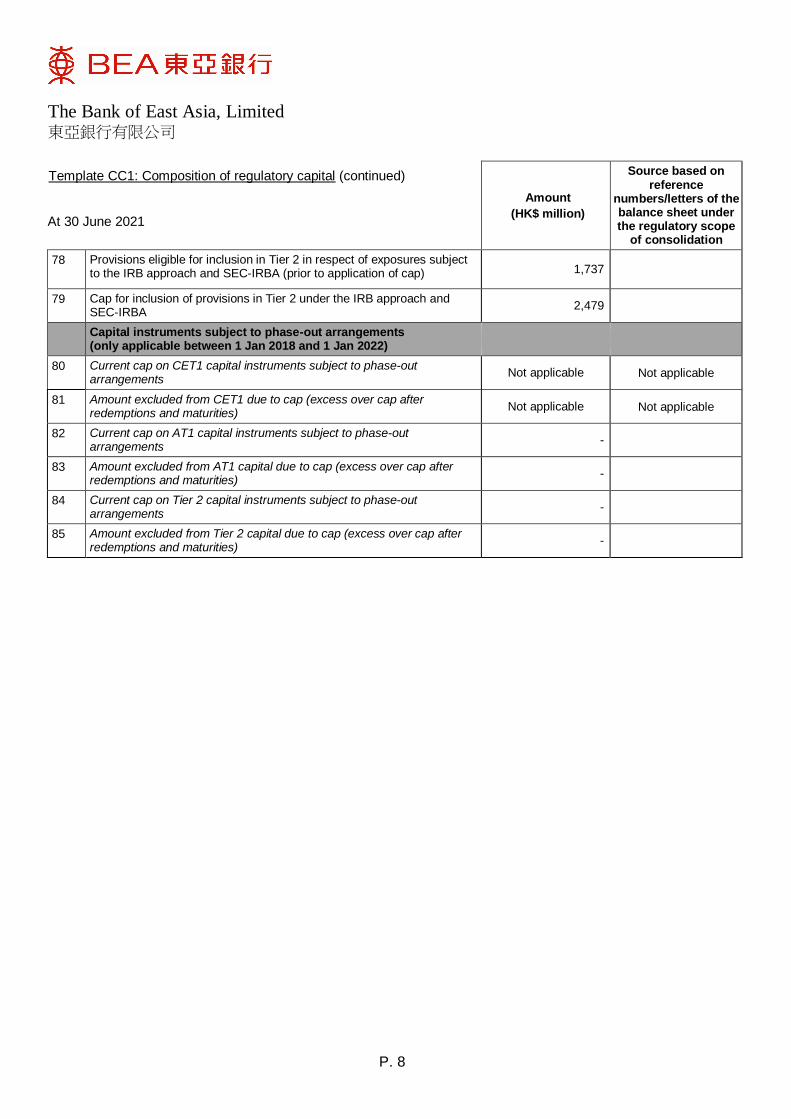
78 Provisions eligible for inclusion in Tier 2 in respect of exposures subject to the IRB approach and SEC-IRBA (prior to application of cap) 1,737
79 Cap for inclusion of provisions in Tier 2 under the IRB approach and SEC-IRBA
2,479
Capital instruments subject to phase-out arrangements (only applicable between 1 Jan 2018 and 1 Jan 2022)
80 Current cap on CET1 capital instruments subject to phase-out arrangements
Not applicable Not applicable
81 Amount excluded from CET1 due to cap (excess over cap after redemptions and maturities)
Not applicable Not applicable
82 Current cap on AT1 capital instruments subject to phase-out arrangements
-
83 Amount excluded from AT1 capital due to cap (excess over cap after redemptions and maturities)
-
84 Current cap on Tier 2 capital instruments subject to phase-out arrangements
-
85 Amount excluded from Tier 2 capital due to cap (excess over cap after redemptions and maturities)
-
Template CC1: Composition of regulatory capital (continued)
The Bank of East Asia, Limited 東亞銀行有限公司
P. 9
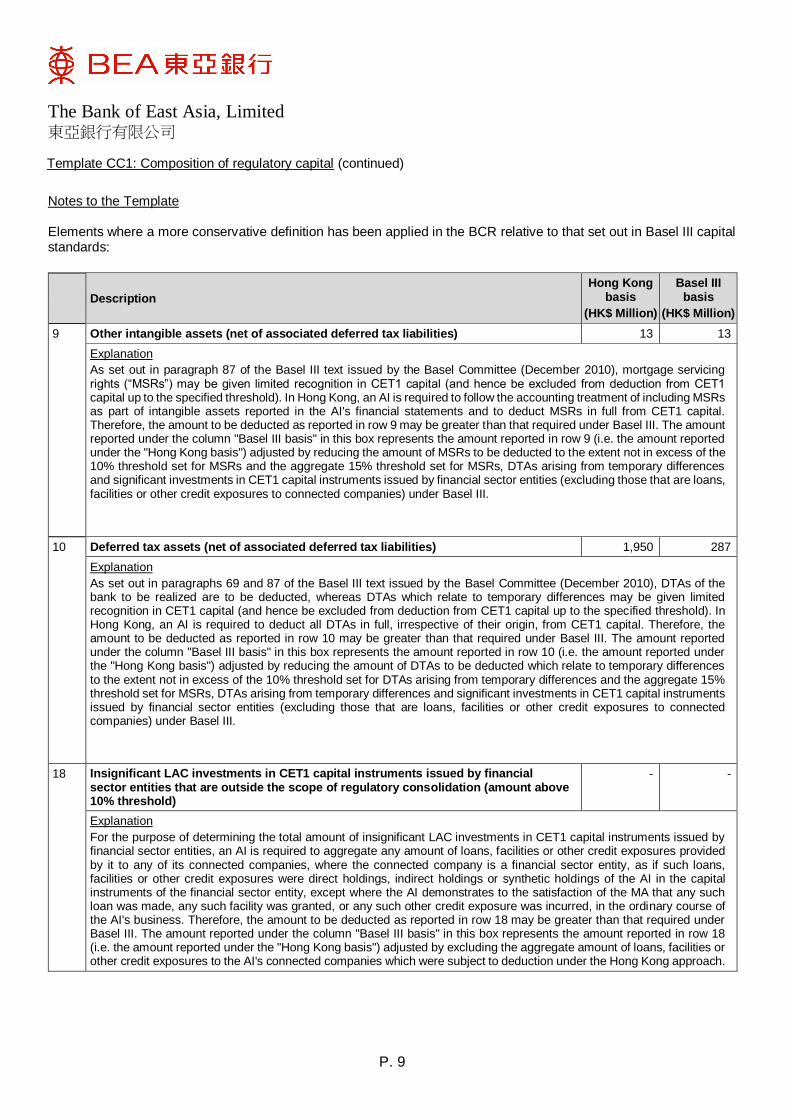
Notes to the Template Elements where a more conservative definition has been applied in the BCR relative to that set out in Basel III capital standards:
Description
Hong Kong basis
(HK$ Million)
Basel III basis
(HK$ Million)
9 Other intangible assets (net of associated deferred tax liabilities) 13 13
Explanation
As set out in paragraph 87 of the Basel III text issued by the Basel Committee (December 2010), mortgage servicing rights (“MSRs”) may be given limited recognition in CET1 capital (and hence be excluded from deduction from CET1 capital up to the specified threshold). In Hong Kong, an AI is required to follow the accounting treatment of including MSRs as part of intangible assets reported in the AI's financial statements and to deduct MSRs in full from CET1 capital. Therefore, the amount to be deducted as reported in row 9 may be greater than that required under Basel III. The amount reported under the column "Basel III basis" in this box represents the amount reported in row 9 (i.e. the amount reported under the "Hong Kong basis") adjusted by reducing the amount of MSRs to be deducted to the extent not in excess of the 10% threshold set for MSRs and the aggregate 15% threshold set for MSRs, DTAs arising from temporary differences and significant investments in CET1 capital instruments issued by financial sector entities (excluding those that are loans, facilities or other credit exposures to connected companies) under Basel III.
10 Deferred tax assets (net of associated deferred tax liabilities) 1,950 287
Explanation
As set out in paragraphs 69 and 87 of the Basel III text issued by the Basel Committee (December 2010), DTAs of the bank to be realized are to be deducted, whereas DTAs which relate to temporary differences may be given limited recognition in CET1 capital (and hence be excluded from deduction from CET1 capital up to the specified threshold). In Hong Kong, an AI is required to deduct all DTAs in full, irrespective of their origin, from CET1 capital. Therefore, the amount to be deducted as reported in row 10 may be greater than that required under Basel III. The amount reported under the column "Basel III basis" in this box represents the amount reported in row 10 (i.e. the amount reported under the "Hong Kong basis") adjusted by reducing the amount of DTAs to be deducted which relate to temporary differences to the extent not in excess of the 10% threshold set for DTAs arising from temporary differences and the aggregate 15% threshold set for MSRs, DTAs arising from temporary differences and significant investments in CET1 capital instruments issued by financial sector entities (excluding those that are loans, facilities or other credit exposures to connected companies) under Basel III.
18 Insignificant LAC investments in CET1 capital instruments issued by financial sector entities that are outside the scope of regulatory consolidation (amount above 10% threshold)
- -
Explanation
For the purpose of determining the total amount of insignificant LAC investments in CET1 capital instruments issued by financial sector entities, an AI is required to aggregate any amount of loans, facilities or other credit exposures provided by it to any of its connected companies, where the connected company is a financial sector entity, as if such loans, facilities or other credit exposures were direct holdings, indirect holdings or synthetic holdings of the AI in the capital instruments of the financial sector entity, except where the AI demonstrates to the satisfaction of the MA that any such loan was made, any such facility was granted, or any such other credit exposure was incurred, in the ordinary course of the AI's business. Therefore, the amount to be deducted as reported in row 18 may be greater than that required under Basel III. The amount reported under the column "Basel III basis" in this box represents the amount reported in row 18 (i.e. the amount reported under the "Hong Kong basis") adjusted by excluding the aggregate amount of loans, facilities or other credit exposures to the AI's connected companies which were subject to deduction under the Hong Kong approach.
Template CC1: Composition of regulatory capital (continued)
The Bank of East Asia, Limited 東亞銀行有限公司
P. 10
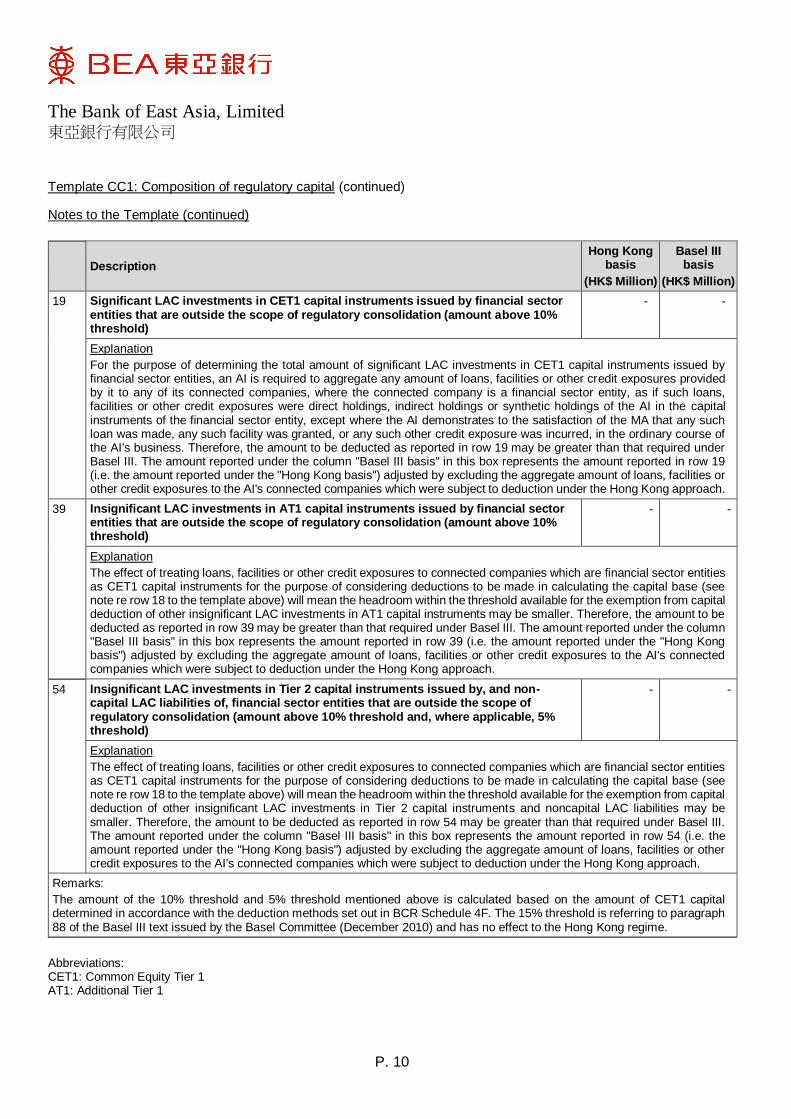
Notes to the Template (continued)
Description
Hong Kong basis
(HK$ Million)
Basel III basis
(HK$ Million)
19 Significant LAC investments in CET1 capital instruments issued by financial sector entities that are outside the scope of regulatory consolidation (amount above 10% threshold)
- -
Explanation
For the purpose of determining the total amount of significant LAC investments in CET1 capital instruments issued by financial sector entities, an AI is required to aggregate any amount of loans, facilities or other credit exposures provided by it to any of its connected companies, where the connected company is a financial sector entity, as if such loans, facilities or other credit exposures were direct holdings, indirect holdings or synthetic holdings of the AI in the capital instruments of the financial sector entity, except where the AI demonstrates to the satisfaction of the MA that any such loan was made, any such facility was granted, or any such other credit exposure was incurred, in the ordinary course of the AI's business. Therefore, the amount to be deducted as reported in row 19 may be greater than that required under Basel III. The amount reported under the column "Basel III basis" in this box represents the amount reported in row 19 (i.e. the amount reported under the "Hong Kong basis") adjusted by excluding the aggregate amount of loans, facilities or other credit exposures to the AI's connected companies which were subject to deduction under the Hong Kong approach.
39 Insignificant LAC investments in AT1 capital instruments issued by financial sector entities that are outside the scope of regulatory consolidation (amount above 10% threshold)
- -
Explanation
The effect of treating loans, facilities or other credit exposures to connected companies which are financial sector entities as CET1 capital instruments for the purpose of considering deductions to be made in calculating the capital base (see note re row 18 to the template above) will mean the headroom within the threshold available for the exemption from capital deduction of other insignificant LAC investments in AT1 capital instruments may be smaller. Therefore, the amount to be deducted as reported in row 39 may be greater than that required under Basel III. The amount reported under the column "Basel III basis" in this box represents the amount reported in row 39 (i.e. the amount reported under the "Hong Kong basis") adjusted by excluding the aggregate amount of loans, facilities or other credit exposures to the AI's connected companies which were subject to deduction under the Hong Kong approach.
54 Insignificant LAC investments in Tier 2 capital instruments issued by, and non-capital LAC liabilities of, financial sector entities that are outside the scope of regulatory consolidation (amount above 10% threshold and, where applicable, 5% threshold)
- -
Explanation
The effect of treating loans, facilities or other credit exposures to connected companies which are financial sector entities as CET1 capital instruments for the purpose of considering deductions to be made in calculating the capital base (see note re row 18 to the template above) will mean the headroom within the threshold available for the exemption from capital deduction of other insignificant LAC investments in Tier 2 capital instruments and noncapital LAC liabilities may be smaller. Therefore, the amount to be deducted as reported in row 54 may be greater than that required under Basel III. The amount reported under the column "Basel III basis" in this box represents the amount reported in row 54 (i.e. the amount reported under the "Hong Kong basis") adjusted by excluding the aggregate amount of loans, facilities or other credit exposures to the AI's connected companies which were subject to deduction under the Hong Kong approach.
Remarks:
The amount of the 10% threshold and 5% threshold mentioned above is calculated based on the amount of CET1 capital determined in accordance with the deduction methods set out in BCR Schedule 4F. The 15% threshold is referring to paragraph 88 of the Basel III text issued by the Basel Committee (December 2010) and has no effect to the Hong Kong regime.
Abbreviations: CET1: Common Equity Tier 1 AT1: Additional Tier 1
Template CC1: Composition of regulatory capital (continued)
The Bank of East Asia, Limited 東亞銀行有限公司
P. 11
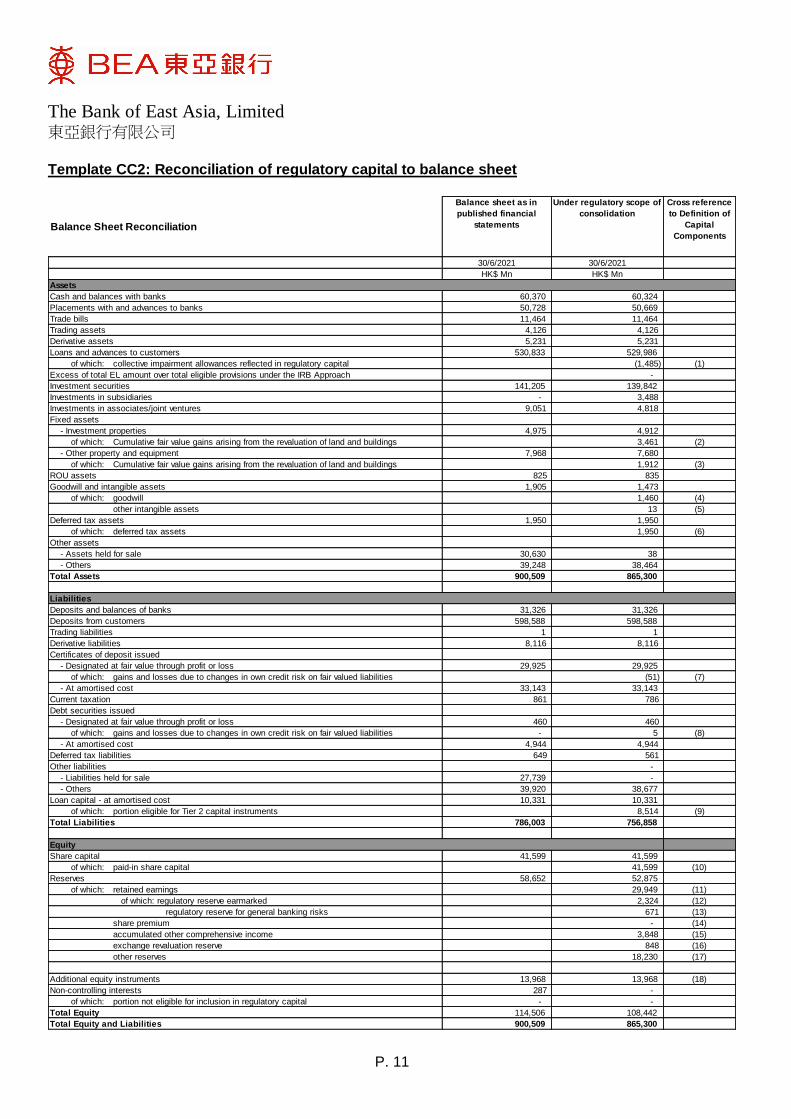
Template CC2: Reconciliation of regulatory capital to balance sheet
Balance sheet as in
published financial
statements
Under regulatory scope of
consolidation
Cross reference
to Definition of
Capital
Components
30/6/2021 30/6/2021
HK$ Mn HK$ Mn
Assets
Cash and balances with banks 60,370 60,324
Placements with and advances to banks 50,728 50,669
Trade bills 11,464 11,464
Trading assets 4,126 4,126
Derivative assets 5,231 5,231
Loans and advances to customers 530,833 529,986
of which: collective impairment allowances reflected in regulatory capital (1,485) (1)
Excess of total EL amount over total eligible provisions under the IRB Approach -
Investment securities 141,205 139,842
Investments in subsidiaries - 3,488
Investments in associates/joint ventures 9,051 4,818
Fixed assets
- Investment properties 4,975 4,912
of which: Cumulative fair value gains arising from the revaluation of land and buildings 3,461 (2)
- Other property and equipment 7,968 7,680
of which: Cumulative fair value gains arising from the revaluation of land and buildings 1,912 (3)
ROU assets 825 835
Goodwill and intangible assets 1,905 1,473
of which: goodwill 1,460 (4)
other intangible assets 13 (5)
Deferred tax assets 1,950 1,950
of which: deferred tax assets 1,950 (6)
Other assets
- Assets held for sale 30,630 38
- Others 39,248 38,464
Total Assets 900,509 865,300
Liabilities
Deposits and balances of banks 31,326 31,326
Deposits from customers 598,588 598,588
Trading liabilities 1 1
Derivative liabilities 8,116 8,116
Certificates of deposit issued
- Designated at fair value through profit or loss 29,925 29,925
of which: gains and losses due to changes in own credit risk on fair valued liabilities (51) (7)
- At amortised cost 33,143 33,143
Current taxation 861 786
Debt securities issued
- Designated at fair value through profit or loss 460 460
of which: gains and losses due to changes in own credit risk on fair valued liabilities - 5 (8)
- At amortised cost 4,944 4,944
Deferred tax liabilities 649 561
Other liabilities -
- Liabilities held for sale 27,739 -
- Others 39,920 38,677
Loan capital - at amortised cost 10,331 10,331
of which: portion eligible for Tier 2 capital instruments 8,514 (9)
786,003 756,858
Equity
Share capital 41,599 41,599
of which: paid-in share capital 41,599 (10)
Reserves 58,652 52,875
of which: retained earnings 29,949 (11)
of which: regulatory reserve earmarked 2,324 (12)
regulatory reserve for general banking risks 671 (13)
share premium - (14)
accumulated other comprehensive income 3,848 (15)
exchange revaluation reserve 848 (16)
other reserves 18,230 (17)
Additional equity instruments 13,968 13,968 (18)
Non-controlling interests 287 -
of which: portion not eligible for inclusion in regulatory capital - -
Total Equity 114,506 108,442
Total Equity and Liabilities 900,509 865,300
Balance Sheet Reconciliation
Total Liabilities
The Bank of East Asia, Limited 東亞銀行有限公司
P. 12
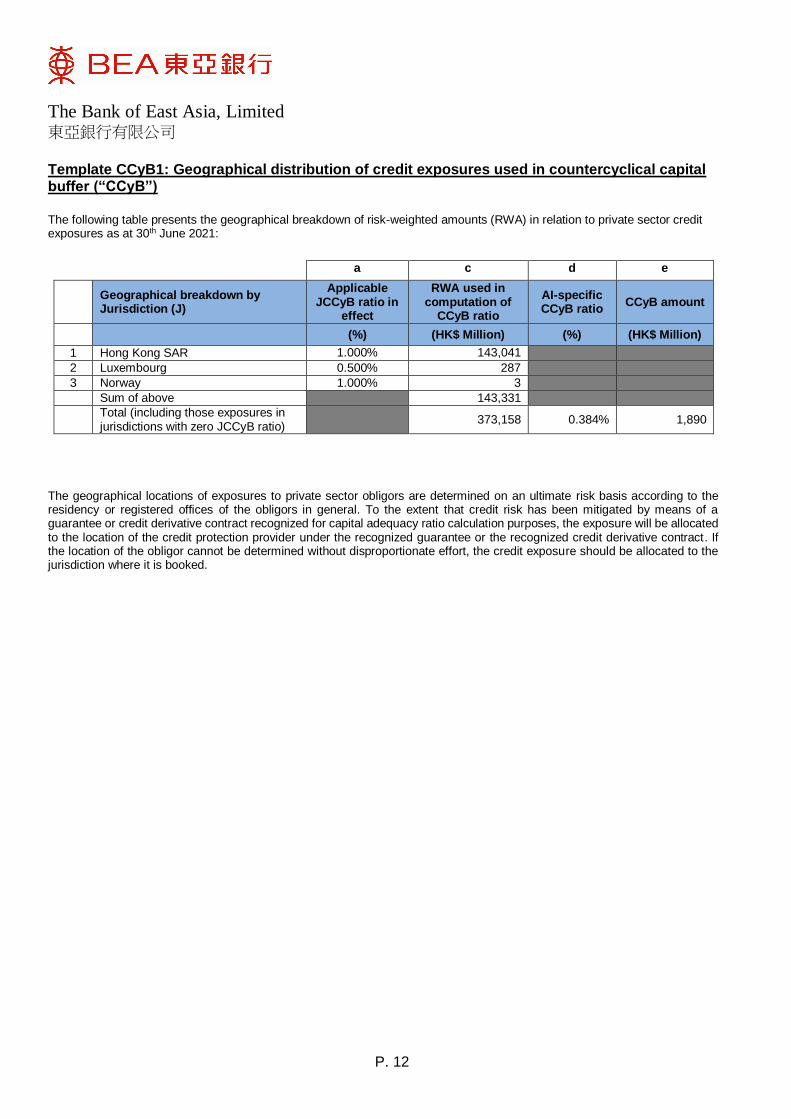
Template CCyB1: Geographical distribution of credit exposures used in countercyclical capital buffer (“CCyB”)
The following table presents the geographical breakdown of risk-weighted amounts (RWA) in relation to private sector credit exposures as at 30th June 2021:
a c d e
Geographical breakdown by Jurisdiction (J)
Applicable JCCyB ratio in
effect
RWA used in computation of
CCyB ratio
AI-specific CCyB ratio
CCyB amount
(%) (HK$ Million) (%) (HK$ Million)
1 Hong Kong SAR 1.000% 143,041
2 Luxembourg 0.500% 287
3 Norway 1.000% 3
Sum of above 143,331
Total (including those exposures in jurisdictions with zero JCCyB ratio)
373,158 0.384% 1,890
The geographical locations of exposures to private sector obligors are determined on an ultimate risk basis according to the residency or registered offices of the obligors in general. To the extent that credit risk has been mitigated by means of a guarantee or credit derivative contract recognized for capital adequacy ratio calculation purposes, the exposure will be allocated to the location of the credit protection provider under the recognized guarantee or the recognized credit derivative contract. If the location of the obligor cannot be determined without disproportionate effort, the credit exposure should be allocated to the jurisdiction where it is booked.
The Bank of East Asia, Limited 東亞銀行有限公司
P. 13
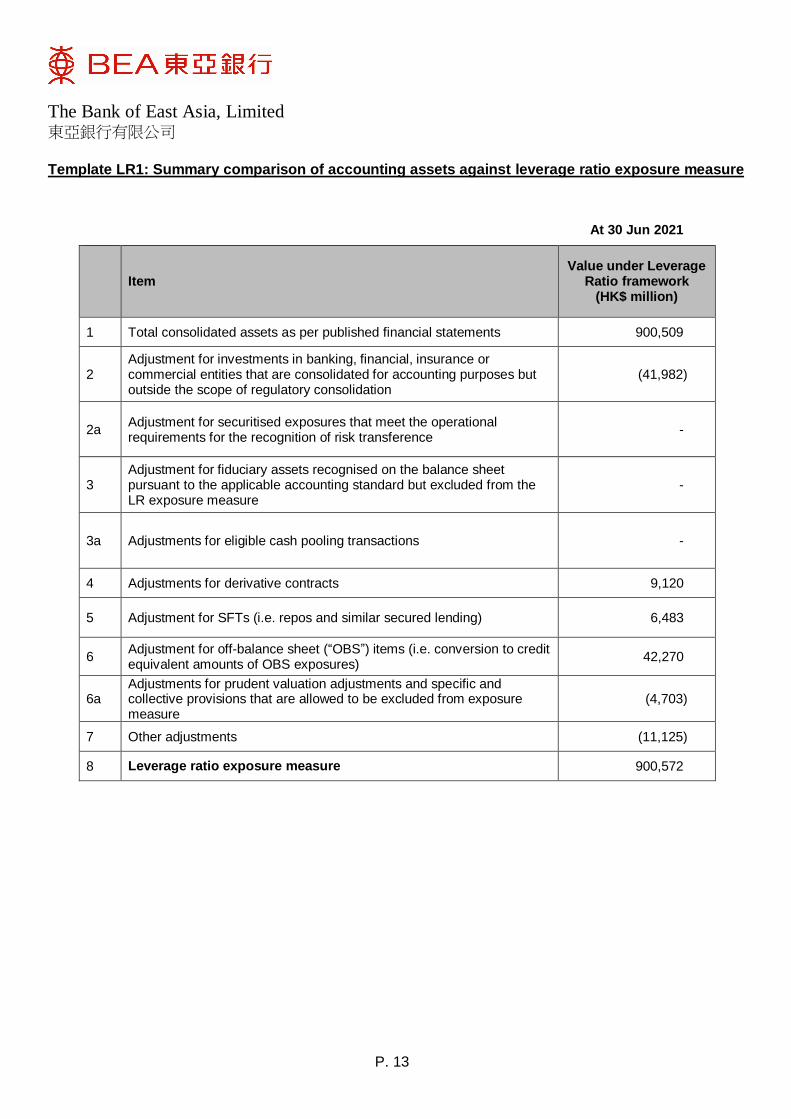
Template LR1: Summary comparison of accounting assets against leverage ratio exposure measure
At 30 Jun 2021
Item Value under Leverage
Ratio framework (HK$ million)
1 Total consolidated assets as per published financial statements 900,509
2 Adjustment for investments in banking, financial, insurance or commercial entities that are consolidated for accounting purposes but outside the scope of regulatory consolidation
(41,982)
2a Adjustment for securitised exposures that meet the operational requirements for the recognition of risk transference
-
3 Adjustment for fiduciary assets recognised on the balance sheet pursuant to the applicable accounting standard but excluded from the LR exposure measure
-
3a Adjustments for eligible cash pooling transactions -
4 Adjustments for derivative contracts 9,120
5 Adjustment for SFTs (i.e. repos and similar secured lending) 6,483
6 Adjustment for off-balance sheet (“OBS”) items (i.e. conversion to credit equivalent amounts of OBS exposures)
42,270
6a Adjustments for prudent valuation adjustments and specific and collective provisions that are allowed to be excluded from exposure measure
(4,703)
7 Other adjustments (11,125)
8 Leverage ratio exposure measure 900,572
The Bank of East Asia, Limited 東亞銀行有限公司
P. 14
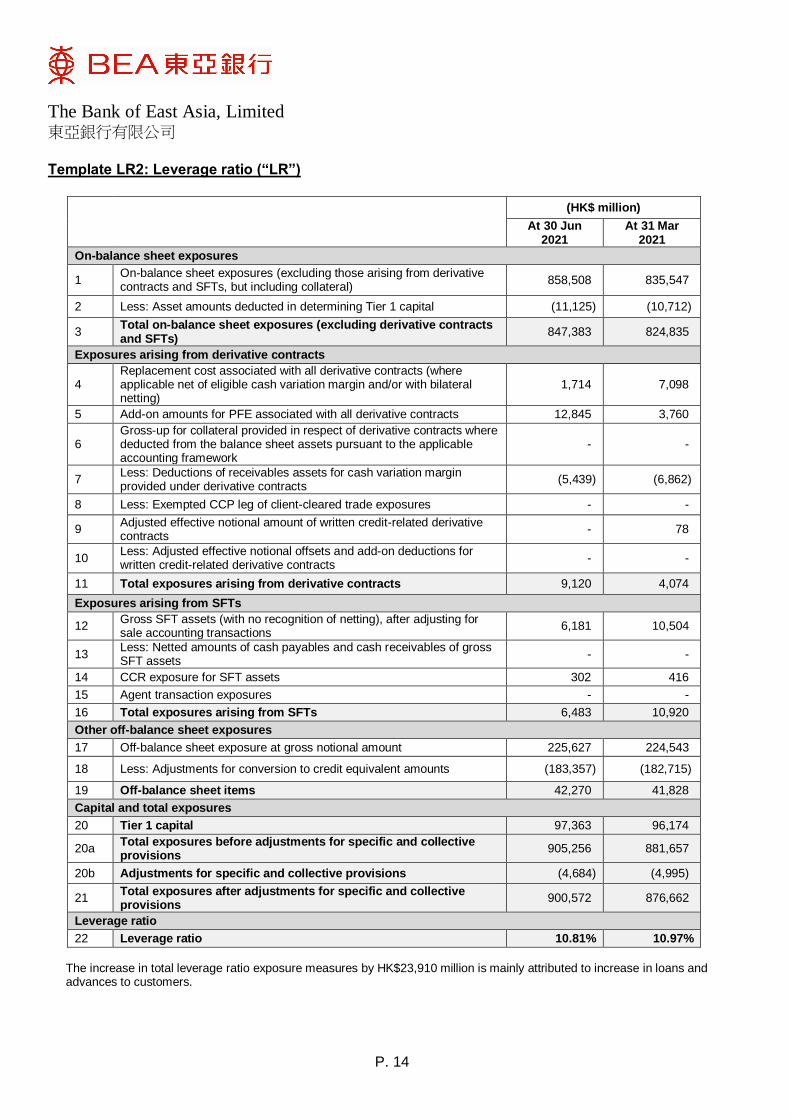
Template LR2: Leverage ratio (“LR”)
(HK$ million)
At 30 Jun
2021 At 31 Mar
2021
On-balance sheet exposures
1 On-balance sheet exposures (excluding those arising from derivative contracts and SFTs, but including collateral)
858,508 835,547
2 Less: Asset amounts deducted in determining Tier 1 capital (11,125) (10,712)
3 Total on-balance sheet exposures (excluding derivative contracts and SFTs)
847,383 824,835
Exposures arising from derivative contracts
4 Replacement cost associated with all derivative contracts (where applicable net of eligible cash variation margin and/or with bilateral netting)
1,714 7,098
5 Add-on amounts for PFE associated with all derivative contracts 12,845 3,760
6 Gross-up for collateral provided in respect of derivative contracts where deducted from the balance sheet assets pursuant to the applicable accounting framework
- -
7 Less: Deductions of receivables assets for cash variation margin provided under derivative contracts
(5,439) (6,862)
8 Less: Exempted CCP leg of client-cleared trade exposures - -
9 Adjusted effective notional amount of written credit-related derivative contracts
- 78
10 Less: Adjusted effective notional offsets and add-on deductions for written credit-related derivative contracts
- -
11 Total exposures arising from derivative contracts 9,120 4,074
Exposures arising from SFTs
12 Gross SFT assets (with no recognition of netting), after adjusting for sale accounting transactions
6,181 10,504
13 Less: Netted amounts of cash payables and cash receivables of gross SFT assets
- -
14 CCR exposure for SFT assets 302 416
15 Agent transaction exposures - -
16 Total exposures arising from SFTs 6,483 10,920
Other off-balance sheet exposures
17 Off-balance sheet exposure at gross notional amount 225,627 224,543
18 Less: Adjustments for conversion to credit equivalent amounts (183,357) (182,715)
19 Off-balance sheet items 42,270 41,828
Capital and total exposures
20 Tier 1 capital 97,363 96,174
20a Total exposures before adjustments for specific and collective provisions
905,256 881,657
20b Adjustments for specific and collective provisions (4,684) (4,995)
21 Total exposures after adjustments for specific and collective provisions
900,572 876,662
Leverage ratio
22 Leverage ratio 10.81% 10.97%
The increase in total leverage ratio exposure measures by HK$23,910 million is mainly attributed to increase in loans and advances to customers.
The Bank of East Asia, Limited 東亞銀行有限公司
P. 15
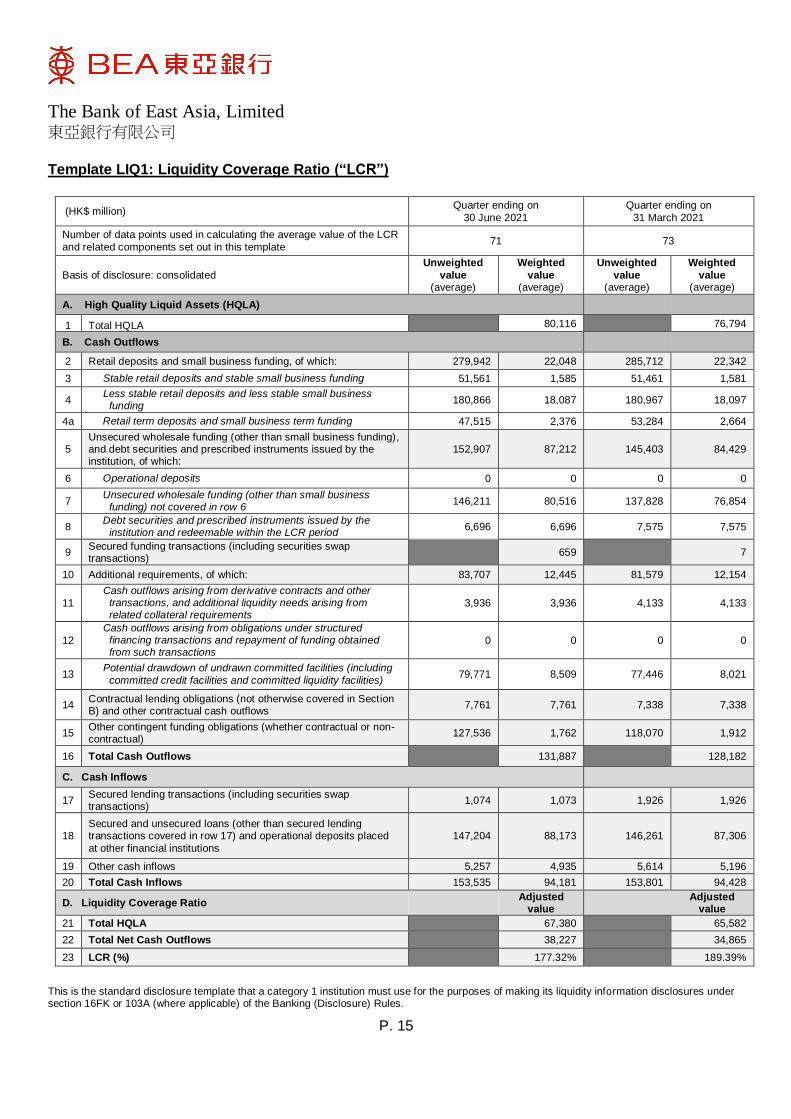
Template LIQ1: Liquidity Coverage Ratio (“LCR”)
(HK$ million) Quarter ending on
30 June 2021
Quarter ending on
31 March 2021
Number of data points used in calculating the average value of the LCR
and related components set out in this template 71 73
Basis of disclosure: consolidated
Unweighted
value (average)
Weighted
value (average)
Unweighted
value (average)
Weighted
value (average)
A. High Quality Liquid Assets (HQLA)
1 Total HQLA 80,116 76,794
B. Cash Outflows
2 Retail deposits and small business funding, of which: 279,942 22,048 285,712 22,342
3 Stable retail deposits and stable small business funding 51,561 1,585 51,461 1,581
4 Less stable retail deposits and less stable small business
funding 180,866 18,087 180,967 18,097
4a Retail term deposits and small business term funding 47,515 2,376 53,284 2,664
5 Unsecured wholesale funding (other than small business funding), and debt securities and prescribed instruments issued by the institution, of which:
152,907 87,212 145,403 84,429
6 Operational deposits 0 0 0 0
7 Unsecured wholesale funding (other than small business
funding) not covered in row 6 146,211 80,516 137,828 76,854
8 Debt securities and prescribed instruments issued by the
institution and redeemable within the LCR period 6,696 6,696 7,575 7,575
9 Secured funding transactions (including securities swap transactions)
659 7
10 Additional requirements, of which: 83,707 12,445 81,579 12,154
11
Cash outflows arising from derivative contracts and other transactions, and additional liquidity needs arising from related collateral requirements
3,936 3,936 4,133 4,133
12
Cash outflows arising from obligations under structured financing transactions and repayment of funding obtained from such transactions
0 0 0 0
13 Potential drawdown of undrawn committed facilities (including
committed credit facilities and committed liquidity facilities) 79,771 8,509 77,446 8,021
14 Contractual lending obligations (not otherwise covered in Section B) and other contractual cash outflows
7,761 7,761 7,338 7,338
15 Other contingent funding obligations (whether contractual or non-contractual)
127,536 1,762 118,070 1,912
16 Total Cash Outflows 131,887 128,182
C. Cash Inflows
17 Secured lending transactions (including securities swap transactions)
1,074 1,073 1,926 1,926
18 Secured and unsecured loans (other than secured lending transactions covered in row 17) and operational deposits placed
at other financial institutions
147,204 88,173 146,261 87,306
19 Other cash inflows 5,257 4,935 5,614 5,196
20 Total Cash Inflows 153,535 94,181 153,801 94,428
D. Liquidity Coverage Ratio Adjusted
value Adjusted
value
21 Total HQLA 67,380 65,582
22 Total Net Cash Outflows 38,227 34,865
23 LCR (%) 177.32% 189.39%
This is the standard disclosure template that a category 1 institution must use for the purposes of making its liquidity information disclosures under section 16FK or 103A (where applicable) of the Banking (Disclosure) Rules.
The Bank of East Asia, Limited 東亞銀行有限公司
P. 16
Template LIQ1: Liquidity Coverage Ratio (“LCR”) (continued) Main drivers of LCR results The Liquidity Coverage Ratio (“LCR”), which came into effect on 1st January, 2015, promotes the short-term resilience of the Group’s liquidity risk by requiring that the Group hold sufficient high quality liquid assets (“HQLAs”) to survive under a pre-defined stress scenario over a period of 30 days. It is expressed as a percentage, of the amount of a category 1 institution’s HQLAs to the amount of the institution’s “total net cash outflows” over 30 calendar days. The Banking (Liquidity) Rules require that Group meets the minimum LCR of not less than 100% starting from 1st January, 2019. The total net cash outflows is the total cash outflows offset by the total cash inflows. Total cash outflows mainly consist of customer deposits which are the Group’s main source of stable funding. Total cash inflows mainly come from maturing assets such as money market placements, loans and securities within 30 calendar days. The Group’s LCR is well above the regulatory limit of 100% throughout the second quarter of 2021. The average LCR decreased from 189% for the first quarter of 2021 to 177% for the second quarter mainly resulted from comparably higher average cash outflows from customer deposits which outweighed the impact of the increase in holdings of high quality liquid assets. The average LCR was maintained at similar level of over 170% when comparing the ratio for the second quarter of 2021 year-on-year. Composition of HQLA The HQLAs for fulfilling the LCR consist of cash, exchange fund bills and notes, high quality government debt securities and other equivalent liquid marketable assets. The majority of HQLAs are denominated in Hong Kong dollars. The classification of HQLAs among level 1, 2A or 2B is based on the credit rating of securities and a number of market factors in determining the degree of readiness of monetizing the assets in short period of time. The Group’s liquid assets are predominately classified as level 1 assets. Concentration of Funding Sources The Group has strengthened the deposit base by retaining loyal customers and maintaining customer relationships. The Group balances funding among retail, small business, and wholesale funding to avoid concentration in any one source. Professional markets are accessed through the issuance of certificates of deposit, medium-term notes, subordinated debt, money market placement, and borrowing for the purposes of providing additional funding, maintaining a presence in local money markets, and optimizing asset and liability maturities. Currency mismatch in the LCR Majority of the Group’s customer deposits are denominated in HKD, USD and RMB. The Bank held an amount of HKD-denominated level 1 assets that was not less than 20% of its HKD-denominated total net cash outflows. The Group manages the composition of its HQLA by currency through funding swaps. There is no significant currency mismatch in the Bank’s LCR at respective levels of consolidation. Degree of centralization of liquidity management The Asset and Liability Management Committee is delegated by the Board to oversee the Group’s liquidity risk management. The Asset and Liability Management Committee sets the strategy, policy, and limits for managing liquidity risk and the means for ensuring that such strategy and policy are implemented. Regular meetings are held to review the compliance status of the monitoring matrix established and the need for any change in strategy and policy. Liquidity is managed daily by the Capital Markets & Liquidity Management Department under the Treasury Markets Division of the Group within the set limits. The Asset & Liability Management Department under the Risk Management Division of the Group is responsible for monitoring the activities relating to liquidity risk. The Internal Audit Division performs periodic reviews to ensure that the liquidity risk management functions are carried out effectively.
The Bank of East Asia, Limited 東亞銀行有限公司
P. 17
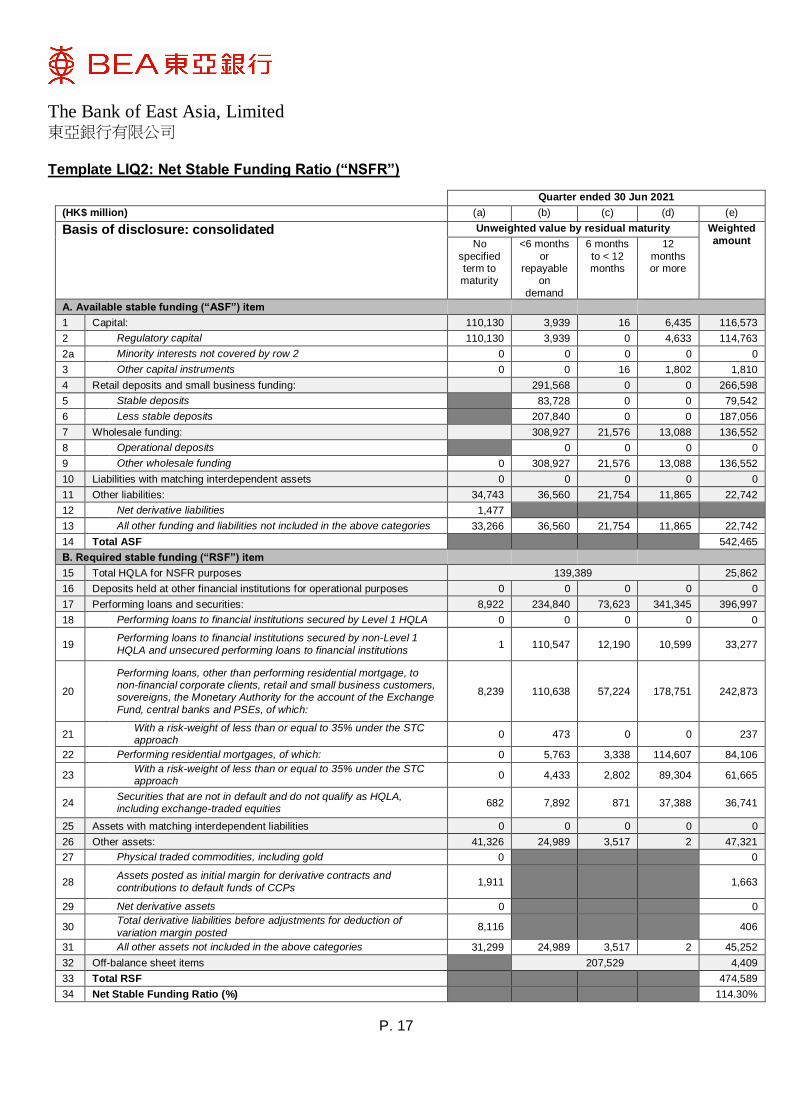
Template LIQ2: Net Stable Funding Ratio (“NSFR”)
Quarter ended 30 Jun 2021
(HK$ million) (a) (b) (c) (d) (e)
Basis of disclosure: consolidated Unweighted value by residual maturity Weighted
amount No
specified term to maturity
<6 months
or repayable
on
demand
6 months
to < 12 months
12
months or more
A. Available stable funding (“ASF”) item
1 Capital: 110,130 3,939 16 6,435 116,573
2 Regulatory capital 110,130 3,939 0 4,633 114,763
2a Minority interests not covered by row 2 0 0 0 0 0
3 Other capital instruments 0 0 16 1,802 1,810
4 Retail deposits and small business funding: 291,568 0 0 266,598
5 Stable deposits 83,728 0 0 79,542
6 Less stable deposits 207,840 0 0 187,056
7 Wholesale funding: 308,927 21,576 13,088 136,552
8 Operational deposits 0 0 0 0
9 Other wholesale funding 0 308,927 21,576 13,088 136,552
10 Liabilities with matching interdependent assets 0 0 0 0 0
11 Other liabilities: 34,743 36,560 21,754 11,865 22,742
12 Net derivative liabilities 1,477
13 All other funding and liabilities not included in the above categories 33,266 36,560 21,754 11,865 22,742
14 Total ASF 542,465
B. Required stable funding (“RSF”) item
15 Total HQLA for NSFR purposes 139,389 25,862
16 Deposits held at other financial institutions for operational purposes 0 0 0 0 0
17 Performing loans and securities: 8,922 234,840 73,623 341,345 396,997
18 Performing loans to financial institutions secured by Level 1 HQLA 0 0 0 0 0
19 Performing loans to financial institutions secured by non-Level 1
HQLA and unsecured performing loans to financial institutions 1 110,547 12,190 10,599 33,277
20
Performing loans, other than performing residential mortgage, to non-financial corporate clients, retail and small business customers, sovereigns, the Monetary Authority for the account of the Exchange
Fund, central banks and PSEs, of which:
8,239 110,638 57,224 178,751 242,873
21 With a risk-weight of less than or equal to 35% under the STC approach
0 473 0 0 237
22 Performing residential mortgages, of which: 0 5,763 3,338 114,607 84,106
23 With a risk-weight of less than or equal to 35% under the STC approach
0 4,433 2,802 89,304 61,665
24 Securities that are not in default and do not qualify as HQLA, including exchange-traded equities
682 7,892 871 37,388 36,741
25 Assets with matching interdependent liabilities 0 0 0 0 0
26 Other assets: 41,326 24,989 3,517 2 47,321
27 Physical traded commodities, including gold 0 0
28 Assets posted as initial margin for derivative contracts and
contributions to default funds of CCPs 1,911 1,663
29 Net derivative assets 0 0
30 Total derivative liabilities before adjustments for deduction of
variation margin posted 8,116 406
31 All other assets not included in the above categories 31,299 24,989 3,517 2 45,252
32 Off-balance sheet items 207,529 4,409
33 Total RSF 474,589
34 Net Stable Funding Ratio (%) 114.30%
The Bank of East Asia, Limited 東亞銀行有限公司
P. 18
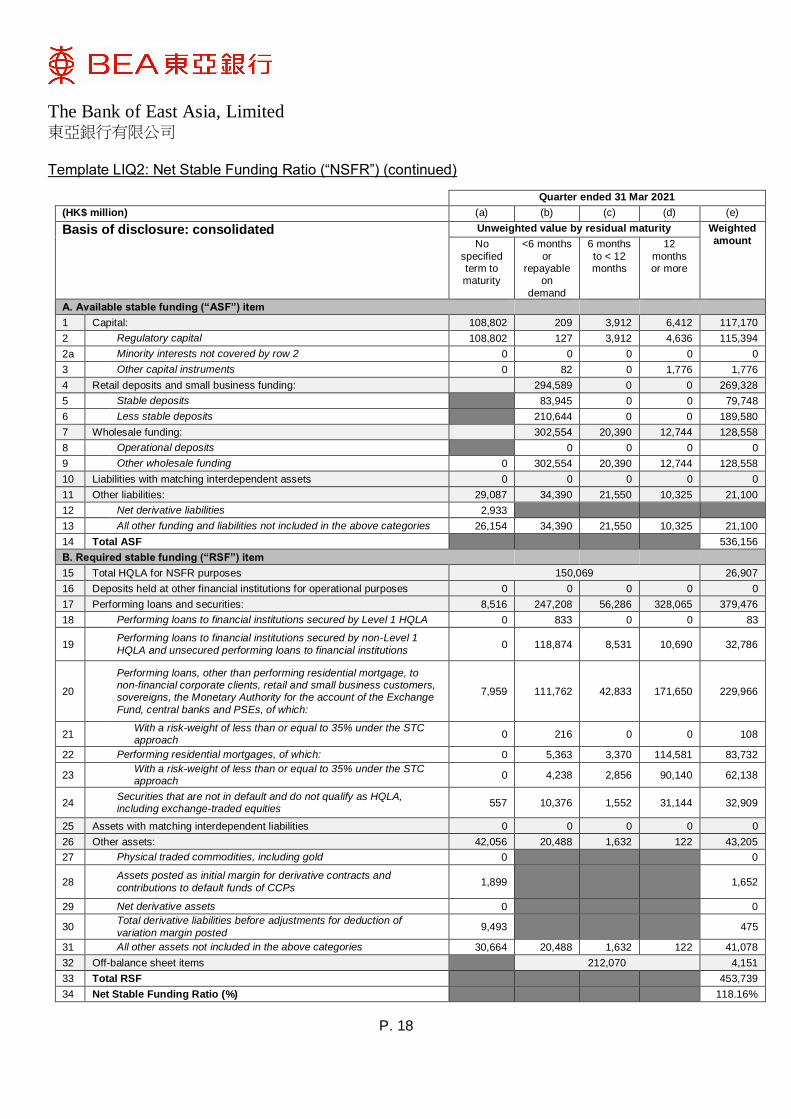
Template LIQ2: Net Stable Funding Ratio (“NSFR”) (continued)
Quarter ended 31 Mar 2021
(HK$ million) (a) (b) (c) (d) (e)
Basis of disclosure: consolidated Unweighted value by residual maturity Weighted
amount No
specified term to maturity
<6 months
or repayable
on
demand
6 months
to < 12 months
12
months or more
A. Available stable funding (“ASF”) item
1 Capital: 108,802 209 3,912 6,412 117,170
2 Regulatory capital 108,802 127 3,912 4,636 115,394
2a Minority interests not covered by row 2 0 0 0 0 0
3 Other capital instruments 0 82 0 1,776 1,776
4 Retail deposits and small business funding: 294,589 0 0 269,328
5 Stable deposits 83,945 0 0 79,748
6 Less stable deposits 210,644 0 0 189,580
7 Wholesale funding: 302,554 20,390 12,744 128,558
8 Operational deposits 0 0 0 0
9 Other wholesale funding 0 302,554 20,390 12,744 128,558
10 Liabilities with matching interdependent assets 0 0 0 0 0
11 Other liabilities: 29,087 34,390 21,550 10,325 21,100
12 Net derivative liabilities 2,933
13 All other funding and liabilities not included in the above categories 26,154 34,390 21,550 10,325 21,100
14 Total ASF 536,156
B. Required stable funding (“RSF”) item
15 Total HQLA for NSFR purposes 150,069 26,907
16 Deposits held at other financial institutions for operational purposes 0 0 0 0 0
17 Performing loans and securities: 8,516 247,208 56,286 328,065 379,476
18 Performing loans to financial institutions secured by Level 1 HQLA 0 833 0 0 83
19 Performing loans to financial institutions secured by non-Level 1
HQLA and unsecured performing loans to financial institutions 0 118,874 8,531 10,690 32,786
20
Performing loans, other than performing residential mortgage, to non-financial corporate clients, retail and small business customers, sovereigns, the Monetary Authority for the account of the Exchange
Fund, central banks and PSEs, of which:
7,959 111,762 42,833 171,650 229,966
21 With a risk-weight of less than or equal to 35% under the STC approach
0 216 0 0 108
22 Performing residential mortgages, of which: 0 5,363 3,370 114,581 83,732
23 With a risk-weight of less than or equal to 35% under the STC approach
0 4,238 2,856 90,140 62,138
24 Securities that are not in default and do not qualify as HQLA, including exchange-traded equities
557 10,376 1,552 31,144 32,909
25 Assets with matching interdependent liabilities 0 0 0 0 0
26 Other assets: 42,056 20,488 1,632 122 43,205
27 Physical traded commodities, including gold 0 0
28 Assets posted as initial margin for derivative contracts and
contributions to default funds of CCPs 1,899 1,652
29 Net derivative assets 0 0
30 Total derivative liabilities before adjustments for deduction of
variation margin posted 9,493 475
31 All other assets not included in the above categories 30,664 20,488 1,632 122 41,078
32 Off-balance sheet items 212,070 4,151
33 Total RSF 453,739
34 Net Stable Funding Ratio (%) 118.16%
The Bank of East Asia, Limited 東亞銀行有限公司
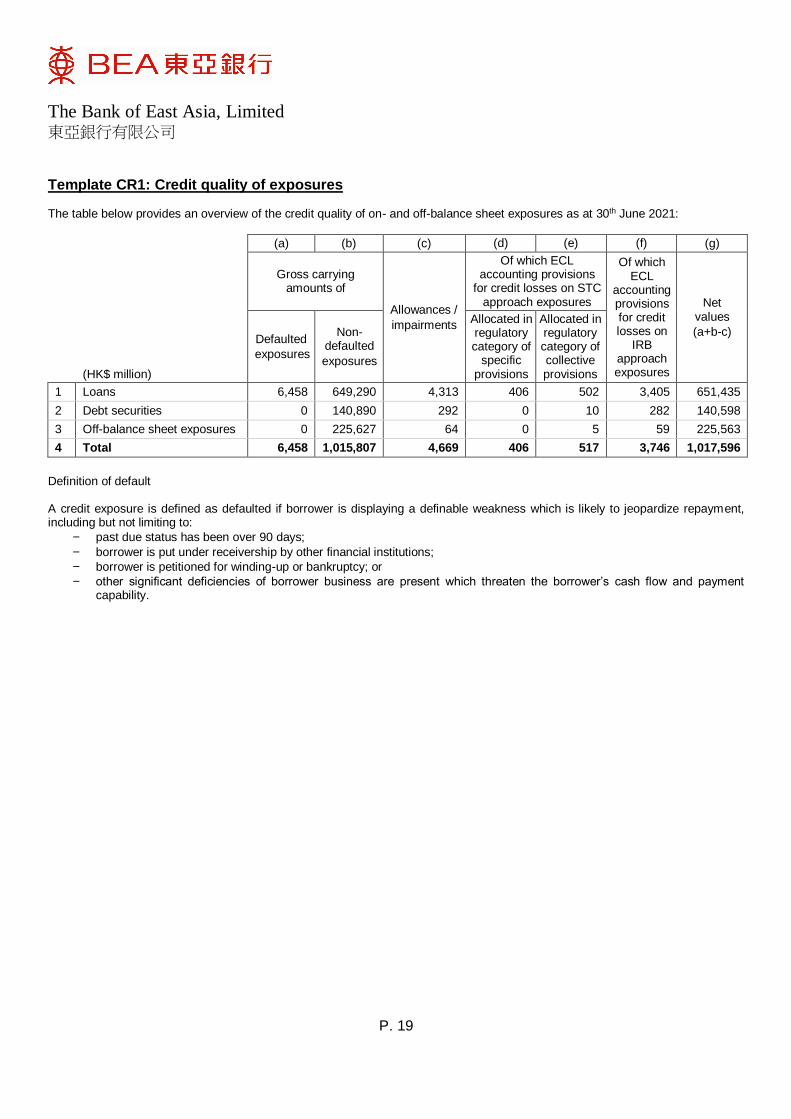
P. 19
Template CR1: Credit quality of exposures
The table below provides an overview of the credit quality of on- and off-balance sheet exposures as at 30th June 2021:
(a) (b) (c) (d) (e) (f) (g)
Gross carrying
amounts of
Allowances /
impairments
Of which ECL accounting provisions
for credit losses on STC approach exposures
Of which ECL
accounting provisions for credit losses on
IRB approach exposures
Net values
(a+b-c)
(HK$ million)
Defaulted
exposures
Non-defaulted
exposures
Allocated in regulatory category of
specific provisions
Allocated in regulatory category of collective provisions
1 Loans 6,458 649,290 4,313 406 502 3,405 651,435
2 Debt securities 0 140,890 292 0 10 282 140,598
3 Off-balance sheet exposures 0 225,627 64 0 5 59 225,563
4 Total 6,458 1,015,807 4,669 406 517 3,746 1,017,596
Definition of default A credit exposure is defined as defaulted if borrower is displaying a definable weakness which is likely to jeopardize repayment, including but not limiting to:
- past due status has been over 90 days;
- borrower is put under receivership by other financial institutions;
- borrower is petitioned for winding-up or bankruptcy; or
- other significant deficiencies of borrower business are present which threaten the borrower’s cash flow and payment capability.
The Bank of East Asia, Limited 東亞銀行有限公司
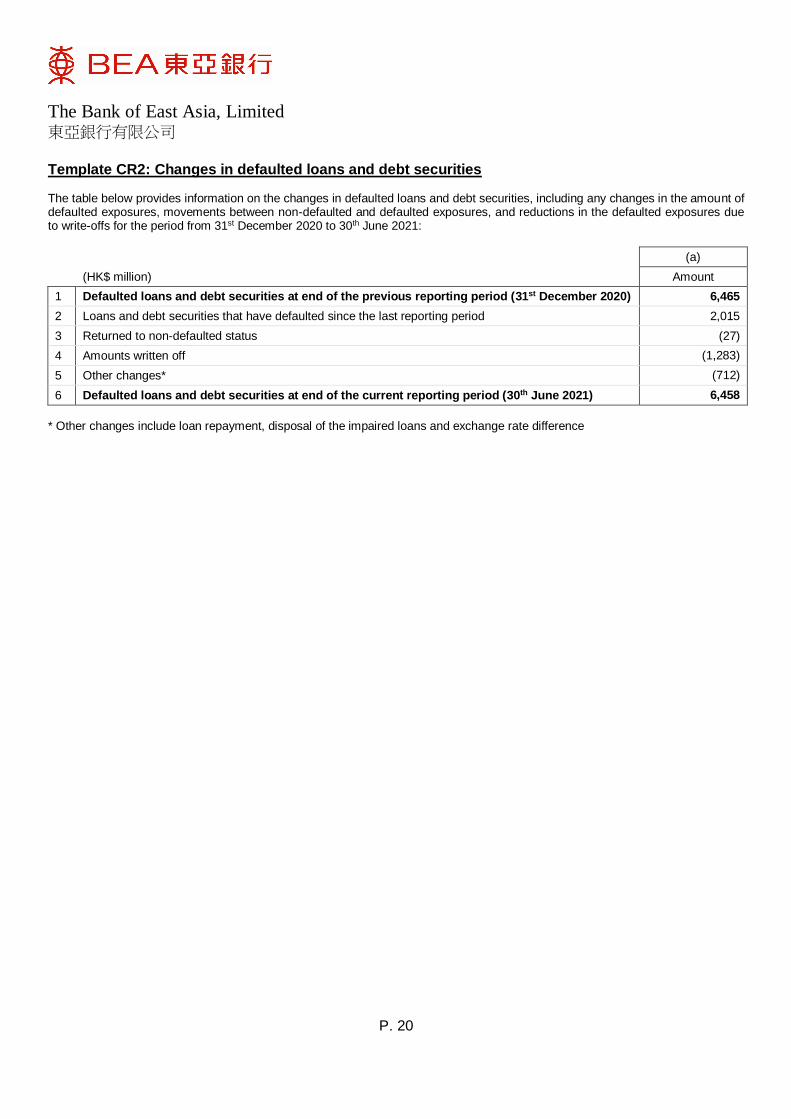
P. 20
Template CR2: Changes in defaulted loans and debt securities
The table below provides information on the changes in defaulted loans and debt securities, including any changes in the amount of defaulted exposures, movements between non-defaulted and defaulted exposures, and reductions in the defaulted exposures due to write-offs for the period from 31st December 2020 to 30th June 2021:
(a)
(HK$ million) Amount
1 Defaulted loans and debt securities at end of the previous reporting period (31st December 2020) 6,465
2 Loans and debt securities that have defaulted since the last reporting period 2,015
3 Returned to non-defaulted status (27)
4 Amounts written off (1,283)
5 Other changes* (712)
6 Defaulted loans and debt securities at end of the current reporting period (30th June 2021) 6,458
* Other changes include loan repayment, disposal of the impaired loans and exchange rate difference
The Bank of East Asia, Limited 東亞銀行有限公司
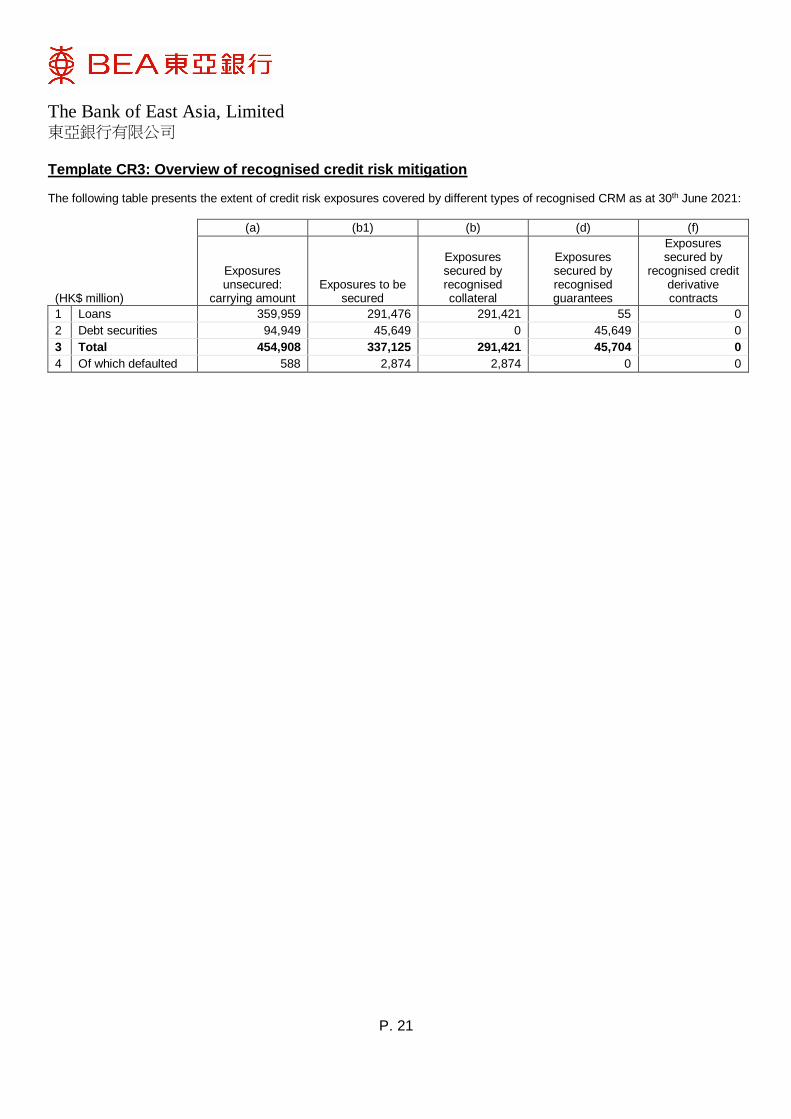
P. 21
Template CR3: Overview of recognised credit risk mitigation
The following table presents the extent of credit risk exposures covered by different types of recognised CRM as at 30th June 2021:
(HK$ million)
(a) (b1) (b) (d) (f)
Exposures unsecured:
carrying amount Exposures to be
secured
Exposures secured by recognised collateral
Exposures secured by recognised guarantees
Exposures secured by
recognised credit derivative contracts
1 Loans 359,959 291,476 291,421 55 0
2 Debt securities 94,949 45,649 0 45,649 0
3 Total 454,908 337,125 291,421 45,704 0
4 Of which defaulted 588 2,874 2,874 0 0
The Bank of East Asia, Limited 東亞銀行有限公司
P. 22
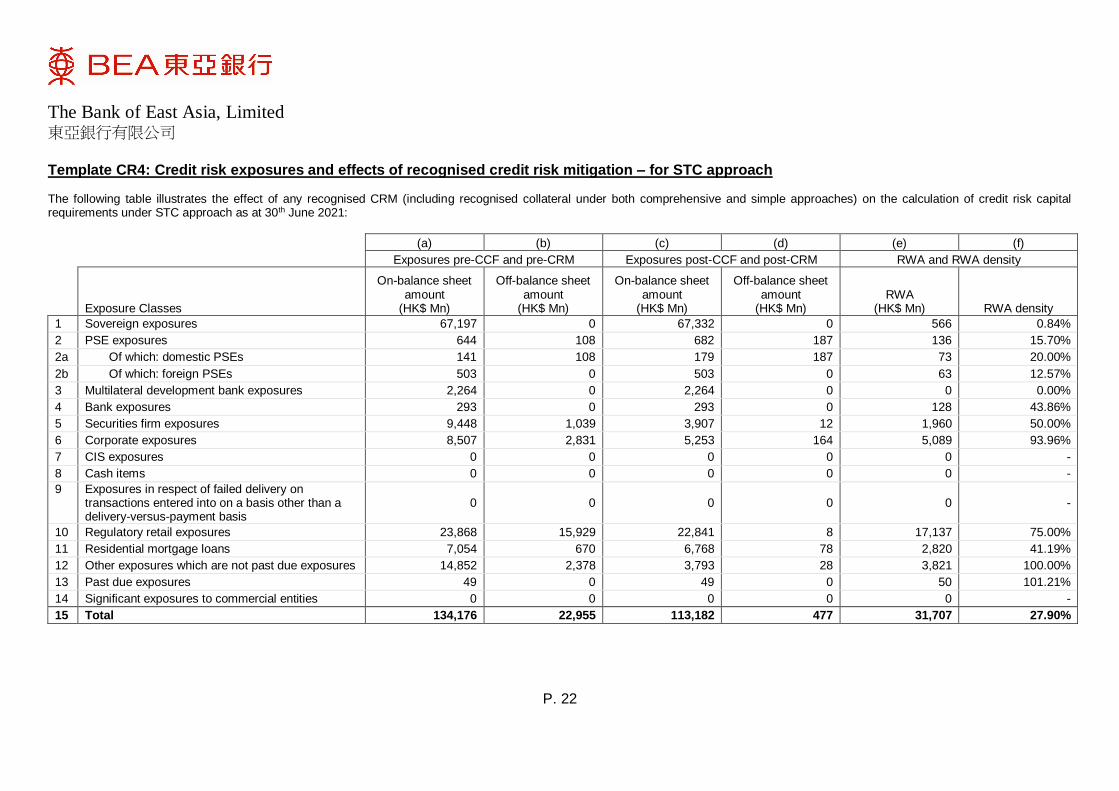
Template CR4: Credit risk exposures and effects of recognised credit risk mitigation – for STC approach
The following table illustrates the effect of any recognised CRM (including recognised collateral under both comprehensive and simple approaches) on the calculation of credit risk capital requirements under STC approach as at 30th June 2021:
(a) (b) (c) (d) (e) (f)
Exposures pre-CCF and pre-CRM Exposures post-CCF and post-CRM RWA and RWA density
Exposure Classes
On-balance sheet amount
(HK$ Mn)
Off-balance sheet amount
(HK$ Mn)
On-balance sheet amount
(HK$ Mn)
Off-balance sheet amount
(HK$ Mn) RWA
(HK$ Mn) RWA density
1 Sovereign exposures 67,197 0 67,332 0 566 0.84%
2 PSE exposures 644 108 682 187 136 15.70%
2a Of which: domestic PSEs 141 108 179 187 73 20.00%
2b Of which: foreign PSEs 503 0 503 0 63 12.57%
3 Multilateral development bank exposures 2,264 0 2,264 0 0 0.00%
4 Bank exposures 293 0 293 0 128 43.86%
5 Securities firm exposures 9,448 1,039 3,907 12 1,960 50.00%
6 Corporate exposures 8,507 2,831 5,253 164 5,089 93.96%
7 CIS exposures 0 0 0 0 0 -
8 Cash items 0 0 0 0 0 -
9
Exposures in respect of failed delivery on transactions entered into on a basis other than a delivery-versus-payment basis
0 0 0 0 0 -
10 Regulatory retail exposures 23,868 15,929 22,841 8 17,137 75.00%
11 Residential mortgage loans 7,054 670 6,768 78 2,820 41.19%
12 Other exposures which are not past due exposures 14,852 2,378 3,793 28 3,821 100.00%
13 Past due exposures 49 0 49 0 50 101.21%
14 Significant exposures to commercial entities 0 0 0 0 0 -
15 Total 134,176 22,955 113,182 477 31,707 27.90%
The Bank of East Asia, Limited 東亞銀行有限公司
P. 23
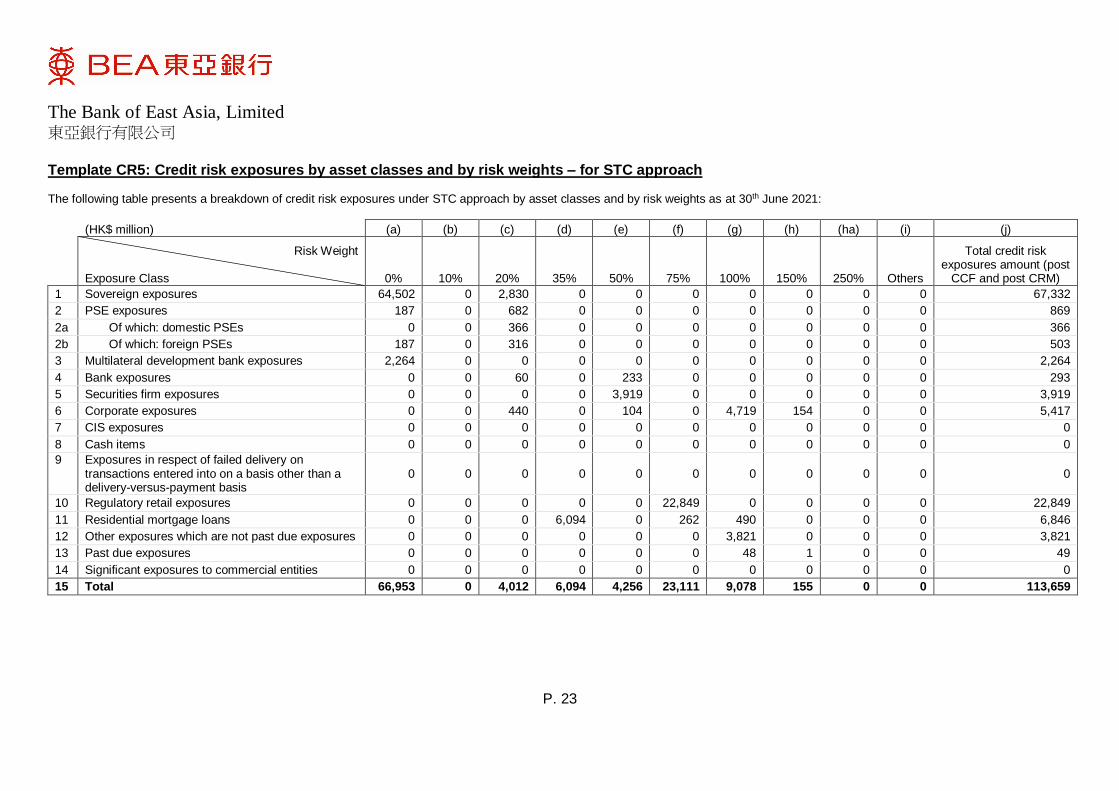
Template CR5: Credit risk exposures by asset classes and by risk weights – for STC approach
The following table presents a breakdown of credit risk exposures under STC approach by asset classes and by risk weights as at 30th June 2021:
(HK$ million) (a) (b) (c) (d) (e) (f) (g) (h) (ha) (i) (j)
Risk Weight Exposure Class 0% 10% 20% 35% 50% 75% 100% 150% 250% Others
Total credit risk exposures amount (post
CCF and post CRM)
1 Sovereign exposures 64,502 0 2,830 0 0 0 0 0 0 0 67,332
2 PSE exposures 187 0 682 0 0 0 0 0 0 0 869
2a Of which: domestic PSEs 0 0 366 0 0 0 0 0 0 0 366
2b Of which: foreign PSEs 187 0 316 0 0 0 0 0 0 0 503
3 Multilateral development bank exposures 2,264 0 0 0 0 0 0 0 0 0 2,264
4 Bank exposures 0 0 60 0 233 0 0 0 0 0 293
5 Securities firm exposures 0 0 0 0 3,919 0 0 0 0 0 3,919
6 Corporate exposures 0 0 440 0 104 0 4,719 154 0 0 5,417
7 CIS exposures 0 0 0 0 0 0 0 0 0 0 0
8 Cash items 0 0 0 0 0 0 0 0 0 0 0
9
Exposures in respect of failed delivery on transactions entered into on a basis other than a delivery-versus-payment basis
0 0 0 0 0 0 0 0 0 0 0
10 Regulatory retail exposures 0 0 0 0 0 22,849 0 0 0 0 22,849
11 Residential mortgage loans 0 0 0 6,094 0 262 490 0 0 0 6,846
12 Other exposures which are not past due exposures 0 0 0 0 0 0 3,821 0 0 0 3,821
13 Past due exposures 0 0 0 0 0 0 48 1 0 0 49
14 Significant exposures to commercial entities 0 0 0 0 0 0 0 0 0 0 0
15 Total 66,953 0 4,012 6,094 4,256 23,111 9,078 155 0 0 113,659
The Bank of East Asia, Limited 東亞銀行有限公司
P. 24
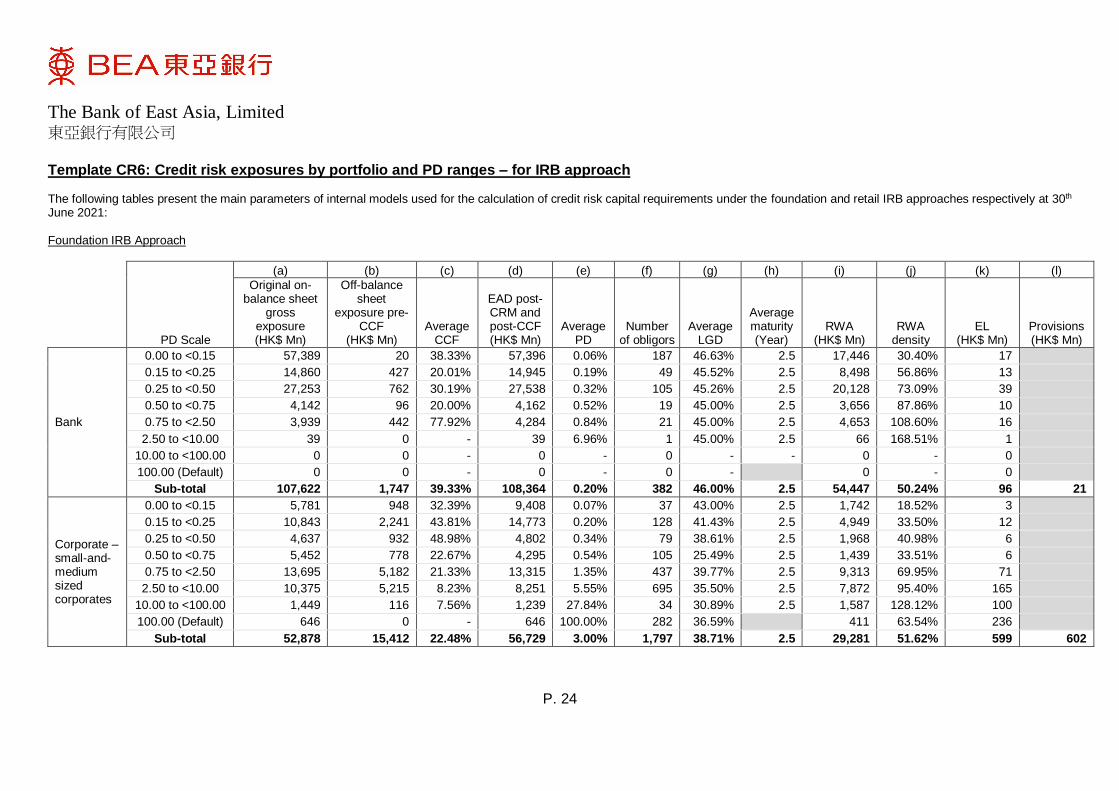
Template CR6: Credit risk exposures by portfolio and PD ranges – for IRB approach The following tables present the main parameters of internal models used for the calculation of credit risk capital requirements under the foundation and retail IRB approaches respectively at 30th June 2021: Foundation IRB Approach
PD Scale
(a) (b) (c) (d) (e) (f) (g) (h) (i) (j) (k) (l)
Original on-balance sheet
gross exposure (HK$ Mn)
Off-balance sheet
exposure pre-CCF
(HK$ Mn) Average
CCF
EAD post-CRM and post-CCF (HK$ Mn)
Average PD
Number of obligors
Average LGD
Average maturity (Year)
RWA (HK$ Mn)
RWA density
EL (HK$ Mn)
Provisions (HK$ Mn)
Bank
0.00 to <0.15 57,389 20 38.33% 57,396 0.06% 187 46.63% 2.5 17,446 30.40% 17
0.15 to <0.25 14,860 427 20.01% 14,945 0.19% 49 45.52% 2.5 8,498 56.86% 13
0.25 to <0.50 27,253 762 30.19% 27,538 0.32% 105 45.26% 2.5 20,128 73.09% 39
0.50 to <0.75 4,142 96 20.00% 4,162 0.52% 19 45.00% 2.5 3,656 87.86% 10
0.75 to <2.50 3,939 442 77.92% 4,284 0.84% 21 45.00% 2.5 4,653 108.60% 16
2.50 to <10.00 39 0 - 39 6.96% 1 45.00% 2.5 66 168.51% 1
10.00 to <100.00 0 0 - 0 - 0 - - 0 - 0
100.00 (Default) 0 0 - 0 - 0 - 0 - 0
Sub-total 107,622 1,747 39.33% 108,364 0.20% 382 46.00% 2.5 54,447 50.24% 96 21
Corporate – small-and-medium sized corporates
0.00 to <0.15 5,781 948 32.39% 9,408 0.07% 37 43.00% 2.5 1,742 18.52% 3
0.15 to <0.25 10,843 2,241 43.81% 14,773 0.20% 128 41.43% 2.5 4,949 33.50% 12
0.25 to <0.50 4,637 932 48.98% 4,802 0.34% 79 38.61% 2.5 1,968 40.98% 6
0.50 to <0.75 5,452 778 22.67% 4,295 0.54% 105 25.49% 2.5 1,439 33.51% 6
0.75 to <2.50 13,695 5,182 21.33% 13,315 1.35% 437 39.77% 2.5 9,313 69.95% 71
2.50 to <10.00 10,375 5,215 8.23% 8,251 5.55% 695 35.50% 2.5 7,872 95.40% 165
10.00 to <100.00 1,449 116 7.56% 1,239 27.84% 34 30.89% 2.5 1,587 128.12% 100
100.00 (Default) 646 0 - 646 100.00% 282 36.59% 411 63.54% 236
Sub-total 52,878 15,412 22.48% 56,729 3.00% 1,797 38.71% 2.5 29,281 51.62% 599 602
The Bank of East Asia, Limited 東亞銀行有限公司
P. 25
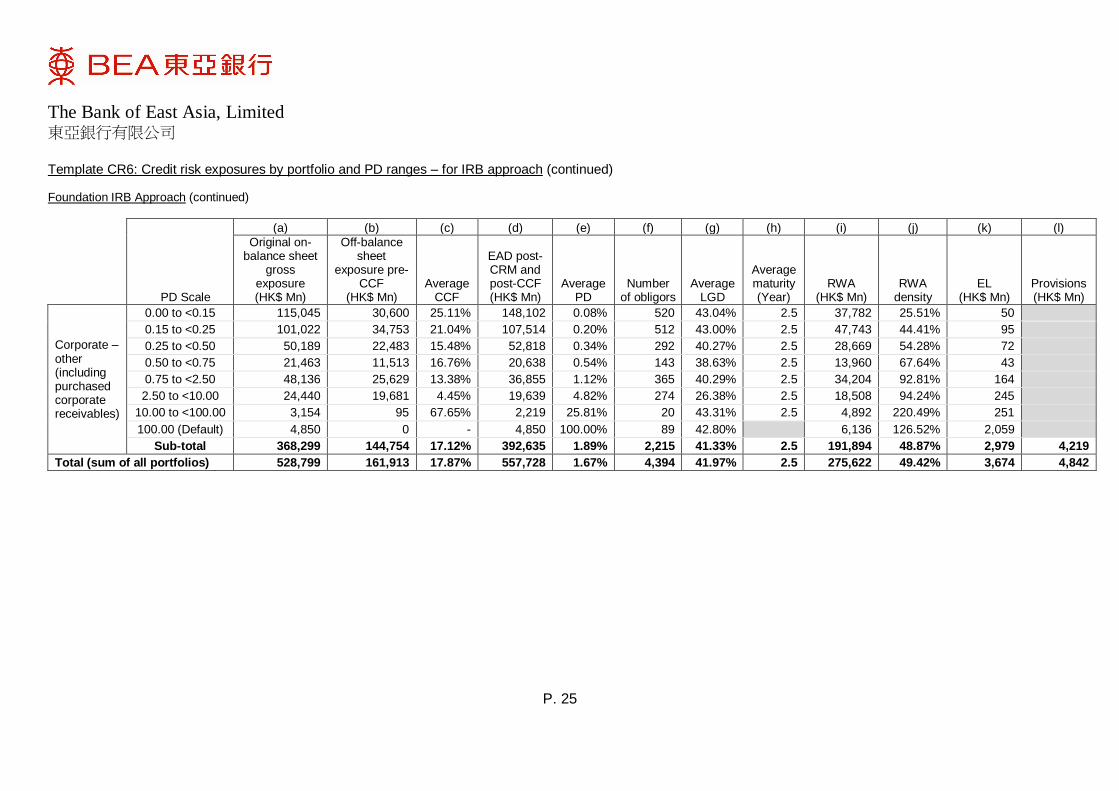
Template CR6: Credit risk exposures by portfolio and PD ranges – for IRB approach (continued) Foundation IRB Approach (continued)
PD Scale
(a) (b) (c) (d) (e) (f) (g) (h) (i) (j) (k) (l)
Original on-balance sheet
gross exposure (HK$ Mn)
Off-balance sheet
exposure pre-CCF
(HK$ Mn) Average
CCF
EAD post-CRM and post-CCF (HK$ Mn)
Average PD
Number of obligors
Average LGD
Average maturity (Year)
RWA (HK$ Mn)
RWA density
EL (HK$ Mn)
Provisions (HK$ Mn)
Corporate – other (including purchased corporate receivables)
0.00 to <0.15 115,045 30,600 25.11% 148,102 0.08% 520 43.04% 2.5 37,782 25.51% 50
0.15 to <0.25 101,022 34,753 21.04% 107,514 0.20% 512 43.00% 2.5 47,743 44.41% 95
0.25 to <0.50 50,189 22,483 15.48% 52,818 0.34% 292 40.27% 2.5 28,669 54.28% 72
0.50 to <0.75 21,463 11,513 16.76% 20,638 0.54% 143 38.63% 2.5 13,960 67.64% 43
0.75 to <2.50 48,136 25,629 13.38% 36,855 1.12% 365 40.29% 2.5 34,204 92.81% 164
2.50 to <10.00 24,440 19,681 4.45% 19,639 4.82% 274 26.38% 2.5 18,508 94.24% 245
10.00 to <100.00 3,154 95 67.65% 2,219 25.81% 20 43.31% 2.5 4,892 220.49% 251
100.00 (Default) 4,850 0 - 4,850 100.00% 89 42.80% 6,136 126.52% 2,059
Sub-total 368,299 144,754 17.12% 392,635 1.89% 2,215 41.33% 2.5 191,894 48.87% 2,979 4,219
Total (sum of all portfolios) 528,799 161,913 17.87% 557,728 1.67% 4,394 41.97% 2.5 275,622 49.42% 3,674 4,842
The Bank of East Asia, Limited 東亞銀行有限公司
P. 26
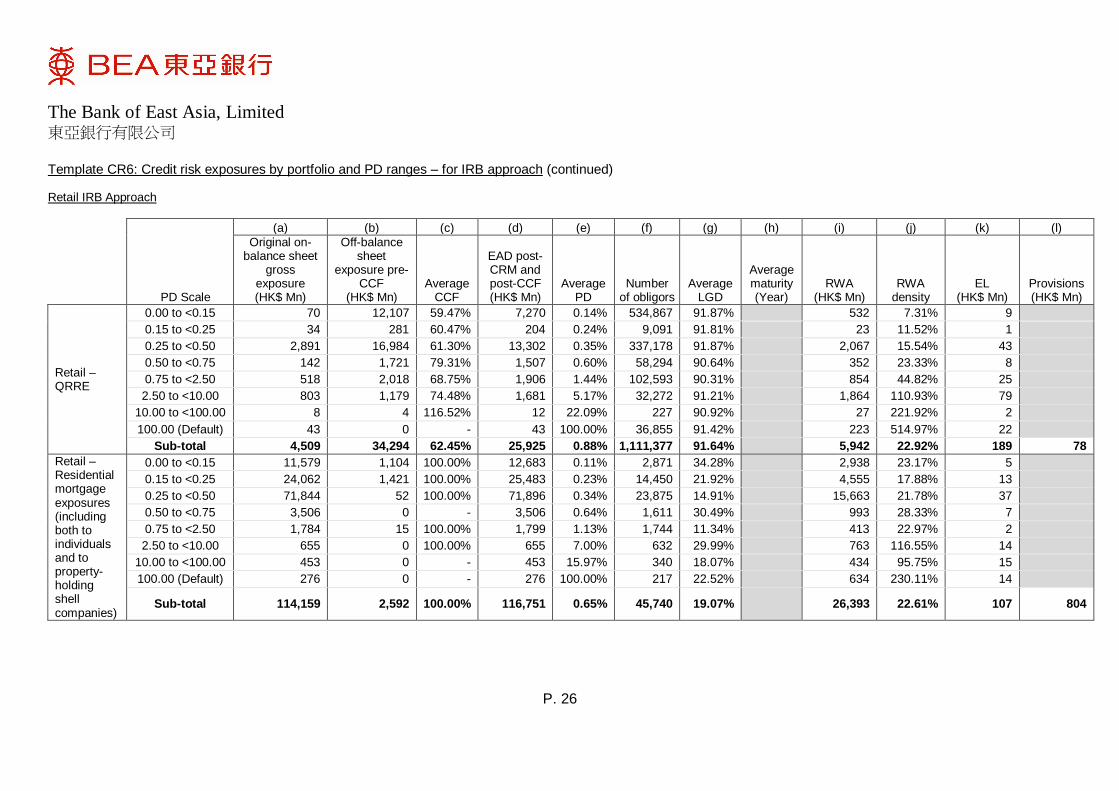
Template CR6: Credit risk exposures by portfolio and PD ranges – for IRB approach (continued) Retail IRB Approach
PD Scale
(a) (b) (c) (d) (e) (f) (g) (h) (i) (j) (k) (l)
Original on-balance sheet
gross exposure (HK$ Mn)
Off-balance sheet
exposure pre-CCF
(HK$ Mn) Average
CCF
EAD post-CRM and post-CCF (HK$ Mn)
Average PD
Number of obligors
Average LGD
Average maturity (Year)
RWA (HK$ Mn)
RWA density
EL (HK$ Mn)
Provisions (HK$ Mn)
Retail – QRRE
0.00 to <0.15 70 12,107 59.47% 7,270 0.14% 534,867 91.87% 532 7.31% 9
0.15 to <0.25 34 281 60.47% 204 0.24% 9,091 91.81% 23 11.52% 1
0.25 to <0.50 2,891 16,984 61.30% 13,302 0.35% 337,178 91.87% 2,067 15.54% 43
0.50 to <0.75 142 1,721 79.31% 1,507 0.60% 58,294 90.64% 352 23.33% 8
0.75 to <2.50 518 2,018 68.75% 1,906 1.44% 102,593 90.31% 854 44.82% 25
2.50 to <10.00 803 1,179 74.48% 1,681 5.17% 32,272 91.21% 1,864 110.93% 79
10.00 to <100.00 8 4 116.52% 12 22.09% 227 90.92% 27 221.92% 2
100.00 (Default) 43 0 - 43 100.00% 36,855 91.42% 223 514.97% 22
Sub-total 4,509 34,294 62.45% 25,925 0.88% 1,111,377 91.64% 5,942 22.92% 189 78
Retail – Residential mortgage exposures (including both to individuals and to property-holding shell companies)
0.00 to <0.15 11,579 1,104 100.00% 12,683 0.11% 2,871 34.28% 2,938 23.17% 5
0.15 to <0.25 24,062 1,421 100.00% 25,483 0.23% 14,450 21.92% 4,555 17.88% 13
0.25 to <0.50 71,844 52 100.00% 71,896 0.34% 23,875 14.91% 15,663 21.78% 37
0.50 to <0.75 3,506 0 - 3,506 0.64% 1,611 30.49% 993 28.33% 7
0.75 to <2.50 1,784 15 100.00% 1,799 1.13% 1,744 11.34% 413 22.97% 2
2.50 to <10.00 655 0 100.00% 655 7.00% 632 29.99% 763 116.55% 14
10.00 to <100.00 453 0 - 453 15.97% 340 18.07% 434 95.75% 15
100.00 (Default) 276 0 - 276 100.00% 217 22.52% 634 230.11% 14
Sub-total 114,159 2,592 100.00% 116,751 0.65% 45,740 19.07% 26,393 22.61% 107 804
The Bank of East Asia, Limited 東亞銀行有限公司
P. 27
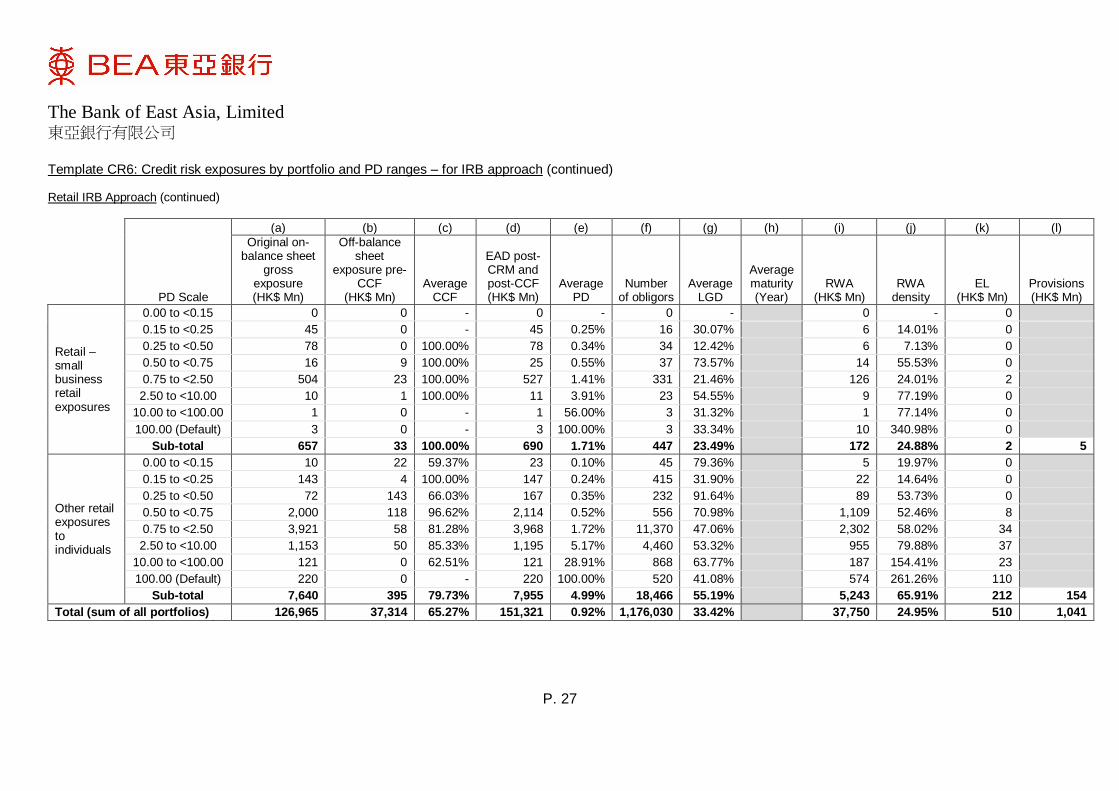
Template CR6: Credit risk exposures by portfolio and PD ranges – for IRB approach (continued) Retail IRB Approach (continued)
PD Scale
(a) (b) (c) (d) (e) (f) (g) (h) (i) (j) (k) (l)
Original on-balance sheet
gross exposure (HK$ Mn)
Off-balance sheet
exposure pre-CCF
(HK$ Mn) Average
CCF
EAD post-CRM and post-CCF (HK$ Mn)
Average PD
Number of obligors
Average LGD
Average maturity (Year)
RWA (HK$ Mn)
RWA density
EL (HK$ Mn)
Provisions (HK$ Mn)
Retail – small business retail exposures
0.00 to <0.15 0 0 - 0 - 0 - 0 - 0
0.15 to <0.25 45 0 - 45 0.25% 16 30.07% 6 14.01% 0
0.25 to <0.50 78 0 100.00% 78 0.34% 34 12.42% 6 7.13% 0
0.50 to <0.75 16 9 100.00% 25 0.55% 37 73.57% 14 55.53% 0
0.75 to <2.50 504 23 100.00% 527 1.41% 331 21.46% 126 24.01% 2
2.50 to <10.00 10 1 100.00% 11 3.91% 23 54.55% 9 77.19% 0
10.00 to <100.00 1 0 - 1 56.00% 3 31.32% 1 77.14% 0
100.00 (Default) 3 0 - 3 100.00% 3 33.34% 10 340.98% 0
Sub-total 657 33 100.00% 690 1.71% 447 23.49% 172 24.88% 2 5
Other retail exposures to individuals
0.00 to <0.15 10 22 59.37% 23 0.10% 45 79.36% 5 19.97% 0
0.15 to <0.25 143 4 100.00% 147 0.24% 415 31.90% 22 14.64% 0
0.25 to <0.50 72 143 66.03% 167 0.35% 232 91.64% 89 53.73% 0
0.50 to <0.75 2,000 118 96.62% 2,114 0.52% 556 70.98% 1,109 52.46% 8
0.75 to <2.50 3,921 58 81.28% 3,968 1.72% 11,370 47.06% 2,302 58.02% 34
2.50 to <10.00 1,153 50 85.33% 1,195 5.17% 4,460 53.32% 955 79.88% 37
10.00 to <100.00 121 0 62.51% 121 28.91% 868 63.77% 187 154.41% 23
100.00 (Default) 220 0 - 220 100.00% 520 41.08% 574 261.26% 110
Sub-total 7,640 395 79.73% 7,955 4.99% 18,466 55.19% 5,243 65.91% 212 154
Total (sum of all portfolios) 126,965 37,314 65.27% 151,321 0.92% 1,176,030 33.42% 37,750 24.95% 510 1,041
The Bank of East Asia, Limited 東亞銀行有限公司
P. 28
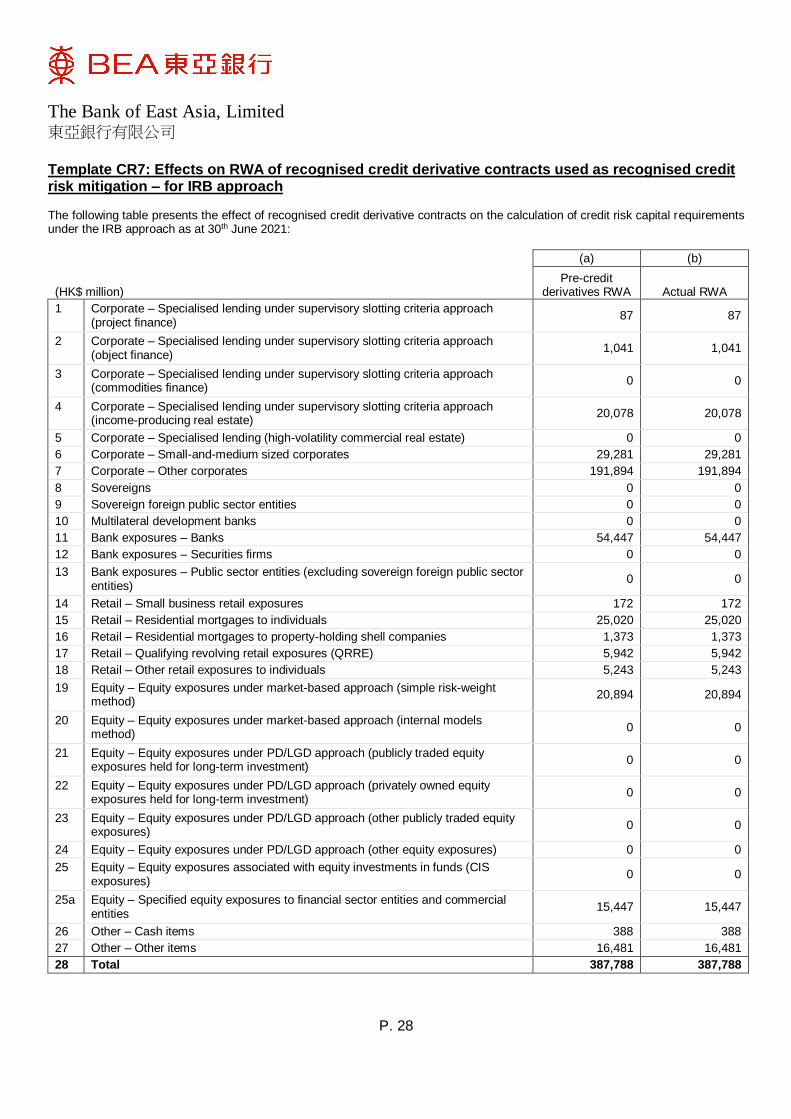
Template CR7: Effects on RWA of recognised credit derivative contracts used as recognised credit risk mitigation – for IRB approach
The following table presents the effect of recognised credit derivative contracts on the calculation of credit risk capital requirements under the IRB approach as at 30th June 2021:
(HK$ million)
(a) (b)
Pre-credit derivatives RWA Actual RWA
1
Corporate – Specialised lending under supervisory slotting criteria approach (project finance)
87 87
2
Corporate – Specialised lending under supervisory slotting criteria approach (object finance)
1,041 1,041
3
Corporate – Specialised lending under supervisory slotting criteria approach (commodities finance)
0 0
4
Corporate – Specialised lending under supervisory slotting criteria approach (income-producing real estate)
20,078 20,078
5 Corporate – Specialised lending (high-volatility commercial real estate) 0 0
6 Corporate – Small-and-medium sized corporates 29,281 29,281
7 Corporate – Other corporates 191,894 191,894
8 Sovereigns 0 0
9 Sovereign foreign public sector entities 0 0
10 Multilateral development banks 0 0
11 Bank exposures – Banks 54,447 54,447
12 Bank exposures – Securities firms 0 0
13
Bank exposures – Public sector entities (excluding sovereign foreign public sector entities)
0 0
14 Retail – Small business retail exposures 172 172
15 Retail – Residential mortgages to individuals 25,020 25,020
16 Retail – Residential mortgages to property-holding shell companies 1,373 1,373
17 Retail – Qualifying revolving retail exposures (QRRE) 5,942 5,942
18 Retail – Other retail exposures to individuals 5,243 5,243
19
Equity – Equity exposures under market-based approach (simple risk-weight method)
20,894 20,894
20
Equity – Equity exposures under market-based approach (internal models method)
0 0
21
Equity – Equity exposures under PD/LGD approach (publicly traded equity exposures held for long-term investment)
0 0
22
Equity – Equity exposures under PD/LGD approach (privately owned equity exposures held for long-term investment)
0 0
23
Equity – Equity exposures under PD/LGD approach (other publicly traded equity exposures)
0 0
24 Equity – Equity exposures under PD/LGD approach (other equity exposures) 0 0
25
Equity – Equity exposures associated with equity investments in funds (CIS exposures)
0 0
25a
Equity – Specified equity exposures to financial sector entities and commercial entities
15,447 15,447
26 Other – Cash items 388 388
27 Other – Other items 16,481 16,481
28 Total 387,788 387,788
The Bank of East Asia, Limited 東亞銀行有限公司
P. 29
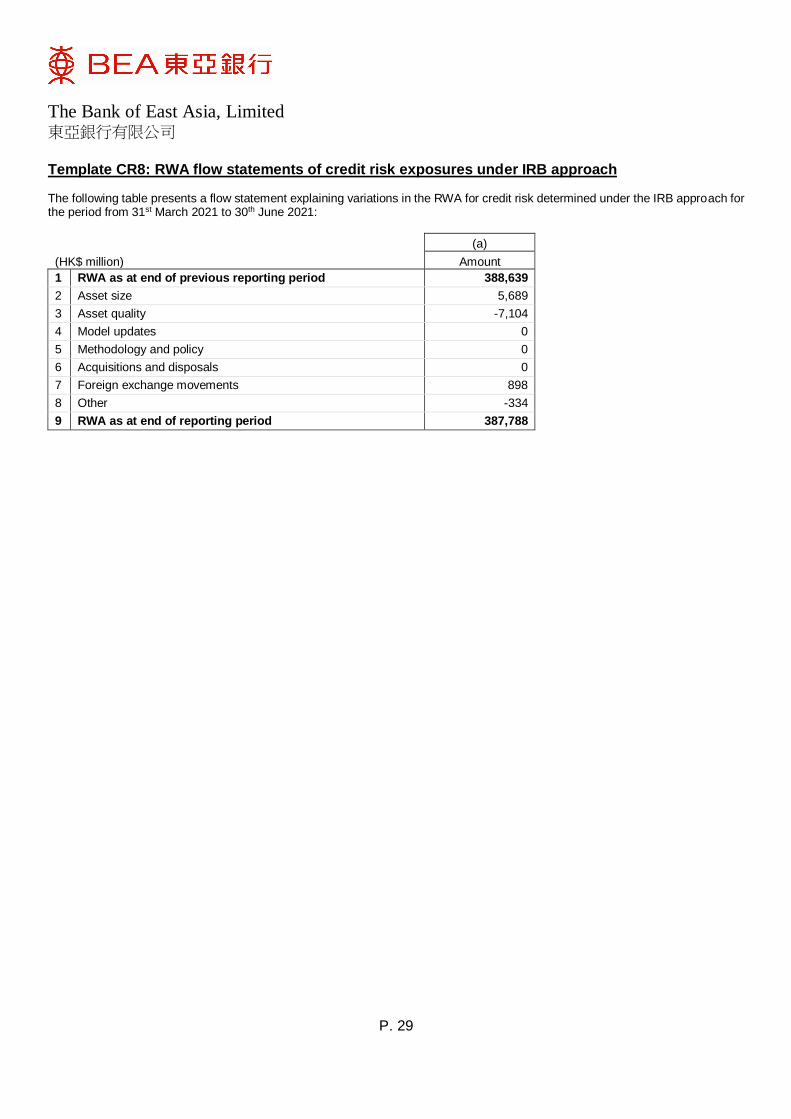
Template CR8: RWA flow statements of credit risk exposures under IRB approach
The following table presents a flow statement explaining variations in the RWA for credit risk determined under the IRB approach for the period from 31st March 2021 to 30th June 2021:
(HK$ million)
(a)
Amount
1 RWA as at end of previous reporting period 388,639
2 Asset size 5,689
3 Asset quality -7,104
4 Model updates 0
5 Methodology and policy 0
6 Acquisitions and disposals 0
7 Foreign exchange movements 898
8 Other -334
9 RWA as at end of reporting period 387,788
The Bank of East Asia, Limited 東亞銀行有限公司
P. 30
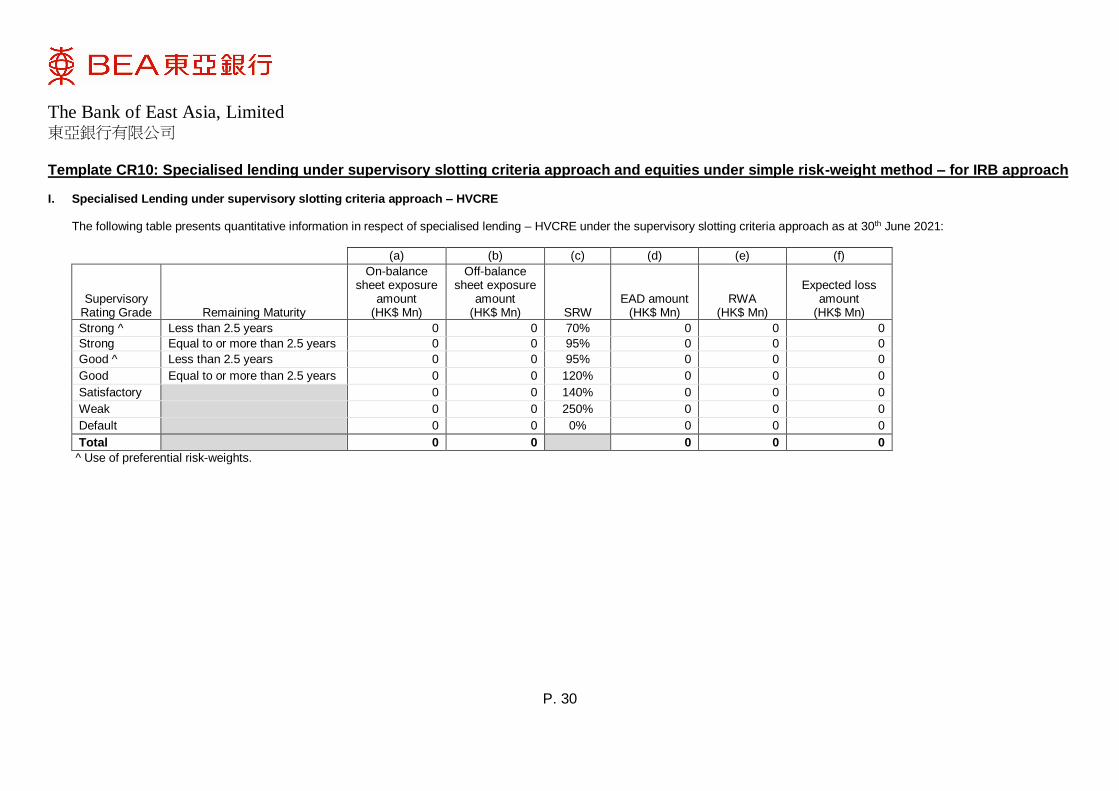
Template CR10: Specialised lending under supervisory slotting criteria approach and equities under simple risk-weight method – for IRB approach
I. Specialised Lending under supervisory slotting criteria approach – HVCRE
The following table presents quantitative information in respect of specialised lending – HVCRE under the supervisory slotting criteria approach as at 30th June 2021:
(a) (b) (c) (d) (e) (f)
Supervisory Rating Grade Remaining Maturity
On-balance sheet exposure
amount (HK$ Mn)
Off-balance sheet exposure
amount (HK$ Mn) SRW
EAD amount (HK$ Mn)
RWA (HK$ Mn)
Expected loss amount
(HK$ Mn)
Strong ̂ Less than 2.5 years 0 0 70% 0 0 0
Strong Equal to or more than 2.5 years 0 0 95% 0 0 0
Good ^ Less than 2.5 years 0 0 95% 0 0 0
Good Equal to or more than 2.5 years 0 0 120% 0 0 0
Satisfactory 0 0 140% 0 0 0
Weak 0 0 250% 0 0 0
Default 0 0 0% 0 0 0
Total 0 0 0 0 0
^ Use of preferential risk-weights.
The Bank of East Asia, Limited 東亞銀行有限公司
P. 31
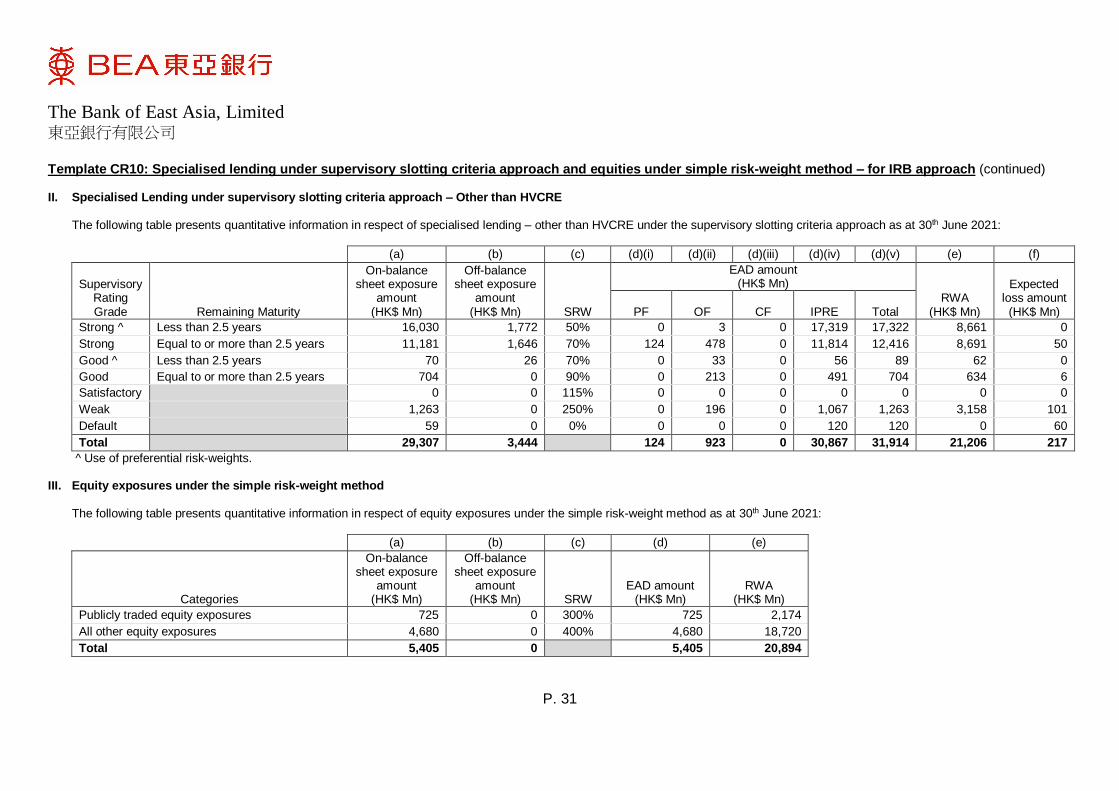
Template CR10: Specialised lending under supervisory slotting criteria approach and equities under simple risk-weight method – for IRB approach (continued) II. Specialised Lending under supervisory slotting criteria approach – Other than HVCRE
The following table presents quantitative information in respect of specialised lending – other than HVCRE under the supervisory slotting criteria approach as at 30th June 2021:
(a) (b) (c) (d)(i) (d)(ii) (d)(iii) (d)(iv) (d)(v) (e) (f)
Supervisory Rating Grade Remaining Maturity
On-balance sheet exposure
amount (HK$ Mn)
Off-balance sheet exposure
amount (HK$ Mn) SRW
EAD amount (HK$ Mn)
RWA (HK$ Mn)
Expected loss amount (HK$ Mn) PF OF CF IPRE Total
Strong ̂ Less than 2.5 years 16,030 1,772 50% 0 3 0 17,319 17,322 8,661 0
Strong Equal to or more than 2.5 years 11,181 1,646 70% 124 478 0 11,814 12,416 8,691 50
Good ^ Less than 2.5 years 70 26 70% 0 33 0 56 89 62 0
Good Equal to or more than 2.5 years 704 0 90% 0 213 0 491 704 634 6
Satisfactory 0 0 115% 0 0 0 0 0 0 0
Weak 1,263 0 250% 0 196 0 1,067 1,263 3,158 101
Default 59 0 0% 0 0 0 120 120 0 60
Total 29,307 3,444 124 923 0 30,867 31,914 21,206 217
^ Use of preferential risk-weights. III. Equity exposures under the simple risk-weight method
The following table presents quantitative information in respect of equity exposures under the simple risk-weight method as at 30th June 2021:
(a) (b) (c) (d) (e)
Categories
On-balance sheet exposure
amount (HK$ Mn)
Off-balance sheet exposure
amount (HK$ Mn) SRW
EAD amount (HK$ Mn)
RWA (HK$ Mn)
Publicly traded equity exposures 725 0 300% 725 2,174
All other equity exposures 4,680 0 400% 4,680 18,720
Total 5,405 0 5,405 20,894
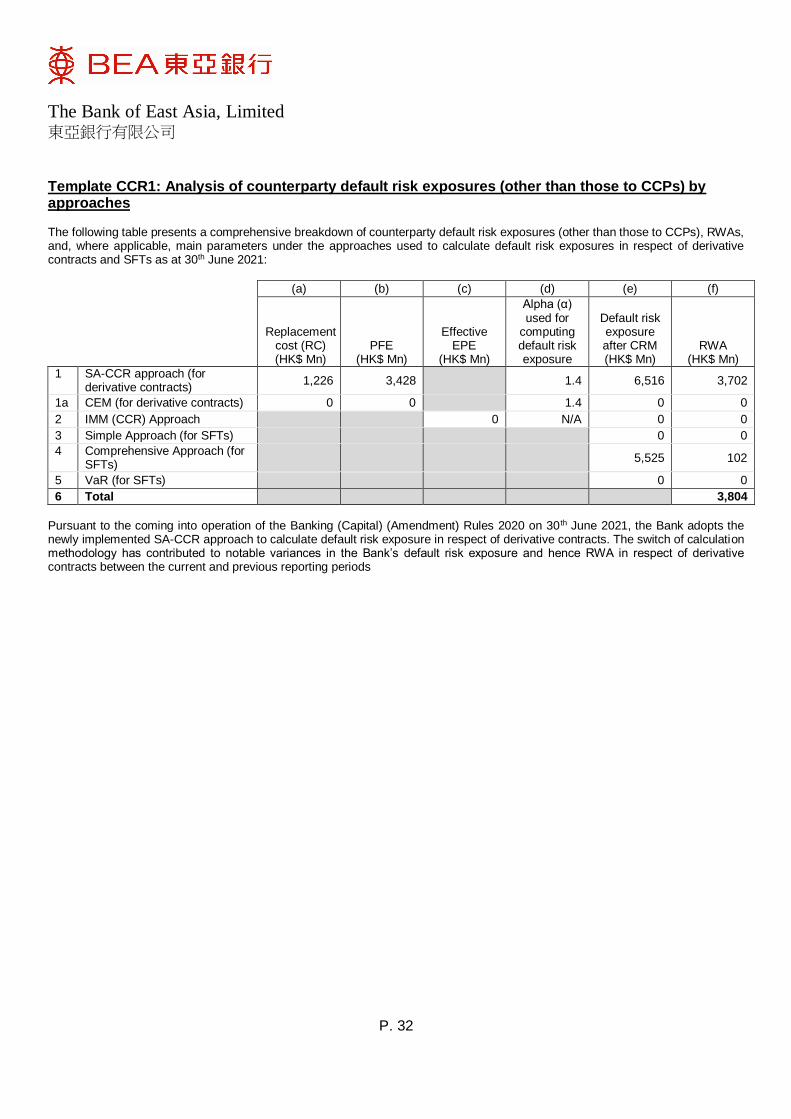
The Bank of East Asia, Limited 東亞銀行有限公司
P. 32
Template CCR1: Analysis of counterparty default risk exposures (other than those to CCPs) by approaches
The following table presents a comprehensive breakdown of counterparty default risk exposures (other than those to CCPs), RWAs, and, where applicable, main parameters under the approaches used to calculate default risk exposures in respect of derivative contracts and SFTs as at 30th June 2021:
(a) (b) (c) (d) (e) (f)
Replacement cost (RC) (HK$ Mn)
PFE (HK$ Mn)
Effective EPE
(HK$ Mn)
Alpha (α) used for
computing default risk exposure
Default risk exposure after CRM (HK$ Mn)
RWA (HK$ Mn)
1
SA-CCR approach (for derivative contracts)
1,226 3,428 1.4 6,516 3,702
1a CEM (for derivative contracts) 0 0 1.4 0 0
2 IMM (CCR) Approach 0 N/A 0 0
3 Simple Approach (for SFTs) 0 0
4
Comprehensive Approach (for SFTs)
5,525 102
5 VaR (for SFTs) 0 0
6 Total 3,804
Pursuant to the coming into operation of the Banking (Capital) (Amendment) Rules 2020 on 30th June 2021, the Bank adopts the newly implemented SA-CCR approach to calculate default risk exposure in respect of derivative contracts. The switch of calculation methodology has contributed to notable variances in the Bank’s default risk exposure and hence RWA in respect of derivative contracts between the current and previous reporting periods
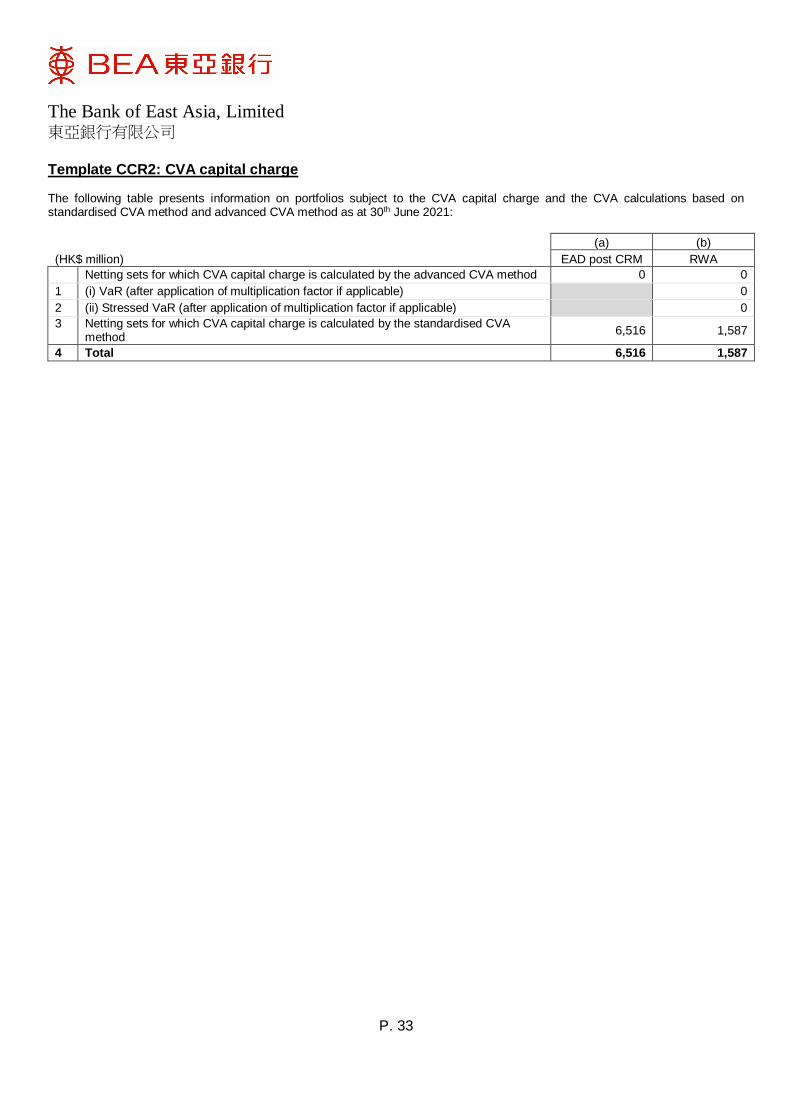
The Bank of East Asia, Limited 東亞銀行有限公司
P. 33
Template CCR2: CVA capital charge
The following table presents information on portfolios subject to the CVA capital charge and the CVA calculations based on standardised CVA method and advanced CVA method as at 30th June 2021:
(HK$ million)
(a) (b)
EAD post CRM RWA
Netting sets for which CVA capital charge is calculated by the advanced CVA method 0 0
1 (i) VaR (after application of multiplication factor if applicable) 0
2 (ii) Stressed VaR (after application of multiplication factor if applicable) 0
3
Netting sets for which CVA capital charge is calculated by the standardised CVA method
6,516 1,587
4 Total 6,516 1,587
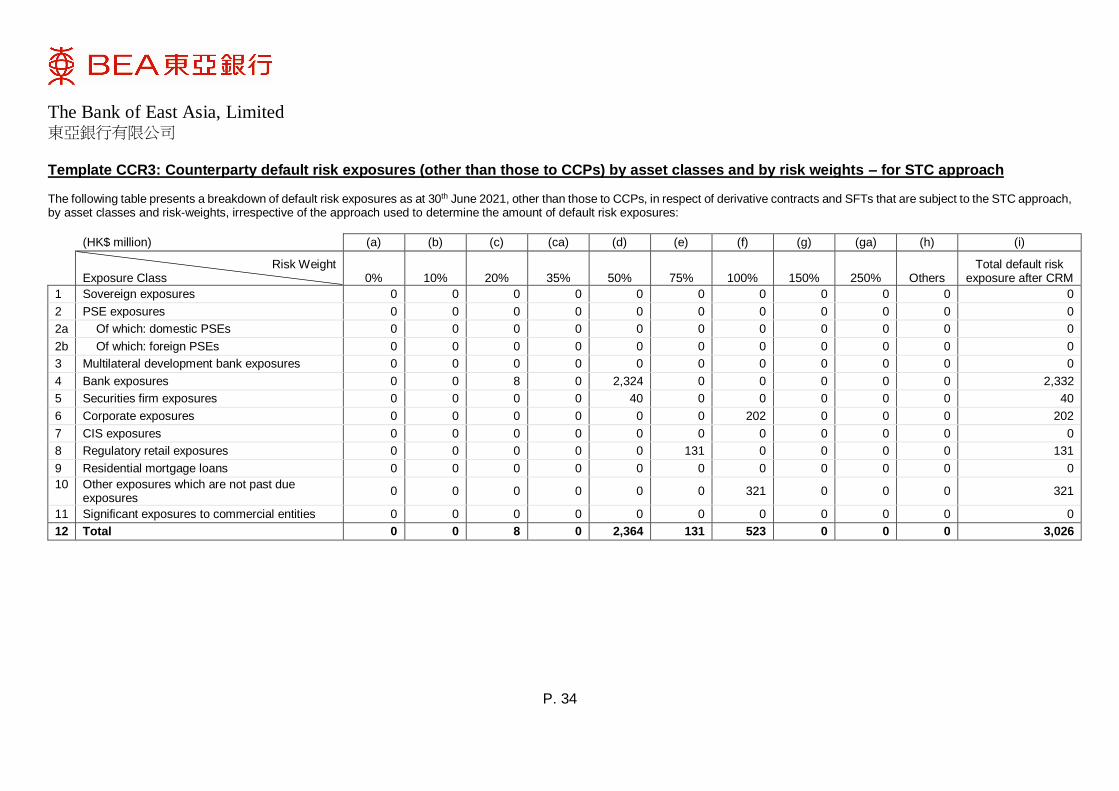
The Bank of East Asia, Limited 東亞銀行有限公司
P. 34
Template CCR3: Counterparty default risk exposures (other than those to CCPs) by asset classes and by risk weights – for STC approach
The following table presents a breakdown of default risk exposures as at 30th June 2021, other than those to CCPs, in respect of derivative contracts and SFTs that are subject to the STC approach, by asset classes and risk-weights, irrespective of the approach used to determine the amount of default risk exposures:
(HK$ million) (a) (b) (c) (ca) (d) (e) (f) (g) (ga) (h) (i)
Risk Weight Exposure Class 0% 10% 20% 35% 50% 75% 100% 150% 250% Others
Total default risk exposure after CRM
1 Sovereign exposures 0 0 0 0 0 0 0 0 0 0 0
2 PSE exposures 0 0 0 0 0 0 0 0 0 0 0
2a Of which: domestic PSEs 0 0 0 0 0 0 0 0 0 0 0
2b Of which: foreign PSEs 0 0 0 0 0 0 0 0 0 0 0
3 Multilateral development bank exposures 0 0 0 0 0 0 0 0 0 0 0
4 Bank exposures 0 0 8 0 2,324 0 0 0 0 0 2,332
5 Securities firm exposures 0 0 0 0 40 0 0 0 0 0 40
6 Corporate exposures 0 0 0 0 0 0 202 0 0 0 202
7 CIS exposures 0 0 0 0 0 0 0 0 0 0 0
8 Regulatory retail exposures 0 0 0 0 0 131 0 0 0 0 131
9 Residential mortgage loans 0 0 0 0 0 0 0 0 0 0 0
10
Other exposures which are not past due exposures
0 0 0 0 0 0 321 0 0 0 321
11 Significant exposures to commercial entities 0 0 0 0 0 0 0 0 0 0 0
12 Total 0 0 8 0 2,364 131 523 0 0 0 3,026
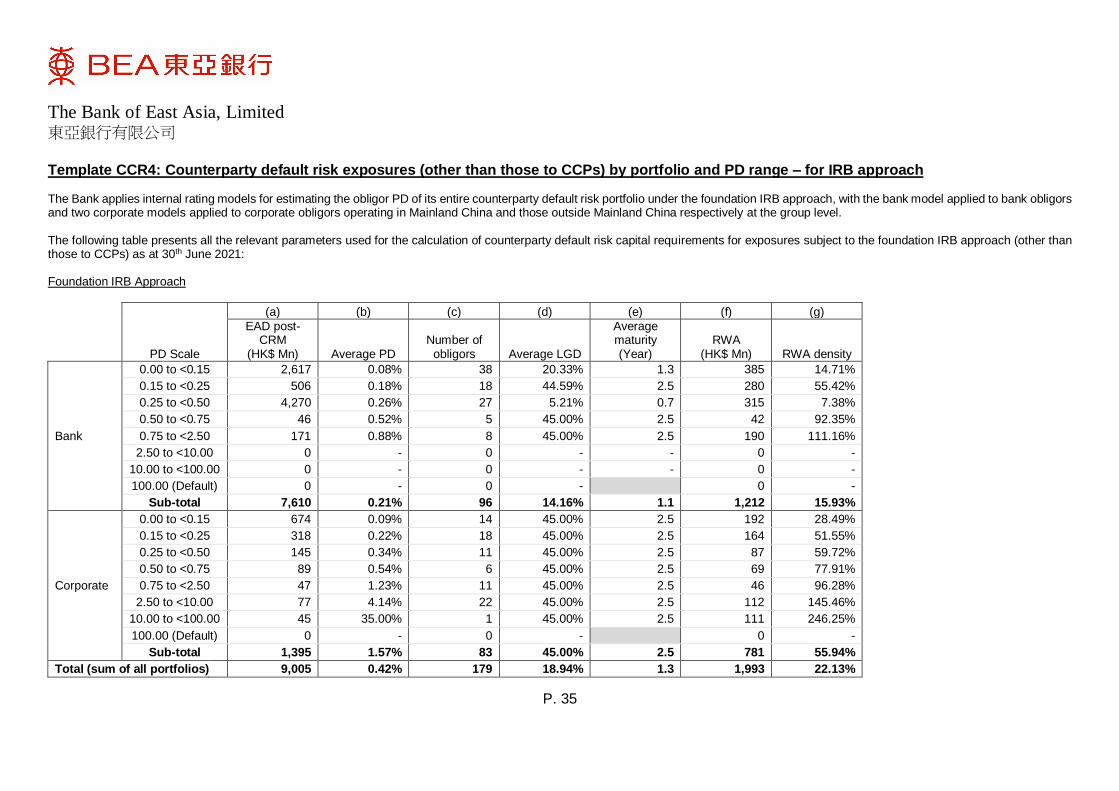
The Bank of East Asia, Limited 東亞銀行有限公司
P. 35
Template CCR4: Counterparty default risk exposures (other than those to CCPs) by portfolio and PD range – for IRB approach
The Bank applies internal rating models for estimating the obligor PD of its entire counterparty default risk portfolio under the foundation IRB approach, with the bank model applied to bank obligors and two corporate models applied to corporate obligors operating in Mainland China and those outside Mainland China respectively at the group level. The following table presents all the relevant parameters used for the calculation of counterparty default risk capital requirements for exposures subject to the foundation IRB approach (other than those to CCPs) as at 30th June 2021: Foundation IRB Approach
PD Scale
(a) (b) (c) (d) (e) (f) (g)
EAD post-CRM
(HK$ Mn) Average PD Number of
obligors Average LGD
Average maturity (Year)
RWA (HK$ Mn) RWA density
Bank
0.00 to <0.15 2,617 0.08% 38 20.33% 1.3 385 14.71%
0.15 to <0.25 506 0.18% 18 44.59% 2.5 280 55.42%
0.25 to <0.50 4,270 0.26% 27 5.21% 0.7 315 7.38%
0.50 to <0.75 46 0.52% 5 45.00% 2.5 42 92.35%
0.75 to <2.50 171 0.88% 8 45.00% 2.5 190 111.16%
2.50 to <10.00 0 - 0 - - 0 -
10.00 to <100.00 0 - 0 - - 0 -
100.00 (Default) 0 - 0 - 0 -
Sub-total 7,610 0.21% 96 14.16% 1.1 1,212 15.93%
Corporate
0.00 to <0.15 674 0.09% 14 45.00% 2.5 192 28.49%
0.15 to <0.25 318 0.22% 18 45.00% 2.5 164 51.55%
0.25 to <0.50 145 0.34% 11 45.00% 2.5 87 59.72%
0.50 to <0.75 89 0.54% 6 45.00% 2.5 69 77.91%
0.75 to <2.50 47 1.23% 11 45.00% 2.5 46 96.28%
2.50 to <10.00 77 4.14% 22 45.00% 2.5 112 145.46%
10.00 to <100.00 45 35.00% 1 45.00% 2.5 111 246.25%
100.00 (Default) 0 - 0 - 0 -
Sub-total 1,395 1.57% 83 45.00% 2.5 781 55.94%
Total (sum of all portfolios) 9,005 0.42% 179 18.94% 1.3 1,993 22.13%
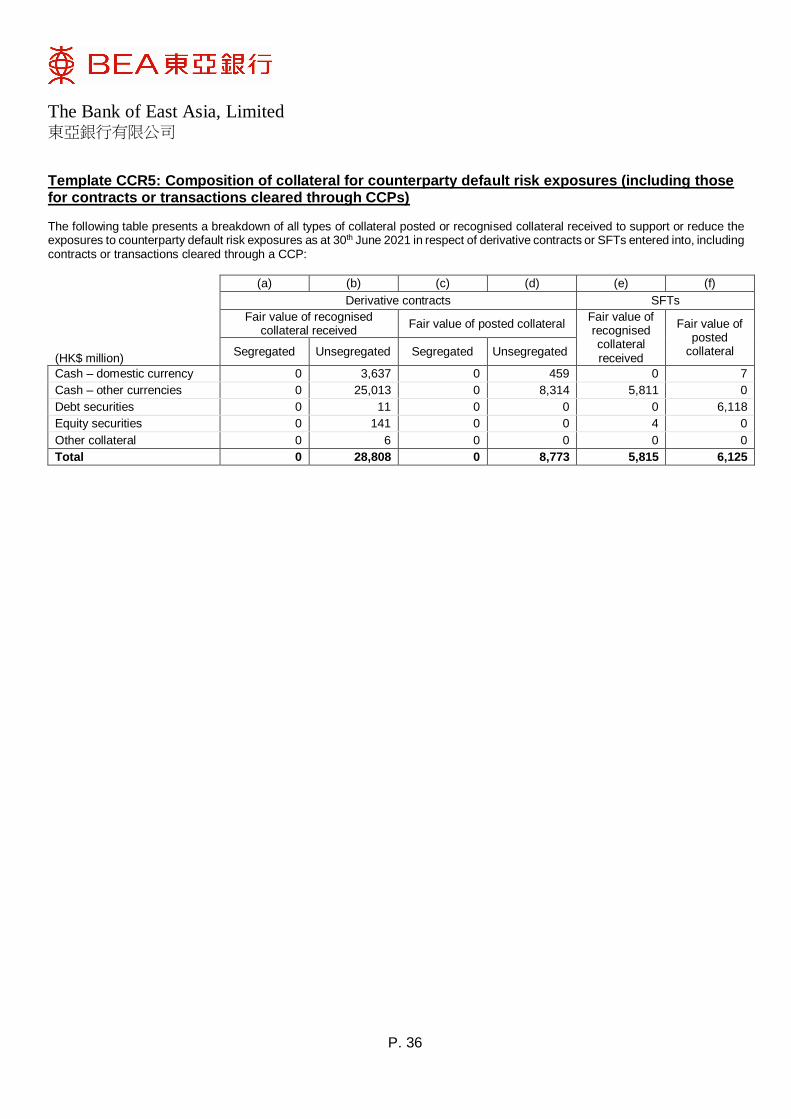
The Bank of East Asia, Limited 東亞銀行有限公司
P. 36
Template CCR5: Composition of collateral for counterparty default risk exposures (including those for contracts or transactions cleared through CCPs)
The following table presents a breakdown of all types of collateral posted or recognised collateral received to support or reduce the exposures to counterparty default risk exposures as at 30th June 2021 in respect of derivative contracts or SFTs entered into, including contracts or transactions cleared through a CCP:
(HK$ million)
(a) (b) (c) (d) (e) (f)
Derivative contracts SFTs
Fair value of recognised collateral received
Fair value of posted collateral Fair value of recognised collateral received
Fair value of posted
collateral Segregated Unsegregated Segregated Unsegregated
Cash – domestic currency 0 3,637 0 459 0 7
Cash – other currencies 0 25,013 0 8,314 5,811 0
Debt securities 0 11 0 0 0 6,118
Equity securities 0 141 0 0 4 0
Other collateral 0 6 0 0 0 0
Total 0 28,808 0 8,773 5,815 6,125
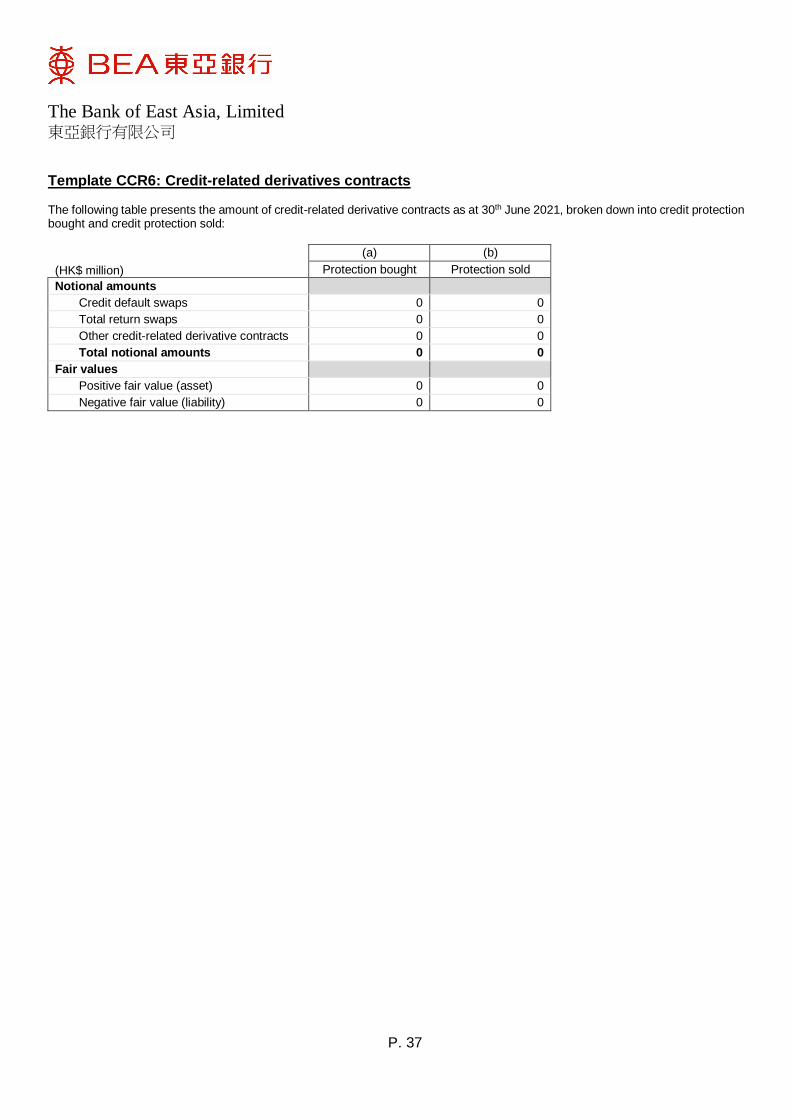
The Bank of East Asia, Limited 東亞銀行有限公司
P. 37
Template CCR6: Credit-related derivatives contracts
The following table presents the amount of credit-related derivative contracts as at 30th June 2021, broken down into credit protection bought and credit protection sold:
(HK$ million)
(a) (b)
Protection bought Protection sold
Notional amounts
Credit default swaps 0 0
Total return swaps 0 0
Other credit-related derivative contracts 0 0
Total notional amounts 0 0
Fair values
Positive fair value (asset) 0 0
Negative fair value (liability) 0 0
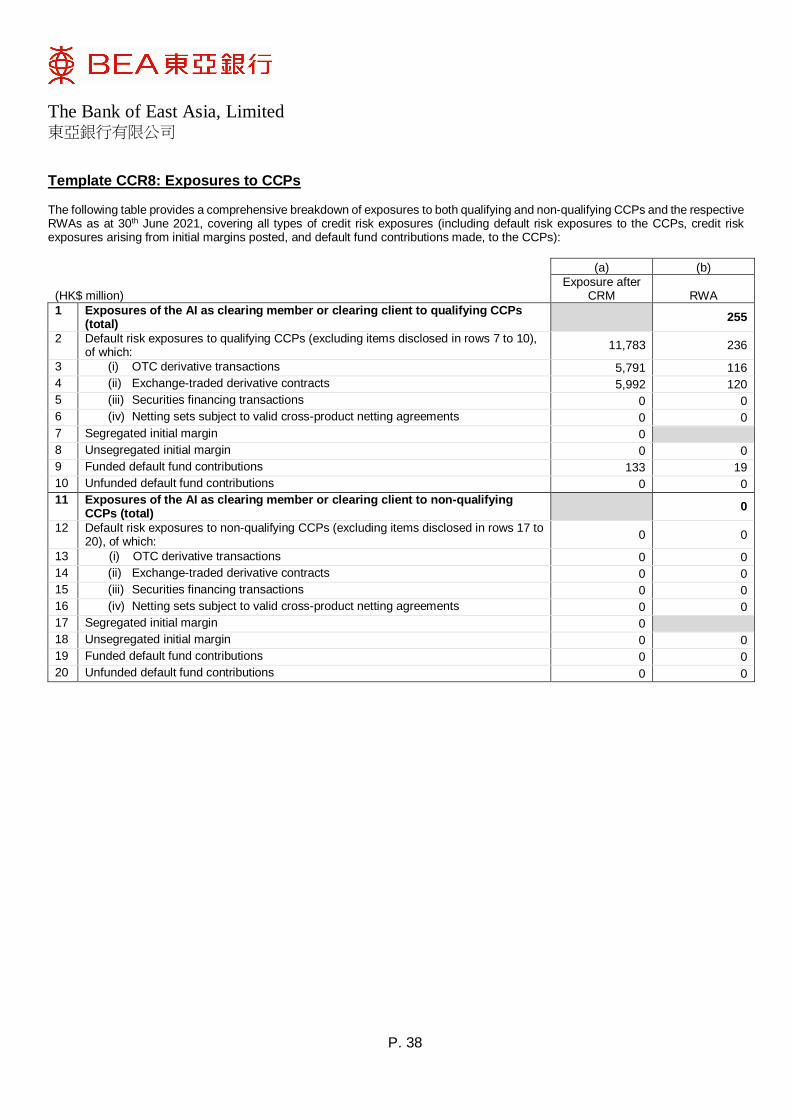
The Bank of East Asia, Limited 東亞銀行有限公司
P. 38
Template CCR8: Exposures to CCPs
The following table provides a comprehensive breakdown of exposures to both qualifying and non-qualifying CCPs and the respective RWAs as at 30th June 2021, covering all types of credit risk exposures (including default risk exposures to the CCPs, credit risk exposures arising from initial margins posted, and default fund contributions made, to the CCPs):
(HK$ million)
(a) (b)
Exposure after CRM RWA
1 Exposures of the AI as clearing member or clearing client to qualifying CCPs (total)
255
2 Default risk exposures to qualifying CCPs (excluding items disclosed in rows 7 to 10), of which:
11,783 236
3 (i) OTC derivative transactions 5,791 116
4 (ii) Exchange-traded derivative contracts 5,992 120
5 (iii) Securities financing transactions 0 0
6 (iv) Netting sets subject to valid cross-product netting agreements 0 0
7 Segregated initial margin 0
8 Unsegregated initial margin 0 0
9 Funded default fund contributions 133 19
10 Unfunded default fund contributions 0 0
11 Exposures of the AI as clearing member or clearing client to non-qualifying CCPs (total)
0
12 Default risk exposures to non-qualifying CCPs (excluding items disclosed in rows 17 to 20), of which:
0 0
13 (i) OTC derivative transactions 0 0
14 (ii) Exchange-traded derivative contracts 0 0
15 (iii) Securities financing transactions 0 0
16 (iv) Netting sets subject to valid cross-product netting agreements 0 0
17 Segregated initial margin 0
18 Unsegregated initial margin 0 0
19 Funded default fund contributions 0 0
20 Unfunded default fund contributions 0 0
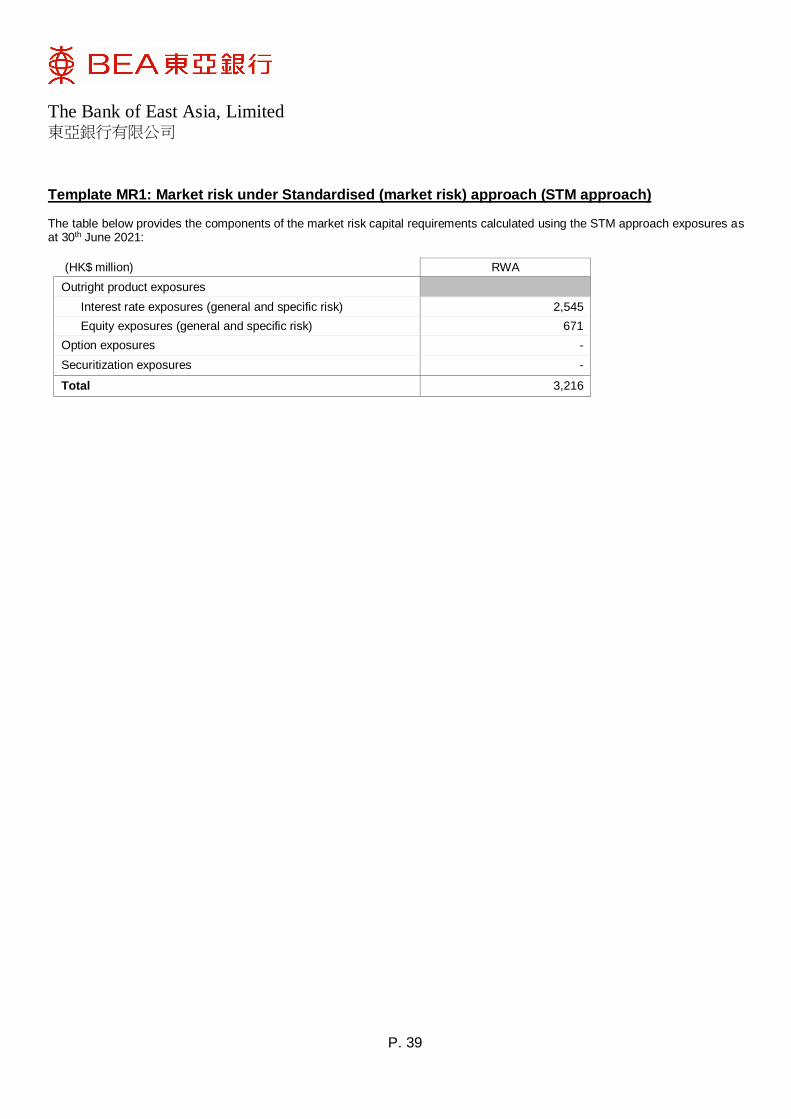
The Bank of East Asia, Limited 東亞銀行有限公司
P. 39
Template MR1: Market risk under Standardised (market risk) approach (STM approach) The table below provides the components of the market risk capital requirements calculated using the STM approach exposures as at 30th June 2021:
(HK$ million) RWA
Outright product exposures
Interest rate exposures (general and specific risk) 2,545
Equity exposures (general and specific risk) 671
Option exposures -
Securitization exposures -
Total 3,216
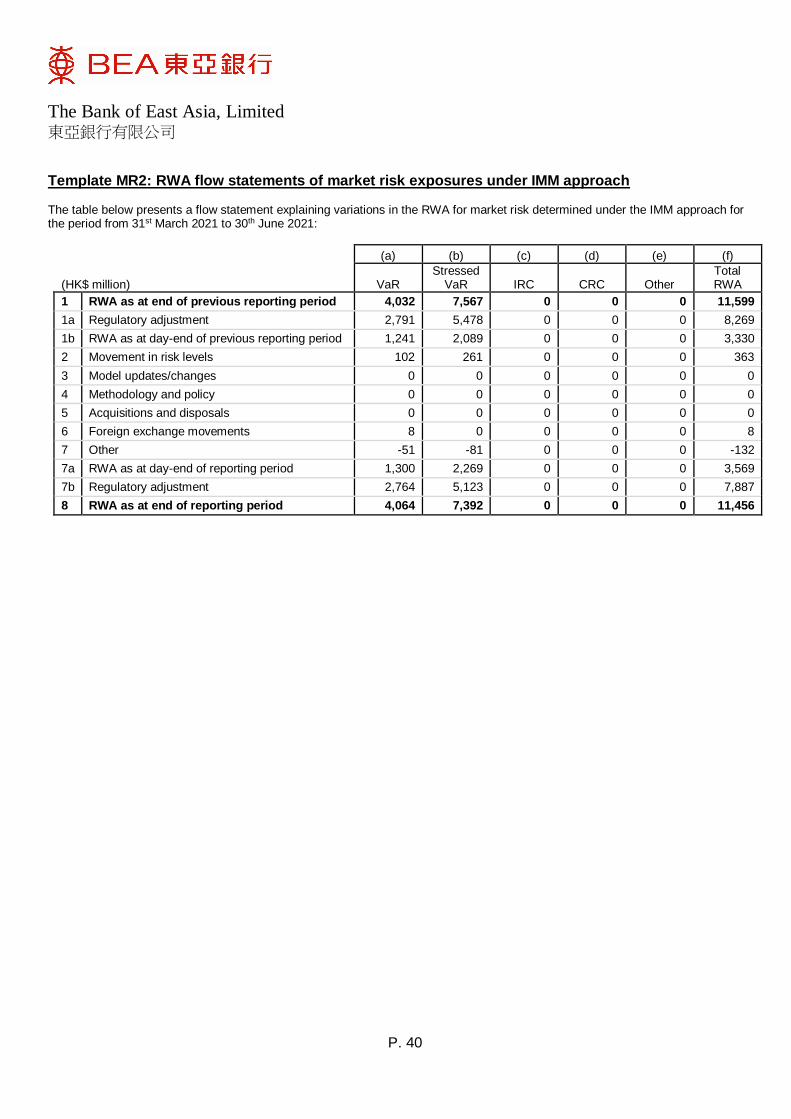
The Bank of East Asia, Limited 東亞銀行有限公司
P. 40
Template MR2: RWA flow statements of market risk exposures under IMM approach
The table below presents a flow statement explaining variations in the RWA for market risk determined under the IMM approach for the period from 31st March 2021 to 30th June 2021:
(HK$ million)
(a) (b) (c) (d) (e) (f)
VaR Stressed
VaR IRC CRC Other Total RWA
1 RWA as at end of previous reporting period 4,032 7,567 0 0 0 11,599
1a Regulatory adjustment 2,791 5,478 0 0 0 8,269
1b RWA as at day-end of previous reporting period 1,241 2,089 0 0 0 3,330
2 Movement in risk levels 102 261 0 0 0 363
3 Model updates/changes 0 0 0 0 0 0
4 Methodology and policy 0 0 0 0 0 0
5 Acquisitions and disposals 0 0 0 0 0 0
6 Foreign exchange movements 8 0 0 0 0 8
7 Other -51 -81 0 0 0 -132
7a RWA as at day-end of reporting period 1,300 2,269 0 0 0 3,569
7b Regulatory adjustment 2,764 5,123 0 0 0 7,887
8 RWA as at end of reporting period 4,064 7,392 0 0 0 11,456
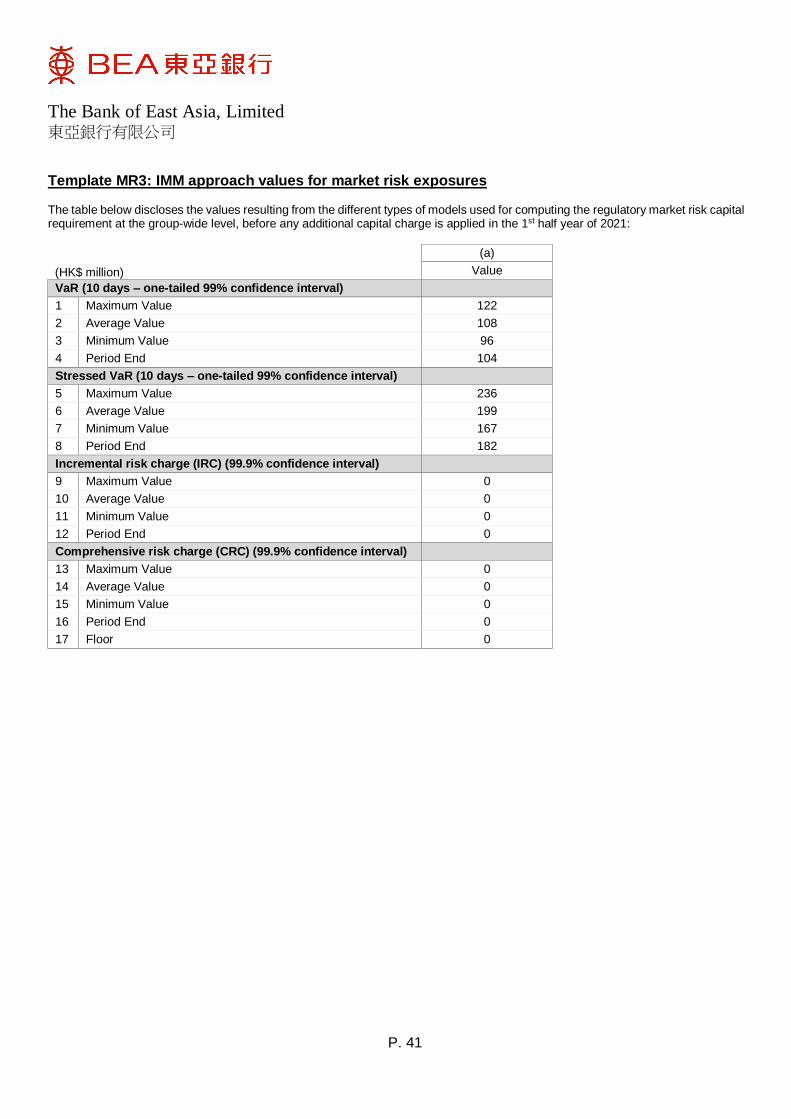
The Bank of East Asia, Limited 東亞銀行有限公司
P. 41
Template MR3: IMM approach values for market risk exposures
The table below discloses the values resulting from the different types of models used for computing the regulatory market risk capital requirement at the group-wide level, before any additional capital charge is applied in the 1st half year of 2021:
(HK$ million)
(a)
Value
VaR (10 days – one-tailed 99% confidence interval)
1 Maximum Value 122
2 Average Value 108
3 Minimum Value 96
4 Period End 104
Stressed VaR (10 days – one-tailed 99% confidence interval)
5 Maximum Value 236
6 Average Value 199
7 Minimum Value 167
8 Period End 182
Incremental risk charge (IRC) (99.9% confidence interval)
9 Maximum Value 0
10 Average Value 0
11 Minimum Value 0
12 Period End 0
Comprehensive risk charge (CRC) (99.9% confidence interval)
13 Maximum Value 0
14 Average Value 0
15 Minimum Value 0
16 Period End 0
17 Floor 0
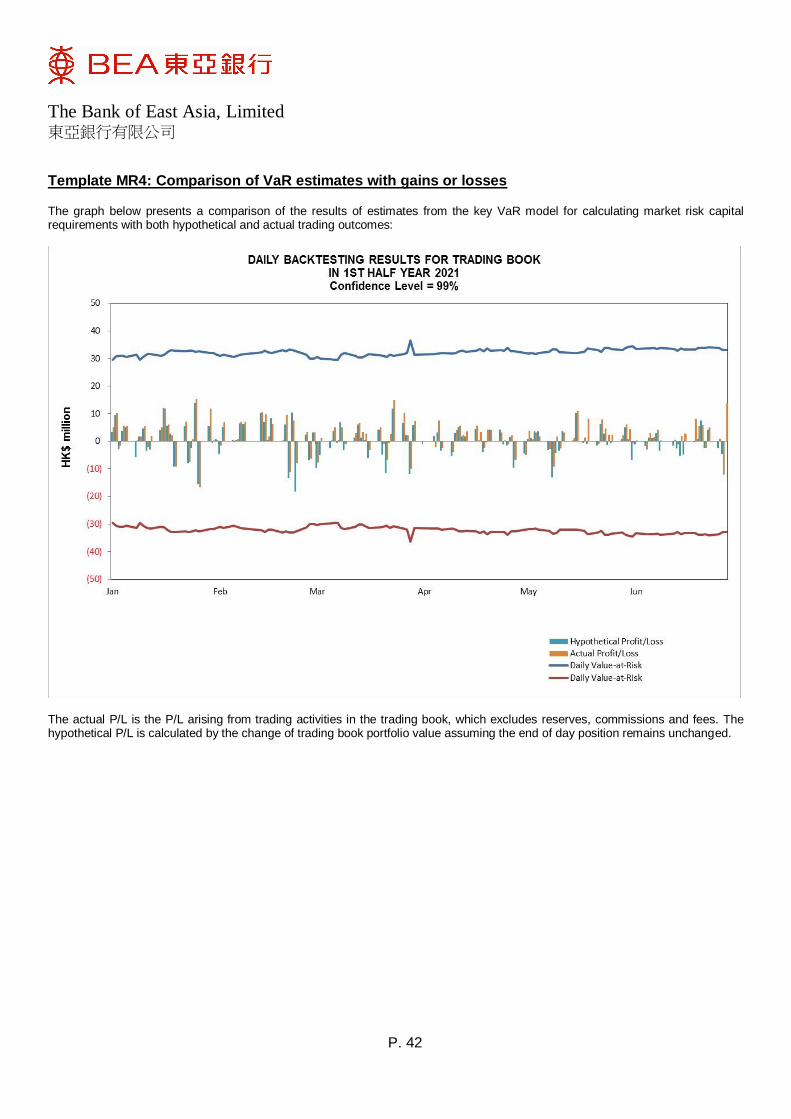
The Bank of East Asia, Limited 東亞銀行有限公司
P. 42
Template MR4: Comparison of VaR estimates with gains or losses
The graph below presents a comparison of the results of estimates from the key VaR model for calculating market risk capital requirements with both hypothetical and actual trading outcomes:
The actual P/L is the P/L arising from trading activities in the trading book, which excludes reserves, commissions and fees. The hypothetical P/L is calculated by the change of trading book portfolio value assuming the end of day position remains unchanged.
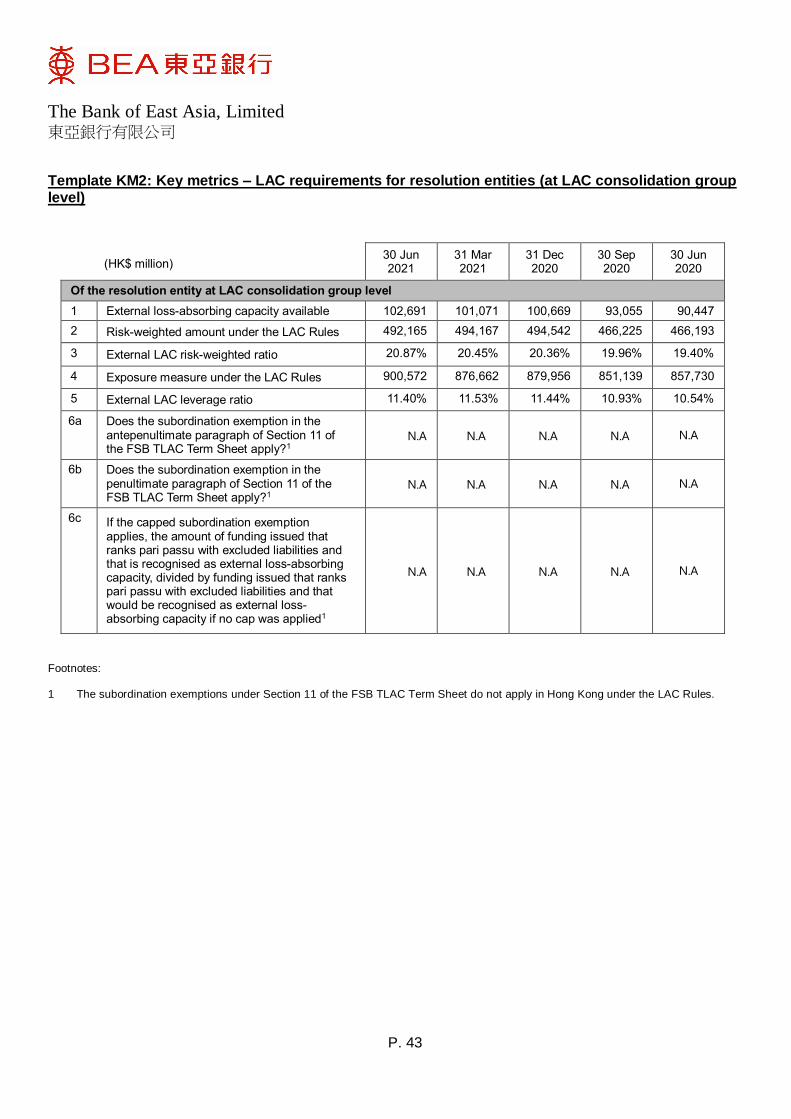
The Bank of East Asia, Limited 東亞銀行有限公司
P. 43
Template KM2: Key metrics – LAC requirements for resolution entities (at LAC consolidation group level)
(HK$ million) 30 Jun 2021
31 Mar 2021
31 Dec 2020
30 Sep 2020
30 Jun 2020
Of the resolution entity at LAC consolidation group level
1 External loss-absorbing capacity available 102,691 101,071 100,669 93,055 90,447
2 Risk-weighted amount under the LAC Rules 492,165 494,167 494,542 466,225 466,193
3 External LAC risk-weighted ratio 20.87% 20.45% 20.36% 19.96% 19.40%
4 Exposure measure under the LAC Rules 900,572 876,662 879,956 851,139 857,730
5 External LAC leverage ratio 11.40% 11.53% 11.44% 10.93% 10.54%
6a Does the subordination exemption in the antepenultimate paragraph of Section 11 of the FSB TLAC Term Sheet apply?1
N.A N.A N.A N.A N.A
6b Does the subordination exemption in the penultimate paragraph of Section 11 of the FSB TLAC Term Sheet apply?1
N.A N.A N.A N.A N.A
6c If the capped subordination exemption applies, the amount of funding issued that ranks pari passu with excluded liabilities and that is recognised as external loss-absorbing capacity, divided by funding issued that ranks pari passu with excluded liabilities and that would be recognised as external loss-absorbing capacity if no cap was applied1
N.A N.A N.A N.A N.A
Footnotes: 1 The subordination exemptions under Section 11 of the FSB TLAC Term Sheet do not apply in Hong Kong under the LAC Rules.
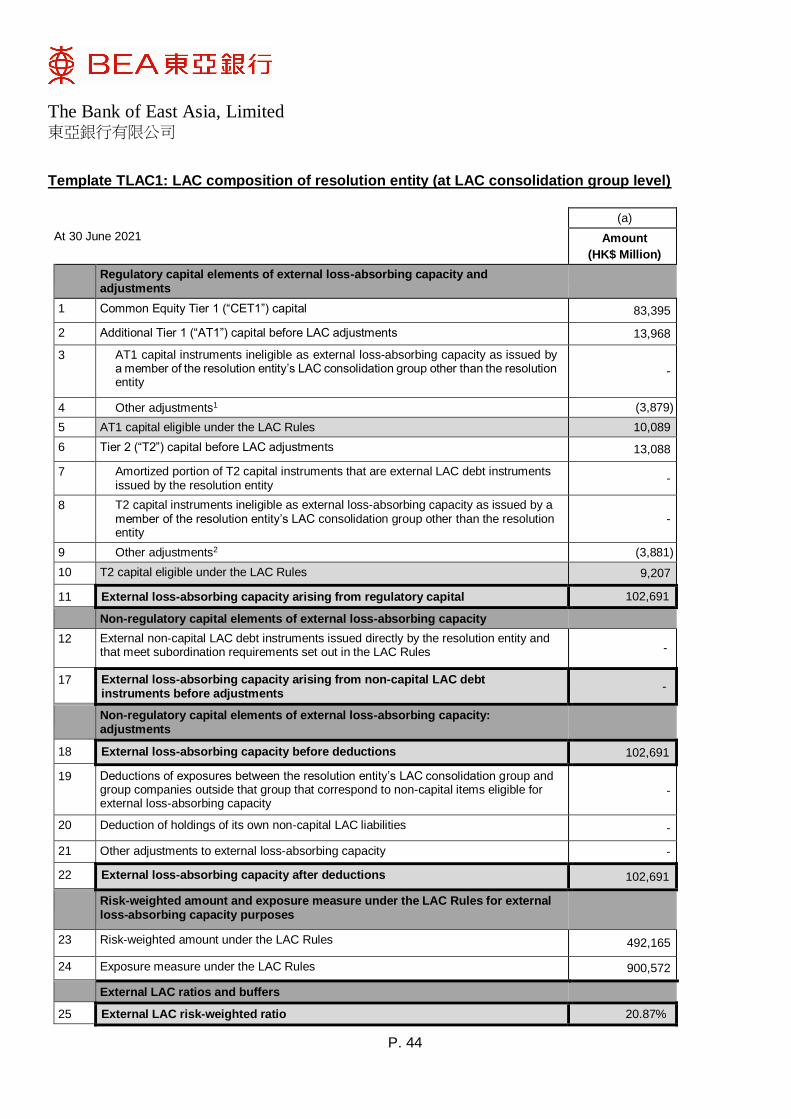
The Bank of East Asia, Limited 東亞銀行有限公司
P. 44
Template TLAC1: LAC composition of resolution entity (at LAC consolidation group level)
At 30 June 2021
(a)
Amount
(HK$ Million)
Regulatory capital elements of external loss-absorbing capacity and adjustments
1 Common Equity Tier 1 (“CET1”) capital 83,395
2 Additional Tier 1 (“AT1”) capital before LAC adjustments 13,968
3 AT1 capital instruments ineligible as external loss-absorbing capacity as issued by a member of the resolution entity’s LAC consolidation group other than the resolution entity
-
4 Other adjustments1 (3,879)
5 AT1 capital eligible under the LAC Rules 10,089
6 Tier 2 (“T2”) capital before LAC adjustments 13,088
7 Amortized portion of T2 capital instruments that are external LAC debt instruments issued by the resolution entity
-
8 T2 capital instruments ineligible as external loss-absorbing capacity as issued by a member of the resolution entity’s LAC consolidation group other than the resolution entity
-
9 Other adjustments2 (3,881)
10 T2 capital eligible under the LAC Rules 9,207
11 External loss-absorbing capacity arising from regulatory capital 102,691
Non-regulatory capital elements of external loss-absorbing capacity
12 External non-capital LAC debt instruments issued directly by the resolution entity and that meet subordination requirements set out in the LAC Rules -
17 External loss-absorbing capacity arising from non-capital LAC debt instruments before adjustments
-
Non-regulatory capital elements of external loss-absorbing capacity: adjustments
18 External loss-absorbing capacity before deductions 102,691
19 Deductions of exposures between the resolution entity’s LAC consolidation group and group companies outside that group that correspond to non-capital items eligible for external loss-absorbing capacity
-
20 Deduction of holdings of its own non-capital LAC liabilities -
21 Other adjustments to external loss-absorbing capacity -
22 External loss-absorbing capacity after deductions 102,691
Risk-weighted amount and exposure measure under the LAC Rules for external loss-absorbing capacity purposes
23 Risk-weighted amount under the LAC Rules 492,165
24 Exposure measure under the LAC Rules 900,572
External LAC ratios and buffers
25 External LAC risk-weighted ratio 20.87%
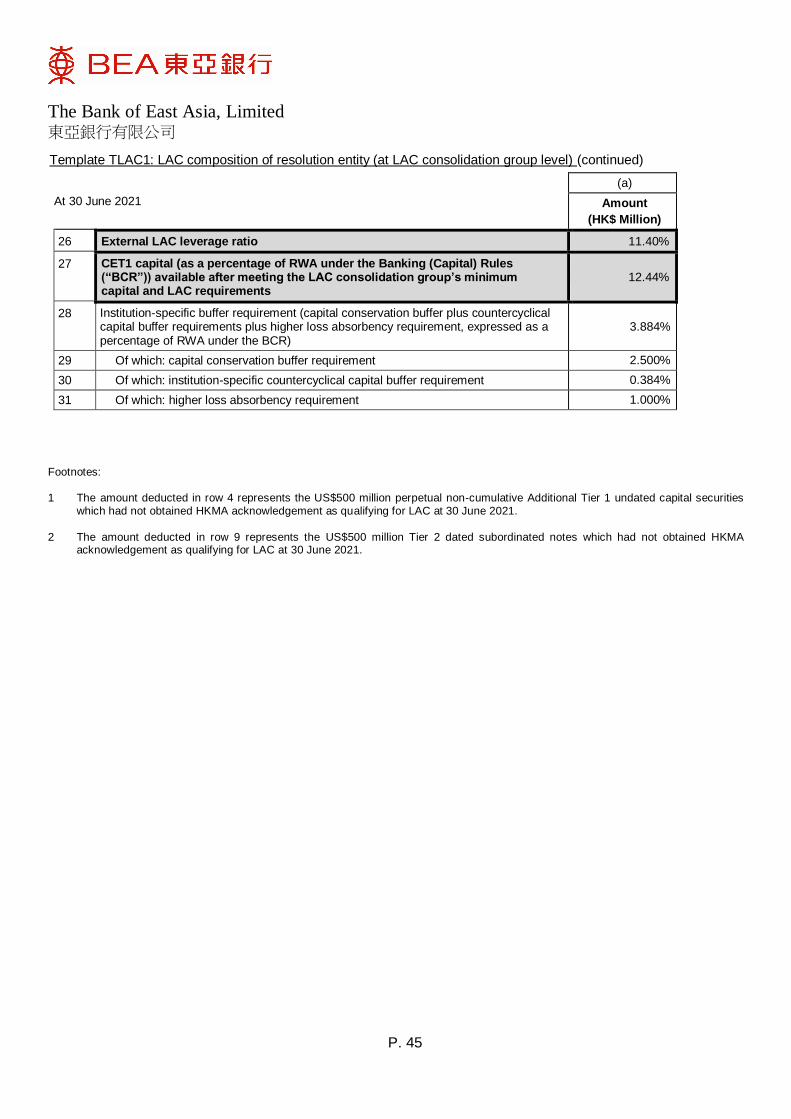
The Bank of East Asia, Limited 東亞銀行有限公司
P. 45
At 30 June 2021
(a)
Amount
(HK$ Million)
26 External LAC leverage ratio 11.40%
27 CET1 capital (as a percentage of RWA under the Banking (Capital) Rules (“BCR”)) available after meeting the LAC consolidation group’s minimum capital and LAC requirements
12.44%
28 Institution-specific buffer requirement (capital conservation buffer plus countercyclical capital buffer requirements plus higher loss absorbency requirement, expressed as a percentage of RWA under the BCR)
3.884%
29 Of which: capital conservation buffer requirement 2.500%
30 Of which: institution-specific countercyclical capital buffer requirement 0.384%
31 Of which: higher loss absorbency requirement 1.000%
Footnotes: 1 The amount deducted in row 4 represents the US$500 million perpetual non-cumulative Additional Tier 1 undated capital securities
which had not obtained HKMA acknowledgement as qualifying for LAC at 30 June 2021. 2 The amount deducted in row 9 represents the US$500 million Tier 2 dated subordinated notes which had not obtained HKMA
acknowledgement as qualifying for LAC at 30 June 2021.
Template TLAC1: LAC composition of resolution entity (at LAC consolidation group level) (continued)
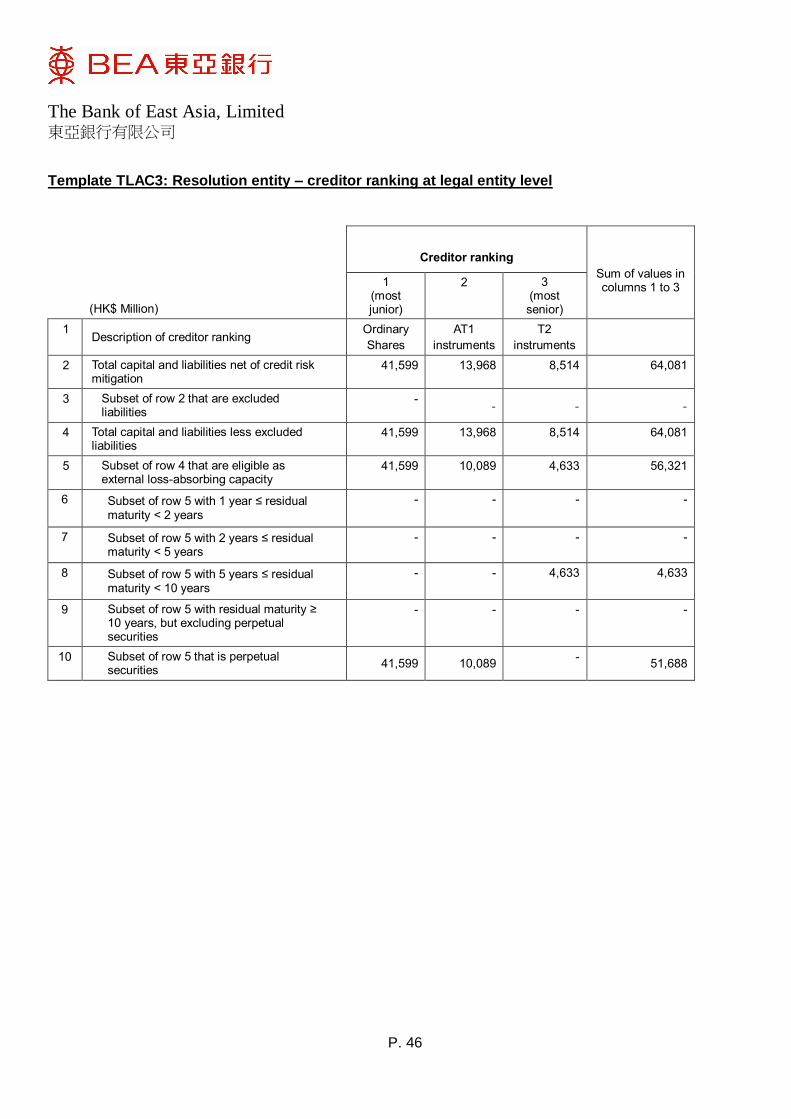
The Bank of East Asia, Limited 東亞銀行有限公司
P. 46
Template TLAC3: Resolution entity – creditor ranking at legal entity level
(HK$ Million)
Creditor ranking
Sum of values in columns 1 to 3 1
(most junior)
2
3 (most senior)
1 Description of creditor ranking
Ordinary
Shares
AT1
instruments
T2
instruments
2 Total capital and liabilities net of credit risk mitigation
41,599 13,968 8,514 64,081
3 Subset of row 2 that are excluded liabilities
- - - -
4 Total capital and liabilities less excluded liabilities
41,599 13,968 8,514 64,081
5 Subset of row 4 that are eligible as external loss-absorbing capacity
41,599 10,089 4,633 56,321
6 Subset of row 5 with 1 year ≤ residual maturity < 2 years
- - - -
7 Subset of row 5 with 2 years ≤ residual maturity < 5 years
- - - -
8 Subset of row 5 with 5 years ≤ residual maturity < 10 years
- - 4,633 4,633
9 Subset of row 5 with residual maturity ≥ 10 years, but excluding perpetual securities
- - - -
10 Subset of row 5 that is perpetual securities
41,599 10,089 -
51,688
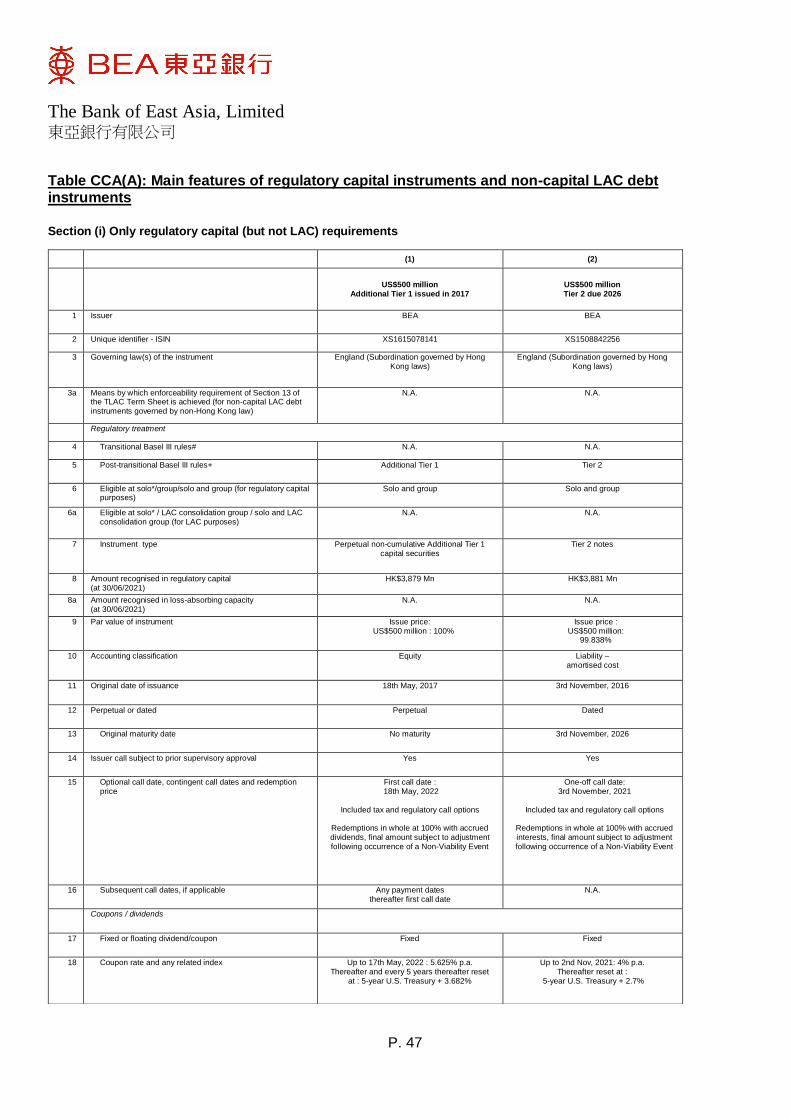
The Bank of East Asia, Limited 東亞銀行有限公司
P. 47
Table CCA(A): Main features of regulatory capital instruments and non-capital LAC debt instruments
Section (i) Only regulatory capital (but not LAC) requirements
(1) (2)
US$500 million Additional Tier 1 issued in 2017
US$500 million Tier 2 due 2026
1 Issuer BEA BEA
2 Unique identifier - ISIN XS1615078141 XS1508842256
3 Governing law(s) of the instrument England (Subordination governed by Hong Kong laws)
England (Subordination governed by Hong Kong laws)
3a Means by which enforceability requirement of Section 13 of the TLAC Term Sheet is achieved (for non-capital LAC debt instruments governed by non-Hong Kong law)
N.A. N.A.
Regulatory treatment
4 Transitional Basel III rules# N.A. N.A.
5 Post-transitional Basel III rules+ Additional Tier 1 Tier 2
6 Eligible at solo*/group/solo and group (for regulatory capital purposes)
Solo and group Solo and group
6a Eligible at solo* / LAC consolidation group / solo and LAC consolidation group (for LAC purposes)
N.A. N.A.
7 Instrument type Perpetual non-cumulative Additional Tier 1 capital securities
Tier 2 notes
8 Amount recognised in regulatory capital (at 30/06/2021)
HK$3,879 Mn HK$3,881 Mn
8a Amount recognised in loss-absorbing capacity (at 30/06/2021)
N.A. N.A.
9 Par value of instrument Issue price: US$500 million : 100%
Issue price : US$500 million:
99.838%
10 Accounting classification Equity Liability – amortised cost
11 Original date of issuance 18th May, 2017 3rd November, 2016
12 Perpetual or dated Perpetual Dated
13 Original maturity date No maturity 3rd November, 2026
14 Issuer call subject to prior supervisory approval Yes Yes
15 Optional call date, contingent call dates and redemption price
First call date : 18th May, 2022
Included tax and regulatory call options
Redemptions in whole at 100% with accrued dividends, final amount subject to adjustment following occurrence of a Non-Viability Event
One-off call date: 3rd November, 2021
Included tax and regulatory call options
Redemptions in whole at 100% with accrued interests, final amount subject to adjustment following occurrence of a Non-Viability Event
16 Subsequent call dates, if applicable Any payment dates thereafter first call date
N.A.
Coupons / dividends
17 Fixed or floating dividend/coupon Fixed Fixed
18 Coupon rate and any related index Up to 17th May, 2022 : 5.625% p.a. Thereafter and every 5 years thereafter reset
at : 5-year U.S. Treasury + 3.682%
Up to 2nd Nov, 2021: 4% p.a. Thereafter reset at :
5-year U.S. Treasury + 2.7%
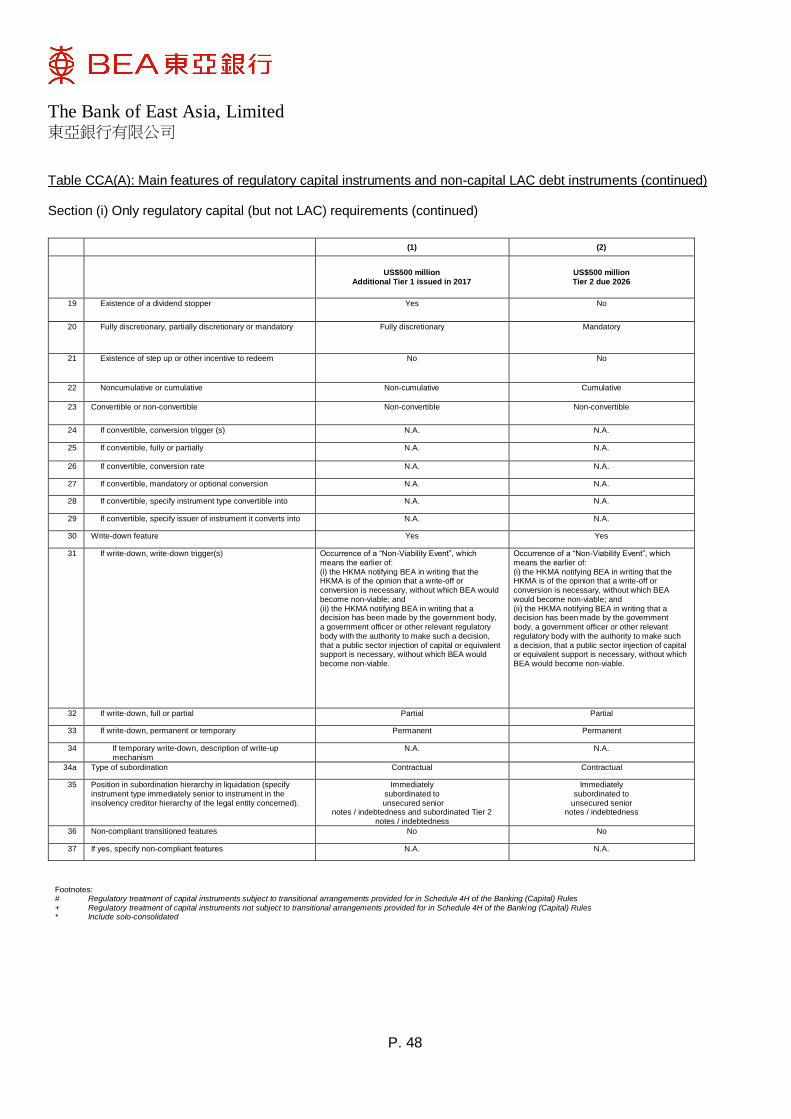
The Bank of East Asia, Limited 東亞銀行有限公司
P. 48
Table CCA(A): Main features of regulatory capital instruments and non-capital LAC debt instruments (continued)
Section (i) Only regulatory capital (but not LAC) requirements (continued)
(1) (2)
US$500 million Additional Tier 1 issued in 2017
US$500 million Tier 2 due 2026
19 Existence of a dividend stopper Yes No
20 Fully discretionary, partially discretionary or mandatory Fully discretionary Mandatory
21 Existence of step up or other incentive to redeem No No
22 Noncumulative or cumulative Non-cumulative Cumulative
23 Convertible or non-convertible Non-convertible Non-convertible
24 If convertible, conversion trigger (s) N.A. N.A.
25 If convertible, fully or partially N.A. N.A.
26 If convertible, conversion rate N.A. N.A.
27 If convertible, mandatory or optional conversion N.A. N.A.
28 If convertible, specify instrument type convertible into N.A. N.A.
29 If convertible, specify issuer of instrument it converts into N.A. N.A.
30 Write-down feature Yes Yes
31 If write-down, write-down trigger(s) Occurrence of a “Non-Viability Event”, which means the earlier of: (i) the HKMA notifying BEA in writing that the HKMA is of the opinion that a write-off or conversion is necessary, without which BEA would become non-viable; and (ii) the HKMA notifying BEA in writing that a decision has been made by the government body, a government officer or other relevant regulatory body with the authority to make such a decision, that a public sector injection of capital or equivalent support is necessary, without which BEA would become non-viable.
Occurrence of a “Non-Viability Event”, which means the earlier of: (i) the HKMA notifying BEA in writing that the HKMA is of the opinion that a write-off or conversion is necessary, without which BEA would become non-viable; and (ii) the HKMA notifying BEA in writing that a decision has been made by the government body, a government officer or other relevant regulatory body with the authority to make such a decision, that a public sector injection of capital or equivalent support is necessary, without which BEA would become non-viable.
32 If write-down, full or partial Partial Partial
33 If write-down, permanent or temporary Permanent Permanent
34 If temporary write-down, description of write-up mechanism
N.A. N.A.
34a Type of subordination Contractual Contractual
35 Position in subordination hierarchy in liquidation (specify instrument type immediately senior to instrument in the insolvency creditor hierarchy of the legal entity concerned).
Immediately subordinated to
unsecured senior notes / indebtedness and subordinated Tier 2
notes / indebtedness
Immediately subordinated to
unsecured senior notes / indebtedness
36 Non-compliant transitioned features No No
37 If yes, specify non-compliant features N.A. N.A.
Footnotes: # Regulatory treatment of capital instruments subject to transitional arrangements provided for in Schedule 4H of the Banking (Capital) Rules + Regulatory treatment of capital instruments not subject to transitional arrangements provided for in Schedule 4H of the Banking (Capital) Rules * Include solo-consolidated
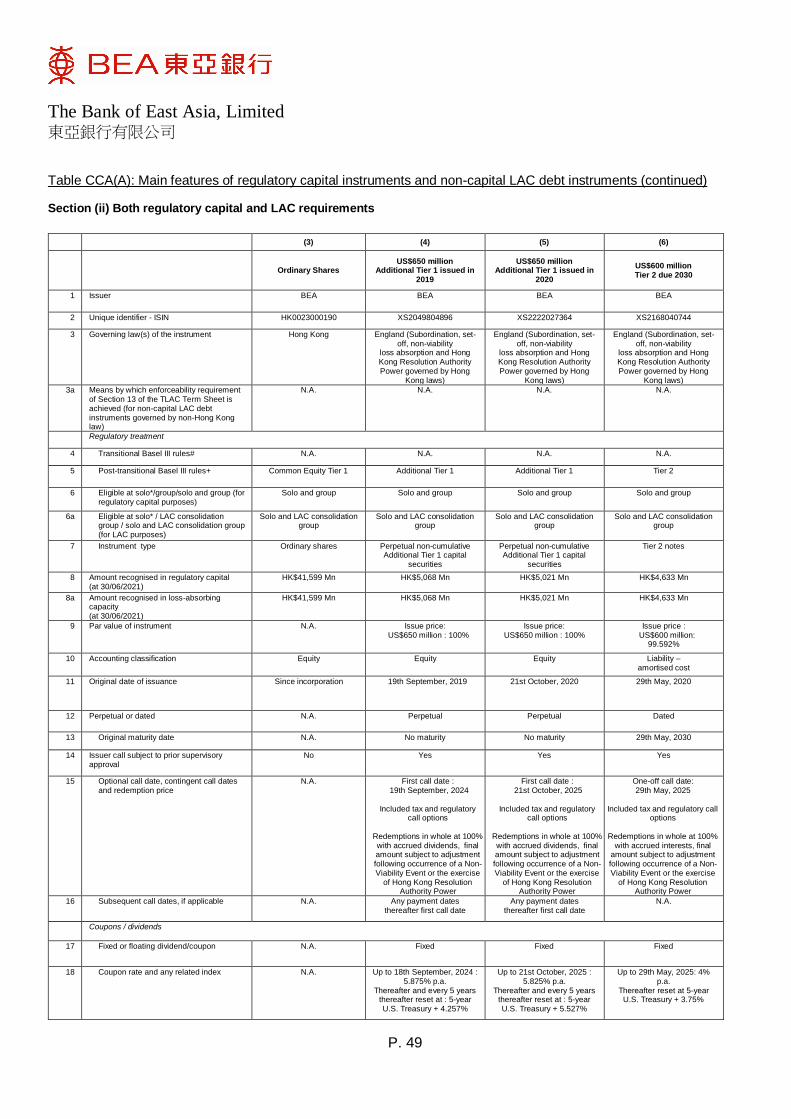
The Bank of East Asia, Limited 東亞銀行有限公司
P. 49
Table CCA(A): Main features of regulatory capital instruments and non-capital LAC debt instruments (continued) Section (ii) Both regulatory capital and LAC requirements
(3) (4) (5) (6)
Ordinary Shares US$650 million
Additional Tier 1 issued in 2019
US$650 million Additional Tier 1 issued in
2020
US$600 million Tier 2 due 2030
1 Issuer BEA BEA BEA BEA
2 Unique identifier - ISIN HK0023000190 XS2049804896 XS2222027364 XS2168040744
3 Governing law(s) of the instrument Hong Kong England (Subordination, set-off, non-viability
loss absorption and Hong Kong Resolution Authority Power governed by Hong
Kong laws)
England (Subordination, set-off, non-viability
loss absorption and Hong Kong Resolution Authority Power governed by Hong
Kong laws)
England (Subordination, set-off, non-viability
loss absorption and Hong Kong Resolution Authority Power governed by Hong
Kong laws)
3a Means by which enforceability requirement of Section 13 of the TLAC Term Sheet is achieved (for non-capital LAC debt instruments governed by non-Hong Kong law)
N.A. N.A. N.A. N.A.
Regulatory treatment
4 Transitional Basel III rules# N.A. N.A. N.A. N.A.
5 Post-transitional Basel III rules+ Common Equity Tier 1 Additional Tier 1 Additional Tier 1 Tier 2
6 Eligible at solo*/group/solo and group (for regulatory capital purposes)
Solo and group Solo and group Solo and group Solo and group
6a Eligible at solo* / LAC consolidation group / solo and LAC consolidation group (for LAC purposes)
Solo and LAC consolidation group
Solo and LAC consolidation group
Solo and LAC consolidation group
Solo and LAC consolidation group
7 Instrument type Ordinary shares Perpetual non-cumulative Additional Tier 1 capital
securities
Perpetual non-cumulative Additional Tier 1 capital
securities
Tier 2 notes
8 Amount recognised in regulatory capital (at 30/06/2021)
HK$41,599 Mn HK$5,068 Mn HK$5,021 Mn
HK$4,633 Mn
8a Amount recognised in loss-absorbing capacity (at 30/06/2021)
HK$41,599 Mn HK$5,068 Mn HK$5,021 Mn
HK$4,633 Mn
9 Par value of instrument N.A. Issue price: US$650 million : 100%
Issue price: US$650 million : 100%
Issue price : US$600 million:
99.592%
10 Accounting classification Equity Equity Equity Liability – amortised cost
11 Original date of issuance Since incorporation 19th September, 2019 21st October, 2020 29th May, 2020
12 Perpetual or dated N.A. Perpetual Perpetual Dated
13 Original maturity date N.A. No maturity No maturity 29th May, 2030
14 Issuer call subject to prior supervisory approval
No Yes Yes Yes
15 Optional call date, contingent call dates and redemption price
N.A. First call date : 19th September, 2024
Included tax and regulatory
call options
Redemptions in whole at 100% with accrued dividends, final amount subject to adjustment following occurrence of a Non-Viability Event or the exercise
of Hong Kong Resolution Authority Power
First call date : 21st October, 2025
Included tax and regulatory
call options
Redemptions in whole at 100% with accrued dividends, final amount subject to adjustment following occurrence of a Non-Viability Event or the exercise
of Hong Kong Resolution Authority Power
One-off call date: 29th May, 2025
Included tax and regulatory call
options
Redemptions in whole at 100% with accrued interests, final
amount subject to adjustment following occurrence of a Non-Viability Event or the exercise
of Hong Kong Resolution Authority Power
16 Subsequent call dates, if applicable N.A. Any payment dates thereafter first call date
Any payment dates thereafter first call date
N.A.
Coupons / dividends
17 Fixed or floating dividend/coupon N.A. Fixed Fixed Fixed
18 Coupon rate and any related index N.A. Up to 18th September, 2024 : 5.875% p.a.
Thereafter and every 5 years thereafter reset at : 5-year U.S. Treasury + 4.257%
Up to 21st October, 2025 : 5.825% p.a.
Thereafter and every 5 years thereafter reset at : 5-year U.S. Treasury + 5.527%
Up to 29th May, 2025: 4% p.a.
Thereafter reset at 5-year U.S. Treasury + 3.75%
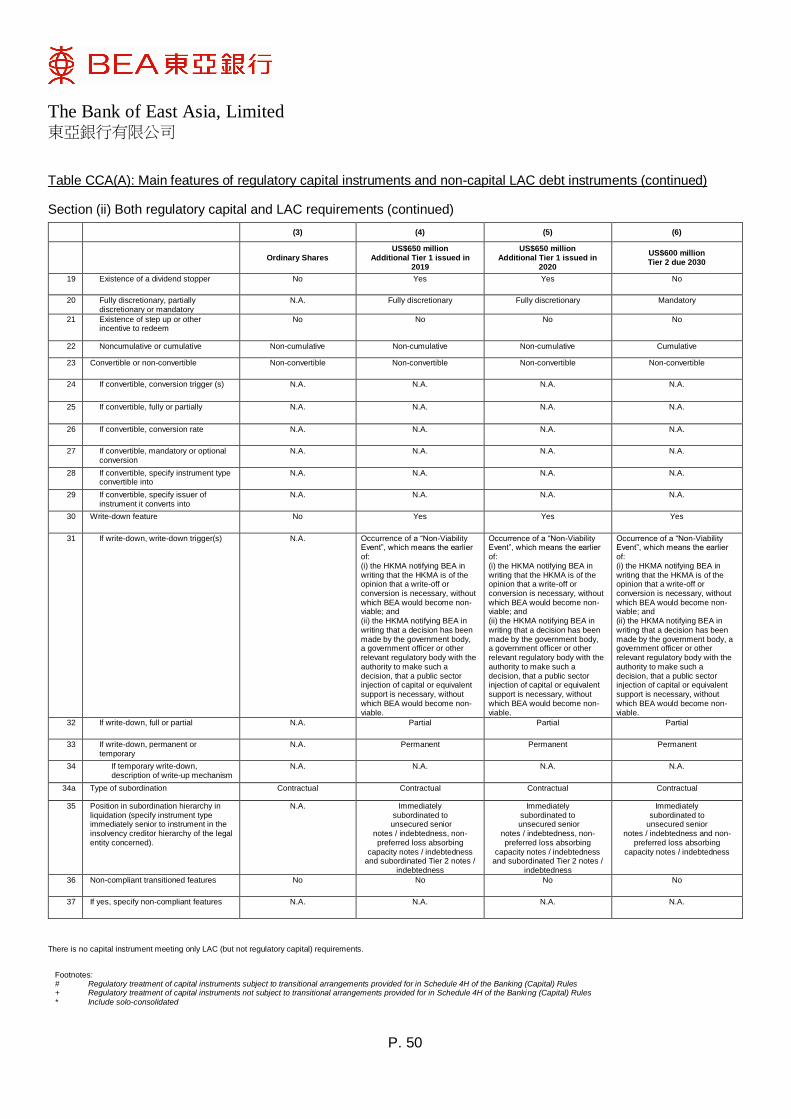
The Bank of East Asia, Limited 東亞銀行有限公司
P. 50
Table CCA(A): Main features of regulatory capital instruments and non-capital LAC debt instruments (continued)
Section (ii) Both regulatory capital and LAC requirements (continued)
There is no capital instrument meeting only LAC (but not regulatory capital) requirements.
(3) (4) (5) (6)
Ordinary Shares US$650 million
Additional Tier 1 issued in 2019
US$650 million Additional Tier 1 issued in
2020
US$600 million Tier 2 due 2030
19 Existence of a dividend stopper No Yes Yes No
20 Fully discretionary, partially discretionary or mandatory
N.A. Fully discretionary Fully discretionary Mandatory
21 Existence of step up or other incentive to redeem
No No No No
22 Noncumulative or cumulative Non-cumulative Non-cumulative Non-cumulative Cumulative
23 Convertible or non-convertible Non-convertible Non-convertible Non-convertible Non-convertible
24 If convertible, conversion trigger (s) N.A. N.A. N.A. N.A.
25 If convertible, fully or partially N.A. N.A. N.A. N.A.
26 If convertible, conversion rate N.A. N.A. N.A. N.A.
27 If convertible, mandatory or optional conversion
N.A. N.A. N.A. N.A.
28 If convertible, specify instrument type convertible into
N.A. N.A. N.A. N.A.
29 If convertible, specify issuer of instrument it converts into
N.A. N.A. N.A. N.A.
30 Write-down feature No Yes Yes Yes
31 If write-down, write-down trigger(s) N.A. Occurrence of a “Non-Viability Event”, which means the earlier of: (i) the HKMA notifying BEA in writing that the HKMA is of the opinion that a write-off or conversion is necessary, without which BEA would become non-viable; and (ii) the HKMA notifying BEA in writing that a decision has been made by the government body, a government officer or other relevant regulatory body with the authority to make such a decision, that a public sector injection of capital or equivalent support is necessary, without which BEA would become non-viable.
Occurrence of a “Non-Viability Event”, which means the earlier of: (i) the HKMA notifying BEA in writing that the HKMA is of the opinion that a write-off or conversion is necessary, without which BEA would become non-viable; and (ii) the HKMA notifying BEA in writing that a decision has been made by the government body, a government officer or other relevant regulatory body with the authority to make such a decision, that a public sector injection of capital or equivalent support is necessary, without which BEA would become non-viable.
Occurrence of a “Non-Viability Event”, which means the earlier of: (i) the HKMA notifying BEA in writing that the HKMA is of the opinion that a write-off or conversion is necessary, without which BEA would become non-viable; and (ii) the HKMA notifying BEA in writing that a decision has been made by the government body, a government officer or other relevant regulatory body with the authority to make such a decision, that a public sector injection of capital or equivalent support is necessary, without which BEA would become non-viable.
32 If write-down, full or partial N.A. Partial Partial Partial
33 If write-down, permanent or temporary
N.A. Permanent Permanent Permanent
34 If temporary write-down, description of write-up mechanism
N.A. N.A. N.A. N.A.
34a Type of subordination Contractual Contractual Contractual Contractual
35 Position in subordination hierarchy in liquidation (specify instrument type immediately senior to instrument in the insolvency creditor hierarchy of the legal entity concerned).
N.A. Immediately subordinated to
unsecured senior notes / indebtedness, non-preferred loss absorbing
capacity notes / indebtedness and subordinated Tier 2 notes /
indebtedness
Immediately subordinated to
unsecured senior notes / indebtedness, non-preferred loss absorbing
capacity notes / indebtedness and subordinated Tier 2 notes /
indebtedness
Immediately subordinated to
unsecured senior notes / indebtedness and non-
preferred loss absorbing capacity notes / indebtedness
36 Non-compliant transitioned features No No No No
37 If yes, specify non-compliant features N.A. N.A. N.A. N.A.
Footnotes: # Regulatory treatment of capital instruments subject to transitional arrangements provided for in Schedule 4H of the Banking (Capital) Rules + Regulatory treatment of capital instruments not subject to transitional arrangements provided for in Schedule 4H of the Banking (Capital) Rules * Include solo-consolidated
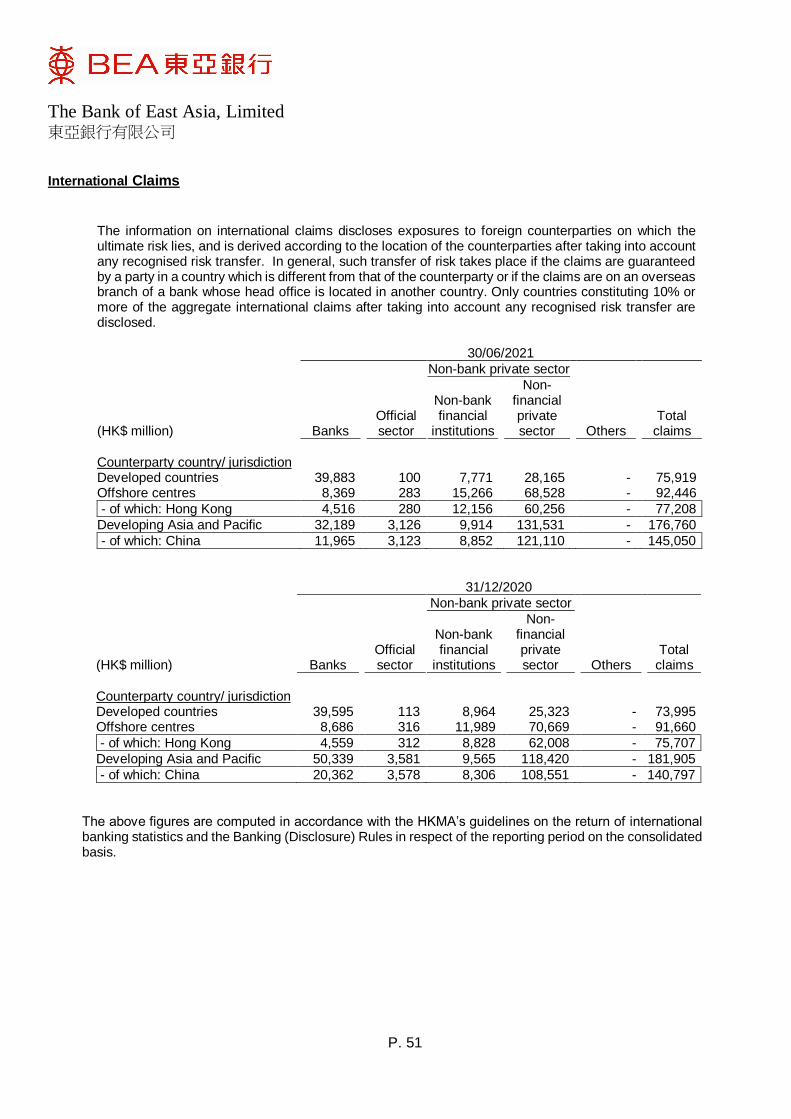
The Bank of East Asia, Limited 東亞銀行有限公司
P. 51
International Claims
The information on international claims discloses exposures to foreign counterparties on which the ultimate risk lies, and is derived according to the location of the counterparties after taking into account any recognised risk transfer. In general, such transfer of risk takes place if the claims are guaranteed by a party in a country which is different from that of the counterparty or if the claims are on an overseas branch of a bank whose head office is located in another country. Only countries constituting 10% or more of the aggregate international claims after taking into account any recognised risk transfer are disclosed.
30/06/2021
Non-bank private sector
(HK$ million) Banks Official sector
Non-bank financial
institutions
Non- financial private sector Others
Total claims
Counterparty country/ jurisdiction Developed countries 39,883 100 7,771 28,165 - 75,919 Offshore centres 8,369 283 15,266 68,528 - 92,446
- of which: Hong Kong 4,516 280 12,156 60,256 - 77,208
Developing Asia and Pacific 32,189 3,126 9,914 131,531 - 176,760
- of which: China 11,965 3,123 8,852 121,110 - 145,050
31/12/2020
Non-bank private sector
(HK$ million) Banks Official sector
Non-bank financial
institutions
Non- financial private sector Others
Total claims
Counterparty country/ jurisdiction Developed countries 39,595 113 8,964 25,323 - 73,995 Offshore centres 8,686 316 11,989 70,669 - 91,660
- of which: Hong Kong 4,559 312 8,828 62,008 - 75,707
Developing Asia and Pacific 50,339 3,581 9,565 118,420 - 181,905
- of which: China 20,362 3,578 8,306 108,551 - 140,797
The above figures are computed in accordance with the HKMA’s guidelines on the return of international banking statistics and the Banking (Disclosure) Rules in respect of the reporting period on the consolidated basis.
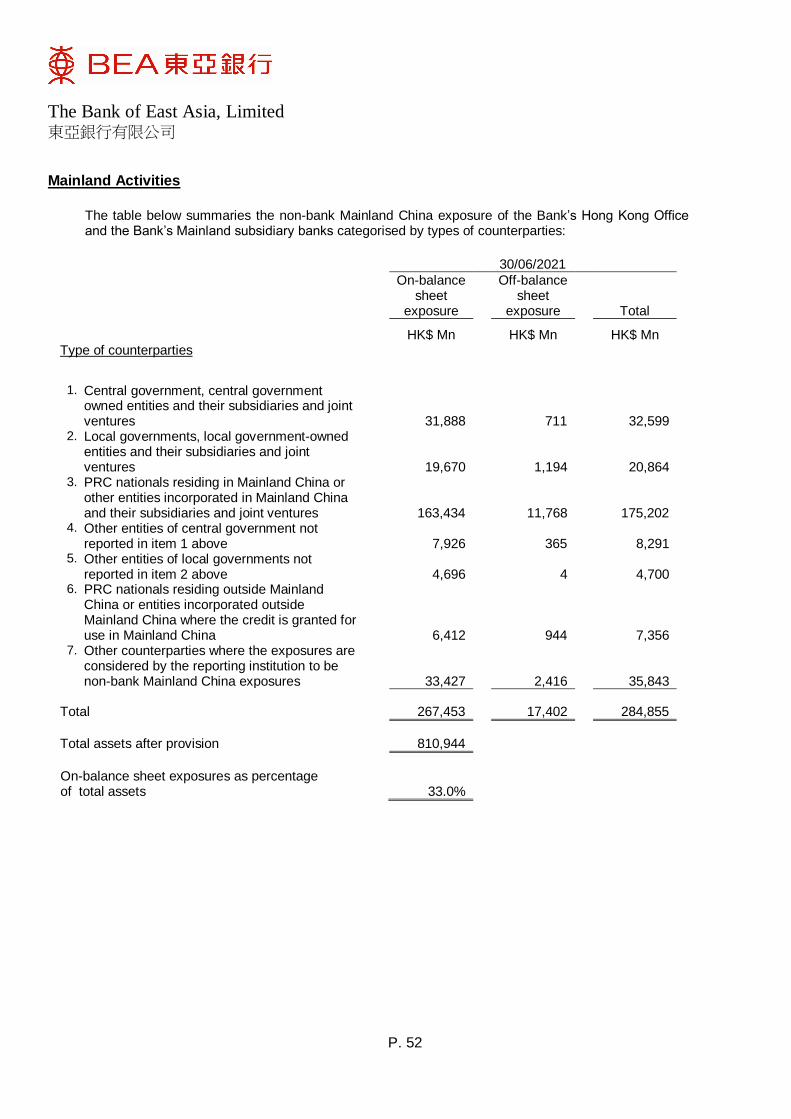
The Bank of East Asia, Limited 東亞銀行有限公司
P. 52
Mainland Activities
The table below summaries the non-bank Mainland China exposure of the Bank’s Hong Kong Office
and the Bank’s Mainland subsidiary banks categorised by types of counterparties:
30/06/2021
On-balance sheet
exposure
Off-balance sheet
exposure Total
HK$ Mn HK$ Mn HK$ Mn Type of counterparties
1. Central government, central government owned entities and their subsidiaries and joint ventures 31,888 711 32,599
2. Local governments, local government-owned entities and their subsidiaries and joint ventures 19,670 1,194 20,864
3. PRC nationals residing in Mainland China or other entities incorporated in Mainland China and their subsidiaries and joint ventures 163,434 11,768 175,202
4. Other entities of central government not reported in item 1 above 7,926 365 8,291
5. Other entities of local governments not reported in item 2 above 4,696 4 4,700
6. PRC nationals residing outside Mainland China or entities incorporated outside Mainland China where the credit is granted for use in Mainland China 6,412 944 7,356
7. Other counterparties where the exposures are considered by the reporting institution to be non-bank Mainland China exposures 33,427 2,416 35,843
Total 267,453 17,402 284,855
Total assets after provision 810,944
On-balance sheet exposures as percentage of total assets 33.0%
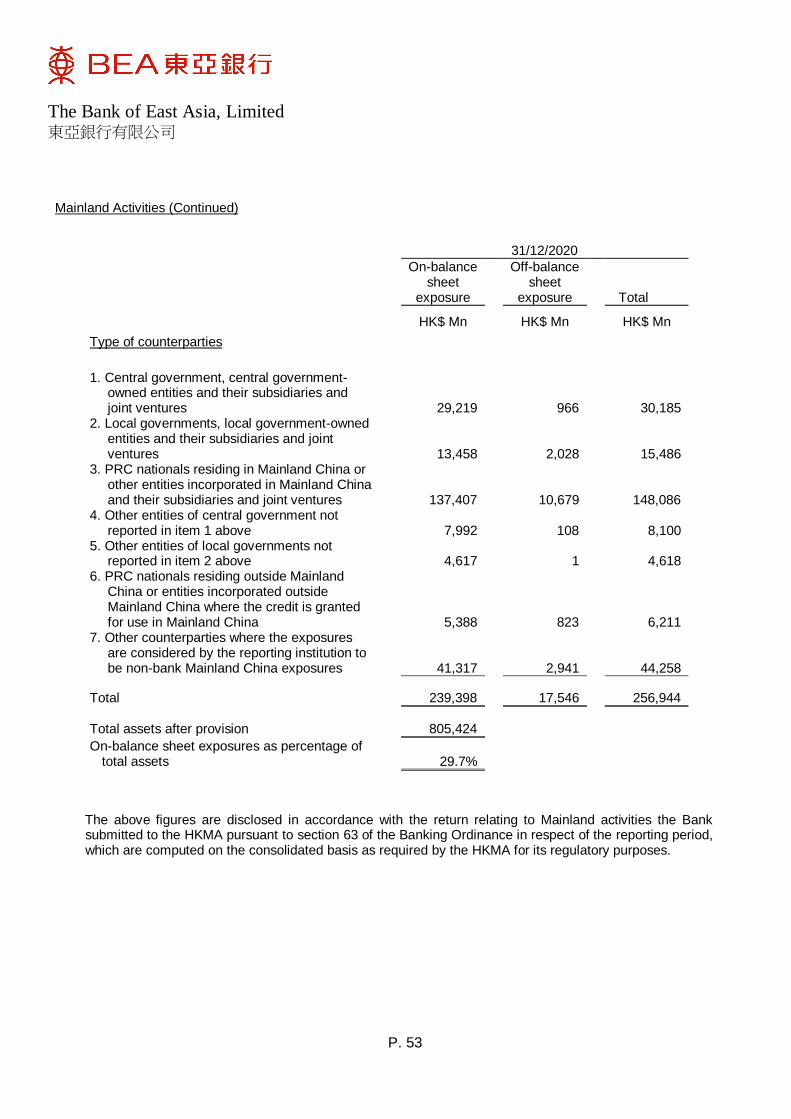
The Bank of East Asia, Limited 東亞銀行有限公司
P. 53
Mainland Activities (Continued)
31/12/2020
On-balance sheet
exposure
Off-balance sheet
exposure Total
HK$ Mn HK$ Mn HK$ Mn Type of counterparties
1. Central government, central government-owned entities and their subsidiaries and joint ventures 29,219 966 30,185
2. Local governments, local government-owned entities and their subsidiaries and joint ventures 13,458 2,028 15,486
3. PRC nationals residing in Mainland China or other entities incorporated in Mainland China and their subsidiaries and joint ventures 137,407 10,679 148,086
4. Other entities of central government not reported in item 1 above 7,992 108 8,100
5. Other entities of local governments not reported in item 2 above 4,617 1 4,618
6. PRC nationals residing outside Mainland China or entities incorporated outside Mainland China where the credit is granted for use in Mainland China 5,388 823 6,211
7. Other counterparties where the exposures are considered by the reporting institution to be non-bank Mainland China exposures 41,317 2,941 44,258
Total 239,398 17,546 256,944
Total assets after provision 805,424
On-balance sheet exposures as percentage of total assets 29.7%
The above figures are disclosed in accordance with the return relating to Mainland activities the Bank
submitted to the HKMA pursuant to section 63 of the Banking Ordinance in respect of the reporting period, which are computed on the consolidated basis as required by the HKMA for its regulatory purposes.
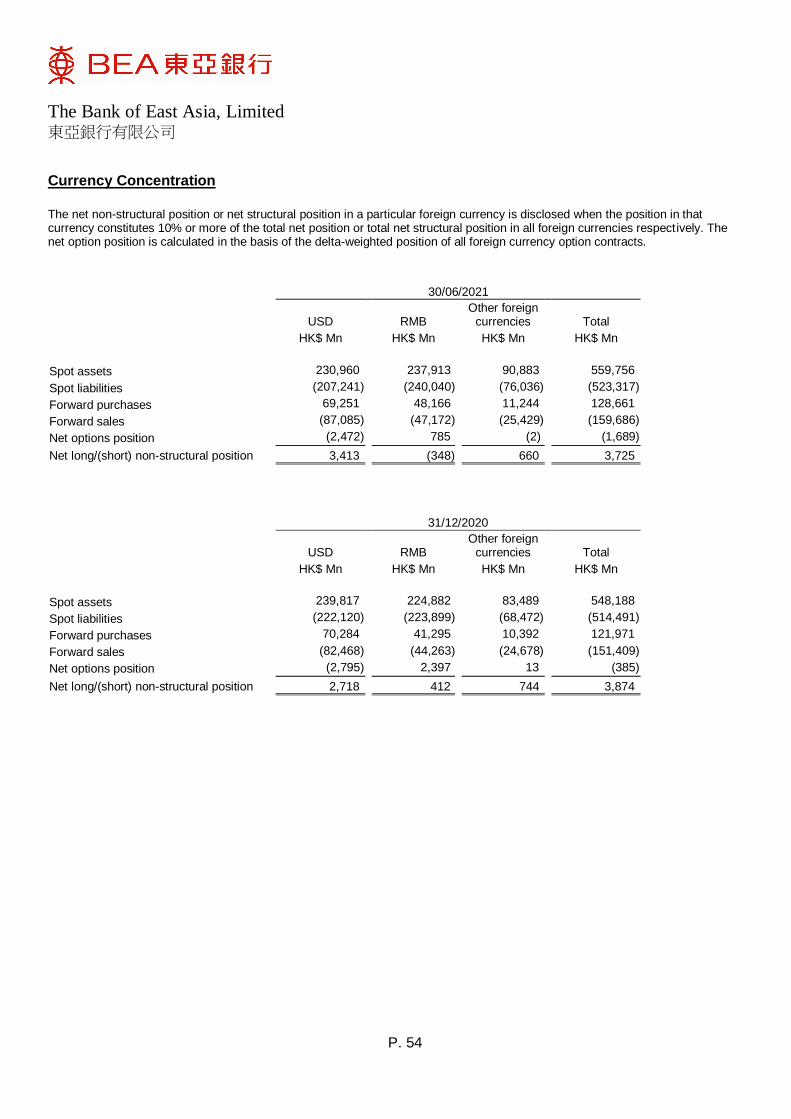
The Bank of East Asia, Limited 東亞銀行有限公司
P. 54
Currency Concentration The net non-structural position or net structural position in a particular foreign currency is disclosed when the position in that currency constitutes 10% or more of the total net position or total net structural position in all foreign currencies respectively. The net option position is calculated in the basis of the delta-weighted position of all foreign currency option contracts.
30/06/2021
USD RMB Other foreign
currencies Total
HK$ Mn HK$ Mn HK$ Mn HK$ Mn
Spot assets 230,960 237,913 90,883 559,756
Spot liabilities (207,241) (240,040) (76,036) (523,317)
Forward purchases 69,251 48,166 11,244 128,661
Forward sales (87,085) (47,172) (25,429) (159,686)
Net options position (2,472) 785 (2) (1,689)
Net long/(short) non-structural position 3,413 (348) ¤ 660 3,725
31/12/2020
USD RMB Other foreign
currencies Total
HK$ Mn HK$ Mn HK$ Mn HK$ Mn
Spot assets 239,817 224,882 83,489 548,188
Spot liabilities (222,120) (223,899) (68,472) (514,491)
Forward purchases 70,284 41,295 10,392 121,971
Forward sales (82,468) (44,263) (24,678) (151,409)
Net options position (2,795) 2,397 13 (385)
Net long/(short) non-structural position 2,718 412 ¤ 744 3,874
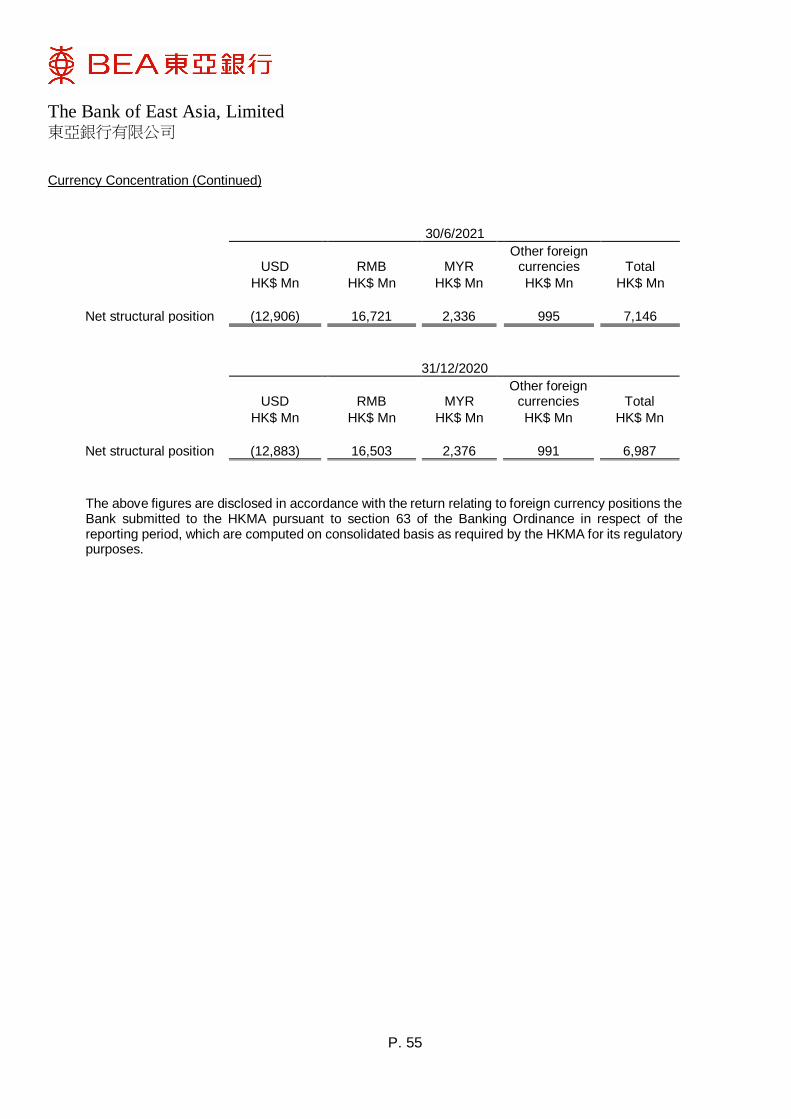
The Bank of East Asia, Limited 東亞銀行有限公司
P. 55
Currency Concentration (Continued)
30/6/2021
USD RMB MYR Other foreign
currencies Total
HK$ Mn HK$ Mn HK$ Mn HK$ Mn HK$ Mn
Net structural position (12,906) 16,721 2,336 995 7,146
31/12/2020
USD RMB MYR Other foreign
currencies Total
HK$ Mn HK$ Mn HK$ Mn HK$ Mn HK$ Mn
Net structural position (12,883) 16,503 2,376 991 6,987
The above figures are disclosed in accordance with the return relating to foreign currency positions the Bank submitted to the HKMA pursuant to section 63 of the Banking Ordinance in respect of the reporting period, which are computed on consolidated basis as required by the HKMA for its regulatory purposes.
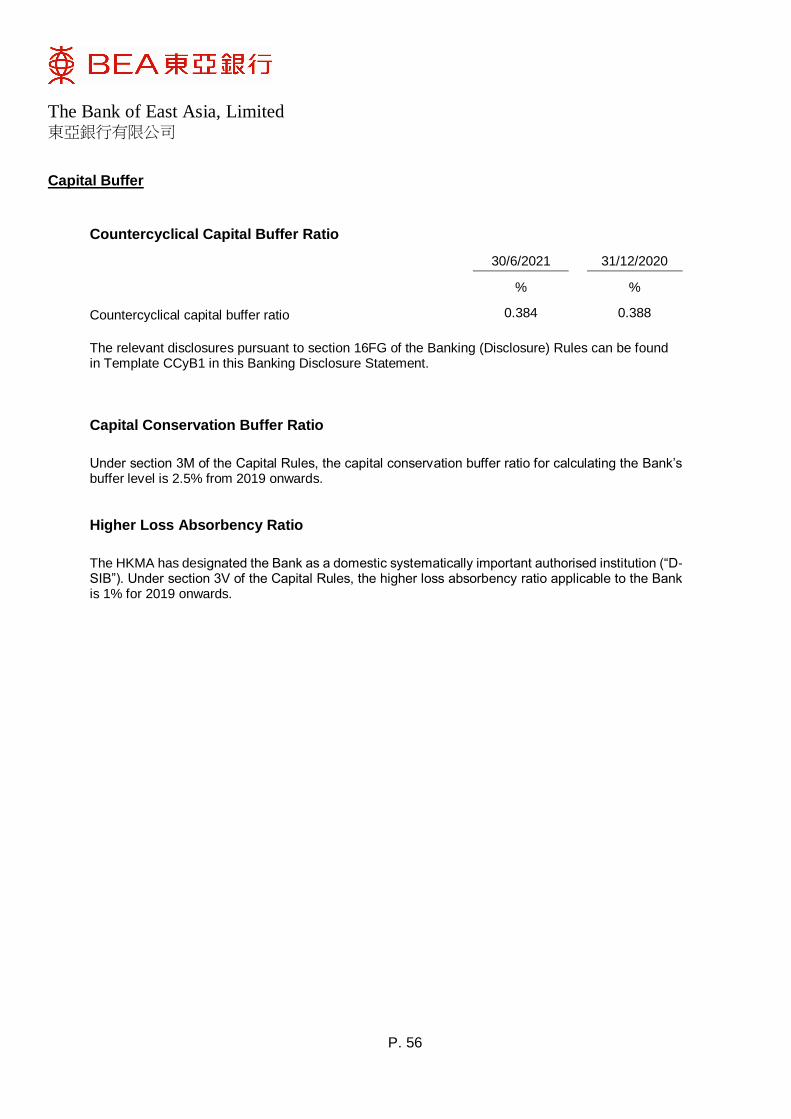
The Bank of East Asia, Limited 東亞銀行有限公司
P. 56
Capital Buffer
Countercyclical Capital Buffer Ratio
30/6/2021 31/12/2020
% %
Countercyclical capital buffer ratio 0.384 0.388
The relevant disclosures pursuant to section 16FG of the Banking (Disclosure) Rules can be found in Template CCyB1 in this Banking Disclosure Statement.
Capital Conservation Buffer Ratio
Under section 3M of the Capital Rules, the capital conservation buffer ratio for calculating the Bank’s buffer level is 2.5% from 2019 onwards.
Higher Loss Absorbency Ratio
The HKMA has designated the Bank as a domestic systematically important authorised institution (“D-SIB”). Under section 3V of the Capital Rules, the higher loss absorbency ratio applicable to the Bank is 1% for 2019 onwards.
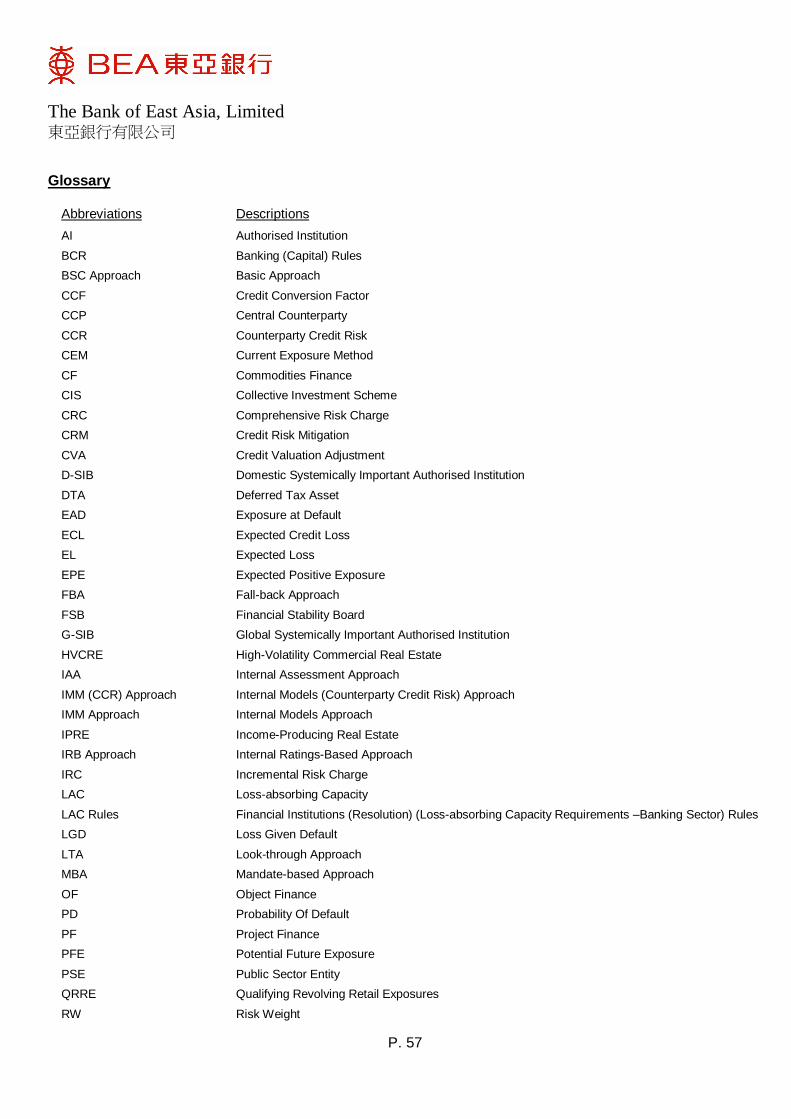
The Bank of East Asia, Limited 東亞銀行有限公司
P. 57
Glossary
Abbreviations Descriptions
AI Authorised Institution
BCR Banking (Capital) Rules
BSC Approach Basic Approach
CCF Credit Conversion Factor
CCP Central Counterparty
CCR Counterparty Credit Risk
CEM Current Exposure Method
CF Commodities Finance
CIS Collective Investment Scheme
CRC Comprehensive Risk Charge
CRM Credit Risk Mitigation
CVA Credit Valuation Adjustment
D-SIB Domestic Systemically Important Authorised Institution
DTA Deferred Tax Asset
EAD Exposure at Default
ECL Expected Credit Loss
EL Expected Loss
EPE Expected Positive Exposure
FBA Fall-back Approach
FSB Financial Stability Board
G-SIB Global Systemically Important Authorised Institution
HVCRE High-Volatility Commercial Real Estate
IAA Internal Assessment Approach
IMM (CCR) Approach Internal Models (Counterparty Credit Risk) Approach
IMM Approach Internal Models Approach
IPRE Income-Producing Real Estate
IRB Approach Internal Ratings-Based Approach
IRC Incremental Risk Charge
LAC Loss-absorbing Capacity
LAC Rules Financial Institutions (Resolution) (Loss-absorbing Capacity Requirements –Banking Sector) Rules
LGD Loss Given Default
LTA Look-through Approach
MBA Mandate-based Approach
OF Object Finance
PD Probability Of Default
PF Project Finance
PFE Potential Future Exposure
PSE Public Sector Entity
QRRE Qualifying Revolving Retail Exposures
RW Risk Weight
The Bank of East Asia, Limited 東亞銀行有限公司
P. 58
Glossary (continued)
Abbreviations Descriptions
RWA Risk-Weighted Amount
SA-CCR Standardised Approach for Counterparty Credit Risk
SEC-ERBA Securitization External Ratings-Based Approach
SEC-FBA Securitization Fall-Back Approach
SEC-IRBA Securitization Internal Ratings-Based Approach
SEC-SA Securitization Standardized Approach
SFT Securities Financing Transaction
SRW Supervisory Risk Weight
STC Approach Standardized (Credit Risk) Approach
STM Approach Standardized (Market Risk) Approach
TLAC Total Loss-absorbing Capacity
VaR Value-at-Risk