高增长/高股息率的特高压的主要受益者;首次覆盖并加入强力买 ...
22
2016 年 6 月 8 日 投资决策 买入 平高电气 (600312.SS) 潜在回报: 32% 证券研究报告 高增长/高股息率的特高压的主要受益者;首次覆盖并加入强力买入名单(摘 要) 建议理由 平高电气作为中国领先的高压开关设备生产企业,将成为中国未来五年对特高压电 线潜在投资 1170 亿美元的主要受益者,得益于其在竞争对手最少的气体绝缘封闭式 组合电器(GIS)市场上的领先份额以及特高压开关业务盈利占比较高等两方面因素。 中长期而言,我们认为非特高压 GIS 市场整合和新产品上市也会推动公司收入/ 净利 润加速增长。由于平高电气股价对应的 12 个月预期市盈率为 13.9 倍,较历史均值 低一个标准差以上,我们认为该股估值尚未体现其强劲的增长前景。我们首次覆盖 该股并将其加入强力买入名单,12 个月目标价格为人民币 19.5 元,隐含 32%的上行 空间。 推动因素 我们认为推动平高电气盈利/股价的因素如下:1) 特高压 GIS,受 2016-20 年预期 特高压投资加速的推动(2016-20 年新增 29 条线路,至 2015 年为 11 条),而且 公司 GIS 产品的市场份额领先(该市场上供应商最少、资金/技术壁垒较高);2) 非特高压 GIS,得益于在行业关注重点从价格转向产品质量的形势下,市场份额将 持续向领先企业整合;3) 真空灭弧室和电动汽车充电桩,受益于中国 2015-20 年 人民币 2 万亿元配电网投资和真空断路器需求增长,以及我们基于中国计划到 2020 年增加 480 万个独立电动汽车充电桩/12,000 个集中电动汽车充电站而预测 的 31%的 2015-20 年电动汽车充电设施投资年均复合增长。 估值 我们基于 2017 年预期 EV/GCI vs. CROCI/WACC 与同业的比较(现金回报倍数 1.04 倍)计算得出 12 个月目标价格为人民币 19.5 元,隐含 32%的上行空间。我 们认为 12 倍的 2017 年预期市盈率和 5%的 2017 年预期股息收益率具有吸引力, 而同业中值分别为 17 倍和 1%。 主要风险 特高压投资低于预期;市场整合慢于预期;新产品推出弱于预期。 *全文翻译将随后提供 所属投资名单 亚太买入名单 亚太强力买入名单 行业评级: 中性 杜茜 执业证书编号: S1420511100001 +86(10)6627-3147 jacqueline.du@ghsl.cn 北京高华证券有限责任公司 北京高华证券有限责任公司及其关联机构与其研究报告所分析的企业 存在业务关系,并且继续寻求发展这些关系。因此,投资者应当考虑 到本公司可能存在可能影响本报告客观性的利益冲突,不应视本报告 为作出投资决策的唯一因素。 有关分析师的申明和其他重要信息,见 信息披露附录,或请与您的投资代表联系。 北京高华证券有限责任公司 投资研究 增长 回报* 估值倍数 波动性 平高电气 (600312.SS) 亚太工业行业平均水平 投资摘要 低 高 百分位 20th 40th 60th 80th 100th * 回报 - 资本回报率 投资摘要指标的全面描述请参见本 报告的信息披露部分。 主要数据 当前 股价(Rmb) 14.72 12个月目标价格(Rmb) 19.50 市值(Rmb mn / US$ mn) 16,743.8 / 2,550.5 外资持股比例(%) -- 12/15 12/16E 12/17E 12/18E 每股盈利(Rmb) 0.73 0.95 1.18 1.44 每股盈利增长(%) 19.3 31.3 23.8 21.6 每股摊薄盈利(Rmb) 0.73 0.95 1.18 1.44 每股基本盈利(Rmb) 0.73 0.95 1.18 1.44 市盈率(X) 29.1 15.4 12.5 10.2 市净率(X) 3.9 2.6 2.4 2.2 EV/EBITDA(X) 19.6 10.5 8.6 7.3 股息收益率(%) 2.4 3.9 4.8 5.9 净资产回报率(%) 13.8 17.1 19.7 22.0 CROCI(%) 16.1 17.4 17.6 18.9 股价走势图 2,500 3,000 3,500 4,000 4,500 5,000 5,500 6,000 6,500 12 14 16 18 20 22 24 26 28 Jun-15 Sep-15 Dec-15 Mar-16 平高电气 (左轴) 沪深300指数 (右轴) 股价表现(%) 3个月 6个月 12个月 绝对 3.3 (20.3) (46.6) 相对于沪深300指数 1.0 (7.5) (12.0) 资料来源:公司数据、高盛研究预测、FactSet(股价为6/07/2016收盘价)
-
Upload
khangminh22 -
Category
Documents
-
view
0 -
download
0
Transcript of 高增长/高股息率的特高压的主要受益者;首次覆盖并加入强力买 ...
2016 年 6 月 8 日
投资决策
买入 平高电气 (600312.SS) 潜在回报: 32% 证券研究报告
高增长/高股息率的特高压的主要受益者;首次覆盖并加入强力买入名单(摘要)建议理由 平高电气作为中国领先的高压开关设备生产企业,将成为中国未来五年对特高压电
线潜在投资 1170亿美元的主要受益者,得益于其在竞争对手最少的气体绝缘封闭式
组合电器(GIS)市场上的领先份额以及特高压开关业务盈利占比较高等两方面因素。
中长期而言,我们认为非特高压 GIS市场整合和新产品上市也会推动公司收入/净利
润加速增长。由于平高电气股价对应的 12个月预期市盈率为 13.9倍,较历史均值
低一个标准差以上,我们认为该股估值尚未体现其强劲的增长前景。我们首次覆盖
该股并将其加入强力买入名单,12个月目标价格为人民币 19.5元,隐含 32%的上行
空间。
推动因素 我们认为推动平高电气盈利/股价的因素如下:1) 特高压 GIS,受 2016-20 年预期
特高压投资加速的推动(2016-20 年新增 29 条线路,至 2015 年为 11 条),而且
公司 GIS 产品的市场份额领先(该市场上供应商最少、资金/技术壁垒较高);2)
非特高压 GIS,得益于在行业关注重点从价格转向产品质量的形势下,市场份额将
持续向领先企业整合;3) 真空灭弧室和电动汽车充电桩,受益于中国 2015-20 年
人民币 2 万亿元配电网投资和真空断路器需求增长,以及我们基于中国计划到
2020 年增加 480 万个独立电动汽车充电桩/12,000 个集中电动汽车充电站而预测
的 31%的 2015-20 年电动汽车充电设施投资年均复合增长。
估值 我们基于 2017 年预期 EV/GCI vs. CROCI/WACC 与同业的比较(现金回报倍数
1.04 倍)计算得出 12 个月目标价格为人民币 19.5 元,隐含 32%的上行空间。我
们认为 12 倍的 2017 年预期市盈率和 5%的 2017 年预期股息收益率具有吸引力,
而同业中值分别为 17 倍和 1%。
主要风险 特高压投资低于预期;市场整合慢于预期;新产品推出弱于预期。
*全文翻译将随后提供
所属投资名单 亚太买入名单
亚太强力买入名单
行业评级: 中性
杜茜 执业证书编号: S1420511100001 +86(10)6627-3147 [email protected] 北京高华证券有限责任公司
北京高华证券有限责任公司及其关联机构与其研究报告所分析的企业存在业务关系,并且继续寻求发展这些关系。因此,投资者应当考虑到本公司可能存在可能影响本报告客观性的利益冲突,不应视本报告为作出投资决策的唯一因素。 有关分析师的申明和其他重要信息,见信息披露附录,或请与您的投资代表联系。
北京高华证券有限责任公司 投资研究
增长
回报*
估值倍数
波动性
平高电气 (600312.SS)
亚太工业行业平均水平
投资摘要
低 高
百分位 20th 40th 60th 80th 100th
* 回报 - 资本回报率 投资摘要指标的全面描述请参见本报告的信息披露部分。
主要数据 当前
股价(Rmb) 14.72
12个月目标价格(Rmb) 19.50
市值(Rmb mn / US$ mn) 16,743.8 / 2,550.5
外资持股比例(%) --
12/15 12/16E 12/17E 12/18E
每股盈利(Rmb) 0.73 0.95 1.18 1.44
每股盈利增长(%) 19.3 31.3 23.8 21.6
每股摊薄盈利(Rmb) 0.73 0.95 1.18 1.44
每股基本盈利(Rmb) 0.73 0.95 1.18 1.44
市盈率(X) 29.1 15.4 12.5 10.2
市净率(X) 3.9 2.6 2.4 2.2
EV/EBITDA(X) 19.6 10.5 8.6 7.3
股息收益率(%) 2.4 3.9 4.8 5.9
净资产回报率(%) 13.8 17.1 19.7 22.0
CROCI(%) 16.1 17.4 17.6 18.9
股价走势图
2,500
3,000
3,500
4,000
4,500
5,000
5,500
6,000
6,500
12
14
16
18
20
22
24
26
28
Jun-15 Sep-15 Dec-15 Mar-16
平高电气 (左轴) 沪深300指数 (右轴)
股价表现(%) 3个月 6个月 12个月
绝对 3.3 (20.3) (46.6)
相对于沪深300指数 1.0 (7.5) (12.0)
资料来源:公司数据、高盛研究预测、FactSet(股价为6/07/2016收盘价)
2016 年 6 月 8 日 平高电气 (600312.SS)
全球投资研究 2
平高电气: 财务数据概要
对此报告有贡献的人员
杜茜
损益表(Rmb mn) 12/15 12/16E 12/17E 12/18E 资产负债表(Rmb mn) 12/15 12/16E 12/17E 12/18E
主营业务收入 5,830.6 7,372.4 8,612.1 10,035.7 现金及等价物 580.5 760.2 796.5 1,030.5
主营业务成本 (4,096.5) (5,123.8) (5,948.9) (6,893.3) 应收账款 6,021.4 7,704.2 9,110.9 10,747.6
销售、一般及管理费用 (544.6) (663.5) (689.0) (752.7) 存货 1,368.6 1,711.8 1,987.5 2,303.0
研发费用 0.0 0.0 0.0 0.0 其它流动资产 315.3 315.3 315.3 315.3
其它营业收入/(支出) (121.2) (147.4) (172.2) (200.7) 流动资产 8,285.8 10,491.5 12,210.1 14,396.3
EBITDA 1,291.6 1,805.2 2,255.6 2,705.0 固定资产净额 2,499.8 2,699.2 2,901.9 2,906.3
折旧和摊销 (223.3) (367.6) (453.6) (516.1) 无形资产净额 991.2 977.1 966.7 948.1
EBIT 1,068.3 1,437.6 1,802.0 2,189.0 长期投资 0.0 0.0 0.0 0.0
利息收入 9.6 10.2 11.4 11.9 其它长期资产 174.7 30.0 30.0 30.0
财务费用 (71.9) (137.7) (186.4) (218.9) 资产合计 11,951.4 14,197.8 16,108.7 18,280.6
联营公司 0.0 0.0 0.0 0.0
其它 8.2 20.0 20.0 20.0 应付账款 3,779.9 4,546.9 5,364.2 6,314.6
税前利润 1,014.2 1,330.1 1,647.0 2,002.0 短期贷款 1,069.8 1,569.8 1,819.8 2,069.8
所得税 (158.7) (199.5) (247.0) (300.3) 其它流动负债 178.1 178.1 178.1 178.1
少数股东损益 (28.8) (45.2) (56.0) (68.1) 流动负债 5,027.8 6,294.8 7,362.1 8,562.6
长期贷款 548.3 1,048.3 1,298.3 1,548.3
优先股股息前净利润 826.8 1,085.4 1,343.9 1,633.6 其它长期负债 9.4 9.4 9.4 9.4
优先股息 0.0 0.0 0.0 0.0 长期负债 557.7 1,057.7 1,307.7 1,557.7
非经常性项目前净利润 826.8 1,085.4 1,343.9 1,633.6 负债合计 5,585.5 7,352.5 8,669.9 10,120.3
税后非经常性损益 0.0 0.0 0.0 0.0
净利润 826.8 1,085.4 1,343.9 1,633.6 优先股 0.0 0.0 0.0 0.0
普通股权益 6,126.9 6,561.0 7,098.6 7,752.0
每股基本盈利(非经常性项目前)(Rmb) 0.73 0.95 1.18 1.44 少数股东权益 239.0 284.2 340.2 408.3
每股基本盈利(非经常性项目后)(Rmb) 0.73 0.95 1.18 1.44
每股摊薄盈利(非经常性项目后)(Rmb) 0.73 0.95 1.18 1.44 负债及股东权益合计 11,951.4 14,197.8 16,108.7 18,280.6
每股股息(Rmb) 0.50 0.57 0.71 0.86
股息支付率(%) 68.8 60.0 60.0 60.0 每股净资产(Rmb) 5.39 5.77 6.24 6.82
自由现金流收益率(%) 0.1 (0.2) 3.0 5.4
增长率和利润率(%) 12/15 12/16E 12/17E 12/18E 比率 12/15 12/16E 12/17E 12/18E
主营业务收入增长率 26.6 26.4 16.8 16.5 CROCI(%) 16.1 17.4 17.6 18.9
EBITDA增长率 36.6 39.8 25.0 19.9 净资产回报率(%) 13.8 17.1 19.7 22.0
EBIT增长率 40.4 34.6 25.3 21.5 总资产回报率(%) 7.6 8.3 8.9 9.5
净利润增长率 19.3 31.3 23.8 21.6 平均运用资本回报率(%) 13.4 15.4 16.8 18.3
每股盈利增长 19.3 31.3 23.8 21.6 存货周转天数 119.3 109.7 113.5 113.6
毛利率 29.7 30.5 30.9 31.3 应收账款周转天数 333.5 339.8 356.3 361.1
EBITDA利润率 22.2 24.5 26.2 27.0 应付账款周转天数 295.0 296.6 304.1 309.2
EBIT利润率 18.3 19.5 20.9 21.8 净负债/股东权益(%) 16.3 27.1 31.2 31.7
EBIT利息保障倍数(X) 17.2 11.3 10.3 10.6
现金流量表(Rmb mn) 12/15 12/16E 12/17E 12/18E 估值 12/15 12/16E 12/17E 12/18E
优先股股息前净利润 826.8 1,085.4 1,343.9 1,633.6
折旧及摊销 223.3 367.6 453.6 516.1 基本市盈率(X) 29.1 15.4 12.5 10.2
少数股东权益 28.8 45.2 56.0 68.1 市净率(X) 3.9 2.6 2.4 2.2
运营资本增减 (875.6) (1,259.0) (865.0) (1,001.8) EV/EBITDA(X) 19.6 10.5 8.6 7.3
其它 114.5 272.2 175.0 207.0 企业价值/总投资现金(X) 3.0 1.8 1.6 1.5
经营活动产生的现金流 317.8 511.4 1,163.5 1,422.9 股息收益率(%) 2.4 3.9 4.8 5.9
资本开支 (298.8) (552.9) (645.9) (501.8)
收购 0.0 0.0 0.0 0.0
剥离 27.1 0.0 0.0 0.0
其它 0.0 0.0 0.0 0.0
投资活动产生的现金流 (271.7) (552.9) (645.9) (501.8)
支付股息的现金(普通股和优先股) (647.1) (651.2) (806.4) (980.2)
借款增减 815.5 1,000.0 500.0 500.0
普通股发行(回购) 0.0 0.0 0.0 0.0
其它 9.7 (127.5) (175.0) (207.0)
筹资活动产生的现金流 178.1 221.3 (481.4) (687.2)
总现金流 223.8 179.7 36.2 234.0 注:最后一个实际年度数据可能包括已公布和预测数据。
资料来源:公司数据、高盛研究预测

2016 年 6 月 8 日 平高电气 (600312.SS)
全球投资研究 3
Contents
Our thesis in six key charts 4
Top high voltage switchgear maker; core strengths in GIS 6
Key UHV beneficiary; consolidation/new product driving LT growth 7
Financials: Robust growth and attractive dividend yield 14
Valuation: 12-month target price implies 32% upside 17
Key risks to our view 19
Details of proposed private placement 19
Disclosure Appendix 21
All prices in this report are as of June 6, 2016 close, unless otherwise stated.
Gao Hua Securities acknowledges the role of Tian Lu, CFA, Frank Shi and Diana Zhao of Goldman Sachs in the preparation of this product.
Exhibit 1: Global power equipment comps table
Source: Bloomberg, Goldman Sachs Global Investment Research.
China power generation equipment
Div yield Net debt/equity
2016E 2017E 2016E 2017E 2016E 2017E 2016E 2017E 2016E 2017E 2016E 2017E 2016E 2016E
Shanghai Electric Group (A) 601727.SS Rmb7.8 15,315 Sell 54.8X 60.7X 2.5X 2.5X 25.7X 28.0X -14% -10% 5% 4% 8% 7% 1% 9%
Shanghai Electric Group (H) 2727.HK HK$3.3 5,449 Sell 19.5X 21.6X 0.9X 0.9X 11.6X 12.5X -14% -10% 5% 4% 8% 7% 2% 9%
Dongfang Electric Corp. (A) 600875.SS Rmb10 3,553 Neutral 98.0X 70.6X 1.0X 1.0X 48.1X 36.3X -47% 39% 1% 1% 5% 5% 0% 49%
Dongfang Electric Corp. (H) 1072.HK HK$5.9 1,781 Neutral 49.1X 35.4X 0.5X 0.5X 32.6X 23.2X -47% 39% 1% 1% 5% 5% 0% 49%
Harbin Electric Co Ltd 1133 HK HKD2.9 519 N/C N/A 19.5X 0.3X 0.3X N/A N/A 34% 319% 0% 2% N/A N/A 0% -38%Median 52.0X 35.4X 0.9X 0.9X 29.2X 25.6X -14% 39% 1% 2% 6% 6% 0% 9%
China transmission & distribution equipment
Div yield Net debt/equity
2016E 2017E 2016E 2017E 2016E 2017E 2016E 2017E 2016E 2017E 2016E 2017E 2016E 2016E
Henan Pinggao Electric Co 600312.SS Rmb14.7 2,551 Buy* 15.4X 12.5X 2.6X 2.4X 10.5X 8.6X 31% 24% 17% 20% 17% 18% 4% 27%
XJ Electric Co Ltd 000400 CH CNY15.1 2,322 N/C 17.2X 12.5X 2.2X 1.9X 11.8X 8.6X 23% 37% 13% 16% N/A N/A 1% -3%
China XD Electric Co Ltd 601179 CH CNY5.4 4,186 N/C 23.3X 18.2X 1.4X 1.4X 10.9X 8.5X 31% 28% 6% 8% N/A N/A 3% -38%
Guodian Nanjing Automation Co 600268 CH CNY7.4 713 N/C 52.6X 36.9X 2.2X 2.1X 11.8X 10.5X 180% 43% 4% 6% N/A N/A 0% 99%
TBEA Co Ltd 600089 CH CNY8.5 4,193 N/C 12.3X 10.2X 1.2X 1.1X 9.4X 8.5X 18% 20% 11% 11% N/A N/A 2% 51%
Beijing Sifang Automation Co L 601126 CH CNY9.8 1,213 N/C 19.2X 15.0X 2.1X 1.8X 16.5X 10.0X 22% 28% 11% 12% N/A N/A 2% -5%
NARI Technology Co Ltd 600406 CH CNY13.5 5,004 N/C 22.1X 19.2X 3.6X 3.2X 17.6X 15.1X 15% 15% 17% 17% N/A N/A 1% -35%
Median 19.2X 15.0X 2.2X 1.9X 11.8X 8.6X 23% 28% 11% 12% 17% 18% 2% -3%
China power source/storage equipment
Div yield Net debt/equity
2016E 2017E 2016E 2017E 2016E 2017E 2016E 2017E 2016E 2017E 2016E 2017E 2016E 2016E
Hangzhou Zhongheng Electric Co. 002364.SZ Rmb26.3 2,096 Neutral 68.1X 53.7X 10.4X 9.1X 56.5X 45.8X 41% 27% 16% 18% 18% 17% 0% 18%
Shenzhen Clou Electronics Co Ltd 002121.SZ Rmb25.5 1,846 Neutral 34.7X 28.4X 4.6X 4.0X 23.3X 17.7X 78% 22% 14% 15% 14% 13% 0% 162%
Sungrow Power Supply Co. 300274.SZ Rmb23.6 2,373 Buy 20.7X 16.5X 4.4X 3.5X 16.3X 12.1X 77% 25% 24% 24% 31% 28% 1% 12%
Zhejiang Wanma Co Ltd 002276 CH CNY19.5 2,792 N/C 51.8X 41.8X 5.7X 5.1X N/A N/A 30% 24% 11% 13% N/A N/A 0% 7%
Shenzhen Auto Electric Power P 002227 CH CNY31.1 1,039 N/C 138.0X 103.5X N/A N/A N/A N/A 411% 33% 6% 8% N/A N/A 0% -14%
Guangdong East Power Co Ltd 300376 CH CNY27.3 2,083 N/C 38.8X 31.1X 5.6X 4.8X N/A N/A 27% 25% 20% 19% N/A N/A 1% 103%
Qingdao TGOOD Electric Co Ltd 300001 CH CNY21.1 3,221 N/C 67.2X 53.6X 7.8X 7.0X N/A N/A 96% 25% 11% 13% N/A N/A 0% 34%
Xiamen Kehua Hengsheng Co Ltd 002335 CH CNY43.4 1,790 N/C 35.0X 22.3X 4.4X 3.8X N/A N/A 88% 58% 16% 21% N/A N/A 0% 40%
Median 45.3X 36.4X 5.6X 4.8X 23.3X 17.7X 78% 25% 15% 17% 18% 17% 0% 26%
Global power equipment
Div yield Net debt/equity
2016E 2017E 2016E 2017E 2016E 2017E 2016E 2017E 2016E 2017E 2016E 2017E 2016E 2016E
Hitachi 6501.T ¥495 22,280 Buy 10.0X 8.1X 0.8X 0.8X 6.5X 6.4X 4% 22% 9% 10% 4% 5% 2% 76%
Toshiba 6502.T ¥274.9 10,859 Sell 12.2X 2.6X 2.0X 22.8X 6.1X 79% 173% -27% 18% 2% 6% 0% 47%
Fuji Electric Co Ltd 6504 JP JPY436 3,038 N/C 10.9X 10.2X 1.0X 1.2X 6.9X 6.7X 10% 0% 10% 12% N/A N/A 2% 73%
Mitsubishi Heavy Industries Lt 7011 JP JPY425.1 13,388 N/C 14.2X 10.1X 0.8X 0.7X 5.1X 4.8X -42% 122% 6% 8% N/A N/A 3% 37%
Delta Electronics 2308.TW NT$151.5 12,150 Buy* 19.4X 17.2X 3.0X 2.8X 11.1X 9.8X 2% 13% 16% 17% 18% 18% 3% -32%
Bharat Heavy Electricals BHEL.BO Rs118.1 4,310 Sell 47.9X 16.4X 0.9X 0.8X 130.5X 9.7X 290% 193% 2% 5% -1% 1% -30%
Doosan Corp 000150 KS KRW96800 1,765 N/C 8.5X 12.1X 0.8X 0.8X 10.5X 9.9X N/A -30% 9% 6% N/A N/A 5% 127%
General Electric Co. GE $30.1 282,285 Neutral 19.8X 17.3X 2.8X 3.1X 13.1X 12.3X 2% 14% 13% 16% 10% 11% 3% 5%
Siemens AG SIEGn.DE €95.7 91,719 Buy 13.2X 12.1X 2.1X 1.9X 7.9X 7.1X 10% 10% 16% 16% 11% 11% 4% -12%
Schneider Electric SCHN.PA €56.8 36,532 Neutral 15.2X 13.5X 1.6X 1.5X 9.7X 8.8X -7% 12% 10% 11% 9% 9% 4% 19%
Areva SA AREVA FP EUR4 1,738 N/C N/A 8.3X N/A N/A 37.1X 9.8X 85% 161% 30% 1% N/A N/A 0% N/A
ABB Ltd ABBN.S CHF20.6 48,803 Sell 14.5X 15.1X 3.4X 3.2X 9.7X 9.4X 7% -4% 22% 22% 11% 12% 4% 12%Median 14.4X 12.2X 1.6X 1.5X 10.1X 9.1X 7% 13% 10% 12% 9% 10% 3% 19%
Price as of 6-Jun-2016 close
* On our regional conviction list
Note: All financials are financial-year based. Not covered (N/C) companies are using Bloomberg consensus.
EV/EBITDA EPS Growth ROECompany Ticker Price
Market cap
(US$ mn)
P/E P/BRating
EV/EBITDA EPS Growth ROECompany Ticker Price
Market cap
(US$ mn)
P/E P/B
Rating
ROECompany Ticker Price
Market cap
(US$ mn)
P/E P/B
Rating
CROCI
CROCI
CROCI
Company Ticker PriceMarket cap
(US$ mn)Rating
P/E P/B EV/EBITDA EPS Growth ROE CROCI
EV/EBITDA EPS Growth

2016 年 6 月 8 日 平高电气 (600312.SS)
全球投资研究 4
Our thesis in six key charts
Exhibit 1: We estimate 22 lines are yet to start UHV GIS tendering on top of the 6 already tendered as of 2015
Exhibit 2: Pinggao’s potential future orders and existing backlog can cover 2X our 2016-18 UHV revenue estimate
Source: Company data, Goldman Sachs Global Investment Research
Source: Company data, Goldman Sachs Global Investment Research.
Exhibit 3: Largest HV switchgear makers have been consolidating share as clients focus more on quality
Exhibit 4: We expect Pinggao’s non-UHV GIS share to continue expanding, driving 18% 2015-18E revenue CAGR
Source: CEEIA.
Source: Company data, Goldman Sachs Global Investment Research.
0
5
10
15
20
25
Delivered Tendered and
partially
delivered
Tendered and
yet to start
delivery
Yet to be
tendered
16 DC
lines
6 AC
lines
Number of UHV lines
-
2,000
4,000
6,000
8,000
10,000
12,000
14,000
Already
tendered/backlog
Potential future new
orders
2016-18E UHV
revenue
Rmb mn
c. Rmb400mn
opportunity
each for the
16 DC lines
c. Rmb1bn
opportunity
each for the
6 AC lines
38% 34% 37% 38%44%
0%
10%
20%
30%
40%
50%
60%
70%
80%
90%
100%
2009 2010 2011 2012 2013
Below Rmb 100mn sales Rmb 100mn-1bn sales
Rmb 1-2bn sales Above Rmb 2bn sales
Share of
industry sales
0.0%
2.0%
4.0%
6.0%
8.0%
10.0%
12.0%
14.0%
16.0%
18.0%
20.0%
20
07
20
08
20
09
20
10
20
11
20
12
20
13
20
14
20
15
20
16
E
20
17
E
20
18
E
Pinggao non-UHV GIS market share
2016 年 6 月 8 日 平高电气 (600312.SS)
全球投资研究 5
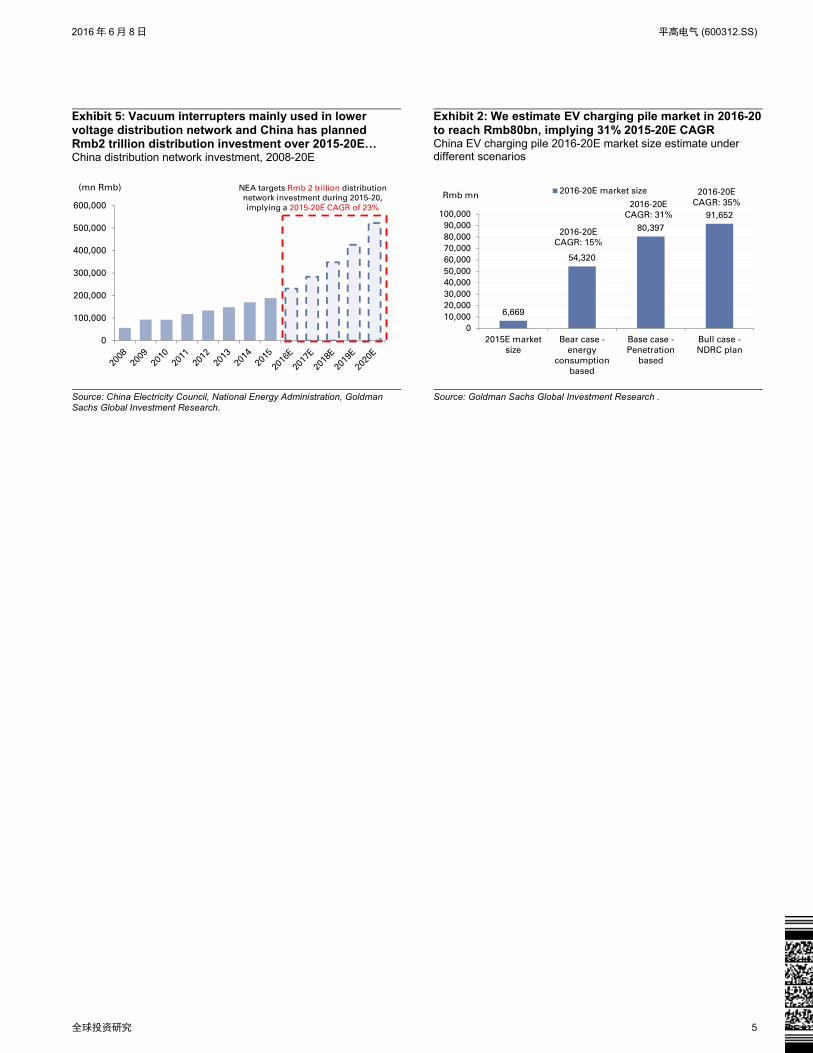
Exhibit 5: Vacuum interrupters mainly used in lower voltage distribution network and China has planned Rmb2 trillion distribution investment over 2015-20E… China distribution network investment, 2008-20E
Exhibit 2: We estimate EV charging pile market in 2016-20 to reach Rmb80bn, implying 31% 2015-20E CAGR China EV charging pile 2016-20E market size estimate under different scenarios
Source: China Electricity Council, National Energy Administration, Goldman Sachs Global Investment Research.
Source: Goldman Sachs Global Investment Research .
0
100,000
200,000
300,000
400,000
500,000
600,000
(mn Rmb) NEA targets Rmb 2 trillion distribution
network investment during 2015-20,
implying a 2015-20E CAGR of 23%
6,669
54,320
80,397
91,652
0
10,000
20,000
30,000
40,000
50,000
60,000
70,000
80,000
90,000
100,000
2015E market
size
Bear case -
energy
consumption
based
Base case -
Penetration
based
Bull case -
NDRC plan
2016-20E market size
2016-20E
CAGR: 31%
2016-20E
CAGR: 35%
2016-20E
CAGR: 15%
Rmb mn
2016 年 6 月 8 日 平高电气 (600312.SS)
全球投资研究 6
Top high voltage switchgear maker; core strengths in GIS
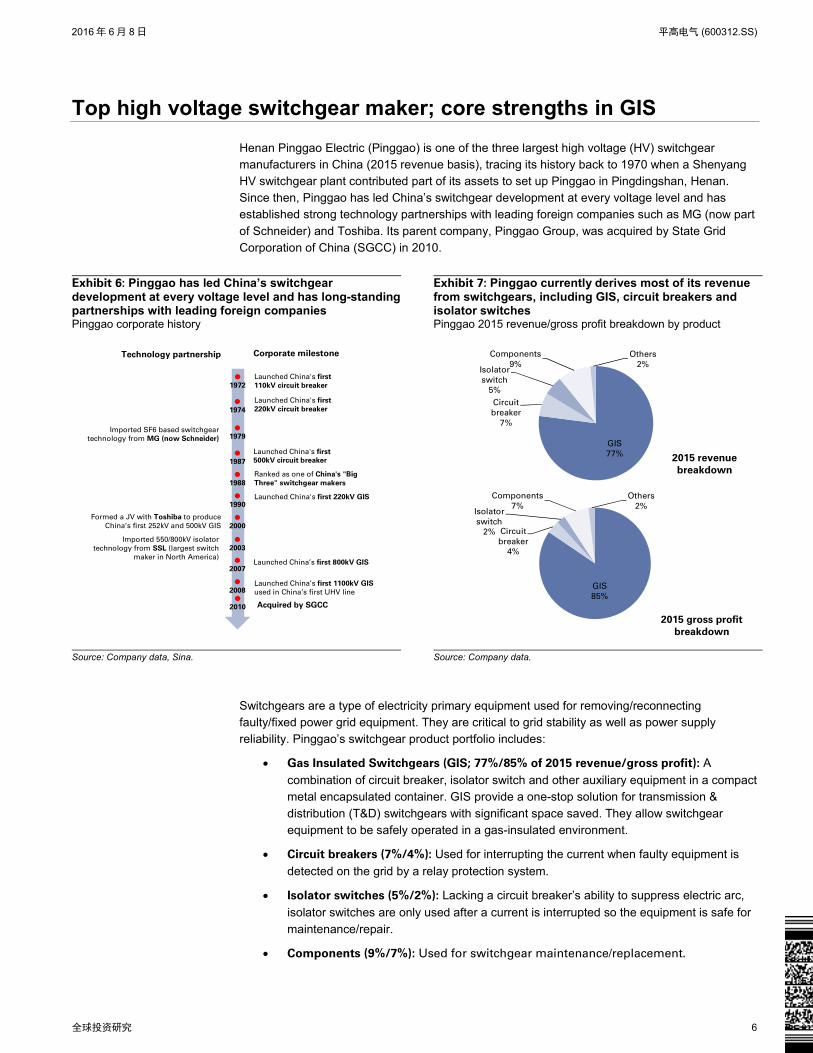
Henan Pinggao Electric (Pinggao) is one of the three largest high voltage (HV) switchgear manufacturers in China (2015 revenue basis), tracing its history back to 1970 when a Shenyang HV switchgear plant contributed part of its assets to set up Pinggao in Pingdingshan, Henan. Since then, Pinggao has led China’s switchgear development at every voltage level and has established strong technology partnerships with leading foreign companies such as MG (now part
of Schneider) and Toshiba. Its parent company, Pinggao Group, was acquired by State Grid Corporation of China (SGCC) in 2010.
Exhibit 6: Pinggao has led China’s switchgear development at every voltage level and has long-standing partnerships with leading foreign companies Pinggao corporate history
Exhibit 7: Pinggao currently derives most of its revenue from switchgears, including GIS, circuit breakers and isolator switches Pinggao 2015 revenue/gross profit breakdown by product
Source: Company data, Sina.
Source: Company data.
Switchgears are a type of electricity primary equipment used for removing/reconnecting faulty/fixed power grid equipment. They are critical to grid stability as well as power supply reliability. Pinggao’s switchgear product portfolio includes:
Gas Insulated Switchgears (GIS; 77%/85% of 2015 revenue/gross profit): A
combination of circuit breaker, isolator switch and other auxiliary equipment in a compact metal encapsulated container. GIS provide a one-stop solution for transmission &
distribution (T&D) switchgears with significant space saved. They allow switchgear equipment to be safely operated in a gas-insulated environment.
Circuit breakers (7%/4%): Used for interrupting the current when faulty equipment is
detected on the grid by a relay protection system.
Isolator switches (5%/2%): Lacking a circuit breaker’s ability to suppress electric arc,
isolator switches are only used after a current is interrupted so the equipment is safe for
maintenance/repair.
Components (9%/7%): Used for switchgear maintenance/replacement.
Launched China's first
110kV circuit breaker
Launched China's first
220kV circuit breaker
Launched China's first
500kV circuit breaker
Ranked as one of China's "Big
Three" switchgear makers
Launched China's first 220kV GIS
Launched China’s first 800kV GIS
Launched China’s first 1100kV GIS
used in China’s first UHV line
Imported SF6 based switchgear
technology from MG (now Schneider)
Formed a JV with Toshiba to produce
China’s first 252kV and 500kV GIS
Imported 550/800kV isolator
technology from SSL (largest switch
maker in North America)
1972
1974
1979
1987
1988
1990
2000
2003
2007
2008
Technology partnership Corporate milestone
Acquired by SGCC2010
GIS
77%
Circuit
breaker
7%
Isolator
switch
5%
Components
9%
Others
2%
2015 revenue
breakdown
GIS
85%
Circuit
breaker
4%
Isolator
switch
2%
Components
7%
Others
2%
2015 gross profit
breakdown
2016 年 6 月 8 日 平高电气 (600312.SS)
全球投资研究 7
Key UHV beneficiary; consolidation/new product driving LT growth
Best positioned in a booming UHV market Construction of the first two ultra-high voltage (UHV) lines began in 2006, and China has since
constructed 11 UHV lines (as of 2015), and has planned/started construction for an additional 29 lines over the 13th Five Year Plan (2016-20). Based on our bottom-up analysis counting each individual line, we estimate that the total length of China’s UHV lines will grow five-fold to 68,158km by 2020 and will drive USD117bn (or Rmb765bn) of investment over 2016-20E, implying a 2015-20E CAGR of 20%, vs. 18% over 2012-15 (for details, see our report China’s Internet of Energy: Creating a smarter, cleaner and more efficient power network, published June
8, 2016.)
We estimate that 44%/56% of this projected US117bn market will be accounted for by AC/DC lines, based on our bottom up analysis through counting each line and categorizing them by AC and DC. Similar to typical AC transmission lines, UHV AC’s key equipment comprises 1000kV GIS, reactors and transformers (15%/3%/5% of total UHV investment in an average AC line) while UHV DC’s key equipment includes converter valves, converter transformers, and lower
voltage 500-750kV GIS (10%/15%/2% of total UHV investment in an average DC line).
Based on available UHV equipment tendering information as of May 2016, we see all key equipment markets dominated by a handful of suppliers, and believe Pinggao is best positioned due to:
Strongest market positioning: Only 3/7 companies are capable of supplying UHV/500-
750kV GIS, vs. 11/10/5 for transformers/reactors/converter valves, and Pinggao has
45%/35% of UHV/500-750kV GIS market share as of May 2016 thanks to its market-leading technology and exclusive focus on switchgears;
Most exposed to UHV: We estimate 2016-2020 revenue from UHV/500-750kV GIS at
Rmb27bn for Pinggao, or 4.6x its 2015 revenue. This compares with equivalent multiples of 3.6x/0.7x for China XD/TBEA, China’s other two listed UHV equipment suppliers.
As UHV equipment generally requires significant upfront capacity investment and has high
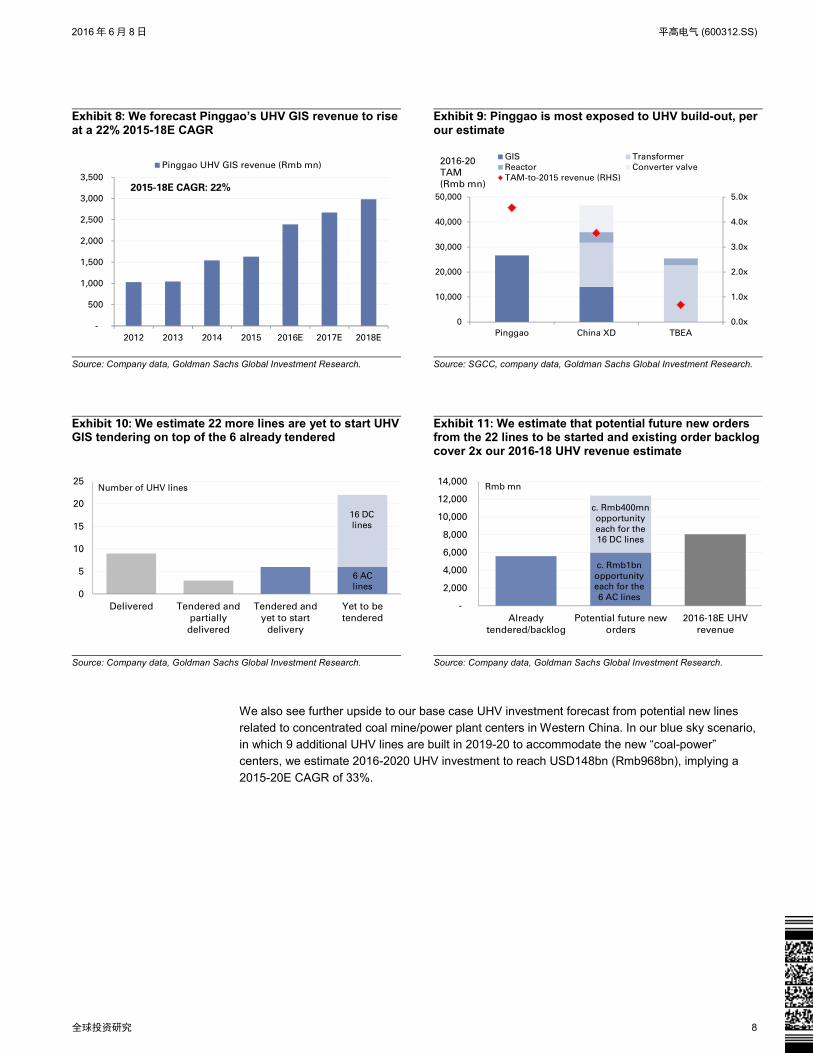
technology entry barriers, we expect Pinggao to sustain its market share and UHV GIS sales to rise at a 22% 2016-18E CAGR, versus 17% over 2012-2015 (Exhibit 9).
Pinggao has historically won over Rmb1bn in UHV GIS new orders for each UHV AC line and c.Rmb400mn on average for each DC line. Thus the 16 DC and 6 AC lines yet to start tendering imply a new orders opportunity of over Rmb12bn, in addition to the company’s close to Rmb6bn order backlog as of end-2015. These figures combined cover more than 2x our total 2016-2018
UHV revenue estimate for Pinggao (Exhibit 12).
2016 年 6 月 8 日 平高电气 (600312.SS)
全球投资研究 8
Exhibit 8: We forecast Pinggao’s UHV GIS revenue to rise at a 22% 2015-18E CAGR
Exhibit 9: Pinggao is most exposed to UHV build-out, per our estimate
Source: Company data, Goldman Sachs Global Investment Research.
Source: SGCC, company data, Goldman Sachs Global Investment Research.
Exhibit 10: We estimate 22 more lines are yet to start UHV GIS tendering on top of the 6 already tendered
Exhibit 11: We estimate that potential future new orders from the 22 lines to be started and existing order backlog cover 2x our 2016-18 UHV revenue estimate
Source: Company data, Goldman Sachs Global Investment Research.
Source: Company data, Goldman Sachs Global Investment Research.
We also see further upside to our base case UHV investment forecast from potential new lines related to concentrated coal mine/power plant centers in Western China. In our blue sky scenario, in which 9 additional UHV lines are built in 2019-20 to accommodate the new “coal-power” centers, we estimate 2016-2020 UHV investment to reach USD148bn (Rmb968bn), implying a
2015-20E CAGR of 33%.
-
500
1,000
1,500
2,000
2,500
3,000
3,500
2012 2013 2014 2015 2016E 2017E 2018E
Pinggao UHV GIS revenue (Rmb mn)
2015-18E CAGR: 22%
0.0x
1.0x
2.0x
3.0x
4.0x
5.0x
0
10,000
20,000
30,000
40,000
50,000
Pinggao China XD TBEA
GIS Transformer
Reactor Converter valve
TAM-to-2015 revenue (RHS)
2016-20
TAM
(Rmb mn)
0
5
10
15
20
25
Delivered Tendered and
partially
delivered
Tendered and
yet to start
delivery
Yet to be
tendered
16 DC
lines
6 AC
lines
Number of UHV lines
-
2,000
4,000
6,000
8,000
10,000
12,000
14,000
Already
tendered/backlog
Potential future new
orders
2016-18E UHV
revenue
Rmb mn
c. Rmb400mn
opportunity
each for the
16 DC lines
c. Rmb1bn
opportunity
each for the
6 AC lines

2016 年 6 月 8 日 平高电气 (600312.SS)
全球投资研究 9
Exhibit 12: In our base case/blue sky scenario, China’s total UHV length reaches 68,158/80,680km by 2020E… China’s UHV total length under base case/blue sky scenario, 2008-20E
Exhibit 13: …which implies a total 2016-20E investment of Rmb765/968bn, a 2015-20E CAGR of 20%/33% China’s annual UHV investment, 2008-20E
Source: SGCC, China Southern Grid, Goldman Sachs Global Investment Research.
Source: SGCC, CSG, Goldman Sachs Global Investment Research.
Exhibit 14: China has made ambitious plans to connect power generation centers with power consumption centers Illustration of China’s existing/under construction/planned UHV lines
Source: SGCC, CSG, China National Bureau of Statistics, Sina, Goldman Sachs Global Investment Research.
0
5,000
10,000
15,000
20,000
25,000
30,000
35,000
0
10,000
20,000
30,000
40,000
50,000
60,000
70,000
80,000
90,000
20
08
20
09
20
10
20
11
20
12
20
13
20
14
20
15
20
16
E
20
17
E
20
18
E
20
19
E
20
20
E
"mine-power" centers related length (LHS)
Base case UHV total length (km) (LHS)
UHV length addition (km) (RHS)
km km
0
50,000
100,000
150,000
200,000
250,000
300,000
20
08
20
09
20
10
20
11
20
12
20
13
20
14
20
15
20
16
E
20
17
E
20
18
E
20
19
E
20
20
E
Potential investment related to "mine-power" centers
Base case UHV investment
Rmb
mn
Representative UHV lines
12 lines:
Xiangjiaba - Shanghai
Chuxiong - Guangzhou
Jinping - Jiangsu
Yunnan Pu'er - Jiangmen
Xiluodu - Zhejiang Jinhua
Sichuan Wudongde - Wenzhou
Sichuan Yanyuan - Nanchang
Sichuan - Hubei
Jinshang - Ji'an
Wudongde - Wenzhou
Baihetan - Hubei
Ya'an - Wuhan
1 line:
South Hami - Zhengzhou
4 lines:
Ximeng - Shandong
Mengxi - Tianjin
Shanghaimiao - Shandong
Inner Mongolia Zhalute - Qingzhou
7 lines:
Ningxia - Zhejiang Shaoxing
Huainan - Shanghai North Loop
Huainan - Shanghai South Loop
Ximeng - Jiangsu Taizhou
North Shanxi - Jiangsu
North Zhejiang - Fuzhou
Longbin - Xuzhou
3 lines:
Yunan Dali - Shenzhen
Yunan Chuxiong - Guangzhou
Batang - Mianyang
9 lines:
Gansu Jiuquan - Hunan
Shaanxi - Jiangxi
North Hami - Chongqing
Xinjiang Zhundong - Chengdun
Mengxi - Xiangnan
Mengxi - Nanchang
Mengxi - Wuhan
Zhundong - Sichuan
Ximeng - Ganzhou
3 lines:Shanxi - Nanyang - Jingmen
Yuheng - Weifang
Jinan - Weifang
No. 1 generation center
No. 2 generation center
No. 3 generation center
No. 1 consumption center
No. 2 consumption center
No. 3 consumption center
2016 年 6 月 8 日 平高电气 (600312.SS)
全球投资研究 10
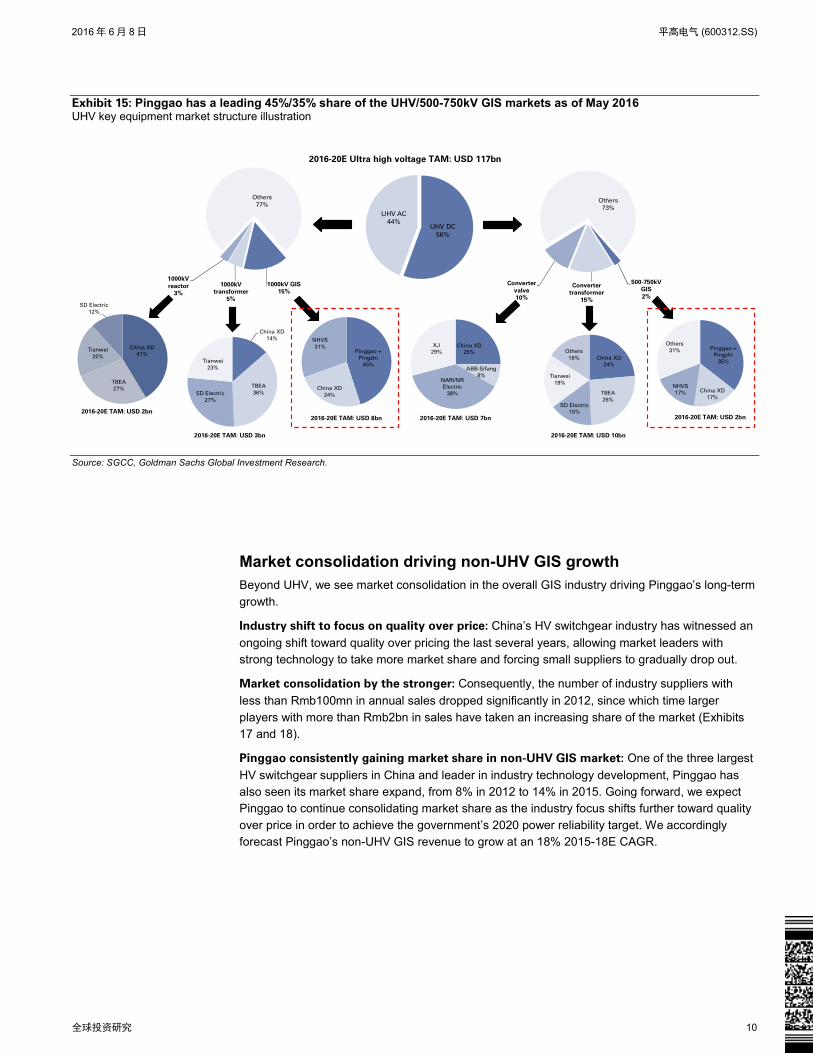
Exhibit 15: Pinggao has a leading 45%/35% share of the UHV/500-750kV GIS markets as of May 2016 UHV key equipment market structure illustration
Source: SGCC, Goldman Sachs Global Investment Research.
Market consolidation driving non-UHV GIS growth Beyond UHV, we see market consolidation in the overall GIS industry driving Pinggao’s long-term
growth.
Industry shift to focus on quality over price: China’s HV switchgear industry has witnessed an
ongoing shift toward quality over pricing the last several years, allowing market leaders with strong technology to take more market share and forcing small suppliers to gradually drop out.
Market consolidation by the stronger: Consequently, the number of industry suppliers with
less than Rmb100mn in annual sales dropped significantly in 2012, since which time larger
players with more than Rmb2bn in sales have taken an increasing share of the market (Exhibits 17 and 18).
Pinggao consistently gaining market share in non-UHV GIS market: One of the three largest
HV switchgear suppliers in China and leader in industry technology development, Pinggao has also seen its market share expand, from 8% in 2012 to 14% in 2015. Going forward, we expect Pinggao to continue consolidating market share as the industry focus shifts further toward quality
over price in order to achieve the government’s 2020 power reliability target. We accordingly forecast Pinggao’s non-UHV GIS revenue to grow at an 18% 2015-18E CAGR.
UHV DC
56%
UHV AC
44%
2016-20E Ultra high voltage TAM: USD 117bn
1000kV GIS
15%1000kV
transformer
5%
1000kV
reactor
3%
Others
77%
China XD
14%
TBEA
36%SD Electric
27%
Tianwei
23%
Pinggao +
Pingzhi
45%
China XD
24%
NHVS
31%China XD
41%
TBEA
27%
Tianwei
20%
SD Electric
12%
2016-20E TAM: USD 2bn
2016-20E TAM: USD 3bn
2016-20E TAM: USD 8bn
500-750kV
GIS
2%
Converter
transformer
15%
Converter
valve
10%
Others
73%
Pinggao +
Pingzhi
35%
China XD
17%
NHVS
17%
Others
31%China XD
25%
ABB-Sifang
8%NARI/NR
Electric
38%
XJ
29%China XD
24%
TBEA
26%SD Electric
15%
Tianwei
19%
Others
16%
2016-20E TAM: USD 7bn
2016-20E TAM: USD 10bn
2016-20E TAM: USD 2bn
2016 年 6 月 8 日 平高电气 (600312.SS)
全球投资研究 11
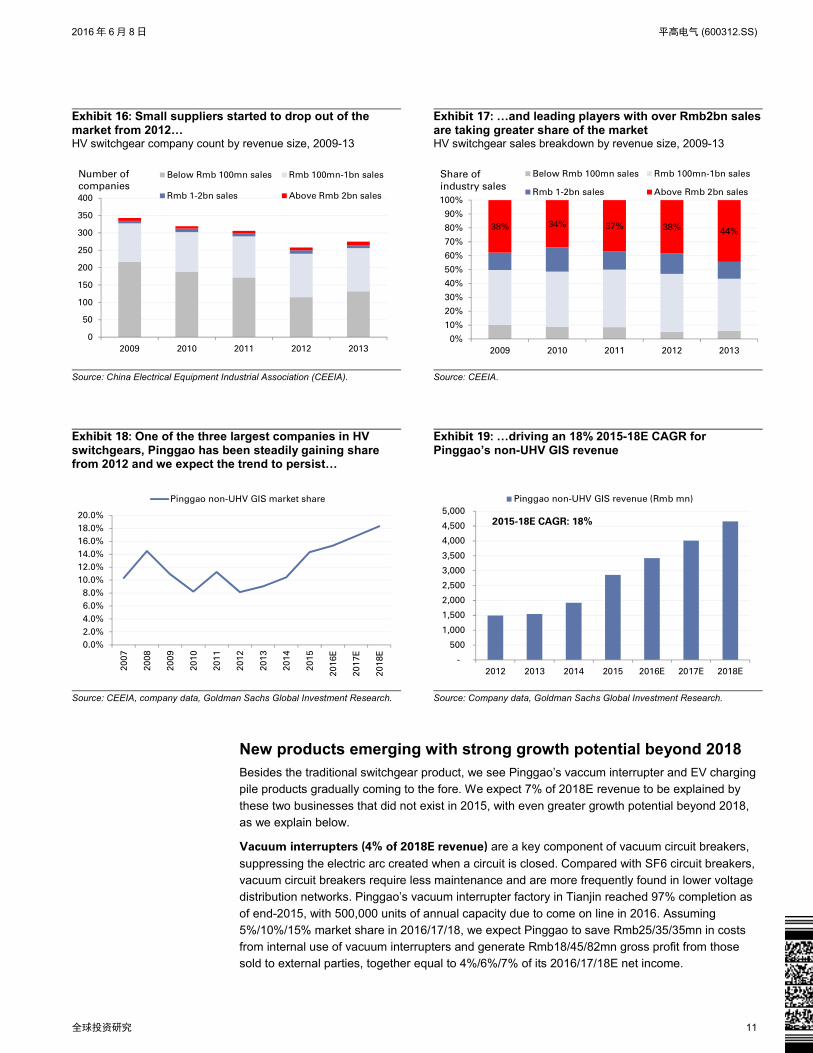
Exhibit 16: Small suppliers started to drop out of the market from 2012… HV switchgear company count by revenue size, 2009-13
Exhibit 17: …and leading players with over Rmb2bn sales are taking greater share of the market HV switchgear sales breakdown by revenue size, 2009-13
Source: China Electrical Equipment Industrial Association (CEEIA).
Source: CEEIA.
Exhibit 18: One of the three largest companies in HV switchgears, Pinggao has been steadily gaining share from 2012 and we expect the trend to persist…
Exhibit 19: …driving an 18% 2015-18E CAGR for Pinggao’s non-UHV GIS revenue
Source: CEEIA, company data, Goldman Sachs Global Investment Research.
Source: Company data, Goldman Sachs Global Investment Research.
New products emerging with strong growth potential beyond 2018 Besides the traditional switchgear product, we see Pinggao’s vaccum interrupter and EV charging pile products gradually coming to the fore. We expect 7% of 2018E revenue to be explained by
these two businesses that did not exist in 2015, with even greater growth potential beyond 2018, as we explain below.
Vacuum interrupters (4% of 2018E revenue) are a key component of vacuum circuit breakers,
suppressing the electric arc created when a circuit is closed. Compared with SF6 circuit breakers, vacuum circuit breakers require less maintenance and are more frequently found in lower voltage distribution networks. Pinggao’s vacuum interrupter factory in Tianjin reached 97% completion as
of end-2015, with 500,000 units of annual capacity due to come on line in 2016. Assuming 5%/10%/15% market share in 2016/17/18, we expect Pinggao to save Rmb25/35/35mn in costs from internal use of vacuum interrupters and generate Rmb18/45/82mn gross profit from those sold to external parties, together equal to 4%/6%/7% of its 2016/17/18E net income.
0
50
100
150
200
250
300
350
400
2009 2010 2011 2012 2013
Below Rmb 100mn sales Rmb 100mn-1bn sales
Rmb 1-2bn sales Above Rmb 2bn sales
Number of
companies
38% 34% 37% 38%44%
0%
10%
20%
30%
40%
50%
60%
70%
80%
90%
100%
2009 2010 2011 2012 2013
Below Rmb 100mn sales Rmb 100mn-1bn sales
Rmb 1-2bn sales Above Rmb 2bn sales
Share of
industry sales
0.0%
2.0%
4.0%
6.0%
8.0%
10.0%
12.0%
14.0%
16.0%
18.0%
20.0%
20
07
20
08
20
09
20
10
20
11
20
12
20
13
20
14
20
15
20
16E
20
17E
20
18E
Pinggao non-UHV GIS market share
-
500
1,000
1,500
2,000
2,500
3,000
3,500
4,000
4,500
5,000
2012 2013 2014 2015 2016E 2017E 2018E
Pinggao non-UHV GIS revenue (Rmb mn)
2015-18E CAGR: 18%
2016 年 6 月 8 日 平高电气 (600312.SS)
全球投资研究 12
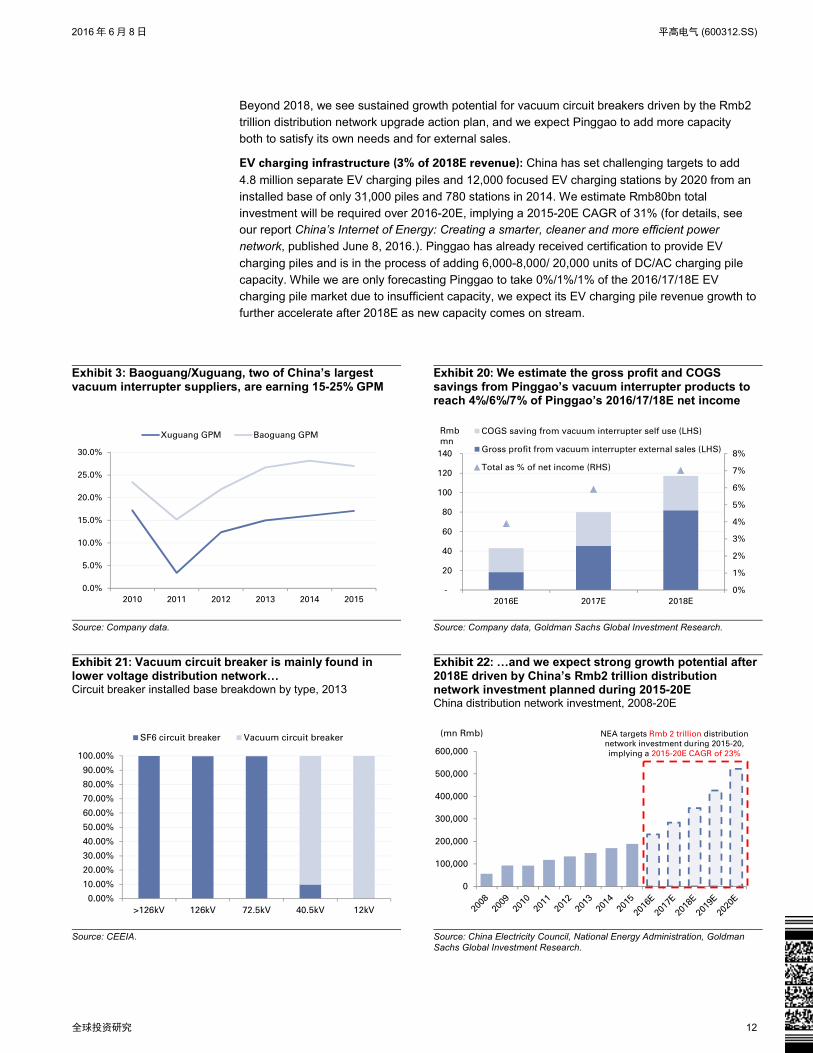
Beyond 2018, we see sustained growth potential for vacuum circuit breakers driven by the Rmb2 trillion distribution network upgrade action plan, and we expect Pinggao to add more capacity both to satisfy its own needs and for external sales.
EV charging infrastructure (3% of 2018E revenue): China has set challenging targets to add
4.8 million separate EV charging piles and 12,000 focused EV charging stations by 2020 from an installed base of only 31,000 piles and 780 stations in 2014. We estimate Rmb80bn total investment will be required over 2016-20E, implying a 2015-20E CAGR of 31% (for details, see our report China’s Internet of Energy: Creating a smarter, cleaner and more efficient power network, published June 8, 2016.). Pinggao has already received certification to provide EV
charging piles and is in the process of adding 6,000-8,000/ 20,000 units of DC/AC charging pile capacity. While we are only forecasting Pinggao to take 0%/1%/1% of the 2016/17/18E EV charging pile market due to insufficient capacity, we expect its EV charging pile revenue growth to further accelerate after 2018E as new capacity comes on stream.
Exhibit 3: Baoguang/Xuguang, two of China’s largest vacuum interrupter suppliers, are earning 15-25% GPM
Exhibit 20: We estimate the gross profit and COGS savings from Pinggao’s vacuum interrupter products to reach 4%/6%/7% of Pinggao’s 2016/17/18E net income
Source: Company data.
Source: Company data, Goldman Sachs Global Investment Research.
Exhibit 21: Vacuum circuit breaker is mainly found in lower voltage distribution network… Circuit breaker installed base breakdown by type, 2013
Exhibit 22: …and we expect strong growth potential after 2018E driven by China’s Rmb2 trillion distribution network investment planned during 2015-20E China distribution network investment, 2008-20E
Source: CEEIA.
Source: China Electricity Council, National Energy Administration, Goldman Sachs Global Investment Research.
0.0%
5.0%
10.0%
15.0%
20.0%
25.0%
30.0%
2010 2011 2012 2013 2014 2015
Xuguang GPM Baoguang GPM
0%
1%
2%
3%
4%
5%
6%
7%
8%
-
20
40
60
80
100
120
140
2016E 2017E 2018E
COGS saving from vacuum interrupter self use (LHS)
Gross profit from vacuum interrupter external sales (LHS)
Total as % of net income (RHS)
Rmb
mn
0.00%
10.00%
20.00%
30.00%
40.00%
50.00%
60.00%
70.00%
80.00%
90.00%
100.00%
>126kV 126kV 72.5kV 40.5kV 12kV
SF6 circuit breaker Vacuum circuit breaker
0
100,000
200,000
300,000
400,000
500,000
600,000
(mn Rmb) NEA targets Rmb 2 trillion distribution
network investment during 2015-20,
implying a 2015-20E CAGR of 23%

2016 年 6 月 8 日 平高电气 (600312.SS)
全球投资研究 13
Exhibit 23: NDRC has set an ambitious target for EV charging infrastructure investment over 2016-20E
Exhibit 24: We estimate EV charging pile market in 2016-20 to reach Rmb80bn, implying 31% 2015-20E CAGR
Source: National Development and Reform Commission, Goldman Sachs Global Investment Research.
Source: Goldman Sachs Global Investment Research
31780
4,831
12,780
0
2,000
4,000
6,000
8,000
10,000
12,000
14,000
Separate EV charging pile ('000) Focused EV charging station
2014 installed base 2020E target installed baseUnit
6,669
54,320
80,397
91,652
0
10,000
20,000
30,000
40,000
50,000
60,000
70,000
80,000
90,000
100,000
2015E market
size
Bear case -
energy
consumption
based
Base case -
Penetration
based
Bull case -
NDRC plan
2016-20E market size
2016-20E
CAGR: 31%
2016-20E
CAGR: 35%
2016-20E
CAGR: 15%
Rmb mn

2016 年 6 月 8 日 平高电气 (600312.SS)
全球投资研究 14
Financials: Robust growth and attractive dividend yield
Robust top-line growth
We forecast Pinggao to sustain its revenue CAGR at 20% over 2015-18E, versus 21% during 2012-15. Specifically we expect:
UHV GIS at 22% 2015-18E CAGR on the back of accelerating UHV build out and
Pinggao’s strong market positioning;
Non-UHV GIS at 18% 2015-18E CAGR on the back of further market consolidation;
Circuit breaker/isolator switch at -5% 2015-18E CAGR on the back of continued
replacement of these products by GIS;
Other (incl. new products) at 41% 2015-18E CAGR on the back of lower revenue base
and vacuum interrupter/EV charging pile new products rolling out.
Exhibit 25: We see strong growth in Pinggao’s GIS and new products… By segment 2015-18E revenue CAGR
Exhibit 26: …with majority of the revenue still contributed by GIS Company’s revenue breakdown by product, 2012-18E
Source: Company data, Goldman Sachs Global Investment Research
Source: Company data, Goldman Sachs Global Investment Research
Attractive dividend payout likely to be sustained
Pinggao had an attractive dividend payout ratio of 82%/69% in 2014/2015, compared with 17%/14% averages for our other power equipment coverage peers. The company is committed to
no less than a 30% dividend payout ratio and expects it to be even higher provided there are no special circumstances such as new capex projects. We forecast Pinggao to maintain a c.60% dividend payout ratio in 2016-18E. Although capex is needed for its foreign factories (particularly in India) and new product related capacity, we expect its capex as a % of sales to moderate from 2013-14 peak investment levels, allowing it more financial resources for dividends. On our 2017 estimates, Pinggao’s dividend yield works out to 5%, which we consider an attractive level relative
to our power equipment coverage peers’ average of 1% and historical average at 2% over 2012-2015.
22%18%
-5% -5%
41%
-10%
0%
10%
20%
30%
40%
50%
UHV GIS Non-UHV
GIS
Circuit
breaker
Isolator
switch
Others (incl.
new
products)
2015-18E revenue CAGR
0
2,000
4,000
6,000
8,000
10,000
12,000
2012 2013 2014 2015 2016E2017E2018E
Other
EV charging poles
Vacuum interrupter
Components
Isolator
Circuit breaker
Non-UHV GIS
UHV GIS
Rmb mn

2016 年 6 月 8 日 平高电气 (600312.SS)
全球投资研究 15
Exhibit 27: We expect Pinggao’s high dividend payout ratio to be sustained at 60% in 2016-18E Pinggao’s dividend payout ratio, 2014-18E
Exhibit 28: Company still has outstanding capex needs on Tianjin Pinggao and oversea factory set-up but its % of sales will peak off from 2013/14 levels Company’s capital expenditure as percentage of total revenue, 2013-18E
Source: Company data, Goldman Sachs Global Investment Research
Source: Company data, Goldman Sachs Global Investment Research.
Gross margin to improve on better mix and key component localization, SG&A savings
driving net margin expansion
We expect Pinggao’s gross margin to improve from 29.7% in 2015 to 31.3% in 2018E, driven by 1) faster revenue growth from UHV GIS, which also has a higher gross margin than Pinggao’s overall gross margin; 2) a higher key component self-supply rate as vacuum interrupter capacity
comes on stream in 2016.
We expect the company’s SG&A ratio to drop gradually during 2016-18E, thanks to 1) slower growth in R&D spending as investment on UHV is largely completed; 2) high client concentration and lower incremental marketing expense needed for additional sales.
As a result, we see the company’s net margin expanding from 14.2% as of 2015 to 16.3% in 2018E, an improvement of 2.1ppt.
Exhibit 29: Gross margin and net margin to improve Gross margin/net margin, 2013-18E
Exhibit 30: SG&A ratio to drop gradually during 2016-18E due to low R&D and marketing spending requirement SG&A expenses and as % of total revenue, 2013-2018E
Source: Company data, Goldman Sachs Global Investment Research
Source: Company data, Goldman Sachs Global Investment Research
-
10%
20%
30%
40%
50%
60%
70%
80%
90%
2014 2015 2016E 2017E 2018E
Dividend payout ratio (%)
0%
2%
4%
6%
8%
10%
12%
14%
16%
2013 2014 2015 2016E 2017E 2018E
Capital expenditure as % of revenue
0.0%
5.0%
10.0%
15.0%
20.0%
25.0%
30.0%
35.0%
2013 2014 2015 2016E 2017E 2018E
Gross margin Net margin
0.0%
2.0%
4.0%
6.0%
8.0%
10.0%
12.0%
14.0%
-
100
200
300
400
500
600
700
800
900
2013 2014 2015 2016E 2017E 2018E
SG&A expense (Rmb mn) (LHS) SG&A % (RHS)

2016 年 6 月 8 日 平高电气 (600312.SS)
全球投资研究 16
Slim operating cash flow on longer payment terms: expecting better working capital
management
Despite Pinggao’s solid topline growth, the company’s operating cash flow remains slim, mainly
due to longer client payment terms. As such, we now forecast receivable days to continue moving upward from 355 days in 2015 to 370 days in 2018E.
However, we forecast stable cash conversion days as we believe the company will also extend its payable days – Pinggao is one of the largest HV switchgear makers in China and with further market consolidation we see increasing bargaining power with suppliers.
Exhibit 31: We expect Pinggao’s operating cash flow to improve… Operating cash flow and its % of net profit, 2013-18E
Exhibit 32: …and overall, we see cash conversion days stabilizing in 2016-18E Cash conversion days breakdown, 2016-18E
Source: Company data, Goldman Sachs Global Investment Research
Source: Company data, Goldman Sachs Global Investment Research
-60%
-40%
-20%
0%
20%
40%
60%
80%
100%
(400)
(200)
-
200
400
600
800
1,000
1,200
1,400
1,600
2013 2014 2015 2016E 2017E 2018E
Operating cash flow (Rmb mn) (LHS)
As % of net profit (RHS)
-400
-300
-200
-100
0
100
200
300
400
500
600
2013 2014 2015 2016E 2017E 2018E
Receivable days Inventory days
Payable days Cash conversion daysDays
2016 年 6 月 8 日 平高电气 (600312.SS)
全球投资研究 17
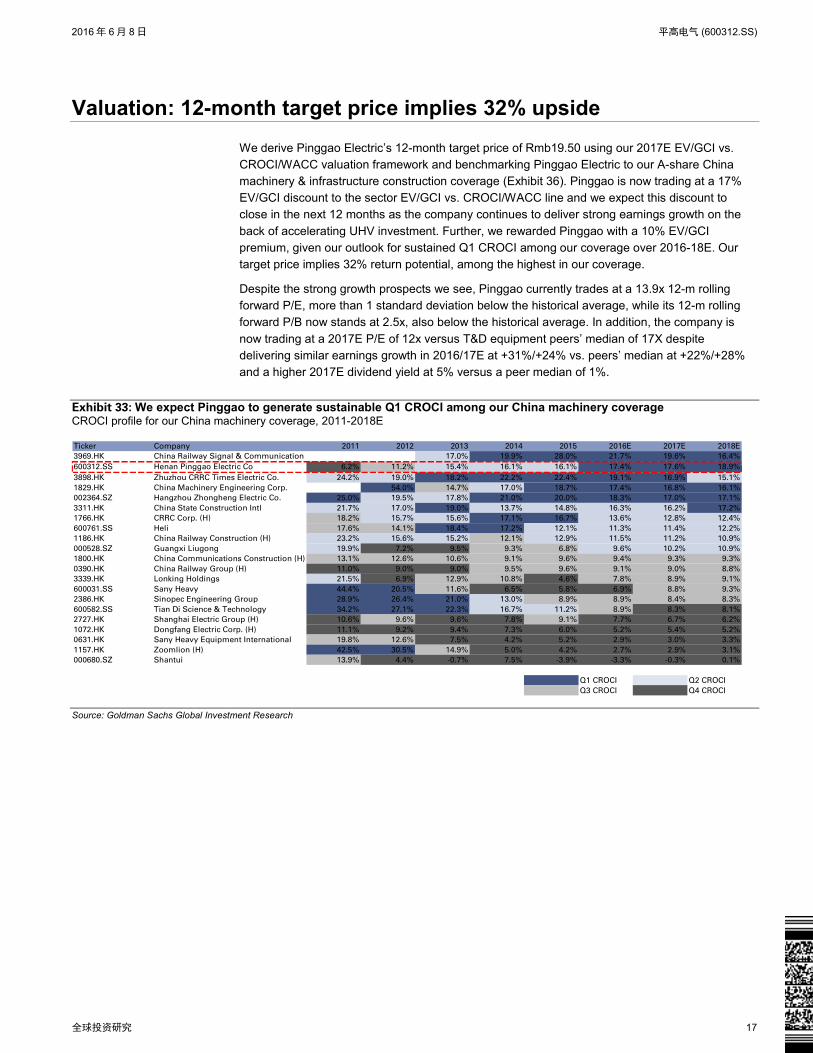
Valuation: 12-month target price implies 32% upside
We derive Pinggao Electric’s 12-month target price of Rmb19.50 using our 2017E EV/GCI vs. CROCI/WACC valuation framework and benchmarking Pinggao Electric to our A-share China machinery & infrastructure construction coverage (Exhibit 36). Pinggao is now trading at a 17% EV/GCI discount to the sector EV/GCI vs. CROCI/WACC line and we expect this discount to close in the next 12 months as the company continues to deliver strong earnings growth on the
back of accelerating UHV investment. Further, we rewarded Pinggao with a 10% EV/GCI premium, given our outlook for sustained Q1 CROCI among our coverage over 2016-18E. Our target price implies 32% return potential, among the highest in our coverage.
Despite the strong growth prospects we see, Pinggao currently trades at a 13.9x 12-m rolling forward P/E, more than 1 standard deviation below the historical average, while its 12-m rolling forward P/B now stands at 2.5x, also below the historical average. In addition, the company is
now trading at a 2017E P/E of 12x versus T&D equipment peers’ median of 17X despite delivering similar earnings growth in 2016/17E at +31%/+24% vs. peers’ median at +22%/+28% and a higher 2017E dividend yield at 5% versus a peer median of 1%.
Exhibit 33: We expect Pinggao to generate sustainable Q1 CROCI among our China machinery coverage CROCI profile for our China machinery coverage, 2011-2018E
Source: Goldman Sachs Global Investment Research
Ticker Company 2011 2012 2013 2014 2015 2016E 2017E 2018E
3969.HK China Railway Signal & Communication 17.0% 19.9% 28.0% 21.7% 19.6% 16.4%
600312.SS Henan Pinggao Electric Co 6.2% 11.2% 15.4% 16.1% 16.1% 17.4% 17.6% 18.9%
3898.HK Zhuzhou CRRC Times Electric Co. 24.2% 19.0% 18.2% 22.2% 22.4% 19.1% 16.9% 15.1%
1829.HK China Machinery Engineering Corp. 54.0% 14.7% 17.0% 18.7% 17.4% 16.8% 16.1%
002364.SZ Hangzhou Zhongheng Electric Co. 25.0% 19.5% 17.8% 21.0% 20.0% 18.3% 17.0% 17.1%
3311.HK China State Construction Intl 21.7% 17.0% 19.0% 13.7% 14.8% 16.3% 16.2% 17.2%
1766.HK CRRC Corp. (H) 18.2% 15.7% 15.6% 17.1% 16.7% 13.6% 12.8% 12.4%
600761.SS Heli 17.6% 14.1% 18.4% 17.2% 12.1% 11.3% 11.4% 12.2%
1186.HK China Railway Construction (H) 23.2% 15.6% 15.2% 12.1% 12.9% 11.5% 11.2% 10.9%
000528.SZ Guangxi Liugong 19.9% 7.2% 9.5% 9.3% 6.8% 9.6% 10.2% 10.9%
1800.HK China Communications Construction (H) 13.1% 12.6% 10.6% 9.1% 9.6% 9.4% 9.3% 9.3%
0390.HK China Railway Group (H) 11.0% 9.0% 9.0% 9.5% 9.6% 9.1% 9.0% 8.8%
3339.HK Lonking Holdings 21.5% 6.9% 12.9% 10.8% 4.6% 7.8% 8.9% 9.1%
600031.SS Sany Heavy 44.4% 20.5% 11.6% 6.5% 5.8% 6.9% 8.8% 9.3%
2386.HK Sinopec Engineering Group 28.9% 26.4% 21.0% 13.0% 8.9% 8.9% 8.4% 8.3%
600582.SS Tian Di Science & Technology 34.2% 27.1% 22.3% 16.7% 11.2% 8.9% 8.3% 8.1%
2727.HK Shanghai Electric Group (H) 10.6% 9.6% 9.6% 7.8% 9.1% 7.7% 6.7% 6.2%
1072.HK Dongfang Electric Corp. (H) 11.1% 9.2% 9.4% 7.3% 6.0% 5.2% 5.4% 5.2%
0631.HK Sany Heavy Equipment International 19.8% 12.6% 7.5% 4.2% 5.2% 2.9% 3.0% 3.3%
1157.HK Zoomlion (H) 42.5% 30.5% 14.9% 5.0% 4.2% 2.7% 2.9% 3.1%
000680.SZ Shantui 13.9% 4.4% -0.7% 7.5% -3.9% -3.3% -0.3% 0.1%
Q1 CROCI Q2 CROCI
Q3 CROCI Q4 CROCI

2016 年 6 月 8 日 平高电气 (600312.SS)
全球投资研究 18
Exhibit 34: We benchmark Pinggao against A-share machinery coverage with a cash return multiple of 1.04x2017E EV/GCI vs CROCI/WACC, A-share machinery coverage
Exhibit 35: We apply a 10% premium to reward Pinggao’s Q1 CROCI, and derive its 12-m target price at Rmb19.5 TP derivation table for Pinggao Electric
Source: Goldman Sachs Global Investment Research *On Conviction List
Source: Goldman Sachs Global Investment Research
Exhibit 36: Pinggao currently trades at an attractive 12-m rolling forward P/E of 13.9x vs. average of 21.4X… 12-month rolling forward P/E for Pinggao
Exhibit 37: …and a 12-m rolling forward P/B at 2.5x vs. average of 2.6x 12-month rolling forward P/B for Pinggao
Source: Datastream, Goldman Sachs Global Investment Research
Source: Datastream, Goldman Sachs Global Investment Research
y = 1.0374x
0.0X
0.2X
0.4X
0.6X
0.8X
1.0X
1.2X
1.4X
1.6X
1.8X
2.0X
0.0X 0.5X 1.0X 1.5X 2.0X
2017E EV/GCI
2017E CROCI/WACC
CCCC A
CRCC A
CRG A
Tian Di
Sany
Liugong
Heli
CRRC A
Shanghai A
Dongfang A
Pinggao
Henan Pinggao
Electric Co
2017E 600312.SS
Sector EV/GCI vs. CROCI/WACC 1.04x
Historical EV/GCI premium/ (discount) 111%
Current EV/GCI premium/ (discount) -17%
Premium/ (discount) applied 10%
CROCI/WACC 1.8x
Implied EV/GCI 2.1x
Gross capital invested (RMB mn) 11,907
Implied EV (RMB mn) 24,798
Net debt and minority interest (RMB mn) 2,662
Implied market cap (RMB mn) 22,136
Number of shares (mn) 1,137
Pricing currency Rmb
Target price 19.5
Current price 14.72
Upside/downside to target price 32%
Rating Buy*
Implied 2016 P/E 20.4x
Implied 2017 P/E 16.5x
Implied 2018 P/E 13.6x
Avg, 21.4
-1 SD, 14.6
+1 SD, 28.2
0.0
10.0
20.0
30.0
40.0
50.0
60.0
Jan
-12
Ap
r-1
2
Ju
l-1
2
Oct-
12
Jan
-13
Ap
r-1
3
Ju
l-1
3
Oct-
13
Jan
-14
Ap
r-1
4
Ju
l-1
4
Oct-
14
Jan
-15
Ap
r-1
5
Ju
l-1
5
Oct-
15
Jan
-16
Ap
r-1
6
P/E Avg -1 SD +1 SD12-m rolling forward P/E (x)
Avg, 2.6
-1 SD, 1.9
+1 SD, 3.3
0.0
1.0
2.0
3.0
4.0
5.0
6.0
Jan
-12
Ap
r-1
2
Ju
l-1
2
Oct-
12
Jan
-13
Ap
r-1
3
Ju
l-1
3
Oct-
13
Jan
-14
Ap
r-1
4
Ju
l-1
4
Oct-
14
Jan
-15
Ap
r-1
5
Ju
l-1
5
Oct-
15
Jan
-16
Ap
r-1
6
P/B Avg -1 SD +1 SD12-m rolling forward P/B (x)

2016 年 6 月 8 日 平高电气 (600312.SS)
全球投资研究 19
Key risks to our view
Key risks to our investment view include:
Lower-than-expected UHV investment
Many planned UHV lines are still subject to final approval by the Chinese government before construction can start. Any delay in approval or decision to cancel certain lines could meaningfully impact UHV’s investment as well as Pinggao’s product delivery.
Also, if certain UHV projects were to face budget constraints and investment were to slow as a consequence, Pinggao may see slower revenue recognition.
Slower-than-expected market consolidation
Although the industry has undergone a shift in focus from price to quality/technology over the past few years and leading suppliers have consistently gained share, we do not rule out the possibility of a shift back to a price focus as a means of saving costs. We believe such a
change could dilute major players’ market share, as small players are usually willing to offer discounted bidding prices at the expense of product quality. In such a scenario, Pinggao’s non-UHV GIS could face significant growth/margin pressures.
Slower-than-expected new product rollout
Our forecasts for new products (vacuum interrupters and EV charging piles) reaching 7% of Pinggao’s 2018E revenue from zero in 2015 is predicated on the assumption that Pinggao
will quickly gain market share, thanks to its technology leadership in HV switchgears, potential for self-use, and strong client relationships. However, if its new products failed to win market share or failed to be applied internally due to insufficient prior experience, Pinggao’s long-term growth outlook might become more challenging.
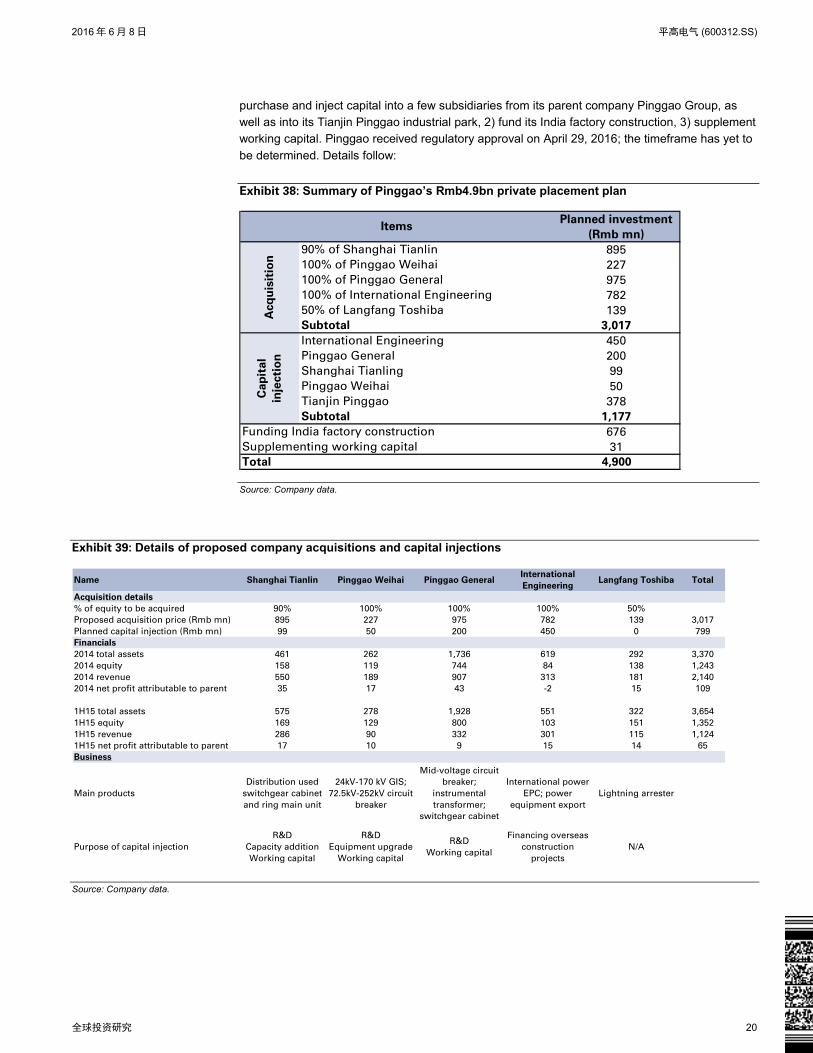
Details of proposed private placement
Pinggao announced in Oct 2015 a Rmb4.9bn private placement (vs. 2015-end shareholders’
equity of Rmb6.1bn, excluding minority interests). According to the announcement, the aim is to 1)
2016 年 6 月 8 日 平高电气 (600312.SS)
全球投资研究 20
purchase and inject capital into a few subsidiaries from its parent company Pinggao Group, as well as into its Tianjin Pinggao industrial park, 2) fund its India factory construction, 3) supplement working capital. Pinggao received regulatory approval on April 29, 2016; the timeframe has yet to
be determined. Details follow:
Exhibit 38: Summary of Pinggao’s Rmb4.9bn private placement plan
Source: Company data.
Exhibit 39: Details of proposed company acquisitions and capital injections
Source: Company data.
Planned investment
(Rmb mn)
90% of Shanghai Tianlin 895
100% of Pinggao Weihai 227
100% of Pinggao General 975
100% of International Engineering 782
50% of Langfang Toshiba 139
Subtotal 3,017
International Engineering 450
Pinggao General 200
Shanghai Tianling 99
Pinggao Weihai 50
Tianjin Pinggao 378
Subtotal 1,177
676
31
4,900
Items
Acq
uis
itio
nC
ap
ital
inje
cti
on
Funding India factory construction
Supplementing working capital
Total
Name Shanghai Tianlin Pinggao Weihai Pinggao GeneralInternational
EngineeringLangfang Toshiba Total
Acquisition details
% of equity to be acquired 90% 100% 100% 100% 50%
Proposed acquisition price (Rmb mn) 895 227 975 782 139 3,017
Planned capital injection (Rmb mn) 99 50 200 450 0 799
Financials
2014 total assets 461 262 1,736 619 292 3,370
2014 equity 158 119 744 84 138 1,243
2014 revenue 550 189 907 313 181 2,140
2014 net profit attributable to parent 35 17 43 -2 15 109
1H15 total assets 575 278 1,928 551 322 3,654
1H15 equity 169 129 800 103 151 1,352
1H15 revenue 286 90 332 301 115 1,124
1H15 net profit attributable to parent 17 10 9 15 14 65
Business
Main products
Distribution used
switchgear cabinet
and ring main unit
24kV-170 kV GIS;
72.5kV-252kV circuit
breaker
Mid-voltage circuit
breaker;
instrumental
transformer;
switchgear cabinet
International power
EPC; power
equipment export
Lightning arrester
Purpose of capital injection
R&D
Capacity addition
Working capital
R&D
Equipment upgrade
Working capital
R&D
Working capital
Financing overseas
construction
projects
N/A
2016 年 6 月 8 日 平高电气 (600312.SS)
全球投资研究 21
信息披露附录 申明 本人,杜茜,在此申明,本报告所表述的所有观点准确反映了本人对上述公司或其证券的个人看法。此外,本人薪金的任何部分不曾与,不与,也将不会与本
报告中的具体推荐意见或观点直接或间接相关。
投资摘要 投资摘要部分通过将一只股票的主要指标与其行业和市场相比较来评价该股的投资环境。所描述的四个主要指标包括增长、回报、估值倍数和波动性。增长、
回报和估值倍数都是运用数种方法综合计算而成,以确定该股在地区研究行业内所处的百分位排名。
每项指标的准确计算方式可能随着财务年度、行业和所属地区的不同而有所变化,但标准方法如下:
增长是下一年预测与当前年度预测的综合比较,如每股盈利、EBITDA 和收入等。 回报是各项资本回报指标一年预测的加总,如 CROCI、平均运用资本回报率
和净资产回报率。 估值倍数根据一年预期估值比率综合计算,如市盈率、股息收益率、EV/FCF、EV/EBITDA、EV/DACF、市净率。 波动性根据 12个月的历史
波动性计算并经股息调整。
Quantum Quantum 是提供具体财务报表数据历史、预测和比率的高盛专有数据库,它可以用于对单一公司的深入分析,或在不同行业和市场的公司之间进行比较。
GS SUSTAIN GS SUSTAIN是侧重于长期做多建议的相对稳定的全球投资策略。GS SUSTAIN关注名单涵盖了我们认为相对于全球同业具有持续竞争优势和出色的资本回
报、因而有望在长期内表现出色的行业领军企业。我们对领军企业的筛选基于对以下三方面的量化分析:现金投资的现金回报、行业地位和管理水平(公司管
理层对行业面临的环境、社会和企业治理方面管理的有效性)。
信息披露
相关的股票研究范围
杜茜:中国资本品。
中国资本品:中国通号、中国中车(A)、中国中车(H)、东方电气(A)、东方电气(H)、埃斯顿、柳工、海天国际、大族激光、中恒电气、合力、平高电气、和利
时、华工科技、龙工、三一重工、三一国际、上海电气(A)、上海电气(H)、新时达、山推、汇川技术、机器人、天地科技、长飞光纤、郑煤机、株洲中车时代
电气、中联重科(A)、中联重科(H)。
与公司有关的法定披露
以下信息披露了高盛高华证券有限责任公司(“高盛高华”)与北京高华证券有限责任公司(“高华证券”)投资研究部所研究的并在本研究报告中提及的公司之间
的关系。
没有对下述公司的具体信息披露: 平高电气 (Rmb14.72)
公司评级、研究行业及评级和相关定义
买入、中性、卖出:分析师建议将评为买入或卖出的股票纳入地区投资名单。一只股票在投资名单中评为买入或卖出由其相对于所属研究行业的潜在回报决定。
任何未获得买入或卖出评级的股票均被视为中性评级。每个地区投资评估委员会根据 25-35%的股票评级为买入、10-15%的股票评级为卖出的全球指导原则来
管理该地区的投资名单;但是,在某一特定行业买入和卖出评级的分布可能根据地区投资评估委员会的决定而有所不同。地区强力买入或卖出名单是以潜在回
报规模或实现回报的可能性为主要依据的投资建议。
潜在回报:代表当前股价与一定时间范围内预测目标价格之差。分析师被要求对研究范围内的所有股票给出目标价格。潜在回报、目标价格及相关时间范围在
每份加入投资名单或重申维持在投资名单的研究报告中都有注明。
研究行业及评级:分析师给出下列评级中的其中一项代表其根据行业历史基本面及/或估值对研究对象的投资前景的看法。 具吸引力(A):未来 12个月内投资前
景优于研究范围的历史基本面及/或估值。 中性(N):未来 12个月内投资前景相对研究范围的历史基本面及/或估值持平。 谨慎(C):未来 12个月内投资前景
劣于研究范围的历史基本面及/或估值。
暂无评级(NR):在高盛高华于涉及该公司的一项合并交易或战略性交易中担任咨询顾问时并在某些其他情况下,投资评级和目标价格已经根据高华证券的政策予
以除去。 暂停评级(RS):由于缺乏足够的基础去确定投资评级或价格目标,或在发表报告方面存在法律、监管或政策的限制,我们已经暂停对这种股票给予投
资评级和价格目标。此前对这种股票作出的投资评级和价格目标(如有的话)将不再有效,因此投资者不应依赖该等资料。 暂停研究(CS):我们已经暂停对该公司
的研究。 没有研究(NC):我们没有对该公司进行研究。 不存在或不适用(NA):此资料不存在或不适用。 无意义(NM):此资料无意义,因此不包括在报告内。
一般披露
本报告在中国由高华证券分发。高华证券具备证券投资咨询业务资格。
本研究报告仅供我们的客户使用。除了与高盛相关的披露,本研究报告是基于我们认为可靠的目前已公开的信息,但我们不保证该信息的准确性和完整性,客
户也不应该依赖该信息是准确和完整的。报告中的信息、观点、估算和预测均截至报告的发表日,且可能在不事先通知的情况下进行调整。我们会适时地更新
我们的研究,但各种规定可能会阻止我们这样做。除了一些定期出版的行业报告之外,绝大多数报告是在分析师认为适当的时候不定期地出版。
高盛高华为高华证券的关联机构,从事投资银行业务。高华证券、高盛高华及它们的关联机构与本报告中涉及的大部分公司保持着投资银行业务和其它业务关
系。
我们的销售人员、交易员和其它专业人员可能会向我们的客户及自营交易部提供与本研究报告中的观点截然相反的口头或书面市场评论或交易策略。我们的资
产管理部门、自营交易部和投资业务部可能会做出与本报告的建议或表达的意见不一致的投资决策。

2016 年 6 月 8 日 平高电气 (600312.SS)
全球投资研究 22
本报告中署名的分析师可能已经与包括高华证券销售人员和交易员在内的我们的客户讨论,或在本报告中讨论交易策略,其中提及可能会对本报告讨论的证券
市场价格产生短期影响的推动因素或事件,该影响在方向上可能与分析师发布的股票目标价格相反。任何此类交易策略都区别于且不影响分析师对于该股的基
本评级,此类评级反映了某只股票相对于报告中描述的研究范围内股票的回报潜力。
高华证券及其关联机构、高级职员、董事和雇员,不包括股票分析师和信贷分析师,将不时地对本研究报告所涉及的证券或衍生工具持有多头或空头头寸,担
任上述证券或衍生工具的交易对手,或买卖上述证券或衍生工具。
在高盛组织的会议上的第三方演讲嘉宾(包括高华证券或高盛其它部门人员)的观点不一定反映全球投资研究部的观点,也并非高华证券或高盛的正式观点。
在任何要约出售股票或征求购买股票要约的行为为非法的地区,本报告不构成该等出售要约或征求购买要约。本报告不构成个人投资建议,也没有考虑到个别
客户特殊的投资目标、财务状况或需求。客户应考虑本报告中的任何意见或建议是否符合其特定状况,以及(若有必要)寻求专家的意见,包括税务意见。本报告
中提及的投资价格和价值以及这些投资带来的收入可能会波动。过去的表现并不代表未来的表现,未来的回报也无法保证,投资者可能会损失本金。
某些交易,包括牵涉期货、期权和其它衍生工具的交易,有很大的风险,因此并不适合所有投资者。外汇汇率波动有可能对某些投资的价值或价格或来自这一
投资的收入产生不良影响。
投资者可以向高华销售代表取得或通过 http://www.theocc.com/about/publications/character-risks.jsp取得当前的期权披露文件。对于包含多重期权买卖的期权
策略结构产品,例如,期权差价结构产品,其交易成本可能较高。与交易相关的文件将根据要求提供。
所有研究报告均以电子出版物的形式刊登在高华客户网上并向所有客户同步提供。高华未授权任何第三方整合者转发其研究报告。有关某特定证券的研究报
告、模型或其它数据,请联络您的销售代表。
北京高华证券有限责任公司版权所有 © 2016 年
未经北京高华证券有限责任公司事先书面同意,本材料的任何部分均不得(i)以任何方式制作任何形式的拷贝、复印件或复制品,或(ii)再次分发。