國立臺灣大學工學院醫學工程研究所 博士論文 社區腦中風病人 ...
137
doi:10.6342/NTU201703518 國立臺灣大學工學院醫學工程研究所 博士論文 Institute of Biomedical Engineering College of Medicine and College of Engineering National Taiwan University Doctoral Dissertation 社區腦中風病人之跌倒預防策略: 跌倒預測因子之研究 Fall Prevention Strategies in Community-Dwelling Stroke Patients: An Investigation of Fall Predictors 魏大森 Ta-Sen Wei 指導教授:章良渭 博士 Advisor: Liang-Wey Chang, Ph.D. 中華民國 106 年 6 月 June, 2017
-
Upload
khangminh22 -
Category
Documents
-
view
0 -
download
0
Transcript of 國立臺灣大學工學院醫學工程研究所 博士論文 社區腦中風病人 ...

doi:10.6342/NTU201703518
國立臺灣大學工學院醫學工程研究所
博士論文
Institute of Biomedical Engineering
College of Medicine and College of Engineering
National Taiwan University
Doctoral Dissertation
社區腦中風病人之跌倒預防策略:
跌倒預測因子之研究
Fall Prevention Strategies
in Community-Dwelling Stroke Patients:
An Investigation of Fall Predictors
魏大森
Ta-Sen Wei
指導教授:章良渭 博士
Advisor: Liang-Wey Chang, Ph.D.
中華民國 106 年 6 月
June, 2017

doi:10.6342/NTU201703518
i

doi:10.6342/NTU201703518
ii
中文摘要
腦中風為老年人好發疾病之一,為國人十大死因之第四位。隨著我國人口
快速老年化、醫療照護進步,死亡率明顯下降,腦中風病患逐年增加。腦中風
患者發病後常見併發症有肢體痙攣、肢體控制不良、平衡與步態能力障礙、內
翻馬蹄足、憂鬱等;這些因素都會導致患者於日常活動中發生跌倒意外,如行
走或移位時(坐到站/站到坐),嚴重者可能造成骨折甚至死亡,衍生之家庭負
擔與社會問題不容小覷。因此,如何於腦中風發病住院期間篩檢出跌倒高風險
因子、提供安全的起身坐站訓練並完整的治療介入策略,實為目前臨床醫護人
員迫切亟待解決的議題。
近年來,腦中風病患者的治療介入模式,已由傳統只單純改善個案的生理
狀況,轉變成全人的照護模式,如何兼顧個案生理與心理與社會參與,將是擬
定腦中風預防跌倒策略的重要面向,也是有效降低個案跌倒或跌倒發生機會之
重要因素。
本論文以多面向與客觀化的評估,探討社區腦中風患者跌倒的預測因子,
並分析腦中風個案坐到站、站到坐時,不同手與腳擺位姿勢之運動學及動力學
表現,來做為日後臨床醫護人員訓練、治療和跌倒預防、介入之重要參考。
研究結果發現兩個預測腦中風出院後發生跌倒之多變項回歸模型,分別為
模型一: 步態不對稱性[調整勝算比, adjusted odds ratio, aOR = 2.2, 95% 信賴區
間 (1.2–3.8)]、小腿腓腸肌痙攣程度[aOR = 3.2 (1.4–7.3)] 與憂鬱[aOR = 1.4 (1.2–

doi:10.6342/NTU201703518
iii
1.8)],模型準確度 (Area under curve, AUC)為 0.856;模型二: 功能獨立評估量
表分數低 [aOR = 0.9 (0.9–1.0)]、步態不對稱性 [aOR = 3.6(1.4–9.2)]與內外側重
心晃動程度[aOR = 1.7 (1.0–2.7)],模型準確度為 0.815。
不同手與腳擺位姿勢之動力學結果發現,偏癱腳在後且手成交握狀時,腦
中風患者由坐姿起身到站立之預備時間最短,過程中雙腳承重對稱性佳,因此
證實臨床治療師訓練患者坐到站時,透過手與腳的姿勢變換,可改善雙腳承重
對稱性外,亦可做為訓練偏癱側下肢承重的訓練方法。
而腦中風由站到坐時,腳的擺位顯著影響腳承重策略及坐下時的衝擊力,
但手的姿勢並無影響。個案若因前腳(健側)無法代償後腳(偏癱腳)的控制
時,將在站到坐過程中產生較大的衝擊力,故為了訓練目的,可將健側腳放置
於前方來誘發偏癱腳的肌肉用力與控制能力。
結論:本論文藉由分析腦中風出院前收集之病患臨床資料與功能性評估結
果,歸納出兩個跌倒預測模型,並透過坐到站與站到坐的動力學實驗,分析個
案對不同姿勢下,肢體動作的調變機制,研究結果提供臨床人員擬訂腦中風個
別化防跌介入與治療之重要參考依據。
關鍵字:腦中風、跌倒、步態不對稱性、憂鬱、痙攣、姿勢晃動、
功能獨立評估

doi:10.6342/NTU201703518
iv
Abstract
Cerebrovascular disease is one of common chronic disease in the elderly and is
the 4th leading cause of death in Taiwan. The numbers of stroke are gradually
increasing annually due to rapid aging of population and excellent healthcare system
which decreases the incidence of mortality. The common complications after stroke
are limb spasticity, poor coordination, balance & gait impairment, equinus-varus foot,
depression and etc. It often results in accidental falls during activity of daily living,
such as sit to stand or stand to sit and may cause fractures or even death. It is of no
doubt that family and society are also having great impact and challenges. Therefore,
it is crucial to predict the risk factors of fall, provide sit-to-stand training and
comprehensive interventions for stroke patients during hospitalization.
Recently, the mode of care and intervention is moving from improving the
physical functioning toward building a holistic health care in stroke patients. A
comprehensive fall prevention strategy, including physical, psychological and
biosocial dimensions is essential to meet the unmet needs in clinical practice and
reduces the incidence of accidental falls in the stroke patients.
In this dissertation, it will discover the predictors of fall by using objective
assessments in the community-dwelling stroke patients. It also analyzes the strategies
doi:10.6342/NTU201703518
v
of leg load discrepancy on bilateral legs during sit to stand and stand to sit tasks
according to different postural configuration of foot and hand.
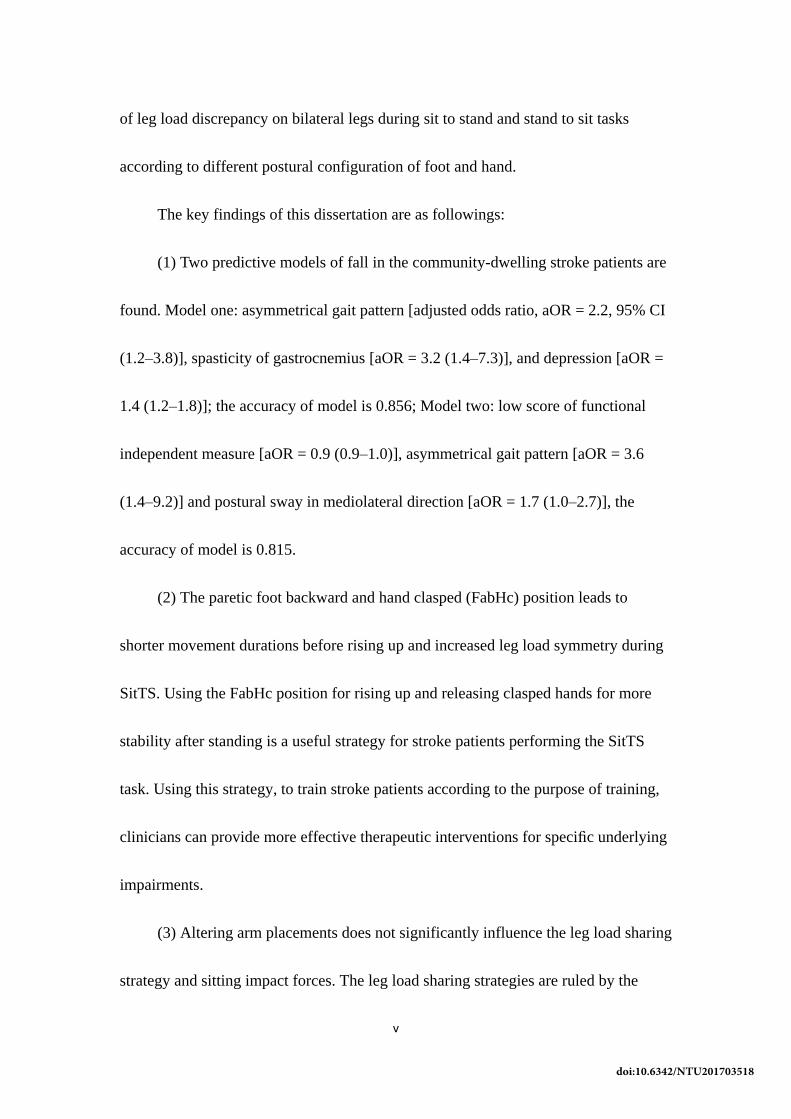
The key findings of this dissertation are as followings:
(1) Two predictive models of fall in the community-dwelling stroke patients are
found. Model one: asymmetrical gait pattern [adjusted odds ratio, aOR = 2.2, 95% CI
(1.2–3.8)], spasticity of gastrocnemius [aOR = 3.2 (1.4–7.3)], and depression [aOR =
1.4 (1.2–1.8)]; the accuracy of model is 0.856; Model two: low score of functional
independent measure [aOR = 0.9 (0.9–1.0)], asymmetrical gait pattern [aOR = 3.6
(1.4–9.2)] and postural sway in mediolateral direction [aOR = 1.7 (1.0–2.7)], the
accuracy of model is 0.815.
(2) The paretic foot backward and hand clasped (FabHc) position leads to
shorter movement durations before rising up and increased leg load symmetry during
SitTS. Using the FabHc position for rising up and releasing clasped hands for more
stability after standing is a useful strategy for stroke patients performing the SitTS
task. Using this strategy, to train stroke patients according to the purpose of training,
clinicians can provide more effective therapeutic interventions for specific underlying
impairments.
(3) Altering arm placements does not significantly influence the leg load sharing
strategy and sitting impact forces. The leg load sharing strategies are ruled by the

doi:10.6342/NTU201703518
vi
preferred use of the non-paretic side and the favored leg position for the
biomechanical load. The paretic leg is incapable of modulating the sitting-down
process, placing the paretic leg posterior induces notably greater sitting impact forces
compared with the counter leg placement. From the strength-training point of view,
however, placing the paretic leg posterior would facilitate exertions of the paretic leg.
Conclusions: Patient falls are a major health concern in the care of patients with
stroke. Two predictive model of fall risks are defined and the loading strategies during
sit to stand and stand to sit are analyzed. The findings of this dissertation may provide
an important information for making individualized fall prevention strategies in the
stroke patients.
Keywords: stroke, fall, gait asymmetry, depression, spasticity, postural sway
functional independence measure

doi:10.6342/NTU201703518
vii
Table of Contents
口試委員審定書…………………………………………………………………………………………………......i
中文摘要………………………………………………………………………………………………………………....ii
Abstract……………………………………………………………………………………………………………………iv
Falls and Fall-related injuries in the Elderly and Stroke ............................. 1
Introduction ............................................................................................ 1
1.1.1 Risks of fall and fall related injury in the stroke patients .............. 4
References .............................................................................................. 8
Gait Asymmetry, Ankle Spasticity, and Depression as Independent
Predictors of Falls in Community-Dwelling Ambulatory Stroke Patients 11
Introduction .......................................................................................... 11
Materials and Methods ......................................................................... 14
2.2.1 Participants ................................................................................... 14
2.2.2 Baseline Measurements ............................................................... 15
2.2.3 Assessment of Falls...................................................................... 19
2.2.4 Statistics ....................................................................................... 19
Results .................................................................................................. 21
Discussion ............................................................................................ 33
2.4.1 Assessment of Falls...................................................................... 34
2.4.2 Balance and Gait Performance ..................................................... 34
2.4.3 Spasticity Related to Falls ............................................................ 35
2.4.4 Effects of Functional Performance .............................................. 37
2.4.5 Effects of Depression in Stroke Patients ...................................... 37
2.4.6 Fall Prediction Model .................................................................. 38
2.4.7 Study Limitations ......................................................................... 40
Conclusions .......................................................................................... 43
References ............................................................................................ 44
Postural influence on Stand-to-Sit leg load sharing strategies and sitting
impact forces in stroke patients ................................................................. 48
Introduction .......................................................................................... 48
Methods................................................................................................ 51
3.2.1 Subjects ........................................................................................ 51
3.2.2 Experiment protocol ..................................................................... 52
3.2.3 Data analysis ................................................................................ 57
3.2.4 Statistical analysis ........................................................................ 57
Result ................................................................................................... 58

doi:10.6342/NTU201703518
viii
3.3.1 Normality check ........................................................................... 58
3.3.2 Two-way ANOVA with post hoc comparisons ............................ 58
3.3.3 Leg load sharing strategy ............................................................. 61
Discussion ............................................................................................ 63
References ............................................................................................ 69
Postural Configuration on Phase Duration and Vertical Force Asymmetry
during Sit-to-Stand Tasks in Patients with Stroke ..................................... 72
Introduction .......................................................................................... 72
Methods................................................................................................ 74
4.2.1 Participants ................................................................................... 74
4.2.2 Ethics............................................................................................ 74
4.2.3 Experimental settings ................................................................... 74
Procedures ............................................................................................ 80
4.3.1 Data processing ............................................................................ 80
4.3.2 Statistical analysis ........................................................................ 84
Results .................................................................................................. 85
Discussion ............................................................................................ 94
4.5.1 Durations in response to hand and foot placement ...................... 94
4.5.2 The effect of foot position on the asymmetry of weight bearing . 95
4.5.3 The effect of hand position on the asymmetry of weight bearing 96
4.5.4 The effect of foot and hand positions on leg load discrepancy .... 98
Limitations ........................................................................................... 99
Conclusions .......................................................................................... 99
References .......................................................................................... 101
Multidisciplinary interventions for fall prevention related to the stroke 104
Fall prevention and management related to the stroke ...................... 105
Treatments of spasticity improves gait asymmetry ............................ 107
ICF model for fall prevention ............................................................ 111
References .......................................................................................... 116

doi:10.6342/NTU201703518
ix
List of Figures
Figure 2-1 Ultraflex Computerized Dynography data logger, Infotronic, Netherland. 18
Figure 2-2 Shoes with force sensors to measure ground reaction force. ..................... 18
Figure 2-3 The ROC curves for predicting the occurrence of falls in stroke patients
using models I and II. AUCs were 0.856 and 0.815, respectively. Arrowheads
indicate the identified optimal cutoffs (Youden Index) for these prediction
models (0.69 in model I and 0.53 in model II). ................................................... 32
Figure 2-4 Balance and gait training for a stroke patient. ............................................ 41
Figure 2-5 Dynamic balance testing and training. ....................................................... 41
Figure 2-6 A protable gait analysis instruments. .......................................................... 42
Figure 2-7 Results of balance and gait Analysis. ......................................................... 42
Figure 3-1 Experiment setup ........................................................................................ 53
Figure 3-2 Typical normalized stool reaction forces. y indicates the first transient
peak, i.e. sitting impact force. .............................................................................. 55
Figure 3-3 Typical normalized dynamic leg load responded to two leg placements and
(a) SA arm placement and (b) GA arm placement during descending period. .... 56
Figure 3-4 Illustrations of leg load strategies of two leg placements corresponding to
(a) SA arm placement and (b) GA arm placement. * represents that there is a
significant difference between two bars. .............................................................. 62
Figure 4-1 Experimental setting: Marker placement and foot position. ...................... 76
Figure 4-2 Arm positions and Knee flexion angle. ...................................................... 77
Figure 4-3 Example of hand grasp during the task of sit to stand. .............................. 77
Figure 4-4 The kinematic and kinetic data collected by optotrak motion system. ...... 79
Figure 4-5 Events of sit to stand task. .......................................................................... 83
Figure 4-6 Bilateral leg load in FspHk and FabHc position. ....................................... 83
Figure 4-7 Asymmetrical leg load compared to FspHk and FabHc. ............................ 83
Figure 4-8 The durations of sit to stand by phase: (A) preparation phase. (B)
ascending phase. (C) stabilization phase. (D) total sit to stand. The values were
plot by mean with standard deviation. ................................................................. 87
Figure 4-9 The asymmetry Index of events according to Foot and Hand Positions: ... 90
Figure 4-10 Leg Load Discrepancy of sit to stand by phase: (A) preparation phase. (B)
ascending phase. (C) stabilization phase. (D) total sit to stand. All values are
represented as mean (standard deviation). ........................................................... 92
Figure 5-1 Management of spasticity algorithm. ....................................................... 108
Figure 5-2 Muscle co-contraction pattern on upper and lower limbs. ....................... 109
Figure 5-3 Ultrasound guided Botox injection for spasticity reduction. .................... 110
Figure 5-4 Improvement of equino-varus foot and claw toes after Botox injection. . 110

doi:10.6342/NTU201703518
x
Figure 5-5 ICF core set of risk factors for falls in acute rehabilitation settings. ....... 112

doi:10.6342/NTU201703518
xi
List of Tables
Table 1-1 Risk factors for the elderly falls by multivariate analysis. ............................. 4
Table 1-2 Risk of fall-related injury by multivariate analysis in the elder. .................... 5
Table 1-3 Risks of fall related injury in stroke patients. ................................................ 6
Table 1-4 Interventions for preventing falls in elder people living in the community. .. 7
Table 2-1 Baseline measurements of the study subjects. ............................................. 23
Table 2-2 Comparison of balance and gait parameters in study subjects. ................... 25
Table 2-3 Correlation coefficients of balance and gait parameters (n = 112). ............. 26
Table 2-4. Correlation between predictors of risk of falls in stroke subjects (n = 112).
.............................................................................................................................. 28
Table 2-5. Multivariate logistic regression for predictors of accidental falls. ............. 31
Table 3-1 Group means and statistical results of descending period, leg load kinetics,
and sitting impact force corresponding to each postural configuration (N= 18). 60
Table 4-1 Leg load discrepancy by phase. ................................................................... 93
Table 5-1 Publications and conferences related to fall prevention for the stroke. ..... 105
Table 5-2 ICF categories included in the ICF core set for falls in acute rehabilitation
settings. .............................................................................................................. 113
Table 5-3 Evaluation of a stroke patient by ICF model. ............................................ 115
Appendix 1 Eighty-eight fall-related parameters and their linked 66 ICF categories
and 5 personal factors. ................................................................................... 121

doi:10.6342/NTU201703518
1
Falls and Fall-related injuries in the Elderly and Stroke
Introduction
The most common fractures related to osteoporosis are distal radial fracture
vertebral fracture, and hip fracture [1]. Hip fractures result in higher mortality and
morbidity in the elderly. This devastating condition also causes economic and
psychological stress to the patients’ families and results in large amounts of insurance
payments. The number of hip fractures is estimated to triple from the year 1999 to
2030 [2]; globally, the total figures could rise from 1.7 million in 1990 to around 6.3
million by 2050 [3]. Hip fracture will be the major public health issue of the elderly in
the twenty-first century. The common risk factors of fall and fall related injuries were
summarized in Table 1-1~1-5.
Cmmings and Nevitt [4] hypothesized that four important factors may determine
whether a fall will cause a hip fracture: (1) fall orientation, (2) protective responses,
(3) local shock absorbers and (4) bone strength at the hip. Studies have shown that hip
fracture in the elderly is closely associated with low bone mineral density (BMD) of
the proximal femur [5] and accidental falls are the predisposing factor [6], [7].
Greenspan et al. proved that a sideways fall was an independent risk factor for hip
fracture either in the ambulatory community elderly [8] or in frail nursing home

doi:10.6342/NTU201703518
2
elderly [9]. Hayes et al.’s study showed that impact near the hip dominated fractures
in elderly nursing home residents who fell[10]. Researchers have also reported that
low body weight [11], [12] or reduced physical activity[13], [14] increases the risk of
hip fractures.
For effective prevention, high-risk groups need to be identified see the Table 1-4.
Though many researchers have investigated the risk factors of hip fracture, most of
them determined the risk factors by bivariate analysis. Few researchers have
approached the risk factors from different aspects, especially as regards the fall
characteristics, functional mobility and BMD. We investigated these risk factors
concurrently to determine in what circumstances an accidental fall may cause a hip
fracture in the elderly and to provide an appropriate strategy for prevention. The
results showed that there were 6 independent risk factors of hip fracture when the
elderly fall, including (1) body mass index (kg/m2), OR=1.8 (1.1~2.8) ; (2) functional
mobility, OR=2.0 (1.1~3.5) ; (3) previous stroke, OR=2.9 (1.3~6.3) ; (4) sideways
falls, OR=2.5 (1.6~3.9) ; (5) direct hip impact, OR=4.9 (2.7~8.8) ; (6) femoral neck
bone density (g/cm2), OR= 1.7 (1.0~2.8)。

doi:10.6342/NTU201703518
3
From the results of these studies, the prevention strategy for hip fracture in the
elderly can be summarized into three categories: (1) increase or maintain BMD of the
proximal femur; (2) modify the risk factors and characteristics of a fall; (3) decrease
the local impact force on the hip after a fall. The preventive strategy for hip fracture
should be focused on easier-to-modify factors. In addition to the maintenance of
BMD, it may be crucial to keep a physically active lifestyle (to modify fall severity)
and to maintain an appropriate body weight (to decrease local impact on the hip).
Owing to the complex interaction of the independent risk factors, the practical effect
of intervention to reduce hip fracture needs to be further investigated. Therefore, the
next aim of fall prevention is to evaluate the predictors of fall in stroke patients who
are in high volume and high risk for hip fracture.
doi:10.6342/NTU201703518
4
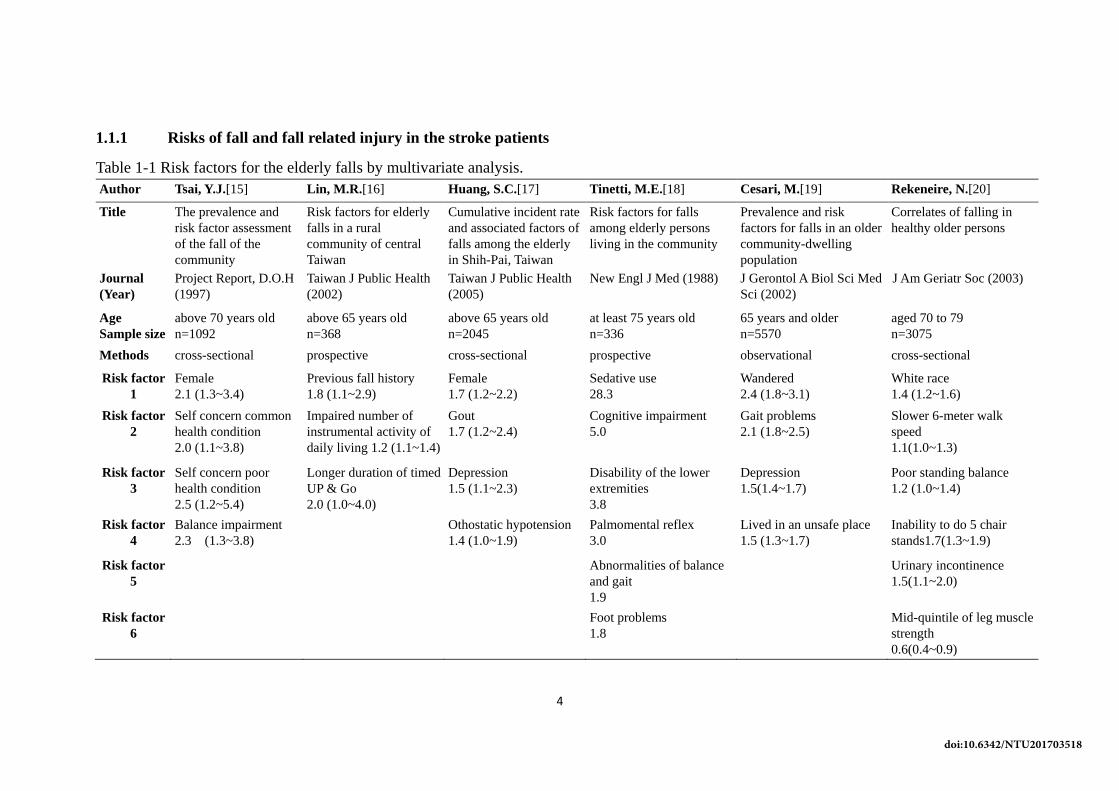
1.1.1 Risks of fall and fall related injury in the stroke patients
Table 1-1 Risk factors for the elderly falls by multivariate analysis.
Author Tsai, Y.J.[15] Lin, M.R.[16] Huang, S.C.[17] Tinetti, M.E.[18] Cesari, M.[19] Rekeneire, N.[20]
Title The prevalence and
risk factor assessment
of the fall of the
community
Risk factors for elderly
falls in a rural
community of central
Taiwan
Cumulative incident rate
and associated factors of
falls among the elderly
in Shih-Pai, Taiwan
Risk factors for falls
among elderly persons
living in the community
Prevalence and risk
factors for falls in an older
community-dwelling
population
Correlates of falling in
healthy older persons
Journal
(Year)
Project Report, D.O.H
(1997)
Taiwan J Public Health
(2002)
Taiwan J Public Health
(2005)
New Engl J Med (1988) J Gerontol A Biol Sci Med
Sci (2002)
J Am Geriatr Soc (2003)
Age
Sample size
above 70 years old
n=1092
above 65 years old
n=368
above 65 years old
n=2045
at least 75 years old
n=336
65 years and older
n=5570
aged 70 to 79
n=3075
Methods cross-sectional prospective cross-sectional prospective observational cross-sectional
Risk factor
1
Female
2.1 (1.3~3.4)
Previous fall history
1.8 (1.1~2.9)
Female
1.7 (1.2~2.2)
Sedative use
28.3
Wandered
2.4 (1.8~3.1)
White race
1.4 (1.2~1.6)
Risk factor
2
Self concern common
health condition
2.0 (1.1~3.8)
Impaired number of
instrumental activity of
daily living 1.2 (1.1~1.4)
Gout
1.7 (1.2~2.4)
Cognitive impairment
5.0
Gait problems
2.1 (1.8~2.5)
Slower 6-meter walk
speed
1.1(1.0~1.3)
Risk factor
3
Self concern poor
health condition
2.5 (1.2~5.4)
Longer duration of timed
UP & Go
2.0 (1.0~4.0)
Depression
1.5 (1.1~2.3)
Disability of the lower
extremities
3.8
Depression
1.5(1.4~1.7)
Poor standing balance
1.2 (1.0~1.4)
Risk factor
4
Balance impairment
2.3 (1.3~3.8)
Othostatic hypotension
1.4 (1.0~1.9)
Palmomental reflex
3.0
Lived in an unsafe place
1.5 (1.3~1.7)
Inability to do 5 chair
stands1.7(1.3~1.9)
Risk factor
5
Abnormalities of balance
and gait
1.9
Urinary incontinence
1.5(1.1~2.0)
Risk factor
6
Foot problems
1.8
Mid-quintile of leg muscle
strength
0.6(0.4~0.9)

doi:10.6342/NTU201703518
5
Table 1-2 Risk of fall-related injury by multivariate analysis in the elder.
Author Grisso JA[6] Herndon JG[21] Colon-Emeric CS[22] Wei T-S[23] Liu W-L[24]
Title Risk factors for falls as
a cause of hip fracture
in women.
Risk of fall injury
events at home in older
adults
Predict Fractures in
Older Adults
Risk Factors of Hip
Fracture in the Elderly
Serious Fall-Related
Injury in an Eldery (III)
Year 1991 1997 2002 2001 1999
Age
Subjects
Average 80
174
Above 65
1185
Above 65
7654
65-84
314
Above 65
806
Journal New Engl J Med J Am Griatr Soc Osteoporosis Int Osteoporosis Int
Department of Health,
Executive Yuan
Method Case-control
Case-control Cohort study Case-control 1st year: cross sectioal
2nd year: prospective
Factor1
OR(95%CI)
lower-limb
dysfunction
1.7(1.1~2.8)
stroke
1.7(1.0~3.0)
Female
1.9~2.3
direct hip impact
4.9 (2.7~8.8)
Age over 80
1.6 (0.9~2.8)
Factor2
OR(95%CI)
previous stroke
2.0(1.0~4.0)
anemia
1.5(1.0~2.2)
Low BMI
1.3
previous stroke
2.9 (1.3~6.3)
Previous fall
2.0 (1.3~3.2)
Factor3
OR(95%CI)
Parkinson
9.4(1.2~76.1)
Caucasian
2.1~2.8
sideways fall 2.5
(1.6~3.9)
Diabetes
2.0 (1.2~3.2)
Factor4
OR(95%CI)
Rosow–Breslau
impairments
1.8~2.1
functional mobility
2.0 (1.1~3.5)
ADL
2.5 (1.3~4.6)
Factor5
OR(95%CI)
age over 75 years
2.1
BMI
1.8 (1.1~2.8)
Balance impairment
2.3 (1.0~5.4)
Factor6
OR(95%CI)
history of stroke
1.9
femoral neck BMD 1.7
(1.0~2.8)
Gait impairment
1.5 (1.0~2.3)

doi:10.6342/NTU201703518
6
Table 1-3 Risks of fall related injury in stroke patients.
Author Melton LJ[25] Sze KH[26] Yates JS[27] Lamb SE[28] Tong P-F[29] Ta-Sen Wei[30]
Title Fracture risk
following ischemic
stroke
Falls among
Chinese stroke
patients during
rehabilitation
Falls in
community-
dwelling stroke
Risk factors for
falling in stroke
women
Balance recovery
and training on
fall prevention in
stroke
Gait asymmetry, ankle
spasticity, and
depression as
independent predictors
of falls in ambulatory
stroke patients
Year 2001 2001 2002 2003 2003 2017
Age
Subjects
28-96
387
≦65 vs. ≥65
677
Age ≥ 18
280
Over 65
124
35~83
25
65~80
112
Journal Osteoporosis Int Arch phys med
rehabil
J Rehabil Res
Dev
Stroke NHRI PLOS One
Method Retro-cohort Cohort Cohort Prospective 1 y Cohort Prospective
Factor 1
OR(95%CI)
increased with age
1.6(1.4~2.0)
Barthal Index
admission
2.6(1.3~5.5)
motor
impairment
2.2(1.0~4.7)
balance problems
while dressing
7.0
Use quadricane the asymmetry ratio of
single support
2.2(1.2±3.8)
Factor 2
OR(95%CI)
moderate functional
impairment
1.6(1.0~2.5)
dysphasia
1.81(1.0~3.2)
motor + sensory
impairments
3.1(1.5~6.8)
esidual balance,
dizziness, or
spinning
5.2
the level of spasticity
in the gastrocnemius
3.2 (1.4±7.3)
Factor 3
OR(95%CI)
hospitalization at
onset of stroke
2.0(1.3~3.2)
depression
1.4 (1.2±1.8)

doi:10.6342/NTU201703518
7
Table 1-4 Interventions for preventing falls in elder people living in the community.
Rate ratio (RaR)*
(95% CI)
Risk ratio (RR)*
(95% CI)
Single Interventions
Exercises
Multiple-component group exercise 0.71 (0.63~0.82) 0.85 (0.76~ 0.96)
Tai Chi 0.72 (0.52~1.00) 0.71 (0.57~ 0.87)
Multiple-component home-based exercise 0.68 (0.58~0.80) 0.78 (0.64 ~ 0.94)
Balance training 0.72 (0.55~0.94) 0.81 (0.62~1.07)
Strength/ Resistance training 3.6 (1.5~8.0)
Medication
Vitamin D 1.00 (0.90~1.11) 0.96 (0.89~1.03)
Withdrawal of psychotropic medication 0.34 (0.16~0.73) 0.61 (0.32~1.17)
Prescribing modification programme for
primary care physicians 0.61 (0.41~0.91)
Surgery
Pacemakers 0.73 (0.57~0.93) 0.78 (0.18~3.39)
First eye cataract surgery 0.66 (0.45~0.95) 0.95 (0.68~1.33)
Oral nutritional supplementation 0.95 (0.83~1.08)
Cognitive behavioural interventions 1.00 (0.37~2.72) 1.11 (0.80~1.54)
Environment/assistive technology
Home safety assessment and modification 0.81 (0.68~0.97) 0.88 (0.80~0.96)
Anti-slip shoe device 0.42 (0.22~0.78)
Multifactorial Interventions 0.76 (0.67~0.86) 0.93 (0.86~1.02)
*Rate ratio (RaR): to compare the rate of falls between intervention and control groups.
Risk ratio (RR): the number of people falling (fallers) in each group to assess the risk of
falling.

doi:10.6342/NTU201703518
8
References
[1] P. Lips, “Epidemiology and predictors of fractures associated with osteoporosis,”
Am. J. Med., vol. 103, no. 2, pp. S3–S11, 1997.
[2] “Hip fractures to treble by the year 2030.,” Bull. World Health Organ., vol. 77,
no. 5, p. 449, 1999.
[3] W. H. Organization and others, “The World Health Report 1998: Life in the 21st
century a vision for all,” in The world health report 1998: life in the 21st century
A vision for all, World Health Organization, 1998.
[4] S. R. Cummings and M. C. Nevitt, “A hypothesis: the causes of hip fractures,” J.
Gerontol., vol. 44, no. 5, pp. M107–M111, 1989.
[5] H. Burger, C. De Laet, A. Weel, A. Hofman, and H. A. P. Pols, “Added value of
bone mineral density in hip fracture risk scores,” Bone, vol. 25, no. 3, pp. 369–
374, 1999.
[6] J. A. Grisso et al., “Risk factors for falls as a cause of hip fracture in women,” N.
Engl. J. Med., vol. 324, no. 19, pp. 1326–1331, 1991.
[7] P. Dargent-Molina et al., “Fall-related factors and risk of hip fracture: the
EPIDOS prospective study,” The Lancet, vol. 348, no. 9021, pp. 145–149, 1996.
[8] S. L. Greenspan, E. R. Myers, L. A. Maitland, N. M. Resnick, and W. C. Hayes,
“Fall severity and bone mineral density as risk factors for hip fracture in
ambulatory elderly,” Jama, vol. 271, no. 2, pp. 128–133, 1994.
[9] S. L. Greenspan, E. R. Myers, D. P. Kiel, R. A. Parker, W. C. Hayes, and N. M.
Resnick, “Fall direction, bone mineral density, and function: risk factors for hip
fracture in frail nursing home elderly,” Am. J. Med., vol. 104, no. 6, pp. 539–545,
1998.
[10] W. C. Hayes, E. R. Myers, J. N. Morris, T. N. Gerhart, H. S. Yett, and L. A.
Lipsitz, “Impact near the hip dominates fracture risk in elderly nursing home
residents who fall,” Calcif. Tissue Int., vol. 52, no. 3, pp. 192–198, 1993.
[11] H. E. Meyer, A. Tverdal, and J. A. Falch, “Changes in body weight and incidence
of hip fracture among middle aged Norwegians.,” BMJ, vol. 311, no. 6997, p. 91,
1995.
[12] J. Bernstein, J. A. Grisso, and F. S. Kaplan, “Body mass and fracture risk: a study
of 330 patients.,” Clin. Orthop., vol. 364, pp. 227–230, 1999.
[13] E. W. Gregg, J. A. Cauley, D. G. Seeley, K. E. Ensrud, and D. C. Bauer,
“Physical activity and osteoporotic fracture risk in older women,” Ann. Intern.
Med., vol. 129, no. 2, pp. 81–88, 1998.
[14] S. B. Jaglal, N. Kreiger, and G. Darlington, “Past and recent physical activity and
risk of hip fracture,” Am. J. Epidemiol., vol. 138, no. 2, pp. 107–118, 1993.
[15] Y. J. Tsai, “The prevalence and risk factor assessment of the fall of the

doi:10.6342/NTU201703518
9
community,” Proj. Rep. DOH, 1997.
[16] M.-R. Lin, S. L. Tsai, S. Y. Chen, and S. J. Tzeng, “Risk factors for elderly falls
in a rural community of central Taiwan,” Taiwan J. Public Health, vol. 21, no. 1,
pp. 73–82, 2002.
[17] S. C. Huang, T. J. Chen, and P. Chou, “Cumulative incident rate and associated
factors of falls among the elderly in Shih-Pai, Taiwan,” Taiwan J Public Health,
vol. 24, no. 136, p. e145, 2005.
[18] M. E. Tinetti, M. Speechley, and S. F. Ginter, “Risk factors for falls among
elderly persons living in the community,” N. Engl. J. Med., vol. 319, no. 26, pp.
1701–1707, 1988.
[19] M. Cesari, F. Landi, S. Torre, G. Onder, F. Lattanzio, and R. Bernabei,
“Prevalence and risk factors for falls in an older community-dwelling
population,” J. Gerontol. A. Biol. Sci. Med. Sci., vol. 57, no. 11, pp. M722–M726,
2002.
[20] N. De Rekeneire et al., “Is a fall just a fall: correlates of falling in healthy older
persons. The Health, Aging and Body Composition Study,” J. Am. Geriatr. Soc.,
vol. 51, no. 6, pp. 841–846, 2003.
[21] J. G. Herndon, C. G. Helmick, R. W. Sattin, J. A. Stevens, C. DeVito, and P. A.
Wingo, “Chronic medical conditions and risk of fall injury events at home in older
adults,” J. Am. Geriatr. Soc., vol. 45, no. 6, pp. 739–743, 1997.
[22] C. S. Colon-Emeric, C. S. Colon-Emeric, C. F. Pieper, C. F. Pieper, C. F. Pieper,
and M. B. Artz, “Can historical and functional risk factors be used to predict
fractures in community-dwelling older adults? Development and validation of a
clinical tool,” Osteoporos. Int., vol. 13, no. 12, pp. 955–961, 2002.
[23] T. S. Wei, C. H. Hu, S. H. Wang, and K. L. H. D. Of, “Fall Characterictics,
Functional Mobility and Bone Mineral Density as Risk Factors of Hip Fracture in
the Community-Dwelling Ambulatory Elderly,” Osteoporos. Int., vol. 12, no. 12,
pp. 1050–1055, Dec. 2001.
[24] W.-L. Liu, “Serious Fall-Related Injury in an Eldery (III),” Dep. Health Exec.
Yuan, 1999.
[25] L. J. Melton Iii, R. D. Brown Jr, S. J. Achenbach, W. M. O’Fallon, J. P.
Whisnant, and J. P. Whisnant, “Long-term fracture risk following ischemic stroke:
a population-based study,” Osteoporos. Int., vol. 12, no. 11, pp. 980–986, 2001.
[26] K. Sze, E. Wong, H. Y. Leung, and J. Woo, “Falls among Chinese stroke patients
during rehabilitation,” Arch. Phys. Med. Rehabil., vol. 82, no. 9, pp. 1219–1225,
2001.
[27] J. S. Yates, S. M. Lai, P. W. Duncan, and S. Studenski, “Falls in community-
dwelling stroke survivors: an accumulated impairments model,” J. Rehabil. Res.

doi:10.6342/NTU201703518
10
Dev., vol. 39, no. 3, p. 385, 2002.
[28] S. E. Lamb, L. Ferrucci, S. Volapto, L. P. Fried, J. M. Guralnik, and others, “Risk
factors for falling in home-dwelling older women with stroke,” Stroke, vol. 34,
no. 2, pp. 494–501, 2003.
[29] P.-F. Tong, “Balance Recovery and Training on Fall Prevention in Stroke,”
NHRI, 2003.
[30] Ta-Sen Wei, Peng-Ta Liu, Liang-Wey Chang, and Sen-Yung Liu, “Gait
asymmetry, ankle spasticity, and depression as independent predictors of falls in
ambulatory stroke patients,” PLOS One, vol. 23;12(5), May 2017.

doi:10.6342/NTU201703518
11
Gait Asymmetry, Ankle Spasticity, and Depression as
Independent Predictors of Falls in Community-Dwelling
Ambulatory Stroke Patients
Introduction
A fall is the common injury in stroke patients. Fall occurrence in stroke survivors is
25–37% within 6 months and 23–50% 6 months post-stroke [1–6]. Accidental falls
and fall-related injuries, such as hip fracture, often lead to serious disability and affect
the patient’s overall health. Many studies have attempted to identify fall risk factors as
predictors and established a sensitive prediction model for stroke patients. Therefore,
early interventions for preventing falls may be beneficial to stroke patients.
The causes of fall are complicated, and several factors may result in falls, including
impaired balance and gait, declining cognition, muscle weakness, and presence of
neurological diseases. Previous studies have demonstrated that balance, walking
ability, and physical performance assessments are useful predictors of fall occurrence
in stroke patients post-discharge from rehabilitation units [7–9]. These studies have
demonstrated that physical performance assessments, including asymmetrical gait
pattern, Berg Balance Score (score≦29 at admission), Fall Efficacy Scale (score ≥
33), and spasticity, predicted the risk of fall in stroke patients to a certain accuracy

doi:10.6342/NTU201703518
12
[10–13].
These findings also suggest that existing predictors of falls exhibit some
limitations, especially gait and balance assessments. For example, clinical measures
typically assign numerical values to determine the level of performance on tests (e.g.,
Berg Balance Scale, Performance-Oriented Mobility Assessment, and Dynamic Gait
Index). These measurements depend on expert ratings and subjective judgments, and
the tests are mostly skill orientated without direct connection to the physiological
mechanisms of temporal and spatial characteristics. Therefore, quantified assessments
have been developed, and these measurements are more objective than the
measurements mentioned above.
A previous study associated impaired balance and gait to increased risk of falls in
stroke survivors using quantified measurements [14]. However, the models used for
this study did not provide high sensitivity or specificity. Another study also
demonstrated that gait and postural variability predicted accidental falls in nursing
home residents [10]. The Interactive Balance System correlated with physiological
mechanisms of fall, but the predictive ability in this study was limited [10].
Psychological factors may also play an important role in fall occurrence in stroke

doi:10.6342/NTU201703518
13
patients. This concept was supported by results that impaired balance and gait
negatively affected psychological distress in stroke survivors [15]. Another study also
demonstrated that 30% of stroke patients suffered depression in the early- or late-
stage post-stroke [16]. Depression was also a risk related to falls in stroke patients in a
previous study [17].
No comprehensive analyses integrate the identified fall risk factors. Quantified gait
and balance measurements are more objective and should be used for clinical
evaluations. Psychological factors may also be important risk factors for predicting
falls in stroke patients. However, studies of fall prediction using objective, quantified
gait and balance assessments and psychological evaluations after stroke are limited.
Therefore, a prediction model for falls in stroke patients should be developed using a
multidimensional assessment to increase prediction accuracy. The present study used
physical assessments, including objective computerized gait and balance
measurements, and psychological evaluation to identify risk factors related to falls in
stroke patients after discharge from hospital and develop a fall prediction model with
high sensitivity and specificity.

doi:10.6342/NTU201703518
14
Materials and Methods
The Institutional Review Board of a tertiary medical center, Changhua Christian
Hospital, approved this prospective cohort study, which was performed in a
rehabilitation ward and patients’ homes.
2.2.1 Participants
A total of 140 hospitalized patients who suffered their first stroke were enrolled
according to the following criteria: (1) stroke confirmed on MRI or CT; (2) ability to
walk independently (with/without assistive device) at least 10 meters; (3) no fall
history within 1 year before stroke onset; and (4) written informed consent. Only
patients who met the above entry criteria were included to specifically identify the fall
risk factors related to stroke.
A ten-meter walk test was included because it is a valid, reliable assessment for
predicting falls in subjects with stroke [12,18]. This test collected dynamic gait
parameters as predictors of fall. Therefore, subjects who walked with a person’s
assistance had an external supportive force that may interfere with the assessment of
gait, and these patients were not included in the present study. No fall history within 1
year before study entry was selected because subjects who experienced falls may
doi:10.6342/NTU201703518
15
exhibit subsequent factors while walking independently, including fear of a fall,
decreased mobility, and changes in gait pattern. Subjects with a history of falling
previously may also have their movements closely monitored by their family
members or caregivers [12]. These conditions may confound the relationship between
variables and fall risk assessment.
Subjects dropped out during the follow-up for the following reasons: nursing home
residency (11 subjects), unstable internal disease (8 subjects), unable to complete the
interview due to dementia or severe cognitive impairment (4 subjects), loss of contact
due to residence address changes (3 subjects), and epilepsy (2 subjects). Therefore,
112 subjects completed the study, and these subjects were further divided into two
groups, faller or non-faller, depending on whether a fall occurred during the study
period.
2.2.2 Baseline Measurements
Initial assessments were performed at baseline including demographic data and a
standardized recording of history and clinical examinations. Baseline physiological
and psychological assessments were performed before subjects were discharged from
the hospital (approximately 1 month after stroke). These baseline measurements of

doi:10.6342/NTU201703518
16
physical and psychological parameters were used as fall risk factors to develop the
fall risk prediction model.
Physical assessments included the Modified Ashworth Scale (MAS), which was
used to assess muscle tone in the elbow flexor, knee extensor, and ankle plantar flexor
[19]. The level of a patient’s disability was assessed according to the Functional
Independence Measure (FIM) [20]. Performance of activities in daily life was
assessed during hospitalization according to eighteen items, including bathing,
dressing, toileting, transferring, urinary continence, cognitive comprehension and
social interaction. This assessment is widely used to measure and predict outcome
[21].
The objective measurements of gait were completed using computerized systems
with wearable inertial sensors. Subjects wore customized shoes (Ultraflex, Infotronic,
the Netherlands) with eight load sensors (Figure 2-1 & Figure 2-2 ) in each shoe to
measure the forces under the foot and detect temporal events in the gait cycle prior to
the gait measurements. Data were sampled at the rate of 100 Hz and stored in a
portable (Walkman size), lightweight data logger that was carried on the lower back
of each subject. Several practice tests were performed before actual data were

doi:10.6342/NTU201703518
17
collected. Subjects walked at a self-selected speed over a 10-m hallway. The mean
values of the two tests were used. Gait parameters were normalized to the subject’s
body height to account for possible effects of anthropometrics [22,23]. The temporal
asymmetry ratios (ASY) for single support time (ASY_ss), double support time
(ASY_ds), single swing time (ASY_swing), stance time (ASY_stance), and step time
(ASY_step) were quantified using the following equation [24]:
𝐴𝑠𝑦𝑚𝑚𝑒𝑡𝑟𝑦 𝑟𝑎𝑡𝑖𝑜 = |1 −𝑎𝑓𝑓𝑒𝑐𝑡𝑒𝑑 𝑠𝑖𝑑𝑒
𝑢𝑛𝑎𝑓𝑓𝑒𝑐𝑡𝑒𝑑 𝑠𝑖𝑑𝑒|
A greater value of this ratio indicates higher asymmetry between the two sides.
The objective computerized measurements of balance were completed while the
subjects stood on a Stabilo-platform (Ultralfex, Infotronic, the Netherlands) in a
comfortable position without footwear or ankle foot orthoses. Subjects kept their eyes
open and arms at their sides and were instructed to maintain their balance for 20
seconds [25,26]. Three tests were performed with a 30-second rest between tests. The
mean value of three tests is presented. Subjects’ performances were recorded as the
center of pressure (COP) trajectory paths. Data were sampled at the rate of 100 Hz,
and COP stability was calculated as the standard deviation of the anterioposterior
(COP_ap) and mediolateral (COP_ml) directions of the points obtained during
measurement. The sway area (COP_area) was calculated as the square root of the sum
of squares of the COP_ap and COP_ml.

doi:10.6342/NTU201703518
18
Figure 2-1 Ultraflex Computerized Dynography data logger, Infotronic, Netherland.
Figure 2-2 Shoes with force sensors to measure ground reaction force.

doi:10.6342/NTU201703518
19
Psychological evaluations included the Mini-Mental State Examination (MMSE)
[27] and Chinese translated version of the Geriatric Depression Scale (GDS) [28],
which were used to screen for cognition and depression, respectively. The modified
Falls Efficacy Scale (mFES) was used to evaluate the fear of falling in stroke patients
[29].
2.2.3 Assessment of Falls
Falls were defined as incidents when the subject came to rest on the floor due to an
unexpected loss of balance. All subjects were followed up for 6 months after the first
assessment to collect the record of falls. Trained research nurses visited the subjects at
home 4, 12 , and 24 weeks after discharge from the hospital or rehabilitation ward.
Phone reports from subjects were also encouraged in this study to prevent errors from
retrospective data collection.
2.2.4 Statistics
Descriptive analysis was used for all variables, and results are presented as the
means, standard deviations and percentages. Significant differences between fallers
and non-fallers were assessed using independent Student’s t-test for continuous
variables and χ2 test analysis for categorical variables. The Mann-Whitney U test was

doi:10.6342/NTU201703518
20
used to detect mean differences between groups when variable distributions were not
normal. Linear correlations between continuous variables were calculated using
Pearson’s correlation test. Multivariate logistic regression (MLR) analysis was
performed using a forward stepwise method with an entry criteria of P =0.1 to identify
the factors that were independently associated with falls. Two models were developed
based on variables with statistical significance from bivariate analysis and clinical
interests. Adjusted Odds Ratios (aOR) were acquired from the estimated coefficients
and presented with the corresponding 95% confidence interval (CI) of the ratio.
The predictive accuracy of the model in discriminating fallers and non-fallers was
assessed using sensitivity and specificity. The optimal cutoff point with the highest
sensitivity and specificity for each model was defined as the Youden index [30,31].
A receiver operating characteristics (ROC) curve was plotted to assess the
discrimination of the generated multivariate logistic models. The area under the curve
(AUC) of the ROC was also calculated for each model to determine the fitness of
individual MLR analysis. An AUC value below 0.5 was considered no discrimination,
0.7≦AUC≦0.8 was considered acceptable discrimination, 0.8≦AUC≦0.9 was
considered excellent discrimination, and 0.9≦AUC≦1.0 was considered outstanding
discrimination [32]. Commercial statistical software, SPSS version 13.0, was used,

doi:10.6342/NTU201703518
21
and a two-tailed P <.05 was considered significant.
Results
A total of 140 subjects were enrolled, and 112 subjects (60 men and 52 women)
completed the study. The mean age, height, and body weight of the subjects were 69.6
±10.3 years old (range, 45-89 years old), 158.1 ± 6.7 cm (range, 143–175 cm), and
61.2 ± 9.9 kg (range, 41–85 kg), respectively. Approximately half (50.8%) of all the
subjects were right hemiplegic patients, and 88.4% of the subjects suffered stroke due
to infarction.
Subjects were further divided into non-faller and faller groups depending on
whether the subject experienced falls during the follow-up period. A total of 37
patients who experienced falls were classified into the faller group, and 75 subjects
were classified into the non-faller group.
No significant differences were found in baseline measurements of age, gender,
height, body weight, stroke affected side, stroke type, mental status, ambulation aids,
or medications between faller and non-faller groups. However, physical and
psychological assessments revealed that the faller group exhibited higher MAS and
GDS and lower FIM and mFES scores compared to the non-faller group (Table 2-1).
These physical and psychological assessments indicated that the faller group exhibited

doi:10.6342/NTU201703518
22
higher muscle tone, more severe depression, poor overall activity performance of
daily life and lower confidence.

doi:10.6342/NTU201703518
23
Table 2-1 Baseline measurements of the study subjects.
Groups
Variables
All subjects
(n = 112)
Non-faller
(n = 75)
Faller
(n = 37) P value
Age 69.6 ± 10.3 69.9 ± 10.0 68.9 ± 10.8 0.629
Female (%) 52(46.4) 35(46.7) 17(46.0) 0.943
Height (cm) 158.1 ± 6.7 158.7 ± 6.7 157.1 ± 6.7 0.269
Weight (kg) 61.2 ± 9.9 61.5 ± 9.5 60.5 ± 10.7 0.635
Affected Side - right (%) 57(50.8) 38(50.7) 19(51.3) 0.946
Type - Infarction (%) 99(88.4) 67(89.3) 32(86.5) 0.853
MAS
Elbow Flexor 0.7 ± 1.1 0.3 ± 0.8 1.4 ± 1.3 < 0.001
Quadriceps 0.6 ± 0.9 0.3 ± 0.7 1.1 ± 1.1 < 0.001
Gastrocnemius 0.6 ± 1.1 0.3 ± 0.7 1.3 ± 1.3 < 0.001
Soleus 0.6 ± 0.9 0.3 ± 0.7 1.1 ± 1.1 < 0.001
MMSE 21.8 ± 5.1 22.4 ± 4.8 20.5 ± 5.5 0.078
FIM
Motor 79.6 ± 12.9 84.2 ± 10.0 71.1 ± 13.6 < 0.001
Cognition 29.9 ± 4.3 31.0 ± 3.8 28.0 ± 4.6 0.001
Total 109.5 ± 15.4 115.1 ± 12.3 99.1 ± 15.4 < 0.001
mFES 96.7 ± 33.8 108.5 ± 29.0 74.9 ± 31.3 < 0.001
GDS 4.5 ± 3.9 3.2 ± 3.3 7.1 ± 3.7 < 0.001
Ambulation Aids
Independent walk (%) 35(31.3) 22(31.4) 13(31.0)
Quadricane (%) 67(58.2) 42(60.0) 25(59.5) 0.947
Walker (%) 10(8.9) 6(8.6) 4(9.5)
Medications
Laxative (%) 66(0.59) 40(53.3) 26(70.3) 0.087
Benzodiazepines (%) 39(0.35) 23(30.7) 16(43.2) 0.189
Hypoglycemic (%) 12(0.11) 8(10.7) 4(10.8) 0.981
Antihypertensives (%) 45(0.40) 26(34.7) 19(51.4) 0.090
Values are % or mean ± SD.
MAS, Modified Ashworth Scale; MMSE, Mini-Mental State Exam; FIM, Functional
Independence Measure; mFES, modified Fall Efficacy Scale; GDS, Geriatric
Depression Scale

doi:10.6342/NTU201703518
24
We used an unbiased quantification using a computerized system to measure the
balance and gait abilities in patients post-stroke to provide objective analyses. These
computerized measurements were considered to be more objective tools than the
traditional assessments [33].
The abilities of balance and gait were different between faller and non-faller
groups. Computerized gait assessment revealed that the faller group exhibited slower
walking velocity and fewer cadences compared to the non-faller group (P < .001)
(Table 2-2). The temporal asymmetry ratios for ASY_ss, ASY_ds, and ASY_step
were significantly greater (approximately twofold) in the faller group (P < .05). These
results indicated that the faller group exhibited more severe asymmetry gait than the
non-faller group.
The faller group exhibited larger COP_area and greater COP_ml in computerized
balance assessments (P < .01). These results demonstrated that the faller group
exhibited worse postural sway in the mediolateral direction and area compared to the
non-faller group. Therefore, the computerized gait and balance assessments may be
used to accurately predict fall in the faller group.

doi:10.6342/NTU201703518
25
Table 2-2 Comparison of balance and gait parameters in study subjects.
Groups
Variables
All subjects
(n = 112)
Non-faller
(n = 75)
Faller
(n = 37) P value
Velocity (m/s) 0.48 ± 0.45 0.57 ± 0.51 0.28 ± 0.16 0.002
Cadence (steps/min) 87.75 ± 22.87 93.55 ± 19.26 76.00 ± 25.27 < 0.001
Asymmetry Ratio
ASY_ss 0.23 ± 0.30 0.15 ± 0.15 0.39 ± 0.43 < 0.001
ASY_ds 0.26 ± 0.34 0.20 ± 0.21 0.38 ± 0.50 0.007
ASY_swing 0.32 ± 0.59 0.25 ± 0.64 0.45 ± 0.46 0.089
ASY_stance 0.07 ± 0.07 0.07 ± 0.07 0.08 ± 0.07 0.284
ASY_step 0.18 ± 0.31 0.11 ± 0.14 0.33 ± 0.47 < 0.001
Trajectory of COP
COP_ml (mm) 3.43 ± 1.62 3.07 ± 1.59 4.11 ± 1.47 0.001
COP_ap (mm) 3.29 ± 1.41 3.17 ± 1.38 3.51 ± 1.45 0.229
COP_area (mm2) 37.62 ± 32.51 32.99 ± 30.94 46.51 ± 34.01 0.040
ASY_ss, asymmetry ratio of single support time; ASY_ds, asymmetry ratio of double
support time; ASY_swing, asymmetry ratio of single swing time; ASY_stance,
asymmetry ratio of stance time; ASY_step, asymmetry ratio of step time; COP, center
of pressure; ml: medial-lateral; ap: anterior-posterior.
Correlation analysis was also performed based on the results in Table 2-2 to
determine the risk factors for predicting fall occurrence. Correlations between gait and
balance variables were evaluated (Table 2-3). All parameters of the temporal
asymmetry ratios negatively correlated with walking velocity and cadence. The
COP_ml and COP_area exhibited a low-to-medium positive correlation with all
parameters of the temporal asymmetry ratios. Therefore, the computer automatically
selected ASY_ss and COP_ml to represent the gait and balance assessments,
respectively, for further analysis.

doi:10.6342/NTU201703518
26
Table 2-3 Correlation coefficients of balance and gait parameters (n = 112).
Variables Cadence Velocity Trajectory of COP
ml ap area
Cadence
(steps/min) 1.00 0.31† −0.34‡ −0.16 −0.32‡
Velocity (m/s) 0.31† 1.00 −0.10 −0.02 −0.08
Asymmetry Ratio
ASY_ss −0.62‡ −0.26† 0.40‡ 0.09 0.28†
ASY_ds −0.50‡ −0.20* 0.23* 0.12 0.23*
ASY_swing −0.54‡ −0.30† 0.49‡ 0.20* 0.48‡
ASY_stance −0.50‡ −0.23* 0.34‡ 0.12 0.34‡
ASY_step −0.61‡ −0.23* 0.32‡ 0.14 0.29†
Trajectory of COP
COP_ml (mm) −0.34‡ −0.10 1.00 0.34‡ 0.82‡
COP_ap (mm) −0.16 −0.02 0.34‡ 1.00 0.70‡
COP_area
(mm2) −0.32‡ −0.08 0.82‡ 0.70‡ 1.00
ASY_ss, asymmetry ratio of single support time; ASY_ds, asymmetry ratio of double
support time; ASY_swing, asymmetry ratio of single swing time; ASY_stance,
asymmetry ratio of stance time; ASY_step, asymmetry ratio of step time; COP, center
of pressure; ml: Medial-Lateral; ap: Anterior-Posterior
*P < .05; † P < .01; ‡ P < .001

doi:10.6342/NTU201703518
27
Correlations between computerized gait and balance assessments and other physical
or psychological assessments were further analyzed. The MAS of the gastrocnemius
exhibited a low-to-medium positive correlation with COP_ml, ASY_ss, and GDS (Table
2-4). FIM also exhibited a medium negative correlation with MAS. This correlation
analysis demonstrated that FIM negatively correlated with most of the physical and
psychological assessments. The strength of the correlation was low-to-moderate between
variables (Table 2-3and Table 2-4), but most correlations revealed significant
differences. These results were used as variables for the subsequent MLR analysis.
doi:10.6342/NTU201703518
28
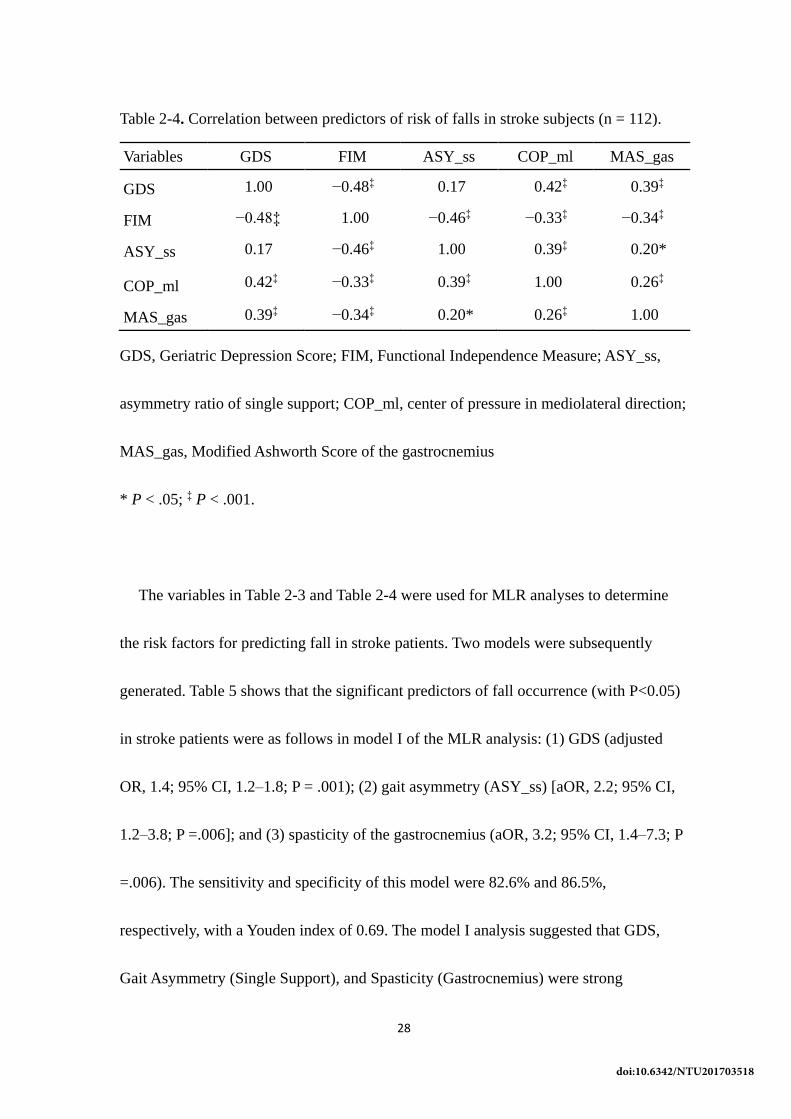
Table 2-4. Correlation between predictors of risk of falls in stroke subjects (n = 112).
Variables GDS FIM ASY_ss COP_ml MAS_gas
GDS 1.00 −0.48‡ 0.17 0.42‡ 0.39‡
FIM −0.48‡ 1.00 −0.46‡ −0.33‡ −0.34‡
ASY_ss 0.17 −0.46‡ 1.00 0.39‡ 0.20*
COP_ml 0.42‡ −0.33‡ 0.39‡ 1.00 0.26‡
MAS_gas 0.39‡ −0.34‡ 0.20* 0.26‡ 1.00
GDS, Geriatric Depression Score; FIM, Functional Independence Measure; ASY_ss,
asymmetry ratio of single support; COP_ml, center of pressure in mediolateral direction;
MAS_gas, Modified Ashworth Score of the gastrocnemius
* P < .05; ‡ P < .001.
The variables in Table 2-3 and Table 2-4 were used for MLR analyses to determine
the risk factors for predicting fall in stroke patients. Two models were subsequently
generated. Table 5 shows that the significant predictors of fall occurrence (with P<0.05)
in stroke patients were as follows in model I of the MLR analysis: (1) GDS (adjusted
OR, 1.4; 95% CI, 1.2–1.8; P = .001); (2) gait asymmetry (ASY_ss) [aOR, 2.2; 95% CI,
1.2–3.8; P =.006]; and (3) spasticity of the gastrocnemius (aOR, 3.2; 95% CI, 1.4–7.3; P
=.006). The sensitivity and specificity of this model were 82.6% and 86.5%,
respectively, with a Youden index of 0.69. The model I analysis suggested that GDS,
Gait Asymmetry (Single Support), and Spasticity (Gastrocnemius) were strong

doi:10.6342/NTU201703518
29
predictors for fall in stroke patients.
Notably, the commonly used measurement for regular functional assessment during
stays in the rehabilitation unit, FIM,[34] was not automatically selected as one of the
predictors after the MLR analysis in model I. This result may be attributed to the results
that GDS exhibited the strongest negative correlation with FIM (-0.48) in the correlation
analysis between risk factors in stroke subjects (Table 2-4). Therefore, GDS was
excluded in another round of MLR analysis, and prediction model II was generated.
Table 2-5 shows that the predictors of determining fall occurrence in model II included
(1) FIM (aOR, 0.9; 95% CI, 0.9-1.0; P = .002), (2) gait asymmetry (ASY_ss) (aOR, 3.6;
95% CI, 1.4-9.2; P =.009), and (3) postural sway (mediolateral, COP_ml) (aOR, 1.7;
95% CI, 1.0-2.7; P = .033). Model II also exhibited relatively high sensitivity (76.9%)
and specificity (75.7%) with a Youden index of 0.53, but the sensitivity and specificity
were lower than model I.
The ROC curves of the two models (Figure 2-3) for predicting falls in stroke patients
were plotted to discriminate the two multivariate logistic models presented in Table 2-5.
The ROC analysis revealed that model I (AUC value: 0.856) was better fitted than
model II (AUC value 0.815). However, both models exhibited excellent fitness to

doi:10.6342/NTU201703518
30
predict fall occurrence in stroke patients with high sensitivity and specificity, with AUC
values greater than 0.8[32].

doi:10.6342/NTU201703518
31
Table 2-5. Multivariate logistic regression for predictors of accidental falls.
Model Factor Coefficient
(ß)
Adjusted odds
ratio (95% CI) P value
I
Geriatric Depression Scale 0.361 1.4 (1.2-1.8)a 0.001
Gait Asymmetry (Single Support) 0.783 2.2 (1.2-3.8)b 0.006
Spasticity (Gastrocnemius) 1.164 3.2 (1.4-7.3)a 0.006
Youden Index = 0.69; Sensitivity = 82.6%, Specificity = 86.5%
II
Functional Independence Measure −0.090 0.9 (0.9–1.0)a 0.002
Gait Asymmetry (Single Support) 1.267 3.6 (1.4–9.2)b 0.009
Postural Sway (Mediolateral) 0.518 1.7 (1.0–2.7)a 0.033
Youden Index = 0.53; Sensitivity = 76.9%, Specificity = 75.7%
a: predicted change in odds for a unit increase in corresponding variables
b: predicted change in odds for a standard deviation (SD = 0.3) in corresponding
variable

doi:10.6342/NTU201703518
32
Figure 2-3 The ROC curves for predicting the occurrence of falls in stroke patients
using models I and II. AUCs were 0.856 and 0.815, respectively. Arrowheads indicate
the identified optimal cutoffs (Youden Index) for these prediction models (0.69 in model
I and 0.53 in model II).

doi:10.6342/NTU201703518
33
Discussion
To our knowledge, this study is the first to include physical and psychological
variables for determining the predictive risk factors of fall in stroke patients. The results
underscore the significance of quantitative gait and balance assessments before
discharge from rehabilitation units for predicting fall in stroke subjects by comparing the
functional and baseline variables between the faller and non-faller groups of stroke
subjects.
The faller group exhibited slower walking speed, asymmetrical gait, unstable balance,
and lower functional performance than the non-faller group at baseline. Thirty-seven of
the 112 enrolled subjects had at least one falling accident within 6 months after a stroke
in this study (33% fall incidence).
Impaired gait symmetry, depression, and higher abnormal muscle tone were found in
stroke patients who experienced falls. Prediction models for falls in stroke patients were
developed using these physical and psychological parameters. The current findings
provide sufficient information for predicting future falls, and early intervention
strategies may be implemented to prevent falls in stroke patients.

doi:10.6342/NTU201703518
34
2.4.1 Assessment of Falls
Previous studies reported that the “gold standard” for collecting information on falls
(e.g., prospective collection with calendars or postcards, regular reminders, and follow-
up telephone calls) was prone to errors (e.g., memory, forgetting to write diaries and
ambiguous definitions of fall)[14]. To minimize these types of errors in this study, falls
were recorded regularly by nurses during home visits 4, 12, and 24 weeks post-discharge
and by subjects’ self-report. Recordings of fall history, environmental risk exam, and
medical consultations were performed during the interviews with each subject. One
advantage of the interview was to provide better interaction between subjects and
research team workers. Therefore, subjects could fully understand the risk of falls and
the ultimate goal of this study to prevent fall occurrence.
2.4.2 Balance and Gait Performance
Poor postural balance was linked to increased fall risk in previous studies[11,35,36].
Mediolateral COP displacement during normal standing may be used as an indicator of
accidental falls in the elderly because it was significantly associated with future falls [37].
The results of this study also demonstrated that postural sway in the mediolateral direction
and area were greater in fallers compared to non-fallers.

doi:10.6342/NTU201703518
35
A hemiparetic gait is described as slow and asymmetrical [38, 39]. Walking velocity
and cadence were lower in the faller group than the non-faller group in the present study.
Gait speed is generally selected as the outcome measurement in clinical practice and a
predictor of fall after a patient has a stroke, but gait speed is often confounded with balance,
motor function, and endurance [40]. The current study adopted a quantitative gait analysis
to help assess the risk of fall and further describe gait performance adequately.
A previous study reported that temporal gait symmetry measurement appeared to better
reflect components related to weight shift, and it was superior to spatial symmetry ratios
for identifying the risk of falls in impaired ambulators [38]. An “asymmetry ratio” was
used to represent the level of temporal asymmetry (ASY_ss, ASY_ds, and ASY_step) in
the present study, which was significantly different between fallers and non-fallers. An
increase of one standard deviation in ASY_ss was associated with a 2.2 and 3.6 times
higher fall risk in models I and II, respectively.
2.4.3 Spasticity Related to Falls
An asymmetrical gait pattern caused by impaired balance and abnormal muscle tone
is commonly seen in stroke patients. The present results demonstrated that the severity
of spasticity in the upper and lower extremities was markedly higher in the faller group

doi:10.6342/NTU201703518
36
compared to the non-faller group. These findings are consistent with another study that
also reported spasticity as a risk factor for predicting falls in chronic stroke patients.
Motor control and functional status of stroke patients declined with increasing spasticity
[13]. Logistic regression model I in this study also demonstrated that spasticity of the
gastrocnemius was a predictor of fall in stroke patients. Another study found that the
degree of spasticity of the affected ankle plantar flexors primarily influenced gait
asymmetryp[24]. A spastic gait in stroke patients diminished power generation,
decreased hip and knee flexion during the swing phase, and reduced stability during the
stance phase due to the affected hip flexors, knee extensors, and ankle plantar
flexors[41]. The present study revealed that the risk of fall increased 3.2 times when the
severity of spasticity in the gastrocnemius increased by one grade. The results also
support that the combination of gait asymmetry and abnormal muscle tone may increase
falls in the stroke population.
Previous studies reported that spasticity reached a peak within 1–3 months after a
stroke [41-45]. Thirty-nine percent of patients who suffered a first stroke exhibited
sustained spasticity after 12 months [19]. Therefore, the early detection of spasticity and
improvement in motor dysfunction using specific interventions, such as stretching,
splinting, electrical stimulation, and botulinum toxin injection, may be crucial to reduce

doi:10.6342/NTU201703518
37
accidental falls[46].
2.4.4 Effects of Functional Performance
The Functional Independence Measure (FIM) is widely used to evaluate the
performance of a patient’s daily activity to determine the level of a patient’s disability.
All functional performance assessment results were significantly higher in non-fallers
than fallers in our study. The fall risk decreased by 10% when the FIM score increased
by one point. Previous studies also reported the significant correlation between FIM and
fall occurrence [47-49]. A previous 10-year retrospective study also demonstrated the
same correlation between the FIM score and fall risk [50], which is consistent with
present results. However, the FIM score as a single variable may not be sufficient to
accurately predict fall risk because falls generally resulted from multiple factors. The
finding is also consistent with our MLR model, which enhanced the sensitivity and
specificity of fall prediction.
2.4.5 Effects of Depression in Stroke Patients
Depressive symptoms are common in the acute phase after stroke, and symptoms are
associated with the persistence of depression and mortality after 12 months [51]. The

doi:10.6342/NTU201703518
38
current MLR model in this study demonstrated that the risk of fall increased 1.4 times
with a one-unit increase in GDS. Moreover, fall risk may cumulatively increase due to a
high cognitive load if the patient also had multiple motor impairments and depression
combined with gait asymmetry and spasticity.
2.4.6 Fall Prediction Model
A bivariate correlation between risk predictors of accident fall in stroke subjects was
performed to determine which variables to include in the MLR analysis. The results of
bivariate correlation test revealed that the FIM and GDS exhibited the highest strength
of negative correlation (Table 2-4). Therefore, two logistic regression models, including
FIM or GDS, were developed in this study to determine the best fit of fall predictive
factors. Notably, model I, which included GDS, gait asymmetry, and spasticity,
exhibited slightly higher specificity, sensitivity, and Youden index than model II. Gait
asymmetry, spasticity, and depression represented the functional, physical, and
psychological domains of the subject’s impairments in function, respectively. Therefore,
these results suggest that model I provides more comprehensive fall prediction than
model II. ROC analysis further verified the discrimination of fitness of model I with a
slightly greater AUC value (0.856) than model II (AUC value 0.815).

doi:10.6342/NTU201703518
39
A previous study model with six predictors, including the Berg Balance score and
functional performance, exhibited high predictive values (AUC = 0.712) in community
stroke patients [52]. Both models in the present study used three predictors and
demonstrated AUC values greater than 0.8. Several differences were observed between
the two studies, including the race of enrolled subjects, time of assessment of falls post-
stroke, and the selection of variables for MLR analysis. The present study included
computerized gait asymmetry as a predictor in model II in addition to balance and
functional predictors. The predictive values of model II reached AUC = 0.815 despite
the inclusion of only three predictors. Computerized gait assessment was included in
both models, and the computerized system may provide a more objective and accurate
evaluation. Overall, these findings suggest that gait asymmetry is an important factor for
the prediction of falls.
An earlier study also found that sideways fall was an independent risk factor (aOR, 2.5;
95% CI, 1. 6-3.9) for hip fractures in the elderly, in which 20% of their population had a
history of stroke. Therefore, preventing sideways fall may decrease the occurrence of hip
fractures in the elderly [53]. Both prediction models in this study included gait asymmetry
as one predictor of a fall. Model II included gait asymmetry and balance factors. Therefore,
the fall prediction models, including computerized gait and balance assessments, may be

doi:10.6342/NTU201703518
40
used in stroke patients and the elderly for preventing possible falls.
2.4.7 Study Limitations
Several limitations may result from the present study design. First, the present study
results cannot be extrapolated to all people with stroke, particularly patients at lower
functional levels with walking disability or severe cognitive impairments. Second, the
subjects were not separated into a construction data set and a validation data set to test
the multivariate logistic regression function because of the small number of subjects
enrolled.

doi:10.6342/NTU201703518
41
Figure 2-4 Balance and gait training for a stroke patient.
Figure 2-5 Dynamic balance testing and training.

doi:10.6342/NTU201703518
42
Figure 2-6 A protable gait analysis instruments.
Figure 2-7 Results of balance and gait Analysis.

doi:10.6342/NTU201703518
43
Conclusions
Multiple factors determine the risk of a fall in stroke patients, and a comprehensive
assessment is needed to better understand the complex correlation between motor
impairment, psychological factors, and the risk of falls in stroke patients.
The results of the present study revealed that the degree of depression, in addition to
gait asymmetry and ankle spasticity, may play a crucial role in predicting a fall in stroke
subjects. Therefore, more attention should be paid to emotional and social consequences
in stroke patients in addition to regular intervention to improve physical function. The
predictive factors determined in the present study provide additional prevention
strategies for the healthcare team to prevent future falls in stroke patients after they
return home.
doi:10.6342/NTU201703518
44
References
[1] Stapleton T, Ashburn A, Stack E. A pilot study of attention deficits, balance
control and falls in the subacute stage following stroke. Clin Rehabil. 2001; 15:
437-444.
[2] Hyndman D, Ashburn A, Stack E. Fall events among people with stroke living in
the community: Circumstances of falls and characteristics of fallers. Arch Phys
Med Rehabil. 2002; 83: 165-170.
[3] Jørgensen L, Engstad T, Jacobsen BK. Higher Incidence of Falls in Long-Term
Stroke Survivors Than in Population Controls Depressive Symptoms Predict
Falls After Stroke. Stroke. 2002; 33: 542-547.
[4] Hyndman D, Ashburn A. People with stroke living in the community: Attention
deficits, balance, ADL ability and falls. Disabil Rehabil. 2003; 25: 817-822.
[5] Lamb SE, Ferrucci L, Volapto S, Fried LP, Guralnik JM. Risk Factors for Falling
in Home-Dwelling Older Women With Stroke The Women's Health and Aging
Study. Stroke. 2003; 34: 494-501.
[6] Kerse N, Parag V, Feigin VL, McNaughton H, Hackett ML, Bennett DA, et al.
Falls After Stroke Results From the Auckland Regional Community Stroke
(ARCOS) Study, 2002 to 2003. Stroke. 2008; 39:1890-1893.
[7] Tinetti ME, Speechley M, Ginter SF. Risk factors for falls among elderly persons
living in the community.N Engl J Med. 1988; 319: 1701-1707.
[8] Thorbahn LDB, Newton RA. Use of the Berg Balance Test to predict falls in
elderly persons. Phys Ther.1996; 76: 576-583.
[9] Graafmans WC, Ooms ME, Hofstee HMA, Bezemer PD, Bouter LM, Lips P. Falls
in the elderly: a prospective study of risk factors and risk profiles. Am J
Epidemiol. 1996; 143: 1129-1136.
[10] Schwesig R, Fischer D, Lauenroth A, Becker S, Leuchte S. Can falls be predicted
with gait analytical and posturographic measurement systems? A prospective
follow-up study in a nursing home population.Clin Rehabil. 2013; 27: 183-190.
[11] Maeda N, Kato J, Shimada T. Predicting the Probability for Fall Incidence in
Stroke Patients Using the Berg Balance Scale. J Int Med Res. 2009; 37: 697-704.
[12] Jalayondeja C, Sullivan PE, Pichaiyongwongdee S. Six-month prospective study
of fall risk factors identification in patients post-stroke. Geriatr Gerontol Int.
2014; 14: 778-785.
[13] Soyuer F,OÈ ztuÈrk A. The effect of spasticity, sense and walking aids in falls of
people after chronic stroke. Disabil Rehabil. 2007; 29: 679-687.
[14] Mansfield A, Wong JS, McIlroy WE, Biasin L, Brunton K, Bayley M, et al. Do
measures of reactive balance control predict falls in people with stroke returning
to the community? Physiotherapy.

doi:10.6342/NTU201703518
45
[15] Alzahrani MA, Dean CM, Ada L, Dorsch S, Canning CG. Mood and Balance are
Associated with Free-Living Physical Activity of People after Stroke Residing in
the community. Stroke Res Treat. 2012;2012: 1-8.
[16] Paolucci S. Epidemiology and treatment of post-stroke depression.
Neuropsychiatr Dis Treat. 2008; 4:145-154.
[17] Weerdesteyn V, de Niet M, van Duijnhoven HJ, CH A, Geurts MD. Falls in
individuals with stroke. differences.2008; 33: 36.
[18] Persson CU, Hansson P-O, Sunnerhagen KS. Clinical Tests Performed in Acute
Stroke Identify the Risk of Falling During the First Year: Postural Stroke Study
in Gothenburg (Postgot). J Rehabil Med.2011; 43: 348-353.
[19] Watkins CL, Leathley MJ, Gregson JM, Moore AP, Smith TL, Sharma AK.
Prevalence of spasticity post stroke. Clin Rehabil. 2002; 16: 515-522.
[20] Granger CV, Hamilton BB, Linacre JM, Heinemann AW, Wright BD.
Performance profiles of the functional independence measure. Am J Phys Med
Rehabil. 1993; 72: 84-89.
[21] Teasell R, McRae M, Foley N, Bhardwaj A. The incidence and consequences of
falls in stroke patients during inpatient rehabilitation: Factors associated with
high risk. Arch Phys Med Rehabil. 2002; 83:329-333.
[22] Dusing SC, Thorpe DE. A normative sample of temporal and spatial gait
parameters in children using the GAITRite® electronic walkway. Gait Posture.
2007; 25: 135-139.
[23] Kim CM, Eng JJ. Symmetry in vertical ground reaction force is accompanied by
symmetry in temporal but not distance variables of gait in persons with stroke.
Gait Posture. 2003; 18: 23-28.
[24] Hsu A-L, Tang P-F, Jan M-H. Analysis of impairments influencing gait velocity
and asymmetry of hemiplegic patients after mild to moderate stroke. Arch Phys
Med Rehabil. 2003; 84: 1185-1193.
[25] Swanenburg J, Bruin ED de, Favero K, Uebelhart D, Mulder T. The reliability of
postural balance measures in single and dual tasking in elderly fallers and non-
fallers. BMC Musculoskelet Disord. 2008; 9:162.
[26] Garland SJ, Ivanova TD, Mochizuki G. Recovery of Standing Balance and
Health-Related Quality of Life After Mild or Moderately Severe Stroke. Arch
Phys Med Rehabil. 2007; 88: 218-227.
[27] Folstein MF, Folstein SE, McHugh PR. ªMini-mental stateº: A practical method
for grading the cognitive state of patients for the clinician. J Psychiatr Res. 1975;
12: 189-198.
[28] Chan AC-M. Clinical validation of the geriatric depression scale (GDS) Chinese
version. J Aging Health.1996; 8: 238-253.

doi:10.6342/NTU201703518
46
[29] Hill KD, Schwarz JA, Kalogeropoulos AJ, Gibson SJ. Fear of falling revisited.
Arch Phys Med Rehabil.1996; 77: 1025-1029.
[30] Bewick V, Cheek L, Ball J. Statistics review 13: Receiver operating
characteristic curves. Crit Care.2004; 8: 508.
[31] Akobeng AK. Understanding diagnostic tests 3: receiver operating characteristic
curves. Acta Pñdiatrica.2007; 96: 644-647.
[32] Hosmer DW, Lemeshow S. Assessing the Fit of the Model. Applied Logistic
Regression. John Wiley &Sons, Inc.; 2000. pp. 143-202.
[33] Wong AMK, Chen C-L, Chen CPC, Chou S-W, Chung C-Y, Chen MJL. Clinical
Effects of Botulinum Toxin A and Phenol Block on Gait in Children with
Cerebral Palsy. Am J Phys Med Rehabil. 2004; 83:284-291.
[34] Ring H, Feder M, Schwartz J, Samuels G. Functional measures of first stroke in
patient rehabilitation:The use of the FIM total score with a clinical rationale. Arch
Phys Med Rehabil. 1997; 78: 630-5.
[35] Harris JE, Eng JJ, Marigold DS, Tokuno CD, Louis CL. Relationship of Balance
and Mobility to Fall Incidence in People With Chronic Stroke. Phys Ther. 2005;
85: 150-158.
[36] Belgen B, Beninato M, Sullivan PE, Narielwalla K. The Association of Balance
Capacity and Falls Self-Efficacy With History of Falling in Community-Dwelling
People With Chronic Stroke. Arch Phys Med Rehabil. 2006; 87: 554-561.
[37] Piirtola M, Era P. Force platform measurements as predictors of falls among
older people-a review.Gerontology. 2006; 52: 1-16.
[38] Patterson KK, Parafianowicz I, Danells CJ, Closson V, Verrier MC, Staines WR,
et al. Gait Asymmetry in Community-Ambulating Stroke Survivors. Arch Phys
Med Rehabil. 2008; 89: 304-310.
[39] Patterson KK, Gage WH, Brooks D, Black SE, McIlroy WE. Changes in Gait
Symmetry and Velocity After Stroke: A Cross-Sectional Study From Weeks to
Years After Stroke. Neurorehabil Neural Repair.2010;
[40] van de Port IG, Kwakkel G, Lindeman E. Community ambulation in patients
with chronic stroke: how is it related to gait speed? J Rehabil Med. 2008; 40: 23-
27.
[41] Fellows SJ, Ross HF, Thilmann AF. The limitations of the tendon jerk as a
marker of pathological stretch reflex activity in human spasticity. J Neurol
Neurosurg Psychiatry. 1993; 56: 531-537.
[42] Crone C, Johnsen LL, Biering-Sørensen F, Nielsen JB. Appearance of reciprocal
facilitation of ankle extensors from ankle flexors in patients with stroke or spinal
cord injury. Brain. 2003; 126: 495-507.
[43] Ju M-S, Chen J-JJ, Lee H-M, Lin T-S, Lin C, Huang Y-Z. Time-course analysis

doi:10.6342/NTU201703518
47
of stretch reflexes in hemiparetic subjects using an on-line spasticity
measurement system. J Electromyogr Kinesiol. 2000;10: 1-14.
[44] O'Dwyer NJ, Ada L, Neilson PD. Spasticity and muscle contracture following
stroke. Brain. 1996; 119:1737-1750.
[45] Thilmann AF, Fellows SJ, Garms E, others. The mechanism of spastic muscle
hypertonus. Brain. 1991;114: 233-244.
[46] Johnson CA, Burridge JH, Strike PW, Wood DE, Swain ID. The effect of
combined use of botulinum toxin type A and functional electric stimulation in the
treatment of spastic drop foot after stroke: a preliminary investigation1. Arch
Phys Med Rehabil. 2004; 85: 902-909.
[47] Saverino A, Benevolo E, Ottonello M, Zsirai E, Sessarego P. Falls in a
rehabilitation setting: functional independence and fall risk. Eur Medicophysica.
2006; 42: 179-184.
[48] Lee JE, Stokic DS. Risk factors for falls during inpatient rehabilitation. Am J
Phys Med Rehabil. 2008;87: 341-353.
[49] Suzuki T, Sonoda S, Misawa K, Saitoh E, Shimizu Y, Kotake T. Incidence and
Consequence of Falls in Inpatient Rehabilitation of Stroke Patients. Exp Aging
Res. 2005; 31: 457-469.
[50] Petitpierre NJ, Trombetti A, Carroll I, Michel J-P, Herrmann FR. The FIM®
instrument to identify patients at risk of falling in geriatric wards: a 10-year
retrospective study. Age Ageing. 2010; 39: 326-331.
[51] Kouwenhoven SE, Kirkevold M, Engedal K, Kim HS. Depression in acute
stroke: prevalence, dominant symptoms and associated factors. A systematic
literature review. Disabil Rehabil. 2011; 33: 539-556.
[52] Ashburn A, Hyndman D, Pickering R, Yardley L, Harris S. Predicting people
with stroke at risk of falls.Age Ageing. 2008; 37: 270-276.
[53] Wei TS, Hu CH, Wang SH, Hwang, K. L. Fall characterictics, functional
mobility and bone mineral density as risk factors of hip fracture in the
community-dwelling ambulatory elderly. Osteoporos Int. 2001;12: 1050-1055.

doi:10.6342/NTU201703518
48
Postural influence on Stand-to-Sit leg load sharing
strategies and sitting impact forces in stroke patients
Introduction
Sit-to-Stand (SitTS) and Stand-to-Sit (StandTS) are both considered essential
activities in everyone’s daily life [1, 2]. Many studies have investigated the
characteristics of SitTS in healthy subjects [3–13], elderly people [11–14], and stroke
patients [2–7,13,15–20], but fewer are focused on StandTS [2,3,10–12,15,16].
Although StandTS seems like a reverse movement of SitTS, the sitting impact
accounts for the inherit difference. Unlike heel strike during gait, sitting impact
cannot be diminished by the active and passive damping components of lower
extremities. Thus, for stroke patients, excessive impact caused by poor modulation of
body descending velocity may result in a damaging load to spine. Further, the
instantaneous instability at impact moment coupled with the position changes of
StandTS [1,3,12] increases the risk of falls. Despite the clinical significance, we could
find no research published investigating the sitting impact in stroke patients.
Following stroke, patients often present asymmetrical leg load due to abnormal
muscle synergy and muscle weakness during their functional activities such as
standing [17,21], SitTS [2–7,15–17,20], and StandTS [2,3,15,16]. The clinical

doi:10.6342/NTU201703518
49
significance of asymmetrical leg load during StandTS in connection to sitting
impact was not reported. In stroke rehabilitation, training paretic legs in muscle
coordination and strength is an important goal [16, 20, 24–26] since it can prevent the
overuse of the non-paretic side through reduced leg load asymmetry. Also, when
patients perform daily living activities in various situations where safety
considerations are top priority, the use of the non-paretic leg becomes a desirable
strategy since the function of the paretic side is limited.
Previous studies have shown that altering the leg placement significantly affects
the leg load of stroke patients for SitTS and/or StandTS [5, 6,15, 16]. The main
finding was that placing paretic legs posterior improves asymmetry of vertical
reaction forces or knee extensor moment between two sides. This evidence thus
suggests that adopting different postural configurations alters the leg load sharing
strategy used to accomplish various functional tasks for stroke patients. In addition to
the leg placement, a specific arm placement was suggested by neurodevelopmental
techniques (NDT) in order to facilitate symmetrical movements for stroke patients
[18,22,23]. Similarly, another study demonstrated that arm movements affect the force
production in lower limbs [9]. However, to our knowledge, the influence of various
combinations of arm and leg placements on leg load sharing strategy during

doi:10.6342/NTU201703518
50
functional tasks has not been investigated.
The purpose of this study was, therefore, to investigate leg load sharing strategies
and sitting impact forces in stroke patients during StandTS movement during different
postural configurations. The hypothesis was that adopting different arm placements,
combined with leg placements, would alter the leg load sharing strategy of sitting
down while performing StandTS and influence the subsequent sitting impact. Four
configurations of arm and leg placements were evaluated on leg load sharing
strategies and sitting impact forces, respectively. This research could provide useful
information for clinicians involved in exercise design for stroke patients with a view
to take sitting impact into account as a safety requirement during rehabilitation.

doi:10.6342/NTU201703518
51
Methods
3.2.1 Subjects
Subjects were diagnosed as first ever stroke by regular medical procedures of a
medical center. Exclusion criteria were as follows: (1) apparent degenerative joints or
neurological disorders, e.g. knee osteoarthritis and Parkinson’s disease (2) unable to
finish successful StandTS with the postural configurations designed in this study, (3)
younger than 40 years, and (4) history of fall-related fracture after stroke. Eighteen
hemiplegic stroke patients (three females,15 males) were recruited from the
rehabilitation department. Eight were left hemiplegics and ten were right hemiplegics.
The mean age was 60.83 years with a range from 43 to 75 years and the mean (±SD)
time since lesion was 13.9(±11.2) months. Mean (±SD) body height and weight were
165.2 (±7.5) cm and 71(±10.7) kg, respectively. All the participants were evaluated
by functional independence measure (mean ±SD:108.6 ±17.3) and mini-mental state
examination (mean ±SD:27.3 ±1.4), which revealed that they were in relatively high
functional level among people with stroke. This study was approved by Institutional
Review Board of the medical center and informed consent was received from each
participant after thoroughly explaining the study procedures.

doi:10.6342/NTU201703518
52
3.2.2 Experiment protocol
There were three force plates (AccuGait, Advanced Mechanical Technology Inc.,
Newton, MA, USA) used in the experiment setup (Figure 3-1a). During StandTS,
subjects placed each leg on one force plate and were asked to sit down on a stool
which was placed on another force plate. The height of the stool was adjusted while
sitting until the thighs were parallel to the ground. The knees of anterior/posterior legs
flexed 800/1000 and thus the distance between anterior/posterior leg placements was
set individually. Each subject was asked to perform four postural configurations
(Figure 3-1b), which were the combinations of two arm placements (SA: symmetrical
arms; GA: grasped arms) and two leg placements (NPLP: non-paretic leg posterior;
PLP: paretic leg posterior). The SA placement referred to that the subjects relaxed and
hung their arms sideways whereas the GA placement referred to that the subjects
flexed forward the shoulder 900 with hands grasped and fingers interlaced which was
the way physiotherapists usually taught for StandTS. Before trials, a table of four
postural configurations was randomly prescribed for each subject. According to the
prescribed postural configurations sequentially, each subject followed given oral
instructions and performed StandTS.

doi:10.6342/NTU201703518
53
Figure 3-1 Experiment setup
configurations of arm and foot placements (- - - paretic and — non-paretic) &
forceplates (from top view)

doi:10.6342/NTU201703518
54
Descending period was measured as the length of time required to sit down. An
infrared-emitting diode (IRED) placed on the mid-point of two bony landmarks of
PSISs was tracked by an optoelectric sensor (Optotrak Certus, Northern Digital Inc.,
Waterloo, Canada) in order to detect the initiation of sitting down which was defined
as the onset of sacrum descending from quite standing. The end of descending period
was determined as the instant when the body initially contacted the stool.
In addition to detect the end of descending period, the force plate underneath the
stool was also used to determine the sitting impact force which was recognized as the
first transient peak of vertical stool reaction force. The vertical ground reaction force
on the foot was acquired by the force plate underneath it to show the dynamic leg load
on each leg. Examples of the sitting impact force and dynamic leg load corresponding
to each postural configuration were shown in Figure 3-2 and Figure 3-3, respectively.
Kinematic and force plate data were collected at both 50 Hz simultaneously. Data
processing and automatic event recognition were finished by an in-house-developed
program using Microsoft Visual Studio 2005 (Microsoft Corp.).

doi:10.6342/NTU201703518
55
Figure 3-2 Typical normalized stool reaction forces. y indicates the first transient
peak, i.e. sitting impact force.

doi:10.6342/NTU201703518
56
Figure 3-3 Typical normalized dynamic leg load responded to two leg placements and
(a) SA arm placement and (b) GA arm placement during descending period.

doi:10.6342/NTU201703518
57
3.2.3 Data analysis
Before the group means were computed, a set of dynamic data of leg load was
processed for each subject to obtain the leg load discrepancy between two sides,
load shared by the non-paretic leg, load shared by the paretic leg, posterior leg
load, and anterior leg load during descending period. The averaged values of leg
load discrepancy were defined according to the following formula:
where T is the descending period, and Rnp and Rp are the loads shared by the
nonpareticleg and by the paretic leg.
3.2.4 Statistical analysis
Interactions of arm placements and leg placements on descending period, leg load
kinetics, and sitting impact were analyzed by two-way repeated-measure ANOVA.
Pairwise tests were utilized for post hoc analysis. In addition, the leg load differences
between non-paretic and paretic legs as well as between anterior and posterior legs
corresponding to each postural configuration were identified by paired t-tests in order to
evaluate the change of leg load sharing strategy. All statistical analyses were performed
using SPSS 11.0 software with a significance level of P < 0.05 (two-tailed).

doi:10.6342/NTU201703518
58
Result
3.3.1 Normality check
The skewness and kurtosis of all data were within a range from -1 to 1. The results
of Shapiro–Wilk test on all data showed insignificant difference from normal
distribution of samples while the alpha level was set to 0.05.
3.3.2 Two-way ANOVA with post hoc comparisons
There was no interaction of arm and leg placements on all variables. Regardless of
arm placements, leg placements demonstrated significant influences on leg load
discrepancy, loads on non-paretic and paretic legs, and sitting impact force. During
StandTS, adopting the PLP leg placement increased the load on the paretic side but
decreased the load on the non-paretic side such that the load shifted from the non-
paretic side to the paretic side. Quite the opposite, with the NPLP leg placement,
because the load on the non-paretic side was augmented and that on the paretic side
was reduced, the load shifted from the paretic side to the non-paretic side. Leg load
discrepancy of PLP was therefore smaller than NPLP. In addition, the PLP leg
placement induces significantly greater sitting impact force compared with the NPLP
placement. Group means and results of post hoc analysis are summarized in Table 3-1.
It should be noted that the values of total load were not equal to body weight because

doi:10.6342/NTU201703518
59
of the typical process of accelerating/decelerating body center-of-mass (BCOM)
during descending period.

doi:10.6342/NTU201703518
60
Table 3-1 Group means and statistical results of descending period, leg load kinetics,
and sitting impact force corresponding to each postural configuration (N= 18).
Parameter SA GA
NPLP(SD) PLP(SD) P-value NPLP(SD) PLP(SD) P-value
Descending period(s) 1.91(0.80) 1.83 (0.58) 0.518 1.79(0.76) 1.70(0.61) 0.339
Average non-paretic
leg load (%BW)
62.10(8.01)a 58.71(7.70)b 0.035* 62.98(7.01)c 59.26(8.37)d 0.014*
Average paretic leg
load (%BW)
37.14(7.85)a 40.63(7.89)b 0.029* 36.08(6.83)c 39.70(8.30)d 0.014*
Average anterior leg
load (%BW)
37.14(7.85) 58.71(7.70) 0.000** 36.08(6.83) 59.26(8.37) 0.000**
Average leg load
discrepancy (%BW)
24.96(15.86) 18.08(15.57) 0.032* 26.90(13.82) 19.56(16.66) 0.014*
Sitting impact force
(%BW)
70.63(28.02) 80.83(35.72) 0.020* 75.32(31.87) 84.67(37.57) 0.036*
%BW: % of body weight.
* P<0.05 from paired-samples tests.
** , a, b, c, d P<0.001 from paired-samples tests.
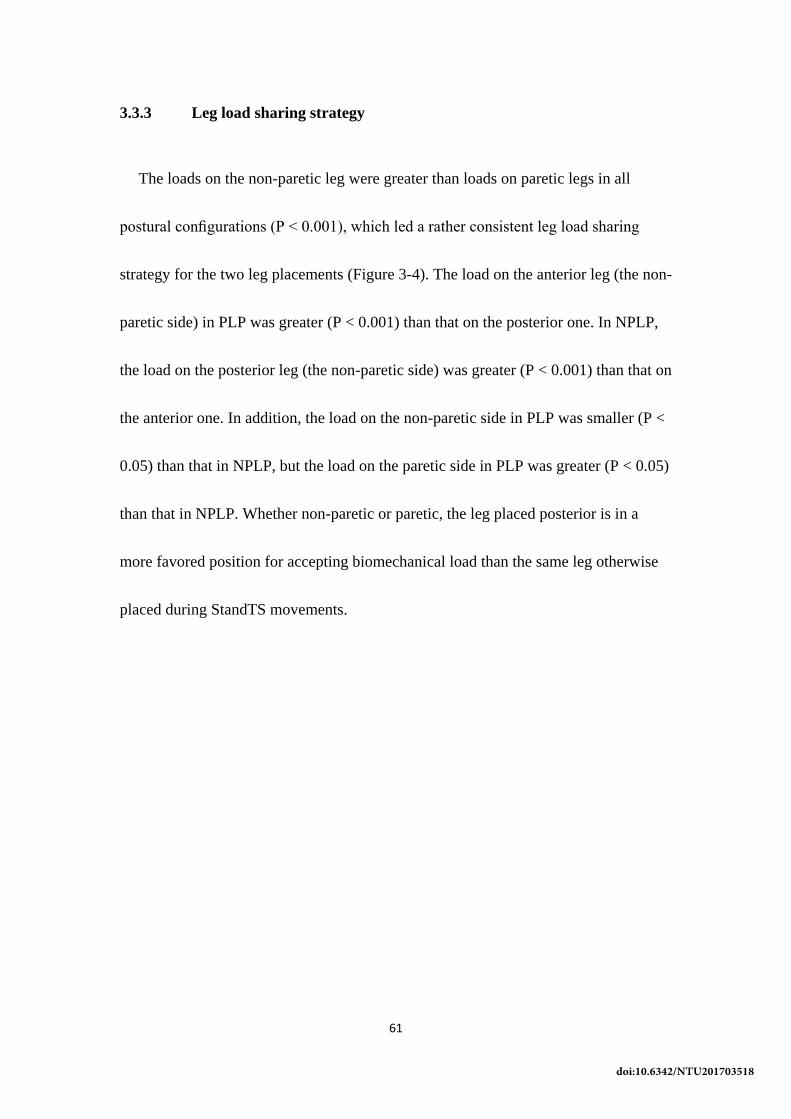
doi:10.6342/NTU201703518
61
3.3.3 Leg load sharing strategy
The loads on the non-paretic leg were greater than loads on paretic legs in all
postural configurations (P < 0.001), which led a rather consistent leg load sharing
strategy for the two leg placements (Figure 3-4). The load on the anterior leg (the non-
paretic side) in PLP was greater (P < 0.001) than that on the posterior one. In NPLP,
the load on the posterior leg (the non-paretic side) was greater (P < 0.001) than that on
the anterior one. In addition, the load on the non-paretic side in PLP was smaller (P <
0.05) than that in NPLP, but the load on the paretic side in PLP was greater (P < 0.05)
than that in NPLP. Whether non-paretic or paretic, the leg placed posterior is in a
more favored position for accepting biomechanical load than the same leg otherwise
placed during StandTS movements.

doi:10.6342/NTU201703518
62
Figure 3-4 Illustrations of leg load strategies of two leg placements corresponding to
(a) SA arm placement and (b) GA arm placement. * represents that there is a
significant difference between two bars.

doi:10.6342/NTU201703518
63
Discussion
No significant differences regarding the parameters utilized in this study were
found between the two arm placements adopted. Leg load discrepancy was not
reduced by adopting the arm grasped placement which however has been a common
practice to facilitate symmetrical functional movements [23]. This result might be due
to the criteria used in this research of subject selection, which required the participants
to be in high functional levels. More sophisticated assessment of postural control,
such as COP-BCOM relationship [27] and angular momentum modulation [28], might
be required to detect the influence of arm placement on StandTS.
In this study, the descending periods of participants did not demonstrate any
significant difference among different postural configurations. From previous
research, the length of time required to finish SitTS, which reflects the gross muscle
strength to accelerate the body rising up, has been related to task performance
[2,7,13,14,20]. Some authors have pointed out that a shorter ascending period would
correlate to better performance of SitTS [2,20]. Since the primary concern during
StandTS is how well the patient modulates the body downwards velocity, rather than
how fast the patient drops, the length of descending period may not be an appropriate
indicator for evaluating performance of StandTS. Because not only muscle strength

doi:10.6342/NTU201703518
64
but also muscle coordination is involved in the deceleration process, descending faster
may actually reflect poor control during sitting down rather than good performance.
Our results imply that the duration of the descending period (in the patients with
relatively good functioning level recruited in this research) was not able to
differentiate performance quality.
The pathological joint movements of stroke subjects play an important role during
StandTS in order to differentiate the performance of postural configurations. The
types of leg muscle contraction for SitTS and StandTS are quite different since rising
up requires concentric contractions of hip extensors, knee extensors and ankle plantar
flexors for acceleration whereas eccentric contraction is demanded for deceleration
while sitting down [15,29]. However, eccentric contractions of paretic muscles, in
which the selective control of joints is limited in stroke patients, may account for the
difficulty to modulate StandTS movement [30]. The StandTS with PLP leg
placements would be more difficult than that with NPLP leg placements because PLP
leg placement requires the paretic muscles to be primary power to perform the
eccentric contractions for the deceleration during sitting down. Clinicians should let
stroke patients be aware that adopting the PLP leg placement to sit down without the
supervision of medical professionals may put them in a dangerous circumstance

doi:10.6342/NTU201703518
65
particularly for those in low functional levels.
In addition to abnormal muscle synergy, disuse muscle atrophy is also an important
issue in stroke rehabilitation. Research has shown that improvement of paretic muscle
strength prevents overuse of the non-paretic side [16,25] and decreases disability
[19,22,26]. In accordance with previous studies [5,6,15,16], placing the paretic leg
posterior in this research not only increases activity of the paretic leg, which is
suitable for strength-training, but also improves the asymmetrical load condition of
StandTS due to the decrease of leg load discrepancy. However, these improvements
cannot transfer to better postural control for stroke patients because the sitting impact
is increased with the PLP leg placement. Hence, more symmetrical load condition
accomplished by more exertions of paretic muscles cannot explicitly relate to better
StandTS performance although it is beneficial in strength-training rehabilitation.
The asymmetrical load condition of NPLP is not a source of postural instability but
rather a result of safe postural configurations during StandTS since the sitting impact
can be reduced with NPLP placement as shown in Table 3-1. Due to the fundamental
characteristic of stroke patients regarding their preferred use of the non-paretic side,
the dominant role of the non-paretic leg on bearing loads consistently ensures safety

doi:10.6342/NTU201703518
66
despite the alteration of postural configurations. The leg load sharing strategy of
StandTS with the NPLP leg placement achieves an effort-efficient status because the
posterior leg bears more load than the anterior leg (Figure 3-4) due to the preferred
use of the non-paretic leg and the favored position for accepting biomechanical load.
In contrast to the NPLP leg placement, adopting the PLP leg placement to sit down
for hemiplegics is unlikely to achieve an effort-efficient status, i.e. the posterior
(paretic) leg bears more loads than the anterior (non-paretic) leg. In other words, the
non-paretic leg is placed anterior in an awkward position with the PLP leg placement
for sitting and thus is unable to adequately compensate paretic muscles on modulating
body descending velocity, which consequently induces the greater sitting impact as
we found in this research. Our result echoes previously published findings [21]
concluding that the postural instability is caused by the inability of the non-paretic leg
to compensate the postural impairment of the paretic leg, rather than by asymmetrical
load condition. Despite the load asymmetry, we found that the NPLP leg placement
reduces sitting impact in addition to the effort-efficient movements when patients
perform StandTS.
This study has demonstrated the sensitivity of the sitting impact on the changes of
leg load sharing strategy due to postural configurations. Hence, sitting impact can be a

doi:10.6342/NTU201703518
67
performance indicator of StandTS since it not only reflects the sitting down efforts of
both legs on decelerating but also represent the smoothness of the weight-transfer
process from legs to a stool. When smooth weight-transfer can be achieved, the risk of
falls may be reduced. Further research is needed to correlate other characteristics of
StandTS to sitting impact in order to uncover the relationship between postural
control and the sitting impact in more detail. Possible predictors of sitting impact
might be the impacting velocity of BCOM, muscle strength of lower extremities,
COP-BCOM relationship, and angular momentum modulation. The ultimate goal of
our study group is to develop reliable predictors on falls, which would contribute to
fall prevention for stroke patients. A longitudinal project has been launched for this
purpose.
The main limitation of this study was that only a chronic population with a high
functional level was examined and hence, the relevance of our findings to an acute
stroke population or to less able chronic patients has not clarified by our current work.
In conclusion, this study confirmed that, in stroke patients with good functional levels,
leg placement significantly influences leg load sharing strategies and sitting impact
forces whereas arm placements do not. The preferred role of the non-paretic leg in
load-bearing and the favored biomechanical load position of the posterior leg

doi:10.6342/NTU201703518
68
accounts for the leg load sharing strategies with the two leg placements investigated.
Consequently, the inability of the anterior non-paretic leg to compensate the poor
controlled paretic leg induces greater sitting impact compared with the non-paretic leg
posterior placement. For training purposes, placing the non-paretic leg anterior would
increase exertions of the paretic leg.

doi:10.6342/NTU201703518
69
References
[1] Nyberg L, Gustafson Y. Patient falls in stroke rehabilitation: a challenge to
rehabilitation strategies. Stroke 1995;26:838–42.
[2] Cheng PT, Wu SH, Liaw MY, Wong AMK, Tang FT. Symmetrical body-weight
distribution training in stroke patients and its effect on fall prevention. Arch Phys
Med Rehabil 2001;82:1650–4.
[3] Cheng PT, Liaw MY, Wong MK, Tang FT, Lee MY, Lin PS. The sit-to-stand
movement in stroke patients and its correlation with falling. Arch Phys Med
Rehabil 1998;79:1043–6.
[4] Bjerlemo B, Johnels B, Kreuter M. The effect of two different arm positions on
body weight distribution when rising from sitting to standing in stroke patients.
Physiother Theor Pract 2002;18:33–41.
[5] Brunt D, Greenberg B, Wankadia S, Trimble MA, Shechtman O. The effect of
foot placement on sit to stand in healthy young subjects and patients with
hemiplegia. Arch Phys Med Rehabil 2002;83:924–9.
[6] Lecours J, Nadeau S, Gravel D, Teixera-Salmela L. Interactions between foot
placement, trunk frontal position, weight-bearing and knee moment asymmetry at
seat off during rising from a chair in healthy controls and persons with
hemiparesis. J Rehabil Med 2008;40:200–7.
[7] Chou SW, Wong AM, Leong CP, Hong WS, Tang FT, Lin TH. Postural control
during sit-to-stand and gait in stroke patients. Am J Phys Med Rehabil
2003;82:42–7.
[8] Reisman DS, Scholz JP, Scho ner G. Coordination underlying the control of
whole body momentum during sit-to-stand. Gait Posture 2002;15:45–55.
[9] Carr JH, Gentile AM. The effect of arm movement on the biomechanics of
standing up. Hum Mov Sci 1994;13:175–93.
[10] Reisman DS, Scholz JP, Scho ner G. Differential joint coordination in the tasks
of standing up and sitting down. J Electromyogr Kines 2002;12:493–505.
[11] Kerr KM, White JA, Barr DA, Mollan RAB. Analysis of sit-stand-sit movement
cycle in normal subjects. Clin Biomech 1997;12:236–45.
[12] Dubost V, Beauchet O, Manckoundia P, Herrmann F, Mourey F. Decreased
trunk angular displacement during sitting down: an early feature of aging. Phys
Ther 2005;85:404–12.
[13] Whitney SL, Wrisley DM, Marchetti GF, Gee MA, Redfern MS, Furman JM.
Clinical measurement of sit-to-stand performance in people with balance
disorders: validity of data for the five-times-sit-to-stand test. Phys Ther
2005;85:1034–45.
[14] Lindemann U, Muche R, Stuber M, Zijlstra W, Hauer K, Becker C. Coordination

doi:10.6342/NTU201703518
70
of strength exertion during the chair-rise movement in very old people. J
Gerontol Med Sci 2007;62A:636–40.
[15] Roy G, Nadeau S, Gravel D, Malouin F, McFadyen BJ, Piotte F. The effect of
foot position and chair height on the asymmetry of vertical forces during sit-
tostand and stand-to-sit tasks in individuals with hemiparesis. Clin Biomech
2006;21:585–93.
[16] Roy G, Nadeau S, Gravel D, Piotte F, Malouin F, McFadyen BJ. Side difference
in the hip and knee joint moments during sit-to-stand and stand-to-sit tasks in
individuals with hemiparesis. Clin Biomech 2007;795–804.
[17] Eng JJ, Chu KS. Reliability and comparison of weight-bearing ability during
standing tasks for individuals with chronic stroke. Arch Phys Med Rehabil
2002;83:1138–44.
[18] Hesse S, Schauer M, Petersen M, Jahnke M. Sit-to-stand manoeuvre in
hemiparetic patients before and after 4-week rehabilitation programme. J Rehabil
Med 1998;30:81–6.
[19] Eriksrud O, Bohannon RW. Relationship of knee extension force to
independence in sit-to-stand performance in patients receiving acute
rehabilitation. Phys Ther 2003;83:544–51.
[20] Lomaglio MJ, Eng JJ. Muscle strength and weight-bearing symmetry relate to
sit-to-stand performance in individuals with stroke. Gait Posture 2005;22:126–
31.
[21] Genthon N, Rougier P, Gissot AS, Froger J, Pe lissier J, Pe rennou D.
Contribution of each lower limb to upright standing in stroke patients. Stroke
2008; 39:1793–9.
[22] Bobath B. Adult hemiplegia: evaluation and treatment. Oxford: Butterworth
Heinemann; 1990.
[23] Davies PM. Steps to follow: the comprehensive treatment of patients with
hemiplegia. Berlin: Springer-Verlag; 2000.
[24] Patten C, Lexell J, Brown HE. Weakness and strength training in persons with
poststroke hemiplegia: rationale, method, and efficacy. J Rehabil Res Dev
2004;41:293–312.
[25] Lomaglio MJ, Eng JJ. Nonuniform weakness in the paretic knee and
compensatory strength gains in the nonparetic knee occurs after stroke.
Cerebrovasc Dis 2008;26:584–91.
[26] Canning CG, Ada L, Adams R, O’Dwyer NJ. Loss of strength contributes more
to physical disability after stroke than loss of dexterity. Clin Rehabil
2004;18:300–8.
[27] Hahn ME, Chou LS. Age-related reduction in sagittal plane center of mass

doi:10.6342/NTU201703518
71
motion during obstacle crossing. J Biomech 2004;37:837–44.
[28] Herr H, Popovic M. Angular momentum in human walking. J Exp Biol
2008;211:467–81.
[29] Carr JH, Shepherd RB. Neurological rehabilitation: optimizing motor
performance. Oxford: Butterworth Heinemann; 1998.
[30] Carr JH, Shepherd RB. Stroke rehabilitation: guidelines for exercise and training
to optimize motor skill. Edinburgh: Butterworth Heinemann; 2003.

doi:10.6342/NTU201703518
72
Postural Configuration on Phase Duration and Vertical
Force Asymmetry during Sit-to-Stand Tasks in Patients with
Stroke
Introduction
Cerebrovascular accidents, a leading cause of death in many countries with a high
morbidity rate, have become a significant public health problem. Complications often
occurring as a direct result of injury to the brain following stroke include an inability
to move freely or to sustain balance. As a result, stroke patients have a high risk of
falling: with 14 to 39% of patients falling in the first month following stroke, and 75%
in the first six months [1,2]. The injury rate in such falls has been reported between 13
and 29% [3–8]. Previous stroke has been demonstrated as a risk factor (adjusted OR,
2.9; 95% CI, 1.3–6.3) for fall-induced hip fractures among elderly persons dwelling in
communities [9]. Poor force exertion in the lower extremities and impaired
coordination of body segments during the SitTS tasks are correlated with fall risk
[2,10].
Past studies have demonstrated longer task duration, larger displacements of the
COM, and asymmetrical weight bearing during SitTS is commonly observed in
doi:10.6342/NTU201703518
73
patients following stroke [11–14]. By comparing fall and non-fall stroke patients, it
was found that asymmetrical distribution of body weight and greater postural sway
were predictors of falls [14]. The asymmetry of body-weight distribution can be
estimated from the vertical ground-reaction forces on feet, and used to quantitatively
assess SitTS movement.
In previous studies, the hand placement position of crossed-arms-on-chest has been
adopted in experimental settings simulating the SitTS task [15]. However, clinically,
crossed-arms-on-chest deprives the patient of the ability to adjust postural sway and
may result in atypical patterns of movement.
The aims of this study were to evaluate the effect of different postural
configurations of the hands and feet on weight bearing in stroke patients during SitTS
tasks. The hands-clasped position is frequently used in clinical practice for SitTS task
training of stroke patients as it is believed to provide better control of upper limbs and
trunk. In addition, activity with hands-clasped position is believed to inhibit the flexor
synergy of upper limbs and facilitate body and joint proprioception in the stroke
patients. Positioning the affected foot backward is also used to facilitate weight
bearing of the weakened leg. We hypothesized the hands-clasped position with the

doi:10.6342/NTU201703518
74
affected foot backward will decrease time expenditure and asymmetry of vertical
ground-reaction forces (GRF) in stroke patients during the SitTS task.
Methods
4.2.1 Participants
Subjects were recruited from the rehabilitation program at a tertiary medical center.
A total of 21 stroke patients (17 males, 4 females) were enrolled in this study. The
mean age was 58.8 years (SD = 12.4), and the time post-onset ranged from 1.7 to 44
months. The mean Functional Independence Measure (FIM) was 108.6 (SD = 17.3).
4.2.2 Ethics
This study was approved by the institutional review board of Changhua Christian
hospital and was conducted in accordance with the Declaration of Helsinki. All
participants received verbal and written information about the study, and signed a
consent form.
4.2.3 Experimental settings
An Optotrak motion capture system (Optotrak Certus, Northern Digital Inc,
doi:10.6342/NTU201703518
75
Waterloo, Ontario, Canada)a was used to track a marker placed on the sacrum (Figure
4-1). Three force plates (AMTI, Watertown, MA, USA)b were employed: two under
each leg and one under the seat. A stool without back or armrests was used to avoid
blocking the tracking marker and to prevent movement of the seat during the SitTS
task. In keeping with finding the finding by Roy et al [16] that seat height has no
significant effect on the level of asymmetry of vertical ground-reaction forces, a
standard seat height was adjusted to the height of knee joint center. For the
asymmetrical foot position, the placement of feet were adjusted to achieve an
anterior/posterior knee flexion of 80°/100° (Figure 4-2). The locations of both feet
were recorded to ensure foot positions were consistent between repeated trials. All
experimental settings were illustrated in Figure 4-4 and Figure 4-5.

doi:10.6342/NTU201703518
76
Figure 4-1 Experimental setting: Marker placement and foot position.

doi:10.6342/NTU201703518
77
Figure 4-2 Arm positions and Knee flexion angle.
Figure 4-3 Example of hand grasp during the task of sit to stand.

doi:10.6342/NTU201703518
78

doi:10.6342/NTU201703518
79
Figure 4-4 The kinematic and kinetic data collected by optotrak motion system.

doi:10.6342/NTU201703518
80
Procedures
Combinations of three hand positions and four foot placements were tested in a
random sequence (Figure 4-3). Hand positions studied were: hands on knees (Hk),
where subjects were asked to rest their hands lightly on their thighs but not to push
them when standing up; hands aside (Ha); and hands clasped (Hc). Foot placements
studied were: spontaneous (Fsp), symmetrical (Fs), affected forward (Faf), and
affected backward (Fab).
Subjects were trained in the SitTS task prior to testing. Subjects performed three
trials of each configuration at their own pace. A verbal cue was used to initiate
movement. An assistant accompanied patients on each side in order to prevent falls.
Subjects were given a 2-min rest period after every three trials to eliminate the effects
of fatigue.
4.3.1 Data processing
Four events (Figure 4-5, E1-E4) were defined by force data and the position of the
marker placed on the sacrum. The first, onset (E1), was defined as the point at which
the sitting subject starts the first movement by leaning the trunk forward and causing
the forceplate under the stool to show force deviating at least 5% from the baseline. The

doi:10.6342/NTU201703518
81
second, seat-off (E2), was defined as the point at which the subject changes from a
sitting to a standing position, defined as the point in time when the vertical force under the
stool becomes equal to the weight of the stool. The third event, standing (E3), was defined
as the point at which a standing position is reached, with the marker on the sacrum at
its highest position. The fourth event, end of task (E4), represents the instant when a
stable standing phase is achieved with no fluctuations greater than 5% of body weight.
Thus, the duration of the SitTS task was defined as the elapsed time from E1 to E4,
subdivided into three phases: preparation (E1 to E2), ascending (E2 to E3), and
stabilization (E3 to E4). Figure 4-6 shows data collected from a representative subject.
Vertical ground-reaction force was measured to calculate weight-bearing
asymmetry during the task. The index of asymmetry was defined as follows,
Asymmetry index =Vna−Vperfect symmetry
Vperfect symmetry
where Vna is the vertical GRF measured from the non-affected side, and Vperfect symmetry
equals to 50% of the sum of the total vertical GRF under the feet [16]. The unit of
index was expressed as a percentage, with 0 representing perfect symmetry, −100%
indicating the load was entirely on the affected side, and +100% corresponding to
loading entirely on the non-affected side.

doi:10.6342/NTU201703518
82
To better understand the fluctuations of vertical GRF during the SitTS task. The
vertical GRF under both legs was acquired to calculate the leg load discrepancy
during the SitTS task (Figure 4-7). The value of the Leg Load Discrepancy (LLD)
was defined according to the following formula, Load discrepancy = ∫ (Vna
T0
−Va)dt
T
∫ (VnaT
0-Va)dt
T
where T is the duration of the phase and Va is the vertical GRF measured from the
affected side [17].

doi:10.6342/NTU201703518
83
Figure 4-5 Events of sit to stand task.
Figure 4-6 Bilateral leg load in FspHk and FabHc position.
Figure 4-7 Asymmetrical leg load compared to FspHk and FabHc.

doi:10.6342/NTU201703518
84
4.3.2 Statistical analysis
Descriptive statistics (means) were calculated for duration, asymmetry index and
leg load discrepancy. Results were analyzed to determine the effect of foot and hand
positions during the SitTS task for the duration and LLD were assessed for each
phase. The asymmetry index was calculated at each event. Because some subjects
failed to perform few difficult postural configurations (such as Faf), it led to data
missing for further statistical analysis. Therefore, we used the Generalized Estimating
Equations (GEE) method to evaluate the effect of foot and hand position on duration,
asymmetry index, and leg load discrepancy, instead of using repeated-measure
ANOVA. Where results of GEE were significant only in main effect of foot or hand,
pair-wise comparisons were tested to determine significant differences for each foot
or hand components. If any complex interactions of foot and hand (foot x hand), a
further simple effect analysis with pairwise contrasts (a Bonferroni adjustment) to
determine where the differences were, such as fixed one independent variable (e.g.,
foot position) on each of the other positions (e.g., for Hc, Hk, and Ha)

doi:10.6342/NTU201703518
85
Results
The effect of foot and hand position on the duration of SitTS (Figure 4-8).
An interaction between foot and hand positioning and the duration of preparation and
ascending phases was observed. The FabHc position led to the shortest preparation
phase duration (0.51 s) and the FspHa position led to the longest (0.59 s). In the Fab
position, Ha position led to a longer preparation phase duration than Hc or Hk
positions [the difference of duration between configurations (Δ), Δ (FabHa vs. FabHc)
= 0.071 s, P = 0.031 and Δ (FabHa vs. FabHk) = 0.044 s, P = 0.012]. In the Faf
position, the Hc position was found to lead to a shorter duration than Ha or Hk
positions (Δ (FafHc vs. FafHa) = 0.070 s, P = 0.044 and Δ (FafHc vs. FafHk) = 0.060
s, P = 0.004). No significant differences were observed between other foot and hand
positions. For the ascending phase, the FspHc position led to the shortest movement
duration (1.21 s) and the FabHk position led to the longest (1.41 s). An effect of foot
position and hand position on the duration of the stabilization phase was observed.
The mean duration of the stabilization phase significantly differed among different
foot (Wald X2 = 10.03, P = 0.018) and and positions and (Wald X2 = 32.56, P <
0.001). Therefore, further pairwise tests were performed demonstrating the duration in
the Fab position was longer than Faf (Fab > Faf, P = 0.01) or Fsp (Fab > Fsp, P =
0.004) positions, and the duration in the Hc position was longer than in Ha or Hk
doi:10.6342/NTU201703518
86
positions (P < 0.001 for Hc > Ha, Hk).

doi:10.6342/NTU201703518
87
Figure 4-8 The durations of sit to stand by phase: (A) preparation phase. (B) ascending
phase. (C) stabilization phase. (D) total sit to stand. The values were plot by mean
with standard deviation.
Fab, Affected foot backward; Faf, Affected foot forward; Fsp, Foot spontaneous; Fs,
Foot Symmetry; Hk, Hands on knees; Hc, Hands clasped; Ha, Hands aside.
E1, Onset; E2, Seat-off; E3, Standing; and E4, End of Task.

doi:10.6342/NTU201703518
88
No interaction (foot x hand) was observed between the total duration of the SitTS
task, but for the main effect of foot (Wald X2 = 9.77, P = 0.021) and effect of hand
(Wald X2 = 19.42, P < 0.001) were significant. The affected foot placed backward
(Fab) position led to a longer duration than Faf (Fab > Faf, P = 0.027) or Fsp (Faf >
Fsp, P = 0.002) positions. The Hc position led to a longer than duration than Hk or Ha
(Hc > Hk, Ha, P < 0.001) positions. The shortest mean duration was 2.57 s (FspHk)
and the longest was 3.36 s (FabHc). Compared to the FspHk (2.57 s) position, the
normal posture of patients, subjects in the affected foot backward and hands clasped
position needed 30% longer (3.36 s) to accomplish the SitTS task.
The effects of hand and foot position on the asymmetry index at each event in the
SitTS task (Figure 4-8). In general, no interactions of foot x hand position on the
asymmetry index were observed for any events. At standing (E3), no significant
difference between the mean asymmetry index and foot and hand position was found.
A significant different was found among foot position on the asymmetry index at E4
only (Wald X2 = 27.79, P < 0.001).
At onset (E1), the mean asymmetry indices were all negative, indicating that the
affected leg took more load than the non-affected leg. At this event, the Fs position

doi:10.6342/NTU201703518
89
had increased asymmetry than Fsp (Fs > Fsp, P = 0.047) and the Hc position led to
decreased asymmetry than Hk (Hc >Hk, P = 0.047).
At seat-off (E2), pairwise comparisons revealed asymmetry in the Fab position was
significantly lower than in the Faf, Fsp, or Fs positions (P < 0.001,Figure 4-8), and
significantly lower in the Hc position than in the Hk position (P = 0.004, Figure 4-9 ).
Similar results were found for foot positions at the end of the task (E4). Although
asymmetry in the Hc position was slightly higher than in other hand positions, it did
not reach statistical significance.

doi:10.6342/NTU201703518
90
(A)
(B)
(C)
(D)
Figure 4-9 The asymmetry Index of events according to Foot and Hand Positions:
(A) onset. (B) seat off. (C) standing. (D) end of task. All values are represented as
mean (standard deviation).
Fab, Affected foot backward; Faf, Affected foot forward; Fsp, Foot spontaneous; Fs,
Foot symmetry; Hk, Hands on knees; Hc, Hands clasped; Ha, Hands aside.

doi:10.6342/NTU201703518
91
The effect of hand and foot position on leg load discrepancy during the SitTS task
(Figure 4-10). Leg load discrepancy was used as an index for the difference in leg
load between the two sides during the task. Significant effects were found only for
foot positions, in each phase, throughout the entire task duration, but no such effects
were found for hand positions (Table 4-1). The results showed that Faf had the
greatest LLD in each phase and total sitTS. Despite of hand position, the placement of
affected foot backward (Fab) was less LLD than Fsp or Fs during the sitTS task.
Figure 4-7 shows a visual presentation of the GRF percentages of each leg in the
FspHk and FabHc positions during SitTS task.
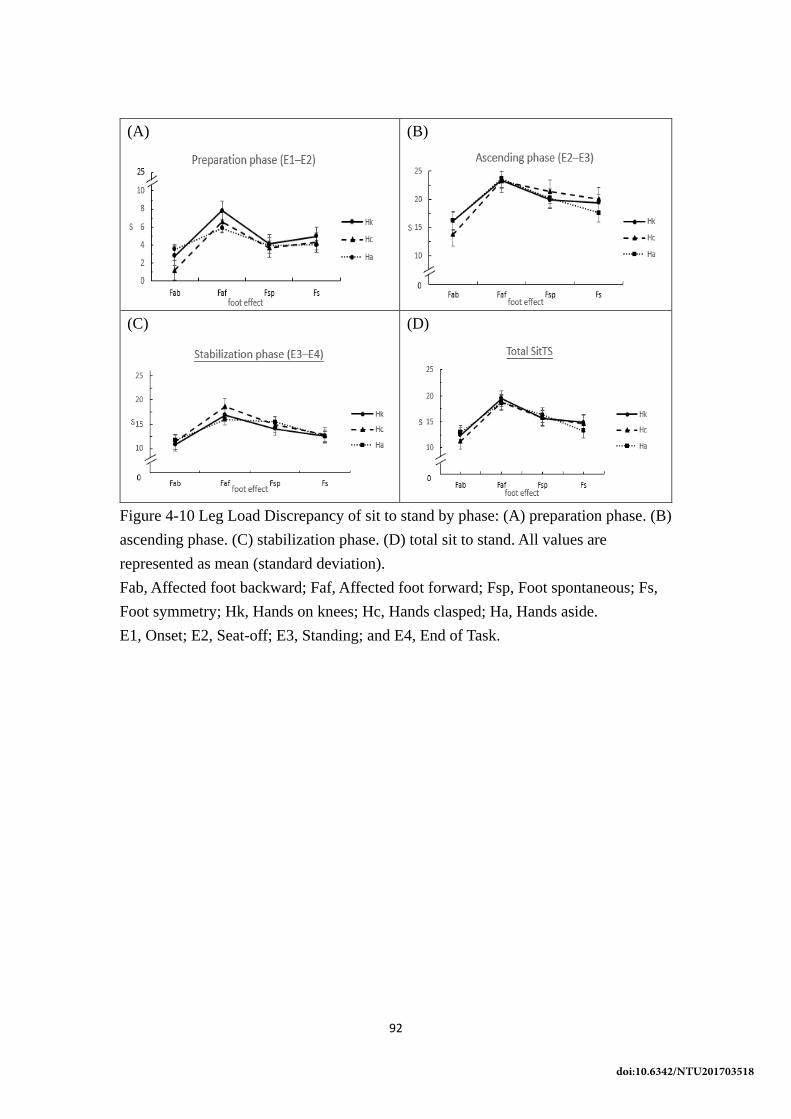
doi:10.6342/NTU201703518
92
(A)
(B)
(C)
(D)
Figure 4-10 Leg Load Discrepancy of sit to stand by phase: (A) preparation phase. (B)
ascending phase. (C) stabilization phase. (D) total sit to stand. All values are
represented as mean (standard deviation).
Fab, Affected foot backward; Faf, Affected foot forward; Fsp, Foot spontaneous; Fs,
Foot symmetry; Hk, Hands on knees; Hc, Hands clasped; Ha, Hands aside.
E1, Onset; E2, Seat-off; E3, Standing; and E4, End of Task.

doi:10.6342/NTU201703518
93
Table 4-1 Leg load discrepancy by phase.
Factors Wald X2 P value Pairwise test
Preparation phase (E1–E2)
Foot effect 13.36 0.004 Faf > Fs, Fsp, Fab
Fs > Fab
Hand effect 2.95 0.229
Foot x Hand interaction 5.11 0.530
Ascending phase (E2–E3)
Foot effect 25.05 0.003 Faf > Fsp, Fs, Fab
Fs, Fsp > Fab
Hand effect 0.91 0.956
Foot x Hand interaction 3.77 0.708
Stabilization phase (E3–E4)
Foot effect 13.87 <0.001 Faf > Fsp, Fs, Fab
Fsp > Fs, Fab
Hand effect 0.38 0.826
Foot x Hand interaction 2.47 0.872
Total SitTS
Foot effect 22.87 <0.001 Faf > Fsp, Fs, Fab
Fsp > Fab
Hand effect 0.55 0.758
Foot x Hand interaction 5.94 0.430

doi:10.6342/NTU201703518
94
Discussion
Most studies of the SitTS movement have included constraints on the use of the
hands to simplify experimental procedures. However, we believe the use of the hands
in performing the SitTS task is common among elderly and hemiparetic patients and
likely to significantly influence foot placement. Therefore, the effects of foot and
hand placement during the SitTS task were the main foci of this study. Our results
demonstrated that a number of events and phases during the SitTS process were
influenced by foot and hand position configurations.
4.5.1 Durations in response to hand and foot placement
During the preparation and ascending phases, there was an interaction effect
between foot and hand positions. After standing, only main effects of foot and hand
position were found. The results imply that at each phase subjects might use their
limbs differently to address the task according to external demands (foot or hand
position) and internal ability (balance and muscle strength). Despite the fact subjects
spent most of their time on the ascending phase, the stabilization phase was the main
determinant of the total time expenditure and where no interaction between foot and
hand positions and total time of SitTS task was observed.

doi:10.6342/NTU201703518
95
In past studies, the mean duration of sit to stand was 4.32 s for stroke fallers,
between 2.31 and 3.89 s for stroke non-fallers, and between 1.88 and 2.42 s for
healthy subjects [14,16,18]. In this study, durations ranged from 2.57 to 3.36 s, similar
to previous studies. Hence, we believe no postural configurations examined in this
study led to an increased SitTS duration in stroke patients, and that these postural
configurations were commonly used in daily life.
4.5.2 The effect of foot position on the asymmetry of weight bearing
The symmetry of weight bearing at seat-off during SitTS has been extensively
studied, as this event is a transition point at which the balance parameters change
from a stable three-point base of support to a relatively unstable two-point base of
support. Roy found asymmetry index values at seat-off range from 11.1 (20.2) to 25.6
(12.7) for four foot positions among stroke patients (spontaneous, symmetrical, and
the 2 asymmetrical foot positions) [16]. By comparison, the average asymmetry index
for SitTS at seat-off is 1.017 (0.979–1.054) among healthy subjects [19], and ranged
from 12.8 (Fab) to 21.4 (Faf) in our study. This was much higher than in normal
subjects even though subjects exhibited relatively high functional performance as
measured by FIM.

doi:10.6342/NTU201703518
96
In terms of the effect of foot position on the asymmetry index, our results were
consistent with previous studies in demonstrating the asymmetrical foot position with
Fab facilitated more leg load on the affected leg and subsequently resulted in reduced
asymmetry index during SitTS tasks [20,21]. The backward foot functioned as a main
pivot at the initial phase. To rise up, the affected lower limb must generate sufficient
joint moment from the ankle, knee, and hip joints. Thus, adopting this foot position
may improve symmetrical leg loading and avoid non-use of the affected leg.
4.5.3 The effect of hand position on the asymmetry of weight bearing
In this study, the position of the hand was found to play an important role in
adjusting motor control before the standing event, even when feet were placed
asymmetrically. When feet were placed asymmetrically (Fab or Faf), the hands-
clasped (Hc) position led to a shorter duration than other hand positions during
preparation and ascending phases, but led to increased duration of the stabilization
phase, which is the major determinant of the overall duration of the SitTS task. The
increase time needed to stabilize the body might result from a lack of hand movement
after standing. It may therefore be inferred that the overall duration of SitTS may be
shortened when subjects stand up from the chair with hands clasped and then release
their hands for further balance control with an asymmetrical foot position. Regarding

doi:10.6342/NTU201703518
97
the effect of hand position on the asymmetry index, the hands clasped position let to
decreased asymmetry at the onset and seat-off events regardless of foot position.
When subjects reach forward in the hands clasped position, the basic kinematics of
forward reach includes forward trunk flexion and hip flexion to bring the center of
mass (COM) forward. Furthermore, the retraction of scapula and associated reactions
in arm is prevented during SitTS with hands held forward. In simulated studies of the
whole-body forward reach task, COM has been shown to be the primary stabilizing
reference for posture and movement coordination [22, 23]. Forward trunk inclination
has been shown in hemiparetic patients to improve stability at seat-off and during the
standing process [18]. As the head-arm-trunk (HAT) segment represents about 70% of
the body mass, a change in trunk position leads to altered weight bearing during the
SitTS task. Their results may indicate the hands clasped position influences COM and
lead to symmetrical alignment of the upper body before standing and during the
ascending phase [21]. Thus, the effect of hand position appears to act as the initiating
events of a kinematic chain-reaction. Correct hand placement before standing up from
the chair usually results in a shorter duration of SitTS and greater symmetry of weight
bearing. Torso-limb coupling is a complex neural circuit pathway [24–26], and a
fundamental concept, often used in clinical practice to train hemiparetic patients.

doi:10.6342/NTU201703518
98
Torso-limb coupling also enhances activity through alignment of limbs and body
segments.
4.5.4 The effect of foot and hand positions on leg load discrepancy
This whole section is unclear and disorganized. There are some good points but
none are fully developed or linked to results. Although the asymmetry index has been
studied for various events (such as seat-off), this may not have been sufficient in
representing the actual muscle activity after each event. Throughout the SitTS task,
the Fab position led the lowest degree of leg load discrepancy.
The stroke patients in this study, with mild functional impairment, compensate for
increased difficulty in rising from a chair by attempting to increase body momentum.
While increasing their momentum, they also need to maintain postural stability. Thus,
the subjects in this study were likely presented with two conflicting situations: the
biomechanical result of projecting the COM onto the posterior foot (affected lower
extremity); and the natural tendency to put more weight on the unaffected side. The
large leg load discrepancy observed asymmetrical foot placement is most likely a
compromise in this difficult situation. The findings in this study, regarding reduced
weight-bearing asymmetry, are consistent in terms of leg load discrepancy.

doi:10.6342/NTU201703518
99
Limitations
First, due to the high demands of this study in terms of participant effort and time,
only 21 subjects with relatively high functional performance completed all trials.
Though study subjects had only mild impairments, significant differences were
observed among postural configurations in this study. It could be inferred that
asymmetry of weight bearing may be even more marked in subjects with moderate
and severe functional impairments. Second, the kinematic data of the upper
extremities and trunk are not included in this study. Understanding the interaction of
the limbs and trunk and changes in COM would be helpful in determining strategies
used by, in, hemiparetic patients performing the SitTS task. Further studies utilizing
full body markers and electromyographic recordings during SitTS are required to
elucidate the neural control of interactions between the trunk and limbs.
Conclusions
The FabHc position leads to shorter movement durations before rising up and
increased leg load symmetry during SitTS. Using the FabHc position for rising up and
releasing clasped hands for more stability after standing is a useful strategy for stroke
patients performing the SitTS task. Using this strategy, to train stroke patients

doi:10.6342/NTU201703518
100
according to the purpose of training, clinicians can provide more effective therapeutic
interventions for specific underlying impairments.

doi:10.6342/NTU201703518
101
References
[1] Ramnemark A, Nilsson M, Borssén B, Gustafson Y. Stroke, a Major and
Increasing Risk Factor for Femoral Neck Fracture. Stroke. 2000 Jul
1;31(7):1572–7.
[2] Hyndman D, Ashburn A, Stack E. Fall events among people with stroke living in
the community: Circumstances of falls and characteristics of fallers. Arch Phys
Med Rehabil. 2002 Feb;83(2):165–70.
[3] Forster A, Young J. Incidence and consequences of falls due to stroke: a
systematic inquiry. BMJ. 1995 Jul 8;311(6997):83–6.
[4] Ugur C, Gücüyener D, Uzuner N, Ö zkan S, Ö zdemir G. Characteristics of falling
in patients with stroke. J Neurol Neurosurg Psychiatry. 2000 Nov 1;69(5):649–
51.
[5] Sze K, Wong E, Leung HY, Woo J. Falls among chinese stroke patients during
rehabilitation. Arch Phys Med Rehabil. 2001 Sep;82(9):1219–25.
[6] Teasell R, McRae M, Foley N, Bhardwaj A. The incidence and consequences of
falls in stroke patients during inpatient rehabilitation: Factors associated with
high risk. Arch Phys Med Rehabil. 2002 Mar;83(3):329–33.
[7] Lamb SE, Ferrucci L, Volapto S, Fried LP, Guralnik JM. Risk Factors for Falling
in Home-Dwelling Older Women With Stroke The Women’s Health and Aging
Study. Stroke. 2003 Feb 1;34(2):494–501.
[8] Moreland JD, Richardson JA, Goldsmith CH, Clase CM. Muscle Weakness and
Falls in Older Adults: A Systematic Review and Meta-Analysis. J Am Geriatr
Soc. 2004 Jul 1;52(7):1121–9.
[9] Wei TS, Hu CH, Wang SH, Hwang KL. Fall characterictics, functional mobility
and bone mineral density as risk factors of hip fracture in the community-
dwelling ambulatory elderly. Osteoporos Int. 2001;12(12):1050–5.
[10] Yamada T, Demura S. Relationships between ground reaction force parameters
during a sit-to-stand movement and physical activity and falling risk of the
elderly and a comparison of the movement characteristics between the young and
the elderly. Arch Gerontol Geriatr. 2009 Jan;48(1):73–7.
[11] Engardt M, Olsson E. Body weight-bearing while rising and sitting down in
patients with stroke. Scand J Rehabil Med. 1992;24(2):67–74.
[12] Hesse S, Schauer M, Jahnke MT. Standing-up in healthy subjects: symmetry of
weight distribution and lateral displacement of the centre of mass as related to
limb dominance. Gait Posture. 1996 Oct;4(4):287–92.
[13] Malouin F, Richards CL, Doyon J, Desrosiers J, Belleville S. Training Mobility
Tasks after Stroke with Combined Mental and Physical Practice: A Feasibility
Study. Neurorehabil Neural Repair. 2004 Jun 1;18(2):66–75.

doi:10.6342/NTU201703518
102
[14] Cheng PT, Liaw MY, Wong MK, Tang FT, Lee MY, Lin PS. The sit-to-stand
movement in stroke patients and its correlation with falling. Arch Phys Med
Rehabil. 1998 Sep;79(9):1043–6.
[15] Janssen WG, Bussmann HB, Stam HJ. Determinants of the Sit-to-Stand
Movement: A Review. Phys Ther. 2002 Sep 1;82(9):866–79.
[16] Roy G, Nadeau S, Gravel D, Malouin F, McFadyen BJ, Piotte F. The effect of
foot position and chair height on the asymmetry of vertical forces during sit-to-
stand and stand-to-sit tasks in individuals with hemiparesis. Clin Biomech. 2006
Jul;21(6):585–93.
[17] Chen HB, Wei TS, Chang LW. Postural influence on Stand-to-Sit leg load sharing
strategies and sitting impact forces in stroke patients. Gait Posture.
2010;32(4):576–80.
[18] Galli M, Cimolin V, Crivellini M, Campanini I. Quantitative analysis of sit to
stand movement: Experimental set-up definition and application to healthy and
hemiplegic adults. Gait Posture. 2008 Jul;28(1):80–5.
[19] Burnett DR, Campbell-Kyureghyan NH, Cerrito PB, Quesada PM. Symmetry of
ground reaction forces and muscle activity in asymptomatic subjects during
walking, sit-to-stand, and stand-to-sit tasks. J Electromyogr Kinesiol. 2011
Aug;21(4):610–5.
[20] Brunt D, Greenberg B, Wankadia S, Trimble MA, Shechtman O. The effect of
foot placement on sit to stand in healthy young subjects and patients with
hemiplegia. Arch Phys Med Rehabil. 2002 Jul;83(7):924–9.
[21] Duclos C, Nadeau S, Lecours J. Lateral Trunk Displacement and Stability During
Sit-to-Stand Transfer in Relation to Foot Placement in Patients With Hemiparesis.
Neurorehabil Neural Repair. 2008 Nov 1;22(6):715–22.
[22] Stapley PJ, Pozzo T, Cheron G, Grishin A. Does the coordination between
posture and movement during human whole-body reaching ensure center of mass
stabilization? Exp Brain Res. 1999;129(1):134–46.
[23] Carr JH. Balancing the centre of body mass during standing up. Physiother
Theory Pract. 1992;8(3):159–64.
[24] Marigold DS, Misiaszek JE. Whole-Body Responses: Neural Control and
Implications for Rehabilitation and Fall Prevention. The Neuroscientist. 2009 Feb
1;15(1):36–46.
[25] Reisman DS, Scholz JP, Schöner G. Coordination underlying the control of whole
body momentum during sit-to-stand. Gait Posture. 2002 Feb;15(1):45–55.
[26] Tseng Y, Scholz JP, Galloway JC. The organization of intralimb and interlimb
synergies in response to different joint dynamics. Exp Brain Res. 2009 Feb
1;193(2):239–54.

doi:10.6342/NTU201703518
103
Suppliers
a. Optotrak Certus, Northern Digital Inc, Waterloo, Ontario, Canada
b. AMTI, Advanced Mechanical Technology, Inc., Watertown, MA, USA

doi:10.6342/NTU201703518
104
Multidisciplinary interventions for fall prevention
related to the stroke
We had presented the research results that the previous stroke was one of risk
factor of fall and fall related injury (OR=2.9, 95% CI. 1.6~6.3).[1] A high sensitivity
and specificity multivariate regression model was built to predict risks of fall for
community-dwelling stroke patients, and asymmetrical gait pattern [adjusted odds
ratio, aOR = 2.2, 95% CI (1.2–3.8)], spasticity of gastrocnemius [aOR = 3.2 (1.4–
7.3)], and depression [aOR = 1.4 (1.2–1.8)]; the accuracy of model is 0.856; Model
two: low score of functional independent measure [aOR = 0.9 (0.9–1.0)],
asymmetrical gait pattern [aOR = 3.6 (1.4–9.2)] and postural sway in mediolateral
direction [aOR = 1.7 (1.0–2.7)] were identified as independent risk factors.
Furthermore, the leg and hand strategies during the sit-to-stand and stand-to-sit task,
which is related to fall risk during the transfer, were investigated. All these
information were useful for making strategies of multidisciplinary interventions for
fall prevention related to the stroke. Recently, the ways of intervention for stroke
patients is changing toward a biopsychosocial care model, instead of traditional
biological model which only focused on physical condition. The International
Classification of Functioning, Disability and Health (ICF) model is based on the
interactions of body functions, body structures, activities and participation, the

doi:10.6342/NTU201703518
105
environment, and personal factors. This model can be used to gather information from
biological, psychological, and social perspectives. Therefore, the ICF model is an
appropriate model for comprehensive fall prevention to organize fall-related risk
factors in stroke patients.
Fall prevention and management related to the stroke
Among the interventions studied in our publications and conference papers, a
multifactorial falls risk assessment and management were list below in Table 5-1. It
includes that exercise program (Yuanji-dance), physical therapy (electrical
acupuncture), and Botulinum Toxin Type-A for spasticity reduction. Although
multifactorial fall prevention interventions might be effective for individual patients.
However, for community programs for stroke populations still have risks, targeted
single intervention is as effective as multifactorial interventions in the beginning of
intervention, may be more acceptable and cost effective.
Table 5-1 Publications and conferences related to fall prevention for the stroke.
Items Publications and Conferences Method
Spasticity reduction
1. Early Injection of Botulinum Toxin
Type-A and Electrical Stimulation
Improve Upper Extremity Motor
Botulinum
Toxin Type-A

doi:10.6342/NTU201703518
106
Function in Stroke Patients(2016
ISPRM)
2. Effect of Electro-acupuncture on
Decreasing Spasticity of Lower Limbs in
Stroke Patients. Journal of Chinese
Medical Association of Acupuncture,
2004
Electrical
accupuncture
Improvement of
Balance & Gait
(Asymmetric-al gait)
1. Application of Electroacupuncture for
Improving Gait Performance of Stroke
Patient. Journal of Rehabilitation
Medicine Association, 1992
2. The Immediate Effect of Electro-
acupuncture on Gait in Stroke Patients
with Spastic Hemiplegia. Journal of
Chinese Medical Association of
Acupuncture, 2011
3. The effect of Chinese Yuanji-dance on
Dynamic Balance and the Associated
Attentional Demands in Elderly Adults. J
Sport Sci Med, 2010
Electrical
acupuncture
Yuanji-dance
Depression
1. The Influence of Nasogastric Tube to
Post-Stroke Depressive Tendency and
Functional Outcome. Journal of
Rehabilitation Medicine Association,
2006
Nasogastric
Tube
Biopsychosocial
assessment &
intervention
1. Delphi-Based Assessment of Fall-
Related Risk Factors in Acute
Rehabilitation Settings According to the
ICF. Archives of Physical Medicine and
Rehabilitation,2014
2. Geriatric health promotion Ch 9: Fall
prevention in the elderly. Farseeing
publisher, 2012
ICF model
(Core set)
Comprehensive
management

doi:10.6342/NTU201703518
107
Treatments of spasticity improves gait asymmetry
Spasticity is an upper motor neuron syndrome. It may cause a variety of symptoms
that interfere with function. Interventions effects of spasticity management in stroke
patients are affected by the length of onset, severity, and distribution of the spasticity;
the locations of injury; the presence and severity of co-morbidities; the family support;
and the goals of treatment (Figure 5-1). In stroke patients, inadequate motor unit
recruitment and co-contraction attributable to impaired antagonist inhibition play in the
movement disorder of the hemiplegic limbs. Electromyographic data could record
muscle activities from agonist and antagonist muscles while subjects attempted to do
specified tasks. Inadequate recruitment of agonists, not increased activity in the
antagonists, was often seen in patients who were unable to carry out the movement
tasks. A case study with co-activation of leg muscles in a patient with stroke was shown
in Figure 5-2.
Abnormal muscle tone reduction is indicated if spasticity interferes with some level
of function, positioning, care, or comfort. Treatment goals should be well defined before
treatment. Botulinum toxin may be used to treat focal spasticity as part of an overall
treatment plan [4] and early intervention is suggested [5].

doi:10.6342/NTU201703518
108
Accurate injection is a fundamental prerequisite for the effective and safe treatment
of focal spasticity with botulinum toxin type A (Figure 5-3), and the excellent outcome
after botulinum toxin injection was shown in Figure 5-4.
Figure 5-1 Management of spasticity algorithm.

doi:10.6342/NTU201703518
109
Figure 5-2 Muscle co-contraction pattern on upper and lower limbs.
Agonist-antagonist muscle co-contraction in a 70-year-old Right Hemiplegic patient.
Left: raw EMG signal at lower legs.
Right: RMS of EMG signal.
(A)L anterior tibialis (B)L gastrocnemius
(C)R anterior tibialis (D)R gastrocnemius
0
0.5
1
1.5
2
2.5
0 10 20 30 40 50 60 70 80 90
Gait cycle (%)
[uV]
0
0.5
1
1.5
2
2.5
0 10 20 30 40 50 60 70 80 90
Gait cycle (%)
[uV]
0
0.5
1
1.5
2
2.5
0 10 20 30 40 50 60 70 80 90
Gait cycle (%)
[uV]
0
0.5
1
1.5
2
2.5
0 10 20 30 40 50 60 70 80 90
步態週期百分比
[uV]

doi:10.6342/NTU201703518
110
Figure 5-3 Ultrasound guided Botox injection for spasticity reduction.
Figure 5-4 Improvement of equino-varus foot and claw toes after Botox injection.

doi:10.6342/NTU201703518
111
ICF model for fall prevention
In the past, specialists approach fall-related risk assessment and the development
of prevention strategies from their own experience. Currently, the International
Classification of Functioning, Disability and Health (ICF) provides a model that
systematically organizes fall related risk factors into a comprehensive framework to
elucidate the multiple domains of items linked to risk and their interrelations provides
a holistic framework for describing and classifying diseases and health conditions.[2]
The ICF model is based on the interactions of body functions, body structures,
activities and participation, the environment, and personal factors. It can be used to
gather information from biological, psychological, and social perspectives. [2]
Therefore, the ICF model is an appropriate model for comprehensively organizing
fall-related risk factors. The advantage of an ICF core set of fall-related risk factors is
that multiple fall-related risk factors can be systematically organized based on the ICF
framework. A total of 88 fall-related risk factors were identified from relevant articles
published between March 1987 and July 2012 were identified from the MEDLINE,
PubMed, and SCOPUS databases. Among them, 86 were derived from the systematic
literature review and 2 were derived from expert opinion, namely, brain structure
defects and ankle spasticity (Appendix 1). This model focused on interactions

doi:10.6342/NTU201703518
112
between falls and functioning, personal attributes, and environmental influences
(Figure 5-5). Table 5-2 showed that the ICF core set for falls by Delphi round in acute
rehabilitation settings. A total of 34 categories achieved threshold values of
importance after the third round: 18 categories in body functions (53%), 2 categories
in body structures (6%), 8 categories in activities and participation (23%), and 4
categories in environmental factors (12%). Two categories in personal factors (6%)
were also identified. For the stroke patients, an example for evaluation of a Stroke
patient by ICF healthcare model was shown in Table 5-3.
Figure 5-5 ICF core set of risk factors for falls in acute rehabilitation settings.

doi:10.6342/NTU201703518
113
Table 5-2 ICF categories included in the ICF core set for falls in acute rehabilitation
settings.
ICF Code ICF Category Title Round1 Round2 Round3
Body functions
b110 Consciousness functions 4.7±0.4 4.9±0.2 4.9±0.2
b114 Orientation functions 4.2±0.9 4.2±0.9 4.4±0.6
b140 Attention functions 4.2±1.2 4.1±0.9 4.2±0.7
b1565 Visuospatial perception 4.6±0.6 4.8±0.4 4.8±0.4
b210 Seeing functions 4.6±0.6 4.6±0.5 4.7±0.4
b235 Vestibular functions 4.8±0.3 4.8±0.4 4.8±0.3
b240 Sensations associated with hearing and
vestibular function 4.5±0.6 4.8±0.4 4.9±0.3
b2402 Sensation of falling 4.4±0.8 4.7±0.4 4.8±0.4
b260 Proprioceptive function 4.2±1.0 4.3±0.7 4.2±0.6
b420 Blood pressure functions 4.2±1.0 4.3±0.7 4.3±0.5
b4201 Decreased blood pressure 4.5±0.8 4.7±0.5 4.7±0.4
b730 Muscle power functions 4.8±0.3 5.0±0.0 5.0±0.0
b735 Muscle tone functions 4.6±0.5 4.7±0.5 4.8±0.3
b740 Muscle endurance functions 4.4±0.7 4.6±0.5 4.7±0.4
b755 Involuntary movement reaction functions 4.5±0.6 4.5±0.7 4.6±0.6
b760 Control of voluntary movement functions 4.6±0.5 4.8±0.4 4.8±0.3
b765 Involuntary movement functions 4.1±0.9 4.2±0.7 4.1±0.4
b770 Gait pattern functions 4.8±0.3 4.9±0.2 4.9±0.2
Body structures
s750 Structure of lower extremity 4.5±0.6 4.6±0.5 4.7±0.4
s770 Additional musculoskeletal structures
related to movement 4.1±0.9 4.0±0.7 4.0±0.7
Activities and participation
d410 Changing basic body position 4.4±0.7 4.5±0.6 4.6±0.6
d415 Maintaining a body position 4.3±0.8 4.2±0.5 4.2±0.4
d420 Transferring oneself 4.4±0.6 4.5±0.5 4.5±0.5
d450 Walking 4.7±0.9 4.9±0.3 4.9±0.3
d455 Moving around 4.0±1.2 4.1±0.8 4.1±0.7

doi:10.6342/NTU201703518
114
d460 Moving around in different locations 4.3±1.0 4.4±0.6 4.3±0.6
d465 Moving around using equipment 4.0±1.0 3.9±0.7* 4.0±0.7
d530 Toileting 4.2±1.1 4.2±0.6 4.2±0.6
Environmental
factors
e1101 Drugs 3.9±1.1 4.1±0.7 4.0±0.6
e120
Products and technology for personal
indoor and outdoor mobility and
transportation
4.1±1.1 4.1±0.7 4.1±0.4
e150
Design, construction, building products,
and technology of buildings for public
use
4.4±0.8 4.4±0.6 4.4±0.5
e240 Light 4±1.0 4.0±0.9 4.0±0.7
Personal factors
Age 4.7±0.5 4.8±0.5 4.8±0.3
Previous falls 4.9±0.2 4.9±0.2 4.9±0.2
NOTE. Values shown are the group’s (20 experts) mean scores ±SD from a 5-point
Likert scale.
* Categories with a mean score <4 in each round.
* The ICD codes with gray mark are consistent with the our findings in chapter 1

doi:10.6342/NTU201703518
115
Table 5-3 Evaluation of a stroke patient by ICF model.
Name:
Mr. Chuang
Age: 80
Medical diagnosis:
Ischemic stroke (I 63)
with left hemiplegia
and aphasia
Primary goal of rehabilitation:
Enhance independence of daily activity
(FIM reach 80)
Prevent fall, reduce shoulder pain
(VAS=2)
Inside walking with cane
Pati
ent'
s p
ersp
ecti
ve
L’t hemiplegia
Marked L’t shoulder pain after
assisted flexion (VAS=5)
Sitting independently
Standing for more than 10 minutes
under minimal assistance
Slow walking with assistance of quad-
cane for 10 meters
Favor to take a walk in the park, but
refuse it after stroke event
Disability for engaging the farmer’s
work
Poor expression which lead to
communication disturbance
Body structures/ Functions Activities/ Participation
Hea
lth
pro
fess
ion
al'
s p
ersp
ecti
ve
L't shoulder ROM limited, (ER-60°,
Abducted-160°)
Loss of muscle strength (MMT: 1-2)
Increased muscle tone (MAS:1-2)
Poor coordination
Abnormal gait pattern (drop foot in
swing phase)
Moderate assisted in ADLs (FIM=68)
Transfer from wheelchair to bed
(moderate support)
No active arm movement
Movement around using wheelchair
need others assisted
Contextual
factors:
Environmental: Lives in a second floor flat, no elevator; good
family support; had cane, wheelchair and AFO's, no other
assistive products
Personal: a farmer, depression after stroke, lives with son;
comorbidity- HTN, DM

doi:10.6342/NTU201703518
116
References
[1] T. S. Wei, C. H. Hu, S. H. Wang, and K. L. H. D. Of, “Fall Characterictics,
Functional Mobility and Bone Mineral Density as Risk Factors of Hip Fracture in
the Community-Dwelling Ambulatory Elderly,” Osteoporos. Int., vol. 12, no. 12,
pp. 1050–1055, Dec. 2001.
[2] World Health Organization. International Classification of Functioning, Disability
and Health: ICF. Geneva: World Health Organization Publishing; 2001.
[3] Stucki G, Grimby G. Applying the ICF in medicine. J Rehabil Med 2004;(44
Suppl):5-6.
[4] 1997 John Wiley & Sons, Inc. Spasticity: Etiology, Evaluation, Management, and
the Role of Botulinum Toxin Type A, MF Brin, editor. Muscle Nerve
1997;20(suppl 6):S14-S20.
[5] U. M. Fietzek, P. Kossmehl, L. Schelosky, G. Ebersbach, and J. Wissel, “Early
botulinum toxin treatment for spastic pes equinovarus – a randomized double-
blind placebo-controlled study,” Eur J Neurol, vol. 21, no. 8, pp. 1089–1095,
Aug. 2014.

doi:10.6342/NTU201703518
117
Publications
Published Paper
[1] Shih-Wei Huang, Ta-Wei Kuo, Jaung-Geng Lin, Ta-Sen Wei, “The Immediate
Effect of Electro-acupuncture on Gait in Stroke Patients with Spastic
Hemiplegia.”, Journal of Chinese Medical Association of Acupuncture, vol. 14,
no. 1, pp. 3–14, 2011.
[2] Ta-Sen Wei, Baii-Jia Yang. ”Application of Electro-acupuncture for Improving
Gait Performance of Stroke Patient,” Taiwan Journal of Physical Medicine and
Rehabilitation, no. 20, pp. P61-67, 01 1992.
[3] Ta-Sen Wei.” Screening and Evaluation of Elderly Patients Who Fall,” Taiwan
Geriatrics Gerontology, vol. 3, no. 2, pp. 91–105, 2008.
[4] Ta-Sen Wei, Peng-Ta Liu, Chen-Chen Liu, Yu-Shiuan Ding. ”The Correlation of
Fall Characteristics and Hip Fracture in Community-dwelling Stroke Patients,”
Taiwan Geriatrics Gerontology, vol. 3, no. 2, pp. 130–40, 2008.
[5] Ta-Sen Wei, Sen-Yung Liu, Po-Wen Chiant. ” Effect of Electro-Acupuncture on
Decreasing Spasticity of Lower Limbs in Stroke Patients,” Journal of Chinese
Medical Association of Acupuncture, no. 7, pp. P33-42, Dec. 2004.
[6] Nai-Chiung Huang, Ta-Sen Wei, Sen-Yung Liu,” The Influence of Nasogastric
Tube to Post-Stroke Depressive Tendency and Functional Outcome,” Taiwan
Journal of Physical Medicine and Rehabilitation, vol. 34, no. 1, pp. 19–26, 2006.
[7] Sen-Yung Liu, Ching-Liang Hsieh, Ta-Sen Wei, Peng-Ta Liu, Yu-Jun Chang, and
Tsai-Chung Li, “Acupuncture stimulation improves balance function in stroke
patients: a single-blinded controlled, randomized study,” The American journal of
Chinese medicine, vol. 37, no. 03, pp. 483–494, 2009.
[10] Ta-Sen Wei, Chiu-Jung Huang, Shen-Kai Chen, Lan-Yuen Guo, and Wen-Lan
Wu, “Effects of Age on Attentional Demands and Postural Control of Obstacle
Crossing: Evidence from a Dual-task Approach,” Journal of Medical and
Biological Engineering, vol. 32, no. 1, pp. 36–41, 2012.
[11] Ta-Sen Wei, Chong-Hing Hu, Shu-Hui Wang, and Kai-Lin Hwang, “Fall
characteristics, functional mobility and bone mineral density as risk factors of hip
fracture in the community-dwelling ambulatory elderly,” Osteoporos Int, vol. 12,
no. 12, pp. 1050–1055, Dec. 2001.
[13] Ta-Sen Wei, Peng-Ta Liu, Liang-Wey Chang, and Sen-Yung Liu, “Gait
asymmetry, ankle spasticity, and depression as independent predictors of falls in
ambulatory stroke patients,” PLOS One, vol. 23;12(5), May 2017.
[14] Peng-Ta Liu, Chong-Min Chiu, Ta-Sen Wei, Tso-Chun Lai, “Impact of Holistic
Care with Tai Chi Exercise on Depressed Patients with Spinocerebellar

doi:10.6342/NTU201703518
118
Degeneration Disease -- Pilot Study,” The Changhua Journal of Medicine, no. 14,
pp. 179–186, 2016.
[16] Hung-Bin Chen, Ta-Sen Wei, and Liang-Wey Chang, “Postural influence on
Stand-to-Sit leg load sharing strategies and sitting impact forces in stroke
patients,” Gait & Posture, vol. 32, pp. 576–580, 2010.
[18] Wen-Lan Wu, Ta-Sen Wei, Shen-Kai Chen, Jyh-Jong Chang, Lan-Yuen Guo, and
Hwai-Ting Lin, “The effect of Chinese Yuanji-dance on dynamic balance and the
associated attentional demands in elderly adults,” J Sport Sci Med, vol. 9, pp.
119–126, 2010.

doi:10.6342/NTU201703518
119
Conference Presentation:
[1] Ta-Sen Wei, “A Clinical Approach to Managing Post-stroke Spasticity and the
Role of Botulinum Toxin: A Rehabilitation Physician’s Perspective.,” in The 2nd
Asia Pacific Conference against Stroke (APCAS), Chiang Mai, Thailand, 2005,
pp. 12–14.
[2] Ta-Sen Wei, Jong-Jer Lin, and Peng-Ta Liu, “An Integrated Transdisciplinary
Approach Decreases Fall Incidence and Related Injuries in Hospitalized
Patients.,” in 7th World Congress of the international society of Physical and
Rehabilitation Medicine (ISPRM)-ePost, Beijing, China, 2013.
[3] Ta-Sen Wei, “Clinical Practice for Fall Prevention in Hospitalized Stroke
Patients.,” in 3rd Korean Society for Neuro Rehabilitation, Korean, 2009.
[4] Ta-Sen Wei, Liang-Wey Chang, and Peng-Ta Liu, “Different Postural
Configurations Affect the Asymmetry of Vertical Forces during Sit-to-Stand
Tasks in Stroke Patients,” in 7th World Congress of the international society of
Physical and Rehabilitation Medicine (ISPRM), 2013.
[5] Ta-Sen Wei, “Early vs. Late Treatment with Botulinum Toxin Type A Injection in
Past-stroke Spasticity Patients.,” in the 2nd Taiwan & Hong Kong Spasticity
Expert Forum., 2008.
[6] Ta-Sen Wei and Liang-Wey Chang, “Effects of Sit-Stand-Sit Strategies on
Postural Stability in Stroke Patients.,” in 2nd Asia-Oceanian Conference of
Physical and Rehabilitation Medicine., 2010.
[7] Ta-Sen Wei, Kai-Lan Chuang, and Chung-Che Lin, “Electro-Acupuncture
Improves Shoulder Pain and Range of Motion in Stroke Patients,” in the 9th
World Congress of International Society of Physical and Rehabilitation
Medicine(ISPRM), Berlin, Germany, 2015.
[8] Ta-Sen Wei, “EMG Patterns Induced by Different Angular Velocity in Stroke
Patients with Ankle Spasticity.,” in 2nd Asian Oceania Society of Physical and
Rehabilitation Medicine (AOCPRM), Taipei, Taiwan, 2010.
[9] Hao-Wei Tang and Ta-Sen Wei, “Fall characteristics among different departments
in hospitalized patients,” in 7th World Congress of the international society of
Physical and Rehabilitation Medicine (ISPRM), 2013.
[10] Ta-Sen Wei, “Fall Prevention in the Elderly: a Transdisciplinary Team
Approach,” in 7th World Congress of the international society of Physical and
Rehabilitation Medicine (ISPRM), Beijing, China, 2013.
[11] Ta-Sen Wei, “Falls in elderly stroke patients: risks and prevention.” in Asia-
Oceanian Conference of Physical & Rehabilitation Medicine(AOCPRM),
Nanjing, China, 2008.

doi:10.6342/NTU201703518
120
[12] Ta-Sen Wei, Liang-Wey Chang, and Peng-Ta Liu, “Gait Asymmetry, Ankle
Spasticity and Depression as Independent Predictors of Accidental Falls in Stroke
Elderly,” in 4rd World Congress of the ISPRM, Seoul, Korea, 2007, vol. 10–14,
pp. 39–40.
[13] Ta-Sen Wei, “How to Maximize the Clinical Benefits of Botulinum Toxin Type
A to Treat Spasticity for Asian,” in 4th World Congress of the Neurorehabilitation
(WCNR), Hong Kong, 2006, p. P16.
[14] Ta-Sen Wei, Pi -Yu Sung, and Ping-Ta Liu, “Post Stroke Checklist Identifies
Unmet Needs for Health Care in Post-Acute Stroke Patients,” in Post Stroke
Checklist Identifies Unmet Needs for Health Care in Post-Acute Stroke Patients,
Berlin, Germany, 2015.
[15] Zong-Han Yang and Ta-Sen Wei, “Risk Factors of Falls in Hospitalized Stroke
Patients.,” in 2nd Asia-Oceanian Conference of Physical & Rehabilitation
Medicine(AOCPRM), Taipei, Taiwan, 2010.
[16] Ta-Sen Wei, Shu-Hui Wang, and Bo-Zen Yang, “Rolling Ability as an
Independent Predictor of Rehabilitation Efficiency for Stroke Inpatients.,” in 3rd
World Congress of the ISPRM, Sao Paulo, Brazil, 2005, vol. 10–55, p. 93.
[17] Hao-Wei Tang, Ta-Sen Wei, Yan-Jun Chen, and Zong-Han Yang, “Spasticity
Onset Correlates with Lesion Location, Severity, and Functional Recovery in
First-Ever Stroke Inpatients,” in The 9th World Congress of International Society
of Physical and Rehabilitation Medicine(ISPRM), Berlin, Germany, 2015.
[18] Ping-Ta Liu, Ta-Sen Wei, and Ching-Shan Liu, “TAI CHI Training Improves
Balance Control in Patients with Spinocerebellar Ataxia,” in 2016 The 10th
International Society of Physical and Rehabilitation Medicine(ISPRM), Kuala
Lumpur, Malaysia, 2016.
[19] Peng-Ta Liu, Ta-Sen Wei, and Liang-Wey Chang, “The Effects of Different
Postural Configurations on the Asymmetry of Vertical Forces during Sit-Stand-Sit
Tasks in Stroke Patients,” in 2011 The 6th International Society of Physical and
Rehabilitation Medicine(ISPRM), 2011.
[20] Kuan-Lin Chen, Ta-Sen Wei, Pi -Yu Sung, and Chung-Che Lin, “The Post
Stroke Checklist Merged with Dysphagia Meets Healthcare Needs in Post-Acute
Stroke Patients,” presented at the 2016-The 10th International Society of Physical
and Rehabilitation Medicine(ISPRM), Kuala Lumpur, Malaysia, 2016.

doi:10.6342/NTU201703518
121
Appendix 1 Eighty-eight fall-related parameters and their linked 66 ICF categories
and 5 personal factors.
Fall-Related Parameters Linked ICF Categories
Personal
1. Age Personal factors
2. Sex Personal factors
3. Previous fall Personal factors
4. Level of education Personal factors
5. Marital status (single) Personal factors
Disease
6. Stroke Health condition
7. Parkinson's disease Health condition
8. Dementia Health condition
9. Amputation s750 Structure of lower
extremity
s770 Additional
musculoskeletal structures
related to movement
10. Knee osteoarthritis Health condition
11. Ischemic heart disease Health condition
12. Brain structural defect* s110 Structure of brain
Nutrition and electrolyte
13. Vitamin D b520 Assimilation functions
supplementation b540 General metabolic
functions
14. Electrolyte
abnormalities b545 Water, mineral, and
electrolyte balance functions
Physical
Balance and posture
stability 15. Berg Balance Scale b235 Vestibular functions
16. Tinetti balance scale b755 Involuntary movement
reaction functions
17. Timed Up &Go test b760 Control of voluntary
movement functions
18. Posturography b765 Involuntary movement
functions
d410 Changing basic body
position

doi:10.6342/NTU201703518
122
d415 Maintaining a body
position
Gait stability 19. Functionalambulation
categories b770 Gait pattern functions
20. Use of walking aids d465 Moving around using
equipment
Motor status related to
stroke
21. Grip strength on
affected/unaffected side b730 Muscle power functions
22. Quadriceps strength b735 Muscle tone functions
23. Left side motor deficit b740 Muscle endurance
functions
24. Bilateral motor
impairment d445 Hand and arm use
25. Motricity index
26. Chedoke-McMaster
Stroke Impairment
Inventory-arm, leg, foot
27. Brunnstrom stage
28. Fugl-Meyer Assessment
Scale
29. Modified Ashworth Scale-
ankle spasticity*
30. Aphasia b167 Mental functions of
language
31. Vision impairment b210 Seeing functions
32. Hearing impairment b230 Hearing functions
33. Proprioceptive
impairment b260 Proprioceptive function
34. Perceptual deficit b156 Perceptual functions
35. Urinary incontinence b620 Urination functions
d530 Toileting
36. Foot problem/pain b28015 Pain in lower limb
37. Chronic musculoskeletal
pain b280 Sensation of pain
b840 Sensation related to the
skin
38. Hemineglect Star Cancellation Test b1565 Visuospatial functions
39. Attention b140 Attention functions

doi:10.6342/NTU201703518
123
d160 Focusing attention
Cognition 40. Mini-Mental State
Examination
b164 Higher-level cognitive
functions
41. Abbreviated Mental Test
42. Impulse control b1304 Impulse control
43. Agitation b1263 Psychic stability
44. Confusion/disorientation b110 Consciousness functions
b114 Orientation functions
Fear of falling 45. Falls Efficacy Scale b2402 Sensation of falling
46. Activities-specific
Balance Confidence Scale
47. Depression Geriatric Depression Scale b152 Emotional functions
48. Executive function Stroop test b164 Higher-level cognitive
functions
d155 Acquiring skills
49. Sleep function b134 Sleep functions
50. Postural hypotension b420 Blood pressure functions
b4201 Decreased blood
pressure
51. Dizziness/vertigo
b240 Sensations associated
with hearing and vestibular
function
Stroke disease severity
52. National Institutes of Health Stroke Scale Not definable
53. Scandinavian Stroke
Scale
54. Stroke Impairment Scale
55. Bilateral lesions
Level of functional
independence
Barthel Index 56. Eating/feeding d230 Carrying out daily routine
Katz Index 57. Grooming d420 Transferring oneself
FIM 58. Bathing d450 Walking
59. Dressing upper
body/lower body d455 Moving around
60. Toileting d460 Moving around in
different locations

doi:10.6342/NTU201703518
124
61. Bowel management d469Walkingand moving,
other specified and unspecified
62. Bladder management d520Caringfor bodyparts
63. Transfer d510 Washing oneself
64. Walking d540Dressing
65. Up/down stairs d530Toileting
d550 Eating
d560Drinking
d570Lookingafter one's health
Medications
66. Antidepressant e1101 Drugs
67. Diuretics
68. Sedatives
69. Antihypertensive
medication
70. Anti-Parkinsonism
71. Antiepileptics
72. Neuroleptics
73. Polypharmacy (>4
medications)
Time of falling 74. Daytime e245 Time-related changes
Location of falling 75. Patient’s room Not covered by ICF
76. Bathroom d530 Toileting
Activities when falling 77. Transferring from sit to
stand
e120 Products and technology
of personal indoor and outdoor
78. Wheelchair activity mobility and transportation
79. Walking d420 Transferring oneself
d450 Walking
80. Time after admission to Not definable
rehabilitation facilities
81. Efficiency of
rehabilitation
Gains in Barthel Index after
rehabilitation Not definable
Environmental and home
hazards
82. Improper foot wear
e1150 General products and
technologyfor personal use in
daily
83. Loose rugs living

doi:10.6342/NTU201703518
125
84. Lack of hand rails e120 Products and technology
of personal indoor and outdoor
85. Light mobility and transportation
e150 Design, construction,
building products, and
technology
of buildings for public use
e240 Light
86. Unobserved/living alone e310 Immediate family
e340 Personal care providers
and personal assistants
87. Health
education/nursing staff e355 Health professionals
adequacy
88. Health policy
e515 Architecture and
construction services, systems,
and
policies
e580 Health services, systems,
and policies
* Fall-related parameters derived from expert opinion.