SURAT PERMOHONAN MENJADI RESPONDENrepository.wima.ac.id/3397/7/Lampiran.pdfSURAT PERMOHONAN MENJADI...
61
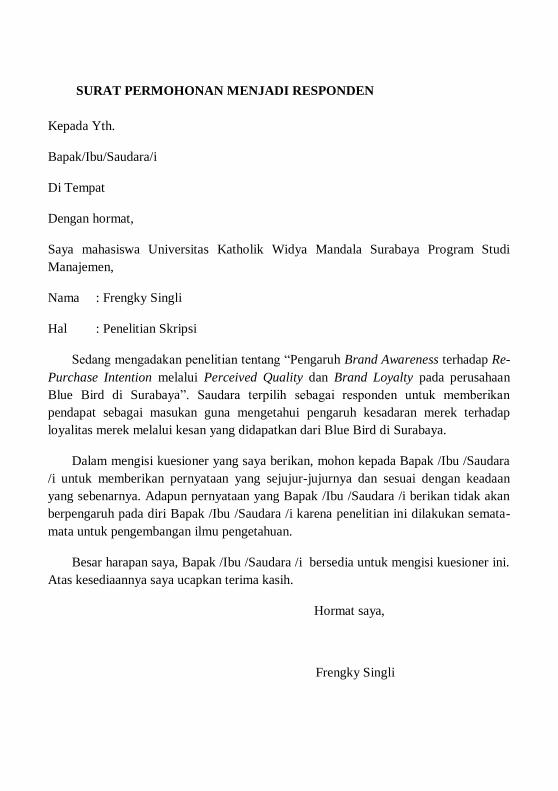
SURAT PERMOHONAN MENJADI RESPONDEN Kepada Yth. Bapak/Ibu/Saudara/i Di Tempat Dengan hormat, Saya mahasiswa Universitas Katholik Widya Mandala Surabaya Program Studi Manajemen, Nama : Frengky Singli Hal : Penelitian Skripsi Sedang mengadakan penelitian tentang “Pengaruh Brand Awareness terhadap Re- Purchase Intention melalui Perceived Quality dan Brand Loyalty pada perusahaan Blue Bird di Surabaya”. Saudara terpilih sebagai responden untuk memberikan pendapat sebagai masukan guna mengetahui pengaruh kesadaran merek terhadap loyalitas merek melalui kesan yang didapatkan dari Blue Bird di Surabaya. Dalam mengisi kuesioner yang saya berikan, mohon kepada Bapak /Ibu /Saudara /i untuk memberikan pernyataan yang sejujur-jujurnya dan sesuai dengan keadaan yang sebenarnya. Adapun pernyataan yang Bapak /Ibu /Saudara /i berikan tidak akan berpengaruh pada diri Bapak /Ibu /Saudara /i karena penelitian ini dilakukan semata- mata untuk pengembangan ilmu pengetahuan. Besar harapan saya, Bapak /Ibu /Saudara /i bersedia untuk mengisi kuesioner ini. Atas kesediaannya saya ucapkan terima kasih. Hormat saya, Frengky Singli
-
Upload
trinhkhanh -
Category
Documents
-
view
265 -
download
0
Transcript of SURAT PERMOHONAN MENJADI RESPONDENrepository.wima.ac.id/3397/7/Lampiran.pdfSURAT PERMOHONAN MENJADI...
SURAT PERMOHONAN MENJADI RESPONDEN
Kepada Yth.
Bapak/Ibu/Saudara/i
Di Tempat
Dengan hormat,
Saya mahasiswa Universitas Katholik Widya Mandala Surabaya Program Studi
Manajemen,
Nama : Frengky Singli
Hal : Penelitian Skripsi
Sedang mengadakan penelitian tentang “Pengaruh Brand Awareness terhadap Re-
Purchase Intention melalui Perceived Quality dan Brand Loyalty pada perusahaan
Blue Bird di Surabaya”. Saudara terpilih sebagai responden untuk memberikan
pendapat sebagai masukan guna mengetahui pengaruh kesadaran merek terhadap
loyalitas merek melalui kesan yang didapatkan dari Blue Bird di Surabaya.
Dalam mengisi kuesioner yang saya berikan, mohon kepada Bapak /Ibu /Saudara
/i untuk memberikan pernyataan yang sejujur-jujurnya dan sesuai dengan keadaan
yang sebenarnya. Adapun pernyataan yang Bapak /Ibu /Saudara /i berikan tidak akan
berpengaruh pada diri Bapak /Ibu /Saudara /i karena penelitian ini dilakukan semata-
mata untuk pengembangan ilmu pengetahuan.
Besar harapan saya, Bapak /Ibu /Saudara /i bersedia untuk mengisi kuesioner ini.
Atas kesediaannya saya ucapkan terima kasih.
Hormat saya,
Frengky Singli
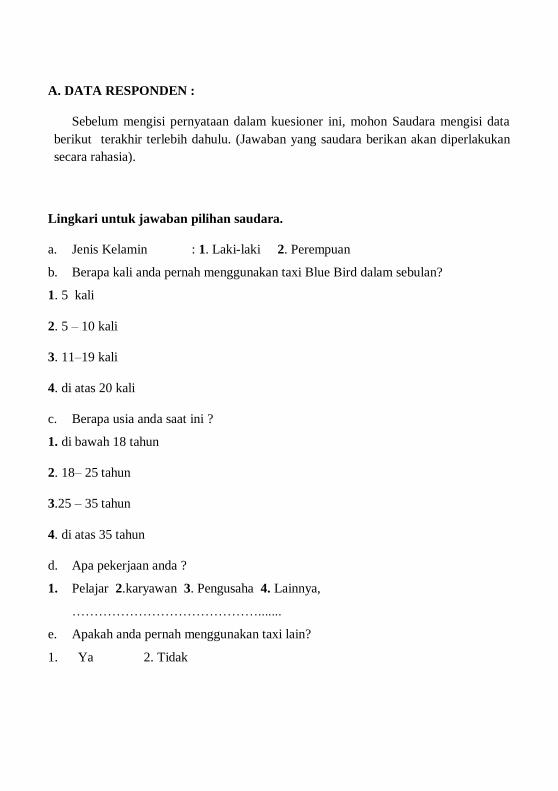
A. DATA RESPONDEN :
Sebelum mengisi pernyataan dalam kuesioner ini, mohon Saudara mengisi data
berikut terakhir terlebih dahulu. (Jawaban yang saudara berikan akan diperlakukan
secara rahasia).
Lingkari untuk jawaban pilihan saudara.
a. Jenis Kelamin : 1. Laki-laki 2. Perempuan
b. Berapa kali anda pernah menggunakan taxi Blue Bird dalam sebulan?
1. 5 kali
2. 5 – 10 kali
3. 11–19 kali
4. di atas 20 kali
c. Berapa usia anda saat ini ?
1. di bawah 18 tahun
2. 18– 25 tahun
3.25 – 35 tahun
4. di atas 35 tahun
d. Apa pekerjaan anda ?
1. Pelajar 2.karyawan 3. Pengusaha 4. Lainnya,
…………………………………….......
e. Apakah anda pernah menggunakan taxi lain?
1. Ya 2. Tidak
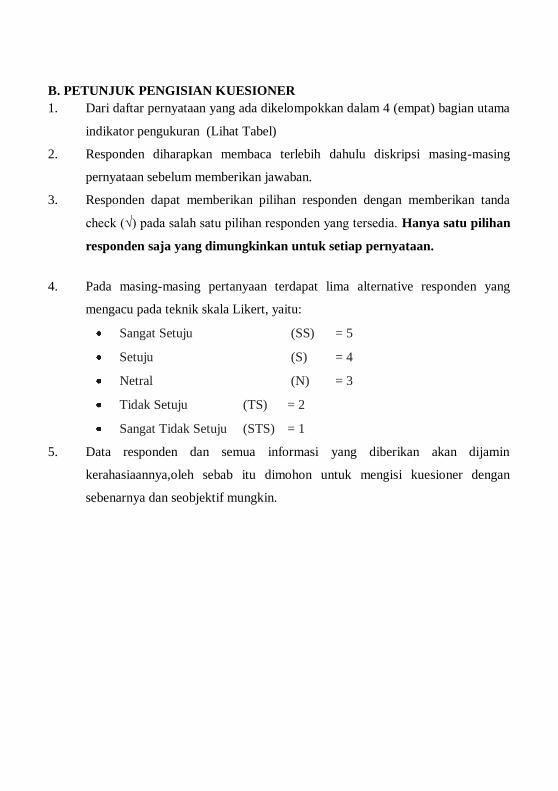
B. PETUNJUK PENGISIAN KUESIONER
1. Dari daftar pernyataan yang ada dikelompokkan dalam 4 (empat) bagian utama
indikator pengukuran (Lihat Tabel)
2. Responden diharapkan membaca terlebih dahulu diskripsi masing-masing
pernyataan sebelum memberikan jawaban.
3. Responden dapat memberikan pilihan responden dengan memberikan tanda
check (√) pada salah satu pilihan responden yang tersedia. Hanya satu pilihan
responden saja yang dimungkinkan untuk setiap pernyataan.
4. Pada masing-masing pertanyaan terdapat lima alternative responden yang
mengacu pada teknik skala Likert, yaitu:
Sangat Setuju (SS) = 5
Setuju (S) = 4
Netral (N) = 3
Tidak Setuju (TS) = 2
Sangat Tidak Setuju (STS) = 1
5. Data responden dan semua informasi yang diberikan akan dijamin
kerahasiaannya,oleh sebab itu dimohon untuk mengisi kuesioner dengan
sebenarnya dan seobjektif mungkin.
NO. Pernyataan Alternatif Tanggapan
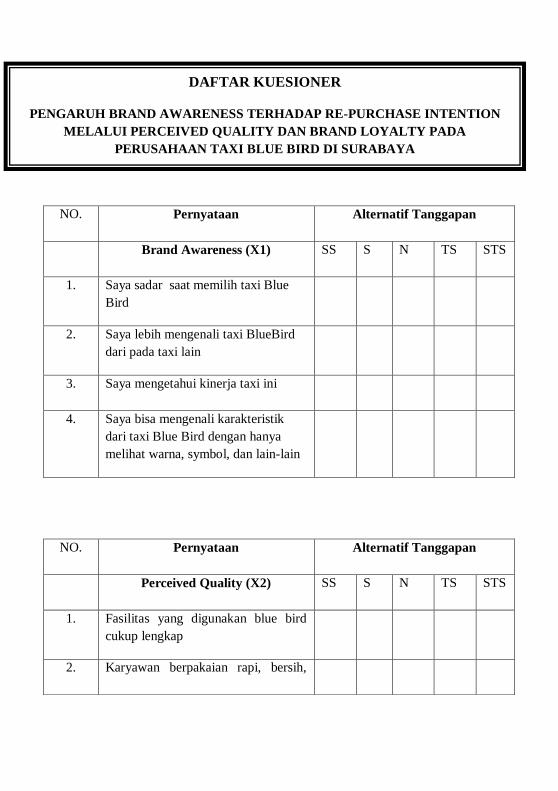
Brand Awareness (X1) SS S N TS STS
1. Saya sadar saat memilih taxi Blue
Bird
2. Saya lebih mengenali taxi BlueBird
dari pada taxi lain
3. Saya mengetahui kinerja taxi ini
4. Saya bisa mengenali karakteristik
dari taxi Blue Bird dengan hanya
melihat warna, symbol, dan lain-lain
NO. Pernyataan Alternatif Tanggapan
Perceived Quality (X2) SS S N TS STS
1. Fasilitas yang digunakan blue bird
cukup lengkap
2. Karyawan berpakaian rapi, bersih,
DAFTAR KUESIONER
PENGARUH BRAND AWARENESS TERHADAP RE-PURCHASE INTENTION
MELALUI PERCEIVED QUALITY DAN BRAND LOYALTY PADA
PERUSAHAAN TAXI BLUE BIRD DI SURABAYA
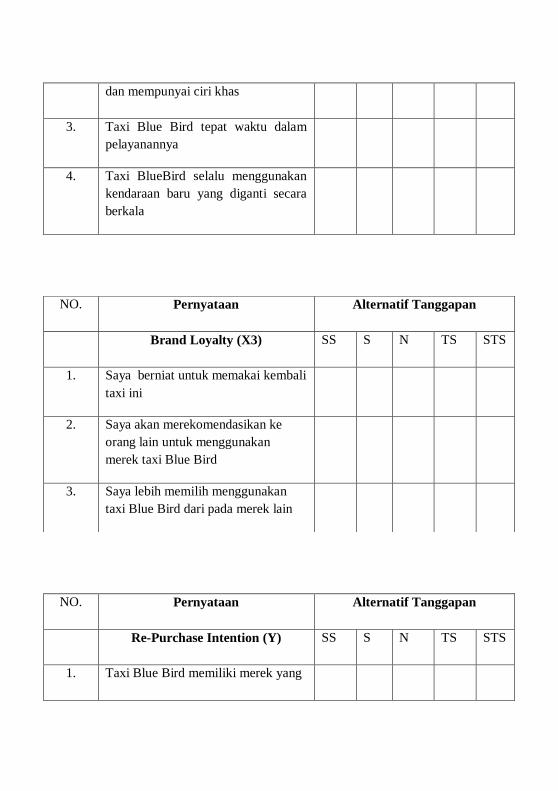
dan mempunyai ciri khas
3. Taxi Blue Bird tepat waktu dalam
pelayanannya
4. Taxi BlueBird selalu menggunakan
kendaraan baru yang diganti secara
berkala
NO. Pernyataan Alternatif Tanggapan
Brand Loyalty (X3) SS S N TS STS
1. Saya berniat untuk memakai kembali
taxi ini
2. Saya akan merekomendasikan ke
orang lain untuk menggunakan
merek taxi Blue Bird
3. Saya lebih memilih menggunakan
taxi Blue Bird dari pada merek lain
NO. Pernyataan Alternatif Tanggapan
Re-Purchase Intention (Y) SS S N TS STS
1. Taxi Blue Bird memiliki merek yang
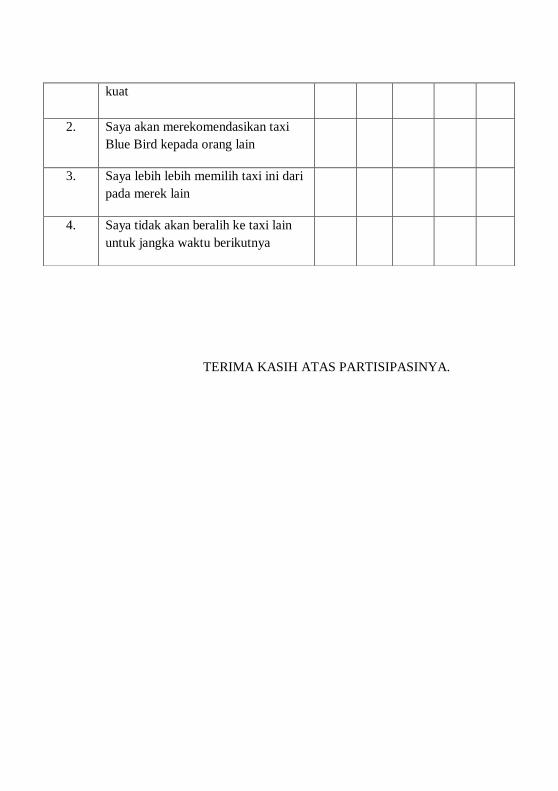
TERIMA KASIH ATAS PARTISIPASINYA.
kuat
2. Saya akan merekomendasikan taxi
Blue Bird kepada orang lain
3. Saya lebih lebih memilih taxi ini dari
pada merek lain
4. Saya tidak akan beralih ke taxi lain
untuk jangka waktu berikutnya
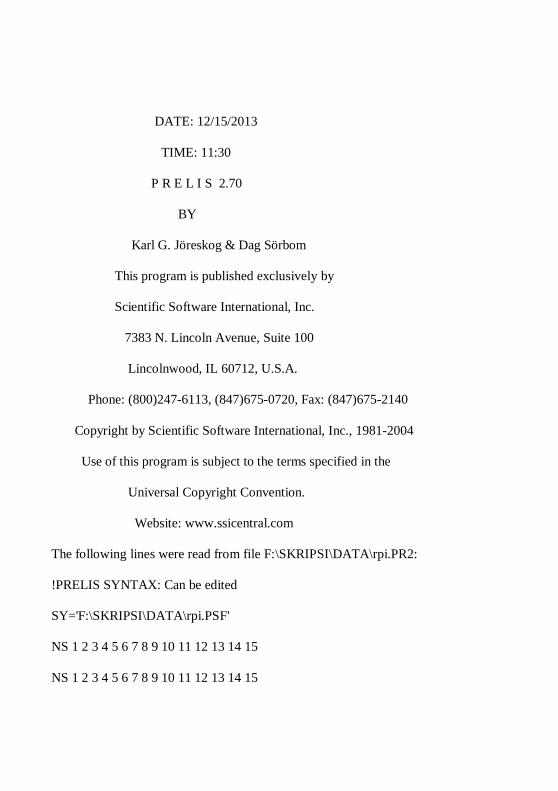
DATE: 12/15/2013
TIME: 11:30
P R E L I S 2.70
BY
Karl G. Jöreskog & Dag Sörbom
This program is published exclusively by
Scientific Software International, Inc.
7383 N. Lincoln Avenue, Suite 100
Lincolnwood, IL 60712, U.S.A.
Phone: (800)247-6113, (847)675-0720, Fax: (847)675-2140
Copyright by Scientific Software International, Inc., 1981-2004
Use of this program is subject to the terms specified in the
Universal Copyright Convention.
Website: www.ssicentral.com
The following lines were read from file F:\SKRIPSI\DATA\rpi.PR2:
!PRELIS SYNTAX: Can be edited
SY='F:\SKRIPSI\DATA\rpi.PSF'
NS 1 2 3 4 5 6 7 8 9 10 11 12 13 14 15
NS 1 2 3 4 5 6 7 8 9 10 11 12 13 14 15
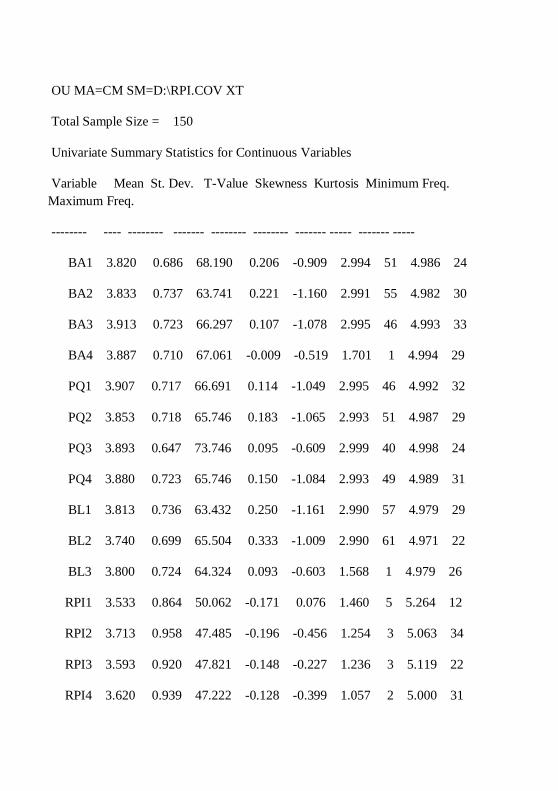
OU MA=CM SM=D:\RPI.COV XT
Total Sample Size = 150
Univariate Summary Statistics for Continuous Variables
Variable Mean St. Dev. T-Value Skewness Kurtosis Minimum Freq.
Maximum Freq.
-------- ---- -------- ------- -------- -------- ------- ----- ------- -----
BA1 3.820 0.686 68.190 0.206 -0.909 2.994 51 4.986 24
BA2 3.833 0.737 63.741 0.221 -1.160 2.991 55 4.982 30
BA3 3.913 0.723 66.297 0.107 -1.078 2.995 46 4.993 33
BA4 3.887 0.710 67.061 -0.009 -0.519 1.701 1 4.994 29
PQ1 3.907 0.717 66.691 0.114 -1.049 2.995 46 4.992 32
PQ2 3.853 0.718 65.746 0.183 -1.065 2.993 51 4.987 29
PQ3 3.893 0.647 73.746 0.095 -0.609 2.999 40 4.998 24
PQ4 3.880 0.723 65.746 0.150 -1.084 2.993 49 4.989 31
BL1 3.813 0.736 63.432 0.250 -1.161 2.990 57 4.979 29
BL2 3.740 0.699 65.504 0.333 -1.009 2.990 61 4.971 22
BL3 3.800 0.724 64.324 0.093 -0.603 1.568 1 4.979 26
RPI1 3.533 0.864 50.062 -0.171 0.076 1.460 5 5.264 12
RPI2 3.713 0.958 47.485 -0.196 -0.456 1.254 3 5.063 34
RPI3 3.593 0.920 47.821 -0.148 -0.227 1.236 3 5.119 22
RPI4 3.620 0.939 47.222 -0.128 -0.399 1.057 2 5.000 31
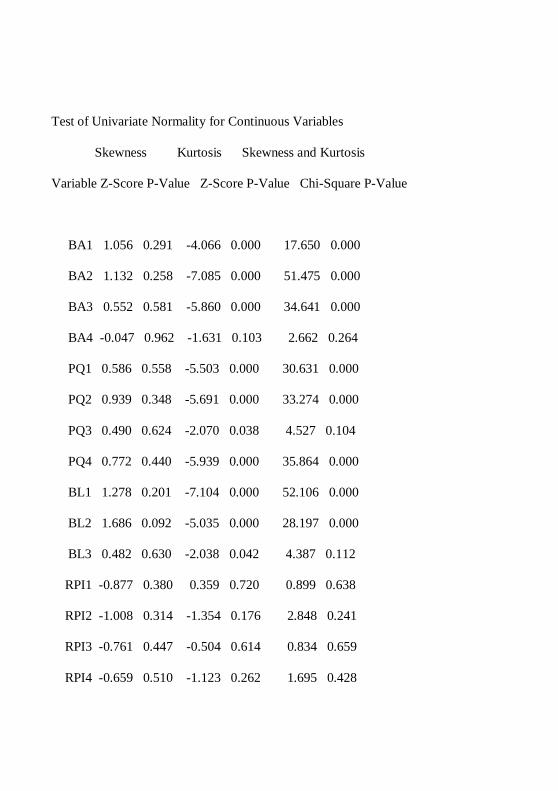
Test of Univariate Normality for Continuous Variables
Skewness Kurtosis Skewness and Kurtosis
Variable Z-Score P-Value Z-Score P-Value Chi-Square P-Value
BA1 1.056 0.291 -4.066 0.000 17.650 0.000
BA2 1.132 0.258 -7.085 0.000 51.475 0.000
BA3 0.552 0.581 -5.860 0.000 34.641 0.000
BA4 -0.047 0.962 -1.631 0.103 2.662 0.264
PQ1 0.586 0.558 -5.503 0.000 30.631 0.000
PQ2 0.939 0.348 -5.691 0.000 33.274 0.000
PQ3 0.490 0.624 -2.070 0.038 4.527 0.104
PQ4 0.772 0.440 -5.939 0.000 35.864 0.000
BL1 1.278 0.201 -7.104 0.000 52.106 0.000
BL2 1.686 0.092 -5.035 0.000 28.197 0.000
BL3 0.482 0.630 -2.038 0.042 4.387 0.112
RPI1 -0.877 0.380 0.359 0.720 0.899 0.638
RPI2 -1.008 0.314 -1.354 0.176 2.848 0.241
RPI3 -0.761 0.447 -0.504 0.614 0.834 0.659
RPI4 -0.659 0.510 -1.123 0.262 1.695 0.428
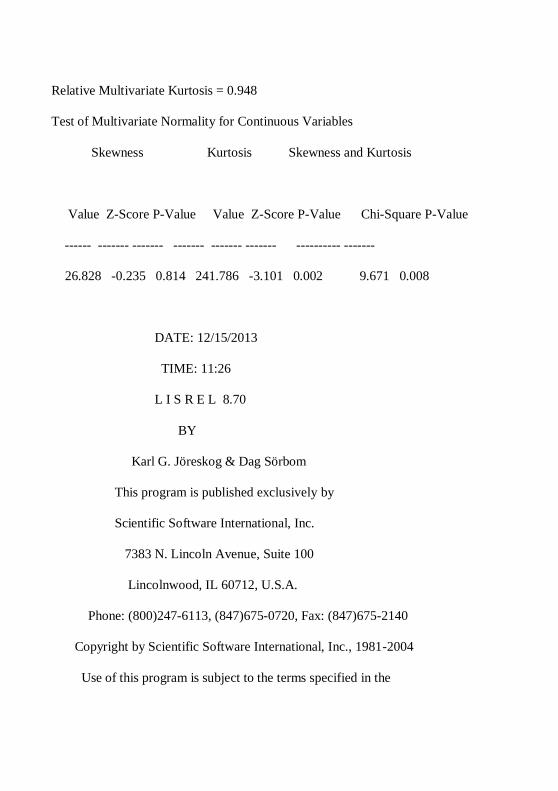
Relative Multivariate Kurtosis = 0.948
Test of Multivariate Normality for Continuous Variables
Skewness Kurtosis Skewness and Kurtosis
Value Z-Score P-Value Value Z-Score P-Value Chi-Square P-Value
------ ------- ------- ------- ------- ------- ---------- -------
26.828 -0.235 0.814 241.786 -3.101 0.002 9.671 0.008
DATE: 12/15/2013
TIME: 11:26
L I S R E L 8.70
BY
Karl G. Jöreskog & Dag Sörbom
This program is published exclusively by
Scientific Software International, Inc.
7383 N. Lincoln Avenue, Suite 100
Lincolnwood, IL 60712, U.S.A.
Phone: (800)247-6113, (847)675-0720, Fax: (847)675-2140
Copyright by Scientific Software International, Inc., 1981-2004
Use of this program is subject to the terms specified in the
Universal Copyright Convention.
Website: www.ssicentral.com
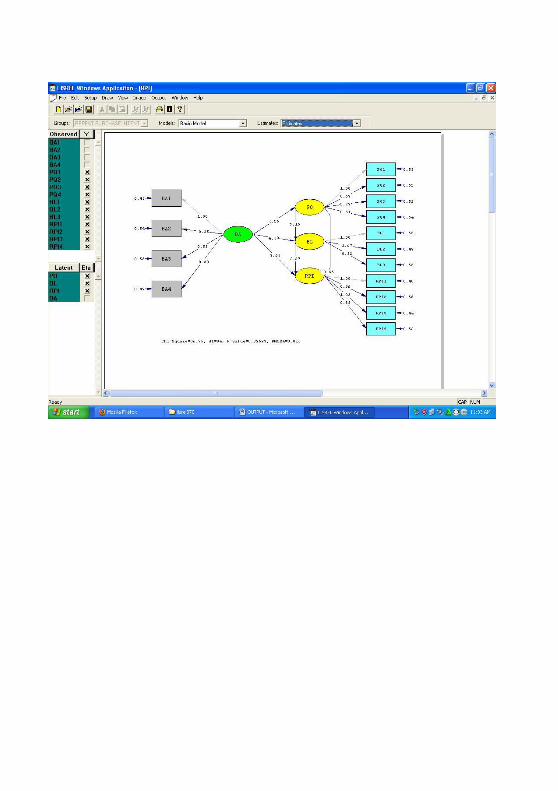
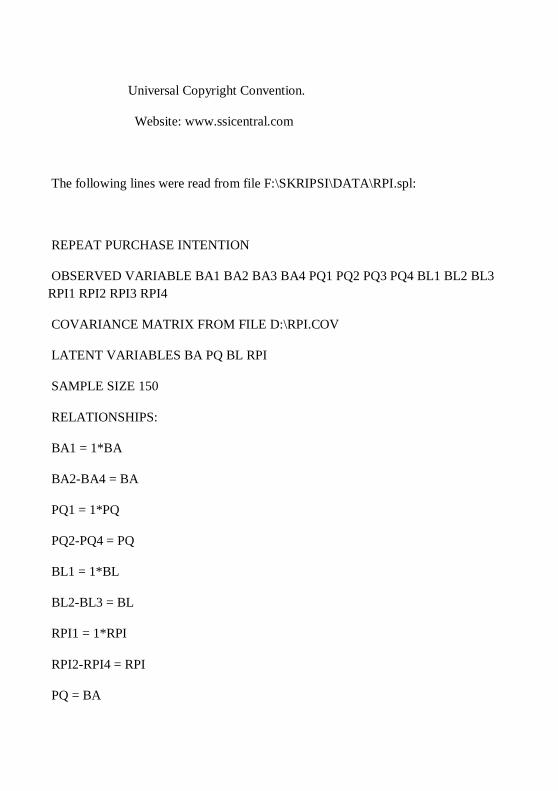
The following lines were read from file F:\SKRIPSI\DATA\RPI.spl:
REPEAT PURCHASE INTENTION
OBSERVED VARIABLE BA1 BA2 BA3 BA4 PQ1 PQ2 PQ3 PQ4 BL1 BL2 BL3
RPI1 RPI2 RPI3 RPI4
COVARIANCE MATRIX FROM FILE D:\RPI.COV
LATENT VARIABLES BA PQ BL RPI
SAMPLE SIZE 150
RELATIONSHIPS:
BA1 = 1*BA
BA2-BA4 = BA
PQ1 = 1*PQ
PQ2-PQ4 = PQ
BL1 = 1*BL
BL2-BL3 = BL
RPI1 = 1*RPI
RPI2-RPI4 = RPI
PQ = BA
BL = BA PQ
RPI = BA PQ BL
OPTIONS: SS SC EF RS AD=OFF
PATH DIAGRAM
END OF PROGRAM
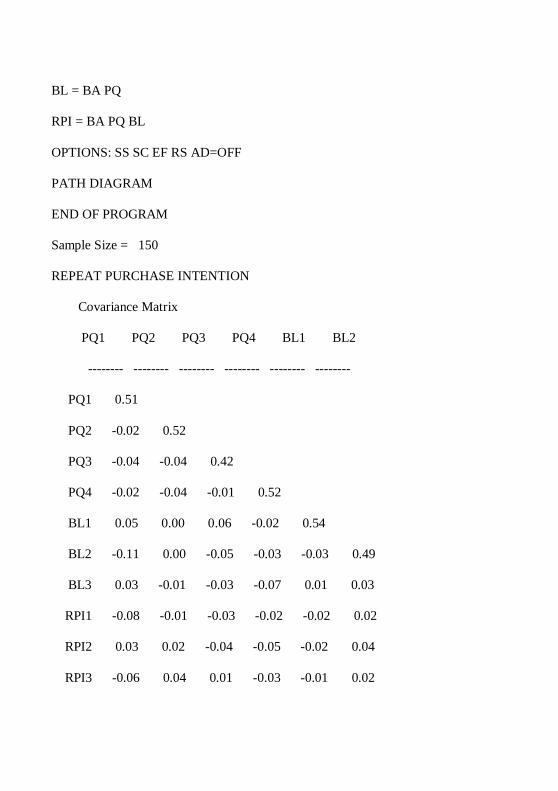
Sample Size = 150
REPEAT PURCHASE INTENTION
Covariance Matrix
PQ1 PQ2 PQ3 PQ4 BL1 BL2
-------- -------- -------- -------- -------- --------
PQ1 0.51
PQ2 -0.02 0.52
PQ3 -0.04 -0.04 0.42
PQ4 -0.02 -0.04 -0.01 0.52
BL1 0.05 0.00 0.06 -0.02 0.54
BL2 -0.11 0.00 -0.05 -0.03 -0.03 0.49
BL3 0.03 -0.01 -0.03 -0.07 0.01 0.03
RPI1 -0.08 -0.01 -0.03 -0.02 -0.02 0.02
RPI2 0.03 0.02 -0.04 -0.05 -0.02 0.04
RPI3 -0.06 0.04 0.01 -0.03 -0.01 0.02
RPI4 -0.04 0.06 0.01 0.00 -0.01 0.06
BA1 0.00 0.01 0.11 0.06 0.06 0.01
BA2 0.02 0.02 -0.08 0.05 0.00 0.00
BA3 0.01 -0.02 0.09 0.03 0.02 -0.04
BA4 -0.05 -0.06 -0.07 -0.05 -0.08 0.00
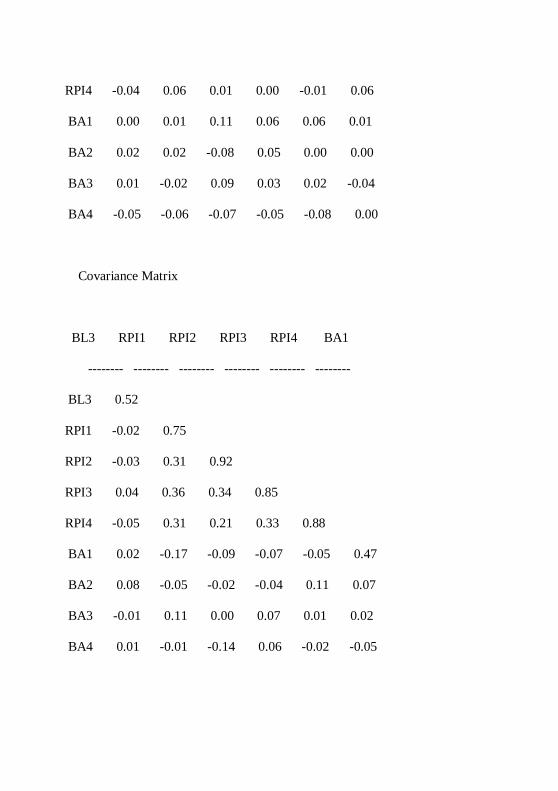
Covariance Matrix
BL3 RPI1 RPI2 RPI3 RPI4 BA1
-------- -------- -------- -------- -------- --------
BL3 0.52
RPI1 -0.02 0.75
RPI2 -0.03 0.31 0.92
RPI3 0.04 0.36 0.34 0.85
RPI4 -0.05 0.31 0.21 0.33 0.88
BA1 0.02 -0.17 -0.09 -0.07 -0.05 0.47
BA2 0.08 -0.05 -0.02 -0.04 0.11 0.07
BA3 -0.01 0.11 0.00 0.07 0.01 0.02
BA4 0.01 -0.01 -0.14 0.06 -0.02 -0.05
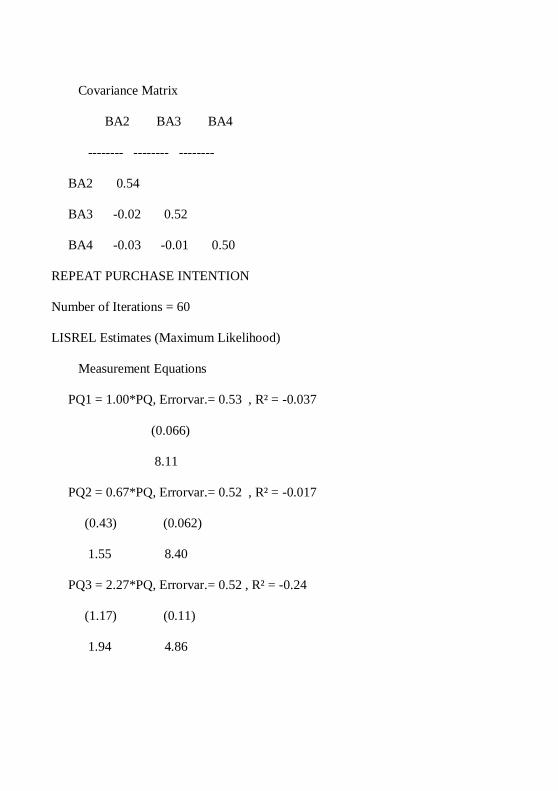
Covariance Matrix
BA2 BA3 BA4
-------- -------- --------
BA2 0.54
BA3 -0.02 0.52
BA4 -0.03 -0.01 0.50
REPEAT PURCHASE INTENTION
Number of Iterations = 60
LISREL Estimates (Maximum Likelihood)
Measurement Equations
PQ1 = 1.00*PQ, Errorvar.= 0.53 , R² = -0.037
(0.066)
8.11
PQ2 = 0.67*PQ, Errorvar.= 0.52 , R² = -0.017
(0.43) (0.062)
1.55 8.40
PQ3 = 2.27*PQ, Errorvar.= 0.52 , R² = -0.24
(1.17) (0.11)
1.94 4.86
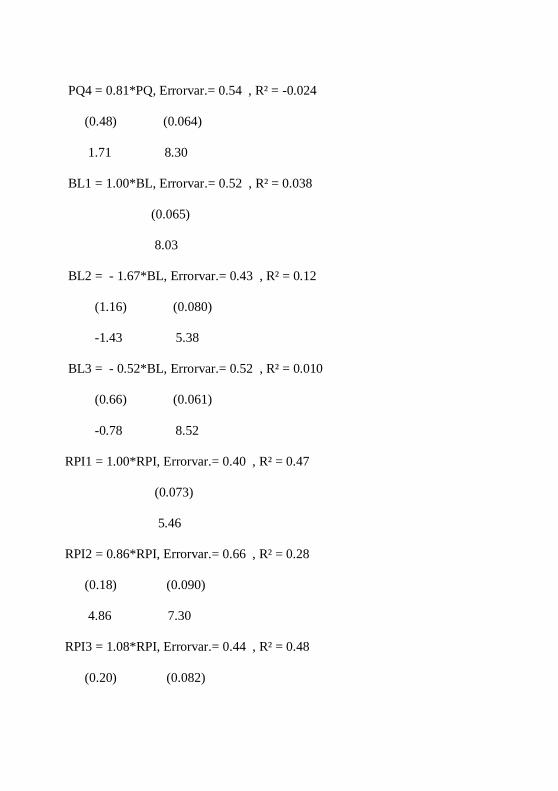
PQ4 = 0.81*PQ, Errorvar.= 0.54 , R² = -0.024
(0.48) (0.064)
1.71 8.30
BL1 = 1.00*BL, Errorvar.= 0.52 , R² = 0.038
(0.065)
8.03
BL2 = - 1.67*BL, Errorvar.= 0.43 , R² = 0.12
(1.16) (0.080)
-1.43 5.38
BL3 = - 0.52*BL, Errorvar.= 0.52 , R² = 0.010
(0.66) (0.061)
-0.78 8.52
RPI1 = 1.00*RPI, Errorvar.= 0.40 , R² = 0.47
(0.073)
5.46
RPI2 = 0.86*RPI, Errorvar.= 0.66 , R² = 0.28
(0.18) (0.090)
4.86 7.30
RPI3 = 1.08*RPI, Errorvar.= 0.44 , R² = 0.48
(0.20) (0.082)
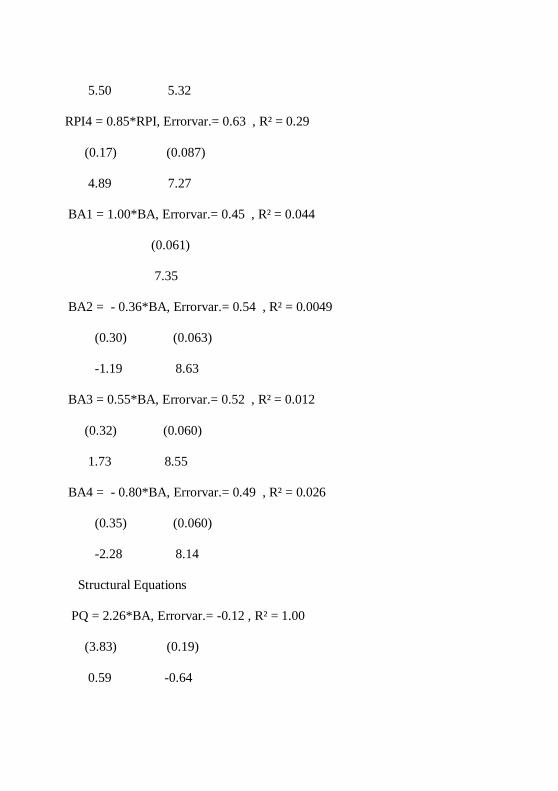
5.50 5.32
RPI4 = 0.85*RPI, Errorvar.= 0.63 , R² = 0.29
(0.17) (0.087)
4.89 7.27
BA1 = 1.00*BA, Errorvar.= 0.45 , R² = 0.044
(0.061)
7.35
BA2 = - 0.36*BA, Errorvar.= 0.54 , R² = 0.0049
(0.30) (0.063)
-1.19 8.63
BA3 = 0.55*BA, Errorvar.= 0.52 , R² = 0.012
(0.32) (0.060)
1.73 8.55
BA4 = - 0.80*BA, Errorvar.= 0.49 , R² = 0.026
(0.35) (0.060)
-2.28 8.14
Structural Equations
PQ = 2.26*BA, Errorvar.= -0.12 , R² = 1.00
(3.83) (0.19)
0.59 -0.64
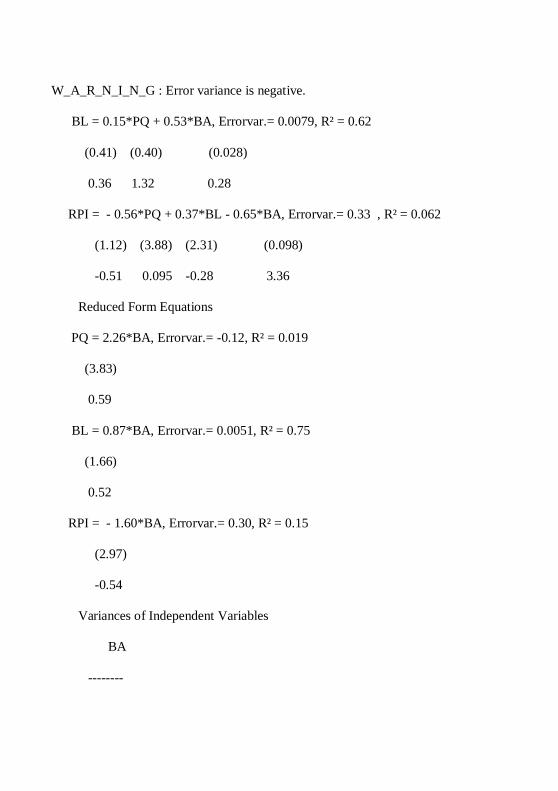
W_A_R_N_I_N_G : Error variance is negative.
BL = 0.15*PQ + 0.53*BA, Errorvar.= 0.0079, R² = 0.62
(0.41) (0.40) (0.028)
0.36 1.32 0.28
RPI = - 0.56*PQ + 0.37*BL - 0.65*BA, Errorvar.= 0.33 , R² = 0.062
(1.12) (3.88) (2.31) (0.098)
-0.51 0.095 -0.28 3.36
Reduced Form Equations
PQ = 2.26*BA, Errorvar.= -0.12, R² = 0.019
(3.83)
0.59
BL = 0.87*BA, Errorvar.= 0.0051, R² = 0.75
(1.66)
0.52
RPI = - 1.60*BA, Errorvar.= 0.30, R² = 0.15
(2.97)
-0.54
Variances of Independent Variables
BA
--------
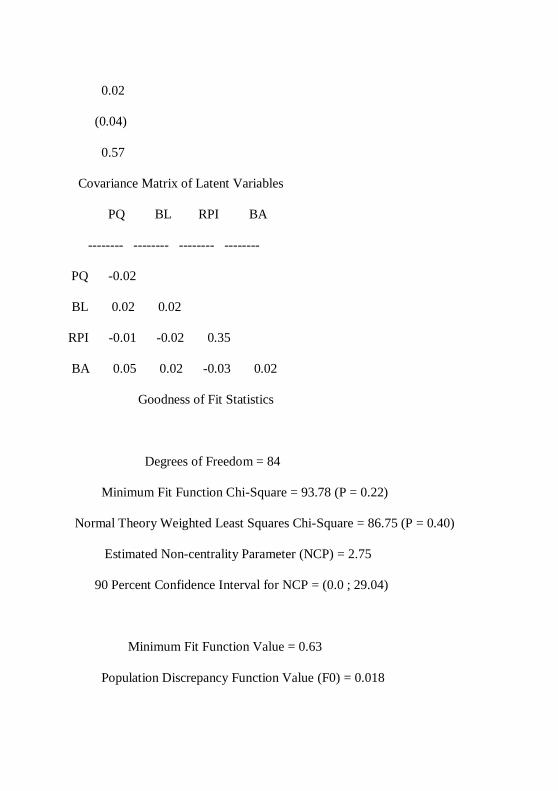
0.02
(0.04)
0.57
Covariance Matrix of Latent Variables
PQ BL RPI BA
-------- -------- -------- --------
PQ -0.02
BL 0.02 0.02
RPI -0.01 -0.02 0.35
BA 0.05 0.02 -0.03 0.02
Goodness of Fit Statistics
Degrees of Freedom = 84
Minimum Fit Function Chi-Square = 93.78 (P = 0.22)
Normal Theory Weighted Least Squares Chi-Square = 86.75 (P = 0.40)
Estimated Non-centrality Parameter (NCP) = 2.75
90 Percent Confidence Interval for NCP = (0.0 ; 29.04)
Minimum Fit Function Value = 0.63
Population Discrepancy Function Value (F0) = 0.018
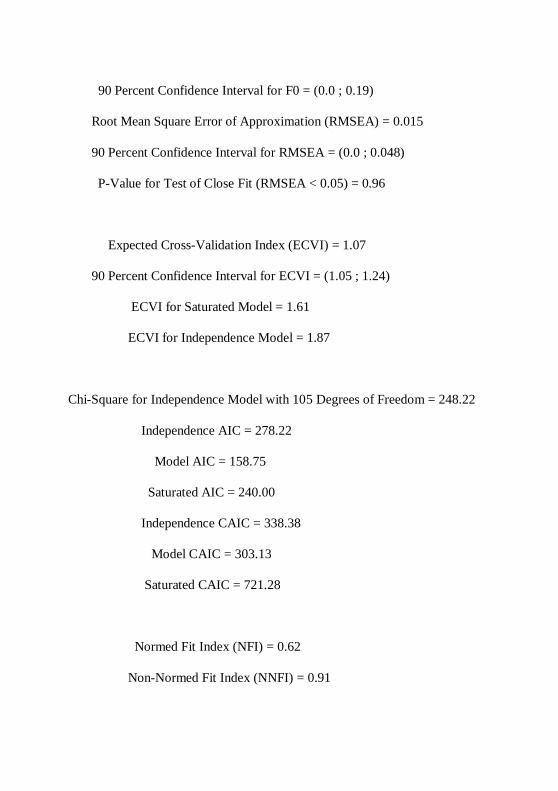
90 Percent Confidence Interval for F0 = (0.0 ; 0.19)
Root Mean Square Error of Approximation (RMSEA) = 0.015
90 Percent Confidence Interval for RMSEA = (0.0 ; 0.048)
P-Value for Test of Close Fit (RMSEA < 0.05) = 0.96
Expected Cross-Validation Index (ECVI) = 1.07
90 Percent Confidence Interval for ECVI = (1.05 ; 1.24)
ECVI for Saturated Model = 1.61
ECVI for Independence Model = 1.87
Chi-Square for Independence Model with 105 Degrees of Freedom = 248.22
Independence AIC = 278.22
Model AIC = 158.75
Saturated AIC = 240.00
Independence CAIC = 338.38
Model CAIC = 303.13
Saturated CAIC = 721.28
Normed Fit Index (NFI) = 0.62
Non-Normed Fit Index (NNFI) = 0.91
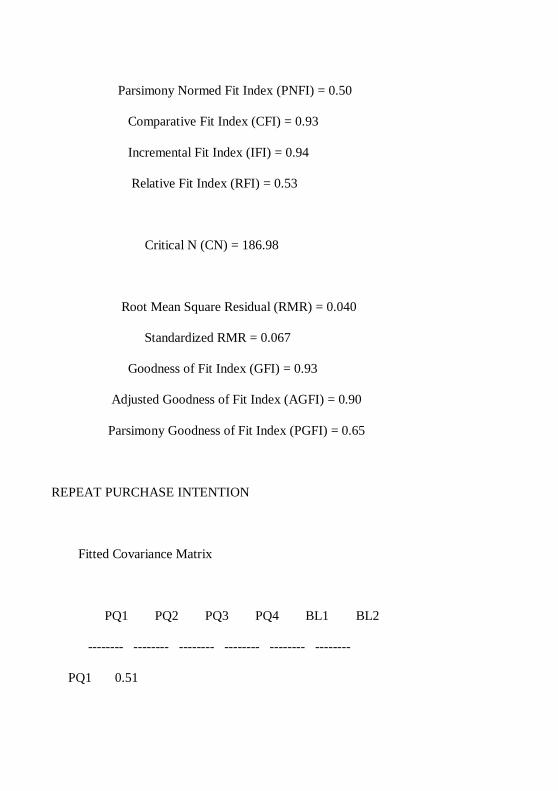
Parsimony Normed Fit Index (PNFI) = 0.50
Comparative Fit Index (CFI) = 0.93
Incremental Fit Index (IFI) = 0.94
Relative Fit Index (RFI) = 0.53
Critical N (CN) = 186.98
Root Mean Square Residual (RMR) = 0.040
Standardized RMR = 0.067
Goodness of Fit Index (GFI) = 0.93
Adjusted Goodness of Fit Index (AGFI) = 0.90
Parsimony Goodness of Fit Index (PGFI) = 0.65
REPEAT PURCHASE INTENTION
Fitted Covariance Matrix
PQ1 PQ2 PQ3 PQ4 BL1 BL2
-------- -------- -------- -------- -------- --------
PQ1 0.51
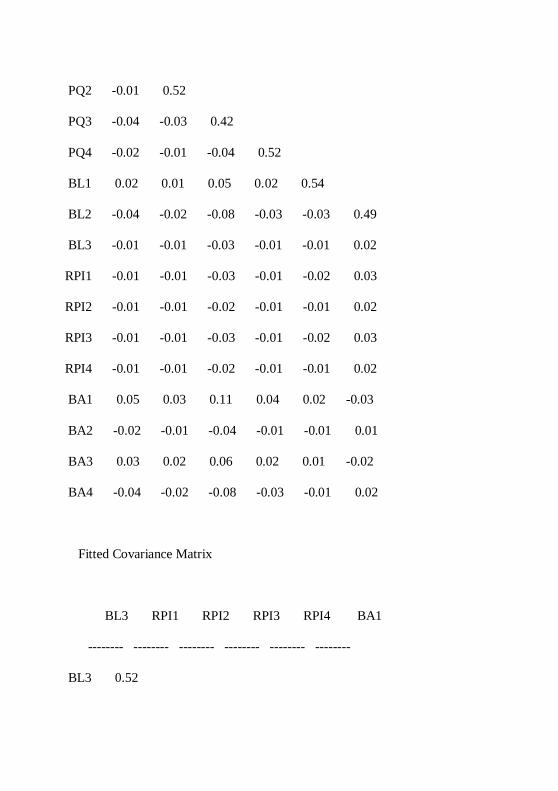
PQ2 -0.01 0.52
PQ3 -0.04 -0.03 0.42
PQ4 -0.02 -0.01 -0.04 0.52
BL1 0.02 0.01 0.05 0.02 0.54
BL2 -0.04 -0.02 -0.08 -0.03 -0.03 0.49
BL3 -0.01 -0.01 -0.03 -0.01 -0.01 0.02
RPI1 -0.01 -0.01 -0.03 -0.01 -0.02 0.03
RPI2 -0.01 -0.01 -0.02 -0.01 -0.01 0.02
RPI3 -0.01 -0.01 -0.03 -0.01 -0.02 0.03
RPI4 -0.01 -0.01 -0.02 -0.01 -0.01 0.02
BA1 0.05 0.03 0.11 0.04 0.02 -0.03
BA2 -0.02 -0.01 -0.04 -0.01 -0.01 0.01
BA3 0.03 0.02 0.06 0.02 0.01 -0.02
BA4 -0.04 -0.02 -0.08 -0.03 -0.01 0.02
Fitted Covariance Matrix
BL3 RPI1 RPI2 RPI3 RPI4 BA1
-------- -------- -------- -------- -------- --------
BL3 0.52
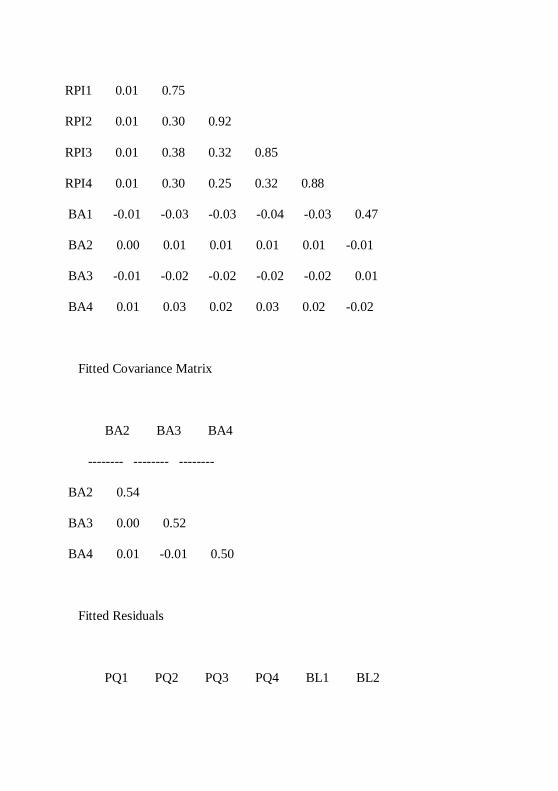
RPI1 0.01 0.75
RPI2 0.01 0.30 0.92
RPI3 0.01 0.38 0.32 0.85
RPI4 0.01 0.30 0.25 0.32 0.88
BA1 -0.01 -0.03 -0.03 -0.04 -0.03 0.47
BA2 0.00 0.01 0.01 0.01 0.01 -0.01
BA3 -0.01 -0.02 -0.02 -0.02 -0.02 0.01
BA4 0.01 0.03 0.02 0.03 0.02 -0.02
Fitted Covariance Matrix
BA2 BA3 BA4
-------- -------- --------
BA2 0.54
BA3 0.00 0.52
BA4 0.01 -0.01 0.50
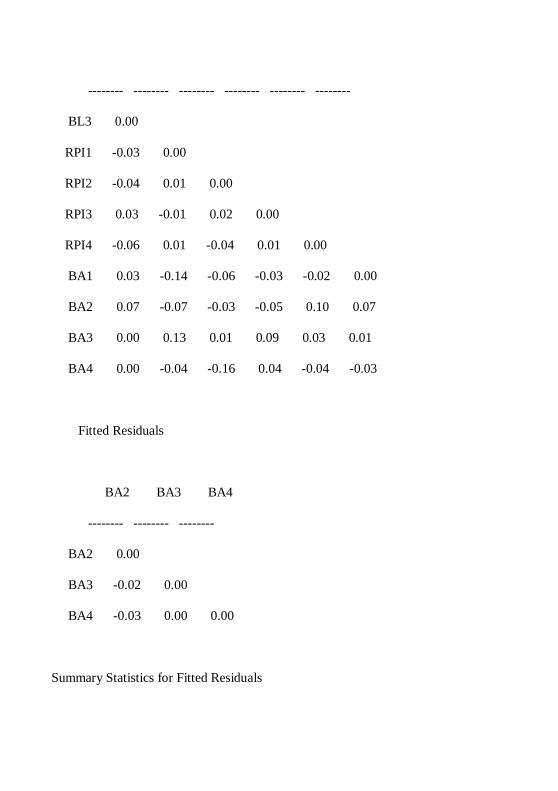
Fitted Residuals
PQ1 PQ2 PQ3 PQ4 BL1 BL2
-------- -------- -------- -------- -------- --------
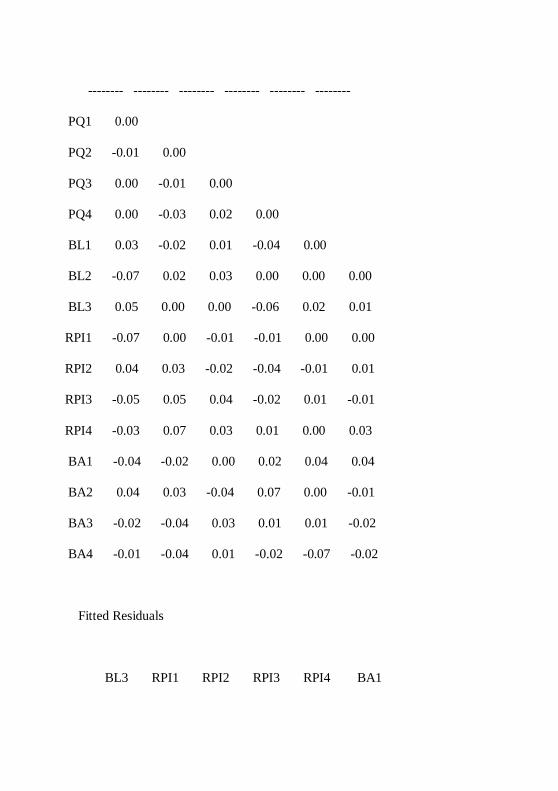
PQ1 0.00
PQ2 -0.01 0.00
PQ3 0.00 -0.01 0.00
PQ4 0.00 -0.03 0.02 0.00
BL1 0.03 -0.02 0.01 -0.04 0.00
BL2 -0.07 0.02 0.03 0.00 0.00 0.00
BL3 0.05 0.00 0.00 -0.06 0.02 0.01
RPI1 -0.07 0.00 -0.01 -0.01 0.00 0.00
RPI2 0.04 0.03 -0.02 -0.04 -0.01 0.01
RPI3 -0.05 0.05 0.04 -0.02 0.01 -0.01
RPI4 -0.03 0.07 0.03 0.01 0.00 0.03
BA1 -0.04 -0.02 0.00 0.02 0.04 0.04
BA2 0.04 0.03 -0.04 0.07 0.00 -0.01
BA3 -0.02 -0.04 0.03 0.01 0.01 -0.02
BA4 -0.01 -0.04 0.01 -0.02 -0.07 -0.02
Fitted Residuals
BL3 RPI1 RPI2 RPI3 RPI4 BA1
-------- -------- -------- -------- -------- --------
BL3 0.00
RPI1 -0.03 0.00
RPI2 -0.04 0.01 0.00
RPI3 0.03 -0.01 0.02 0.00
RPI4 -0.06 0.01 -0.04 0.01 0.00
BA1 0.03 -0.14 -0.06 -0.03 -0.02 0.00
BA2 0.07 -0.07 -0.03 -0.05 0.10 0.07
BA3 0.00 0.13 0.01 0.09 0.03 0.01
BA4 0.00 -0.04 -0.16 0.04 -0.04 -0.03
Fitted Residuals
BA2 BA3 BA4
-------- -------- --------
BA2 0.00
BA3 -0.02 0.00
BA4 -0.03 0.00 0.00
Summary Statistics for Fitted Residuals
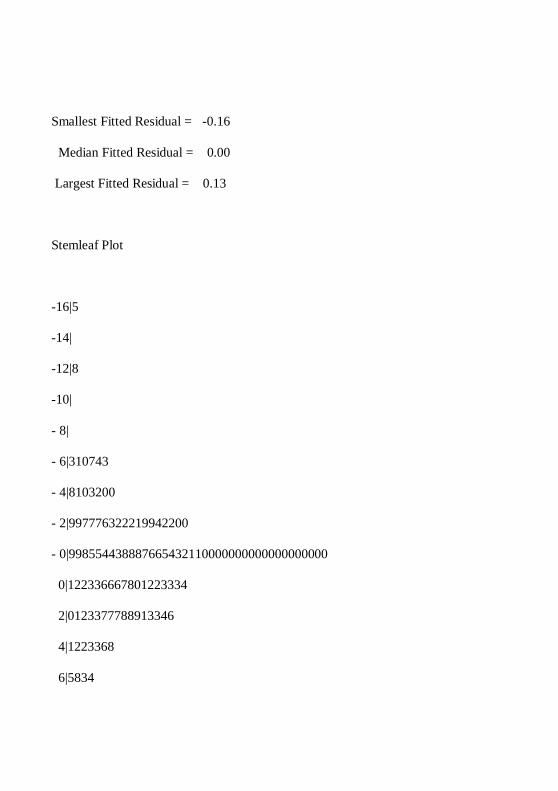
Smallest Fitted Residual = -0.16
Median Fitted Residual = 0.00
Largest Fitted Residual = 0.13
Stemleaf Plot
-16|5
-14|
-12|8
-10|
- 8|
- 6|310743
- 4|8103200
- 2|997776322219942200
- 0|998554438887665432110000000000000000000
0|122336667801223334
2|0123377788913346
4|1223368
6|5834
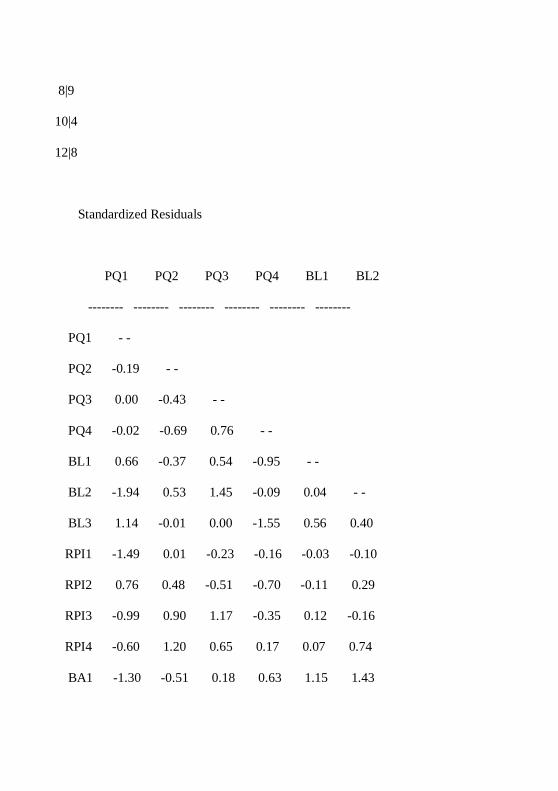
8|9
10|4
12|8
Standardized Residuals
PQ1 PQ2 PQ3 PQ4 BL1 BL2
-------- -------- -------- -------- -------- --------
PQ1 - -
PQ2 -0.19 - -
PQ3 0.00 -0.43 - -
PQ4 -0.02 -0.69 0.76 - -
BL1 0.66 -0.37 0.54 -0.95 - -
BL2 -1.94 0.53 1.45 -0.09 0.04 - -
BL3 1.14 -0.01 0.00 -1.55 0.56 0.40
RPI1 -1.49 0.01 -0.23 -0.16 -0.03 -0.10
RPI2 0.76 0.48 -0.51 -0.70 -0.11 0.29
RPI3 -0.99 0.90 1.17 -0.35 0.12 -0.16
RPI4 -0.60 1.20 0.65 0.17 0.07 0.74
BA1 -1.30 -0.51 0.18 0.63 1.15 1.43
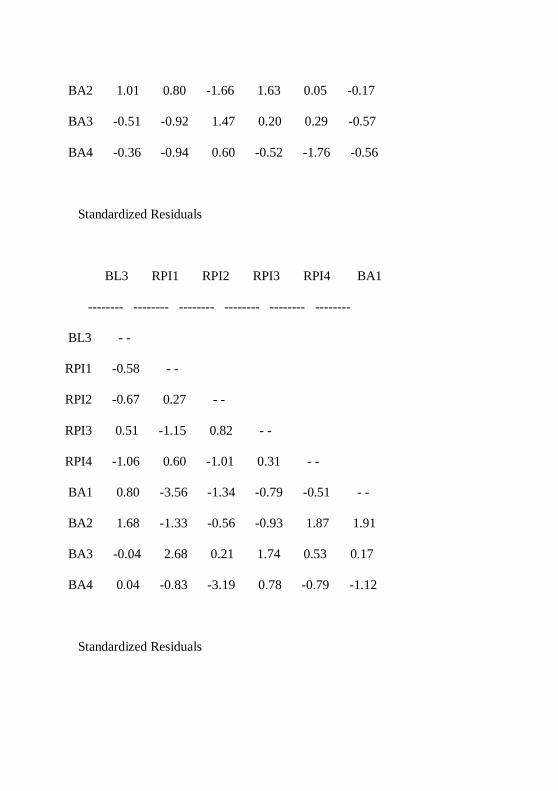
BA2 1.01 0.80 -1.66 1.63 0.05 -0.17
BA3 -0.51 -0.92 1.47 0.20 0.29 -0.57
BA4 -0.36 -0.94 0.60 -0.52 -1.76 -0.56
Standardized Residuals
BL3 RPI1 RPI2 RPI3 RPI4 BA1
-------- -------- -------- -------- -------- --------
BL3 - -
RPI1 -0.58 - -
RPI2 -0.67 0.27 - -
RPI3 0.51 -1.15 0.82 - -
RPI4 -1.06 0.60 -1.01 0.31 - -
BA1 0.80 -3.56 -1.34 -0.79 -0.51 - -
BA2 1.68 -1.33 -0.56 -0.93 1.87 1.91
BA3 -0.04 2.68 0.21 1.74 0.53 0.17
BA4 0.04 -0.83 -3.19 0.78 -0.79 -1.12
Standardized Residuals
BA2 BA3 BA4
-------- -------- --------
BA2 - -
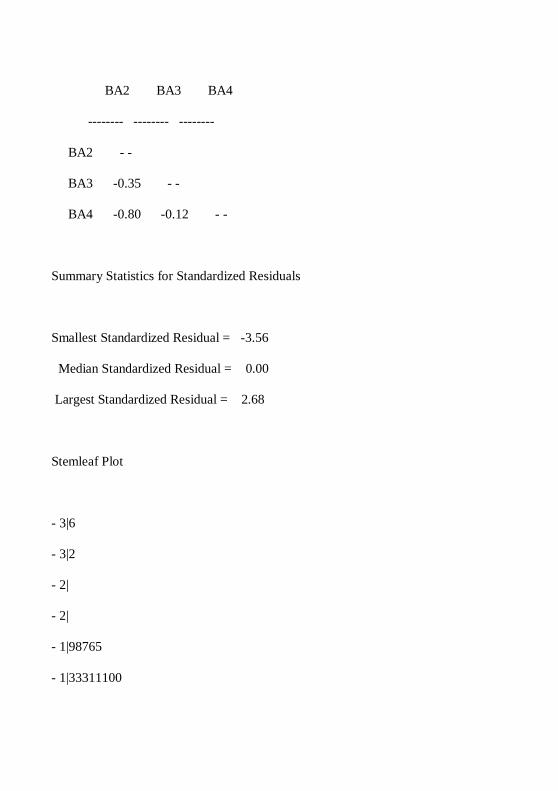
BA3 -0.35 - -
BA4 -0.80 -0.12 - -
Summary Statistics for Standardized Residuals
Smallest Standardized Residual = -3.56
Median Standardized Residual = 0.00
Largest Standardized Residual = 2.68
Stemleaf Plot
- 3|6
- 3|2
- 2|
- 2|
- 1|98765
- 1|33311100
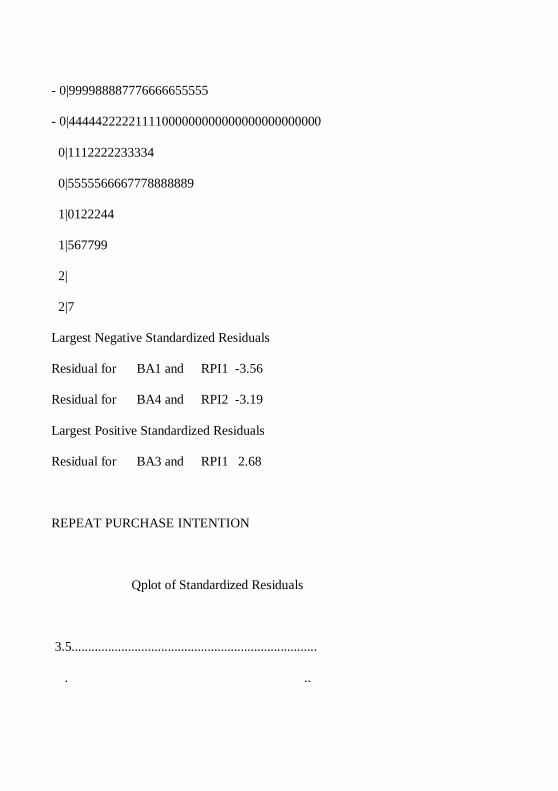
- 0|999988887776666655555
- 0|44444222221111000000000000000000000000
0|1112222233334
0|5555566667778888889
1|0122244
1|567799
2|
2|7
Largest Negative Standardized Residuals
Residual for BA1 and RPI1 -3.56
Residual for BA4 and RPI2 -3.19
Largest Positive Standardized Residuals
Residual for BA3 and RPI1 2.68
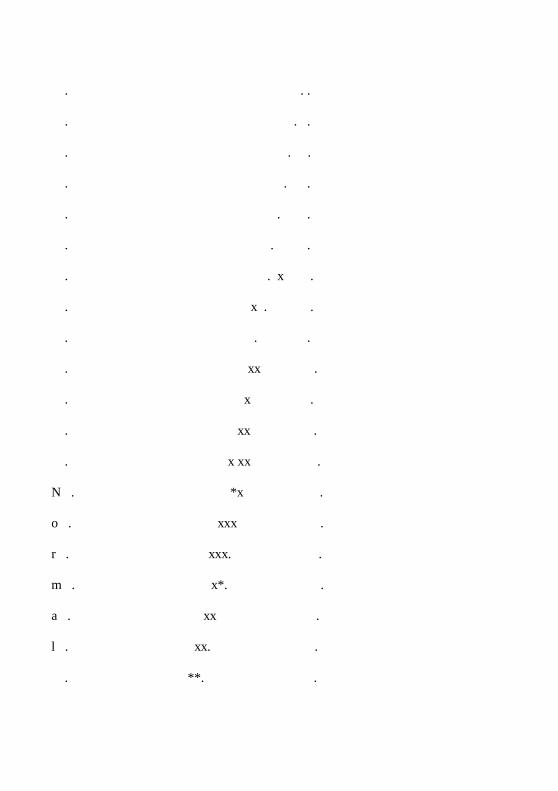
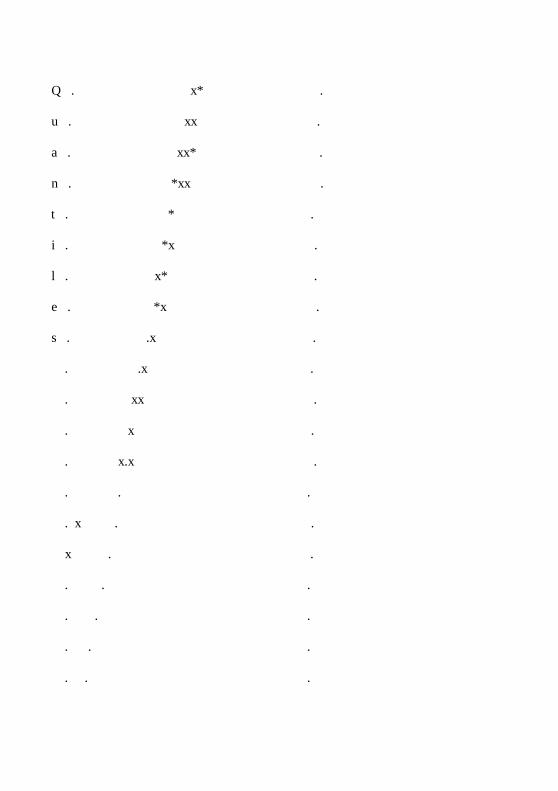
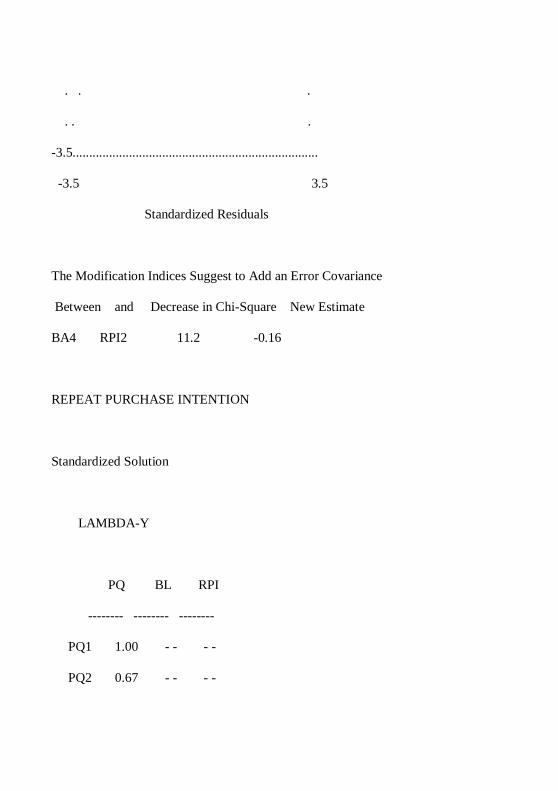
REPEAT PURCHASE INTENTION
Qplot of Standardized Residuals
3.5..........................................................................
. ..
. . .
. . .
. . .
. . .
. . .
. . .
. . x .
. x . .
. . .
. xx .
. x .
. xx .
. x xx .
N . *x .
o . xxx .
r . xxx. .
m . x*. .
a . xx .
l . xx. .
. **. .
Q . x* .
u . xx .
a . xx* .
n . *xx .
t . * .
i . *x .
l . x* .
e . *x .
s . .x .
. .x .
. xx .
. x .
. x.x .
. . .
. x . .
x . .
. . .
. . .
. . .
. . .
. . .
. . .
-3.5..........................................................................
-3.5 3.5
Standardized Residuals
The Modification Indices Suggest to Add an Error Covariance
Between and Decrease in Chi-Square New Estimate
BA4 RPI2 11.2 -0.16
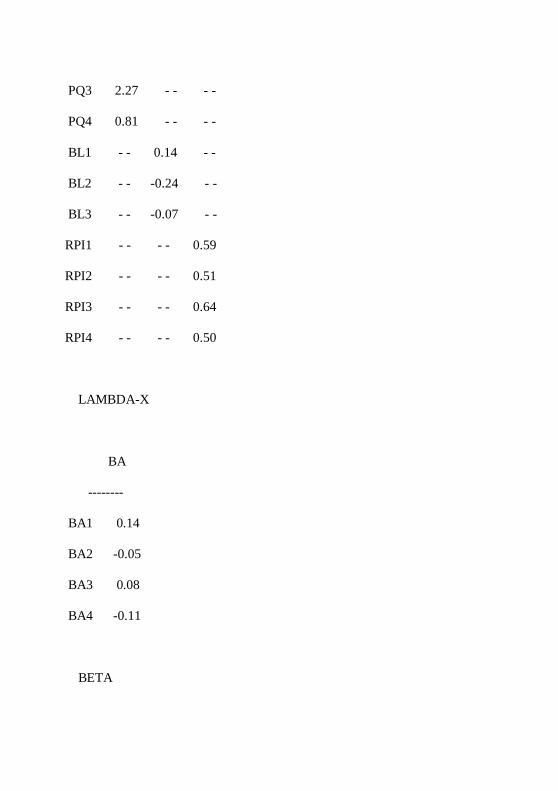
REPEAT PURCHASE INTENTION
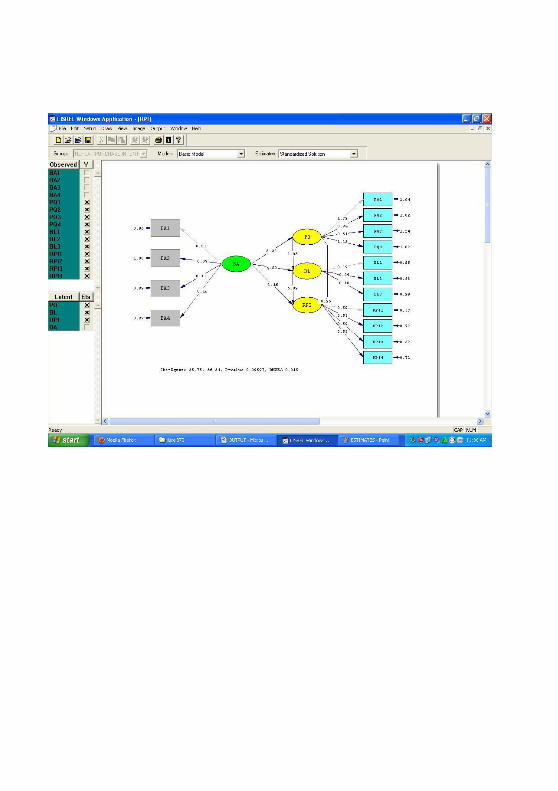
Standardized Solution
LAMBDA-Y
PQ BL RPI
-------- -------- --------
PQ1 1.00 - - - -
PQ2 0.67 - - - -
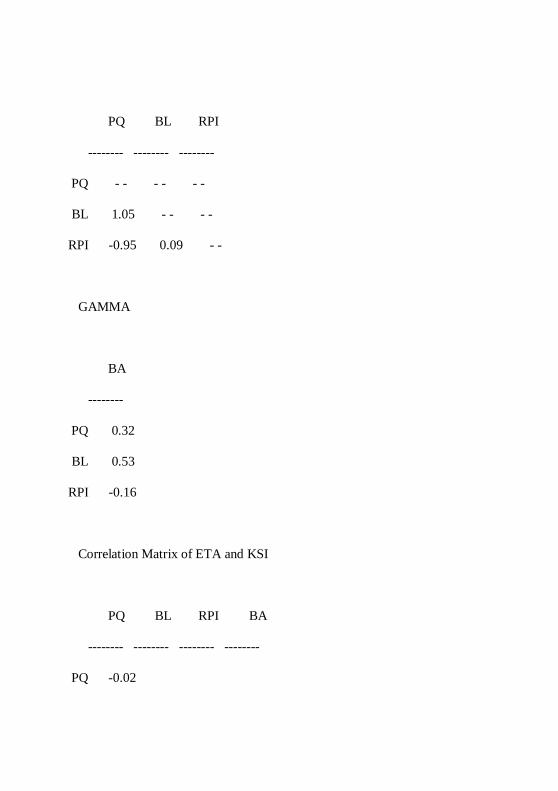
PQ3 2.27 - - - -
PQ4 0.81 - - - -
BL1 - - 0.14 - -
BL2 - - -0.24 - -
BL3 - - -0.07 - -
RPI1 - - - - 0.59
RPI2 - - - - 0.51
RPI3 - - - - 0.64
RPI4 - - - - 0.50
LAMBDA-X
BA
--------
BA1 0.14
BA2 -0.05
BA3 0.08
BA4 -0.11
BETA
PQ BL RPI
-------- -------- --------
PQ - - - - - -
BL 1.05 - - - -
RPI -0.95 0.09 - -
GAMMA
BA
--------
PQ 0.32
BL 0.53
RPI -0.16
Correlation Matrix of ETA and KSI
PQ BL RPI BA
-------- -------- -------- --------
PQ -0.02
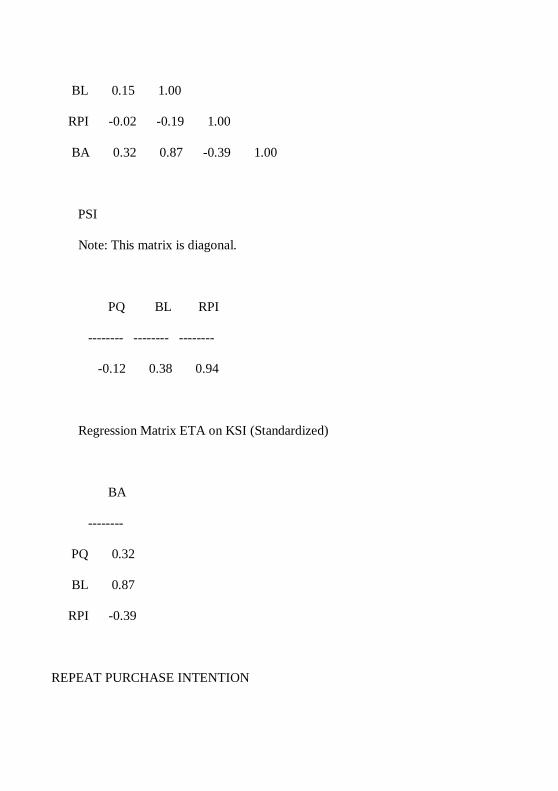
BL 0.15 1.00
RPI -0.02 -0.19 1.00
BA 0.32 0.87 -0.39 1.00
PSI
Note: This matrix is diagonal.
PQ BL RPI
-------- -------- --------
-0.12 0.38 0.94
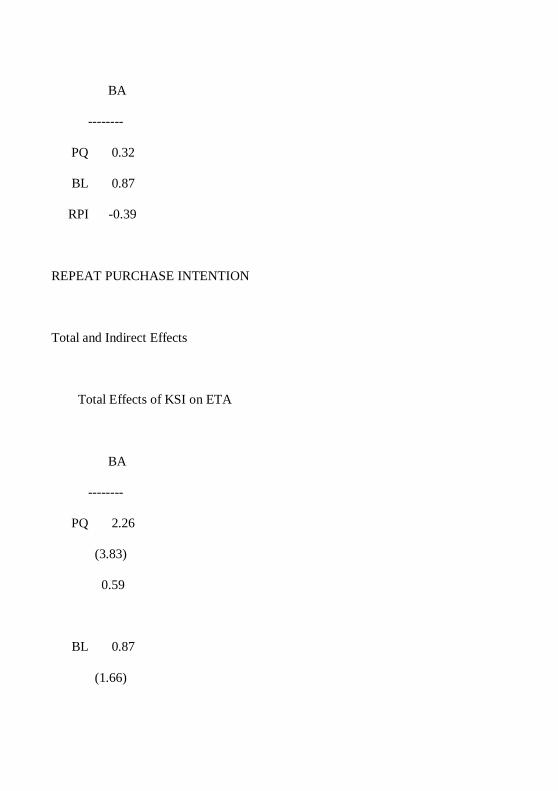
Regression Matrix ETA on KSI (Standardized)
BA
--------
PQ 0.32
BL 0.87
RPI -0.39
REPEAT PURCHASE INTENTION
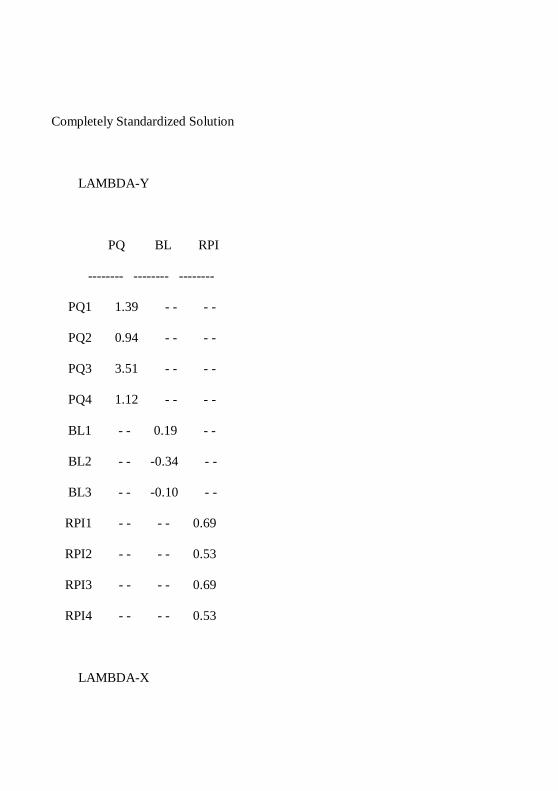
Completely Standardized Solution
LAMBDA-Y
PQ BL RPI
-------- -------- --------
PQ1 1.39 - - - -
PQ2 0.94 - - - -
PQ3 3.51 - - - -
PQ4 1.12 - - - -
BL1 - - 0.19 - -
BL2 - - -0.34 - -
BL3 - - -0.10 - -
RPI1 - - - - 0.69
RPI2 - - - - 0.53
RPI3 - - - - 0.69
RPI4 - - - - 0.53
LAMBDA-X
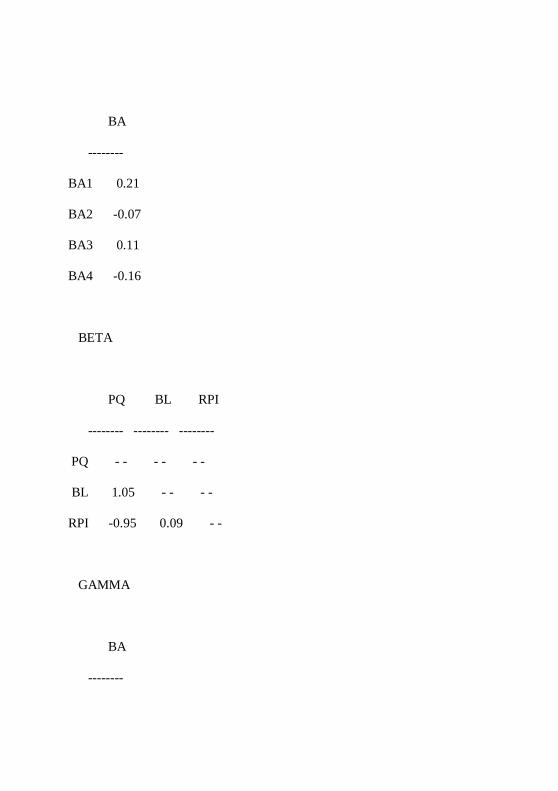
BA
--------
BA1 0.21
BA2 -0.07
BA3 0.11
BA4 -0.16
BETA
PQ BL RPI
-------- -------- --------
PQ - - - - - -
BL 1.05 - - - -
RPI -0.95 0.09 - -
GAMMA
BA
--------
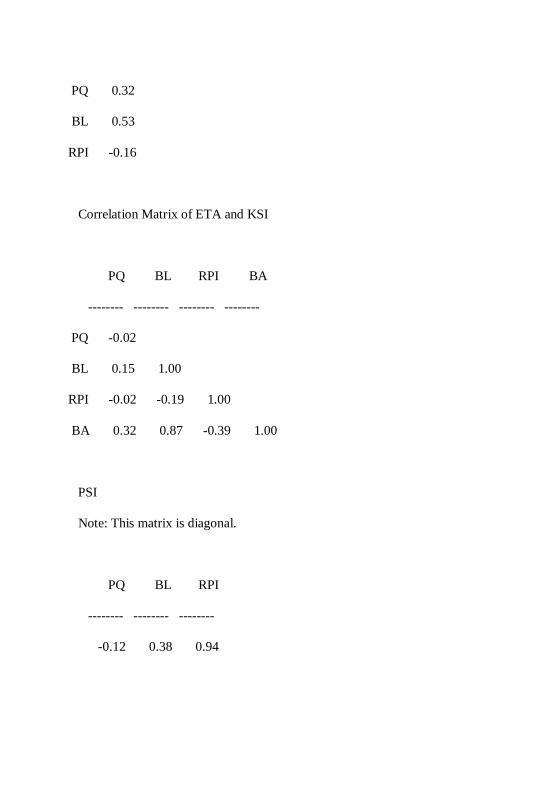
PQ 0.32
BL 0.53
RPI -0.16
Correlation Matrix of ETA and KSI
PQ BL RPI BA
-------- -------- -------- --------
PQ -0.02
BL 0.15 1.00
RPI -0.02 -0.19 1.00
BA 0.32 0.87 -0.39 1.00
PSI
Note: This matrix is diagonal.
PQ BL RPI
-------- -------- --------
-0.12 0.38 0.94
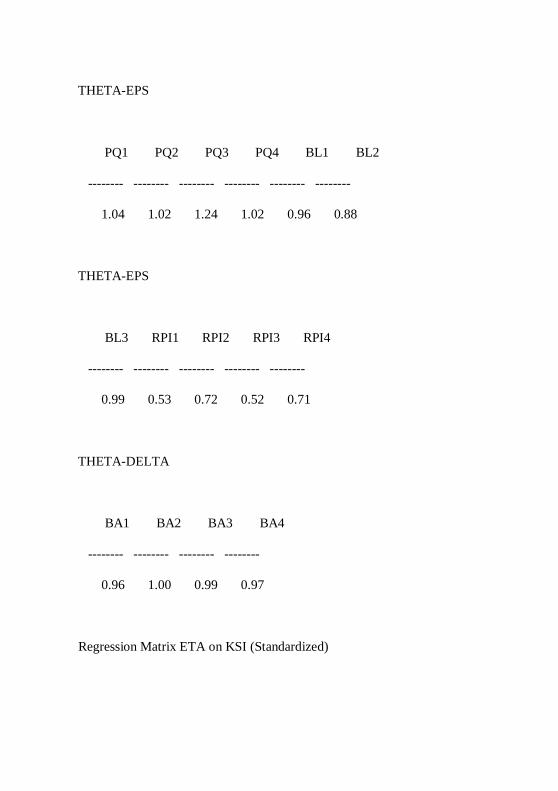
THETA-EPS
PQ1 PQ2 PQ3 PQ4 BL1 BL2
-------- -------- -------- -------- -------- --------
1.04 1.02 1.24 1.02 0.96 0.88
THETA-EPS
BL3 RPI1 RPI2 RPI3 RPI4
-------- -------- -------- -------- --------
0.99 0.53 0.72 0.52 0.71
THETA-DELTA
BA1 BA2 BA3 BA4
-------- -------- -------- --------
0.96 1.00 0.99 0.97
Regression Matrix ETA on KSI (Standardized)
BA
--------
PQ 0.32
BL 0.87
RPI -0.39
REPEAT PURCHASE INTENTION
Total and Indirect Effects
Total Effects of KSI on ETA
BA
--------
PQ 2.26
(3.83)
0.59
BL 0.87
(1.66)
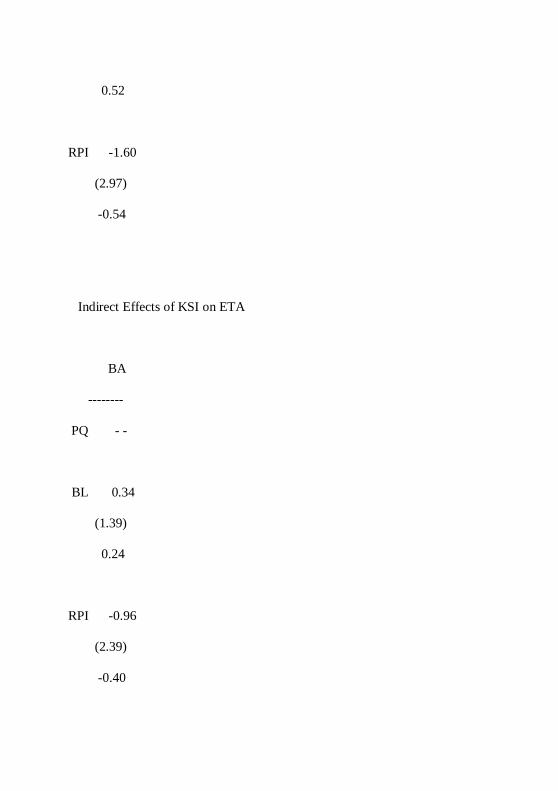
0.52
RPI -1.60
(2.97)
-0.54
Indirect Effects of KSI on ETA
BA
--------
PQ - -
BL 0.34
(1.39)
0.24
RPI -0.96
(2.39)
-0.40
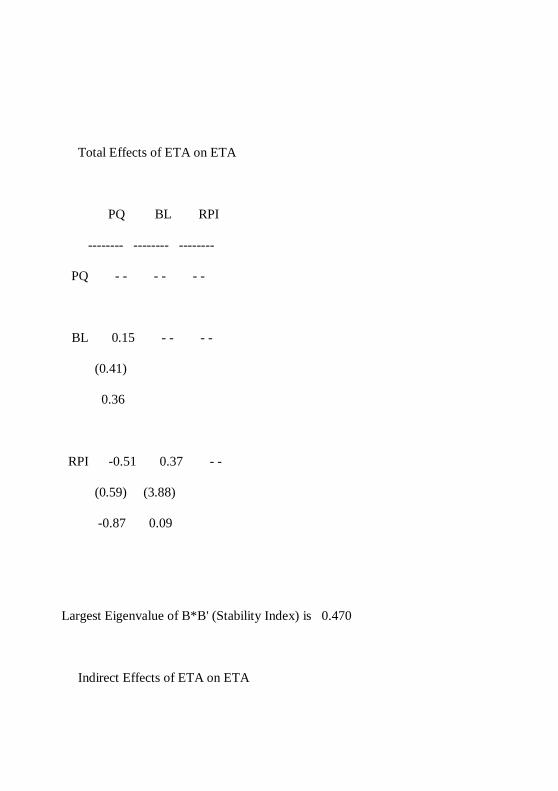
Total Effects of ETA on ETA
PQ BL RPI
-------- -------- --------
PQ - - - - - -
BL 0.15 - - - -
(0.41)
0.36
RPI -0.51 0.37 - -
(0.59) (3.88)
-0.87 0.09
Largest Eigenvalue of B*B' (Stability Index) is 0.470
Indirect Effects of ETA on ETA
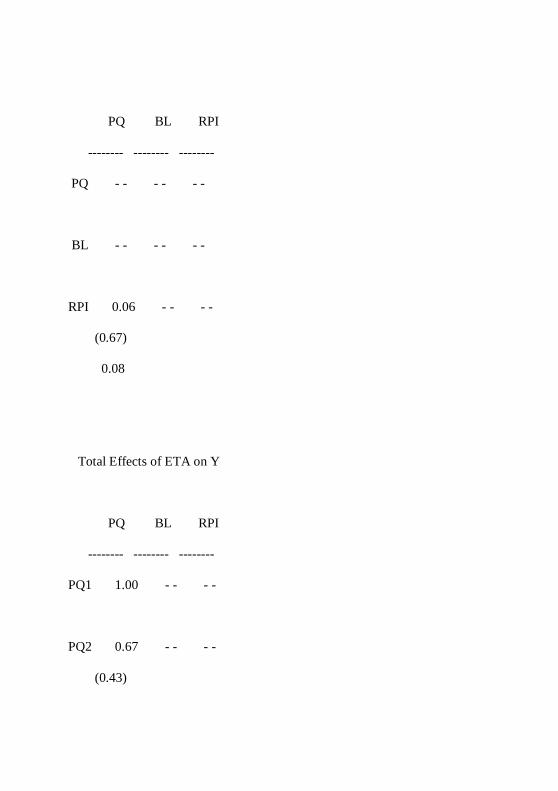
PQ BL RPI
-------- -------- --------
PQ - - - - - -
BL - - - - - -
RPI 0.06 - - - -
(0.67)
0.08
Total Effects of ETA on Y
PQ BL RPI
-------- -------- --------
PQ1 1.00 - - - -
PQ2 0.67 - - - -
(0.43)
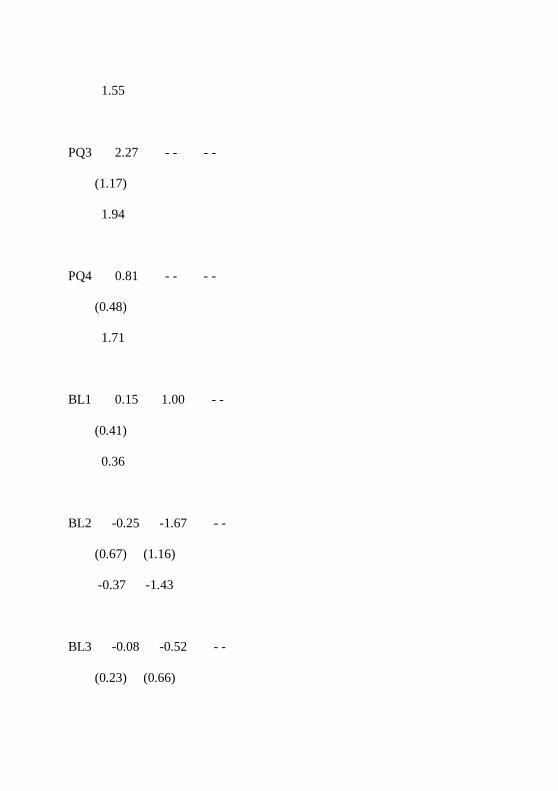
1.55
PQ3 2.27 - - - -
(1.17)
1.94
PQ4 0.81 - - - -
(0.48)
1.71
BL1 0.15 1.00 - -
(0.41)
0.36
BL2 -0.25 -1.67 - -
(0.67) (1.16)
-0.37 -1.43
BL3 -0.08 -0.52 - -
(0.23) (0.66)
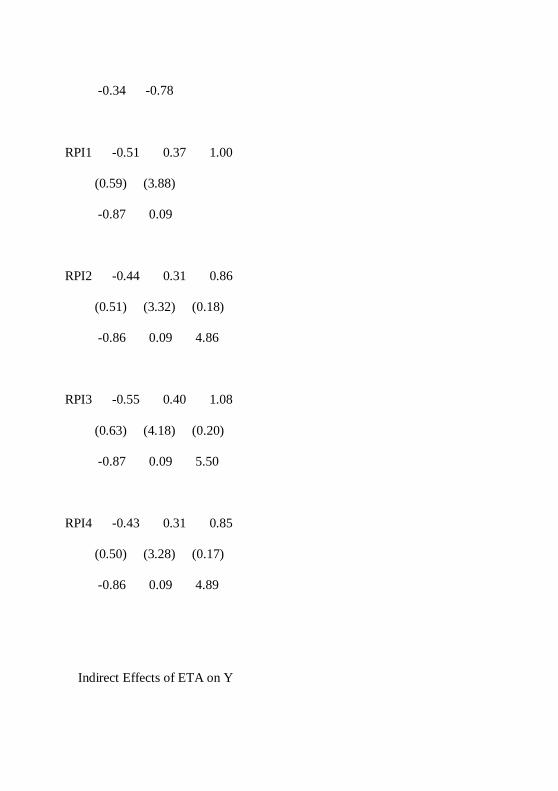
-0.34 -0.78
RPI1 -0.51 0.37 1.00
(0.59) (3.88)
-0.87 0.09
RPI2 -0.44 0.31 0.86
(0.51) (3.32) (0.18)
-0.86 0.09 4.86
RPI3 -0.55 0.40 1.08
(0.63) (4.18) (0.20)
-0.87 0.09 5.50
RPI4 -0.43 0.31 0.85
(0.50) (3.28) (0.17)
-0.86 0.09 4.89
Indirect Effects of ETA on Y
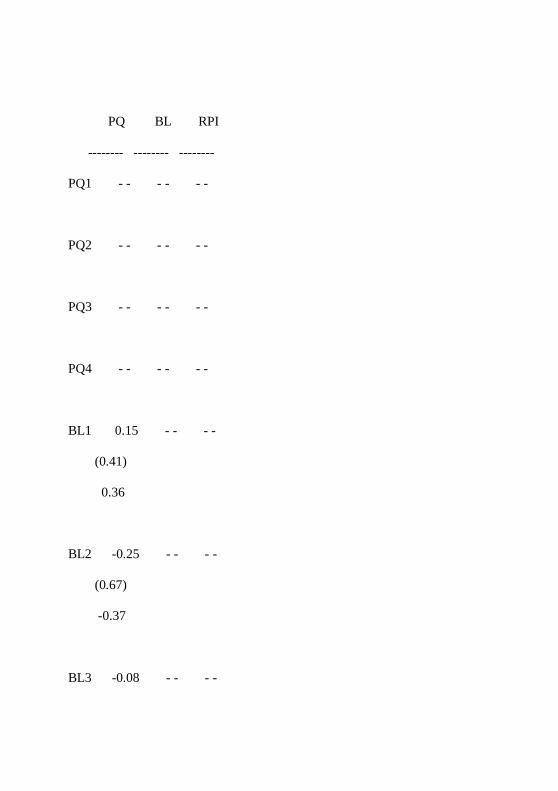
PQ BL RPI
-------- -------- --------
PQ1 - - - - - -
PQ2 - - - - - -
PQ3 - - - - - -
PQ4 - - - - - -
BL1 0.15 - - - -
(0.41)
0.36
BL2 -0.25 - - - -
(0.67)
-0.37
BL3 -0.08 - - - -
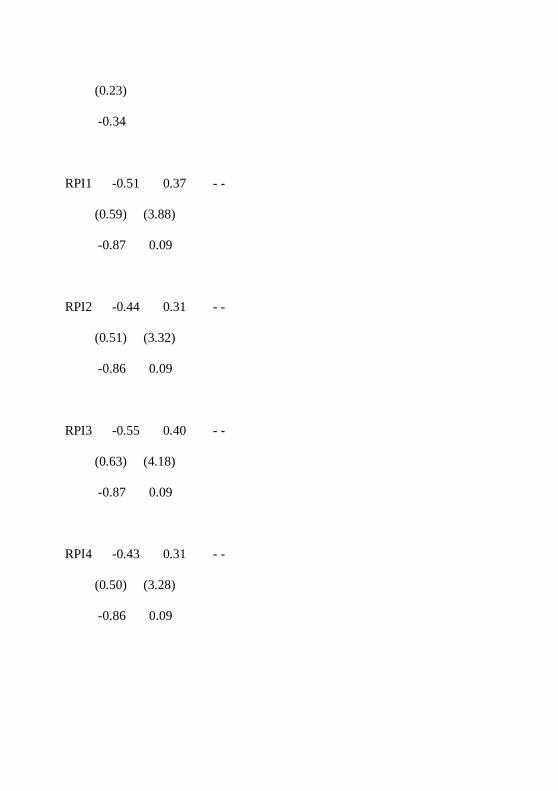
(0.23)
-0.34
RPI1 -0.51 0.37 - -
(0.59) (3.88)
-0.87 0.09
RPI2 -0.44 0.31 - -
(0.51) (3.32)
-0.86 0.09
RPI3 -0.55 0.40 - -
(0.63) (4.18)
-0.87 0.09
RPI4 -0.43 0.31 - -
(0.50) (3.28)
-0.86 0.09
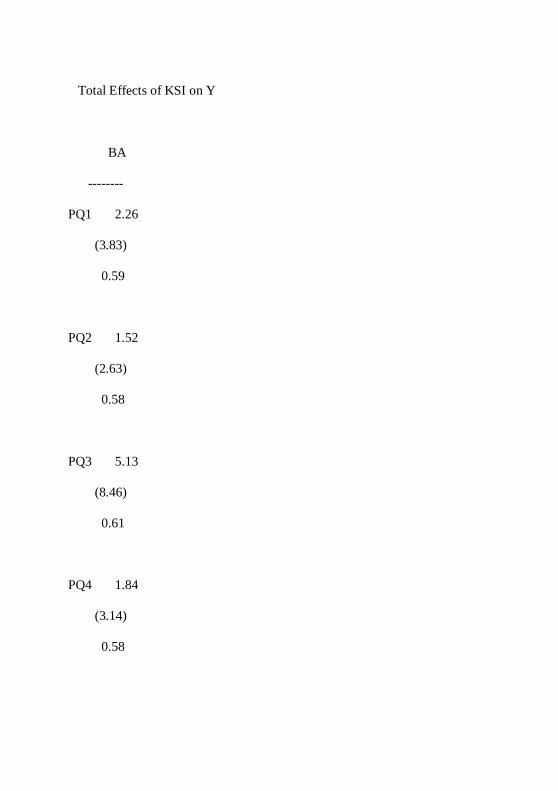
Total Effects of KSI on Y
BA
--------
PQ1 2.26
(3.83)
0.59
PQ2 1.52
(2.63)
0.58
PQ3 5.13
(8.46)
0.61
PQ4 1.84
(3.14)
0.58
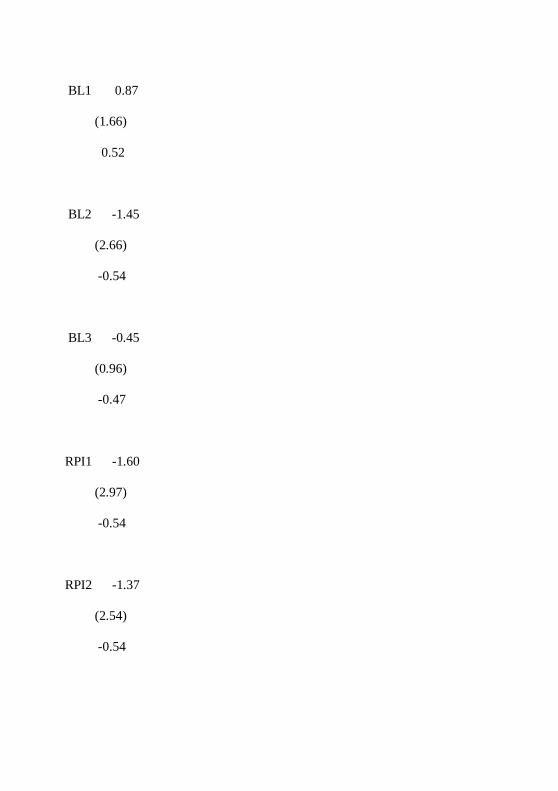
BL1 0.87
(1.66)
0.52
BL2 -1.45
(2.66)
-0.54
BL3 -0.45
(0.96)
-0.47
RPI1 -1.60
(2.97)
-0.54
RPI2 -1.37
(2.54)
-0.54
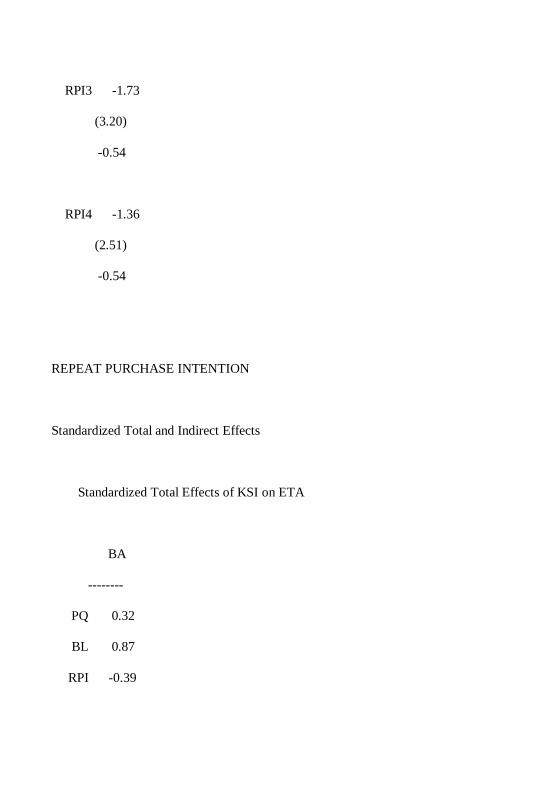
RPI3 -1.73
(3.20)
-0.54
RPI4 -1.36
(2.51)
-0.54
REPEAT PURCHASE INTENTION
Standardized Total and Indirect Effects
Standardized Total Effects of KSI on ETA
BA
--------
PQ 0.32
BL 0.87
RPI -0.39
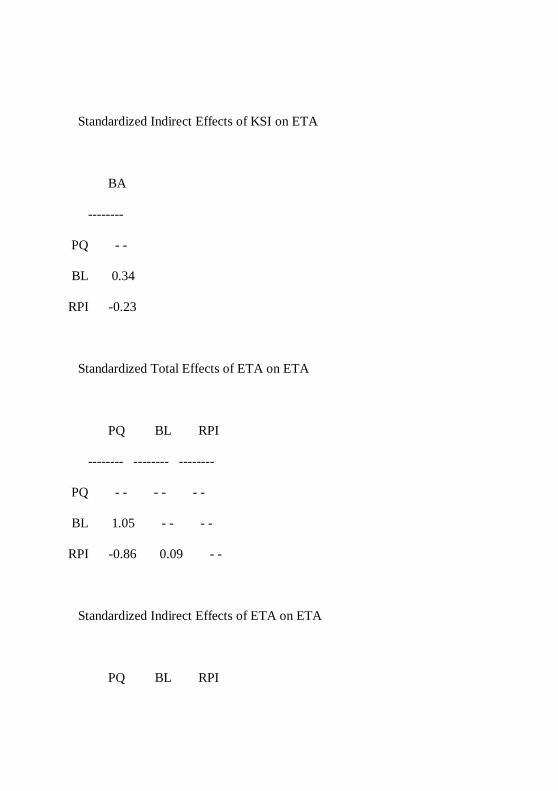
Standardized Indirect Effects of KSI on ETA
BA
--------
PQ - -
BL 0.34
RPI -0.23
Standardized Total Effects of ETA on ETA
PQ BL RPI
-------- -------- --------
PQ - - - - - -
BL 1.05 - - - -
RPI -0.86 0.09 - -
Standardized Indirect Effects of ETA on ETA
PQ BL RPI
-------- -------- --------
PQ - - - - - -
BL - - - - - -
RPI 0.09 - - - -
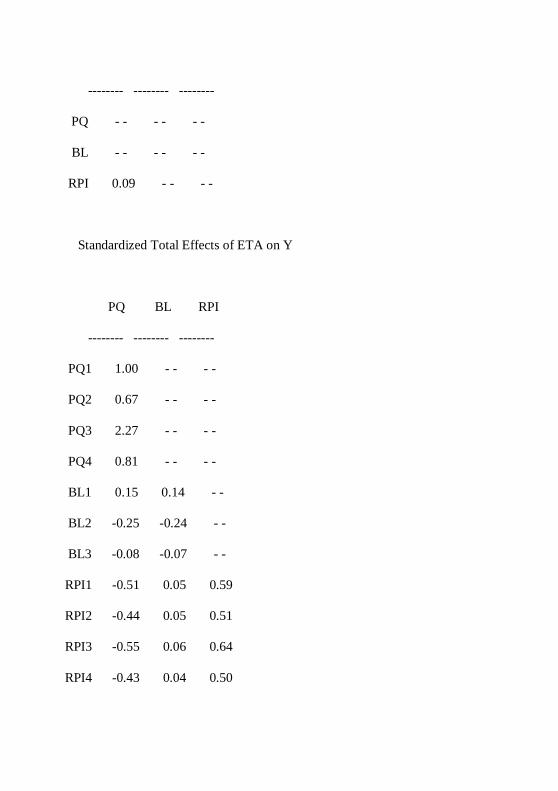
Standardized Total Effects of ETA on Y
PQ BL RPI
-------- -------- --------
PQ1 1.00 - - - -
PQ2 0.67 - - - -
PQ3 2.27 - - - -
PQ4 0.81 - - - -
BL1 0.15 0.14 - -
BL2 -0.25 -0.24 - -
BL3 -0.08 -0.07 - -
RPI1 -0.51 0.05 0.59
RPI2 -0.44 0.05 0.51
RPI3 -0.55 0.06 0.64
RPI4 -0.43 0.04 0.50
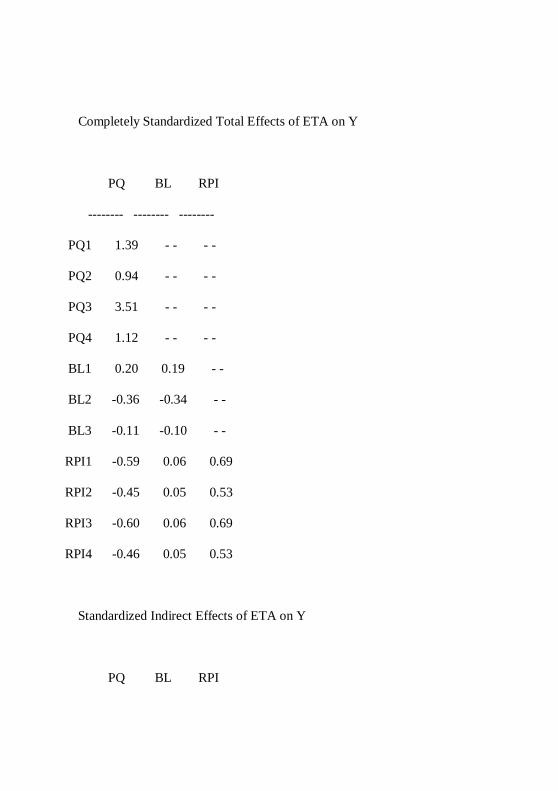
Completely Standardized Total Effects of ETA on Y
PQ BL RPI
-------- -------- --------
PQ1 1.39 - - - -
PQ2 0.94 - - - -
PQ3 3.51 - - - -
PQ4 1.12 - - - -
BL1 0.20 0.19 - -
BL2 -0.36 -0.34 - -
BL3 -0.11 -0.10 - -
RPI1 -0.59 0.06 0.69
RPI2 -0.45 0.05 0.53
RPI3 -0.60 0.06 0.69
RPI4 -0.46 0.05 0.53
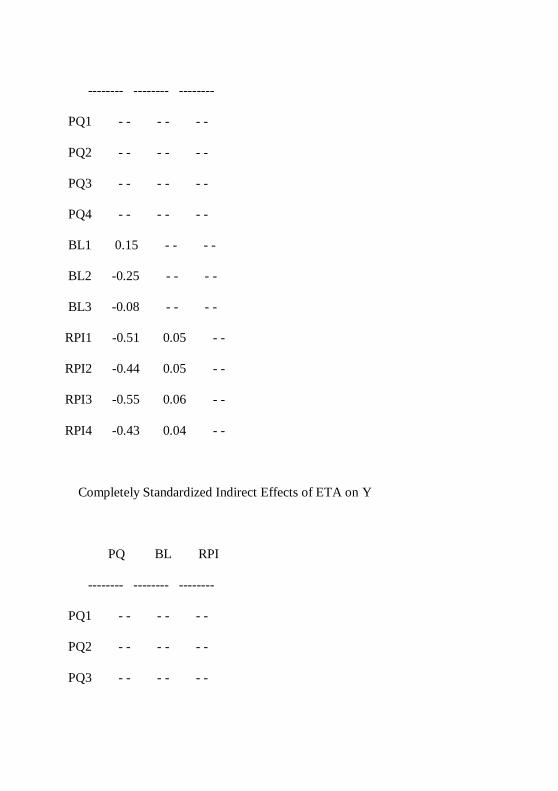
Standardized Indirect Effects of ETA on Y
PQ BL RPI
-------- -------- --------
PQ1 - - - - - -
PQ2 - - - - - -
PQ3 - - - - - -
PQ4 - - - - - -
BL1 0.15 - - - -
BL2 -0.25 - - - -
BL3 -0.08 - - - -
RPI1 -0.51 0.05 - -
RPI2 -0.44 0.05 - -
RPI3 -0.55 0.06 - -
RPI4 -0.43 0.04 - -
Completely Standardized Indirect Effects of ETA on Y
PQ BL RPI
-------- -------- --------
PQ1 - - - - - -
PQ2 - - - - - -
PQ3 - - - - - -
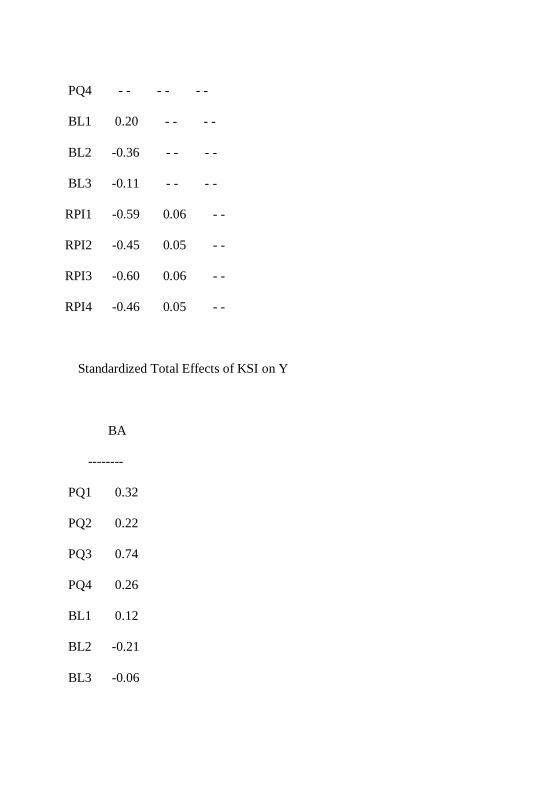
PQ4 - - - - - -
BL1 0.20 - - - -
BL2 -0.36 - - - -
BL3 -0.11 - - - -
RPI1 -0.59 0.06 - -
RPI2 -0.45 0.05 - -
RPI3 -0.60 0.06 - -
RPI4 -0.46 0.05 - -
Standardized Total Effects of KSI on Y
BA
--------
PQ1 0.32
PQ2 0.22
PQ3 0.74
PQ4 0.26
BL1 0.12
BL2 -0.21
BL3 -0.06
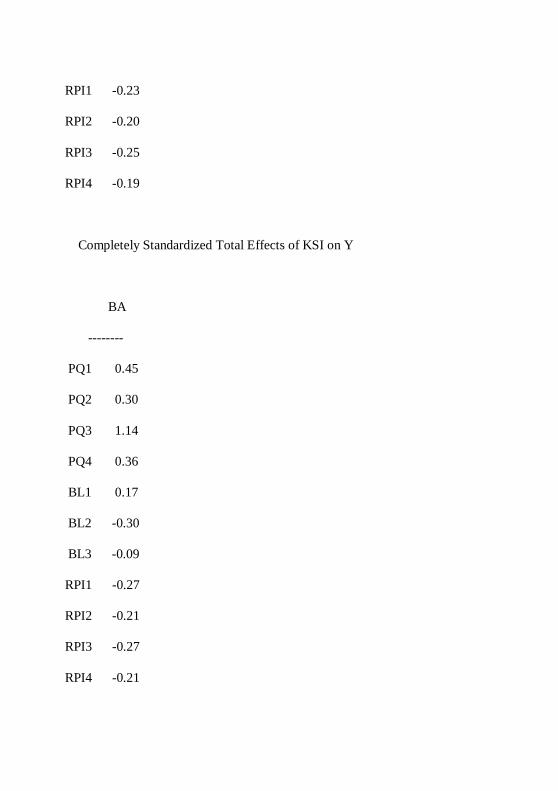
RPI1 -0.23
RPI2 -0.20
RPI3 -0.25
RPI4 -0.19
Completely Standardized Total Effects of KSI on Y
BA
--------
PQ1 0.45
PQ2 0.30
PQ3 1.14
PQ4 0.36
BL1 0.17
BL2 -0.30
BL3 -0.09
RPI1 -0.27
RPI2 -0.21
RPI3 -0.27
RPI4 -0.21

Time used: 0.094 Seconds