LAMPIRAN - eprints.unwahas.ac.ideprints.unwahas.ac.id/879/6/LAMPIRAN.pdf · D. Pembuatan Larutan...
22
54 LAMPIRAN
Transcript of LAMPIRAN - eprints.unwahas.ac.ideprints.unwahas.ac.id/879/6/LAMPIRAN.pdf · D. Pembuatan Larutan...

54
LAMPIRAN

Lampiran 1. Surat Keterangan Hasil Determinasi Tanaman Kenikir

Lampiran 1. Lanjutan..

Lampiran 1. Lanjutan..
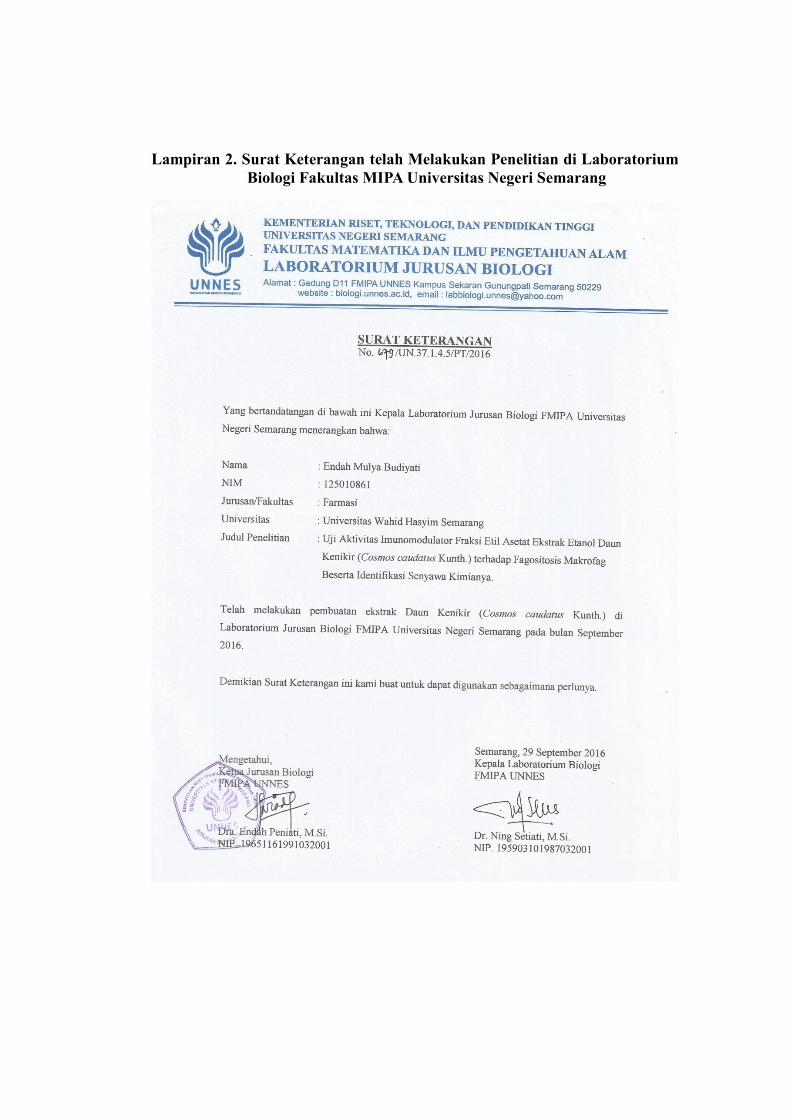
Lampiran 2. Surat Keterangan telah Melakukan Penelitian di Laboratorium
Biologi Fakultas MIPA Universitas Negeri Semarang

Lampiran 3. Surat Keterangan Ethical Clearance

Lampiran 4. Surat Keterangan telah Melakukan Penelitian di Laboratorium
Biologi Fakultas MIPA Universitas Negeri Semarang

Lampiran 5. Surat Keterangan Telah Melakukan Penelitian di
Laboratorium Parasitologi Fakultas Kedokteran Universitas
Gadjah Mada Yogyakarta

Lampiran 6. Data Perhitungan Preparasi Sampel Uji, Kontrol Positif,
Kontrol Negatif dan Vaksin.
A. Pembuatan Seri Konsentrasi Sampel Uji 42, 84, 168 mg/ BB
Perhitungan konsentrasi sampel uji
1. Konsentrasi 168 mg/BB
Ekstrak yang ditimbang :
168 mg x 5 (mencit) x 17 (hari) = 14280 mg
= 14280 mg x 2 (untuk melebihkan larutan stok)
= 28560 mg 28,6 g
Rumus per oral = 1 mL / mencit / hari / 20 g BB
1 mL x 5 (mencit) x 17 (hari) x 2 = 170 mL
CMC Na 1% = 1,7 g
Keterangan :
Untuk melarutkan CMC Na 1% ditimbang 1,7 g dilarutkan dengan air panas 70
mL. Kemudian ekstrak yang sudah ditimbang sebanyak 28,6 g dicampur dengan
larutan CMC Na hingga homogen selanjutnya ditambah sisa air (100 mL) hingga
larut sempurna. Sedangkan untuk perhitungan dosis 42 dan 84 mg/BB dibagi
menjadi separuhnya.
B. Pembuatan larutan kontrol positif stimuno
Dosis yang tertera dalam kemasan stimuno = 5mg/mL
Dosis yang digunakan 0,1mg/mL
Konsentrasi :
V1 x M1 = V2 x M2
V1 x 0,1 = 5 x 1
V1 = 0,02mL

Jadi dosis yang diberikan tiap mencit adalah 0.02 mL
Volume per oral :
0,02mL x 6(mencit) x 17 (hari)= 2,04 mL
Larutan stok:
0,5mL / 20 g BB mencit x 6(mencit)x 17(hari)= 51 mL
Diambil stimuno sebanyak 2,04 mL di add dengan aquades sampai volume 51
mL.
C. Pembuatan larutan kontrol negatif CMC Na
CMC Na yang digunakan 1%
1 g x 6 (mencit) x 17(hari) = 102
1% x 102mL =1,02 g ( yang ditimbang)
Larutan stok : ditimbang 1,02 g CMC Na di add dengan air panas 102 mL
Rumus per oral 0,5 mL / 20g BB mencit.
D. Pembuatan Larutan Vaksin Hepatitis B
Dosis yang tertera dalam kemasan vaksin hepatitis B adalah 20 µg/mL
Dosis yang digunakan 2,6 µL/20 g BB mencit
Vaksin diberikan dua kali pada hari ke 8 dan 14
2,6 µL/20 g BB x 48 (mencit) x 2 = 249,6 µl
Diketahui = 1 µL = 0,001 µg
Diambil dari kemasan vaksin 0,26 mL kemudian di add dengan 10 mL larutan
NaCl fisiologis. Dilakukan pengenceran 100 kali sehingga didapatkan kadar
vaksin dalam 1 mL mengandung 0,0026 mL.
Rumus per intraperitoneal 0,1 mL/20 g BB.

Lampiran 7. Perhitungan Jumlah Sel Makrofag dengan Haemositometer
Perhitungan Sel pada Hemositometer
Kuadran I : 31
II : 29
III : 37
IV : 36
V : 34
167
Menghitung kepadatan sel
= 167 x 104 x 25/5
= 865 x 104
= 432,5 x 104
= 43,25 x 105
= 4,325 x 106
Hasil dari perhitungan kepadatan sel, kemudian dimasukkan pada rumus untuk
menghitung sel yang harus ditambahkan pada coverslip.
Sebagai patokan setiap sumuran mengandung : 2,5 x 10⁶, sehingga
V1. N1 = V2.N2
V1. 4,325 = 1. 2,5
V1 = 0,58 ml
V1= 580 µL
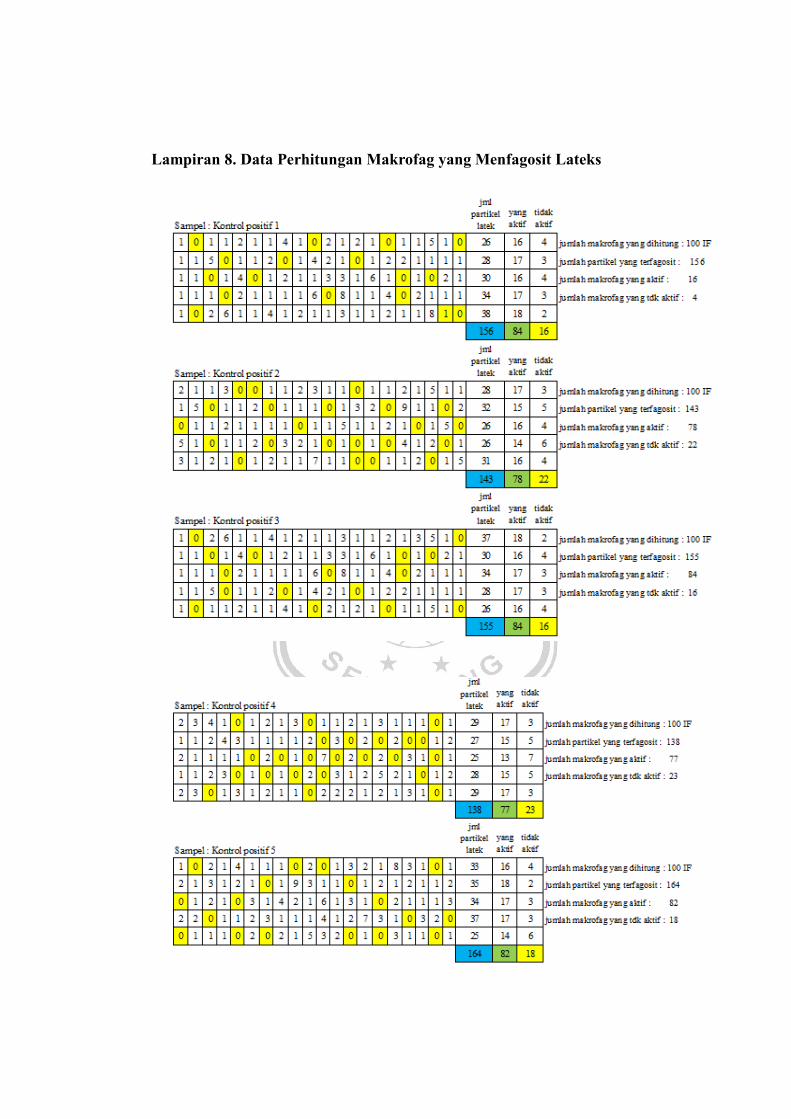
Lampiran 8. Data Perhitungan Makrofag yang Menfagosit Lateks


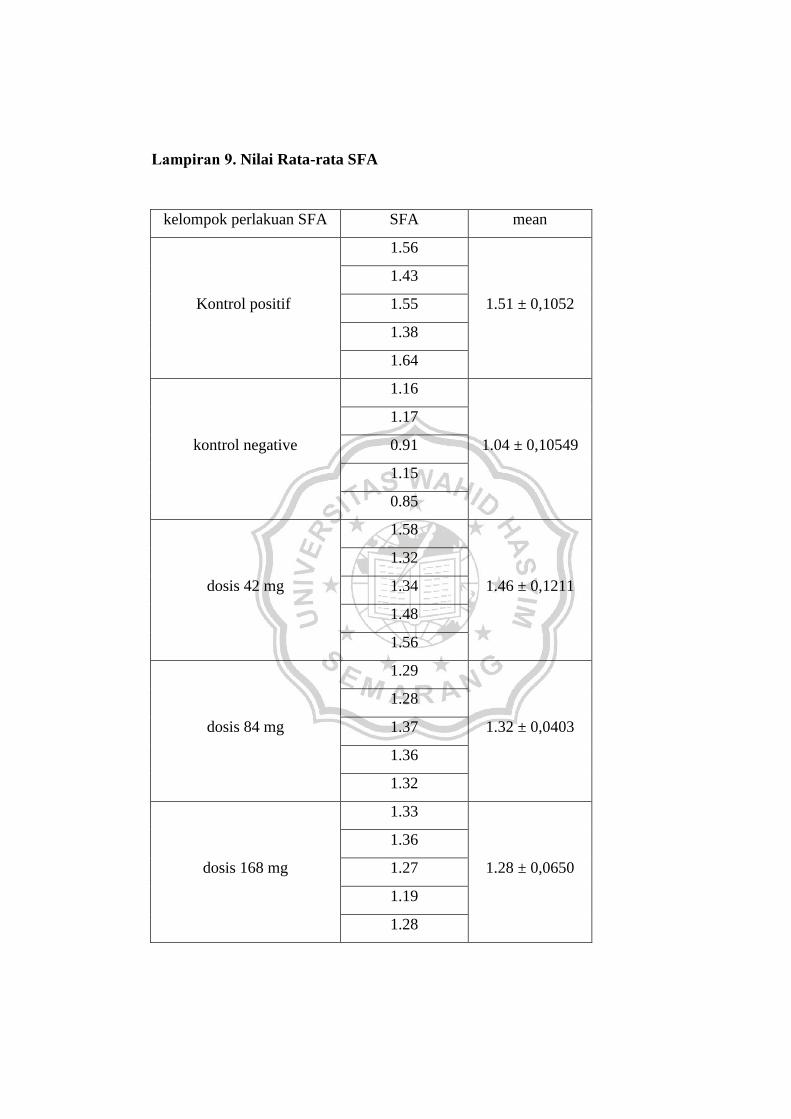
Lampiran 9. Nilai Rata-rata SFA
kelompok perlakuan SFA SFA mean
Kontrol positif
1.56
1.51 ± 0,1052
1.43
1.55
1.38
1.64
kontrol negative
1.16
1.04 ± 0,10549
1.17
0.91
1.15
0.85
dosis 42 mg
1.58
1.46 ± 0,1211
1.32
1.34
1.48
1.56
dosis 84 mg
1.29
1.32 ± 0,0403
1.28
1.37
1.36
1.32
dosis 168 mg
1.33
1.28 ± 0,0650
1.36
1.27
1.19
1.28
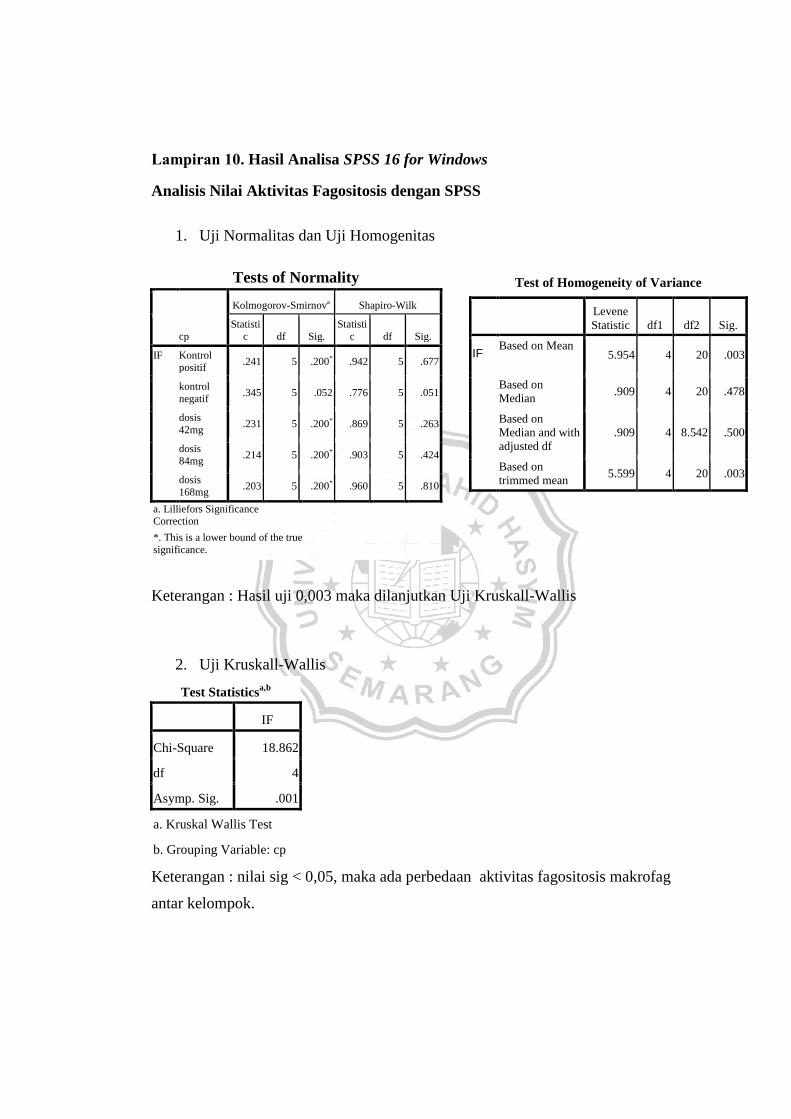
Lampiran 10. Hasil Analisa SPSS 16 for Windows
Analisis Nilai Aktivitas Fagositosis dengan SPSS
1. Uji Normalitas dan Uji Homogenitas
Tests of Normality
cp
Kolmogorov-Smirnova Shapiro-Wilk
Statisti
c df Sig.
Statisti
c df Sig.
IF Kontrol
positif .241 5 .200* .942 5 .677
kontrol
negatif .345 5 .052 .776 5 .051
dosis
42mg .231 5 .200* .869 5 .263
dosis
84mg .214 5 .200* .903 5 .424
dosis
168mg .203 5 .200* .960 5 .810
a. Lilliefors Significance Correction
*. This is a lower bound of the true
significance.
Keterangan : Hasil uji 0,003 maka dilanjutkan Uji Kruskall-Wallis
2. Uji Kruskall-Wallis
Test Statisticsa,b
IF
Chi-Square 18.862
df 4
Asymp. Sig. .001
a. Kruskal Wallis Test
b. Grouping Variable: cp
Keterangan : nilai sig < 0,05, maka ada perbedaan aktivitas fagositosis makrofag
antar kelompok.
Test of Homogeneity of Variance
Levene
Statistic df1 df2 Sig.
IF Based on Mean
5.954 4 20 .003
Based on
Median .909 4 20 .478
Based on
Median and with
adjusted df
.909 4 8.542 .500
Based on
trimmed mean 5.599 4 20 .003

3.Uji Mann-Whitney
1. Kontrol positif –negatif
Ranks
Cp N Mean Rank
Sum of Ranks
IF Kontrol positif
5 8.00 40.00
kontrol negative
5 3.00 15.00
Total 10
2. Kontrol positif – dosis 42 mg
Ranks
Cp N
Mean Rank
Sum of Ranks
IF Kontrol positif
5 6.10 30.50
dosis 42mg
5 4.90 24.50
Total 10
3. Kontrol positif – dosis 84 mg Ranks
cp N
Mean Rank
Sum of Ranks
IF Kontrol positif
5 8.00 40.00
dosis 84mg
5 3.00 15.00
Total 10
Test Statisticsb
IF
Mann-Whitney U .000
Wilcoxon W 15.000
Z -2.611
Asymp. Sig. (2-tailed) .009
Exact Sig. [2*(1-tailed Sig.)] .008
a
a. Not corrected for ties.
b. Grouping Variable: cp
Test Statisticsb
IF
Mann-Whitney U 9.500
Wilcoxon W 24.500
Z -.629
Asymp. Sig. (2-tailed) .530
Exact Sig. [2*(1-tailed Sig.)] .548
a
a. Not corrected for ties.
b. Grouping Variable: cp
Test Statisticsb
IF
Mann-Whitney U .000
Wilcoxon W 15.000
Z -2.611
Asymp. Sig. (2-tailed) .009
Exact Sig. [2*(1-tailed Sig.)] .008a
a. Not corrected for ties.
b. Grouping Variable: cp

4. Kontrol positif – dosis 168 mg
Ranks
cp N
Mean Rank
Sum of Ranks
IF Kontrol positif
5 8.00 40.00
dosis 168mg
5 3.00 15.00
Total 10
5. Kontrol negatif – dosis 42 mg
Ranks
cp N
Mean Rank
Sum of Ranks
IF kontrol negatif
5 3.00 15.00
dosis 42mg 5 8.00 40.00
Total 10
6. Kontrol negatif – dosis 84 mg
Ranks
cp N
Mean Rank
Sum of Ranks
IF kontrol negatif
5 3.00 15.00
dosis 84mg 5 8.00 40.00
Total 10
Test Statisticsb
IF
Mann-Whitney U .000
Wilcoxon W 15.000
Z -2.611
Asymp. Sig. (2-tailed) .009
Exact Sig. [2*(1-tailed Sig.)] .008a
a. Not corrected for ties.
b. Grouping Variable: cp
Test Statisticsb
IF
Mann-Whitney U .000
Wilcoxon W 15.000
Z -2.611
Asymp. Sig. (2-tailed) .009
Exact Sig. [2*(1-tailed Sig.)] .008a
a. Not corrected for ties.
b. Grouping Variable: cp
Test Statistics
b
IF
Mann-Whitney U .000
Wilcoxon W 15.000
Z -2.611
Asymp. Sig. (2-tailed) .009
Exact Sig. [2*(1-tailed Sig.)] .008
a
a. Not corrected for ties.
b. Grouping Variable: cp
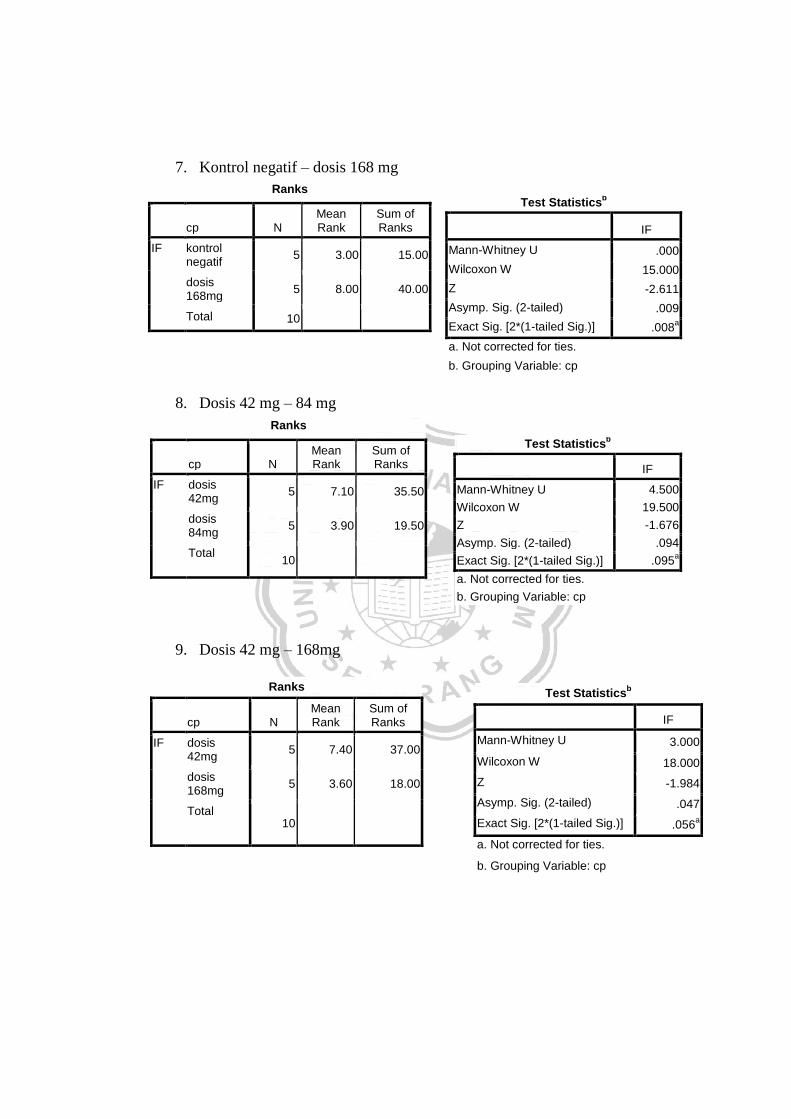
7. Kontrol negatif – dosis 168 mg
Ranks
cp N
Mean Rank
Sum of Ranks
IF kontrol negatif
5 3.00 15.00
dosis 168mg
5 8.00 40.00
Total 10
8. Dosis 42 mg – 84 mg
Ranks
cp N
Mean Rank
Sum of Ranks
IF dosis 42mg
5 7.10 35.50
dosis 84mg
5 3.90 19.50
Total 10
9. Dosis 42 mg – 168mg
Ranks
cp N
Mean Rank
Sum of Ranks
IF dosis 42mg
5 7.40 37.00
dosis 168mg
5 3.60 18.00
Total 10
Test Statisticsb
IF
Mann-Whitney U .000
Wilcoxon W 15.000
Z -2.611
Asymp. Sig. (2-tailed) .009
Exact Sig. [2*(1-tailed Sig.)] .008a
a. Not corrected for ties.
b. Grouping Variable: cp
Test Statisticsb
IF
Mann-Whitney U 4.500
Wilcoxon W 19.500
Z -1.676
Asymp. Sig. (2-tailed) .094
Exact Sig. [2*(1-tailed Sig.)] .095a
a. Not corrected for ties.
b. Grouping Variable: cp
Test Statisticsb
IF
Mann-Whitney U 3.000
Wilcoxon W 18.000
Z -1.984
Asymp. Sig. (2-tailed) .047
Exact Sig. [2*(1-tailed Sig.)] .056a
a. Not corrected for ties.
b. Grouping Variable: cp

10. Dosis 84 mg – 168 mg
Ranks
cp N
Mean Rank
Sum of Ranks
IF dosis 84mg
5 6.60 33.00
dosis 168mg
5 4.40 22.00
Total
10
Test Statisticsb
IF
Mann-Whitney U 7.000
Wilcoxon W 22.000
Z -1.156
Asymp. Sig. (2-tailed) .248
Exact Sig. [2*(1-tailed Sig.)] .310a
a. Not corrected for ties.
b. Grouping Variable: cp