ING in 2015
23
ING in 2015 Ralph Hamers, CEO ING Group Improved customer experience, robust commercial growth, strong earnings Amsterdam • 4 February 2016
-
Upload
ing -
Category
Economy & Finance
-
view
7.211 -
download
0
Transcript of ING in 2015
ING in 2015
Ralph Hamers, CEO ING Group
Improved customer experience, robust commercial growth, strong earnings
Amsterdam • 4 February 2016

Improved customer experience, robust commercial growth, solid results
2
…resulting in strong results… • Underlying net result ING Bank rose to EUR 4,219 mln in 2015, up 23.2% from 2014 • Fourth quarter 2015 underlying result before tax ING Bank EUR 1,202 mln
…boosting our capital ratios • Fully-loaded CET 1 ratio ING Group rose from 12.3% to 12.7%, above the regulatory fully-loaded requirement of 12.5% • Pro-forma Group CET1 on a fully-loaded basis of 13.4%
Continued growth in customer numbers and lending… • Our retail customer base grew by over 1.4 mln to 34.4 mln at year-end • Our core lending franchises grew by EUR 21.7 bln or 4.2% in 2015, in line with our guidance

Our Think Forward strategy was launched in 2014 In its second year we continued progress on many fronts Highlights include: • Increasing the pace of
innovation • Empowering customers • Diversifying lending
capabilities • Sustainable transitions • Earning the primary
relationship
3
In 2015 we continued to make progress on strategic initiatives
Strategic initiatives: focus on innovation
4
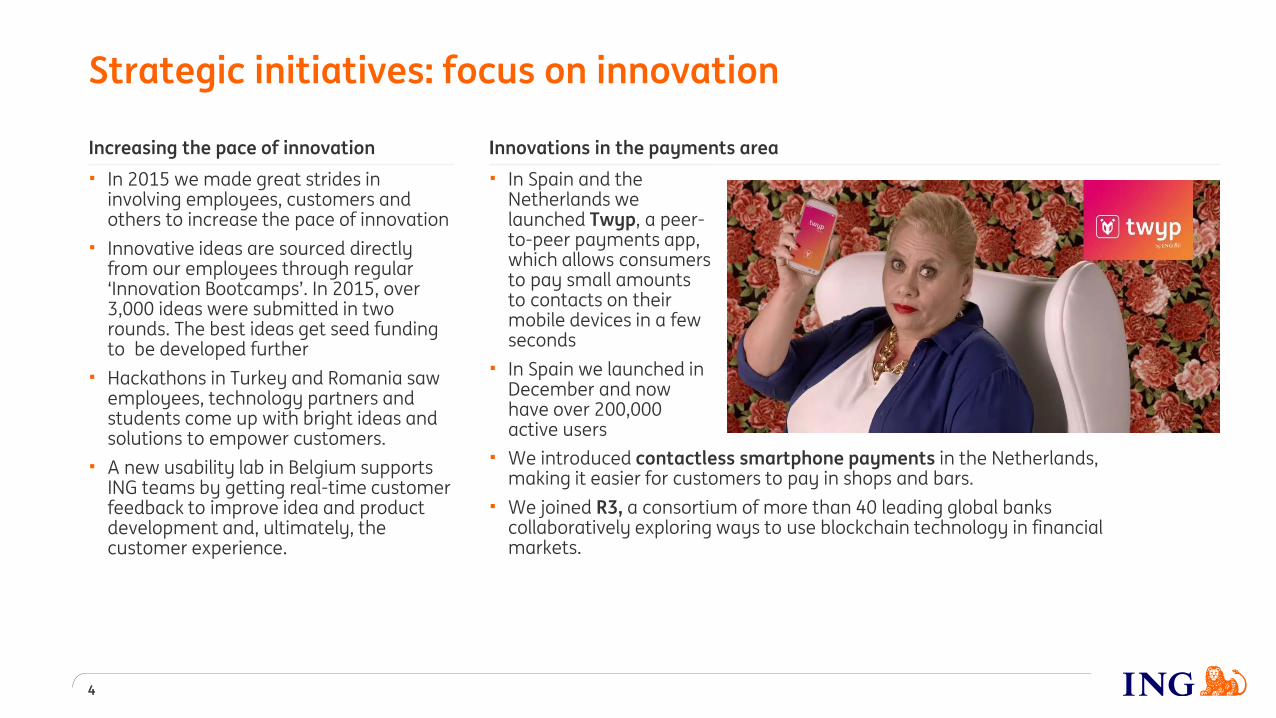
• We introduced contactless smartphone payments in the Netherlands, making it easier for customers to pay in shops and bars.
• We joined R3, a consortium of more than 40 leading global banks collaboratively exploring ways to use blockchain technology in financial markets.
Increasing the pace of innovation • In 2015 we made great strides in
involving employees, customers and others to increase the pace of innovation
• Innovative ideas are sourced directly from our employees through regular ‘Innovation Bootcamps’. In 2015, over 3,000 ideas were submitted in two rounds. The best ideas get seed funding to be developed further
• Hackathons in Turkey and Romania saw employees, technology partners and students come up with bright ideas and solutions to empower customers.
• A new usability lab in Belgium supports ING teams by getting real-time customer feedback to improve idea and product development and, ultimately, the customer experience.
Innovations in the payments area
I • In Spain and the
Netherlands we launched Twyp, a peer-to-peer payments app, which allows consumers to pay small amounts to contacts on their mobile devices in a few seconds
• In Spain we launched in December and now have over 200,000 active users

Strategic initiatives: empowerment and lending capabilities
5
Empowering people • Innovation helps to empower people to make better
financial decisions • In Poland we launched Moje ING, a new omnichannel
banking platform, based on a similar platform in Spain. • The platform gives customers insight into their personal
finances in an easy and intuitive way
• In the Netherlands, ING 360 is a fee-based personalised financial dashboard that gives entrepreneurs insight ‘anytime, anywhere’ into opportunities to optimise their operations and increase revenue.
Strengthening lending capabilities • We are looking at fintech innovations to help strengthen
our lending capabilities and better serve our consumer and SME clients
• We launched a strategic partnership with Kabbage, one of the leading US-based technology platforms providing automated lending to SMEs. We also took an equity stake.
• A first pilot project, in Spain, is underway
• In January 2016, we made an investment in fintech WeLab, which provides consumer loans in China and Hong Kong in a fully automated process that just takes minutes, from application to approval

6
Reducing ING’s own environmental footprint • We published our ambitions to reduce our carbon dioxide
footprint, water usage and waste by 20% by 2020 • We have committed to procuring 100% renewable
electricity for all our buildings by 2020 • Successfully issued our first-ever green bond in November,
highly oversubscribed and raising approximately EUR 1.2 bln (dual currency). Proceeds support sustainable projects in six sectors
• Efforts are well regarded by leading external agencies
Sustainable transitions • The ING Sustainable Finance team promotes sustainable
business opportunities in addition to our ongoing assessment and management of environmental and social risks (ESR)
• We ended the financing of new coal-fired power plants and thermal coal mines worldwide. Going forward, we will reduce our global credit exposure to thermal coal-related businesses
• Sustainable transitions financed represents the volume of business that ING conducts with clients and projects that provide sustainable solutions and outperform their sector on environmental performance
Sustainability approach: reducing our own footprint and accelerating sustainable transitions
* In the DJSI ING in 2012 was rated in the category ‘Insurance’, in 2013-2014 in ‘Diversified Financials’, in 2015 in ‘Banks’. ** ING Groenbank offers lending services at favourable rates for a diverse range of sustainable projects, from wind turbines to organic faming to solar panels, both in and outside the Netherlands. Funding comes from savings with fiscal incentive.
DJSI rating ING, 2012-2015*
40
60
80
100
2012 2013 2014 2015
INGIndustry Avg.
Sustainable transitions financed (Lending credits outstanding in EUR bln)
2014 2015
Environmental OutperformersProject Finance - Renewable EnergyING Groenbank**Sustainable Real EstateOther
19.5 23.8

In Germany ING DiBa was named ´Best Bank´ by Euro magazine for the eighth time, in a comparison of 31 Nationally active banks. It was also voted the ´most liked bank´ for the ninth time in a row in a poll among more than 130,000 readers of the magazine.
In Australia ING Direct was again named Best Bank in the Mozo People´s Choice Awards, based on 34,000 customers reviews. ING also won the awards for Best Bank Account and Best Savings Account. Money Magazine awarded us for the Best Everyday Account, Cheapest Flexible Home Loan and Best Savings Account Regular Deposits
• In 2015 ING again won many awards for its banking services, both in Retail and Wholesale Banking
• We are particularly proud of the recognition we got from customer groups like the titles for ‘Best Bank’ in both Australia and Germany
• Apart from the award and in line with our Think Forward Strategy, we continuously monitor customer behaviour and satisfaction to adapt our services
7
POLAND
BELGIUM THE NETHERLANDS
Awards mean recognition from experts and customers
Best Bank Western Europe, Belgium and the Netherlands
Our customer growth continued in 2015 …
8
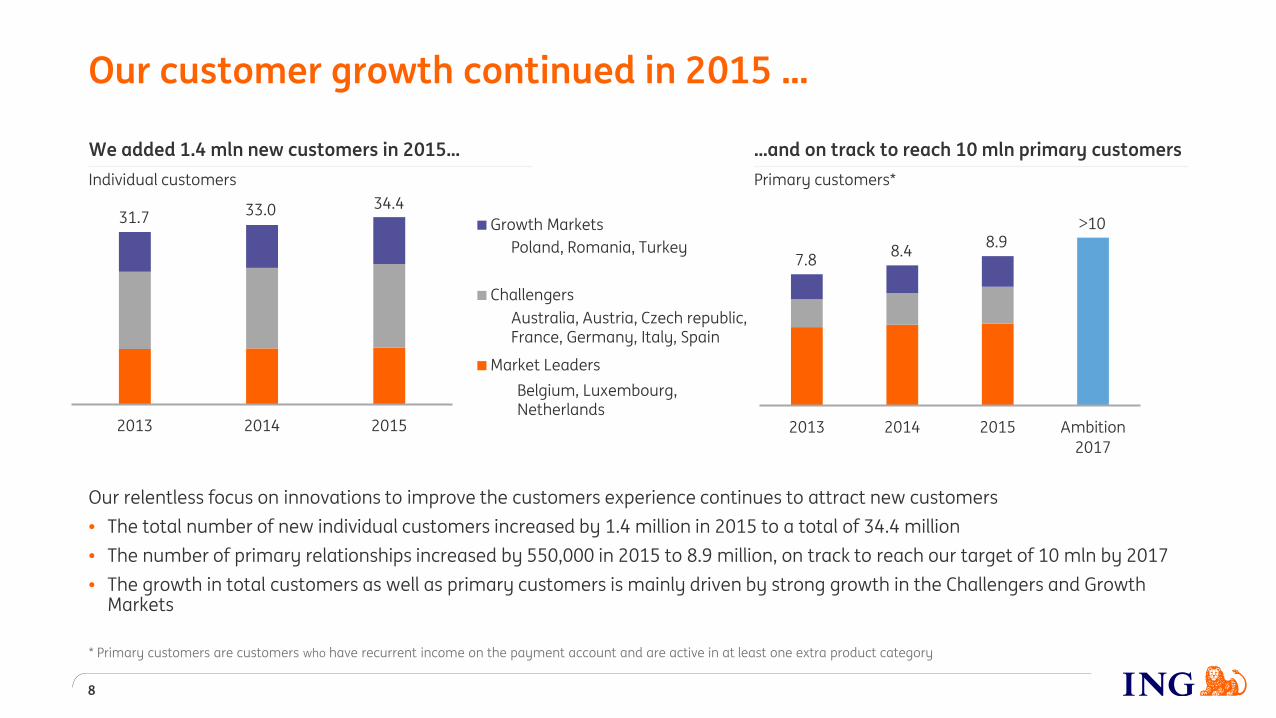
* Primary customers are customers who have recurrent income on the payment account and are active in at least one extra product category
Our relentless focus on innovations to improve the customers experience continues to attract new customers • The total number of new individual customers increased by 1.4 million in 2015 to a total of 34.4 million • The number of primary relationships increased by 550,000 in 2015 to 8.9 million, on track to reach our target of 10 mln by 2017 • The growth in total customers as well as primary customers is mainly driven by strong growth in the Challengers and Growth
Markets
We added 1.4 mln new customers in 2015… Individual customers
…and on track to reach 10 mln primary customers Primary customers*
2013 2014 2015
Growth Markets
Challengers
Market Leaders
31.7 33.0 34.4
2013 2014 2015 Ambition2017
Belgium, Luxembourg, Netherlands
Australia, Austria, Czech republic, France, Germany, Italy, Spain
Poland, Romania, Turkey 7.8 8.4 8.9
>10

…resulting in ongoing deposit and loan growth
9
85%
13% 2%
Retail BankingWholeslae BankingCorporate Line
Customer deposits (in EUR bln) Customer lending (in EUR bln)
Customer deposits, breakdown (in%) Attractive funding profile • 61% of the balance sheet is funded by customer deposits • 85% of customer deposits is retail based • Comfortable Loan-to-deposit ratio of 1.04 as per
31 December 2015
2013 2014 2015
RB Other C&G
RB Germany
RB Belgium
RB Netherlands
Wholesale Banking*
509 489
2013 2014 2015
RB Other C&G
RB Germany
RB Belgium
RB Netherlands
Wholesale Banking*
533 514 499 475
*Wholesale Banking segment in graphs including Corporate Line
532,7
513,5
2,81,5
3,810,9
7,8
2,51,7
-3.1-3.8-0.3-1.7
-2.9
31-12-14 Retail NL RetailBelgium
RetailGermany
RetailOtherCGM*
WB IL* WB GL&TS*WB Other* CorporateLine
WUB run-off /
transfers**
Lease andother
run-off /sales***
BankTreasury
FX / Other 31-12-15
Customer lending 2015 (in EUR bln)
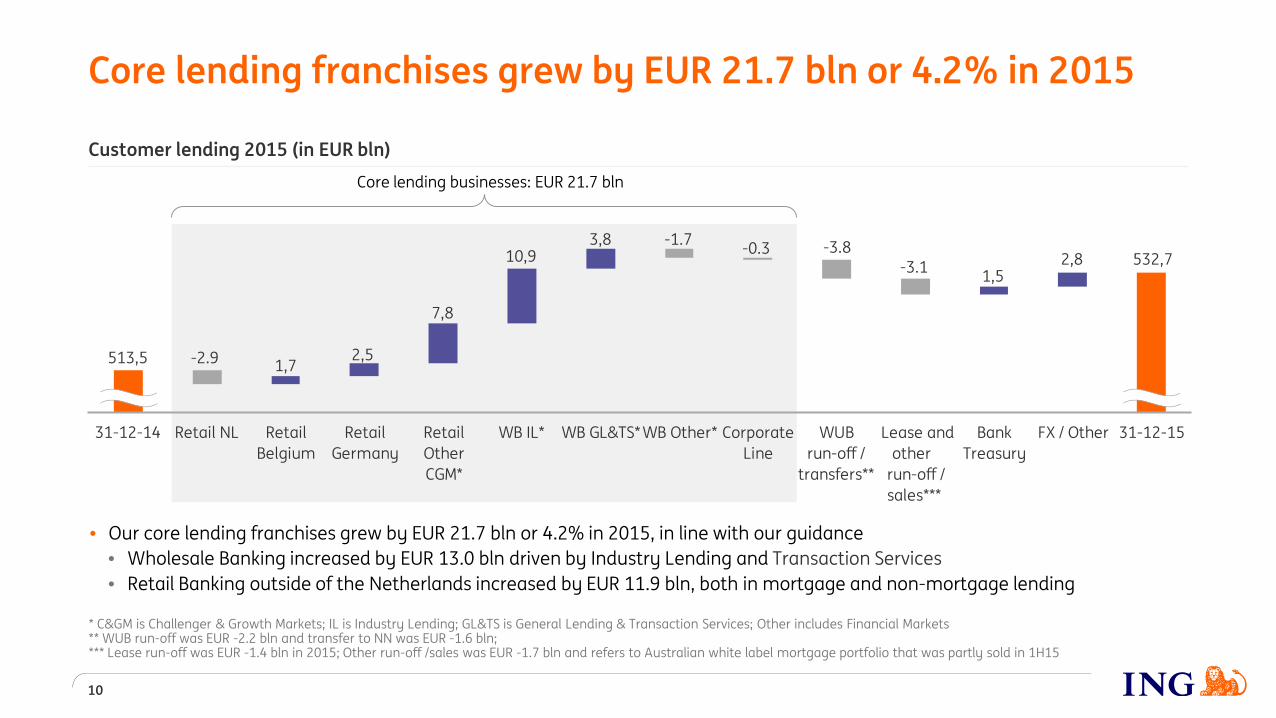
Core lending franchises grew by EUR 21.7 bln or 4.2% in 2015
10
Core lending businesses: EUR 21.7 bln
• Our core lending franchises grew by EUR 21.7 bln or 4.2% in 2015, in line with our guidance • Wholesale Banking increased by EUR 13.0 bln driven by Industry Lending and Transaction Services • Retail Banking outside of the Netherlands increased by EUR 11.9 bln, both in mortgage and non-mortgage lending
* C&GM is Challenger & Growth Markets; IL is Industry Lending; GL&TS is General Lending & Transaction Services; Other includes Financial Markets ** WUB run-off was EUR -2.2 bln and transfer to NN was EUR -1.6 bln; *** Lease run-off was EUR -1.4 bln in 2015; Other run-off /sales was EUR -1.7 bln and refers to Australian white label mortgage portfolio that was partly sold in 1H15
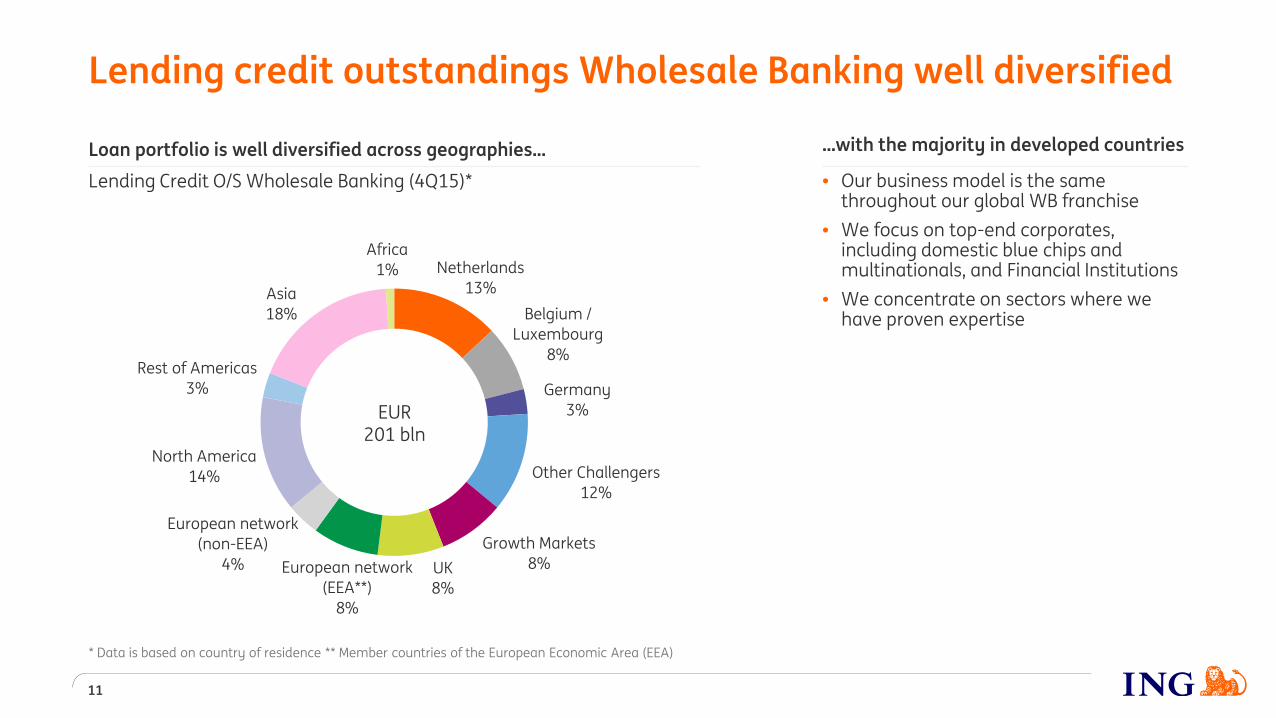
Netherlands 13%
Belgium / Luxembourg
8%
Germany 3%
Other Challengers 12%
Growth Markets 8% UK
8% European network
(EEA**) 8%
European network (non-EEA)
4%
North America 14%
Rest of Americas 3%
Asia 18%
Africa 1%
Lending credit outstandings Wholesale Banking well diversified
11
* Data is based on country of residence ** Member countries of the European Economic Area (EEA)
...with the majority in developed countries
• Our business model is the same throughout our global WB franchise
• We focus on top-end corporates, including domestic blue chips and multinationals, and Financial Institutions
• We concentrate on sectors where we have proven expertise
EUR 201 bln
Loan portfolio is well diversified across geographies… Lending Credit O/S Wholesale Banking (4Q15)*
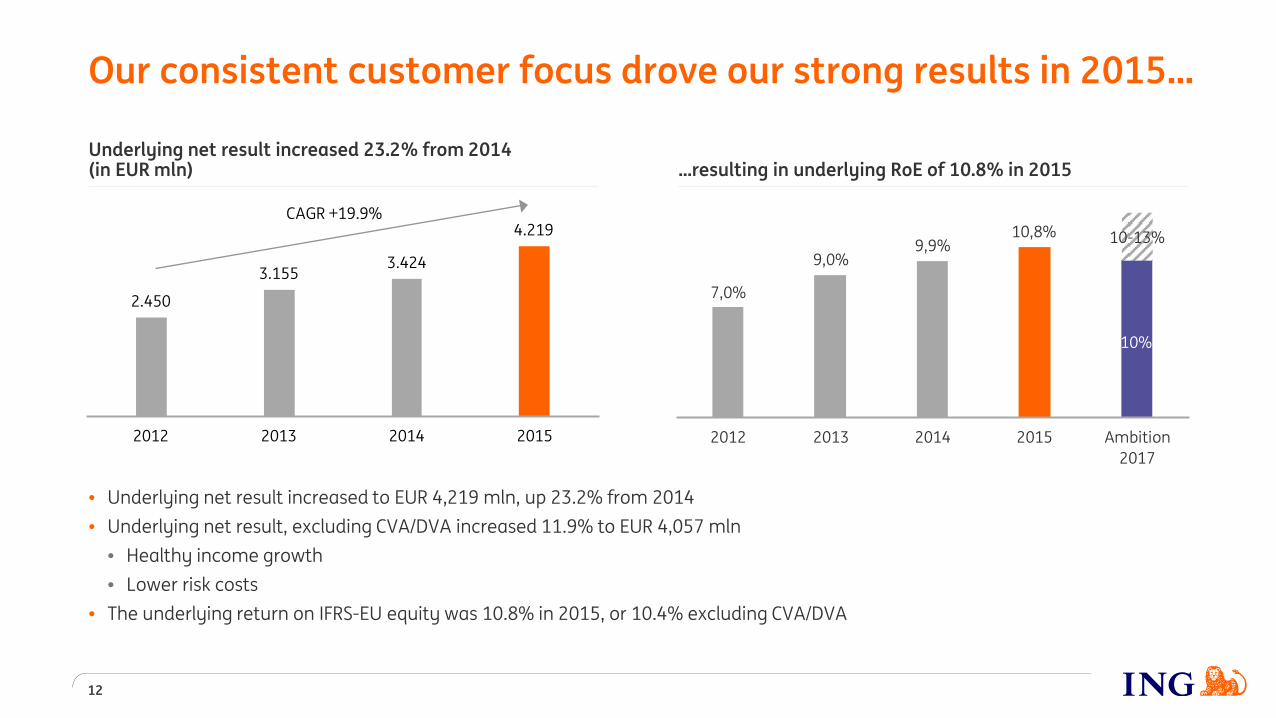
Underlying net result increased 23.2% from 2014 (in EUR mln)
10%
10,8%9,9%
7,0%
9,0%
2012 2013 2014 2015 Ambition2017
2.450
3.1553.424
4.219
2012 2013 2014 2015
CAGR +19.9%
…resulting in underlying RoE of 10.8% in 2015
• Underlying net result increased to EUR 4,219 mln, up 23.2% from 2014 • Underlying net result, excluding CVA/DVA increased 11.9% to EUR 4,057 mln
• Healthy income growth • Lower risk costs
• The underlying return on IFRS-EU equity was 10.8% in 2015, or 10.4% excluding CVA/DVA
12
Our consistent customer focus drove our strong results in 2015…
10-13%

2,1 2,3 1,6 1,3
74 83
55 44
2012 2013 2014 2015
Loan losses (in EUR bln)bps (of RWA)
15,0 15,2 15,616,3
2012 2013 2014 2015
11,0 11,3 11,6 12,2
2012 2013 2014 2015
Risk costs (in EUR bln and bps of RWA)
Net interest result excl. FM (in EUR bln)
Underlying income excl. CVA/DVA (in EUR bln)
…supported by healthy income growth and lower risk costs
13
CAGR +3.4%
CAGR +3.0%
• Underlying income excluding CVA/DVA grew by 4.9% in 2015 versus 2014, driven by higher net interest income • Risk costs declined to EUR 1.3 bln in 2015, or 44 bps of average RWA

72% 6%
15% 7%
MortgagesConsumer loansWholesale BankingOther / Bank Treasury
597771
1.012
2013 2014 2015
Retail Banking Wholesale Banking
ING Germany’s pre-tax profit increased to EUR 1,152 mln in 2015, reaching above EUR 1 bln for the first time
14
866
634
CAGR +34.8%
43%
22%
13%
12% 7% 3%
SavingsMortgagesConsumer loansWBInvestm. productsPayment accounts
765 837
917 51%
47% 43%
2013 2014 2015Expenses Cost/income ratio
…resulting in a diversified income profile…
…with strong cost discipline, while selectively investing in the business Cost/income ratio (%)
1,152
Pre-tax profit ING Germany above EUR 1 bln for the first time (in EUR mln)
Diversifying our Balance Sheet… Customer lending (in %)
2013 2014 2015WB lending Consumer lending
…by growing consumer lending and Wholesale Banking lending… (in EUR bln)
CAGR +47%
8.9 12.2
19.2
4Q15 results
15
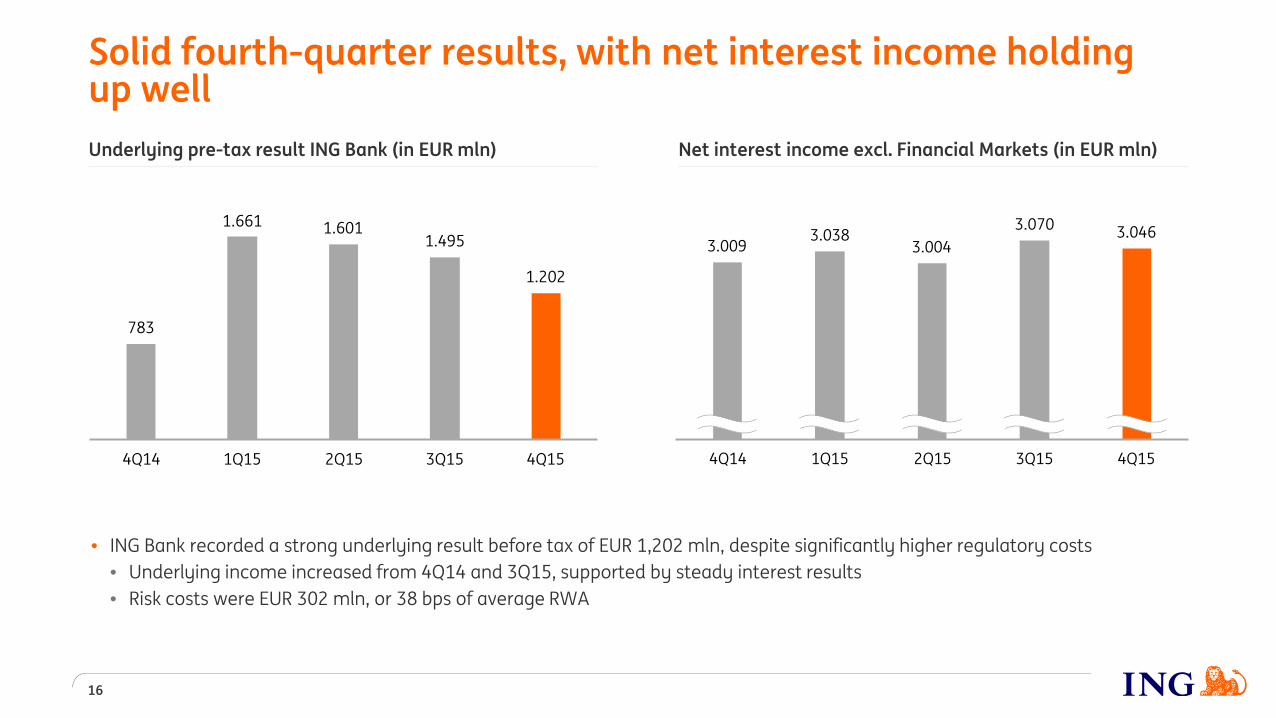
Net interest income excl. Financial Markets (in EUR mln) Underlying pre-tax result ING Bank (in EUR mln)
Solid fourth-quarter results, with net interest income holding up well
783
1.661 1.6011.495
1.202
4Q14 1Q15 2Q15 3Q15 4Q15
16
3.0463.0703.004
3.0383.009
4Q14 1Q15 2Q15 3Q15 4Q15
• ING Bank recorded a strong underlying result before tax of EUR 1,202 mln, despite significantly higher regulatory costs • Underlying income increased from 4Q14 and 3Q15, supported by steady interest results • Risk costs were EUR 302 mln, or 38 bps of average RWA

Net interest margin up from 3Q15 (in bps)
Net interest margin remains steady from 3Q15
17
Volatility in net interest margin largely reflects volatility of interest results in Financial Markets (in bps)
Underlying income Financial Markets* (in EUR mln)
509745
432
783 479836
2013 2014 2015Interest income Non-interest income
1,292 1,224 1,269
142
151 146
2013 2014 2015
Net interest margin up from 3Q15, down from 4Q14 • Interest margin up from 3Q15 by 1 bps, due to higher net
interest results in Financial Markets • Interest margin down by 6 bps from 4Q14, largely due to
lower interest results from Financial Markets • Lower margins on current accounts, partly offset by
higher margins on savings as a result of lower client savings rates to align with record low interest rates
• Lending margins down from 4Q14 and 3Q15, mainly due to lower margins on Belgian mortgages
* Excl. CVA/DVA
153
147 143
146 147
4Q14 1Q15 2Q15 3Q15 4Q15

Operating expenses heavily impacted by regulatory costs
• We took a number of smaller redundancy provisions in Retail Benelux and Wholesale Banking this quarter, which in aggregate amounted to EUR 120 mln and which are expected to deliver annual savings of EUR 65 mln by 2017
• Adjusted for the redundancy costs and regulatory costs, expenses increased by 6.2% from 4Q14 and were in line with 3Q15 • Increase from 4Q14 mainly due to the Corporate Line, where expenses were higher reflecting releases in 4Q14, as well as in
Retail Challengers & Growth Markets and Wholesale Banking, reflecting investments to support business growth
2.015 2.068 2.157 2.141 2.139
4Q14 1Q15 2Q15 3Q15 4Q15
Expenses Regulatory costs Redundancy costs
18
11
260 213 249 244 147
85 161 159 233
143
2011 2012 2013 2014 2015
Bank taxes DGS NRF*
408
158
344 374
620
* National Resolution Fund (NRF)
Underlying operating expenses (in EUR mln) Regulatory costs (in EUR mln)

Risk costs (in EUR mln)
165 153 140 82 59
18 48 40
16 65
65 59 62
66 80
152 173
111
97 97
4Q14 1Q15 2Q15 3Q15 4Q15
Wholesale BankingRetail Challengers & Growth MarketsRetail BelgiumRetail Netherlands
Risk costs amounted to EUR 302 mln or 38 bps of RWA and NPL ratio improved to 2.5%
302 353
261
19
• Risk costs were EUR 302 mln, or 38 bps of RWA, down from 4Q14, but up from 3Q15 due to higher risk costs in Retail Banking • NPL ratio down to 2.5%, with improvements in both Retail Banking and Wholesale Banking
400 432
3,0% 3,0%
2,8%
2,6% 2,5%
3,3% 3,3%
3,1%
2,9% 2,8%
2,8% 2,8%
2,6% 2,5%
2,4%
4Q14 1Q15 2Q15 3Q15 4Q15
NPL ratio ING BankNPL ratio Wholesale BankingNPL ratio Retail Banking
NPL ratio

Capital position strengthens further
20
ING Group pro-forma fully-loaded CET1 ratio at 13.4% after 2015 dividend payment (in %)
• Group CET 1 capital increased to 12.7%, largely mirroring developments of the Bank, and including a EUR 600 mln release from interim profits that had not been not included in capital in the first nine months of 2015
• Pro-forma Group CET 1 capital ratio after full divestment of NN Group would be 13.4% in 4Q15 • Bank CET 1 capital increased to 11.6% due to a positive net profit impact of 26 bps in 4Q15 and an increase in the revaluation
reserves of our equity stakes, partly offset by an increase in RWA
* Impact includes capital and related RWA movements ** Impact RWA is excl. RWA impact revaluation reserves/FX *** Other includes EUR 0.6 bln release from ‘interim profits not included in CET 1 capital
0,3% 0,1% 0,2%
10,4%
11,6% 12,3% 12,3%
12,7% 13,4%
4Q14 1Q15 2Q15 3Q15 Net profit Equitystakes / FX*
RWA** Other*** 4Q15 Pro-formaafter full
divestmentNN Group
-0,1%

Wrap up
21
…resulting in strong results… • Underlying net result ING Bank rose to EUR 4,219 mln in 2015, up 23.2% from 2014 • Fourth quarter 2015 underlying result before tax ING Bank EUR 1,202 mln
…boosting our capital ratios • Fully-loaded CET 1 ratio ING Group rose from 12.3% to 12.7%, above the regulatory fully-loaded requirement of 12.5% • Pro-forma Group CET1 on a fully-loaded basis of 13.4%,
Continued growth in customer numbers and lending… • Our retail customer base grew by over 1.4 mln to 34.4 mln at year-end • Our core lending franchises grew by EUR 21.7 bln or 4.2% in 2015, in line with our guidance

Important legal information ING Group’s Annual Accounts are prepared in accordance with International Financial Reporting Standards as adopted by the European Union (‘IFRS-EU’). In preparing the financial information in this document, the same accounting principles are applied as in the 2014 ING Group Annual Accounts. The Financial statements for 2015 are in progress and may be subject to adjustments from subsequent events. All figures in this document are unaudited. Small differences are possible in the tables due to rounding. Actual results, performance or events may differ materially from those in such statements due to, without limitation: (1) changes in general economic conditions, in particular economic conditions in ING’s core markets, (2) changes in performance of financial markets, including developing markets, (3) consequences of a potential (partial) break-up of the euro, (4) ING’s implementation of the restructuring plan as agreed with the European Commission, (5) changes in the availability of, and costs associated with, sources of liquidity such as interbank funding, as well as conditions in the credit markets generally, including changes in borrower and counterparty creditworthiness, (6) changes affecting interest rate levels, (7) changes affecting currency exchange rates, (8) changes in investor and customer behaviour, (9) changes in general competitive factors, (10) changes in laws and regulations, (11) changes in the policies of governments and/or regulatory authorities, (12) conclusions with regard to purchase accounting assumptions and methodologies, (13) changes in ownership that could affect the future availability to us of net operating loss, net capital and built-in loss carry forwards, (14) changes in credit ratings, (15) ING’s ability to achieve projected operational synergies and (16) the other risks and uncertainties detailed in the Risk Factors section contained in the most recent annual report of ING Groep N.V. Any forward-looking statements made by or on behalf of ING speak only as of the date they are made, and, ING assumes no obligation to publicly update or revise any forward-looking statements, whether as a result of new information or for any other reason. This document does not constitute an offer to sell, or a solicitation of an offer to purchase, any securities in the United States or any other jurisdiction. The securities of NN Group have not been and will not be registered under the U.S. Securities Act of 1933, as amended (the “Securities Act”), and may not be offered or sold within the United States absent registration or an applicable exemption from the registration requirements of the Securities Act. www.ing.com
22

Follow us to stay a step ahead
ING.com
YouTube.com/ING
SlideShare.net/ING @ING_News LinkedIn.com/company/ING
Flickr.com/INGGroup Facebook.com/ING