DAFTAR PUSTAKA -...
32
52 DAFTAR PUSTAKA 1. Bornstein NM. Stroke Practical Guide for Clinicians Bornstein NM. Switzerland: Karger; 2009. 9-23 p. 2. RI BP dan PKKK. Riset Kesehatan Dasar 2013. Jakarta; 2013. 3. Widyono. Profil Kesehatan Kota Semarang 2014 [Internet]. Semarang; 2014. Available from: www.dinkes-kotasemarang.go.id 4. Mohr, JP, Philip A Wolf JCG. Stroke Pathophysiology, Diagnosis and Management. Elsevier Saunders. Philadelphia; 2011. 295-307 p. 5. Martin JH. Neuroanatomy Text and Atlas. 3rd ed. Mc Graw Hill; 2003. 6. Chong TT-J, Fedi M. Acute management of stroke – II: haemorrhagic stroke. Anaesth Intensive Care Med [Internet]. 2013;14(9):366–70. Available from: http://linkinghub.elsevier.com/retrieve/pii/S1472029913001975 7. Zis P, Leivadeas P, Michas D, Kravaritis D, Angelidakis P, Tavernarakis A. Predicting 30-day case fatality of primary inoperable intracerebral hemorrhage based on findings at the emergency department. J Stroke Cerebrovasc Dis [Internet]. 2014 Aug 8;23(7):1928–33. Available from: http://www.strokejournal.org/article/S1052305714000664/fulltext 8. Hanifah, Dinna, Dyan Roshinta Laksmi Dewi SNYRSA. Pengaruh Volume Perdarahan dan Skor Glasgow Coma Scale (GCS) Saat Masuk Rumah Sakit Terhadap Kejadian Mortalitas Pada Pasien Stroke Perdarahan Intraserebral Di RSUD DR. Soedarso Pontianak. 2015;1:1689–99. 9. WJ Powers JJ. Stroke Overview. Elsevier Saunders. Philadelphia; 2014. 10. Zazulia A. Intracerebral Hemorrhage, Primary. Elsevier Saunders. Philadelphia; 2014. 11. Kleinman JT, Jordan LC, Hillis AE. ABC/2: estimating intracerebral haemorrhage volume and total brain volume and predicting outcome in children. Dev Med Child Neurol. 2010;
Transcript of DAFTAR PUSTAKA -...
52
DAFTAR PUSTAKA
1. Bornstein NM. Stroke Practical Guide for Clinicians Bornstein NM.
Switzerland: Karger; 2009. 9-23 p.
2. RI BP dan PKKK. Riset Kesehatan Dasar 2013. Jakarta; 2013.
3. Widyono. Profil Kesehatan Kota Semarang 2014 [Internet]. Semarang;
2014. Available from: www.dinkes-kotasemarang.go.id
4. Mohr, JP, Philip A Wolf JCG. Stroke Pathophysiology, Diagnosis and
Management. Elsevier Saunders. Philadelphia; 2011. 295-307 p.
5. Martin JH. Neuroanatomy Text and Atlas. 3rd ed. Mc Graw Hill; 2003.
6. Chong TT-J, Fedi M. Acute management of stroke – II: haemorrhagic
stroke. Anaesth Intensive Care Med [Internet]. 2013;14(9):366–70.
Available from:
http://linkinghub.elsevier.com/retrieve/pii/S1472029913001975
7. Zis P, Leivadeas P, Michas D, Kravaritis D, Angelidakis P, Tavernarakis
A. Predicting 30-day case fatality of primary inoperable intracerebral
hemorrhage based on findings at the emergency department. J Stroke
Cerebrovasc Dis [Internet]. 2014 Aug 8;23(7):1928–33. Available from:
http://www.strokejournal.org/article/S1052305714000664/fulltext
8. Hanifah, Dinna, Dyan Roshinta Laksmi Dewi SNYRSA. Pengaruh Volume
Perdarahan dan Skor Glasgow Coma Scale (GCS) Saat Masuk Rumah
Sakit Terhadap Kejadian Mortalitas Pada Pasien Stroke Perdarahan
Intraserebral Di RSUD DR. Soedarso Pontianak. 2015;1:1689–99.
9. WJ Powers JJ. Stroke Overview. Elsevier Saunders. Philadelphia; 2014.
10. Zazulia A. Intracerebral Hemorrhage, Primary. Elsevier Saunders.
Philadelphia; 2014.
11. Kleinman JT, Jordan LC, Hillis AE. ABC/2: estimating intracerebral
haemorrhage volume and total brain volume and predicting outcome in
children. Dev Med Child Neurol. 2010;
53
12. Kumar A, Shetty V. Abstract W P330: Intracerebral Hemorrhage Volume
Measurement: Modified ABC/2 Method is Faster and Reliable. Stroke
[Internet]. 2015 Feb 1;46(Suppl_1):AWP330 – . Available from:
http://stroke.ahajournals.org/content/46/Suppl_1/AWP330
13. Harrison JK, McArthur KS, Quinn TJ. Assessment scales in stroke:
clinimetric and clinical considerations. Clin Interv Aging [Internet].
2013;8:201–11. Available from:
http://www.ncbi.nlm.nih.gov/pmc/articles/PMC3578502/
14. Budiyono T. Hubungan Derajat Berat Stroke Non Hemoragik pada saat
Masuk Rumah Sakit dengan Waktu Pencapaian Maksimal Aktifitas
Kehidupan Sehari-hari. Universitas Diponegoro; 2005.
15. Wihartantie A, dr. Retno Dwi Danarti SRO. Hubungan Perdarahan
Intraserebral Dan Glasgow Coma Scale Pada Stroke Dengan Pemeriksaan
Multiclice Computed Tomography Scan. 2011; Available from:
http://etd.repository.ugm.ac.id/index.php?mod=penelitian_detail&sub=Pen
elitianDetail&act=view&typ=html&buku_id=53536
16. Singh AJ, Pmr DNB. CT Scan as a Tool for Predicting Outcome of Stroke
due to Intracerebral Haemorrhage at a Referral Hospital.
2006;17(October):33–8.
17. Demchuk AM, Dowlatshahi D, Rodriguez-Luna D, Molina C a., Blas YS,
Dzialowski I, et al. Prediction of haematoma growth and outcome in
patients with intracerebral haemorrhage using the CT-angiography spot
sign (PREDICT): A prospective observational study. Lancet Neurol
[Internet]. 2012;11(4):307–14. Available from:
http://dx.doi.org/10.1016/S1474-4422(12)70038-8
18. Ritarwan K. Pengaruh Suhu Tubuh Terhadap Outcome Penderita Stroke
Yang Dirawat Di RSUP H. Adam Malik Medan. 2003;1–30.
19. Kim K-H. Predictors of 30-day mortality and 90-day functional recovery
after primary intracerebral hemorrhage : hospital based multivariate
analysis in 585 patients. J Korean Neurosurg Soc [Internet]. 2009
Jun;45(6):341–9. Available from:
54
http://www.pubmedcentral.nih.gov/articlerender.fcgi?artid=2711231&tool=
pmcentrez&rendertype=abstract
20. Joarder M, Karim A, Barua K, Hossain M. A study on-effect of hematoma
and perihematomal edema volume on GCS at the time of admission in
patients with spontaneous lobar and basal ganglia hemorrhage. Pulse
[Internet]. 2015 May 7;7(1):22. Available from:
http://www.banglajol.info/index.php/PULSE/article/view/23246
21. Rea P. Essential Clinical Anatomy of The Nervous System. Academic
Press; 2015. 4 p.
22. David S Liebeskind M. Hemorrhagic Stroke: Practice Essentials,
Background, Anatomy. Medscape [Internet]. 2015; Available from:
http://emedicine.medscape.com/article/1916662-overview
23. Sidharta P DG. Anatomi Susunan Saraf Pusat Manusia. Jakarta: Dian
Rakyat; 1986. 398 p.
24. J G. Basic Neurology 3rd Edition. 3rd ed. New York: McGraw-Hill; 2000.
25. Layanto A. Hubungan Antara Lokasi Lesi Pada Penderita Stroke Iskemik
Fase Akut Dengan Waktu Perawatan Dan Waktu Kematian Dalam 30 Hari
Pertama. Universitas Diponegoro Semarang; 2009.
26. Tubbs RS. Circle of Willis Anatomy: Overview, Gross Anatomy, Natural
Variants. Medscape [Internet]. 2013; Available from:
http://emedicine.medscape.com/article/1877617-overview
27. Cristy. Asosiasi Genotip Apolipoprotein E Dengan Fungsi Kognitif Pada
Pasien Pasca Stroke Iskemik. Universitas Diponegoro Semarang; 2011.
28. Donnan GA, Fisher M, Macleod M, Davis SM. Stroke. Lancet [Internet].
2008 May 10;371(9624):1612–23. Available from:
http://www.thelancet.com/article/S0140673608606947/fulltext
29. Smith EE, Liang L, Hernandez a., Reeves MJ, Cannon CP, Fonarow GC,
et al. Influence of stroke subtype on quality of care in the Get with the
Guidelines-Stroke Program. Neurology. 2009;73(9):709–16.
30. Sacco RL, Kasner SE, Broderick JP, Caplan LR, Connors JJB, Culebras A,
et al. An updated definition of stroke for the 21st century: a statement for
55
healthcare professionals from the American Heart Association/American
Stroke Association. Stroke [Internet]. 2013 Jul;44(7):2064–89. Available
from: http://www.ncbi.nlm.nih.gov/pubmed/23652265
31. Soeharto I. Penyakit Jantung Koroner dan Serangan Jantung :
Pencegahan,Penyembuhan, Rehabilitasi. Jakarta: PT Gramedia Pustaka;
2004.
32. Saenger AK, Christenson RH. Stroke biomarkers: progress and challenges
for diagnosis, prognosis, differentiation, and treatment. Clin Chem
[Internet]. 2010 Jan;56(1):21–33. Available from:
http://www.ncbi.nlm.nih.gov/pubmed/19926776
33. Gorelick PB. Risk factors for vascular dementia and Alzheimer disease.
Stroke. 2004;35(11 SUPPL. 1):2620–2.
34. Zebian B, Critchley G. Spontaneous intracranial haemorrhage. Surgery
[Internet]. 2012;30(3):136–41. Available from:
http://dx.doi.org/10.1016/j.mpsur.2011.12.005
35. LR C. Caplan’s Stroke : A Clinical Approach. 3rd ed. Boston: Butterworth-
Heineman; 2000.
36. Quinones-Hinojosa A. Schmidek & sweet Operative Neurosurgical
Techniques Indications, Methods, and Results. 2nd ed. Philadelphia:
Elsevier; 2012.
37. Chan S, Hemphill JC. Critical Care Management of Intracerebral
Hemorrhage. Crit Care Clin [Internet]. 2014;30(4):699–717. Available
from: http://linkinghub.elsevier.com/retrieve/pii/S0749070414000499
38. Alberti A, Agnelli G, Caso V, Venti M, Acciarresi M, D’Amore C, et al.
Non-neurological complications of acute stroke: frequency and influence
on clinical outcome. Intern Emerg Med. 2011;6(S1):119–23.
39. Bonaiuti D, Sioli P, Fumagalli L, Beghi E, Agostoni E. Acute medical
complications in patients admitted to a stroke unit and safe transfer to
rehabilitation. Neurol Sci [Internet]. 2011;32(4):619–23. Available from:
http://link.springer.com/10.1007/s10072-011-0588-2
40. Zimmerman RD, Maldjian JA, Brun NC, Horvath B, Skolnick BE.

56
Radiologic estimation of hematoma volume in intracerebral hemorrhage
trial by CT scan. AJNR Am J Neuroradiol [Internet]. 2006 Mar;27(3):666–
70. Available from: http://www.ncbi.nlm.nih.gov/pubmed/16552014
41. Broderick JP, Brott TG, Duldner JE, Tomsick T, Huster G. Volume of
Intracerebral Hemorrhage A Powerful and Easy-to-Use Predictor of 30-Day
Mortality. 1988;
42. Setiahardja AS. Penilaian Keseimbangan dengan Aktivitas Kehidupan
Sehari-hari pada Lansia. Universitas Diponegoro; 2005.
43. Isaac E. MDS. Hemorrhagic Stroke: An Atlas of Investigation and
Treatment. Clinical Publishing; 2010.
44. Yasaka M, Sakata T, Minematsu K, Naritomi H. Correction of INR by
prothrombin complex concentrate and vitamin K in patients with warfarin
related hemorrhagic complication. Thromb Res. 2002;108(1):25–30.
45. Nag C, Das K, Ghosh M, Khandakar MR. Prediction of clinical outcome in
acute hemorrhagic stroke from a single CT scan on admission. N Am J
Med Sci. 2012;4(10):463–7.
46. Anggiamurni L. Hubungan Volume Dan Letak Lesi Hematoma Dengan
Kecepatan Pemulihan Fungsi Motorik Penderita Stroke Hemoragik
Berdasarkan Kategori Skala Orgogozo. Universitas Diponegoro; 2010.
47. Castellanos M, Leira R, Tejada J, Gil-Peralta A, Dávalos A, Castillo J, et
al. Predictors of good outcome in medium to large spontaneous
supratentorial intracerebral haemorrhages. J Neurol Neurosurg Psychiatry
[Internet]. 2005 May;76(5):691–5. Available from:
http://www.ncbi.nlm.nih.gov/pubmed/15834028
48. Molshatzki N, Orion D, Tsabari R, Schwammenthal Y, Merzeliak O,
Toashi M, et al. Chronic kidney disease in patients with acute intracerebral
hemorrhage: association with large hematoma volume and poor outcome.
Cerebrovasc Dis [Internet]. 2011;31(3):271–7. Available from:
http://www.ncbi.nlm.nih.gov/pubmed/21178352
49. Bagg S, Pombo AP, Hopman W. Effect of Age on Functional Outcomes
After Stroke Rehabilitation. Stroke [Internet]. 2002 Jan 1;33(1):179–85.
57
Available from:
http://stroke.ahajournals.org/cgi/doi/10.1161/hs0102.101224
50. Yu C, An Z, Zhao W, Wang W, Gao C, Liu S, et al. Sex Differences in
Stroke Subtypes, Severity, Risk Factors, and Outcomes among Elderly
Patients with Acute Ischemic Stroke. Front Aging Neurosci [Internet].
2015;7:174. Available from:
http://www.ncbi.nlm.nih.gov/pubmed/26441636
51. Saxena A, Anderson CS, Wang X, Sato S, Arima H, Chan E, et al.
Prognostic Significance of Hyperglycemia in Acute Intracerebral
Hemorrhage. Stroke [Internet]. 2016 Jan
26;47(3):STROKEAHA.115.011627. Available from:
http://stroke.ahajournals.org/lookup/doi/10.1161/STROKEAHA.115.01162
7
52. Iqbal M, Frida M, Yaswir R. Perbedaan Rerata Kadar Gula Darah pada
Luaran Stroke Iskemik Berdasarkan Indeks Barthel. J Kesehat Andalas.
2014;3(3).
53. Karunawan NH, Pinzon RT, Saputro SA. Pengaruh Kondisi Hiperglikemia
Saat Masuk RS terhadap Luaran Fungsional Pasien Stroke Iskemik di RS
Bethesda. Cermin Dunia Kedokt. 2016;43(2):87–90.
54. Kurube I. Stroke Hemoragik Pada Pasien Yang Dirawat Di RSUP Dr .
Wahidin Sudirohusodo Periode Juli 2012- Desember 2012. 2013;
55. Susilo TA. Pengaruh Hiperglikemia Terhadap Mortalitas Pada Penderita
Stroke Iskemik Fase Akut Di Rsud Dr. Moewardi. 2015;
56. Greer DM, Funk SE, Reaven NL, Ouzounelli M, Uman GC. Impact of
fever on outcome in patients with stroke and neurologic injury: a
comprehensive meta-analysis. Stroke [Internet]. 2008 Nov;39(11):3029–35.
Available from: http://www.ncbi.nlm.nih.gov/pubmed/18723420
57. El-solh A, Sikka P, Bozkanat E, Jaafar W. Morbid Obesity in the Medical
ICU Morbid Obesity in the Medical ICU. October. 2007;1989–97.
58. Marlina I, Dr. dr. Ismail Setyopranoto SS. Skor Perdarahan Intraventrikel
Sebagai Prediktor Mortalitas Pada Pasien Stroke Perdarahan Intraserebral.
58
2013.
59. Chen G, Arima H, Wu G, Heeley E, Delcourt C, Zhang P, et al.
Subarachnoid extension of intracerebral hemorrhage and 90-day outcomes
in INTERACT2. Stroke [Internet]. 2014 Jan;45(1):258–60. Available from:
http://www.ncbi.nlm.nih.gov/pubmed/24149007
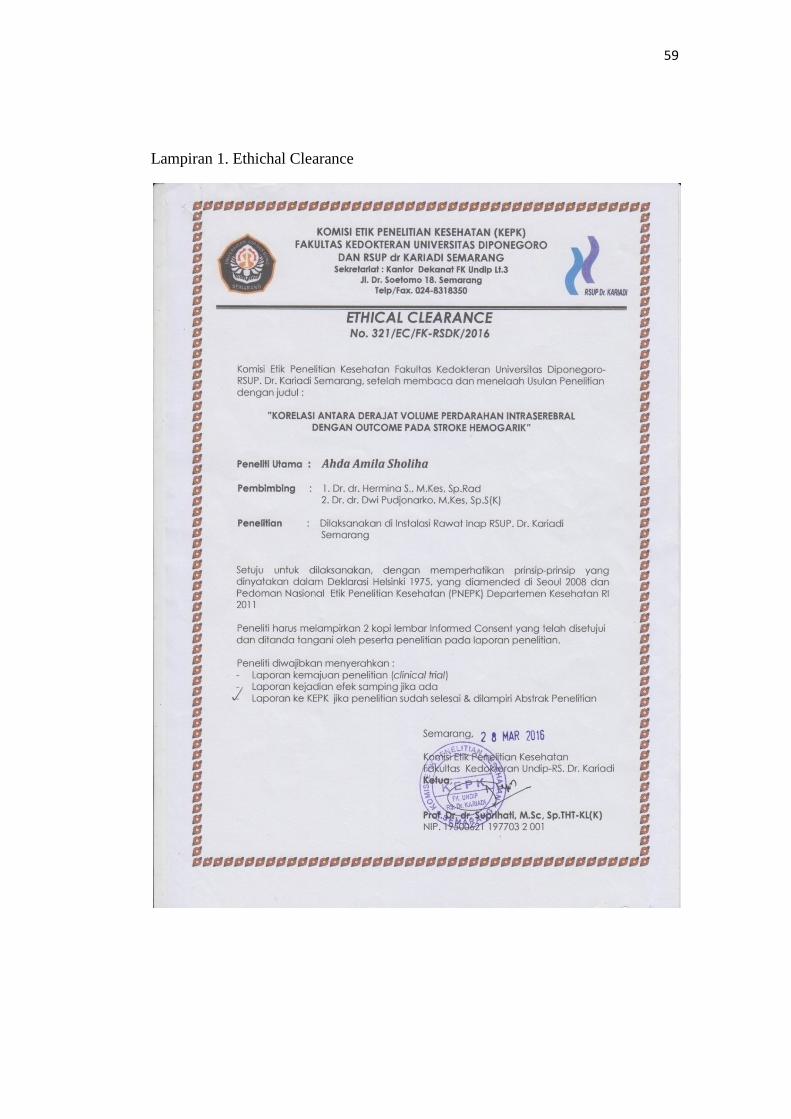
59
Lampiran 1. Ethichal Clearance
60
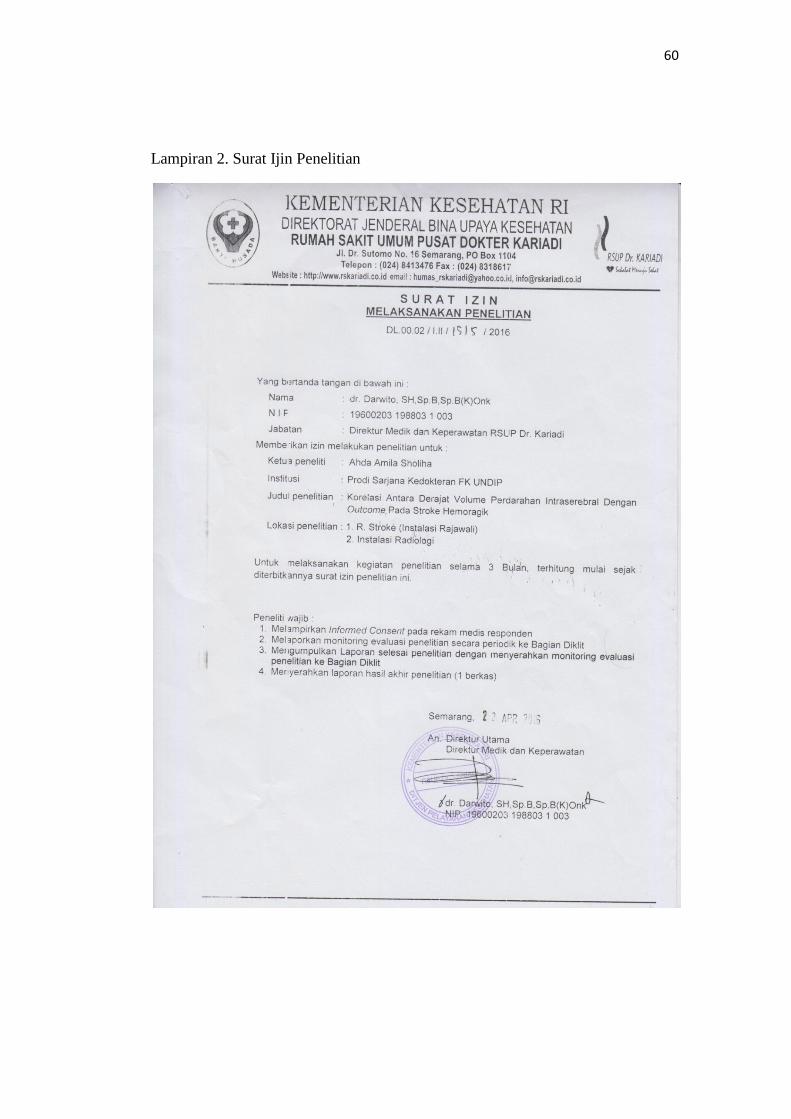
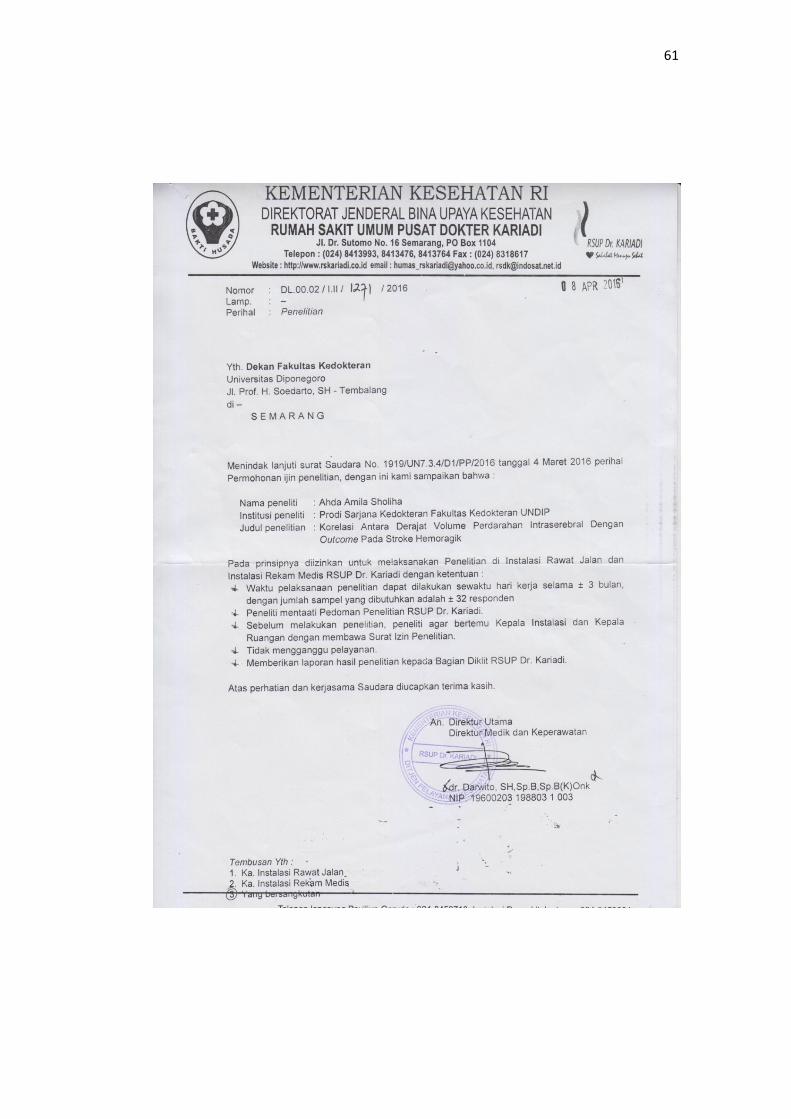
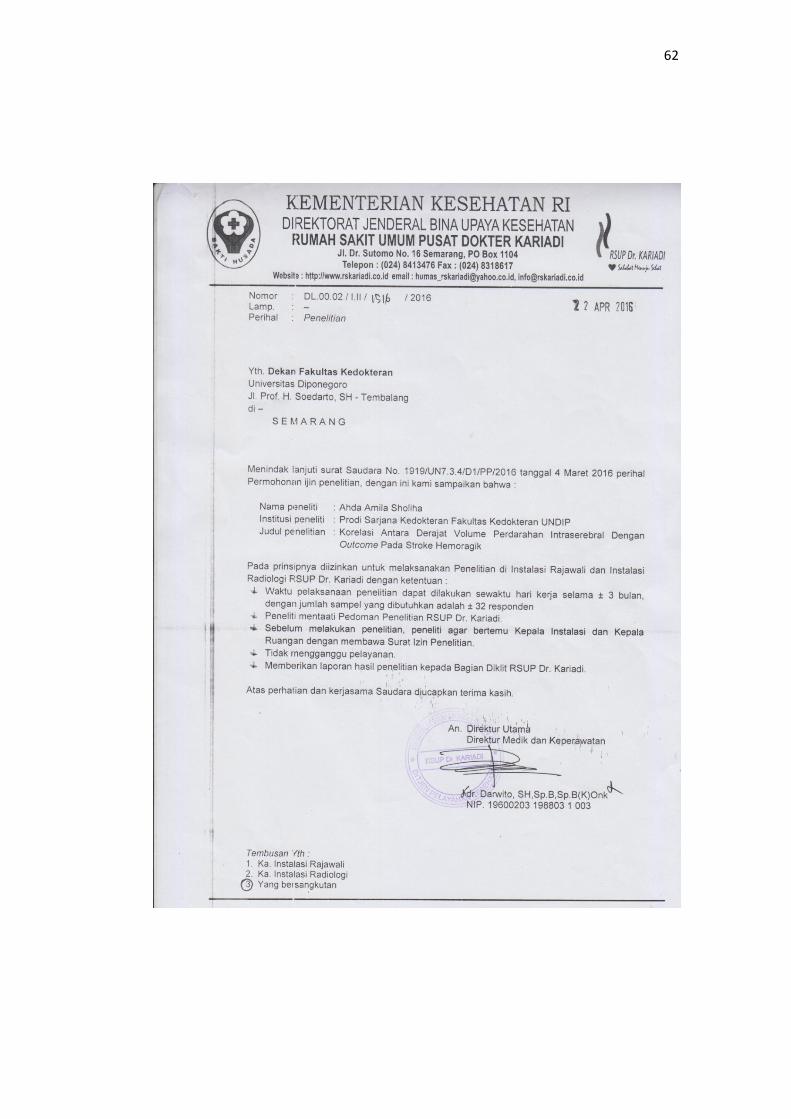
Lampiran 2. Surat Ijin Penelitian
61
62

63
Lampiran 3. Data Hasil Pengukuran
No CM Usia Jenis
kelamin
Hipertensi Diabetes
Melitus
Hiperkolesterolemia Obesitas SAH IVH Volume
perdarahan
Barthel
Index
C550543 55 tahun laki-laki Ya Tidak Tidak Tidak Tidak Tidak 80 0
A567266 48 tahun laki-laki Tidak Tidak Tidak Ya Tidak Tidak 10,28 38
C563832 78 tahun laki-laki Ya Ya Tidak Tidak Tidak Tidak 14,22 20
C540047 63 tahun laki-laki Ya Tidak Tidak Tidak Tidak Tidak 16,8 0
C579201 40 tahun perempuan Ya Ya Ya Tidak Tidak Tidak 45 0
C542601 48 tahun perempuan Ya Tidak Tidak Tidak Tidak Tidak 18,66 20
C568878 74 tahun perempuan Ya Ya Ya Tidak Tidak Tidak 30,75 0
C540566 50 tahun perempuan Ya Ya Tidak Tidak Tidak Tidak 18,36 35
C586734 60 tahun perempuan Ya Tidak Ya Tidak Tidak Tidak 26 19
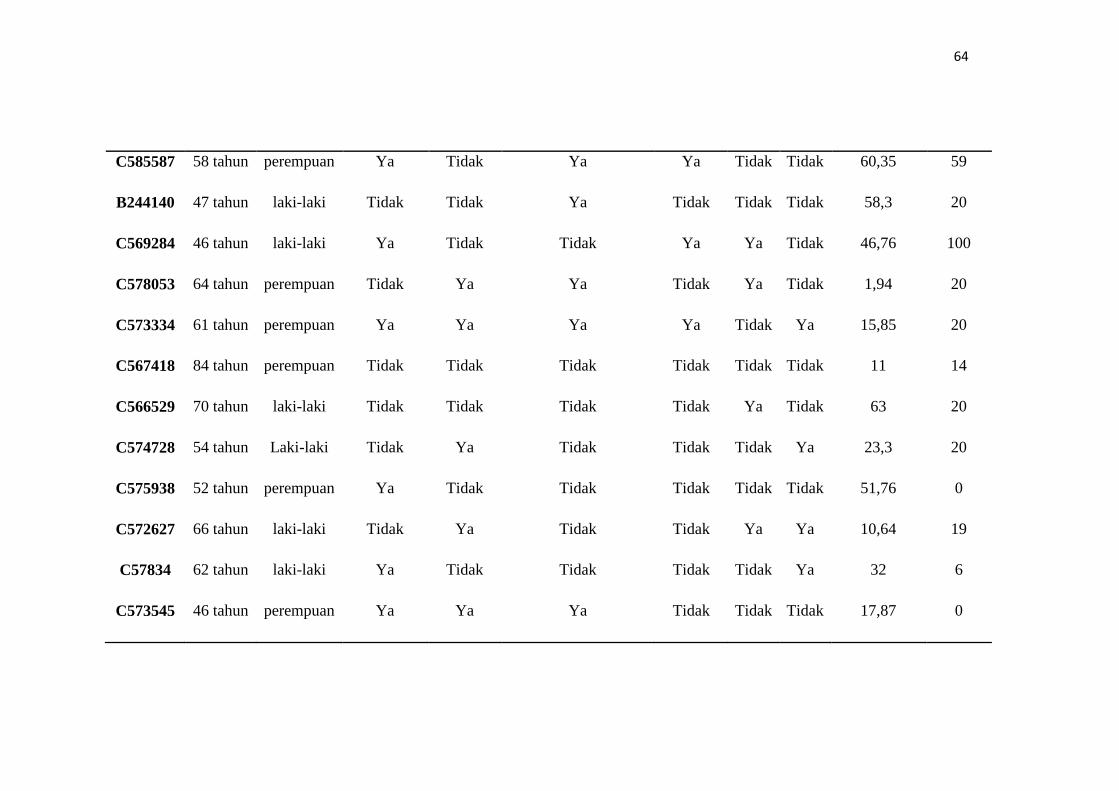
64
C585587 58 tahun perempuan Ya Tidak Ya Ya Tidak Tidak 60,35 59
B244140 47 tahun laki-laki Tidak Tidak Ya Tidak Tidak Tidak 58,3 20
C569284 46 tahun laki-laki Ya Tidak Tidak Ya Ya Tidak 46,76 100
C578053 64 tahun perempuan Tidak Ya Ya Tidak Ya Tidak 1,94 20
C573334 61 tahun perempuan Ya Ya Ya Ya Tidak Ya 15,85 20
C567418 84 tahun perempuan Tidak Tidak Tidak Tidak Tidak Tidak 11 14
C566529 70 tahun laki-laki Tidak Tidak Tidak Tidak Ya Tidak 63 20
C574728 54 tahun Laki-laki Tidak Ya Tidak Tidak Tidak Ya 23,3 20
C575938 52 tahun perempuan Ya Tidak Tidak Tidak Tidak Tidak 51,76 0
C572627 66 tahun laki-laki Tidak Ya Tidak Tidak Ya Ya 10,64 19
C57834 62 tahun laki-laki Ya Tidak Tidak Tidak Tidak Ya 32 6
C573545 46 tahun perempuan Ya Ya Ya Tidak Tidak Tidak 17,87 0
65
C366230 55 tahun perempuan Ya Ya Tidak Ya Tidak Ya 44,46 17
C586775 61 tahun perempuan Ya Tidak Tidak Tidak Tidak Tidak 48,02 32
C565083 61 tahun laki-laki Ya Ya Tidak Tidak Tidak Ya 74 0
B260516 74 tahun perempuan Ya Tidak Ya Tidak Tidak Tidak 1,29 20
C572827 74 tahun perempuan Ya Tidak Tidak Tidak Tidak Tidak 39 17
C510142 46 tahun perempuan Ya Tidak Ya Ya Tidak Tidak 19,21 19
C567202 52 tahun perempuan Ya Ya Ya Ya Tidak Tidak 5,6 0
C576094 57 tahun laki-laki Ya Tidak Tidak Ya Tidak Ya 0,42 51

66
Lampiran 4. Hasil Analisa Statistik
Frequencies
Frequency Table
Jenis kelamin
12 41.4 41.4 41.4
17 58.6 58.6 100.0
29 100.0 100.0
Laki-laki
Perempuan
Total
Valid
Frequency Percent Valid Percent
Cumulat iv e
Percent
Hipertensi
22 75.9 75.9 75.9
7 24.1 24.1 100.0
29 100.0 100.0
Ya
Tidak
Total
Valid
Frequency Percent Valid Percent
Cumulat iv e
Percent
DM
12 41.4 41.4 41.4
17 58.6 58.6 100.0
29 100.0 100.0
Ya
Tidak
Total
Valid
Frequency Percent Valid Percent
Cumulat iv e
Percent
Hiperkolesterolemia
11 37.9 37.9 37.9
18 62.1 62.1 100.0
29 100.0 100.0
Ya
Tidak
Total
Valid
Frequency Percent Valid Percent
Cumulat iv e
Percent
67
Obesitas
8 27.6 27.6 27.6
21 72.4 72.4 100.0
29 100.0 100.0
Ya
Tidak
Total
Valid
Frequency Percent Valid Percent
Cumulat iv e
Percent
SAH
4 13.8 13.8 13.8
25 86.2 86.2 100.0
29 100.0 100.0
Ya
Tidak
Total
Valid
Frequency Percent Valid Percent
Cumulat iv e
Percent
IVH
7 24.1 24.1 24.1
22 75.9 75.9 100.0
29 100.0 100.0
Ya
Tidak
Total
Valid
Frequency Percent Valid Percent
Cumulat iv e
Percent
Barthel Index
23 79.3 79.3 79.3
5 17.2 17.2 96.6
1 3.4 3.4 100.0
29 100.0 100.0
Total
Berat
Mandiri
Total
Valid
Frequency Percent Valid Percent
Cumulat iv e
Percent
68
Explore
Nonparametric Correlations
Case Summaries
29 29 29
58.83 30.51 20.21
11.000 22.565 21.569
58.00 23.30 19.00
40 0 0
84 80 100
N
Mean
Std. Dev iation
Median
Minimum
Maximum
Usia
Volume
perdarahan Barthel Index
Tests of Normality
.963 29 .382
.933 29 .065
.773 29 .000
Usia
Volume perdarahan
Barthel Index
Stat ist ic df Sig.
Shapiro-Wilk
Lillief ors Signif icance Correctiona.
Correlations
1.000 -.200 -.074
. .299 .704
29 29 29
-.200 1.000 -.165
.299 . .391
29 29 29
-.074 -.165 1.000
.704 .391 .
29 29 29
Correlation Coef f icient
Sig. (2-tailed)
N
Correlation Coef f icient
Sig. (2-tailed)
N
Correlation Coef f icient
Sig. (2-tailed)
N
Usia
Volume perdarahan
Barthel Index
Spearman's rho
Usia
Volume
perdarahan Barthel Index
69
Graph
Graph
70
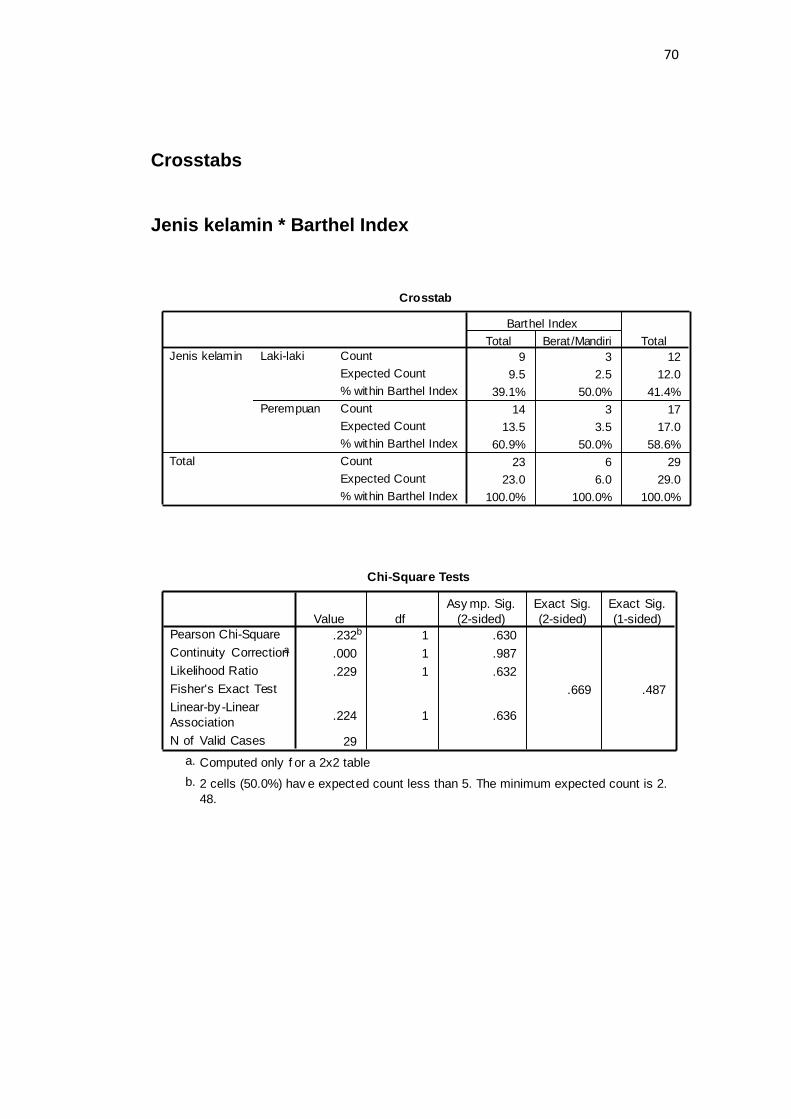
Crosstabs
Jenis kelamin * Barthel Index
Crosstab
9 3 12
9.5 2.5 12.0
39.1% 50.0% 41.4%
14 3 17
13.5 3.5 17.0
60.9% 50.0% 58.6%
23 6 29
23.0 6.0 29.0
100.0% 100.0% 100.0%
Count
Expected Count
% within Barthel Index
Count
Expected Count
% within Barthel Index
Count
Expected Count
% within Barthel Index
Laki-laki
Perempuan
Jenis kelamin
Total
Total Berat /Mandiri
Barthel Index
Total
Chi-Square Tests
.232b 1 .630
.000 1 .987
.229 1 .632
.669 .487
.224 1 .636
29
Pearson Chi-Square
Continuity Correctiona
Likelihood Ratio
Fisher's Exact Test
Linear-by-Linear
Association
N of Valid Cases
Value df
Asy mp. Sig.
(2-sided)
Exact Sig.
(2-sided)
Exact Sig.
(1-sided)
Computed only f or a 2x2 tablea.
2 cells (50.0%) hav e expected count less than 5. The minimum expected count is 2.
48.
b.
71
Hipertensi * Barthel Index
Crosstab
17 5 22
17.4 4.6 22.0
73.9% 83.3% 75.9%
6 1 7
5.6 1.4 7.0
26.1% 16.7% 24.1%
23 6 29
23.0 6.0 29.0
100.0% 100.0% 100.0%
Count
Expected Count
% within Barthel Index
Count
Expected Count
% within Barthel Index
Count
Expected Count
% within Barthel Index
Ya
Tidak
Hipertensi
Total
Total Berat /Mandiri
Barthel Index
Total
Chi-Square Tests
.231b 1 .631
.000 1 1.000
.245 1 .620
1.000 .545
.223 1 .637
29
Pearson Chi-Square
Continuity Correctiona
Likelihood Ratio
Fisher's Exact Test
Linear-by-Linear
Association
N of Valid Cases
Value df
Asy mp. Sig.
(2-sided)
Exact Sig.
(2-sided)
Exact Sig.
(1-sided)
Computed only f or a 2x2 tablea.
2 cells (50.0%) hav e expected count less than 5. The minimum expected count is 1.
45.
b.
72
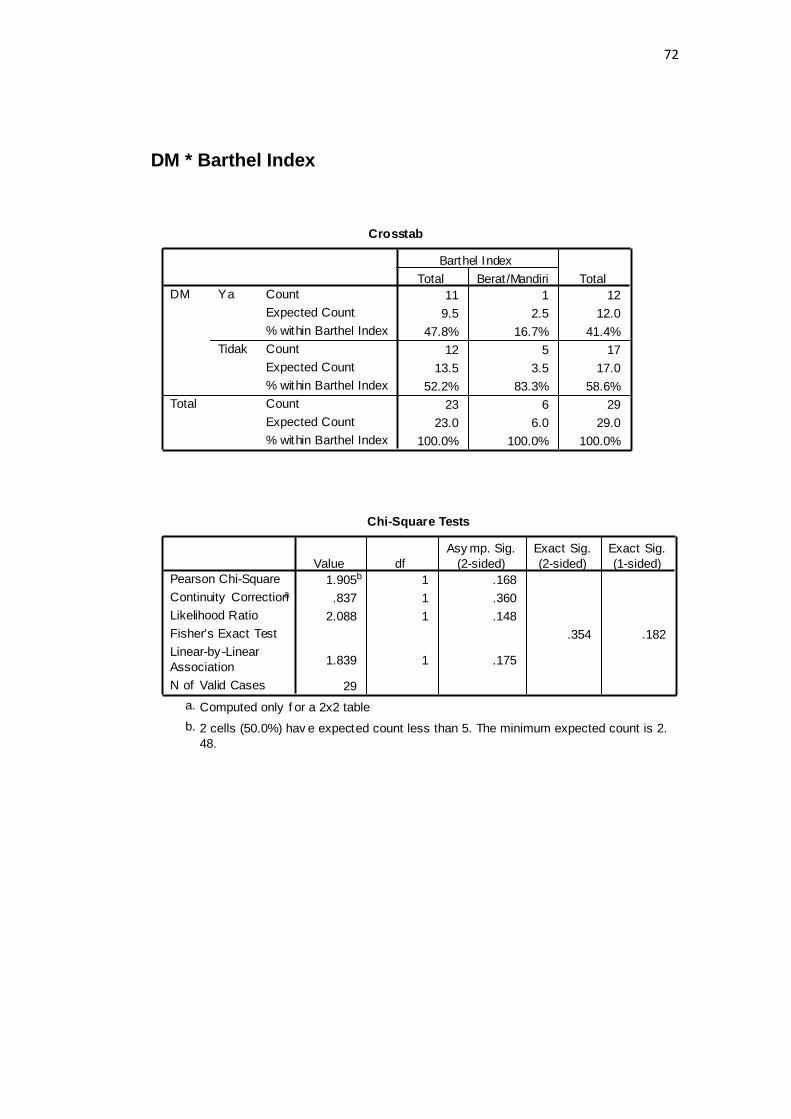
DM * Barthel Index
Crosstab
11 1 12
9.5 2.5 12.0
47.8% 16.7% 41.4%
12 5 17
13.5 3.5 17.0
52.2% 83.3% 58.6%
23 6 29
23.0 6.0 29.0
100.0% 100.0% 100.0%
Count
Expected Count
% within Barthel Index
Count
Expected Count
% within Barthel Index
Count
Expected Count
% within Barthel Index
Ya
Tidak
DM
Total
Total Berat /Mandiri
Barthel Index
Total
Chi-Square Tests
1.905b 1 .168
.837 1 .360
2.088 1 .148
.354 .182
1.839 1 .175
29
Pearson Chi-Square
Continuity Correctiona
Likelihood Ratio
Fisher's Exact Test
Linear-by-Linear
Association
N of Valid Cases
Value df
Asy mp. Sig.
(2-sided)
Exact Sig.
(2-sided)
Exact Sig.
(1-sided)
Computed only f or a 2x2 tablea.
2 cells (50.0%) hav e expected count less than 5. The minimum expected count is 2.
48.
b.

73
Hiperkolesterolemia * Barthel Index
Crosstab
10 1 11
8.7 2.3 11.0
43.5% 16.7% 37.9%
13 5 18
14.3 3.7 18.0
56.5% 83.3% 62.1%
23 6 29
23.0 6.0 29.0
100.0% 100.0% 100.0%
Count
Expected Count
% within Barthel Index
Count
Expected Count
% within Barthel Index
Count
Expected Count
% within Barthel Index
Ya
Tidak
Hiperkolesterolemia
Total
Total Berat /Mandiri
Barthel Index
Total
Chi-Square Tests
1.453b 1 .228
.537 1 .464
1.597 1 .206
.362 .237
1.403 1 .236
29
Pearson Chi-Square
Continuity Correctiona
Likelihood Ratio
Fisher's Exact Test
Linear-by-Linear
Association
N of Valid Cases
Value df
Asy mp. Sig.
(2-sided)
Exact Sig.
(2-sided)
Exact Sig.
(1-sided)
Computed only f or a 2x2 tablea.
2 cells (50.0%) hav e expected count less than 5. The minimum expected count is 2.
28.
b.

74
Obesitas * Barthel Index
Crosstab
4 4 8
6.3 1.7 8.0
17.4% 66.7% 27.6%
19 2 21
16.7 4.3 21.0
82.6% 33.3% 72.4%
23 6 29
23.0 6.0 29.0
100.0% 100.0% 100.0%
Count
Expected Count
% within Barthel Index
Count
Expected Count
% within Barthel Index
Count
Expected Count
% within Barthel Index
Ya
Tidak
Obesitas
Total
Total Berat /Mandiri
Barthel Index
Total
Chi-Square Tests
5.784b 1 .016
3.580 1 .058
5.270 1 .022
.033 .033
5.585 1 .018
29
Pearson Chi-Square
Continuity Correctiona
Likelihood Ratio
Fisher's Exact Test
Linear-by-Linear
Association
N of Valid Cases
Value df
Asy mp. Sig.
(2-sided)
Exact Sig.
(2-sided)
Exact Sig.
(1-sided)
Computed only f or a 2x2 tablea.
2 cells (50.0%) hav e expected count less than 5. The minimum expected count is 1.
66.
b.

75
SAH * Barthel Index
Crosstab
3 1 4
3.2 .8 4.0
13.0% 16.7% 13.8%
20 5 25
19.8 5.2 25.0
87.0% 83.3% 86.2%
23 6 29
23.0 6.0 29.0
100.0% 100.0% 100.0%
Count
Expected Count
% within Barthel Index
Count
Expected Count
% within Barthel Index
Count
Expected Count
% within Barthel Index
Ya
Tidak
SAH
Total
Total Berat /Mandiri
Barthel Index
Total
Chi-Square Tests
.053b 1 .819
.000 1 1.000
.051 1 .822
1.000 .627
.051 1 .822
29
Pearson Chi-Square
Continuity Correctiona
Likelihood Ratio
Fisher's Exact Test
Linear-by-Linear
Association
N of Valid Cases
Value df
Asy mp. Sig.
(2-sided)
Exact Sig.
(2-sided)
Exact Sig.
(1-sided)
Computed only f or a 2x2 tablea.
2 cells (50.0%) hav e expected count less than 5. The minimum expected count is .
83.
b.
76
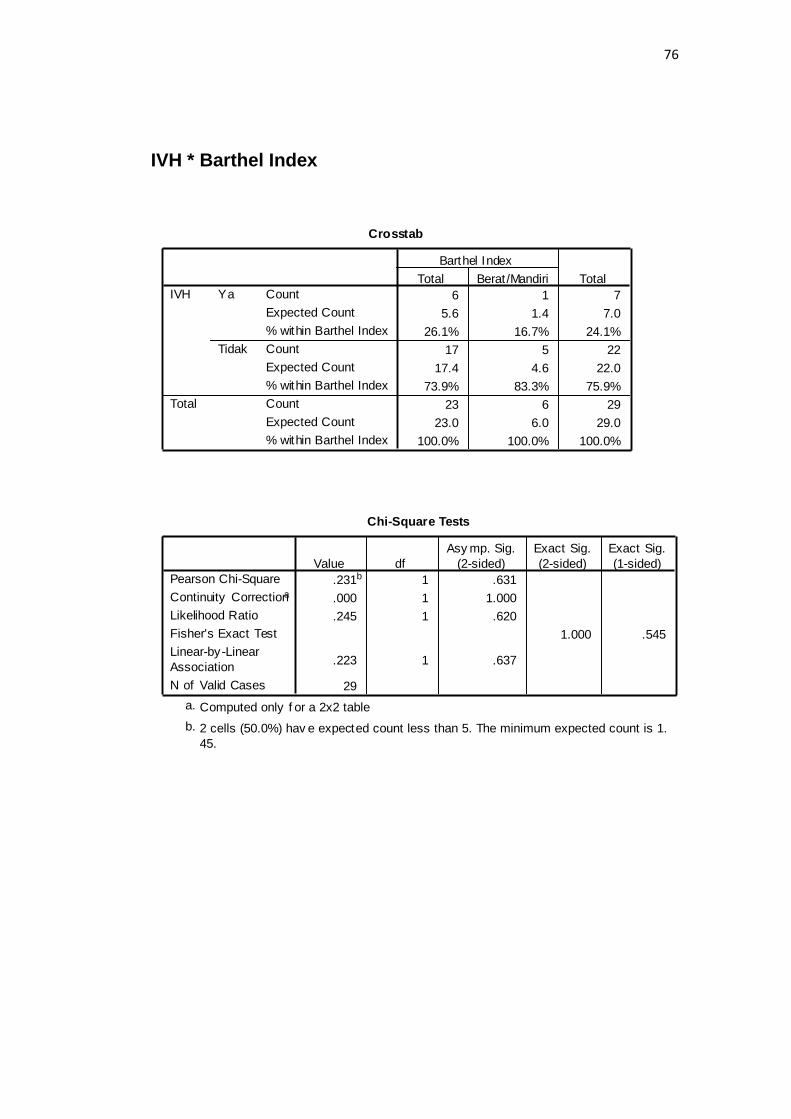
IVH * Barthel Index
Crosstab
6 1 7
5.6 1.4 7.0
26.1% 16.7% 24.1%
17 5 22
17.4 4.6 22.0
73.9% 83.3% 75.9%
23 6 29
23.0 6.0 29.0
100.0% 100.0% 100.0%
Count
Expected Count
% within Barthel Index
Count
Expected Count
% within Barthel Index
Count
Expected Count
% within Barthel Index
Ya
Tidak
IVH
Total
Total Berat /Mandiri
Barthel Index
Total
Chi-Square Tests
.231b 1 .631
.000 1 1.000
.245 1 .620
1.000 .545
.223 1 .637
29
Pearson Chi-Square
Continuity Correctiona
Likelihood Ratio
Fisher's Exact Test
Linear-by-Linear
Association
N of Valid Cases
Value df
Asy mp. Sig.
(2-sided)
Exact Sig.
(2-sided)
Exact Sig.
(1-sided)
Computed only f or a 2x2 tablea.
2 cells (50.0%) hav e expected count less than 5. The minimum expected count is 1.
45.
b.
77
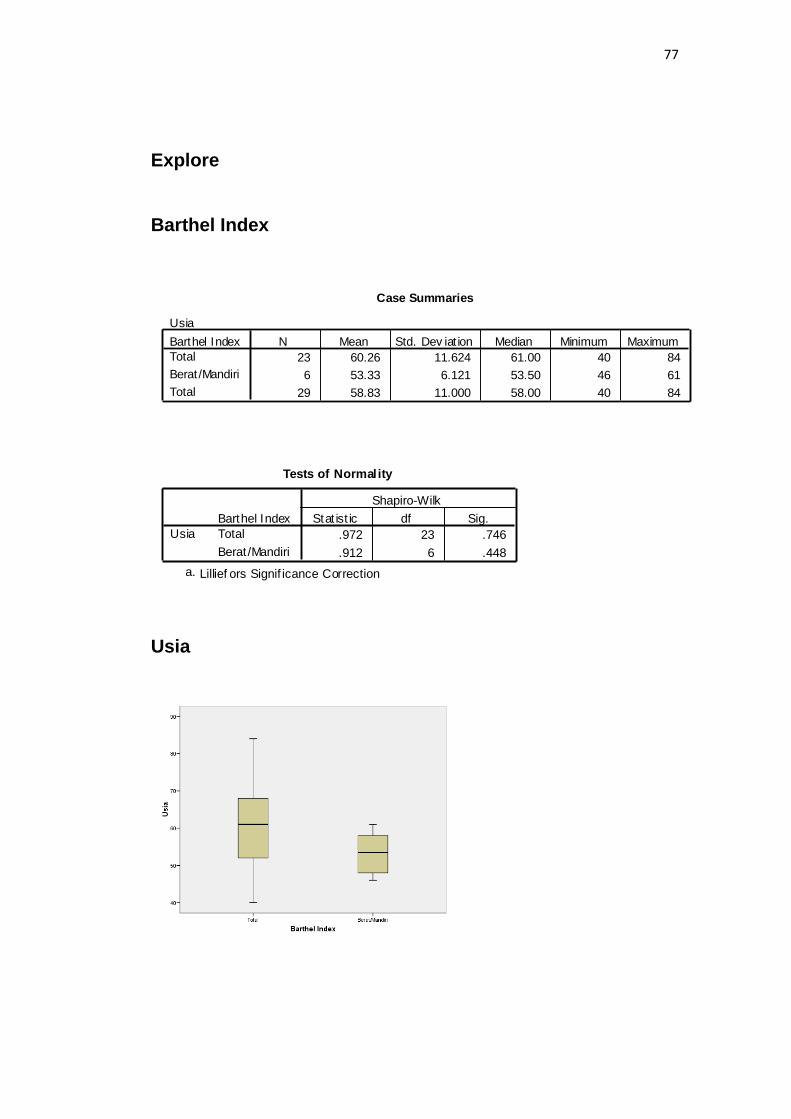
Explore
Barthel Index
Usia
Case Summaries
Usia
23 60.26 11.624 61.00 40 84
6 53.33 6.121 53.50 46 61
29 58.83 11.000 58.00 40 84
Barthel Index
Total
Berat /Mandiri
Total
N Mean Std. Dev iat ion Median Minimum Maximum
Tests of Normality
.972 23 .746
.912 6 .448
Barthel Index
Total
Berat /Mandiri
Usia
Stat ist ic df Sig.
Shapiro-Wilk
Lillief ors Signif icance Correctiona.
78
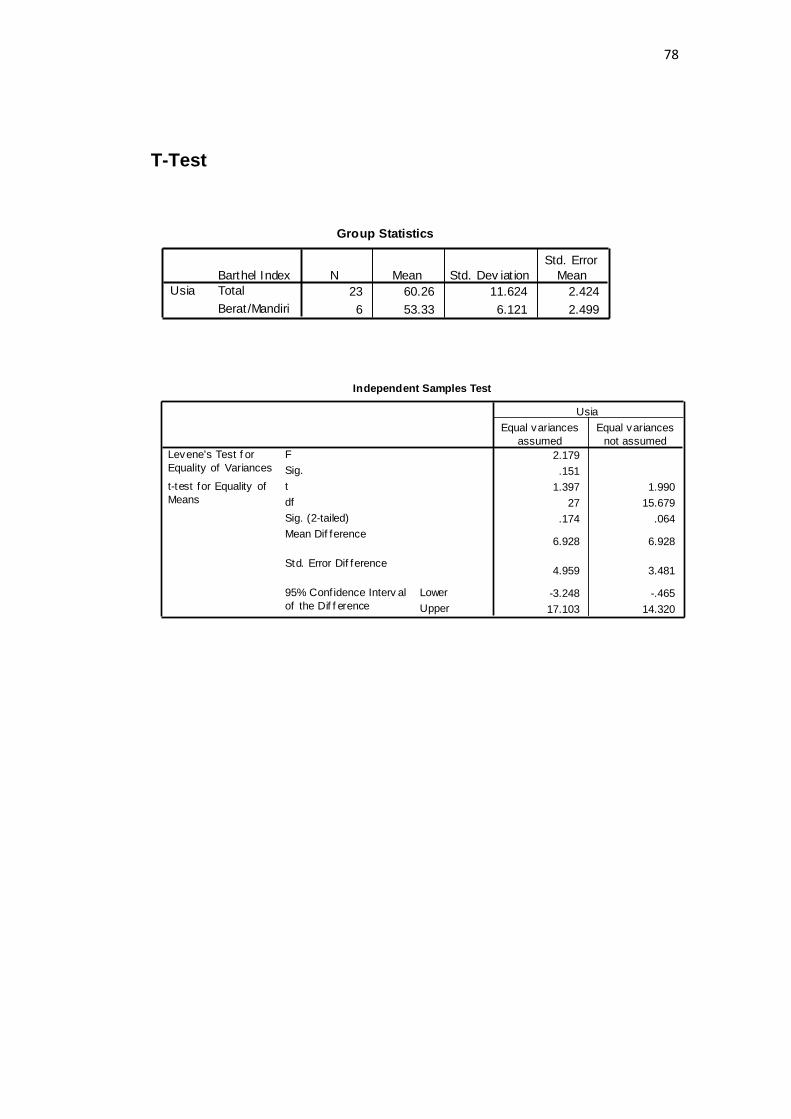
T-Test
Group Statistics
23 60.26 11.624 2.424
6 53.33 6.121 2.499
Barthel Index
Total
Berat /Mandiri
Usia
N Mean Std. Dev iat ion
Std. Error
Mean
Independent Samples Test
2.179
.151
1.397 1.990
27 15.679
.174 .064
6.928 6.928
4.959 3.481
-3.248 -.465
17.103 14.320
F
Sig.
Levene's Test f or
Equality of Variances
t
df
Sig. (2-tailed)
Mean Dif ference
Std. Error Dif ference
Lower
Upper
95% Conf idence Interv al
of the Dif f erence
t-test for Equality of
Means
Equal variances
assumed
Equal variances
not assumed
Usia
79
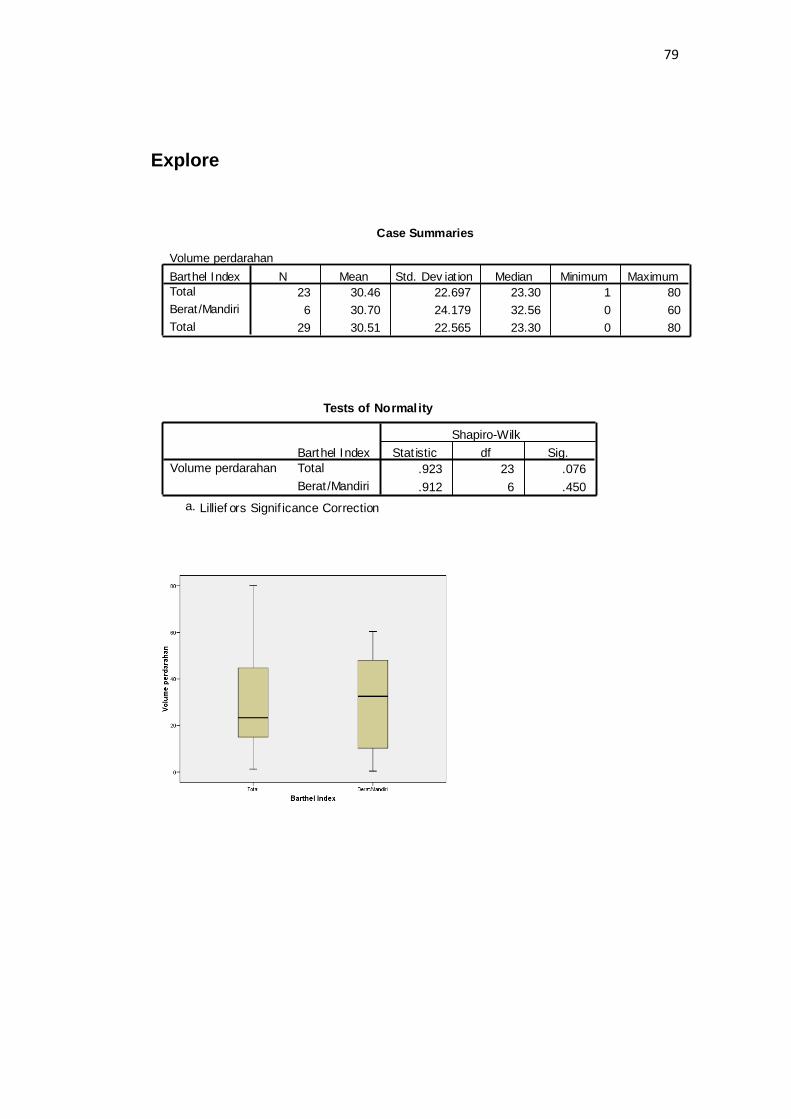
Explore
Case Summaries
Volume perdarahan
23 30.46 22.697 23.30 1 80
6 30.70 24.179 32.56 0 60
29 30.51 22.565 23.30 0 80
Barthel Index
Total
Berat /Mandiri
Total
N Mean Std. Dev iat ion Median Minimum Maximum
Tests of Normality
.923 23 .076
.912 6 .450
Barthel Index
Total
Berat /Mandiri
Volume perdarahan
Stat istic df Sig.
Shapiro-Wilk
Lillief ors Signif icance Correctiona.

80
T-Test
Group Statistics
23 30.46 22.697 4.733
6 30.70 24.179 9.871
Barthel Index
Total
Berat /Mandiri
Volume perdarahan
N Mean Std. Dev iation
Std. Error
Mean
Independent Samples Test
.207
.652
-.022 -.021
27 7.473
.982 .983
-.235 -.235
10.534 10.947
-21.849 -25.792
21.378 25.322
F
Sig.
Levene's Test f or
Equality of Variances
t
df
Sig. (2-tailed)
Mean Dif ference
Std. Error Dif ference
Lower
Upper
95% Conf idence Interv al
of the Dif f erence
t-test for Equality of
Means
Equal variances
assumed
Equal variances
not assumed
Volume perdarahan
81
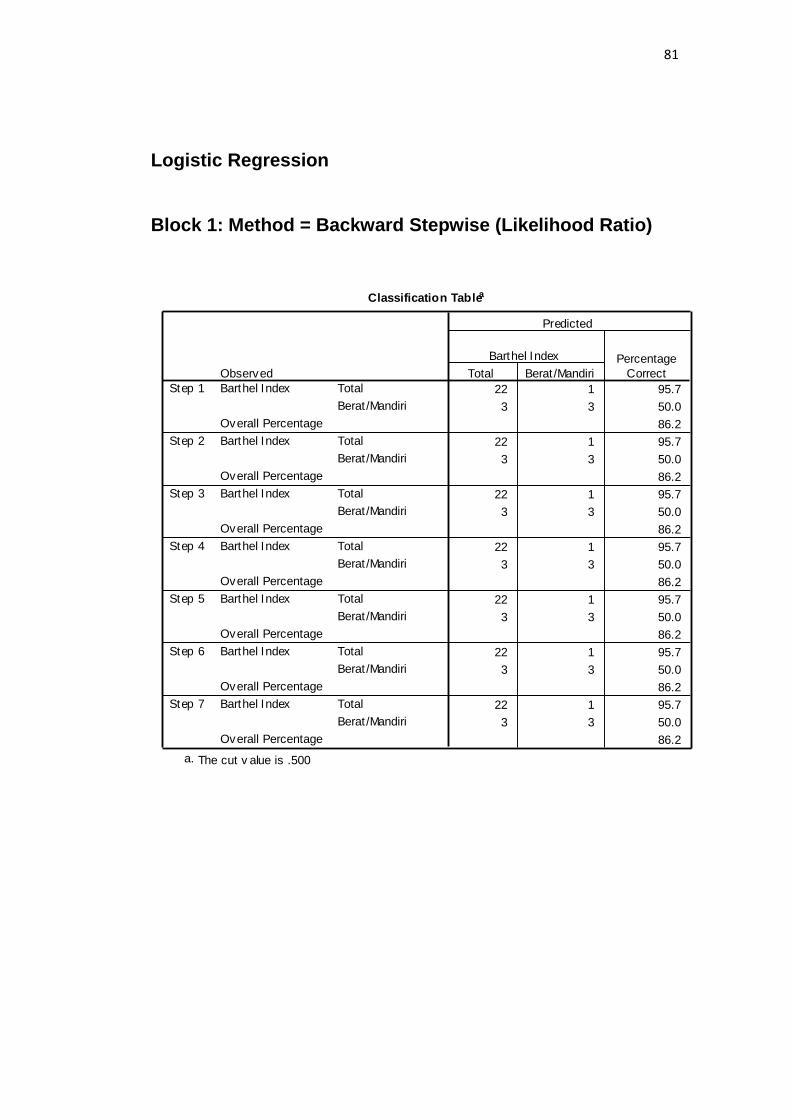
Logistic Regression
Block 1: Method = Backward Stepwise (Likelihood Ratio)
Classification Tablea
22 1 95.7
3 3 50.0
86.2
22 1 95.7
3 3 50.0
86.2
22 1 95.7
3 3 50.0
86.2
22 1 95.7
3 3 50.0
86.2
22 1 95.7
3 3 50.0
86.2
22 1 95.7
3 3 50.0
86.2
22 1 95.7
3 3 50.0
86.2
Observed
Total
Berat /Mandiri
Barthel Index
Overall Percentage
Total
Berat /Mandiri
Barthel Index
Overall Percentage
Total
Berat /Mandiri
Barthel Index
Overall Percentage
Total
Berat /Mandiri
Barthel Index
Overall Percentage
Total
Berat /Mandiri
Barthel Index
Overall Percentage
Total
Berat /Mandiri
Barthel Index
Overall Percentage
Total
Berat /Mandiri
Barthel Index
Overall Percentage
Step 1
Step 2
Step 3
Step 4
Step 5
Step 6
Step 7
Total Berat /Mandiri
Barthel Index Percentage
Correct
Predicted
The cut v alue is .500a.
82
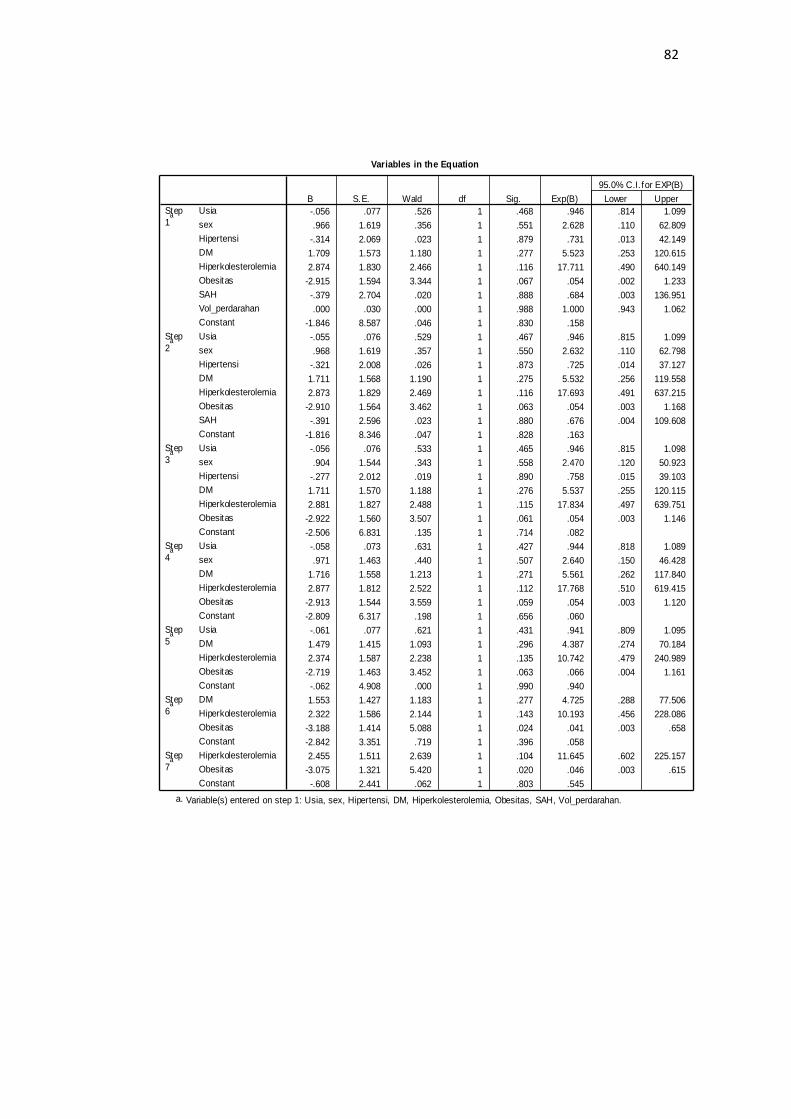
Variables in the Equation
-.056 .077 .526 1 .468 .946 .814 1.099
.966 1.619 .356 1 .551 2.628 .110 62.809
-.314 2.069 .023 1 .879 .731 .013 42.149
1.709 1.573 1.180 1 .277 5.523 .253 120.615
2.874 1.830 2.466 1 .116 17.711 .490 640.149
-2.915 1.594 3.344 1 .067 .054 .002 1.233
-.379 2.704 .020 1 .888 .684 .003 136.951
.000 .030 .000 1 .988 1.000 .943 1.062
-1.846 8.587 .046 1 .830 .158
-.055 .076 .529 1 .467 .946 .815 1.099
.968 1.619 .357 1 .550 2.632 .110 62.798
-.321 2.008 .026 1 .873 .725 .014 37.127
1.711 1.568 1.190 1 .275 5.532 .256 119.558
2.873 1.829 2.469 1 .116 17.693 .491 637.215
-2.910 1.564 3.462 1 .063 .054 .003 1.168
-.391 2.596 .023 1 .880 .676 .004 109.608
-1.816 8.346 .047 1 .828 .163
-.056 .076 .533 1 .465 .946 .815 1.098
.904 1.544 .343 1 .558 2.470 .120 50.923
-.277 2.012 .019 1 .890 .758 .015 39.103
1.711 1.570 1.188 1 .276 5.537 .255 120.115
2.881 1.827 2.488 1 .115 17.834 .497 639.751
-2.922 1.560 3.507 1 .061 .054 .003 1.146
-2.506 6.831 .135 1 .714 .082
-.058 .073 .631 1 .427 .944 .818 1.089
.971 1.463 .440 1 .507 2.640 .150 46.428
1.716 1.558 1.213 1 .271 5.561 .262 117.840
2.877 1.812 2.522 1 .112 17.768 .510 619.415
-2.913 1.544 3.559 1 .059 .054 .003 1.120
-2.809 6.317 .198 1 .656 .060
-.061 .077 .621 1 .431 .941 .809 1.095
1.479 1.415 1.093 1 .296 4.387 .274 70.184
2.374 1.587 2.238 1 .135 10.742 .479 240.989
-2.719 1.463 3.452 1 .063 .066 .004 1.161
-.062 4.908 .000 1 .990 .940
1.553 1.427 1.183 1 .277 4.725 .288 77.506
2.322 1.586 2.144 1 .143 10.193 .456 228.086
-3.188 1.414 5.088 1 .024 .041 .003 .658
-2.842 3.351 .719 1 .396 .058
2.455 1.511 2.639 1 .104 11.645 .602 225.157
-3.075 1.321 5.420 1 .020 .046 .003 .615
-.608 2.441 .062 1 .803 .545
Usia
sex
Hipertensi
DM
Hiperkolesterolemia
Obesitas
SAH
Vol_perdarahan
Constant
Step
1a
Usia
sex
Hipertensi
DM
Hiperkolesterolemia
Obesitas
SAH
Constant
Step
2a
Usia
sex
Hipertensi
DM
Hiperkolesterolemia
Obesitas
Constant
Step
3a
Usia
sex
DM
Hiperkolesterolemia
Obesitas
Constant
Step
4a
Usia
DM
Hiperkolesterolemia
Obesitas
Constant
Step
5a
DM
Hiperkolesterolemia
Obesitas
Constant
Step
6a
Hiperkolesterolemia
Obesitas
Constant
Step
7a
B S.E. Wald df Sig. Exp(B) Lower Upper
95.0% C.I. for EXP(B)
Variable(s) entered on step 1: Usia, sex, Hipertensi, DM, Hiperkolesterolemia, Obesitas, SAH, Vol_perdarahan.a.
83
Lampiran 5. Biodata Mahasiswa
Identitas
Nama : Ahda Amila Sholiha
NIM : 22010112130198
Tempat/tanggal lahir : Grobogan, 22 November 1993
Jenis kelamin : Perempuan
Alamat : Jalan Pondok Dustira 234A Sukamaju Padasuka RT9
RW6 Cimahi Tengah 40526
Nomor telepon : (022)-6610418
Nomor HP : 087832840125
e-mail : [email protected]
Riwayat Pendidikan Formal
1. SD : MI Asih Putera Lulus tahun : 2005
2. SMP : SMP Negeri 2 Cimahi Lulus tahun : 2008
3. SMA : SMA Negeri 2 Cimahi Lulus tahun : 2011
4. FK UNDIP : Masuk tahun : 2012
Keanggotaan Organisasi
1. Eksekutif muda EKOBIS BEM KM FK UNDIP tahun 2014
2. Staf departemen KSKI ROHIS KU UNDIP tahun 2013 sampai 2014
3. Anggota KSM KU UNDIP tahun 2013 sampai 2014