Chapter 3 Business Research Design - Jurnal Ilmiahku · PDF fileProposal Data Collection...
43
Chapter 3 Business Research Design Business Research Design (Desain Desain Penelitian Penelitian Bisnis Bisnis) ) • Definisi Desain Penelitian • Jenis-jenis desain penelitian 1
Transcript of Chapter 3 Business Research Design - Jurnal Ilmiahku · PDF fileProposal Data Collection...

Chapter 3Business Research DesignBusiness Research Design
((DesainDesain PenelitianPenelitian BisnisBisnis) )
• Definisi Desain Penelitian• Jenis-jenis desain penelitian
1

DefinisiDefinisi DesainDesain PenelitianPenelitian
� Kerangka (framework)/cetak biru
(blueprint) yang berisikan rencana dan
2
prosedur untuk mengarahkan penelitian
(mengumpulkan, mengukur, dan analisa
data) menjawab masalah penelitian
(research questions).
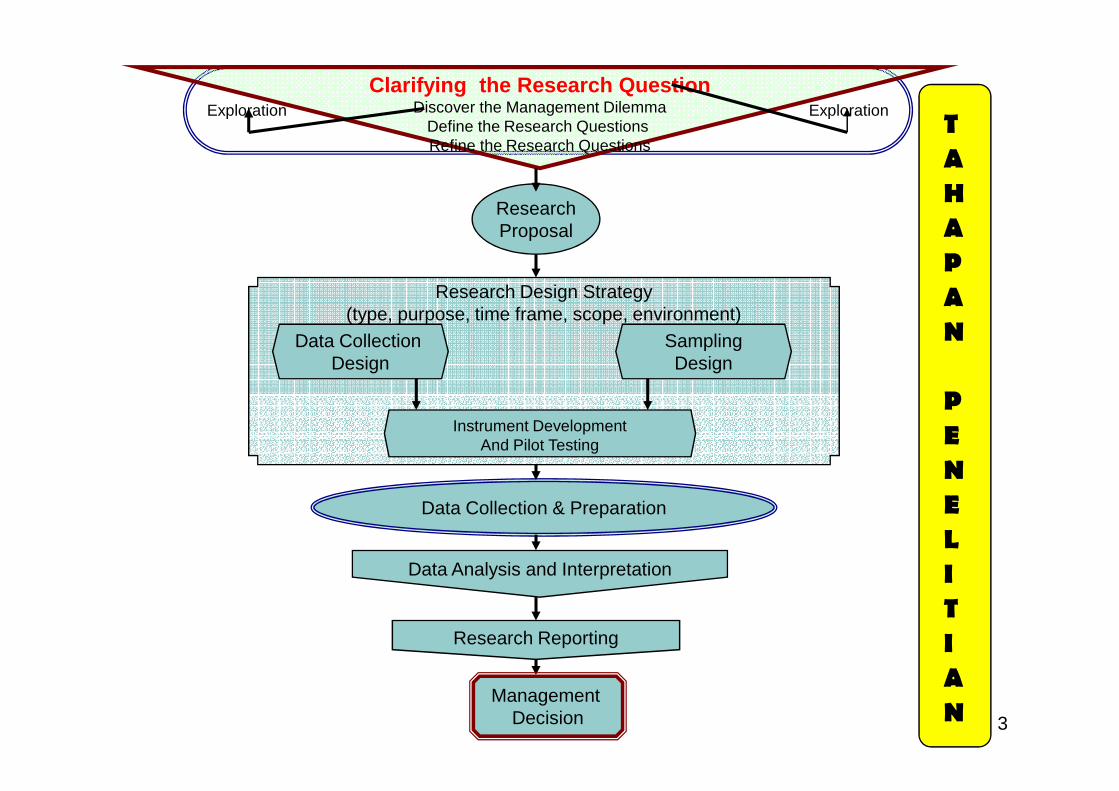
Exploration Exploration
Research Design Strategy(type, purpose, time frame, scope, environment)
Clarifying the Research QuestionDiscover the Management Dilemma
Define the Research Questions Refine the Research Questions
ResearchProposal
Data Collection Design
SamplingDesign
T
A
H
A
P
A
N
P
Data Collection & Preparation
Management Decision
Data Analysis and Interpretation
Research Reporting
Instrument DevelopmentAnd Pilot Testing
P
E
N
E
L
I
T
I
A
N 3
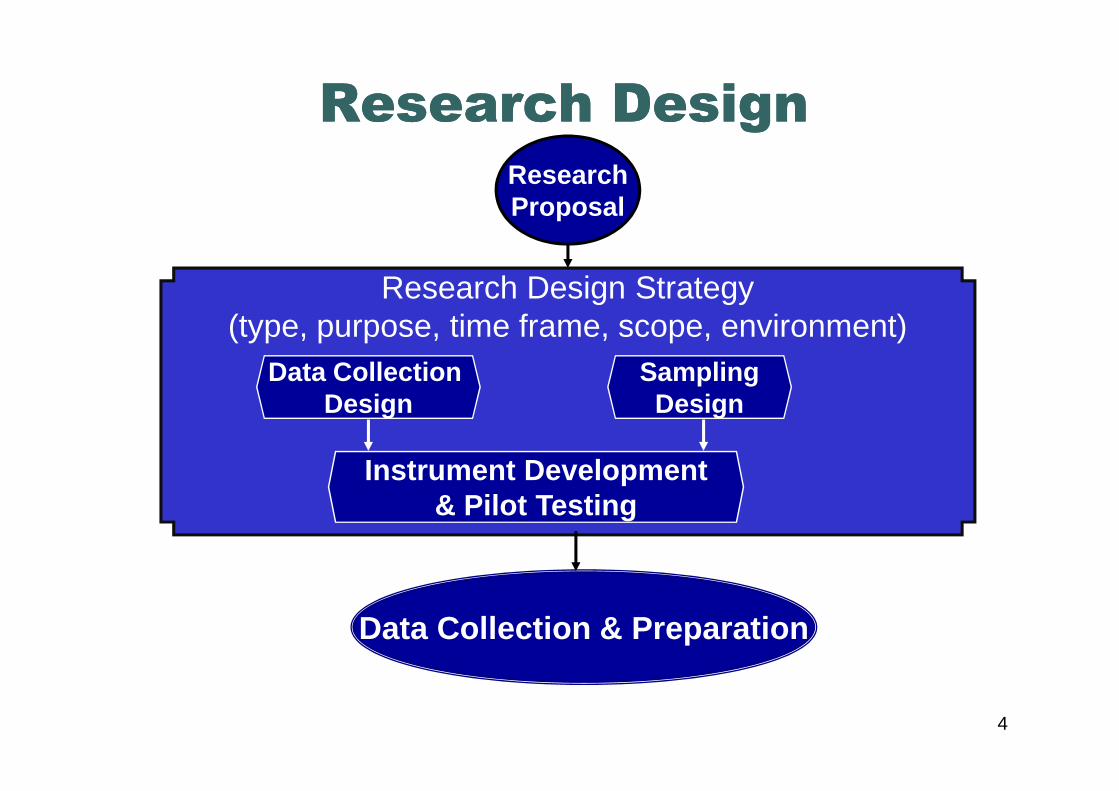
Research Design Research Design
Research Design Strategy(type, purpose, time frame, scope, environment)
ResearchProposal
Data Collection Design
SamplingDesign
Data Collection & Preparation
Design Design
Instrument Development& Pilot Testing
4

Types of Research Design
Research Design
Conclusive Research Design
Exploratory Research Design
5
Single Cross-Sectional Design
Multiple Cross-Sectional Design
Descriptive Research
Causal Research
Cross-Sectional Design
Longitudinal Design
Sumber: Malhotra, 2004; Zikmund, 2002
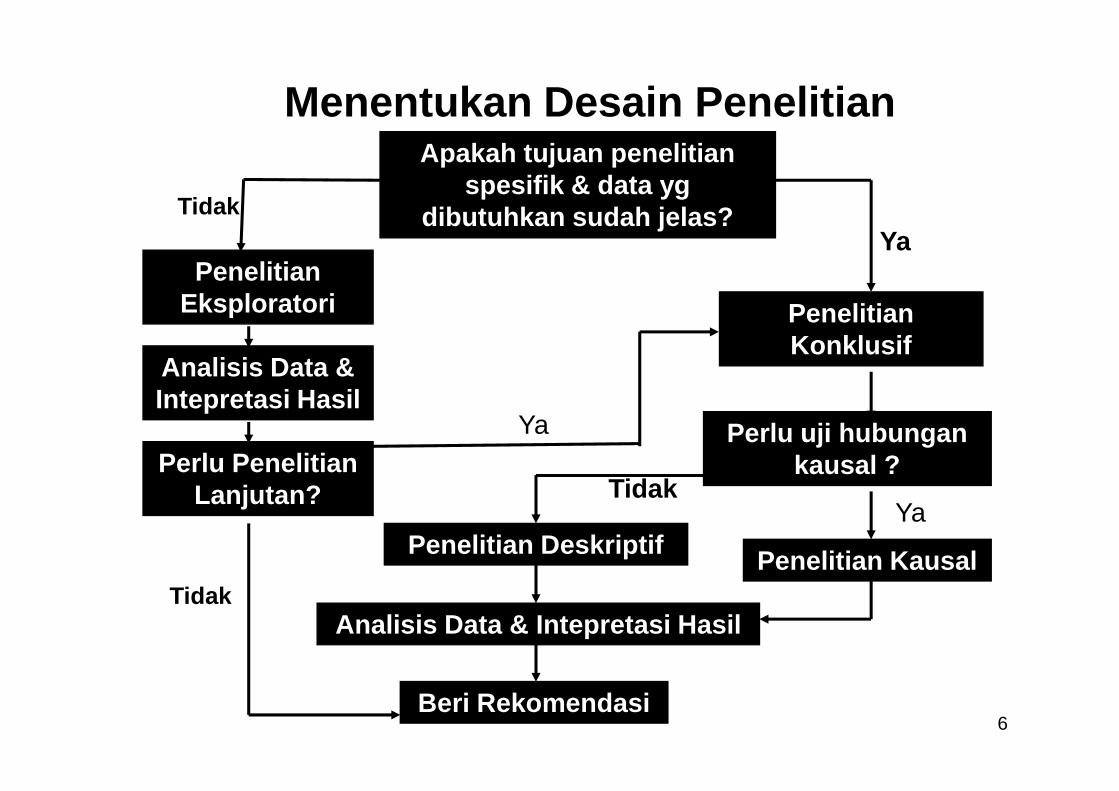
Menentukan Desain PenelitianApakah tujuan penelitian
spesifik & data yg dibutuhkan sudah jelas?
Penelitian Eksploratori
Analisis Data & Intepretasi Hasil
Penelitian Konklusif
YaTidak
6
Intepretasi Hasil
Perlu Penelitian Lanjutan?
Perlu uji hubungan kausal ?
Penelitian Kausal
Analisis Data & Intepretasi Hasil
Beri Rekomendasi
Penelitian Deskriptif Ya
Ya
Tidak
Tidak
Exploratory Studies
� Bila gagasan/persoalan yang diteliti kurang jelas, lakukan penelitian/studi eksplorasi.
� Melalui studi eksplorasi dapat dikembangkan konsep yang lebih jelas, menetapkan prioritas penelitian, mengembangkan definisi operasional, atau memperbaiki desain penelitian.
7

FaktorPembeda
Riset Eksploratori Riset Konklusif
Tujuan Umum, untuk menemukanpandangan awal ttg suatu
situasi
Spesifik, untukmemperoleh informasi
bagi pengambilankeputusan
Data ygdibutuhkan
Samar Jelas
Sumber data Kurang terdefinisi Terdefinisi dgn baik
Sampel Umumnya kecil, dipilih secara Relatif besar, dipilih
8
Sampel Umumnya kecil, dipilih secarasubjektif, yg dapat memberi
pandangan (insight)
Relatif besar, dipilihsecara objektif agar
hasil dpt digeneralisasi
Pengumpulandata
Fleksibel, tidak perlu prosedur Ketat, perlu proseduryg jelas
Analisis data Informal, umumnya tidakkuantitatif
Formal, umumnyakuantitatif
Kesimpulan, rekomendasi
Cenderung sementara Cenderung final
Sumber: Malhotra, 2004; Zikmund, 2002
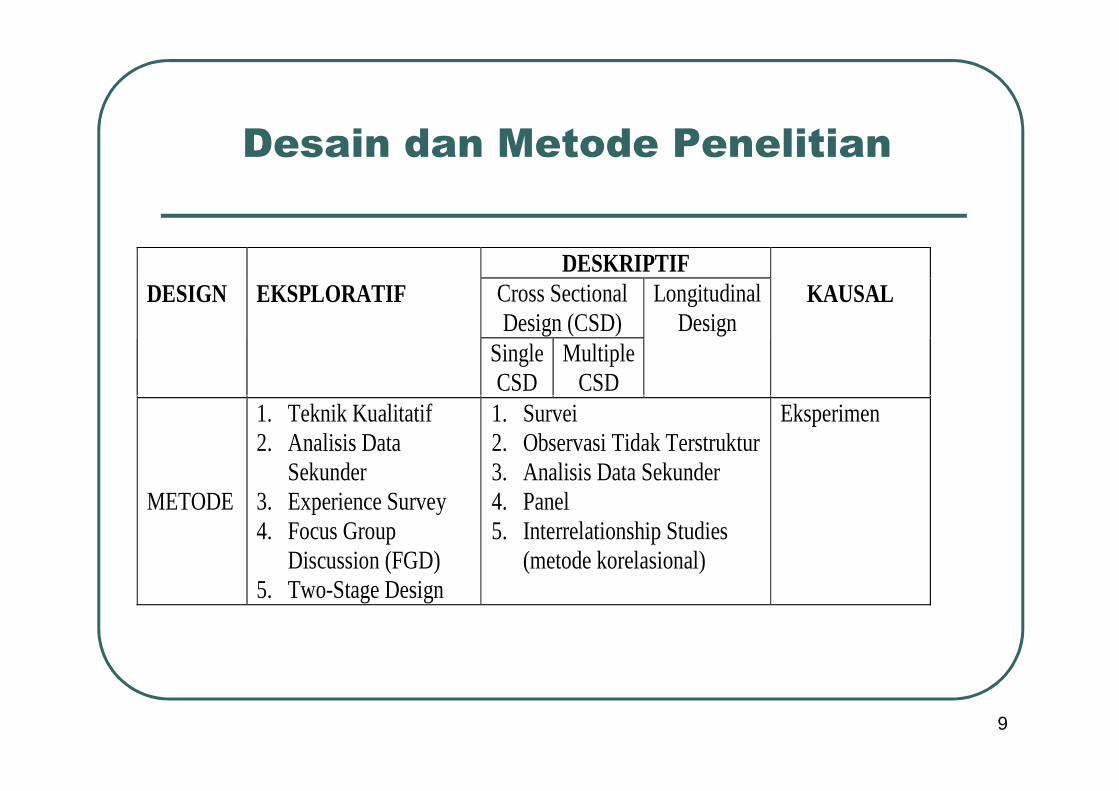
Desain dan Metode Penelitian
DESKRIPTIF DESIGN EKSPLORATIF Cross Sectional
Design (CSD) Longitudinal
Design KAUSAL
Single CSD
Multiple CSD
9
CSD CSD METODE
1. Teknik Kualitatif 2. Analisis Data
Sekunder 3. Experience Survey 4. Focus Group
Discussion (FGD) 5. Two-Stage Design
1. Survei 2. Observasi Tidak Terstruktur 3. Analisis Data Sekunder 4. Panel 5. Interrelationship Studies
(metode korelasional)
Eksperimen
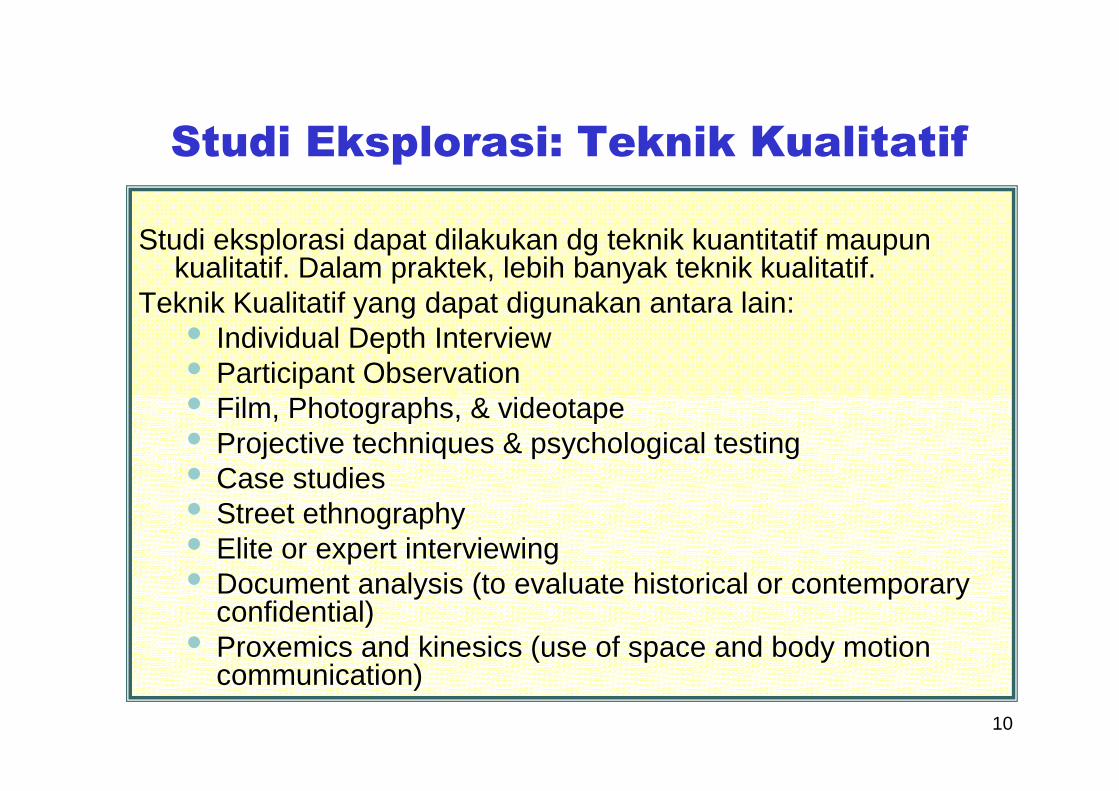
Studi Eksplorasi: Teknik Kualitatif
Studi eksplorasi dapat dilakukan dg teknik kuantitatif maupun kualitatif. Dalam praktek, lebih banyak teknik kualitatif.
Teknik Kualitatif yang dapat digunakan antara lain: • Individual Depth Interview• Participant Observation• Film, Photographs, & videotape• Film, Photographs, & videotape• Projective techniques & psychological testing• Case studies• Street ethnography• Elite or expert interviewing• Document analysis (to evaluate historical or contemporary
confidential)• Proxemics and kinesics (use of space and body motion
communication)
10

Studi Eksplorasi:
Secondary Data Analysis
� Langkah awal studi eksplorasi adalah mencari data sekunder melalui literatur.
� Bahan-bahan data sekunder adalah dokumen-dokumen yang telah dipublikasikan berbagai perusahaan/peneliti.
11
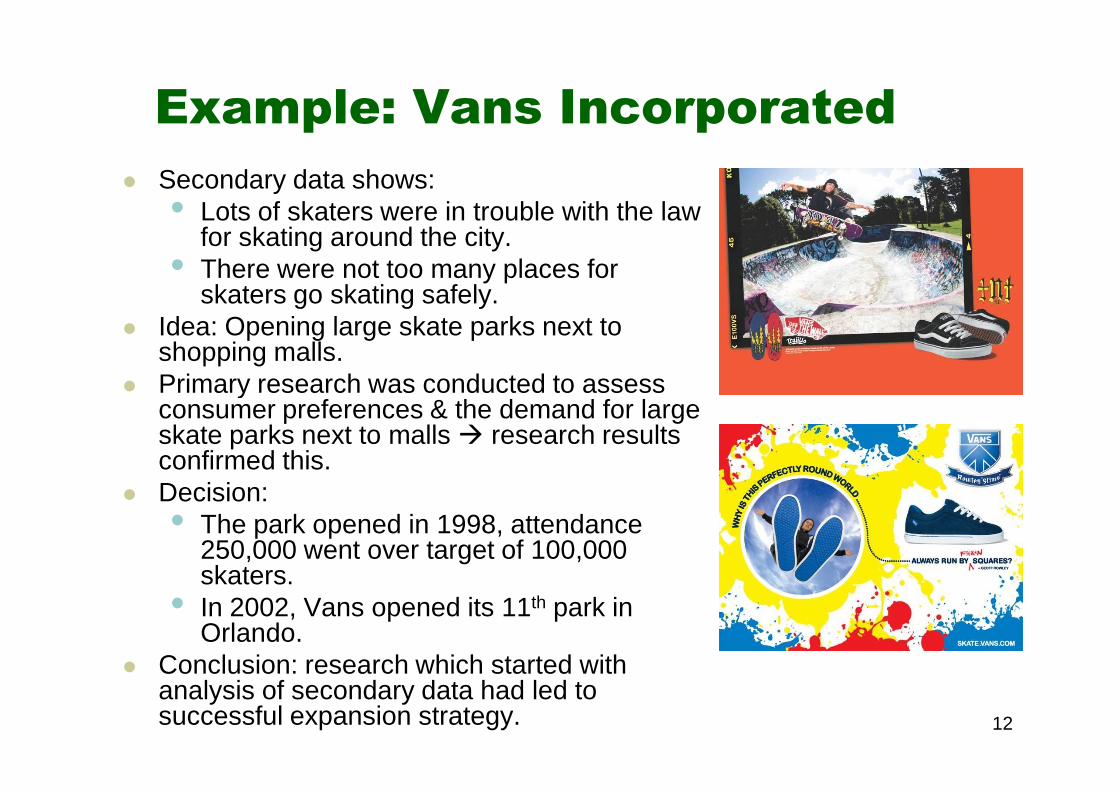
� Secondary data shows:• Lots of skaters were in trouble with the law
for skating around the city.• There were not too many places for
skaters go skating safely.� Idea: Opening large skate parks next to
shopping malls.� Primary research was conducted to assess
consumer preferences & the demand for large
Example: Vans Incorporated
12
� Primary research was conducted to assess consumer preferences & the demand for large skate parks next to malls � research results confirmed this.
� Decision:• The park opened in 1998, attendance
250,000 went over target of 100,000 skaters.
• In 2002, Vans opened its 11th park in Orlando.
� Conclusion: research which started with analysis of secondary data had led to successful expansion strategy.
Studi Eksplorasi:
Experience Survey
� Experience Survey dilakukan dengan menginterview orang-orang secara individual maupun kelompok.
� Peneliti harus menggali gagasan-gagasan orang yang diwawancarai tentang isu-isu penting atau aspek-aspek dari subyek dan menemukan apa yang penting.
13

Repositioning Diet Cherry Coke
� 2001, sales down more than 8 million cases.� Industry experts consultation � Diet Cherry Coke
was not positioned correctly.� Brand image was a key factor influencing soft drink
sales.� It was perceived as conventional & old fashioned,
inconsistent with Cherry Coke.
14
inconsistent with Cherry Coke.� Research to measure the image & positioning of Diet
Cherry Coke � confirmed the experts’� Brand then repositioned to align it more closely to the
image of Cherry Coke.� Targeted younger drinkers.� Packaging was remade consistent with Cherry Coke.
Placed with Cherry Coke in a teen-targeted promotional giveaway.
� Sales recovered.
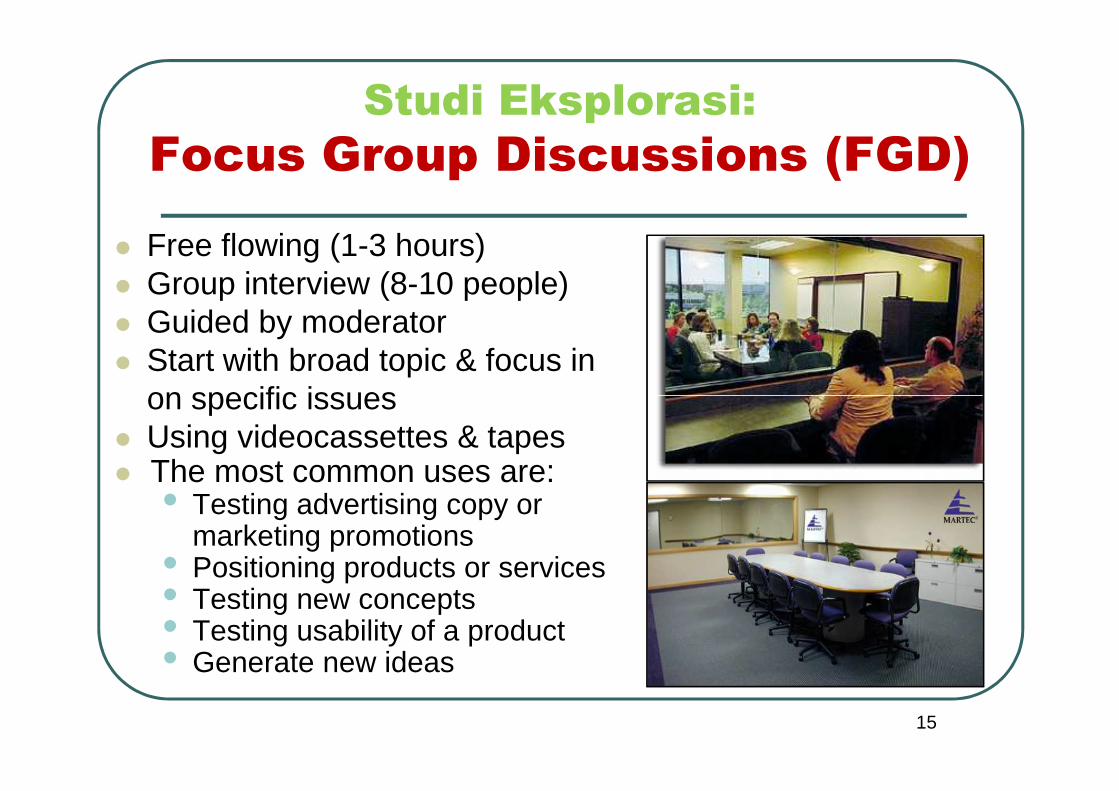
Studi Eksplorasi:
Focus Group Discussions (FGD)
� Free flowing (1-3 hours)� Group interview (8-10 people)� Guided by moderator� Start with broad topic & focus in
on specific issues
15
on specific issues� Using videocassettes & tapes� The most common uses are:
• Testing advertising copy or marketing promotions
• Positioning products or services• Testing new concepts• Testing usability of a product• Generate new ideas
When to Avoid Focus Groups
� Focus groups should not be used to make a final decision. � Results of focus groups are not statistically valid and should be used
more as a thermometer to test the temperature of the market rather than as a ruler to provide precise measurements.
� Likewise, the following represent good examples of when to avoid using focus groups � When you need a numerical response to questions like “what percentage…?” or “how many…?”
� Focus groups do not provide quantitative results.� Focus groups do not provide quantitative results.� When you need to explore issues that are very personal or sensitive
in nature.� People are not really comfortable discussing personal topics in a
group situation.� When you want to set prices for your products or your services.� Again, these results are not quantitative in nature hence it is not
advisable to make final pricing decisions based on small group responses.
16

Studi Deskriptif
Bentuk studi Deskriptif lebih formal dan terstruktur dibanding eksplorasi, dengan pernyataan (hipotesis) dan pertanyaan investigatif yang lebih jelas.
Studi deskriptif digunakan menjawab tujuan penelitian, seperti berikut:
� Deskripsi fenomena atau karakteristik terkait dengan � Deskripsi fenomena atau karakteristik terkait dengan sebuah populasi (who, what, when, where, and how)
� Estimasi proporsi populasi yang memiliki karakteristik/ perilaku tertentu
� Menentukan persepsi ttg karakteristik produk� Menemukan asosiasi di antara berbagai variabel
(correlational study)
17

Descriptive Research
Time-frame of research…� Cross-sectional design
(CSD)
18
(CSD)� Longitudinal design

Studi Cross-sectional
vs Longitudinal
� Studi cross-sectional dilakukan pada suatu titik waktu tertentu yg bersamaan dari berbagai tempat yg berbeda.
� Studi longitudinal dilakukan pada berbagai pengulangan sepanjang rentang waktu tertentu dari suatu tempat yang sama.
19

Cross-Sectional Designs
� The collection of information from any given sample of population elements only once.
� Single cross-sectional designs: only one sample of respondents and information is obtained from this sample only once.
20
obtained from this sample only once.� Multiple cross-sectional designs: two or
more samples of respondents, and information from each sample is obtained only once. Often, information from different samples is obtained at different times.

Longitudinal Designs
� A fixed sample (or samples) of population elements is measured repeatedly on the same variables
21
� A longitudinal design differs from a cross-sectional design in that the sample or samples remain the same over time
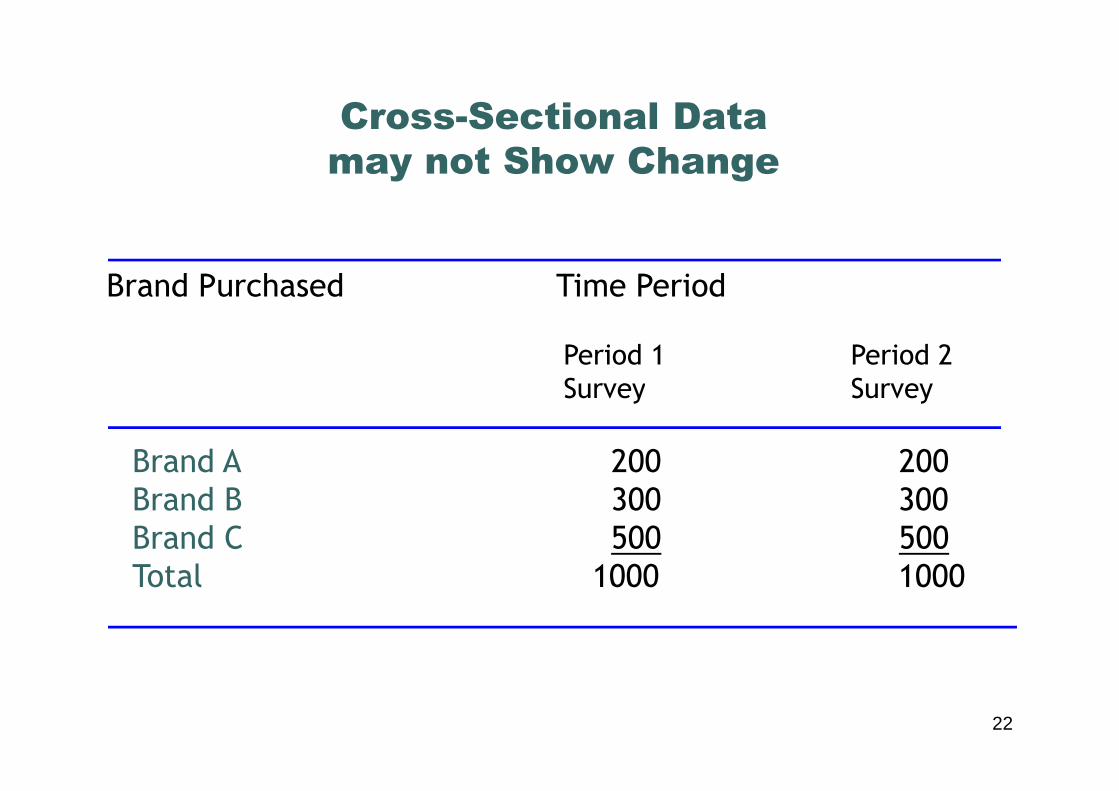
Cross-Sectional Data
may not Show Change
Brand Purchased Time Period
Period 1 Period 2
Survey Survey
22
Survey Survey
Brand A 200 200
Brand B 300 300
Brand C 500 500
Total 1000 1000
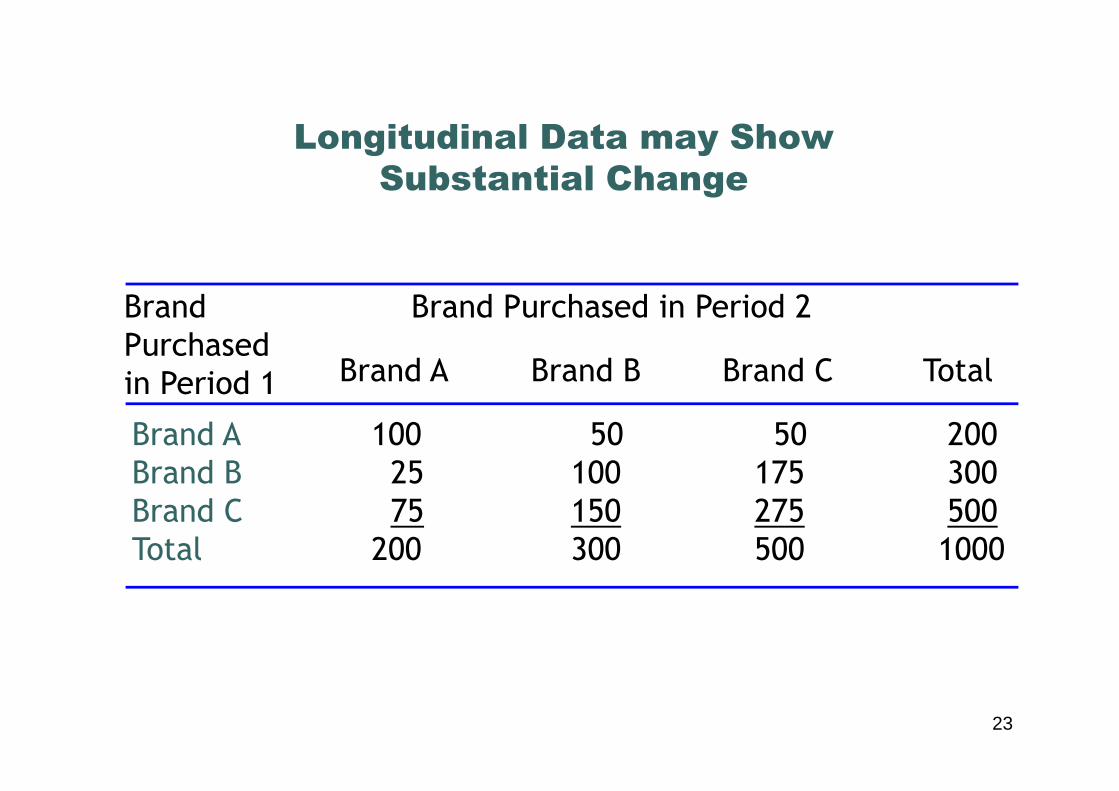
Longitudinal Data may Show
Substantial Change
Brand
Purchased
in Period 1
Brand Purchased in Period 2
Brand A Brand B Brand C Total
23
in Period 1
Brand A
Brand B
Brand C
Total
100
25
75
200
50
100
150
300
50
175
275
500
200
300
500
1000
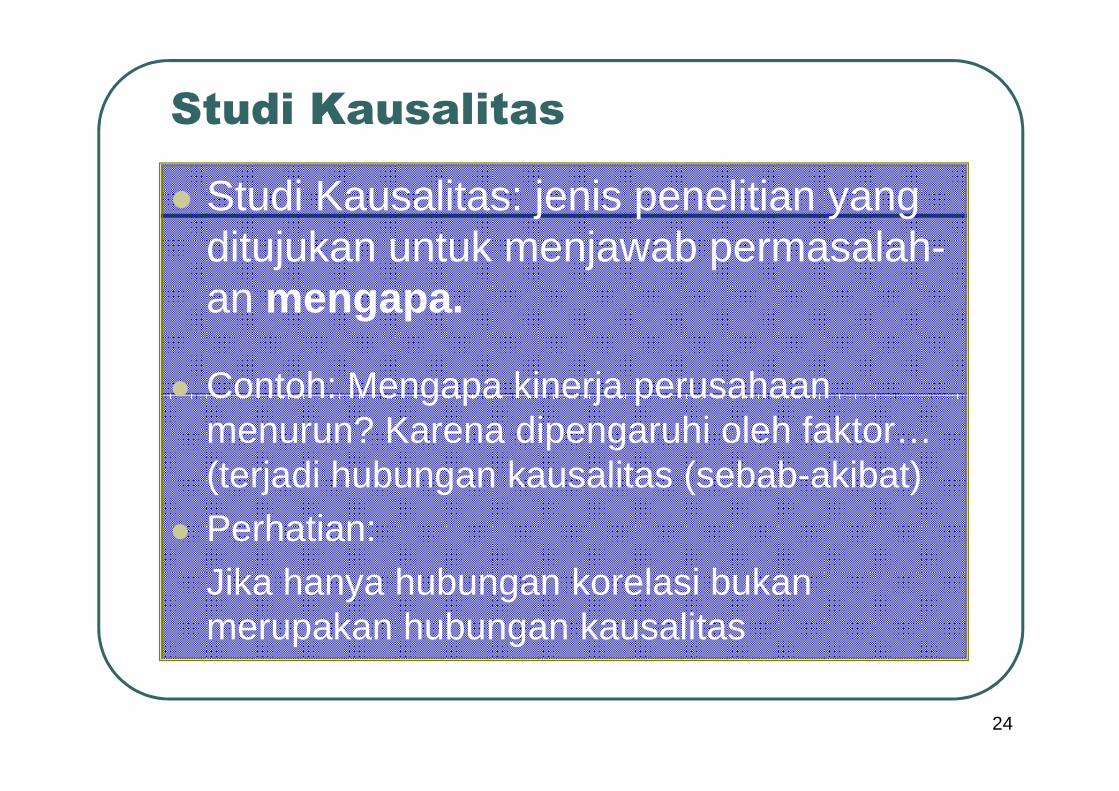
Studi Kausalitas
� Studi Kausalitas: jenis penelitian yang ditujukan untuk menjawab permasalah-an mengapa.
� Contoh: Mengapa kinerja perusahaan � Contoh: Mengapa kinerja perusahaan menurun? Karena dipengaruhi oleh faktor… (terjadi hubungan kausalitas (sebab-akibat)
� Perhatian:Jika hanya hubungan korelasi bukan merupakan hubungan kausalitas
24
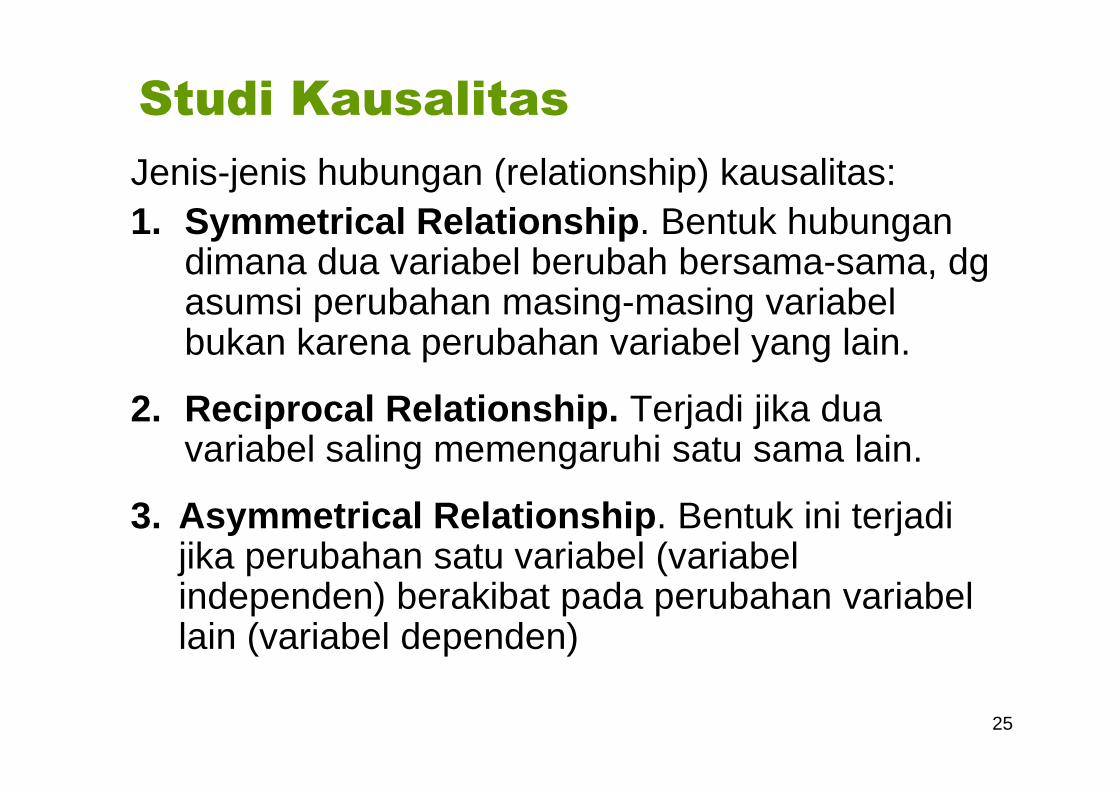
Studi Kausalitas
Jenis-jenis hubungan (relationship) kausalitas:1. Symmetrical Relationship. Bentuk hubungan
dimana dua variabel berubah bersama-sama, dg asumsi perubahan masing-masing variabelbukan karena perubahan variabel yang lain.
2. Reciprocal Relationship. Terjadi jika dua2. Reciprocal Relationship. Terjadi jika duavariabel saling memengaruhi satu sama lain.
3. Asymmetrical Relationship. Bentuk ini terjadijika perubahan satu variabel (variabelindependen) berakibat pada perubahan variabellain (variabel dependen)
25

Potential Sources of Error in Research Designs
Total Error
Non-sampling
Error
Sampling Error
Non-response Response
26
Surrogate Information Error
Measurement Error
Problem Definition Error
Data Analysis Error
Respondent Selection Error
Questioning Error
Recording Error
Cheating/dishonest Error
Inability Error
Unwillingness Error
Non-response
Error
Response
Error
Interviewer
Error
Respondent
Error
Researcher
Error
Sumber: Malhotra, 2004; Zikmund, 2002
Errors in Research Design
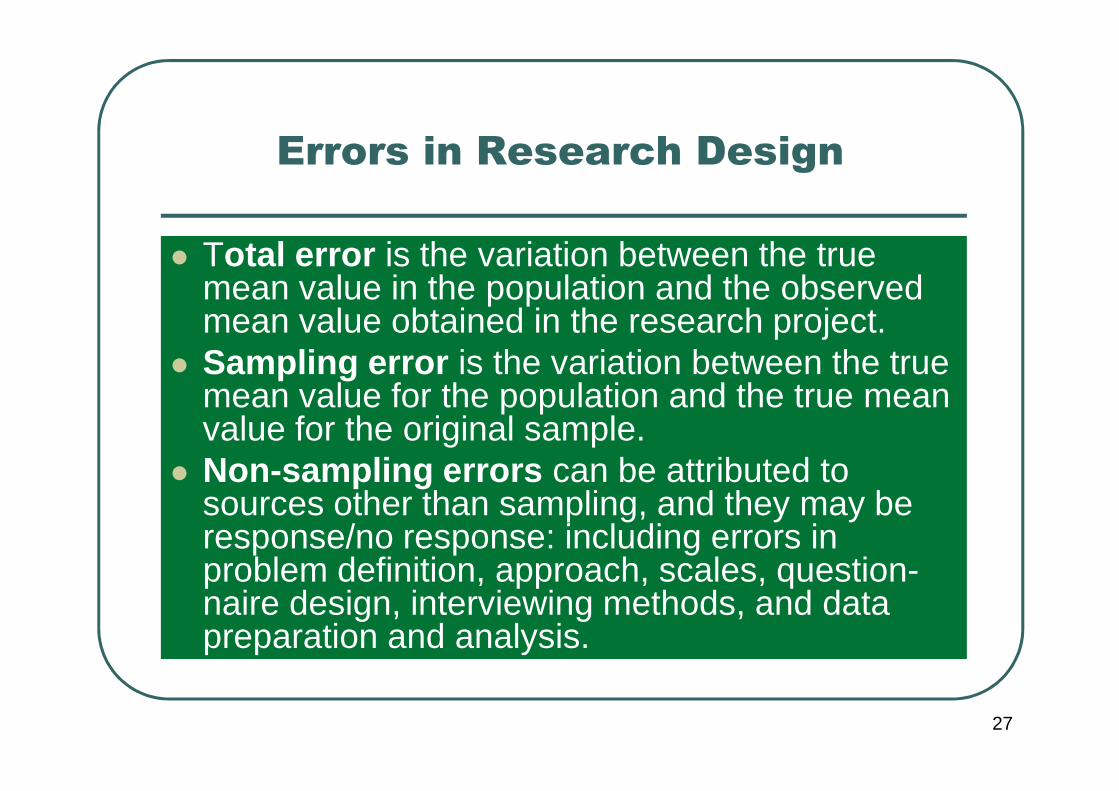
� Total error is the variation between the true mean value in the population and the observed mean value obtained in the research project.
� Sampling error is the variation between the true mean value for the population and the true mean
27
mean value for the population and the true mean value for the original sample.
� Non-sampling errors can be attributed to sources other than sampling, and they may be response/no response: including errors in problem definition, approach, scales, question-naire design, interviewing methods, and data preparation and analysis.
Errors in Research Design
� Non-response error arises when some of the respondents included in the sample do not respond.
� Response error arises when respondents give
28
� Response error arises when respondents give inaccurate answers or their answers are misrecorded or misanalyzed.
Qualitative vs. Quantitative Research
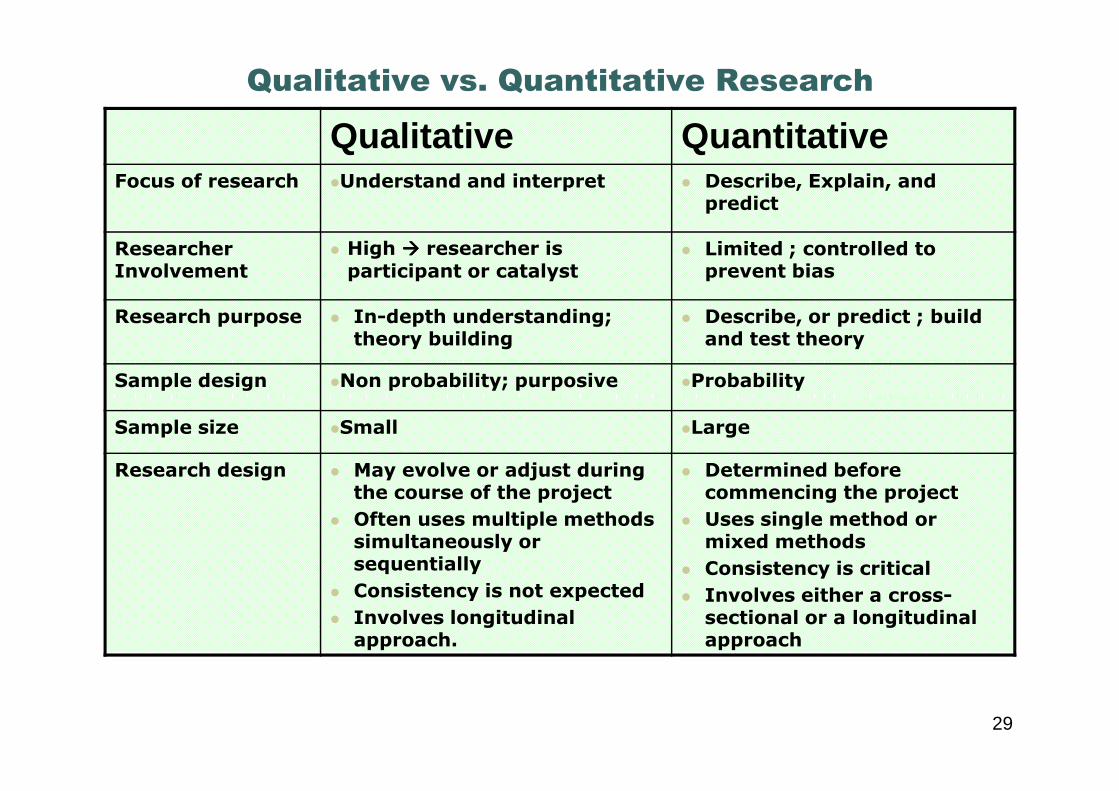
Qualitative QuantitativeFocus of research �Understand and interpret � Describe, Explain, and
predict
Researcher Involvement
� High ���� researcher is participant or catalyst
� Limited ; controlled to prevent bias
Research purpose � In-depth understanding; theory building
� Describe, or predict ; build and test theory
Sample design �Non probability; purposive �Probability
Sample size �Small �Large
Research design � May evolve or adjust during the course of the project
� Often uses multiple methods simultaneously or sequentially
� Consistency is not expected
� Involves longitudinal approach.
� Determined before commencing the project
� Uses single method or mixed methods
� Consistency is critical
� Involves either a cross-sectional or a longitudinal approach
29

Qualitative vs Quantitative Research
Qualitative QuantitativeParticipant Preparation
� Pre-tasking is common � No preparation desired to avoid biasing the participant
Data type and preparation
� Verbal or pictorial descriptions
� Reduced to verbal codes (sometimes with computer assistance)
� Verbal descriptions
� Reduced to numerical codes for computerized analysis
Data Analysis � Human analysis following � Computerized analysis –Data Analysis � Human analysis following computer or human coding; primarily non-quantitative
� Forces researcher to see the contextual framework of the phenomenon being measured—distinction between facts and judgments less clear
� Always ongoing during the project.
� Computerized analysis –statistical and mathematical methods dominate.
� Analysis may be ongoing during the project
� Maintains clear distinction between facts and judgment.
30

Features of Qualitative & Quantitative Research
Qualitative Quantitative
"All research ultimately has a qualitative grounding"
- Donald Campbell
"There's no such thing as qualitative data. Everything is either 1 or 0"
- Fred Kerlinger
The aim is a complete, detailed description.The aim is to classify features, count them, and
construct statistical models in an attempt to explain what is observed.
Researcher may only know roughly in advance what he/she is looking for.
Researcher knows clearly in advance what he/she is looking for.
Recommended during earlier phases of research projects.
Recommended during latter phases of research projects.
The design emerges as the study unfolds. All aspects of the study are carefully designed
before data is collected.
Researcher is the data gathering instrument.Researcher uses tools, such as questionnaires or
equipment to collect numerical data.
Data is in the form of words, pictures or objects. Data is in the form of numbers and statistics.
Subjective - individuals’ interpretation of events is important ,e.g., uses participant observation, in-depth interviews etc.
Objective – seeks precise measurement & analysis of target concepts, e.g., uses surveys, questionnaires etc.
Qualitative data is more 'rich', time consuming, and less able to be generalized.
Quantitative data is more efficient, able to test hypotheses, but may miss contextual detail.
Researcher tends to become subjectively immersed in the subject matter.
Researcher tends to remain objectively separated from the subject matter.
31
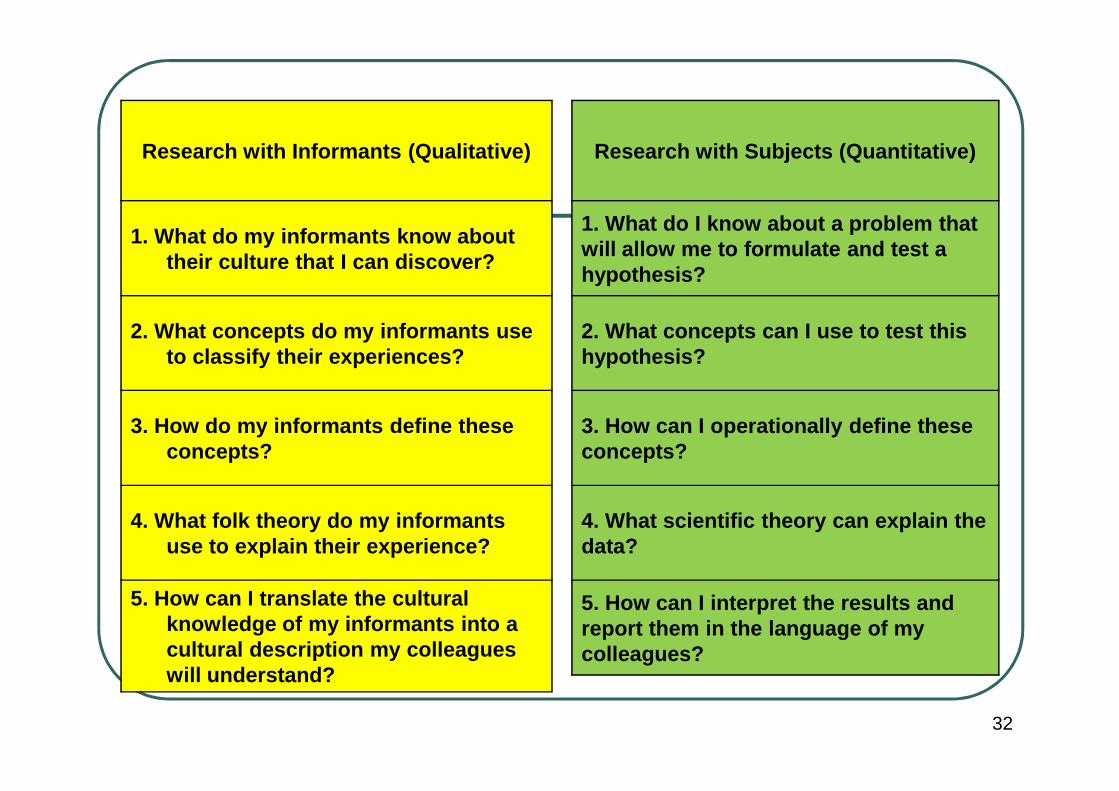
Research with Informants (Qualitative)
1. What do my informants know about their culture that I can discover?
2. What concepts do my informants use to classify their experiences?
Research with Subjects (Quantitative)
1. What do I know about a problem that will allow me to formulate and test a hypothesis?
2. What concepts can I use to test this hypothesis?
3. How do my informants define these concepts?
4. What folk theory do my informants use to explain their experience?
5. How can I translate the cultural knowledge of my informants into a cultural description my colleagues will understand?
3. How can I operationally define these concepts?
4. What scientific theory can explain the data?
5. How can I interpret the results and report them in the language of my colleagues?
32

Teknik-teknik Kualitatif
Teknik Kualitatif yang bisa digunakan al:• Individual Depth Interview• Participant Observation• Film, Photographs and videotape• Film, Photographs and videotape• Projective techniques and psychological testing• Case studies• Street ethnography• Elite or expert interviewing• Document analysis (to evaluate historical or contemporary
confidential)• Proxemics and kinesics (use of space and body motion
communication)
33

Individual Depth Interview and Group Interviews
Individual Interview Group Interview� Research Objective :� Explore life of individual in depth� Create case histories through repeated interview s
over time� Test a survey
� Research Objective:� Orient the researcher to a field of inquiry and the
language of the field� Explore a range of attitudes, opinions, and
behaviors� Observe a process of consensus and
disagreement� Add contextual detail to quantitative findings
Topic Concerns : Topic Concerns :� Topic Concerns :� Detailed individual experiences, choices,
biographies.� Sensitive issues that might provoke anxiety
� Topic Concerns :� Issues of public interest or common concern� Issues where little is known or of a hypothetical
nature
� Participants: � Time pressed participant or those difficult to recruit
(e.g., elite or high-status participants)� Participants with sufficient language skill (e.g.,
those older than seven)� Participants whose distinction would inhibit
participation
� Participants :� Participants whose backgrounds are similar or
not so dissimilar as to generate conflict or discomfort.
� Participants who offer a range of positions on issues.
34
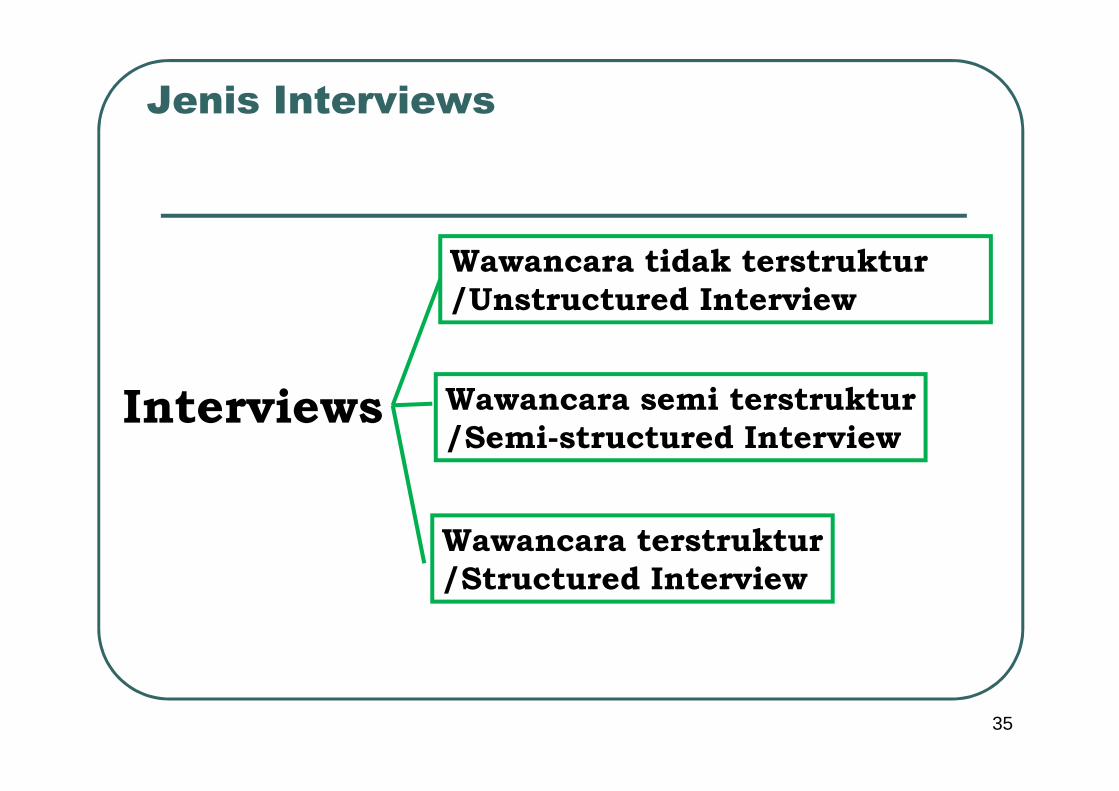
Interviews
Wawancara tidak terstruktur
/Unstructured Interview
Wawancara semi terstruktur
Jenis Interviews
Interviews Wawancara semi terstruktur
/Semi-structured Interview
Wawancara terstruktur
/Structured Interview
35
Statistical studies vs. Case Studies
� Studi secara statistikal dirancang lebih untuk mengungkapkan keluasan cakupan daripada kedalamannya. Studi ini mencoba mengungkapkan karakteristik suatu populasi dengan melakukan inferensi karakteristik suatu sampel. Hipotesis-hipotesis diuji secara kuantitatif. Generalisasi atas temuannya disajikan berdasarkan keterwakilan sampel dan validitas dari rancangannya.rancangannya.
� Studi kasus lebih menekankan pada sebuah analisis kontekstual yang menyeluruh atas kejadian-kejadian atau kondisi-kondisi yang lebih sempit dan menekankan interrelasinya.
36

Teknik Kualitatif: Teknik-Teknik Projektif
Word association: Participants are asked to match images, experiences, emotions, products and services, even people and places, to whatever is being studied. Contoh: “Apa yang Anda pikirkan bila mendengar kata KEJU……”
Sentence completion: Sentence completion: Participants are asked to complete a sentenceContoh: “Lengkapi kalimat berikut ini: Restoran yang menawarkan diskon kartu kredit berarti… ….. “
Cartoons or empty balloonsParticipants are asked to write the dialog for a cartoon-like picture
37

A Cartoon Test GiantGiant
38
Let’s see if we can pick
up some house wares
at Giant……….………………

Teknik Kualitatif: Teknik-teknik Projektif
Component sorts: Participants are presented with a flash cards containing component features and asked to create new combinations
Sensory sorts: Participants are presented with scents, textures, and sound, usually verbalized on cards, and asked to textures, and sound, usually verbalized on cards, and asked to arrange them by one or more criteria
Laddering or benefit chain: Participants are asked to link functional features to their physical and psychological benefits, both real and ideal
Thematic Apperception Test: Participants are confronted with a picture (usually a photograph or drawing) and asked to describe how the person in the picture feels and thinks
39
Thematic Apperception Test
(TAT)
40

� Imagination exercises: Participants are asked to
relate the properties of one thing/person/brand to another.� Imaginary universe: Participants are asked to assume that
the brand and its users populate an entire universe; then they describe the features of this new world
Teknik Kualitatif:
Teknik-teknik Projektif
the features of this new world
� Visitor from another planet: Participant are asked to assume that they are aliens and are confronting the product for the first time; they then describe their reactions, questions, and attitudes about purchase or retrial.
� Personification. Participants are asked to imagine inanimate objects with the traits, characteristics, and features, and personalities of humans. “if brand X were a person, what type of person would brand X be ?
41
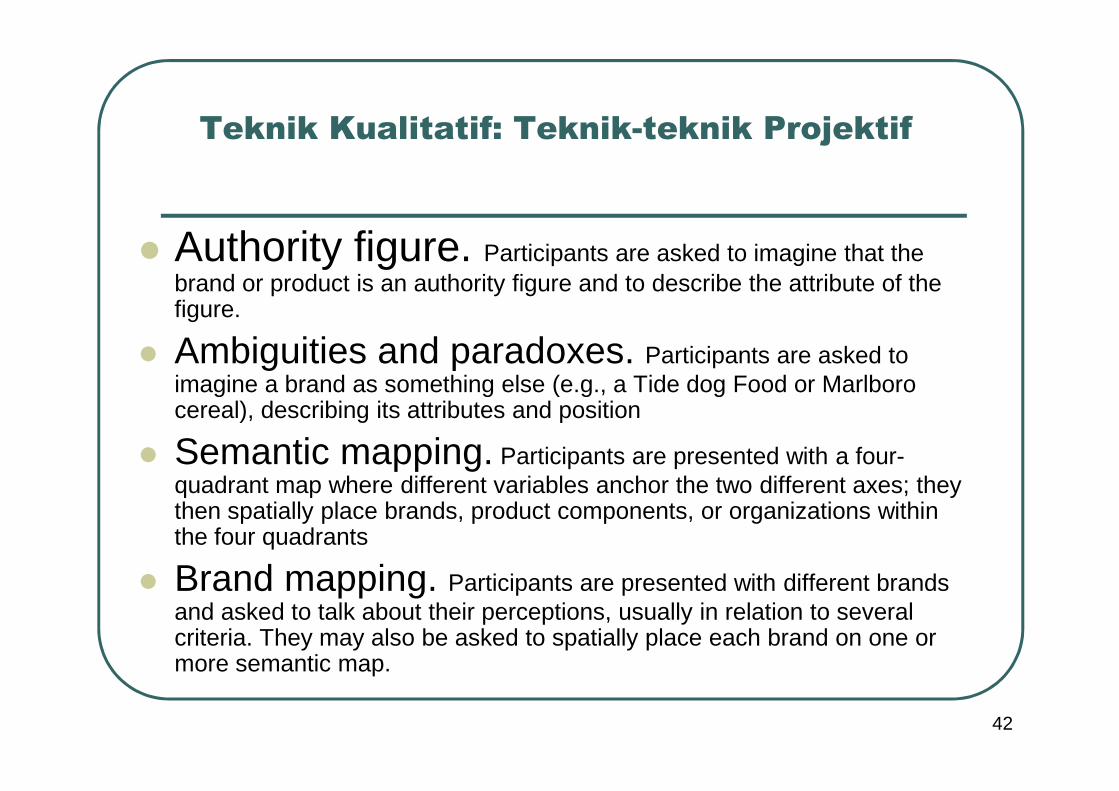
� Authority figure. Participants are asked to imagine that the brand or product is an authority figure and to describe the attribute of the figure.
� Ambiguities and paradoxes. Participants are asked to imagine a brand as something else (e.g., a Tide dog Food or Marlboro
Teknik Kualitatif: Teknik-teknik Projektif
imagine a brand as something else (e.g., a Tide dog Food or Marlboro cereal), describing its attributes and position
� Semantic mapping. Participants are presented with a four-quadrant map where different variables anchor the two different axes; they then spatially place brands, product components, or organizations within the four quadrants
� Brand mapping. Participants are presented with different brands and asked to talk about their perceptions, usually in relation to several criteria. They may also be asked to spatially place each brand on one or more semantic map.
42

Contoh Brand Mapping
High moisturizing
Nondeodorant Deodorant
Zest
Lever 2000
Safeguard
Dove
Biore
LuxCoast
2
4
5
7
8
low moisturizing
Nondeodorant Deodorant
GivLifebuoy
Lux
Medicare
1
38
6
43