BAB V CHAPTER V PERTANIAN AGRICULTURE · types of irrigation are becoming more and more embraced...
30
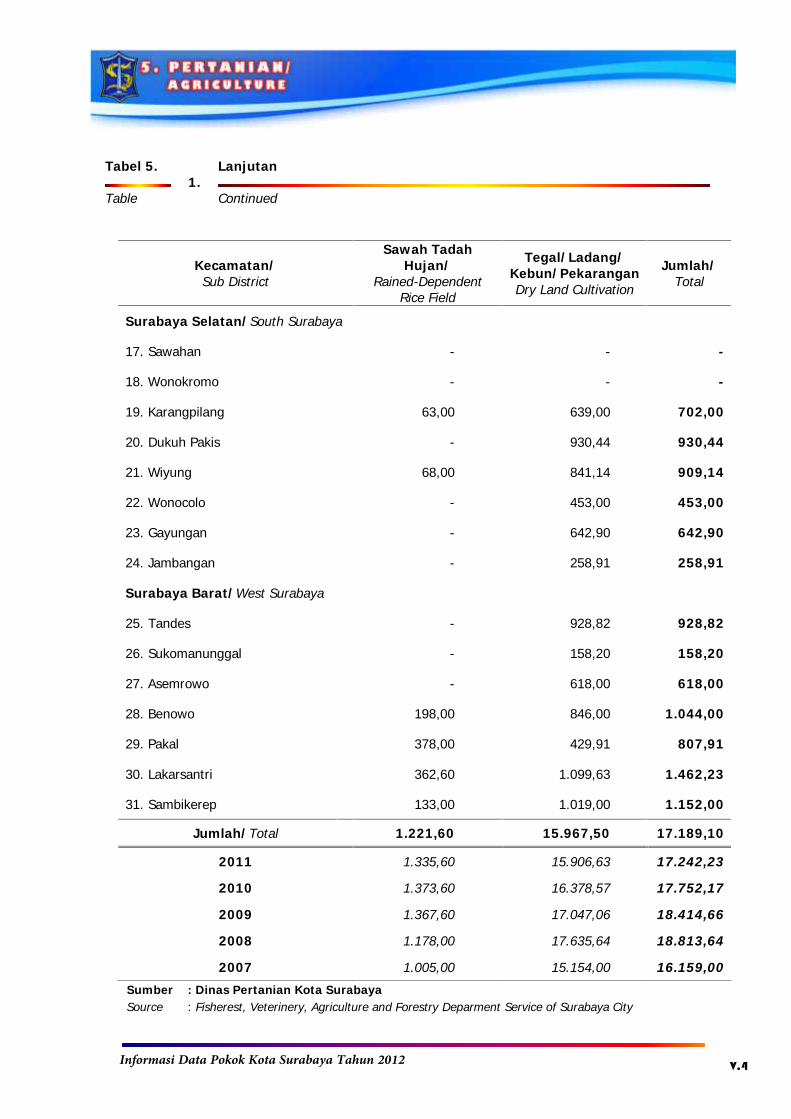
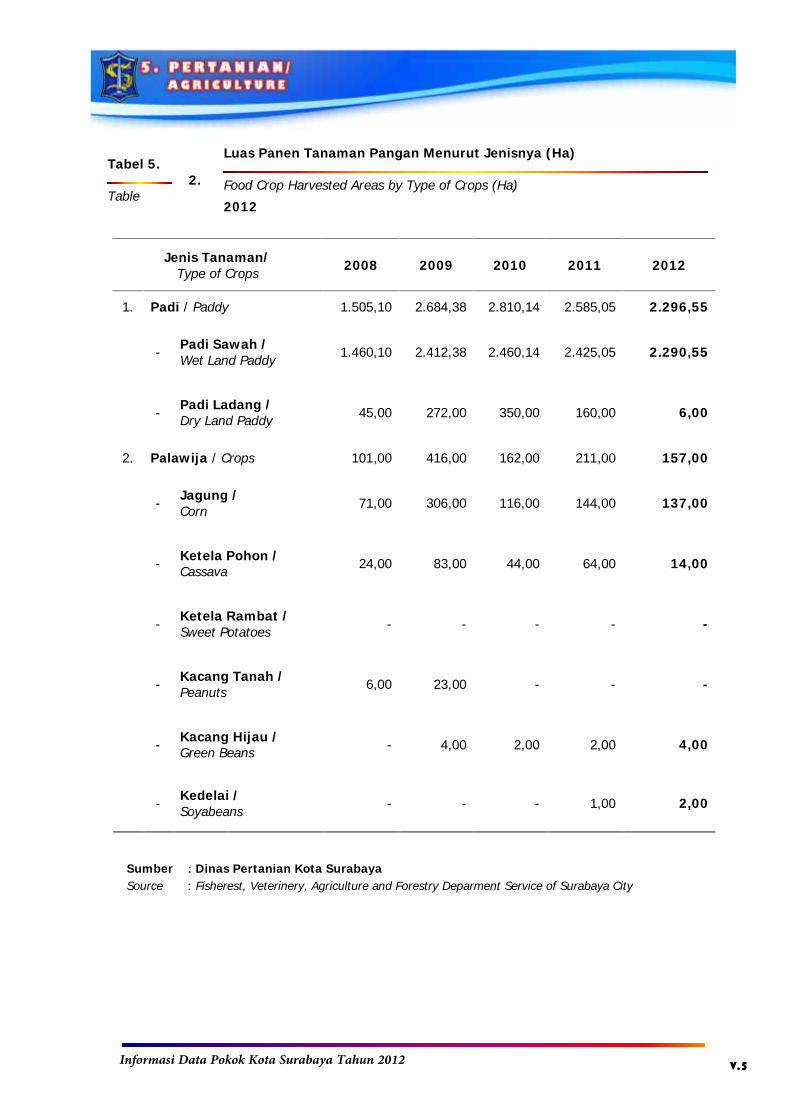
Informasi Data Pokok Kota Surabaya Tahun 2012 V.a BAB V PERTANIAN 1. PERTANIAN Luas lahan pertanian yang diusahakan menurut jenis pengairan sederhana yang terluas ada di kecamatan Lakarsantri dengan luas 101 Ha, kemudian seluas 100 Ha di kecamatan Bulak, kemudian 17 Ha di kecamatan Rungkut, 20 ha di Gunung Anyar, 40 Ha di Sukolilo yang paling sedikit ada di kecamatan Wonocolo sebesar 4 Ha saja. Dari jenis pengairannya semakin hari Surabaya semakin banyak menganut jenis pengairan sederhana, walaupun di tahun 2007 masih terdapat 31 ha lahan berjenis pengairan teknis dan di tahun 2010 masih terdapat 24 ha lahan dengan pengairan setengah teknis. Sawah tadah hujan terbesar terdapat di kecamatan Pakal dengan luas 378 Ha dan yang tersempit di kecamatan Tambaksari dengan luas 1 Ha saja. Lahan pertanian jenis tegal/lading/kebun/pekarangan terluas berada di wilayah kecamatan Mulyorejo dengan luas 1.128 Ha dan yang tersempit di wilayah Sukomanunggal dengan luasan hanya 158,20 Ha. Jika melihat tren nya, jumlah luasan sawah tadah hujan dari tahun 2010 ke tahun 2011 mengalami penurunan dari 1.373,60 Ha menjadi 1.335,60 Ha. Begitu pula luas tegalan yang bahkan sejak 2008 lalu selalu mengalami penurunan luas. Menurut jenisnya, di tahun 2012, luas tanaman panen menurut jenisnya yang terbanyak masih padi sawah dengan luasan 2.290,55 Ha, kemudian jagung dengan 137 Ha, CHAPTER V AGRICULTURE 1. FOOD CROP AGRICULTURAL Cultivated agricultural land area by type of simple irrigation of the widest in the district of lakarsantri with an area of 101, then an area of 100 hectares in the district of Bulak, then 17 hectares in the district Rungkut, 20 ha in Mount Newer, 40 Ha in Sukolilo that at least in Wonocolo district by 4 hectares only. Of types of irrigation are becoming more and more embraced Surabaya simple irrigation types, although in 2007 there are 31 ha of irrigation manifold technical and in 2010 there are 24 ha of land with a semi-technical irrigation. The Largest Rainfed located in Pakal's l districts with an area of 378 hectares and the narrowest with an area only of 1 ha in the Tambaksari district. Agricultural land types tegal / lading / garden / yard is in the widest districts with an area of 1,128 Ha Mulyorejo and narrowest in the Sukomanunggal region with an area of only 158.20 ha. If you look at his trend, the number of rainfed area from 2010 to 2011 has decreased from 1373.60 to 1335.60 Ha Ha. Similarly, the broad moor even since 2008 always had broad decline. According to its kind, in the year 2012, the planted area of crop by type were most rice is still an area of 2290.55 Ha with, then corn with 137 Ha, 14 Ha sweet potatoes, green beans 4 Ha, Ha and soybean 2. Since 2010, the amount of rice and corn yields tend to decline, but it does not happen on the green beans and
Transcript of BAB V CHAPTER V PERTANIAN AGRICULTURE · types of irrigation are becoming more and more embraced...
Informasi Data Pokok Kota Surabaya Tahun 2012 V.a
BAB V
PERTANIAN
1. PERTANIAN
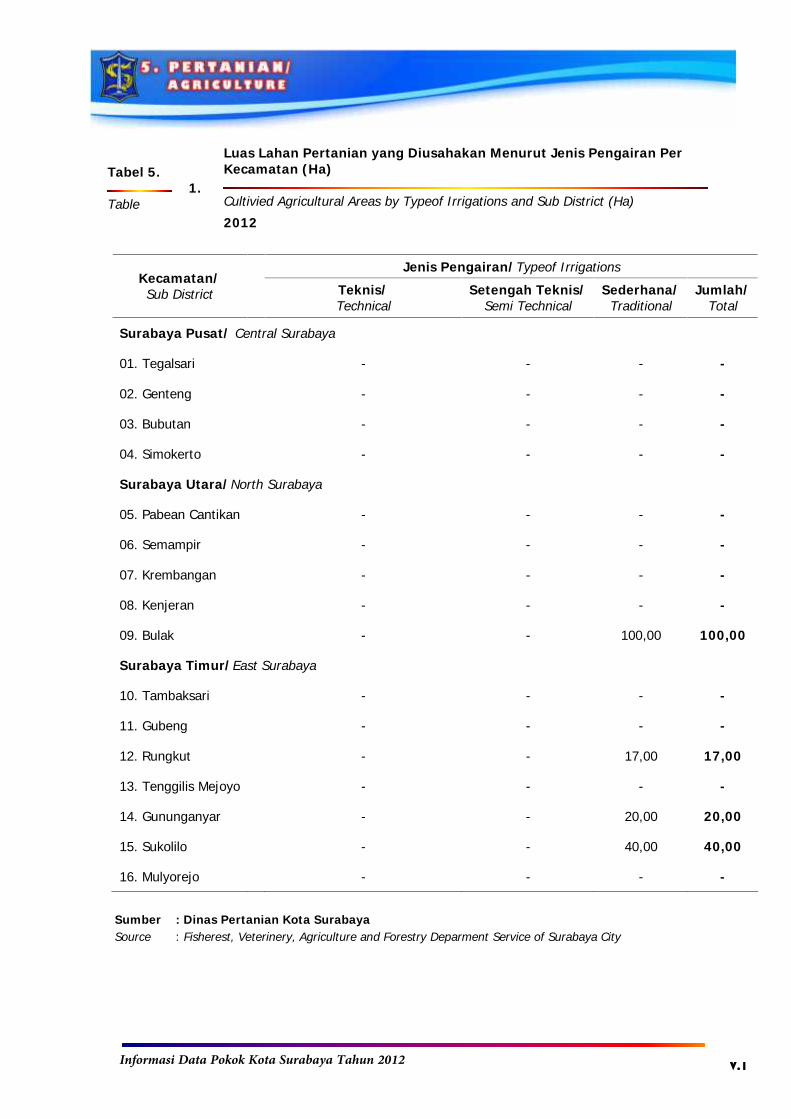
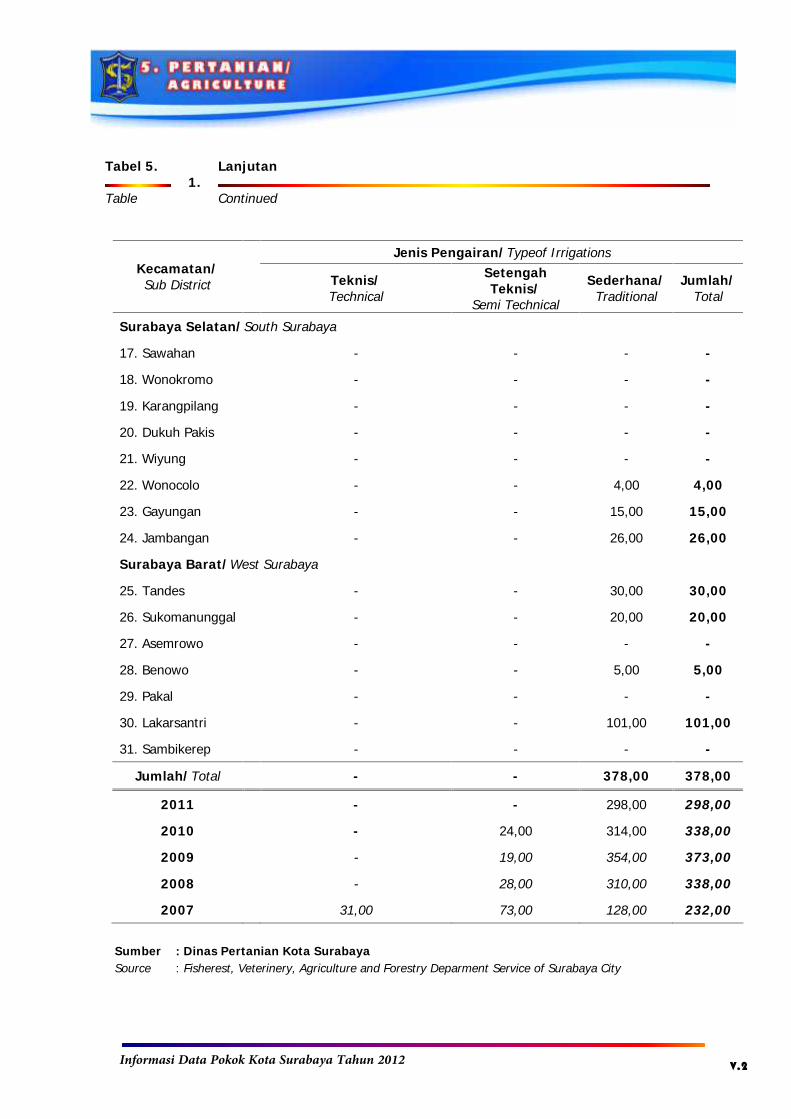
Luas lahan pertanian yang diusahakan
menurut jenis pengairan sederhana yang
terluas ada di kecamatan Lakarsantri dengan
luas 101 Ha, kemudian seluas 100 Ha di
kecamatan Bulak, kemudian 17 Ha di
kecamatan Rungkut, 20 ha di Gunung Anyar,
40 Ha di Sukolilo yang paling sedikit ada di
kecamatan Wonocolo sebesar 4 Ha saja. Dari
jenis pengairannya semakin hari Surabaya
semakin banyak menganut jenis pengairan
sederhana, walaupun di tahun 2007 masih
terdapat 31 ha lahan berjenis pengairan teknis
dan di tahun 2010 masih terdapat 24 ha lahan
dengan pengairan setengah teknis.
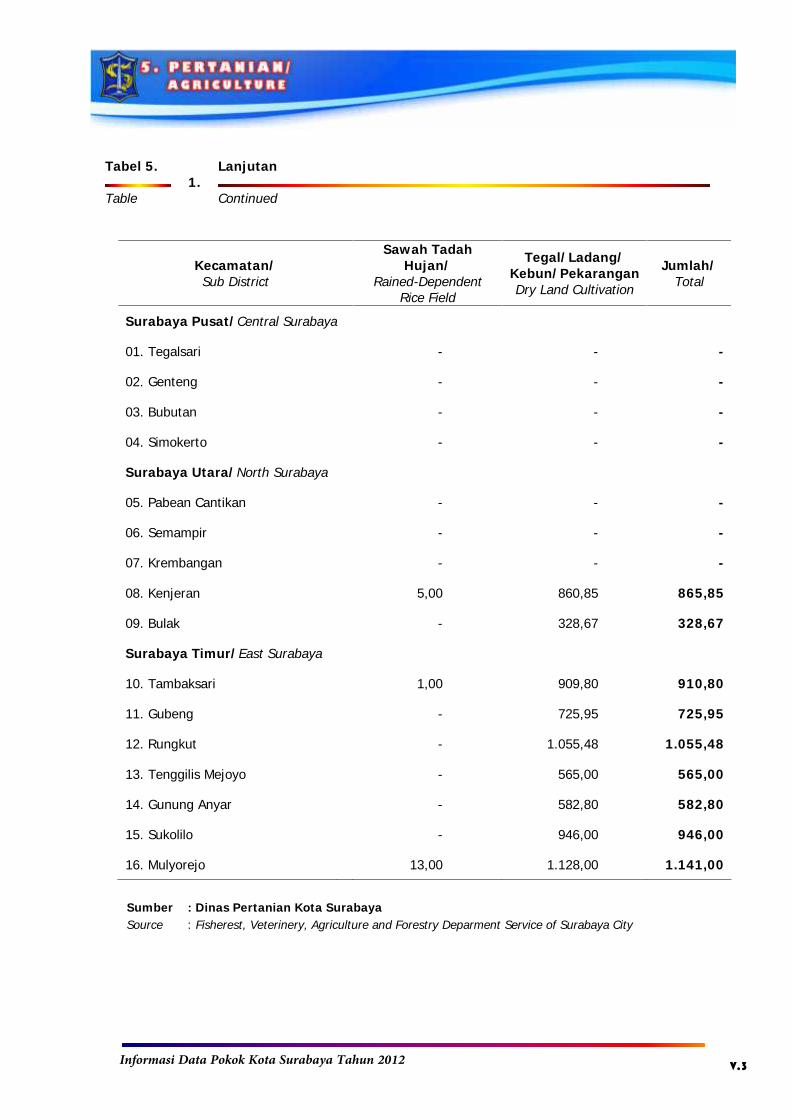
Sawah tadah hujan terbesar terdapat
di kecamatan Pakal dengan luas 378 Ha dan
yang tersempit di kecamatan Tambaksari
dengan luas 1 Ha saja. Lahan pertanian jenis
tegal/lading/kebun/pekarangan terluas berada
di wilayah kecamatan Mulyorejo dengan luas
1.128 Ha dan yang tersempit di wilayah
Sukomanunggal dengan luasan hanya 158,20
Ha. Jika melihat tren nya, jumlah luasan sawah
tadah hujan dari tahun 2010 ke tahun 2011
mengalami penurunan dari 1.373,60 Ha
menjadi 1.335,60 Ha. Begitu pula luas tegalan
yang bahkan sejak 2008 lalu selalu mengalami
penurunan luas.
Menurut jenisnya, di tahun 2012, luas
tanaman panen menurut jenisnya yang
terbanyak masih padi sawah dengan luasan
2.290,55 Ha, kemudian jagung dengan 137 Ha,
CHAPTER V
AGRICULTURE
1. FOOD CROP AGRICULTURAL
Cultivated agricultural land area by type
of simple irrigation of the widest in the district
of lakarsantri with an area of 101, then an
area of 100 hectares in the district of Bulak,
then 17 hectares in the district Rungkut, 20 ha
in Mount Newer, 40 Ha in Sukolilo that at least
in Wonocolo district by 4 hectares only. Of
types of irrigation are becoming more and
more embraced Surabaya simple irrigation
types, although in 2007 there are 31 ha of
irrigation manifold technical and in 2010 there
are 24 ha of land with a semi-technical
irrigation.
The Largest Rainfed located in Pakal's l
districts with an area of 378 hectares and the
narrowest with an area only of 1 ha in the
Tambaksari district. Agricultural land types
tegal / lading / garden / yard is in the widest
districts with an area of 1,128 Ha Mulyorejo
and narrowest in the Sukomanunggal region
with an area of only 158.20 ha. If you look at
his trend, the number of rainfed area from
2010 to 2011 has decreased from 1373.60 to
1335.60 Ha Ha. Similarly, the broad moor even
since 2008 always had broad decline.
According to its kind, in the year 2012,
the planted area of crop by type were most rice
is still an area of 2290.55 Ha with, then corn
with 137 Ha, 14 Ha sweet potatoes, green
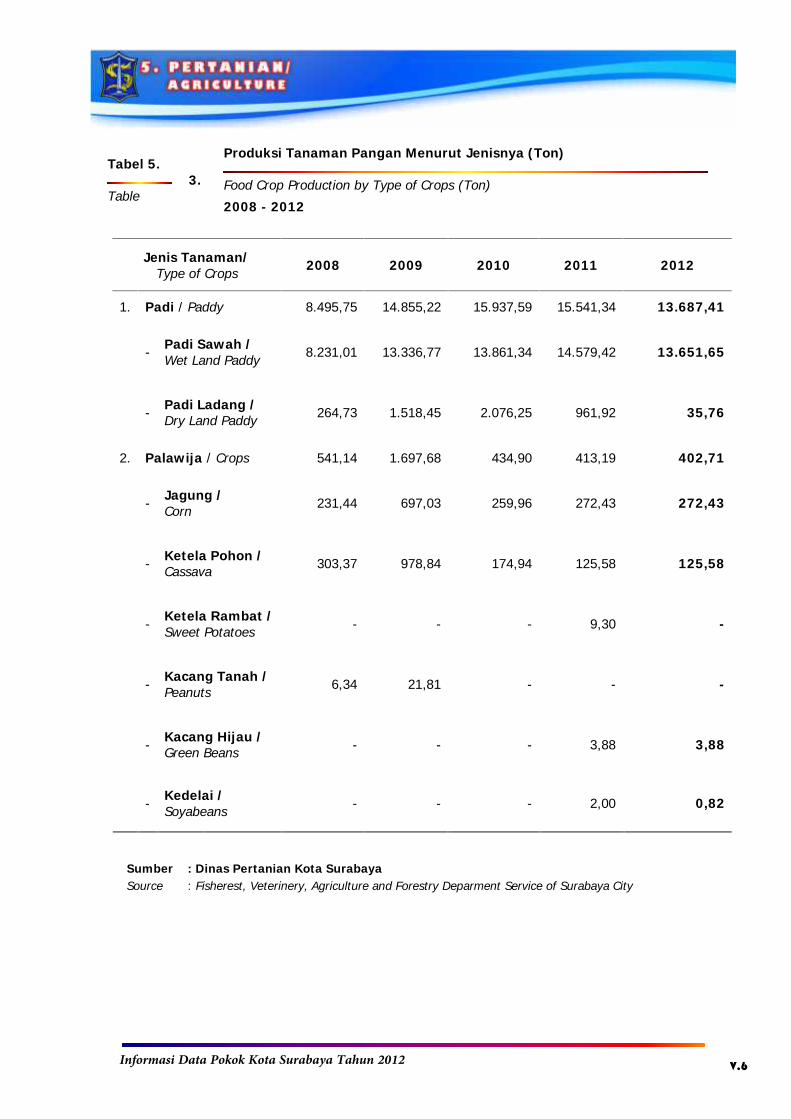
beans 4 Ha, Ha and soybean 2. Since 2010, the
amount of rice and corn yields tend to decline,
but it does not happen on the green beans and
Informasi Data Pokok Kota Surabaya Tahun 2012 V.b
ketela rambat 14 Ha, kacang hijau 4 Ha, dan
kedelai 2 Ha. Sejak 2010, jumlah hasil panen
padi dan jagung cenderung mengalami
penurunan, namun itu tidak terjadi pada
kacang hijau dan kedelai yang selama kurun
waktu dua tahun terakhir cenderung
mengalami kenaikan.
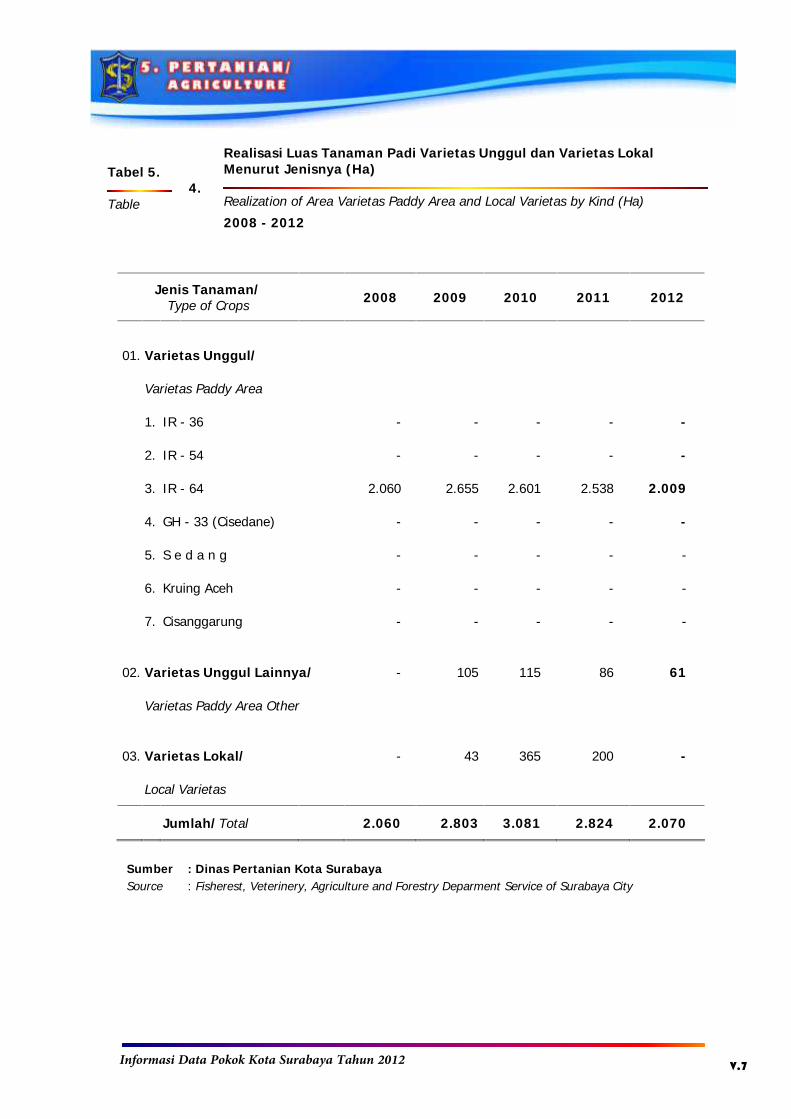
Menurut jenisnya, realisasi luas
tanaman padi varietas unggul IR-64 dari tahun
2009 terus mengalami penurunan, mulai dari
2.655 Ha di tahun 2009, kini hanya seluas
2.009 Ha di tahun 2012. Sedangkan untuk
varietas unggul lainnya mengalami penurunan
baru dari kurun waktu 2010 hingga 2012.
Begitu pula dengan varietas lokal yang
mengalami kenaikan di 2010, kemudian
kembali turun di 2011 dan tidak ada sama
sekali di tahun 2012.
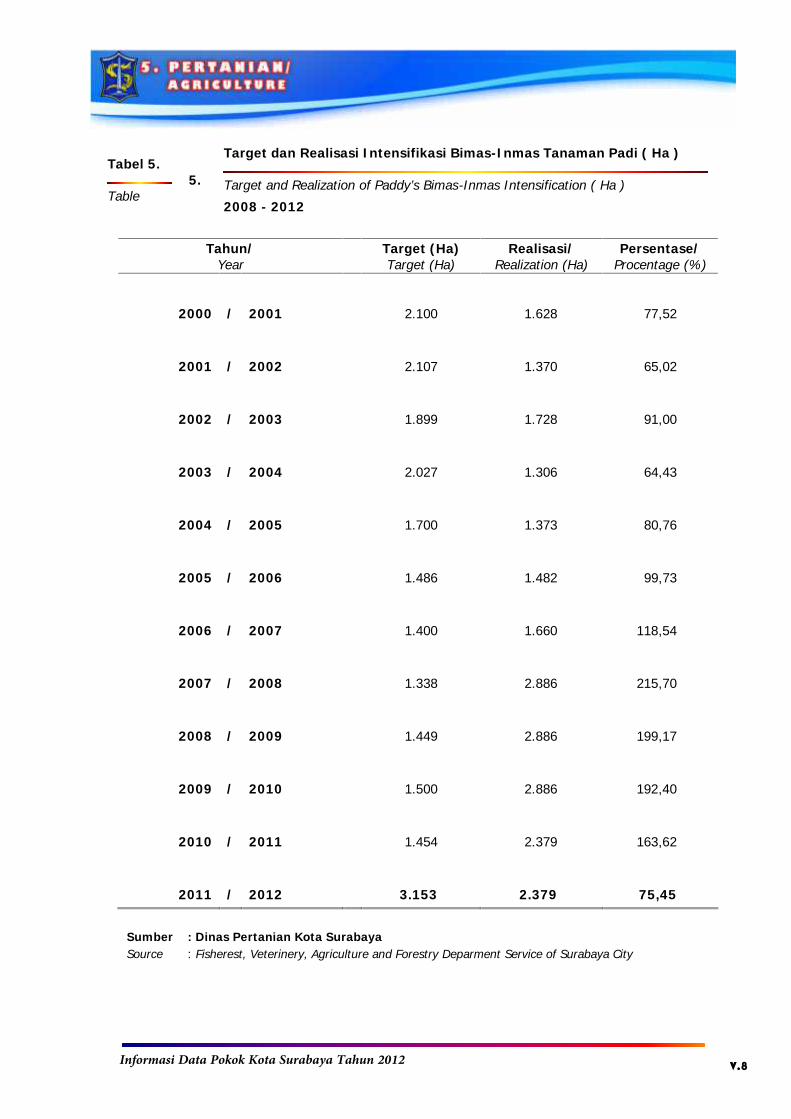
Untuk target intensifikasi Bimas-Inmas
tanaman padi (Ha) di Surabaya terjadi
penurunan prosentase sejak tahun 2007/2008.
Namun dalam periode 2003/2004 hingga
2007/2008 sempat mengalami kenaikan yang
cukup konstan.
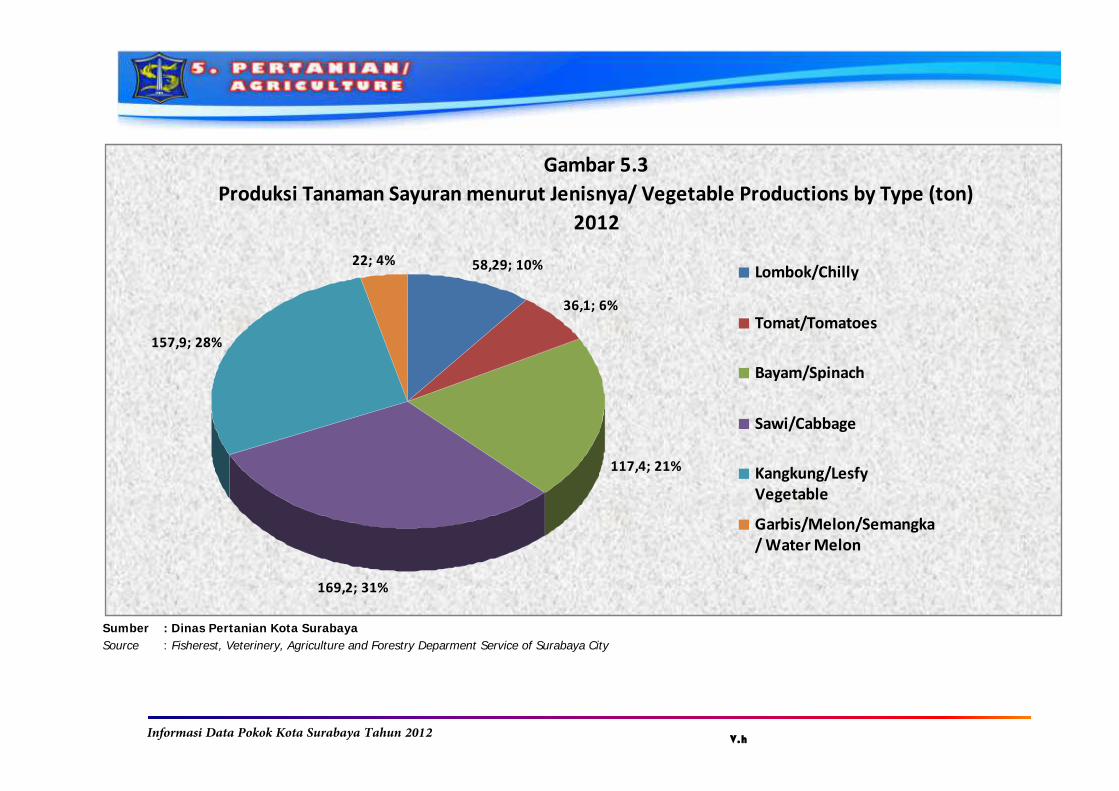
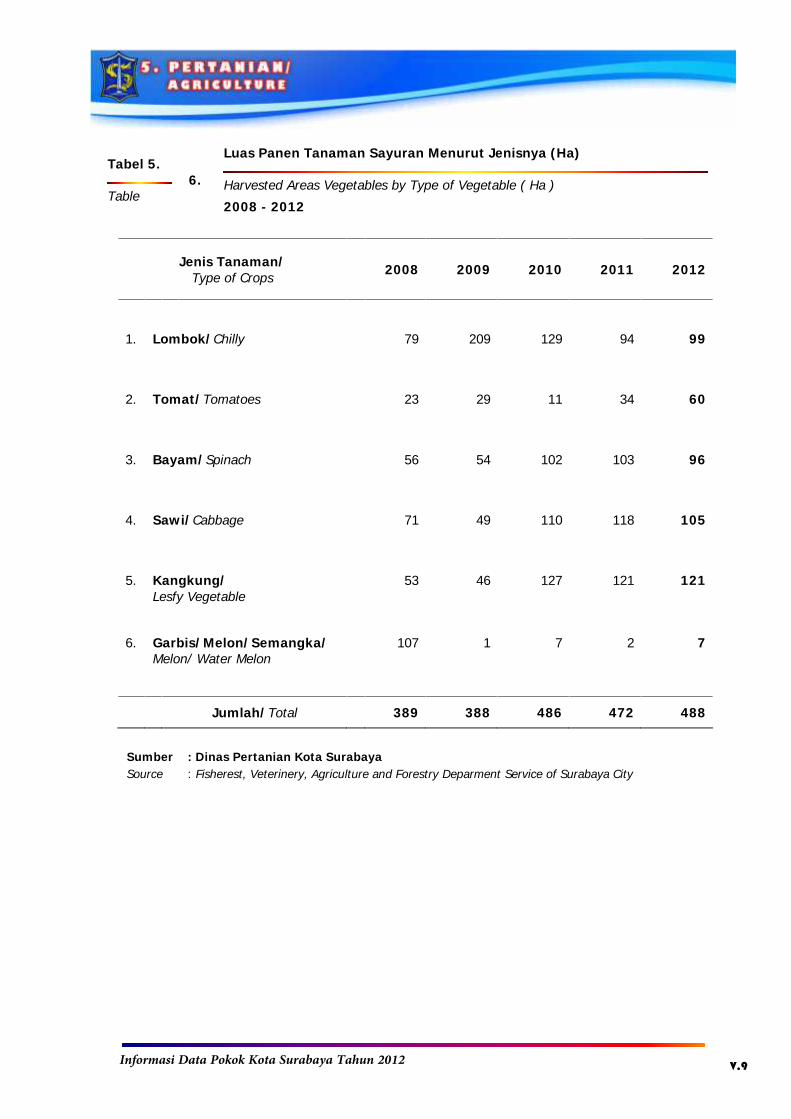
Luas panen tanaman sayuran menurut
jenisnya di tahun 2012 didominasi oleh
kangkung (121 Ha) dan disusul oleh sawi (105
Ha). Hasil tanaman sayur terkecil adalah
garbis/melon/semangka dengan hanya 7 Ha
saja. Peningkatan luas panen terdapat pada
Lombok dari yang sebelumnya di tahun 2011
sebanyak 94 Ha menjadi 99 Ha serta Tomat
dari yang sebelumnya 34 Ha di tahun 2011 lalu
menjadi 60 Ha di tahun 2012. Sementara walau
menghasilkan cukup banyak, namun bayam
dan sawi mengalami penurunan luas panen.
soybeans during the last two years tends to
increase.
By type, the realization of the rice
varieties IR-64 of the year 2009 continued to
decline, from 2,655 hectares in 2009, is now
just an area of 2,009 hectares in the year
2012. As for the other varieties decreased
recently from the period 2010 to 2012. As well
as local varieties which increased in 2010, then
back down in 2011 and none at all in 2012.
Guidance for the target-Inmas
intensification of rice plants (Ha) in Surabaya
percentage decline since 2007/2008. However,
in the period 2003/2004 to 2007/2008 had
increased fairly constant.
Harvested area of vegetables by type in
2012 was dominated by swamp (121 ha),
followed by mustard (105 Ha). Smallest
vegetable crops are Garbis / melon /
watermelon with only 7 ha only. There is an
increase in harvested area in Lombok from the
previous in the year 2011 as many as 94 ha to
99 ha and tomatoes from the previous 34
hectares in the year 2011 and to 60 ha in 2012.
While generating quite a lot though, but
spinach and mustard greens harvested area
decreased.
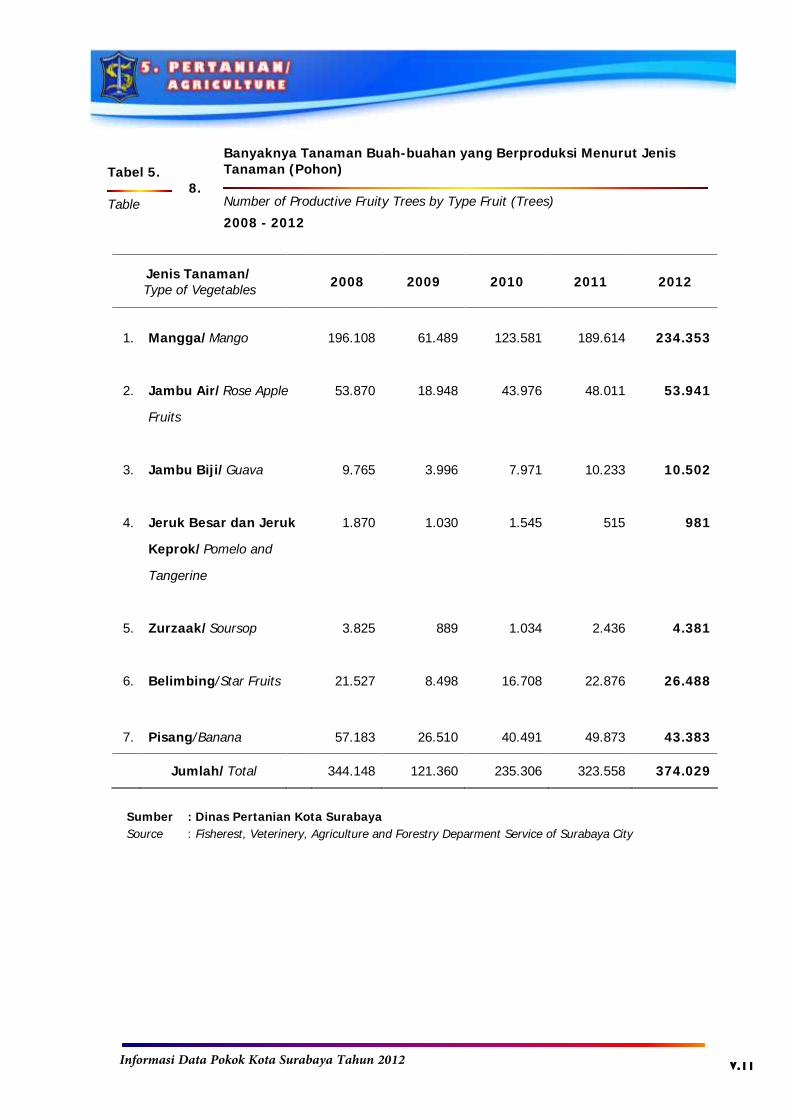
According to the types of plants, fruit
trees that produce the biggest mango in the
year 2012 is the increase in production from
the year 2011 as many as 189 614 to 234 353.
The increase in mango production was followed
by other fruits. Nevertheless, it has not
happened in banana production has decreased
from the previous amount of 49,873 to 43,383
only.
Informasi Data Pokok Kota Surabaya Tahun 2012 V.c
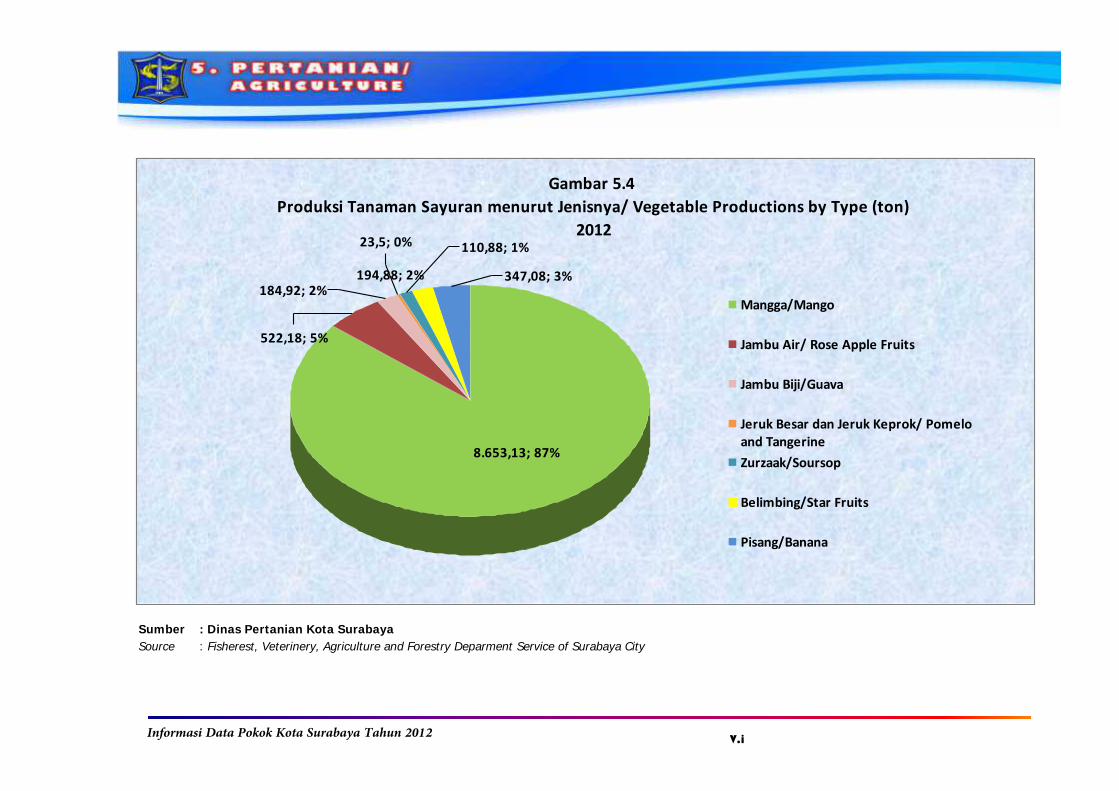
Menurut jenis tanamannya, tanaman
buah-buahan yang berproduksi terbesar di
tahun 2012 adalah mangga dengan
peningkatan produksi dari tahun 2011
sebanyak 189.614 menjadi 234.353. Kenaikan
produksi mangga ini diikuti oleh buah-buahan
yang lainnya. Namun demikian hal tersebut
tidak terjadi pada pisang yang justru
mengalami penurunan dari produksi
sebelumnya sebesar 49.873 menjadi 43.383
saja.
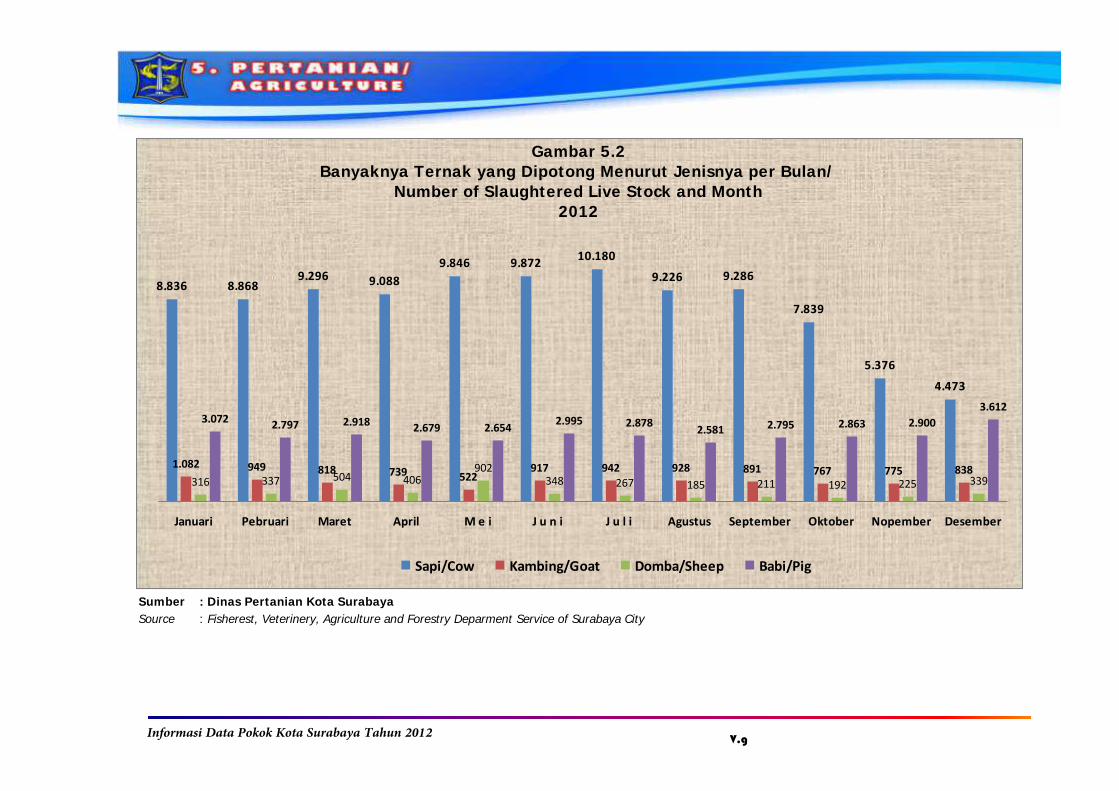
2. PETERNAKAN
Jumlah hewan ternak yang dipotong di
Surabaya di tahun 2012 sebanyak 102.186 ekor
sapi, 10.168 ekor kambing, 4.232 ekor domba
dan 34.744 ekor babi. Dimana jumlah tertinggi
untuk pemotongan sapi terjadi di bulan Juli
(10.180 ekor) dan kambing di bulan Januari
(1.082 ekor), sedang domba di bulan Mei (902
ekor) dan babi di bulan Desember (3.612 ekor).
Populasi ternak sapi perah di Surabaya
pada tahun 2012 telah habis, padahal di tahun
2011 masih terdapat sekitar 658 ekor sapi.
Namun demikian, populasi sapi dan kerbau di
Surabaya mengalami peningkatan di Surabaya
di tahun 2012. Begitu pula dengan populasi
ayam dan itik yang menjadi berjumlah 54.778.
Pencegahan terhadap wabah flu
burung adalah tindakan yang sangat penting,
di Surabaya selama tahun 2012 diberikan
79.843 vaksin flu burung. Vaksin tersebut
diberikan pada 67.644 ayam, 9.200 itik, 1.472
angsa, 1.458 burung dan 69 kalkun.
2. ANIMAL HUSBANDRY
The number of livestock slaughtered in
Surabaya in 2012 as many as 102 186 head of
cow, 10,168 goats, 4,232 sheep and 34,744
pigs. Where the highest number of livestock
going to slaughter in July (10 180 cow) and
goats in January (1,082 goat), are sheep in
May (902 sheep) and pigs in December (3,612
pigs).
Milch Cow population in Surabaya in
2012 had expired, whereas in 2011 there were
still about 658 Milch Cow. Nevertheless, cow
and buffalo population has increased in
Surabaya in Surabaya in 2012. Similarly, with a
population of chickens and ducks are being
numbered 54 778.
Precaution against bird flu outbreak is a
very important action, in Surabaya during the
2012 bird flu vaccine given 79 843. The vaccine
is given at 67 644 chickens, 9,200 ducks, 1,472
geese, 1,458 birds and 69 turkeys.
3. FISHERY
Of the fisheries sector in Surabaya
there are an increasing number of fishermen in
motorisation of 1,376 in 2010 to 2,006 in 2011.
And a decline in the number of traditional
fishermen from 466 in 2010 to 345 in 2011. It
influences the average increase that turned out
to be more decreased between 2010 and 2011.
While the number of farms in Surabaya
businessman has decreased the amount of the
previous 911 people in 2010, dropped to 901 in
2011 and 2012. However, the average income
of farm businesses increased every year since
2010 to 2012.
Informasi Data Pokok Kota Surabaya Tahun 2012 V.d
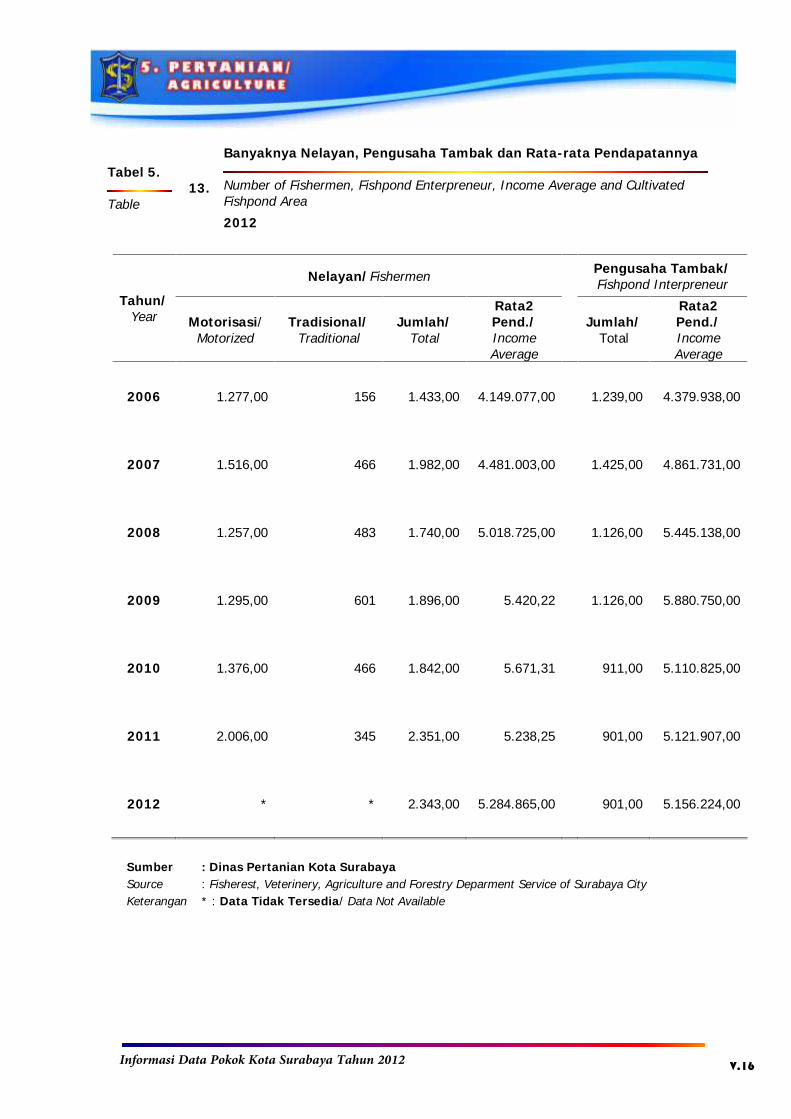
3. PERIKANAN
Dari sektor perikanan di Surabaya
terdapat peningkatan jumlah nelayan
motorisasi dari 1.376 di tahun 2010 menjadi
2.006 di tahun 2011. Dan terjadi penurunan
jumlah nelayan tradisional dari 466 di tahun
2010 menjadi 345 di tahun 2011. Hal tersebut
memperngaruhi peningkatan rata-rata yang
ternyata menjadi lebih menurun antara tahun
2010 dan 2011. Sementara itu jumlah
pengusaha tambak di Surabaya mengalami
penurunan jumlah dari yang sebelumnya 911
orang di tahun 2010, menurun menjadi 901 di
tahun 2011 dan 2012. Namun demikian, rata-
rata pendapatan dari pengusaha tambak
meningkat setiap tahunnya sejak tahun 2010
hingga 2012.
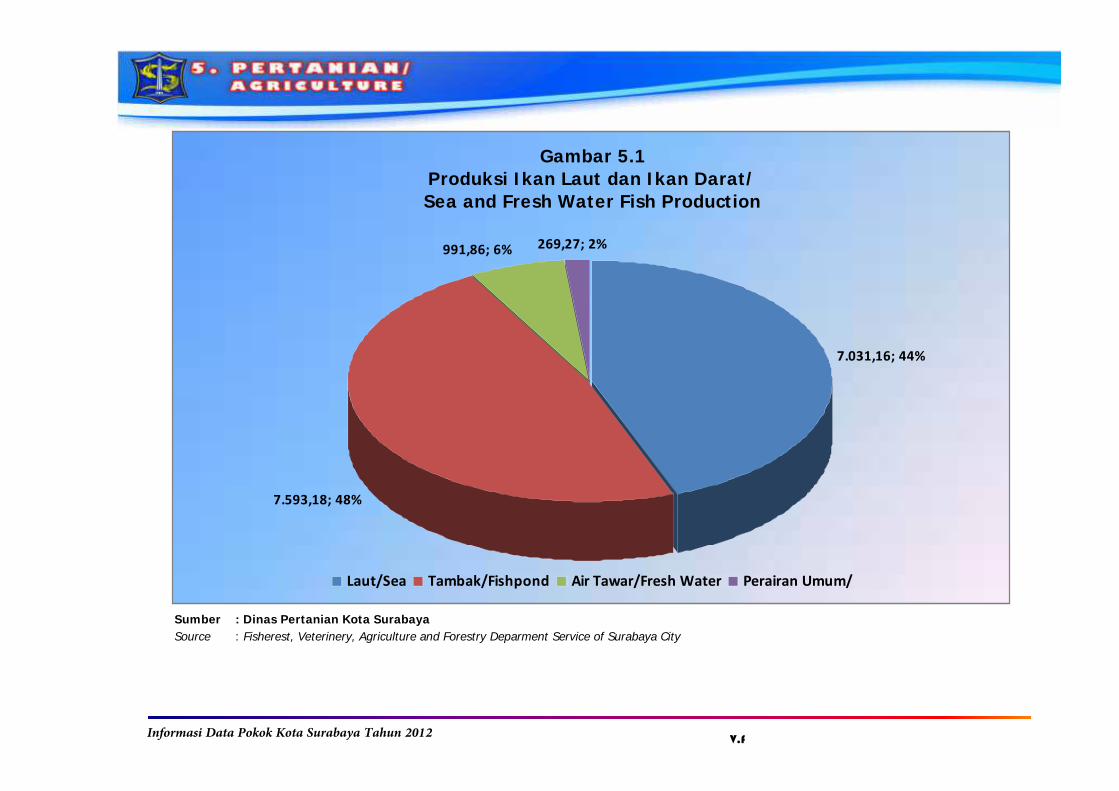
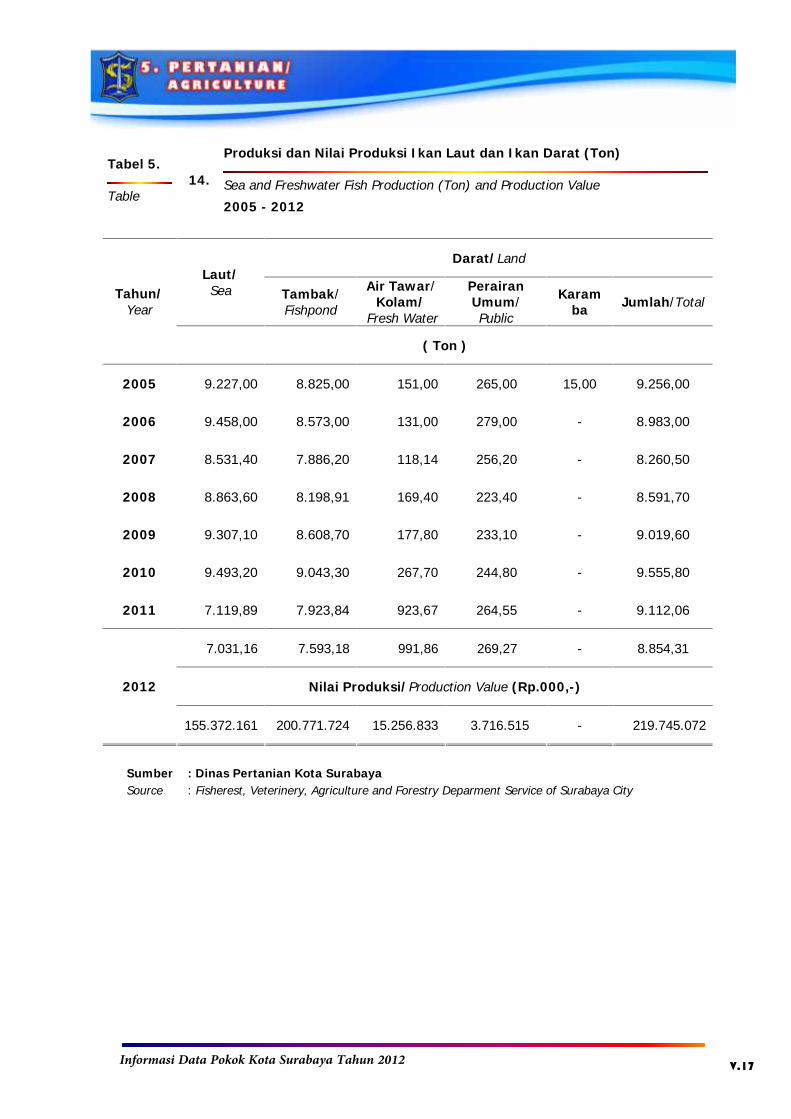
Produksi nilai ikan laut mengalami
penurunan sejak tahun 2010.Demikian pula
dengan produksi ikan tambak yang juga
menurun sejak tahun 2010 lalu. Namun hal ini
tidak diikuti dengan produksi ikan tawar/kolam
dan perairan umum yang mengalami
peningkatan bahkan sejak tahun 2008 hingga
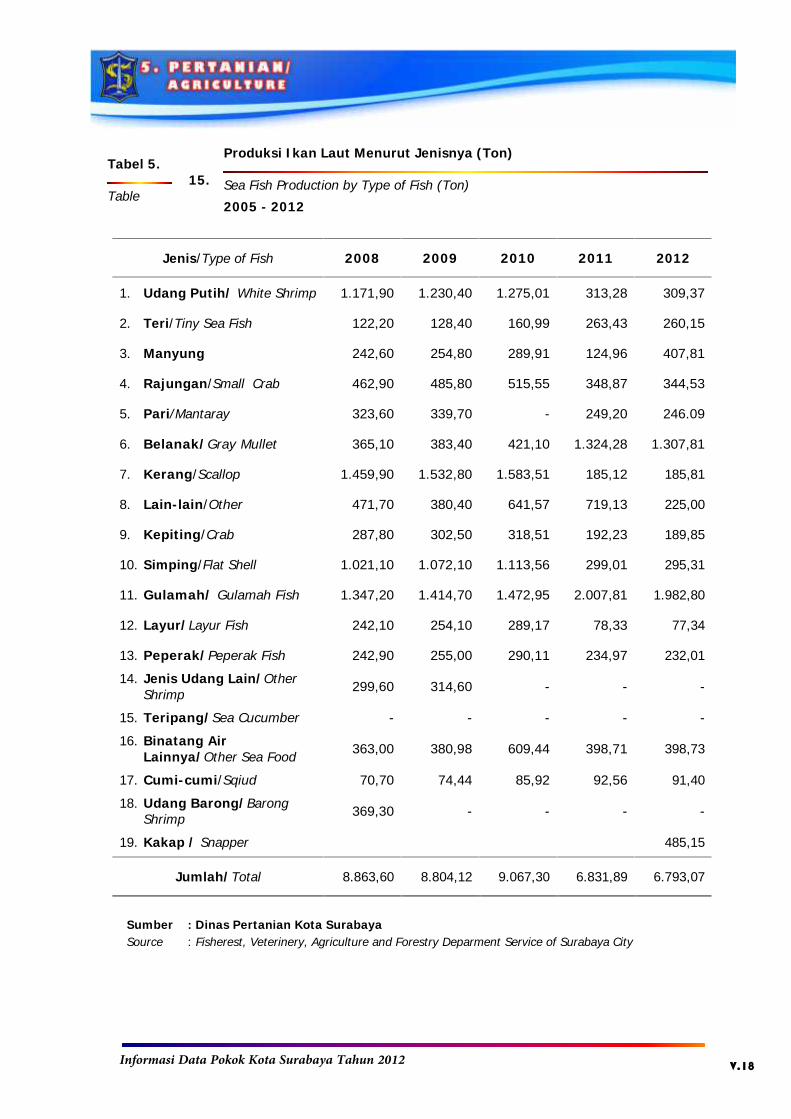
tahun 2012. Menurut jenisnya, ikan laut
terbanyak di tahun 2012 adalah Gulamah
(1.982,80 ton), kemudian ikan Belanak
(1.307,81 ton). Sedangkan ikan laut yang
paling sedikit diproduksi selama 2012 adalah
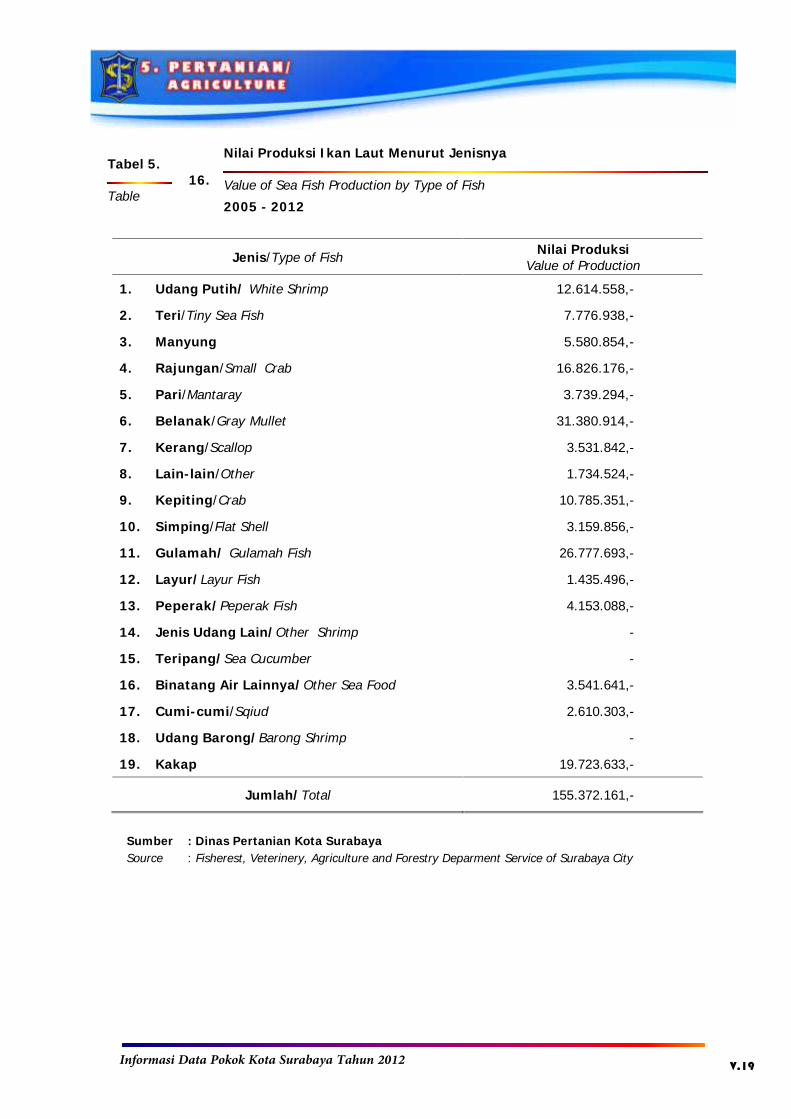
cumi-cumi (91,40 ton). Menurut nilainya, ikan
laut yang paling besar nilainya adalah ikan
belanak (31.380.914,-) kemudian ikan gulamah
(26.777,693,-). Ikan laut yang paling sedikit
nilainya adalah ikan peperak (1.435.496,-).
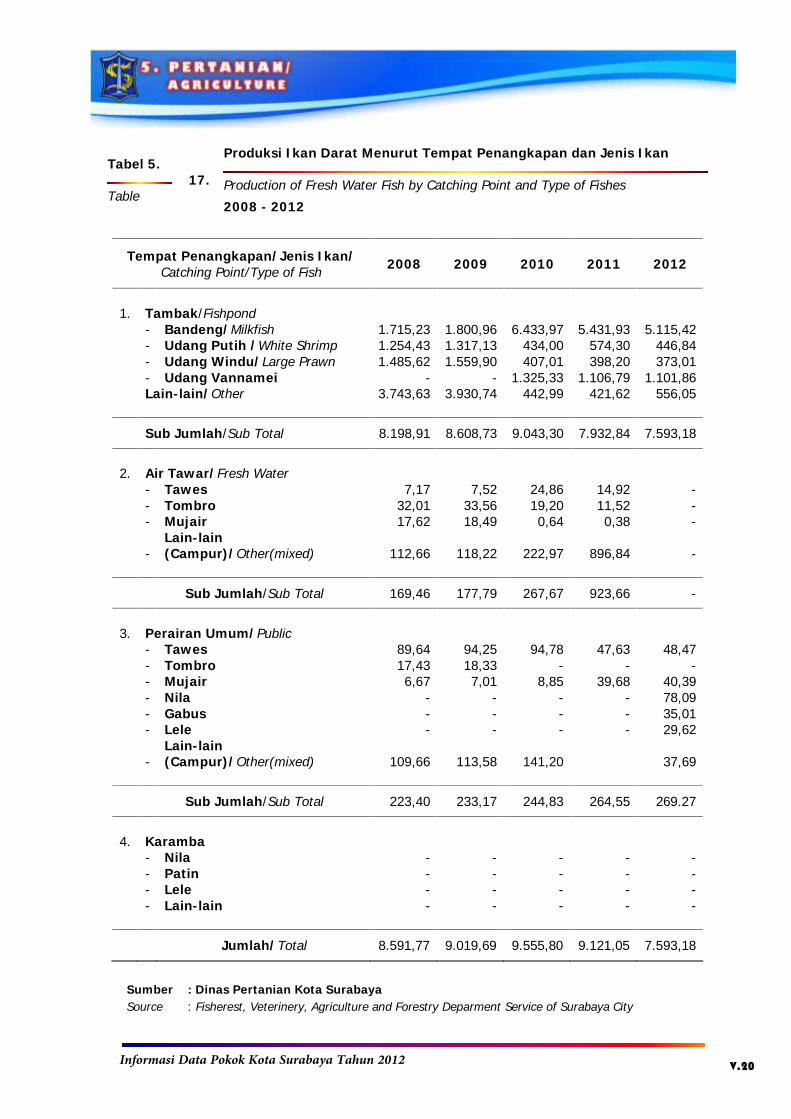
Produksi ikan darat terbanyak di tahun
2012 adalah bandeng, sebanyak 5.115,42 ton
Production value of marine fish has
decreased since 2010. As well as pond fish
production has also decreased since 2010.
However this is not followed by the production
of freshwater fish / pond and open water that
has increased even since 2008 until 2012. By
type, most marine fish in 2012 was Gulamah
(1982.80 tonnes), then fish Belanak (1307.81
tonnes). While marine fish at least produced
during 2012 was the squid (91.40 tons).
According to its value, most marine fish are of
great value mullets (31,380,914, -) then fish
gulamah (26777.693, -). Marine fish is the least
value of fish peperak (1435496, -).
Land fish production in 2012 was
highest in milkfish, as much as 5115.42 tons
and the least is the number of catfish
production 29.62 tons. Add the fish when
viewed from the trend of 2011 and 2012
decreased, while fish public waters tend to
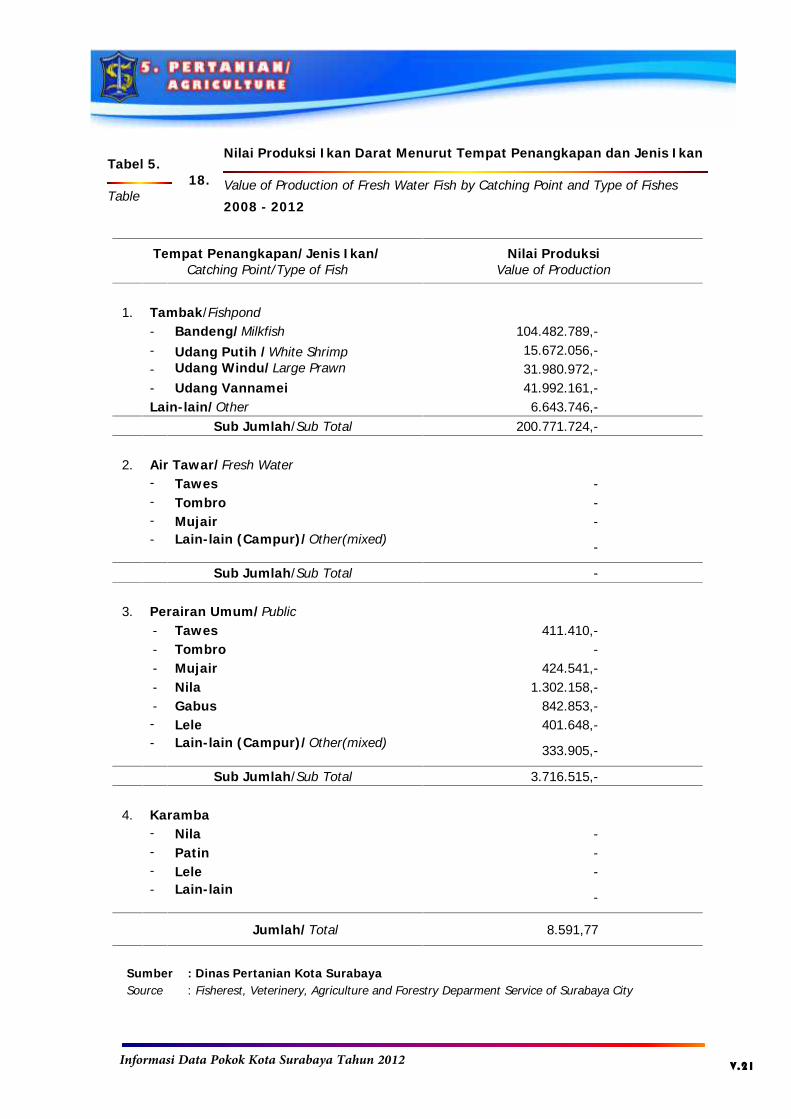
increase results. Milkfish production value in
2012 reached 104 482 789, -,
Informasi Data Pokok Kota Surabaya Tahun 2012 V.e
dan yang paling sedikit adalah lele dengan
jumlah hasil produksi 29,62 ton. Ikan hasil
tambah jika dilihat dari tren dari tahun 2011
dan 2012 mengalami penurunan, sedangkan
ikan perairan umum cenderung meningkat
hasilnya. Nilai produksi bandeng di tahun 2012
mencapai 104.482.789,-,
Informasi Data Pokok Kota Surabaya Tahun 2012 V.f
Gambar 5.1Produksi Ikan Laut dan Ikan Darat/Sea and Fresh Water Fish Production
7.031,16; 44%
7.593,18; 48%
991,86; 6% 269,27; 2%
Laut/Sea Tambak/Fishpond Air Tawar/Fresh Water Perairan Umum/
Sumber : Dinas Pertanian Kota SurabayaSource : Fisherest, Veterinery, Agriculture and Forestry Deparment Service of Surabaya City
Informasi Data Pokok Kota Surabaya Tahun 2012 V.g
Gambar 5.2Banyaknya Ternak yang Dipotong Menurut Jenisnya per Bulan/
Number of Slaughtered Live Stock and Month2012
8.836 8.8689.296 9.088
9.846 9.872 10.180
9.226 9.286
7.839
5.376
4.473
1.082 949 818 739 522917 942 928 891 767 775 838
316 337 504 406902
348 267 185 211 192 225 339
3.072 2.797 2.918 2.679 2.654 2.995 2.878 2.581 2.795 2.863 2.9003.612
Januari Pebruari Maret April M e i J u n i J u l i Agustus September Oktober Nopember Desember
Sapi/Cow Kambing/Goat Domba/Sheep Babi/Pig
Sumber : Dinas Pertanian Kota SurabayaSource : Fisherest, Veterinery, Agriculture and Forestry Deparment Service of Surabaya City
Informasi Data Pokok Kota Surabaya Tahun 2012 V.h
Gambar 5.3Produksi Tanaman Sayuran menurut Jenisnya/ Vegetable Productions by Type (ton)
2012
58,29; 10%
36,1; 6%
117,4; 21%
169,2; 31%
157,9; 28%
22; 4%Lombok/Chilly
Tomat/Tomatoes
Bayam/Spinach
Sawi/Cabbage
Kangkung/LesfyVegetable
Garbis/Melon/Semangka/ Water Melon
Sumber : Dinas Pertanian Kota SurabayaSource : Fisherest, Veterinery, Agriculture and Forestry Deparment Service of Surabaya City
Informasi Data Pokok Kota Surabaya Tahun 2012 V.i
Gambar 5.4Produksi Tanaman Sayuran menurut Jenisnya/ Vegetable Productions by Type (ton)
2012
194,88; 2% 347,08; 3%
110,88; 1%23,5; 0%
184,92; 2%
522,18; 5%
8.653,13; 87%
Mangga/Mango
Jambu Air/ Rose Apple Fruits
Jambu Biji/Guava
Jeruk Besar dan Jeruk Keprok/ Pomeloand TangerineZurzaak/Soursop
Belimbing/Star Fruits
Pisang/Banana
Sumber : Dinas Pertanian Kota SurabayaSource : Fisherest, Veterinery, Agriculture and Forestry Deparment Service of Surabaya City
Informasi Data Pokok Kota Surabaya Tahun 2012 V.1
Luas Lahan Pertanian yang Diusahakan Menurut Jenis Pengairan PerKecamatan (Ha)
Cultivied Agricultural Areas by Typeof Irrigations and Sub District (Ha)
Tabel 5.
Table1.
2012
Jenis Pengairan/Typeof IrrigationsKecamatan/Sub District Teknis/
TechnicalSetengah Teknis/
Semi TechnicalSederhana/
TraditionalJumlah/
Total
Surabaya Pusat/ Central Surabaya
01. Tegalsari - - - -
02. Genteng - - - -
03. Bubutan - - - -
04. Simokerto - - - -
Surabaya Utara/North Surabaya
05. Pabean Cantikan - - - -
06. Semampir - - - -
07. Krembangan - - - -
08. Kenjeran - - - -
09. Bulak - - 100,00 100,00
Surabaya Timur/East Surabaya
10. Tambaksari - - - -
11. Gubeng - - - -
12. Rungkut - - 17,00 17,00
13. Tenggilis Mejoyo - - - -
14. Gununganyar - - 20,00 20,00
15. Sukolilo - - 40,00 40,00
16. Mulyorejo - - - -
Sumber : Dinas Pertanian Kota SurabayaSource : Fisherest, Veterinery, Agriculture and Forestry Deparment Service of Surabaya City
Informasi Data Pokok Kota Surabaya Tahun 2012 V.2
Tabel 5.
Table1.
Lanjutan
Continued
Jenis Pengairan/Typeof IrrigationsKecamatan/Sub District Teknis/
Technical
SetengahTeknis/
Semi Technical
Sederhana/Traditional
Jumlah/Total
Surabaya Selatan/South Surabaya
17. Sawahan - - - -
18. Wonokromo - - - -
19. Karangpilang - - - -
20. Dukuh Pakis - - - -
21. Wiyung - - - -
22. Wonocolo - - 4,00 4,00
23. Gayungan - - 15,00 15,00
24. Jambangan - - 26,00 26,00
Surabaya Barat/West Surabaya
25. Tandes - - 30,00 30,00
26. Sukomanunggal - - 20,00 20,00
27. Asemrowo - - - -
28. Benowo - - 5,00 5,00
29. Pakal - - - -
30. Lakarsantri - - 101,00 101,00
31. Sambikerep - - - -
Jumlah/Total - - 378,00 378,00
2011 - - 298,00 298,00
2010 - 24,00 314,00 338,00
2009 - 19,00 354,00 373,00
2008 - 28,00 310,00 338,00
2007 31,00 73,00 128,00 232,00
Sumber : Dinas Pertanian Kota SurabayaSource : Fisherest, Veterinery, Agriculture and Forestry Deparment Service of Surabaya City
Informasi Data Pokok Kota Surabaya Tahun 2012 V.3
Tabel 5.
Table1.
Lanjutan
Continued
Kecamatan/Sub District
Sawah TadahHujan/
Rained-DependentRice Field
Tegal/Ladang/Kebun/PekaranganDry Land Cultivation
Jumlah/Total
Surabaya Pusat/Central Surabaya
01. Tegalsari - - -
02. Genteng - - -
03. Bubutan - - -
04. Simokerto - - -
Surabaya Utara/North Surabaya
05. Pabean Cantikan - - -
06. Semampir - - -
07. Krembangan - - -
08. Kenjeran 5,00 860,85 865,85
09. Bulak - 328,67 328,67
Surabaya Timur/East Surabaya
10. Tambaksari 1,00 909,80 910,80
11. Gubeng - 725,95 725,95
12. Rungkut - 1.055,48 1.055,48
13. Tenggilis Mejoyo - 565,00 565,00
14. Gunung Anyar - 582,80 582,80
15. Sukolilo - 946,00 946,00
16. Mulyorejo 13,00 1.128,00 1.141,00
Sumber : Dinas Pertanian Kota SurabayaSource : Fisherest, Veterinery, Agriculture and Forestry Deparment Service of Surabaya City
Informasi Data Pokok Kota Surabaya Tahun 2012 V.4
Tabel 5.
Table1.
Lanjutan
Continued
Kecamatan/Sub District
Sawah TadahHujan/
Rained-DependentRice Field
Tegal/Ladang/Kebun/PekaranganDry Land Cultivation
Jumlah/Total
Surabaya Selatan/South Surabaya
17. Sawahan - - -
18. Wonokromo - - -
19. Karangpilang 63,00 639,00 702,00
20. Dukuh Pakis - 930,44 930,44
21. Wiyung 68,00 841,14 909,14
22. Wonocolo - 453,00 453,00
23. Gayungan - 642,90 642,90
24. Jambangan - 258,91 258,91
Surabaya Barat/West Surabaya
25. Tandes - 928,82 928,82
26. Sukomanunggal - 158,20 158,20
27. Asemrowo - 618,00 618,00
28. Benowo 198,00 846,00 1.044,00
29. Pakal 378,00 429,91 807,91
30. Lakarsantri 362,60 1.099,63 1.462,23
31. Sambikerep 133,00 1.019,00 1.152,00
Jumlah/Total 1.221,60 15.967,50 17.189,10
2011 1.335,60 15.906,63 17.242,23
2010 1.373,60 16.378,57 17.752,17
2009 1.367,60 17.047,06 18.414,66
2008 1.178,00 17.635,64 18.813,64
2007 1.005,00 15.154,00 16.159,00
Sumber : Dinas Pertanian Kota SurabayaSource : Fisherest, Veterinery, Agriculture and Forestry Deparment Service of Surabaya City
Informasi Data Pokok Kota Surabaya Tahun 2012 V.5
Luas Panen Tanaman Pangan Menurut Jenisnya (Ha)
Food Crop Harvested Areas by Type of Crops (Ha)
Tabel 5.
Table2.
2012
Jenis Tanaman/Type of Crops 2008 2009 2010 2011 2012
1. Padi / Paddy 1.505,10 2.684,38 2.810,14 2.585,05 2.296,55
- Padi Sawah /Wet Land Paddy 1.460,10 2.412,38 2.460,14 2.425,05 2.290,55
- Padi Ladang /Dry Land Paddy 45,00 272,00 350,00 160,00 6,00
2. Palawija / Crops 101,00 416,00 162,00 211,00 157,00
- Jagung /Corn 71,00 306,00 116,00 144,00 137,00
- Ketela Pohon /Cassava 24,00 83,00 44,00 64,00 14,00
- Ketela Rambat /Sweet Potatoes - - - - -
- Kacang Tanah /Peanuts 6,00 23,00 - - -
- Kacang Hijau /Green Beans - 4,00 2,00 2,00 4,00
- Kedelai /Soyabeans - - - 1,00 2,00
Sumber : Dinas Pertanian Kota SurabayaSource : Fisherest, Veterinery, Agriculture and Forestry Deparment Service of Surabaya City
Informasi Data Pokok Kota Surabaya Tahun 2012 V.6
Produksi Tanaman Pangan Menurut Jenisnya (Ton)
Food Crop Production by Type of Crops (Ton)
Tabel 5.
Table3.
2008 - 2012
Jenis Tanaman/Type of Crops 2008 2009 2010 2011 2012
1. Padi / Paddy 8.495,75 14.855,22 15.937,59 15.541,34 13.687,41
- Padi Sawah /Wet Land Paddy 8.231,01 13.336,77 13.861,34 14.579,42 13.651,65
- Padi Ladang /Dry Land Paddy 264,73 1.518,45 2.076,25 961,92 35,76
2. Palawija / Crops 541,14 1.697,68 434,90 413,19 402,71
- Jagung /Corn 231,44 697,03 259,96 272,43 272,43
- Ketela Pohon /Cassava 303,37 978,84 174,94 125,58 125,58
- Ketela Rambat /Sweet Potatoes - - - 9,30 -
- Kacang Tanah /Peanuts 6,34 21,81 - - -
- Kacang Hijau /Green Beans - - - 3,88 3,88
- Kedelai /Soyabeans - - - 2,00 0,82
Sumber : Dinas Pertanian Kota SurabayaSource : Fisherest, Veterinery, Agriculture and Forestry Deparment Service of Surabaya City
Informasi Data Pokok Kota Surabaya Tahun 2012 V.7
Realisasi Luas Tanaman Padi Varietas Unggul dan Varietas LokalMenurut Jenisnya (Ha)
Realization of Area Varietas Paddy Area and Local Varietas by Kind (Ha)
Tabel 5.
Table4.
2008 - 2012
Jenis Tanaman/Type of Crops 2008 2009 2010 2011 2012
01. Varietas Unggul/
Varietas Paddy Area
1. IR - 36 - - - - -
2. IR - 54 - - - - -
3. IR - 64 2.060 2.655 2.601 2.538 2.009
4. GH - 33 (Cisedane) - - - - -
5. S e d a n g - - - - -
6. Kruing Aceh - - - - -
7. Cisanggarung - - - - -
02. Varietas Unggul Lainnya/ - 105 115 86 61
Varietas Paddy Area Other
03. Varietas Lokal/ - 43 365 200 -
Local Varietas
Jumlah/Total 2.060 2.803 3.081 2.824 2.070
Sumber : Dinas Pertanian Kota SurabayaSource : Fisherest, Veterinery, Agriculture and Forestry Deparment Service of Surabaya City
Informasi Data Pokok Kota Surabaya Tahun 2012 V.8
Target dan Realisasi Intensifikasi Bimas-Inmas Tanaman Padi ( Ha )
Target and Realization of Paddy’s Bimas-Inmas Intensification ( Ha )
Tabel 5.
Table5.
2008 - 2012
Tahun/Year
Target (Ha)Target (Ha)
Realisasi/Realization (Ha)
Persentase/Procentage (%)
2000 / 2001 2.100 1.628 77,52
2001 / 2002 2.107 1.370 65,02
2002 / 2003 1.899 1.728 91,00
2003 / 2004 2.027 1.306 64,43
2004 / 2005 1.700 1.373 80,76
2005 / 2006 1.486 1.482 99,73
2006 / 2007 1.400 1.660 118,54
2007 / 2008 1.338 2.886 215,70
2008 / 2009 1.449 2.886 199,17
2009 / 2010 1.500 2.886 192,40
2010 / 2011 1.454 2.379 163,62
2011 / 2012 3.153 2.379 75,45
Sumber : Dinas Pertanian Kota SurabayaSource : Fisherest, Veterinery, Agriculture and Forestry Deparment Service of Surabaya City
Informasi Data Pokok Kota Surabaya Tahun 2012 V.9
Luas Panen Tanaman Sayuran Menurut Jenisnya (Ha)
Harvested Areas Vegetables by Type of Vegetable ( Ha )
Tabel 5.
Table6.
2008 - 2012
Jenis Tanaman/Type of Crops 2008 2009 2010 2011 2012
1. Lombok/Chilly 79 209 129 94 99
2. Tomat/Tomatoes 23 29 11 34 60
3. Bayam/Spinach 56 54 102 103 96
4. Sawi/Cabbage 71 49 110 118 105
5. Kangkung/Lesfy Vegetable
53 46 127 121 121
6. Garbis/Melon/Semangka/Melon/ Water Melon
107 1 7 2 7
Jumlah/Total 389 388 486 472 488
Sumber : Dinas Pertanian Kota SurabayaSource : Fisherest, Veterinery, Agriculture and Forestry Deparment Service of Surabaya City
Informasi Data Pokok Kota Surabaya Tahun 2012 V.10
Produksi Tanaman Sayuran Menurut Jenisnya (Ton)
Vegetable Productions by Type Vegetable (Ton)
Tabel 5.
Table7.
2008 - 2012
Jenis Tanaman/Type of Vegetables 2008 2009 2010 2011 2012
1. Lombok/Chilly 758,00 666,30 291,40 442,20 58,29
2. Tomat/Tomatoes 108,40 70,90 50,50 40,85 36,10
3. Bayam/Spinach 156,40 136,00 211,90 143,45 117,40
4. Sawi/Cabbage 352,75 174,90 240,78 196,57 169,20
5. Kangkung/LesfyVegetable 300,10 172,90 288,40 190,25 157,90
6. Garbis/Melon/Semangka/Water Melon 1.212,40 5,00 8,75 40,00 22,00
Jumlah/Total 2.888,05 1.226,00 1.091,73 1.053,32 560,89
Sumber : Dinas Pertanian Kota SurabayaSource : Fisherest, Veterinery, Agriculture and Forestry Deparment Service of Surabaya City
Informasi Data Pokok Kota Surabaya Tahun 2012 V.11
Banyaknya Tanaman Buah-buahan yang Berproduksi Menurut JenisTanaman (Pohon)
Number of Productive Fruity Trees by Type Fruit (Trees)
Tabel 5.
Table8.
2008 - 2012
Jenis Tanaman/Type of Vegetables 2008 2009 2010 2011 2012
1. Mangga/Mango 196.108 61.489 123.581 189.614 234.353
2. Jambu Air/Rose Apple 53.870 18.948 43.976 48.011 53.941
Fruits
3. Jambu Biji/Guava 9.765 3.996 7.971 10.233 10.502
4. Jeruk Besar dan Jeruk 1.870 1.030 1.545 515 981
Keprok/Pomelo and
Tangerine
5. Zurzaak/Soursop 3.825 889 1.034 2.436 4.381
6. Belimbing/Star Fruits 21.527 8.498 16.708 22.876 26.488
7. Pisang/Banana 57.183 26.510 40.491 49.873 43.383
Jumlah/Total 344.148 121.360 235.306 323.558 374.029
Sumber : Dinas Pertanian Kota SurabayaSource : Fisherest, Veterinery, Agriculture and Forestry Deparment Service of Surabaya City
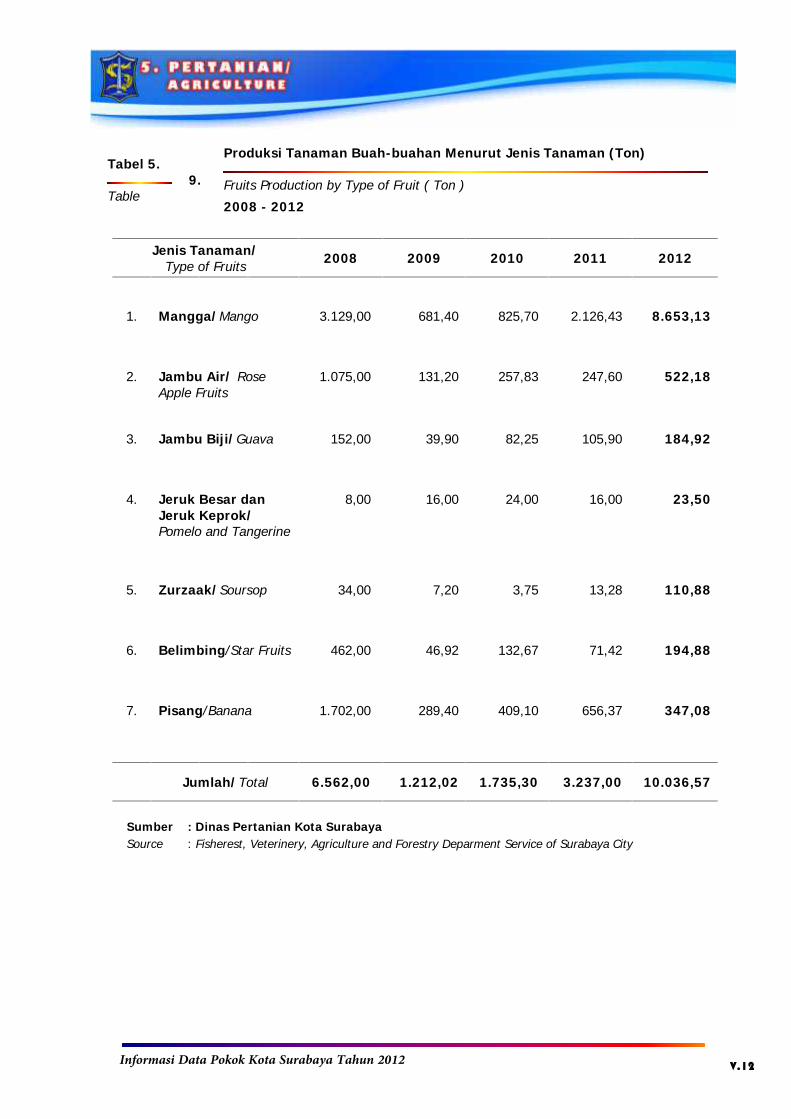
Informasi Data Pokok Kota Surabaya Tahun 2012 V.12
Produksi Tanaman Buah-buahan Menurut Jenis Tanaman (Ton)
Fruits Production by Type of Fruit ( Ton )
Tabel 5.
Table9.
2008 - 2012
Jenis Tanaman/Type of Fruits 2008 2009 2010 2011 2012
1. Mangga/Mango 3.129,00 681,40 825,70 2.126,43 8.653,13
2. Jambu Air/ RoseApple Fruits
1.075,00 131,20 257,83 247,60 522,18
3. Jambu Biji/Guava 152,00 39,90 82,25 105,90 184,92
4. 8,00 16,00 24,00 16,00 23,50Jeruk Besar danJeruk Keprok/Pomelo and Tangerine
5. Zurzaak/Soursop 34,00 7,20 3,75 13,28 110,88
6. Belimbing/Star Fruits 462,00 46,92 132,67 71,42 194,88
7. Pisang/Banana 1.702,00 289,40 409,10 656,37 347,08
Jumlah/Total 6.562,00 1.212,02 1.735,30 3.237,00 10.036,57
Sumber : Dinas Pertanian Kota SurabayaSource : Fisherest, Veterinery, Agriculture and Forestry Deparment Service of Surabaya City
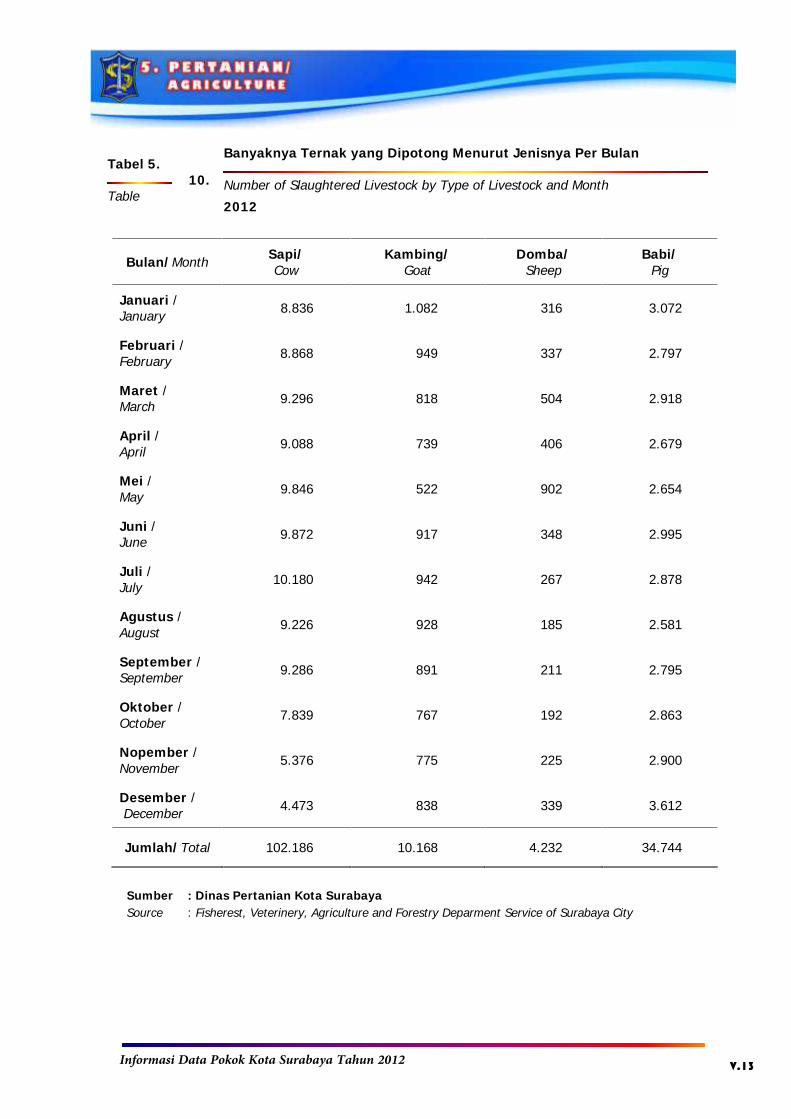
Informasi Data Pokok Kota Surabaya Tahun 2012 V.13
Banyaknya Ternak yang Dipotong Menurut Jenisnya Per Bulan
Number of Slaughtered Livestock by Type of Livestock and Month
Tabel 5.
Table10.
2012
Bulan/Month Sapi/Cow
Kambing/Goat
Domba/Sheep
Babi/Pig
Januari /January 8.836 1.082 316 3.072
Februari /February 8.868 949 337 2.797
Maret /March 9.296 818 504 2.918
April /April 9.088 739 406 2.679
Mei /May 9.846 522 902 2.654
Juni /June 9.872 917 348 2.995
Juli /July 10.180 942 267 2.878
Agustus /August 9.226 928 185 2.581
September /September 9.286 891 211 2.795
Oktober /October 7.839 767 192 2.863
Nopember /November 5.376 775 225 2.900
Desember /December 4.473 838 339 3.612
Jumlah/Total 102.186 10.168 4.232 34.744
Sumber : Dinas Pertanian Kota SurabayaSource : Fisherest, Veterinery, Agriculture and Forestry Deparment Service of Surabaya City
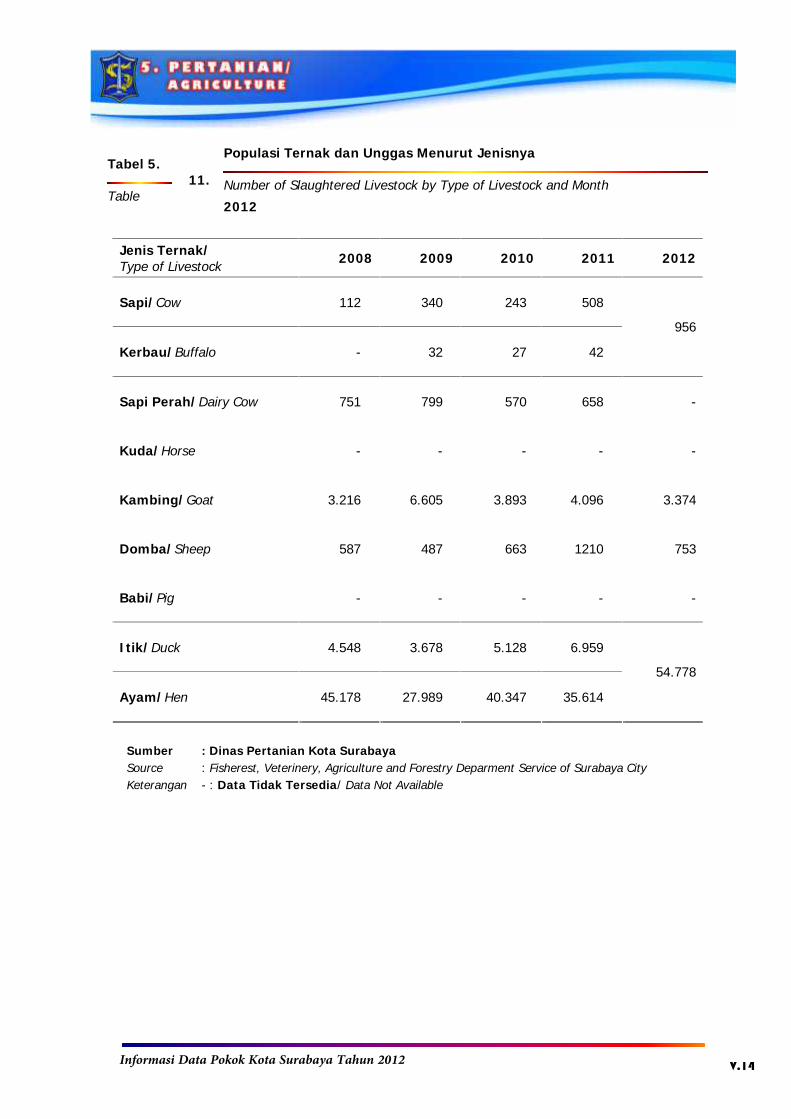
Informasi Data Pokok Kota Surabaya Tahun 2012 V.14
Populasi Ternak dan Unggas Menurut Jenisnya
Number of Slaughtered Livestock by Type of Livestock and Month
Tabel 5.
Table11.
2012
Jenis Ternak/Type of Livestock 2008 2009 2010 2011 2012
Sapi/Cow 112 340 243 508
Kerbau/Buffalo - 32 27 42
956
Sapi Perah/Dairy Cow 751 799 570 658 -
Kuda/Horse - - - - -
Kambing/Goat 3.216 6.605 3.893 4.096 3.374
Domba/Sheep 587 487 663 1210 753
Babi/Pig - - - - -
Itik/Duck 4.548 3.678 5.128 6.959
Ayam/Hen 45.178 27.989 40.347 35.614
54.778
Sumber : Dinas Pertanian Kota SurabayaSource : Fisherest, Veterinery, Agriculture and Forestry Deparment Service of Surabaya CityKeterangan - : Data Tidak Tersedia/ Data Not Available
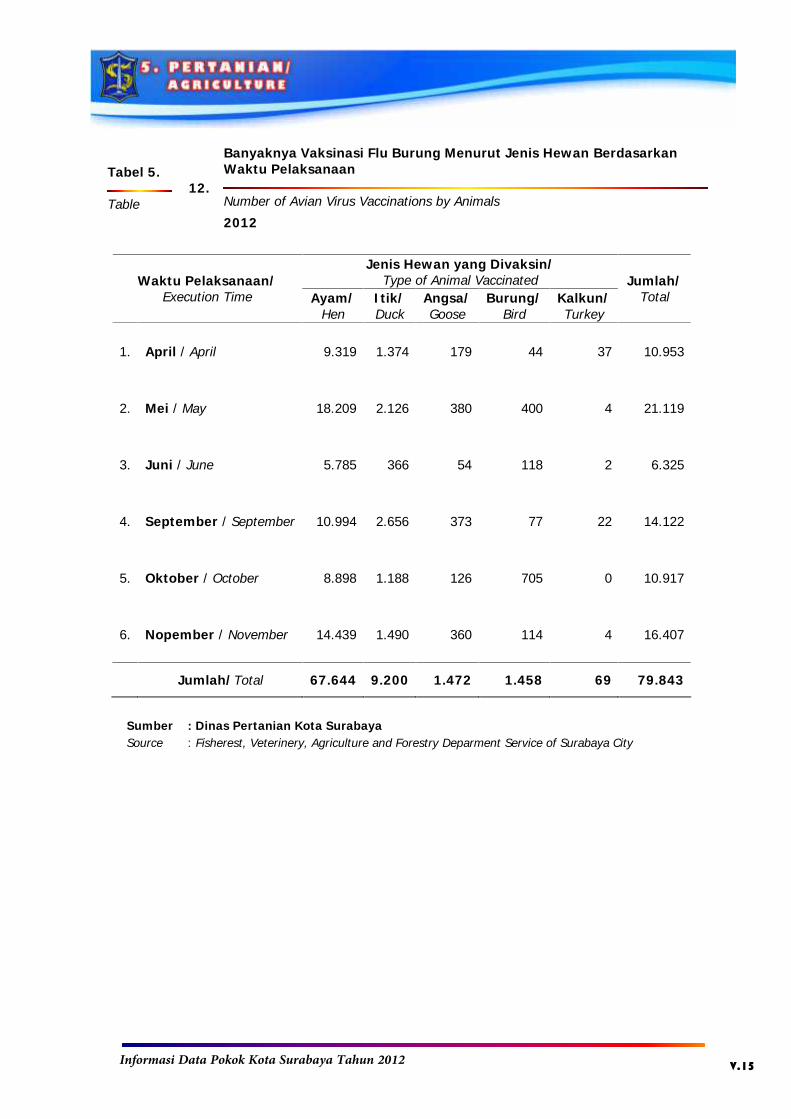
Informasi Data Pokok Kota Surabaya Tahun 2012 V.15
Banyaknya Vaksinasi Flu Burung Menurut Jenis Hewan BerdasarkanWaktu Pelaksanaan
Number of Avian Virus Vaccinations by Animals
Tabel 5.
Table12.
2012
Jenis Hewan yang Divaksin/Type of Animal VaccinatedWaktu Pelaksanaan/
Execution Time Ayam/Hen
Itik/Duck
Angsa/Goose
Burung/Bird
Kalkun/Turkey
Jumlah/Total
1. April / April 9.319 1.374 179 44 37 10.953
2. Mei / May 18.209 2.126 380 400 4 21.119
3. Juni / June 5.785 366 54 118 2 6.325
4. September / September 10.994 2.656 373 77 22 14.122
5. Oktober / October 8.898 1.188 126 705 0 10.917
6. Nopember / November 14.439 1.490 360 114 4 16.407
Jumlah/Total 67.644 9.200 1.472 1.458 69 79.843
Sumber : Dinas Pertanian Kota SurabayaSource : Fisherest, Veterinery, Agriculture and Forestry Deparment Service of Surabaya City
Informasi Data Pokok Kota Surabaya Tahun 2012 V.16
Banyaknya Nelayan, Pengusaha Tambak dan Rata-rata Pendapatannya
Number of Fishermen, Fishpond Enterpreneur, Income Average and CultivatedFishpond Area
Tabel 5.
Table13.
2012
Nelayan/Fishermen Pengusaha Tambak/Fishpond Interpreneur
Tahun/Year Motorisasi/
MotorizedTradisional/
TraditionalJumlah/
Total
Rata2Pend./IncomeAverage
Jumlah/Total
Rata2Pend./IncomeAverage
2006 1.277,00 156 1.433,00 4.149.077,00 1.239,00 4.379.938,00
2007 1.516,00 466 1.982,00 4.481.003,00 1.425,00 4.861.731,00
2008 1.257,00 483 1.740,00 5.018.725,00 1.126,00 5.445.138,00
2009 1.295,00 601 1.896,00 5.420,22 1.126,00 5.880.750,00
2010 1.376,00 466 1.842,00 5.671,31 911,00 5.110.825,00
2011 2.006,00 345 2.351,00 5.238,25 901,00 5.121.907,00
2012 * * 2.343,00 5.284.865,00 901,00 5.156.224,00
Sumber : Dinas Pertanian Kota SurabayaSource : Fisherest, Veterinery, Agriculture and Forestry Deparment Service of Surabaya CityKeterangan * : Data Tidak Tersedia/ Data Not Available
Informasi Data Pokok Kota Surabaya Tahun 2012 V.17
Produksi dan Nilai Produksi Ikan Laut dan Ikan Darat (Ton)
Sea and Freshwater Fish Production (Ton) and Production Value
Tabel 5.
Table14.
2005 - 2012
Darat/LandLaut/Sea Tambak/
Fishpond
Air Tawar/Kolam/
Fresh Water
PerairanUmum/Public
Karamba Jumlah/Total
Tahun/Year
( Ton )
2005 9.227,00 8.825,00 151,00 265,00 15,00 9.256,00
2006 9.458,00 8.573,00 131,00 279,00 - 8.983,00
2007 8.531,40 7.886,20 118,14 256,20 - 8.260,50
2008 8.863,60 8.198,91 169,40 223,40 - 8.591,70
2009 9.307,10 8.608,70 177,80 233,10 - 9.019,60
2010 9.493,20 9.043,30 267,70 244,80 - 9.555,80
2011 7.119,89 7.923,84 923,67 264,55 - 9.112,06
7.031,16 7.593,18 991,86 269,27 - 8.854,31
Nilai Produksi/Production Value (Rp.000,-)2012
155.372.161 200.771.724 15.256.833 3.716.515 - 219.745.072
Sumber : Dinas Pertanian Kota SurabayaSource : Fisherest, Veterinery, Agriculture and Forestry Deparment Service of Surabaya City
Informasi Data Pokok Kota Surabaya Tahun 2012 V.18
Produksi Ikan Laut Menurut Jenisnya (Ton)
Sea Fish Production by Type of Fish (Ton)
Tabel 5.
Table15.
2005 - 2012
Jenis/Type of Fish 2008 2009 2010 2011 2012
1. Udang Putih/ White Shrimp 1.171,90 1.230,40 1.275,01 313,28 309,37
2. Teri/Tiny Sea Fish 122,20 128,40 160,99 263,43 260,15
3. Manyung 242,60 254,80 289,91 124,96 407,81
4. Rajungan/Small Crab 462,90 485,80 515,55 348,87 344,53
5. Pari/Mantaray 323,60 339,70 - 249,20 246.09
6. Belanak/Gray Mullet 365,10 383,40 421,10 1.324,28 1.307,81
7. Kerang/Scallop 1.459,90 1.532,80 1.583,51 185,12 185,81
8. Lain-lain/Other 471,70 380,40 641,57 719,13 225,00
9. Kepiting/Crab 287,80 302,50 318,51 192,23 189,85
10. Simping/Flat Shell 1.021,10 1.072,10 1.113,56 299,01 295,31
11. Gulamah/ Gulamah Fish 1.347,20 1.414,70 1.472,95 2.007,81 1.982,80
12. Layur/Layur Fish 242,10 254,10 289,17 78,33 77,34
13. Peperak/Peperak Fish 242,90 255,00 290,11 234,97 232,01
14. Jenis Udang Lain/OtherShrimp 299,60 314,60 - - -
15. Teripang/Sea Cucumber - - - - -
16. Binatang AirLainnya/Other Sea Food 363,00 380,98 609,44 398,71 398,73
17. Cumi-cumi/Sqiud 70,70 74,44 85,92 92,56 91,40
18. Udang Barong/BarongShrimp 369,30 - - - -
19. Kakap / Snapper 485,15
Jumlah/Total 8.863,60 8.804,12 9.067,30 6.831,89 6.793,07
Sumber : Dinas Pertanian Kota SurabayaSource : Fisherest, Veterinery, Agriculture and Forestry Deparment Service of Surabaya City
Informasi Data Pokok Kota Surabaya Tahun 2012 V.19
Nilai Produksi Ikan Laut Menurut Jenisnya
Value of Sea Fish Production by Type of Fish
Tabel 5.
Table16.
2005 - 2012
Jenis/Type of Fish Nilai ProduksiValue of Production
1. Udang Putih/ White Shrimp 12.614.558,-
2. Teri/Tiny Sea Fish 7.776.938,-
3. Manyung 5.580.854,-
4. Rajungan/Small Crab 16.826.176,-
5. Pari/Mantaray 3.739.294,-
6. Belanak/Gray Mullet 31.380.914,-
7. Kerang/Scallop 3.531.842,-
8. Lain-lain/Other 1.734.524,-
9. Kepiting/Crab 10.785.351,-
10. Simping/Flat Shell 3.159.856,-
11. Gulamah/ Gulamah Fish 26.777.693,-
12. Layur/Layur Fish 1.435.496,-
13. Peperak/Peperak Fish 4.153.088,-
14. Jenis Udang Lain/Other Shrimp -
15. Teripang/Sea Cucumber -
16. Binatang Air Lainnya/Other Sea Food 3.541.641,-
17. Cumi-cumi/Sqiud 2.610.303,-
18. Udang Barong/Barong Shrimp -
19. Kakap 19.723.633,-
Jumlah/Total 155.372.161,-
Sumber : Dinas Pertanian Kota SurabayaSource : Fisherest, Veterinery, Agriculture and Forestry Deparment Service of Surabaya City
Informasi Data Pokok Kota Surabaya Tahun 2012 V.20
Produksi Ikan Darat Menurut Tempat Penangkapan dan Jenis Ikan
Production of Fresh Water Fish by Catching Point and Type of Fishes
Tabel 5.
Table17.
2008 - 2012
Tempat Penangkapan/Jenis Ikan/Catching Point/Type of Fish 2008 2009 2010 2011 2012
1. Tambak/Fishpond- Bandeng/Milkfish 1.715,23 1.800,96 6.433,97 5.431,93 5.115,42- Udang Putih /White Shrimp 1.254,43 1.317,13 434,00 574,30 446,84- Udang Windu/Large Prawn 1.485,62 1.559,90 407,01 398,20 373,01- Udang Vannamei - - 1.325,33 1.106,79 1.101,86Lain-lain/Other 3.743,63 3.930,74 442,99 421,62 556,05
Sub Jumlah/Sub Total 8.198,91 8.608,73 9.043,30 7.932,84 7.593,18
2. Air Tawar/Fresh Water- Tawes 7,17 7,52 24,86 14,92 -- Tombro 32,01 33,56 19,20 11,52 -- Mujair 17,62 18,49 0,64 0,38 -
-Lain-lain(Campur)/Other(mixed) 112,66 118,22 222,97 896,84 -
Sub Jumlah/Sub Total 169,46 177,79 267,67 923,66 -
3. Perairan Umum/Public- Tawes 89,64 94,25 94,78 47,63 48,47- Tombro 17,43 18,33 - - -- Mujair 6,67 7,01 8,85 39,68 40,39- Nila - - - - 78,09- Gabus - - - - 35,01- Lele - - - - 29,62
-Lain-lain(Campur)/Other(mixed) 109,66 113,58 141,20 37,69
Sub Jumlah/Sub Total 223,40 233,17 244,83 264,55 269.27
4. Karamba- Nila - - - - -- Patin - - - - -- Lele - - - - -- Lain-lain - - - - -
Jumlah/Total 8.591,77 9.019,69 9.555,80 9.121,05 7.593,18
Sumber : Dinas Pertanian Kota SurabayaSource : Fisherest, Veterinery, Agriculture and Forestry Deparment Service of Surabaya City
Informasi Data Pokok Kota Surabaya Tahun 2012 V.21
Nilai Produksi Ikan Darat Menurut Tempat Penangkapan dan Jenis Ikan
Value of Production of Fresh Water Fish by Catching Point and Type of Fishes
Tabel 5.
Table18.
2008 - 2012
Tempat Penangkapan/Jenis Ikan/Catching Point/Type of Fish
Nilai ProduksiValue of Production
1. Tambak/Fishpond- Bandeng/Milkfish 104.482.789,-- 15.672.056,--
Udang Putih /White ShrimpUdang Windu/Large Prawn 31.980.972,-
- Udang Vannamei 41.992.161,-Lain-lain/Other 6.643.746,-
Sub Jumlah/Sub Total 200.771.724,-
2. Air Tawar/Fresh Water- Tawes -- Tombro -- Mujair -- Lain-lain (Campur)/Other(mixed) -
Sub Jumlah/Sub Total -
3. Perairan Umum/Public- Tawes 411.410,-- Tombro -- Mujair 424.541,-- Nila 1.302.158,-- Gabus 842.853,-- Lele 401.648,-- Lain-lain (Campur)/Other(mixed) 333.905,-
Sub Jumlah/Sub Total 3.716.515,-
4. Karamba- Nila -- Patin -- Lele -- Lain-lain -
Jumlah/Total 8.591,77
Sumber : Dinas Pertanian Kota SurabayaSource : Fisherest, Veterinery, Agriculture and Forestry Deparment Service of Surabaya City