ANALISIS-JALUR-Makruf-Akbar (1).pdf
49
TEKNIK ANALISIS JALUR DAN TERAPANNYA Maruf Akbar PROGRAM PASCASARJANA UNIVERSITAS NEGERI JAKARTA 2013
Transcript of ANALISIS-JALUR-Makruf-Akbar (1).pdf
TEKNIK ANALISIS JALUR DAN TERAPANNYA
Maruf Akbar
PROGRAM PASCASARJANA UNIVERSITAS NEGERI JAKARTA
2013
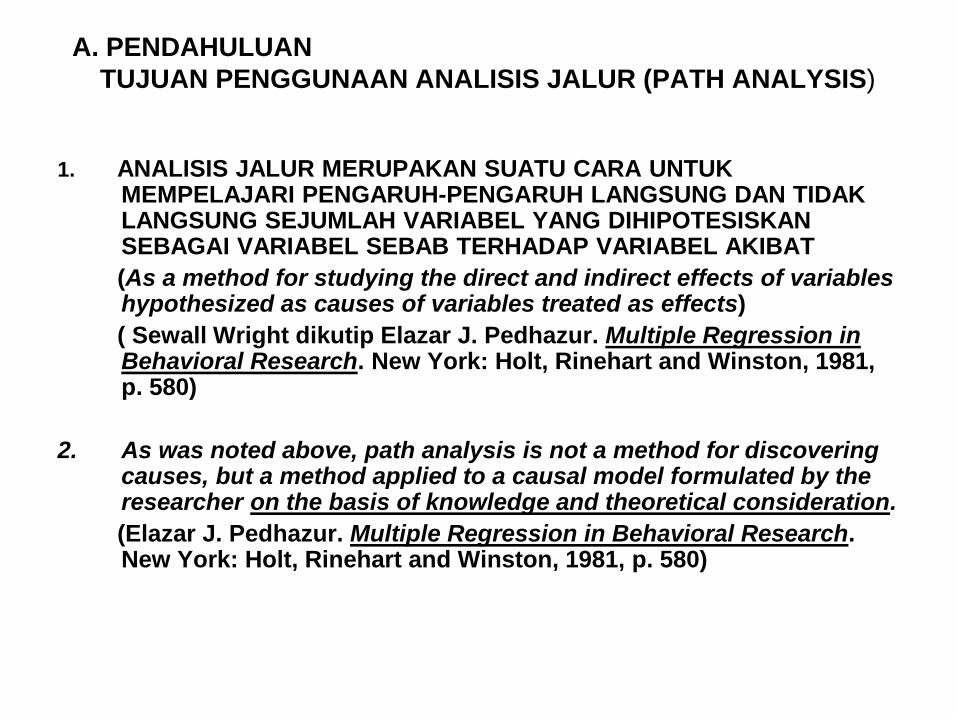
A. PENDAHULUAN TUJUAN PENGGUNAAN ANALISIS JALUR (PATH ANALYSIS)
1. ANALISIS JALUR MERUPAKAN SUATU CARA UNTUK MEMPELAJARI PENGARUH-PENGARUH LANGSUNG DAN TIDAK LANGSUNG SEJUMLAH VARIABEL YANG DIHIPOTESISKAN SEBAGAI VARIABEL SEBAB TERHADAP VARIABEL AKIBAT
(As a method for studying the direct and indirect effects of variables hypothesized as causes of variables treated as effects)
( Sewall Wright dikutip Elazar J. Pedhazur. Multiple Regression in Behavioral Research. New York: Holt, Rinehart and Winston, 1981, p. 580)
2. As was noted above, path analysis is not a method for discovering
causes, but a method applied to a causal model formulated by the researcher on the basis of knowledge and theoretical consideration.
(Elazar J. Pedhazur. Multiple Regression in Behavioral Research. New York: Holt, Rinehart and Winston, 1981, p. 580)
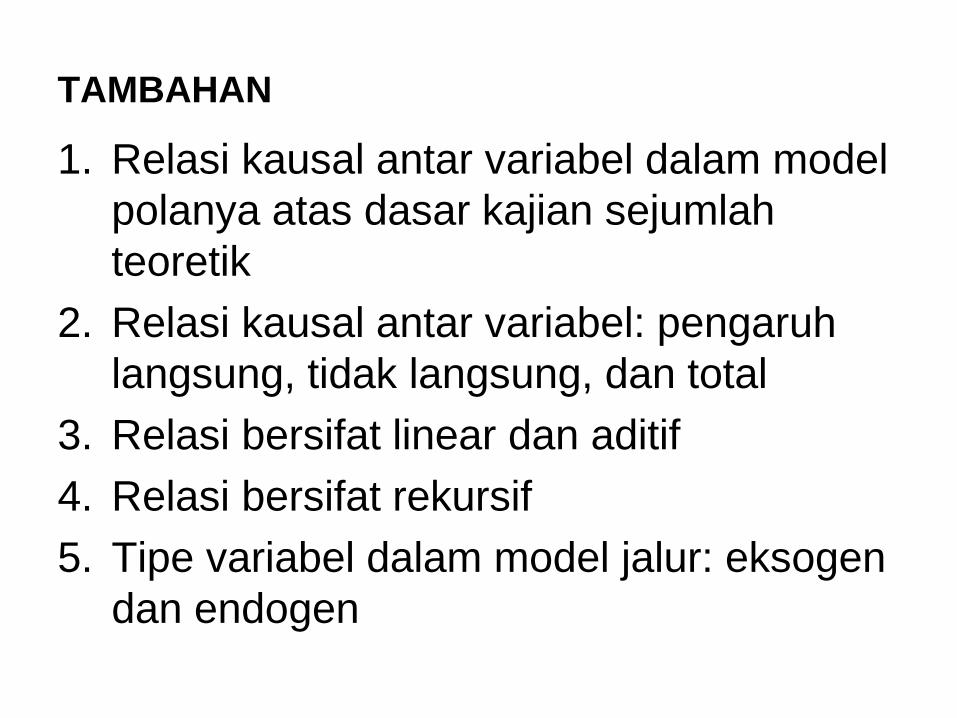
TAMBAHAN
1. Relasi kausal antar variabel dalam model polanya atas dasar kajian sejumlah teoretik
2. Relasi kausal antar variabel: pengaruh langsung, tidak langsung, dan total
3. Relasi bersifat linear dan aditif 4. Relasi bersifat rekursif 5. Tipe variabel dalam model jalur: eksogen
dan endogen
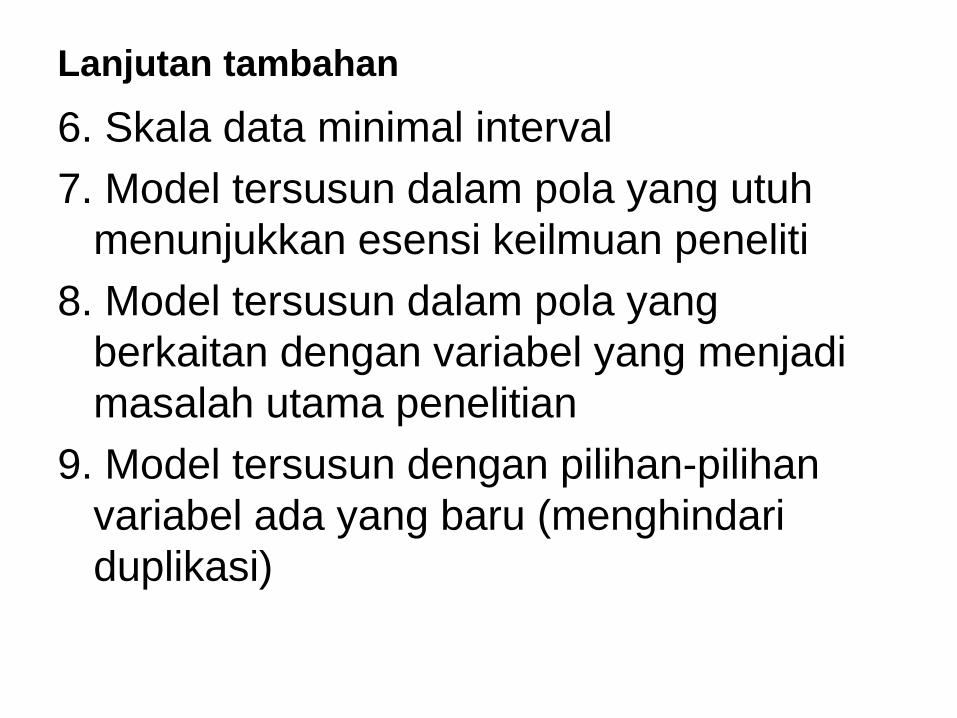
Lanjutan tambahan
6. Skala data minimal interval 7. Model tersusun dalam pola yang utuh
menunjukkan esensi keilmuan peneliti 8. Model tersusun dalam pola yang
berkaitan dengan variabel yang menjadi masalah utama penelitian
9. Model tersusun dengan pilihan-pilihan variabel ada yang baru (menghindari duplikasi)
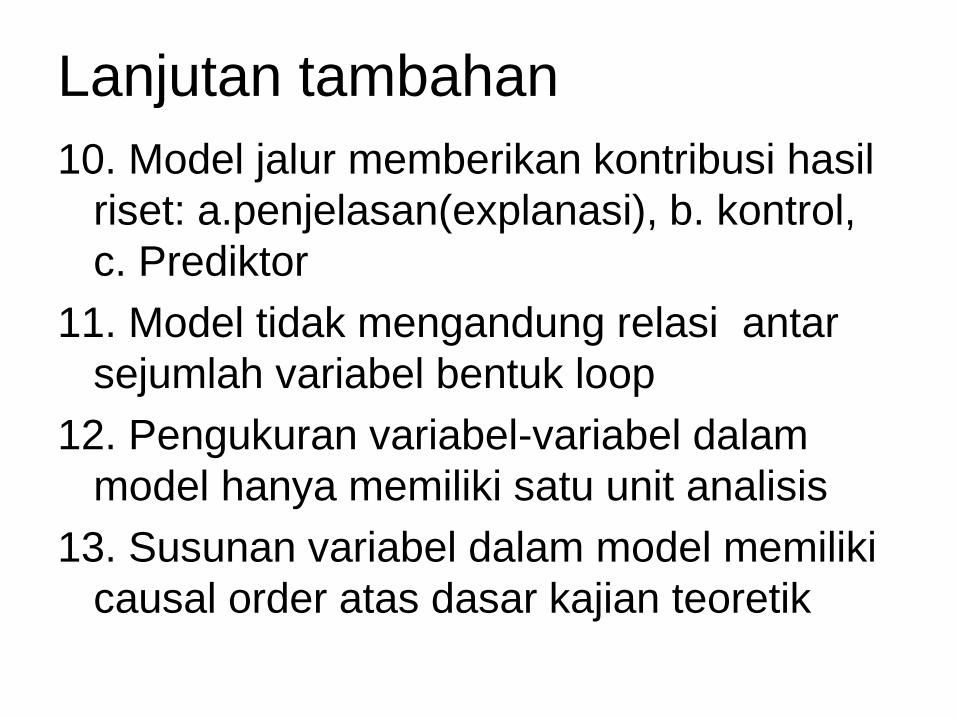
Lanjutan tambahan 10. Model jalur memberikan kontribusi hasil
riset: a.penjelasan(explanasi), b. kontrol, c. Prediktor
11. Model tidak mengandung relasi antar sejumlah variabel bentuk loop
12. Pengukuran variabel-variabel dalam model hanya memiliki satu unit analisis
13. Susunan variabel dalam model memiliki causal order atas dasar kajian teoretik
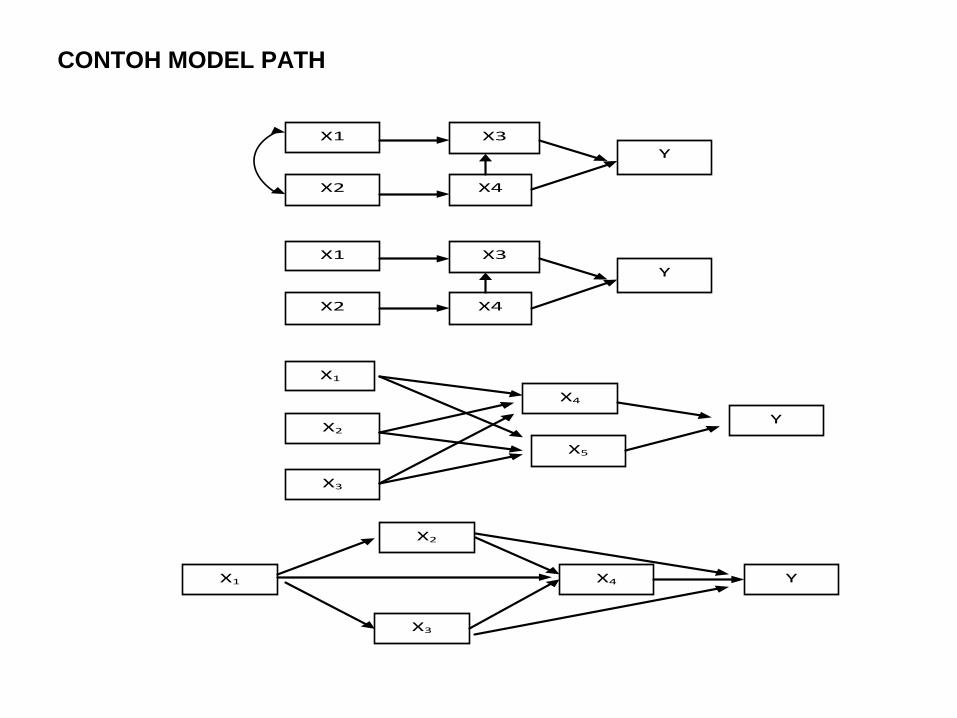
CONTOH MODEL PATH
X1
X2
X3
X4
Y
X1
X2
X3
X4
Y
X1
X2
X5
X3
X4
Y
Y
X3
X4
X2
X1
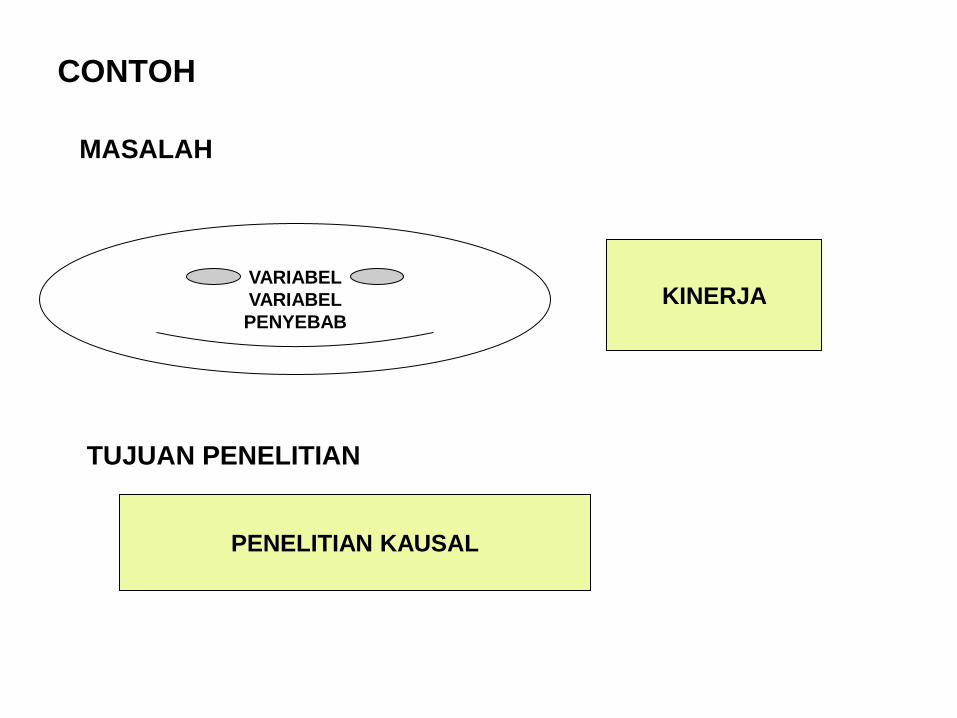
CONTOH
MASALAH TUJUAN PENELITIAN
KINERJA
PENELITIAN KAUSAL
VARIABEL VARIABEL PENYEBAB
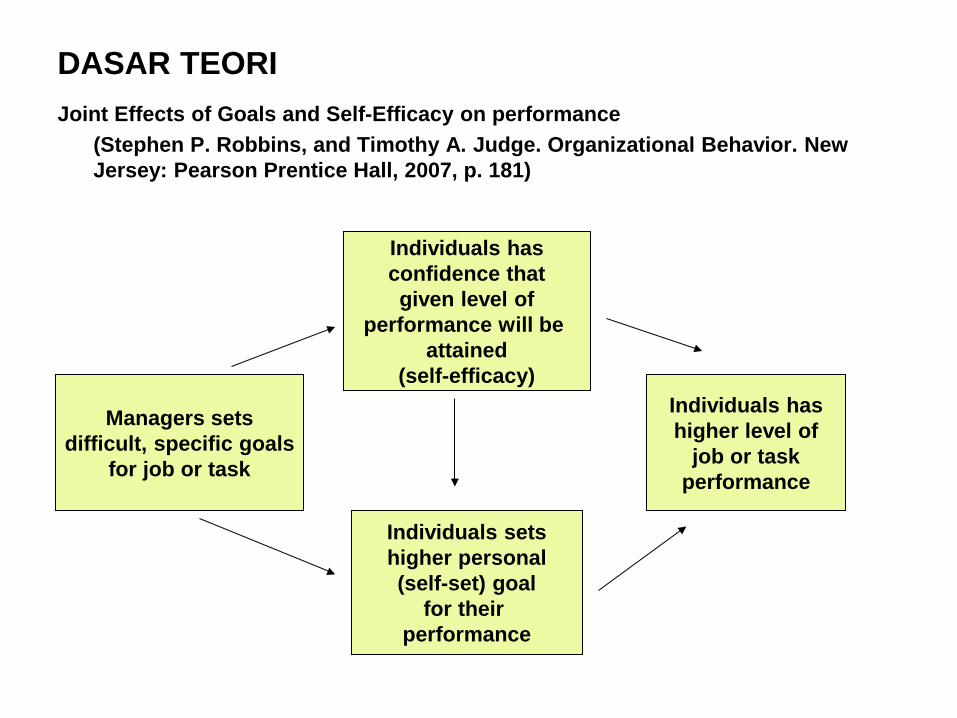
DASAR TEORI Joint Effects of Goals and Self-Efficacy on performance (Stephen P. Robbins, and Timothy A. Judge. Organizational Behavior. New
Jersey: Pearson Prentice Hall, 2007, p. 181)
Managers sets difficult, specific goals
for job or task
Individuals sets higher personal (self-set) goal
for their performance
Individuals has higher level of
job or task performance
Individuals has confidence that given level of
performance will be attained
(self-efficacy)
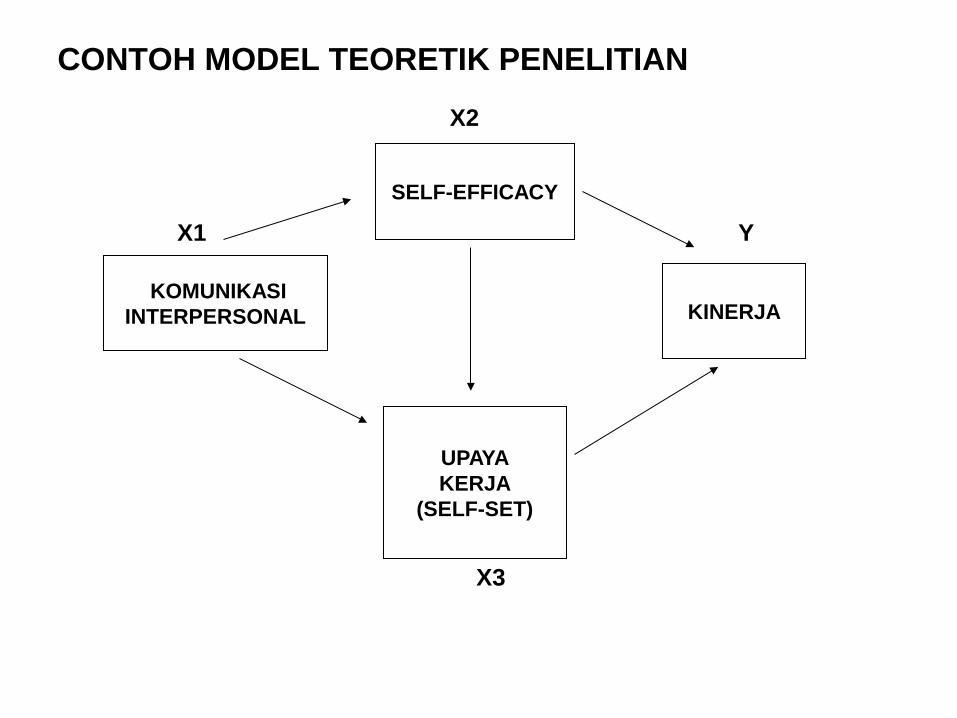
CONTOH MODEL TEORETIK PENELITIAN
X2 X1 Y X3
KINERJA
UPAYA KERJA
(SELF-SET)
KOMUNIKASI INTERPERSONAL
SELF-EFFICACY
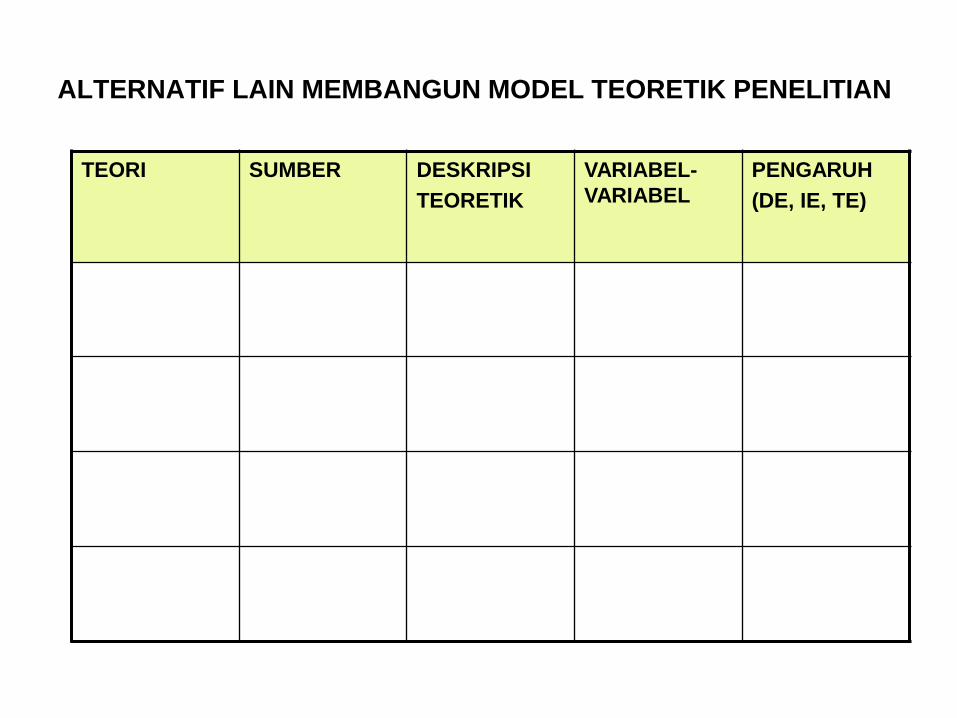
ALTERNATIF LAIN MEMBANGUN MODEL TEORETIK PENELITIAN
TEORI SUMBER DESKRIPSI TEORETIK
VARIABEL-VARIABEL
PENGARUH (DE, IE, TE)
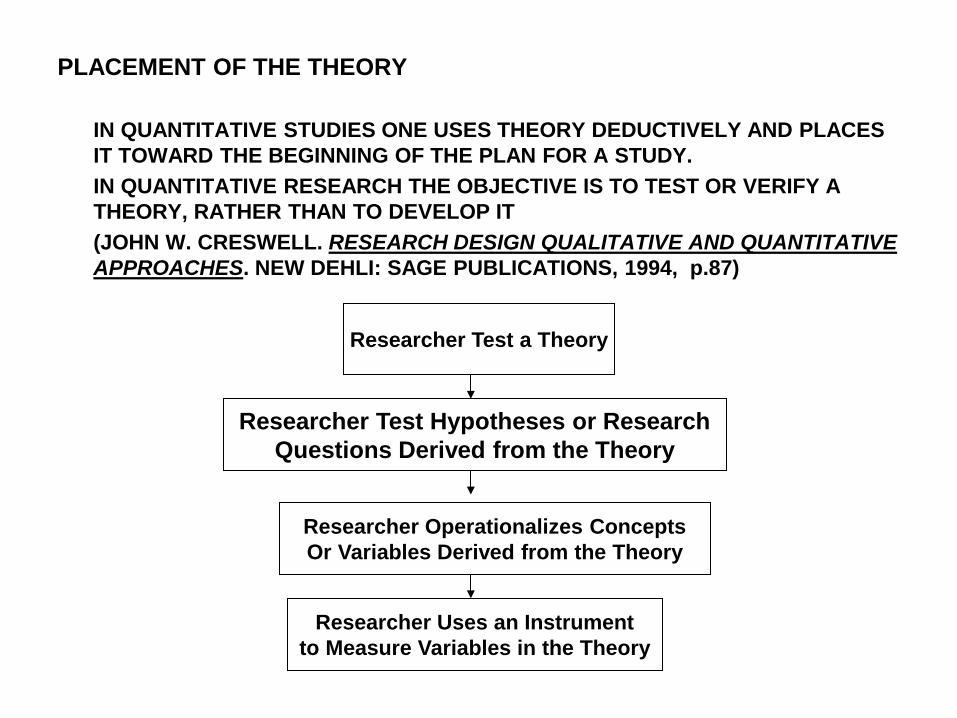
PLACEMENT OF THE THEORY
IN QUANTITATIVE STUDIES ONE USES THEORY DEDUCTIVELY AND PLACES IT TOWARD THE BEGINNING OF THE PLAN FOR A STUDY.
IN QUANTITATIVE RESEARCH THE OBJECTIVE IS TO TEST OR VERIFY A THEORY, RATHER THAN TO DEVELOP IT
(JOHN W. CRESWELL. RESEARCH DESIGN QUALITATIVE AND QUANTITATIVE APPROACHES. NEW DEHLI: SAGE PUBLICATIONS, 1994, p.87)
Researcher Test a Theory
Researcher Test Hypotheses or Research Questions Derived from the Theory
Researcher Operationalizes Concepts Or Variables Derived from the Theory
Researcher Uses an Instrument to Measure Variables in the Theory
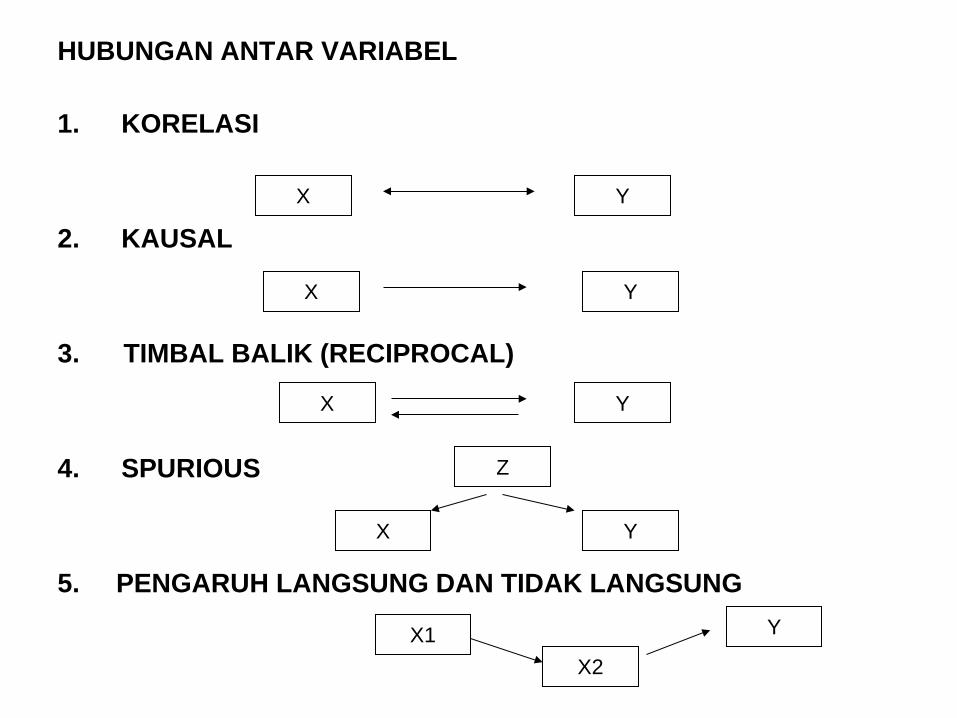
HUBUNGAN ANTAR VARIABEL 1. KORELASI 2. KAUSAL 3. TIMBAL BALIK (RECIPROCAL) 4. SPURIOUS 5. PENGARUH LANGSUNG DAN TIDAK LANGSUNG
X Y
X Y
X Y
X Y
Z
X1 Y
X2
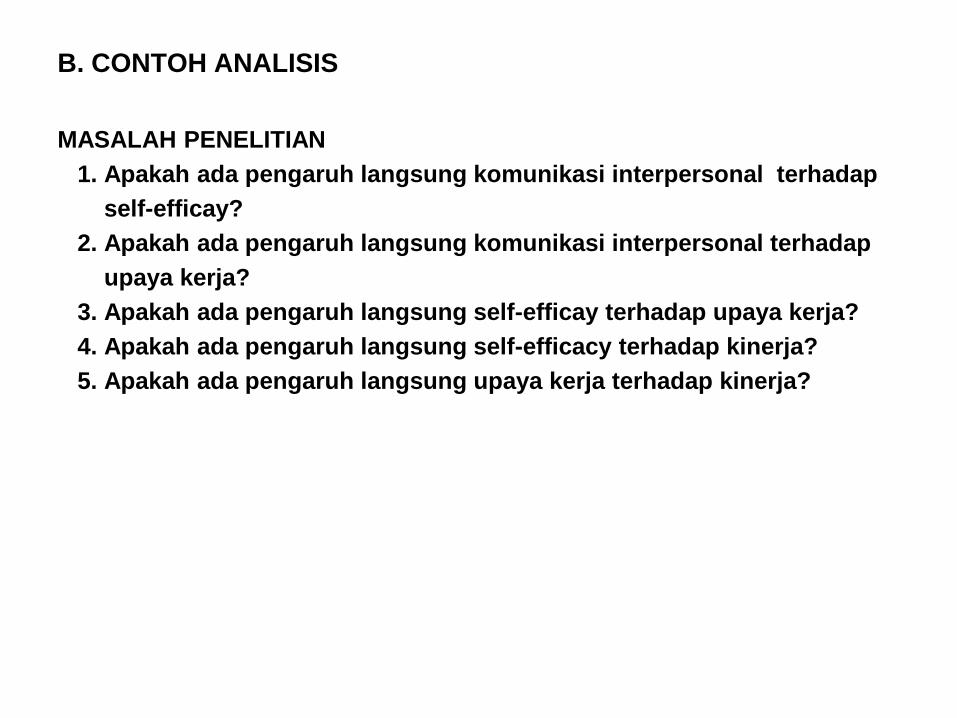
B. CONTOH ANALISIS
MASALAH PENELITIAN 1. Apakah ada pengaruh langsung komunikasi interpersonal terhadap self-efficay? 2. Apakah ada pengaruh langsung komunikasi interpersonal terhadap upaya kerja? 3. Apakah ada pengaruh langsung self-efficay terhadap upaya kerja? 4. Apakah ada pengaruh langsung self-efficacy terhadap kinerja? 5. Apakah ada pengaruh langsung upaya kerja terhadap kinerja?
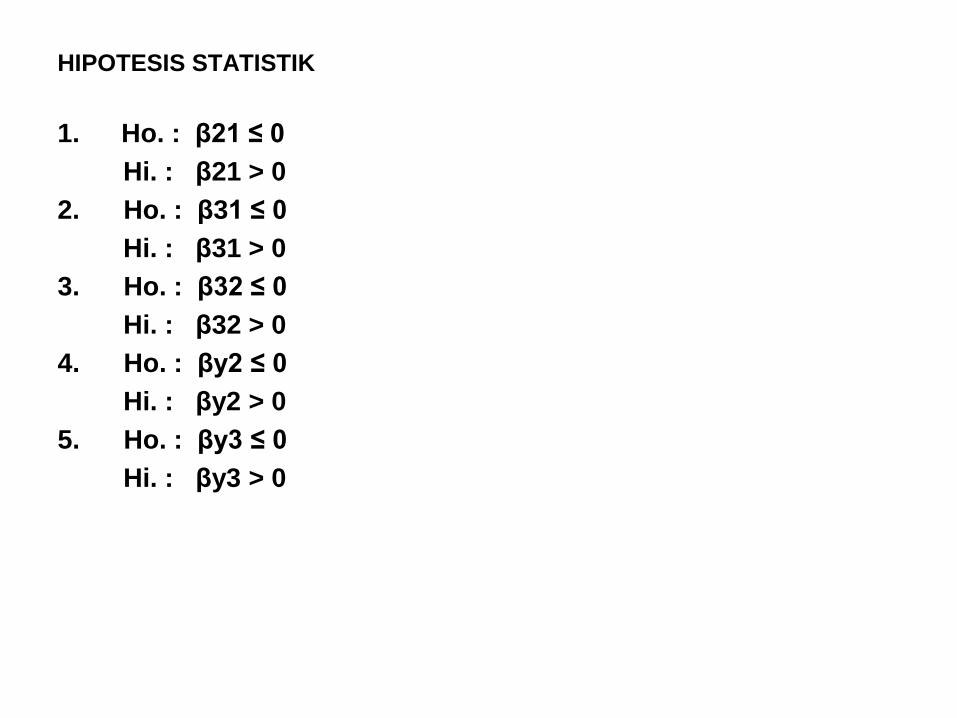
HIPOTESIS STATISTIK
1. Ho. : β21 ≤ 0 Hi. : β21 > 0 2. Ho. : β31 ≤ 0 Hi. : β31 > 0 3. Ho. : β32 ≤ 0 Hi. : β32 > 0 4. Ho. : βy2 ≤ 0 Hi. : βy2 > 0 5. Ho. : βy3 ≤ 0 Hi. : βy3 > 0
PILIHAN ANALISIS (SOFTWARE PROGRAM)
1. SPSS 2. LISREL
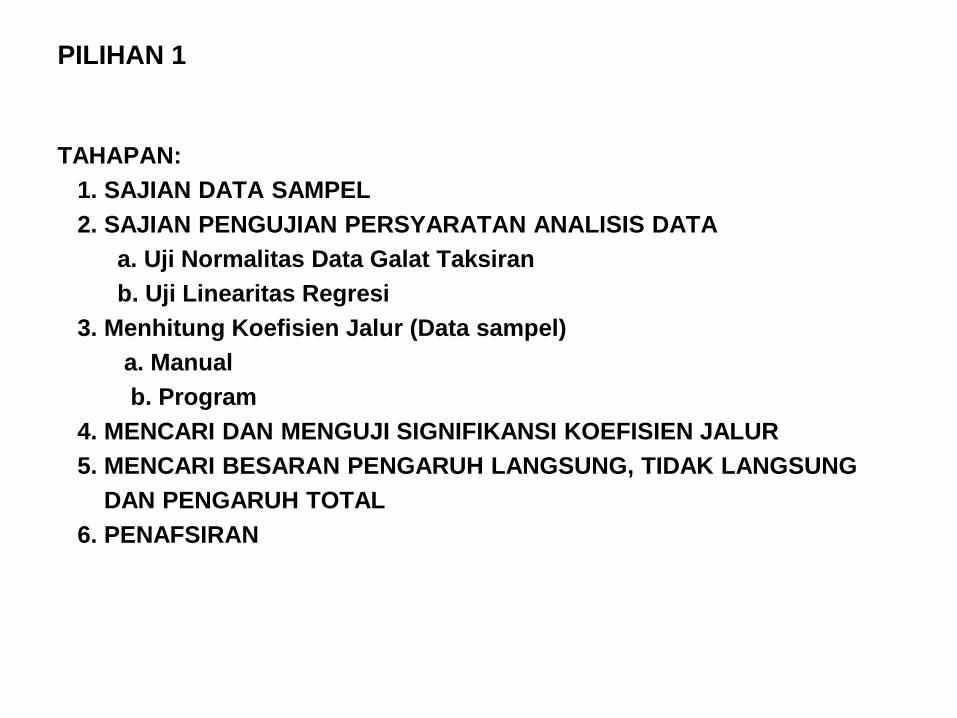
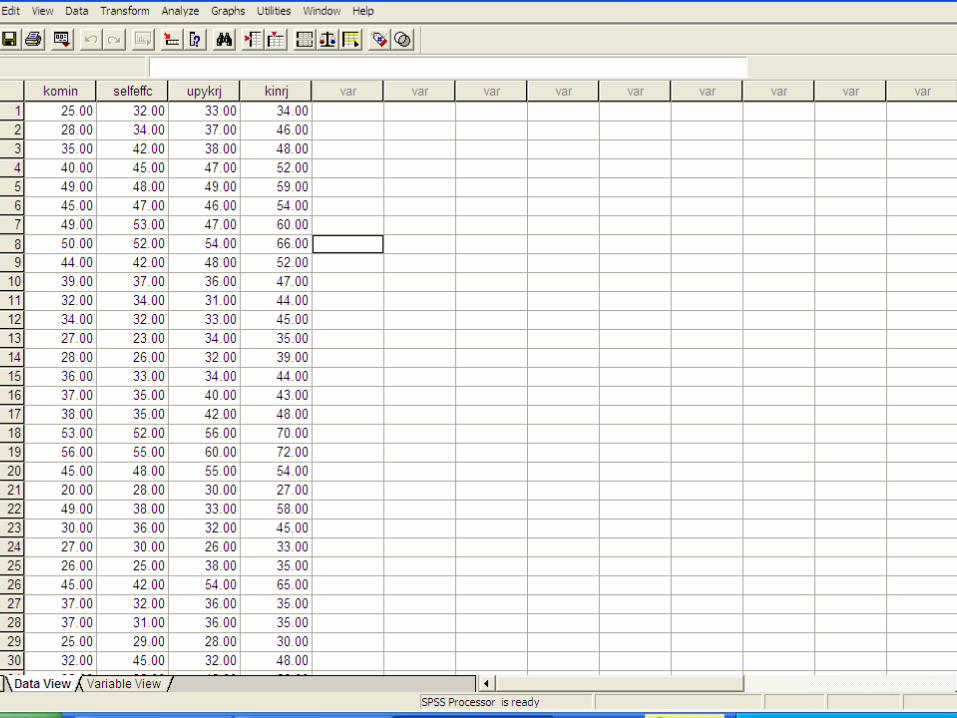
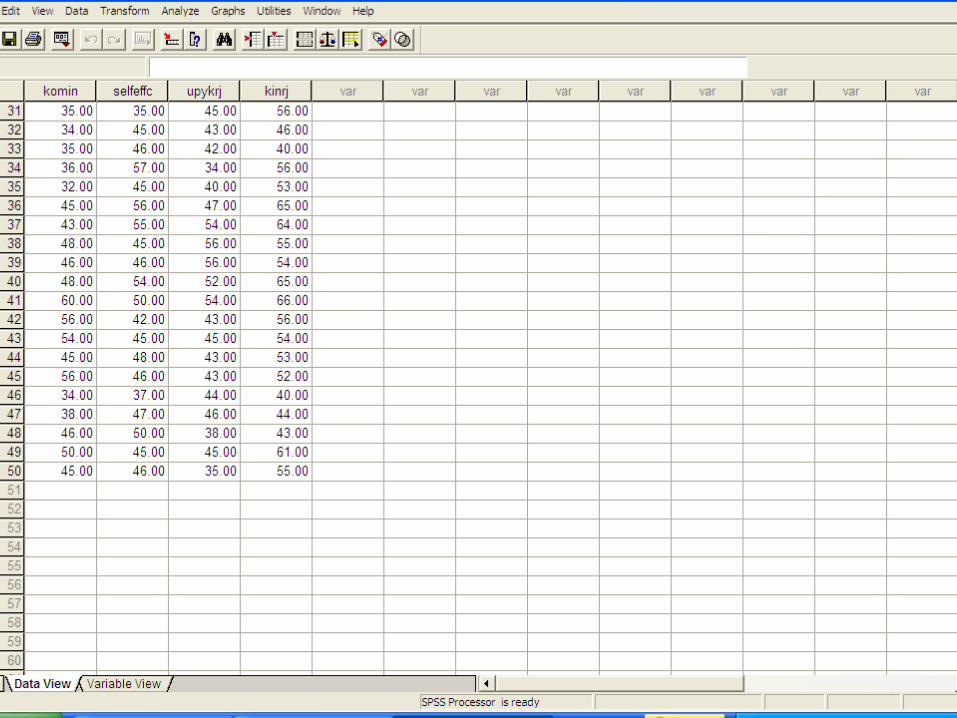
PILIHAN 1
TAHAPAN: 1. SAJIAN DATA SAMPEL 2. SAJIAN PENGUJIAN PERSYARATAN ANALISIS DATA a. Uji Normalitas Data Galat Taksiran b. Uji Linearitas Regresi 3. Menhitung Koefisien Jalur (Data sampel) a. Manual b. Program 4. MENCARI DAN MENGUJI SIGNIFIKANSI KOEFISIEN JALUR 5. MENCARI BESARAN PENGARUH LANGSUNG, TIDAK LANGSUNG DAN PENGARUH TOTAL 6. PENAFSIRAN
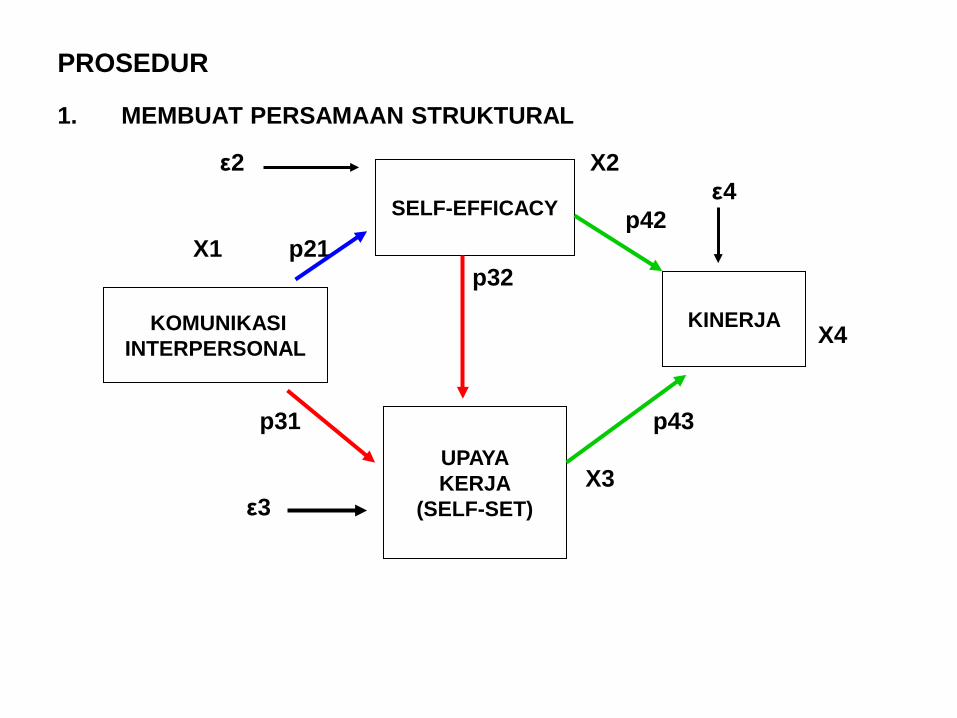
PROSEDUR
1. MEMBUAT PERSAMAAN STRUKTURAL
ε2 X2 ε4 p42 X1 p21 p32 X4 p31 p43 X3 ε3
SELF-EFFICACY
KOMUNIKASI INTERPERSONAL
UPAYA KERJA
(SELF-SET)
KINERJA
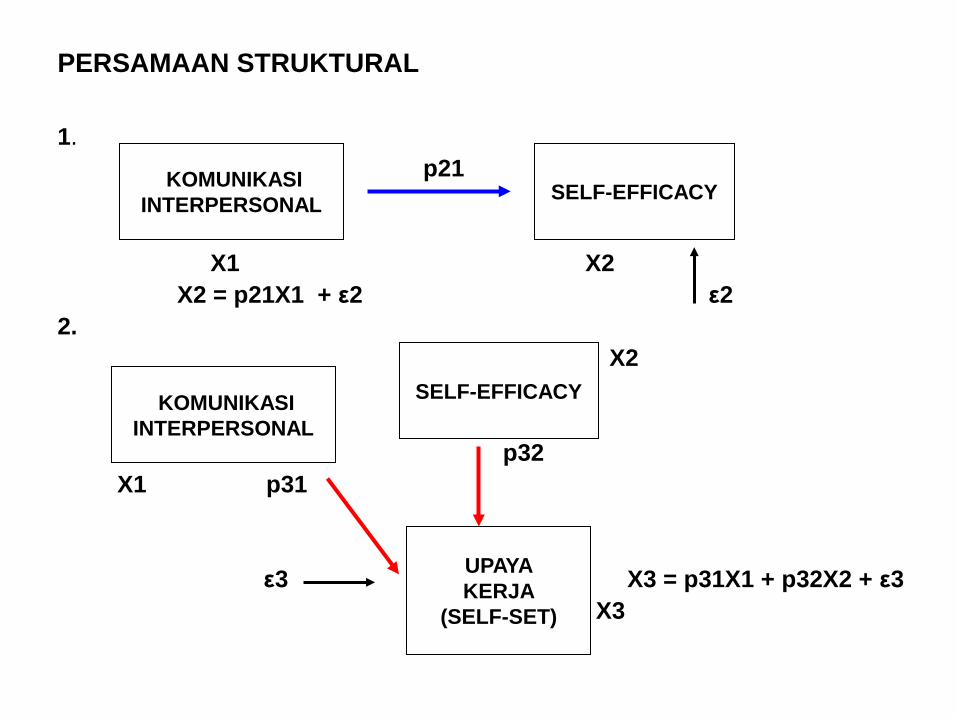
PERSAMAAN STRUKTURAL
1. p21 X1 X2 X2 = p21X1 + ε2 ε2 2. X2 p32 X1 p31 ε3 X3 = p31X1 + p32X2 + ε3 X3
KOMUNIKASI INTERPERSONAL SELF-EFFICACY
KOMUNIKASI INTERPERSONAL
SELF-EFFICACY
UPAYA KERJA
(SELF-SET)
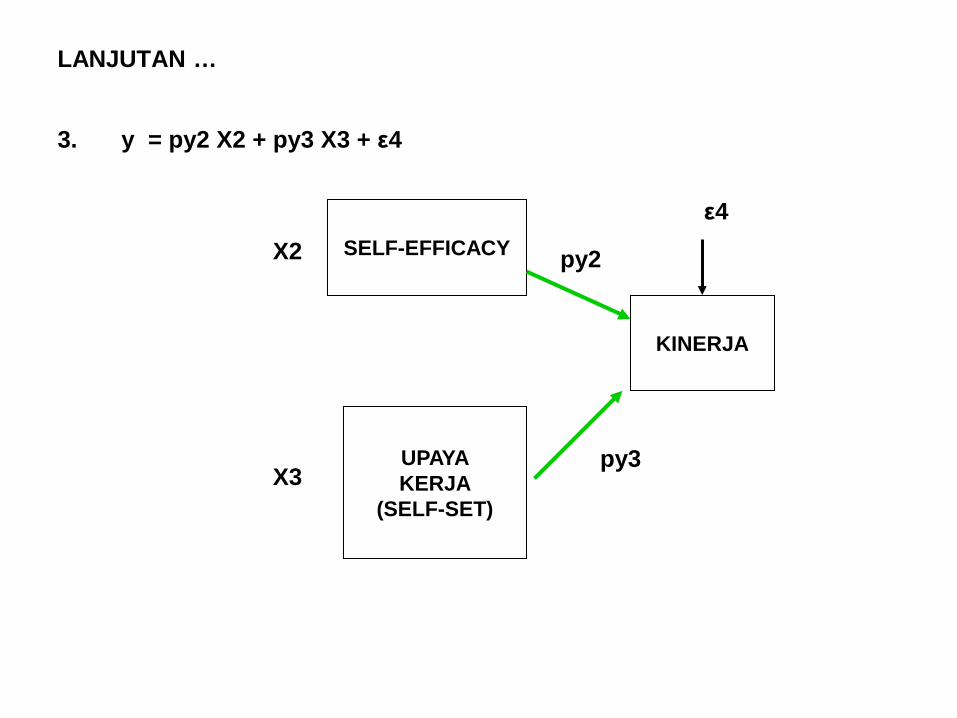
LANJUTAN …
3. y = py2 X2 + py3 X3 + ε4
SELF-EFFICACY
UPAYA KERJA
(SELF-SET)
KINERJA
ε4
py2
py3
X2
X3
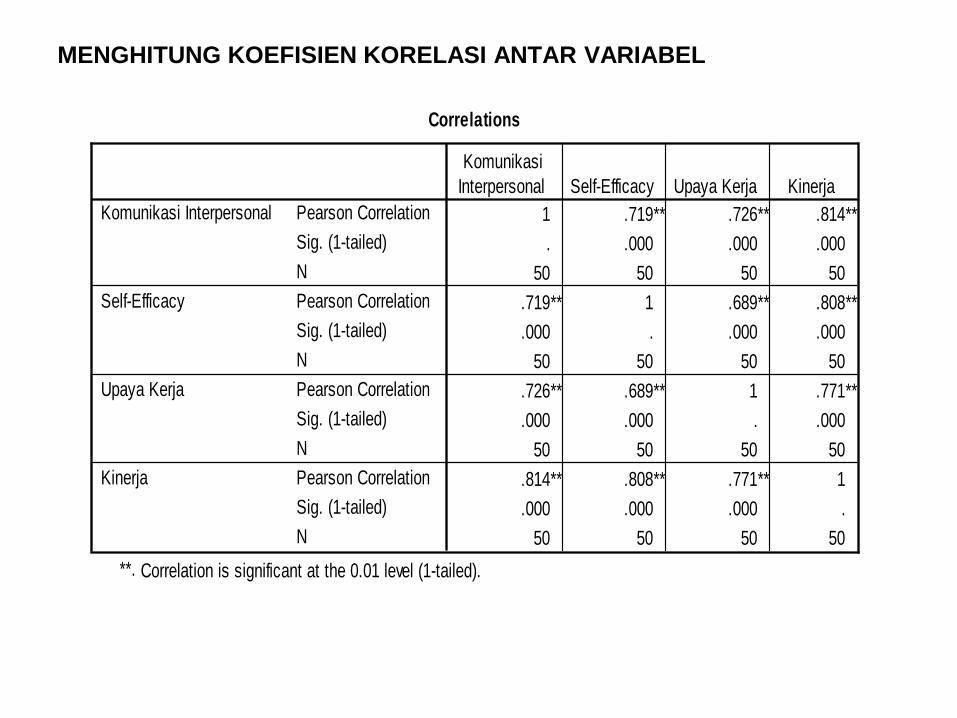
MENGHITUNG KOEFISIEN KORELASI ANTAR VARIABEL
Correlations
1 .719** .726** .814**. .000 .000 .000
50 50 50 50.719** 1 .689** .808**.000 . .000 .000
50 50 50 50.726** .689** 1 .771**.000 .000 . .000
50 50 50 50.814** .808** .771** 1.000 .000 .000 .
50 50 50 50
Pearson CorrelationSig. (1-tailed)NPearson CorrelationSig. (1-tailed)NPearson CorrelationSig. (1-tailed)NPearson CorrelationSig. (1-tailed)N
Komunikasi Interpersonal
Self-Efficacy
Upaya Kerja
Kinerja
KomunikasiInterpersonal Self-Efficacy Upaya Kerja Kinerja
Correlation is significant at the 0.01 level (1-tailed).**.
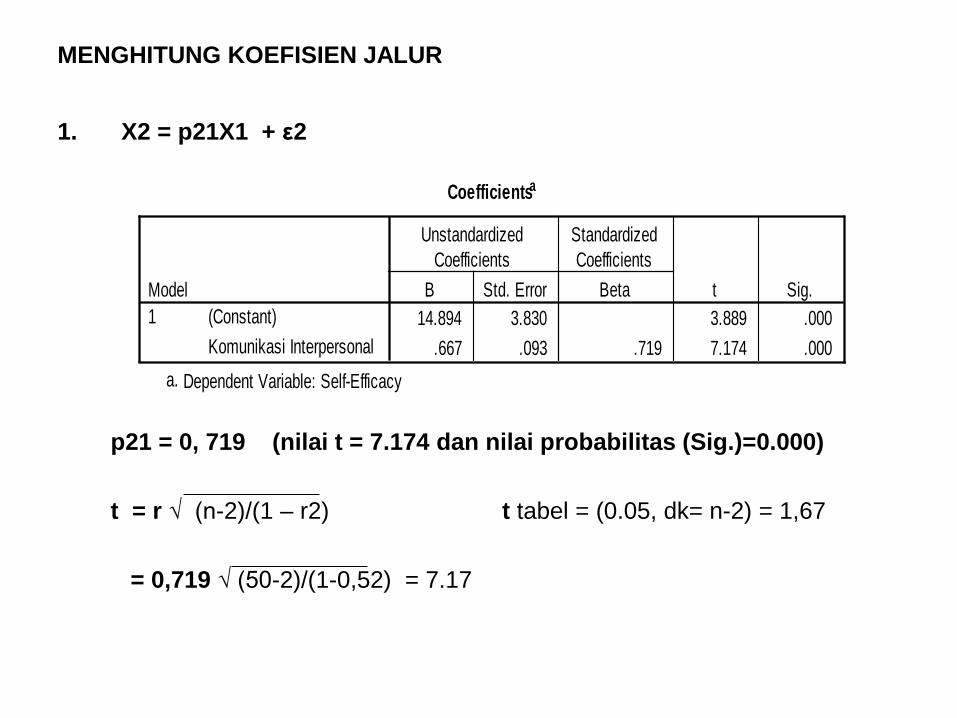
MENGHITUNG KOEFISIEN JALUR
1. X2 = p21X1 + ε2
p21 = 0, 719 (nilai t = 7.174 dan nilai probabilitas (Sig.)=0.000) t = r √ (n-2)/(1 – r2) t tabel = (0.05, dk= n-2) = 1,67 = 0,719 √ (50-2)/(1-0,52) = 7.17
Coefficientsa
14.894 3.830 3.889 .000.667 .093 .719 7.174 .000
(Constant)Komunikasi Interpersonal
Model1
B Std. Error
UnstandardizedCoefficients
Beta
StandardizedCoefficients
t Sig.
Dependent Variable: Self-Efficacya.
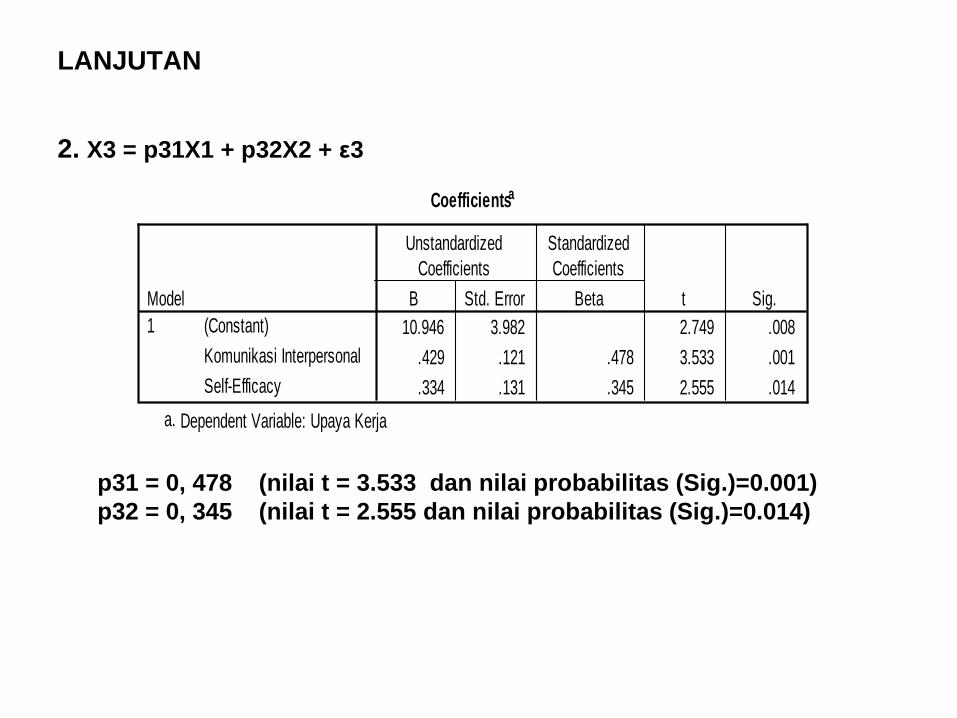
LANJUTAN
2. X3 = p31X1 + p32X2 + ε3 Coefficientsa
10.946 3.982 2.749 .008.429 .121 .478 3.533 .001.334 .131 .345 2.555 .014
(Constant)Komunikasi InterpersonalSelf-Efficacy
Model1
B Std. Error
UnstandardizedCoefficients
Beta
StandardizedCoefficients
t Sig.
Dependent Variable: Upaya Kerjaa.
p31 = 0, 478 (nilai t = 3.533 dan nilai probabilitas (Sig.)=0.001) p32 = 0, 345 (nilai t = 2.555 dan nilai probabilitas (Sig.)=0.014)
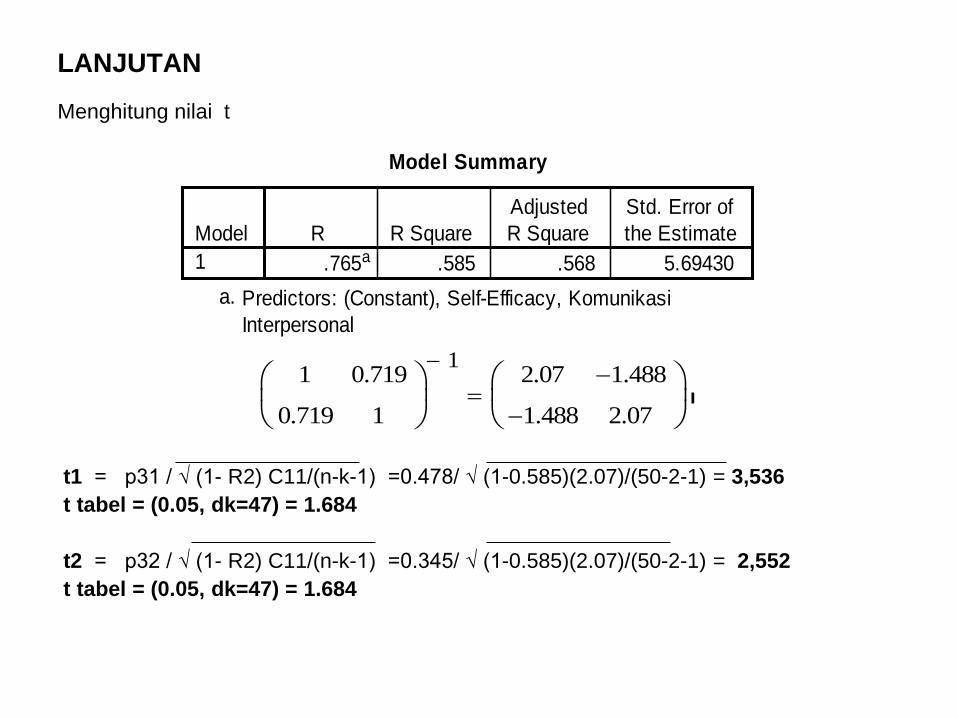
LANJUTAN
Menghitung nilai t t1 = p31 / √ (1- R2) C11/(n-k-1) =0.478/ √ (1-0.585)(2.07)/(50-2-1) = 3,536 t tabel = (0.05, dk=47) = 1.684 t2 = p32 / √ (1- R2) C11/(n-k-1) =0.345/ √ (1-0.585)(2.07)/(50-2-1) = 2,552 t tabel = (0.05, dk=47) = 1.684
Model Summary
.765a .585 .568 5.69430Model1
R R SquareAdjustedR Square
Std. Error ofthe Estimate
Predictors: (Constant), Self-Efficacy, KomunikasiInterpersonal
a.
1
0.719
0.719
1
1− 2.07
1.488−
1.488−
2.07
=
LANJUTAN
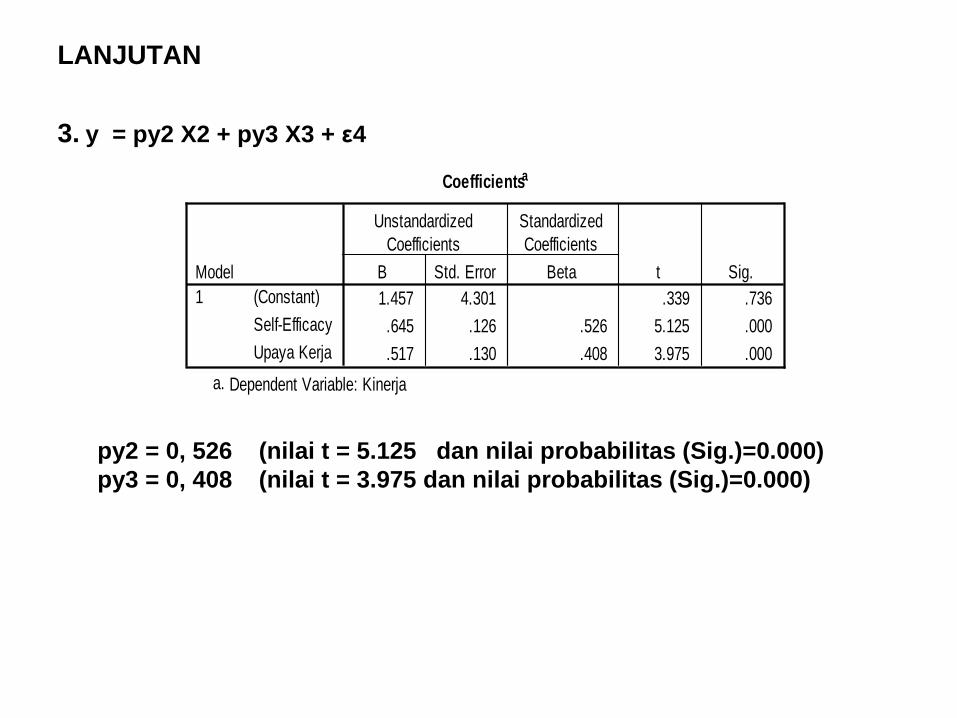
3. y = py2 X2 + py3 X3 + ε4
Coefficientsa
1.457 4.301 .339 .736.645 .126 .526 5.125 .000.517 .130 .408 3.975 .000
(Constant)Self-EfficacyUpaya Kerja
Model1
B Std. Error
UnstandardizedCoefficients
Beta
StandardizedCoefficients
t Sig.
Dependent Variable: Kinerjaa.
py2 = 0, 526 (nilai t = 5.125 dan nilai probabilitas (Sig.)=0.000) py3 = 0, 408 (nilai t = 3.975 dan nilai probabilitas (Sig.)=0.000)
LANJUTAN
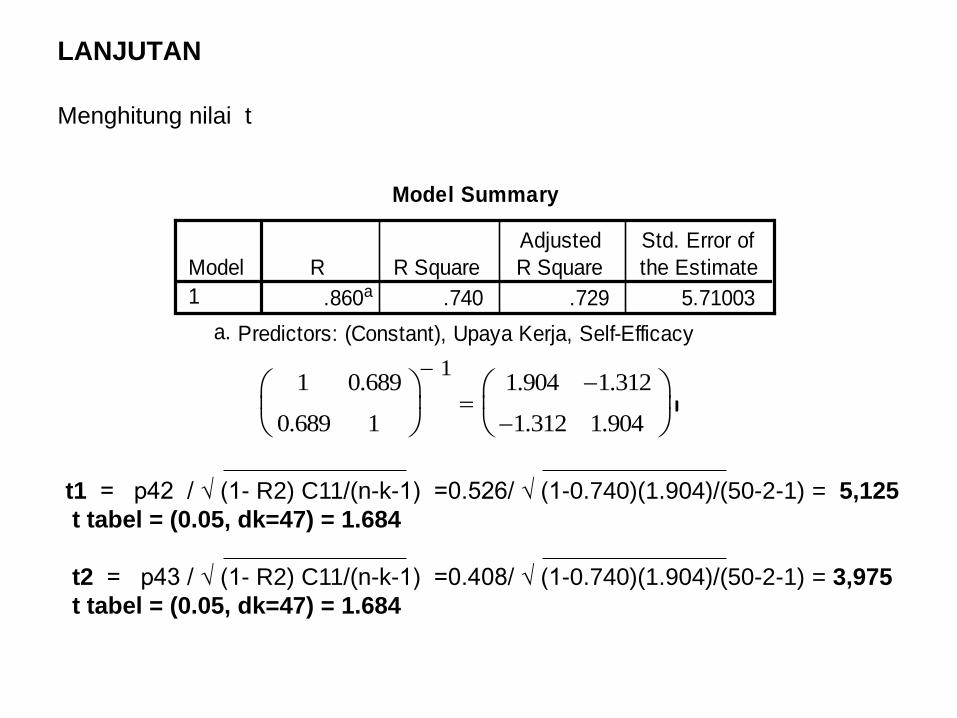
Menghitung nilai t
Model Summary
.860a .740 .729 5.71003Model1
R R SquareAdjustedR Square
Std. Error ofthe Estimate
Predictors: (Constant), Upaya Kerja, Self-Efficacya.
1
0.689
0.689
1
1− 1.904
1.312−
1.312−
1.904
=
t1 = p42 / √ (1- R2) C11/(n-k-1) =0.526/ √ (1-0.740)(1.904)/(50-2-1) = 5,125 t tabel = (0.05, dk=47) = 1.684 t2 = p43 / √ (1- R2) C11/(n-k-1) =0.408/ √ (1-0.740)(1.904)/(50-2-1) = 3,975 t tabel = (0.05, dk=47) = 1.684
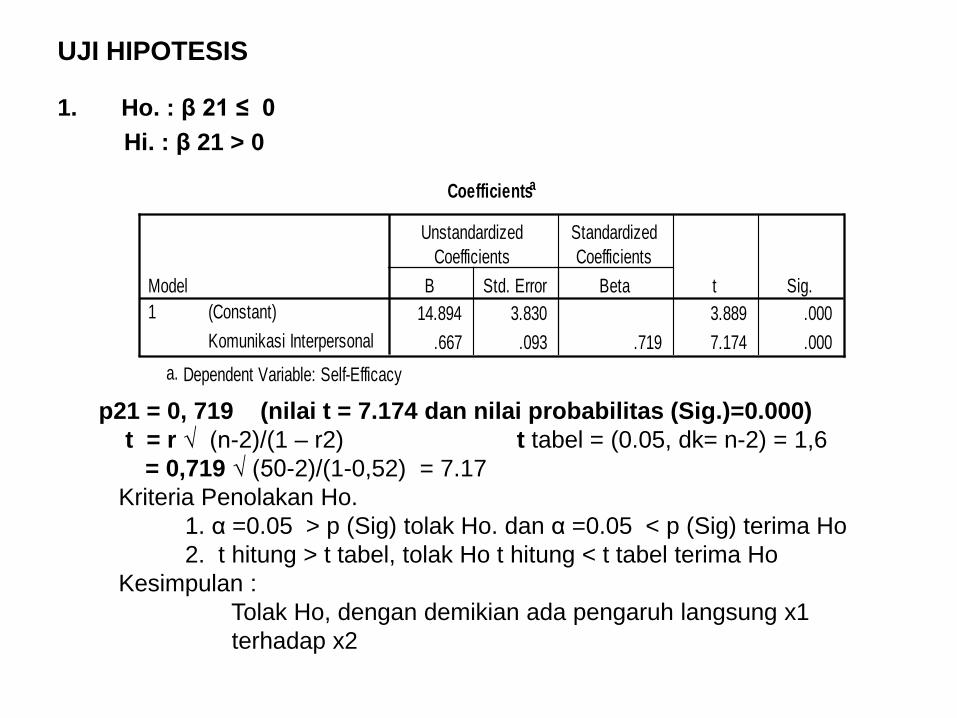
UJI HIPOTESIS
1. Ho. : β 21 ≤ 0 Hi. : β 21 > 0
Coefficientsa
14.894 3.830 3.889 .000.667 .093 .719 7.174 .000
(Constant)Komunikasi Interpersonal
Model1
B Std. Error
UnstandardizedCoefficients
Beta
StandardizedCoefficients
t Sig.
Dependent Variable: Self-Efficacya.
p21 = 0, 719 (nilai t = 7.174 dan nilai probabilitas (Sig.)=0.000) t = r √ (n-2)/(1 – r2) t tabel = (0.05, dk= n-2) = 1,6 = 0,719 √ (50-2)/(1-0,52) = 7.17 Kriteria Penolakan Ho. 1. α =0.05 > p (Sig) tolak Ho. dan α =0.05 < p (Sig) terima Ho 2. t hitung > t tabel, tolak Ho t hitung < t tabel terima Ho Kesimpulan : Tolak Ho, dengan demikian ada pengaruh langsung x1 terhadap x2
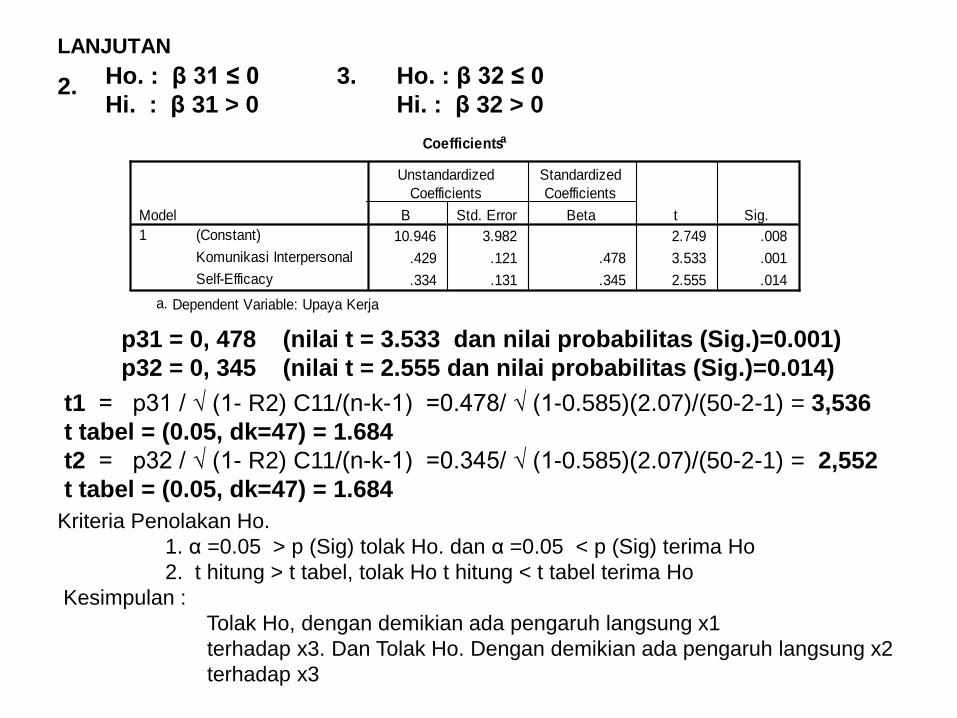
LANJUTAN
2. Ho. : β 31 ≤ 0 Hi. : β 31 > 0
Coefficientsa
10.946 3.982 2.749 .008.429 .121 .478 3.533 .001.334 .131 .345 2.555 .014
(Constant)Komunikasi InterpersonalSelf-Efficacy
Model1
B Std. Error
UnstandardizedCoefficients
Beta
StandardizedCoefficients
t Sig.
Dependent Variable: Upaya Kerjaa.
p31 = 0, 478 (nilai t = 3.533 dan nilai probabilitas (Sig.)=0.001) p32 = 0, 345 (nilai t = 2.555 dan nilai probabilitas (Sig.)=0.014)
3. Ho. : β 32 ≤ 0 Hi. : β 32 > 0
t1 = p31 / √ (1- R2) C11/(n-k-1) =0.478/ √ (1-0.585)(2.07)/(50-2-1) = 3,536 t tabel = (0.05, dk=47) = 1.684 t2 = p32 / √ (1- R2) C11/(n-k-1) =0.345/ √ (1-0.585)(2.07)/(50-2-1) = 2,552 t tabel = (0.05, dk=47) = 1.684 Kriteria Penolakan Ho. 1. α =0.05 > p (Sig) tolak Ho. dan α =0.05 < p (Sig) terima Ho 2. t hitung > t tabel, tolak Ho t hitung < t tabel terima Ho Kesimpulan : Tolak Ho, dengan demikian ada pengaruh langsung x1 terhadap x3. Dan Tolak Ho. Dengan demikian ada pengaruh langsung x2 terhadap x3
LANJUTAN
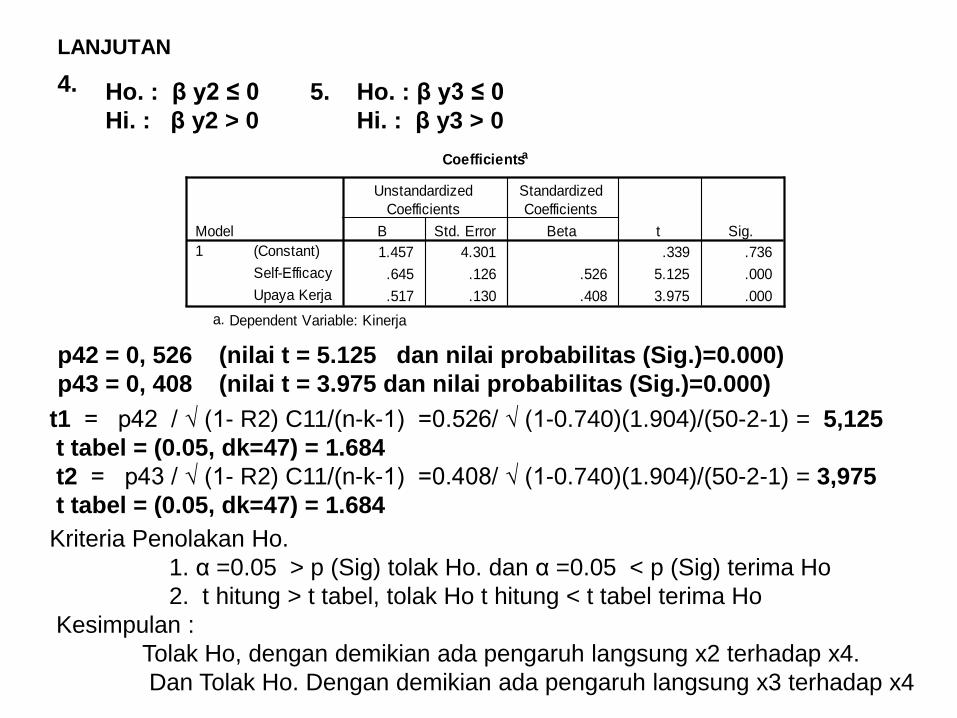
4. Ho. : β y2 ≤ 0 Hi. : β y2 > 0
5. Ho. : β y3 ≤ 0 Hi. : β y3 > 0
Coefficientsa
1.457 4.301 .339 .736.645 .126 .526 5.125 .000.517 .130 .408 3.975 .000
(Constant)Self-EfficacyUpaya Kerja
Model1
B Std. Error
UnstandardizedCoefficients
Beta
StandardizedCoefficients
t Sig.
Dependent Variable: Kinerjaa.
p42 = 0, 526 (nilai t = 5.125 dan nilai probabilitas (Sig.)=0.000) p43 = 0, 408 (nilai t = 3.975 dan nilai probabilitas (Sig.)=0.000)
t1 = p42 / √ (1- R2) C11/(n-k-1) =0.526/ √ (1-0.740)(1.904)/(50-2-1) = 5,125 t tabel = (0.05, dk=47) = 1.684 t2 = p43 / √ (1- R2) C11/(n-k-1) =0.408/ √ (1-0.740)(1.904)/(50-2-1) = 3,975 t tabel = (0.05, dk=47) = 1.684 Kriteria Penolakan Ho. 1. α =0.05 > p (Sig) tolak Ho. dan α =0.05 < p (Sig) terima Ho 2. t hitung > t tabel, tolak Ho t hitung < t tabel terima Ho Kesimpulan : Tolak Ho, dengan demikian ada pengaruh langsung x2 terhadap x4. Dan Tolak Ho. Dengan demikian ada pengaruh langsung x3 terhadap x4
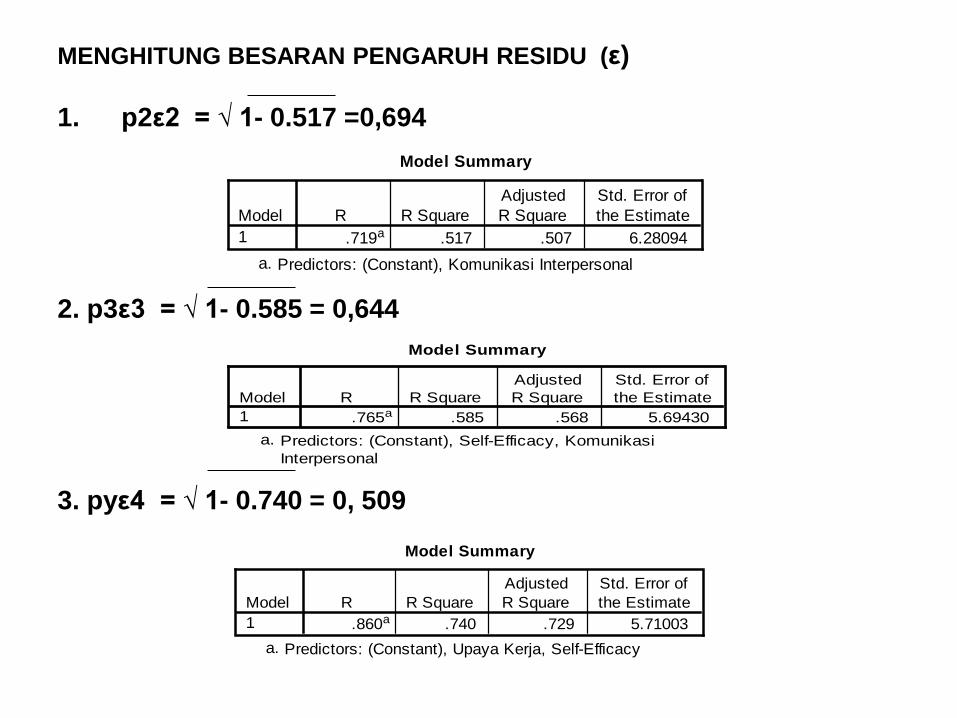
MENGHITUNG BESARAN PENGARUH RESIDU (ε)
1. p2ε2 = √ 1- 0.517 =0,694 2. p3ε3 = √ 1- 0.585 = 0,644 3. pyε4 = √ 1- 0.740 = 0, 509
Model Summary
.719a .517 .507 6.28094Model1
R R SquareAdjustedR Square
Std. Error ofthe Estimate
Predictors: (Constant), Komunikasi Interpersonala.
Model Summary
.765a .585 .568 5.69430Model1
R R SquareAdjustedR Square
Std. Error ofthe Estimate
Predictors: (Constant), Self-Efficacy, KomunikasiInterpersonal
a.
Model Summary
.860a .740 .729 5.71003Model1
R R SquareAdjustedR Square
Std. Error ofthe Estimate
Predictors: (Constant), Upaya Kerja, Self-Efficacya.
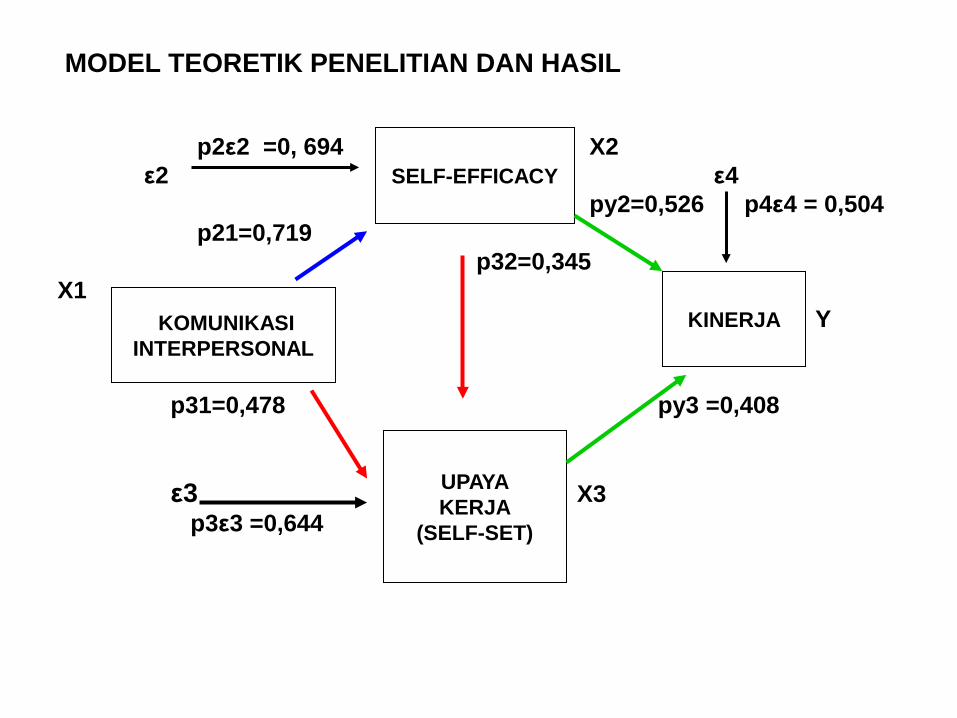
MODEL TEORETIK PENELITIAN DAN HASIL
p2ε2 =0, 694 X2 ε2 ε4 py2=0,526 p4ε4 = 0,504 p21=0,719 p32=0,345 X1 Y p31=0,478 py3 =0,408 ε3 X3 p3ε3 =0,644
SELF-EFFICACY
KOMUNIKASI INTERPERSONAL
UPAYA KERJA
(SELF-SET)
KINERJA
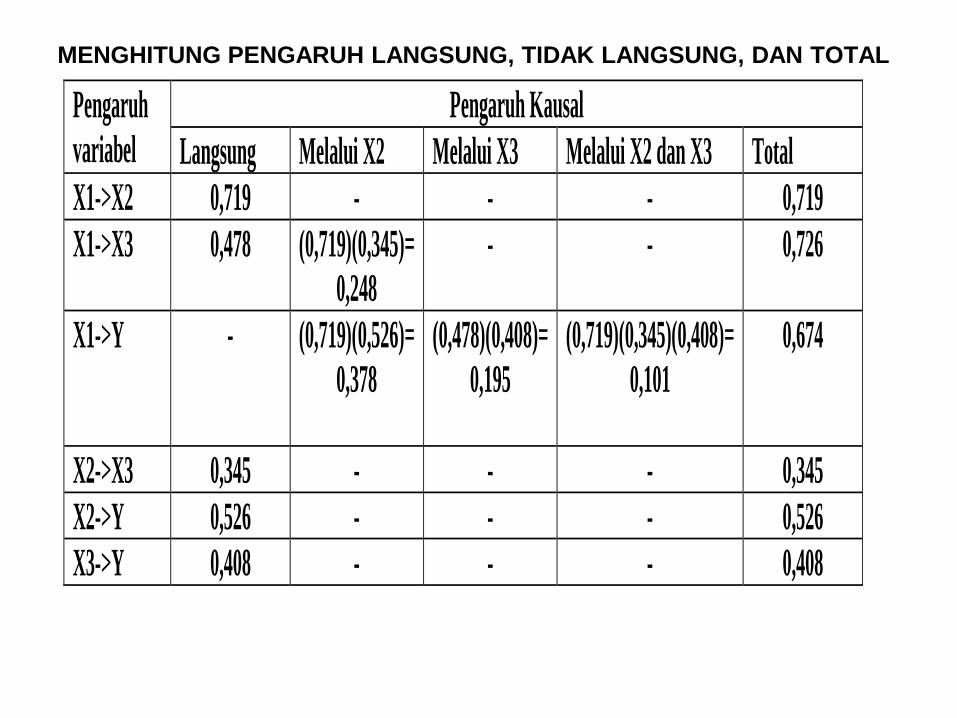
MENGHITUNG PENGARUH LANGSUNG, TIDAK LANGSUNG, DAN TOTAL
Pengaruh variabel
Pengaruh Kausal Langsung Melalui X2 Melalui X3 Melalui X2 dan X3 Total
X1->X2 0,719 - - - 0,719 X1->X3 0,478 (0,719)(0,345)=
0,248 - - 0,726
X1->Y - (0,719)(0,526)= 0,378
(0,478)(0,408)= 0,195
(0,719)(0,345)(0,408)= 0,101
0,674
X2->X3 0,345 - - - 0,345 X2->Y 0,526 - - - 0,526 X3->Y 0,408 - - - 0,408
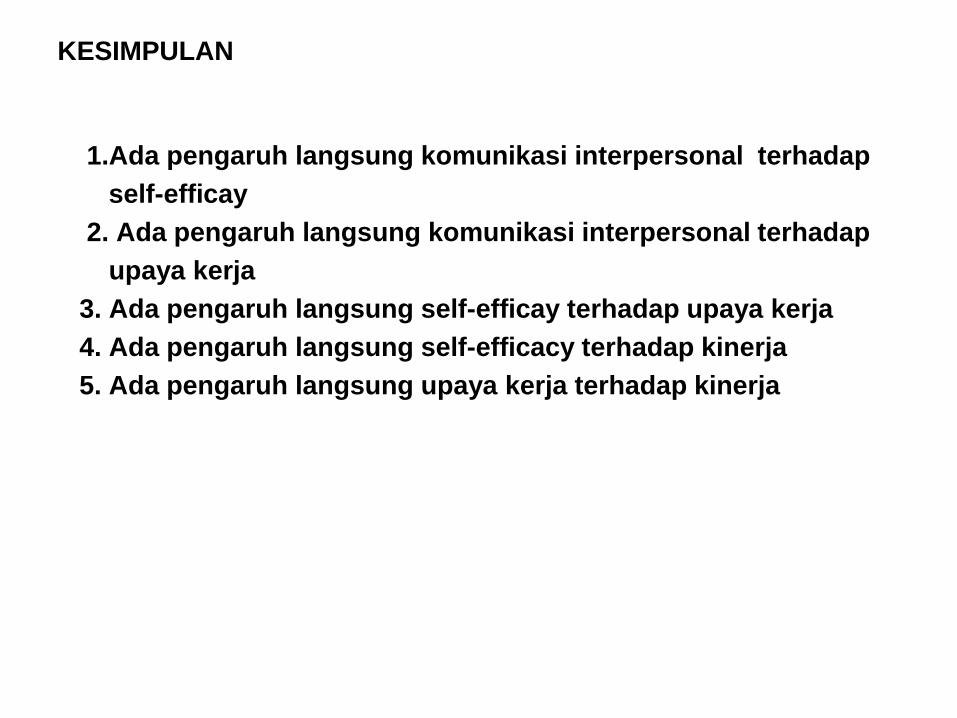
KESIMPULAN
1.Ada pengaruh langsung komunikasi interpersonal terhadap self-efficay 2. Ada pengaruh langsung komunikasi interpersonal terhadap upaya kerja 3. Ada pengaruh langsung self-efficay terhadap upaya kerja 4. Ada pengaruh langsung self-efficacy terhadap kinerja 5. Ada pengaruh langsung upaya kerja terhadap kinerja
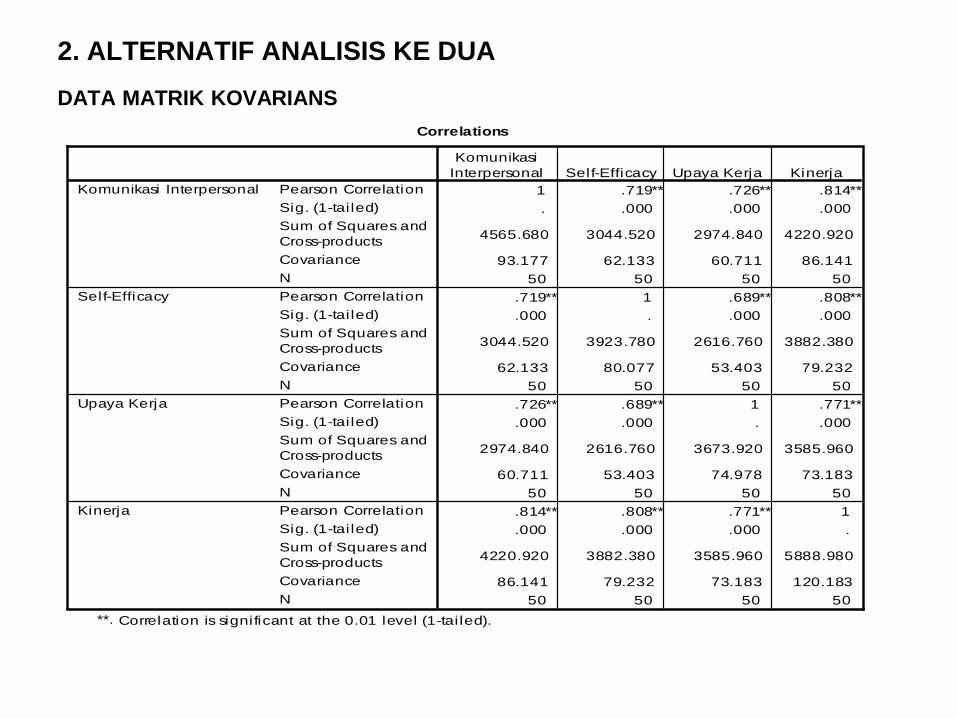
2. ALTERNATIF ANALISIS KE DUA DATA MATRIK KOVARIANS
Correlations
1 .719** .726** .814**. .000 .000 .000
4565.680 3044.520 2974.840 4220.920
93.177 62.133 60.711 86.14150 50 50 50
.719** 1 .689** .808**
.000 . .000 .000
3044.520 3923.780 2616.760 3882.380
62.133 80.077 53.403 79.23250 50 50 50
.726** .689** 1 .771**
.000 .000 . .000
2974.840 2616.760 3673.920 3585.960
60.711 53.403 74.978 73.18350 50 50 50
.814** .808** .771** 1
.000 .000 .000 .
4220.920 3882.380 3585.960 5888.980
86.141 79.232 73.183 120.18350 50 50 50
Pearson CorrelationSig. (1-tai led)Sum of Squares andCross-productsCovarianceNPearson CorrelationSig. (1-tai led)Sum of Squares andCross-productsCovarianceNPearson CorrelationSig. (1-tai led)Sum of Squares andCross-productsCovarianceNPearson CorrelationSig. (1-tai led)Sum of Squares andCross-productsCovarianceN
Komunikasi Interpersonal
Self-Efficacy
Upaya Kerja
Kinerja
KomunikasiInterpersonal Self-Efficacy Upaya Kerja Kinerja
Correlation is significant at the 0.01 level (1-tai led).**.
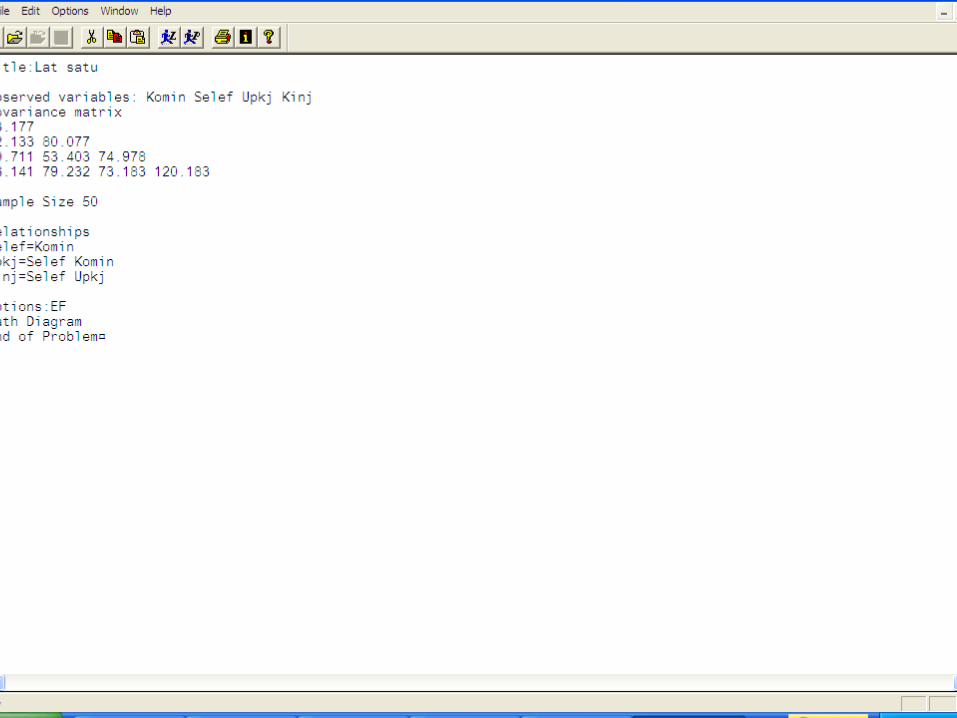
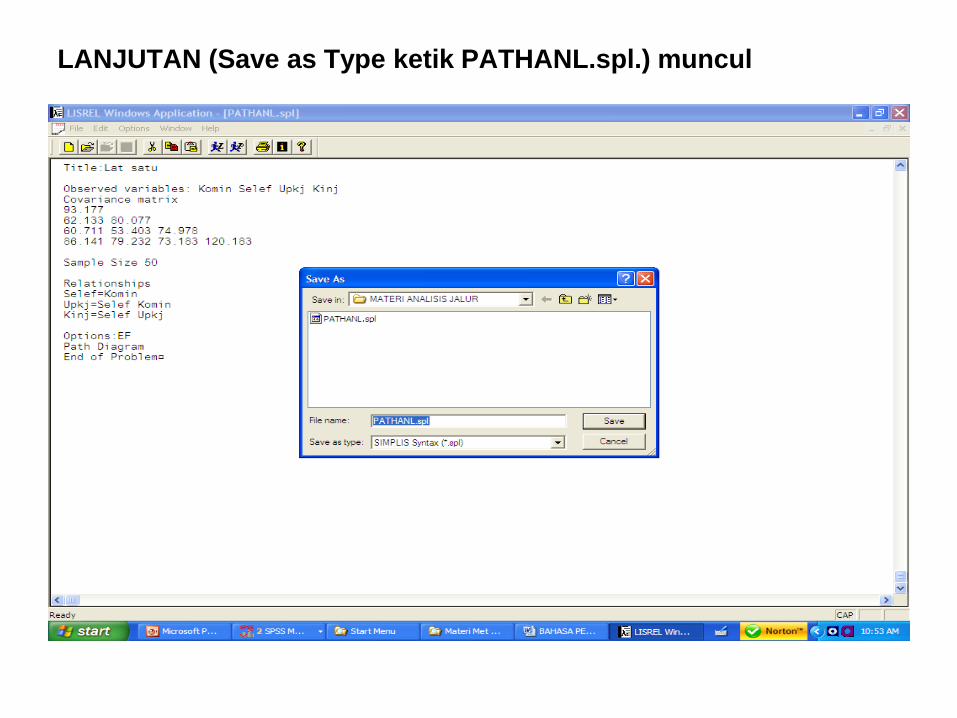
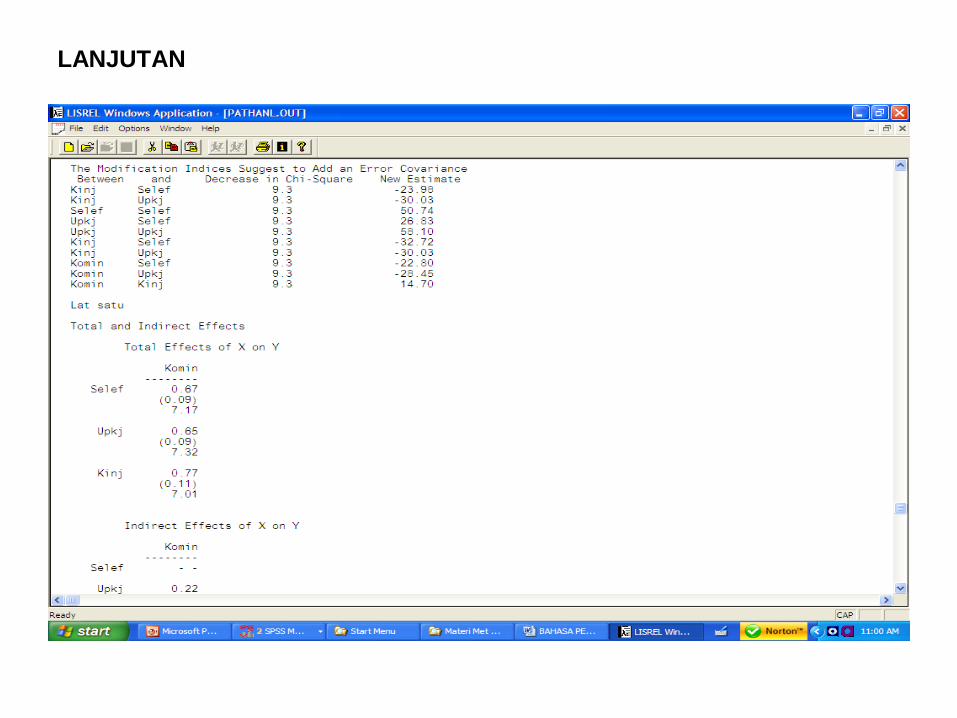
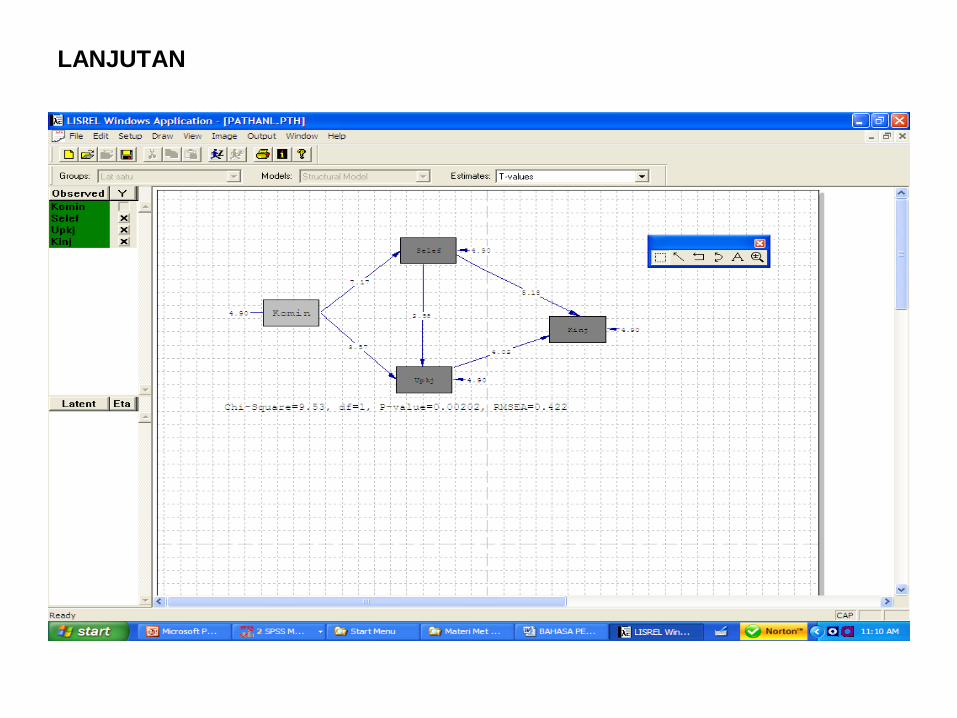
LANJUTAN (Save as Type ketik PATHANL.spl.) muncul
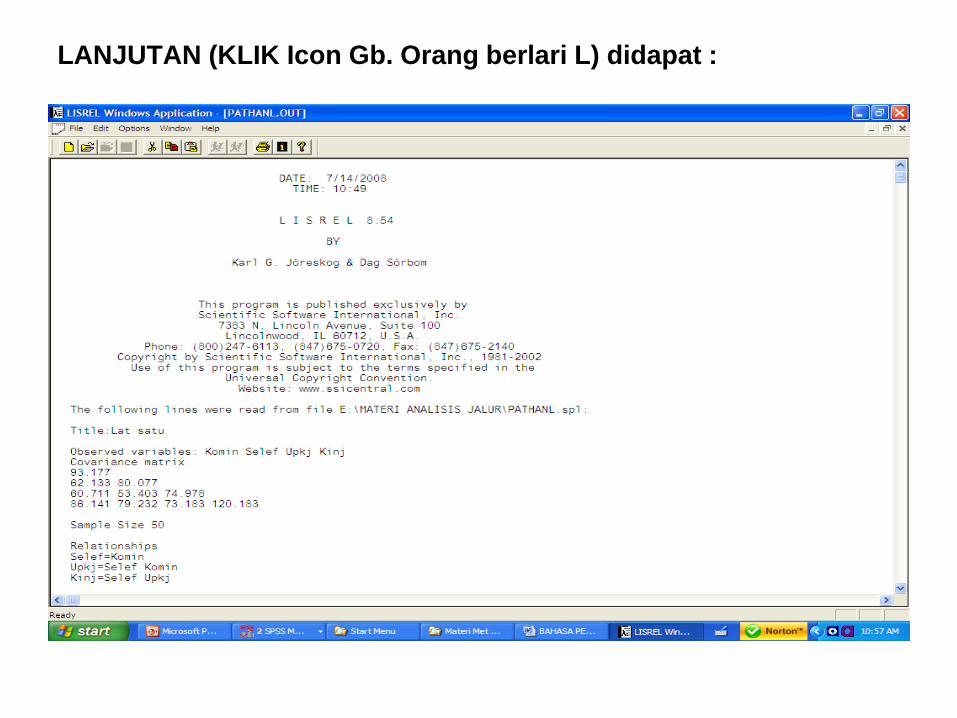
LANJUTAN (KLIK Icon Gb. Orang berlari L) didapat :
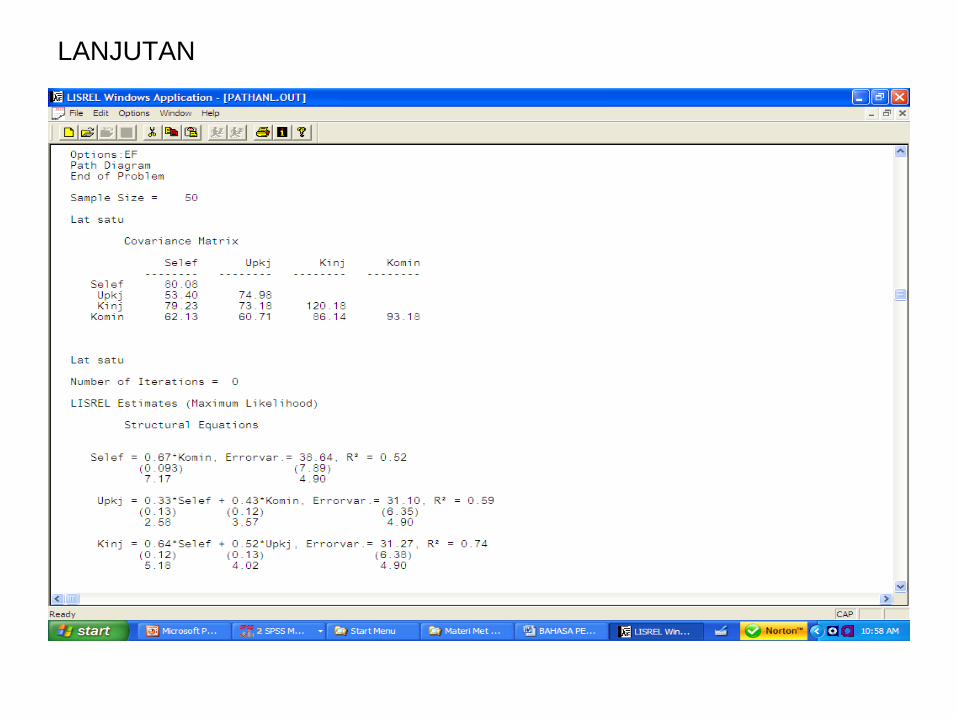
LANJUTAN
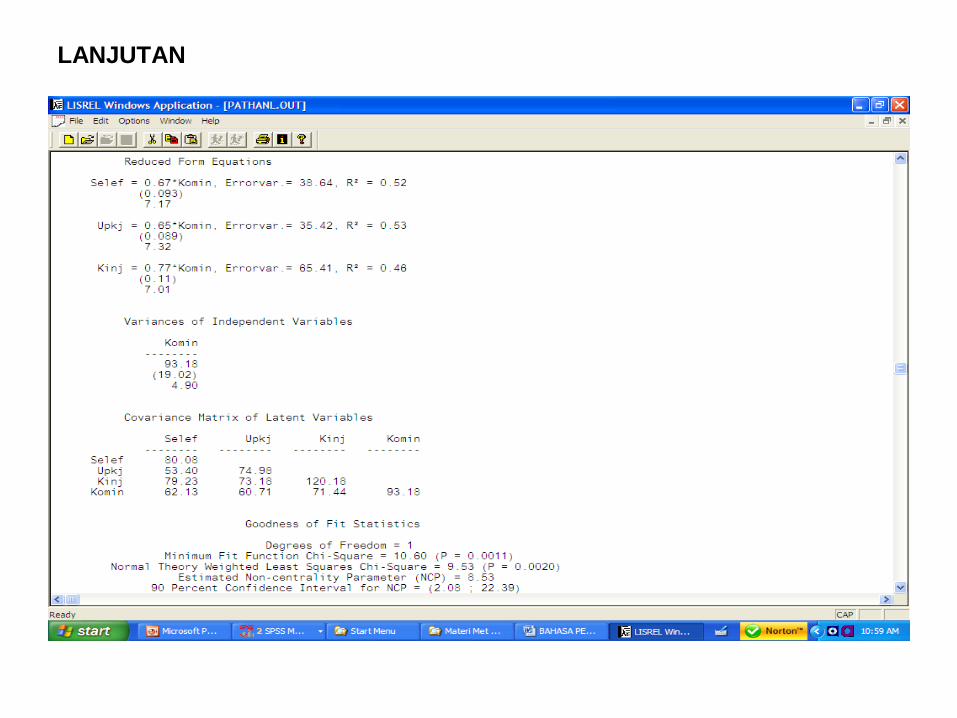
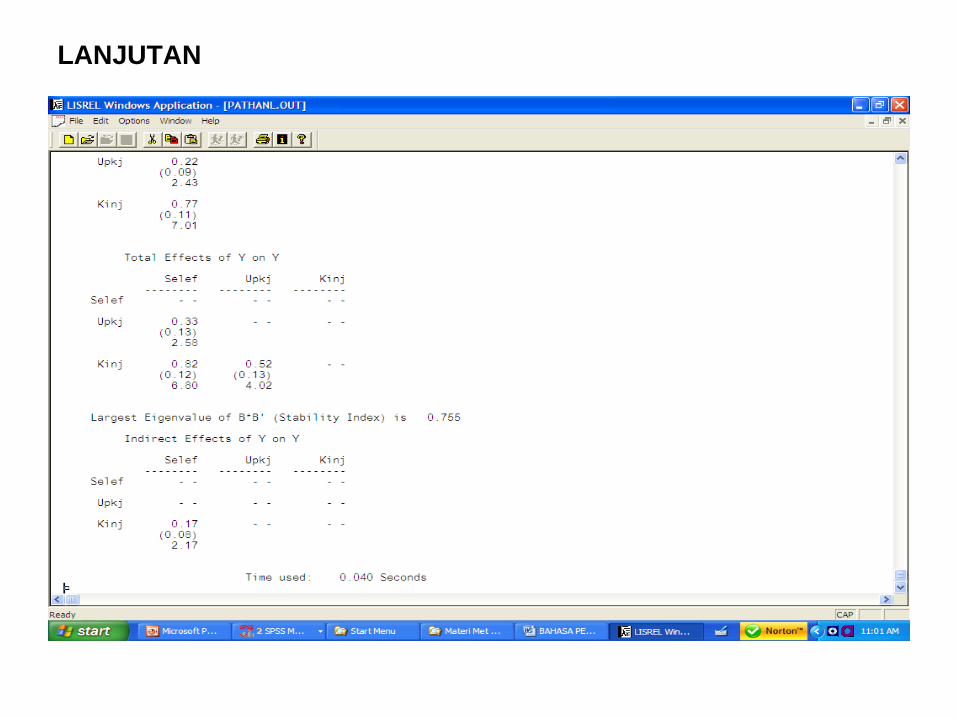
LANJUTAN
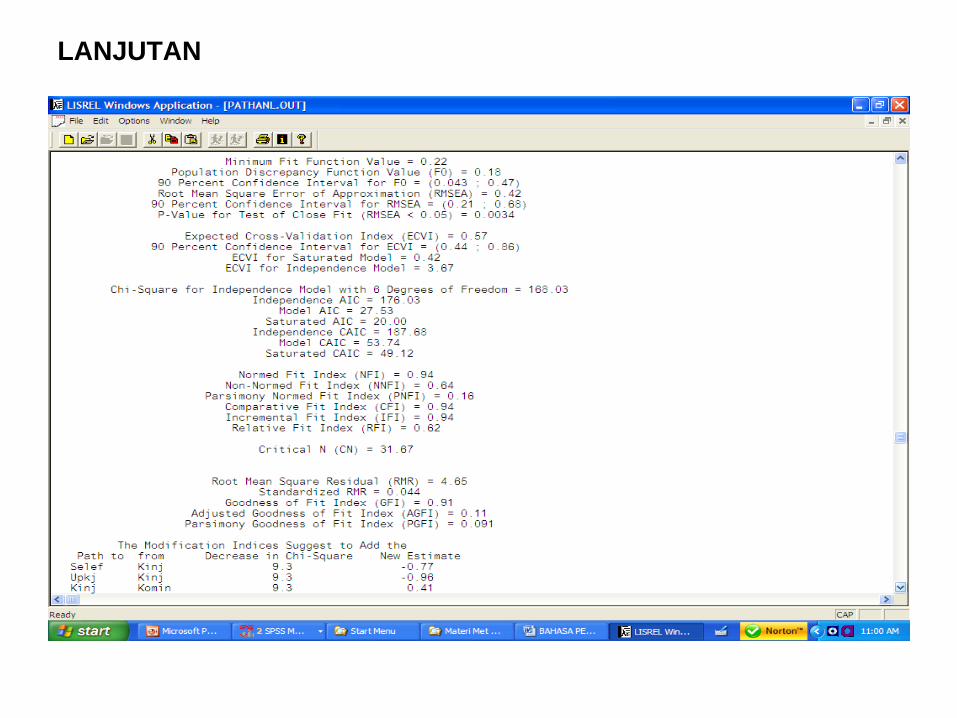
LANJUTAN
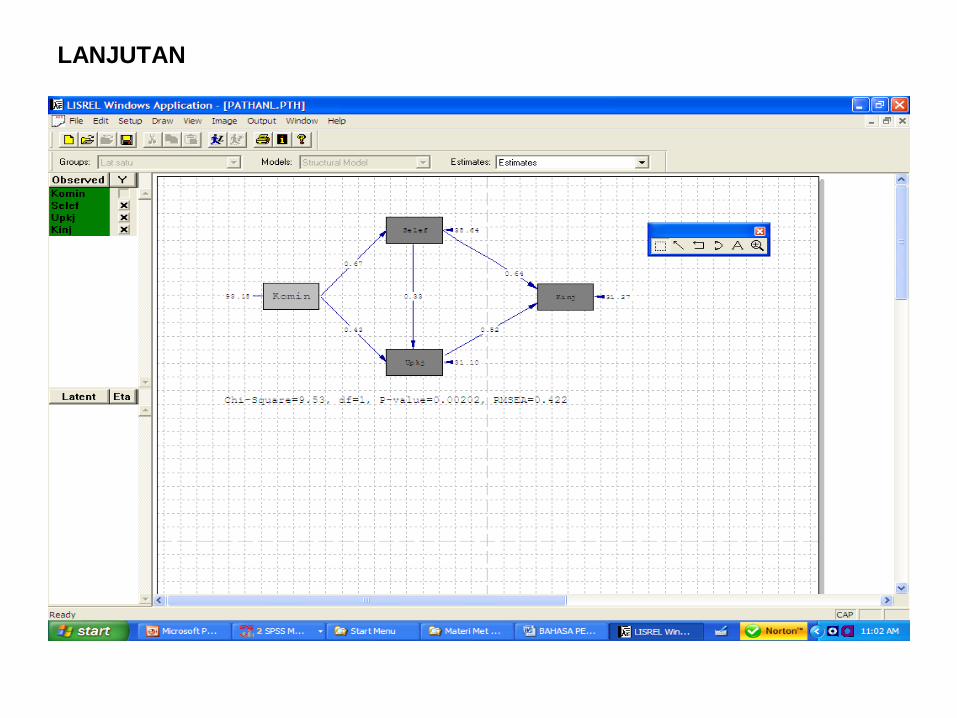
LANJUTAN
LANJUTAN
LANJUTAN
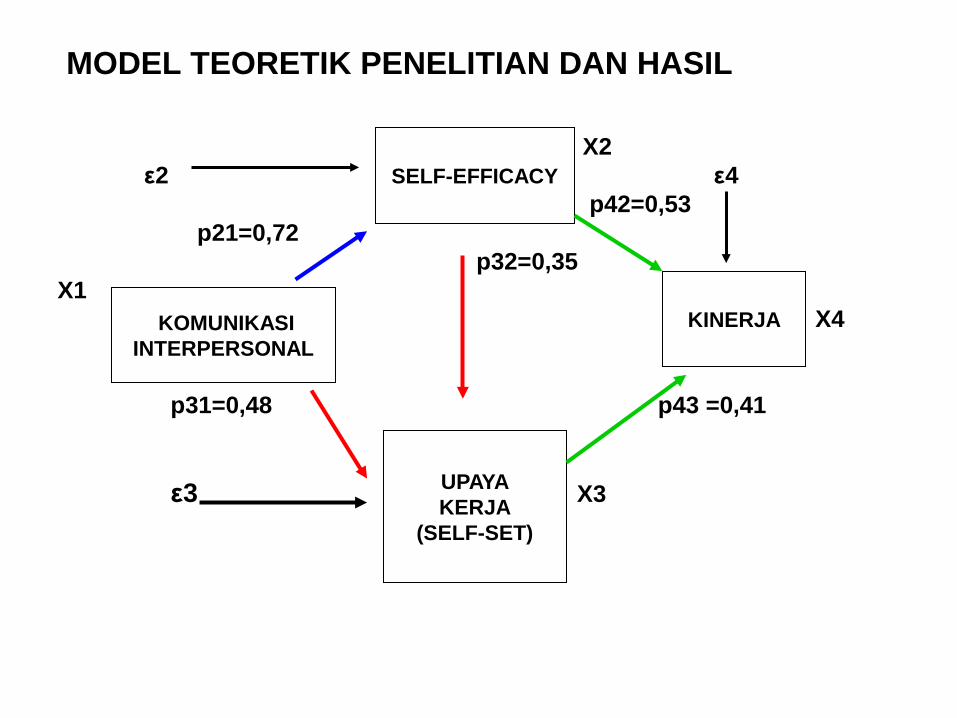
MODEL TEORETIK PENELITIAN DAN HASIL
X2 ε2 ε4 p42=0,53 p21=0,72 p32=0,35 X1 X4 p31=0,48 p43 =0,41 ε3 X3
SELF-EFFICACY
KOMUNIKASI INTERPERSONAL
UPAYA KERJA
(SELF-SET)
KINERJA
LANJUTAN
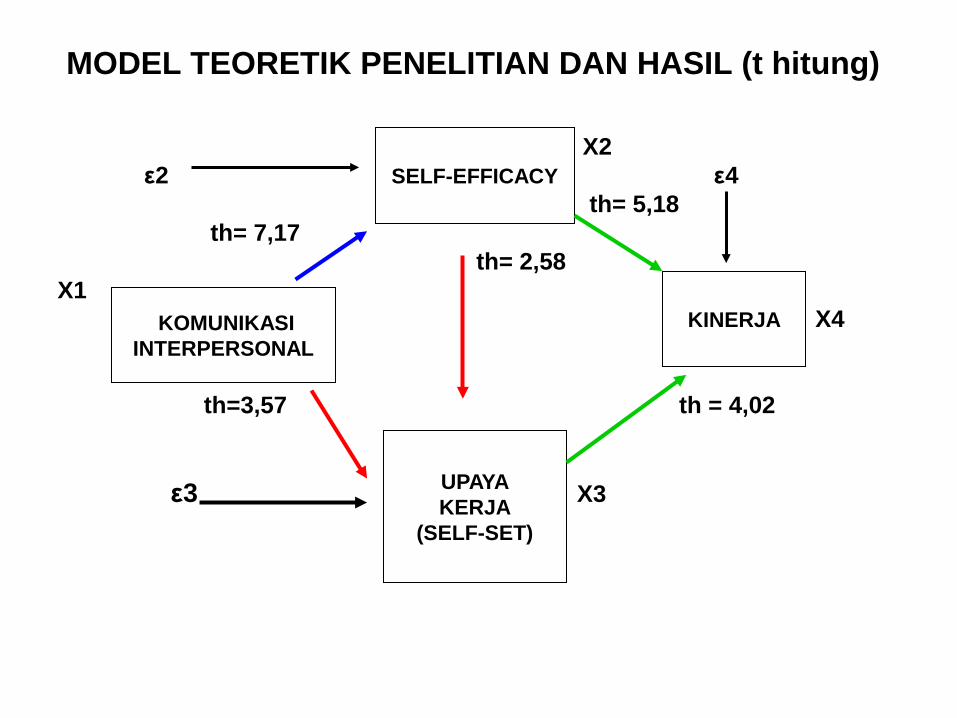
MODEL TEORETIK PENELITIAN DAN HASIL (t hitung)
X2 ε2 ε4 th= 5,18 th= 7,17 th= 2,58 X1 X4 th=3,57 th = 4,02 ε3 X3
SELF-EFFICACY
KOMUNIKASI INTERPERSONAL
UPAYA KERJA
(SELF-SET)
KINERJA
DAFTAR PUSTAKA Elazar J.Pedhazur. Multiple Regression in Behavioral
Research. (New York: CBS College Publishing, 1982) Randall E. Schumacker, Richard G.Lomax. A
Beginner’s Guide to Structural Equation Modeling (New York: Taylor & Francis Group, 2004)
Petter Cuttance. Structural Modeling by Example
Applications in Educational, Sociological, and Behavioral Research (New York: Cambridge University Press, 2009)

SELAMAT MENCOBA